
| 2023-12-31 | 2023-09-30 | 2023-06-30 | 2023-03-31 | 2022-12-31 | 2022-09-30 | 2022-06-30 | 2022-03-31 | 2021-12-31 | 2021-09-30 | 2021-06-30 | 2021-03-31 | 2020-12-31 | 2020-09-30 | 2020-06-30 | 2020-03-31 | 2019-12-31 | 2019-09-30 | 2019-06-30 | 2019-03-31 | 2018-12-31 | 2018-09-30 | 2018-06-30 | 2018-03-31 | 2017-12-31 | 2017-09-30 | 2017-06-30 | 2017-03-31 | ||
|---|---|---|---|---|---|---|---|---|---|---|---|---|---|---|---|---|---|---|---|---|---|---|---|---|---|---|---|---|---|
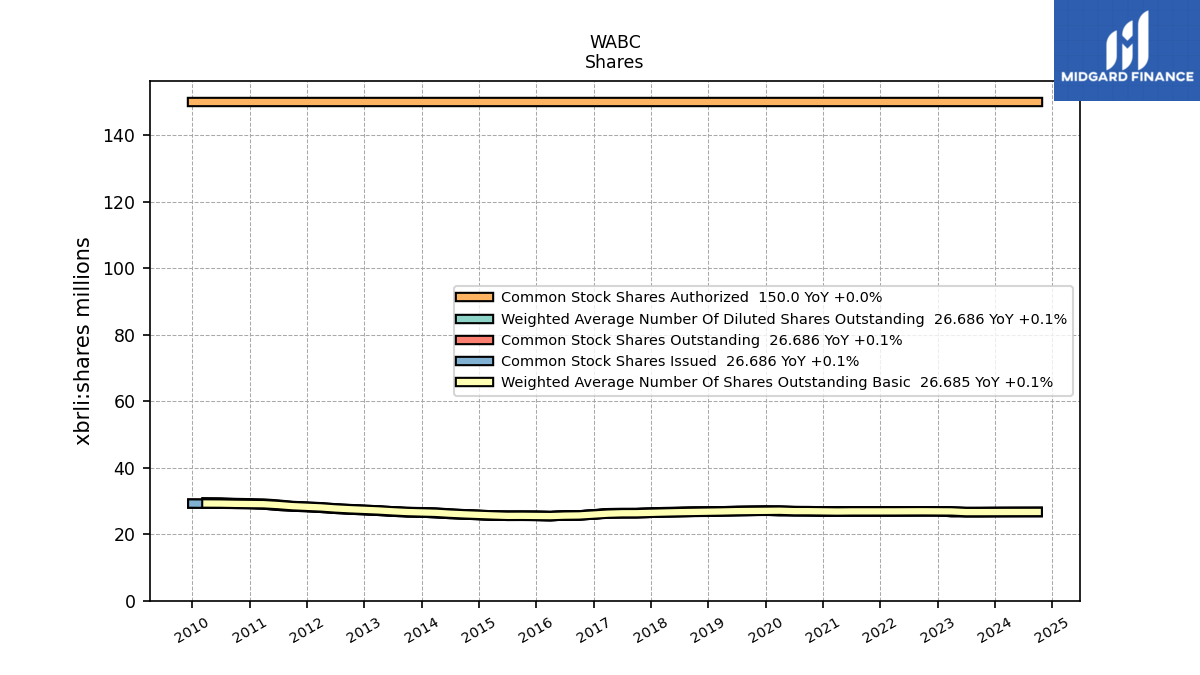
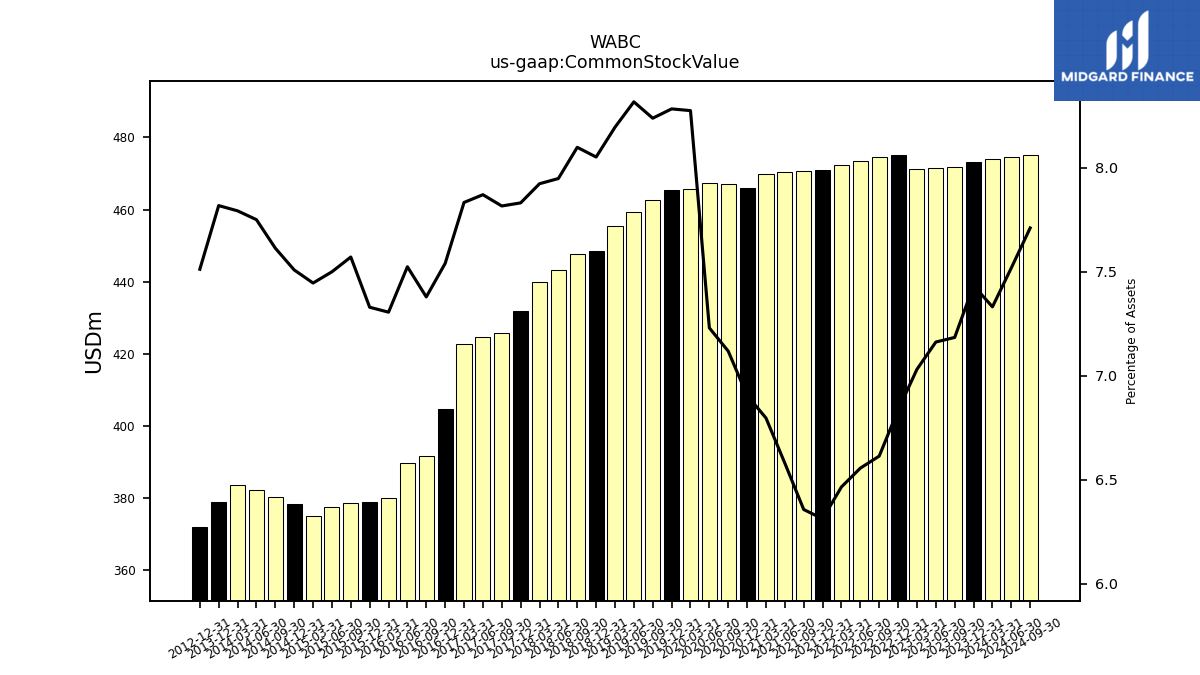
| Common Stock Value | 473.14 | 471.83 | 471.48 | 471.12 | 475.09 | 474.70 | 473.52 | 472.44 | 471.01 | 470.68 | 470.33 | 469.85 | 466.01 | 467.20 | 467.35 | 465.70 | 465.46 | 462.65 | 459.37 | 455.30 | 448.35 | 447.79 | 443.34 | 439.82 | 431.73 | 425.65 | 424.48 | 422.67 | |
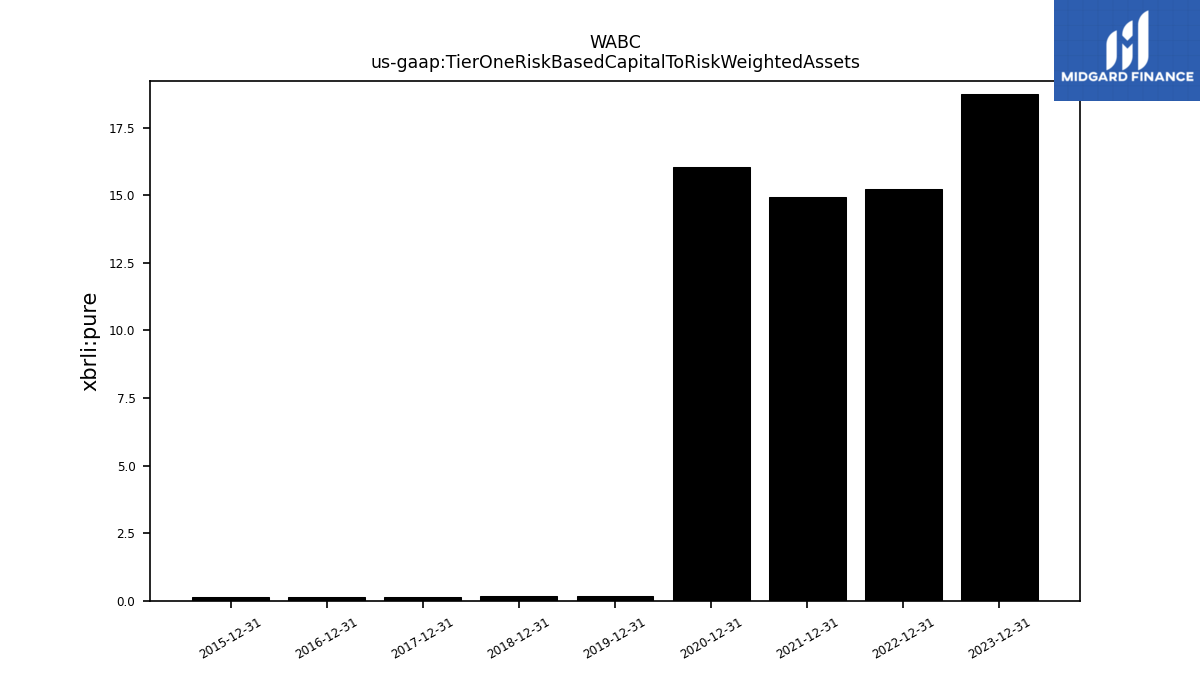
| Tier One Risk Based Capital To Risk Weighted Assets | 0.00 | NA | NA | NA | 0.00 | NA | NA | NA | 0.00 | NA | NA | NA | 0.00 | NA | NA | NA | 0.00 | NA | NA | NA | 0.00 | NA | NA | NA | 0.00 | NA | NA | NA | |
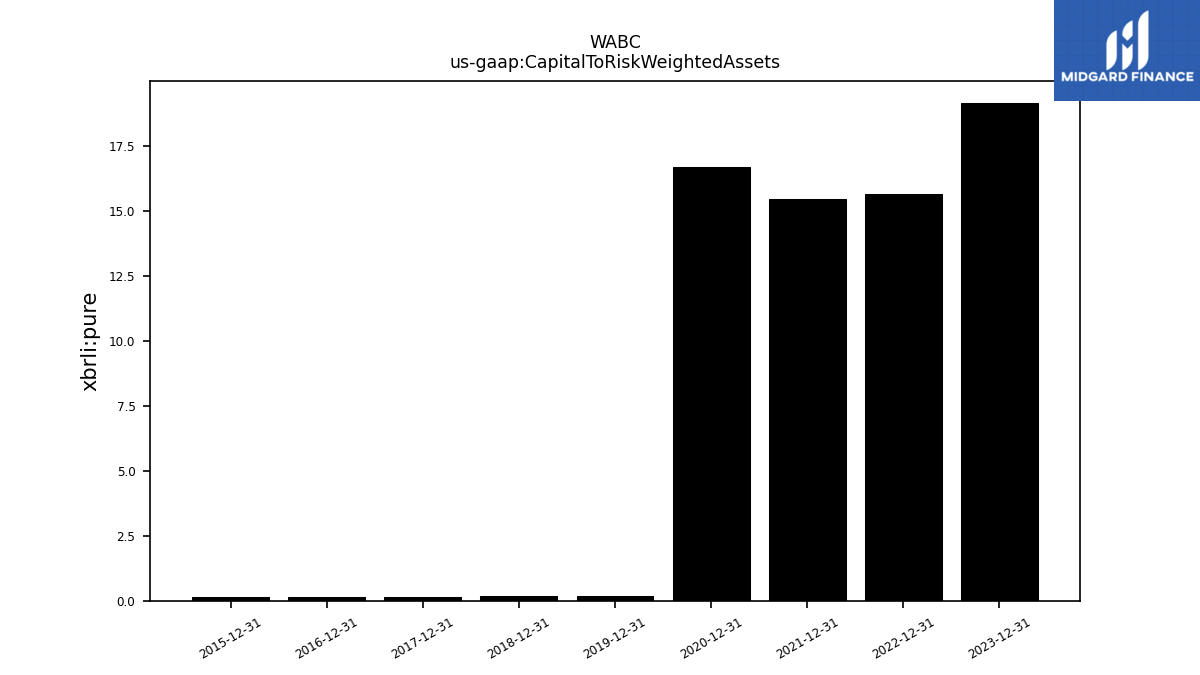
| Capital To Risk Weighted Assets | 0.00 | NA | NA | NA | 0.00 | NA | NA | NA | 0.00 | NA | NA | NA | 0.00 | NA | NA | NA | 0.00 | NA | NA | NA | 0.00 | NA | NA | NA | 0.00 | NA | NA | NA |
| 2023-12-31 | 2023-09-30 | 2023-06-30 | 2023-03-31 | 2022-12-31 | 2022-09-30 | 2022-06-30 | 2022-03-31 | 2021-12-31 | 2021-09-30 | 2021-06-30 | 2021-03-31 | 2020-12-31 | 2020-09-30 | 2020-06-30 | 2020-03-31 | 2019-12-31 | 2019-09-30 | 2019-06-30 | 2019-03-31 | 2018-12-31 | 2018-09-30 | 2018-06-30 | 2018-03-31 | 2017-12-31 | 2017-09-30 | 2017-06-30 | 2017-03-31 | ||
|---|---|---|---|---|---|---|---|---|---|---|---|---|---|---|---|---|---|---|---|---|---|---|---|---|---|---|---|---|---|
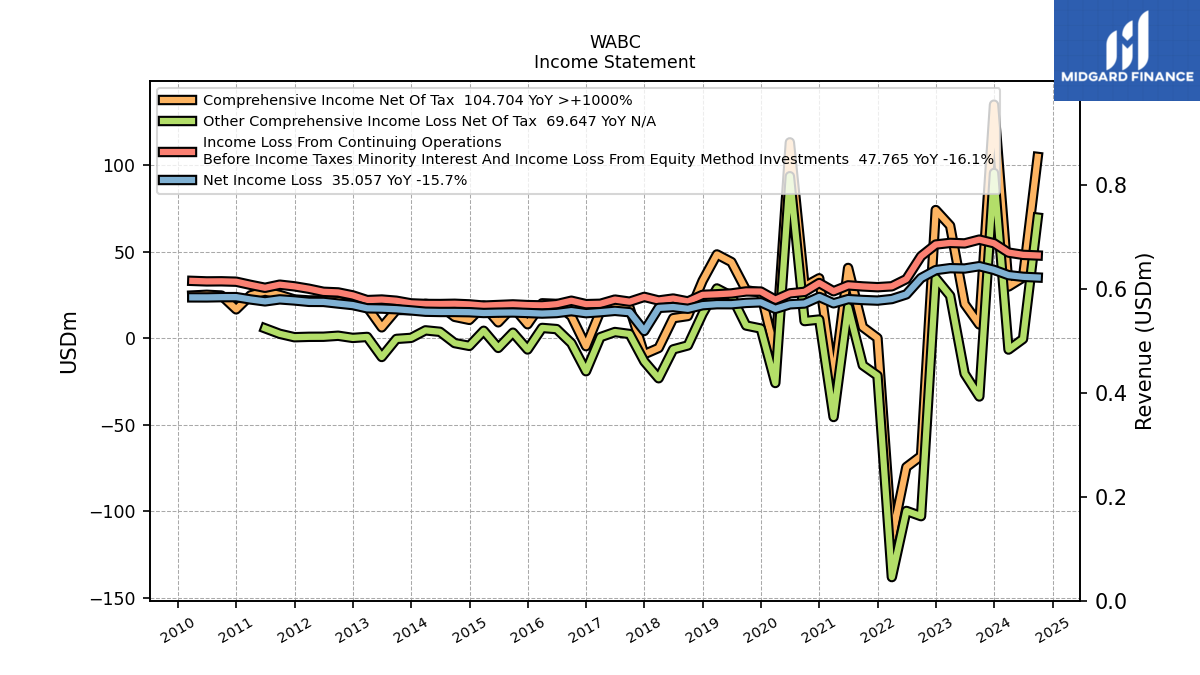
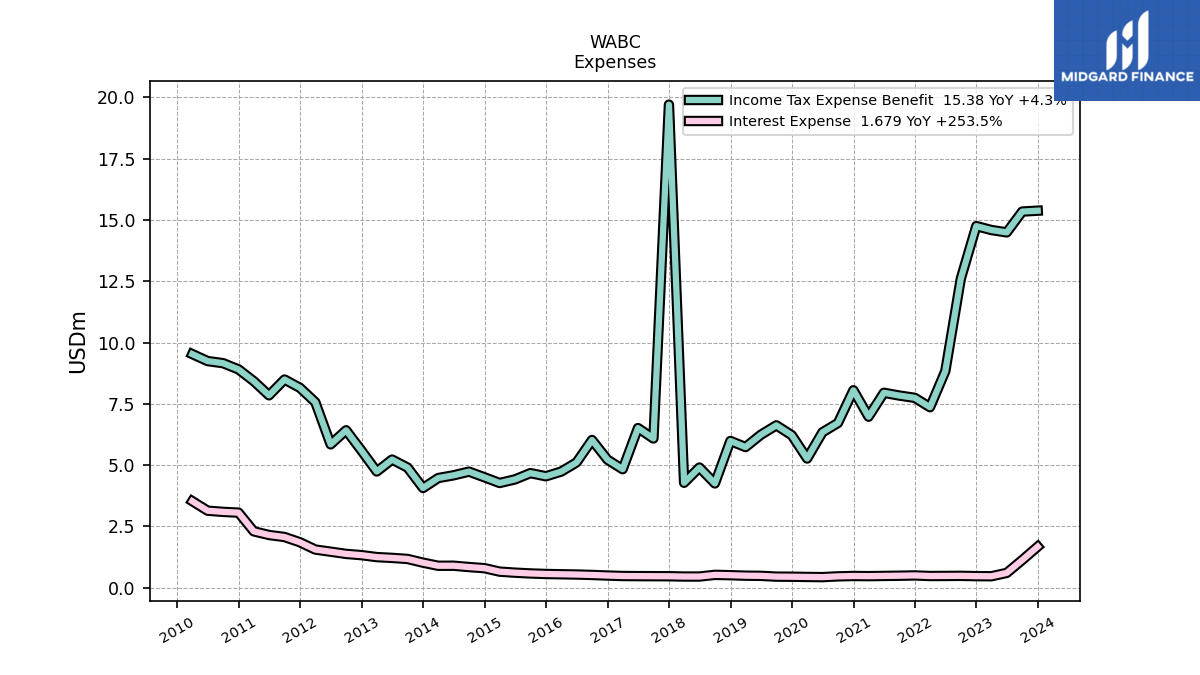
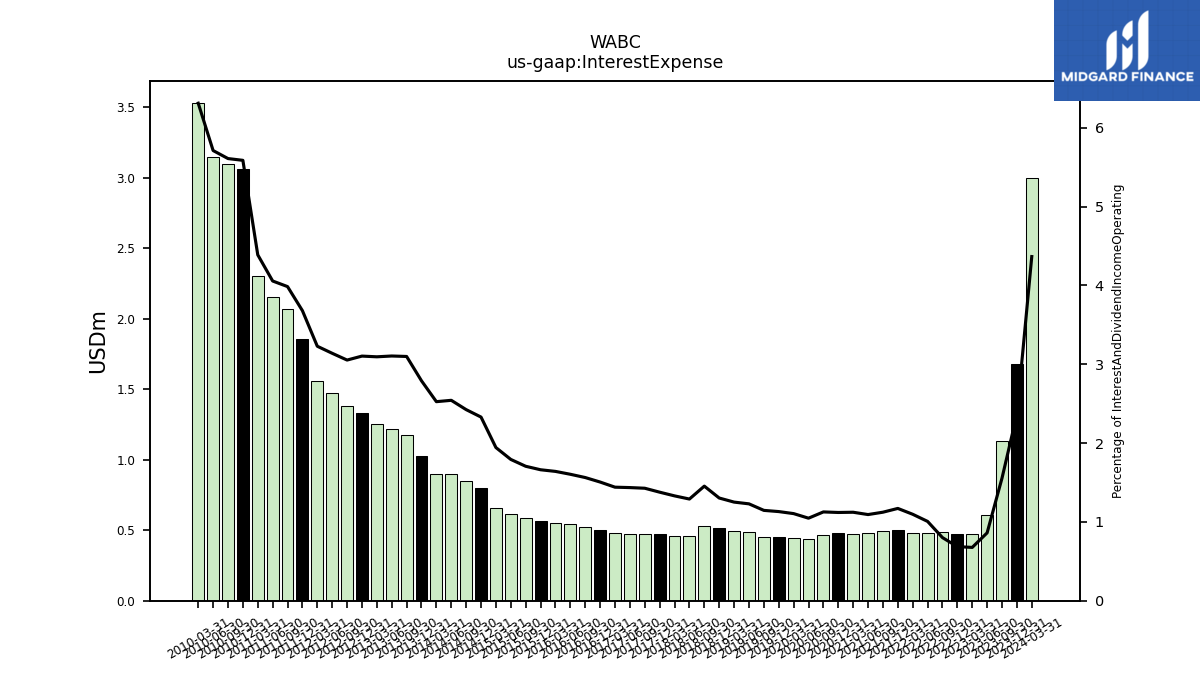
| Interest Expense | 1.68 | 1.13 | 0.61 | 0.47 | 0.47 | 0.49 | 0.48 | 0.48 | 0.50 | 0.49 | 0.48 | 0.47 | 0.48 | 0.47 | 0.43 | 0.44 | 0.45 | 0.46 | 0.49 | 0.49 | 0.51 | 0.53 | 0.46 | 0.46 | 0.47 | 0.47 | 0.48 | 0.48 | |
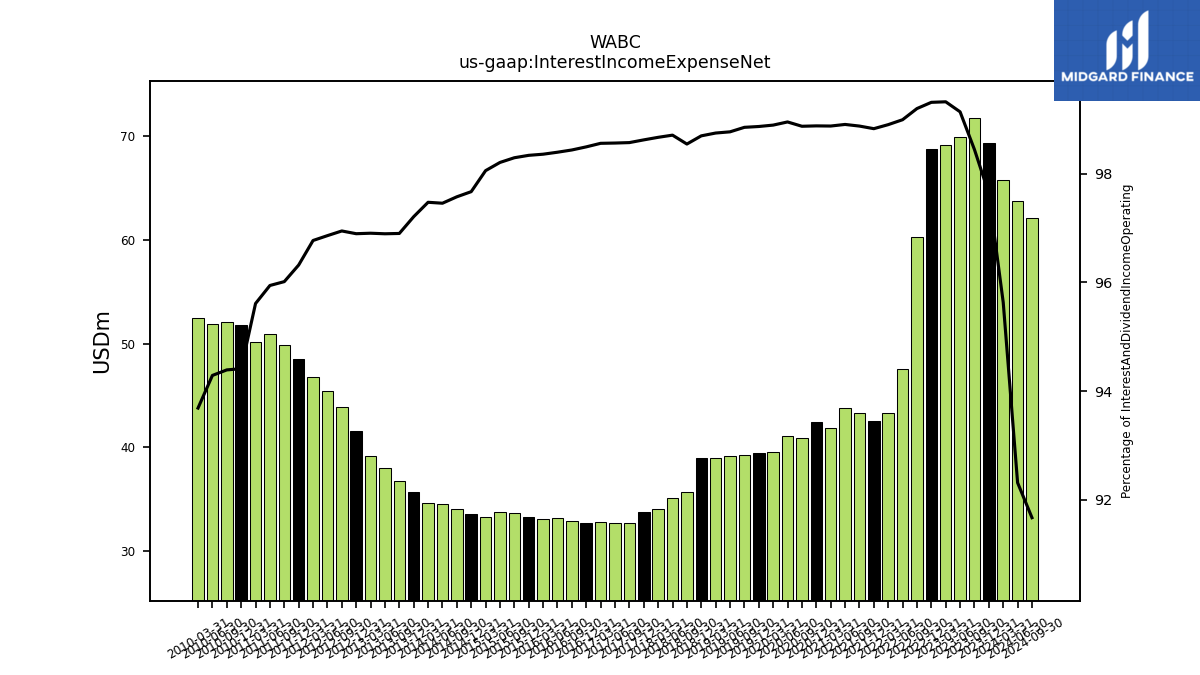
| Interest Income Expense Net | 69.37 | 71.72 | 69.88 | 69.15 | 68.72 | 60.31 | 47.51 | 43.28 | 42.54 | 43.32 | 43.79 | 41.84 | 42.48 | 40.90 | 41.10 | 39.55 | 39.43 | 39.24 | 39.14 | 38.99 | 38.93 | 35.73 | 35.12 | 34.05 | 33.73 | 32.67 | 32.69 | 32.84 | |
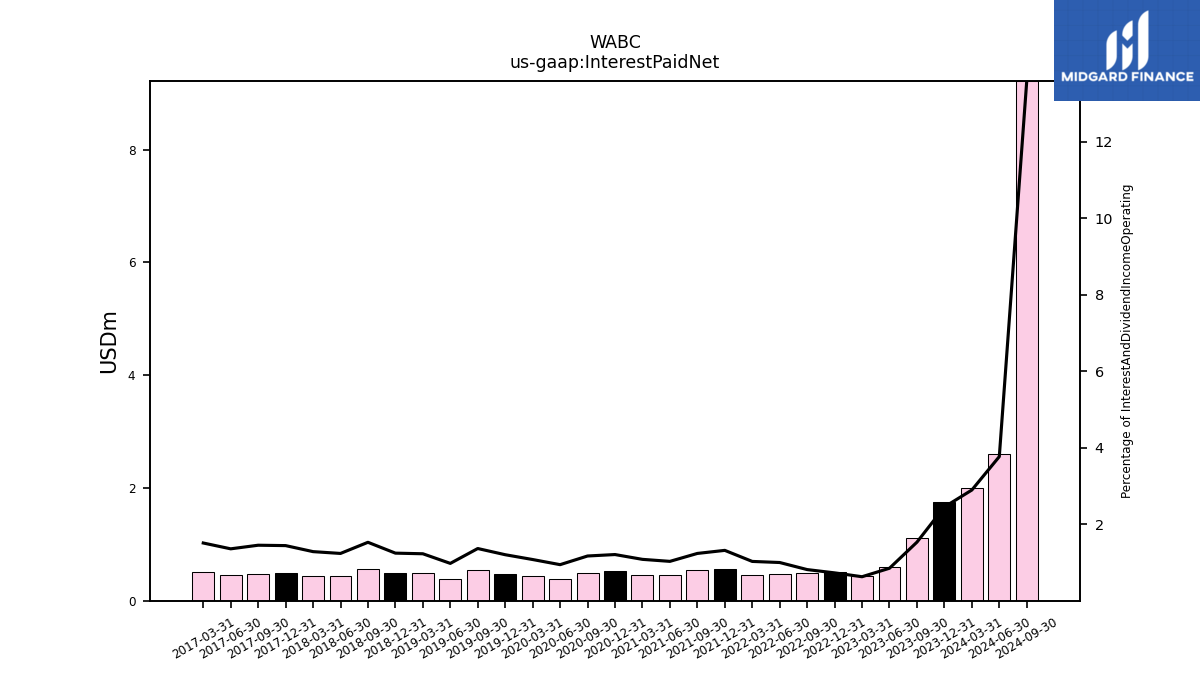
| Interest Paid Net | 1.74 | 1.12 | 0.60 | 0.44 | 0.51 | 0.50 | 0.48 | 0.45 | 0.57 | 0.54 | 0.46 | 0.46 | 0.52 | 0.48 | 0.39 | 0.43 | 0.48 | 0.54 | 0.39 | 0.49 | 0.49 | 0.56 | 0.44 | 0.44 | 0.49 | 0.48 | 0.45 | 0.50 | |
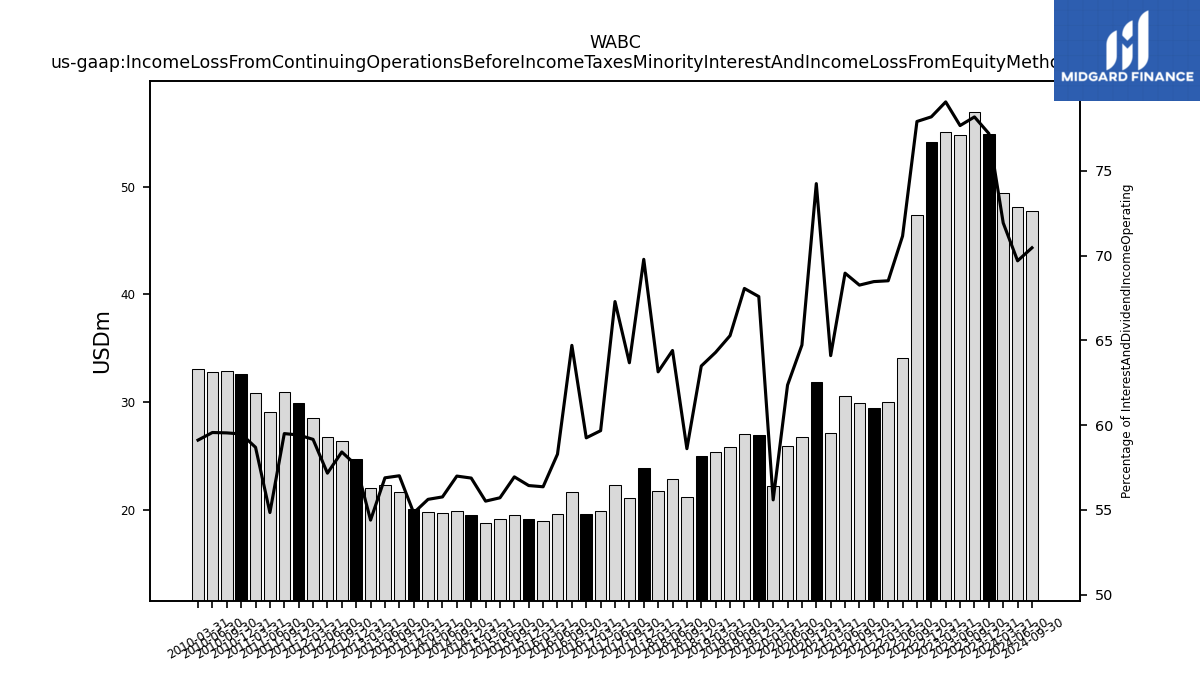
| Income Loss From Continuing Operations Before Income Taxes Minority Interest And Income Loss From Equity Method Investments | 54.85 | 56.95 | 54.74 | 55.04 | 54.10 | 47.37 | 34.15 | 29.98 | 29.47 | 29.90 | 30.53 | 27.12 | 31.89 | 26.77 | 25.90 | 22.23 | 26.95 | 27.02 | 25.87 | 25.39 | 25.04 | 21.25 | 22.91 | 21.79 | 23.87 | 21.11 | 22.31 | 19.89 | |
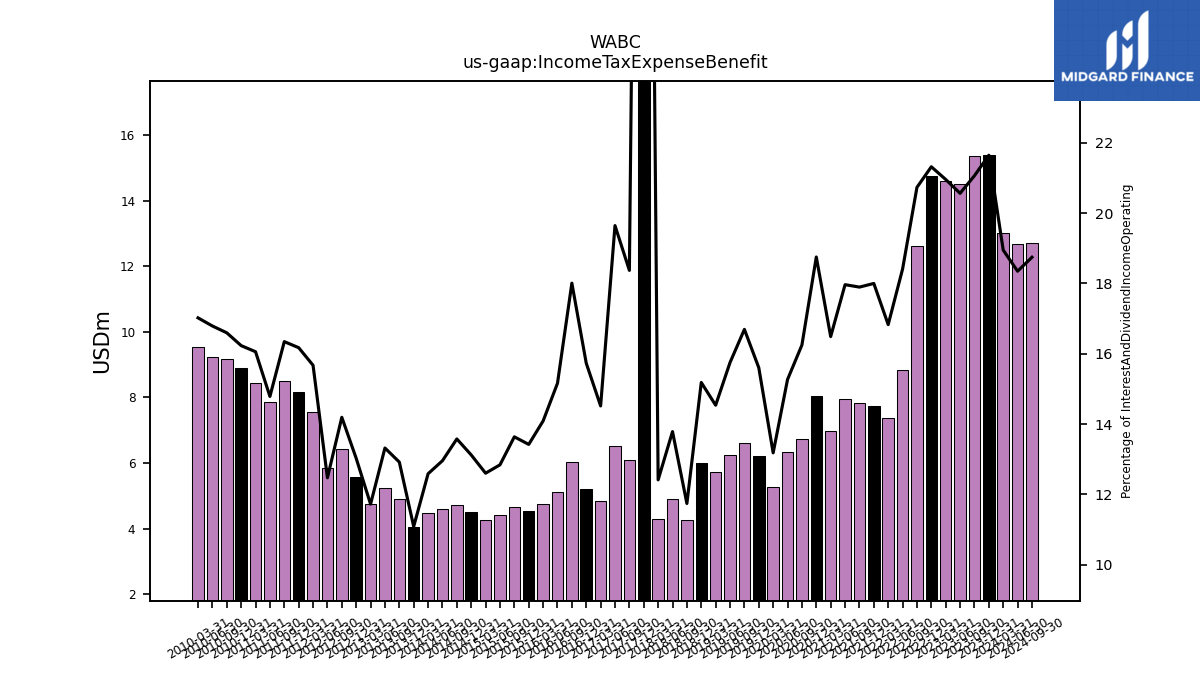
| Income Tax Expense Benefit | 15.38 | 15.35 | 14.49 | 14.59 | 14.75 | 12.61 | 8.84 | 7.36 | 7.75 | 7.84 | 7.95 | 6.98 | 8.06 | 6.72 | 6.34 | 5.27 | 6.22 | 6.63 | 6.24 | 5.74 | 5.99 | 4.26 | 4.91 | 4.28 | 19.71 | 6.09 | 6.51 | 4.84 | |
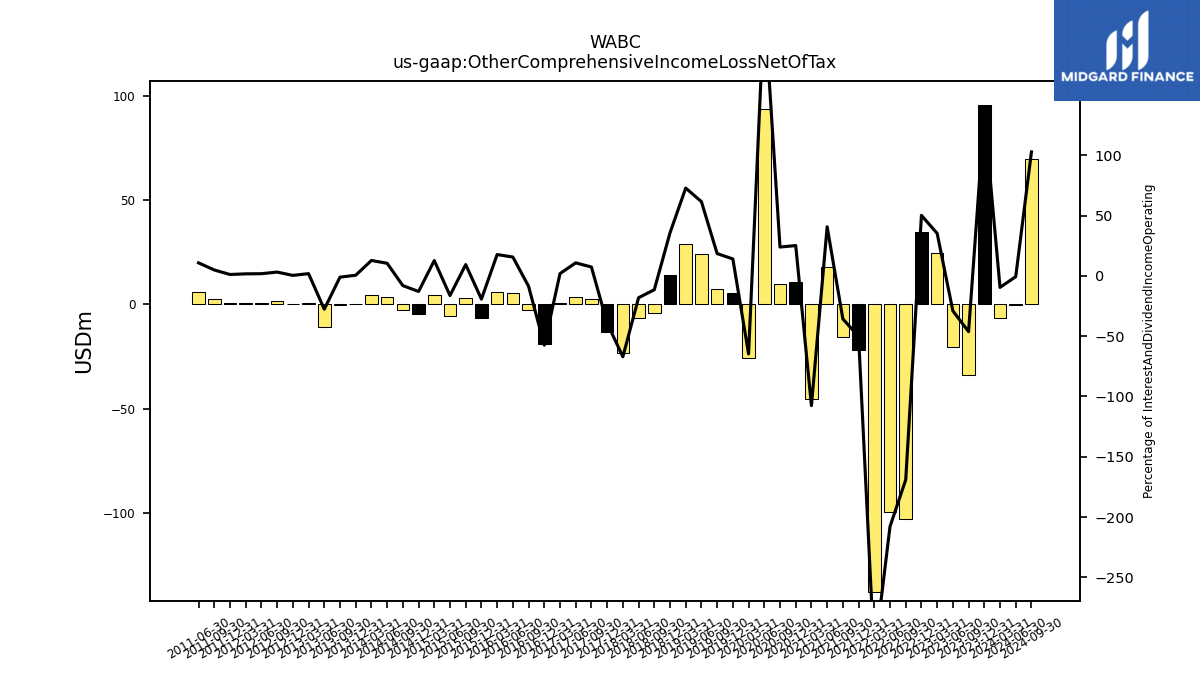
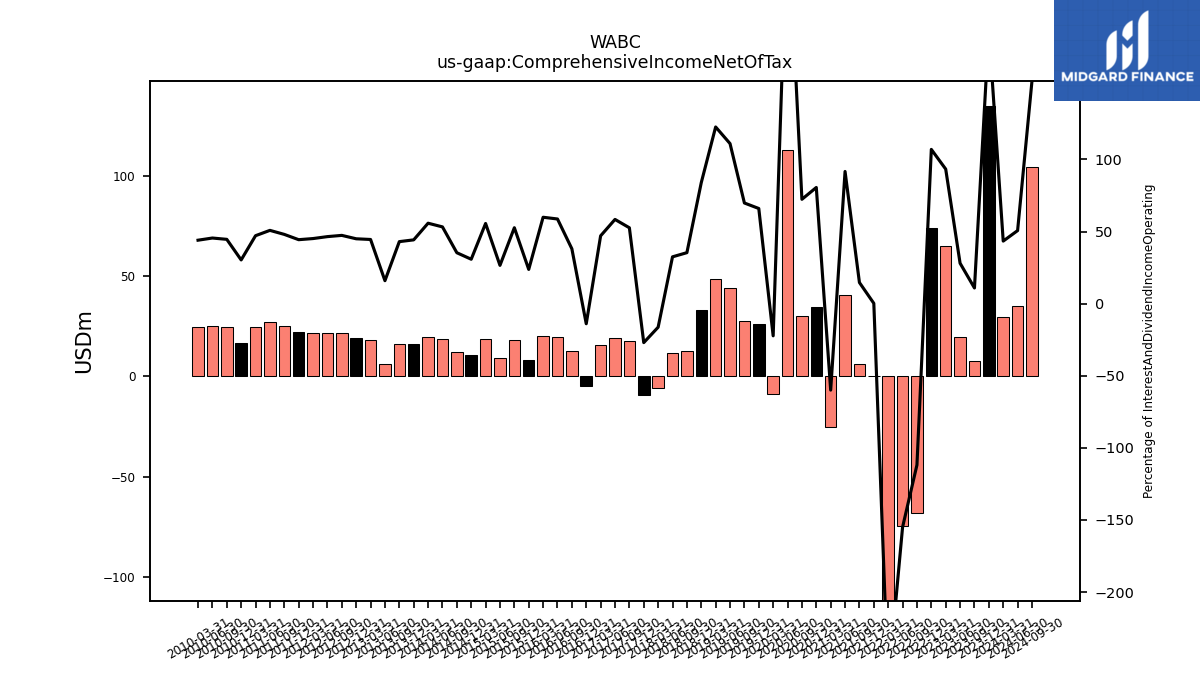
| Other Comprehensive Income Loss Net Of Tax | 95.43 | -33.67 | -20.47 | 24.53 | 34.69 | -102.77 | -99.72 | -137.96 | -21.62 | -15.64 | 18.02 | -45.51 | 10.79 | 9.89 | 93.56 | -25.88 | 5.60 | 7.33 | 24.37 | 28.75 | 14.07 | -4.17 | -6.45 | -23.14 | -13.40 | 2.43 | 3.58 | 0.63 | |
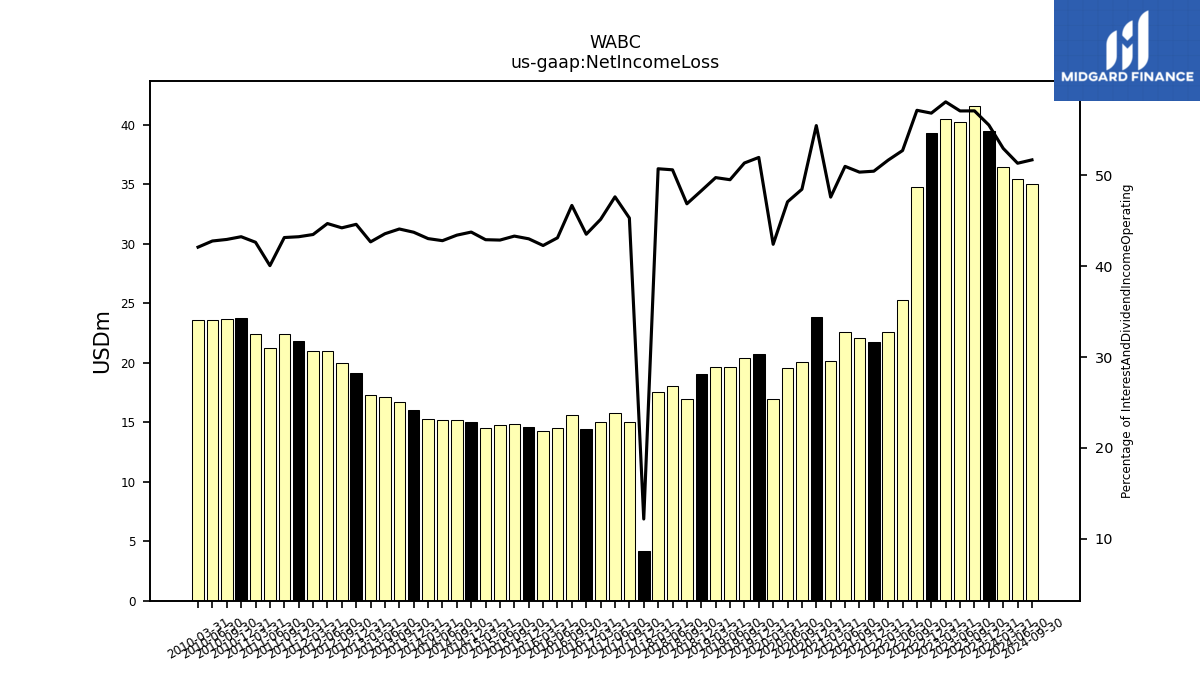
| Net Income Loss | 39.47 | 41.60 | 40.25 | 40.45 | 39.34 | 34.76 | 25.31 | 22.62 | 21.72 | 22.06 | 22.58 | 20.15 | 23.84 | 20.05 | 19.56 | 16.96 | 20.73 | 20.39 | 19.62 | 19.65 | 19.05 | 16.99 | 18.01 | 17.51 | 4.16 | 15.02 | 15.80 | 15.05 | |
| Comprehensive Income Net Of Tax | 134.90 | 7.93 | 19.78 | 64.98 | 74.04 | -68.01 | -74.41 | -115.35 | 0.10 | 6.43 | 40.60 | -25.36 | 34.63 | 29.94 | 113.12 | -8.92 | 26.32 | 27.72 | 44.00 | 48.39 | 33.12 | 12.83 | 11.56 | -5.63 | -9.24 | 17.45 | 19.38 | 15.68 | |
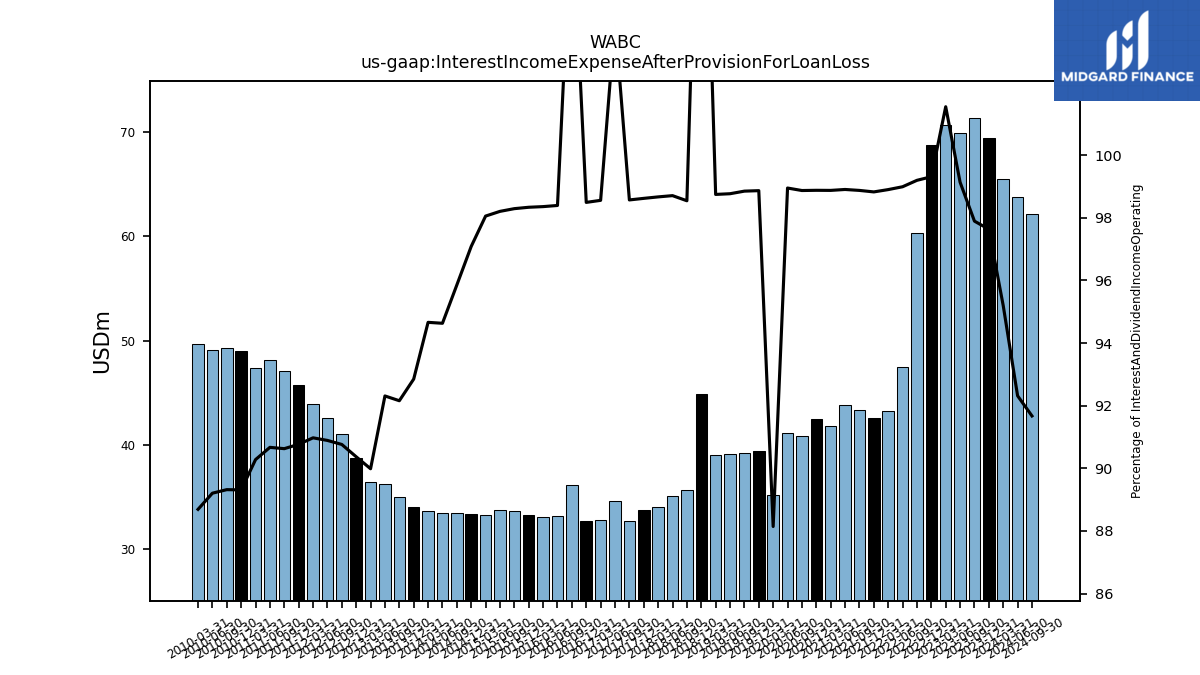
| Interest Income Expense After Provision For Loan Loss | 69.37 | 71.31 | 69.88 | 70.70 | 68.72 | 60.31 | 47.51 | 43.28 | 42.54 | 43.32 | 43.79 | 41.84 | 42.48 | 40.90 | 41.10 | 35.25 | 39.43 | 39.24 | 39.14 | 38.99 | 44.87 | 35.73 | 35.12 | 34.05 | 33.73 | 32.67 | 34.59 | 32.84 | |
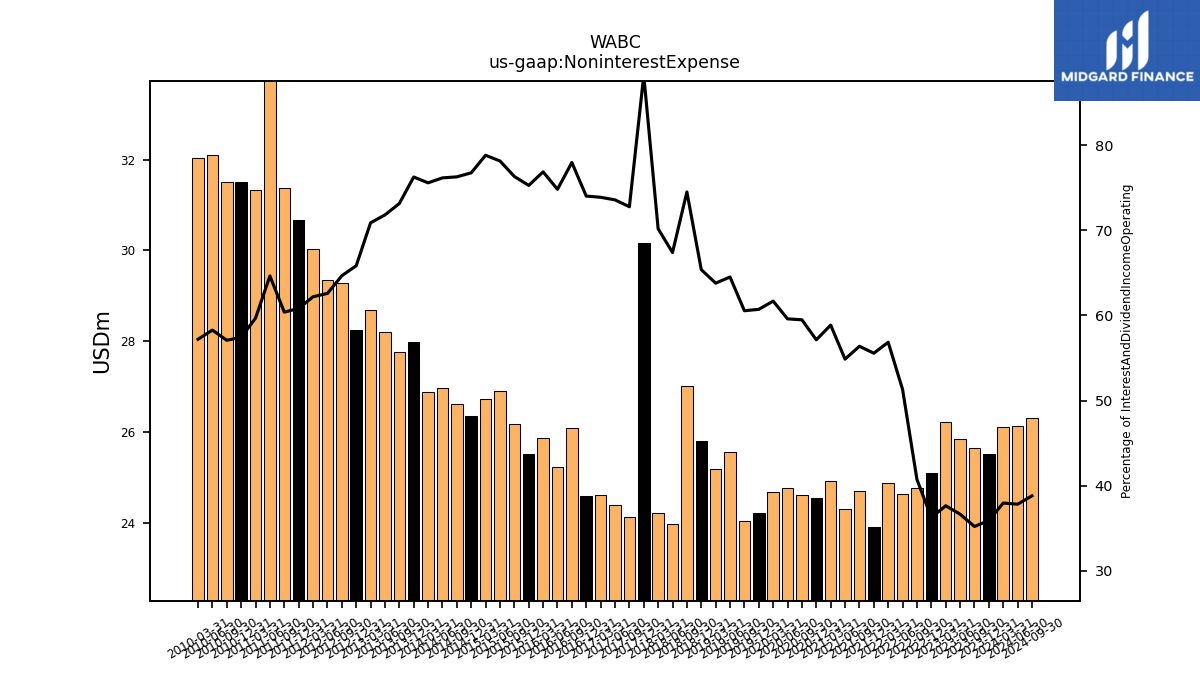
| Noninterest Expense | 25.52 | 25.65 | 25.84 | 26.21 | 25.09 | 24.77 | 24.63 | 24.88 | 23.91 | 24.70 | 24.29 | 24.91 | 24.55 | 24.60 | 24.75 | 24.66 | 24.21 | 24.03 | 25.56 | 25.18 | 25.79 | 27.00 | 23.98 | 24.21 | 30.17 | 24.11 | 24.40 | 24.61 | |
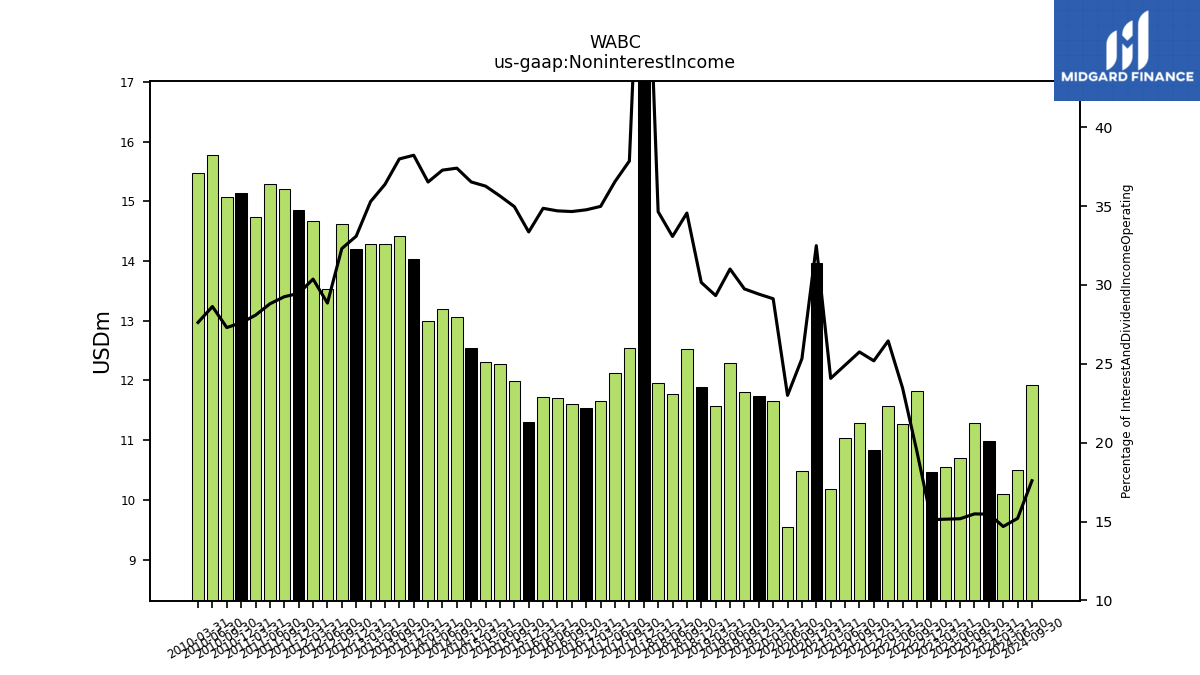
| Noninterest Income | 10.99 | 11.28 | 10.70 | 10.55 | 10.46 | 11.82 | 11.26 | 11.58 | 10.84 | 11.28 | 11.03 | 10.19 | 13.96 | 10.48 | 9.55 | 11.65 | 11.73 | 11.81 | 12.29 | 11.58 | 11.90 | 12.53 | 11.77 | 11.96 | 20.30 | 12.55 | 12.12 | 11.66 |
| 2023-12-31 | 2023-09-30 | 2023-06-30 | 2023-03-31 | 2022-12-31 | 2022-09-30 | 2022-06-30 | 2022-03-31 | 2021-12-31 | 2021-09-30 | 2021-06-30 | 2021-03-31 | 2020-12-31 | 2020-09-30 | 2020-06-30 | 2020-03-31 | 2019-12-31 | 2019-09-30 | 2019-06-30 | 2019-03-31 | 2018-12-31 | 2018-09-30 | 2018-06-30 | 2018-03-31 | 2017-12-31 | 2017-09-30 | 2017-06-30 | 2017-03-31 | ||
|---|---|---|---|---|---|---|---|---|---|---|---|---|---|---|---|---|---|---|---|---|---|---|---|---|---|---|---|---|---|
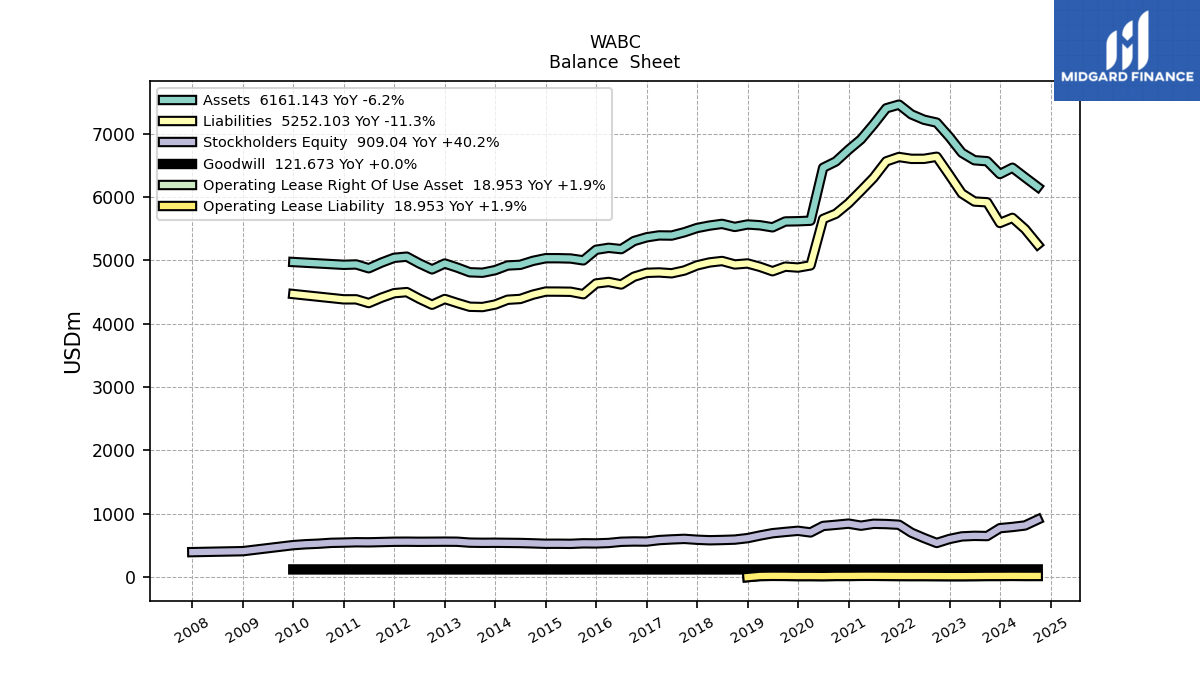
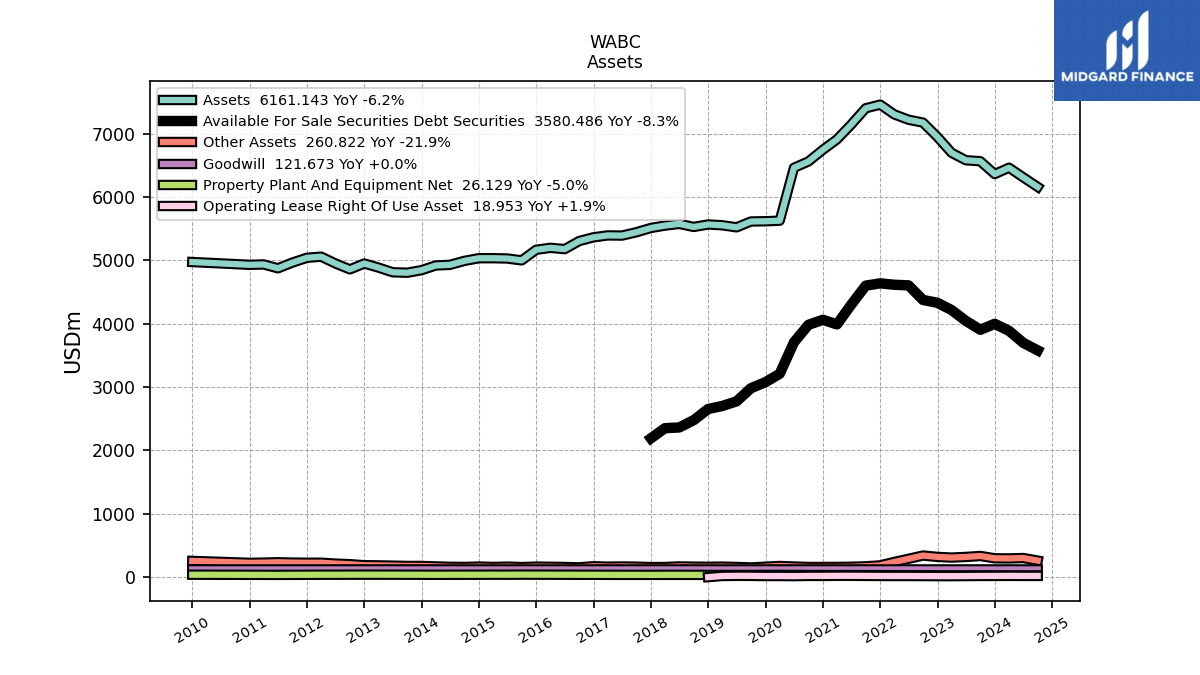
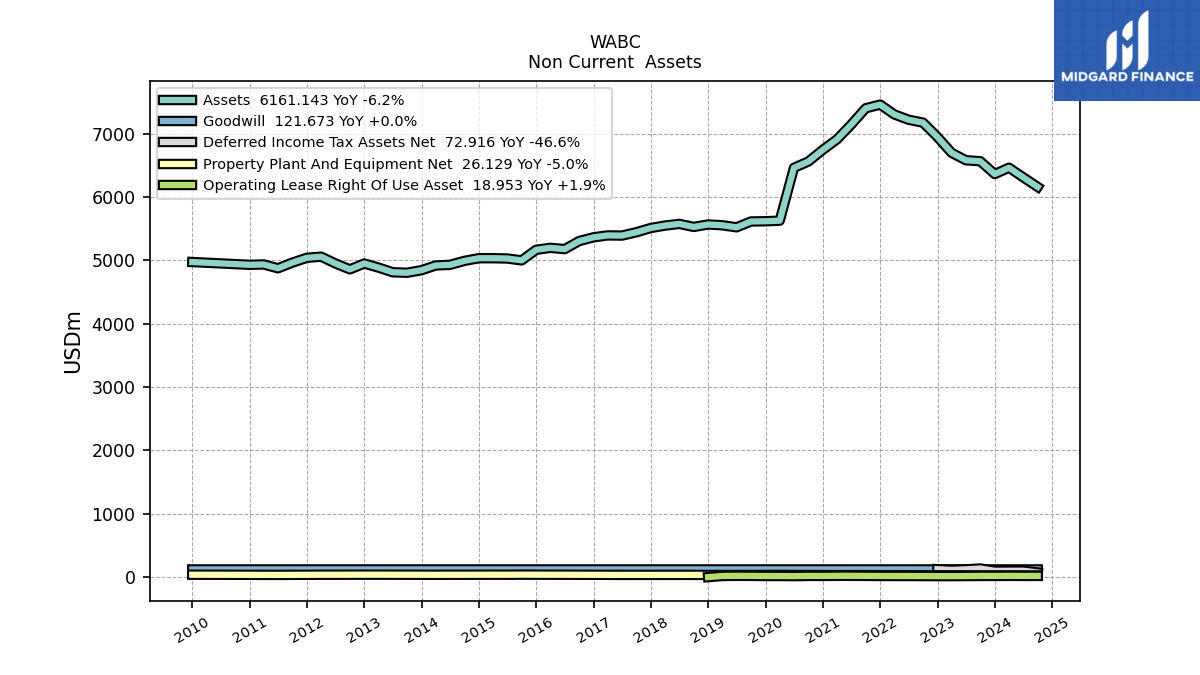
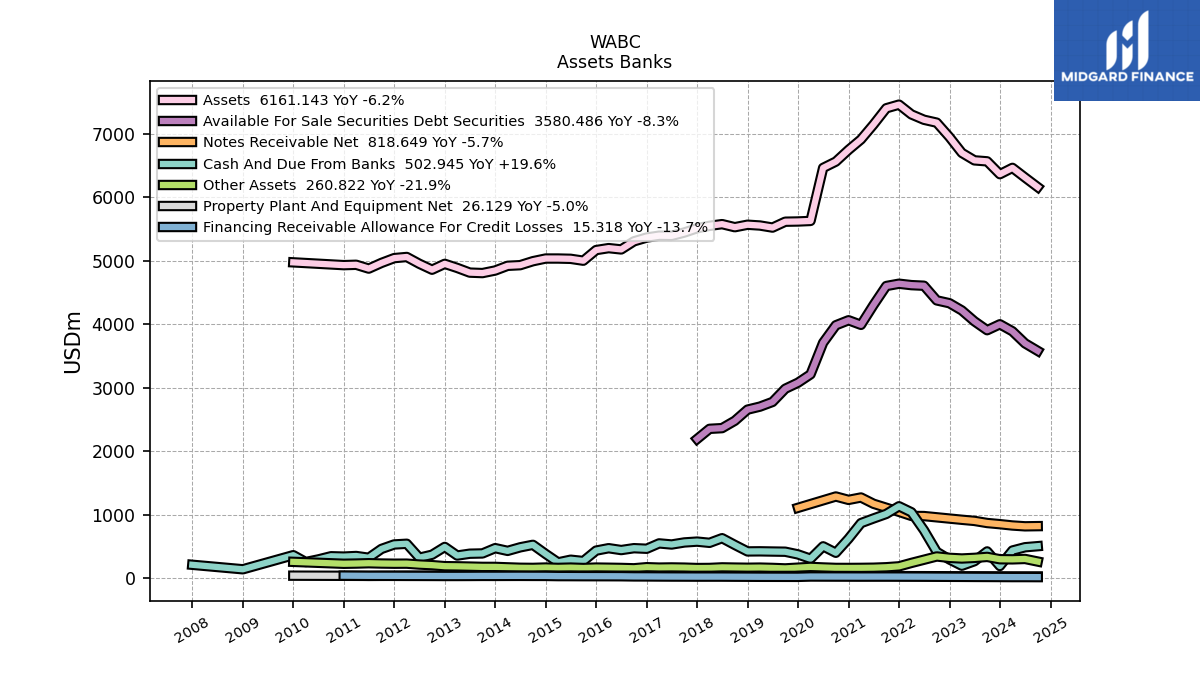
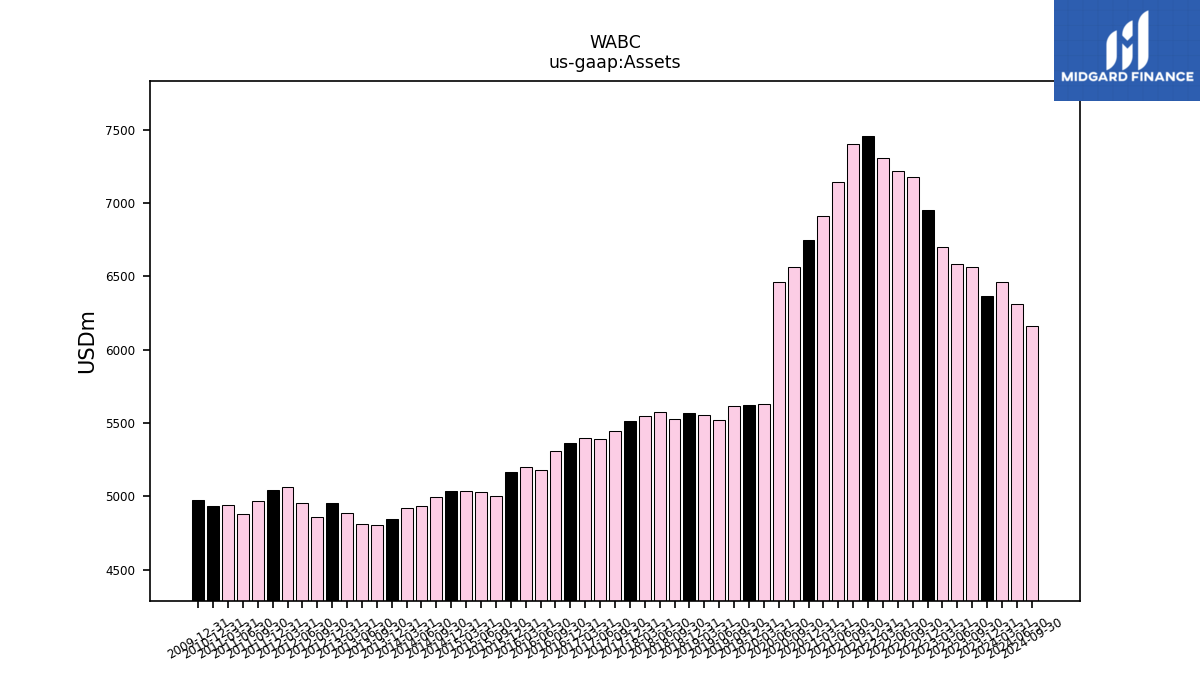
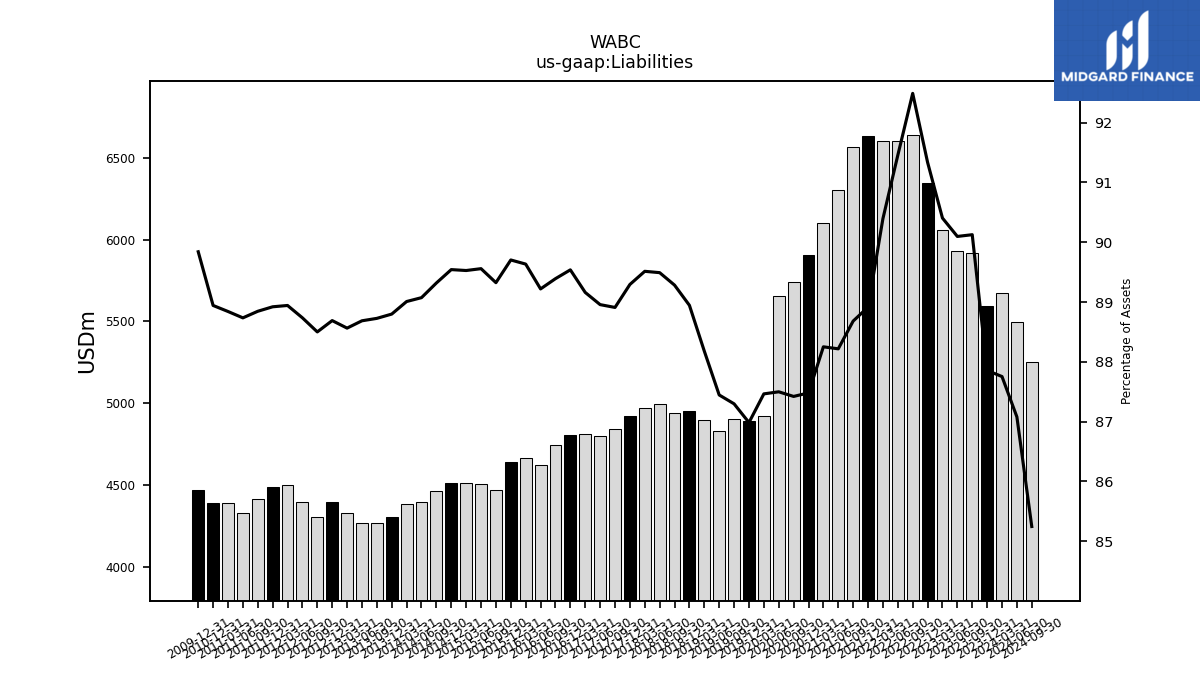
| Assets | 6364.59 | 6567.29 | 6582.74 | 6700.47 | 6950.32 | 7177.02 | 7222.40 | 7306.42 | 7461.03 | 7403.57 | 7147.78 | 6912.48 | 6747.93 | 6563.22 | 6463.89 | 5628.13 | 5619.56 | 5616.06 | 5523.45 | 5555.96 | 5568.53 | 5529.46 | 5577.84 | 5551.04 | 5513.05 | 5445.81 | 5393.35 | 5395.95 | |
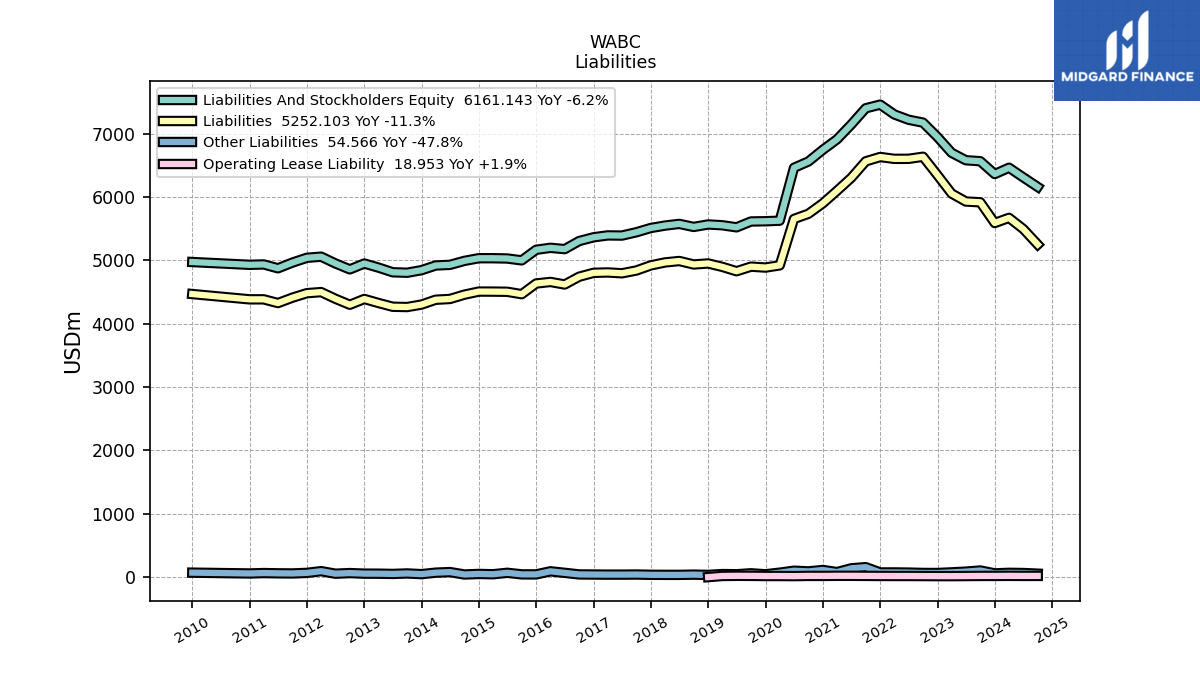
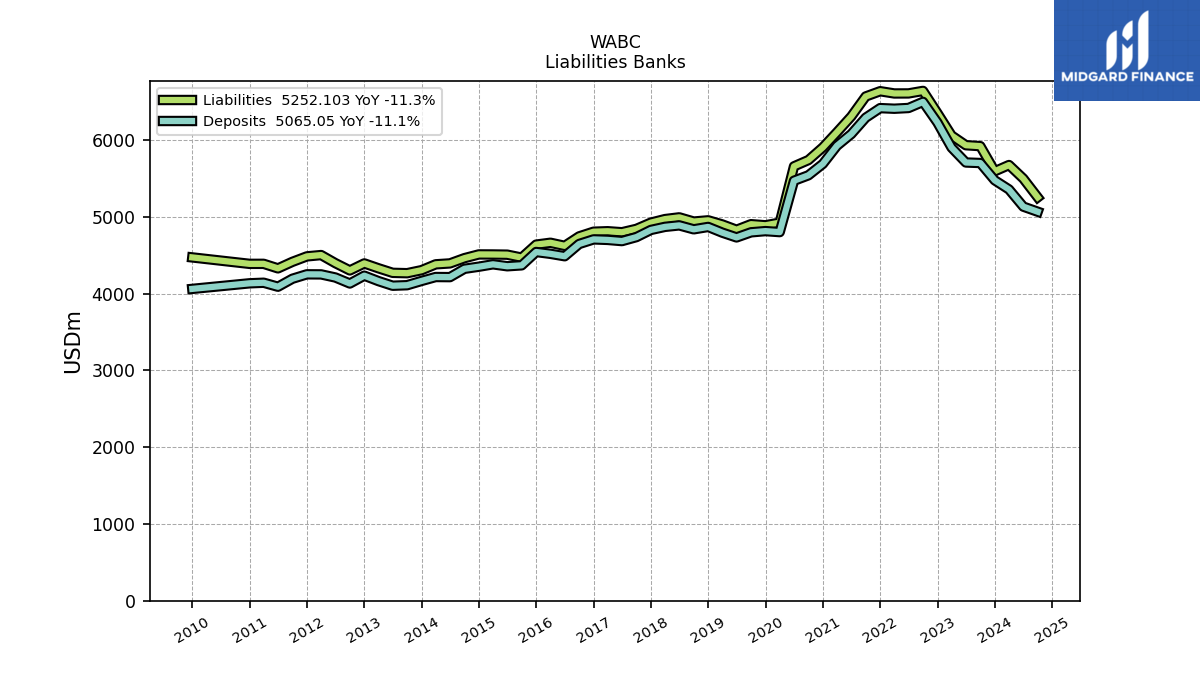
| Liabilities | 5591.70 | 5918.86 | 5930.88 | 6057.55 | 6348.21 | 6638.04 | 6605.28 | 6604.67 | 6633.92 | 6565.62 | 6305.58 | 6100.35 | 5903.12 | 5737.64 | 5655.81 | 4922.58 | 4888.14 | 4902.68 | 4830.01 | 4899.19 | 4952.94 | 4936.87 | 4991.71 | 4968.95 | 4922.81 | 4841.85 | 4797.76 | 4811.06 | |
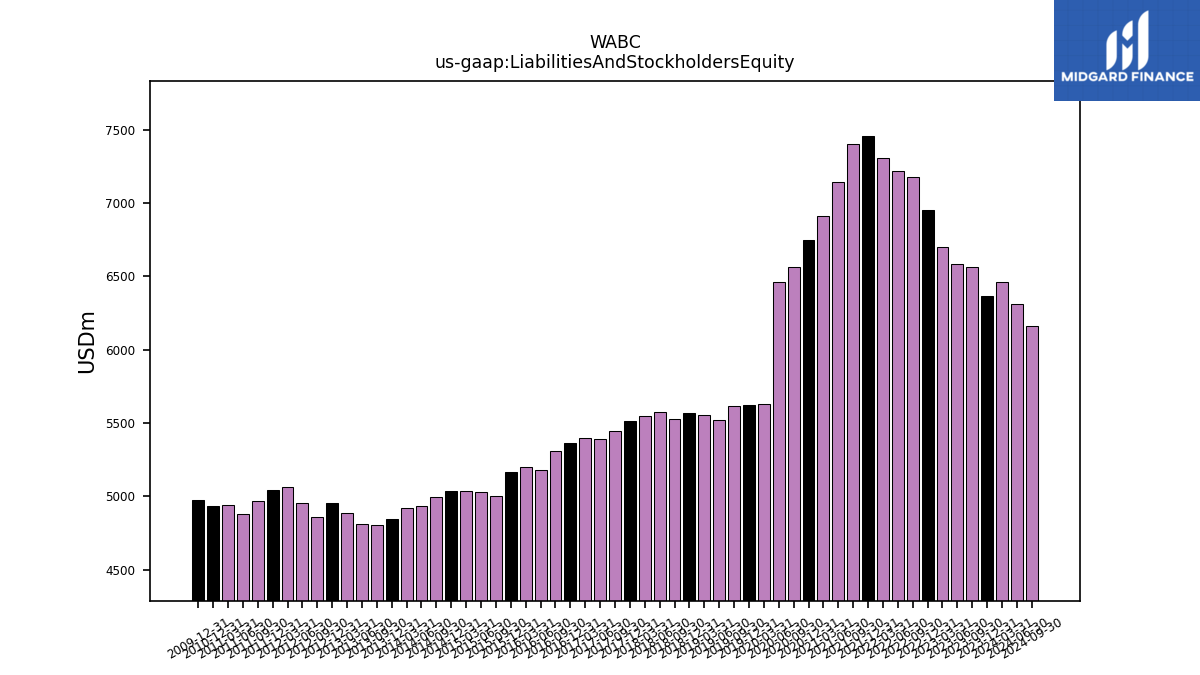
| Liabilities And Stockholders Equity | 6364.59 | 6567.29 | 6582.74 | 6700.47 | 6950.32 | 7177.02 | 7222.40 | 7306.42 | 7461.03 | 7403.57 | 7147.78 | 6912.48 | 6747.93 | 6563.22 | 6463.89 | 5628.13 | 5619.56 | 5616.06 | 5523.45 | 5555.96 | 5568.53 | 5529.46 | 5577.84 | 5551.04 | 5513.05 | 5445.81 | 5393.35 | 5395.95 | |
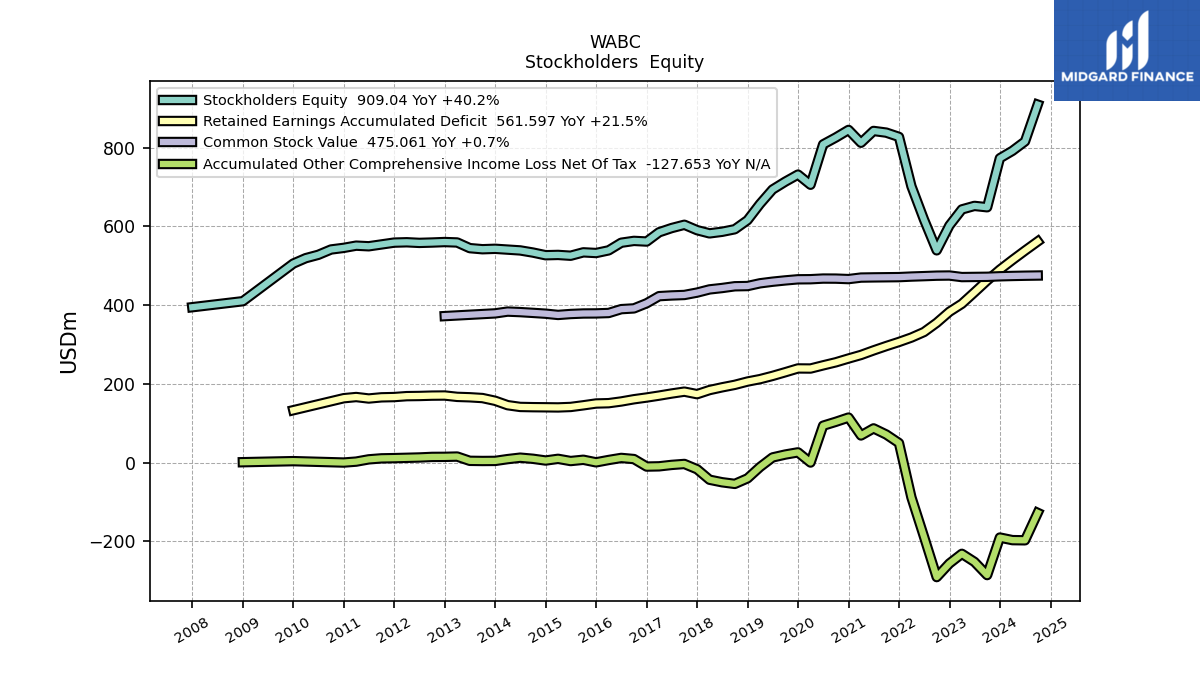
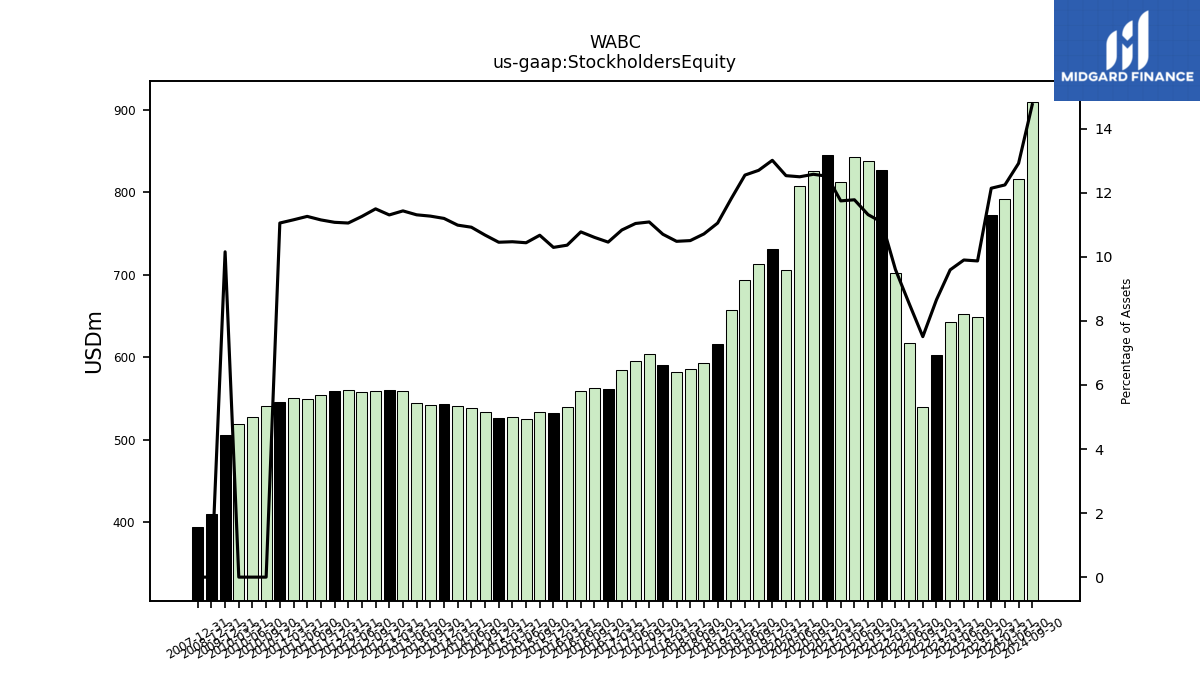
| Stockholders Equity | 772.89 | 648.42 | 651.86 | 642.92 | 602.11 | 538.99 | 617.13 | 701.74 | 827.10 | 837.95 | 842.20 | 812.13 | 844.81 | 825.58 | 808.08 | 705.55 | 731.42 | 713.38 | 693.44 | 656.77 | 615.59 | 592.59 | 586.14 | 582.08 | 590.24 | 603.96 | 595.59 | 584.89 | |
| Tier One Risk Based Capital | 841.61 | NA | NA | NA | 736.41 | NA | NA | NA | 653.03 | NA | NA | NA | 604.83 | NA | NA | NA | 579.22 | NA | NA | NA | 528.04 | NA | NA | NA | 479.26 | NA | NA | NA |
| 2023-12-31 | 2023-09-30 | 2023-06-30 | 2023-03-31 | 2022-12-31 | 2022-09-30 | 2022-06-30 | 2022-03-31 | 2021-12-31 | 2021-09-30 | 2021-06-30 | 2021-03-31 | 2020-12-31 | 2020-09-30 | 2020-06-30 | 2020-03-31 | 2019-12-31 | 2019-09-30 | 2019-06-30 | 2019-03-31 | 2018-12-31 | 2018-09-30 | 2018-06-30 | 2018-03-31 | 2017-12-31 | 2017-09-30 | 2017-06-30 | 2017-03-31 | ||
|---|---|---|---|---|---|---|---|---|---|---|---|---|---|---|---|---|---|---|---|---|---|---|---|---|---|---|---|---|---|
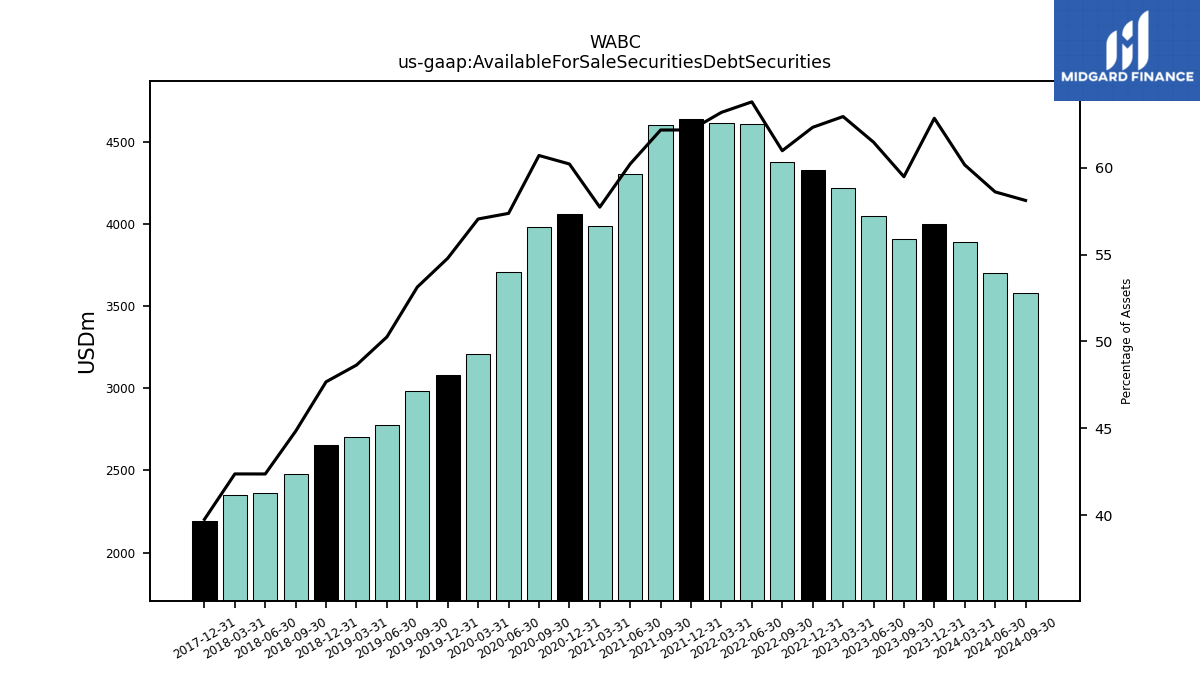
| Available For Sale Securities Debt Securities | 3999.80 | 3906.23 | 4046.46 | 4217.51 | 4331.74 | 4376.33 | 4607.11 | 4616.59 | 4638.85 | 4602.71 | 4304.16 | 3990.57 | 4063.18 | 3983.99 | 3708.37 | 3210.69 | 3078.85 | 2983.77 | 2775.90 | 2702.24 | 2654.67 | 2478.91 | 2363.19 | 2351.97 | 2191.71 | NA | NA | NA |
| 2023-12-31 | 2023-09-30 | 2023-06-30 | 2023-03-31 | 2022-12-31 | 2022-09-30 | 2022-06-30 | 2022-03-31 | 2021-12-31 | 2021-09-30 | 2021-06-30 | 2021-03-31 | 2020-12-31 | 2020-09-30 | 2020-06-30 | 2020-03-31 | 2019-12-31 | 2019-09-30 | 2019-06-30 | 2019-03-31 | 2018-12-31 | 2018-09-30 | 2018-06-30 | 2018-03-31 | 2017-12-31 | 2017-09-30 | 2017-06-30 | 2017-03-31 | ||
|---|---|---|---|---|---|---|---|---|---|---|---|---|---|---|---|---|---|---|---|---|---|---|---|---|---|---|---|---|---|
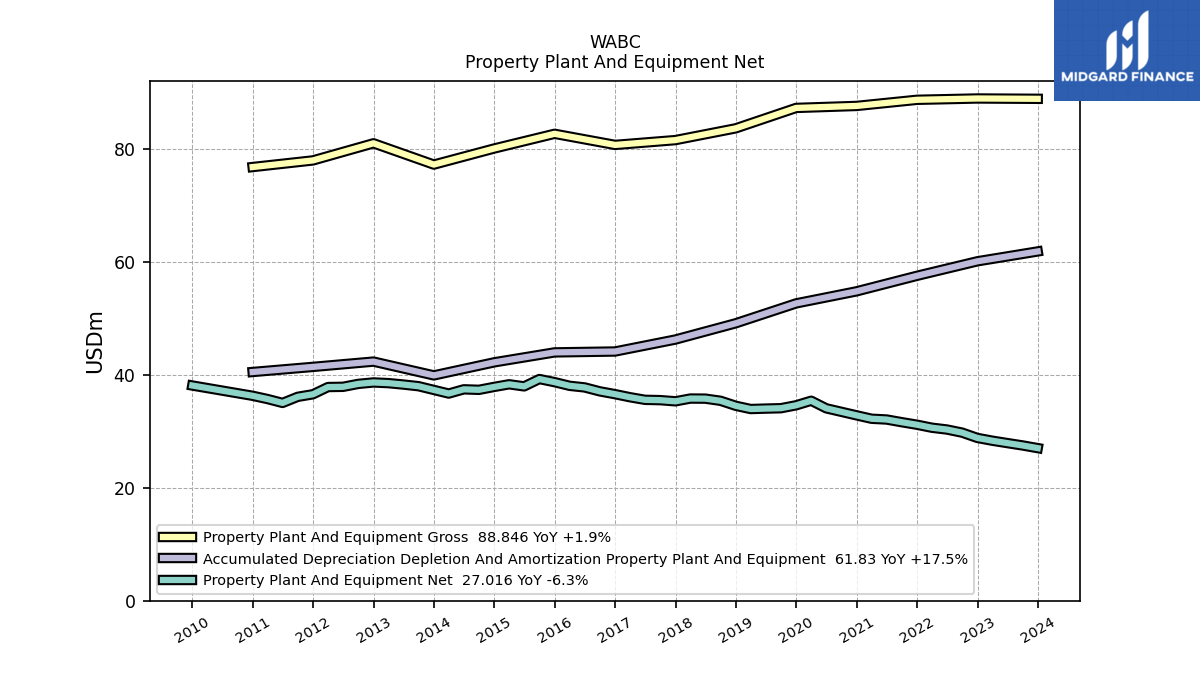
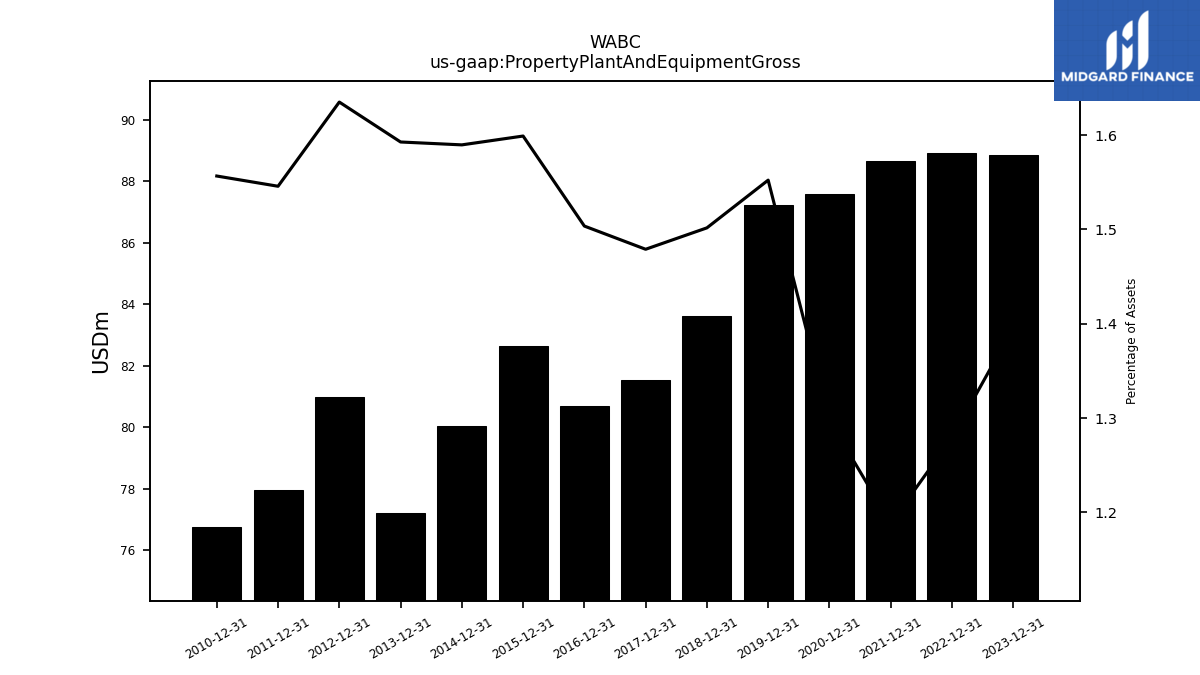
| Property Plant And Equipment Gross | 88.85 | NA | NA | NA | 88.90 | NA | NA | NA | 88.67 | NA | NA | NA | 87.58 | NA | NA | NA | 87.23 | NA | NA | NA | 83.62 | NA | NA | NA | 81.54 | NA | NA | NA | |
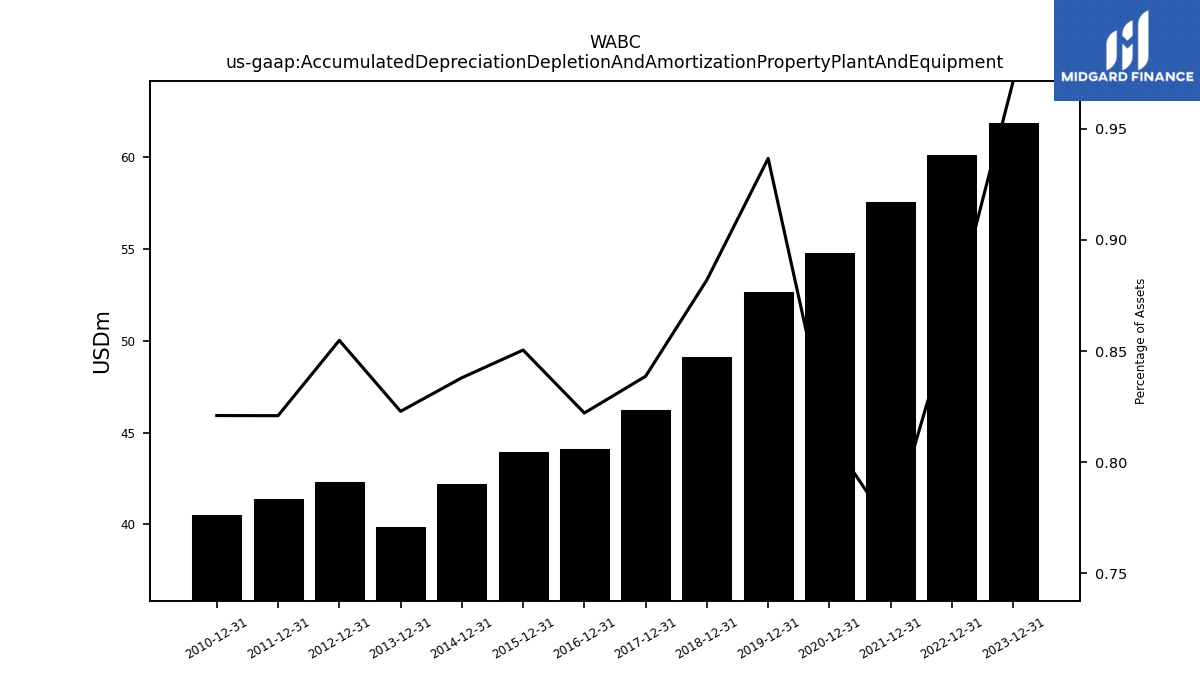
| Accumulated Depreciation Depletion And Amortization Property Plant And Equipment | 61.83 | NA | NA | NA | 60.09 | NA | NA | NA | 57.52 | NA | NA | NA | 54.77 | NA | NA | NA | 52.63 | NA | NA | NA | 49.12 | NA | NA | NA | 46.24 | NA | NA | NA | |
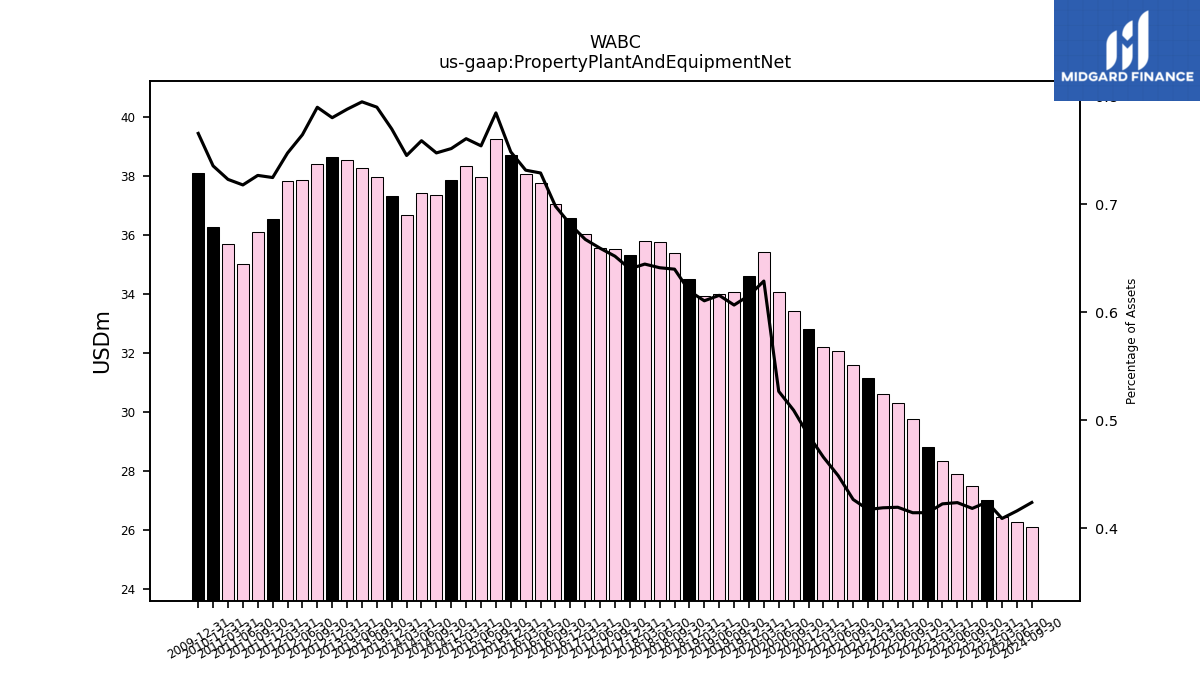
| Property Plant And Equipment Net | 27.02 | 27.49 | 27.91 | 28.33 | 28.82 | 29.76 | 30.31 | 30.63 | 31.16 | 31.60 | 32.08 | 32.22 | 32.81 | 33.44 | 34.06 | 35.40 | 34.60 | 34.08 | 34.01 | 33.93 | 34.51 | 35.39 | 35.77 | 35.79 | 35.30 | 35.51 | 35.56 | 36.02 | |
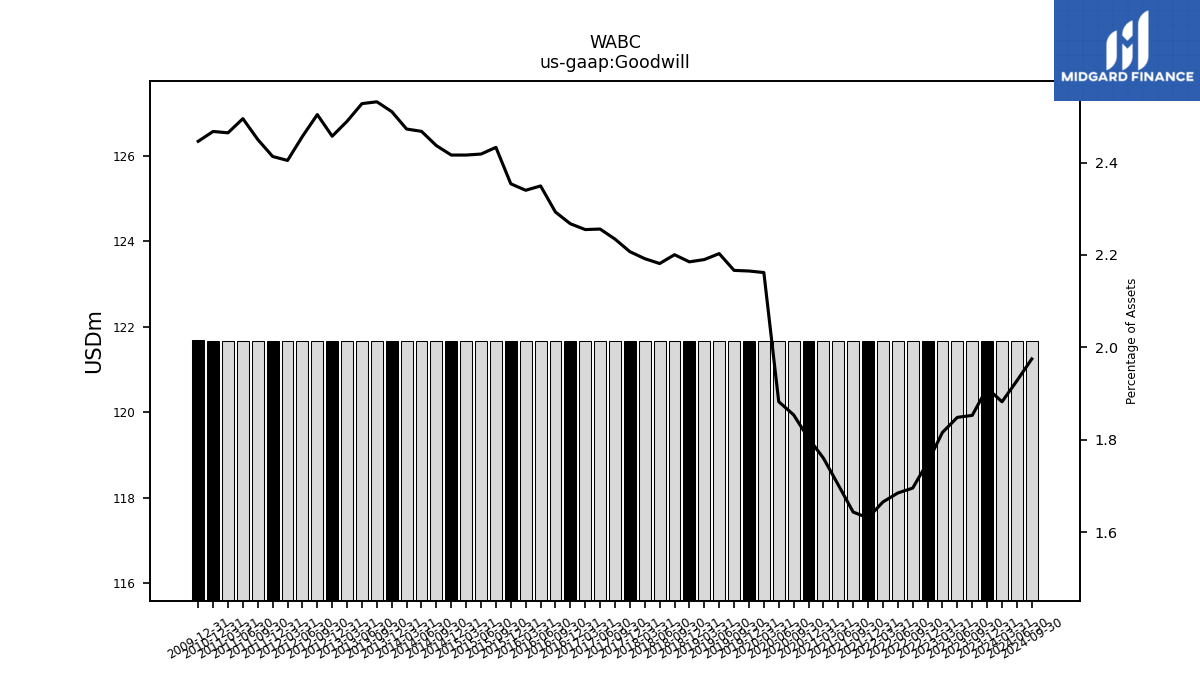
| Goodwill | 121.67 | 121.67 | 121.67 | 121.67 | 121.67 | 121.67 | 121.67 | 121.67 | 121.67 | 121.67 | 121.67 | 121.67 | 121.67 | 121.67 | 121.67 | 121.67 | 121.67 | 121.67 | 121.67 | 121.67 | 121.67 | 121.67 | 121.67 | 121.67 | 121.67 | 121.67 | 121.67 | 121.67 | |
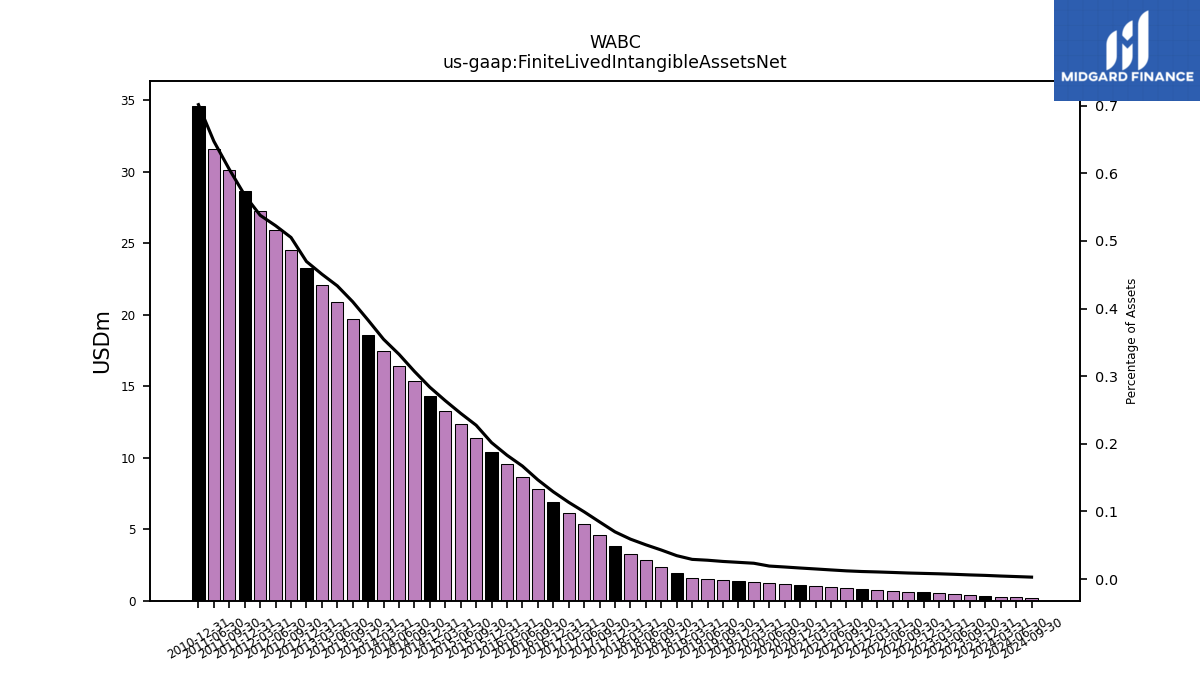
| Finite Lived Intangible Assets Net | 0.35 | 0.40 | 0.46 | 0.52 | 0.58 | 0.64 | 0.71 | 0.77 | 0.83 | 0.90 | 0.97 | 1.03 | 1.10 | 1.17 | 1.25 | 1.32 | 1.39 | 1.46 | 1.54 | 1.62 | 1.93 | 2.38 | 2.83 | 3.28 | 3.85 | 4.61 | 5.37 | 6.13 | |
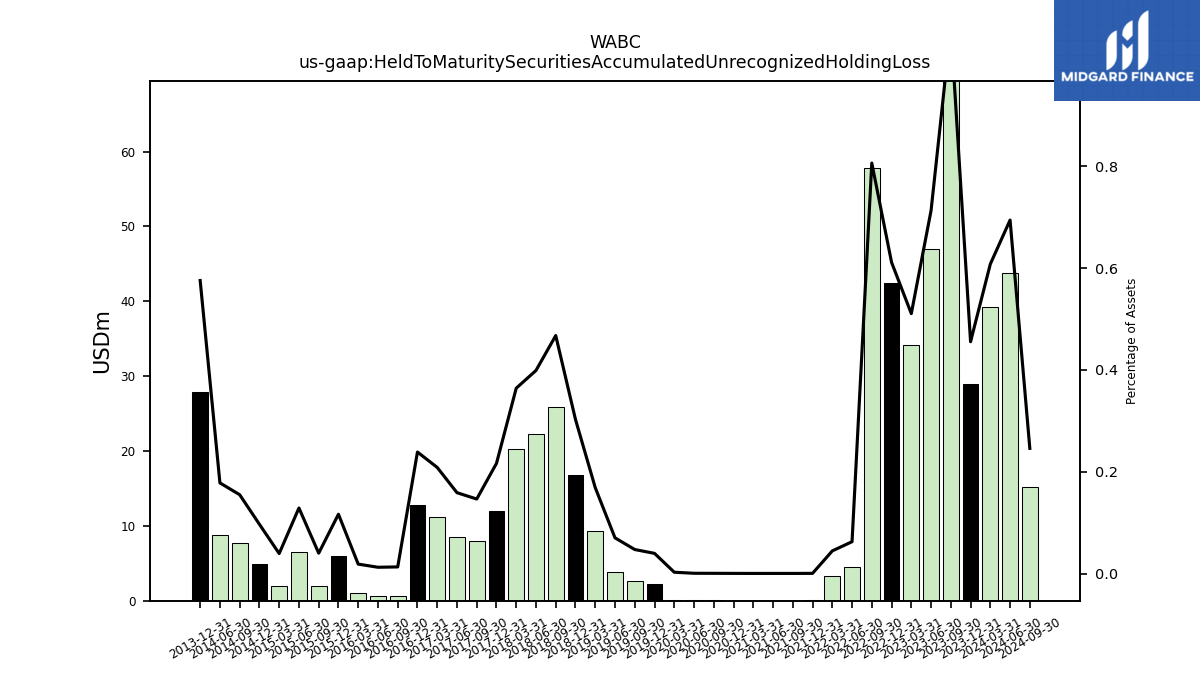
| Held To Maturity Securities Accumulated Unrecognized Holding Loss | 28.98 | 70.47 | 46.93 | 34.21 | 42.49 | 57.86 | 4.53 | 3.26 | 0.04 | 0.03 | 0.03 | 0.03 | 0.03 | 0.04 | 0.04 | 0.15 | 2.24 | 2.66 | 3.88 | 9.38 | 16.86 | 25.85 | 22.25 | 20.21 | 11.93 | 7.98 | 8.57 | 11.25 | |
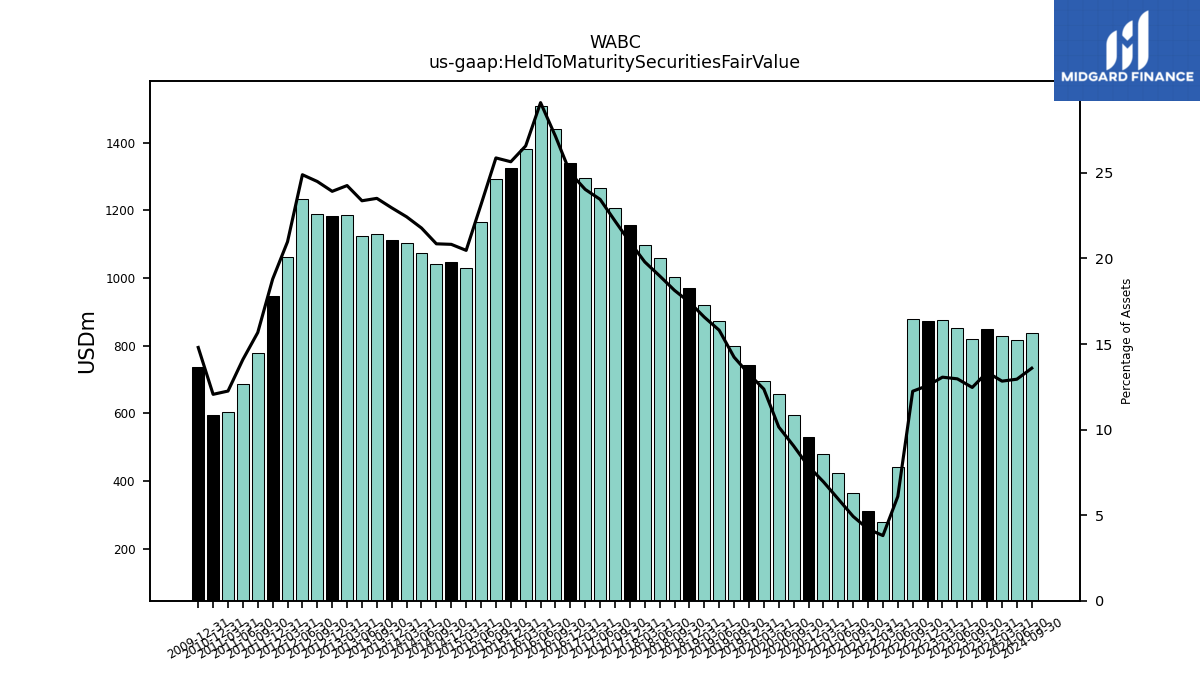
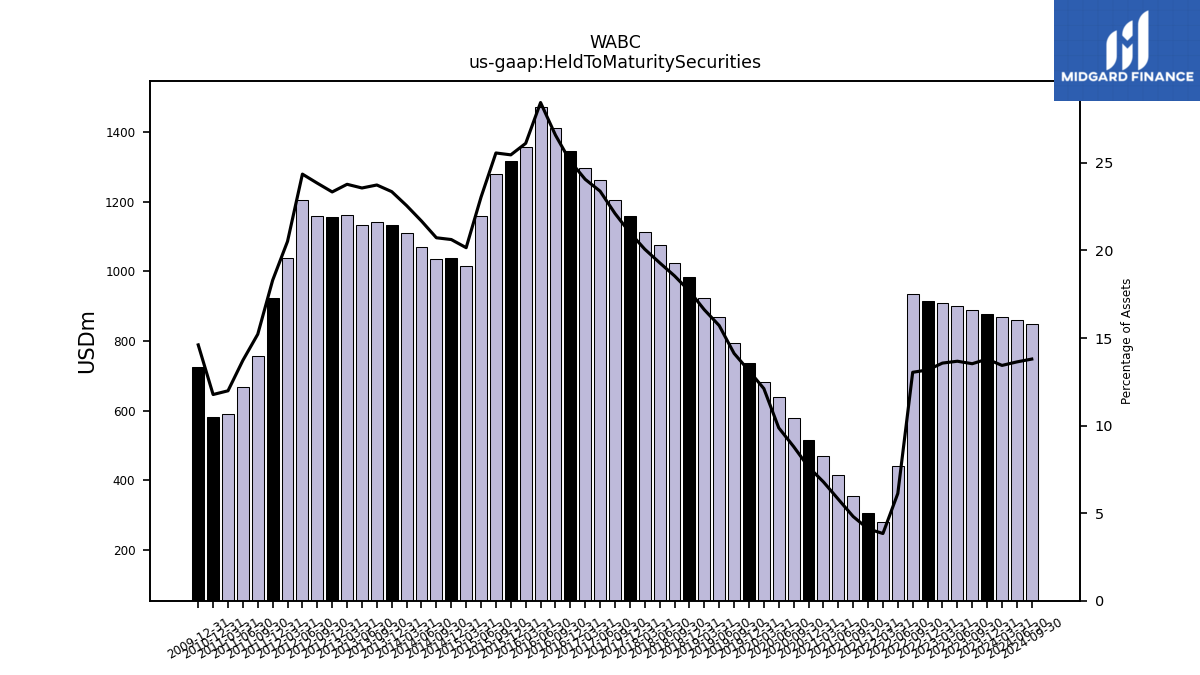
| Held To Maturity Securities Fair Value | 849.56 | 818.39 | 853.47 | 875.27 | 873.51 | 878.46 | 440.07 | 278.19 | 312.56 | 364.75 | 424.61 | 480.56 | 529.69 | 593.72 | 656.39 | 695.86 | 744.30 | 799.24 | 872.98 | 920.60 | 971.45 | 1002.65 | 1058.57 | 1098.89 | 1155.34 | 1208.28 | 1264.76 | 1296.74 | |
| Held To Maturity Securities | 878.40 | 888.86 | 900.36 | 909.32 | 915.91 | 936.27 | 442.36 | 280.53 | 306.40 | 356.11 | 414.42 | 469.27 | 515.60 | 577.81 | 638.30 | 681.84 | 738.07 | 793.22 | 867.99 | 923.19 | 984.61 | 1025.70 | 1076.46 | 1114.29 | 1158.86 | 1204.24 | 1261.32 | 1298.41 | |
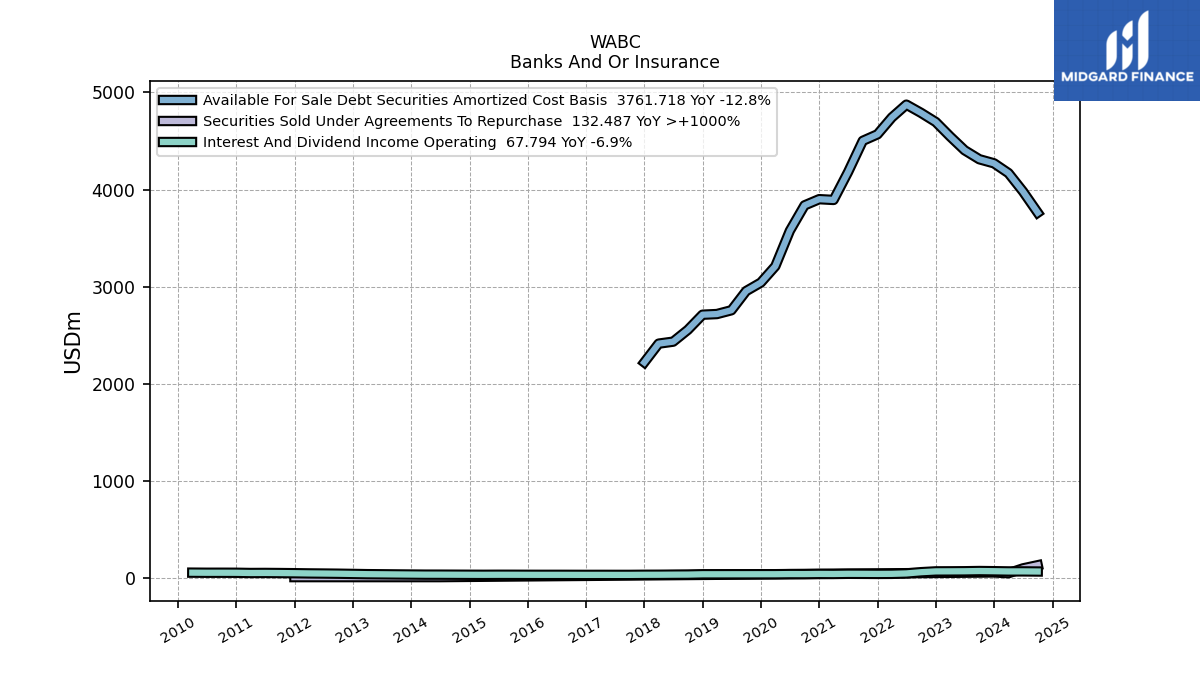
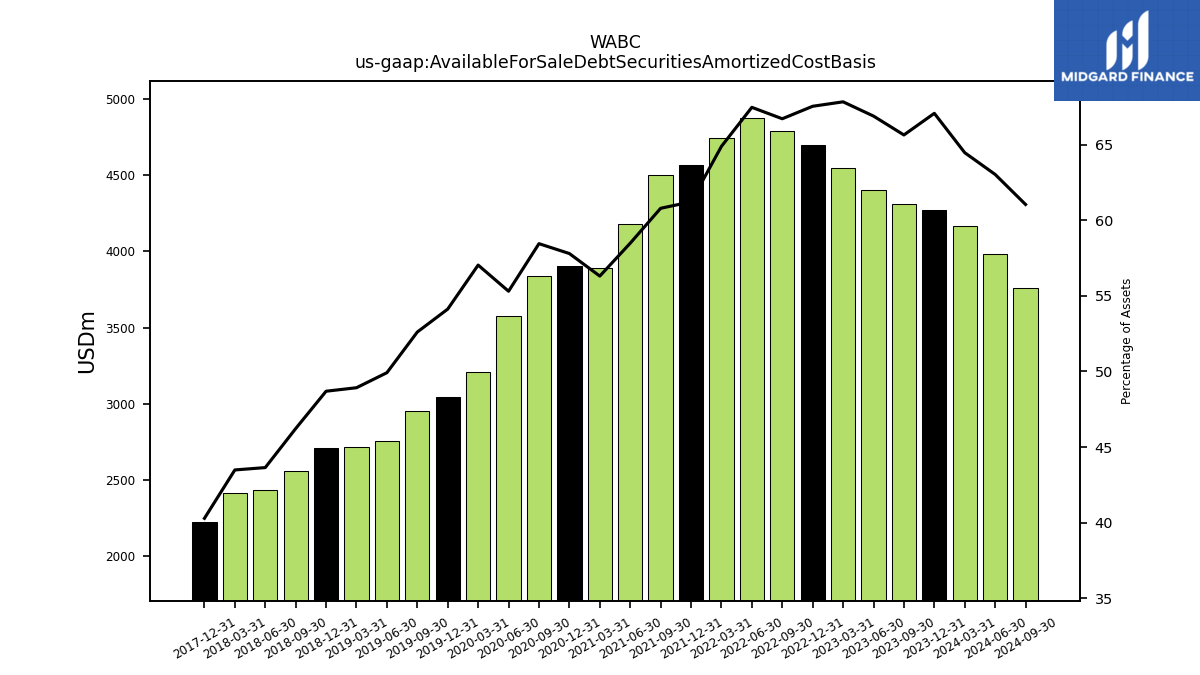
| Available For Sale Debt Securities Amortized Cost Basis | 4269.95 | 4311.86 | 4404.29 | 4546.28 | 4695.34 | 4789.18 | 4874.06 | 4741.95 | 4568.35 | 4501.50 | 4180.76 | 3892.75 | 3900.75 | 3836.88 | 3575.30 | 3210.45 | 3041.86 | 2954.73 | 2757.27 | 2718.21 | 2711.45 | 2555.67 | 2434.04 | 2413.66 | 2220.55 | NA | NA | NA | |
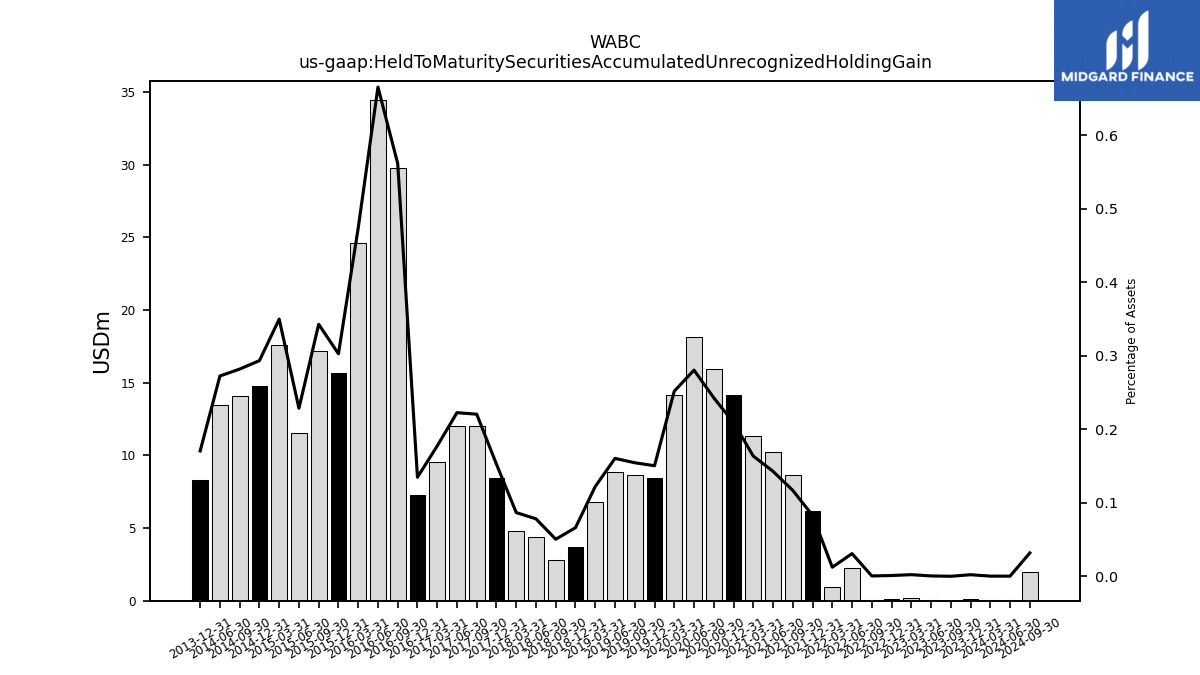
| Held To Maturity Securities Accumulated Unrecognized Holding Gain | 0.15 | 0.01 | 0.04 | 0.16 | 0.09 | 0.05 | 2.24 | 0.92 | 6.20 | 8.66 | 10.21 | 11.32 | 14.12 | 15.95 | 18.14 | 14.18 | 8.46 | 8.68 | 8.87 | 6.79 | 3.69 | 2.80 | 4.37 | 4.82 | 8.41 | 12.02 | 12.01 | 9.58 | |
| Held To Maturity Securities Accumulated Unrecognized Holding Loss | 28.98 | 70.47 | 46.93 | 34.21 | 42.49 | 57.86 | 4.53 | 3.26 | 0.04 | 0.03 | 0.03 | 0.03 | 0.03 | 0.04 | 0.04 | 0.15 | 2.24 | 2.66 | 3.88 | 9.38 | 16.86 | 25.85 | 22.25 | 20.21 | 11.93 | 7.98 | 8.57 | 11.25 | |
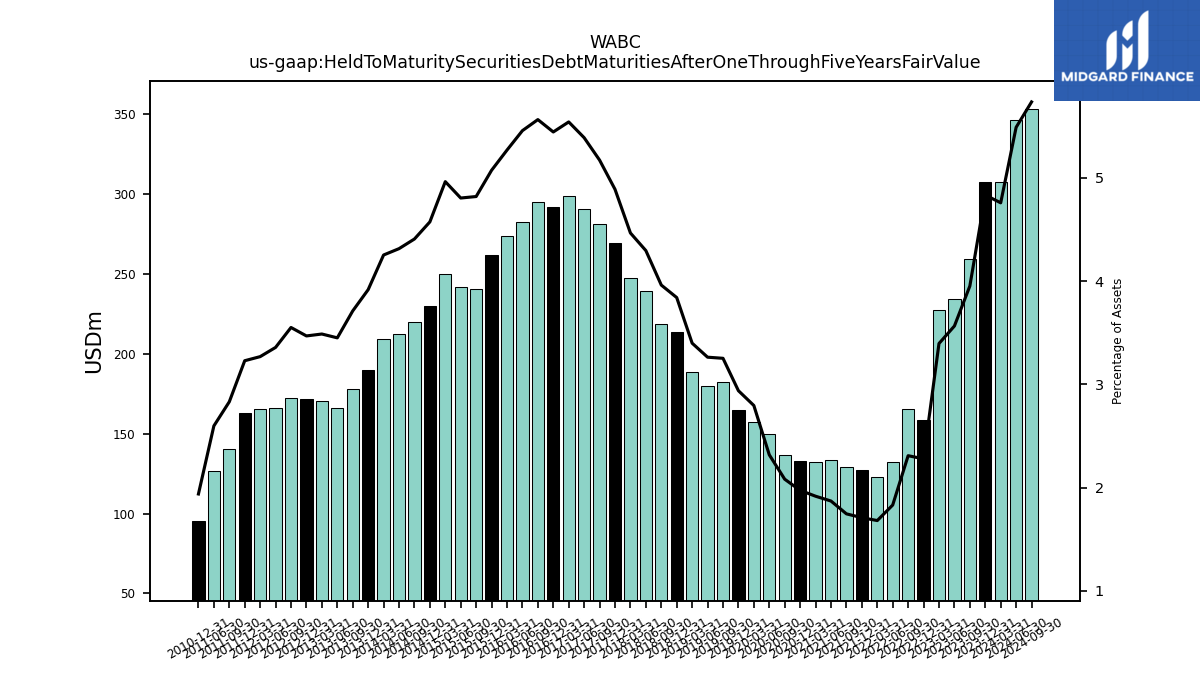
| Held To Maturity Securities Debt Maturities After One Through Five Years Fair Value | 307.56 | 259.49 | 234.64 | 227.50 | 158.41 | 165.74 | 132.31 | 122.86 | 127.54 | 129.31 | 133.71 | 132.53 | 133.19 | 136.64 | 149.82 | 157.31 | 165.13 | 182.63 | 180.22 | 188.82 | 213.83 | 219.02 | 239.55 | 247.86 | 269.47 | 281.58 | 290.55 | 298.93 | |
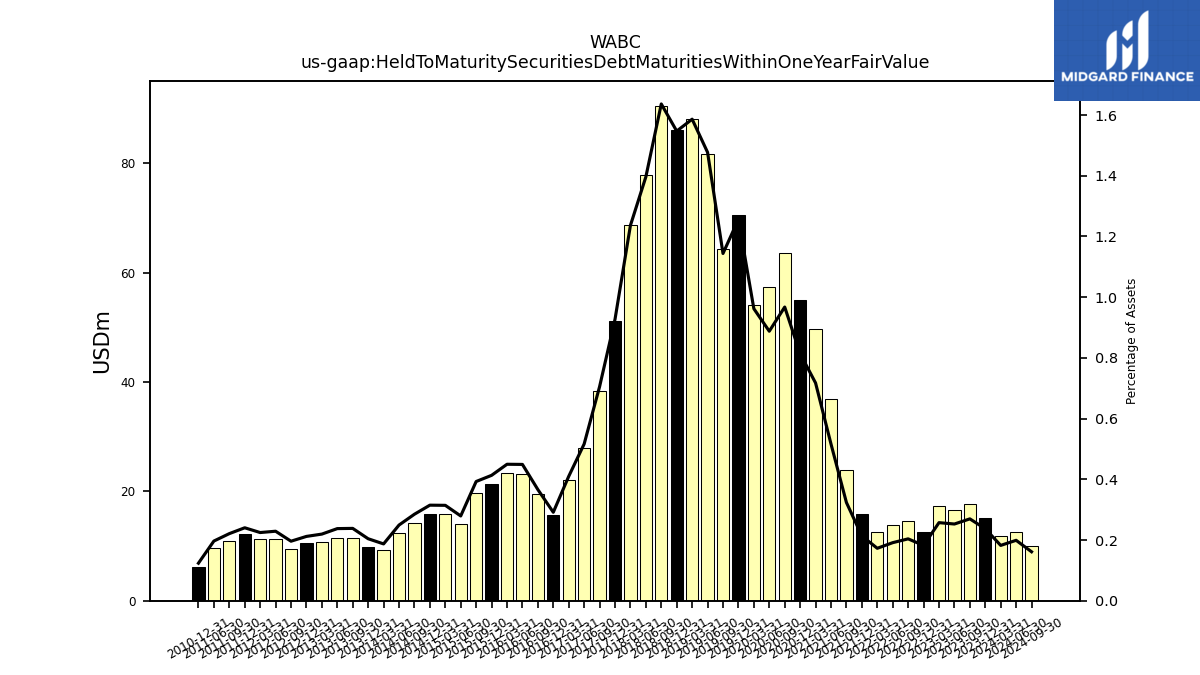
| Held To Maturity Securities Debt Maturities Within One Year Fair Value | 15.10 | 17.71 | 16.64 | 17.24 | 12.66 | 14.63 | 13.82 | 12.62 | 15.94 | 23.97 | 36.91 | 49.59 | 54.93 | 63.50 | 57.39 | 54.15 | 70.60 | 64.25 | 81.59 | 88.14 | 86.15 | 90.49 | 77.88 | 68.64 | 51.10 | 38.40 | 27.85 | 22.11 | |
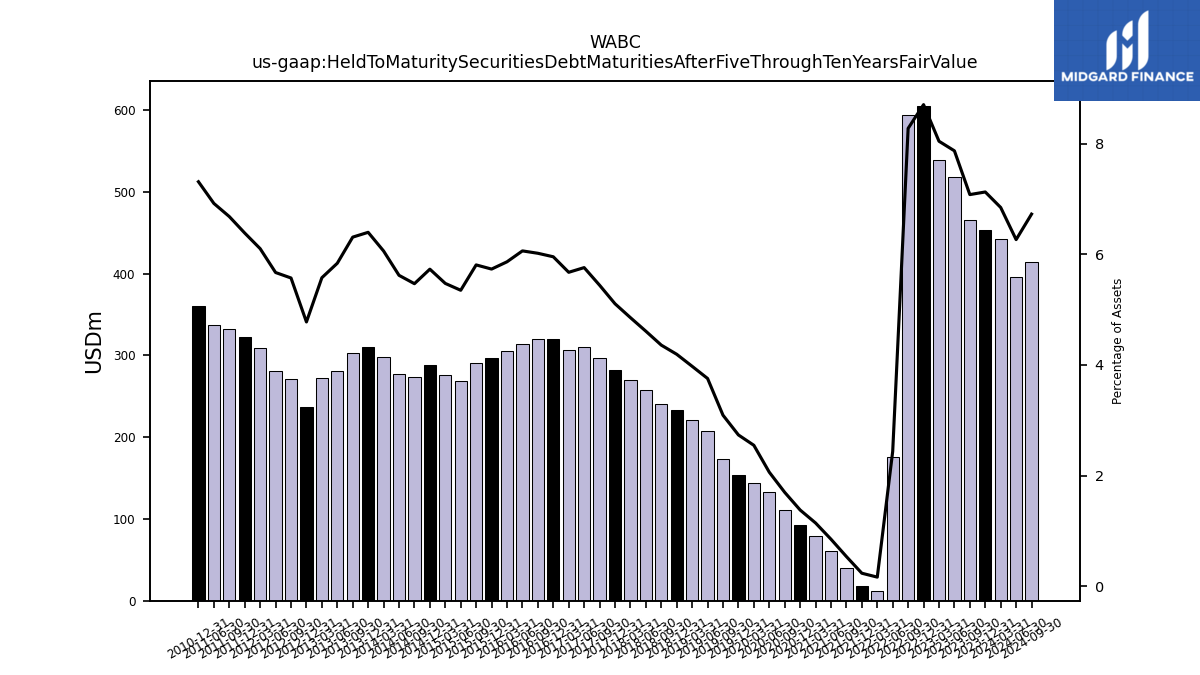
| Held To Maturity Securities Debt Maturities After Five Through Ten Years Fair Value | 453.60 | 464.95 | 518.11 | 538.99 | 605.08 | 593.98 | 176.15 | 12.10 | 17.61 | 39.75 | 60.79 | 79.10 | 93.04 | 111.45 | 133.29 | 143.43 | 153.72 | 173.66 | 207.47 | 220.91 | 233.51 | 241.02 | 257.16 | 269.53 | 281.55 | 296.36 | 310.66 | 306.23 |
| 2023-12-31 | 2023-09-30 | 2023-06-30 | 2023-03-31 | 2022-12-31 | 2022-09-30 | 2022-06-30 | 2022-03-31 | 2021-12-31 | 2021-09-30 | 2021-06-30 | 2021-03-31 | 2020-12-31 | 2020-09-30 | 2020-06-30 | 2020-03-31 | 2019-12-31 | 2019-09-30 | 2019-06-30 | 2019-03-31 | 2018-12-31 | 2018-09-30 | 2018-06-30 | 2018-03-31 | 2017-12-31 | 2017-09-30 | 2017-06-30 | 2017-03-31 | ||
|---|---|---|---|---|---|---|---|---|---|---|---|---|---|---|---|---|---|---|---|---|---|---|---|---|---|---|---|---|---|
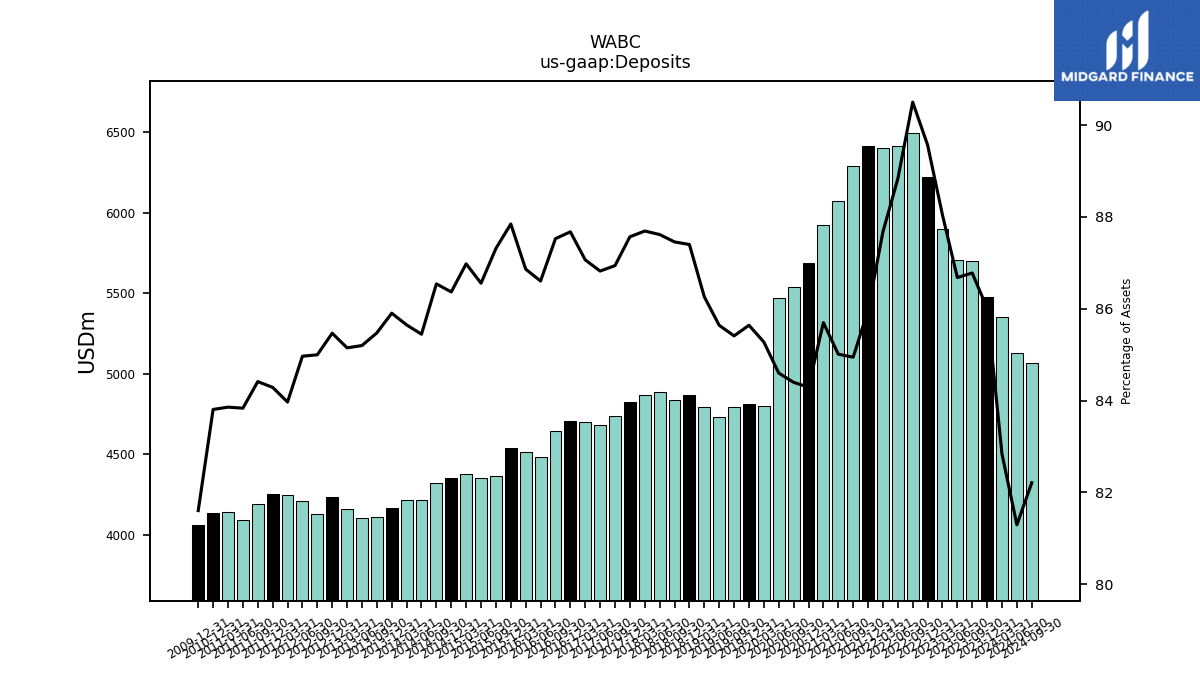
| Deposits | 5474.27 | 5699.01 | 5705.93 | 5899.31 | 6225.29 | 6495.26 | 6415.59 | 6405.87 | 6413.96 | 6288.96 | 6076.39 | 5923.83 | 5687.98 | 5539.19 | 5468.41 | 4799.43 | 4812.62 | 4796.62 | 4730.26 | 4792.58 | 4866.84 | 4835.84 | 4887.12 | 4867.87 | 4827.61 | 4734.58 | 4682.57 | 4697.97 |
| 2023-12-31 | 2023-09-30 | 2023-06-30 | 2023-03-31 | 2022-12-31 | 2022-09-30 | 2022-06-30 | 2022-03-31 | 2021-12-31 | 2021-09-30 | 2021-06-30 | 2021-03-31 | 2020-12-31 | 2020-09-30 | 2020-06-30 | 2020-03-31 | 2019-12-31 | 2019-09-30 | 2019-06-30 | 2019-03-31 | 2018-12-31 | 2018-09-30 | 2018-06-30 | 2018-03-31 | 2017-12-31 | 2017-09-30 | 2017-06-30 | 2017-03-31 | ||
|---|---|---|---|---|---|---|---|---|---|---|---|---|---|---|---|---|---|---|---|---|---|---|---|---|---|---|---|---|---|
| Stockholders Equity | 772.89 | 648.42 | 651.86 | 642.92 | 602.11 | 538.99 | 617.13 | 701.74 | 827.10 | 837.95 | 842.20 | 812.13 | 844.81 | 825.58 | 808.08 | 705.55 | 731.42 | 713.38 | 693.44 | 656.77 | 615.59 | 592.59 | 586.14 | 582.08 | 590.24 | 603.96 | 595.59 | 584.89 | |
| Common Stock Value | 473.14 | 471.83 | 471.48 | 471.12 | 475.09 | 474.70 | 473.52 | 472.44 | 471.01 | 470.68 | 470.33 | 469.85 | 466.01 | 467.20 | 467.35 | 465.70 | 465.46 | 462.65 | 459.37 | 455.30 | 448.35 | 447.79 | 443.34 | 439.82 | 431.73 | 425.65 | 424.48 | 422.67 | |
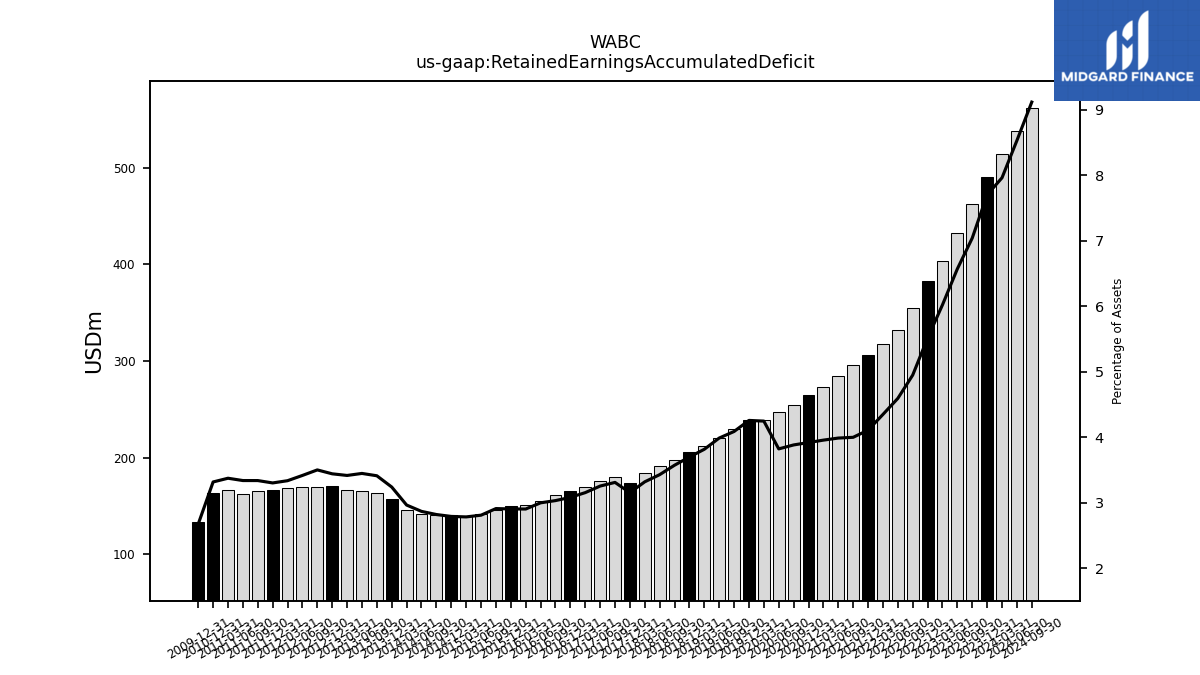
| Retained Earnings Accumulated Deficit | 490.00 | 462.27 | 432.39 | 403.34 | 383.09 | 355.05 | 331.60 | 317.57 | 306.39 | 295.96 | 284.91 | 273.35 | 264.36 | 254.72 | 246.96 | 238.90 | 239.13 | 229.50 | 220.17 | 211.94 | 205.84 | 197.48 | 191.17 | 184.19 | 173.80 | 180.20 | 175.45 | 170.13 | |
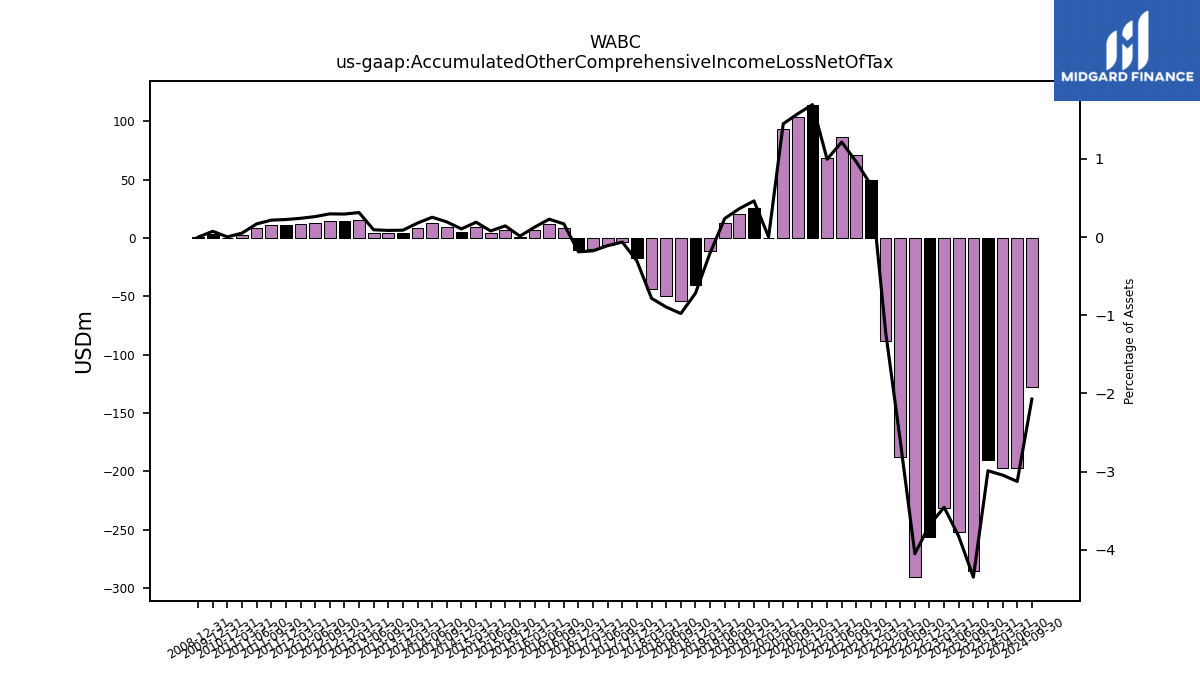
| Accumulated Other Comprehensive Income Loss Net Of Tax | -190.28 | -285.71 | -252.04 | -231.57 | -256.11 | -290.80 | -188.03 | -88.30 | 49.66 | 71.28 | 86.92 | 68.90 | 114.41 | 103.62 | 93.73 | 0.17 | 26.05 | 20.45 | 13.12 | -11.25 | -40.00 | -54.07 | -49.90 | -43.45 | -16.83 | -3.43 | -5.86 | -9.44 |
| 2023-12-31 | 2023-09-30 | 2023-06-30 | 2023-03-31 | 2022-12-31 | 2022-09-30 | 2022-06-30 | 2022-03-31 | 2021-12-31 | 2021-09-30 | 2021-06-30 | 2021-03-31 | 2020-12-31 | 2020-09-30 | 2020-06-30 | 2020-03-31 | 2019-12-31 | 2019-09-30 | 2019-06-30 | 2019-03-31 | 2018-12-31 | 2018-09-30 | 2018-06-30 | 2018-03-31 | 2017-12-31 | 2017-09-30 | 2017-06-30 | 2017-03-31 | ||
|---|---|---|---|---|---|---|---|---|---|---|---|---|---|---|---|---|---|---|---|---|---|---|---|---|---|---|---|---|---|
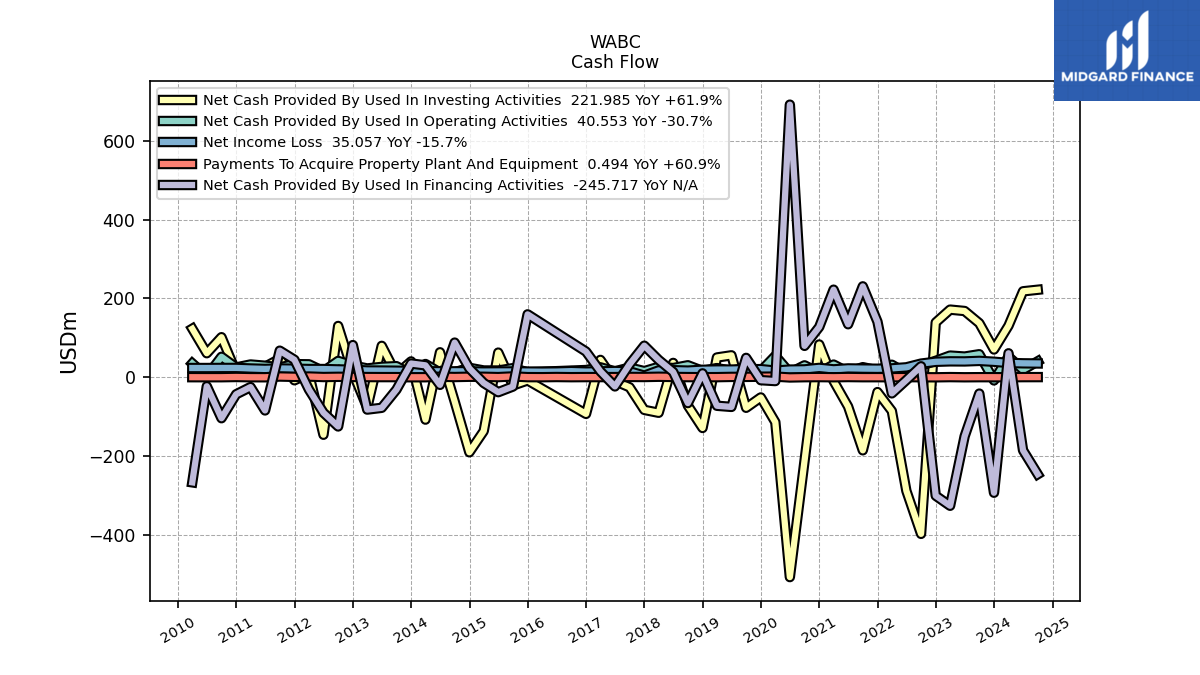
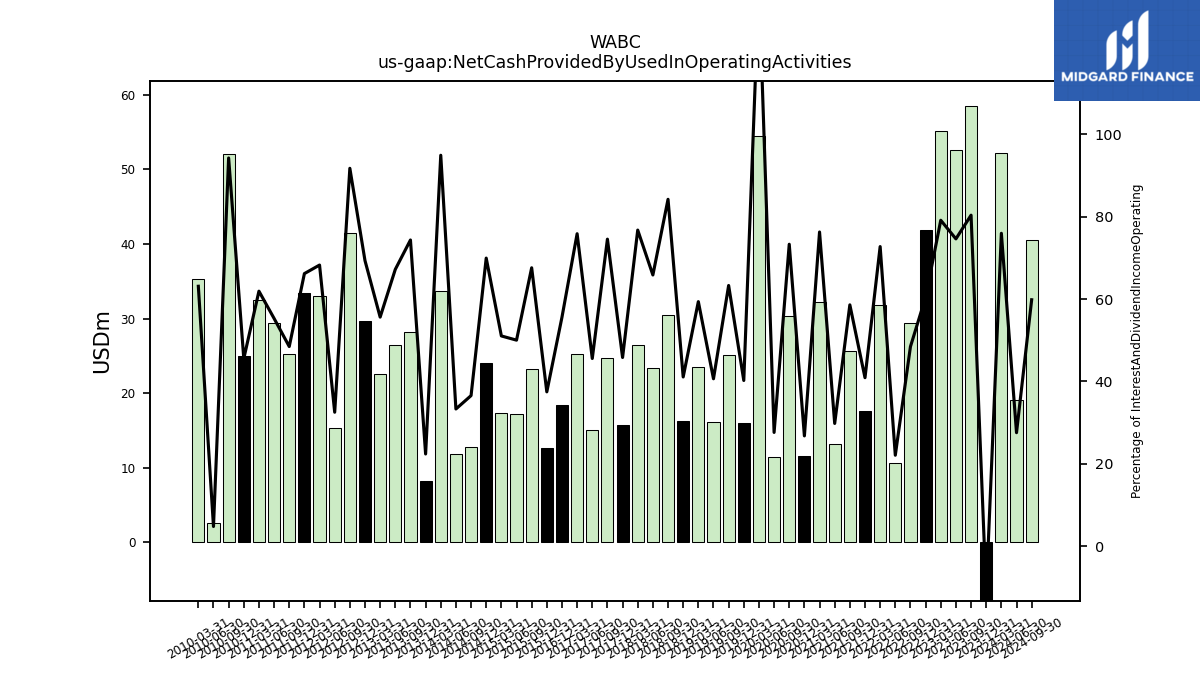
| Net Cash Provided By Used In Operating Activities | -7.98 | 58.53 | 52.58 | 55.08 | 41.82 | 29.46 | 10.60 | 31.82 | 17.61 | 25.66 | 13.19 | 32.27 | 11.50 | 30.32 | 11.47 | 54.45 | 16.04 | 25.12 | 16.10 | 23.44 | 16.20 | 30.52 | 23.42 | 26.48 | 15.67 | 24.70 | 15.11 | 25.27 | |
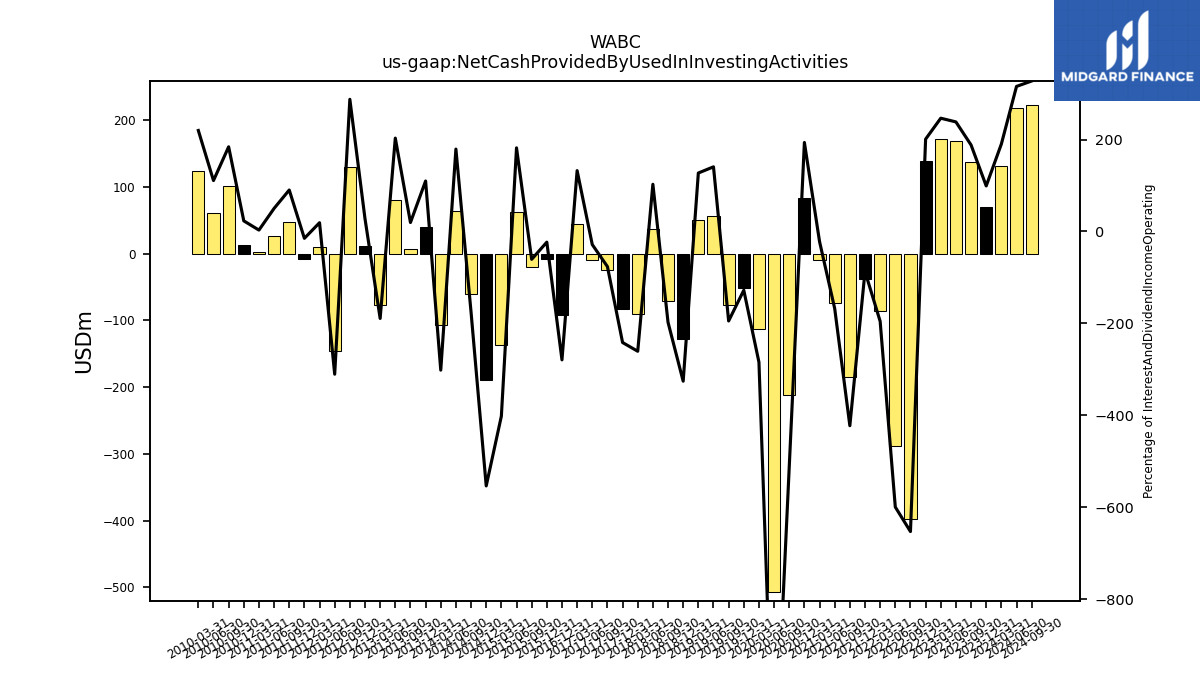
| Net Cash Provided By Used In Investing Activities | 70.45 | 137.14 | 168.07 | 171.61 | 139.03 | -396.99 | -287.78 | -85.55 | -37.42 | -185.16 | -74.20 | -9.30 | 83.23 | -211.84 | -506.61 | -113.70 | -50.97 | -77.30 | 55.74 | 50.23 | -128.51 | -71.67 | 36.55 | -89.94 | -82.63 | -25.32 | -9.44 | 44.13 | |
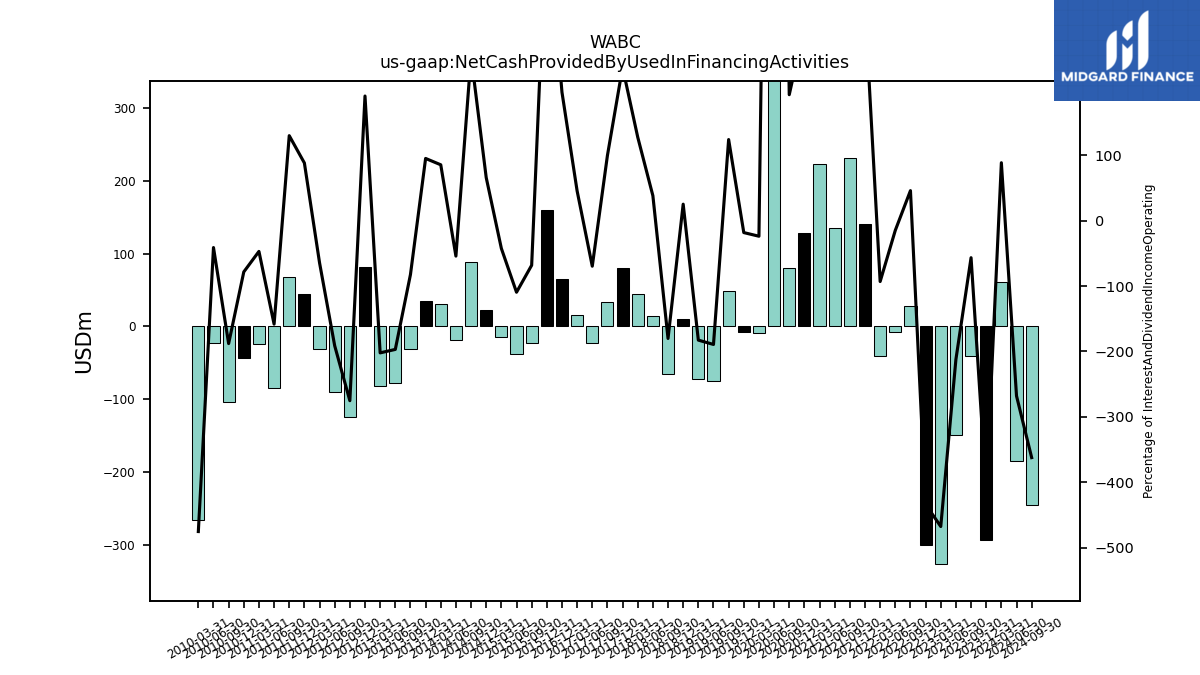
| Net Cash Provided By Used In Financing Activities | -292.71 | -41.30 | -149.66 | -325.73 | -300.28 | 27.90 | -7.12 | -40.76 | 140.86 | 230.62 | 134.48 | 222.21 | 127.58 | 79.67 | 691.33 | -9.54 | -7.29 | 49.23 | -75.05 | -72.16 | 9.93 | -65.34 | 13.56 | 44.06 | 80.20 | 33.02 | -23.12 | 15.13 |
| 2023-12-31 | 2023-09-30 | 2023-06-30 | 2023-03-31 | 2022-12-31 | 2022-09-30 | 2022-06-30 | 2022-03-31 | 2021-12-31 | 2021-09-30 | 2021-06-30 | 2021-03-31 | 2020-12-31 | 2020-09-30 | 2020-06-30 | 2020-03-31 | 2019-12-31 | 2019-09-30 | 2019-06-30 | 2019-03-31 | 2018-12-31 | 2018-09-30 | 2018-06-30 | 2018-03-31 | 2017-12-31 | 2017-09-30 | 2017-06-30 | 2017-03-31 | ||
|---|---|---|---|---|---|---|---|---|---|---|---|---|---|---|---|---|---|---|---|---|---|---|---|---|---|---|---|---|---|
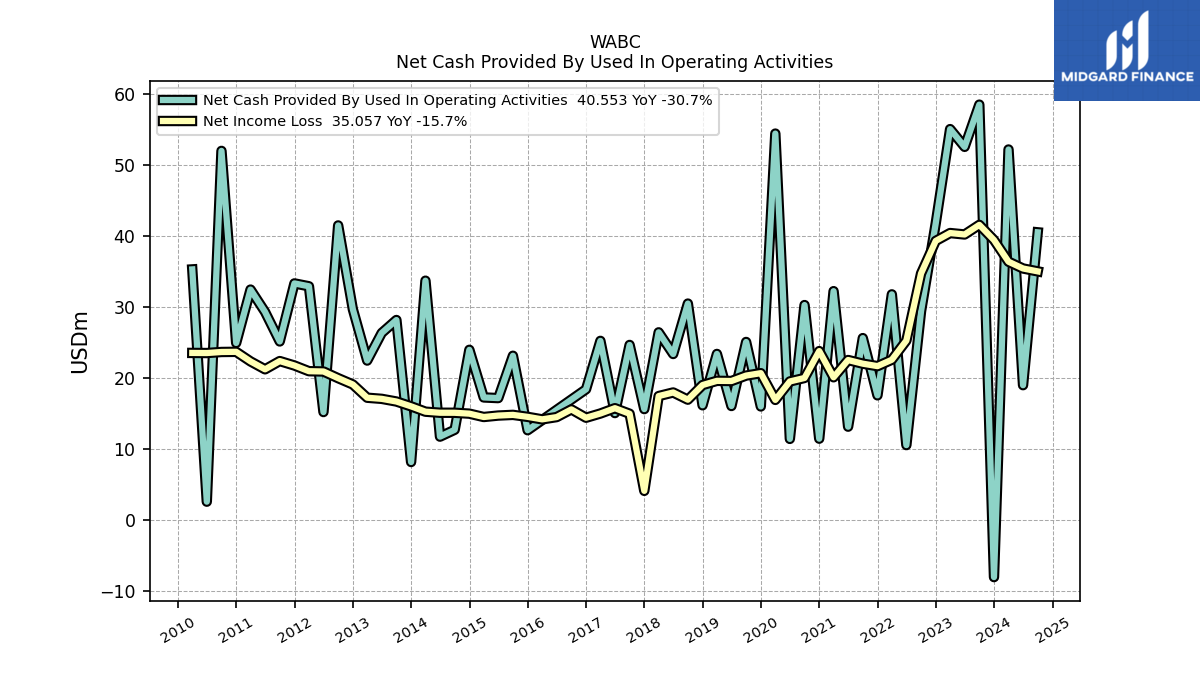
| Net Cash Provided By Used In Operating Activities | -7.98 | 58.53 | 52.58 | 55.08 | 41.82 | 29.46 | 10.60 | 31.82 | 17.61 | 25.66 | 13.19 | 32.27 | 11.50 | 30.32 | 11.47 | 54.45 | 16.04 | 25.12 | 16.10 | 23.44 | 16.20 | 30.52 | 23.42 | 26.48 | 15.67 | 24.70 | 15.11 | 25.27 | |
| Net Income Loss | 39.47 | 41.60 | 40.25 | 40.45 | 39.34 | 34.76 | 25.31 | 22.62 | 21.72 | 22.06 | 22.58 | 20.15 | 23.84 | 20.05 | 19.56 | 16.96 | 20.73 | 20.39 | 19.62 | 19.65 | 19.05 | 16.99 | 18.01 | 17.51 | 4.16 | 15.02 | 15.80 | 15.05 |
| 2023-12-31 | 2023-09-30 | 2023-06-30 | 2023-03-31 | 2022-12-31 | 2022-09-30 | 2022-06-30 | 2022-03-31 | 2021-12-31 | 2021-09-30 | 2021-06-30 | 2021-03-31 | 2020-12-31 | 2020-09-30 | 2020-06-30 | 2020-03-31 | 2019-12-31 | 2019-09-30 | 2019-06-30 | 2019-03-31 | 2018-12-31 | 2018-09-30 | 2018-06-30 | 2018-03-31 | 2017-12-31 | 2017-09-30 | 2017-06-30 | 2017-03-31 | ||
|---|---|---|---|---|---|---|---|---|---|---|---|---|---|---|---|---|---|---|---|---|---|---|---|---|---|---|---|---|---|
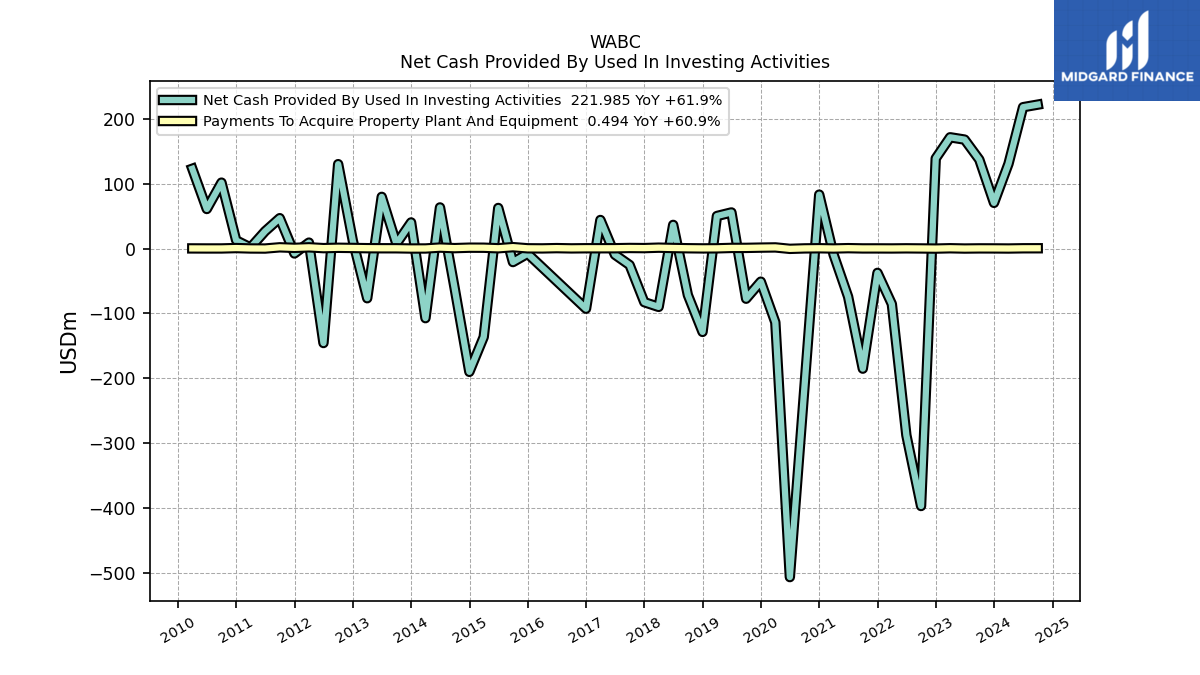
| Net Cash Provided By Used In Investing Activities | 70.45 | 137.14 | 168.07 | 171.61 | 139.03 | -396.99 | -287.78 | -85.55 | -37.42 | -185.16 | -74.20 | -9.30 | 83.23 | -211.84 | -506.61 | -113.70 | -50.97 | -77.30 | 55.74 | 50.23 | -128.51 | -71.67 | 36.55 | -89.94 | -82.63 | -25.32 | -9.44 | 44.13 | |
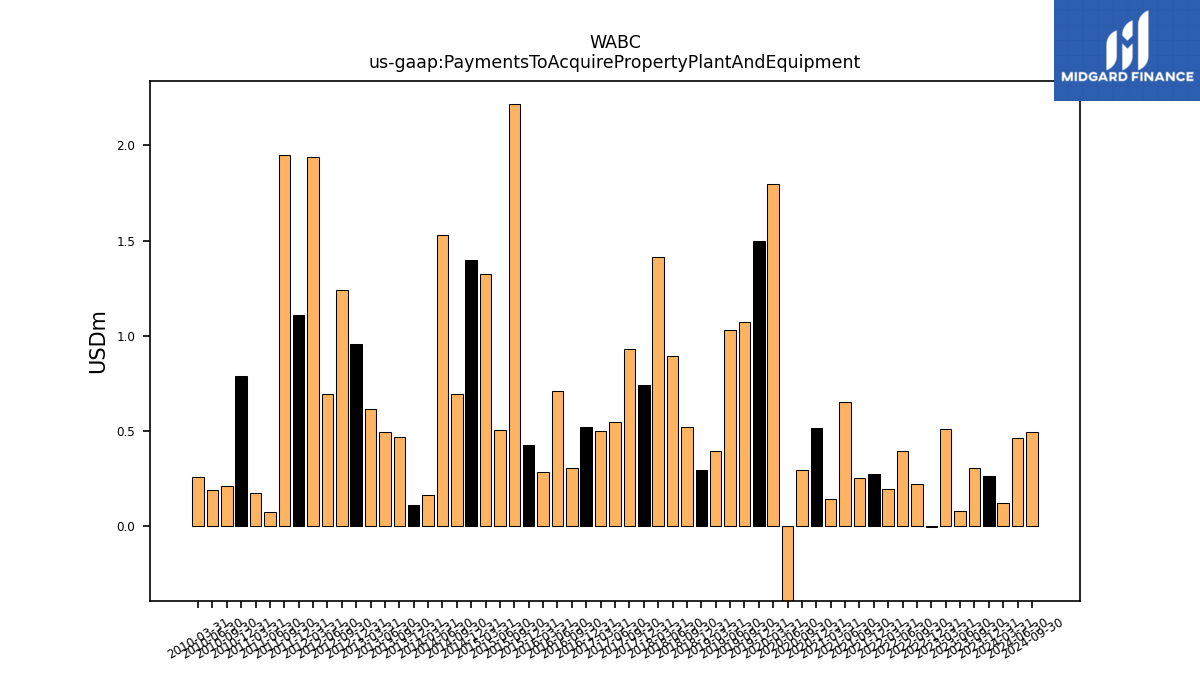
| Payments To Acquire Property Plant And Equipment | 0.26 | 0.31 | 0.08 | 0.51 | -0.00 | 0.22 | 0.39 | 0.20 | 0.27 | 0.25 | 0.66 | 0.14 | 0.52 | 0.29 | -0.41 | 1.80 | 1.50 | 1.07 | 1.03 | 0.39 | 0.29 | 0.52 | 0.90 | 1.41 | 0.74 | 0.93 | 0.55 | 0.50 |
| 2023-12-31 | 2023-09-30 | 2023-06-30 | 2023-03-31 | 2022-12-31 | 2022-09-30 | 2022-06-30 | 2022-03-31 | 2021-12-31 | 2021-09-30 | 2021-06-30 | 2021-03-31 | 2020-12-31 | 2020-09-30 | 2020-06-30 | 2020-03-31 | 2019-12-31 | 2019-09-30 | 2019-06-30 | 2019-03-31 | 2018-12-31 | 2018-09-30 | 2018-06-30 | 2018-03-31 | 2017-12-31 | 2017-09-30 | 2017-06-30 | 2017-03-31 | ||
|---|---|---|---|---|---|---|---|---|---|---|---|---|---|---|---|---|---|---|---|---|---|---|---|---|---|---|---|---|---|
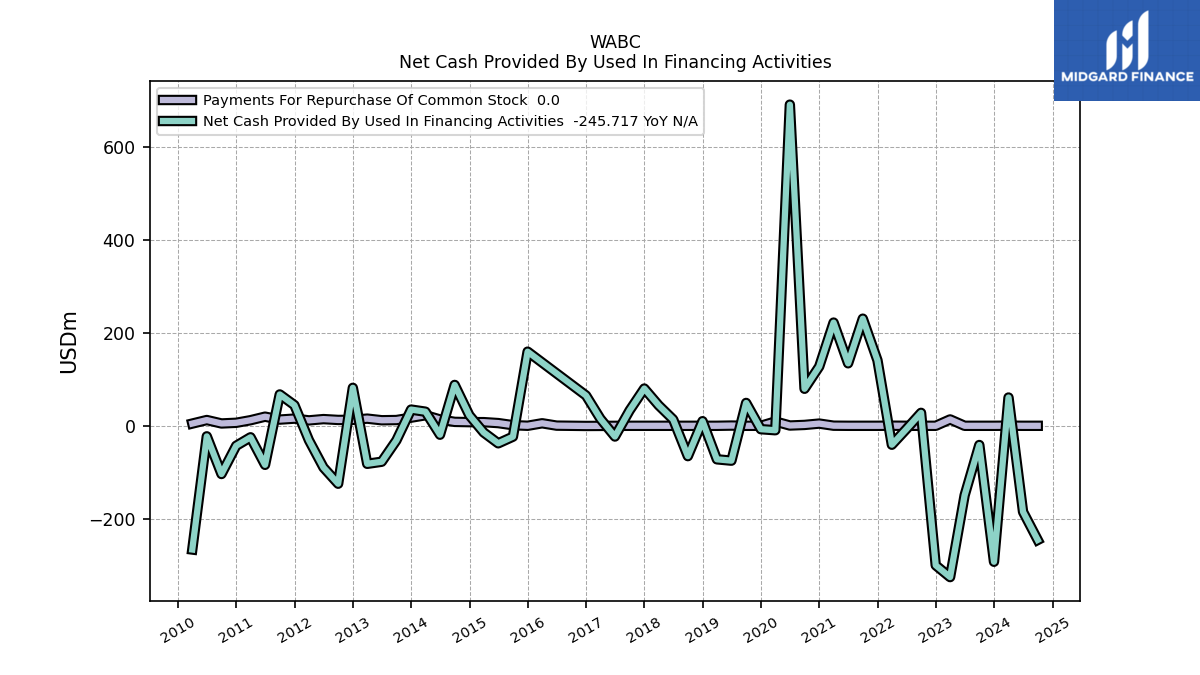
| Net Cash Provided By Used In Financing Activities | -292.71 | -41.30 | -149.66 | -325.73 | -300.28 | 27.90 | -7.12 | -40.76 | 140.86 | 230.62 | 134.48 | 222.21 | 127.58 | 79.67 | 691.33 | -9.54 | -7.29 | 49.23 | -75.05 | -72.16 | 9.93 | -65.34 | 13.56 | 44.06 | 80.20 | 33.02 | -23.12 | 15.13 | |
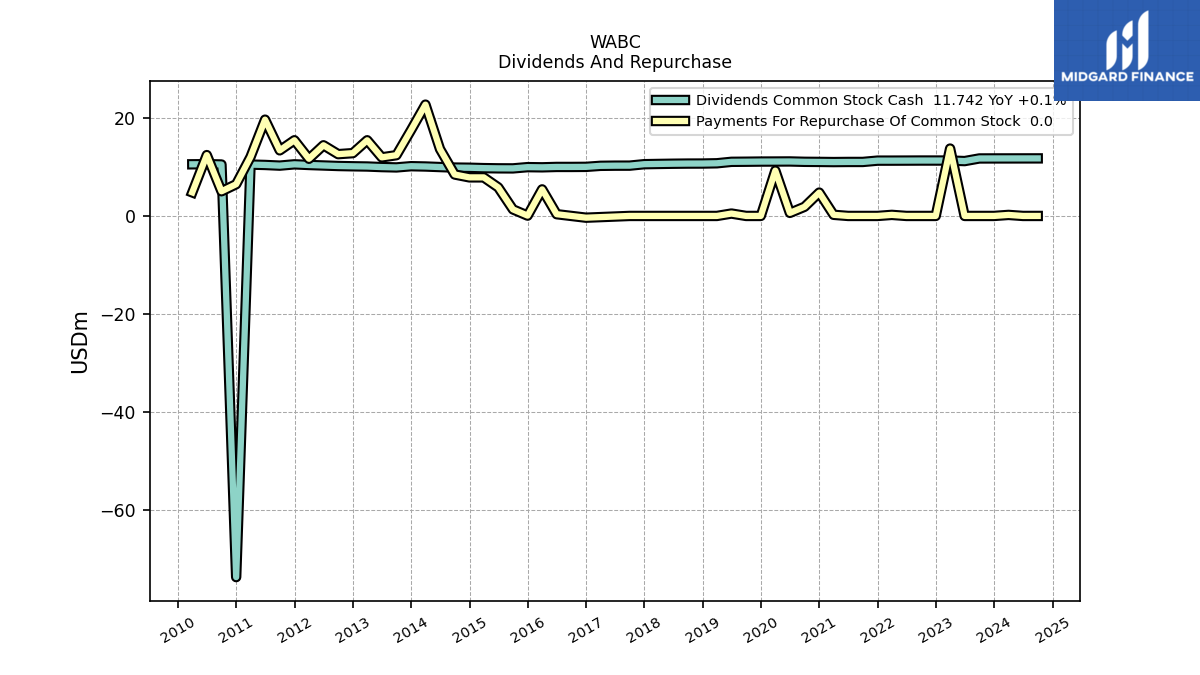
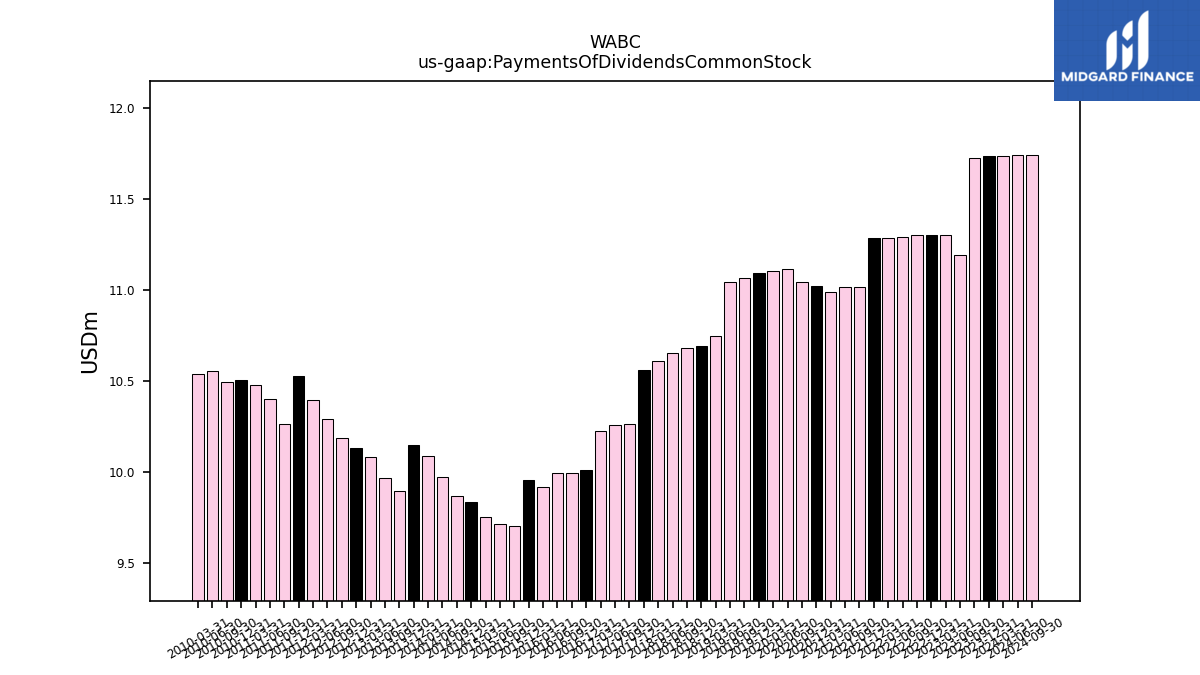
| Payments Of Dividends Common Stock | 11.73 | 11.73 | 11.19 | 11.30 | 11.30 | 11.30 | 11.29 | 11.28 | 11.28 | 11.02 | 11.02 | 10.99 | 11.02 | 11.04 | 11.12 | 11.10 | 11.09 | 11.06 | 11.04 | 10.74 | 10.69 | 10.68 | 10.65 | 10.61 | 10.56 | 10.26 | 10.26 | 10.22 | |
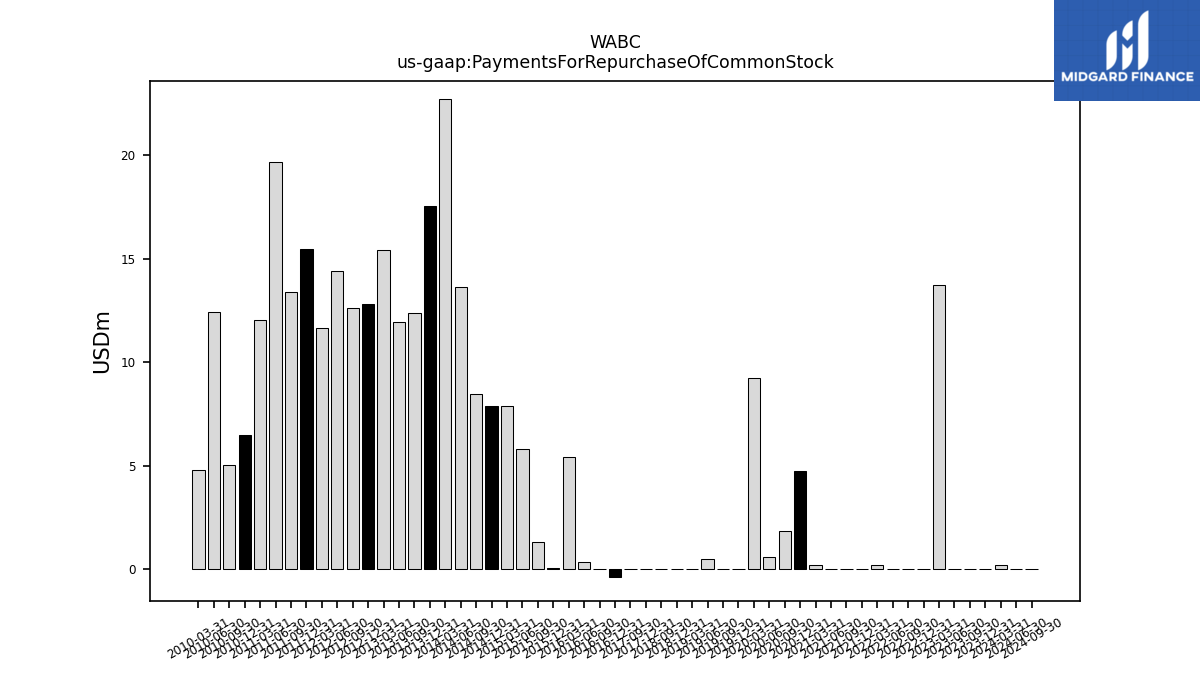
| Payments For Repurchase Of Common Stock | 0.00 | 0.00 | 0.00 | 13.75 | 0.00 | 0.00 | 0.00 | 0.22 | 0.00 | 0.00 | 0.00 | 0.23 | 4.76 | 1.87 | 0.62 | 9.25 | 0.00 | 0.00 | 0.49 | -0.00 | 0.00 | 0.00 | NA | NA | 0.00 | 0.00 | NA | NA |
| 2023-12-31 | 2023-09-30 | 2023-06-30 | 2023-03-31 | 2022-12-31 | 2022-09-30 | 2022-06-30 | 2022-03-31 | 2021-12-31 | 2021-09-30 | 2021-06-30 | 2021-03-31 | 2020-12-31 | 2020-09-30 | 2020-06-30 | 2020-03-31 | 2019-12-31 | 2019-09-30 | 2019-06-30 | 2019-03-31 | 2018-12-31 | 2018-09-30 | 2018-06-30 | 2018-03-31 | 2017-12-31 | 2017-09-30 | 2017-06-30 | 2017-03-31 | ||
|---|---|---|---|---|---|---|---|---|---|---|---|---|---|---|---|---|---|---|---|---|---|---|---|---|---|---|---|---|---|
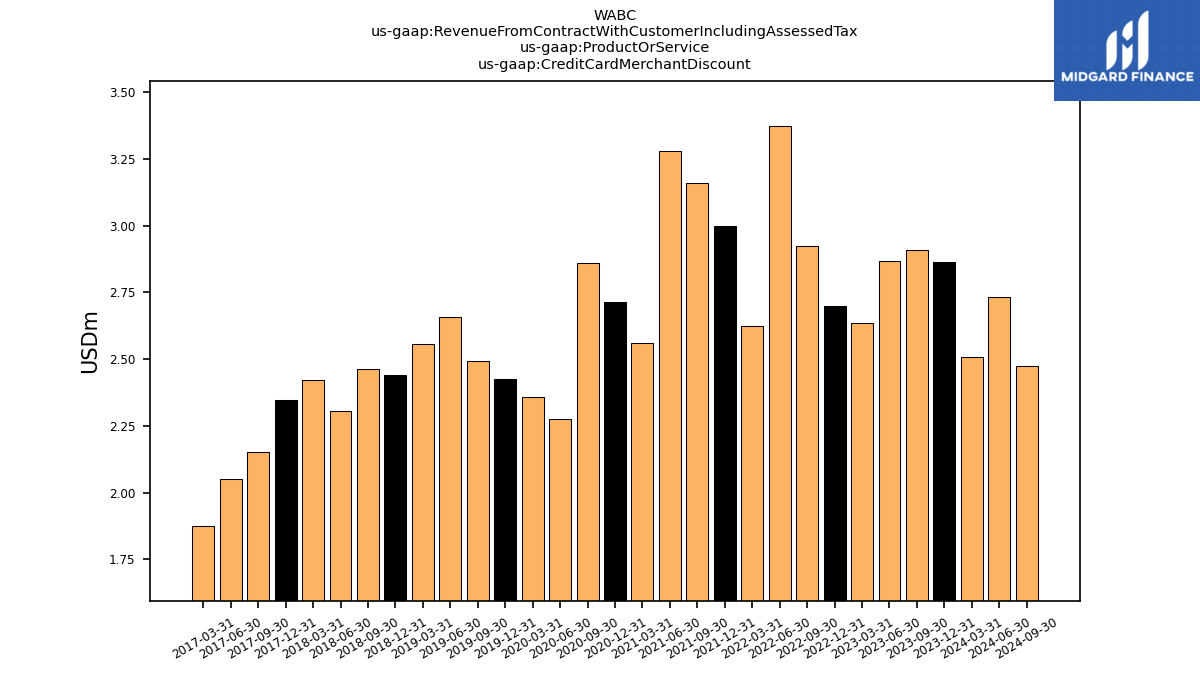
| Credit Card Merchant Discount | 2.86 | 2.91 | 2.87 | 2.64 | 2.70 | 2.92 | 3.37 | 2.62 | 3.00 | 3.16 | 3.28 | 2.56 | 2.71 | 2.86 | 2.28 | 2.36 | 2.42 | 2.49 | 2.66 | 2.56 | 2.44 | 2.46 | 2.31 | 2.42 | 2.35 | 2.15 | 2.05 | 1.88 | |
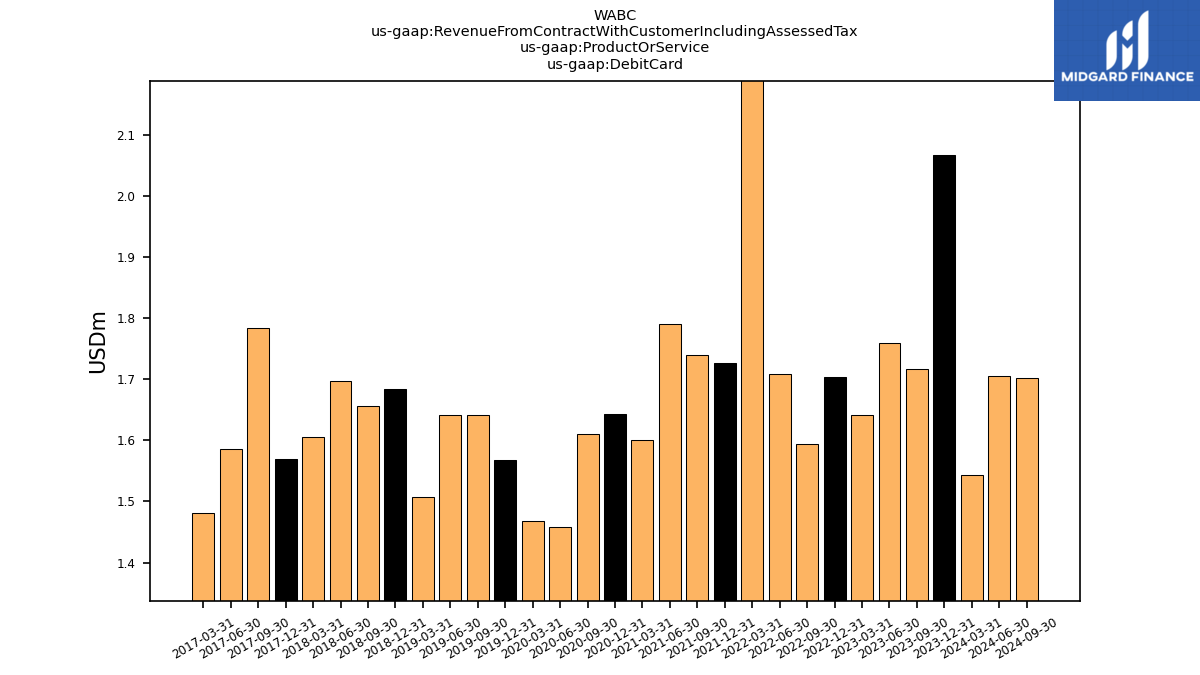
| Debit Card | 2.07 | 1.72 | 1.76 | 1.64 | 1.70 | 1.59 | 1.71 | 2.87 | 1.73 | 1.74 | 1.79 | 1.60 | 1.64 | 1.61 | 1.46 | 1.47 | 1.57 | 1.64 | 1.64 | 1.51 | 1.68 | 1.66 | 1.70 | 1.60 | 1.57 | 1.78 | 1.59 | 1.48 | |
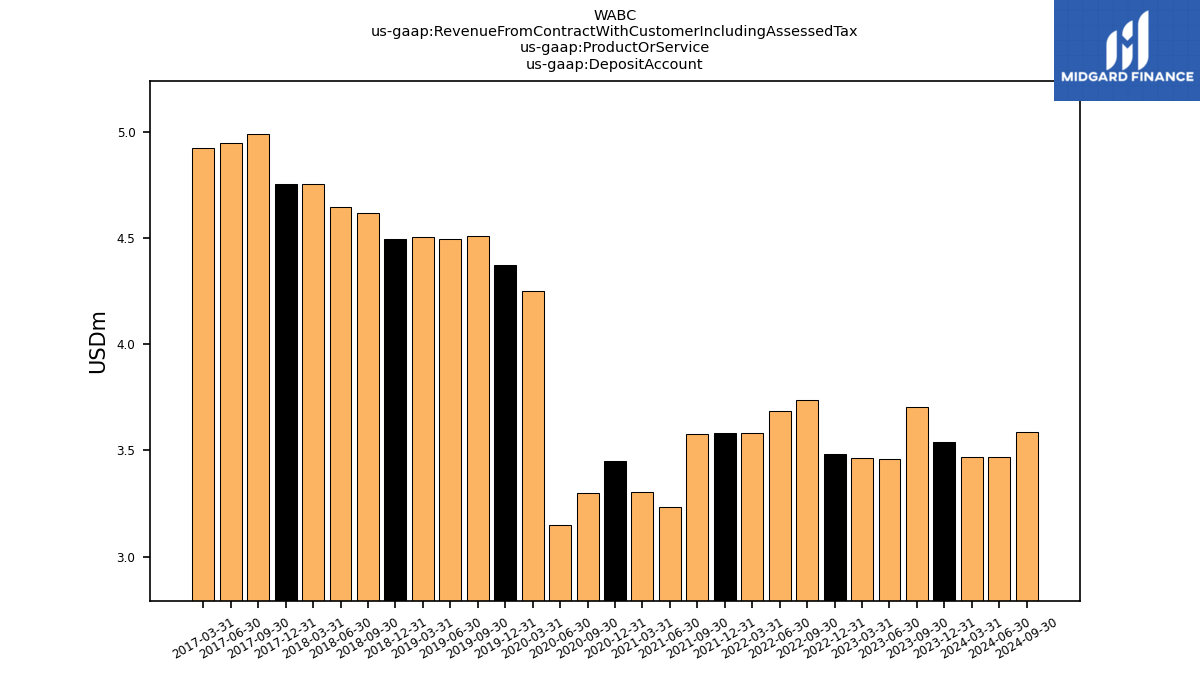
| Deposit Account | 3.54 | 3.71 | 3.46 | 3.46 | 3.48 | 3.74 | 3.69 | 3.58 | 3.58 | 3.58 | 3.23 | 3.30 | 3.45 | 3.30 | 3.15 | 4.25 | 4.37 | 4.51 | 4.49 | 4.50 | 4.50 | 4.62 | 4.64 | 4.75 | 4.75 | 4.99 | 4.95 | 4.92 | |
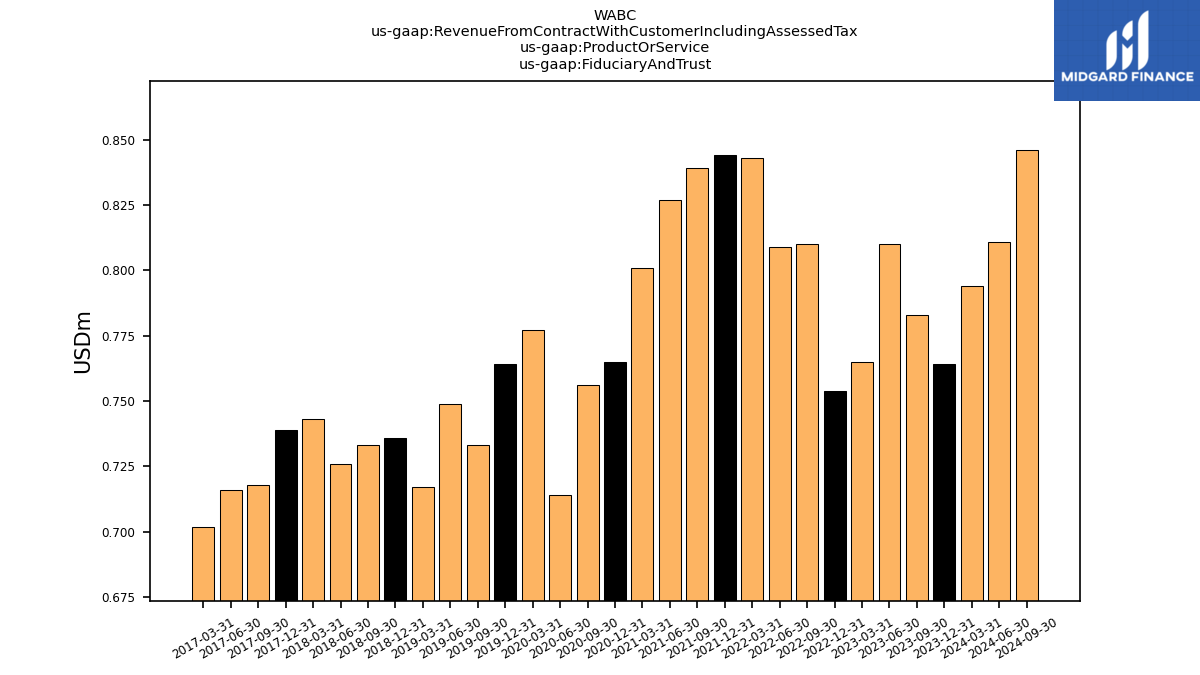
| Fiduciary And Trust | 0.76 | 0.78 | 0.81 | 0.77 | 0.75 | 0.81 | 0.81 | 0.84 | 0.84 | 0.84 | 0.83 | 0.80 | 0.77 | 0.76 | 0.71 | 0.78 | 0.76 | 0.73 | 0.75 | 0.72 | 0.74 | 0.73 | 0.73 | 0.74 | 0.74 | 0.72 | 0.72 | 0.70 | |
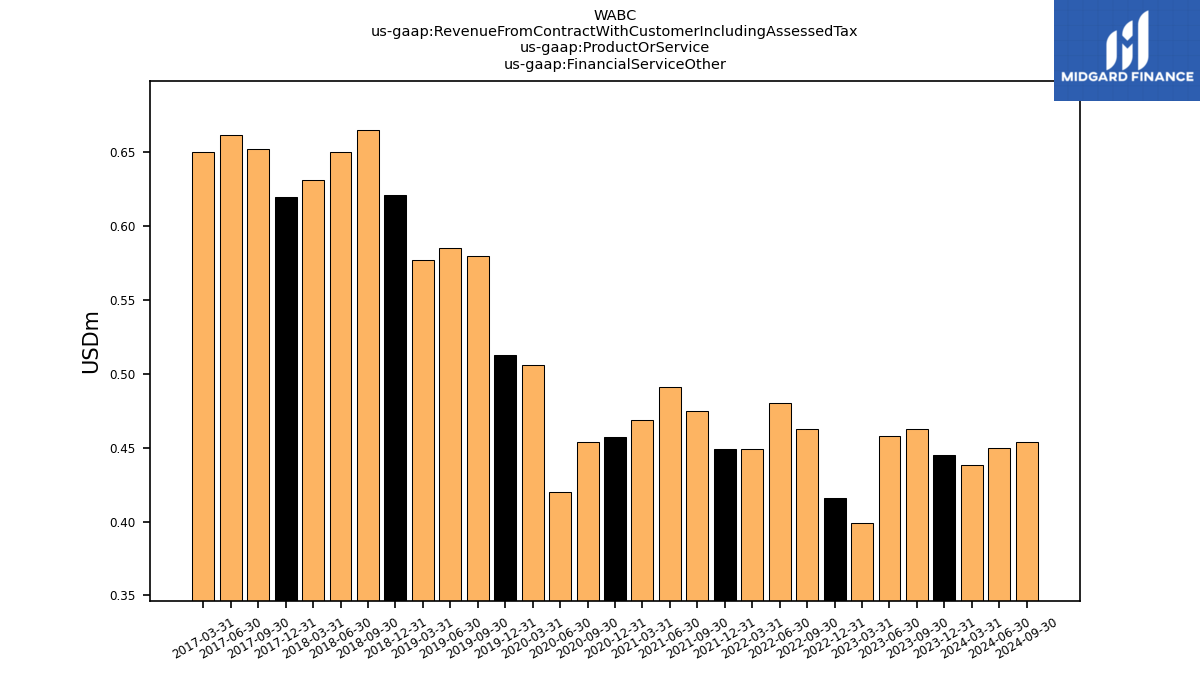
| Financial Service Other | 0.45 | 0.46 | 0.46 | 0.40 | 0.42 | 0.46 | 0.48 | 0.45 | 0.45 | 0.47 | 0.49 | 0.47 | 0.46 | 0.45 | 0.42 | 0.51 | 0.51 | 0.58 | 0.58 | 0.58 | 0.62 | 0.67 | 0.65 | 0.63 | 0.62 | 0.65 | 0.66 | 0.65 | |
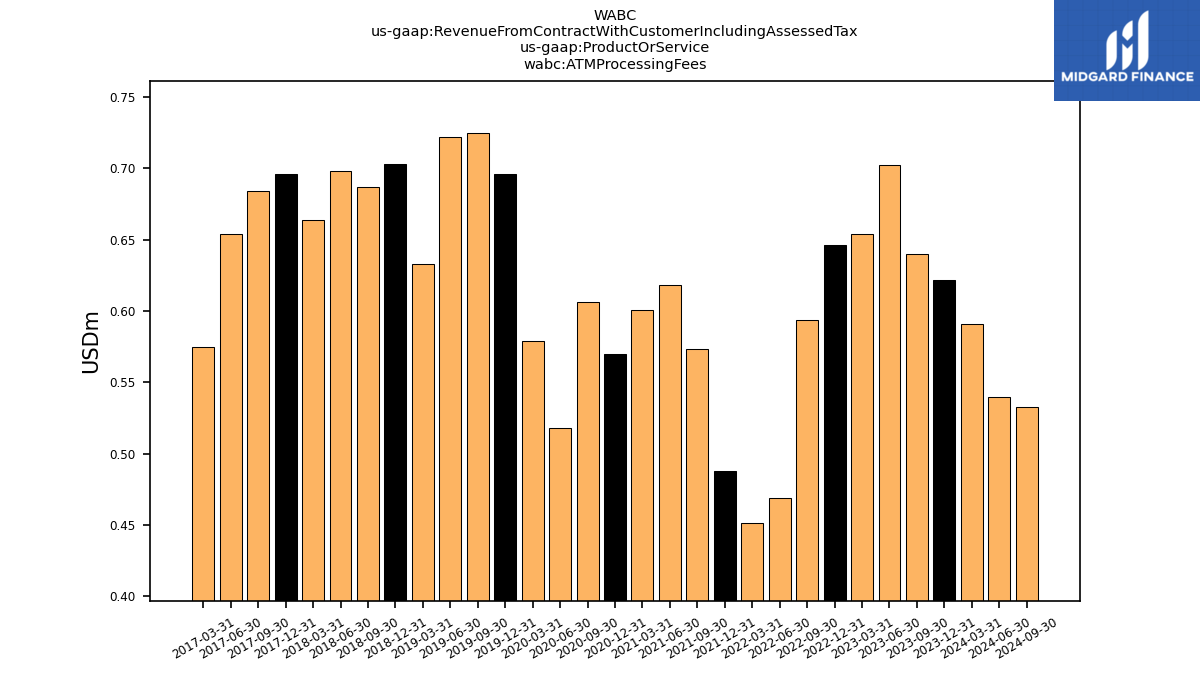
| A T M Processing Fees | 0.62 | 0.64 | 0.70 | 0.65 | 0.65 | 0.59 | 0.47 | 0.45 | 0.49 | 0.57 | 0.62 | 0.60 | 0.57 | 0.61 | 0.52 | 0.58 | 0.70 | 0.72 | 0.72 | 0.63 | 0.70 | 0.69 | 0.70 | 0.66 | 0.70 | 0.68 | 0.65 | 0.57 | |
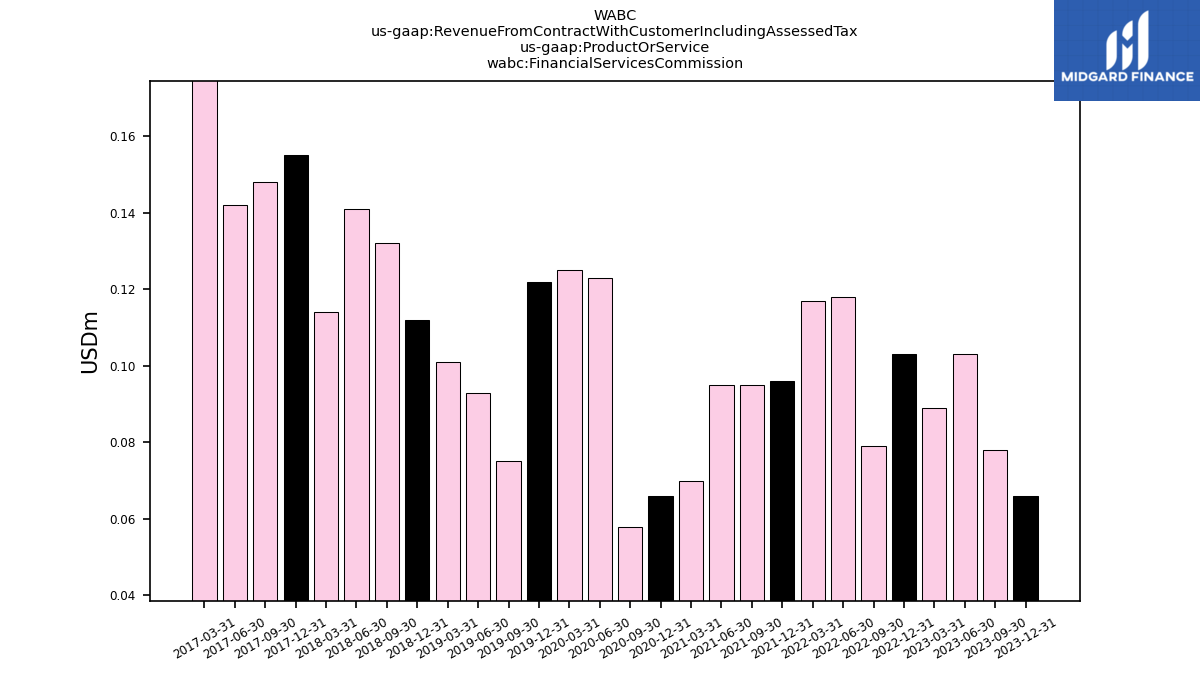
| Financial Services Commission | 0.07 | 0.08 | 0.10 | 0.09 | 0.10 | 0.08 | 0.12 | 0.12 | 0.10 | 0.10 | 0.10 | 0.07 | 0.07 | 0.06 | 0.12 | 0.12 | 0.12 | 0.07 | 0.09 | 0.10 | 0.11 | 0.13 | 0.14 | 0.11 | 0.15 | 0.15 | 0.14 | 0.20 |