
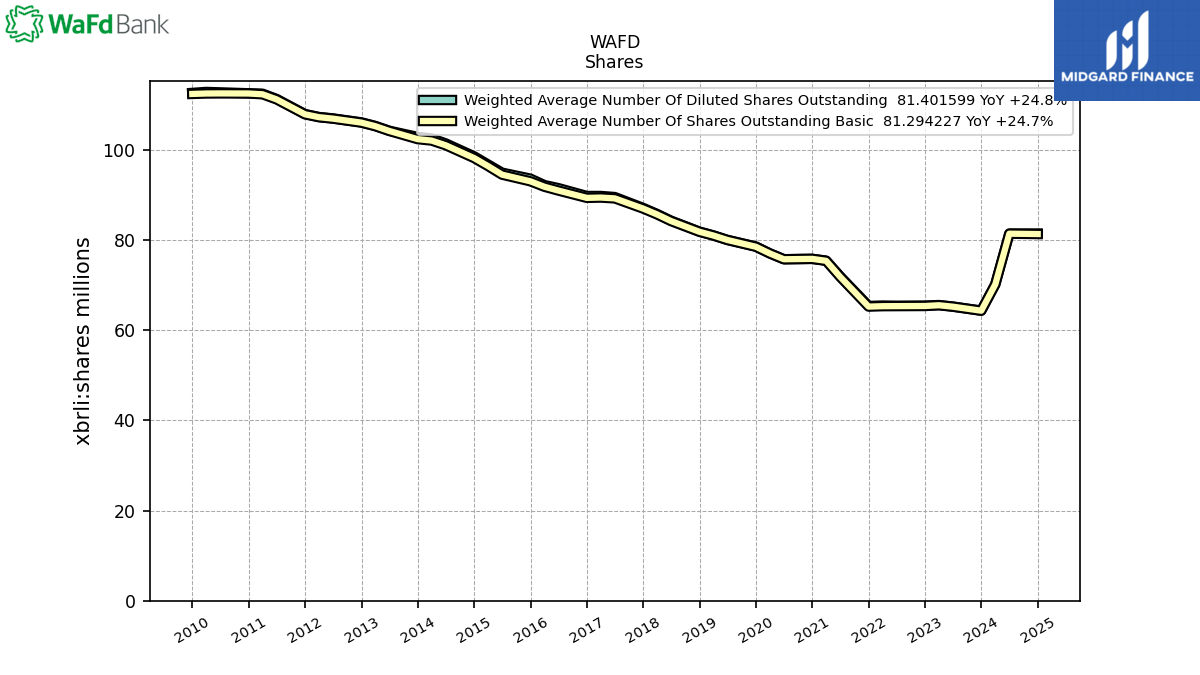
| 2023-12-31 | 2023-09-30 | 2023-06-30 | 2023-03-31 | 2022-12-31 | 2022-09-30 | 2022-06-30 | 2022-03-31 | 2021-12-31 | 2021-09-30 | 2021-06-30 | 2021-03-31 | 2020-12-31 | 2020-09-30 | 2020-06-30 | 2020-03-31 | 2019-12-31 | 2019-09-30 | 2019-06-30 | ||
|---|---|---|---|---|---|---|---|---|---|---|---|---|---|---|---|---|---|---|---|---|
| Common Stock Value | 136.68 | 136.47 | 136.46 | 136.41 | 136.37 | 136.27 | 136.26 | 136.24 | 136.20 | 135.99 | 135.99 | 135.98 | 135.94 | 135.73 | 135.74 | 135.74 | 135.72 | 135.54 | 135.53 | |
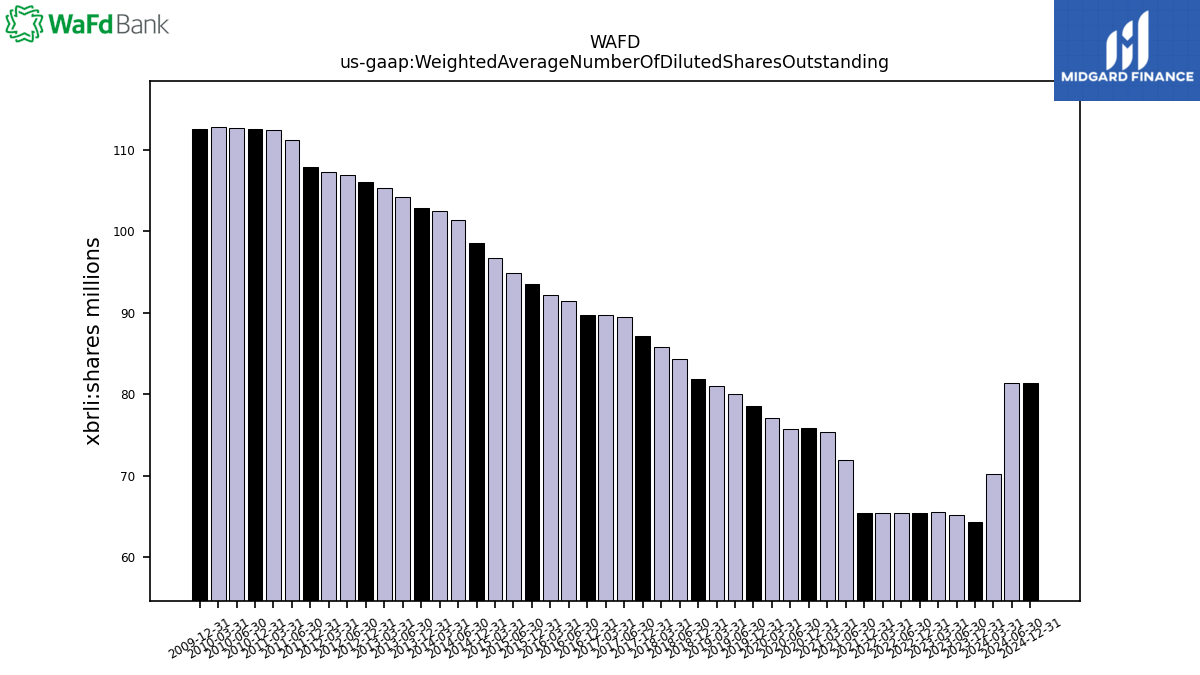
| Weighted Average Number Of Diluted Shares Outstanding | 64.31 | NA | 65.21 | 65.55 | 65.43 | NA | 65.40 | 65.45 | 65.35 | NA | 71.90 | 75.39 | 75.80 | NA | 75.71 | 77.01 | 78.54 | NA | 79.99 | |
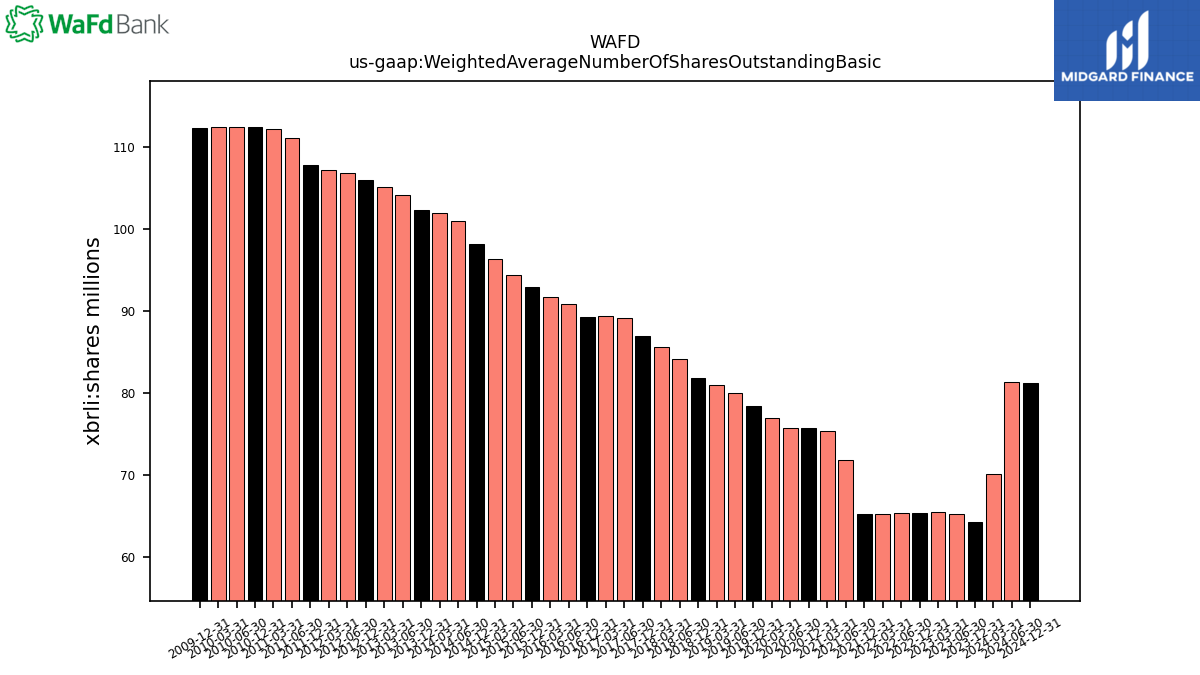
| Weighted Average Number Of Shares Outstanding Basic | 64.30 | NA | 65.19 | 65.51 | 65.34 | NA | 65.32 | 65.30 | 65.21 | NA | 71.80 | 75.35 | 75.79 | NA | 75.71 | 76.99 | 78.48 | NA | 79.98 | |
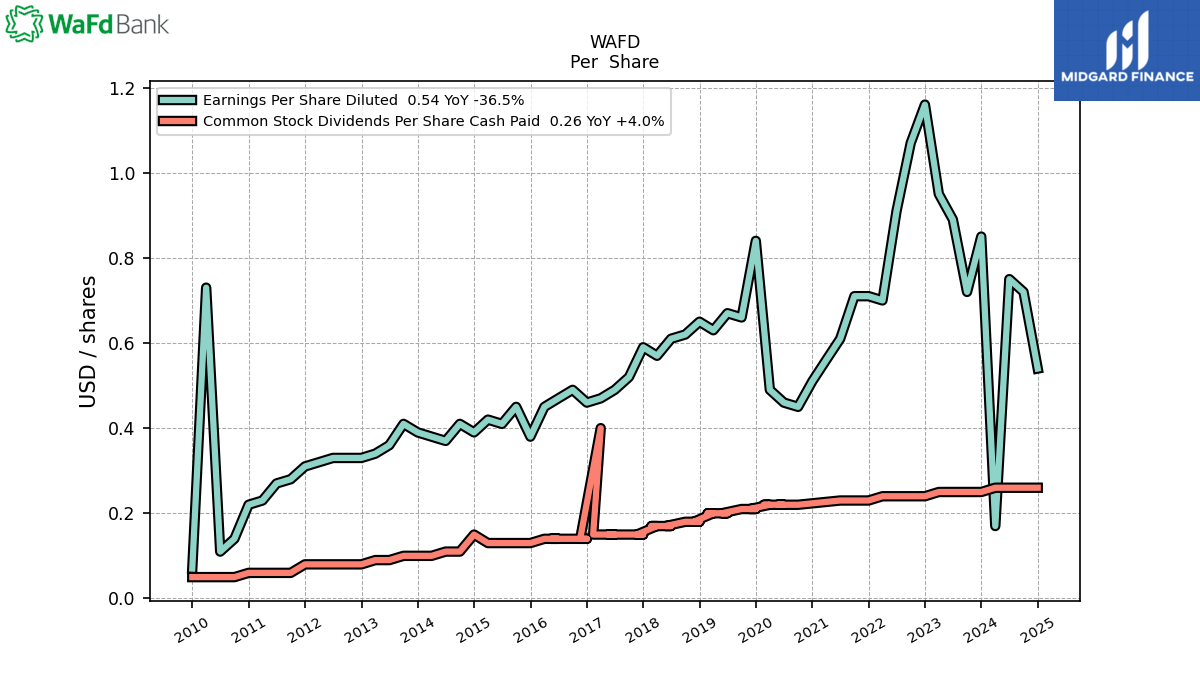
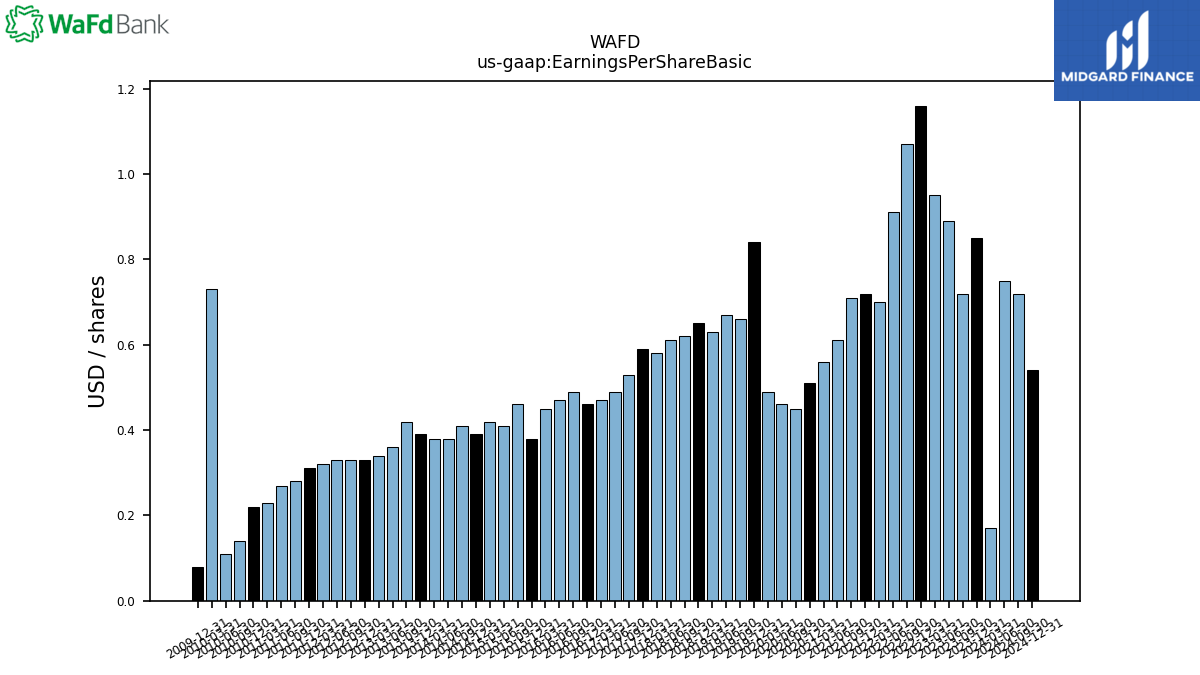
| Earnings Per Share Basic | 0.85 | 0.72 | 0.89 | 0.95 | 1.16 | 1.07 | 0.91 | 0.70 | 0.72 | 0.71 | 0.61 | 0.56 | 0.51 | 0.45 | 0.46 | 0.49 | 0.84 | 0.66 | 0.67 | |
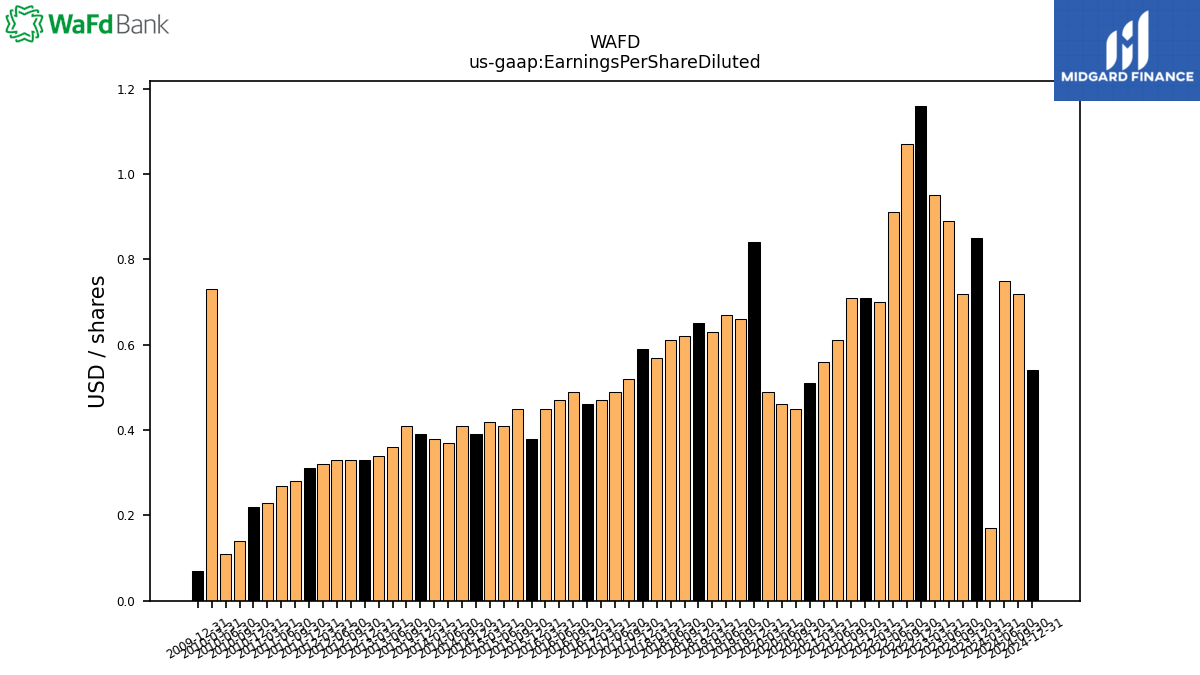
| Earnings Per Share Diluted | 0.85 | 0.72 | 0.89 | 0.95 | 1.16 | 1.07 | 0.91 | 0.70 | 0.71 | 0.71 | 0.61 | 0.56 | 0.51 | 0.45 | 0.46 | 0.49 | 0.84 | 0.66 | 0.67 |
| 2023-12-31 | 2023-09-30 | 2023-06-30 | 2023-03-31 | 2022-12-31 | 2022-09-30 | 2022-06-30 | 2022-03-31 | 2021-12-31 | 2021-09-30 | 2021-06-30 | 2021-03-31 | 2020-12-31 | 2020-09-30 | 2020-06-30 | 2020-03-31 | 2019-12-31 | 2019-09-30 | 2019-06-30 | ||
|---|---|---|---|---|---|---|---|---|---|---|---|---|---|---|---|---|---|---|---|---|
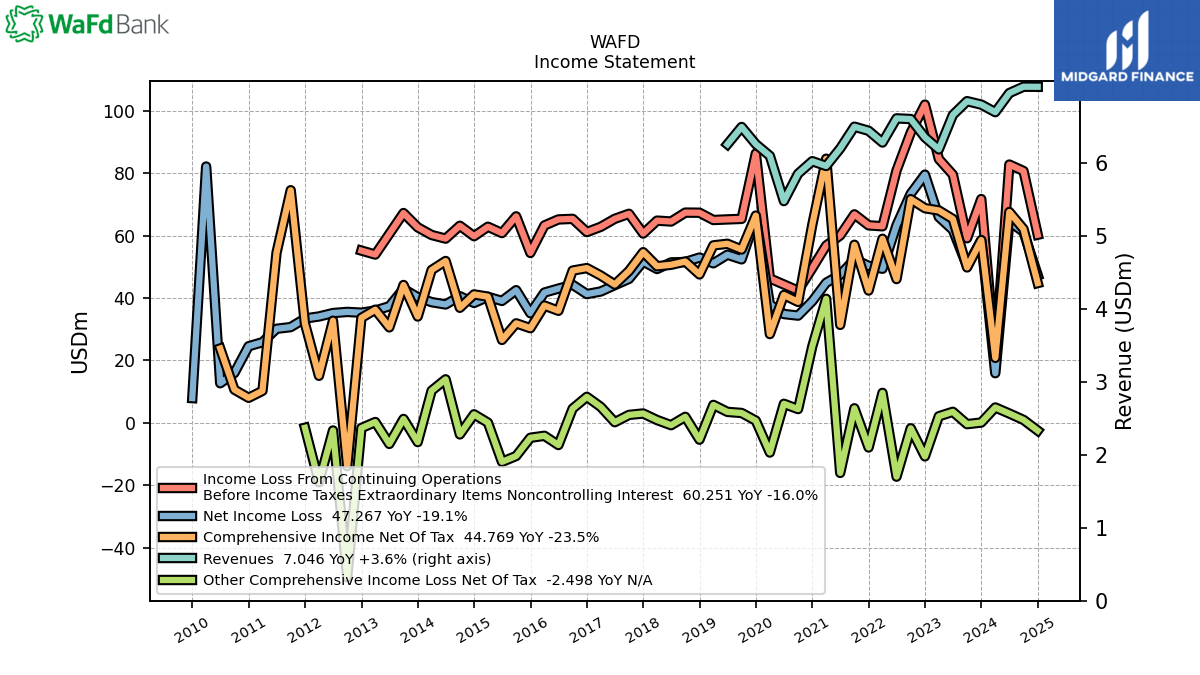
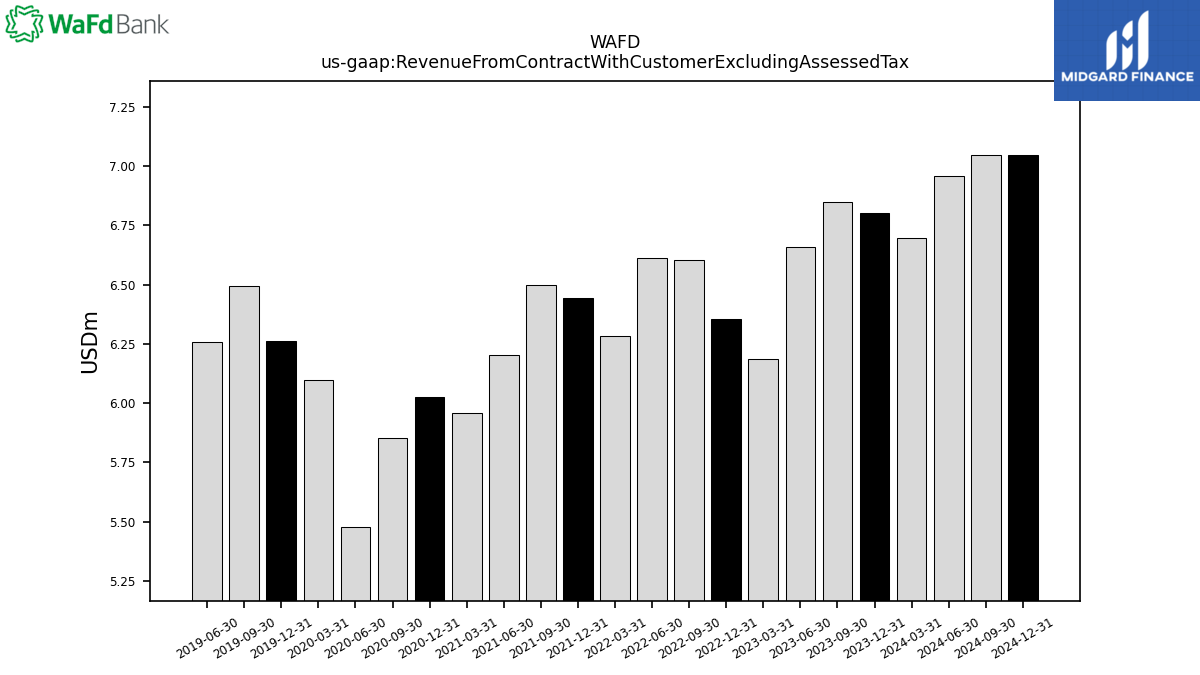
| Revenue From Contract With Customer Excluding Assessed Tax | 6.80 | 6.85 | 6.66 | 6.19 | 6.35 | 6.60 | 6.61 | 6.28 | 6.44 | 6.50 | 6.20 | 5.96 | 6.03 | 5.85 | 5.48 | 6.10 | 6.26 | 6.50 | 6.26 | |
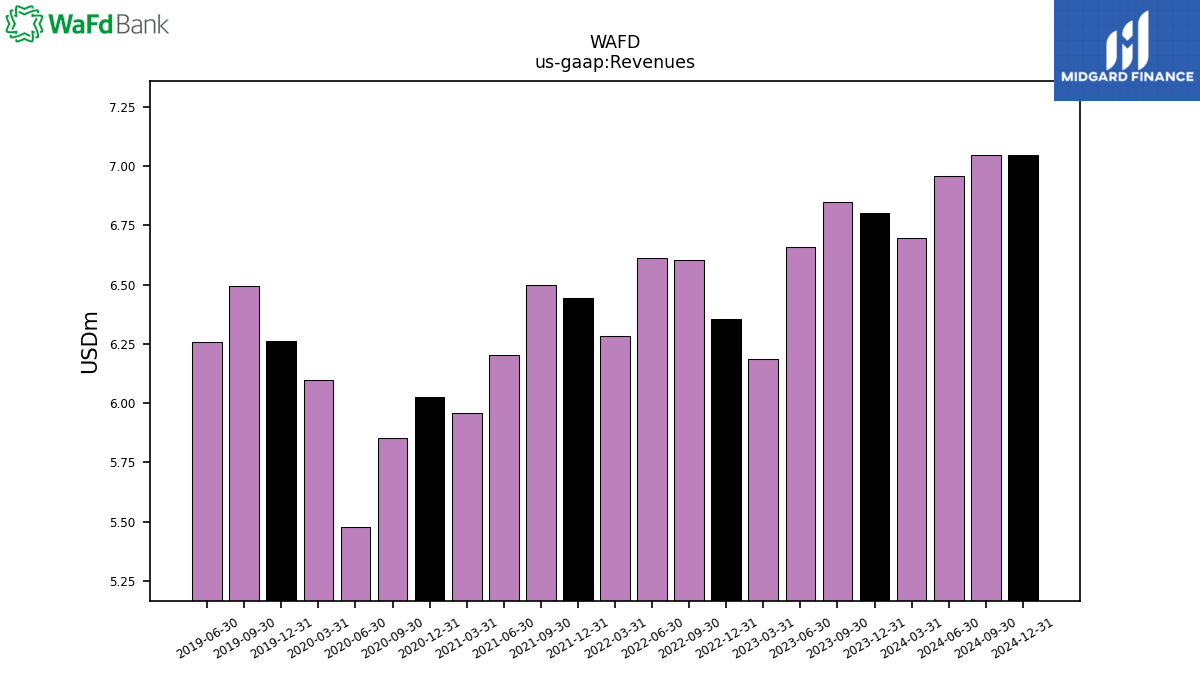
| Revenues | 6.80 | 6.85 | 6.66 | 6.19 | 6.35 | 6.60 | 6.61 | 6.28 | 6.44 | 6.50 | 6.20 | 5.96 | 6.03 | 5.85 | 5.48 | 6.10 | 6.26 | 6.50 | 6.26 | |
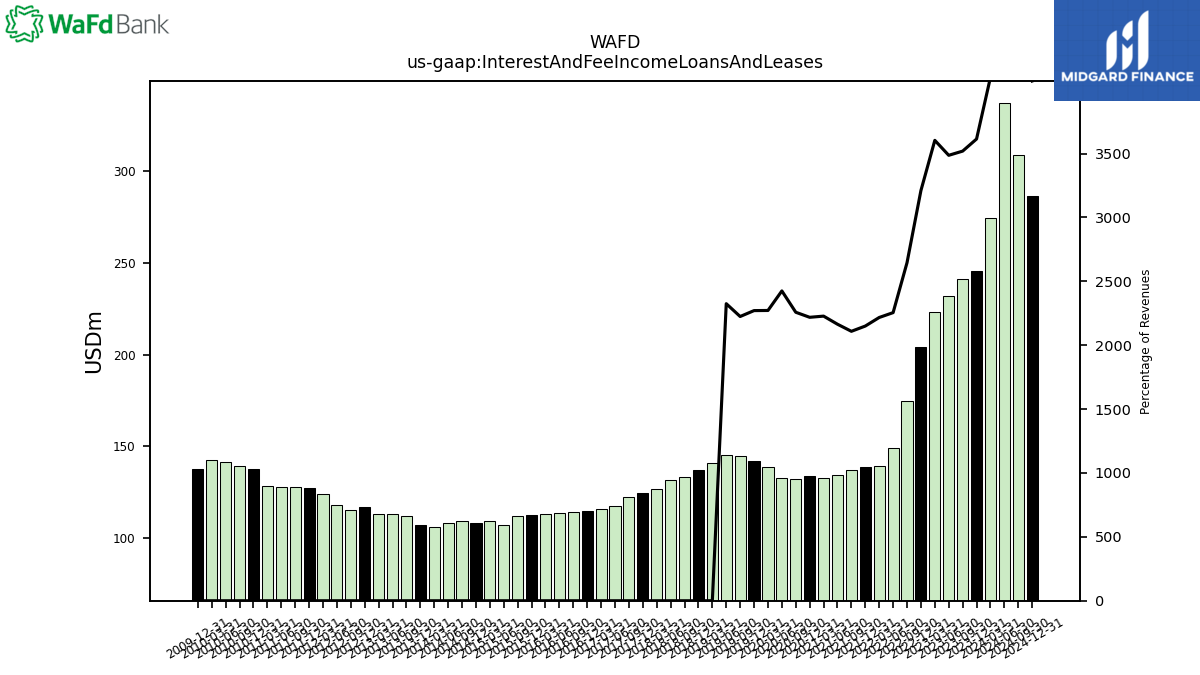
| Interest And Fee Income Loans And Leases | 245.79 | 241.00 | 232.17 | 222.96 | 203.95 | 174.71 | 149.11 | 139.26 | 138.51 | 137.04 | 134.19 | 132.76 | 133.67 | 132.16 | 132.85 | 138.55 | 142.15 | 144.48 | 145.49 | |
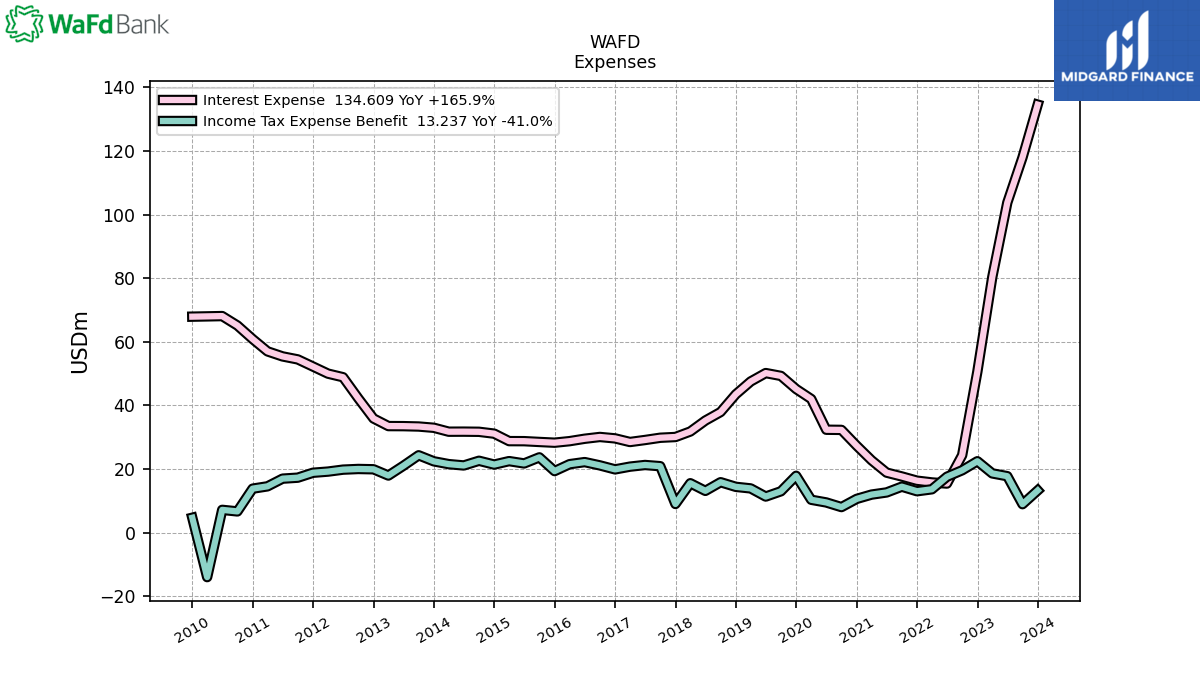
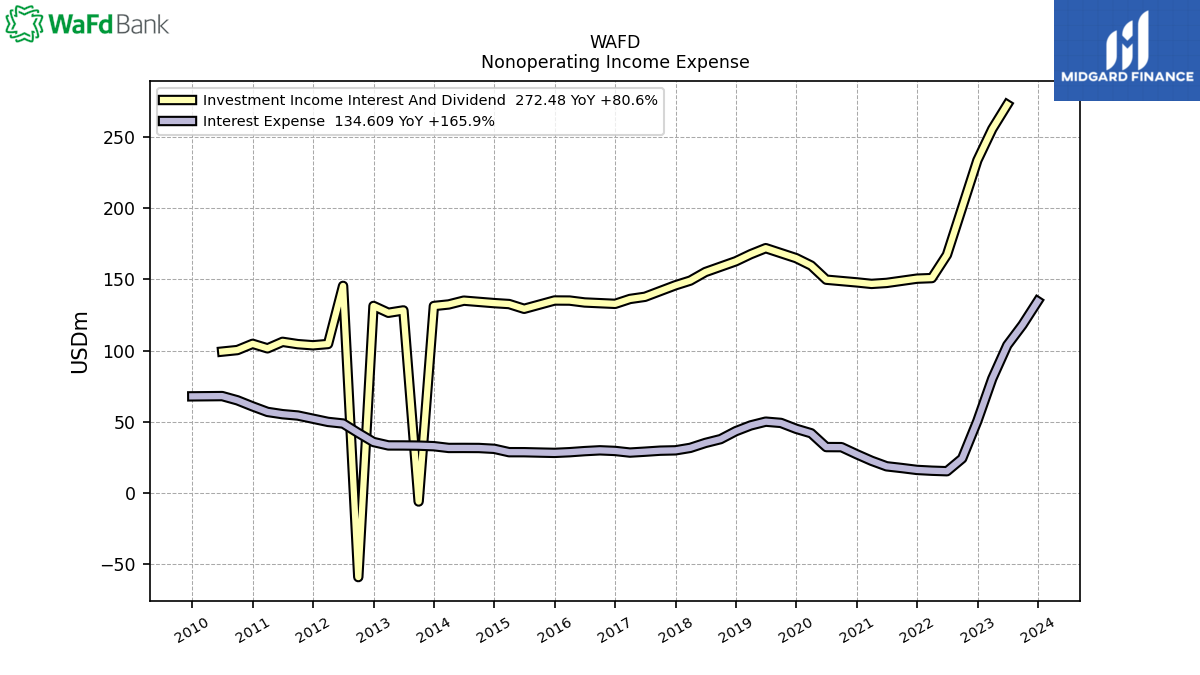
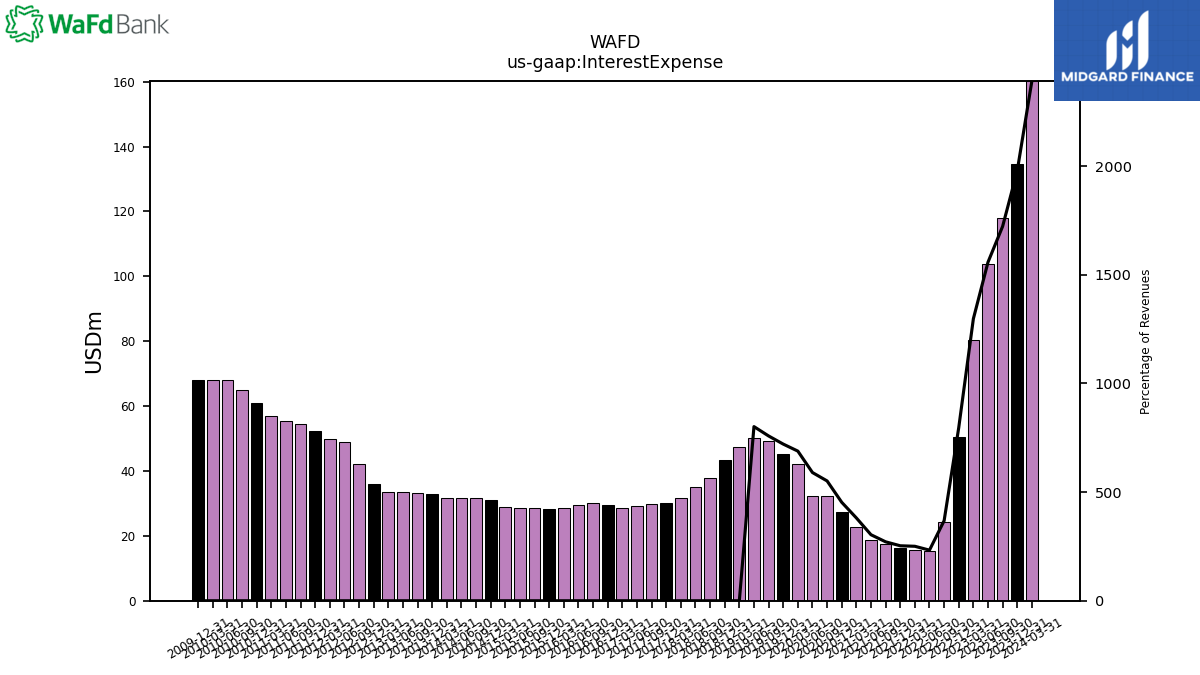
| Interest Expense | 134.61 | 118.01 | 103.78 | 80.31 | 50.62 | 24.31 | 15.40 | 15.75 | 16.30 | 17.63 | 18.84 | 22.72 | 27.31 | 32.28 | 32.33 | 42.01 | 45.14 | 49.26 | 50.16 | |
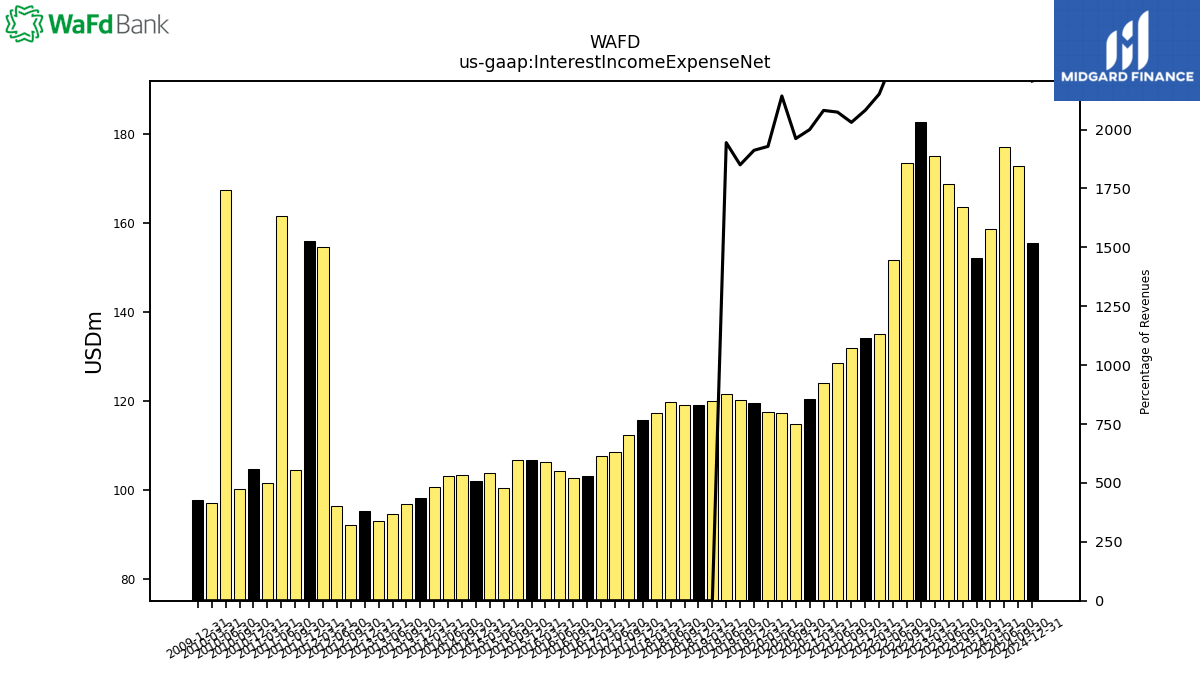
| Interest Income Expense Net | 152.24 | 163.70 | 168.70 | 175.04 | 182.80 | 173.62 | 151.75 | 135.09 | 134.14 | 131.96 | 128.60 | 124.03 | 120.51 | 114.83 | 117.38 | 117.61 | 119.69 | 120.17 | 121.67 | |
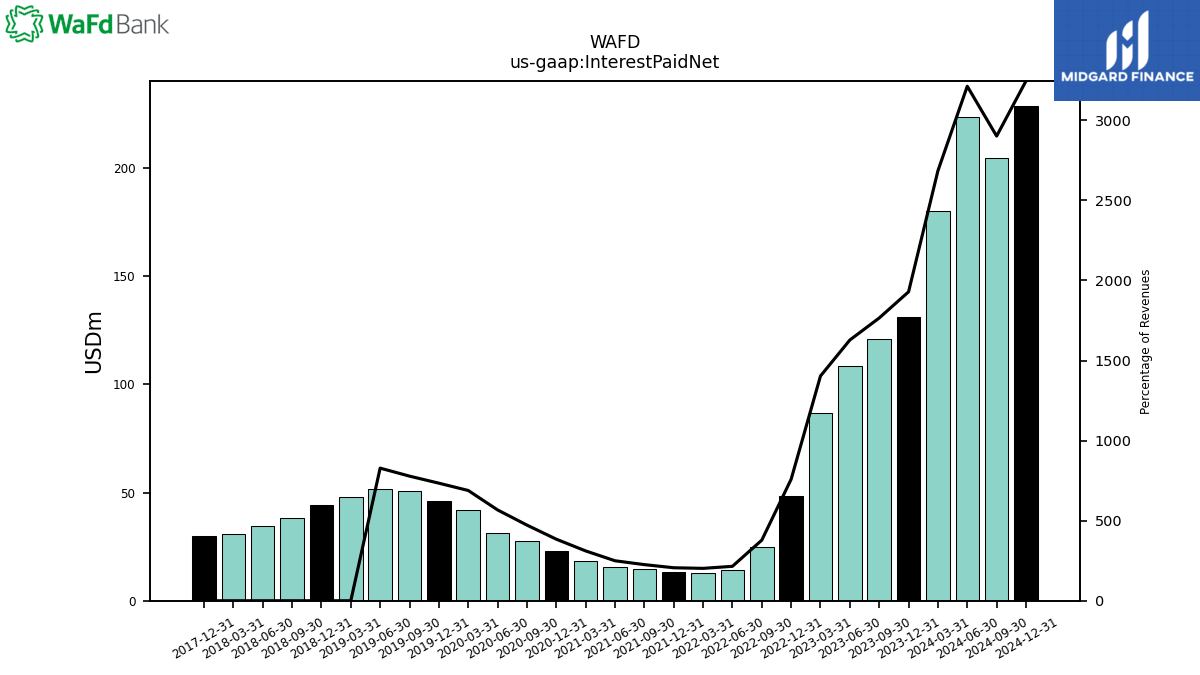
| Interest Paid Net | 131.20 | 120.92 | 108.43 | 86.84 | 48.20 | 24.98 | 14.22 | 12.70 | 13.28 | 14.66 | 15.48 | 18.54 | 23.16 | 27.65 | 31.07 | 41.99 | 45.95 | 50.54 | 51.82 | |
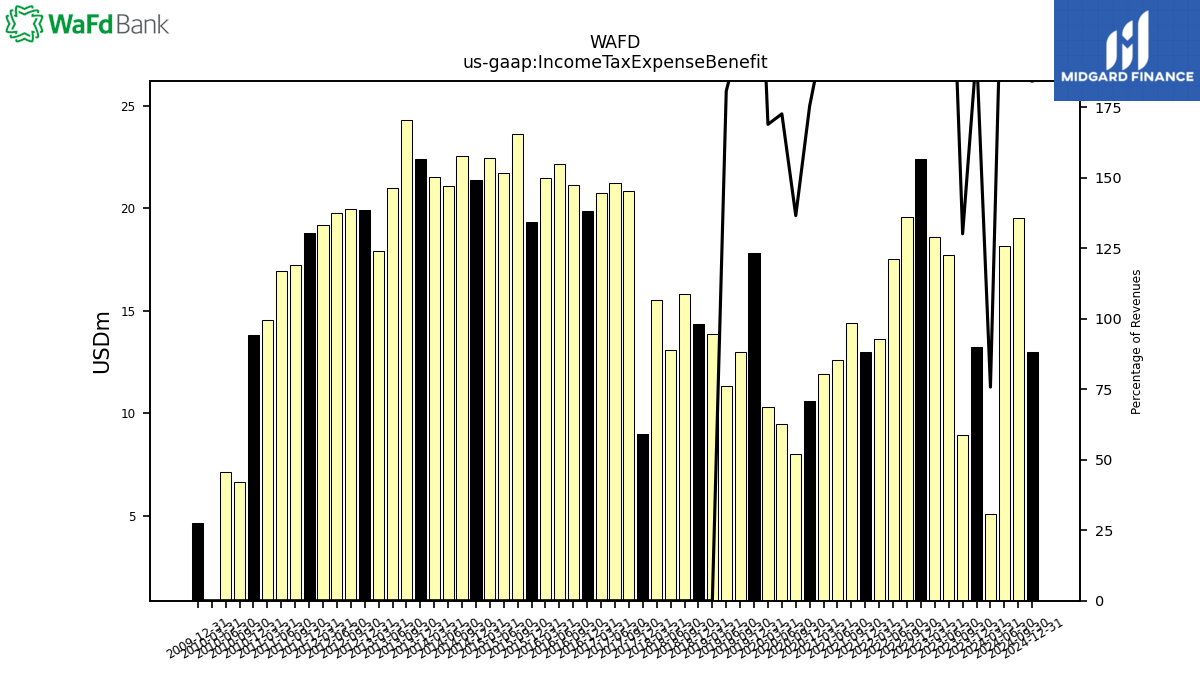
| Income Tax Expense Benefit | 13.24 | 8.91 | 17.72 | 18.60 | 22.42 | 19.58 | 17.55 | 13.60 | 12.98 | 14.42 | 12.60 | 11.93 | 10.57 | 7.99 | 9.46 | 10.30 | 17.84 | 12.97 | 11.31 | |
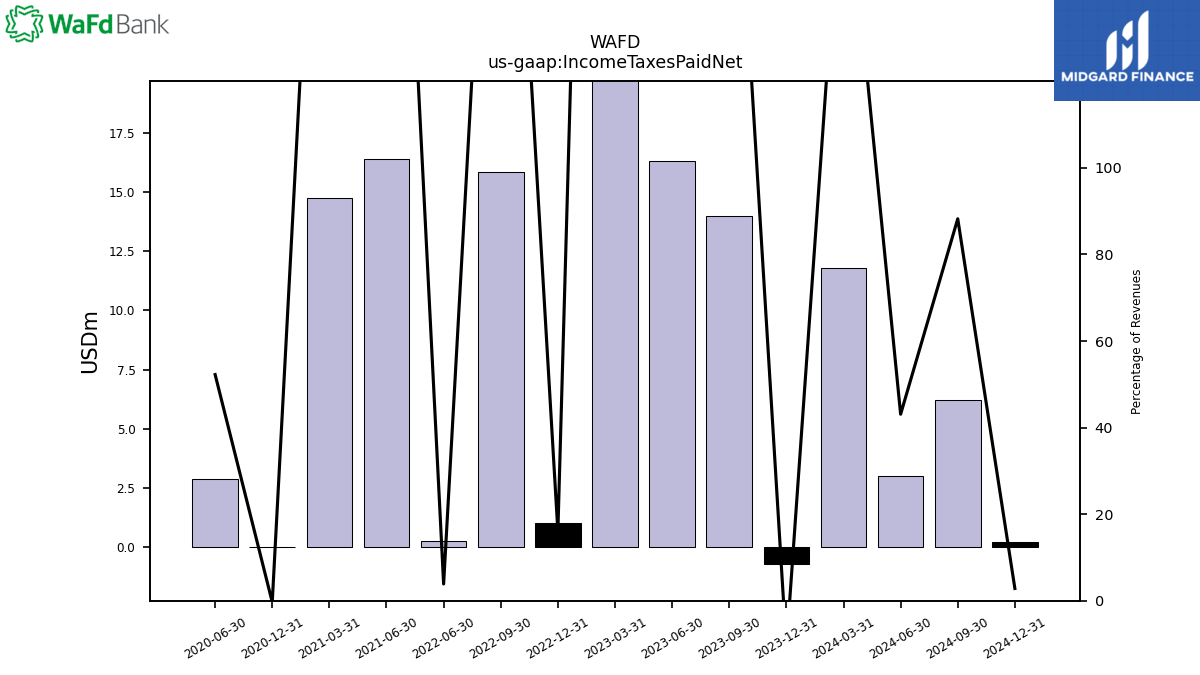
| Income Taxes Paid Net | -0.74 | NA | 16.30 | 29.93 | 1.02 | NA | 0.26 | NA | NA | NA | 16.41 | 14.76 | -0.02 | NA | 2.86 | NA | NA | NA | NA | |
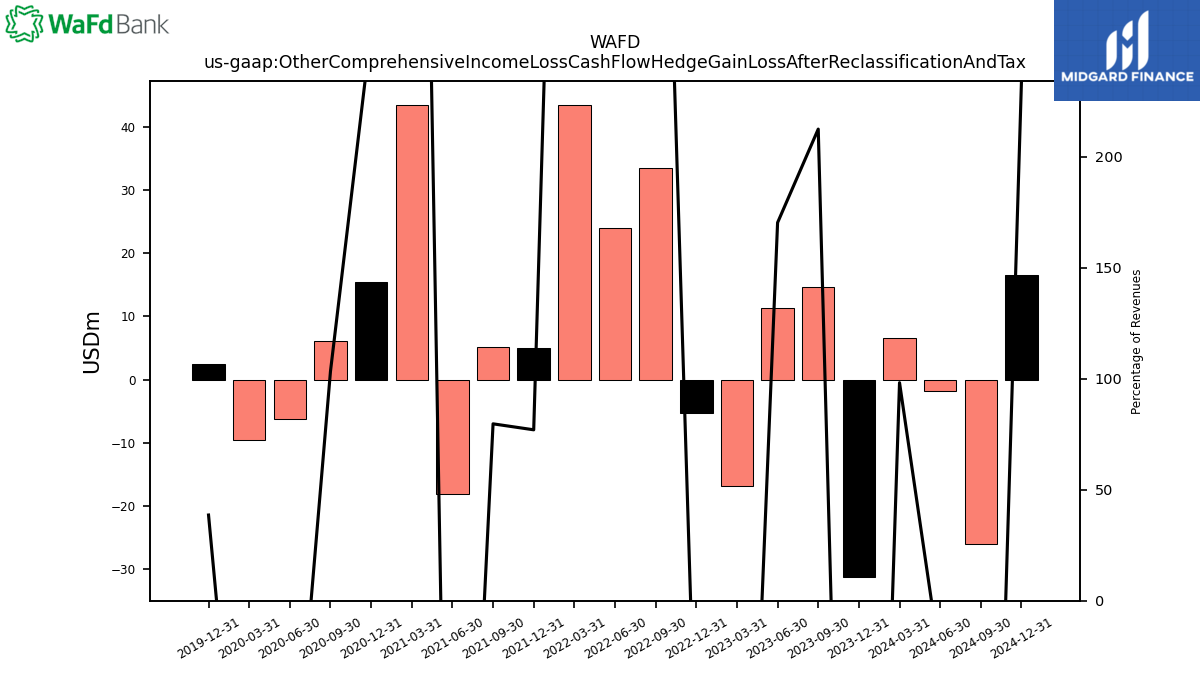
| Other Comprehensive Income Loss Cash Flow Hedge Gain Loss After Reclassification And Tax | -31.25 | 14.56 | 11.35 | -16.90 | -5.23 | 33.46 | 23.91 | 43.37 | 4.96 | 5.18 | -18.08 | 43.47 | 15.49 | 6.05 | -6.20 | -9.57 | 2.42 | NA | NA | |
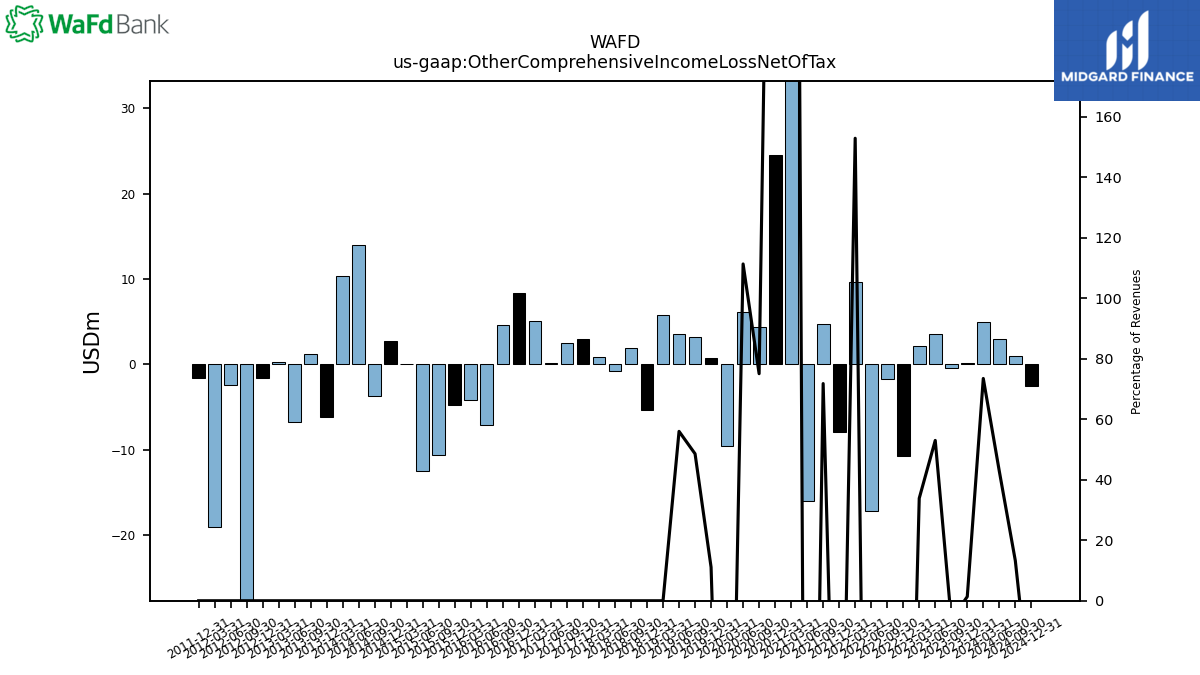
| Other Comprehensive Income Loss Net Of Tax | 0.09 | -0.43 | 3.53 | 2.10 | -10.76 | -1.75 | -17.25 | 9.60 | -7.91 | 4.67 | -16.06 | 39.74 | 24.48 | 4.39 | 6.10 | -9.53 | 0.69 | 3.15 | 3.50 | |
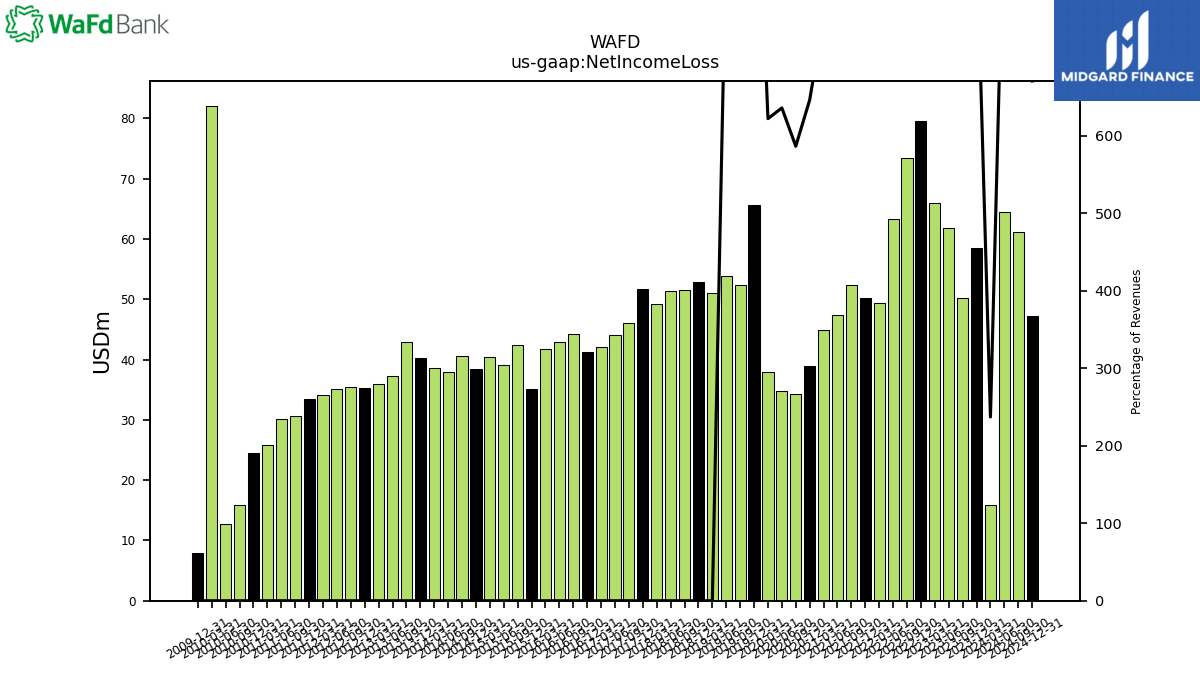
| Net Income Loss | 58.45 | 50.21 | 61.77 | 65.93 | 79.51 | 73.39 | 63.30 | 49.36 | 50.28 | 52.37 | 47.42 | 44.87 | 38.95 | 34.34 | 34.85 | 37.95 | 65.70 | 52.36 | 53.85 | |
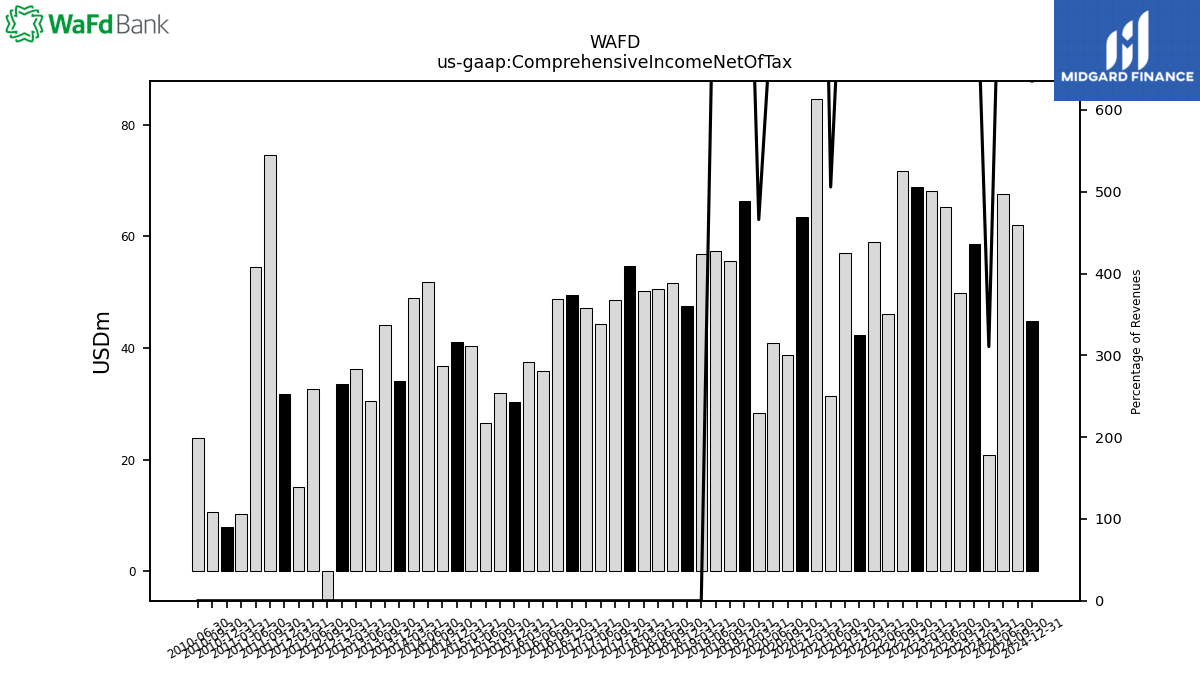
| Comprehensive Income Net Of Tax | 58.55 | 49.78 | 65.30 | 68.03 | 68.75 | 71.65 | 46.04 | 58.96 | 42.37 | 57.04 | 31.37 | 84.61 | 63.43 | 38.74 | 40.95 | 28.43 | 66.40 | 55.52 | 57.36 | |
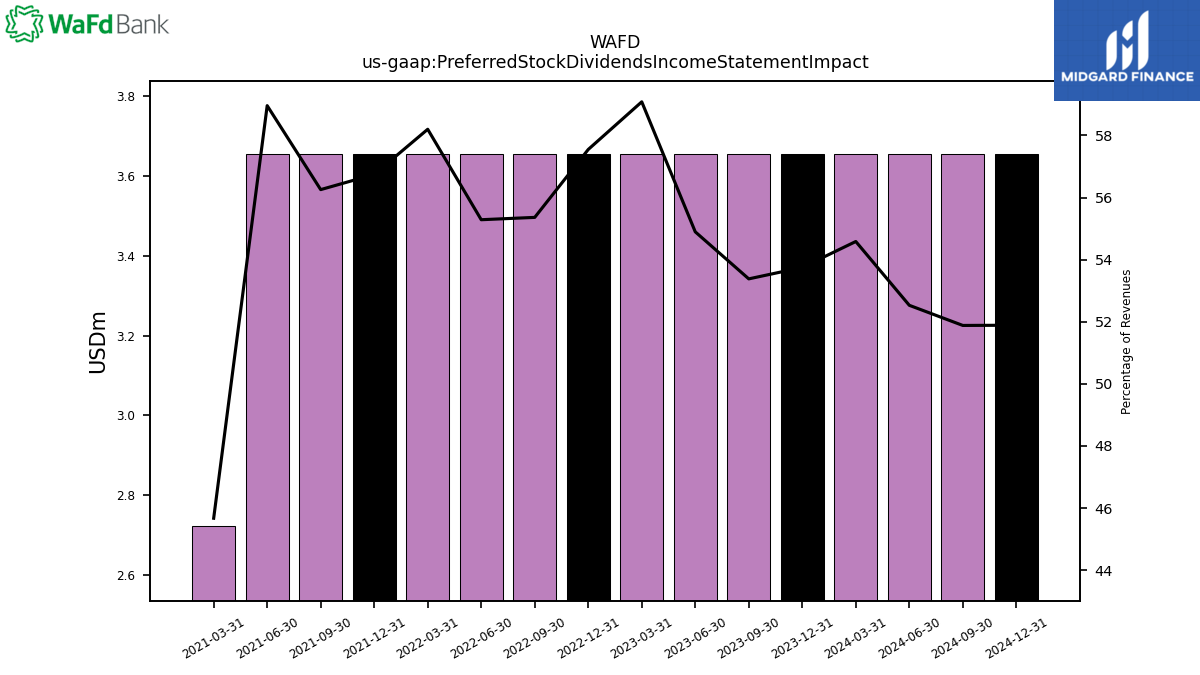
| Preferred Stock Dividends Income Statement Impact | 3.66 | 3.66 | 3.66 | 3.66 | 3.66 | 3.66 | 3.66 | 3.66 | 3.66 | 3.66 | 3.66 | 2.72 | NA | NA | NA | NA | NA | NA | NA | |
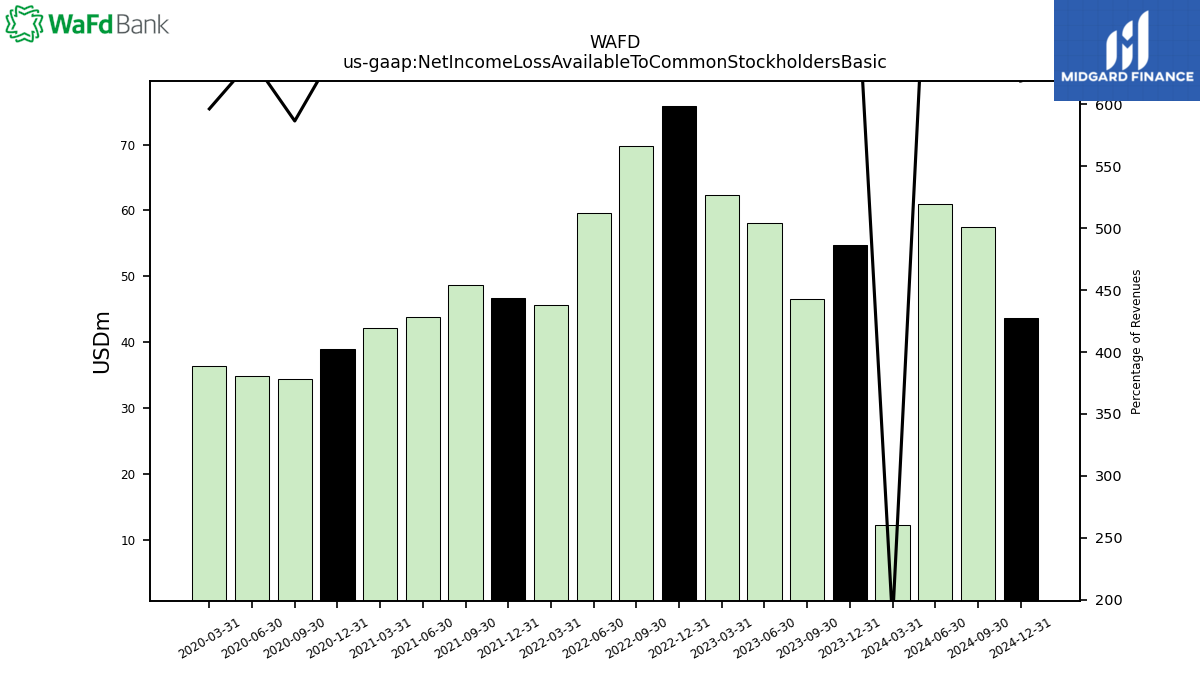
| Net Income Loss Available To Common Stockholders Basic | 54.80 | 46.55 | 58.12 | 62.28 | 75.85 | 69.74 | 59.64 | 45.70 | 46.62 | 48.72 | 43.77 | 42.15 | 38.95 | 34.34 | 34.85 | 36.38 | NA | NA | NA | |
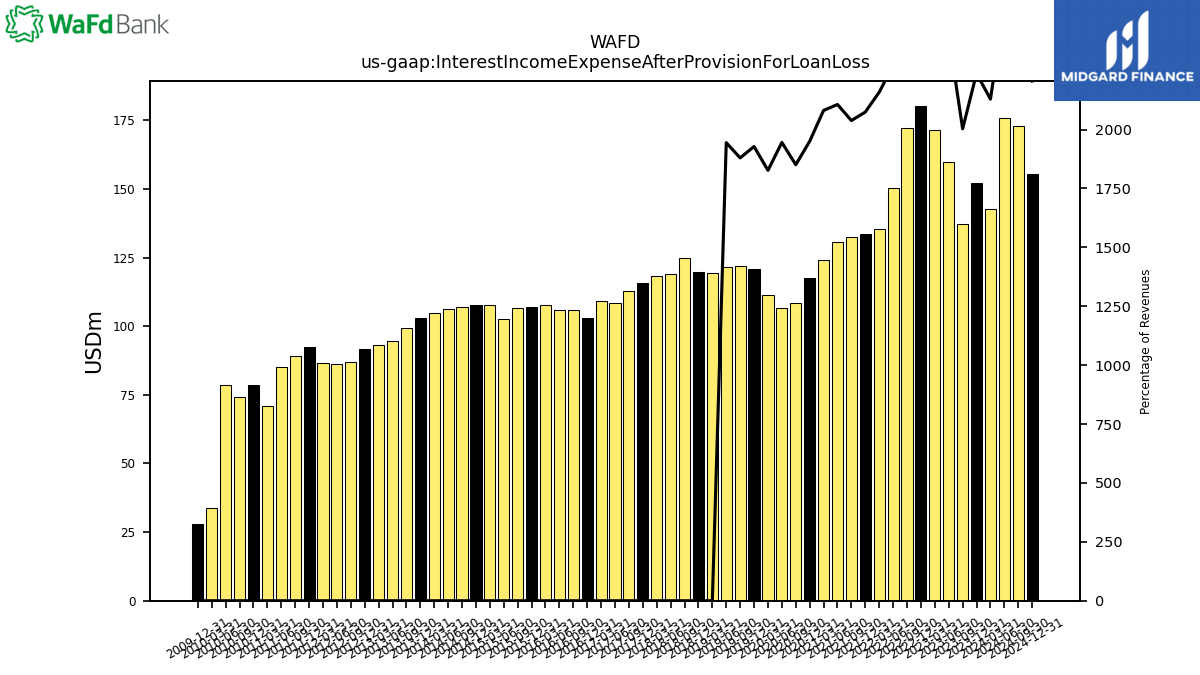
| Interest Income Expense After Provision For Loan Loss | 152.24 | 137.20 | 159.70 | 171.54 | 180.30 | 172.12 | 150.25 | 135.59 | 133.64 | 132.46 | 130.60 | 124.03 | 117.51 | 108.33 | 106.58 | 111.41 | 120.69 | 122.07 | 121.67 | |
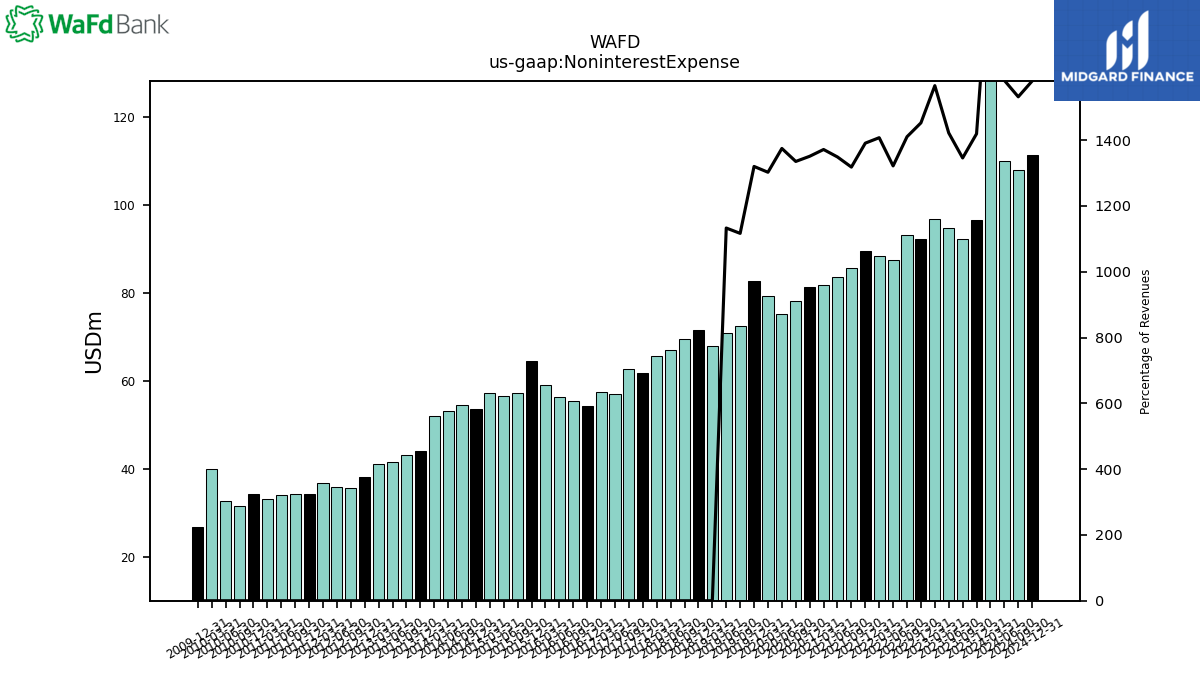
| Noninterest Expense | 96.54 | 92.18 | 94.70 | 96.88 | 92.28 | 93.14 | 87.40 | 88.42 | 89.61 | 85.66 | 83.64 | 81.75 | 81.41 | 78.17 | 75.32 | 79.43 | 82.64 | 72.53 | 70.90 | |
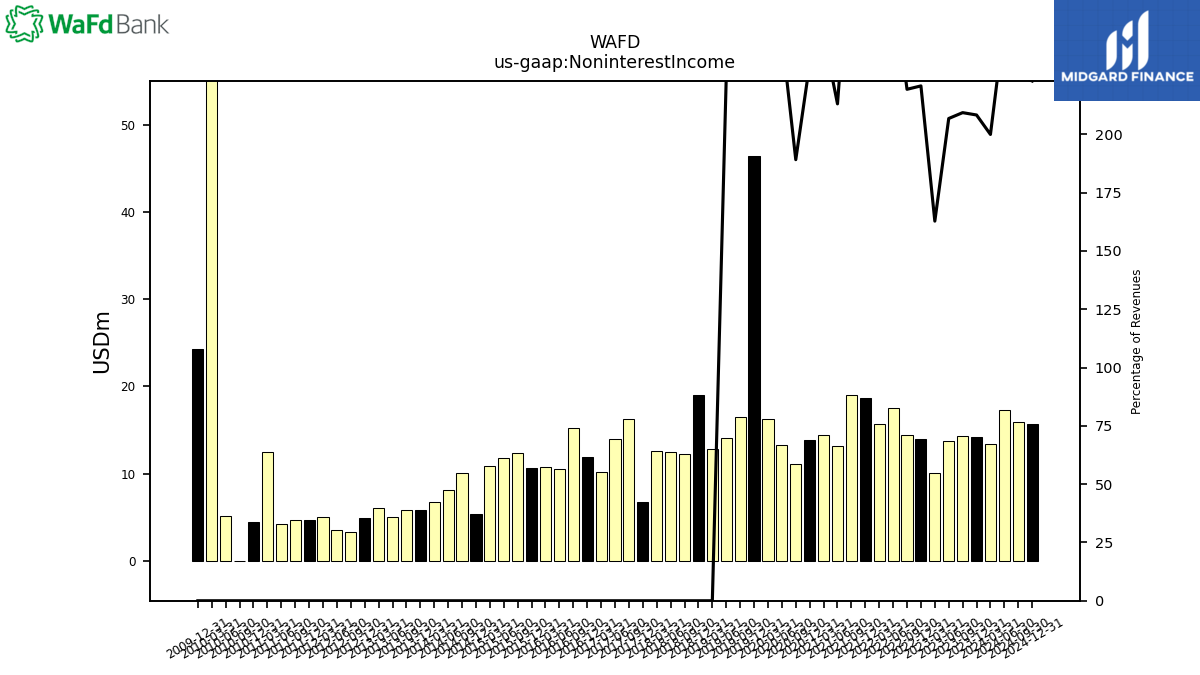
| Noninterest Income | 14.17 | 14.33 | 13.77 | 10.07 | 14.02 | 14.48 | 17.55 | 15.66 | 18.68 | 19.00 | 13.21 | 14.48 | 13.87 | 11.07 | 13.27 | 16.24 | 46.38 | 16.46 | 14.04 |
| 2023-12-31 | 2023-09-30 | 2023-06-30 | 2023-03-31 | 2022-12-31 | 2022-09-30 | 2022-06-30 | 2022-03-31 | 2021-12-31 | 2021-09-30 | 2021-06-30 | 2021-03-31 | 2020-12-31 | 2020-09-30 | 2020-06-30 | 2020-03-31 | 2019-12-31 | 2019-09-30 | 2019-06-30 | ||
|---|---|---|---|---|---|---|---|---|---|---|---|---|---|---|---|---|---|---|---|---|
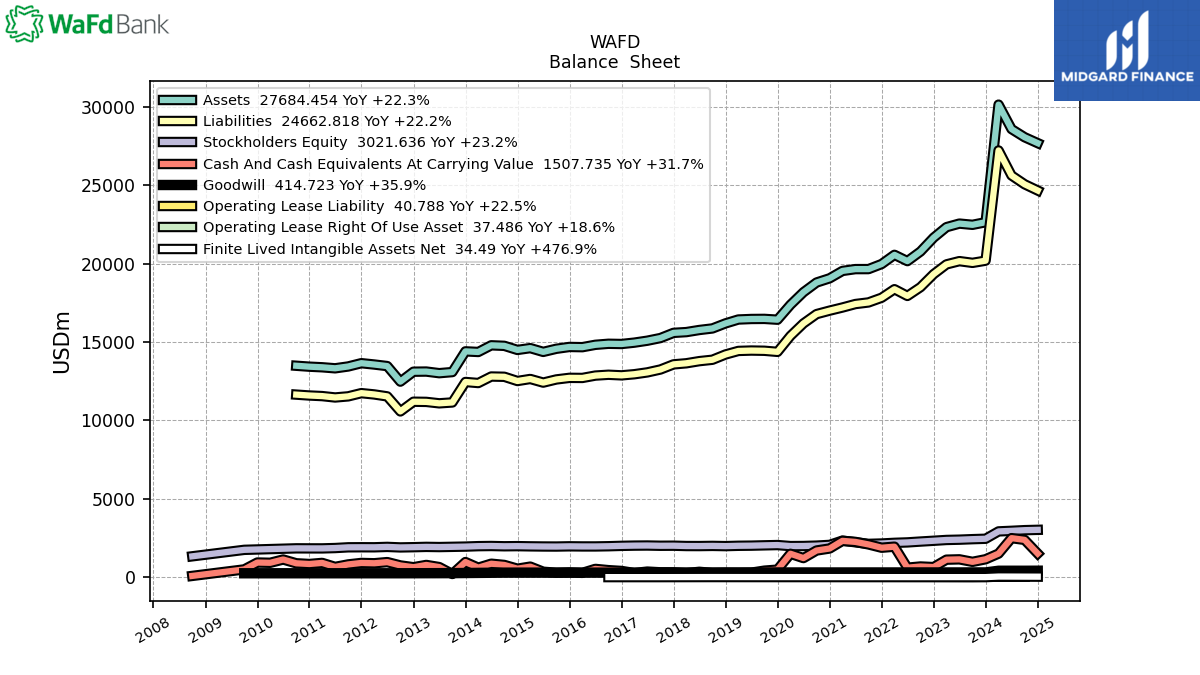
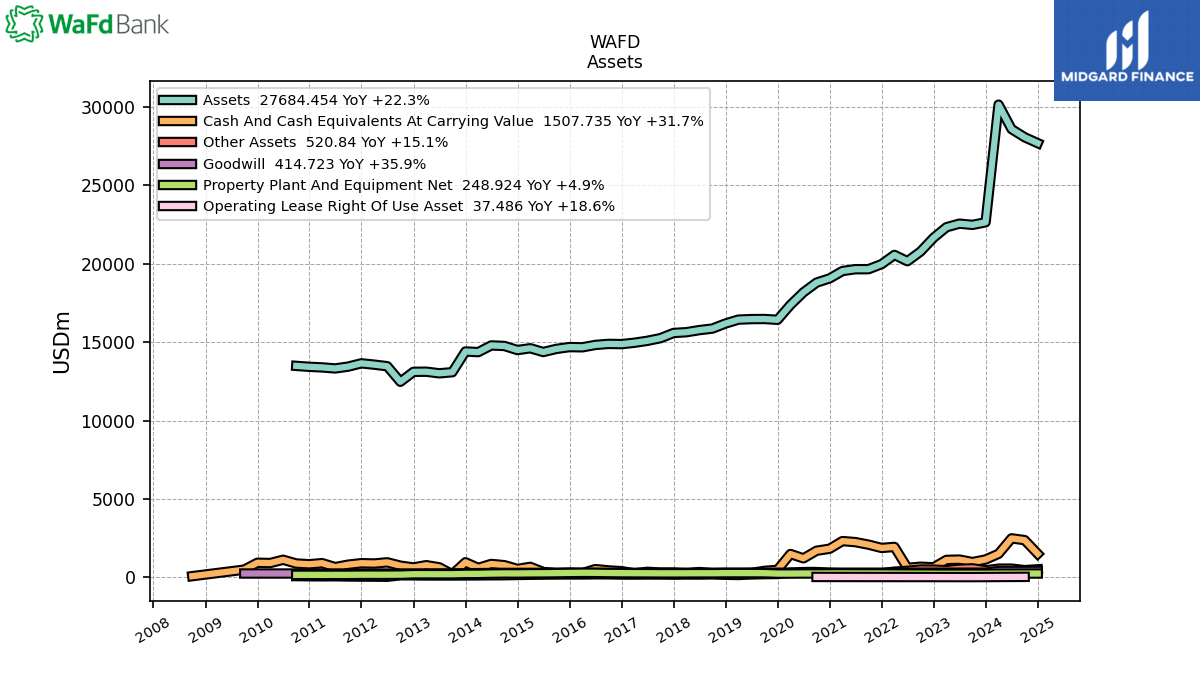
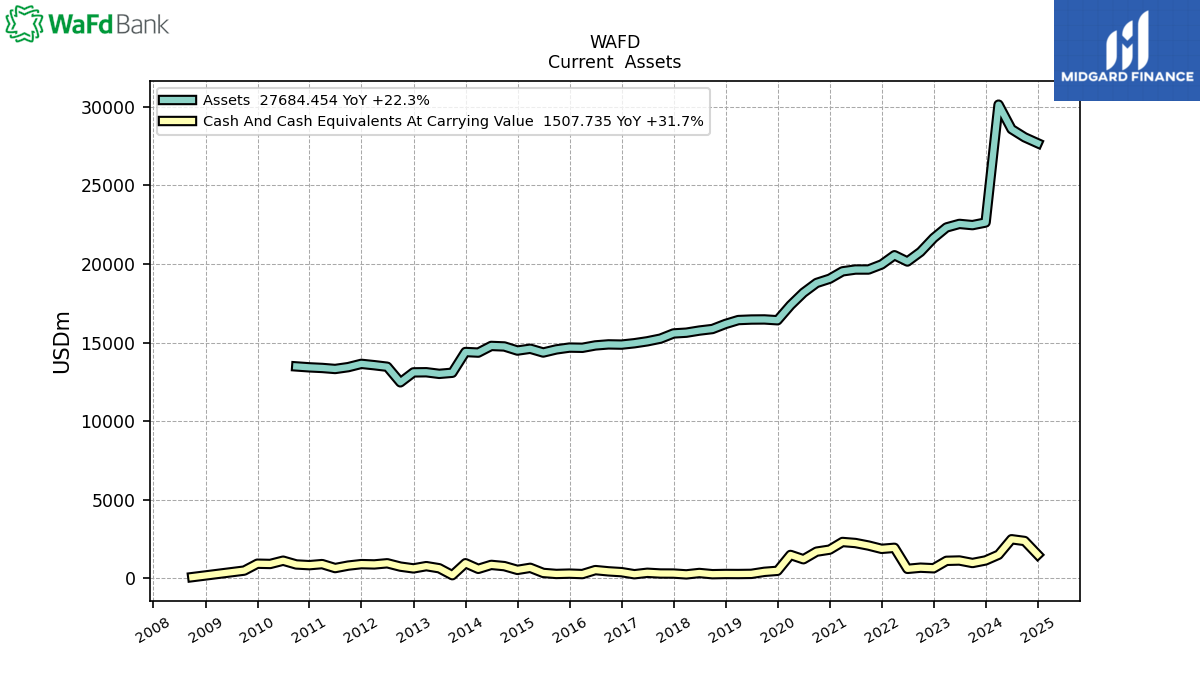
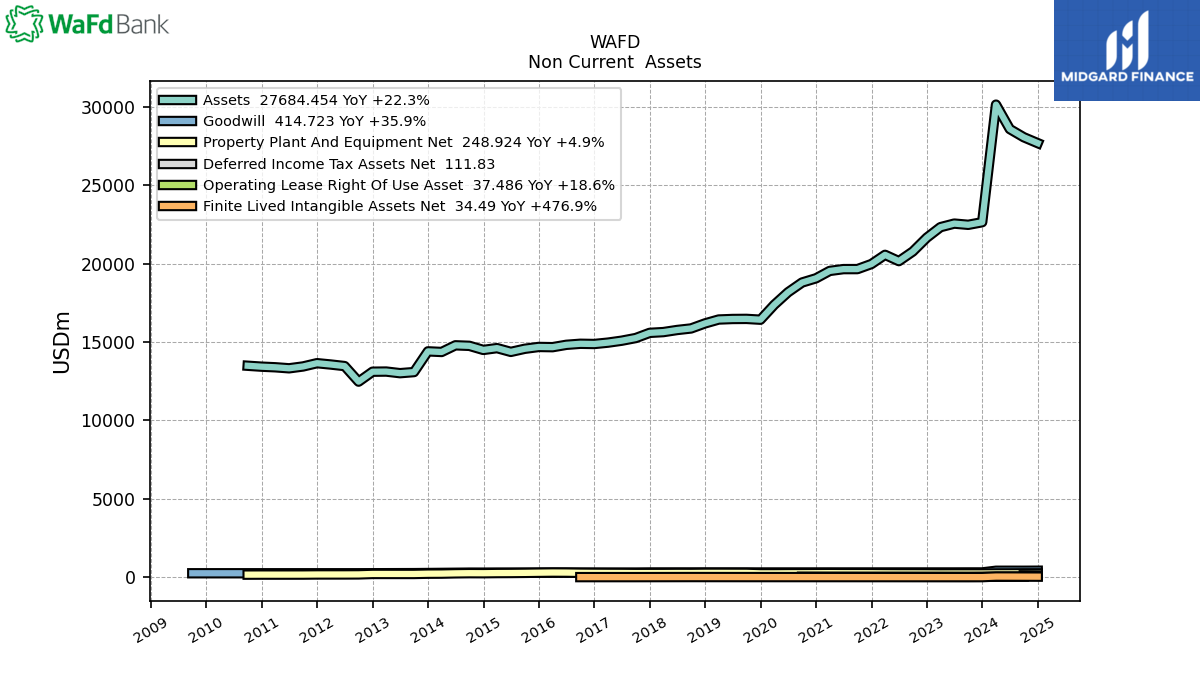
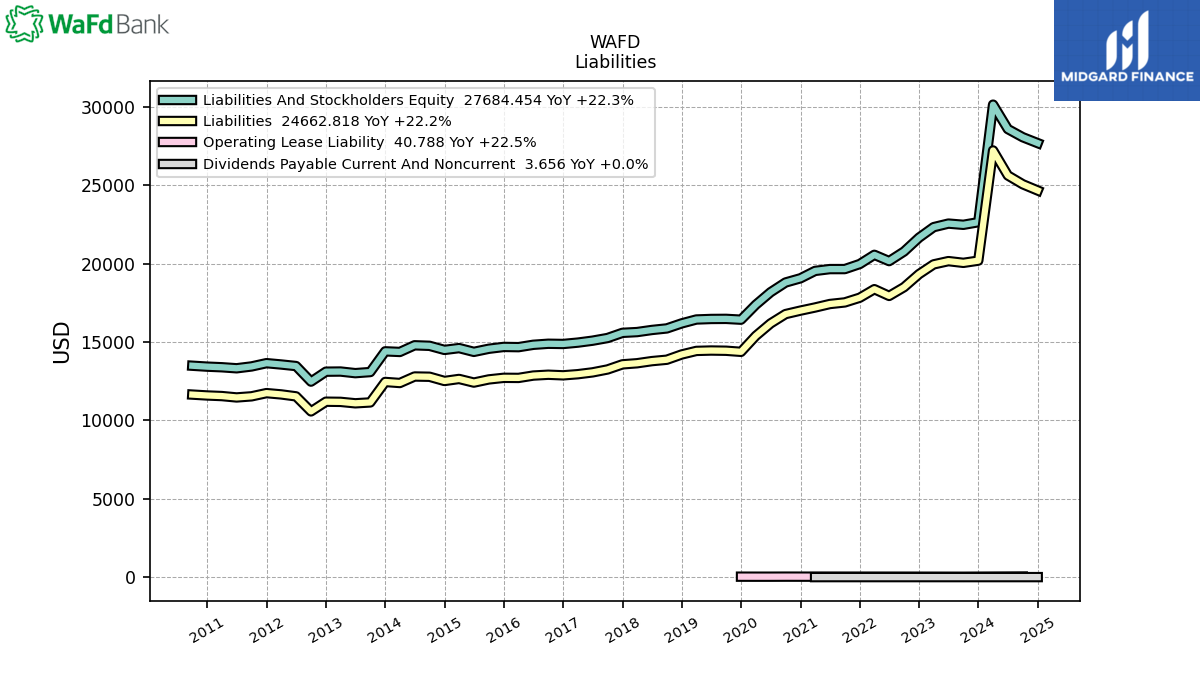
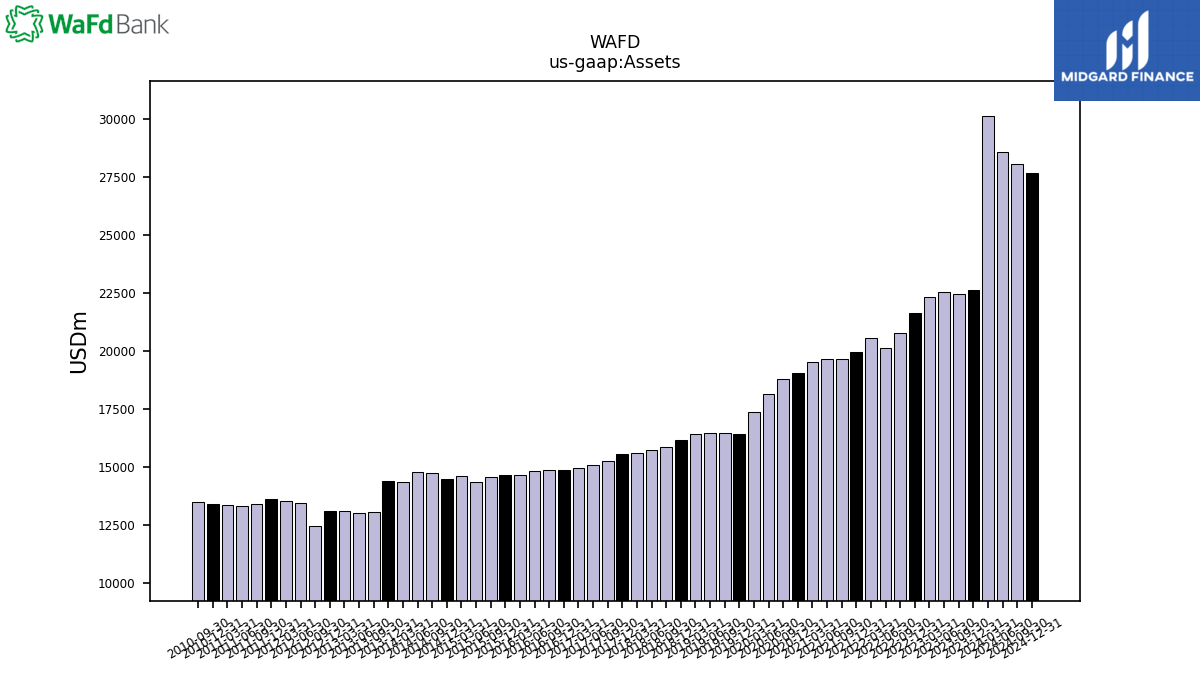
| Assets | 22640.12 | 22474.67 | 22552.59 | 22325.21 | 21653.81 | 20772.13 | 20158.83 | 20560.28 | 19973.17 | 19650.57 | 19649.51 | 19533.58 | 19063.62 | 18794.06 | 18175.10 | 17375.63 | 16423.16 | 16474.91 | 16468.53 | |
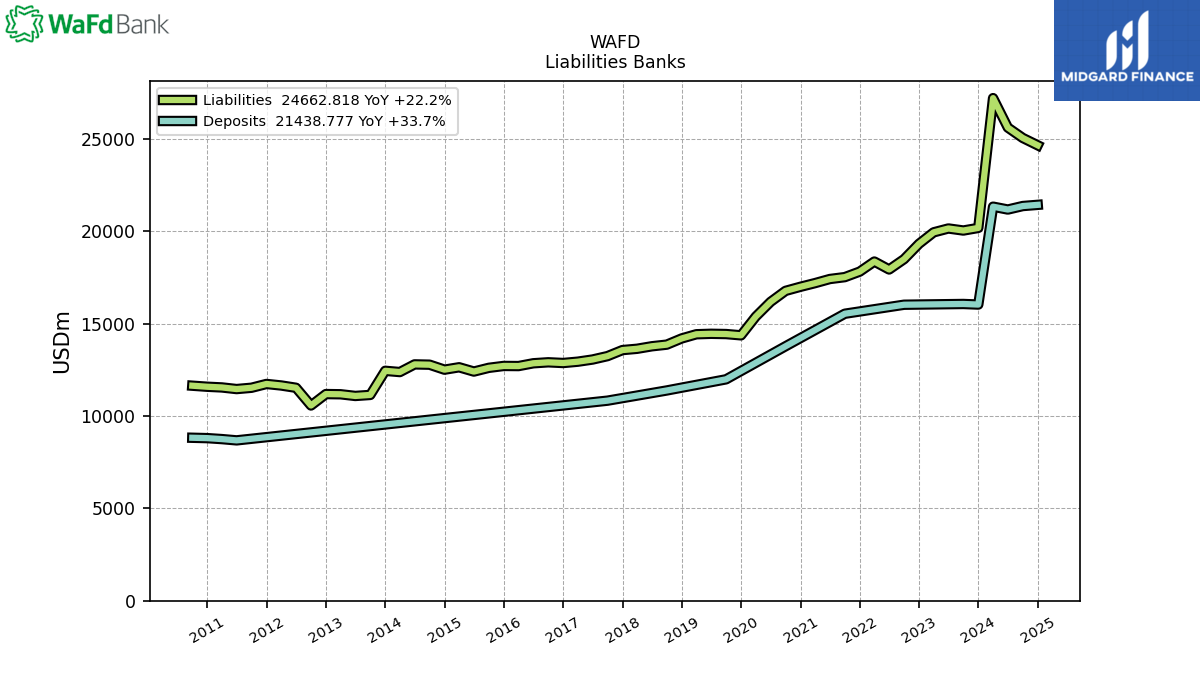
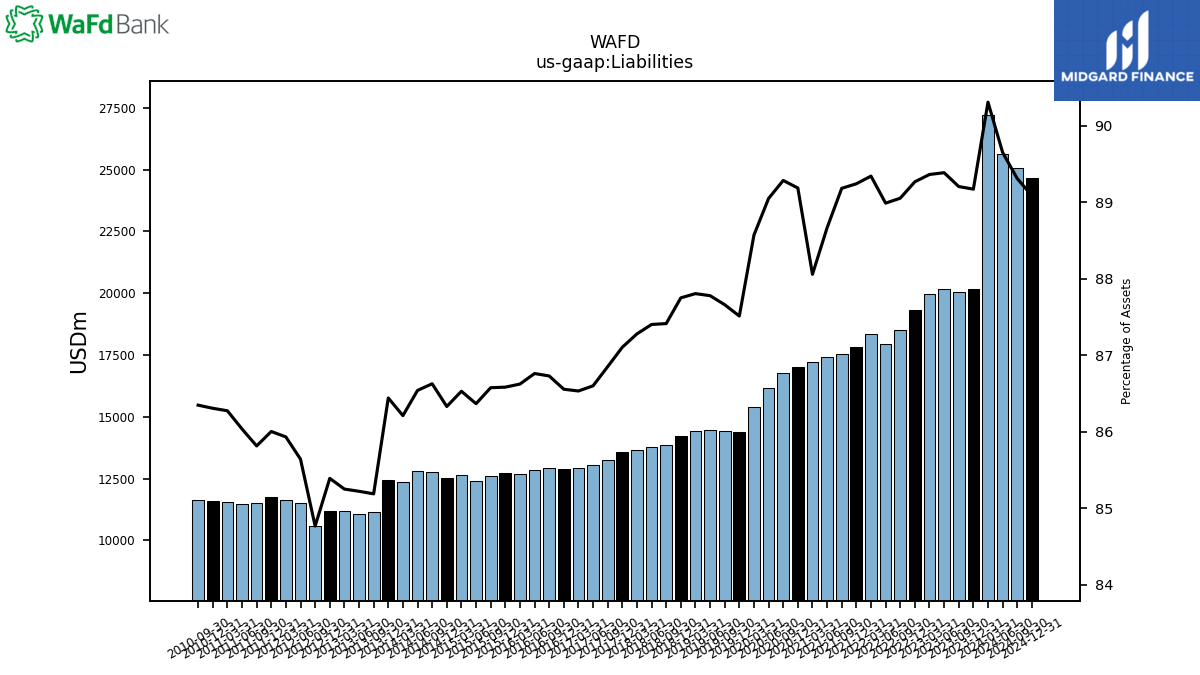
| Liabilities | 20188.12 | 20048.25 | 20158.52 | 19950.09 | 19329.43 | 18497.87 | 17938.72 | 18368.58 | 17824.04 | 17524.51 | 17422.27 | 17200.63 | 17001.85 | 16779.92 | 16184.59 | 15389.66 | 14372.25 | 14441.92 | 14455.79 | |
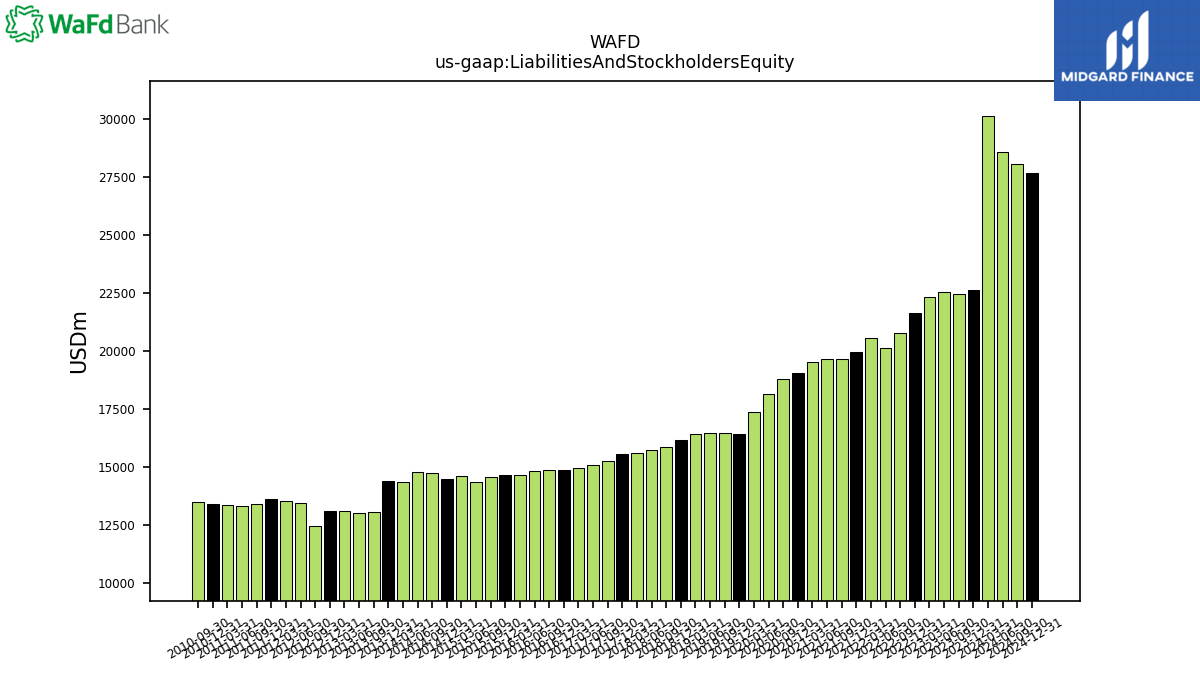
| Liabilities And Stockholders Equity | 22640.12 | 22474.67 | 22552.59 | 22325.21 | 21653.81 | 20772.13 | 20158.83 | 20560.28 | 19973.17 | 19650.57 | 19649.51 | 19533.58 | 19063.62 | 18794.06 | 18175.10 | 17375.63 | 16423.16 | 16474.91 | 16468.53 | |
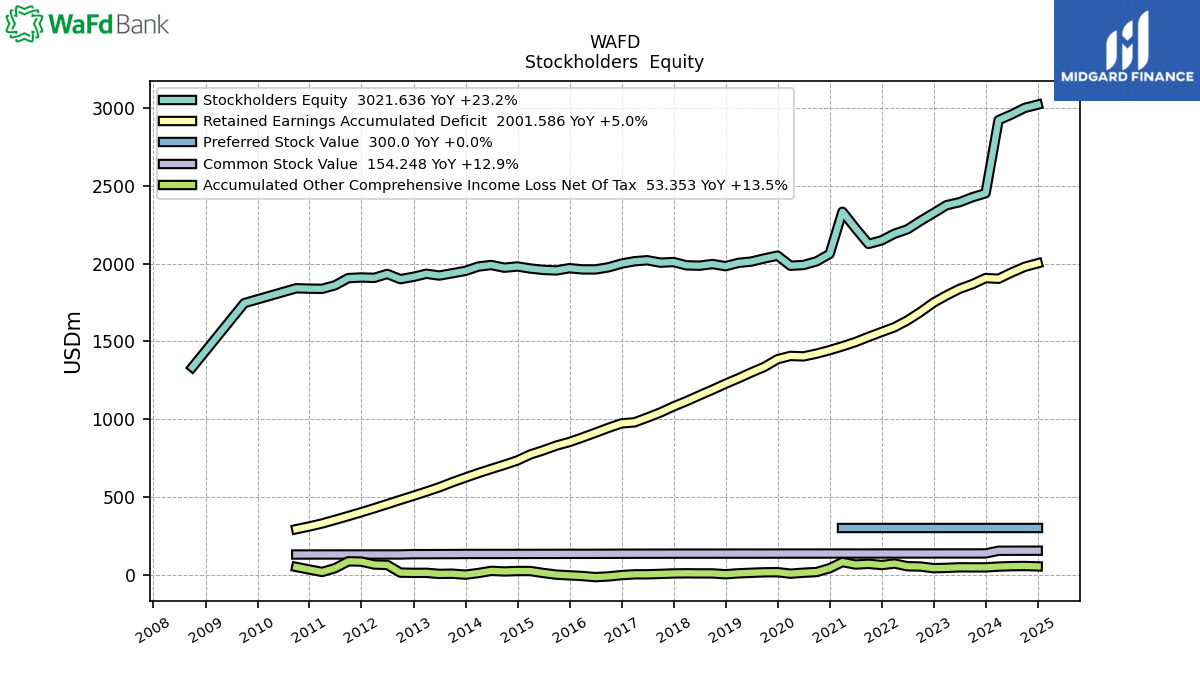
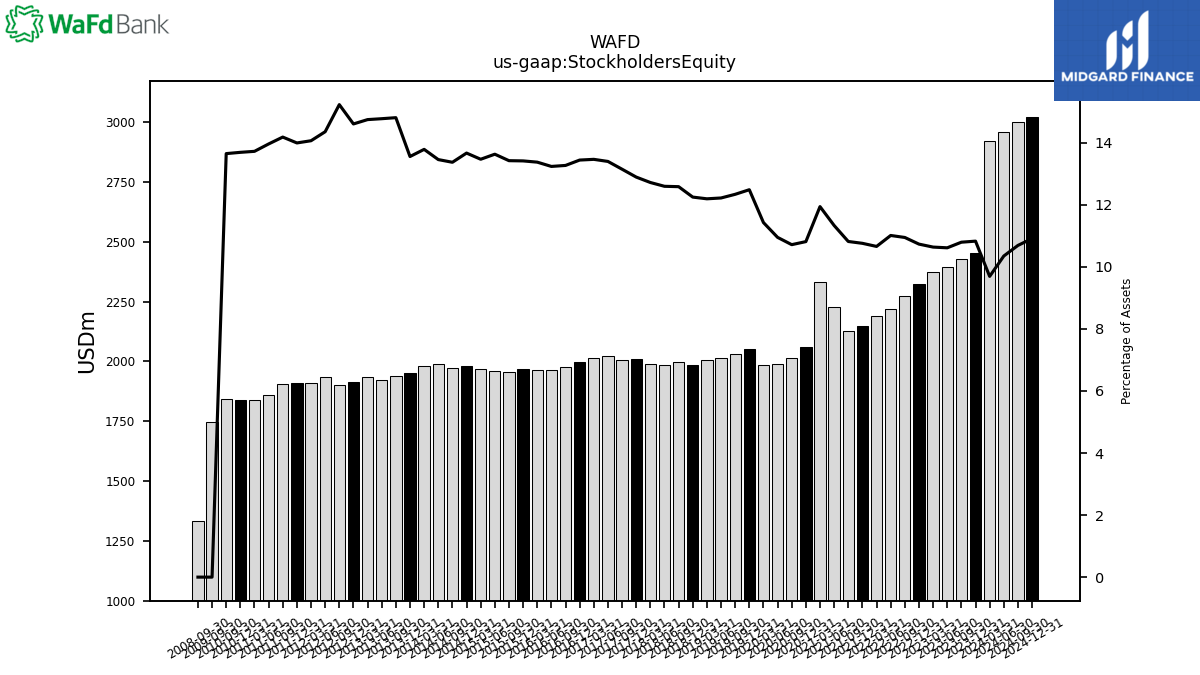
| Stockholders Equity | 2452.00 | 2426.43 | 2394.07 | 2375.12 | 2324.38 | 2274.26 | 2220.11 | 2191.70 | 2149.13 | 2126.06 | 2227.24 | 2332.95 | 2061.77 | 2014.13 | 1990.51 | 1985.97 | 2050.91 | 2032.99 | 2012.73 |
| 2023-12-31 | 2023-09-30 | 2023-06-30 | 2023-03-31 | 2022-12-31 | 2022-09-30 | 2022-06-30 | 2022-03-31 | 2021-12-31 | 2021-09-30 | 2021-06-30 | 2021-03-31 | 2020-12-31 | 2020-09-30 | 2020-06-30 | 2020-03-31 | 2019-12-31 | 2019-09-30 | 2019-06-30 | ||
|---|---|---|---|---|---|---|---|---|---|---|---|---|---|---|---|---|---|---|---|---|
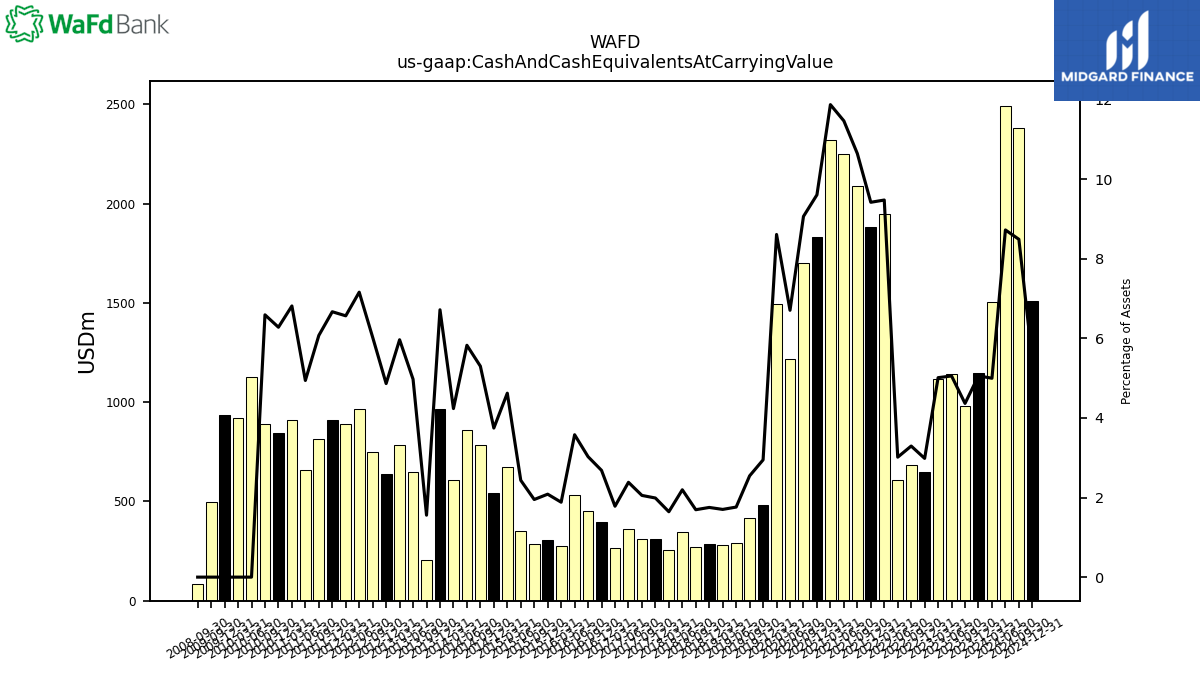
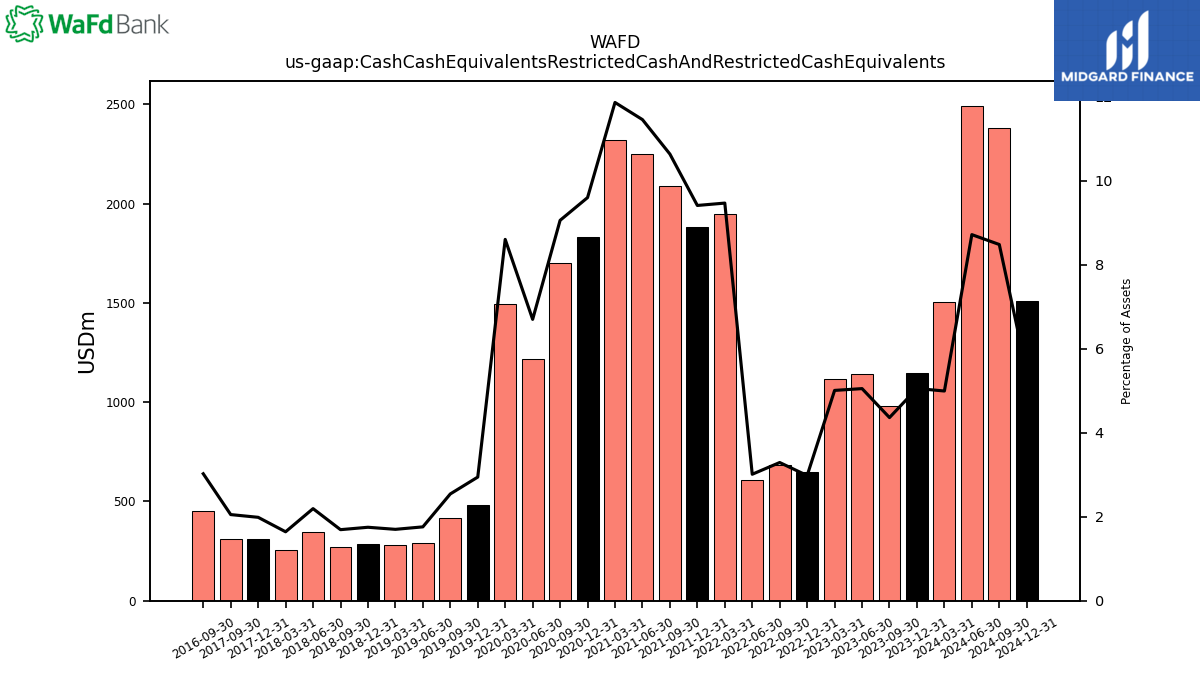
| Cash And Cash Equivalents At Carrying Value | 1144.77 | 980.65 | 1139.64 | 1118.54 | 645.86 | 683.97 | 607.42 | 1947.50 | 1880.65 | 2090.81 | 2251.96 | 2318.45 | 1830.72 | 1702.98 | 1218.24 | 1495.57 | 483.81 | 419.16 | 289.83 | |
| Cash Cash Equivalents Restricted Cash And Restricted Cash Equivalents | 1144.77 | 980.65 | 1139.64 | 1118.54 | 645.86 | 683.97 | 607.42 | 1947.50 | 1880.65 | 2090.81 | 2251.96 | 2318.45 | 1830.72 | 1702.98 | 1218.24 | 1495.57 | 483.81 | 419.16 | 289.83 |
| 2023-12-31 | 2023-09-30 | 2023-06-30 | 2023-03-31 | 2022-12-31 | 2022-09-30 | 2022-06-30 | 2022-03-31 | 2021-12-31 | 2021-09-30 | 2021-06-30 | 2021-03-31 | 2020-12-31 | 2020-09-30 | 2020-06-30 | 2020-03-31 | 2019-12-31 | 2019-09-30 | 2019-06-30 | ||
|---|---|---|---|---|---|---|---|---|---|---|---|---|---|---|---|---|---|---|---|---|
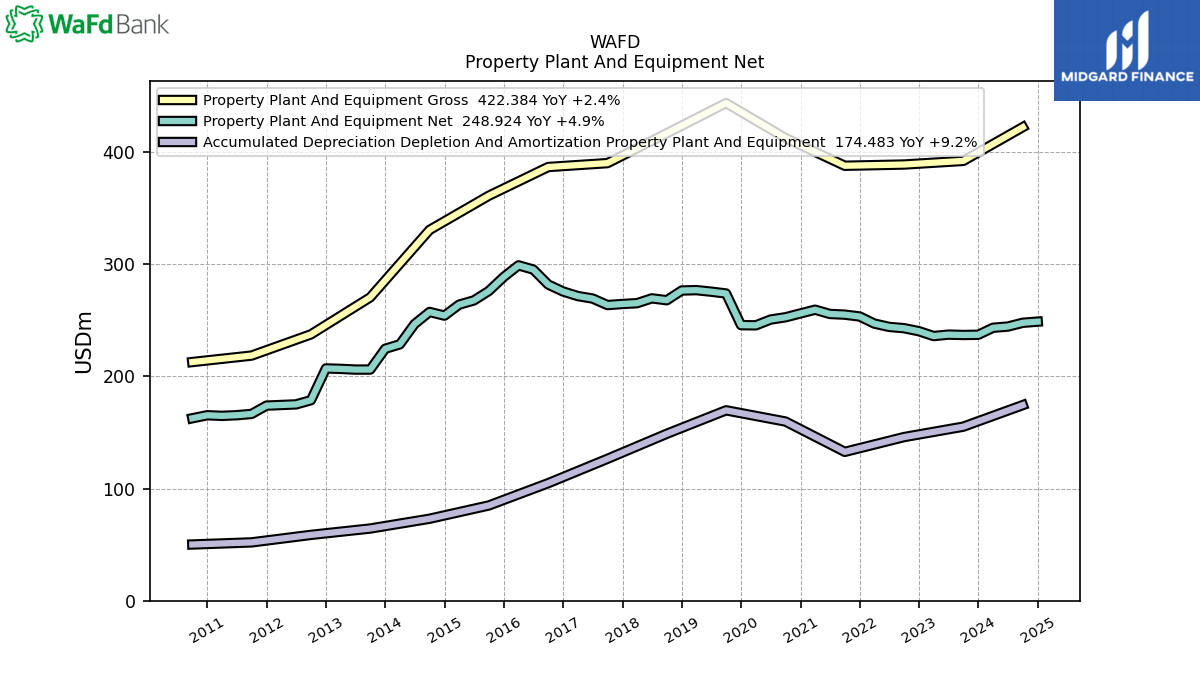
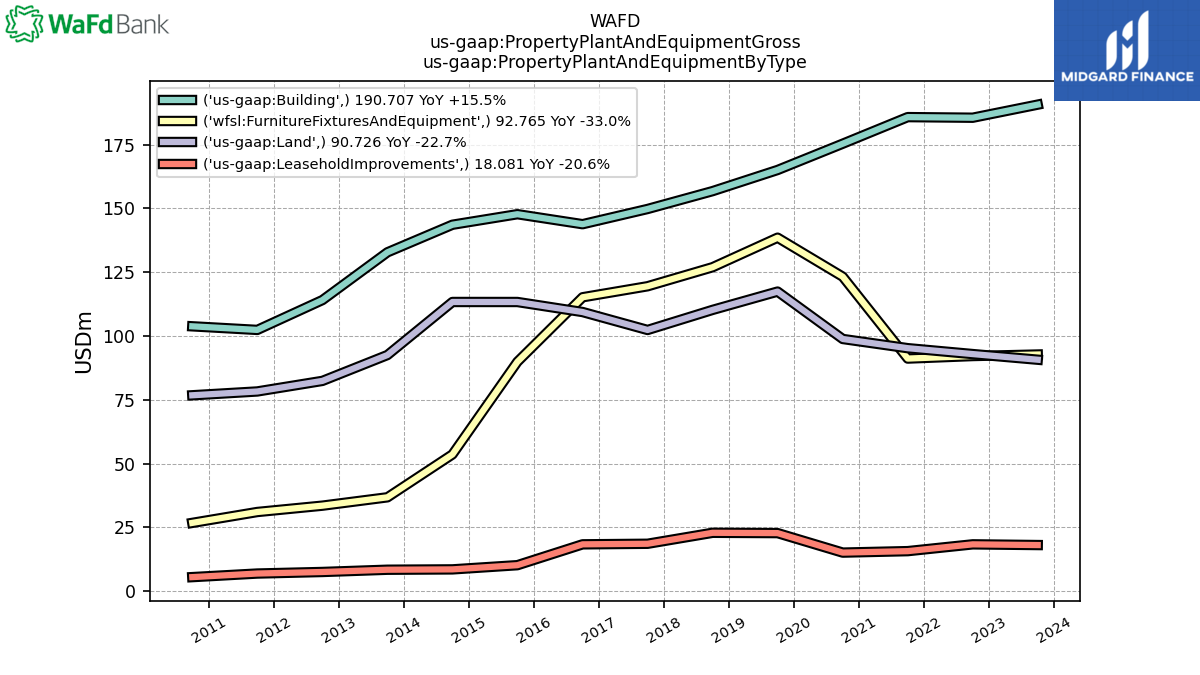
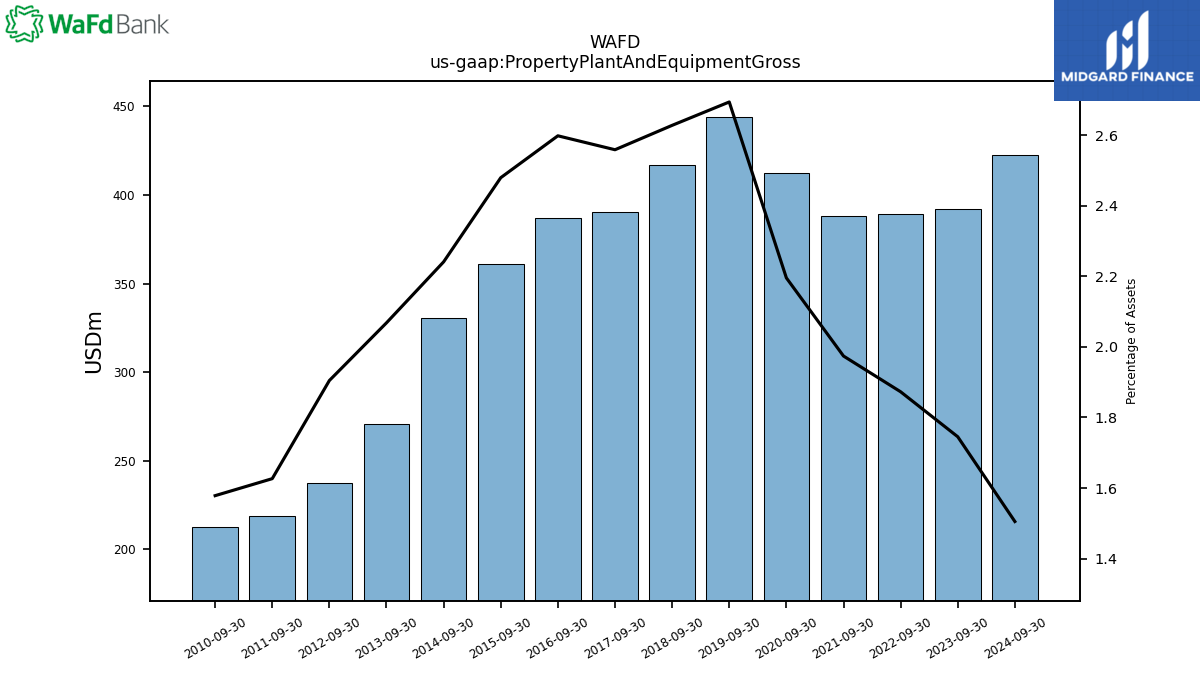
| Property Plant And Equipment Gross | NA | 392.28 | NA | NA | NA | 389.04 | NA | NA | NA | 387.93 | NA | NA | NA | 412.63 | NA | NA | NA | 443.84 | NA | |
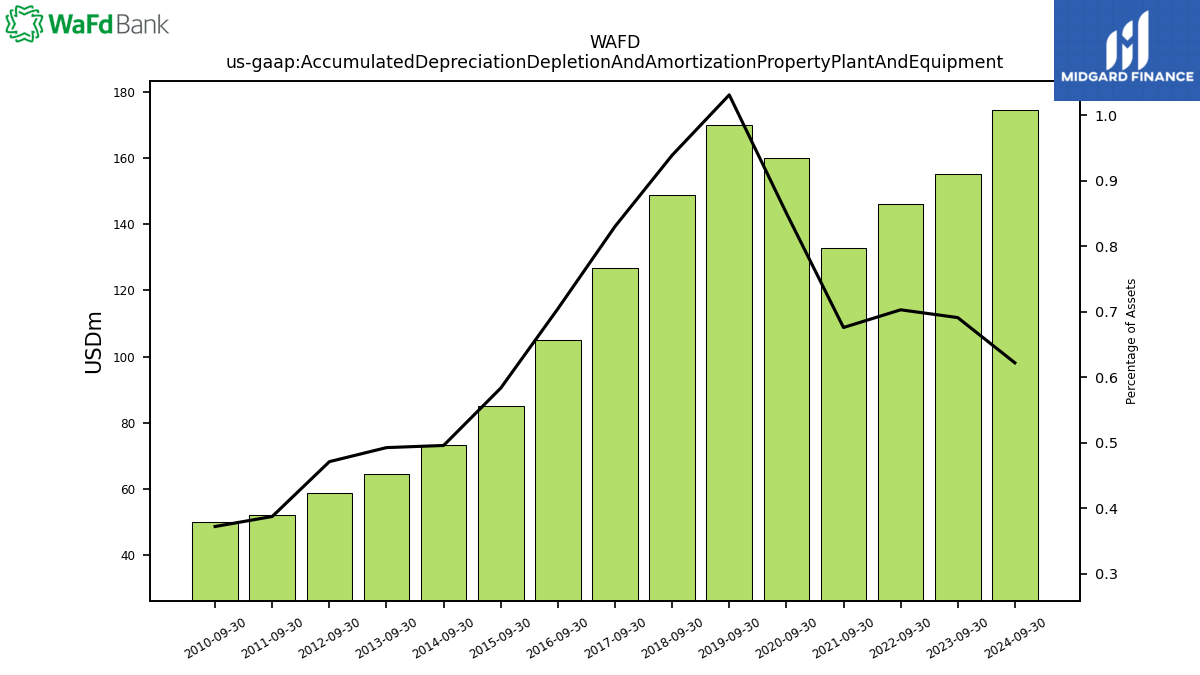
| Accumulated Depreciation Depletion And Amortization Property Plant And Equipment | NA | 155.27 | NA | NA | NA | 145.97 | NA | NA | NA | 132.78 | NA | NA | NA | 159.82 | NA | NA | NA | 169.82 | NA | |
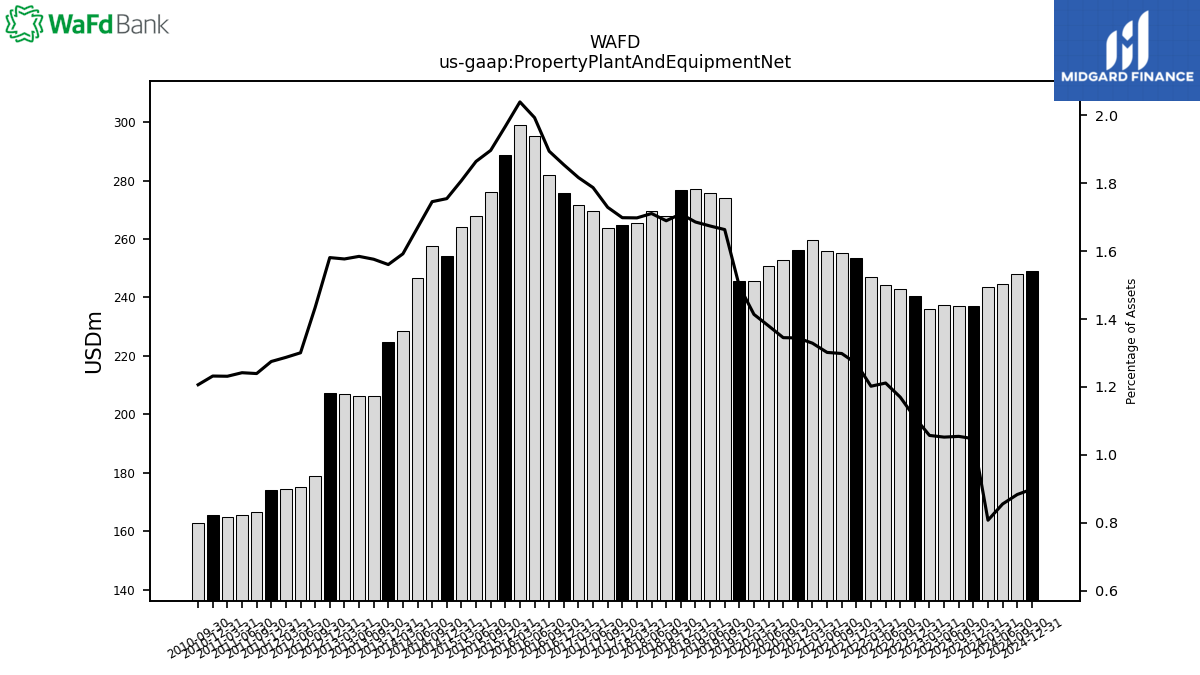
| Property Plant And Equipment Net | 237.20 | 237.01 | 237.34 | 236.05 | 240.36 | 243.06 | 244.23 | 247.17 | 253.49 | 255.15 | 255.76 | 259.56 | 256.24 | 252.81 | 250.78 | 245.61 | 245.79 | 274.01 | 275.64 | |
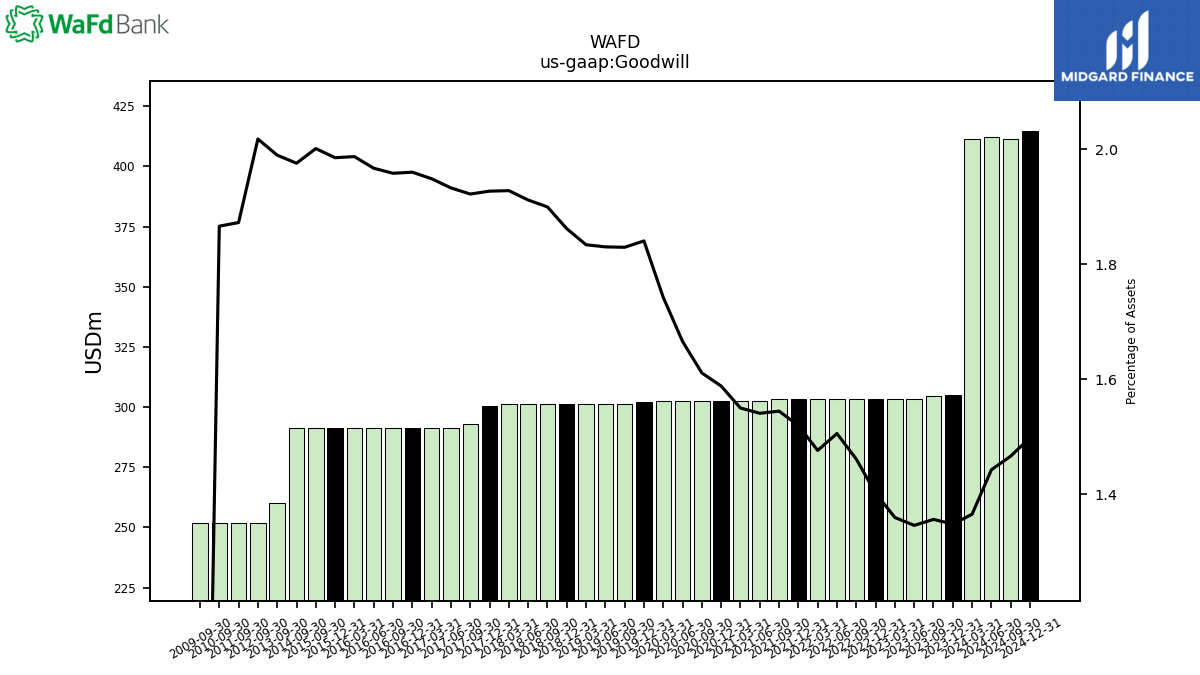
| Goodwill | 305.12 | 304.75 | 303.46 | 303.46 | 303.46 | 303.46 | 303.46 | 303.46 | 303.46 | 303.46 | 302.71 | 302.71 | 302.71 | 302.71 | 302.71 | 302.69 | 302.23 | 301.37 | 301.37 | |
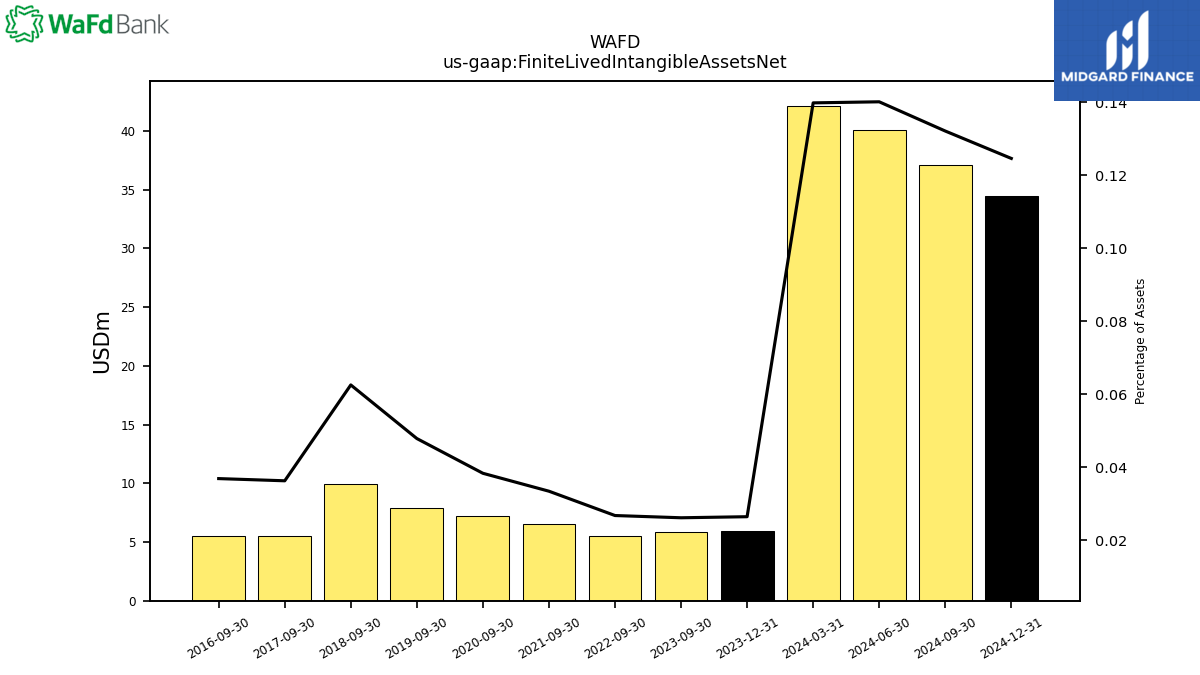
| Finite Lived Intangible Assets Net | NA | 5.87 | NA | NA | NA | 5.55 | NA | NA | NA | 6.56 | NA | NA | NA | 7.20 | NA | NA | NA | 7.88 | NA | |
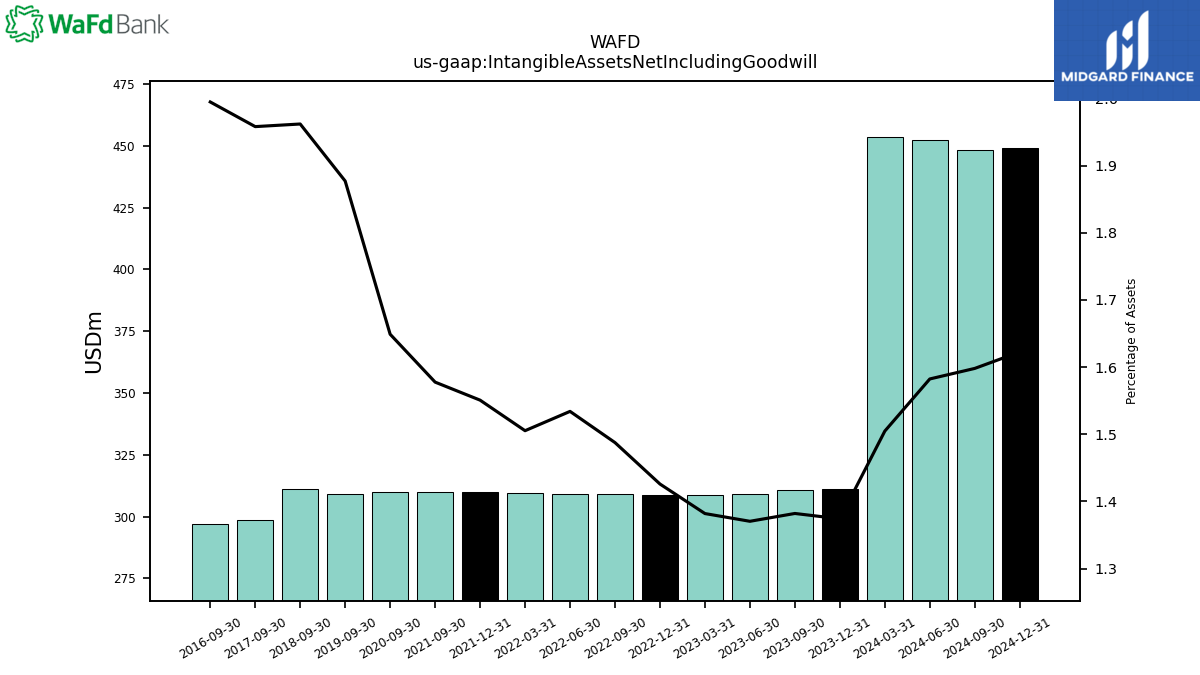
| Intangible Assets Net Including Goodwill | 311.10 | 310.62 | 309.07 | 308.52 | 308.77 | 309.01 | 309.25 | 309.50 | 309.75 | 310.02 | NA | NA | NA | 309.91 | NA | NA | NA | 309.25 | NA | |
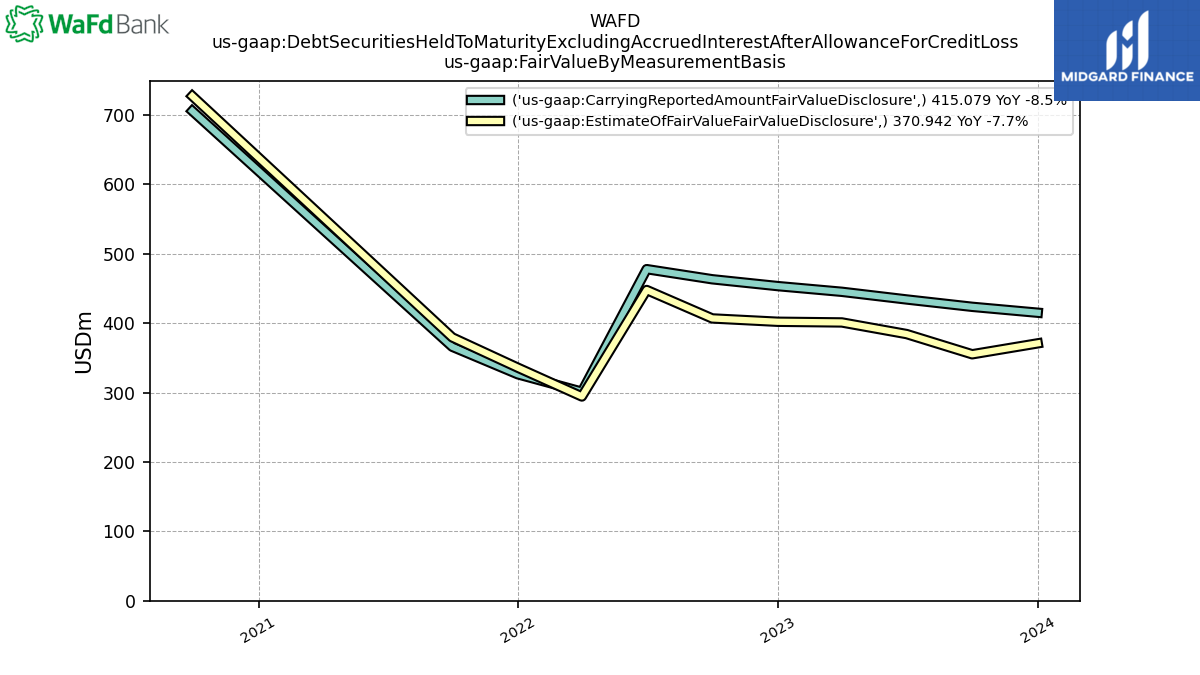
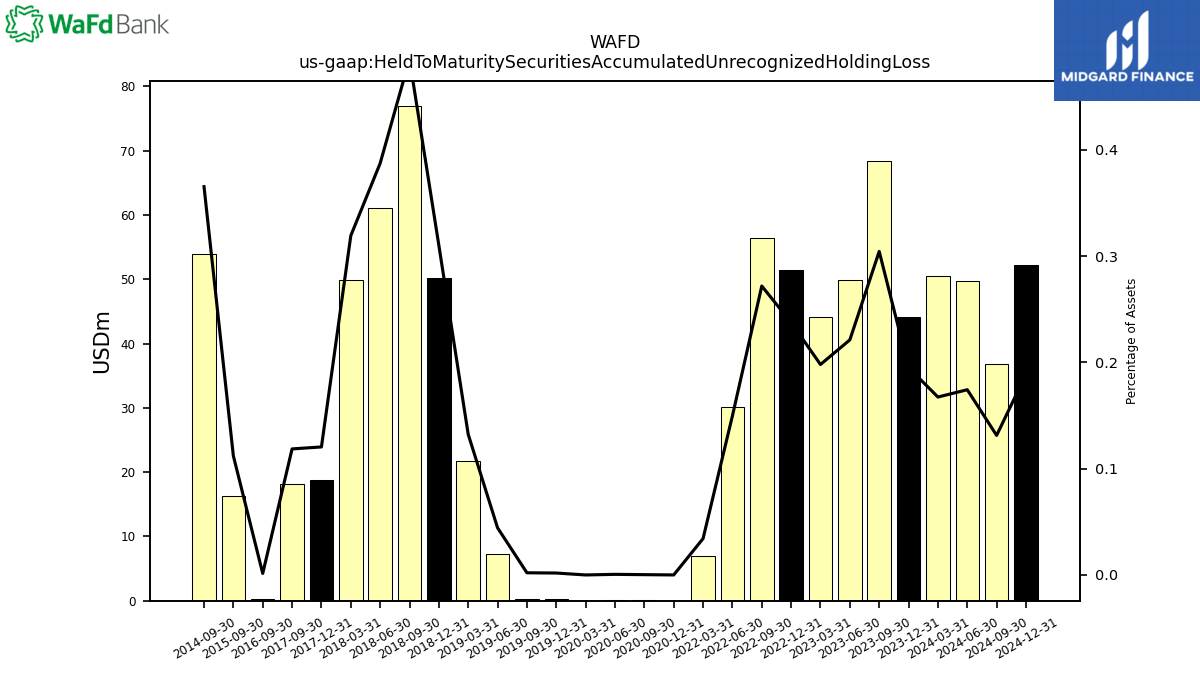
| Held To Maturity Securities Accumulated Unrecognized Holding Loss | 44.16 | 68.40 | 49.88 | 44.20 | 51.41 | 56.46 | 30.17 | 7.04 | NA | NA | NA | NA | 0.00 | 0.05 | 0.10 | 0.00 | 0.30 | 0.34 | 7.30 | |
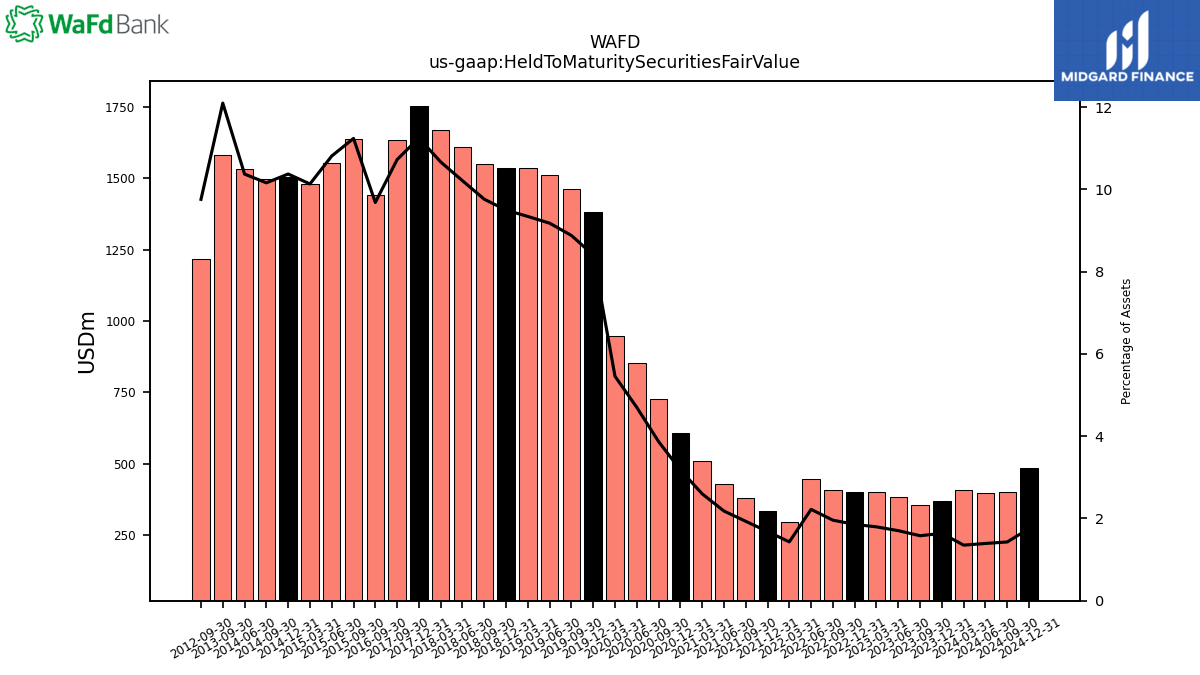
| Held To Maturity Securities Fair Value | 370.94 | 355.19 | 384.31 | 401.08 | 402.06 | 406.86 | 447.83 | 294.35 | 335.89 | 379.55 | 428.55 | 507.90 | 606.17 | 727.37 | 854.42 | 948.19 | 1380.42 | 1463.10 | 1511.68 | |
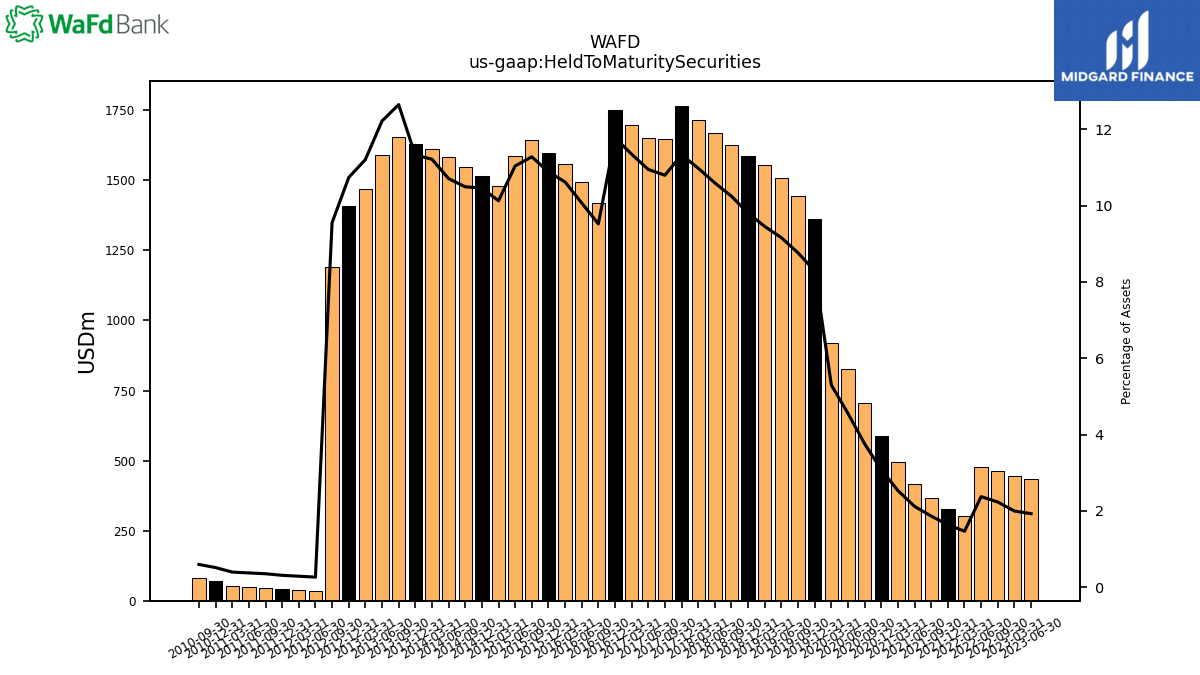
| Held To Maturity Securities | NA | NA | 434.17 | 445.22 | NA | 463.30 | 477.88 | 301.22 | 326.39 | 366.02 | 415.75 | 494.09 | 586.87 | 705.84 | 827.32 | 920.25 | 1360.69 | 1443.48 | 1508.17 | |
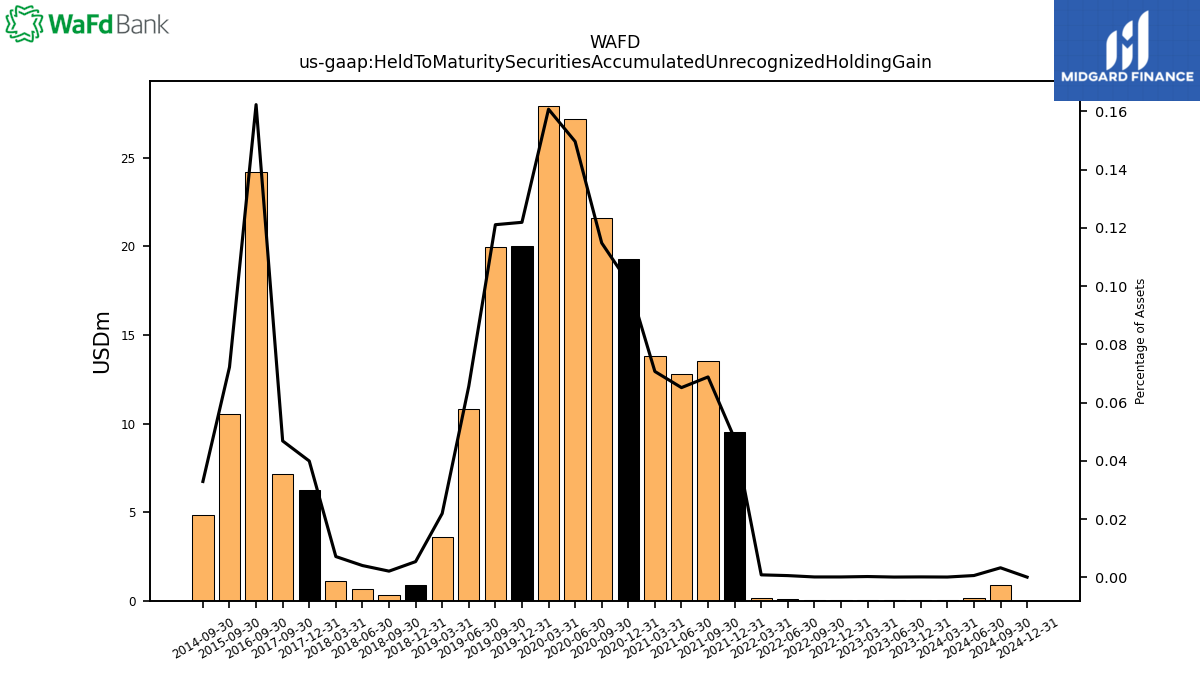
| Held To Maturity Securities Accumulated Unrecognized Holding Gain | 0.03 | NA | 0.02 | 0.06 | 0.02 | 0.02 | 0.12 | 0.17 | 9.51 | 13.52 | 12.80 | 13.81 | 19.31 | 21.58 | 27.21 | 27.94 | 20.02 | 19.95 | 10.80 | |
| Held To Maturity Securities Accumulated Unrecognized Holding Loss | 44.16 | 68.40 | 49.88 | 44.20 | 51.41 | 56.46 | 30.17 | 7.04 | NA | NA | NA | NA | 0.00 | 0.05 | 0.10 | 0.00 | 0.30 | 0.34 | 7.30 | |
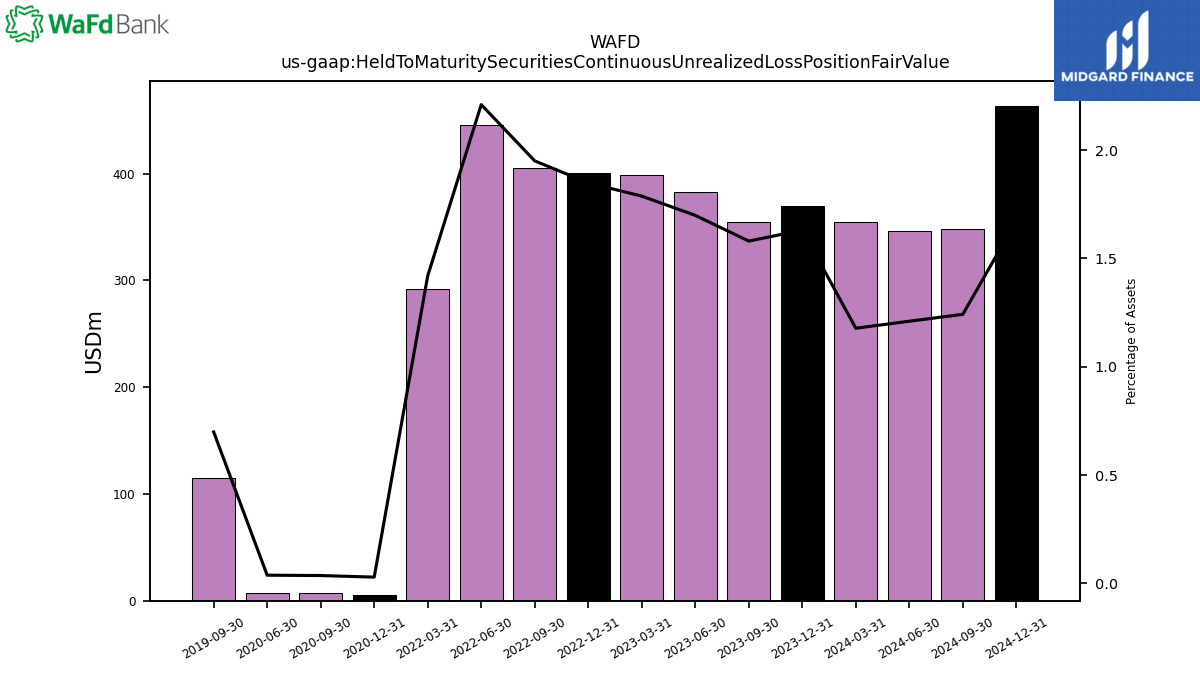
| Held To Maturity Securities Continuous Unrealized Loss Position Fair Value | 369.26 | 355.19 | 383.21 | 399.16 | 400.42 | 405.17 | 445.58 | 291.91 | NA | NA | NA | NA | 5.55 | 6.85 | 6.91 | NA | NA | 115.18 | NA | |
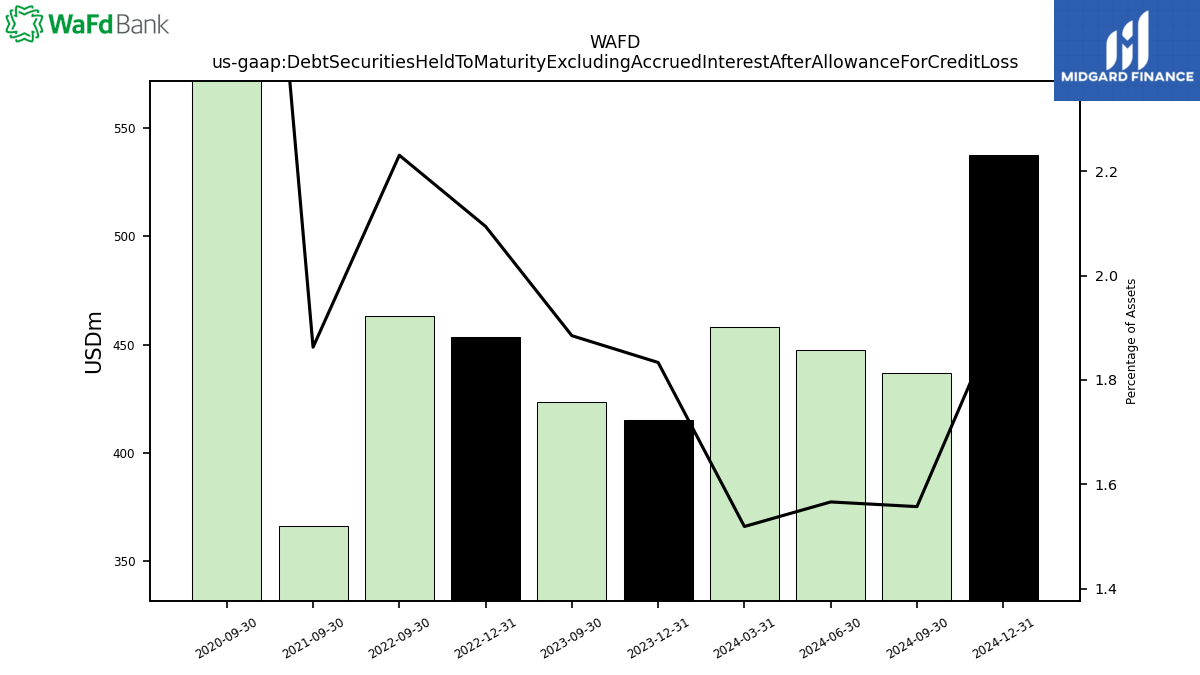
| Debt Securities Held To Maturity Excluding Accrued Interest After Allowance For Credit Loss | 415.08 | 423.59 | NA | NA | 453.44 | 463.30 | NA | NA | NA | 366.02 | NA | NA | NA | 705.84 | NA | NA | NA | NA | NA | |
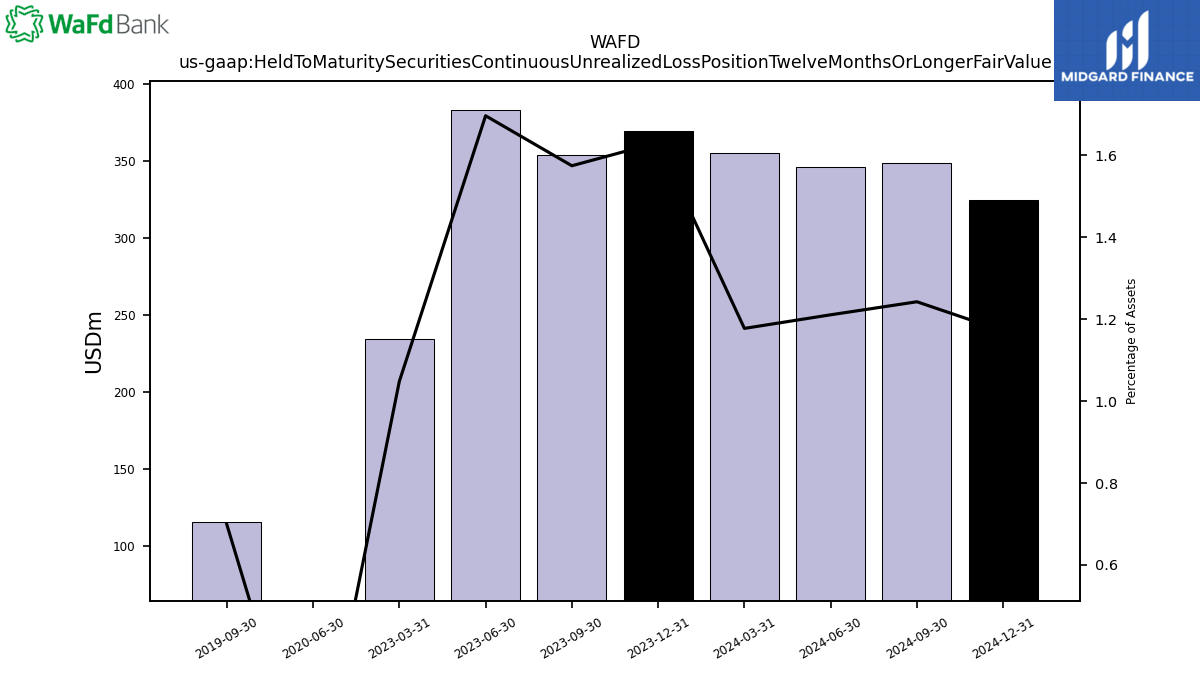
| Held To Maturity Securities Continuous Unrealized Loss Position Twelve Months Or Longer Fair Value | 369.26 | 353.76 | 382.50 | 233.94 | NA | NA | NA | NA | NA | NA | NA | NA | NA | NA | 0.00 | NA | NA | 115.18 | NA | |
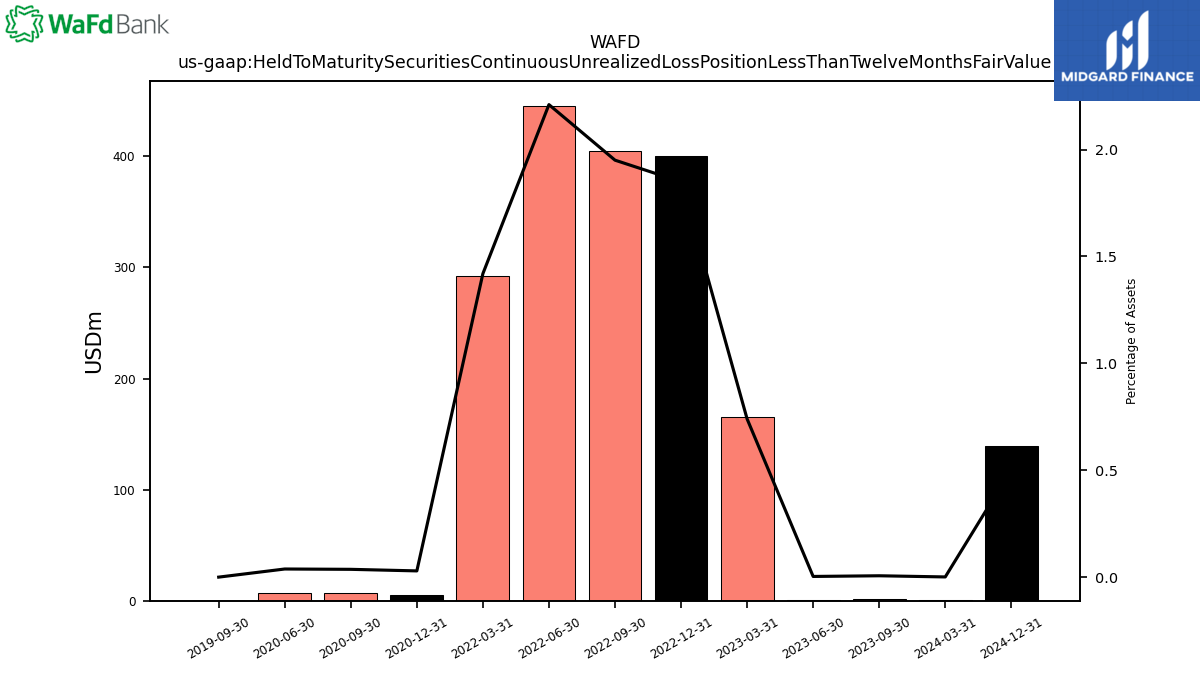
| Held To Maturity Securities Continuous Unrealized Loss Position Less Than Twelve Months Fair Value | NA | 1.42 | 0.71 | 165.22 | 400.42 | 405.17 | 445.58 | 291.91 | NA | NA | NA | NA | 5.55 | 6.85 | 6.91 | NA | NA | 0.00 | NA |
| 2023-12-31 | 2023-09-30 | 2023-06-30 | 2023-03-31 | 2022-12-31 | 2022-09-30 | 2022-06-30 | 2022-03-31 | 2021-12-31 | 2021-09-30 | 2021-06-30 | 2021-03-31 | 2020-12-31 | 2020-09-30 | 2020-06-30 | 2020-03-31 | 2019-12-31 | 2019-09-30 | 2019-06-30 | ||
|---|---|---|---|---|---|---|---|---|---|---|---|---|---|---|---|---|---|---|---|---|
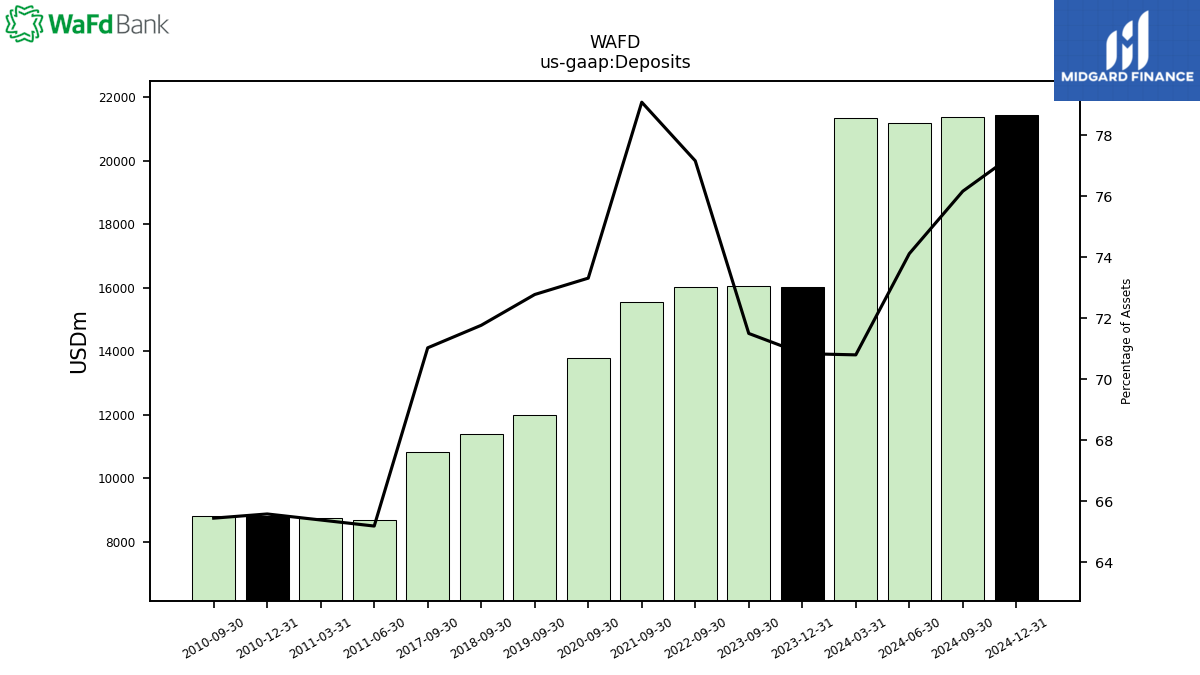
| Deposits | 16038.79 | 16070.33 | NA | NA | NA | 16029.57 | NA | NA | NA | 15542.11 | NA | NA | NA | 13779.62 | NA | NA | NA | 11990.76 | NA |
| 2023-12-31 | 2023-09-30 | 2023-06-30 | 2023-03-31 | 2022-12-31 | 2022-09-30 | 2022-06-30 | 2022-03-31 | 2021-12-31 | 2021-09-30 | 2021-06-30 | 2021-03-31 | 2020-12-31 | 2020-09-30 | 2020-06-30 | 2020-03-31 | 2019-12-31 | 2019-09-30 | 2019-06-30 | ||
|---|---|---|---|---|---|---|---|---|---|---|---|---|---|---|---|---|---|---|---|---|
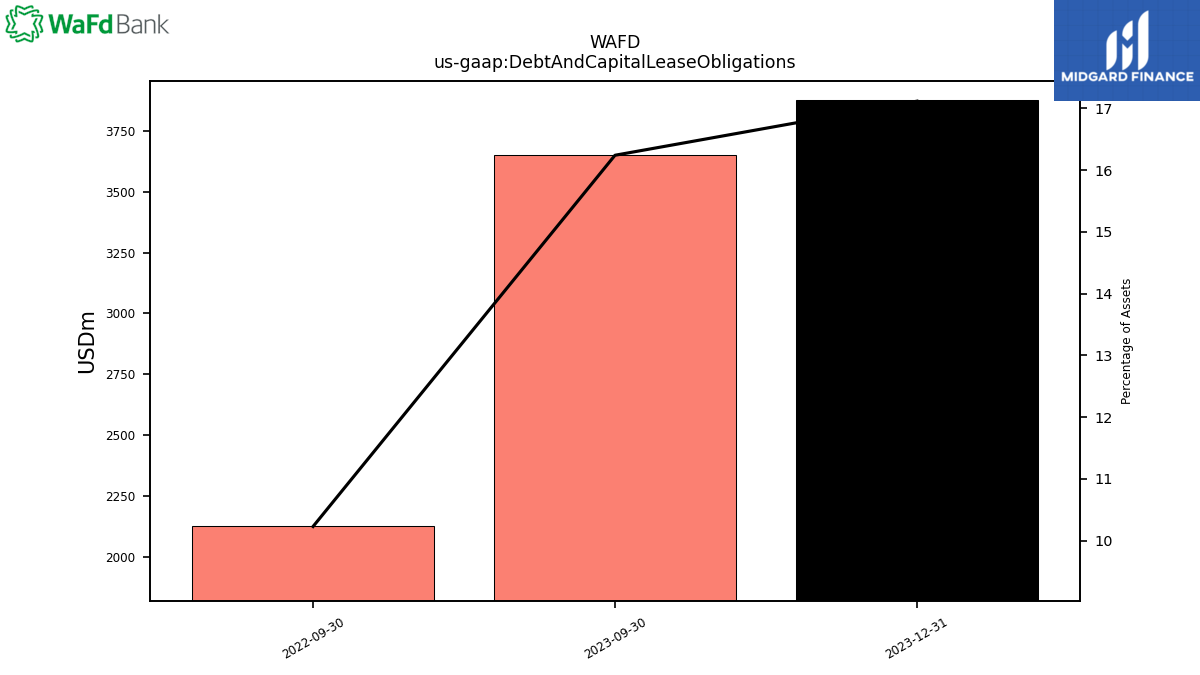
| Debt And Capital Lease Obligations | 3875.00 | 3650.00 | NA | NA | NA | 2125.00 | NA | NA | NA | NA | NA | NA | NA | NA | NA | NA | NA | NA | NA |
| 2023-12-31 | 2023-09-30 | 2023-06-30 | 2023-03-31 | 2022-12-31 | 2022-09-30 | 2022-06-30 | 2022-03-31 | 2021-12-31 | 2021-09-30 | 2021-06-30 | 2021-03-31 | 2020-12-31 | 2020-09-30 | 2020-06-30 | 2020-03-31 | 2019-12-31 | 2019-09-30 | 2019-06-30 | ||
|---|---|---|---|---|---|---|---|---|---|---|---|---|---|---|---|---|---|---|---|---|
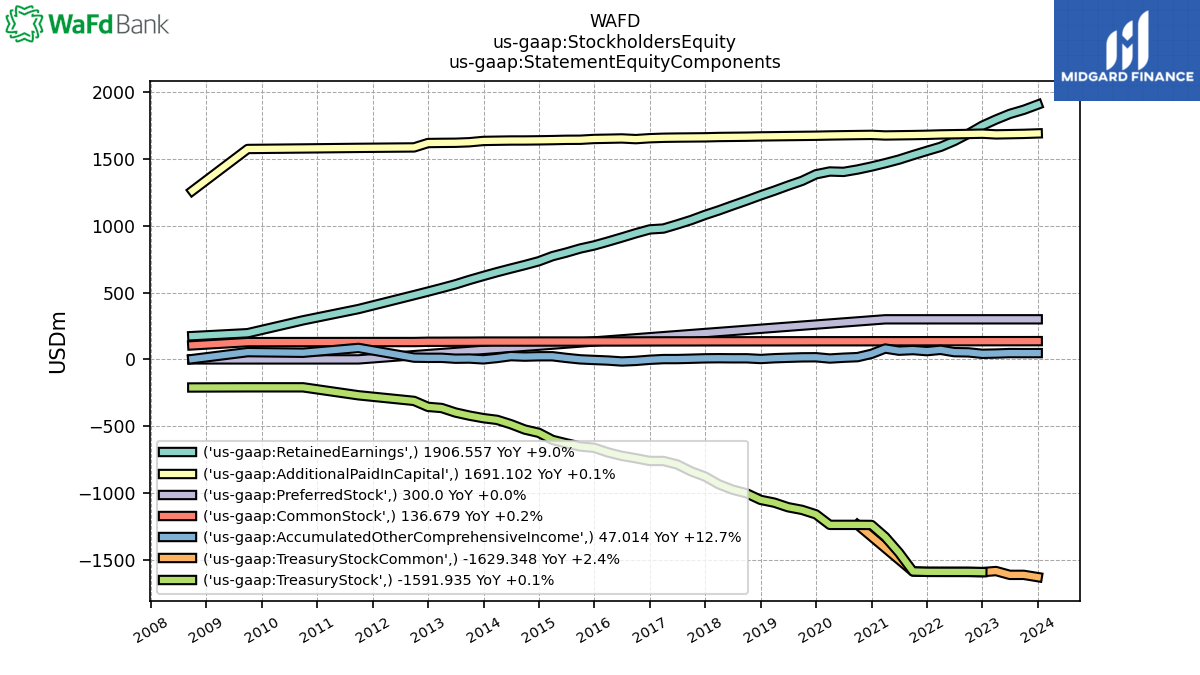
| Stockholders Equity | 2452.00 | 2426.43 | 2394.07 | 2375.12 | 2324.38 | 2274.26 | 2220.11 | 2191.70 | 2149.13 | 2126.06 | 2227.24 | 2332.95 | 2061.77 | 2014.13 | 1990.51 | 1985.97 | 2050.91 | 2032.99 | 2012.73 | |
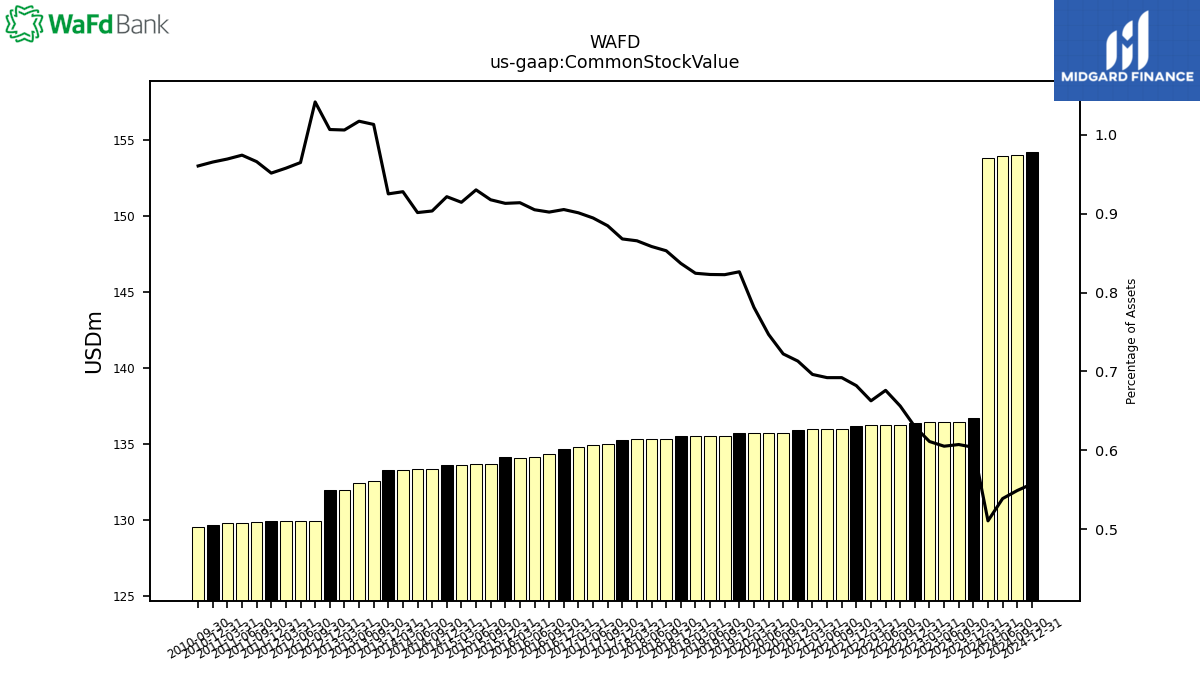
| Common Stock Value | 136.68 | 136.47 | 136.46 | 136.41 | 136.37 | 136.27 | 136.26 | 136.24 | 136.20 | 135.99 | 135.99 | 135.98 | 135.94 | 135.73 | 135.74 | 135.74 | 135.72 | 135.54 | 135.53 | |
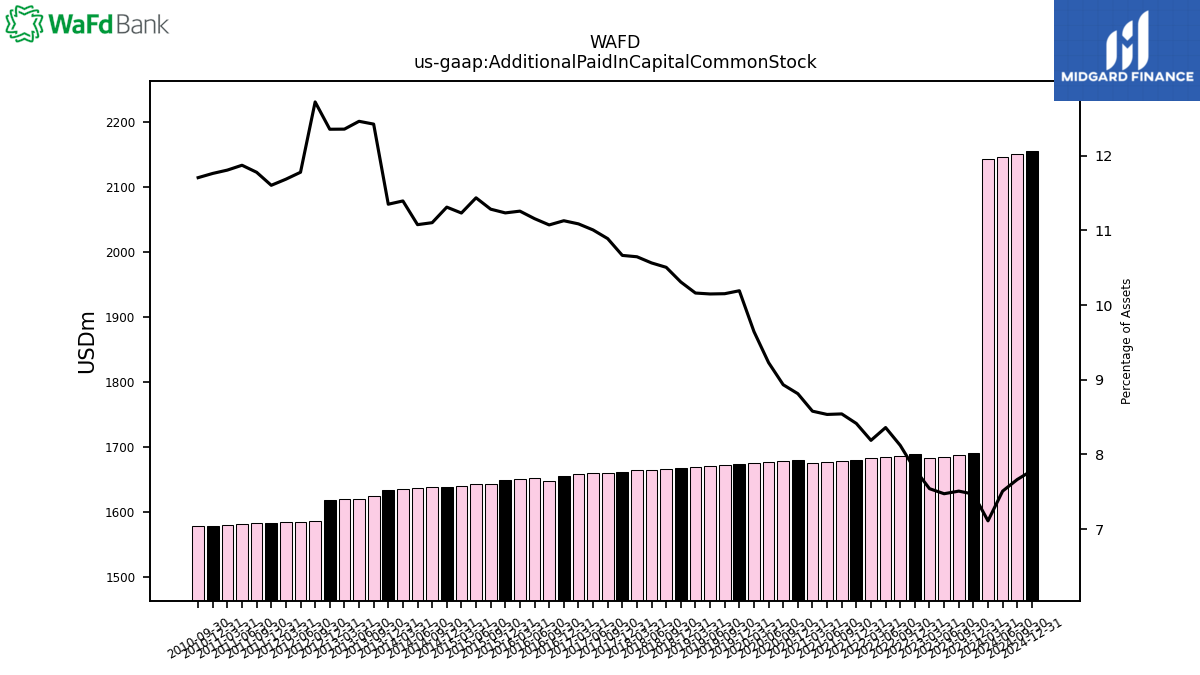
| Additional Paid In Capital Common Stock | 1691.10 | 1687.63 | 1685.59 | 1683.72 | 1689.21 | 1686.97 | 1685.22 | 1683.58 | 1680.64 | 1678.62 | 1677.16 | 1675.77 | 1680.11 | 1678.84 | 1677.37 | 1675.83 | 1673.67 | 1672.42 | 1671.20 | |
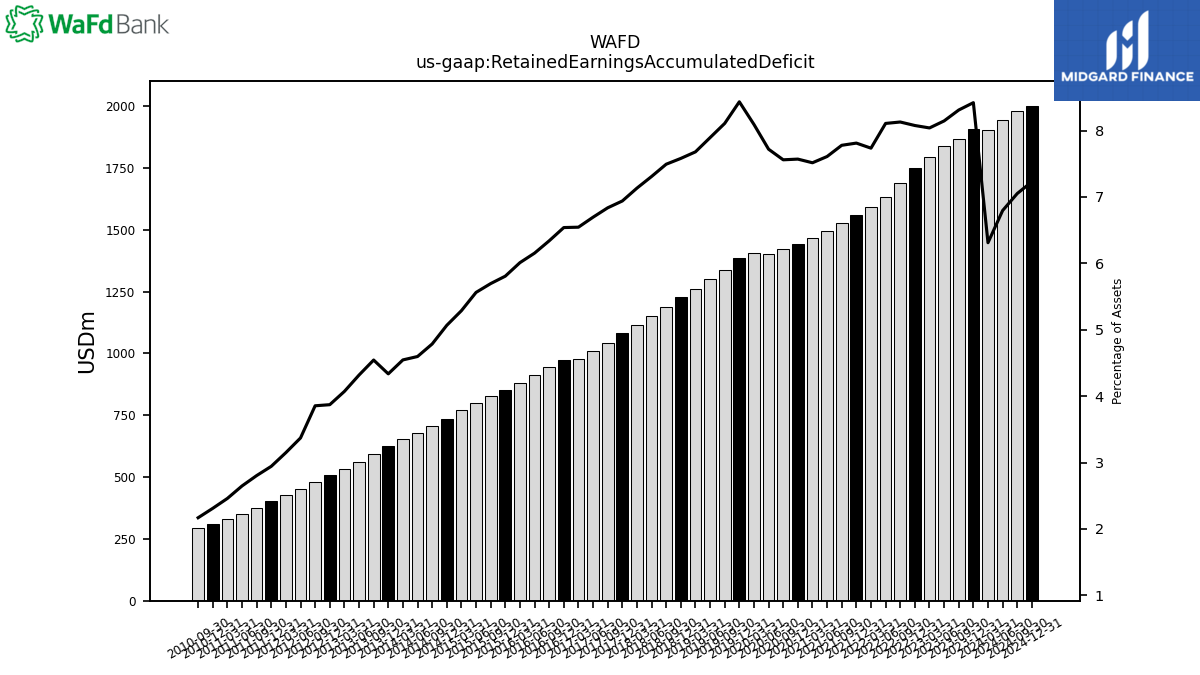
| Retained Earnings Accumulated Deficit | 1906.56 | 1867.75 | 1837.16 | 1795.04 | 1749.01 | 1688.74 | 1634.56 | 1590.48 | 1560.34 | 1528.61 | 1495.34 | 1468.09 | 1443.28 | 1420.91 | 1403.12 | 1406.19 | 1385.18 | 1335.91 | 1300.12 | |
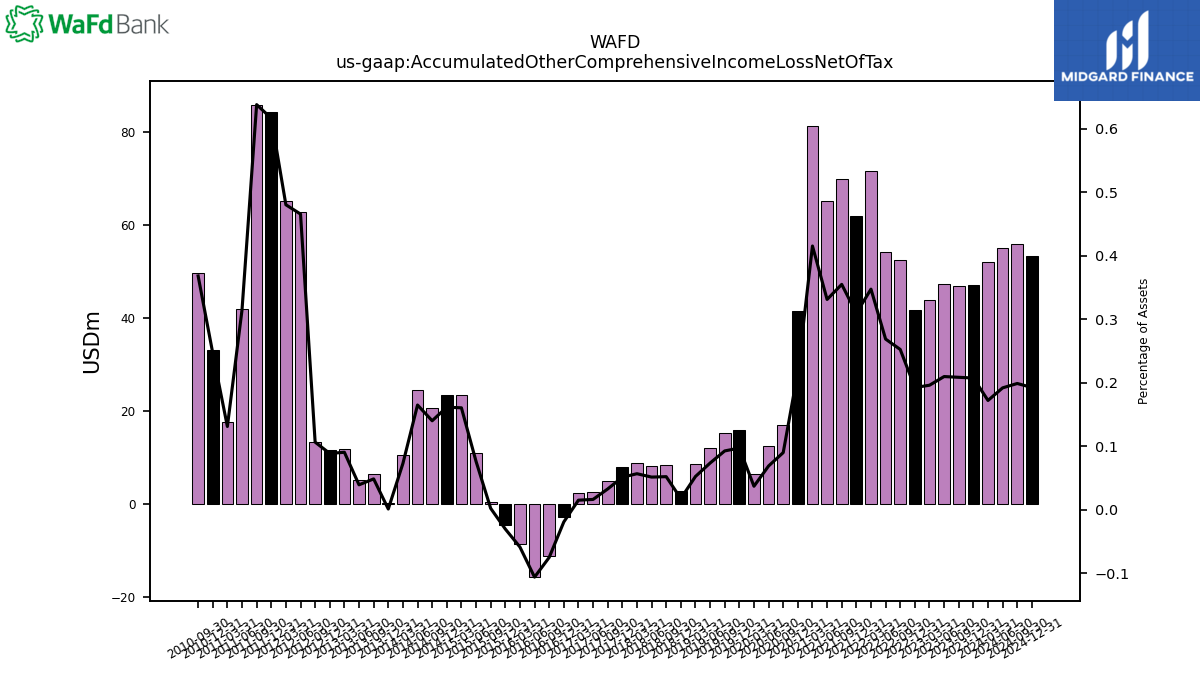
| Accumulated Other Comprehensive Income Loss Net Of Tax | 47.01 | 46.92 | 47.35 | 43.82 | 41.73 | 52.48 | 54.23 | 71.48 | 61.88 | 69.78 | 65.12 | 81.18 | 41.44 | 16.95 | 12.56 | 6.46 | 15.99 | 15.29 | 12.14 | |
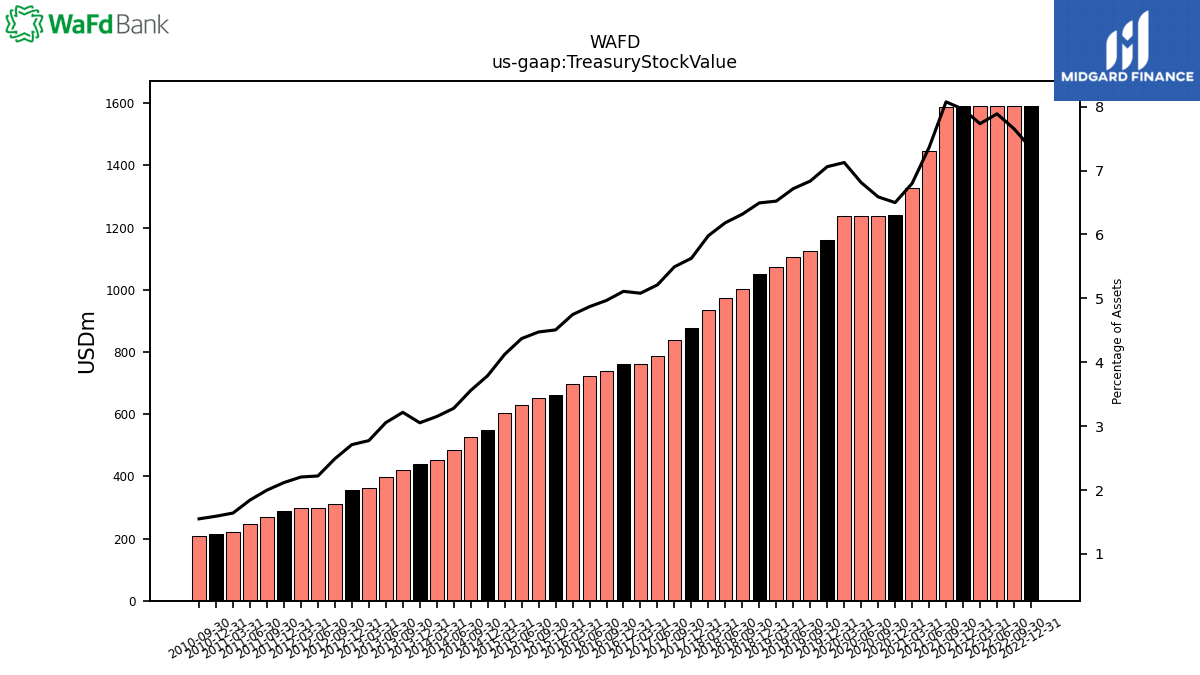
| Treasury Stock Value | NA | NA | NA | NA | 1591.93 | 1590.21 | 1590.16 | 1590.08 | 1589.92 | 1586.95 | 1446.37 | 1328.07 | 1239.00 | 1238.30 | 1238.29 | 1238.25 | 1159.64 | 1126.16 | 1106.24 | |
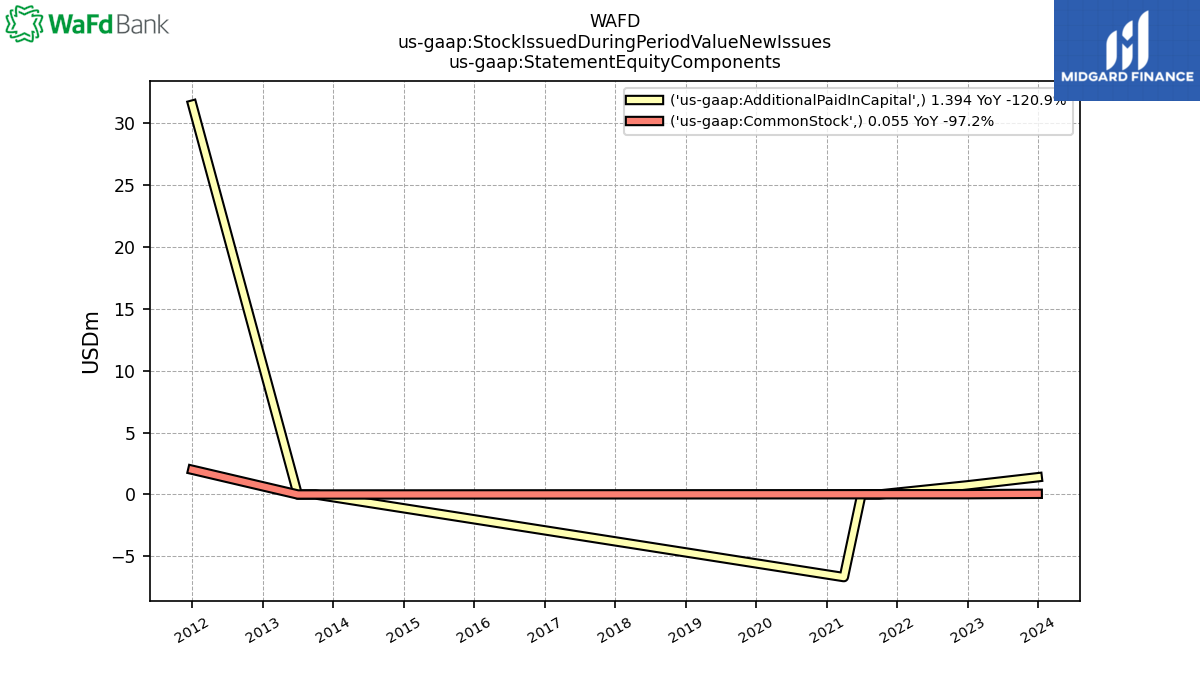
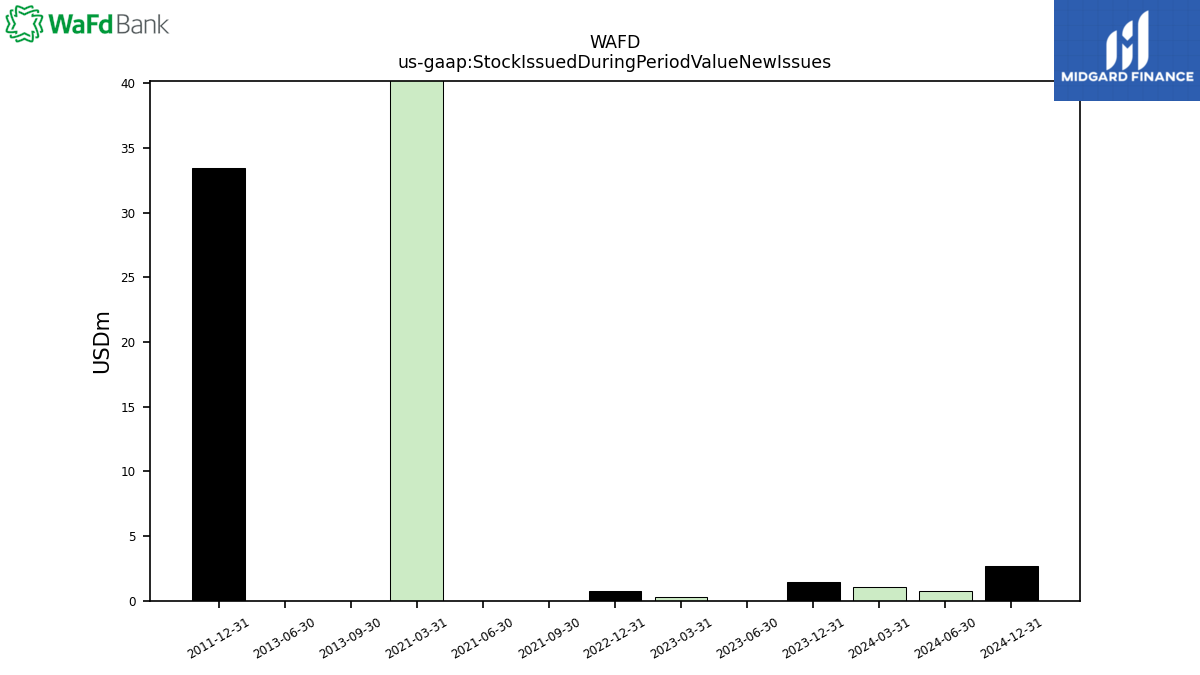
| Stock Issued During Period Value New Issues | 1.45 | NA | NA | NA | 0.77 | NA | NA | NA | NA | 0.00 | 0.00 | 293.32 | NA | NA | NA | NA | NA | NA | NA |
| 2023-12-31 | 2023-09-30 | 2023-06-30 | 2023-03-31 | 2022-12-31 | 2022-09-30 | 2022-06-30 | 2022-03-31 | 2021-12-31 | 2021-09-30 | 2021-06-30 | 2021-03-31 | 2020-12-31 | 2020-09-30 | 2020-06-30 | 2020-03-31 | 2019-12-31 | 2019-09-30 | 2019-06-30 | ||
|---|---|---|---|---|---|---|---|---|---|---|---|---|---|---|---|---|---|---|---|---|
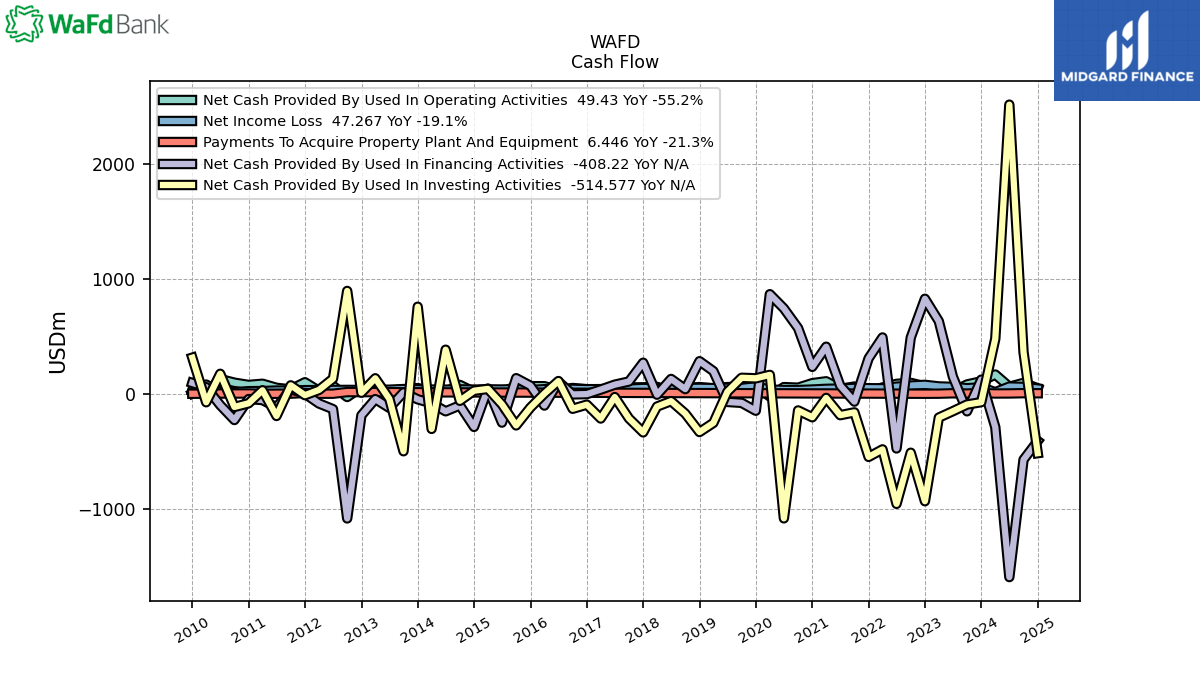
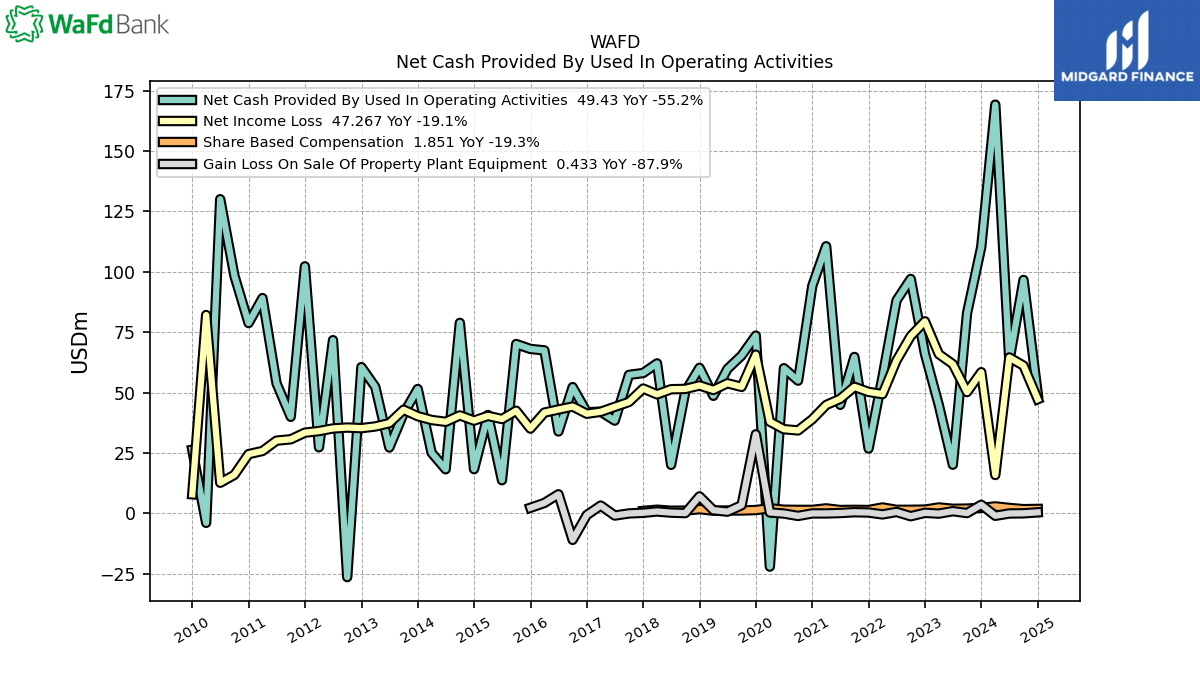
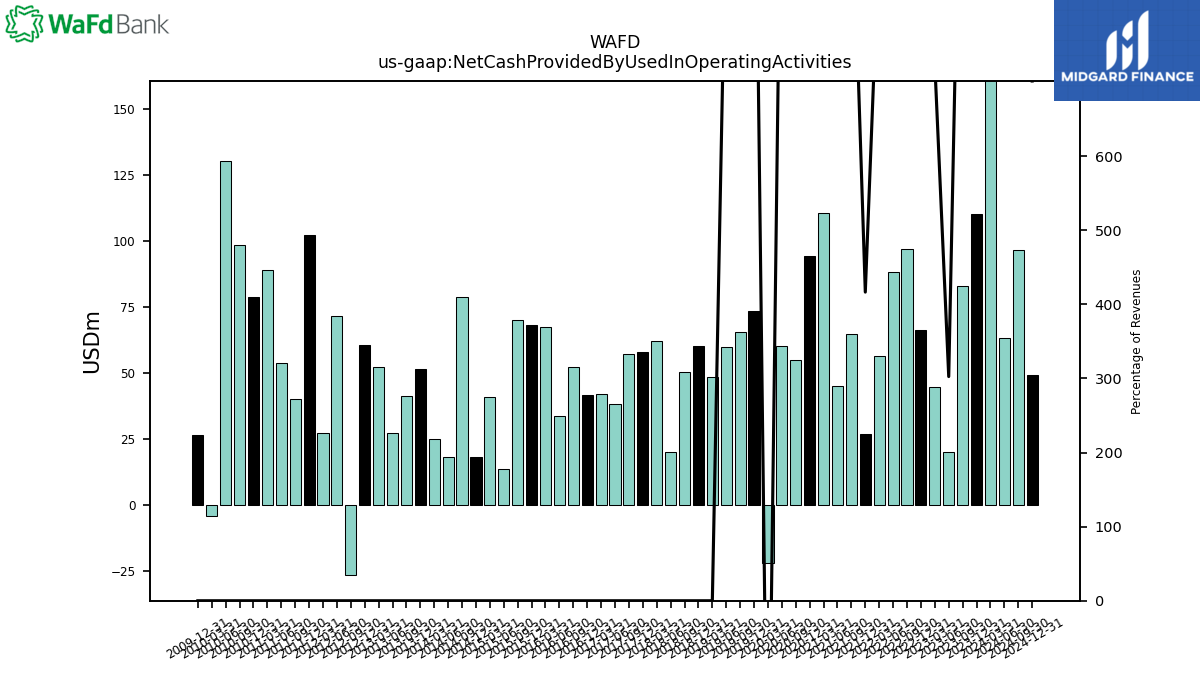
| Net Cash Provided By Used In Operating Activities | 110.26 | 82.88 | 20.15 | 44.83 | 66.10 | 97.06 | 88.16 | 56.41 | 26.84 | 64.76 | 44.94 | 110.58 | 94.18 | 54.94 | 60.11 | -22.04 | 73.59 | 65.35 | 59.77 | |
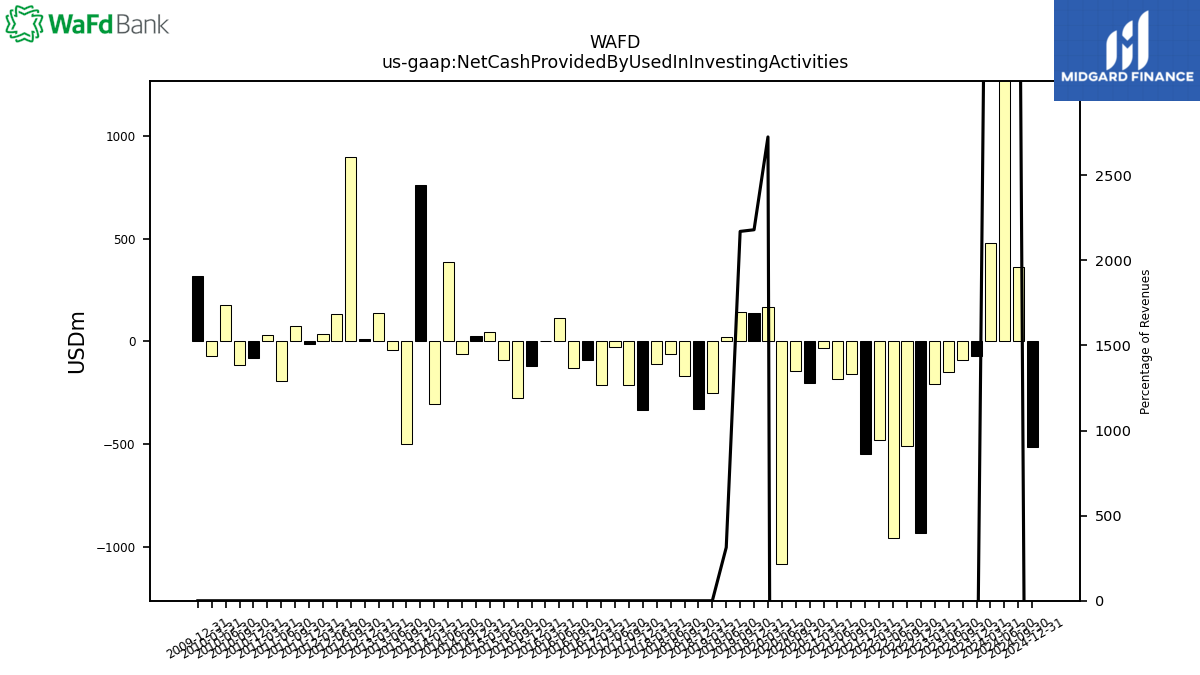
| Net Cash Provided By Used In Investing Activities | -71.03 | -91.40 | -149.48 | -204.99 | -932.04 | -510.27 | -954.93 | -481.19 | -546.77 | -159.47 | -184.07 | -34.02 | -202.18 | -142.71 | -1080.97 | 166.23 | 136.47 | 140.96 | 19.62 | |
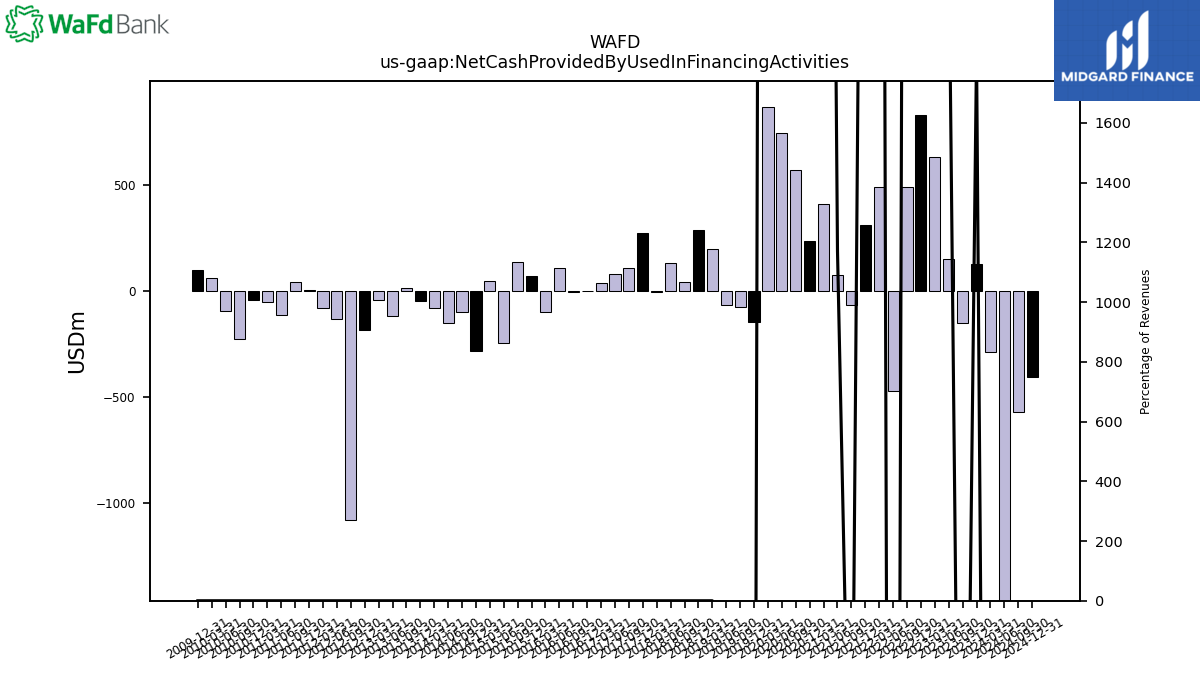
| Net Cash Provided By Used In Financing Activities | 124.89 | -150.47 | 150.43 | 632.85 | 827.84 | 489.76 | -473.31 | 491.63 | 309.77 | -66.44 | 72.64 | 411.17 | 235.75 | 572.51 | 743.52 | 867.58 | -145.42 | -76.98 | -69.11 |
| 2023-12-31 | 2023-09-30 | 2023-06-30 | 2023-03-31 | 2022-12-31 | 2022-09-30 | 2022-06-30 | 2022-03-31 | 2021-12-31 | 2021-09-30 | 2021-06-30 | 2021-03-31 | 2020-12-31 | 2020-09-30 | 2020-06-30 | 2020-03-31 | 2019-12-31 | 2019-09-30 | 2019-06-30 | ||
|---|---|---|---|---|---|---|---|---|---|---|---|---|---|---|---|---|---|---|---|---|
| Net Cash Provided By Used In Operating Activities | 110.26 | 82.88 | 20.15 | 44.83 | 66.10 | 97.06 | 88.16 | 56.41 | 26.84 | 64.76 | 44.94 | 110.58 | 94.18 | 54.94 | 60.11 | -22.04 | 73.59 | 65.35 | 59.77 | |
| Net Income Loss | 58.45 | 50.21 | 61.77 | 65.93 | 79.51 | 73.39 | 63.30 | 49.36 | 50.28 | 52.37 | 47.42 | 44.87 | 38.95 | 34.34 | 34.85 | 37.95 | 65.70 | 52.36 | 53.85 | |
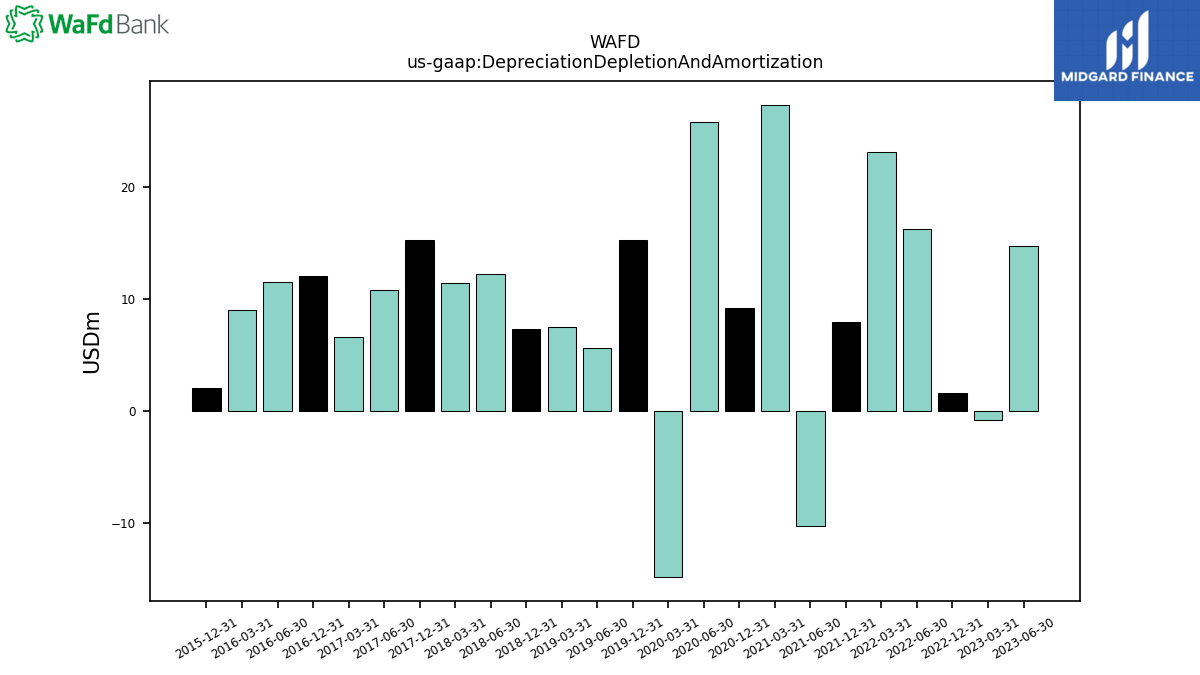
| Depreciation Depletion And Amortization | NA | NA | 14.80 | -0.75 | 1.61 | NA | 16.29 | 23.17 | 7.94 | NA | -10.28 | 27.40 | 9.21 | NA | 25.87 | -14.81 | 15.28 | NA | 5.68 | |
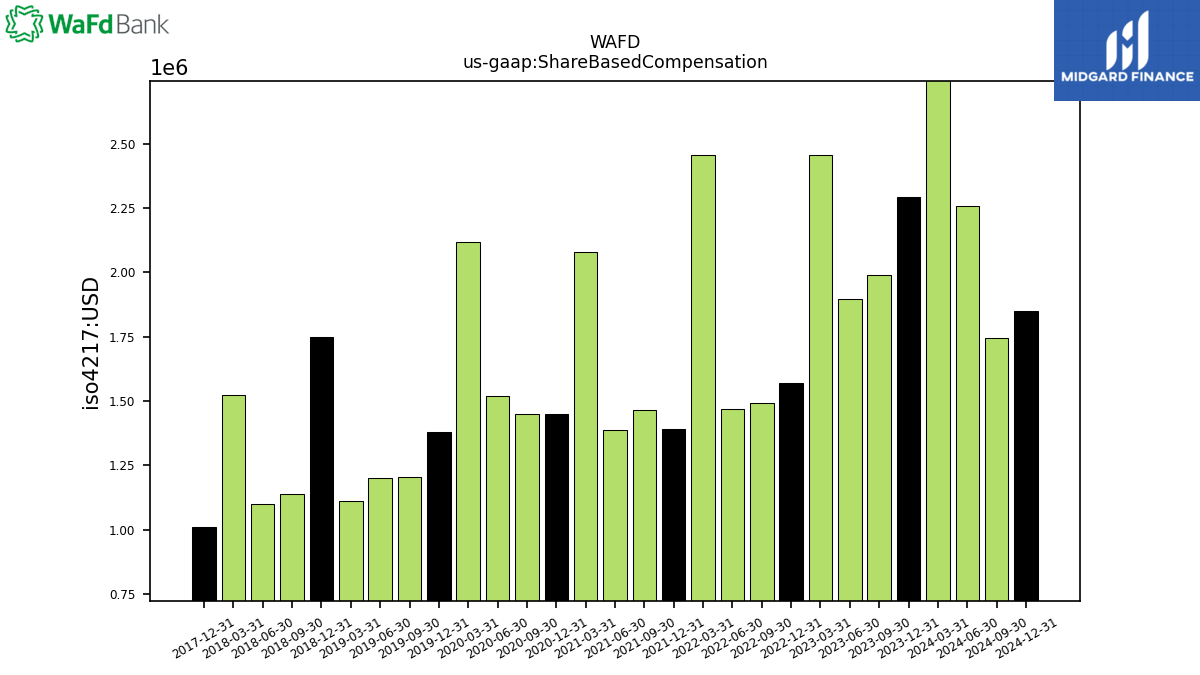
| Share Based Compensation | 2.29 | 1.99 | 1.90 | 2.46 | 1.57 | 1.49 | 1.47 | 2.46 | 1.39 | 1.47 | 1.39 | 2.08 | 1.45 | 1.45 | 1.52 | 2.12 | 1.38 | 1.20 | 1.20 |
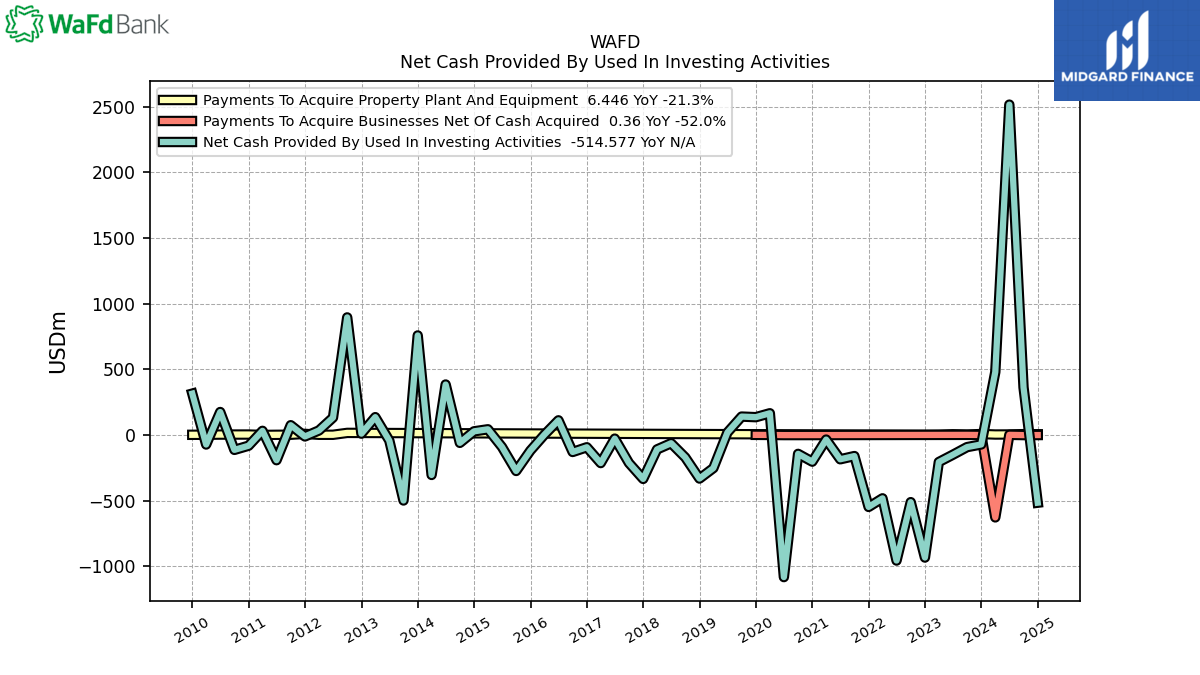
| 2023-12-31 | 2023-09-30 | 2023-06-30 | 2023-03-31 | 2022-12-31 | 2022-09-30 | 2022-06-30 | 2022-03-31 | 2021-12-31 | 2021-09-30 | 2021-06-30 | 2021-03-31 | 2020-12-31 | 2020-09-30 | 2020-06-30 | 2020-03-31 | 2019-12-31 | 2019-09-30 | 2019-06-30 | ||
|---|---|---|---|---|---|---|---|---|---|---|---|---|---|---|---|---|---|---|---|---|
| Net Cash Provided By Used In Investing Activities | -71.03 | -91.40 | -149.48 | -204.99 | -932.04 | -510.27 | -954.93 | -481.19 | -546.77 | -159.47 | -184.07 | -34.02 | -202.18 | -142.71 | -1080.97 | 166.23 | 136.47 | 140.96 | 19.62 | |
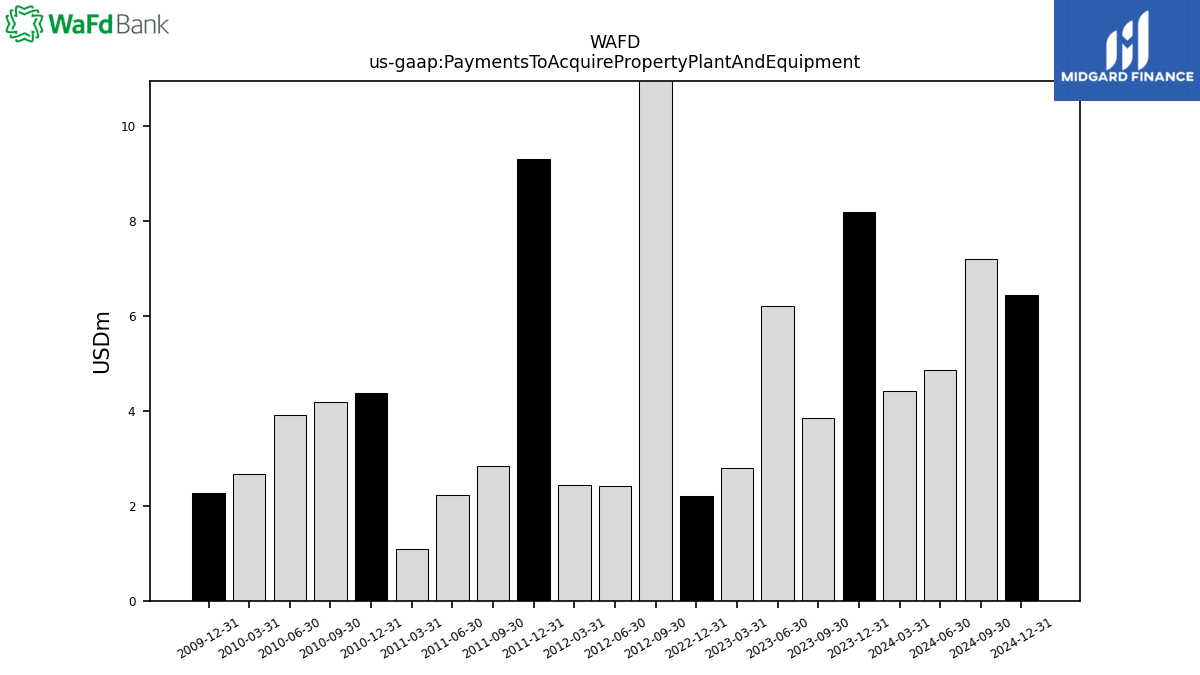
| Payments To Acquire Property Plant And Equipment | 8.20 | NA | NA | NA | 2.22 | NA | NA | NA | NA | NA | NA | NA | NA | NA | NA | NA | NA | NA | NA |
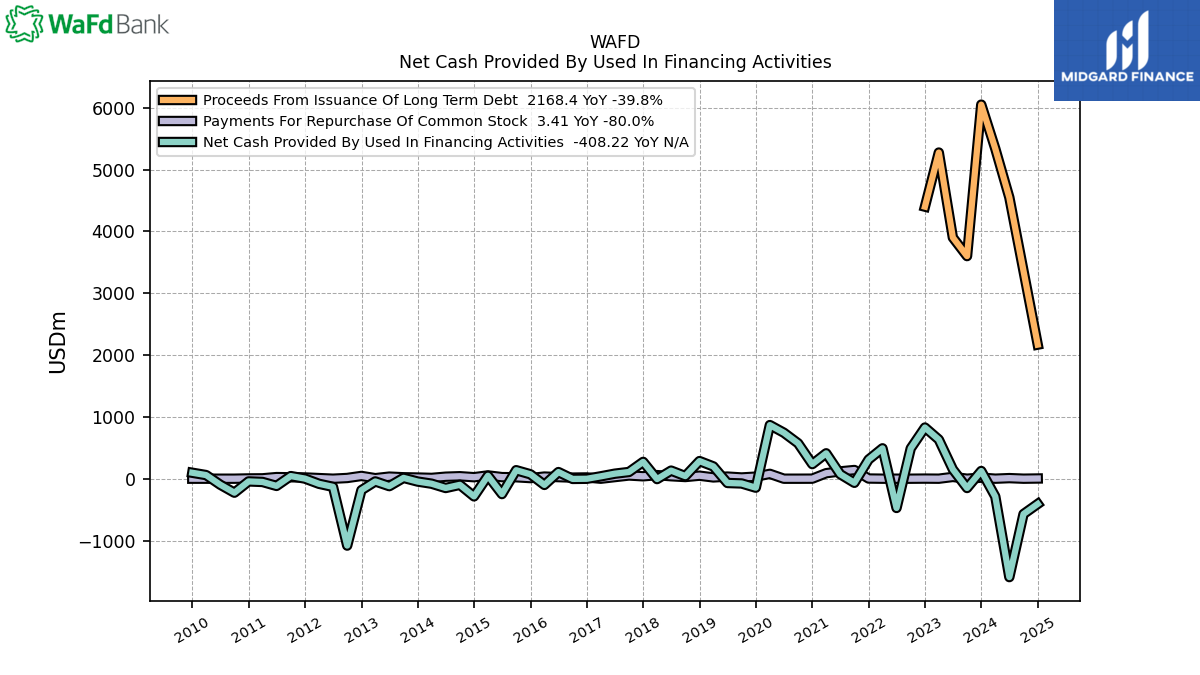
| 2023-12-31 | 2023-09-30 | 2023-06-30 | 2023-03-31 | 2022-12-31 | 2022-09-30 | 2022-06-30 | 2022-03-31 | 2021-12-31 | 2021-09-30 | 2021-06-30 | 2021-03-31 | 2020-12-31 | 2020-09-30 | 2020-06-30 | 2020-03-31 | 2019-12-31 | 2019-09-30 | 2019-06-30 | ||
|---|---|---|---|---|---|---|---|---|---|---|---|---|---|---|---|---|---|---|---|---|
| Net Cash Provided By Used In Financing Activities | 124.89 | -150.47 | 150.43 | 632.85 | 827.84 | 489.76 | -473.31 | 491.63 | 309.77 | -66.44 | 72.64 | 411.17 | 235.75 | 572.51 | 743.52 | 867.58 | -145.42 | -76.98 | -69.11 | |
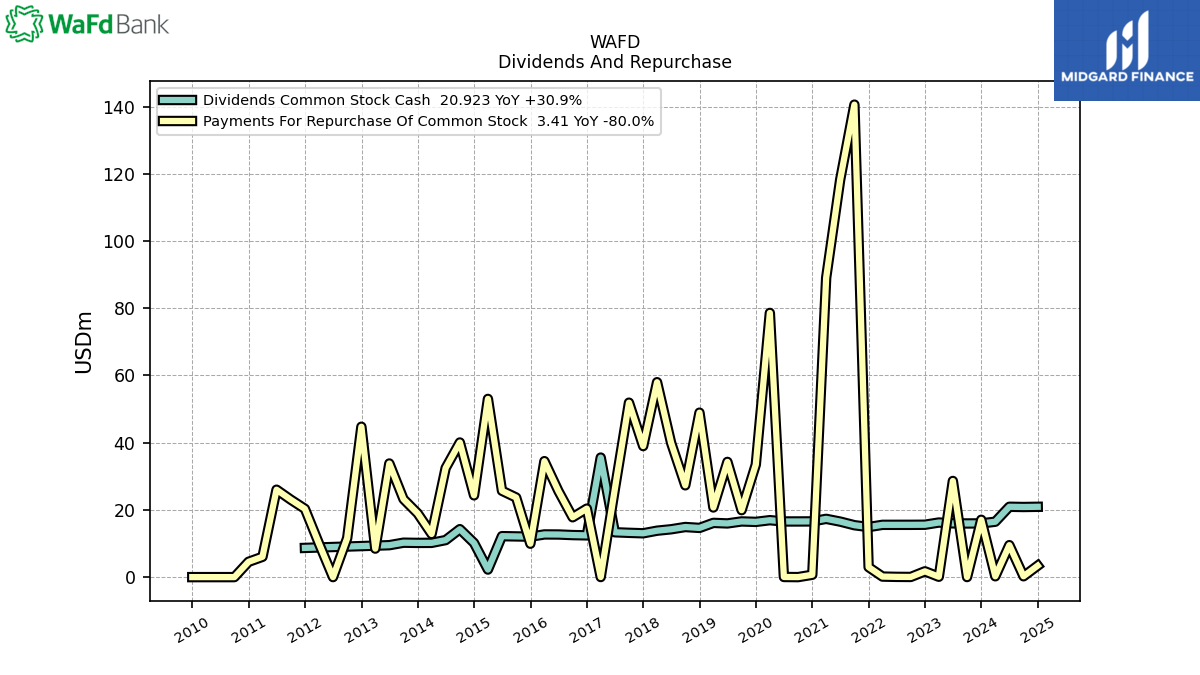
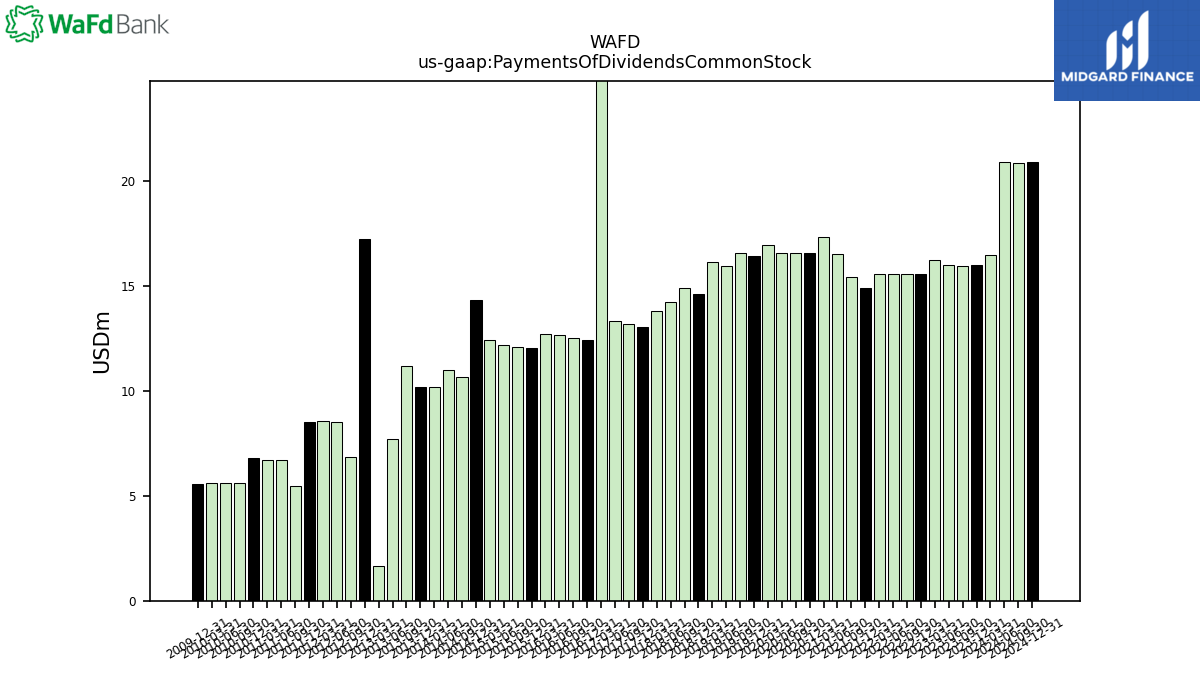
| Payments Of Dividends Common Stock | 15.99 | 15.97 | 16.00 | 16.24 | 15.59 | 15.56 | 15.56 | 15.56 | 14.90 | 15.45 | 16.52 | 17.34 | 16.58 | 16.56 | 16.56 | 16.94 | 16.43 | 16.57 | 15.97 | |
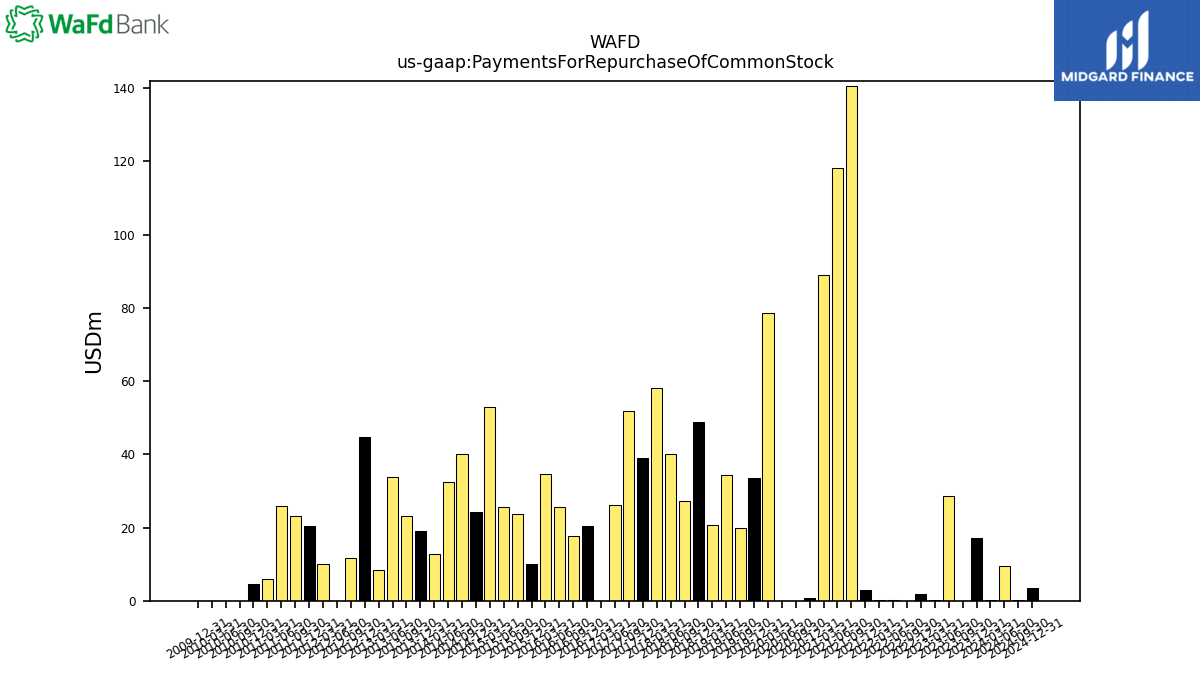
| Payments For Repurchase Of Common Stock | 17.06 | 0.01 | 28.61 | 0.11 | 1.73 | 0.05 | 0.08 | 0.16 | 2.97 | 140.58 | 118.30 | 89.07 | 0.70 | 0.00 | 0.04 | 78.61 | 33.48 | 19.92 | 34.29 |
| 2023-12-31 | 2023-09-30 | 2023-06-30 | 2023-03-31 | 2022-12-31 | 2022-09-30 | 2022-06-30 | 2022-03-31 | 2021-12-31 | 2021-09-30 | 2021-06-30 | 2021-03-31 | 2020-12-31 | 2020-09-30 | 2020-06-30 | 2020-03-31 | 2019-12-31 | 2019-09-30 | 2019-06-30 | ||
|---|---|---|---|---|---|---|---|---|---|---|---|---|---|---|---|---|---|---|---|---|
| Revenues | 6.80 | 6.85 | 6.66 | 6.19 | 6.35 | 6.60 | 6.61 | 6.28 | 6.44 | 6.50 | 6.20 | 5.96 | 6.03 | 5.85 | 5.48 | 6.10 | 6.26 | 6.50 | 6.26 | |
| Revenue From Contract With Customer Excluding Assessed Tax | 6.80 | 6.85 | 6.66 | 6.19 | 6.35 | 6.60 | 6.61 | 6.28 | 6.44 | 6.50 | 6.20 | 5.96 | 6.03 | 5.85 | 5.48 | 6.10 | 6.26 | 6.50 | 6.26 |
