
| 2023-12-31 | 2023-09-30 | 2023-06-30 | 2023-03-31 | 2022-12-31 | 2022-09-30 | 2022-06-30 | 2022-03-31 | 2021-12-31 | 2021-09-30 | 2021-06-30 | 2021-03-31 | 2020-12-31 | 2020-09-30 | 2020-06-30 | 2020-03-31 | 2019-12-31 | 2019-09-30 | 2019-06-30 | 2019-03-31 | 2018-12-31 | 2018-09-30 | 2018-06-30 | 2018-03-31 | 2017-12-31 | 2017-09-30 | 2017-06-30 | 2017-03-31 | 2016-12-31 | 2016-09-30 | 2016-06-30 | 2016-03-31 | 2015-12-31 | 2015-09-30 | 2015-06-30 | 2015-03-31 | 2014-12-31 | 2014-09-30 | 2014-06-30 | 2014-03-31 | 2013-12-31 | 2013-09-30 | 2013-06-30 | 2013-03-31 | 2012-12-31 | 2012-09-30 | 2012-06-30 | 2012-03-31 | 2011-12-31 | 2011-09-30 | 2011-06-30 | 2011-03-31 | 2010-12-31 | 2010-09-30 | 2010-06-30 | 2010-03-31 | ||
|---|---|---|---|---|---|---|---|---|---|---|---|---|---|---|---|---|---|---|---|---|---|---|---|---|---|---|---|---|---|---|---|---|---|---|---|---|---|---|---|---|---|---|---|---|---|---|---|---|---|---|---|---|---|---|---|---|---|
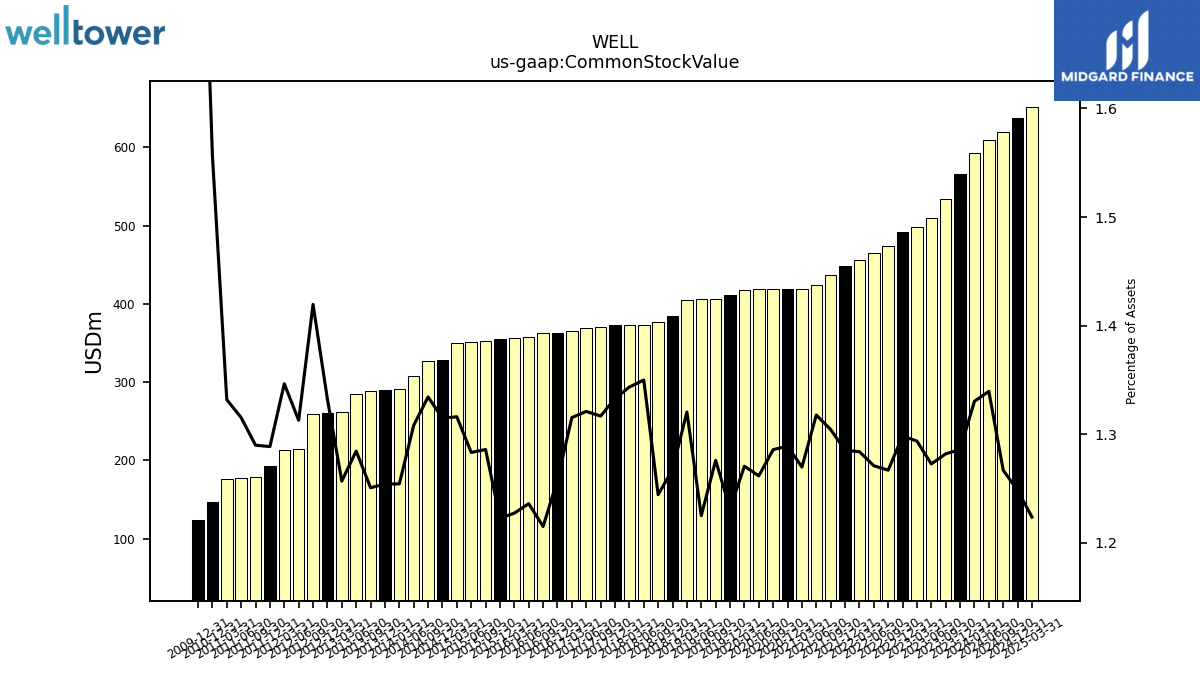
| Common Stock Value | 565.89 | 533.92 | 509.81 | 497.93 | 491.92 | 473.93 | 464.78 | 455.38 | 448.61 | 436.64 | 423.93 | 418.87 | 418.69 | 418.36 | 418.34 | 418.23 | 411.00 | 406.50 | 406.01 | 404.51 | 384.46 | 376.35 | 372.80 | 372.73 | 372.45 | 371.01 | 369.52 | 365.19 | 363.07 | 362.70 | 357.95 | 356.95 | 354.81 | 353.02 | 351.65 | 350.43 | 328.83 | 327.43 | 308.36 | 291.09 | 289.46 | 288.25 | 285.08 | 261.25 | 260.40 | 259.52 | 214.59 | 213.53 | 192.30 | 178.77 | 177.29 | 176.56 | 147.16 | NA | NA | NA | |
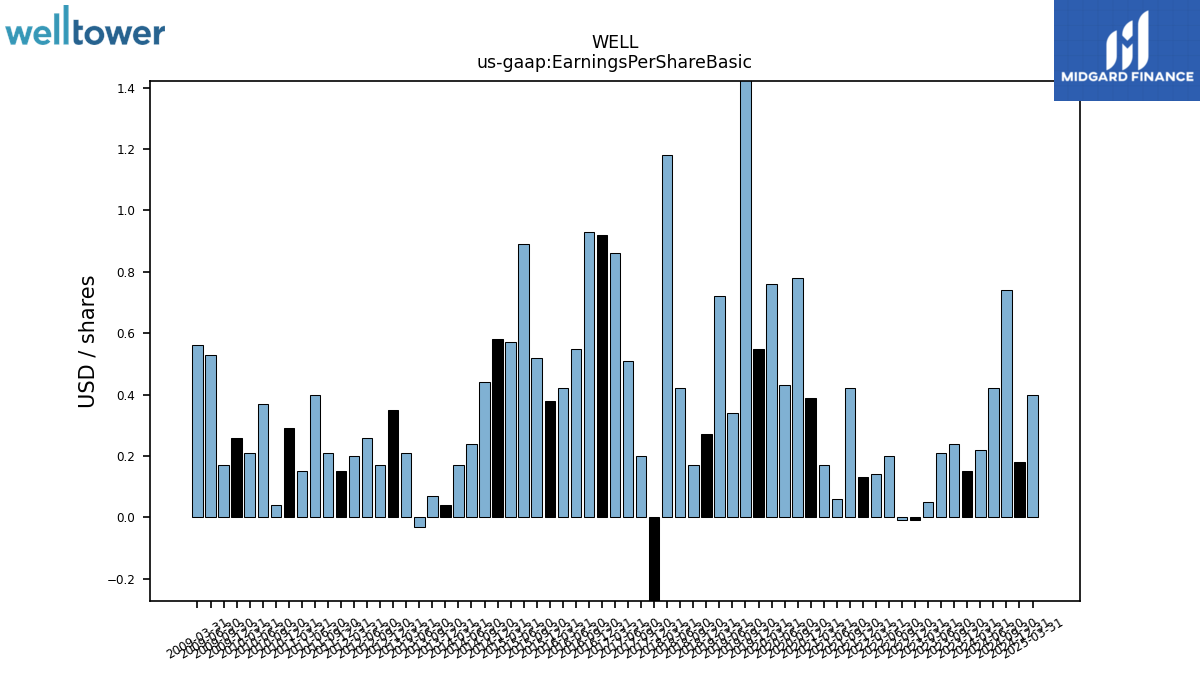
| Earnings Per Share Basic | 0.15 | 0.24 | 0.21 | 0.05 | -0.01 | -0.01 | 0.20 | 0.14 | 0.13 | 0.42 | 0.06 | 0.17 | 0.39 | 0.78 | 0.43 | 0.76 | 0.55 | 1.46 | 0.34 | 0.72 | 0.27 | 0.17 | 0.42 | 1.18 | -0.31 | 0.20 | 0.51 | 0.86 | 0.92 | 0.93 | 0.55 | 0.42 | 0.38 | 0.52 | 0.89 | 0.57 | 0.58 | 0.44 | 0.24 | 0.17 | 0.04 | 0.07 | -0.03 | 0.21 | 0.35 | 0.17 | 0.26 | 0.20 | 0.15 | 0.21 | 0.40 | 0.15 | 0.29 | 0.04 | 0.37 | 0.21 | |
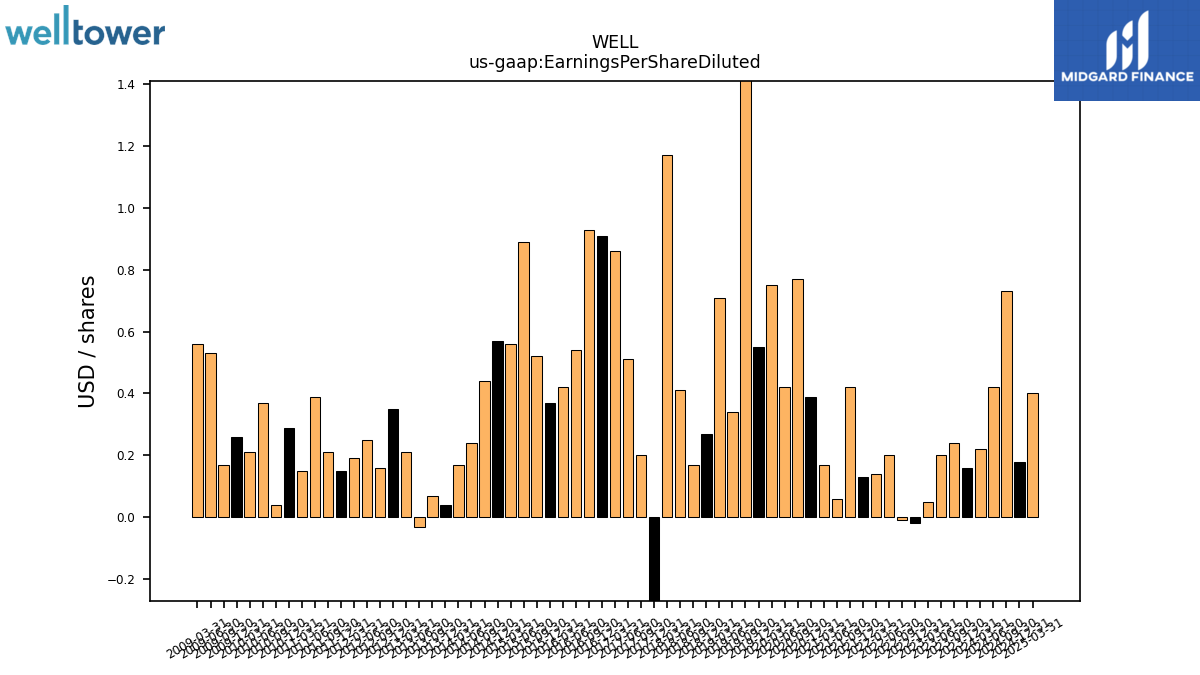
| Earnings Per Share Diluted | 0.16 | 0.24 | 0.20 | 0.05 | -0.02 | -0.01 | 0.20 | 0.14 | 0.13 | 0.42 | 0.06 | 0.17 | 0.39 | 0.77 | 0.42 | 0.75 | 0.55 | 1.45 | 0.34 | 0.71 | 0.27 | 0.17 | 0.41 | 1.17 | -0.31 | 0.20 | 0.51 | 0.86 | 0.91 | 0.93 | 0.54 | 0.42 | 0.37 | 0.52 | 0.89 | 0.56 | 0.57 | 0.44 | 0.24 | 0.17 | 0.04 | 0.07 | -0.03 | 0.21 | 0.35 | 0.16 | 0.25 | 0.19 | 0.15 | 0.21 | 0.39 | 0.15 | 0.29 | 0.04 | 0.37 | 0.21 | |
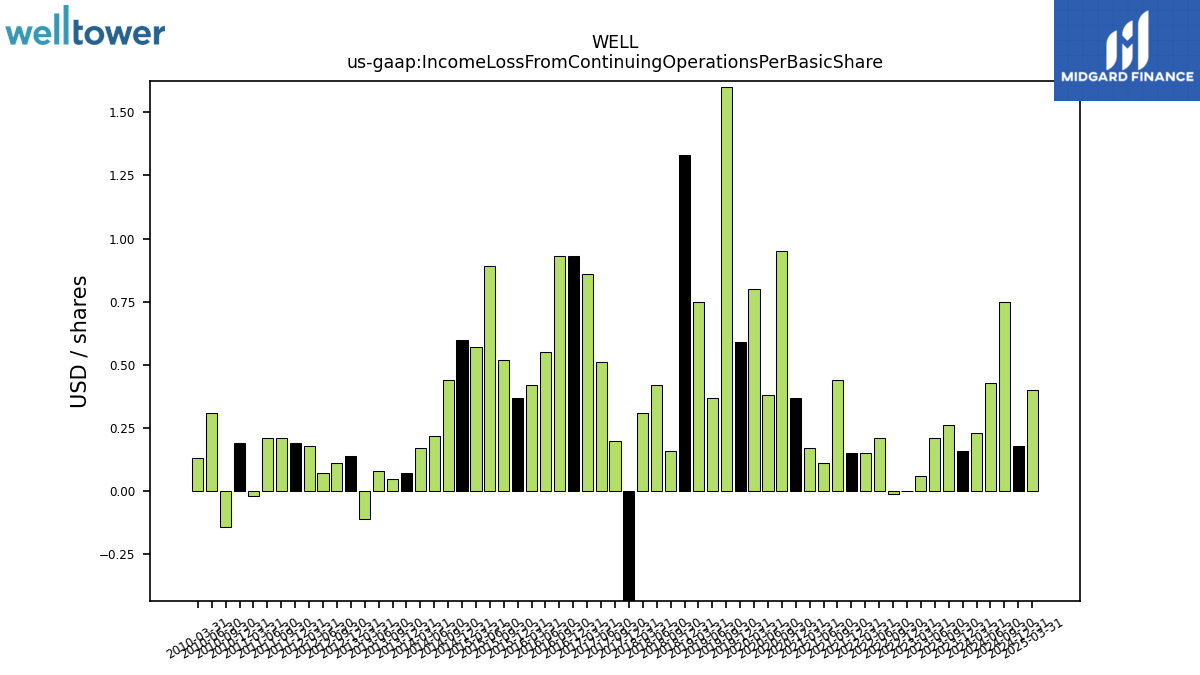
| Income Loss From Continuing Operations Per Basic Share | 0.00 | 0.00 | 0.00 | 0.00 | 0.00 | -0.00 | 0.00 | 0.00 | 0.00 | 0.00 | 0.00 | 0.00 | 0.00 | 0.00 | 0.00 | 0.00 | 0.00 | 0.00 | 0.00 | 0.00 | 0.00 | 0.00 | 0.00 | 0.00 | -0.00 | 0.00 | 0.00 | 0.00 | 0.00 | 0.00 | 0.00 | 0.00 | 0.00 | 0.00 | 0.00 | 0.00 | 0.00 | 0.00 | 0.00 | 0.00 | 0.00 | 0.00 | 0.00 | -0.00 | 0.00 | 0.00 | 0.00 | 0.00 | 0.00 | 0.00 | 0.00 | -0.00 | 0.00 | -0.00 | 0.00 | 0.00 | |
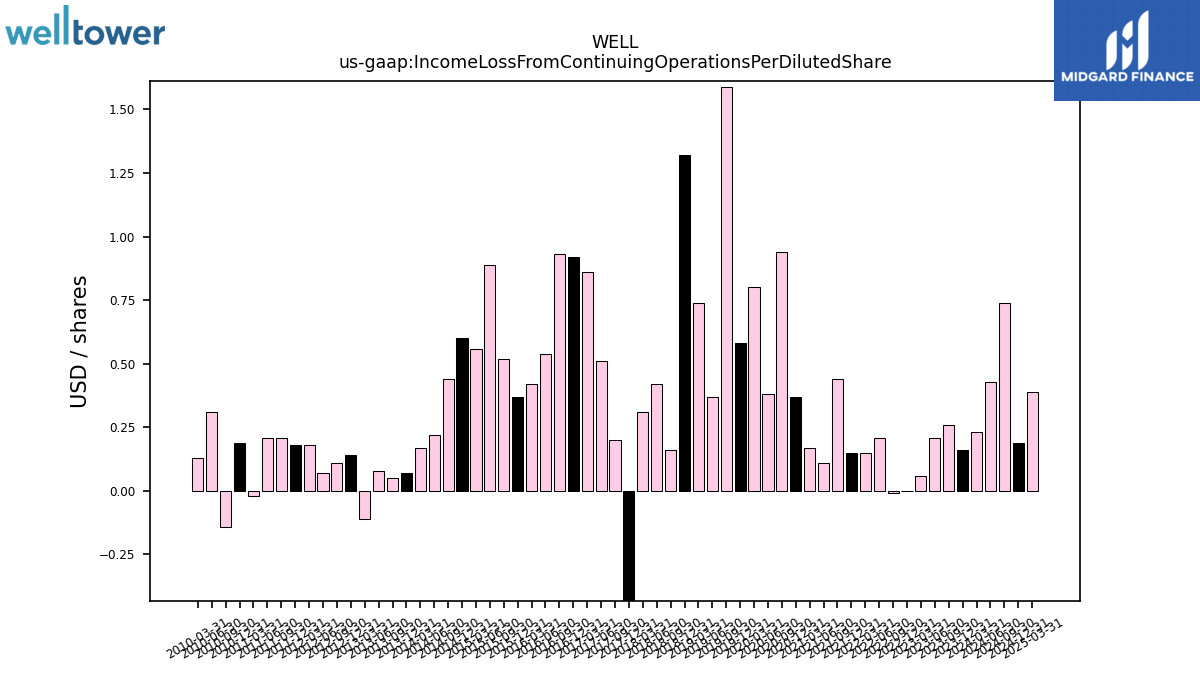
| Income Loss From Continuing Operations Per Diluted Share | 0.00 | 0.00 | 0.00 | 0.00 | 0.00 | -0.00 | 0.00 | 0.00 | 0.00 | 0.00 | 0.00 | 0.00 | 0.00 | 0.00 | 0.00 | 0.00 | 0.00 | 0.00 | 0.00 | 0.00 | 0.00 | 0.00 | 0.00 | 0.00 | -0.00 | 0.00 | 0.00 | 0.00 | 0.00 | 0.00 | 0.00 | 0.00 | 0.00 | 0.00 | 0.00 | 0.00 | 0.00 | 0.00 | 0.00 | 0.00 | 0.00 | 0.00 | 0.00 | -0.00 | 0.00 | 0.00 | 0.00 | 0.00 | 0.00 | 0.00 | 0.00 | -0.00 | 0.00 | -0.00 | 0.00 | 0.00 |
| 2023-12-31 | 2023-09-30 | 2023-06-30 | 2023-03-31 | 2022-12-31 | 2022-09-30 | 2022-06-30 | 2022-03-31 | 2021-12-31 | 2021-09-30 | 2021-06-30 | 2021-03-31 | 2020-12-31 | 2020-09-30 | 2020-06-30 | 2020-03-31 | 2019-12-31 | 2019-09-30 | 2019-06-30 | 2019-03-31 | 2018-12-31 | 2018-09-30 | 2018-06-30 | 2018-03-31 | 2017-12-31 | 2017-09-30 | 2017-06-30 | 2017-03-31 | 2016-12-31 | 2016-09-30 | 2016-06-30 | 2016-03-31 | 2015-12-31 | 2015-09-30 | 2015-06-30 | 2015-03-31 | 2014-12-31 | 2014-09-30 | 2014-06-30 | 2014-03-31 | 2013-12-31 | 2013-09-30 | 2013-06-30 | 2013-03-31 | 2012-12-31 | 2012-09-30 | 2012-06-30 | 2012-03-31 | 2011-12-31 | 2011-09-30 | 2011-06-30 | 2011-03-31 | 2010-12-31 | 2010-09-30 | 2010-06-30 | 2010-03-31 | ||
|---|---|---|---|---|---|---|---|---|---|---|---|---|---|---|---|---|---|---|---|---|---|---|---|---|---|---|---|---|---|---|---|---|---|---|---|---|---|---|---|---|---|---|---|---|---|---|---|---|---|---|---|---|---|---|---|---|---|
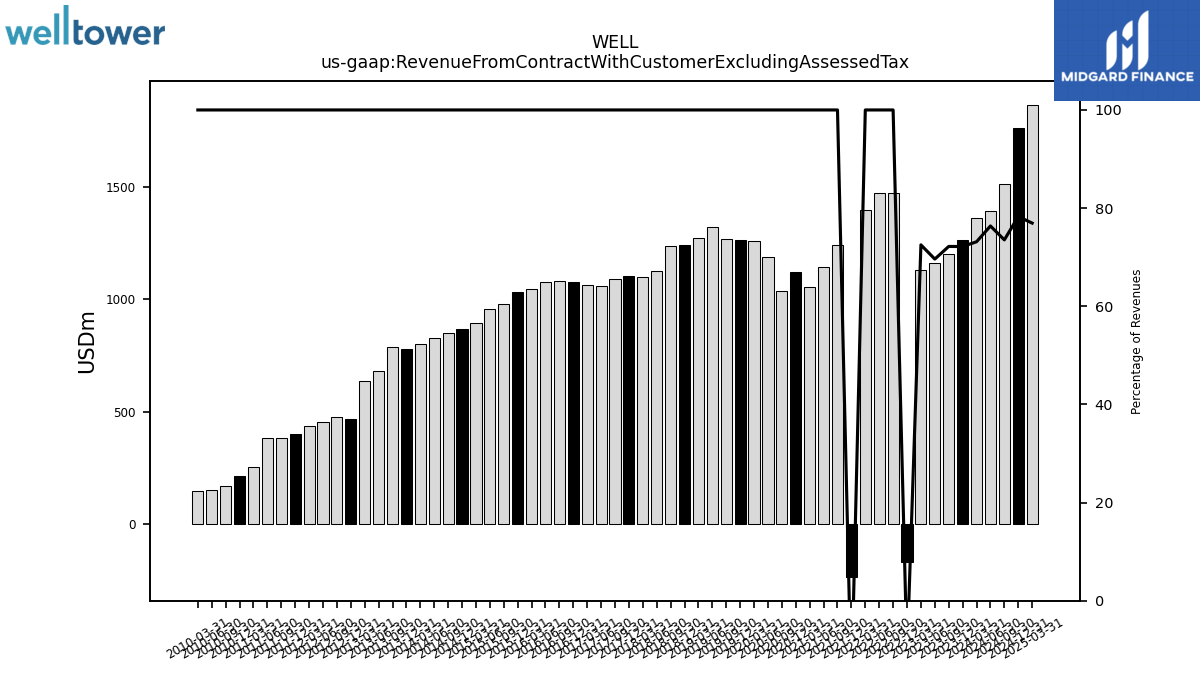
| Revenue From Contract With Customer Excluding Assessed Tax | -134.42 | 1662.01 | 1665.48 | 1560.73 | -168.37 | 1473.84 | 1472.54 | 1395.70 | -235.63 | 1239.80 | 1140.99 | 1052.06 | 1122.02 | 1036.87 | 1188.47 | 1258.60 | 1262.82 | 1266.13 | 1320.11 | 1272.24 | 1241.24 | 1236.38 | 1125.91 | 1096.96 | 1104.26 | 1091.48 | 1058.60 | 1062.30 | 1078.32 | 1079.13 | 1076.66 | 1047.05 | 1029.48 | 979.00 | 957.17 | 894.18 | 867.77 | 847.52 | 826.45 | 801.81 | 779.01 | 786.93 | 682.12 | 633.91 | 468.54 | 474.14 | 453.08 | 435.36 | 402.35 | 384.79 | 381.06 | 255.48 | 214.80 | 168.94 | 153.75 | 145.38 | |
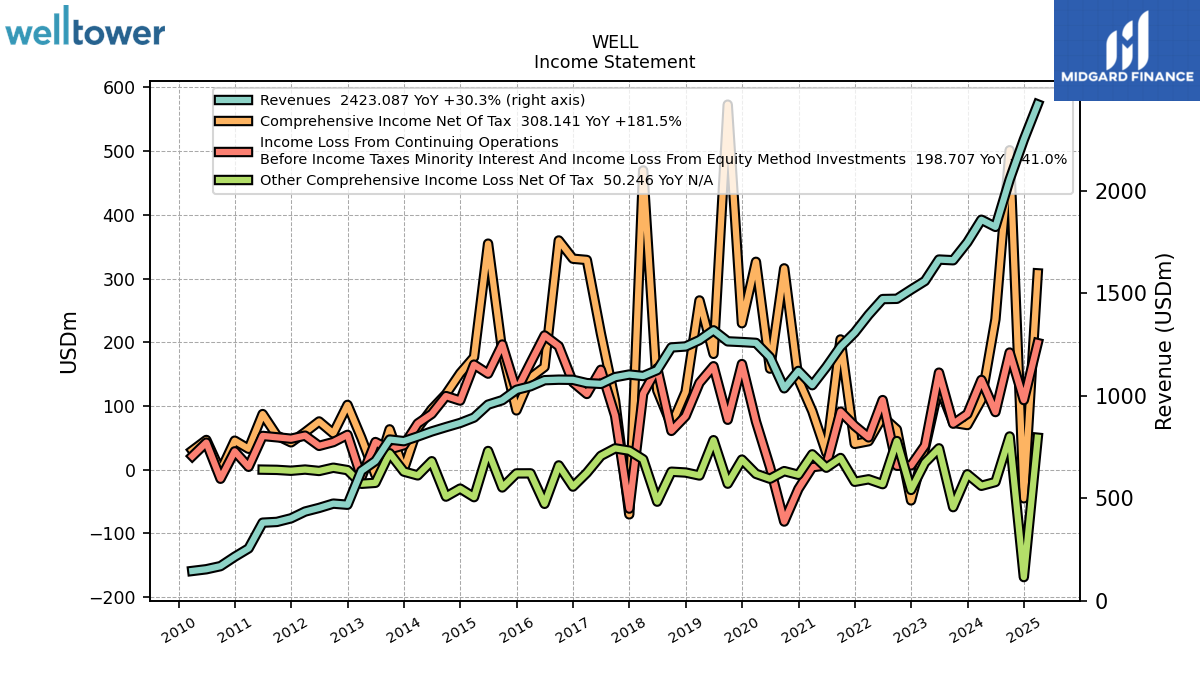
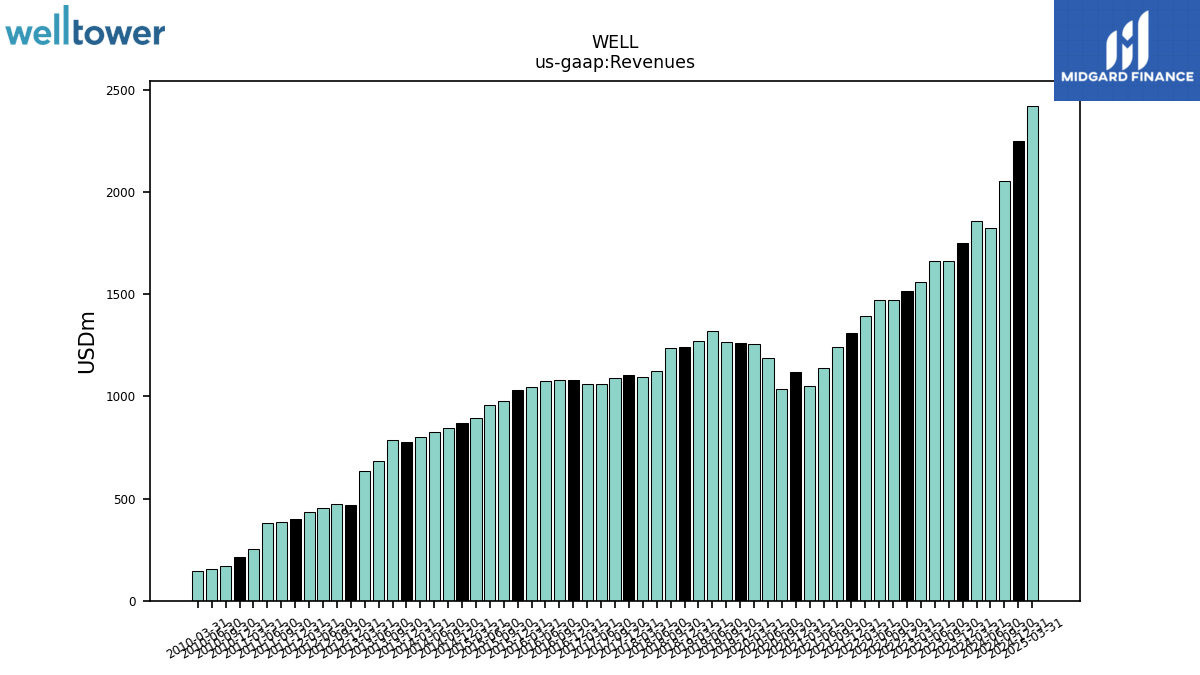
| Revenues | 1749.78 | 1662.01 | 1665.48 | 1560.73 | 1518.53 | 1473.84 | 1472.54 | 1395.70 | 1309.26 | 1239.80 | 1140.99 | 1052.06 | 1122.02 | 1036.87 | 1188.47 | 1258.60 | 1262.82 | 1266.13 | 1320.11 | 1272.24 | 1241.24 | 1236.38 | 1125.91 | 1096.96 | 1104.26 | 1091.48 | 1058.60 | 1062.30 | 1078.32 | 1079.13 | 1076.66 | 1047.05 | 1029.48 | 979.00 | 957.17 | 894.18 | 867.77 | 847.52 | 826.45 | 801.81 | 779.01 | 786.93 | 682.12 | 633.91 | 468.54 | 474.14 | 453.08 | 435.36 | 402.35 | 384.79 | 381.06 | 255.48 | 214.80 | 168.94 | 153.75 | 145.38 | |
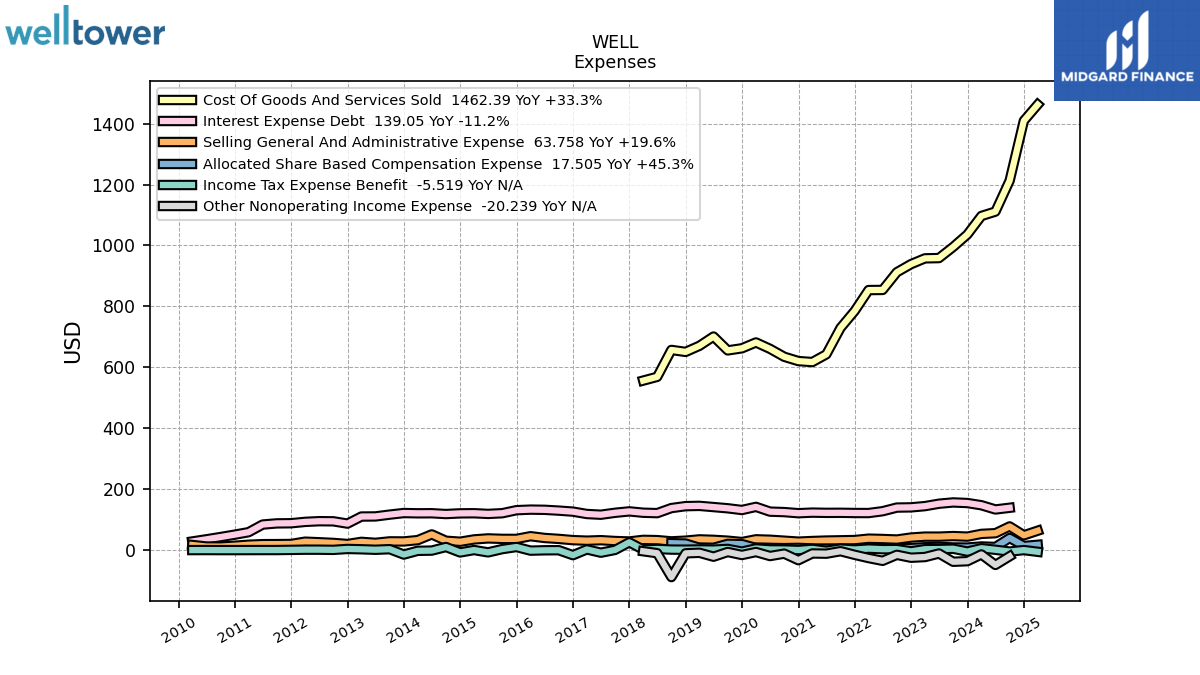
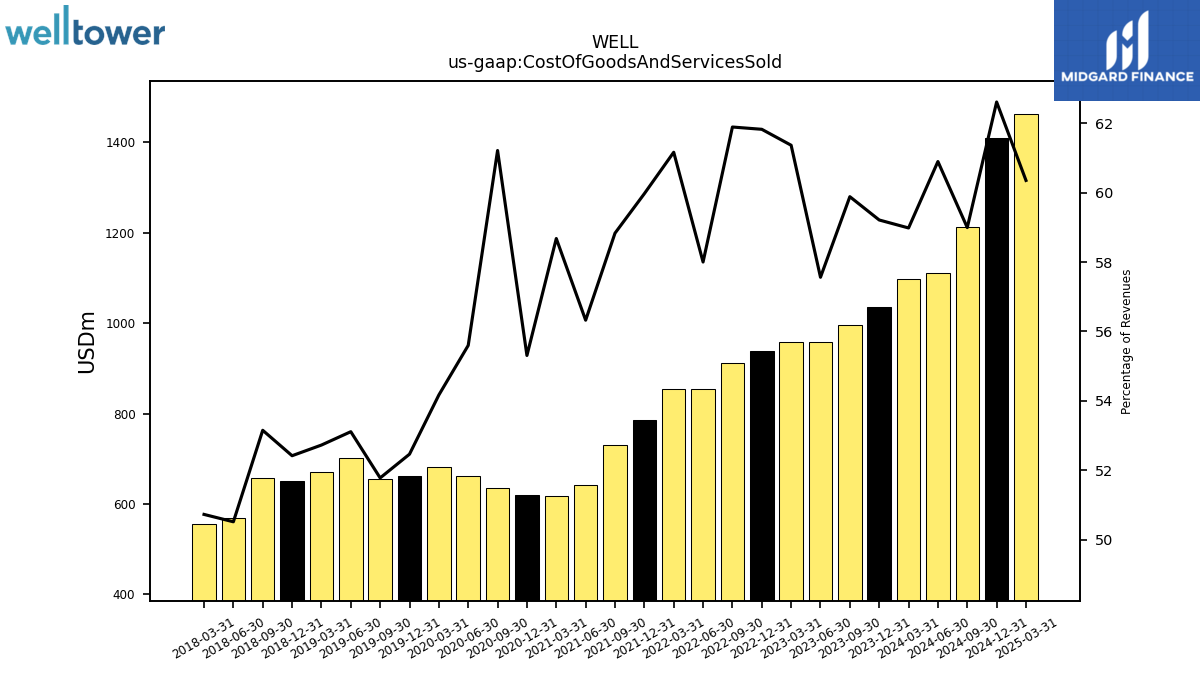
| Cost Of Goods And Services Sold | 1036.08 | 995.27 | 958.67 | 957.75 | 938.84 | 912.18 | 854.08 | 853.67 | 785.18 | 729.40 | 642.66 | 617.33 | 620.56 | 634.72 | 660.76 | 681.78 | 662.52 | 655.59 | 701.13 | 670.81 | 650.64 | 657.16 | 568.75 | 556.47 | NA | NA | NA | NA | NA | NA | NA | NA | NA | NA | NA | NA | NA | NA | NA | NA | NA | NA | NA | NA | NA | NA | NA | NA | NA | NA | NA | NA | NA | NA | NA | NA | |
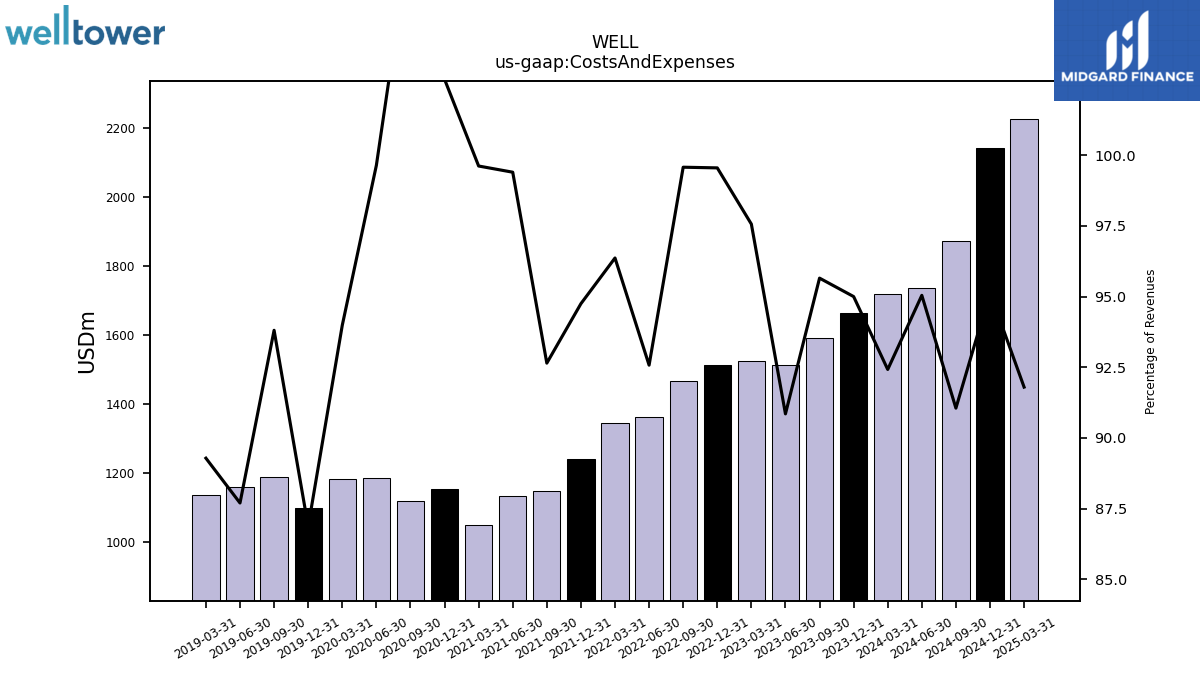
| Costs And Expenses | 1662.31 | 1589.78 | 1513.13 | 1522.72 | 1511.75 | 1467.61 | 1363.21 | 1344.99 | 1240.52 | 1148.64 | 1134.15 | 1048.06 | 1152.17 | 1118.22 | 1184.22 | 1182.91 | 1097.00 | 1187.74 | 1157.74 | 1135.93 | NA | NA | NA | NA | NA | NA | NA | NA | NA | NA | NA | NA | NA | NA | NA | NA | NA | NA | NA | NA | NA | NA | NA | NA | NA | NA | NA | NA | NA | NA | NA | NA | NA | NA | NA | NA | |
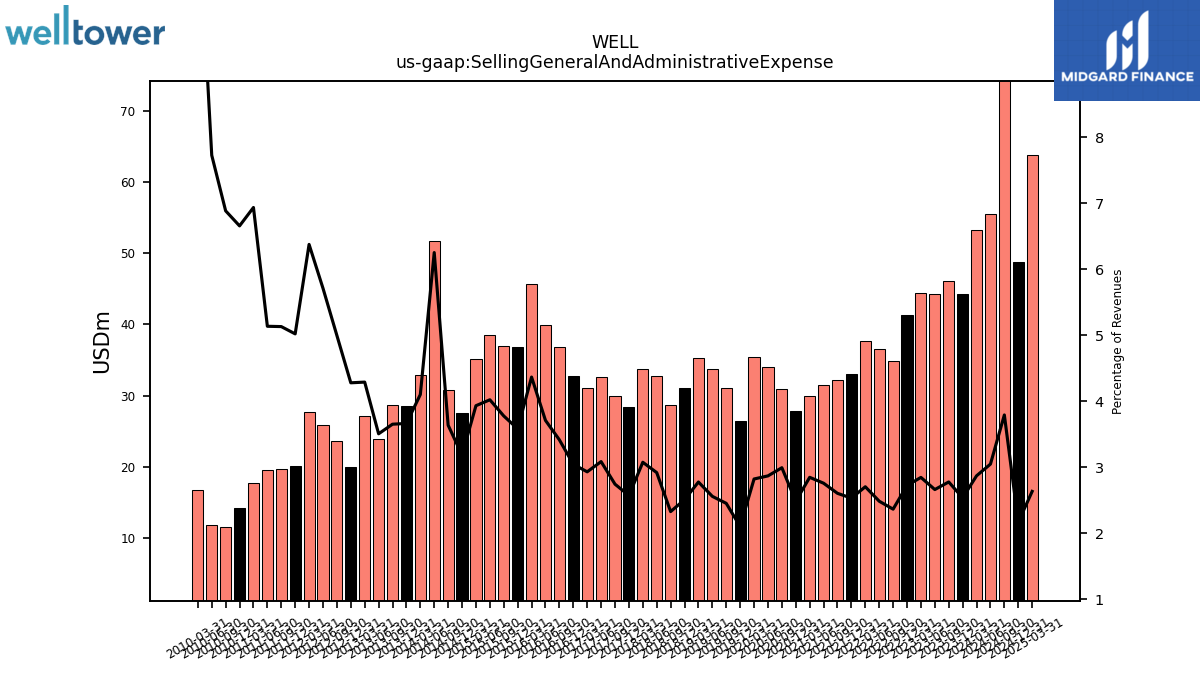
| Selling General And Administrative Expense | 44.33 | 46.11 | 44.29 | 44.37 | 41.32 | 34.81 | 36.55 | 37.71 | 33.11 | 32.26 | 31.44 | 29.93 | 27.85 | 31.00 | 34.06 | 35.48 | 26.51 | 31.02 | 33.74 | 35.28 | 31.10 | 28.75 | 32.83 | 33.70 | 28.36 | 29.91 | 32.63 | 31.10 | 32.81 | 36.83 | 39.91 | 45.69 | 36.85 | 36.95 | 38.47 | 35.14 | 27.62 | 30.80 | 51.66 | 32.87 | 28.52 | 28.72 | 23.90 | 27.18 | 20.04 | 23.68 | 25.87 | 27.75 | 20.19 | 19.73 | 19.56 | 17.71 | 14.29 | 11.63 | 11.88 | 16.82 | |
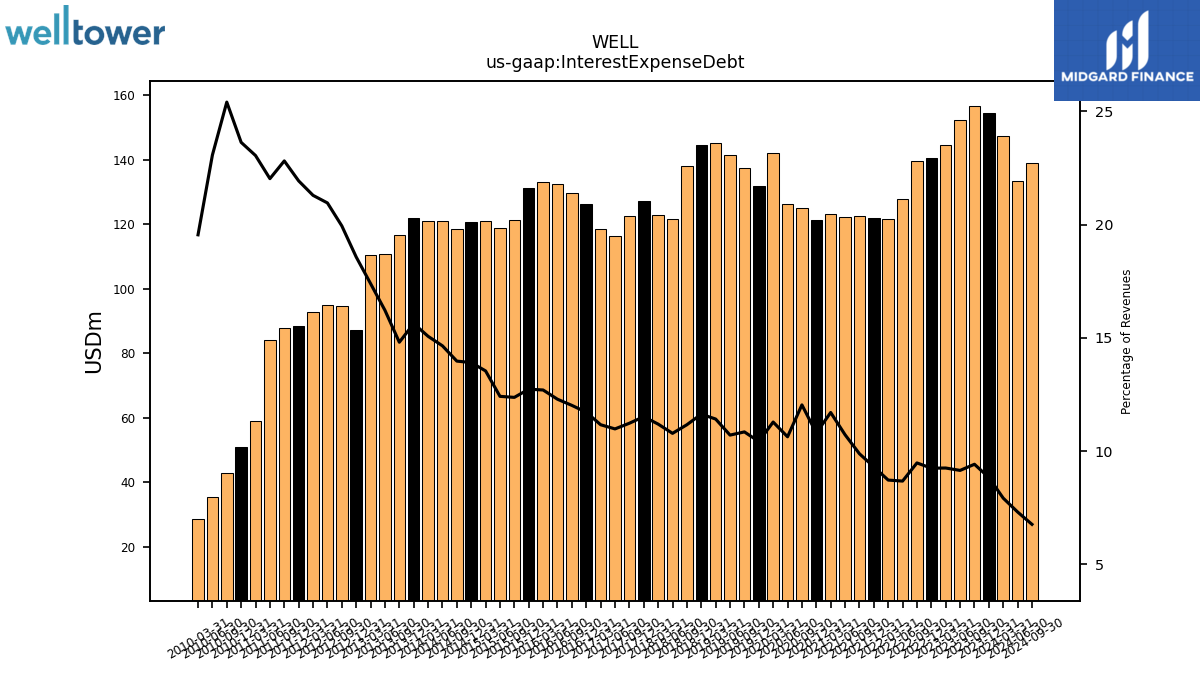
| Interest Expense Debt | 154.57 | 156.53 | 152.34 | 144.40 | 140.39 | 139.68 | 127.75 | 121.70 | 121.85 | 122.52 | 122.34 | 123.14 | 121.17 | 124.85 | 126.36 | 142.01 | 131.65 | 137.34 | 141.34 | 145.23 | 144.37 | 138.03 | 121.42 | 122.78 | 127.22 | 122.58 | 116.23 | 118.60 | 126.36 | 129.70 | 132.33 | 132.96 | 131.10 | 121.13 | 118.86 | 121.08 | 120.70 | 118.44 | 121.06 | 120.83 | 121.78 | 116.53 | 110.63 | 110.29 | 87.03 | 94.58 | 94.97 | 92.71 | 88.25 | 87.80 | 83.96 | 58.90 | 50.77 | 42.94 | 35.48 | 28.43 | |
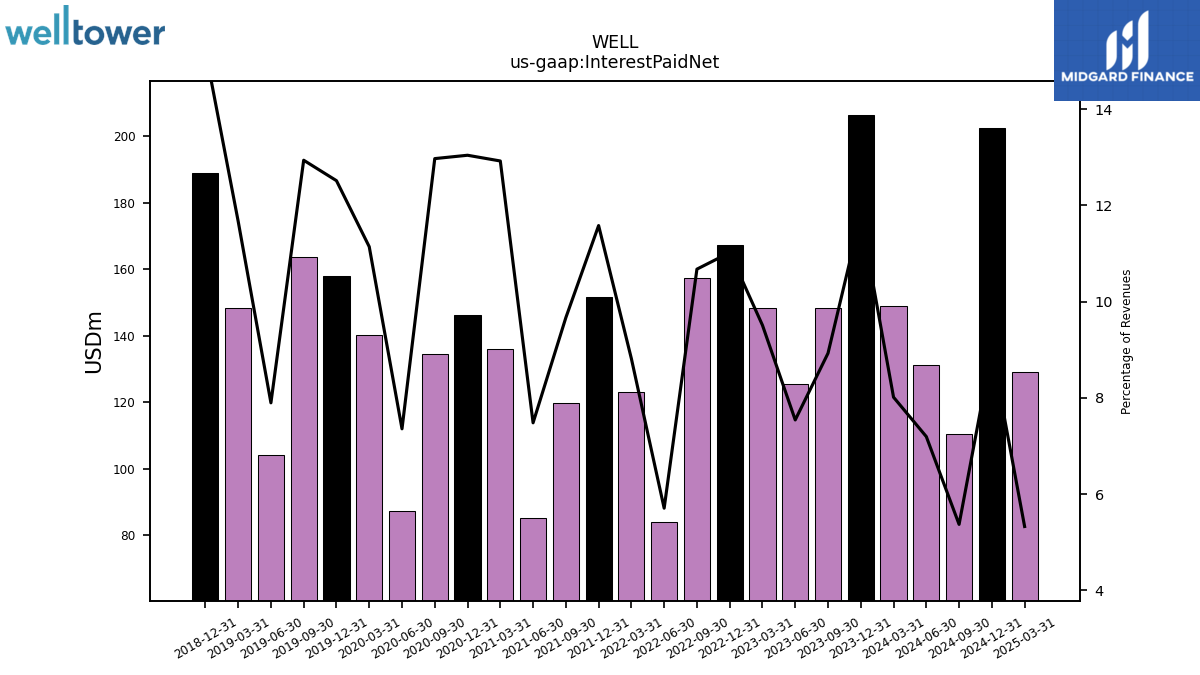
| Interest Paid Net | 206.25 | 148.35 | 125.58 | 148.40 | 167.33 | 157.31 | 84.02 | 123.01 | 151.61 | 119.84 | 85.35 | 135.95 | 146.32 | 134.50 | 87.42 | 140.22 | 158.01 | 163.81 | 104.23 | 148.49 | 188.95 | NA | NA | NA | NA | NA | NA | NA | NA | NA | NA | NA | NA | NA | NA | NA | NA | NA | NA | NA | NA | NA | NA | NA | NA | NA | NA | NA | NA | NA | NA | NA | NA | NA | NA | NA | |
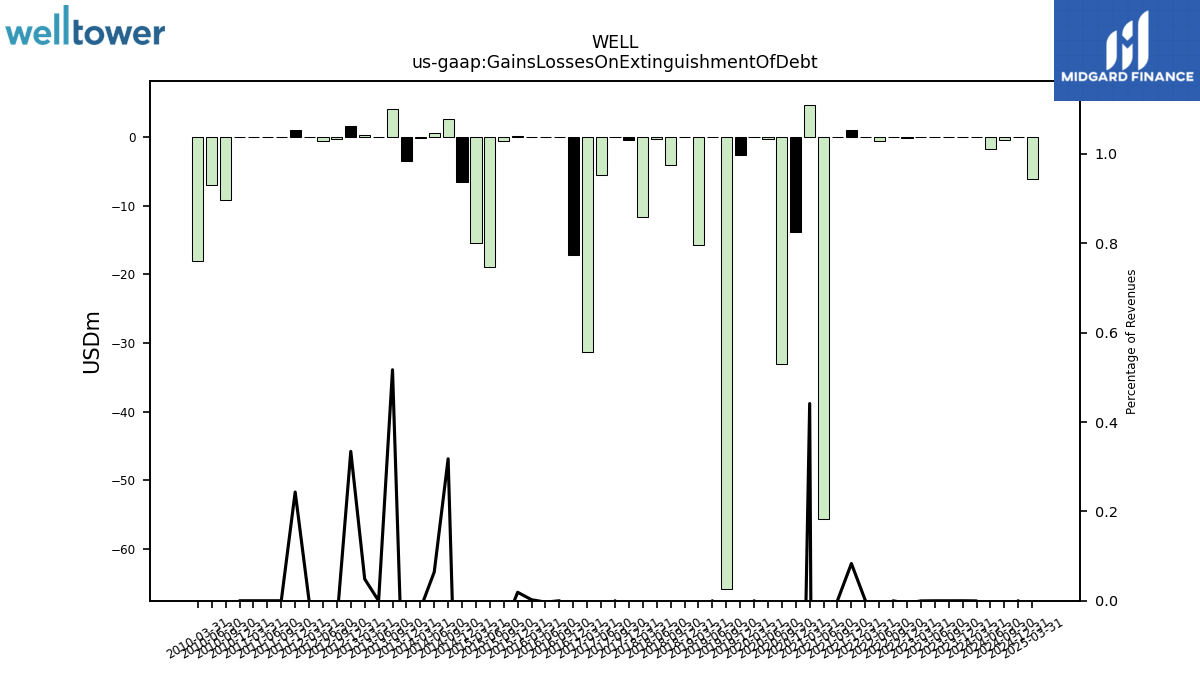
| Gains Losses On Extinguishment Of Debt | 0.00 | -0.00 | -0.00 | -0.01 | -0.09 | -0.00 | -0.60 | 0.01 | 1.09 | 0.01 | -55.61 | 4.64 | -13.80 | -33.00 | -0.25 | 0.00 | -2.61 | -65.82 | 0.00 | -15.72 | -0.05 | -4.04 | -0.30 | -11.71 | -0.37 | 0.00 | -5.51 | -31.36 | -17.20 | 0.00 | -0.03 | 0.02 | 0.20 | -0.58 | -18.89 | -15.40 | -6.48 | 2.69 | 0.53 | -0.15 | -3.47 | 4.07 | 0.00 | 0.31 | 1.57 | -0.21 | -0.58 | 0.00 | 0.98 | 0.00 | 0.00 | 0.00 | 0.00 | -9.10 | -7.04 | -18.04 | |
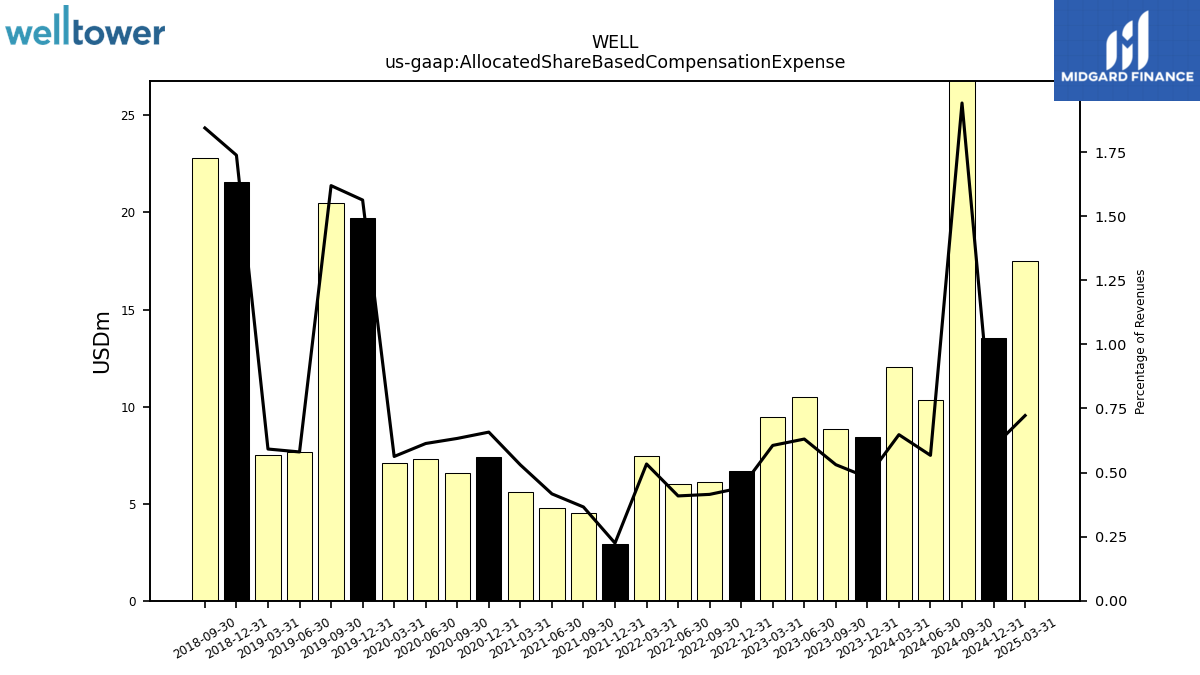
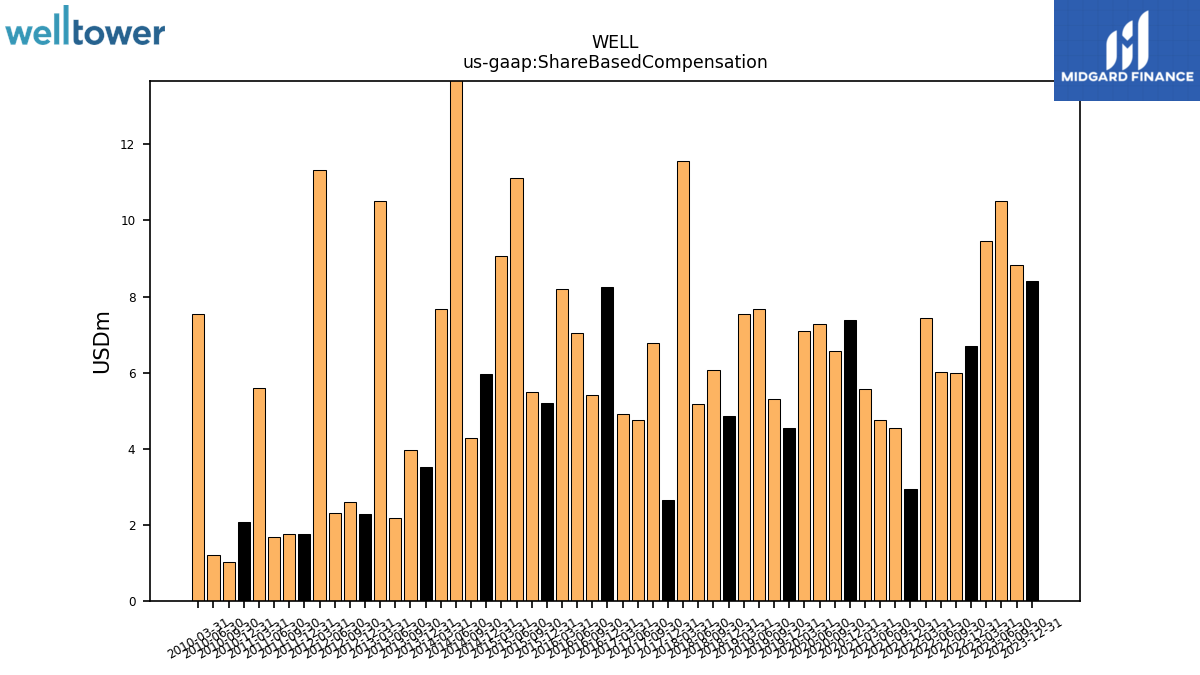
| Allocated Share Based Compensation Expense | 8.42 | 8.82 | 10.50 | 9.46 | 6.69 | 6.12 | 6.02 | 7.45 | 2.94 | 4.54 | 4.76 | 5.58 | 7.38 | 6.57 | 7.29 | 7.08 | 19.74 | 20.50 | 7.66 | 7.53 | 21.57 | 22.80 | NA | NA | NA | NA | NA | NA | NA | NA | NA | NA | NA | NA | NA | NA | NA | NA | NA | NA | NA | NA | NA | NA | NA | NA | NA | NA | NA | NA | NA | NA | NA | NA | NA | NA | |
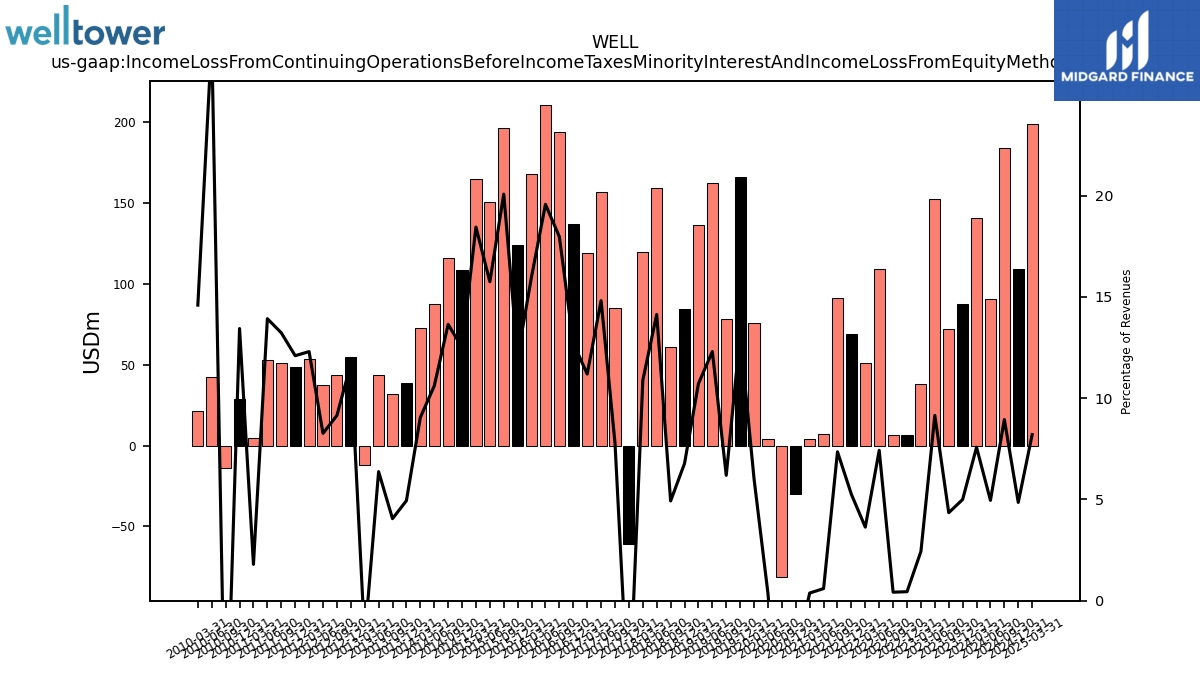
| Income Loss From Continuing Operations Before Income Taxes Minority Interest And Income Loss From Equity Method Investments | 87.46 | 72.23 | 152.34 | 38.00 | 6.78 | 6.24 | 109.33 | 50.71 | 68.75 | 91.15 | 6.84 | 4.01 | -30.15 | -81.34 | 4.25 | 75.69 | 165.82 | 78.39 | 162.37 | 136.31 | 84.09 | 60.90 | 159.11 | 119.39 | -61.01 | 84.94 | 156.82 | 118.87 | 137.19 | 193.83 | 210.66 | 167.57 | 123.98 | 196.50 | 150.72 | 164.92 | 108.46 | 115.60 | 87.60 | 72.56 | 38.49 | 31.89 | 43.48 | -11.99 | 54.74 | 43.35 | 37.43 | 53.54 | 48.67 | 50.89 | 53.05 | 4.59 | 28.86 | -14.16 | 42.60 | 21.21 | |
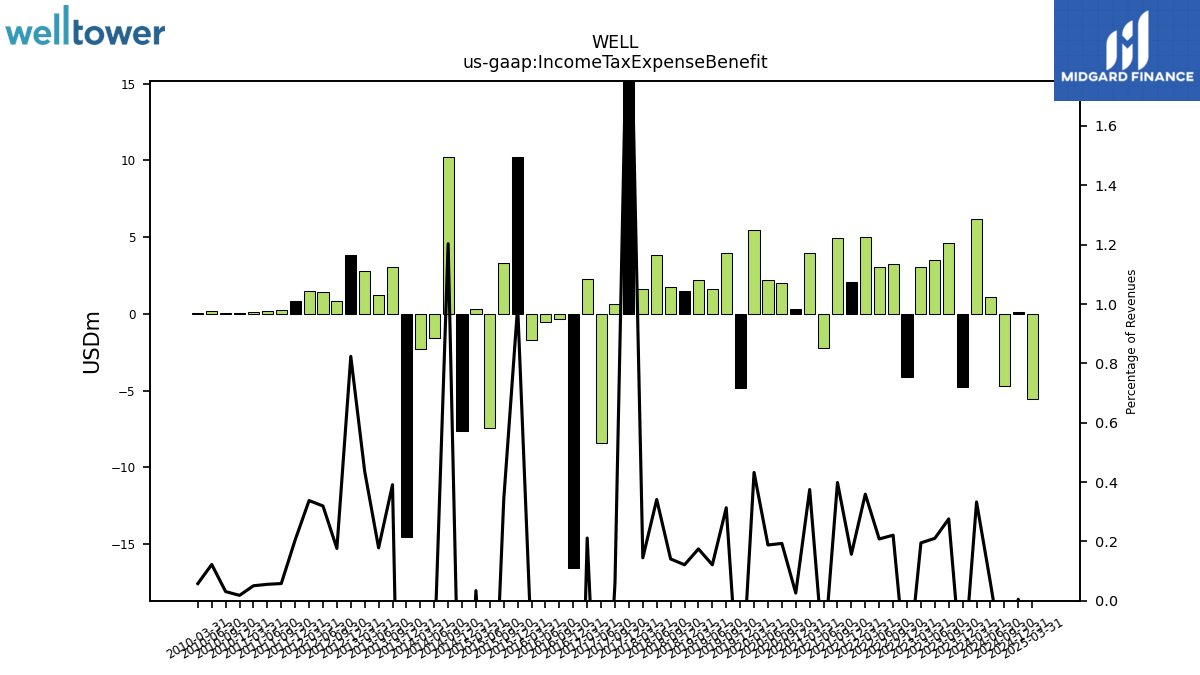
| Income Tax Expense Benefit | -4.77 | 4.58 | 3.50 | 3.04 | -4.09 | 3.26 | 3.06 | 5.01 | 2.05 | 4.94 | -2.22 | 3.94 | 0.29 | 2.00 | 2.23 | 5.44 | -4.83 | 3.97 | 1.60 | 2.22 | 1.50 | 1.74 | 3.84 | 1.59 | 25.66 | 0.67 | -8.45 | 2.25 | -16.59 | -0.30 | -0.51 | -1.73 | 10.22 | 3.34 | -7.42 | 0.30 | -7.64 | 10.20 | -1.57 | -2.26 | -14.55 | 3.08 | 1.22 | 2.76 | 3.86 | 0.84 | 1.45 | 1.47 | 0.82 | 0.22 | 0.21 | 0.13 | 0.04 | 0.05 | 0.19 | 0.08 | |
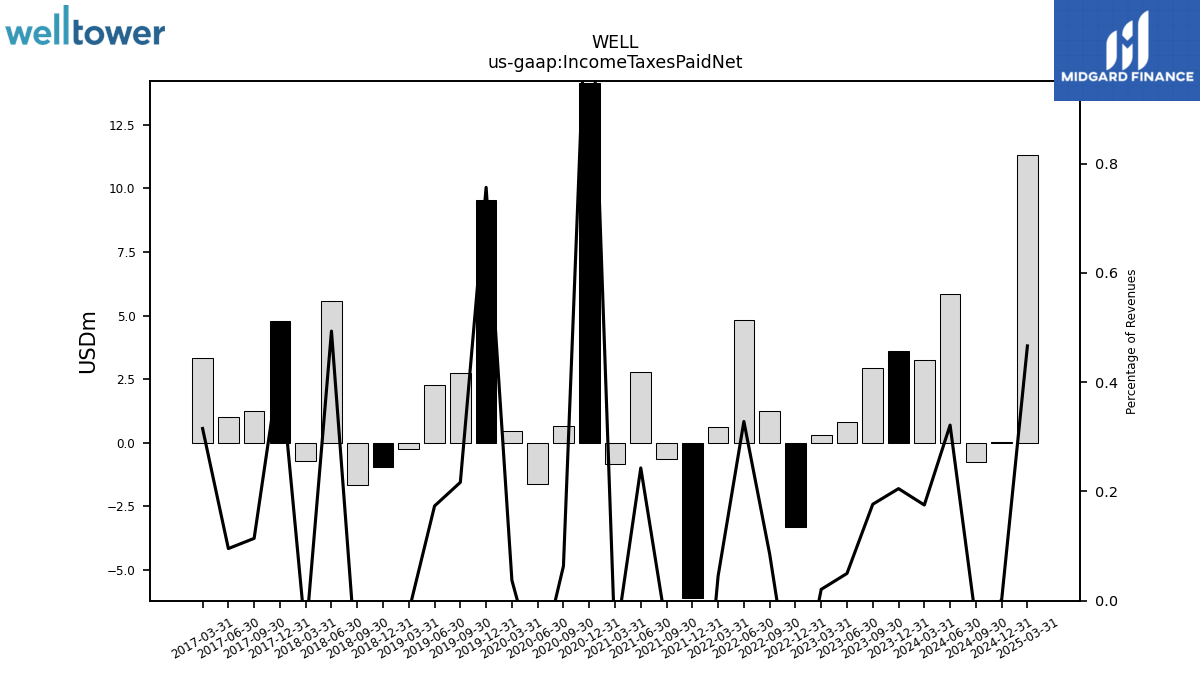
| Income Taxes Paid Net | 3.59 | 2.94 | 0.83 | 0.33 | -3.29 | 1.26 | 4.83 | 0.63 | -6.10 | -0.63 | 2.77 | -0.85 | 14.16 | 0.66 | -1.61 | 0.47 | 9.55 | 2.74 | 2.29 | -0.25 | -0.94 | -1.64 | 5.56 | -0.72 | 4.80 | 1.25 | 1.01 | 3.35 | NA | NA | NA | NA | NA | NA | NA | NA | NA | NA | NA | NA | NA | NA | NA | NA | NA | NA | NA | NA | NA | NA | NA | NA | NA | NA | NA | NA | |
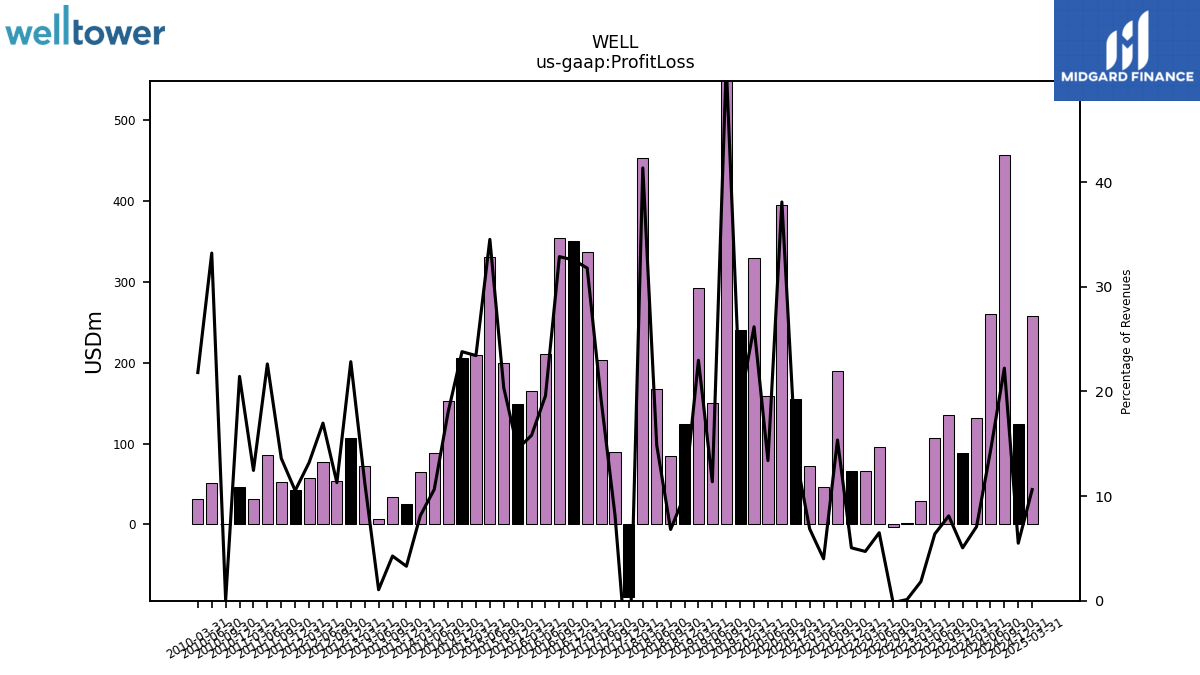
| Profit Loss | 88.44 | 134.72 | 106.34 | 28.64 | 1.80 | -2.65 | 95.67 | 65.75 | 66.19 | 190.34 | 45.76 | 72.19 | 155.28 | 394.98 | 159.22 | 329.38 | 240.14 | 647.93 | 150.04 | 292.30 | 124.70 | 84.23 | 167.27 | 453.56 | -89.74 | 89.30 | 203.44 | 337.61 | 351.11 | 354.74 | 210.75 | 165.47 | 149.41 | 199.26 | 330.46 | 209.42 | 206.47 | 152.77 | 87.85 | 65.20 | 25.69 | 33.60 | 7.18 | 71.80 | 107.00 | 53.51 | 76.88 | 57.46 | 42.34 | 52.35 | 86.21 | 31.81 | 46.03 | 0.09 | 51.06 | 31.69 | |
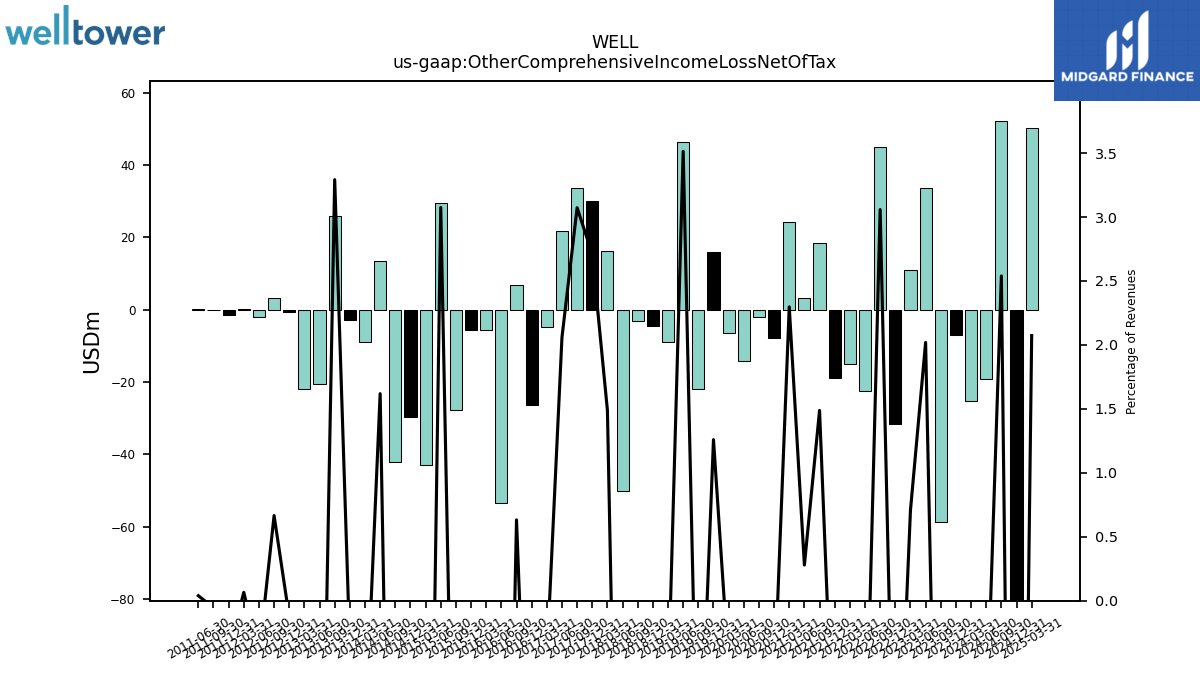
| Other Comprehensive Income Loss Net Of Tax | -7.10 | -58.74 | 33.63 | 11.03 | -31.71 | 45.07 | -22.64 | -15.01 | -18.93 | 18.45 | 3.19 | 24.17 | -7.98 | -2.16 | -14.16 | -6.46 | 15.90 | -21.89 | 46.38 | -9.06 | -4.40 | -3.09 | -50.12 | 16.33 | 29.93 | 33.54 | 21.80 | -4.86 | -26.46 | 6.82 | -53.51 | -5.69 | -5.77 | -27.82 | 29.43 | -43.04 | -29.57 | -42.21 | 13.38 | -8.90 | -2.91 | 25.91 | -20.54 | -22.06 | -0.60 | 3.16 | -1.95 | 0.29 | -1.57 | -0.21 | 0.15 | NA | NA | NA | NA | NA | |
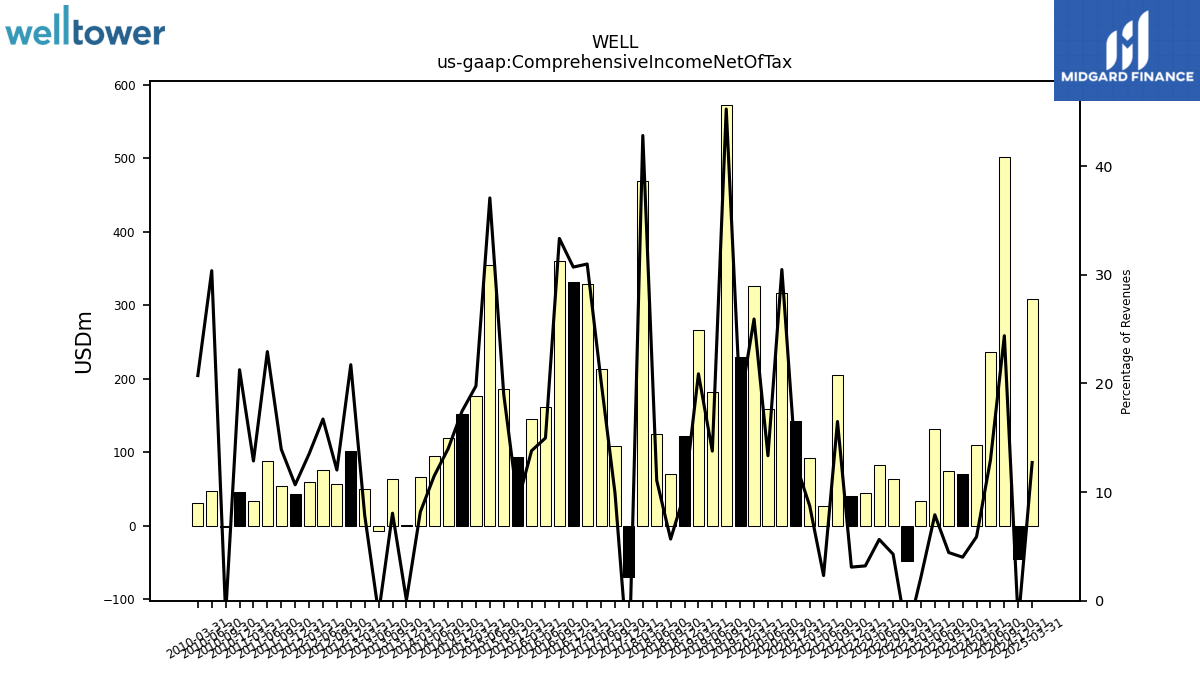
| Comprehensive Income Net Of Tax | 70.11 | 73.70 | 131.69 | 33.82 | -48.17 | 63.16 | 83.06 | 44.77 | 40.53 | 204.43 | 26.45 | 91.91 | 141.69 | 315.97 | 158.60 | 326.23 | 229.84 | 572.82 | 181.76 | 265.62 | 122.16 | 70.20 | 124.73 | 469.56 | -70.07 | 108.10 | 213.68 | 329.12 | 331.05 | 359.72 | 161.24 | 144.51 | 93.07 | 185.71 | 354.75 | 176.66 | 151.33 | 118.55 | 94.96 | 65.49 | 0.41 | 63.39 | -7.99 | 49.88 | 101.75 | 57.03 | 75.75 | 58.80 | 42.94 | 53.63 | 87.35 | 32.86 | 45.65 | -2.15 | 46.70 | 30.12 | |
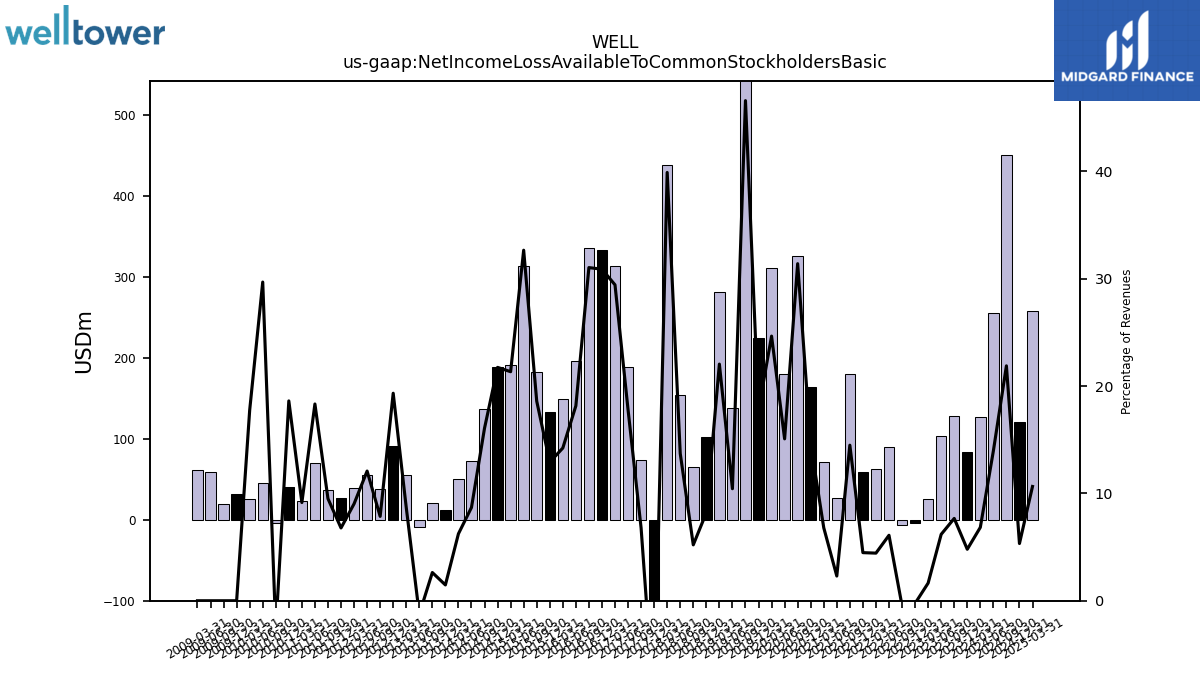
| Net Income Loss Available To Common Stockholders Basic | 83.91 | 127.47 | 103.04 | 25.67 | -3.73 | -6.77 | 89.78 | 61.92 | 58.67 | 179.66 | 26.26 | 71.55 | 163.73 | 325.58 | 179.25 | 310.28 | 224.32 | 589.88 | 137.76 | 280.47 | 101.76 | 64.38 | 154.43 | 437.67 | -111.52 | 74.04 | 188.43 | 312.64 | 333.04 | 334.91 | 195.47 | 148.97 | 132.93 | 182.04 | 312.57 | 190.80 | 188.64 | 136.25 | 71.83 | 50.02 | 11.47 | 20.69 | -8.51 | 55.06 | 90.58 | 37.27 | 54.73 | 39.31 | 27.28 | 36.61 | 69.85 | 23.37 | 39.99 | -4.56 | 45.65 | 25.81 |
| 2023-12-31 | 2023-09-30 | 2023-06-30 | 2023-03-31 | 2022-12-31 | 2022-09-30 | 2022-06-30 | 2022-03-31 | 2021-12-31 | 2021-09-30 | 2021-06-30 | 2021-03-31 | 2020-12-31 | 2020-09-30 | 2020-06-30 | 2020-03-31 | 2019-12-31 | 2019-09-30 | 2019-06-30 | 2019-03-31 | 2018-12-31 | 2018-09-30 | 2018-06-30 | 2018-03-31 | 2017-12-31 | 2017-09-30 | 2017-06-30 | 2017-03-31 | 2016-12-31 | 2016-09-30 | 2016-06-30 | 2016-03-31 | 2015-12-31 | 2015-09-30 | 2015-06-30 | 2015-03-31 | 2014-12-31 | 2014-09-30 | 2014-06-30 | 2014-03-31 | 2013-12-31 | 2013-09-30 | 2013-06-30 | 2013-03-31 | 2012-12-31 | 2012-09-30 | 2012-06-30 | 2012-03-31 | 2011-12-31 | 2011-09-30 | 2011-06-30 | 2011-03-31 | 2010-12-31 | 2010-09-30 | 2010-06-30 | 2010-03-31 | ||
|---|---|---|---|---|---|---|---|---|---|---|---|---|---|---|---|---|---|---|---|---|---|---|---|---|---|---|---|---|---|---|---|---|---|---|---|---|---|---|---|---|---|---|---|---|---|---|---|---|---|---|---|---|---|---|---|---|---|
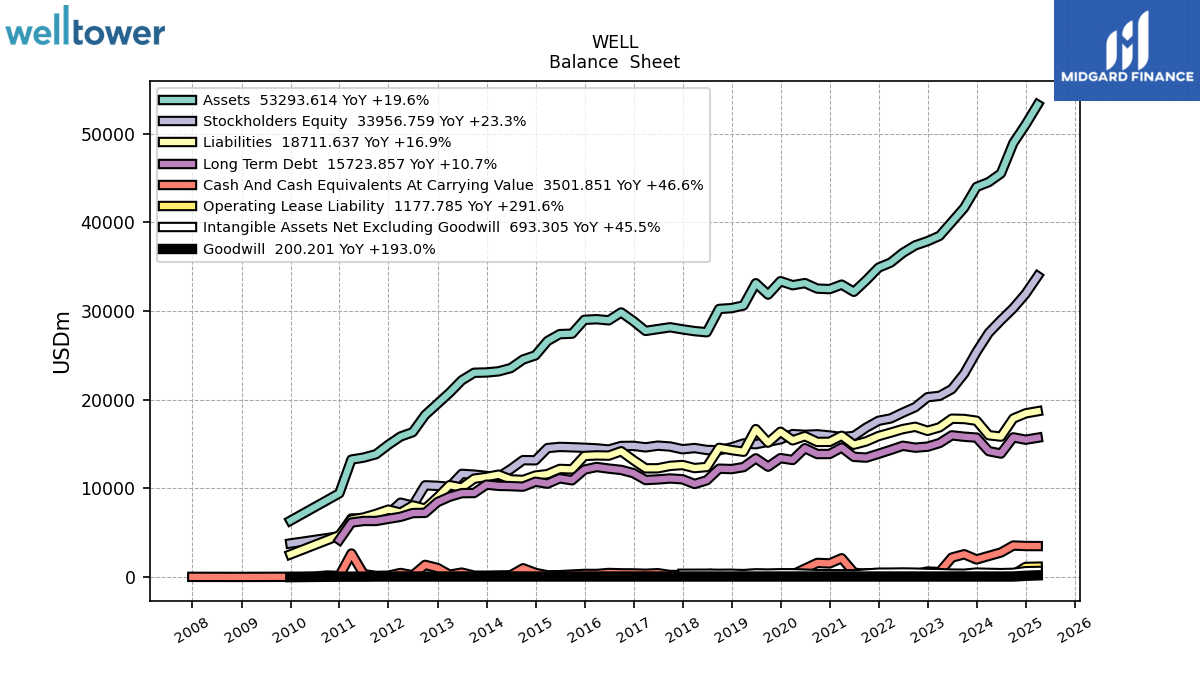
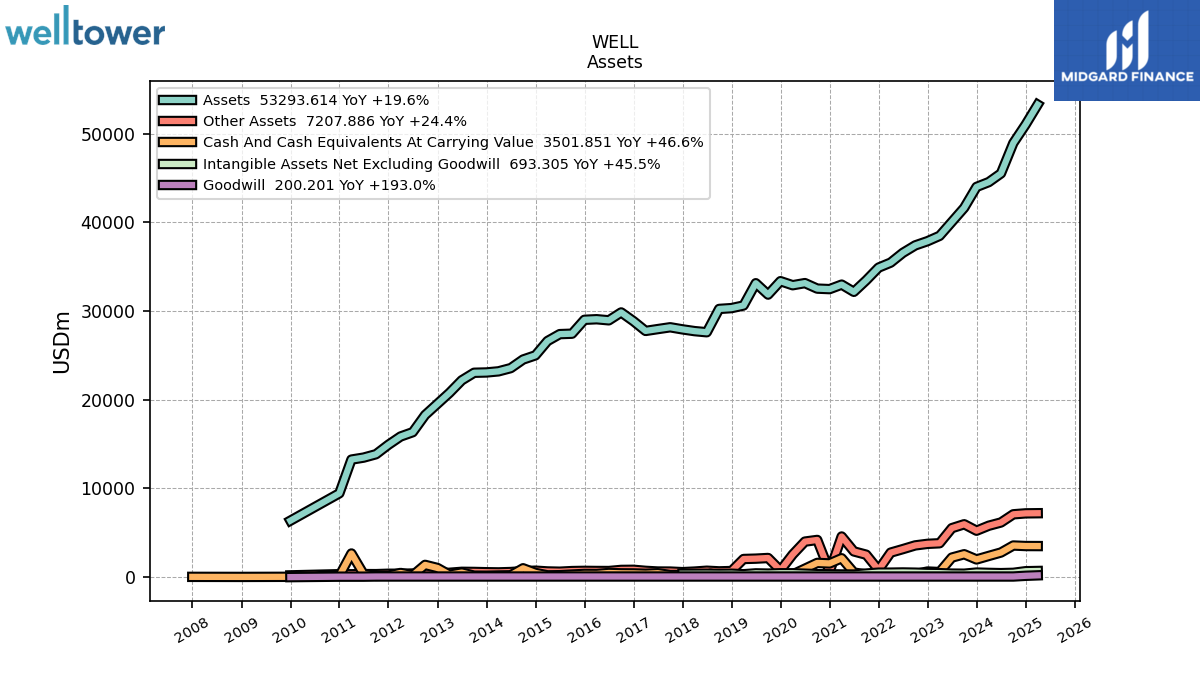
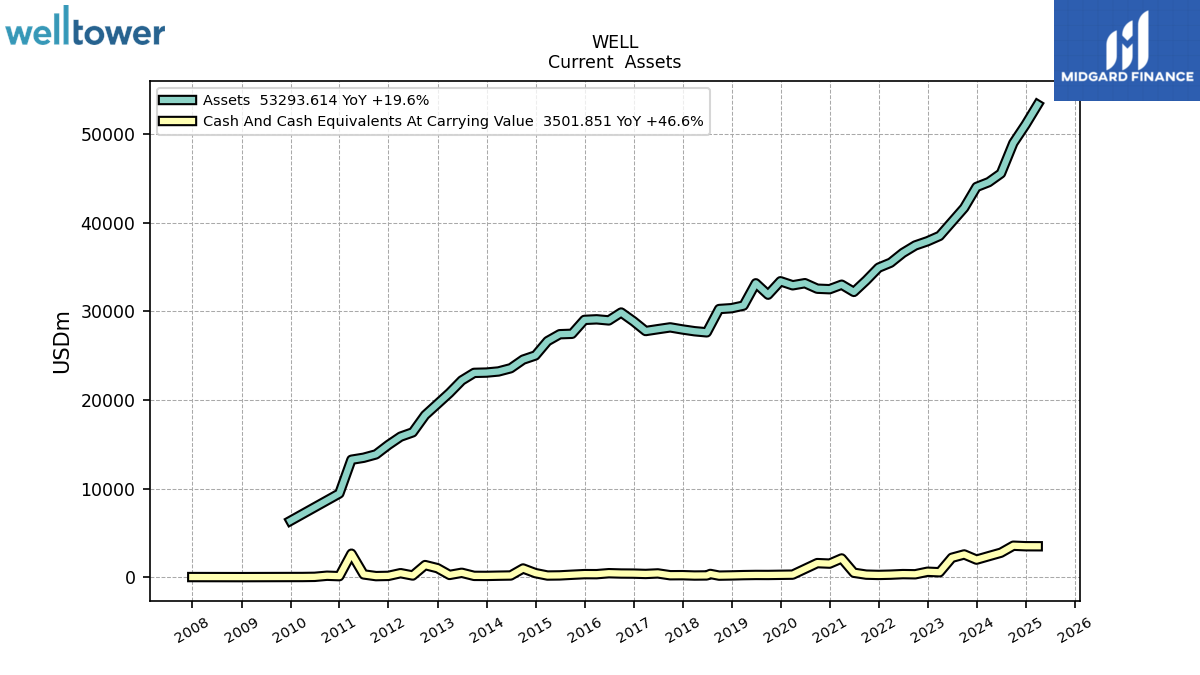
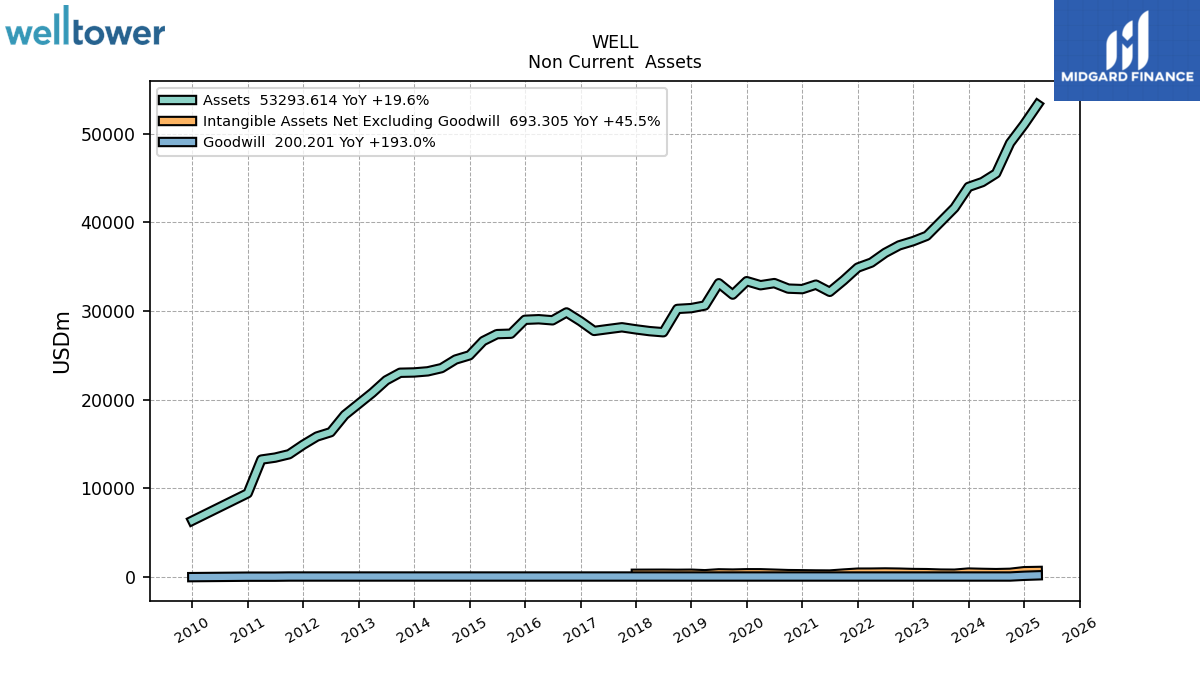
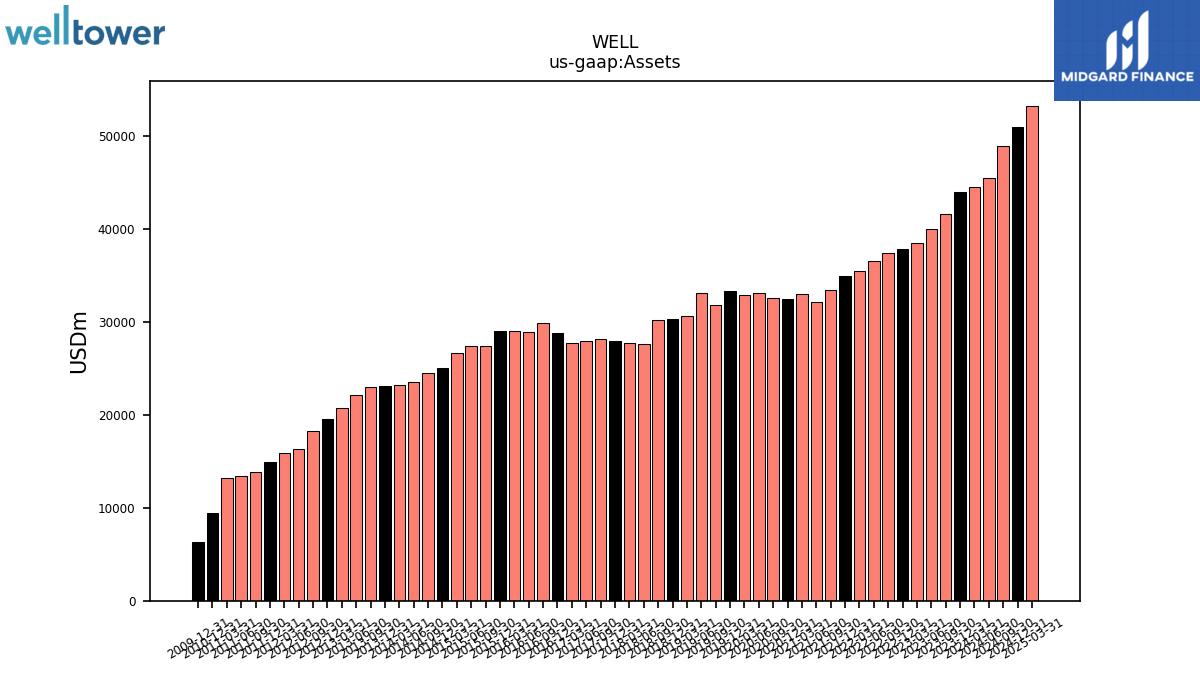
| Assets | 44012.17 | 41654.70 | 40064.14 | 38493.89 | 37893.23 | 37414.49 | 36573.67 | 35472.45 | 34910.32 | 33480.03 | 32176.12 | 32992.25 | 32483.64 | 32541.60 | 33162.65 | 32923.03 | 33380.75 | 31863.96 | 33148.70 | 30637.34 | 30342.07 | 30249.12 | 27618.98 | 27746.66 | 27944.44 | 28180.38 | 27975.79 | 27767.28 | 28865.18 | 29856.34 | 28964.50 | 29088.29 | 29023.85 | 27456.37 | 27407.48 | 26629.40 | 25014.30 | 24541.72 | 23573.89 | 23211.04 | 23083.96 | 23049.81 | 22196.39 | 20788.97 | 19549.11 | 18282.28 | 16347.43 | 15859.73 | 14924.61 | 13861.09 | 13480.66 | 13258.04 | 9451.73 | NA | NA | NA | |
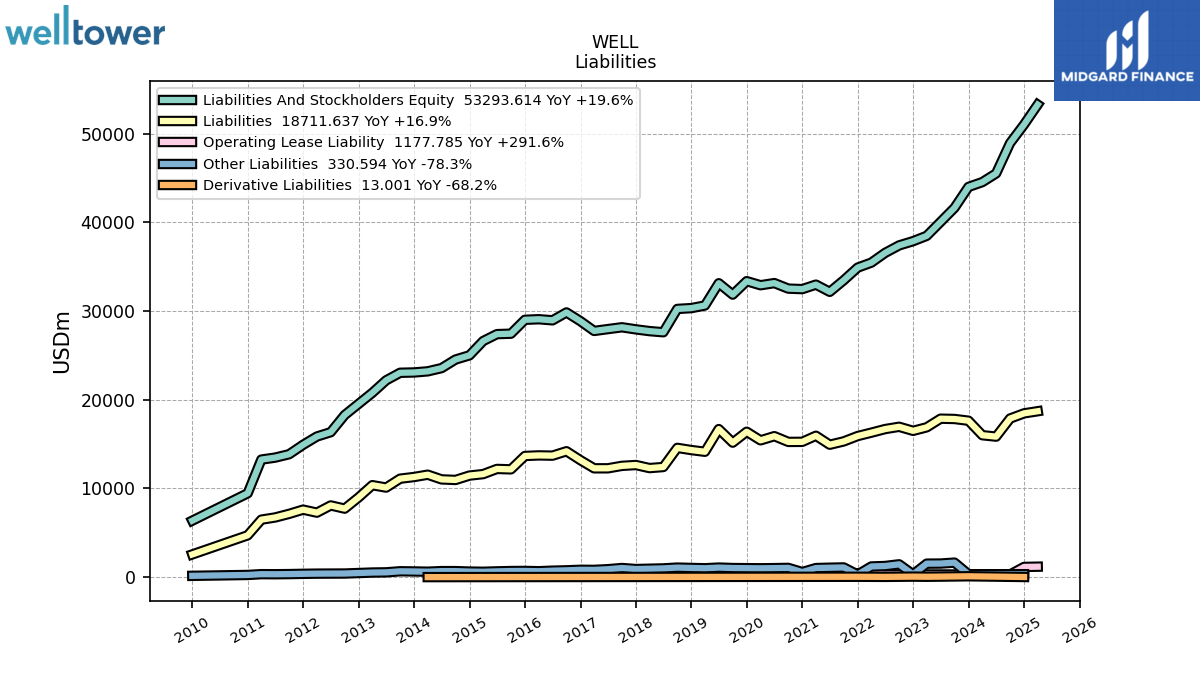
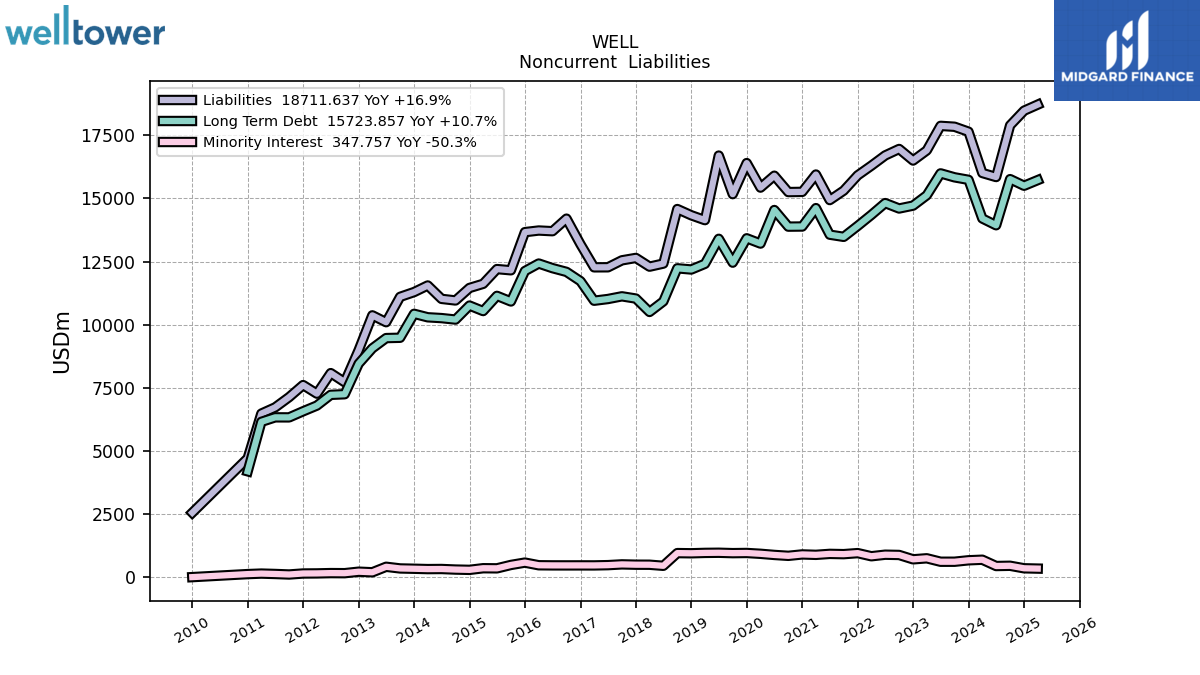
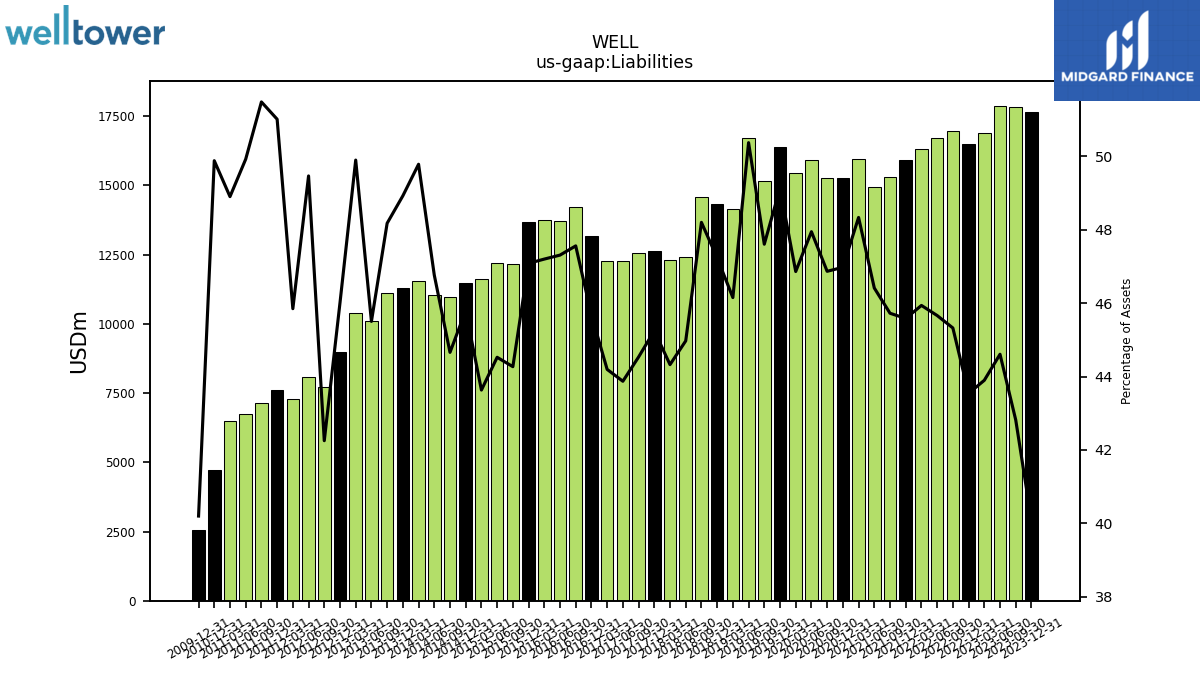
| Liabilities | 17640.44 | 17836.08 | 17871.02 | 16897.73 | 16499.24 | 16956.84 | 16699.76 | 16294.43 | 15912.45 | 15307.91 | 14932.91 | 15945.32 | 15258.58 | 15250.44 | 15898.98 | 15427.33 | 16398.25 | 15167.89 | 16695.89 | 14138.96 | 14331.43 | 14579.05 | 12420.34 | 12298.46 | 12643.80 | 12548.97 | 12273.39 | 12271.60 | 13185.28 | 14198.57 | 13701.81 | 13728.84 | 13664.88 | 12154.43 | 12202.80 | 11618.94 | 11454.84 | 10959.88 | 11023.60 | 11554.15 | 11292.59 | 11103.68 | 10099.43 | 10372.10 | 8994.00 | 7724.82 | 8085.56 | 7271.18 | 7612.31 | 7135.06 | 6729.21 | 6482.90 | 4714.08 | NA | NA | NA | |
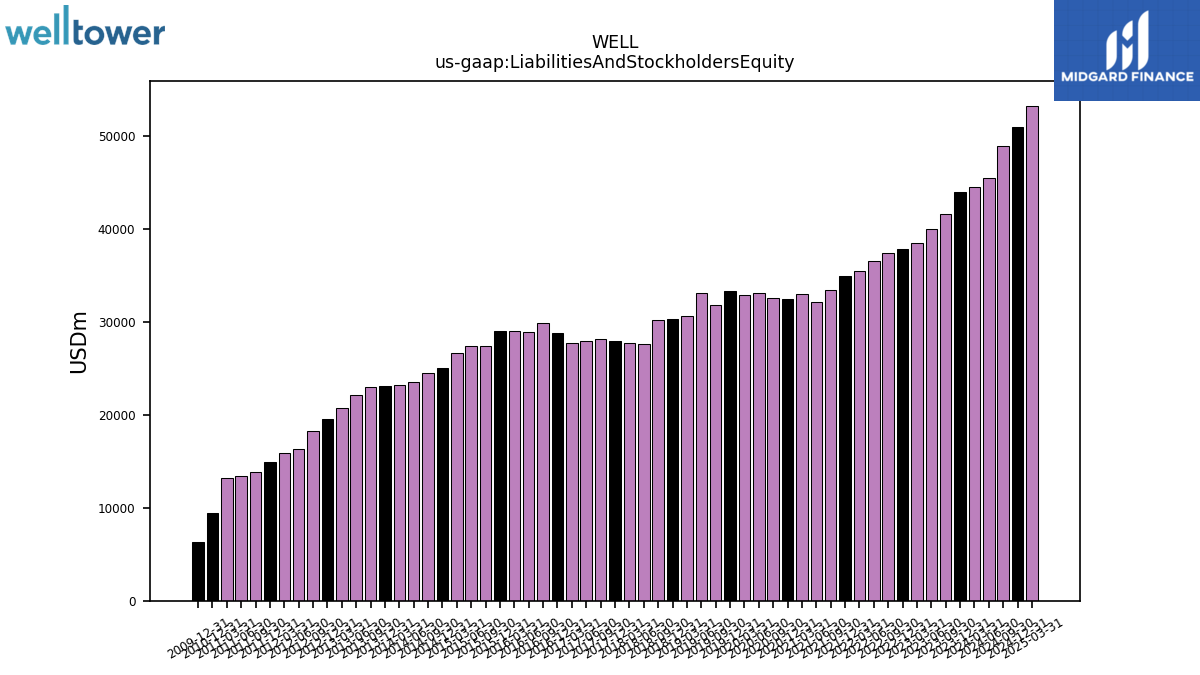
| Liabilities And Stockholders Equity | 44012.17 | 41654.70 | 40064.14 | 38493.89 | 37893.23 | 37414.49 | 36573.67 | 35472.45 | 34910.32 | 33480.03 | 32176.12 | 32992.25 | 32483.64 | 32541.60 | 33162.65 | 32923.03 | 33380.75 | 31863.96 | 33148.70 | 30637.34 | 30342.07 | 30249.12 | 27618.98 | 27746.66 | 27944.44 | 28180.38 | 27975.79 | 27767.28 | 28865.18 | 29856.34 | 28964.50 | 29088.29 | 29023.85 | 27456.37 | 27407.48 | 26629.40 | 25014.30 | 24541.72 | 23573.89 | 23211.04 | 23083.96 | 23049.81 | 22196.39 | 20788.97 | 19549.11 | 18282.28 | 16347.43 | 15859.73 | 14924.61 | 13861.09 | 13480.66 | 13258.04 | 9451.73 | NA | NA | NA | |
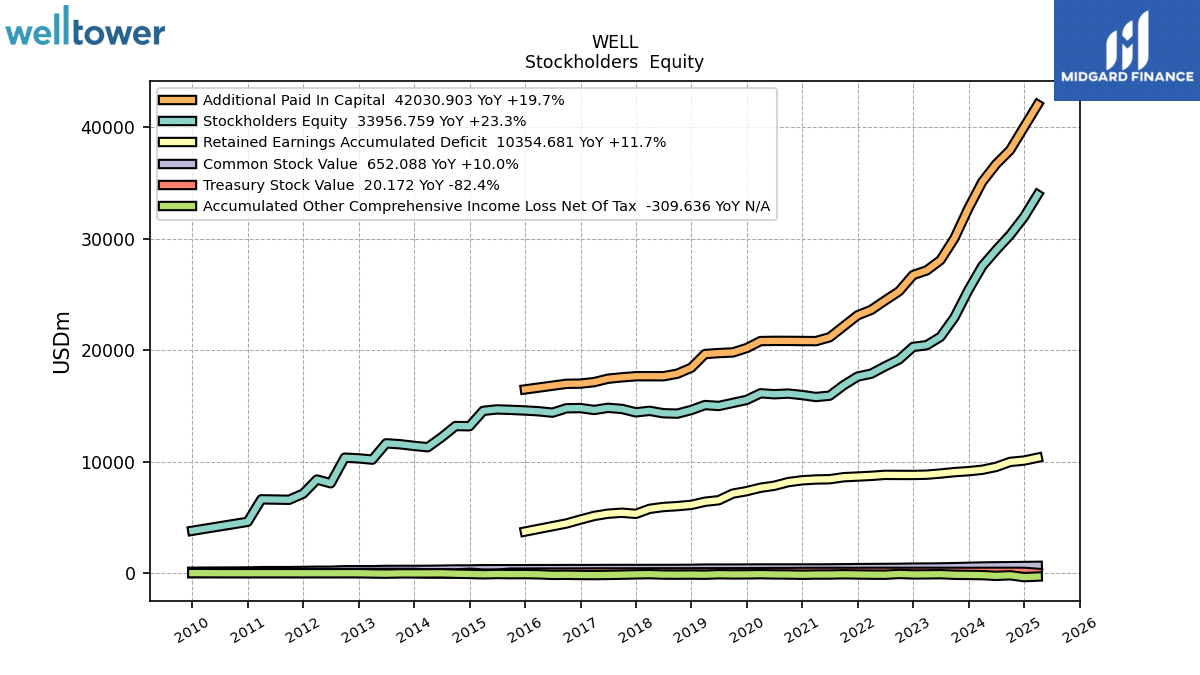
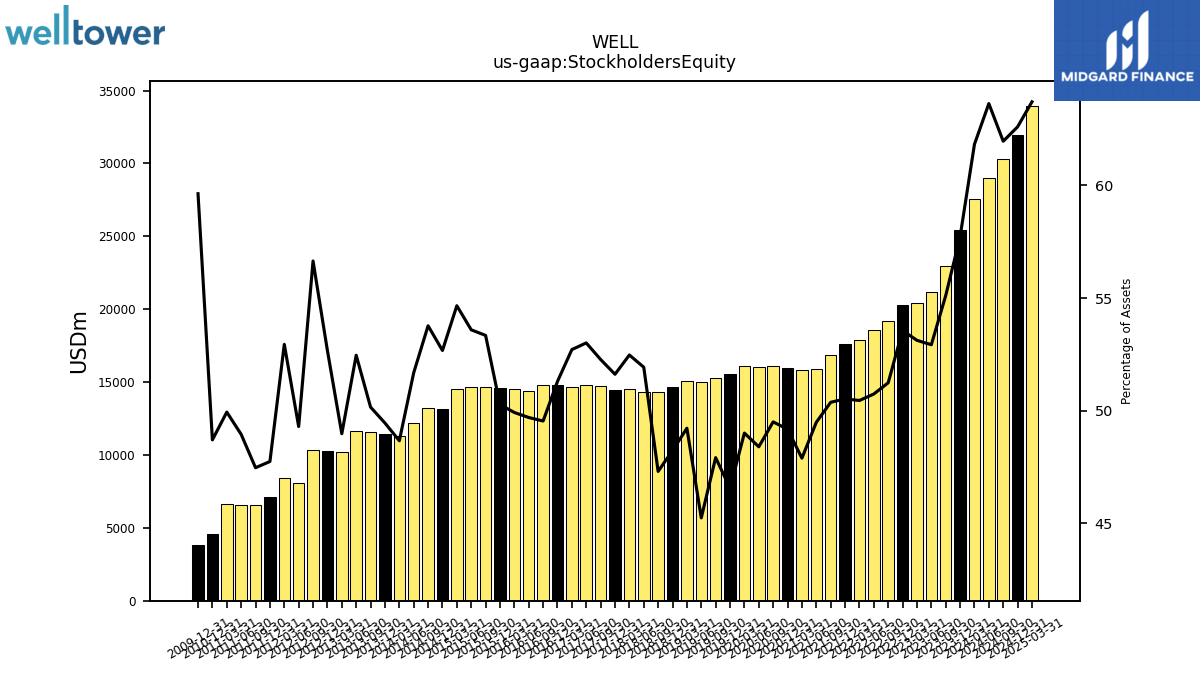
| Stockholders Equity | 25404.38 | 22954.04 | 21204.44 | 20448.15 | 20294.81 | 19169.31 | 18556.18 | 17895.58 | 17636.00 | 16863.20 | 15920.45 | 15798.88 | 15972.72 | 16107.87 | 16048.14 | 16132.78 | 15540.44 | 15266.07 | 14994.45 | 15078.49 | 14632.33 | 14307.68 | 14341.92 | 14558.43 | 14423.15 | 14729.92 | 14828.83 | 14636.20 | 14806.39 | 14789.84 | 14393.37 | 14519.59 | 14590.56 | 14645.09 | 14687.17 | 14555.39 | 13175.15 | 13195.61 | 12182.77 | 11294.35 | 11414.58 | 11560.46 | 11644.16 | 10180.77 | 10294.80 | 10356.03 | 8058.07 | 8396.39 | 7124.76 | 6578.79 | 6598.19 | 6620.14 | 4602.85 | NA | NA | NA |
| 2023-12-31 | 2023-09-30 | 2023-06-30 | 2023-03-31 | 2022-12-31 | 2022-09-30 | 2022-06-30 | 2022-03-31 | 2021-12-31 | 2021-09-30 | 2021-06-30 | 2021-03-31 | 2020-12-31 | 2020-09-30 | 2020-06-30 | 2020-03-31 | 2019-12-31 | 2019-09-30 | 2019-06-30 | 2019-03-31 | 2018-12-31 | 2018-09-30 | 2018-06-30 | 2018-03-31 | 2017-12-31 | 2017-09-30 | 2017-06-30 | 2017-03-31 | 2016-12-31 | 2016-09-30 | 2016-06-30 | 2016-03-31 | 2015-12-31 | 2015-09-30 | 2015-06-30 | 2015-03-31 | 2014-12-31 | 2014-09-30 | 2014-06-30 | 2014-03-31 | 2013-12-31 | 2013-09-30 | 2013-06-30 | 2013-03-31 | 2012-12-31 | 2012-09-30 | 2012-06-30 | 2012-03-31 | 2011-12-31 | 2011-09-30 | 2011-06-30 | 2011-03-31 | 2010-12-31 | 2010-09-30 | 2010-06-30 | 2010-03-31 | ||
|---|---|---|---|---|---|---|---|---|---|---|---|---|---|---|---|---|---|---|---|---|---|---|---|---|---|---|---|---|---|---|---|---|---|---|---|---|---|---|---|---|---|---|---|---|---|---|---|---|---|---|---|---|---|---|---|---|---|
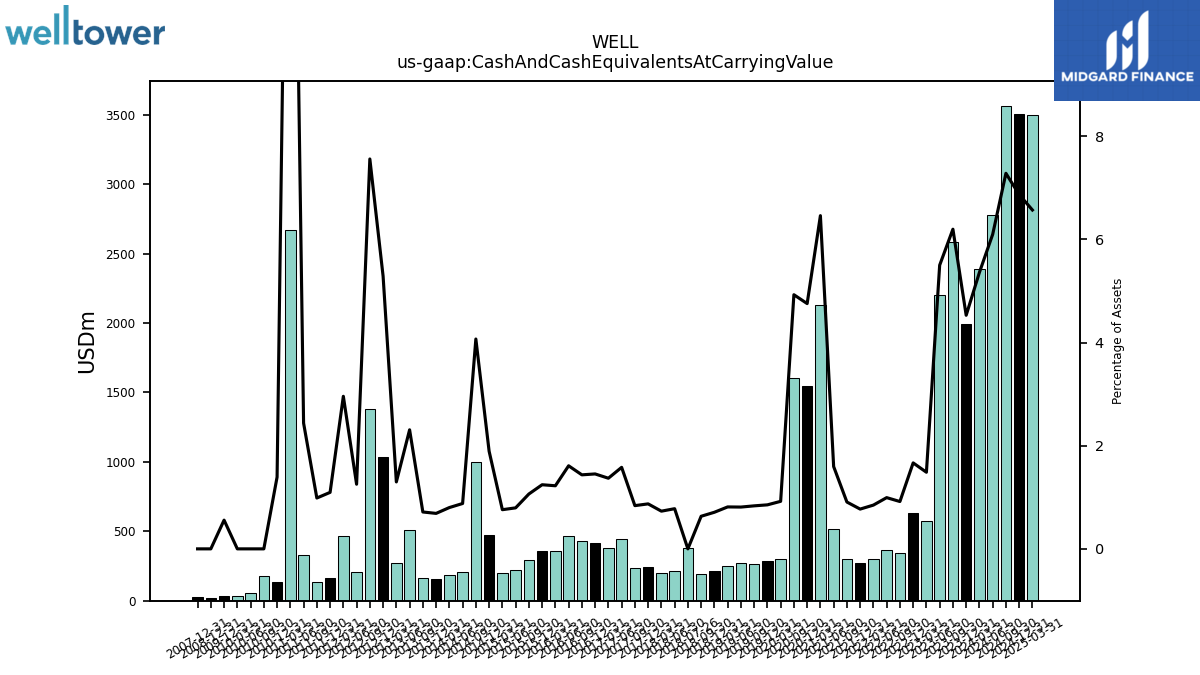
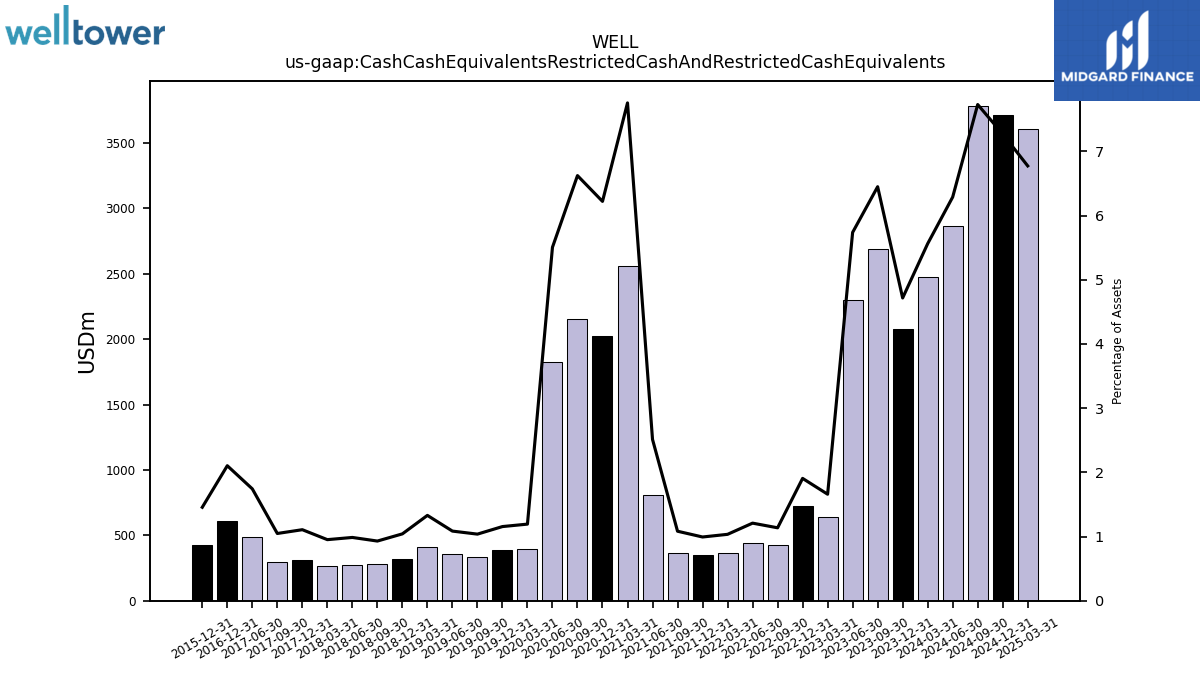
| Cash And Cash Equivalents At Carrying Value | 1993.65 | 2582.04 | 2203.79 | 571.90 | 631.68 | 343.45 | 363.34 | 301.09 | 269.26 | 303.98 | 513.60 | 2131.85 | 1545.05 | 1603.74 | NA | 303.42 | 284.92 | 265.79 | 268.67 | 249.13 | 215.38 | 191.20 | 215.12 | 202.82 | 243.78 | 236.25 | 442.28 | 380.36 | 419.38 | 428.62 | 466.58 | 355.95 | 360.91 | 292.04 | 217.94 | 202.27 | 473.73 | 998.68 | 207.35 | 185.93 | 158.78 | 164.84 | 512.47 | 269.84 | 1033.76 | 1382.25 | 204.90 | 469.22 | 163.48 | 136.68 | 328.76 | 2667.99 | 131.57 | 181.15 | 55.42 | 36.56 | |
| Cash Cash Equivalents Restricted Cash And Restricted Cash Equivalents | 2076.08 | 2686.71 | 2299.07 | 638.80 | 722.29 | 425.18 | 442.25 | 367.04 | 346.75 | 362.64 | 808.70 | 2558.82 | 2021.04 | 2155.33 | 1826.24 | 393.07 | 385.77 | 330.74 | 359.72 | 407.44 | 316.13 | 281.29 | 272.38 | 264.12 | 309.30 | 295.31 | 487.64 | NA | 607.22 | NA | NA | NA | 422.69 | NA | NA | NA | NA | NA | NA | NA | NA | NA | NA | NA | NA | NA | NA | NA | NA | NA | NA | NA | NA | NA | NA | NA |
| 2023-12-31 | 2023-09-30 | 2023-06-30 | 2023-03-31 | 2022-12-31 | 2022-09-30 | 2022-06-30 | 2022-03-31 | 2021-12-31 | 2021-09-30 | 2021-06-30 | 2021-03-31 | 2020-12-31 | 2020-09-30 | 2020-06-30 | 2020-03-31 | 2019-12-31 | 2019-09-30 | 2019-06-30 | 2019-03-31 | 2018-12-31 | 2018-09-30 | 2018-06-30 | 2018-03-31 | 2017-12-31 | 2017-09-30 | 2017-06-30 | 2017-03-31 | 2016-12-31 | 2016-09-30 | 2016-06-30 | 2016-03-31 | 2015-12-31 | 2015-09-30 | 2015-06-30 | 2015-03-31 | 2014-12-31 | 2014-09-30 | 2014-06-30 | 2014-03-31 | 2013-12-31 | 2013-09-30 | 2013-06-30 | 2013-03-31 | 2012-12-31 | 2012-09-30 | 2012-06-30 | 2012-03-31 | 2011-12-31 | 2011-09-30 | 2011-06-30 | 2011-03-31 | 2010-12-31 | 2010-09-30 | 2010-06-30 | 2010-03-31 | ||
|---|---|---|---|---|---|---|---|---|---|---|---|---|---|---|---|---|---|---|---|---|---|---|---|---|---|---|---|---|---|---|---|---|---|---|---|---|---|---|---|---|---|---|---|---|---|---|---|---|---|---|---|---|---|---|---|---|---|
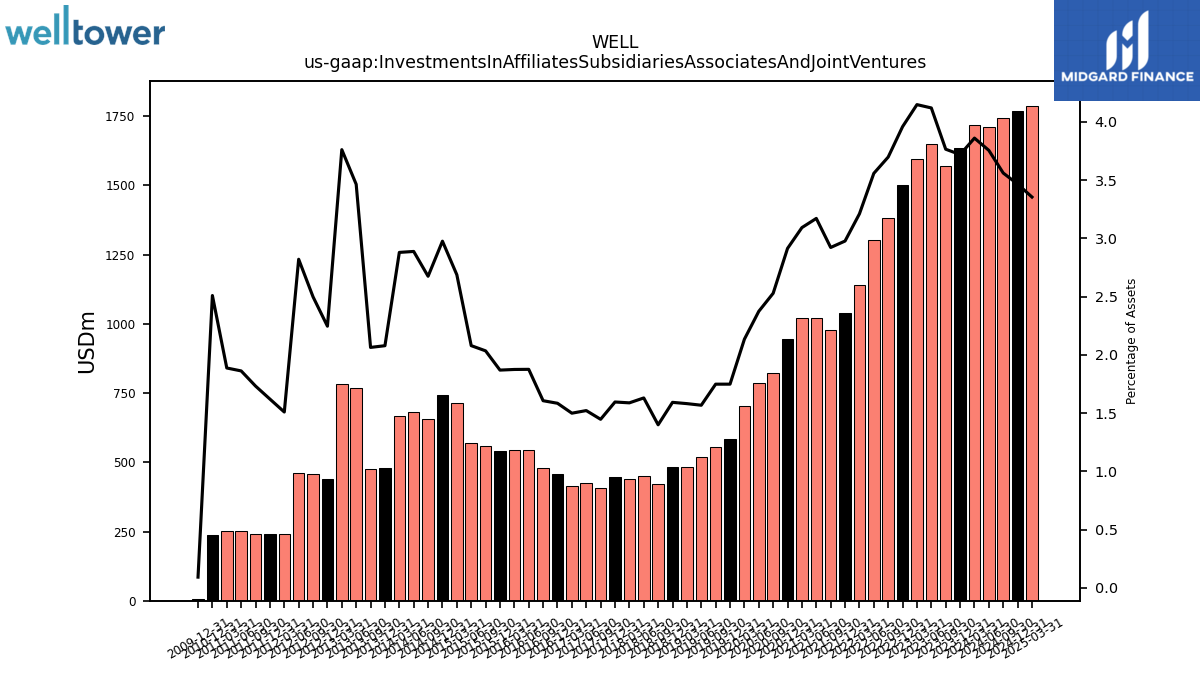
| Investments In Affiliates Subsidiaries Associates And Joint Ventures | 1636.53 | 1568.10 | 1650.13 | 1596.41 | 1499.79 | 1383.25 | 1300.97 | 1138.53 | 1039.04 | 977.96 | 1020.11 | 1020.01 | 946.23 | 822.59 | 786.92 | 702.50 | 583.42 | 556.85 | 519.39 | 484.26 | 482.91 | 423.19 | 450.03 | 440.42 | 445.58 | 407.51 | 425.49 | 416.11 | 457.14 | 479.38 | 543.07 | 545.07 | 542.28 | 558.35 | 569.62 | 715.47 | 744.15 | 656.21 | 680.56 | 668.17 | 479.63 | 475.57 | 768.74 | 781.79 | 438.94 | 456.55 | 460.96 | 239.25 | 241.72 | 239.98 | 250.93 | 250.11 | 237.11 | NA | NA | NA | |
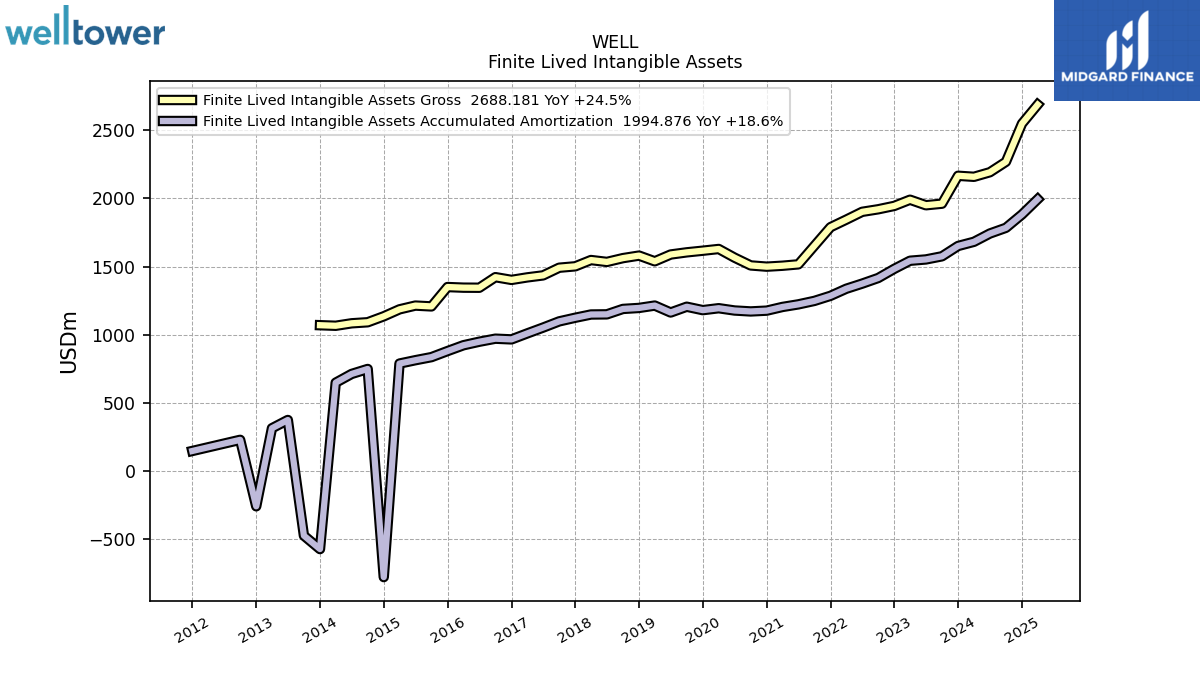
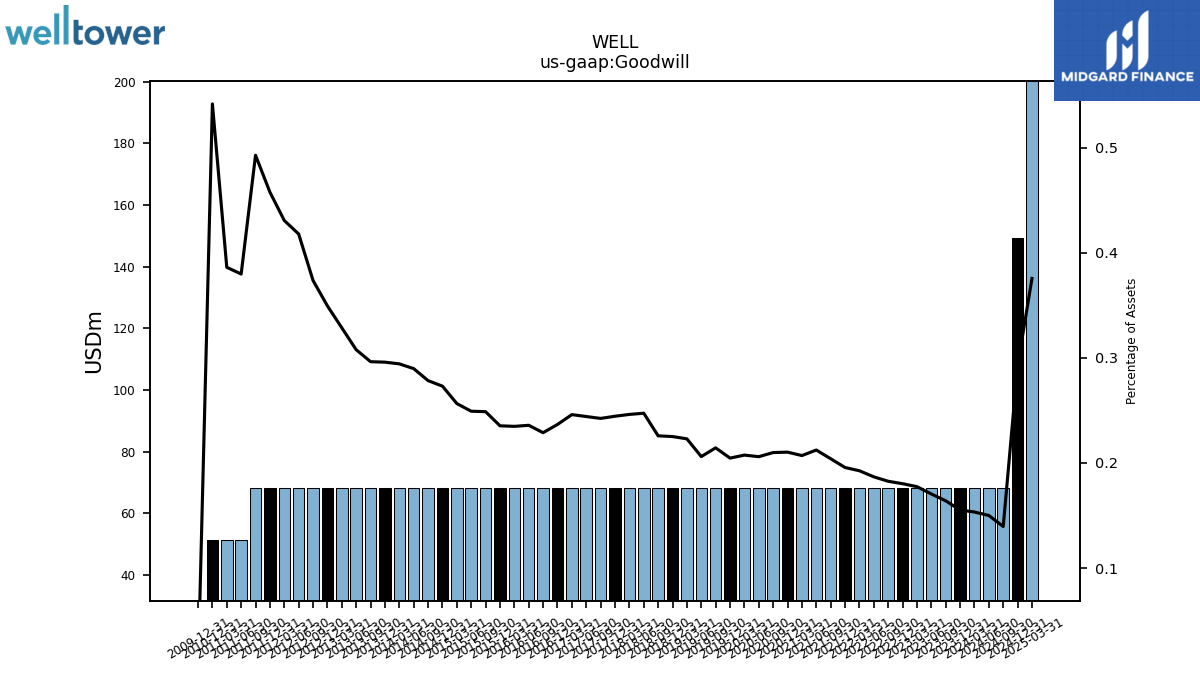
| Goodwill | 68.32 | 68.32 | 68.32 | 68.32 | 68.32 | 68.32 | 68.32 | 68.32 | 68.32 | 68.32 | 68.32 | 68.32 | 68.32 | 68.32 | 68.32 | 68.32 | 68.32 | 68.32 | 68.32 | 68.32 | 68.32 | 68.32 | 68.32 | 68.32 | 68.32 | 68.32 | 68.32 | 68.32 | 68.32 | 68.32 | 68.32 | 68.32 | 68.32 | 68.32 | 68.32 | 68.32 | 68.32 | 68.32 | 68.32 | 68.32 | 68.32 | 68.32 | 68.32 | 68.32 | 68.32 | 68.32 | 68.32 | 68.32 | 68.32 | 68.32 | 51.21 | 51.21 | 51.21 | NA | NA | NA | |
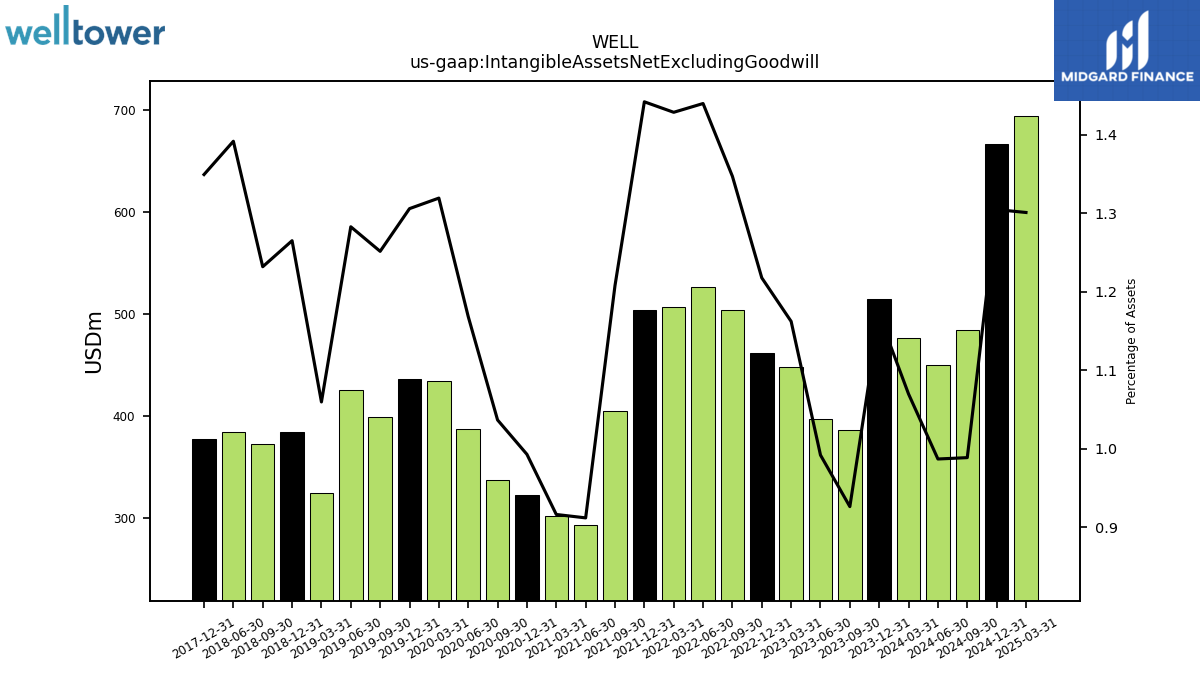
| Intangible Assets Net Excluding Goodwill | 514.81 | 385.84 | 397.40 | 447.37 | 461.41 | 503.95 | 526.55 | 506.73 | 503.37 | 404.38 | 293.42 | 302.29 | 322.52 | 337.33 | 387.46 | 434.33 | 435.89 | 398.75 | 425.20 | 324.63 | 383.82 | 372.62 | 384.36 | NA | 377.03 | NA | NA | NA | NA | NA | NA | NA | NA | NA | NA | NA | NA | NA | NA | NA | NA | NA | NA | NA | NA | NA | NA | NA | NA | NA | NA | NA | NA | NA | NA | NA |
| 2023-12-31 | 2023-09-30 | 2023-06-30 | 2023-03-31 | 2022-12-31 | 2022-09-30 | 2022-06-30 | 2022-03-31 | 2021-12-31 | 2021-09-30 | 2021-06-30 | 2021-03-31 | 2020-12-31 | 2020-09-30 | 2020-06-30 | 2020-03-31 | 2019-12-31 | 2019-09-30 | 2019-06-30 | 2019-03-31 | 2018-12-31 | 2018-09-30 | 2018-06-30 | 2018-03-31 | 2017-12-31 | 2017-09-30 | 2017-06-30 | 2017-03-31 | 2016-12-31 | 2016-09-30 | 2016-06-30 | 2016-03-31 | 2015-12-31 | 2015-09-30 | 2015-06-30 | 2015-03-31 | 2014-12-31 | 2014-09-30 | 2014-06-30 | 2014-03-31 | 2013-12-31 | 2013-09-30 | 2013-06-30 | 2013-03-31 | 2012-12-31 | 2012-09-30 | 2012-06-30 | 2012-03-31 | 2011-12-31 | 2011-09-30 | 2011-06-30 | 2011-03-31 | 2010-12-31 | 2010-09-30 | 2010-06-30 | 2010-03-31 | ||
|---|---|---|---|---|---|---|---|---|---|---|---|---|---|---|---|---|---|---|---|---|---|---|---|---|---|---|---|---|---|---|---|---|---|---|---|---|---|---|---|---|---|---|---|---|---|---|---|---|---|---|---|---|---|---|---|---|---|
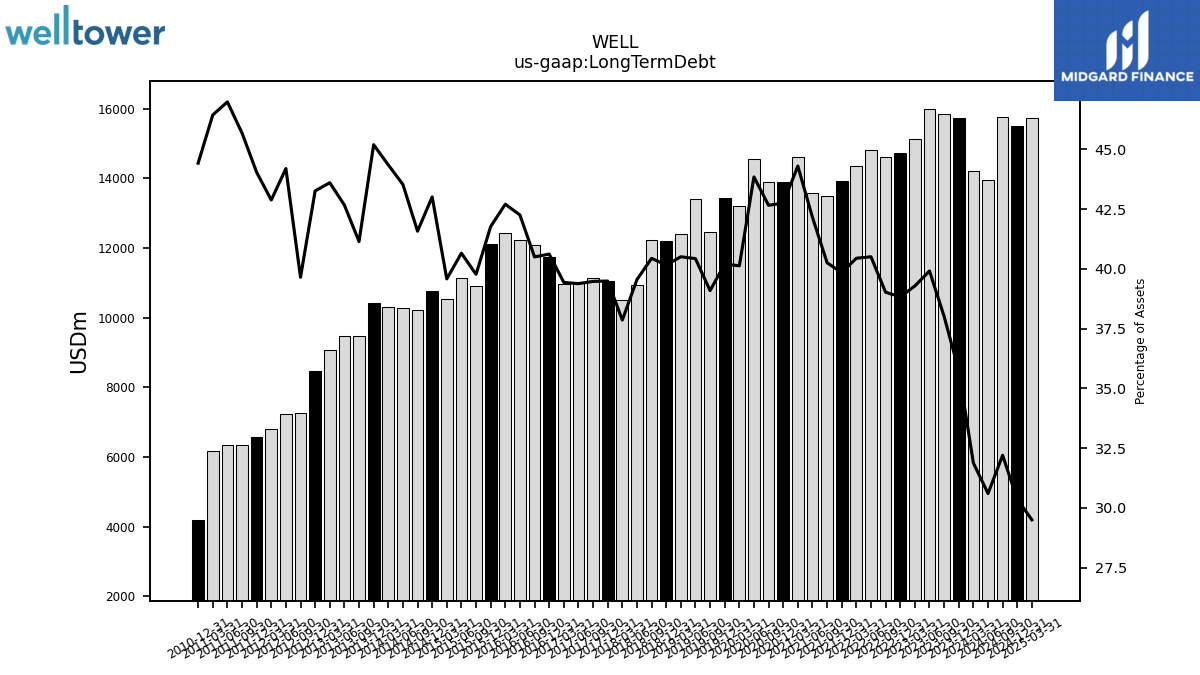
| Long Term Debt | 15735.55 | 15834.24 | 15991.14 | 15122.21 | 14714.48 | 14600.33 | 14814.95 | 14347.24 | 13910.27 | 13478.12 | 13564.11 | 14615.76 | 13887.61 | 13882.47 | 14540.70 | 13211.51 | 13420.90 | 12456.29 | 13401.54 | 12410.50 | 12185.69 | 12233.45 | 10923.83 | 10505.38 | 11035.85 | 11124.40 | 11017.83 | 10949.74 | 11725.10 | 12091.58 | 12238.79 | 12422.58 | 12123.97 | 10920.24 | 11143.33 | 10540.58 | 10758.92 | 10204.05 | 10262.33 | 10294.33 | 10432.42 | 9484.11 | 9471.23 | 9065.16 | 8457.04 | 7249.07 | 7224.78 | 6800.99 | 6573.31 | 6332.63 | 6334.06 | 6156.64 | 4198.65 | NA | NA | NA | |
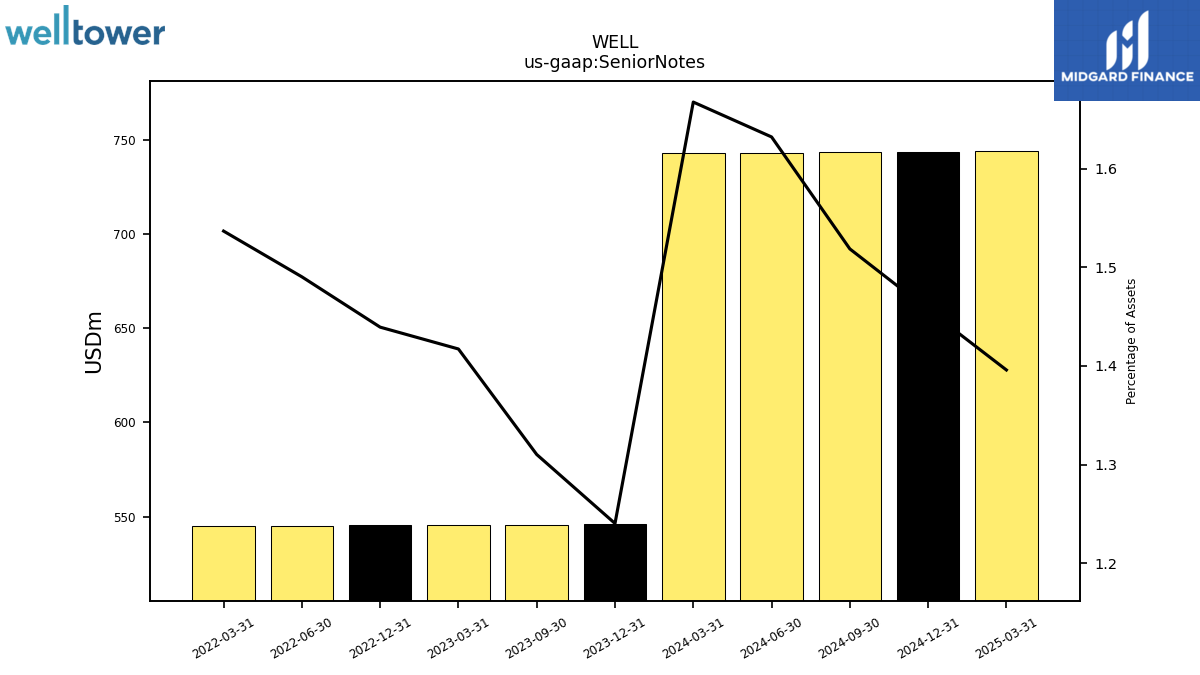
| Senior Notes | 545.87 | 545.75 | NA | 545.50 | 545.38 | NA | 545.05 | 545.08 | NA | NA | NA | NA | NA | NA | NA | NA | NA | NA | NA | NA | NA | NA | NA | NA | NA | NA | NA | NA | NA | NA | NA | NA | NA | NA | NA | NA | NA | NA | NA | NA | NA | NA | NA | NA | NA | NA | NA | NA | NA | NA | NA | NA | NA | NA | NA | NA | |
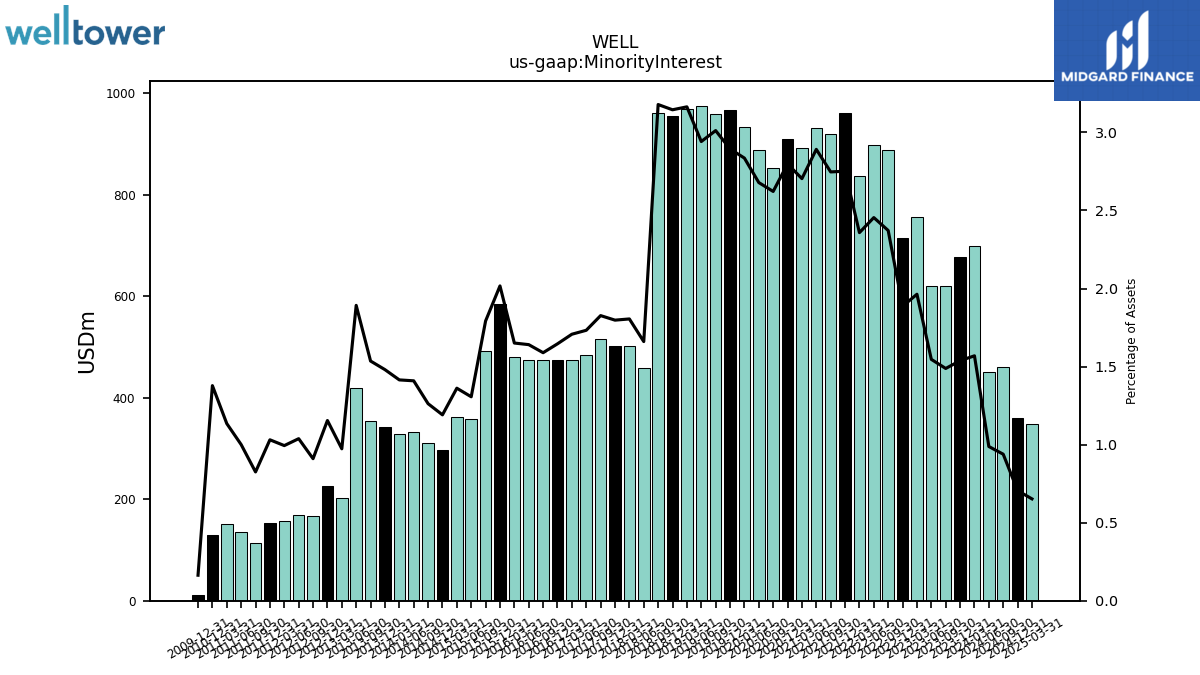
| Minority Interest | 676.75 | 619.79 | 619.48 | 755.80 | 714.74 | 887.38 | 897.72 | 836.49 | 960.58 | 919.71 | 930.38 | 892.14 | 908.85 | 853.23 | 888.39 | 933.55 | 966.18 | 959.66 | 975.12 | 969.34 | 954.26 | 961.52 | 458.56 | 500.89 | 502.31 | 514.74 | 484.69 | 474.06 | 475.08 | 474.39 | 475.19 | 480.20 | 585.33 | 492.08 | 358.11 | 362.56 | 297.90 | 309.81 | 332.12 | 328.37 | 341.75 | 353.96 | 420.00 | 202.38 | 225.72 | 166.38 | 169.72 | 157.63 | 153.88 | 114.37 | 134.85 | 150.46 | 130.25 | NA | NA | NA |
| 2023-12-31 | 2023-09-30 | 2023-06-30 | 2023-03-31 | 2022-12-31 | 2022-09-30 | 2022-06-30 | 2022-03-31 | 2021-12-31 | 2021-09-30 | 2021-06-30 | 2021-03-31 | 2020-12-31 | 2020-09-30 | 2020-06-30 | 2020-03-31 | 2019-12-31 | 2019-09-30 | 2019-06-30 | 2019-03-31 | 2018-12-31 | 2018-09-30 | 2018-06-30 | 2018-03-31 | 2017-12-31 | 2017-09-30 | 2017-06-30 | 2017-03-31 | 2016-12-31 | 2016-09-30 | 2016-06-30 | 2016-03-31 | 2015-12-31 | 2015-09-30 | 2015-06-30 | 2015-03-31 | 2014-12-31 | 2014-09-30 | 2014-06-30 | 2014-03-31 | 2013-12-31 | 2013-09-30 | 2013-06-30 | 2013-03-31 | 2012-12-31 | 2012-09-30 | 2012-06-30 | 2012-03-31 | 2011-12-31 | 2011-09-30 | 2011-06-30 | 2011-03-31 | 2010-12-31 | 2010-09-30 | 2010-06-30 | 2010-03-31 | ||
|---|---|---|---|---|---|---|---|---|---|---|---|---|---|---|---|---|---|---|---|---|---|---|---|---|---|---|---|---|---|---|---|---|---|---|---|---|---|---|---|---|---|---|---|---|---|---|---|---|---|---|---|---|---|---|---|---|---|
| Stockholders Equity | 25404.38 | 22954.04 | 21204.44 | 20448.15 | 20294.81 | 19169.31 | 18556.18 | 17895.58 | 17636.00 | 16863.20 | 15920.45 | 15798.88 | 15972.72 | 16107.87 | 16048.14 | 16132.78 | 15540.44 | 15266.07 | 14994.45 | 15078.49 | 14632.33 | 14307.68 | 14341.92 | 14558.43 | 14423.15 | 14729.92 | 14828.83 | 14636.20 | 14806.39 | 14789.84 | 14393.37 | 14519.59 | 14590.56 | 14645.09 | 14687.17 | 14555.39 | 13175.15 | 13195.61 | 12182.77 | 11294.35 | 11414.58 | 11560.46 | 11644.16 | 10180.77 | 10294.80 | 10356.03 | 8058.07 | 8396.39 | 7124.76 | 6578.79 | 6598.19 | 6620.14 | 4602.85 | NA | NA | NA | |
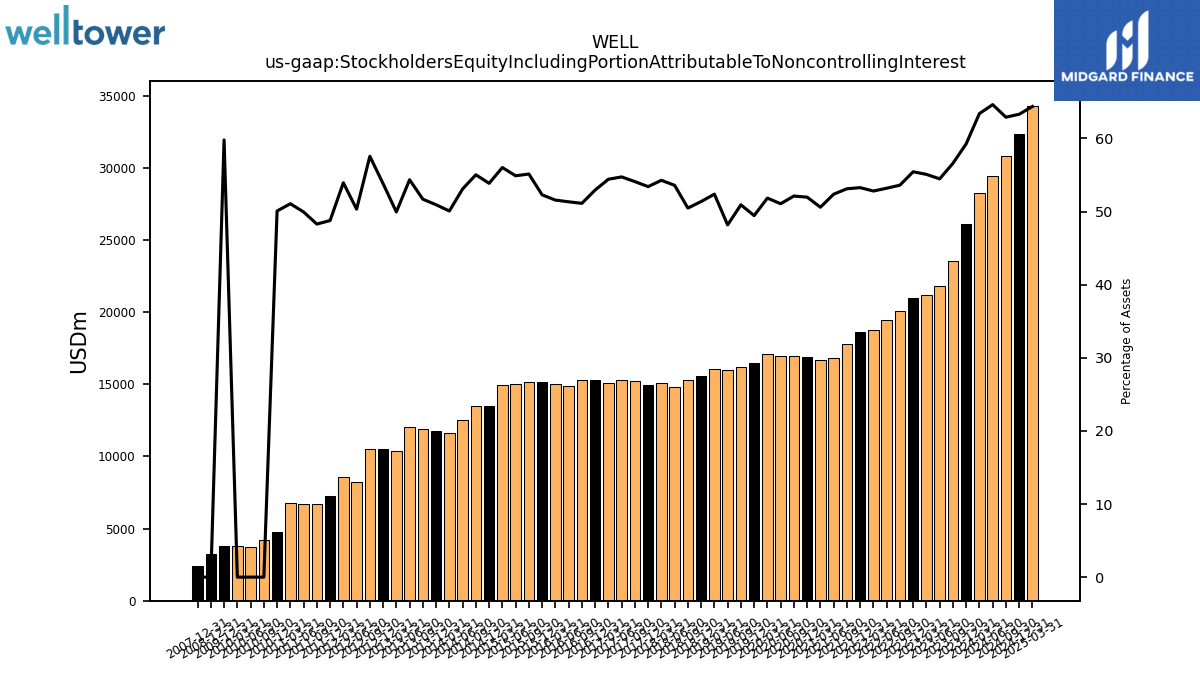
| Stockholders Equity Including Portion Attributable To Noncontrolling Interest | 26081.12 | 23573.83 | 21823.92 | 21203.96 | 21009.55 | 20056.69 | 19453.90 | 18732.07 | 18596.58 | 17782.92 | 16850.83 | 16691.02 | 16881.57 | 16961.10 | 16936.53 | 17066.34 | 16506.63 | 16225.73 | 15969.57 | 16047.83 | 15586.60 | 15269.20 | 14800.49 | 15059.33 | 14925.45 | 15244.66 | 15313.52 | 15110.26 | 15281.47 | 15264.24 | 14868.57 | 14999.79 | 15175.89 | 15137.17 | 15045.28 | 14917.95 | 13473.05 | 13505.42 | 12514.89 | 11622.73 | 11756.33 | 11914.42 | 12064.16 | 10383.15 | 10520.52 | 10522.41 | 8227.79 | 8554.02 | 7278.65 | 6693.17 | 6733.04 | 6770.60 | 4733.10 | 4213.80 | 3737.12 | 3759.92 | |
| Common Stock Value | 565.89 | 533.92 | 509.81 | 497.93 | 491.92 | 473.93 | 464.78 | 455.38 | 448.61 | 436.64 | 423.93 | 418.87 | 418.69 | 418.36 | 418.34 | 418.23 | 411.00 | 406.50 | 406.01 | 404.51 | 384.46 | 376.35 | 372.80 | 372.73 | 372.45 | 371.01 | 369.52 | 365.19 | 363.07 | 362.70 | 357.95 | 356.95 | 354.81 | 353.02 | 351.65 | 350.43 | 328.83 | 327.43 | 308.36 | 291.09 | 289.46 | 288.25 | 285.08 | 261.25 | 260.40 | 259.52 | 214.59 | 213.53 | 192.30 | 178.77 | 177.29 | 176.56 | 147.16 | NA | NA | NA | |
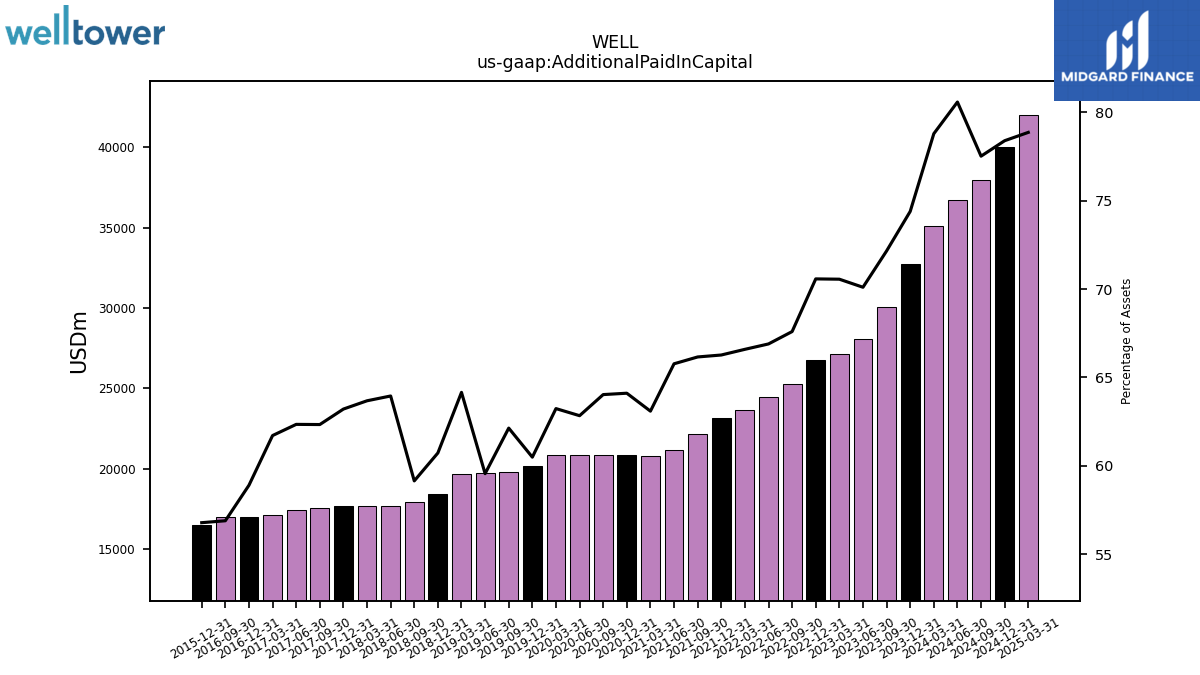
| Additional Paid In Capital | 32741.95 | 30056.08 | 28085.30 | 27160.01 | 26742.75 | 25289.43 | 24465.04 | 23620.11 | 23133.64 | 22148.86 | 21161.84 | 20814.20 | 20823.15 | 20835.02 | 20836.54 | 20818.23 | 20190.11 | 19796.68 | 19740.15 | 19654.14 | 18424.37 | 17889.51 | 17661.38 | 17667.67 | 17662.68 | 17564.81 | 17439.98 | 17134.49 | 16999.69 | 16983.56 | NA | NA | 16478.30 | NA | NA | NA | NA | NA | NA | NA | NA | NA | NA | NA | NA | NA | NA | NA | NA | NA | NA | NA | NA | NA | NA | NA | |
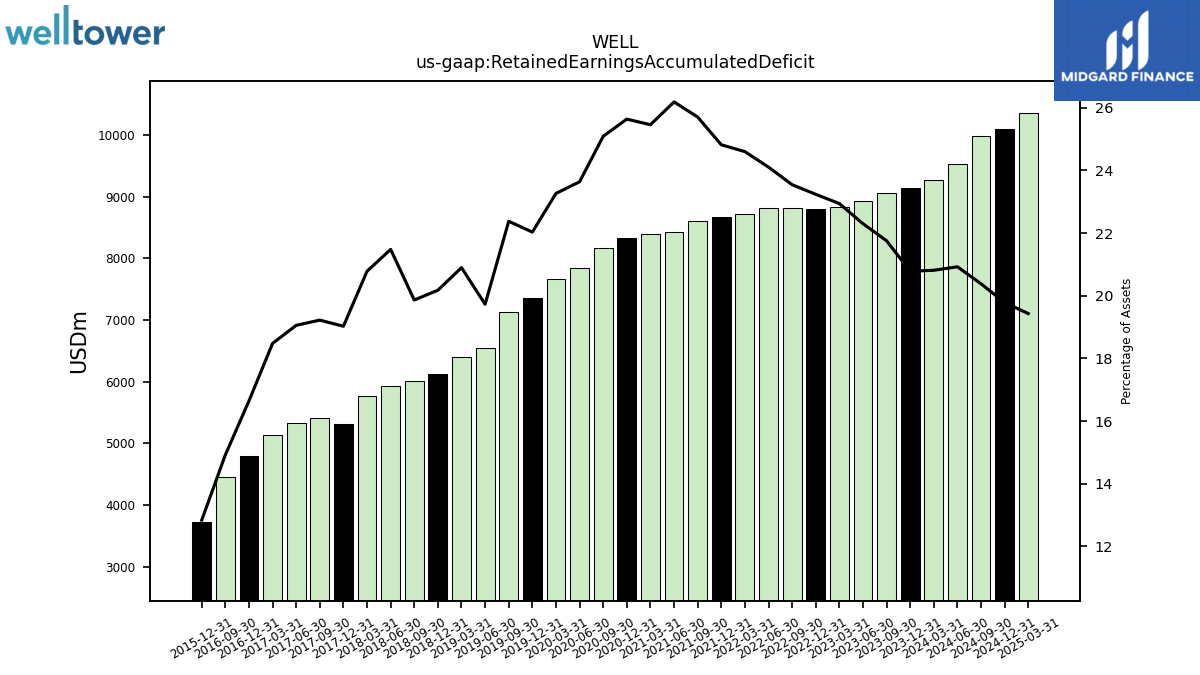
| Retained Earnings Accumulated Deficit | 9145.04 | 9061.13 | 8933.66 | 8830.62 | 8804.95 | 8808.68 | 8815.45 | 8725.66 | 8663.74 | 8605.06 | 8425.40 | 8399.14 | 8327.60 | 8163.87 | 7838.28 | 7659.04 | 7353.97 | 7129.64 | 6539.77 | 6402.00 | 6121.53 | 6008.10 | 5932.03 | 5765.93 | 5316.58 | 5416.43 | 5330.70 | 5130.59 | 4803.57 | 4454.18 | NA | NA | 3725.77 | NA | NA | NA | NA | NA | NA | NA | NA | NA | NA | NA | NA | NA | NA | NA | NA | NA | NA | NA | NA | NA | NA | NA | |
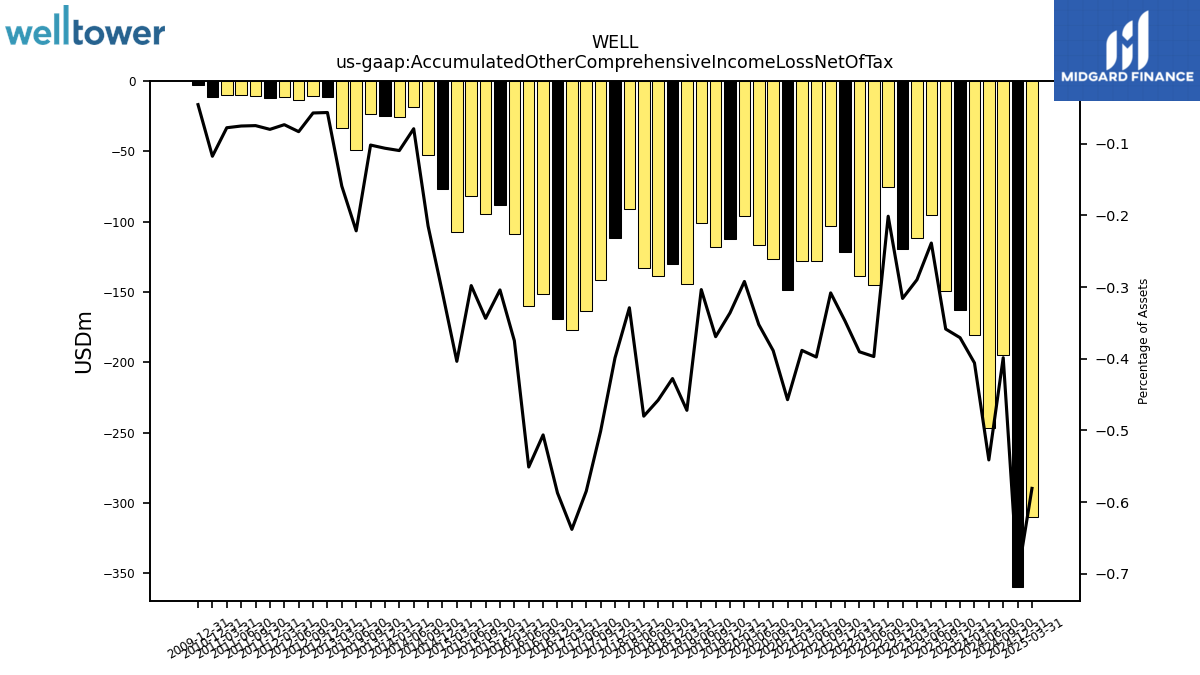
| Accumulated Other Comprehensive Income Loss Net Of Tax | -163.16 | -149.36 | -95.59 | -111.56 | -119.71 | -75.27 | -145.20 | -138.47 | -121.32 | -103.18 | -127.95 | -128.14 | -148.50 | -126.47 | -116.86 | -96.21 | -112.16 | -117.68 | -100.62 | -144.62 | -129.77 | -138.49 | -132.63 | -91.25 | -111.47 | -141.24 | -163.62 | -177.20 | -169.53 | -151.18 | -159.64 | -109.05 | -88.24 | -94.36 | -81.67 | -107.50 | -77.01 | -52.70 | -18.64 | -25.42 | -24.53 | -23.48 | -49.17 | -33.09 | -11.03 | -10.43 | -13.59 | -11.64 | -11.93 | -10.35 | -10.14 | -10.29 | -11.10 | NA | NA | NA | |
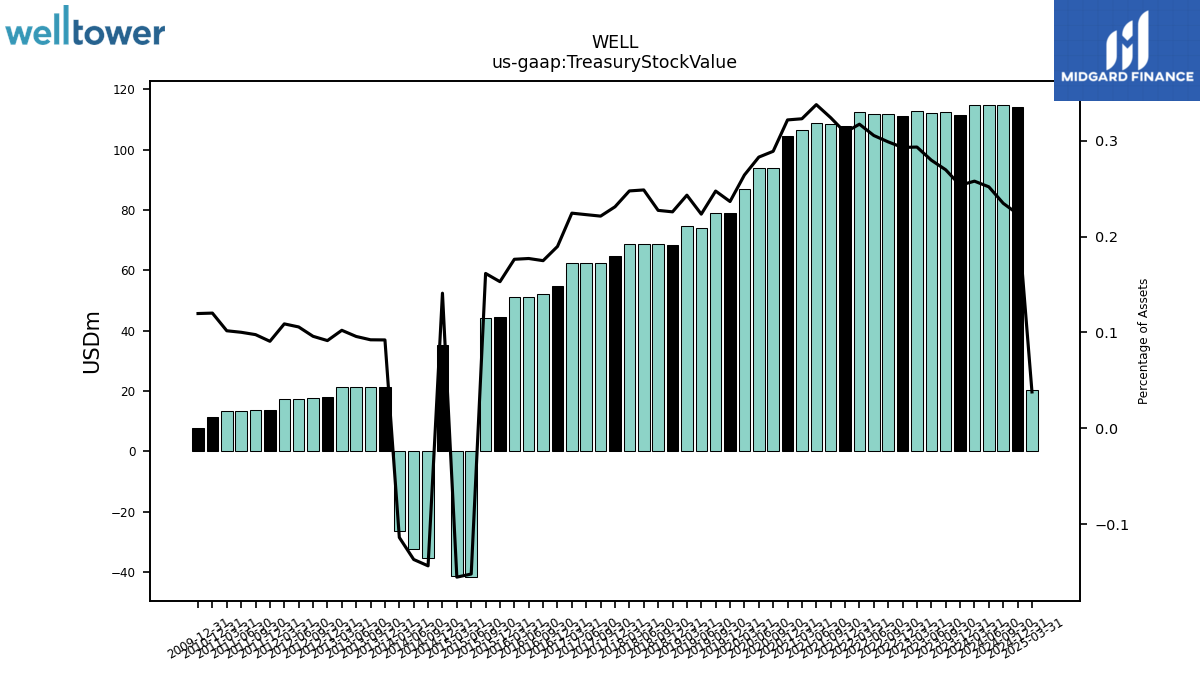
| Treasury Stock Value | 111.58 | 112.31 | 112.03 | 112.92 | 111.00 | 111.77 | 111.69 | 112.52 | 107.75 | 108.48 | 108.63 | 106.52 | 104.49 | 94.02 | 93.80 | 86.97 | 78.95 | 78.84 | 74.04 | 74.49 | 68.50 | 68.75 | 68.66 | 68.70 | 64.56 | 62.36 | 62.34 | 62.31 | 54.74 | 52.19 | 51.29 | 51.27 | 44.37 | 44.34 | -41.69 | -41.37 | 35.24 | -35.24 | -32.29 | -26.45 | 21.26 | 21.26 | 21.25 | 21.24 | 17.88 | 17.53 | 17.27 | 17.27 | 13.54 | 13.54 | 13.49 | 13.48 | 11.35 | NA | NA | NA | |
| Minority Interest | 676.75 | 619.79 | 619.48 | 755.80 | 714.74 | 887.38 | 897.72 | 836.49 | 960.58 | 919.71 | 930.38 | 892.14 | 908.85 | 853.23 | 888.39 | 933.55 | 966.18 | 959.66 | 975.12 | 969.34 | 954.26 | 961.52 | 458.56 | 500.89 | 502.31 | 514.74 | 484.69 | 474.06 | 475.08 | 474.39 | 475.19 | 480.20 | 585.33 | 492.08 | 358.11 | 362.56 | 297.90 | 309.81 | 332.12 | 328.37 | 341.75 | 353.96 | 420.00 | 202.38 | 225.72 | 166.38 | 169.72 | 157.63 | 153.88 | 114.37 | 134.85 | 150.46 | 130.25 | NA | NA | NA |
| 2023-12-31 | 2023-09-30 | 2023-06-30 | 2023-03-31 | 2022-12-31 | 2022-09-30 | 2022-06-30 | 2022-03-31 | 2021-12-31 | 2021-09-30 | 2021-06-30 | 2021-03-31 | 2020-12-31 | 2020-09-30 | 2020-06-30 | 2020-03-31 | 2019-12-31 | 2019-09-30 | 2019-06-30 | 2019-03-31 | 2018-12-31 | 2018-09-30 | 2018-06-30 | 2018-03-31 | 2017-12-31 | 2017-09-30 | 2017-06-30 | 2017-03-31 | 2016-12-31 | 2016-09-30 | 2016-06-30 | 2016-03-31 | 2015-12-31 | 2015-09-30 | 2015-06-30 | 2015-03-31 | 2014-12-31 | 2014-09-30 | 2014-06-30 | 2014-03-31 | 2013-12-31 | 2013-09-30 | 2013-06-30 | 2013-03-31 | 2012-12-31 | 2012-09-30 | 2012-06-30 | 2012-03-31 | 2011-12-31 | 2011-09-30 | 2011-06-30 | 2011-03-31 | 2010-12-31 | 2010-09-30 | 2010-06-30 | 2010-03-31 | ||
|---|---|---|---|---|---|---|---|---|---|---|---|---|---|---|---|---|---|---|---|---|---|---|---|---|---|---|---|---|---|---|---|---|---|---|---|---|---|---|---|---|---|---|---|---|---|---|---|---|---|---|---|---|---|---|---|---|---|
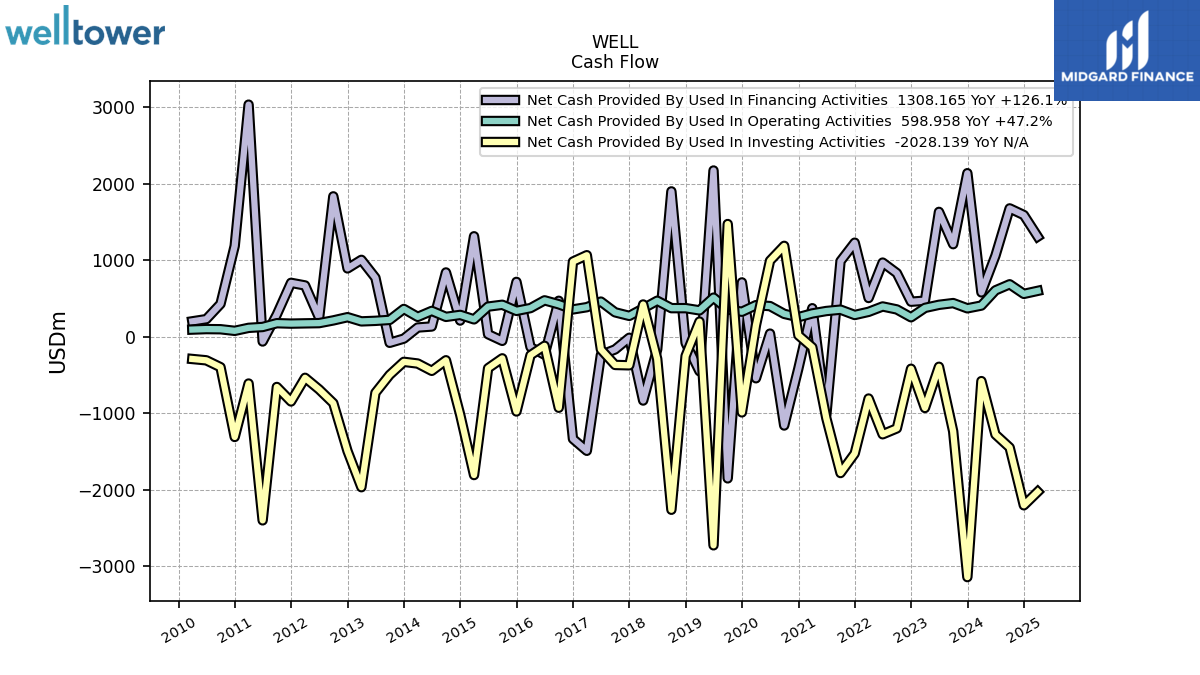
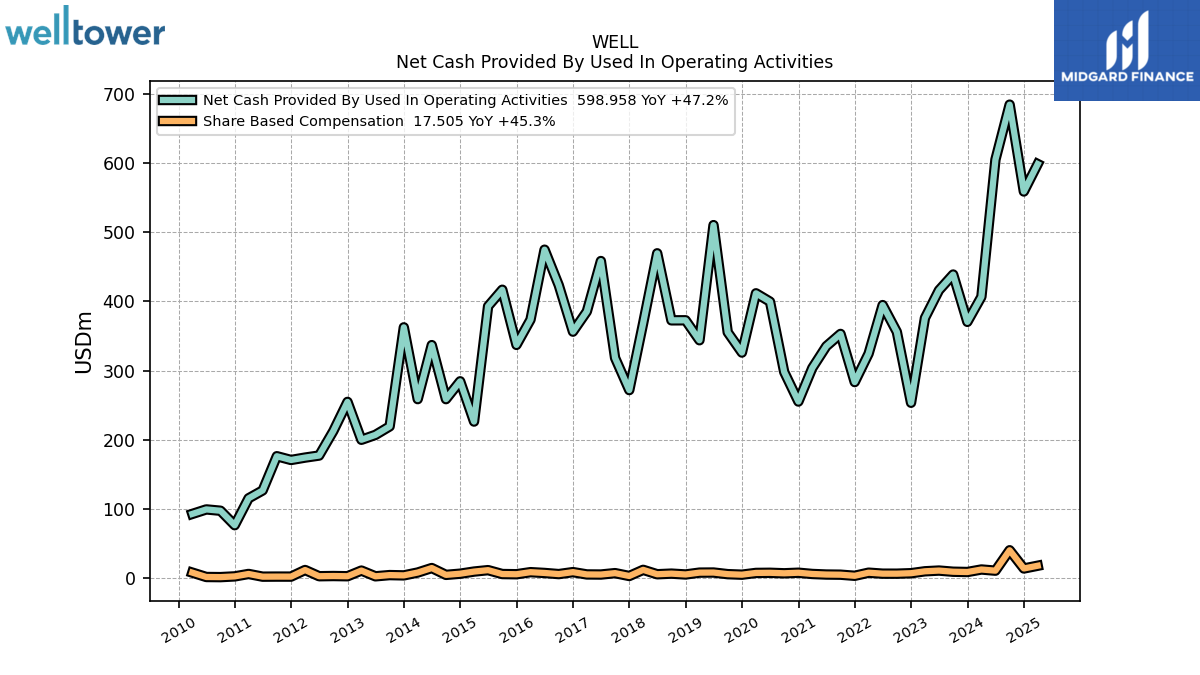
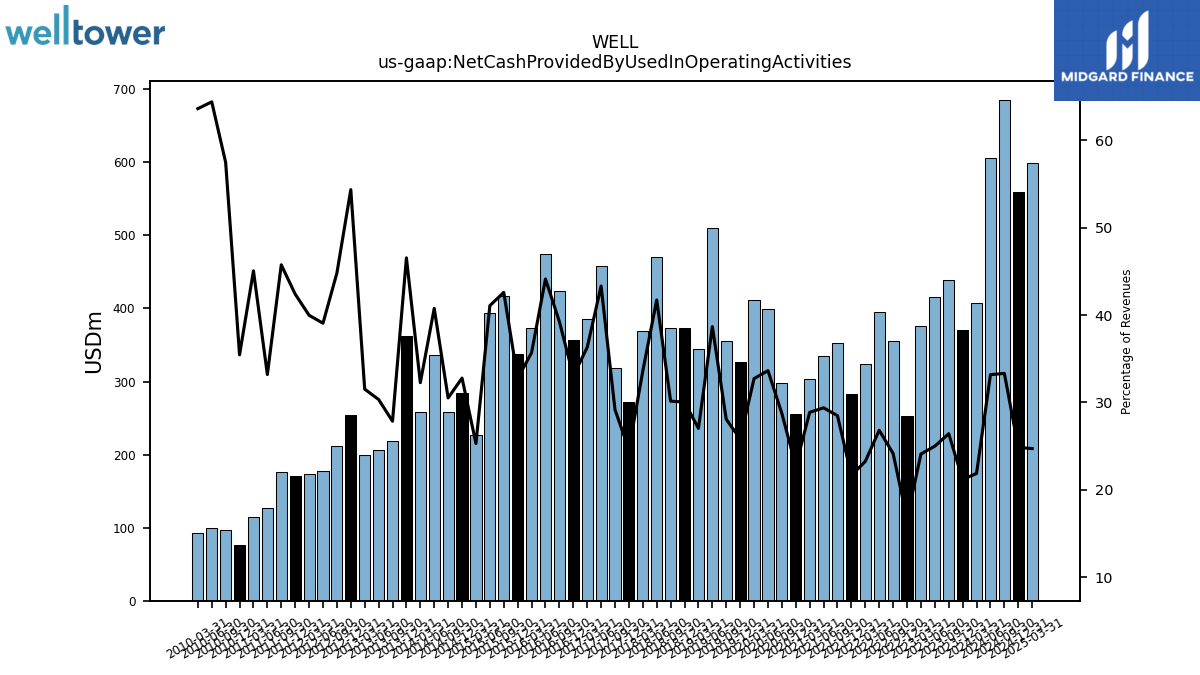
| Net Cash Provided By Used In Operating Activities | 370.50 | 439.06 | 416.25 | 376.06 | 253.39 | 355.99 | 394.81 | 324.52 | 283.33 | 353.08 | 335.25 | 303.66 | 255.17 | 297.97 | 399.76 | 411.86 | 326.07 | 355.42 | 510.59 | 343.89 | 372.80 | 372.72 | 469.78 | 368.64 | 271.71 | 318.36 | 458.58 | 385.53 | 356.35 | 423.61 | 475.03 | 373.71 | 337.14 | 417.02 | 393.12 | 226.18 | 284.50 | 258.63 | 336.87 | 258.66 | 362.59 | 219.17 | 206.93 | 199.81 | 254.66 | 212.43 | 176.99 | 174.04 | 170.59 | 176.03 | 126.49 | 115.11 | 76.14 | 97.10 | 99.02 | 92.49 | |
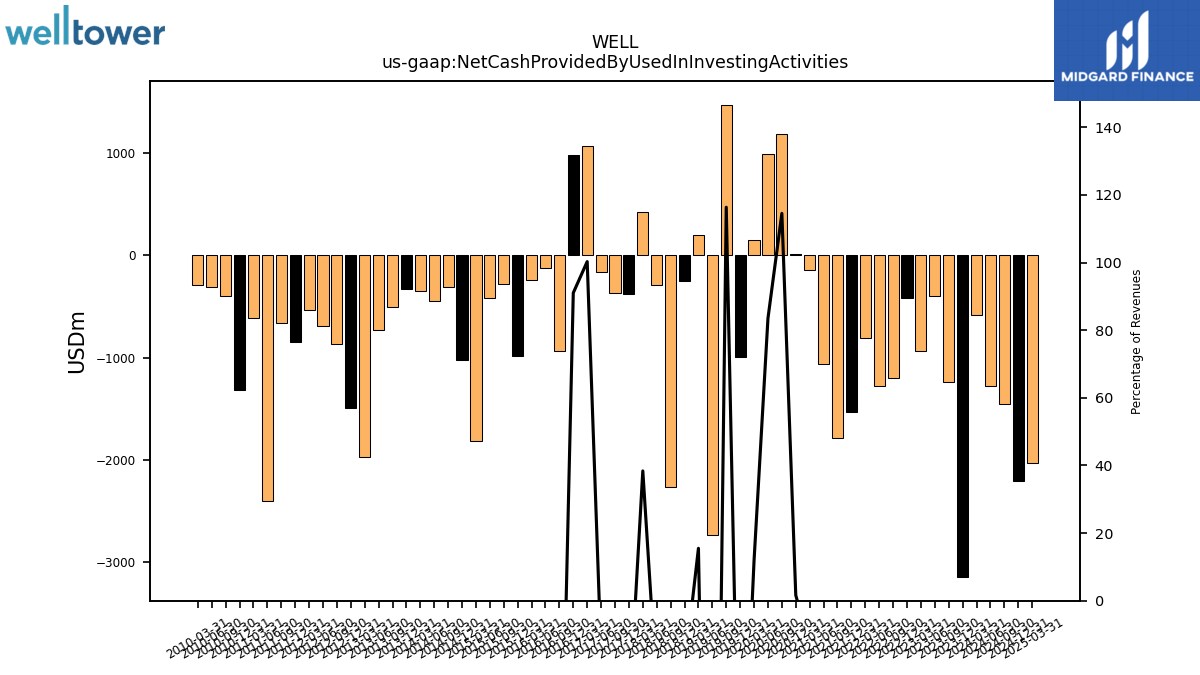
| Net Cash Provided By Used In Investing Activities | -3144.19 | -1237.34 | -393.38 | -932.84 | -419.31 | -1199.25 | -1276.71 | -808.55 | -1527.80 | -1783.34 | -1065.99 | -139.14 | 18.18 | 1187.57 | 992.43 | 149.75 | -990.47 | 1473.04 | -2728.63 | 197.27 | -253.18 | -2263.54 | -290.83 | 421.08 | -374.62 | -369.93 | -166.11 | 1065.24 | 981.63 | -929.70 | -119.47 | -241.96 | -978.52 | -283.25 | -412.63 | -1809.77 | -1019.31 | -308.47 | -447.03 | -351.39 | -329.04 | -499.99 | -733.87 | -1968.70 | -1495.37 | -869.77 | -690.00 | -537.84 | -847.49 | -657.74 | -2402.19 | -612.71 | -1311.79 | -399.11 | -309.28 | -291.86 | |
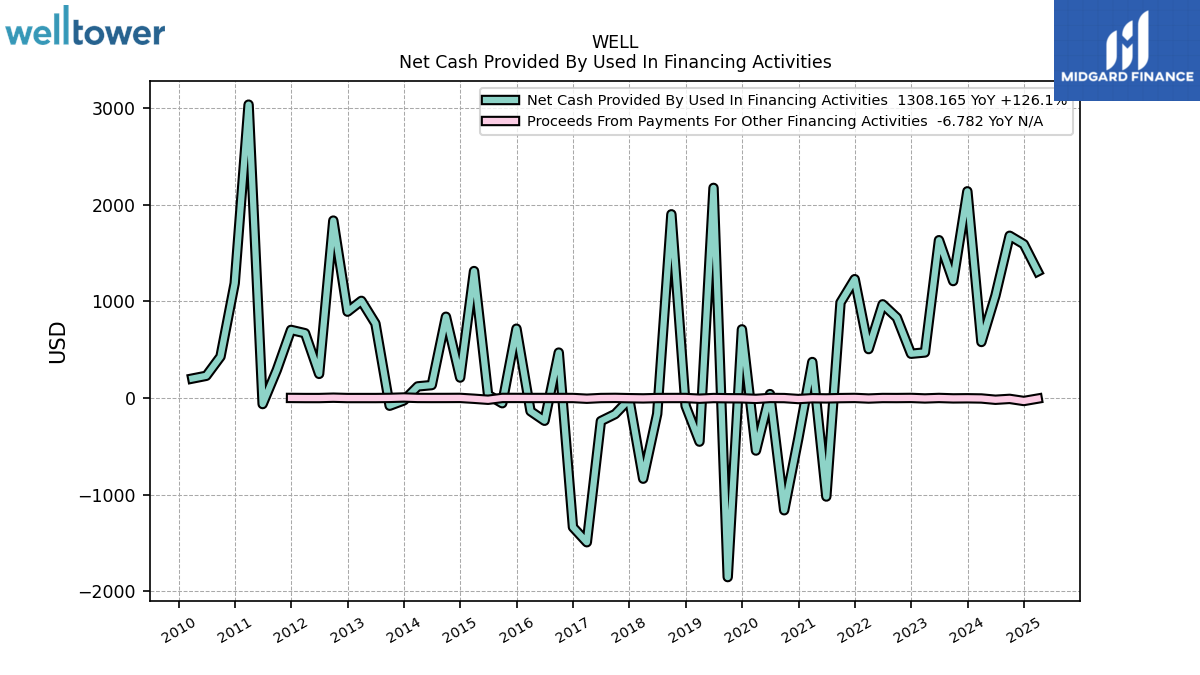
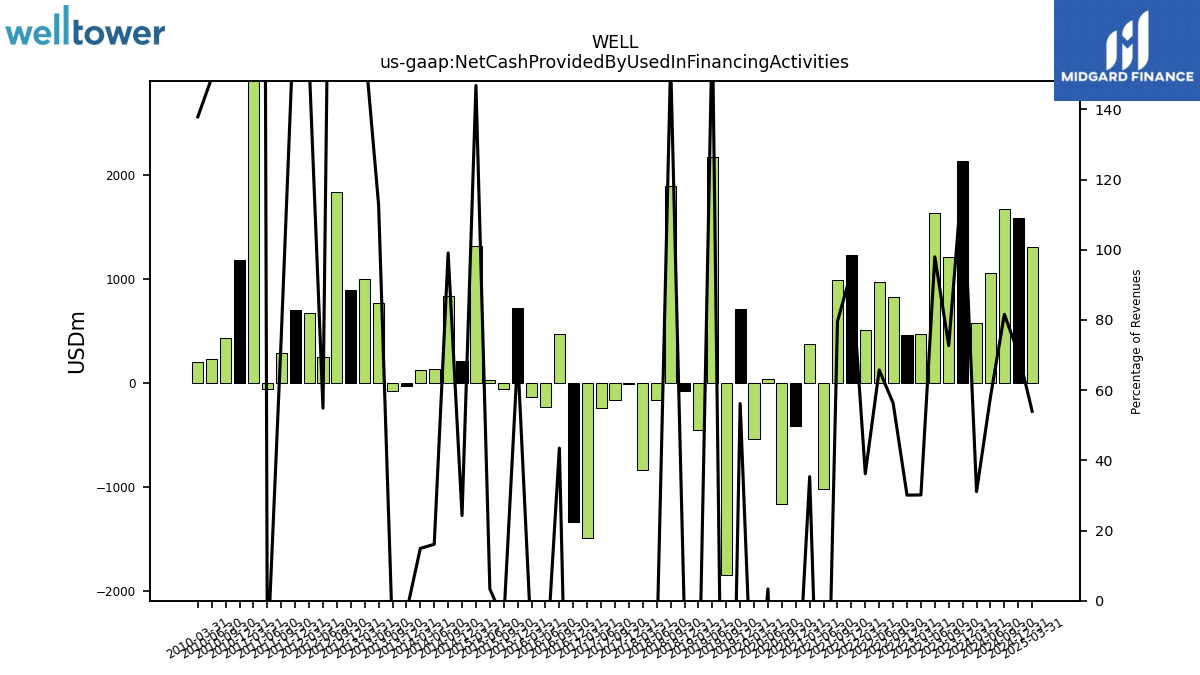
| Net Cash Provided By Used In Financing Activities | 2137.54 | 1208.79 | 1631.84 | 470.47 | 457.04 | 830.62 | 968.51 | 505.11 | 1228.74 | 987.03 | -1020.02 | 371.90 | -414.66 | -1161.89 | 39.99 | -544.29 | 709.68 | -1853.34 | 2173.01 | -452.20 | -81.19 | 1899.85 | -164.94 | -835.35 | -14.42 | -167.13 | -239.35 | -1492.63 | -1336.64 | 469.37 | -236.15 | -137.03 | 716.50 | -54.77 | 31.89 | 1312.82 | 210.68 | 839.97 | 132.92 | 119.60 | -25.64 | -80.56 | 769.45 | 1004.42 | 892.21 | 1834.70 | 248.69 | 669.53 | 703.71 | 289.62 | -63.53 | 3034.02 | 1186.08 | 427.74 | 229.12 | 200.46 |
| 2023-12-31 | 2023-09-30 | 2023-06-30 | 2023-03-31 | 2022-12-31 | 2022-09-30 | 2022-06-30 | 2022-03-31 | 2021-12-31 | 2021-09-30 | 2021-06-30 | 2021-03-31 | 2020-12-31 | 2020-09-30 | 2020-06-30 | 2020-03-31 | 2019-12-31 | 2019-09-30 | 2019-06-30 | 2019-03-31 | 2018-12-31 | 2018-09-30 | 2018-06-30 | 2018-03-31 | 2017-12-31 | 2017-09-30 | 2017-06-30 | 2017-03-31 | 2016-12-31 | 2016-09-30 | 2016-06-30 | 2016-03-31 | 2015-12-31 | 2015-09-30 | 2015-06-30 | 2015-03-31 | 2014-12-31 | 2014-09-30 | 2014-06-30 | 2014-03-31 | 2013-12-31 | 2013-09-30 | 2013-06-30 | 2013-03-31 | 2012-12-31 | 2012-09-30 | 2012-06-30 | 2012-03-31 | 2011-12-31 | 2011-09-30 | 2011-06-30 | 2011-03-31 | 2010-12-31 | 2010-09-30 | 2010-06-30 | 2010-03-31 | ||
|---|---|---|---|---|---|---|---|---|---|---|---|---|---|---|---|---|---|---|---|---|---|---|---|---|---|---|---|---|---|---|---|---|---|---|---|---|---|---|---|---|---|---|---|---|---|---|---|---|---|---|---|---|---|---|---|---|---|
| Net Cash Provided By Used In Operating Activities | 370.50 | 439.06 | 416.25 | 376.06 | 253.39 | 355.99 | 394.81 | 324.52 | 283.33 | 353.08 | 335.25 | 303.66 | 255.17 | 297.97 | 399.76 | 411.86 | 326.07 | 355.42 | 510.59 | 343.89 | 372.80 | 372.72 | 469.78 | 368.64 | 271.71 | 318.36 | 458.58 | 385.53 | 356.35 | 423.61 | 475.03 | 373.71 | 337.14 | 417.02 | 393.12 | 226.18 | 284.50 | 258.63 | 336.87 | 258.66 | 362.59 | 219.17 | 206.93 | 199.81 | 254.66 | 212.43 | 176.99 | 174.04 | 170.59 | 176.03 | 126.49 | 115.11 | 76.14 | 97.10 | 99.02 | 92.49 | |
| Profit Loss | 88.44 | 134.72 | 106.34 | 28.64 | 1.80 | -2.65 | 95.67 | 65.75 | 66.19 | 190.34 | 45.76 | 72.19 | 155.28 | 394.98 | 159.22 | 329.38 | 240.14 | 647.93 | 150.04 | 292.30 | 124.70 | 84.23 | 167.27 | 453.56 | -89.74 | 89.30 | 203.44 | 337.61 | 351.11 | 354.74 | 210.75 | 165.47 | 149.41 | 199.26 | 330.46 | 209.42 | 206.47 | 152.77 | 87.85 | 65.20 | 25.69 | 33.60 | 7.18 | 71.80 | 107.00 | 53.51 | 76.88 | 57.46 | 42.34 | 52.35 | 86.21 | 31.81 | 46.03 | 0.09 | 51.06 | 31.69 | |
| Share Based Compensation | 8.42 | 8.82 | 10.50 | 9.46 | 6.69 | 5.99 | 6.02 | 7.45 | 2.94 | 4.54 | 4.76 | 5.58 | 7.38 | 6.57 | 7.29 | 7.08 | 4.55 | 5.31 | 7.66 | 7.53 | 4.85 | 6.08 | 5.17 | 11.56 | 2.64 | 6.79 | 4.76 | 4.91 | 8.25 | 5.40 | 7.03 | 8.19 | 5.19 | 5.48 | 11.12 | 9.05 | 5.97 | 4.27 | 14.17 | 7.67 | 3.53 | 3.96 | 2.19 | 10.51 | 2.29 | 2.59 | 2.31 | 11.32 | 1.75 | 1.77 | 1.68 | 5.59 | 2.07 | 1.01 | 1.20 | 7.55 |
| 2023-12-31 | 2023-09-30 | 2023-06-30 | 2023-03-31 | 2022-12-31 | 2022-09-30 | 2022-06-30 | 2022-03-31 | 2021-12-31 | 2021-09-30 | 2021-06-30 | 2021-03-31 | 2020-12-31 | 2020-09-30 | 2020-06-30 | 2020-03-31 | 2019-12-31 | 2019-09-30 | 2019-06-30 | 2019-03-31 | 2018-12-31 | 2018-09-30 | 2018-06-30 | 2018-03-31 | 2017-12-31 | 2017-09-30 | 2017-06-30 | 2017-03-31 | 2016-12-31 | 2016-09-30 | 2016-06-30 | 2016-03-31 | 2015-12-31 | 2015-09-30 | 2015-06-30 | 2015-03-31 | 2014-12-31 | 2014-09-30 | 2014-06-30 | 2014-03-31 | 2013-12-31 | 2013-09-30 | 2013-06-30 | 2013-03-31 | 2012-12-31 | 2012-09-30 | 2012-06-30 | 2012-03-31 | 2011-12-31 | 2011-09-30 | 2011-06-30 | 2011-03-31 | 2010-12-31 | 2010-09-30 | 2010-06-30 | 2010-03-31 | ||
|---|---|---|---|---|---|---|---|---|---|---|---|---|---|---|---|---|---|---|---|---|---|---|---|---|---|---|---|---|---|---|---|---|---|---|---|---|---|---|---|---|---|---|---|---|---|---|---|---|---|---|---|---|---|---|---|---|---|
| Net Cash Provided By Used In Investing Activities | -3144.19 | -1237.34 | -393.38 | -932.84 | -419.31 | -1199.25 | -1276.71 | -808.55 | -1527.80 | -1783.34 | -1065.99 | -139.14 | 18.18 | 1187.57 | 992.43 | 149.75 | -990.47 | 1473.04 | -2728.63 | 197.27 | -253.18 | -2263.54 | -290.83 | 421.08 | -374.62 | -369.93 | -166.11 | 1065.24 | 981.63 | -929.70 | -119.47 | -241.96 | -978.52 | -283.25 | -412.63 | -1809.77 | -1019.31 | -308.47 | -447.03 | -351.39 | -329.04 | -499.99 | -733.87 | -1968.70 | -1495.37 | -869.77 | -690.00 | -537.84 | -847.49 | -657.74 | -2402.19 | -612.71 | -1311.79 | -399.11 | -309.28 | -291.86 |
| 2023-12-31 | 2023-09-30 | 2023-06-30 | 2023-03-31 | 2022-12-31 | 2022-09-30 | 2022-06-30 | 2022-03-31 | 2021-12-31 | 2021-09-30 | 2021-06-30 | 2021-03-31 | 2020-12-31 | 2020-09-30 | 2020-06-30 | 2020-03-31 | 2019-12-31 | 2019-09-30 | 2019-06-30 | 2019-03-31 | 2018-12-31 | 2018-09-30 | 2018-06-30 | 2018-03-31 | 2017-12-31 | 2017-09-30 | 2017-06-30 | 2017-03-31 | 2016-12-31 | 2016-09-30 | 2016-06-30 | 2016-03-31 | 2015-12-31 | 2015-09-30 | 2015-06-30 | 2015-03-31 | 2014-12-31 | 2014-09-30 | 2014-06-30 | 2014-03-31 | 2013-12-31 | 2013-09-30 | 2013-06-30 | 2013-03-31 | 2012-12-31 | 2012-09-30 | 2012-06-30 | 2012-03-31 | 2011-12-31 | 2011-09-30 | 2011-06-30 | 2011-03-31 | 2010-12-31 | 2010-09-30 | 2010-06-30 | 2010-03-31 | ||
|---|---|---|---|---|---|---|---|---|---|---|---|---|---|---|---|---|---|---|---|---|---|---|---|---|---|---|---|---|---|---|---|---|---|---|---|---|---|---|---|---|---|---|---|---|---|---|---|---|---|---|---|---|---|---|---|---|---|
| Net Cash Provided By Used In Financing Activities | 2137.54 | 1208.79 | 1631.84 | 470.47 | 457.04 | 830.62 | 968.51 | 505.11 | 1228.74 | 987.03 | -1020.02 | 371.90 | -414.66 | -1161.89 | 39.99 | -544.29 | 709.68 | -1853.34 | 2173.01 | -452.20 | -81.19 | 1899.85 | -164.94 | -835.35 | -14.42 | -167.13 | -239.35 | -1492.63 | -1336.64 | 469.37 | -236.15 | -137.03 | 716.50 | -54.77 | 31.89 | 1312.82 | 210.68 | 839.97 | 132.92 | 119.60 | -25.64 | -80.56 | 769.45 | 1004.42 | 892.21 | 1834.70 | 248.69 | 669.53 | 703.71 | 289.62 | -63.53 | 3034.02 | 1186.08 | 427.74 | 229.12 | 200.46 | |
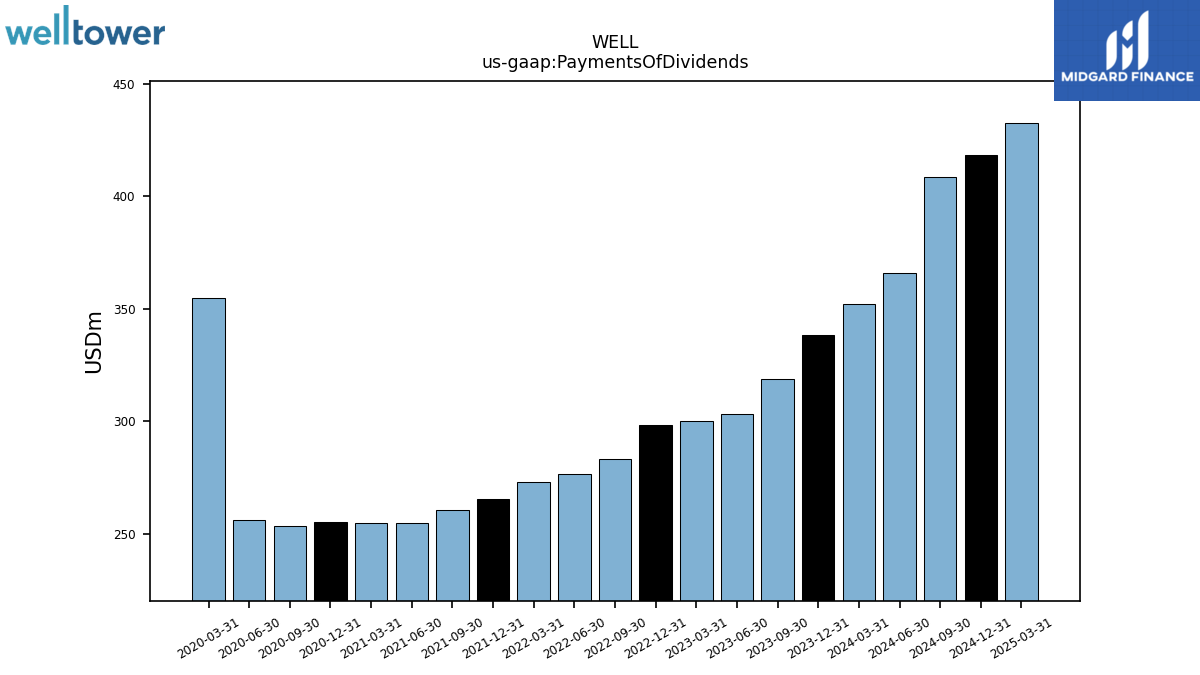
| Payments Of Dividends | 338.29 | 318.69 | 303.40 | 300.19 | 298.23 | 283.45 | 276.80 | 273.05 | 265.45 | 260.79 | 254.75 | 254.91 | 255.12 | 253.27 | 256.17 | 354.68 | NA | NA | NA | NA | NA | NA | NA | NA | NA | NA | NA | NA | NA | NA | NA | NA | NA | NA | NA | NA | NA | NA | NA | NA | NA | NA | NA | NA | NA | NA | NA | NA | NA | NA | NA | NA | NA | NA | NA | NA | |
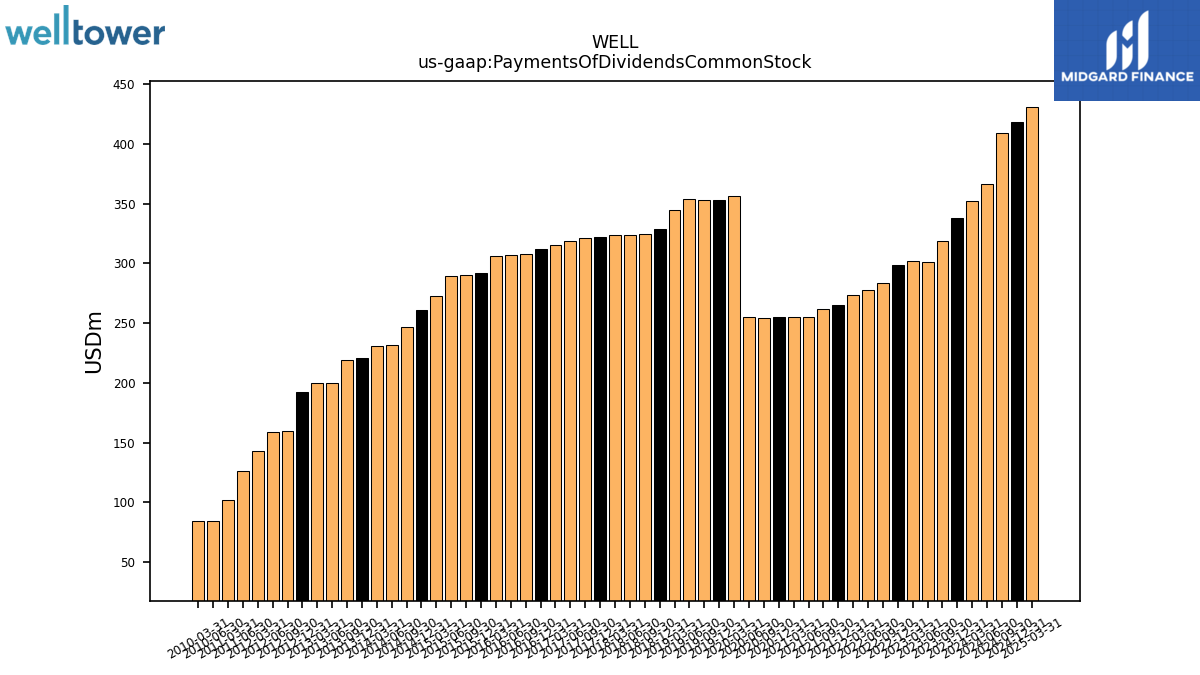
| Payments Of Dividends Common Stock | 338.36 | 318.72 | 300.77 | 301.83 | 298.40 | 283.50 | 277.62 | 273.67 | 265.21 | 261.56 | 255.47 | 254.95 | 254.83 | 254.51 | 254.85 | 356.00 | 353.29 | 353.25 | 353.68 | 344.76 | 328.86 | 324.18 | 323.37 | 323.73 | 321.69 | 321.33 | 318.88 | 315.42 | 312.14 | 308.22 | 307.39 | 305.77 | 292.16 | 290.65 | 289.35 | 272.57 | 260.74 | 246.37 | 231.75 | 230.80 | 220.95 | 219.18 | 200.27 | 199.55 | 192.38 | 159.43 | 158.58 | 142.92 | NA | NA | 126.53 | 102.04 | NA | NA | 84.55 | 84.52 |
| 2023-12-31 | 2023-09-30 | 2023-06-30 | 2023-03-31 | 2022-12-31 | 2022-09-30 | 2022-06-30 | 2022-03-31 | 2021-12-31 | 2021-09-30 | 2021-06-30 | 2021-03-31 | 2020-12-31 | 2020-09-30 | 2020-06-30 | 2020-03-31 | 2019-12-31 | 2019-09-30 | 2019-06-30 | 2019-03-31 | 2018-12-31 | 2018-09-30 | 2018-06-30 | 2018-03-31 | 2017-12-31 | 2017-09-30 | 2017-06-30 | 2017-03-31 | 2016-12-31 | 2016-09-30 | 2016-06-30 | 2016-03-31 | 2015-12-31 | 2015-09-30 | 2015-06-30 | 2015-03-31 | 2014-12-31 | 2014-09-30 | 2014-06-30 | 2014-03-31 | 2013-12-31 | 2013-09-30 | 2013-06-30 | 2013-03-31 | 2012-12-31 | 2012-09-30 | 2012-06-30 | 2012-03-31 | 2011-12-31 | 2011-09-30 | 2011-06-30 | 2011-03-31 | 2010-12-31 | 2010-09-30 | 2010-06-30 | 2010-03-31 | ||
|---|---|---|---|---|---|---|---|---|---|---|---|---|---|---|---|---|---|---|---|---|---|---|---|---|---|---|---|---|---|---|---|---|---|---|---|---|---|---|---|---|---|---|---|---|---|---|---|---|---|---|---|---|---|---|---|---|---|
| Revenues | 1749.78 | 1662.01 | 1665.48 | 1560.73 | 1518.53 | 1473.84 | 1472.54 | 1395.70 | 1309.26 | 1239.80 | 1140.99 | 1052.06 | 1122.02 | 1036.87 | 1188.47 | 1258.60 | 1262.82 | 1266.13 | 1320.11 | 1272.24 | 1241.24 | 1236.38 | 1125.91 | 1096.96 | 1104.26 | 1091.48 | 1058.60 | 1062.30 | 1078.32 | 1079.13 | 1076.66 | 1047.05 | 1029.48 | 979.00 | 957.17 | 894.18 | 867.77 | 847.52 | 826.45 | 801.81 | 779.01 | 786.93 | 682.12 | 633.91 | 468.54 | 474.14 | 453.08 | 435.36 | 402.35 | 384.79 | 381.06 | 255.48 | 214.80 | 168.94 | 153.75 | 145.38 | |
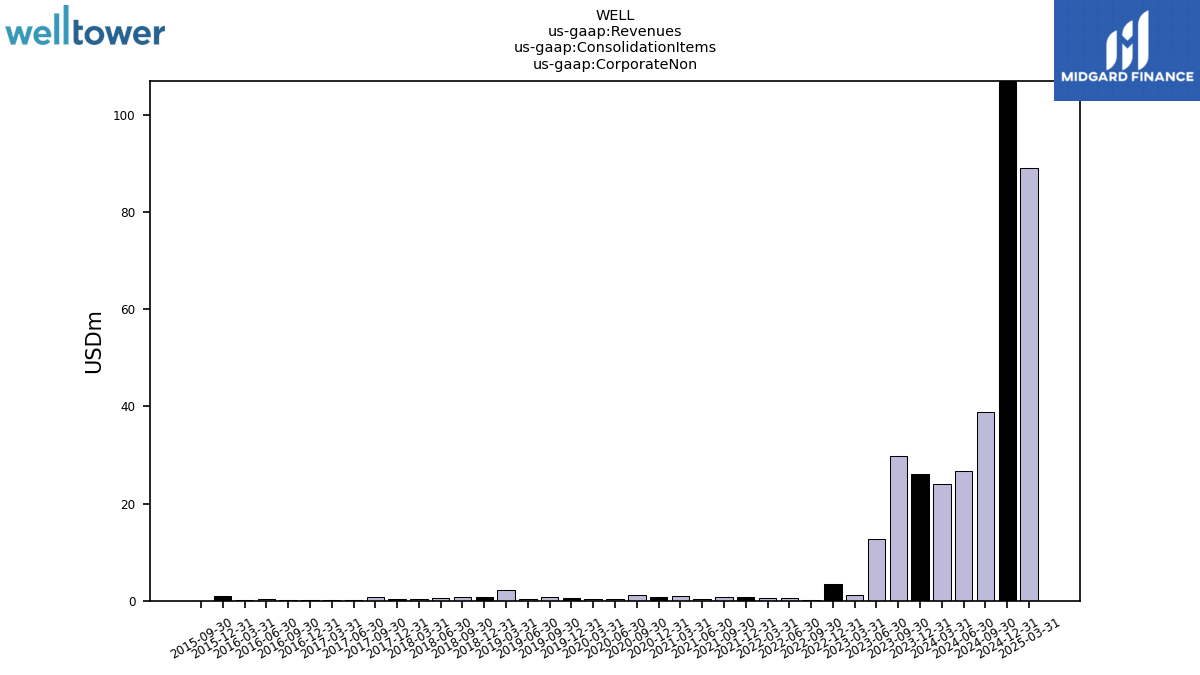
| Corporate Non | 26.16 | 29.83 | 12.72 | 1.15 | 3.44 | 0.25 | 0.64 | 0.61 | 0.82 | 0.79 | 0.43 | 0.95 | 0.81 | 1.18 | 0.38 | 0.42 | 0.51 | 0.84 | 0.45 | 2.16 | 0.71 | 0.69 | 0.50 | 0.37 | 0.37 | 0.70 | 0.24 | 0.23 | 0.23 | 0.19 | 0.45 | 0.06 | 1.01 | 0.02 | NA | NA | NA | NA | NA | NA | NA | NA | NA | NA | NA | NA | NA | NA | NA | NA | NA | NA | NA | NA | NA | NA | |
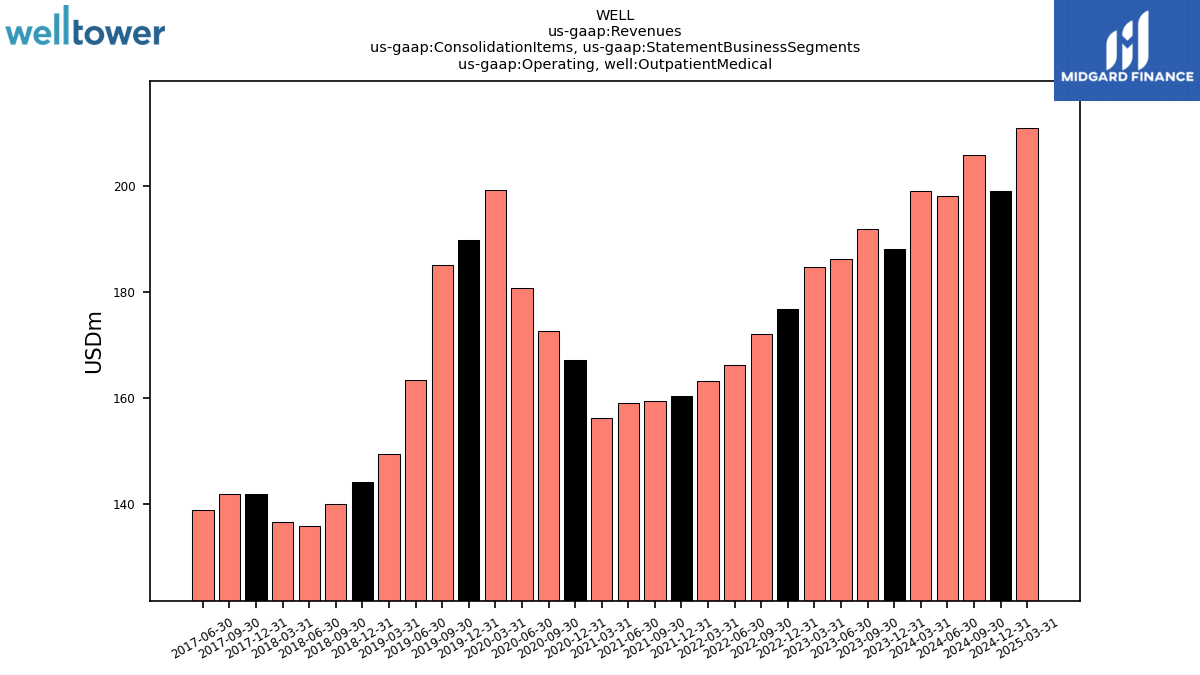
| Operating, Outpatient Medical | 188.17 | 191.96 | 186.19 | 184.83 | 176.93 | 172.18 | 166.32 | 163.32 | 160.49 | 159.50 | 159.07 | 156.22 | 167.16 | 172.70 | 180.83 | 199.33 | 189.81 | 185.19 | 163.37 | 149.46 | 144.24 | 140.07 | 135.83 | 136.67 | 142.02 | 141.99 | 138.93 | NA | NA | NA | NA | NA | NA | NA | NA | NA | NA | NA | NA | NA | NA | NA | NA | NA | NA | NA | NA | NA | NA | NA | NA | NA | NA | NA | NA | NA | |
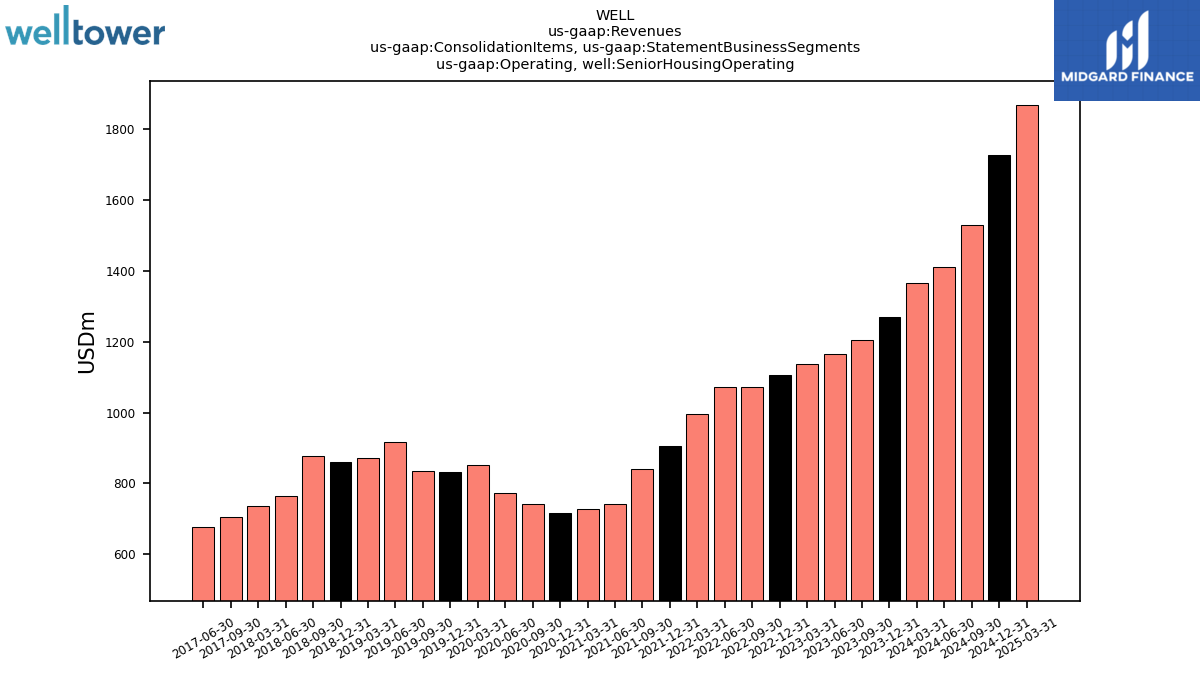
| Operating, Senior Housing Operating | 1268.62 | 1203.90 | 1164.44 | 1136.68 | 1104.99 | 1072.60 | 1071.21 | 996.61 | 904.78 | 839.52 | 742.55 | 726.40 | 715.02 | 742.07 | 773.65 | 851.13 | 833.46 | 835.50 | 915.53 | 872.39 | 861.62 | 876.50 | 765.17 | 737.17 | NA | 703.88 | 678.09 | NA | NA | NA | NA | NA | NA | NA | NA | NA | NA | NA | NA | NA | NA | NA | NA | NA | NA | NA | NA | NA | NA | NA | NA | NA | NA | NA | NA | NA | |
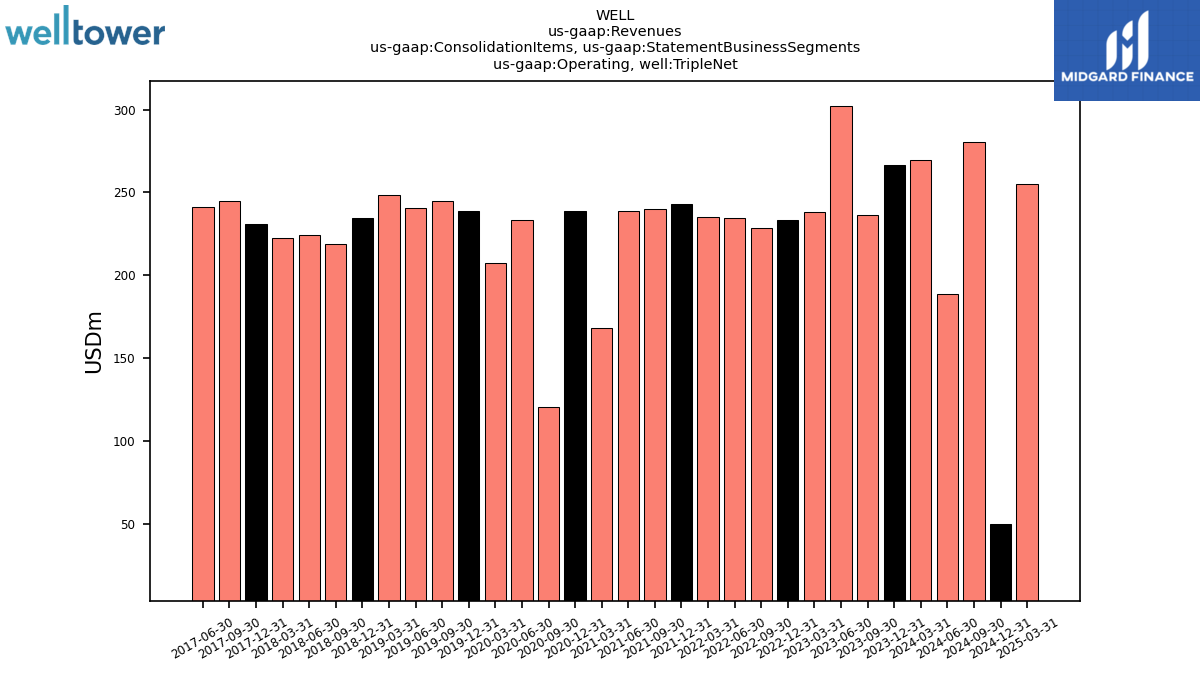
| Operating, Triple Net | 266.81 | 236.32 | 302.13 | 238.06 | 233.16 | 228.82 | 234.36 | 235.16 | 243.18 | 239.99 | 238.94 | 168.48 | 239.03 | 120.93 | 233.62 | 207.73 | 239.04 | 244.61 | 240.76 | 248.24 | 234.68 | 219.11 | 224.42 | 222.76 | 231.09 | 244.92 | 241.35 | NA | NA | NA | NA | NA | NA | NA | NA | NA | NA | NA | NA | NA | NA | NA | NA | NA | NA | NA | NA | NA | NA | NA | NA | NA | NA | NA | NA | NA | |
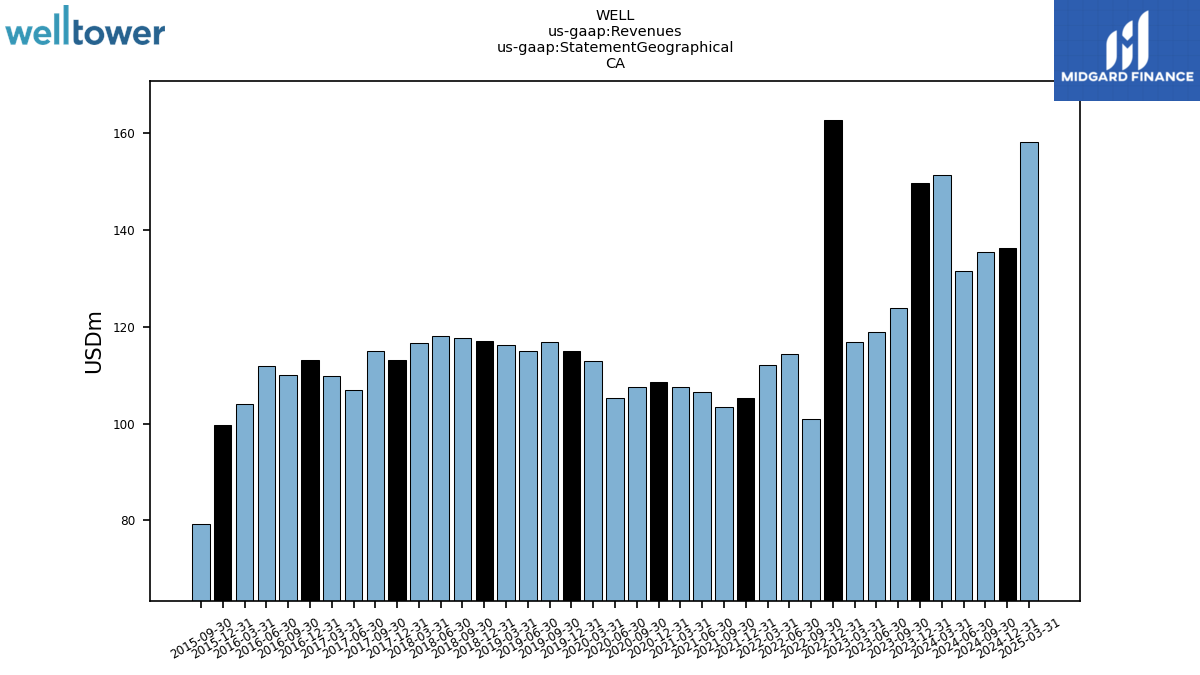
| 149.68 | 123.87 | 118.94 | 116.83 | 162.65 | 101.00 | 114.31 | 112.20 | 105.20 | 103.45 | 106.56 | 107.54 | 108.67 | 107.54 | 105.27 | 112.94 | 115.06 | 116.81 | 115.08 | 116.16 | 117.11 | 117.67 | 118.15 | 116.65 | 113.04 | 115.02 | 106.91 | 109.79 | 113.19 | 110.02 | 111.95 | 104.14 | 99.73 | 79.20 | NA | NA | NA | NA | NA | NA | NA | NA | NA | NA | NA | NA | NA | NA | NA | NA | NA | NA | NA | NA | NA | NA | ||
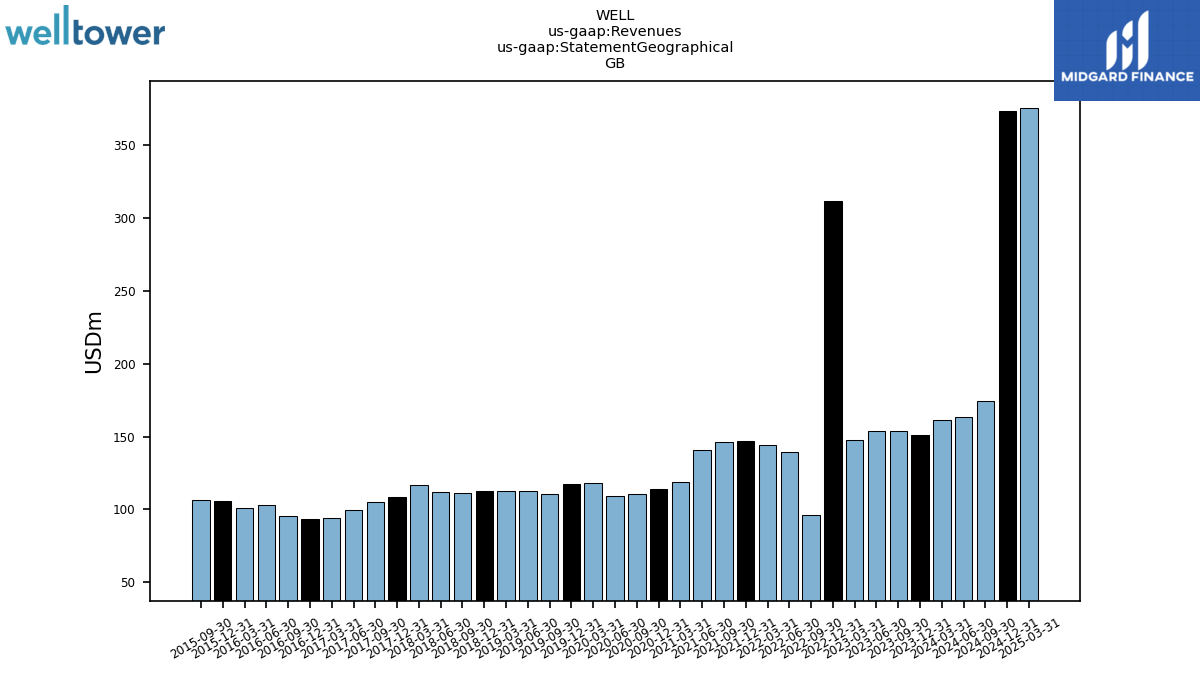
| 151.08 | 153.76 | 154.03 | 147.88 | 312.08 | 95.91 | 139.35 | 144.49 | 146.71 | 146.31 | 140.76 | 118.87 | 113.80 | 110.28 | 109.44 | 117.88 | 117.33 | 110.30 | 112.65 | 112.42 | 112.90 | 111.50 | 112.03 | 116.53 | 108.73 | 105.03 | 99.75 | 93.84 | 93.18 | 95.07 | 102.59 | 100.56 | 106.03 | 106.37 | NA | NA | NA | NA | NA | NA | NA | NA | NA | NA | NA | NA | NA | NA | NA | NA | NA | NA | NA | NA | NA | NA | ||
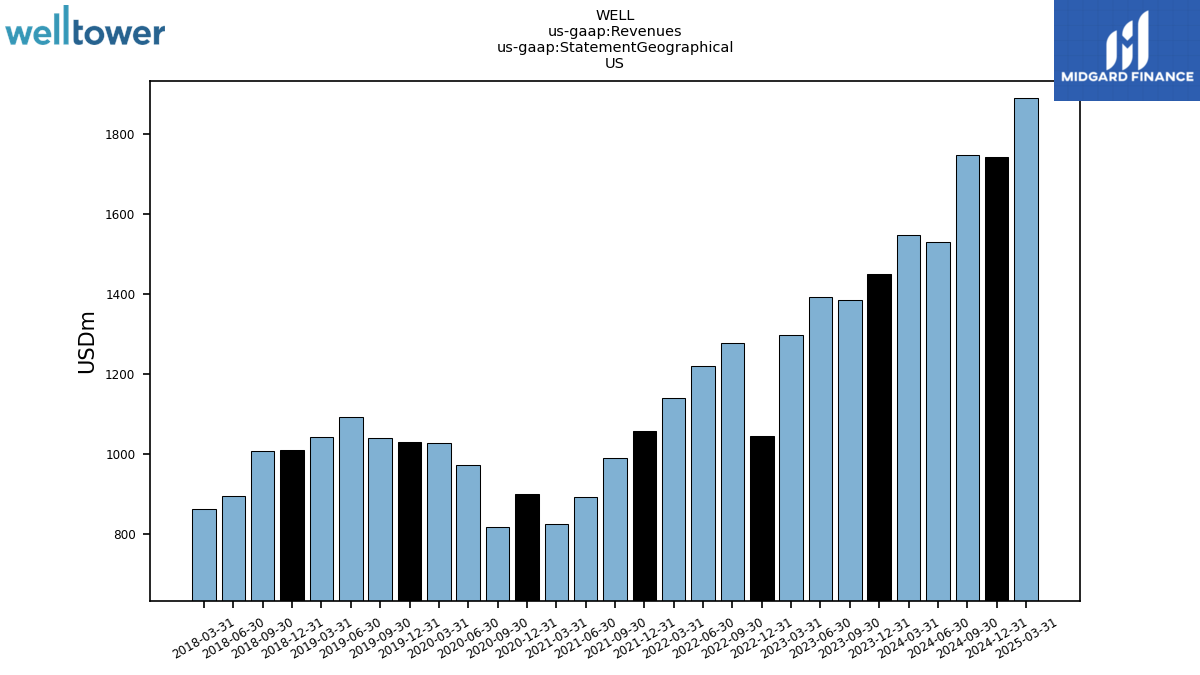
| US | 1449.02 | 1384.38 | 1392.51 | 1296.02 | 1043.80 | 1276.93 | 1218.88 | 1139.02 | 1057.35 | 990.03 | 893.67 | 825.65 | 899.55 | 819.06 | 973.77 | 1027.78 | 1030.43 | 1039.02 | 1092.38 | 1043.67 | 1011.23 | 1007.20 | 895.73 | 863.79 | NA | NA | NA | NA | NA | NA | NA | NA | NA | NA | NA | NA | NA | NA | NA | NA | NA | NA | NA | NA | NA | NA | NA | NA | NA | NA | NA | NA | NA | NA | NA | NA | |
| Revenue From Contract With Customer Excluding Assessed Tax | -134.42 | 1662.01 | 1665.48 | 1560.73 | -168.37 | 1473.84 | 1472.54 | 1395.70 | -235.63 | 1239.80 | 1140.99 | 1052.06 | 1122.02 | 1036.87 | 1188.47 | 1258.60 | 1262.82 | 1266.13 | 1320.11 | 1272.24 | 1241.24 | 1236.38 | 1125.91 | 1096.96 | 1104.26 | 1091.48 | 1058.60 | 1062.30 | 1078.32 | 1079.13 | 1076.66 | 1047.05 | 1029.48 | 979.00 | 957.17 | 894.18 | 867.77 | 847.52 | 826.45 | 801.81 | 779.01 | 786.93 | 682.12 | 633.91 | 468.54 | 474.14 | 453.08 | 435.36 | 402.35 | 384.79 | 381.06 | 255.48 | 214.80 | 168.94 | 153.75 | 145.38 |