
| 2023-09-30 | 2023-06-30 | 2023-03-31 | 2022-12-31 | 2022-09-30 | 2022-06-30 | 2022-03-31 | 2021-12-31 | 2021-09-30 | 2021-06-30 | 2021-03-31 | 2020-12-31 | 2020-09-30 | 2020-06-30 | 2020-03-31 | 2019-12-31 | 2019-09-30 | 2019-06-30 | 2019-03-31 | 2018-12-31 | 2018-09-30 | 2018-06-30 | 2018-03-31 | 2017-12-31 | 2017-09-30 | 2017-06-30 | 2017-03-31 | 2016-12-31 | 2016-09-30 | 2016-06-30 | 2016-03-31 | 2015-12-31 | 2015-09-30 | 2015-06-30 | 2015-03-31 | 2014-12-31 | 2014-09-30 | 2014-06-30 | 2014-03-31 | 2013-12-31 | 2013-09-30 | 2013-06-30 | 2013-03-31 | 2012-12-31 | 2012-09-30 | 2012-06-30 | 2012-03-31 | ||
|---|---|---|---|---|---|---|---|---|---|---|---|---|---|---|---|---|---|---|---|---|---|---|---|---|---|---|---|---|---|---|---|---|---|---|---|---|---|---|---|---|---|---|---|---|---|---|---|---|
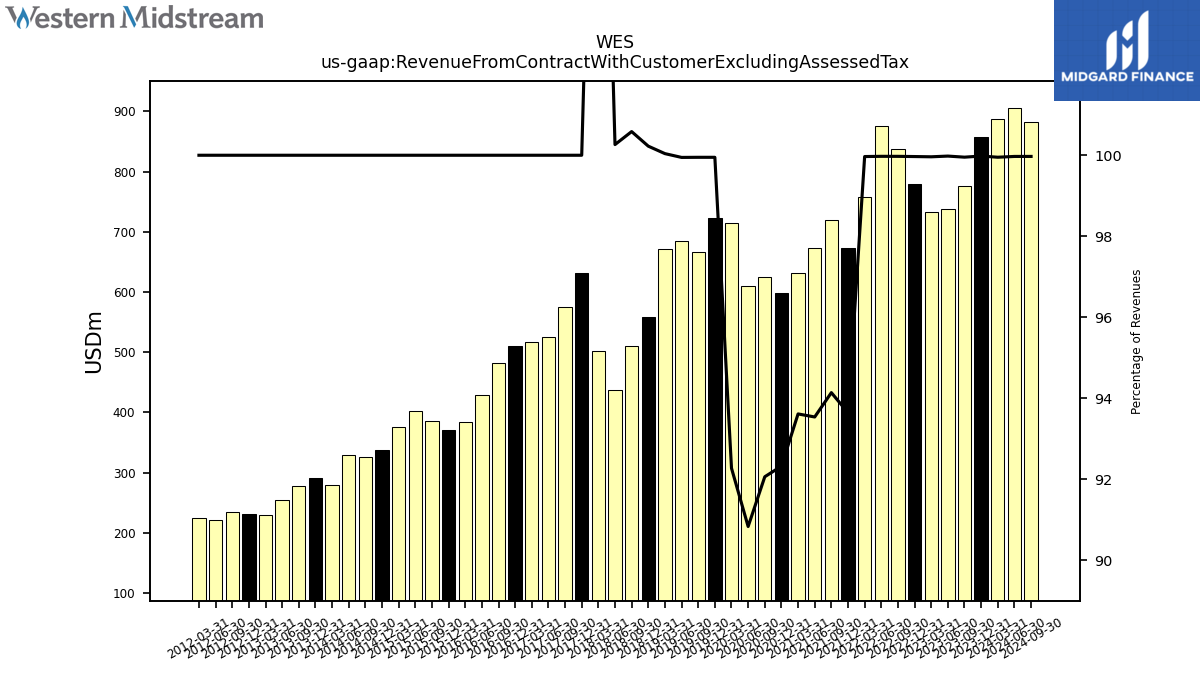
| Revenue From Contract With Customer Excluding Assessed Tax | 775.64 | 738.12 | 733.70 | 779.19 | 837.34 | 876.19 | 758.05 | 673.50 | 719.08 | 672.67 | 631.87 | 597.78 | 625.15 | 610.19 | 714.49 | 722.84 | 665.69 | 684.69 | 672.15 | 559.04 | 510.73 | 437.10 | 502.06 | 632.02 | 574.70 | 525.45 | 516.19 | 510.82 | 481.64 | 428.66 | 383.14 | 371.29 | 385.10 | 402.41 | 375.09 | 337.90 | 326.46 | 329.94 | 279.46 | 290.62 | 278.00 | 255.13 | 229.75 | 230.87 | 234.73 | 220.31 | 224.68 | |
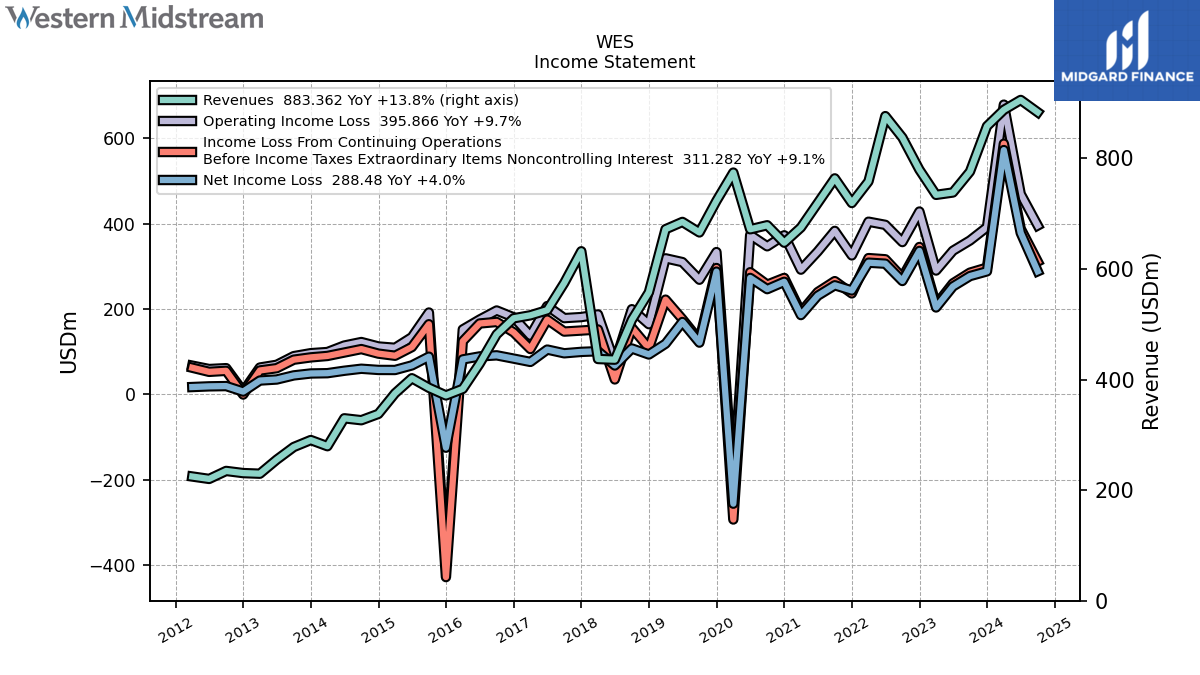
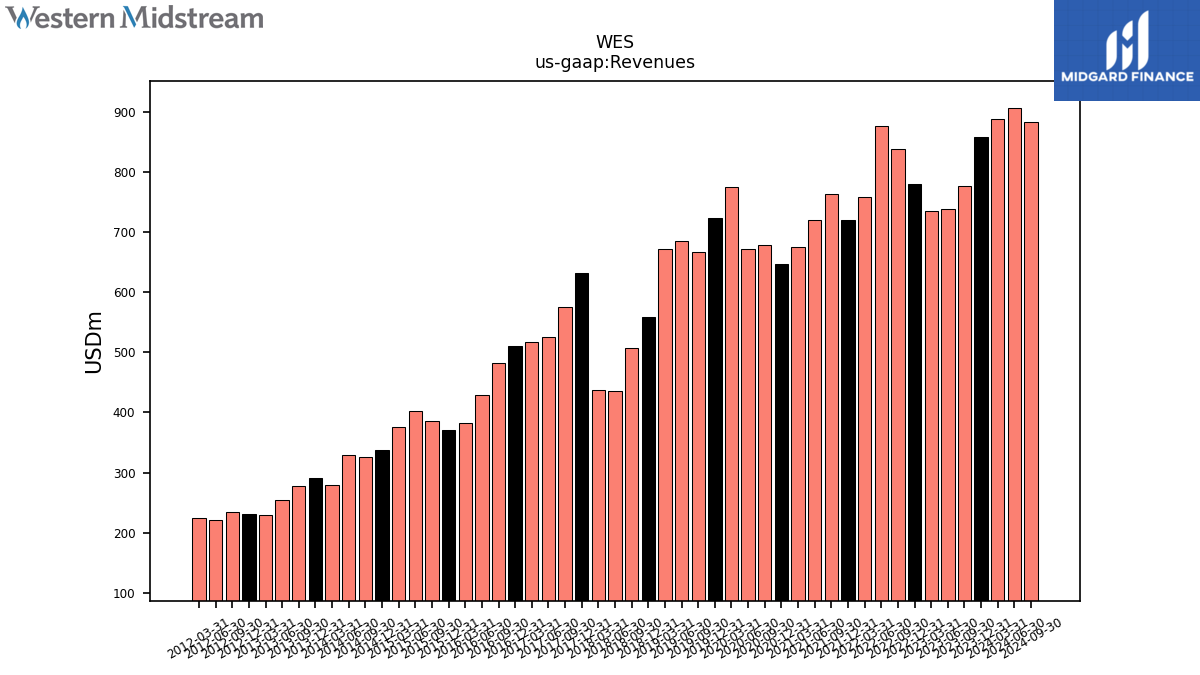
| Revenues | 776.01 | 738.27 | 733.98 | 779.44 | 837.57 | 876.42 | 758.30 | 719.21 | 763.84 | 719.13 | 674.97 | 647.48 | 679.04 | 671.75 | 774.31 | 723.21 | 666.03 | 685.05 | 671.88 | 557.79 | 507.76 | 435.95 | 437.17 | 632.02 | 574.70 | 525.45 | 516.19 | 510.82 | 481.64 | 428.66 | 383.14 | 371.29 | 385.10 | 402.41 | 375.09 | 337.90 | 326.46 | 329.94 | 279.46 | 290.62 | 278.00 | 255.13 | 229.75 | 230.87 | 234.73 | 220.31 | 224.68 | |
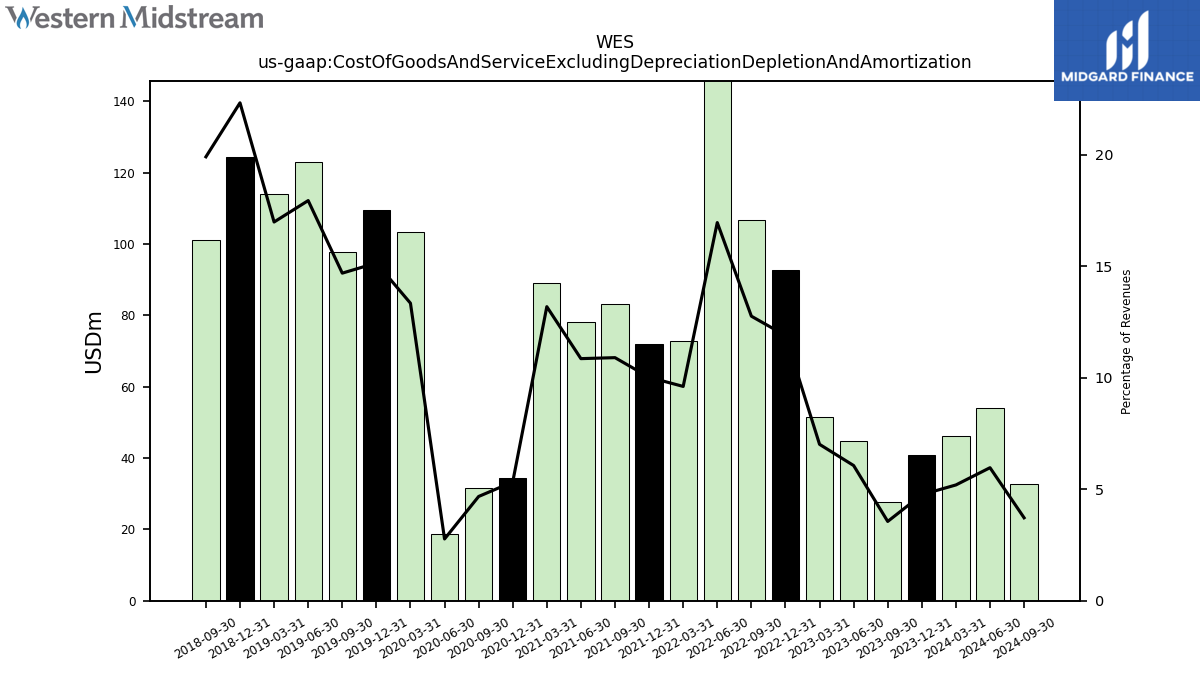
| Cost Of Goods And Service Excluding Depreciation Depletion And Amortization | 27.59 | 44.75 | 51.46 | 92.66 | 106.83 | 148.56 | 72.85 | 72.04 | 83.23 | 78.04 | 88.97 | 34.48 | 31.74 | 18.60 | 103.27 | 109.51 | 97.80 | 122.88 | 114.06 | 124.50 | 101.03 | NA | NA | NA | NA | NA | NA | NA | NA | NA | NA | NA | NA | NA | NA | NA | NA | NA | NA | NA | NA | NA | NA | NA | NA | NA | NA | |
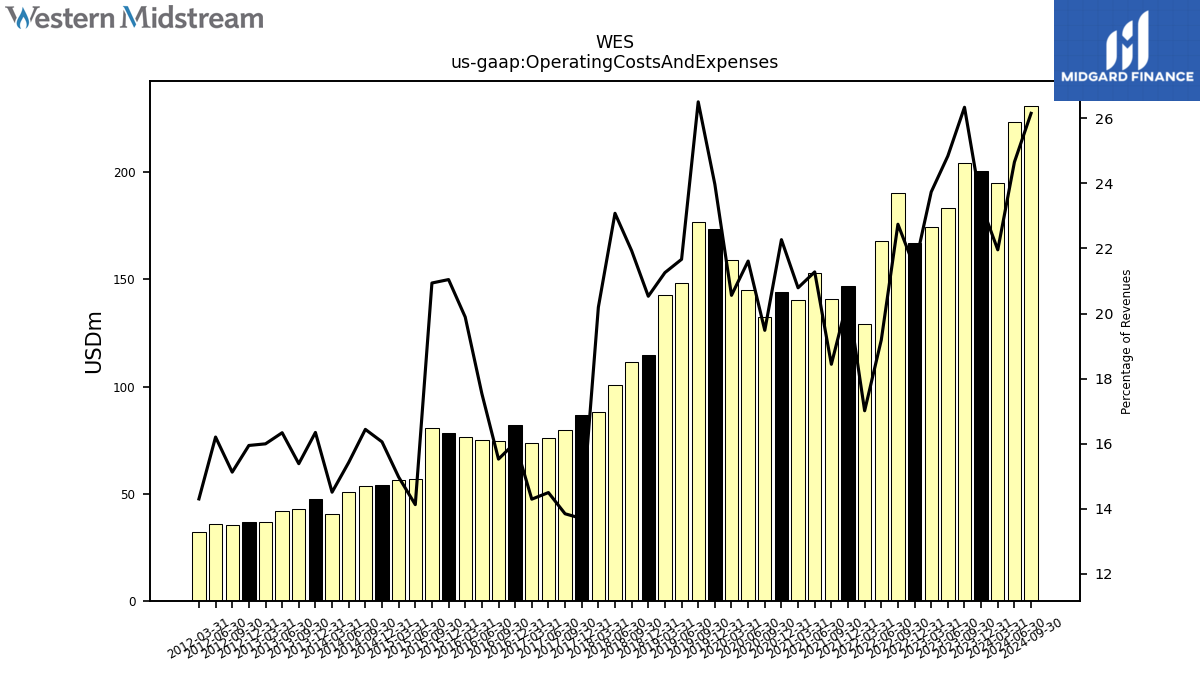
| Operating Costs And Expenses | 204.43 | 183.43 | 174.24 | 166.92 | 190.51 | 168.15 | 128.98 | 147.10 | 140.84 | 153.03 | 140.33 | 144.20 | 132.29 | 145.19 | 159.19 | 173.39 | 176.57 | 148.43 | 142.83 | 114.52 | 111.36 | 100.63 | 88.28 | 86.55 | 79.54 | 76.15 | 73.76 | 81.87 | 74.75 | 75.17 | 76.21 | 78.13 | 80.63 | 56.83 | 56.15 | 54.24 | 53.66 | 50.88 | 40.53 | 47.49 | 42.76 | 41.67 | 36.74 | 36.80 | 35.49 | 35.69 | 32.12 | |
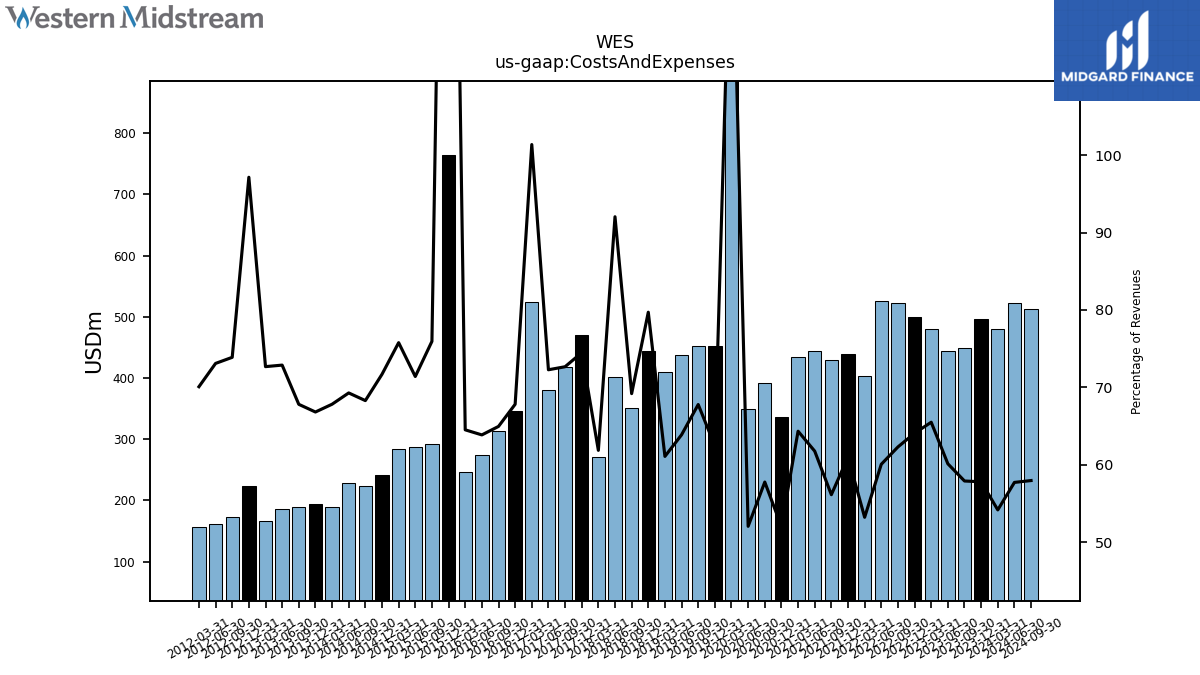
| Costs And Expenses | 449.26 | 443.86 | 480.67 | 499.43 | 521.76 | 526.35 | 403.45 | 438.56 | 428.72 | 444.07 | 434.22 | 336.77 | 392.21 | 349.56 | 1050.52 | 451.61 | 451.44 | 437.53 | 410.36 | 444.63 | 351.31 | 401.30 | 270.41 | 470.74 | 417.59 | 379.75 | 523.33 | 346.39 | 312.82 | 273.71 | 247.16 | 763.77 | 292.46 | 287.32 | 284.23 | 242.23 | 222.93 | 228.58 | 189.52 | 194.17 | 188.50 | 185.92 | 166.98 | 224.30 | 173.42 | 161.03 | 157.46 | |
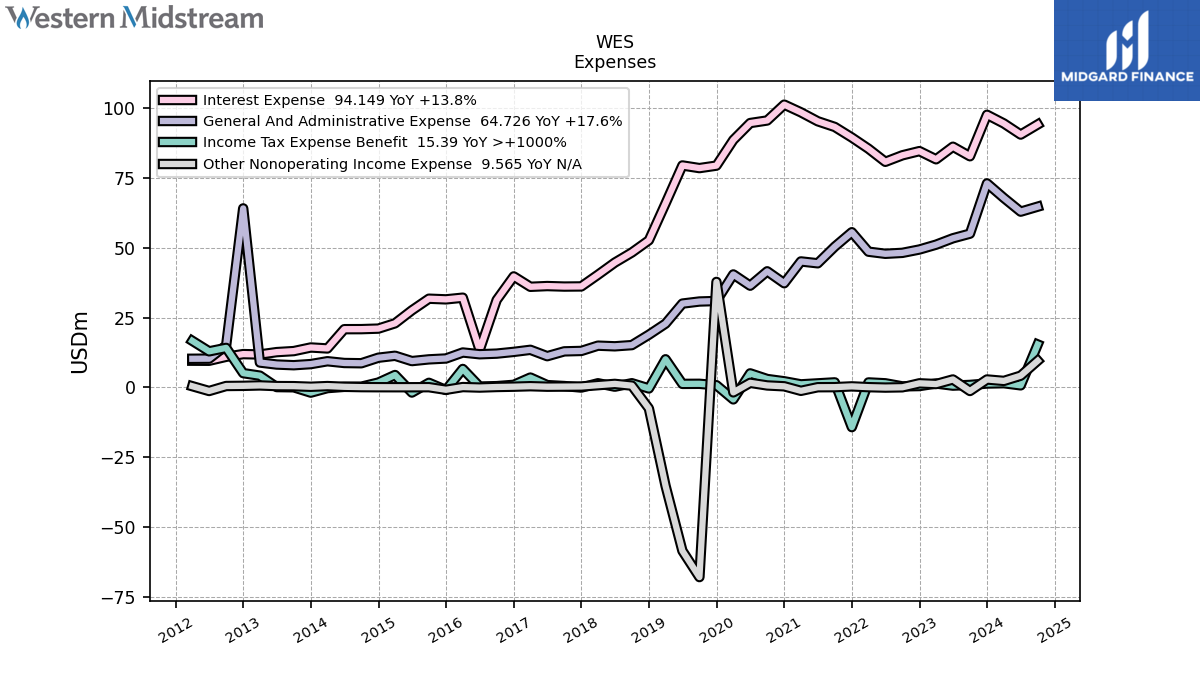
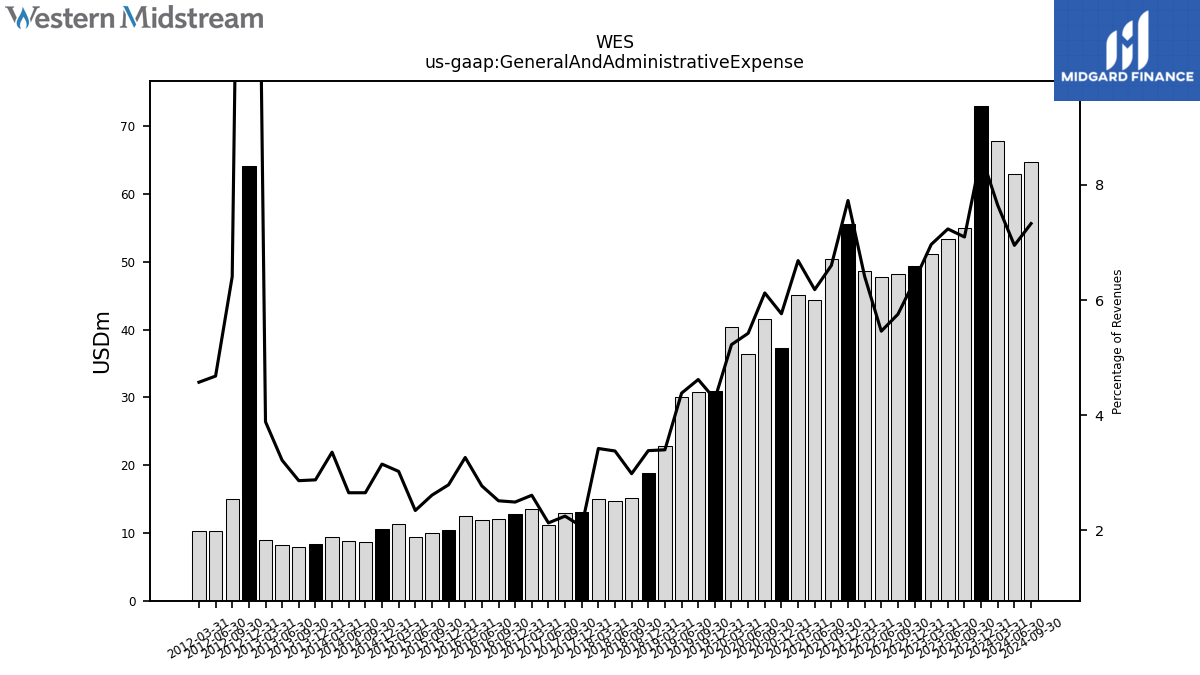
| General And Administrative Expense | 55.05 | 53.41 | 51.12 | 49.38 | 48.19 | 47.85 | 48.60 | 55.58 | 50.41 | 44.45 | 45.12 | 37.30 | 41.58 | 36.42 | 40.47 | 30.95 | 30.77 | 30.03 | 22.84 | 18.88 | 15.16 | 14.73 | 14.96 | 13.07 | 12.92 | 11.20 | 13.48 | 12.73 | 12.11 | 11.89 | 12.52 | 10.37 | 10.06 | 9.44 | 11.35 | 10.65 | 8.67 | 8.76 | 9.39 | 8.36 | 7.96 | 8.21 | 8.93 | 64.11 | 15.04 | 10.31 | 10.27 | |
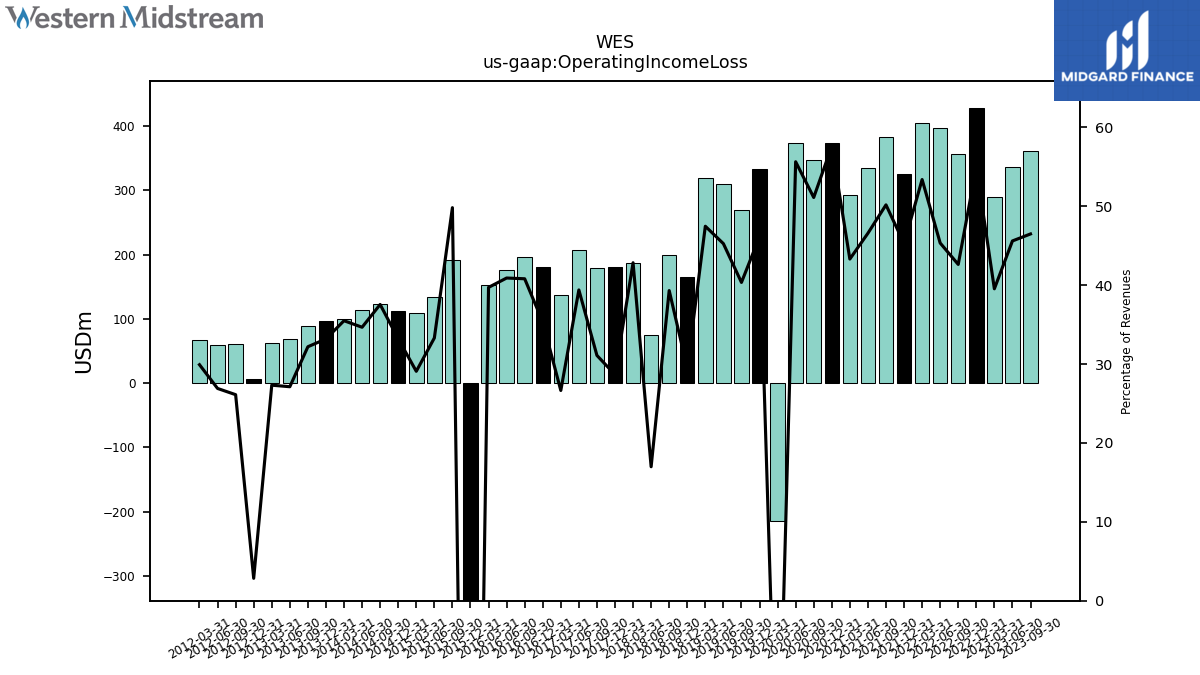
| Operating Income Loss | 360.76 | 336.67 | 290.21 | 428.66 | 357.02 | 397.39 | 404.82 | 325.72 | 383.27 | 334.95 | 292.34 | 372.95 | 347.10 | 373.77 | -214.90 | 333.63 | 268.73 | 310.06 | 318.93 | 164.40 | 199.63 | 74.04 | 187.29 | 181.14 | 178.69 | 207.00 | 137.57 | 180.47 | 196.56 | 175.34 | 152.16 | -400.59 | 191.87 | 134.03 | 109.08 | 112.18 | 122.60 | 114.38 | 99.19 | 96.45 | 89.50 | 69.21 | 62.77 | 6.57 | 61.31 | 59.28 | 67.22 | |
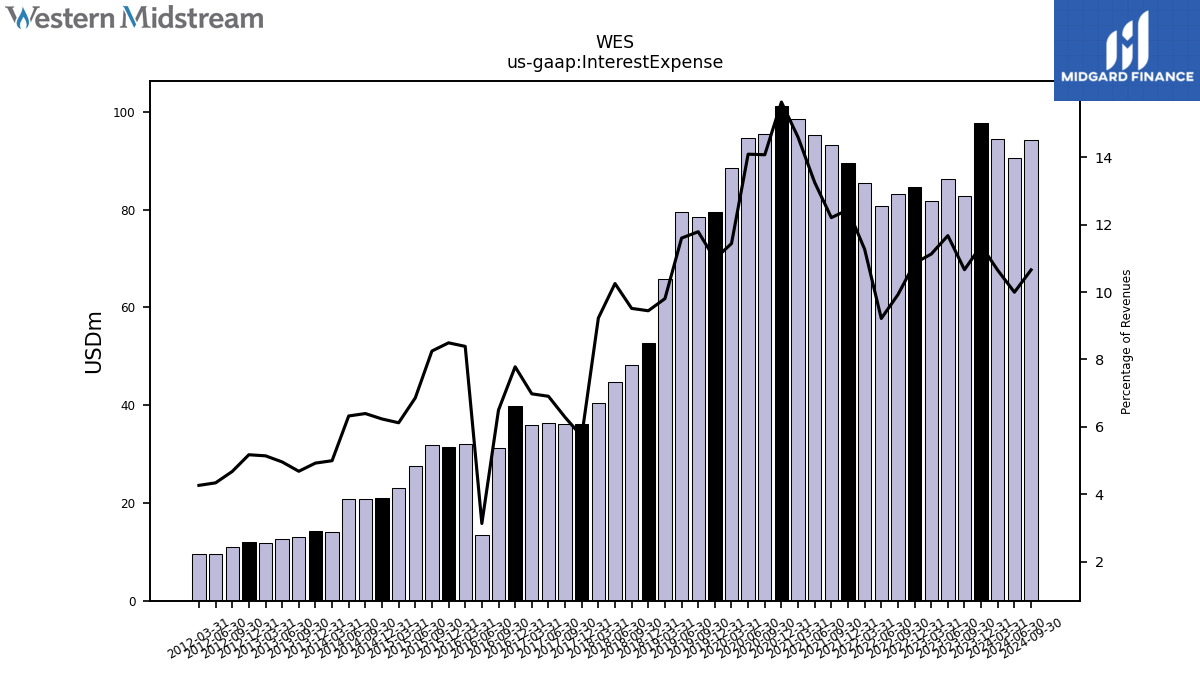
| Interest Expense | 82.75 | 86.18 | 81.67 | 84.61 | 83.11 | 80.77 | 85.45 | 89.47 | 93.26 | 95.29 | 98.49 | 101.25 | 95.57 | 94.65 | 88.59 | 79.41 | 78.52 | 79.47 | 65.88 | 52.68 | 48.32 | 44.70 | 40.35 | 36.17 | 36.12 | 36.30 | 36.03 | 39.76 | 31.30 | 13.43 | 32.14 | 31.54 | 31.77 | 27.60 | 22.96 | 21.07 | 20.88 | 20.86 | 13.96 | 14.31 | 13.02 | 12.65 | 11.81 | 11.94 | 10.98 | 9.56 | 9.58 | |
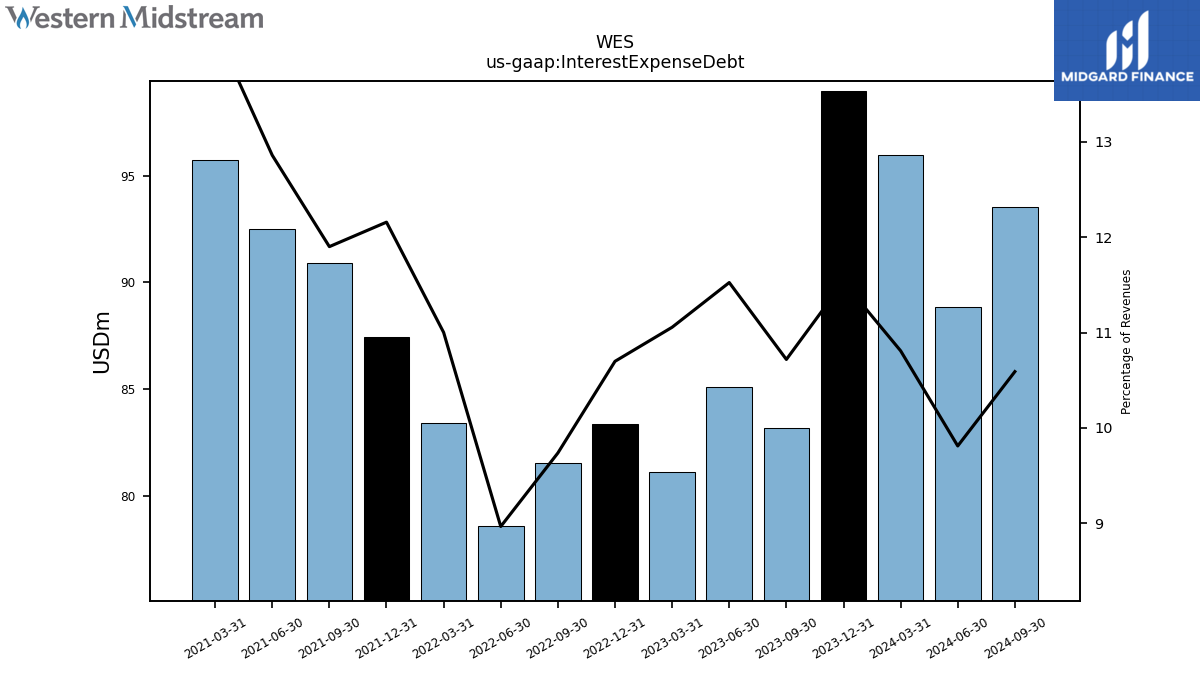
| Interest Expense Debt | 83.18 | 85.09 | 81.15 | 83.39 | 81.55 | 78.58 | 83.43 | 87.45 | 90.91 | 92.49 | 95.72 | NA | NA | NA | NA | NA | NA | NA | NA | NA | NA | NA | NA | NA | NA | NA | NA | NA | NA | NA | NA | NA | NA | NA | NA | NA | NA | NA | NA | NA | NA | NA | NA | NA | NA | NA | NA | |
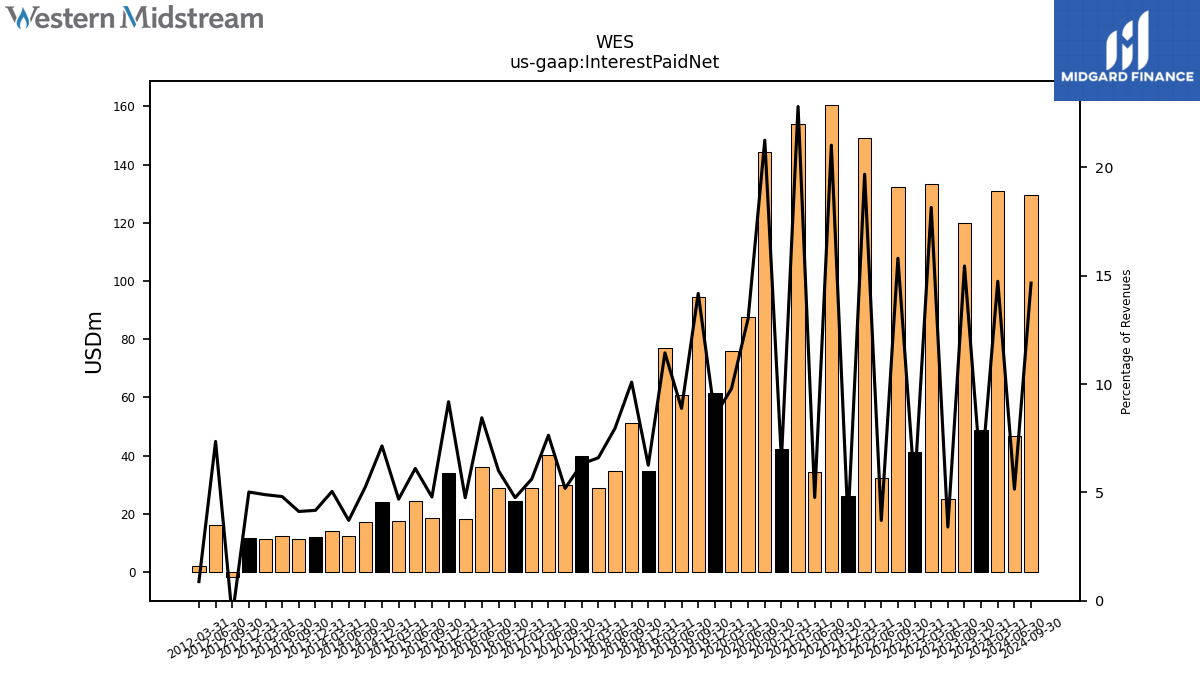
| Interest Paid Net | 119.91 | 25.13 | 133.25 | 41.17 | 132.40 | 32.50 | 149.29 | 26.10 | 160.62 | 34.30 | 153.98 | 42.20 | 144.35 | 87.52 | 75.84 | 61.65 | 94.46 | 60.81 | 76.87 | 34.89 | 51.24 | 34.70 | 28.86 | 39.91 | 29.81 | 40.13 | 29.01 | 24.30 | 28.92 | 36.21 | 18.22 | 34.11 | 18.45 | 24.57 | 17.60 | 24.14 | 17.16 | 12.24 | 14.11 | 12.12 | 11.46 | 12.27 | 11.24 | 11.58 | -1.73 | 16.20 | 1.99 | |
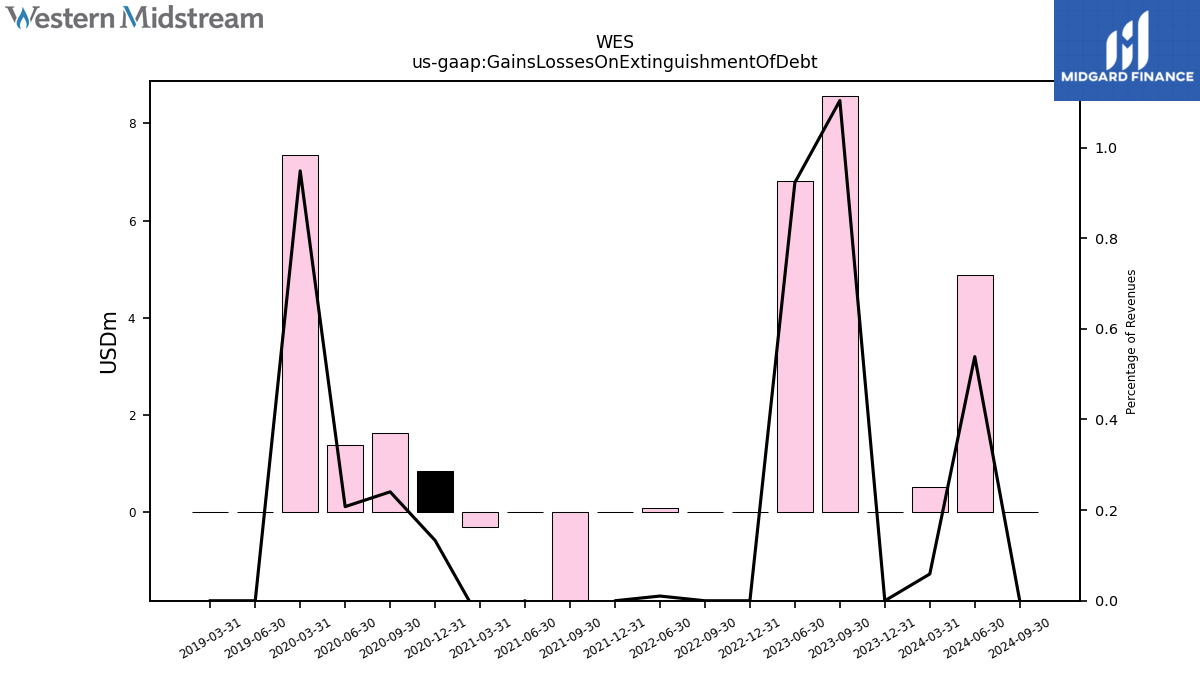
| Gains Losses On Extinguishment Of Debt | 8.56 | 6.81 | NA | 0.00 | 0.00 | 0.09 | NA | 0.00 | -24.66 | 0.00 | -0.29 | 0.86 | 1.63 | 1.40 | 7.34 | NA | NA | 0.00 | 0.00 | NA | NA | NA | NA | NA | NA | NA | NA | NA | NA | NA | NA | NA | NA | NA | NA | NA | NA | NA | NA | NA | NA | NA | NA | NA | NA | NA | NA | |
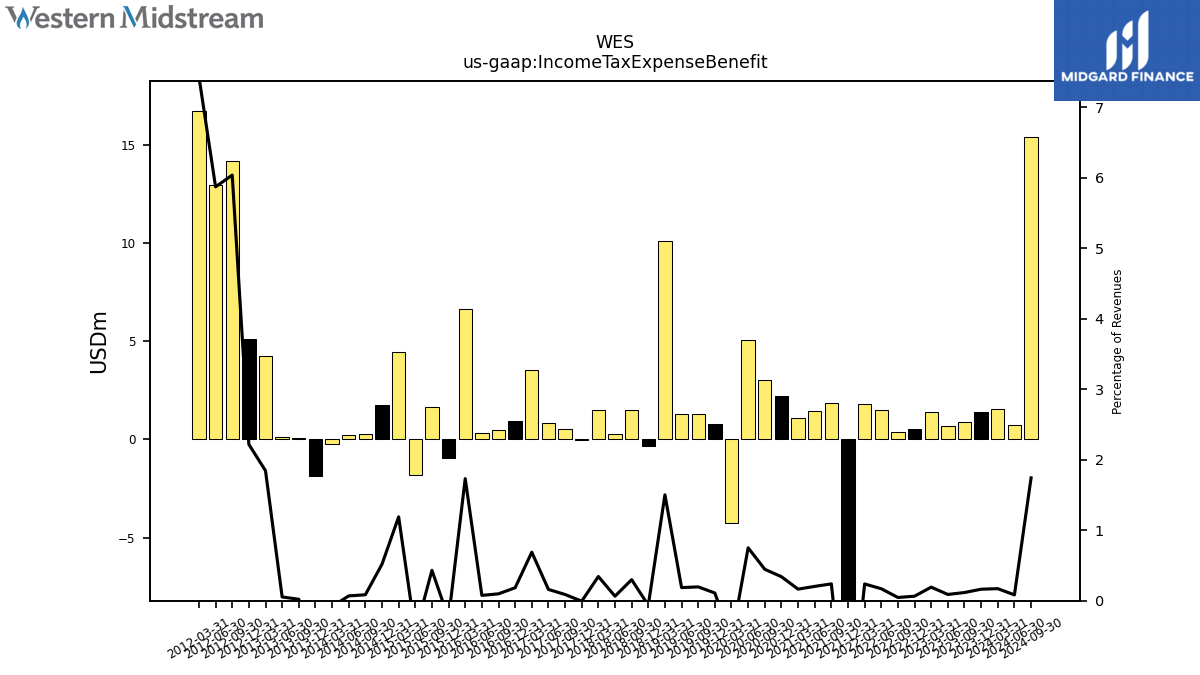
| Income Tax Expense Benefit | 0.91 | 0.66 | 1.42 | 0.50 | 0.39 | 1.49 | 1.80 | -14.21 | 1.83 | 1.47 | 1.11 | 2.21 | 3.03 | 5.04 | -4.28 | 0.79 | 1.31 | 1.28 | 10.09 | -0.35 | 1.52 | 0.28 | 1.50 | -0.04 | 0.51 | 0.84 | 3.55 | 0.94 | 0.47 | 0.33 | 6.63 | -0.93 | 1.66 | -1.82 | 4.46 | 1.75 | 0.28 | 0.23 | -0.23 | -1.85 | 0.06 | 0.14 | 4.24 | 5.12 | 14.17 | 12.93 | 16.70 | |
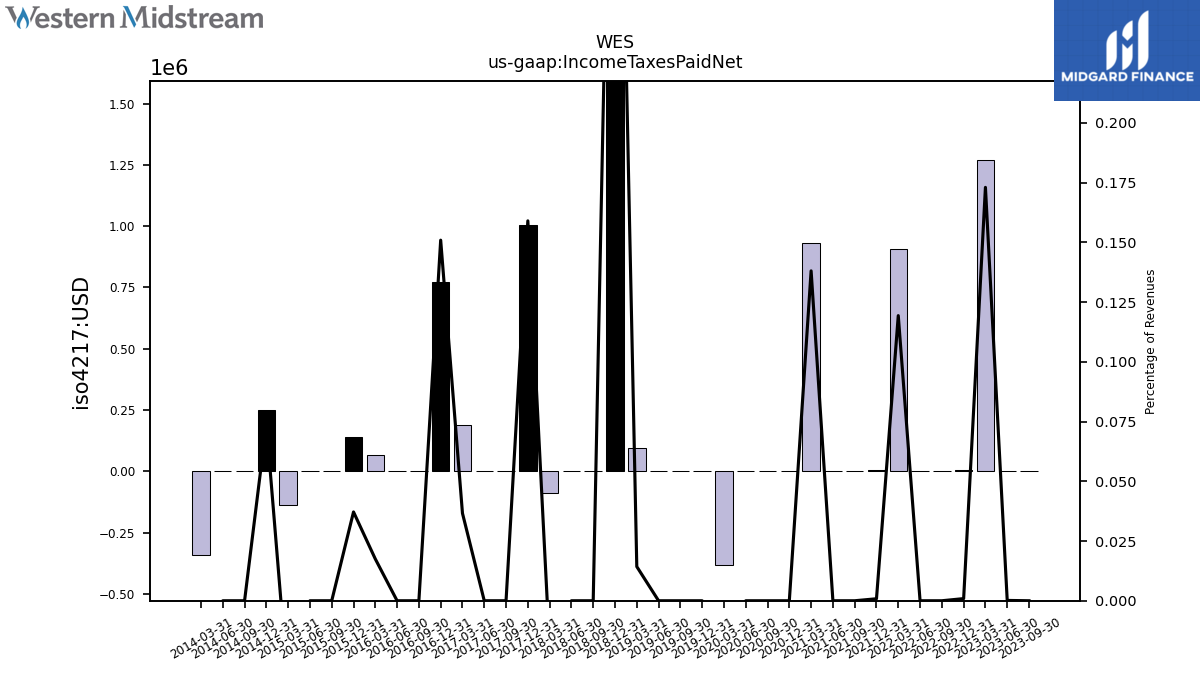
| Income Taxes Paid Net | 0.00 | 0.00 | 1.27 | 0.01 | 0.00 | 0.00 | 0.91 | 0.01 | 0.00 | 0.00 | 0.93 | 0.00 | 0.00 | 0.00 | -0.38 | 0.00 | 0.00 | 0.00 | 0.10 | 2.50 | 0.00 | 0.00 | -0.09 | 1.00 | 0.00 | 0.00 | 0.19 | 0.77 | 0.00 | 0.00 | 0.07 | 0.14 | 0.00 | 0.00 | -0.14 | 0.25 | 0.00 | 0.00 | -0.34 | NA | NA | NA | NA | NA | NA | NA | NA | |
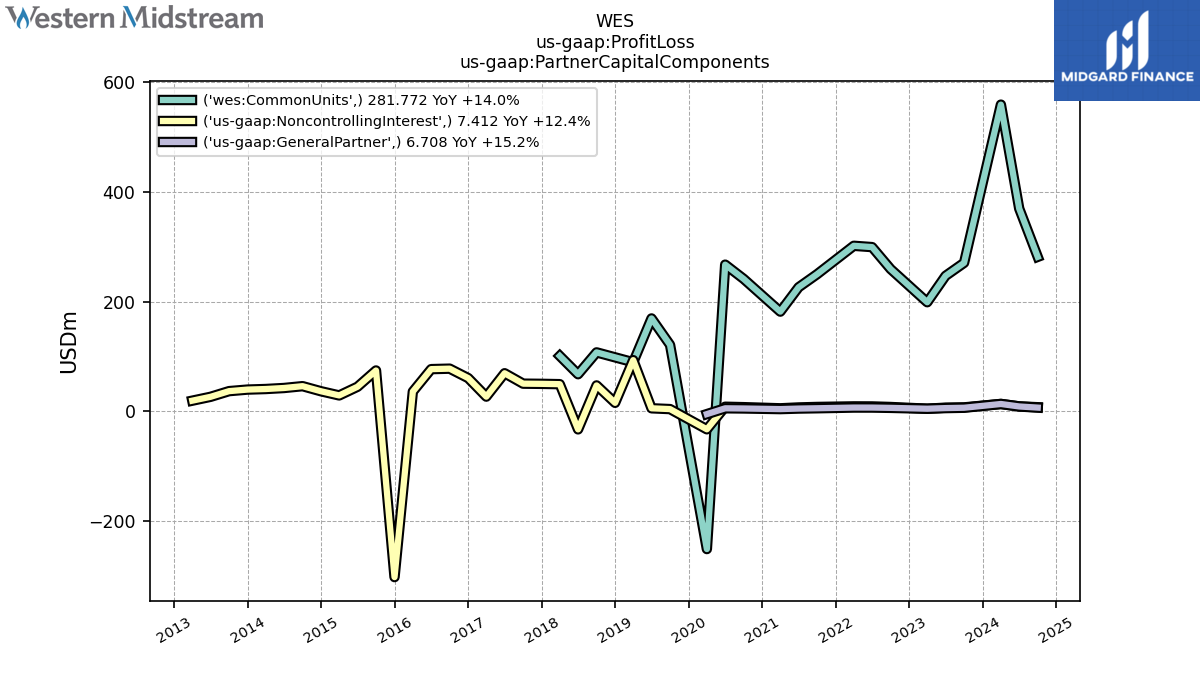
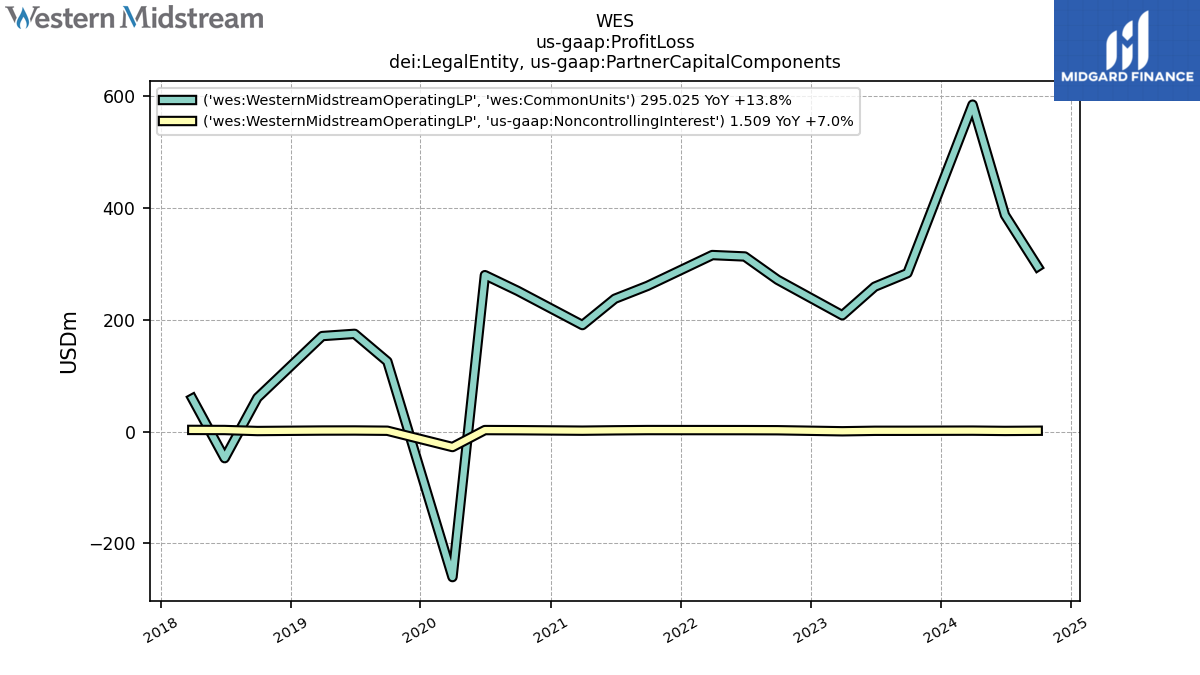
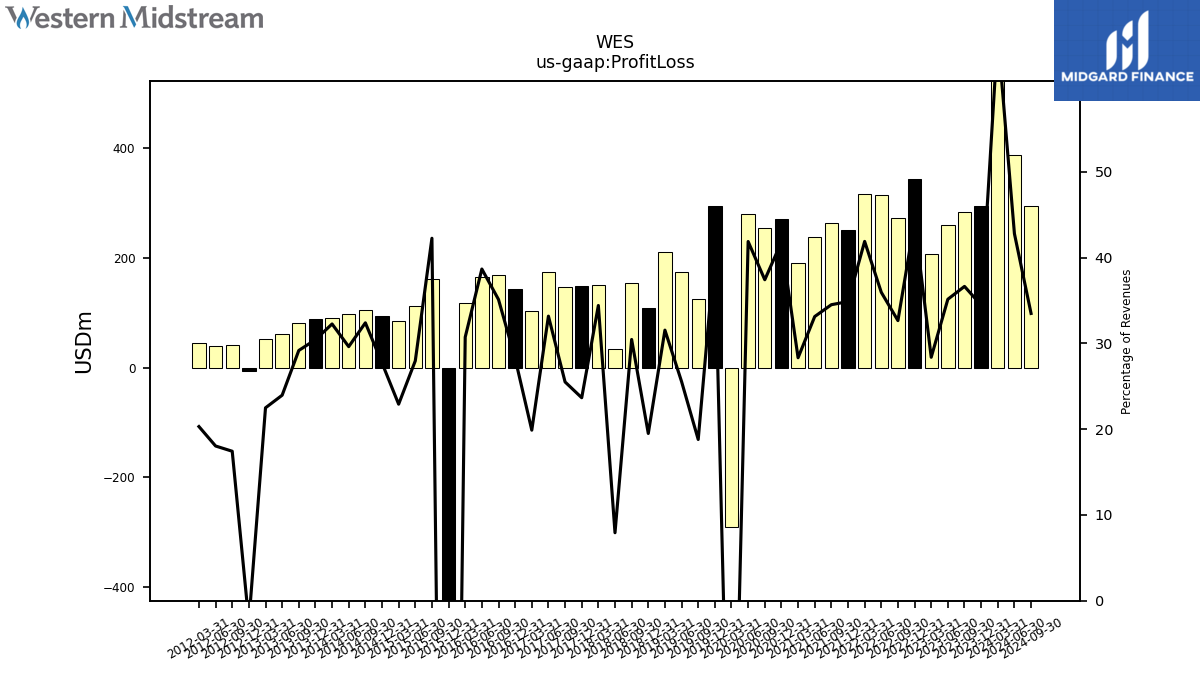
| Profit Loss | 284.40 | 259.52 | 208.34 | 345.03 | 273.58 | 315.17 | 317.67 | 250.85 | 263.64 | 238.28 | 191.24 | 270.78 | 254.13 | 281.34 | -289.40 | 295.44 | 125.22 | 175.06 | 211.98 | 108.78 | 154.68 | 34.56 | 150.49 | 149.59 | 146.60 | 174.35 | 102.66 | 144.27 | 169.18 | 165.78 | 117.76 | -427.81 | 162.75 | 112.55 | 85.97 | 93.67 | 105.78 | 97.75 | 90.17 | 88.46 | 81.12 | 61.13 | 51.68 | -5.69 | 40.92 | 39.75 | 45.63 | |
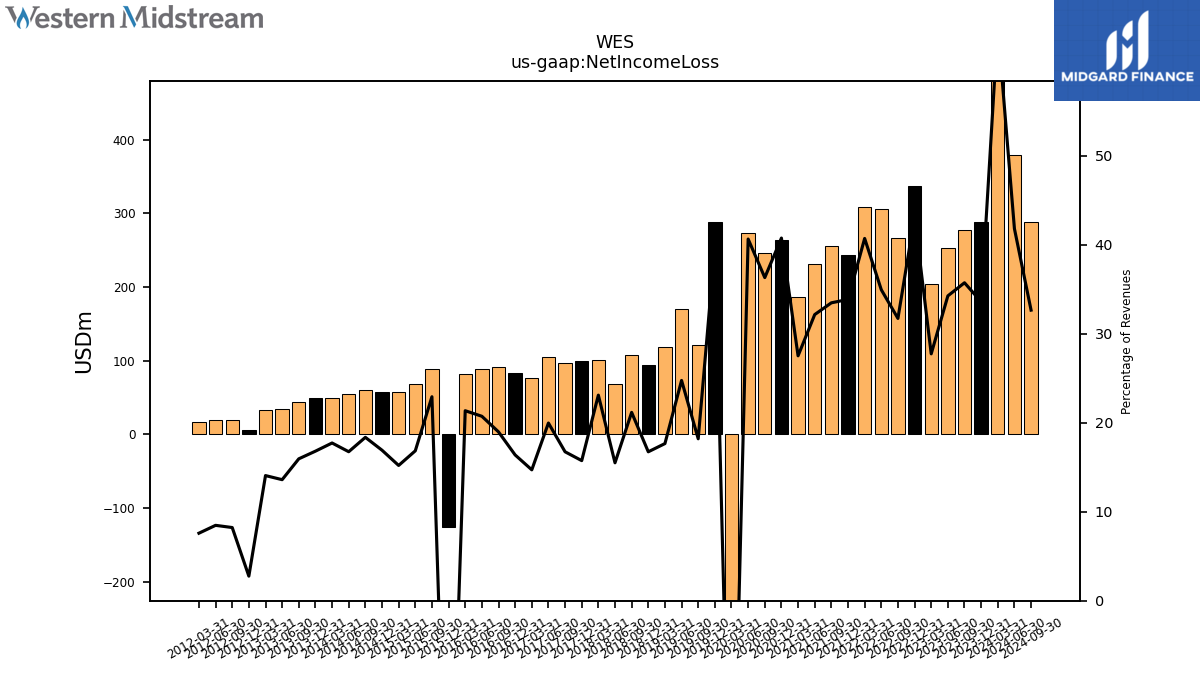
| Net Income Loss | 277.30 | 252.92 | 203.65 | 336.32 | 265.75 | 306.32 | 308.72 | 243.52 | 255.72 | 231.26 | 185.79 | 263.89 | 246.61 | 273.04 | -256.53 | 287.77 | 121.22 | 169.59 | 118.66 | 93.37 | 107.47 | 67.58 | 101.00 | 99.52 | 96.20 | 104.94 | 75.94 | 83.70 | 91.40 | 88.86 | 81.82 | -125.25 | 88.28 | 67.80 | 57.03 | 57.16 | 59.95 | 55.25 | 49.54 | 48.85 | 44.34 | 34.71 | 32.31 | 6.38 | 19.31 | 18.67 | 17.05 |
| 2023-09-30 | 2023-06-30 | 2023-03-31 | 2022-12-31 | 2022-09-30 | 2022-06-30 | 2022-03-31 | 2021-12-31 | 2021-09-30 | 2021-06-30 | 2021-03-31 | 2020-12-31 | 2020-09-30 | 2020-06-30 | 2020-03-31 | 2019-12-31 | 2019-09-30 | 2019-06-30 | 2019-03-31 | 2018-12-31 | 2018-09-30 | 2018-06-30 | 2018-03-31 | 2017-12-31 | 2017-09-30 | 2017-06-30 | 2017-03-31 | 2016-12-31 | 2016-09-30 | 2016-06-30 | 2016-03-31 | 2015-12-31 | 2015-09-30 | 2015-06-30 | 2015-03-31 | 2014-12-31 | 2014-09-30 | 2014-06-30 | 2014-03-31 | 2013-12-31 | 2013-09-30 | 2013-06-30 | 2013-03-31 | 2012-12-31 | 2012-09-30 | 2012-06-30 | 2012-03-31 | ||
|---|---|---|---|---|---|---|---|---|---|---|---|---|---|---|---|---|---|---|---|---|---|---|---|---|---|---|---|---|---|---|---|---|---|---|---|---|---|---|---|---|---|---|---|---|---|---|---|---|
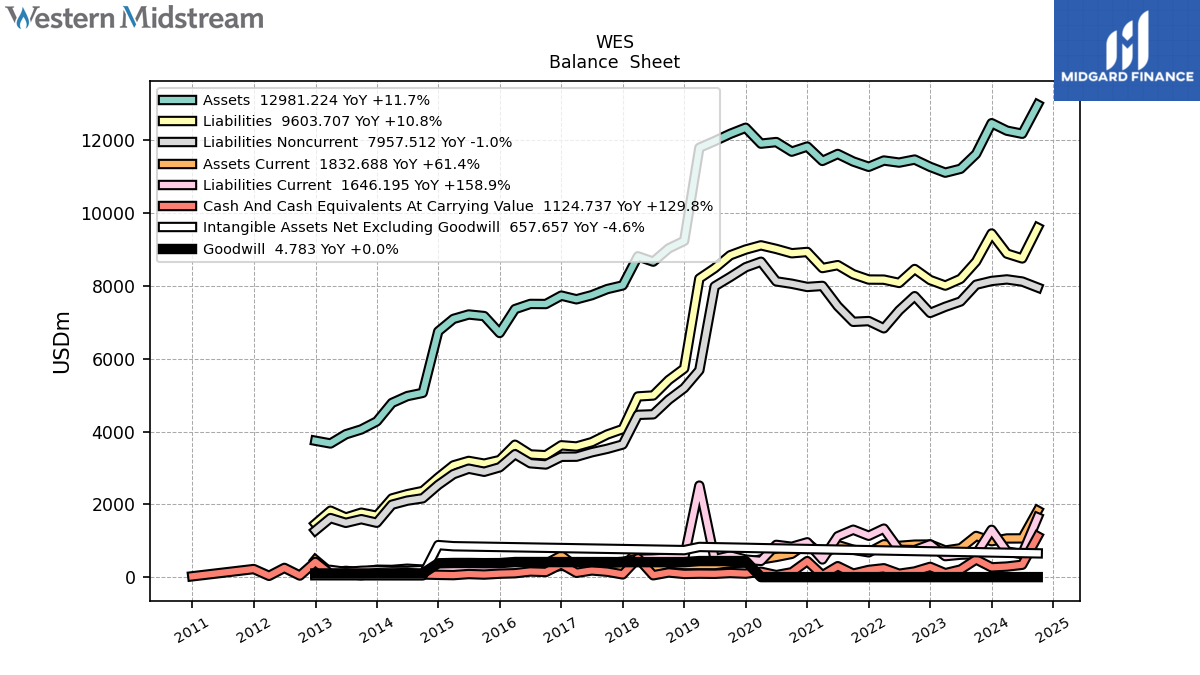
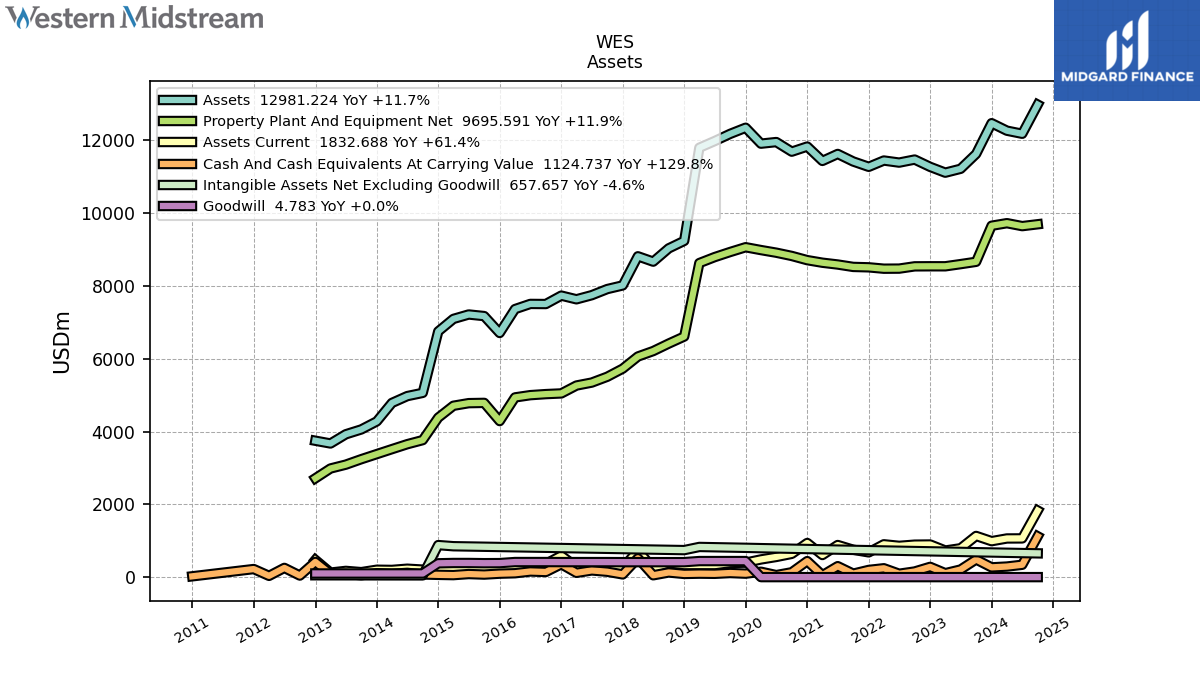
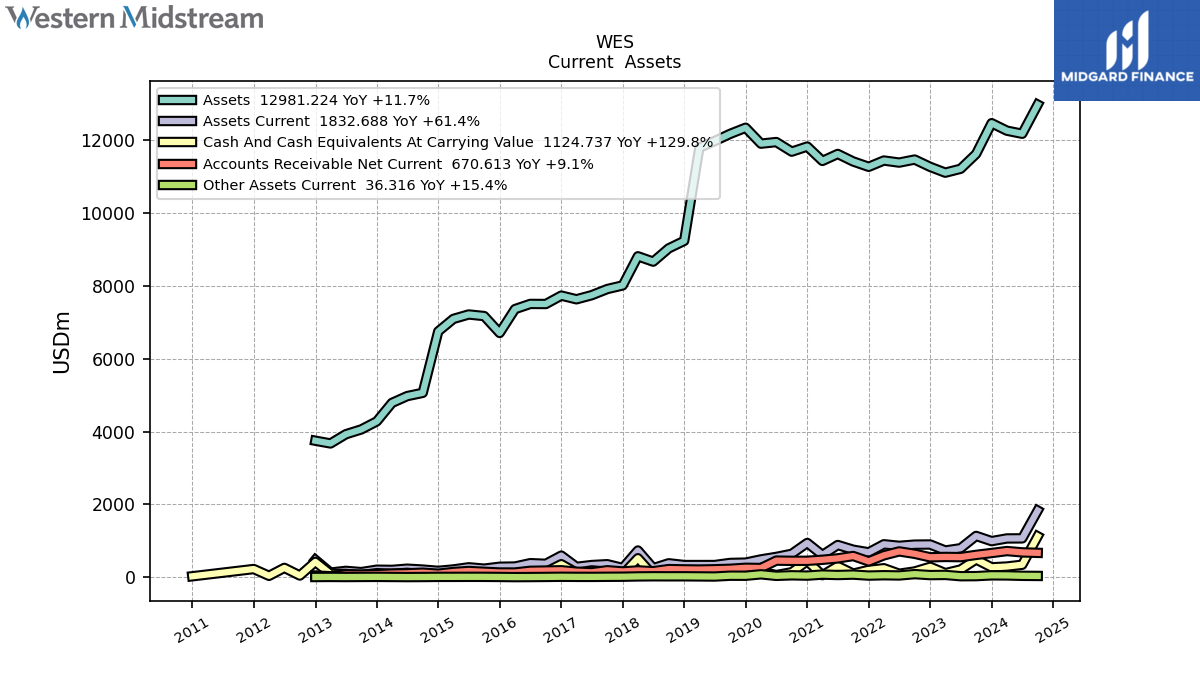
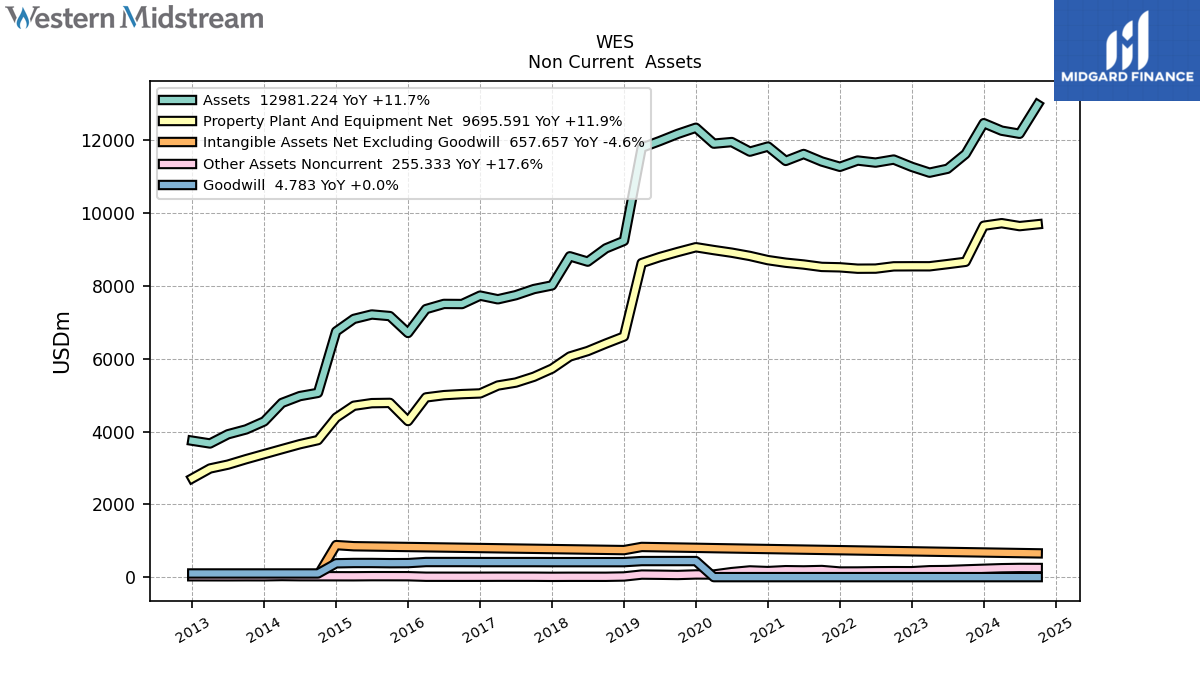
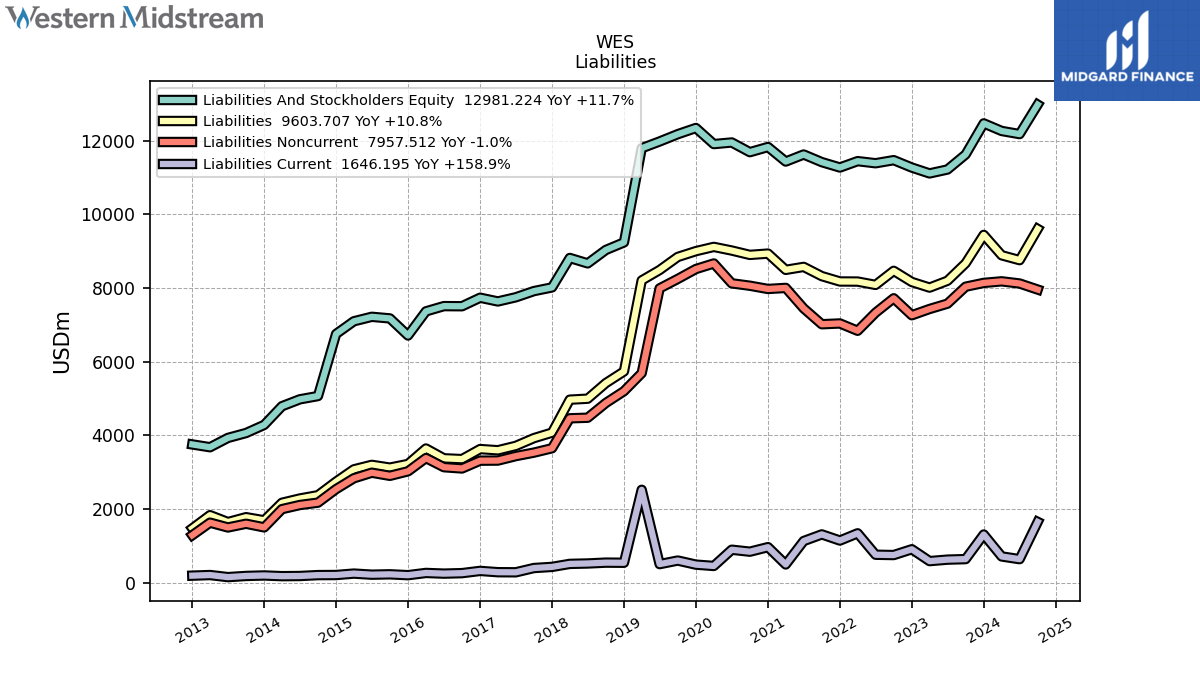
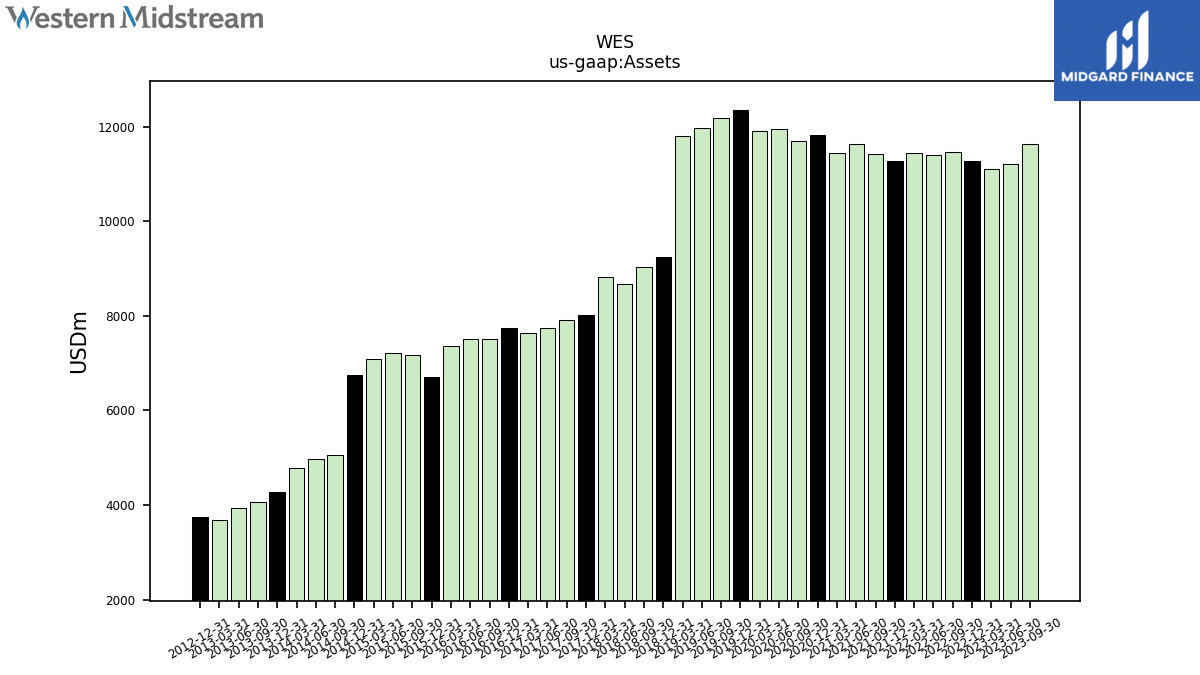
| Assets | 11626.55 | 11218.95 | 11112.49 | 11271.63 | 11472.58 | 11388.86 | 11445.87 | 11273.08 | 11419.38 | 11626.30 | 11435.04 | 11830.03 | 11689.67 | 11953.24 | 11909.00 | 12346.45 | 12178.23 | 11980.53 | 11797.00 | 9238.64 | 9033.56 | 8668.83 | 8815.89 | 8016.31 | 7915.92 | 7747.75 | 7634.78 | 7736.10 | 7504.70 | 7507.81 | 7365.68 | 6709.41 | 7174.00 | 7217.65 | 7096.27 | 6752.34 | 5064.97 | 4976.47 | 4788.58 | 4281.04 | 4061.01 | 3927.78 | 3674.93 | 3750.81 | NA | NA | NA | |
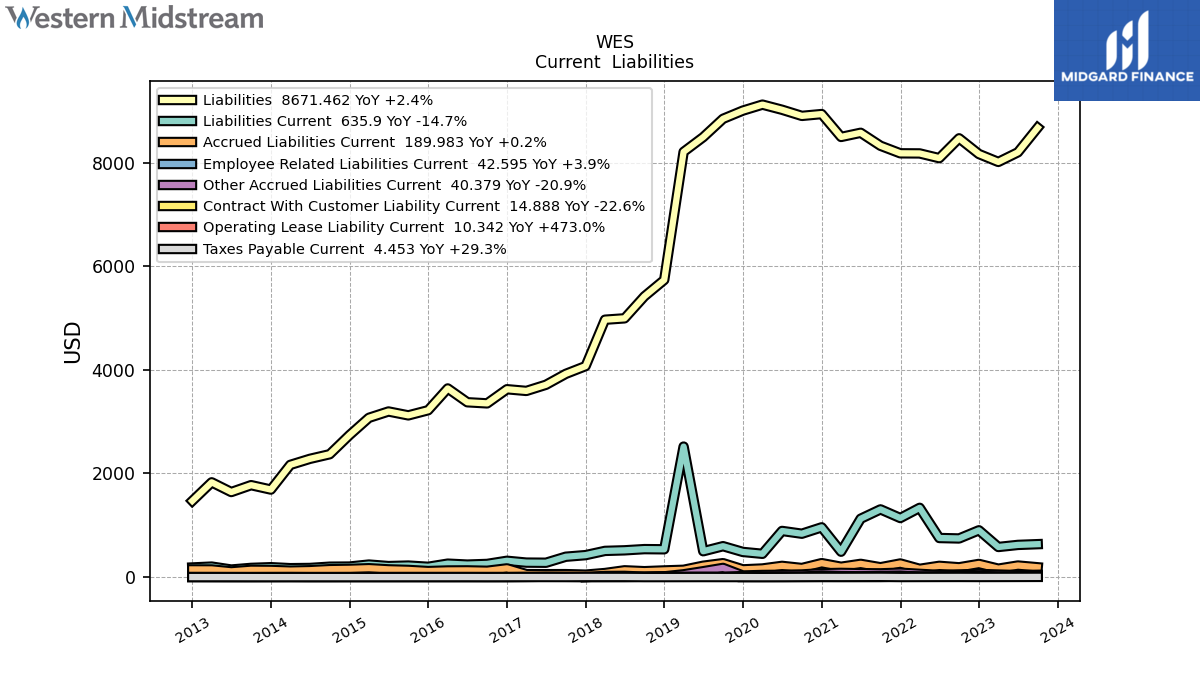
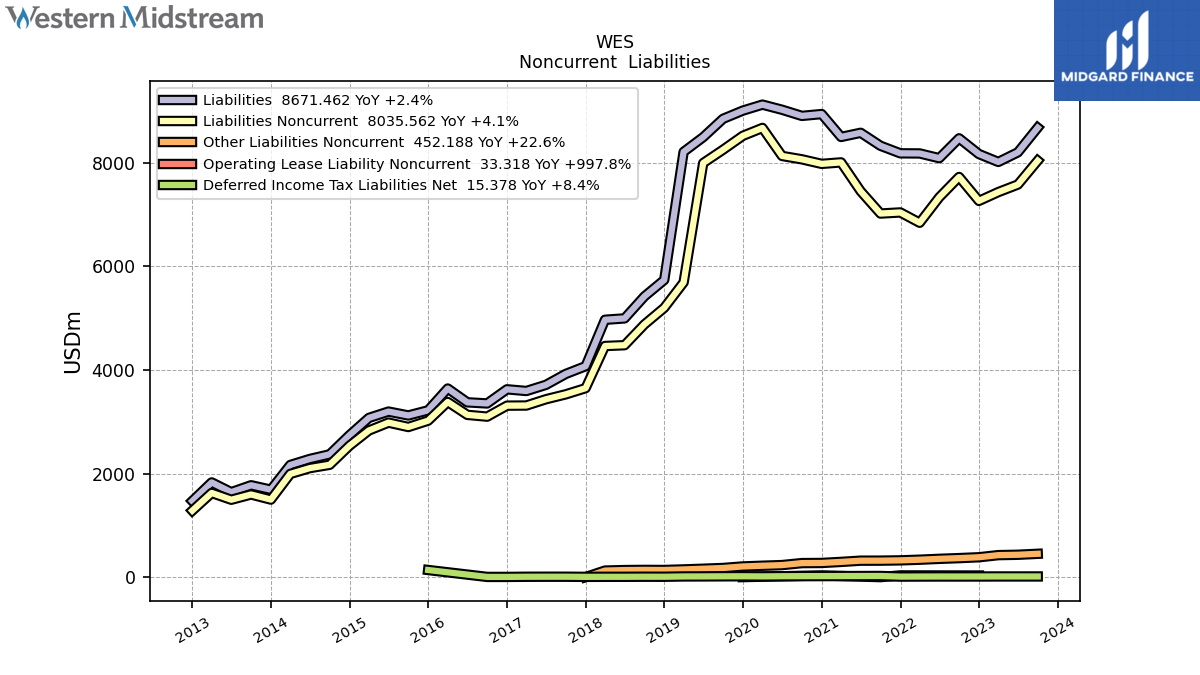
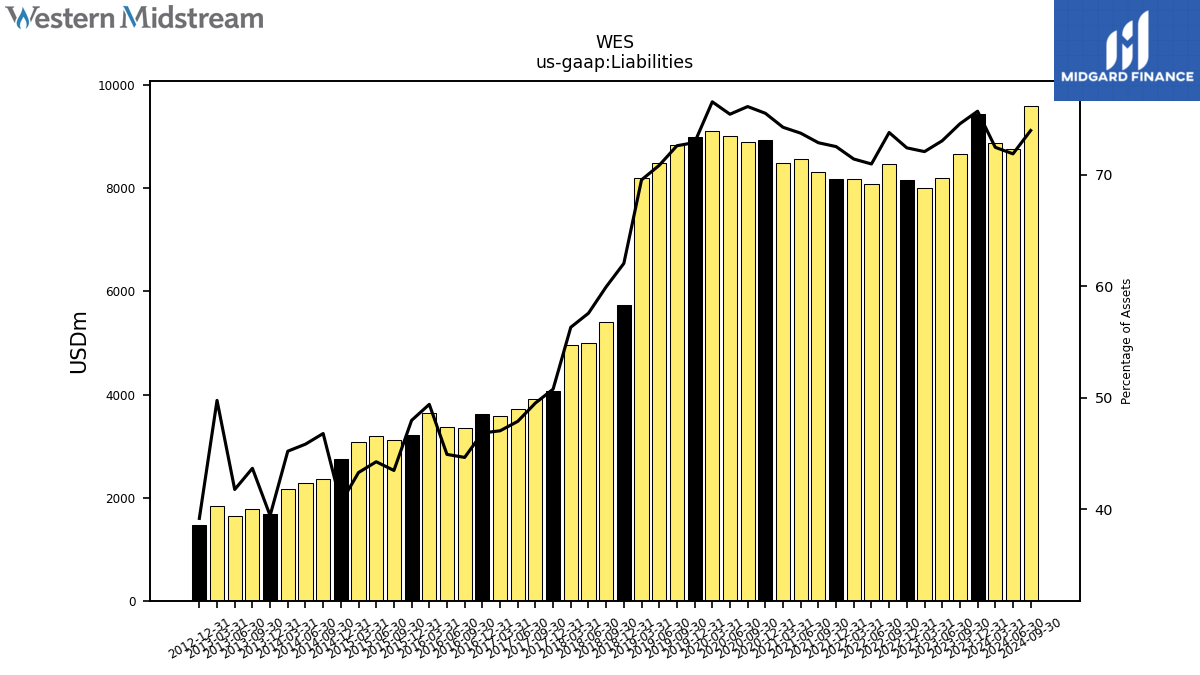
| Liabilities | 8671.46 | 8196.79 | 8010.92 | 8163.51 | 8466.90 | 8083.86 | 8175.07 | 8177.32 | 8322.93 | 8573.43 | 8492.92 | 8934.82 | 8899.22 | 9017.73 | 9116.71 | 9001.16 | 8843.15 | 8489.32 | 8205.45 | 5733.98 | 5416.92 | 4993.17 | 4966.80 | 4071.43 | 3921.99 | 3711.30 | 3592.62 | 3625.33 | 3352.37 | 3374.02 | 3640.58 | 3219.91 | 3120.84 | 3195.96 | 3073.78 | 2740.99 | 2371.01 | 2282.14 | 2165.74 | 1689.11 | 1774.39 | 1641.55 | 1829.45 | 1470.43 | NA | NA | NA | |
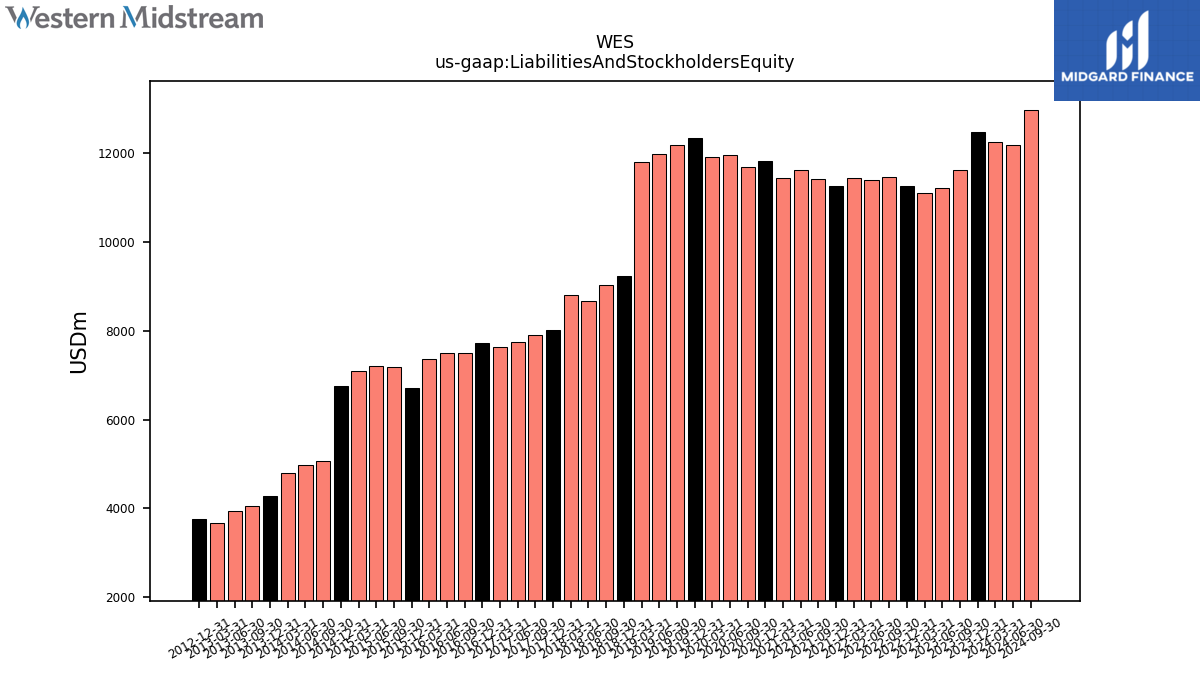
| Liabilities And Stockholders Equity | 11626.55 | 11218.95 | 11112.49 | 11271.63 | 11472.58 | 11388.86 | 11445.87 | 11273.08 | 11419.38 | 11626.30 | 11435.04 | 11830.03 | 11689.67 | 11953.24 | 11909.00 | 12346.45 | 12178.23 | 11980.53 | 11797.00 | 9238.64 | 9033.56 | 8668.83 | 8815.89 | 8016.31 | 7915.92 | 7747.75 | 7634.78 | 7736.10 | 7504.70 | 7507.81 | 7365.68 | 6709.41 | 7174.00 | 7217.65 | 7096.27 | 6752.34 | 5064.97 | 4976.47 | 4788.58 | 4281.04 | 4061.01 | 3927.78 | 3674.93 | 3750.81 | NA | NA | NA |
| 2023-09-30 | 2023-06-30 | 2023-03-31 | 2022-12-31 | 2022-09-30 | 2022-06-30 | 2022-03-31 | 2021-12-31 | 2021-09-30 | 2021-06-30 | 2021-03-31 | 2020-12-31 | 2020-09-30 | 2020-06-30 | 2020-03-31 | 2019-12-31 | 2019-09-30 | 2019-06-30 | 2019-03-31 | 2018-12-31 | 2018-09-30 | 2018-06-30 | 2018-03-31 | 2017-12-31 | 2017-09-30 | 2017-06-30 | 2017-03-31 | 2016-12-31 | 2016-09-30 | 2016-06-30 | 2016-03-31 | 2015-12-31 | 2015-09-30 | 2015-06-30 | 2015-03-31 | 2014-12-31 | 2014-09-30 | 2014-06-30 | 2014-03-31 | 2013-12-31 | 2013-09-30 | 2013-06-30 | 2013-03-31 | 2012-12-31 | 2012-09-30 | 2012-06-30 | 2012-03-31 | ||
|---|---|---|---|---|---|---|---|---|---|---|---|---|---|---|---|---|---|---|---|---|---|---|---|---|---|---|---|---|---|---|---|---|---|---|---|---|---|---|---|---|---|---|---|---|---|---|---|---|
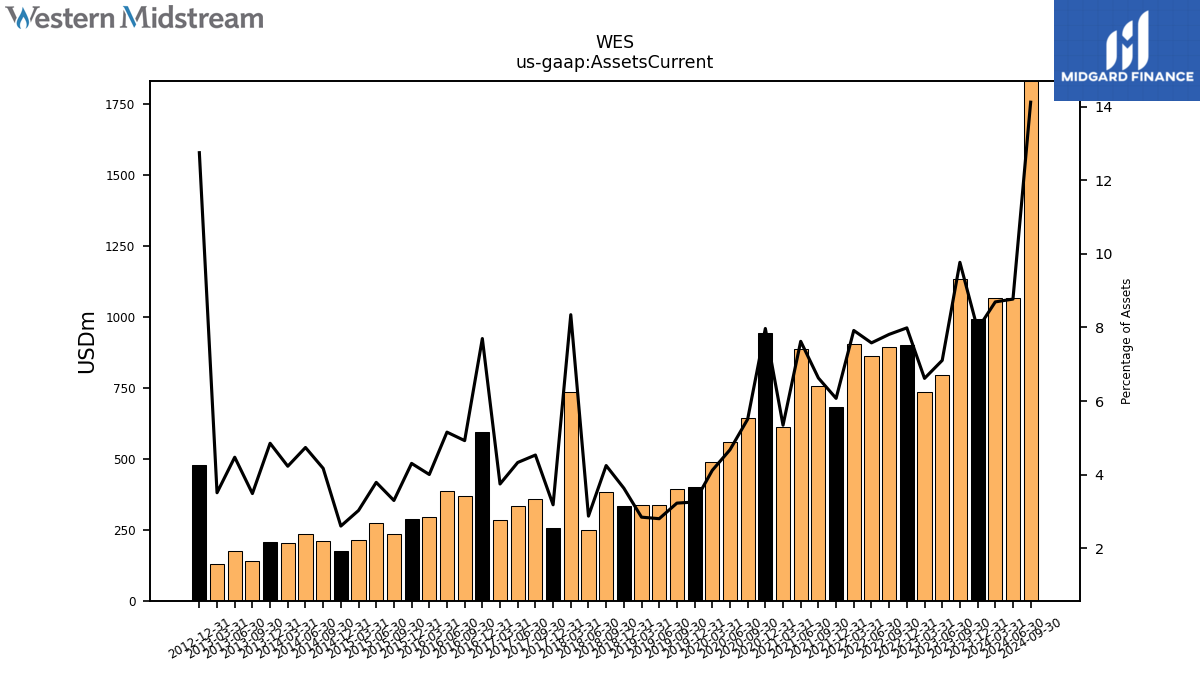
| Assets Current | 1135.81 | 797.20 | 735.30 | 900.42 | 896.30 | 863.44 | 906.29 | 684.76 | 756.71 | 886.25 | 611.16 | 943.06 | 643.93 | 559.16 | 490.55 | 402.41 | 393.24 | 336.19 | 335.94 | 335.82 | 383.88 | 249.36 | 735.82 | 255.21 | 358.97 | 335.68 | 286.24 | 595.59 | 369.75 | 387.17 | 295.12 | 289.03 | 236.81 | 273.71 | 214.98 | 175.94 | 211.38 | 235.87 | 202.62 | 207.83 | 141.69 | 175.79 | 129.04 | 478.10 | NA | NA | NA | |
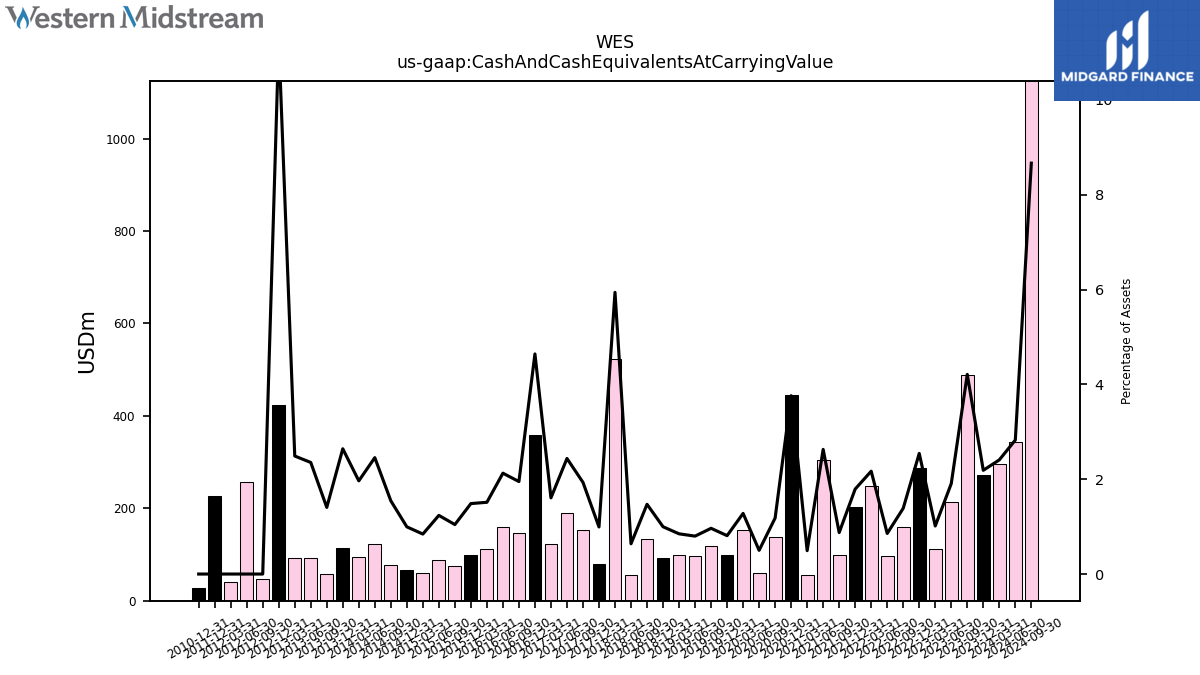
| Cash And Cash Equivalents At Carrying Value | 489.49 | 213.95 | 112.64 | 286.66 | 159.09 | 97.43 | 248.25 | 202.00 | 99.86 | 305.57 | 56.38 | 444.92 | 138.04 | 59.74 | 152.28 | 99.96 | 117.43 | 95.80 | 100.05 | 92.14 | 132.88 | 55.32 | 523.69 | 79.59 | 153.04 | 188.83 | 122.65 | 359.07 | 146.35 | 159.67 | 111.46 | 99.69 | 74.84 | 89.26 | 59.82 | 67.21 | 78.22 | 122.14 | 94.12 | 113.08 | 57.08 | 92.41 | 91.46 | 422.56 | 47.49 | 258.05 | 39.62 | |
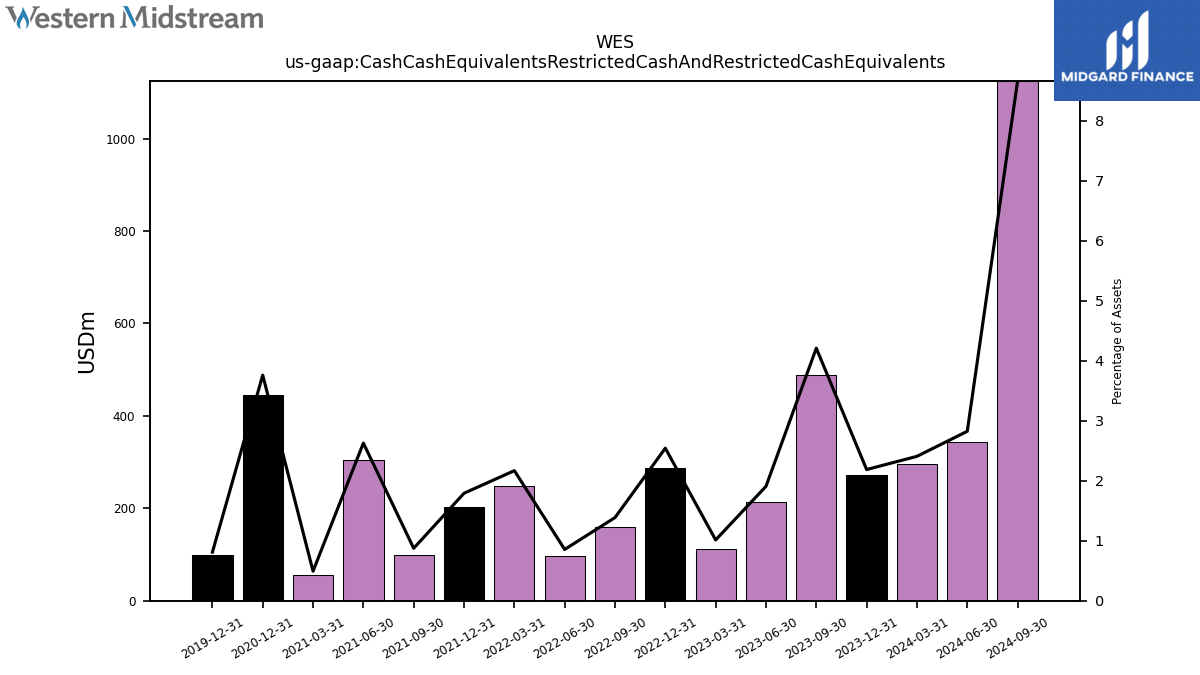
| Cash Cash Equivalents Restricted Cash And Restricted Cash Equivalents | 489.49 | 213.95 | 112.64 | 286.66 | 159.09 | 97.43 | 248.25 | 202.00 | 99.86 | 305.57 | 56.38 | 444.92 | NA | NA | NA | 99.96 | NA | NA | NA | NA | NA | NA | NA | NA | NA | NA | NA | NA | NA | NA | NA | NA | NA | NA | NA | NA | NA | NA | NA | NA | NA | NA | NA | NA | NA | NA | NA | |
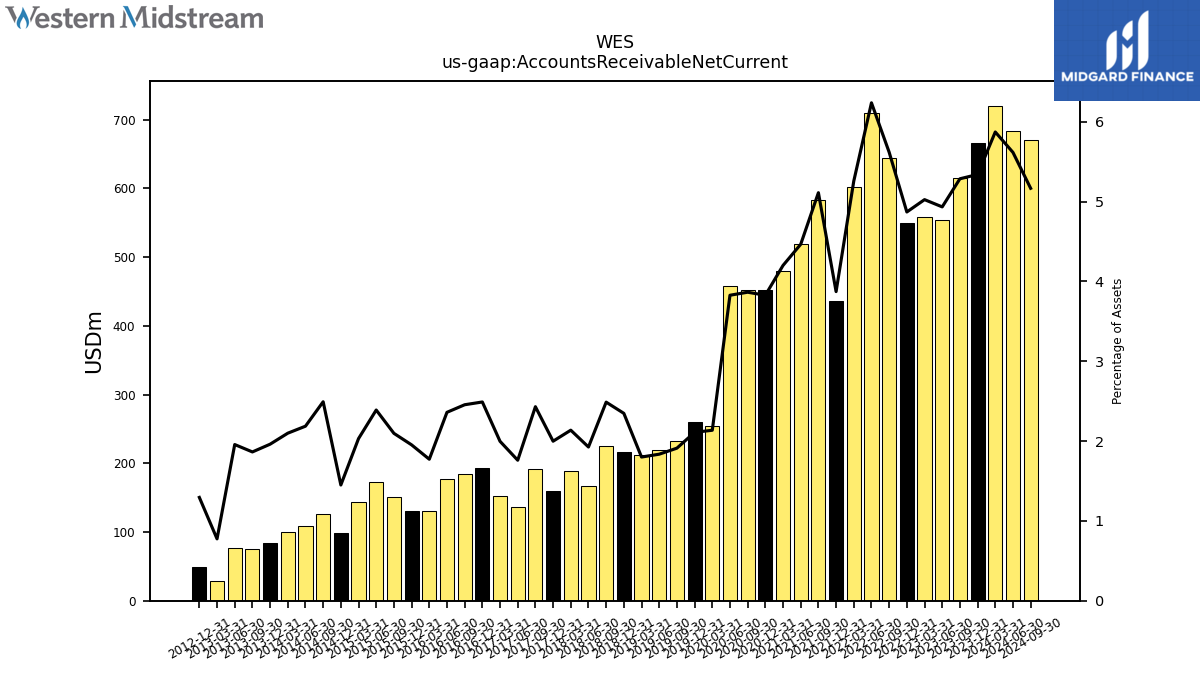
| Accounts Receivable Net Current | 614.49 | 553.46 | 558.30 | 548.86 | 644.52 | 710.32 | 601.64 | 436.51 | 583.65 | 519.11 | 480.26 | 452.72 | 451.73 | 457.40 | 254.31 | 260.46 | 232.76 | 219.92 | 212.34 | 216.85 | 224.72 | 166.92 | 188.35 | 160.19 | 192.39 | 136.36 | 152.47 | 192.61 | 184.24 | 177.20 | 130.56 | 131.00 | 150.43 | 172.43 | 144.12 | 97.89 | 126.25 | 108.81 | 100.50 | 83.94 | 75.69 | 76.85 | 28.49 | 48.55 | NA | NA | NA | |
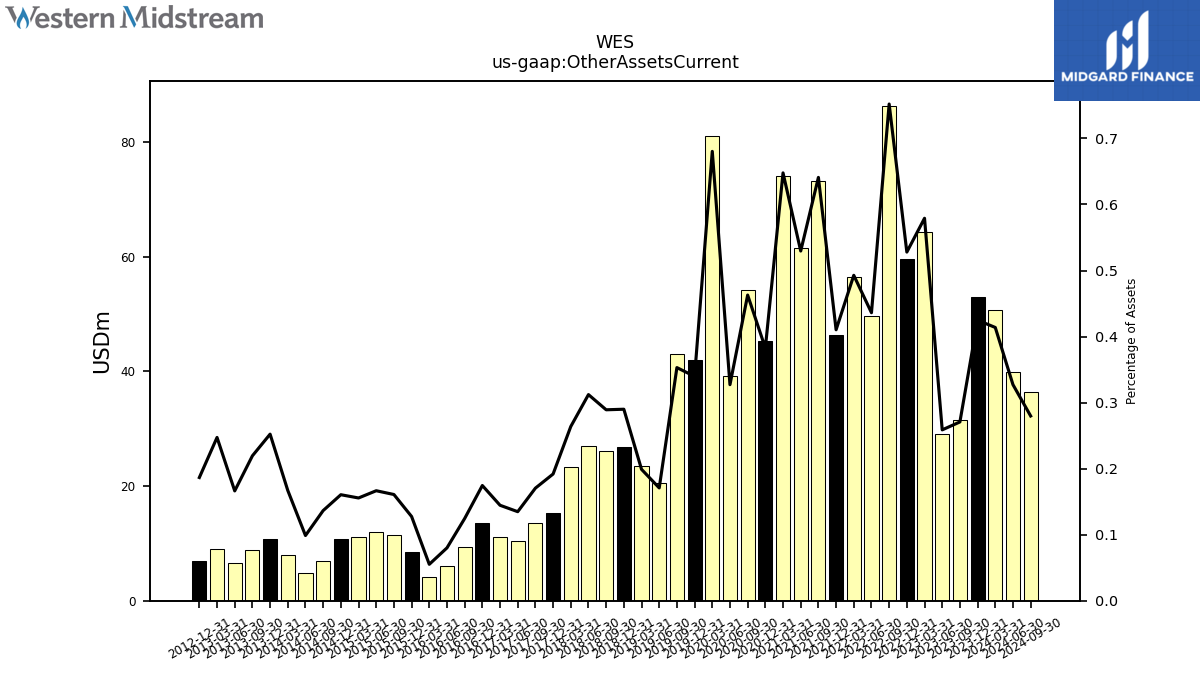
| Other Assets Current | 31.48 | 29.03 | 64.35 | 59.51 | 86.28 | 49.67 | 56.40 | 46.25 | 73.20 | 61.56 | 74.08 | 45.26 | 54.10 | 39.11 | 81.03 | 41.94 | 42.99 | 20.47 | 23.47 | 26.79 | 26.12 | 27.06 | 23.26 | 15.38 | 13.50 | 10.45 | 11.04 | 13.50 | 9.34 | 6.01 | 4.06 | 8.56 | 11.54 | 12.02 | 11.04 | 10.84 | 6.92 | 4.91 | 8.00 | 10.80 | 8.91 | 6.53 | 9.09 | 7.00 | NA | NA | NA |
| 2023-09-30 | 2023-06-30 | 2023-03-31 | 2022-12-31 | 2022-09-30 | 2022-06-30 | 2022-03-31 | 2021-12-31 | 2021-09-30 | 2021-06-30 | 2021-03-31 | 2020-12-31 | 2020-09-30 | 2020-06-30 | 2020-03-31 | 2019-12-31 | 2019-09-30 | 2019-06-30 | 2019-03-31 | 2018-12-31 | 2018-09-30 | 2018-06-30 | 2018-03-31 | 2017-12-31 | 2017-09-30 | 2017-06-30 | 2017-03-31 | 2016-12-31 | 2016-09-30 | 2016-06-30 | 2016-03-31 | 2015-12-31 | 2015-09-30 | 2015-06-30 | 2015-03-31 | 2014-12-31 | 2014-09-30 | 2014-06-30 | 2014-03-31 | 2013-12-31 | 2013-09-30 | 2013-06-30 | 2013-03-31 | 2012-12-31 | 2012-09-30 | 2012-06-30 | 2012-03-31 | ||
|---|---|---|---|---|---|---|---|---|---|---|---|---|---|---|---|---|---|---|---|---|---|---|---|---|---|---|---|---|---|---|---|---|---|---|---|---|---|---|---|---|---|---|---|---|---|---|---|---|
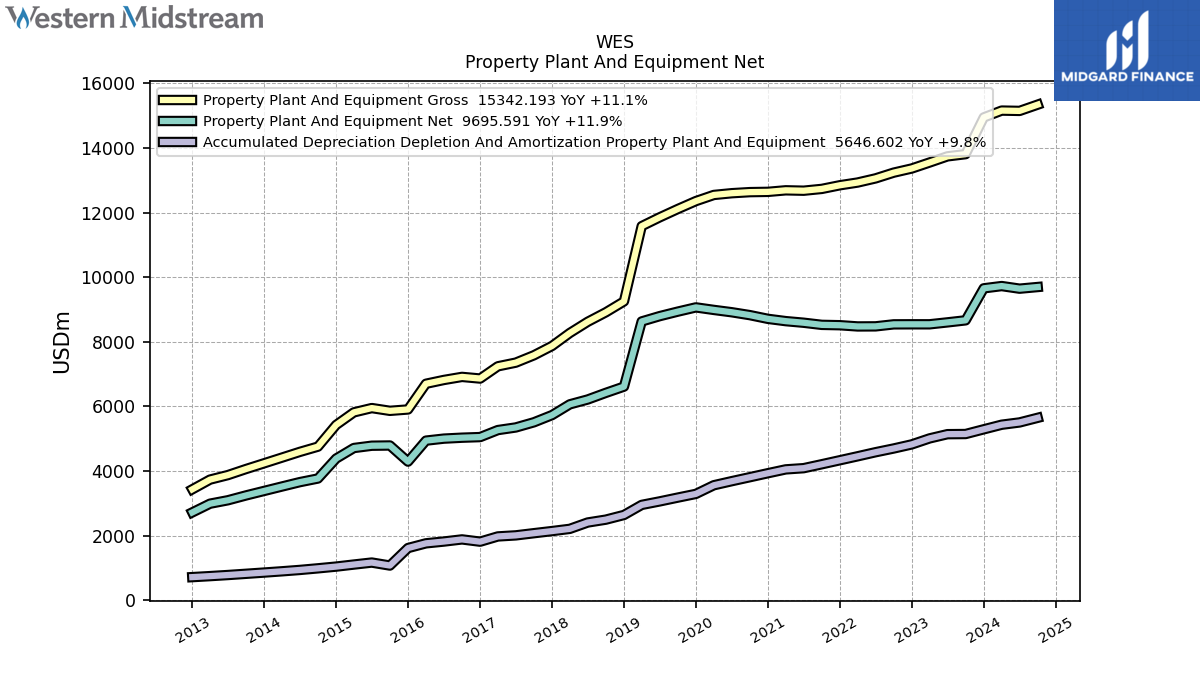
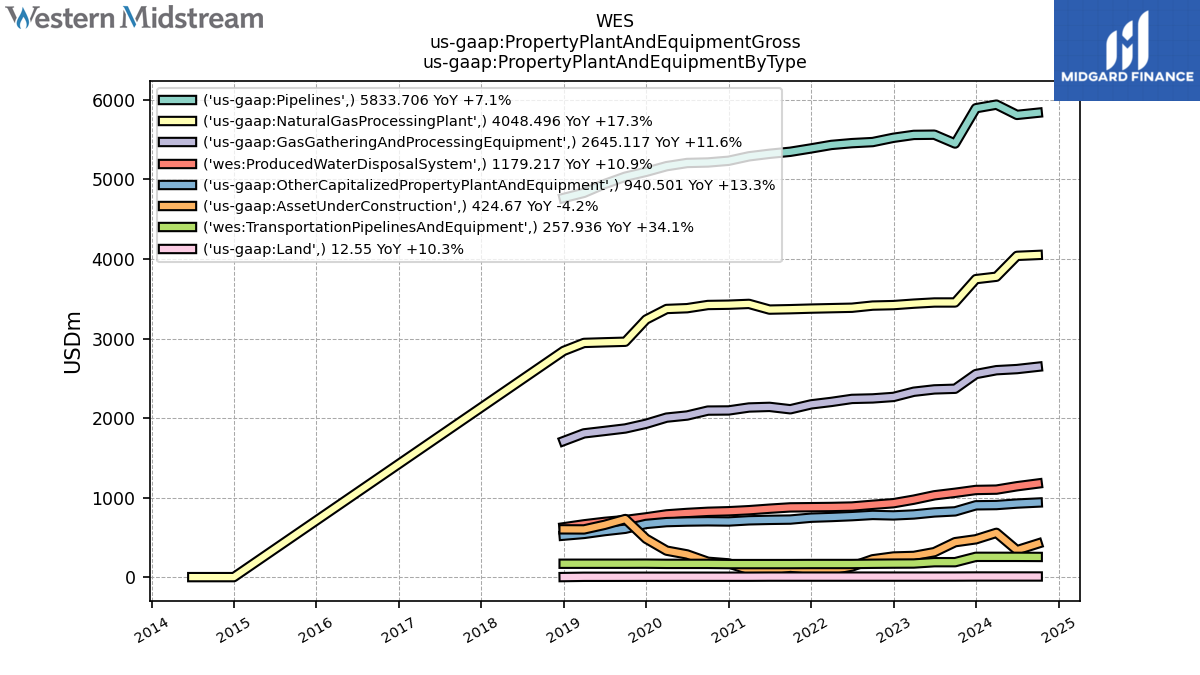
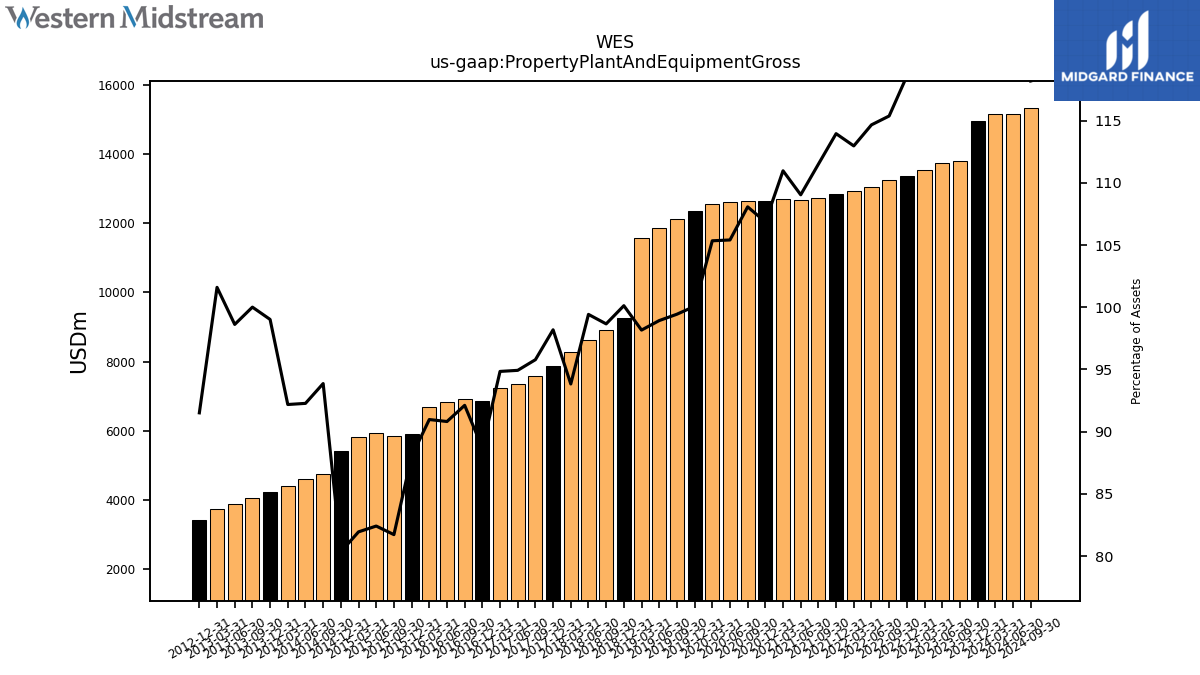
| Property Plant And Equipment Gross | 13809.08 | 13740.91 | 13550.06 | 13365.59 | 13236.50 | 13058.69 | 12930.36 | 12846.08 | 12732.93 | 12677.33 | 12689.44 | 12641.75 | 12633.14 | 12599.72 | 12545.36 | 12355.67 | 12109.92 | 11852.16 | 11580.33 | 9250.23 | 8912.75 | 8618.99 | 8272.08 | 7871.10 | 7582.18 | 7354.78 | 7240.89 | 6861.94 | 6912.91 | 6818.17 | 6700.81 | 5904.64 | 5862.72 | 5948.15 | 5814.91 | 5424.70 | 4754.28 | 4591.94 | 4414.17 | 4239.10 | 4061.39 | 3873.54 | 3733.69 | 3432.39 | NA | NA | NA | |
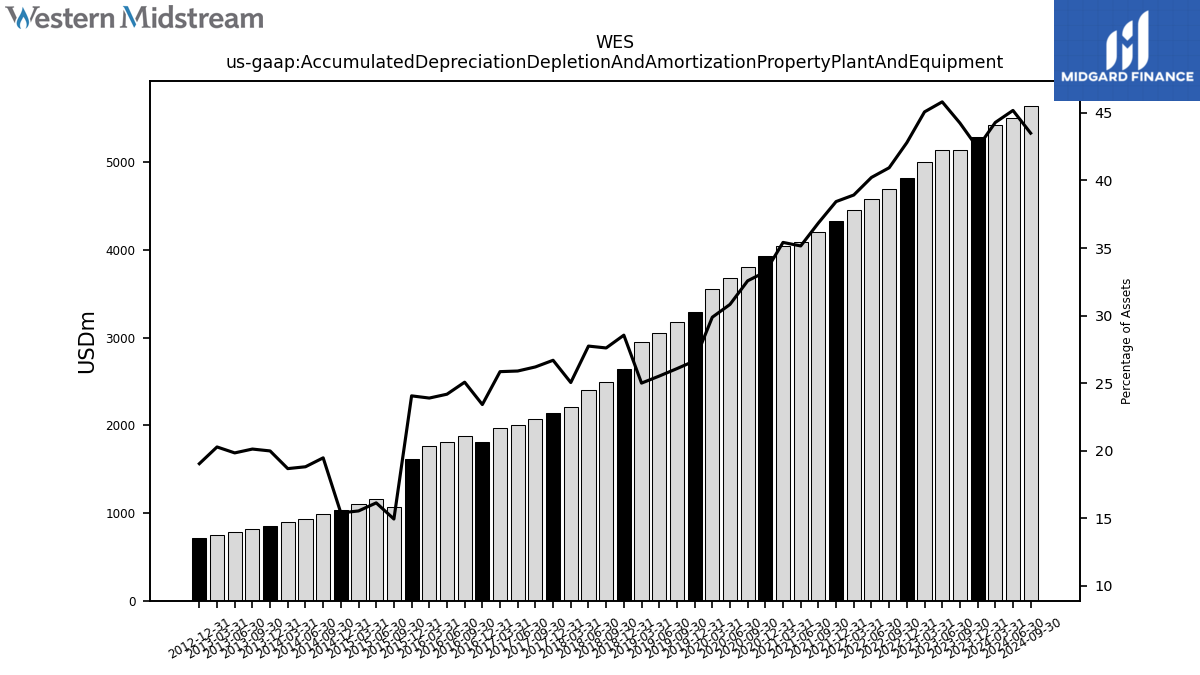
| Accumulated Depreciation Depletion And Amortization Property Plant And Equipment | 5144.68 | 5139.94 | 5008.84 | 4823.99 | 4696.82 | 4581.12 | 4455.16 | 4333.17 | 4208.85 | 4087.36 | 4049.90 | 3931.80 | 3808.01 | 3685.01 | 3558.63 | 3290.74 | 3176.09 | 3058.51 | 2950.33 | 2638.16 | 2494.12 | 2405.42 | 2208.54 | 2140.21 | 2074.46 | 2006.99 | 1974.08 | 1812.01 | 1882.01 | 1816.03 | 1760.59 | 1614.66 | 1072.80 | 1165.61 | 1103.64 | 1040.33 | 986.69 | 936.57 | 894.69 | 855.85 | 817.49 | 779.51 | 745.48 | 714.44 | NA | NA | NA | |
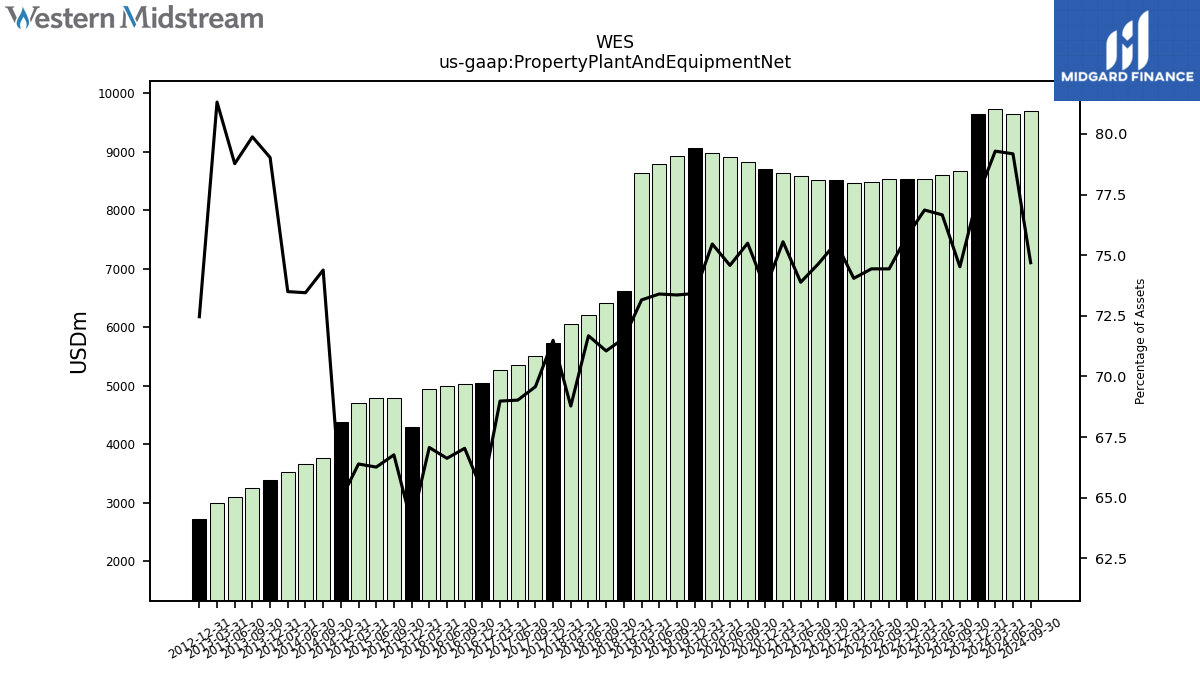
| Property Plant And Equipment Net | 8664.40 | 8600.97 | 8541.22 | 8541.60 | 8539.68 | 8477.57 | 8475.20 | 8512.91 | 8524.08 | 8589.97 | 8639.54 | 8709.94 | 8825.14 | 8914.72 | 8986.73 | 9064.93 | 8933.83 | 8793.65 | 8630.00 | 6612.07 | 6418.63 | 6213.57 | 6063.55 | 5730.89 | 5507.71 | 5347.79 | 5266.81 | 5049.93 | 5030.89 | 5002.14 | 4940.22 | 4289.97 | 4789.92 | 4782.54 | 4711.27 | 4384.37 | 3767.59 | 3655.37 | 3519.48 | 3383.26 | 3243.90 | 3094.03 | 2988.21 | 2717.96 | NA | NA | NA | |
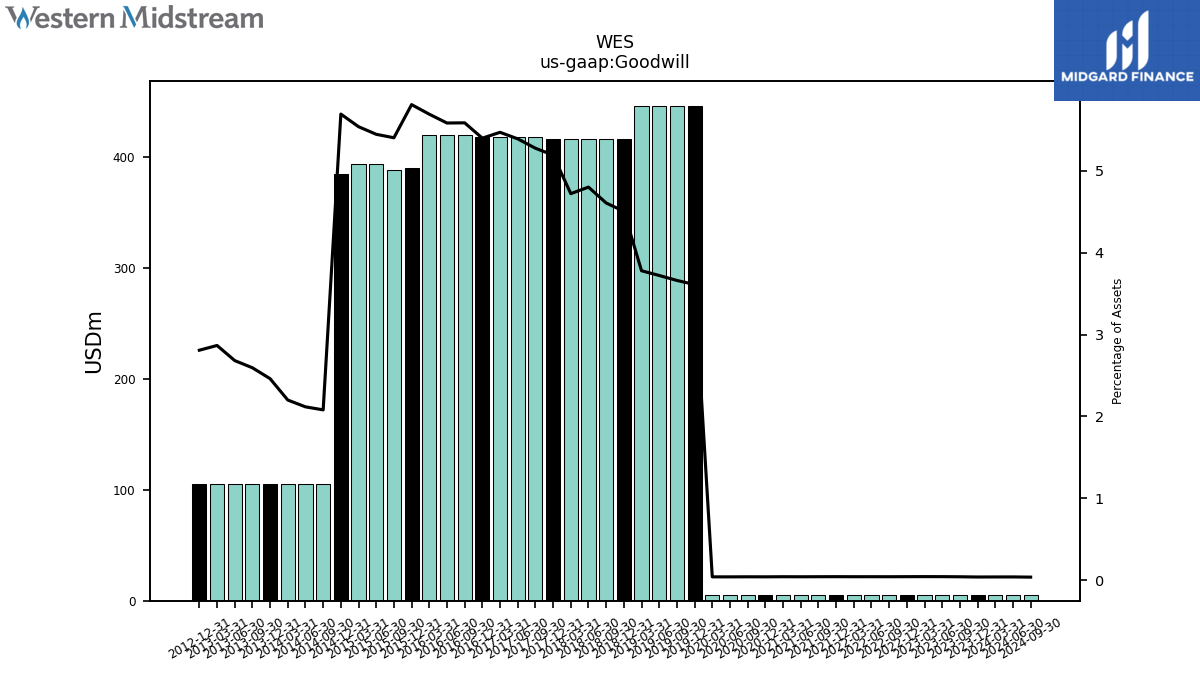
| Goodwill | 4.78 | 4.78 | 4.78 | 4.78 | 4.78 | 4.78 | 4.78 | 4.78 | 4.78 | 4.78 | 4.78 | 4.78 | 4.78 | 4.78 | 4.78 | 445.80 | 445.80 | 445.80 | 445.80 | 416.16 | 416.16 | 416.16 | 416.16 | 416.16 | 417.61 | 417.61 | 417.61 | 417.61 | 419.19 | 419.19 | 419.19 | 389.69 | 387.63 | 393.04 | 393.04 | 384.39 | 105.34 | 105.34 | 105.34 | 105.34 | 105.34 | 105.34 | 105.34 | 105.34 | NA | NA | NA | |
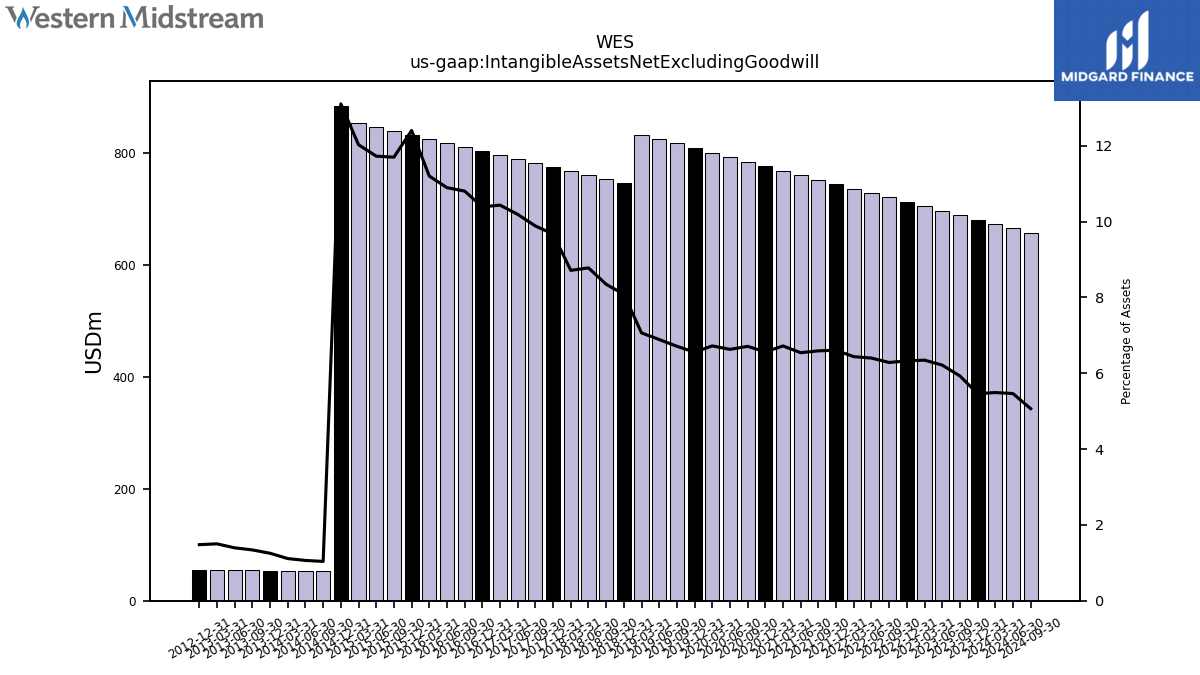
| Intangible Assets Net Excluding Goodwill | 689.32 | 697.24 | 705.16 | 713.08 | 720.99 | 728.91 | 736.83 | 744.74 | 752.66 | 760.58 | 768.49 | 776.41 | 784.33 | 792.56 | 800.48 | 809.39 | 817.39 | 825.40 | 833.40 | 746.80 | 753.95 | 761.05 | 768.16 | 775.27 | 782.38 | 789.48 | 796.59 | 803.70 | 810.80 | 817.91 | 825.02 | 832.13 | 839.23 | 846.34 | 853.45 | 884.86 | 52.56 | 52.91 | 53.26 | 53.61 | 54.44 | 54.80 | 55.16 | 55.49 | NA | NA | NA | |
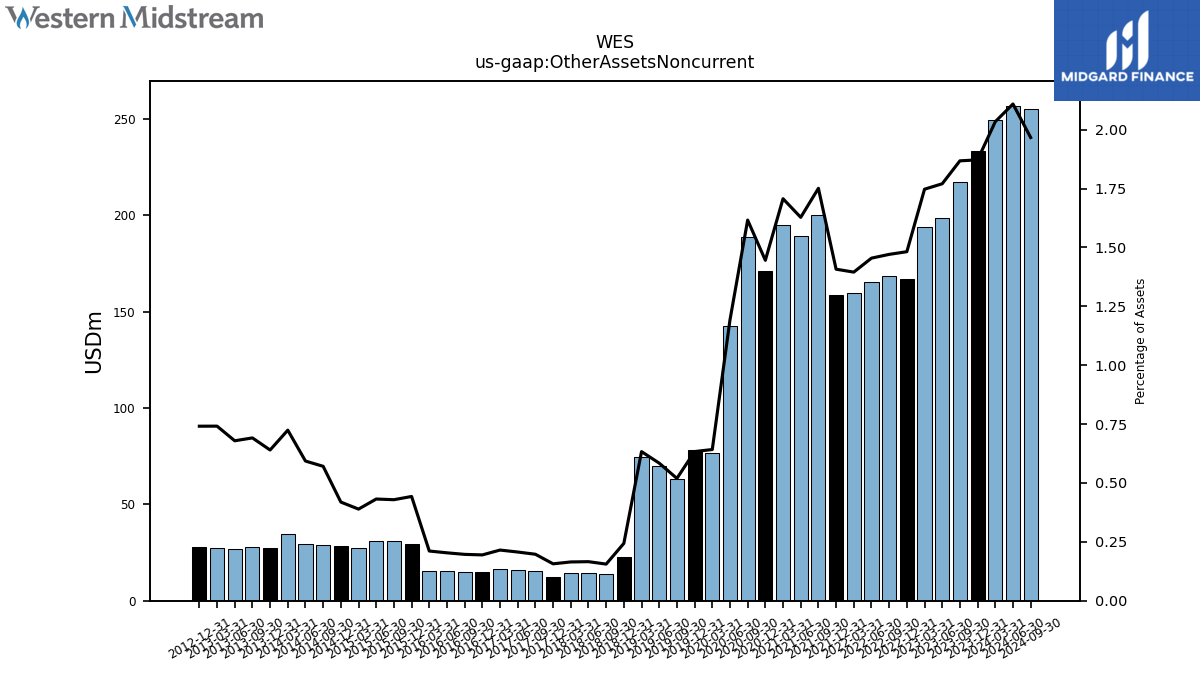
| Other Assets Noncurrent | 217.16 | 198.63 | 194.18 | 167.05 | 168.72 | 165.67 | 159.71 | 158.70 | 199.96 | 189.27 | 195.19 | 171.01 | 188.94 | 142.50 | 76.47 | 78.20 | 63.26 | 69.99 | 74.69 | 22.50 | 14.06 | 14.38 | 14.53 | 12.57 | 15.63 | 16.03 | 16.43 | 15.06 | 14.78 | 15.28 | 15.55 | 29.71 | 30.78 | 31.17 | 27.62 | 28.29 | 28.91 | 29.52 | 34.68 | 27.40 | 28.08 | 26.68 | 27.25 | 27.80 | NA | NA | NA |
| 2023-09-30 | 2023-06-30 | 2023-03-31 | 2022-12-31 | 2022-09-30 | 2022-06-30 | 2022-03-31 | 2021-12-31 | 2021-09-30 | 2021-06-30 | 2021-03-31 | 2020-12-31 | 2020-09-30 | 2020-06-30 | 2020-03-31 | 2019-12-31 | 2019-09-30 | 2019-06-30 | 2019-03-31 | 2018-12-31 | 2018-09-30 | 2018-06-30 | 2018-03-31 | 2017-12-31 | 2017-09-30 | 2017-06-30 | 2017-03-31 | 2016-12-31 | 2016-09-30 | 2016-06-30 | 2016-03-31 | 2015-12-31 | 2015-09-30 | 2015-06-30 | 2015-03-31 | 2014-12-31 | 2014-09-30 | 2014-06-30 | 2014-03-31 | 2013-12-31 | 2013-09-30 | 2013-06-30 | 2013-03-31 | 2012-12-31 | 2012-09-30 | 2012-06-30 | 2012-03-31 | ||
|---|---|---|---|---|---|---|---|---|---|---|---|---|---|---|---|---|---|---|---|---|---|---|---|---|---|---|---|---|---|---|---|---|---|---|---|---|---|---|---|---|---|---|---|---|---|---|---|---|
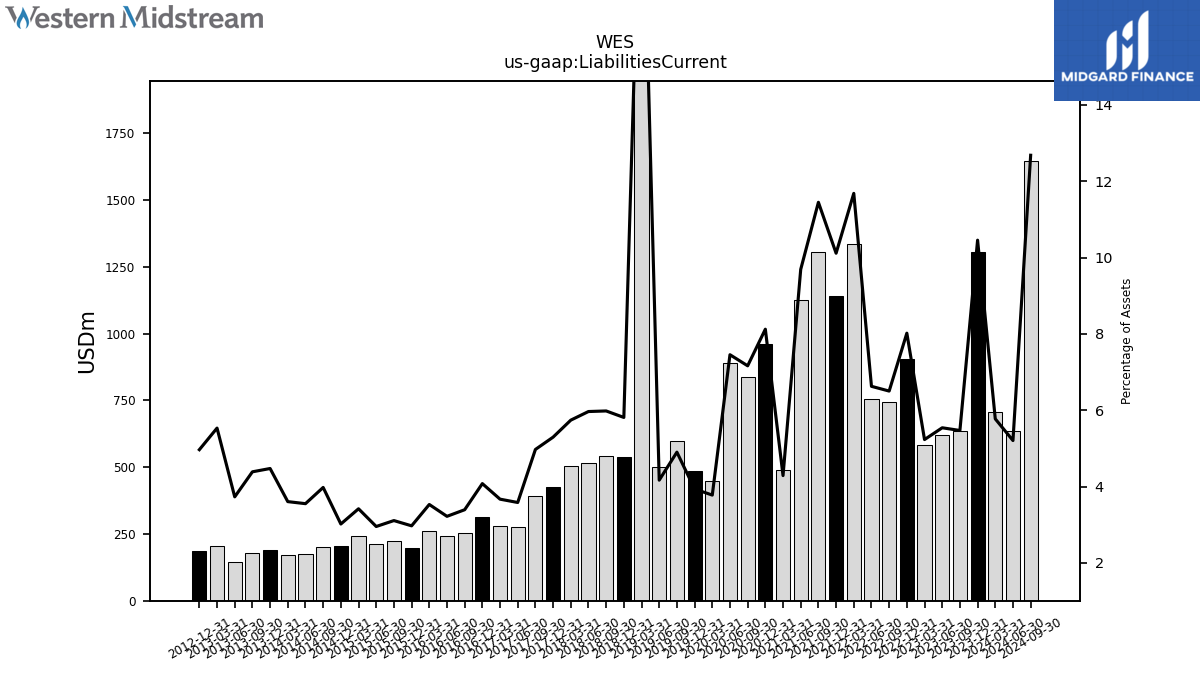
| Liabilities Current | 635.90 | 621.54 | 581.33 | 903.86 | 745.92 | 754.68 | 1337.13 | 1140.20 | 1307.34 | 1126.67 | 490.26 | 960.93 | 837.43 | 891.05 | 449.73 | 485.95 | 596.87 | 499.32 | 2518.85 | 536.86 | 540.28 | 517.16 | 506.02 | 424.43 | 393.57 | 277.54 | 280.15 | 315.39 | 254.59 | 241.71 | 260.01 | 199.31 | 223.00 | 213.14 | 242.53 | 203.80 | 201.41 | 176.74 | 172.62 | 191.48 | 178.12 | 146.50 | 203.29 | 186.25 | NA | NA | NA | |
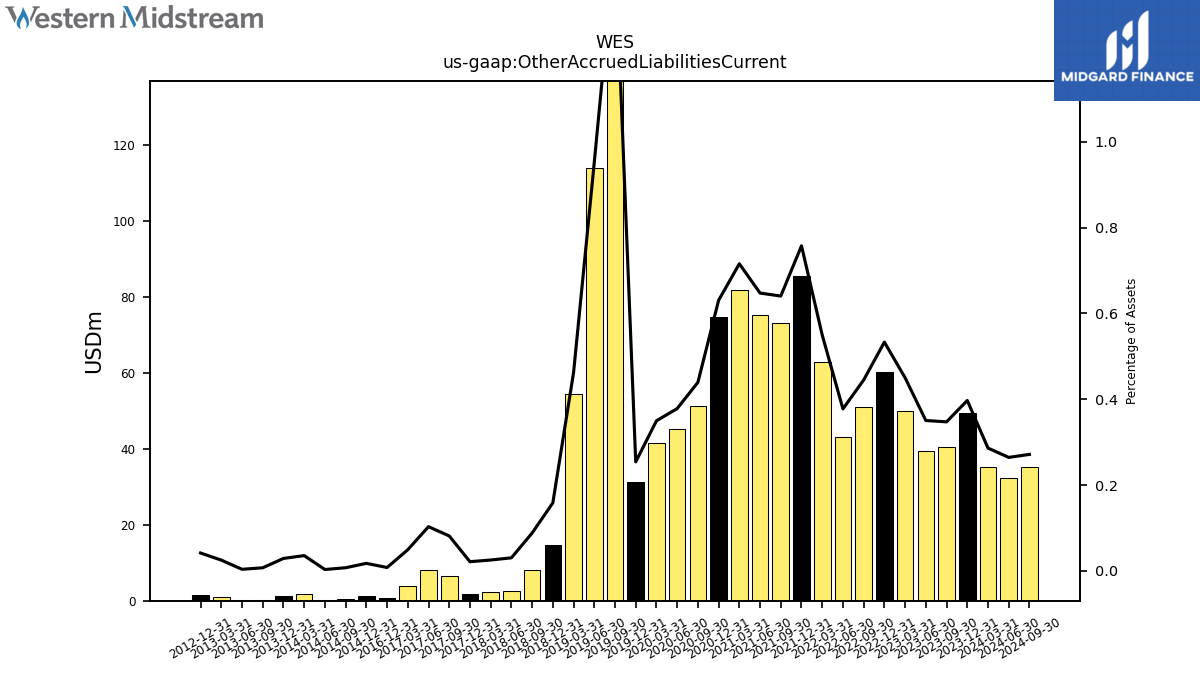
| Other Accrued Liabilities Current | 40.38 | 39.32 | 50.01 | 60.09 | 51.04 | 42.99 | 62.92 | 85.41 | 73.14 | 75.28 | 81.84 | 74.60 | 51.36 | 45.22 | 41.64 | 31.37 | 177.75 | 114.05 | 54.49 | 14.64 | 7.96 | 2.64 | 2.23 | 1.71 | 6.45 | 7.98 | 3.76 | 0.61 | NA | NA | NA | NA | NA | NA | NA | 1.18 | 0.37 | 0.16 | 1.70 | 1.24 | 0.29 | 0.14 | 0.92 | 1.56 | NA | NA | NA | |
| Taxes Payable Current | 4.45 | 3.65 | 2.92 | 2.43 | 3.44 | 2.89 | 2.19 | 1.52 | 4.59 | 3.77 | 3.02 | 3.40 | 2.10 | 0.66 | 0.00 | 0.70 | 0.91 | 1.32 | 0.86 | 0.38 | 0.25 | 2.76 | 2.67 | 2.50 | 1.02 | 1.63 | 1.43 | 1.01 | 0.49 | 1.13 | 0.93 | 0.77 | 0.70 | 0.42 | 0.30 | 0.21 | 0.26 | 0.41 | 0.36 | 0.00 | 0.19 | 0.66 | 0.63 | 0.55 | NA | NA | NA | |
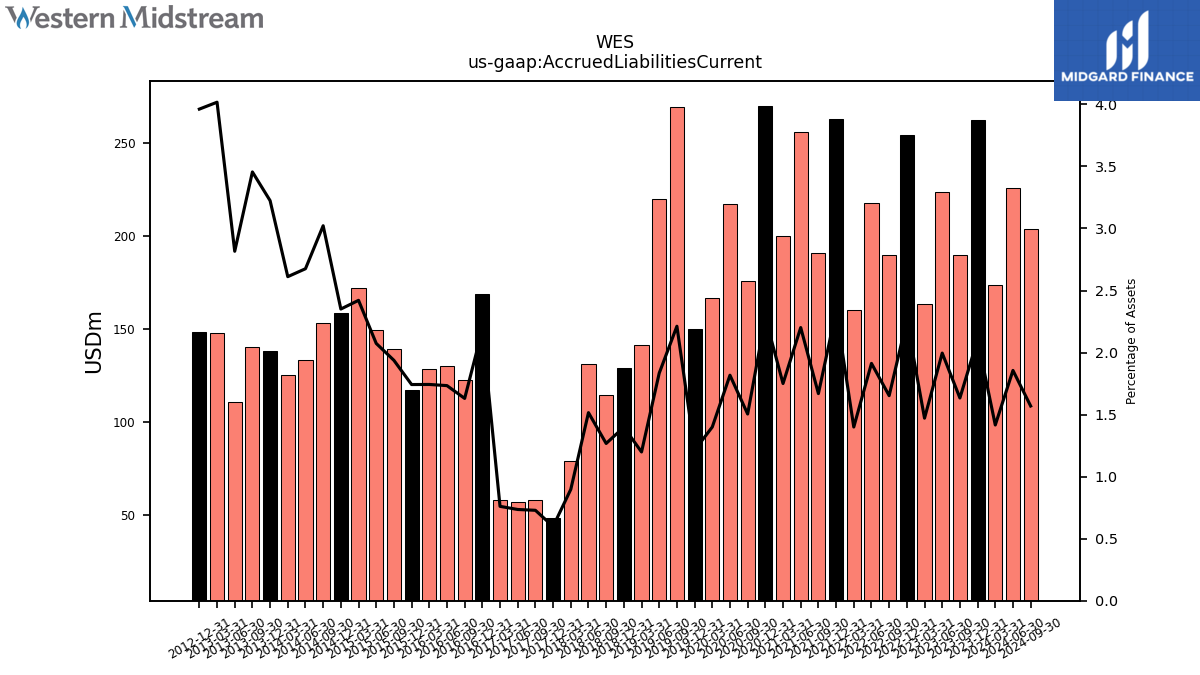
| Accrued Liabilities Current | 189.98 | 223.89 | 163.50 | 254.64 | 189.62 | 217.82 | 160.25 | 263.25 | 190.63 | 255.94 | 200.19 | 269.95 | 175.91 | 217.22 | 166.74 | 149.79 | 269.39 | 219.73 | 141.44 | 129.20 | 114.50 | 131.40 | 79.12 | 47.99 | 57.70 | 56.98 | 58.08 | 168.98 | 122.36 | 130.16 | 128.38 | 116.89 | 138.99 | 149.67 | 171.79 | 158.73 | 153.06 | 133.15 | 125.06 | 138.03 | 140.32 | 110.61 | 147.64 | 148.60 | NA | NA | NA | |
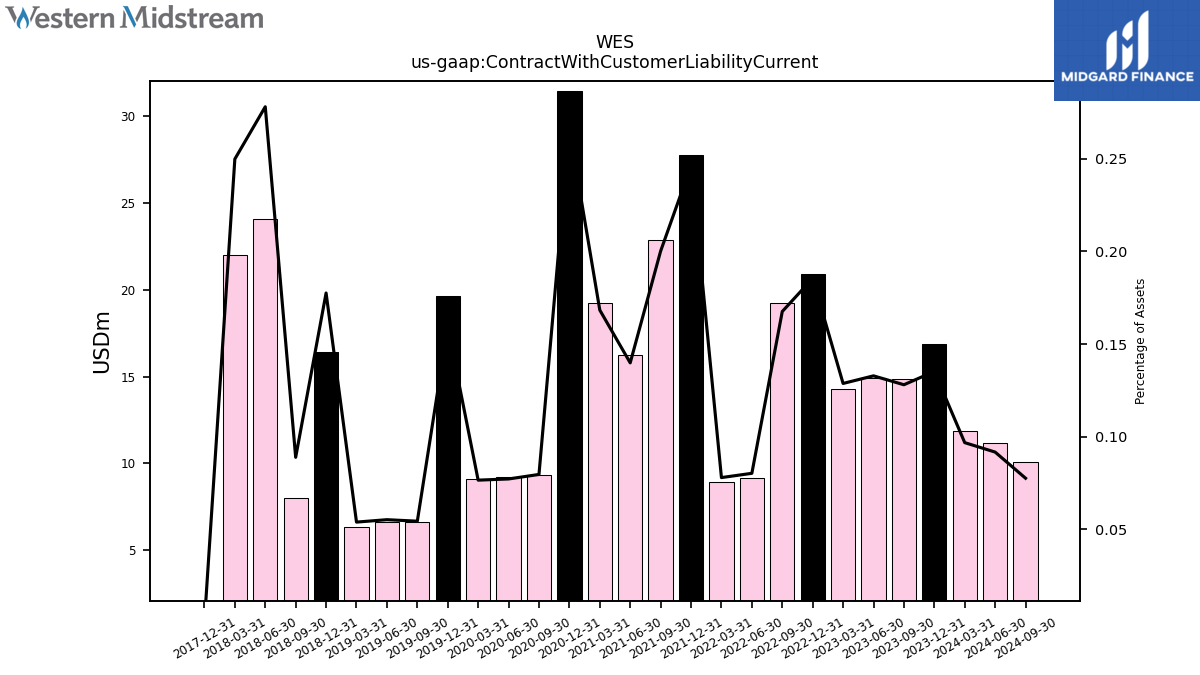
| Contract With Customer Liability Current | 14.89 | 14.90 | 14.31 | 20.90 | 19.22 | 9.14 | 8.92 | 27.76 | 22.85 | 16.26 | 19.25 | 31.48 | 9.31 | 9.23 | 9.12 | 19.66 | 6.63 | 6.62 | 6.36 | 16.40 | 8.03 | 24.10 | 22.02 | 0.00 | NA | NA | NA | NA | NA | NA | NA | NA | NA | NA | NA | NA | NA | NA | NA | NA | NA | NA | NA | NA | NA | NA | NA |
| 2023-09-30 | 2023-06-30 | 2023-03-31 | 2022-12-31 | 2022-09-30 | 2022-06-30 | 2022-03-31 | 2021-12-31 | 2021-09-30 | 2021-06-30 | 2021-03-31 | 2020-12-31 | 2020-09-30 | 2020-06-30 | 2020-03-31 | 2019-12-31 | 2019-09-30 | 2019-06-30 | 2019-03-31 | 2018-12-31 | 2018-09-30 | 2018-06-30 | 2018-03-31 | 2017-12-31 | 2017-09-30 | 2017-06-30 | 2017-03-31 | 2016-12-31 | 2016-09-30 | 2016-06-30 | 2016-03-31 | 2015-12-31 | 2015-09-30 | 2015-06-30 | 2015-03-31 | 2014-12-31 | 2014-09-30 | 2014-06-30 | 2014-03-31 | 2013-12-31 | 2013-09-30 | 2013-06-30 | 2013-03-31 | 2012-12-31 | 2012-09-30 | 2012-06-30 | 2012-03-31 | ||
|---|---|---|---|---|---|---|---|---|---|---|---|---|---|---|---|---|---|---|---|---|---|---|---|---|---|---|---|---|---|---|---|---|---|---|---|---|---|---|---|---|---|---|---|---|---|---|---|---|
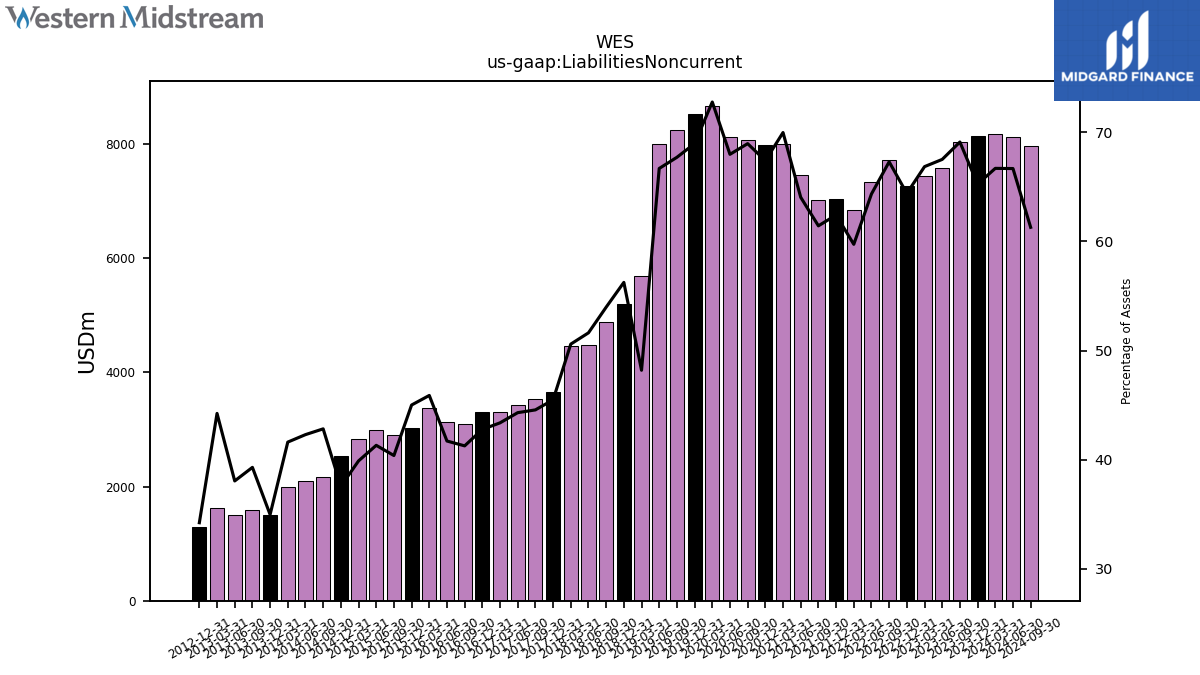
| Liabilities Noncurrent | 8035.56 | 7575.24 | 7429.60 | 7259.66 | 7720.97 | 7329.18 | 6837.94 | 7037.12 | 7015.59 | 7446.76 | 8002.66 | 7973.88 | 8061.79 | 8126.68 | 8666.99 | 8515.21 | 8246.28 | 7990.01 | 5686.60 | 5197.12 | 4876.64 | 4476.01 | 4460.78 | 3647.01 | 3528.42 | 3433.76 | 3312.47 | 3309.94 | 3097.78 | 3132.31 | 3380.57 | 3020.60 | 2897.84 | 2982.82 | 2831.26 | 2537.19 | 2169.60 | 2105.40 | 1993.12 | 1497.62 | 1596.28 | 1495.04 | 1626.16 | 1284.18 | NA | NA | NA | |
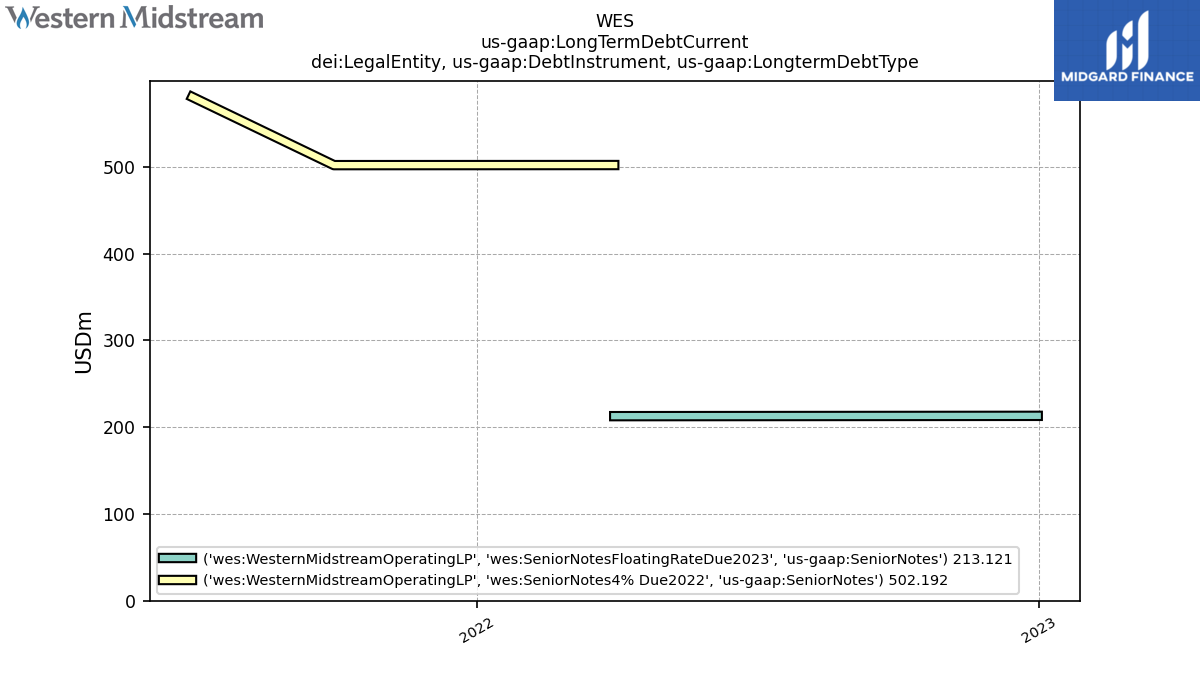
| Long Term Debt And Capital Lease Obligations | 7260.05 | 6824.21 | 6693.94 | 6569.58 | 7027.36 | 6656.12 | 6188.75 | 6400.62 | 6399.87 | 6835.84 | 7416.00 | 7415.83 | 7440.39 | 7544.40 | NA | 7951.56 | NA | NA | NA | NA | NA | NA | NA | NA | NA | NA | NA | NA | NA | NA | NA | NA | NA | NA | NA | NA | NA | NA | NA | NA | NA | NA | NA | NA | NA | NA | NA | |
| Deferred Income Tax Liabilities Net | 15.38 | 15.28 | 15.35 | 14.42 | 14.18 | 14.35 | 13.56 | 12.43 | 24.47 | 23.47 | 22.75 | 22.20 | 21.29 | 19.70 | 16.73 | 18.90 | 17.89 | 16.18 | 15.36 | 9.70 | 10.29 | 8.75 | 8.59 | 7.41 | 10.28 | 10.17 | 9.53 | 6.40 | 6.36 | NA | NA | 139.70 | NA | NA | NA | NA | NA | NA | NA | NA | NA | NA | NA | NA | NA | NA | NA | |
| Other Liabilities Noncurrent | 452.19 | 433.77 | 426.59 | 385.63 | 368.93 | 355.16 | 338.45 | 325.81 | 320.22 | 319.82 | 295.95 | 275.57 | 272.82 | 234.62 | 222.04 | 208.35 | 178.71 | 164.31 | 151.12 | 140.07 | 141.96 | 138.49 | 128.76 | 3.49 | NA | NA | NA | NA | NA | NA | NA | NA | NA | NA | NA | NA | NA | NA | NA | NA | NA | NA | NA | NA | NA | NA | NA | |
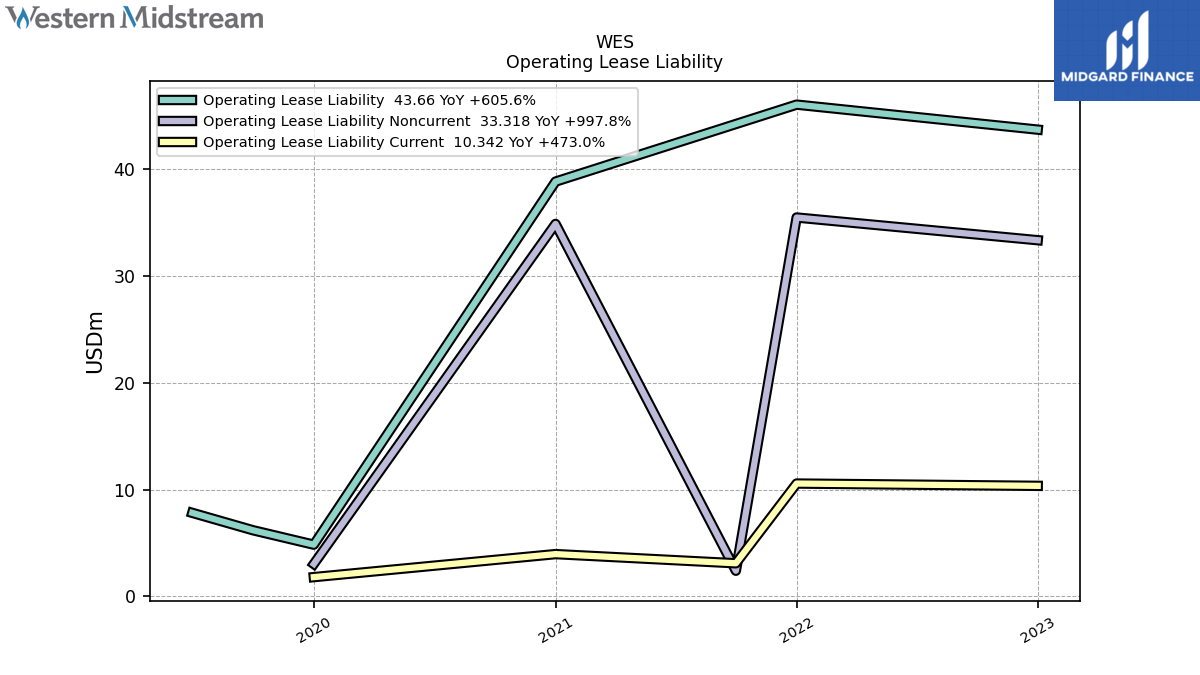
| Operating Lease Liability Noncurrent | NA | NA | NA | 33.32 | NA | NA | NA | 35.44 | 2.40 | NA | NA | 34.84 | NA | NA | NA | 3.04 | NA | NA | NA | NA | NA | NA | NA | NA | NA | NA | NA | NA | NA | NA | NA | NA | NA | NA | NA | NA | NA | NA | NA | NA | NA | NA | NA | NA | NA | NA | NA |
| 2023-09-30 | 2023-06-30 | 2023-03-31 | 2022-12-31 | 2022-09-30 | 2022-06-30 | 2022-03-31 | 2021-12-31 | 2021-09-30 | 2021-06-30 | 2021-03-31 | 2020-12-31 | 2020-09-30 | 2020-06-30 | 2020-03-31 | 2019-12-31 | 2019-09-30 | 2019-06-30 | 2019-03-31 | 2018-12-31 | 2018-09-30 | 2018-06-30 | 2018-03-31 | 2017-12-31 | 2017-09-30 | 2017-06-30 | 2017-03-31 | 2016-12-31 | 2016-09-30 | 2016-06-30 | 2016-03-31 | 2015-12-31 | 2015-09-30 | 2015-06-30 | 2015-03-31 | 2014-12-31 | 2014-09-30 | 2014-06-30 | 2014-03-31 | 2013-12-31 | 2013-09-30 | 2013-06-30 | 2013-03-31 | 2012-12-31 | 2012-09-30 | 2012-06-30 | 2012-03-31 | ||
|---|---|---|---|---|---|---|---|---|---|---|---|---|---|---|---|---|---|---|---|---|---|---|---|---|---|---|---|---|---|---|---|---|---|---|---|---|---|---|---|---|---|---|---|---|---|---|---|---|
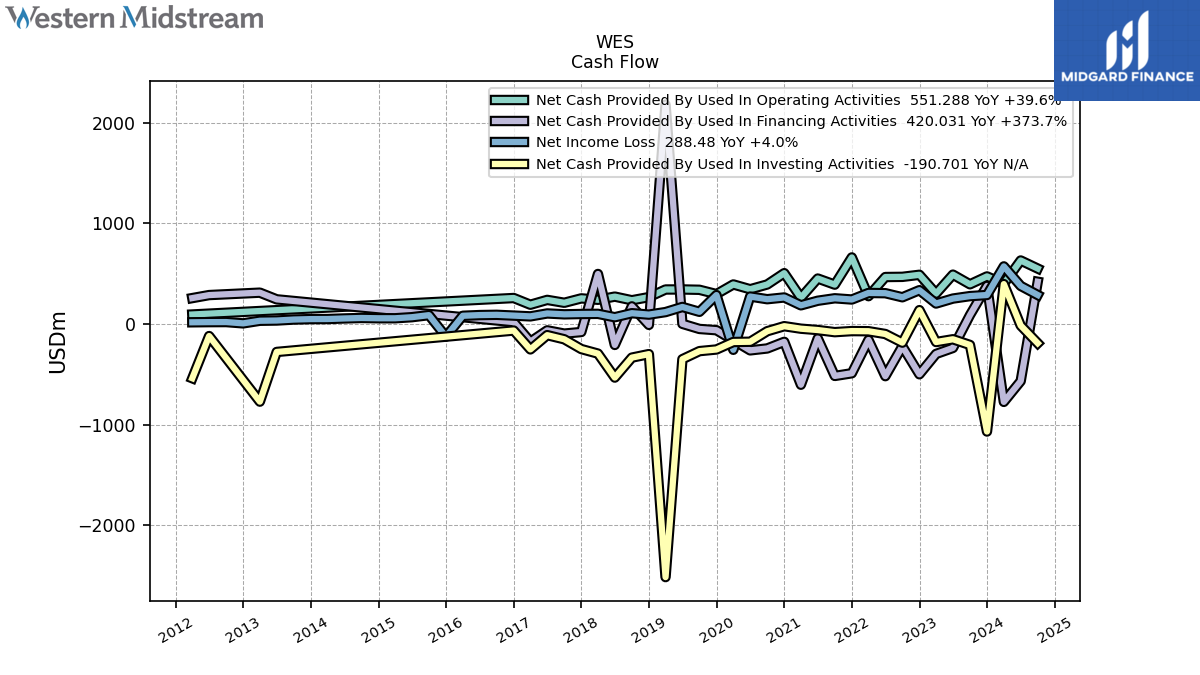
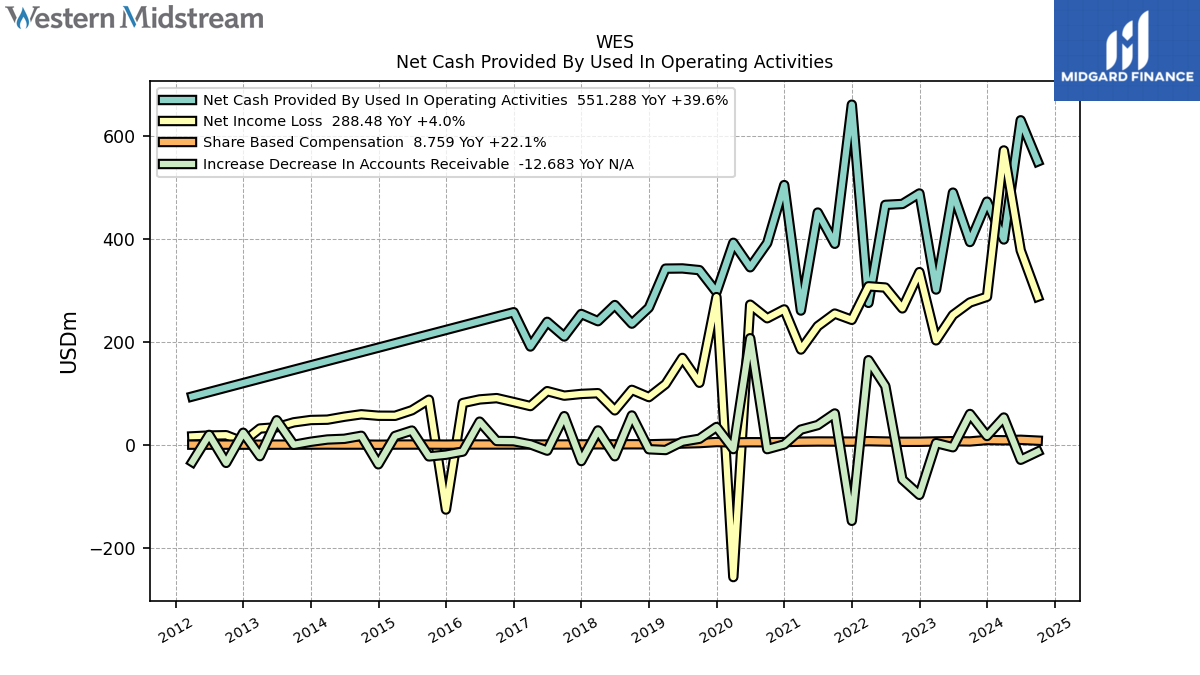
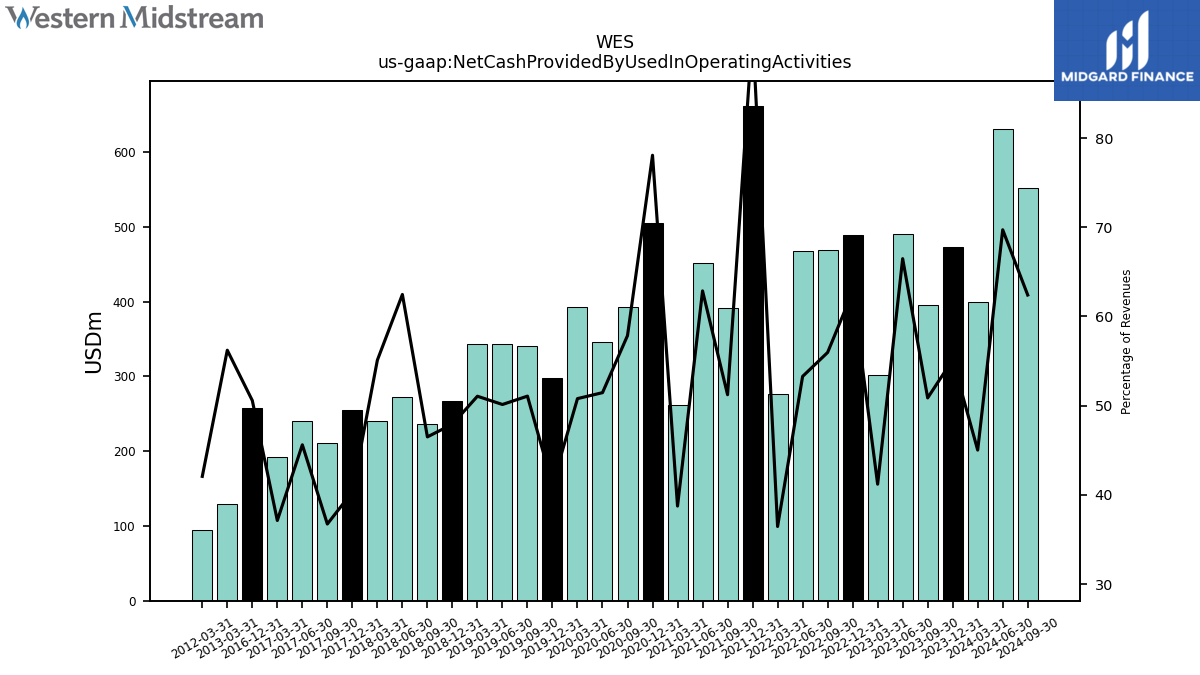
| Net Cash Provided By Used In Operating Activities | 394.79 | 490.82 | 302.42 | 489.22 | 468.77 | 466.98 | 276.46 | 661.86 | 391.33 | 452.11 | 261.55 | 505.52 | 392.89 | 345.69 | 393.31 | 297.42 | 340.15 | 343.46 | 343.07 | 267.32 | 236.13 | 272.33 | 240.92 | 254.94 | 211.11 | 239.69 | 191.67 | 258.38 | NA | NA | NA | NA | NA | NA | NA | NA | NA | NA | NA | NA | NA | NA | 129.16 | NA | NA | NA | 94.53 | |
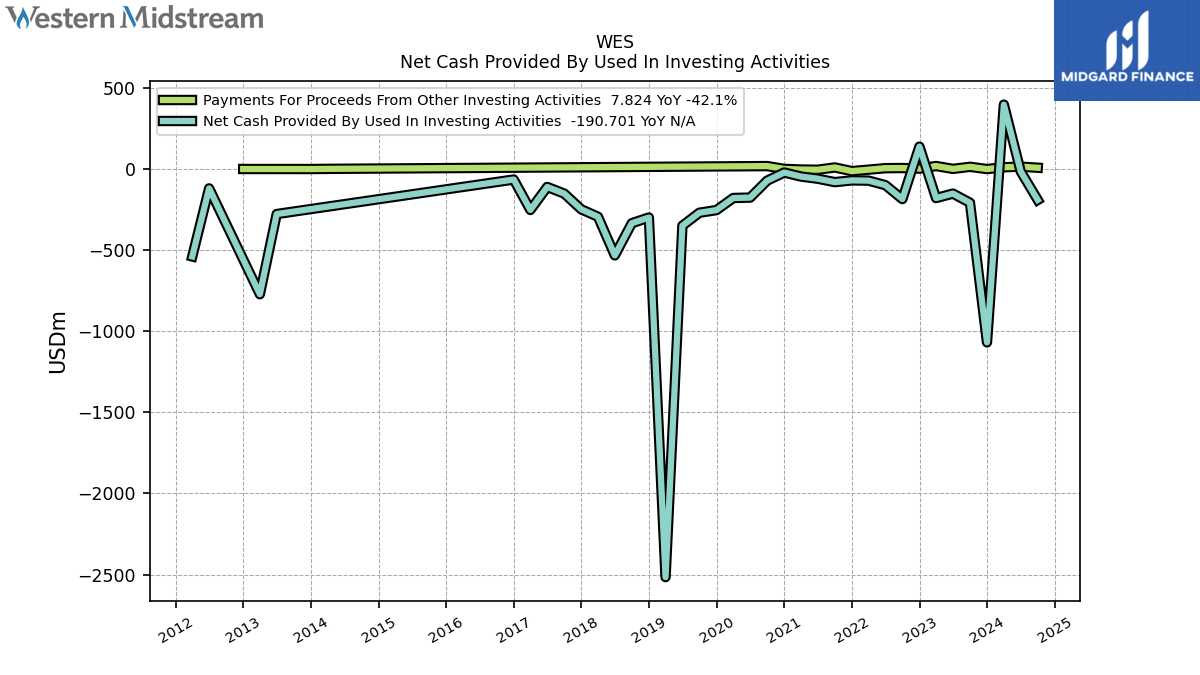
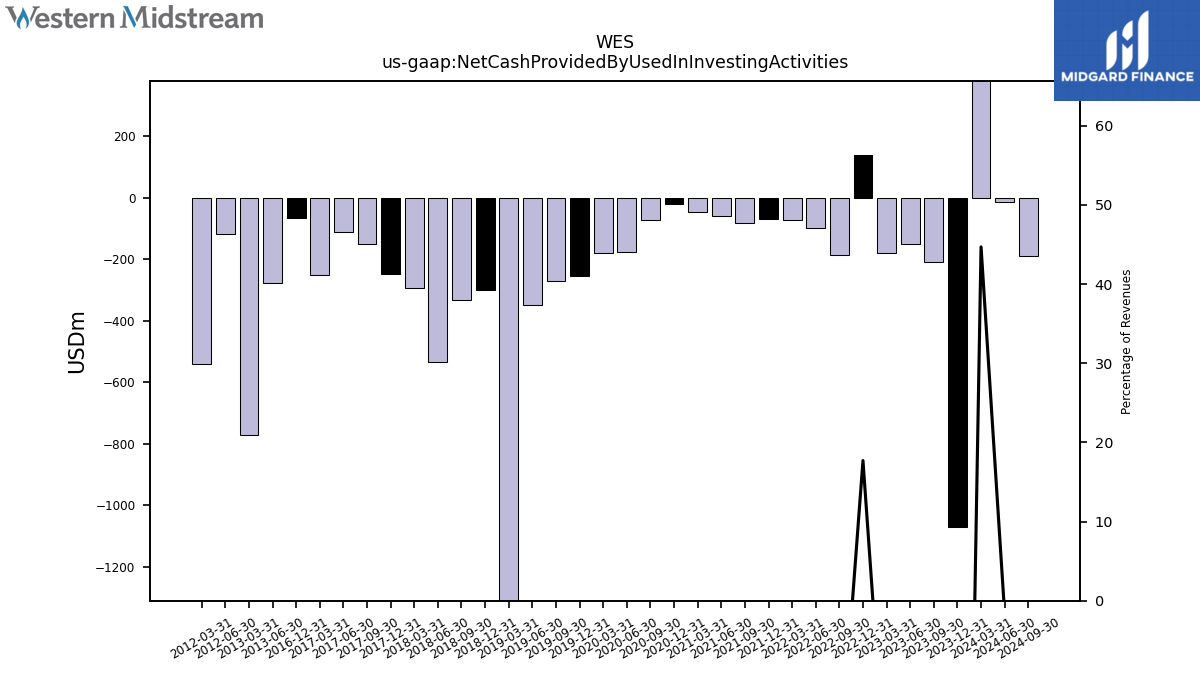
| Net Cash Provided By Used In Investing Activities | -207.92 | -151.49 | -179.18 | 138.01 | -185.31 | -99.33 | -71.62 | -70.25 | -80.88 | -59.93 | -46.47 | -21.58 | -71.67 | -176.28 | -178.72 | -253.21 | -269.48 | -349.44 | -2515.73 | -299.11 | -334.03 | -532.49 | -294.17 | -248.81 | -151.67 | -110.70 | -252.43 | -64.84 | NA | NA | NA | NA | NA | NA | NA | NA | NA | NA | NA | NA | NA | -277.60 | -771.89 | NA | NA | -119.48 | -539.07 | |
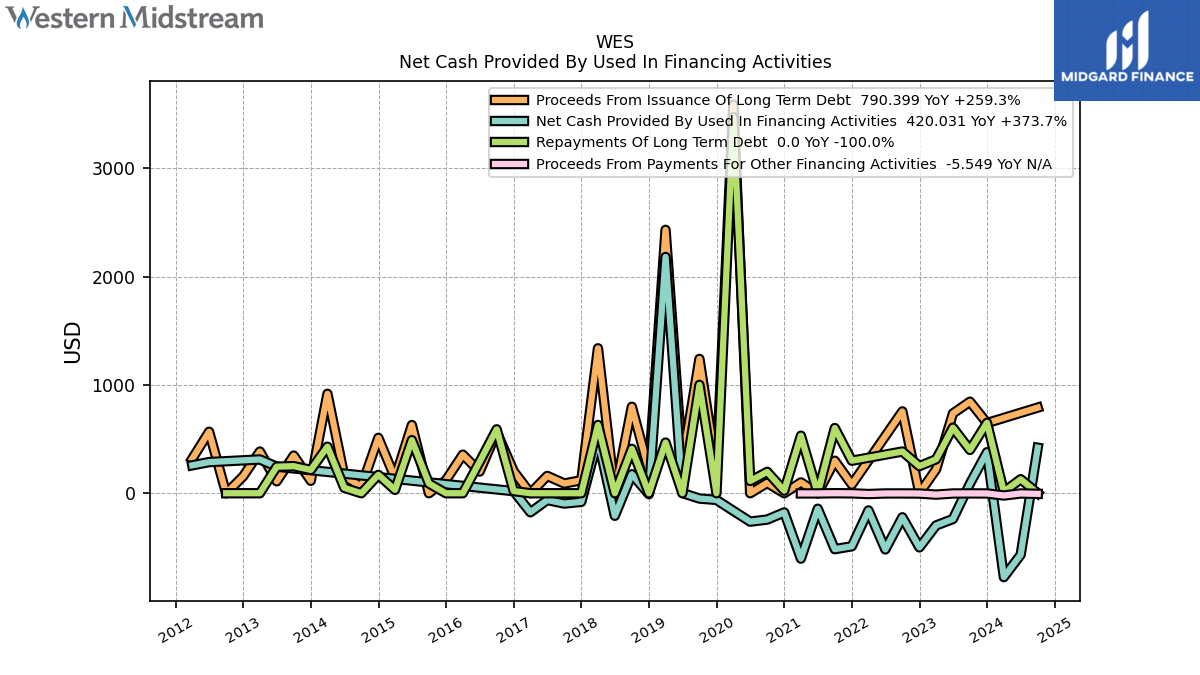
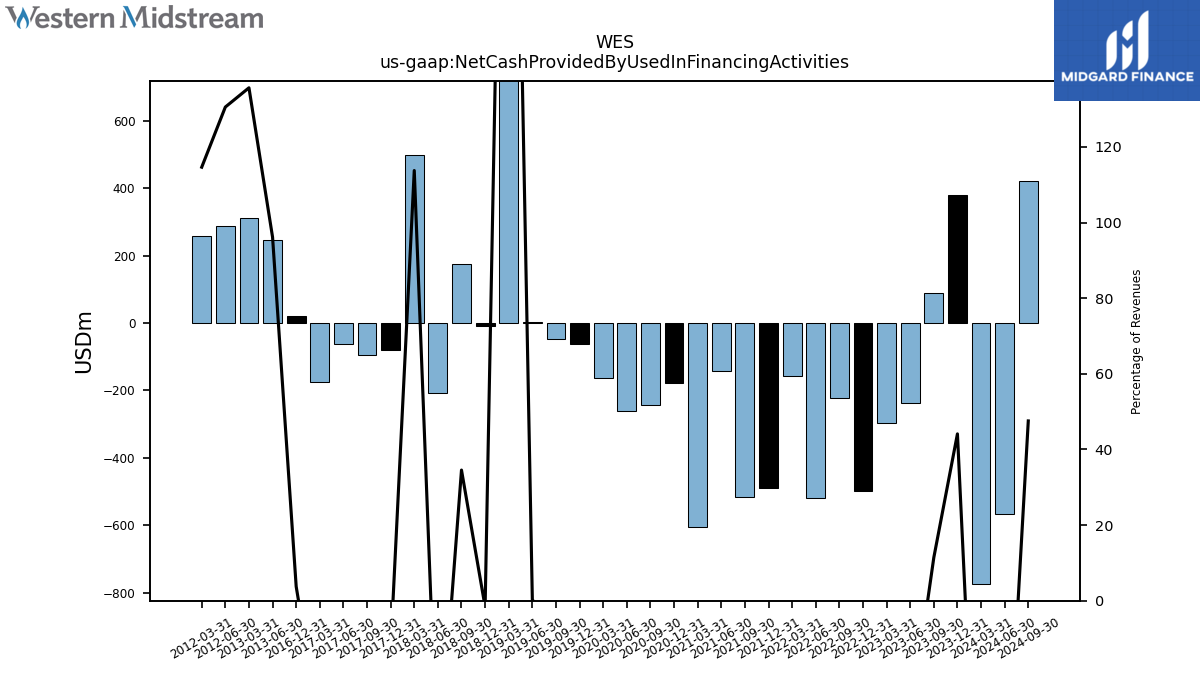
| Net Cash Provided By Used In Financing Activities | 88.67 | -238.03 | -297.26 | -499.67 | -221.80 | -518.47 | -158.59 | -489.47 | -516.16 | -142.98 | -603.62 | -177.06 | -242.92 | -261.95 | -162.27 | -61.67 | -49.04 | 1.73 | 2180.56 | -8.94 | 175.46 | -208.22 | 497.35 | -79.58 | -95.24 | -62.81 | -175.66 | 19.19 | NA | NA | NA | NA | NA | NA | NA | NA | NA | NA | NA | NA | NA | 245.30 | 311.63 | NA | NA | 287.62 | 257.60 |
| 2023-09-30 | 2023-06-30 | 2023-03-31 | 2022-12-31 | 2022-09-30 | 2022-06-30 | 2022-03-31 | 2021-12-31 | 2021-09-30 | 2021-06-30 | 2021-03-31 | 2020-12-31 | 2020-09-30 | 2020-06-30 | 2020-03-31 | 2019-12-31 | 2019-09-30 | 2019-06-30 | 2019-03-31 | 2018-12-31 | 2018-09-30 | 2018-06-30 | 2018-03-31 | 2017-12-31 | 2017-09-30 | 2017-06-30 | 2017-03-31 | 2016-12-31 | 2016-09-30 | 2016-06-30 | 2016-03-31 | 2015-12-31 | 2015-09-30 | 2015-06-30 | 2015-03-31 | 2014-12-31 | 2014-09-30 | 2014-06-30 | 2014-03-31 | 2013-12-31 | 2013-09-30 | 2013-06-30 | 2013-03-31 | 2012-12-31 | 2012-09-30 | 2012-06-30 | 2012-03-31 | ||
|---|---|---|---|---|---|---|---|---|---|---|---|---|---|---|---|---|---|---|---|---|---|---|---|---|---|---|---|---|---|---|---|---|---|---|---|---|---|---|---|---|---|---|---|---|---|---|---|---|
| Net Cash Provided By Used In Operating Activities | 394.79 | 490.82 | 302.42 | 489.22 | 468.77 | 466.98 | 276.46 | 661.86 | 391.33 | 452.11 | 261.55 | 505.52 | 392.89 | 345.69 | 393.31 | 297.42 | 340.15 | 343.46 | 343.07 | 267.32 | 236.13 | 272.33 | 240.92 | 254.94 | 211.11 | 239.69 | 191.67 | 258.38 | NA | NA | NA | NA | NA | NA | NA | NA | NA | NA | NA | NA | NA | NA | 129.16 | NA | NA | NA | 94.53 | |
| Net Income Loss | 277.30 | 252.92 | 203.65 | 336.32 | 265.75 | 306.32 | 308.72 | 243.52 | 255.72 | 231.26 | 185.79 | 263.89 | 246.61 | 273.04 | -256.53 | 287.77 | 121.22 | 169.59 | 118.66 | 93.37 | 107.47 | 67.58 | 101.00 | 99.52 | 96.20 | 104.94 | 75.94 | 83.70 | 91.40 | 88.86 | 81.82 | -125.25 | 88.28 | 67.80 | 57.03 | 57.16 | 59.95 | 55.25 | 49.54 | 48.85 | 44.34 | 34.71 | 32.31 | 6.38 | 19.31 | 18.67 | 17.05 | |
| Profit Loss | 284.40 | 259.52 | 208.34 | 345.03 | 273.58 | 315.17 | 317.67 | 250.85 | 263.64 | 238.28 | 191.24 | 270.78 | 254.13 | 281.34 | -289.40 | 295.44 | 125.22 | 175.06 | 211.98 | 108.78 | 154.68 | 34.56 | 150.49 | 149.59 | 146.60 | 174.35 | 102.66 | 144.27 | 169.18 | 165.78 | 117.76 | -427.81 | 162.75 | 112.55 | 85.97 | 93.67 | 105.78 | 97.75 | 90.17 | 88.46 | 81.12 | 61.13 | 51.68 | -5.69 | 40.92 | 39.75 | 45.63 | |
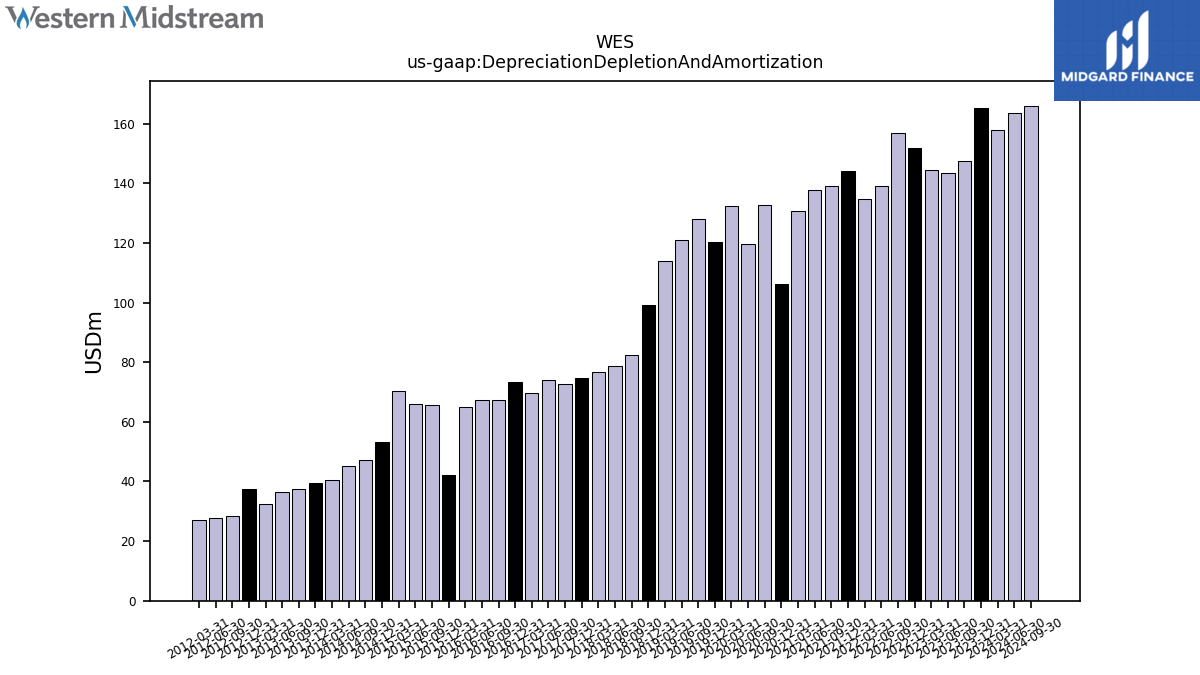
| Depreciation Depletion And Amortization | 147.36 | 143.49 | 144.63 | 151.91 | 156.84 | 139.04 | 134.58 | 144.22 | 139.00 | 137.85 | 130.55 | 106.40 | 132.56 | 119.81 | 132.32 | 120.28 | 127.91 | 121.12 | 113.95 | 99.35 | 82.55 | 78.79 | 76.84 | 74.60 | 72.54 | 74.03 | 69.70 | 73.29 | 67.25 | 67.31 | 65.09 | 42.22 | 65.69 | 65.96 | 70.29 | 53.15 | 47.28 | 45.30 | 40.61 | 39.37 | 37.62 | 36.50 | 32.44 | 37.34 | 28.45 | 27.74 | 27.07 | |
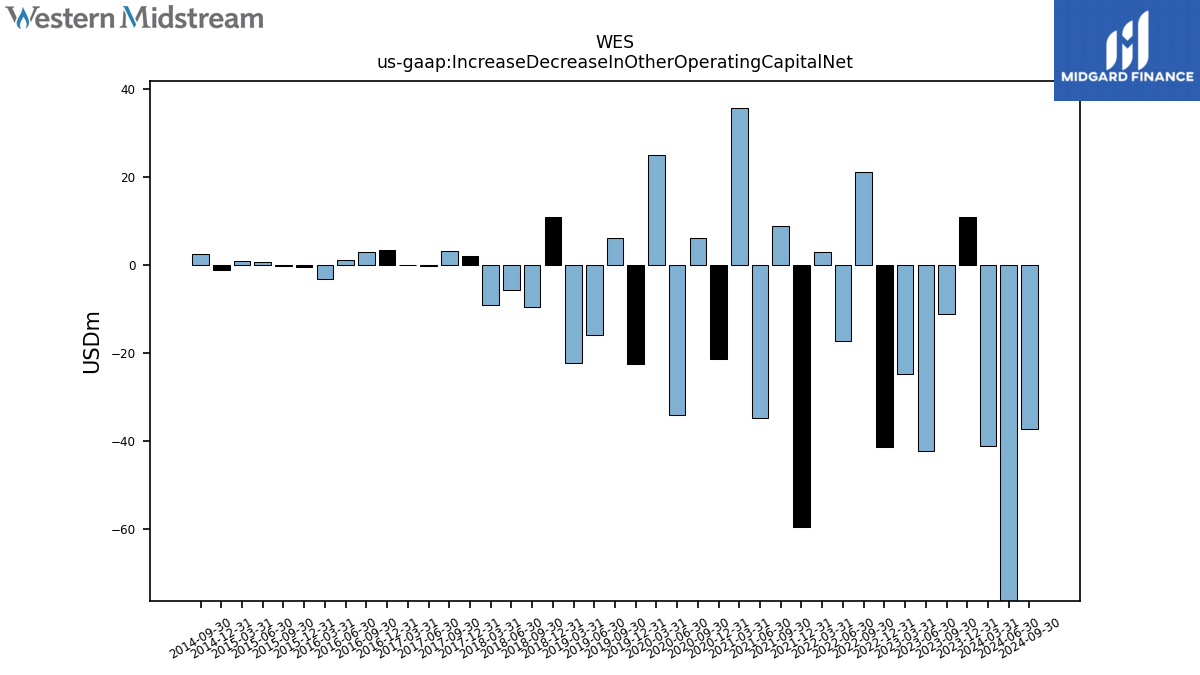
| Increase Decrease In Other Operating Capital Net | -11.29 | -42.23 | -24.83 | -41.44 | 21.02 | -17.28 | 2.92 | -59.47 | 8.88 | -34.87 | 35.60 | -21.48 | 5.96 | -34.16 | 24.86 | -22.64 | 6.01 | -15.86 | -22.39 | 10.93 | -9.53 | -5.81 | -9.17 | 1.88 | 3.01 | -0.30 | -0.16 | 3.42 | 2.99 | 1.12 | -3.24 | -0.46 | -0.36 | 0.64 | 0.90 | -1.21 | 2.39 | NA | NA | NA | NA | NA | NA | NA | NA | NA | NA | |
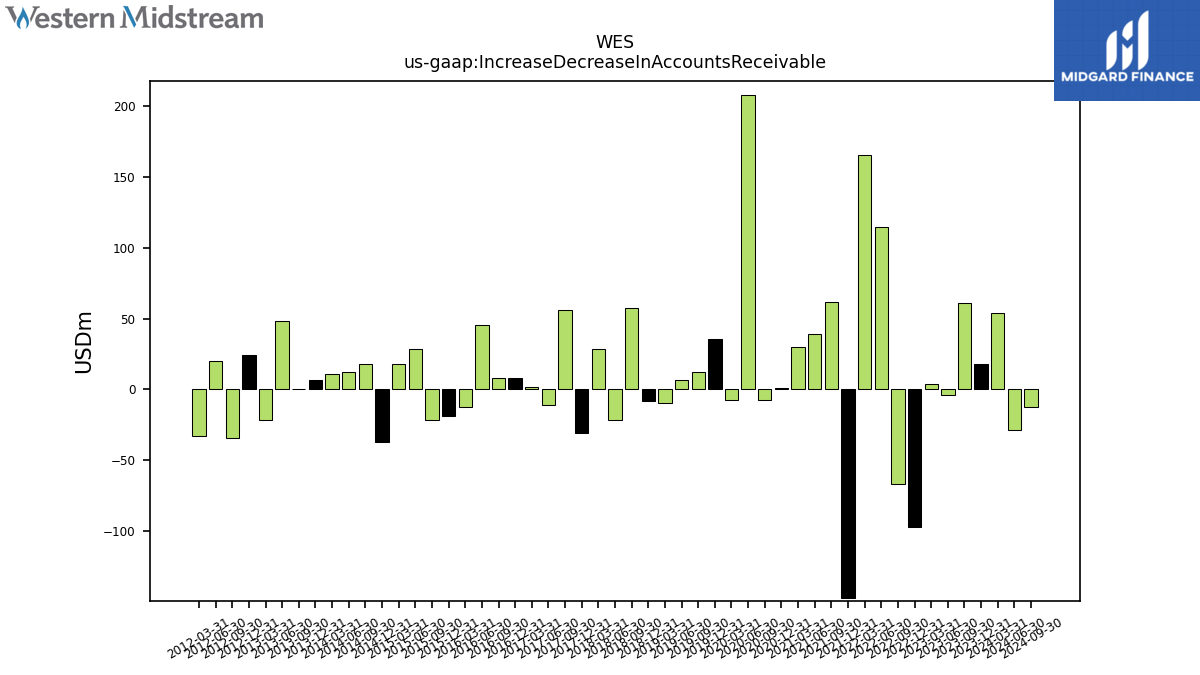
| Increase Decrease In Accounts Receivable | 60.61 | -4.08 | 4.04 | -96.66 | -66.88 | 114.70 | 165.13 | -147.14 | 61.61 | 38.98 | 30.18 | 1.35 | -7.80 | 207.84 | -7.70 | 35.28 | 12.42 | 6.82 | -9.49 | -7.98 | 57.67 | -21.63 | 28.65 | -30.94 | 56.33 | -10.72 | 1.53 | 7.73 | 8.09 | 45.69 | -12.51 | -18.59 | -21.91 | 28.37 | 17.80 | -37.32 | 18.17 | 12.29 | 10.98 | 6.61 | 0.59 | 48.39 | -21.44 | 24.11 | -34.55 | 19.98 | -32.70 | |
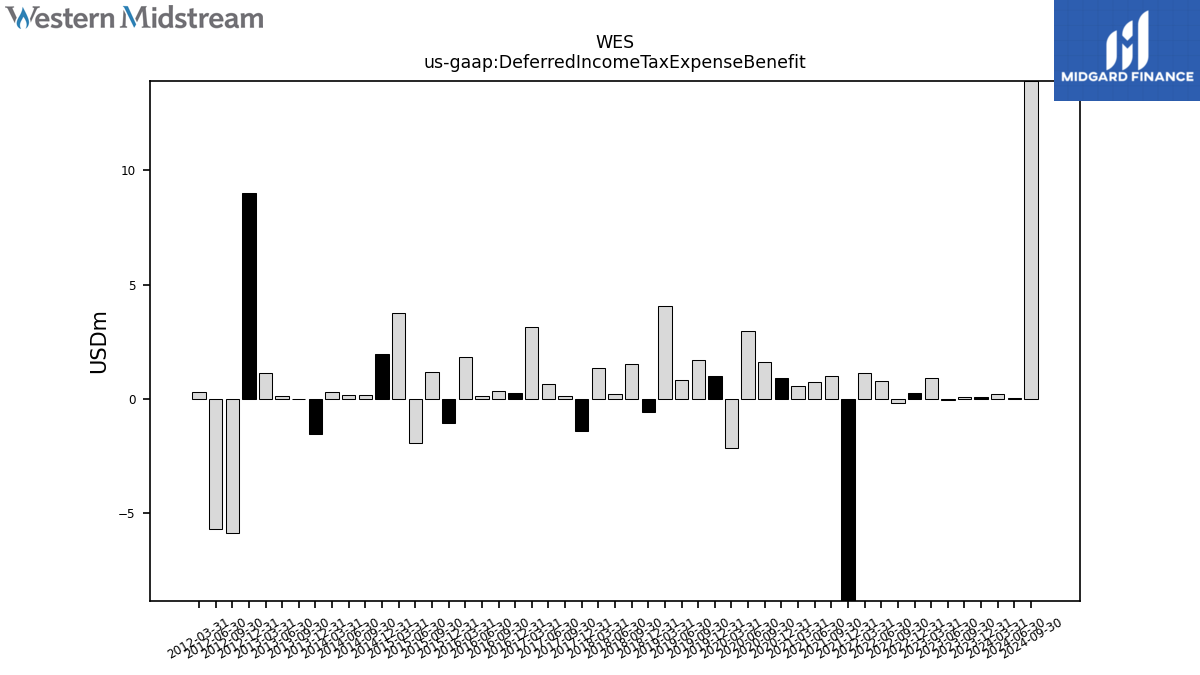
| Deferred Income Tax Expense Benefit | 0.10 | -0.07 | 0.92 | 0.24 | -0.16 | 0.79 | 1.13 | -12.04 | 1.00 | 0.72 | 0.56 | 0.90 | 1.59 | 2.97 | -2.17 | 1.01 | 1.72 | 0.82 | 4.07 | -0.59 | 1.53 | 0.19 | 1.33 | -1.42 | 0.12 | 0.64 | 3.13 | 0.23 | 0.34 | 0.13 | 1.85 | -1.06 | 1.17 | -1.93 | 3.76 | 1.94 | 0.18 | 0.17 | 0.29 | -1.52 | -0.02 | 0.10 | 1.12 | 9.02 | -5.87 | -5.70 | 0.29 | |
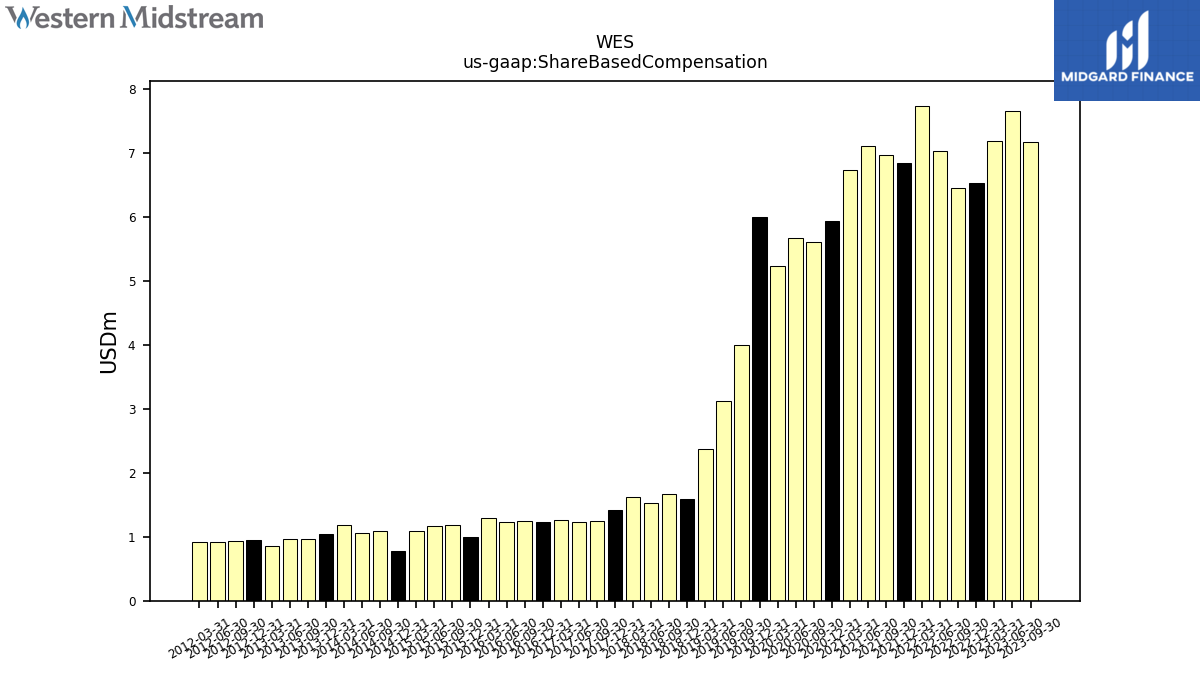
| Share Based Compensation | 7.17 | 7.67 | 7.20 | 6.54 | 6.46 | 7.04 | 7.74 | 6.84 | 6.98 | 7.12 | 6.73 | 5.93 | 5.62 | 5.68 | 5.23 | 6.00 | 4.00 | 3.12 | 2.37 | 1.60 | 1.67 | 1.53 | 1.63 | 1.42 | 1.25 | 1.23 | 1.27 | 1.23 | 1.24 | 1.23 | 1.29 | 0.99 | 1.19 | 1.17 | 1.10 | 0.77 | 1.09 | 1.07 | 1.18 | 1.04 | 0.96 | 0.96 | 0.86 | 0.95 | 0.94 | 0.92 | 0.91 |
| 2023-09-30 | 2023-06-30 | 2023-03-31 | 2022-12-31 | 2022-09-30 | 2022-06-30 | 2022-03-31 | 2021-12-31 | 2021-09-30 | 2021-06-30 | 2021-03-31 | 2020-12-31 | 2020-09-30 | 2020-06-30 | 2020-03-31 | 2019-12-31 | 2019-09-30 | 2019-06-30 | 2019-03-31 | 2018-12-31 | 2018-09-30 | 2018-06-30 | 2018-03-31 | 2017-12-31 | 2017-09-30 | 2017-06-30 | 2017-03-31 | 2016-12-31 | 2016-09-30 | 2016-06-30 | 2016-03-31 | 2015-12-31 | 2015-09-30 | 2015-06-30 | 2015-03-31 | 2014-12-31 | 2014-09-30 | 2014-06-30 | 2014-03-31 | 2013-12-31 | 2013-09-30 | 2013-06-30 | 2013-03-31 | 2012-12-31 | 2012-09-30 | 2012-06-30 | 2012-03-31 | ||
|---|---|---|---|---|---|---|---|---|---|---|---|---|---|---|---|---|---|---|---|---|---|---|---|---|---|---|---|---|---|---|---|---|---|---|---|---|---|---|---|---|---|---|---|---|---|---|---|---|
| Net Cash Provided By Used In Investing Activities | -207.92 | -151.49 | -179.18 | 138.01 | -185.31 | -99.33 | -71.62 | -70.25 | -80.88 | -59.93 | -46.47 | -21.58 | -71.67 | -176.28 | -178.72 | -253.21 | -269.48 | -349.44 | -2515.73 | -299.11 | -334.03 | -532.49 | -294.17 | -248.81 | -151.67 | -110.70 | -252.43 | -64.84 | NA | NA | NA | NA | NA | NA | NA | NA | NA | NA | NA | NA | NA | -277.60 | -771.89 | NA | NA | -119.48 | -539.07 |
| 2023-09-30 | 2023-06-30 | 2023-03-31 | 2022-12-31 | 2022-09-30 | 2022-06-30 | 2022-03-31 | 2021-12-31 | 2021-09-30 | 2021-06-30 | 2021-03-31 | 2020-12-31 | 2020-09-30 | 2020-06-30 | 2020-03-31 | 2019-12-31 | 2019-09-30 | 2019-06-30 | 2019-03-31 | 2018-12-31 | 2018-09-30 | 2018-06-30 | 2018-03-31 | 2017-12-31 | 2017-09-30 | 2017-06-30 | 2017-03-31 | 2016-12-31 | 2016-09-30 | 2016-06-30 | 2016-03-31 | 2015-12-31 | 2015-09-30 | 2015-06-30 | 2015-03-31 | 2014-12-31 | 2014-09-30 | 2014-06-30 | 2014-03-31 | 2013-12-31 | 2013-09-30 | 2013-06-30 | 2013-03-31 | 2012-12-31 | 2012-09-30 | 2012-06-30 | 2012-03-31 | ||
|---|---|---|---|---|---|---|---|---|---|---|---|---|---|---|---|---|---|---|---|---|---|---|---|---|---|---|---|---|---|---|---|---|---|---|---|---|---|---|---|---|---|---|---|---|---|---|---|---|
| Net Cash Provided By Used In Financing Activities | 88.67 | -238.03 | -297.26 | -499.67 | -221.80 | -518.47 | -158.59 | -489.47 | -516.16 | -142.98 | -603.62 | -177.06 | -242.92 | -261.95 | -162.27 | -61.67 | -49.04 | 1.73 | 2180.56 | -8.94 | 175.46 | -208.22 | 497.35 | -79.58 | -95.24 | -62.81 | -175.66 | 19.19 | NA | NA | NA | NA | NA | NA | NA | NA | NA | NA | NA | NA | NA | 245.30 | 311.63 | NA | NA | 287.62 | 257.60 | |
| Payments Of Dividends | 221.44 | 336.99 | 196.57 | 197.06 | 197.74 | 206.20 | 134.75 | 134.86 | 134.66 | 132.97 | 131.26 | 132.25 | 140.90 | 140.89 | 281.79 | 280.88 | 279.96 | 276.32 | 131.91 | 130.27 | 127.53 | 124.52 | 120.14 | 117.68 | 115.49 | 107.55 | 101.25 | 97.97 | 94.96 | 92.77 | 88.39 | 83.46 | 79.63 | 74.98 | 68.41 | 63.76 | 59.38 | 54.73 | 50.62 | 46.79 | 43.23 | 39.13 | 7.85 | 0.00 | NA | NA | NA | |
| Payments For Repurchase Of Common Stock | 127.50 | 0.04 | 7.06 | 40.52 | 367.86 | 74.07 | 5.15 | 113.10 | 88.12 | 0.00 | 16.24 | NA | NA | NA | NA | NA | NA | NA | NA | NA | NA | NA | NA | NA | NA | NA | NA | NA | NA | NA | NA | NA | NA | NA | NA | NA | NA | NA | NA | NA | NA | NA | NA | NA | NA | NA | NA |
| 2023-09-30 | 2023-06-30 | 2023-03-31 | 2022-12-31 | 2022-09-30 | 2022-06-30 | 2022-03-31 | 2021-12-31 | 2021-09-30 | 2021-06-30 | 2021-03-31 | 2020-12-31 | 2020-09-30 | 2020-06-30 | 2020-03-31 | 2019-12-31 | 2019-09-30 | 2019-06-30 | 2019-03-31 | 2018-12-31 | 2018-09-30 | 2018-06-30 | 2018-03-31 | 2017-12-31 | 2017-09-30 | 2017-06-30 | 2017-03-31 | 2016-12-31 | 2016-09-30 | 2016-06-30 | 2016-03-31 | 2015-12-31 | 2015-09-30 | 2015-06-30 | 2015-03-31 | 2014-12-31 | 2014-09-30 | 2014-06-30 | 2014-03-31 | 2013-12-31 | 2013-09-30 | 2013-06-30 | 2013-03-31 | 2012-12-31 | 2012-09-30 | 2012-06-30 | 2012-03-31 | ||
|---|---|---|---|---|---|---|---|---|---|---|---|---|---|---|---|---|---|---|---|---|---|---|---|---|---|---|---|---|---|---|---|---|---|---|---|---|---|---|---|---|---|---|---|---|---|---|---|---|
| Revenues | 776.01 | 738.27 | 733.98 | 779.44 | 837.57 | 876.42 | 758.30 | 719.21 | 763.84 | 719.13 | 674.97 | 647.48 | 679.04 | 671.75 | 774.31 | 723.21 | 666.03 | 685.05 | 671.88 | 557.79 | 507.76 | 435.95 | 437.17 | 632.02 | 574.70 | 525.45 | 516.19 | 510.82 | 481.64 | 428.66 | 383.14 | 371.29 | 385.10 | 402.41 | 375.09 | 337.90 | 326.46 | 329.94 | 279.46 | 290.62 | 278.00 | 255.13 | 229.75 | 230.87 | 234.73 | 220.31 | 224.68 | |
| Western Midstream Operating L P | 776.01 | 738.27 | 733.98 | 779.44 | 837.57 | 876.42 | 758.30 | 719.21 | 763.84 | 719.13 | 674.97 | 647.48 | 679.04 | 671.75 | 774.31 | 723.21 | 666.03 | 685.05 | 671.88 | 692.63 | 587.90 | 518.08 | 501.05 | NA | NA | NA | NA | NA | NA | NA | NA | NA | NA | NA | NA | NA | NA | NA | NA | NA | NA | NA | NA | NA | NA | NA | NA | |
| Western Midstream Operating L P, Product | 31.65 | 29.66 | 39.02 | 84.27 | 79.43 | 149.74 | 85.59 | 63.59 | 84.30 | 72.26 | 70.81 | 30.07 | 30.11 | 21.74 | 56.65 | 71.54 | 68.25 | 74.47 | NA | NA | NA | NA | NA | NA | NA | NA | NA | NA | NA | NA | NA | NA | NA | NA | NA | NA | NA | NA | NA | NA | NA | NA | NA | NA | NA | NA | NA | |
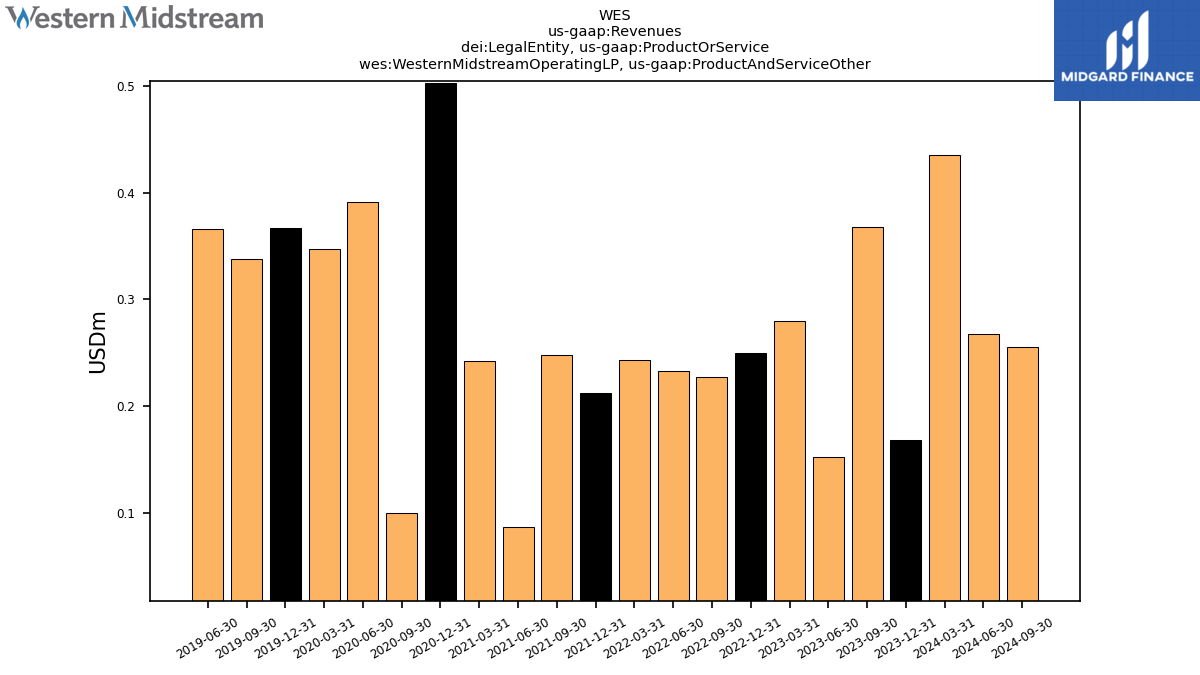
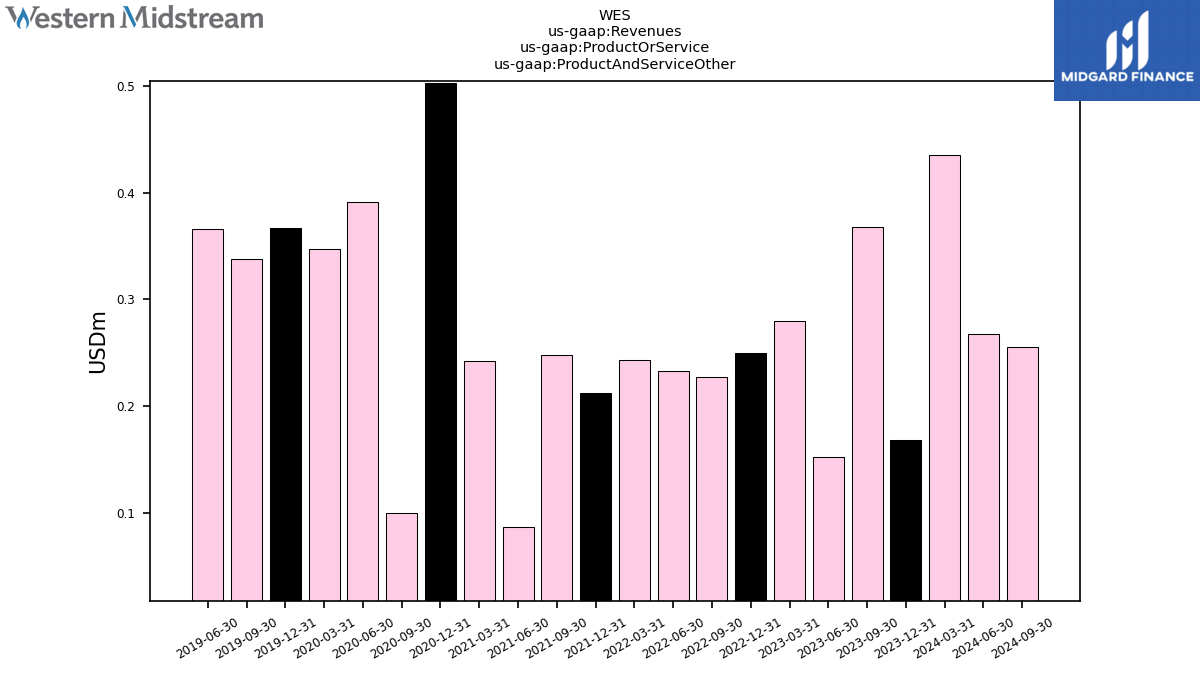
| Western Midstream Operating L P, Product And Service Other | 0.37 | 0.15 | 0.28 | 0.25 | 0.23 | 0.23 | 0.24 | 0.21 | 0.25 | 0.09 | 0.24 | 0.50 | 0.10 | 0.39 | 0.35 | 0.37 | 0.34 | 0.37 | NA | NA | NA | NA | NA | NA | NA | NA | NA | NA | NA | NA | NA | NA | NA | NA | NA | NA | NA | NA | NA | NA | NA | NA | NA | NA | NA | NA | NA | |
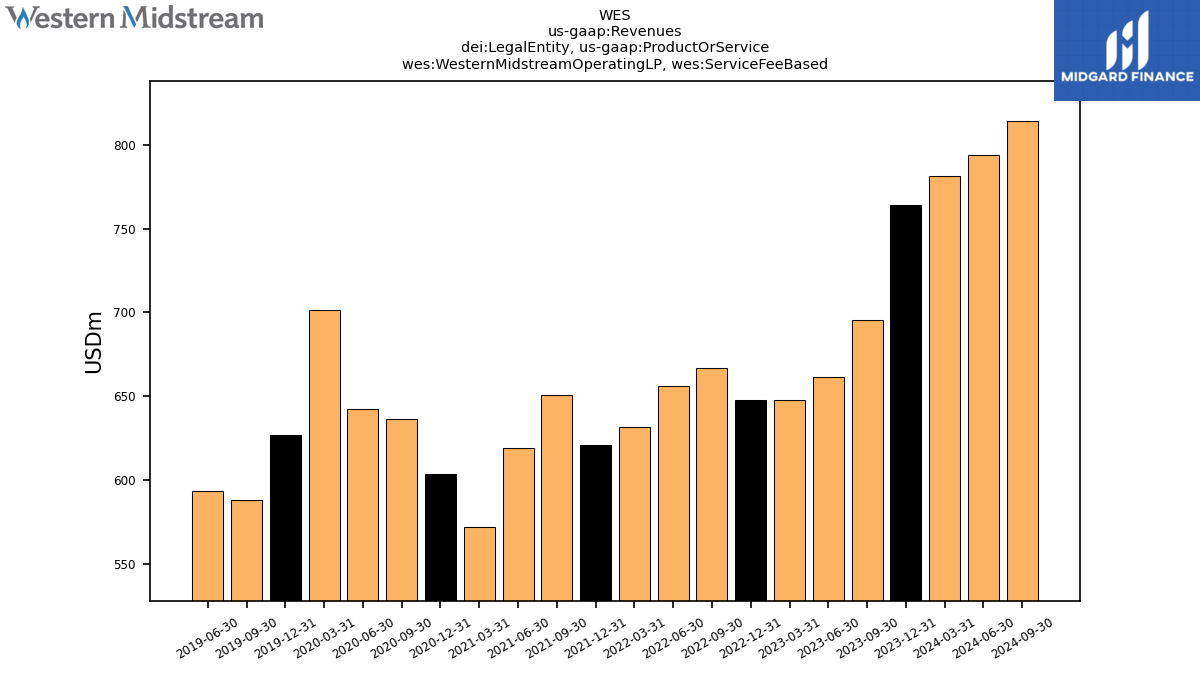
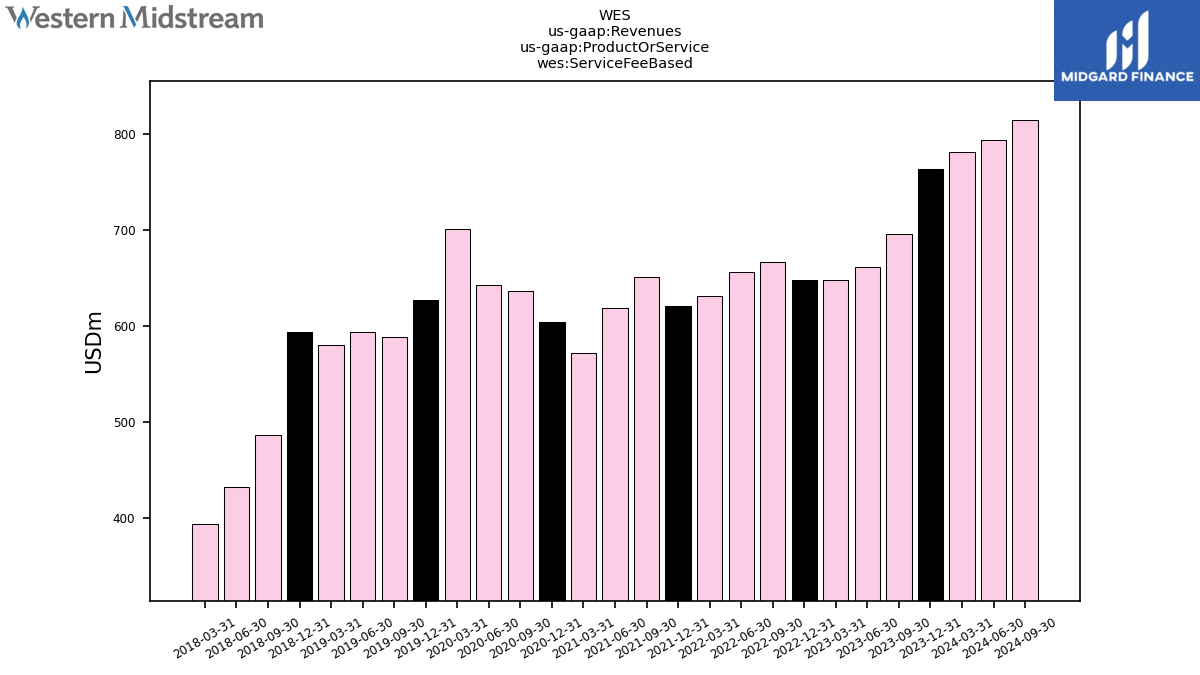
| Western Midstream Operating L P, Service Fee Based | 695.55 | 661.51 | 647.87 | 647.95 | 666.55 | 655.95 | 631.60 | 621.09 | 650.48 | 618.99 | 572.27 | 603.78 | 636.52 | 642.63 | 701.40 | 626.71 | 587.97 | 593.54 | NA | NA | NA | NA | NA | NA | NA | NA | NA | NA | NA | NA | NA | NA | NA | NA | NA | NA | NA | NA | NA | NA | NA | NA | NA | NA | NA | NA | NA | |
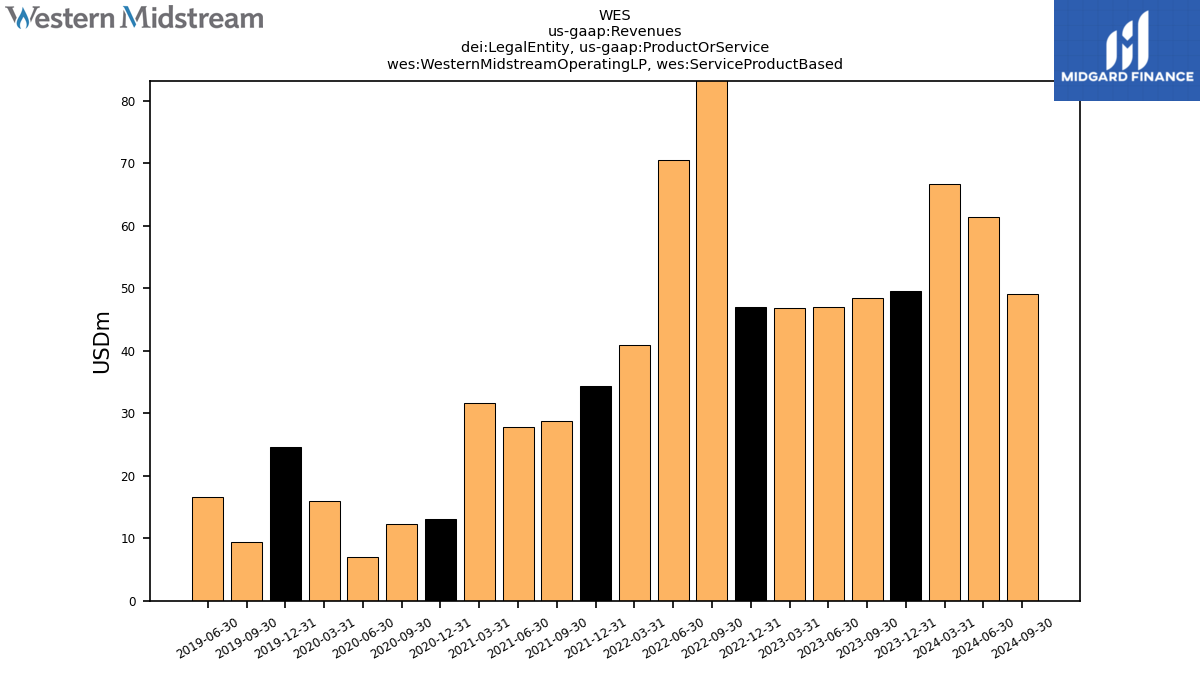
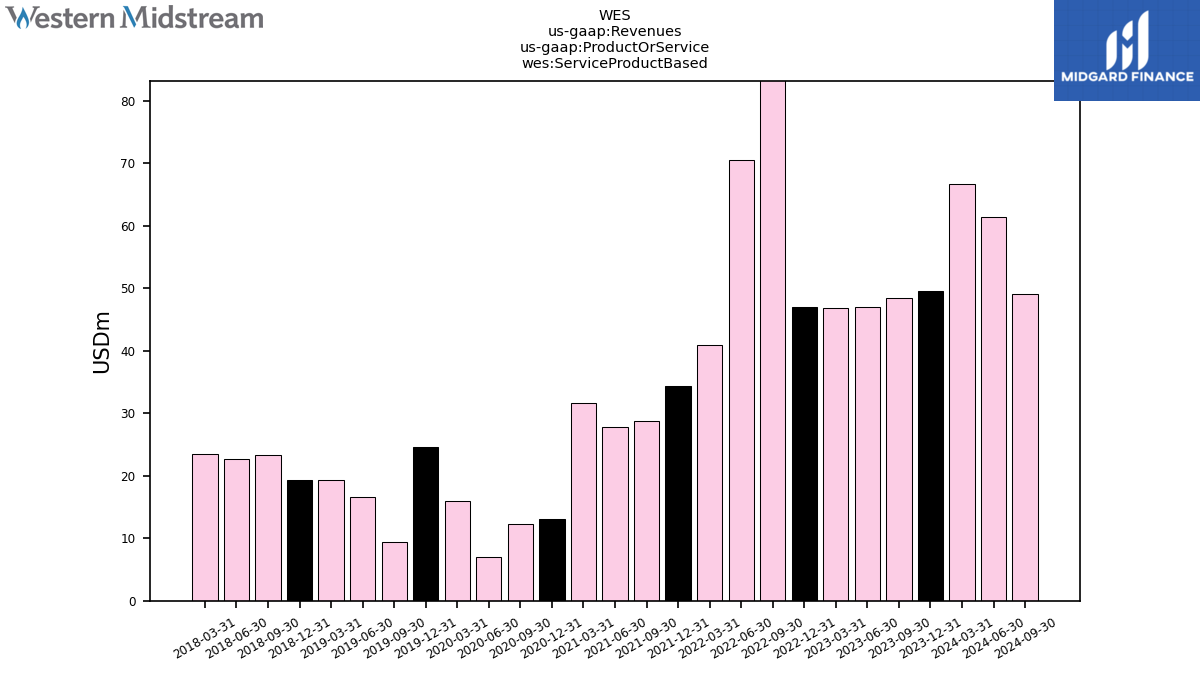
| Western Midstream Operating L P, Service Product Based | 48.45 | 46.96 | 46.81 | 46.97 | 91.36 | 70.50 | 40.87 | 34.32 | 28.81 | 27.80 | 31.65 | 13.13 | 12.32 | 7.00 | 15.92 | 24.60 | 9.48 | 16.68 | NA | NA | NA | NA | NA | NA | NA | NA | NA | NA | NA | NA | NA | NA | NA | NA | NA | NA | NA | NA | NA | NA | NA | NA | NA | NA | NA | NA | NA | |
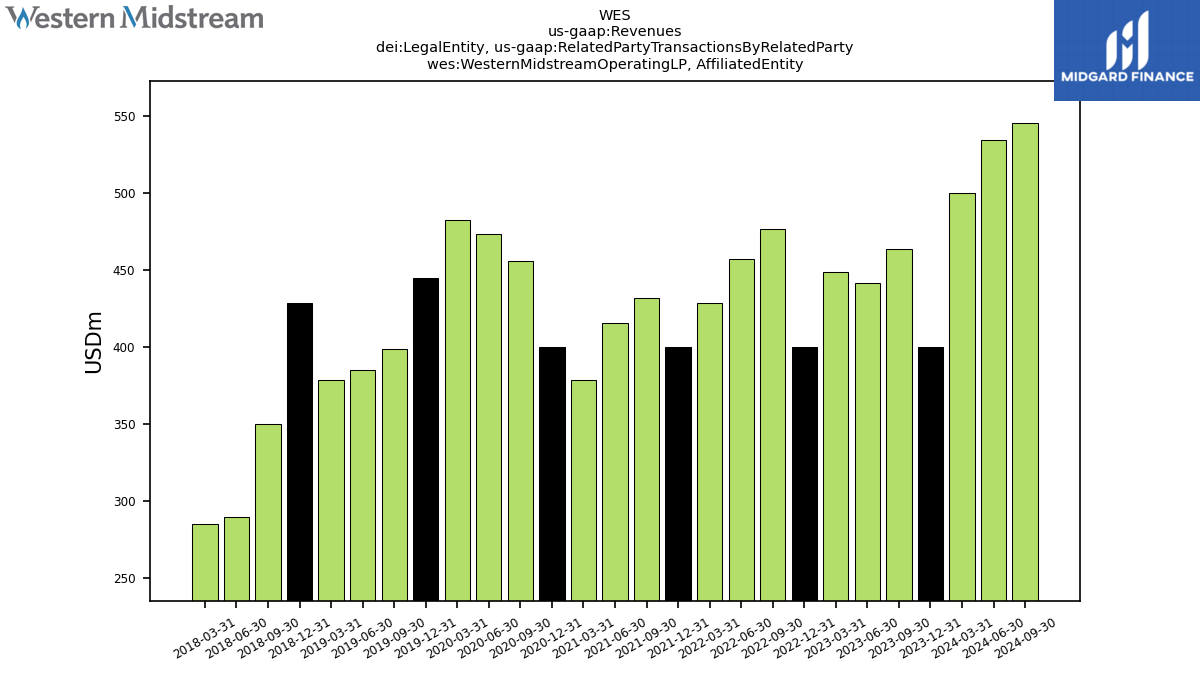
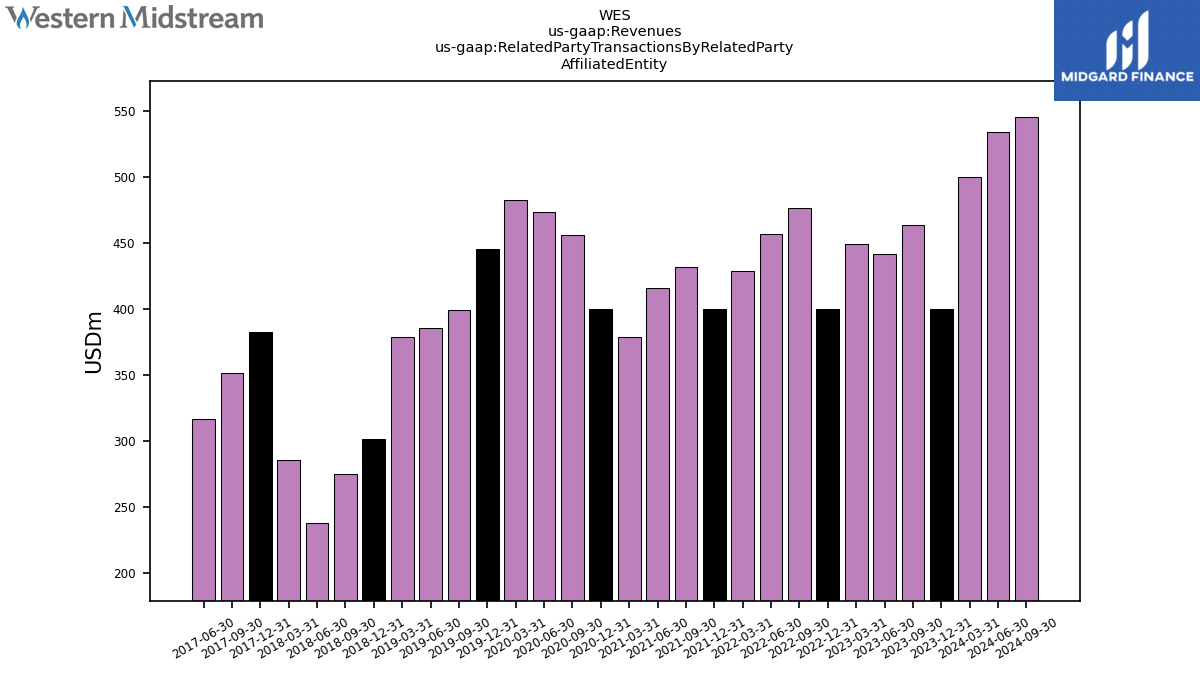
| Western Midstream Operating L P, | 463.60 | 441.60 | 448.80 | 400.00 | 476.50 | 456.80 | 428.70 | 400.00 | 431.70 | 415.40 | 378.30 | 400.00 | 455.60 | 473.40 | 482.38 | 445.02 | 398.75 | 385.18 | 378.44 | 428.70 | 350.29 | 289.54 | 285.18 | NA | NA | NA | NA | NA | NA | NA | NA | NA | NA | NA | NA | NA | NA | NA | NA | NA | NA | NA | NA | NA | NA | NA | NA | |
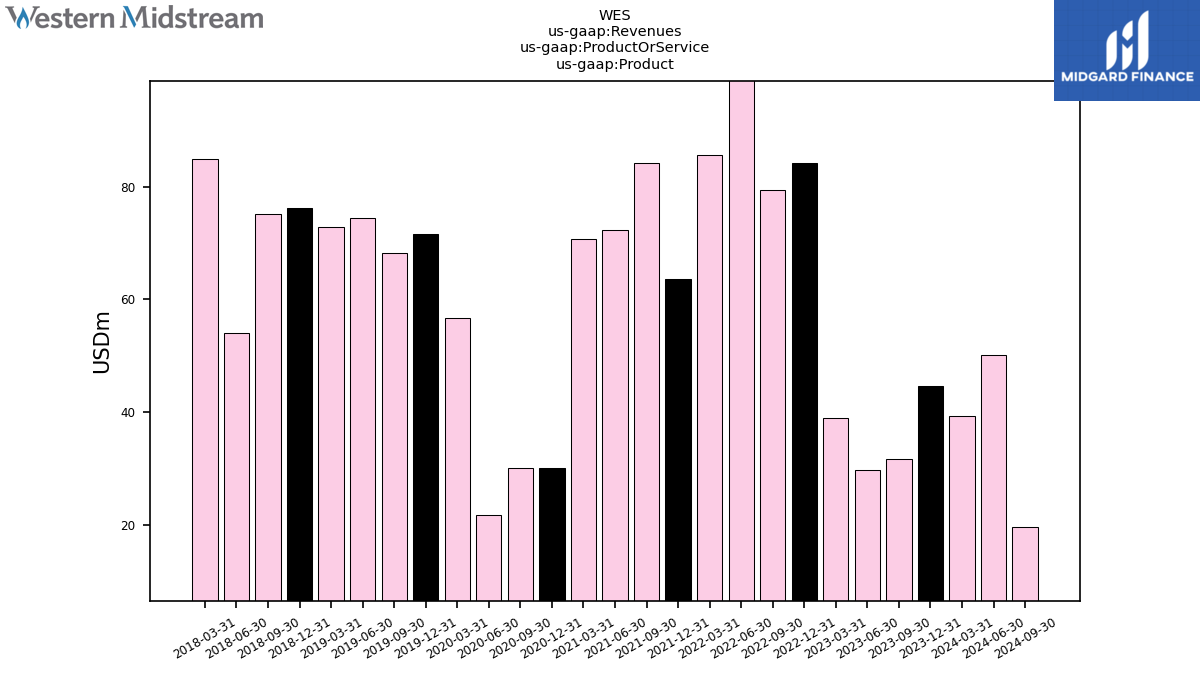
| Product | 31.65 | 29.66 | 39.02 | 84.27 | 79.43 | 149.74 | 85.59 | 63.59 | 84.30 | 72.26 | 70.81 | 30.07 | 30.11 | 21.74 | 56.65 | 71.54 | 68.25 | 74.47 | 72.80 | 76.25 | 75.15 | 54.08 | 84.87 | NA | NA | NA | NA | NA | NA | NA | NA | NA | NA | NA | NA | NA | NA | NA | NA | NA | NA | NA | NA | NA | NA | NA | NA | |
| Product And Service Other | 0.37 | 0.15 | 0.28 | 0.25 | 0.23 | 0.23 | 0.24 | 0.21 | 0.25 | 0.09 | 0.24 | 0.50 | 0.10 | 0.39 | 0.35 | 0.37 | 0.34 | 0.37 | NA | NA | NA | NA | NA | NA | NA | NA | NA | NA | NA | NA | NA | NA | NA | NA | NA | NA | NA | NA | NA | NA | NA | NA | NA | NA | NA | NA | NA | |
| Service Fee Based | 695.55 | 661.51 | 647.87 | 647.95 | 666.55 | 655.95 | 631.60 | 621.09 | 650.48 | 618.99 | 572.27 | 603.78 | 636.52 | 642.63 | 701.40 | 626.71 | 587.97 | 593.54 | 579.97 | 593.76 | 486.33 | 431.86 | 393.77 | NA | NA | NA | NA | NA | NA | NA | NA | NA | NA | NA | NA | NA | NA | NA | NA | NA | NA | NA | NA | NA | NA | NA | NA | |
| Service Product Based | 48.45 | 46.96 | 46.81 | 46.97 | 91.36 | 70.50 | 40.87 | 34.32 | 28.81 | 27.80 | 31.65 | 13.13 | 12.32 | 7.00 | 15.92 | 24.60 | 9.48 | 16.68 | 19.38 | 19.36 | 23.34 | 22.66 | 23.42 | NA | NA | NA | NA | NA | NA | NA | NA | NA | NA | NA | NA | NA | NA | NA | NA | NA | NA | NA | NA | NA | NA | NA | NA | |
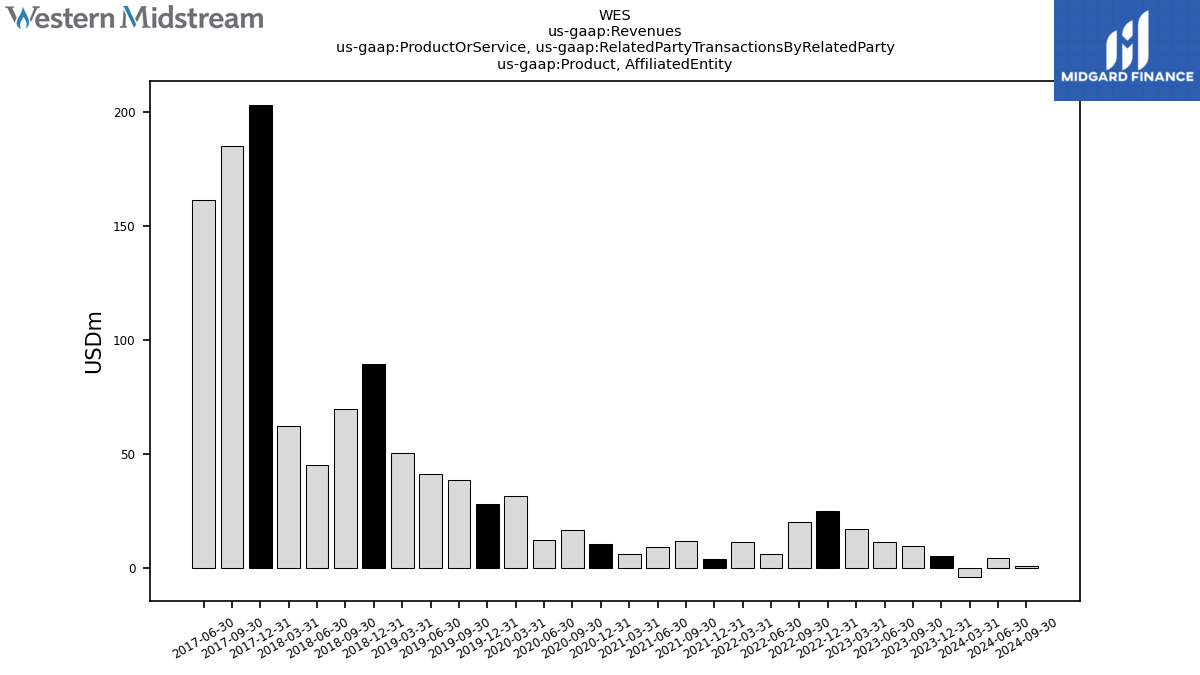
| Product, | 9.82 | 11.61 | 17.17 | 25.14 | 20.32 | 6.34 | 11.57 | 4.07 | 11.66 | 9.10 | 6.27 | 10.65 | 16.69 | 12.14 | 31.62 | 28.29 | 38.66 | 41.07 | 50.44 | 89.65 | 69.72 | 45.26 | 62.51 | 203.28 | 185.00 | 161.33 | NA | NA | NA | NA | NA | NA | NA | NA | NA | NA | NA | NA | NA | NA | NA | NA | NA | NA | NA | NA | NA | |
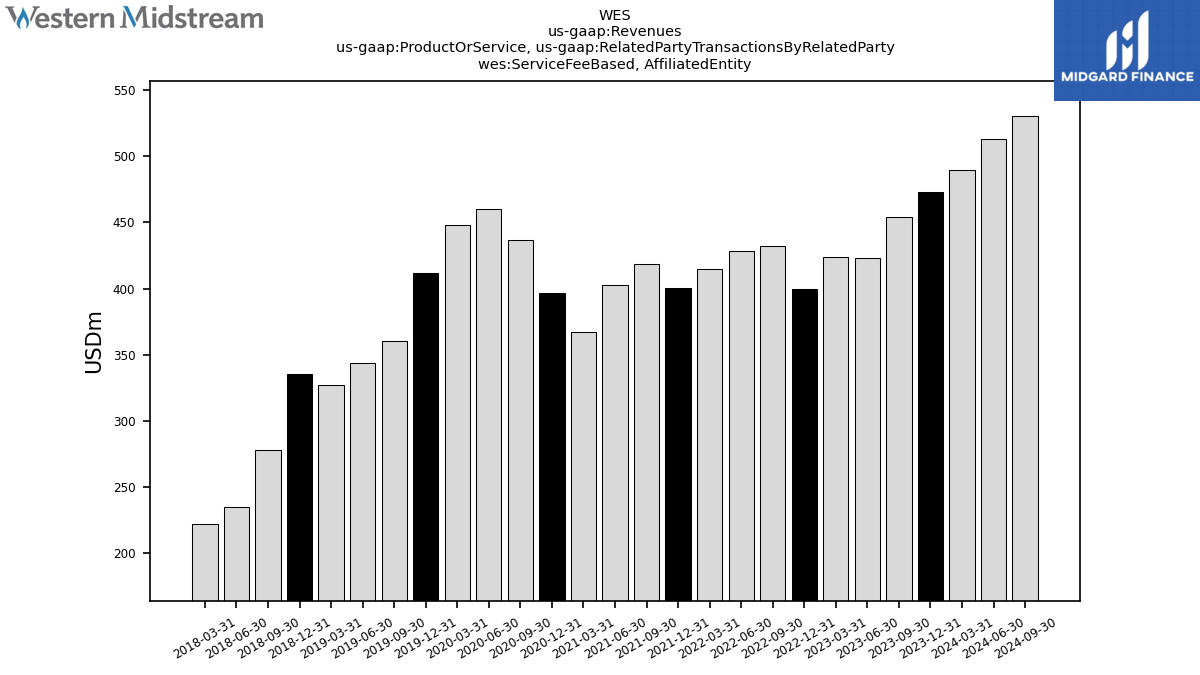
| Service Fee Based, | 454.04 | 423.33 | 423.50 | 399.49 | 431.94 | 428.63 | 414.90 | 400.69 | 418.52 | 402.68 | 367.48 | 396.67 | 436.40 | 460.14 | 447.78 | 411.74 | 360.01 | 343.48 | 326.64 | 335.59 | 277.92 | 234.51 | 222.04 | NA | NA | NA | NA | NA | NA | NA | NA | NA | NA | NA | NA | NA | NA | NA | NA | NA | NA | NA | NA | NA | NA | NA | NA | |
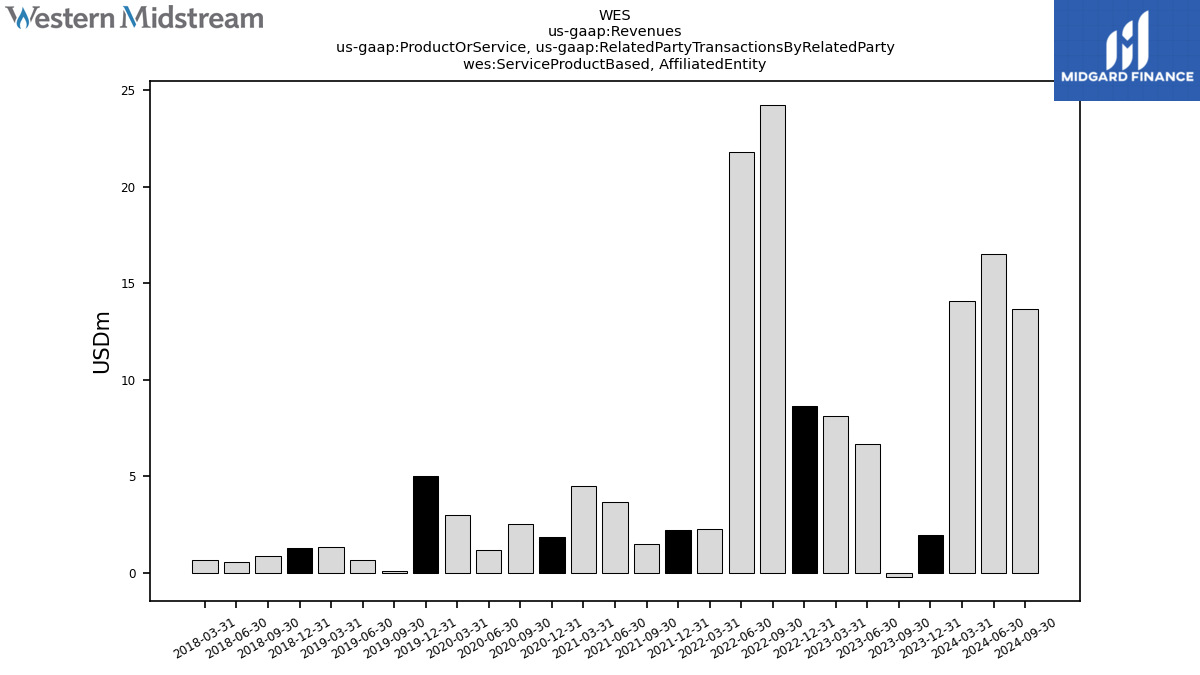
| Service Product Based, | -0.23 | 6.64 | 8.12 | 8.61 | 24.25 | 21.81 | 2.24 | 2.23 | 1.50 | 3.66 | 4.50 | 1.82 | 2.54 | 1.17 | 2.98 | 4.99 | 0.08 | 0.63 | 1.35 | 1.29 | 0.88 | 0.54 | 0.63 | NA | NA | NA | NA | NA | NA | NA | NA | NA | NA | NA | NA | NA | NA | NA | NA | NA | NA | NA | NA | NA | NA | NA | NA | |
| 463.60 | 441.60 | 448.80 | 400.00 | 476.50 | 456.80 | 428.70 | 400.00 | 431.70 | 415.40 | 378.30 | 400.00 | 455.60 | 473.40 | 482.38 | 445.02 | 398.75 | 385.18 | 378.44 | 301.68 | 274.51 | 238.03 | 285.18 | 382.72 | 351.13 | 316.31 | NA | NA | NA | NA | NA | NA | NA | NA | NA | NA | NA | NA | NA | NA | NA | NA | NA | NA | NA | NA | NA | ||
| Revenue From Contract With Customer Excluding Assessed Tax | 775.64 | 738.12 | 733.70 | 779.19 | 837.34 | 876.19 | 758.05 | 673.50 | 719.08 | 672.67 | 631.87 | 597.78 | 625.15 | 610.19 | 714.49 | 722.84 | 665.69 | 684.69 | 672.15 | 559.04 | 510.73 | 437.10 | 502.06 | 632.02 | 574.70 | 525.45 | 516.19 | 510.82 | 481.64 | 428.66 | 383.14 | 371.29 | 385.10 | 402.41 | 375.09 | 337.90 | 326.46 | 329.94 | 279.46 | 290.62 | 278.00 | 255.13 | 229.75 | 230.87 | 234.73 | 220.31 | 224.68 | |
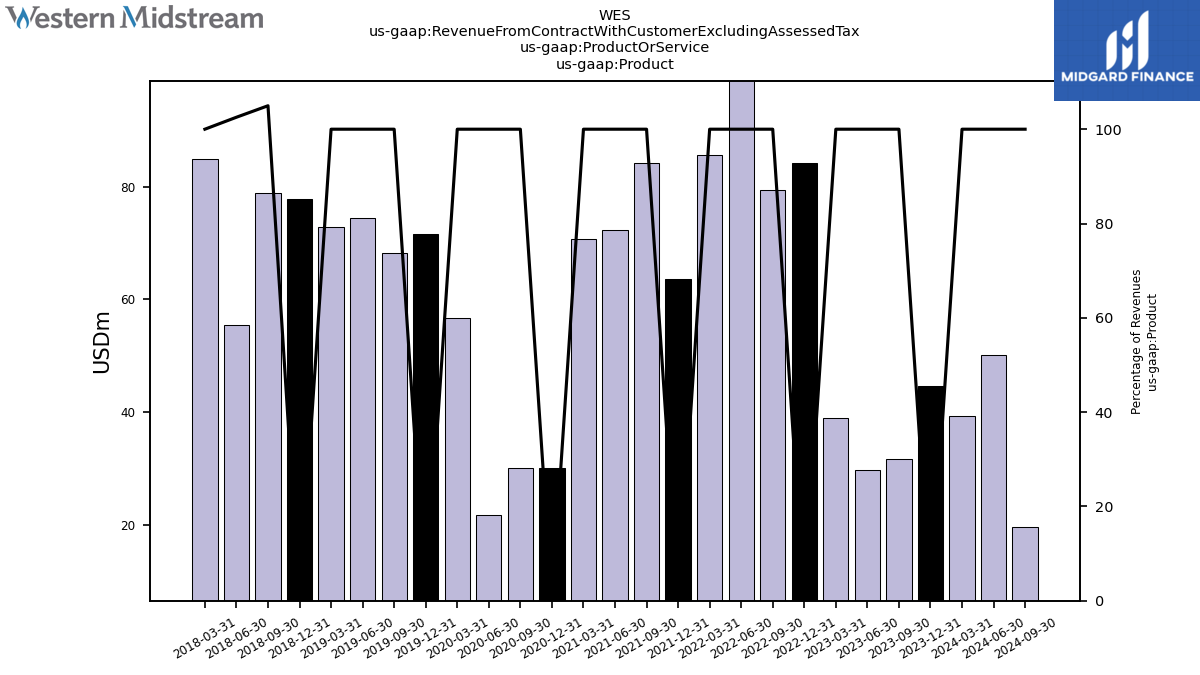
| Product | 31.65 | 29.66 | 39.02 | 84.27 | 79.43 | 149.74 | 85.59 | 63.59 | 84.30 | 72.26 | 70.81 | 30.07 | 30.11 | 21.74 | 56.65 | 71.54 | 68.25 | 74.47 | 72.80 | 77.78 | 78.89 | 55.45 | 84.87 | NA | NA | NA | NA | NA | NA | NA | NA | NA | NA | NA | NA | NA | NA | NA | NA | NA | NA | NA | NA | NA | NA | NA | NA | |
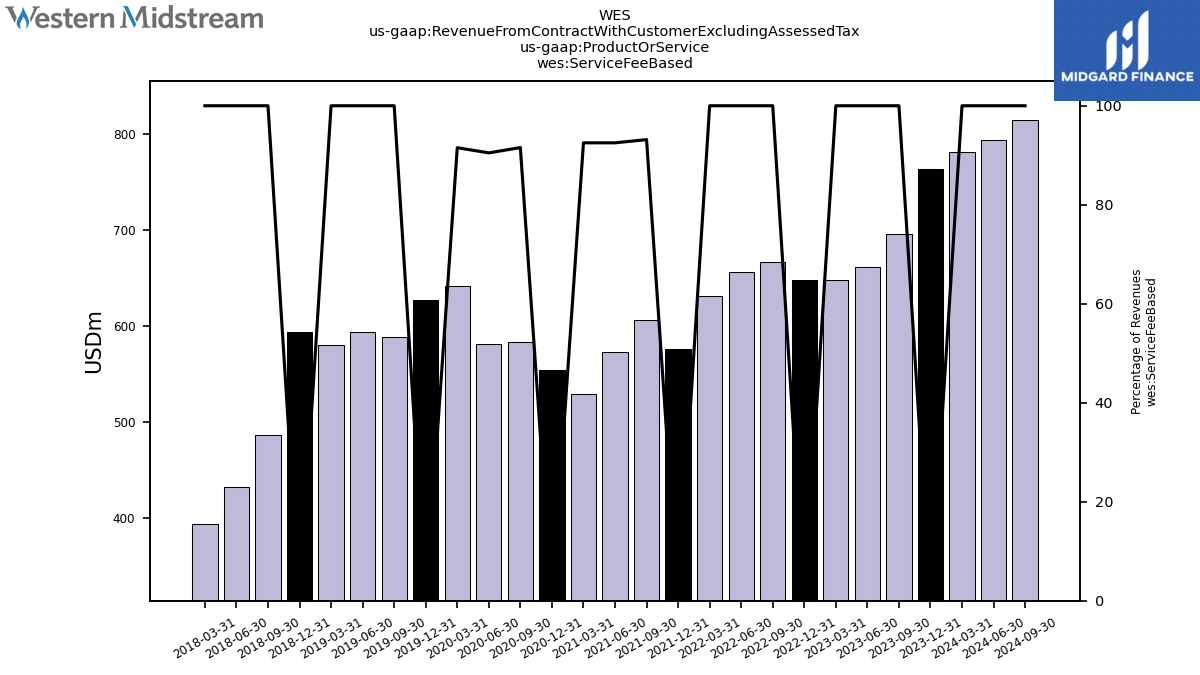
| Service Fee Based | 695.55 | 661.51 | 647.87 | 647.95 | 666.55 | 655.95 | 631.60 | 575.60 | 605.97 | 572.61 | 529.41 | 554.58 | 582.73 | 581.45 | 641.92 | 626.71 | 587.97 | 593.54 | 579.97 | 593.76 | 486.33 | 431.86 | 393.77 | NA | NA | NA | NA | NA | NA | NA | NA | NA | NA | NA | NA | NA | NA | NA | NA | NA | NA | NA | NA | NA | NA | NA | NA | |
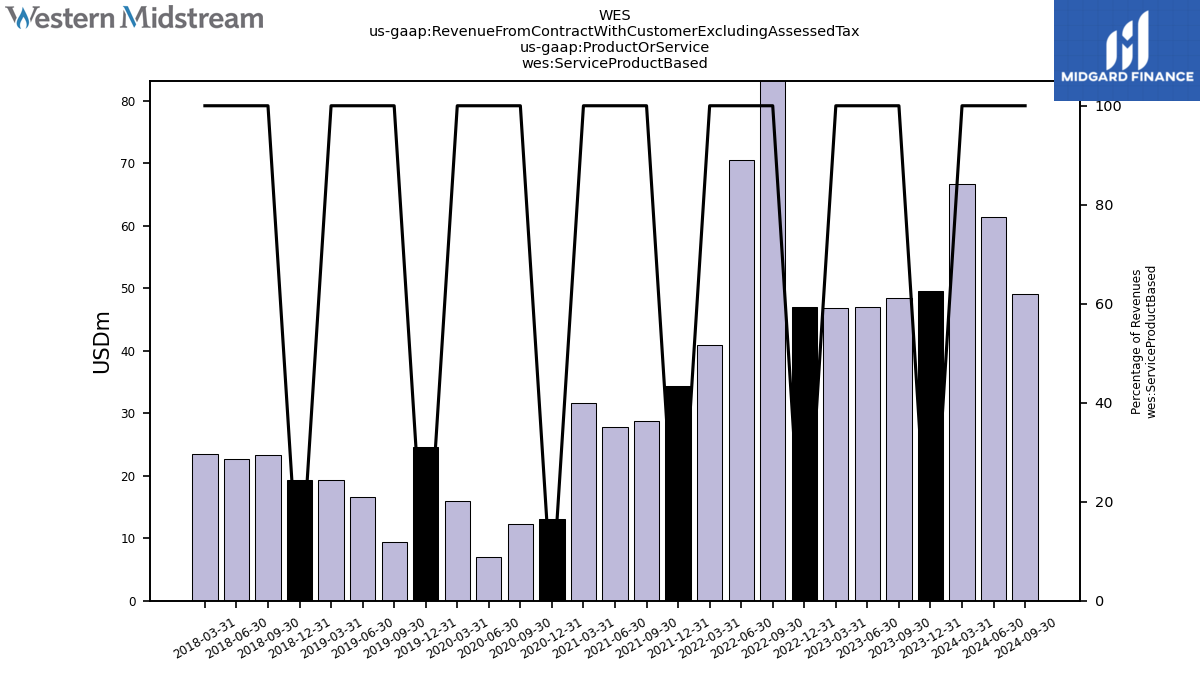
| Service Product Based | 48.45 | 46.96 | 46.81 | 46.97 | 91.36 | 70.50 | 40.87 | 34.32 | 28.81 | 27.80 | 31.65 | 13.13 | 12.32 | 7.00 | 15.92 | 24.60 | 9.48 | 16.68 | 19.38 | 19.36 | 23.34 | 22.66 | 23.42 | NA | NA | NA | NA | NA | NA | NA | NA | NA | NA | NA | NA | NA | NA | NA | NA | NA | NA | NA | NA | NA | NA | NA | NA |
