
| 2023-12-31 | 2023-09-30 | 2023-06-30 | 2023-03-31 | 2022-12-31 | 2022-09-30 | 2022-06-30 | 2022-03-31 | 2021-12-31 | 2021-09-30 | 2021-06-30 | 2021-03-31 | 2020-12-31 | 2020-09-30 | 2020-06-30 | 2020-03-31 | 2019-12-31 | 2019-09-30 | 2019-06-30 | 2019-03-31 | 2018-12-31 | 2018-09-30 | 2018-06-30 | 2018-03-31 | 2017-12-31 | 2017-09-30 | 2017-06-30 | 2017-03-31 | 2016-12-31 | 2016-09-30 | 2016-06-30 | 2016-03-31 | 2015-12-31 | 2015-09-30 | 2015-06-30 | 2015-03-31 | 2014-12-31 | 2014-09-30 | 2014-06-30 | 2014-03-31 | 2013-12-31 | 2013-09-30 | 2013-06-30 | 2013-03-31 | 2012-12-31 | 2012-09-30 | 2012-06-30 | 2012-03-31 | 2011-12-31 | 2011-09-30 | 2011-06-30 | 2011-03-31 | 2010-12-31 | 2010-09-30 | 2010-06-30 | ||
|---|---|---|---|---|---|---|---|---|---|---|---|---|---|---|---|---|---|---|---|---|---|---|---|---|---|---|---|---|---|---|---|---|---|---|---|---|---|---|---|---|---|---|---|---|---|---|---|---|---|---|---|---|---|---|---|---|
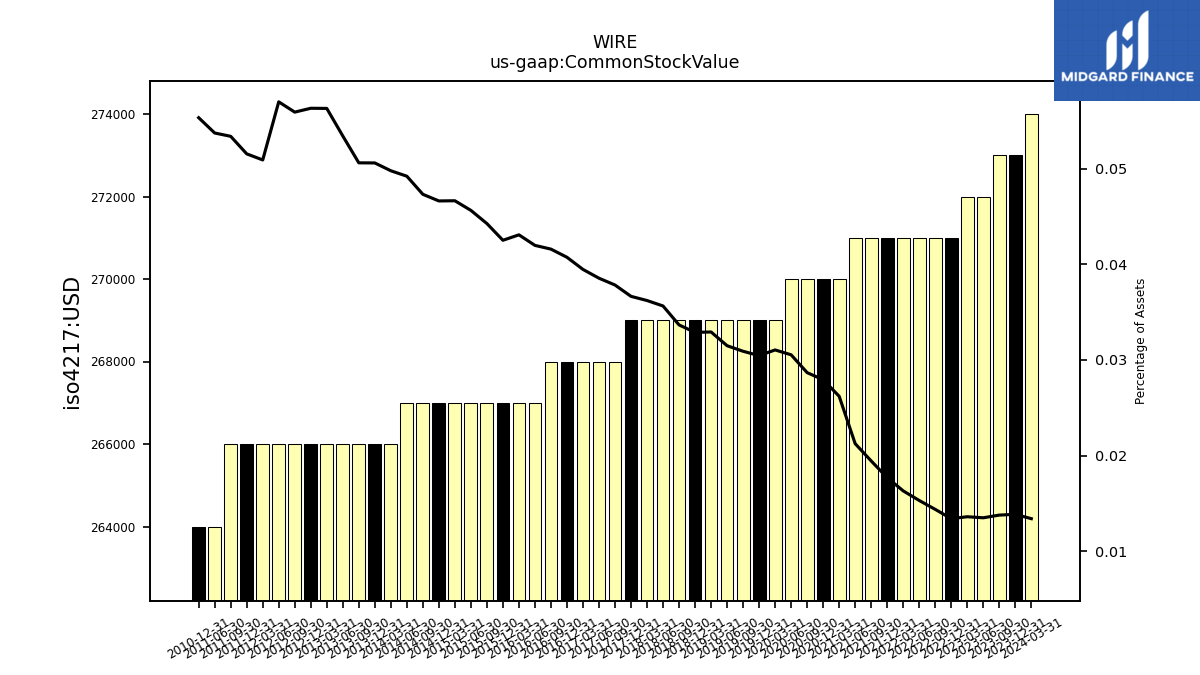
| Common Stock Value | 0.27 | 0.27 | 0.27 | 0.27 | 0.27 | 0.27 | 0.27 | 0.27 | 0.27 | 0.27 | 0.27 | 0.27 | 0.27 | 0.27 | 0.27 | 0.27 | 0.27 | 0.27 | 0.27 | 0.27 | 0.27 | 0.27 | 0.27 | 0.27 | 0.27 | 0.27 | 0.27 | 0.27 | 0.27 | 0.27 | 0.27 | 0.27 | 0.27 | 0.27 | 0.27 | 0.27 | 0.27 | 0.27 | 0.27 | 0.27 | 0.27 | 0.27 | 0.27 | 0.27 | 0.27 | 0.27 | 0.27 | 0.27 | 0.27 | 0.27 | 0.26 | NA | 0.26 | NA | NA | |
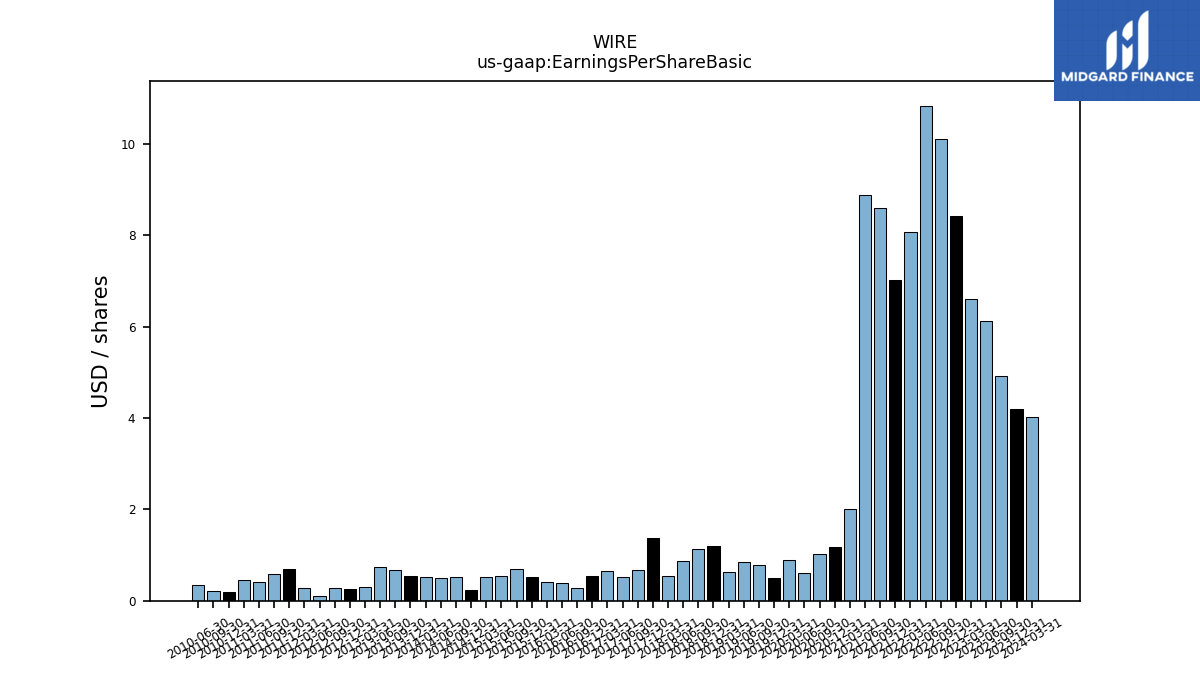
| Earnings Per Share Basic | 4.21 | 4.93 | 6.13 | 6.60 | 8.43 | 10.11 | 10.84 | 8.08 | 7.02 | 8.60 | 8.89 | 2.00 | 1.17 | 1.02 | 0.60 | 0.89 | 0.50 | 0.78 | 0.85 | 0.64 | 1.20 | 1.14 | 0.87 | 0.54 | 1.37 | 0.67 | 0.53 | 0.66 | 0.55 | 0.29 | 0.38 | 0.42 | 0.53 | 0.70 | 0.55 | 0.52 | 0.24 | 0.53 | 0.49 | 0.52 | 0.54 | 0.67 | 0.75 | 0.31 | 0.25 | 0.27 | 0.11 | 0.29 | 0.70 | 0.59 | 0.41 | 0.46 | 0.20 | 0.22 | 0.35 | |
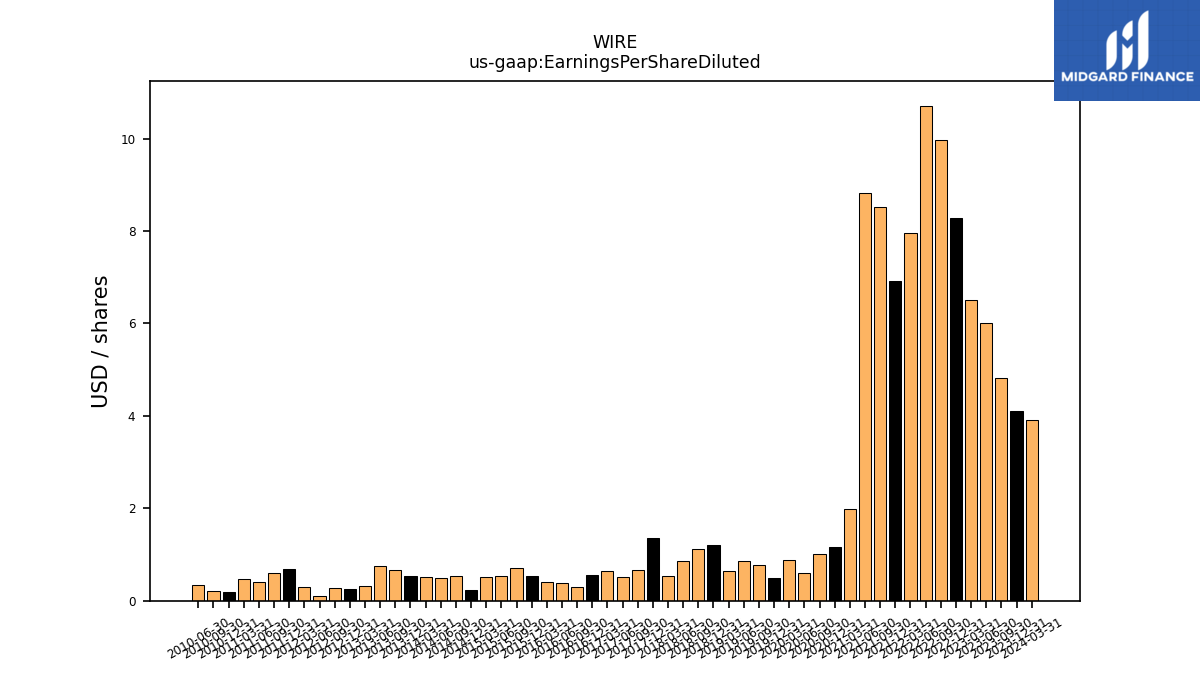
| Earnings Per Share Diluted | 4.10 | 4.82 | 6.01 | 6.50 | 8.28 | 9.97 | 10.71 | 7.96 | 6.91 | 8.51 | 8.82 | 1.99 | 1.17 | 1.02 | 0.60 | 0.89 | 0.50 | 0.78 | 0.85 | 0.64 | 1.20 | 1.13 | 0.86 | 0.54 | 1.36 | 0.67 | 0.52 | 0.65 | 0.55 | 0.29 | 0.38 | 0.41 | 0.53 | 0.70 | 0.54 | 0.52 | 0.24 | 0.53 | 0.49 | 0.52 | 0.54 | 0.66 | 0.75 | 0.31 | 0.25 | 0.27 | 0.11 | 0.29 | 0.69 | 0.59 | 0.40 | 0.46 | 0.20 | 0.22 | 0.35 |
| 2023-12-31 | 2023-09-30 | 2023-06-30 | 2023-03-31 | 2022-12-31 | 2022-09-30 | 2022-06-30 | 2022-03-31 | 2021-12-31 | 2021-09-30 | 2021-06-30 | 2021-03-31 | 2020-12-31 | 2020-09-30 | 2020-06-30 | 2020-03-31 | 2019-12-31 | 2019-09-30 | 2019-06-30 | 2019-03-31 | 2018-12-31 | 2018-09-30 | 2018-06-30 | 2018-03-31 | 2017-12-31 | 2017-09-30 | 2017-06-30 | 2017-03-31 | 2016-12-31 | 2016-09-30 | 2016-06-30 | 2016-03-31 | 2015-12-31 | 2015-09-30 | 2015-06-30 | 2015-03-31 | 2014-12-31 | 2014-09-30 | 2014-06-30 | 2014-03-31 | 2013-12-31 | 2013-09-30 | 2013-06-30 | 2013-03-31 | 2012-12-31 | 2012-09-30 | 2012-06-30 | 2012-03-31 | 2011-12-31 | 2011-09-30 | 2011-06-30 | 2011-03-31 | 2010-12-31 | 2010-09-30 | 2010-06-30 | ||
|---|---|---|---|---|---|---|---|---|---|---|---|---|---|---|---|---|---|---|---|---|---|---|---|---|---|---|---|---|---|---|---|---|---|---|---|---|---|---|---|---|---|---|---|---|---|---|---|---|---|---|---|---|---|---|---|---|
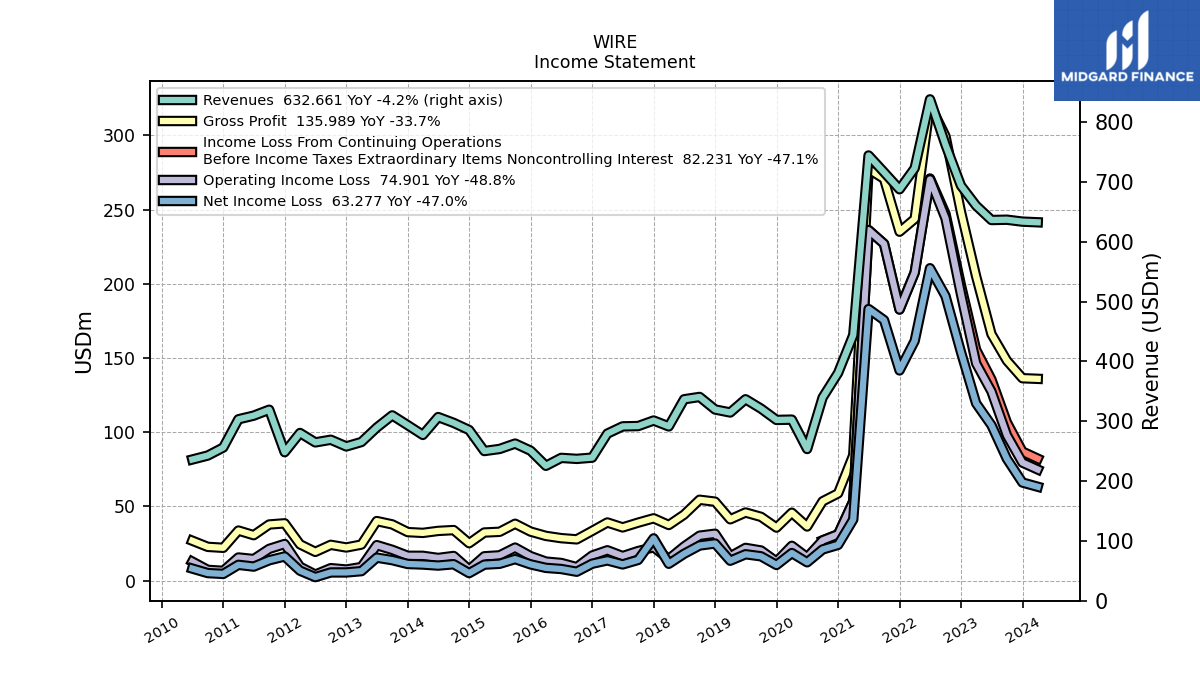
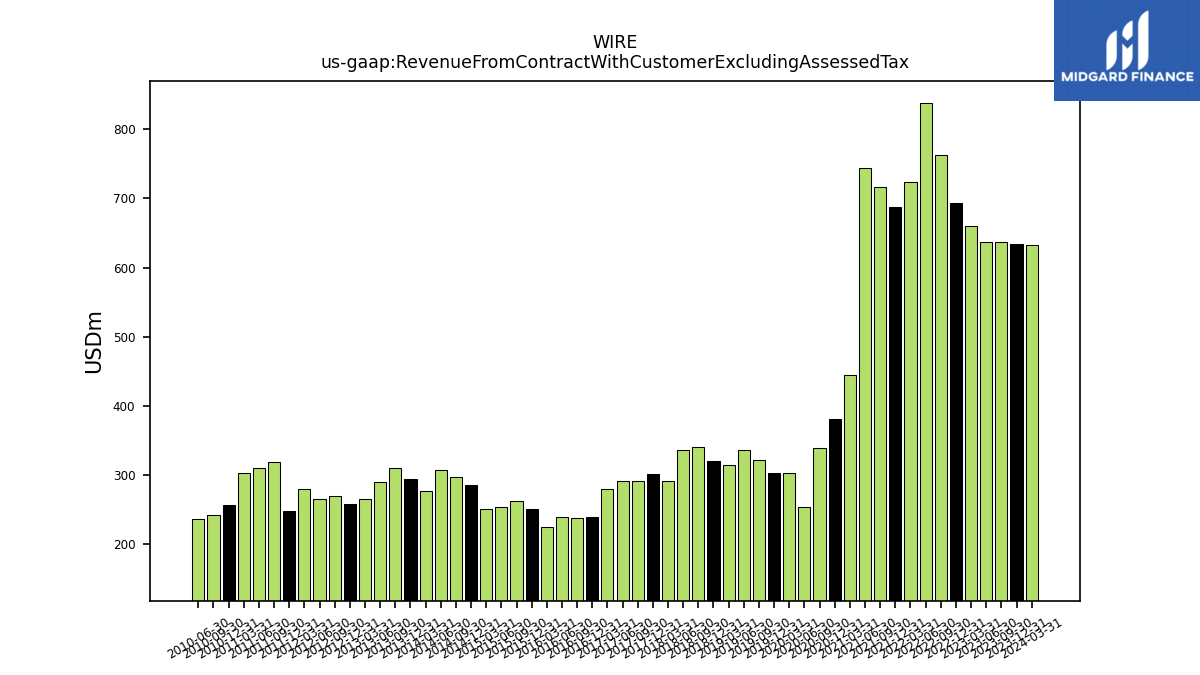
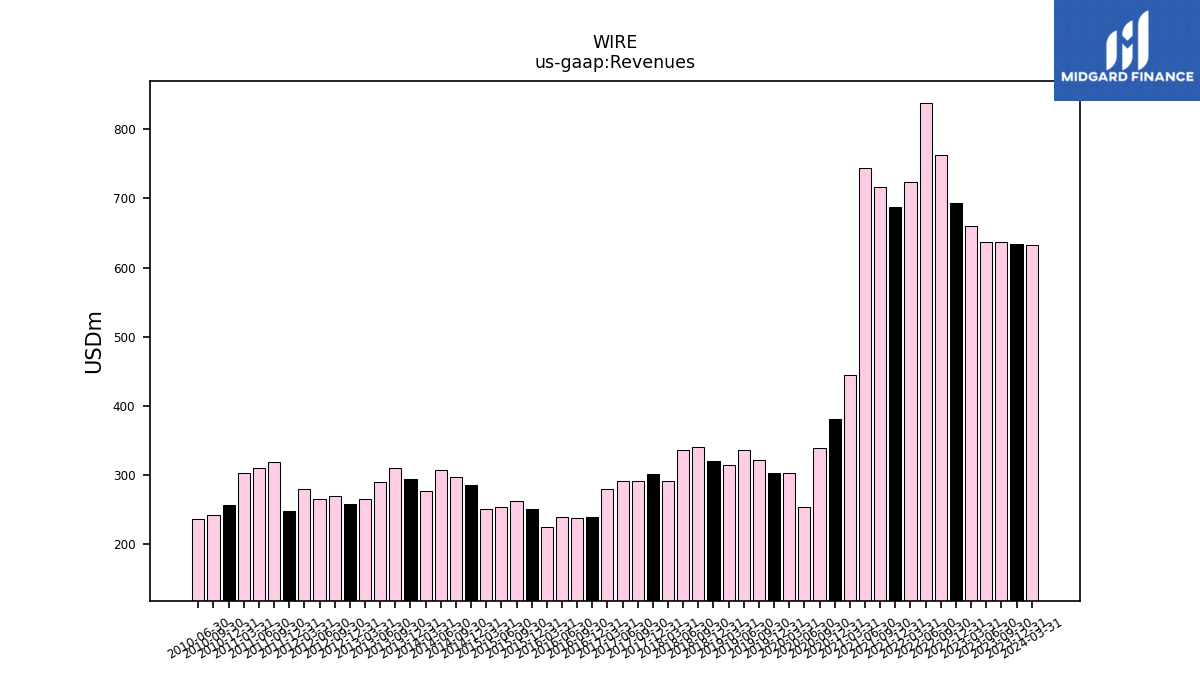
| Revenue From Contract With Customer Excluding Assessed Tax | 633.78 | 636.99 | 636.46 | 660.49 | 693.88 | 762.36 | 838.24 | 723.07 | 687.85 | 716.32 | 744.41 | 444.14 | 380.82 | 339.70 | 253.63 | 302.79 | 302.25 | 321.17 | 336.87 | 314.71 | 319.73 | 340.73 | 336.79 | 291.43 | 301.29 | 292.03 | 291.53 | 279.39 | 239.25 | 237.17 | 238.83 | 225.54 | 250.86 | 262.76 | 253.75 | 250.26 | 285.34 | 297.35 | 307.09 | 277.20 | 293.51 | 309.93 | 289.46 | 265.35 | 258.00 | 269.15 | 264.73 | 280.47 | 248.30 | 319.36 | 309.47 | 303.35 | 256.15 | 242.75 | 236.09 | |
| Revenues | 633.78 | 636.99 | 636.46 | 660.49 | 693.88 | 762.36 | 838.24 | 723.07 | 687.85 | 716.32 | 744.41 | 444.14 | 380.82 | 339.70 | 253.63 | 302.79 | 302.25 | 321.17 | 336.87 | 314.71 | 319.73 | 340.73 | 336.79 | 291.43 | 301.29 | 292.03 | 291.53 | 279.39 | 239.25 | 237.17 | 238.83 | 225.54 | 250.86 | 262.76 | 253.75 | 250.26 | 285.34 | 297.35 | 307.09 | 277.20 | 293.51 | 309.93 | 289.46 | 265.35 | 258.00 | 269.15 | 264.73 | 280.47 | 248.30 | 319.36 | 309.47 | 303.35 | 256.15 | 242.75 | 236.09 | |
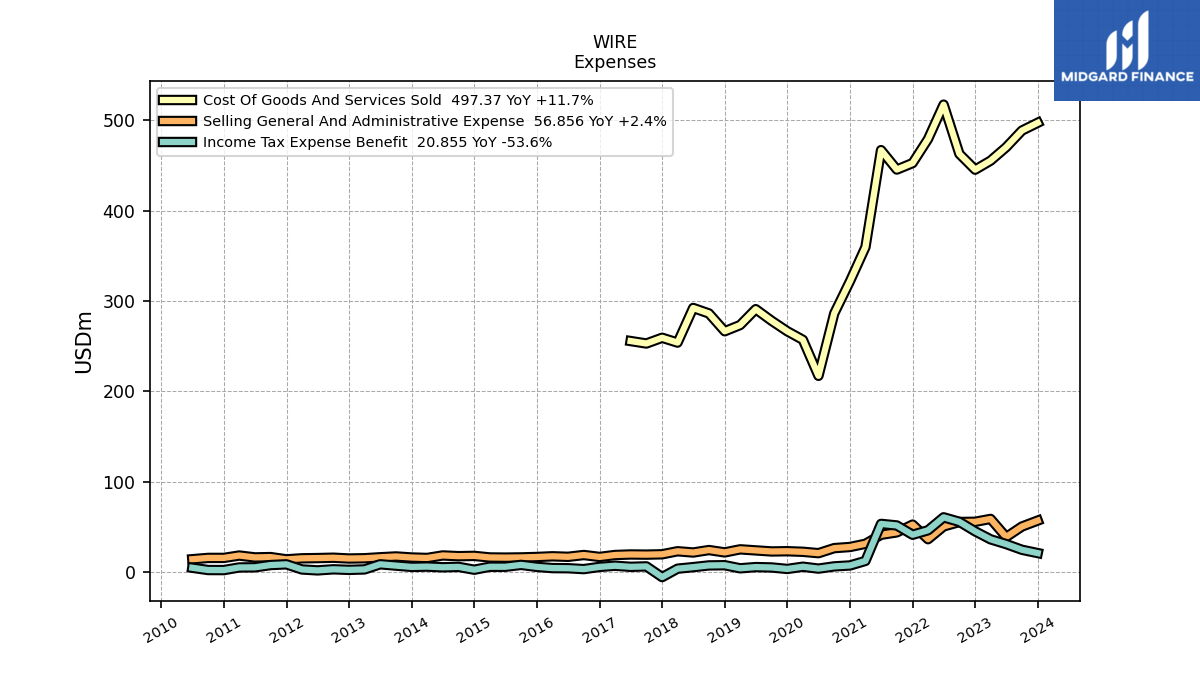
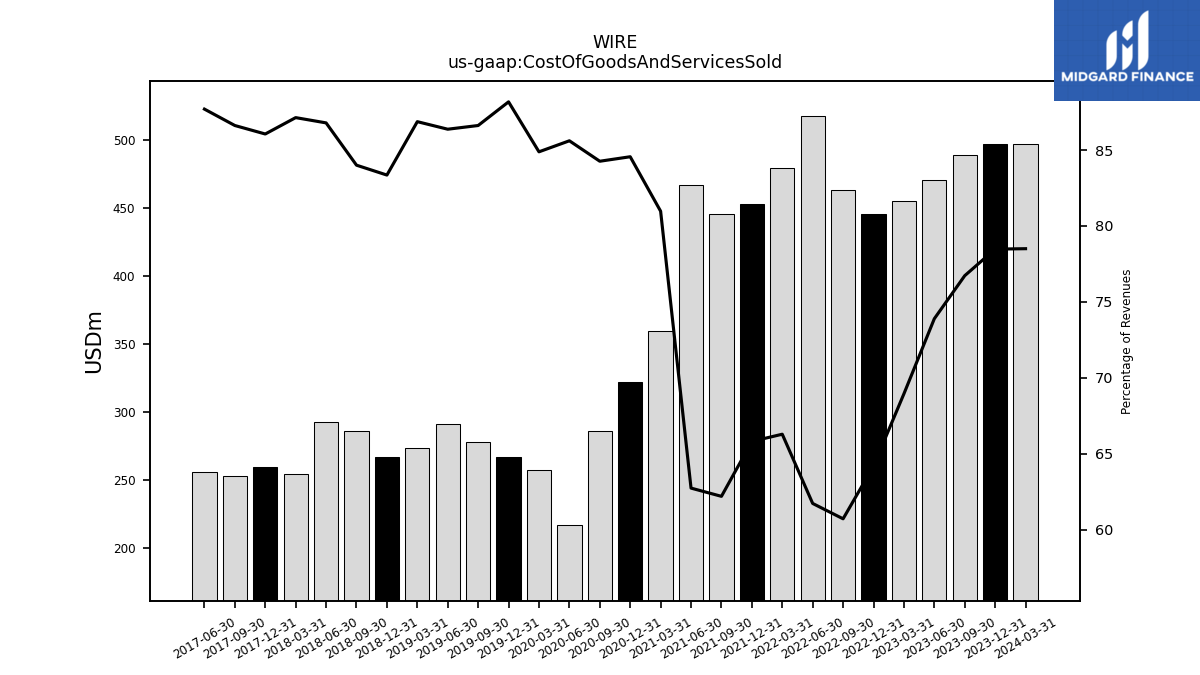
| Cost Of Goods And Services Sold | 497.37 | 488.75 | 470.31 | 455.41 | 445.43 | 462.92 | 517.46 | 479.32 | 452.72 | 445.55 | 467.07 | 359.64 | 322.02 | 286.24 | 217.13 | 257.02 | 266.50 | 278.18 | 290.96 | 273.38 | 266.50 | 286.23 | 292.30 | 253.94 | 259.28 | 252.94 | 255.66 | NA | NA | NA | NA | NA | NA | NA | NA | NA | NA | NA | NA | NA | NA | NA | NA | NA | NA | NA | NA | NA | NA | NA | NA | NA | NA | NA | NA | |
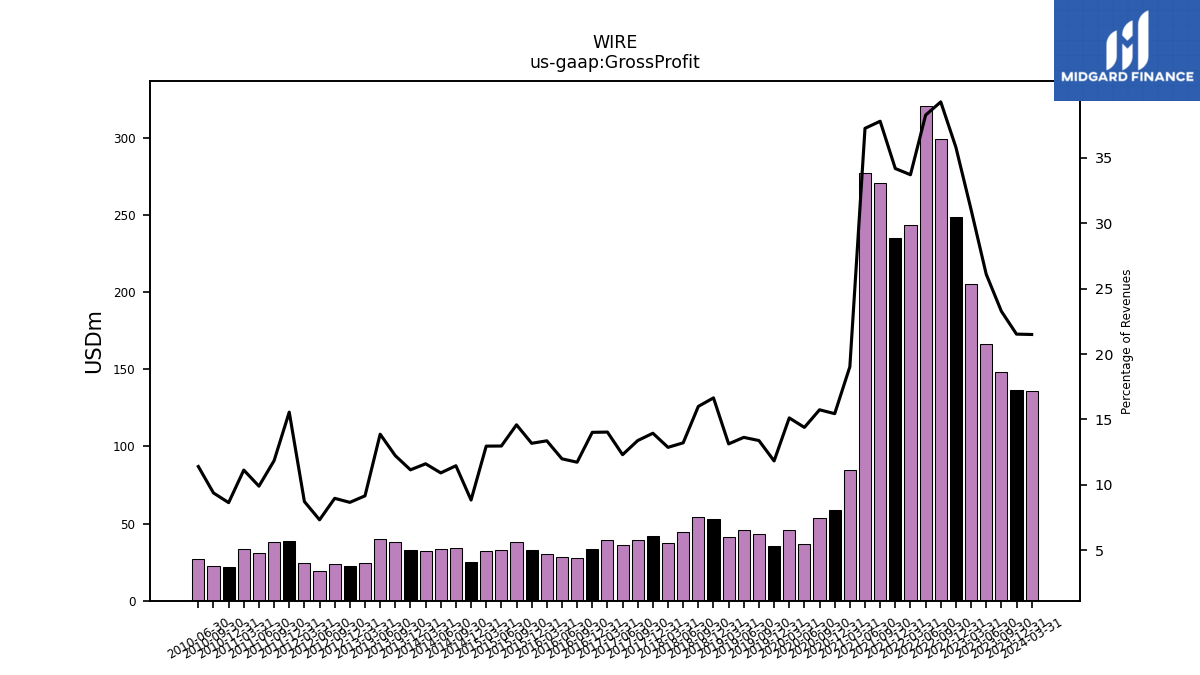
| Gross Profit | 136.41 | 148.24 | 166.15 | 205.09 | 248.46 | 299.45 | 320.77 | 243.75 | 235.13 | 270.77 | 277.34 | 84.50 | 58.80 | 53.46 | 36.50 | 45.77 | 35.75 | 42.99 | 45.91 | 41.33 | 53.23 | 54.51 | 44.50 | 37.49 | 42.01 | 39.09 | 35.87 | 39.20 | 33.52 | 27.82 | 28.63 | 30.14 | 33.05 | 38.34 | 32.91 | 32.43 | 25.22 | 34.07 | 33.51 | 32.18 | 32.72 | 37.90 | 40.15 | 24.30 | 22.34 | 24.14 | 19.39 | 24.46 | 38.63 | 37.84 | 30.63 | 33.76 | 22.12 | 22.77 | 26.91 | |
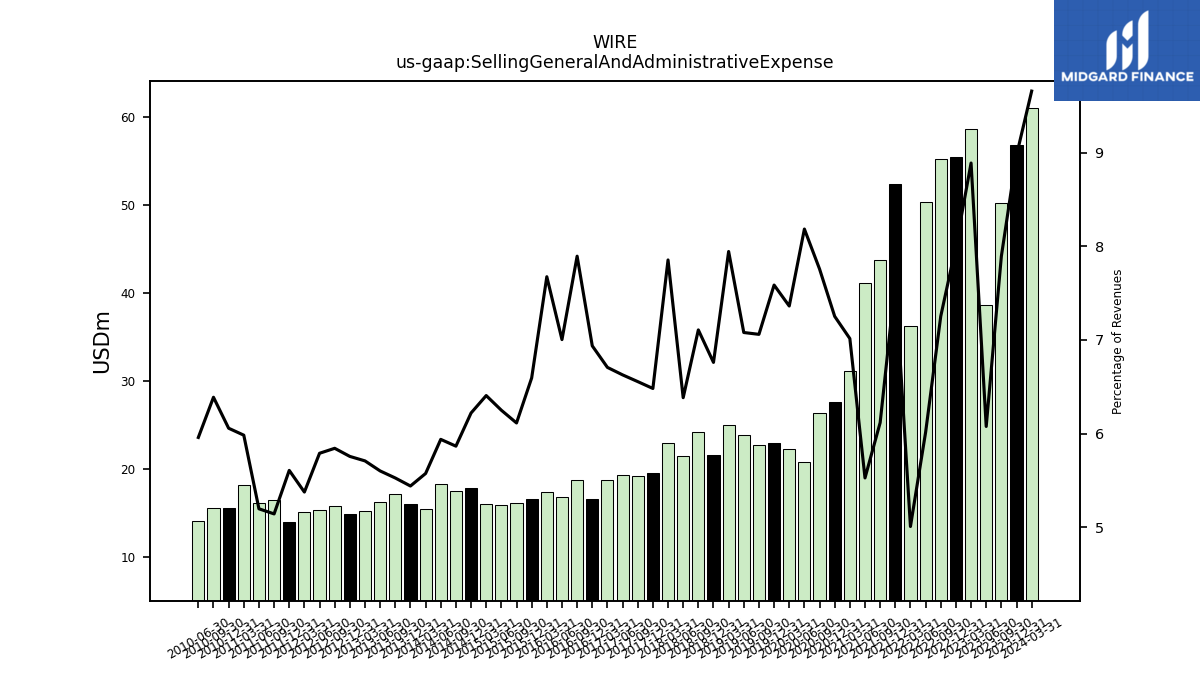
| Selling General And Administrative Expense | 56.86 | 50.28 | 38.67 | 58.70 | 55.51 | 55.29 | 50.41 | 36.21 | 52.43 | 43.82 | 41.14 | 31.15 | 27.61 | 26.35 | 20.75 | 22.29 | 22.93 | 22.67 | 23.85 | 25.00 | 21.61 | 24.21 | 21.50 | 22.89 | 19.53 | 19.14 | 19.32 | 18.74 | 16.59 | 18.72 | 16.73 | 17.31 | 16.54 | 16.06 | 15.86 | 16.03 | 17.75 | 17.44 | 18.23 | 15.45 | 15.97 | 17.13 | 16.21 | 15.15 | 14.85 | 15.73 | 15.33 | 15.08 | 13.92 | 16.42 | 16.08 | 18.15 | 15.52 | 15.51 | 14.07 | |
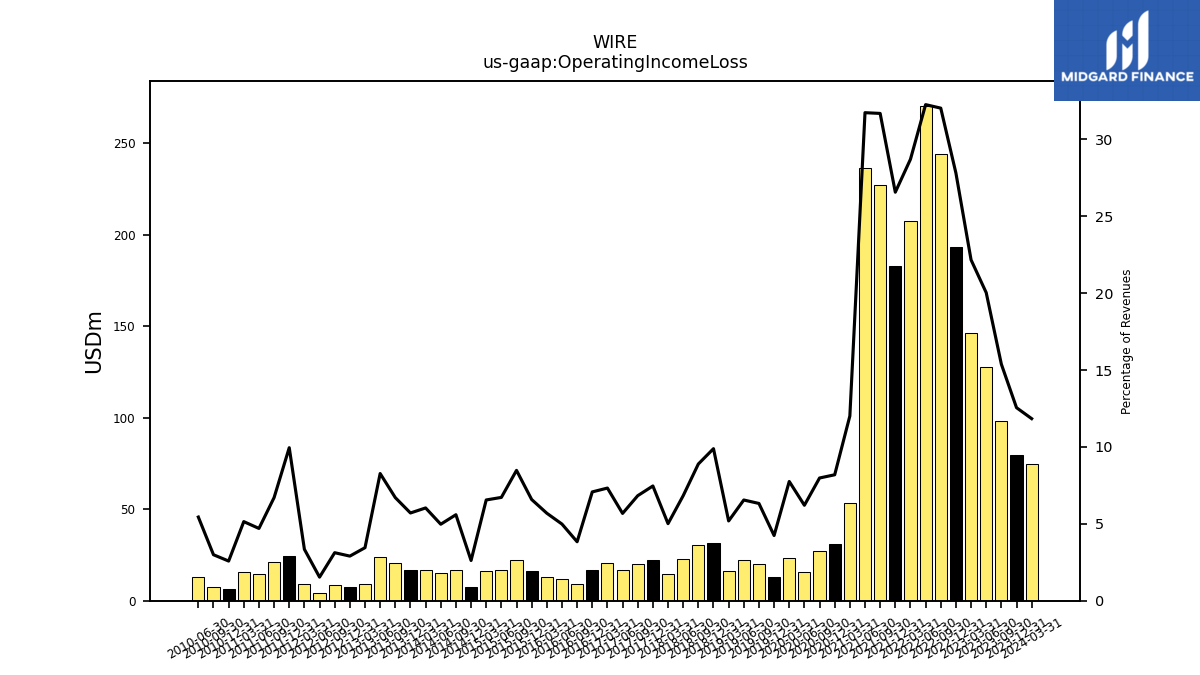
| Operating Income Loss | 79.55 | 97.96 | 127.48 | 146.38 | 192.94 | 244.16 | 270.37 | 207.53 | 182.70 | 226.95 | 236.20 | 53.35 | 31.19 | 27.11 | 15.74 | 23.48 | 12.82 | 20.32 | 22.06 | 16.33 | 31.61 | 30.29 | 23.00 | 14.61 | 22.48 | 19.95 | 16.55 | 20.47 | 16.93 | 9.10 | 11.90 | 12.83 | 16.51 | 22.27 | 17.05 | 16.40 | 7.47 | 16.63 | 15.28 | 16.73 | 16.75 | 20.78 | 23.94 | 9.15 | 7.49 | 8.41 | 4.06 | 9.38 | 24.71 | 21.42 | 14.55 | 15.61 | 6.61 | 7.26 | 12.85 | |
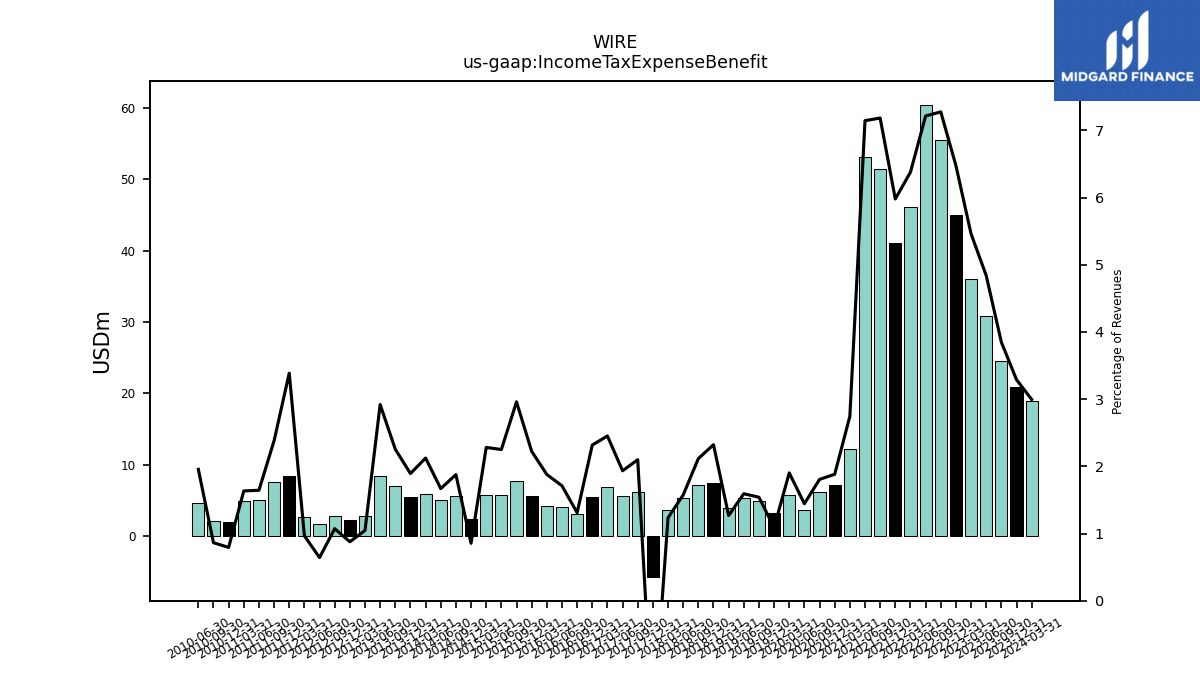
| Income Tax Expense Benefit | 20.86 | 24.51 | 30.80 | 36.07 | 44.94 | 55.47 | 60.48 | 46.12 | 41.13 | 51.46 | 53.19 | 12.19 | 7.17 | 6.14 | 3.66 | 5.76 | 3.29 | 4.95 | 5.36 | 4.00 | 7.42 | 7.21 | 5.30 | 3.60 | -5.76 | 6.13 | 5.64 | 6.85 | 5.54 | 3.11 | 4.09 | 4.24 | 5.58 | 7.78 | 5.71 | 5.71 | 2.44 | 5.58 | 5.13 | 5.89 | 5.56 | 6.99 | 8.45 | 2.78 | 2.27 | 2.89 | 1.70 | 2.71 | 8.41 | 7.61 | 5.09 | 4.96 | 2.03 | 2.10 | 4.62 | |
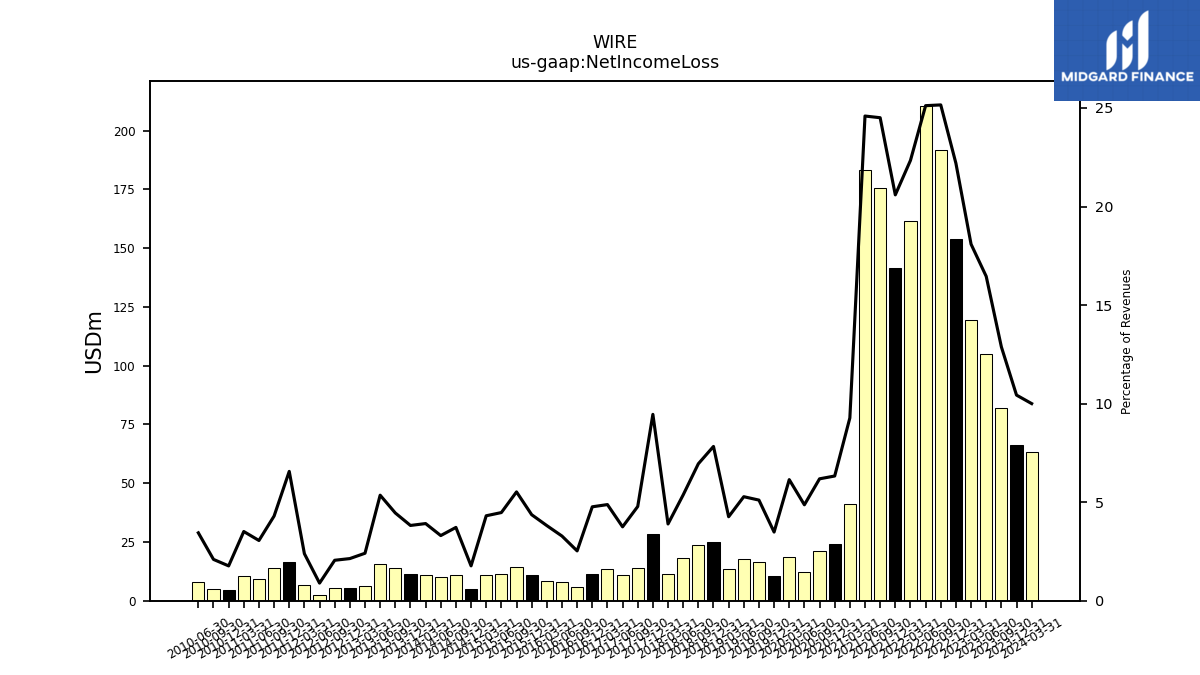
| Net Income Loss | 66.12 | 82.05 | 104.74 | 119.48 | 154.00 | 191.77 | 210.54 | 161.53 | 141.64 | 175.54 | 183.05 | 41.19 | 24.10 | 21.01 | 12.35 | 18.61 | 10.54 | 16.40 | 17.78 | 13.41 | 25.03 | 23.68 | 18.09 | 11.35 | 28.49 | 13.96 | 10.93 | 13.63 | 11.40 | 6.00 | 7.84 | 8.60 | 10.95 | 14.51 | 11.35 | 10.79 | 5.05 | 11.06 | 10.15 | 10.85 | 11.21 | 13.80 | 15.50 | 6.39 | 5.52 | 5.53 | 2.37 | 6.69 | 16.30 | 13.72 | 9.46 | 10.65 | 4.53 | 5.09 | 8.13 |
| 2023-12-31 | 2023-09-30 | 2023-06-30 | 2023-03-31 | 2022-12-31 | 2022-09-30 | 2022-06-30 | 2022-03-31 | 2021-12-31 | 2021-09-30 | 2021-06-30 | 2021-03-31 | 2020-12-31 | 2020-09-30 | 2020-06-30 | 2020-03-31 | 2019-12-31 | 2019-09-30 | 2019-06-30 | 2019-03-31 | 2018-12-31 | 2018-09-30 | 2018-06-30 | 2018-03-31 | 2017-12-31 | 2017-09-30 | 2017-06-30 | 2017-03-31 | 2016-12-31 | 2016-09-30 | 2016-06-30 | 2016-03-31 | 2015-12-31 | 2015-09-30 | 2015-06-30 | 2015-03-31 | 2014-12-31 | 2014-09-30 | 2014-06-30 | 2014-03-31 | 2013-12-31 | 2013-09-30 | 2013-06-30 | 2013-03-31 | 2012-12-31 | 2012-09-30 | 2012-06-30 | 2012-03-31 | 2011-12-31 | 2011-09-30 | 2011-06-30 | 2011-03-31 | 2010-12-31 | 2010-09-30 | 2010-06-30 | ||
|---|---|---|---|---|---|---|---|---|---|---|---|---|---|---|---|---|---|---|---|---|---|---|---|---|---|---|---|---|---|---|---|---|---|---|---|---|---|---|---|---|---|---|---|---|---|---|---|---|---|---|---|---|---|---|---|---|
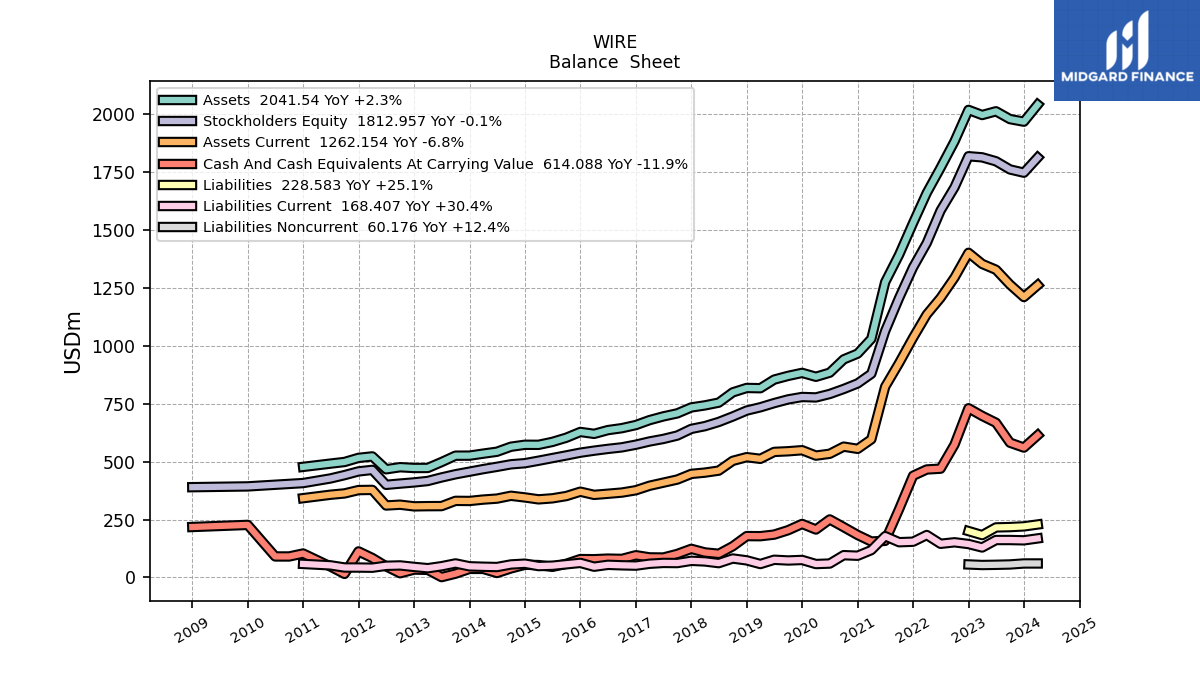
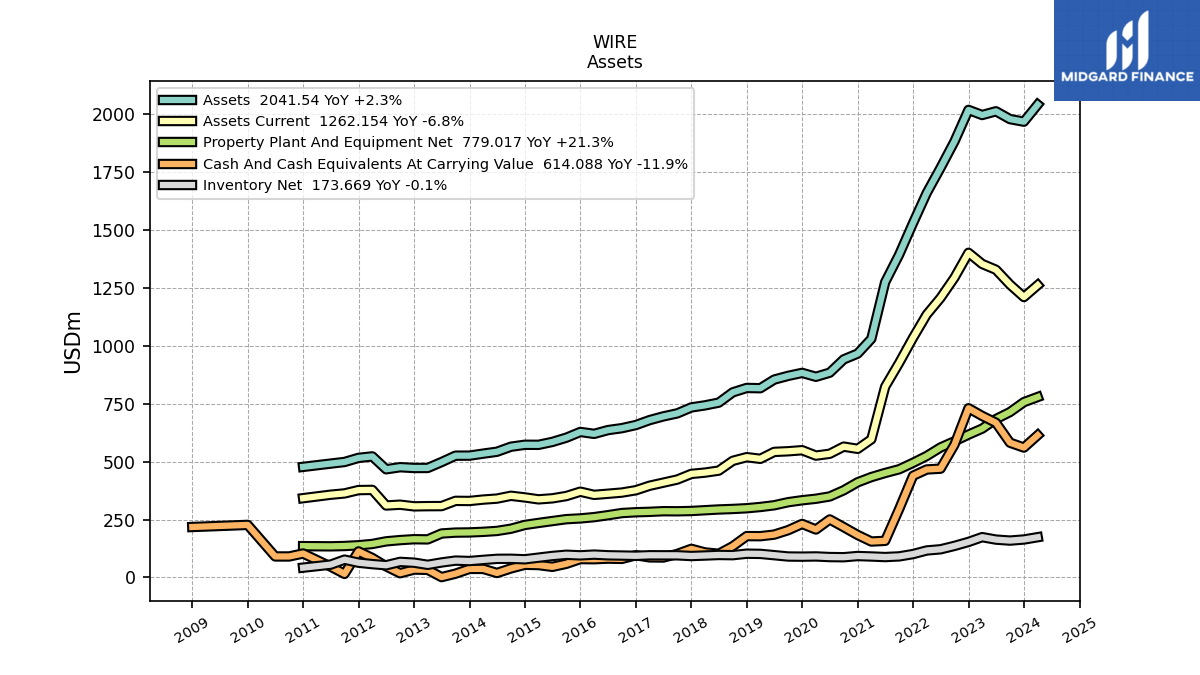
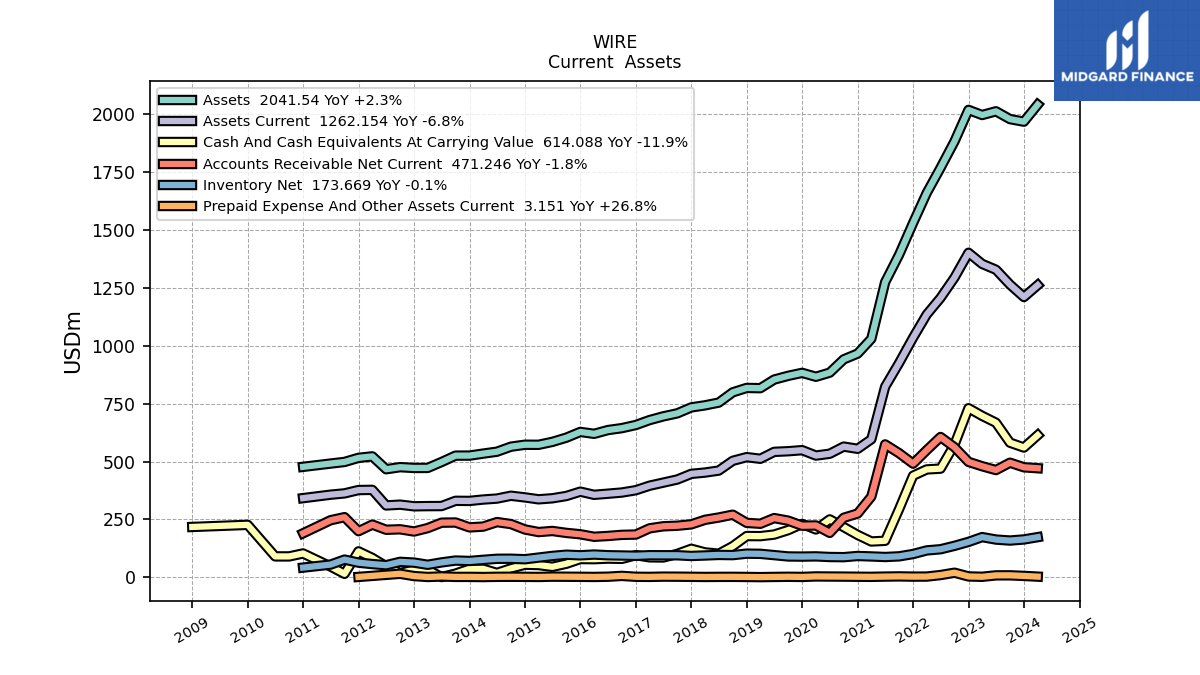
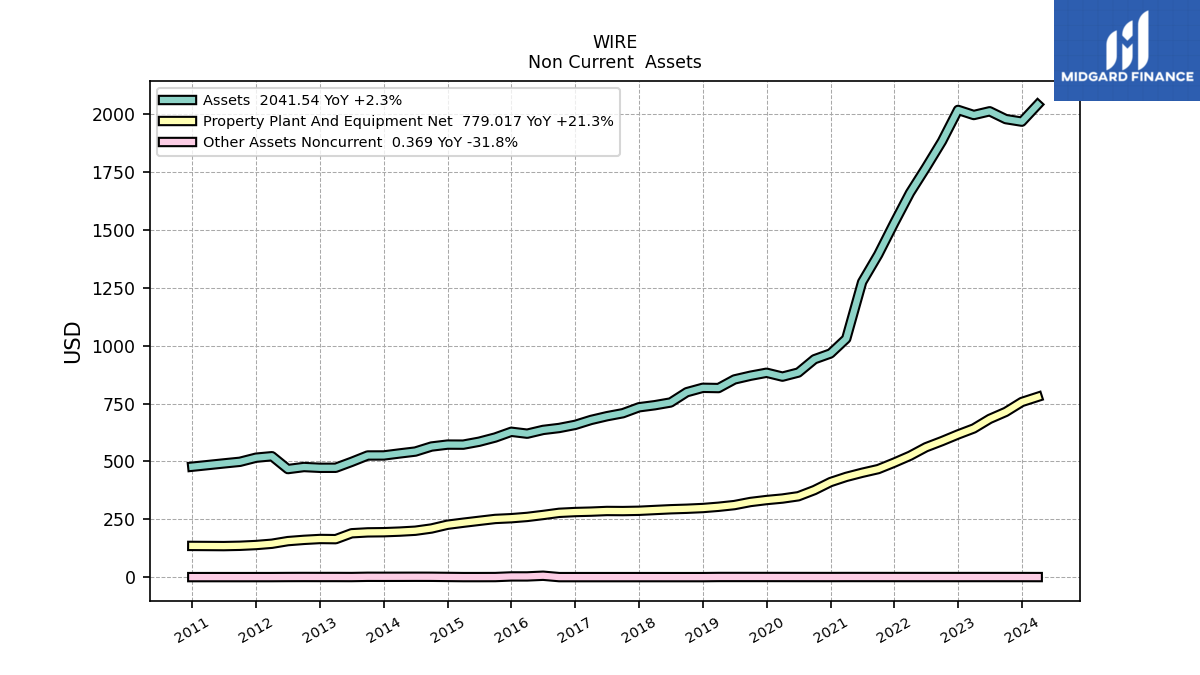
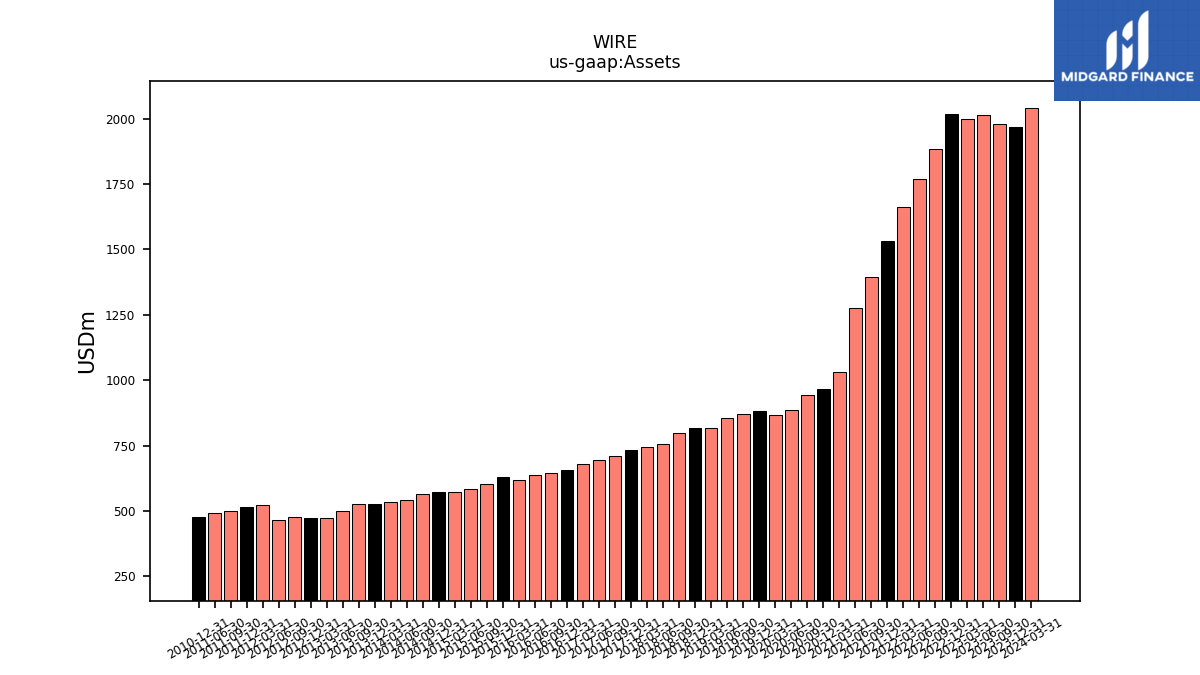
| Assets | 1967.91 | 1978.99 | 2012.78 | 1996.61 | 2018.73 | 1883.05 | 1768.78 | 1660.22 | 1530.54 | 1393.38 | 1274.90 | 1030.19 | 966.45 | 941.52 | 884.04 | 866.35 | 883.15 | 870.25 | 854.18 | 816.96 | 818.06 | 799.04 | 754.71 | 742.85 | 733.98 | 708.37 | 695.30 | 679.13 | 657.96 | 644.48 | 636.10 | 619.84 | 628.12 | 603.32 | 585.12 | 572.51 | 572.75 | 564.35 | 542.66 | 534.45 | 525.83 | 525.70 | 498.07 | 472.60 | 472.47 | 475.87 | 466.90 | 522.57 | 516.15 | 498.43 | 491.47 | NA | 477.28 | NA | NA | |
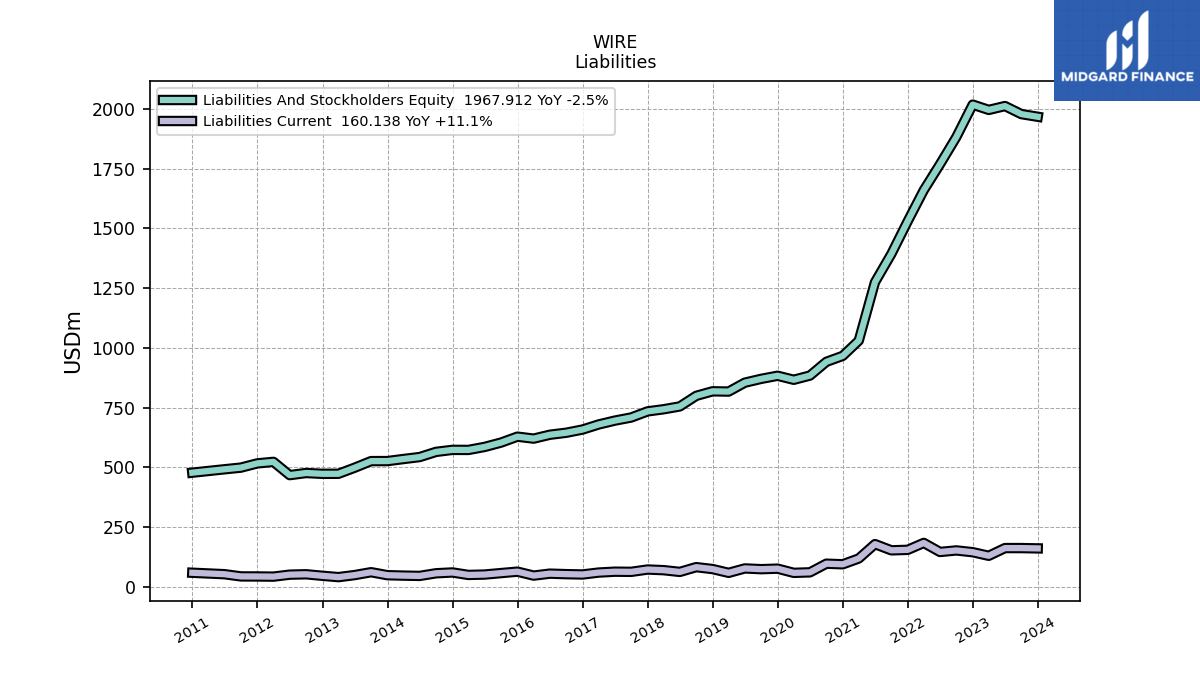
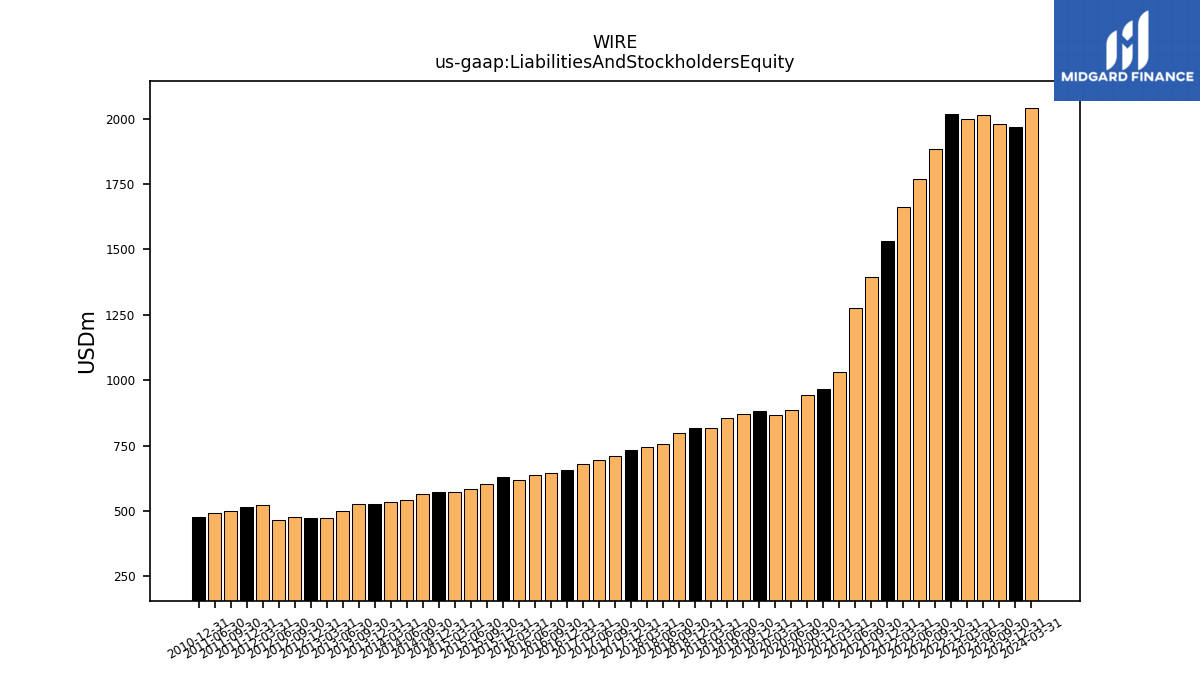
| Liabilities And Stockholders Equity | 1967.91 | 1978.99 | 2012.78 | 1996.61 | 2018.73 | 1883.05 | 1768.78 | 1660.22 | 1530.54 | 1393.38 | 1274.90 | 1030.19 | 966.45 | 941.52 | 884.04 | 866.35 | 883.15 | 870.25 | 854.18 | 816.96 | 818.06 | 799.04 | 754.71 | 742.85 | 733.98 | 708.37 | 695.30 | 679.13 | 657.96 | 644.48 | 636.10 | 619.84 | 628.12 | 603.32 | 585.12 | 572.51 | 572.75 | 564.35 | 542.66 | 534.45 | 525.83 | 525.70 | 498.07 | 472.60 | 472.47 | 475.87 | 466.90 | 522.57 | 516.15 | 498.43 | 491.47 | NA | 477.28 | NA | NA | |
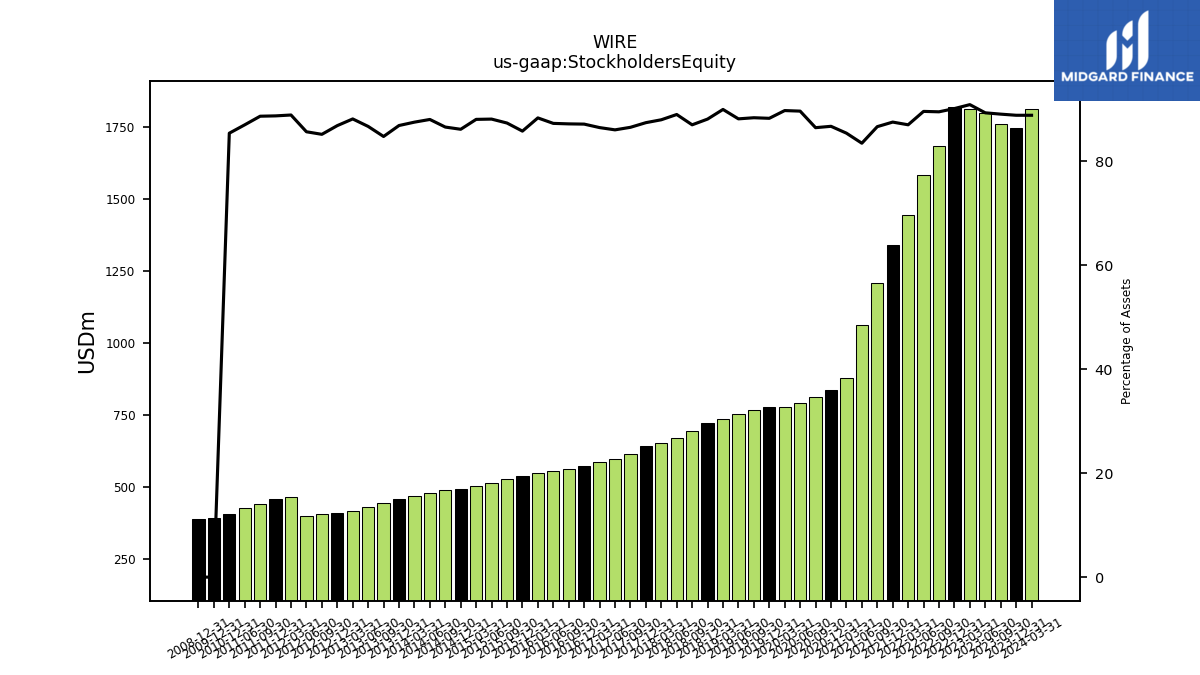
| Stockholders Equity | 1747.58 | 1761.69 | 1796.89 | 1813.90 | 1818.67 | 1684.72 | 1583.90 | 1443.94 | 1339.09 | 1206.88 | 1063.62 | 879.40 | 837.73 | 813.65 | 792.11 | 777.17 | 779.10 | 768.68 | 752.64 | 734.64 | 720.46 | 694.90 | 671.33 | 653.24 | 641.35 | 612.64 | 597.95 | 587.00 | 573.11 | 561.65 | 554.95 | 547.29 | 538.64 | 526.75 | 515.31 | 503.88 | 493.19 | 488.37 | 477.53 | 467.53 | 456.58 | 445.39 | 431.63 | 416.34 | 410.16 | 405.15 | 399.81 | 464.32 | 457.74 | 441.71 | 427.42 | NA | 407.38 | NA | NA |
| 2023-12-31 | 2023-09-30 | 2023-06-30 | 2023-03-31 | 2022-12-31 | 2022-09-30 | 2022-06-30 | 2022-03-31 | 2021-12-31 | 2021-09-30 | 2021-06-30 | 2021-03-31 | 2020-12-31 | 2020-09-30 | 2020-06-30 | 2020-03-31 | 2019-12-31 | 2019-09-30 | 2019-06-30 | 2019-03-31 | 2018-12-31 | 2018-09-30 | 2018-06-30 | 2018-03-31 | 2017-12-31 | 2017-09-30 | 2017-06-30 | 2017-03-31 | 2016-12-31 | 2016-09-30 | 2016-06-30 | 2016-03-31 | 2015-12-31 | 2015-09-30 | 2015-06-30 | 2015-03-31 | 2014-12-31 | 2014-09-30 | 2014-06-30 | 2014-03-31 | 2013-12-31 | 2013-09-30 | 2013-06-30 | 2013-03-31 | 2012-12-31 | 2012-09-30 | 2012-06-30 | 2012-03-31 | 2011-12-31 | 2011-09-30 | 2011-06-30 | 2011-03-31 | 2010-12-31 | 2010-09-30 | 2010-06-30 | ||
|---|---|---|---|---|---|---|---|---|---|---|---|---|---|---|---|---|---|---|---|---|---|---|---|---|---|---|---|---|---|---|---|---|---|---|---|---|---|---|---|---|---|---|---|---|---|---|---|---|---|---|---|---|---|---|---|---|
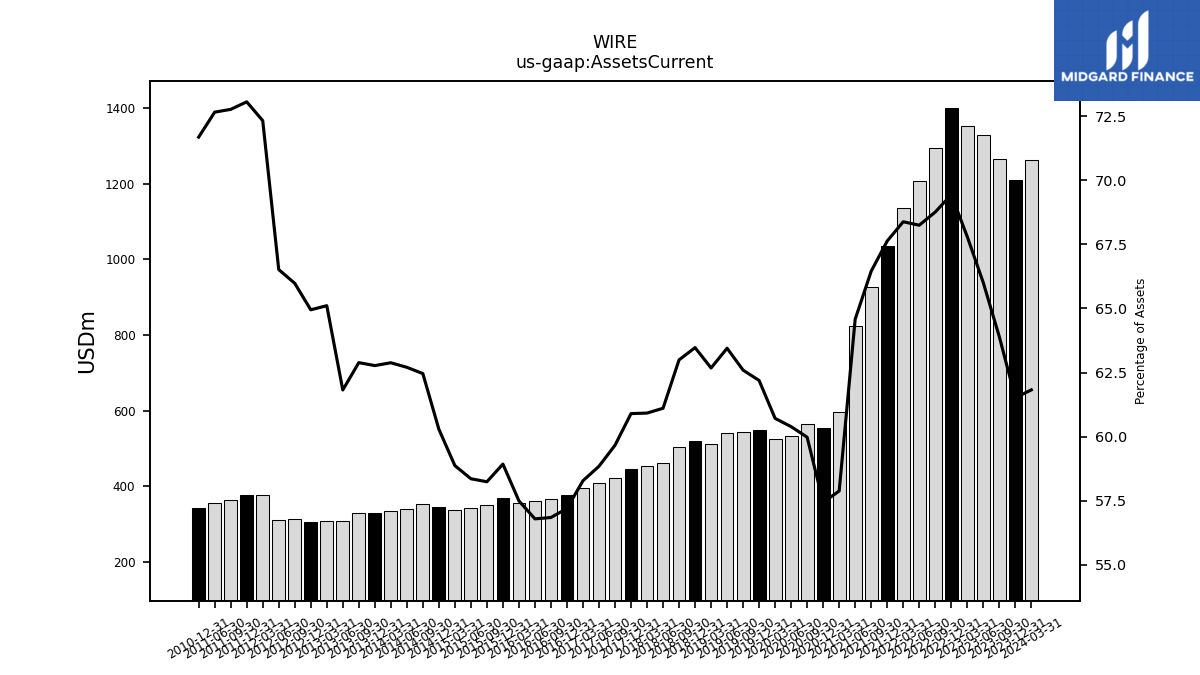
| Assets Current | 1210.58 | 1264.56 | 1328.51 | 1353.62 | 1401.64 | 1294.70 | 1207.07 | 1135.22 | 1035.05 | 925.91 | 823.33 | 596.30 | 555.13 | 564.71 | 533.88 | 525.98 | 549.24 | 544.71 | 541.95 | 512.05 | 519.24 | 503.34 | 461.19 | 452.54 | 446.98 | 422.64 | 409.16 | 395.81 | 376.38 | 366.38 | 361.28 | 356.40 | 370.15 | 351.39 | 341.47 | 337.05 | 345.31 | 352.49 | 340.27 | 336.07 | 330.07 | 330.59 | 307.91 | 307.69 | 306.85 | 313.97 | 310.55 | 377.92 | 377.05 | 362.65 | 357.06 | NA | 342.10 | NA | NA | |
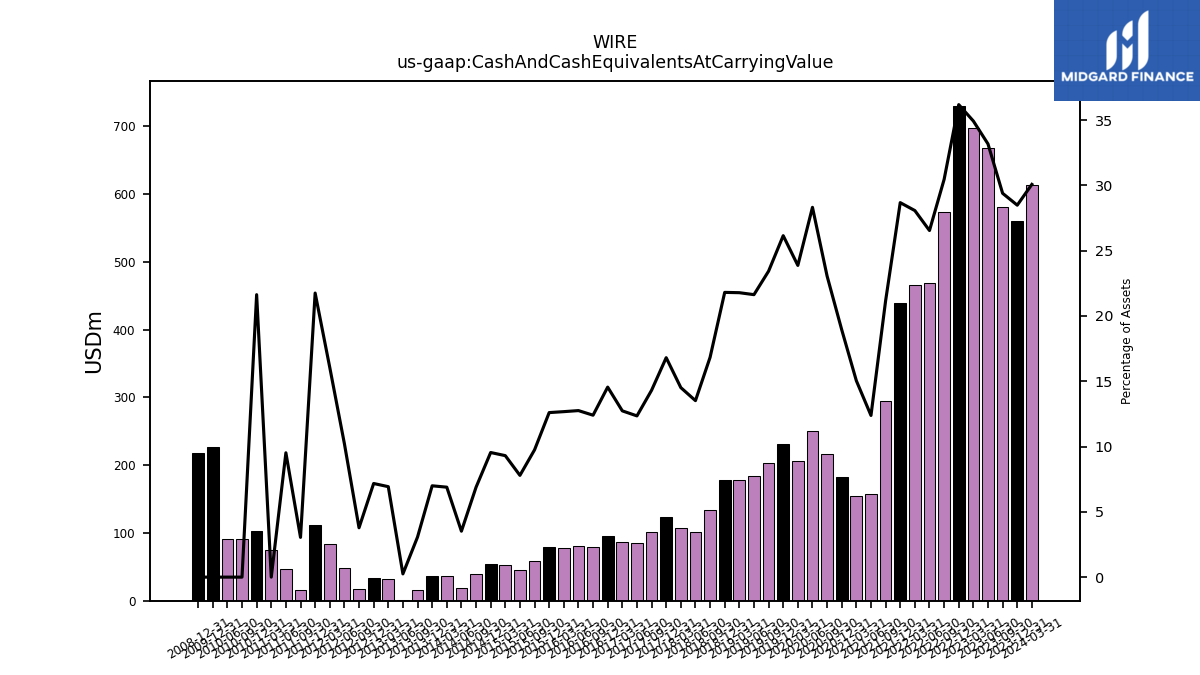
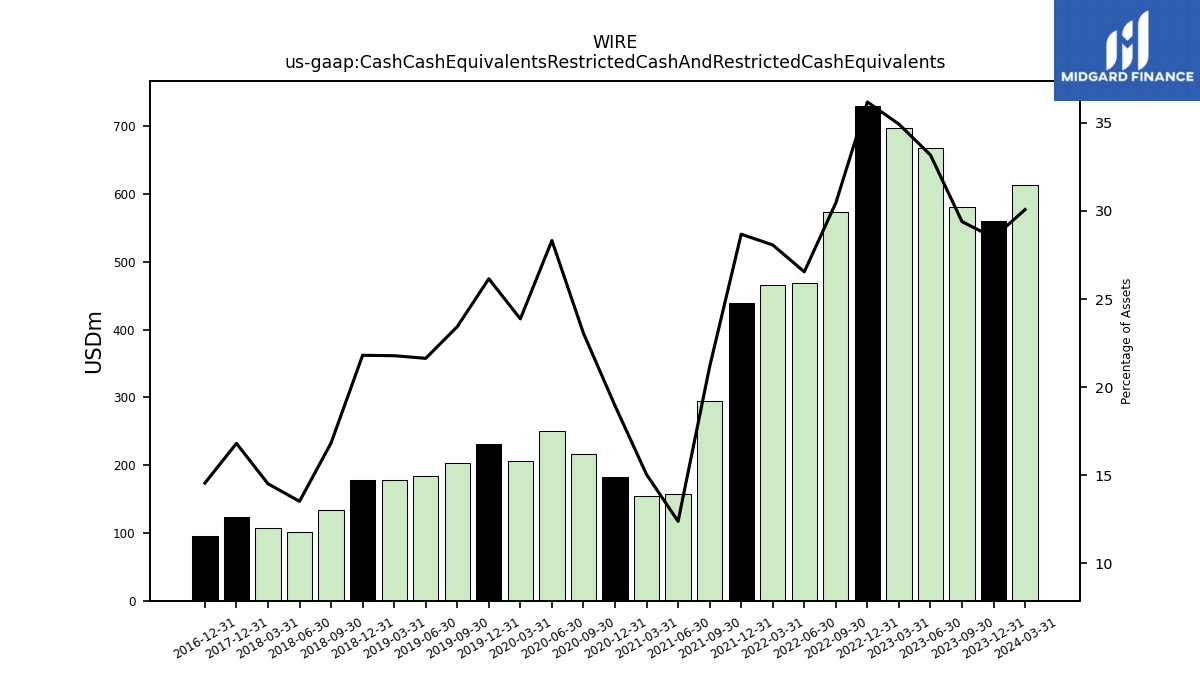
| Cash And Cash Equivalents At Carrying Value | 560.63 | 581.75 | 667.79 | 697.42 | 730.56 | 573.58 | 469.54 | 466.09 | 438.99 | 294.86 | 157.87 | 154.97 | 183.12 | 217.10 | 250.38 | 206.84 | 230.97 | 203.94 | 184.80 | 177.97 | 178.41 | 134.50 | 102.02 | 107.83 | 123.36 | 101.37 | 85.86 | 86.48 | 95.75 | 79.93 | 81.14 | 78.56 | 79.15 | 58.82 | 45.60 | 53.27 | 54.66 | 38.84 | 19.09 | 36.82 | 36.78 | 16.14 | 1.23 | 32.74 | 33.88 | 17.99 | 47.73 | 83.92 | 112.30 | 15.17 | 46.80 | 75.23 | 103.25 | 90.41 | 90.50 | |
| Cash Cash Equivalents Restricted Cash And Restricted Cash Equivalents | 560.63 | 581.75 | 667.79 | 697.42 | 730.56 | 573.58 | 469.54 | 466.09 | 438.99 | 294.86 | 157.87 | 154.97 | 183.12 | 217.10 | 250.38 | 206.84 | 230.97 | 203.94 | 184.80 | 177.97 | 178.41 | 134.50 | 102.02 | 107.83 | 123.36 | NA | NA | NA | 95.75 | NA | NA | NA | NA | NA | NA | NA | NA | NA | NA | NA | NA | NA | NA | NA | NA | NA | NA | NA | NA | NA | NA | NA | NA | NA | NA | |
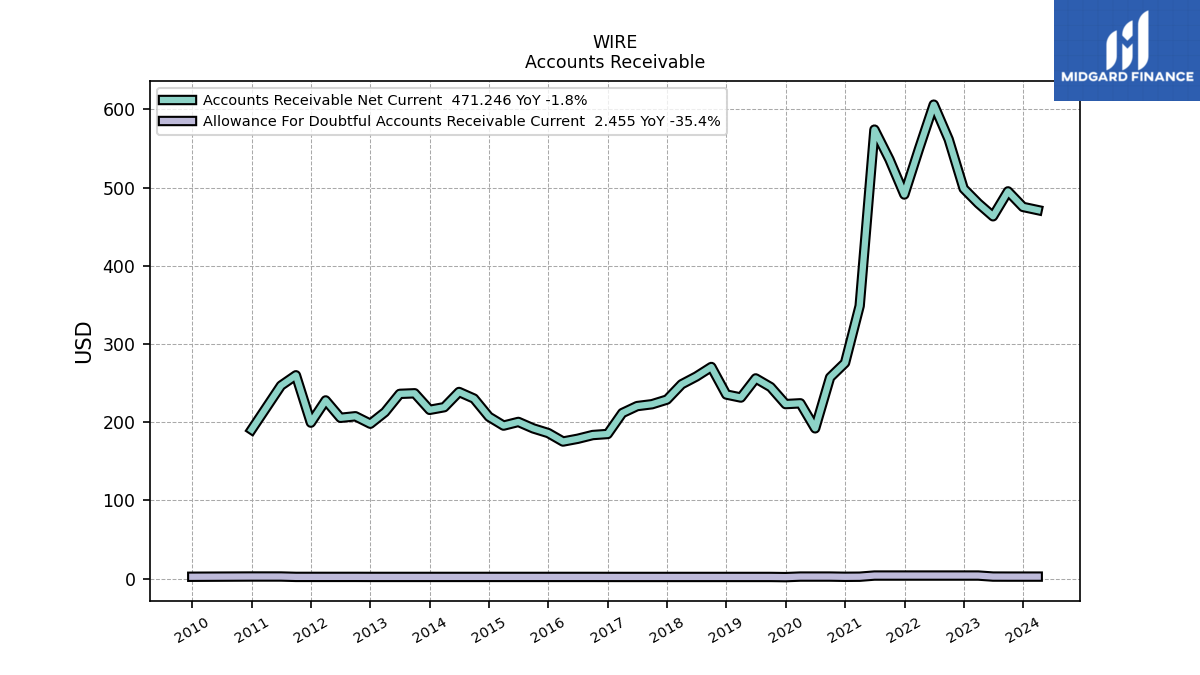
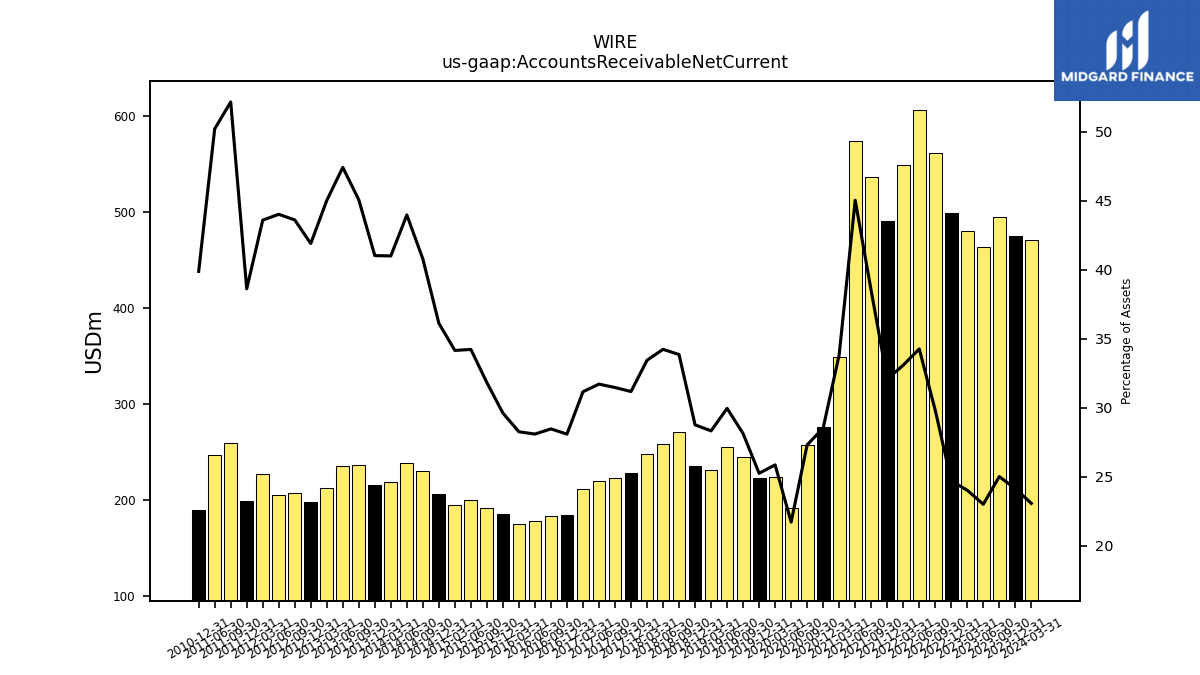
| Accounts Receivable Net Current | 475.29 | 495.18 | 463.32 | 479.83 | 498.76 | 561.67 | 606.13 | 549.40 | 491.13 | 536.18 | 574.19 | 348.71 | 275.78 | 257.21 | 192.07 | 224.12 | 223.10 | 244.87 | 255.97 | 231.47 | 235.35 | 270.59 | 258.41 | 248.47 | 228.88 | 222.95 | 220.55 | 211.67 | 184.88 | 183.53 | 178.76 | 175.22 | 186.06 | 192.00 | 200.31 | 195.57 | 206.91 | 230.18 | 238.62 | 219.15 | 215.74 | 236.93 | 236.17 | 212.79 | 197.98 | 207.54 | 205.53 | 227.82 | 199.37 | 259.95 | 246.75 | NA | 190.36 | NA | NA | |
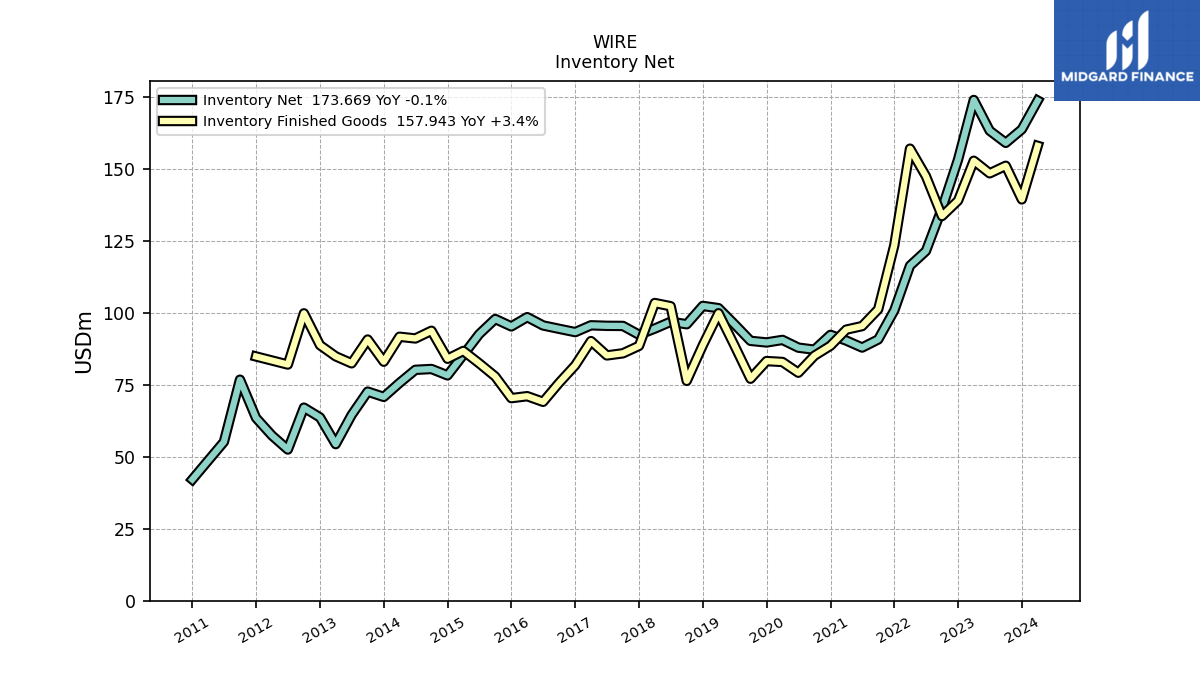
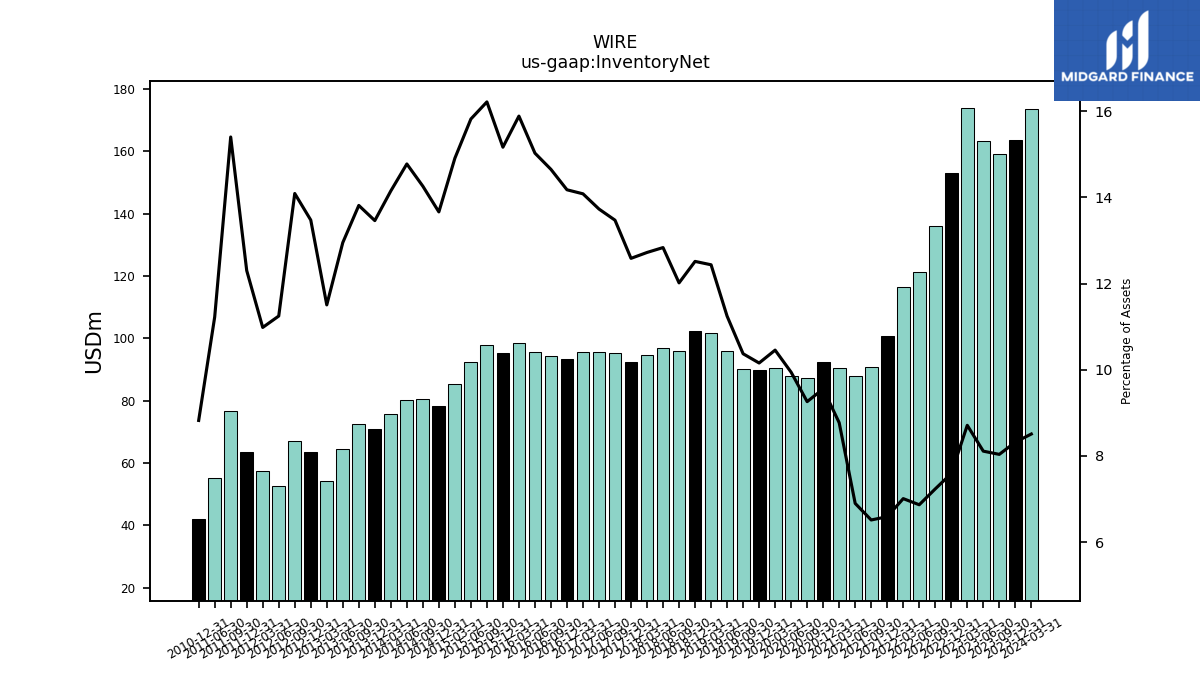
| Inventory Net | 163.68 | 158.99 | 163.22 | 173.88 | 153.19 | 136.19 | 121.42 | 116.33 | 100.82 | 90.73 | 87.92 | 90.34 | 92.32 | 87.17 | 87.88 | 90.57 | 89.68 | 90.24 | 96.04 | 101.59 | 102.37 | 96.01 | 96.87 | 94.50 | 92.36 | 95.42 | 95.46 | 95.64 | 93.27 | 94.42 | 95.58 | 98.47 | 95.25 | 97.83 | 92.56 | 85.35 | 78.25 | 80.47 | 80.18 | 75.62 | 70.78 | 72.61 | 64.50 | 54.37 | 63.66 | 67.05 | 52.51 | 57.38 | 63.49 | 76.77 | 55.16 | NA | 42.10 | NA | NA | |
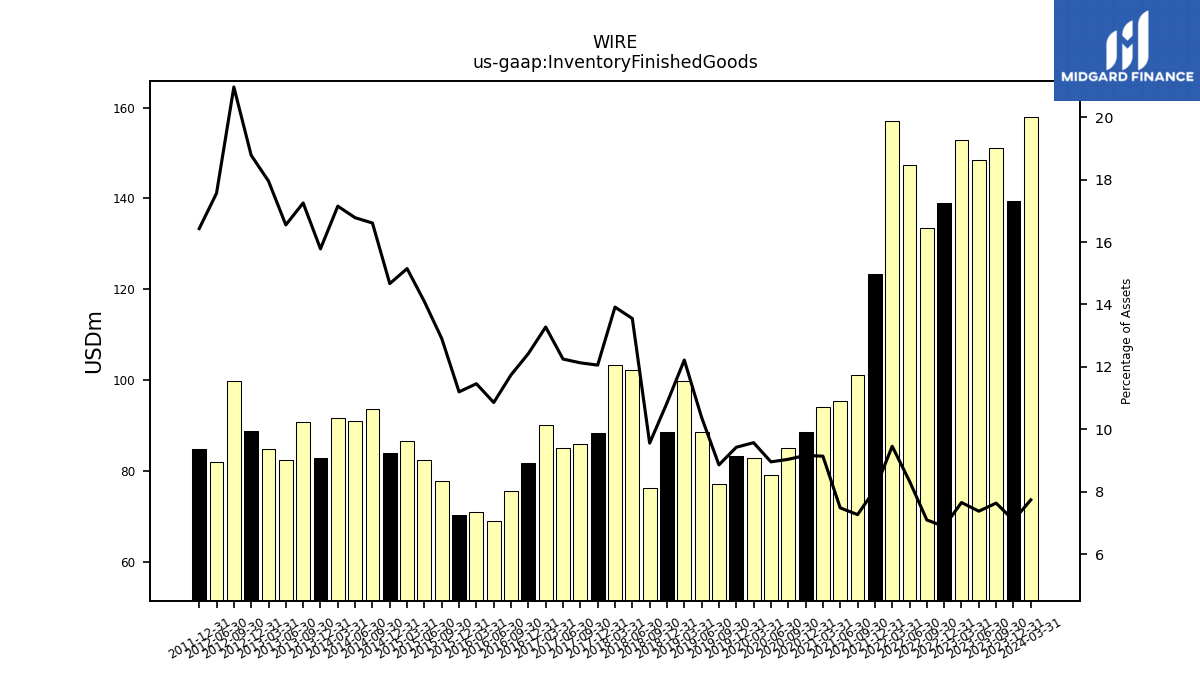
| Inventory Finished Goods | 139.35 | 151.04 | 148.41 | 152.78 | 138.94 | 133.56 | 147.42 | 156.98 | 123.40 | 101.20 | 95.37 | 94.14 | 88.54 | 85.08 | 79.17 | 82.91 | 83.22 | 77.09 | 88.66 | 99.83 | 88.71 | 76.34 | 102.27 | 103.38 | 88.50 | 85.92 | 85.18 | 90.17 | 81.76 | 75.68 | 69.06 | 71.03 | 70.35 | 77.88 | 82.45 | 86.74 | 84.02 | 93.75 | 91.07 | 91.67 | 83.00 | 90.70 | 82.44 | 84.86 | 88.75 | 99.80 | 82.01 | NA | 84.82 | NA | NA | NA | NA | NA | NA | |
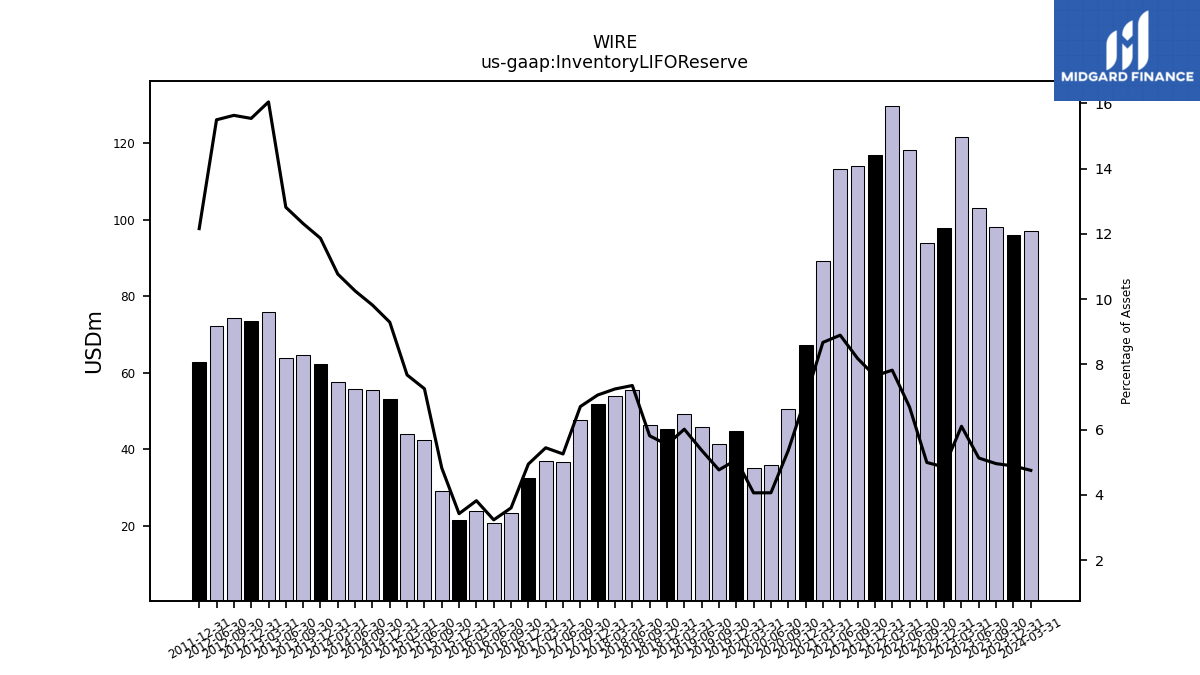
| Inventory L I F O Reserve | 96.10 | 98.08 | 103.21 | 121.81 | 97.93 | 94.00 | 118.38 | 129.86 | 117.02 | 114.01 | 113.39 | 89.34 | 67.38 | 50.45 | 35.92 | 35.17 | 44.80 | 41.46 | 45.84 | 49.11 | 45.33 | 46.41 | 55.48 | 53.82 | 51.81 | 47.50 | 36.52 | 36.96 | 32.52 | 23.20 | 20.56 | 23.68 | 21.49 | 29.10 | 42.44 | 43.94 | 53.22 | 55.40 | 55.62 | 57.54 | 62.39 | 64.74 | 63.83 | 75.83 | 73.42 | 74.39 | 72.35 | NA | 62.77 | NA | NA | NA | NA | NA | NA | |
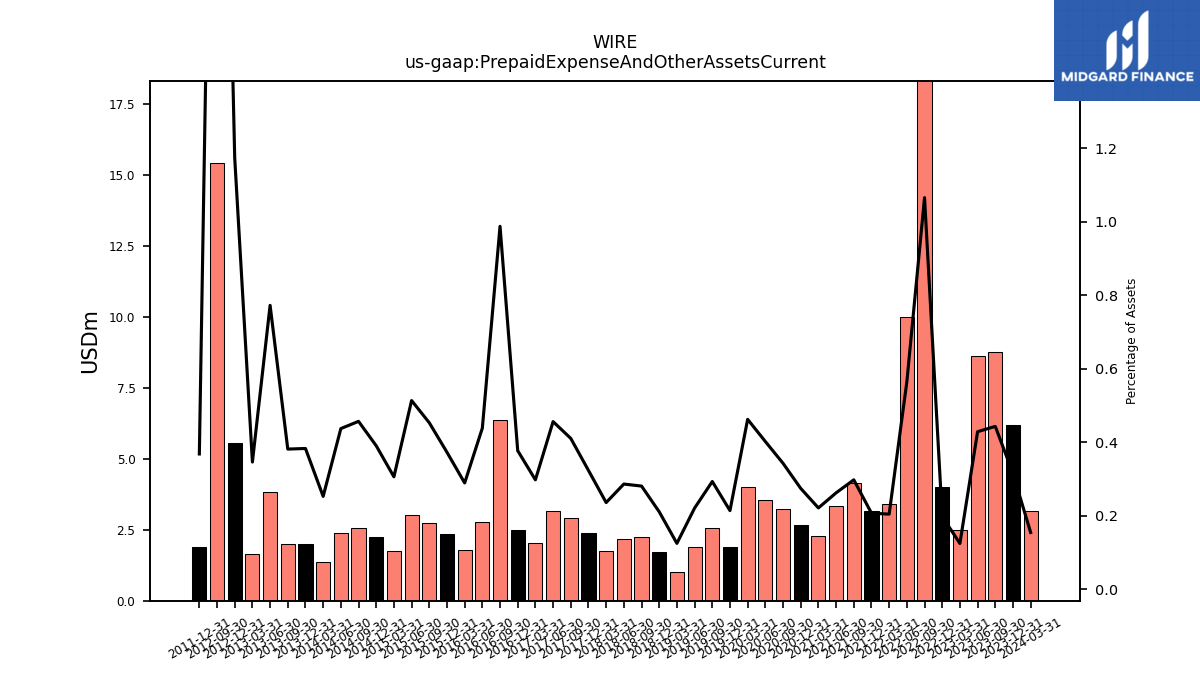
| Prepaid Expense And Other Assets Current | 6.20 | 8.77 | 8.62 | 2.48 | 3.99 | 20.06 | 9.98 | 3.39 | 3.17 | 4.15 | 3.34 | 2.28 | 2.65 | 3.23 | 3.55 | 4.00 | 1.89 | 2.55 | 1.89 | 1.02 | 1.72 | 2.24 | 2.16 | 1.75 | 2.37 | 2.91 | 3.17 | 2.02 | 2.48 | 6.36 | 2.79 | 1.79 | 2.34 | 2.73 | 3.00 | 1.75 | 2.23 | 2.58 | 2.37 | 1.35 | 2.01 | 2.00 | 3.85 | 1.64 | 5.54 | 15.42 | NA | NA | 1.90 | NA | NA | NA | NA | NA | NA |
| 2023-12-31 | 2023-09-30 | 2023-06-30 | 2023-03-31 | 2022-12-31 | 2022-09-30 | 2022-06-30 | 2022-03-31 | 2021-12-31 | 2021-09-30 | 2021-06-30 | 2021-03-31 | 2020-12-31 | 2020-09-30 | 2020-06-30 | 2020-03-31 | 2019-12-31 | 2019-09-30 | 2019-06-30 | 2019-03-31 | 2018-12-31 | 2018-09-30 | 2018-06-30 | 2018-03-31 | 2017-12-31 | 2017-09-30 | 2017-06-30 | 2017-03-31 | 2016-12-31 | 2016-09-30 | 2016-06-30 | 2016-03-31 | 2015-12-31 | 2015-09-30 | 2015-06-30 | 2015-03-31 | 2014-12-31 | 2014-09-30 | 2014-06-30 | 2014-03-31 | 2013-12-31 | 2013-09-30 | 2013-06-30 | 2013-03-31 | 2012-12-31 | 2012-09-30 | 2012-06-30 | 2012-03-31 | 2011-12-31 | 2011-09-30 | 2011-06-30 | 2011-03-31 | 2010-12-31 | 2010-09-30 | 2010-06-30 | ||
|---|---|---|---|---|---|---|---|---|---|---|---|---|---|---|---|---|---|---|---|---|---|---|---|---|---|---|---|---|---|---|---|---|---|---|---|---|---|---|---|---|---|---|---|---|---|---|---|---|---|---|---|---|---|---|---|---|
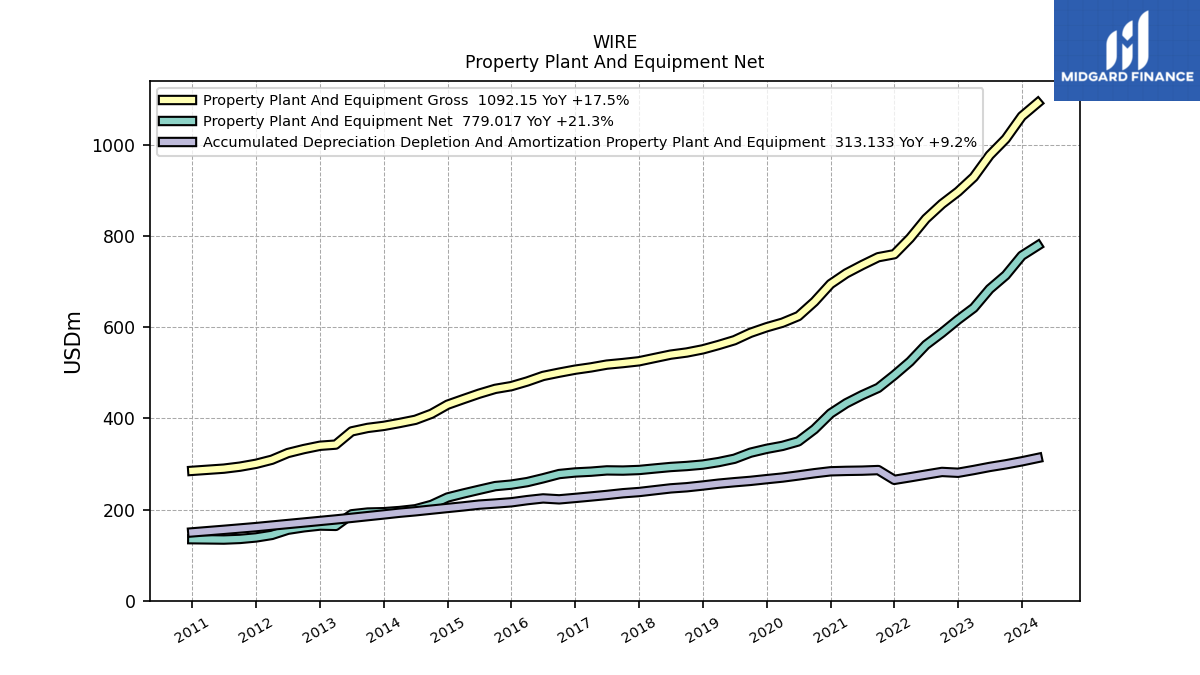
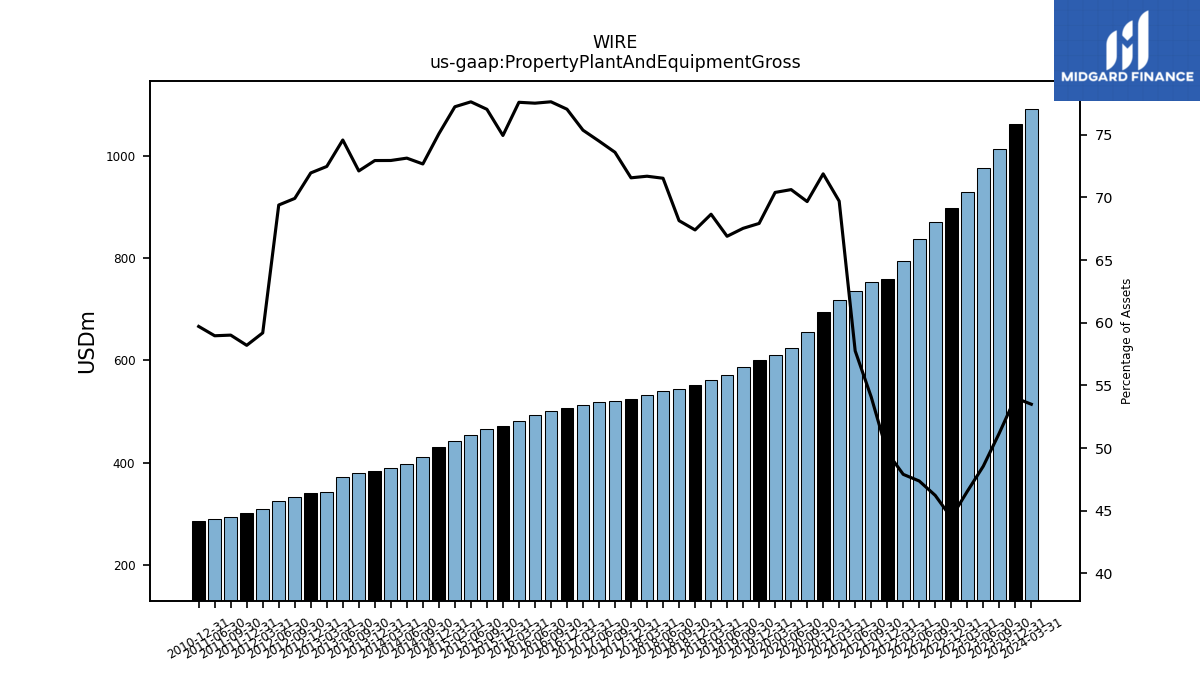
| Property Plant And Equipment Gross | 1062.66 | 1013.13 | 977.23 | 929.24 | 897.33 | 870.36 | 837.87 | 795.26 | 760.10 | 753.52 | 736.32 | 718.07 | 694.69 | 655.94 | 624.33 | 609.89 | 599.87 | 587.70 | 571.43 | 560.91 | 551.41 | 544.51 | 539.84 | 532.55 | 525.26 | 521.35 | 517.97 | 511.82 | 506.89 | 500.31 | 493.10 | 480.94 | 470.72 | 464.74 | 454.21 | 442.17 | 430.01 | 410.10 | 396.87 | 389.86 | 383.54 | 379.09 | 371.47 | 342.49 | 339.95 | 332.73 | 323.99 | 309.31 | 300.38 | 294.13 | 289.77 | NA | 284.96 | NA | NA | |
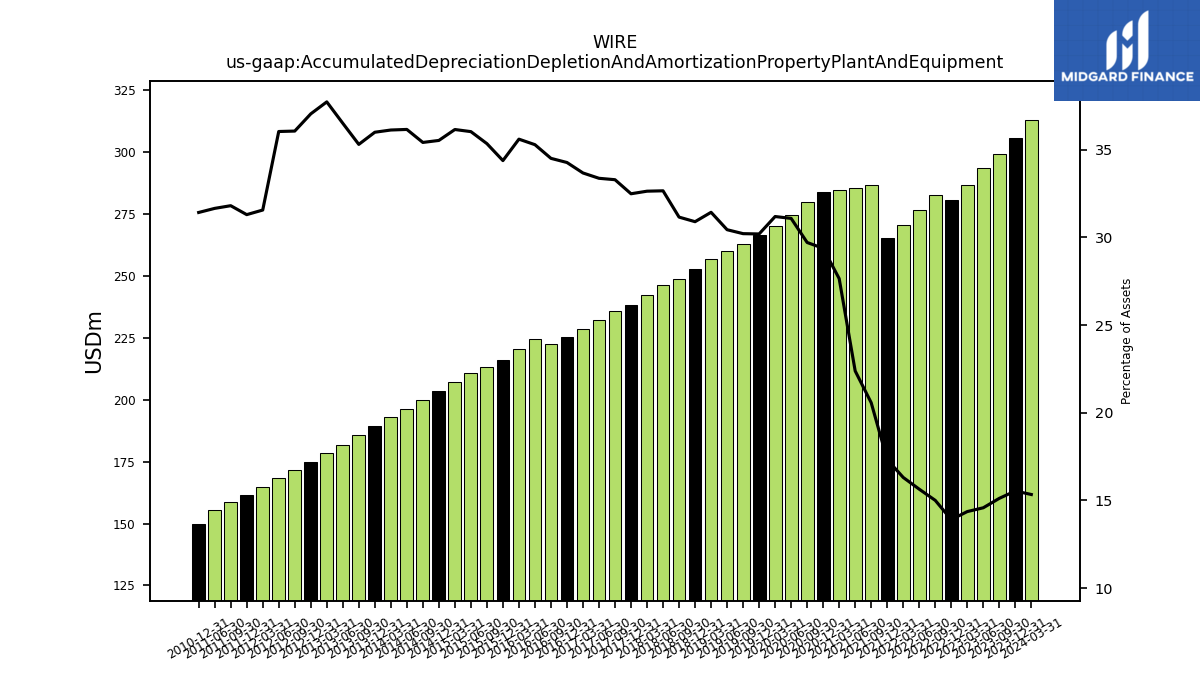
| Accumulated Depreciation Depletion And Amortization Property Plant And Equipment | 305.80 | 299.19 | 293.48 | 286.79 | 280.73 | 282.53 | 276.66 | 270.79 | 265.18 | 286.66 | 285.38 | 284.85 | 283.92 | 279.73 | 274.80 | 270.22 | 266.69 | 262.94 | 260.01 | 256.79 | 252.75 | 248.97 | 246.47 | 242.44 | 238.46 | 235.82 | 232.03 | 228.70 | 225.50 | 222.40 | 224.47 | 220.69 | 215.95 | 213.26 | 210.84 | 206.98 | 203.50 | 199.87 | 196.22 | 193.07 | 189.29 | 185.60 | 181.85 | 178.31 | 175.03 | 171.62 | 168.27 | 164.93 | 161.55 | 158.55 | 155.58 | NA | 149.97 | NA | NA | |
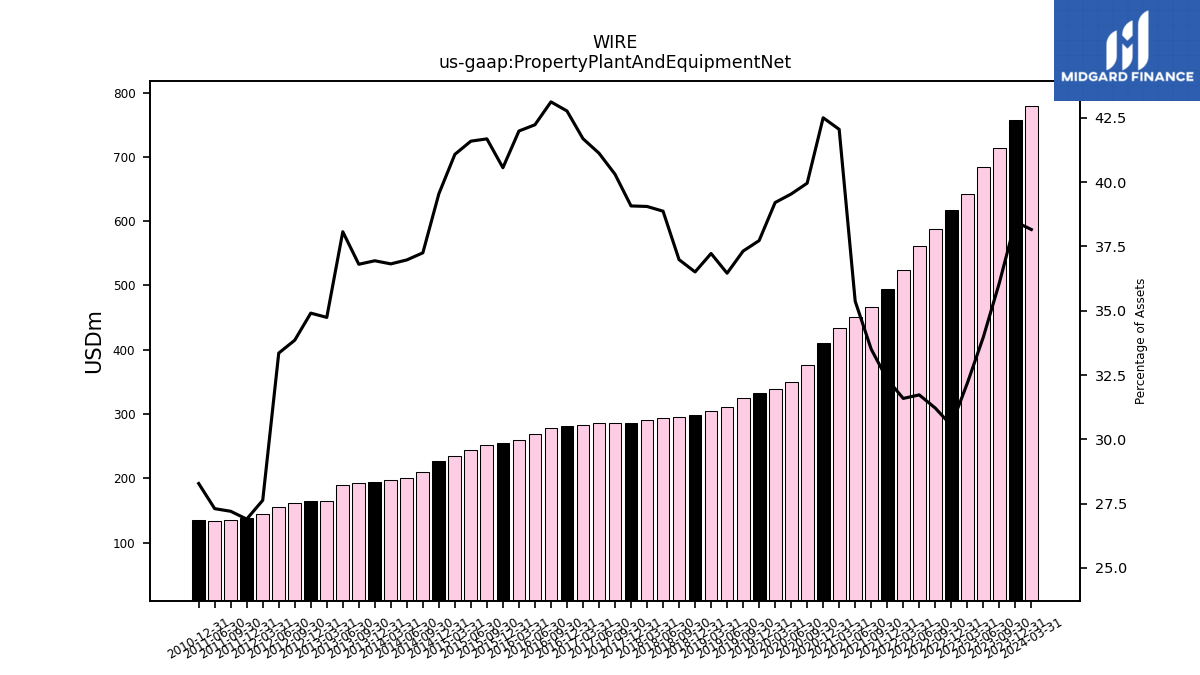
| Property Plant And Equipment Net | 756.86 | 713.94 | 683.75 | 642.45 | 616.60 | 587.83 | 561.21 | 524.47 | 494.92 | 466.87 | 450.94 | 433.22 | 410.77 | 376.21 | 349.53 | 339.66 | 333.18 | 324.77 | 311.42 | 304.12 | 298.66 | 295.54 | 293.36 | 290.11 | 286.80 | 285.53 | 285.94 | 283.12 | 281.39 | 277.90 | 268.62 | 260.25 | 254.77 | 251.47 | 243.38 | 235.19 | 226.51 | 210.23 | 200.65 | 196.79 | 194.25 | 193.49 | 189.62 | 164.19 | 164.92 | 161.10 | 155.72 | 144.39 | 138.83 | 135.58 | 134.19 | NA | 134.99 | NA | NA | |
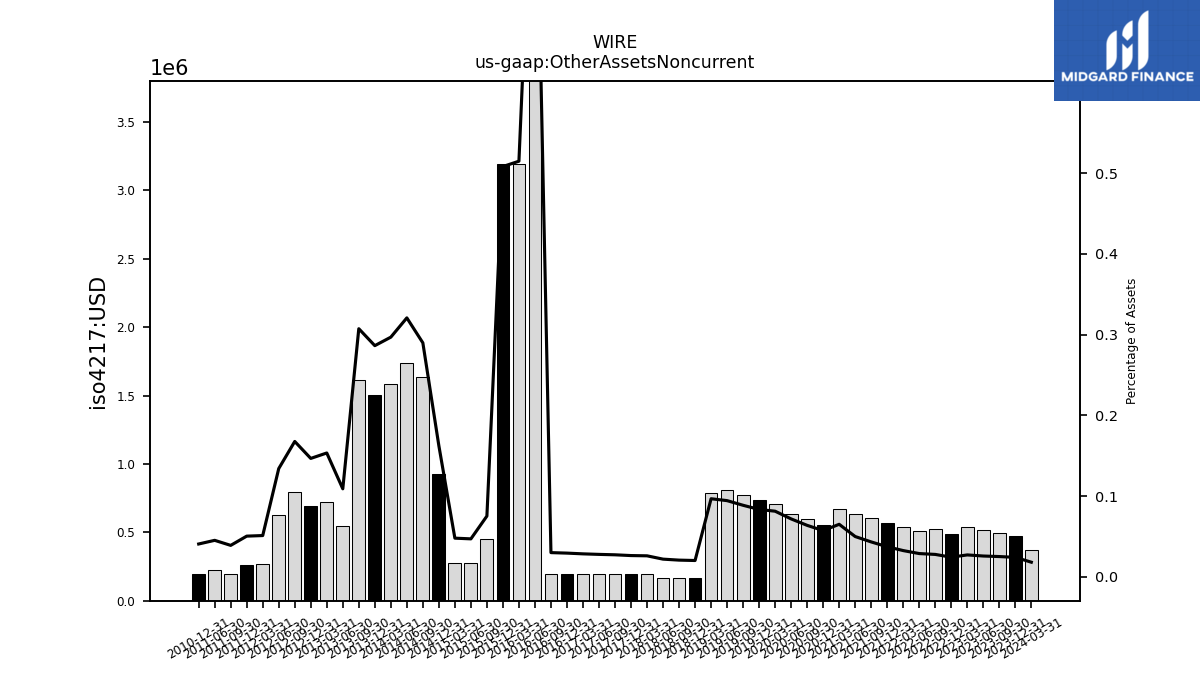
| Other Assets Noncurrent | 0.47 | 0.50 | 0.52 | 0.54 | 0.49 | 0.52 | 0.51 | 0.54 | 0.57 | 0.60 | 0.64 | 0.67 | 0.55 | 0.60 | 0.63 | 0.70 | 0.74 | 0.77 | 0.81 | 0.79 | 0.17 | 0.17 | 0.17 | 0.19 | 0.19 | 0.19 | 0.19 | 0.19 | 0.19 | 0.19 | 6.19 | 3.19 | 3.19 | 0.45 | 0.28 | 0.27 | 0.93 | 1.64 | 1.74 | 1.59 | 1.51 | 1.62 | 0.54 | 0.72 | 0.69 | 0.80 | 0.63 | 0.27 | 0.26 | 0.19 | 0.22 | NA | 0.19 | NA | NA |
| 2023-12-31 | 2023-09-30 | 2023-06-30 | 2023-03-31 | 2022-12-31 | 2022-09-30 | 2022-06-30 | 2022-03-31 | 2021-12-31 | 2021-09-30 | 2021-06-30 | 2021-03-31 | 2020-12-31 | 2020-09-30 | 2020-06-30 | 2020-03-31 | 2019-12-31 | 2019-09-30 | 2019-06-30 | 2019-03-31 | 2018-12-31 | 2018-09-30 | 2018-06-30 | 2018-03-31 | 2017-12-31 | 2017-09-30 | 2017-06-30 | 2017-03-31 | 2016-12-31 | 2016-09-30 | 2016-06-30 | 2016-03-31 | 2015-12-31 | 2015-09-30 | 2015-06-30 | 2015-03-31 | 2014-12-31 | 2014-09-30 | 2014-06-30 | 2014-03-31 | 2013-12-31 | 2013-09-30 | 2013-06-30 | 2013-03-31 | 2012-12-31 | 2012-09-30 | 2012-06-30 | 2012-03-31 | 2011-12-31 | 2011-09-30 | 2011-06-30 | 2011-03-31 | 2010-12-31 | 2010-09-30 | 2010-06-30 | ||
|---|---|---|---|---|---|---|---|---|---|---|---|---|---|---|---|---|---|---|---|---|---|---|---|---|---|---|---|---|---|---|---|---|---|---|---|---|---|---|---|---|---|---|---|---|---|---|---|---|---|---|---|---|---|---|---|---|
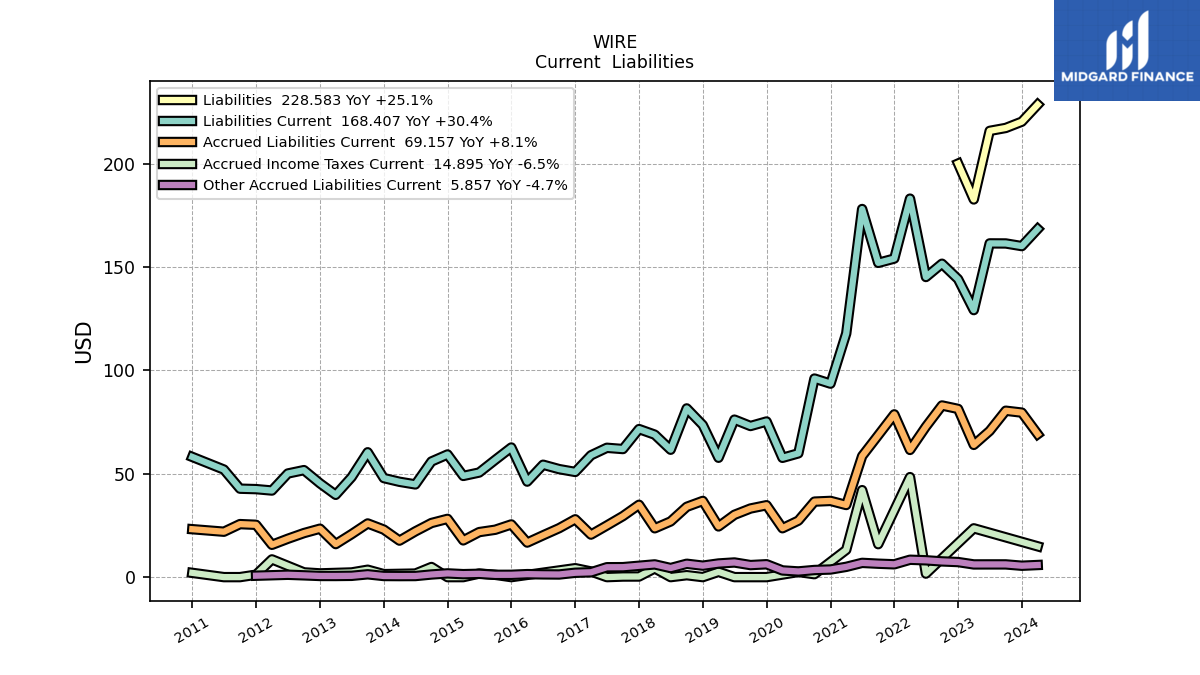
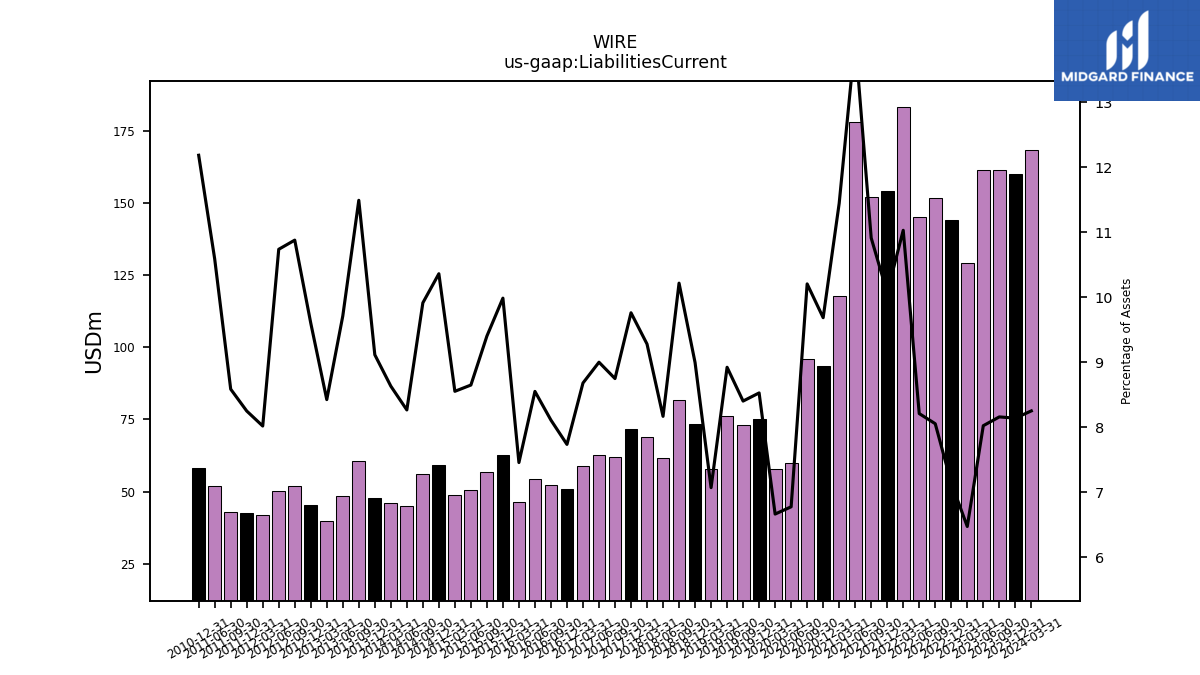
| Liabilities Current | 160.14 | 161.42 | 161.45 | 129.17 | 144.16 | 151.62 | 145.18 | 183.11 | 154.10 | 152.03 | 178.09 | 117.89 | 93.59 | 96.07 | 59.88 | 57.71 | 75.30 | 73.10 | 76.20 | 57.74 | 73.57 | 81.63 | 61.62 | 68.92 | 71.63 | 61.96 | 62.57 | 58.94 | 50.88 | 52.25 | 54.38 | 46.20 | 62.72 | 56.72 | 50.60 | 48.95 | 59.34 | 55.94 | 44.85 | 46.12 | 47.92 | 60.41 | 48.36 | 39.81 | 45.36 | 51.76 | 50.13 | 41.89 | 42.57 | 42.78 | 52.04 | NA | 58.15 | NA | NA | |
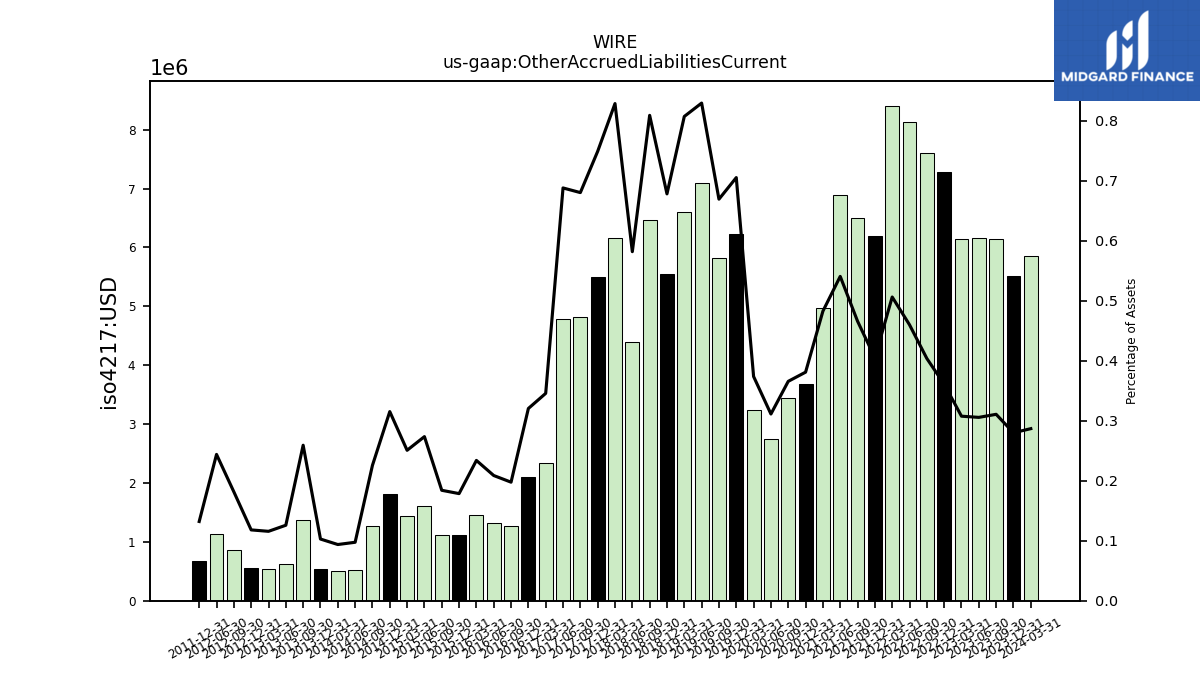
| Other Accrued Liabilities Current | 5.51 | 6.15 | 6.15 | 6.14 | 7.29 | 7.61 | 8.14 | 8.41 | 6.20 | 6.49 | 6.89 | 4.97 | 3.68 | 3.44 | 2.75 | 3.24 | 6.23 | 5.83 | 7.09 | 6.60 | 5.55 | 6.47 | 4.39 | 6.16 | 5.50 | 4.82 | 4.79 | 2.35 | 2.11 | 1.27 | 1.33 | 1.45 | 1.12 | 1.11 | 1.60 | 1.44 | 1.81 | 1.27 | 0.53 | 0.50 | 0.54 | 1.36 | 0.63 | 0.55 | 0.56 | 0.86 | 1.14 | NA | 0.68 | NA | NA | NA | NA | NA | NA | |
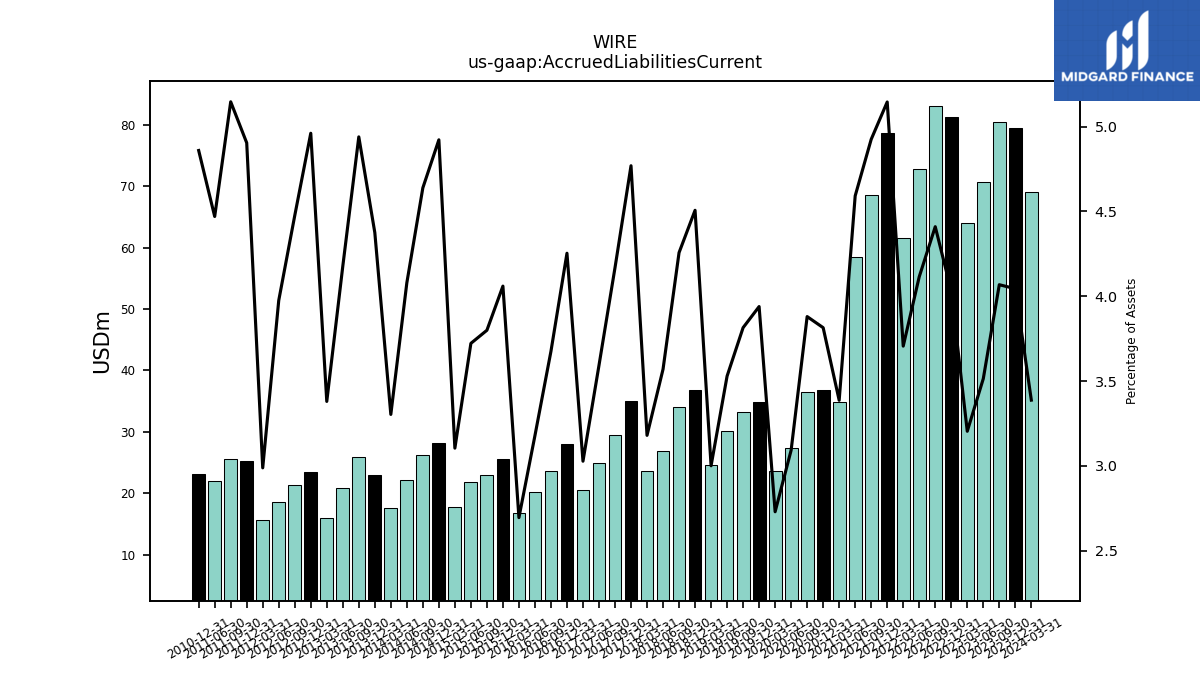
| Accrued Liabilities Current | 79.59 | 80.50 | 70.72 | 63.97 | 81.38 | 83.04 | 72.78 | 61.52 | 78.75 | 68.62 | 58.54 | 34.89 | 36.87 | 36.53 | 27.34 | 23.65 | 34.79 | 33.20 | 30.14 | 24.51 | 36.87 | 34.02 | 26.94 | 23.62 | 35.01 | 29.52 | 24.98 | 20.56 | 27.99 | 23.69 | 20.22 | 16.70 | 25.50 | 22.92 | 21.78 | 17.77 | 28.19 | 26.18 | 22.14 | 17.65 | 23.01 | 25.97 | 20.80 | 15.97 | 23.44 | 21.30 | 18.56 | 15.62 | 25.31 | 25.65 | 21.97 | NA | 23.19 | NA | NA |
| 2023-12-31 | 2023-09-30 | 2023-06-30 | 2023-03-31 | 2022-12-31 | 2022-09-30 | 2022-06-30 | 2022-03-31 | 2021-12-31 | 2021-09-30 | 2021-06-30 | 2021-03-31 | 2020-12-31 | 2020-09-30 | 2020-06-30 | 2020-03-31 | 2019-12-31 | 2019-09-30 | 2019-06-30 | 2019-03-31 | 2018-12-31 | 2018-09-30 | 2018-06-30 | 2018-03-31 | 2017-12-31 | 2017-09-30 | 2017-06-30 | 2017-03-31 | 2016-12-31 | 2016-09-30 | 2016-06-30 | 2016-03-31 | 2015-12-31 | 2015-09-30 | 2015-06-30 | 2015-03-31 | 2014-12-31 | 2014-09-30 | 2014-06-30 | 2014-03-31 | 2013-12-31 | 2013-09-30 | 2013-06-30 | 2013-03-31 | 2012-12-31 | 2012-09-30 | 2012-06-30 | 2012-03-31 | 2011-12-31 | 2011-09-30 | 2011-06-30 | 2011-03-31 | 2010-12-31 | 2010-09-30 | 2010-06-30 | ||
|---|---|---|---|---|---|---|---|---|---|---|---|---|---|---|---|---|---|---|---|---|---|---|---|---|---|---|---|---|---|---|---|---|---|---|---|---|---|---|---|---|---|---|---|---|---|---|---|---|---|---|---|---|---|---|---|---|
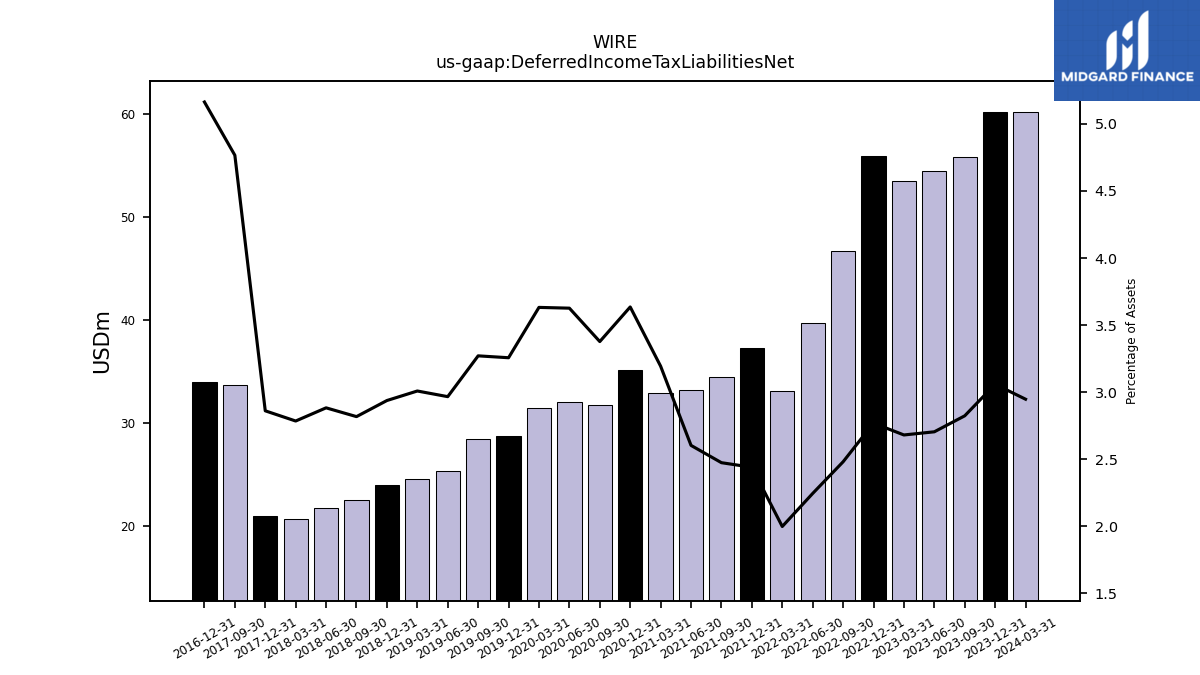
| Deferred Income Tax Liabilities Net | 60.20 | 55.88 | 54.44 | 53.53 | 55.91 | 46.72 | 39.71 | 33.18 | 37.35 | 34.48 | 33.19 | 32.90 | 35.13 | 31.80 | 32.06 | 31.47 | 28.76 | 28.46 | 25.34 | 24.58 | 24.03 | 22.52 | 21.76 | 20.69 | 21.00 | 33.76 | NA | NA | 33.97 | NA | NA | NA | NA | NA | NA | NA | NA | NA | NA | NA | NA | NA | NA | NA | NA | NA | NA | NA | NA | NA | NA | NA | NA | NA | NA |
| 2023-12-31 | 2023-09-30 | 2023-06-30 | 2023-03-31 | 2022-12-31 | 2022-09-30 | 2022-06-30 | 2022-03-31 | 2021-12-31 | 2021-09-30 | 2021-06-30 | 2021-03-31 | 2020-12-31 | 2020-09-30 | 2020-06-30 | 2020-03-31 | 2019-12-31 | 2019-09-30 | 2019-06-30 | 2019-03-31 | 2018-12-31 | 2018-09-30 | 2018-06-30 | 2018-03-31 | 2017-12-31 | 2017-09-30 | 2017-06-30 | 2017-03-31 | 2016-12-31 | 2016-09-30 | 2016-06-30 | 2016-03-31 | 2015-12-31 | 2015-09-30 | 2015-06-30 | 2015-03-31 | 2014-12-31 | 2014-09-30 | 2014-06-30 | 2014-03-31 | 2013-12-31 | 2013-09-30 | 2013-06-30 | 2013-03-31 | 2012-12-31 | 2012-09-30 | 2012-06-30 | 2012-03-31 | 2011-12-31 | 2011-09-30 | 2011-06-30 | 2011-03-31 | 2010-12-31 | 2010-09-30 | 2010-06-30 | ||
|---|---|---|---|---|---|---|---|---|---|---|---|---|---|---|---|---|---|---|---|---|---|---|---|---|---|---|---|---|---|---|---|---|---|---|---|---|---|---|---|---|---|---|---|---|---|---|---|---|---|---|---|---|---|---|---|---|
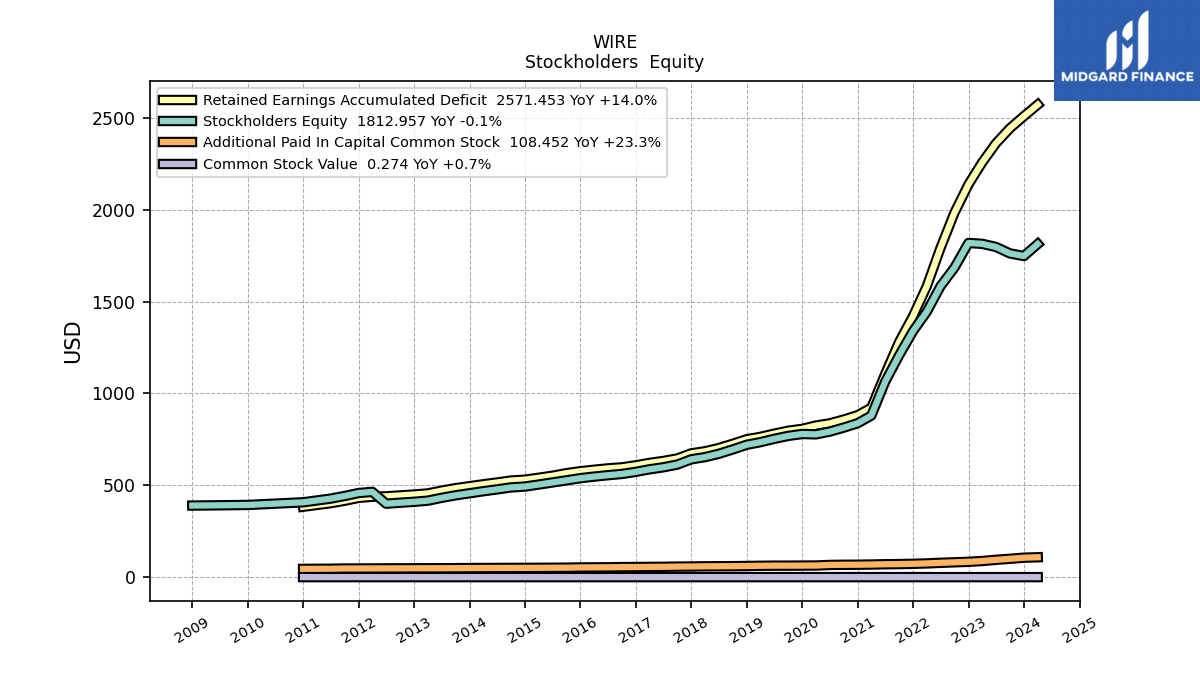
| Stockholders Equity | 1747.58 | 1761.69 | 1796.89 | 1813.90 | 1818.67 | 1684.72 | 1583.90 | 1443.94 | 1339.09 | 1206.88 | 1063.62 | 879.40 | 837.73 | 813.65 | 792.11 | 777.17 | 779.10 | 768.68 | 752.64 | 734.64 | 720.46 | 694.90 | 671.33 | 653.24 | 641.35 | 612.64 | 597.95 | 587.00 | 573.11 | 561.65 | 554.95 | 547.29 | 538.64 | 526.75 | 515.31 | 503.88 | 493.19 | 488.37 | 477.53 | 467.53 | 456.58 | 445.39 | 431.63 | 416.34 | 410.16 | 405.15 | 399.81 | 464.32 | 457.74 | 441.71 | 427.42 | NA | 407.38 | NA | NA | |
| Common Stock Value | 0.27 | 0.27 | 0.27 | 0.27 | 0.27 | 0.27 | 0.27 | 0.27 | 0.27 | 0.27 | 0.27 | 0.27 | 0.27 | 0.27 | 0.27 | 0.27 | 0.27 | 0.27 | 0.27 | 0.27 | 0.27 | 0.27 | 0.27 | 0.27 | 0.27 | 0.27 | 0.27 | 0.27 | 0.27 | 0.27 | 0.27 | 0.27 | 0.27 | 0.27 | 0.27 | 0.27 | 0.27 | 0.27 | 0.27 | 0.27 | 0.27 | 0.27 | 0.27 | 0.27 | 0.27 | 0.27 | 0.27 | 0.27 | 0.27 | 0.27 | 0.26 | NA | 0.26 | NA | NA | |
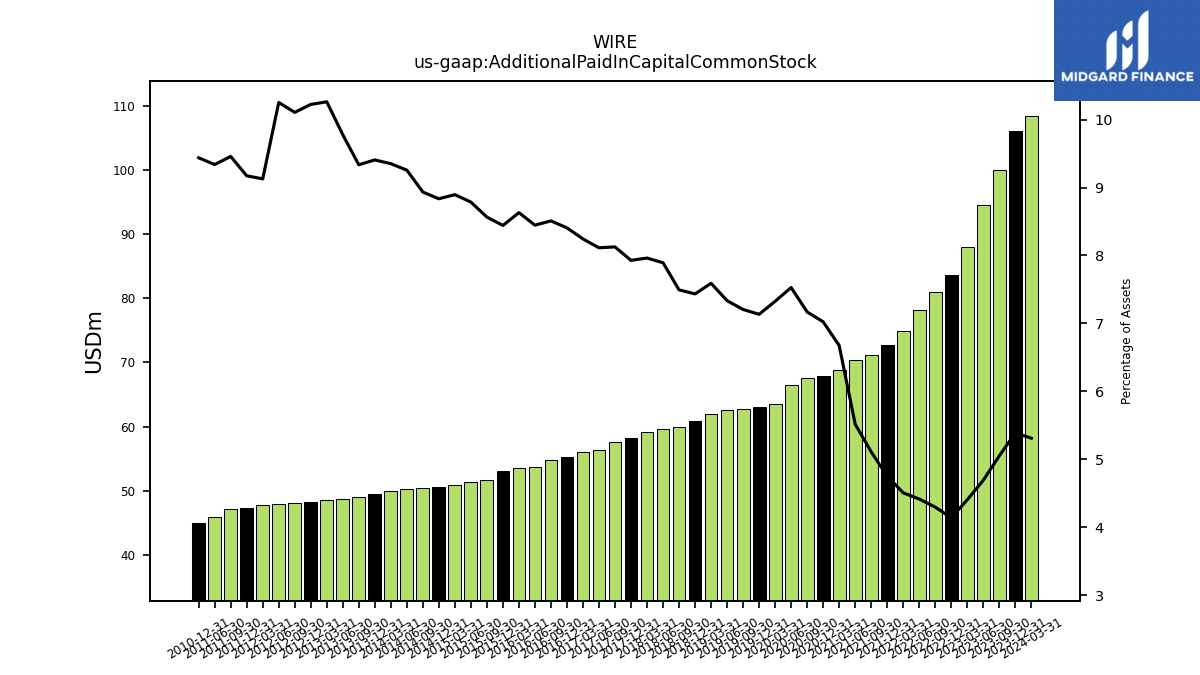
| Additional Paid In Capital Common Stock | 106.03 | 99.98 | 94.47 | 87.98 | 83.62 | 80.93 | 78.12 | 74.85 | 72.75 | 71.22 | 70.37 | 68.78 | 67.89 | 67.49 | 66.55 | 63.47 | 63.01 | 62.70 | 62.65 | 62.01 | 60.82 | 59.88 | 59.57 | 59.15 | 58.19 | 57.56 | 56.41 | 55.98 | 55.31 | 54.84 | 53.73 | 53.49 | 53.02 | 51.67 | 51.41 | 50.92 | 50.60 | 50.42 | 50.23 | 49.97 | 49.46 | 49.07 | 48.69 | 48.49 | 48.30 | 48.09 | 47.86 | 47.70 | 47.34 | 47.14 | 45.89 | NA | 45.04 | NA | NA | |
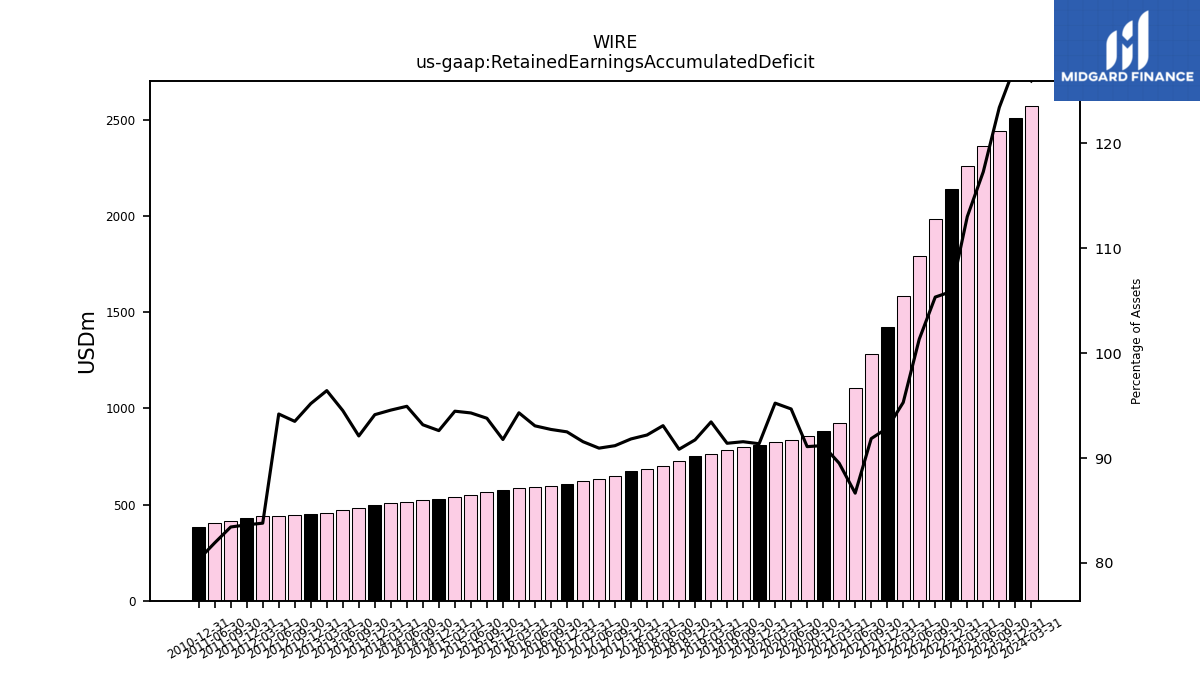
| Retained Earnings Accumulated Deficit | 2508.49 | 2442.68 | 2360.95 | 2256.55 | 2137.41 | 1983.78 | 1792.37 | 1582.22 | 1421.08 | 1279.84 | 1104.71 | 922.07 | 881.29 | 857.60 | 837.00 | 825.07 | 806.87 | 796.76 | 780.78 | 763.41 | 750.42 | 725.81 | 702.55 | 684.88 | 673.94 | 645.87 | 632.32 | 621.80 | 608.59 | 597.60 | 592.01 | 584.59 | 576.40 | 565.87 | 551.77 | 540.83 | 530.46 | 525.82 | 515.17 | 505.43 | 494.99 | 484.19 | 470.80 | 455.72 | 449.73 | 444.93 | 439.81 | 437.86 | 431.63 | 415.81 | 402.55 | NA | 383.37 | NA | NA |
| 2023-12-31 | 2023-09-30 | 2023-06-30 | 2023-03-31 | 2022-12-31 | 2022-09-30 | 2022-06-30 | 2022-03-31 | 2021-12-31 | 2021-09-30 | 2021-06-30 | 2021-03-31 | 2020-12-31 | 2020-09-30 | 2020-06-30 | 2020-03-31 | 2019-12-31 | 2019-09-30 | 2019-06-30 | 2019-03-31 | 2018-12-31 | 2018-09-30 | 2018-06-30 | 2018-03-31 | 2017-12-31 | 2017-09-30 | 2017-06-30 | 2017-03-31 | 2016-12-31 | 2016-09-30 | 2016-06-30 | 2016-03-31 | 2015-12-31 | 2015-09-30 | 2015-06-30 | 2015-03-31 | 2014-12-31 | 2014-09-30 | 2014-06-30 | 2014-03-31 | 2013-12-31 | 2013-09-30 | 2013-06-30 | 2013-03-31 | 2012-12-31 | 2012-09-30 | 2012-06-30 | 2012-03-31 | 2011-12-31 | 2011-09-30 | 2011-06-30 | 2011-03-31 | 2010-12-31 | 2010-09-30 | 2010-06-30 | ||
|---|---|---|---|---|---|---|---|---|---|---|---|---|---|---|---|---|---|---|---|---|---|---|---|---|---|---|---|---|---|---|---|---|---|---|---|---|---|---|---|---|---|---|---|---|---|---|---|---|---|---|---|---|---|---|---|---|
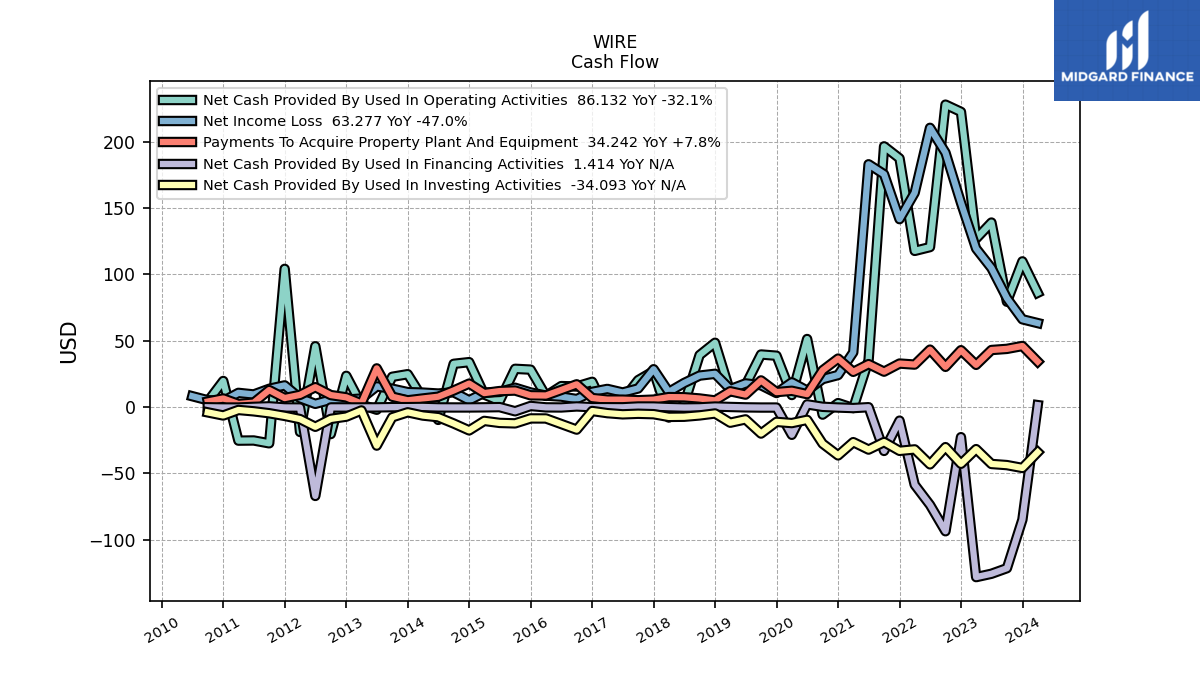
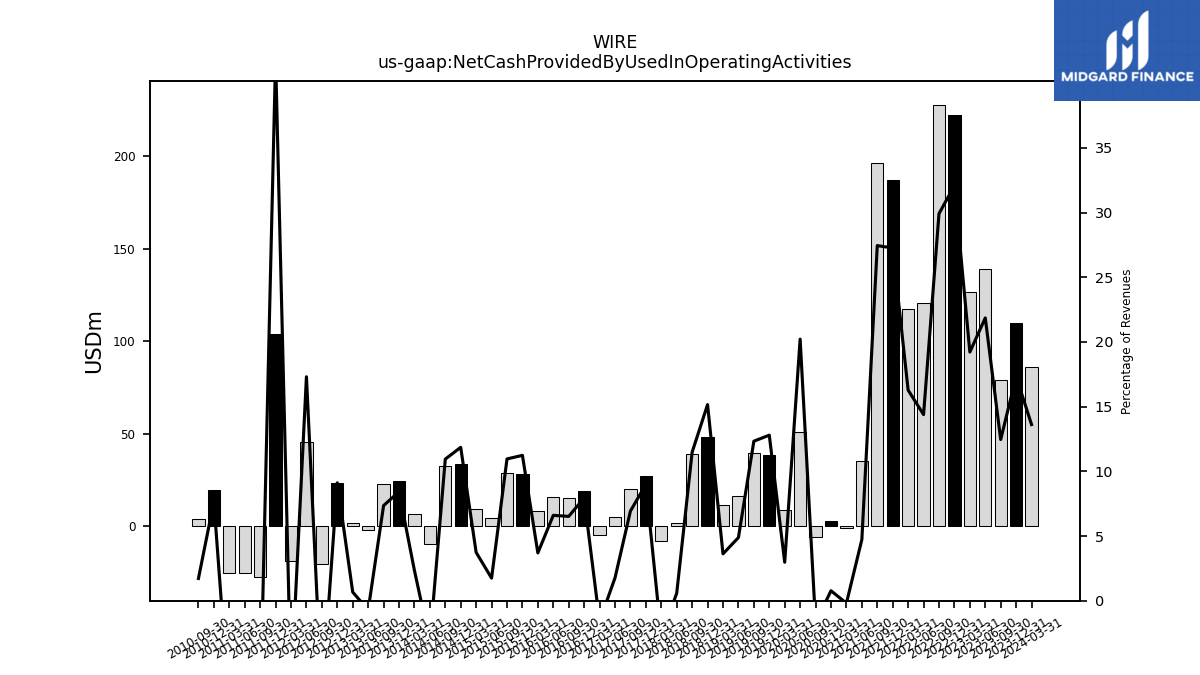
| Net Cash Provided By Used In Operating Activities | 109.82 | 79.35 | 139.10 | 126.94 | 222.57 | 228.02 | 120.58 | 117.71 | 187.49 | 196.59 | 35.18 | -0.84 | 2.94 | -5.76 | 51.28 | 9.01 | 38.67 | 39.59 | 16.45 | 11.41 | 48.46 | 39.13 | 1.96 | -7.96 | 27.06 | 20.25 | 5.15 | -4.45 | 19.00 | 15.46 | 15.76 | 8.34 | 28.18 | 28.80 | 4.44 | 9.35 | 33.83 | 32.55 | -9.74 | 6.48 | 24.74 | 22.79 | -2.09 | 1.78 | 23.52 | -20.43 | 45.82 | -18.85 | 104.19 | -27.40 | -25.25 | -25.36 | 19.63 | 4.18 | NA | |
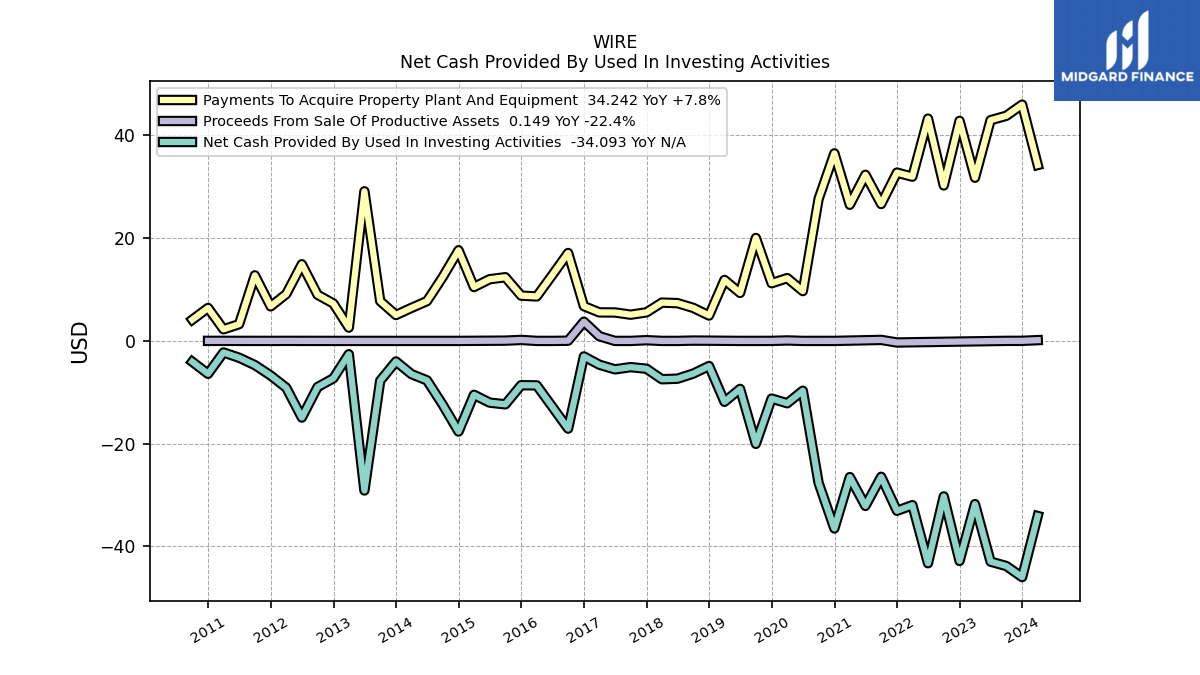
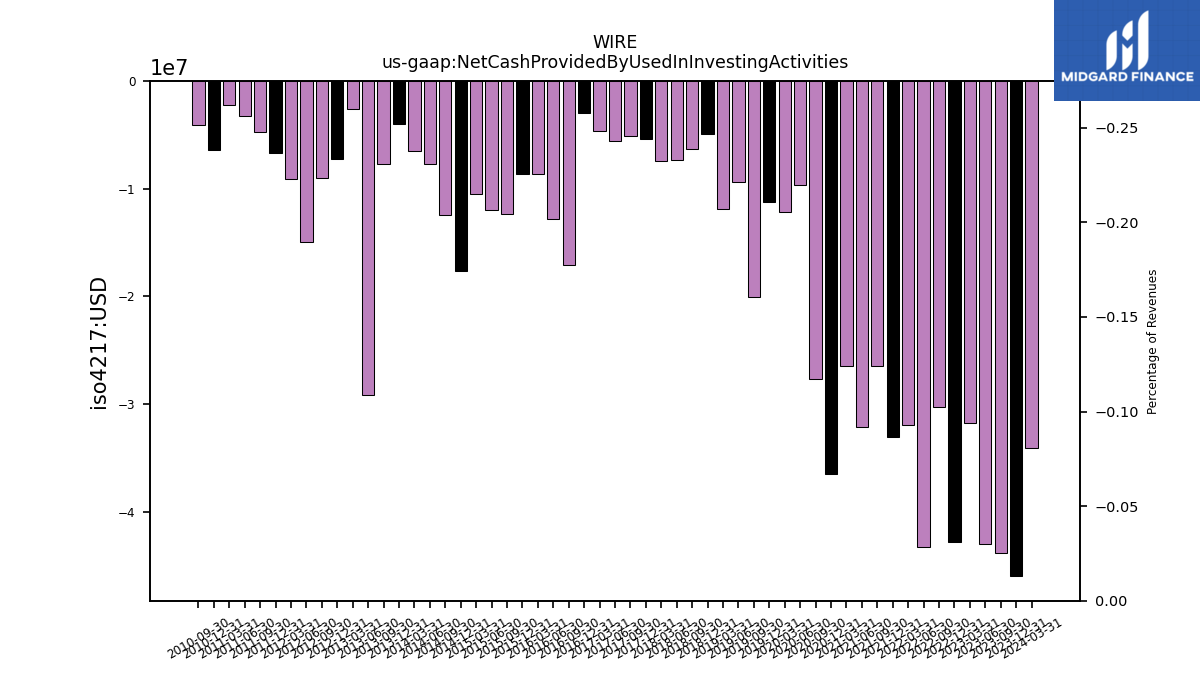
| Net Cash Provided By Used In Investing Activities | -45.98 | -43.82 | -42.97 | -31.77 | -42.84 | -30.26 | -43.27 | -31.97 | -33.07 | -26.45 | -32.13 | -26.50 | -36.51 | -27.65 | -9.70 | -12.13 | -11.23 | -20.04 | -9.34 | -11.85 | -4.89 | -6.36 | -7.35 | -7.46 | -5.42 | -5.10 | -5.54 | -4.63 | -3.02 | -17.08 | -12.83 | -8.65 | -8.62 | -12.35 | -12.01 | -10.49 | -17.65 | -12.45 | -7.68 | -6.46 | -4.00 | -7.75 | -29.12 | -2.59 | -7.28 | -8.97 | -14.92 | -9.11 | -6.73 | -4.70 | -3.27 | -2.25 | -6.41 | -4.06 | NA | |
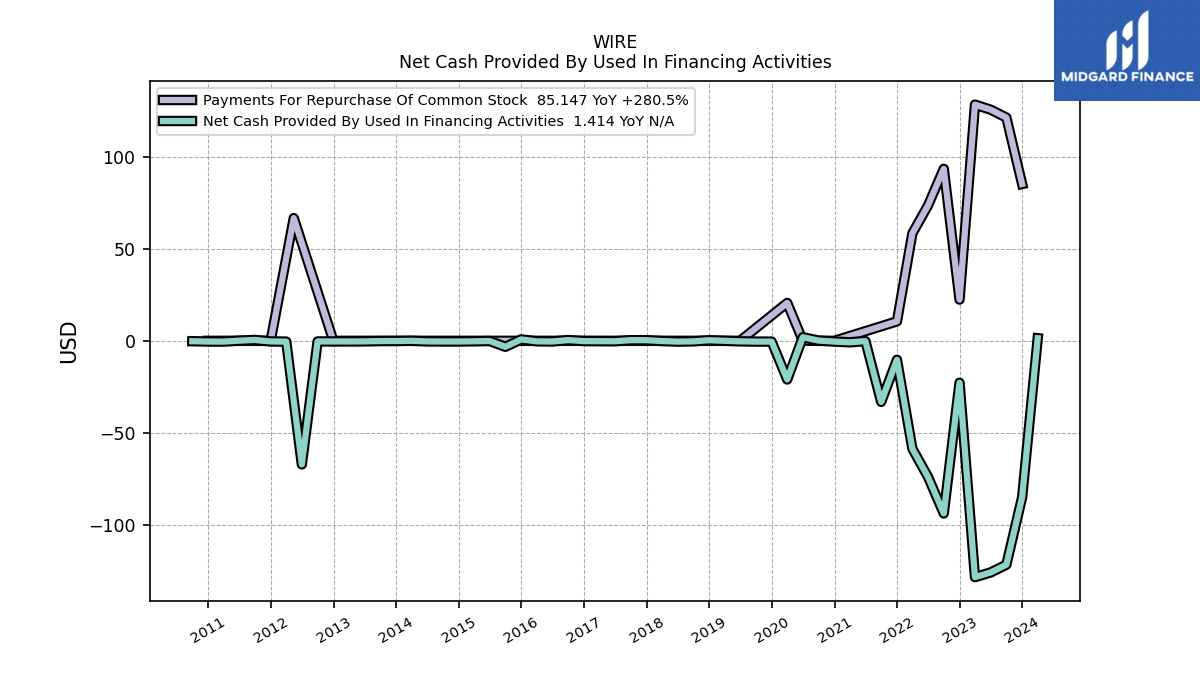
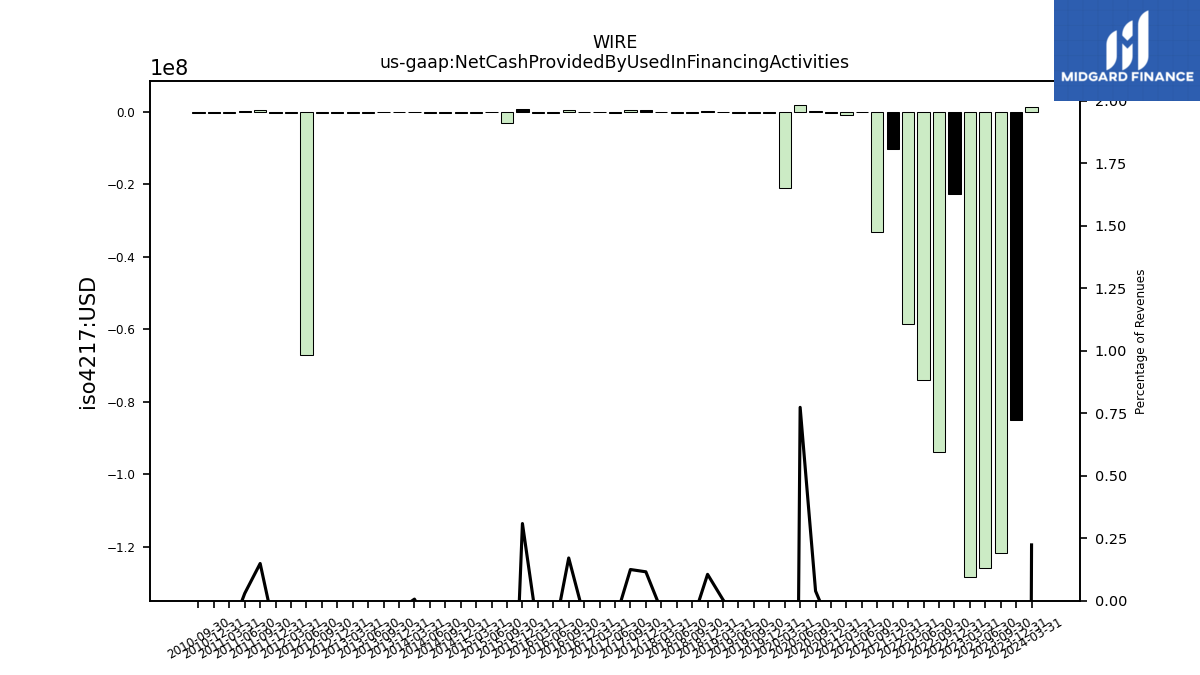
| Net Cash Provided By Used In Financing Activities | -84.95 | -121.57 | -125.77 | -128.30 | -22.75 | -93.72 | -73.86 | -58.63 | -10.29 | -33.14 | -0.15 | -0.81 | -0.41 | 0.13 | 1.96 | -21.00 | -0.42 | -0.42 | -0.28 | 0.01 | 0.34 | -0.29 | -0.42 | -0.11 | 0.35 | 0.36 | -0.23 | -0.19 | -0.15 | 0.41 | -0.35 | -0.28 | 0.78 | -3.23 | -0.10 | -0.25 | -0.36 | -0.35 | -0.31 | 0.02 | -0.11 | -0.12 | -0.30 | -0.33 | -0.34 | -0.33 | -67.09 | -0.42 | -0.34 | 0.48 | 0.09 | -0.41 | -0.38 | -0.21 | NA |
| 2023-12-31 | 2023-09-30 | 2023-06-30 | 2023-03-31 | 2022-12-31 | 2022-09-30 | 2022-06-30 | 2022-03-31 | 2021-12-31 | 2021-09-30 | 2021-06-30 | 2021-03-31 | 2020-12-31 | 2020-09-30 | 2020-06-30 | 2020-03-31 | 2019-12-31 | 2019-09-30 | 2019-06-30 | 2019-03-31 | 2018-12-31 | 2018-09-30 | 2018-06-30 | 2018-03-31 | 2017-12-31 | 2017-09-30 | 2017-06-30 | 2017-03-31 | 2016-12-31 | 2016-09-30 | 2016-06-30 | 2016-03-31 | 2015-12-31 | 2015-09-30 | 2015-06-30 | 2015-03-31 | 2014-12-31 | 2014-09-30 | 2014-06-30 | 2014-03-31 | 2013-12-31 | 2013-09-30 | 2013-06-30 | 2013-03-31 | 2012-12-31 | 2012-09-30 | 2012-06-30 | 2012-03-31 | 2011-12-31 | 2011-09-30 | 2011-06-30 | 2011-03-31 | 2010-12-31 | 2010-09-30 | 2010-06-30 | ||
|---|---|---|---|---|---|---|---|---|---|---|---|---|---|---|---|---|---|---|---|---|---|---|---|---|---|---|---|---|---|---|---|---|---|---|---|---|---|---|---|---|---|---|---|---|---|---|---|---|---|---|---|---|---|---|---|---|
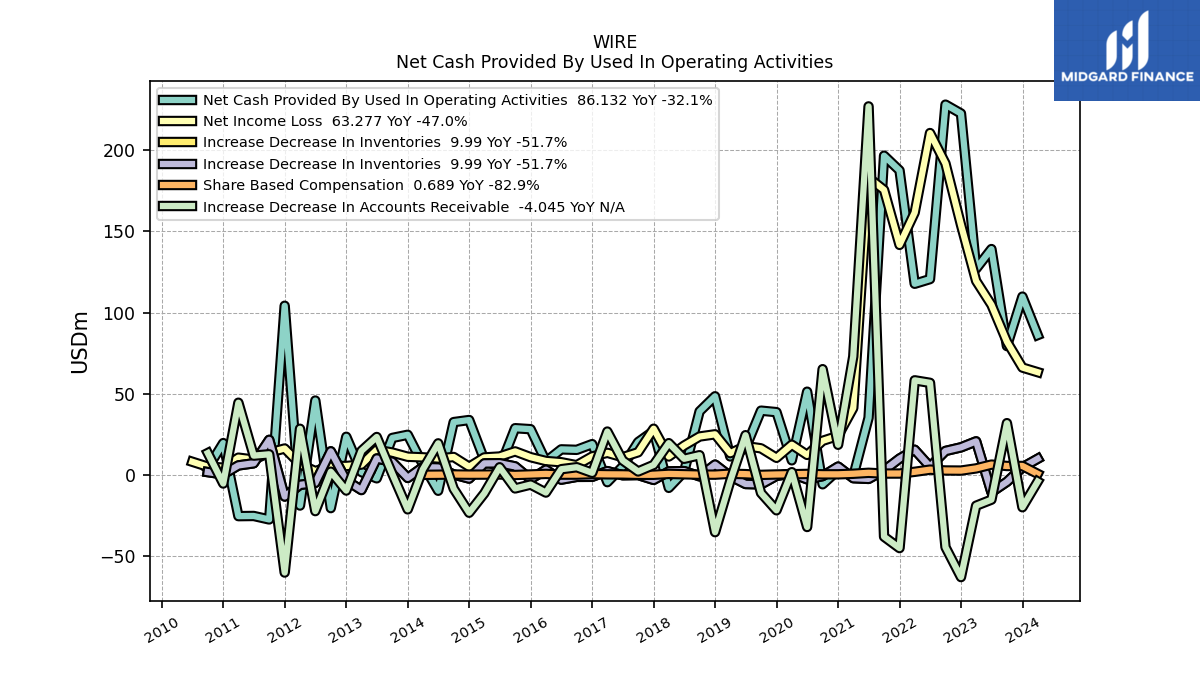
| Net Cash Provided By Used In Operating Activities | 109.82 | 79.35 | 139.10 | 126.94 | 222.57 | 228.02 | 120.58 | 117.71 | 187.49 | 196.59 | 35.18 | -0.84 | 2.94 | -5.76 | 51.28 | 9.01 | 38.67 | 39.59 | 16.45 | 11.41 | 48.46 | 39.13 | 1.96 | -7.96 | 27.06 | 20.25 | 5.15 | -4.45 | 19.00 | 15.46 | 15.76 | 8.34 | 28.18 | 28.80 | 4.44 | 9.35 | 33.83 | 32.55 | -9.74 | 6.48 | 24.74 | 22.79 | -2.09 | 1.78 | 23.52 | -20.43 | 45.82 | -18.85 | 104.19 | -27.40 | -25.25 | -25.36 | 19.63 | 4.18 | NA | |
| Net Income Loss | 66.12 | 82.05 | 104.74 | 119.48 | 154.00 | 191.77 | 210.54 | 161.53 | 141.64 | 175.54 | 183.05 | 41.19 | 24.10 | 21.01 | 12.35 | 18.61 | 10.54 | 16.40 | 17.78 | 13.41 | 25.03 | 23.68 | 18.09 | 11.35 | 28.49 | 13.96 | 10.93 | 13.63 | 11.40 | 6.00 | 7.84 | 8.60 | 10.95 | 14.51 | 11.35 | 10.79 | 5.05 | 11.06 | 10.15 | 10.85 | 11.21 | 13.80 | 15.50 | 6.39 | 5.52 | 5.53 | 2.37 | 6.69 | 16.30 | 13.72 | 9.46 | 10.65 | 4.53 | 5.09 | 8.13 | |
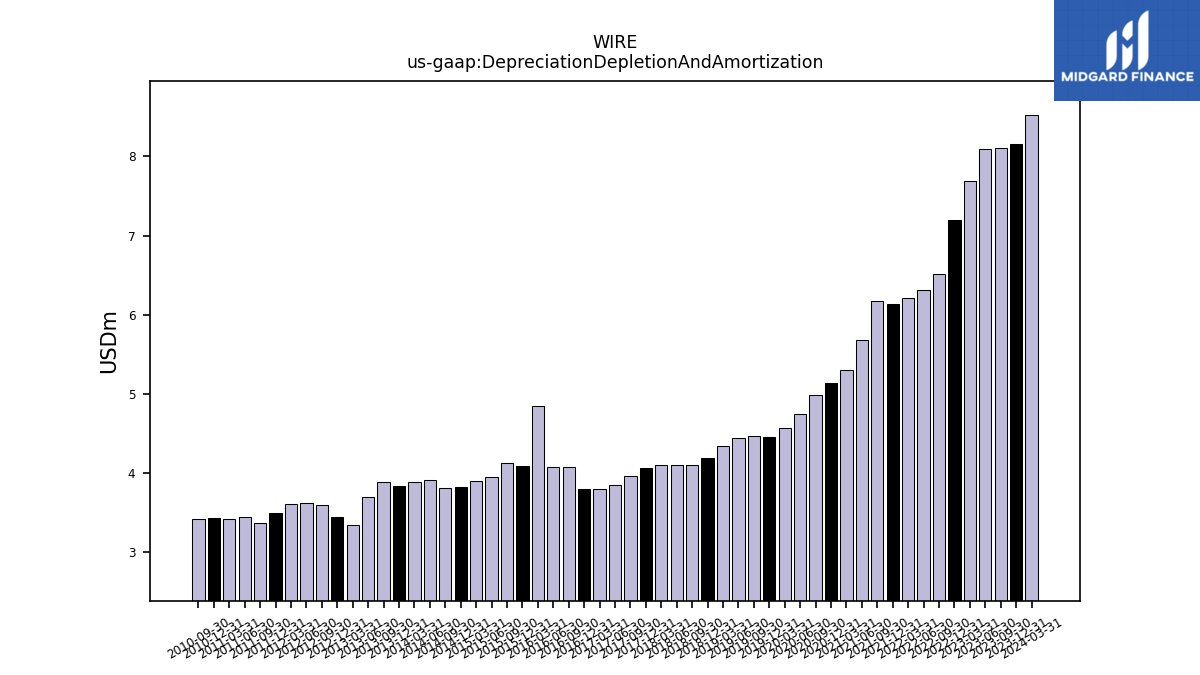
| Depreciation Depletion And Amortization | 8.16 | 8.11 | 8.09 | 7.69 | 7.20 | 6.51 | 6.31 | 6.21 | 6.13 | 6.18 | 5.68 | 5.30 | 5.14 | 4.99 | 4.75 | 4.57 | 4.45 | 4.47 | 4.44 | 4.34 | 4.19 | 4.11 | 4.10 | 4.11 | 4.07 | 3.96 | 3.85 | 3.80 | 3.80 | 4.08 | 4.08 | 4.85 | 4.09 | 4.12 | 3.95 | 3.90 | 3.82 | 3.82 | 3.92 | 3.90 | 3.84 | 3.90 | 3.70 | 3.35 | 3.45 | 3.60 | 3.63 | 3.61 | 3.50 | 3.37 | 3.44 | 3.42 | 3.43 | 3.42 | NA | |
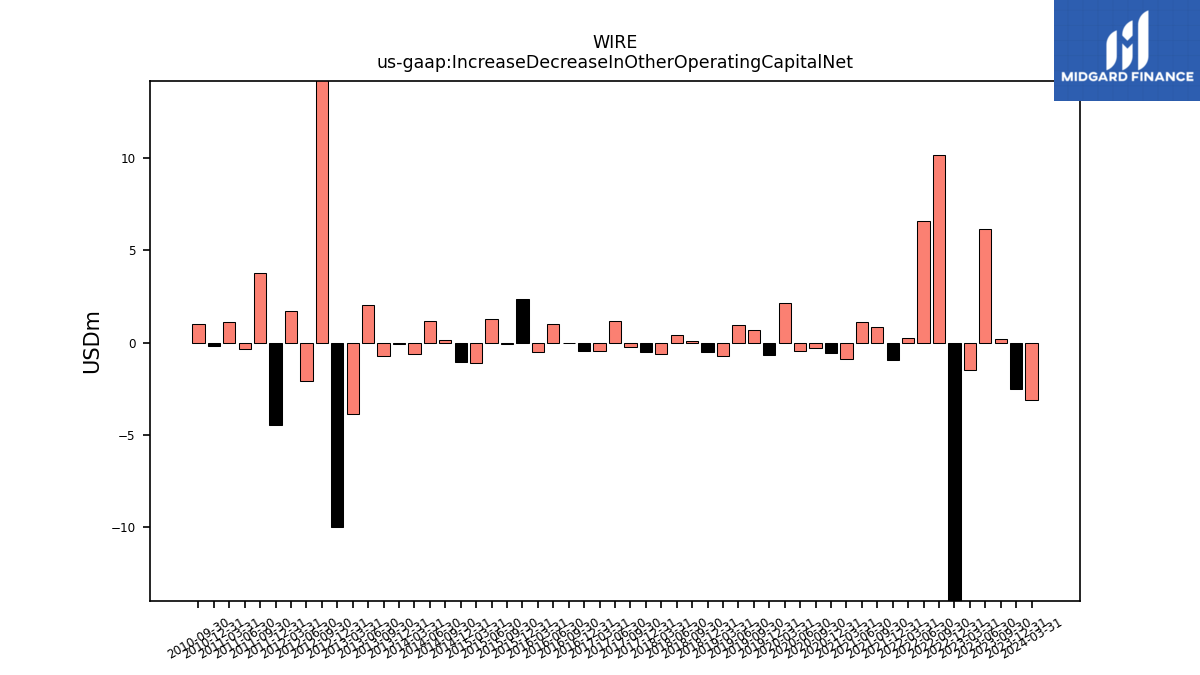
| Increase Decrease In Other Operating Capital Net | -2.54 | 0.17 | 6.16 | -1.48 | -16.04 | 10.15 | 6.61 | 0.25 | -0.95 | 0.83 | 1.09 | -0.91 | -0.59 | -0.32 | -0.47 | 2.13 | -0.65 | 0.68 | 0.92 | -0.72 | -0.51 | 0.10 | 0.39 | -0.61 | -0.52 | -0.25 | 1.16 | -0.45 | -0.44 | -0.05 | 1.01 | -0.54 | 2.36 | -0.08 | 1.26 | -1.13 | -1.04 | 0.11 | 1.19 | -0.60 | -0.09 | -0.76 | 2.04 | -3.86 | -9.97 | 14.46 | -2.08 | 1.70 | -4.45 | 3.79 | -0.35 | 1.12 | -0.20 | 1.00 | NA | |
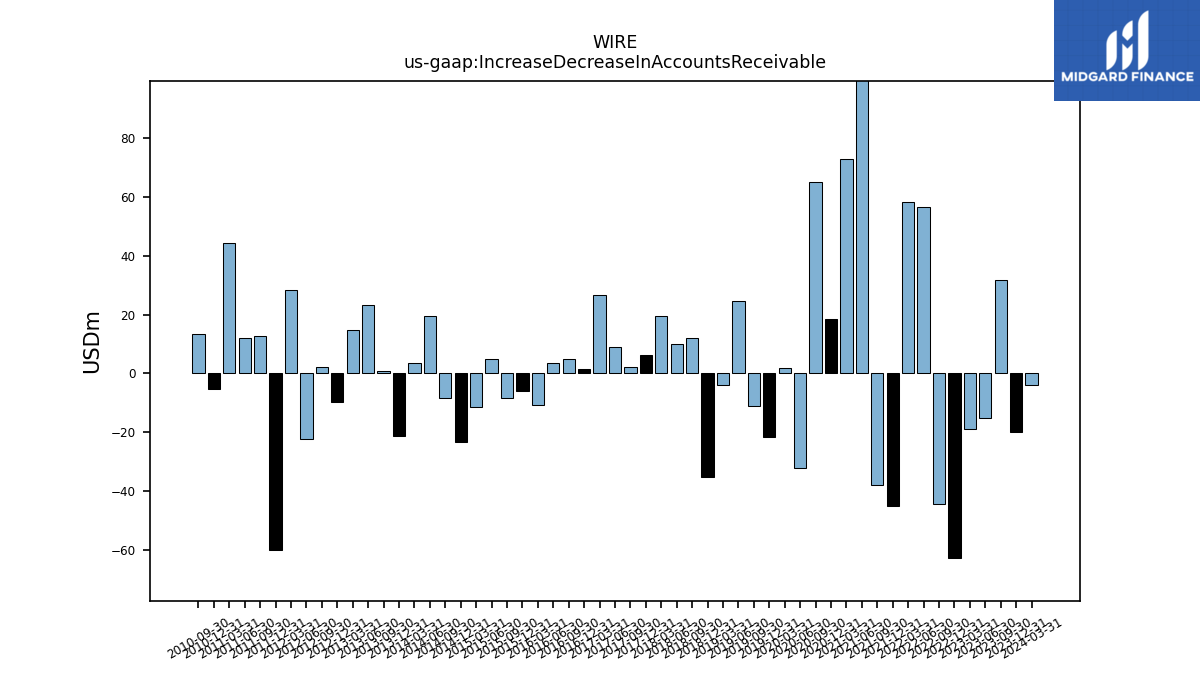
| Increase Decrease In Accounts Receivable | -19.89 | 31.91 | -15.21 | -18.93 | -62.91 | -44.46 | 56.73 | 58.28 | -45.05 | -38.01 | 226.94 | 72.93 | 18.57 | 65.14 | -32.06 | 1.73 | -21.77 | -11.10 | 24.50 | -3.88 | -35.24 | 12.18 | 9.95 | 19.58 | 6.19 | 2.15 | 8.97 | 26.73 | 1.32 | 4.77 | 3.55 | -10.85 | -5.94 | -8.30 | 4.74 | -11.34 | -23.27 | -8.44 | 19.48 | 3.41 | -21.19 | 0.76 | 23.38 | 14.81 | -9.61 | 2.02 | -22.28 | 28.45 | -60.10 | 12.72 | 11.90 | 44.49 | -5.29 | 13.49 | NA | |
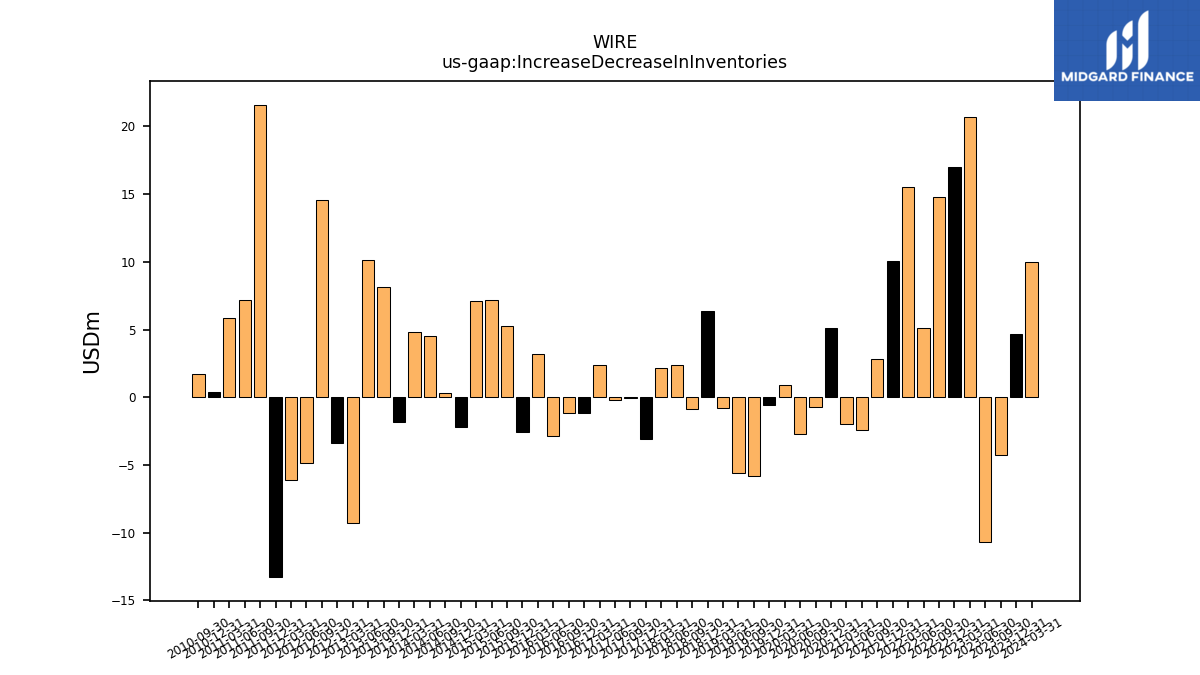
| Increase Decrease In Inventories | 4.69 | -4.22 | -10.66 | 20.69 | 17.00 | 14.77 | 5.09 | 15.52 | 10.09 | 2.81 | -2.42 | -1.98 | 5.15 | -0.71 | -2.69 | 0.88 | -0.56 | -5.79 | -5.55 | -0.78 | 6.36 | -0.86 | 2.37 | 2.13 | -3.05 | -0.04 | -0.18 | 2.36 | -1.14 | -1.17 | -2.89 | 3.22 | -2.58 | 5.27 | 7.21 | 7.10 | -2.22 | 0.29 | 4.56 | 4.84 | -1.83 | 8.11 | 10.13 | -9.29 | -3.39 | 14.54 | -4.88 | -6.11 | -13.28 | 21.61 | 7.18 | 5.87 | 0.36 | 1.75 | NA | |
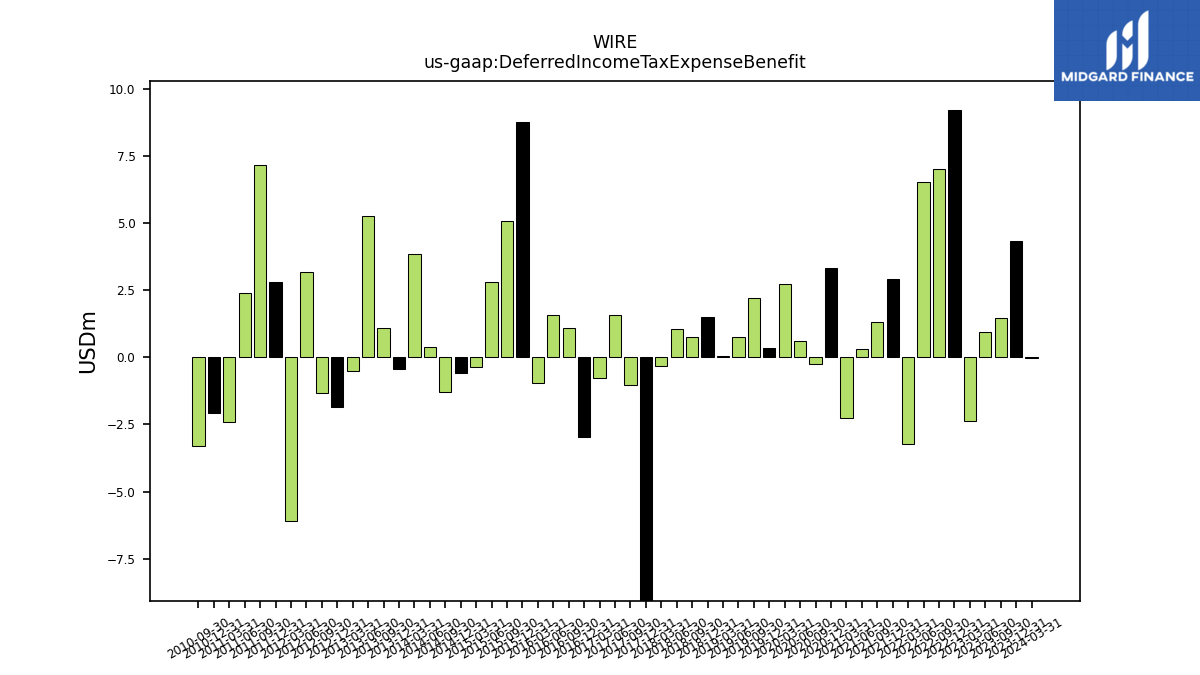
| Deferred Income Tax Expense Benefit | 4.34 | 1.47 | 0.93 | -2.39 | 9.20 | 7.02 | 6.54 | -3.22 | 2.90 | 1.32 | 0.32 | -2.28 | 3.35 | -0.24 | 0.61 | 2.72 | 0.33 | 2.23 | 0.77 | 0.05 | 1.52 | 0.76 | 1.07 | -0.31 | -12.76 | -1.02 | 1.59 | -0.78 | -2.97 | 1.10 | 1.57 | -0.97 | 8.76 | 5.08 | 2.83 | -0.35 | -0.59 | -1.30 | 0.37 | 3.87 | -0.43 | 1.08 | 5.28 | -0.51 | -1.84 | -1.34 | 3.19 | -6.10 | 2.83 | 7.15 | 2.41 | -2.41 | -2.07 | -3.31 | NA | |
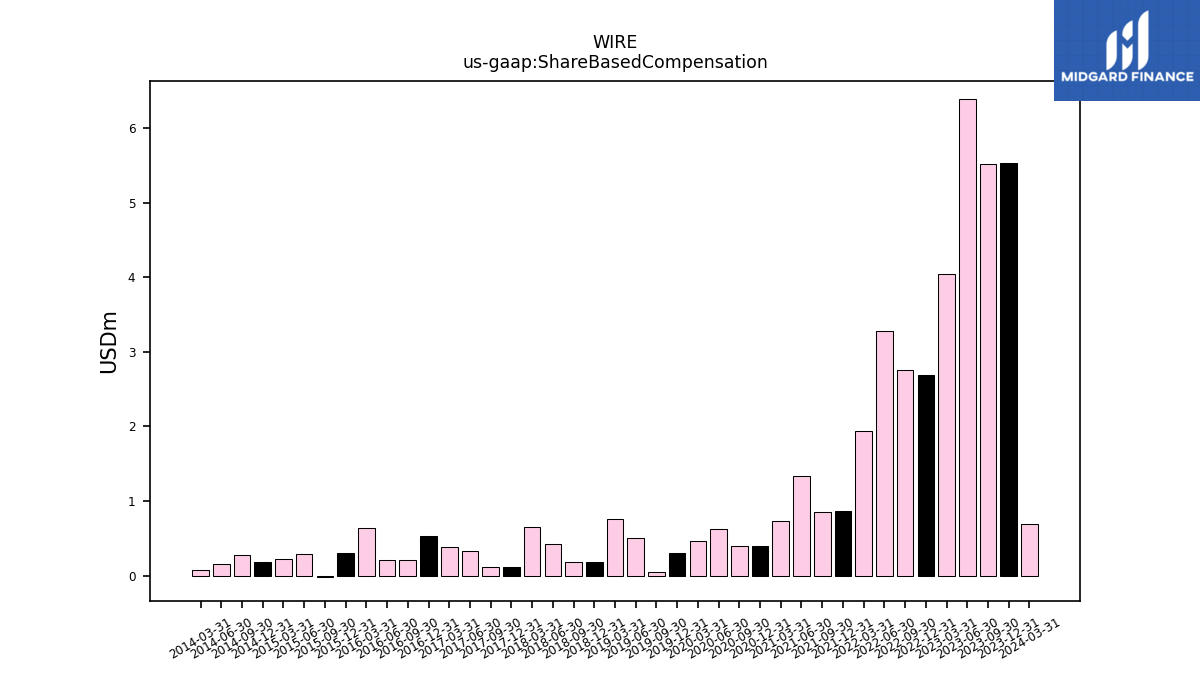
| Share Based Compensation | 5.53 | 5.52 | 6.39 | 4.04 | 2.69 | 2.76 | 3.28 | 1.94 | 0.87 | 0.85 | 1.33 | 0.74 | 0.39 | 0.40 | 0.63 | 0.46 | 0.30 | 0.05 | 0.50 | 0.76 | 0.19 | 0.19 | 0.42 | 0.65 | 0.12 | 0.12 | 0.34 | 0.38 | 0.54 | 0.21 | 0.21 | 0.64 | 0.30 | -0.02 | 0.30 | 0.22 | 0.19 | 0.28 | 0.15 | 0.08 | NA | NA | NA | NA | NA | NA | NA | NA | NA | NA | NA | NA | NA | NA | NA |
| 2023-12-31 | 2023-09-30 | 2023-06-30 | 2023-03-31 | 2022-12-31 | 2022-09-30 | 2022-06-30 | 2022-03-31 | 2021-12-31 | 2021-09-30 | 2021-06-30 | 2021-03-31 | 2020-12-31 | 2020-09-30 | 2020-06-30 | 2020-03-31 | 2019-12-31 | 2019-09-30 | 2019-06-30 | 2019-03-31 | 2018-12-31 | 2018-09-30 | 2018-06-30 | 2018-03-31 | 2017-12-31 | 2017-09-30 | 2017-06-30 | 2017-03-31 | 2016-12-31 | 2016-09-30 | 2016-06-30 | 2016-03-31 | 2015-12-31 | 2015-09-30 | 2015-06-30 | 2015-03-31 | 2014-12-31 | 2014-09-30 | 2014-06-30 | 2014-03-31 | 2013-12-31 | 2013-09-30 | 2013-06-30 | 2013-03-31 | 2012-12-31 | 2012-09-30 | 2012-06-30 | 2012-03-31 | 2011-12-31 | 2011-09-30 | 2011-06-30 | 2011-03-31 | 2010-12-31 | 2010-09-30 | 2010-06-30 | ||
|---|---|---|---|---|---|---|---|---|---|---|---|---|---|---|---|---|---|---|---|---|---|---|---|---|---|---|---|---|---|---|---|---|---|---|---|---|---|---|---|---|---|---|---|---|---|---|---|---|---|---|---|---|---|---|---|---|
| Net Cash Provided By Used In Investing Activities | -45.98 | -43.82 | -42.97 | -31.77 | -42.84 | -30.26 | -43.27 | -31.97 | -33.07 | -26.45 | -32.13 | -26.50 | -36.51 | -27.65 | -9.70 | -12.13 | -11.23 | -20.04 | -9.34 | -11.85 | -4.89 | -6.36 | -7.35 | -7.46 | -5.42 | -5.10 | -5.54 | -4.63 | -3.02 | -17.08 | -12.83 | -8.65 | -8.62 | -12.35 | -12.01 | -10.49 | -17.65 | -12.45 | -7.68 | -6.46 | -4.00 | -7.75 | -29.12 | -2.59 | -7.28 | -8.97 | -14.92 | -9.11 | -6.73 | -4.70 | -3.27 | -2.25 | -6.41 | -4.06 | NA | |
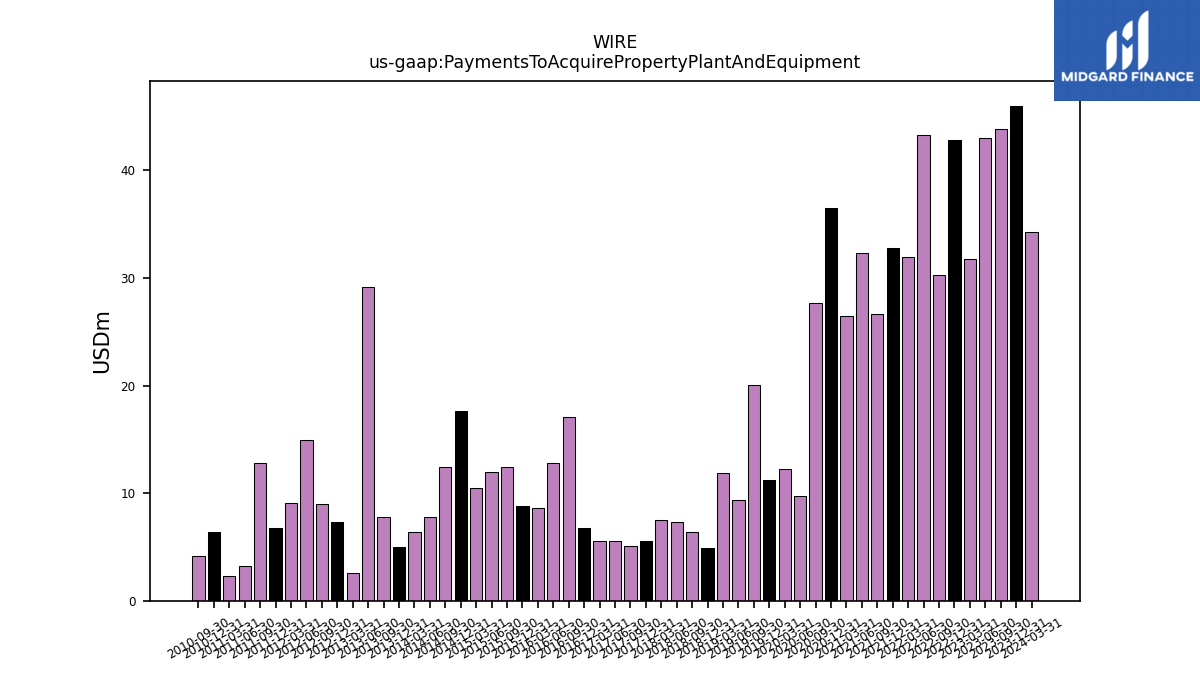
| Payments To Acquire Property Plant And Equipment | 46.00 | 43.83 | 42.97 | 31.77 | 42.84 | 30.26 | 43.27 | 31.97 | 32.76 | 26.64 | 32.34 | 26.50 | 36.51 | 27.65 | 9.70 | 12.22 | 11.23 | 20.04 | 9.34 | 11.87 | 4.94 | 6.43 | 7.35 | 7.46 | 5.56 | 5.10 | 5.54 | 5.55 | 6.77 | 17.12 | 12.83 | 8.66 | 8.81 | 12.40 | 12.01 | 10.49 | 17.65 | 12.45 | 7.75 | 6.42 | 5.04 | 7.75 | 29.12 | 2.59 | 7.28 | 8.98 | 14.92 | 9.12 | 6.73 | 12.76 | 3.26 | 2.26 | 6.42 | 4.13 | NA |
| 2023-12-31 | 2023-09-30 | 2023-06-30 | 2023-03-31 | 2022-12-31 | 2022-09-30 | 2022-06-30 | 2022-03-31 | 2021-12-31 | 2021-09-30 | 2021-06-30 | 2021-03-31 | 2020-12-31 | 2020-09-30 | 2020-06-30 | 2020-03-31 | 2019-12-31 | 2019-09-30 | 2019-06-30 | 2019-03-31 | 2018-12-31 | 2018-09-30 | 2018-06-30 | 2018-03-31 | 2017-12-31 | 2017-09-30 | 2017-06-30 | 2017-03-31 | 2016-12-31 | 2016-09-30 | 2016-06-30 | 2016-03-31 | 2015-12-31 | 2015-09-30 | 2015-06-30 | 2015-03-31 | 2014-12-31 | 2014-09-30 | 2014-06-30 | 2014-03-31 | 2013-12-31 | 2013-09-30 | 2013-06-30 | 2013-03-31 | 2012-12-31 | 2012-09-30 | 2012-06-30 | 2012-03-31 | 2011-12-31 | 2011-09-30 | 2011-06-30 | 2011-03-31 | 2010-12-31 | 2010-09-30 | 2010-06-30 | ||
|---|---|---|---|---|---|---|---|---|---|---|---|---|---|---|---|---|---|---|---|---|---|---|---|---|---|---|---|---|---|---|---|---|---|---|---|---|---|---|---|---|---|---|---|---|---|---|---|---|---|---|---|---|---|---|---|---|
| Net Cash Provided By Used In Financing Activities | -84.95 | -121.57 | -125.77 | -128.30 | -22.75 | -93.72 | -73.86 | -58.63 | -10.29 | -33.14 | -0.15 | -0.81 | -0.41 | 0.13 | 1.96 | -21.00 | -0.42 | -0.42 | -0.28 | 0.01 | 0.34 | -0.29 | -0.42 | -0.11 | 0.35 | 0.36 | -0.23 | -0.19 | -0.15 | 0.41 | -0.35 | -0.28 | 0.78 | -3.23 | -0.10 | -0.25 | -0.36 | -0.35 | -0.31 | 0.02 | -0.11 | -0.12 | -0.30 | -0.33 | -0.34 | -0.33 | -67.09 | -0.42 | -0.34 | 0.48 | 0.09 | -0.41 | -0.38 | -0.21 | NA | |
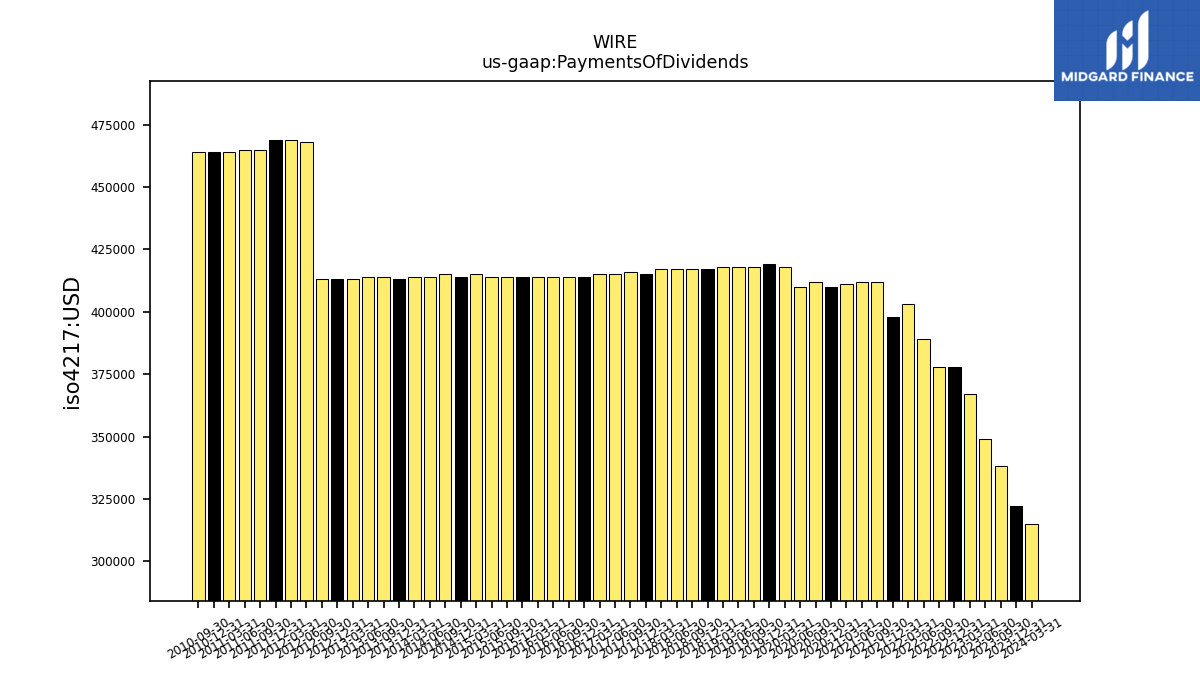
| Payments Of Dividends | 0.32 | 0.34 | 0.35 | 0.37 | 0.38 | 0.38 | 0.39 | 0.40 | 0.40 | 0.41 | 0.41 | 0.41 | 0.41 | 0.41 | 0.41 | 0.42 | 0.42 | 0.42 | 0.42 | 0.42 | 0.42 | 0.42 | 0.42 | 0.42 | 0.41 | 0.42 | 0.41 | 0.41 | 0.41 | 0.41 | 0.41 | 0.41 | 0.41 | 0.41 | 0.41 | 0.41 | 0.41 | 0.41 | 0.41 | 0.41 | 0.41 | 0.41 | 0.41 | 0.41 | 0.41 | 0.41 | 0.47 | 0.47 | 0.47 | 0.47 | 0.47 | 0.46 | 0.46 | 0.46 | NA | |
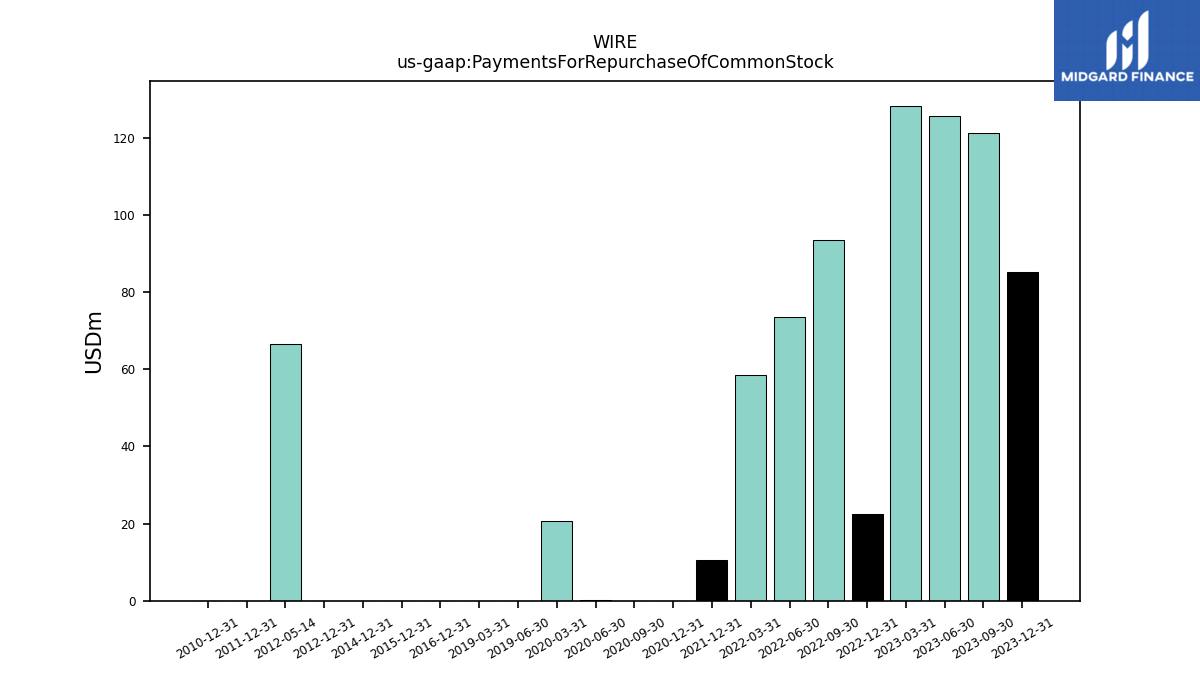
| Payments For Repurchase Of Common Stock | 85.15 | 121.23 | 125.52 | 128.25 | 22.38 | 93.39 | 73.47 | 58.38 | 10.56 | NA | NA | NA | 0.00 | 0.00 | 0.08 | 20.58 | NA | NA | 0.00 | 0.00 | NA | NA | NA | NA | NA | NA | NA | NA | 0.00 | NA | NA | NA | 0.00 | NA | NA | NA | 0.00 | NA | NA | NA | NA | NA | NA | NA | 0.00 | NA | NA | NA | 0.00 | NA | NA | NA | 0.00 | NA | NA |
| 2023-12-31 | 2023-09-30 | 2023-06-30 | 2023-03-31 | 2022-12-31 | 2022-09-30 | 2022-06-30 | 2022-03-31 | 2021-12-31 | 2021-09-30 | 2021-06-30 | 2021-03-31 | 2020-12-31 | 2020-09-30 | 2020-06-30 | 2020-03-31 | 2019-12-31 | 2019-09-30 | 2019-06-30 | 2019-03-31 | 2018-12-31 | 2018-09-30 | 2018-06-30 | 2018-03-31 | 2017-12-31 | 2017-09-30 | 2017-06-30 | 2017-03-31 | 2016-12-31 | 2016-09-30 | 2016-06-30 | 2016-03-31 | 2015-12-31 | 2015-09-30 | 2015-06-30 | 2015-03-31 | 2014-12-31 | 2014-09-30 | 2014-06-30 | 2014-03-31 | 2013-12-31 | 2013-09-30 | 2013-06-30 | 2013-03-31 | 2012-12-31 | 2012-09-30 | 2012-06-30 | 2012-03-31 | 2011-12-31 | 2011-09-30 | 2011-06-30 | 2011-03-31 | 2010-12-31 | 2010-09-30 | 2010-06-30 | ||
|---|---|---|---|---|---|---|---|---|---|---|---|---|---|---|---|---|---|---|---|---|---|---|---|---|---|---|---|---|---|---|---|---|---|---|---|---|---|---|---|---|---|---|---|---|---|---|---|---|---|---|---|---|---|---|---|---|
| Revenues | 633.78 | 636.99 | 636.46 | 660.49 | 693.88 | 762.36 | 838.24 | 723.07 | 687.85 | 716.32 | 744.41 | 444.14 | 380.82 | 339.70 | 253.63 | 302.79 | 302.25 | 321.17 | 336.87 | 314.71 | 319.73 | 340.73 | 336.79 | 291.43 | 301.29 | 292.03 | 291.53 | 279.39 | 239.25 | 237.17 | 238.83 | 225.54 | 250.86 | 262.76 | 253.75 | 250.26 | 285.34 | 297.35 | 307.09 | 277.20 | 293.51 | 309.93 | 289.46 | 265.35 | 258.00 | 269.15 | 264.73 | 280.47 | 248.30 | 319.36 | 309.47 | 303.35 | 256.15 | 242.75 | 236.09 | |
| Revenue From Contract With Customer Excluding Assessed Tax | 633.78 | 636.99 | 636.46 | 660.49 | 693.88 | 762.36 | 838.24 | 723.07 | 687.85 | 716.32 | 744.41 | 444.14 | 380.82 | 339.70 | 253.63 | 302.79 | 302.25 | 321.17 | 336.87 | 314.71 | 319.73 | 340.73 | 336.79 | 291.43 | 301.29 | 292.03 | 291.53 | 279.39 | 239.25 | 237.17 | 238.83 | 225.54 | 250.86 | 262.76 | 253.75 | 250.26 | 285.34 | 297.35 | 307.09 | 277.20 | 293.51 | 309.93 | 289.46 | 265.35 | 258.00 | 269.15 | 264.73 | 280.47 | 248.30 | 319.36 | 309.47 | 303.35 | 256.15 | 242.75 | 236.09 |