
| 2023-12-31 | 2023-09-30 | 2023-06-30 | 2023-03-31 | 2022-12-31 | 2022-09-30 | 2022-06-30 | 2022-03-31 | 2021-12-31 | 2021-09-30 | 2021-06-30 | 2021-03-31 | 2020-12-31 | 2020-09-30 | 2020-06-30 | 2020-03-31 | 2019-12-31 | 2019-09-30 | 2019-06-30 | 2019-03-31 | 2018-12-31 | 2018-09-30 | 2018-06-30 | 2018-03-31 | 2017-12-31 | 2017-09-30 | 2017-06-30 | 2017-03-31 | 2016-12-31 | 2016-09-30 | 2016-06-30 | 2016-03-31 | 2015-12-31 | 2015-09-30 | 2015-06-30 | 2015-03-31 | 2014-12-31 | 2014-09-30 | 2014-06-30 | 2014-03-31 | 2013-12-31 | 2013-09-30 | 2013-06-30 | 2013-03-31 | 2012-12-31 | 2012-09-30 | 2012-06-30 | 2012-03-31 | 2011-12-31 | 2011-09-30 | 2011-06-30 | 2011-03-31 | 2010-12-31 | 2010-09-30 | 2010-06-30 | ||
|---|---|---|---|---|---|---|---|---|---|---|---|---|---|---|---|---|---|---|---|---|---|---|---|---|---|---|---|---|---|---|---|---|---|---|---|---|---|---|---|---|---|---|---|---|---|---|---|---|---|---|---|---|---|---|---|---|
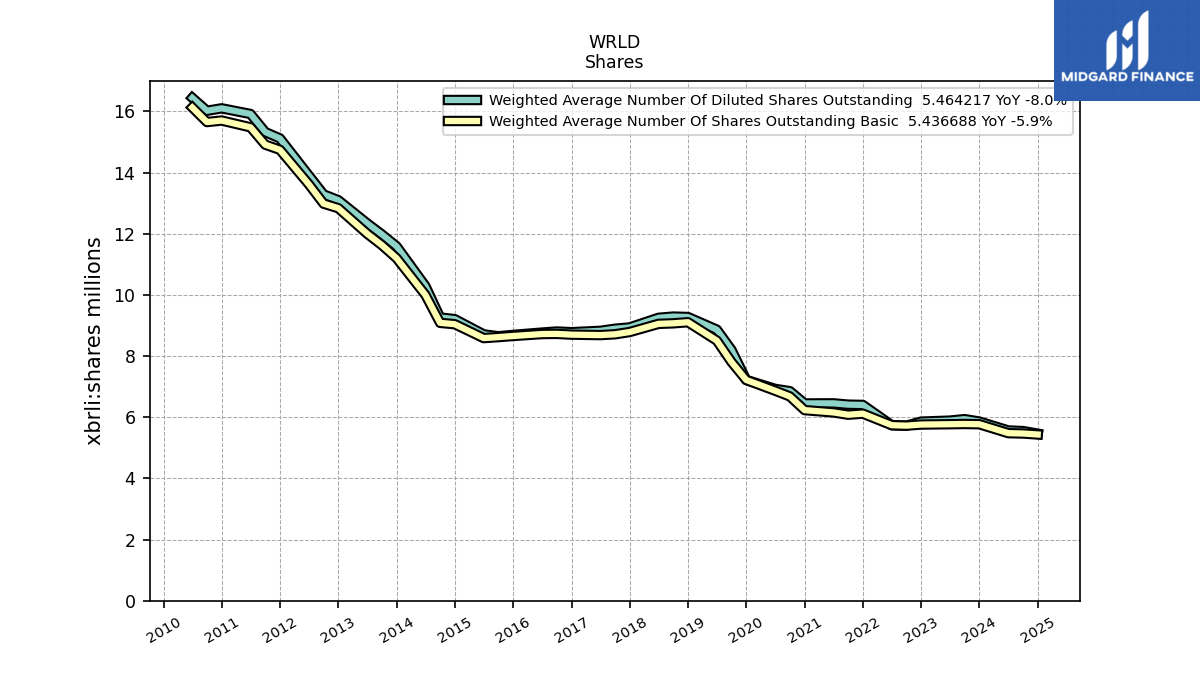
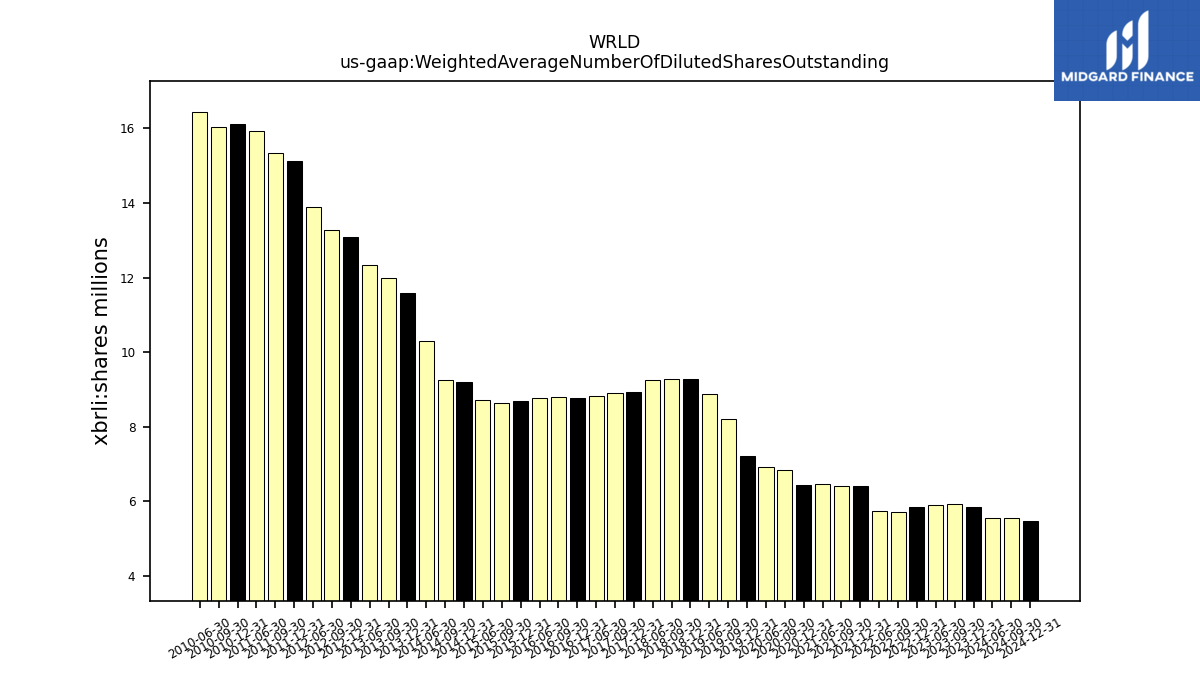
| Weighted Average Number Of Diluted Shares Outstanding | 5.86 | 5.94 | 5.89 | NA | 5.86 | 5.73 | 5.74 | NA | 6.40 | 6.41 | 6.46 | NA | 6.45 | 6.85 | 6.93 | NA | 7.22 | 8.20 | 8.87 | NA | 9.28 | 9.29 | 9.25 | NA | 8.94 | 8.90 | 8.83 | NA | 8.78 | 8.80 | 8.77 | NA | 8.69 | 8.65 | 8.71 | NA | 9.21 | 9.26 | 10.29 | NA | 11.59 | 11.98 | 12.34 | NA | 13.10 | 13.29 | 13.90 | NA | 15.12 | 15.33 | 15.92 | NA | 16.10 | 16.02 | 16.45 | |
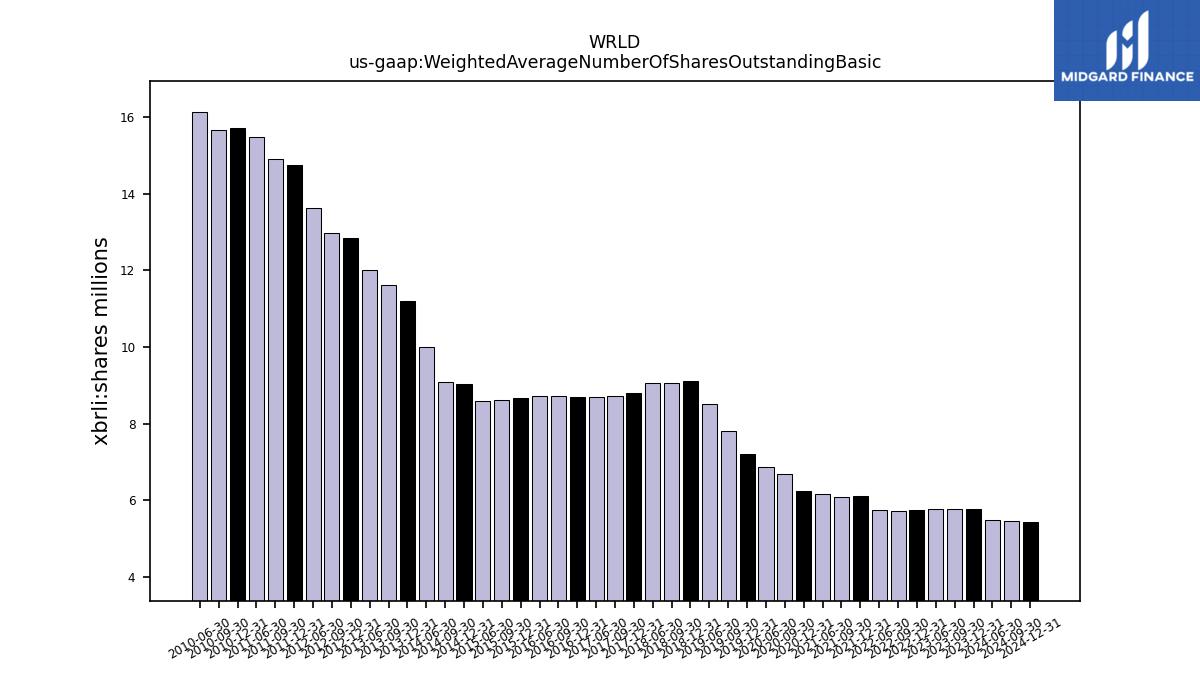
| Weighted Average Number Of Shares Outstanding Basic | 5.77 | 5.78 | 5.77 | NA | 5.76 | 5.73 | 5.74 | NA | 6.12 | 6.08 | 6.16 | NA | 6.23 | 6.68 | 6.87 | NA | 7.22 | 7.81 | 8.51 | NA | 9.11 | 9.07 | 9.05 | NA | 8.79 | 8.71 | 8.69 | NA | 8.70 | 8.73 | 8.72 | NA | 8.66 | 8.62 | 8.59 | NA | 9.04 | 9.09 | 10.00 | NA | 11.20 | 11.63 | 12.00 | NA | 12.84 | 12.99 | 13.61 | NA | 14.75 | 14.92 | 15.48 | NA | 15.70 | 15.65 | 16.13 | |
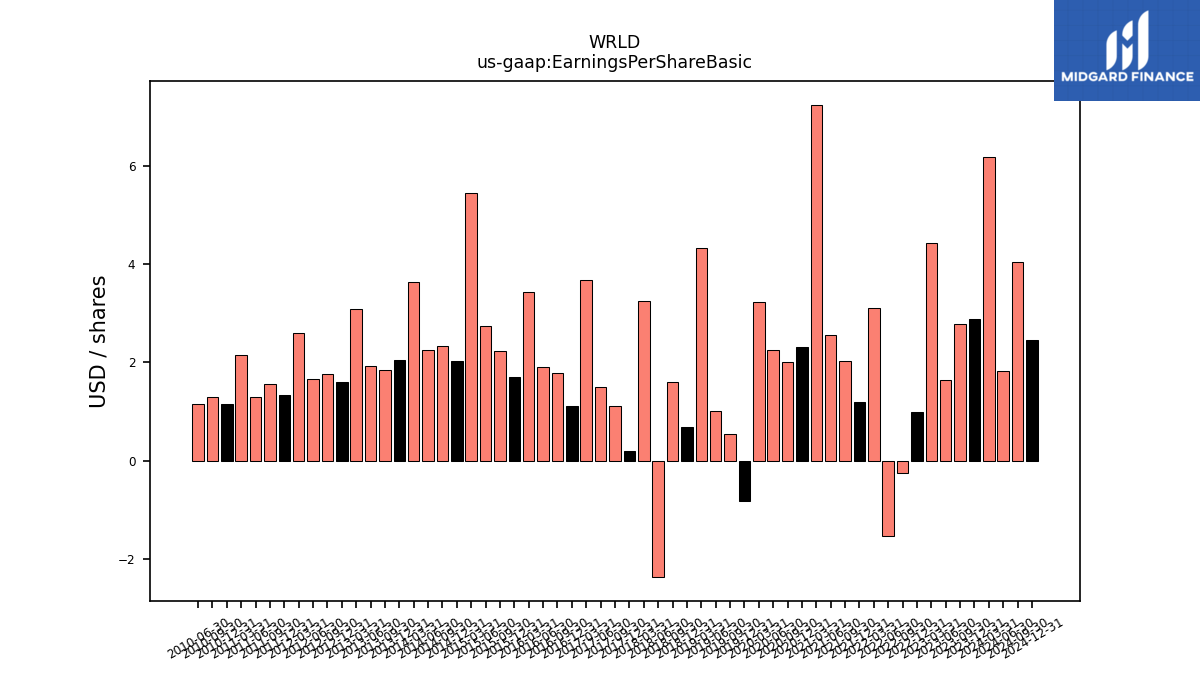
| Earnings Per Share Basic | 2.89 | 2.78 | 1.65 | 4.44 | 1.00 | -0.24 | -1.53 | 3.10 | 1.20 | 2.04 | 2.56 | 7.25 | 2.32 | 2.01 | 2.26 | 3.23 | -0.81 | 0.54 | 1.01 | 4.34 | 0.69 | 1.60 | -2.37 | 3.25 | 0.19 | 1.12 | 1.50 | 3.67 | 1.11 | 1.78 | 1.91 | 3.44 | 1.70 | 2.23 | 2.75 | 5.45 | 2.04 | 2.34 | 2.26 | 3.63 | 2.05 | 1.85 | 1.93 | 3.08 | 1.61 | 1.76 | 1.66 | 2.60 | 1.33 | 1.56 | 1.30 | 2.16 | 1.15 | 1.29 | 1.16 | |
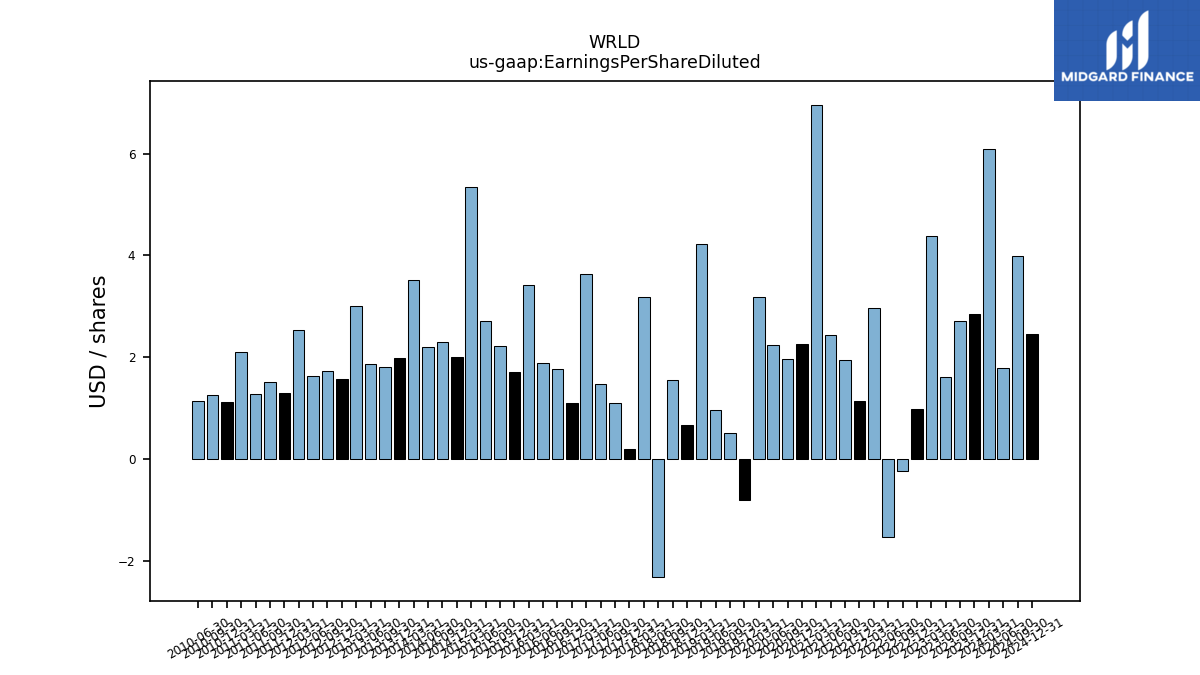
| Earnings Per Share Diluted | 2.84 | 2.71 | 1.62 | 4.37 | 0.98 | -0.24 | -1.53 | 2.97 | 1.14 | 1.94 | 2.44 | 6.96 | 2.25 | 1.96 | 2.24 | 3.18 | -0.81 | 0.51 | 0.97 | 4.22 | 0.67 | 1.56 | -2.32 | 3.18 | 0.19 | 1.10 | 1.48 | 3.64 | 1.10 | 1.76 | 1.89 | 3.42 | 1.70 | 2.22 | 2.71 | 5.34 | 2.01 | 2.30 | 2.19 | 3.52 | 1.98 | 1.80 | 1.87 | 3.01 | 1.58 | 1.72 | 1.63 | 2.54 | 1.30 | 1.52 | 1.27 | 2.11 | 1.12 | 1.26 | 1.14 |
| 2023-12-31 | 2023-09-30 | 2023-06-30 | 2023-03-31 | 2022-12-31 | 2022-09-30 | 2022-06-30 | 2022-03-31 | 2021-12-31 | 2021-09-30 | 2021-06-30 | 2021-03-31 | 2020-12-31 | 2020-09-30 | 2020-06-30 | 2020-03-31 | 2019-12-31 | 2019-09-30 | 2019-06-30 | 2019-03-31 | 2018-12-31 | 2018-09-30 | 2018-06-30 | 2018-03-31 | 2017-12-31 | 2017-09-30 | 2017-06-30 | 2017-03-31 | 2016-12-31 | 2016-09-30 | 2016-06-30 | 2016-03-31 | 2015-12-31 | 2015-09-30 | 2015-06-30 | 2015-03-31 | 2014-12-31 | 2014-09-30 | 2014-06-30 | 2014-03-31 | 2013-12-31 | 2013-09-30 | 2013-06-30 | 2013-03-31 | 2012-12-31 | 2012-09-30 | 2012-06-30 | 2012-03-31 | 2011-12-31 | 2011-09-30 | 2011-06-30 | 2011-03-31 | 2010-12-31 | 2010-09-30 | 2010-06-30 | ||
|---|---|---|---|---|---|---|---|---|---|---|---|---|---|---|---|---|---|---|---|---|---|---|---|---|---|---|---|---|---|---|---|---|---|---|---|---|---|---|---|---|---|---|---|---|---|---|---|---|---|---|---|---|---|---|---|---|
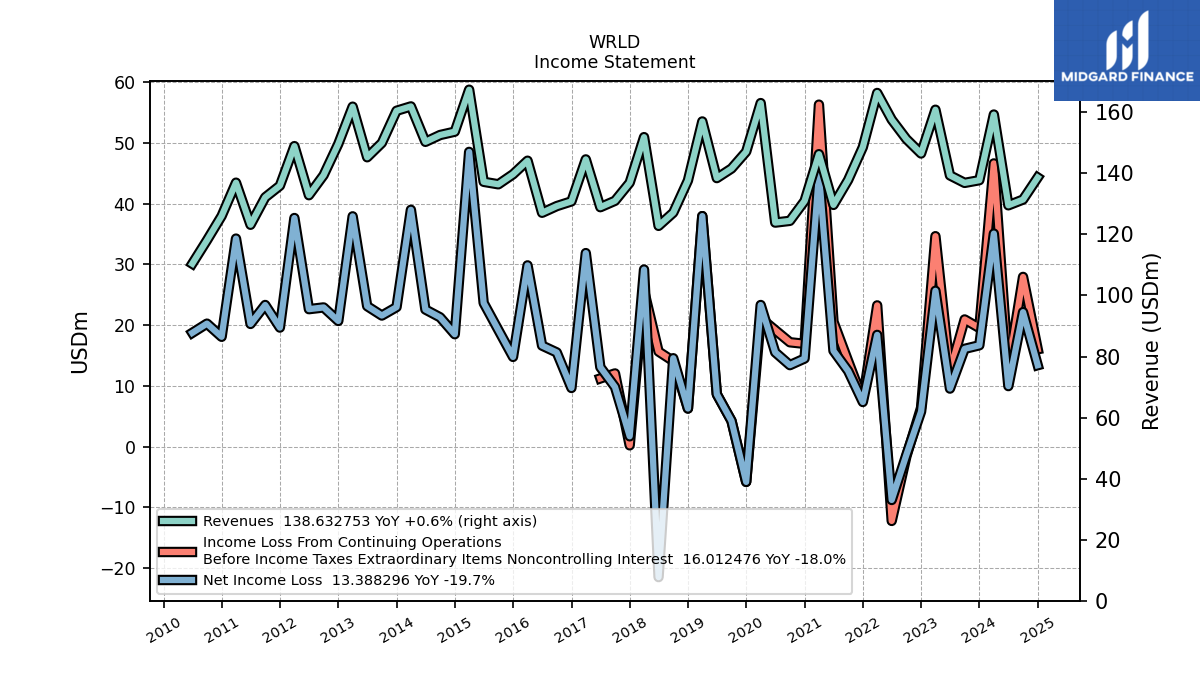
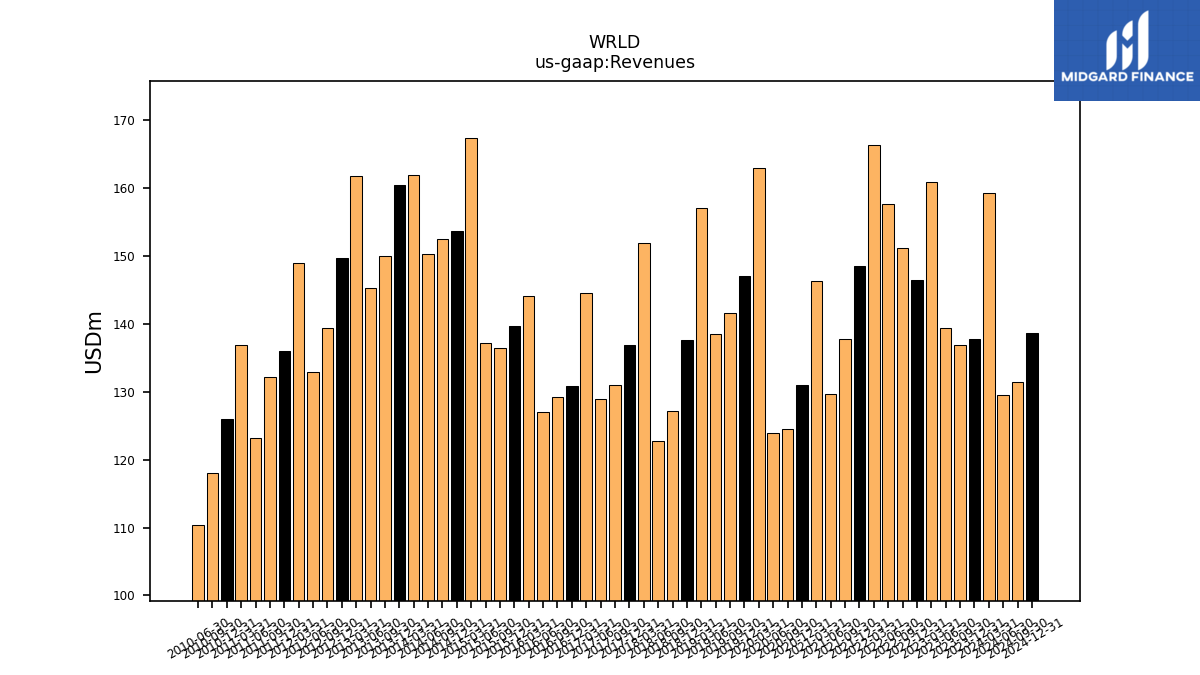
| Revenues | 137.75 | 136.88 | 139.32 | 160.84 | 146.50 | 151.23 | 157.59 | 166.33 | 148.57 | 137.83 | 129.66 | 146.28 | 130.95 | 124.44 | 123.87 | 163.02 | 147.08 | 141.57 | 138.44 | 157.00 | 137.64 | 127.12 | 122.79 | 151.86 | 136.93 | 131.01 | 128.91 | 144.57 | 130.81 | 129.27 | 127.08 | 144.14 | 139.70 | 136.41 | 137.22 | 167.40 | 153.65 | 152.55 | 150.31 | 161.93 | 160.49 | 149.96 | 145.27 | 161.84 | 149.64 | 139.40 | 132.84 | 148.92 | 135.95 | 132.14 | 123.16 | 136.94 | 126.04 | 118.07 | 110.40 | |
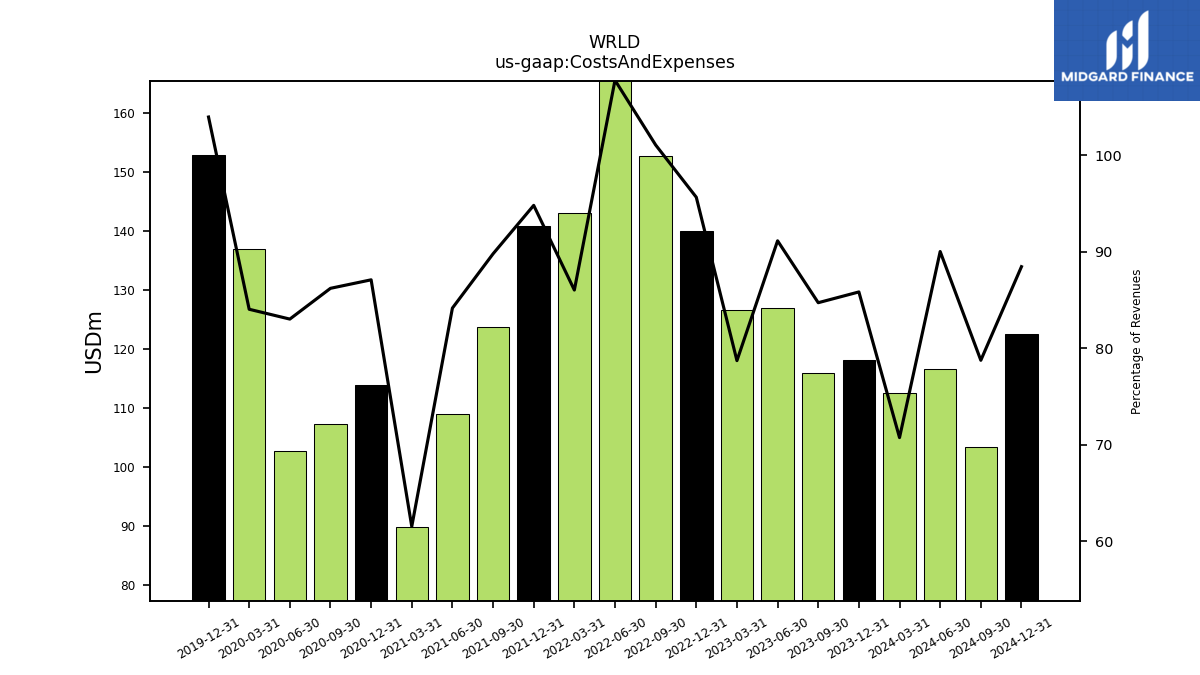
| Costs And Expenses | 118.23 | 115.95 | 126.97 | 126.60 | 140.12 | 152.84 | 169.85 | 143.09 | 140.85 | 123.75 | 109.12 | 89.99 | 114.04 | 107.28 | 102.83 | 136.99 | 152.91 | NA | NA | NA | NA | NA | NA | NA | NA | NA | NA | NA | NA | NA | NA | NA | NA | NA | NA | NA | NA | NA | NA | NA | NA | NA | NA | NA | NA | NA | NA | NA | NA | NA | NA | NA | NA | NA | NA | |
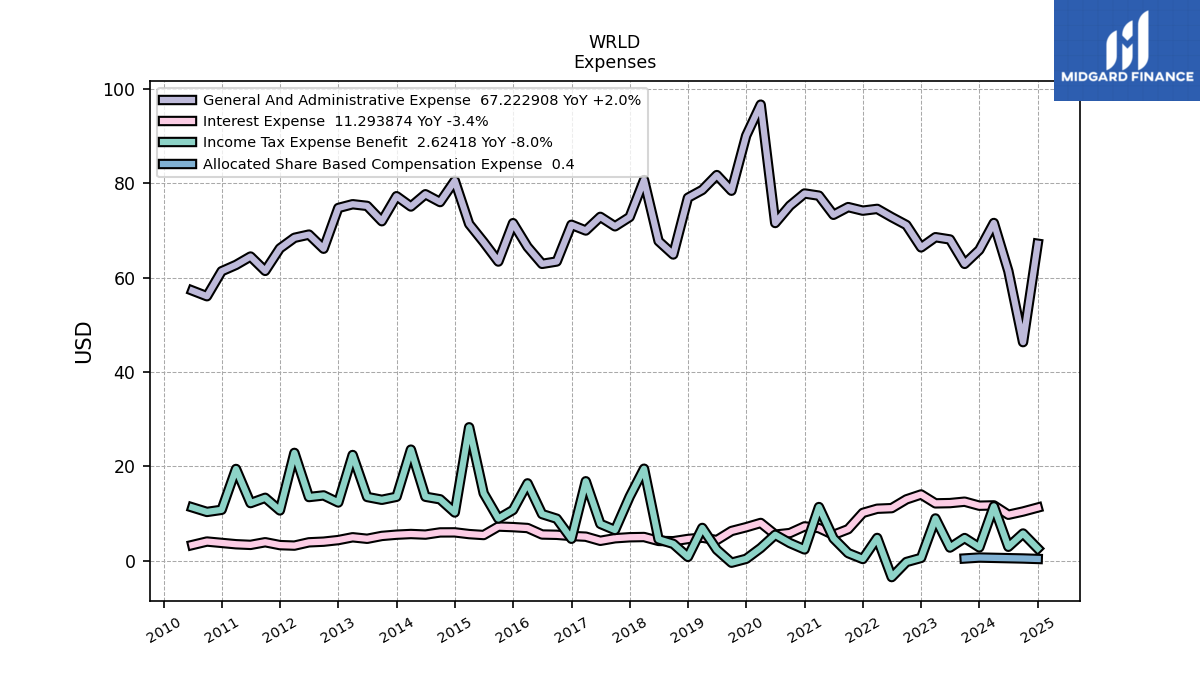
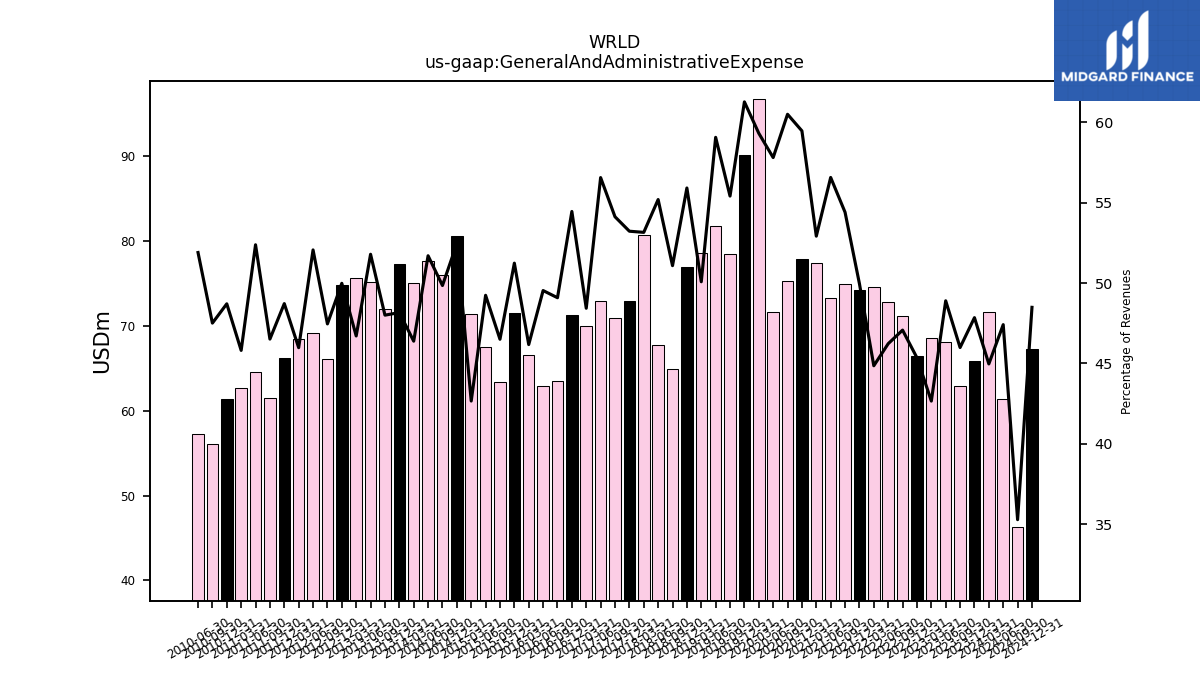
| General And Administrative Expense | 65.91 | 62.95 | 68.13 | 68.61 | 66.44 | 71.19 | 72.85 | 74.61 | 74.23 | 74.99 | 73.35 | 77.41 | 77.88 | 75.29 | 71.61 | 96.71 | 90.12 | 78.45 | 81.78 | 78.63 | 76.96 | 64.94 | 67.78 | 80.72 | 72.89 | 70.91 | 72.92 | 70.02 | 71.24 | 63.46 | 62.95 | 66.56 | 71.58 | 63.44 | 67.57 | 71.41 | 80.58 | 76.05 | 77.71 | 75.11 | 77.30 | 71.99 | 75.24 | 75.59 | 74.80 | 66.16 | 69.16 | 68.47 | 66.23 | 61.46 | 64.51 | 62.73 | 61.39 | 56.09 | 57.30 | |
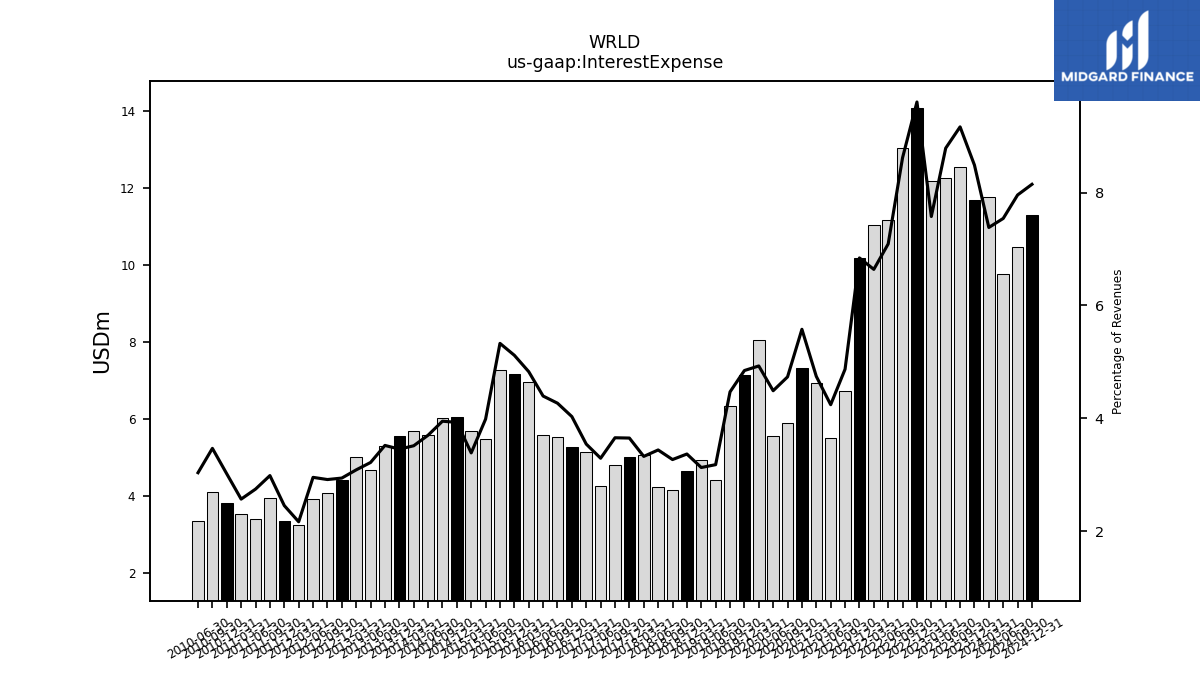
| Interest Expense | 11.69 | 12.54 | 12.24 | 12.19 | 14.07 | 13.03 | 11.17 | 11.04 | 10.17 | 6.71 | 5.50 | 6.94 | 7.30 | 5.89 | 5.56 | 8.04 | 7.13 | 6.33 | 4.40 | 4.91 | 4.64 | 4.16 | 4.23 | 5.05 | 5.00 | 4.79 | 4.25 | 5.12 | 5.27 | 5.52 | 5.59 | 6.96 | 7.15 | 7.27 | 5.47 | 5.67 | 6.04 | 6.03 | 5.56 | 5.69 | 5.55 | 5.28 | 4.68 | 5.00 | 4.40 | 4.07 | 3.93 | 3.23 | 3.34 | 3.95 | 3.38 | 3.52 | 3.80 | 4.10 | 3.35 | |
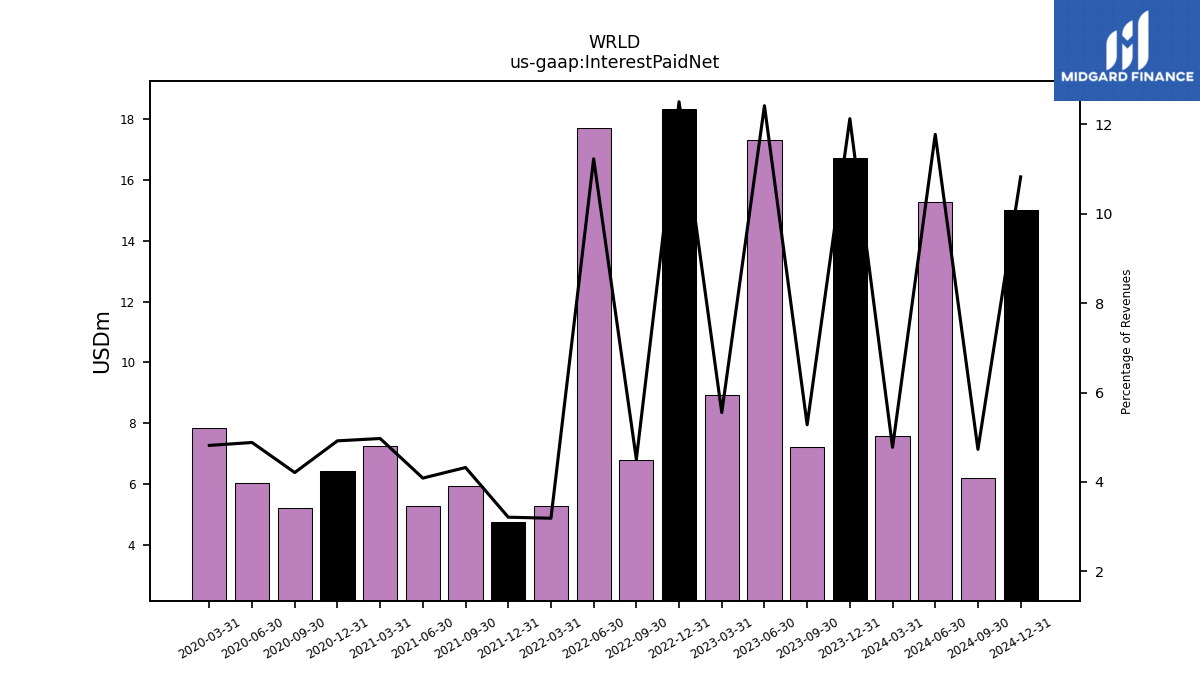
| Interest Paid Net | 16.71 | 7.23 | 17.30 | 8.93 | 18.32 | 6.81 | 17.70 | 5.30 | 4.77 | 5.96 | 5.30 | 7.27 | 6.44 | 5.24 | 6.05 | 7.85 | NA | NA | NA | NA | NA | NA | NA | NA | NA | NA | NA | NA | NA | NA | NA | NA | NA | NA | NA | NA | NA | NA | NA | NA | NA | NA | NA | NA | NA | NA | NA | NA | NA | NA | NA | NA | NA | NA | NA | |
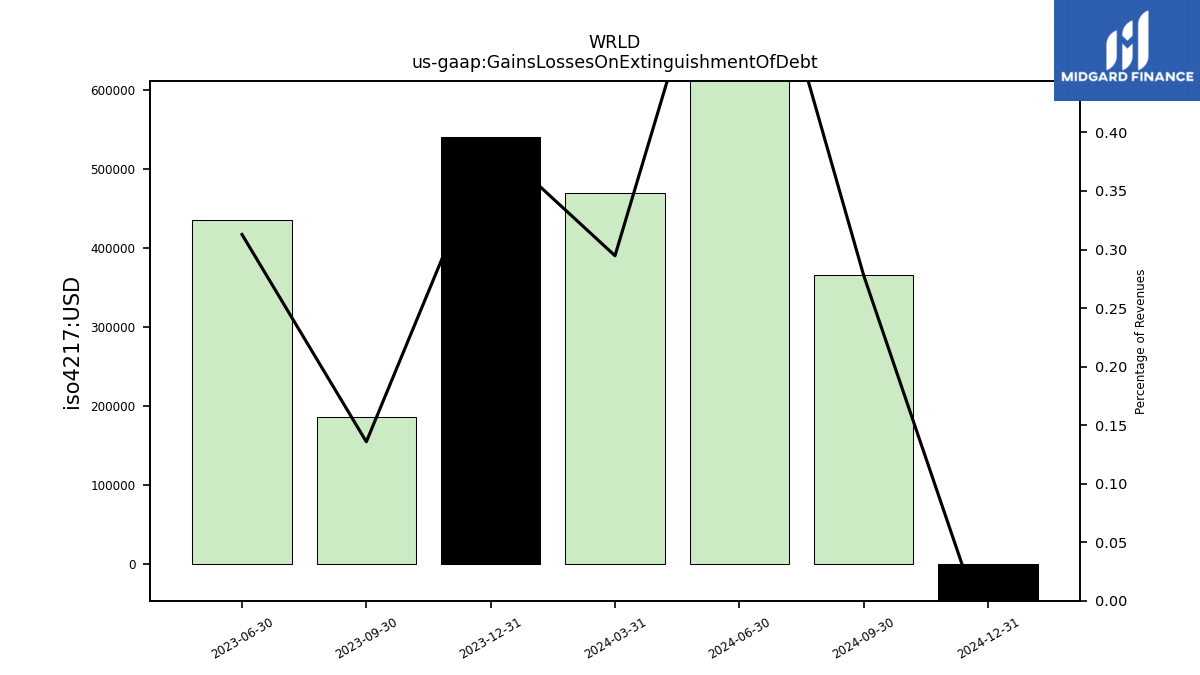
| Gains Losses On Extinguishment Of Debt | 0.54 | 0.19 | 0.44 | NA | NA | NA | NA | NA | NA | NA | NA | NA | NA | NA | NA | NA | NA | NA | NA | NA | NA | NA | NA | NA | NA | NA | NA | NA | NA | NA | NA | NA | NA | NA | NA | NA | NA | NA | NA | NA | NA | NA | NA | NA | NA | NA | NA | NA | NA | NA | NA | NA | NA | NA | NA | |
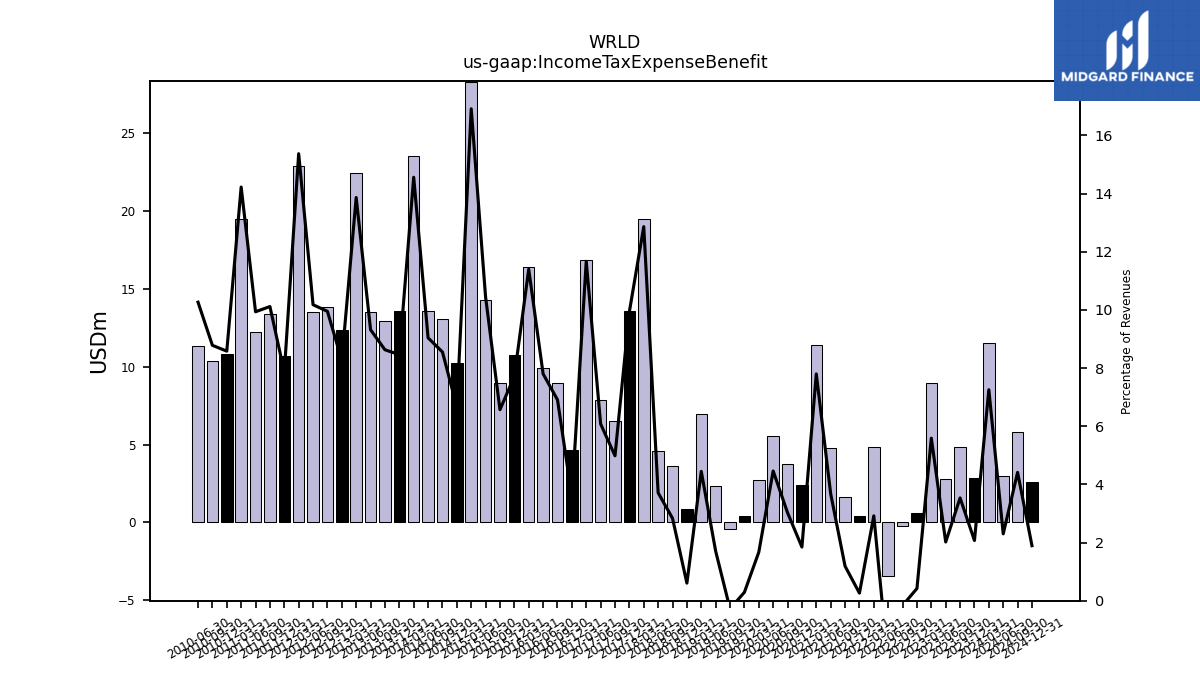
| Income Tax Expense Benefit | 2.85 | 4.84 | 2.82 | 8.99 | 0.62 | -0.25 | -3.45 | 4.86 | 0.39 | 1.64 | 4.77 | 11.41 | 2.42 | 3.77 | 5.53 | 2.72 | 0.43 | -0.40 | 2.36 | 6.98 | 0.83 | 3.60 | 4.56 | 19.53 | 13.61 | 6.53 | 7.84 | 16.87 | 4.68 | 8.93 | 9.91 | 16.43 | 10.77 | 8.96 | 14.32 | 28.32 | 10.24 | 13.05 | 13.59 | 23.58 | 13.58 | 12.94 | 13.54 | 22.44 | 12.37 | 13.87 | 13.52 | 22.89 | 10.68 | 13.37 | 12.24 | 19.48 | 10.82 | 10.37 | 11.33 | |
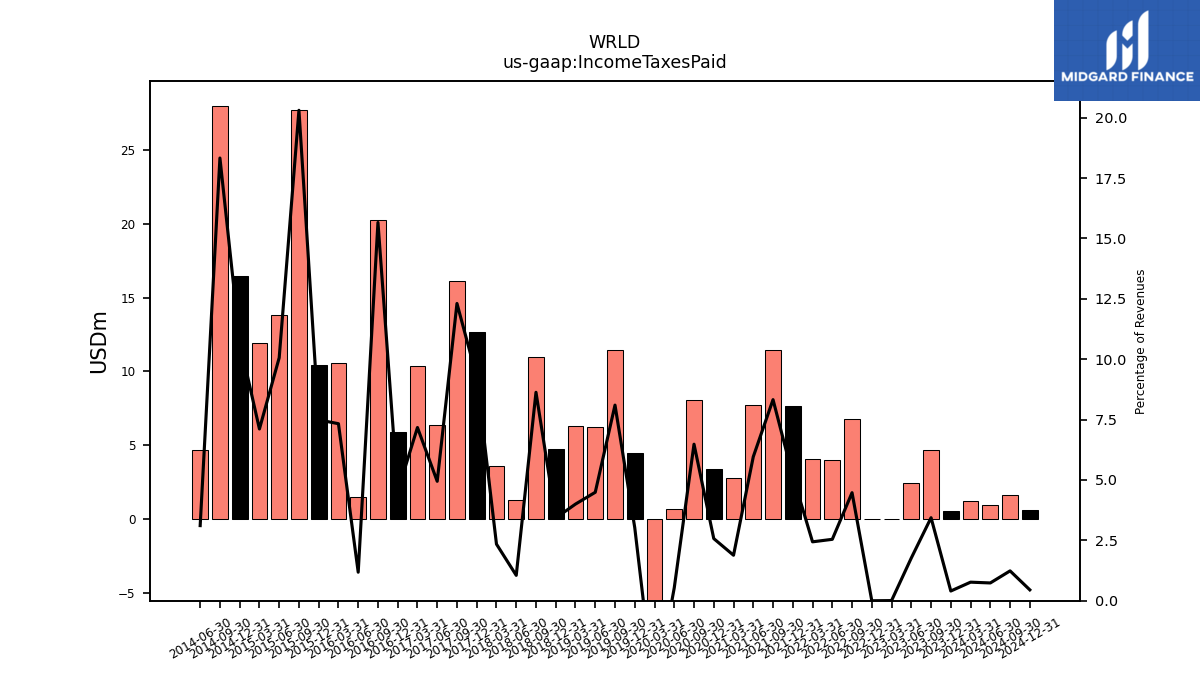
| Income Taxes Paid | 0.56 | 4.71 | 2.47 | 0.01 | 0.00 | 6.76 | 4.01 | 4.06 | 7.68 | 11.47 | 7.73 | 2.76 | 3.37 | 8.07 | 0.67 | -6.42 | 4.45 | 11.47 | 6.22 | 6.28 | 4.71 | 10.97 | 1.29 | 3.56 | 12.68 | 16.12 | 6.38 | 10.37 | 5.93 | 20.25 | 1.50 | 10.57 | 10.46 | 27.70 | 13.80 | 11.90 | 16.48 | 27.96 | 4.68 | NA | NA | NA | NA | NA | NA | NA | NA | NA | NA | NA | NA | NA | NA | NA | NA | |
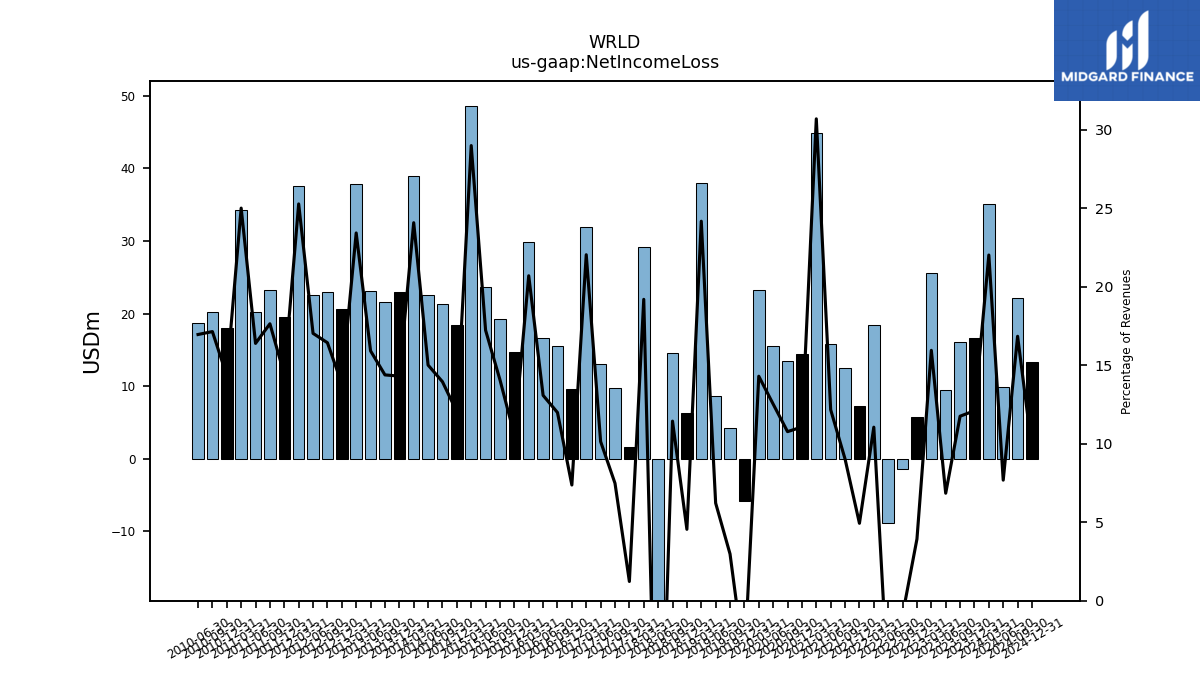
| Net Income Loss | 16.66 | 16.08 | 9.54 | 25.64 | 5.76 | -1.37 | -8.80 | 18.38 | 7.33 | 12.44 | 15.77 | 44.88 | 14.49 | 13.40 | 15.51 | 23.30 | -5.82 | 4.22 | 8.61 | 37.94 | 6.26 | 14.54 | -21.50 | 29.14 | 1.68 | 9.80 | 13.07 | 31.85 | 9.64 | 15.49 | 16.62 | 29.83 | 14.75 | 19.19 | 23.63 | 48.52 | 18.49 | 21.27 | 22.56 | 38.98 | 22.95 | 21.57 | 23.11 | 37.90 | 20.67 | 22.90 | 22.61 | 37.63 | 19.58 | 23.30 | 20.18 | 34.24 | 18.06 | 20.23 | 18.71 | |
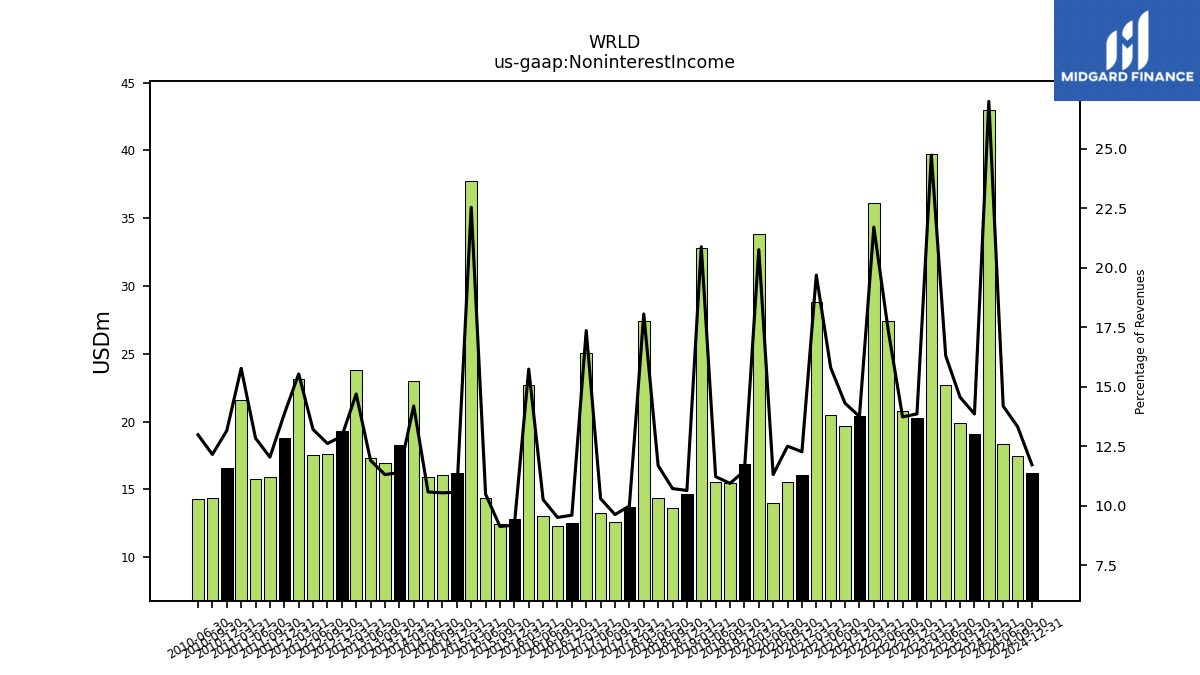
| Noninterest Income | 19.08 | 19.92 | 22.70 | 39.76 | 20.30 | 20.76 | 27.39 | 36.10 | 20.42 | 19.71 | 20.48 | 28.80 | 16.06 | 15.56 | 14.01 | 33.83 | 16.85 | 15.48 | 15.53 | 32.78 | 14.64 | 13.63 | 14.35 | 27.41 | 13.67 | 12.61 | 13.27 | 25.09 | 12.56 | 12.29 | 13.04 | 22.68 | 12.83 | 12.45 | 14.39 | 37.72 | 16.24 | 16.08 | 15.90 | 22.97 | 18.28 | 16.95 | 17.29 | 23.78 | 19.33 | 17.58 | 17.54 | 23.13 | 18.83 | 15.91 | 15.81 | 21.60 | 16.58 | 14.35 | 14.33 |
| 2023-12-31 | 2023-09-30 | 2023-06-30 | 2023-03-31 | 2022-12-31 | 2022-09-30 | 2022-06-30 | 2022-03-31 | 2021-12-31 | 2021-09-30 | 2021-06-30 | 2021-03-31 | 2020-12-31 | 2020-09-30 | 2020-06-30 | 2020-03-31 | 2019-12-31 | 2019-09-30 | 2019-06-30 | 2019-03-31 | 2018-12-31 | 2018-09-30 | 2018-06-30 | 2018-03-31 | 2017-12-31 | 2017-09-30 | 2017-06-30 | 2017-03-31 | 2016-12-31 | 2016-09-30 | 2016-06-30 | 2016-03-31 | 2015-12-31 | 2015-09-30 | 2015-06-30 | 2015-03-31 | 2014-12-31 | 2014-09-30 | 2014-06-30 | 2014-03-31 | 2013-12-31 | 2013-09-30 | 2013-06-30 | 2013-03-31 | 2012-12-31 | 2012-09-30 | 2012-06-30 | 2012-03-31 | 2011-12-31 | 2011-09-30 | 2011-06-30 | 2011-03-31 | 2010-12-31 | 2010-09-30 | 2010-06-30 | ||
|---|---|---|---|---|---|---|---|---|---|---|---|---|---|---|---|---|---|---|---|---|---|---|---|---|---|---|---|---|---|---|---|---|---|---|---|---|---|---|---|---|---|---|---|---|---|---|---|---|---|---|---|---|---|---|---|---|
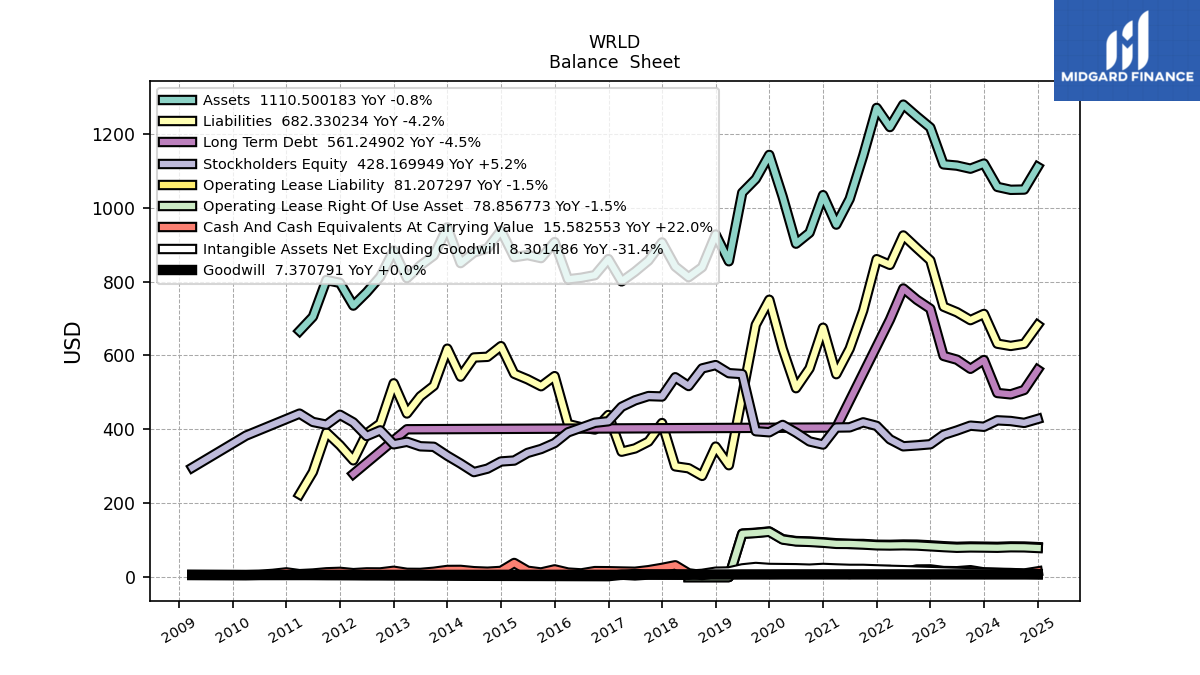
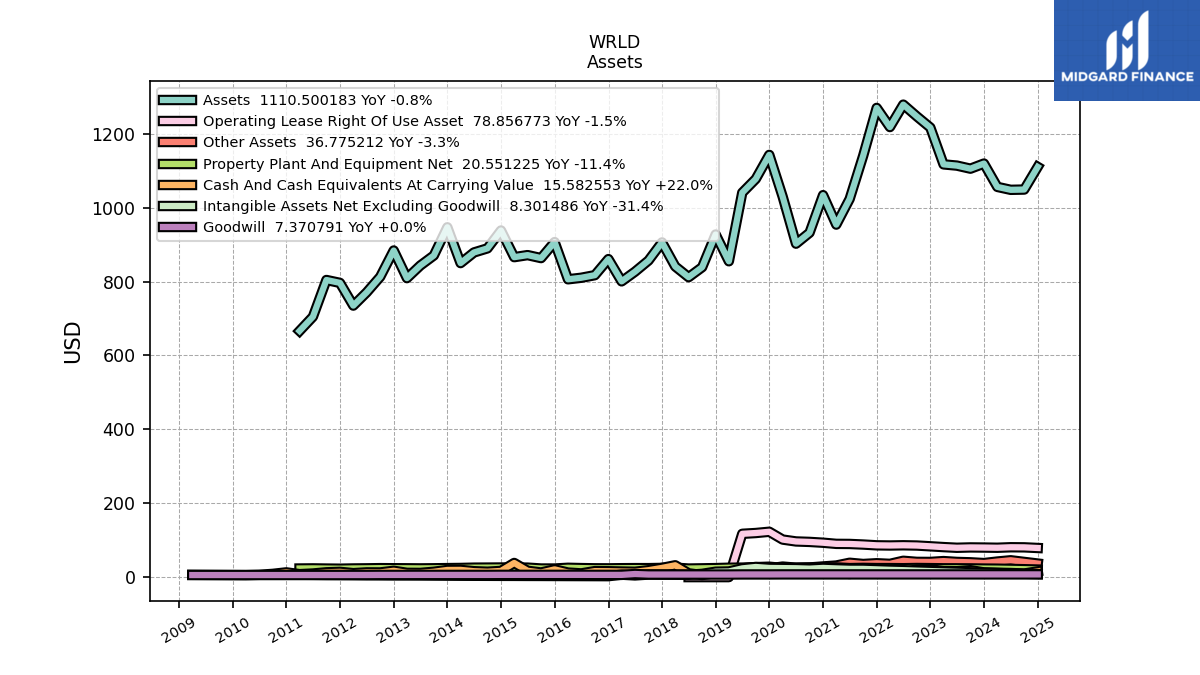
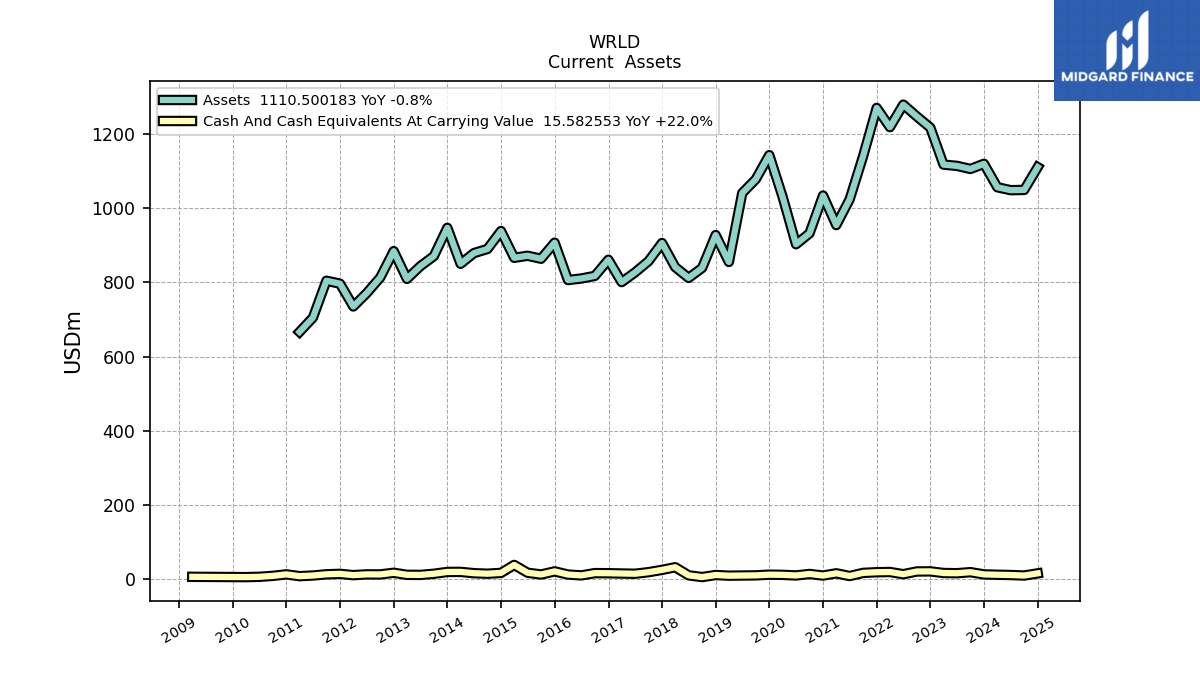
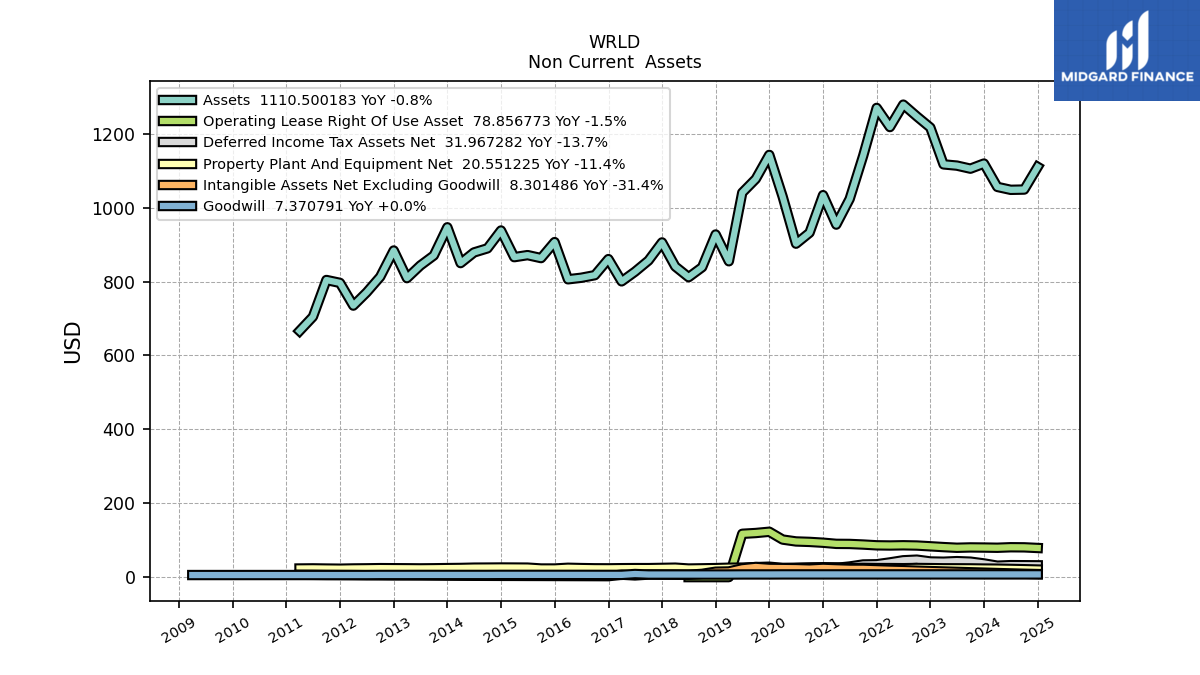
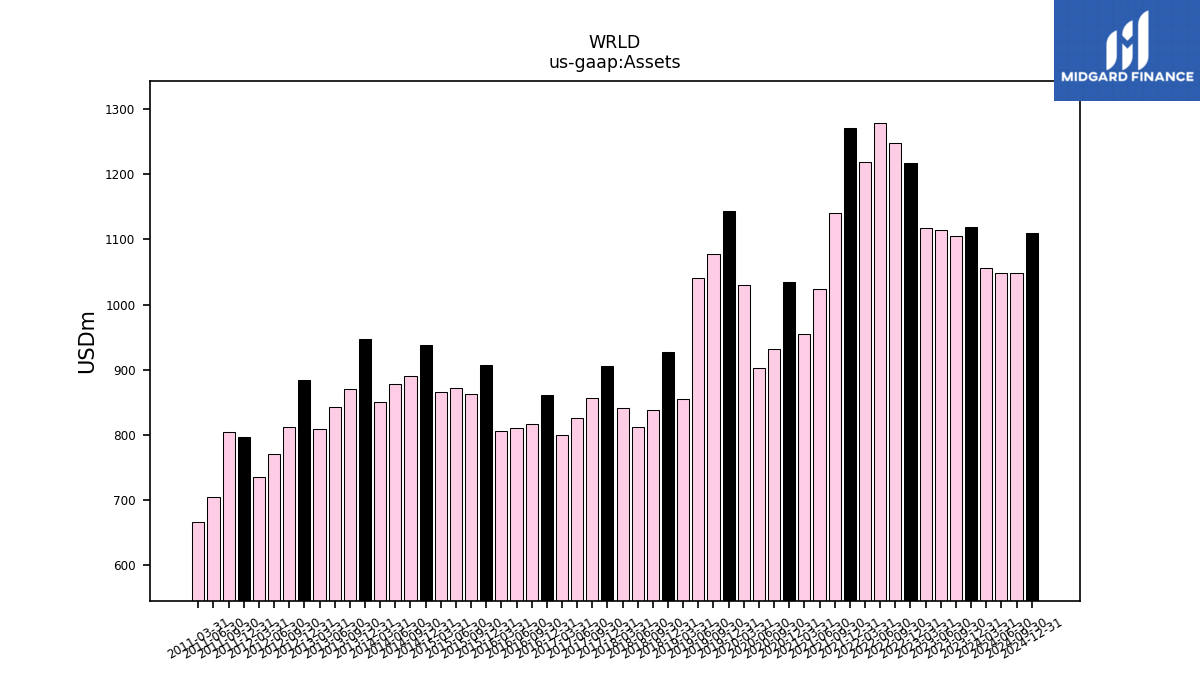
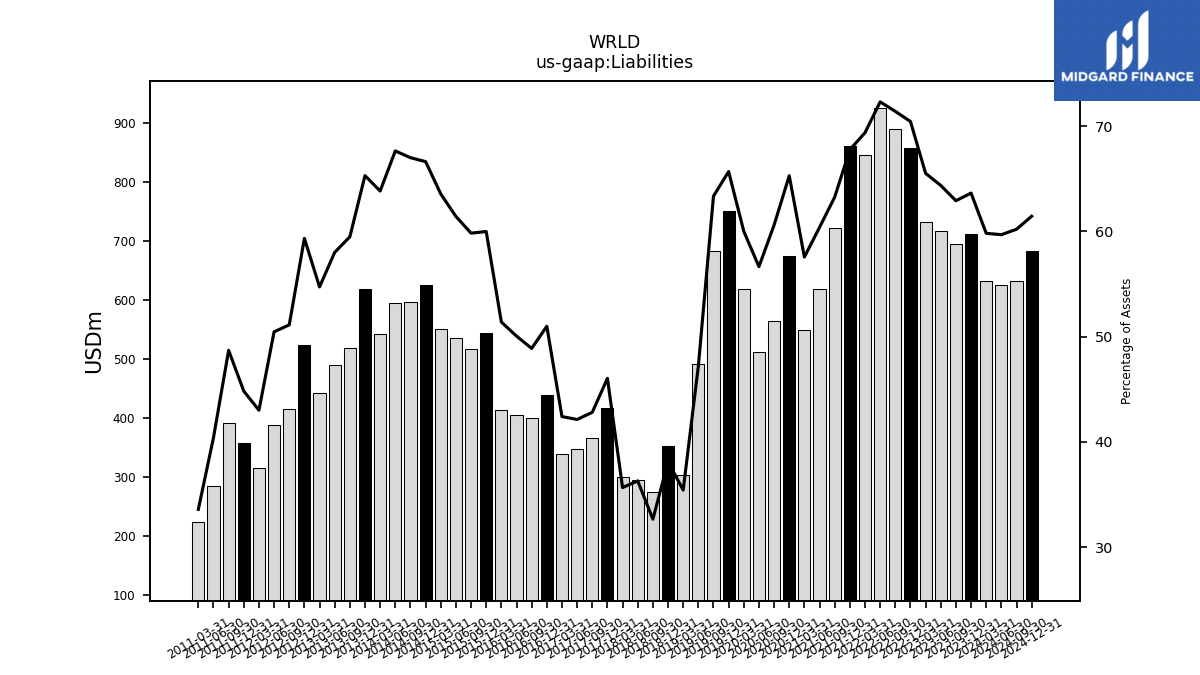
| Assets | 1119.54 | 1105.70 | 1113.97 | 1117.32 | 1216.98 | 1247.26 | 1279.07 | 1218.30 | 1270.20 | 1140.58 | 1023.68 | 954.27 | 1034.03 | 932.29 | 902.64 | 1030.09 | 1143.01 | 1077.82 | 1040.69 | 854.99 | 927.51 | 838.95 | 811.98 | 840.99 | 906.09 | 857.07 | 826.76 | 800.59 | 860.94 | 817.40 | 810.43 | 806.22 | 906.98 | 863.58 | 871.71 | 866.13 | 938.35 | 889.98 | 878.87 | 850.03 | 947.01 | 870.71 | 843.53 | 809.32 | 884.18 | 812.96 | 770.88 | 735.00 | 796.55 | 804.35 | 704.83 | 666.40 | NA | NA | NA | |
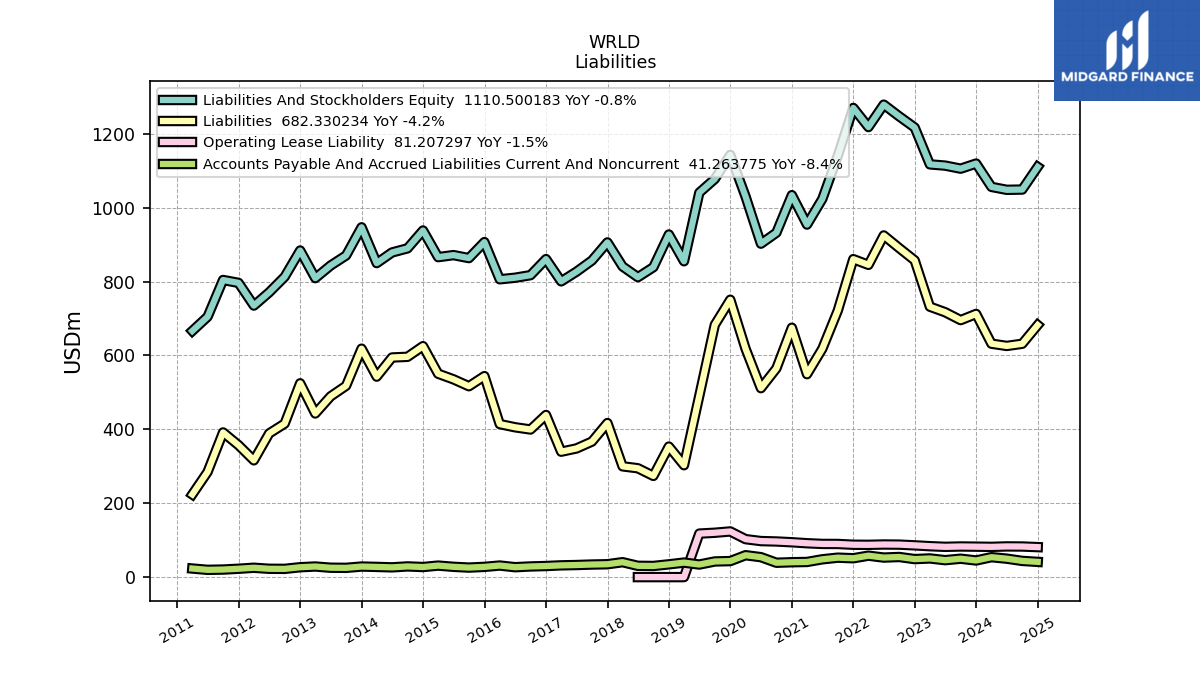
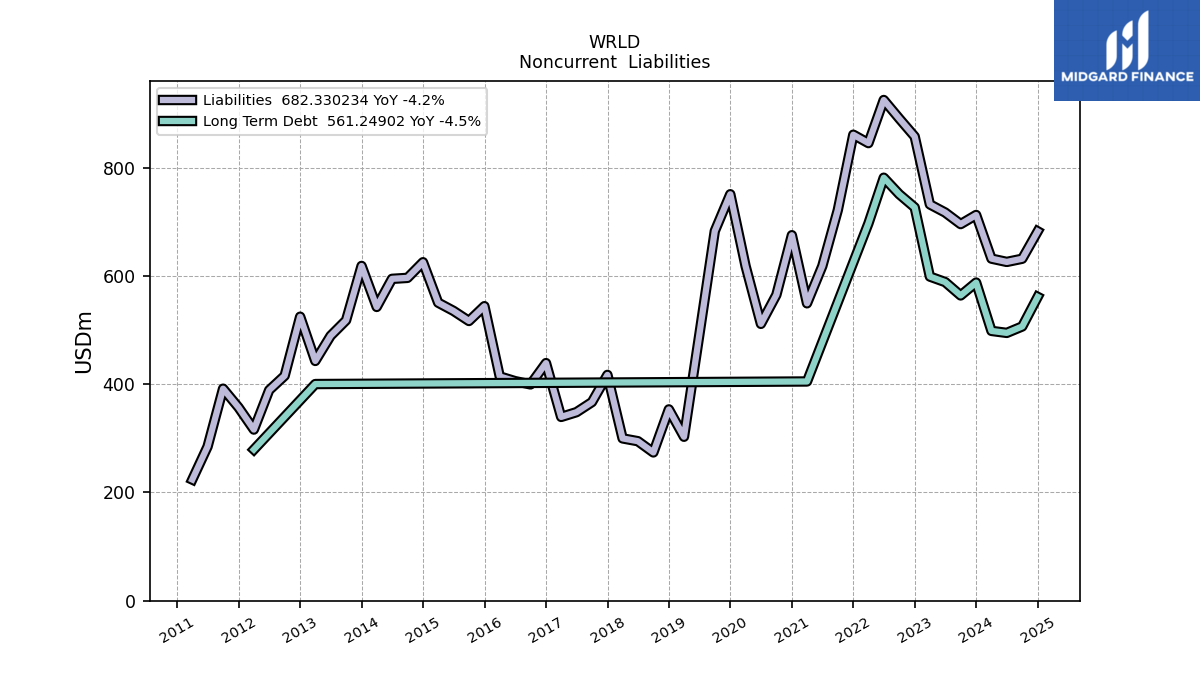
| Liabilities | 712.52 | 695.68 | 717.09 | 732.09 | 857.35 | 890.68 | 924.95 | 845.27 | 860.80 | 721.57 | 618.21 | 549.34 | 675.17 | 565.02 | 511.40 | 618.12 | 750.85 | 682.87 | 491.03 | 302.87 | 353.44 | 273.96 | 294.71 | 299.88 | 417.15 | 366.92 | 348.30 | 339.53 | 438.95 | 399.58 | 405.65 | 414.32 | 544.11 | 516.74 | 535.45 | 550.56 | 625.28 | 596.37 | 594.57 | 542.67 | 618.44 | 517.98 | 489.36 | 442.93 | 524.68 | 415.57 | 389.02 | 316.13 | 357.04 | 391.71 | 284.79 | 223.82 | NA | NA | NA | |
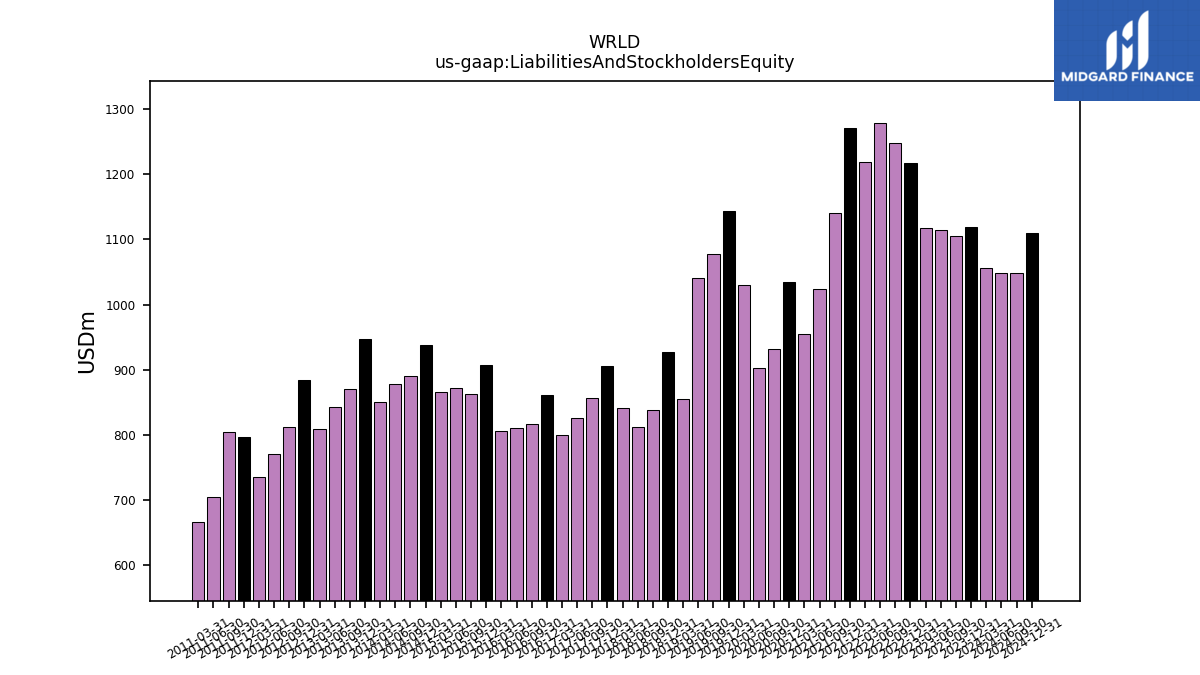
| Liabilities And Stockholders Equity | 1119.54 | 1105.70 | 1113.97 | 1117.32 | 1216.98 | 1247.26 | 1279.07 | 1218.30 | 1270.20 | 1140.58 | 1023.68 | 954.27 | 1034.03 | 932.29 | 902.64 | 1030.09 | 1143.01 | 1077.82 | 1040.69 | 854.99 | 927.51 | 838.95 | 811.98 | 840.99 | 906.09 | 857.07 | 826.76 | 800.59 | 860.94 | 817.40 | 810.43 | 806.22 | 906.98 | 863.58 | 871.71 | 866.13 | 938.35 | 889.98 | 878.87 | 850.03 | 947.01 | 870.71 | 843.53 | 809.32 | 884.18 | 812.96 | 770.88 | 735.00 | 796.55 | 804.35 | 704.83 | 666.40 | NA | NA | NA | |
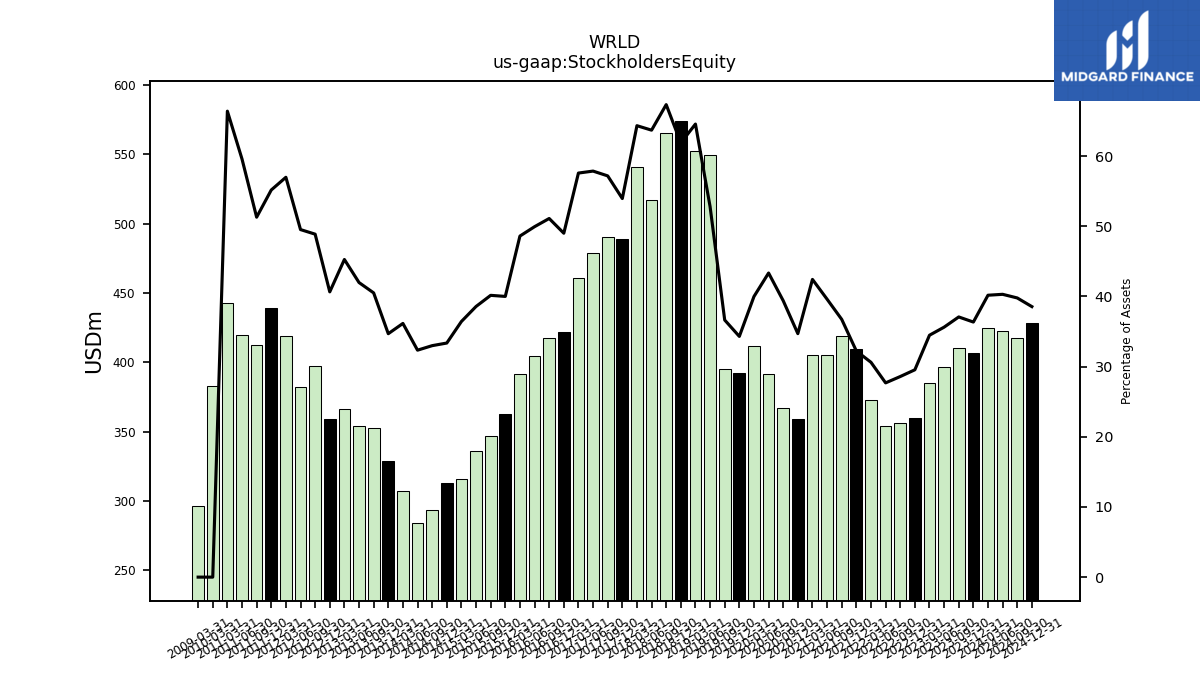
| Stockholders Equity | 407.02 | 410.02 | 396.89 | 385.23 | 359.63 | 356.58 | 354.13 | 373.02 | 409.41 | 419.01 | 405.47 | 404.93 | 358.86 | 367.28 | 391.24 | 411.96 | 392.16 | 394.94 | 549.66 | 552.12 | 574.07 | 564.99 | 517.27 | 541.11 | 488.94 | 490.15 | 478.46 | 461.06 | 421.99 | 417.82 | 404.78 | 391.90 | 362.87 | 346.84 | 336.26 | 315.57 | 313.07 | 293.61 | 284.30 | 307.36 | 328.57 | 352.73 | 354.17 | 366.40 | 359.51 | 397.39 | 381.86 | 418.88 | 439.51 | 412.64 | 420.04 | 442.58 | NA | NA | NA |
| 2023-12-31 | 2023-09-30 | 2023-06-30 | 2023-03-31 | 2022-12-31 | 2022-09-30 | 2022-06-30 | 2022-03-31 | 2021-12-31 | 2021-09-30 | 2021-06-30 | 2021-03-31 | 2020-12-31 | 2020-09-30 | 2020-06-30 | 2020-03-31 | 2019-12-31 | 2019-09-30 | 2019-06-30 | 2019-03-31 | 2018-12-31 | 2018-09-30 | 2018-06-30 | 2018-03-31 | 2017-12-31 | 2017-09-30 | 2017-06-30 | 2017-03-31 | 2016-12-31 | 2016-09-30 | 2016-06-30 | 2016-03-31 | 2015-12-31 | 2015-09-30 | 2015-06-30 | 2015-03-31 | 2014-12-31 | 2014-09-30 | 2014-06-30 | 2014-03-31 | 2013-12-31 | 2013-09-30 | 2013-06-30 | 2013-03-31 | 2012-12-31 | 2012-09-30 | 2012-06-30 | 2012-03-31 | 2011-12-31 | 2011-09-30 | 2011-06-30 | 2011-03-31 | 2010-12-31 | 2010-09-30 | 2010-06-30 | ||
|---|---|---|---|---|---|---|---|---|---|---|---|---|---|---|---|---|---|---|---|---|---|---|---|---|---|---|---|---|---|---|---|---|---|---|---|---|---|---|---|---|---|---|---|---|---|---|---|---|---|---|---|---|---|---|---|---|
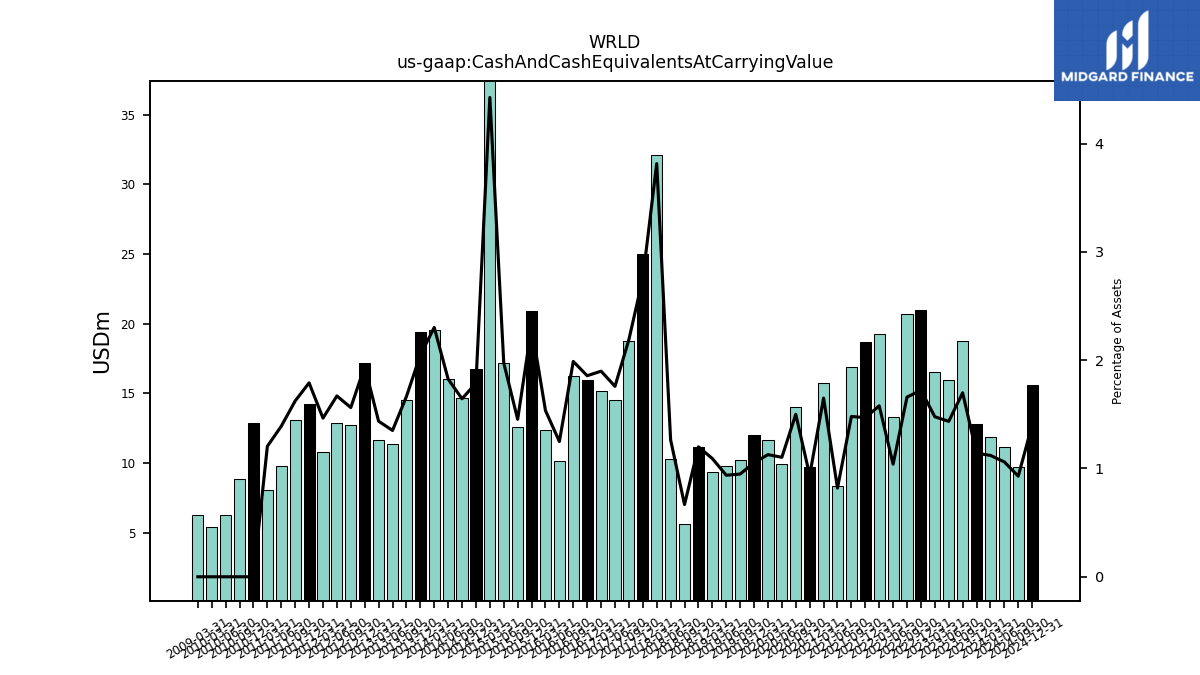
| Cash And Cash Equivalents At Carrying Value | 12.78 | 18.79 | 15.99 | 16.51 | 20.96 | 20.69 | 13.30 | 19.24 | 18.67 | 16.89 | 8.39 | 15.75 | 9.69 | 13.99 | 9.96 | 11.62 | 12.04 | 10.22 | 9.76 | 9.34 | 11.13 | 5.60 | 10.26 | 32.09 | 24.97 | 18.78 | 14.54 | 15.20 | 15.99 | 16.26 | 10.12 | 12.38 | 20.94 | 12.56 | 17.21 | 38.34 | 16.78 | 14.63 | 16.04 | 19.57 | 19.39 | 14.49 | 11.40 | 11.63 | 17.17 | 12.70 | 12.88 | 10.77 | 14.27 | 13.06 | 9.80 | 8.03 | 12.86 | 8.83 | 6.28 | |
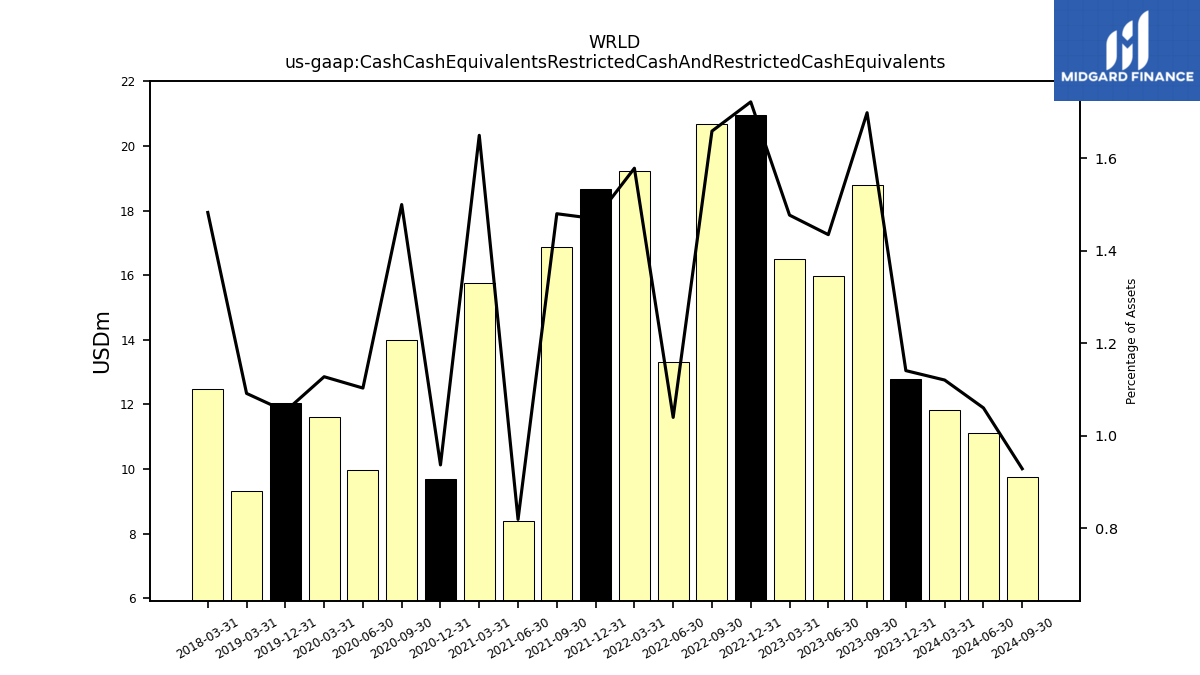
| Cash Cash Equivalents Restricted Cash And Restricted Cash Equivalents | 12.78 | 18.79 | 15.99 | 16.51 | 20.96 | 20.69 | 13.30 | 19.24 | 18.67 | 16.89 | 8.39 | 15.75 | 9.69 | 13.99 | 9.96 | 11.62 | 12.04 | NA | NA | 9.34 | NA | NA | NA | 12.47 | NA | NA | NA | NA | NA | NA | NA | NA | NA | NA | NA | NA | NA | NA | NA | NA | NA | NA | NA | NA | NA | NA | NA | NA | NA | NA | NA | NA | NA | NA | NA |
| 2023-12-31 | 2023-09-30 | 2023-06-30 | 2023-03-31 | 2022-12-31 | 2022-09-30 | 2022-06-30 | 2022-03-31 | 2021-12-31 | 2021-09-30 | 2021-06-30 | 2021-03-31 | 2020-12-31 | 2020-09-30 | 2020-06-30 | 2020-03-31 | 2019-12-31 | 2019-09-30 | 2019-06-30 | 2019-03-31 | 2018-12-31 | 2018-09-30 | 2018-06-30 | 2018-03-31 | 2017-12-31 | 2017-09-30 | 2017-06-30 | 2017-03-31 | 2016-12-31 | 2016-09-30 | 2016-06-30 | 2016-03-31 | 2015-12-31 | 2015-09-30 | 2015-06-30 | 2015-03-31 | 2014-12-31 | 2014-09-30 | 2014-06-30 | 2014-03-31 | 2013-12-31 | 2013-09-30 | 2013-06-30 | 2013-03-31 | 2012-12-31 | 2012-09-30 | 2012-06-30 | 2012-03-31 | 2011-12-31 | 2011-09-30 | 2011-06-30 | 2011-03-31 | 2010-12-31 | 2010-09-30 | 2010-06-30 | ||
|---|---|---|---|---|---|---|---|---|---|---|---|---|---|---|---|---|---|---|---|---|---|---|---|---|---|---|---|---|---|---|---|---|---|---|---|---|---|---|---|---|---|---|---|---|---|---|---|---|---|---|---|---|---|---|---|---|
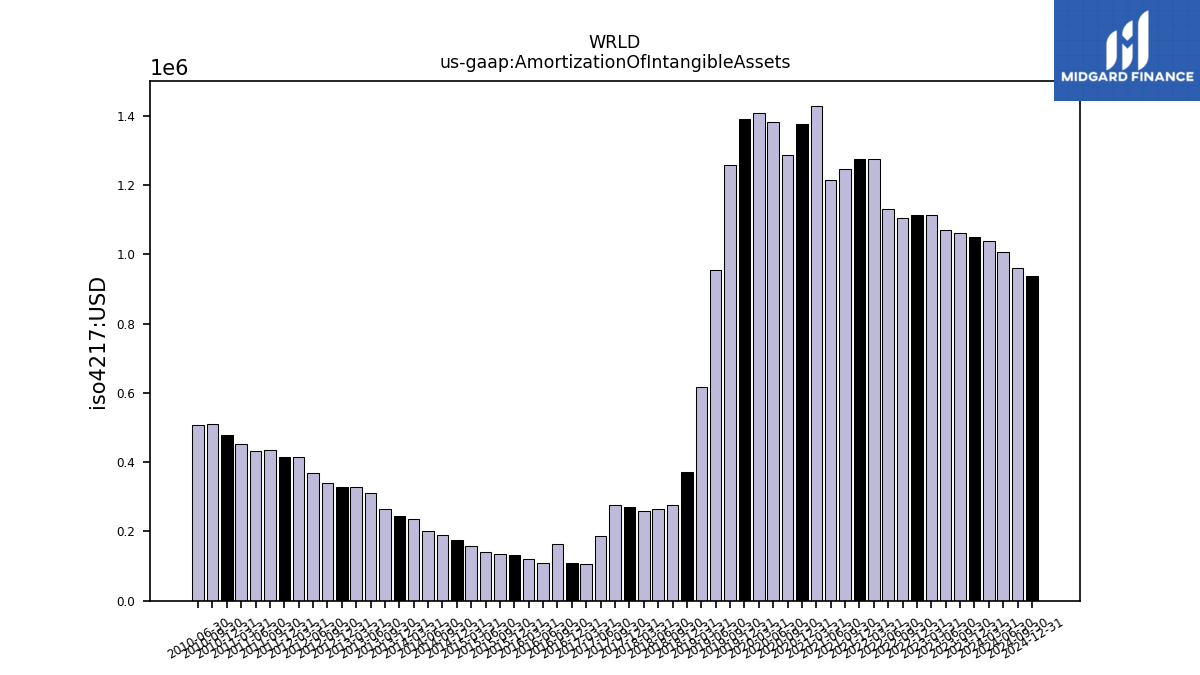
| Amortization Of Intangible Assets | 1.05 | 1.06 | 1.07 | 1.11 | 1.11 | 1.11 | 1.13 | 1.27 | 1.28 | 1.25 | 1.21 | 1.43 | 1.38 | 1.29 | 1.38 | 1.41 | 1.39 | 1.26 | 0.95 | 0.62 | 0.37 | 0.28 | 0.26 | 0.26 | 0.27 | 0.28 | 0.19 | 0.11 | 0.11 | 0.16 | 0.11 | 0.12 | 0.13 | 0.14 | 0.14 | 0.16 | 0.18 | 0.19 | 0.20 | 0.24 | 0.24 | 0.27 | 0.31 | 0.33 | 0.33 | 0.34 | 0.37 | 0.42 | 0.41 | 0.43 | 0.43 | 0.45 | 0.48 | 0.51 | 0.51 | |
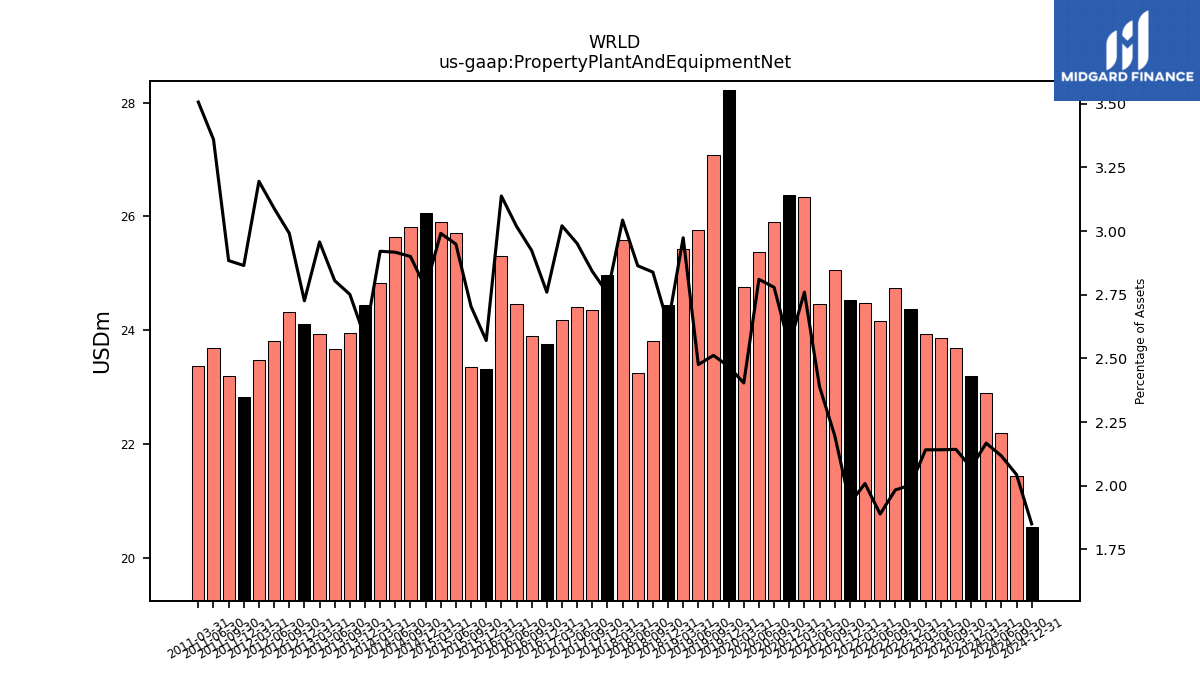
| Property Plant And Equipment Net | 23.20 | 23.70 | 23.86 | 23.93 | 24.38 | 24.74 | 24.16 | 24.48 | 24.53 | 25.07 | 24.46 | 26.34 | 26.38 | 25.91 | 25.37 | 24.76 | 28.22 | 27.08 | 25.77 | 25.42 | 24.44 | 23.82 | 23.25 | 25.59 | 24.97 | 24.36 | 24.40 | 24.18 | 23.76 | 23.90 | 24.47 | 25.30 | 23.31 | 23.35 | 25.70 | 25.91 | 26.06 | 25.81 | 25.64 | 24.83 | 24.45 | 23.96 | 23.66 | 23.94 | 24.10 | 24.32 | 23.82 | 23.49 | 22.82 | 23.20 | 23.68 | 23.37 | NA | NA | NA | |
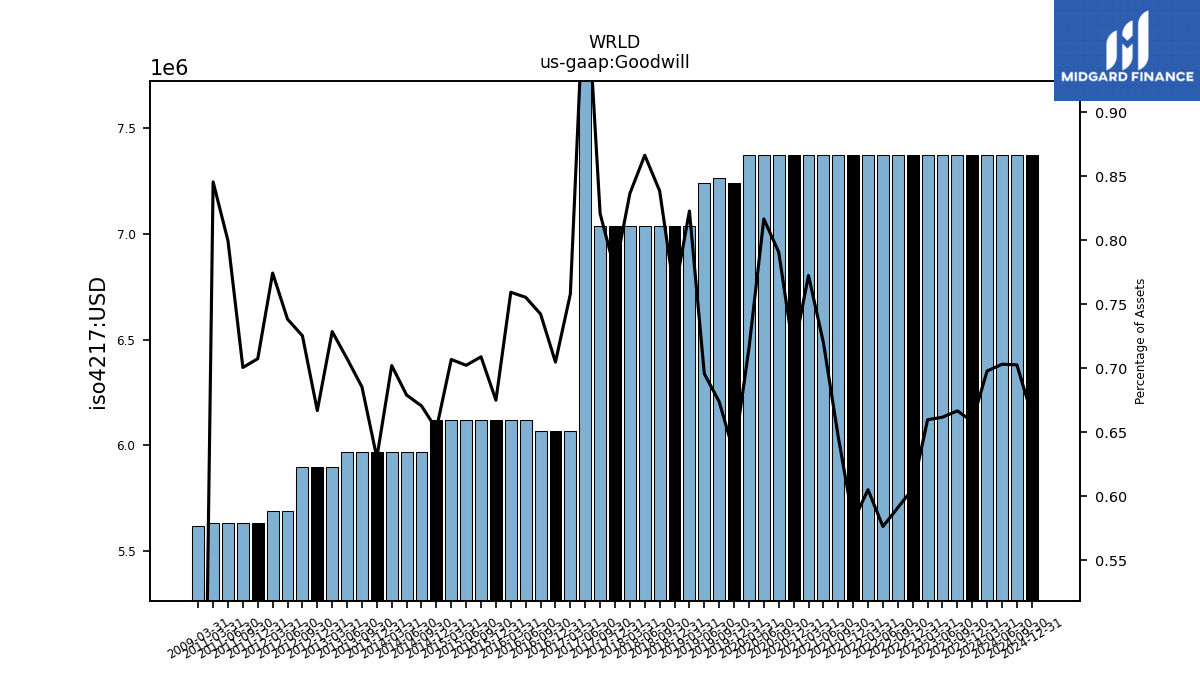
| Goodwill | 7.37 | 7.37 | 7.37 | 7.37 | 7.37 | 7.37 | 7.37 | 7.37 | 7.37 | 7.37 | 7.37 | 7.37 | 7.37 | 7.37 | 7.37 | 7.37 | 7.24 | 7.26 | 7.24 | 7.03 | 7.03 | 7.03 | 7.03 | 7.03 | 7.03 | 7.03 | 8.43 | 6.07 | 6.07 | 6.07 | 6.12 | 6.12 | 6.12 | 6.12 | 6.12 | 6.12 | 6.12 | 5.97 | 5.97 | 5.97 | 5.97 | 5.97 | 5.97 | 5.90 | 5.90 | 5.90 | 5.69 | 5.69 | 5.63 | 5.63 | 5.63 | 5.63 | NA | NA | NA | |
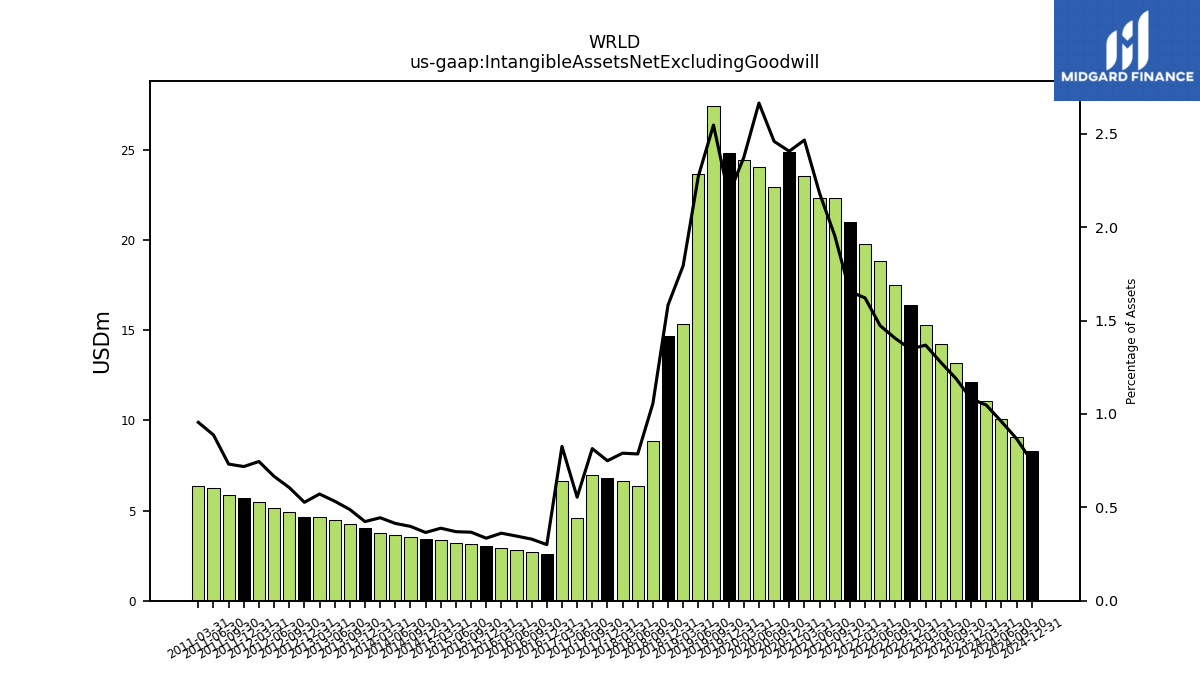
| Intangible Assets Net Excluding Goodwill | 12.11 | 13.16 | 14.22 | 15.29 | 16.40 | 17.52 | 18.84 | 19.76 | 21.03 | 22.31 | 22.34 | 23.54 | 24.89 | 22.93 | 24.05 | 24.45 | 24.83 | 27.45 | 23.65 | 15.34 | 14.68 | 8.86 | 6.38 | 6.64 | 6.79 | 6.98 | 4.58 | 6.61 | 2.59 | 2.70 | 2.81 | 2.92 | 3.04 | 3.17 | 3.22 | 3.36 | 3.43 | 3.54 | 3.64 | 3.78 | 4.01 | 4.25 | 4.50 | 4.62 | 4.66 | 4.93 | 5.13 | 5.48 | 5.72 | 5.88 | 6.26 | 6.36 | NA | NA | NA |
| 2023-12-31 | 2023-09-30 | 2023-06-30 | 2023-03-31 | 2022-12-31 | 2022-09-30 | 2022-06-30 | 2022-03-31 | 2021-12-31 | 2021-09-30 | 2021-06-30 | 2021-03-31 | 2020-12-31 | 2020-09-30 | 2020-06-30 | 2020-03-31 | 2019-12-31 | 2019-09-30 | 2019-06-30 | 2019-03-31 | 2018-12-31 | 2018-09-30 | 2018-06-30 | 2018-03-31 | 2017-12-31 | 2017-09-30 | 2017-06-30 | 2017-03-31 | 2016-12-31 | 2016-09-30 | 2016-06-30 | 2016-03-31 | 2015-12-31 | 2015-09-30 | 2015-06-30 | 2015-03-31 | 2014-12-31 | 2014-09-30 | 2014-06-30 | 2014-03-31 | 2013-12-31 | 2013-09-30 | 2013-06-30 | 2013-03-31 | 2012-12-31 | 2012-09-30 | 2012-06-30 | 2012-03-31 | 2011-12-31 | 2011-09-30 | 2011-06-30 | 2011-03-31 | 2010-12-31 | 2010-09-30 | 2010-06-30 | ||
|---|---|---|---|---|---|---|---|---|---|---|---|---|---|---|---|---|---|---|---|---|---|---|---|---|---|---|---|---|---|---|---|---|---|---|---|---|---|---|---|---|---|---|---|---|---|---|---|---|---|---|---|---|---|---|---|---|
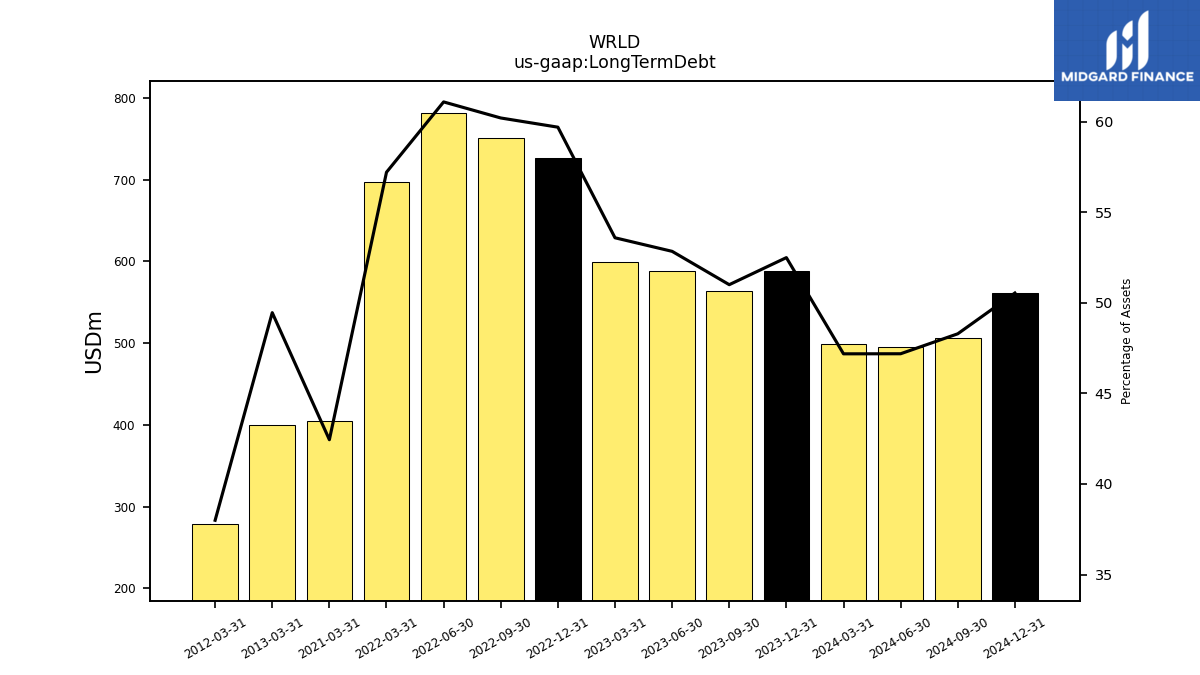
| Long Term Debt | 587.70 | 563.92 | 588.64 | 598.77 | 726.49 | 750.90 | 781.39 | 696.97 | NA | NA | NA | 405.01 | NA | NA | NA | NA | NA | NA | NA | NA | NA | NA | NA | NA | NA | NA | NA | NA | NA | NA | NA | NA | NA | NA | NA | NA | NA | NA | NA | NA | NA | NA | NA | 400.25 | NA | NA | NA | 279.25 | NA | NA | NA | NA | NA | NA | NA | |
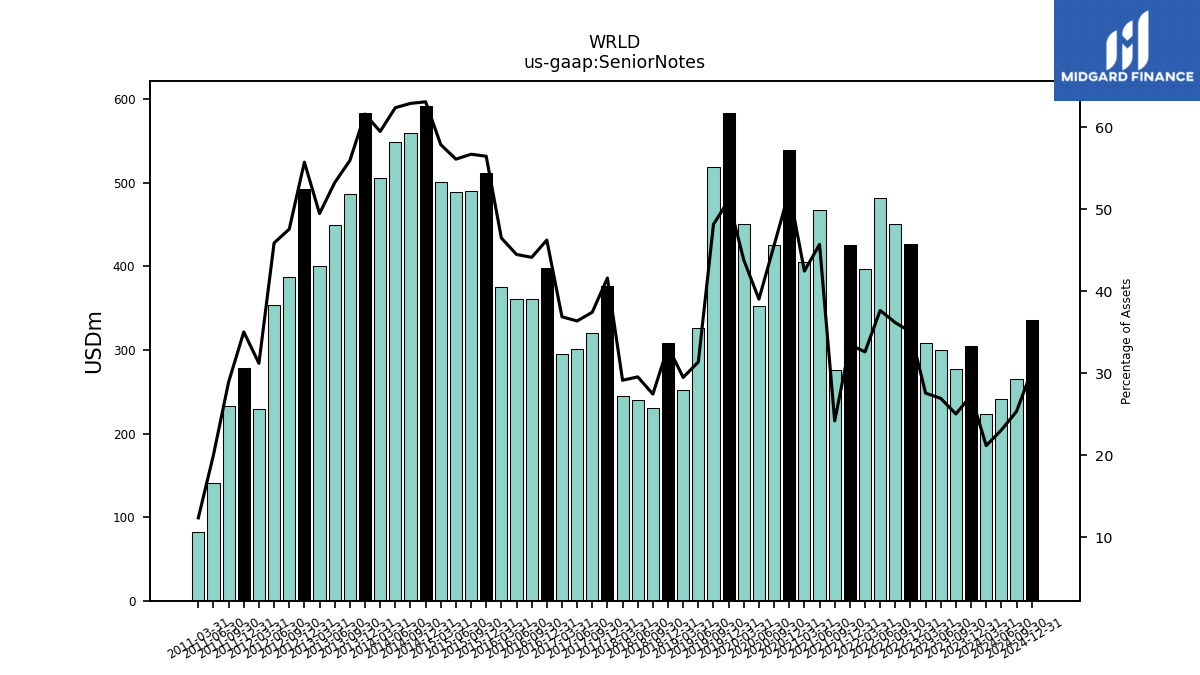
| Senior Notes | 305.09 | 276.56 | 299.78 | 307.91 | 426.49 | 450.90 | 481.39 | 396.97 | 425.17 | 275.71 | 467.70 | 405.01 | 539.60 | 424.90 | 352.21 | 451.10 | 583.73 | 518.83 | 326.39 | 251.94 | 308.04 | 230.19 | 239.84 | 244.90 | 376.85 | 320.75 | 300.55 | 295.14 | 397.94 | 360.59 | 360.36 | 374.69 | 511.94 | 489.58 | 488.95 | 501.15 | 591.95 | 559.70 | 548.10 | 505.50 | 583.25 | 486.85 | 448.95 | 400.25 | 492.70 | 386.60 | 353.60 | 229.25 | 278.92 | 232.60 | 141.15 | 82.25 | NA | NA | NA |
| 2023-12-31 | 2023-09-30 | 2023-06-30 | 2023-03-31 | 2022-12-31 | 2022-09-30 | 2022-06-30 | 2022-03-31 | 2021-12-31 | 2021-09-30 | 2021-06-30 | 2021-03-31 | 2020-12-31 | 2020-09-30 | 2020-06-30 | 2020-03-31 | 2019-12-31 | 2019-09-30 | 2019-06-30 | 2019-03-31 | 2018-12-31 | 2018-09-30 | 2018-06-30 | 2018-03-31 | 2017-12-31 | 2017-09-30 | 2017-06-30 | 2017-03-31 | 2016-12-31 | 2016-09-30 | 2016-06-30 | 2016-03-31 | 2015-12-31 | 2015-09-30 | 2015-06-30 | 2015-03-31 | 2014-12-31 | 2014-09-30 | 2014-06-30 | 2014-03-31 | 2013-12-31 | 2013-09-30 | 2013-06-30 | 2013-03-31 | 2012-12-31 | 2012-09-30 | 2012-06-30 | 2012-03-31 | 2011-12-31 | 2011-09-30 | 2011-06-30 | 2011-03-31 | 2010-12-31 | 2010-09-30 | 2010-06-30 | ||
|---|---|---|---|---|---|---|---|---|---|---|---|---|---|---|---|---|---|---|---|---|---|---|---|---|---|---|---|---|---|---|---|---|---|---|---|---|---|---|---|---|---|---|---|---|---|---|---|---|---|---|---|---|---|---|---|---|
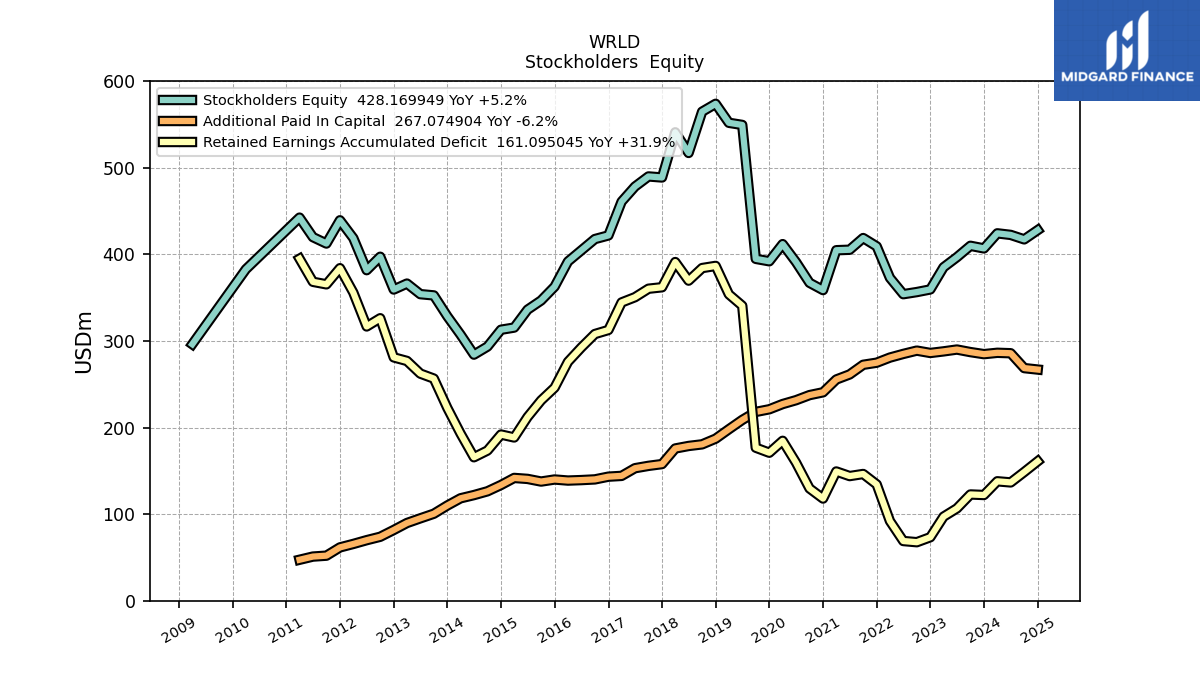
| Stockholders Equity | 407.02 | 410.02 | 396.89 | 385.23 | 359.63 | 356.58 | 354.13 | 373.02 | 409.41 | 419.01 | 405.47 | 404.93 | 358.86 | 367.28 | 391.24 | 411.96 | 392.16 | 394.94 | 549.66 | 552.12 | 574.07 | 564.99 | 517.27 | 541.11 | 488.94 | 490.15 | 478.46 | 461.06 | 421.99 | 417.82 | 404.78 | 391.90 | 362.87 | 346.84 | 336.26 | 315.57 | 313.07 | 293.61 | 284.30 | 307.36 | 328.57 | 352.73 | 354.17 | 366.40 | 359.51 | 397.39 | 381.86 | 418.88 | 439.51 | 412.64 | 420.04 | 442.58 | NA | NA | NA | |
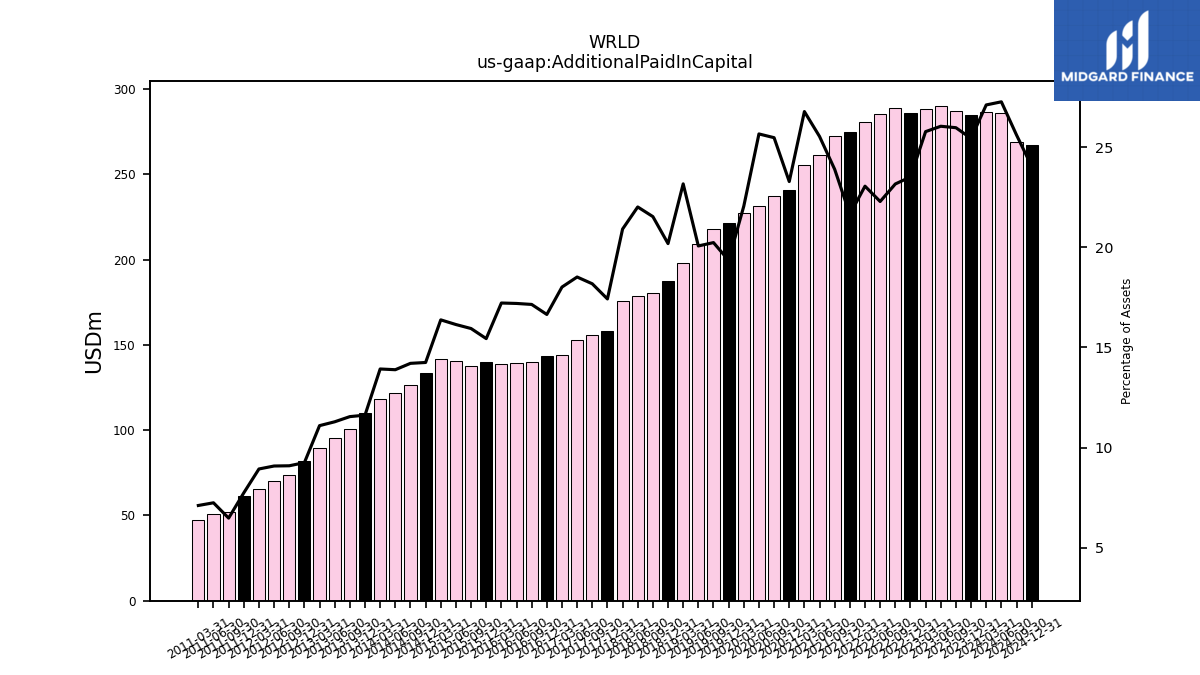
| Additional Paid In Capital | 284.87 | 287.25 | 290.19 | 288.07 | 286.23 | 288.95 | 285.13 | 280.91 | 274.99 | 272.57 | 261.45 | 255.59 | 240.81 | 237.55 | 231.68 | 227.21 | 221.17 | 218.14 | 208.88 | 198.13 | 187.26 | 180.68 | 178.79 | 175.89 | 157.87 | 155.82 | 153.11 | 144.24 | 143.34 | 140.18 | 139.38 | 138.84 | 140.06 | 137.70 | 140.74 | 141.86 | 133.71 | 126.43 | 122.06 | 118.37 | 110.03 | 100.53 | 95.21 | 89.79 | 81.75 | 73.90 | 69.98 | 65.63 | 61.63 | 52.08 | 51.03 | 47.35 | NA | NA | NA | |
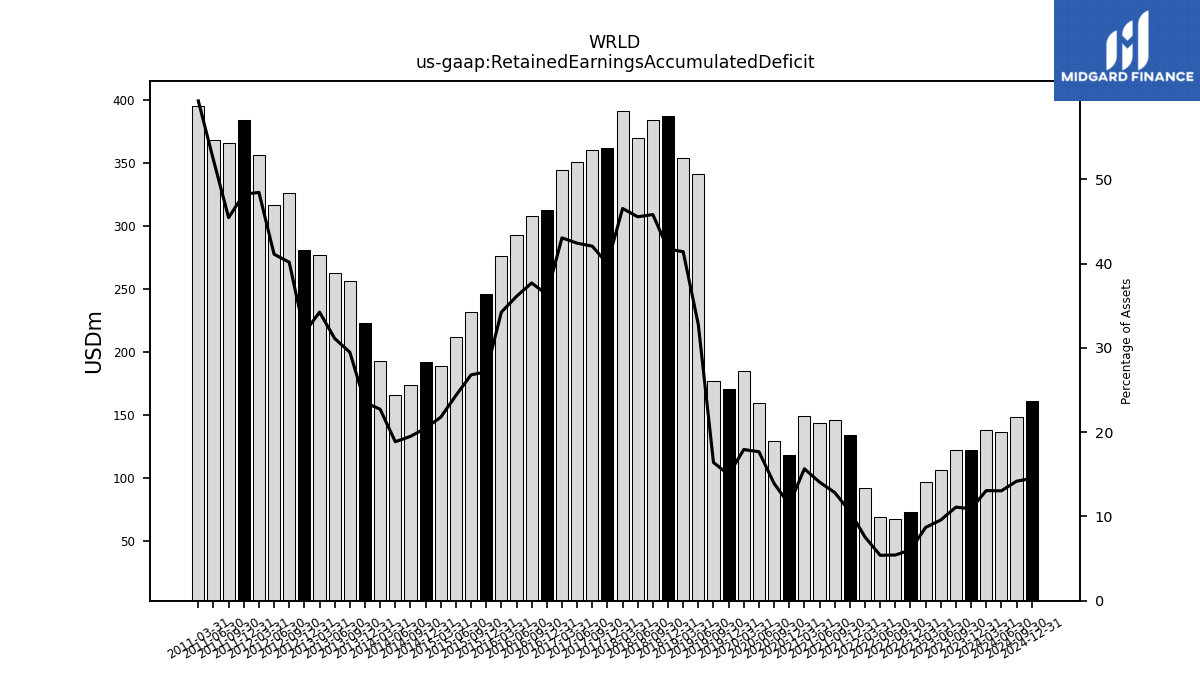
| Retained Earnings Accumulated Deficit | 122.15 | 122.78 | 106.69 | 97.15 | 73.39 | 67.63 | 69.00 | 92.12 | 134.41 | 146.44 | 144.02 | 149.34 | 118.06 | 129.73 | 159.56 | 184.75 | 170.98 | 176.81 | 340.78 | 353.99 | 386.81 | 384.31 | 369.77 | 391.28 | 362.13 | 360.45 | 350.65 | 344.61 | 312.75 | 308.11 | 292.62 | 276.00 | 246.18 | 231.42 | 212.24 | 188.61 | 192.01 | 173.52 | 165.75 | 193.10 | 222.66 | 256.64 | 262.40 | 277.02 | 281.15 | 326.36 | 316.86 | 355.98 | 384.17 | 365.51 | 368.43 | 395.09 | NA | NA | NA | |
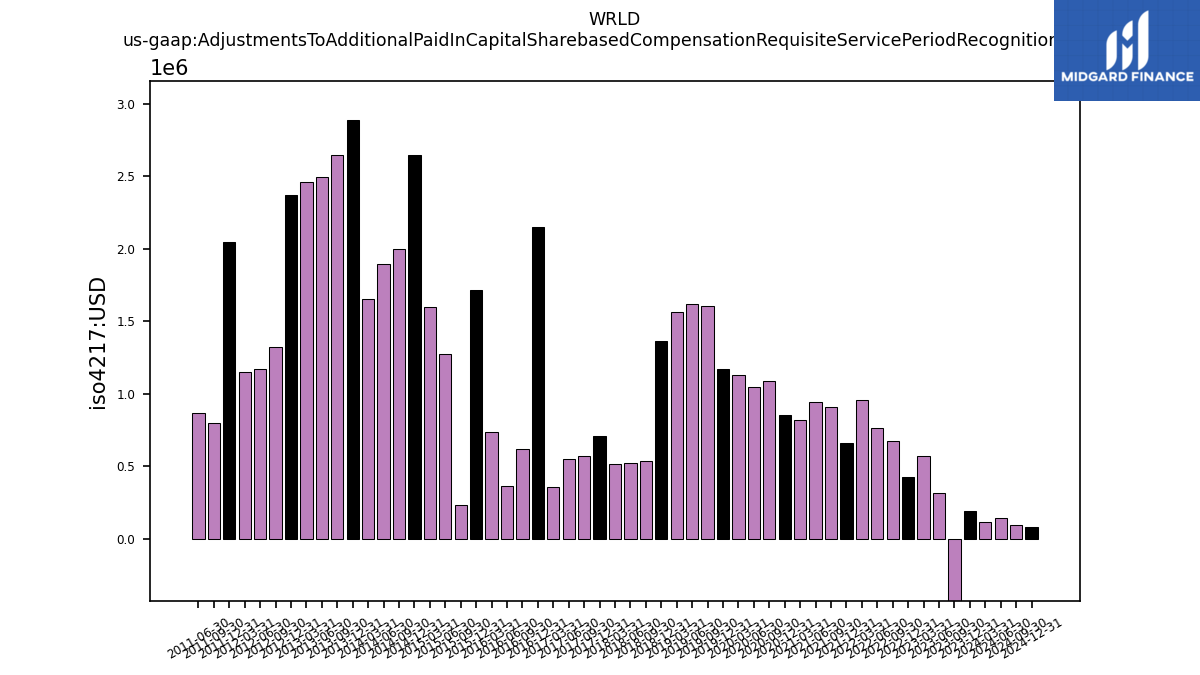
| Adjustments To Additional Paid In Capital Sharebased Compensation Requisite Service Period Recognition Value | 0.19 | -4.37 | 0.31 | 0.57 | 0.43 | 0.68 | 0.77 | 0.96 | 0.66 | 0.91 | 0.94 | 0.82 | 0.85 | 1.09 | 1.05 | 1.13 | 1.17 | 1.60 | 1.62 | 1.57 | 1.36 | 0.54 | 0.52 | 0.52 | 0.71 | 0.57 | 0.55 | 0.36 | 2.15 | 0.62 | 0.37 | 0.74 | 1.72 | 0.23 | 1.28 | 1.60 | 2.65 | 2.00 | 1.89 | 1.65 | 2.88 | 2.64 | 2.50 | 2.46 | 2.37 | 1.32 | 1.17 | 1.15 | 2.05 | 0.80 | 0.87 | NA | NA | NA | NA |
| 2023-12-31 | 2023-09-30 | 2023-06-30 | 2023-03-31 | 2022-12-31 | 2022-09-30 | 2022-06-30 | 2022-03-31 | 2021-12-31 | 2021-09-30 | 2021-06-30 | 2021-03-31 | 2020-12-31 | 2020-09-30 | 2020-06-30 | 2020-03-31 | 2019-12-31 | 2019-09-30 | 2019-06-30 | 2019-03-31 | 2018-12-31 | 2018-09-30 | 2018-06-30 | 2018-03-31 | 2017-12-31 | 2017-09-30 | 2017-06-30 | 2017-03-31 | 2016-12-31 | 2016-09-30 | 2016-06-30 | 2016-03-31 | 2015-12-31 | 2015-09-30 | 2015-06-30 | 2015-03-31 | 2014-12-31 | 2014-09-30 | 2014-06-30 | 2014-03-31 | 2013-12-31 | 2013-09-30 | 2013-06-30 | 2013-03-31 | 2012-12-31 | 2012-09-30 | 2012-06-30 | 2012-03-31 | 2011-12-31 | 2011-09-30 | 2011-06-30 | 2011-03-31 | 2010-12-31 | 2010-09-30 | 2010-06-30 | ||
|---|---|---|---|---|---|---|---|---|---|---|---|---|---|---|---|---|---|---|---|---|---|---|---|---|---|---|---|---|---|---|---|---|---|---|---|---|---|---|---|---|---|---|---|---|---|---|---|---|---|---|---|---|---|---|---|---|
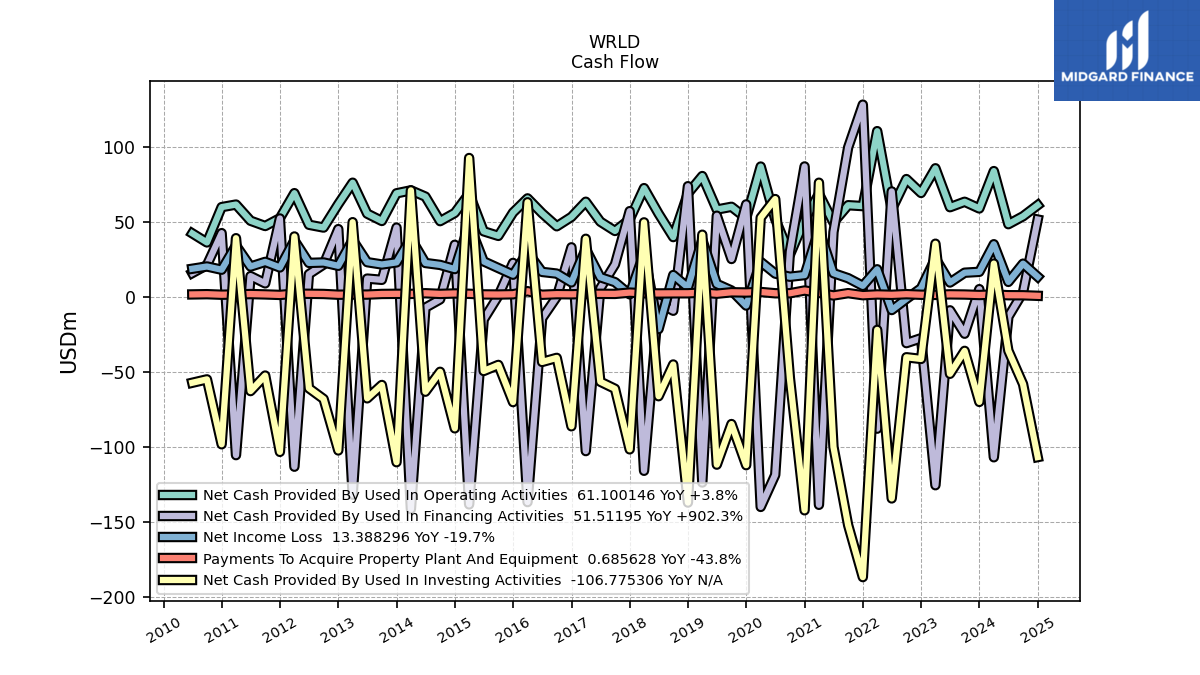
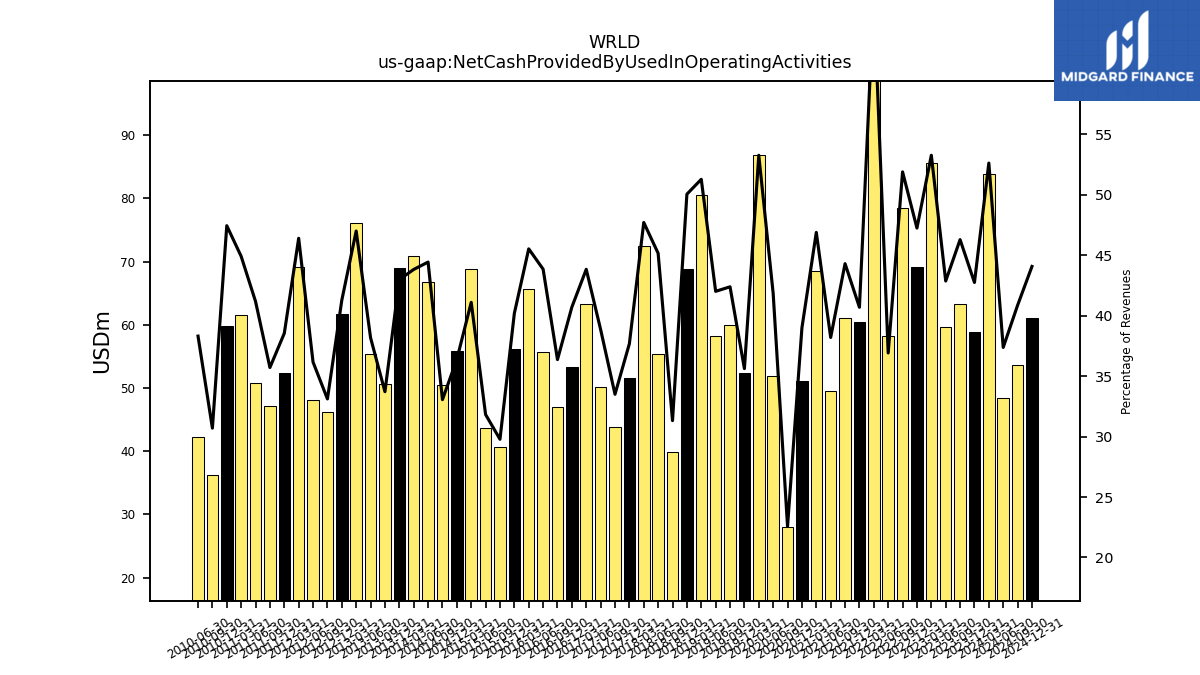
| Net Cash Provided By Used In Operating Activities | 58.88 | 63.36 | 59.73 | 85.68 | 69.22 | 78.48 | 58.18 | 110.43 | 60.46 | 61.06 | 49.53 | 68.59 | 51.05 | 28.08 | 51.84 | 86.84 | 52.39 | 60.01 | 58.16 | 80.51 | 68.89 | 39.81 | 55.45 | 72.45 | 51.60 | 43.89 | 50.09 | 63.37 | 53.26 | 47.01 | 55.72 | 65.63 | 56.15 | 40.62 | 43.67 | 68.81 | 55.90 | 50.43 | 66.79 | 70.96 | 68.99 | 50.55 | 55.46 | 76.07 | 61.78 | 46.16 | 48.03 | 69.10 | 52.39 | 47.19 | 50.71 | 61.50 | 59.80 | 36.24 | 42.30 | |
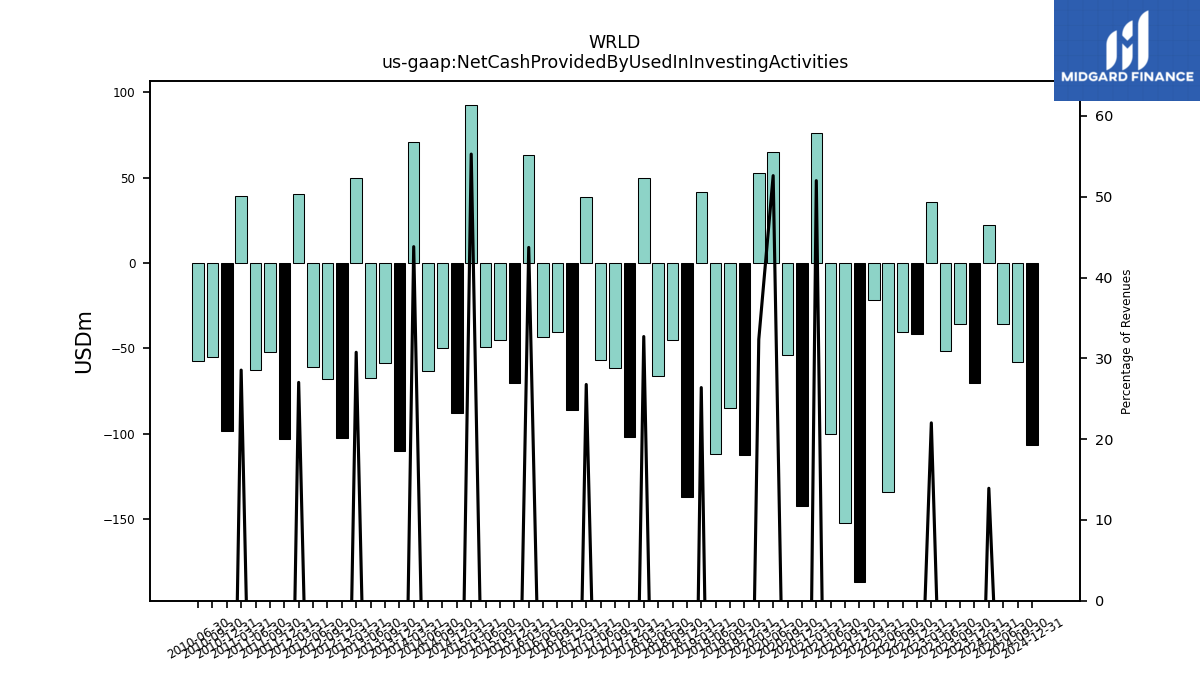
| Net Cash Provided By Used In Investing Activities | -70.03 | -35.99 | -51.28 | 35.41 | -41.39 | -40.25 | -134.35 | -22.00 | -186.77 | -152.14 | -100.01 | 76.05 | -142.25 | -54.18 | 65.17 | 52.74 | -112.18 | -84.76 | -111.82 | 41.42 | -137.10 | -45.06 | -66.23 | 49.65 | -101.64 | -61.27 | -56.56 | 38.70 | -86.27 | -40.66 | -43.39 | 63.03 | -70.15 | -45.35 | -49.42 | 92.54 | -87.63 | -49.95 | -63.21 | 70.96 | -110.20 | -58.71 | -67.63 | 49.77 | -102.35 | -68.05 | -60.90 | 40.24 | -103.32 | -52.44 | -62.81 | 39.09 | -98.25 | -54.98 | -57.25 | |
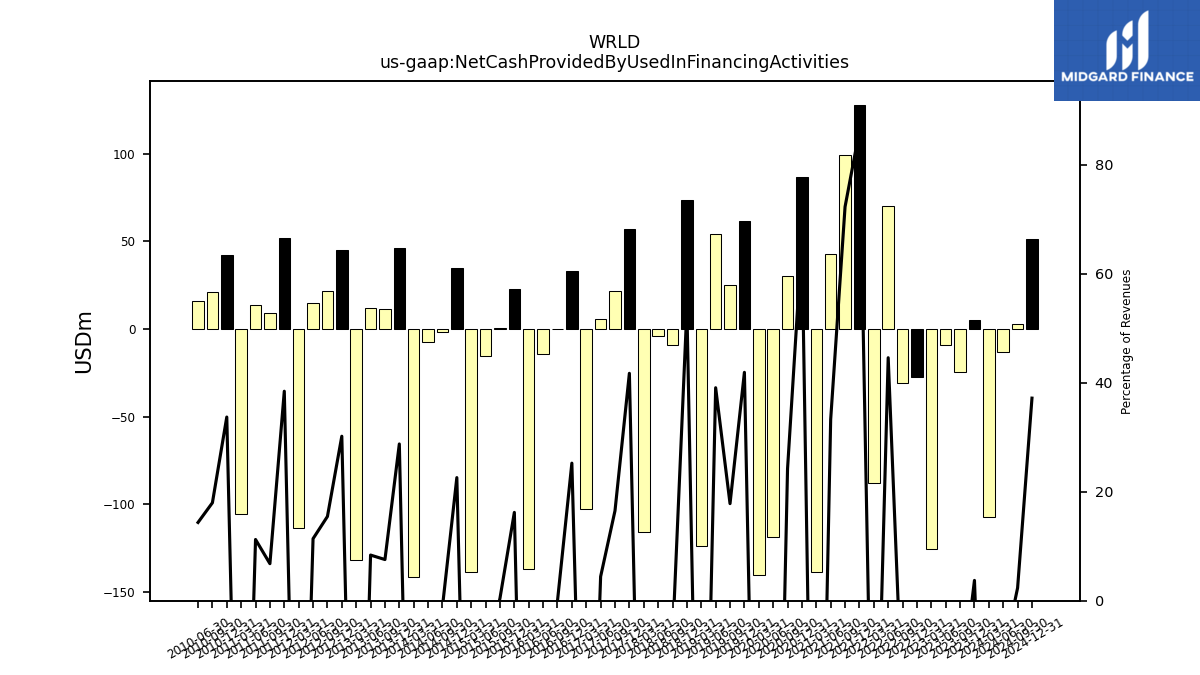
| Net Cash Provided By Used In Financing Activities | 5.14 | -24.57 | -8.97 | -125.54 | -27.55 | -30.84 | 70.24 | -87.86 | 128.09 | 99.58 | 43.13 | -138.59 | 86.90 | 30.13 | -118.67 | -140.00 | 61.61 | 25.22 | 54.08 | -123.72 | 73.74 | -9.26 | -3.87 | -115.92 | 57.11 | 21.63 | 5.71 | -102.80 | 33.01 | -0.03 | -14.33 | -136.78 | 22.63 | 0.64 | -15.12 | -138.33 | 34.70 | -1.68 | -7.17 | -141.48 | 46.15 | 11.33 | 12.17 | -131.85 | 45.15 | 21.55 | 15.12 | -113.20 | 52.24 | 8.99 | 13.83 | -105.50 | 42.46 | 21.21 | 15.85 |
| 2023-12-31 | 2023-09-30 | 2023-06-30 | 2023-03-31 | 2022-12-31 | 2022-09-30 | 2022-06-30 | 2022-03-31 | 2021-12-31 | 2021-09-30 | 2021-06-30 | 2021-03-31 | 2020-12-31 | 2020-09-30 | 2020-06-30 | 2020-03-31 | 2019-12-31 | 2019-09-30 | 2019-06-30 | 2019-03-31 | 2018-12-31 | 2018-09-30 | 2018-06-30 | 2018-03-31 | 2017-12-31 | 2017-09-30 | 2017-06-30 | 2017-03-31 | 2016-12-31 | 2016-09-30 | 2016-06-30 | 2016-03-31 | 2015-12-31 | 2015-09-30 | 2015-06-30 | 2015-03-31 | 2014-12-31 | 2014-09-30 | 2014-06-30 | 2014-03-31 | 2013-12-31 | 2013-09-30 | 2013-06-30 | 2013-03-31 | 2012-12-31 | 2012-09-30 | 2012-06-30 | 2012-03-31 | 2011-12-31 | 2011-09-30 | 2011-06-30 | 2011-03-31 | 2010-12-31 | 2010-09-30 | 2010-06-30 | ||
|---|---|---|---|---|---|---|---|---|---|---|---|---|---|---|---|---|---|---|---|---|---|---|---|---|---|---|---|---|---|---|---|---|---|---|---|---|---|---|---|---|---|---|---|---|---|---|---|---|---|---|---|---|---|---|---|---|
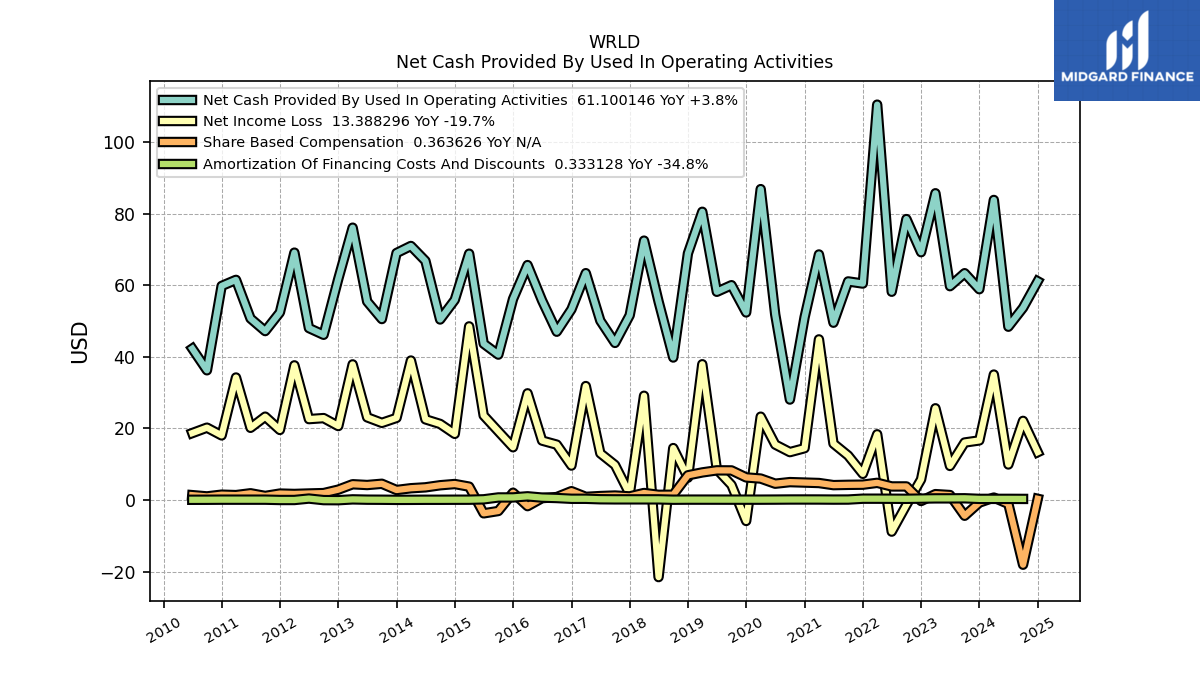
| Net Cash Provided By Used In Operating Activities | 58.88 | 63.36 | 59.73 | 85.68 | 69.22 | 78.48 | 58.18 | 110.43 | 60.46 | 61.06 | 49.53 | 68.59 | 51.05 | 28.08 | 51.84 | 86.84 | 52.39 | 60.01 | 58.16 | 80.51 | 68.89 | 39.81 | 55.45 | 72.45 | 51.60 | 43.89 | 50.09 | 63.37 | 53.26 | 47.01 | 55.72 | 65.63 | 56.15 | 40.62 | 43.67 | 68.81 | 55.90 | 50.43 | 66.79 | 70.96 | 68.99 | 50.55 | 55.46 | 76.07 | 61.78 | 46.16 | 48.03 | 69.10 | 52.39 | 47.19 | 50.71 | 61.50 | 59.80 | 36.24 | 42.30 | |
| Net Income Loss | 16.66 | 16.08 | 9.54 | 25.64 | 5.76 | -1.37 | -8.80 | 18.38 | 7.33 | 12.44 | 15.77 | 44.88 | 14.49 | 13.40 | 15.51 | 23.30 | -5.82 | 4.22 | 8.61 | 37.94 | 6.26 | 14.54 | -21.50 | 29.14 | 1.68 | 9.80 | 13.07 | 31.85 | 9.64 | 15.49 | 16.62 | 29.83 | 14.75 | 19.19 | 23.63 | 48.52 | 18.49 | 21.27 | 22.56 | 38.98 | 22.95 | 21.57 | 23.11 | 37.90 | 20.67 | 22.90 | 22.61 | 37.63 | 19.58 | 23.30 | 20.18 | 34.24 | 18.06 | 20.23 | 18.71 | |
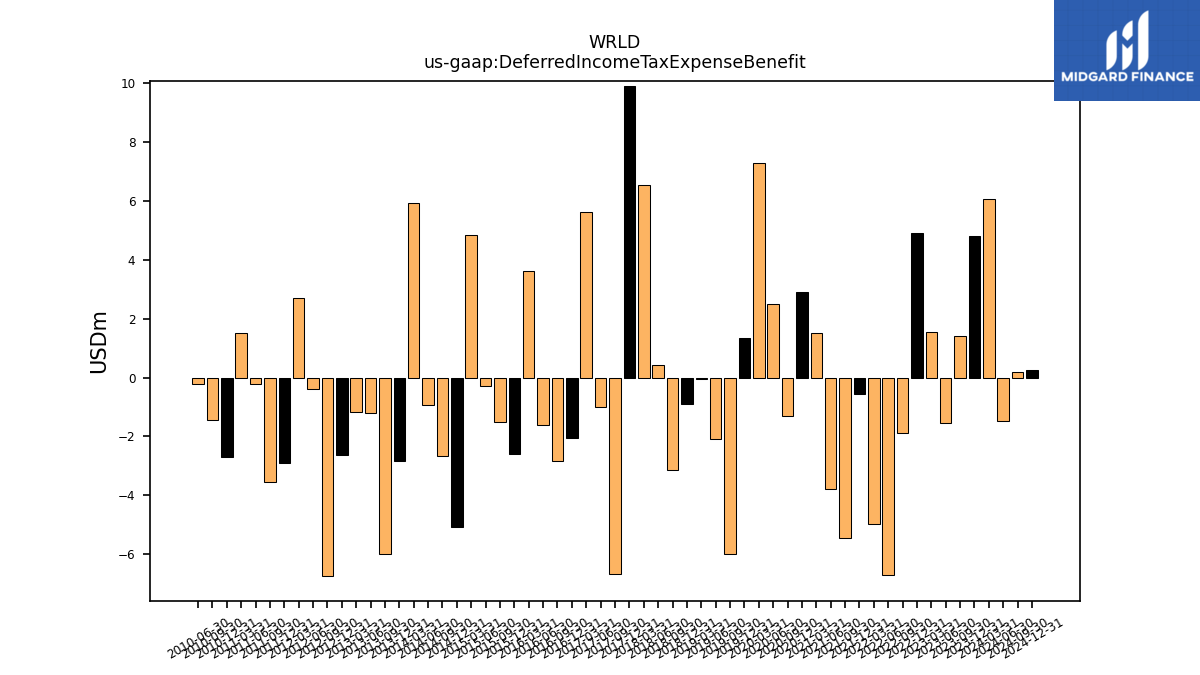
| Deferred Income Tax Expense Benefit | 4.81 | 1.41 | -1.55 | 1.56 | 4.91 | -1.88 | -6.70 | -4.99 | -0.56 | -5.47 | -3.79 | 1.51 | 2.92 | -1.29 | 2.51 | 7.29 | 1.35 | -6.00 | -2.07 | -0.05 | -0.89 | -3.13 | 0.41 | 6.54 | 9.92 | -6.69 | -0.99 | 5.63 | -2.07 | -2.85 | -1.61 | 3.63 | -2.59 | -1.52 | -0.29 | 4.84 | -5.06 | -2.68 | -0.93 | 5.94 | -2.83 | -5.99 | -1.21 | -1.17 | -2.64 | -6.75 | -0.38 | 2.69 | -2.90 | -3.55 | -0.23 | 1.53 | -2.71 | -1.45 | -0.20 | |
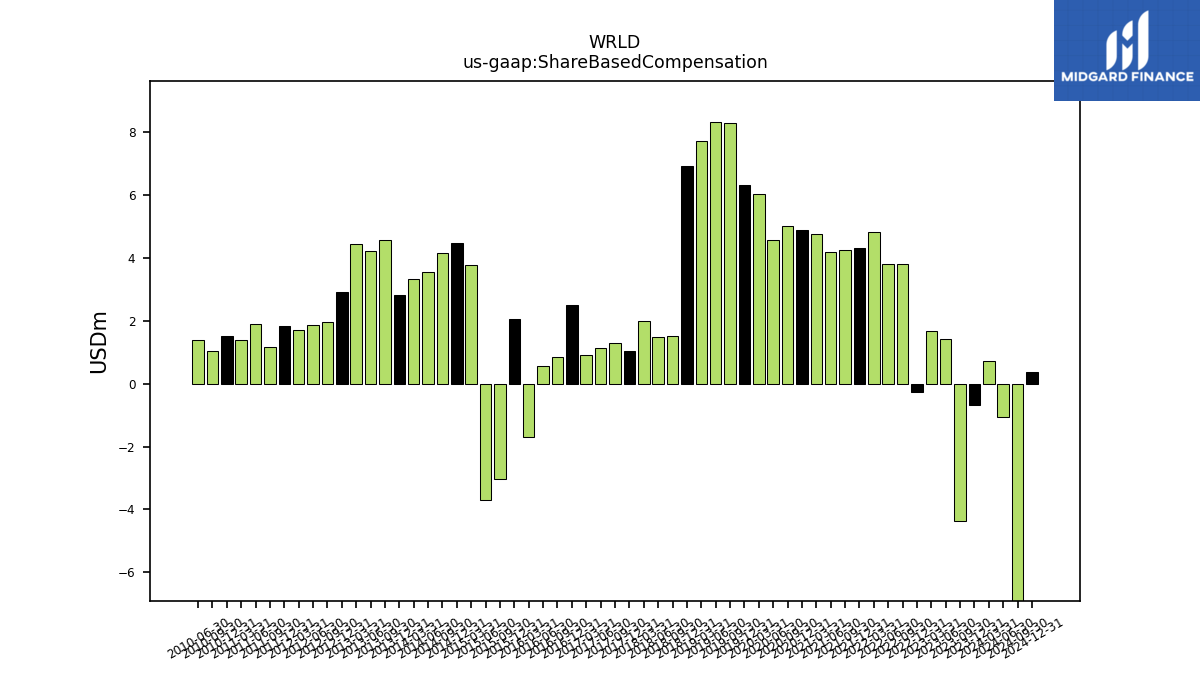
| Share Based Compensation | -0.50 | -3.31 | 1.41 | 1.67 | -0.25 | 3.82 | 3.82 | 4.83 | 4.31 | 4.27 | 4.18 | 4.77 | 4.90 | 5.03 | 4.58 | 6.02 | 6.33 | 8.29 | 8.31 | 7.73 | 6.93 | 1.50 | 1.48 | 1.99 | 1.04 | 1.28 | 1.13 | 0.90 | 2.50 | 0.85 | 0.55 | -1.69 | 2.07 | -3.04 | -3.70 | 3.76 | 4.49 | 4.15 | 3.57 | 3.32 | 2.82 | 4.56 | 4.21 | 4.43 | 2.93 | 1.96 | 1.85 | 1.72 | 1.83 | 1.16 | 1.91 | 1.40 | 1.52 | 1.03 | 1.39 |
| 2023-12-31 | 2023-09-30 | 2023-06-30 | 2023-03-31 | 2022-12-31 | 2022-09-30 | 2022-06-30 | 2022-03-31 | 2021-12-31 | 2021-09-30 | 2021-06-30 | 2021-03-31 | 2020-12-31 | 2020-09-30 | 2020-06-30 | 2020-03-31 | 2019-12-31 | 2019-09-30 | 2019-06-30 | 2019-03-31 | 2018-12-31 | 2018-09-30 | 2018-06-30 | 2018-03-31 | 2017-12-31 | 2017-09-30 | 2017-06-30 | 2017-03-31 | 2016-12-31 | 2016-09-30 | 2016-06-30 | 2016-03-31 | 2015-12-31 | 2015-09-30 | 2015-06-30 | 2015-03-31 | 2014-12-31 | 2014-09-30 | 2014-06-30 | 2014-03-31 | 2013-12-31 | 2013-09-30 | 2013-06-30 | 2013-03-31 | 2012-12-31 | 2012-09-30 | 2012-06-30 | 2012-03-31 | 2011-12-31 | 2011-09-30 | 2011-06-30 | 2011-03-31 | 2010-12-31 | 2010-09-30 | 2010-06-30 | ||
|---|---|---|---|---|---|---|---|---|---|---|---|---|---|---|---|---|---|---|---|---|---|---|---|---|---|---|---|---|---|---|---|---|---|---|---|---|---|---|---|---|---|---|---|---|---|---|---|---|---|---|---|---|---|---|---|---|
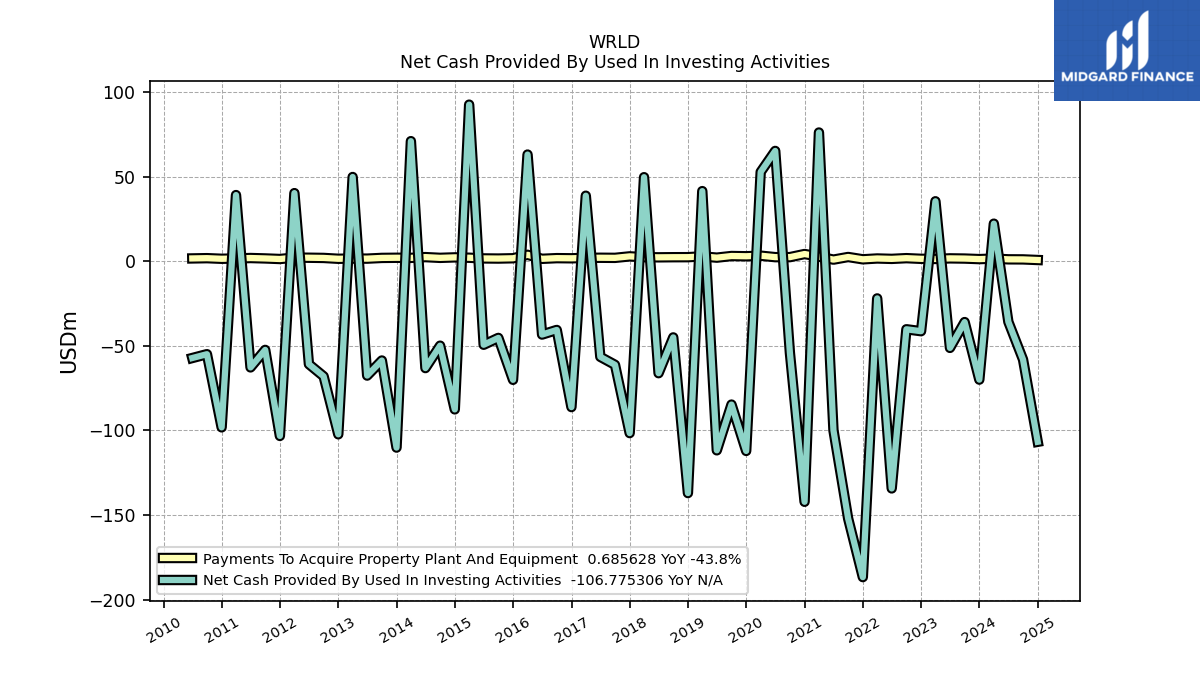
| Net Cash Provided By Used In Investing Activities | -70.03 | -35.99 | -51.28 | 35.41 | -41.39 | -40.25 | -134.35 | -22.00 | -186.77 | -152.14 | -100.01 | 76.05 | -142.25 | -54.18 | 65.17 | 52.74 | -112.18 | -84.76 | -111.82 | 41.42 | -137.10 | -45.06 | -66.23 | 49.65 | -101.64 | -61.27 | -56.56 | 38.70 | -86.27 | -40.66 | -43.39 | 63.03 | -70.15 | -45.35 | -49.42 | 92.54 | -87.63 | -49.95 | -63.21 | 70.96 | -110.20 | -58.71 | -67.63 | 49.77 | -102.35 | -68.05 | -60.90 | 40.24 | -103.32 | -52.44 | -62.81 | 39.09 | -98.25 | -54.98 | -57.25 | |
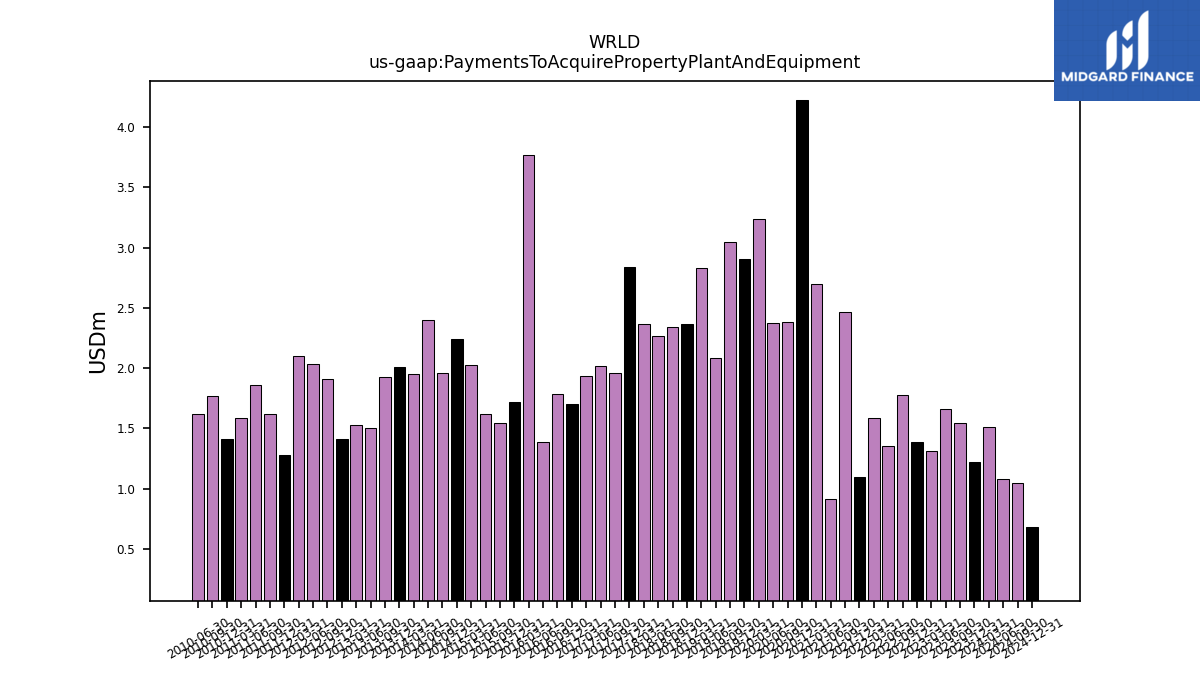
| Payments To Acquire Property Plant And Equipment | 1.22 | 1.54 | 1.66 | 1.31 | 1.39 | 1.78 | 1.35 | 1.59 | 1.10 | 2.47 | 0.92 | 2.70 | 4.23 | 2.38 | 2.38 | 3.24 | 2.90 | 3.05 | 2.08 | 2.83 | 2.36 | 2.34 | 2.27 | 2.36 | 2.84 | 1.96 | 2.02 | 1.94 | 1.70 | 1.79 | 1.39 | 3.77 | 1.72 | 1.55 | 1.62 | 2.03 | 2.24 | 1.96 | 2.40 | 1.95 | 2.01 | 1.92 | 1.50 | 1.53 | 1.42 | 1.91 | 2.03 | 2.10 | 1.28 | 1.62 | 1.86 | 1.59 | 1.41 | 1.77 | 1.62 |
| 2023-12-31 | 2023-09-30 | 2023-06-30 | 2023-03-31 | 2022-12-31 | 2022-09-30 | 2022-06-30 | 2022-03-31 | 2021-12-31 | 2021-09-30 | 2021-06-30 | 2021-03-31 | 2020-12-31 | 2020-09-30 | 2020-06-30 | 2020-03-31 | 2019-12-31 | 2019-09-30 | 2019-06-30 | 2019-03-31 | 2018-12-31 | 2018-09-30 | 2018-06-30 | 2018-03-31 | 2017-12-31 | 2017-09-30 | 2017-06-30 | 2017-03-31 | 2016-12-31 | 2016-09-30 | 2016-06-30 | 2016-03-31 | 2015-12-31 | 2015-09-30 | 2015-06-30 | 2015-03-31 | 2014-12-31 | 2014-09-30 | 2014-06-30 | 2014-03-31 | 2013-12-31 | 2013-09-30 | 2013-06-30 | 2013-03-31 | 2012-12-31 | 2012-09-30 | 2012-06-30 | 2012-03-31 | 2011-12-31 | 2011-09-30 | 2011-06-30 | 2011-03-31 | 2010-12-31 | 2010-09-30 | 2010-06-30 | ||
|---|---|---|---|---|---|---|---|---|---|---|---|---|---|---|---|---|---|---|---|---|---|---|---|---|---|---|---|---|---|---|---|---|---|---|---|---|---|---|---|---|---|---|---|---|---|---|---|---|---|---|---|---|---|---|---|---|
| Net Cash Provided By Used In Financing Activities | 5.14 | -24.57 | -8.97 | -125.54 | -27.55 | -30.84 | 70.24 | -87.86 | 128.09 | 99.58 | 43.13 | -138.59 | 86.90 | 30.13 | -118.67 | -140.00 | 61.61 | 25.22 | 54.08 | -123.72 | 73.74 | -9.26 | -3.87 | -115.92 | 57.11 | 21.63 | 5.71 | -102.80 | 33.01 | -0.03 | -14.33 | -136.78 | 22.63 | 0.64 | -15.12 | -138.33 | 34.70 | -1.68 | -7.17 | -141.48 | 46.15 | 11.33 | 12.17 | -131.85 | 45.15 | 21.55 | 15.12 | -113.20 | 52.24 | 8.99 | 13.83 | -105.50 | 42.46 | 21.21 | 15.85 |
| 2023-12-31 | 2023-09-30 | 2023-06-30 | 2023-03-31 | 2022-12-31 | 2022-09-30 | 2022-06-30 | 2022-03-31 | 2021-12-31 | 2021-09-30 | 2021-06-30 | 2021-03-31 | 2020-12-31 | 2020-09-30 | 2020-06-30 | 2020-03-31 | 2019-12-31 | 2019-09-30 | 2019-06-30 | 2019-03-31 | 2018-12-31 | 2018-09-30 | 2018-06-30 | 2018-03-31 | 2017-12-31 | 2017-09-30 | 2017-06-30 | 2017-03-31 | 2016-12-31 | 2016-09-30 | 2016-06-30 | 2016-03-31 | 2015-12-31 | 2015-09-30 | 2015-06-30 | 2015-03-31 | 2014-12-31 | 2014-09-30 | 2014-06-30 | 2014-03-31 | 2013-12-31 | 2013-09-30 | 2013-06-30 | 2013-03-31 | 2012-12-31 | 2012-09-30 | 2012-06-30 | 2012-03-31 | 2011-12-31 | 2011-09-30 | 2011-06-30 | 2011-03-31 | 2010-12-31 | 2010-09-30 | 2010-06-30 | ||
|---|---|---|---|---|---|---|---|---|---|---|---|---|---|---|---|---|---|---|---|---|---|---|---|---|---|---|---|---|---|---|---|---|---|---|---|---|---|---|---|---|---|---|---|---|---|---|---|---|---|---|---|---|---|---|---|---|
| Revenues | 137.75 | 136.88 | 139.32 | 160.84 | 146.50 | 151.23 | 157.59 | 166.33 | 148.57 | 137.83 | 129.66 | 146.28 | 130.95 | 124.44 | 123.87 | 163.02 | 147.08 | 141.57 | 138.44 | 157.00 | 137.64 | 127.12 | 122.79 | 151.86 | 136.93 | 131.01 | 128.91 | 144.57 | 130.81 | 129.27 | 127.08 | 144.14 | 139.70 | 136.41 | 137.22 | 167.40 | 153.65 | 152.55 | 150.31 | 161.93 | 160.49 | 149.96 | 145.27 | 161.84 | 149.64 | 139.40 | 132.84 | 148.92 | 135.95 | 132.14 | 123.16 | 136.94 | 126.04 | 118.07 | 110.40 |