
| 2023-12-31 | 2023-09-30 | 2023-06-30 | 2023-03-31 | 2022-12-31 | 2022-09-30 | 2022-06-30 | 2022-03-31 | 2021-12-31 | 2021-09-30 | 2021-06-30 | 2021-03-31 | 2020-12-31 | 2020-09-30 | 2020-06-30 | 2020-03-31 | 2019-12-31 | 2019-09-30 | 2019-06-30 | 2019-03-31 | 2018-12-31 | 2018-09-30 | 2018-06-30 | 2018-03-31 | 2017-12-31 | 2017-09-30 | 2017-06-30 | 2017-03-31 | 2016-12-31 | 2016-09-30 | 2016-06-30 | 2016-03-31 | 2015-12-31 | 2015-09-30 | 2015-06-30 | 2015-03-31 | 2014-12-31 | 2014-09-30 | 2014-06-30 | 2014-03-31 | ||
|---|---|---|---|---|---|---|---|---|---|---|---|---|---|---|---|---|---|---|---|---|---|---|---|---|---|---|---|---|---|---|---|---|---|---|---|---|---|---|---|---|---|
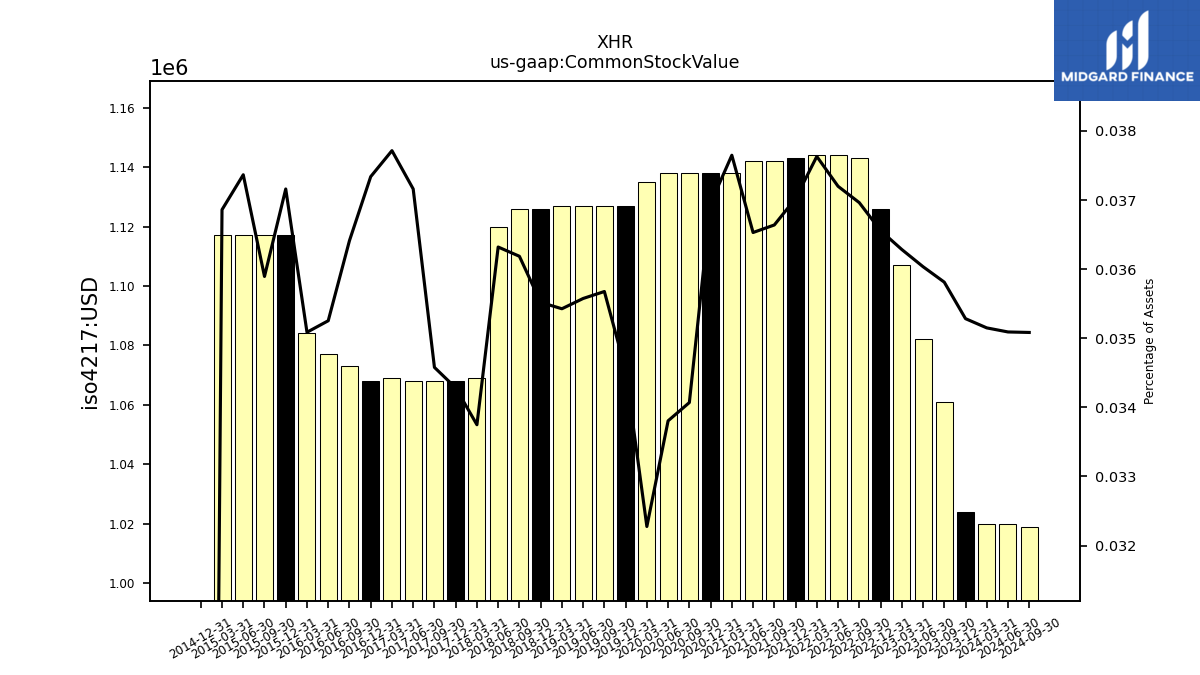
| Common Stock Value | 1.02 | 1.06 | 1.08 | 1.11 | 1.13 | 1.14 | 1.14 | 1.14 | 1.14 | 1.14 | 1.14 | 1.14 | 1.14 | 1.14 | 1.14 | 1.14 | 1.13 | 1.13 | 1.13 | 1.13 | 1.13 | 1.13 | 1.12 | 1.07 | 1.07 | 1.07 | 1.07 | 1.07 | 1.07 | 1.07 | 1.08 | 1.08 | 1.12 | 1.12 | 1.12 | 1.12 | 0.00 | NA | NA | NA | |
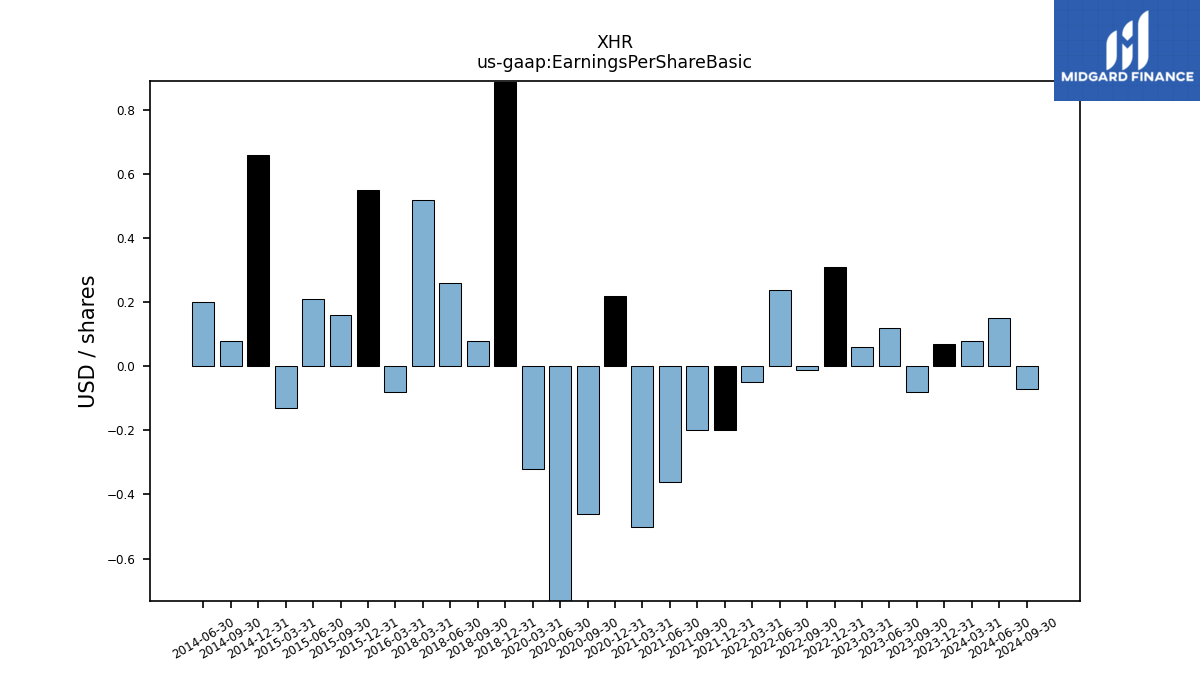
| Earnings Per Share Basic | 0.07 | -0.08 | 0.12 | 0.06 | 0.31 | -0.01 | 0.24 | -0.05 | -0.20 | -0.20 | -0.36 | -0.50 | 0.22 | -0.46 | -0.88 | -0.32 | NA | NA | NA | NA | 0.89 | 0.08 | 0.26 | 0.52 | NA | NA | NA | NA | NA | NA | NA | -0.08 | 0.55 | 0.16 | 0.21 | -0.13 | 0.66 | 0.08 | 0.20 | NA | |
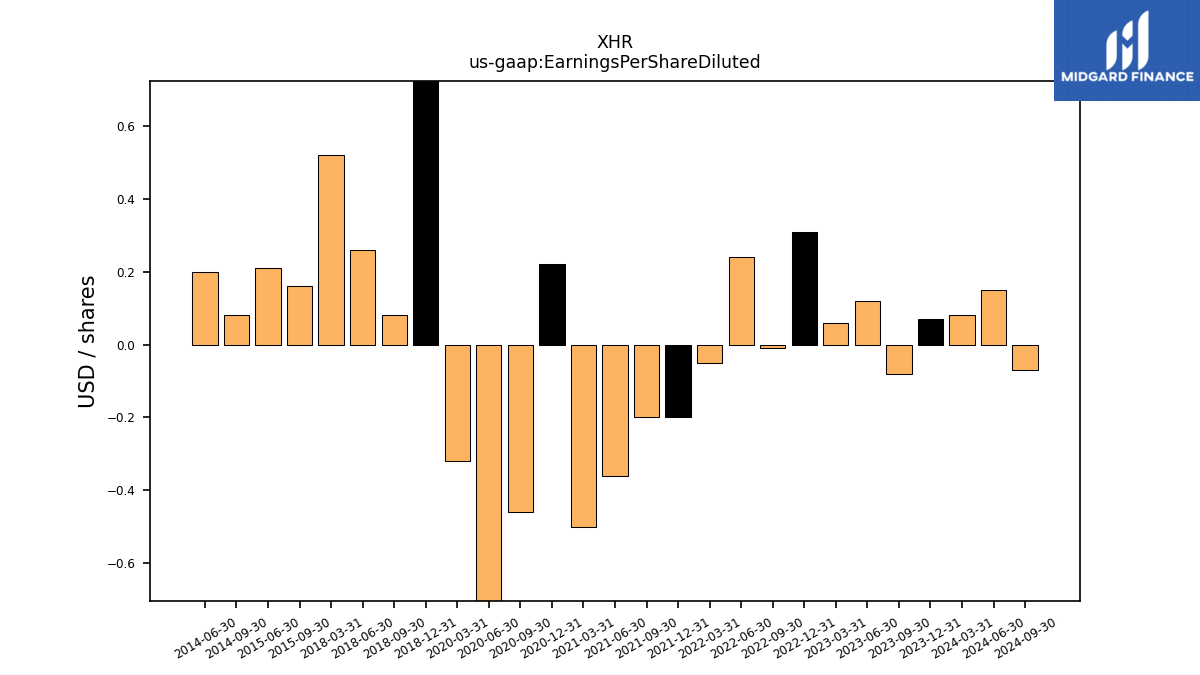
| Earnings Per Share Diluted | 0.07 | -0.08 | 0.12 | 0.06 | 0.31 | -0.01 | 0.24 | -0.05 | -0.20 | -0.20 | -0.36 | -0.50 | 0.22 | -0.46 | -0.88 | -0.32 | NA | NA | NA | NA | 0.88 | 0.08 | 0.26 | 0.52 | NA | NA | NA | NA | NA | NA | NA | NA | NA | 0.16 | 0.21 | NA | NA | 0.08 | 0.20 | NA |
| 2023-12-31 | 2023-09-30 | 2023-06-30 | 2023-03-31 | 2022-12-31 | 2022-09-30 | 2022-06-30 | 2022-03-31 | 2021-12-31 | 2021-09-30 | 2021-06-30 | 2021-03-31 | 2020-12-31 | 2020-09-30 | 2020-06-30 | 2020-03-31 | 2019-12-31 | 2019-09-30 | 2019-06-30 | 2019-03-31 | 2018-12-31 | 2018-09-30 | 2018-06-30 | 2018-03-31 | 2017-12-31 | 2017-09-30 | 2017-06-30 | 2017-03-31 | 2016-12-31 | 2016-09-30 | 2016-06-30 | 2016-03-31 | 2015-12-31 | 2015-09-30 | 2015-06-30 | 2015-03-31 | 2014-12-31 | 2014-09-30 | 2014-06-30 | 2014-03-31 | ||
|---|---|---|---|---|---|---|---|---|---|---|---|---|---|---|---|---|---|---|---|---|---|---|---|---|---|---|---|---|---|---|---|---|---|---|---|---|---|---|---|---|---|
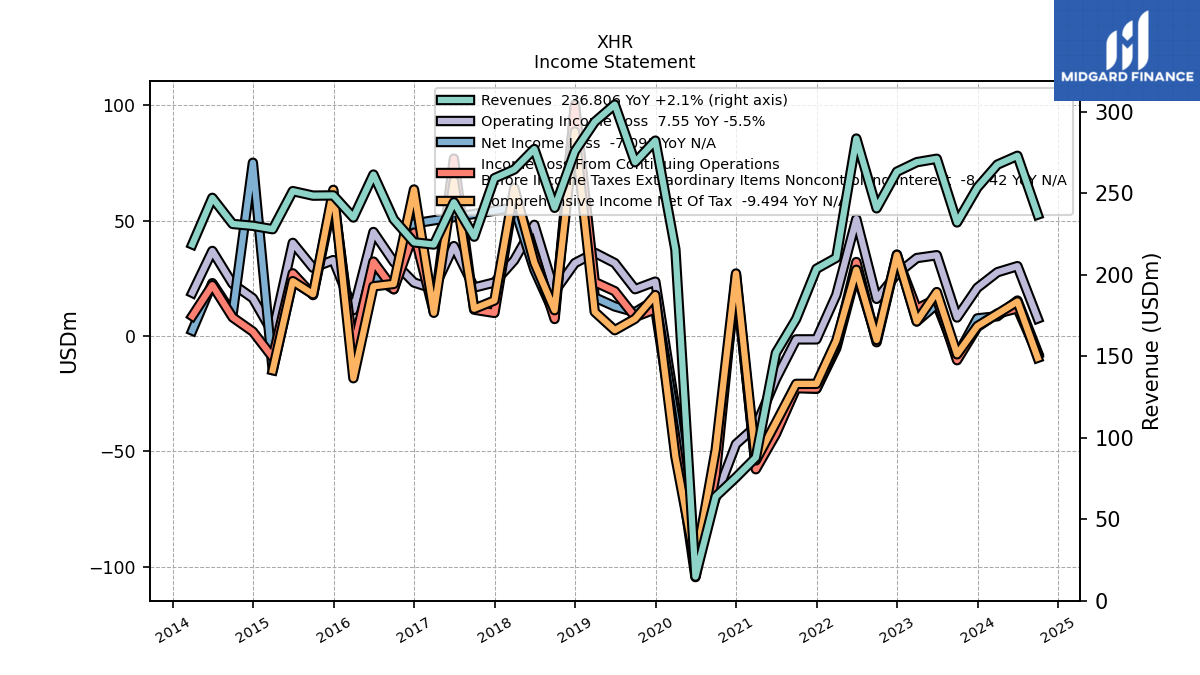
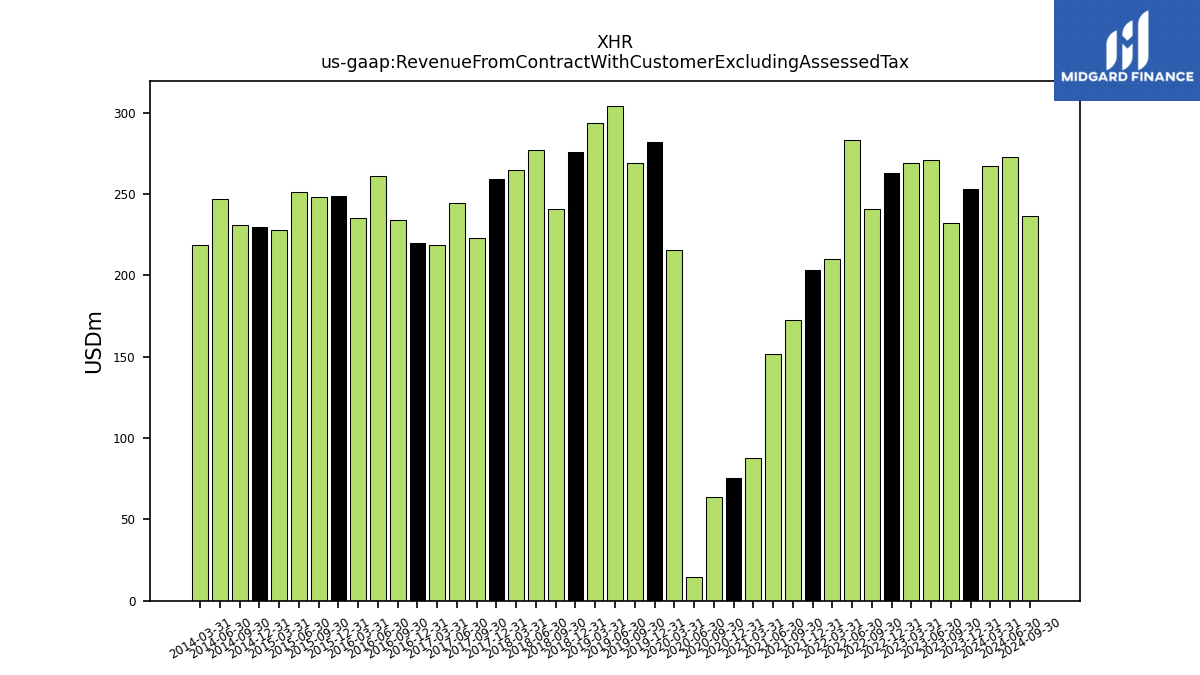
| Revenue From Contract With Customer Excluding Assessed Tax | 253.38 | 232.02 | 271.07 | 268.97 | 263.14 | 240.67 | 283.45 | 210.35 | 203.58 | 172.78 | 151.97 | 87.85 | 75.64 | 63.95 | 14.82 | 215.35 | 282.18 | 268.93 | 304.29 | 293.69 | 275.66 | 240.99 | 277.06 | 264.50 | 259.14 | 223.29 | 244.39 | 218.46 | 219.80 | 233.95 | 261.38 | 235.03 | 248.59 | 248.45 | 251.22 | 227.87 | 229.94 | 231.09 | 247.11 | 218.53 | |
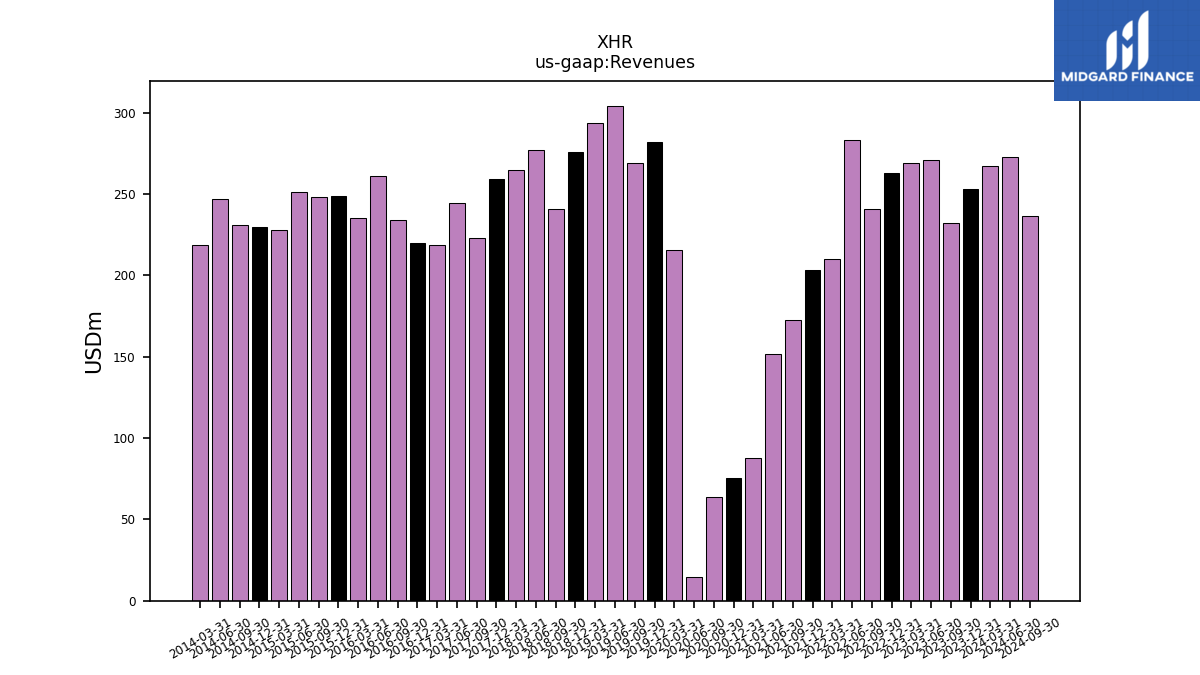
| Revenues | 253.38 | 232.02 | 271.07 | 268.97 | 263.14 | 240.67 | 283.45 | 210.35 | 203.58 | 172.78 | 151.97 | 87.85 | 75.64 | 63.95 | 14.82 | 215.35 | 282.18 | 268.93 | 304.29 | 293.69 | 275.66 | 240.99 | 277.06 | 264.50 | 259.14 | 223.29 | 244.39 | 218.46 | 219.80 | 233.95 | 261.38 | 235.03 | 248.59 | 248.45 | 251.22 | 227.87 | 229.94 | 231.09 | 247.11 | 218.53 | |
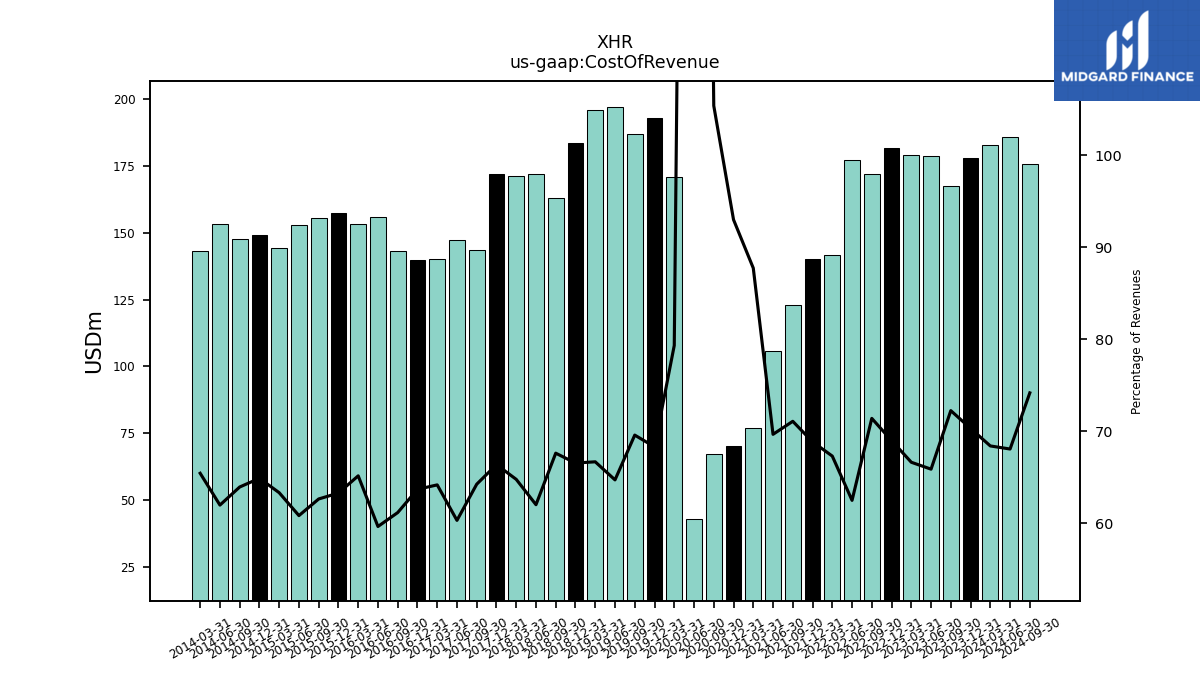
| Cost Of Revenue | 178.20 | 167.66 | 178.64 | 179.28 | 181.59 | 171.88 | 177.19 | 141.61 | 140.21 | 122.85 | 105.90 | 77.08 | 70.35 | 67.39 | 42.93 | 170.86 | 192.80 | 187.18 | 196.98 | 195.89 | 183.49 | 163.00 | 171.89 | 171.38 | 172.05 | 143.50 | 147.46 | 140.24 | 140.04 | 143.14 | 155.97 | 153.19 | 157.37 | 155.69 | 152.89 | 144.35 | 149.25 | 147.81 | 153.21 | 143.04 | |
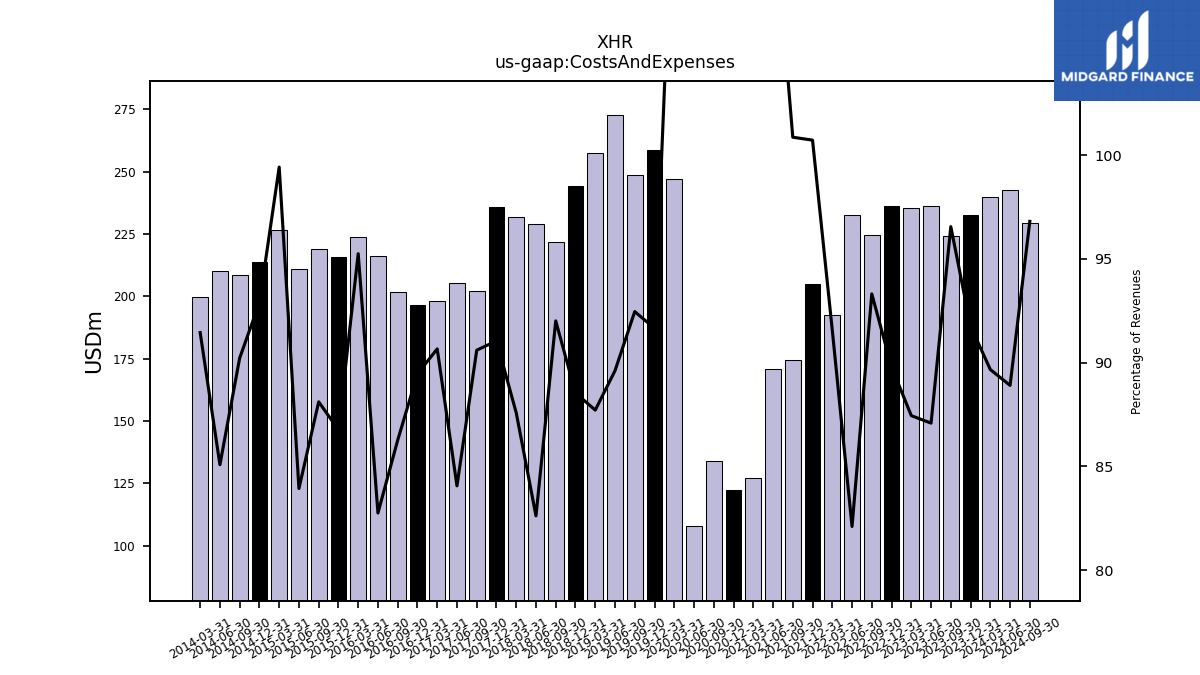
| Costs And Expenses | 232.51 | 224.03 | 236.07 | 235.21 | 236.29 | 224.59 | 232.73 | 192.61 | 205.06 | 174.29 | 170.70 | 127.03 | 122.53 | 133.97 | 108.07 | 246.90 | 258.64 | 248.67 | 272.69 | 257.61 | 244.07 | 221.75 | 228.90 | 231.66 | 235.95 | 202.31 | 205.45 | 198.07 | 196.64 | 201.82 | 216.31 | 223.88 | 215.70 | 218.92 | 210.87 | 226.57 | 213.61 | 208.51 | 210.26 | 199.84 | |
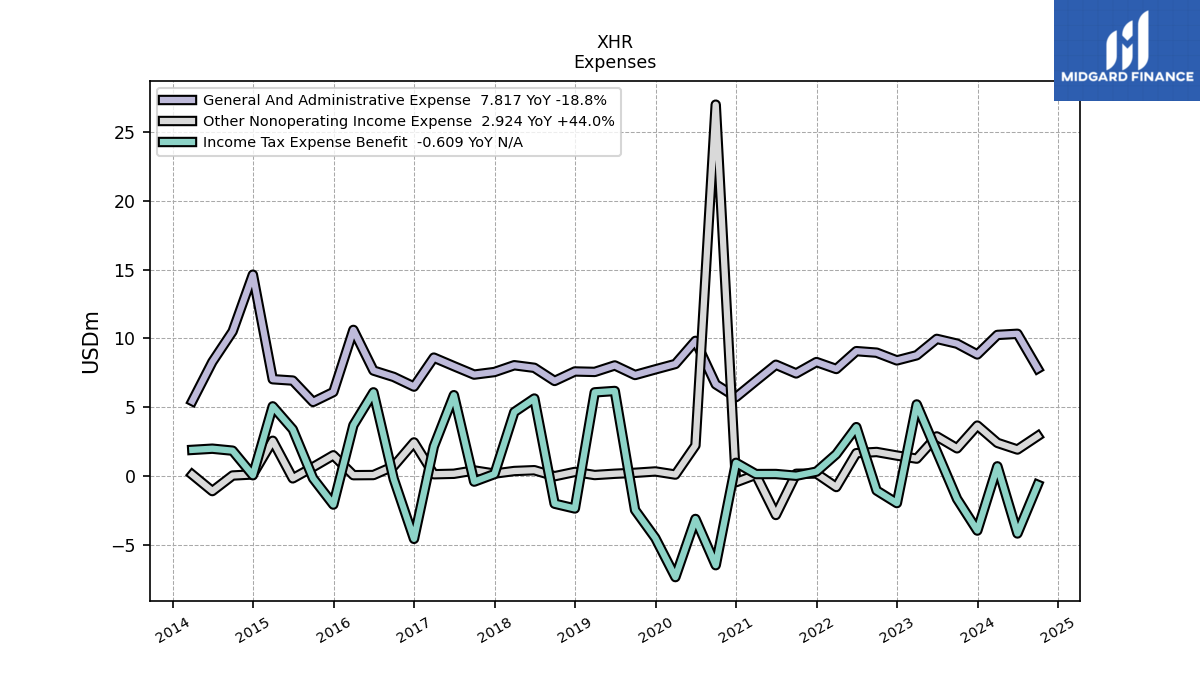
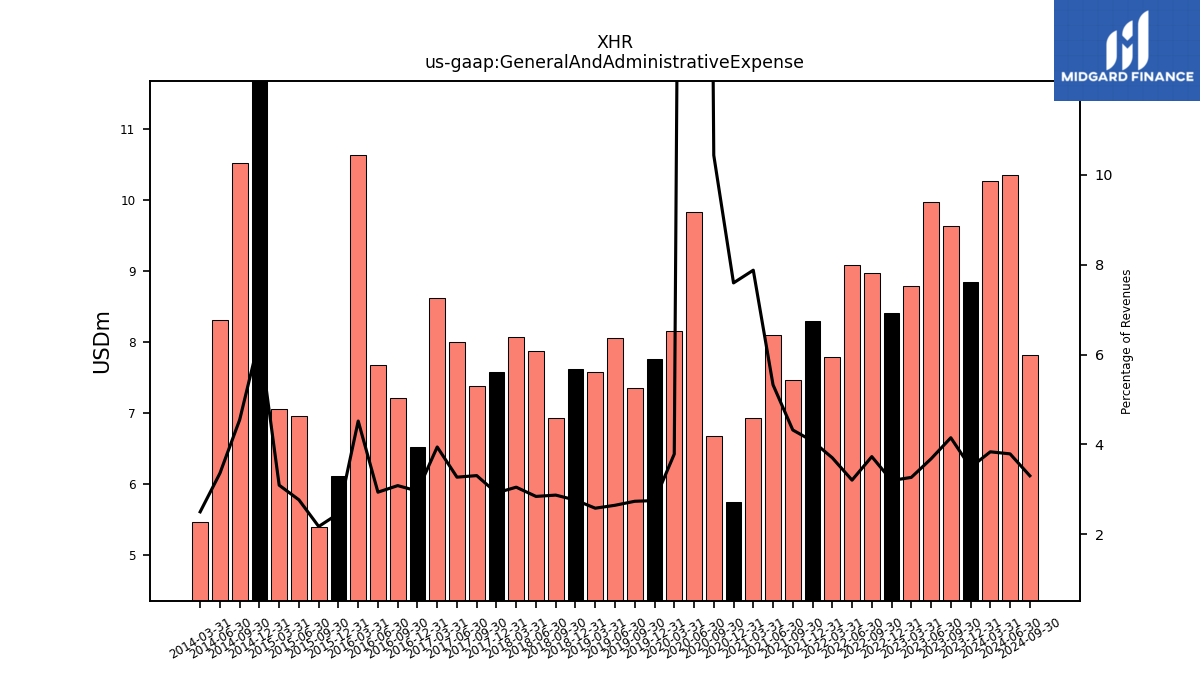
| General And Administrative Expense | 8.84 | 9.62 | 9.97 | 8.78 | 8.41 | 8.97 | 9.08 | 7.79 | 8.29 | 7.47 | 8.10 | 6.92 | 5.75 | 6.68 | 9.83 | 8.15 | 7.76 | 7.35 | 8.05 | 7.58 | 7.61 | 6.92 | 7.87 | 8.06 | 7.57 | 7.38 | 7.99 | 8.61 | 6.51 | 7.21 | 7.67 | 10.62 | 6.11 | 5.40 | 6.95 | 7.04 | 14.63 | 10.51 | 8.30 | 5.46 | |
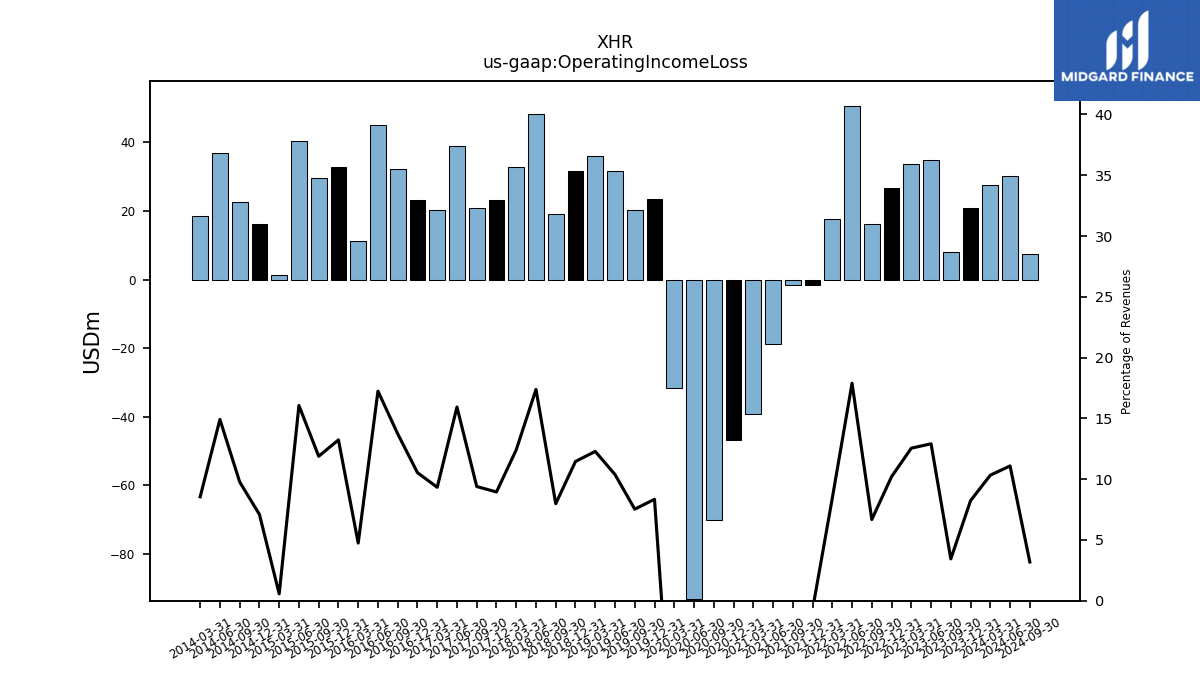
| Operating Income Loss | 20.86 | 7.99 | 35.00 | 33.76 | 26.85 | 16.08 | 50.72 | 17.74 | -1.48 | -1.50 | -18.72 | -39.18 | -46.88 | -70.02 | -93.25 | -31.54 | 23.55 | 20.26 | 31.60 | 36.07 | 31.59 | 19.24 | 48.16 | 32.83 | 23.18 | 20.98 | 38.95 | 20.39 | 23.16 | 32.12 | 45.07 | 11.15 | 32.89 | 29.53 | 40.35 | 1.30 | 16.32 | 22.58 | 36.86 | 18.68 | |
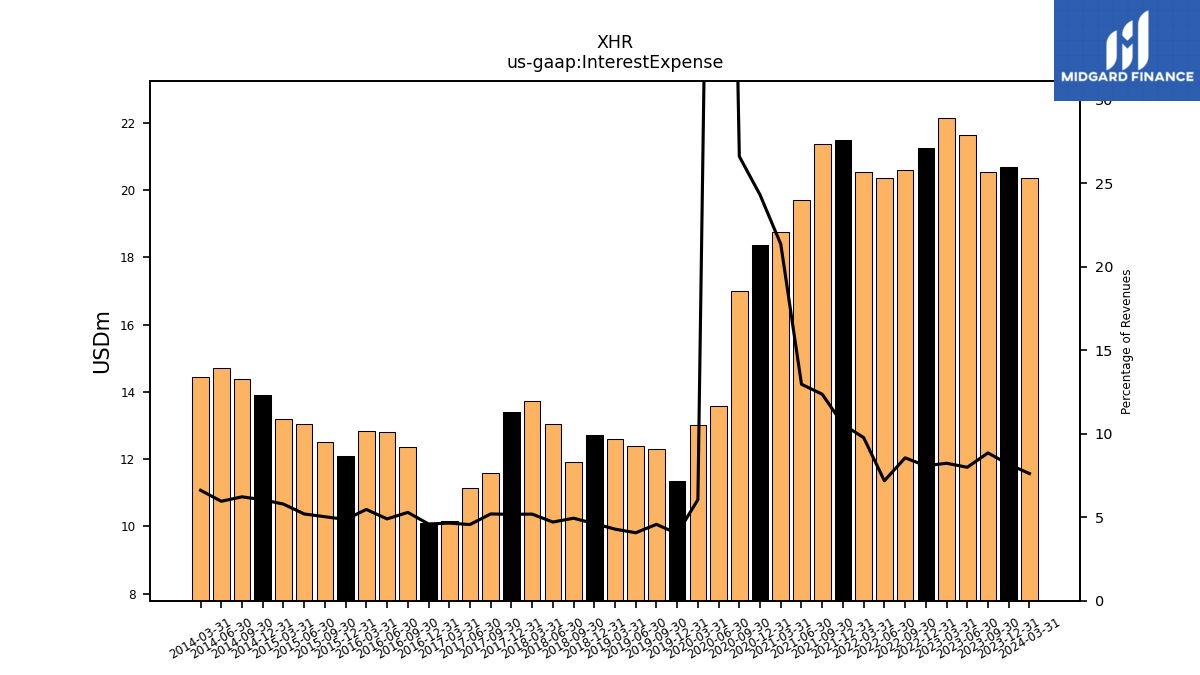
| Interest Expense | 20.69 | 20.52 | 21.65 | 22.13 | 21.25 | 20.58 | 20.35 | 20.54 | 21.49 | 21.36 | 19.69 | 18.75 | 18.37 | 17.01 | 13.57 | 13.02 | 11.35 | 12.29 | 12.38 | 12.59 | 12.73 | 11.90 | 13.05 | 13.72 | 13.40 | 11.60 | 11.15 | 10.15 | 10.10 | 12.37 | 12.80 | 12.84 | 12.09 | 12.50 | 13.05 | 13.18 | 13.89 | 14.37 | 14.71 | 14.45 | |
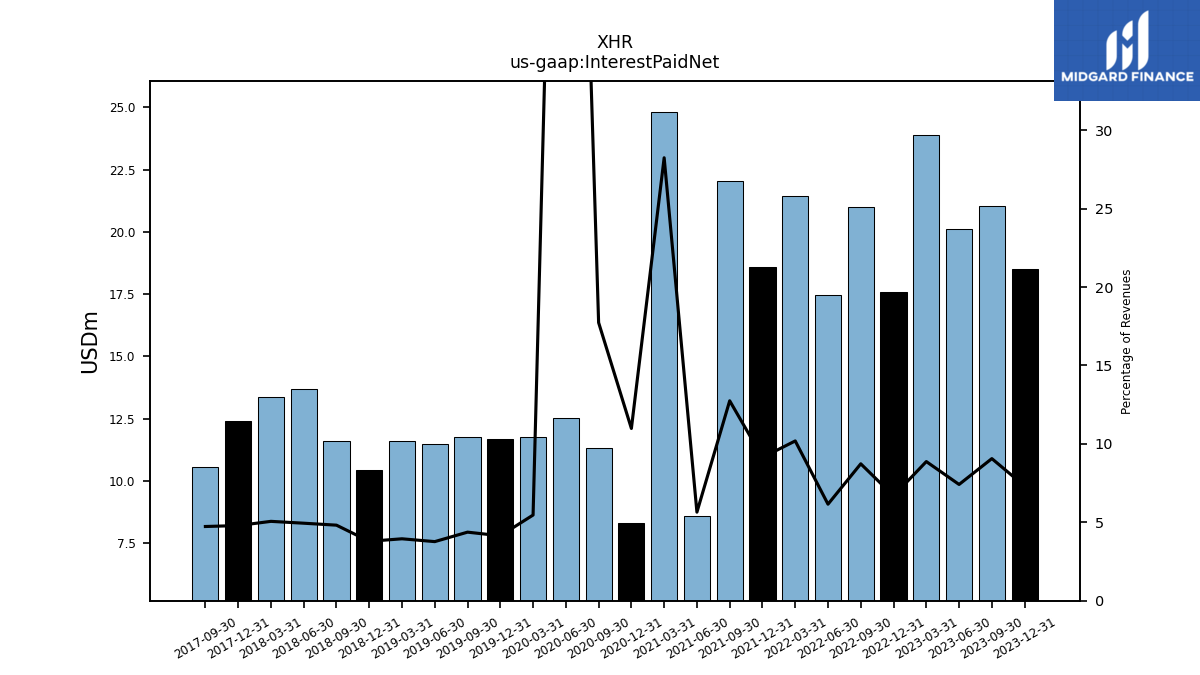
| Interest Paid Net | 18.53 | 21.03 | 20.10 | 23.87 | 17.59 | 21.01 | 17.45 | 21.43 | 18.59 | 22.03 | 8.59 | 24.81 | 8.31 | 11.34 | 12.54 | 11.77 | 11.69 | 11.76 | 11.47 | 11.60 | 10.45 | 11.61 | 13.70 | 13.39 | 12.42 | 10.57 | NA | NA | NA | NA | NA | NA | NA | NA | NA | NA | NA | NA | NA | NA | |
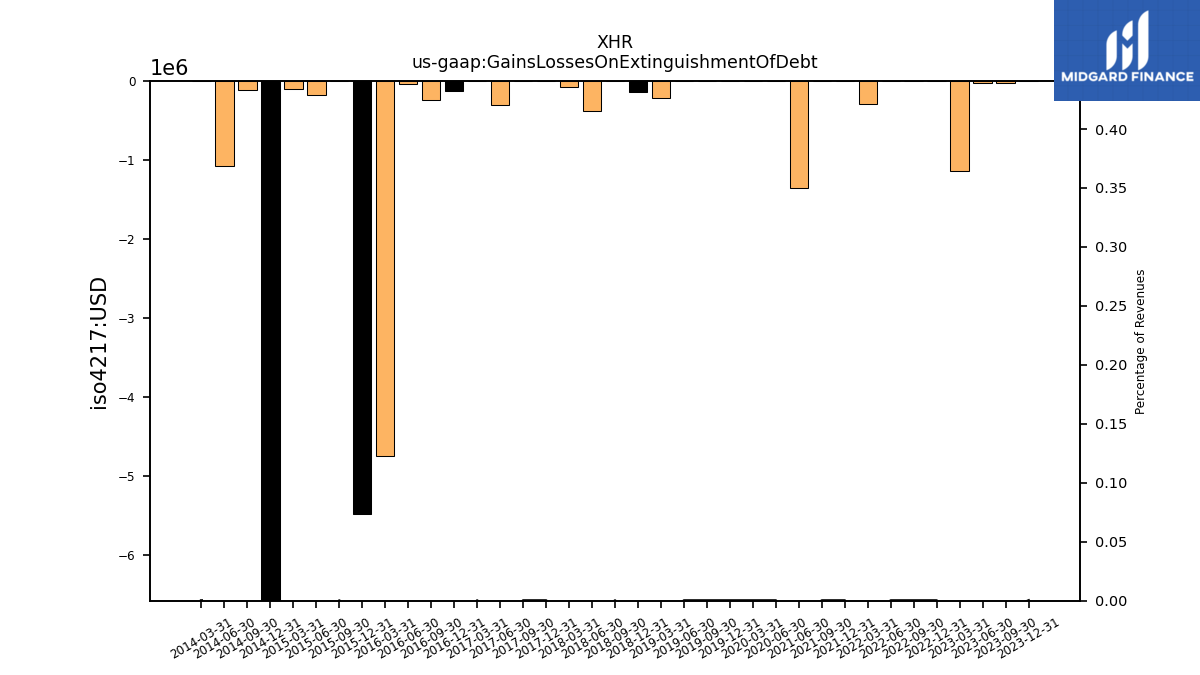
| Gains Losses On Extinguishment Of Debt | 0.00 | -0.02 | -0.03 | -1.14 | 0.00 | 0.00 | 0.00 | -0.29 | 0.00 | 0.00 | -1.36 | NA | NA | NA | 0.00 | 0.00 | 0.00 | 0.00 | 0.00 | -0.21 | -0.13 | 0.00 | -0.38 | -0.08 | 0.00 | 0.00 | -0.30 | 0.00 | -0.13 | -0.24 | -0.04 | -4.74 | -5.48 | 0.00 | -0.18 | -0.10 | -65.91 | -0.12 | -1.08 | 0.00 | |
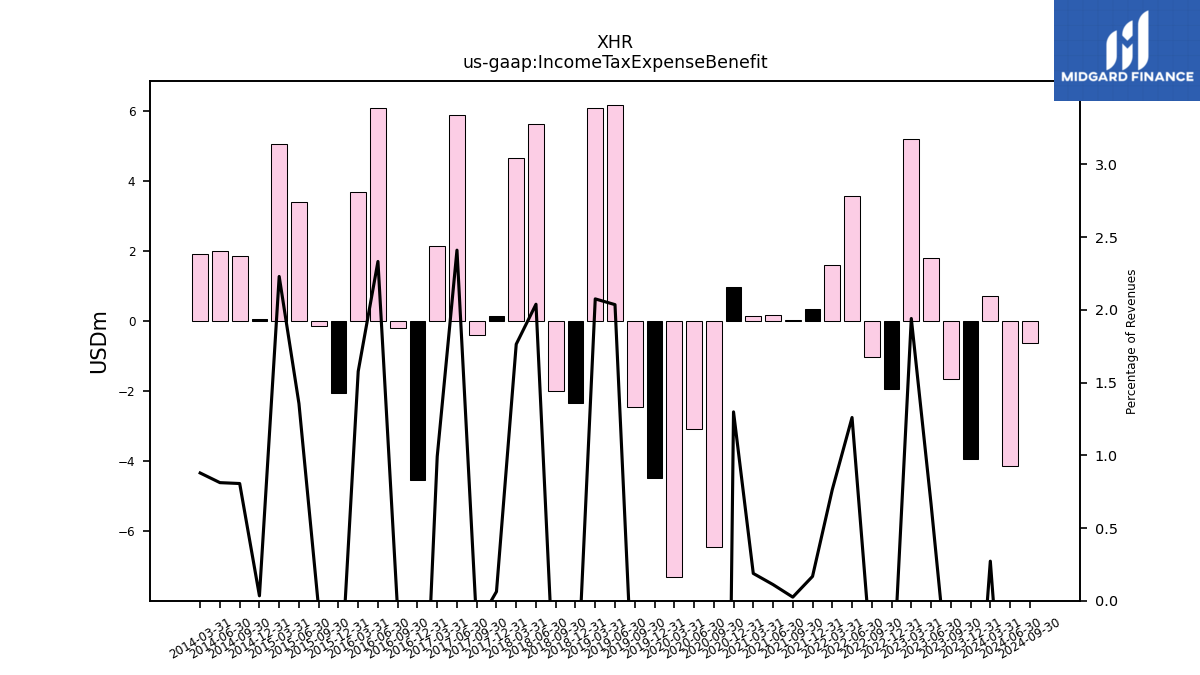
| Income Tax Expense Benefit | -3.94 | -1.64 | 1.80 | 5.22 | -1.94 | -1.03 | 3.57 | 1.61 | 0.34 | 0.04 | 0.17 | 0.17 | 0.98 | -6.45 | -3.09 | -7.31 | -4.48 | -2.44 | 6.19 | 6.09 | -2.33 | -1.99 | 5.65 | 4.66 | 0.16 | -0.39 | 5.89 | 2.17 | -4.54 | -0.19 | 6.09 | 3.71 | -2.05 | -0.14 | 3.40 | 5.08 | 0.08 | 1.86 | 2.01 | 1.92 | |
| Income Taxes Paid Net | -16.72 | 0.05 | 3.52 | 0.22 | 0.07 | 1.09 | NA | NA | 0.11 | 0.03 | NA | NA | -1.68 | 1.15 | -0.05 | 2.20 | 0.46 | 2.01 | 0.40 | 1.48 | 2.00 | 0.40 | 2.39 | 2.92 | 0.73 | 0.12 | 3.15 | 0.66 | 1.21 | 1.58 | 4.74 | 0.33 | 4.10 | 0.00 | 0.25 | 0.11 | NA | NA | NA | NA | |
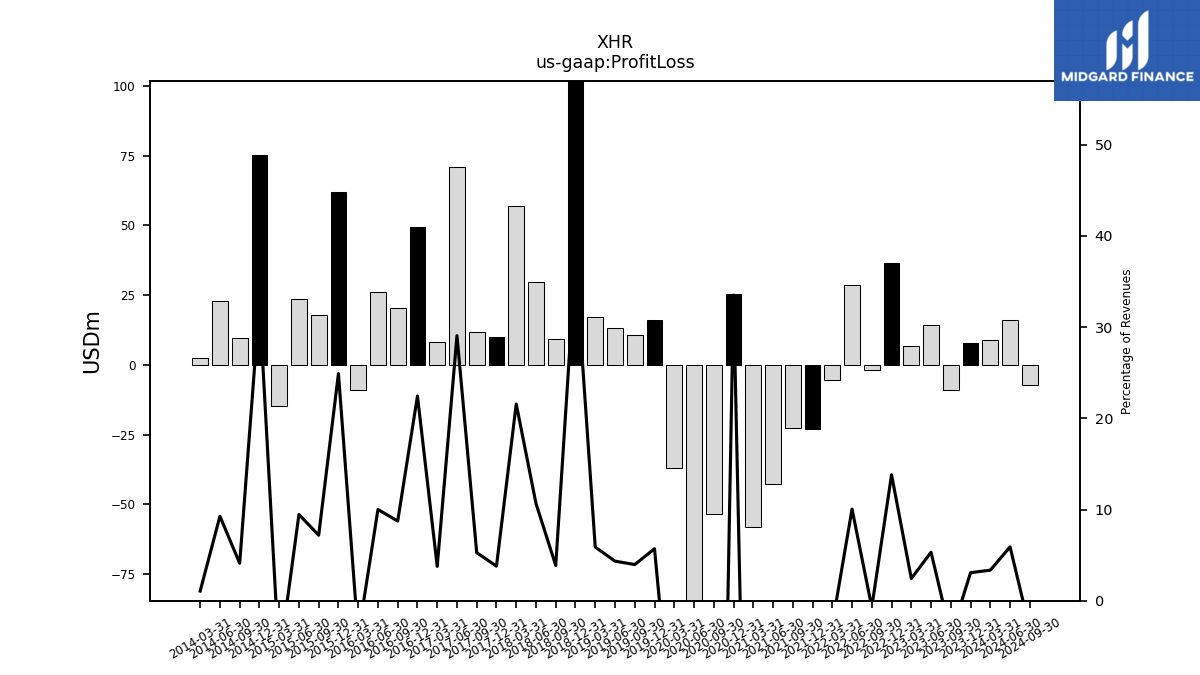
| Profit Loss | 7.79 | -8.88 | 14.41 | 6.55 | 36.34 | -1.71 | 28.48 | -5.48 | -23.18 | -22.72 | -42.74 | -57.98 | 25.34 | -53.61 | -101.49 | -37.13 | 16.08 | 10.67 | 13.21 | 17.28 | 102.62 | 9.33 | 29.53 | 57.04 | 9.82 | 11.77 | 71.00 | 8.23 | 49.33 | 20.43 | 26.14 | -9.17 | 61.91 | 17.85 | 23.75 | -14.87 | 75.10 | 9.49 | 22.88 | 2.32 | |
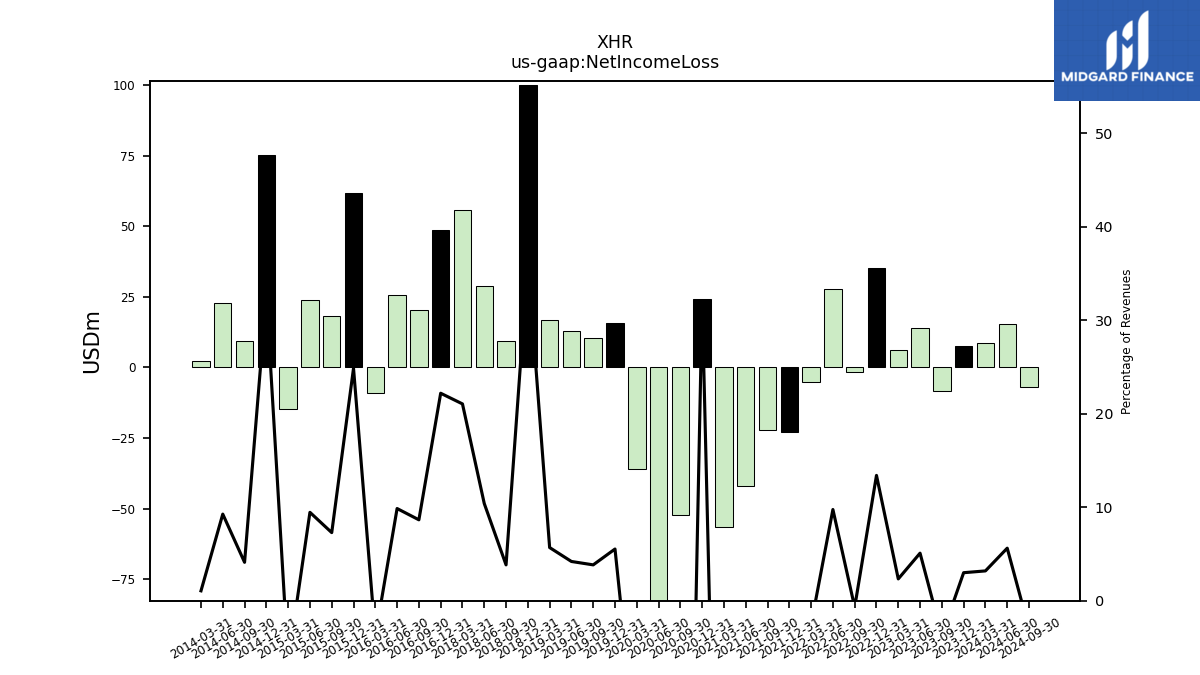
| Net Income Loss | 7.60 | -8.53 | 13.79 | 6.28 | 35.26 | -1.66 | 27.65 | -5.32 | -22.93 | -22.19 | -42.04 | -56.35 | 24.28 | -52.34 | -99.12 | -36.14 | 15.61 | 10.31 | 12.78 | 16.70 | 99.99 | 9.24 | 28.79 | 55.66 | NA | NA | NA | NA | 48.76 | 20.24 | 25.77 | -8.91 | 61.78 | 18.10 | 23.75 | -14.87 | 75.10 | 9.49 | 22.88 | 2.32 | |
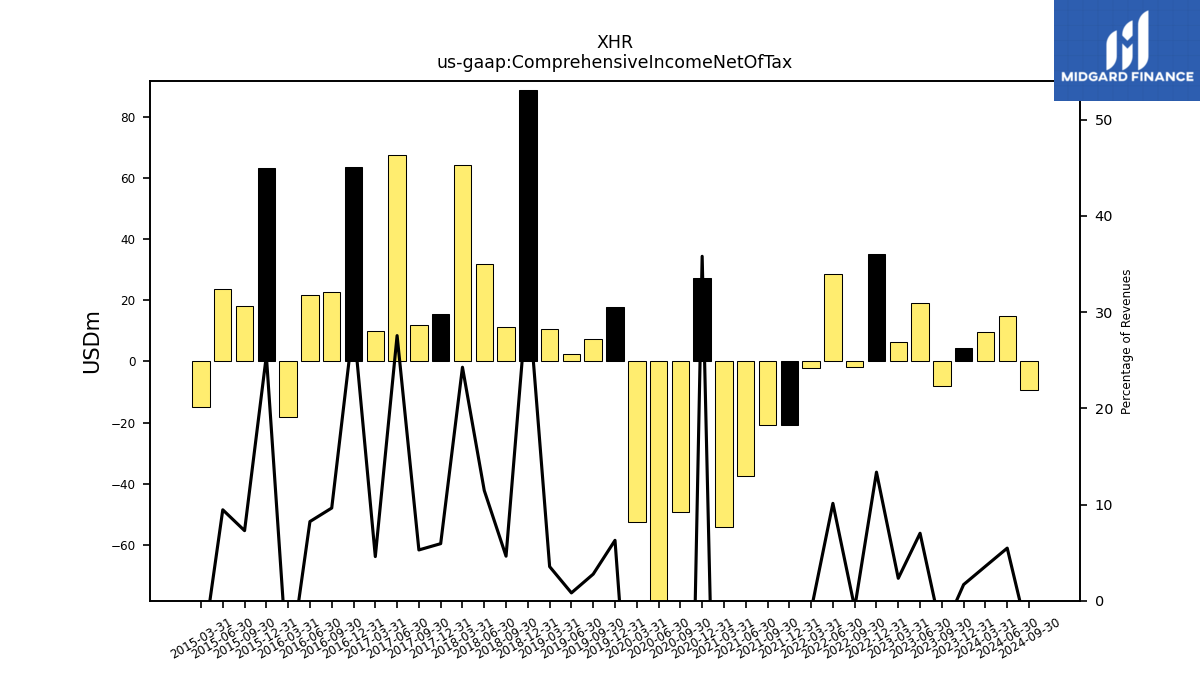
| Comprehensive Income Net Of Tax | 4.26 | -7.97 | 19.01 | 6.28 | 35.17 | -1.77 | 28.69 | -2.07 | -20.78 | -20.79 | -37.62 | -53.98 | 27.08 | -49.31 | -98.56 | -52.36 | 17.71 | 7.44 | 2.49 | 10.42 | 88.65 | 11.16 | 31.75 | 64.18 | 15.38 | 11.79 | 67.34 | 10.03 | 63.49 | 22.55 | 21.51 | -18.35 | 63.33 | 18.10 | 23.75 | -14.87 | NA | NA | NA | NA | |
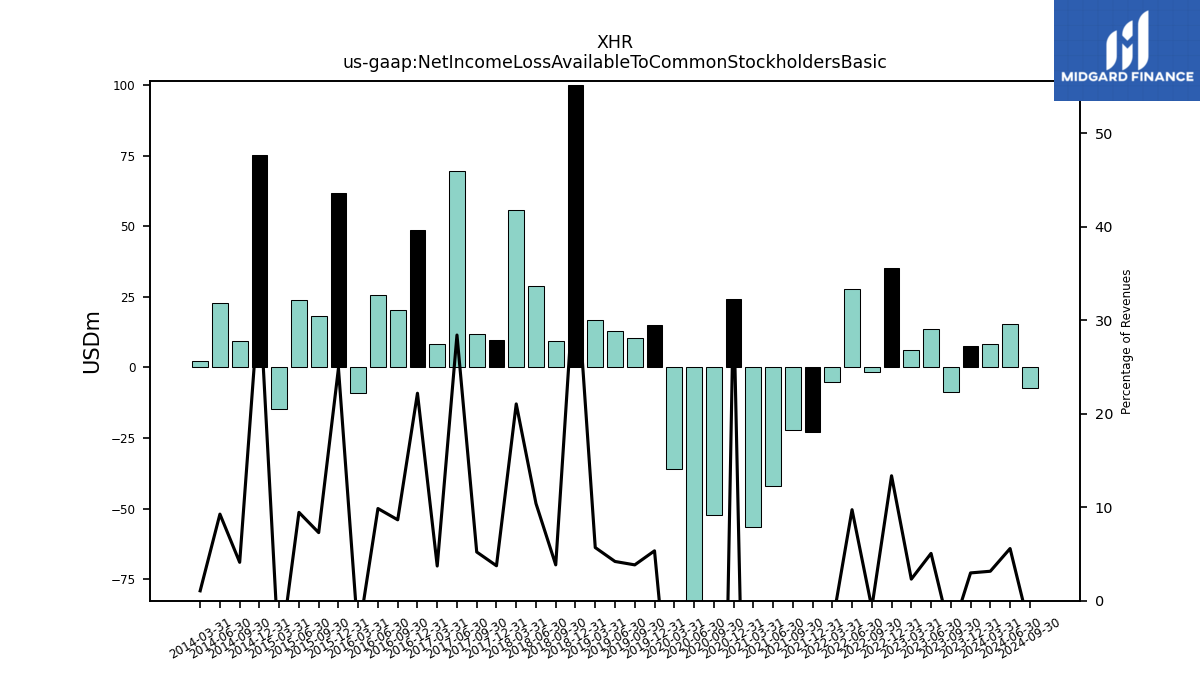
| Net Income Loss Available To Common Stockholders Basic | 7.54 | -8.59 | 13.72 | 6.21 | 35.16 | -1.78 | 27.59 | -5.32 | -22.93 | -22.19 | -42.04 | -56.35 | 24.28 | -52.34 | -99.12 | -36.14 | 15.06 | 10.31 | 12.78 | 16.70 | 99.99 | 9.24 | 28.79 | 55.66 | 9.69 | 11.64 | 69.42 | 8.11 | 48.76 | 20.24 | 25.77 | -8.91 | 61.78 | 18.09 | 23.74 | -14.87 | 75.10 | 9.49 | 22.88 | 2.32 | |
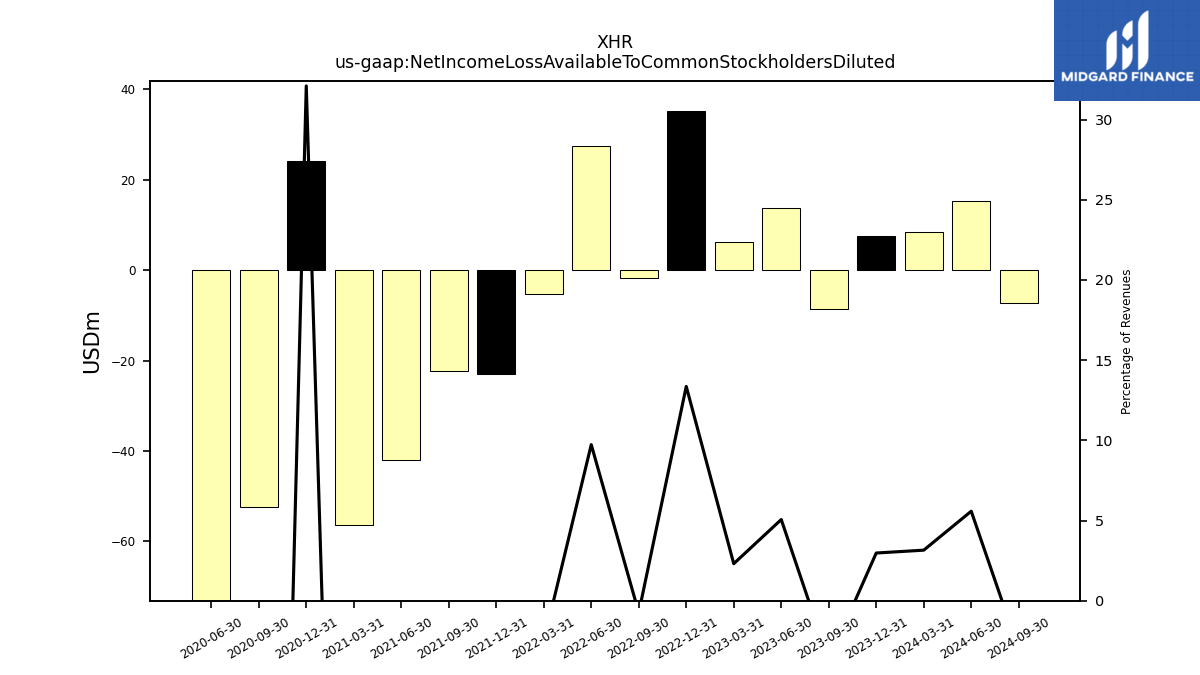
| Net Income Loss Available To Common Stockholders Diluted | 7.54 | -8.59 | 13.72 | 6.21 | 35.16 | -1.78 | 27.59 | -5.32 | -22.93 | -22.19 | -42.04 | -56.35 | 24.28 | -52.34 | -99.12 | NA | NA | NA | NA | NA | NA | NA | NA | NA | NA | NA | NA | NA | NA | NA | NA | NA | NA | NA | NA | NA | NA | NA | NA | NA |
| 2023-12-31 | 2023-09-30 | 2023-06-30 | 2023-03-31 | 2022-12-31 | 2022-09-30 | 2022-06-30 | 2022-03-31 | 2021-12-31 | 2021-09-30 | 2021-06-30 | 2021-03-31 | 2020-12-31 | 2020-09-30 | 2020-06-30 | 2020-03-31 | 2019-12-31 | 2019-09-30 | 2019-06-30 | 2019-03-31 | 2018-12-31 | 2018-09-30 | 2018-06-30 | 2018-03-31 | 2017-12-31 | 2017-09-30 | 2017-06-30 | 2017-03-31 | 2016-12-31 | 2016-09-30 | 2016-06-30 | 2016-03-31 | 2015-12-31 | 2015-09-30 | 2015-06-30 | 2015-03-31 | 2014-12-31 | 2014-09-30 | 2014-06-30 | 2014-03-31 | ||
|---|---|---|---|---|---|---|---|---|---|---|---|---|---|---|---|---|---|---|---|---|---|---|---|---|---|---|---|---|---|---|---|---|---|---|---|---|---|---|---|---|---|
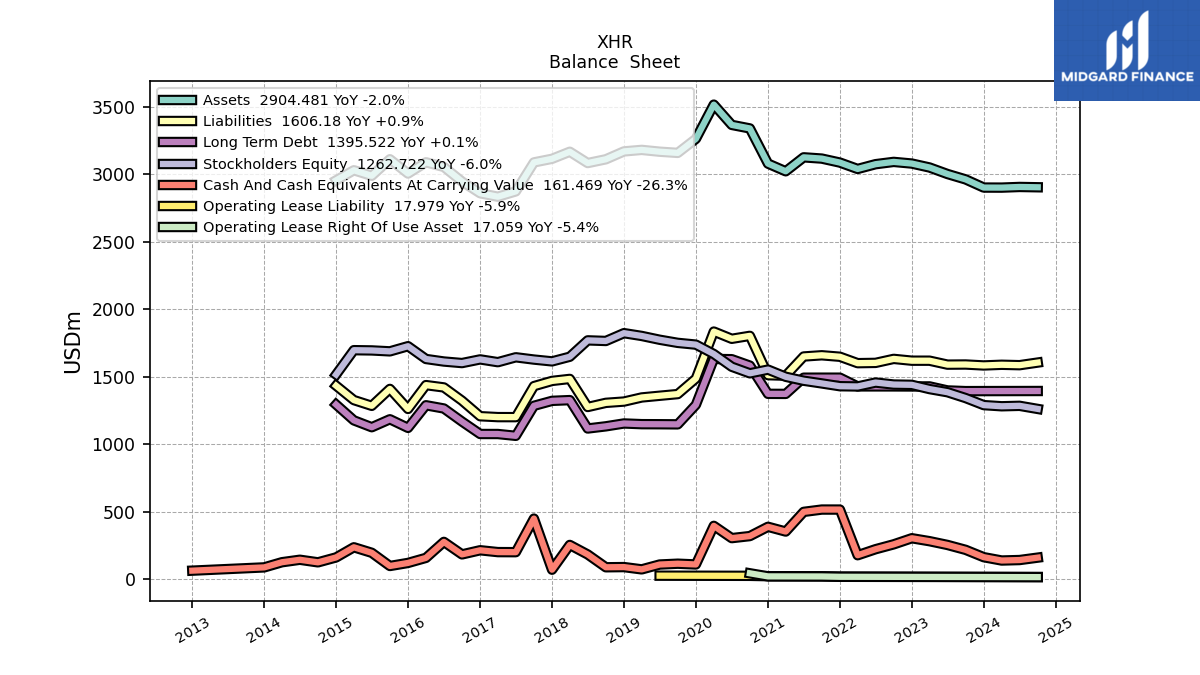
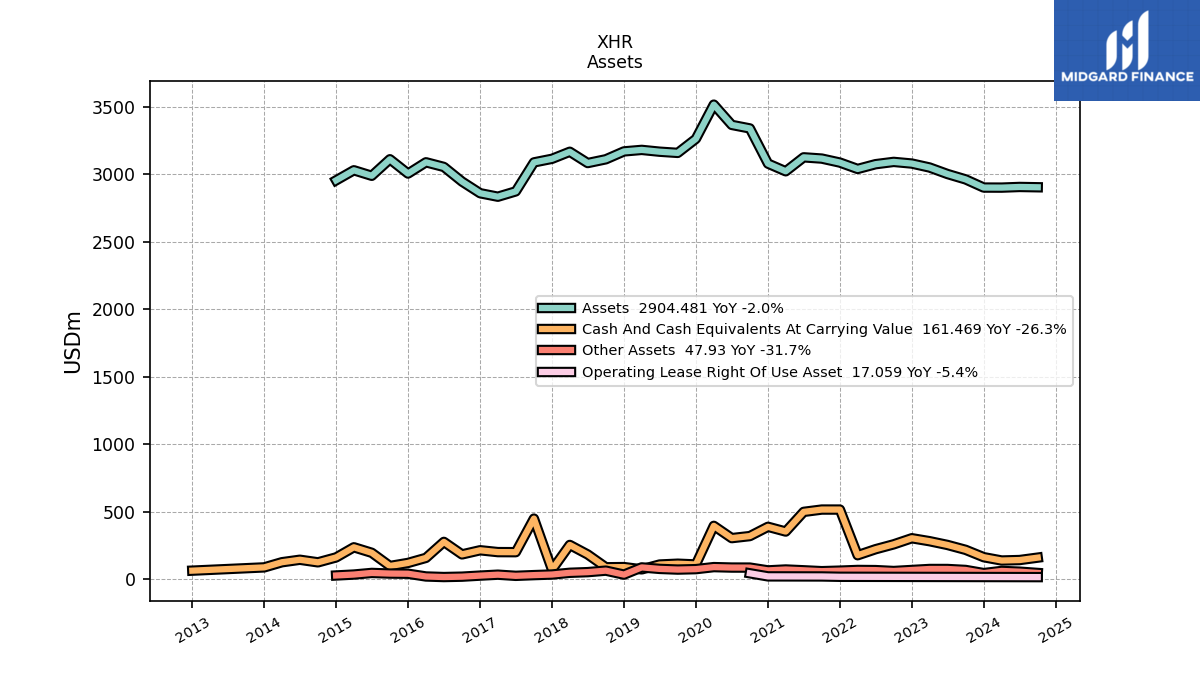
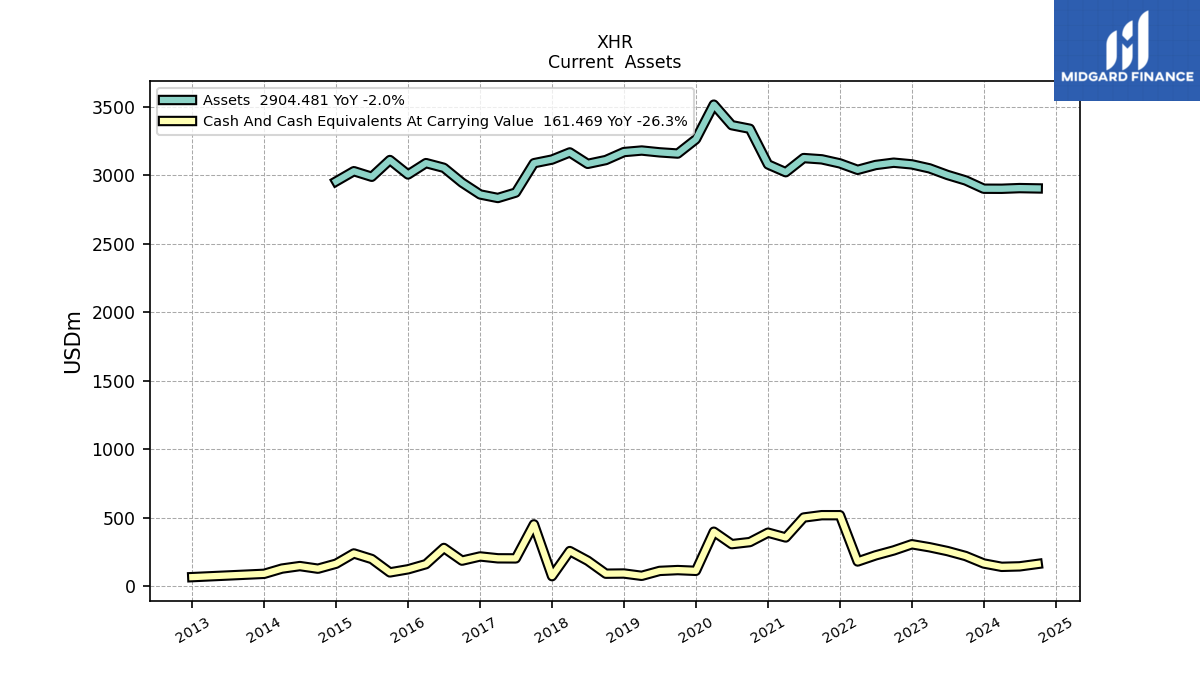
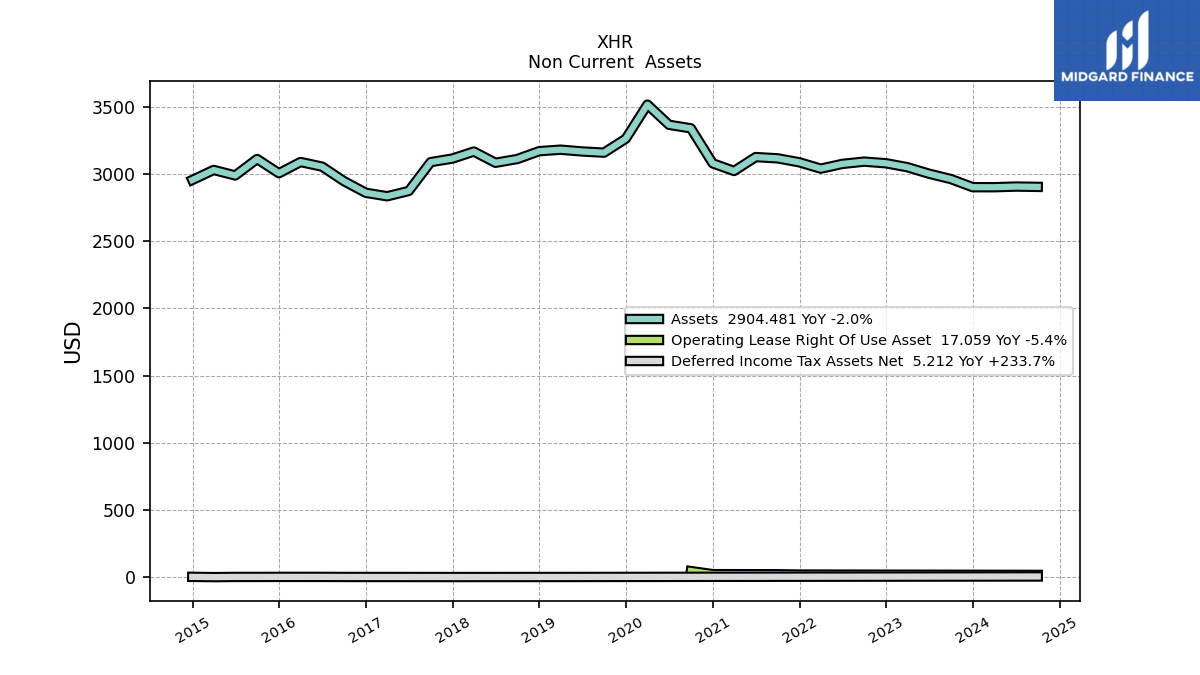
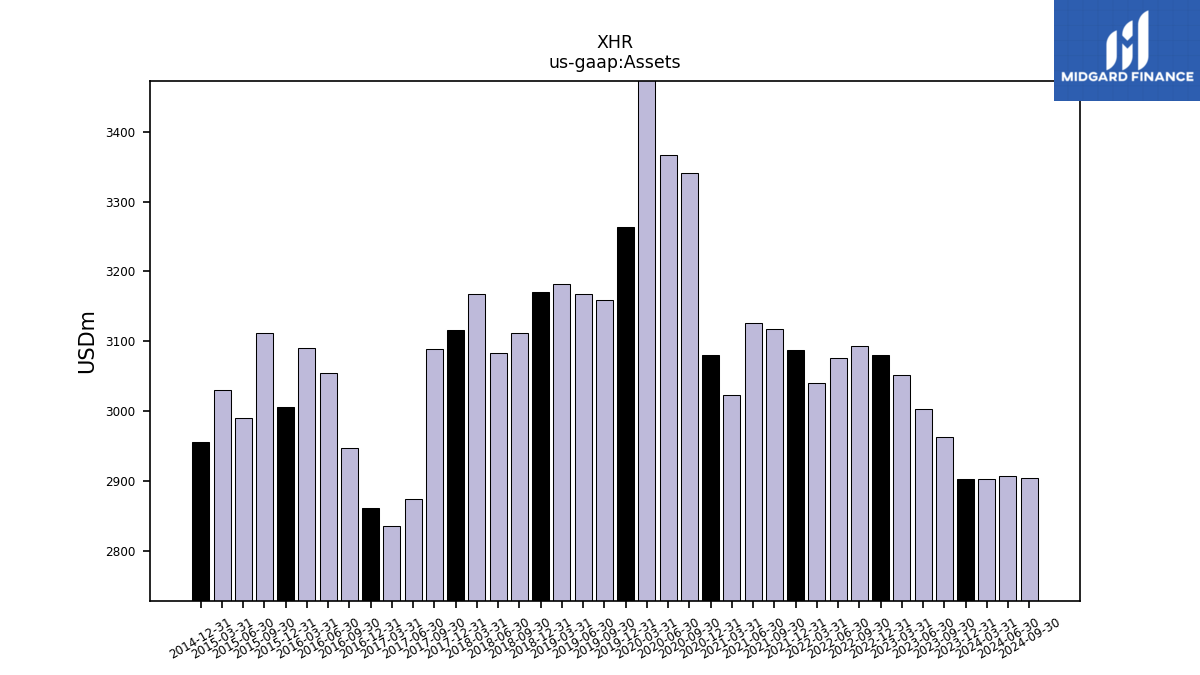
| Assets | 2902.23 | 2962.72 | 3002.60 | 3050.90 | 3080.05 | 3092.37 | 3075.38 | 3040.09 | 3087.32 | 3116.91 | 3126.21 | 3022.76 | 3079.60 | 3340.24 | 3366.32 | 3516.55 | 3263.01 | 3158.98 | 3167.93 | 3181.24 | 3170.09 | 3111.71 | 3083.72 | 3167.53 | 3115.31 | 3088.63 | 2874.08 | 2834.48 | 2860.34 | 2946.81 | 3055.05 | 3089.49 | 3005.95 | 3111.94 | 2989.41 | 3030.41 | 2955.75 | NA | NA | NA | |
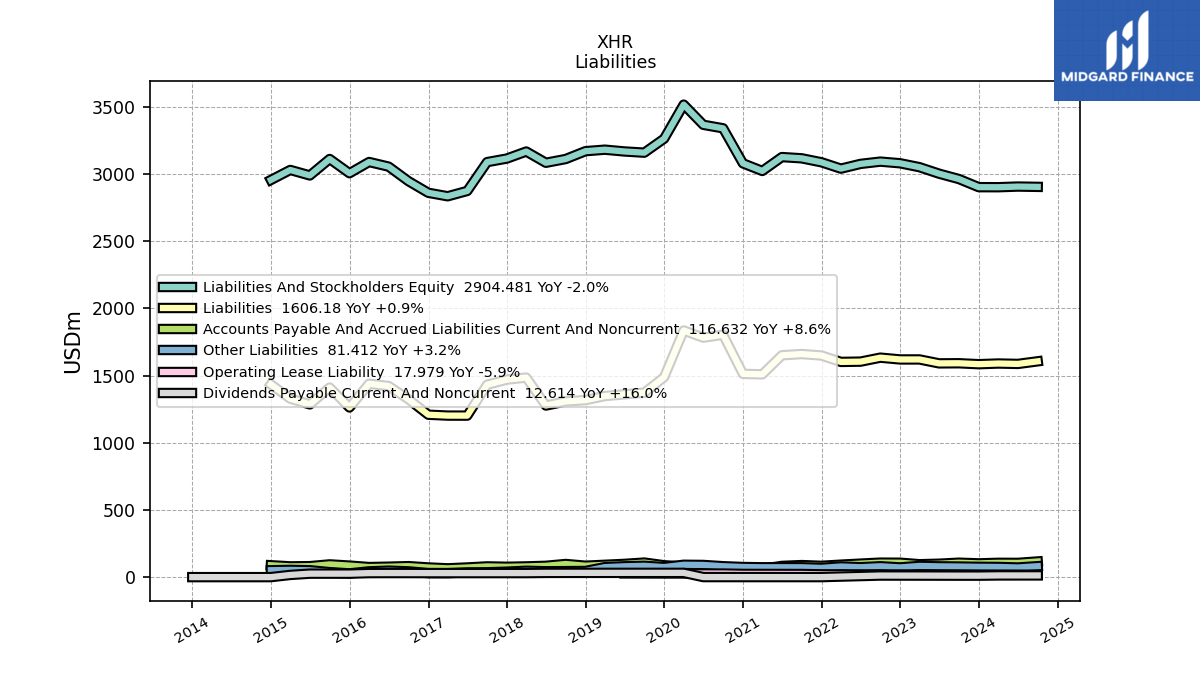
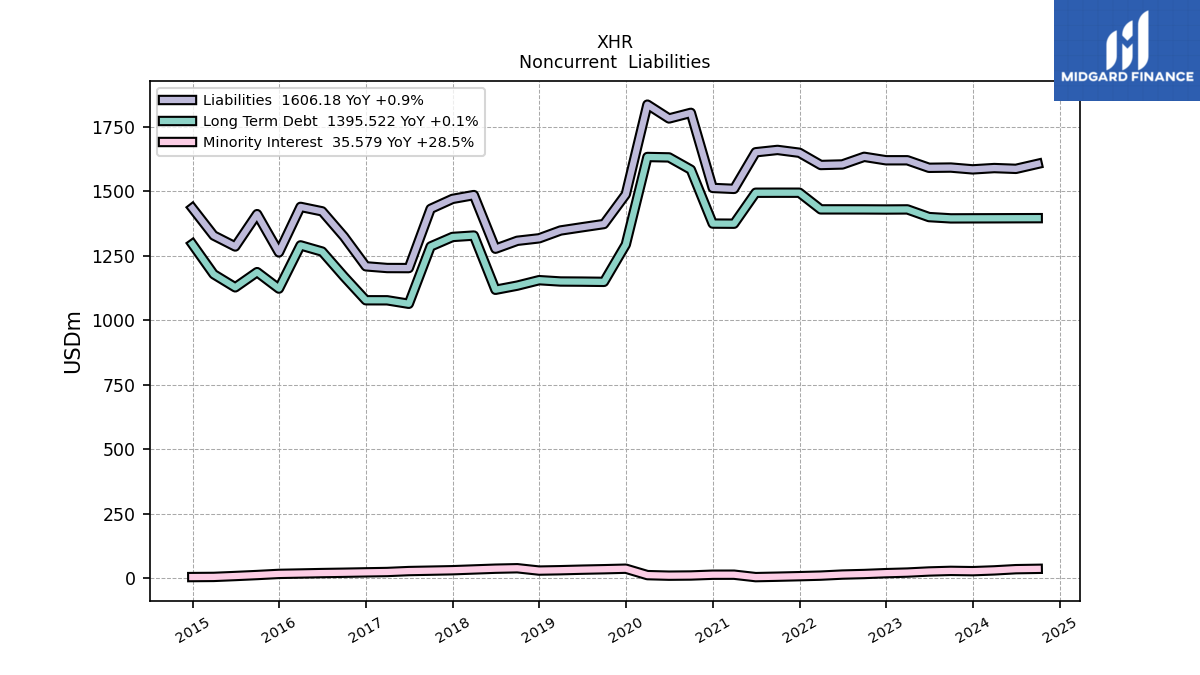
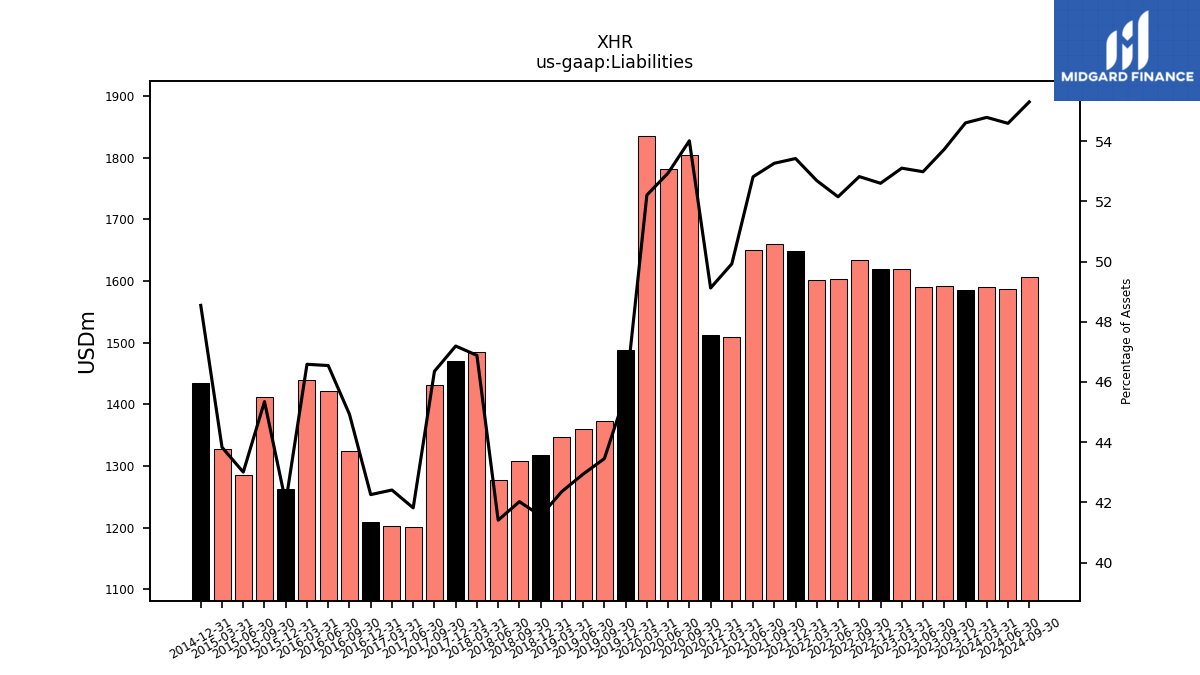
| Liabilities | 1584.73 | 1591.77 | 1590.83 | 1620.03 | 1620.05 | 1633.40 | 1603.79 | 1601.68 | 1649.23 | 1660.15 | 1651.11 | 1509.08 | 1512.74 | 1804.03 | 1782.10 | 1835.85 | 1487.85 | 1372.78 | 1360.32 | 1347.68 | 1317.38 | 1307.74 | 1276.98 | 1485.09 | 1470.22 | 1431.71 | 1201.91 | 1202.16 | 1208.78 | 1323.93 | 1422.00 | 1439.30 | 1262.59 | 1411.20 | 1285.64 | 1328.27 | 1434.83 | NA | NA | NA | |
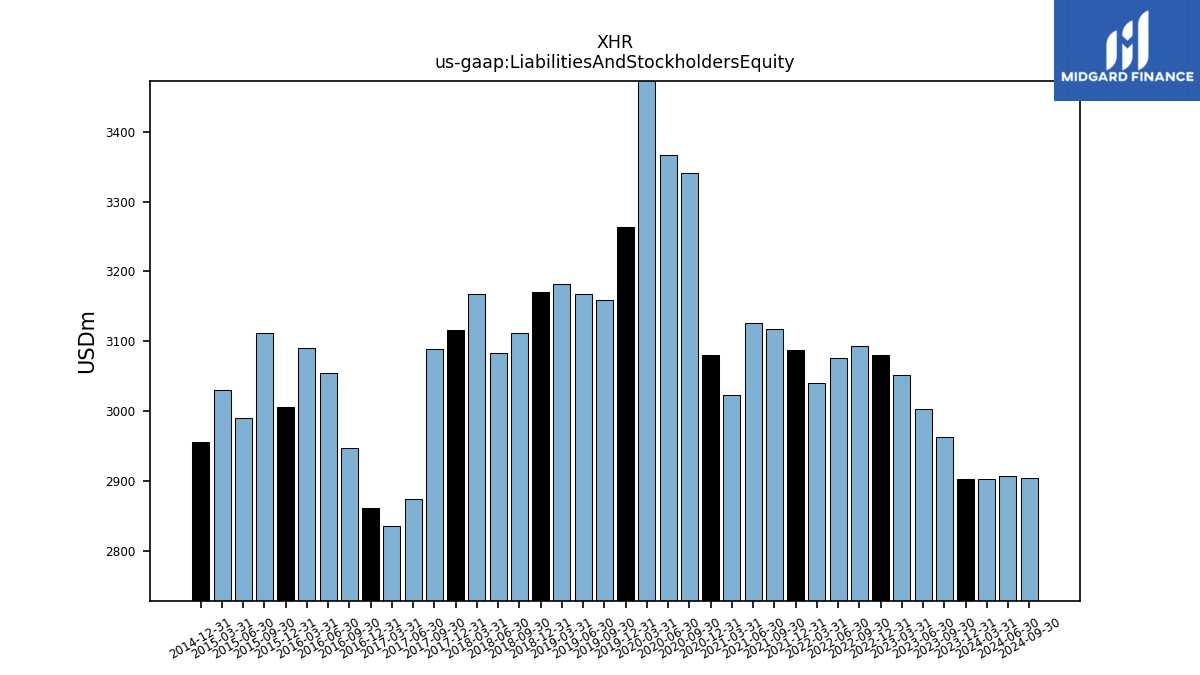
| Liabilities And Stockholders Equity | 2902.23 | 2962.72 | 3002.60 | 3050.90 | 3080.05 | 3092.37 | 3075.38 | 3040.09 | 3087.32 | 3116.91 | 3126.21 | 3022.76 | 3079.60 | 3340.24 | 3366.32 | 3516.55 | 3263.01 | 3158.98 | 3167.93 | 3181.24 | 3170.09 | 3111.71 | 3083.72 | 3167.53 | 3115.31 | 3088.63 | 2874.08 | 2834.48 | 2860.34 | 2946.81 | 3055.05 | 3089.49 | 3005.95 | 3111.94 | 2989.41 | 3030.41 | 2955.75 | NA | NA | NA | |
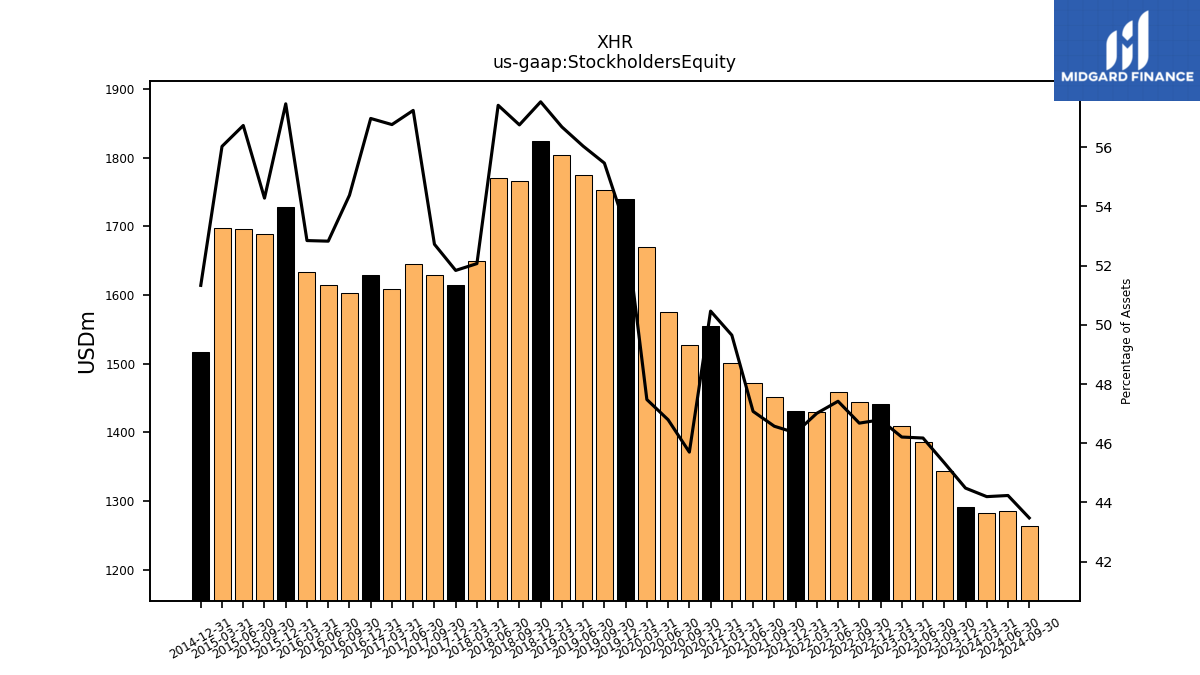
| Stockholders Equity | 1290.99 | 1343.26 | 1386.45 | 1409.75 | 1441.18 | 1443.45 | 1458.25 | 1429.15 | 1430.99 | 1451.64 | 1471.66 | 1500.82 | 1554.08 | 1526.45 | 1575.17 | 1669.47 | 1739.02 | 1752.09 | 1775.23 | 1803.30 | 1823.91 | 1766.08 | 1770.59 | 1649.27 | 1614.90 | 1628.39 | 1645.25 | 1609.02 | 1629.60 | 1602.42 | 1613.88 | 1632.69 | 1727.43 | 1689.18 | 1696.05 | 1697.90 | 1517.27 | NA | NA | NA |
| 2023-12-31 | 2023-09-30 | 2023-06-30 | 2023-03-31 | 2022-12-31 | 2022-09-30 | 2022-06-30 | 2022-03-31 | 2021-12-31 | 2021-09-30 | 2021-06-30 | 2021-03-31 | 2020-12-31 | 2020-09-30 | 2020-06-30 | 2020-03-31 | 2019-12-31 | 2019-09-30 | 2019-06-30 | 2019-03-31 | 2018-12-31 | 2018-09-30 | 2018-06-30 | 2018-03-31 | 2017-12-31 | 2017-09-30 | 2017-06-30 | 2017-03-31 | 2016-12-31 | 2016-09-30 | 2016-06-30 | 2016-03-31 | 2015-12-31 | 2015-09-30 | 2015-06-30 | 2015-03-31 | 2014-12-31 | 2014-09-30 | 2014-06-30 | 2014-03-31 | ||
|---|---|---|---|---|---|---|---|---|---|---|---|---|---|---|---|---|---|---|---|---|---|---|---|---|---|---|---|---|---|---|---|---|---|---|---|---|---|---|---|---|---|
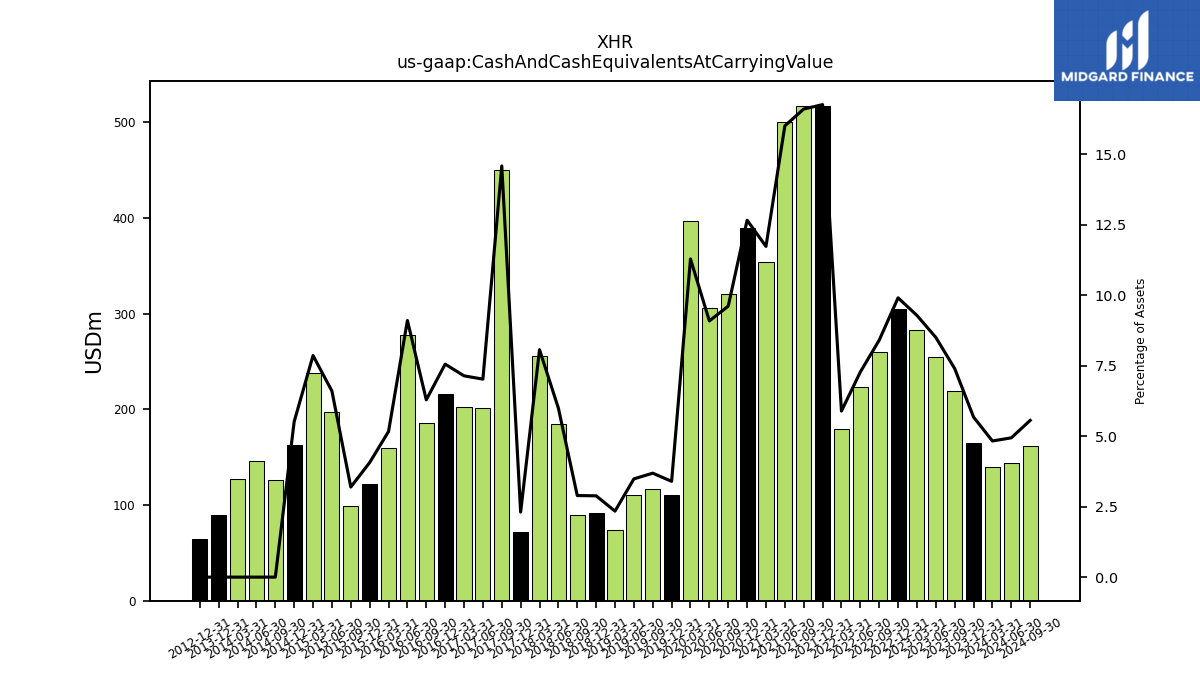
| Cash And Cash Equivalents At Carrying Value | 164.72 | 219.16 | 255.29 | 283.15 | 305.10 | 259.88 | 223.76 | 179.08 | 517.38 | 517.46 | 500.34 | 354.60 | 389.82 | 321.05 | 305.89 | 396.82 | 110.84 | 116.48 | 110.37 | 74.46 | 91.41 | 90.04 | 184.81 | 255.51 | 71.88 | 450.44 | 201.81 | 202.37 | 216.05 | 185.31 | 278.06 | 159.58 | 122.15 | 99.43 | 197.30 | 238.13 | 163.05 | 126.53 | 145.72 | 127.34 | |
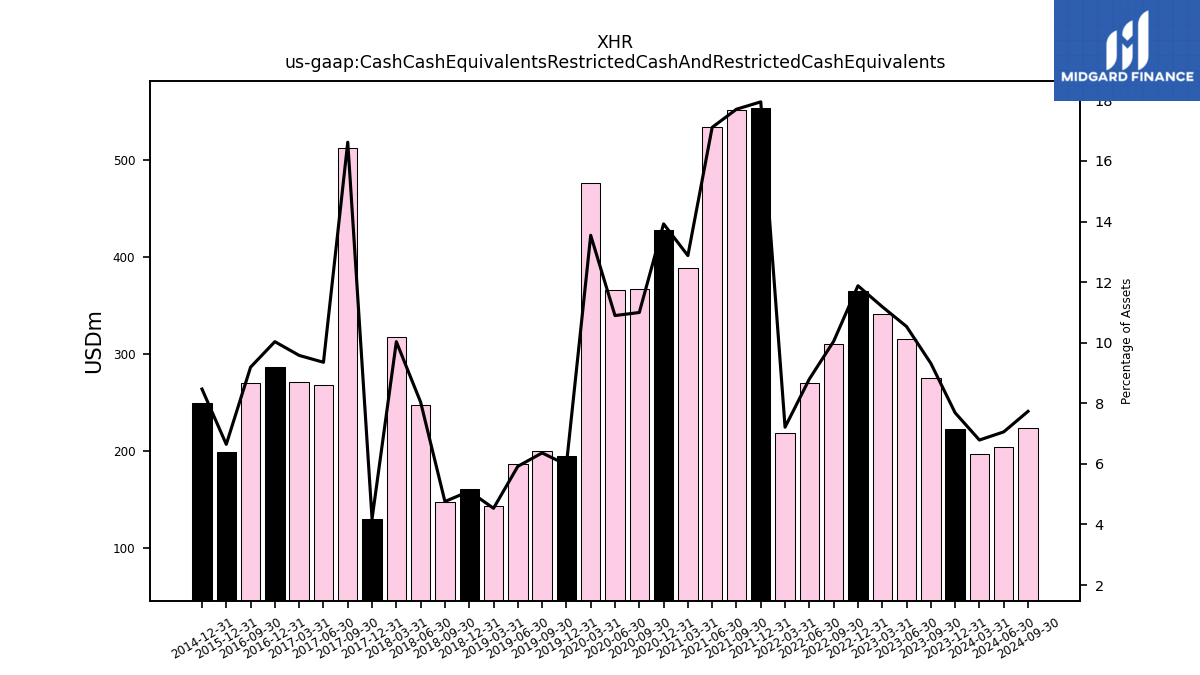
| Cash Cash Equivalents Restricted Cash And Restricted Cash Equivalents | 223.07 | 276.11 | 316.31 | 341.36 | 365.91 | 310.67 | 270.68 | 219.24 | 554.23 | 551.96 | 534.91 | 389.23 | 428.79 | 367.35 | 366.81 | 476.35 | 194.95 | 200.97 | 187.51 | 144.25 | 161.61 | 148.03 | 247.81 | 317.83 | 130.40 | 513.32 | 268.84 | 271.57 | 287.03 | 270.89 | NA | NA | 199.75 | NA | NA | NA | 250.35 | NA | NA | NA | |
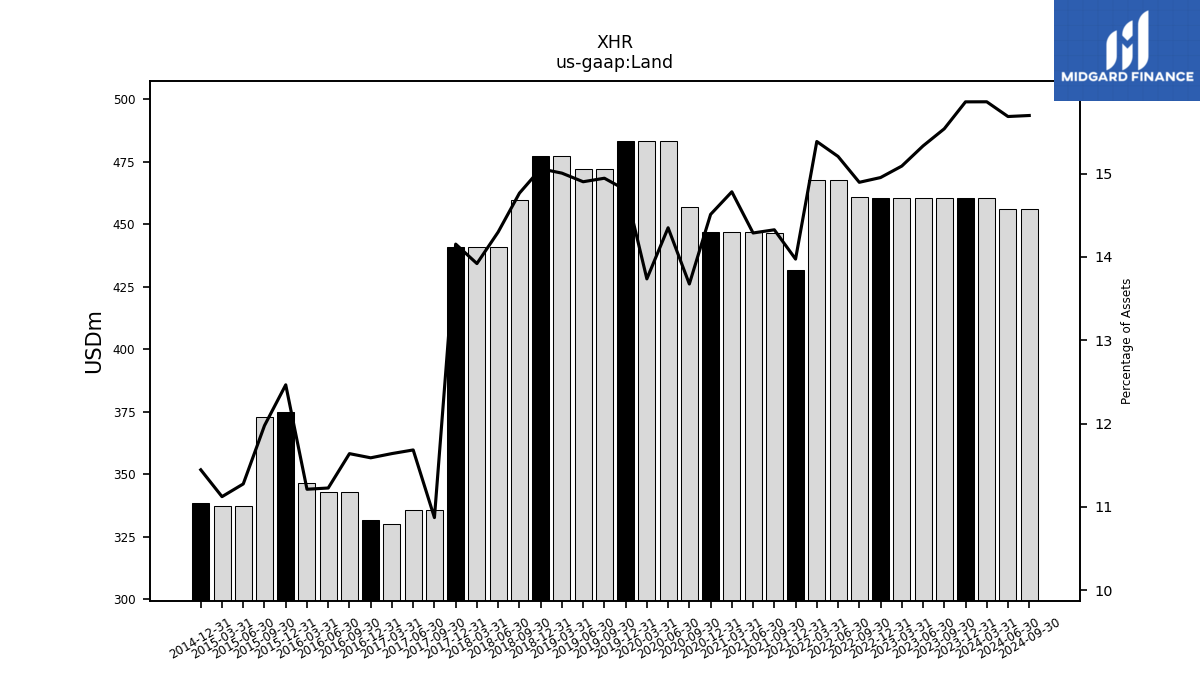
| Land | 460.31 | 460.33 | 460.34 | 460.38 | 460.54 | 460.62 | 467.63 | 467.71 | 431.43 | 446.51 | 446.65 | 446.81 | 446.86 | 456.78 | 483.05 | 483.05 | 483.05 | 472.08 | 472.08 | 477.35 | 477.35 | 459.44 | 440.93 | 440.93 | 440.93 | 335.81 | 335.81 | 329.95 | 331.50 | 343.00 | 343.00 | 346.41 | 374.70 | 372.70 | 337.09 | 337.09 | 338.31 | NA | NA | NA |
| 2023-12-31 | 2023-09-30 | 2023-06-30 | 2023-03-31 | 2022-12-31 | 2022-09-30 | 2022-06-30 | 2022-03-31 | 2021-12-31 | 2021-09-30 | 2021-06-30 | 2021-03-31 | 2020-12-31 | 2020-09-30 | 2020-06-30 | 2020-03-31 | 2019-12-31 | 2019-09-30 | 2019-06-30 | 2019-03-31 | 2018-12-31 | 2018-09-30 | 2018-06-30 | 2018-03-31 | 2017-12-31 | 2017-09-30 | 2017-06-30 | 2017-03-31 | 2016-12-31 | 2016-09-30 | 2016-06-30 | 2016-03-31 | 2015-12-31 | 2015-09-30 | 2015-06-30 | 2015-03-31 | 2014-12-31 | 2014-09-30 | 2014-06-30 | 2014-03-31 | ||
|---|---|---|---|---|---|---|---|---|---|---|---|---|---|---|---|---|---|---|---|---|---|---|---|---|---|---|---|---|---|---|---|---|---|---|---|---|---|---|---|---|---|
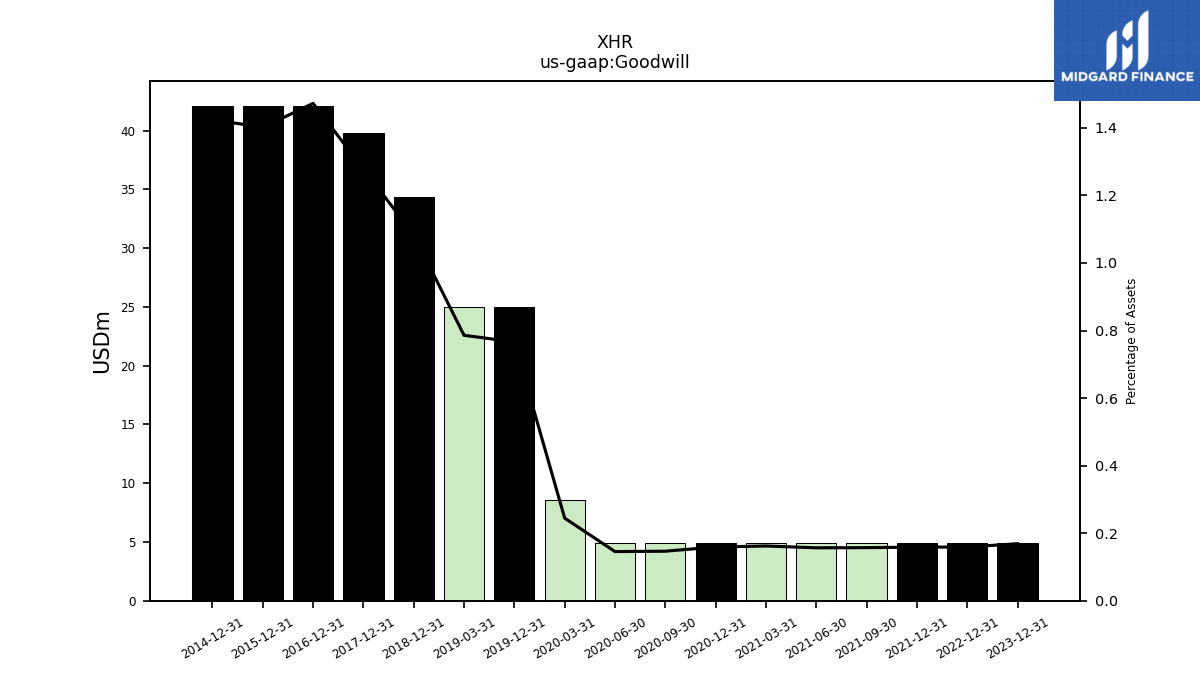
| Goodwill | 4.90 | NA | NA | NA | 4.90 | NA | NA | NA | 4.90 | 4.90 | 4.90 | 4.90 | 4.90 | 4.90 | 4.90 | 8.60 | 25.00 | NA | NA | 25.00 | 34.35 | NA | NA | NA | 39.83 | NA | NA | NA | 42.11 | NA | NA | NA | 42.11 | NA | NA | NA | 42.11 | NA | NA | NA | |
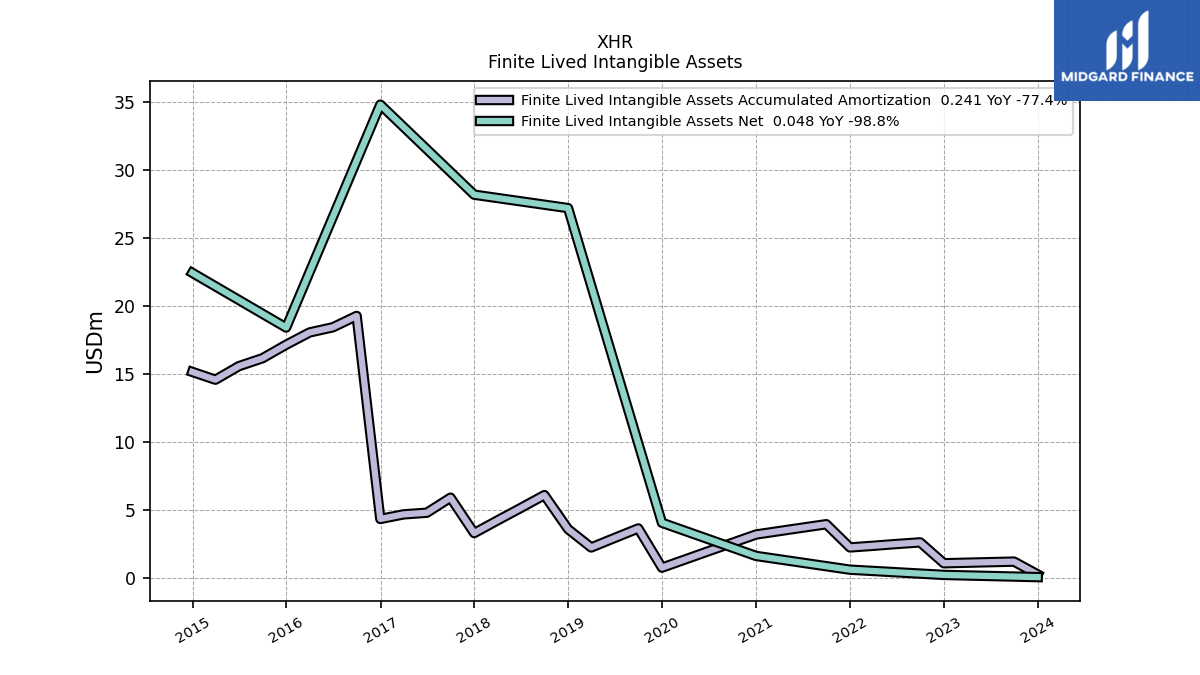
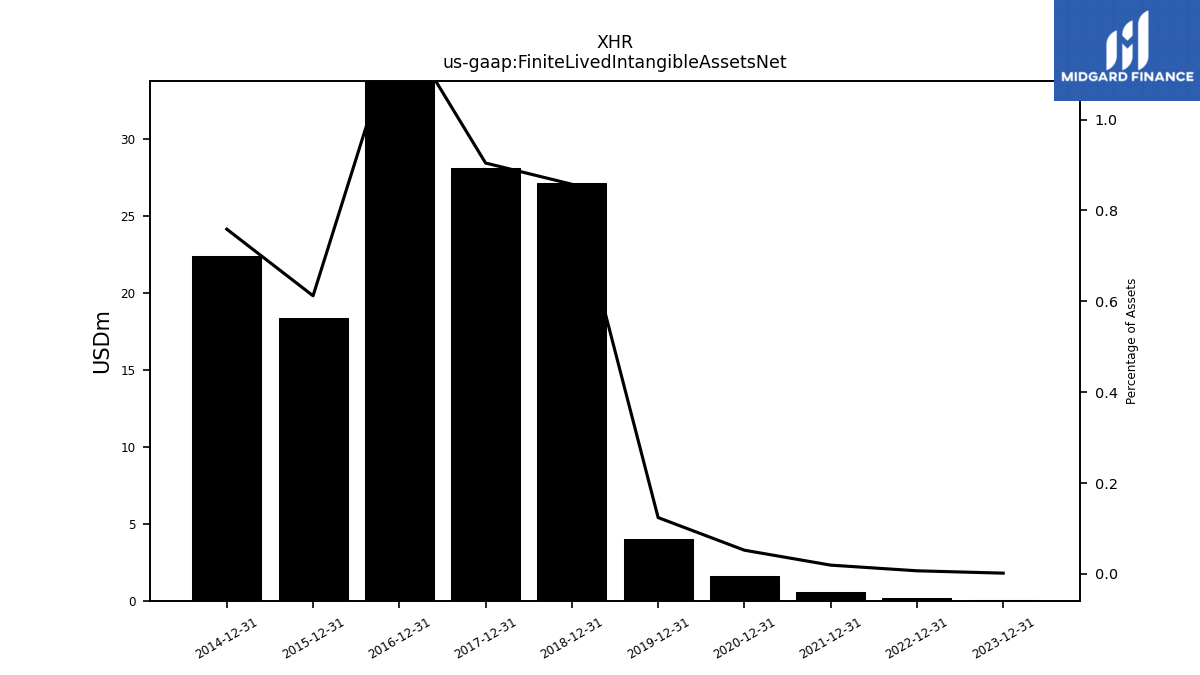
| Finite Lived Intangible Assets Net | 0.05 | NA | NA | NA | 0.21 | NA | NA | NA | 0.60 | NA | NA | NA | 1.61 | NA | NA | NA | 4.04 | NA | NA | NA | 27.19 | NA | NA | NA | 28.18 | NA | NA | NA | 34.80 | NA | NA | NA | 18.40 | NA | NA | NA | 22.43 | NA | NA | NA | |
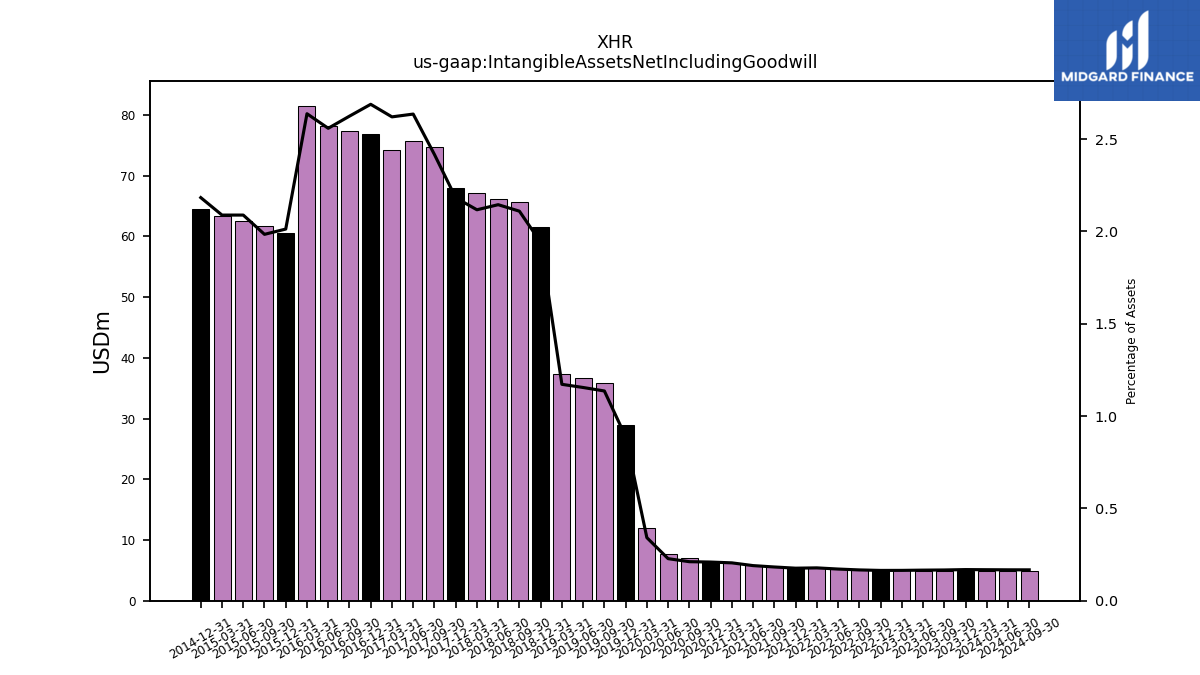
| Intangible Assets Net Including Goodwill | 4.90 | 4.94 | 4.98 | 5.02 | 5.06 | 5.16 | 5.28 | 5.41 | 5.45 | 5.70 | 5.95 | 6.20 | 6.46 | 7.07 | 7.67 | 12.02 | 29.00 | 35.89 | 36.59 | 37.29 | 61.54 | 65.66 | 66.15 | 67.08 | 68.00 | 74.66 | 75.76 | 74.29 | 76.91 | 77.35 | 78.18 | 81.50 | 60.52 | 61.76 | 62.45 | 63.30 | 64.54 | NA | NA | NA |
| 2023-12-31 | 2023-09-30 | 2023-06-30 | 2023-03-31 | 2022-12-31 | 2022-09-30 | 2022-06-30 | 2022-03-31 | 2021-12-31 | 2021-09-30 | 2021-06-30 | 2021-03-31 | 2020-12-31 | 2020-09-30 | 2020-06-30 | 2020-03-31 | 2019-12-31 | 2019-09-30 | 2019-06-30 | 2019-03-31 | 2018-12-31 | 2018-09-30 | 2018-06-30 | 2018-03-31 | 2017-12-31 | 2017-09-30 | 2017-06-30 | 2017-03-31 | 2016-12-31 | 2016-09-30 | 2016-06-30 | 2016-03-31 | 2015-12-31 | 2015-09-30 | 2015-06-30 | 2015-03-31 | 2014-12-31 | 2014-09-30 | 2014-06-30 | 2014-03-31 | ||
|---|---|---|---|---|---|---|---|---|---|---|---|---|---|---|---|---|---|---|---|---|---|---|---|---|---|---|---|---|---|---|---|---|---|---|---|---|---|---|---|---|---|
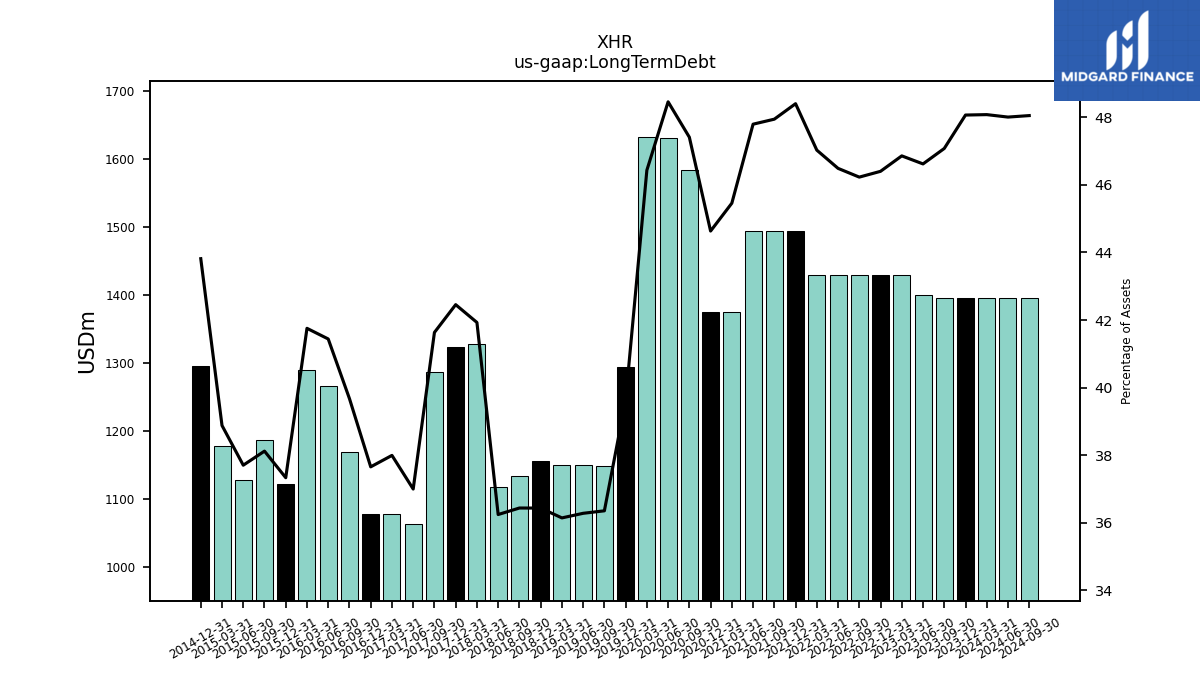
| Long Term Debt | 1394.91 | 1394.68 | 1399.74 | 1429.52 | 1429.11 | 1429.52 | 1429.63 | 1429.62 | 1494.23 | 1494.29 | 1494.11 | 1374.04 | 1374.48 | 1583.53 | 1631.15 | 1632.78 | 1293.05 | 1148.50 | 1149.42 | 1149.92 | 1155.09 | 1133.89 | 1117.75 | 1328.09 | 1322.59 | 1285.89 | 1063.44 | 1076.99 | 1077.13 | 1169.13 | 1266.00 | 1290.01 | 1122.31 | 1186.34 | 1127.19 | 1178.21 | 1295.05 | NA | NA | NA | |
| Minority Interest | 26.50 | 27.69 | 25.32 | 21.12 | 18.82 | 15.52 | 13.33 | 9.26 | 7.09 | 5.12 | 3.44 | 12.87 | 12.79 | 9.76 | 9.05 | 11.22 | 36.14 | 34.10 | 32.38 | 30.25 | 28.79 | 37.88 | 36.15 | 33.16 | 30.18 | 28.53 | 26.93 | 23.30 | 21.97 | 20.46 | 19.17 | 17.50 | 15.93 | 11.56 | 7.72 | 4.24 | 3.65 | NA | NA | NA |
| 2023-12-31 | 2023-09-30 | 2023-06-30 | 2023-03-31 | 2022-12-31 | 2022-09-30 | 2022-06-30 | 2022-03-31 | 2021-12-31 | 2021-09-30 | 2021-06-30 | 2021-03-31 | 2020-12-31 | 2020-09-30 | 2020-06-30 | 2020-03-31 | 2019-12-31 | 2019-09-30 | 2019-06-30 | 2019-03-31 | 2018-12-31 | 2018-09-30 | 2018-06-30 | 2018-03-31 | 2017-12-31 | 2017-09-30 | 2017-06-30 | 2017-03-31 | 2016-12-31 | 2016-09-30 | 2016-06-30 | 2016-03-31 | 2015-12-31 | 2015-09-30 | 2015-06-30 | 2015-03-31 | 2014-12-31 | 2014-09-30 | 2014-06-30 | 2014-03-31 | ||
|---|---|---|---|---|---|---|---|---|---|---|---|---|---|---|---|---|---|---|---|---|---|---|---|---|---|---|---|---|---|---|---|---|---|---|---|---|---|---|---|---|---|
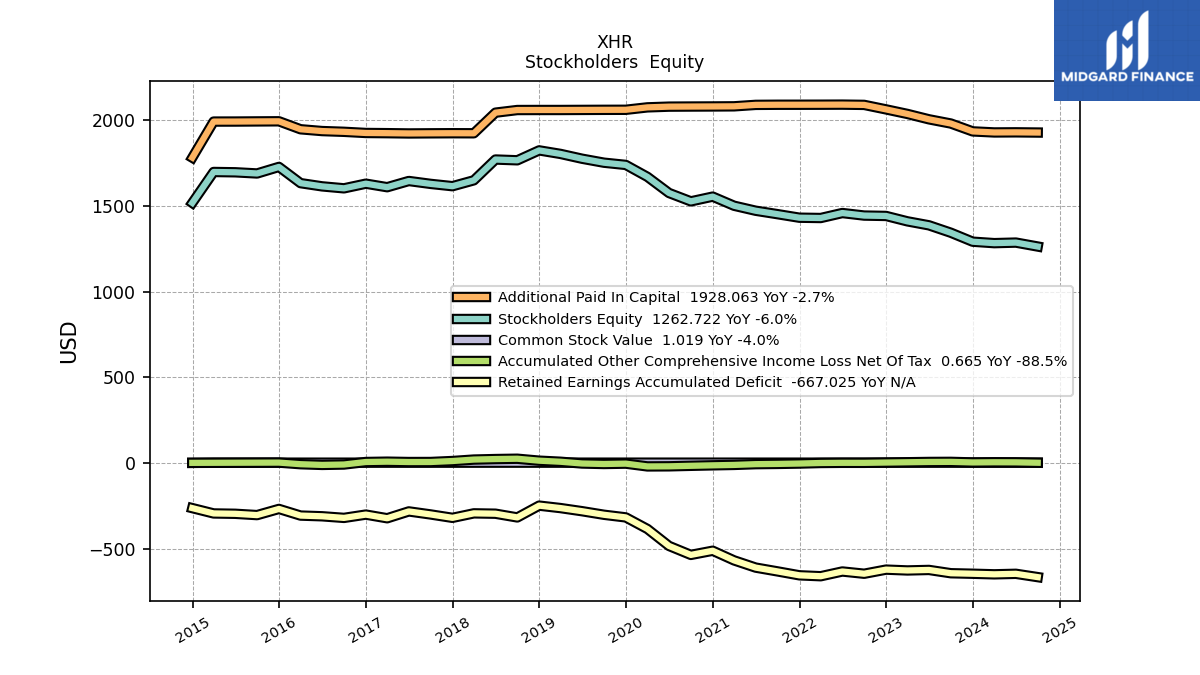
| Stockholders Equity | 1290.99 | 1343.26 | 1386.45 | 1409.75 | 1441.18 | 1443.45 | 1458.25 | 1429.15 | 1430.99 | 1451.64 | 1471.66 | 1500.82 | 1554.08 | 1526.45 | 1575.17 | 1669.47 | 1739.02 | 1752.09 | 1775.23 | 1803.30 | 1823.91 | 1766.08 | 1770.59 | 1649.27 | 1614.90 | 1628.39 | 1645.25 | 1609.02 | 1629.60 | 1602.42 | 1613.88 | 1632.69 | 1727.43 | 1689.18 | 1696.05 | 1697.90 | 1517.27 | NA | NA | NA | |
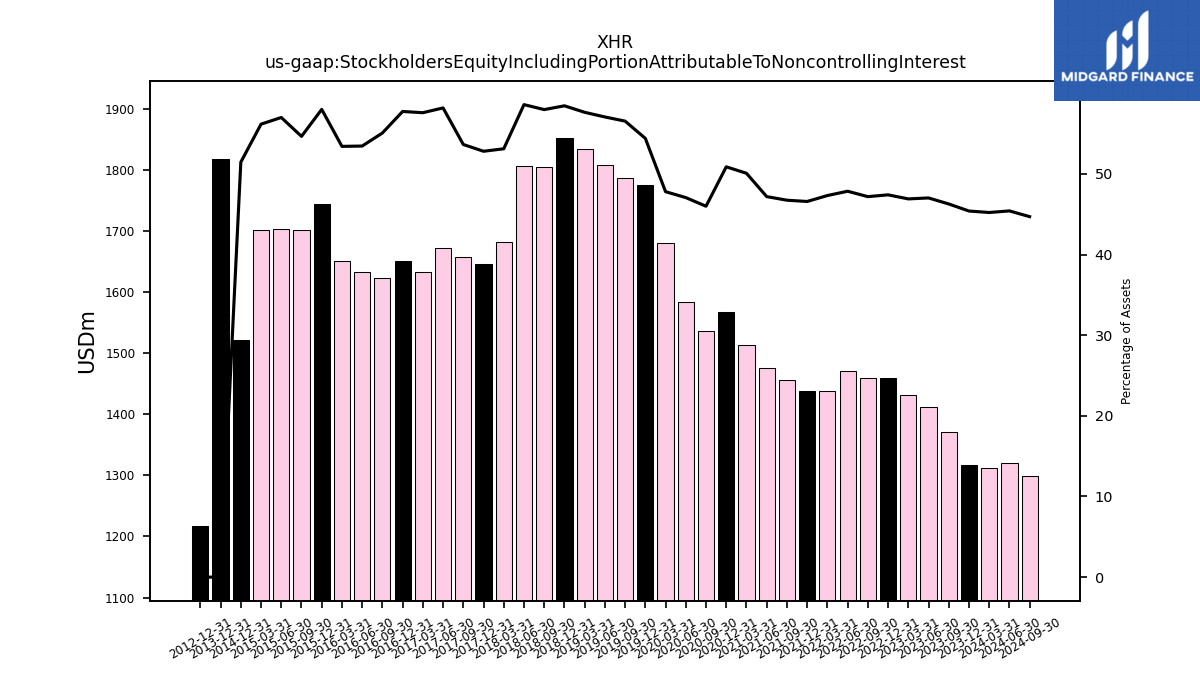
| Stockholders Equity Including Portion Attributable To Noncontrolling Interest | 1317.50 | 1370.95 | 1411.77 | 1430.87 | 1460.01 | 1458.97 | 1471.58 | 1438.40 | 1438.08 | 1456.76 | 1475.09 | 1513.69 | 1566.86 | 1536.21 | 1584.22 | 1680.69 | 1775.16 | 1786.20 | 1807.61 | 1833.56 | 1852.70 | 1803.96 | 1806.74 | 1682.44 | 1645.09 | 1656.92 | 1672.17 | 1632.32 | 1651.57 | 1622.88 | 1633.05 | 1650.19 | 1743.36 | 1700.74 | 1703.77 | 1702.14 | 1520.92 | NA | NA | NA | |
| Common Stock Value | 1.02 | 1.06 | 1.08 | 1.11 | 1.13 | 1.14 | 1.14 | 1.14 | 1.14 | 1.14 | 1.14 | 1.14 | 1.14 | 1.14 | 1.14 | 1.14 | 1.13 | 1.13 | 1.13 | 1.13 | 1.13 | 1.13 | 1.12 | 1.07 | 1.07 | 1.07 | 1.07 | 1.07 | 1.07 | 1.07 | 1.08 | 1.08 | 1.12 | 1.12 | 1.12 | 1.12 | 0.00 | NA | NA | NA | |
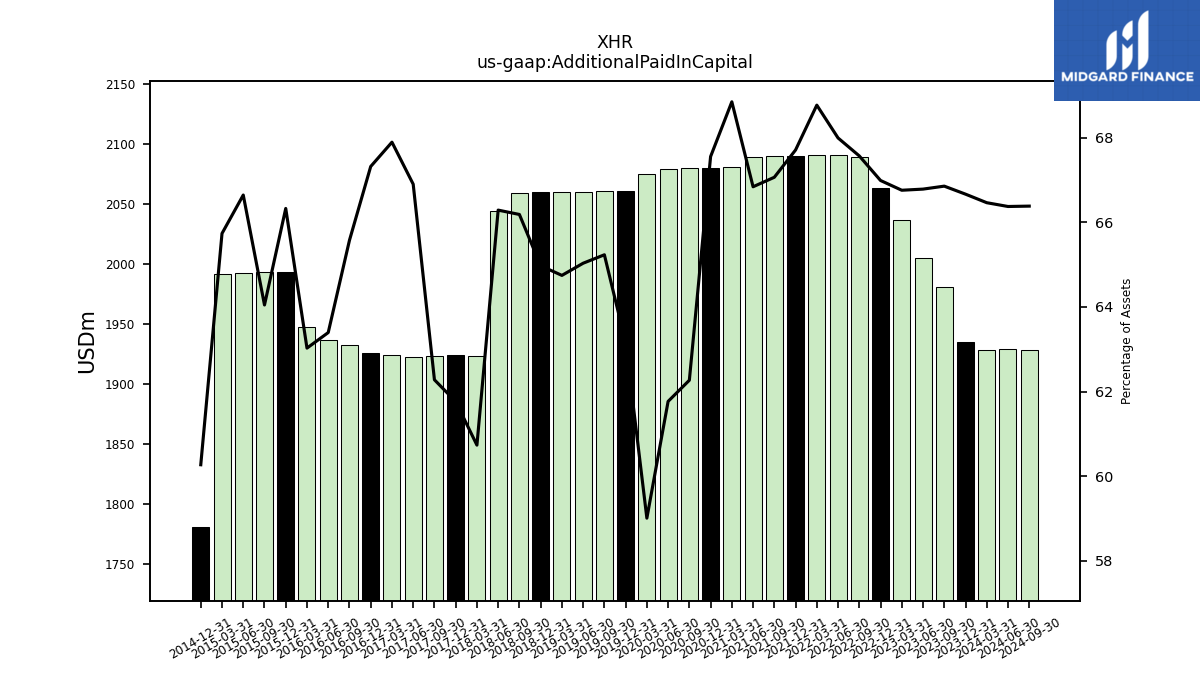
| Additional Paid In Capital | 1934.78 | 1980.71 | 2005.27 | 2036.71 | 2063.27 | 2089.46 | 2091.04 | 2090.63 | 2090.39 | 2090.33 | 2089.55 | 2081.09 | 2080.36 | 2079.88 | 2079.28 | 2075.04 | 2060.92 | 2060.67 | 2060.19 | 2059.69 | 2059.70 | 2059.48 | 2044.13 | 1923.77 | 1924.12 | 1923.54 | 1922.79 | 1924.42 | 1925.55 | 1932.36 | 1936.72 | 1947.20 | 1993.76 | 1993.07 | 1992.27 | 1992.08 | 1781.43 | NA | NA | NA | |
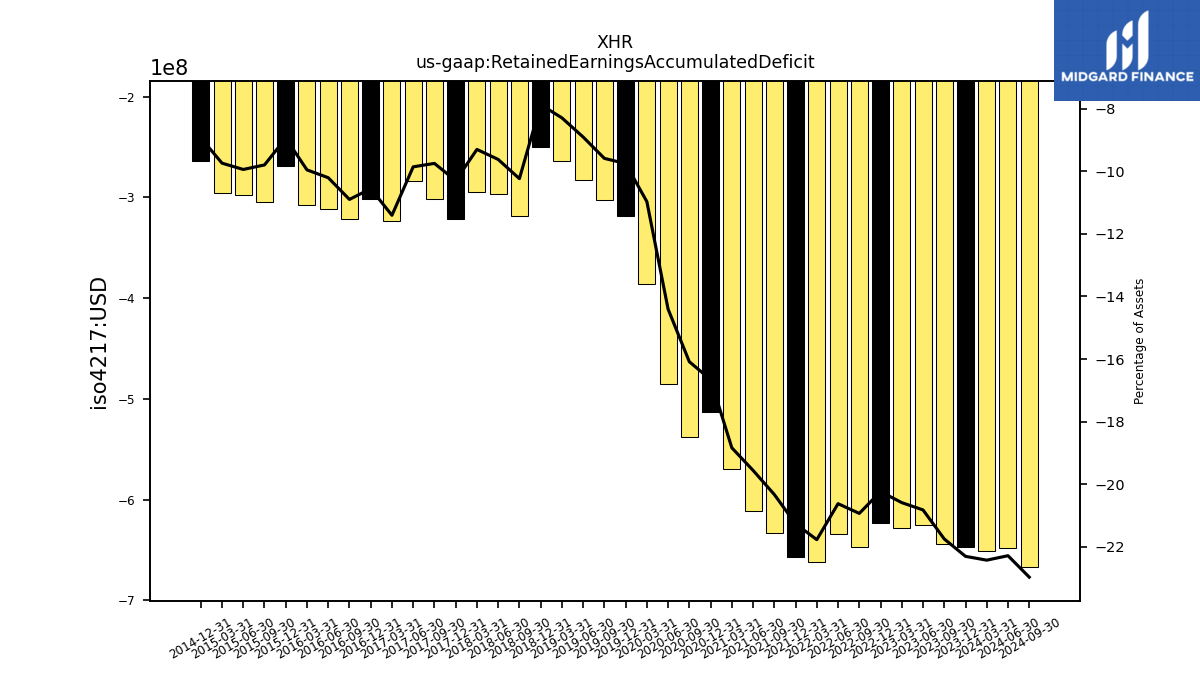
| Retained Earnings Accumulated Deficit | -647.25 | -644.29 | -625.12 | -628.06 | -623.22 | -647.25 | -634.14 | -661.78 | -656.46 | -633.58 | -611.39 | -569.35 | -513.00 | -537.34 | -485.00 | -385.88 | -318.43 | -303.00 | -282.26 | -263.98 | -249.65 | -318.62 | -296.83 | -294.77 | -320.96 | -301.22 | -283.45 | -323.40 | -302.03 | -321.29 | -311.90 | -307.71 | -268.99 | -305.00 | -297.33 | -295.30 | -264.16 | NA | NA | NA | |
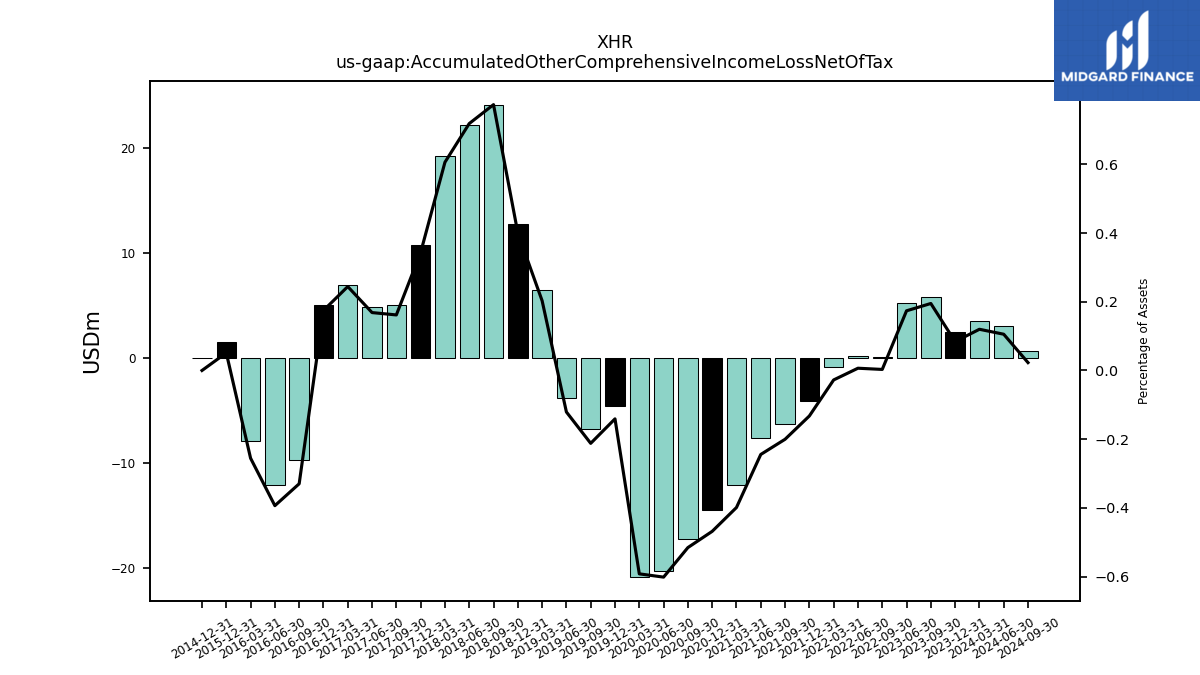
| Accumulated Other Comprehensive Income Loss Net Of Tax | 2.44 | 5.78 | 5.22 | NA | NA | 0.09 | 0.20 | -0.84 | -4.09 | -6.24 | -7.64 | -12.06 | -14.43 | -17.22 | -20.25 | -20.82 | -4.60 | -6.70 | -3.83 | 6.46 | 12.70 | 24.09 | 22.17 | 19.20 | 10.70 | 5.00 | 4.84 | 6.92 | 5.00 | -9.72 | -12.03 | -7.89 | 1.54 | NA | NA | NA | 0.00 | NA | NA | NA | |
| Minority Interest | 26.50 | 27.69 | 25.32 | 21.12 | 18.82 | 15.52 | 13.33 | 9.26 | 7.09 | 5.12 | 3.44 | 12.87 | 12.79 | 9.76 | 9.05 | 11.22 | 36.14 | 34.10 | 32.38 | 30.25 | 28.79 | 37.88 | 36.15 | 33.16 | 30.18 | 28.53 | 26.93 | 23.30 | 21.97 | 20.46 | 19.17 | 17.50 | 15.93 | 11.56 | 7.72 | 4.24 | 3.65 | NA | NA | NA |
| 2023-12-31 | 2023-09-30 | 2023-06-30 | 2023-03-31 | 2022-12-31 | 2022-09-30 | 2022-06-30 | 2022-03-31 | 2021-12-31 | 2021-09-30 | 2021-06-30 | 2021-03-31 | 2020-12-31 | 2020-09-30 | 2020-06-30 | 2020-03-31 | 2019-12-31 | 2019-09-30 | 2019-06-30 | 2019-03-31 | 2018-12-31 | 2018-09-30 | 2018-06-30 | 2018-03-31 | 2017-12-31 | 2017-09-30 | 2017-06-30 | 2017-03-31 | 2016-12-31 | 2016-09-30 | 2016-06-30 | 2016-03-31 | 2015-12-31 | 2015-09-30 | 2015-06-30 | 2015-03-31 | 2014-12-31 | 2014-09-30 | 2014-06-30 | 2014-03-31 | ||
|---|---|---|---|---|---|---|---|---|---|---|---|---|---|---|---|---|---|---|---|---|---|---|---|---|---|---|---|---|---|---|---|---|---|---|---|---|---|---|---|---|---|
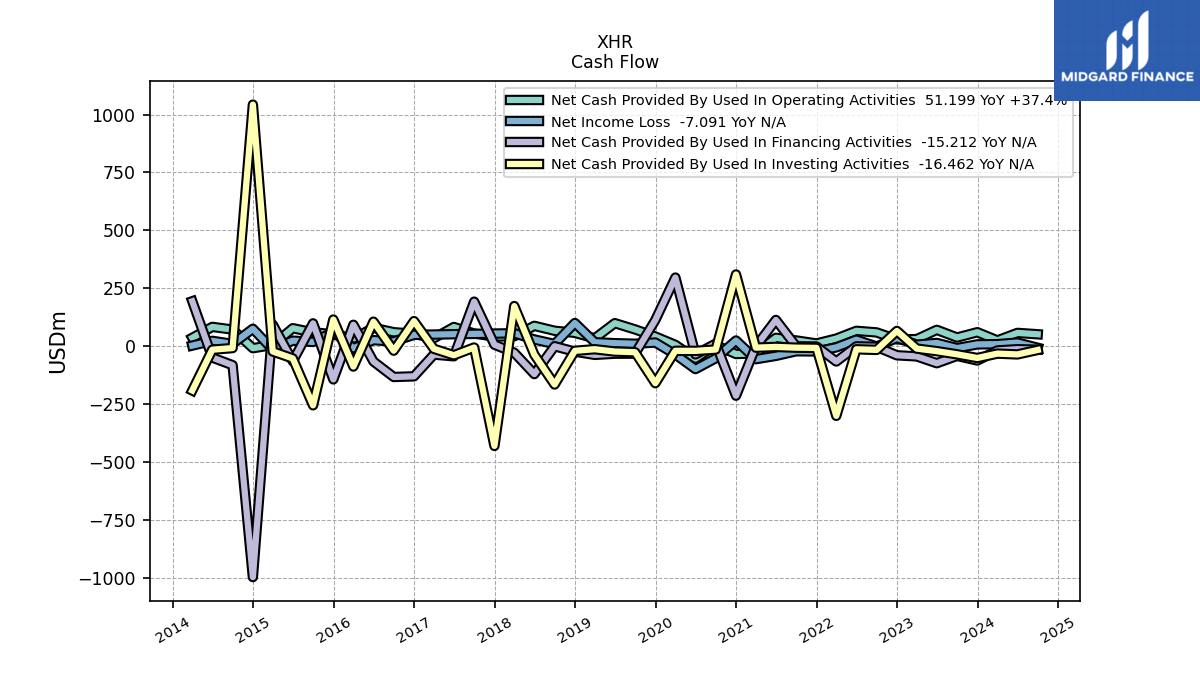
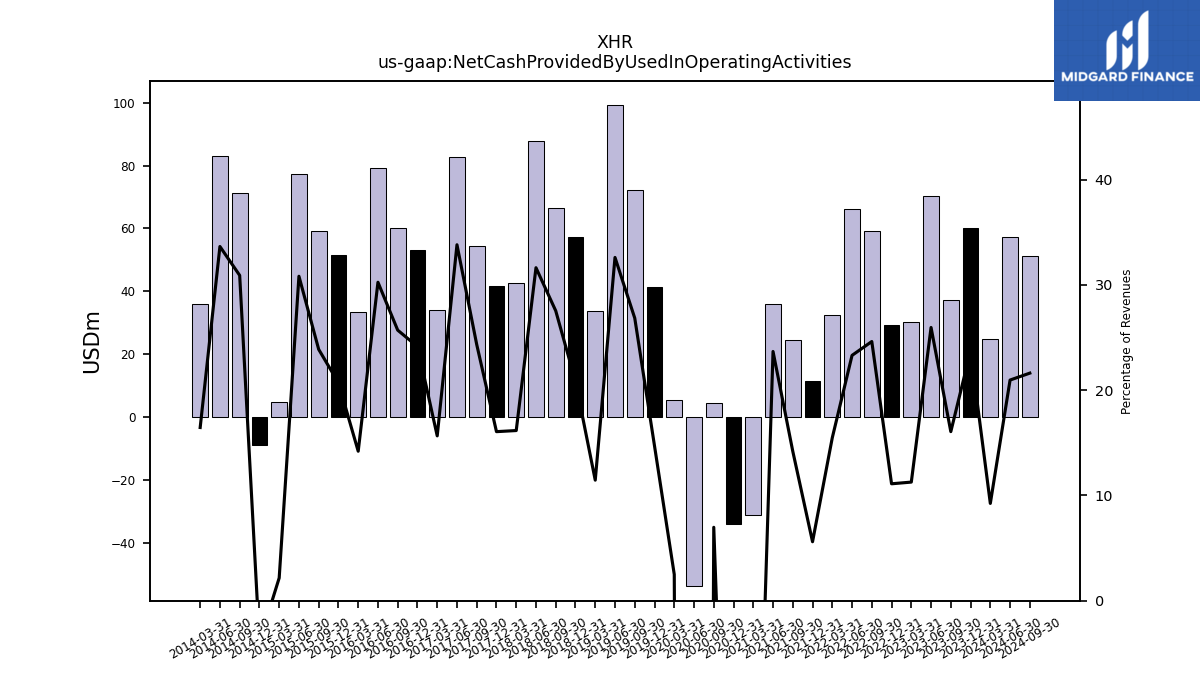
| Net Cash Provided By Used In Operating Activities | 60.12 | 37.27 | 70.36 | 30.31 | 29.23 | 59.26 | 66.06 | 32.57 | 11.41 | 24.53 | 35.98 | -31.16 | -34.01 | 4.46 | -53.56 | 5.39 | 41.51 | 72.20 | 99.22 | 33.64 | 57.43 | 66.36 | 87.64 | 42.76 | 41.62 | 54.34 | 82.64 | 34.21 | 53.07 | 60.13 | 79.07 | 33.38 | 51.46 | 59.32 | 77.43 | 4.94 | -8.92 | 71.42 | 83.14 | 35.96 | |
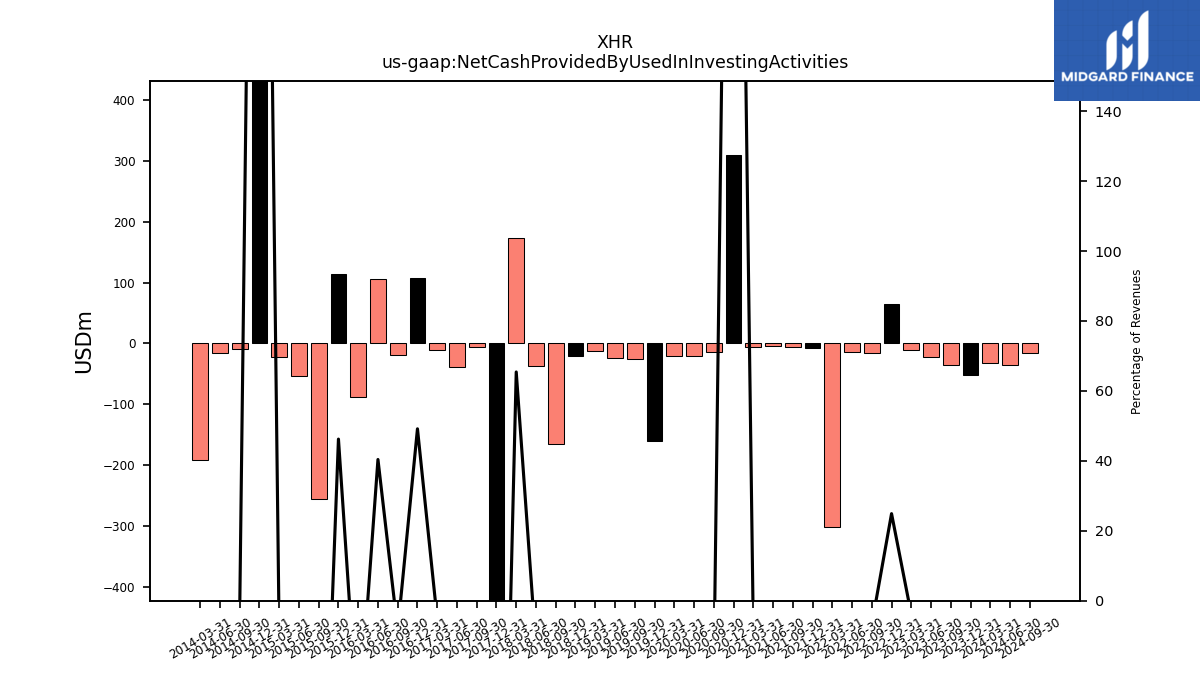
| Net Cash Provided By Used In Investing Activities | -51.17 | -35.36 | -21.66 | -10.56 | 65.54 | -16.26 | -13.59 | -301.09 | -7.58 | -6.66 | -3.42 | -6.55 | 309.48 | -14.71 | -20.41 | -20.18 | -160.09 | -26.23 | -23.30 | -13.26 | -20.14 | -165.72 | -36.98 | 173.04 | -430.92 | -5.90 | -39.30 | -11.44 | 108.07 | -19.64 | 105.58 | -88.18 | 114.92 | -255.60 | -53.10 | -22.89 | 1042.84 | -8.40 | -15.33 | -191.60 | |
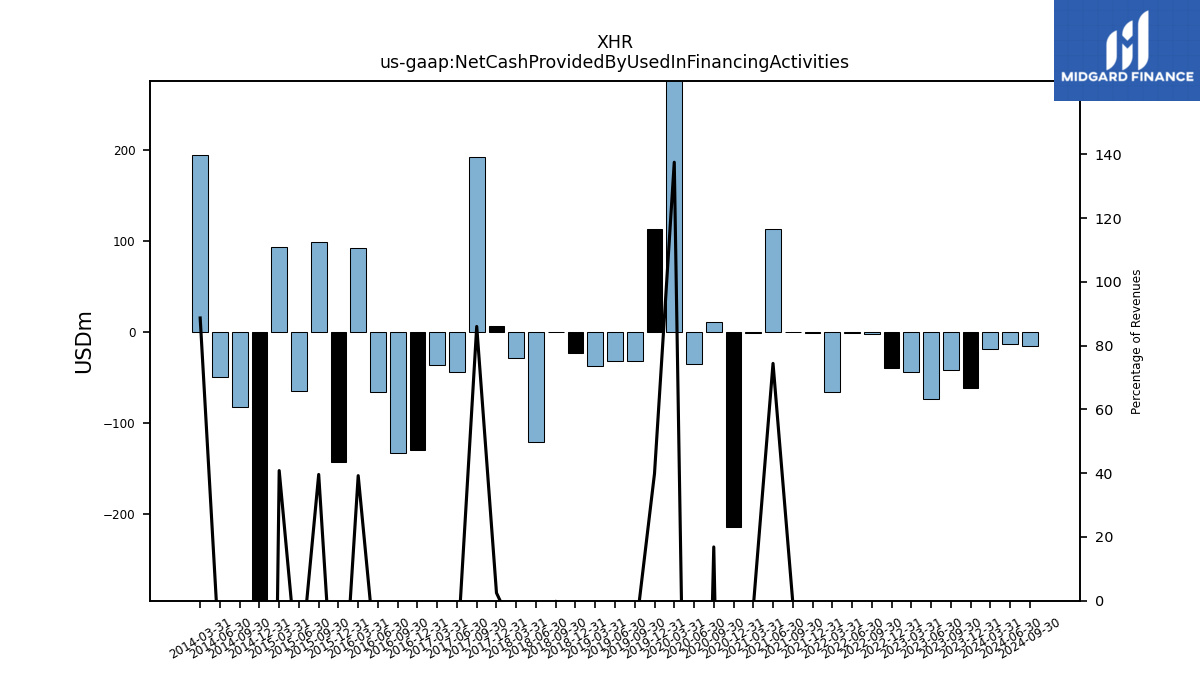
| Net Cash Provided By Used In Financing Activities | -61.98 | -42.12 | -73.75 | -44.30 | -39.54 | -3.01 | -1.03 | -66.48 | -1.56 | -0.82 | 113.13 | -1.85 | -214.03 | 10.79 | -35.58 | 296.19 | 112.56 | -32.51 | -32.65 | -37.74 | -23.71 | -0.42 | -120.68 | -28.38 | 6.38 | 192.09 | -43.90 | -36.46 | -130.39 | -133.23 | -66.17 | 92.22 | -143.66 | 98.41 | -65.16 | 93.03 | -997.40 | -82.21 | -49.44 | 193.81 |
| 2023-12-31 | 2023-09-30 | 2023-06-30 | 2023-03-31 | 2022-12-31 | 2022-09-30 | 2022-06-30 | 2022-03-31 | 2021-12-31 | 2021-09-30 | 2021-06-30 | 2021-03-31 | 2020-12-31 | 2020-09-30 | 2020-06-30 | 2020-03-31 | 2019-12-31 | 2019-09-30 | 2019-06-30 | 2019-03-31 | 2018-12-31 | 2018-09-30 | 2018-06-30 | 2018-03-31 | 2017-12-31 | 2017-09-30 | 2017-06-30 | 2017-03-31 | 2016-12-31 | 2016-09-30 | 2016-06-30 | 2016-03-31 | 2015-12-31 | 2015-09-30 | 2015-06-30 | 2015-03-31 | 2014-12-31 | 2014-09-30 | 2014-06-30 | 2014-03-31 | ||
|---|---|---|---|---|---|---|---|---|---|---|---|---|---|---|---|---|---|---|---|---|---|---|---|---|---|---|---|---|---|---|---|---|---|---|---|---|---|---|---|---|---|
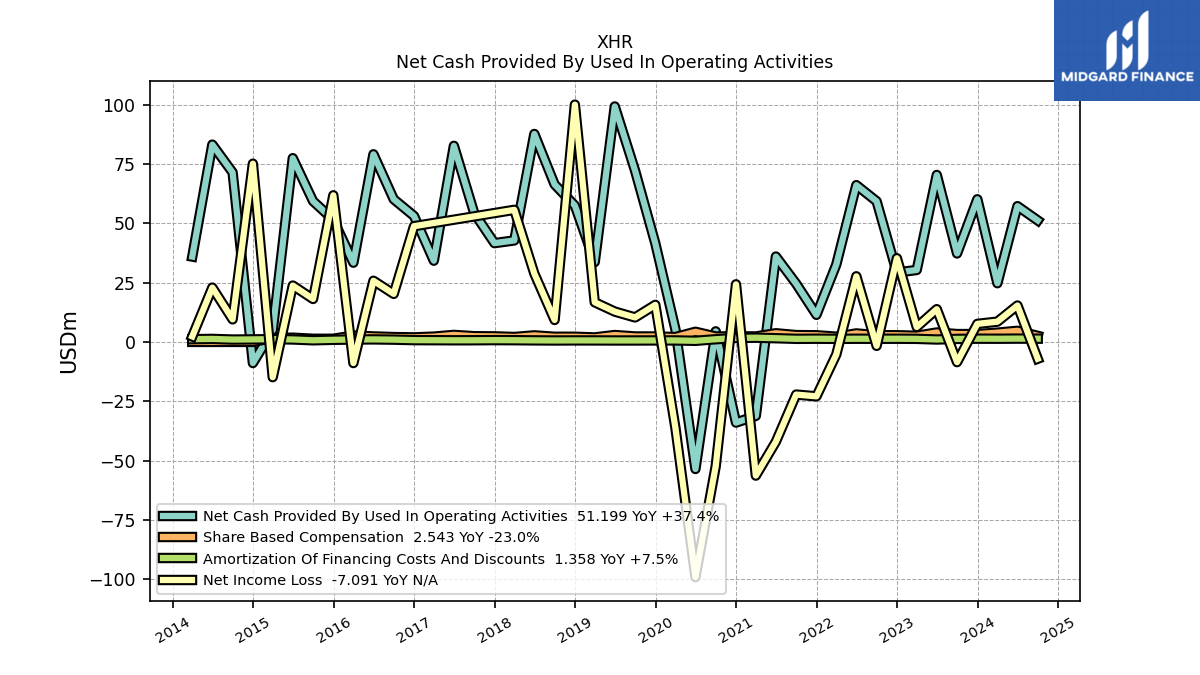
| Net Cash Provided By Used In Operating Activities | 60.12 | 37.27 | 70.36 | 30.31 | 29.23 | 59.26 | 66.06 | 32.57 | 11.41 | 24.53 | 35.98 | -31.16 | -34.01 | 4.46 | -53.56 | 5.39 | 41.51 | 72.20 | 99.22 | 33.64 | 57.43 | 66.36 | 87.64 | 42.76 | 41.62 | 54.34 | 82.64 | 34.21 | 53.07 | 60.13 | 79.07 | 33.38 | 51.46 | 59.32 | 77.43 | 4.94 | -8.92 | 71.42 | 83.14 | 35.96 | |
| Net Income Loss | 7.60 | -8.53 | 13.79 | 6.28 | 35.26 | -1.66 | 27.65 | -5.32 | -22.93 | -22.19 | -42.04 | -56.35 | 24.28 | -52.34 | -99.12 | -36.14 | 15.61 | 10.31 | 12.78 | 16.70 | 99.99 | 9.24 | 28.79 | 55.66 | NA | NA | NA | NA | 48.76 | 20.24 | 25.77 | -8.91 | 61.78 | 18.10 | 23.75 | -14.87 | 75.10 | 9.49 | 22.88 | 2.32 | |
| Profit Loss | 7.79 | -8.88 | 14.41 | 6.55 | 36.34 | -1.71 | 28.48 | -5.48 | -23.18 | -22.72 | -42.74 | -57.98 | 25.34 | -53.61 | -101.49 | -37.13 | 16.08 | 10.67 | 13.21 | 17.28 | 102.62 | 9.33 | 29.53 | 57.04 | 9.82 | 11.77 | 71.00 | 8.23 | 49.33 | 20.43 | 26.14 | -9.17 | 61.91 | 17.85 | 23.75 | -14.87 | 75.10 | 9.49 | 22.88 | 2.32 | |
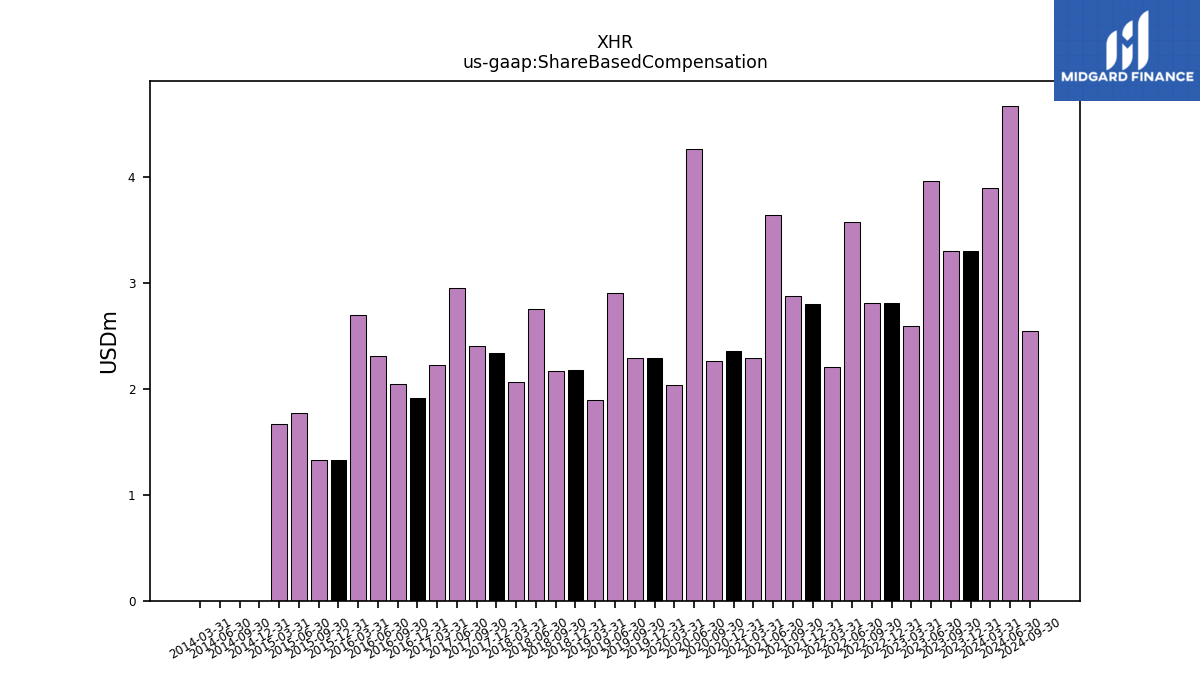
| Share Based Compensation | 3.31 | 3.30 | 3.97 | 2.59 | 2.81 | 2.81 | 3.58 | 2.21 | 2.80 | 2.88 | 3.64 | 2.29 | 2.36 | 2.27 | 4.27 | 2.04 | 2.29 | 2.29 | 2.90 | 1.89 | 2.18 | 2.17 | 2.76 | 2.07 | 2.34 | 2.40 | 2.95 | 2.23 | 1.92 | 2.04 | 2.31 | 2.70 | 1.33 | 1.33 | 1.77 | 1.67 | 0.00 | 0.00 | 0.00 | 0.00 |
| 2023-12-31 | 2023-09-30 | 2023-06-30 | 2023-03-31 | 2022-12-31 | 2022-09-30 | 2022-06-30 | 2022-03-31 | 2021-12-31 | 2021-09-30 | 2021-06-30 | 2021-03-31 | 2020-12-31 | 2020-09-30 | 2020-06-30 | 2020-03-31 | 2019-12-31 | 2019-09-30 | 2019-06-30 | 2019-03-31 | 2018-12-31 | 2018-09-30 | 2018-06-30 | 2018-03-31 | 2017-12-31 | 2017-09-30 | 2017-06-30 | 2017-03-31 | 2016-12-31 | 2016-09-30 | 2016-06-30 | 2016-03-31 | 2015-12-31 | 2015-09-30 | 2015-06-30 | 2015-03-31 | 2014-12-31 | 2014-09-30 | 2014-06-30 | 2014-03-31 | ||
|---|---|---|---|---|---|---|---|---|---|---|---|---|---|---|---|---|---|---|---|---|---|---|---|---|---|---|---|---|---|---|---|---|---|---|---|---|---|---|---|---|---|
| Net Cash Provided By Used In Investing Activities | -51.17 | -35.36 | -21.66 | -10.56 | 65.54 | -16.26 | -13.59 | -301.09 | -7.58 | -6.66 | -3.42 | -6.55 | 309.48 | -14.71 | -20.41 | -20.18 | -160.09 | -26.23 | -23.30 | -13.26 | -20.14 | -165.72 | -36.98 | 173.04 | -430.92 | -5.90 | -39.30 | -11.44 | 108.07 | -19.64 | 105.58 | -88.18 | 114.92 | -255.60 | -53.10 | -22.89 | 1042.84 | -8.40 | -15.33 | -191.60 |
| 2023-12-31 | 2023-09-30 | 2023-06-30 | 2023-03-31 | 2022-12-31 | 2022-09-30 | 2022-06-30 | 2022-03-31 | 2021-12-31 | 2021-09-30 | 2021-06-30 | 2021-03-31 | 2020-12-31 | 2020-09-30 | 2020-06-30 | 2020-03-31 | 2019-12-31 | 2019-09-30 | 2019-06-30 | 2019-03-31 | 2018-12-31 | 2018-09-30 | 2018-06-30 | 2018-03-31 | 2017-12-31 | 2017-09-30 | 2017-06-30 | 2017-03-31 | 2016-12-31 | 2016-09-30 | 2016-06-30 | 2016-03-31 | 2015-12-31 | 2015-09-30 | 2015-06-30 | 2015-03-31 | 2014-12-31 | 2014-09-30 | 2014-06-30 | 2014-03-31 | ||
|---|---|---|---|---|---|---|---|---|---|---|---|---|---|---|---|---|---|---|---|---|---|---|---|---|---|---|---|---|---|---|---|---|---|---|---|---|---|---|---|---|---|
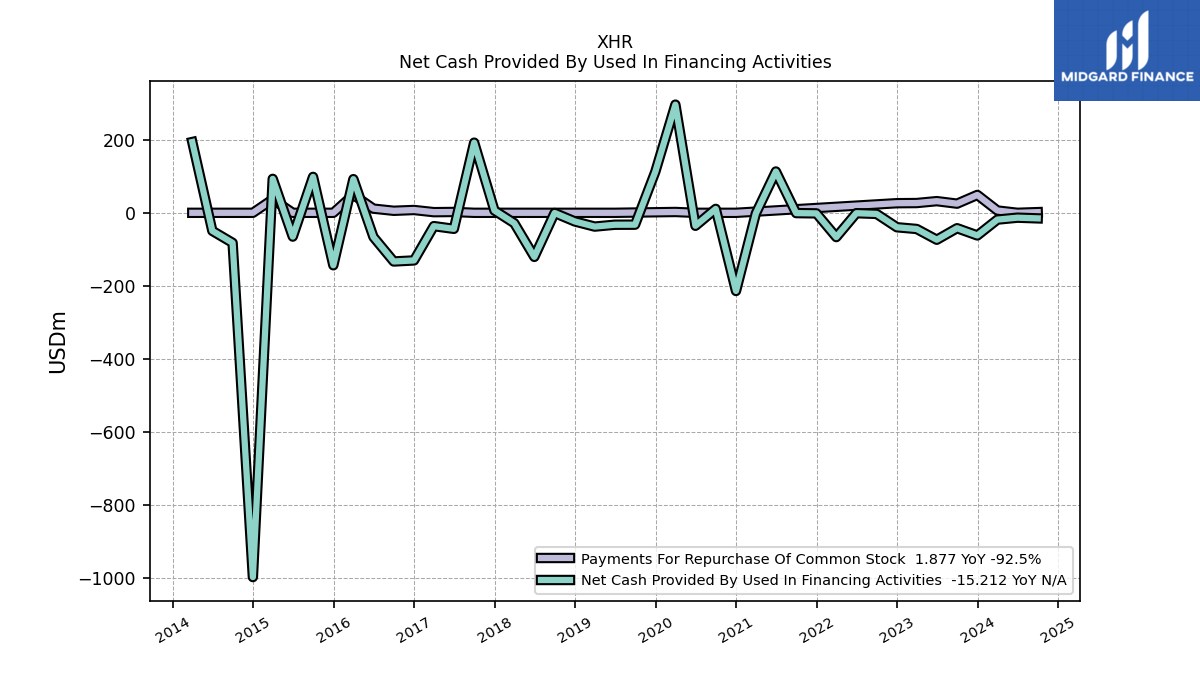
| Net Cash Provided By Used In Financing Activities | -61.98 | -42.12 | -73.75 | -44.30 | -39.54 | -3.01 | -1.03 | -66.48 | -1.56 | -0.82 | 113.13 | -1.85 | -214.03 | 10.79 | -35.58 | 296.19 | 112.56 | -32.51 | -32.65 | -37.74 | -23.71 | -0.42 | -120.68 | -28.38 | 6.38 | 192.09 | -43.90 | -36.46 | -130.39 | -133.23 | -66.17 | 92.22 | -143.66 | 98.41 | -65.16 | 93.03 | -997.40 | -82.21 | -49.44 | 193.81 | |
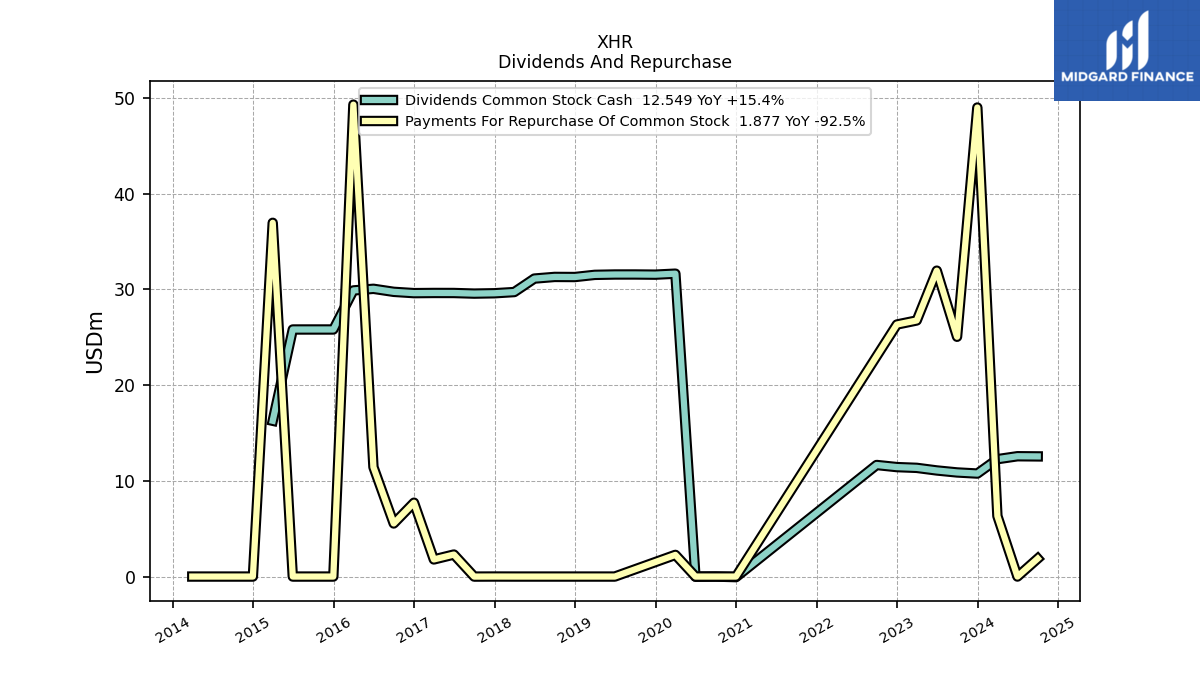
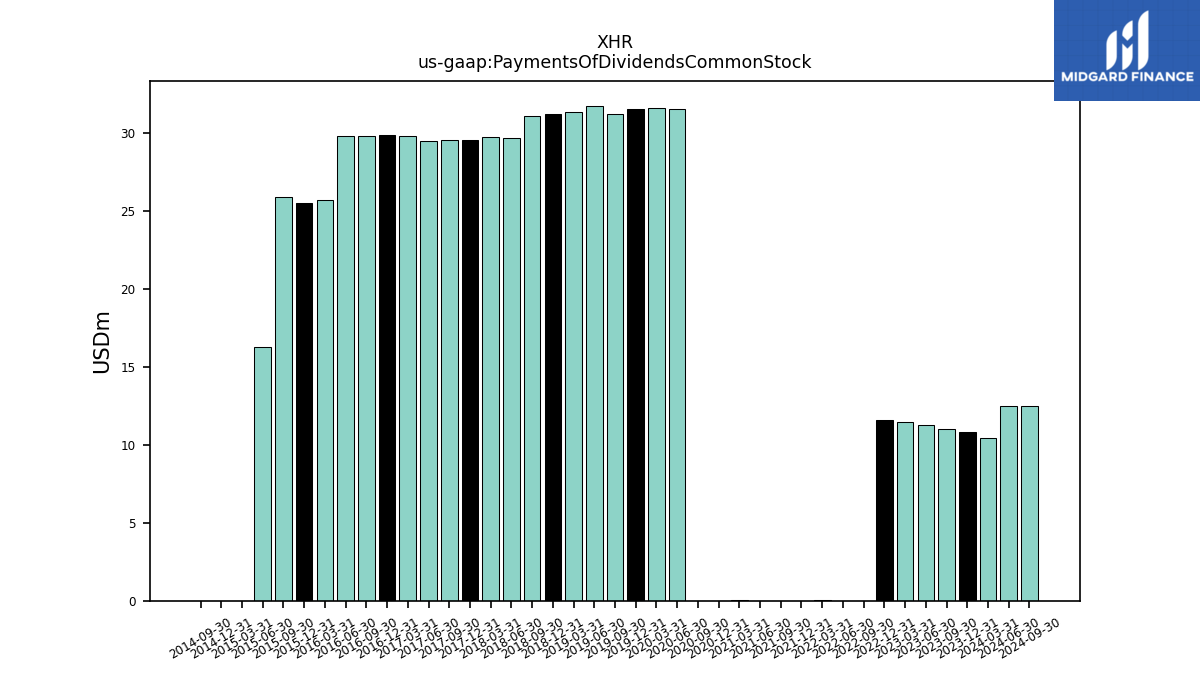
| Payments Of Dividends Common Stock | 10.80 | 11.05 | 11.30 | 11.46 | 11.63 | 0.00 | 0.00 | 0.05 | 0.00 | 0.00 | 0.00 | 0.05 | 0.00 | 0.00 | 31.55 | 31.61 | 31.57 | 31.20 | 31.76 | 31.34 | 31.25 | 31.07 | 29.67 | 29.74 | 29.55 | 29.59 | 29.52 | 29.79 | 29.86 | 29.79 | 29.80 | 25.68 | 25.52 | 25.92 | 16.27 | 0.00 | 0.00 | 0.00 | NA | NA | |
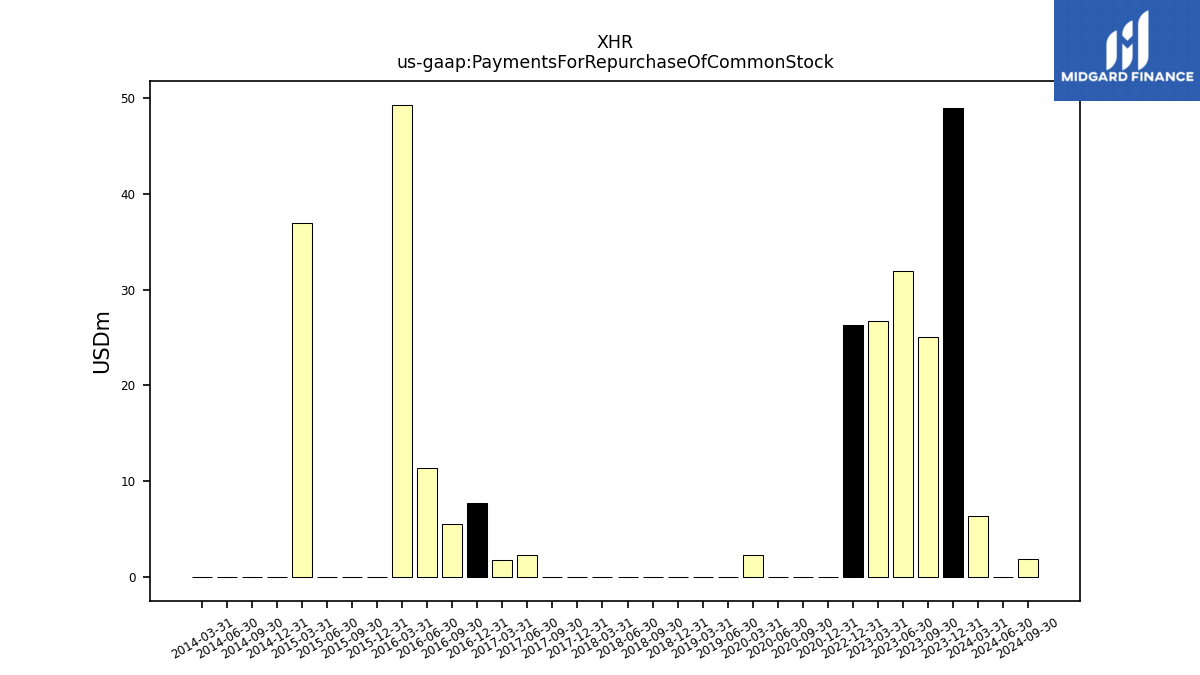
| Payments For Repurchase Of Common Stock | 48.99 | 25.04 | 31.95 | 26.75 | 26.32 | NA | NA | NA | NA | NA | NA | NA | 0.00 | 0.00 | 0.00 | 2.26 | NA | NA | 0.00 | 0.00 | 0.00 | 0.00 | 0.00 | 0.00 | 0.00 | -0.00 | 2.30 | 1.79 | 7.71 | 5.54 | 11.43 | 49.29 | 0.00 | 0.00 | 0.00 | 36.95 | 0.00 | 0.00 | 0.00 | 0.00 |
| 2023-12-31 | 2023-09-30 | 2023-06-30 | 2023-03-31 | 2022-12-31 | 2022-09-30 | 2022-06-30 | 2022-03-31 | 2021-12-31 | 2021-09-30 | 2021-06-30 | 2021-03-31 | 2020-12-31 | 2020-09-30 | 2020-06-30 | 2020-03-31 | 2019-12-31 | 2019-09-30 | 2019-06-30 | 2019-03-31 | 2018-12-31 | 2018-09-30 | 2018-06-30 | 2018-03-31 | 2017-12-31 | 2017-09-30 | 2017-06-30 | 2017-03-31 | 2016-12-31 | 2016-09-30 | 2016-06-30 | 2016-03-31 | 2015-12-31 | 2015-09-30 | 2015-06-30 | 2015-03-31 | 2014-12-31 | 2014-09-30 | 2014-06-30 | 2014-03-31 | ||
|---|---|---|---|---|---|---|---|---|---|---|---|---|---|---|---|---|---|---|---|---|---|---|---|---|---|---|---|---|---|---|---|---|---|---|---|---|---|---|---|---|---|
| Revenues | 253.38 | 232.02 | 271.07 | 268.97 | 263.14 | 240.67 | 283.45 | 210.35 | 203.58 | 172.78 | 151.97 | 87.85 | 75.64 | 63.95 | 14.82 | 215.35 | 282.18 | 268.93 | 304.29 | 293.69 | 275.66 | 240.99 | 277.06 | 264.50 | 259.14 | 223.29 | 244.39 | 218.46 | 219.80 | 233.95 | 261.38 | 235.03 | 248.59 | 248.45 | 251.22 | 227.87 | 229.94 | 231.09 | 247.11 | 218.53 | |
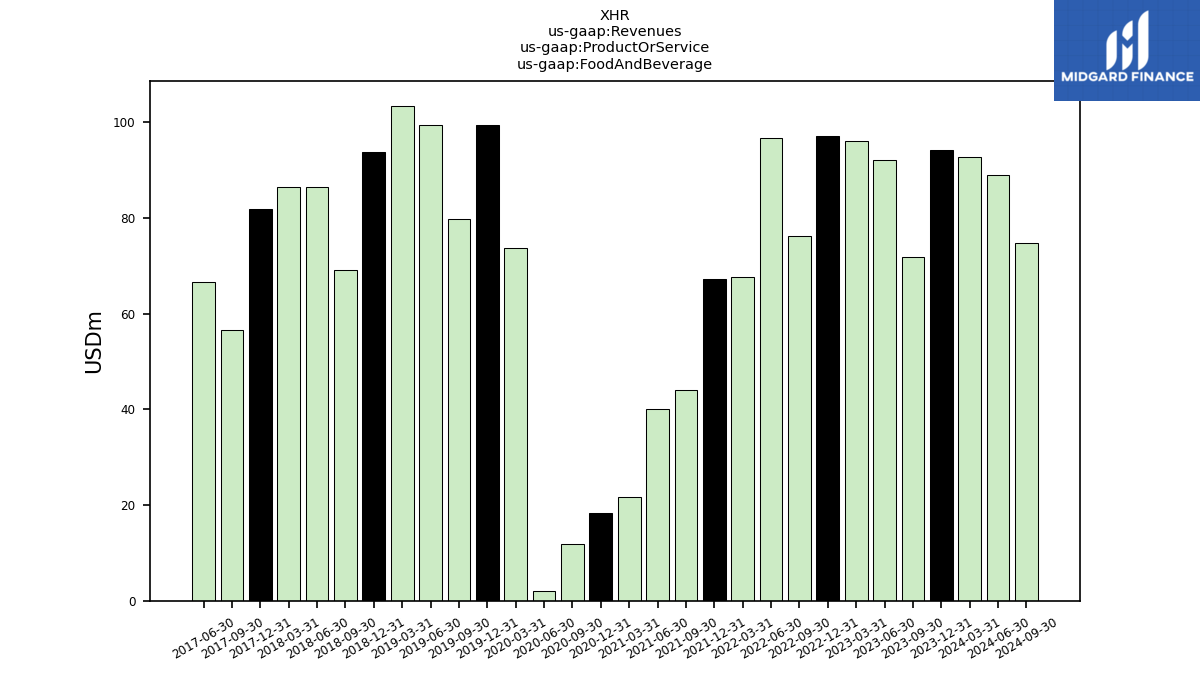
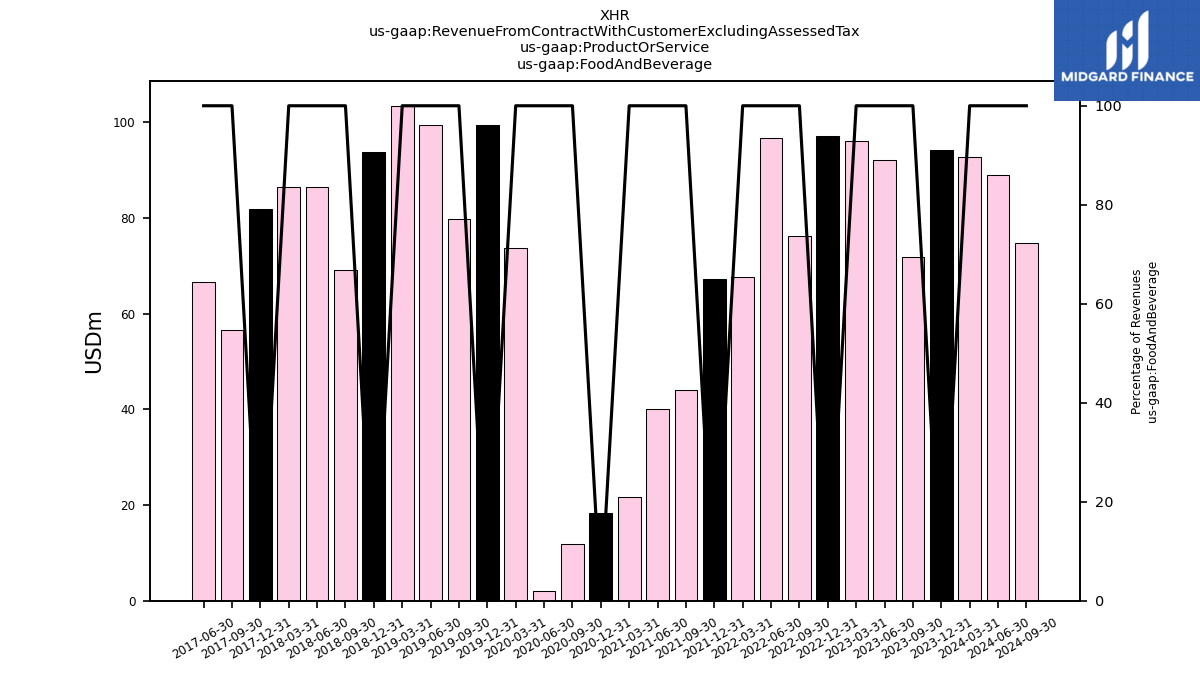
| Food And Beverage | 94.14 | 71.81 | 92.03 | 96.12 | 97.12 | 76.15 | 96.78 | 67.73 | 67.30 | 44.00 | 40.14 | 21.59 | 18.27 | 11.76 | 2.10 | 73.73 | 99.35 | 79.83 | 99.40 | 103.46 | 93.71 | 69.18 | 86.42 | 86.42 | 81.95 | 56.65 | 66.55 | NA | NA | NA | NA | NA | NA | NA | NA | NA | NA | NA | NA | NA | |
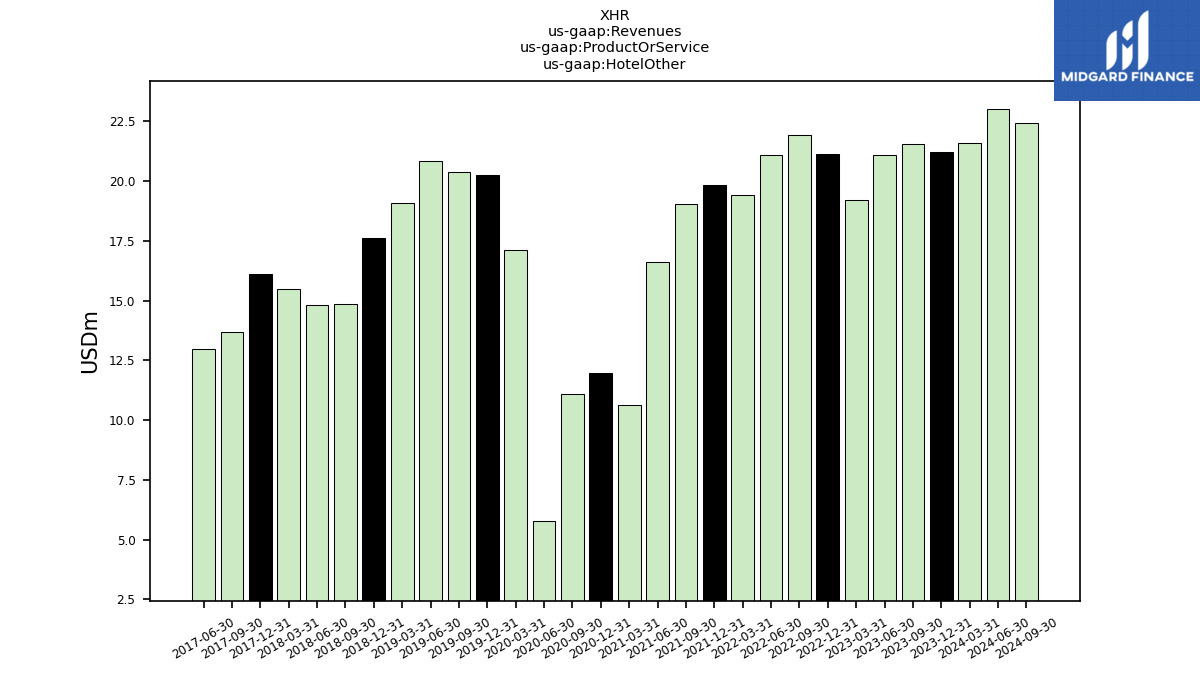
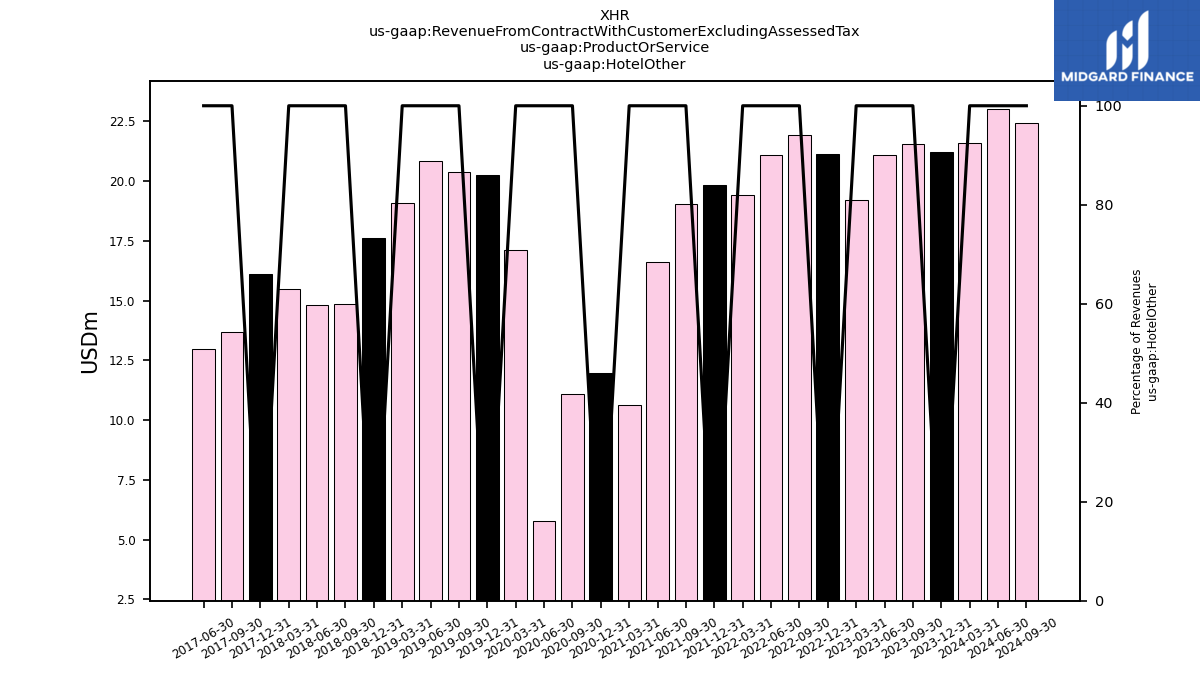
| Hotel Other | 21.21 | 21.54 | 21.09 | 19.20 | 21.12 | 21.91 | 21.09 | 19.41 | 19.86 | 19.03 | 16.64 | 10.61 | 11.97 | 11.11 | 5.77 | 17.11 | 20.27 | 20.36 | 20.86 | 19.08 | 17.64 | 14.84 | 14.81 | 15.50 | 16.12 | 13.69 | 12.97 | NA | NA | NA | NA | NA | NA | NA | NA | NA | NA | NA | NA | NA | |
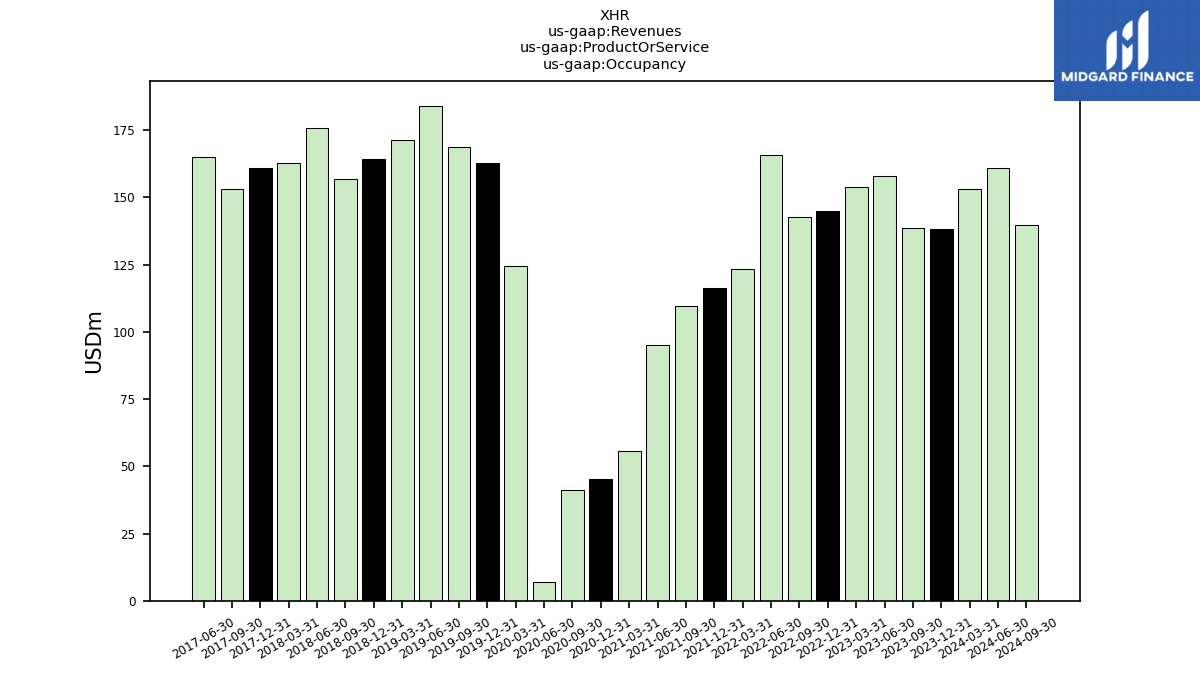
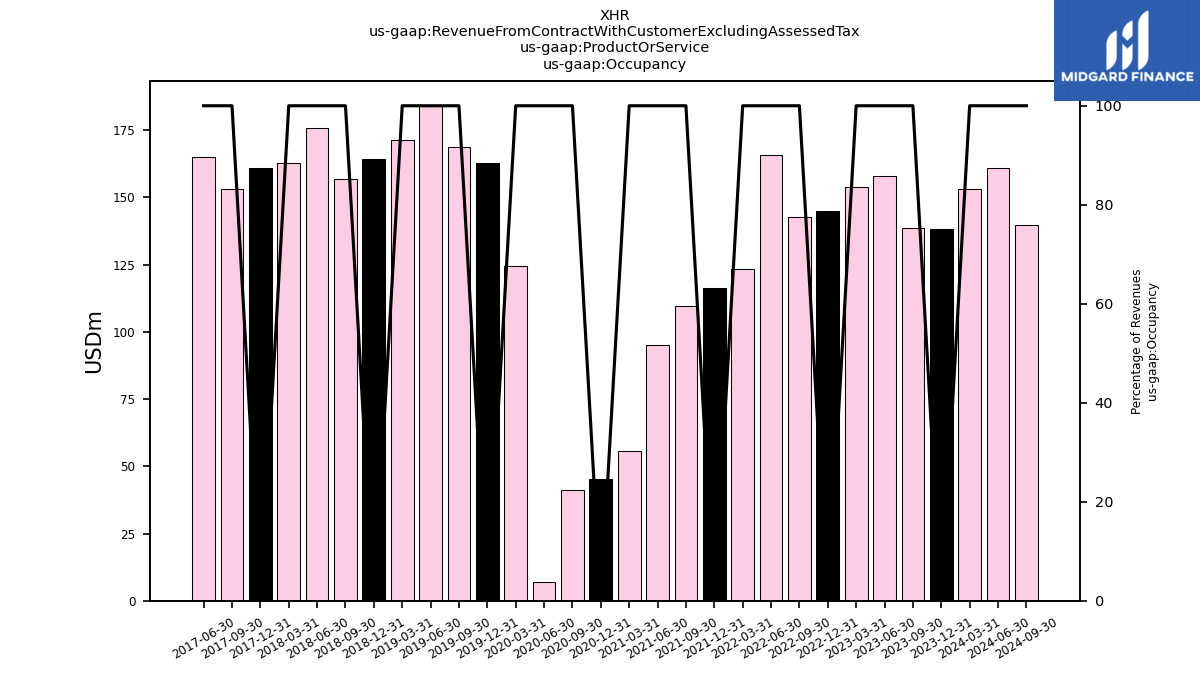
| Occupancy | 138.02 | 138.67 | 157.94 | 153.65 | 144.90 | 142.60 | 165.58 | 123.20 | 116.43 | 109.75 | 95.19 | 55.65 | 45.41 | 41.08 | 6.96 | 124.52 | 162.57 | 168.74 | 184.03 | 171.14 | 164.32 | 156.97 | 175.82 | 162.58 | 161.07 | 152.94 | 164.87 | NA | NA | NA | NA | NA | NA | NA | NA | NA | NA | NA | NA | NA | |
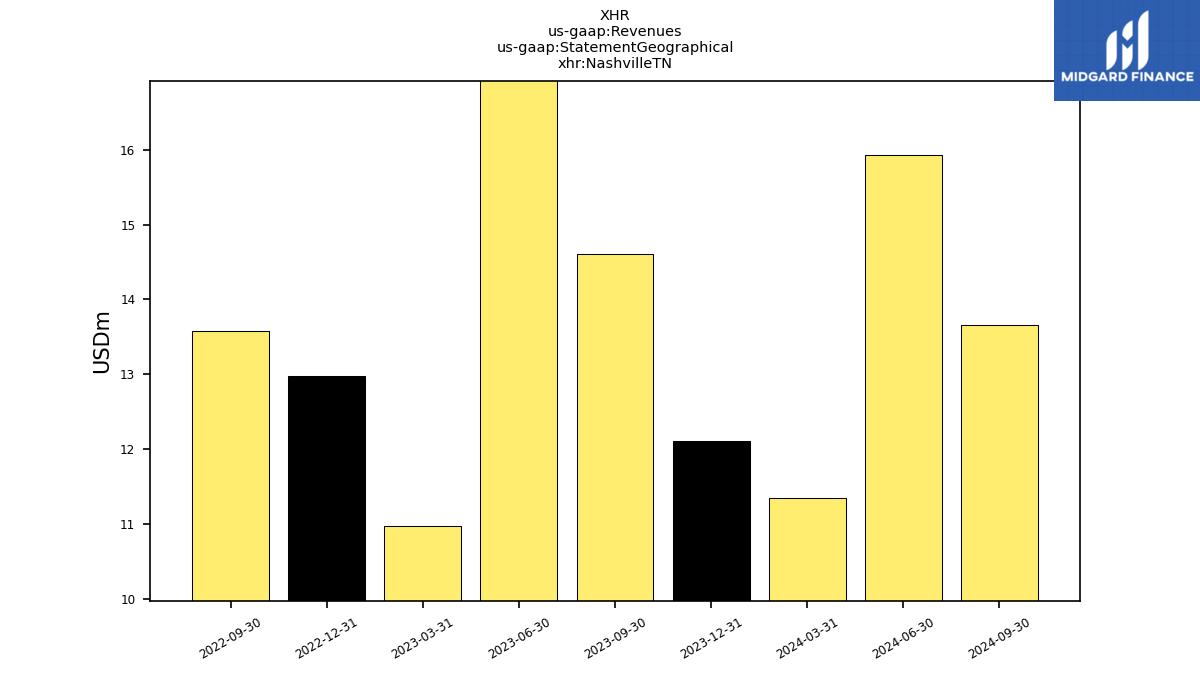
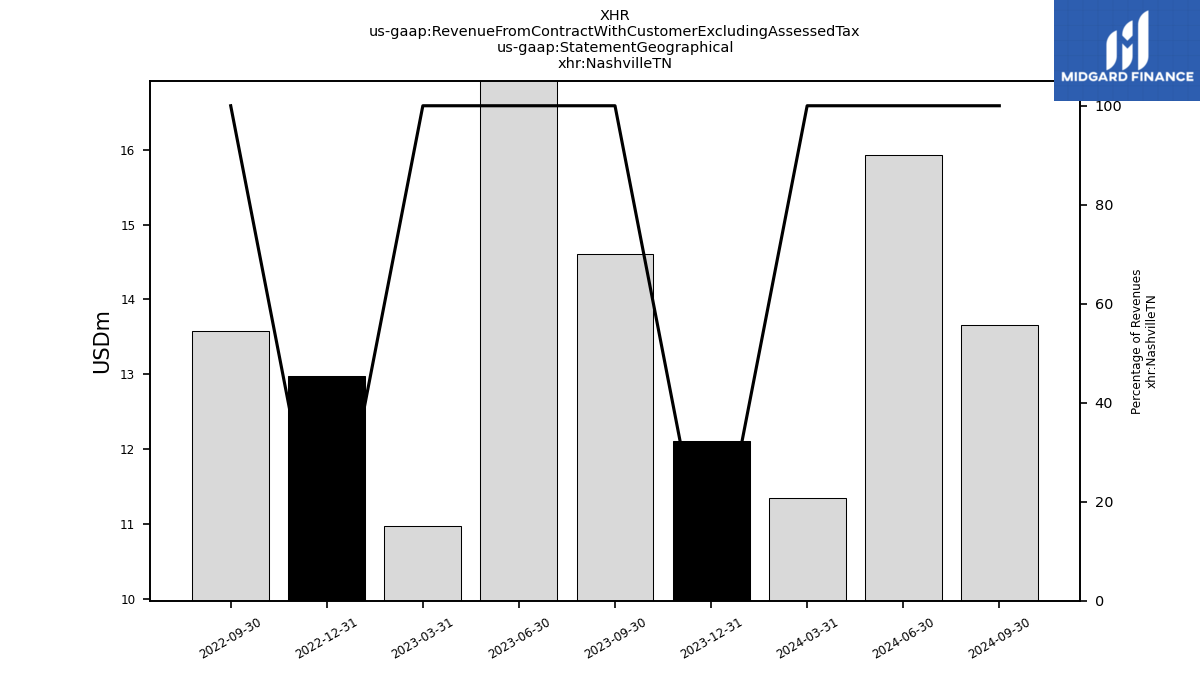
| Nashville T N | 12.11 | 14.61 | 17.34 | 10.97 | 12.98 | 13.57 | NA | NA | NA | NA | NA | NA | NA | NA | NA | NA | NA | NA | NA | NA | NA | NA | NA | NA | NA | NA | NA | NA | NA | NA | NA | NA | NA | NA | NA | NA | NA | NA | NA | NA | |
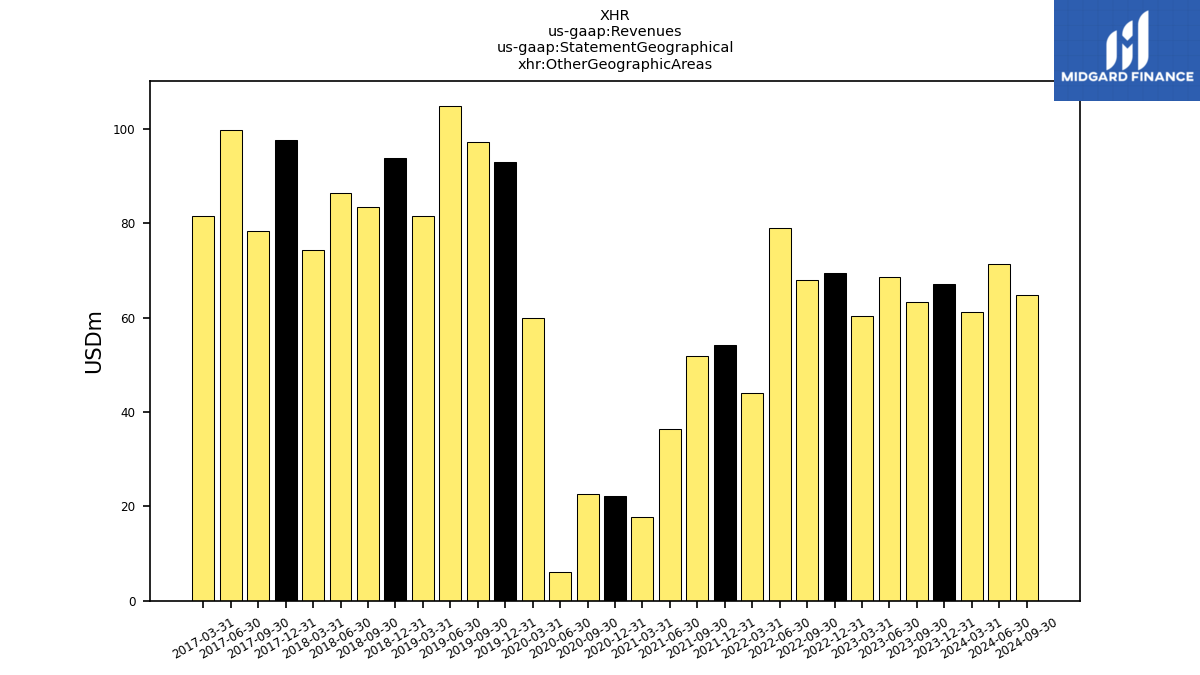
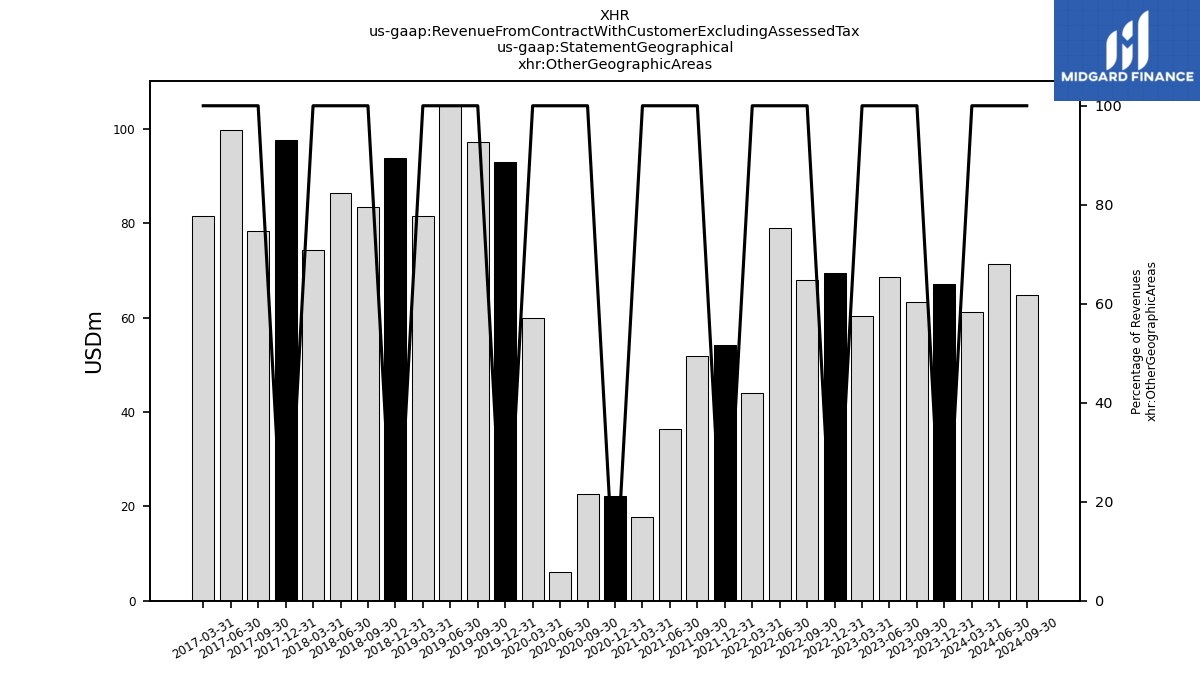
| Other Geographic Areas | 67.13 | 63.28 | 68.58 | 60.38 | 69.41 | 67.86 | 78.89 | 43.98 | 54.29 | 51.80 | 36.40 | 17.83 | 22.28 | 22.67 | 6.00 | 59.87 | 92.99 | 97.24 | 104.87 | 81.46 | 93.82 | 83.37 | 86.39 | 74.22 | 97.61 | 78.36 | 99.78 | 81.44 | NA | NA | NA | NA | NA | NA | NA | NA | NA | NA | NA | NA | |
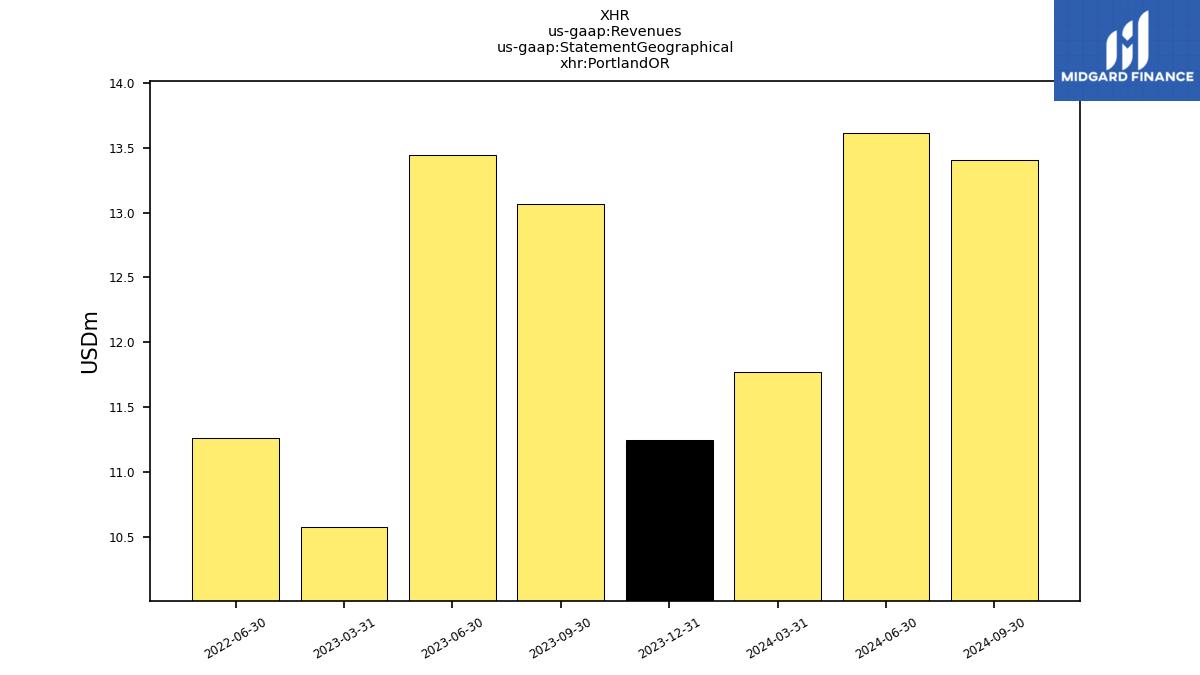
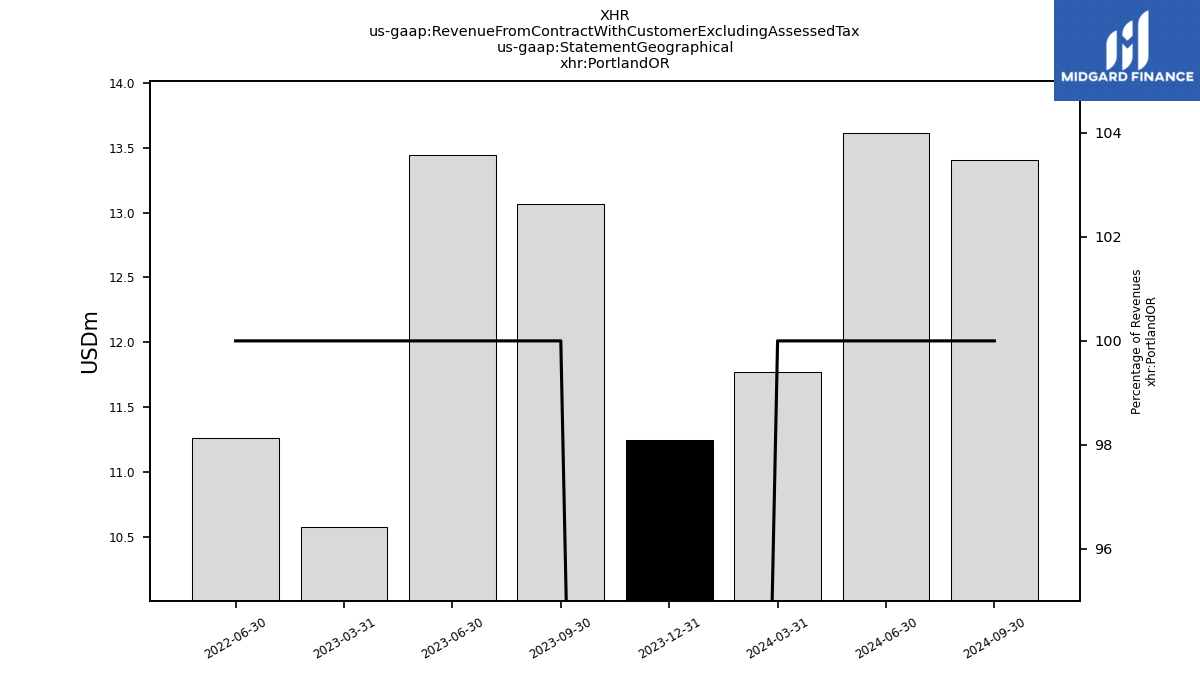
| Portland O R | 11.24 | 13.06 | 13.44 | 10.58 | NA | NA | 11.26 | NA | NA | NA | NA | NA | NA | NA | NA | NA | NA | NA | NA | NA | NA | NA | NA | NA | NA | NA | NA | NA | NA | NA | NA | NA | NA | NA | NA | NA | NA | NA | NA | NA | |
| Revenue From Contract With Customer Excluding Assessed Tax | 253.38 | 232.02 | 271.07 | 268.97 | 263.14 | 240.67 | 283.45 | 210.35 | 203.58 | 172.78 | 151.97 | 87.85 | 75.64 | 63.95 | 14.82 | 215.35 | 282.18 | 268.93 | 304.29 | 293.69 | 275.66 | 240.99 | 277.06 | 264.50 | 259.14 | 223.29 | 244.39 | 218.46 | 219.80 | 233.95 | 261.38 | 235.03 | 248.59 | 248.45 | 251.22 | 227.87 | 229.94 | 231.09 | 247.11 | 218.53 | |
| Food And Beverage | 94.14 | 71.81 | 92.03 | 96.12 | 97.12 | 76.15 | 96.78 | 67.73 | 67.30 | 44.00 | 40.14 | 21.59 | 18.27 | 11.76 | 2.10 | 73.73 | 99.35 | 79.83 | 99.40 | 103.46 | 93.71 | 69.18 | 86.42 | 86.42 | 81.95 | 56.65 | 66.55 | NA | NA | NA | NA | NA | NA | NA | NA | NA | NA | NA | NA | NA | |
| Hotel Other | 21.21 | 21.54 | 21.09 | 19.20 | 21.12 | 21.91 | 21.09 | 19.41 | 19.86 | 19.03 | 16.64 | 10.61 | 11.97 | 11.11 | 5.77 | 17.11 | 20.27 | 20.36 | 20.86 | 19.08 | 17.64 | 14.84 | 14.81 | 15.50 | 16.12 | 13.69 | 12.97 | NA | NA | NA | NA | NA | NA | NA | NA | NA | NA | NA | NA | NA | |
| Occupancy | 138.02 | 138.67 | 157.94 | 153.65 | 144.90 | 142.60 | 165.58 | 123.20 | 116.43 | 109.75 | 95.19 | 55.65 | 45.41 | 41.08 | 6.96 | 124.52 | 162.57 | 168.74 | 184.03 | 171.14 | 164.32 | 156.97 | 175.82 | 162.58 | 161.07 | 152.94 | 164.87 | NA | NA | NA | NA | NA | NA | NA | NA | NA | NA | NA | NA | NA | |
| Nashville T N | 12.11 | 14.61 | 17.34 | 10.97 | 12.98 | 13.57 | NA | NA | NA | NA | NA | NA | NA | NA | NA | NA | NA | NA | NA | NA | NA | NA | NA | NA | NA | NA | NA | NA | NA | NA | NA | NA | NA | NA | NA | NA | NA | NA | NA | NA | |
| Other Geographic Areas | 67.13 | 63.28 | 68.58 | 60.38 | 69.41 | 67.86 | 78.89 | 43.98 | 54.29 | 51.80 | 36.40 | 17.83 | 22.28 | 22.67 | 6.00 | 59.87 | 92.99 | 97.24 | 104.87 | 81.46 | 93.82 | 83.37 | 86.39 | 74.22 | 97.61 | 78.36 | 99.78 | 81.44 | NA | NA | NA | NA | NA | NA | NA | NA | NA | NA | NA | NA | |
| Portland O R | 11.24 | 13.06 | 13.44 | 10.58 | NA | NA | 11.26 | NA | NA | NA | NA | NA | NA | NA | NA | NA | NA | NA | NA | NA | NA | NA | NA | NA | NA | NA | NA | NA | NA | NA | NA | NA | NA | NA | NA | NA | NA | NA | NA | NA |