
| 2023-09-30 | 2023-06-30 | 2023-03-31 | 2022-12-31 | 2022-09-30 | 2022-06-30 | 2022-03-31 | 2021-12-31 | 2021-09-30 | 2021-06-30 | 2021-03-31 | 2020-12-31 | 2020-09-30 | 2020-06-30 | ||
|---|---|---|---|---|---|---|---|---|---|---|---|---|---|---|---|
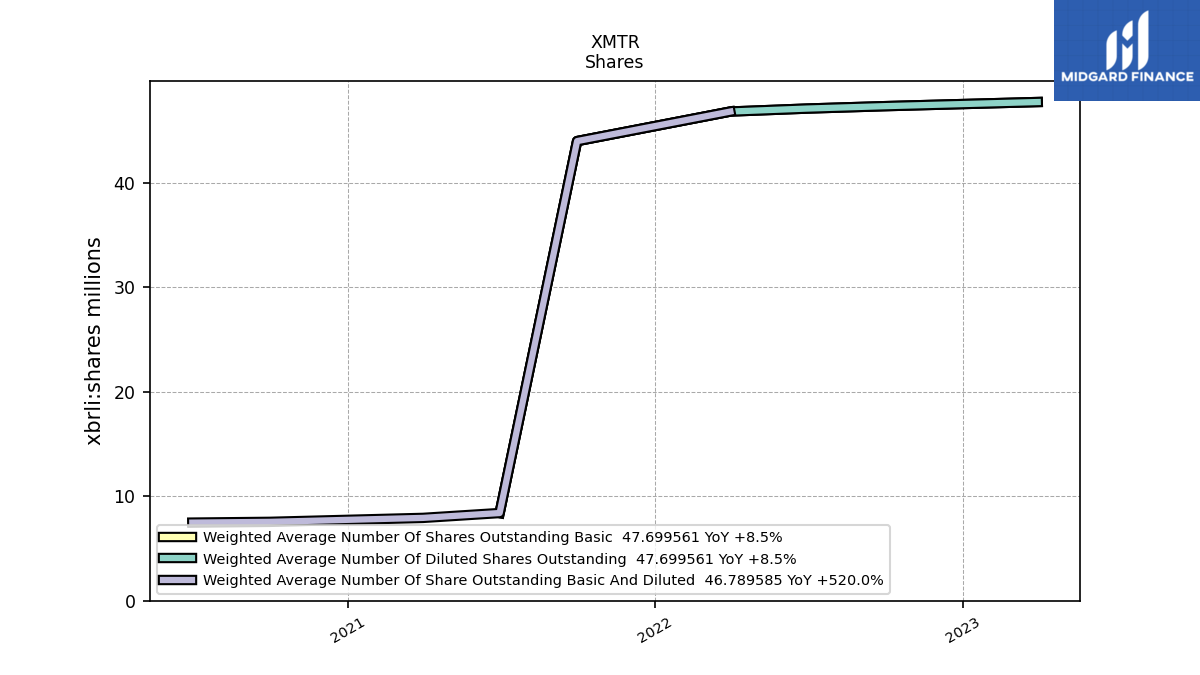
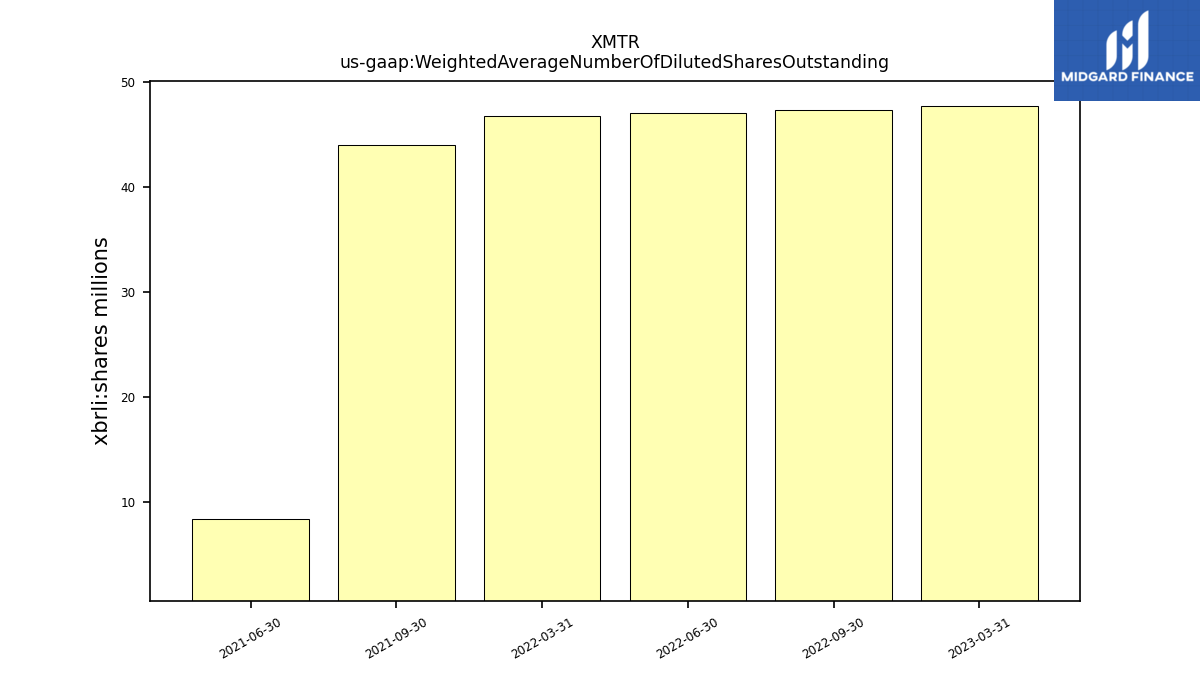
| Weighted Average Number Of Diluted Shares Outstanding | NA | NA | 47.70 | NA | 47.30 | 47.07 | 46.79 | NA | 43.96 | 8.39 | NA | NA | NA | NA | |
| Weighted Average Number Of Shares Outstanding Basic | NA | NA | 47.70 | NA | 47.30 | 47.07 | 46.79 | NA | 43.96 | 8.39 | NA | NA | NA | NA | |
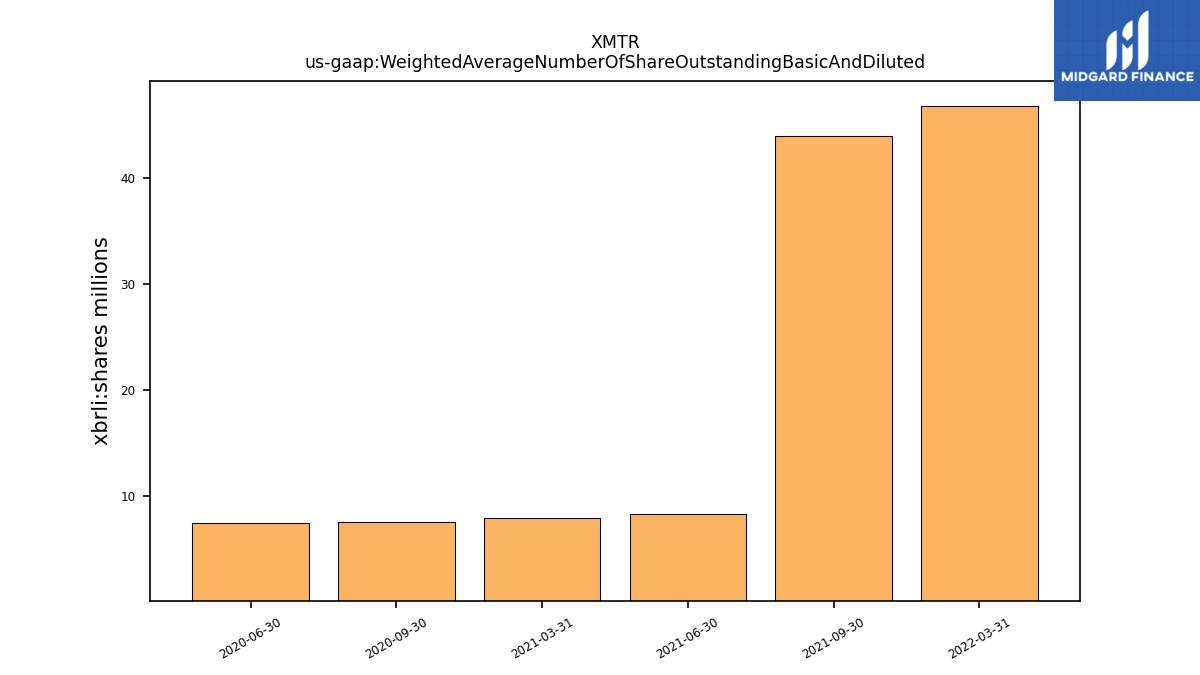
| Weighted Average Number Of Share Outstanding Basic And Diluted | NA | NA | NA | NA | NA | NA | 46.79 | NA | 43.96 | 8.39 | 7.92 | NA | 7.55 | 7.47 | |
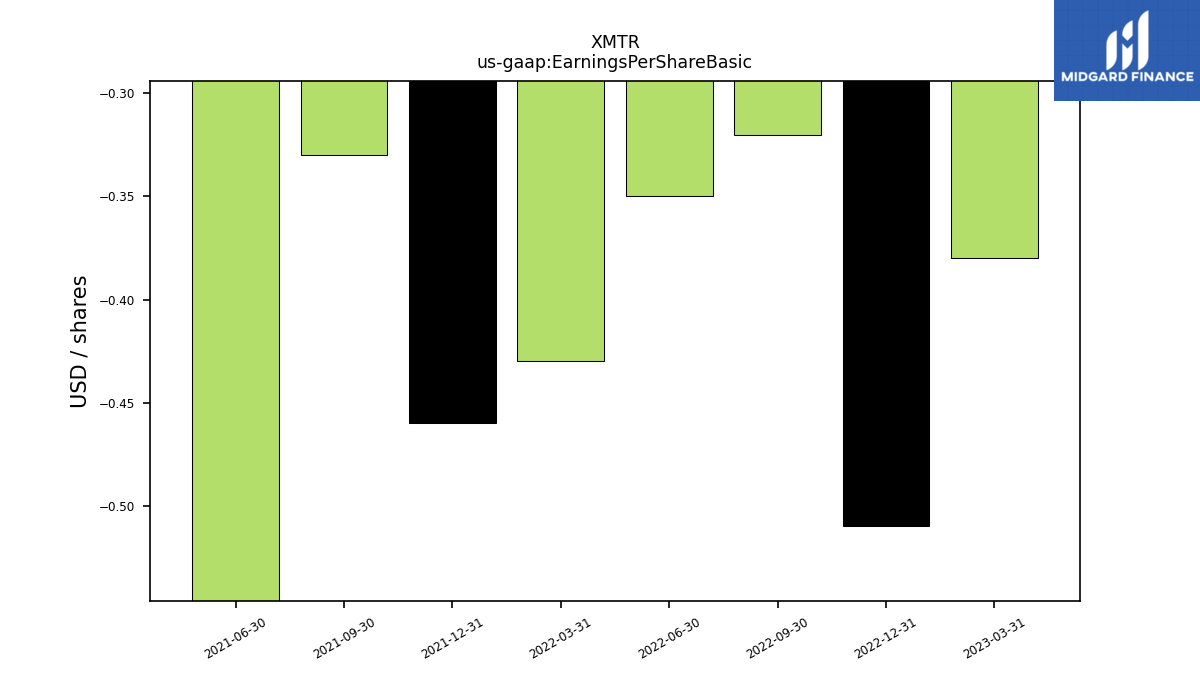
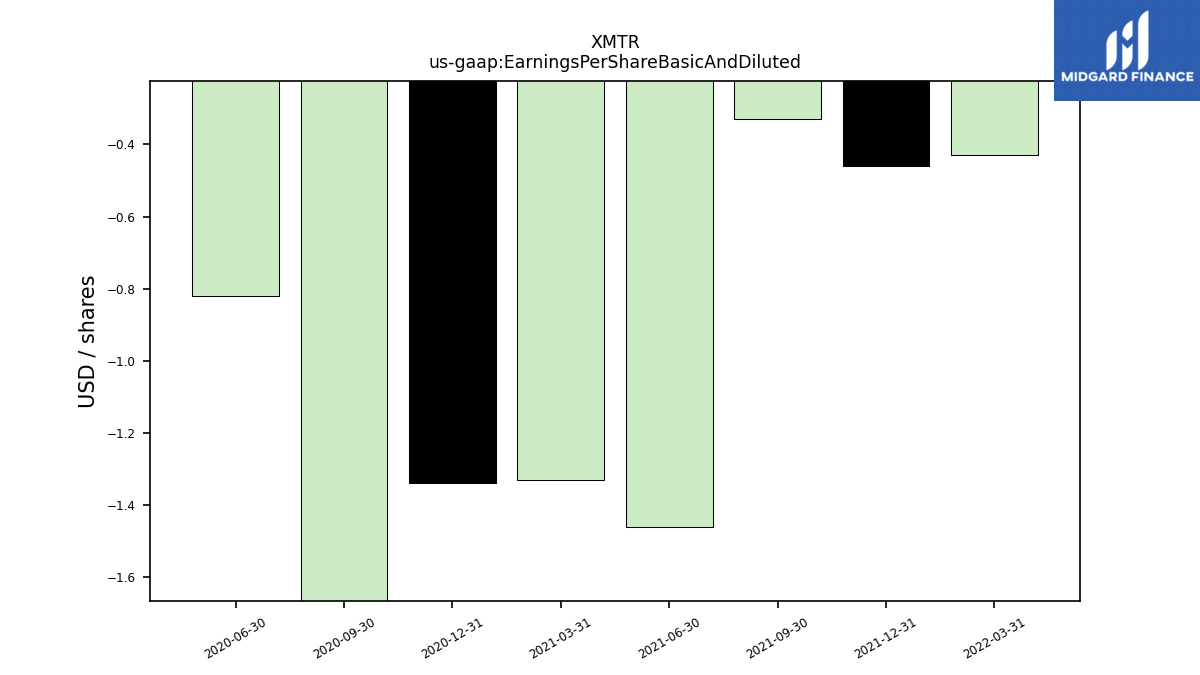
| Earnings Per Share Basic | NA | NA | -0.38 | -0.51 | -0.32 | -0.35 | -0.43 | -0.46 | -0.33 | -1.46 | NA | NA | NA | NA | |
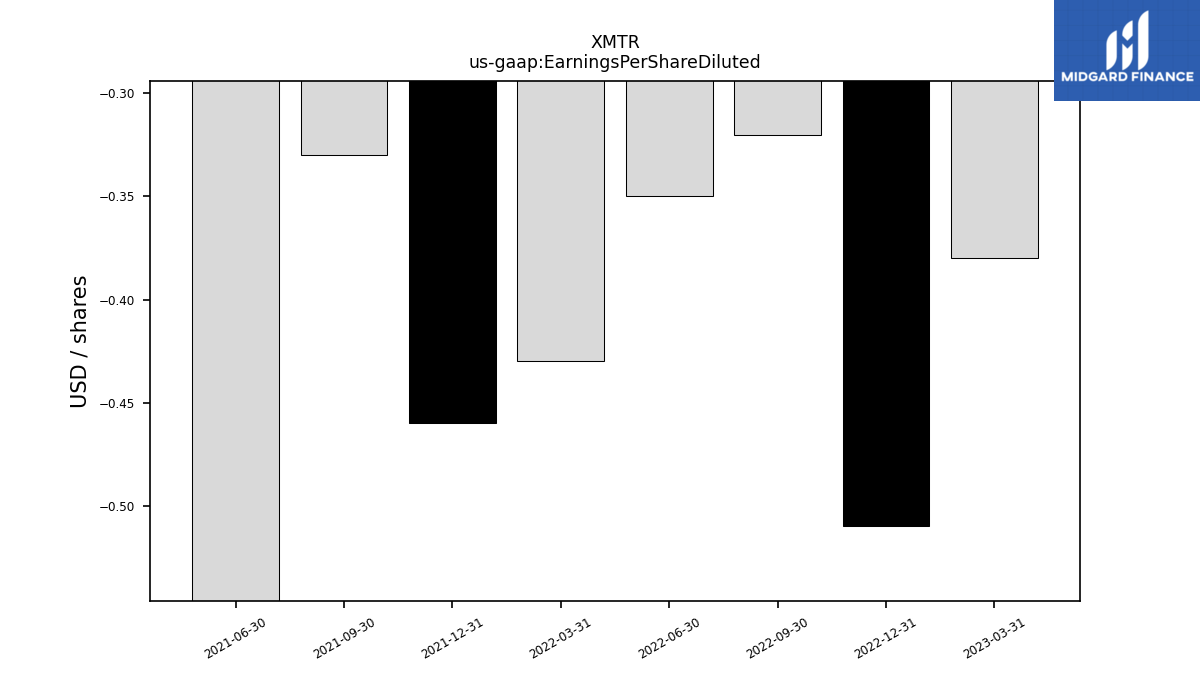
| Earnings Per Share Diluted | NA | NA | -0.38 | -0.51 | -0.32 | -0.35 | -0.43 | -0.46 | -0.33 | -1.46 | NA | NA | NA | NA | |
| Earnings Per Share Basic And Diluted | NA | NA | NA | NA | NA | NA | -0.43 | -0.46 | -0.33 | -1.46 | -1.33 | -1.34 | -1.99 | -0.82 |
| 2023-09-30 | 2023-06-30 | 2023-03-31 | 2022-12-31 | 2022-09-30 | 2022-06-30 | 2022-03-31 | 2021-12-31 | 2021-09-30 | 2021-06-30 | 2021-03-31 | 2020-12-31 | 2020-09-30 | 2020-06-30 | ||
|---|---|---|---|---|---|---|---|---|---|---|---|---|---|---|---|
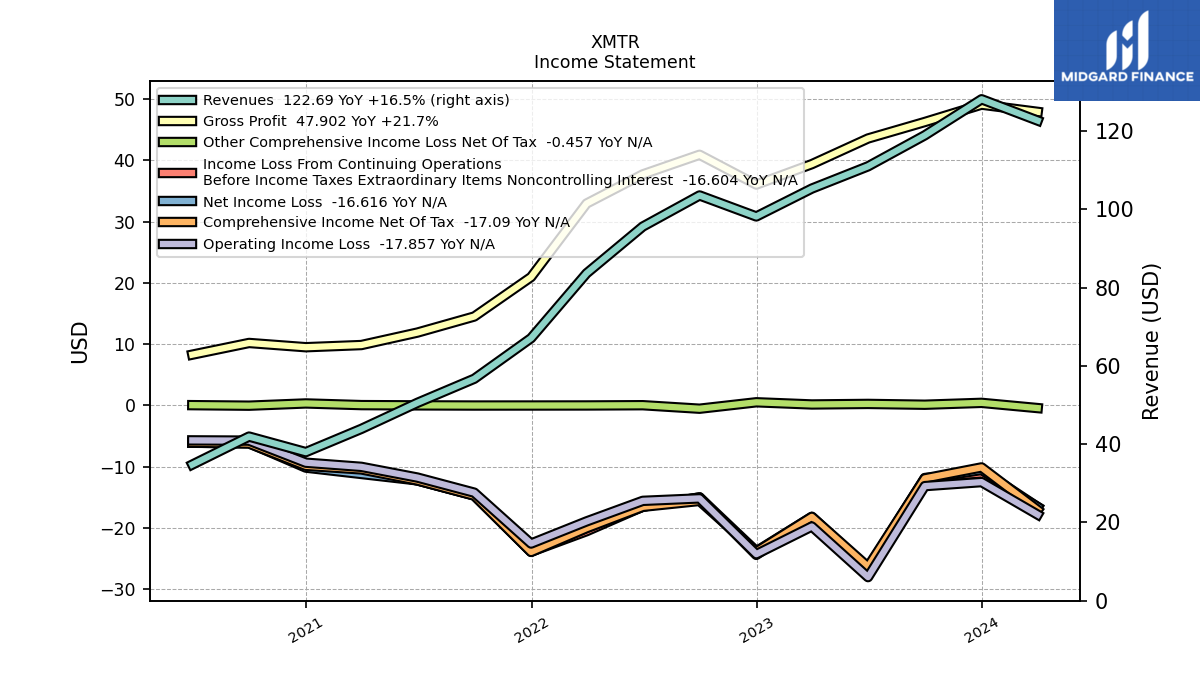
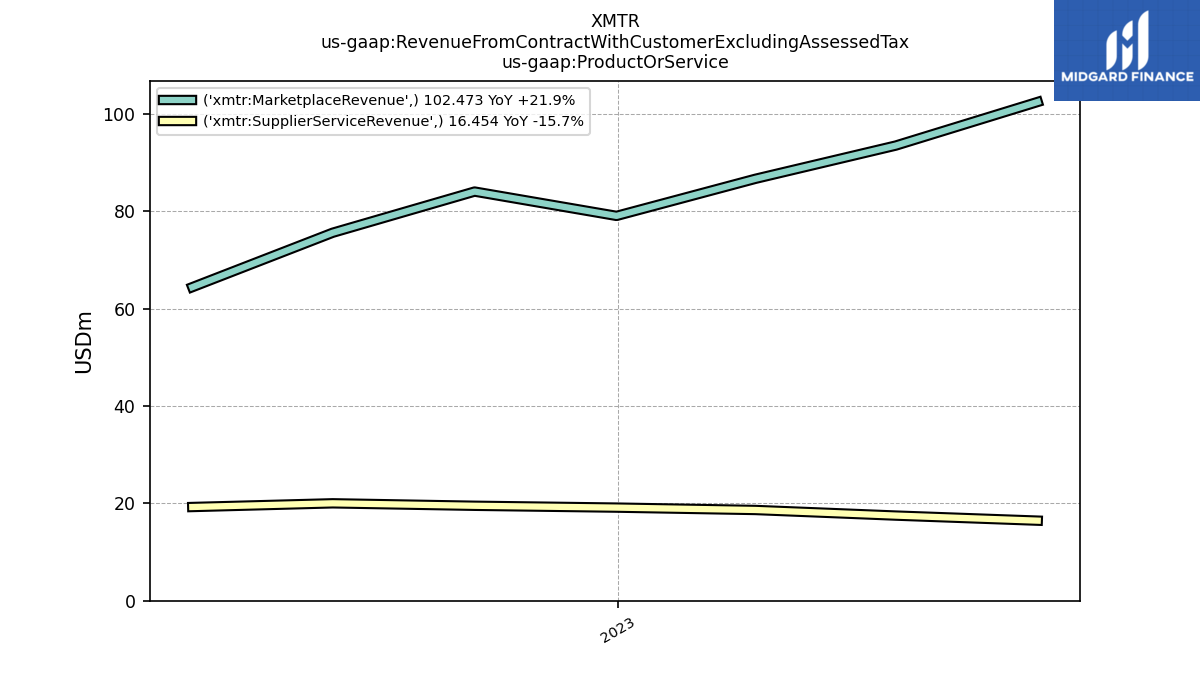
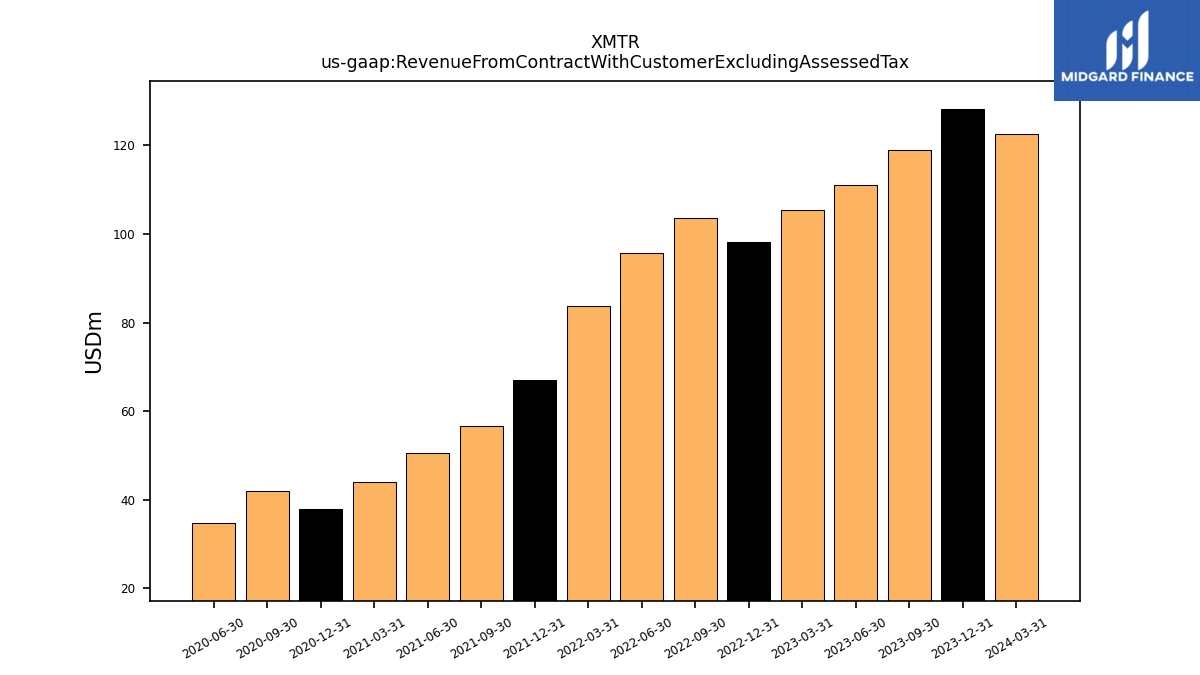
| Revenue From Contract With Customer Excluding Assessed Tax | 118.93 | 111.01 | 105.33 | 98.20 | 103.57 | 95.61 | 83.67 | 67.10 | 56.73 | 50.59 | 43.92 | 37.98 | 41.95 | 34.78 | |
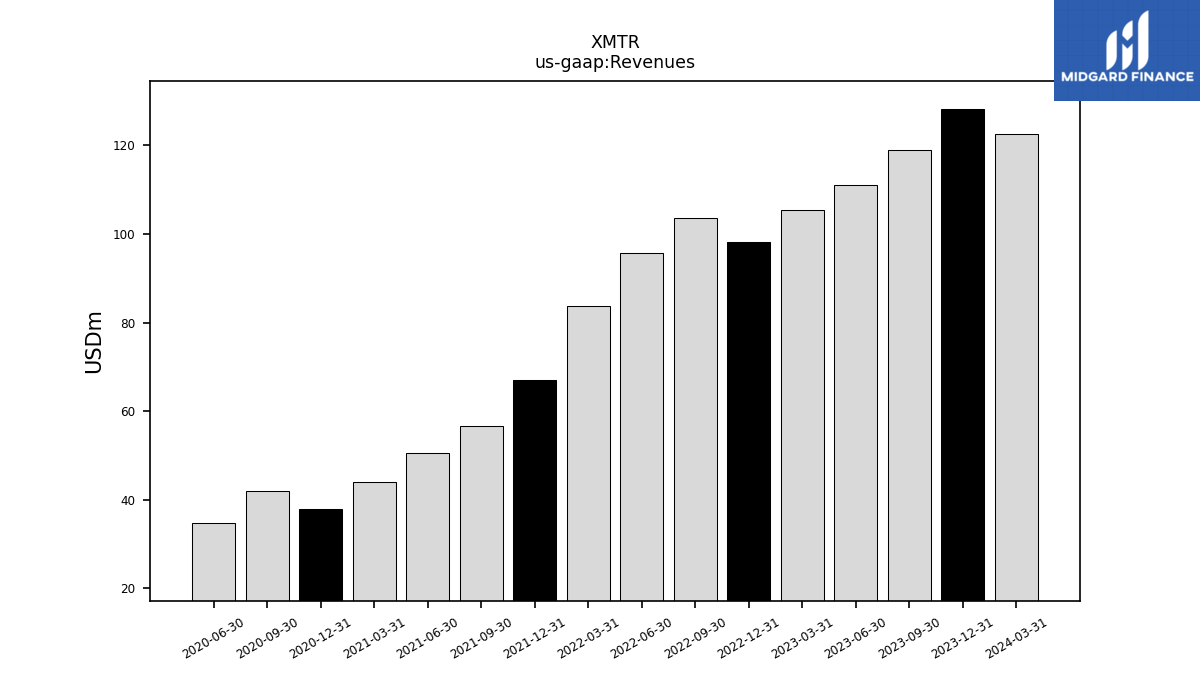
| Revenues | 118.93 | 111.01 | 105.33 | 98.20 | 103.57 | 95.61 | 83.67 | 67.10 | 56.73 | 50.59 | 43.92 | 37.98 | 41.95 | 34.78 | |
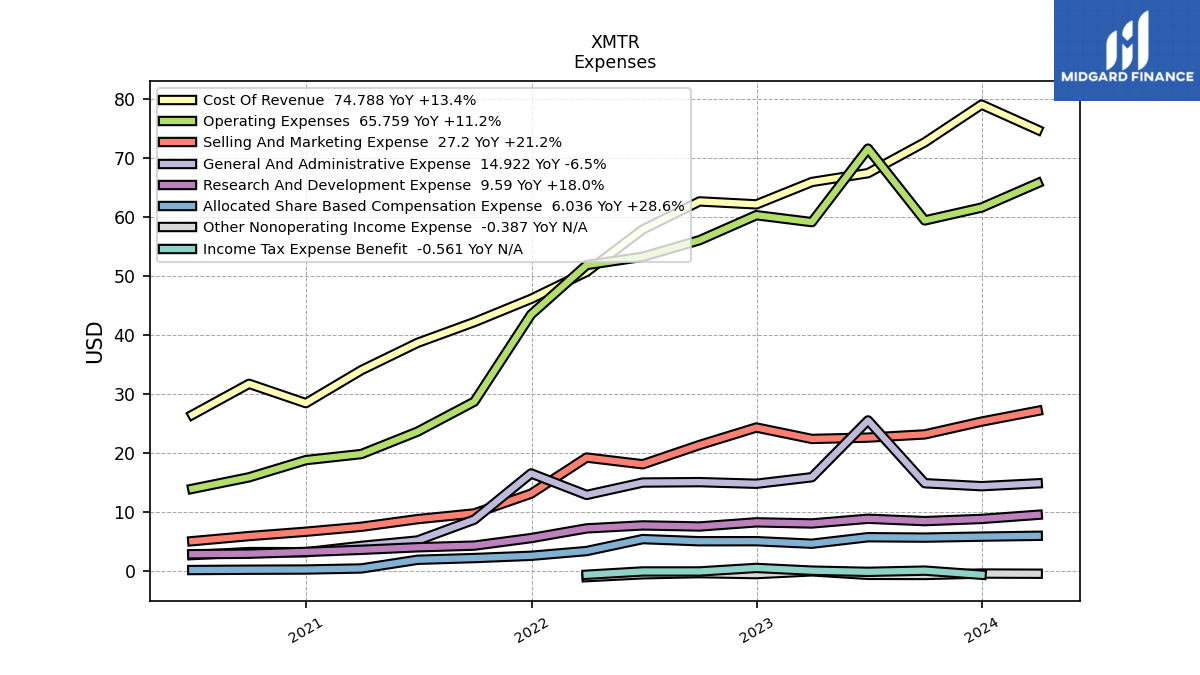
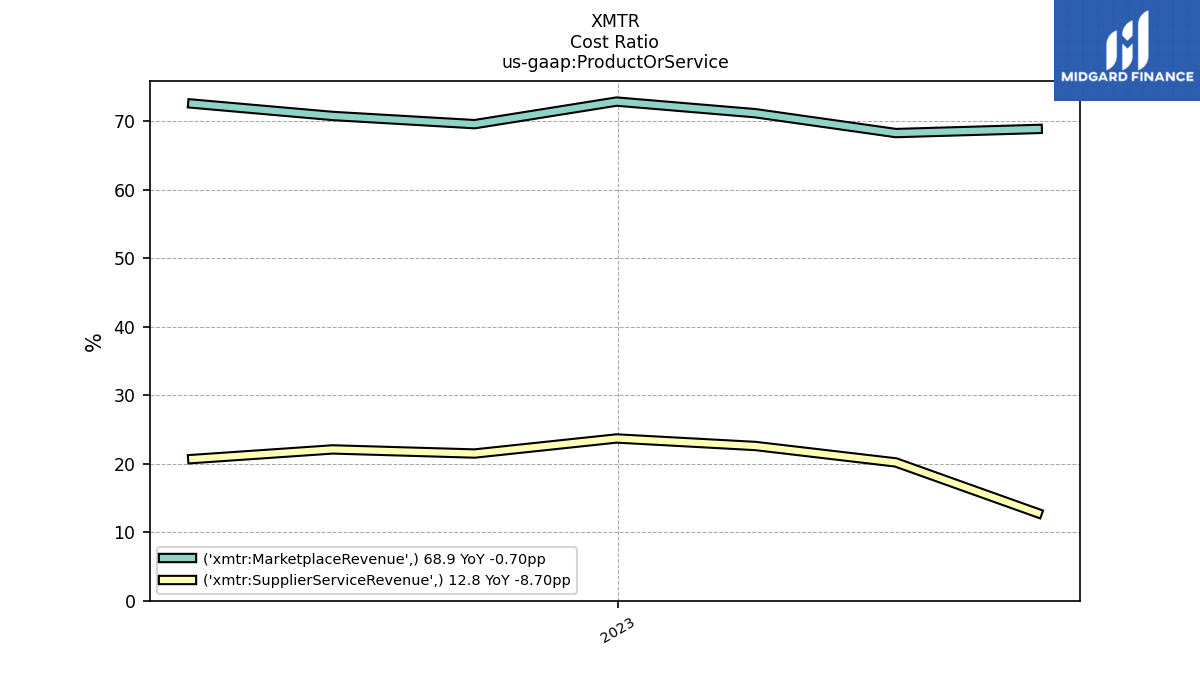
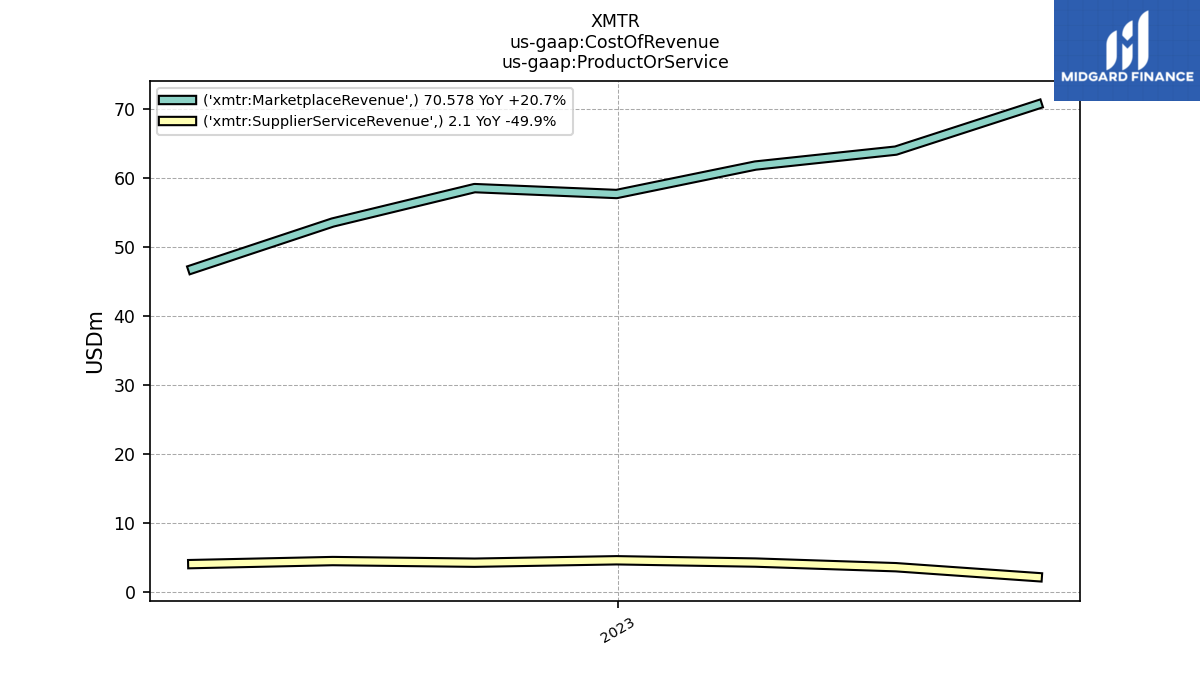
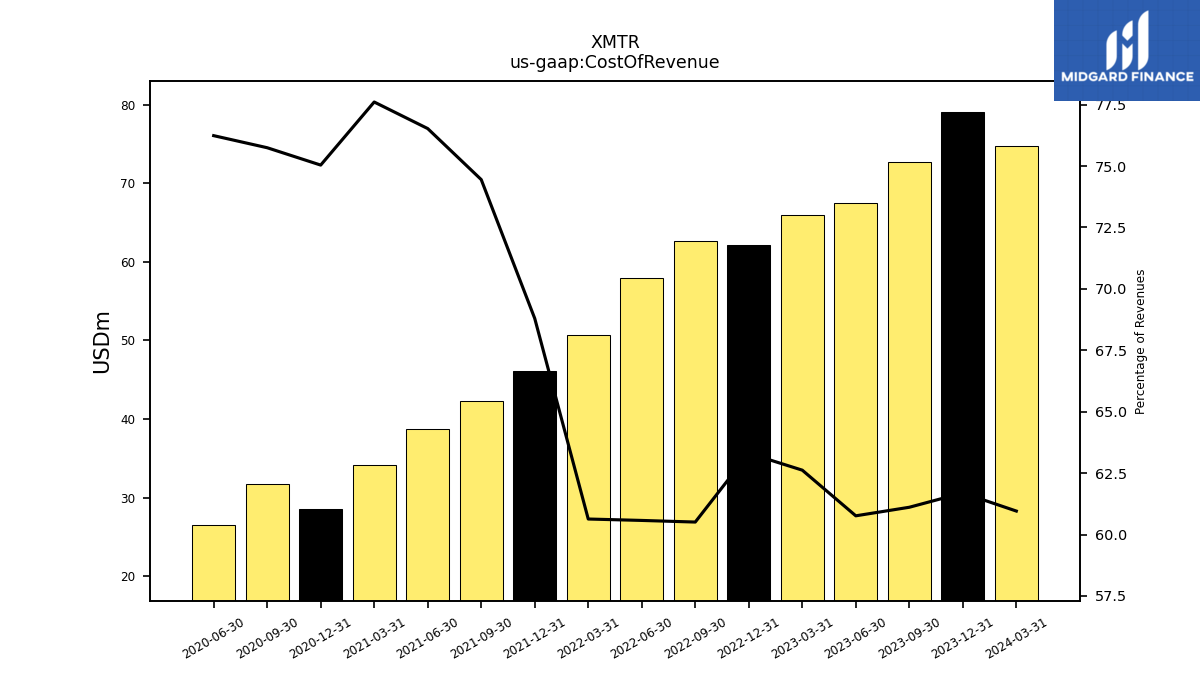
| Cost Of Revenue | 72.68 | 67.45 | 65.96 | 62.17 | 62.67 | 57.92 | 50.73 | 46.16 | 42.23 | 38.71 | 34.09 | 28.50 | 31.78 | 26.52 | |
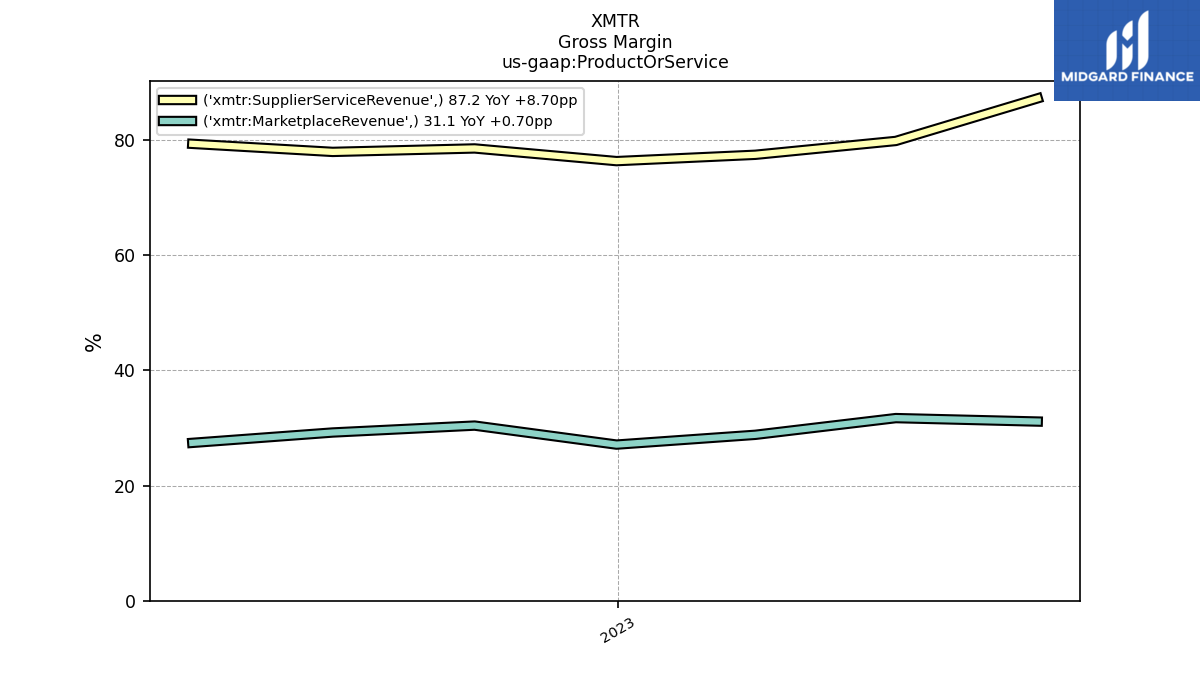
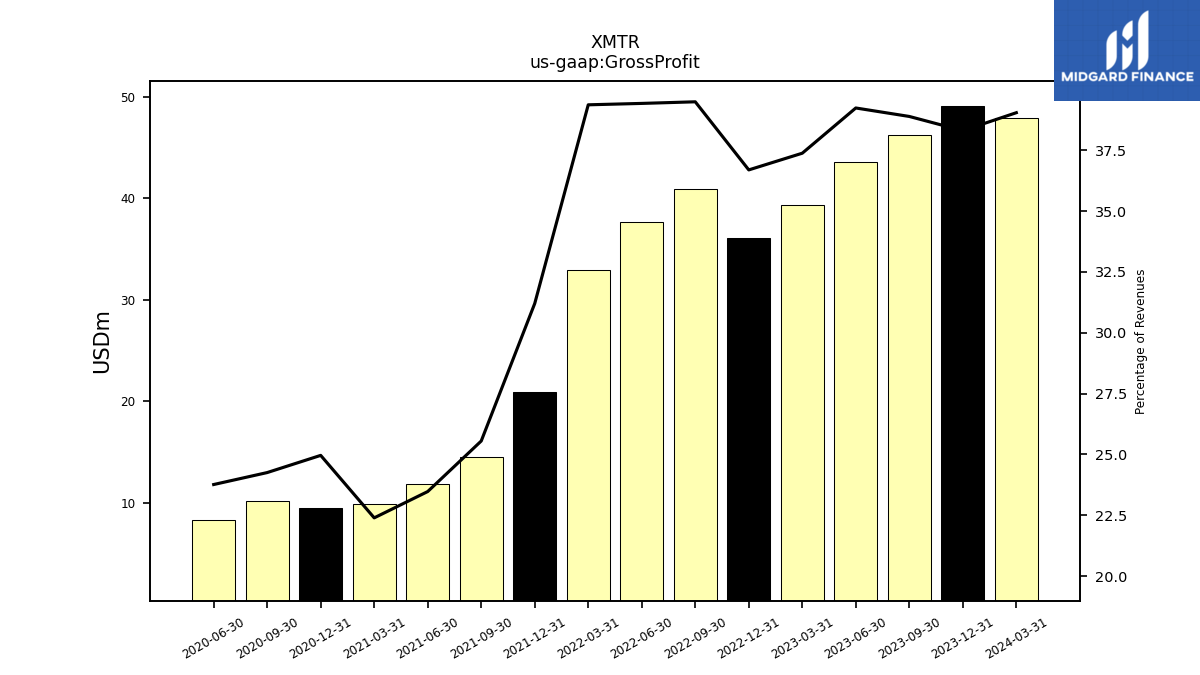
| Gross Profit | 46.25 | 43.56 | 39.37 | 36.03 | 40.90 | 37.70 | 32.94 | 20.94 | 14.49 | 11.88 | 9.84 | 9.48 | 10.18 | 8.27 | |
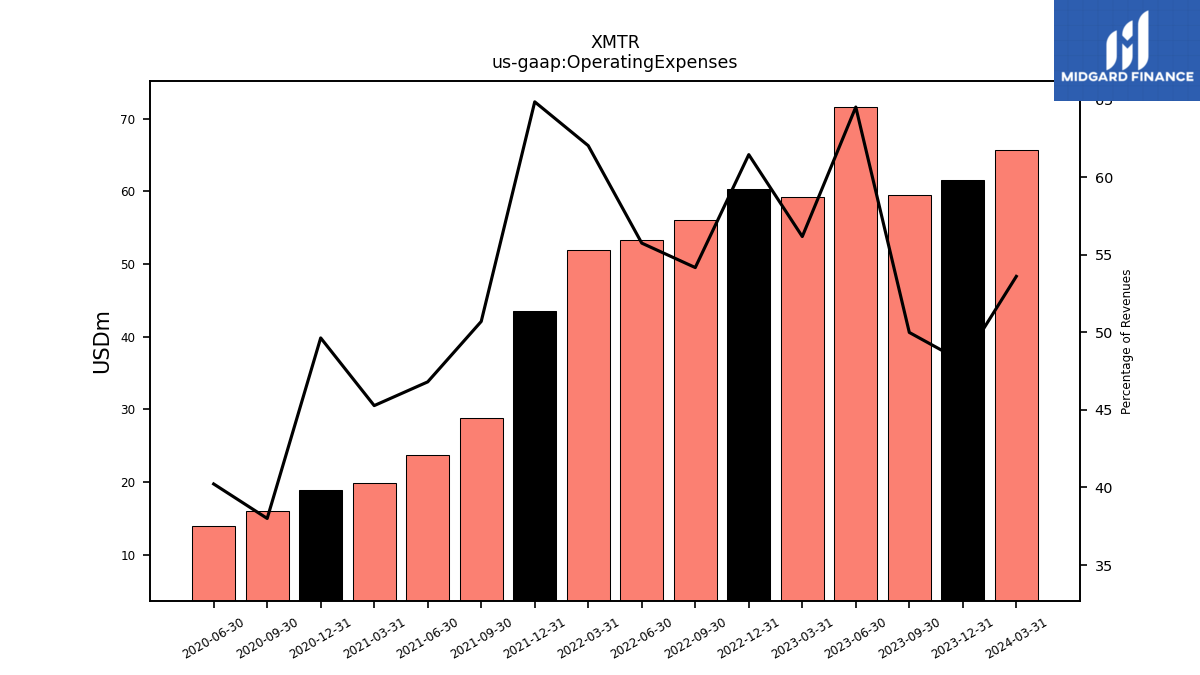
| Operating Expenses | 59.45 | 71.61 | 59.16 | 60.33 | 56.10 | 53.30 | 51.89 | 43.51 | 28.76 | 23.68 | 19.88 | 18.85 | 15.94 | 13.99 | |
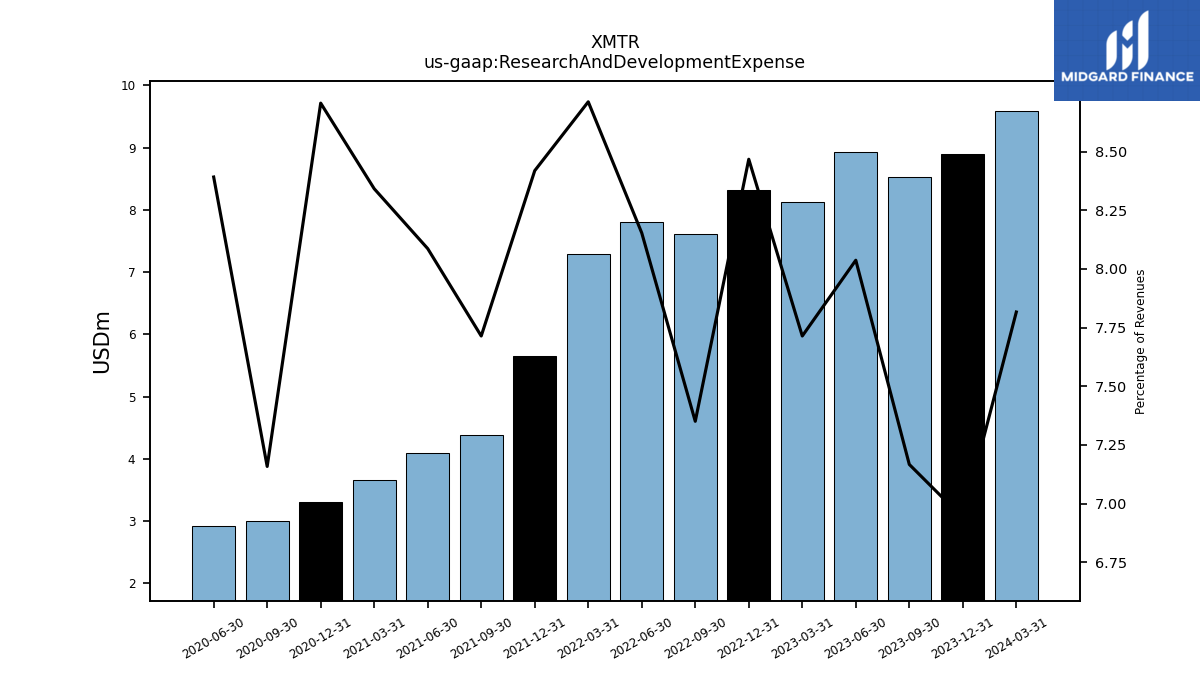
| Research And Development Expense | 8.52 | 8.92 | 8.12 | 8.31 | 7.61 | 7.80 | 7.29 | 5.65 | 4.38 | 4.09 | 3.66 | 3.31 | 3.00 | 2.92 | |
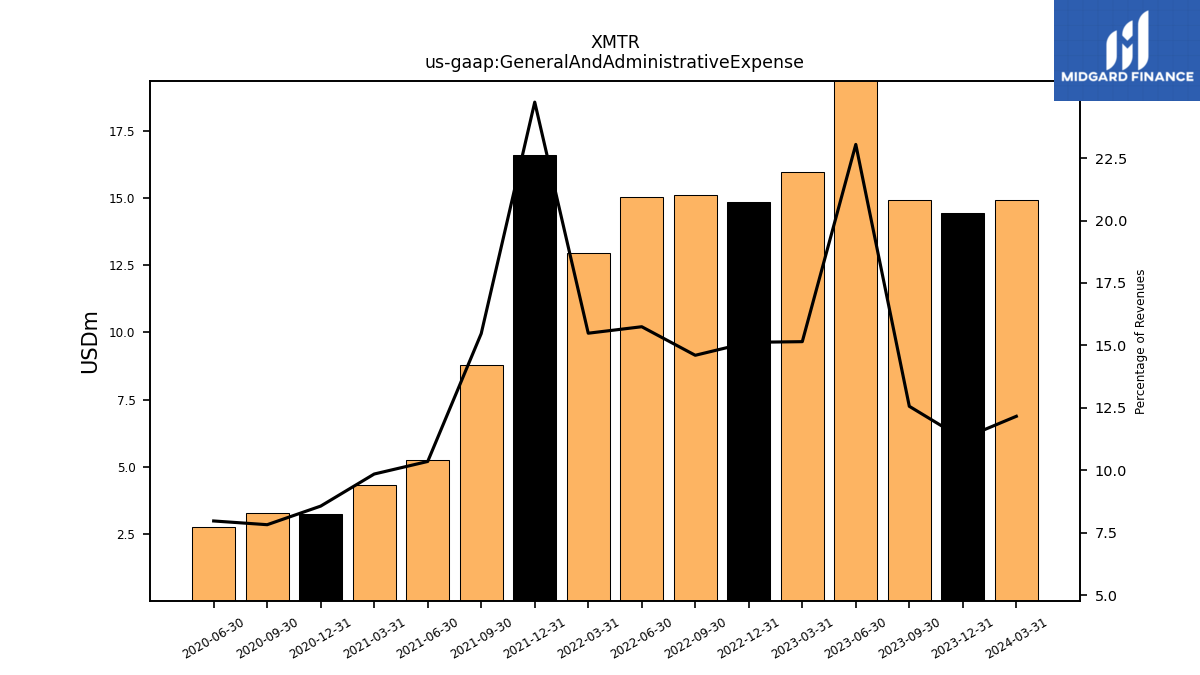
| General And Administrative Expense | 14.94 | 25.58 | 15.96 | 14.85 | 15.13 | 15.06 | 12.96 | 16.60 | 8.78 | 5.24 | 4.33 | 3.25 | 3.28 | 2.77 | |
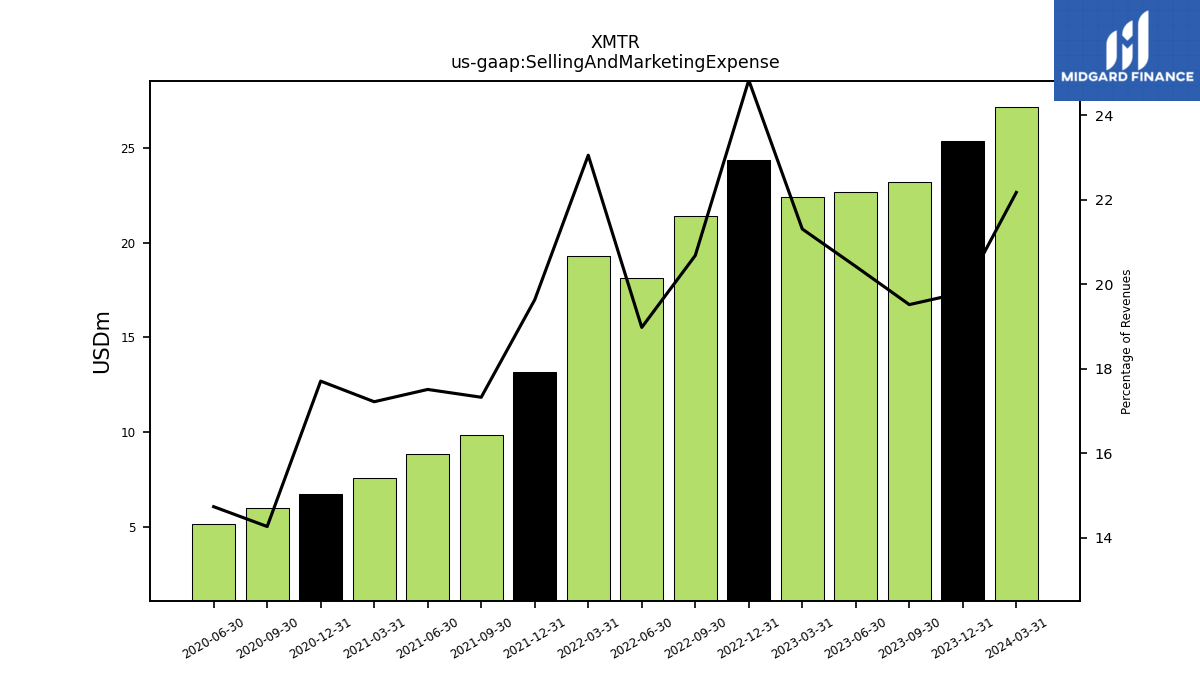
| Selling And Marketing Expense | 23.21 | 22.67 | 22.44 | 24.38 | 21.42 | 18.14 | 19.29 | 13.17 | 9.83 | 8.86 | 7.56 | 6.72 | 5.99 | 5.13 | |
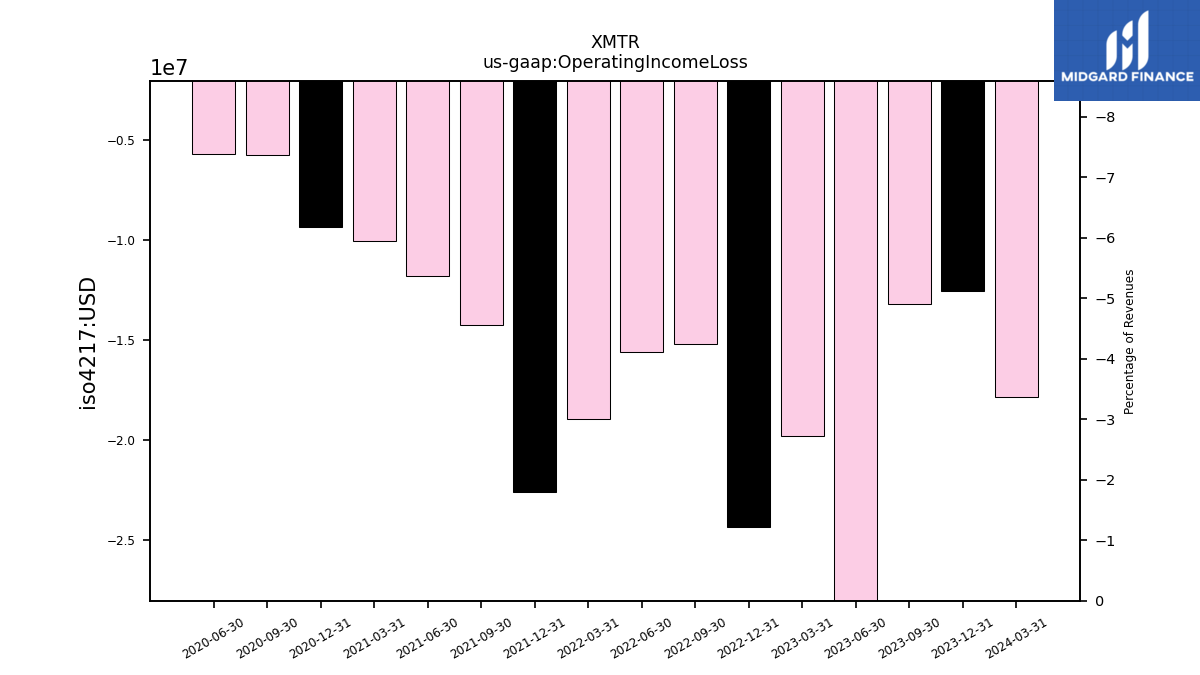
| Operating Income Loss | -13.20 | -28.05 | -19.79 | -24.30 | -15.20 | -15.60 | -18.95 | -22.57 | -14.26 | -11.80 | -10.05 | -9.37 | -5.77 | -5.73 | |
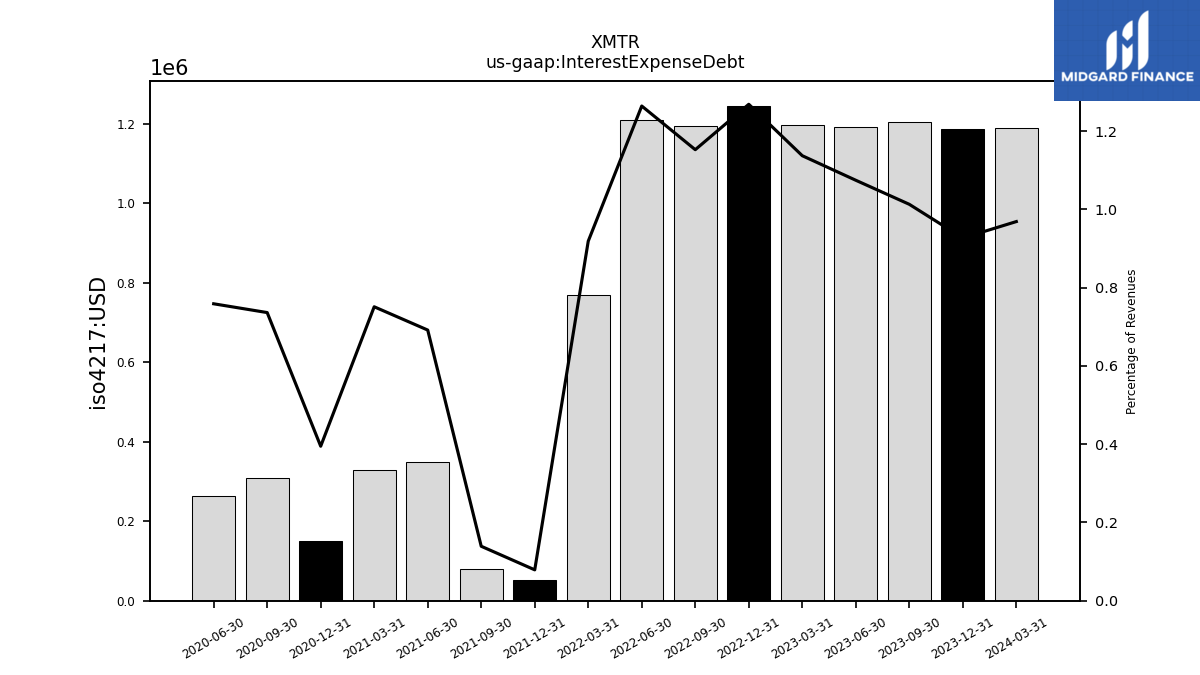
| Interest Expense Debt | 1.21 | 1.19 | 1.20 | 1.25 | 1.19 | 1.21 | 0.77 | 0.05 | 0.08 | 0.35 | 0.33 | 0.15 | 0.31 | 0.26 | |
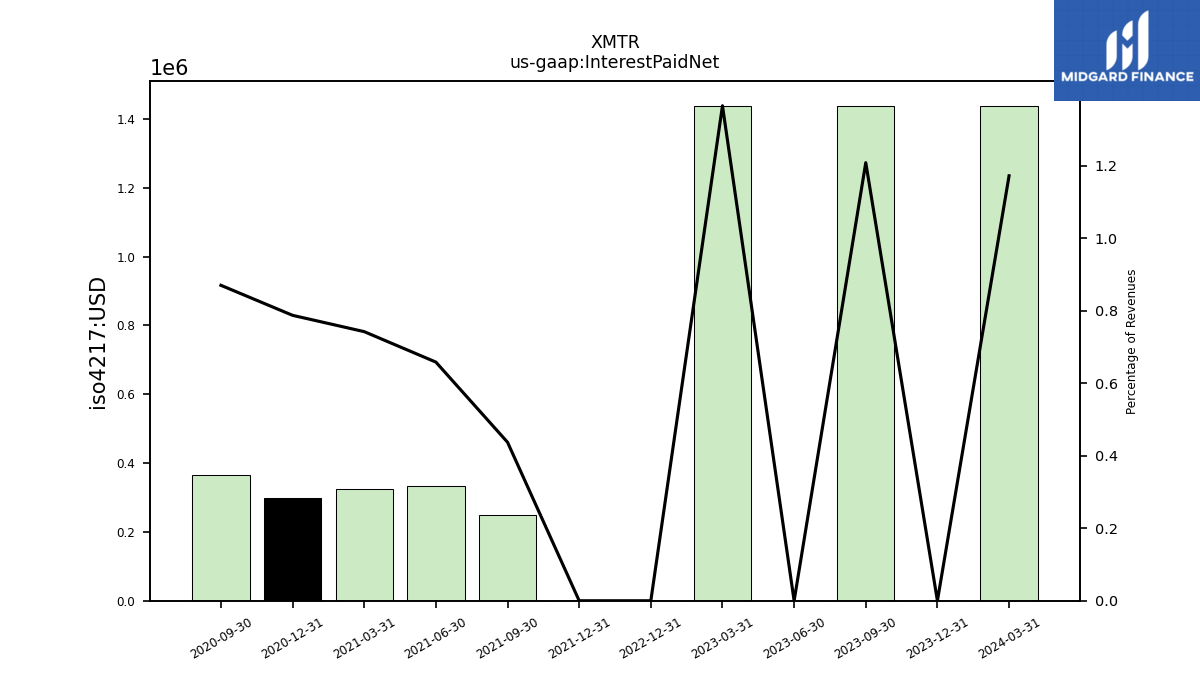
| Interest Paid Net | 1.44 | 0.00 | 1.44 | 0.00 | NA | NA | NA | 0.00 | 0.25 | 0.33 | 0.33 | 0.30 | 0.36 | NA | |
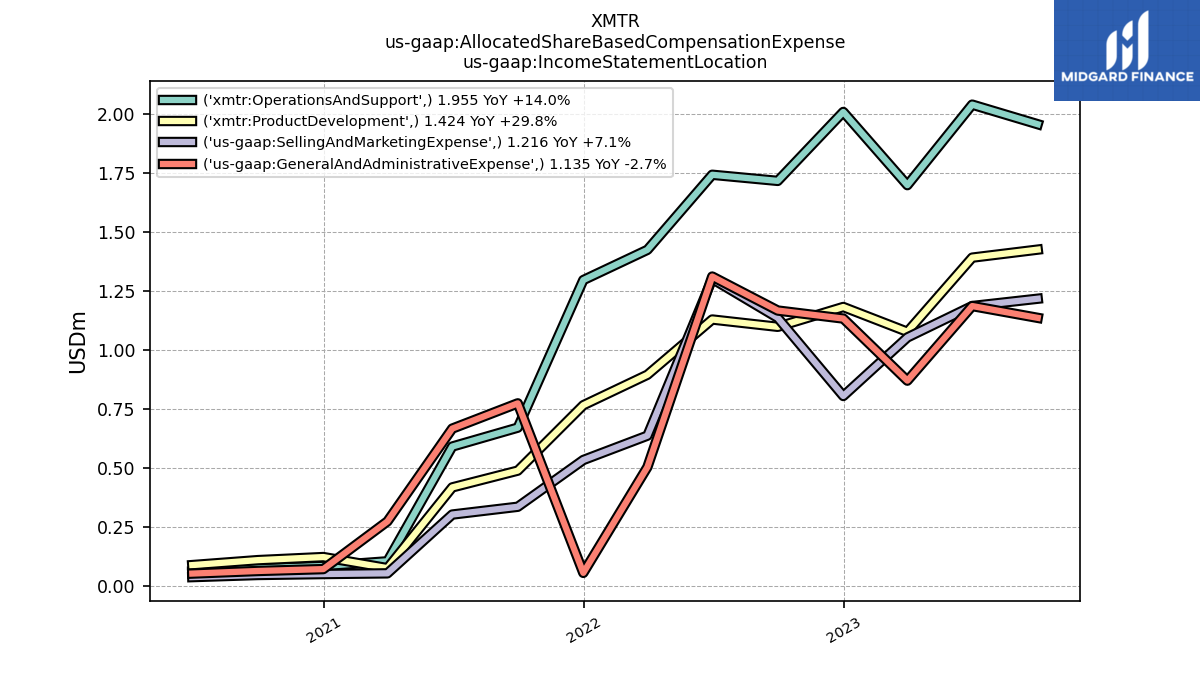
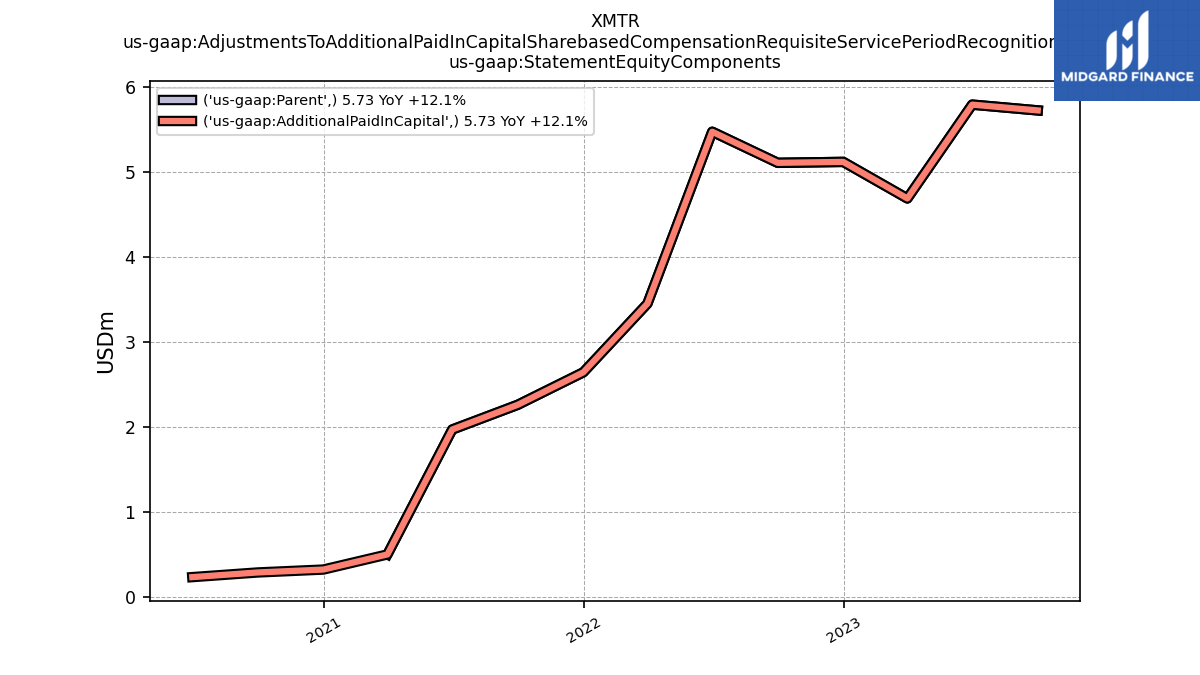
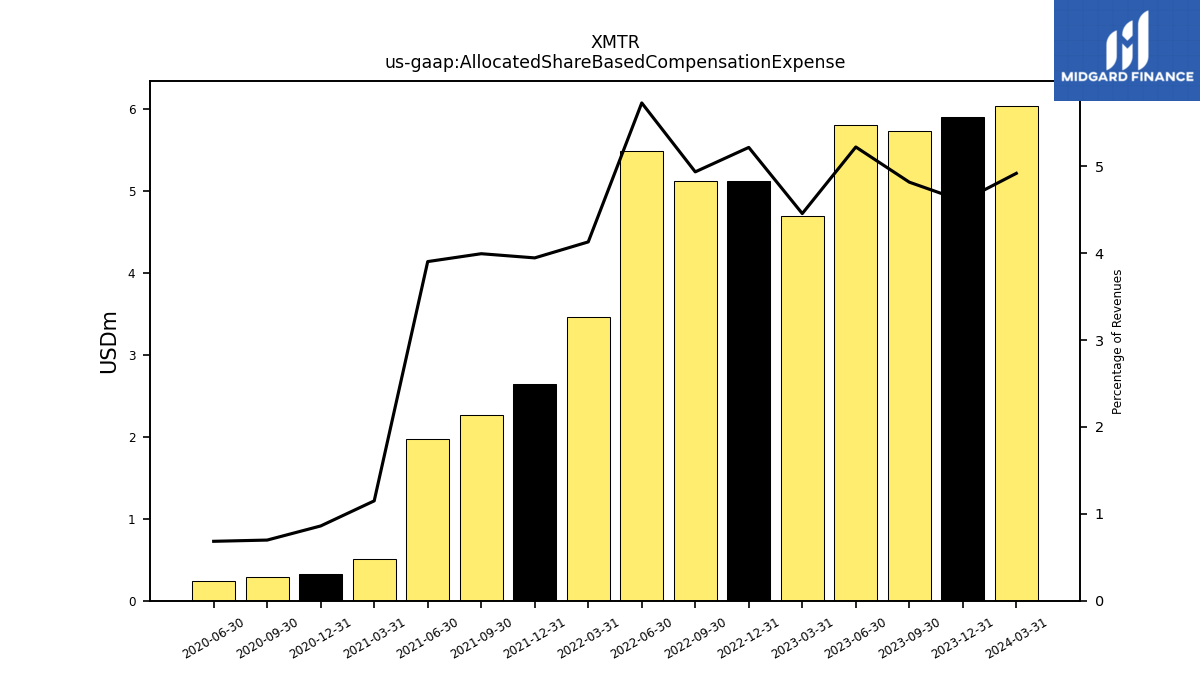
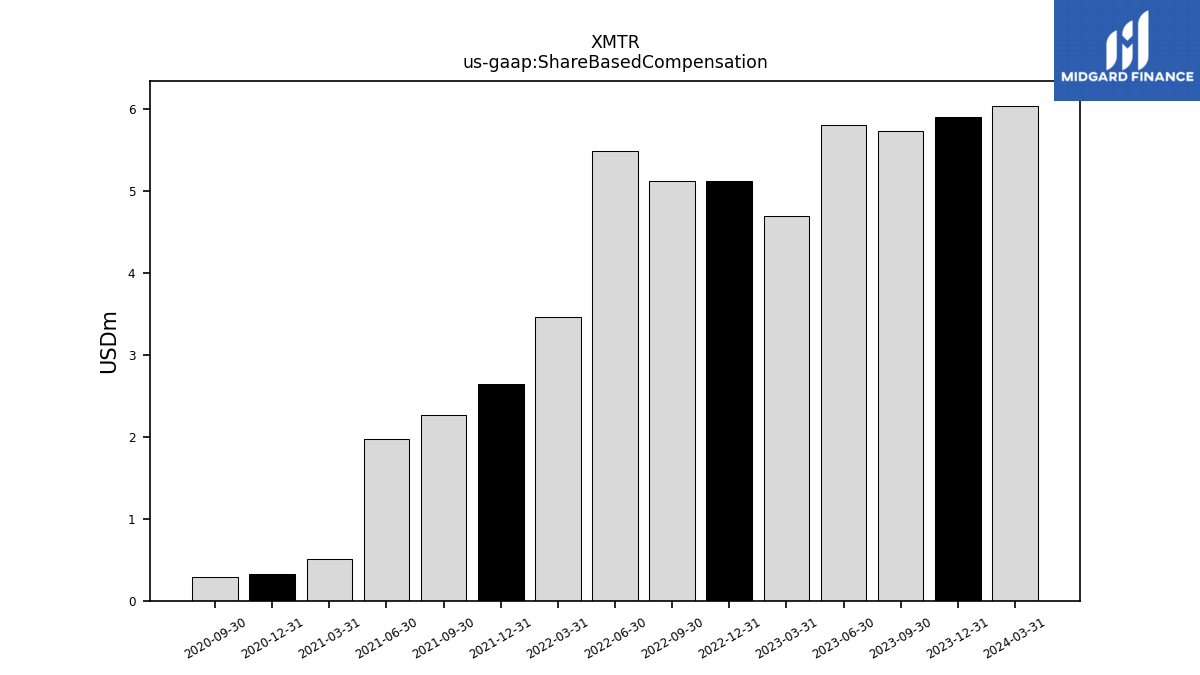
| Allocated Share Based Compensation Expense | 5.73 | 5.80 | 4.69 | 5.12 | 5.11 | 5.48 | 3.46 | 2.65 | 2.27 | 1.98 | 0.51 | 0.33 | 0.29 | 0.24 | |
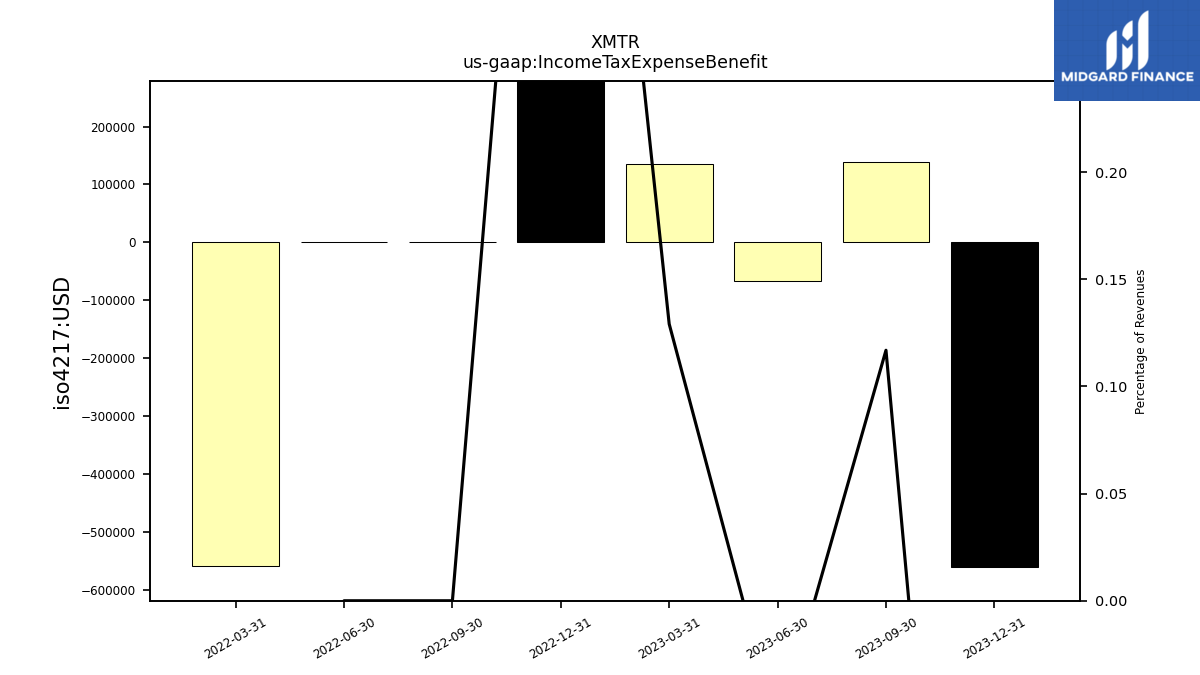
| Income Tax Expense Benefit | 0.14 | -0.07 | 0.14 | 0.59 | 0.00 | 0.00 | -0.56 | NA | NA | NA | NA | NA | NA | NA | |
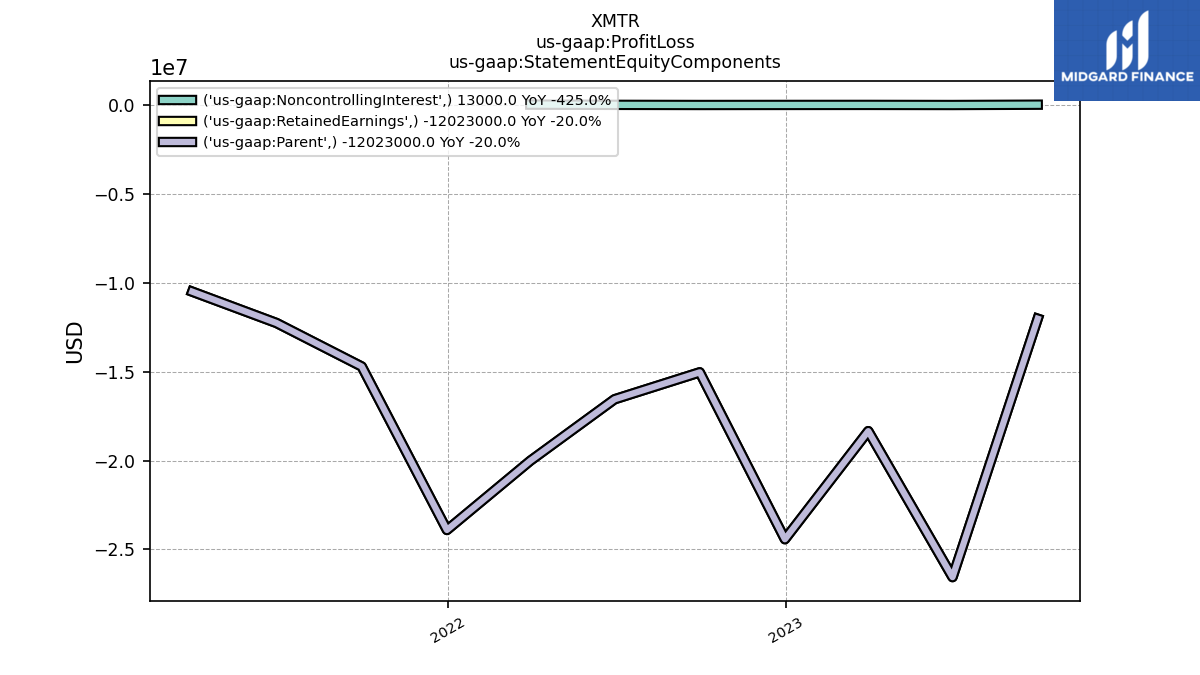
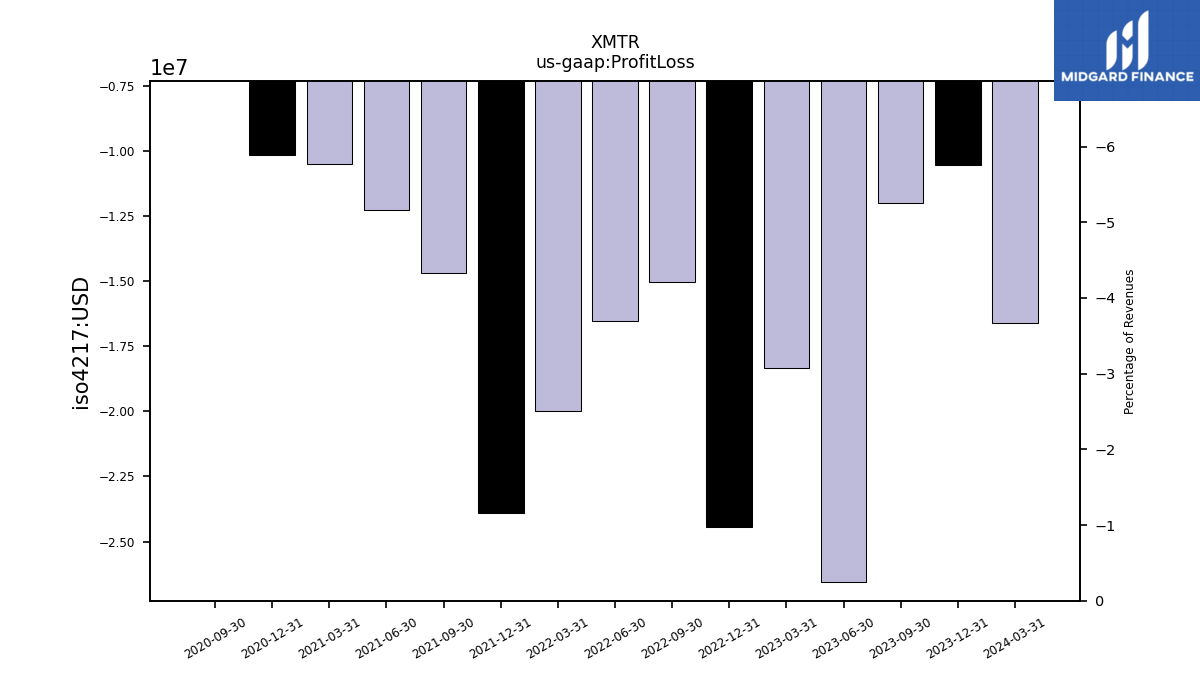
| Profit Loss | -12.01 | -26.56 | -18.34 | -24.42 | -15.04 | -16.55 | -20.00 | -23.91 | -14.71 | -12.26 | -10.50 | -10.18 | -6.18 | NA | |
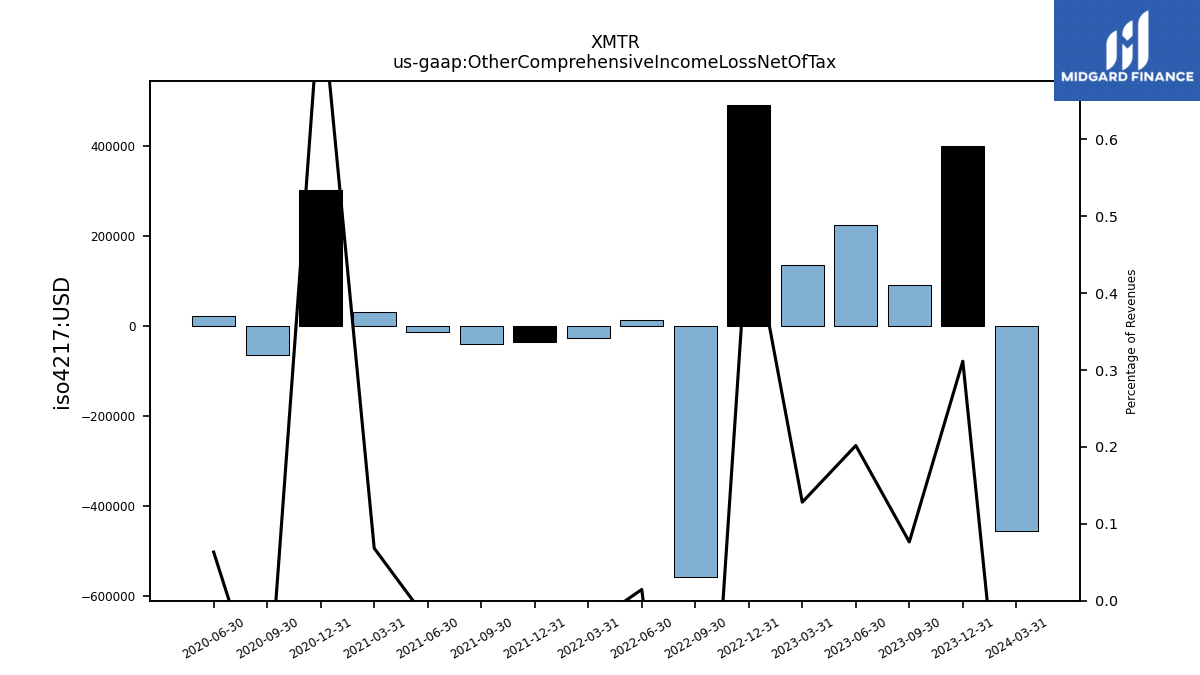
| Other Comprehensive Income Loss Net Of Tax | 0.09 | 0.22 | 0.14 | 0.49 | -0.56 | 0.01 | -0.03 | -0.04 | -0.04 | -0.01 | 0.03 | 0.30 | -0.07 | 0.02 | |
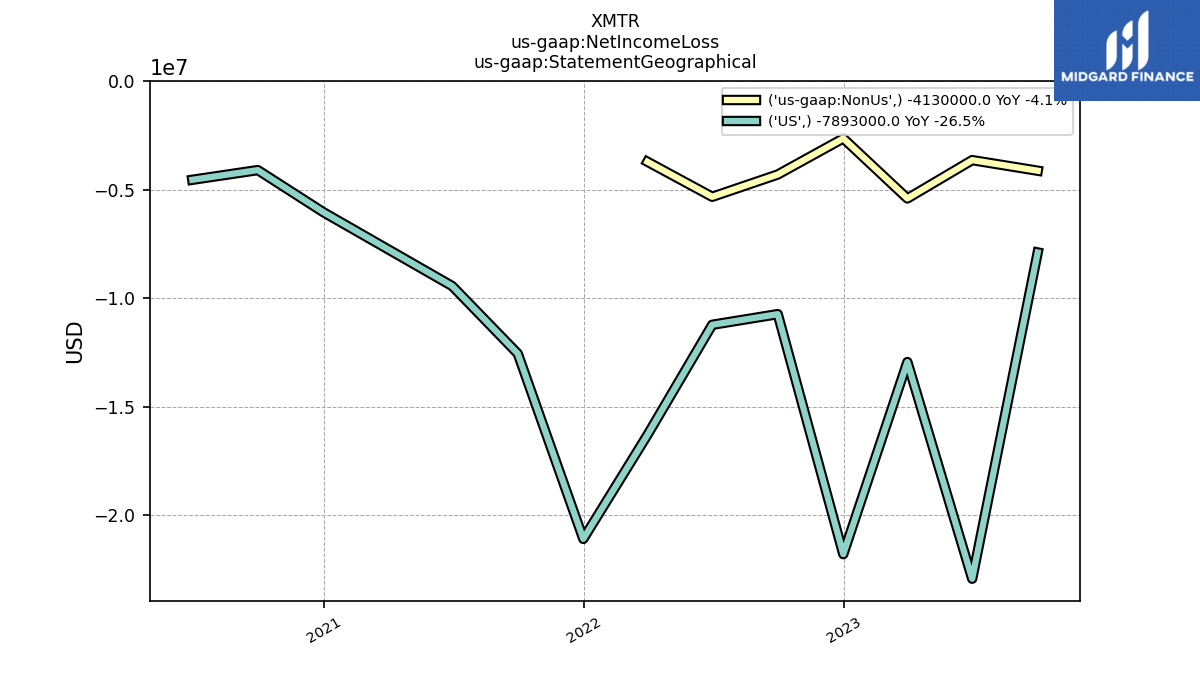
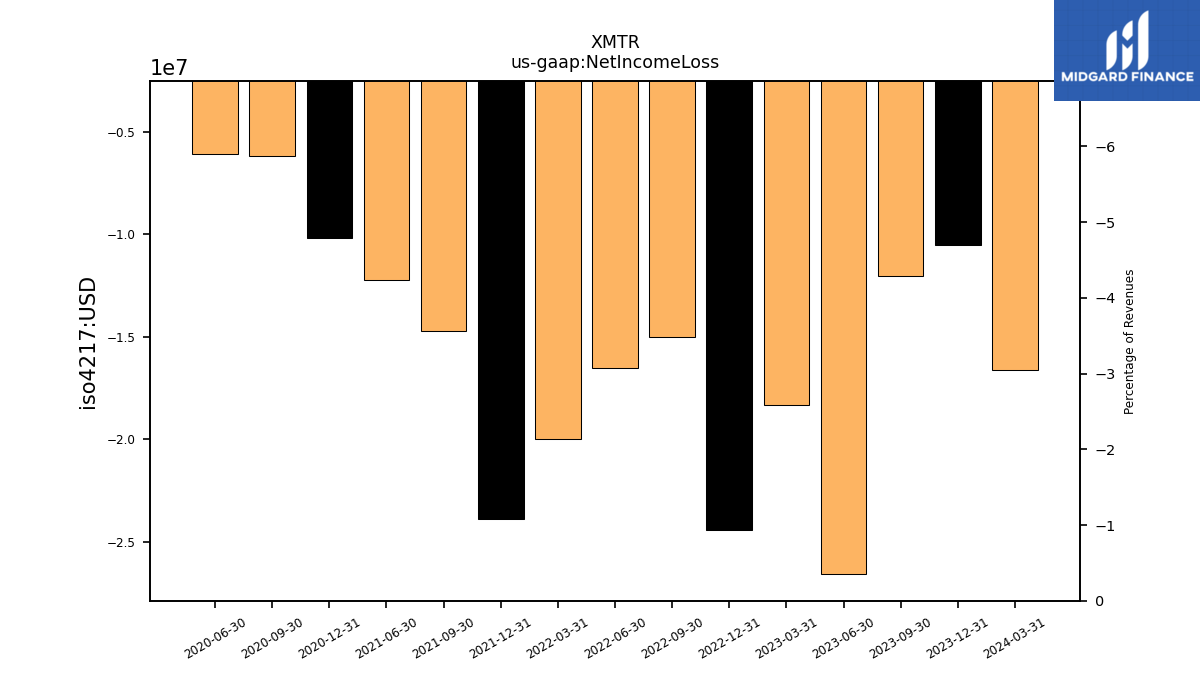
| Net Income Loss | -12.02 | -26.55 | -18.34 | -24.42 | -15.04 | -16.55 | -20.01 | -23.91 | -14.71 | -12.26 | NA | -10.18 | -6.18 | -6.12 | |
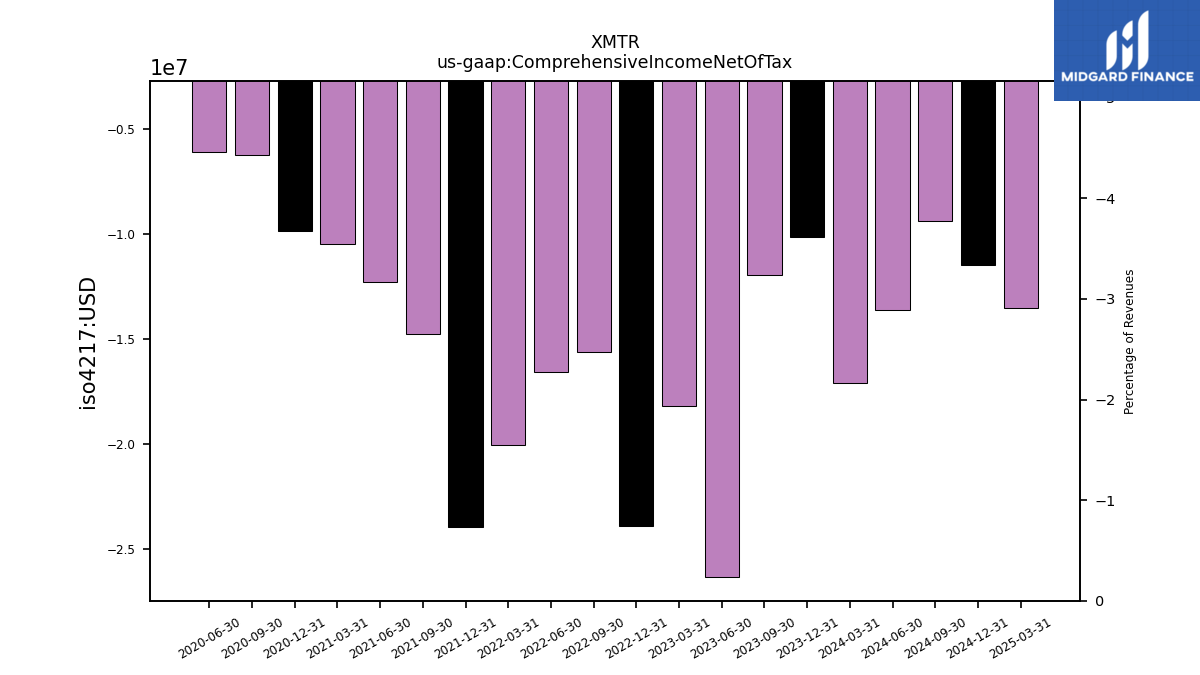
| Comprehensive Income Net Of Tax | -11.94 | -26.35 | -18.21 | -23.90 | -15.61 | -16.57 | -20.06 | -23.94 | -14.75 | -12.28 | -10.47 | -9.87 | -6.25 | -6.10 | |
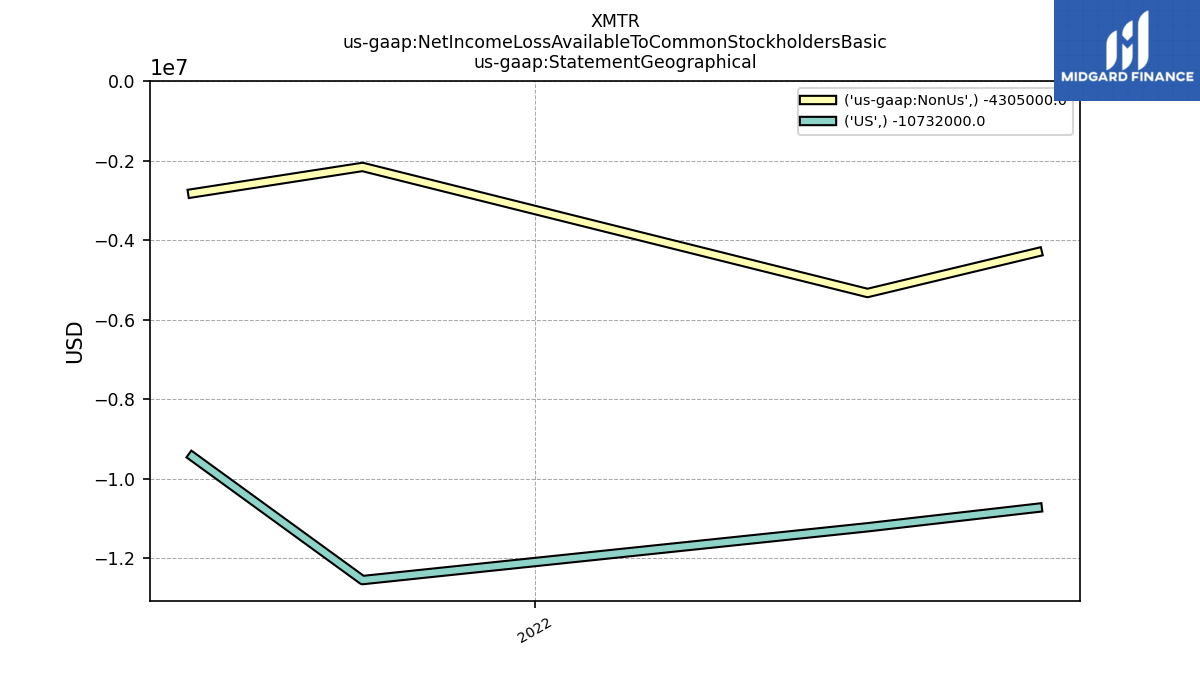
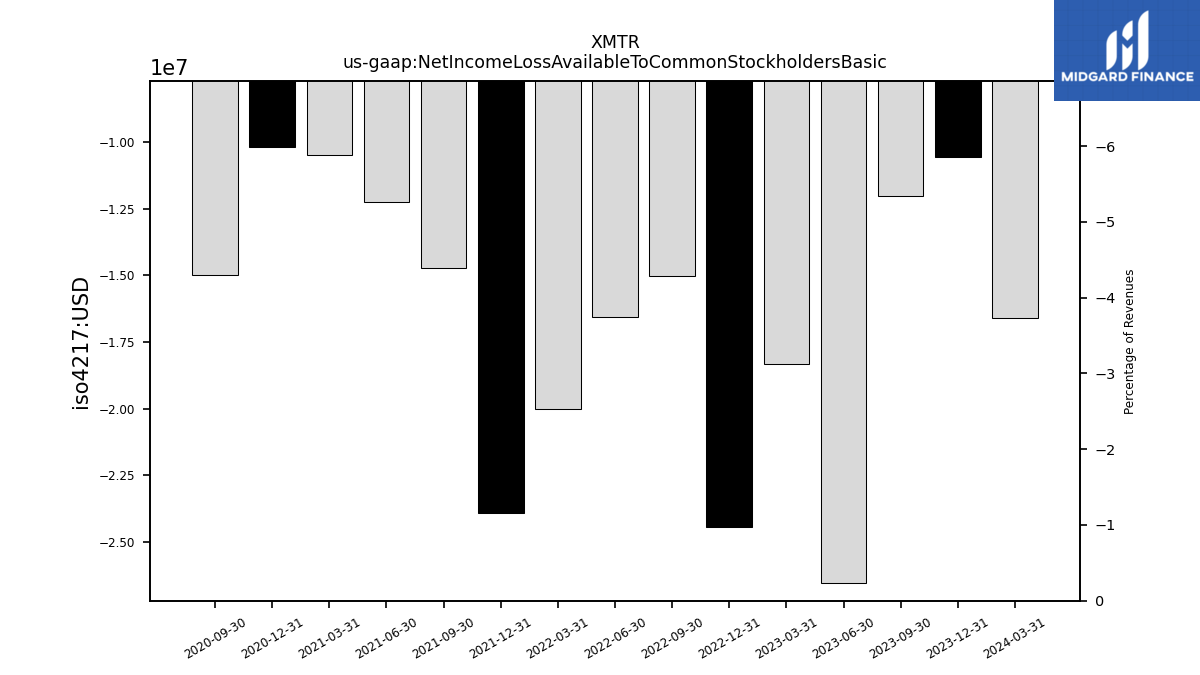
| Net Income Loss Available To Common Stockholders Basic | -12.02 | -26.55 | -18.34 | -24.42 | -15.04 | -16.55 | -20.01 | -23.90 | -14.71 | -12.26 | -10.50 | -10.18 | -14.98 | NA |
| 2023-09-30 | 2023-06-30 | 2023-03-31 | 2022-12-31 | 2022-09-30 | 2022-06-30 | 2022-03-31 | 2021-12-31 | 2021-09-30 | 2021-06-30 | 2021-03-31 | 2020-12-31 | 2020-09-30 | 2020-06-30 | ||
|---|---|---|---|---|---|---|---|---|---|---|---|---|---|---|---|
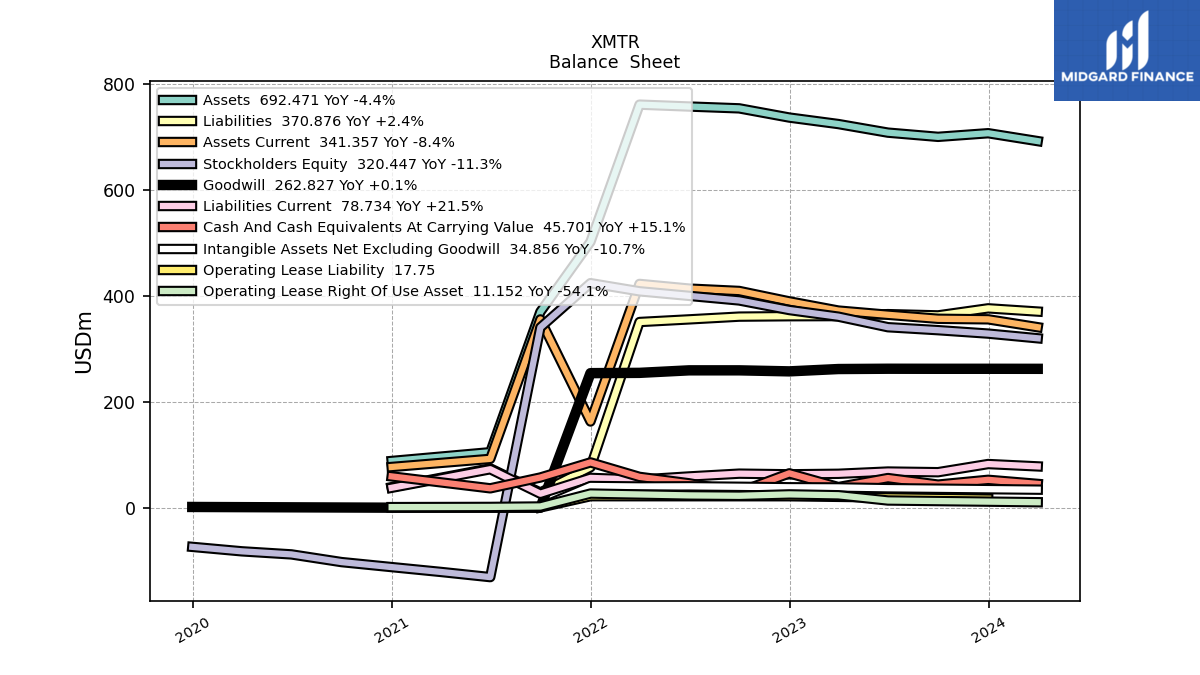
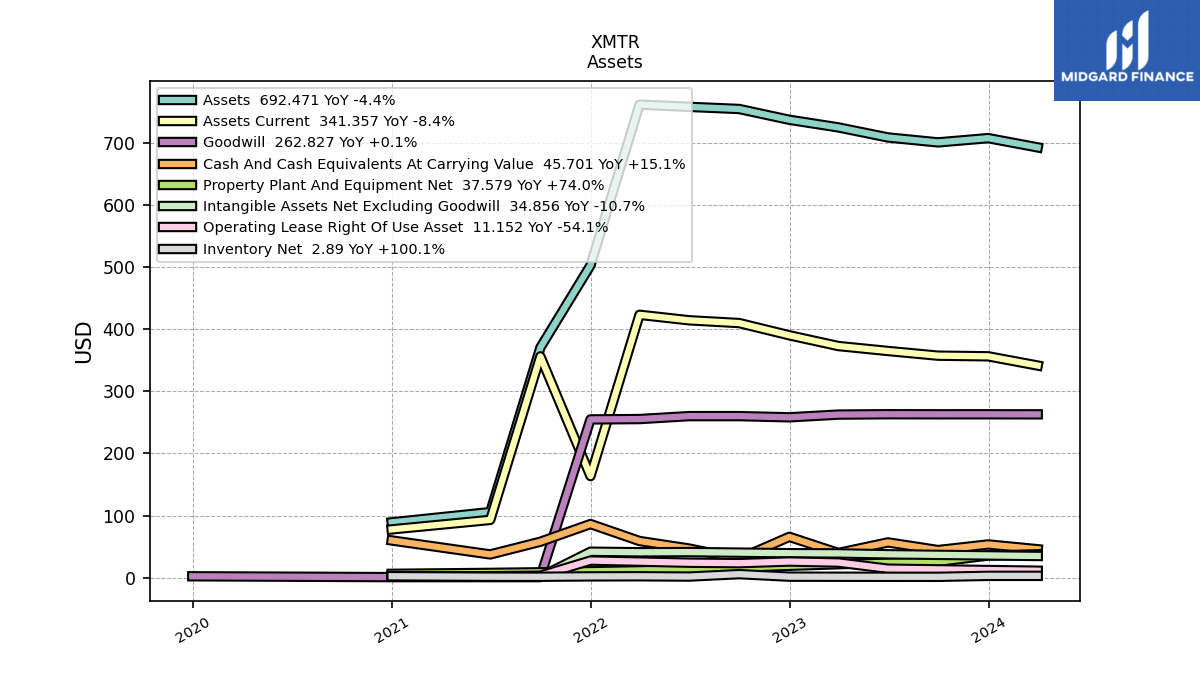
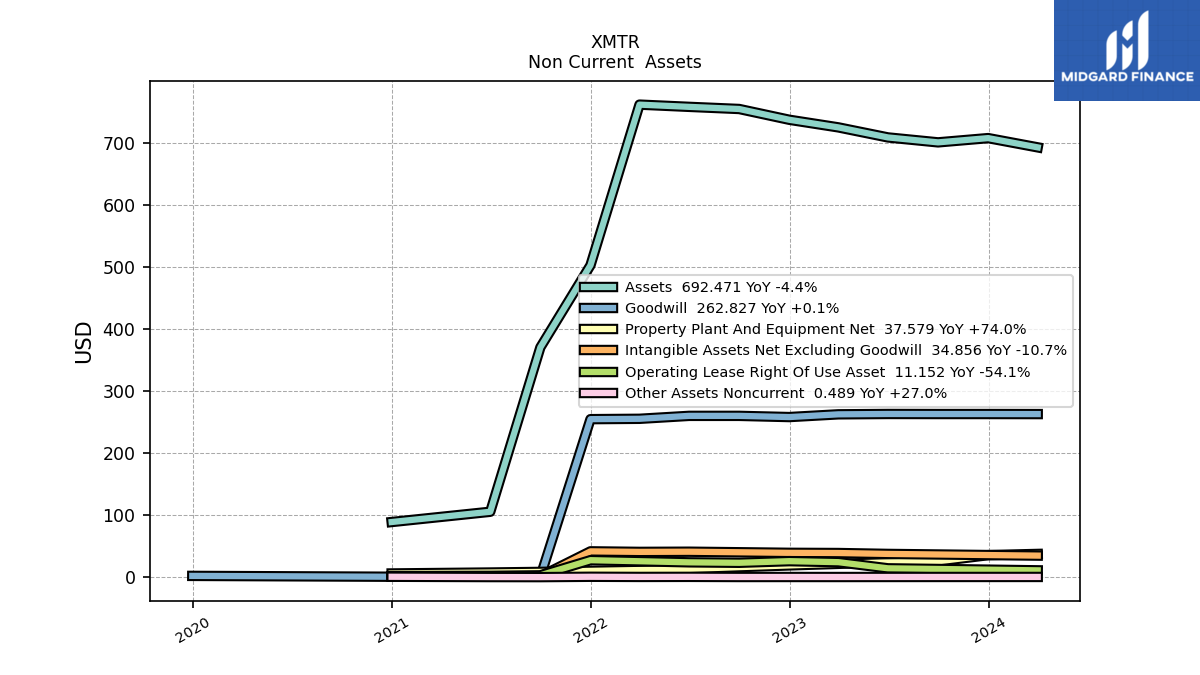
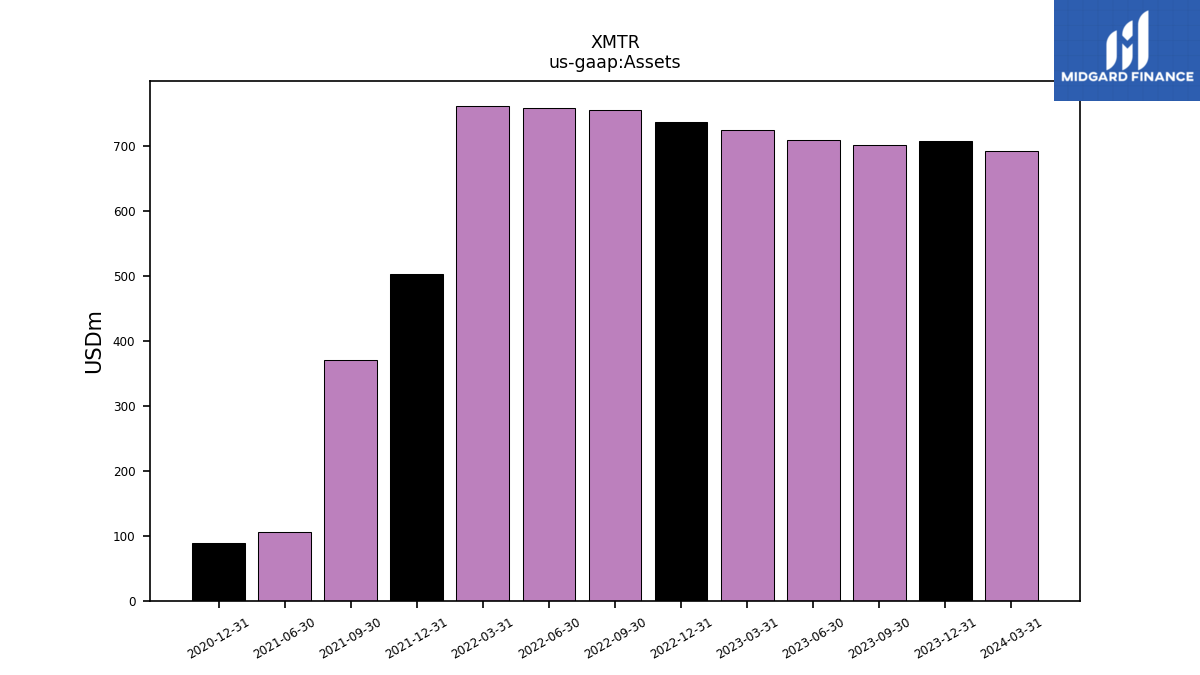
| Assets | 700.53 | 708.48 | 724.68 | 736.92 | 754.28 | 757.74 | 761.33 | 502.59 | 370.30 | 105.48 | NA | 88.96 | NA | NA | |
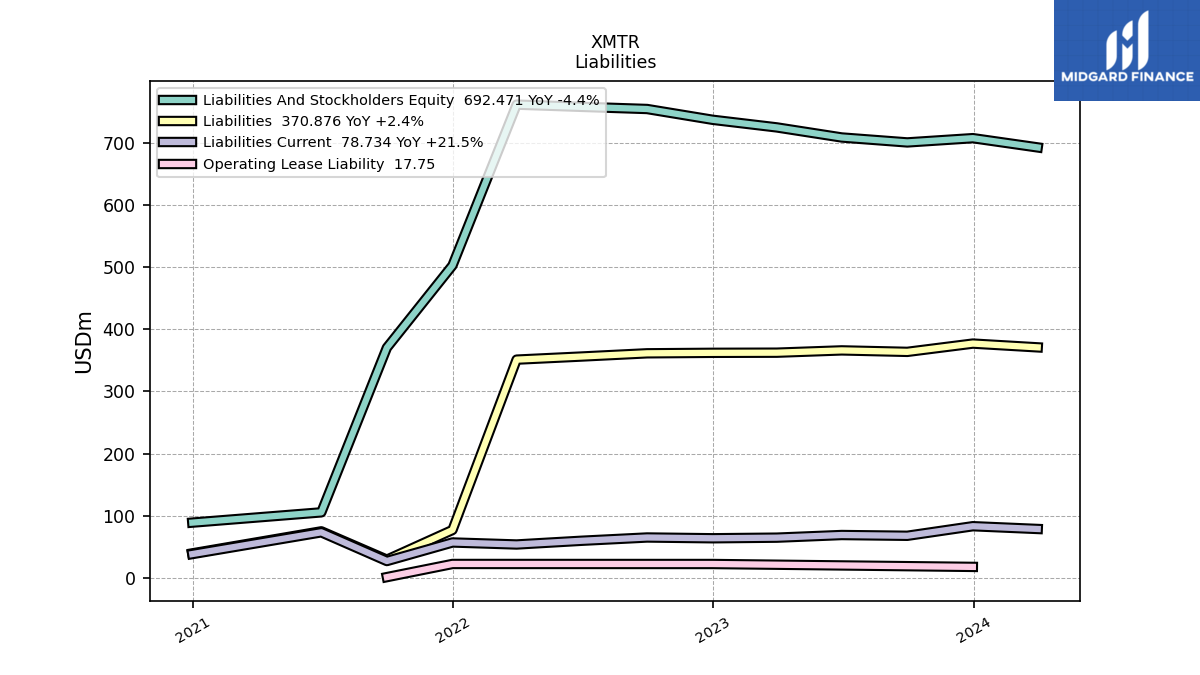
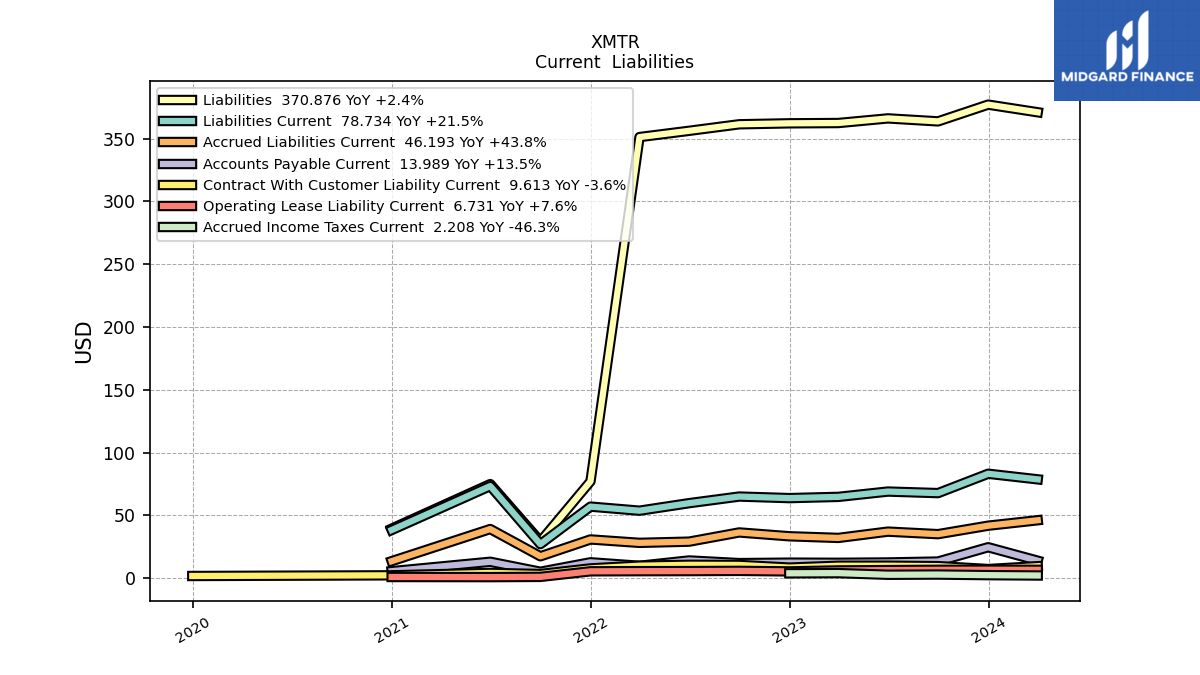
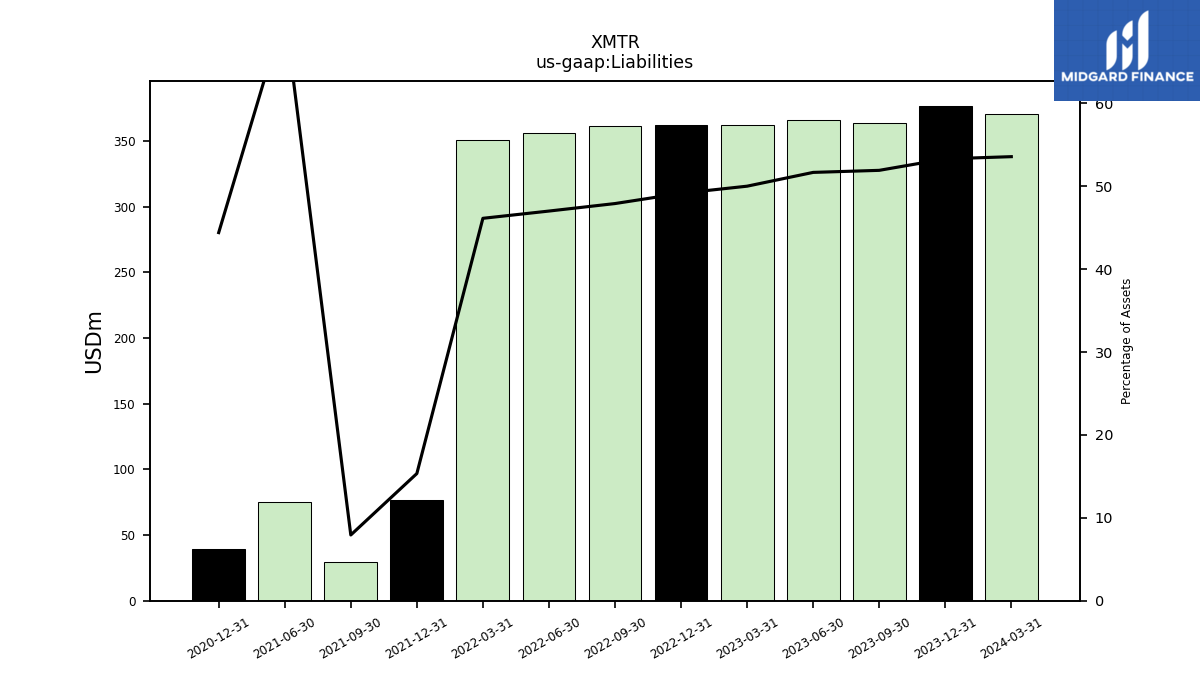
| Liabilities | 363.63 | 366.01 | 362.32 | 362.09 | 361.32 | 356.13 | 351.15 | 77.10 | 29.37 | 74.95 | NA | 39.50 | NA | NA | |
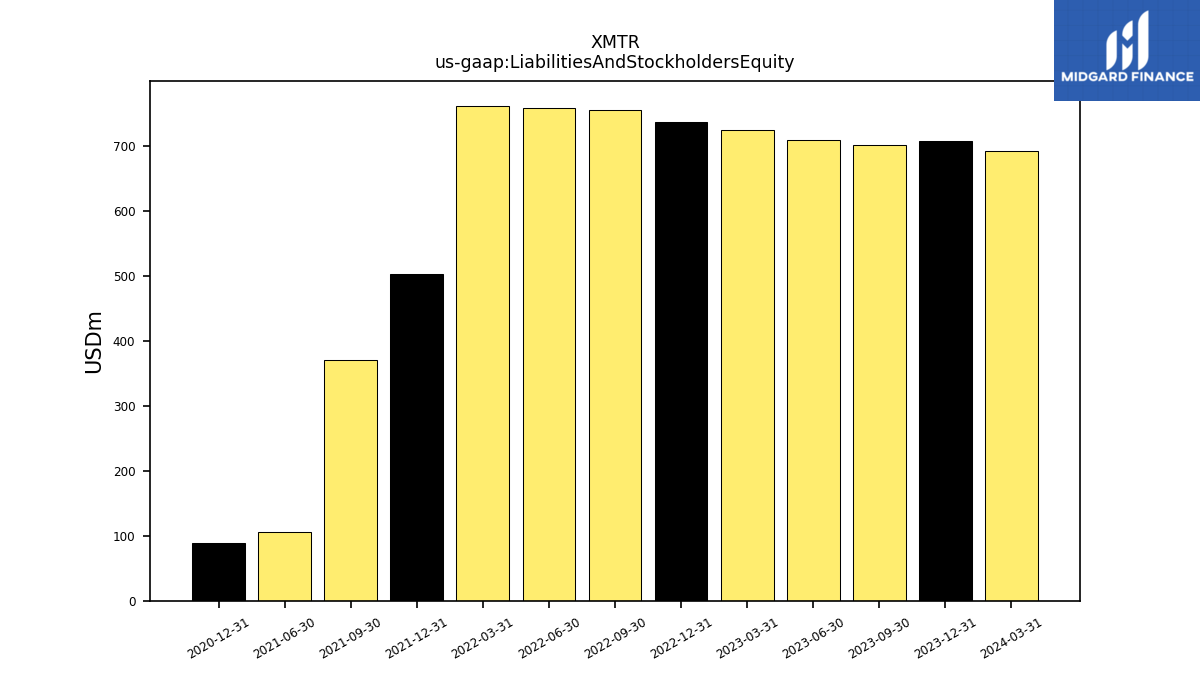
| Liabilities And Stockholders Equity | 700.53 | 708.48 | 724.68 | 736.92 | 754.28 | 757.74 | 761.33 | 502.59 | 370.30 | 105.48 | NA | 88.96 | NA | NA | |
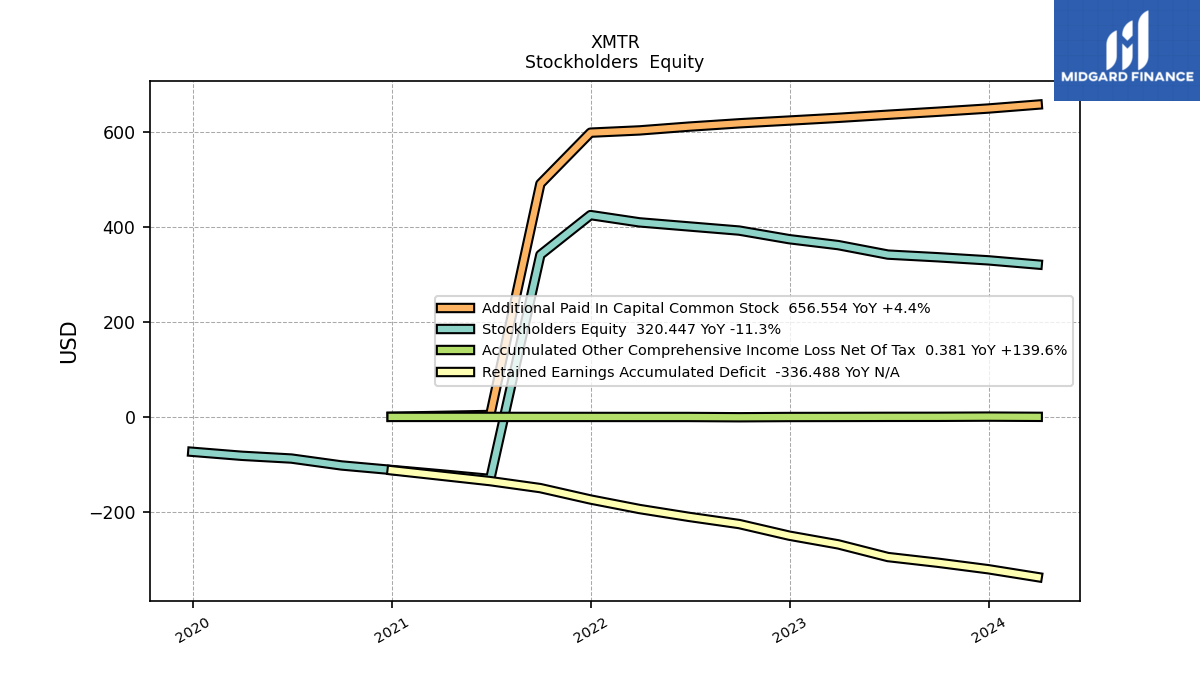
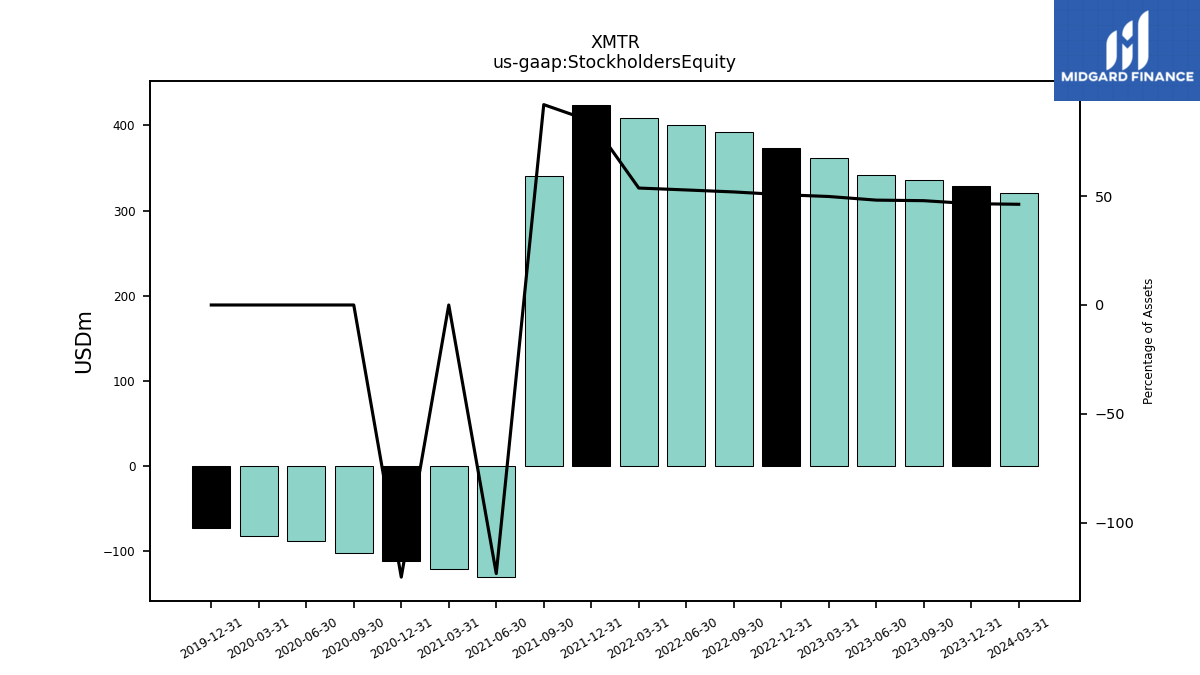
| Stockholders Equity | 335.76 | 341.36 | 361.26 | 373.74 | 391.84 | 400.51 | 409.11 | 424.45 | 340.92 | -130.19 | -120.37 | -111.25 | -101.81 | -87.30 |
| 2023-09-30 | 2023-06-30 | 2023-03-31 | 2022-12-31 | 2022-09-30 | 2022-06-30 | 2022-03-31 | 2021-12-31 | 2021-09-30 | 2021-06-30 | 2021-03-31 | 2020-12-31 | 2020-09-30 | 2020-06-30 | ||
|---|---|---|---|---|---|---|---|---|---|---|---|---|---|---|---|
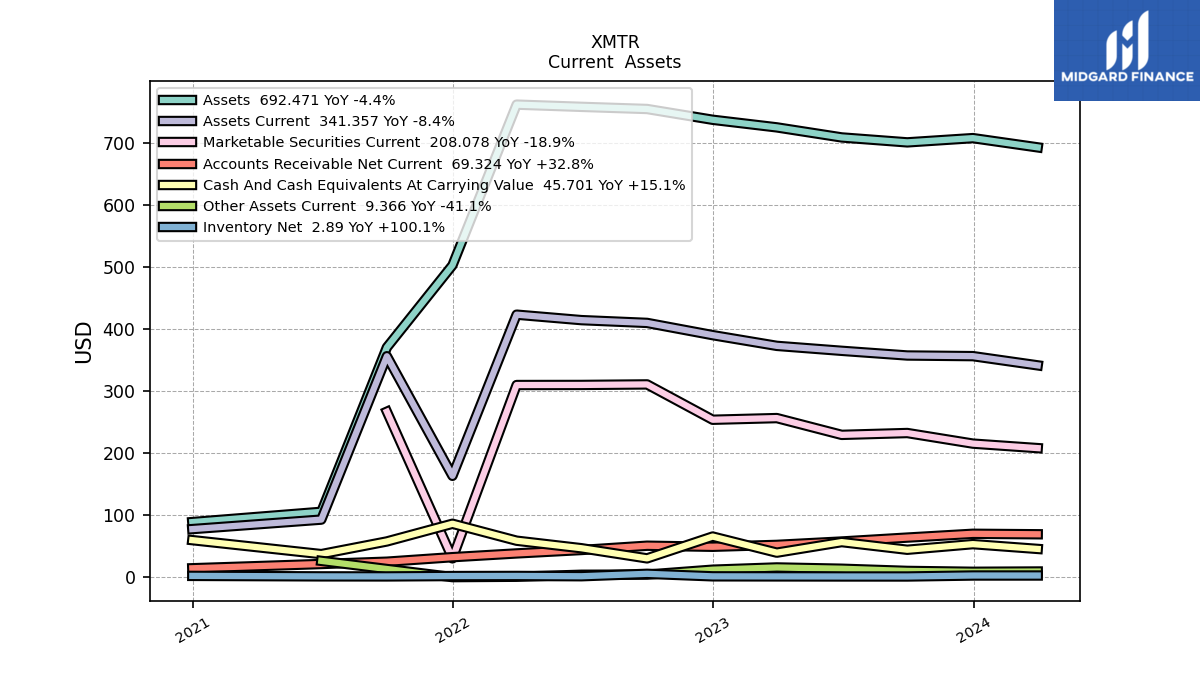
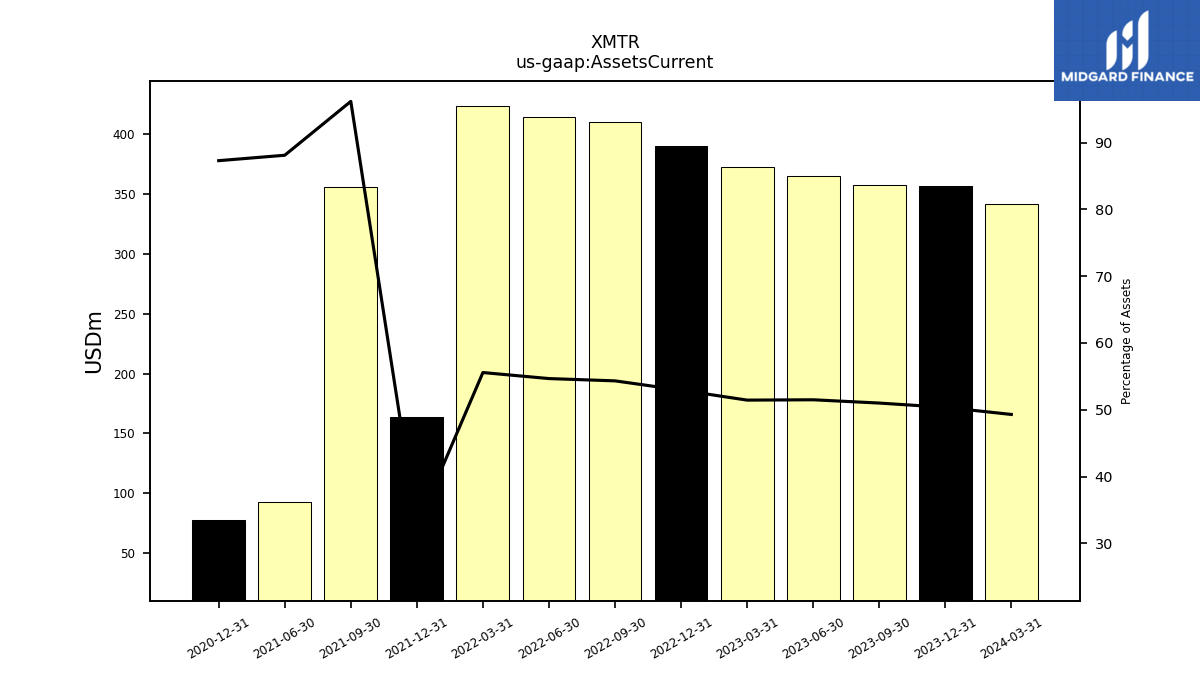
| Assets Current | 357.26 | 364.80 | 372.78 | 390.06 | 409.74 | 414.22 | 423.05 | 163.43 | 356.09 | 92.93 | NA | 77.66 | NA | NA | |
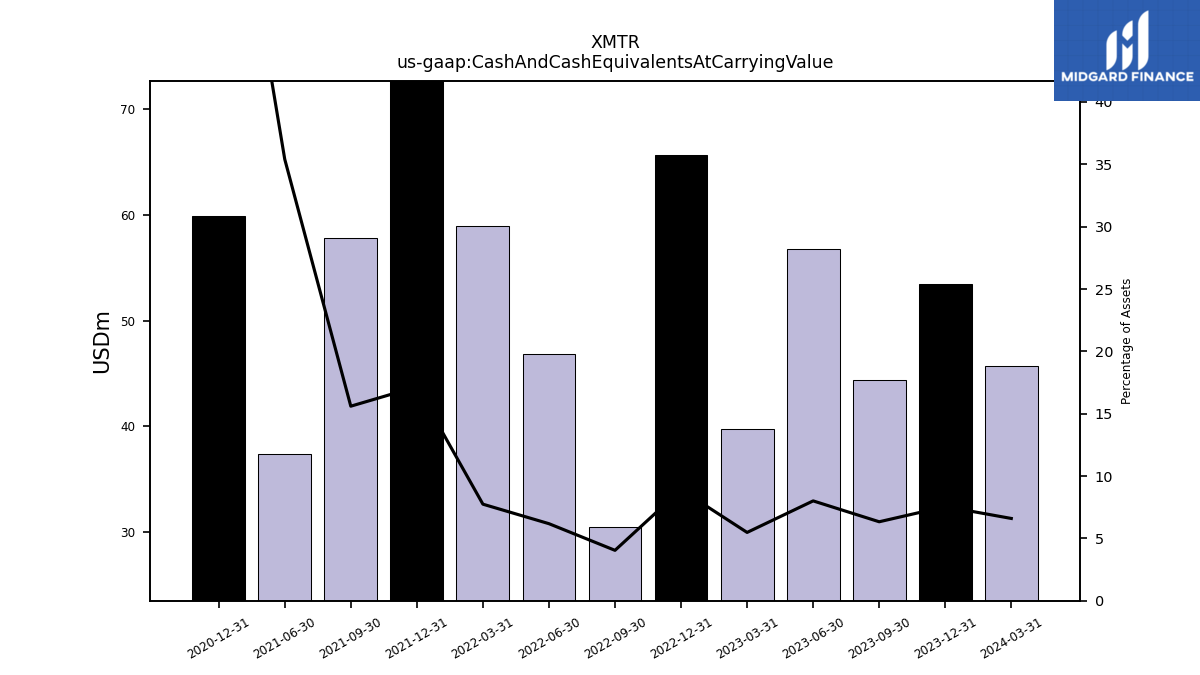
| Cash And Cash Equivalents At Carrying Value | 44.37 | 56.74 | 39.70 | 65.66 | 30.50 | 46.83 | 58.97 | 86.26 | 57.78 | 37.35 | NA | 59.87 | NA | NA | |
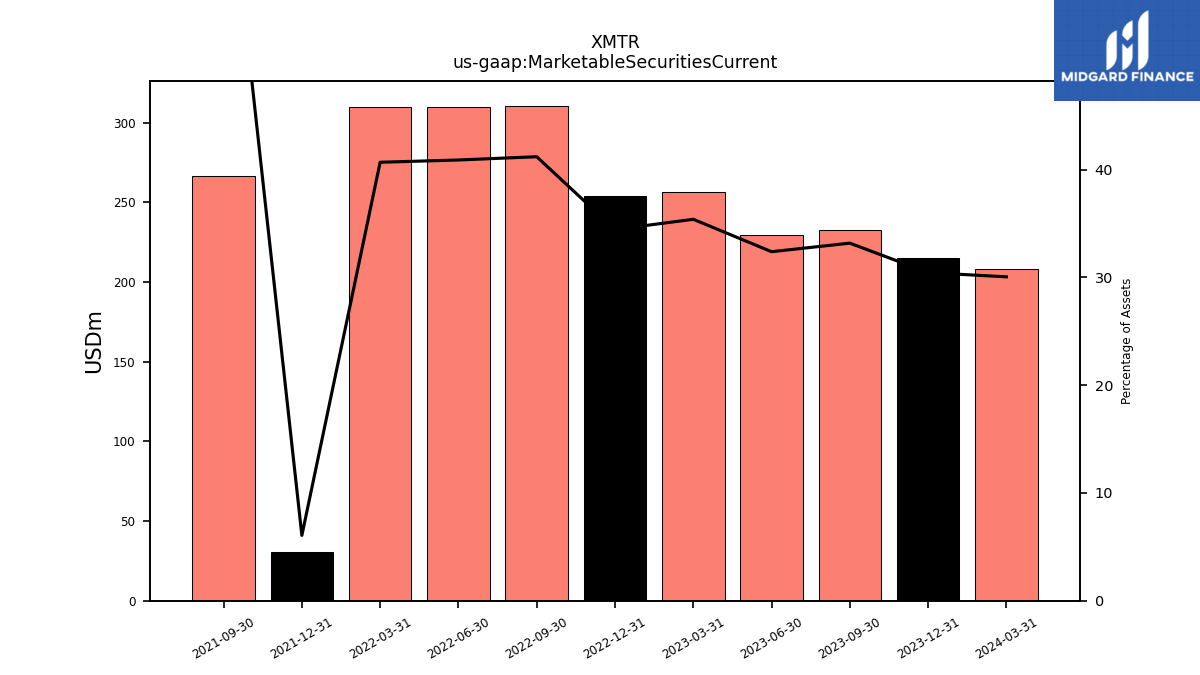
| Marketable Securities Current | 232.40 | 229.41 | 256.46 | 253.77 | 310.69 | 309.83 | 309.69 | 30.46 | 266.74 | NA | NA | NA | NA | NA | |
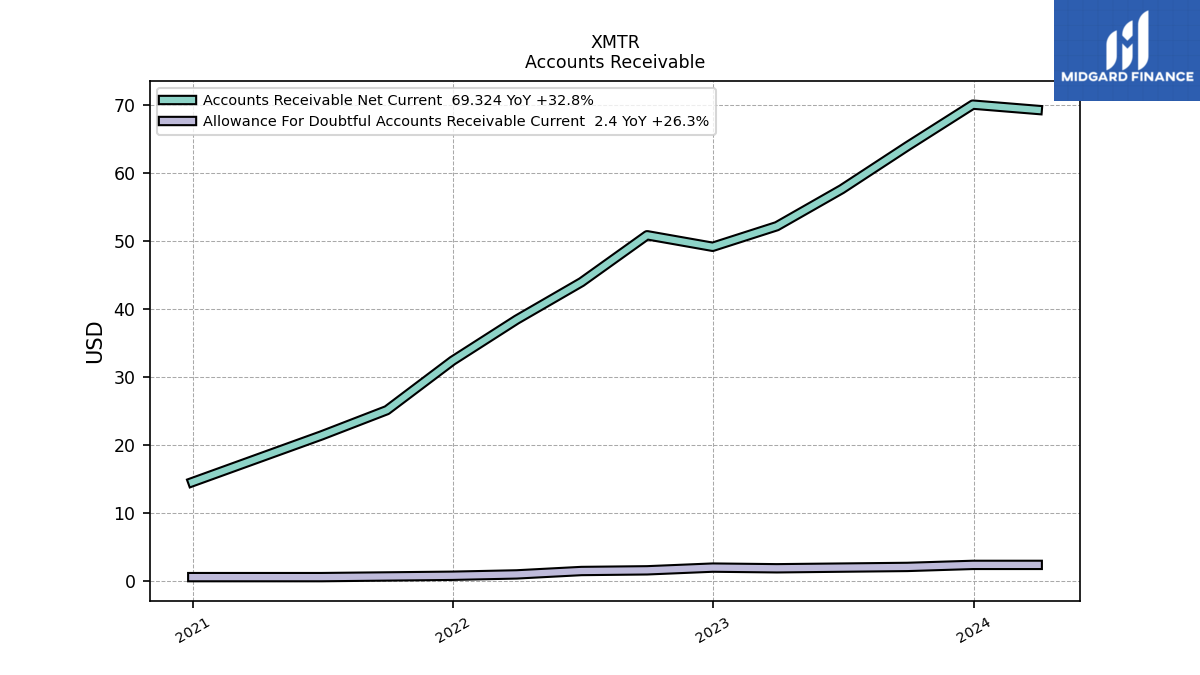
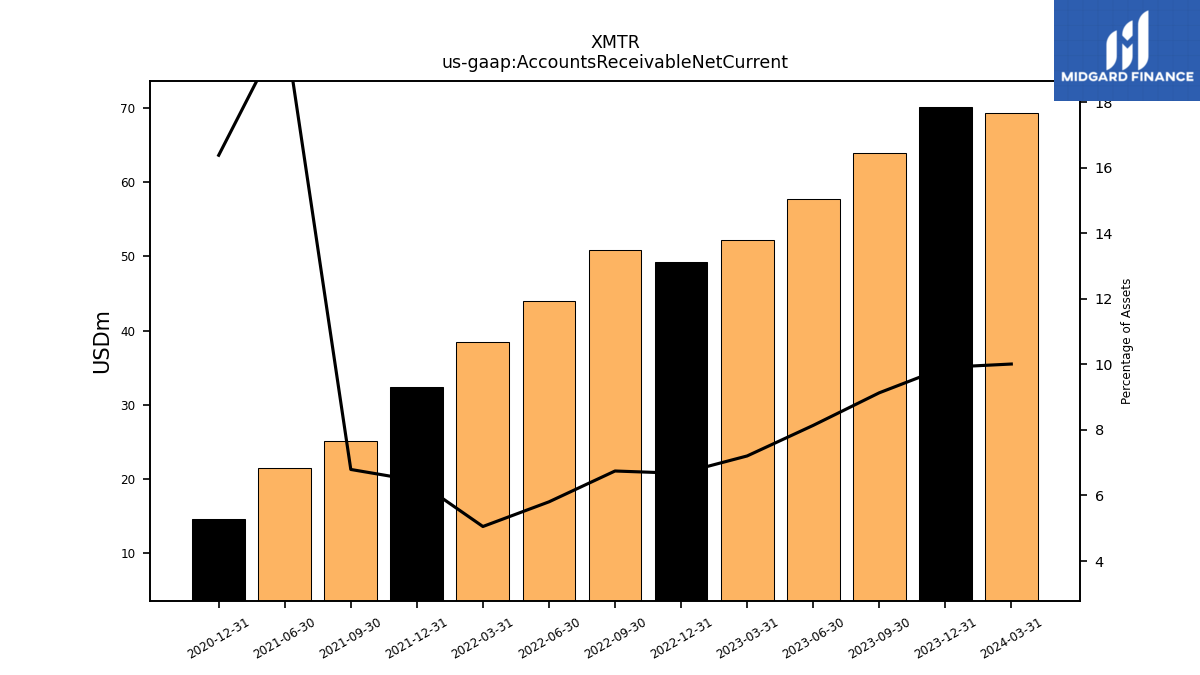
| Accounts Receivable Net Current | 63.97 | 57.66 | 52.22 | 49.19 | 50.89 | 43.99 | 38.47 | 32.43 | 25.16 | 21.43 | NA | 14.57 | NA | NA | |
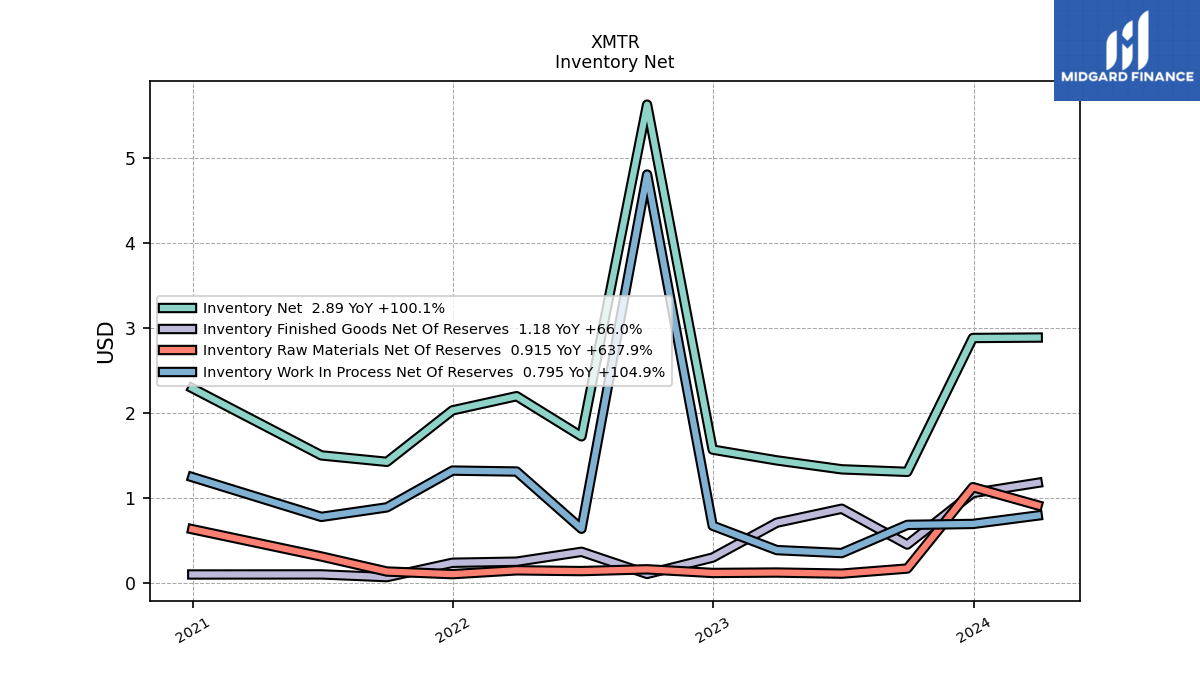
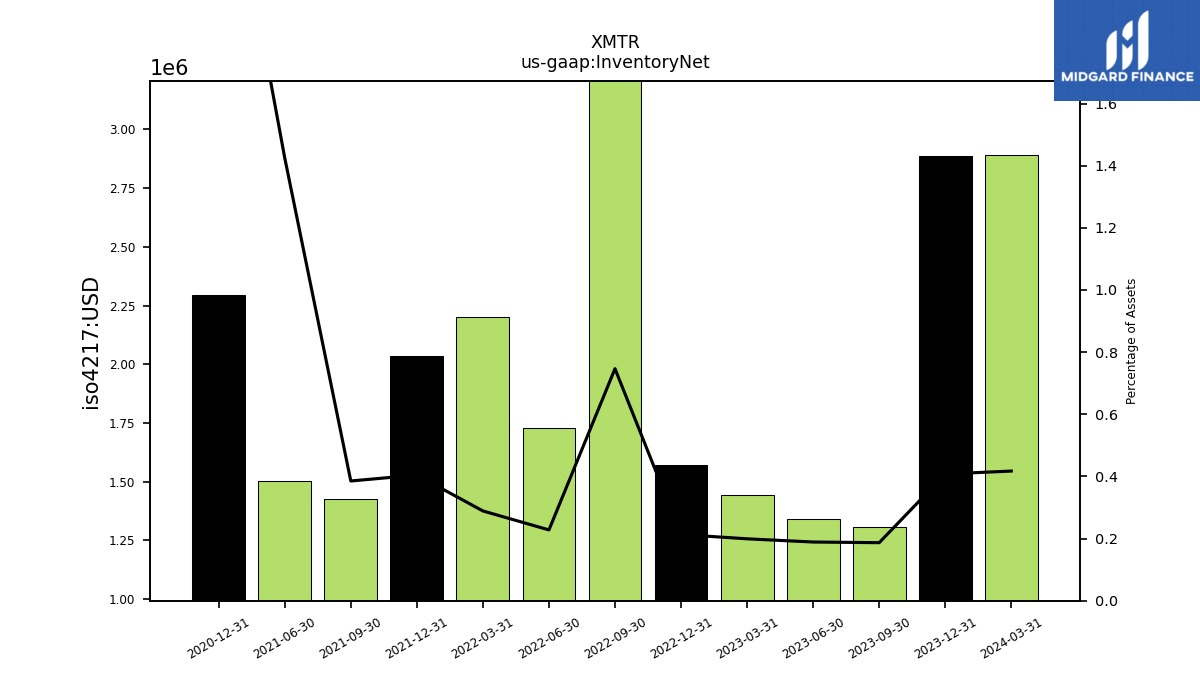
| Inventory Net | 1.31 | 1.34 | 1.44 | 1.57 | 5.63 | 1.73 | 2.20 | 2.03 | 1.43 | 1.50 | NA | 2.29 | NA | NA | |
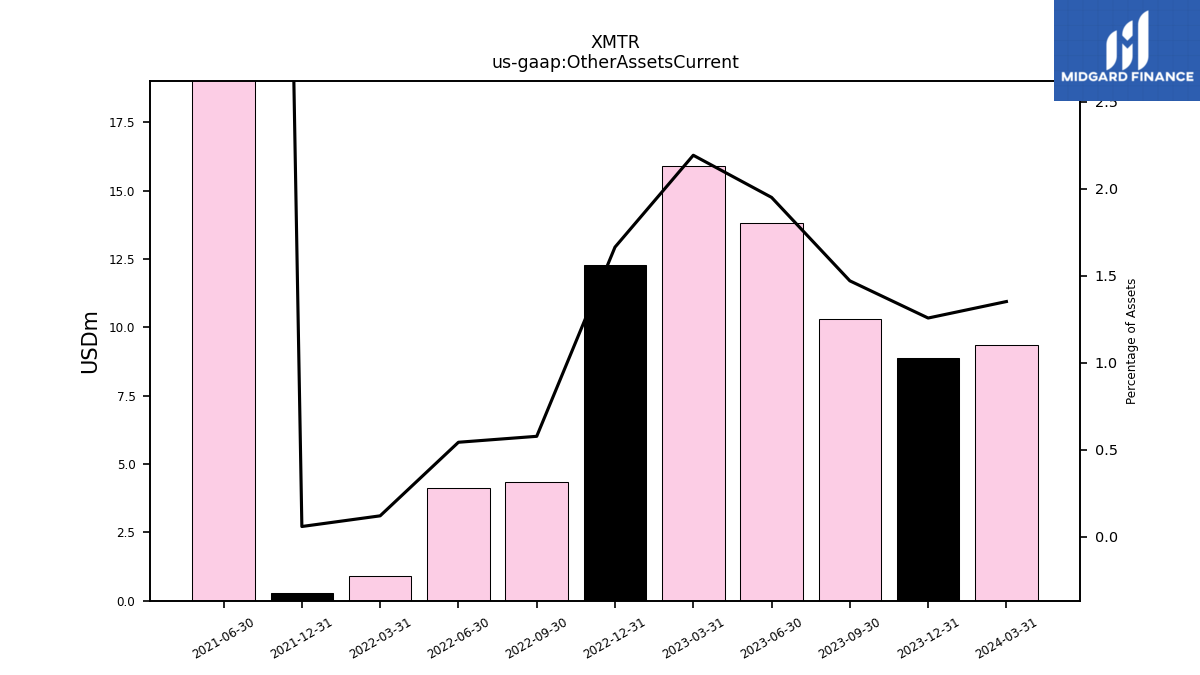
| Other Assets Current | 10.31 | 13.82 | 15.90 | 12.27 | 4.36 | 4.12 | 0.92 | 0.30 | NA | 26.46 | NA | NA | NA | NA |
| 2023-09-30 | 2023-06-30 | 2023-03-31 | 2022-12-31 | 2022-09-30 | 2022-06-30 | 2022-03-31 | 2021-12-31 | 2021-09-30 | 2021-06-30 | 2021-03-31 | 2020-12-31 | 2020-09-30 | 2020-06-30 | ||
|---|---|---|---|---|---|---|---|---|---|---|---|---|---|---|---|
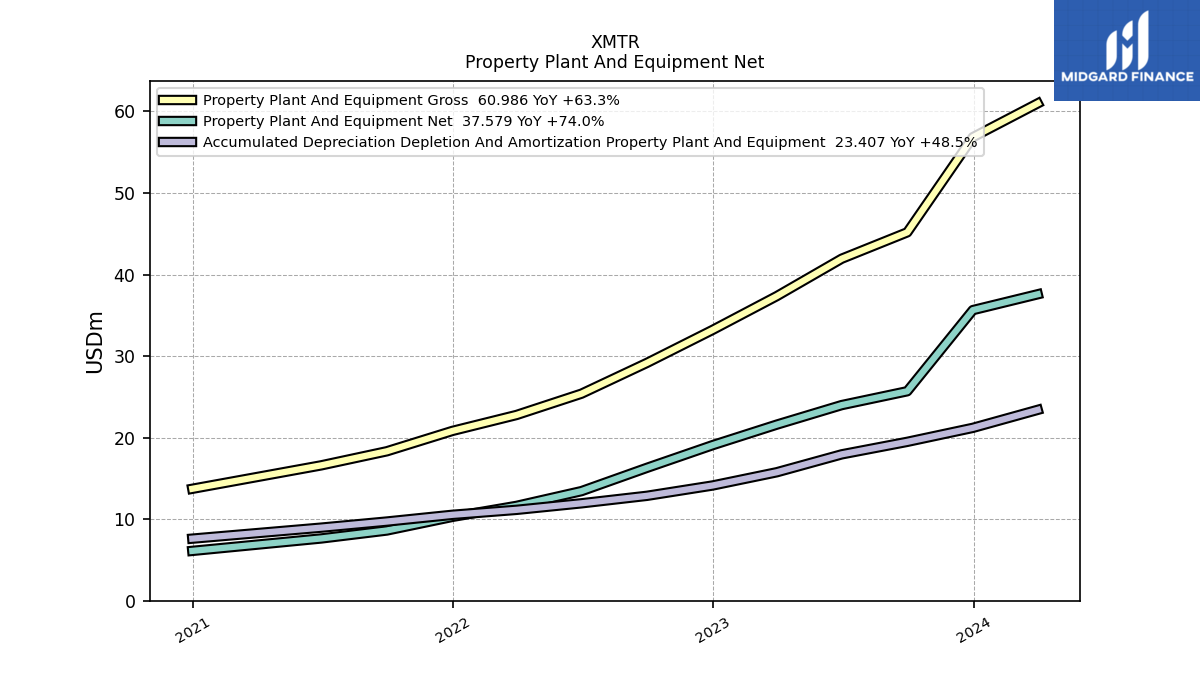
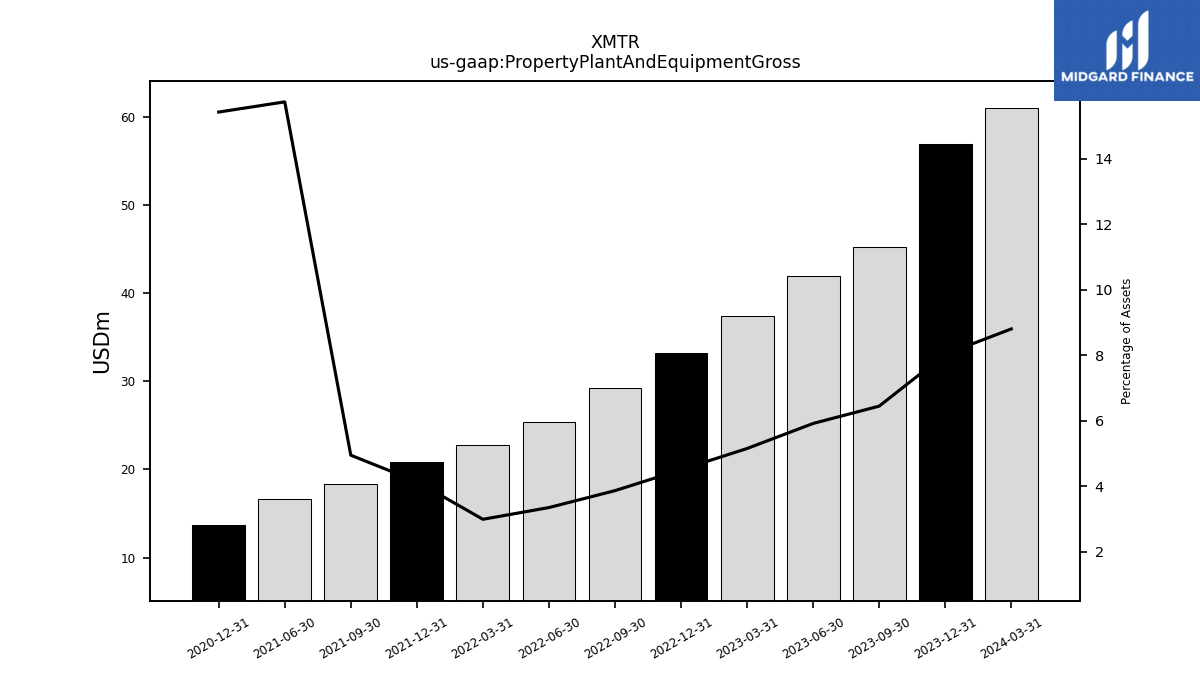
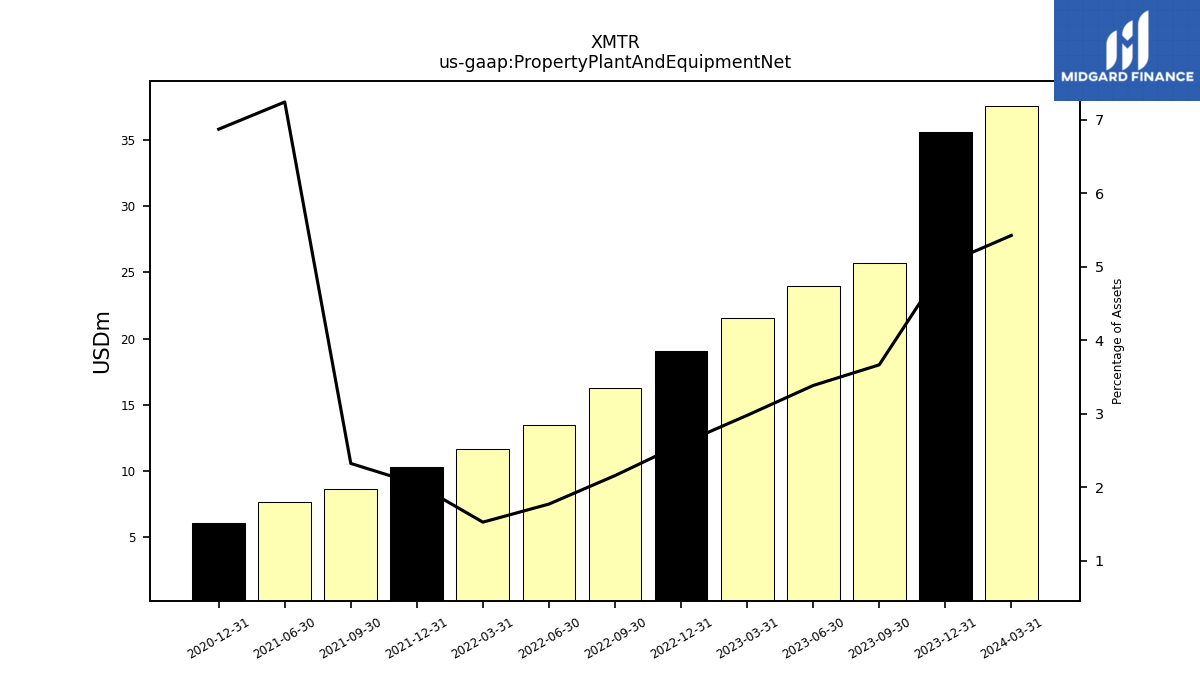
| Property Plant And Equipment Gross | 45.17 | 41.94 | 37.35 | 33.21 | 29.17 | 25.39 | 22.78 | 20.83 | 18.33 | 16.60 | NA | 13.73 | NA | NA | |
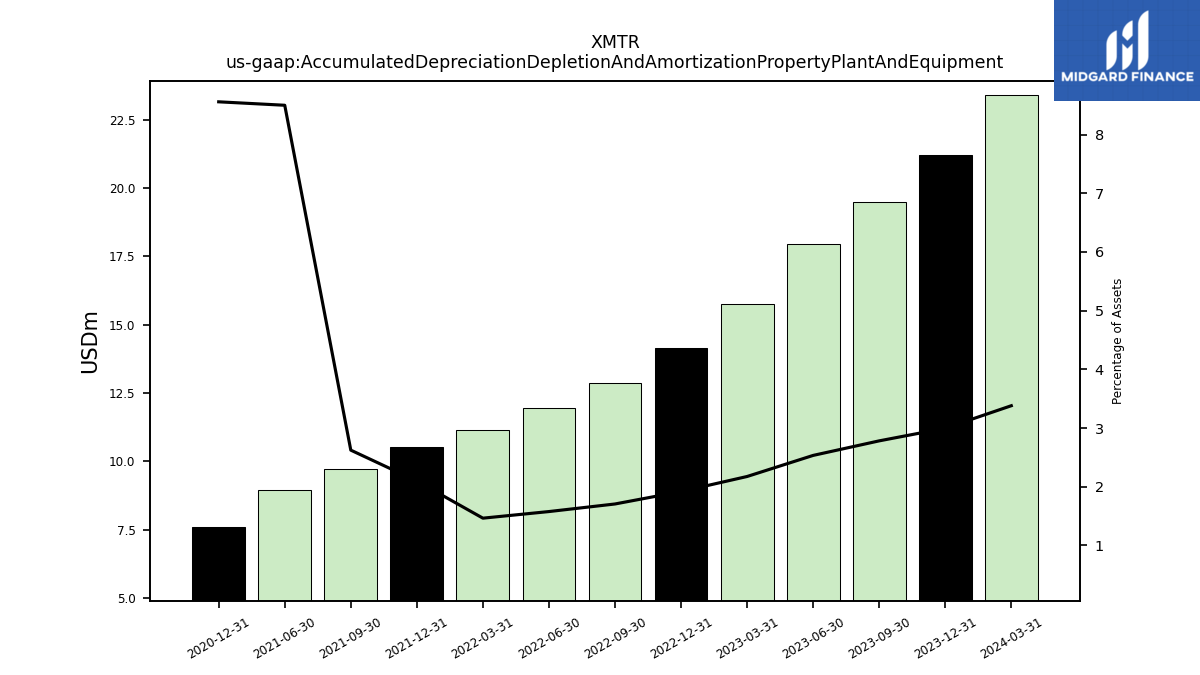
| Accumulated Depreciation Depletion And Amortization Property Plant And Equipment | 19.48 | 17.95 | 15.76 | 14.13 | 12.87 | 11.95 | 11.15 | 10.54 | 9.71 | 8.97 | NA | 7.61 | NA | NA | |
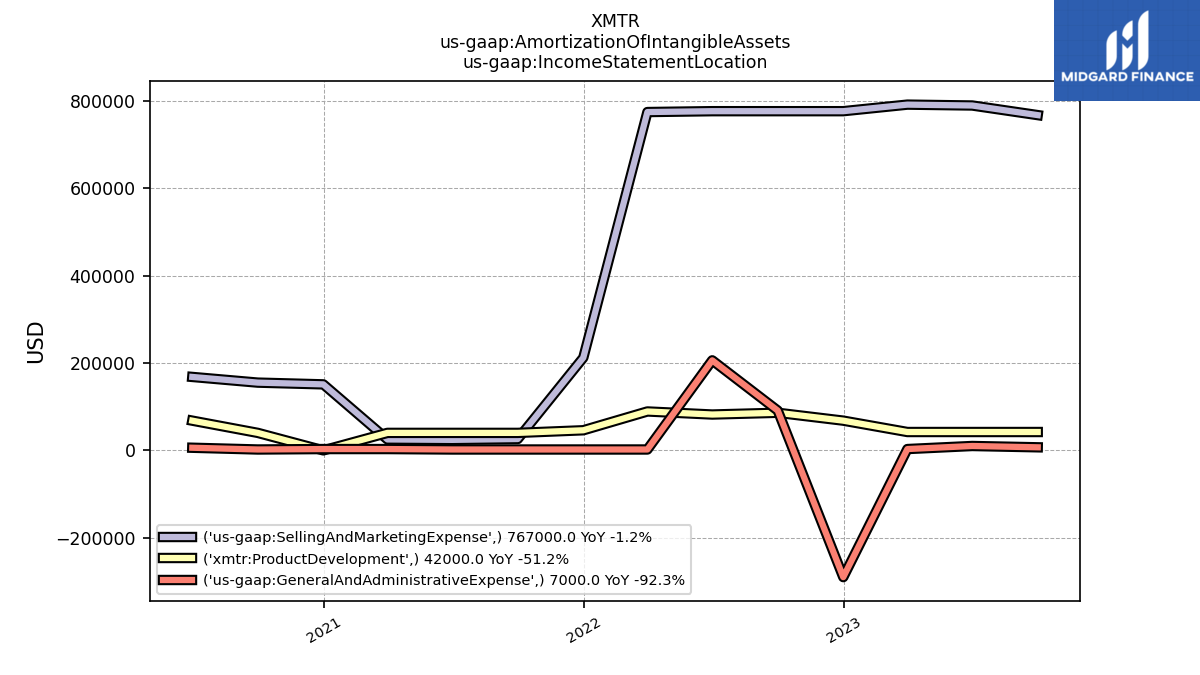
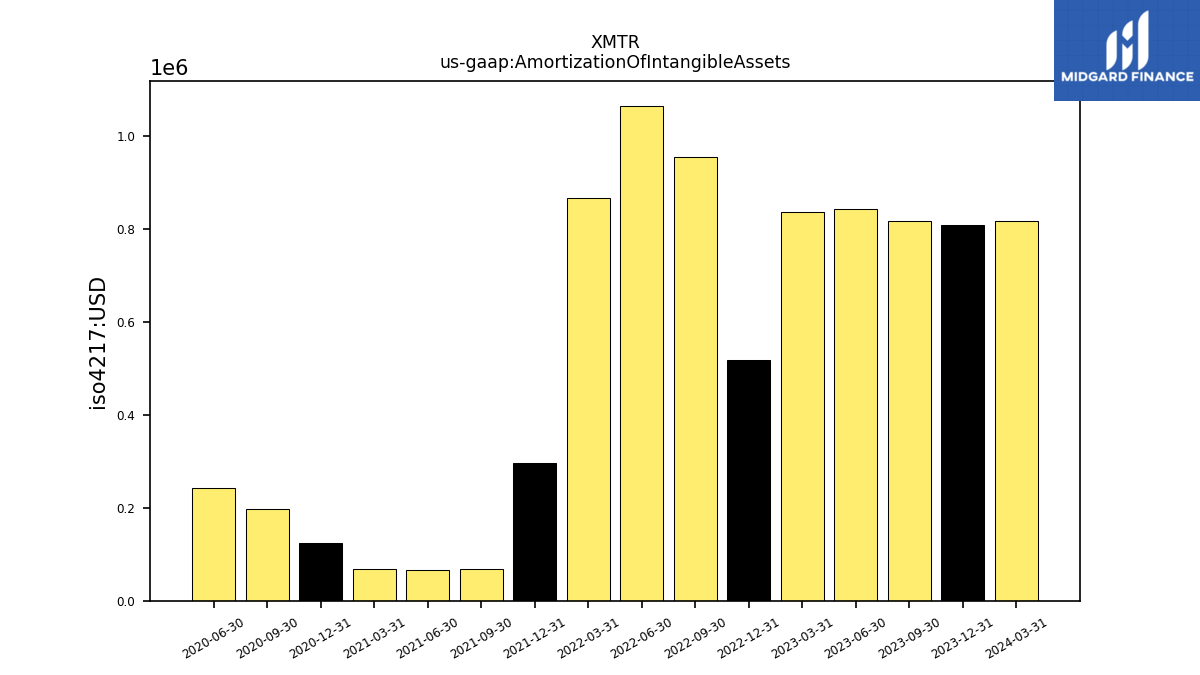
| Amortization Of Intangible Assets | 0.82 | 0.84 | 0.84 | 0.52 | 0.95 | 1.06 | 0.86 | 0.30 | 0.07 | 0.07 | 0.07 | 0.12 | 0.20 | 0.24 | |
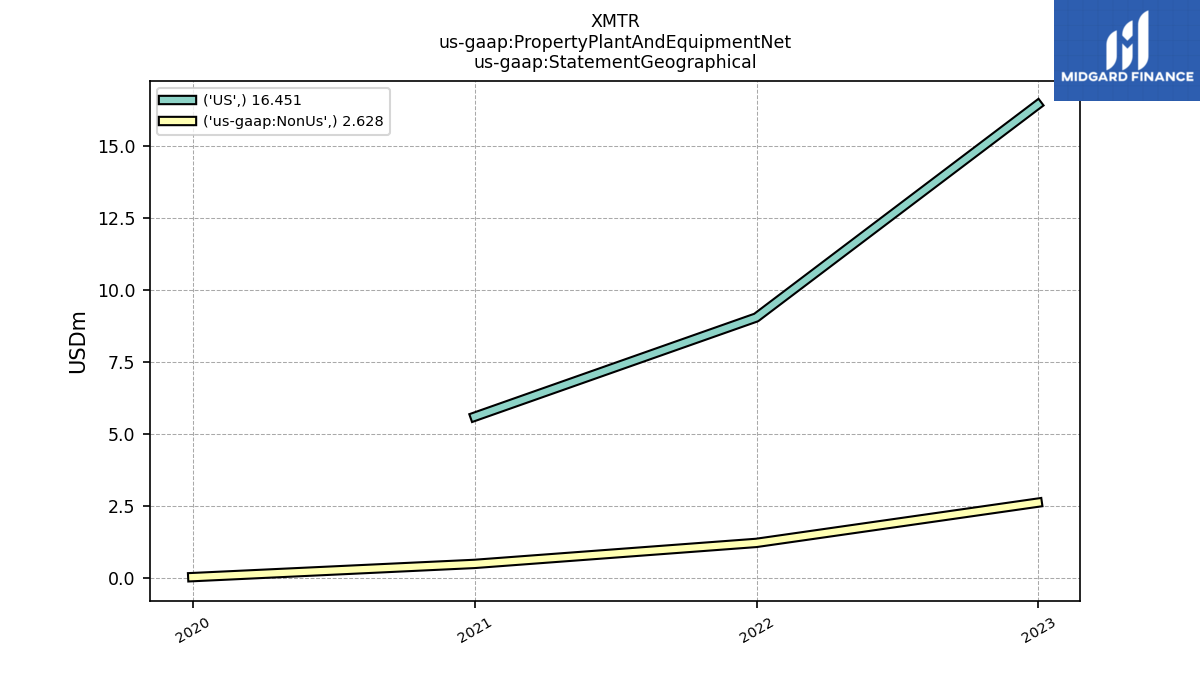
| Property Plant And Equipment Net | 25.69 | 23.99 | 21.60 | 19.08 | 16.30 | 13.44 | 11.63 | 10.29 | 8.62 | 7.64 | NA | 6.11 | NA | NA | |
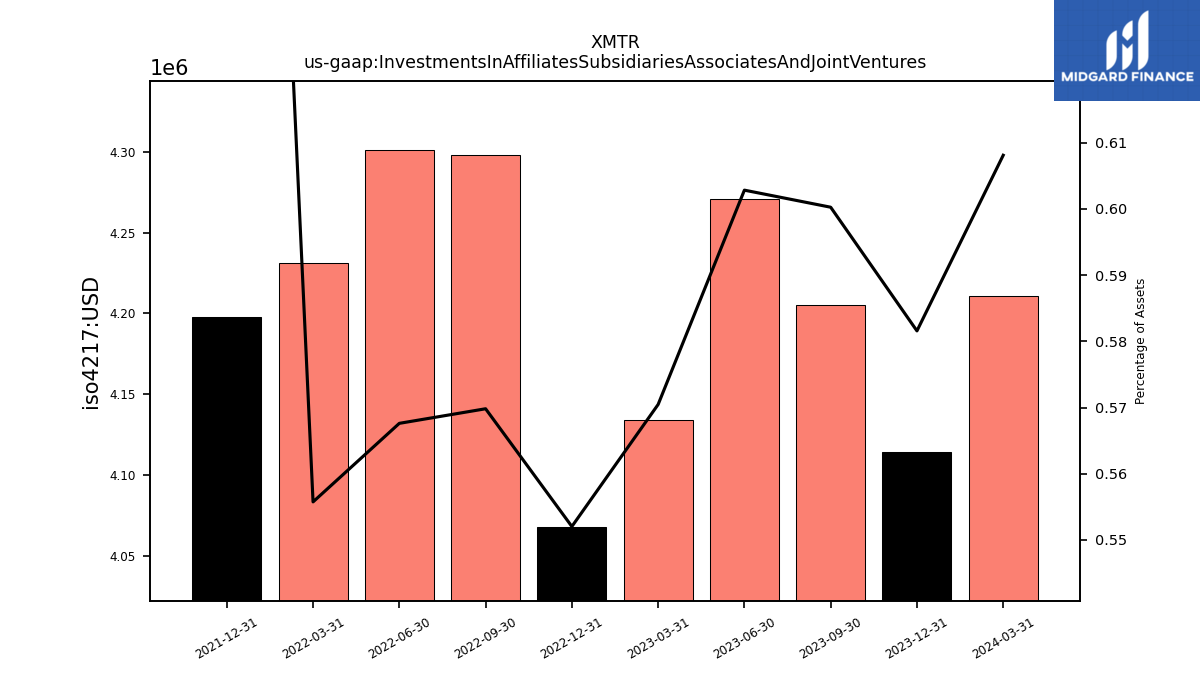
| Investments In Affiliates Subsidiaries Associates And Joint Ventures | 4.21 | 4.27 | 4.13 | 4.07 | 4.30 | 4.30 | 4.23 | 4.20 | NA | NA | NA | NA | NA | NA | |
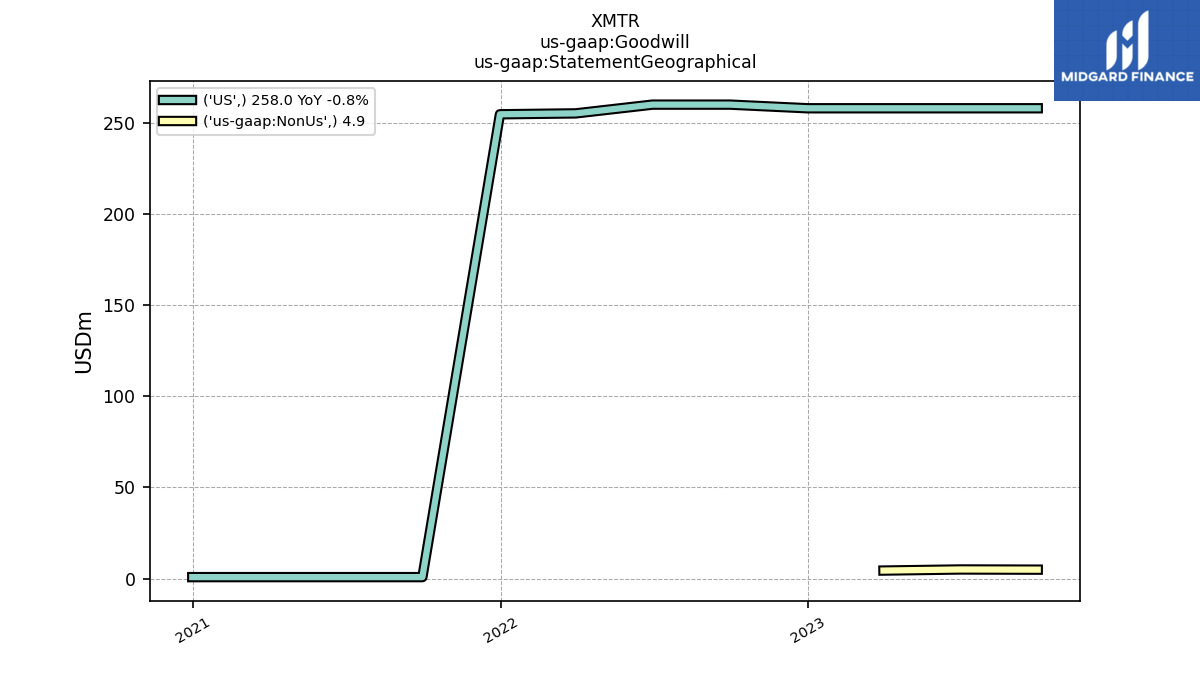
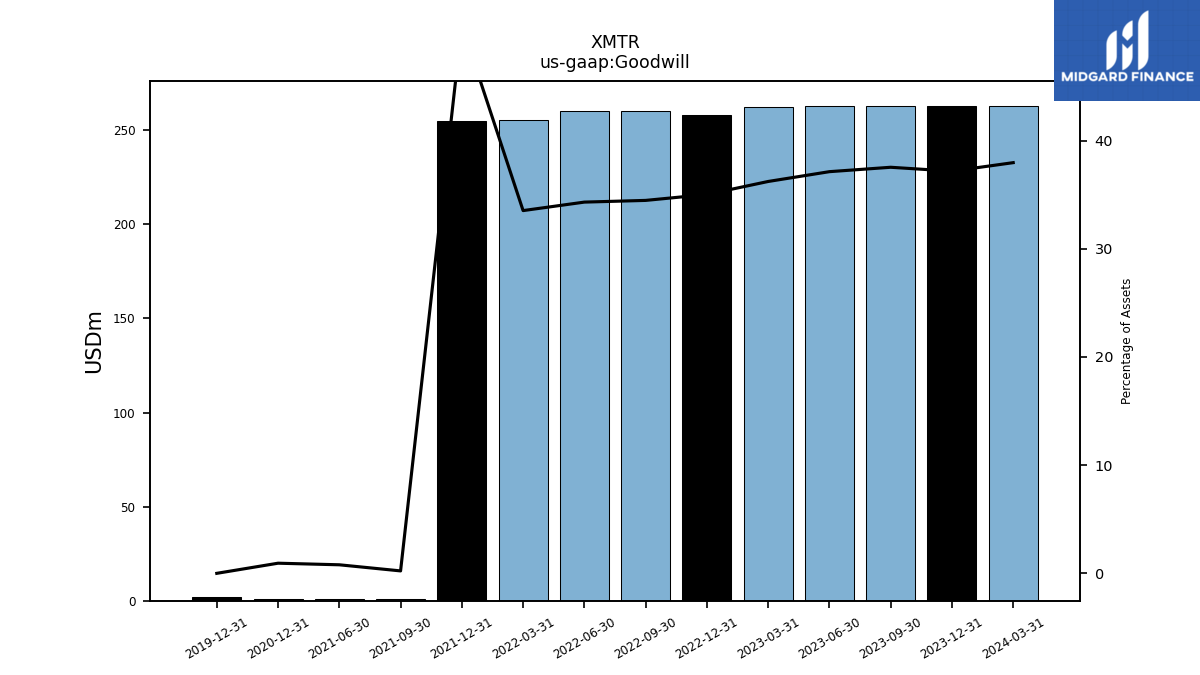
| Goodwill | 262.90 | 263.00 | 262.44 | 258.04 | 259.97 | 259.97 | 255.23 | 254.67 | 0.83 | 0.83 | NA | 0.83 | NA | NA | |
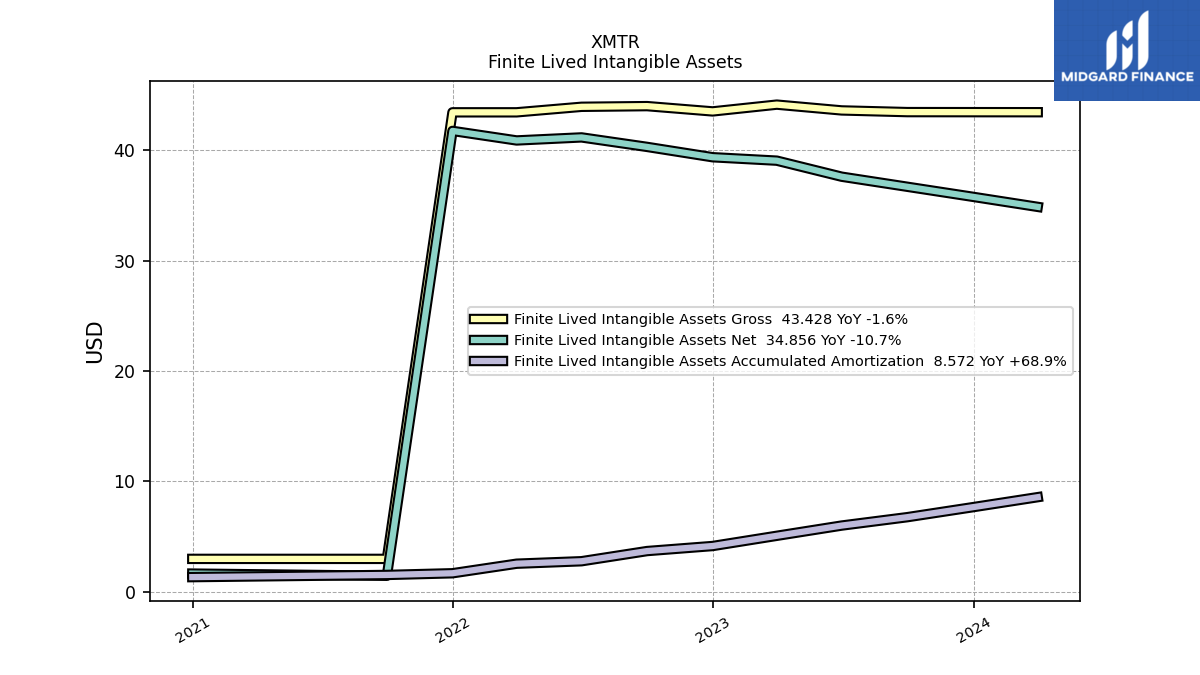
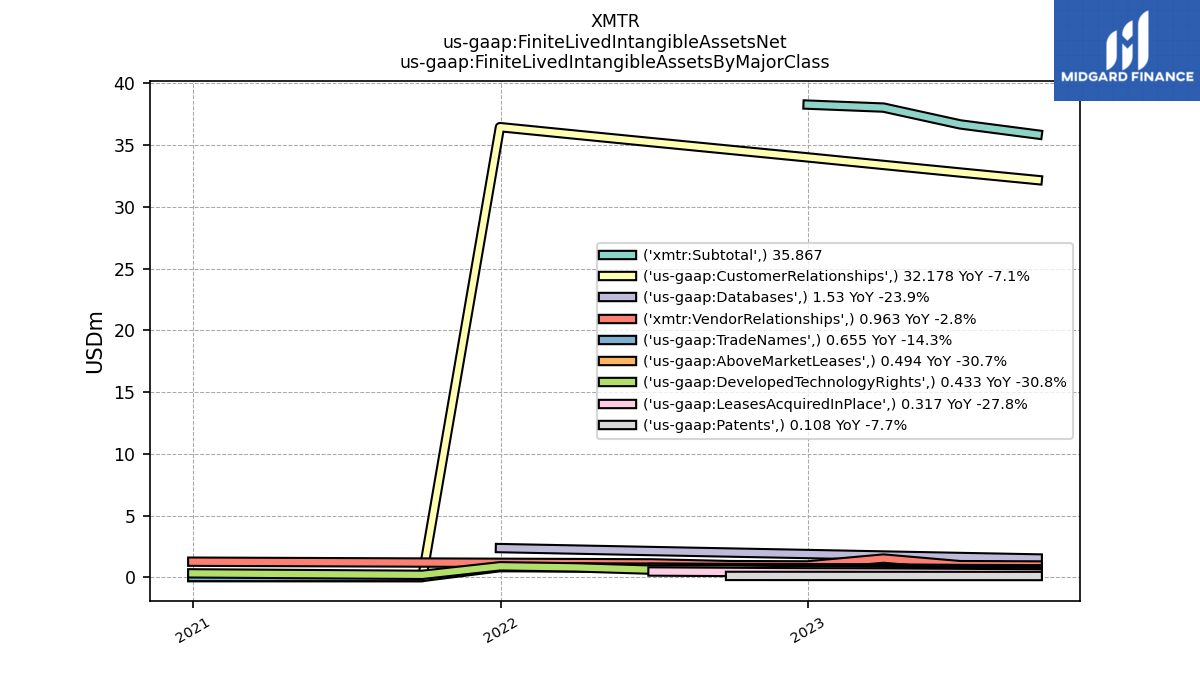
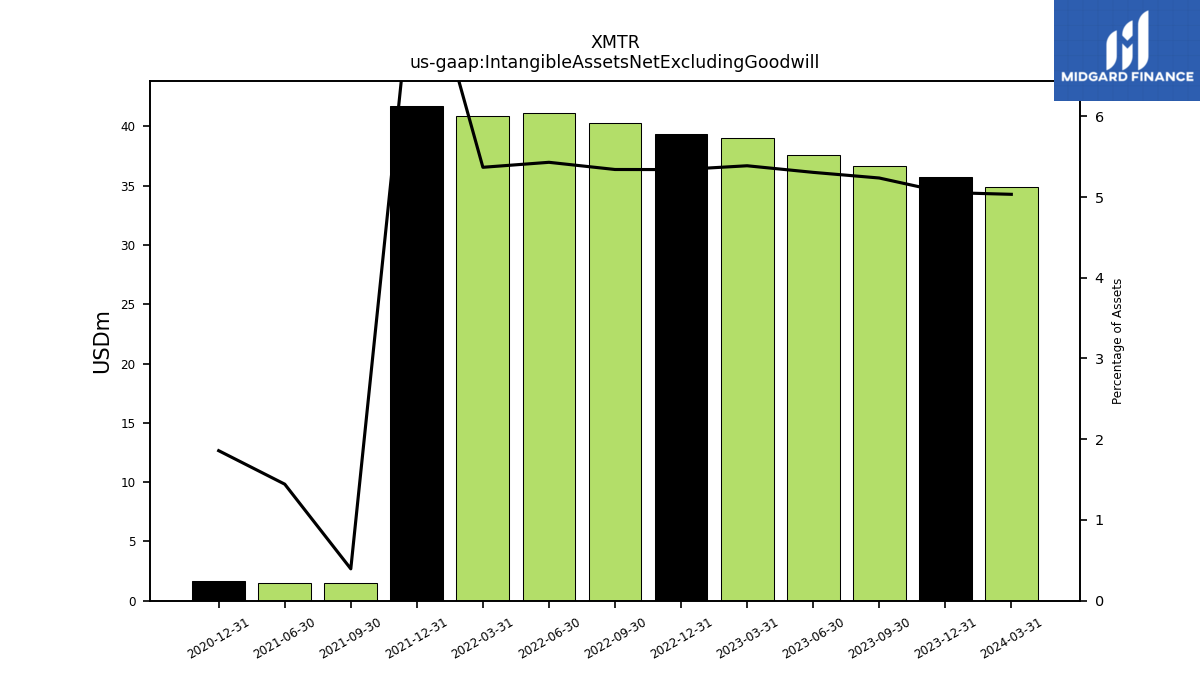
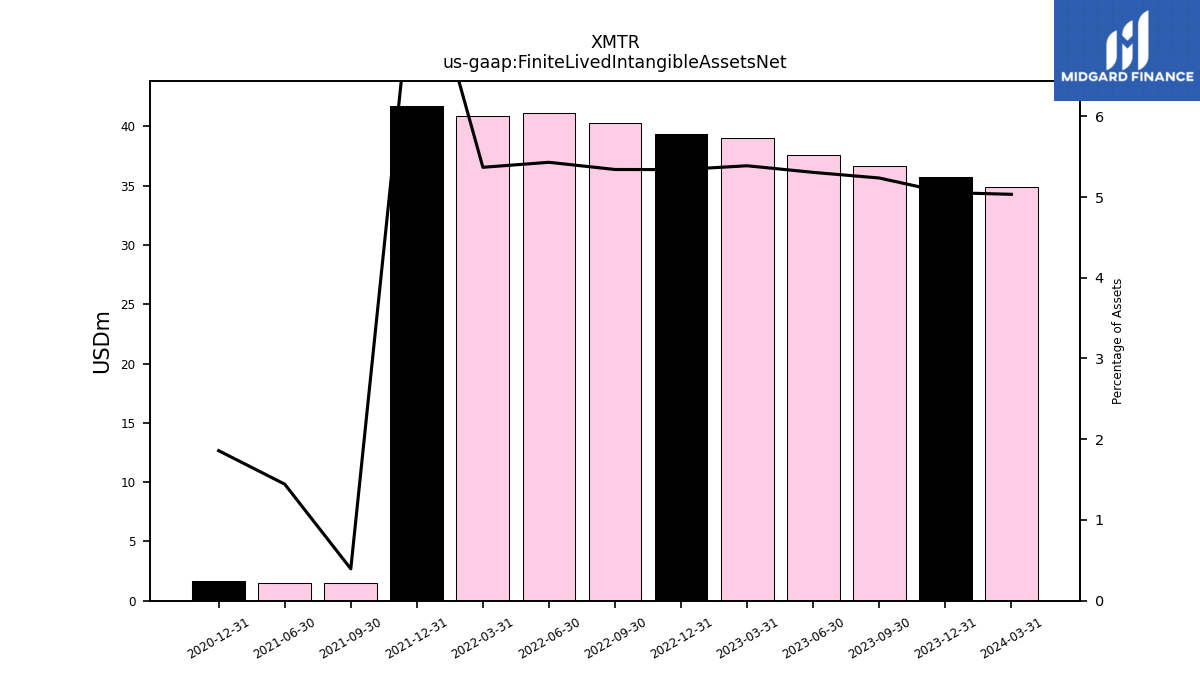
| Intangible Assets Net Excluding Goodwill | 36.68 | 37.59 | 39.04 | 39.35 | 40.29 | 41.15 | 40.87 | 41.74 | 1.46 | 1.52 | NA | 1.65 | NA | NA | |
| Finite Lived Intangible Assets Net | 36.68 | 37.59 | 39.04 | 39.35 | 40.29 | 41.15 | 40.87 | 41.74 | 1.46 | 1.52 | NA | 1.65 | NA | NA | |
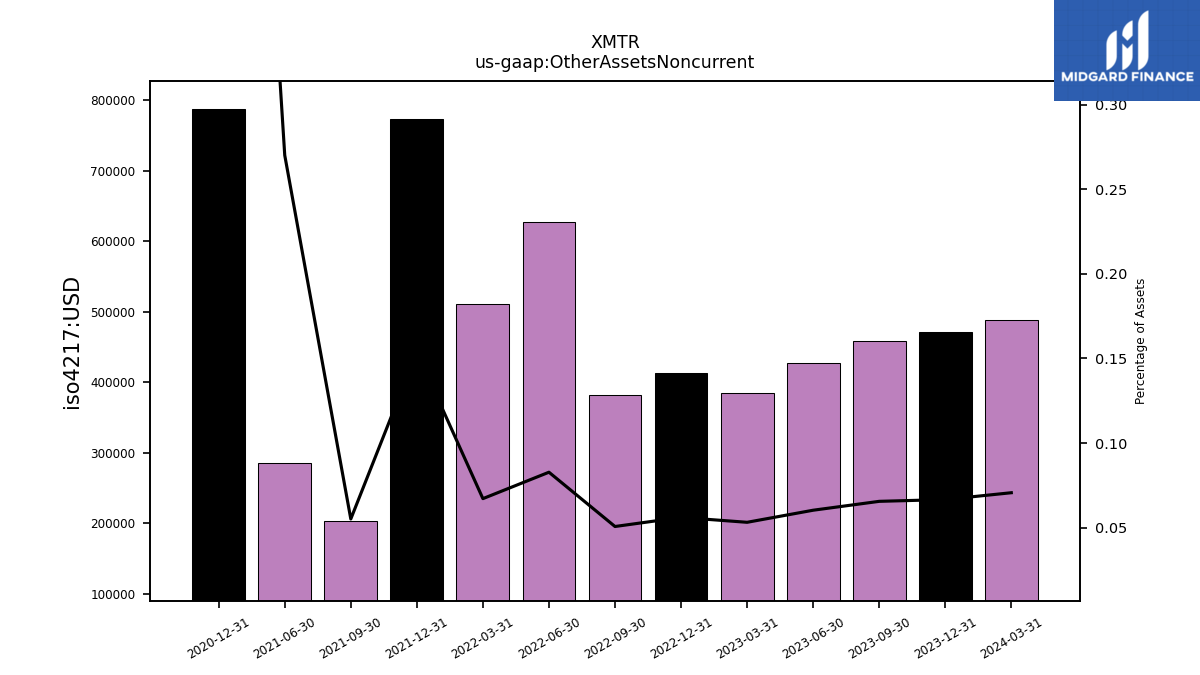
| Other Assets Noncurrent | 0.46 | 0.43 | 0.39 | 0.41 | 0.38 | 0.63 | 0.51 | 0.77 | 0.20 | 0.28 | NA | 0.79 | NA | NA |
| 2023-09-30 | 2023-06-30 | 2023-03-31 | 2022-12-31 | 2022-09-30 | 2022-06-30 | 2022-03-31 | 2021-12-31 | 2021-09-30 | 2021-06-30 | 2021-03-31 | 2020-12-31 | 2020-09-30 | 2020-06-30 | ||
|---|---|---|---|---|---|---|---|---|---|---|---|---|---|---|---|
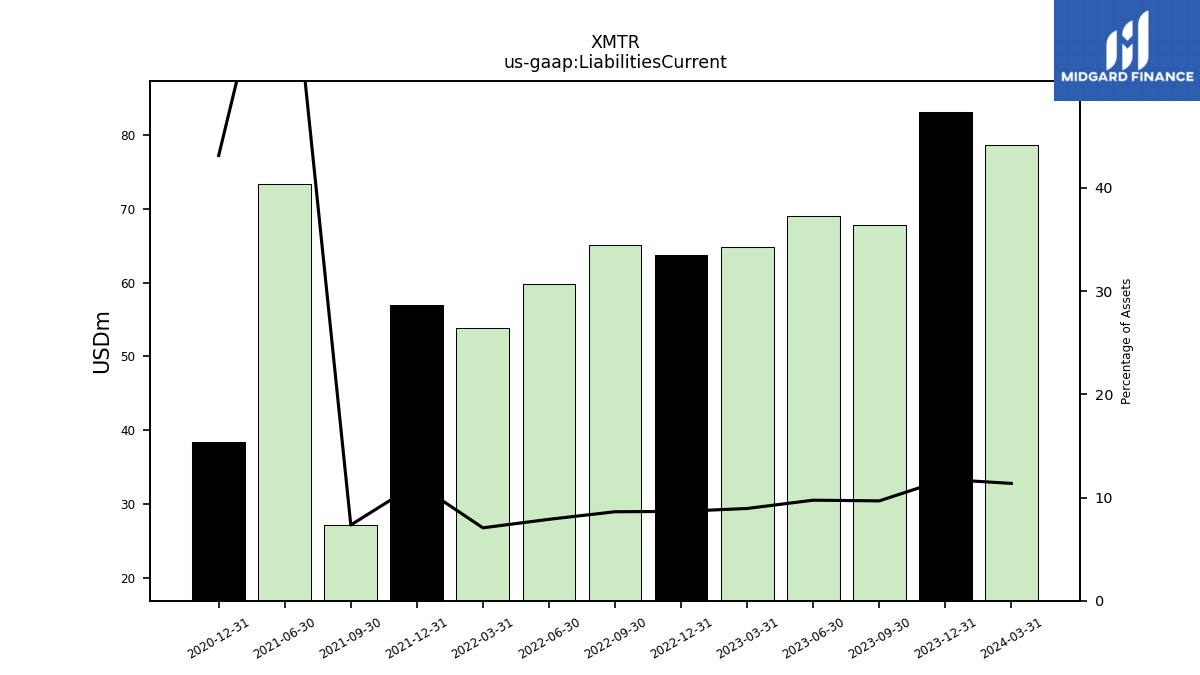
| Liabilities Current | 67.79 | 69.03 | 64.78 | 63.80 | 65.05 | 59.78 | 53.80 | 57.04 | 27.18 | 73.38 | NA | 38.38 | NA | NA | |
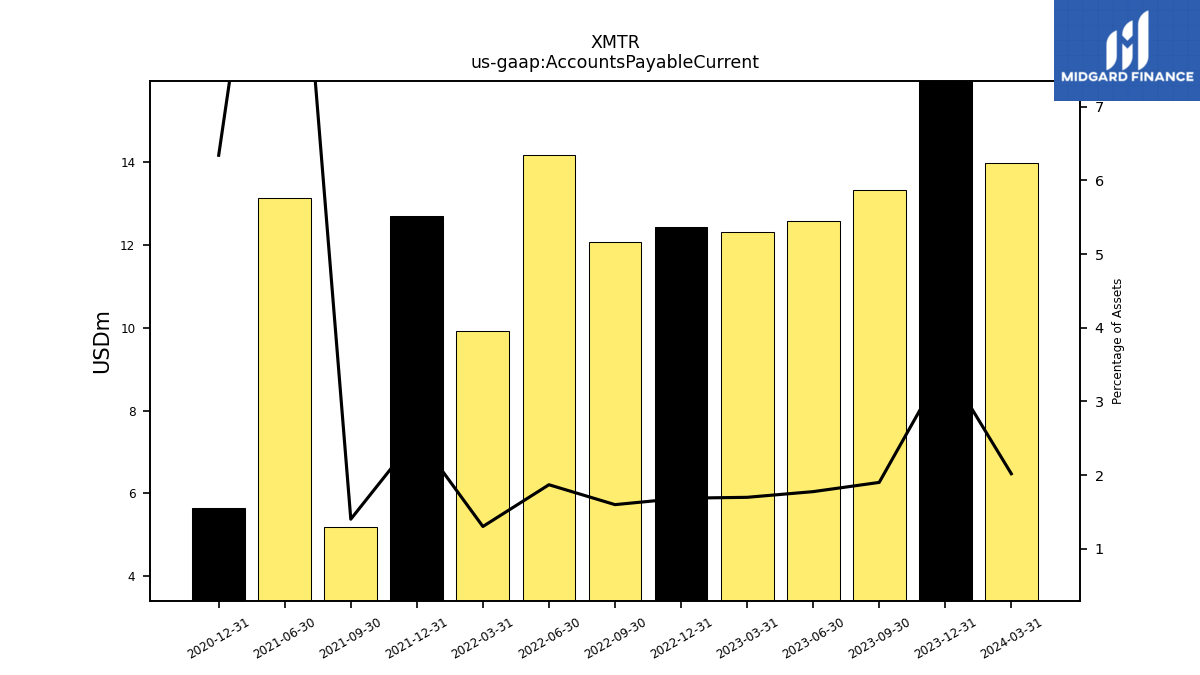
| Accounts Payable Current | 13.33 | 12.59 | 12.32 | 12.44 | 12.07 | 14.18 | 9.93 | 12.72 | 5.20 | 13.14 | NA | 5.64 | NA | NA | |
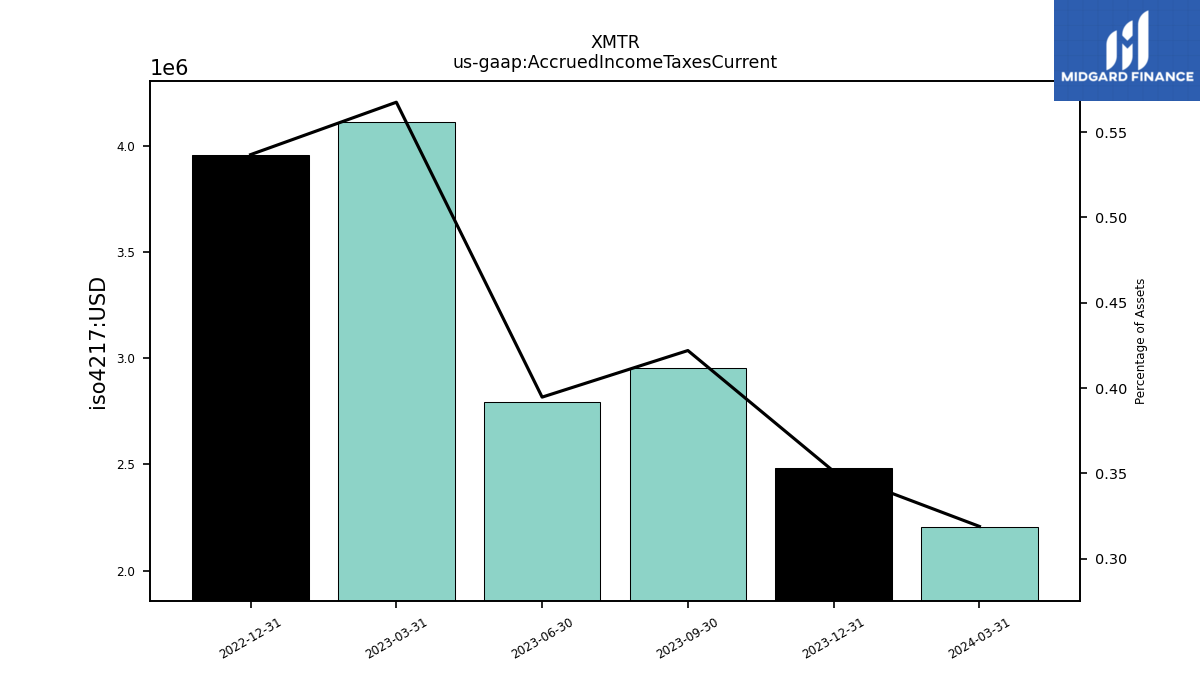
| Accrued Income Taxes Current | 2.96 | 2.80 | 4.11 | 3.96 | NA | NA | NA | NA | NA | NA | NA | NA | NA | NA | |
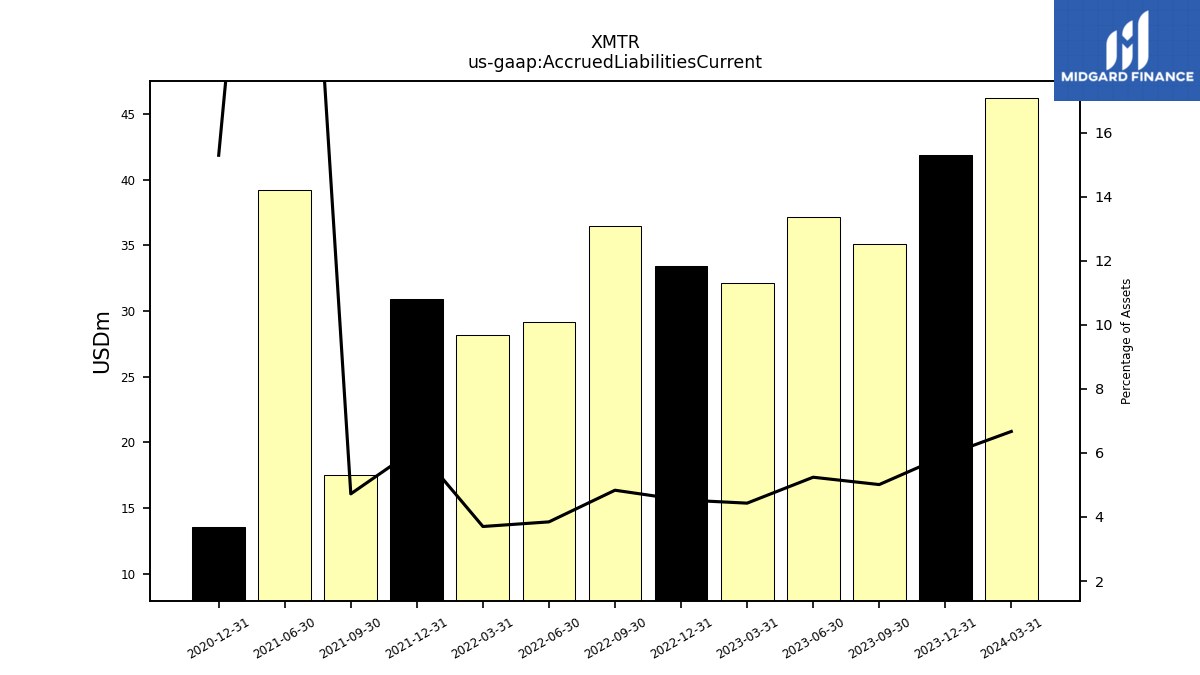
| Accrued Liabilities Current | 35.11 | 37.14 | 32.12 | 33.43 | 36.48 | 29.16 | 28.20 | 30.91 | 17.49 | 39.20 | NA | 13.61 | NA | NA | |
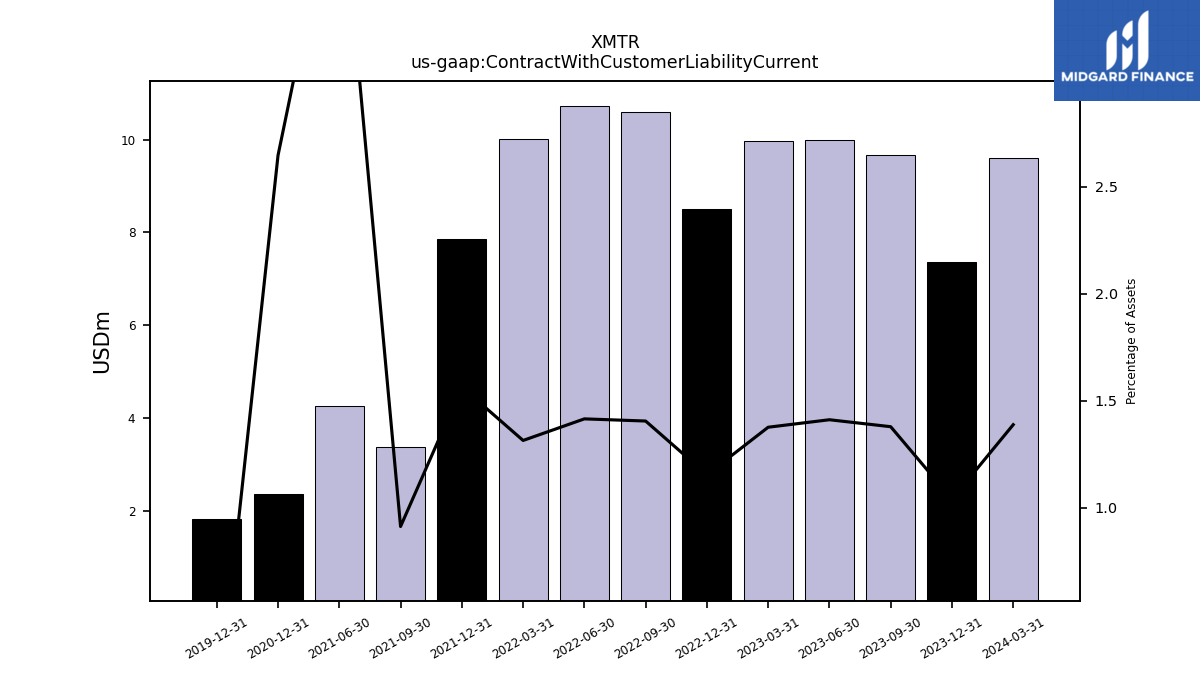
| Contract With Customer Liability Current | 9.66 | 10.00 | 9.97 | 8.51 | 10.60 | 10.72 | 10.01 | 7.86 | 3.38 | 4.25 | NA | 2.35 | NA | NA |
| 2023-09-30 | 2023-06-30 | 2023-03-31 | 2022-12-31 | 2022-09-30 | 2022-06-30 | 2022-03-31 | 2021-12-31 | 2021-09-30 | 2021-06-30 | 2021-03-31 | 2020-12-31 | 2020-09-30 | 2020-06-30 | ||
|---|---|---|---|---|---|---|---|---|---|---|---|---|---|---|---|
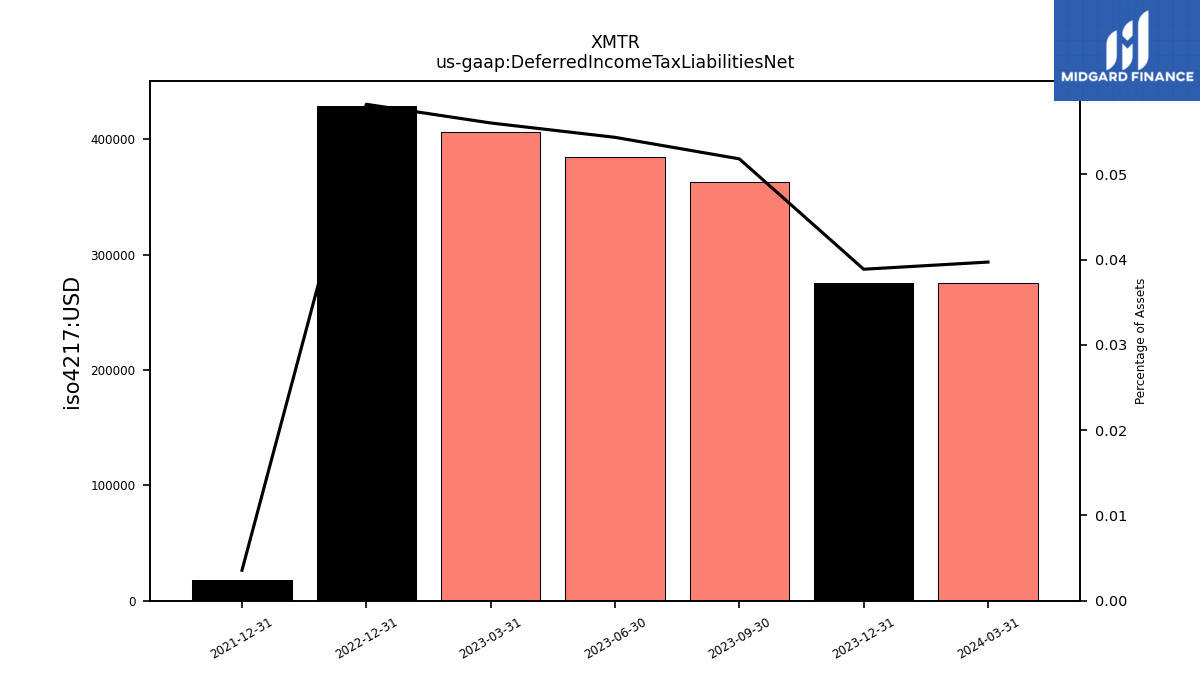
| Deferred Income Tax Liabilities Net | 0.36 | 0.39 | 0.41 | 0.43 | NA | NA | NA | 0.02 | NA | NA | NA | NA | NA | NA | |
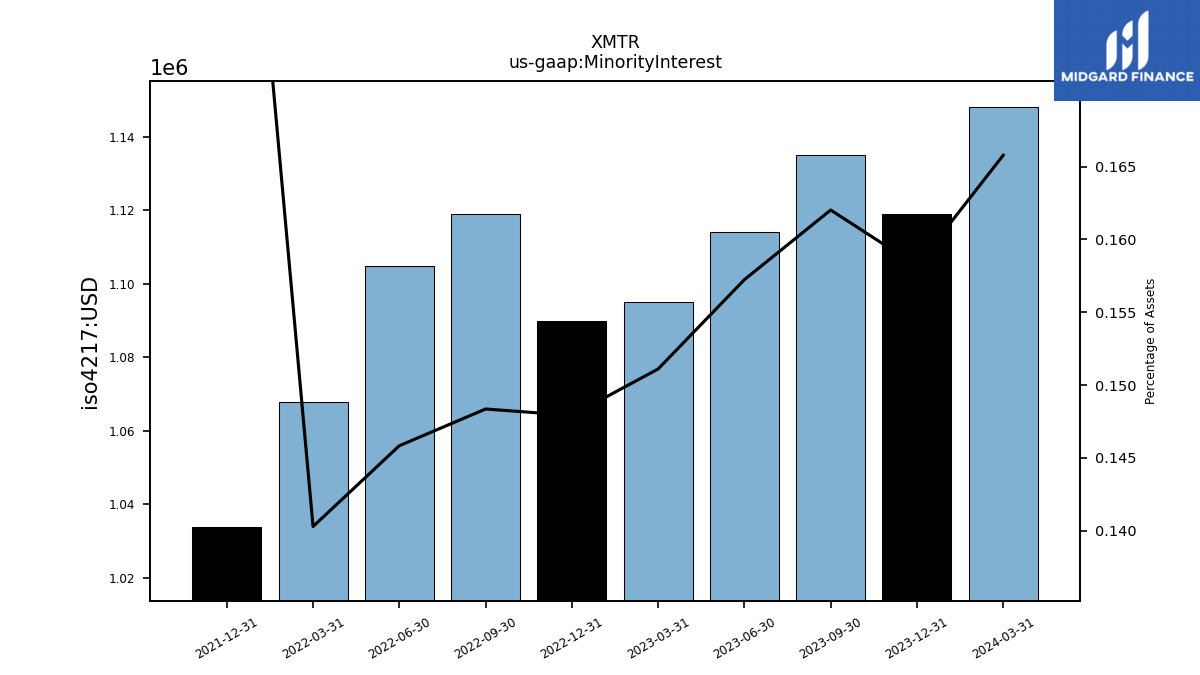
| Minority Interest | 1.14 | 1.11 | 1.09 | 1.09 | 1.12 | 1.10 | 1.07 | 1.03 | NA | NA | NA | NA | NA | NA | |
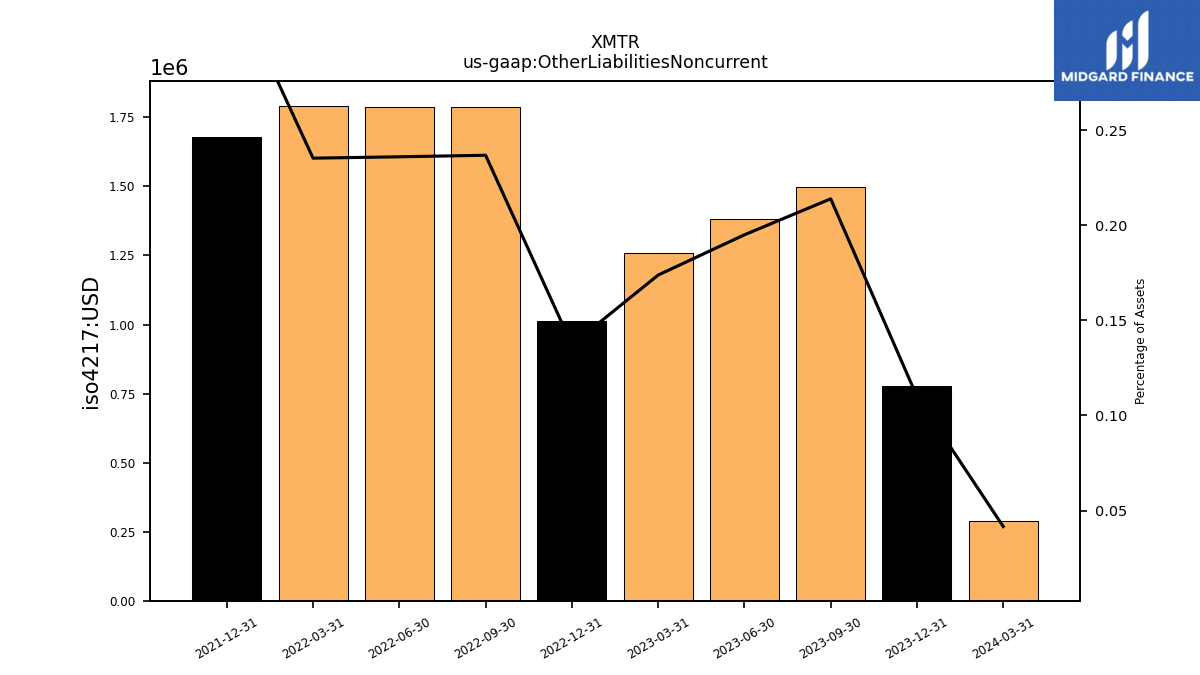
| Other Liabilities Noncurrent | 1.50 | 1.38 | 1.26 | 1.01 | 1.79 | 1.79 | 1.79 | 1.68 | NA | NA | NA | NA | NA | NA | |
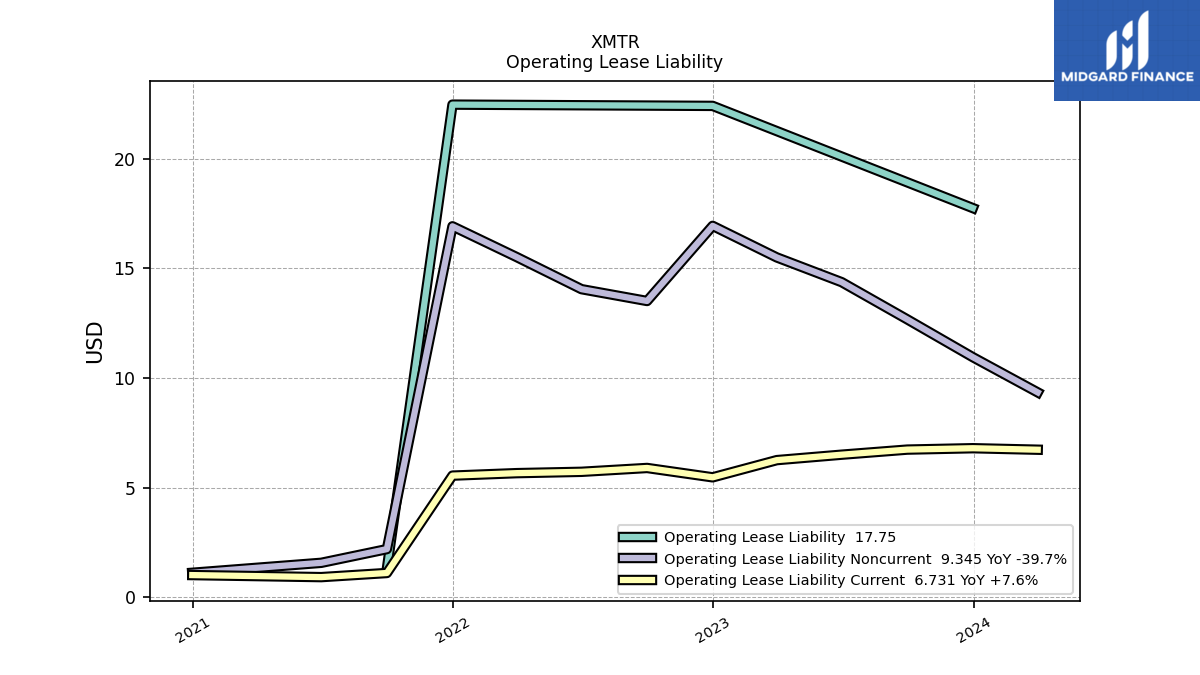
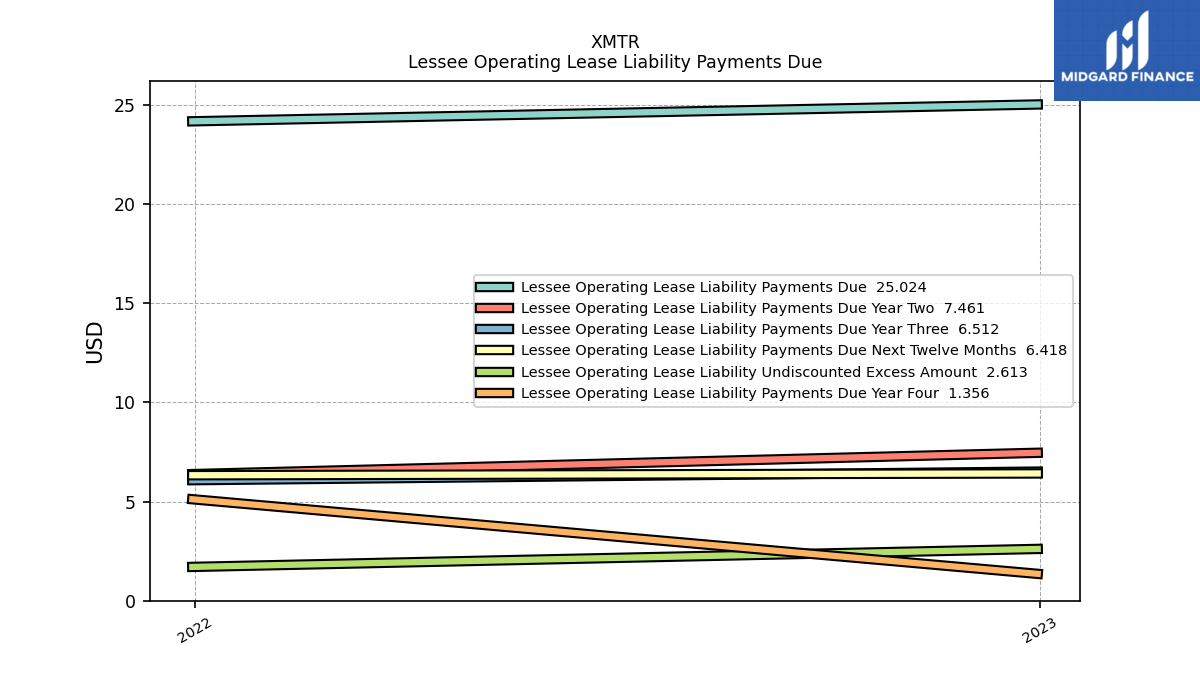
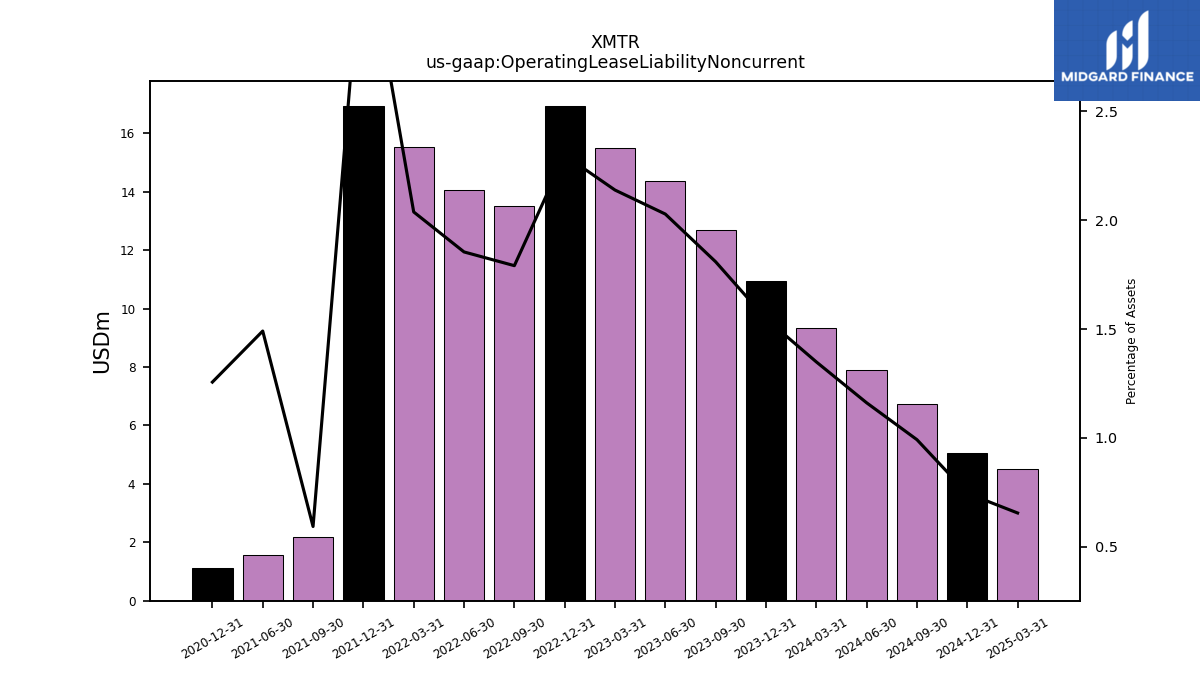
| Operating Lease Liability Noncurrent | 12.68 | 14.37 | 15.50 | 16.94 | 13.51 | 14.05 | 15.52 | 16.92 | 2.20 | 1.57 | NA | 1.12 | NA | NA |
| 2023-09-30 | 2023-06-30 | 2023-03-31 | 2022-12-31 | 2022-09-30 | 2022-06-30 | 2022-03-31 | 2021-12-31 | 2021-09-30 | 2021-06-30 | 2021-03-31 | 2020-12-31 | 2020-09-30 | 2020-06-30 | ||
|---|---|---|---|---|---|---|---|---|---|---|---|---|---|---|---|
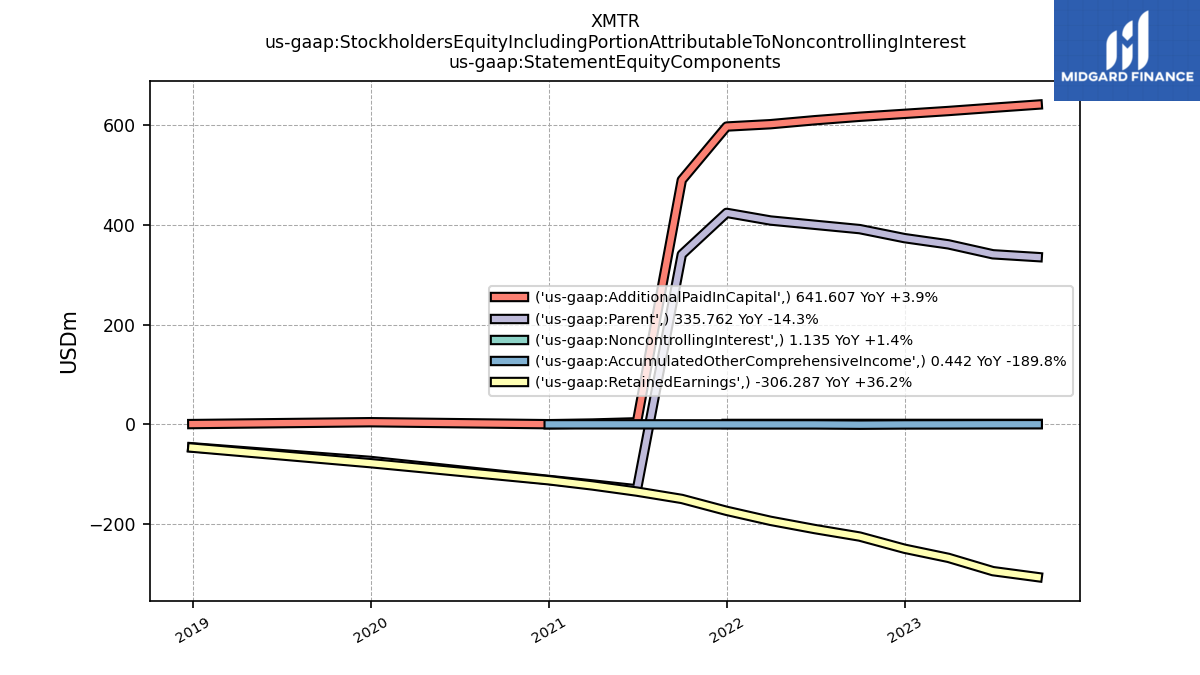
| Stockholders Equity | 335.76 | 341.36 | 361.26 | 373.74 | 391.84 | 400.51 | 409.11 | 424.45 | 340.92 | -130.19 | -120.37 | -111.25 | -101.81 | -87.30 | |
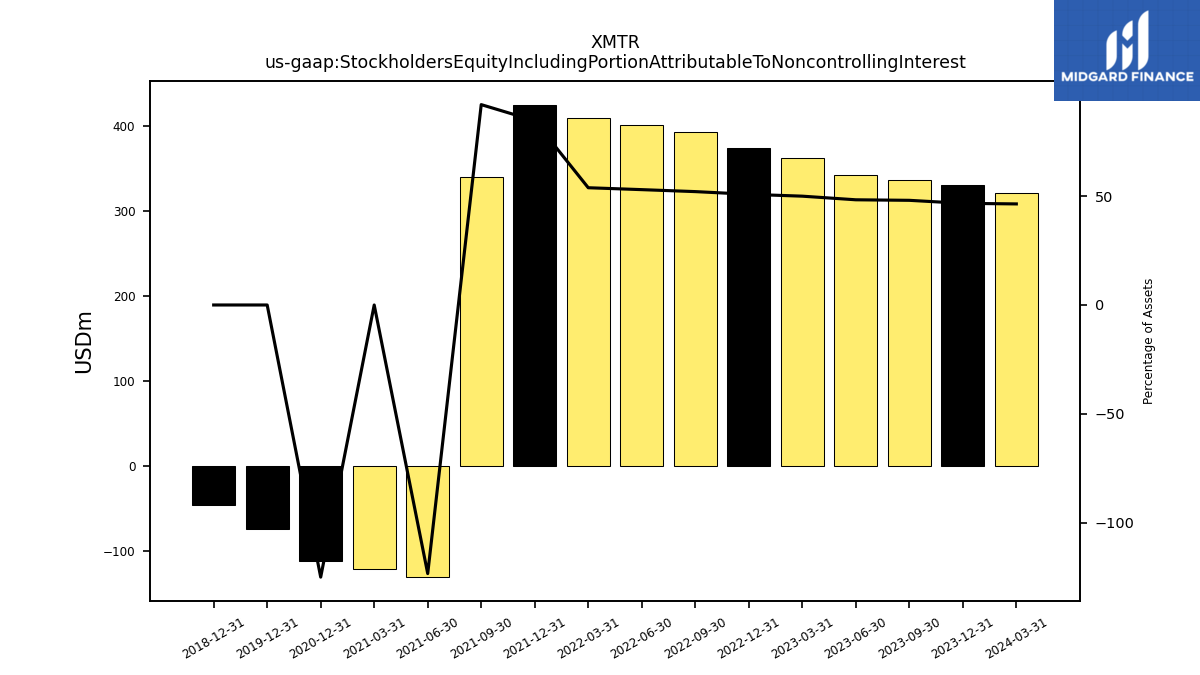
| Stockholders Equity Including Portion Attributable To Noncontrolling Interest | 336.90 | 342.48 | 362.35 | 374.83 | 392.96 | 401.62 | 410.18 | 425.48 | 340.92 | -130.19 | -120.37 | -111.25 | NA | NA | |
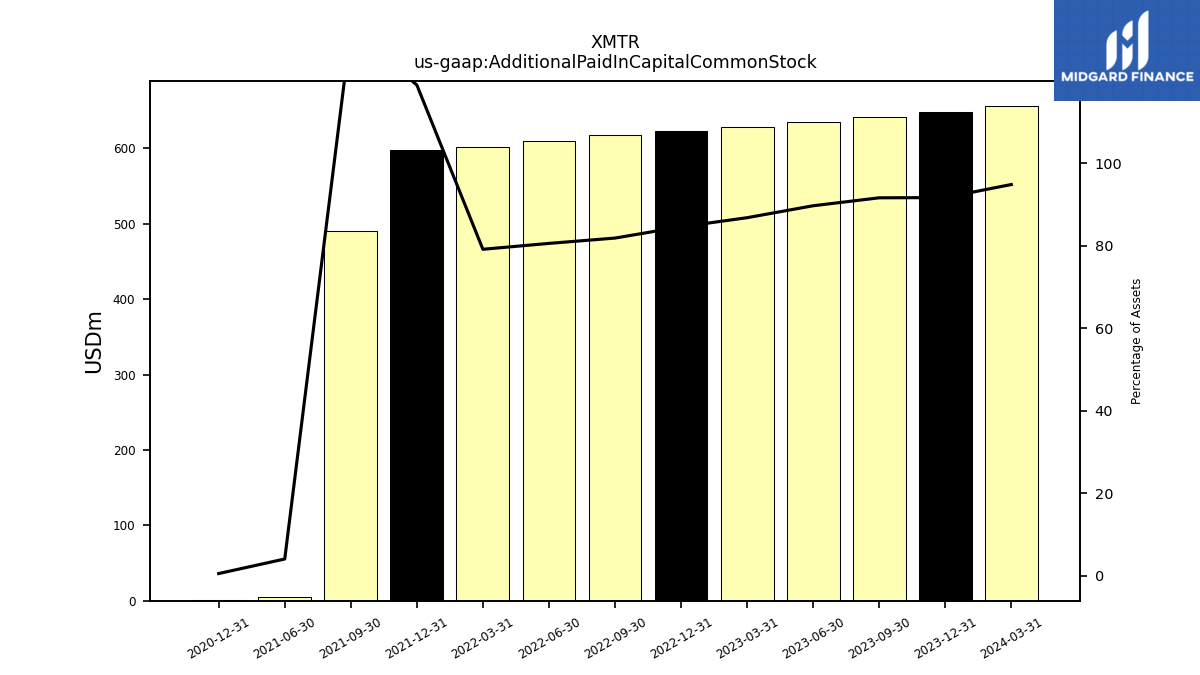
| Additional Paid In Capital Common Stock | 641.61 | 635.27 | 628.81 | 623.08 | 617.28 | 610.33 | 602.36 | 597.64 | 490.18 | 4.32 | NA | 0.50 | NA | NA | |
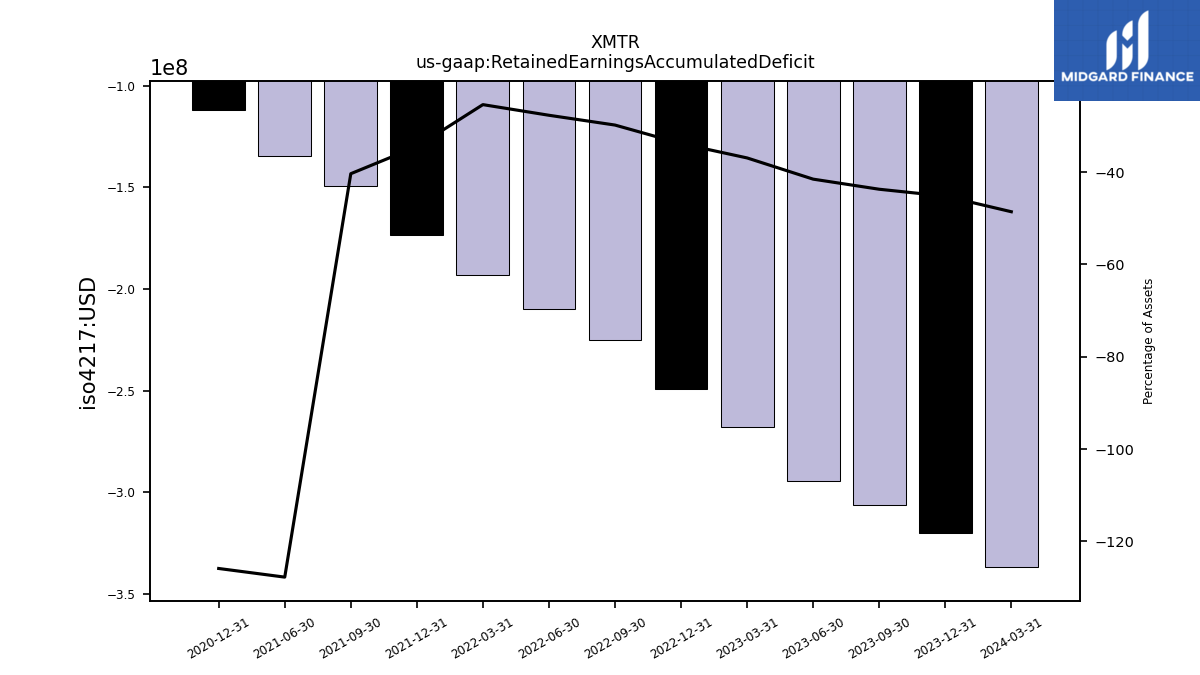
| Retained Earnings Accumulated Deficit | -306.29 | -294.26 | -267.71 | -249.37 | -224.94 | -209.91 | -193.35 | -173.34 | -149.44 | -134.73 | NA | -111.96 | NA | NA | |
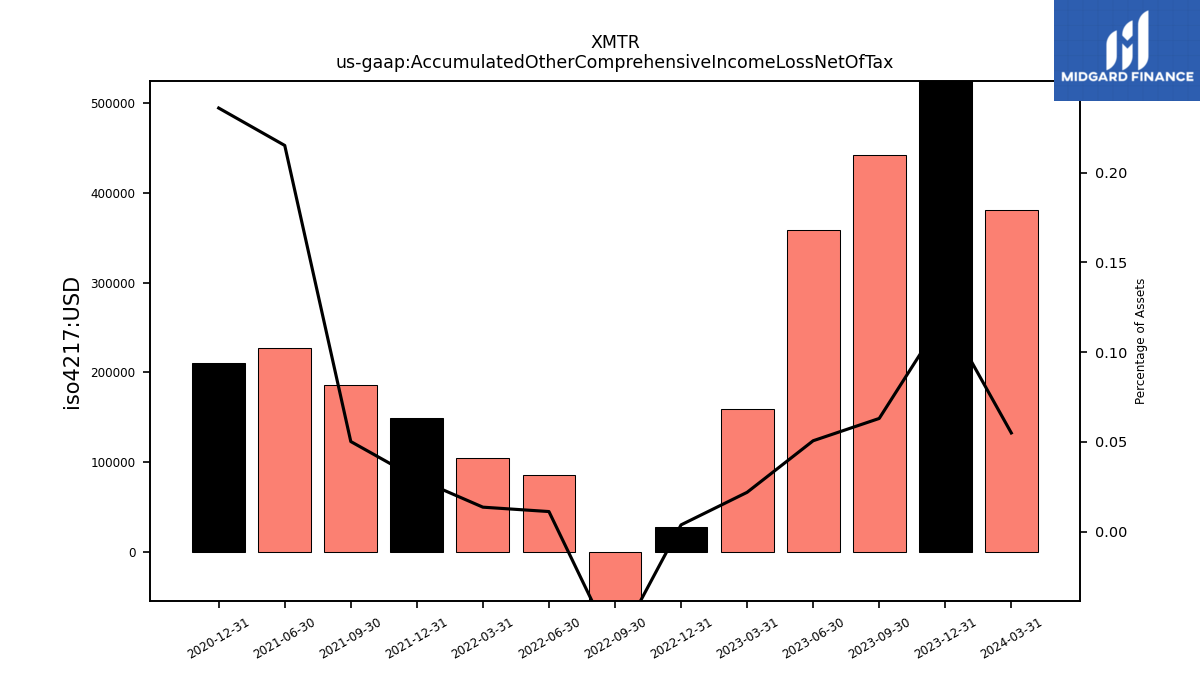
| Accumulated Other Comprehensive Income Loss Net Of Tax | 0.44 | 0.36 | 0.16 | 0.03 | -0.49 | 0.09 | 0.10 | 0.15 | 0.19 | 0.23 | NA | 0.21 | NA | NA | |
| Minority Interest | 1.14 | 1.11 | 1.09 | 1.09 | 1.12 | 1.10 | 1.07 | 1.03 | NA | NA | NA | NA | NA | NA | |
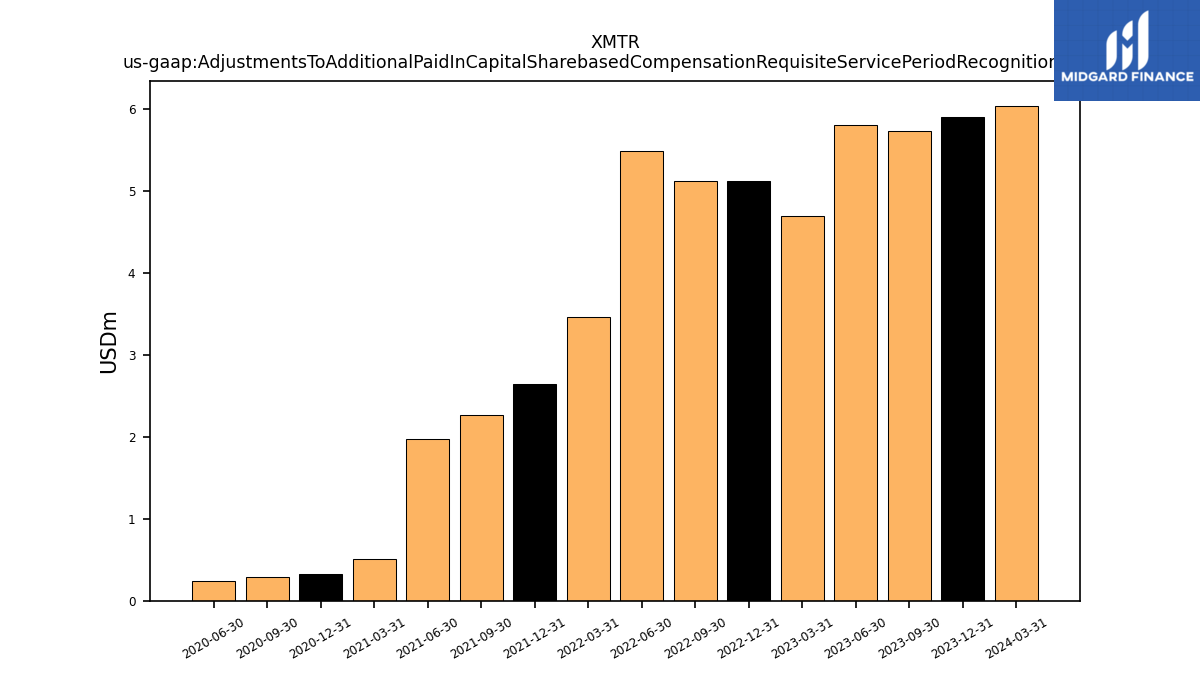
| Adjustments To Additional Paid In Capital Sharebased Compensation Requisite Service Period Recognition Value | 5.73 | 5.80 | 4.69 | 5.12 | 5.11 | 5.48 | 3.46 | 2.65 | 2.27 | 1.98 | 0.51 | 0.33 | 0.29 | 0.24 |
| 2023-09-30 | 2023-06-30 | 2023-03-31 | 2022-12-31 | 2022-09-30 | 2022-06-30 | 2022-03-31 | 2021-12-31 | 2021-09-30 | 2021-06-30 | 2021-03-31 | 2020-12-31 | 2020-09-30 | 2020-06-30 | ||
|---|---|---|---|---|---|---|---|---|---|---|---|---|---|---|---|
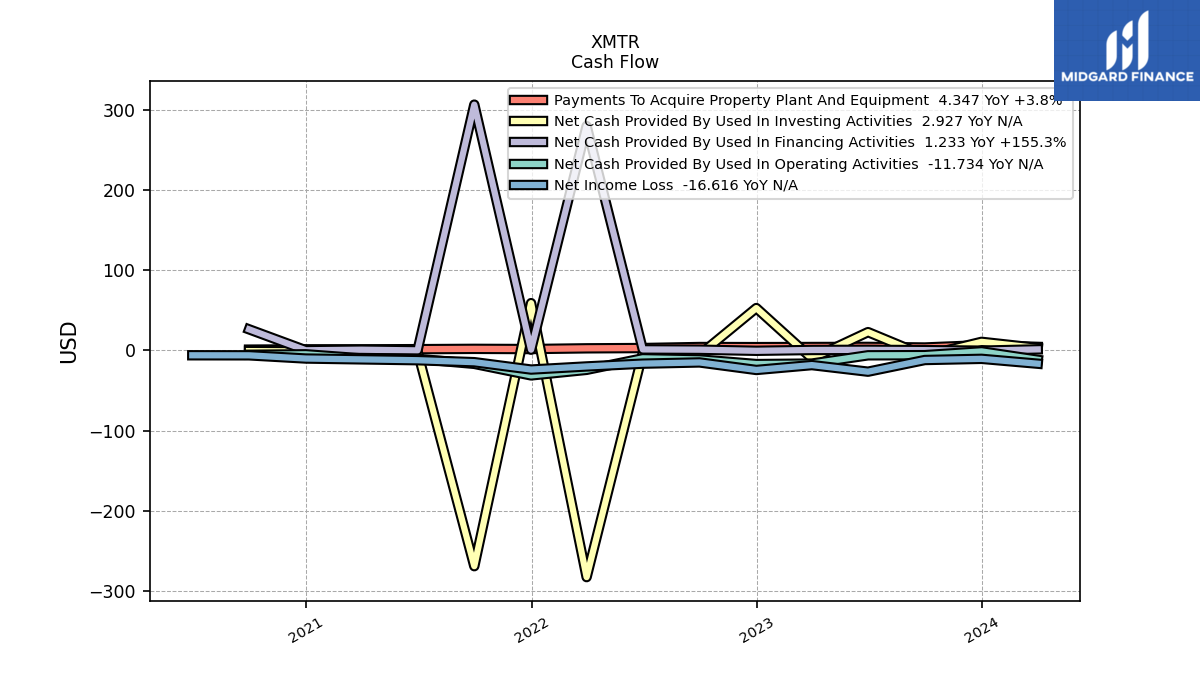
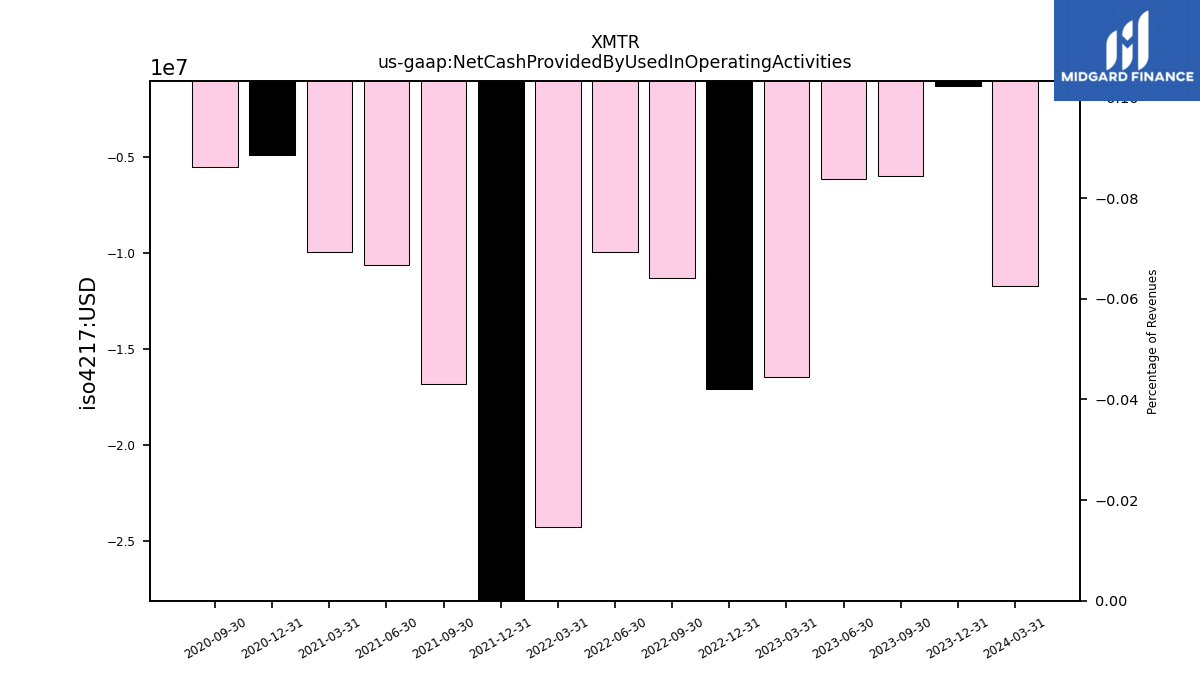
| Net Cash Provided By Used In Operating Activities | -5.98 | -6.15 | -16.45 | -17.07 | -11.31 | -9.94 | -24.26 | -31.20 | -16.81 | -10.62 | -9.94 | -4.90 | -5.50 | NA | |
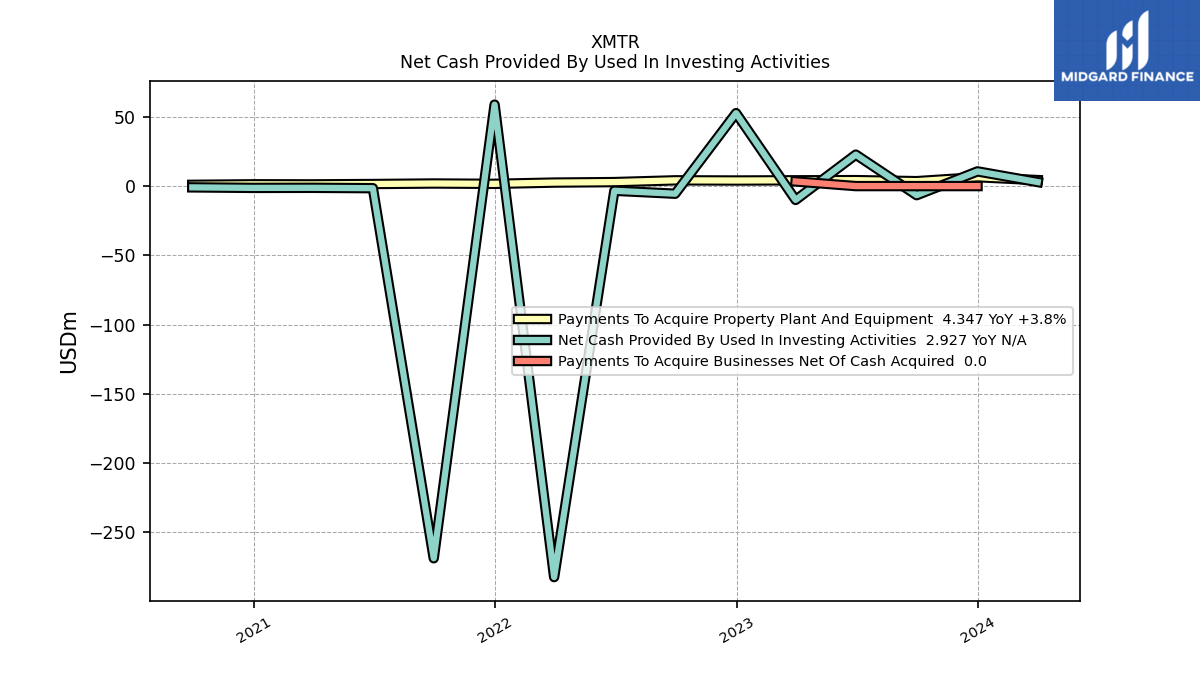
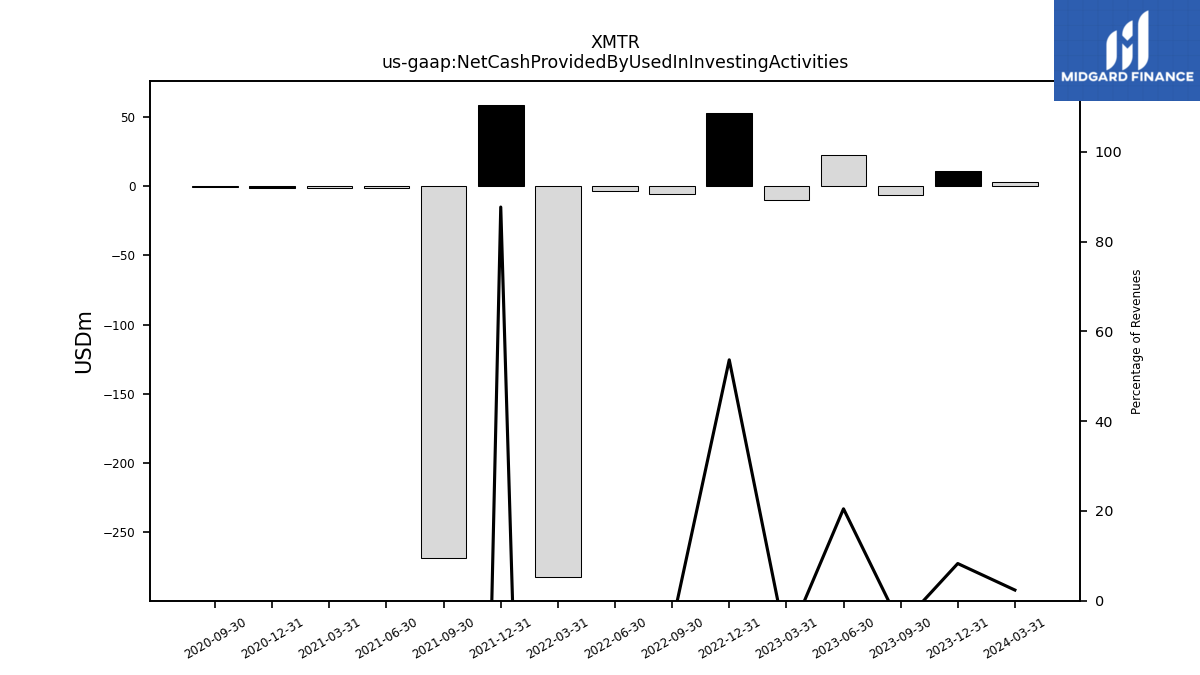
| Net Cash Provided By Used In Investing Activities | -6.56 | 22.74 | -10.00 | 52.71 | -5.51 | -3.36 | -282.46 | 58.85 | -268.86 | -1.50 | -1.24 | -1.30 | -0.92 | NA | |
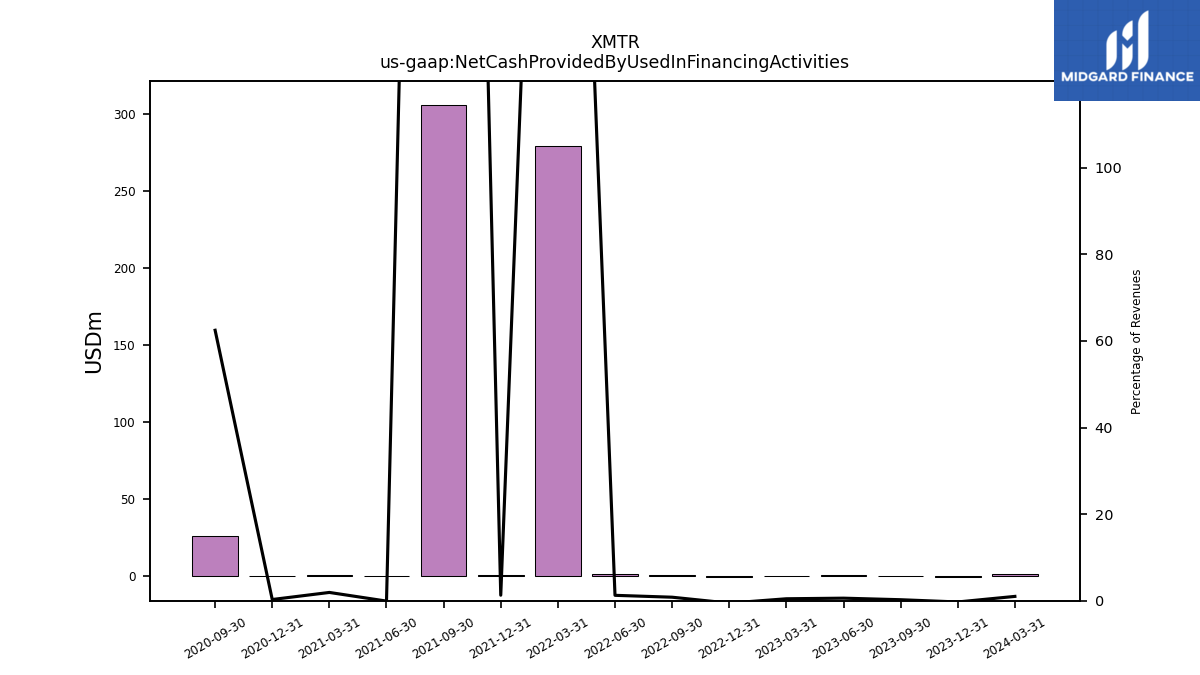
| Net Cash Provided By Used In Financing Activities | 0.28 | 0.66 | 0.48 | -0.53 | 0.85 | 1.20 | 279.46 | 0.86 | 306.11 | -0.04 | 0.84 | 0.11 | 26.21 | NA |
| 2023-09-30 | 2023-06-30 | 2023-03-31 | 2022-12-31 | 2022-09-30 | 2022-06-30 | 2022-03-31 | 2021-12-31 | 2021-09-30 | 2021-06-30 | 2021-03-31 | 2020-12-31 | 2020-09-30 | 2020-06-30 | ||
|---|---|---|---|---|---|---|---|---|---|---|---|---|---|---|---|
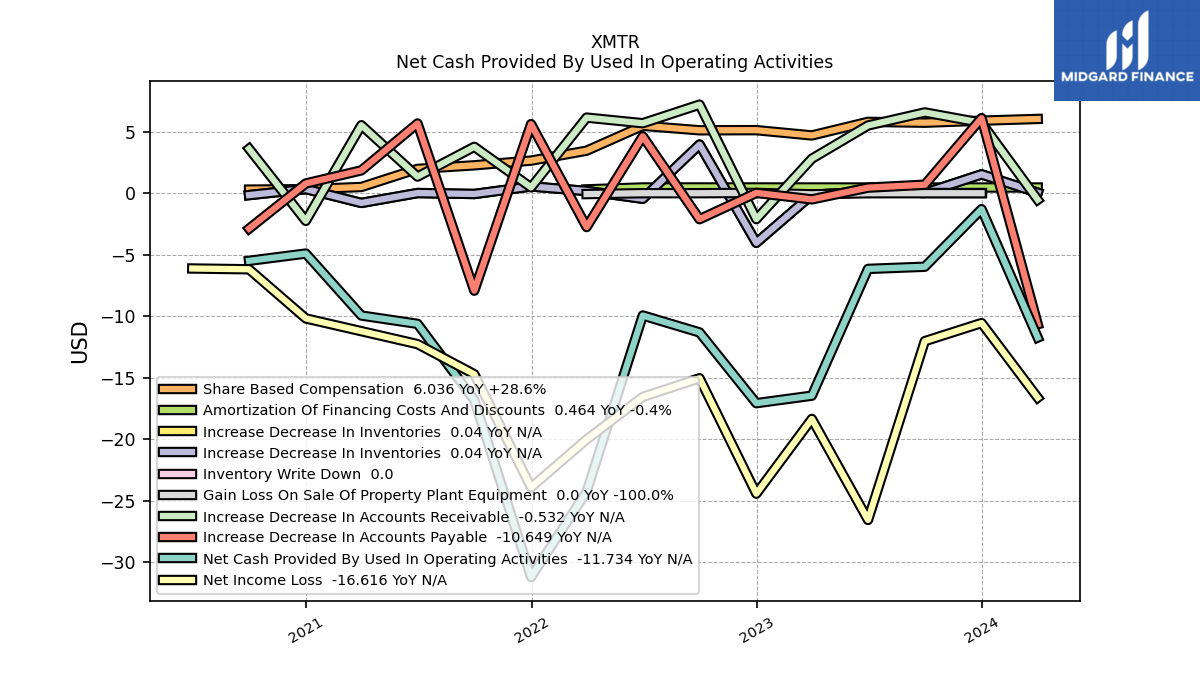
| Net Cash Provided By Used In Operating Activities | -5.98 | -6.15 | -16.45 | -17.07 | -11.31 | -9.94 | -24.26 | -31.20 | -16.81 | -10.62 | -9.94 | -4.90 | -5.50 | NA | |
| Net Income Loss | -12.02 | -26.55 | -18.34 | -24.42 | -15.04 | -16.55 | -20.01 | -23.91 | -14.71 | -12.26 | NA | -10.18 | -6.18 | -6.12 | |
| Profit Loss | -12.01 | -26.56 | -18.34 | -24.42 | -15.04 | -16.55 | -20.00 | -23.91 | -14.71 | -12.26 | -10.50 | -10.18 | -6.18 | NA | |
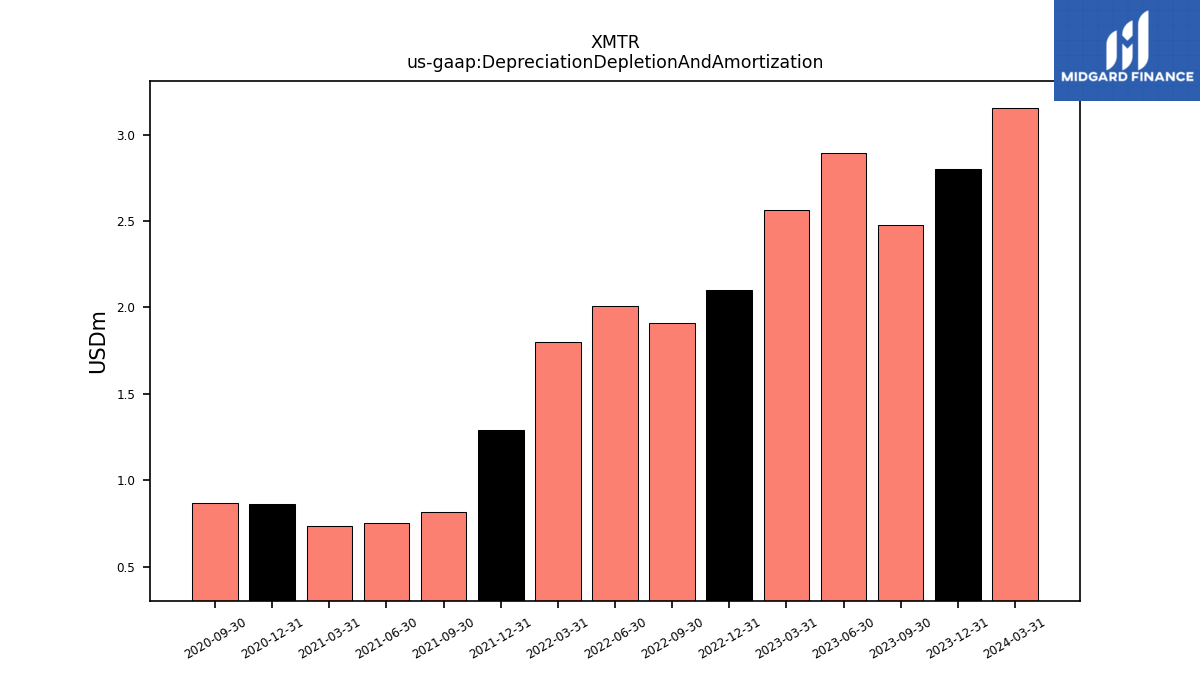
| Depreciation Depletion And Amortization | 2.48 | 2.90 | 2.57 | 2.10 | 1.91 | 2.01 | 1.80 | 1.29 | 0.82 | 0.75 | 0.73 | 0.86 | 0.87 | NA | |
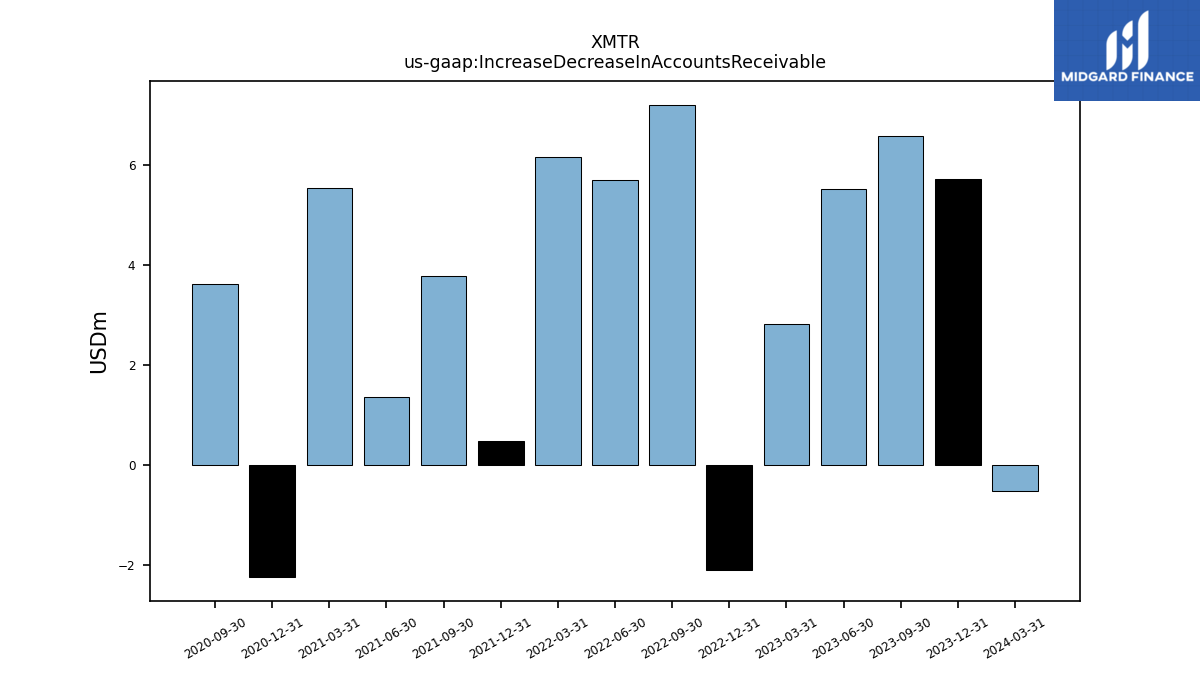
| Increase Decrease In Accounts Receivable | 6.57 | 5.50 | 2.80 | -2.11 | 7.20 | 5.69 | 6.14 | 0.47 | 3.77 | 1.35 | 5.53 | -2.25 | 3.61 | NA | |
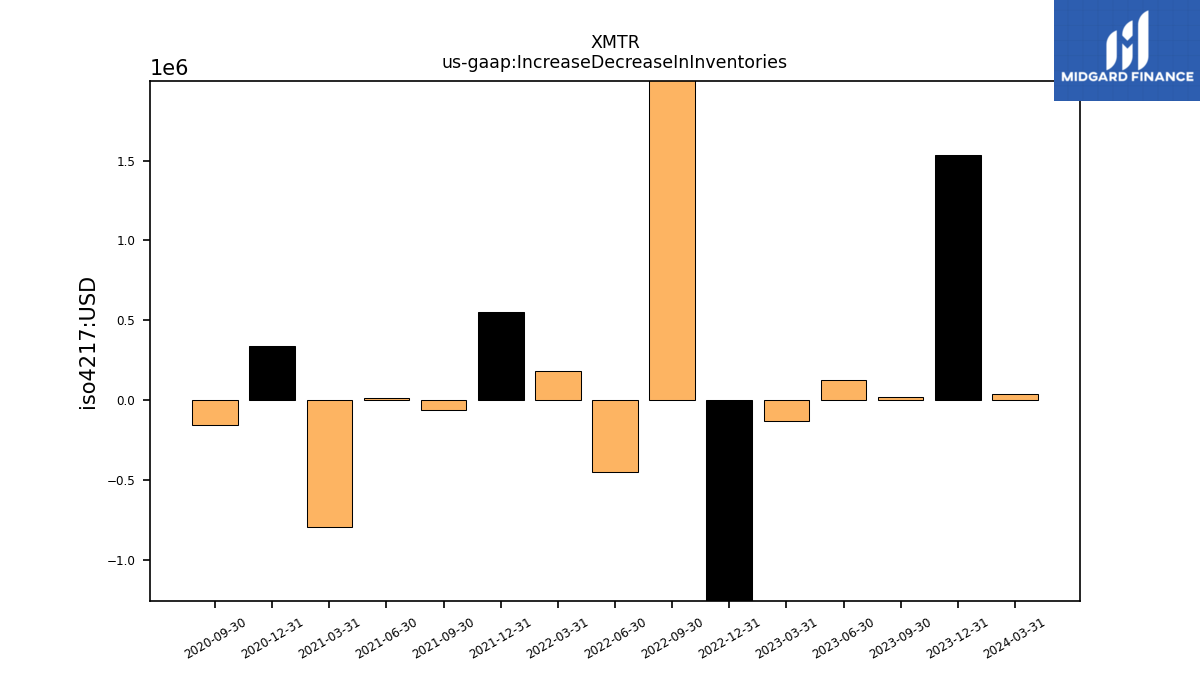
| Increase Decrease In Inventories | 0.02 | 0.13 | -0.13 | -4.03 | 3.95 | -0.45 | 0.18 | 0.55 | -0.06 | 0.01 | -0.79 | 0.34 | -0.15 | NA | |
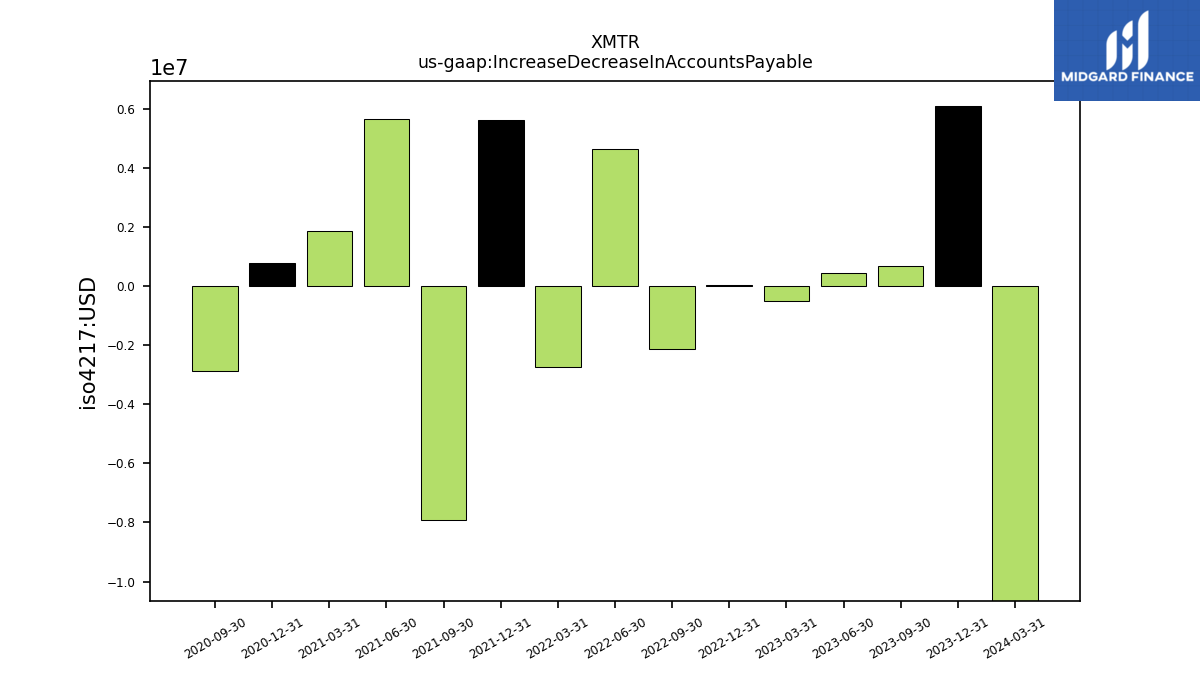
| Increase Decrease In Accounts Payable | 0.69 | 0.45 | -0.50 | 0.03 | -2.11 | 4.62 | -2.75 | 5.62 | -7.92 | 5.67 | 1.86 | 0.79 | -2.88 | NA | |
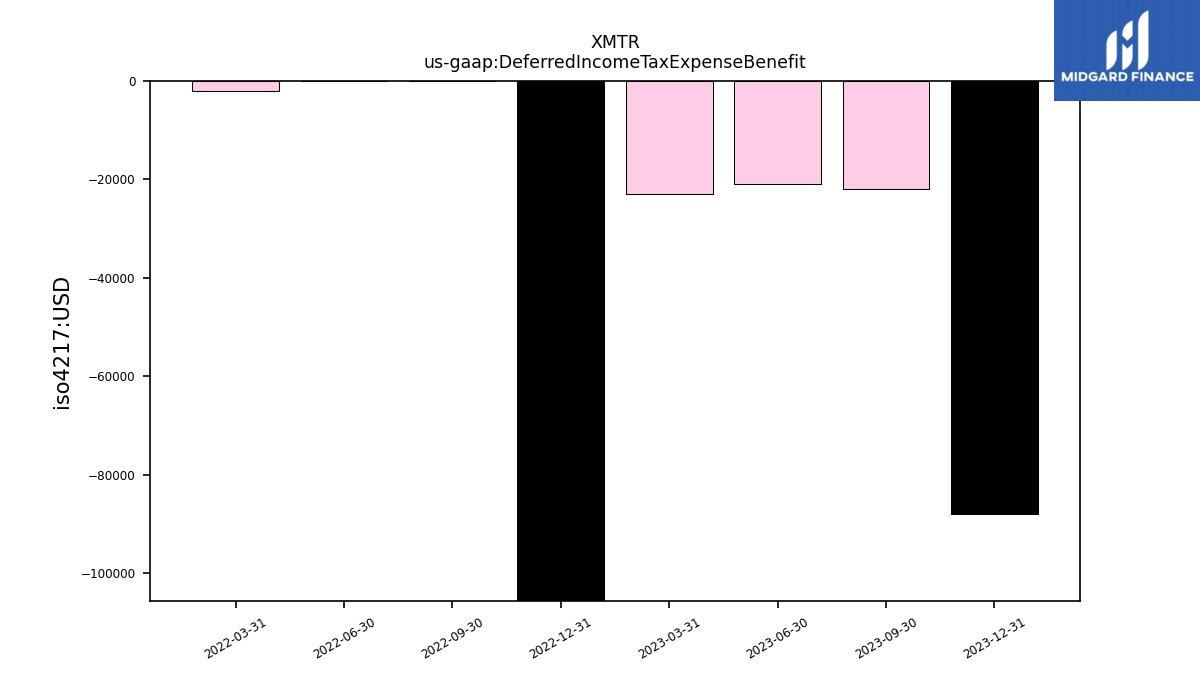
| Deferred Income Tax Expense Benefit | -0.02 | -0.02 | -0.02 | -0.65 | 0.00 | 0.00 | -0.00 | NA | NA | NA | NA | NA | NA | NA | |
| Share Based Compensation | 5.73 | 5.80 | 4.69 | 5.12 | 5.11 | 5.48 | 3.46 | 2.65 | 2.27 | 1.98 | 0.51 | 0.33 | 0.29 | NA |
| 2023-09-30 | 2023-06-30 | 2023-03-31 | 2022-12-31 | 2022-09-30 | 2022-06-30 | 2022-03-31 | 2021-12-31 | 2021-09-30 | 2021-06-30 | 2021-03-31 | 2020-12-31 | 2020-09-30 | 2020-06-30 | ||
|---|---|---|---|---|---|---|---|---|---|---|---|---|---|---|---|
| Net Cash Provided By Used In Investing Activities | -6.56 | 22.74 | -10.00 | 52.71 | -5.51 | -3.36 | -282.46 | 58.85 | -268.86 | -1.50 | -1.24 | -1.30 | -0.92 | NA | |
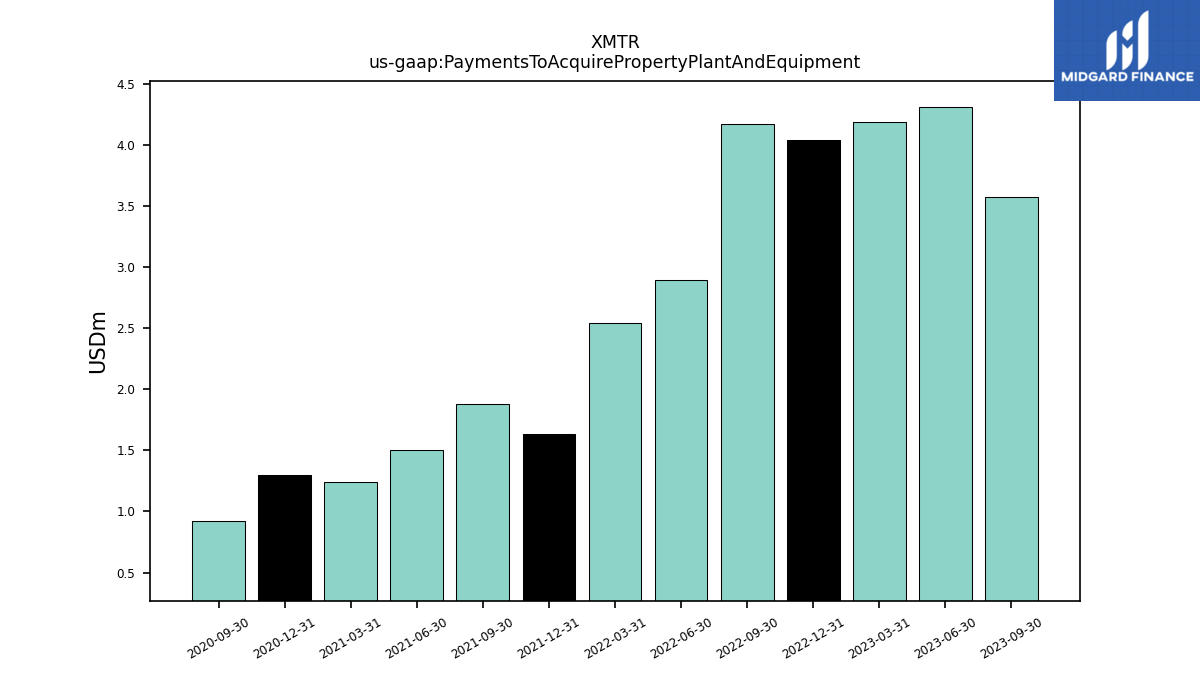
| Payments To Acquire Property Plant And Equipment | 3.57 | 4.31 | 4.19 | 4.04 | 4.17 | 2.89 | 2.54 | 1.64 | 1.88 | 1.50 | 1.24 | 1.30 | 0.92 | NA |
| 2023-09-30 | 2023-06-30 | 2023-03-31 | 2022-12-31 | 2022-09-30 | 2022-06-30 | 2022-03-31 | 2021-12-31 | 2021-09-30 | 2021-06-30 | 2021-03-31 | 2020-12-31 | 2020-09-30 | 2020-06-30 | ||
|---|---|---|---|---|---|---|---|---|---|---|---|---|---|---|---|
| Net Cash Provided By Used In Financing Activities | 0.28 | 0.66 | 0.48 | -0.53 | 0.85 | 1.20 | 279.46 | 0.86 | 306.11 | -0.04 | 0.84 | 0.11 | 26.21 | NA |
| 2023-09-30 | 2023-06-30 | 2023-03-31 | 2022-12-31 | 2022-09-30 | 2022-06-30 | 2022-03-31 | 2021-12-31 | 2021-09-30 | 2021-06-30 | 2021-03-31 | 2020-12-31 | 2020-09-30 | 2020-06-30 | ||
|---|---|---|---|---|---|---|---|---|---|---|---|---|---|---|---|
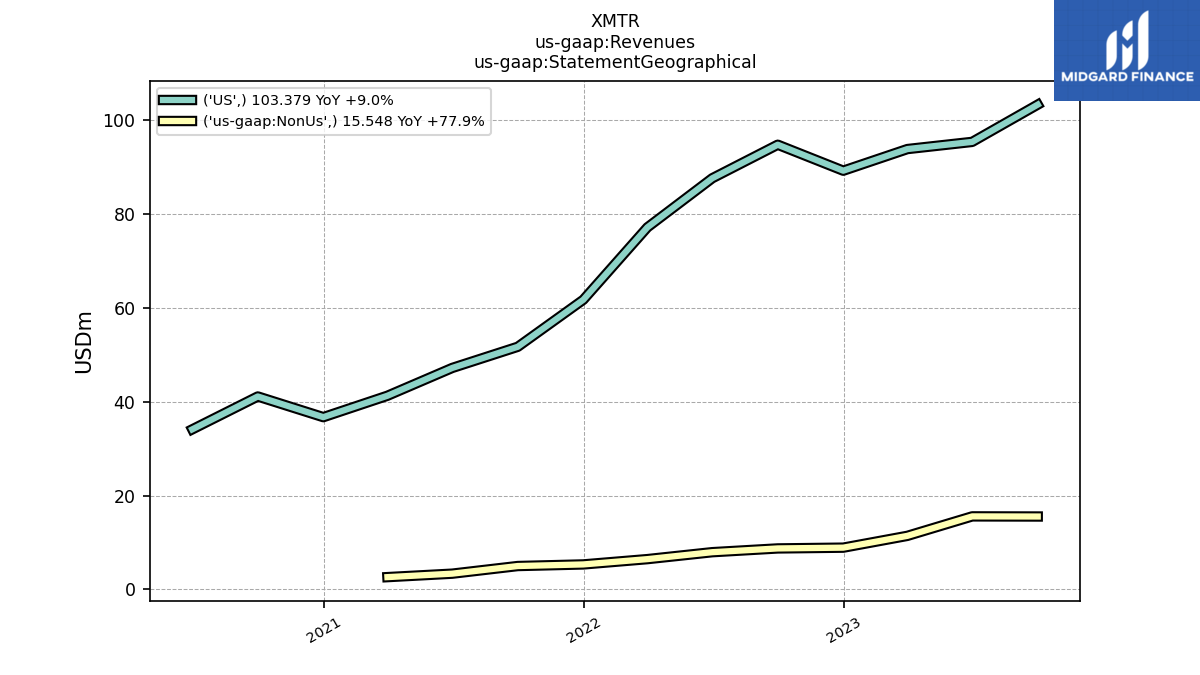
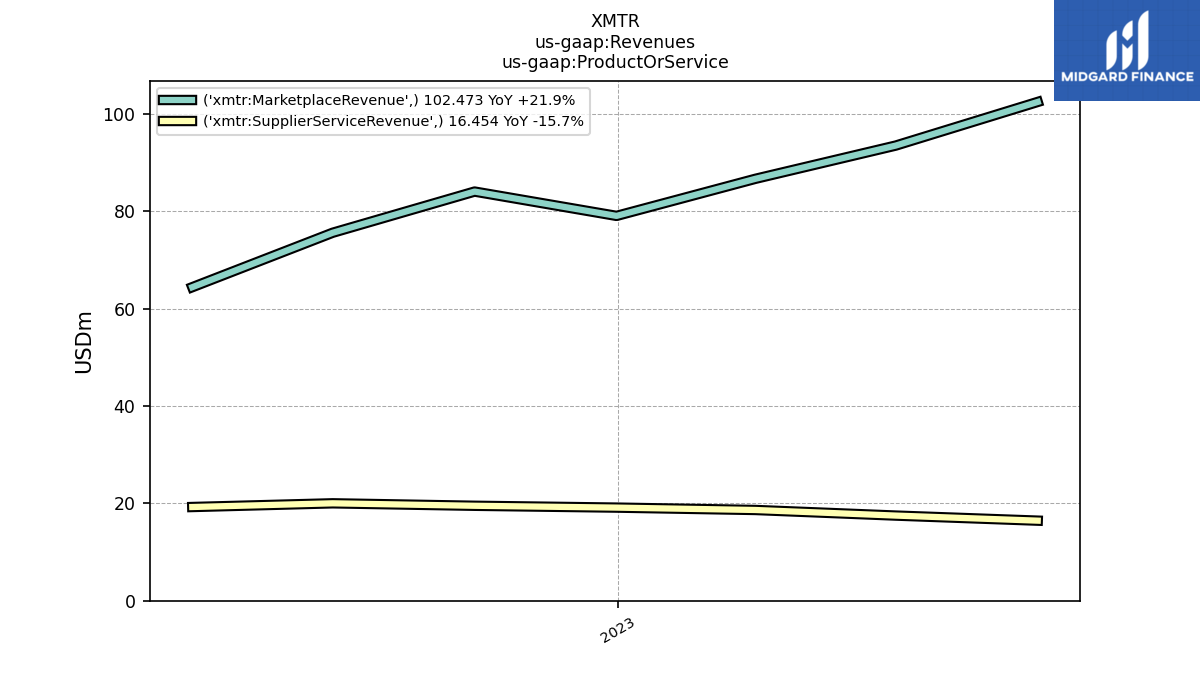
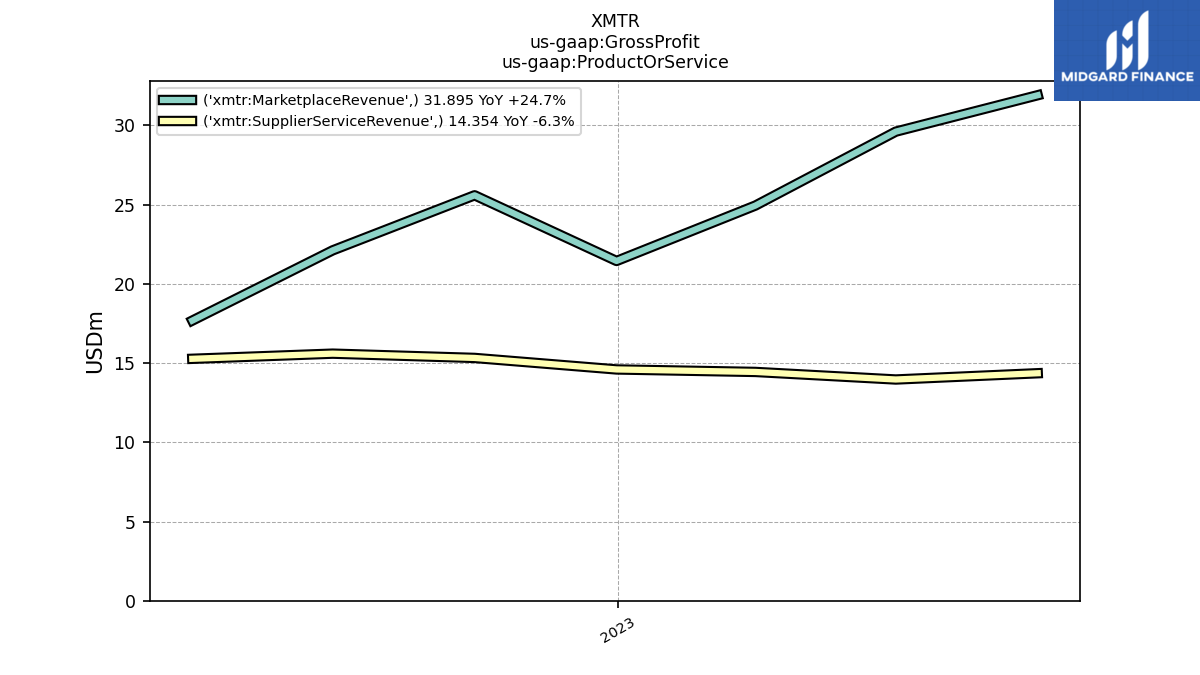
| Revenues | 118.93 | 111.01 | 105.33 | 98.20 | 103.57 | 95.61 | 83.67 | 67.10 | 56.73 | 50.59 | 43.92 | 37.98 | 41.95 | 34.78 | |
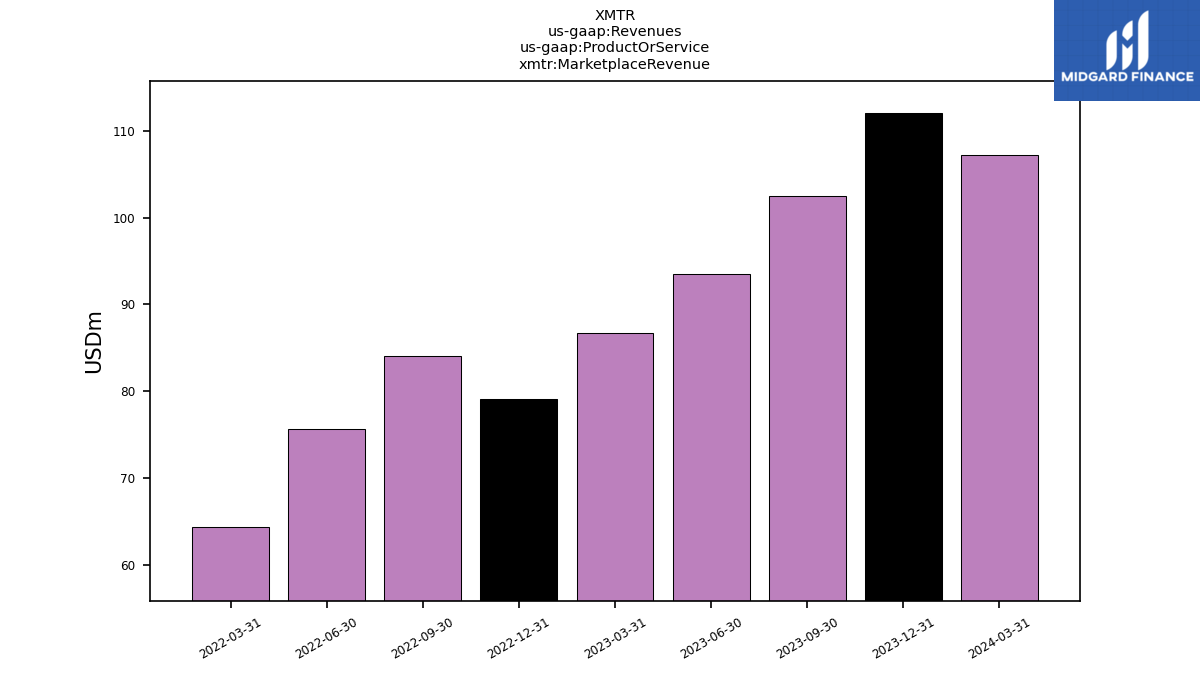
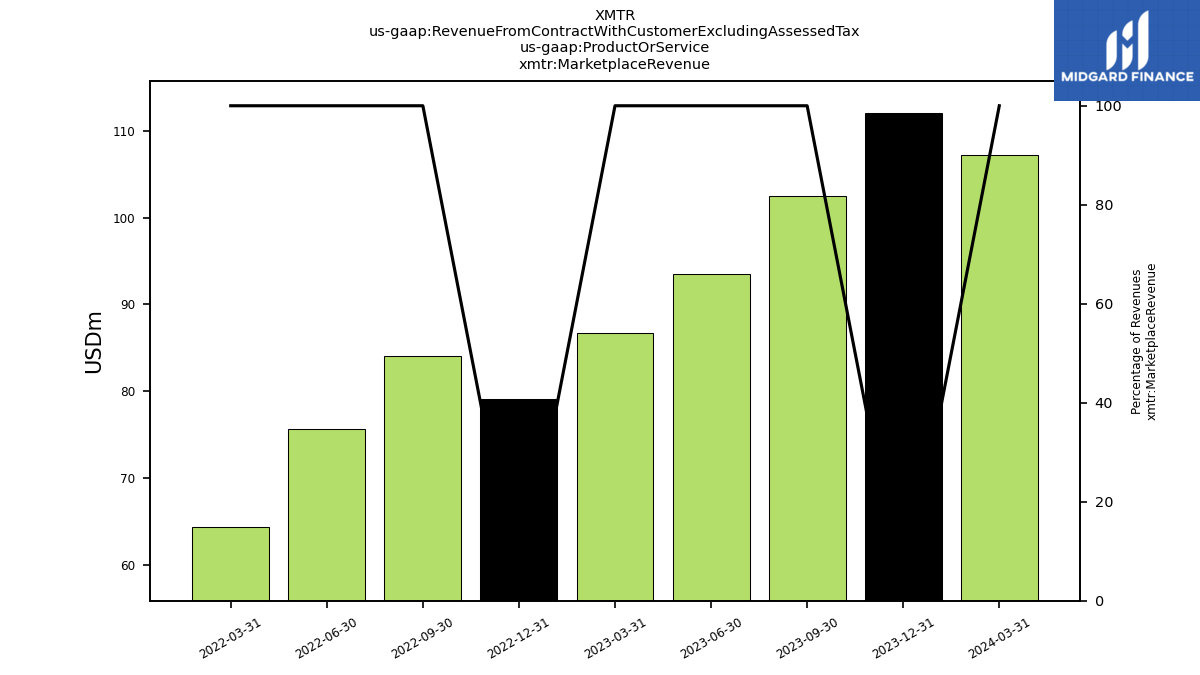
| Marketplace Revenue | 102.47 | 93.51 | 86.68 | 79.06 | 84.06 | 75.60 | 64.42 | NA | NA | NA | NA | NA | NA | NA | |
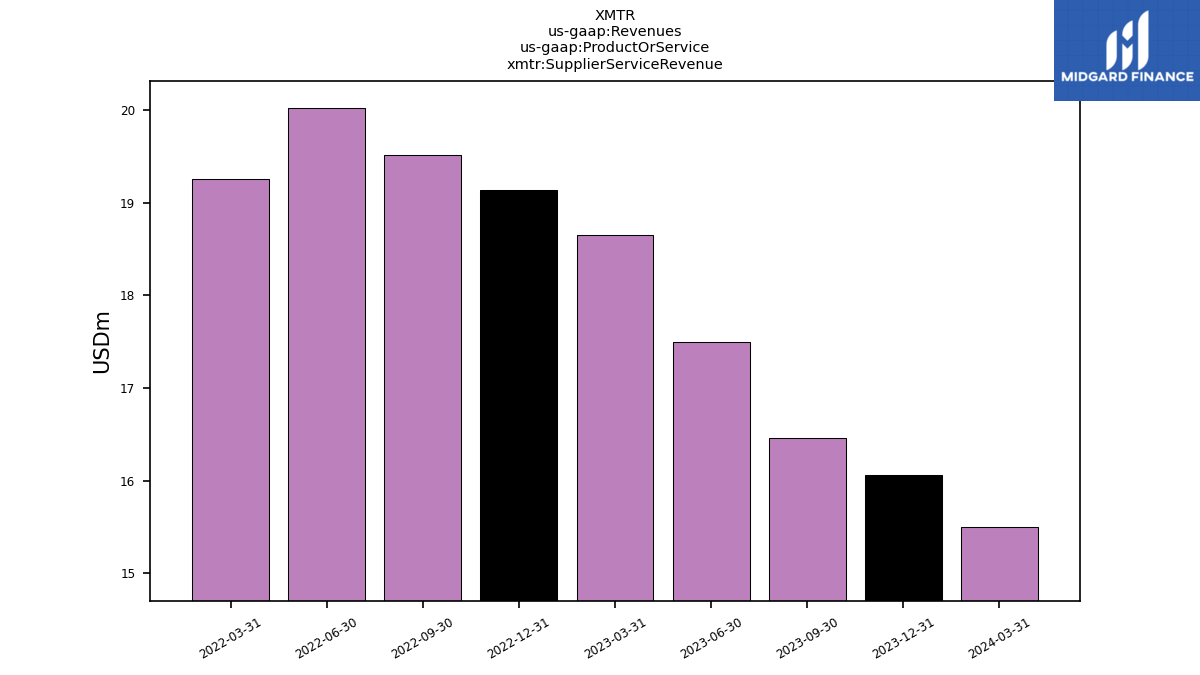
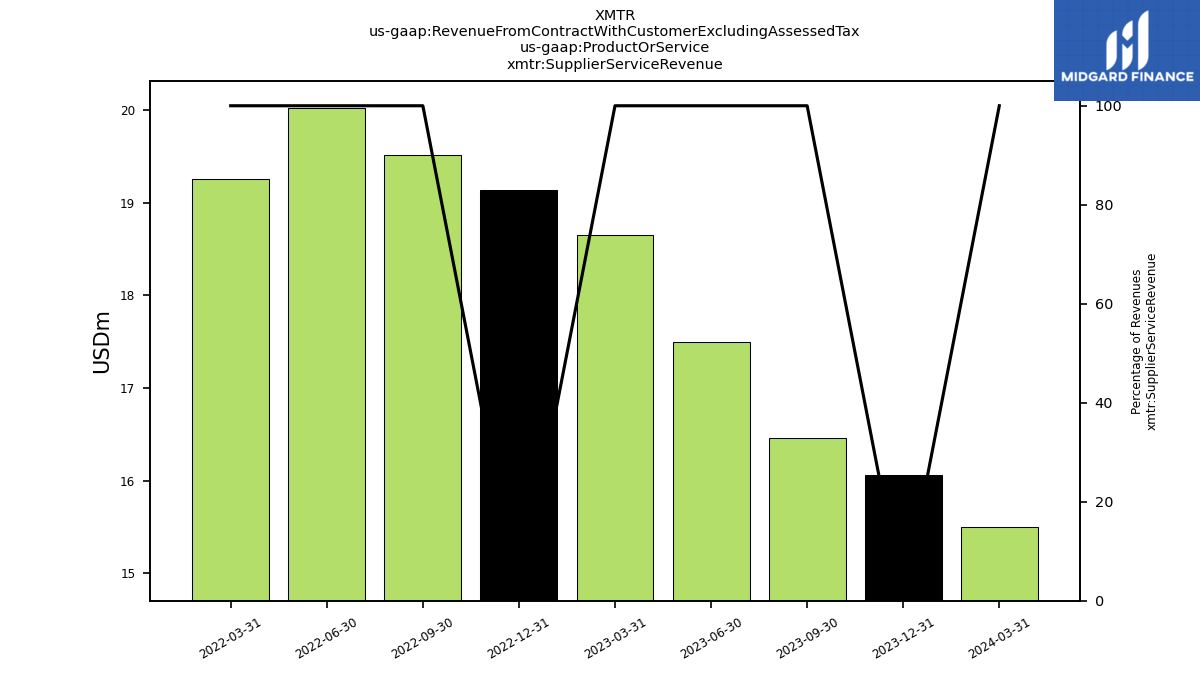
| Supplier Service Revenue | 16.45 | 17.50 | 18.65 | 19.14 | 19.51 | 20.02 | 19.26 | NA | NA | NA | NA | NA | NA | NA | |
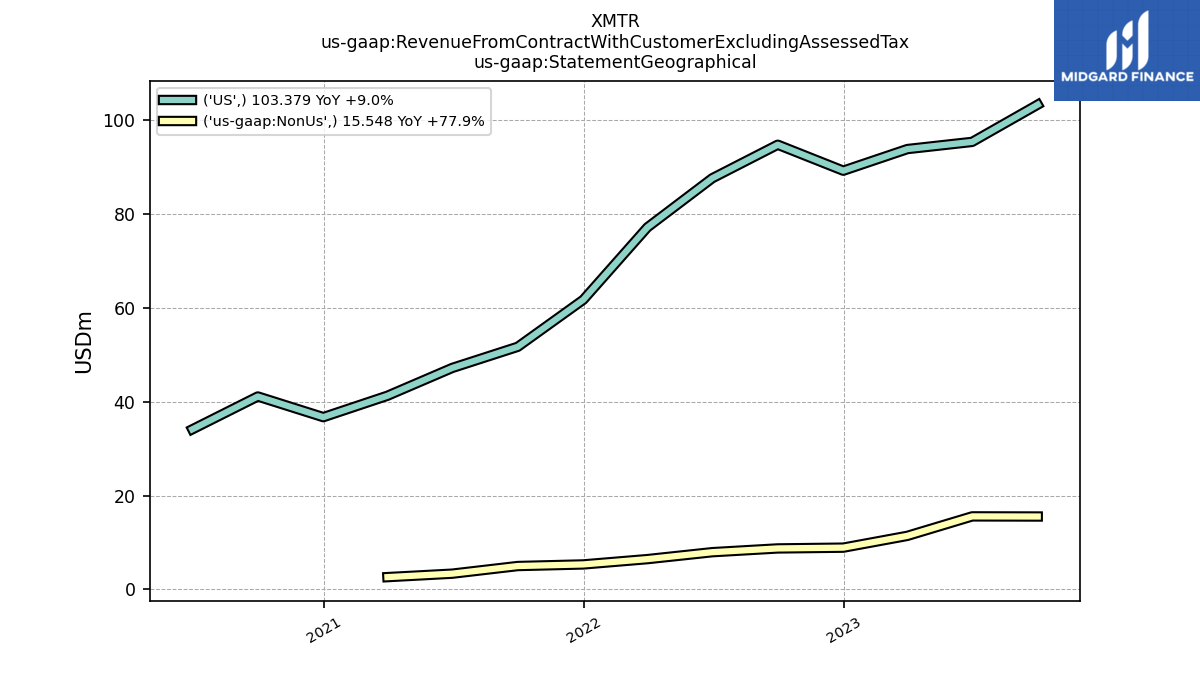
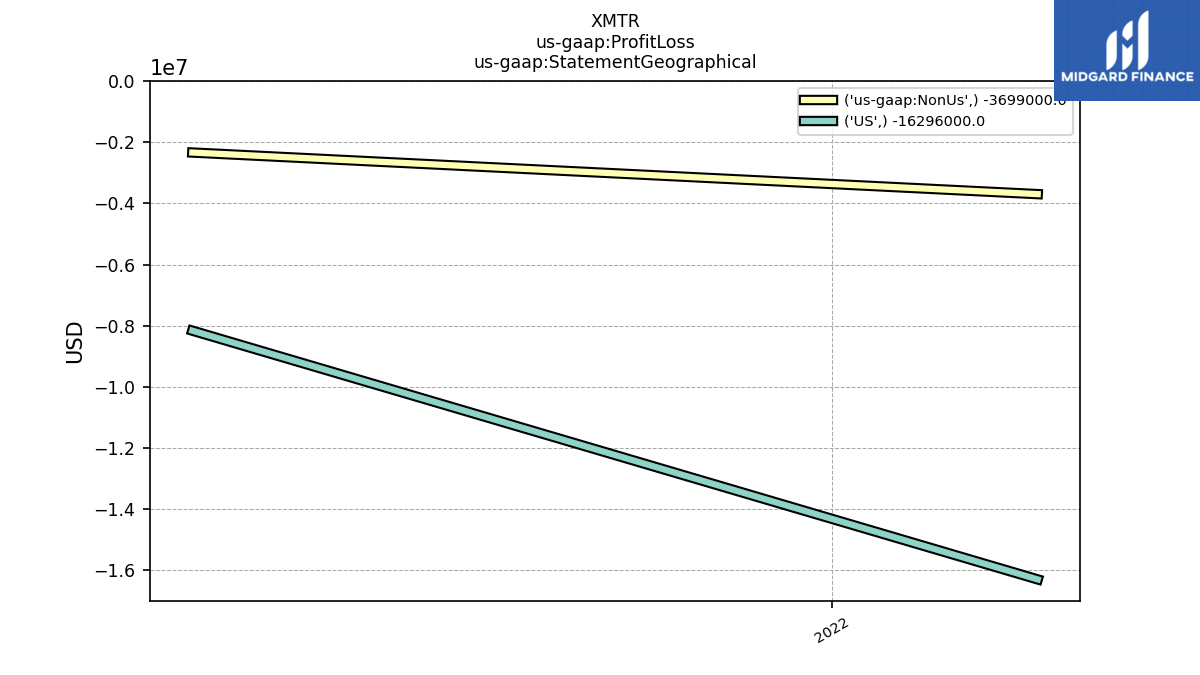
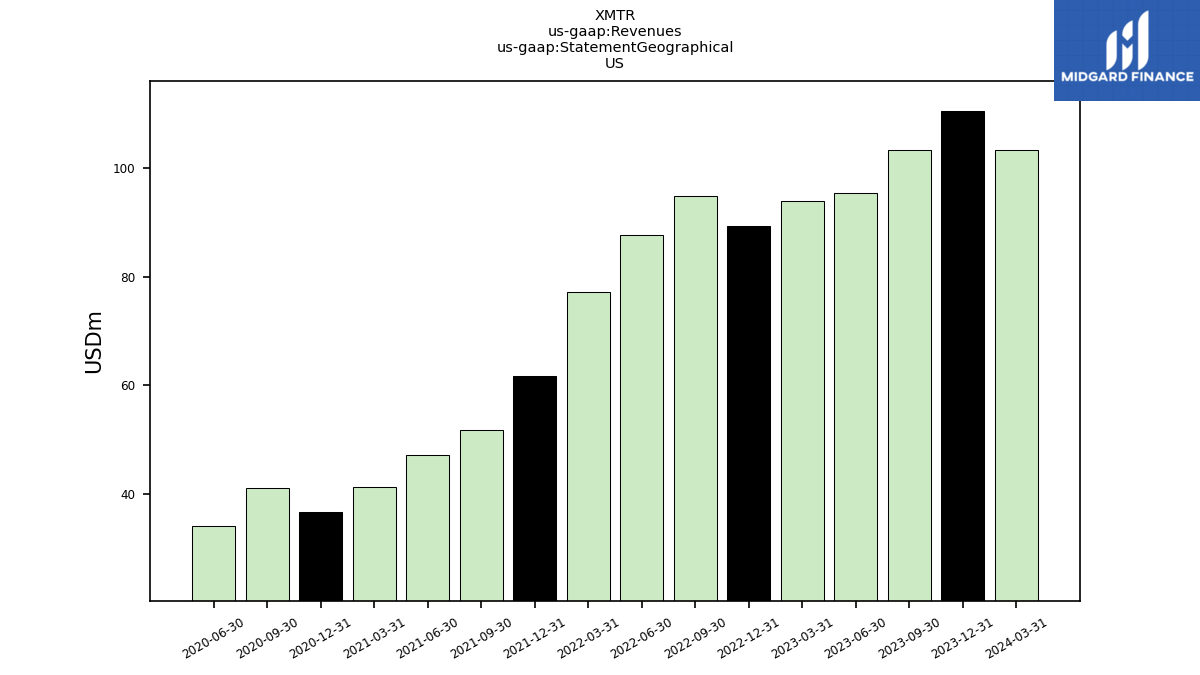
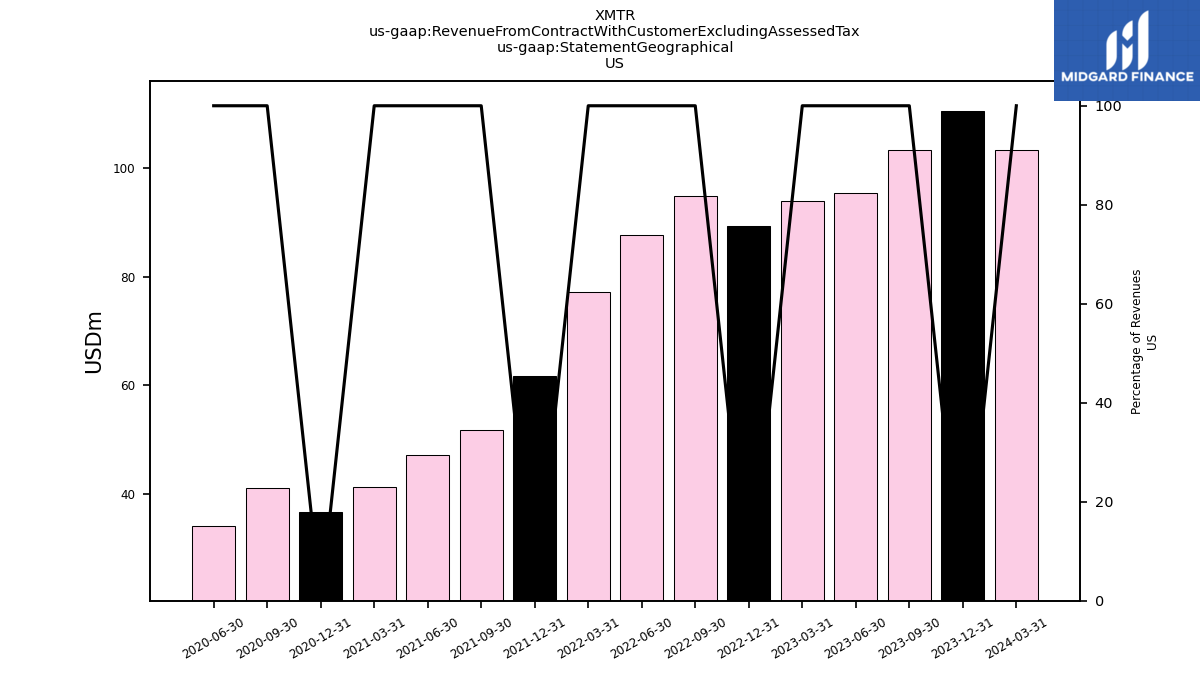
| US | 103.38 | 95.43 | 93.90 | 89.29 | 94.83 | 87.67 | 77.21 | 61.77 | 51.74 | 47.23 | 41.30 | 36.73 | 41.15 | 34.13 | |
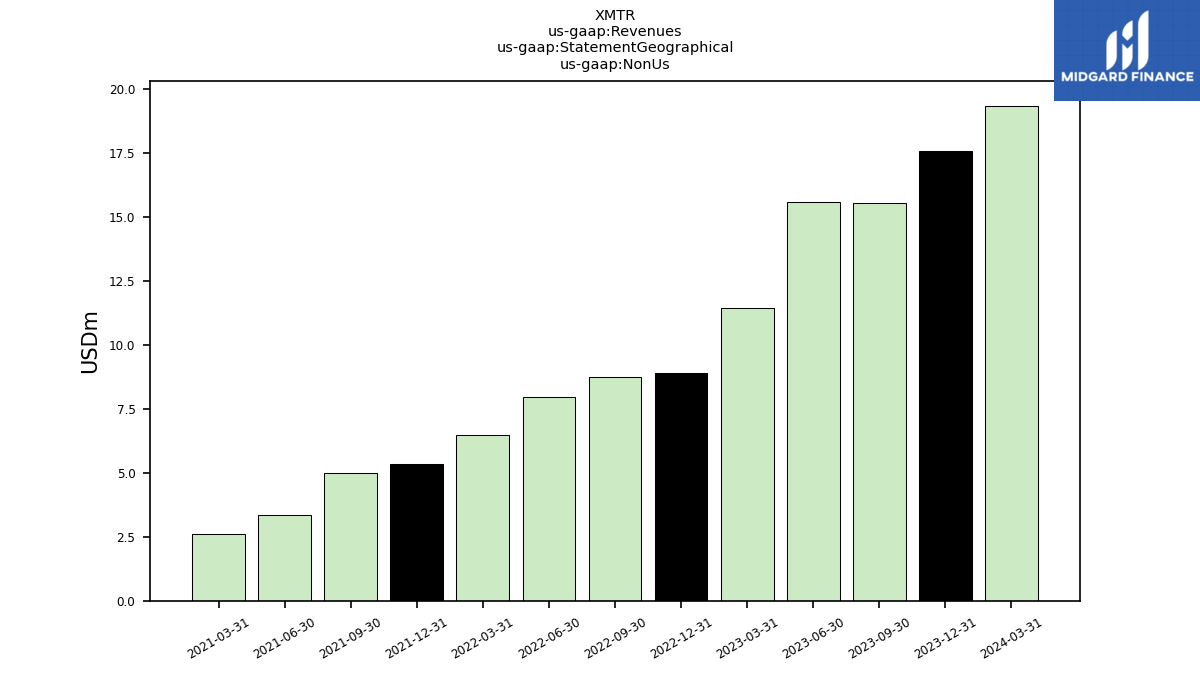
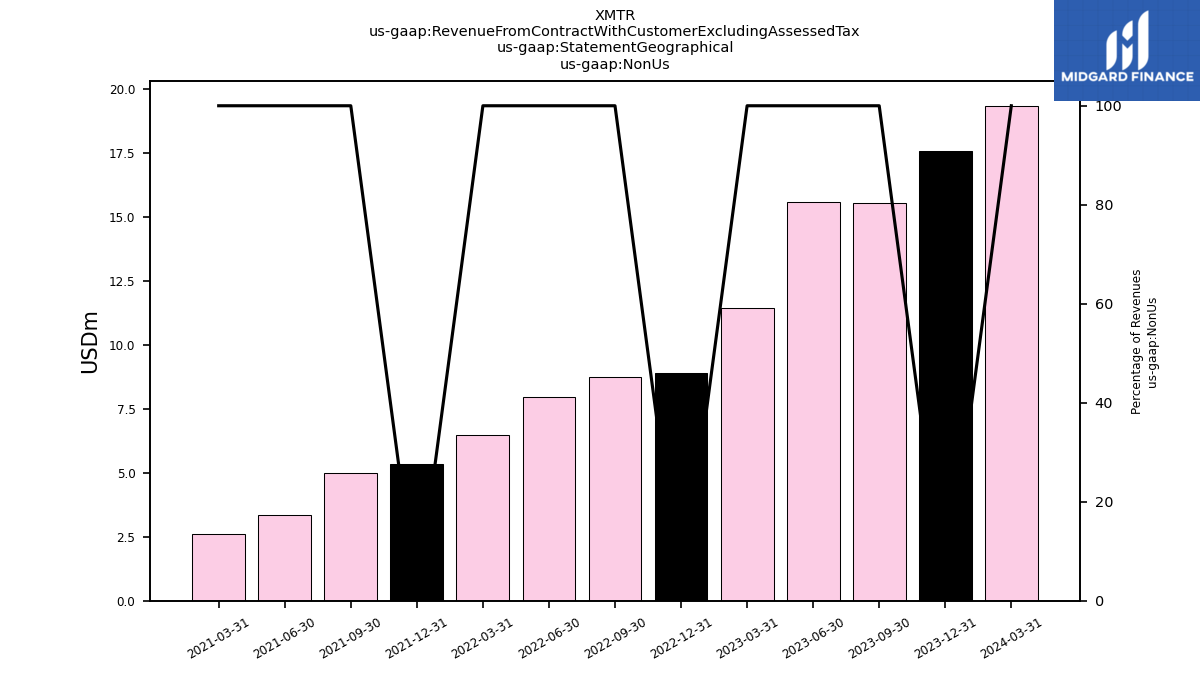
| Non Us | 15.55 | 15.57 | 11.42 | 8.91 | 8.74 | 7.94 | 6.46 | 5.33 | 4.99 | 3.36 | 2.62 | NA | NA | NA | |
| Revenue From Contract With Customer Excluding Assessed Tax | 118.93 | 111.01 | 105.33 | 98.20 | 103.57 | 95.61 | 83.67 | 67.10 | 56.73 | 50.59 | 43.92 | 37.98 | 41.95 | 34.78 | |
| Marketplace Revenue | 102.47 | 93.51 | 86.68 | 79.06 | 84.06 | 75.60 | 64.42 | NA | NA | NA | NA | NA | NA | NA | |
| Supplier Service Revenue | 16.45 | 17.50 | 18.65 | 19.14 | 19.51 | 20.02 | 19.26 | NA | NA | NA | NA | NA | NA | NA | |
| US | 103.38 | 95.43 | 93.90 | 89.29 | 94.83 | 87.67 | 77.21 | 61.77 | 51.74 | 47.23 | 41.30 | 36.73 | 41.15 | 34.13 | |
| Non Us | 15.55 | 15.57 | 11.42 | 8.91 | 8.74 | 7.94 | 6.46 | 5.33 | 4.99 | 3.36 | 2.62 | NA | NA | NA |
