
| 2023-12-31 | 2023-09-30 | 2023-06-30 | 2023-03-31 | 2022-12-31 | 2022-09-30 | 2022-06-30 | 2022-03-31 | 2021-12-31 | 2021-09-30 | ||
|---|---|---|---|---|---|---|---|---|---|---|---|
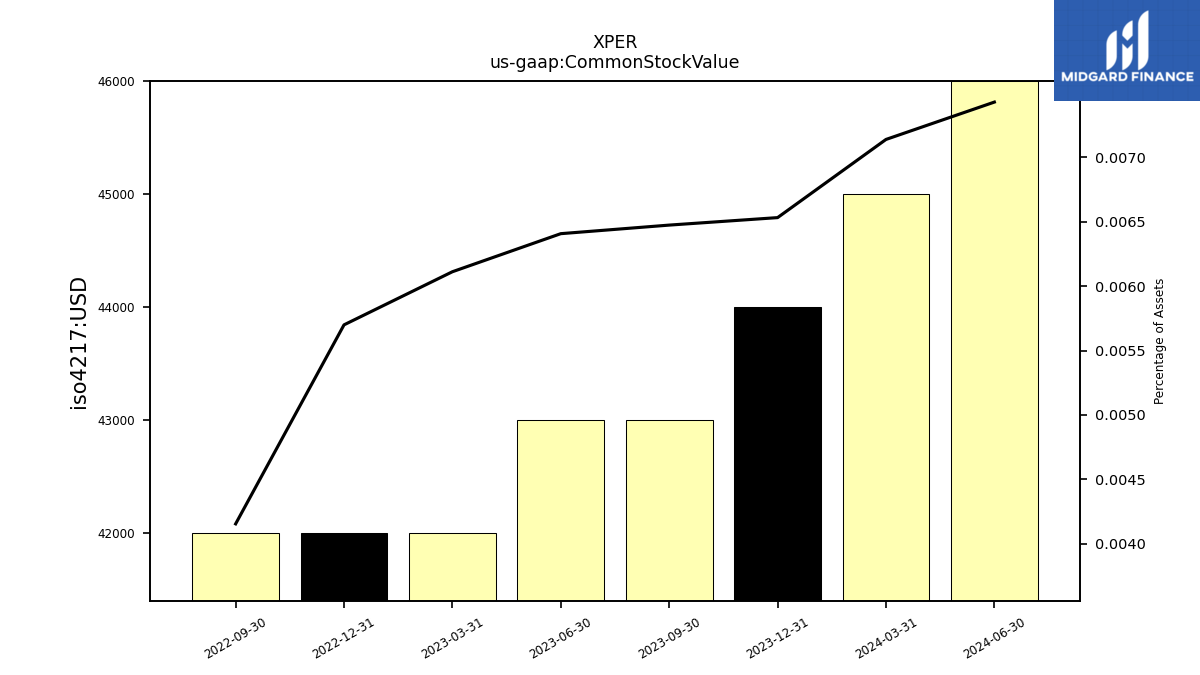
| Common Stock Value | 0.04 | 0.04 | 0.04 | 0.04 | 0.04 | 0.04 | NA | NA | NA | NA | |
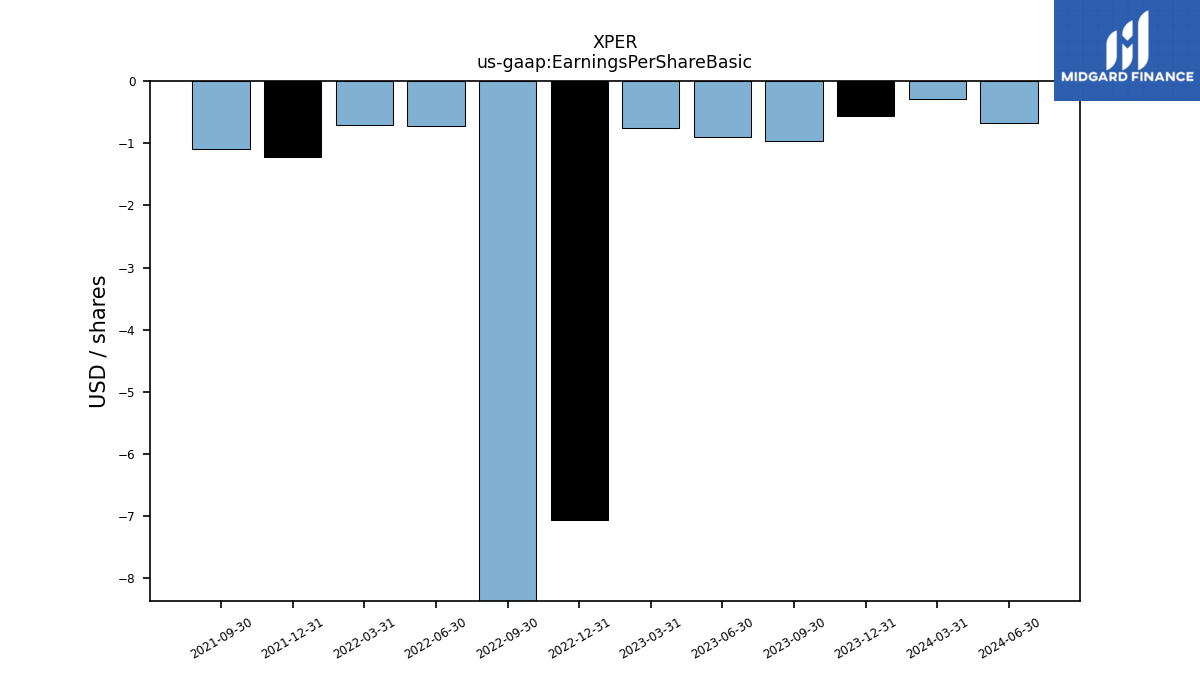
| Earnings Per Share Basic | -0.57 | -0.96 | -0.90 | -0.76 | -7.06 | -9.54 | -0.72 | -0.70 | -1.23 | -1.10 | |
| Earnings Per Share Diluted | -0.57 | -0.96 | -0.90 | -0.76 | -7.06 | -9.54 | -0.72 | -0.70 | -1.23 | -1.10 |
| 2023-12-31 | 2023-09-30 | 2023-06-30 | 2023-03-31 | 2022-12-31 | 2022-09-30 | 2022-06-30 | 2022-03-31 | 2021-12-31 | 2021-09-30 | ||
|---|---|---|---|---|---|---|---|---|---|---|---|
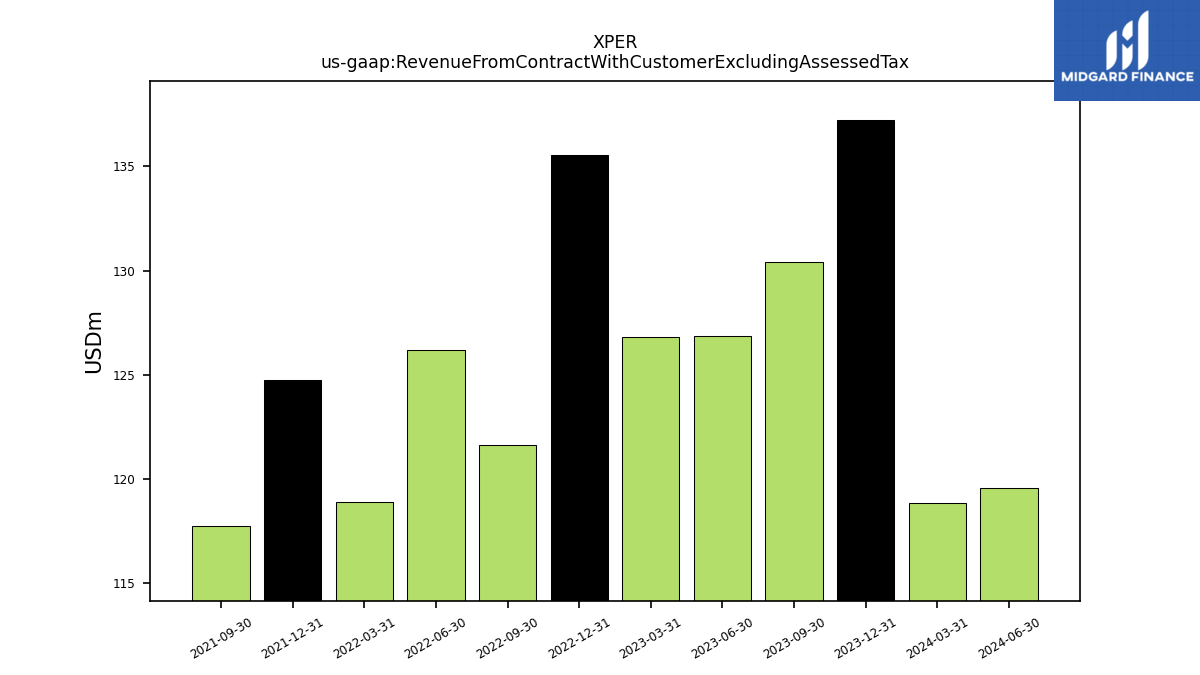
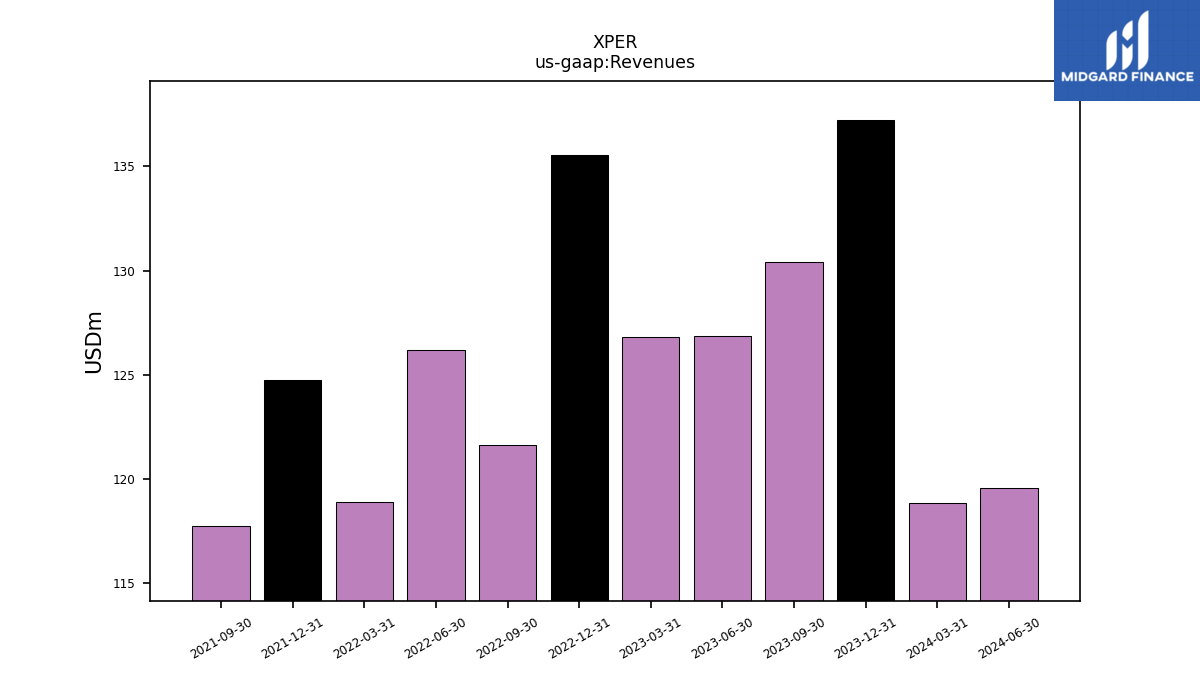
| Revenue From Contract With Customer Excluding Assessed Tax | 137.23 | 130.39 | 126.87 | 126.84 | 135.53 | 121.64 | 126.20 | 118.89 | 124.75 | 117.73 | |
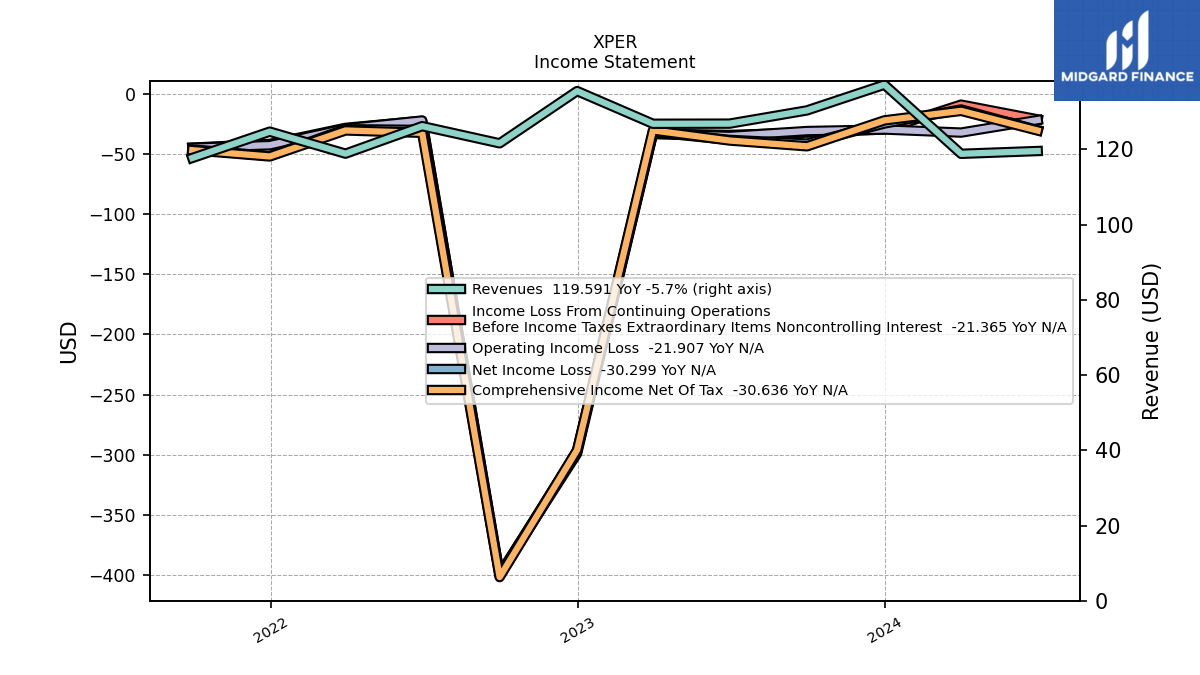
| Revenues | 137.23 | 130.39 | 126.87 | 126.84 | 135.53 | 121.64 | 126.20 | 118.89 | 124.75 | 117.73 | |
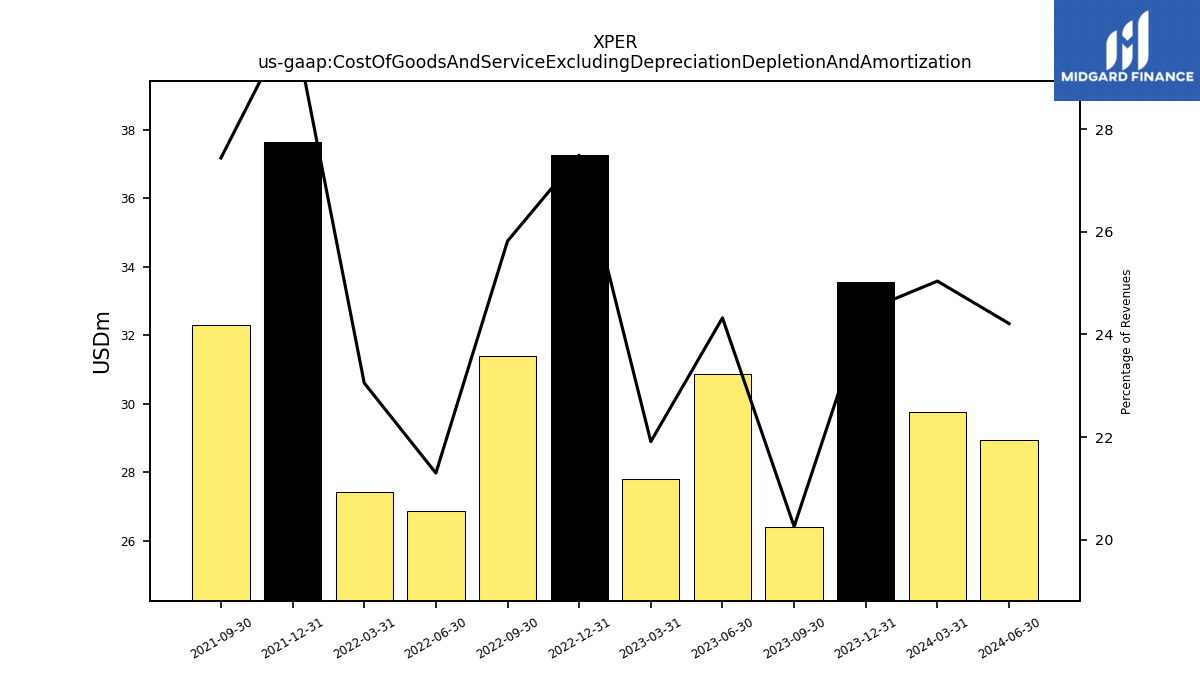
| Cost Of Goods And Service Excluding Depreciation Depletion And Amortization | 33.57 | 26.41 | 30.86 | 27.79 | 37.26 | 31.40 | 26.88 | 27.41 | 37.64 | 32.30 | |
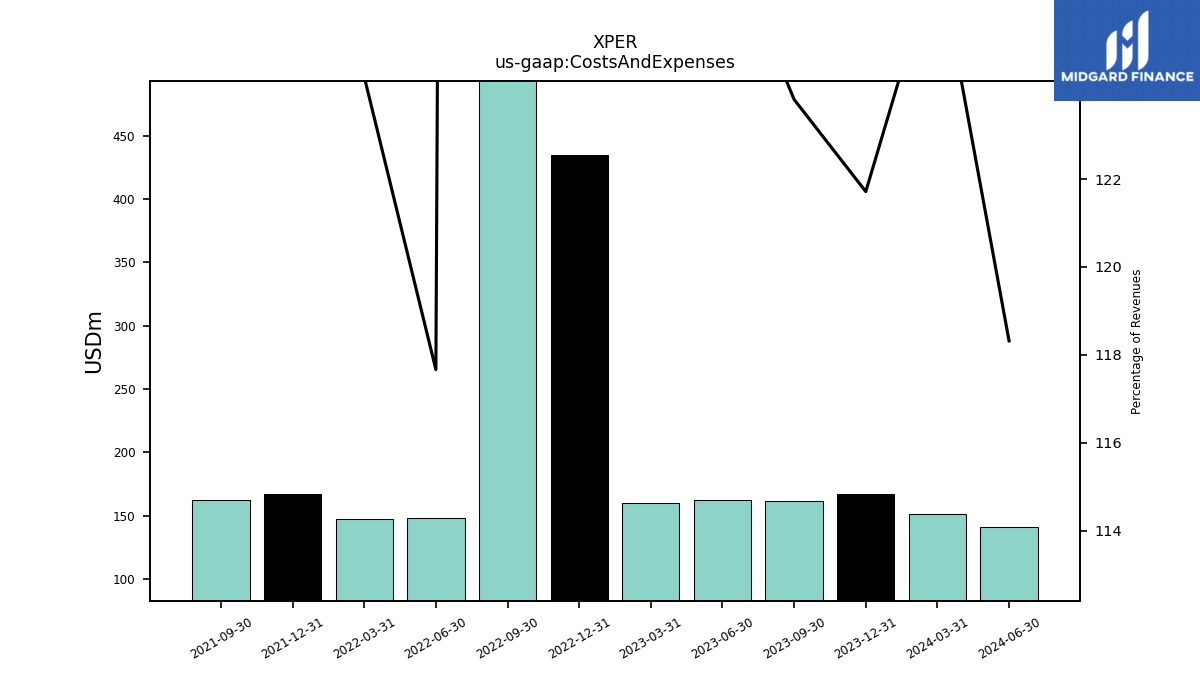
| Costs And Expenses | 167.04 | 161.44 | 162.05 | 160.44 | 434.61 | 520.78 | 148.50 | 147.81 | 167.55 | 162.70 | |
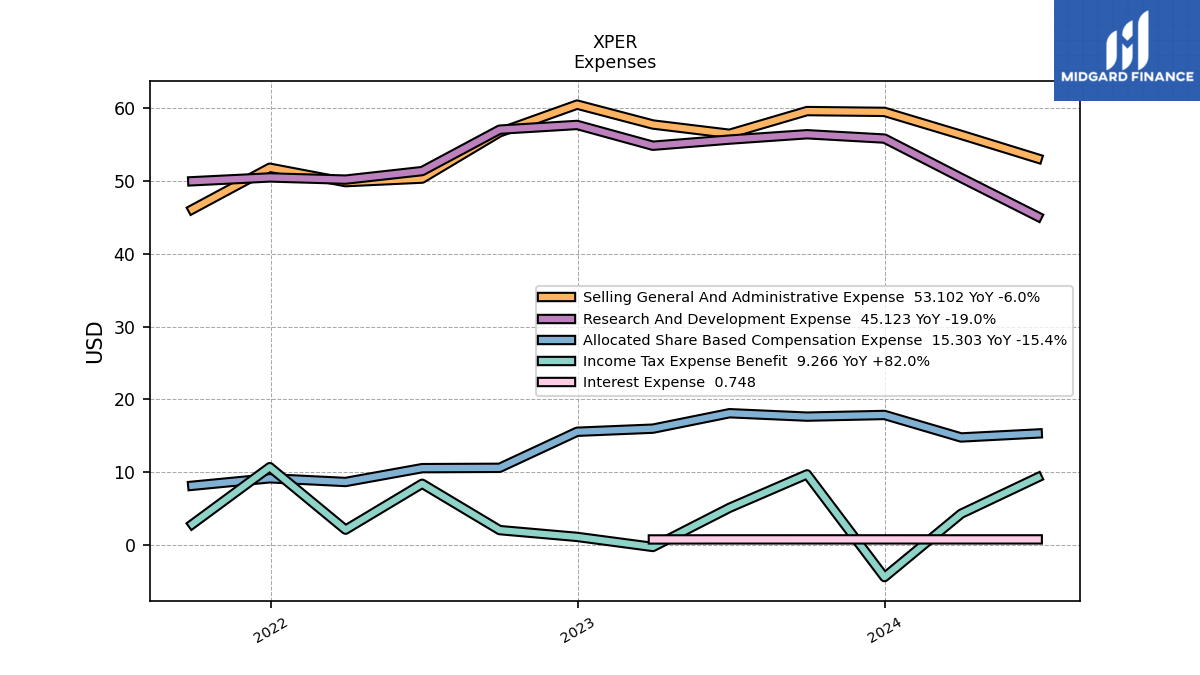
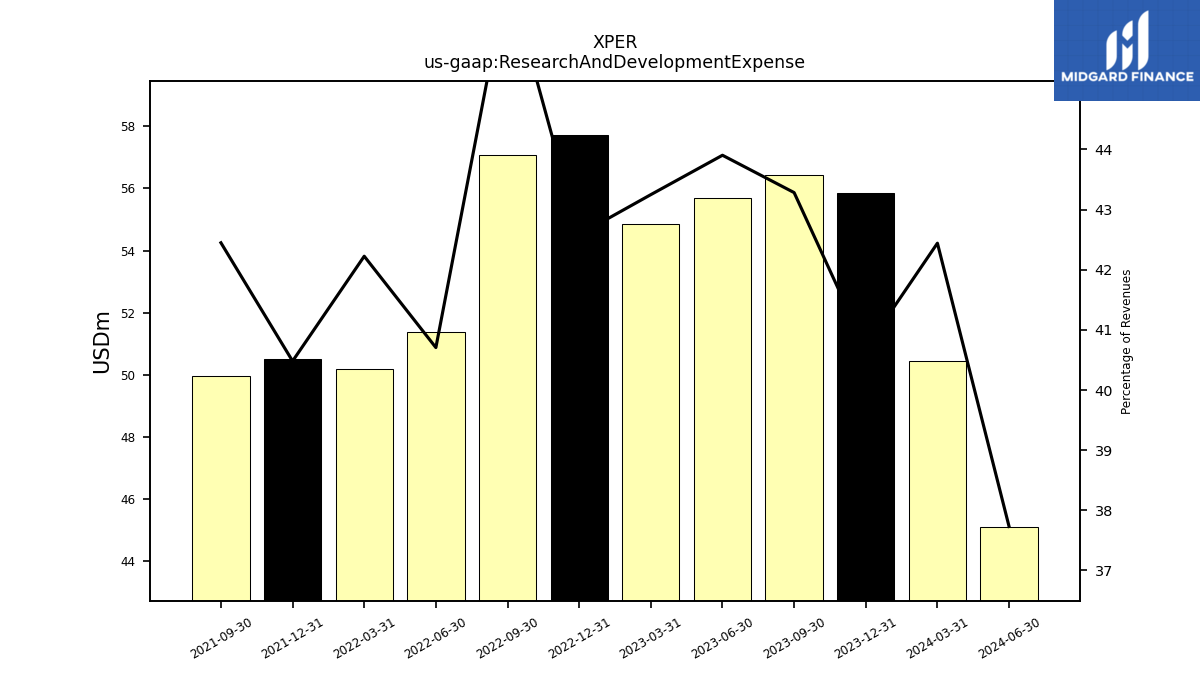
| Research And Development Expense | 55.84 | 56.44 | 55.70 | 54.86 | 57.71 | 57.07 | 51.37 | 50.20 | 50.50 | 49.98 | |
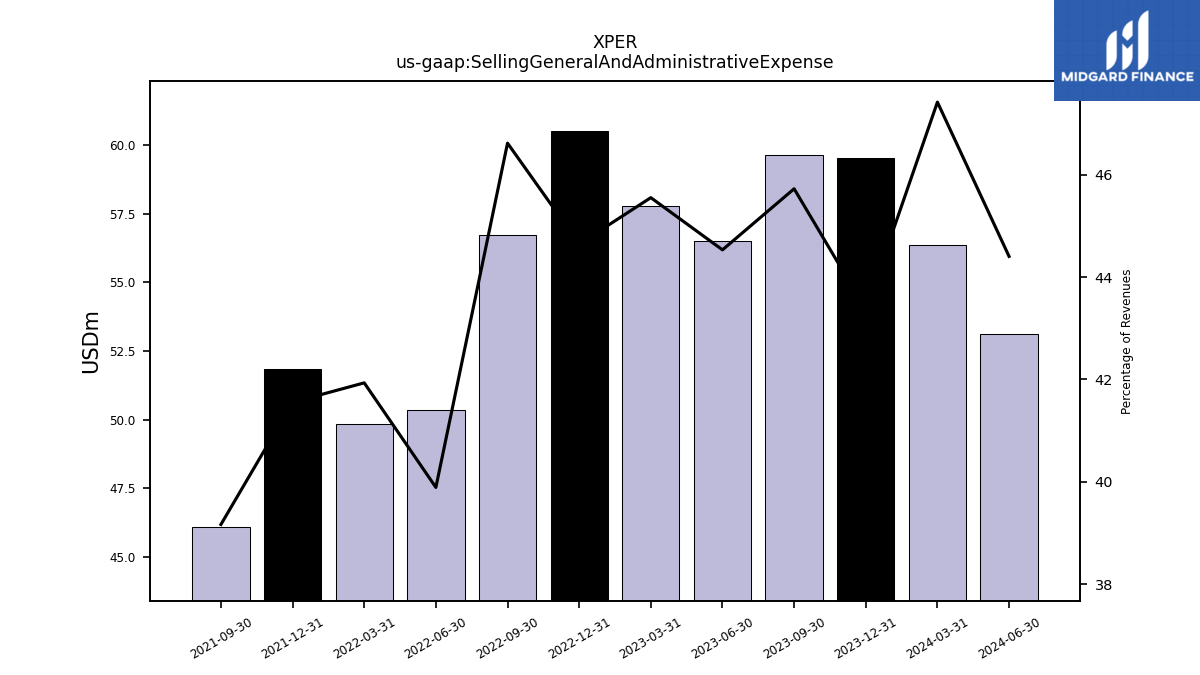
| Selling General And Administrative Expense | 59.51 | 59.62 | 56.50 | 57.78 | 60.51 | 56.70 | 50.34 | 49.85 | 51.83 | 46.11 | |
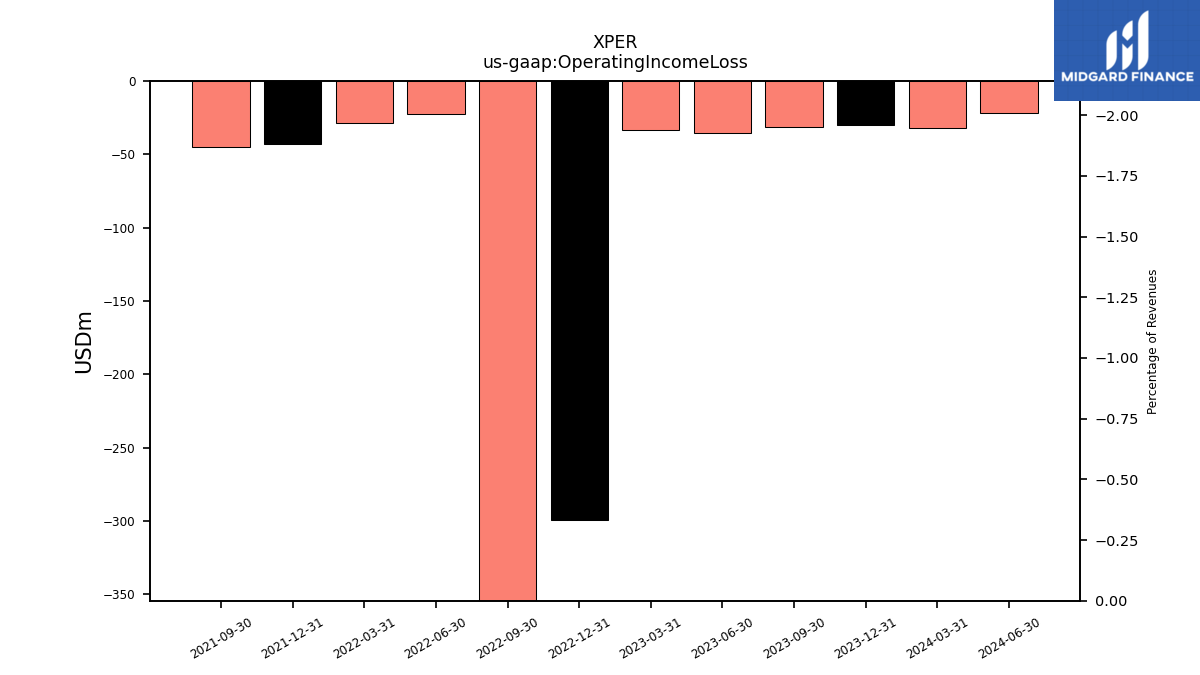
| Operating Income Loss | -29.80 | -31.05 | -35.18 | -33.60 | -299.07 | -399.14 | -22.29 | -28.93 | -42.80 | -44.97 | |
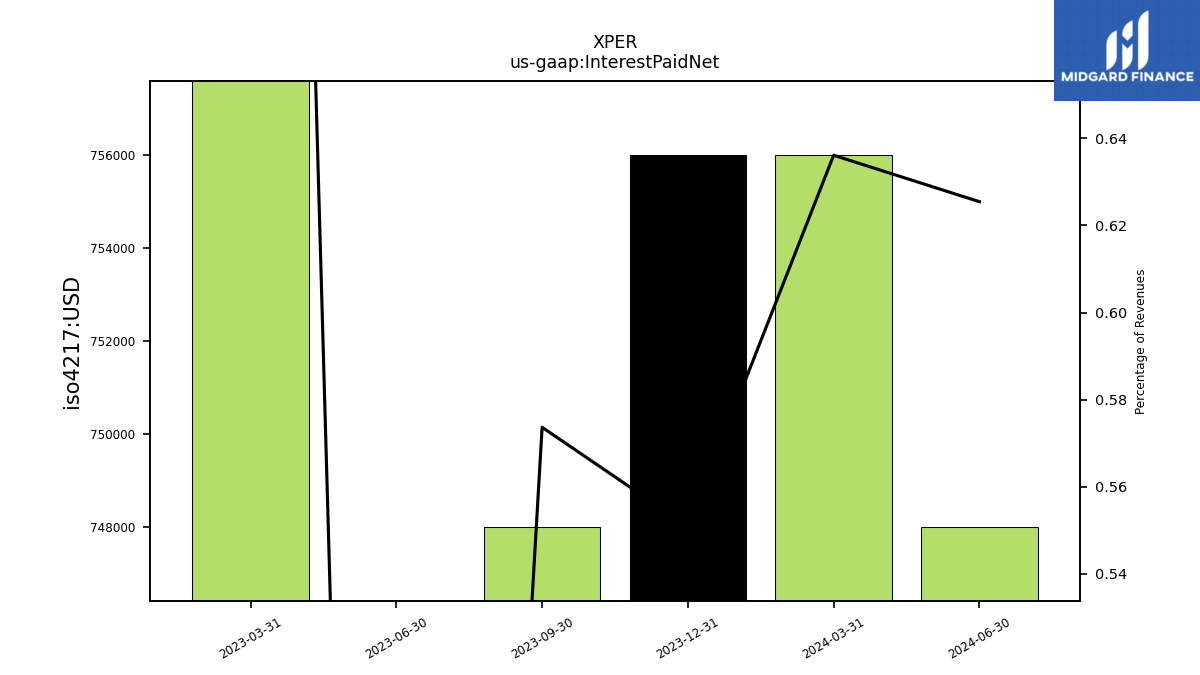
| Interest Paid Net | 0.76 | 0.75 | 0.00 | 1.50 | NA | NA | NA | NA | NA | NA | |
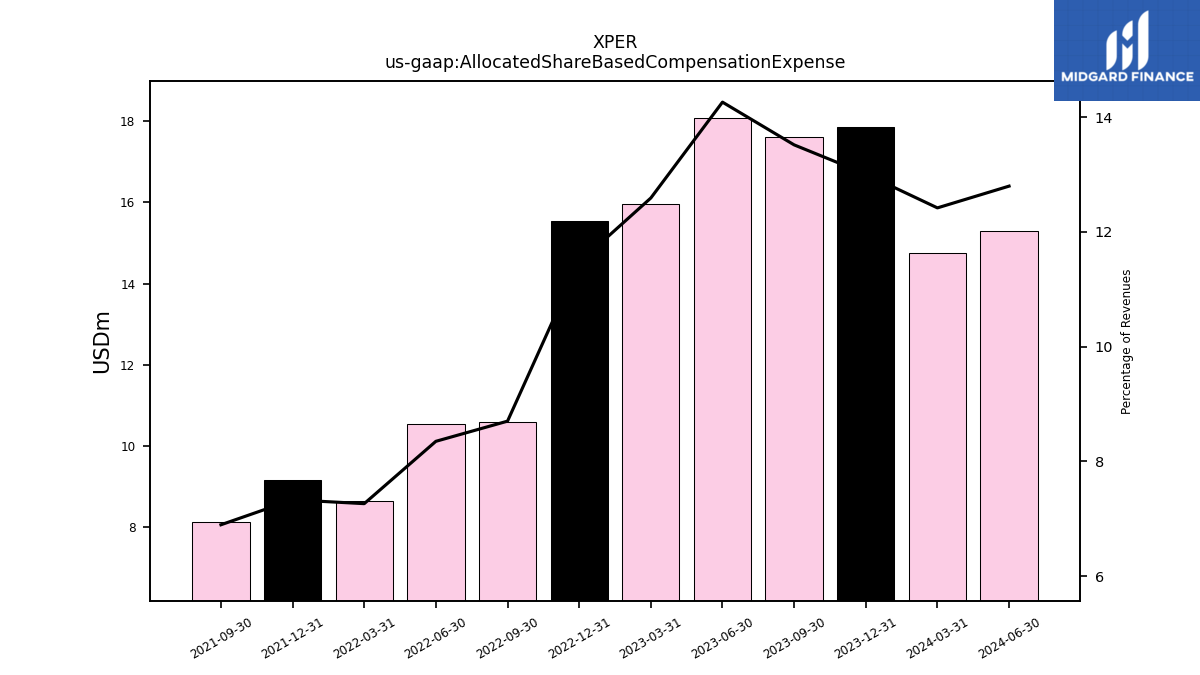
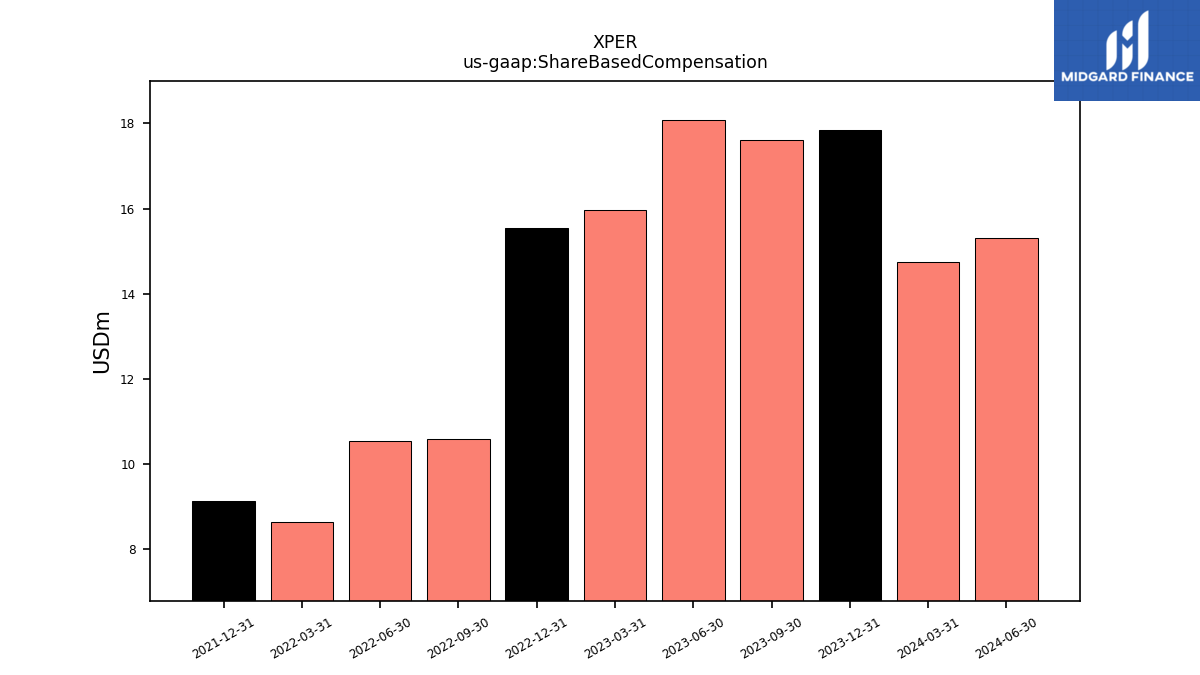
| Allocated Share Based Compensation Expense | 17.85 | 17.62 | 18.09 | 15.97 | 15.54 | 10.59 | 10.54 | 8.64 | 9.15 | 8.12 | |
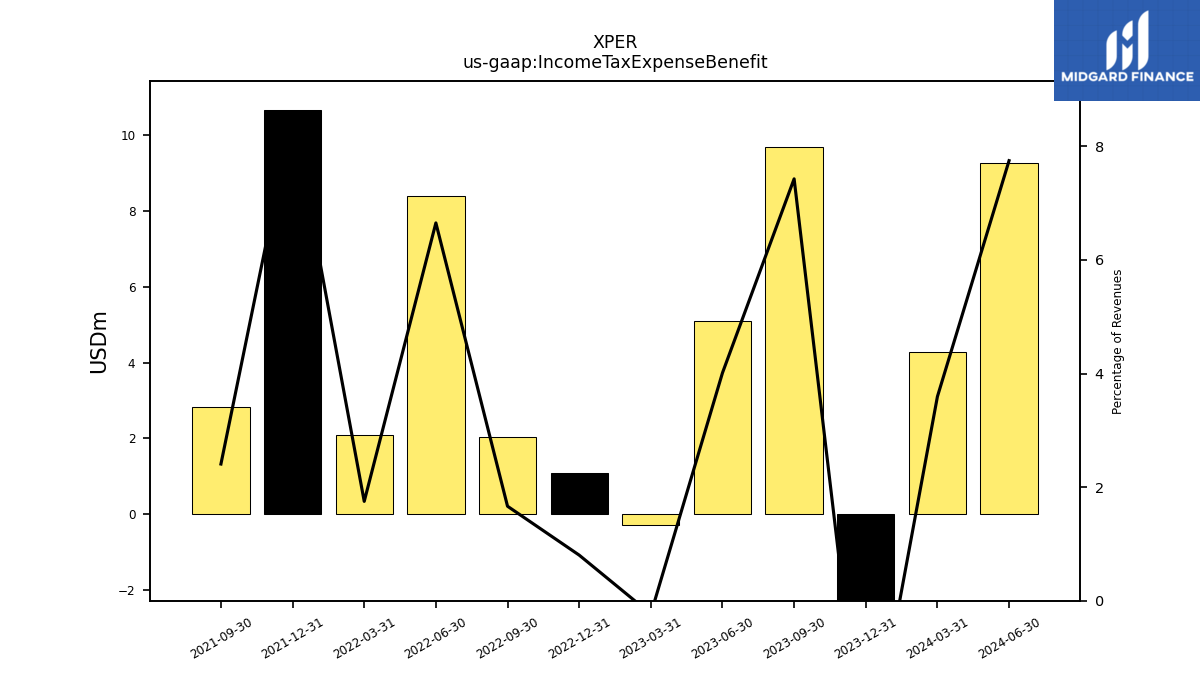
| Income Tax Expense Benefit | -4.44 | 9.69 | 5.09 | -0.29 | 1.09 | 2.02 | 8.39 | 2.08 | 10.68 | 2.83 | |
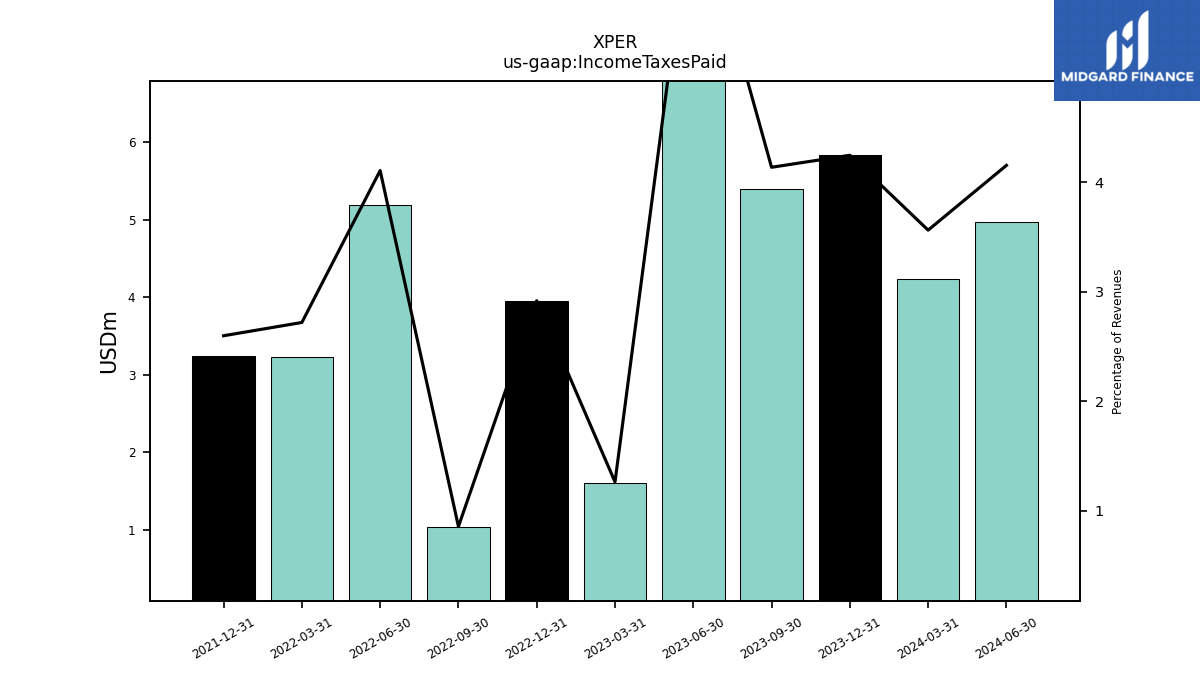
| Income Taxes Paid | 5.83 | 5.39 | 8.51 | 1.60 | 3.96 | 1.04 | 5.18 | 3.23 | 3.24 | NA | |
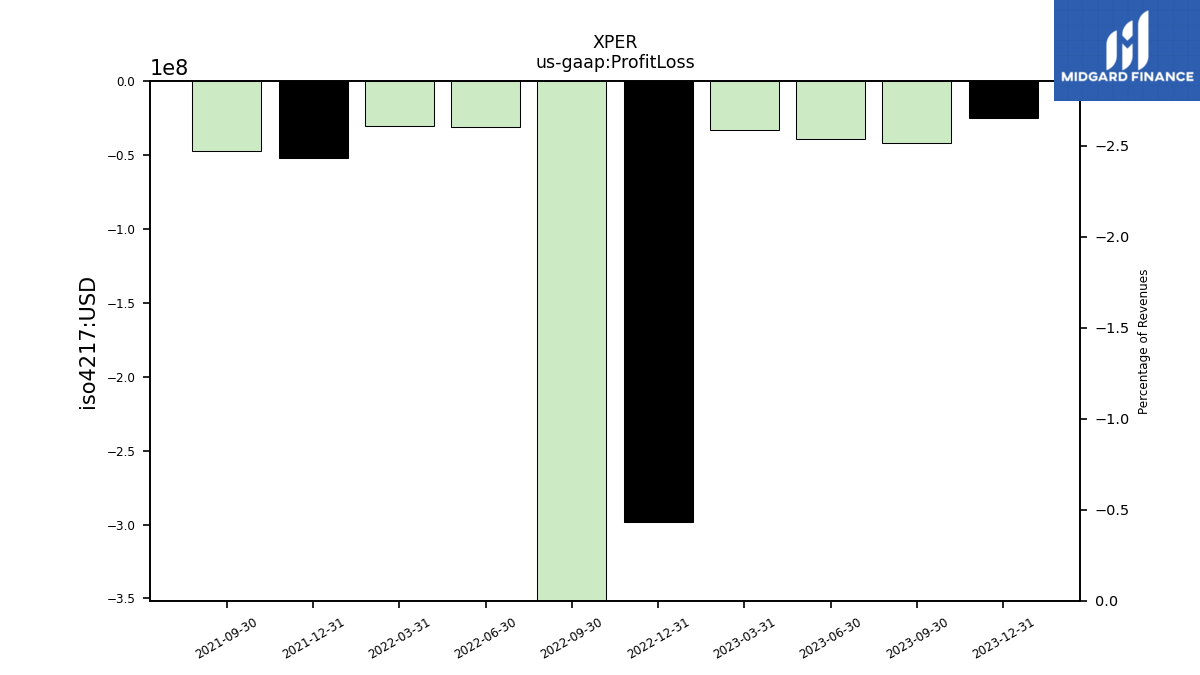
| Profit Loss | -25.31 | -42.07 | -39.36 | -32.94 | -298.05 | -401.69 | -30.98 | -30.49 | -52.40 | -47.66 | |
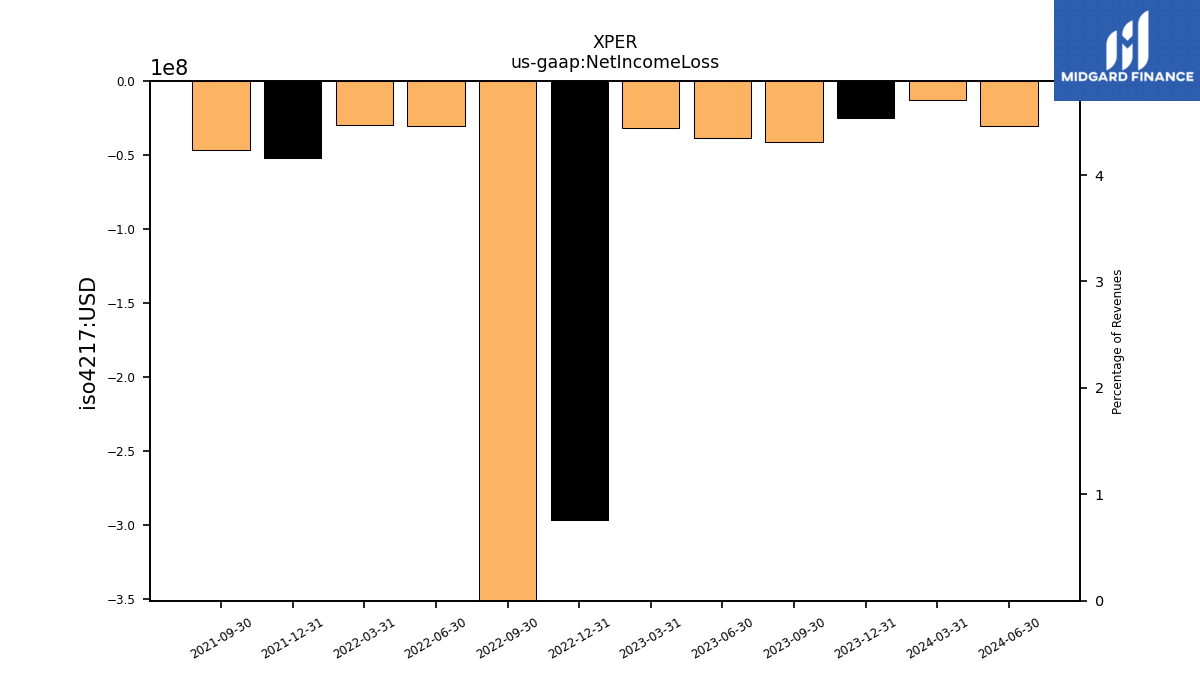
| Net Income Loss | -24.79 | -41.43 | -38.40 | -32.00 | -297.03 | -400.80 | -30.13 | -29.52 | -51.77 | -46.35 | |
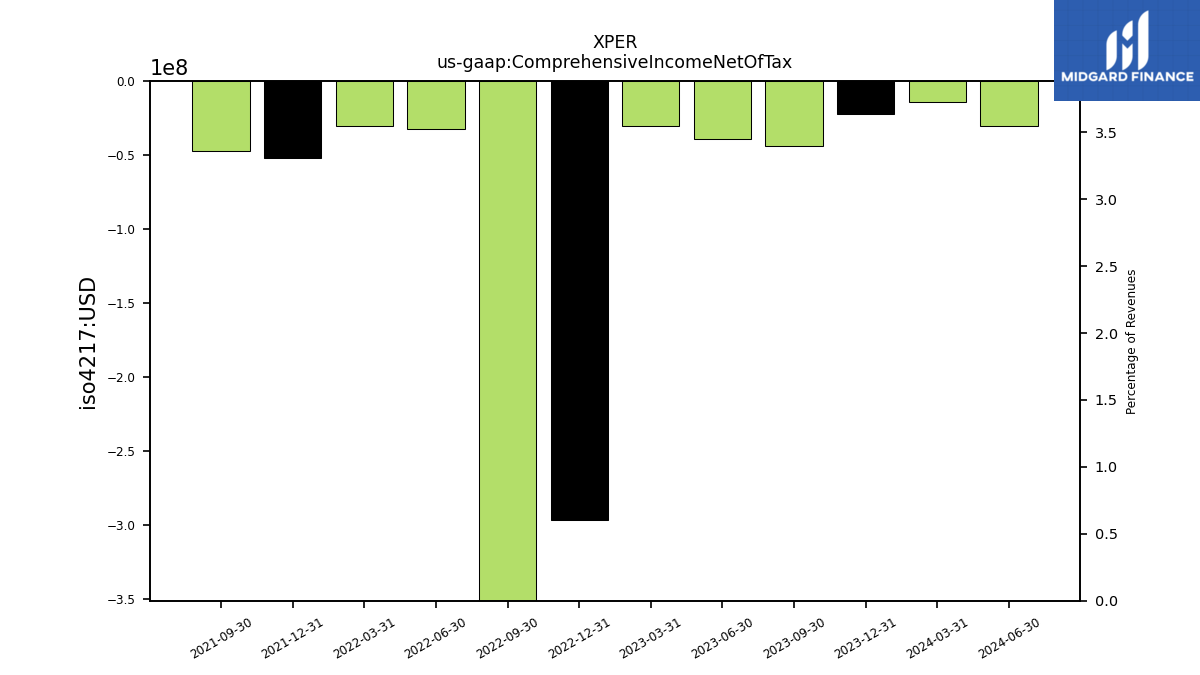
| Comprehensive Income Net Of Tax | -22.16 | -43.74 | -38.93 | -30.52 | -296.11 | -401.72 | -32.53 | -30.57 | -52.17 | -46.94 | |
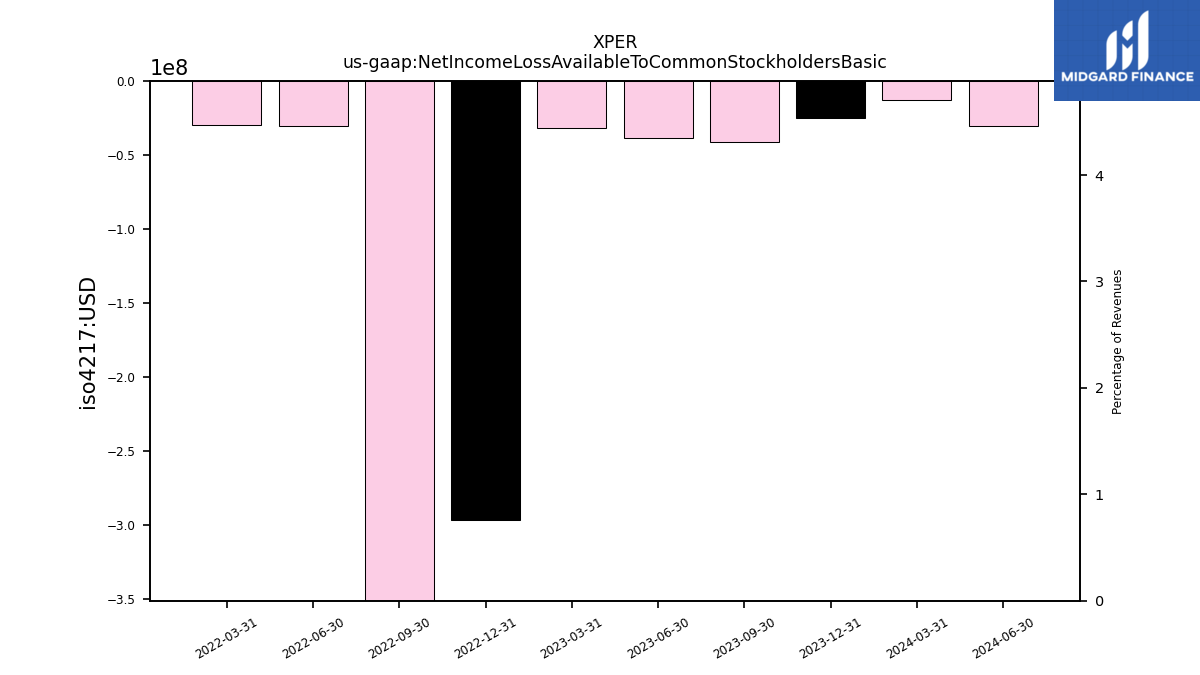
| Net Income Loss Available To Common Stockholders Basic | -24.79 | -41.43 | -38.40 | -32.00 | -297.03 | -400.80 | -30.13 | -29.52 | NA | NA | |
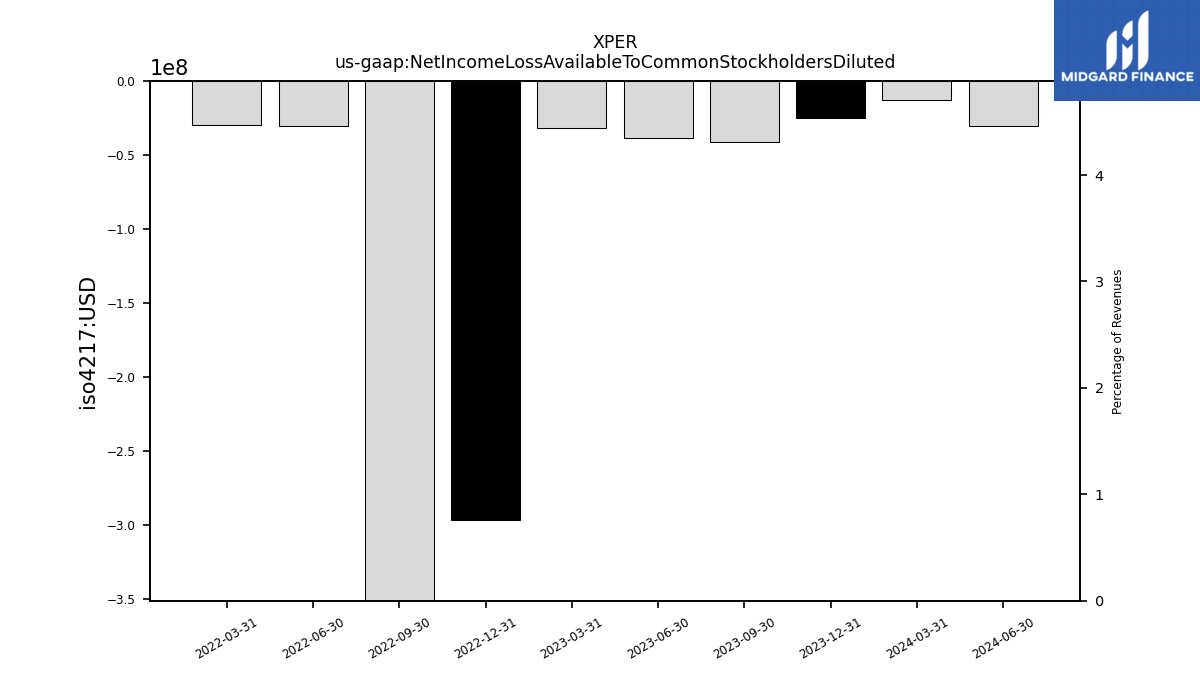
| Net Income Loss Available To Common Stockholders Diluted | -24.79 | -41.43 | -38.40 | -32.00 | -297.03 | -400.80 | -30.13 | -29.52 | NA | NA |
| 2023-12-31 | 2023-09-30 | 2023-06-30 | 2023-03-31 | 2022-12-31 | 2022-09-30 | 2022-06-30 | 2022-03-31 | 2021-12-31 | 2021-09-30 | ||
|---|---|---|---|---|---|---|---|---|---|---|---|
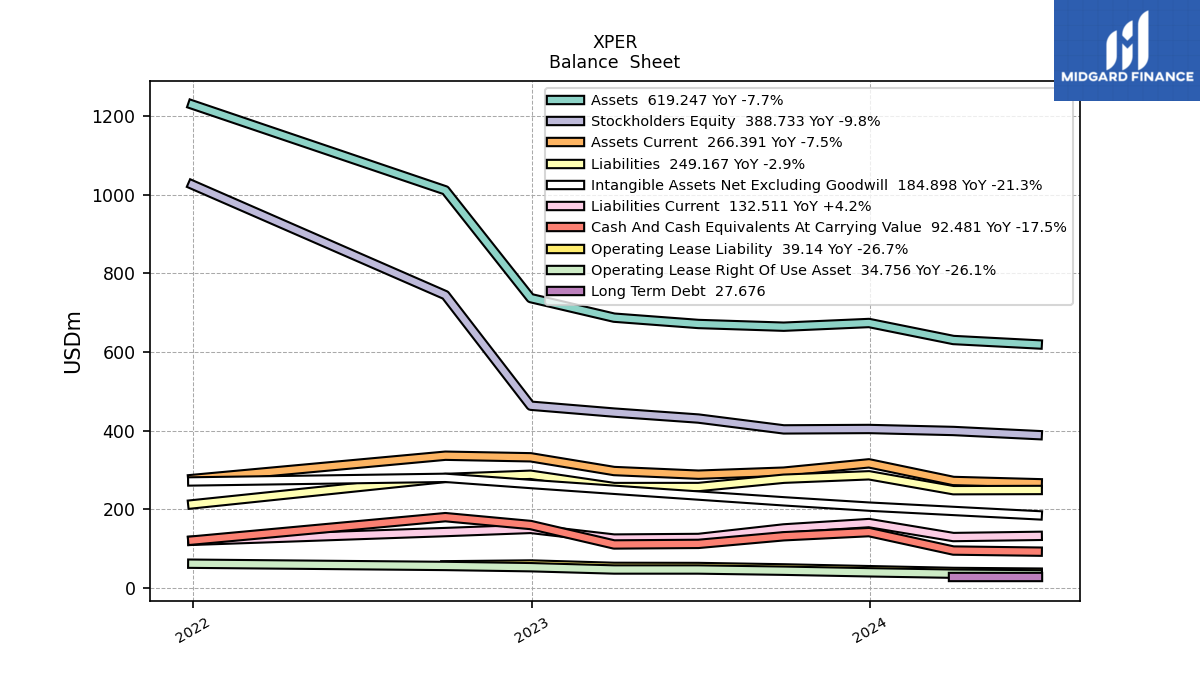
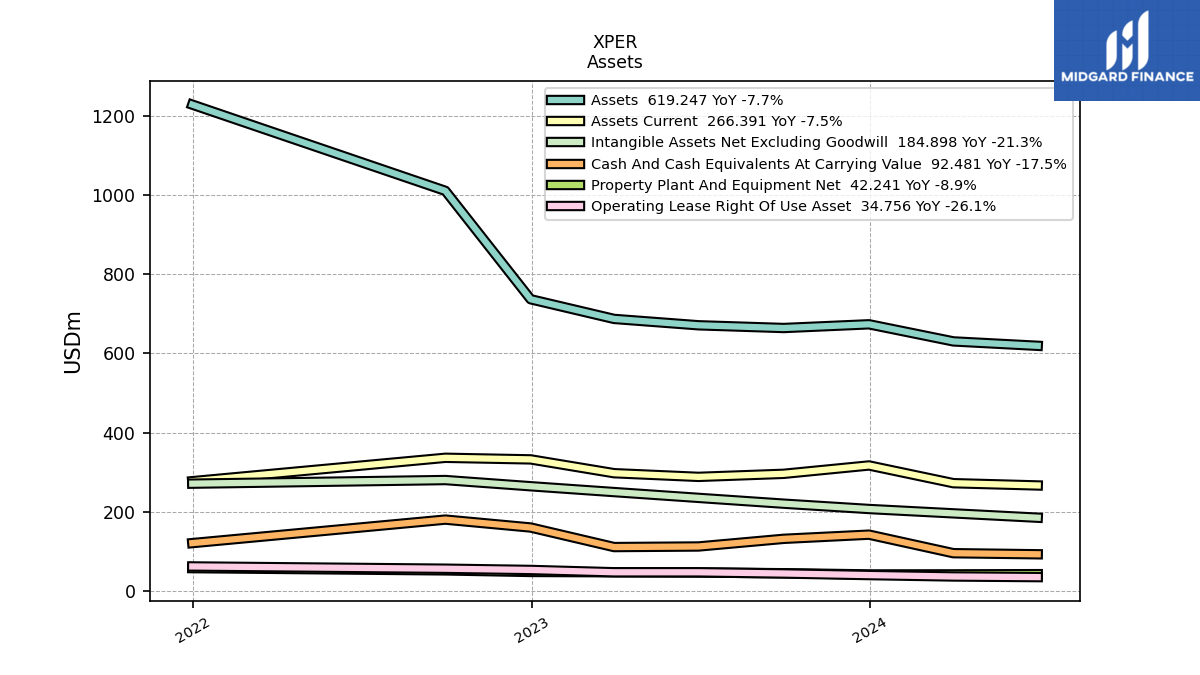
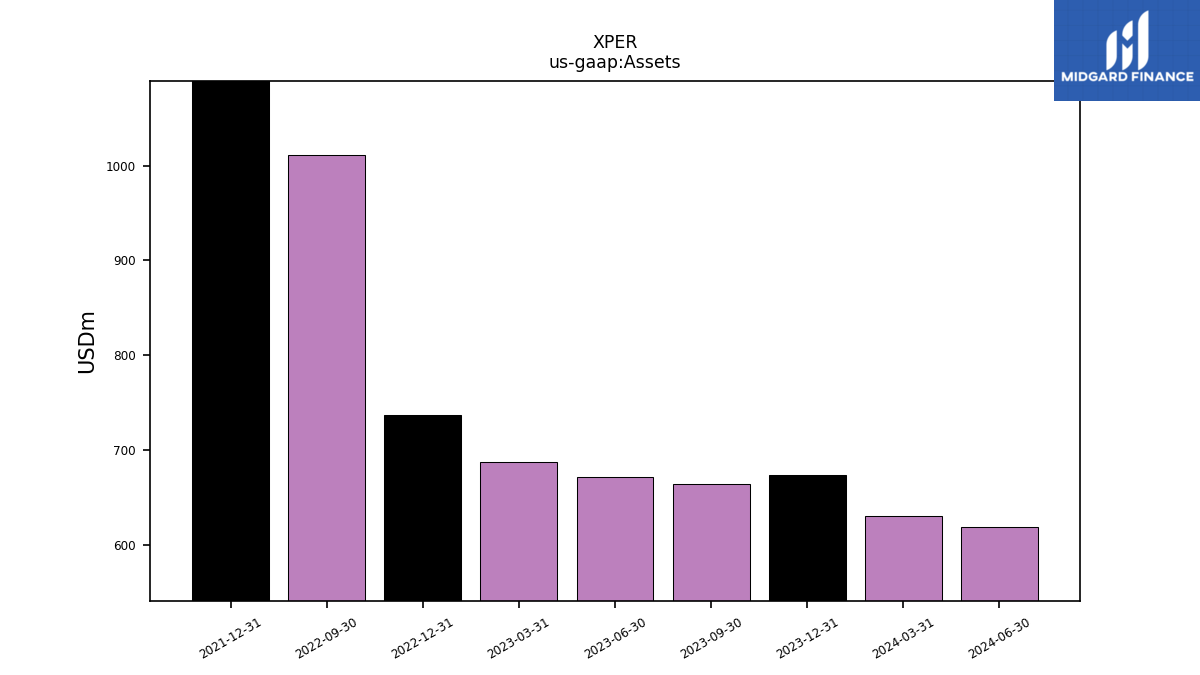
| Assets | 673.63 | 664.23 | 671.13 | 687.21 | 736.91 | 1010.89 | NA | NA | 1228.71 | NA | |
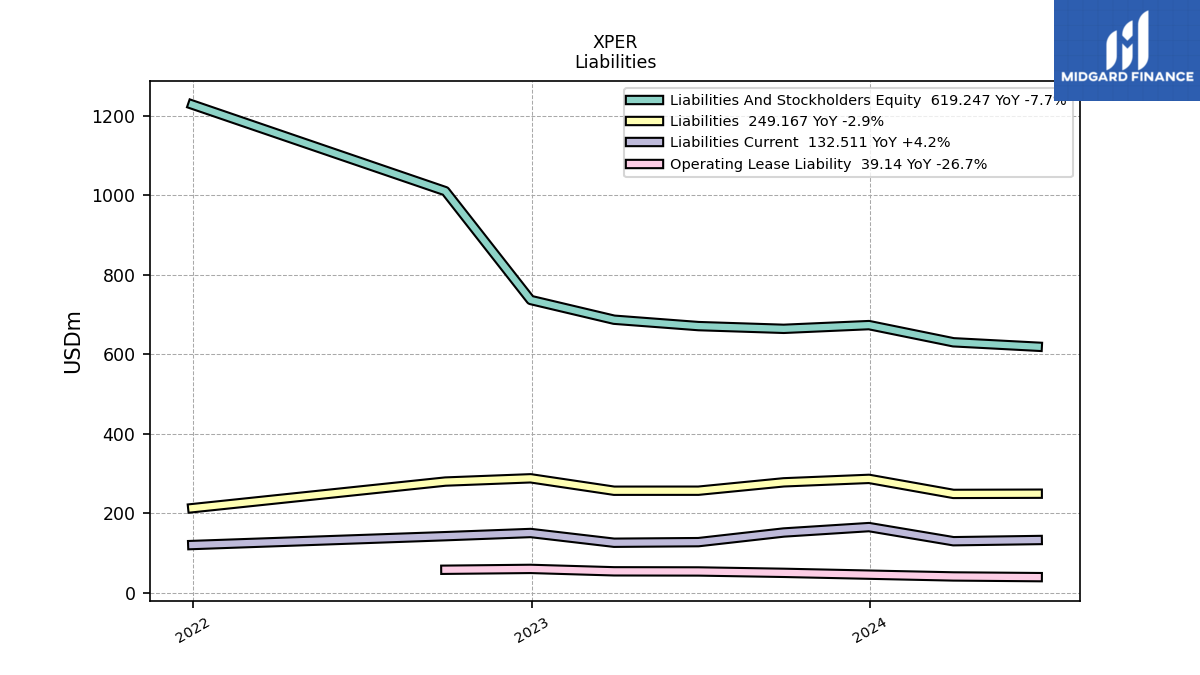
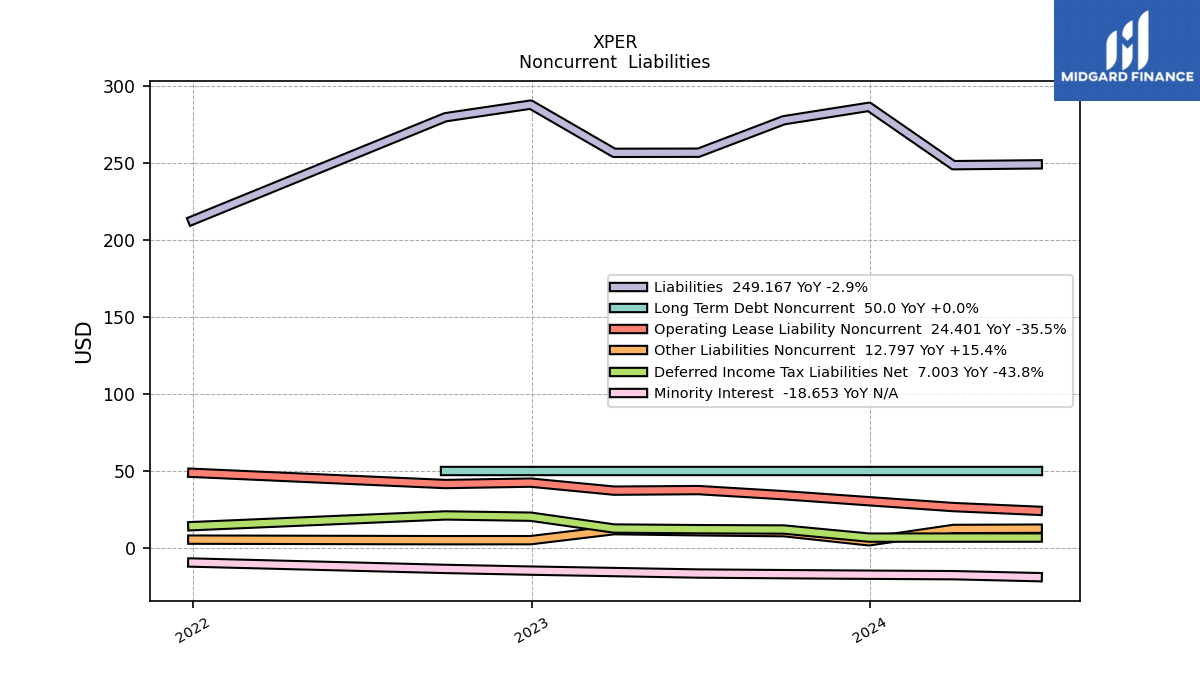
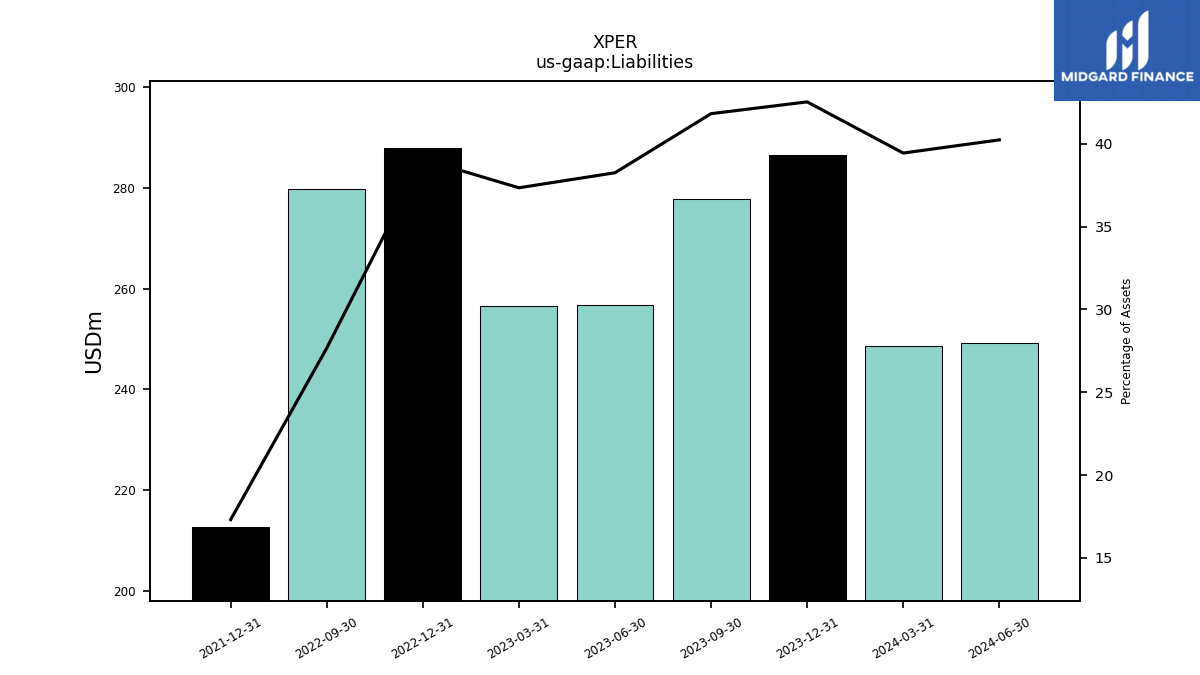
| Liabilities | 286.50 | 277.78 | 256.72 | 256.64 | 287.93 | 279.73 | NA | NA | 212.75 | NA | |
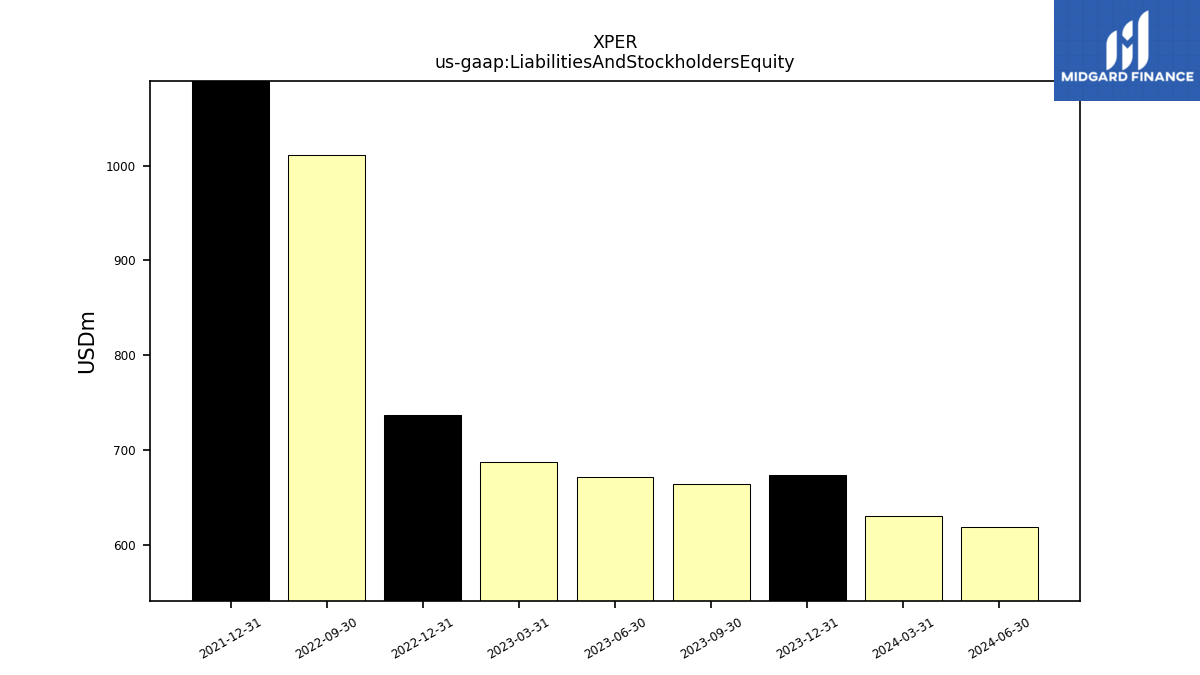
| Liabilities And Stockholders Equity | 673.63 | 664.23 | 671.13 | 687.21 | 736.91 | 1010.89 | NA | NA | 1228.71 | NA | |
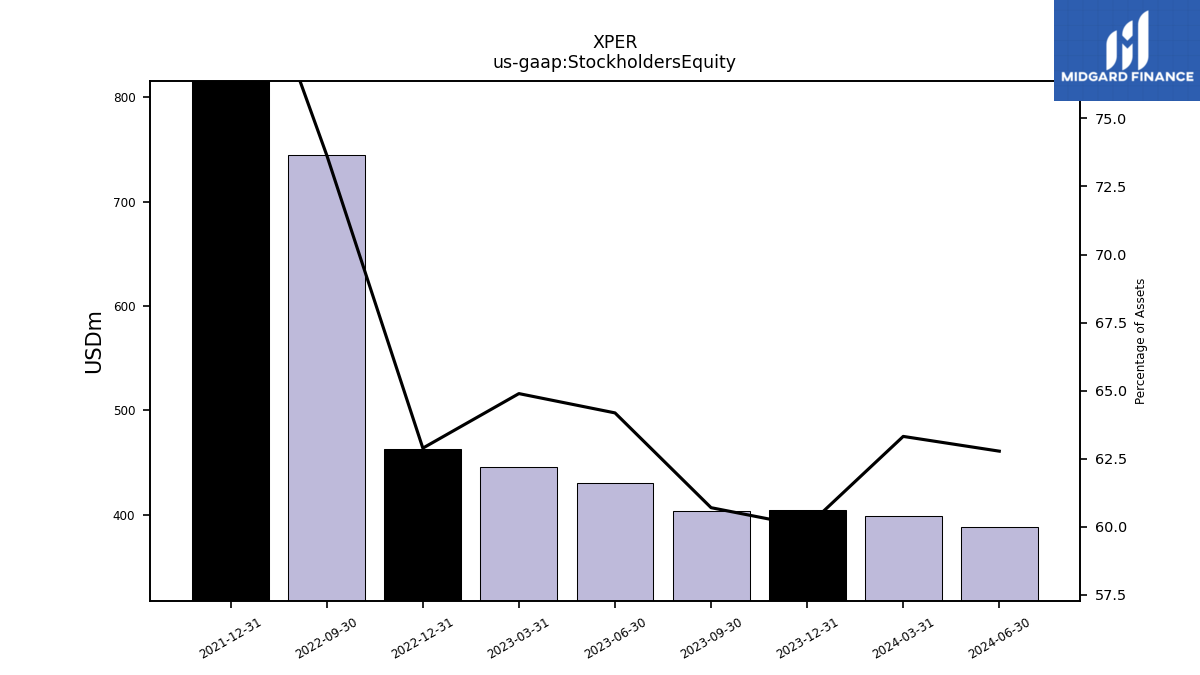
| Stockholders Equity | 404.23 | 403.18 | 430.74 | 445.93 | 463.42 | 744.50 | NA | NA | 1025.16 | NA |
| 2023-12-31 | 2023-09-30 | 2023-06-30 | 2023-03-31 | 2022-12-31 | 2022-09-30 | 2022-06-30 | 2022-03-31 | 2021-12-31 | 2021-09-30 | ||
|---|---|---|---|---|---|---|---|---|---|---|---|
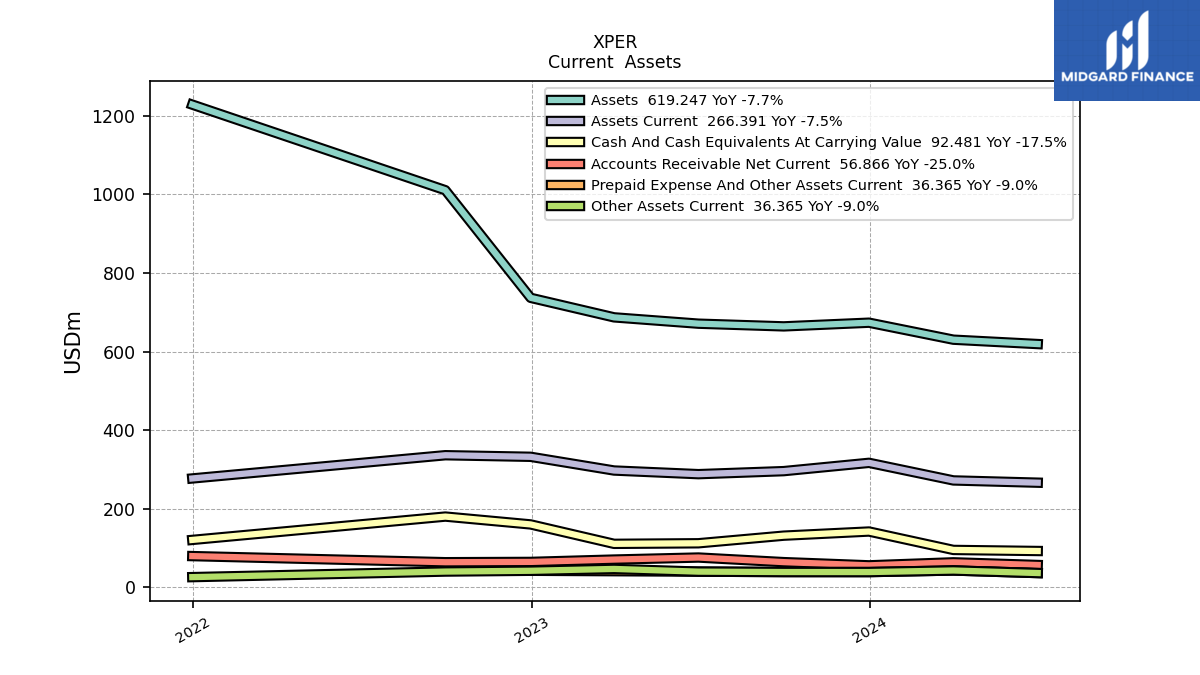
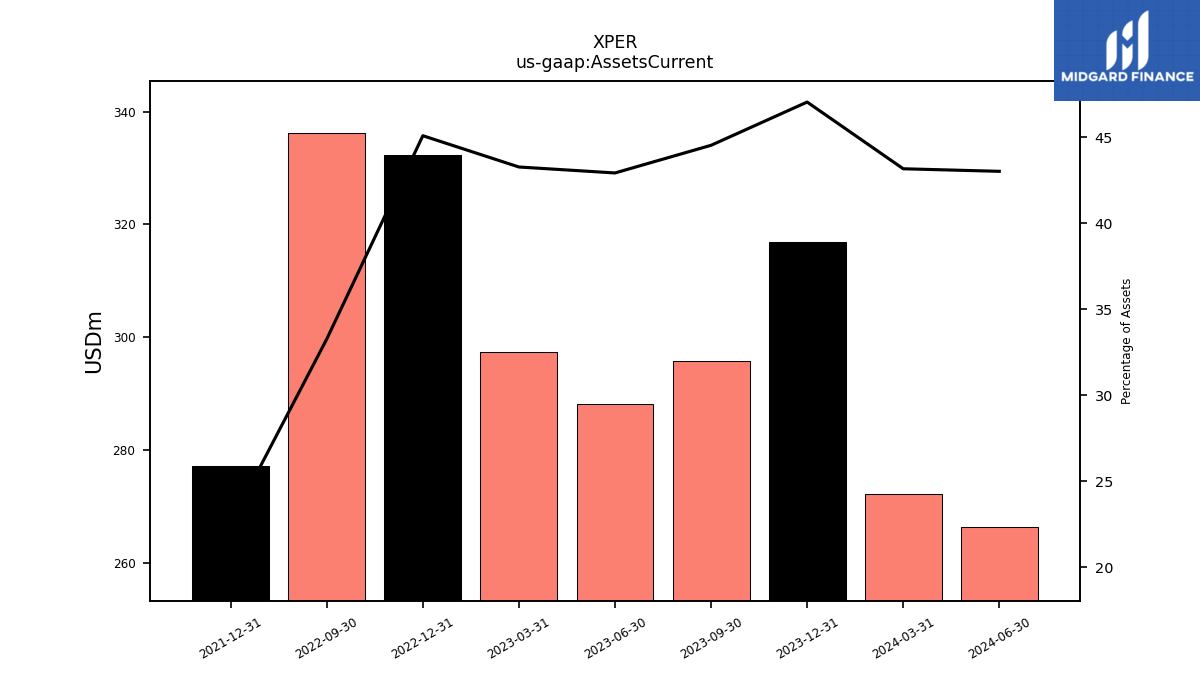
| Assets Current | 316.92 | 295.80 | 288.07 | 297.36 | 332.26 | 336.30 | NA | NA | 277.14 | NA | |
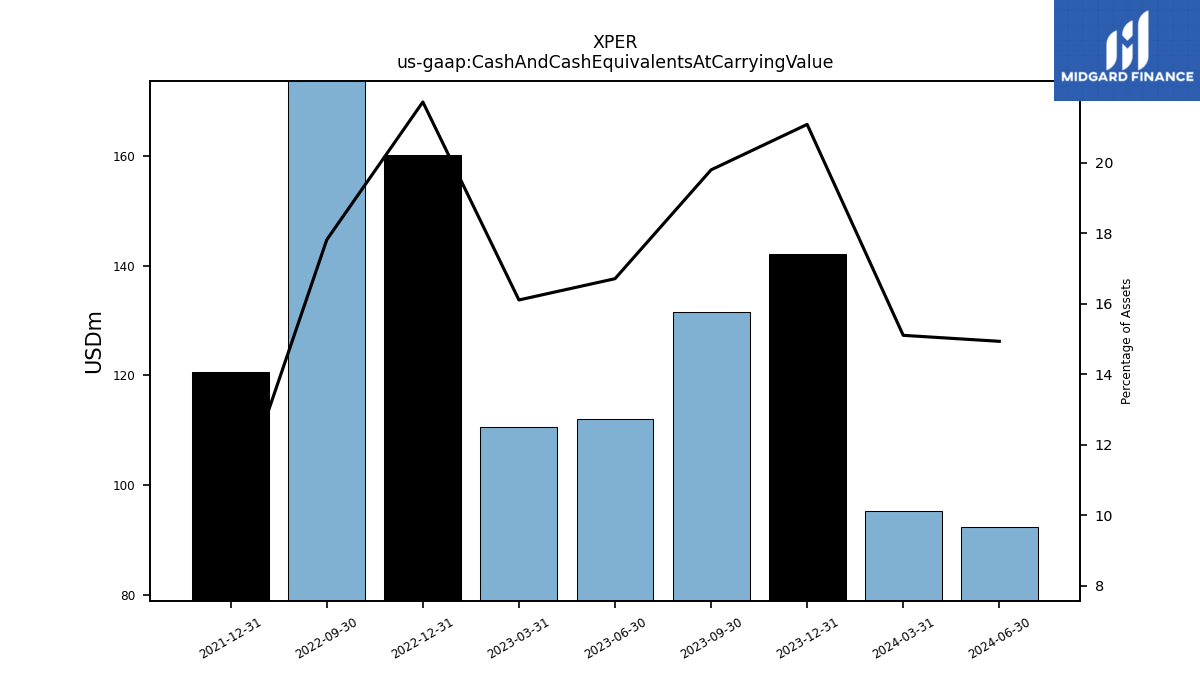
| Cash And Cash Equivalents At Carrying Value | 142.09 | 131.53 | 112.16 | 110.70 | 160.13 | 180.12 | NA | NA | 120.69 | NA | |
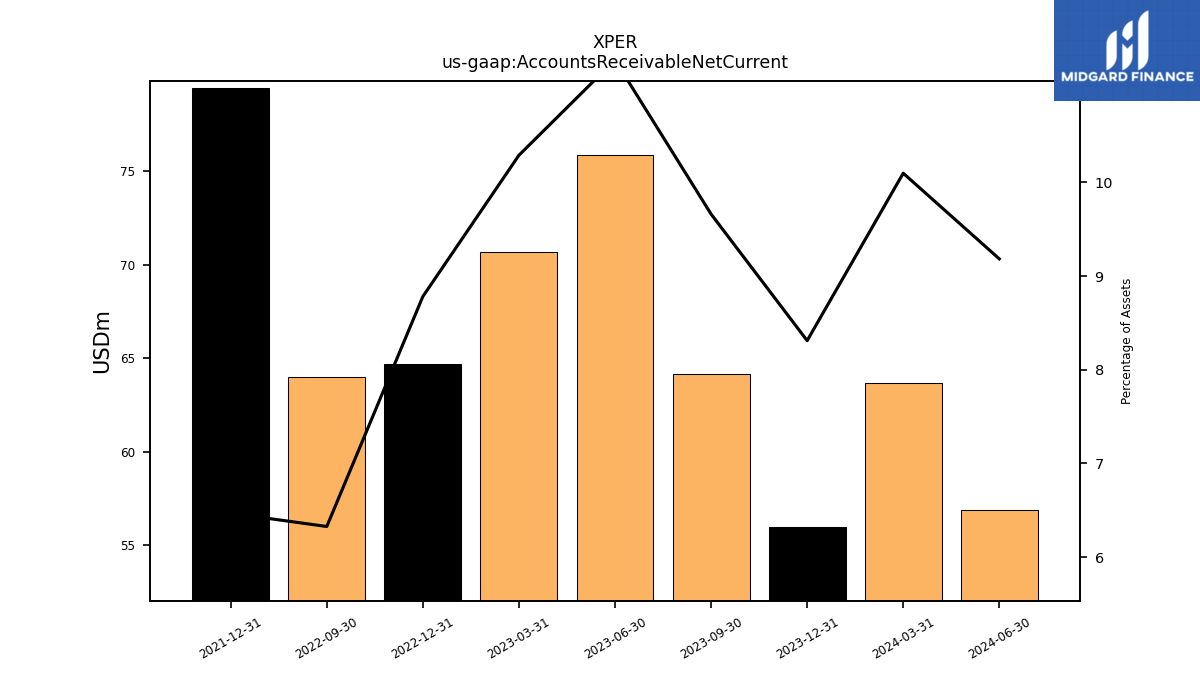
| Accounts Receivable Net Current | 55.98 | 64.17 | 75.87 | 70.70 | 64.71 | 63.97 | NA | NA | 79.49 | NA | |
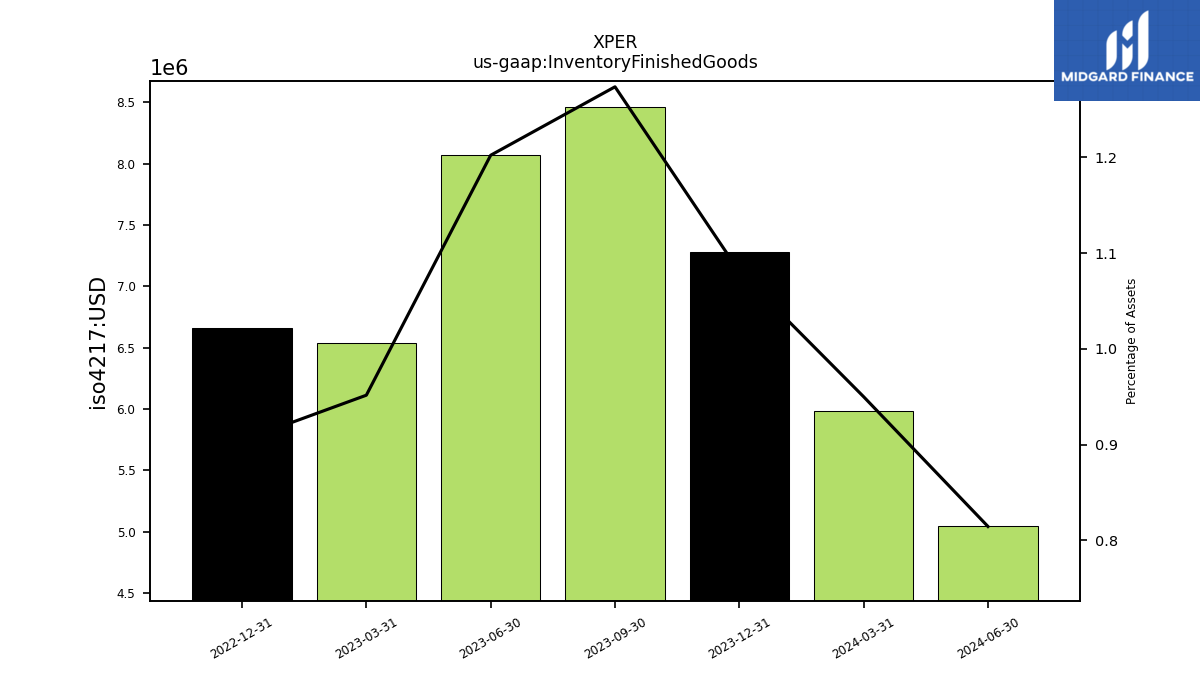
| Inventory Finished Goods | 7.28 | 8.46 | 8.07 | 6.54 | 6.66 | NA | NA | NA | NA | NA | |
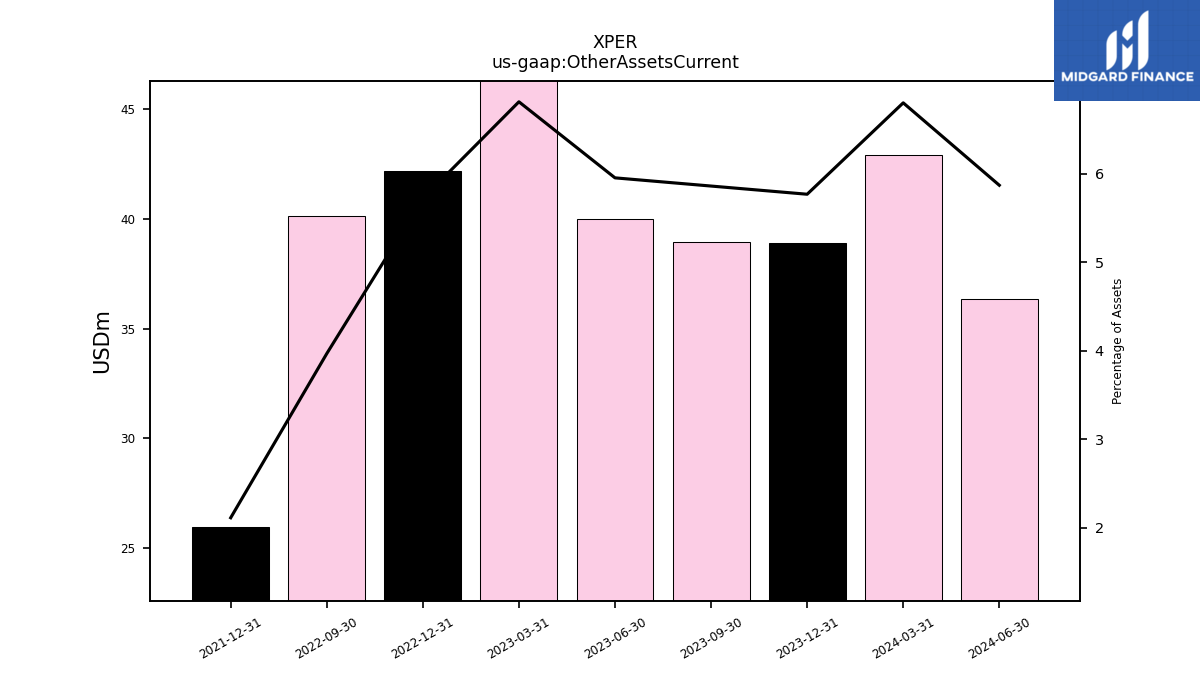
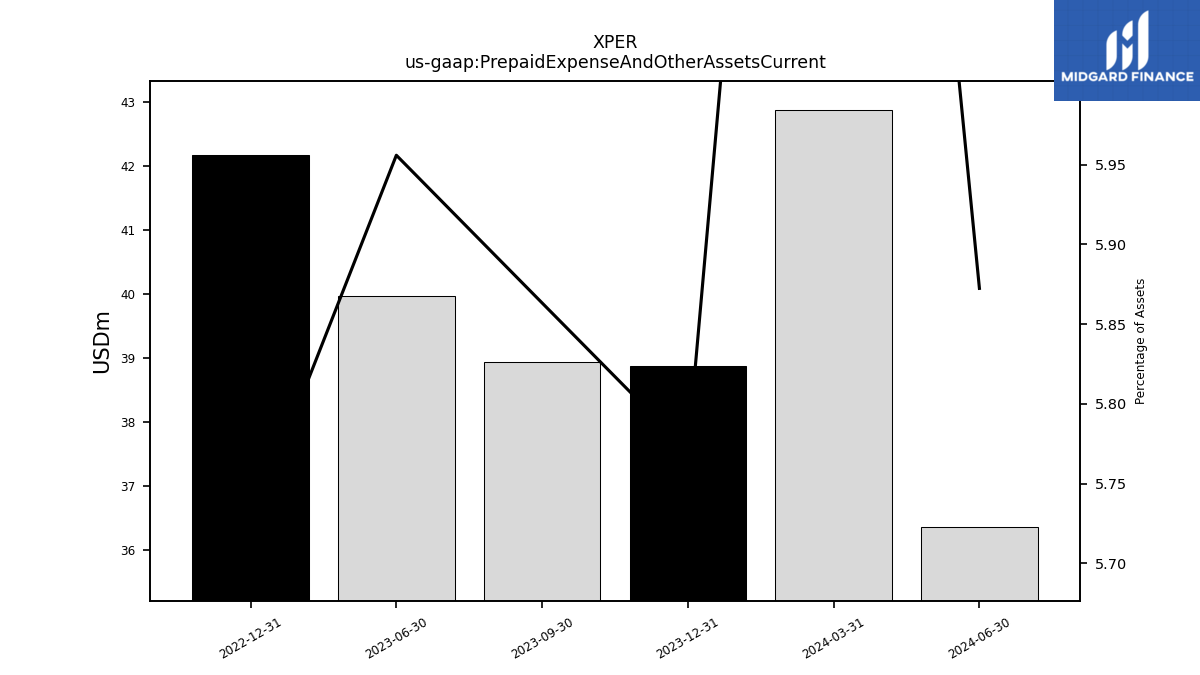
| Other Assets Current | 38.87 | 38.95 | 39.97 | 46.84 | 42.17 | 40.13 | NA | NA | 25.98 | NA | |
| Prepaid Expense And Other Assets Current | 38.87 | 38.95 | 39.97 | NA | 42.17 | NA | NA | NA | NA | NA |
| 2023-12-31 | 2023-09-30 | 2023-06-30 | 2023-03-31 | 2022-12-31 | 2022-09-30 | 2022-06-30 | 2022-03-31 | 2021-12-31 | 2021-09-30 | ||
|---|---|---|---|---|---|---|---|---|---|---|---|
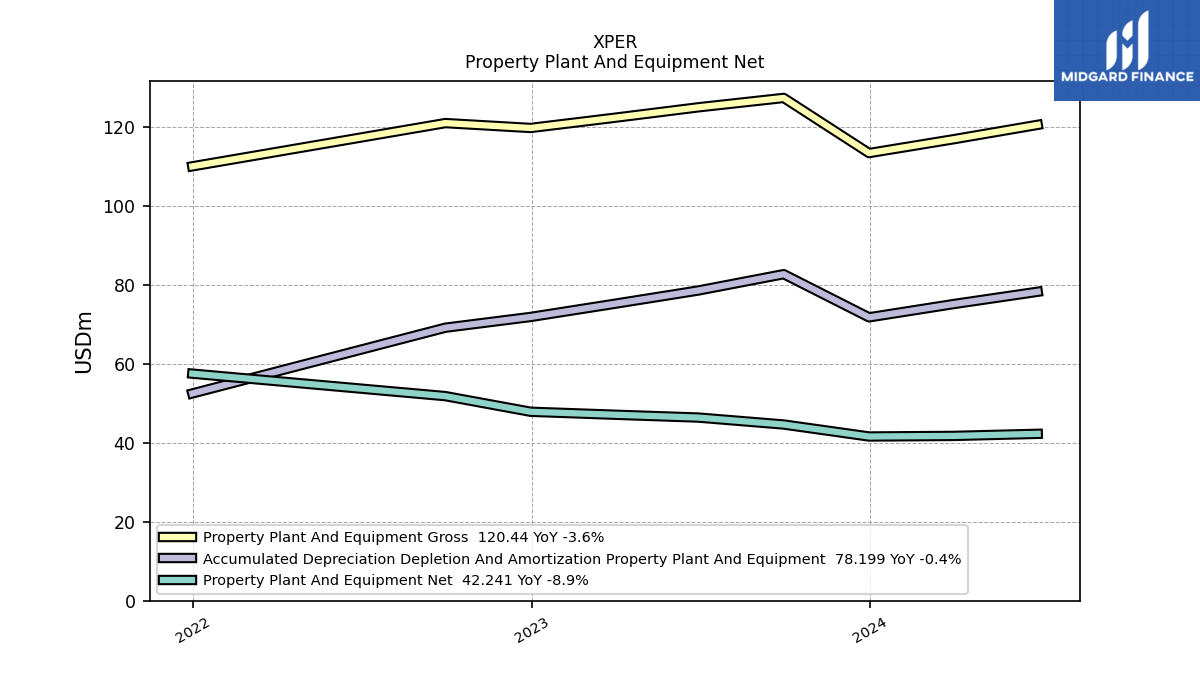
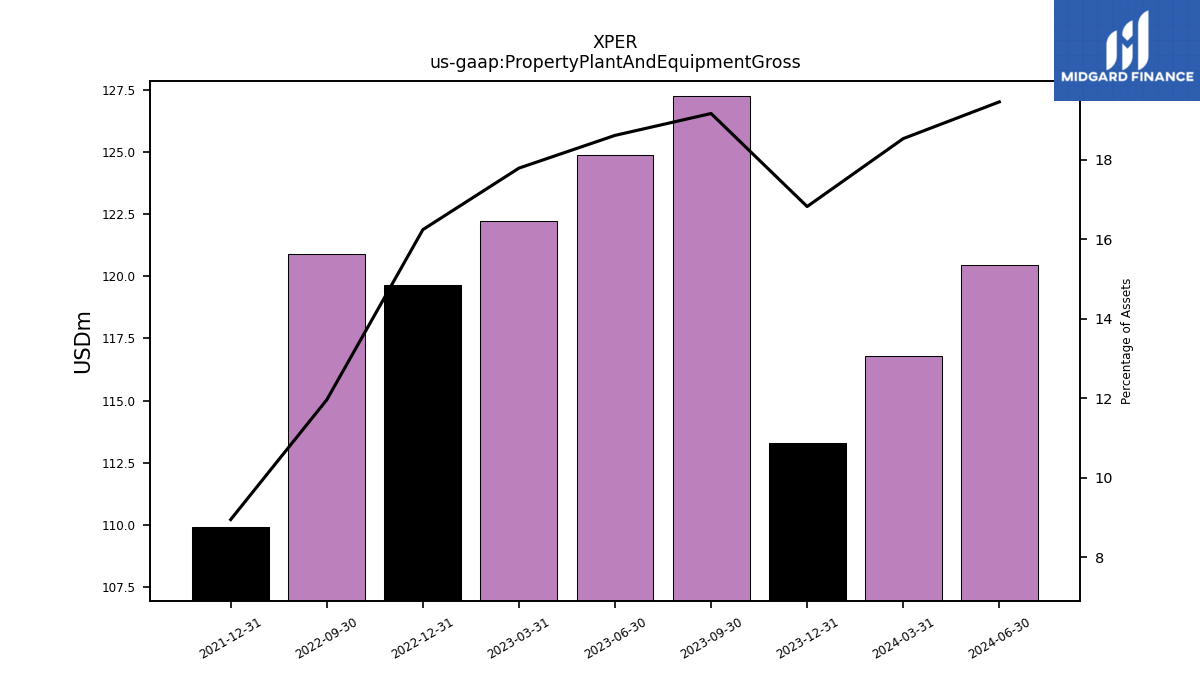
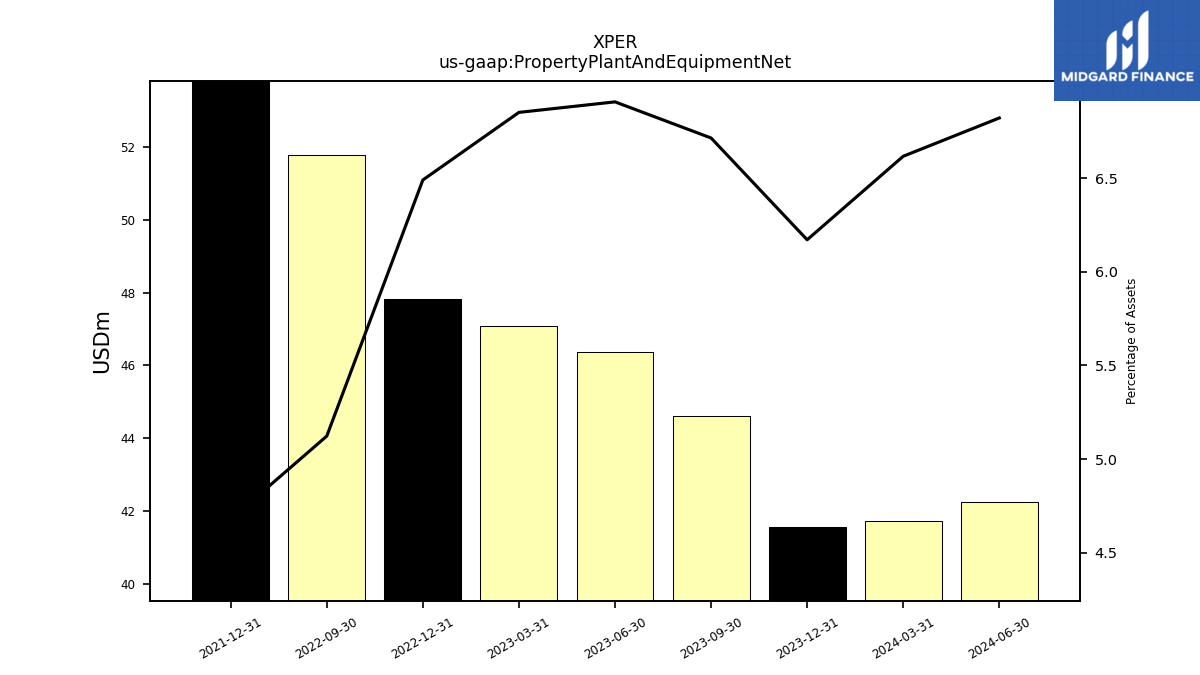
| Property Plant And Equipment Gross | 113.29 | 127.25 | 124.88 | 122.21 | 119.64 | 120.88 | NA | NA | 109.93 | NA | |
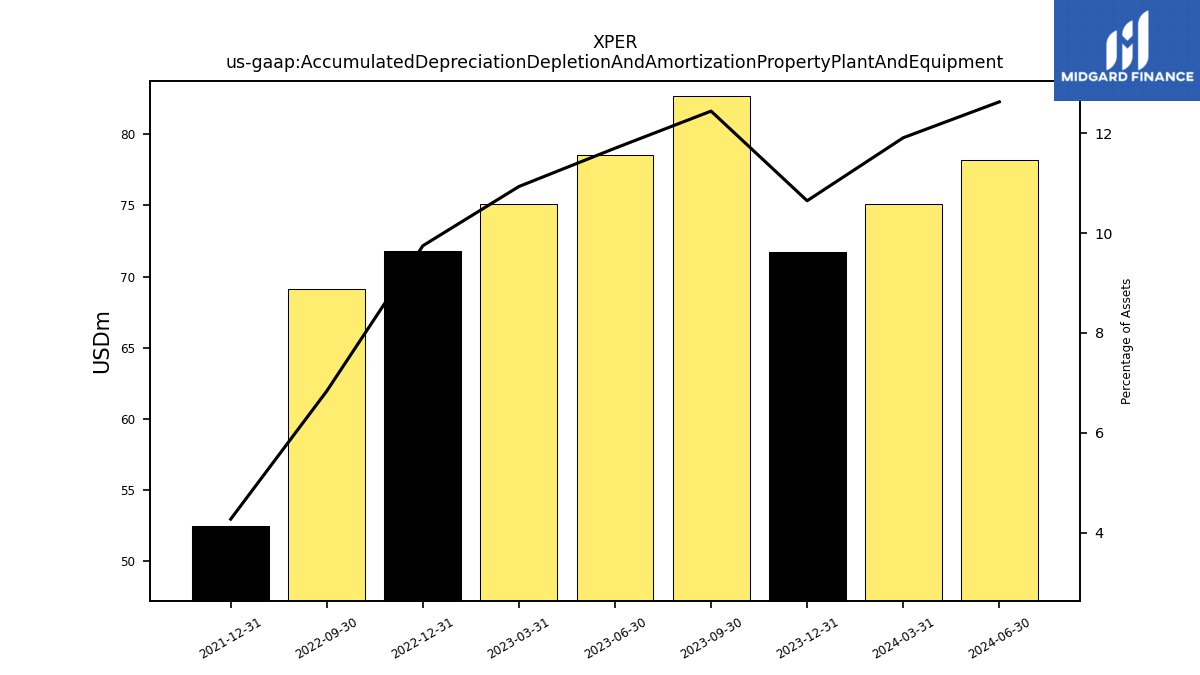
| Accumulated Depreciation Depletion And Amortization Property Plant And Equipment | 71.72 | 82.65 | 78.52 | 75.13 | 71.82 | 69.10 | NA | NA | 52.45 | NA | |
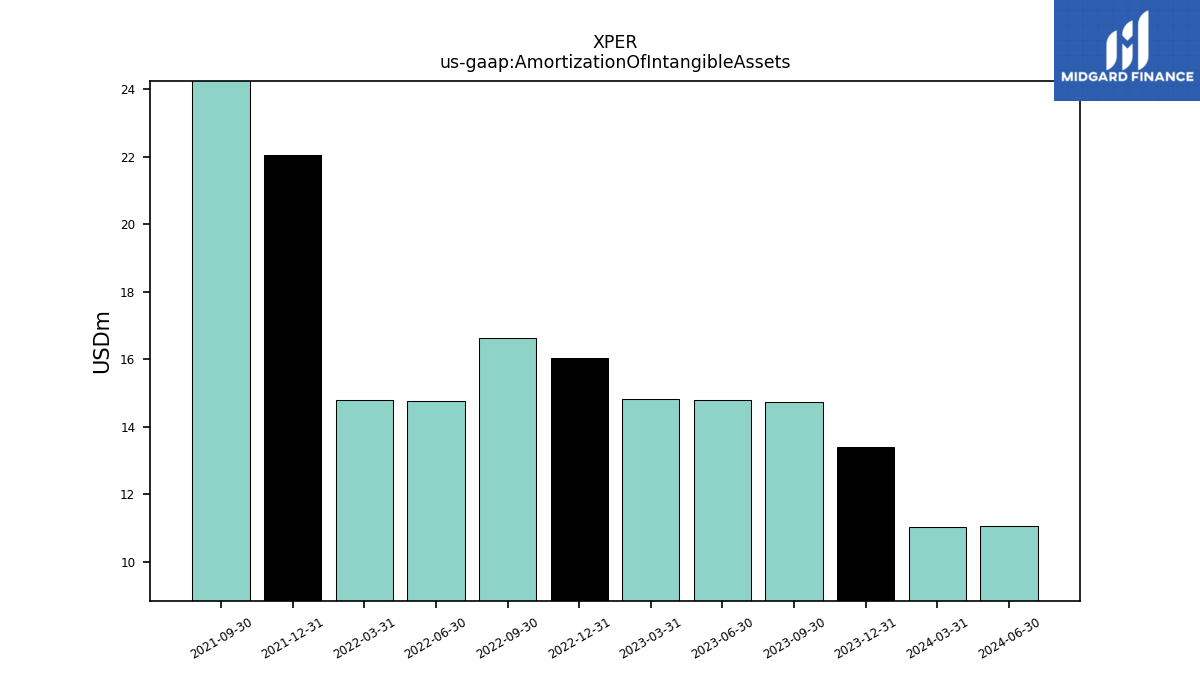
| Amortization Of Intangible Assets | 13.40 | 14.72 | 14.80 | 14.83 | 16.04 | 16.61 | 14.76 | 14.79 | 22.05 | 27.83 | |
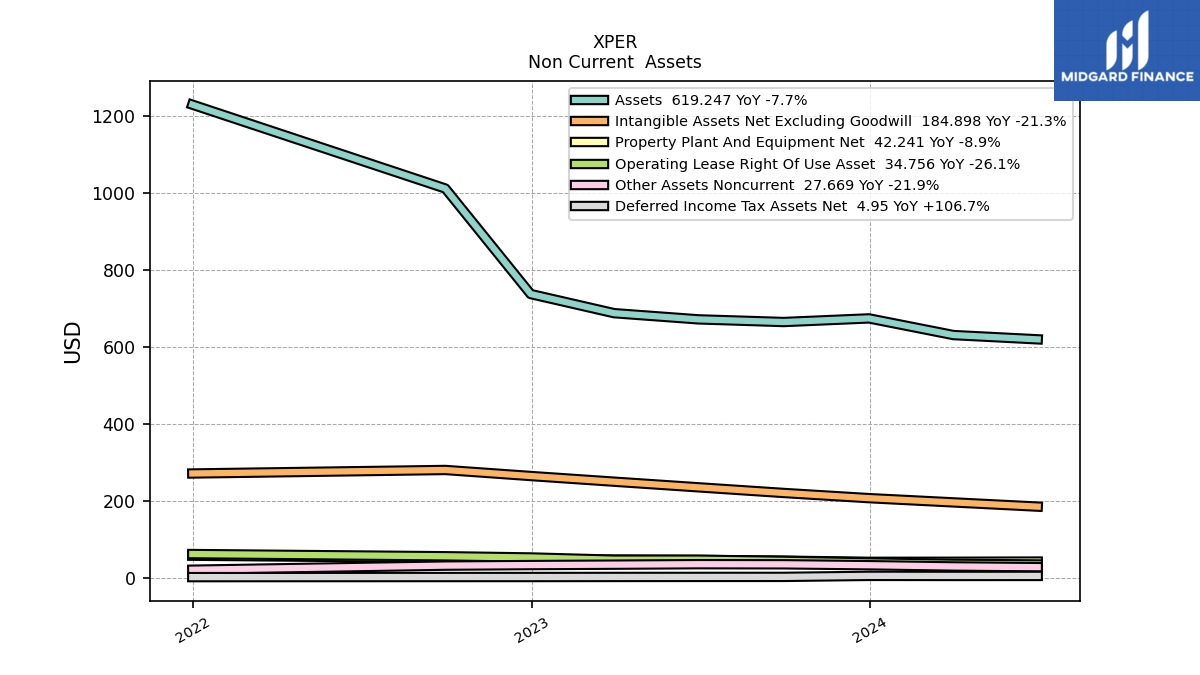
| Property Plant And Equipment Net | 41.57 | 44.60 | 46.36 | 47.08 | 47.83 | 51.78 | NA | NA | 57.48 | NA | |
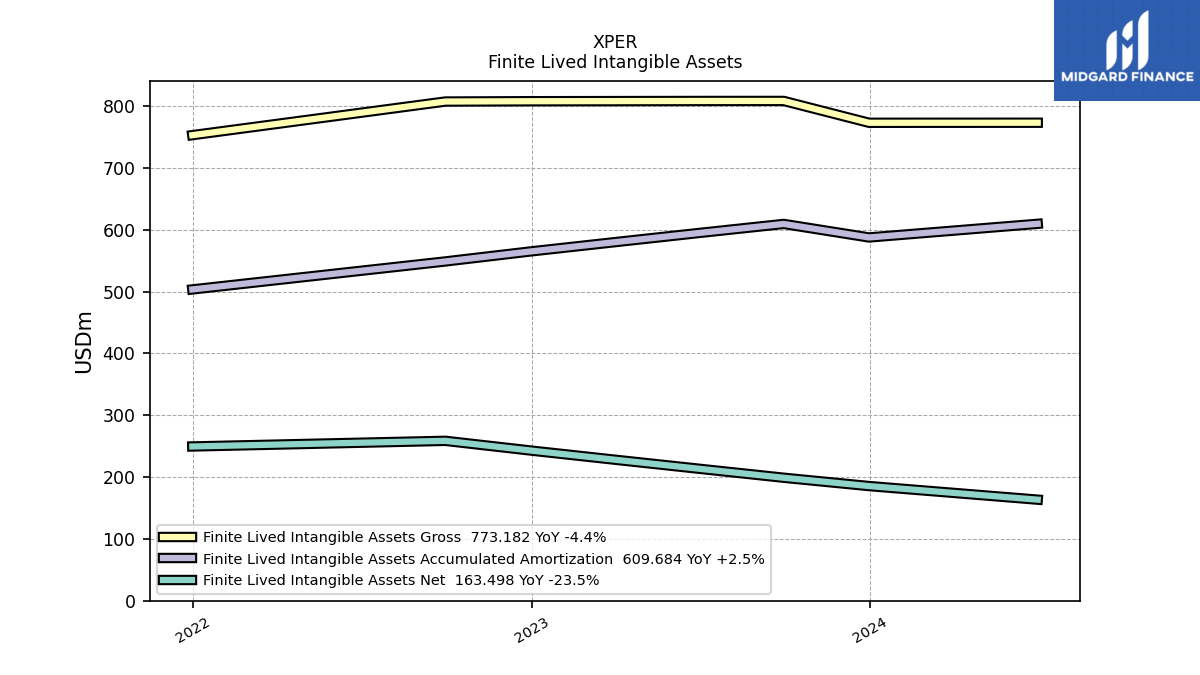
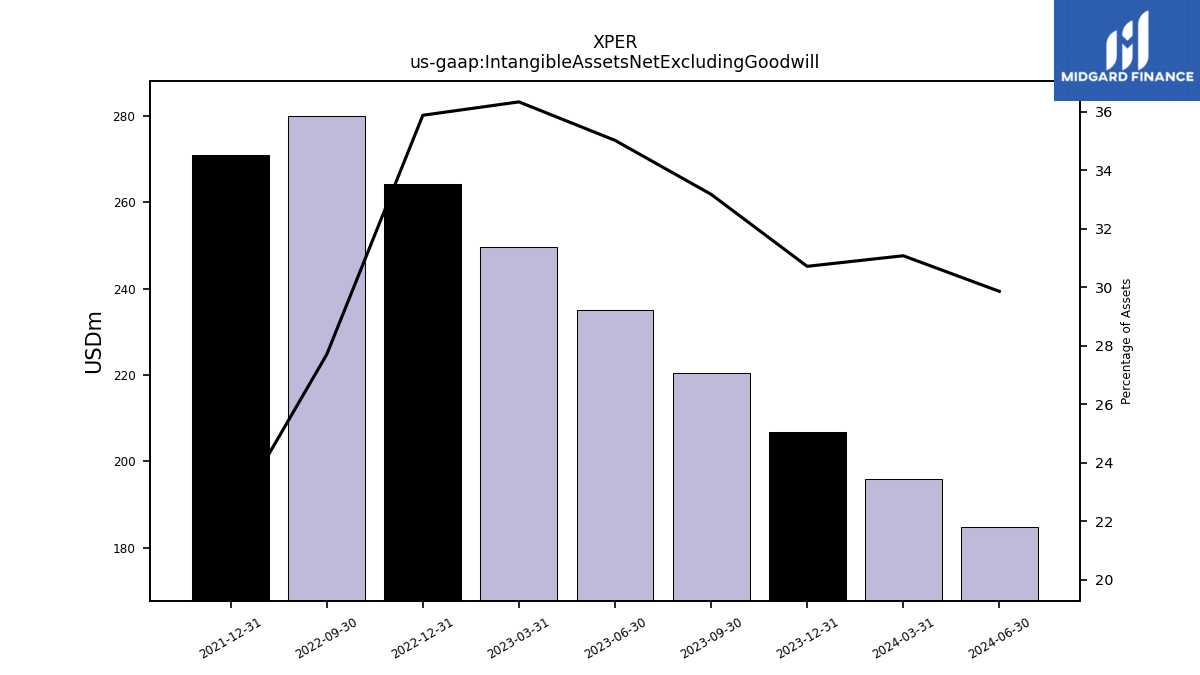
| Intangible Assets Net Excluding Goodwill | 206.90 | 220.36 | 235.02 | 249.68 | 264.38 | 280.06 | NA | NA | 270.93 | NA | |
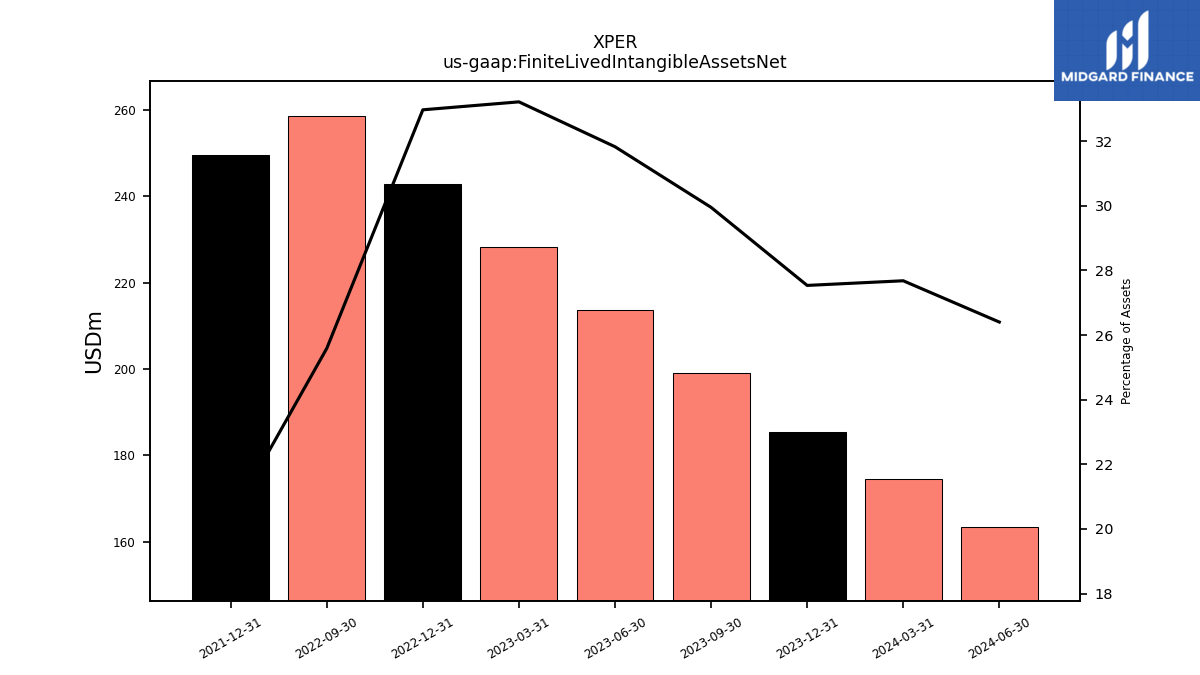
| Finite Lived Intangible Assets Net | 185.50 | 198.96 | 213.62 | 228.28 | 242.98 | 258.66 | NA | NA | 249.53 | NA | |
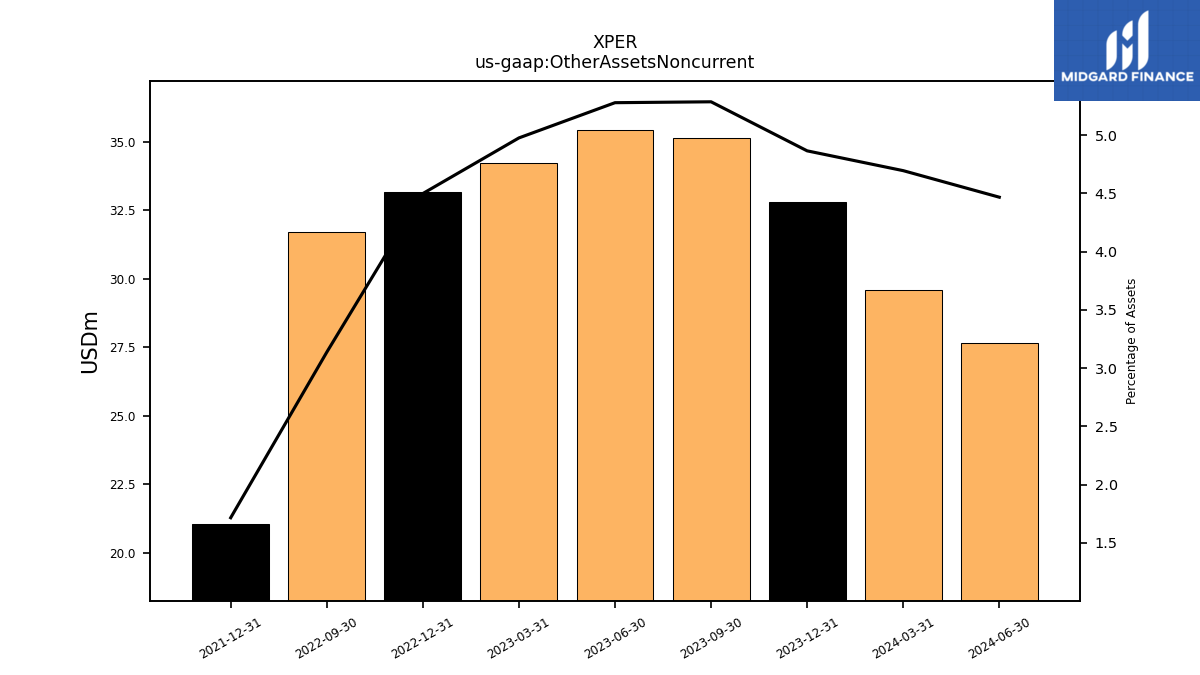
| Other Assets Noncurrent | 32.78 | 35.12 | 35.44 | 34.20 | 33.16 | 31.71 | NA | NA | 21.07 | NA |
| 2023-12-31 | 2023-09-30 | 2023-06-30 | 2023-03-31 | 2022-12-31 | 2022-09-30 | 2022-06-30 | 2022-03-31 | 2021-12-31 | 2021-09-30 | ||
|---|---|---|---|---|---|---|---|---|---|---|---|
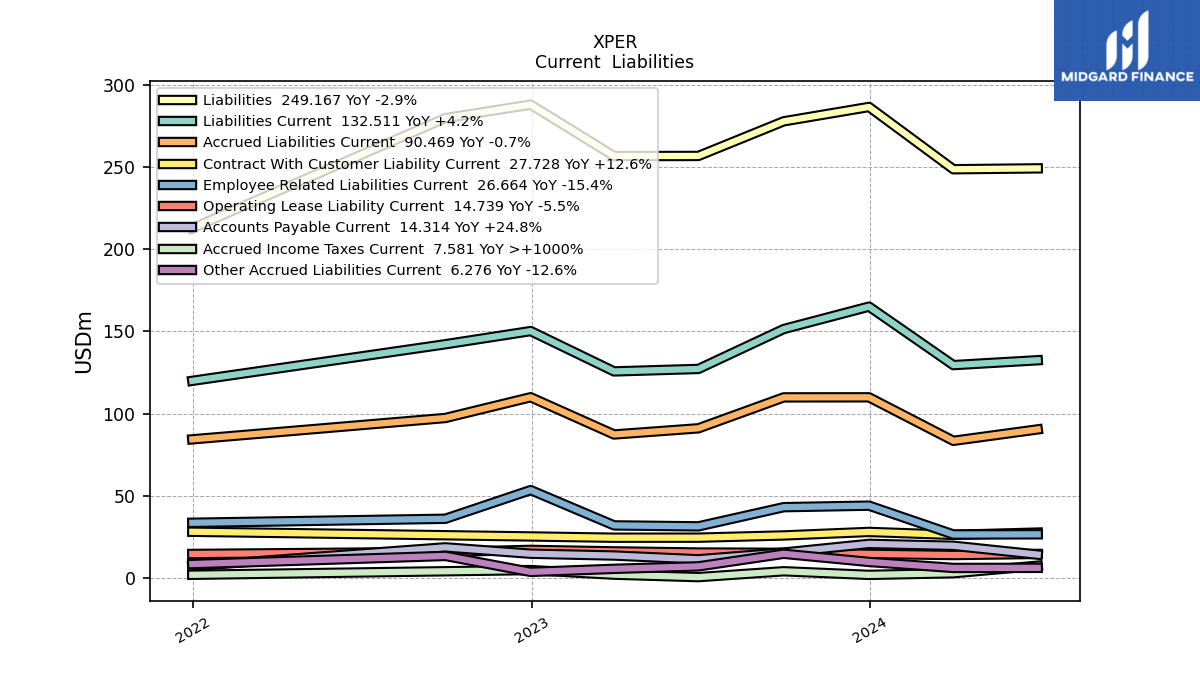
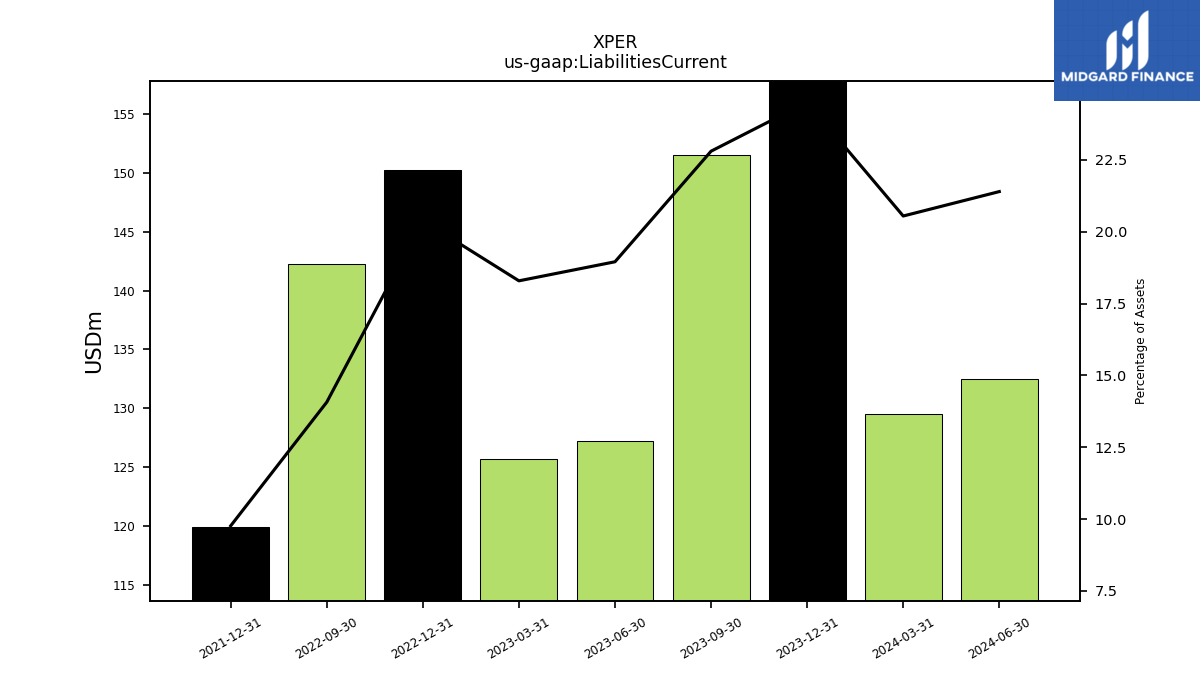
| Liabilities Current | 165.11 | 151.48 | 127.22 | 125.71 | 150.24 | 142.23 | NA | NA | 119.98 | NA | |
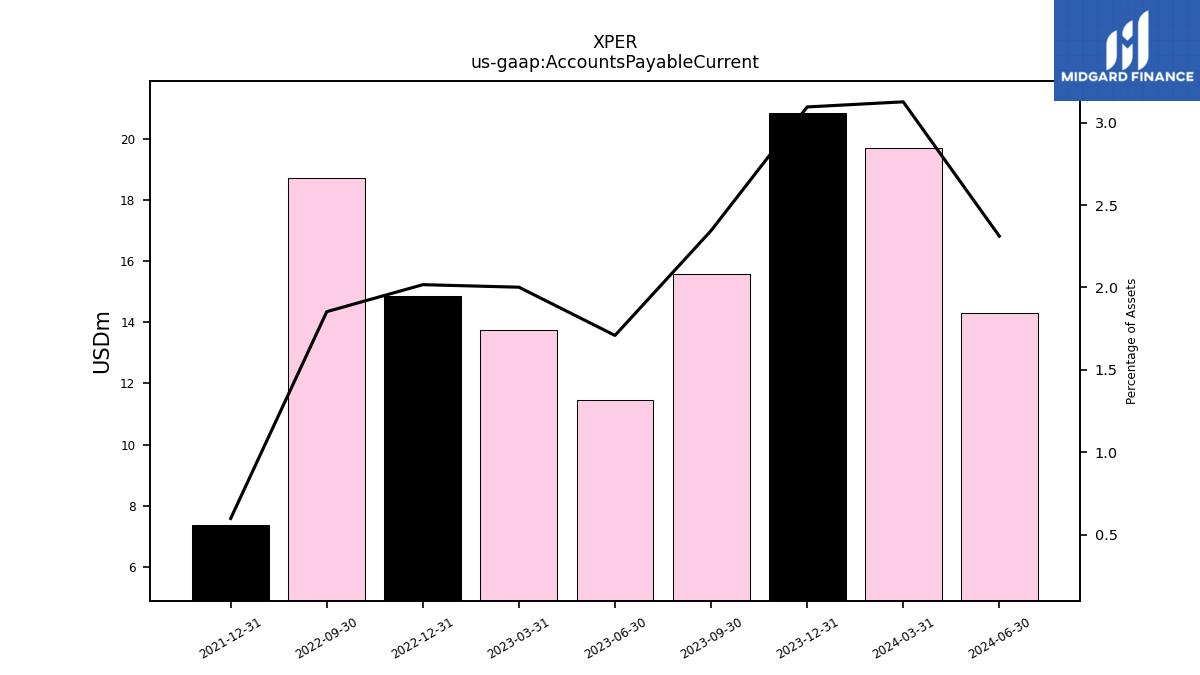
| Accounts Payable Current | 20.85 | 15.57 | 11.47 | 13.76 | 14.86 | 18.73 | NA | NA | 7.36 | NA | |
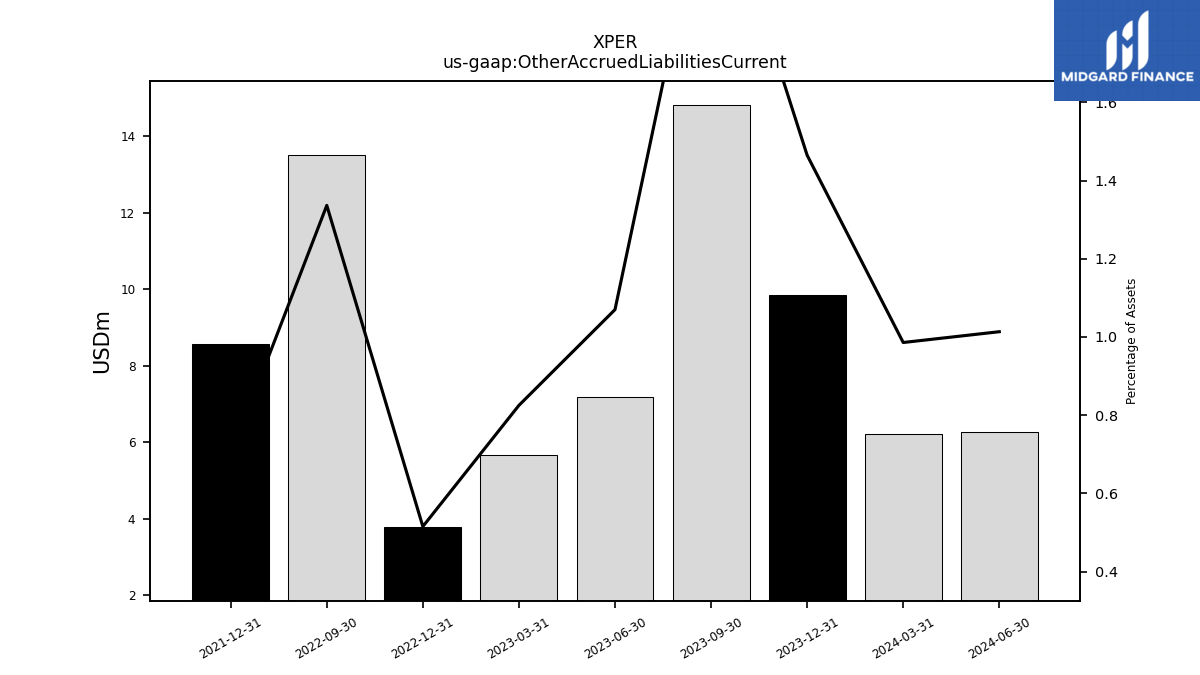
| Other Accrued Liabilities Current | 9.87 | 14.82 | 7.18 | 5.67 | 3.80 | 13.51 | NA | NA | 8.59 | NA | |
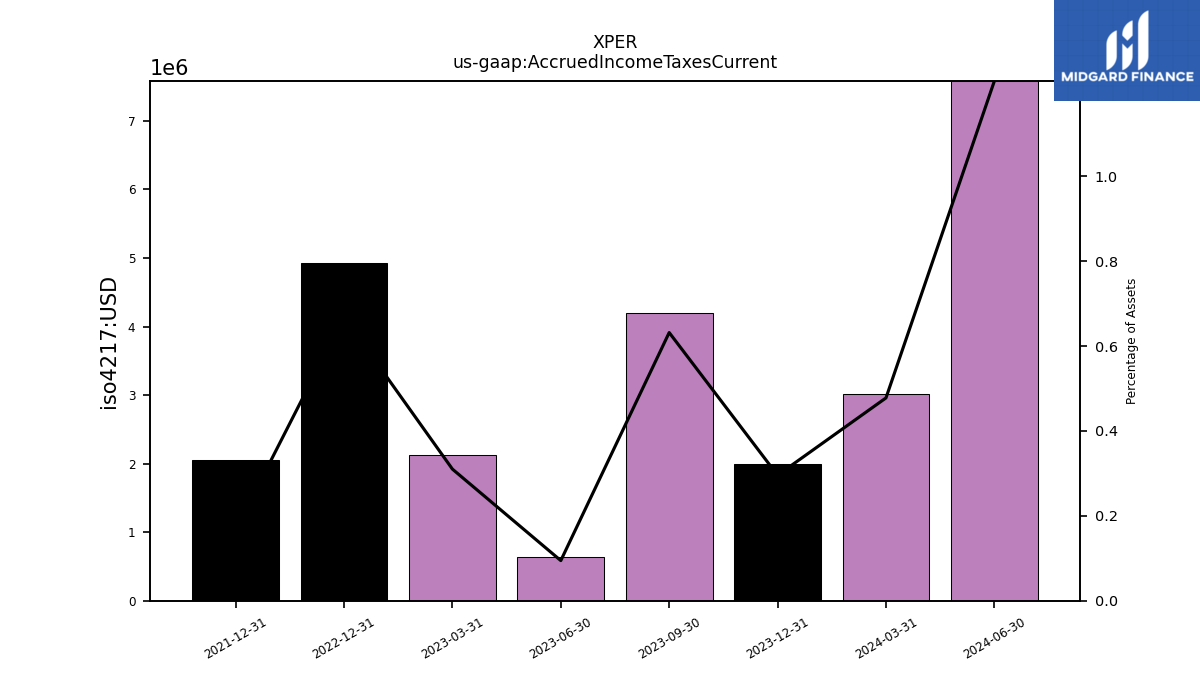
| Accrued Income Taxes Current | 1.99 | 4.20 | 0.64 | 2.13 | 4.93 | NA | NA | NA | 2.06 | NA | |
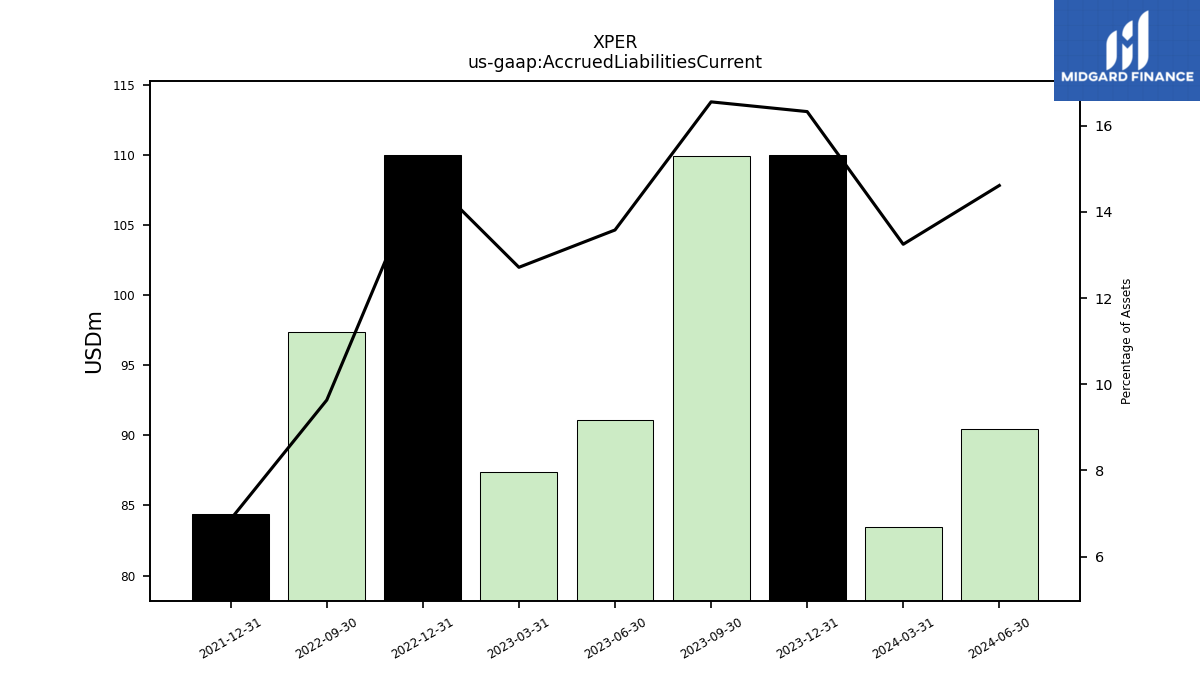
| Accrued Liabilities Current | 109.96 | 109.92 | 91.12 | 87.36 | 110.01 | 97.39 | NA | NA | 84.40 | NA | |
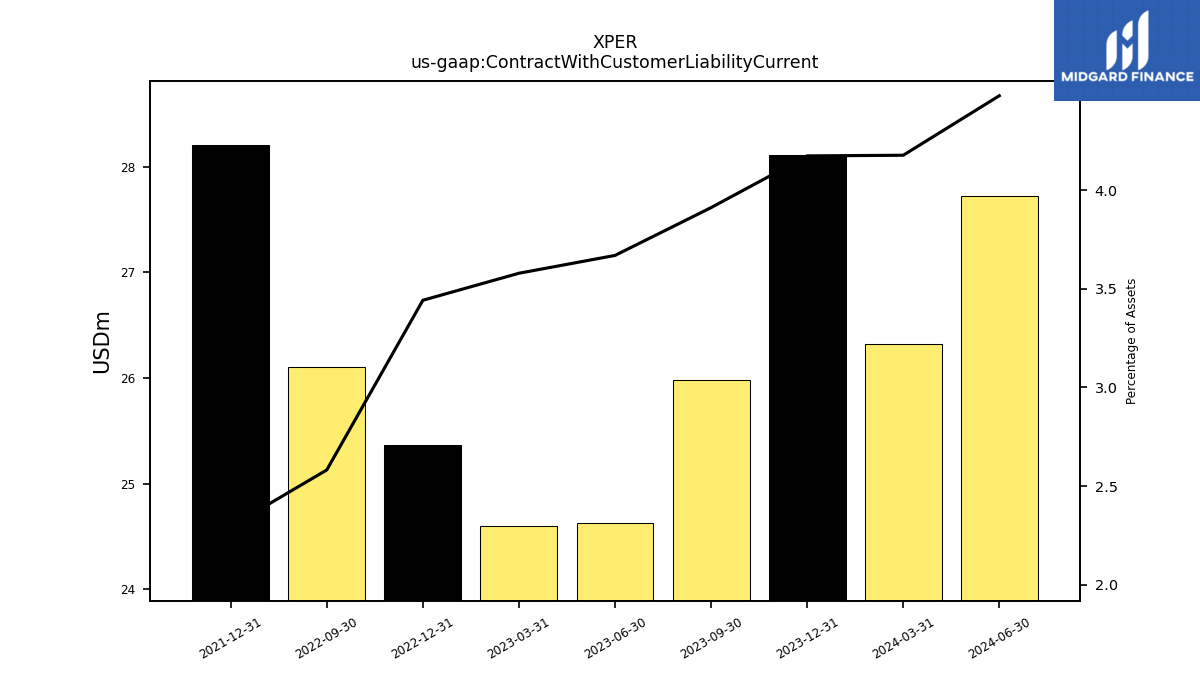
| Contract With Customer Liability Current | 28.11 | 25.98 | 24.62 | 24.59 | 25.36 | 26.11 | NA | NA | 28.21 | NA |
| 2023-12-31 | 2023-09-30 | 2023-06-30 | 2023-03-31 | 2022-12-31 | 2022-09-30 | 2022-06-30 | 2022-03-31 | 2021-12-31 | 2021-09-30 | ||
|---|---|---|---|---|---|---|---|---|---|---|---|
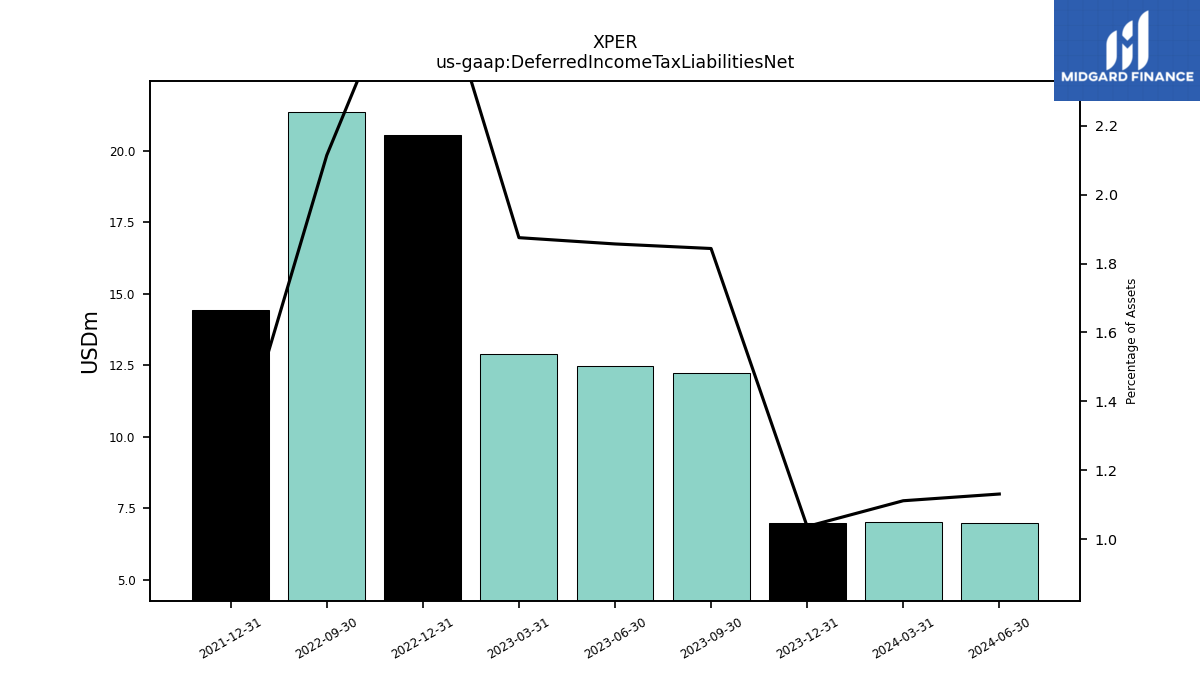
| Deferred Income Tax Liabilities Net | 6.98 | 12.25 | 12.46 | 12.89 | 20.56 | 21.37 | NA | NA | 14.43 | NA | |
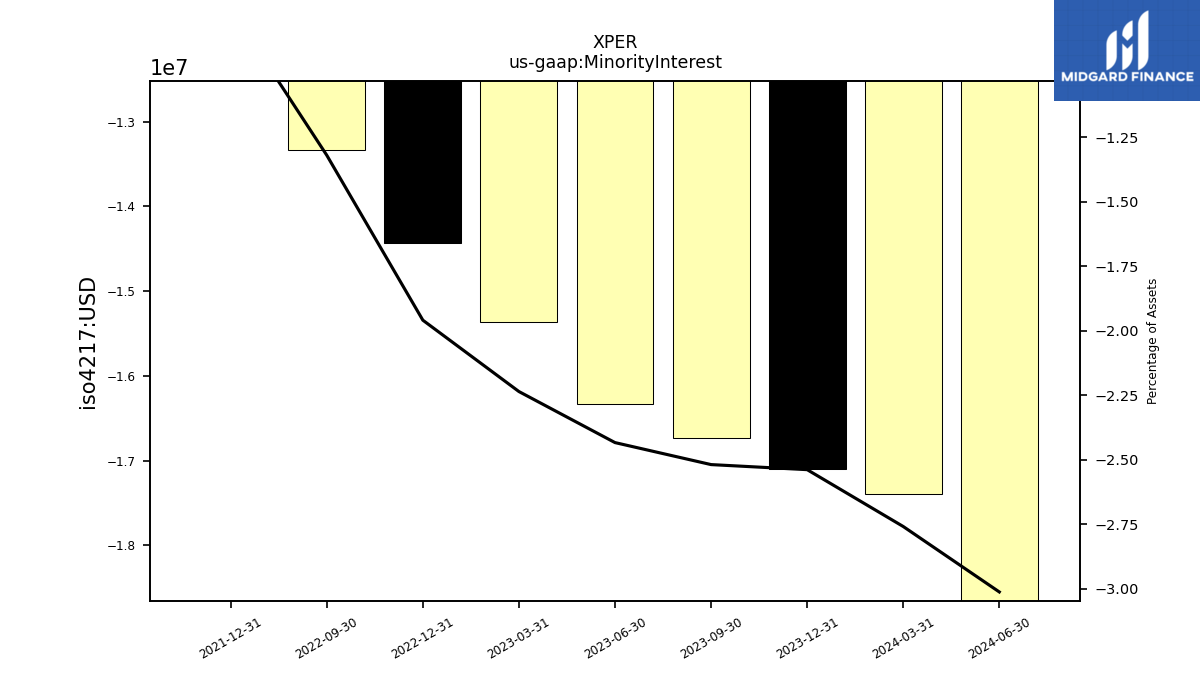
| Minority Interest | -17.10 | -16.73 | -16.33 | -15.36 | -14.43 | -13.33 | NA | NA | -9.21 | NA | |
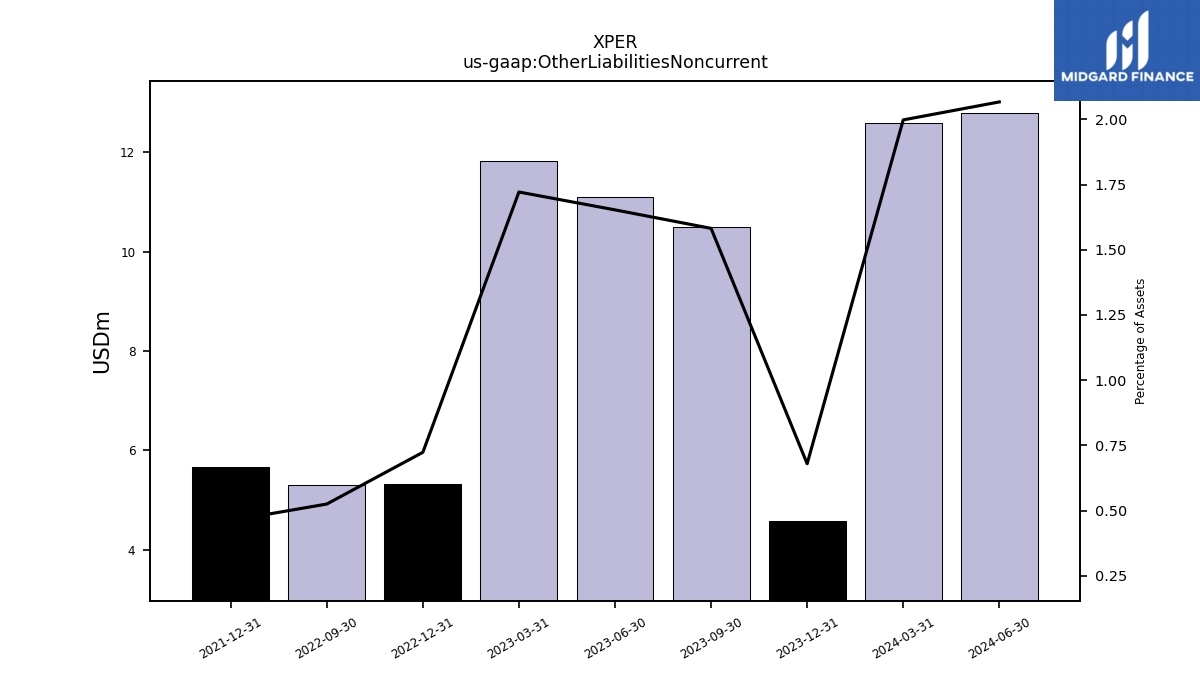
| Other Liabilities Noncurrent | 4.58 | 10.51 | 11.09 | 11.83 | 5.33 | 5.31 | NA | NA | 5.67 | NA | |
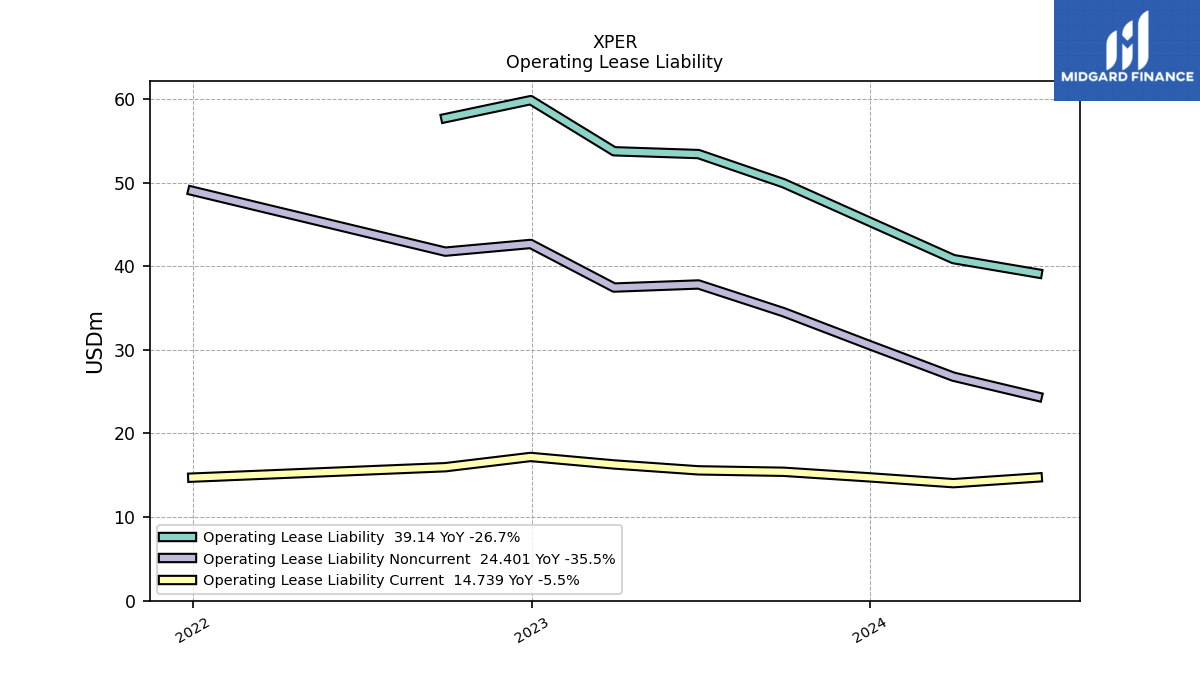
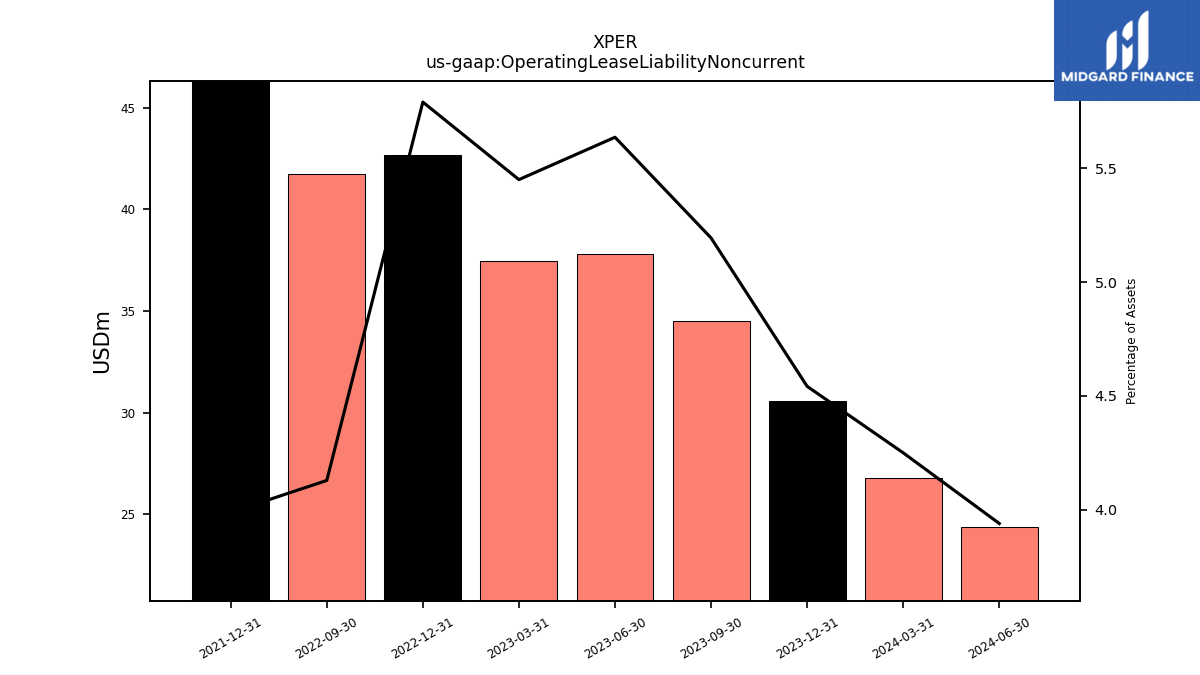
| Operating Lease Liability Noncurrent | 30.60 | 34.50 | 37.82 | 37.45 | 42.67 | 41.74 | NA | NA | 49.02 | NA |
| 2023-12-31 | 2023-09-30 | 2023-06-30 | 2023-03-31 | 2022-12-31 | 2022-09-30 | 2022-06-30 | 2022-03-31 | 2021-12-31 | 2021-09-30 | ||
|---|---|---|---|---|---|---|---|---|---|---|---|
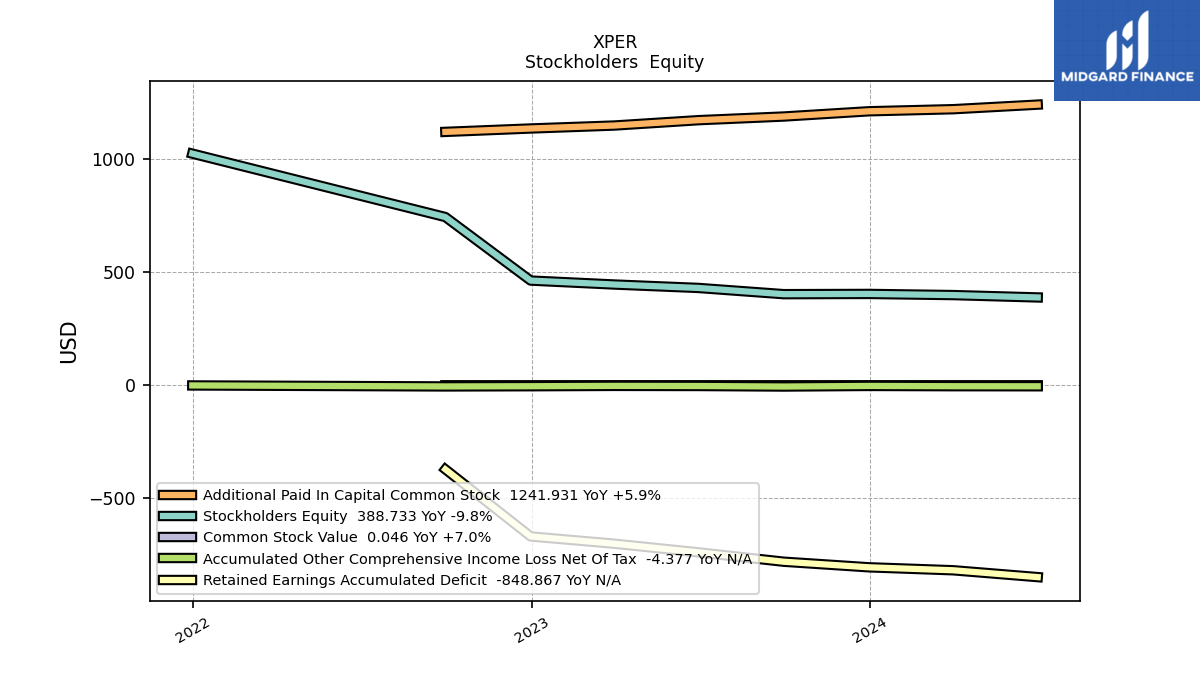
| Stockholders Equity | 404.23 | 403.18 | 430.74 | 445.93 | 463.42 | 744.50 | NA | NA | 1025.16 | NA | |
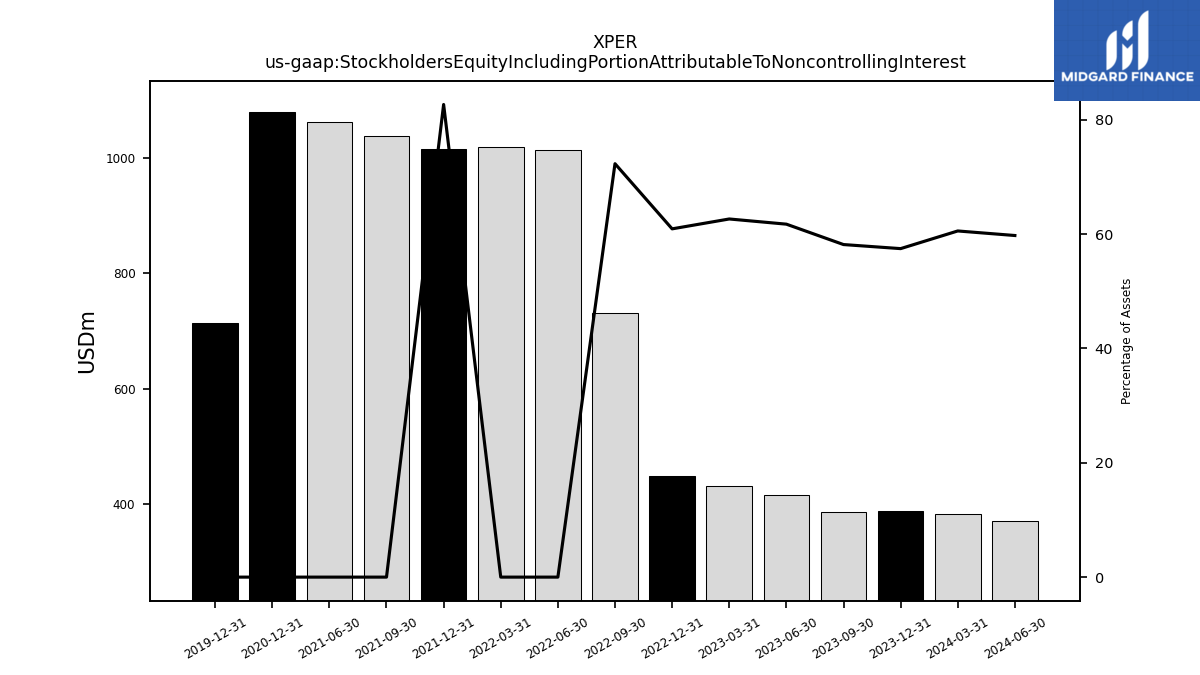
| Stockholders Equity Including Portion Attributable To Noncontrolling Interest | 387.13 | 386.45 | 414.41 | 430.57 | 448.99 | 731.16 | 1014.35 | 1018.81 | 1015.96 | 1039.47 | |
| Common Stock Value | 0.04 | 0.04 | 0.04 | 0.04 | 0.04 | 0.04 | NA | NA | NA | NA | |
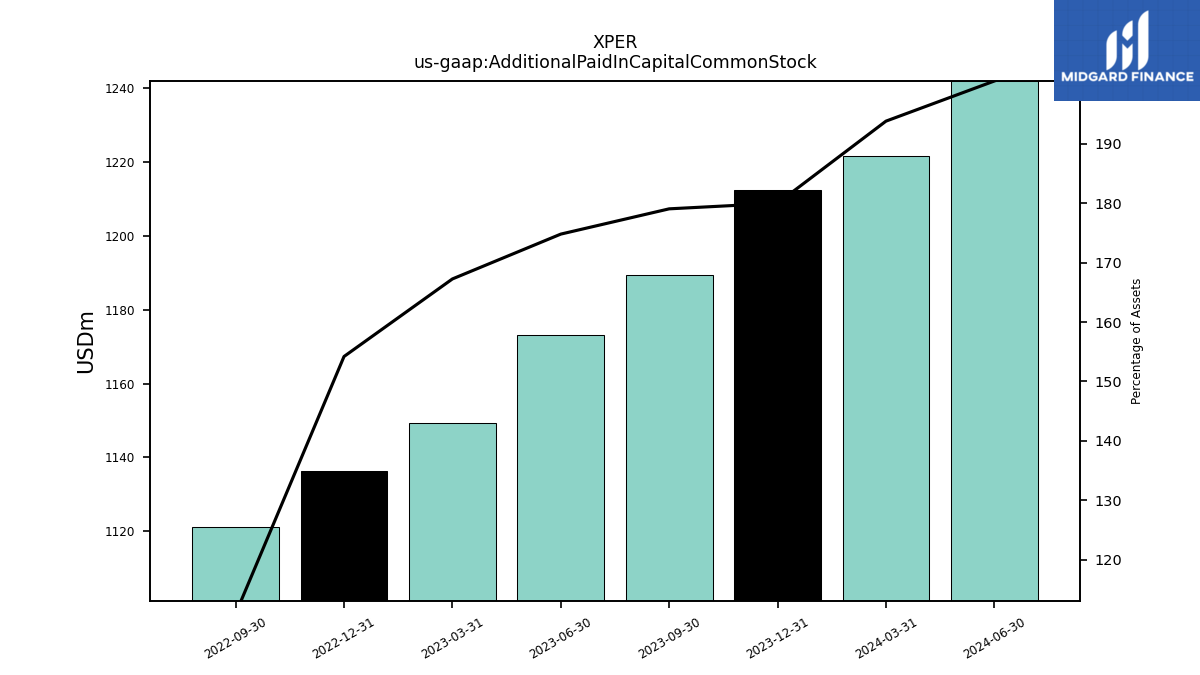
| Additional Paid In Capital Common Stock | 1212.50 | 1189.29 | 1173.10 | 1149.37 | 1136.33 | 1121.30 | NA | NA | NA | NA | |
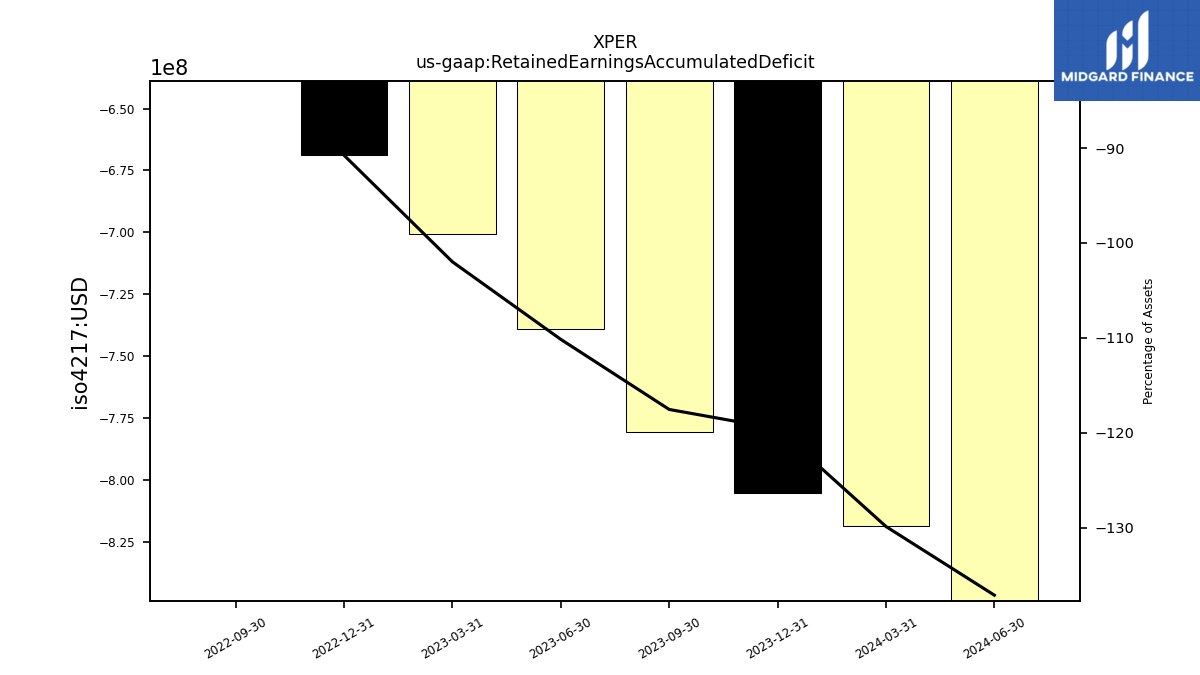
| Retained Earnings Accumulated Deficit | -805.45 | -780.66 | -739.23 | -700.84 | -668.84 | -371.81 | NA | NA | NA | NA | |
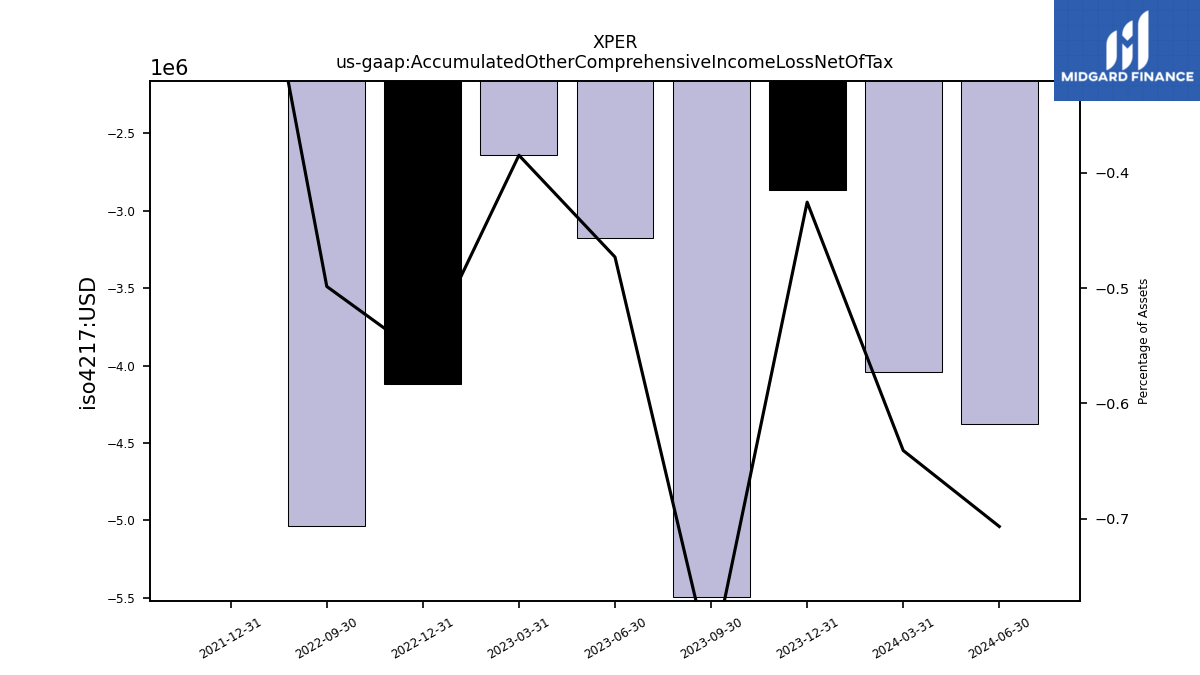
| Accumulated Other Comprehensive Income Loss Net Of Tax | -2.87 | -5.49 | -3.17 | -2.64 | -4.12 | -5.04 | NA | NA | -0.68 | NA | |
| Minority Interest | -17.10 | -16.73 | -16.33 | -15.36 | -14.43 | -13.33 | NA | NA | -9.21 | NA | |
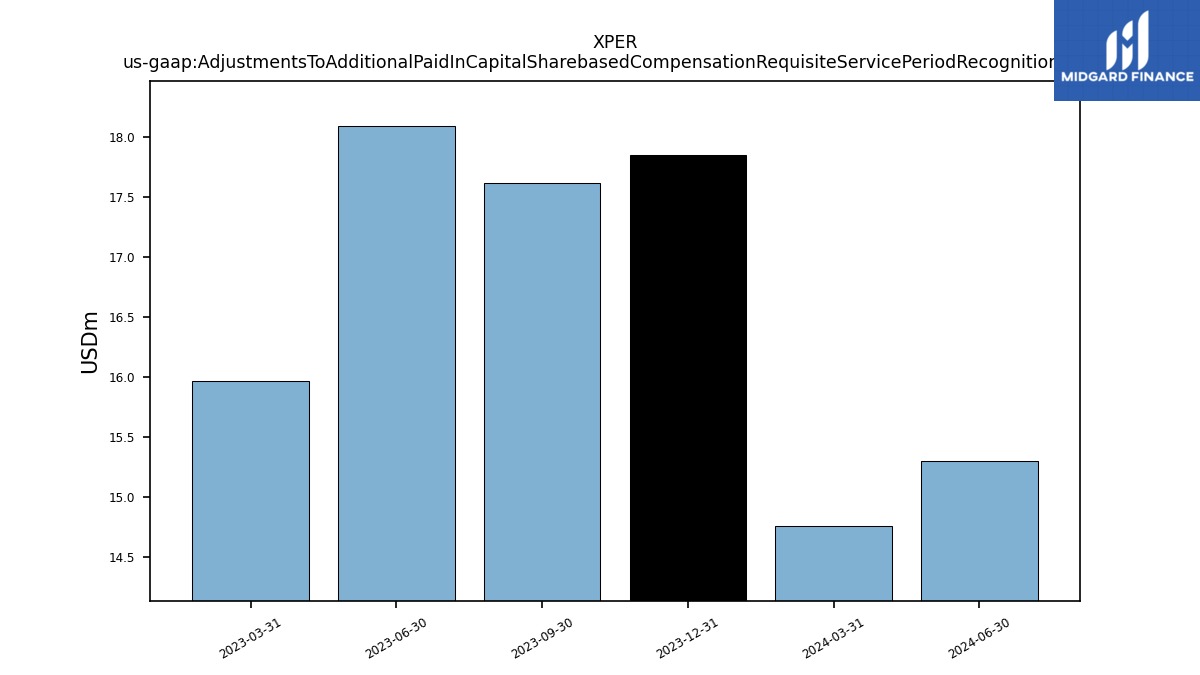
| Adjustments To Additional Paid In Capital Sharebased Compensation Requisite Service Period Recognition Value | 17.85 | 17.62 | 18.09 | 15.97 | NA | NA | NA | NA | NA | NA |
| 2023-12-31 | 2023-09-30 | 2023-06-30 | 2023-03-31 | 2022-12-31 | 2022-09-30 | 2022-06-30 | 2022-03-31 | 2021-12-31 | 2021-09-30 | ||
|---|---|---|---|---|---|---|---|---|---|---|---|
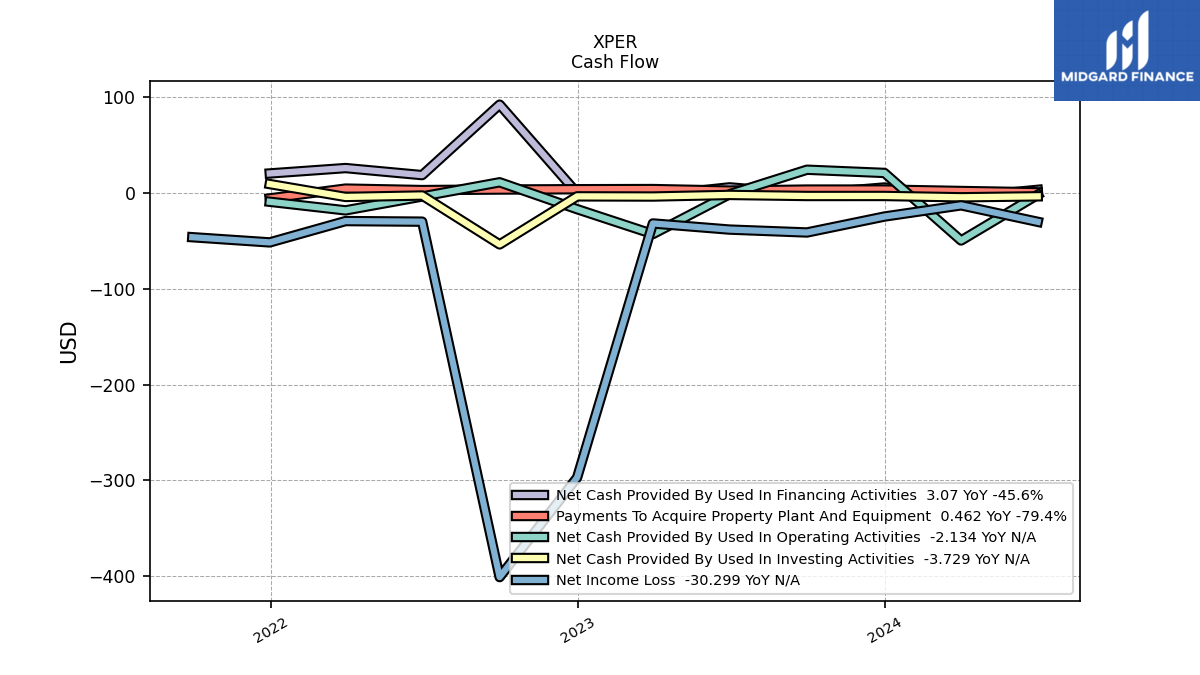
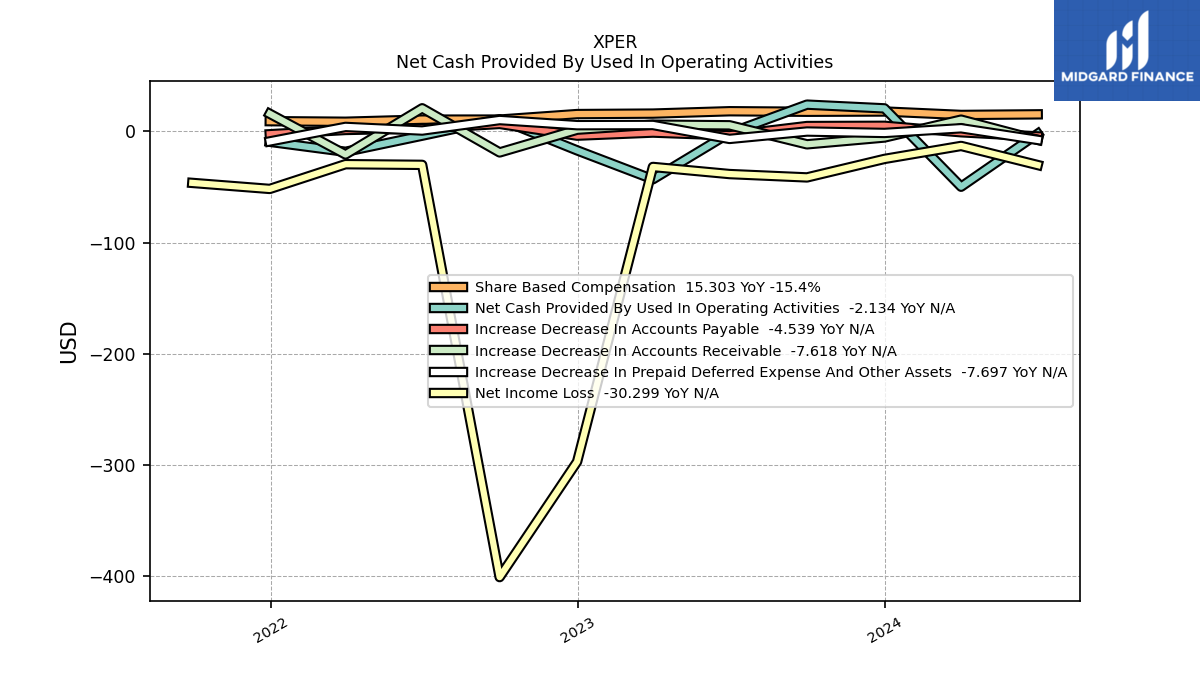
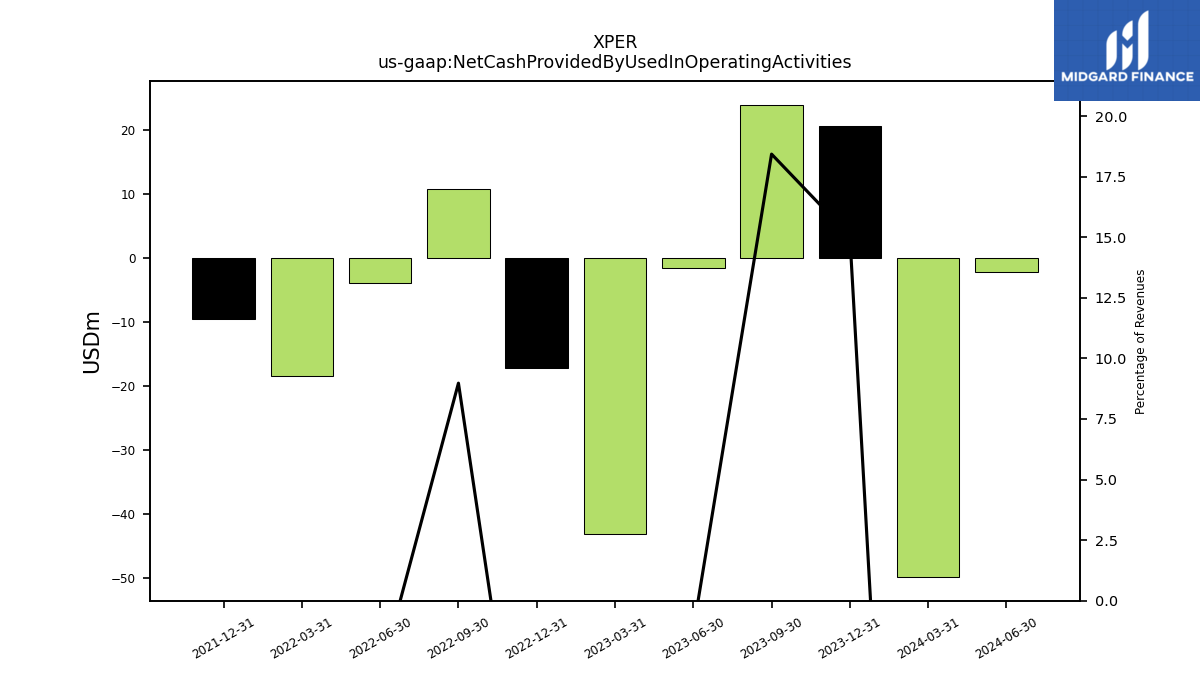
| Net Cash Provided By Used In Operating Activities | 20.66 | 24.03 | -1.53 | -43.10 | -17.11 | 10.92 | -3.89 | -18.36 | -9.39 | NA | |
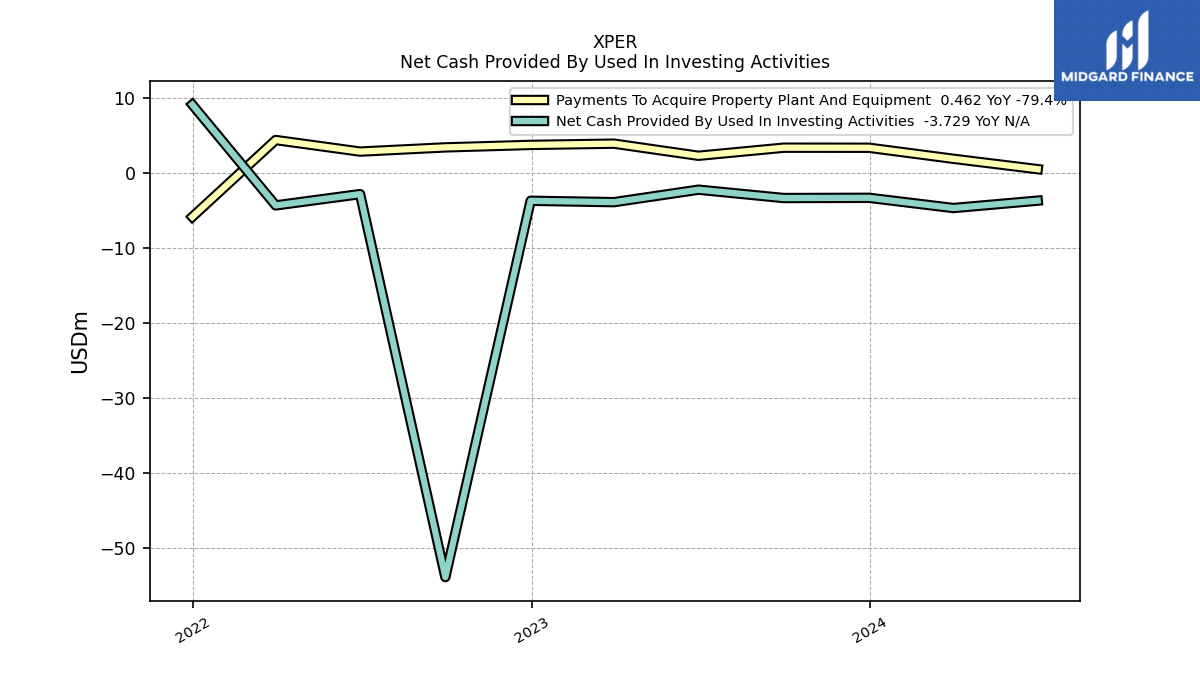
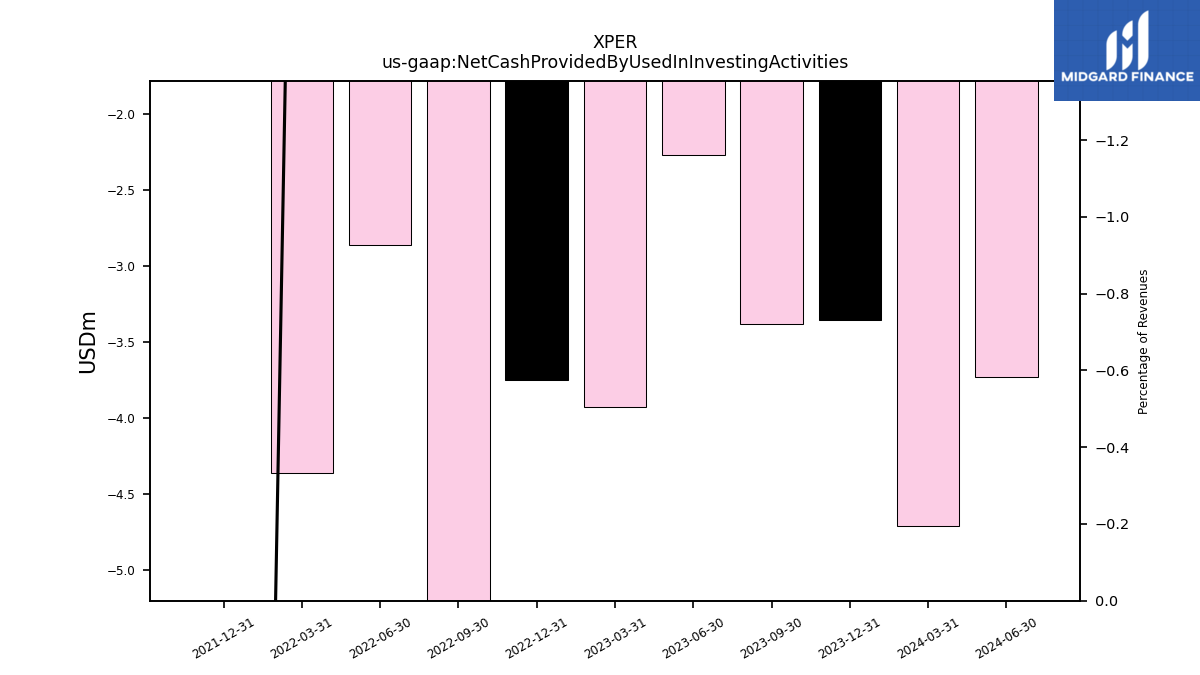
| Net Cash Provided By Used In Investing Activities | -3.35 | -3.38 | -2.27 | -3.93 | -3.75 | -53.87 | -2.86 | -4.37 | 9.06 | NA | |
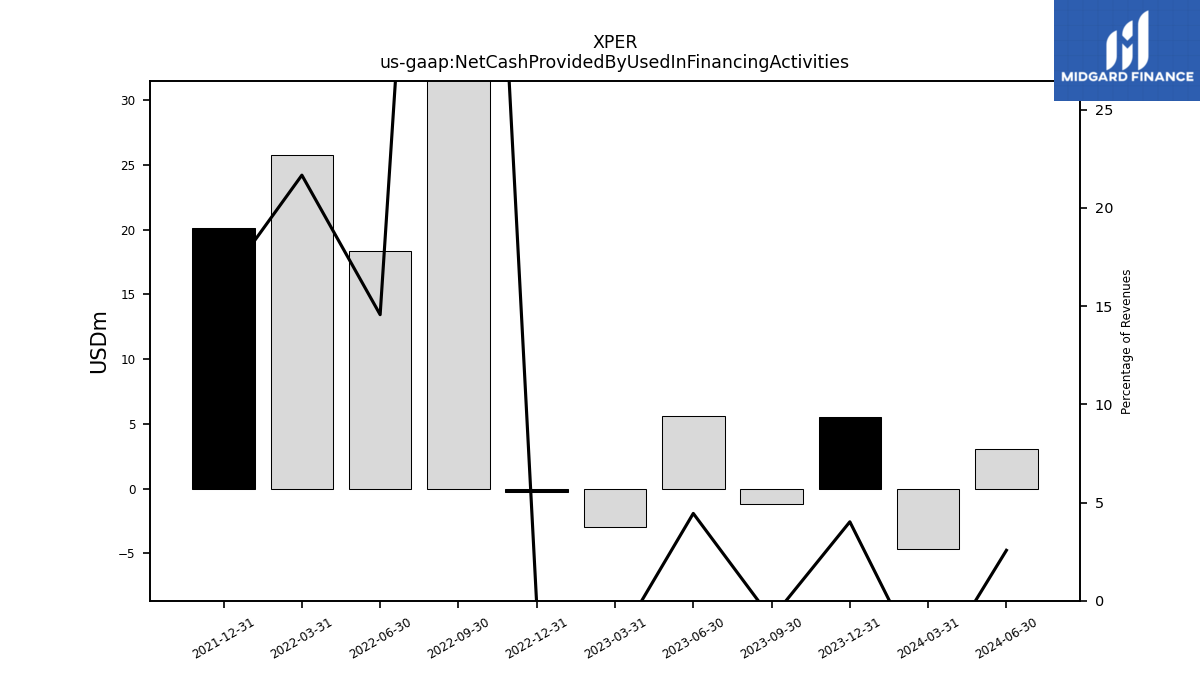
| Net Cash Provided By Used In Financing Activities | 5.51 | -1.19 | 5.64 | -2.92 | -0.29 | 91.91 | 18.38 | 25.75 | 20.14 | NA |
| 2023-12-31 | 2023-09-30 | 2023-06-30 | 2023-03-31 | 2022-12-31 | 2022-09-30 | 2022-06-30 | 2022-03-31 | 2021-12-31 | 2021-09-30 | ||
|---|---|---|---|---|---|---|---|---|---|---|---|
| Net Cash Provided By Used In Operating Activities | 20.66 | 24.03 | -1.53 | -43.10 | -17.11 | 10.92 | -3.89 | -18.36 | -9.39 | NA | |
| Net Income Loss | -24.79 | -41.43 | -38.40 | -32.00 | -297.03 | -400.80 | -30.13 | -29.52 | -51.77 | -46.35 | |
| Profit Loss | -25.31 | -42.07 | -39.36 | -32.94 | -298.05 | -401.69 | -30.98 | -30.49 | -52.40 | -47.66 | |
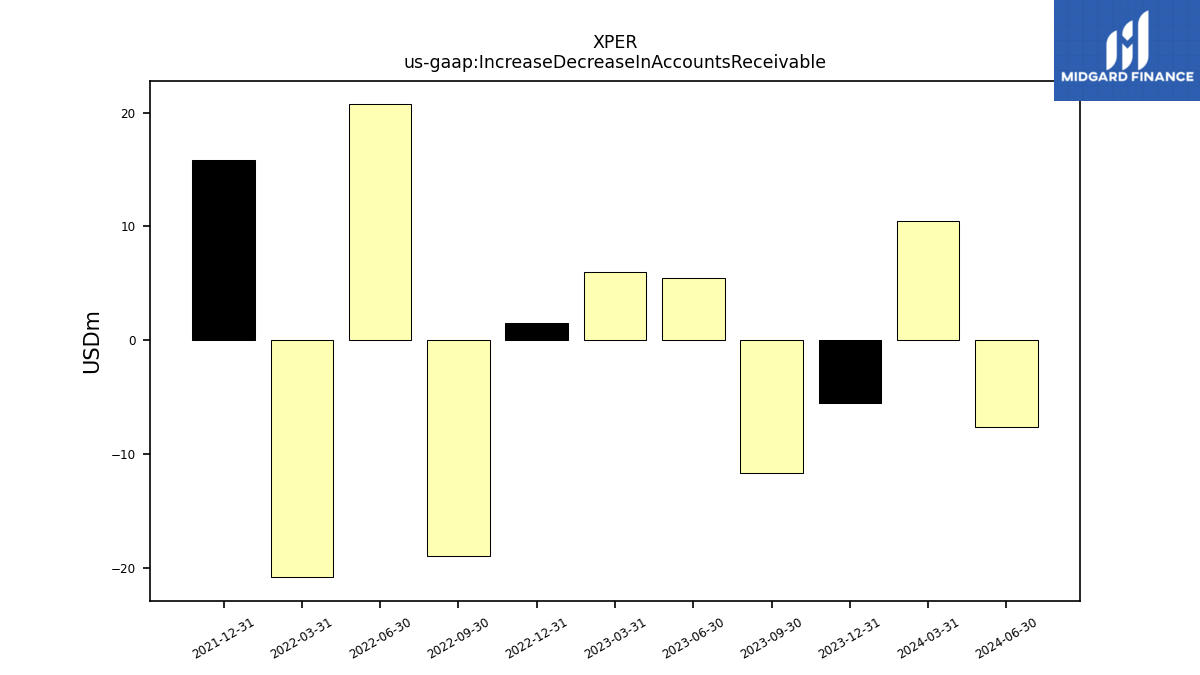
| Increase Decrease In Accounts Receivable | -5.53 | -11.67 | 5.46 | 6.02 | 1.49 | -18.96 | 20.76 | -20.79 | 15.82 | NA | |
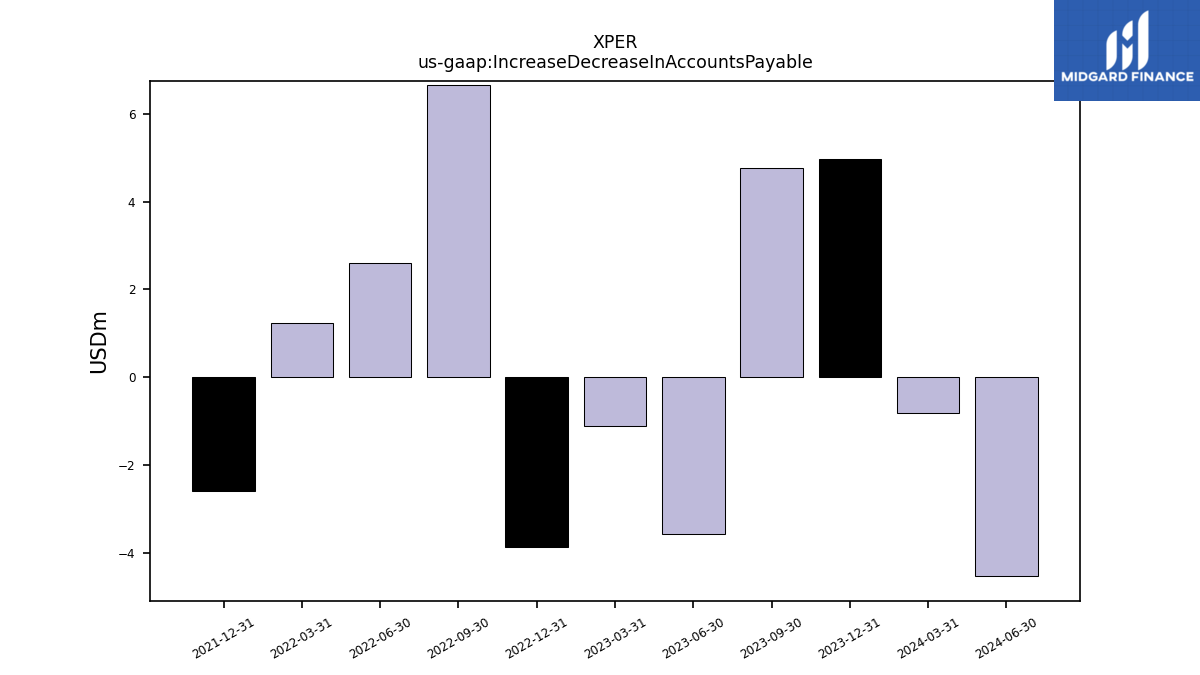
| Increase Decrease In Accounts Payable | 4.98 | 4.78 | -3.58 | -1.11 | -3.87 | 6.67 | 2.60 | 1.24 | -2.60 | NA | |
| Share Based Compensation | 17.85 | 17.62 | 18.09 | 15.97 | 15.54 | 10.59 | 10.54 | 8.64 | 9.15 | NA |
| 2023-12-31 | 2023-09-30 | 2023-06-30 | 2023-03-31 | 2022-12-31 | 2022-09-30 | 2022-06-30 | 2022-03-31 | 2021-12-31 | 2021-09-30 | ||
|---|---|---|---|---|---|---|---|---|---|---|---|
| Net Cash Provided By Used In Investing Activities | -3.35 | -3.38 | -2.27 | -3.93 | -3.75 | -53.87 | -2.86 | -4.37 | 9.06 | NA | |
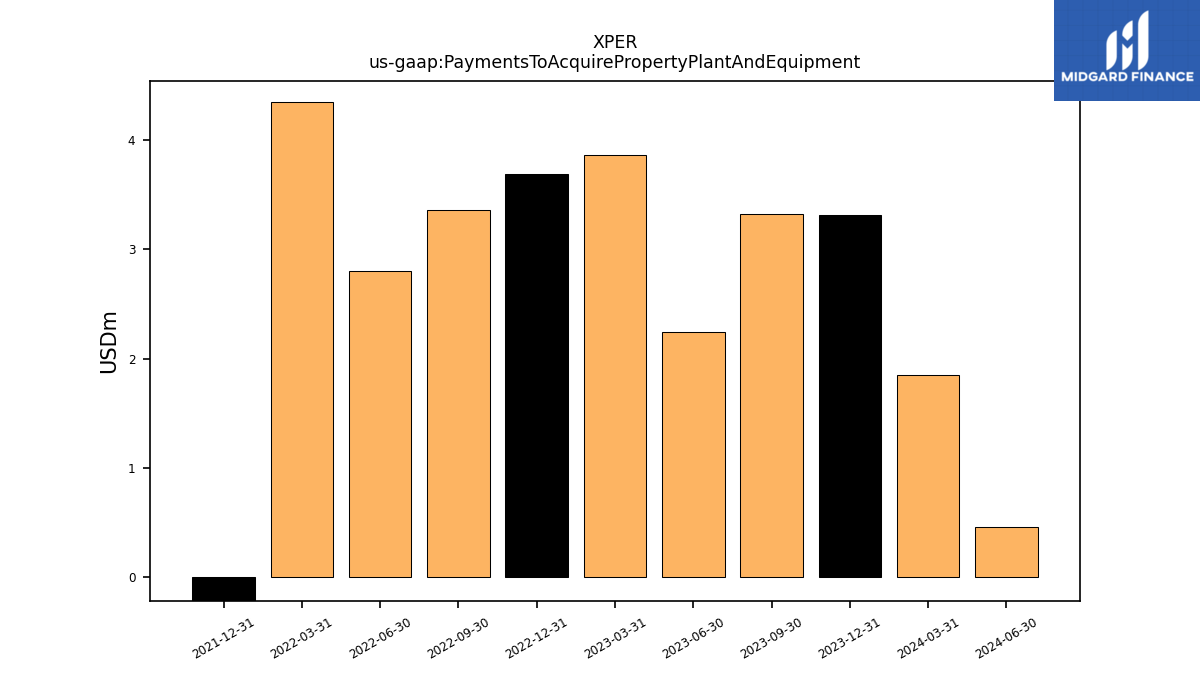
| Payments To Acquire Property Plant And Equipment | 3.32 | 3.32 | 2.25 | 3.86 | 3.69 | 3.36 | 2.81 | 4.34 | -5.89 | NA |
| 2023-12-31 | 2023-09-30 | 2023-06-30 | 2023-03-31 | 2022-12-31 | 2022-09-30 | 2022-06-30 | 2022-03-31 | 2021-12-31 | 2021-09-30 | ||
|---|---|---|---|---|---|---|---|---|---|---|---|
| Net Cash Provided By Used In Financing Activities | 5.51 | -1.19 | 5.64 | -2.92 | -0.29 | 91.91 | 18.38 | 25.75 | 20.14 | NA |
| 2023-12-31 | 2023-09-30 | 2023-06-30 | 2023-03-31 | 2022-12-31 | 2022-09-30 | 2022-06-30 | 2022-03-31 | 2021-12-31 | 2021-09-30 | ||
|---|---|---|---|---|---|---|---|---|---|---|---|
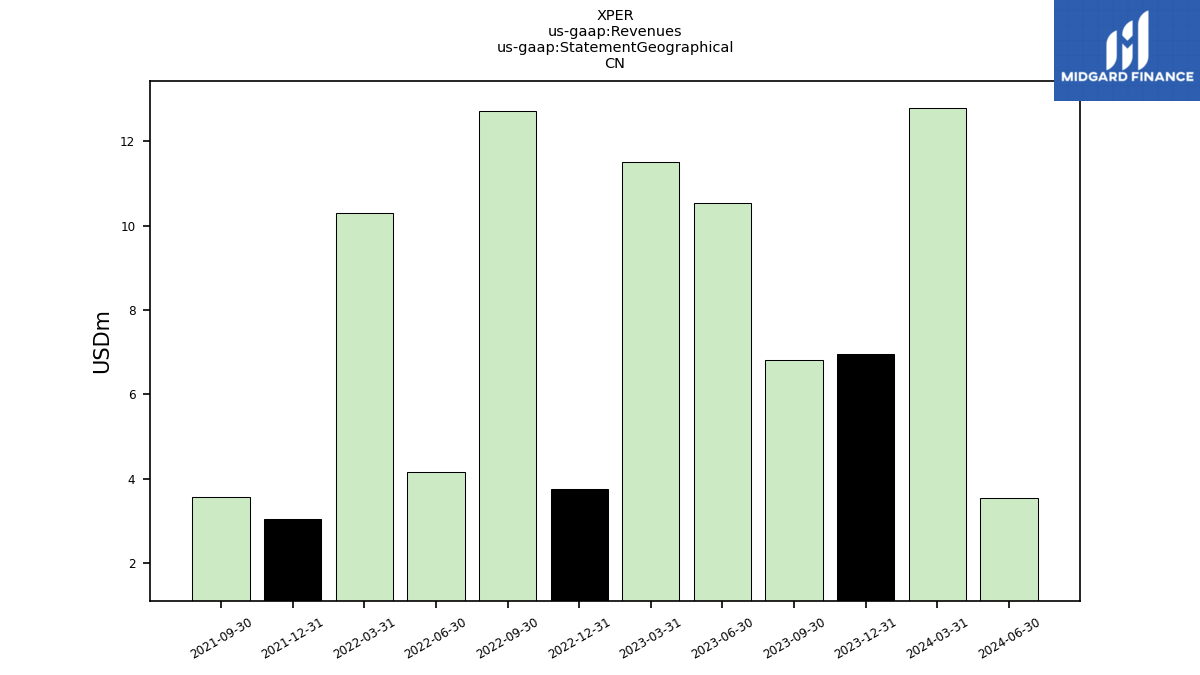
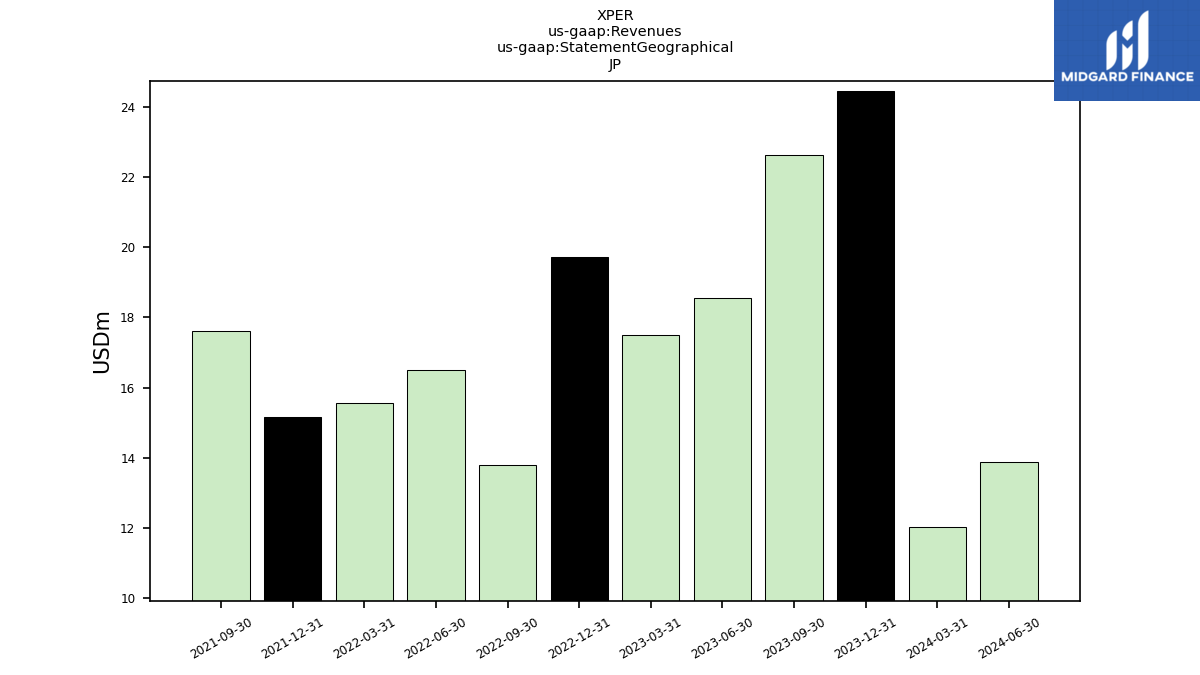
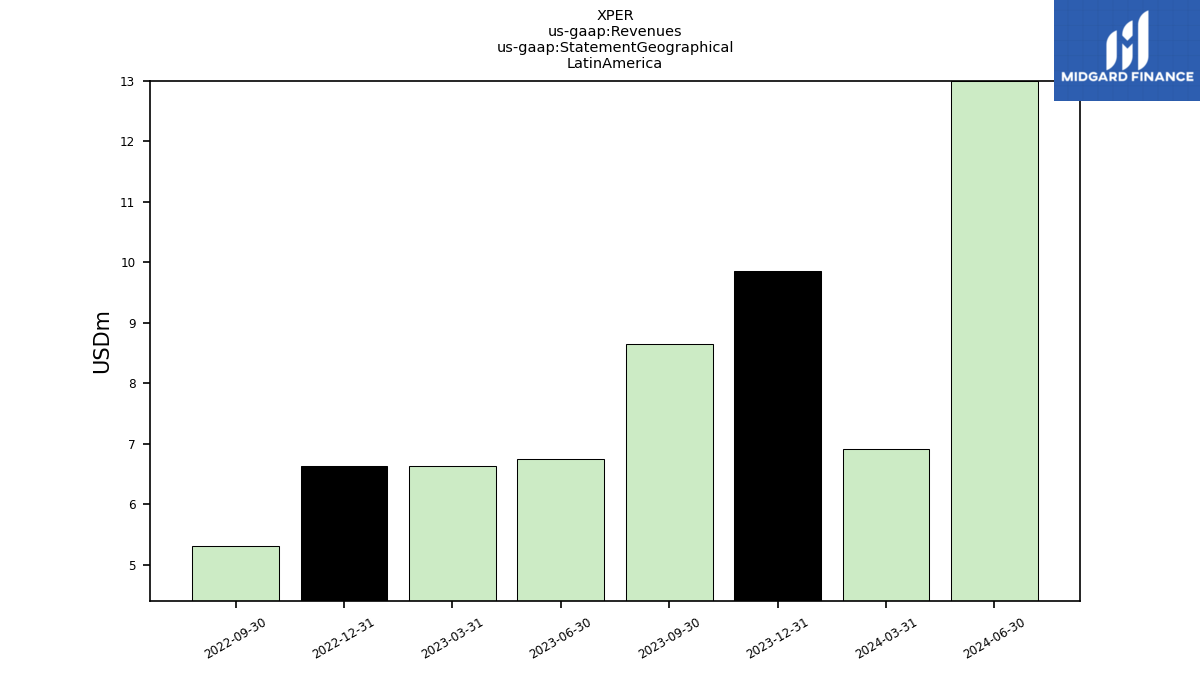
| Revenues | 137.23 | 130.39 | 126.87 | 126.84 | 135.53 | 121.64 | 126.20 | 118.89 | 124.75 | 117.73 | |
| 6.96 | 6.81 | 10.53 | 11.51 | 3.76 | 12.71 | 4.16 | 10.29 | 3.04 | 3.56 | ||
| 24.45 | 22.62 | 18.57 | 17.50 | 19.71 | 13.80 | 16.49 | 15.55 | 15.16 | 17.61 | ||
| 9.85 | 8.65 | NA | NA | 6.62 | 5.31 | NA | NA | NA | NA | ||
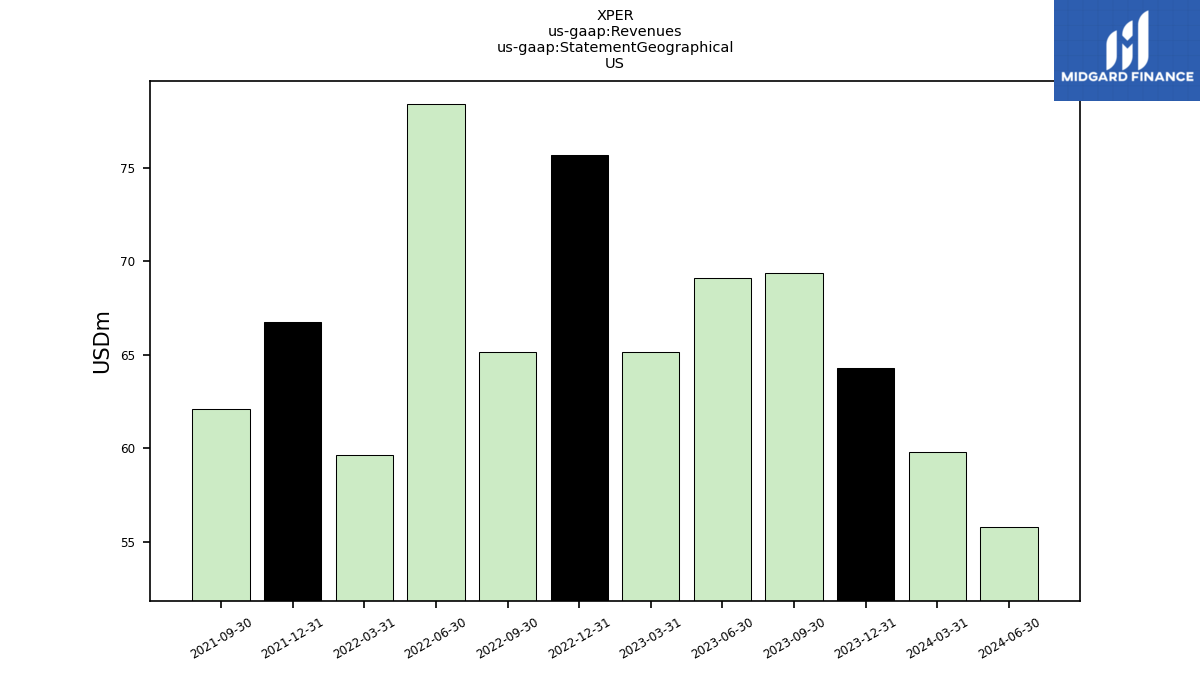
| US | 64.32 | 69.38 | 69.13 | 65.16 | 75.67 | 65.17 | 78.41 | 59.67 | 66.78 | 62.13 | |
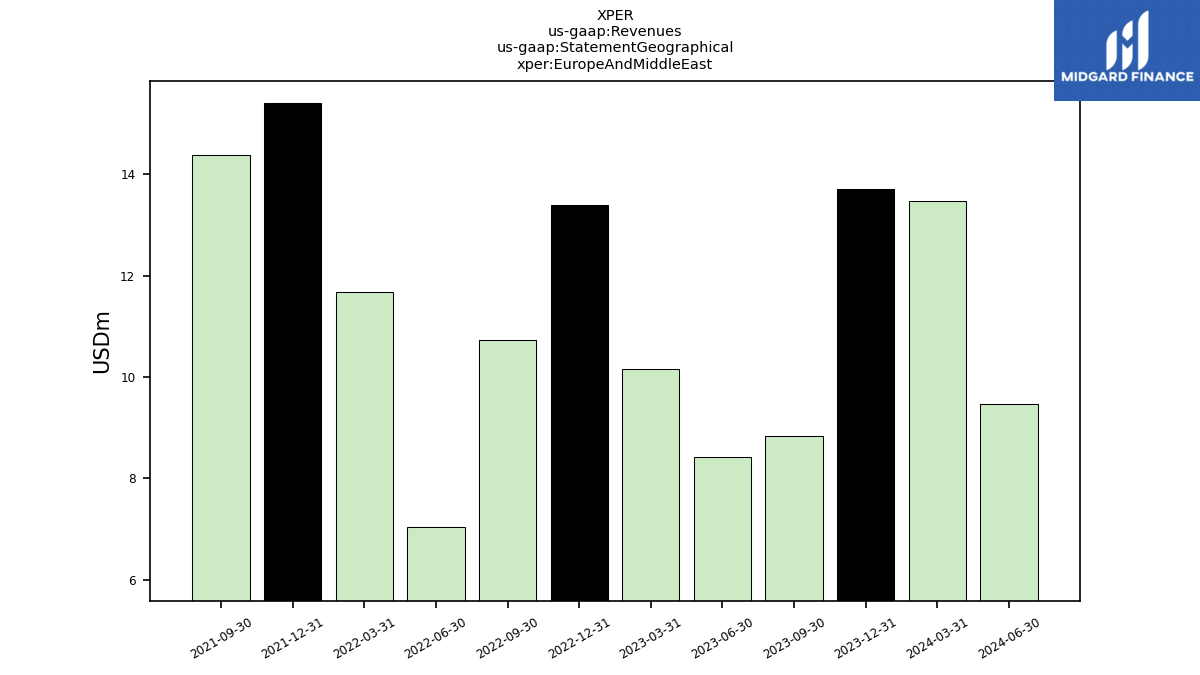
| Europe And Middle East | 13.70 | 8.83 | 8.42 | 10.17 | 13.39 | 10.72 | 7.05 | 11.69 | 15.42 | 14.38 | |
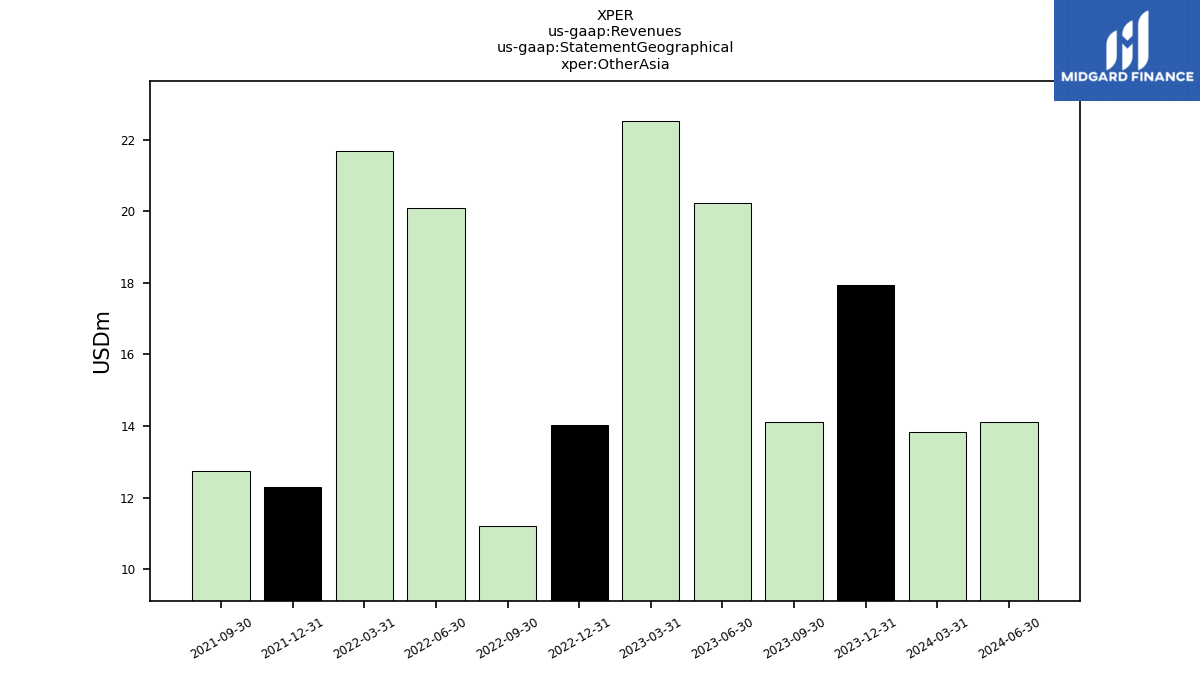
| Other Asia | 17.94 | 14.10 | 20.23 | 22.51 | 14.02 | 11.22 | 20.09 | 21.69 | 12.29 | 12.75 | |
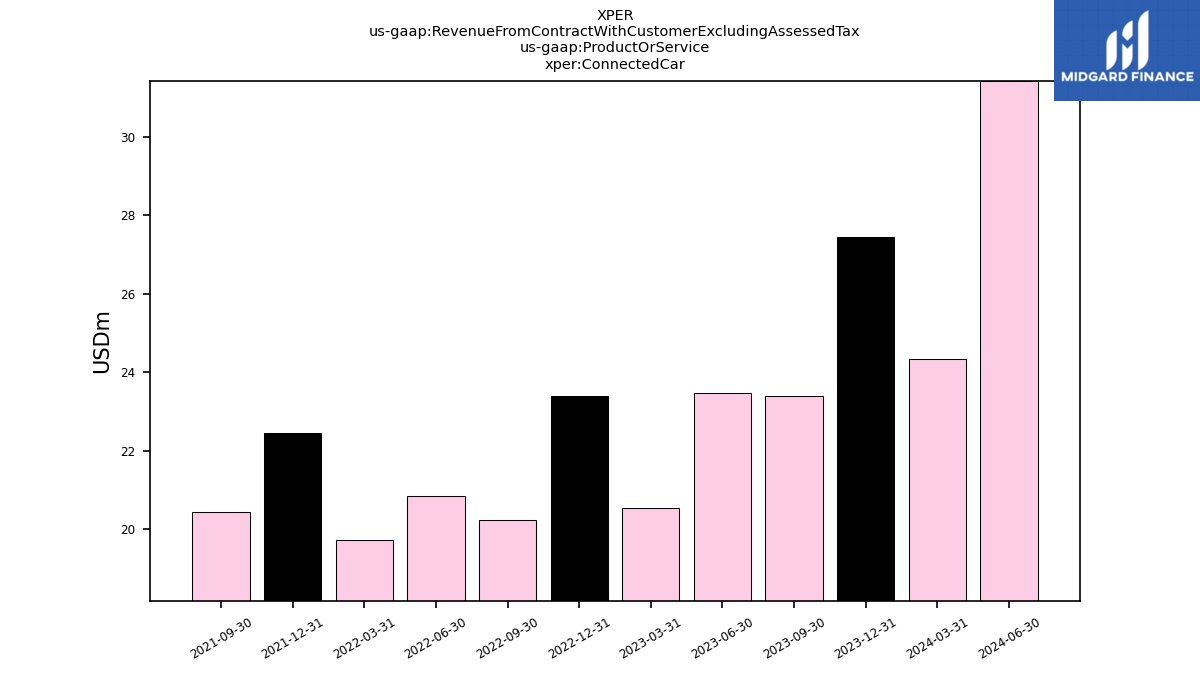
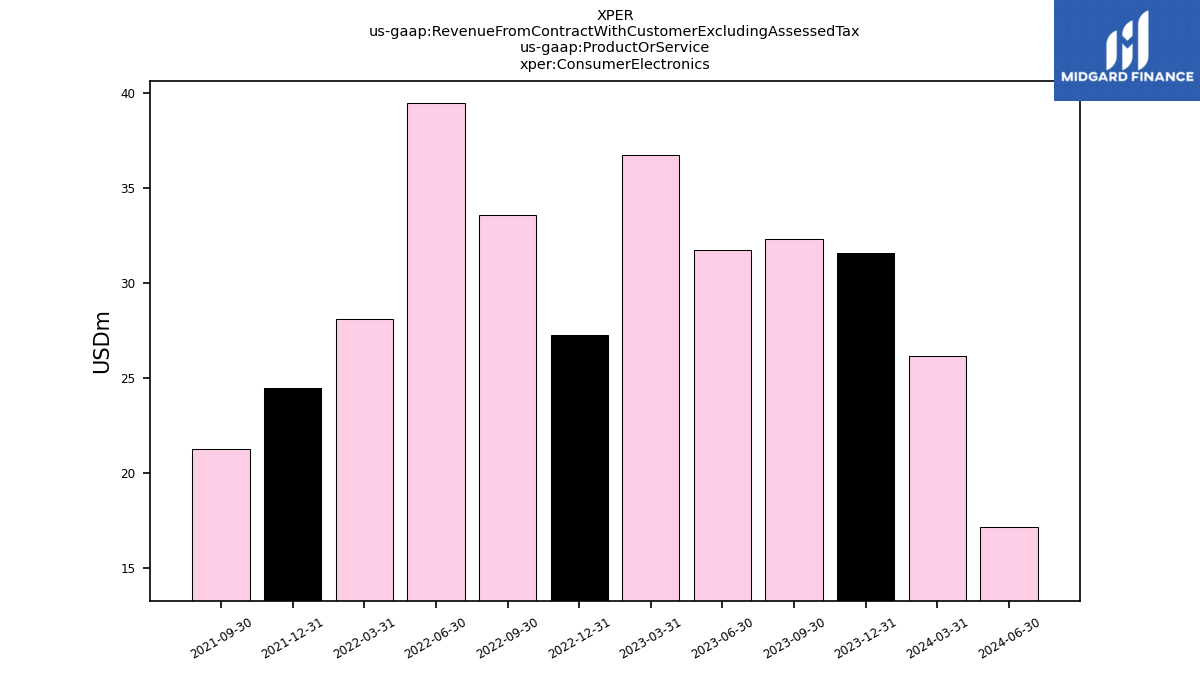
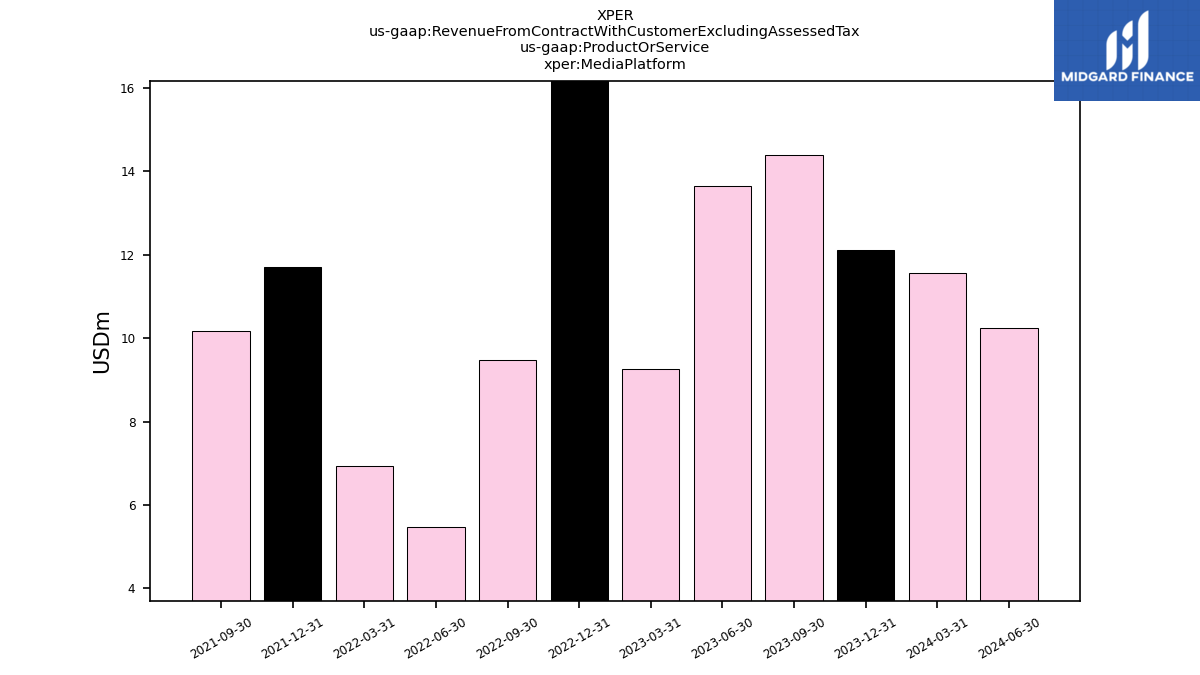
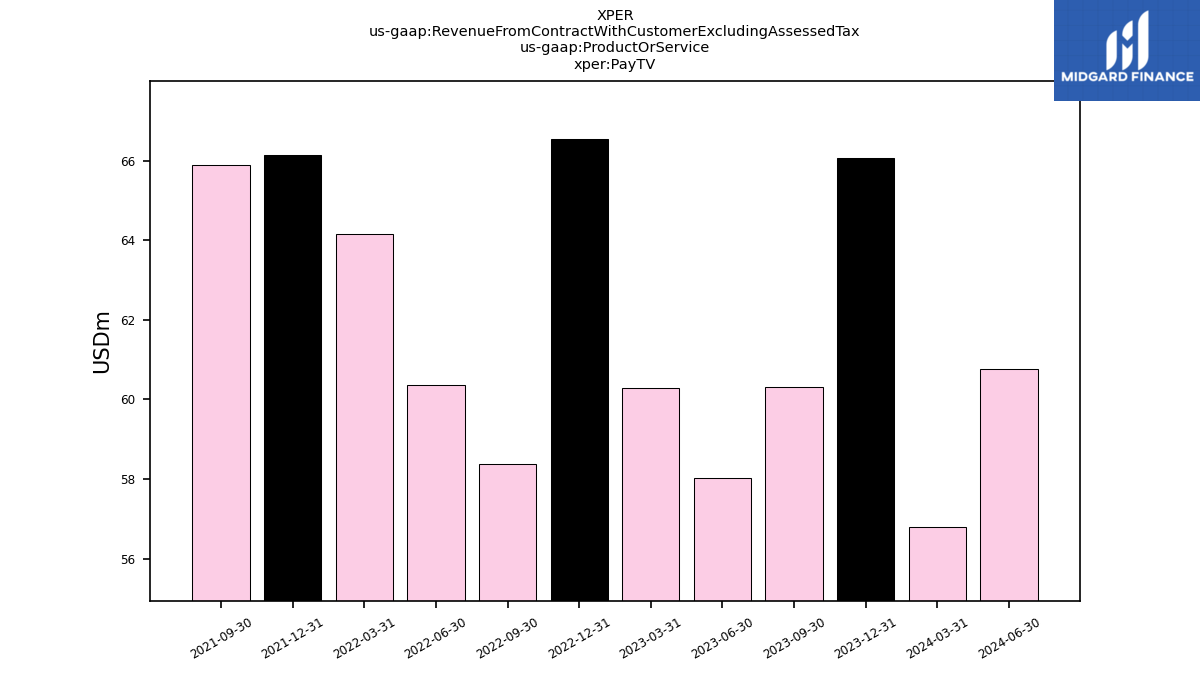
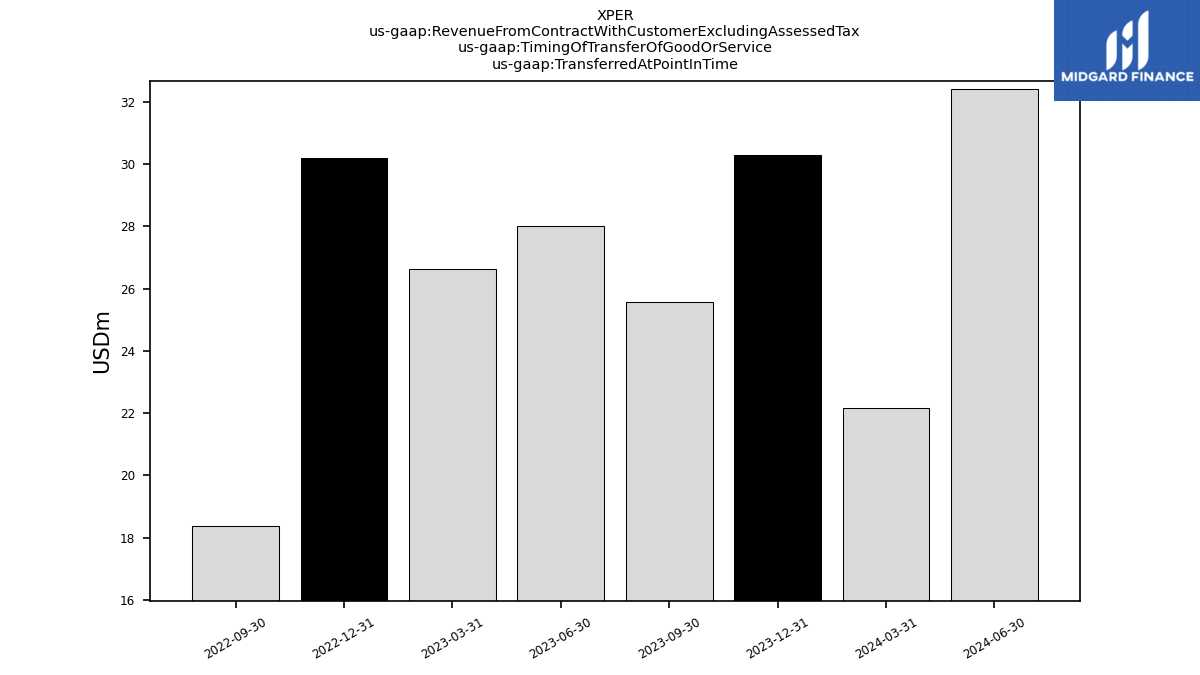
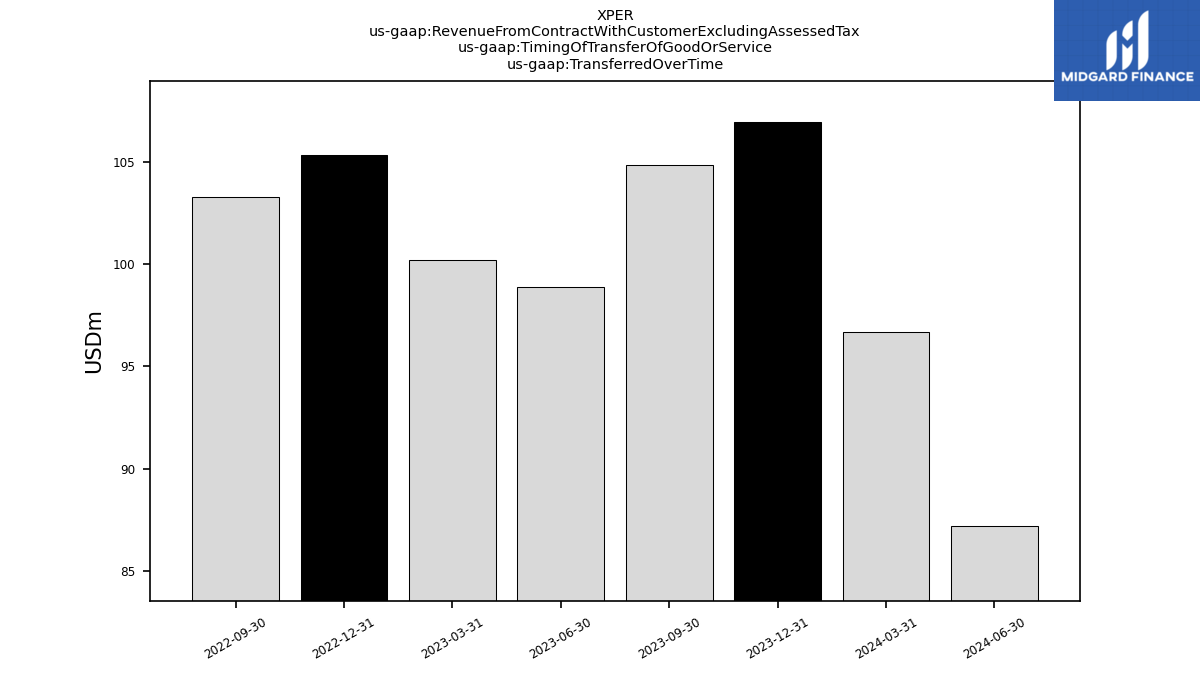
| Revenue From Contract With Customer Excluding Assessed Tax | 137.23 | 130.39 | 126.87 | 126.84 | 135.53 | 121.64 | 126.20 | 118.89 | 124.75 | 117.73 | |
| Connected Car | 27.45 | 23.39 | 23.47 | 20.55 | 23.40 | 20.22 | 20.86 | 19.72 | 22.44 | 20.45 | |
| Consumer Electronics | 31.61 | 32.30 | 31.72 | 36.73 | 27.25 | 33.56 | 39.49 | 28.09 | 24.48 | 21.23 | |
| Media Platform | 12.11 | 14.38 | 13.65 | 9.26 | 18.32 | 9.47 | 5.48 | 6.92 | 11.70 | 10.16 | |
| Pay T V | 66.06 | 60.32 | 58.03 | 60.29 | 66.55 | 58.38 | 60.37 | 64.16 | 66.13 | 65.89 | |
| Transferred At Point In Time | 30.28 | 25.56 | NA | NA | 30.20 | 18.36 | NA | NA | NA | NA | |
| Transferred Over Time | 106.95 | 104.83 | NA | NA | 105.33 | 103.28 | NA | NA | NA | NA |