
| 2023-12-31 | 2023-09-30 | 2023-06-30 | 2023-03-31 | 2022-12-31 | 2022-09-30 | 2022-06-30 | 2022-03-31 | 2021-12-31 | 2021-09-30 | 2021-06-30 | 2021-03-31 | 2020-12-31 | 2020-09-30 | 2020-06-30 | 2020-03-31 | 2019-12-31 | 2019-09-30 | 2019-06-30 | 2019-03-31 | 2018-12-31 | 2018-09-30 | 2018-06-30 | 2018-03-31 | 2017-12-31 | 2017-09-30 | 2017-06-30 | 2017-03-31 | 2016-12-31 | 2016-09-30 | 2016-06-30 | 2016-03-31 | 2015-12-31 | 2015-09-30 | 2015-06-30 | 2015-03-31 | 2014-12-31 | 2014-09-30 | 2014-06-30 | 2014-03-31 | 2013-12-31 | 2013-09-30 | 2013-06-30 | 2013-03-31 | 2012-12-31 | 2012-09-30 | 2012-06-30 | 2012-03-31 | 2011-12-31 | 2011-09-30 | 2011-06-30 | 2011-03-31 | 2010-12-31 | 2010-09-30 | 2010-06-30 | ||
|---|---|---|---|---|---|---|---|---|---|---|---|---|---|---|---|---|---|---|---|---|---|---|---|---|---|---|---|---|---|---|---|---|---|---|---|---|---|---|---|---|---|---|---|---|---|---|---|---|---|---|---|---|---|---|---|---|
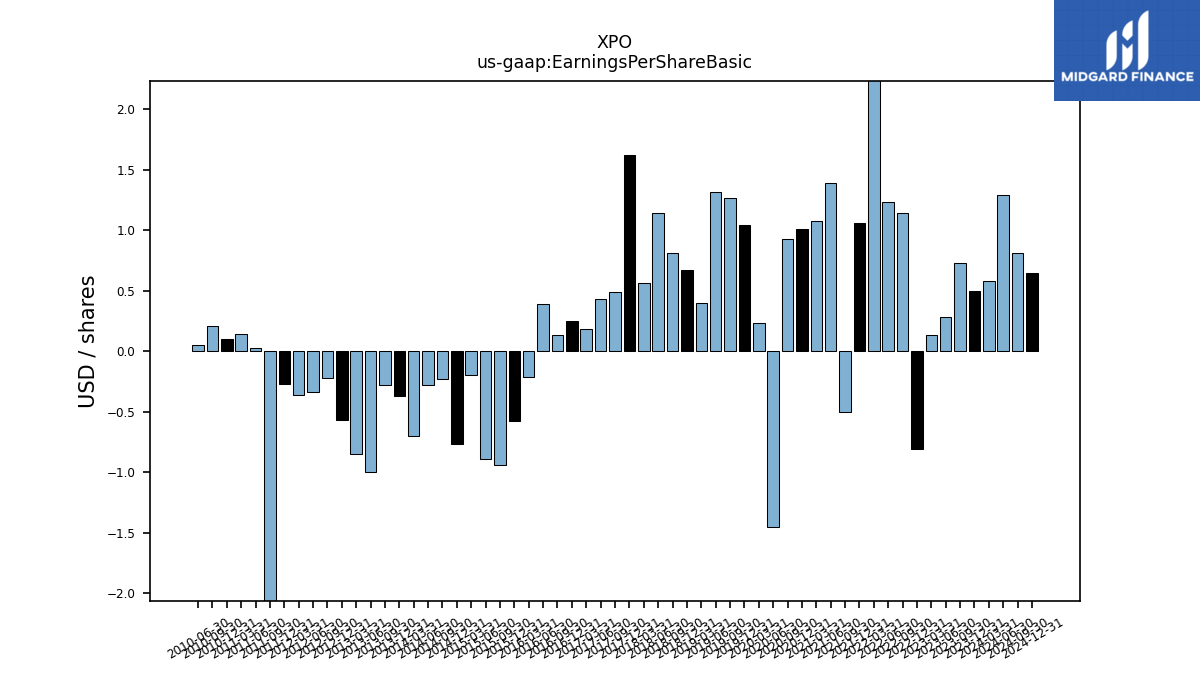
| Earnings Per Share Basic | 0.50 | 0.73 | 0.28 | 0.13 | -0.81 | 1.14 | 1.23 | 4.25 | 1.06 | -0.50 | 1.39 | 1.08 | 1.01 | 0.93 | -1.45 | 0.23 | 1.04 | 1.27 | 1.32 | 0.40 | 0.67 | 0.81 | 1.14 | 0.56 | 1.62 | 0.49 | 0.43 | 0.18 | 0.25 | 0.13 | 0.39 | -0.21 | -0.58 | -0.94 | -0.89 | -0.20 | -0.77 | -0.23 | -0.28 | -0.70 | -0.37 | -0.28 | -1.00 | -0.85 | -0.57 | -0.22 | -0.34 | -0.36 | -0.27 | -5.38 | 0.03 | 0.14 | 0.10 | 0.21 | 0.05 | |
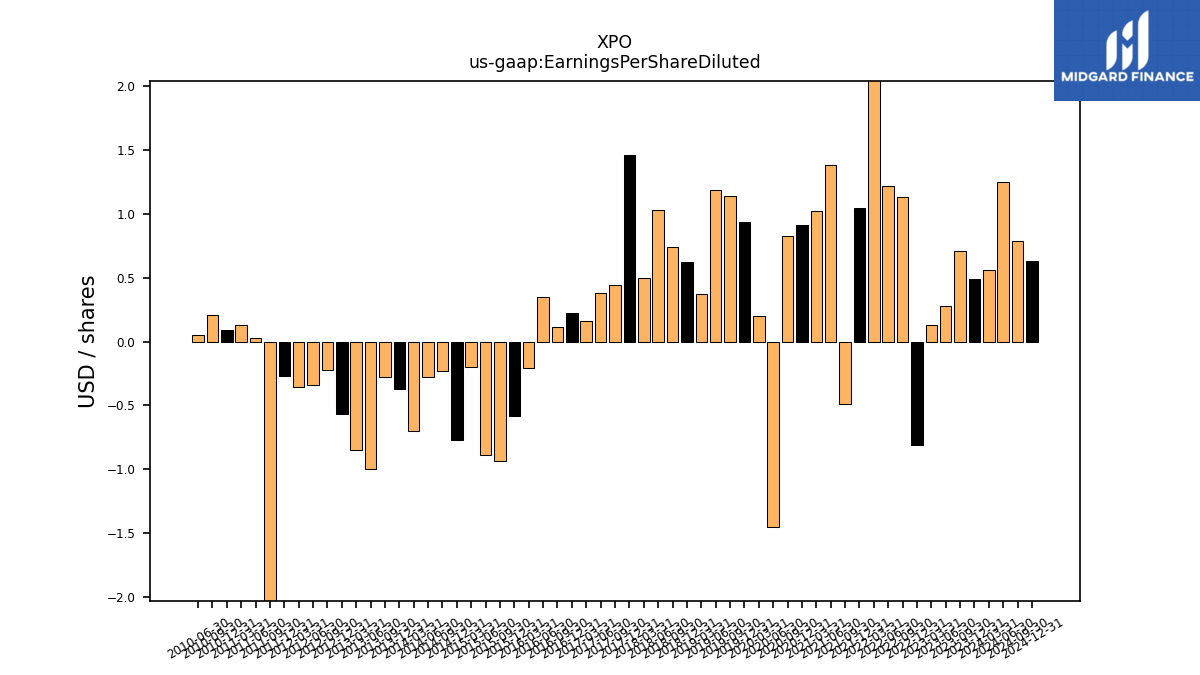
| Earnings Per Share Diluted | 0.49 | 0.71 | 0.28 | 0.13 | -0.81 | 1.13 | 1.22 | 4.22 | 1.05 | -0.49 | 1.38 | 1.02 | 0.91 | 0.83 | -1.45 | 0.20 | 0.94 | 1.14 | 1.19 | 0.37 | 0.62 | 0.74 | 1.03 | 0.50 | 1.46 | 0.44 | 0.38 | 0.16 | 0.22 | 0.11 | 0.35 | -0.21 | -0.58 | -0.94 | -0.89 | -0.20 | -0.77 | -0.23 | -0.28 | -0.70 | -0.37 | -0.28 | -1.00 | -0.85 | -0.57 | -0.22 | -0.34 | -0.36 | -0.27 | -5.38 | 0.03 | 0.13 | 0.09 | 0.21 | 0.05 | |
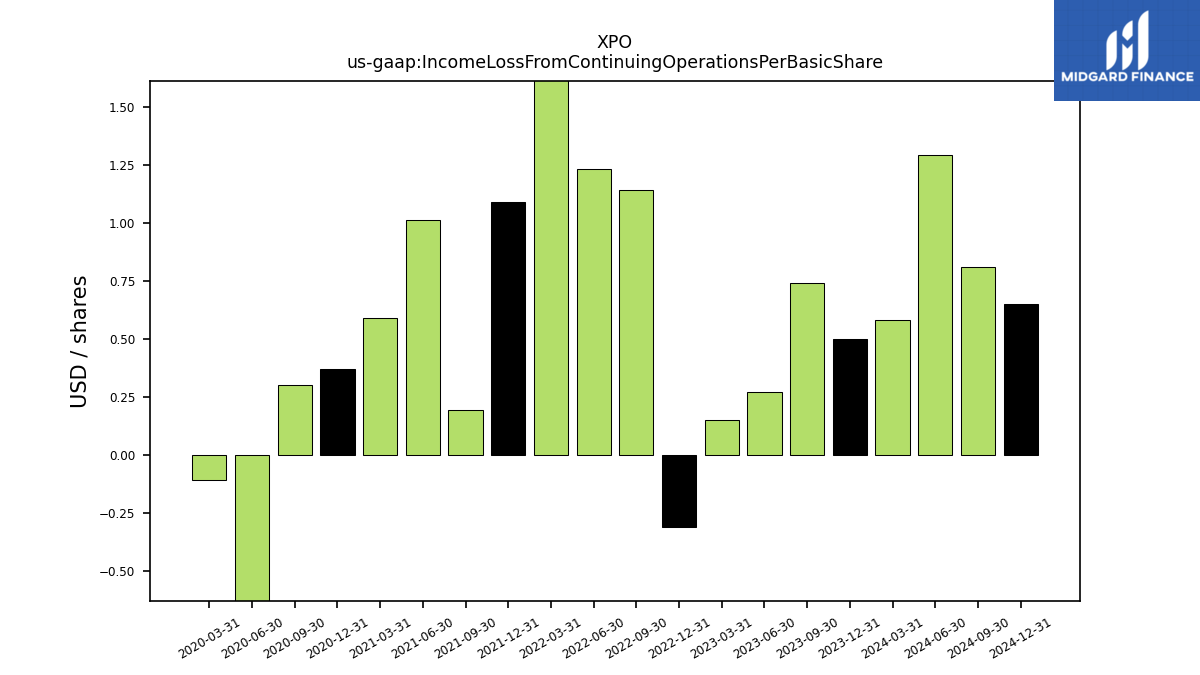
| Income Loss From Continuing Operations Per Basic Share | 0.00 | 0.00 | 0.00 | 0.00 | -0.00 | 0.00 | 0.00 | 0.00 | 0.00 | 0.00 | 0.00 | 0.00 | 0.00 | 0.00 | -0.00 | -0.00 | NA | NA | NA | NA | NA | NA | NA | NA | NA | NA | NA | NA | NA | NA | NA | NA | NA | NA | NA | NA | NA | NA | NA | NA | NA | NA | NA | NA | NA | NA | NA | NA | NA | NA | NA | NA | NA | NA | NA | |
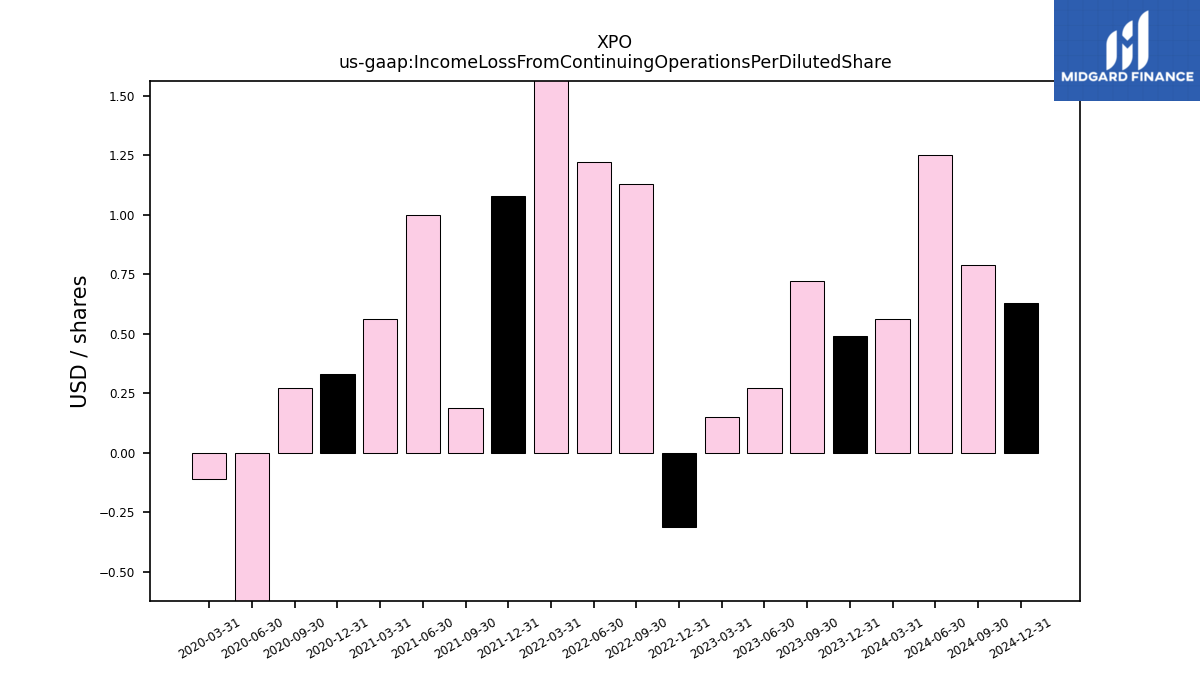
| Income Loss From Continuing Operations Per Diluted Share | 0.00 | 0.00 | 0.00 | 0.00 | -0.00 | 0.00 | 0.00 | 0.00 | 0.00 | 0.00 | 0.00 | 0.00 | 0.00 | 0.00 | -0.00 | -0.00 | NA | NA | NA | NA | NA | NA | NA | NA | NA | NA | NA | NA | NA | NA | NA | NA | NA | NA | NA | NA | NA | NA | NA | NA | NA | NA | NA | NA | NA | NA | NA | NA | NA | NA | NA | NA | NA | NA | NA |
| 2023-12-31 | 2023-09-30 | 2023-06-30 | 2023-03-31 | 2022-12-31 | 2022-09-30 | 2022-06-30 | 2022-03-31 | 2021-12-31 | 2021-09-30 | 2021-06-30 | 2021-03-31 | 2020-12-31 | 2020-09-30 | 2020-06-30 | 2020-03-31 | 2019-12-31 | 2019-09-30 | 2019-06-30 | 2019-03-31 | 2018-12-31 | 2018-09-30 | 2018-06-30 | 2018-03-31 | 2017-12-31 | 2017-09-30 | 2017-06-30 | 2017-03-31 | 2016-12-31 | 2016-09-30 | 2016-06-30 | 2016-03-31 | 2015-12-31 | 2015-09-30 | 2015-06-30 | 2015-03-31 | 2014-12-31 | 2014-09-30 | 2014-06-30 | 2014-03-31 | 2013-12-31 | 2013-09-30 | 2013-06-30 | 2013-03-31 | 2012-12-31 | 2012-09-30 | 2012-06-30 | 2012-03-31 | 2011-12-31 | 2011-09-30 | 2011-06-30 | 2011-03-31 | 2010-12-31 | 2010-09-30 | 2010-06-30 | ||
|---|---|---|---|---|---|---|---|---|---|---|---|---|---|---|---|---|---|---|---|---|---|---|---|---|---|---|---|---|---|---|---|---|---|---|---|---|---|---|---|---|---|---|---|---|---|---|---|---|---|---|---|---|---|---|---|---|
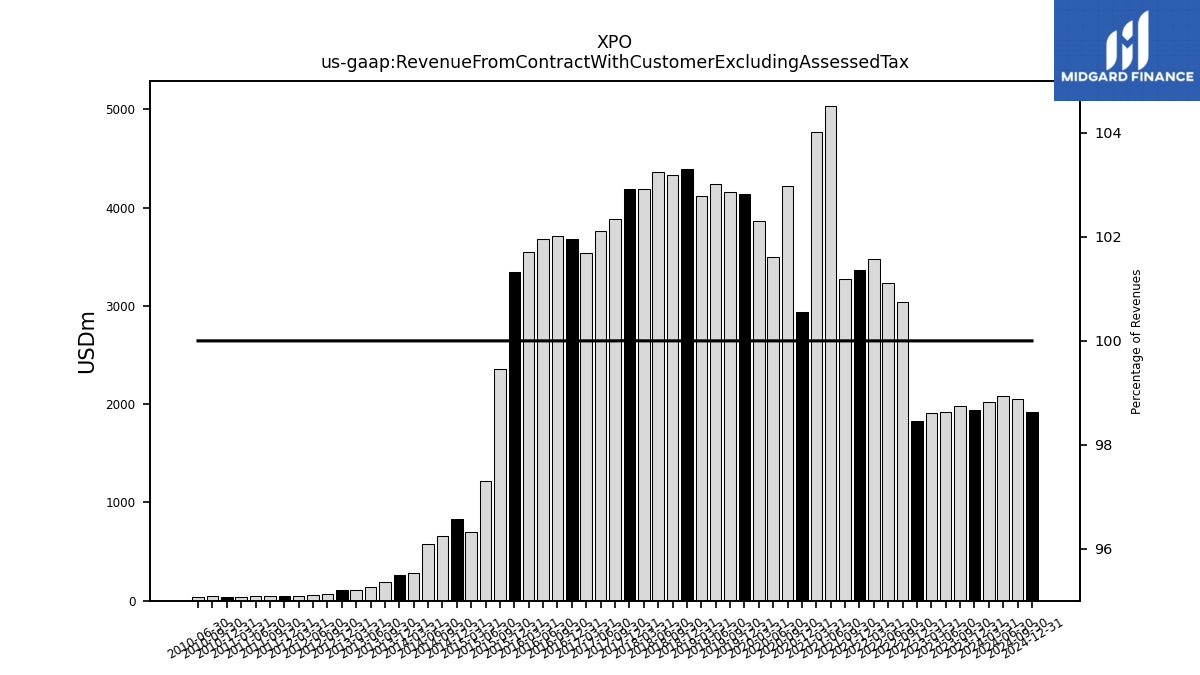
| Revenue From Contract With Customer Excluding Assessed Tax | 1940.00 | 1980.00 | 1917.00 | 1907.00 | 1831.00 | 3042.00 | 3232.00 | 3473.00 | 3361.00 | 3270.00 | 5036.00 | 4774.00 | 2938.00 | 4221.00 | 3502.00 | 3864.00 | 4136.00 | 4154.00 | 4238.00 | 4120.00 | 4388.90 | 4335.10 | 4363.50 | 4191.50 | 4194.10 | 3887.10 | 3760.30 | 3539.50 | 3676.60 | 3713.80 | 3683.30 | 3545.70 | 3342.30 | 2362.10 | 1215.90 | 703.00 | 830.70 | 662.47 | 581.01 | 282.40 | 257.23 | 193.98 | 137.09 | 114.00 | 108.50 | 70.99 | 54.54 | 44.56 | 44.09 | 47.39 | 44.09 | 41.51 | 41.56 | 44.45 | 40.34 | |
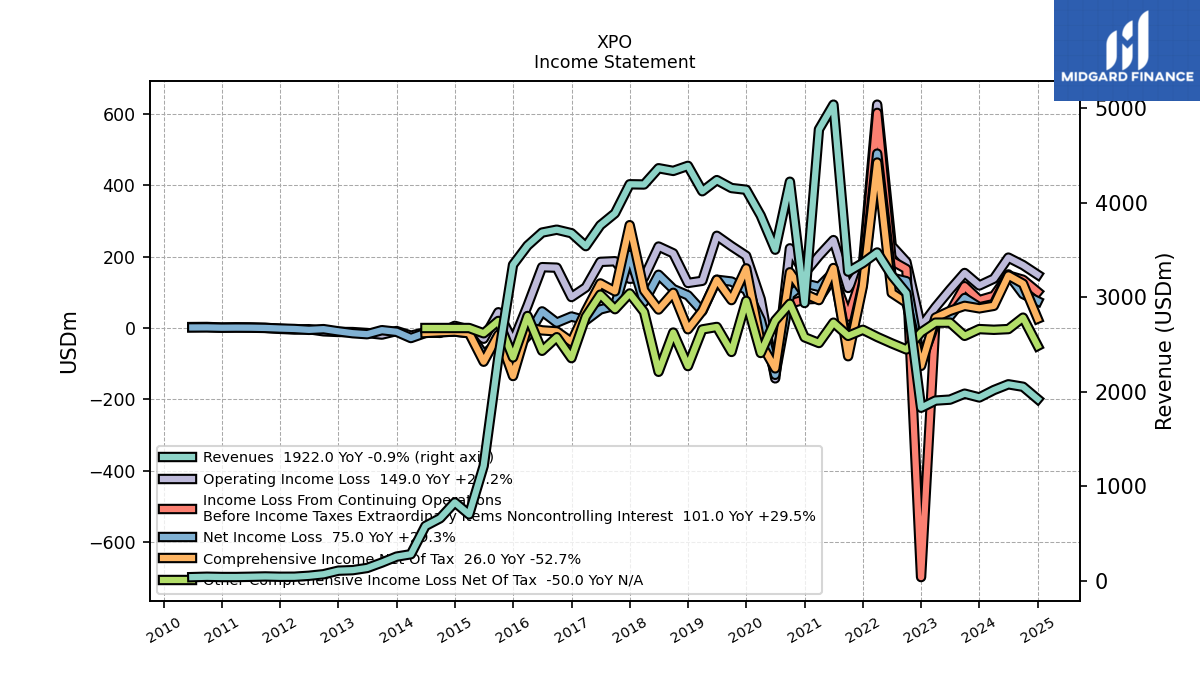
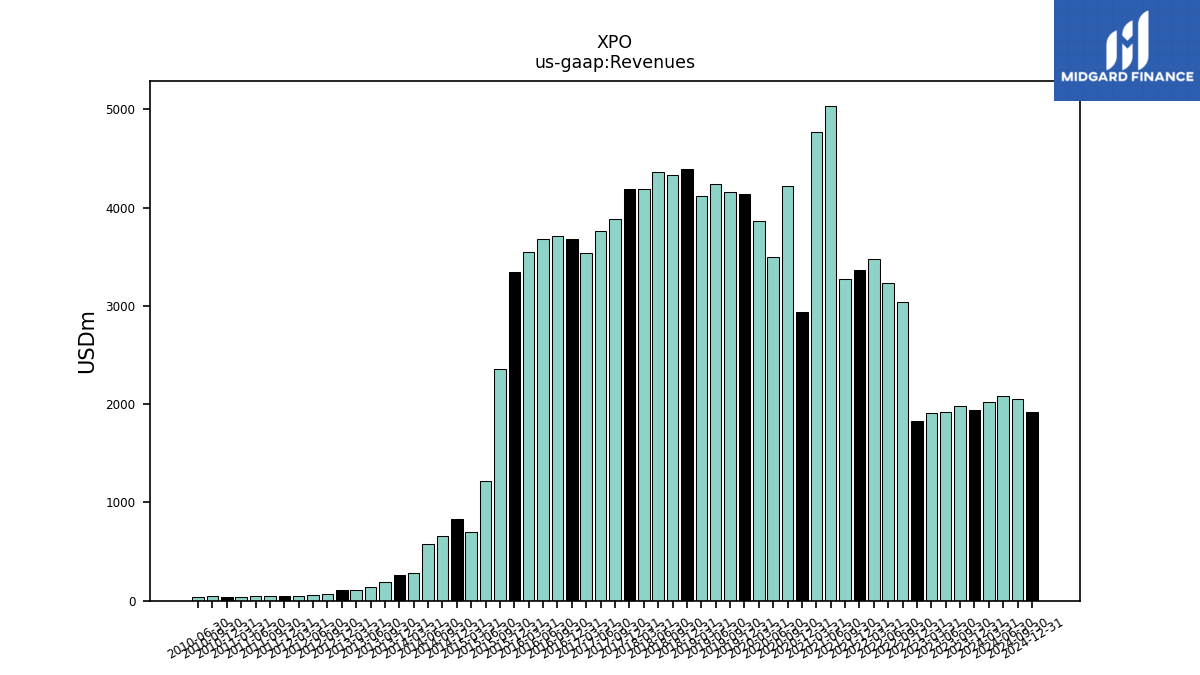
| Revenues | 1940.00 | 1980.00 | 1917.00 | 1907.00 | 1831.00 | 3042.00 | 3232.00 | 3473.00 | 3361.00 | 3270.00 | 5036.00 | 4774.00 | 2938.00 | 4221.00 | 3502.00 | 3864.00 | 4136.00 | 4154.00 | 4238.00 | 4120.00 | 4388.90 | 4335.10 | 4363.50 | 4191.50 | 4193.90 | 3887.10 | 3760.30 | 3539.50 | 3676.60 | 3713.80 | 3683.30 | 3545.70 | 3342.30 | 2362.10 | 1215.90 | 703.00 | 830.70 | 662.47 | 581.01 | 282.40 | 257.23 | 193.98 | 137.09 | 114.00 | 108.50 | 70.99 | 54.54 | 44.56 | 44.09 | 47.39 | 44.09 | 41.51 | 41.56 | 44.45 | 40.34 | |
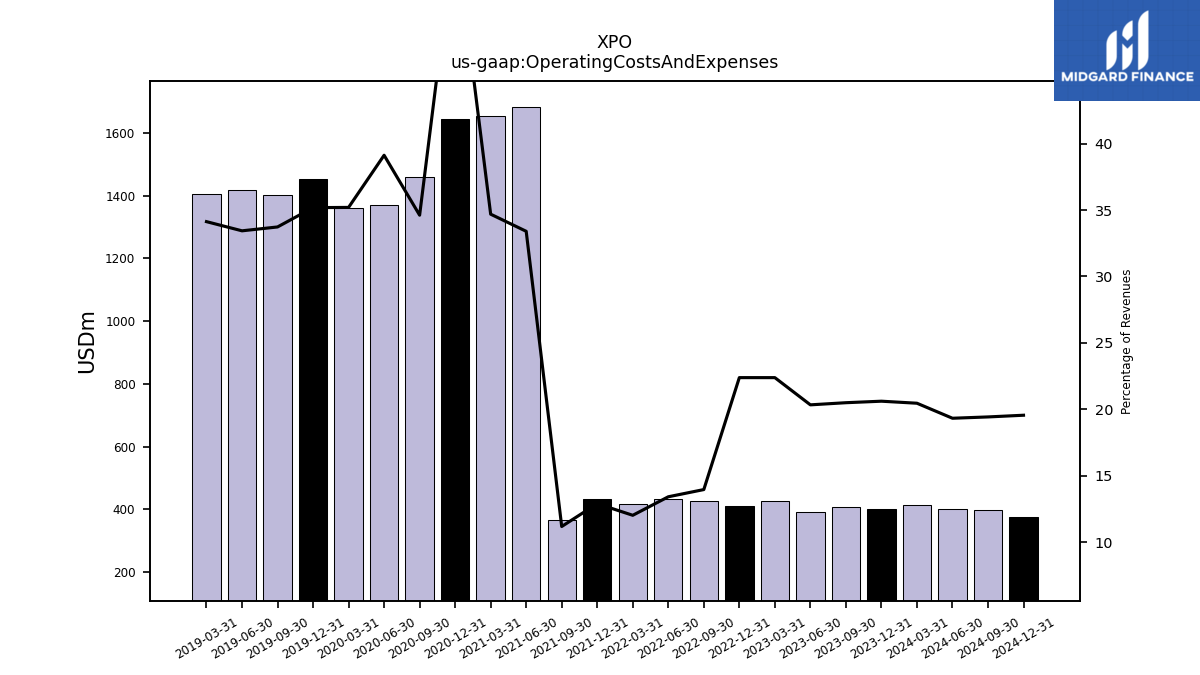
| Operating Costs And Expenses | 400.00 | 406.00 | 390.00 | 427.00 | 410.00 | 425.00 | 434.00 | 418.00 | 434.00 | 366.00 | 1682.00 | 1656.00 | 1646.00 | 1461.00 | 1370.00 | 1360.00 | 1455.00 | 1401.00 | 1417.00 | 1406.00 | NA | NA | NA | NA | NA | NA | NA | NA | NA | NA | NA | NA | NA | NA | NA | NA | NA | NA | NA | NA | NA | NA | NA | NA | NA | NA | NA | NA | NA | NA | NA | NA | NA | NA | NA | |
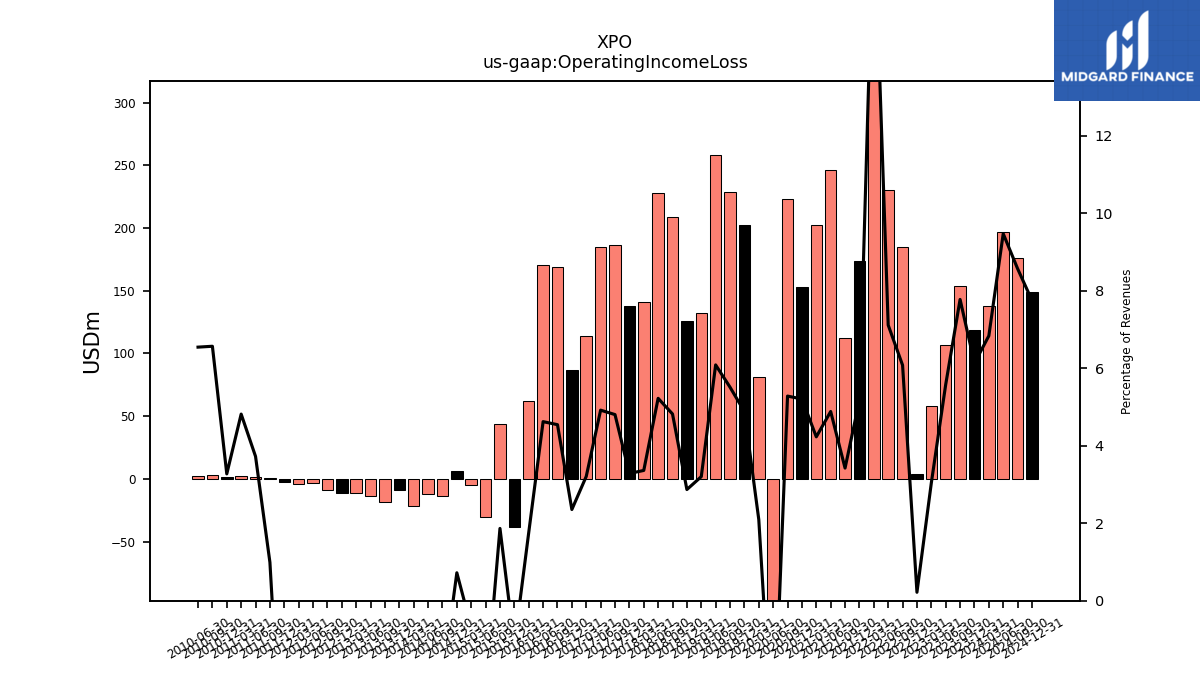
| Operating Income Loss | 119.00 | 154.00 | 107.00 | 58.00 | 4.00 | 185.00 | 230.00 | 625.00 | 174.00 | 112.00 | 246.00 | 202.00 | 153.00 | 223.00 | -141.00 | 81.00 | 202.00 | 229.00 | 258.00 | 132.00 | 126.00 | 209.00 | 228.00 | 141.00 | 137.80 | 186.80 | 185.00 | 113.60 | 86.60 | 168.80 | 170.30 | 62.40 | -38.00 | 44.10 | -30.10 | -4.80 | 6.00 | -13.64 | -11.89 | -21.36 | -8.50 | -18.42 | -14.02 | -11.37 | -11.10 | -9.28 | -3.37 | -4.22 | -2.39 | 0.47 | 1.64 | 2.00 | 1.36 | 2.92 | 2.64 | |
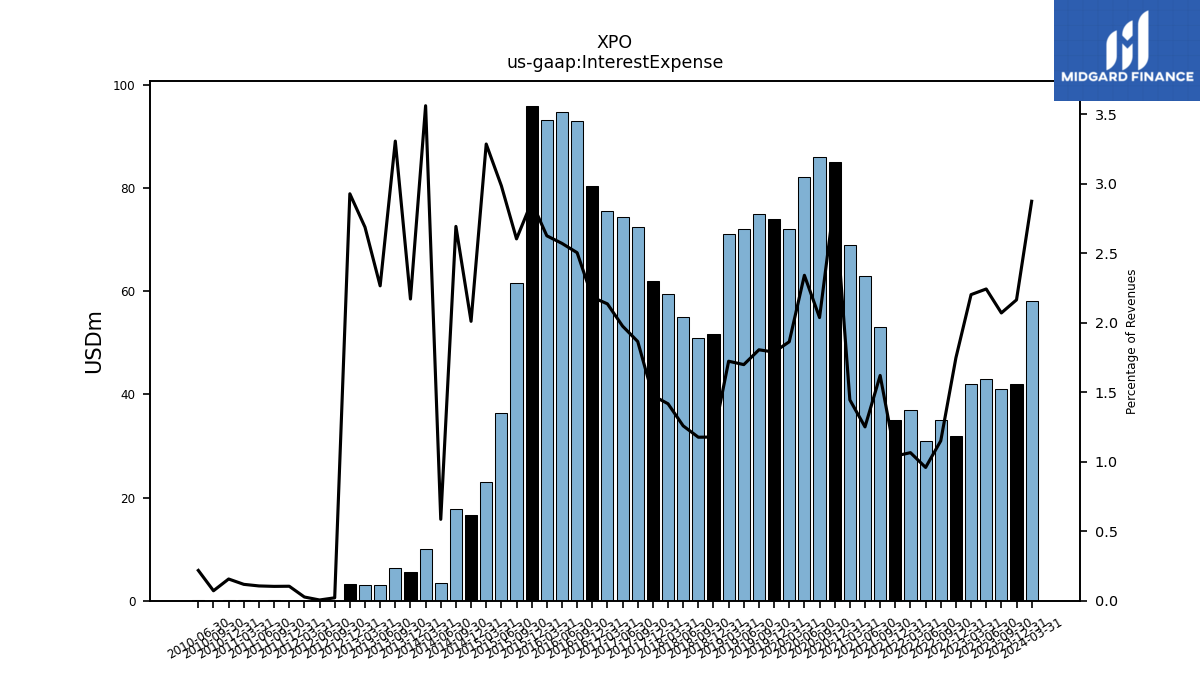
| Interest Expense | 42.00 | 41.00 | 43.00 | 42.00 | 32.00 | 35.00 | 31.00 | 37.00 | 35.00 | 53.00 | 63.00 | 69.00 | 85.00 | 86.00 | 82.00 | 72.00 | 74.00 | 75.00 | 72.00 | 71.00 | 51.70 | 51.00 | 54.90 | 59.40 | 61.90 | 72.50 | 74.30 | 75.60 | 80.30 | 93.00 | 94.70 | 93.10 | 95.90 | 61.50 | 36.30 | 23.10 | 16.70 | 17.84 | 3.40 | 10.06 | 5.58 | 6.42 | 3.11 | 3.06 | 3.18 | 0.01 | 0.00 | 0.01 | 0.05 | 0.05 | 0.05 | 0.05 | 0.07 | 0.03 | 0.09 | |
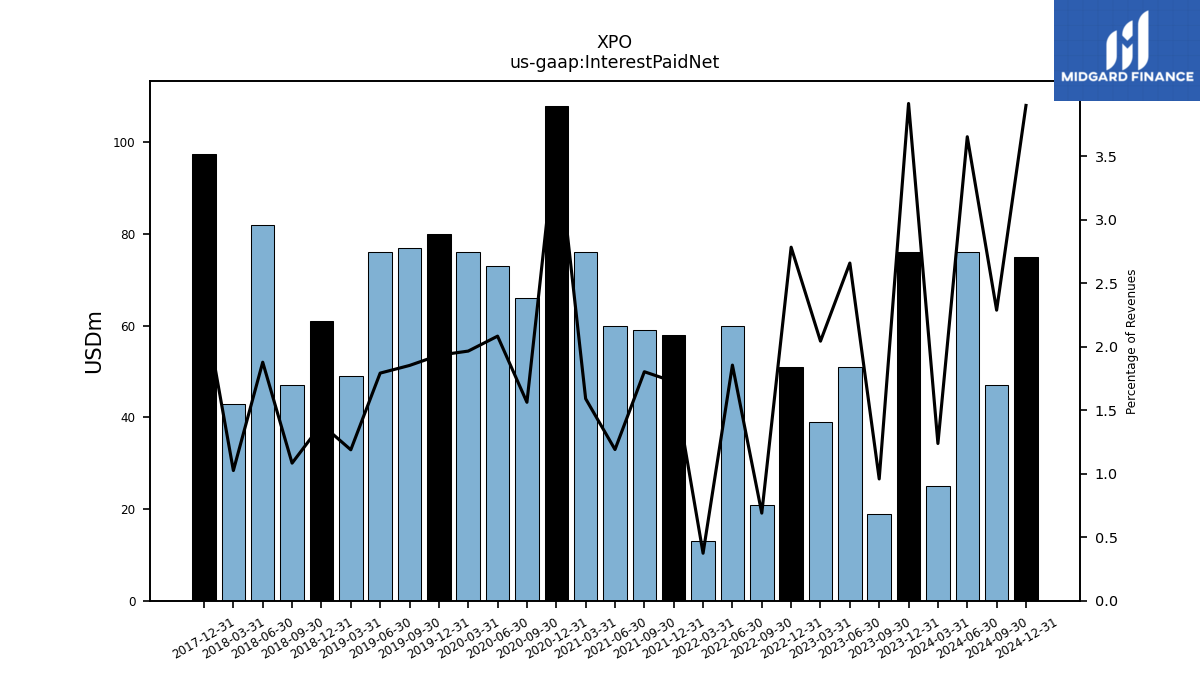
| Interest Paid Net | 76.00 | 19.00 | 51.00 | 39.00 | 51.00 | 21.00 | 60.00 | 13.00 | 58.00 | 59.00 | 60.00 | 76.00 | 108.00 | 66.00 | 73.00 | 76.00 | 80.00 | 77.00 | 76.00 | 49.00 | 61.00 | 47.00 | 82.00 | 43.00 | 97.50 | NA | NA | NA | NA | NA | NA | NA | NA | NA | NA | NA | NA | NA | NA | NA | NA | NA | NA | NA | NA | NA | NA | NA | NA | NA | NA | NA | NA | NA | NA | |
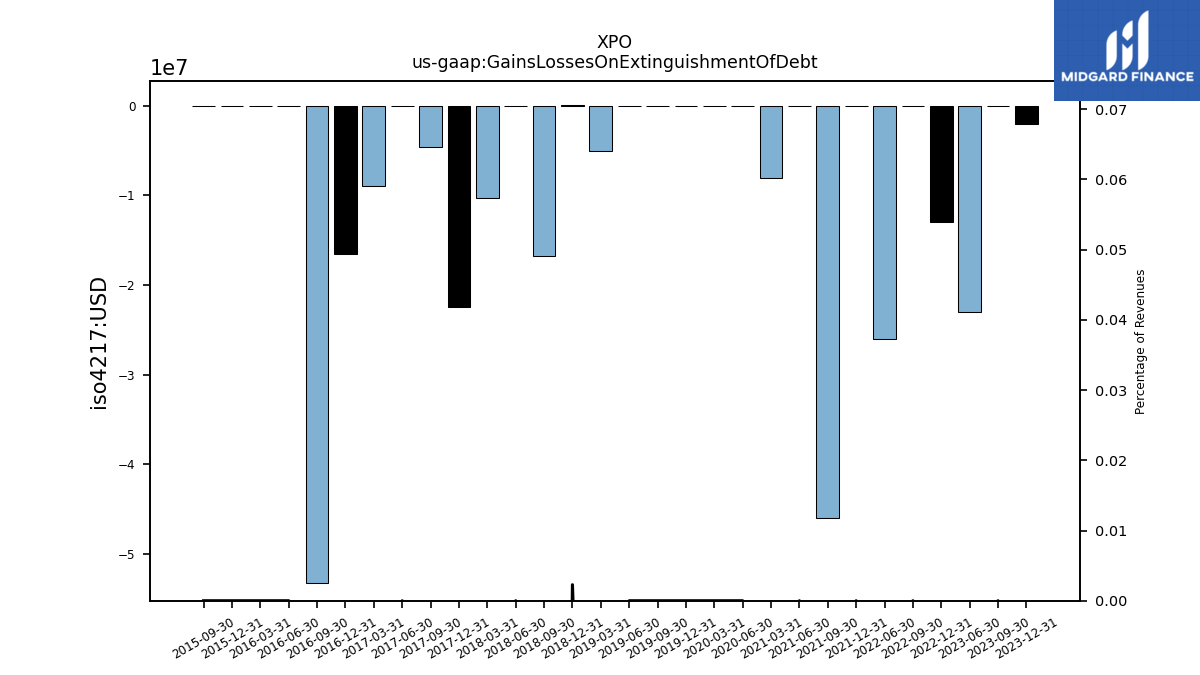
| Gains Losses On Extinguishment Of Debt | -2.00 | 0.00 | -23.00 | NA | -13.00 | 0.00 | -26.00 | NA | 0.00 | -46.00 | 0.00 | -8.00 | NA | NA | 0.00 | 0.00 | 0.00 | 0.00 | 0.00 | -5.00 | 0.10 | -16.80 | 0.00 | -10.30 | -22.40 | -4.60 | 0.00 | -9.00 | -16.50 | -53.20 | 0.00 | 0.00 | 0.00 | 0.00 | NA | NA | NA | NA | NA | NA | NA | NA | NA | NA | NA | NA | NA | NA | NA | NA | NA | NA | NA | NA | NA | |
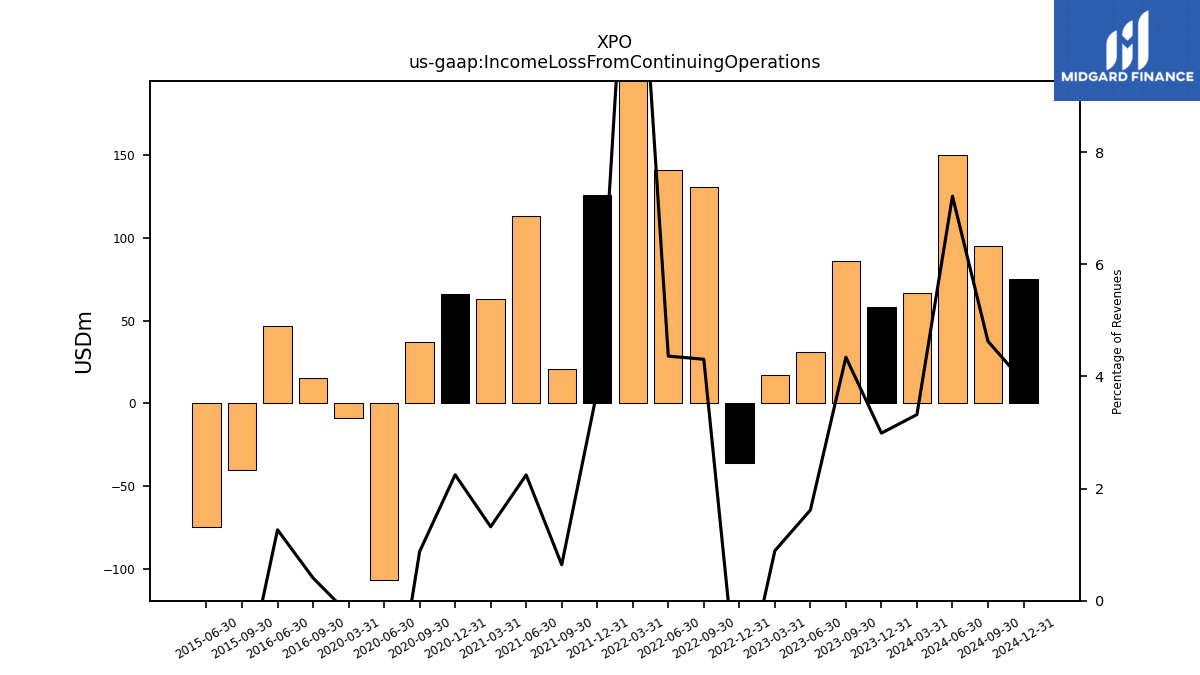
| Income Loss From Continuing Operations | 58.00 | 86.00 | 31.00 | 17.00 | -36.00 | 131.00 | 141.00 | 489.00 | 126.00 | 21.00 | 113.00 | 63.00 | 66.00 | 37.00 | -107.00 | -9.00 | NA | NA | NA | NA | NA | NA | NA | NA | NA | NA | NA | NA | NA | 15.10 | 46.60 | NA | NA | -40.40 | -74.40 | NA | NA | NA | NA | NA | NA | NA | NA | NA | NA | NA | NA | NA | NA | NA | NA | NA | NA | NA | NA | |
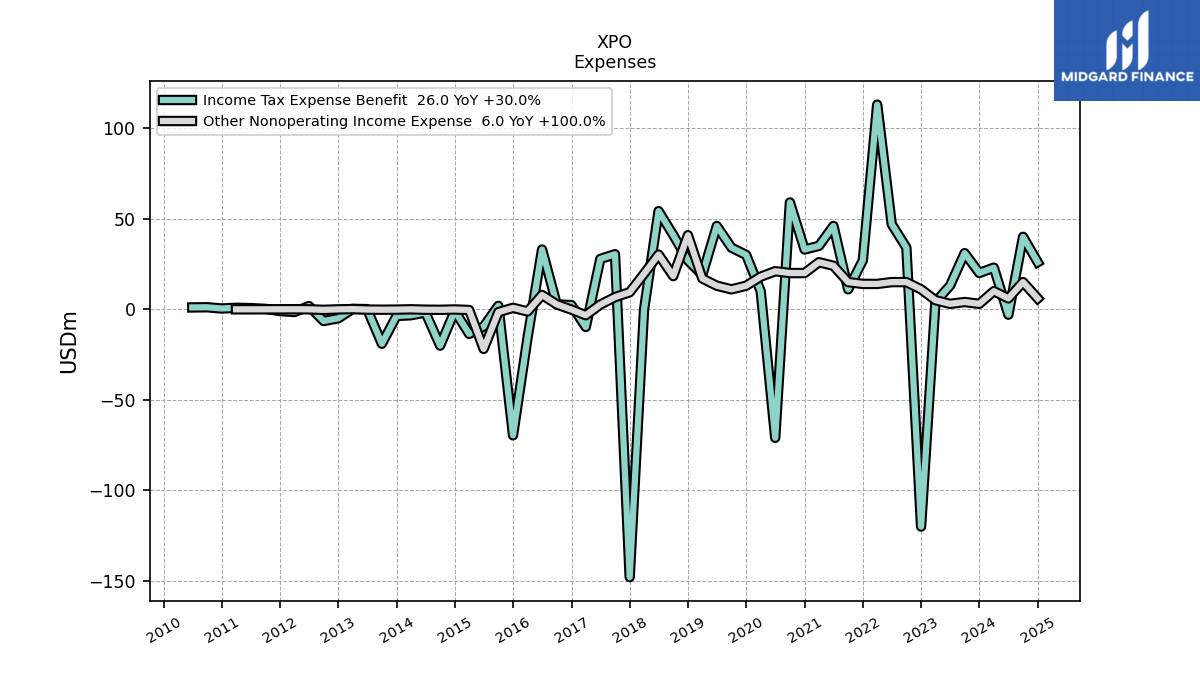
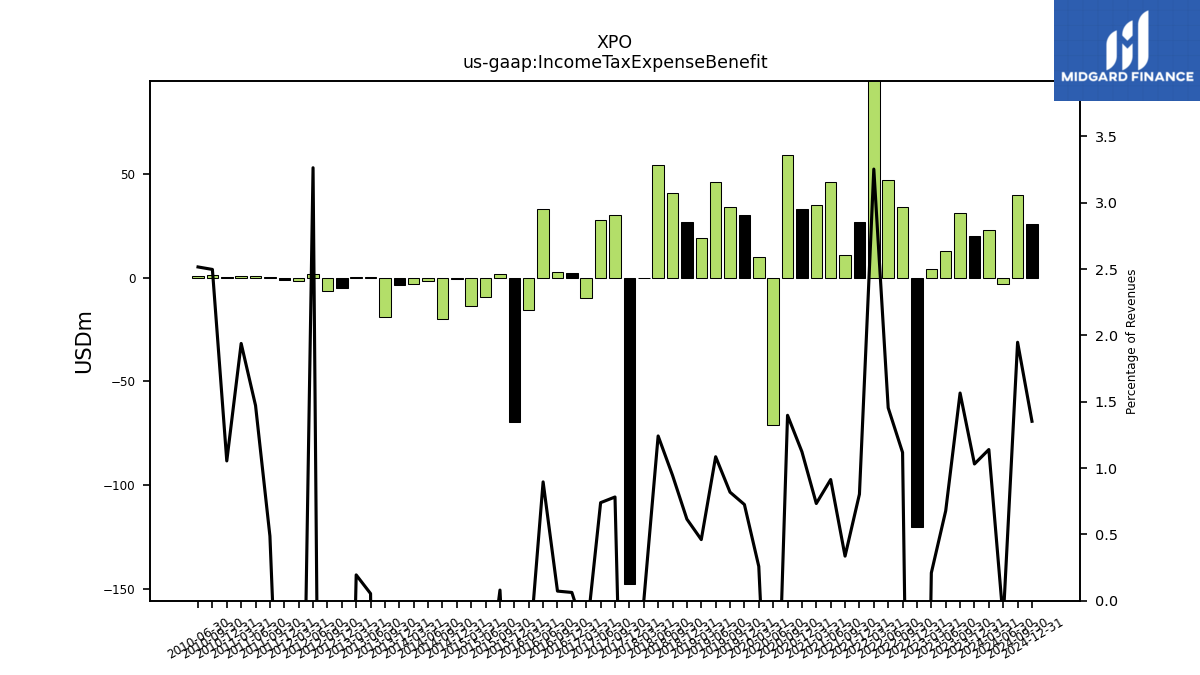
| Income Tax Expense Benefit | 20.00 | 31.00 | 13.00 | 4.00 | -120.00 | 34.00 | 47.00 | 113.00 | 27.00 | 11.00 | 46.00 | 35.00 | 33.00 | 59.00 | -71.00 | 10.00 | 30.00 | 34.00 | 46.00 | 19.00 | 27.00 | 41.00 | 54.20 | -0.20 | -147.90 | 30.40 | 27.80 | -9.80 | 2.30 | 2.70 | 33.00 | -15.70 | -69.60 | 1.90 | -9.50 | -13.60 | -0.90 | -20.08 | -1.77 | -3.30 | -3.69 | -19.04 | 0.07 | 0.22 | -4.99 | -6.46 | 1.78 | -1.52 | -0.97 | 0.23 | 0.65 | 0.81 | 0.44 | 1.11 | 1.01 | |
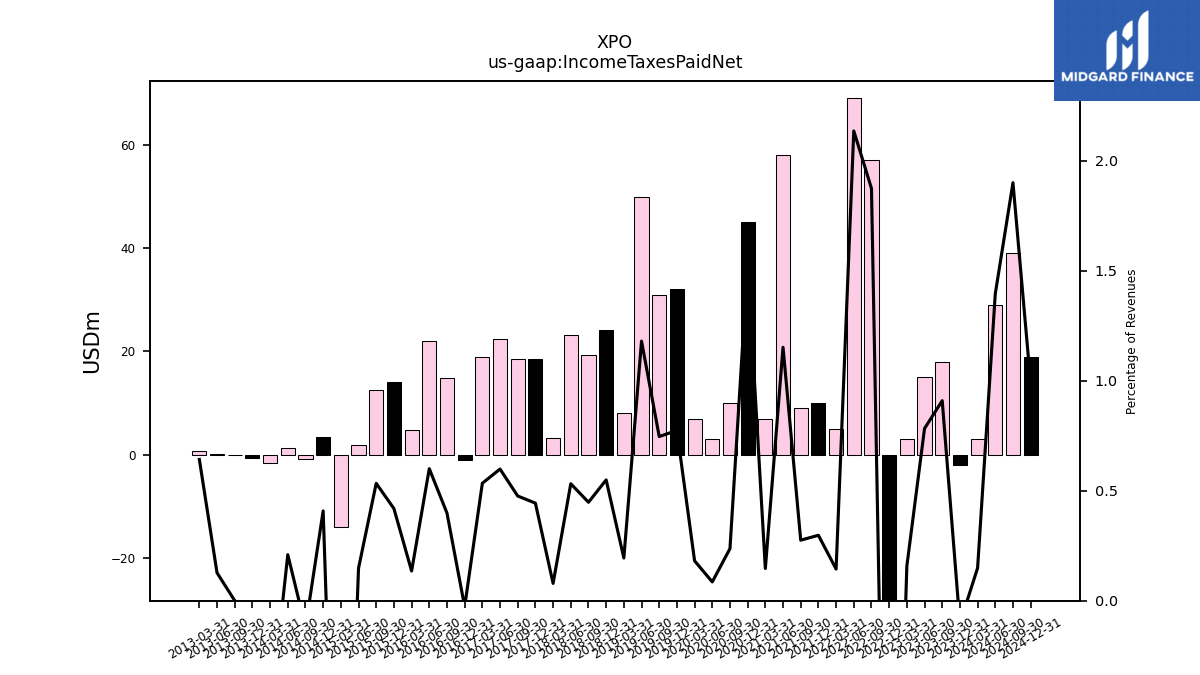
| Income Taxes Paid Net | -2.00 | 18.00 | 15.00 | 3.00 | -44.00 | 57.00 | 69.00 | 5.00 | 10.00 | 9.00 | 58.00 | 7.00 | 45.00 | 10.00 | 3.00 | 7.00 | 32.00 | 31.00 | 50.00 | 8.00 | 24.10 | 19.40 | 23.20 | 3.30 | 18.60 | 18.50 | 22.50 | 18.90 | -1.00 | 14.80 | 22.10 | 4.80 | 14.00 | 12.60 | 1.80 | -13.90 | 3.39 | -0.80 | 1.22 | -1.51 | -0.66 | 0.00 | 0.17 | 0.73 | NA | NA | NA | NA | NA | NA | NA | NA | NA | NA | NA | |
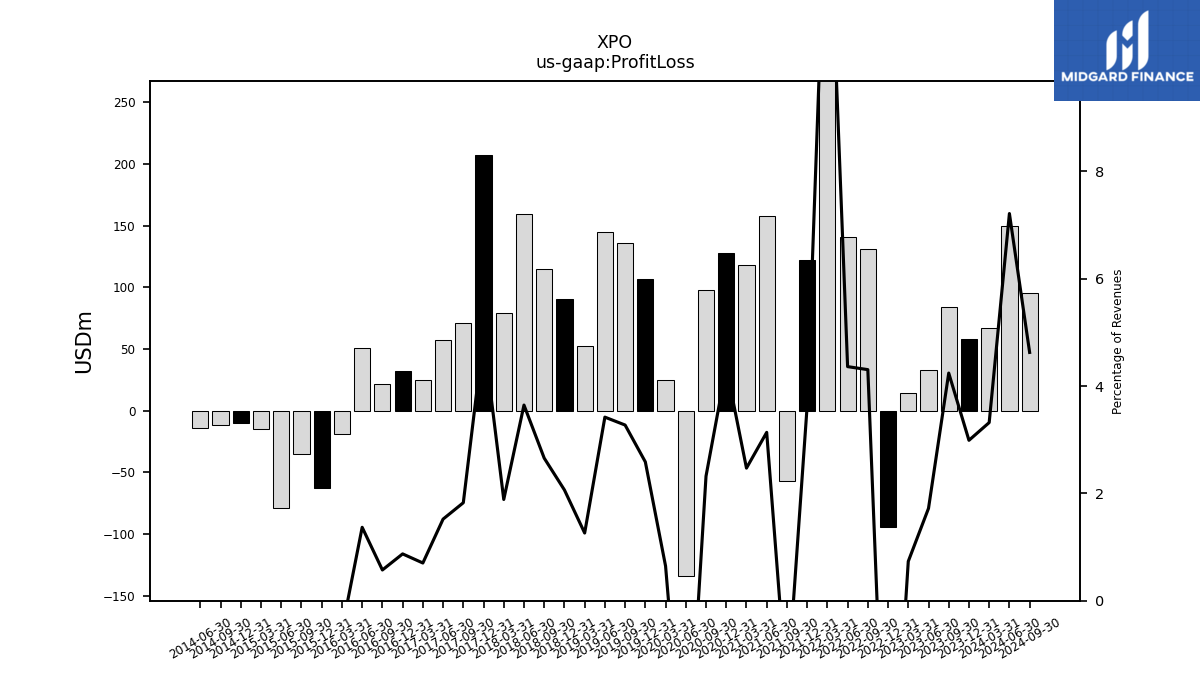
| Profit Loss | 58.00 | 84.00 | 33.00 | 14.00 | -94.00 | 131.00 | 141.00 | 488.00 | 122.00 | -57.00 | 158.00 | 118.00 | 128.00 | 98.00 | -134.00 | 25.00 | 107.00 | 136.00 | 145.00 | 52.00 | 90.60 | 115.20 | 159.10 | 79.10 | 207.10 | 71.00 | 57.20 | 24.90 | 32.10 | 21.30 | 50.40 | -19.30 | -62.90 | -35.40 | -78.80 | -14.70 | -9.90 | -11.60 | -13.80 | NA | NA | NA | NA | NA | NA | NA | NA | NA | NA | NA | NA | NA | NA | NA | NA | |
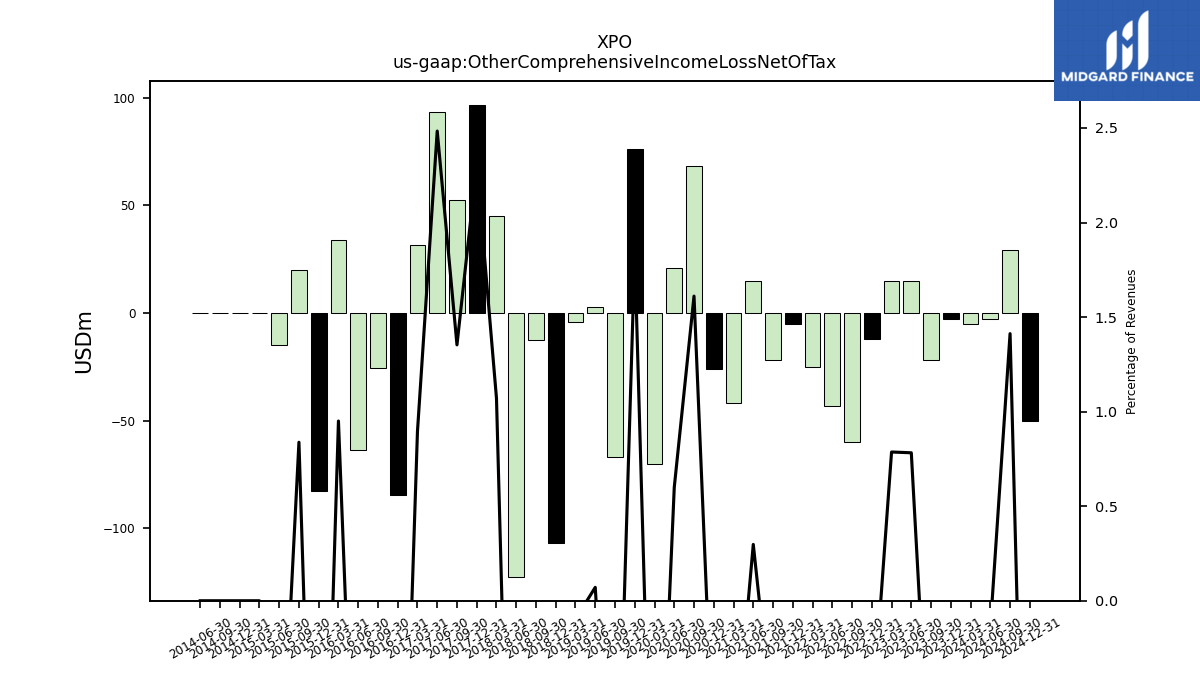
| Other Comprehensive Income Loss Net Of Tax | -3.00 | -22.00 | 15.00 | 15.00 | -12.00 | -60.00 | -43.00 | -25.00 | -5.00 | -22.00 | 15.00 | -42.00 | -26.00 | 68.00 | 21.00 | -70.00 | 76.00 | -67.00 | 3.00 | -4.00 | -106.60 | -12.70 | -122.60 | 44.90 | 96.70 | 52.60 | 93.40 | 31.70 | -84.30 | -25.70 | -63.80 | 33.70 | -82.40 | 19.80 | -14.80 | 0.00 | 0.00 | 0.00 | 0.00 | NA | NA | NA | NA | NA | NA | NA | NA | NA | NA | NA | NA | NA | NA | NA | NA | |
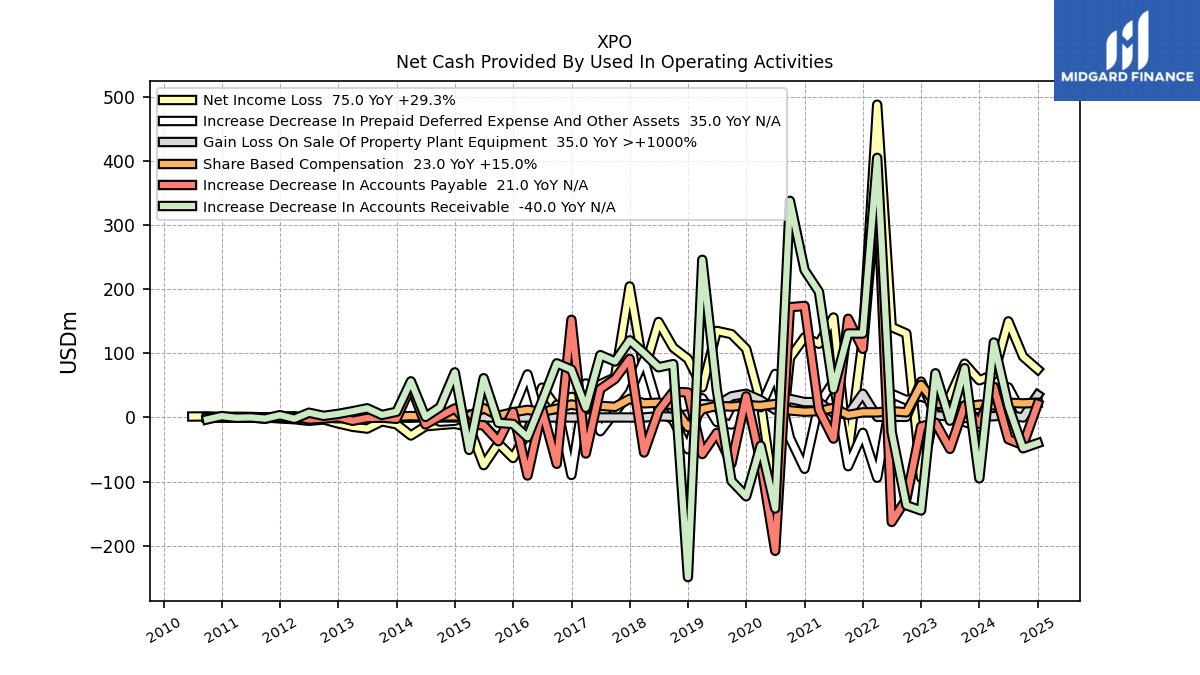
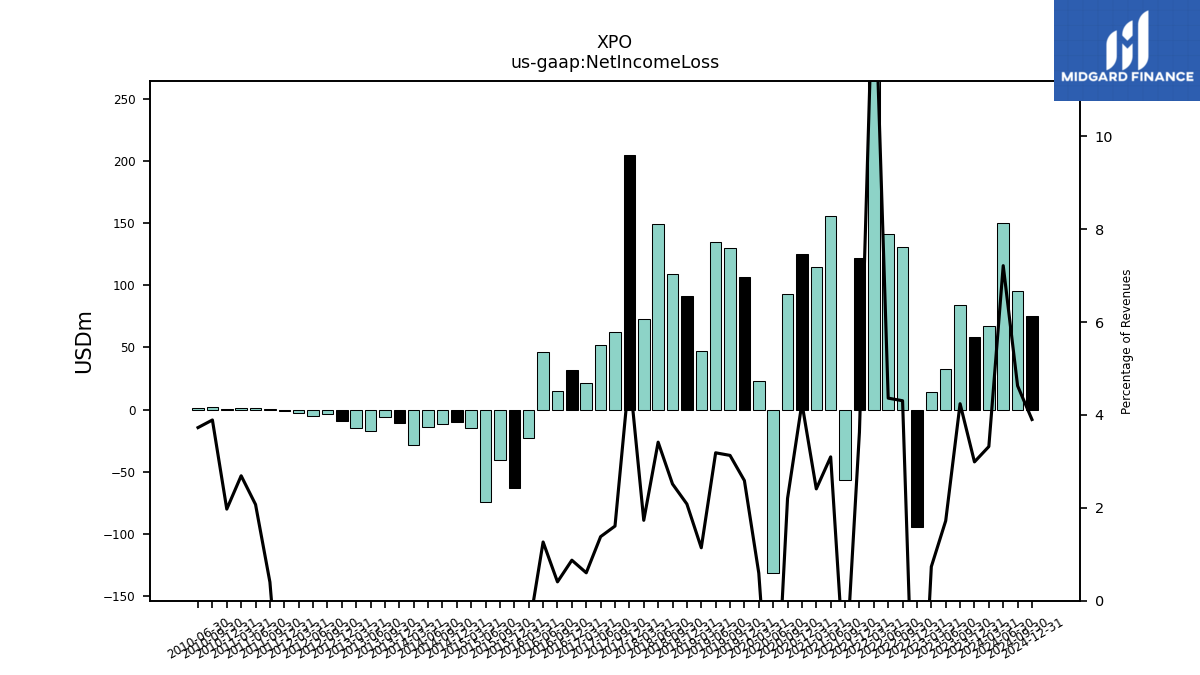
| Net Income Loss | 58.00 | 84.00 | 33.00 | 14.00 | -94.00 | 131.00 | 141.00 | 488.00 | 122.00 | -57.00 | 156.00 | 115.00 | 125.00 | 93.00 | -131.00 | 23.00 | 107.00 | 130.00 | 135.00 | 47.00 | 91.40 | 109.00 | 149.00 | 72.60 | 204.50 | 62.50 | 51.90 | 21.30 | 32.10 | 15.10 | 46.60 | -22.50 | -63.10 | -40.40 | -74.40 | -14.70 | -9.90 | -11.70 | -13.76 | -28.14 | -10.60 | -6.03 | -17.36 | -14.54 | -9.32 | -3.15 | -5.18 | -2.69 | -1.46 | 0.19 | 0.91 | 1.12 | 0.82 | 1.73 | 1.50 | |
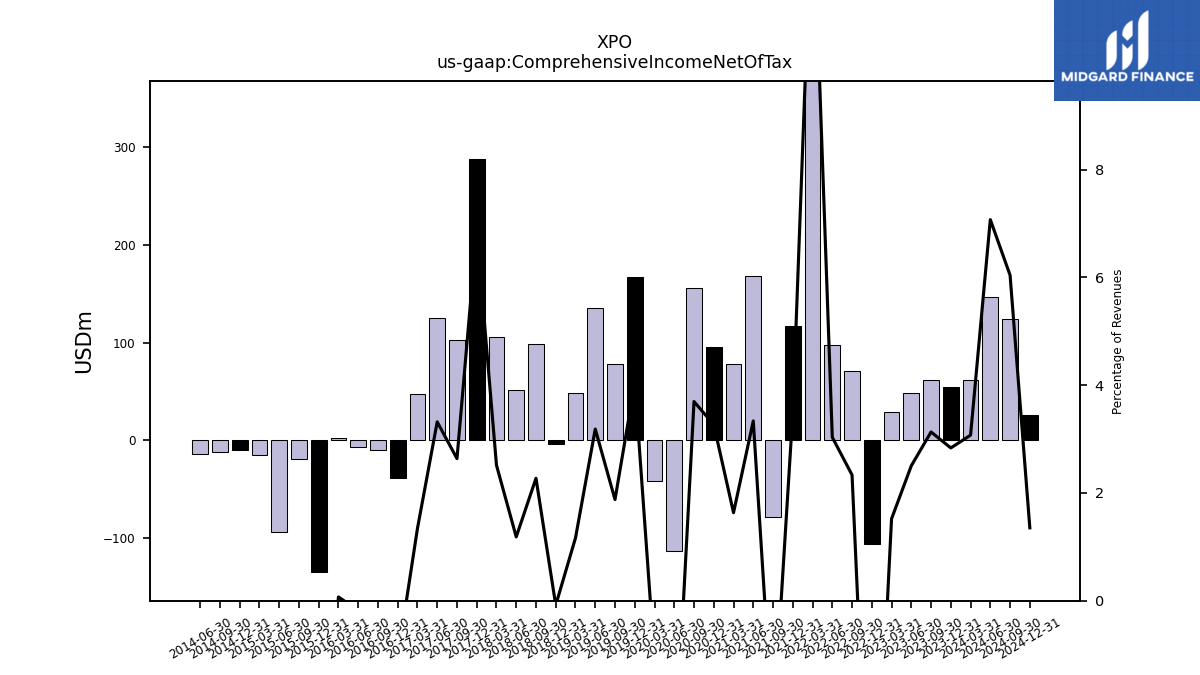
| Comprehensive Income Net Of Tax | 55.00 | 62.00 | 48.00 | 29.00 | -106.00 | 71.00 | 98.00 | 463.00 | 117.00 | -79.00 | 168.00 | 78.00 | 96.00 | 156.00 | -113.00 | -42.00 | 167.00 | 78.00 | 135.00 | 48.00 | -3.60 | 98.50 | 51.70 | 105.40 | 287.80 | 102.50 | 124.80 | 47.50 | -38.80 | -9.50 | -6.60 | 2.50 | -134.50 | -18.80 | -94.40 | -14.70 | -9.90 | -11.60 | -13.80 | NA | NA | NA | NA | NA | NA | NA | NA | NA | NA | NA | NA | NA | NA | NA | NA | |
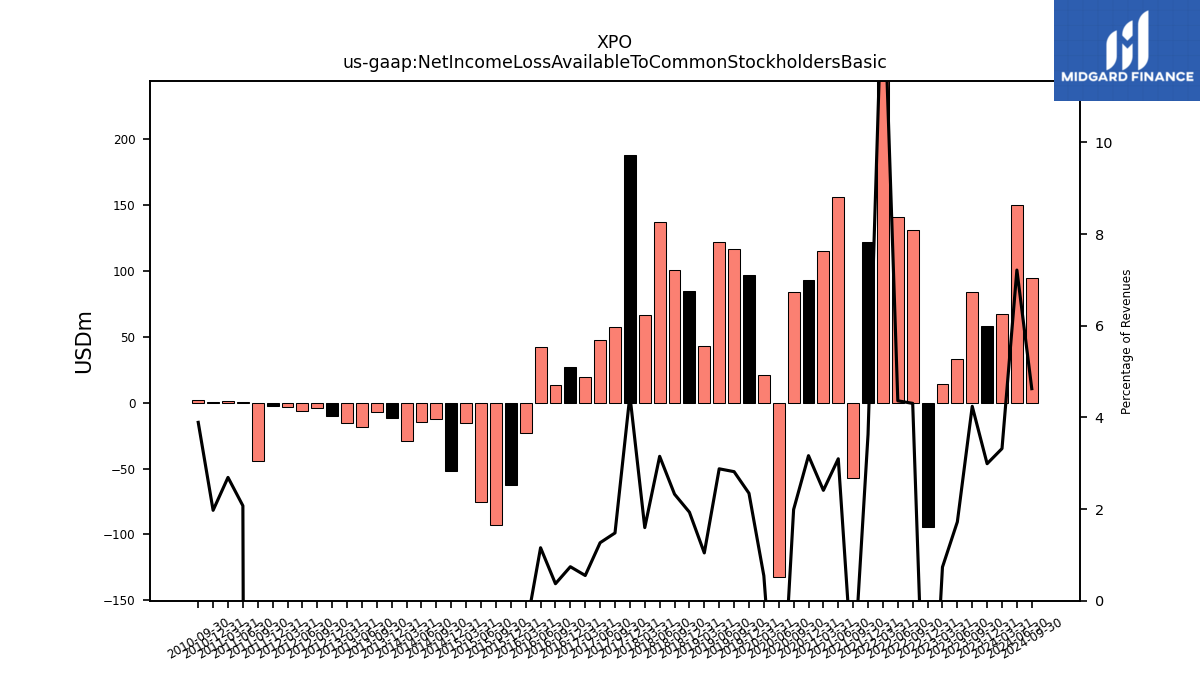
| Net Income Loss Available To Common Stockholders Basic | 58.00 | 84.00 | 33.00 | 14.00 | -94.00 | 131.00 | 141.00 | 488.00 | 122.00 | -57.00 | 156.00 | 115.00 | 93.00 | 84.00 | -132.00 | 21.00 | 97.00 | 117.00 | 122.00 | 43.00 | 84.80 | 100.80 | 137.50 | 66.90 | 187.90 | 57.50 | 47.60 | 19.50 | 27.30 | 13.80 | 42.60 | -23.20 | -62.80 | -93.10 | -75.10 | -15.40 | -51.50 | -12.43 | -14.49 | -28.88 | -11.34 | -6.77 | -18.11 | -15.29 | -10.06 | -3.90 | -5.93 | -3.44 | -2.21 | -44.40 | 0.91 | 1.12 | 0.82 | 1.73 | NA | |
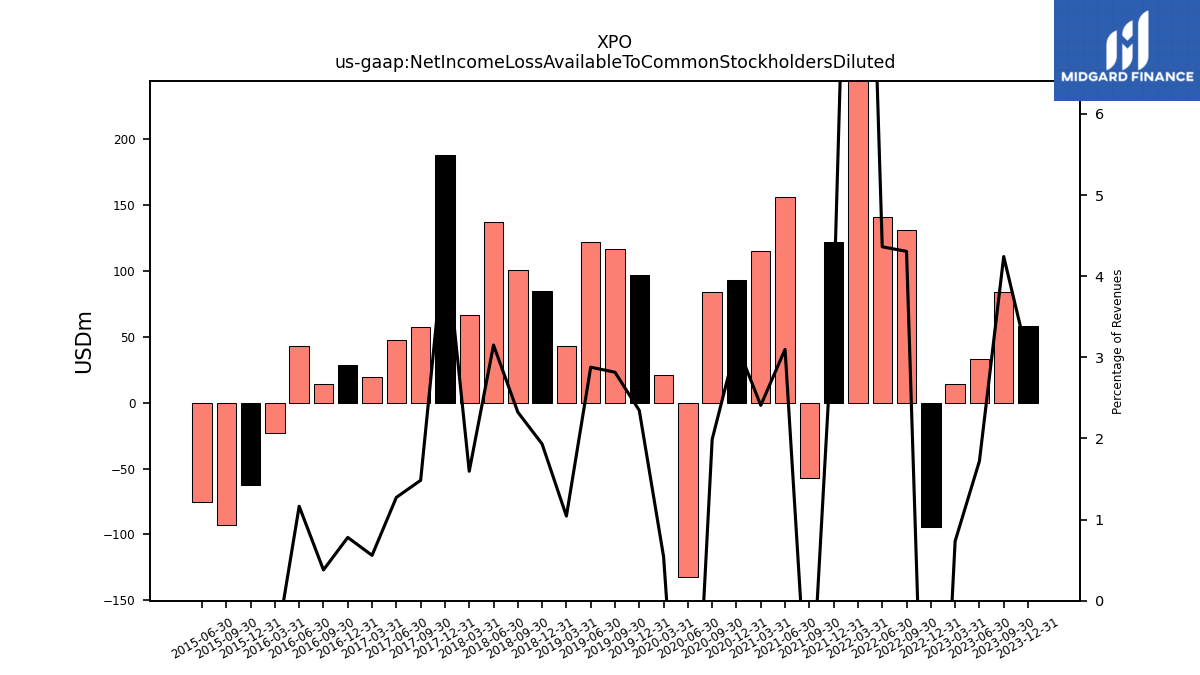
| Net Income Loss Available To Common Stockholders Diluted | 58.00 | 84.00 | 33.00 | 14.00 | -94.00 | 131.00 | 141.00 | 488.00 | 122.00 | -57.00 | 156.00 | 115.00 | 93.00 | 84.00 | -132.00 | 21.00 | 97.00 | 117.00 | 122.00 | 43.00 | 84.80 | 100.80 | 137.50 | 66.90 | 188.00 | 57.70 | 47.90 | 19.80 | 28.70 | 14.10 | 42.90 | -23.20 | -62.40 | -93.10 | -75.10 | NA | NA | NA | NA | NA | NA | NA | NA | NA | NA | NA | NA | NA | NA | NA | NA | NA | NA | NA | NA |
| 2023-12-31 | 2023-09-30 | 2023-06-30 | 2023-03-31 | 2022-12-31 | 2022-09-30 | 2022-06-30 | 2022-03-31 | 2021-12-31 | 2021-09-30 | 2021-06-30 | 2021-03-31 | 2020-12-31 | 2020-09-30 | 2020-06-30 | 2020-03-31 | 2019-12-31 | 2019-09-30 | 2019-06-30 | 2019-03-31 | 2018-12-31 | 2018-09-30 | 2018-06-30 | 2018-03-31 | 2017-12-31 | 2017-09-30 | 2017-06-30 | 2017-03-31 | 2016-12-31 | 2016-09-30 | 2016-06-30 | 2016-03-31 | 2015-12-31 | 2015-09-30 | 2015-06-30 | 2015-03-31 | 2014-12-31 | 2014-09-30 | 2014-06-30 | 2014-03-31 | 2013-12-31 | 2013-09-30 | 2013-06-30 | 2013-03-31 | 2012-12-31 | 2012-09-30 | 2012-06-30 | 2012-03-31 | 2011-12-31 | 2011-09-30 | 2011-06-30 | 2011-03-31 | 2010-12-31 | 2010-09-30 | 2010-06-30 | ||
|---|---|---|---|---|---|---|---|---|---|---|---|---|---|---|---|---|---|---|---|---|---|---|---|---|---|---|---|---|---|---|---|---|---|---|---|---|---|---|---|---|---|---|---|---|---|---|---|---|---|---|---|---|---|---|---|---|
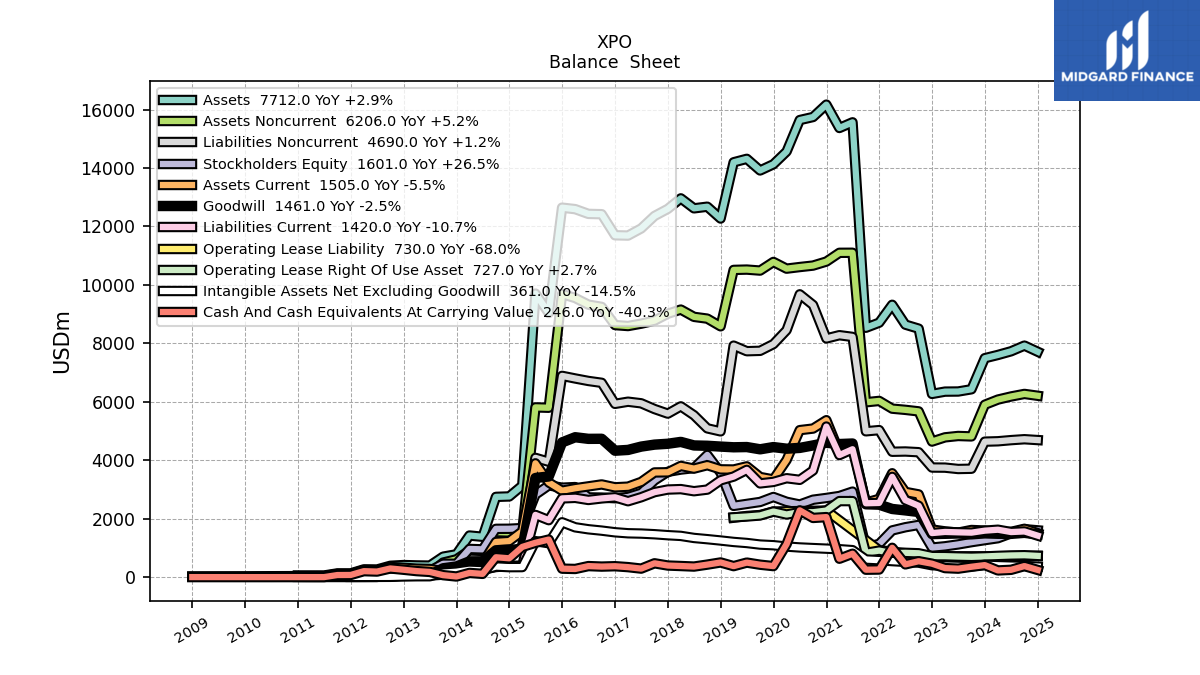
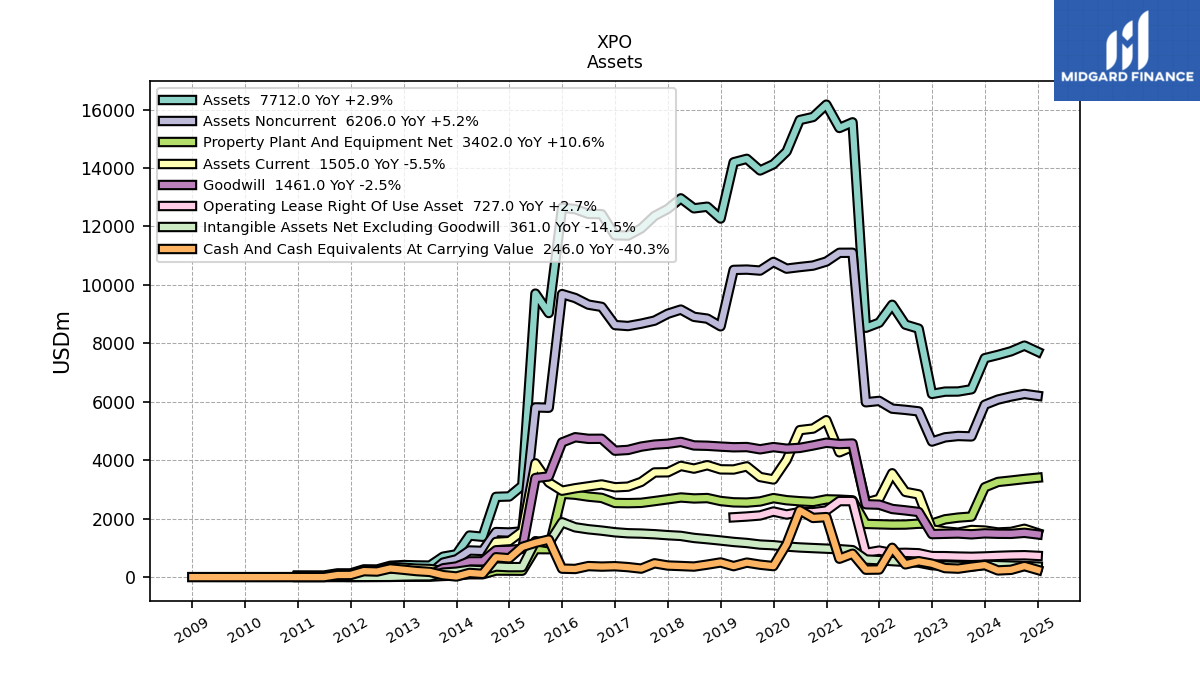
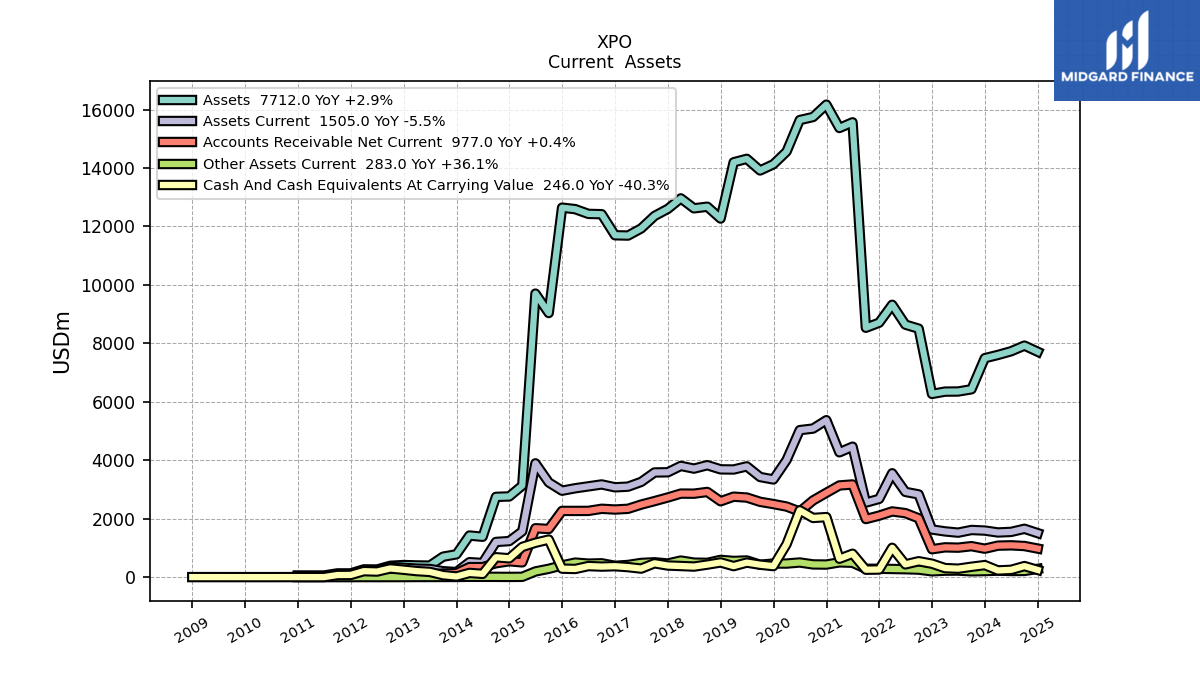
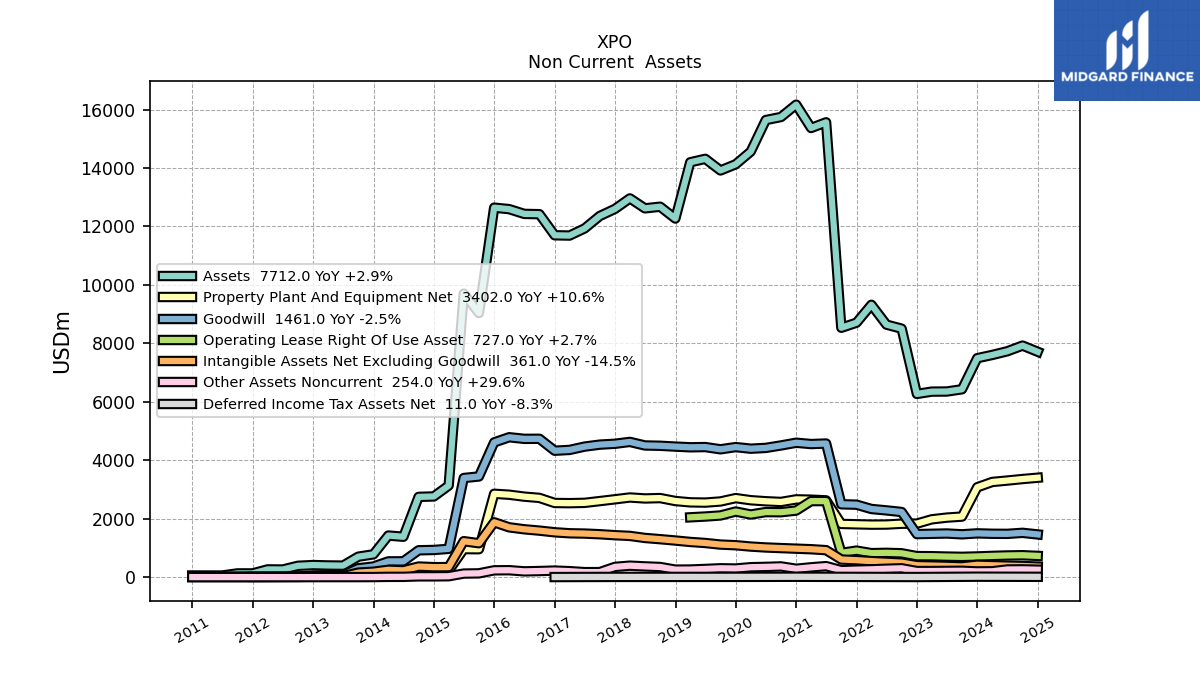
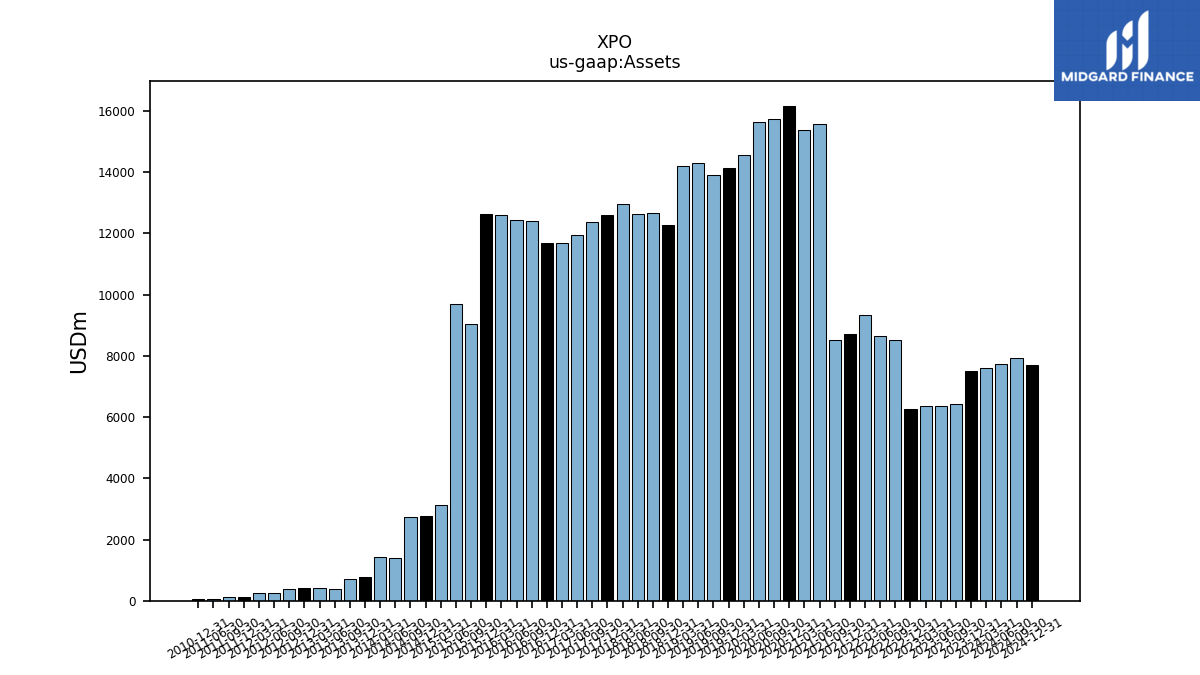
| Assets | 7492.00 | 6428.00 | 6352.00 | 6348.00 | 6269.00 | 8503.00 | 8640.00 | 9320.00 | 8707.00 | 8533.00 | 15564.00 | 15369.00 | 16169.00 | 15745.00 | 15641.00 | 14562.00 | 14128.00 | 13916.00 | 14314.00 | 14196.00 | 12270.00 | 12676.10 | 12619.70 | 12961.30 | 12601.60 | 12358.20 | 11931.90 | 11688.30 | 11698.40 | 12419.30 | 12430.30 | 12592.30 | 12643.20 | 9036.60 | 9702.70 | 3133.10 | 2761.20 | 2746.29 | 1380.83 | 1423.76 | 780.24 | 700.33 | 394.48 | 400.45 | 413.21 | 387.77 | 260.73 | 265.25 | 127.64 | 128.03 | 55.60 | NA | 56.67 | NA | NA | |
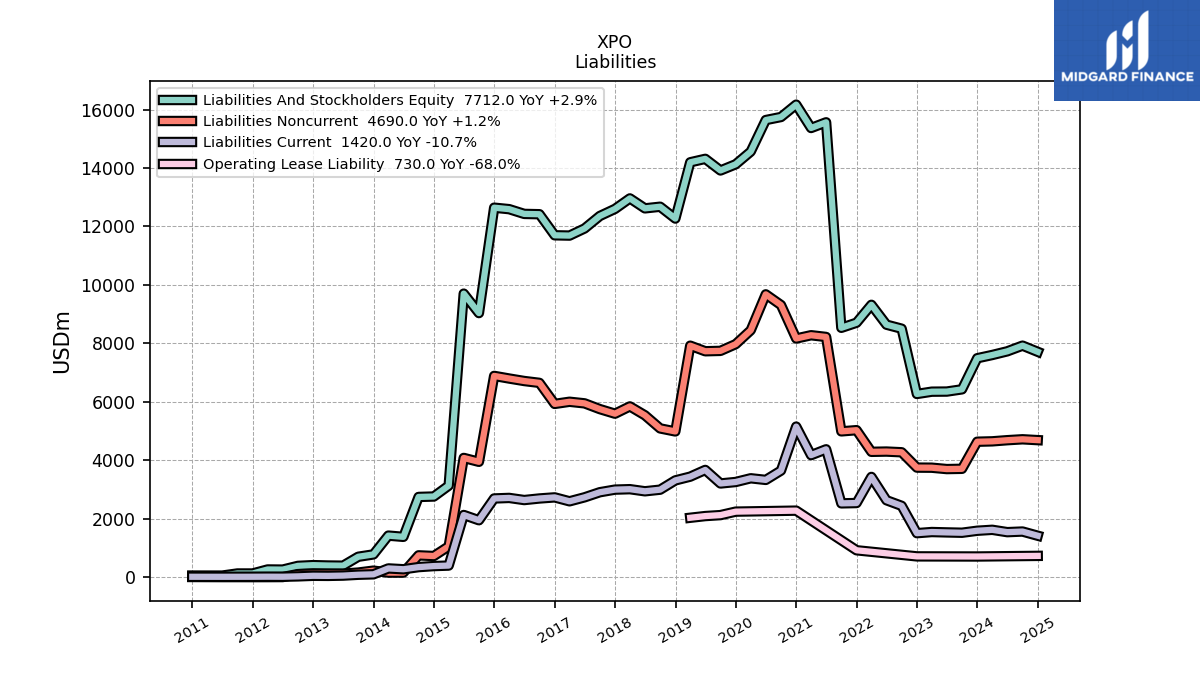
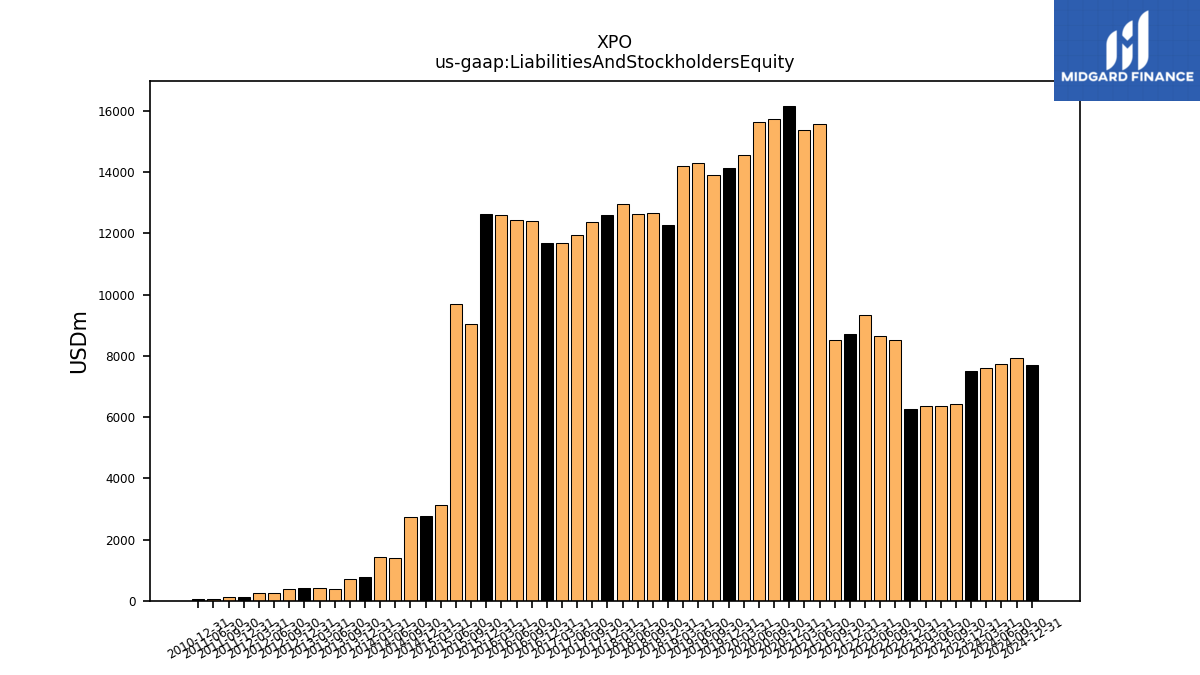
| Liabilities And Stockholders Equity | 7492.00 | 6428.00 | 6352.00 | 6348.00 | 6269.00 | 8503.00 | 8640.00 | 9320.00 | 8707.00 | 8533.00 | 15564.00 | 15369.00 | 16169.00 | 15745.00 | 15641.00 | 14562.00 | 14128.00 | 13916.00 | 14314.00 | 14196.00 | 12270.00 | 12676.10 | 12619.70 | 12961.30 | 12601.60 | 12358.20 | 11931.90 | 11688.30 | 11698.40 | 12419.30 | 12430.30 | 12592.30 | 12643.20 | 9036.60 | 9702.70 | 3133.10 | 2761.20 | 2746.29 | 1380.83 | 1423.76 | 780.24 | 700.33 | 394.48 | 400.45 | 413.21 | 387.77 | 260.73 | 265.25 | 127.64 | 128.03 | 55.60 | NA | 56.67 | NA | NA | |
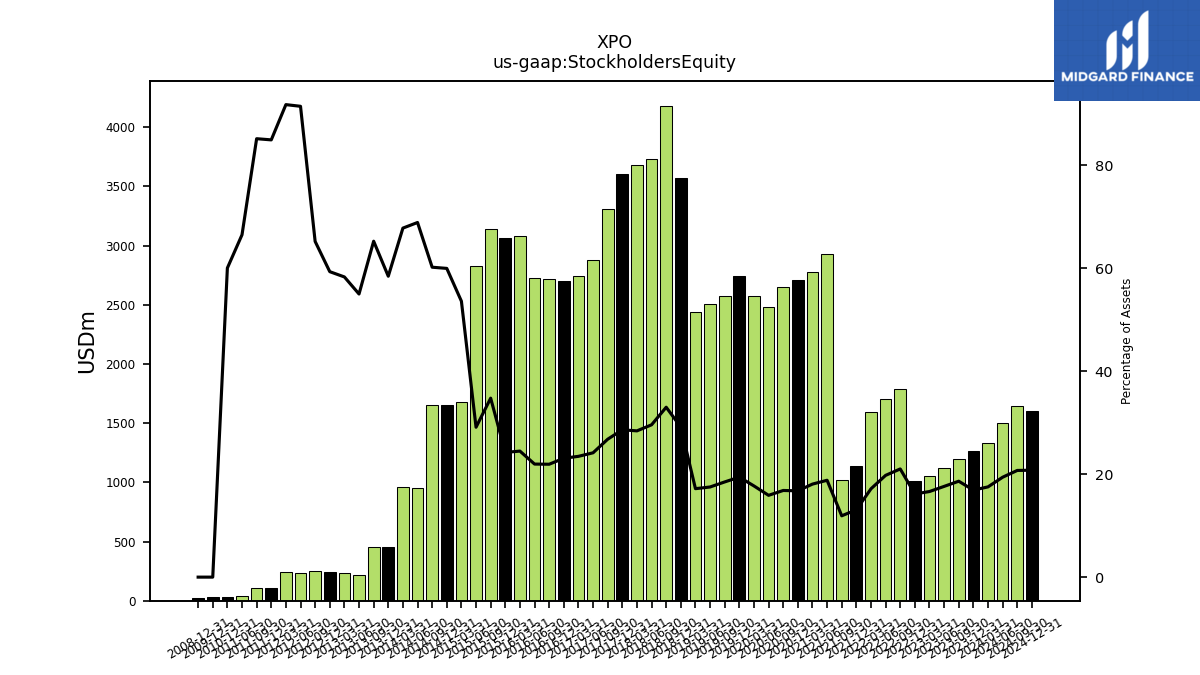
| Stockholders Equity | 1266.00 | 1197.00 | 1119.00 | 1055.00 | 1012.00 | 1786.00 | 1707.00 | 1598.00 | 1138.00 | 1016.00 | 2927.00 | 2776.00 | 2709.00 | 2649.00 | 2484.00 | 2578.00 | 2743.00 | 2572.00 | 2505.00 | 2438.00 | 3575.00 | 4181.50 | 3732.00 | 3680.70 | 3604.40 | 3308.80 | 2880.20 | 2741.20 | 2700.00 | 2722.00 | 2728.40 | 3081.60 | 3060.80 | 3139.80 | 2823.80 | 1678.40 | 1655.10 | 1652.49 | 950.75 | 964.78 | 455.84 | 456.75 | 216.83 | 233.40 | 245.06 | 252.74 | 238.35 | 243.33 | 108.36 | 108.98 | 36.95 | NA | 34.01 | NA | NA |
| 2023-12-31 | 2023-09-30 | 2023-06-30 | 2023-03-31 | 2022-12-31 | 2022-09-30 | 2022-06-30 | 2022-03-31 | 2021-12-31 | 2021-09-30 | 2021-06-30 | 2021-03-31 | 2020-12-31 | 2020-09-30 | 2020-06-30 | 2020-03-31 | 2019-12-31 | 2019-09-30 | 2019-06-30 | 2019-03-31 | 2018-12-31 | 2018-09-30 | 2018-06-30 | 2018-03-31 | 2017-12-31 | 2017-09-30 | 2017-06-30 | 2017-03-31 | 2016-12-31 | 2016-09-30 | 2016-06-30 | 2016-03-31 | 2015-12-31 | 2015-09-30 | 2015-06-30 | 2015-03-31 | 2014-12-31 | 2014-09-30 | 2014-06-30 | 2014-03-31 | 2013-12-31 | 2013-09-30 | 2013-06-30 | 2013-03-31 | 2012-12-31 | 2012-09-30 | 2012-06-30 | 2012-03-31 | 2011-12-31 | 2011-09-30 | 2011-06-30 | 2011-03-31 | 2010-12-31 | 2010-09-30 | 2010-06-30 | ||
|---|---|---|---|---|---|---|---|---|---|---|---|---|---|---|---|---|---|---|---|---|---|---|---|---|---|---|---|---|---|---|---|---|---|---|---|---|---|---|---|---|---|---|---|---|---|---|---|---|---|---|---|---|---|---|---|---|
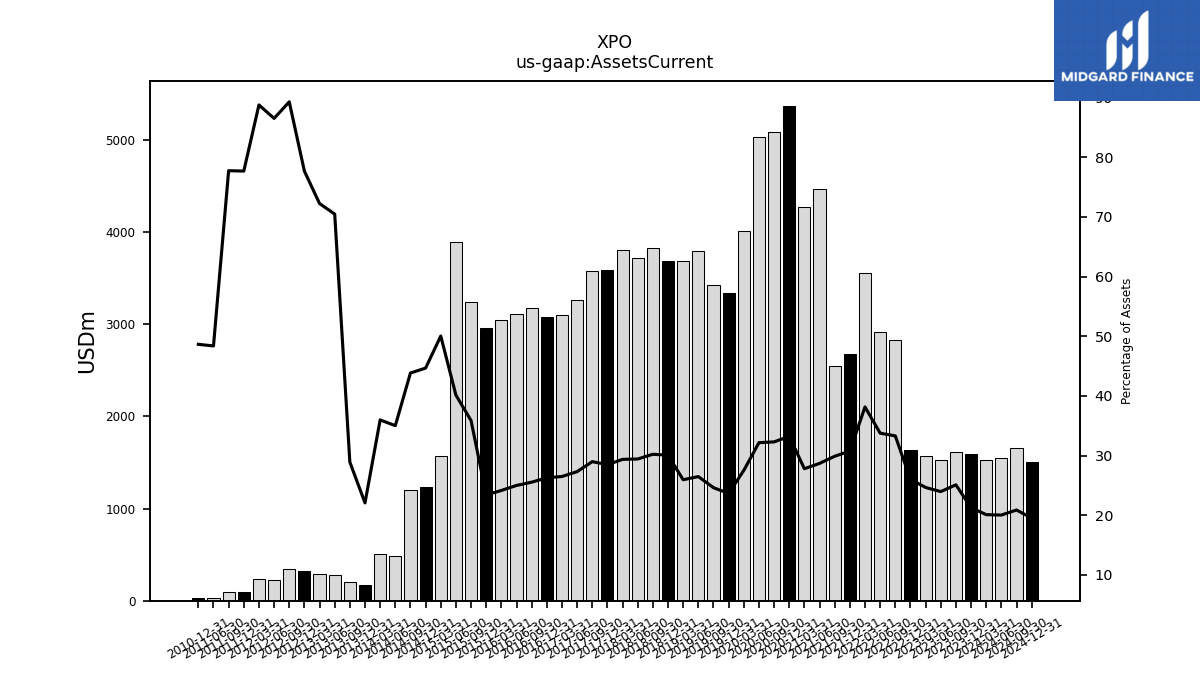
| Assets Current | 1593.00 | 1613.00 | 1522.00 | 1565.00 | 1630.00 | 2831.00 | 2916.00 | 3555.00 | 2677.00 | 2550.00 | 4464.00 | 4271.00 | 5370.00 | 5084.00 | 5030.00 | 4006.00 | 3342.00 | 3426.00 | 3790.00 | 3683.00 | 3688.00 | 3830.30 | 3713.30 | 3805.50 | 3587.90 | 3581.70 | 3258.30 | 3096.10 | 3073.60 | 3171.70 | 3106.00 | 3041.10 | 2957.20 | 3240.70 | 3894.30 | 1567.40 | 1233.10 | 1203.78 | 483.42 | 512.20 | 172.17 | 202.41 | 277.97 | 289.26 | 320.93 | 346.21 | 225.54 | 235.43 | 99.14 | 99.53 | 26.89 | NA | 27.57 | NA | NA | |
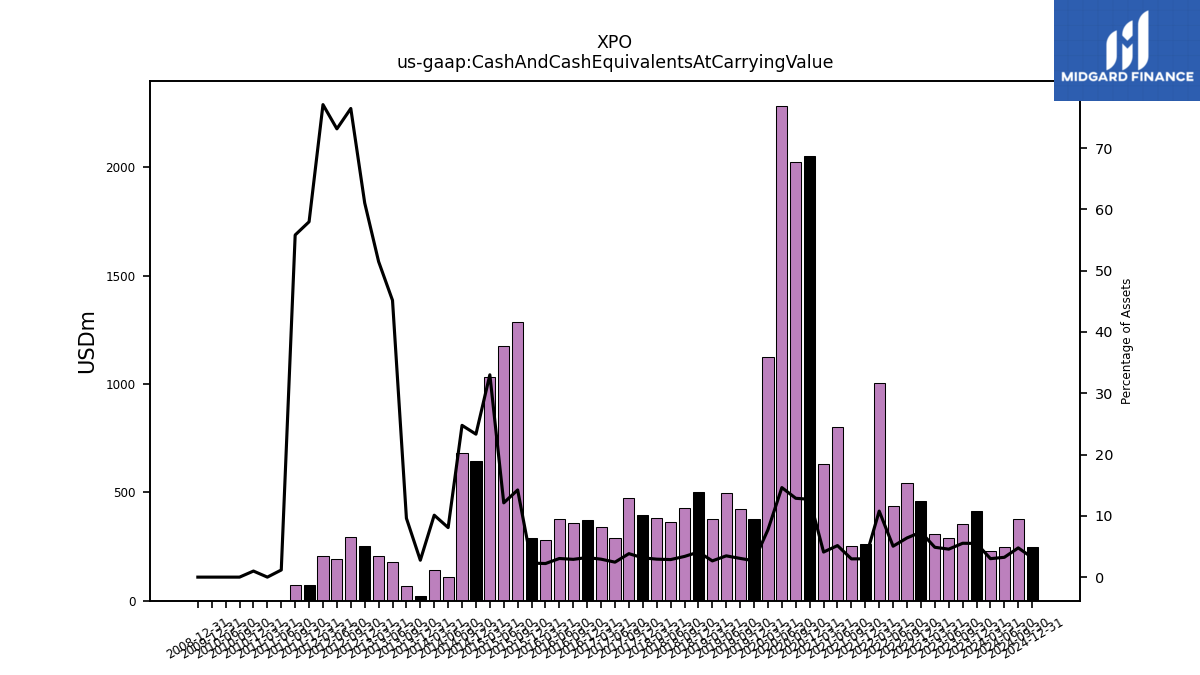
| Cash And Cash Equivalents At Carrying Value | 412.00 | 355.00 | 290.00 | 309.00 | 460.00 | 544.00 | 436.00 | 1004.00 | 260.00 | 254.00 | 801.00 | 629.00 | 2054.00 | 2025.00 | 2285.00 | 1127.00 | 377.00 | 425.00 | 497.00 | 376.00 | 502.00 | 427.90 | 361.40 | 380.00 | 396.90 | 473.10 | 291.40 | 342.00 | 373.40 | 360.30 | 377.80 | 279.00 | 289.80 | 1285.30 | 1175.80 | 1034.30 | 644.10 | 680.10 | 111.62 | 143.89 | 21.52 | 67.26 | 178.16 | 206.18 | 252.29 | 296.50 | 190.71 | 204.50 | 74.01 | 71.47 | 0.65 | 0.05 | 0.56 | 0.95 | 0.28 | |
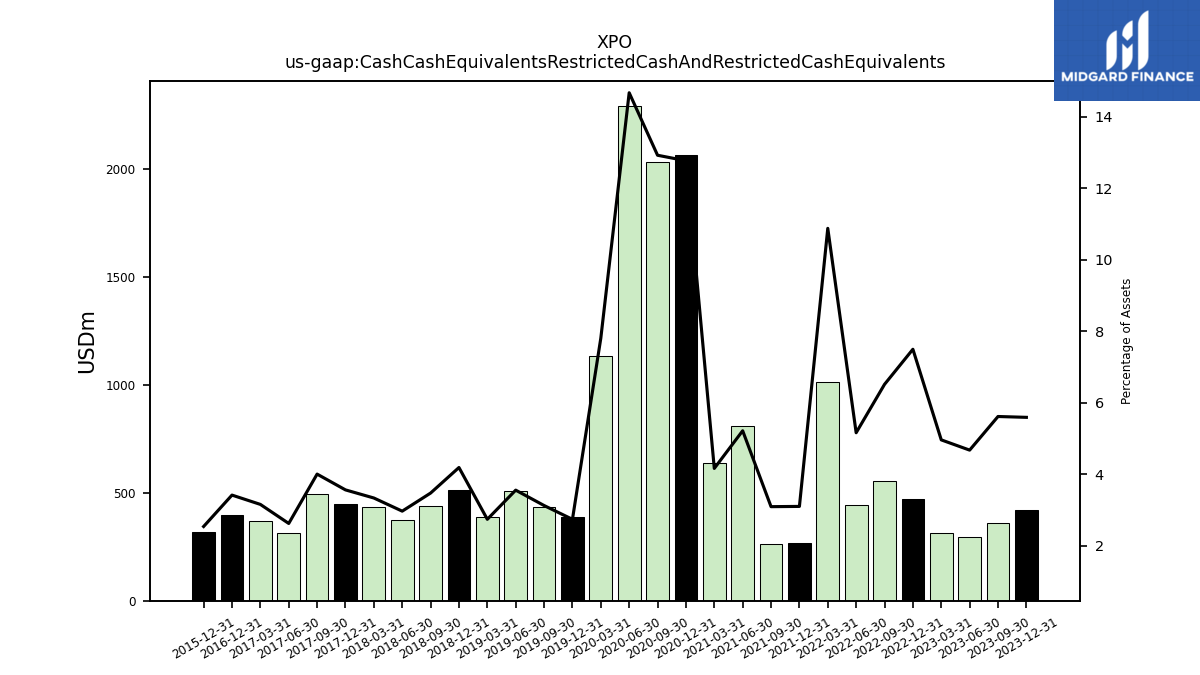
| Cash Cash Equivalents Restricted Cash And Restricted Cash Equivalents | 419.00 | 361.00 | 297.00 | 315.00 | 470.00 | 554.00 | 446.00 | 1014.00 | 270.00 | 264.00 | 812.00 | 640.00 | 2065.00 | 2035.00 | 2295.00 | 1137.00 | 387.00 | 435.00 | 509.00 | 389.00 | 514.00 | 440.40 | 374.60 | 432.40 | 449.00 | 494.90 | 313.10 | 369.00 | 399.80 | NA | NA | NA | 321.00 | NA | NA | NA | NA | NA | NA | NA | NA | NA | NA | NA | NA | NA | NA | NA | NA | NA | NA | NA | NA | NA | NA | |
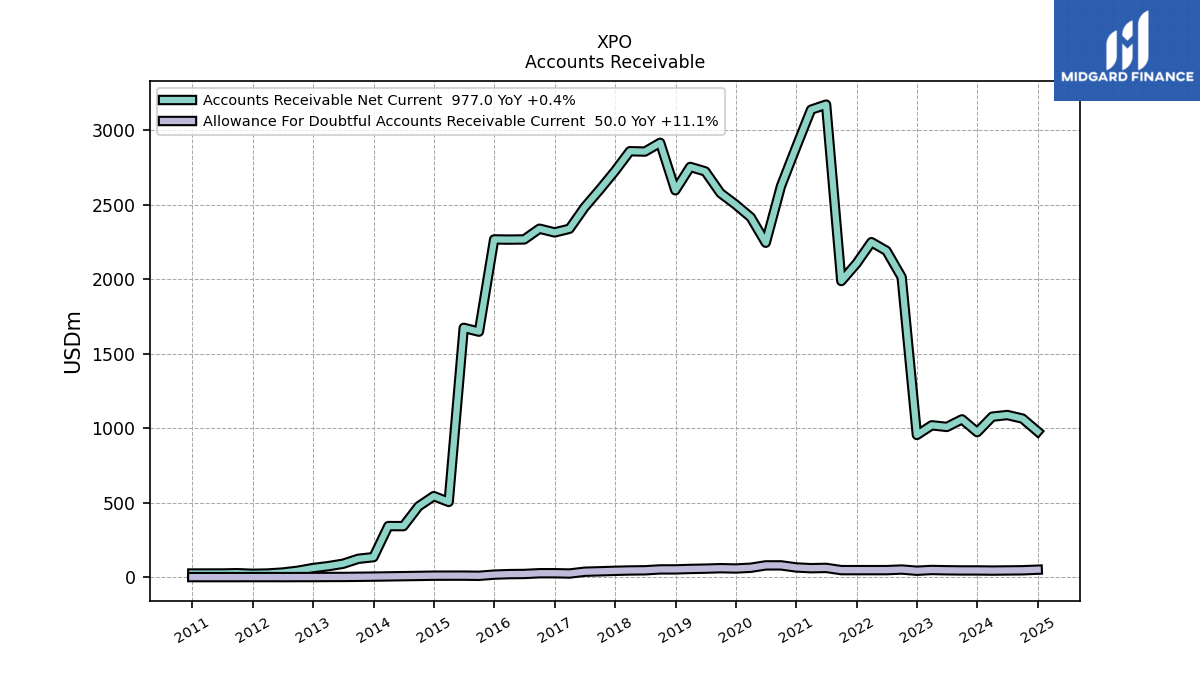
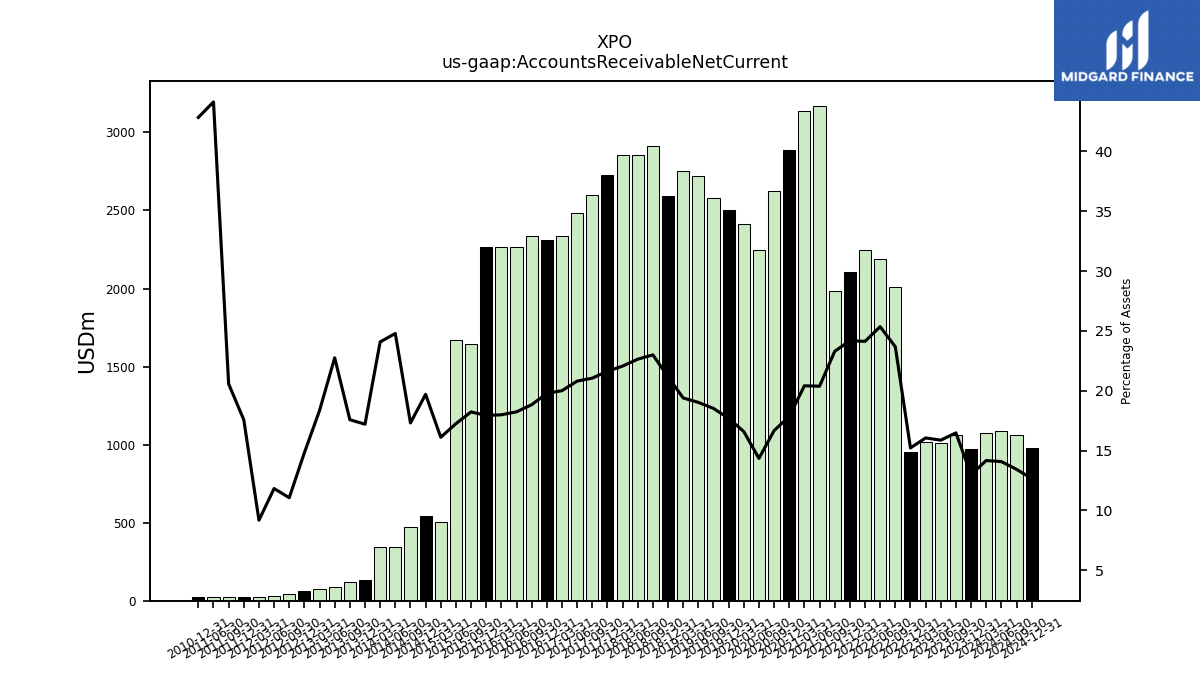
| Accounts Receivable Net Current | 973.00 | 1059.00 | 1008.00 | 1019.00 | 954.00 | 2013.00 | 2190.00 | 2248.00 | 2105.00 | 1987.00 | 3171.00 | 3137.00 | 2886.00 | 2624.00 | 2244.00 | 2415.00 | 2500.00 | 2577.00 | 2723.00 | 2753.00 | 2596.00 | 2914.90 | 2855.90 | 2858.40 | 2725.30 | 2601.00 | 2481.90 | 2338.00 | 2313.30 | 2338.40 | 2266.40 | 2265.10 | 2266.40 | 1647.20 | 1673.20 | 504.70 | 543.80 | 475.32 | 342.18 | 342.75 | 134.23 | 123.08 | 89.74 | 73.45 | 61.24 | 42.88 | 30.83 | 24.35 | 22.43 | 26.33 | 24.53 | NA | 24.27 | NA | NA | |
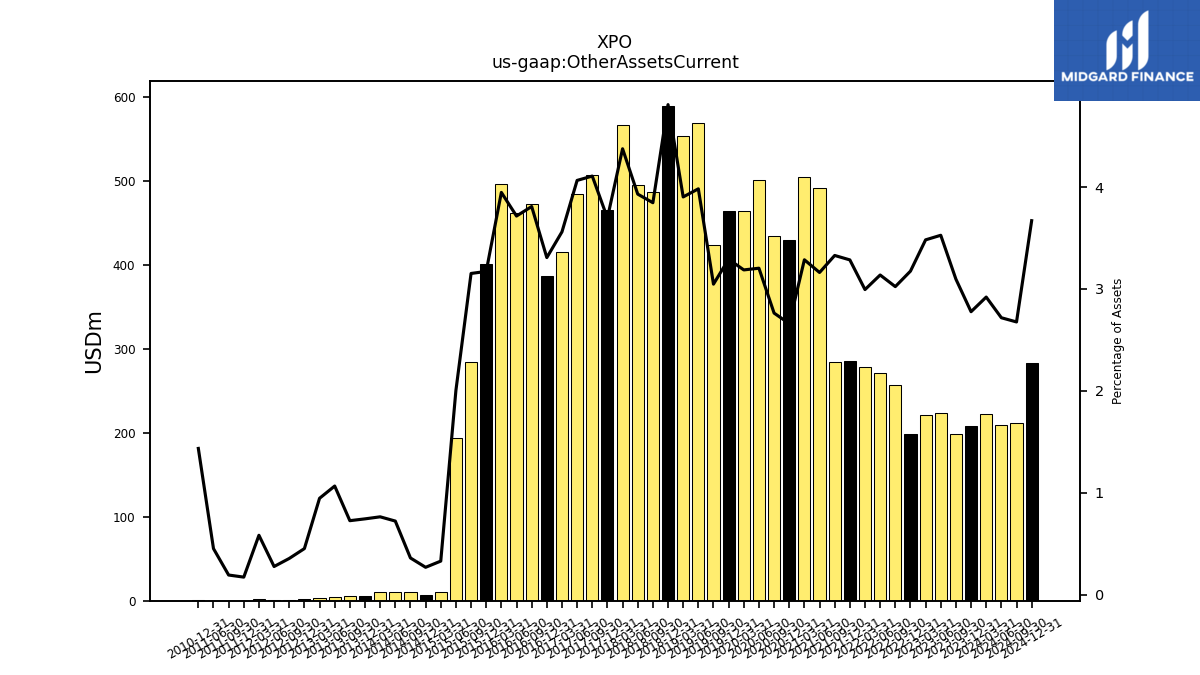
| Other Assets Current | 208.00 | 199.00 | 224.00 | 221.00 | 199.00 | 257.00 | 271.00 | 279.00 | 286.00 | 284.00 | 492.00 | 505.00 | 430.00 | 435.00 | 501.00 | 464.00 | 465.00 | 424.00 | 570.00 | 554.00 | 590.00 | 487.50 | 496.00 | 567.10 | 465.70 | 507.60 | 485.00 | 416.10 | 386.90 | 473.00 | 461.80 | 497.00 | 401.00 | 284.80 | 194.40 | 10.30 | 7.40 | 9.88 | 9.96 | 10.87 | 5.80 | 5.08 | 4.20 | 3.79 | 1.87 | 1.38 | 0.72 | 1.54 | 0.22 | 0.25 | 0.25 | NA | 0.81 | NA | NA |
| 2023-12-31 | 2023-09-30 | 2023-06-30 | 2023-03-31 | 2022-12-31 | 2022-09-30 | 2022-06-30 | 2022-03-31 | 2021-12-31 | 2021-09-30 | 2021-06-30 | 2021-03-31 | 2020-12-31 | 2020-09-30 | 2020-06-30 | 2020-03-31 | 2019-12-31 | 2019-09-30 | 2019-06-30 | 2019-03-31 | 2018-12-31 | 2018-09-30 | 2018-06-30 | 2018-03-31 | 2017-12-31 | 2017-09-30 | 2017-06-30 | 2017-03-31 | 2016-12-31 | 2016-09-30 | 2016-06-30 | 2016-03-31 | 2015-12-31 | 2015-09-30 | 2015-06-30 | 2015-03-31 | 2014-12-31 | 2014-09-30 | 2014-06-30 | 2014-03-31 | 2013-12-31 | 2013-09-30 | 2013-06-30 | 2013-03-31 | 2012-12-31 | 2012-09-30 | 2012-06-30 | 2012-03-31 | 2011-12-31 | 2011-09-30 | 2011-06-30 | 2011-03-31 | 2010-12-31 | 2010-09-30 | 2010-06-30 | ||
|---|---|---|---|---|---|---|---|---|---|---|---|---|---|---|---|---|---|---|---|---|---|---|---|---|---|---|---|---|---|---|---|---|---|---|---|---|---|---|---|---|---|---|---|---|---|---|---|---|---|---|---|---|---|---|---|---|
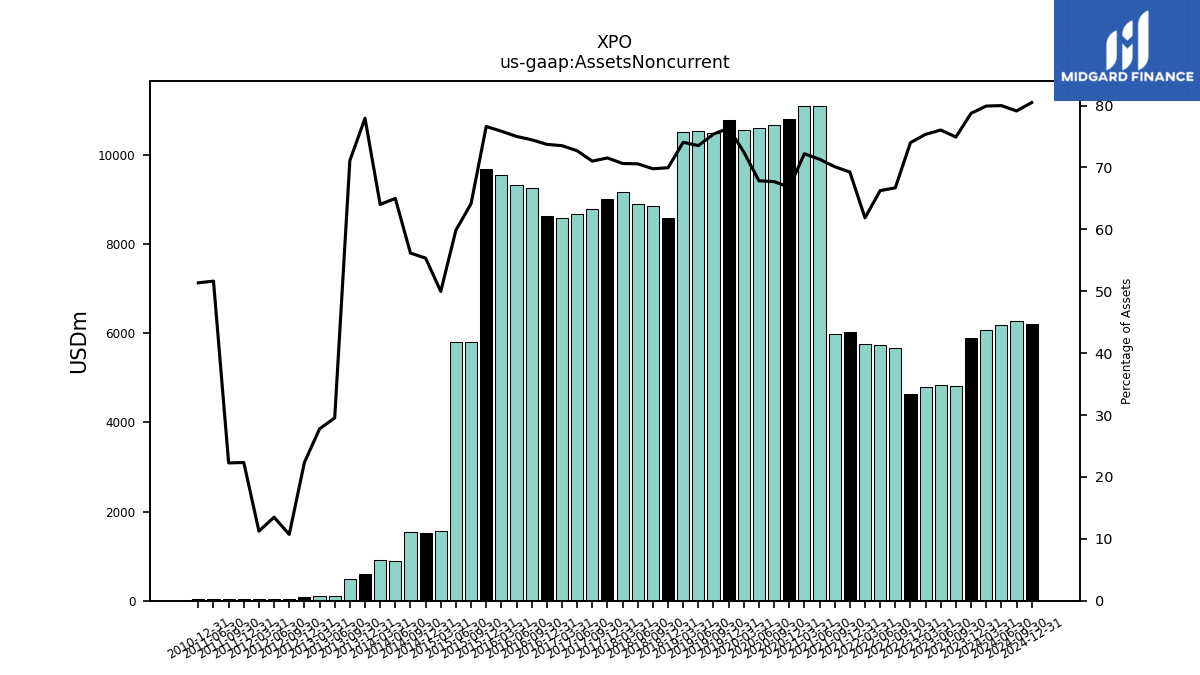
| Assets Noncurrent | 5899.00 | 4815.00 | 4830.00 | 4783.00 | 4639.00 | 5672.00 | 5724.00 | 5765.00 | 6030.00 | 5983.00 | 11100.00 | 11098.00 | 10799.00 | 10661.00 | 10611.00 | 10556.00 | 10786.00 | 10490.00 | 10524.00 | 10513.00 | 8582.00 | 8845.80 | 8906.40 | 9155.80 | 9013.70 | 8776.50 | 8673.60 | 8592.20 | 8624.80 | 9247.60 | 9324.30 | 9551.20 | 9686.00 | 5795.90 | 5808.40 | 1565.70 | 1528.10 | 1542.51 | 897.41 | 911.55 | 608.07 | 497.92 | 116.51 | 111.20 | 92.27 | 41.56 | 35.19 | 29.82 | 28.50 | 28.50 | 28.70 | NA | 29.11 | NA | NA | |
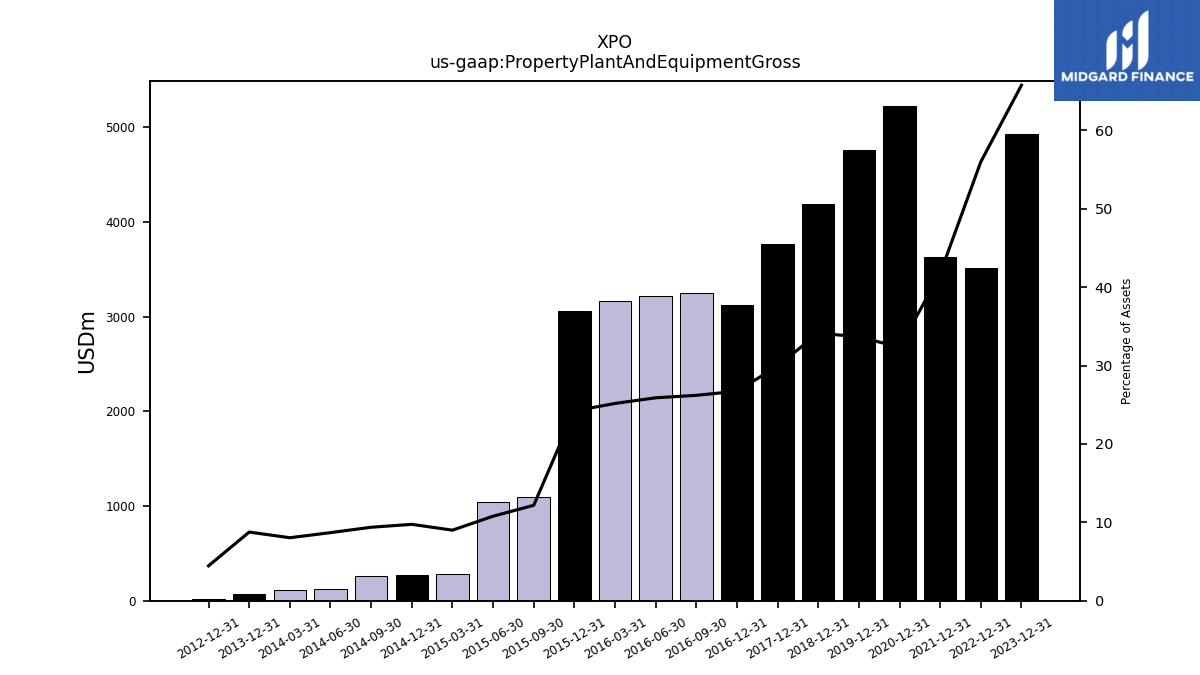
| Property Plant And Equipment Gross | 4928.00 | NA | NA | NA | 3511.00 | NA | NA | NA | 3636.00 | NA | NA | NA | 5229.00 | NA | NA | NA | 4758.00 | NA | NA | NA | 4190.00 | NA | NA | NA | 3773.20 | NA | NA | NA | 3127.30 | 3255.00 | 3218.60 | 3170.20 | 3061.50 | 1100.30 | 1046.60 | 282.20 | 269.20 | 257.53 | 120.01 | 114.48 | 68.37 | NA | NA | NA | 18.41 | NA | NA | NA | NA | NA | NA | NA | NA | NA | NA | |
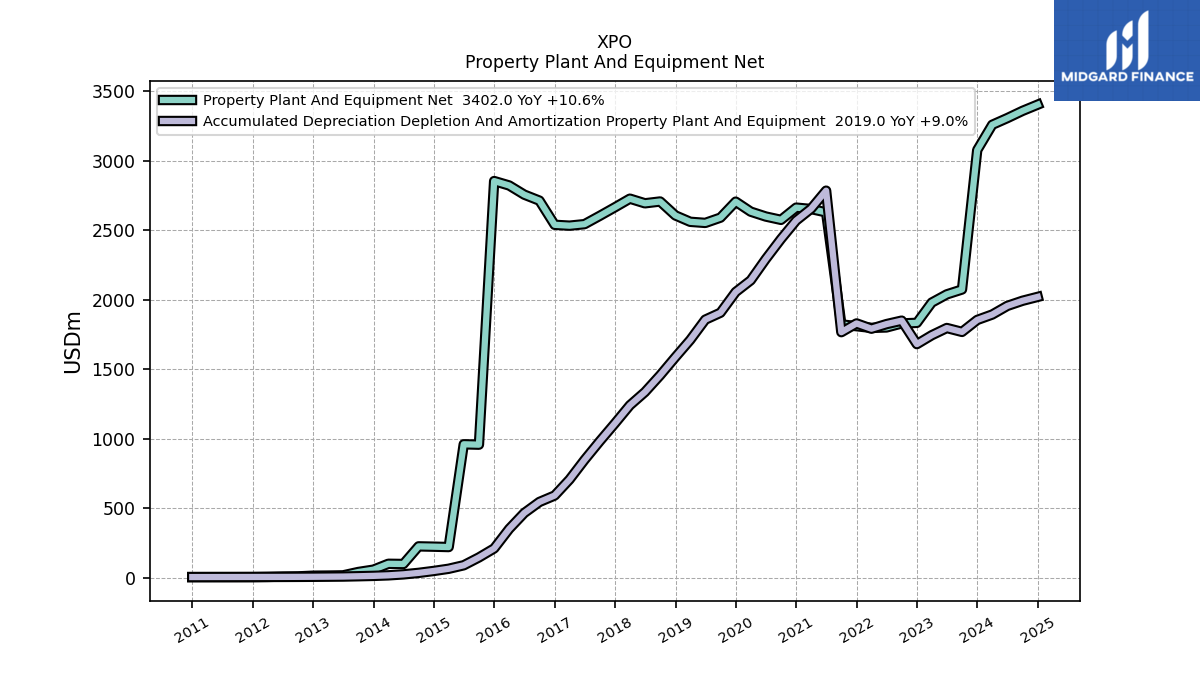
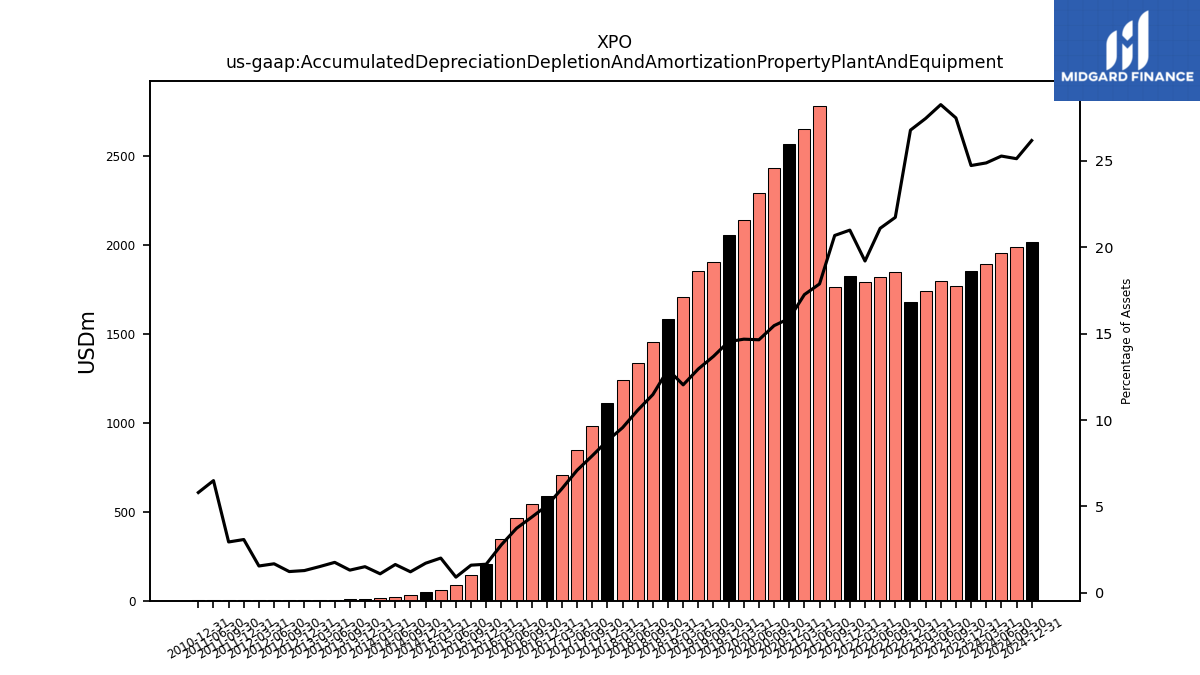
| Accumulated Depreciation Depletion And Amortization Property Plant And Equipment | 1853.00 | 1767.00 | 1795.00 | 1743.00 | 1679.00 | 1848.00 | 1823.00 | 1790.00 | 1828.00 | 1765.00 | 2783.00 | 2653.00 | 2568.00 | 2435.00 | 2291.00 | 2138.00 | 2054.00 | 1905.00 | 1855.00 | 1709.00 | 1585.00 | 1454.80 | 1334.10 | 1239.10 | 1109.50 | 980.60 | 846.60 | 705.10 | 589.90 | 543.70 | 464.10 | 349.90 | 209.30 | 144.60 | 88.10 | 63.00 | 47.30 | 33.39 | 22.63 | 15.66 | 11.80 | 9.19 | 6.95 | 6.07 | 5.32 | 4.77 | 4.38 | 4.12 | 3.94 | 3.77 | 3.61 | NA | 3.29 | NA | NA | |
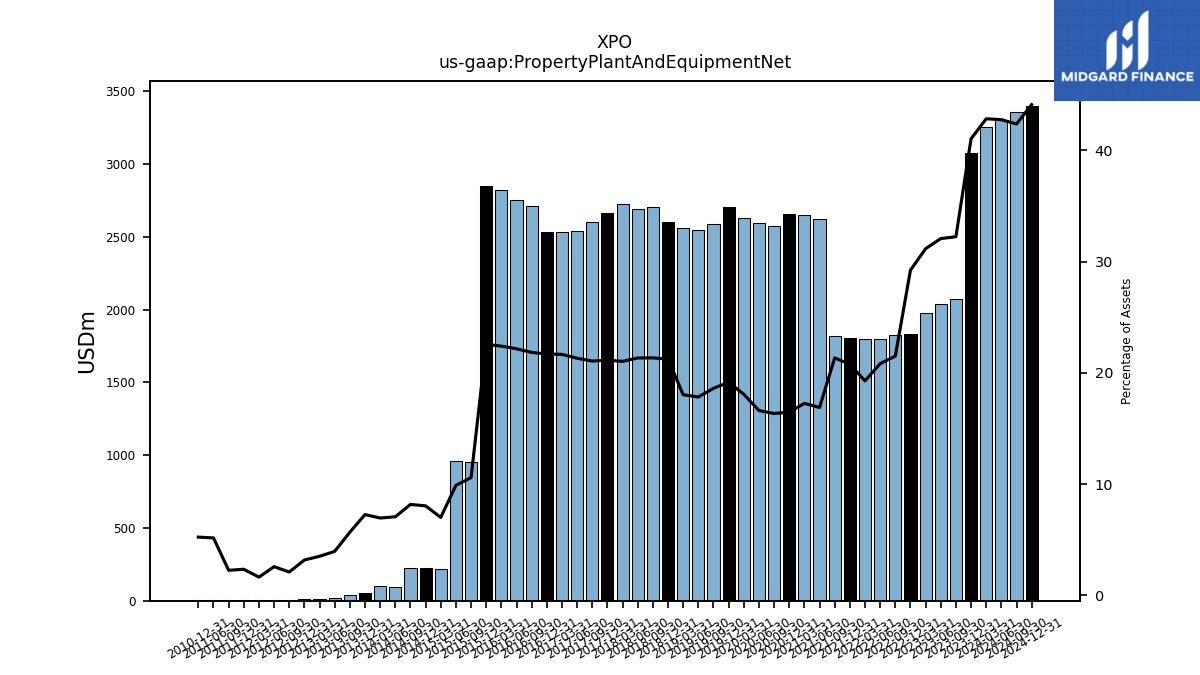
| Property Plant And Equipment Net | 3075.00 | 2072.00 | 2037.00 | 1978.00 | 1832.00 | 1828.00 | 1799.00 | 1796.00 | 1808.00 | 1821.00 | 2627.00 | 2651.00 | 2661.00 | 2573.00 | 2597.00 | 2632.00 | 2704.00 | 2589.00 | 2551.00 | 2559.00 | 2605.00 | 2705.20 | 2692.10 | 2725.50 | 2663.70 | 2602.10 | 2542.20 | 2531.20 | 2537.40 | 2711.30 | 2754.50 | 2820.30 | 2852.20 | 955.70 | 958.50 | 219.20 | 221.90 | 224.14 | 97.38 | 98.82 | 56.57 | 39.67 | 15.55 | 14.01 | 13.09 | 8.08 | 6.69 | 4.32 | 2.98 | 2.87 | 2.87 | NA | 2.96 | NA | NA | |
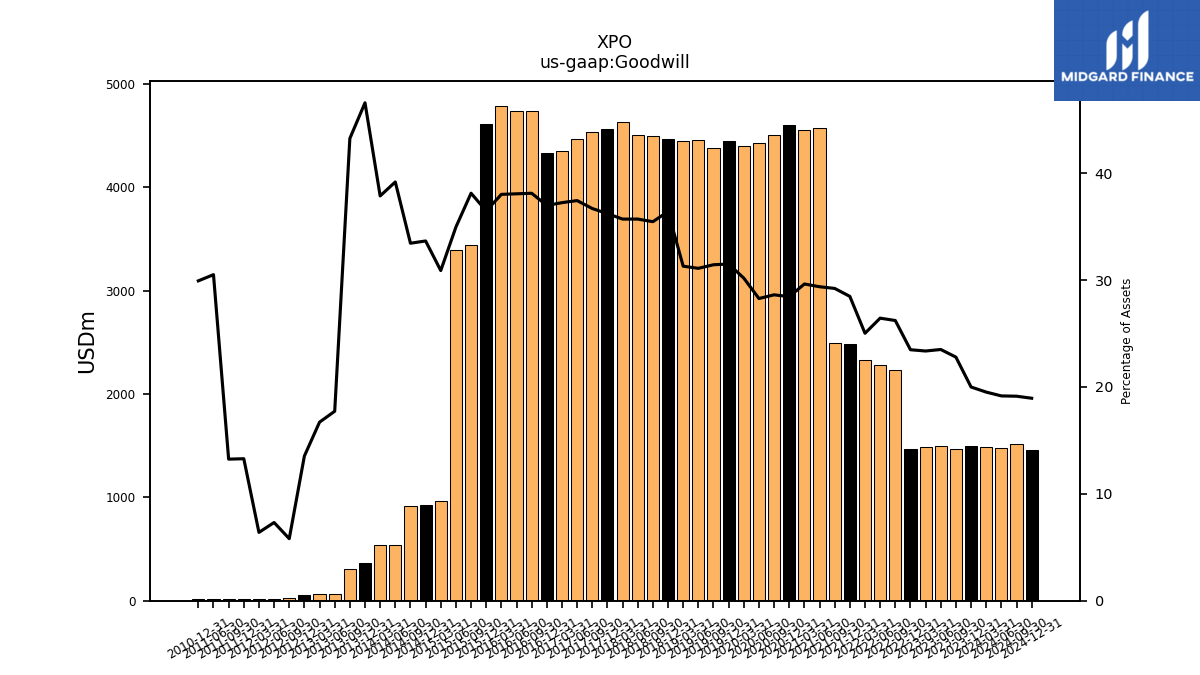
| Goodwill | 1498.00 | 1465.00 | 1493.00 | 1483.00 | 1472.00 | 2229.00 | 2284.00 | 2332.00 | 2479.00 | 2493.00 | 4572.00 | 4554.00 | 4599.00 | 4506.00 | 4422.00 | 4395.00 | 4450.00 | 4374.00 | 4451.00 | 4443.00 | 4467.00 | 4494.80 | 4505.90 | 4627.40 | 4563.60 | 4534.30 | 4466.70 | 4352.70 | 4325.80 | 4734.10 | 4732.00 | 4787.00 | 4610.60 | 3445.00 | 3391.80 | 967.80 | 929.30 | 918.49 | 540.95 | 539.17 | 363.45 | 302.85 | 69.93 | 66.90 | 55.95 | 22.52 | 19.08 | 16.96 | 16.96 | 16.96 | 16.96 | NA | 16.96 | NA | NA | |
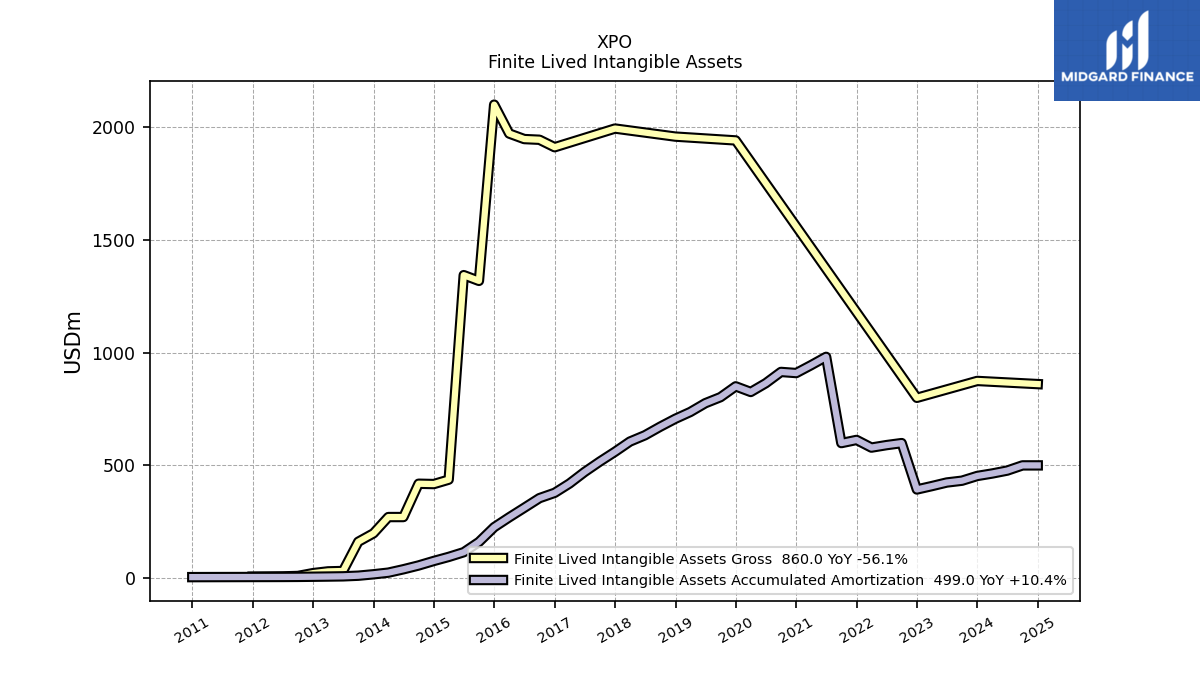
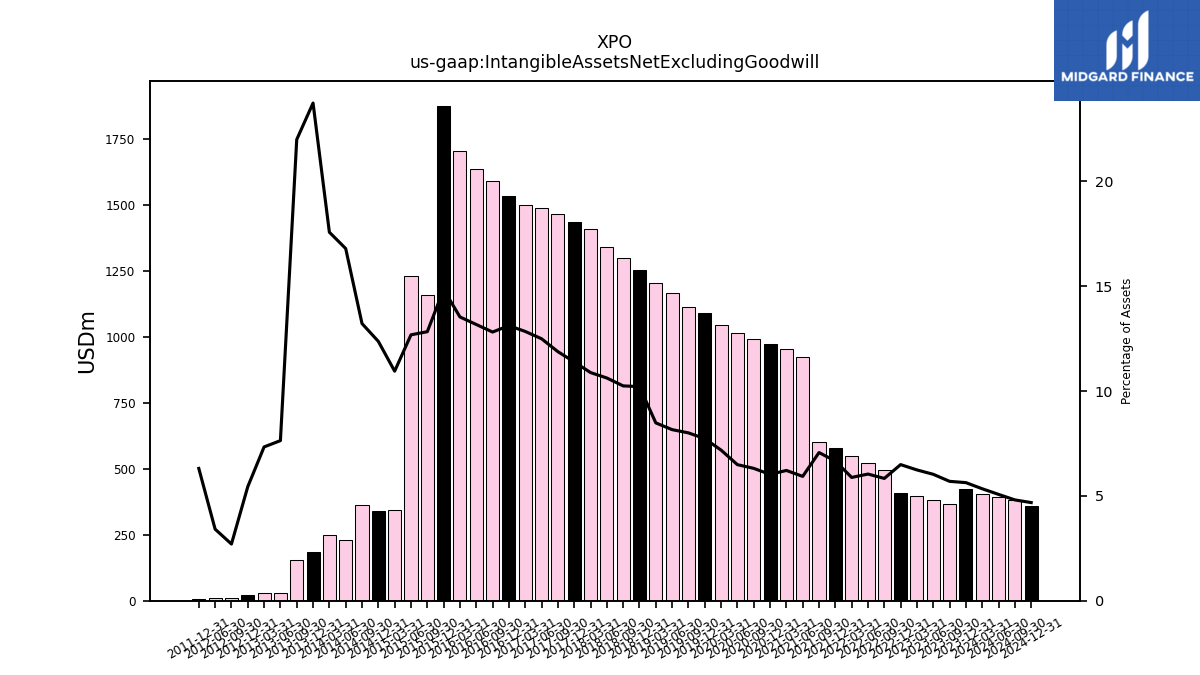
| Intangible Assets Net Excluding Goodwill | 422.00 | 366.00 | 383.00 | 396.00 | 407.00 | 496.00 | 522.00 | 548.00 | 580.00 | 603.00 | 923.00 | 955.00 | 974.00 | 994.00 | 1015.00 | 1046.00 | 1092.00 | 1114.00 | 1168.00 | 1204.00 | 1253.00 | 1298.70 | 1340.50 | 1410.40 | 1435.30 | 1468.00 | 1490.70 | 1501.00 | 1534.70 | 1591.40 | 1637.50 | 1704.20 | 1876.50 | 1159.40 | 1230.40 | 343.00 | 341.50 | 363.00 | 231.91 | 250.20 | 185.18 | 154.03 | 30.12 | 29.37 | 22.47 | 10.49 | 8.90 | NA | 8.05 | NA | NA | NA | NA | NA | NA | |
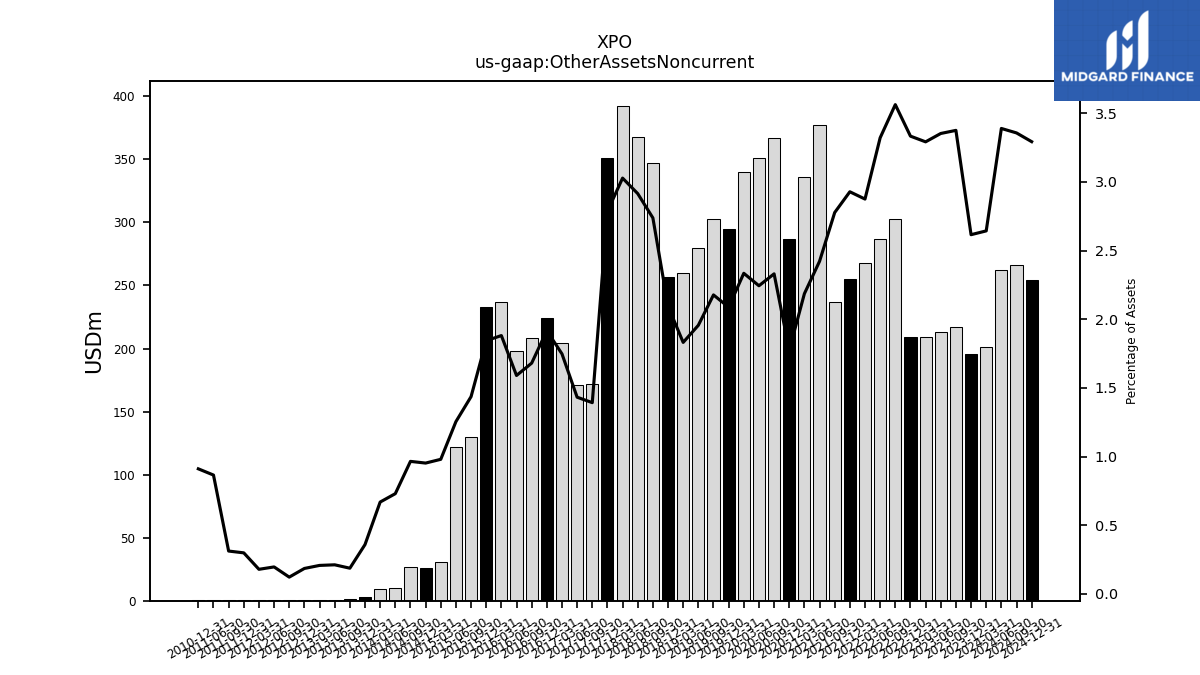
| Other Assets Noncurrent | 196.00 | 217.00 | 213.00 | 209.00 | 209.00 | 303.00 | 287.00 | 268.00 | 255.00 | 237.00 | 377.00 | 336.00 | 287.00 | 367.00 | 351.00 | 340.00 | 295.00 | 303.00 | 280.00 | 260.00 | 257.00 | 347.10 | 367.90 | 392.50 | 351.10 | 172.10 | 170.90 | 204.30 | 224.20 | 208.70 | 197.70 | 236.90 | 233.10 | 129.80 | 121.70 | 30.70 | 26.30 | 26.50 | 10.07 | 9.52 | 2.80 | 1.31 | 0.83 | 0.83 | 0.76 | 0.47 | 0.51 | 0.47 | 0.38 | 0.40 | 0.48 | NA | 0.52 | NA | NA |
| 2023-12-31 | 2023-09-30 | 2023-06-30 | 2023-03-31 | 2022-12-31 | 2022-09-30 | 2022-06-30 | 2022-03-31 | 2021-12-31 | 2021-09-30 | 2021-06-30 | 2021-03-31 | 2020-12-31 | 2020-09-30 | 2020-06-30 | 2020-03-31 | 2019-12-31 | 2019-09-30 | 2019-06-30 | 2019-03-31 | 2018-12-31 | 2018-09-30 | 2018-06-30 | 2018-03-31 | 2017-12-31 | 2017-09-30 | 2017-06-30 | 2017-03-31 | 2016-12-31 | 2016-09-30 | 2016-06-30 | 2016-03-31 | 2015-12-31 | 2015-09-30 | 2015-06-30 | 2015-03-31 | 2014-12-31 | 2014-09-30 | 2014-06-30 | 2014-03-31 | 2013-12-31 | 2013-09-30 | 2013-06-30 | 2013-03-31 | 2012-12-31 | 2012-09-30 | 2012-06-30 | 2012-03-31 | 2011-12-31 | 2011-09-30 | 2011-06-30 | 2011-03-31 | 2010-12-31 | 2010-09-30 | 2010-06-30 | ||
|---|---|---|---|---|---|---|---|---|---|---|---|---|---|---|---|---|---|---|---|---|---|---|---|---|---|---|---|---|---|---|---|---|---|---|---|---|---|---|---|---|---|---|---|---|---|---|---|---|---|---|---|---|---|---|---|---|
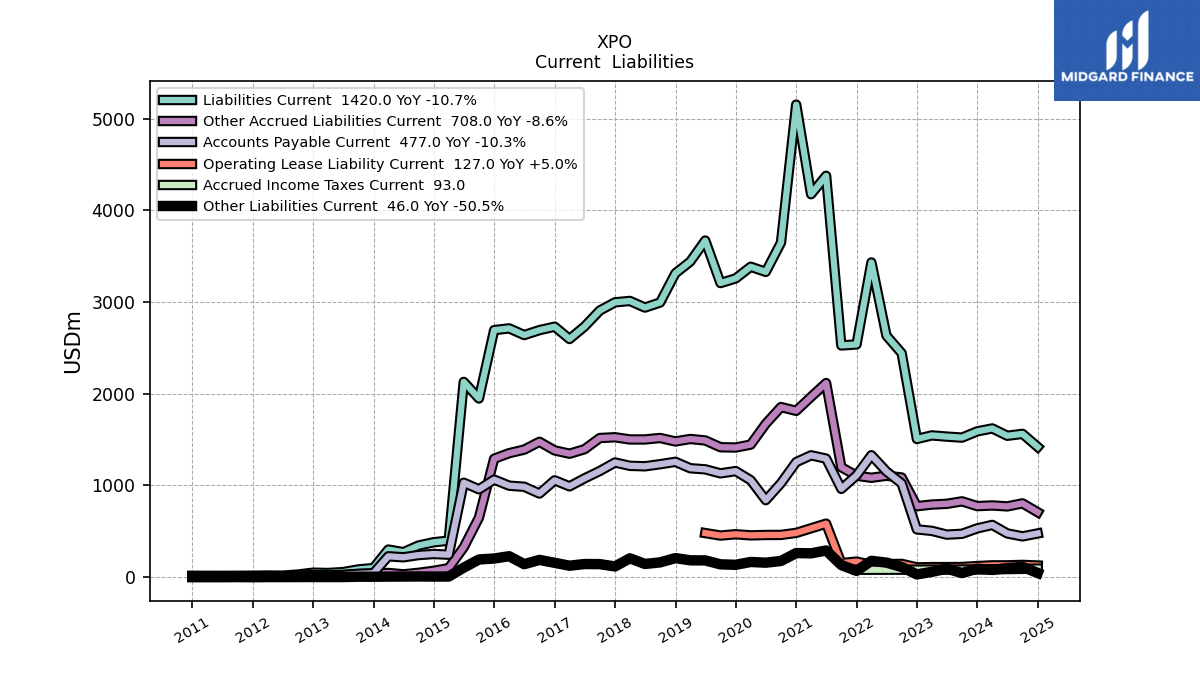
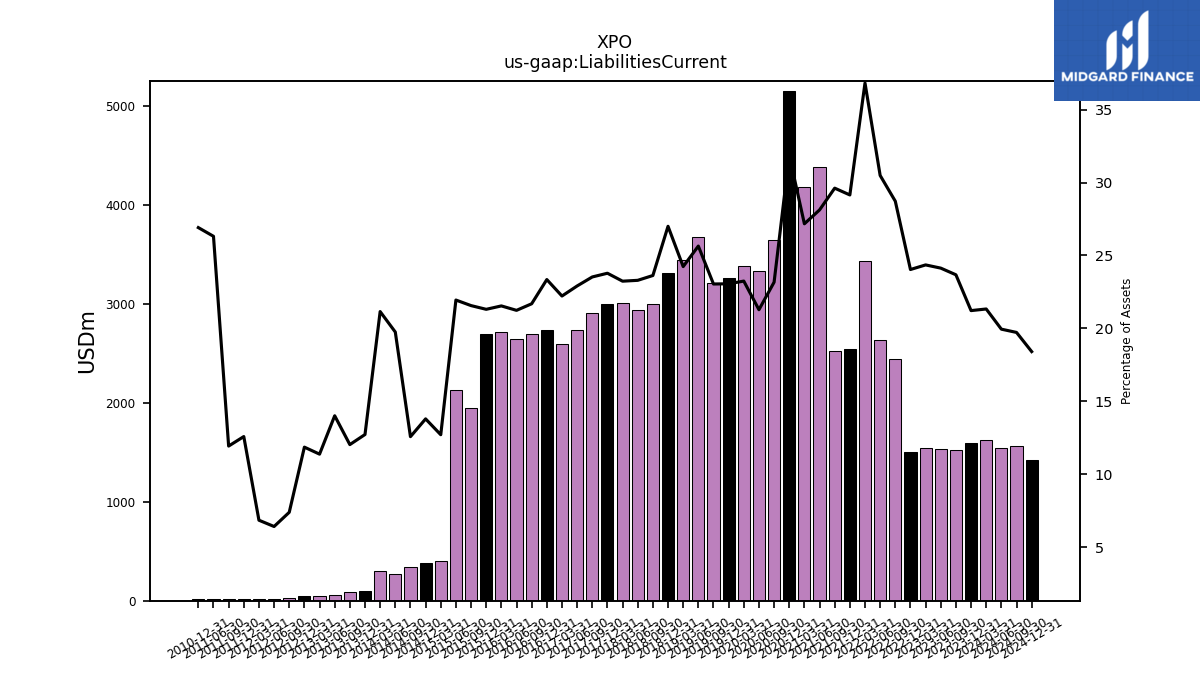
| Liabilities Current | 1590.00 | 1522.00 | 1533.00 | 1546.00 | 1507.00 | 2442.00 | 2634.00 | 3432.00 | 2538.00 | 2527.00 | 4377.00 | 4176.00 | 5153.00 | 3648.00 | 3329.00 | 3385.00 | 3258.00 | 3207.00 | 3671.00 | 3441.00 | 3313.00 | 2995.10 | 2940.10 | 3012.10 | 2997.10 | 2907.70 | 2733.70 | 2597.30 | 2731.60 | 2693.90 | 2640.20 | 2712.90 | 2694.40 | 1948.80 | 2129.40 | 398.40 | 381.10 | 345.57 | 272.75 | 301.20 | 99.33 | 84.32 | 55.29 | 45.59 | 49.03 | 28.70 | 16.76 | 18.19 | 16.07 | 15.29 | 14.63 | NA | 15.25 | NA | NA | |
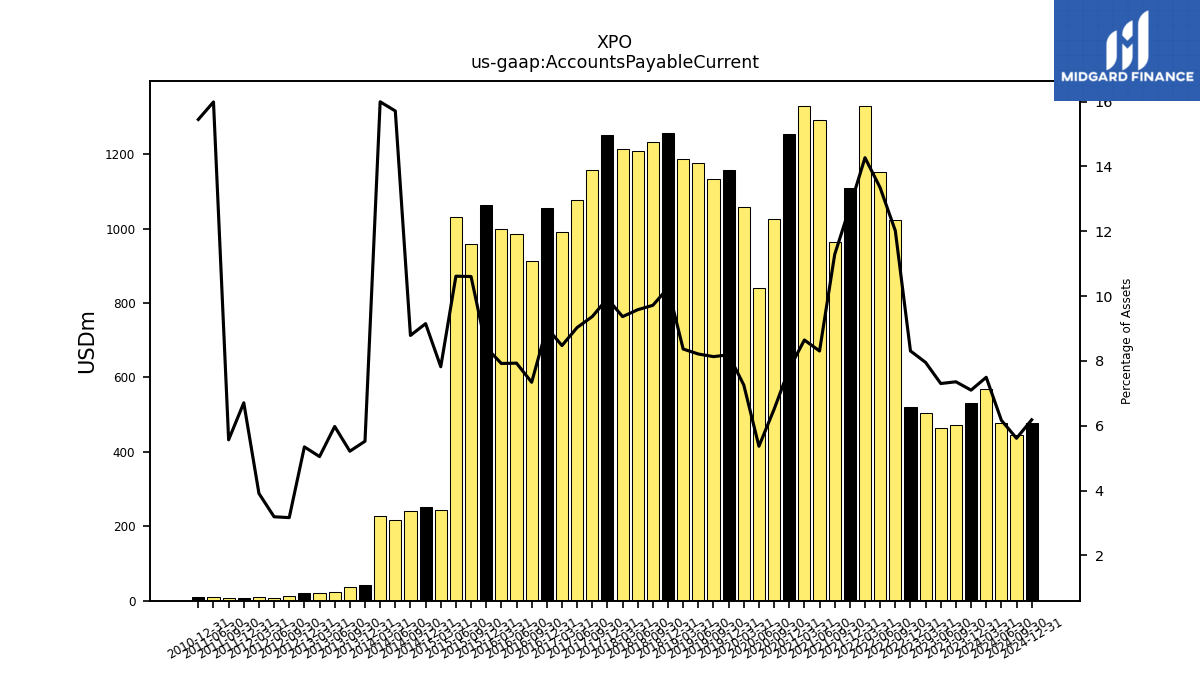
| Accounts Payable Current | 532.00 | 473.00 | 464.00 | 505.00 | 521.00 | 1022.00 | 1153.00 | 1330.00 | 1110.00 | 963.00 | 1293.00 | 1329.00 | 1255.00 | 1025.00 | 840.00 | 1057.00 | 1157.00 | 1132.00 | 1176.00 | 1188.00 | 1258.00 | 1231.80 | 1209.20 | 1214.30 | 1250.70 | 1158.00 | 1077.70 | 990.70 | 1056.30 | 912.00 | 986.10 | 997.70 | 1063.70 | 958.40 | 1030.00 | 245.10 | 252.70 | 241.35 | 216.97 | 227.74 | 43.11 | 36.53 | 23.59 | 20.23 | 22.11 | 12.29 | 8.33 | 10.38 | 8.56 | 7.13 | 8.89 | NA | 8.76 | NA | NA | |
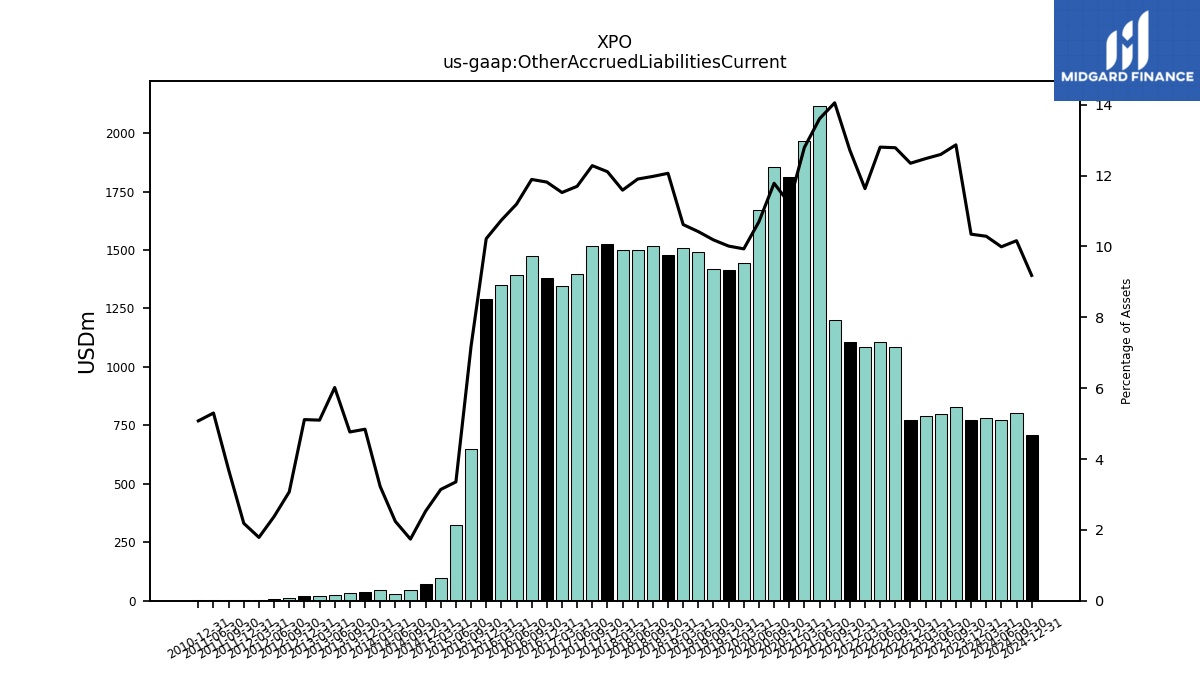
| Other Accrued Liabilities Current | 775.00 | 827.00 | 800.00 | 792.00 | 774.00 | 1087.00 | 1106.00 | 1084.00 | 1107.00 | 1199.00 | 2117.00 | 1966.00 | 1814.00 | 1855.00 | 1673.00 | 1446.00 | 1414.00 | 1417.00 | 1491.00 | 1507.00 | 1480.00 | 1517.90 | 1501.80 | 1501.80 | 1525.80 | 1517.40 | 1395.50 | 1346.50 | 1382.10 | 1476.50 | 1391.20 | 1352.30 | 1291.80 | 648.90 | 325.40 | 98.40 | 69.80 | 47.77 | 30.95 | 45.95 | 37.77 | 33.36 | 23.73 | 20.41 | 21.12 | 11.91 | 6.20 | 4.74 | 2.79 | 4.73 | 2.94 | NA | 2.88 | NA | NA | |
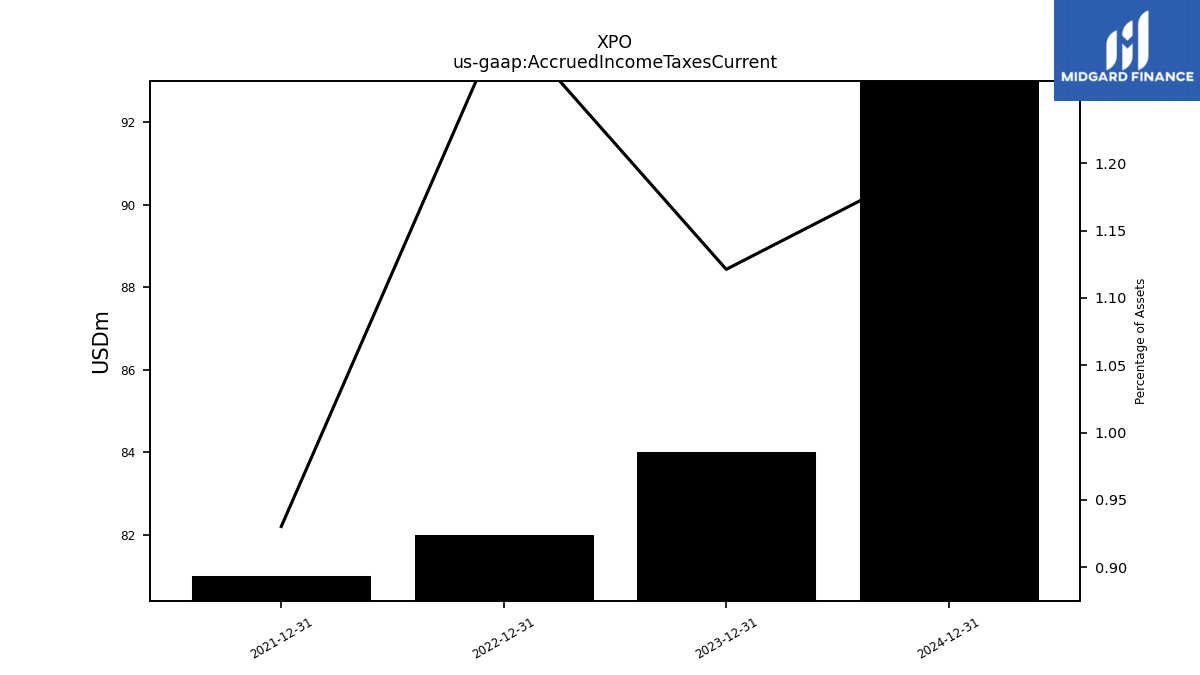
| Accrued Income Taxes Current | 84.00 | NA | NA | NA | 82.00 | NA | NA | NA | 81.00 | NA | NA | NA | NA | NA | NA | NA | NA | NA | NA | NA | NA | NA | NA | NA | NA | NA | NA | NA | NA | NA | NA | NA | NA | NA | NA | NA | NA | NA | NA | NA | NA | NA | NA | NA | NA | NA | NA | NA | NA | NA | NA | NA | NA | NA | NA | |
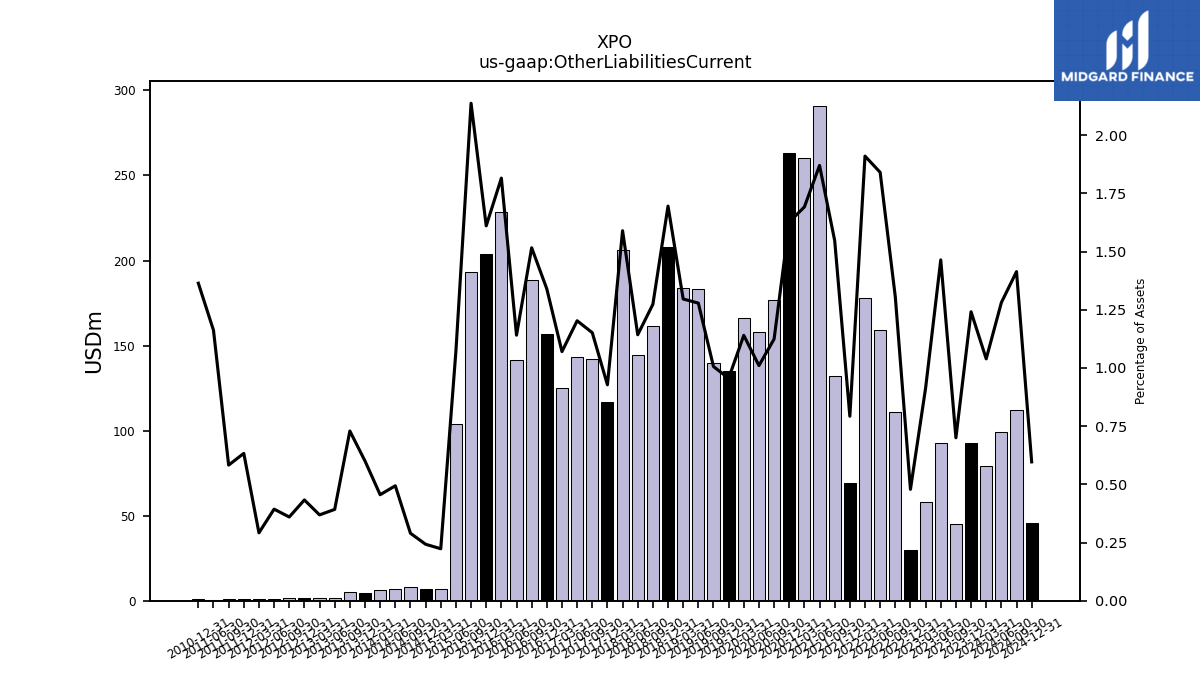
| Other Liabilities Current | 93.00 | 45.00 | 93.00 | 58.00 | 30.00 | 111.00 | 159.00 | 178.00 | 69.00 | 132.00 | 291.00 | 260.00 | 263.00 | 177.00 | 158.00 | 166.00 | 135.00 | 140.00 | 183.00 | 184.00 | 208.00 | 161.40 | 144.20 | 206.00 | 116.90 | 142.30 | 143.50 | 125.10 | 156.70 | 188.30 | 141.80 | 228.60 | 203.60 | 193.10 | 104.00 | 7.00 | 6.70 | 7.96 | 6.82 | 6.49 | 4.68 | 5.11 | 1.55 | 1.48 | 1.79 | 1.40 | 1.03 | 0.77 | 0.81 | 0.75 | 0.65 | NA | 0.77 | NA | NA |
| 2023-12-31 | 2023-09-30 | 2023-06-30 | 2023-03-31 | 2022-12-31 | 2022-09-30 | 2022-06-30 | 2022-03-31 | 2021-12-31 | 2021-09-30 | 2021-06-30 | 2021-03-31 | 2020-12-31 | 2020-09-30 | 2020-06-30 | 2020-03-31 | 2019-12-31 | 2019-09-30 | 2019-06-30 | 2019-03-31 | 2018-12-31 | 2018-09-30 | 2018-06-30 | 2018-03-31 | 2017-12-31 | 2017-09-30 | 2017-06-30 | 2017-03-31 | 2016-12-31 | 2016-09-30 | 2016-06-30 | 2016-03-31 | 2015-12-31 | 2015-09-30 | 2015-06-30 | 2015-03-31 | 2014-12-31 | 2014-09-30 | 2014-06-30 | 2014-03-31 | 2013-12-31 | 2013-09-30 | 2013-06-30 | 2013-03-31 | 2012-12-31 | 2012-09-30 | 2012-06-30 | 2012-03-31 | 2011-12-31 | 2011-09-30 | 2011-06-30 | 2011-03-31 | 2010-12-31 | 2010-09-30 | 2010-06-30 | ||
|---|---|---|---|---|---|---|---|---|---|---|---|---|---|---|---|---|---|---|---|---|---|---|---|---|---|---|---|---|---|---|---|---|---|---|---|---|---|---|---|---|---|---|---|---|---|---|---|---|---|---|---|---|---|---|---|---|
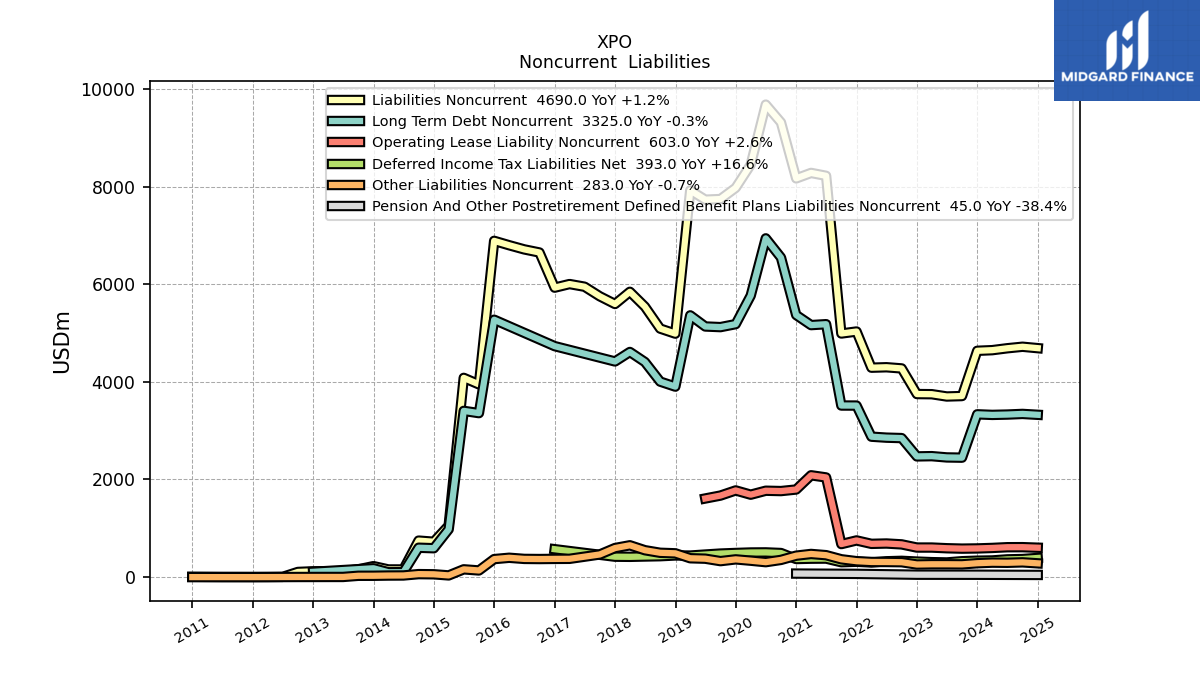
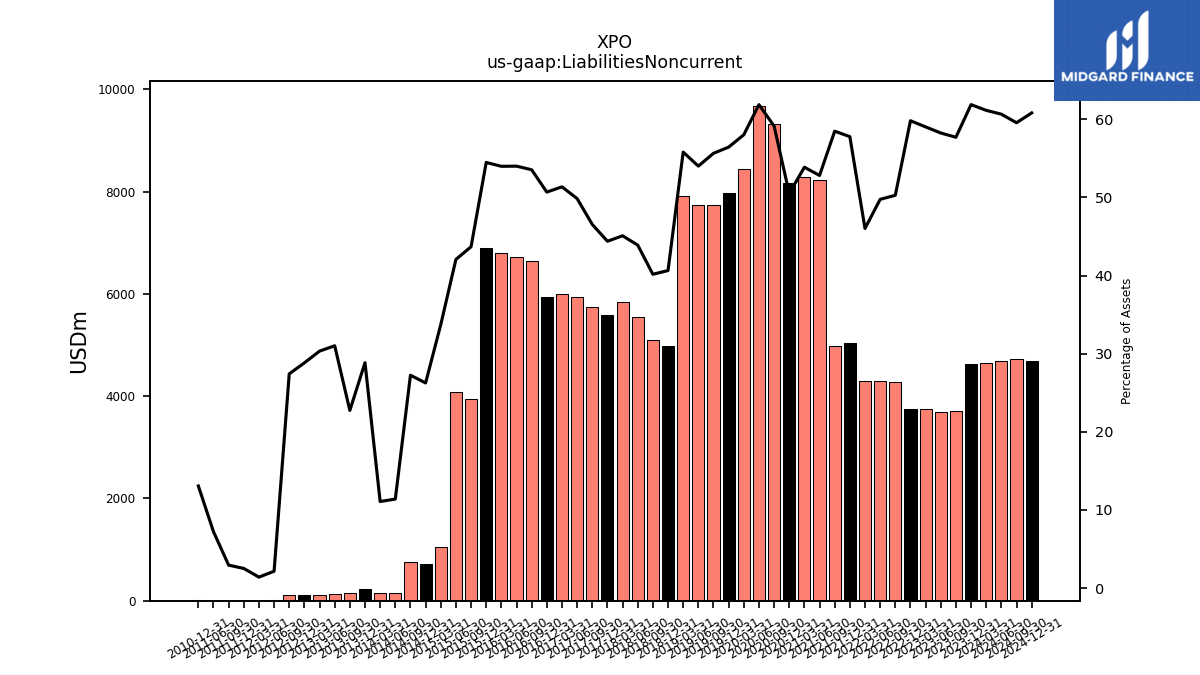
| Liabilities Noncurrent | 4636.00 | 3709.00 | 3700.00 | 3747.00 | 3750.00 | 4275.00 | 4299.00 | 4290.00 | 5031.00 | 4990.00 | 8220.00 | 8279.00 | 8167.00 | 9312.00 | 9678.00 | 8449.00 | 7974.00 | 7744.00 | 7731.00 | 7922.00 | 4987.00 | 5091.20 | 5539.90 | 5844.30 | 5594.50 | 5752.10 | 5948.40 | 6003.10 | 5929.20 | 6649.50 | 6712.90 | 6797.80 | 6888.00 | 3948.00 | 4081.70 | 1056.30 | 725.00 | 748.24 | 157.32 | 157.77 | 225.06 | 159.27 | 122.36 | 121.46 | 119.12 | 106.33 | 5.63 | 3.72 | 3.21 | 3.76 | 4.01 | NA | 7.41 | NA | NA | |
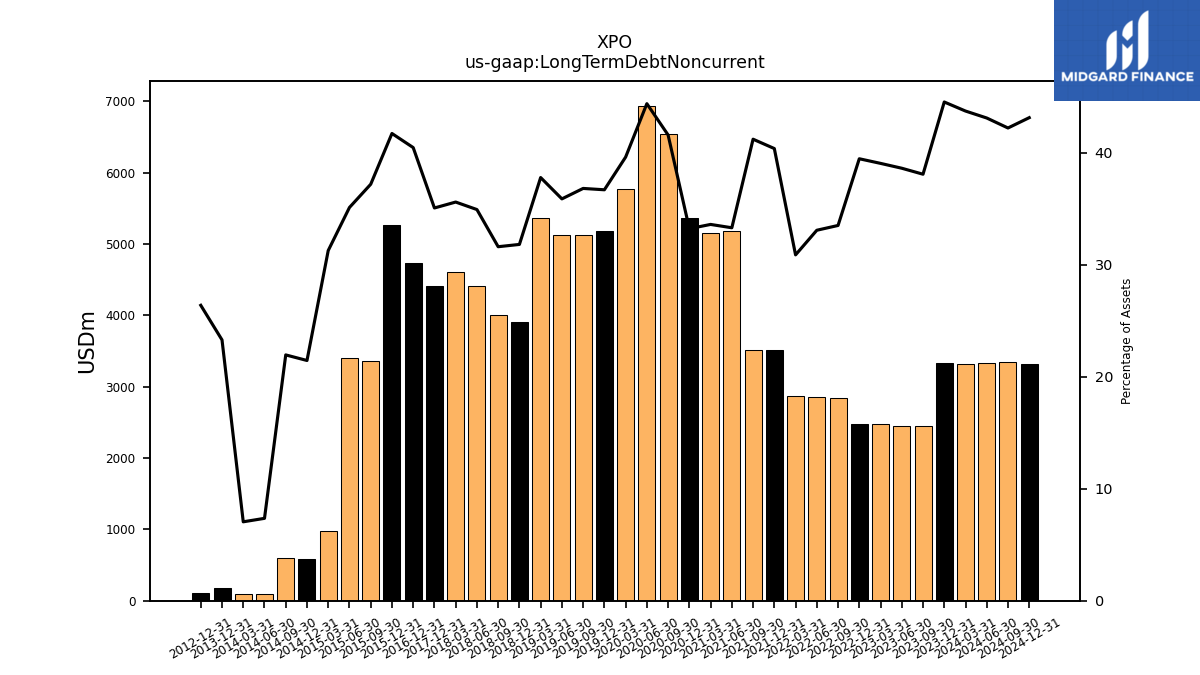
| Long Term Debt Noncurrent | 3335.00 | 2447.00 | 2452.00 | 2478.00 | 2473.00 | 2848.00 | 2857.00 | 2877.00 | 3514.00 | 3515.00 | 5181.00 | 5162.00 | 5369.00 | 6545.00 | 6939.00 | 5766.00 | 5182.00 | 5121.00 | 5134.00 | 5362.00 | 3902.00 | 4005.30 | 4406.10 | 4612.10 | 4417.50 | NA | NA | NA | 4731.50 | NA | NA | NA | 5272.60 | 3359.10 | 3405.70 | 979.30 | 592.10 | 602.57 | 101.56 | 100.31 | 181.64 | NA | NA | NA | 108.96 | NA | NA | NA | NA | NA | NA | NA | NA | NA | NA | |
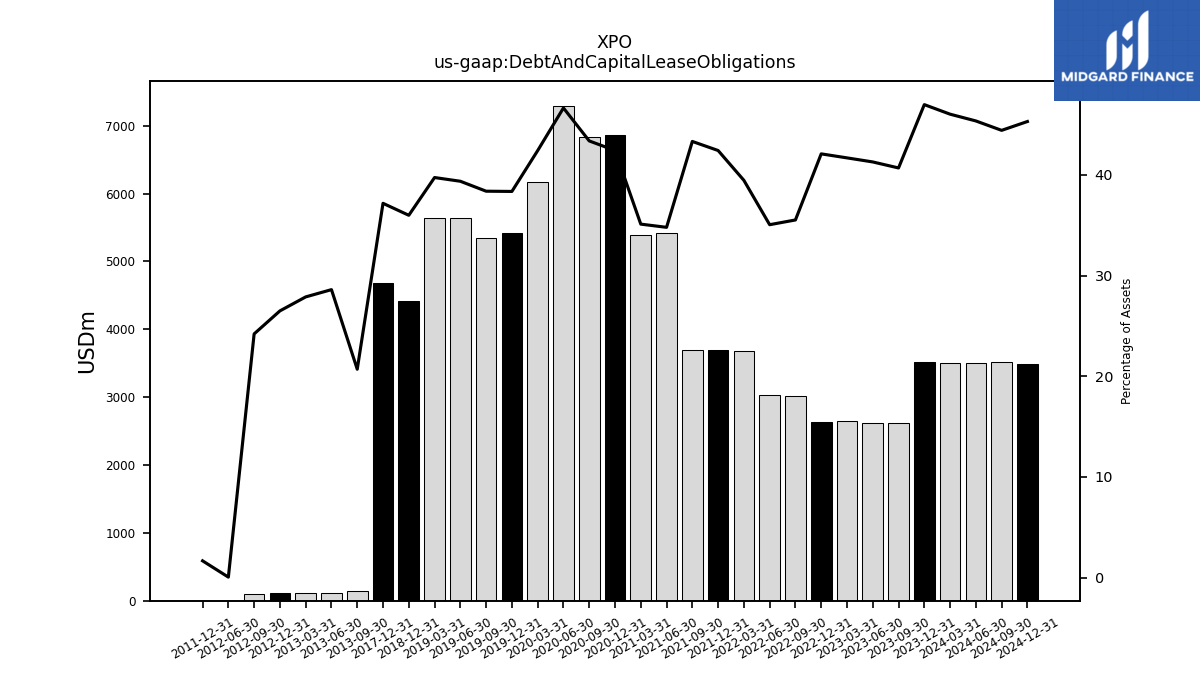
| Debt And Capital Lease Obligations | 3519.00 | 2615.00 | 2622.00 | 2646.00 | 2638.00 | 3020.00 | 3028.00 | 3677.00 | 3693.00 | 3696.00 | 5414.00 | 5395.00 | 6858.00 | 6828.00 | 7295.00 | 6175.00 | 5418.00 | 5340.00 | 5634.00 | 5640.00 | 4415.00 | NA | NA | NA | 4684.00 | NA | NA | NA | NA | NA | NA | NA | NA | NA | NA | NA | NA | NA | NA | NA | NA | 144.93 | 112.81 | 111.63 | 109.45 | 93.85 | 0.13 | NA | 2.13 | NA | NA | NA | NA | NA | NA | |
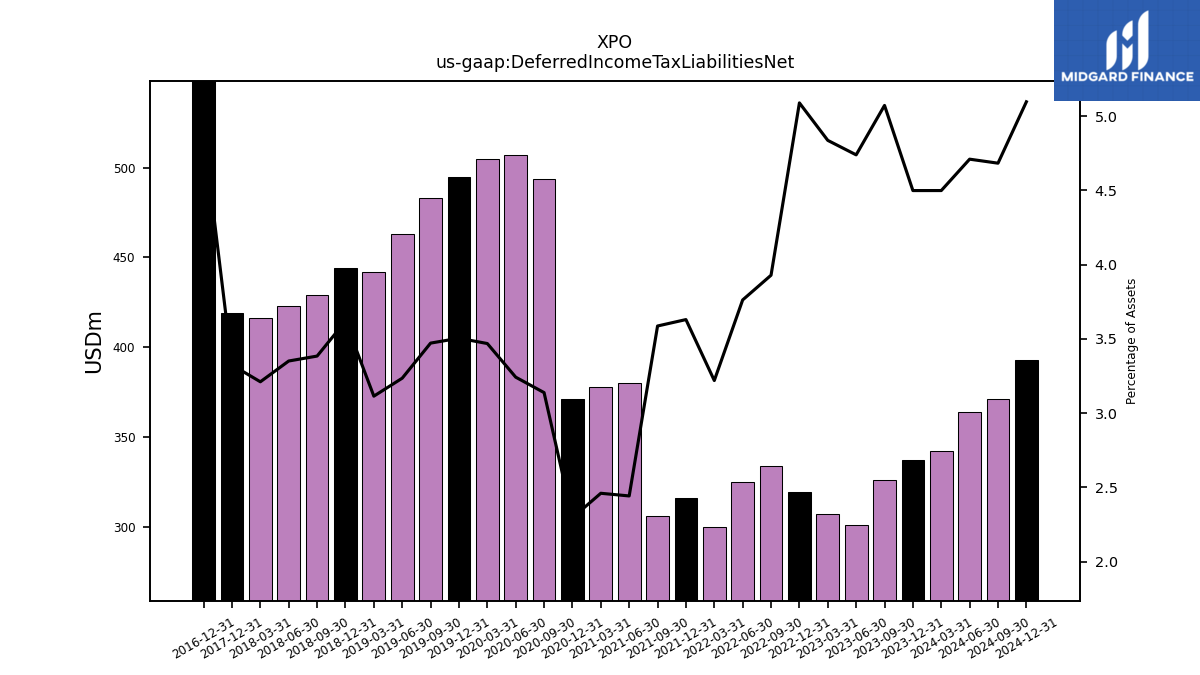
| Deferred Income Tax Liabilities Net | 337.00 | 326.00 | 301.00 | 307.00 | 319.00 | 334.00 | 325.00 | 300.00 | 316.00 | 306.00 | 380.00 | 378.00 | 371.00 | 494.00 | 507.00 | 505.00 | 495.00 | 483.00 | 463.00 | 442.00 | 444.00 | 428.90 | 422.80 | 416.10 | 418.80 | NA | NA | NA | 572.40 | NA | NA | NA | NA | NA | NA | NA | NA | NA | NA | NA | NA | NA | NA | NA | NA | NA | NA | NA | NA | NA | NA | NA | NA | NA | NA | |
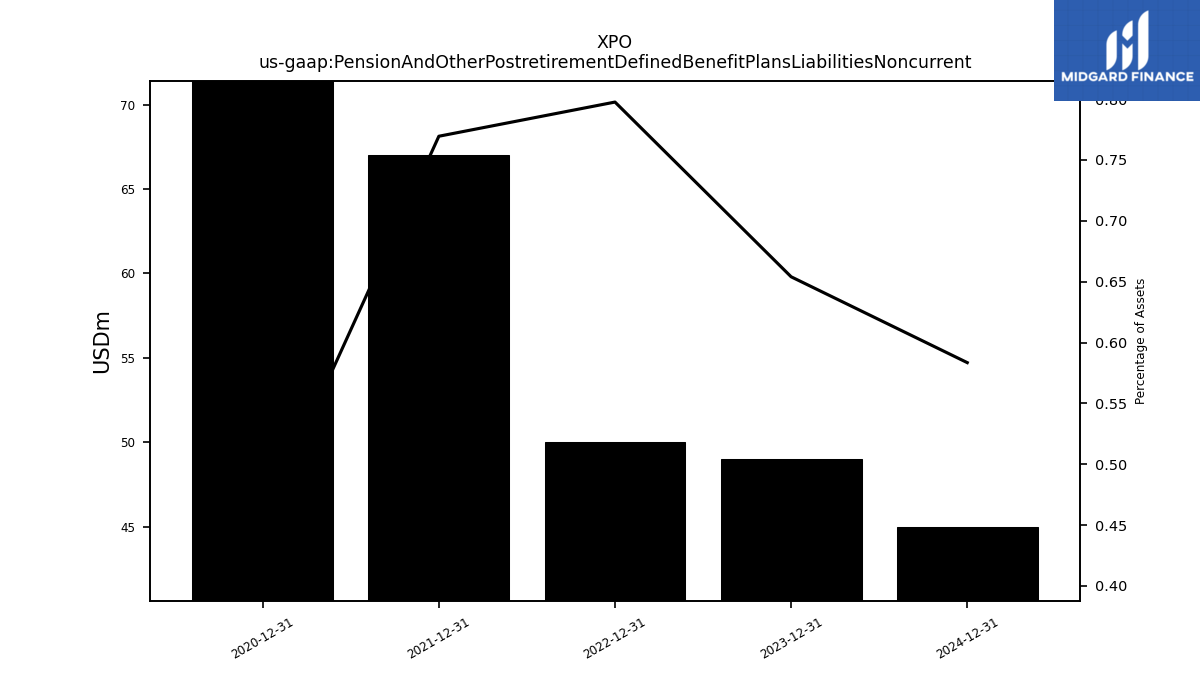
| Pension And Other Postretirement Defined Benefit Plans Liabilities Noncurrent | 49.00 | NA | NA | NA | 50.00 | NA | NA | NA | 67.00 | NA | NA | NA | 73.00 | NA | NA | NA | NA | NA | NA | NA | NA | NA | NA | NA | NA | NA | NA | NA | NA | NA | NA | NA | NA | NA | NA | NA | NA | NA | NA | NA | NA | NA | NA | NA | NA | NA | NA | NA | NA | NA | NA | NA | NA | NA | NA | |
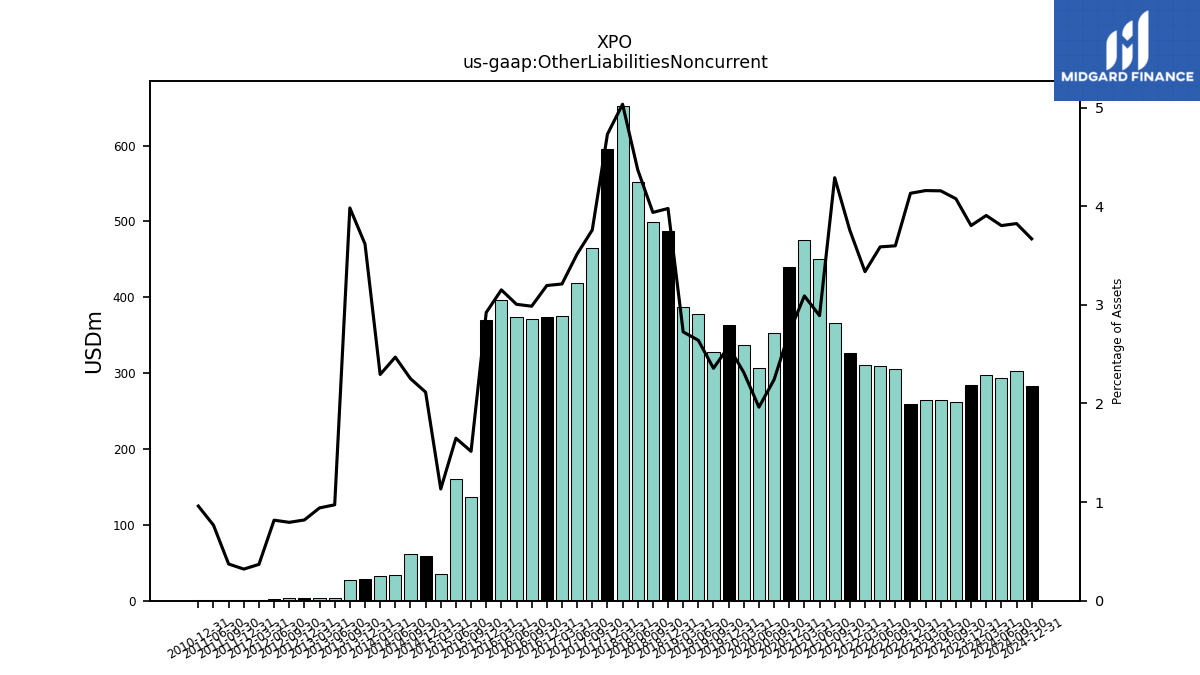
| Other Liabilities Noncurrent | 285.00 | 262.00 | 264.00 | 264.00 | 259.00 | 306.00 | 310.00 | 311.00 | 327.00 | 366.00 | 450.00 | 475.00 | 440.00 | 353.00 | 307.00 | 337.00 | 364.00 | 328.00 | 378.00 | 387.00 | 488.00 | 499.10 | 551.50 | 652.50 | 596.10 | 464.60 | 419.50 | 375.40 | 373.90 | 370.90 | 373.60 | 396.90 | 369.50 | 136.90 | 159.90 | 35.50 | 58.40 | 61.85 | 34.11 | 32.66 | 28.22 | 27.89 | 3.84 | 3.77 | 3.38 | 3.08 | 2.13 | 0.98 | 0.41 | 0.48 | 0.43 | NA | 0.54 | NA | NA | |
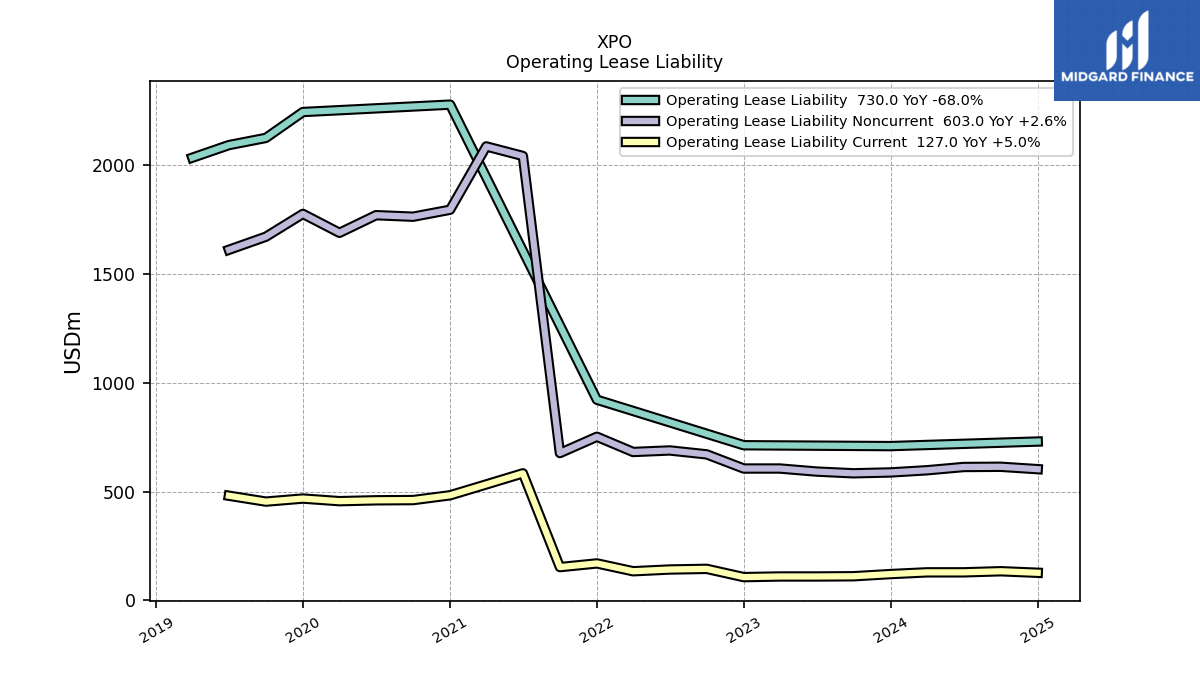
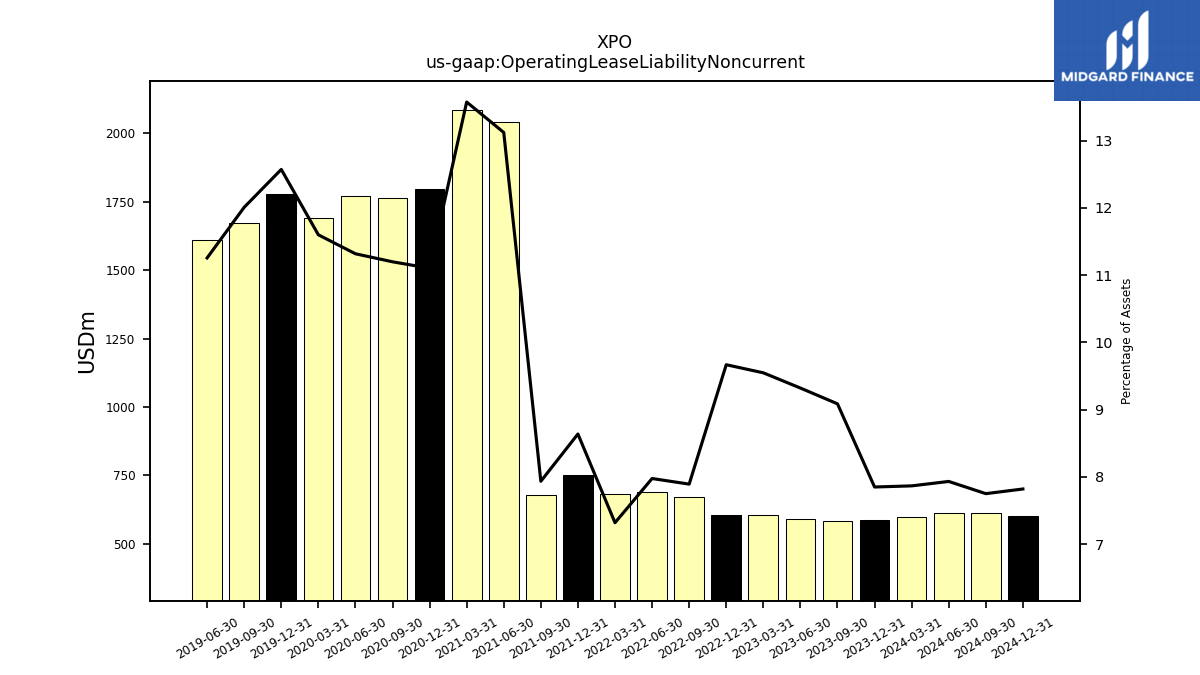
| Operating Lease Liability Noncurrent | 588.00 | 584.00 | 592.00 | 606.00 | 606.00 | 671.00 | 689.00 | 682.00 | 752.00 | 677.00 | 2042.00 | 2086.00 | 1795.00 | 1763.00 | 1770.00 | 1689.00 | 1776.00 | 1671.00 | 1611.00 | NA | NA | NA | NA | NA | NA | NA | NA | NA | NA | NA | NA | NA | NA | NA | NA | NA | NA | NA | NA | NA | NA | NA | NA | NA | NA | NA | NA | NA | NA | NA | NA | NA | NA | NA | NA |
| 2023-12-31 | 2023-09-30 | 2023-06-30 | 2023-03-31 | 2022-12-31 | 2022-09-30 | 2022-06-30 | 2022-03-31 | 2021-12-31 | 2021-09-30 | 2021-06-30 | 2021-03-31 | 2020-12-31 | 2020-09-30 | 2020-06-30 | 2020-03-31 | 2019-12-31 | 2019-09-30 | 2019-06-30 | 2019-03-31 | 2018-12-31 | 2018-09-30 | 2018-06-30 | 2018-03-31 | 2017-12-31 | 2017-09-30 | 2017-06-30 | 2017-03-31 | 2016-12-31 | 2016-09-30 | 2016-06-30 | 2016-03-31 | 2015-12-31 | 2015-09-30 | 2015-06-30 | 2015-03-31 | 2014-12-31 | 2014-09-30 | 2014-06-30 | 2014-03-31 | 2013-12-31 | 2013-09-30 | 2013-06-30 | 2013-03-31 | 2012-12-31 | 2012-09-30 | 2012-06-30 | 2012-03-31 | 2011-12-31 | 2011-09-30 | 2011-06-30 | 2011-03-31 | 2010-12-31 | 2010-09-30 | 2010-06-30 | ||
|---|---|---|---|---|---|---|---|---|---|---|---|---|---|---|---|---|---|---|---|---|---|---|---|---|---|---|---|---|---|---|---|---|---|---|---|---|---|---|---|---|---|---|---|---|---|---|---|---|---|---|---|---|---|---|---|---|
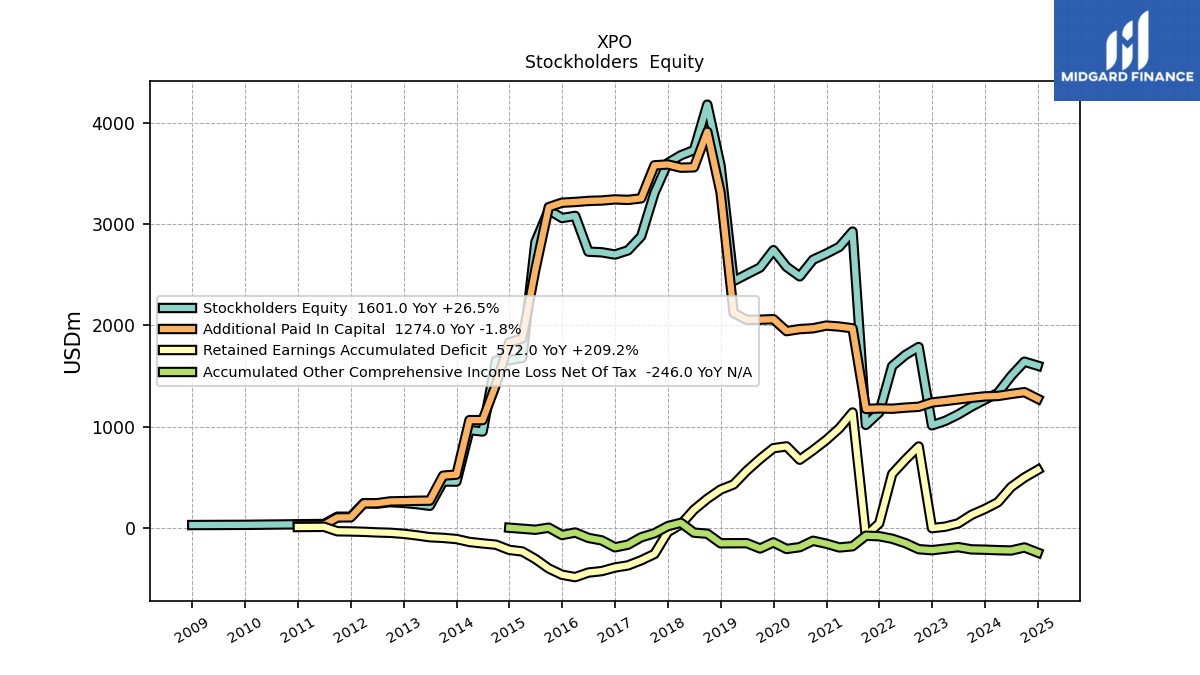
| Stockholders Equity | 1266.00 | 1197.00 | 1119.00 | 1055.00 | 1012.00 | 1786.00 | 1707.00 | 1598.00 | 1138.00 | 1016.00 | 2927.00 | 2776.00 | 2709.00 | 2649.00 | 2484.00 | 2578.00 | 2743.00 | 2572.00 | 2505.00 | 2438.00 | 3575.00 | 4181.50 | 3732.00 | 3680.70 | 3604.40 | 3308.80 | 2880.20 | 2741.20 | 2700.00 | 2722.00 | 2728.40 | 3081.60 | 3060.80 | 3139.80 | 2823.80 | 1678.40 | 1655.10 | 1652.49 | 950.75 | 964.78 | 455.84 | 456.75 | 216.83 | 233.40 | 245.06 | 252.74 | 238.35 | 243.33 | 108.36 | 108.98 | 36.95 | NA | 34.01 | NA | NA | |
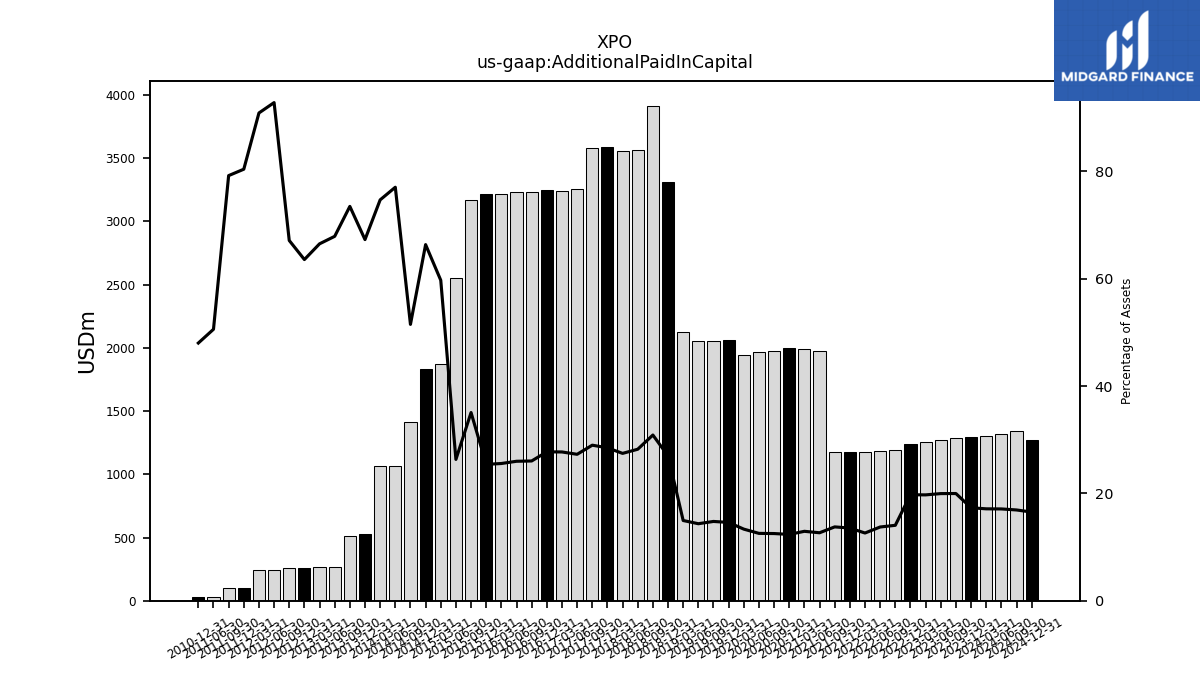
| Additional Paid In Capital | 1298.00 | 1284.00 | 1268.00 | 1252.00 | 1238.00 | 1195.00 | 1187.00 | 1176.00 | 1179.00 | 1174.00 | 1971.00 | 1988.00 | 1998.00 | 1971.00 | 1963.00 | 1943.00 | 2061.00 | 2056.00 | 2054.00 | 2122.00 | 3311.00 | 3913.50 | 3561.80 | 3558.30 | 3590.00 | 3581.60 | 3255.10 | 3239.80 | 3244.90 | 3233.90 | 3229.80 | 3219.40 | 3212.30 | 3168.30 | 2554.50 | 1870.60 | 1831.90 | 1413.86 | 1063.71 | 1063.24 | 524.97 | 514.51 | 267.81 | 266.27 | 262.64 | 260.25 | 241.96 | 241.02 | 102.61 | 101.40 | 28.12 | NA | 27.21 | NA | NA | |
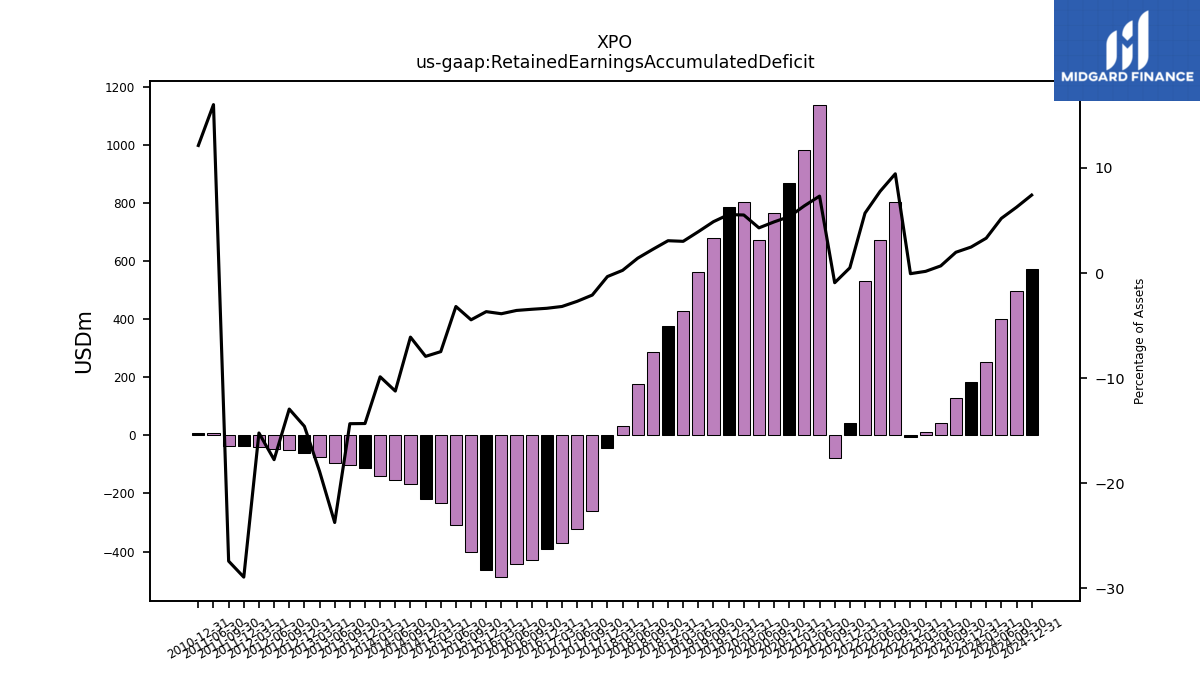
| Retained Earnings Accumulated Deficit | 185.00 | 127.00 | 43.00 | 10.00 | -4.00 | 803.00 | 672.00 | 531.00 | 43.00 | -79.00 | 1139.00 | 983.00 | 868.00 | 766.00 | 672.00 | 804.00 | 786.00 | 680.00 | 563.00 | 428.00 | 377.00 | 286.10 | 177.90 | 32.60 | -42.60 | -259.50 | -321.70 | -372.40 | -392.90 | -428.90 | -443.00 | -488.20 | -465.00 | -402.60 | -309.40 | -234.50 | -219.10 | -167.59 | -155.16 | -140.67 | -111.79 | -100.45 | -93.68 | -75.57 | -60.29 | -50.22 | -46.32 | -40.39 | -36.95 | -35.11 | 8.91 | NA | 6.88 | NA | NA | |
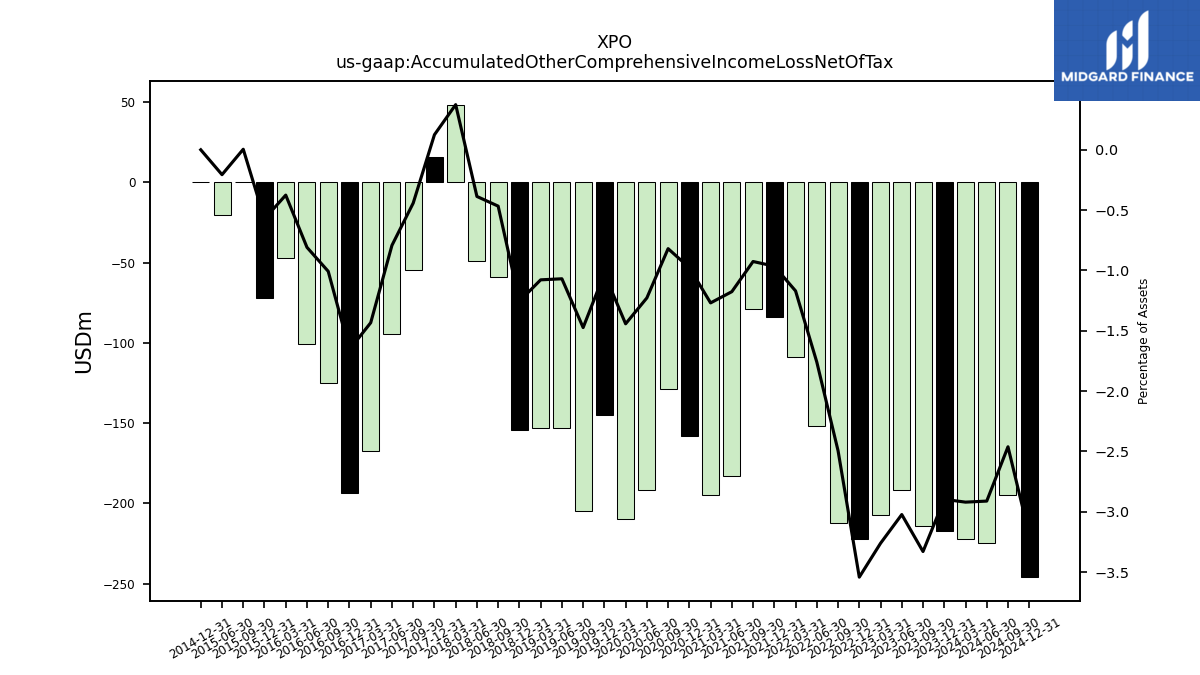
| Accumulated Other Comprehensive Income Loss Net Of Tax | -217.00 | -214.00 | -192.00 | -207.00 | -222.00 | -212.00 | -152.00 | -109.00 | -84.00 | -79.00 | -183.00 | -195.00 | -158.00 | -129.00 | -192.00 | -210.00 | -145.00 | -205.00 | -153.00 | -153.00 | -154.00 | -59.20 | -48.80 | 48.50 | 15.70 | -54.60 | -94.50 | -167.50 | -193.70 | -125.10 | -100.50 | -47.30 | -72.30 | 0.40 | -20.00 | NA | 0.00 | NA | NA | NA | NA | NA | NA | NA | NA | NA | NA | NA | NA | NA | NA | NA | NA | NA | NA |
| 2023-12-31 | 2023-09-30 | 2023-06-30 | 2023-03-31 | 2022-12-31 | 2022-09-30 | 2022-06-30 | 2022-03-31 | 2021-12-31 | 2021-09-30 | 2021-06-30 | 2021-03-31 | 2020-12-31 | 2020-09-30 | 2020-06-30 | 2020-03-31 | 2019-12-31 | 2019-09-30 | 2019-06-30 | 2019-03-31 | 2018-12-31 | 2018-09-30 | 2018-06-30 | 2018-03-31 | 2017-12-31 | 2017-09-30 | 2017-06-30 | 2017-03-31 | 2016-12-31 | 2016-09-30 | 2016-06-30 | 2016-03-31 | 2015-12-31 | 2015-09-30 | 2015-06-30 | 2015-03-31 | 2014-12-31 | 2014-09-30 | 2014-06-30 | 2014-03-31 | 2013-12-31 | 2013-09-30 | 2013-06-30 | 2013-03-31 | 2012-12-31 | 2012-09-30 | 2012-06-30 | 2012-03-31 | 2011-12-31 | 2011-09-30 | 2011-06-30 | 2011-03-31 | 2010-12-31 | 2010-09-30 | 2010-06-30 | ||
|---|---|---|---|---|---|---|---|---|---|---|---|---|---|---|---|---|---|---|---|---|---|---|---|---|---|---|---|---|---|---|---|---|---|---|---|---|---|---|---|---|---|---|---|---|---|---|---|---|---|---|---|---|---|---|---|---|
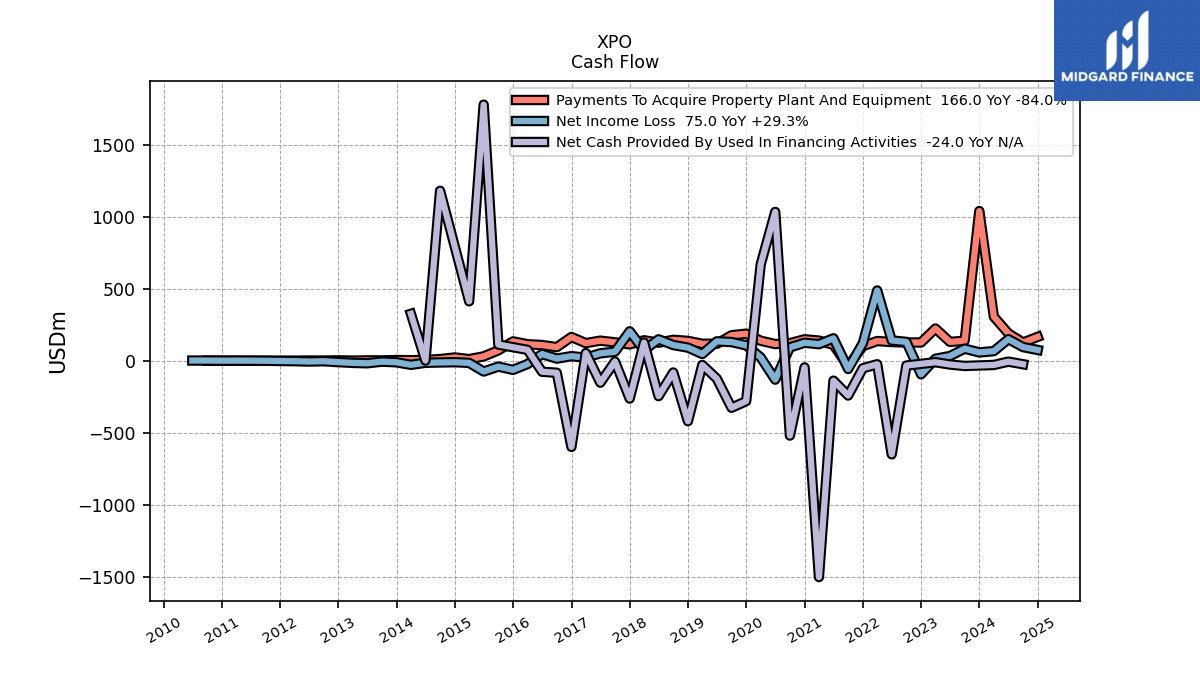
| Net Income Loss | 58.00 | 84.00 | 33.00 | 14.00 | -94.00 | 131.00 | 141.00 | 488.00 | 122.00 | -57.00 | 156.00 | 115.00 | 125.00 | 93.00 | -131.00 | 23.00 | 107.00 | 130.00 | 135.00 | 47.00 | 91.40 | 109.00 | 149.00 | 72.60 | 204.50 | 62.50 | 51.90 | 21.30 | 32.10 | 15.10 | 46.60 | -22.50 | -63.10 | -40.40 | -74.40 | -14.70 | -9.90 | -11.70 | -13.76 | -28.14 | -10.60 | -6.03 | -17.36 | -14.54 | -9.32 | -3.15 | -5.18 | -2.69 | -1.46 | 0.19 | 0.91 | 1.12 | 0.82 | 1.73 | 1.50 | |
| Profit Loss | 58.00 | 84.00 | 33.00 | 14.00 | -94.00 | 131.00 | 141.00 | 488.00 | 122.00 | -57.00 | 158.00 | 118.00 | 128.00 | 98.00 | -134.00 | 25.00 | 107.00 | 136.00 | 145.00 | 52.00 | 90.60 | 115.20 | 159.10 | 79.10 | 207.10 | 71.00 | 57.20 | 24.90 | 32.10 | 21.30 | 50.40 | -19.30 | -62.90 | -35.40 | -78.80 | -14.70 | -9.90 | -11.60 | -13.80 | NA | NA | NA | NA | NA | NA | NA | NA | NA | NA | NA | NA | NA | NA | NA | NA | |
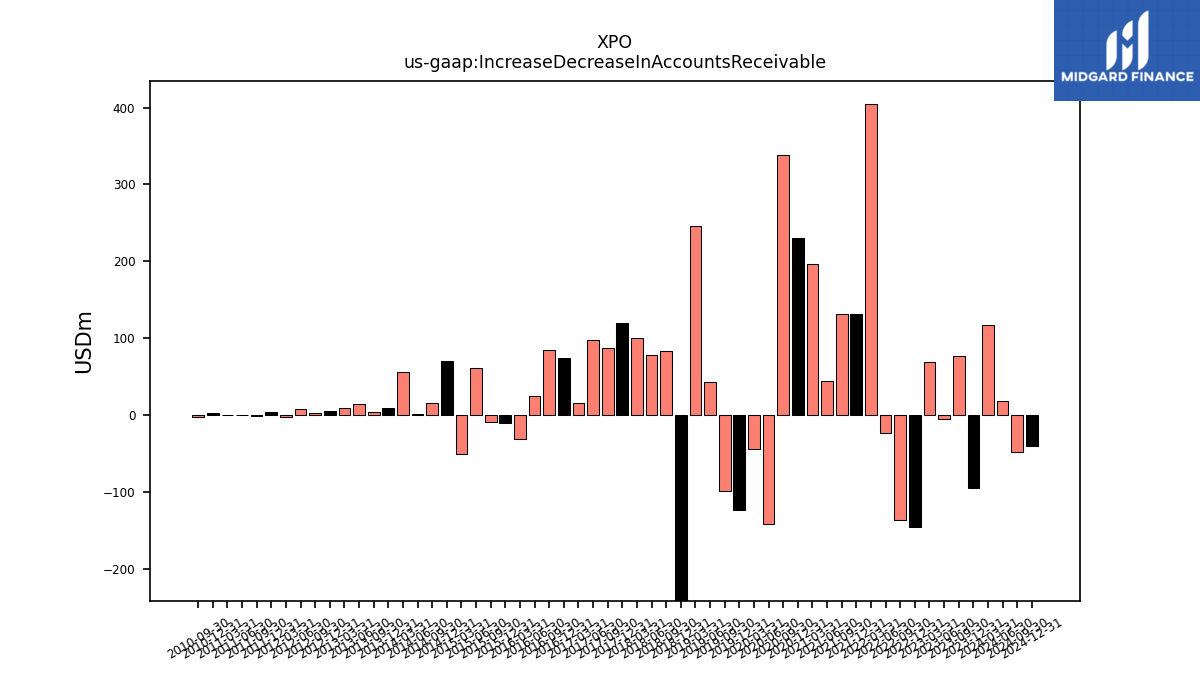
| Increase Decrease In Accounts Receivable | -95.00 | 77.00 | -5.00 | 69.00 | -145.00 | -137.00 | -23.00 | 405.00 | 131.00 | 131.00 | 44.00 | 196.00 | 230.00 | 338.00 | -142.00 | -44.00 | -123.00 | -99.00 | 43.00 | 246.00 | -249.00 | 83.30 | 78.30 | 100.40 | 120.30 | 87.30 | 97.30 | 15.20 | 74.70 | 84.50 | 25.40 | -30.90 | -10.10 | -8.40 | 61.30 | -50.60 | 70.43 | 16.14 | 0.92 | 56.41 | 8.88 | 3.96 | 14.36 | 9.77 | 5.68 | 2.58 | 7.47 | -1.98 | 3.66 | -1.77 | 0.12 | -0.39 | 2.17 | -3.04 | NA | |
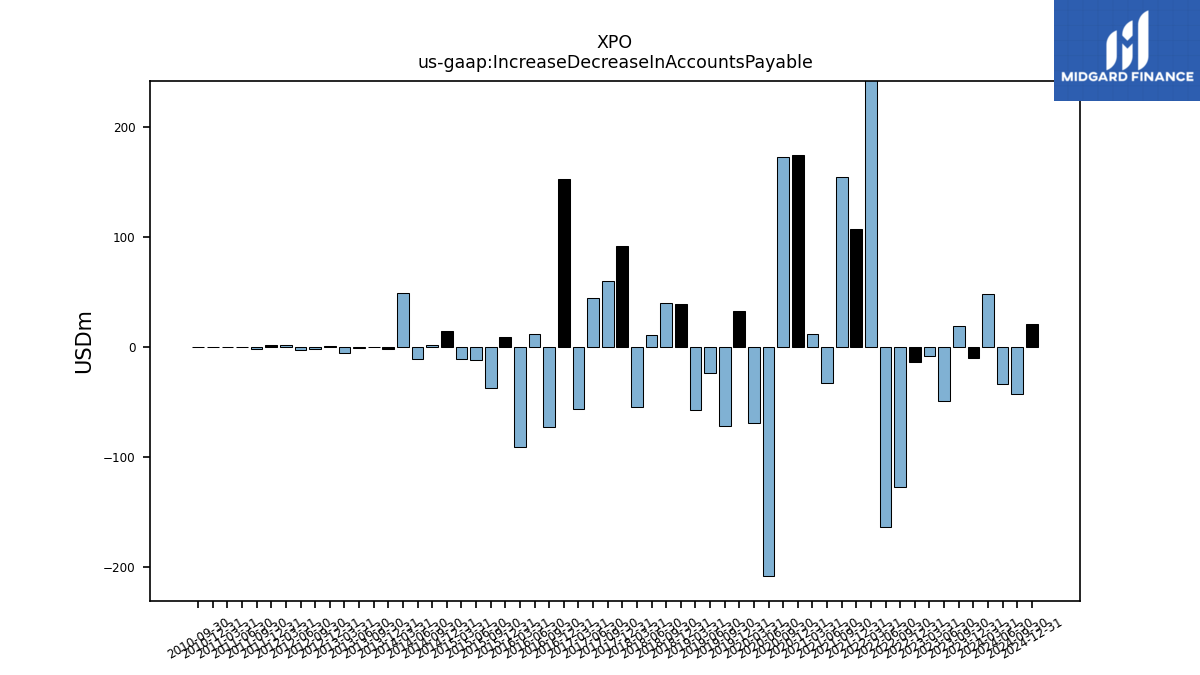
| Increase Decrease In Accounts Payable | -10.00 | 19.00 | -49.00 | -8.00 | -14.00 | -127.00 | -163.00 | 366.00 | 107.00 | 154.00 | -33.00 | 12.00 | 174.00 | 172.00 | -208.00 | -69.00 | 33.00 | -72.00 | -24.00 | -57.00 | 39.10 | 40.10 | 10.40 | -54.60 | 91.50 | 60.20 | 44.60 | -56.20 | 152.40 | -72.30 | 12.10 | -90.50 | 8.60 | -37.10 | -12.20 | -10.60 | 14.19 | 1.92 | -10.88 | 48.68 | -2.15 | -0.16 | -0.77 | -5.20 | 0.55 | -1.82 | -3.13 | 1.82 | 1.43 | -1.76 | 0.17 | -0.04 | -0.02 | -0.09 | NA | |
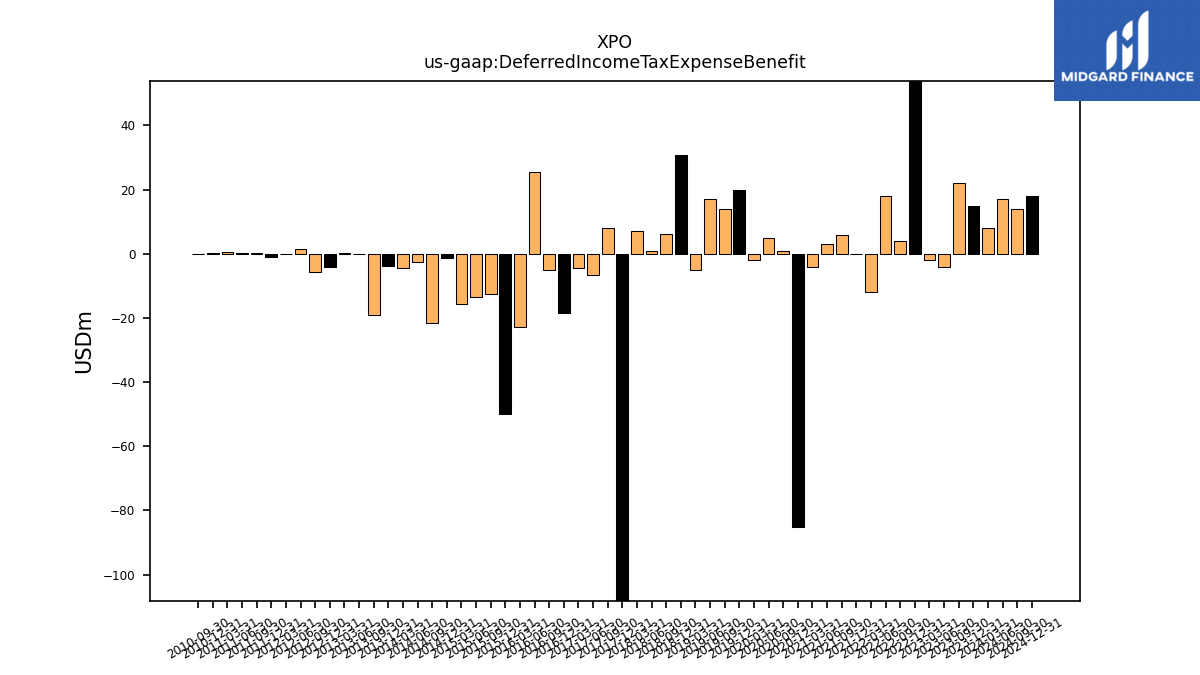
| Deferred Income Tax Expense Benefit | 15.00 | 22.00 | -4.00 | -2.00 | 70.00 | 4.00 | 18.00 | -12.00 | 0.00 | 6.00 | 3.00 | -4.00 | -85.00 | 1.00 | 5.00 | -2.00 | 20.00 | 14.00 | 17.00 | -5.00 | 30.70 | 6.20 | 0.90 | 7.20 | -154.60 | 7.90 | -6.50 | -4.50 | -18.60 | -5.00 | 25.40 | -22.70 | -50.00 | -12.50 | -13.60 | -15.80 | -1.31 | -21.61 | -2.54 | -4.53 | -3.79 | -19.05 | 0.03 | 0.14 | -3.98 | -5.81 | 1.52 | 0.01 | -1.11 | 0.09 | 0.28 | 0.42 | 0.24 | 0.03 | NA | |
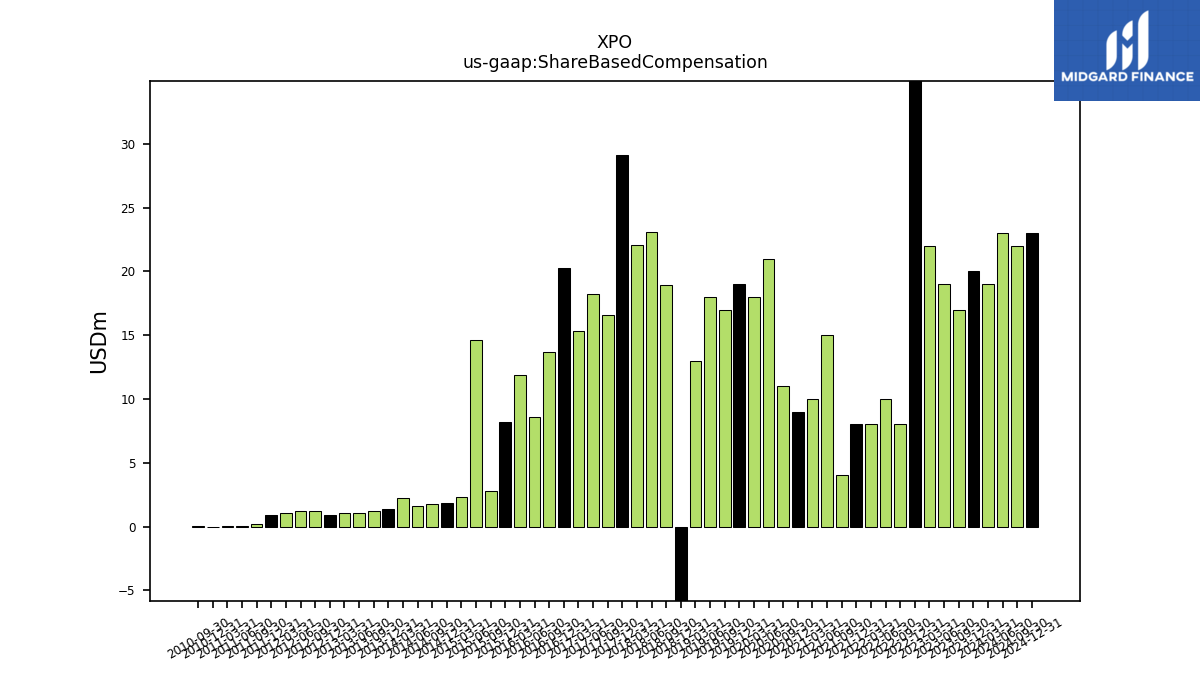
| Share Based Compensation | 20.00 | 17.00 | 19.00 | 22.00 | 51.00 | 8.00 | 10.00 | 8.00 | 8.00 | 4.00 | 15.00 | 10.00 | 9.00 | 11.00 | 21.00 | 18.00 | 19.00 | 17.00 | 18.00 | 13.00 | -15.10 | 18.90 | 23.10 | 22.10 | 29.10 | 16.60 | 18.20 | 15.30 | 20.30 | 13.70 | 8.60 | 11.90 | 8.20 | 2.80 | 14.60 | 2.30 | 1.86 | 1.79 | 1.64 | 2.21 | 1.37 | 1.23 | 1.05 | 1.10 | 0.91 | 1.22 | 1.23 | 1.03 | 0.88 | 0.21 | 0.04 | 0.04 | 0.00 | 0.06 | NA |
| 2023-12-31 | 2023-09-30 | 2023-06-30 | 2023-03-31 | 2022-12-31 | 2022-09-30 | 2022-06-30 | 2022-03-31 | 2021-12-31 | 2021-09-30 | 2021-06-30 | 2021-03-31 | 2020-12-31 | 2020-09-30 | 2020-06-30 | 2020-03-31 | 2019-12-31 | 2019-09-30 | 2019-06-30 | 2019-03-31 | 2018-12-31 | 2018-09-30 | 2018-06-30 | 2018-03-31 | 2017-12-31 | 2017-09-30 | 2017-06-30 | 2017-03-31 | 2016-12-31 | 2016-09-30 | 2016-06-30 | 2016-03-31 | 2015-12-31 | 2015-09-30 | 2015-06-30 | 2015-03-31 | 2014-12-31 | 2014-09-30 | 2014-06-30 | 2014-03-31 | 2013-12-31 | 2013-09-30 | 2013-06-30 | 2013-03-31 | 2012-12-31 | 2012-09-30 | 2012-06-30 | 2012-03-31 | 2011-12-31 | 2011-09-30 | 2011-06-30 | 2011-03-31 | 2010-12-31 | 2010-09-30 | 2010-06-30 | ||
|---|---|---|---|---|---|---|---|---|---|---|---|---|---|---|---|---|---|---|---|---|---|---|---|---|---|---|---|---|---|---|---|---|---|---|---|---|---|---|---|---|---|---|---|---|---|---|---|---|---|---|---|---|---|---|---|---|
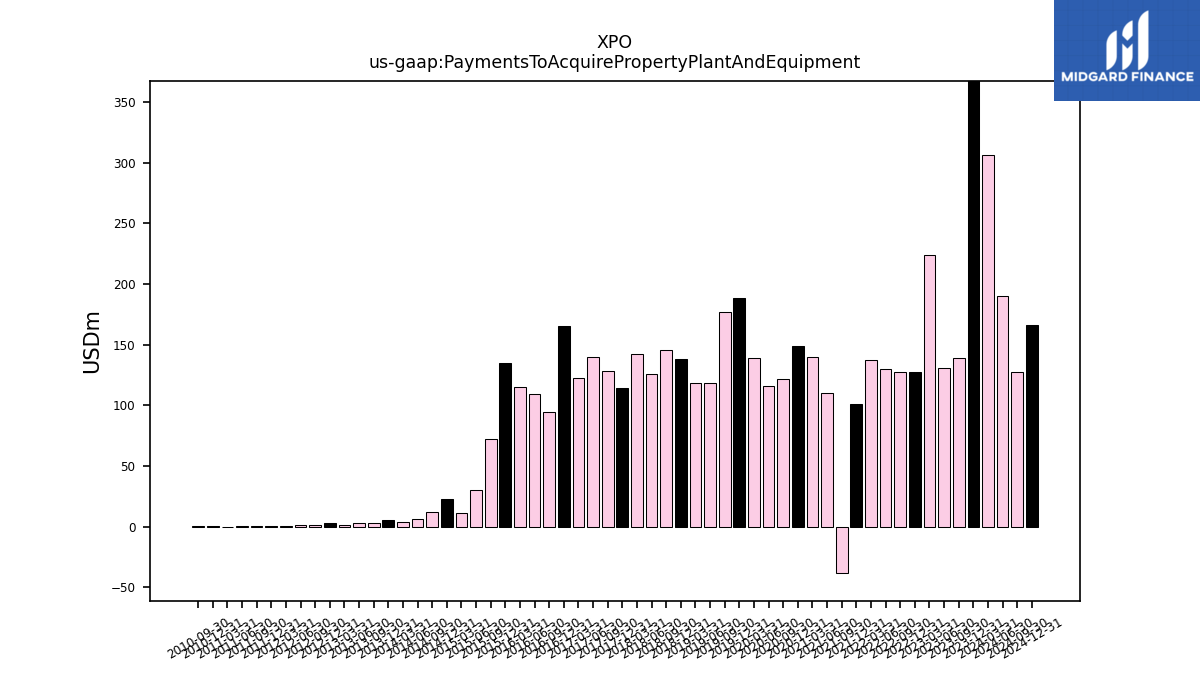
| Payments To Acquire Property Plant And Equipment | 1039.00 | 139.00 | 131.00 | 224.00 | 127.00 | 127.00 | 130.00 | 137.00 | 101.00 | -38.00 | 110.00 | 140.00 | 149.00 | 122.00 | 116.00 | 139.00 | 188.00 | 177.00 | 118.00 | 118.00 | 137.90 | 145.40 | 125.60 | 142.10 | 113.90 | 127.90 | 139.60 | 122.40 | 164.90 | 94.50 | 109.30 | 114.70 | 134.60 | 72.50 | 30.50 | 11.40 | 23.00 | 11.78 | 5.89 | 3.94 | 5.05 | 2.67 | 2.78 | 1.08 | 3.00 | 1.42 | 1.73 | 0.84 | 0.31 | 0.18 | 0.17 | 0.09 | 0.33 | 0.33 | NA |
| 2023-12-31 | 2023-09-30 | 2023-06-30 | 2023-03-31 | 2022-12-31 | 2022-09-30 | 2022-06-30 | 2022-03-31 | 2021-12-31 | 2021-09-30 | 2021-06-30 | 2021-03-31 | 2020-12-31 | 2020-09-30 | 2020-06-30 | 2020-03-31 | 2019-12-31 | 2019-09-30 | 2019-06-30 | 2019-03-31 | 2018-12-31 | 2018-09-30 | 2018-06-30 | 2018-03-31 | 2017-12-31 | 2017-09-30 | 2017-06-30 | 2017-03-31 | 2016-12-31 | 2016-09-30 | 2016-06-30 | 2016-03-31 | 2015-12-31 | 2015-09-30 | 2015-06-30 | 2015-03-31 | 2014-12-31 | 2014-09-30 | 2014-06-30 | 2014-03-31 | 2013-12-31 | 2013-09-30 | 2013-06-30 | 2013-03-31 | 2012-12-31 | 2012-09-30 | 2012-06-30 | 2012-03-31 | 2011-12-31 | 2011-09-30 | 2011-06-30 | 2011-03-31 | 2010-12-31 | 2010-09-30 | 2010-06-30 | ||
|---|---|---|---|---|---|---|---|---|---|---|---|---|---|---|---|---|---|---|---|---|---|---|---|---|---|---|---|---|---|---|---|---|---|---|---|---|---|---|---|---|---|---|---|---|---|---|---|---|---|---|---|---|---|---|---|---|
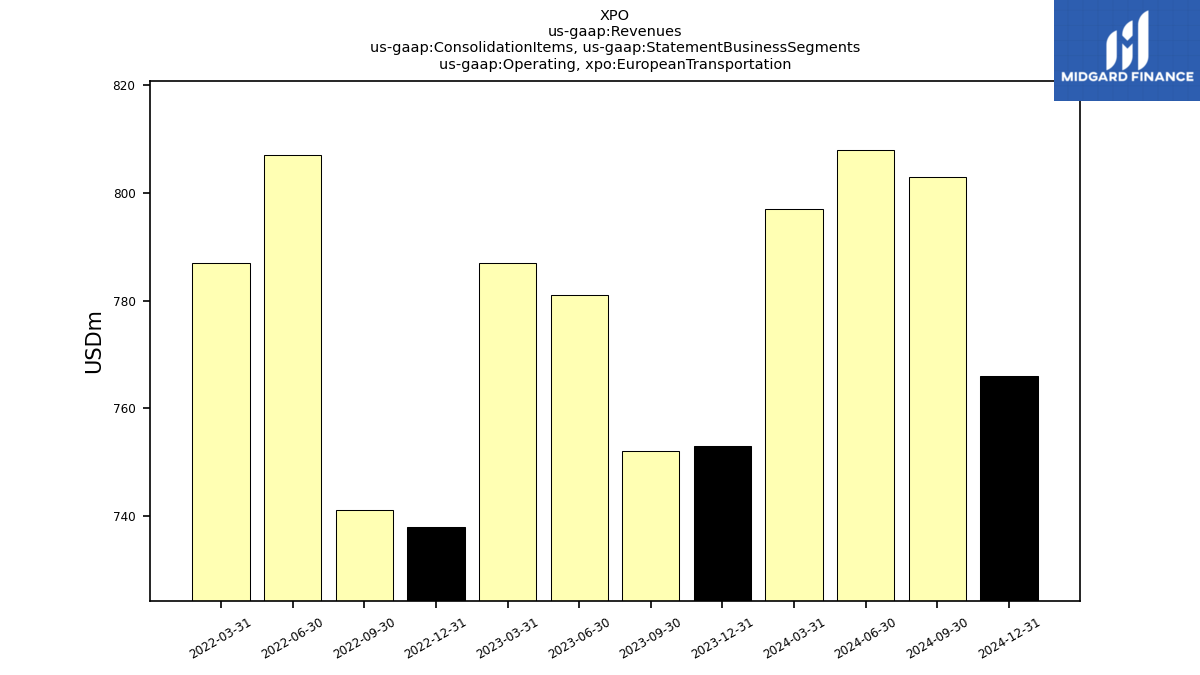
| Revenues | 1940.00 | 1980.00 | 1917.00 | 1907.00 | 1831.00 | 3042.00 | 3232.00 | 3473.00 | 3361.00 | 3270.00 | 5036.00 | 4774.00 | 2938.00 | 4221.00 | 3502.00 | 3864.00 | 4136.00 | 4154.00 | 4238.00 | 4120.00 | 4388.90 | 4335.10 | 4363.50 | 4191.50 | 4193.90 | 3887.10 | 3760.30 | 3539.50 | 3676.60 | 3713.80 | 3683.30 | 3545.70 | 3342.30 | 2362.10 | 1215.90 | 703.00 | 830.70 | 662.47 | 581.01 | 282.40 | 257.23 | 193.98 | 137.09 | 114.00 | 108.50 | 70.99 | 54.54 | 44.56 | 44.09 | 47.39 | 44.09 | 41.51 | 41.56 | 44.45 | 40.34 | |
| Operating, European Transportation | 753.00 | 752.00 | 781.00 | 787.00 | 738.00 | 741.00 | 807.00 | 787.00 | NA | NA | NA | NA | NA | NA | NA | NA | NA | NA | NA | NA | NA | NA | NA | NA | NA | NA | NA | NA | NA | NA | NA | NA | NA | NA | NA | NA | NA | NA | NA | NA | NA | NA | NA | NA | NA | NA | NA | NA | NA | NA | NA | NA | NA | NA | NA | |
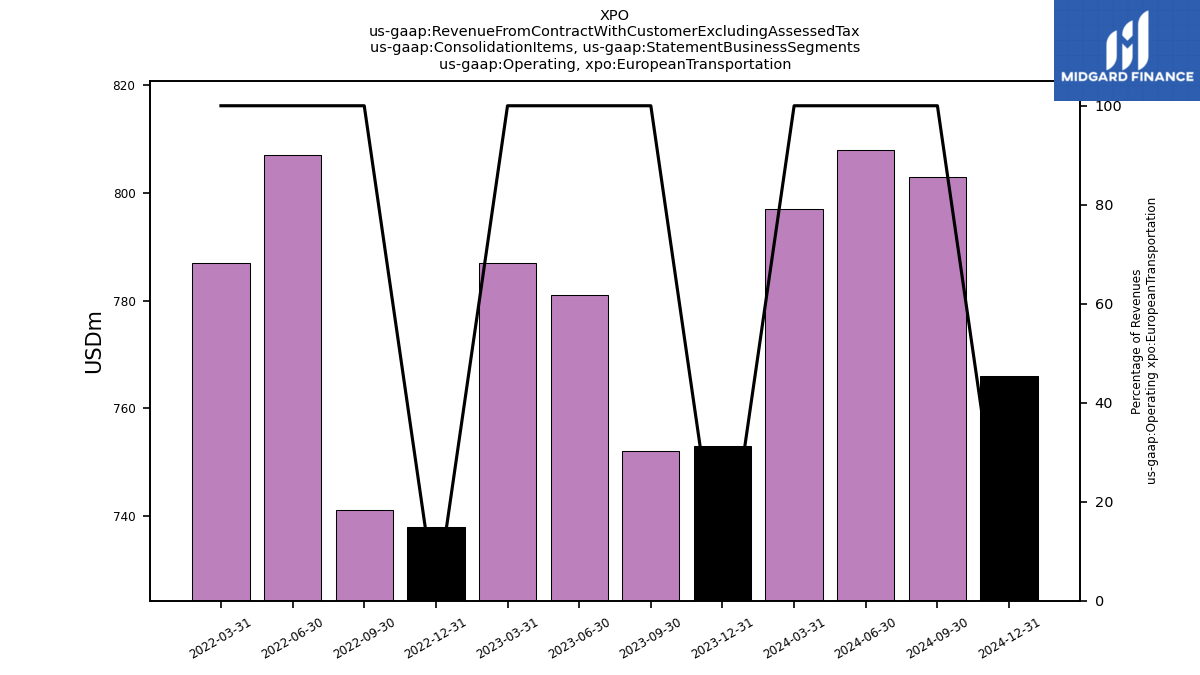
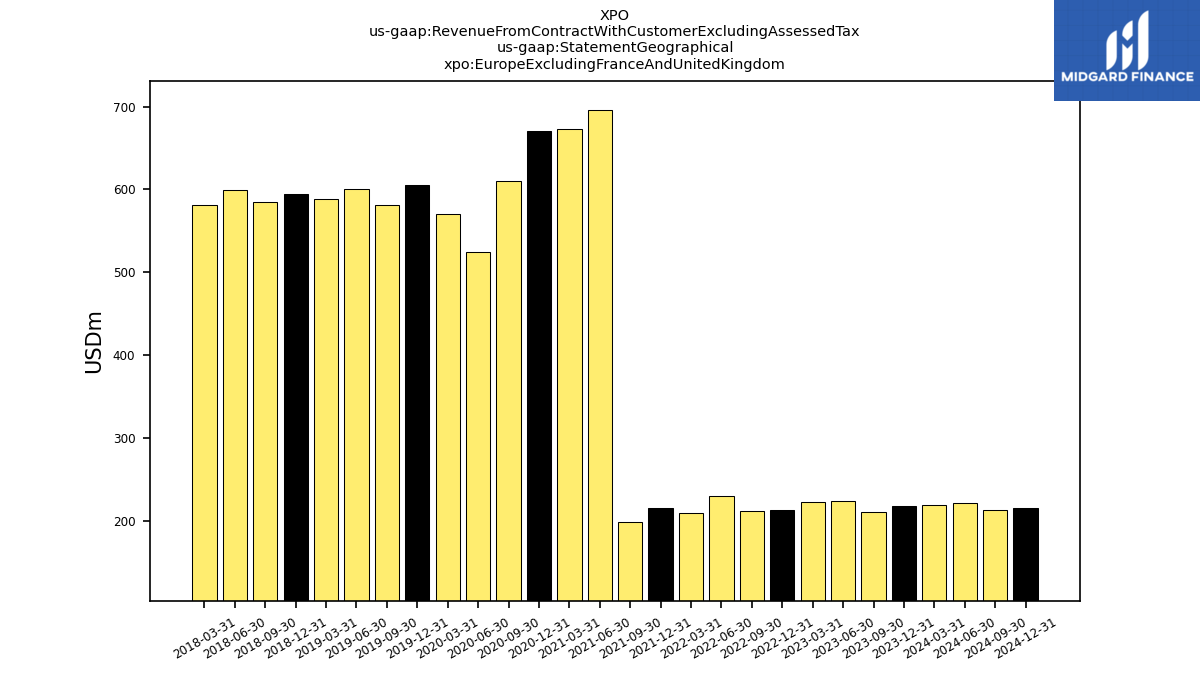
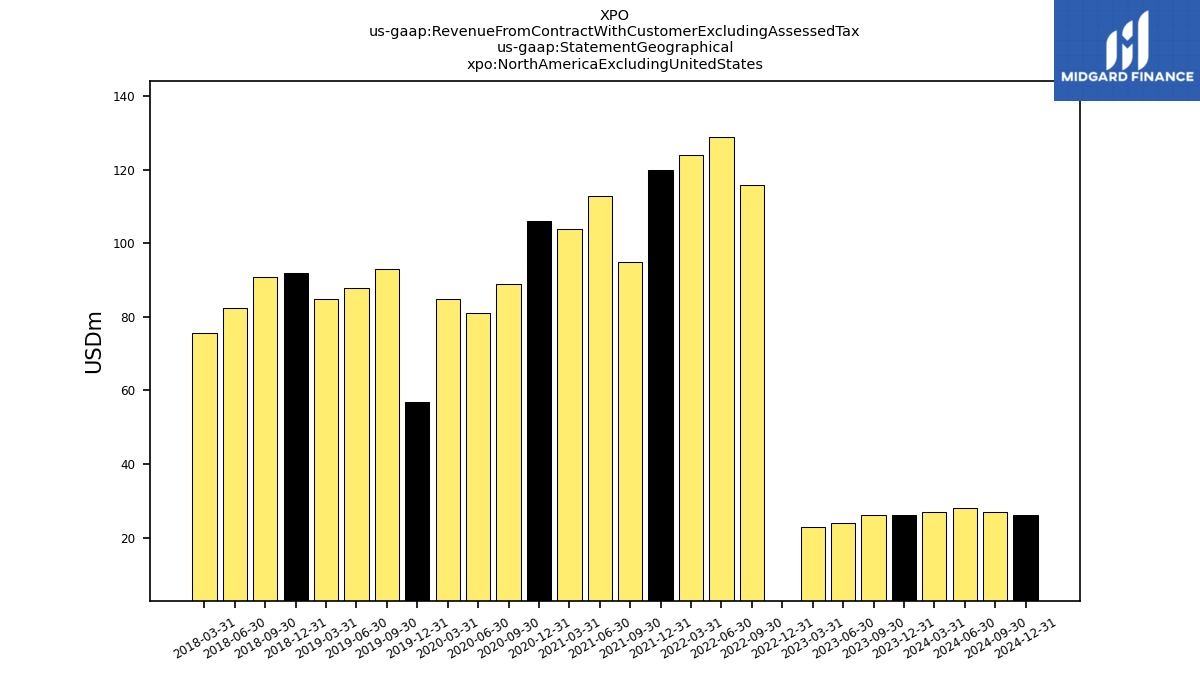
| Revenue From Contract With Customer Excluding Assessed Tax | 1940.00 | 1980.00 | 1917.00 | 1907.00 | 1831.00 | 3042.00 | 3232.00 | 3473.00 | 3361.00 | 3270.00 | 5036.00 | 4774.00 | 2938.00 | 4221.00 | 3502.00 | 3864.00 | 4136.00 | 4154.00 | 4238.00 | 4120.00 | 4388.90 | 4335.10 | 4363.50 | 4191.50 | 4194.10 | 3887.10 | 3760.30 | 3539.50 | 3676.60 | 3713.80 | 3683.30 | 3545.70 | 3342.30 | 2362.10 | 1215.90 | 703.00 | 830.70 | 662.47 | 581.01 | 282.40 | 257.23 | 193.98 | 137.09 | 114.00 | 108.50 | 70.99 | 54.54 | 44.56 | 44.09 | 47.39 | 44.09 | 41.51 | 41.56 | 44.45 | 40.34 | |
| Operating, European Transportation | 753.00 | 752.00 | 781.00 | 787.00 | 738.00 | 741.00 | 807.00 | 787.00 | NA | NA | NA | NA | NA | NA | NA | NA | NA | NA | NA | NA | NA | NA | NA | NA | NA | NA | NA | NA | NA | NA | NA | NA | NA | NA | NA | NA | NA | NA | NA | NA | NA | NA | NA | NA | NA | NA | NA | NA | NA | NA | NA | NA | NA | NA | NA | |
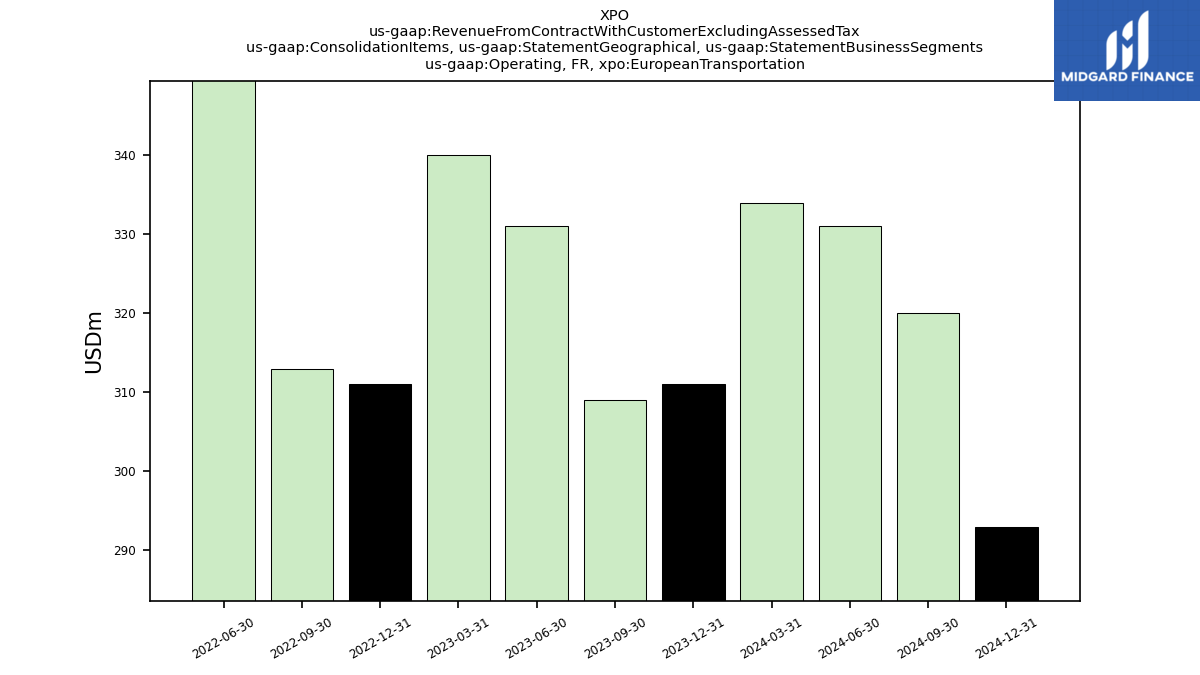
| Operating,, European Transportation | 311.00 | 309.00 | 331.00 | NA | 311.00 | 313.00 | 352.00 | NA | NA | NA | NA | NA | NA | NA | NA | NA | NA | NA | NA | NA | NA | NA | NA | NA | NA | NA | NA | NA | NA | NA | NA | NA | NA | NA | NA | NA | NA | NA | NA | NA | NA | NA | NA | NA | NA | NA | NA | NA | NA | NA | NA | NA | NA | NA | NA | |
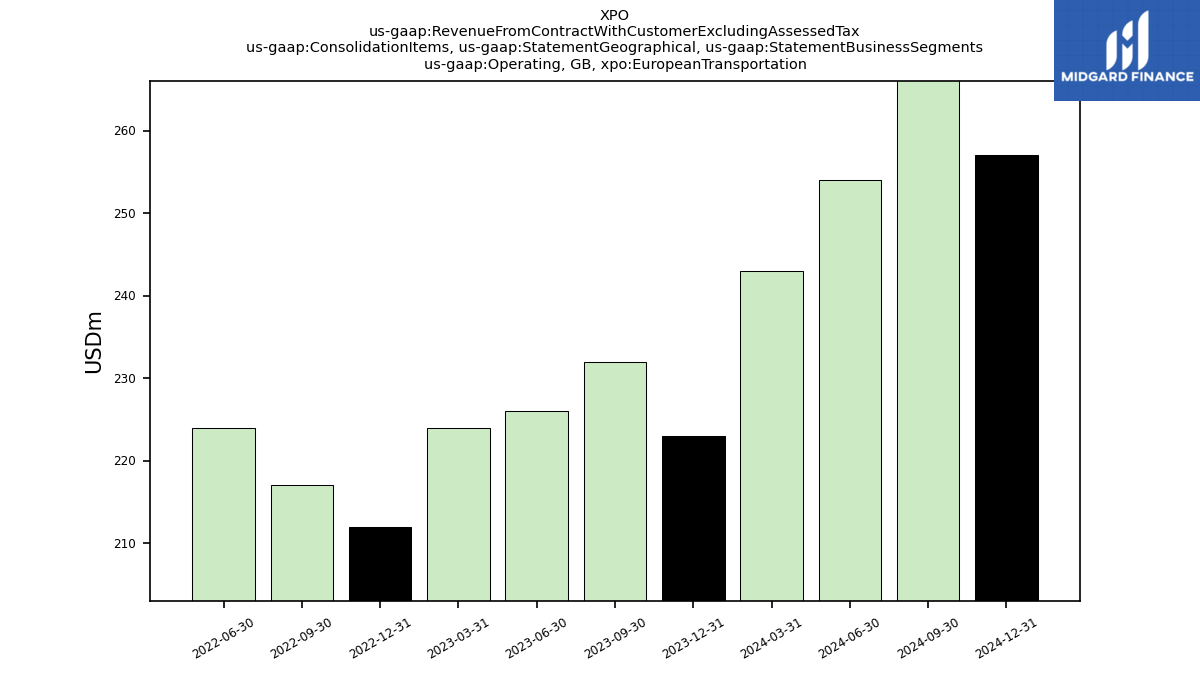
| Operating,, European Transportation | 223.00 | 232.00 | 226.00 | NA | 212.00 | 217.00 | 224.00 | NA | NA | NA | NA | NA | NA | NA | NA | NA | NA | NA | NA | NA | NA | NA | NA | NA | NA | NA | NA | NA | NA | NA | NA | NA | NA | NA | NA | NA | NA | NA | NA | NA | NA | NA | NA | NA | NA | NA | NA | NA | NA | NA | NA | NA | NA | NA | NA | |
| Operating, Europe Excluding France And United Kingdom, European Transportation | 219.00 | 211.00 | 224.00 | NA | 215.00 | 211.00 | 231.00 | NA | NA | NA | NA | NA | NA | NA | NA | NA | NA | NA | NA | NA | NA | NA | NA | NA | NA | NA | NA | NA | NA | NA | NA | NA | NA | NA | NA | NA | NA | NA | NA | NA | NA | NA | NA | NA | NA | NA | NA | NA | NA | NA | NA | NA | NA | NA | NA | |
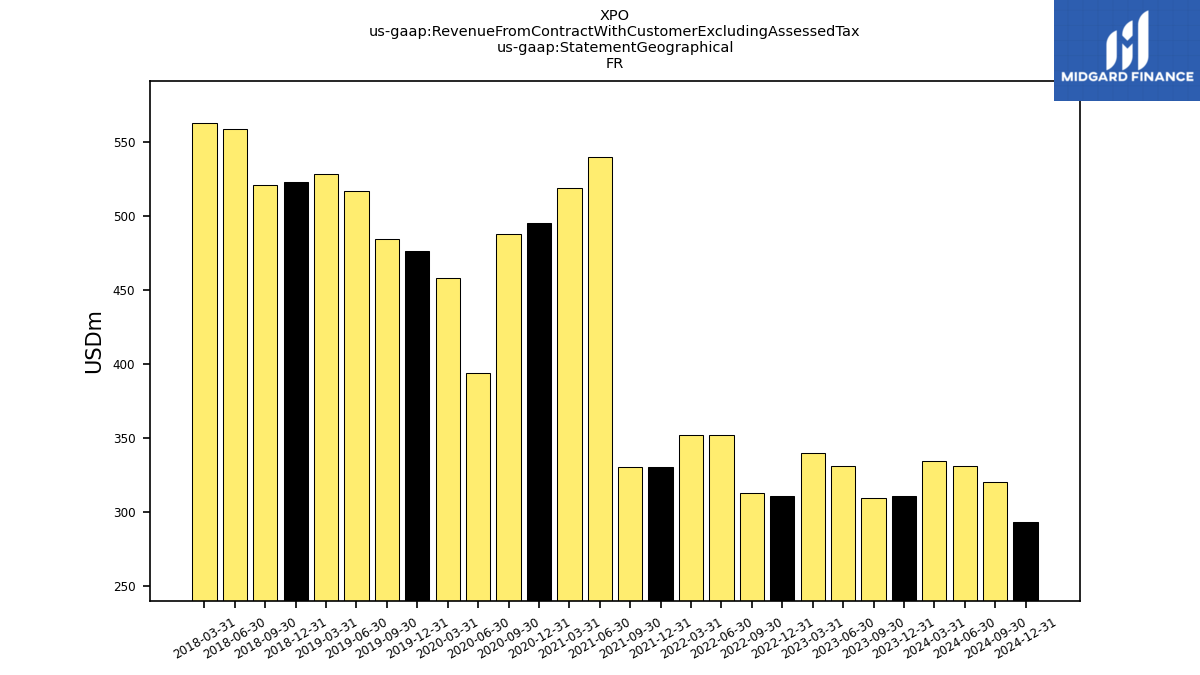
| 311.00 | 309.00 | 331.00 | 340.00 | 311.00 | 313.00 | 352.00 | 352.00 | 330.00 | 330.00 | 540.00 | 519.00 | 495.00 | 488.00 | 394.00 | 458.00 | 476.00 | 484.00 | 517.00 | 528.00 | 522.60 | 521.10 | 558.40 | 562.90 | NA | NA | NA | NA | NA | NA | NA | NA | NA | NA | NA | NA | NA | NA | NA | NA | NA | NA | NA | NA | NA | NA | NA | NA | NA | NA | NA | NA | NA | NA | NA | ||
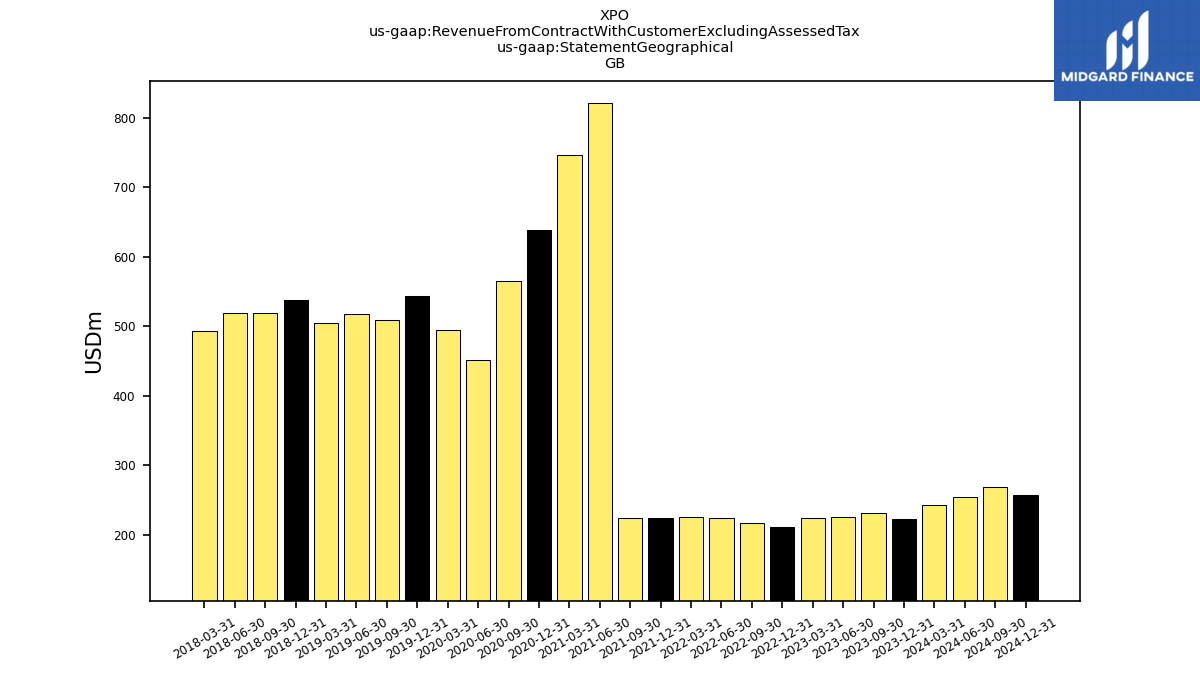
| 223.00 | 232.00 | 226.00 | 224.00 | 212.00 | 217.00 | 224.00 | 225.00 | 224.00 | 224.00 | 821.00 | 746.00 | 638.00 | 565.00 | 452.00 | 495.00 | 544.00 | 509.00 | 518.00 | 505.00 | 538.40 | 519.10 | 519.10 | 493.40 | NA | NA | NA | NA | NA | NA | NA | NA | NA | NA | NA | NA | NA | NA | NA | NA | NA | NA | NA | NA | NA | NA | NA | NA | NA | NA | NA | NA | NA | NA | NA | ||
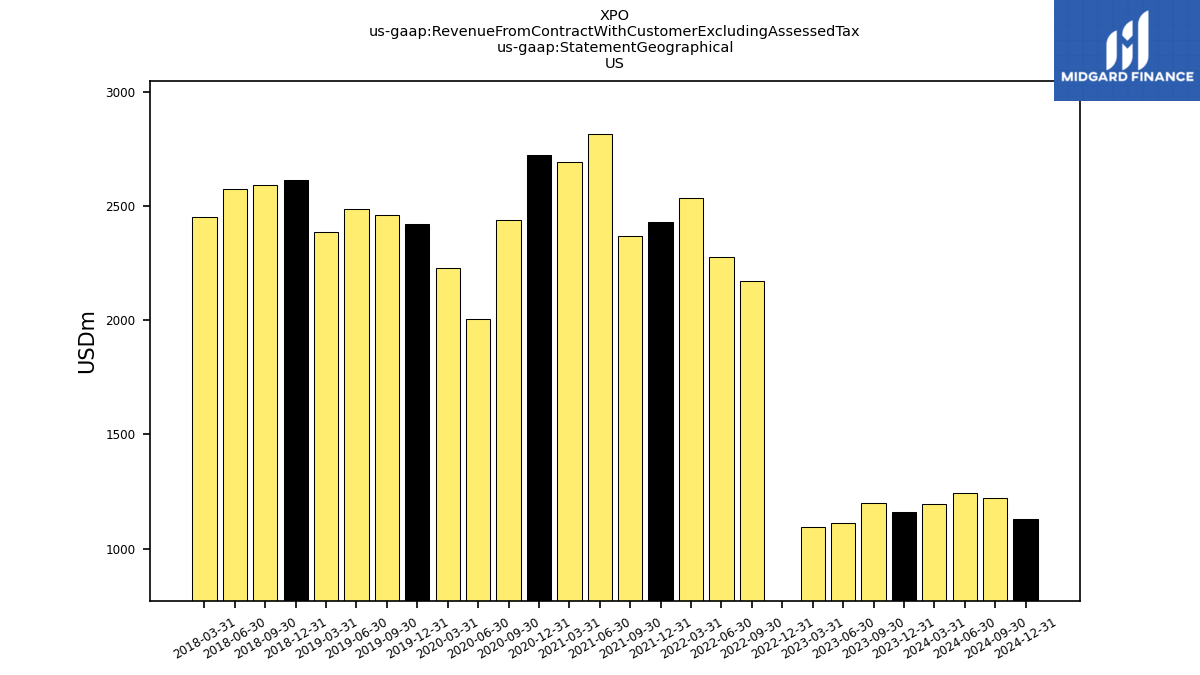
| US | 1161.00 | 1202.00 | 1112.00 | 1097.00 | -2441.00 | 2174.00 | 2279.00 | 2537.00 | 2432.00 | 2371.00 | 2817.00 | 2693.00 | 2723.00 | 2441.00 | 2004.00 | 2229.00 | 2424.00 | 2460.00 | 2487.00 | 2388.00 | 2615.10 | 2591.70 | 2574.00 | 2451.20 | NA | NA | NA | NA | NA | NA | NA | NA | NA | NA | NA | NA | NA | NA | NA | NA | NA | NA | NA | NA | NA | NA | NA | NA | NA | NA | NA | NA | NA | NA | NA | |
| Europe Excluding France And United Kingdom | 219.00 | 211.00 | 224.00 | 223.00 | 214.00 | 212.00 | 231.00 | 210.00 | 216.00 | 199.00 | 696.00 | 673.00 | 670.00 | 610.00 | 525.00 | 571.00 | 606.00 | 581.00 | 600.00 | 589.00 | 594.40 | 584.60 | 599.10 | 580.90 | NA | NA | NA | NA | NA | NA | NA | NA | NA | NA | NA | NA | NA | NA | NA | NA | NA | NA | NA | NA | NA | NA | NA | NA | NA | NA | NA | NA | NA | NA | NA | |
| North America Excluding United States | 26.00 | 26.00 | 24.00 | 23.00 | -273.00 | 116.00 | 129.00 | 124.00 | 120.00 | 95.00 | 113.00 | 104.00 | 106.00 | 89.00 | 81.00 | 85.00 | 57.00 | 93.00 | 88.00 | 85.00 | 91.90 | 91.00 | 82.40 | 75.70 | NA | NA | NA | NA | NA | NA | NA | NA | NA | NA | NA | NA | NA | NA | NA | NA | NA | NA | NA | NA | NA | NA | NA | NA | NA | NA | NA | NA | NA | NA | NA |