
| 2023-09-30 | 2023-06-30 | 2023-03-31 | 2022-12-31 | 2022-09-30 | 2022-06-30 | 2022-03-31 | 2021-12-31 | 2021-09-30 | 2021-06-30 | 2021-03-31 | 2020-12-31 | 2020-09-30 | 2020-06-30 | 2020-03-31 | 2019-12-31 | 2019-09-30 | 2019-06-30 | 2019-03-31 | 2018-12-31 | 2018-09-30 | 2018-06-30 | 2018-03-31 | 2017-12-31 | 2017-09-30 | 2017-06-30 | 2017-03-31 | 2016-12-31 | 2016-09-30 | 2016-06-30 | 2016-03-31 | 2015-12-31 | 2015-09-30 | 2015-06-30 | 2015-03-31 | 2014-12-31 | 2014-09-30 | 2014-06-30 | 2014-03-31 | 2013-12-31 | 2013-09-30 | 2013-06-30 | 2013-03-31 | 2012-12-31 | 2012-09-30 | 2012-06-30 | 2012-03-31 | ||
|---|---|---|---|---|---|---|---|---|---|---|---|---|---|---|---|---|---|---|---|---|---|---|---|---|---|---|---|---|---|---|---|---|---|---|---|---|---|---|---|---|---|---|---|---|---|---|---|---|
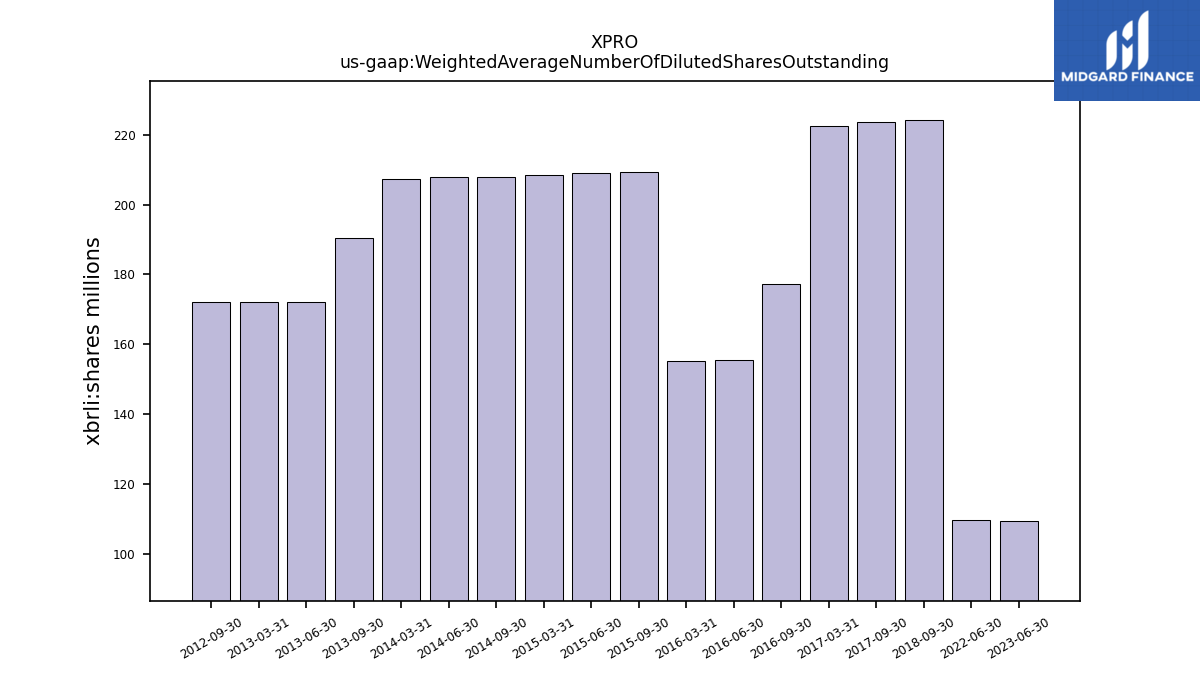
| Weighted Average Number Of Diluted Shares Outstanding | NA | 109.38 | NA | NA | NA | 109.58 | NA | NA | NA | NA | NA | NA | NA | NA | NA | NA | NA | NA | NA | NA | 224.18 | NA | NA | NA | 223.58 | NA | 222.56 | NA | 177.12 | 155.44 | 155.24 | NA | 209.35 | 209.11 | 208.48 | NA | 207.93 | 207.82 | 207.20 | NA | 190.44 | 172.00 | 172.00 | NA | 172.00 | NA | NA | |
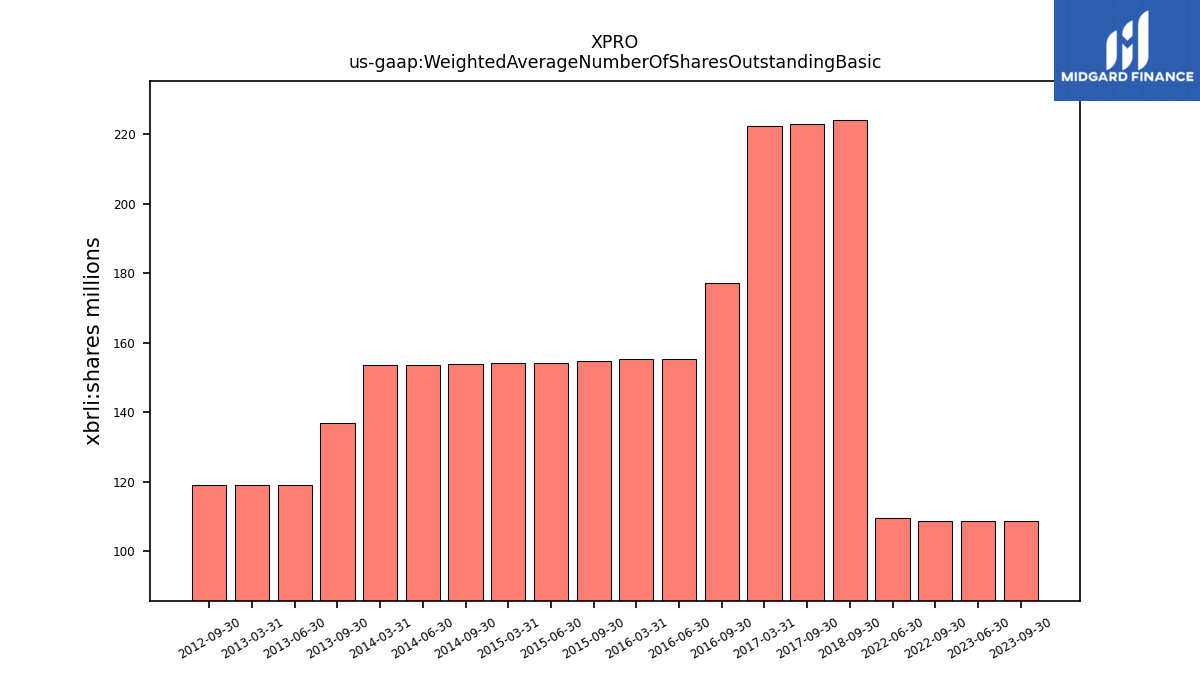
| Weighted Average Number Of Shares Outstanding Basic | 108.78 | 108.66 | NA | NA | 108.71 | 109.58 | NA | NA | NA | NA | NA | NA | NA | NA | NA | NA | NA | NA | NA | NA | 224.18 | NA | NA | NA | 223.06 | NA | 222.56 | NA | 177.12 | 155.44 | 155.24 | NA | 154.81 | 154.34 | 154.33 | NA | 153.92 | 153.52 | 153.52 | NA | 137.02 | 119.02 | 119.02 | NA | 119.02 | NA | NA |
| 2023-09-30 | 2023-06-30 | 2023-03-31 | 2022-12-31 | 2022-09-30 | 2022-06-30 | 2022-03-31 | 2021-12-31 | 2021-09-30 | 2021-06-30 | 2021-03-31 | 2020-12-31 | 2020-09-30 | 2020-06-30 | 2020-03-31 | 2019-12-31 | 2019-09-30 | 2019-06-30 | 2019-03-31 | 2018-12-31 | 2018-09-30 | 2018-06-30 | 2018-03-31 | 2017-12-31 | 2017-09-30 | 2017-06-30 | 2017-03-31 | 2016-12-31 | 2016-09-30 | 2016-06-30 | 2016-03-31 | 2015-12-31 | 2015-09-30 | 2015-06-30 | 2015-03-31 | 2014-12-31 | 2014-09-30 | 2014-06-30 | 2014-03-31 | 2013-12-31 | 2013-09-30 | 2013-06-30 | 2013-03-31 | 2012-12-31 | 2012-09-30 | 2012-06-30 | 2012-03-31 | ||
|---|---|---|---|---|---|---|---|---|---|---|---|---|---|---|---|---|---|---|---|---|---|---|---|---|---|---|---|---|---|---|---|---|---|---|---|---|---|---|---|---|---|---|---|---|---|---|---|---|
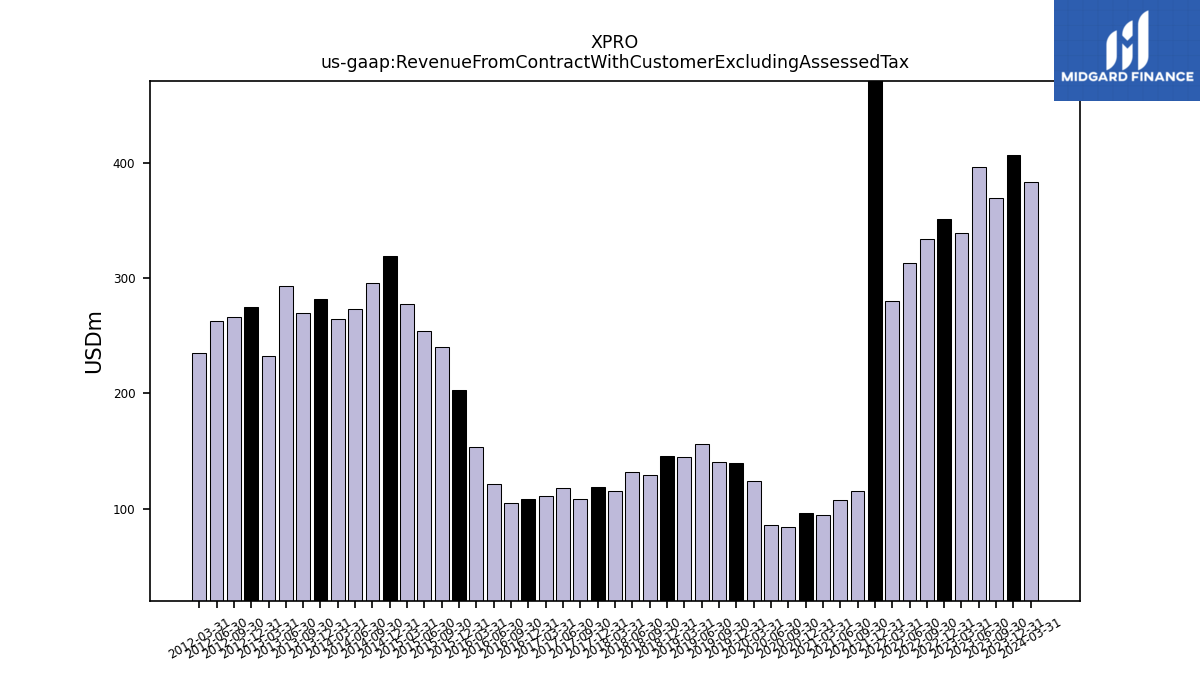
| Revenue From Contract With Customer Excluding Assessed Tax | 369.82 | 396.92 | 339.28 | 350.97 | 334.35 | 313.62 | 280.48 | 508.17 | 114.94 | 107.84 | 94.81 | 96.35 | 84.42 | 86.10 | 123.49 | 139.44 | 140.42 | 155.65 | 144.41 | 145.85 | 128.99 | 132.09 | 115.57 | 118.32 | 108.08 | 117.66 | 110.73 | 107.98 | 105.11 | 120.95 | 153.49 | 202.98 | 239.88 | 254.30 | 277.44 | 319.02 | 296.18 | 272.94 | 264.49 | 282.07 | 270.10 | 292.98 | 232.57 | 274.86 | 266.41 | 262.69 | 235.09 | |
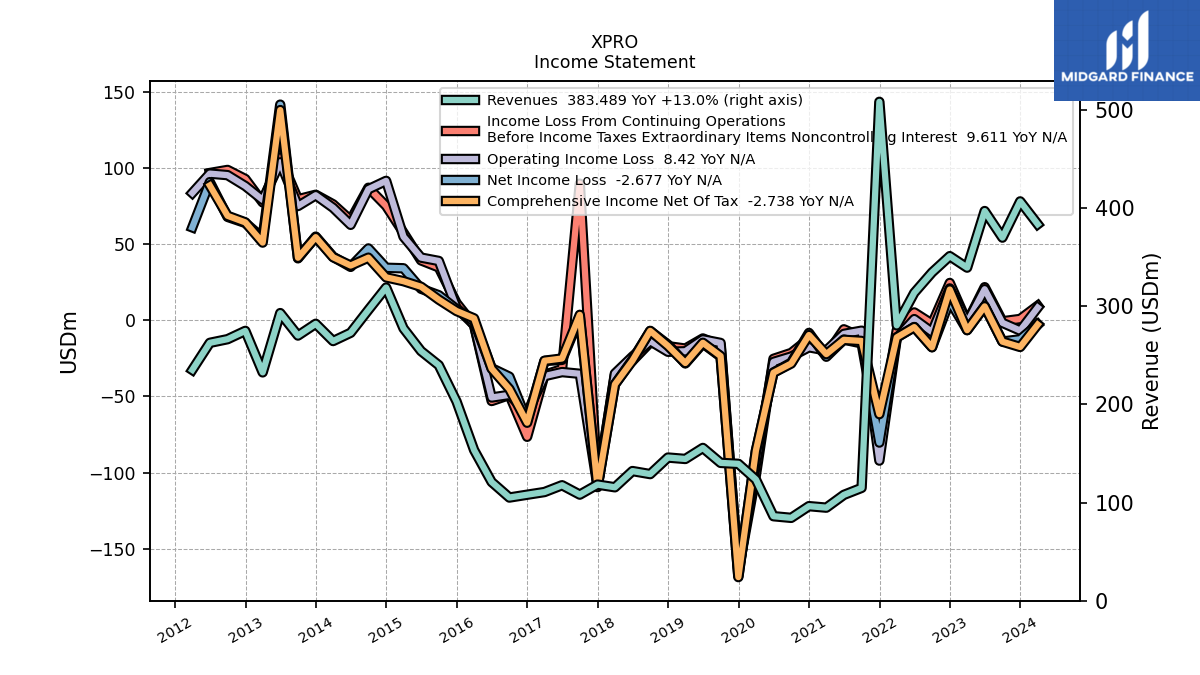
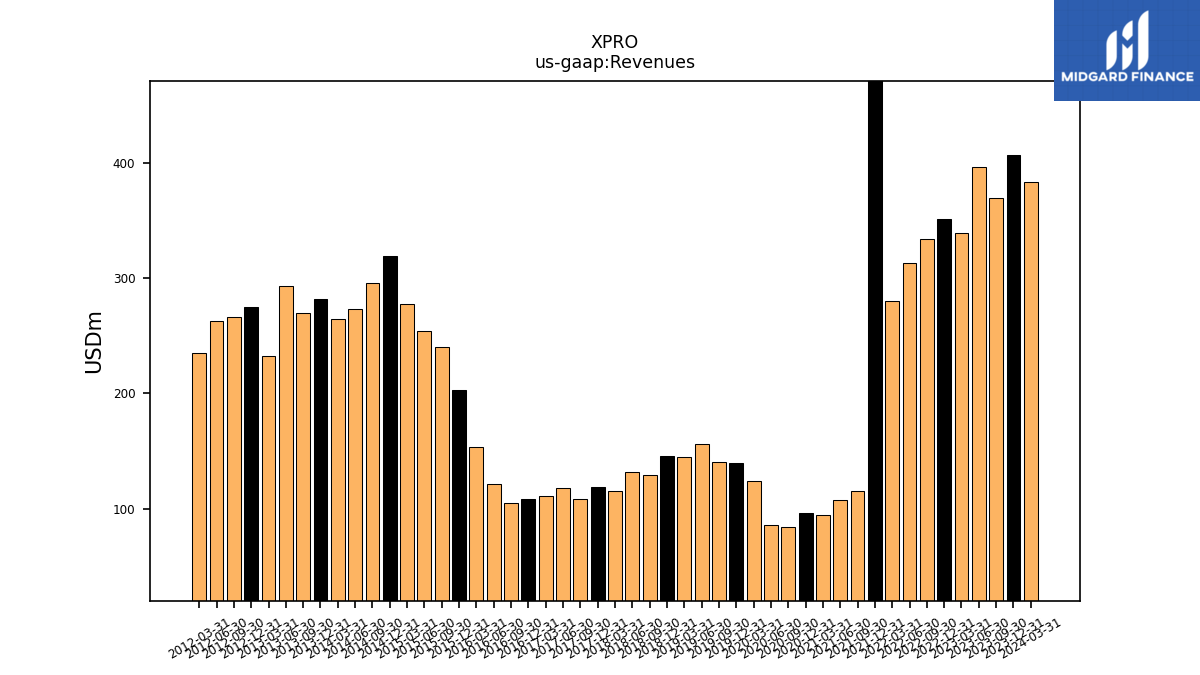
| Revenues | 369.82 | 396.92 | 339.28 | 350.97 | 334.35 | 313.62 | 280.48 | 508.17 | 114.94 | 107.84 | 94.81 | 96.35 | 84.42 | 86.10 | 123.49 | 139.44 | 140.42 | 155.65 | 144.41 | 145.85 | 128.99 | 132.09 | 115.57 | 118.32 | 108.08 | 117.66 | 110.73 | 107.98 | 105.11 | 120.95 | 153.49 | 202.98 | 239.88 | 254.30 | 277.44 | 319.02 | 296.18 | 272.94 | 264.49 | 282.07 | 270.10 | 292.98 | 232.57 | 274.86 | 266.41 | 262.69 | 235.09 | |
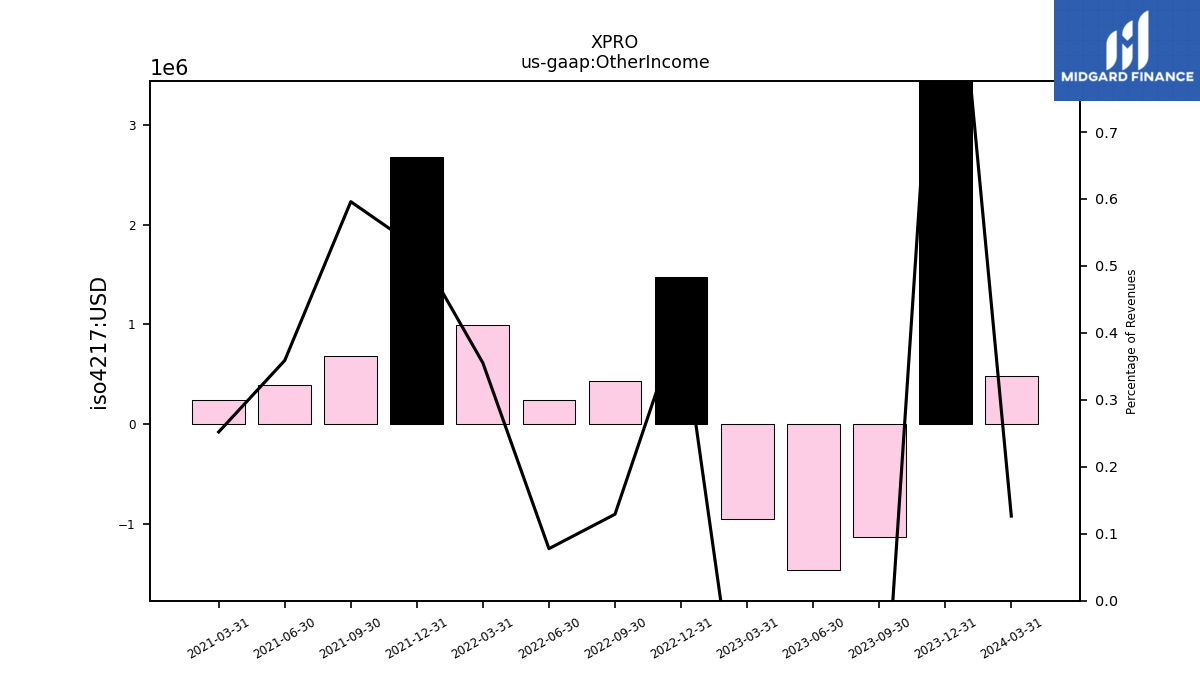
| Other Income | -1.13 | -1.46 | -0.95 | 1.48 | 0.43 | 0.24 | 1.00 | 2.68 | 0.69 | 0.39 | 0.24 | NA | NA | NA | NA | NA | NA | NA | NA | NA | NA | NA | NA | NA | NA | NA | NA | NA | NA | NA | NA | NA | NA | NA | NA | NA | NA | NA | NA | NA | NA | NA | NA | NA | NA | NA | NA | |
| Cost Of Goods And Service Excluding Depreciation Depletion And Amortization | 315.82 | 318.95 | 289.65 | 277.55 | 283.69 | 256.58 | 239.53 | 252.37 | 164.00 | 147.72 | 137.07 | NA | NA | NA | NA | NA | NA | NA | NA | NA | NA | NA | NA | NA | NA | NA | NA | NA | NA | NA | NA | NA | NA | NA | NA | NA | NA | NA | NA | NA | NA | NA | NA | NA | NA | NA | NA | |
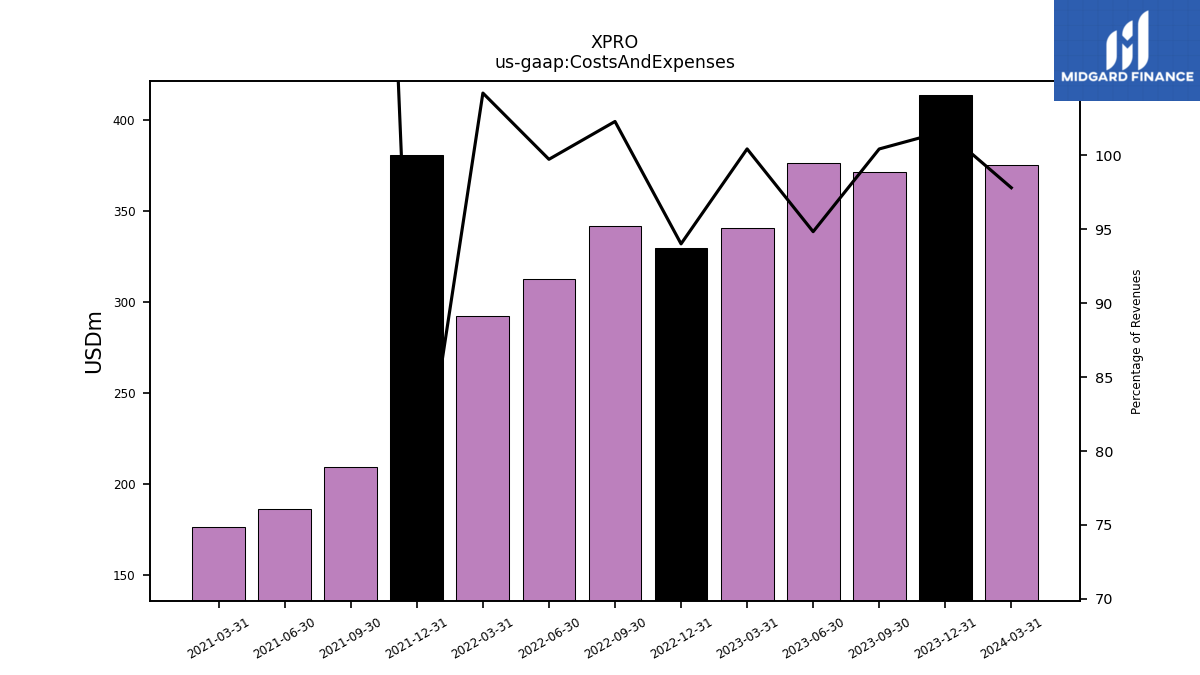
| Costs And Expenses | 371.39 | 376.41 | 340.73 | 329.94 | 341.98 | 312.76 | 292.27 | 380.61 | 209.23 | 186.65 | 176.85 | NA | NA | NA | NA | NA | NA | NA | NA | NA | NA | NA | NA | NA | NA | NA | NA | NA | NA | NA | NA | NA | NA | NA | NA | NA | NA | NA | NA | NA | NA | NA | NA | NA | NA | NA | NA | |
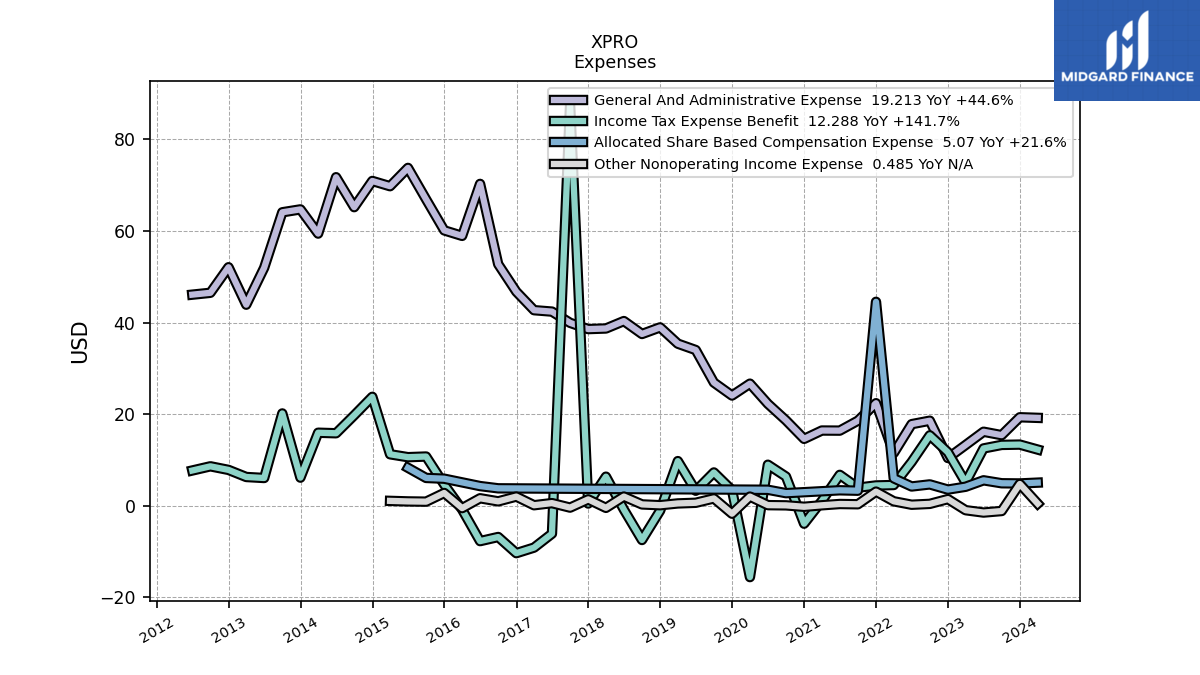
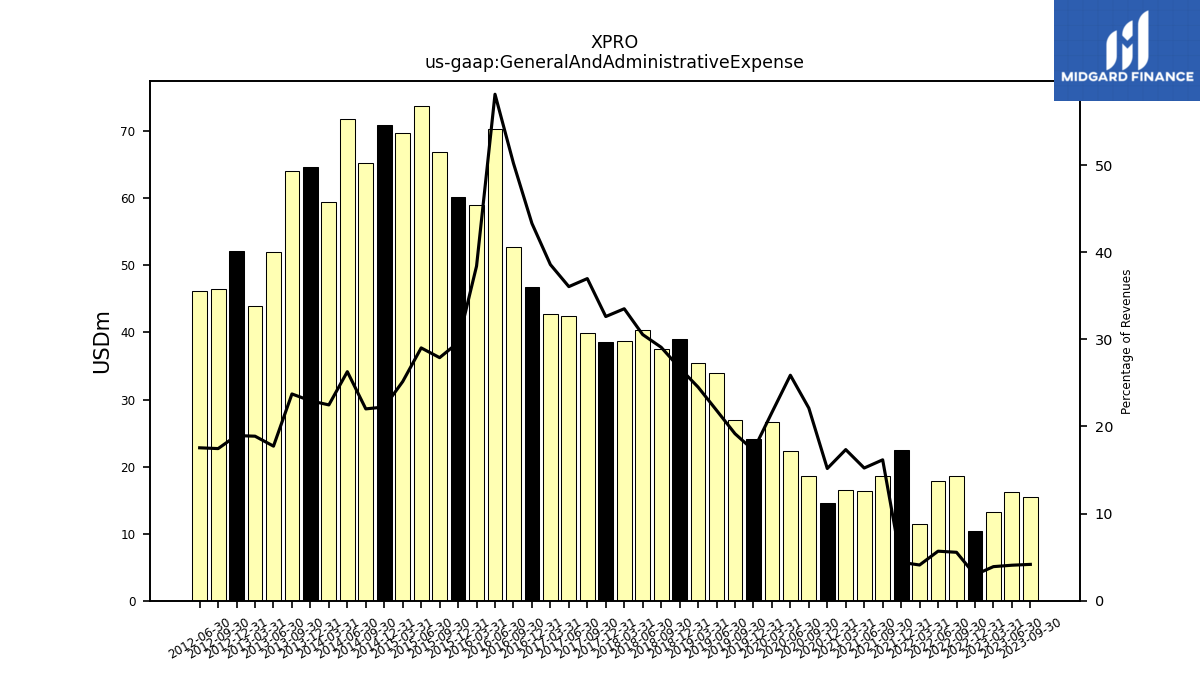
| General And Administrative Expense | 15.44 | 16.19 | 13.29 | 10.44 | 18.59 | 17.84 | 11.51 | 22.41 | 18.59 | 16.43 | 16.45 | 14.62 | 18.66 | 22.29 | 26.68 | 24.09 | 26.92 | 34.03 | 35.41 | 38.98 | 37.53 | 40.35 | 38.73 | 38.60 | 39.96 | 42.42 | 42.73 | 46.77 | 52.77 | 70.31 | 58.95 | 60.16 | 66.93 | 73.80 | 69.80 | 70.95 | 65.22 | 71.76 | 59.45 | 64.74 | 64.10 | 51.99 | 43.92 | 52.11 | 46.52 | 46.12 | NA | |
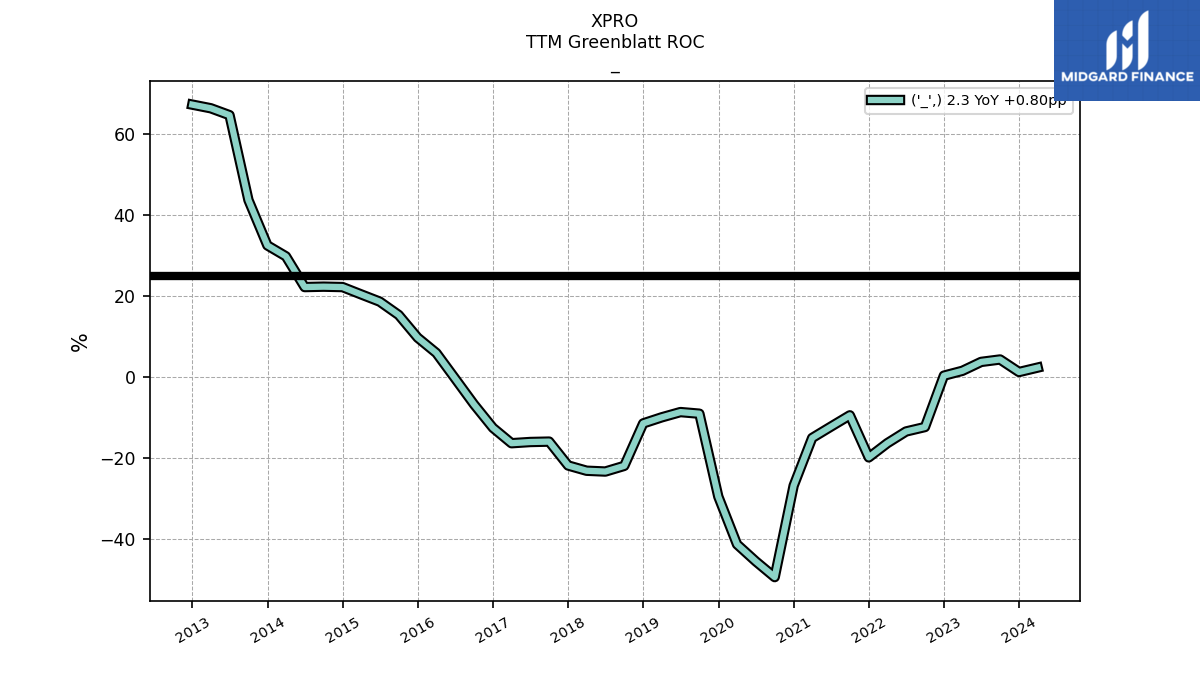
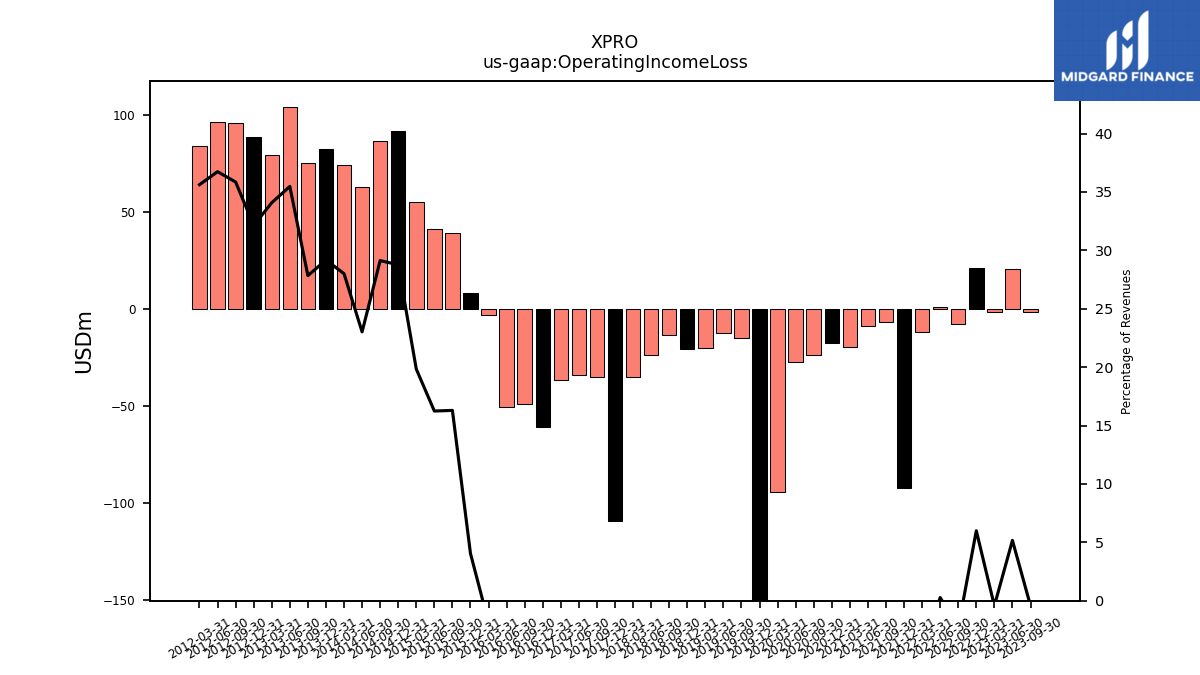
| Operating Income Loss | -1.57 | 20.51 | -1.46 | 21.03 | -7.63 | 0.86 | -11.79 | -92.17 | -6.74 | -8.87 | -19.79 | -17.65 | -23.75 | -27.29 | -94.21 | -165.28 | -14.80 | -12.51 | -20.29 | -20.60 | -13.59 | -23.78 | -34.91 | -109.09 | -35.08 | -33.97 | -36.61 | -60.87 | -48.93 | -50.68 | -2.88 | 8.21 | 39.10 | 41.31 | 55.03 | 91.76 | 86.27 | 62.84 | 74.07 | 82.28 | 75.19 | 103.93 | 79.26 | 88.35 | 95.51 | 96.51 | 83.75 | |
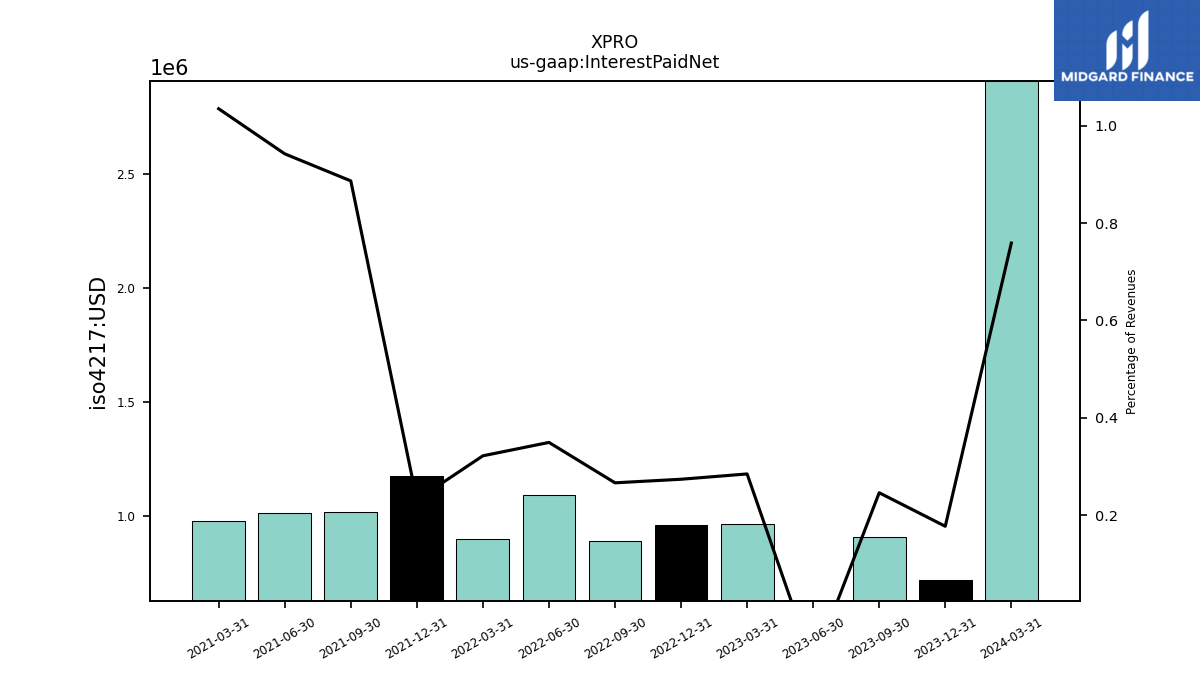
| Interest Paid Net | 0.91 | -0.42 | 0.97 | 0.96 | 0.89 | 1.10 | 0.90 | 1.18 | 1.02 | 1.02 | 0.98 | NA | NA | NA | NA | NA | NA | NA | NA | NA | NA | NA | NA | NA | NA | NA | NA | NA | NA | NA | NA | NA | NA | NA | NA | NA | NA | NA | NA | NA | NA | NA | NA | NA | NA | NA | NA | |
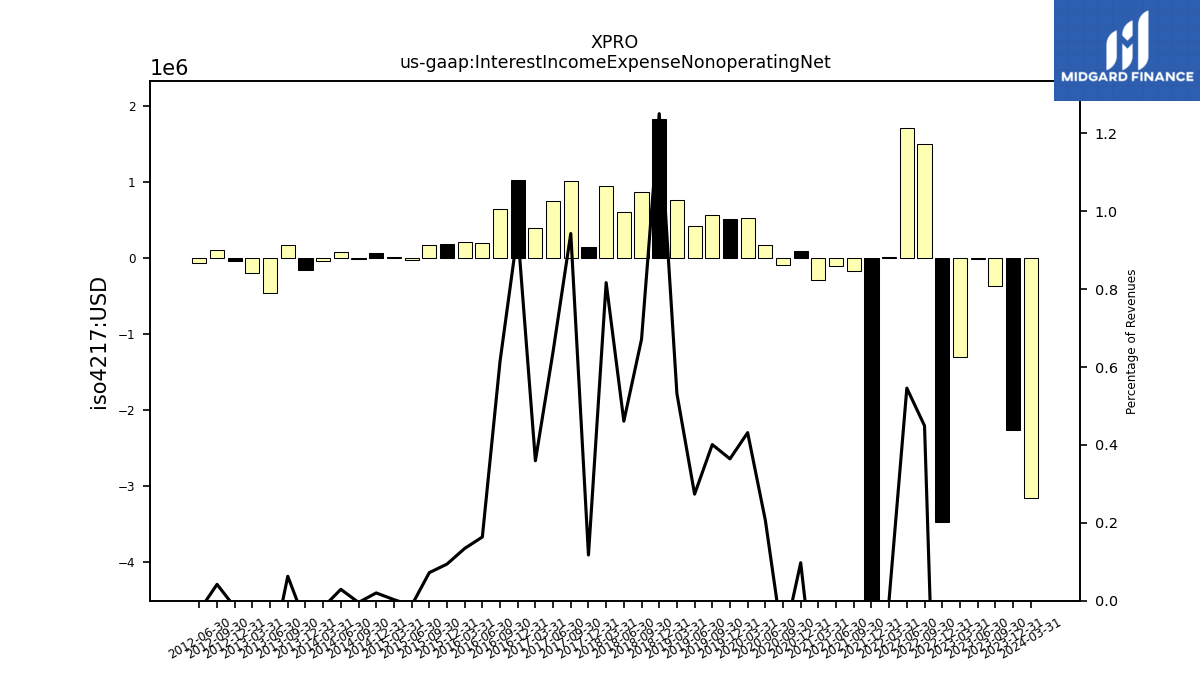
| Interest Income Expense Nonoperating Net | -0.37 | -0.02 | -1.30 | -3.47 | 1.50 | 1.71 | 0.01 | -8.24 | -0.17 | -0.10 | -0.29 | 0.09 | -0.09 | 0.18 | 0.53 | 0.51 | 0.56 | 0.43 | 0.77 | 1.82 | 0.87 | 0.61 | 0.94 | 0.14 | 1.02 | 0.75 | 0.40 | 1.02 | 0.65 | 0.20 | 0.21 | 0.19 | 0.17 | -0.03 | 0.01 | 0.06 | -0.01 | 0.08 | -0.04 | -0.16 | 0.17 | -0.46 | -0.20 | -0.04 | 0.11 | -0.07 | NA | |
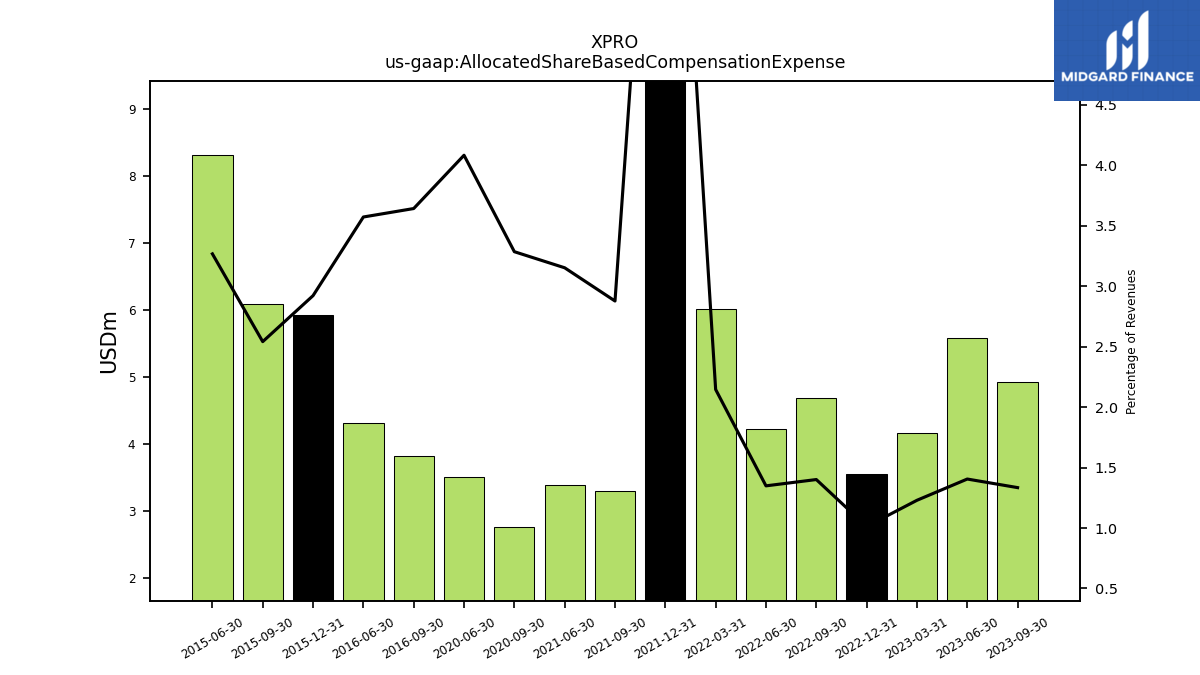
| Allocated Share Based Compensation Expense | 4.93 | 5.58 | 4.17 | 3.55 | 4.68 | 4.23 | 6.02 | 44.56 | 3.31 | 3.40 | NA | NA | 2.77 | 3.52 | NA | NA | NA | NA | NA | NA | NA | NA | NA | NA | NA | NA | NA | NA | 3.83 | 4.32 | NA | 5.93 | 6.10 | 8.31 | NA | NA | NA | NA | NA | NA | NA | NA | NA | NA | NA | NA | NA | |
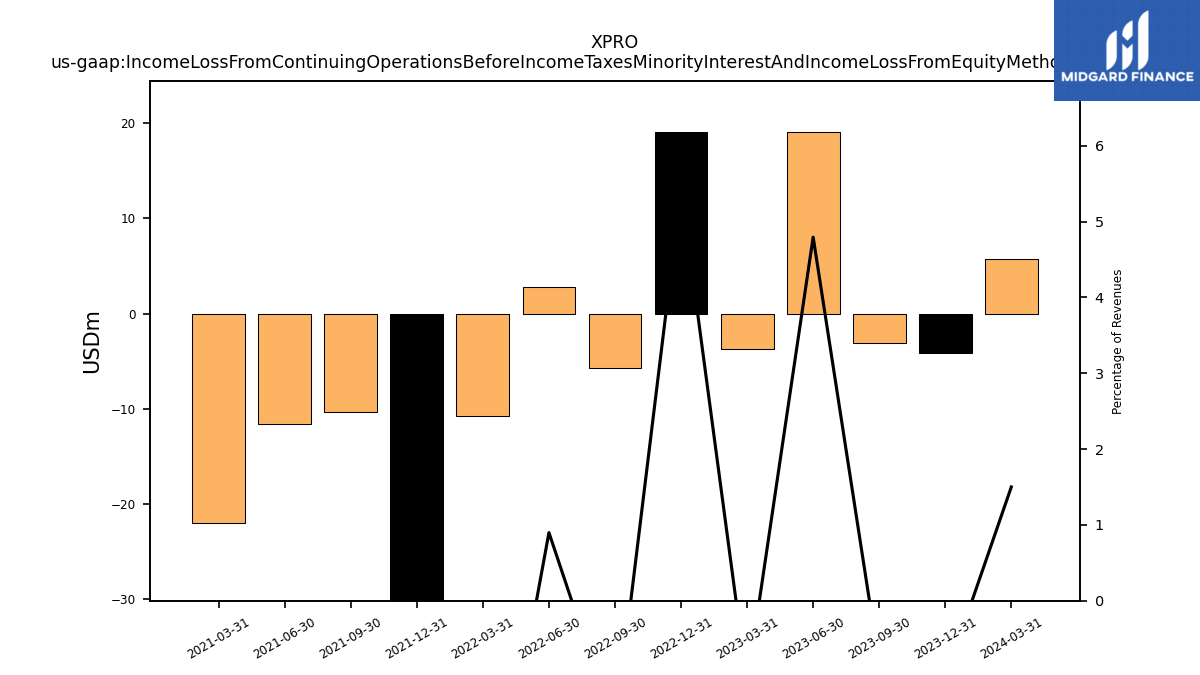
| Income Loss From Continuing Operations Before Income Taxes Minority Interest And Income Loss From Equity Method Investments | -3.07 | 19.03 | -3.70 | 19.04 | -5.70 | 2.82 | -10.79 | -88.50 | -10.32 | -11.61 | -21.94 | NA | NA | NA | NA | NA | NA | NA | NA | NA | NA | NA | NA | NA | NA | NA | NA | NA | NA | NA | NA | NA | NA | NA | NA | NA | NA | NA | NA | NA | NA | NA | NA | NA | NA | NA | NA | |
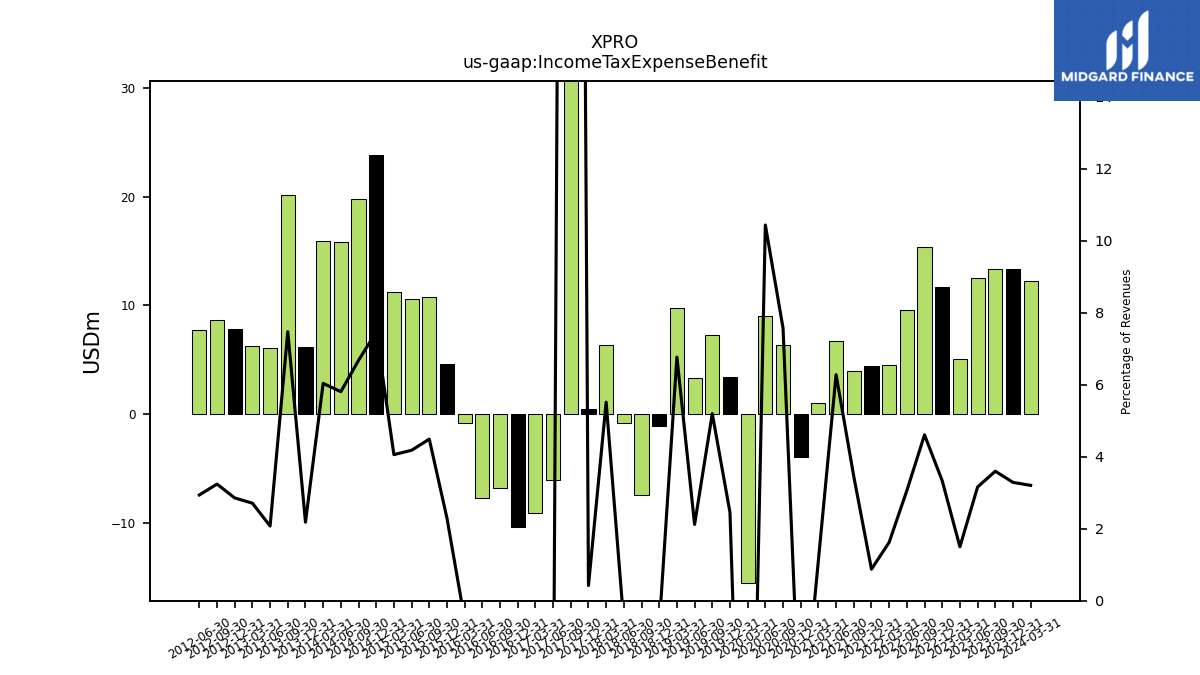
| Income Tax Expense Benefit | 13.31 | 12.54 | 5.08 | 11.70 | 15.40 | 9.60 | 4.55 | 4.46 | 3.97 | 6.77 | 1.07 | -3.90 | 6.39 | 8.99 | -15.56 | 3.42 | 7.30 | 3.30 | 9.77 | -1.05 | -7.46 | -0.81 | 6.38 | 0.50 | 87.61 | -6.08 | -9.12 | -10.33 | -6.80 | -7.71 | -0.81 | 4.66 | 10.77 | 10.63 | 11.26 | 23.81 | 19.78 | 15.85 | 15.97 | 6.16 | 20.18 | 6.08 | 6.30 | 7.85 | 8.63 | 7.72 | NA | |
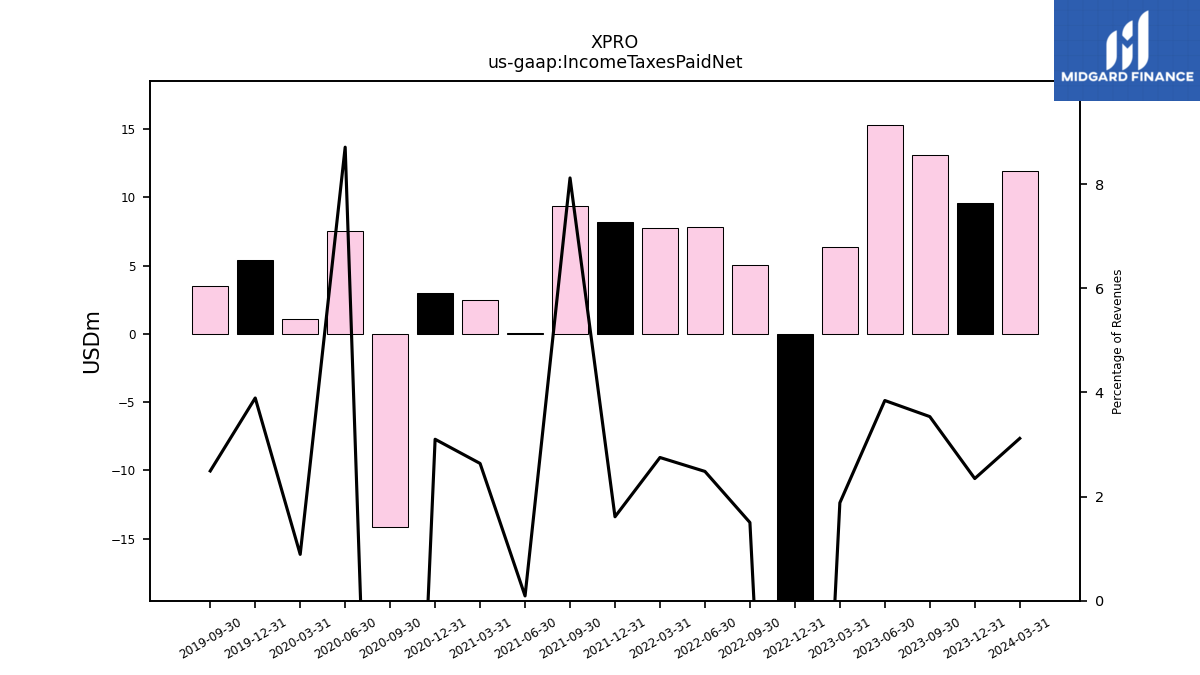
| Income Taxes Paid Net | 13.08 | 15.26 | 6.38 | -53.70 | 5.02 | 7.79 | 7.72 | 8.20 | 9.33 | 0.10 | 2.50 | 2.99 | -14.10 | 7.50 | 1.10 | 5.43 | 3.50 | NA | NA | NA | NA | NA | NA | NA | NA | NA | NA | NA | NA | NA | NA | NA | NA | NA | NA | NA | NA | NA | NA | NA | NA | NA | NA | NA | NA | NA | NA | |
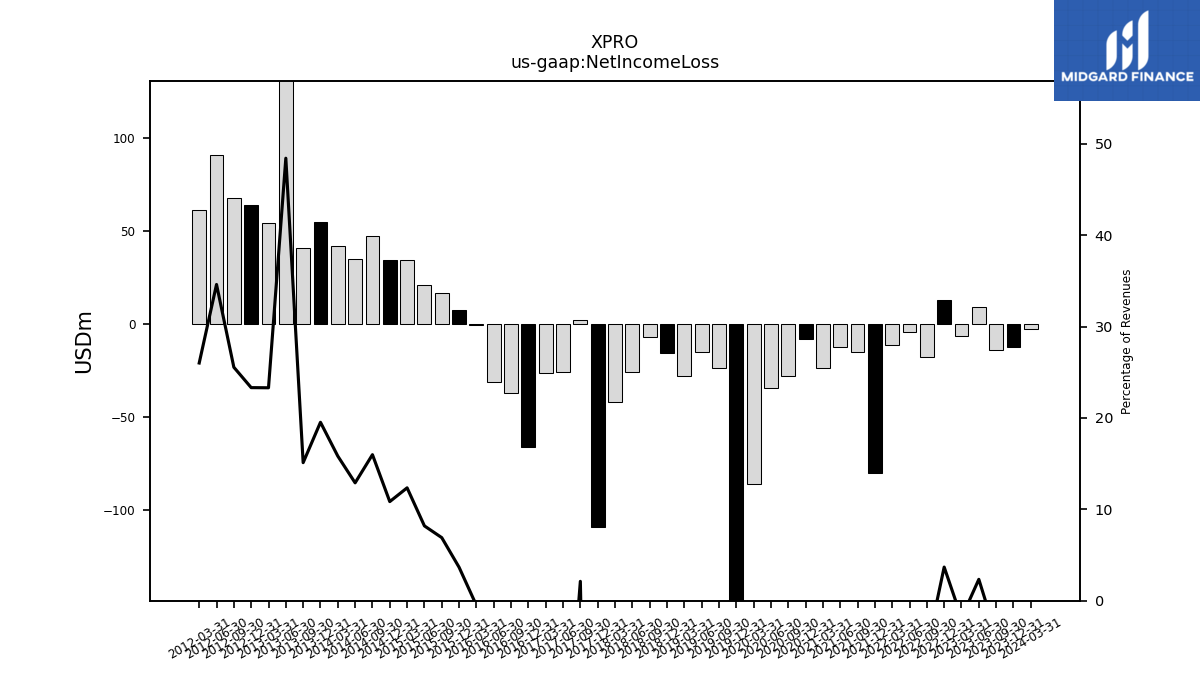
| Net Income Loss | -13.89 | 9.29 | -6.35 | 12.93 | -17.59 | -4.35 | -11.13 | -80.31 | -15.08 | -12.62 | -23.89 | -8.21 | -27.79 | -34.24 | -85.98 | -168.09 | -23.79 | -15.16 | -28.29 | -15.90 | -7.00 | -25.76 | -42.07 | -109.14 | 2.30 | -25.95 | -26.66 | -66.19 | -36.98 | -31.40 | -0.77 | 7.44 | 16.57 | 20.83 | 34.28 | 34.61 | 47.35 | 35.22 | 41.86 | 55.09 | 40.81 | 141.87 | 54.20 | 64.10 | 68.07 | 90.91 | 61.16 | |
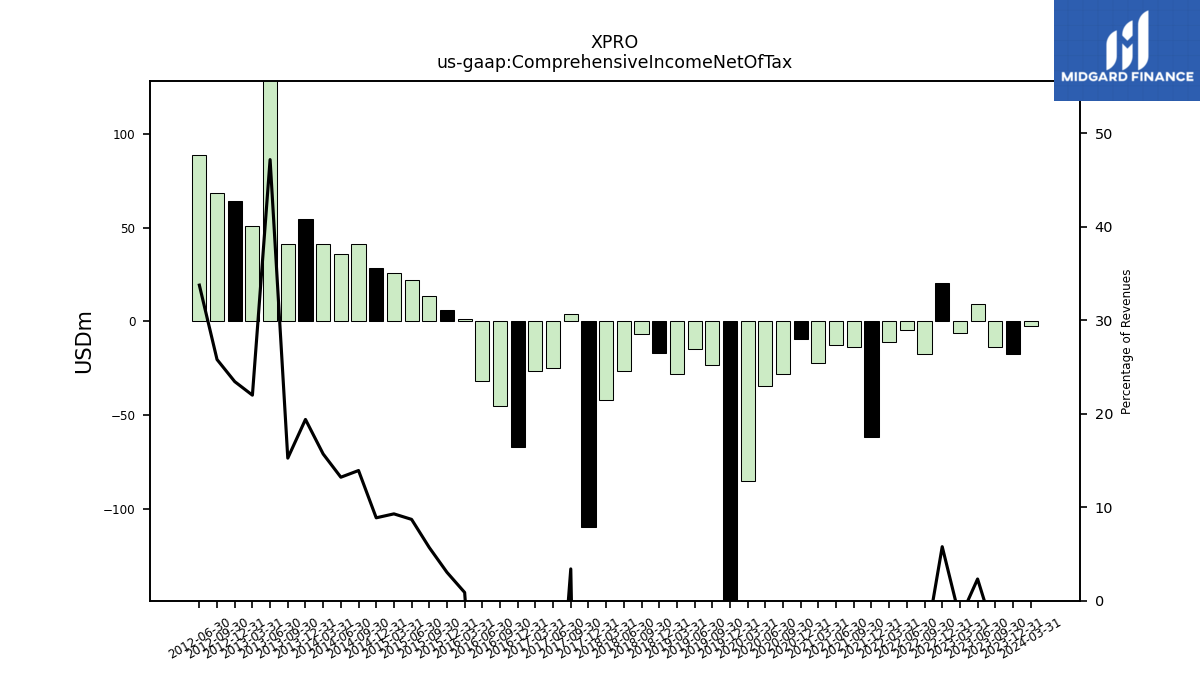
| Comprehensive Income Net Of Tax | -13.95 | 9.23 | -6.41 | 20.30 | -17.66 | -4.41 | -11.19 | -61.62 | -13.49 | -12.75 | -22.17 | -9.61 | -28.34 | -34.38 | -85.55 | -168.77 | -23.42 | -14.70 | -28.02 | -16.72 | -6.88 | -26.43 | -42.07 | -109.60 | 3.68 | -25.04 | -26.50 | -67.27 | -45.12 | -31.73 | 1.36 | 6.17 | 13.65 | 22.14 | 25.79 | 28.31 | 41.27 | 36.08 | 41.54 | 54.73 | 41.22 | 138.30 | 51.16 | 64.46 | 68.77 | 88.72 | NA | |
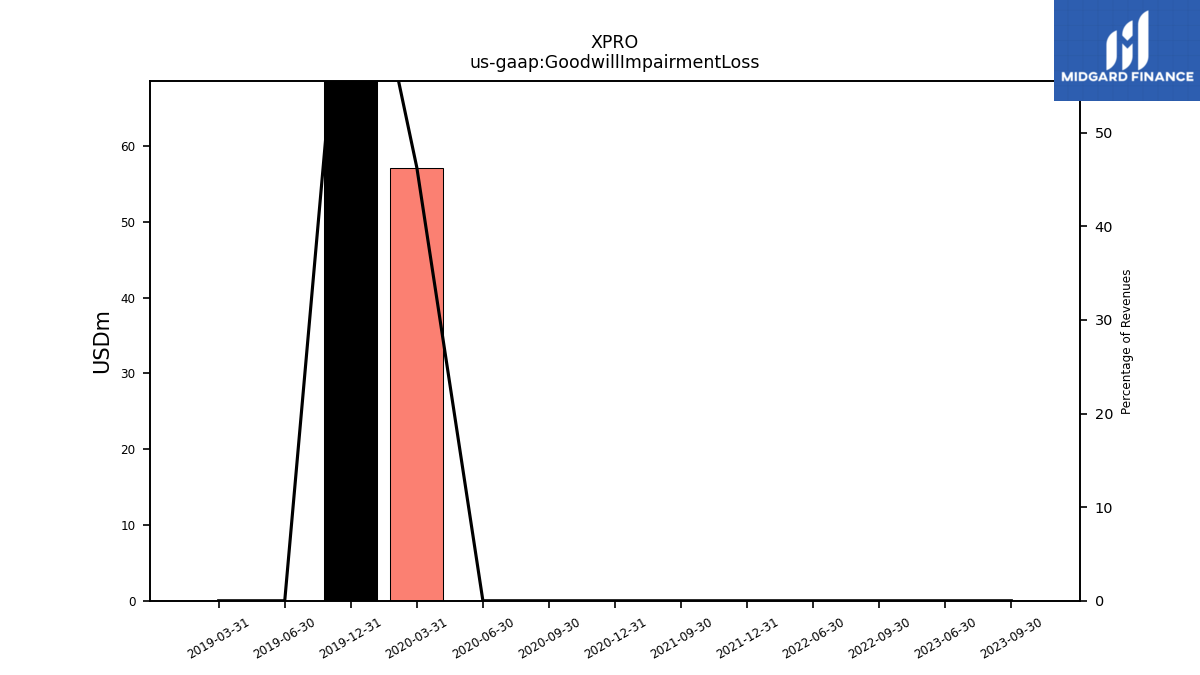
| Goodwill Impairment Loss | 0.00 | 0.00 | NA | NA | 0.00 | 0.00 | NA | 0.00 | 0.00 | NA | NA | 0.00 | 0.00 | 0.00 | 57.15 | 111.10 | NA | 0.00 | 0.00 | NA | NA | NA | NA | NA | NA | NA | NA | NA | NA | NA | NA | NA | NA | NA | NA | NA | NA | NA | NA | NA | NA | NA | NA | NA | NA | NA | NA |
| 2023-09-30 | 2023-06-30 | 2023-03-31 | 2022-12-31 | 2022-09-30 | 2022-06-30 | 2022-03-31 | 2021-12-31 | 2021-09-30 | 2021-06-30 | 2021-03-31 | 2020-12-31 | 2020-09-30 | 2020-06-30 | 2020-03-31 | 2019-12-31 | 2019-09-30 | 2019-06-30 | 2019-03-31 | 2018-12-31 | 2018-09-30 | 2018-06-30 | 2018-03-31 | 2017-12-31 | 2017-09-30 | 2017-06-30 | 2017-03-31 | 2016-12-31 | 2016-09-30 | 2016-06-30 | 2016-03-31 | 2015-12-31 | 2015-09-30 | 2015-06-30 | 2015-03-31 | 2014-12-31 | 2014-09-30 | 2014-06-30 | 2014-03-31 | 2013-12-31 | 2013-09-30 | 2013-06-30 | 2013-03-31 | 2012-12-31 | 2012-09-30 | 2012-06-30 | 2012-03-31 | ||
|---|---|---|---|---|---|---|---|---|---|---|---|---|---|---|---|---|---|---|---|---|---|---|---|---|---|---|---|---|---|---|---|---|---|---|---|---|---|---|---|---|---|---|---|---|---|---|---|---|
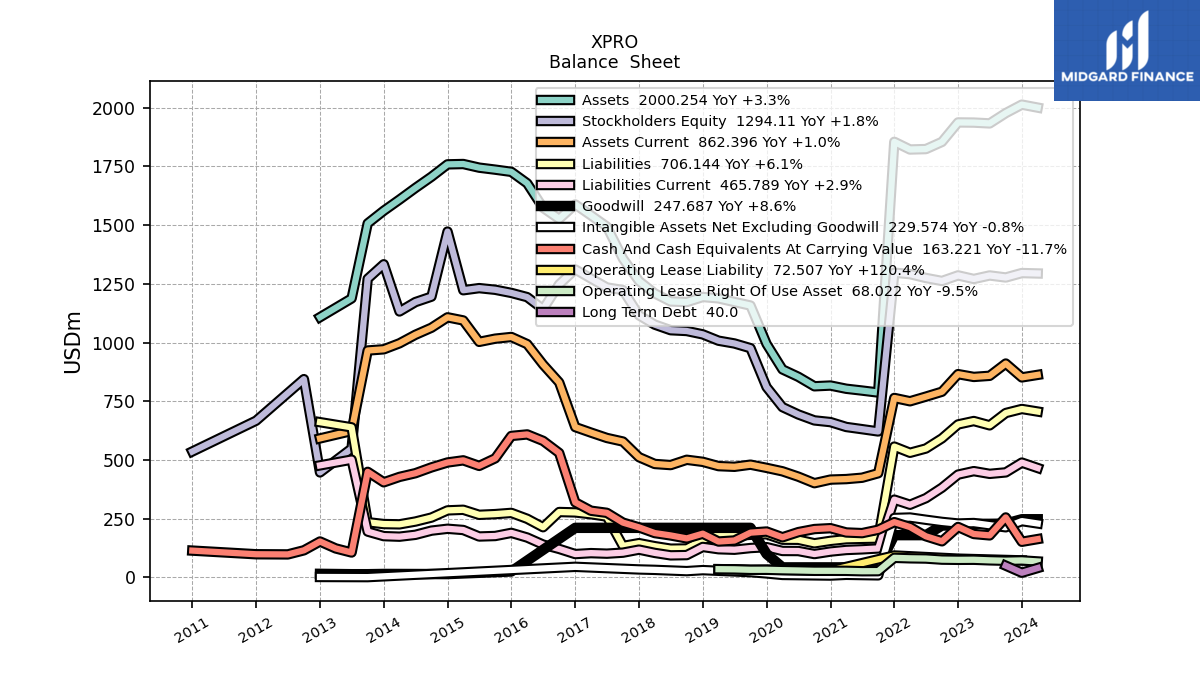
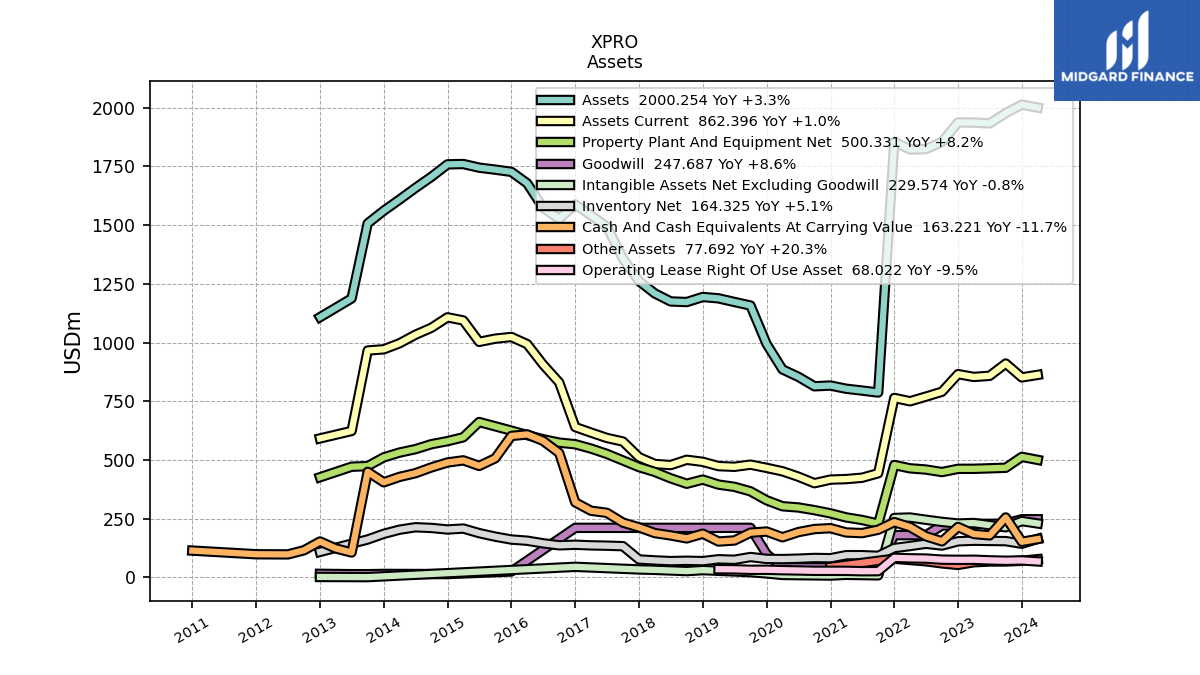
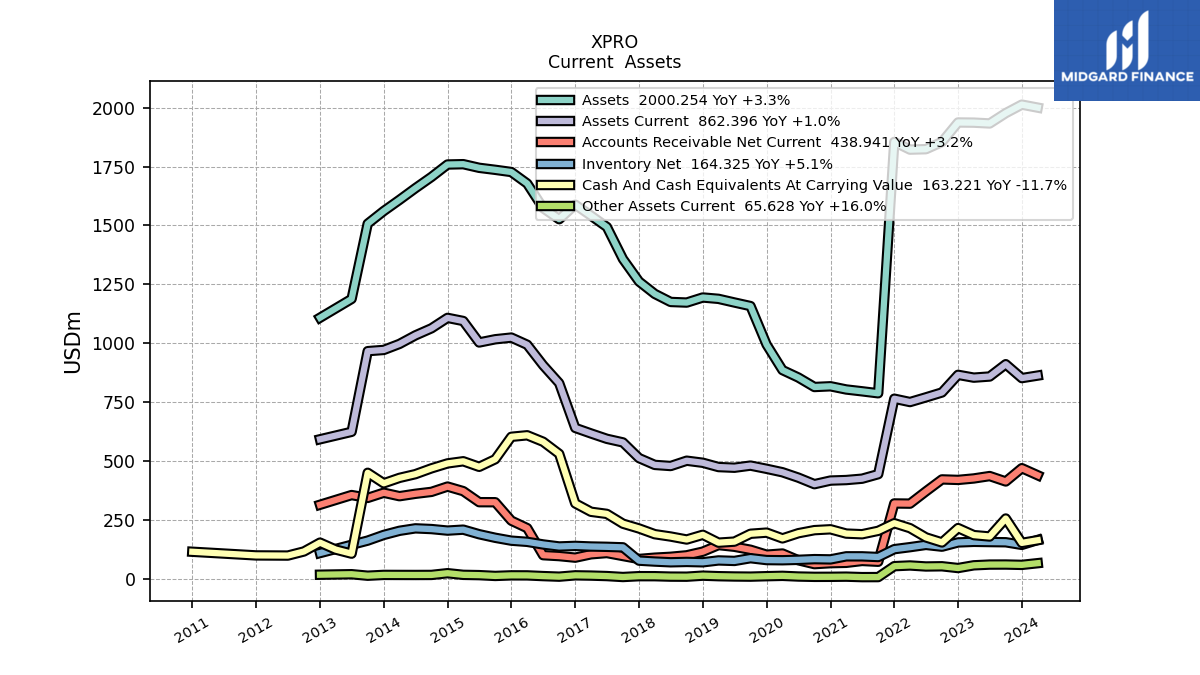
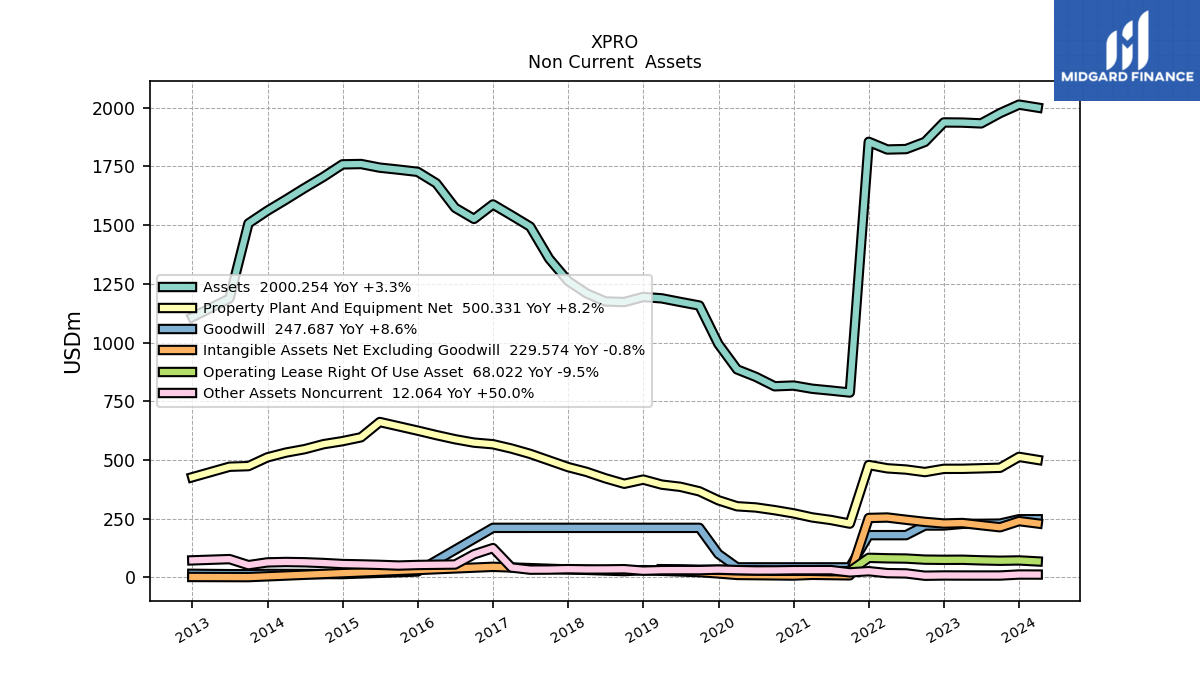
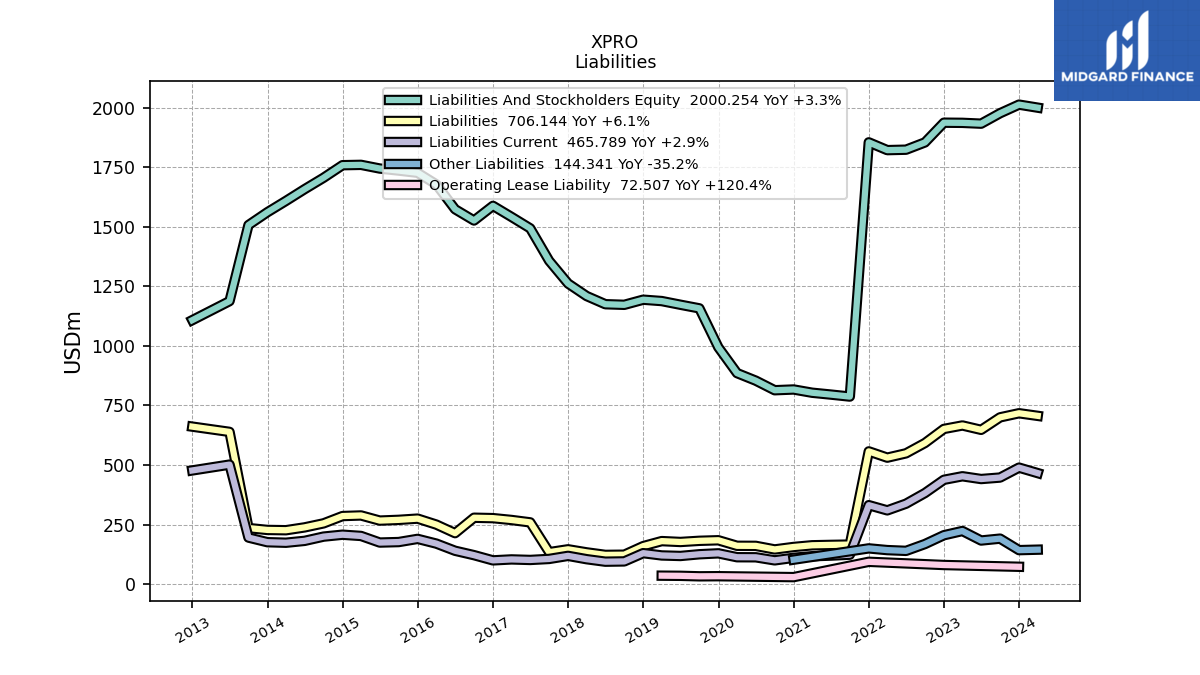
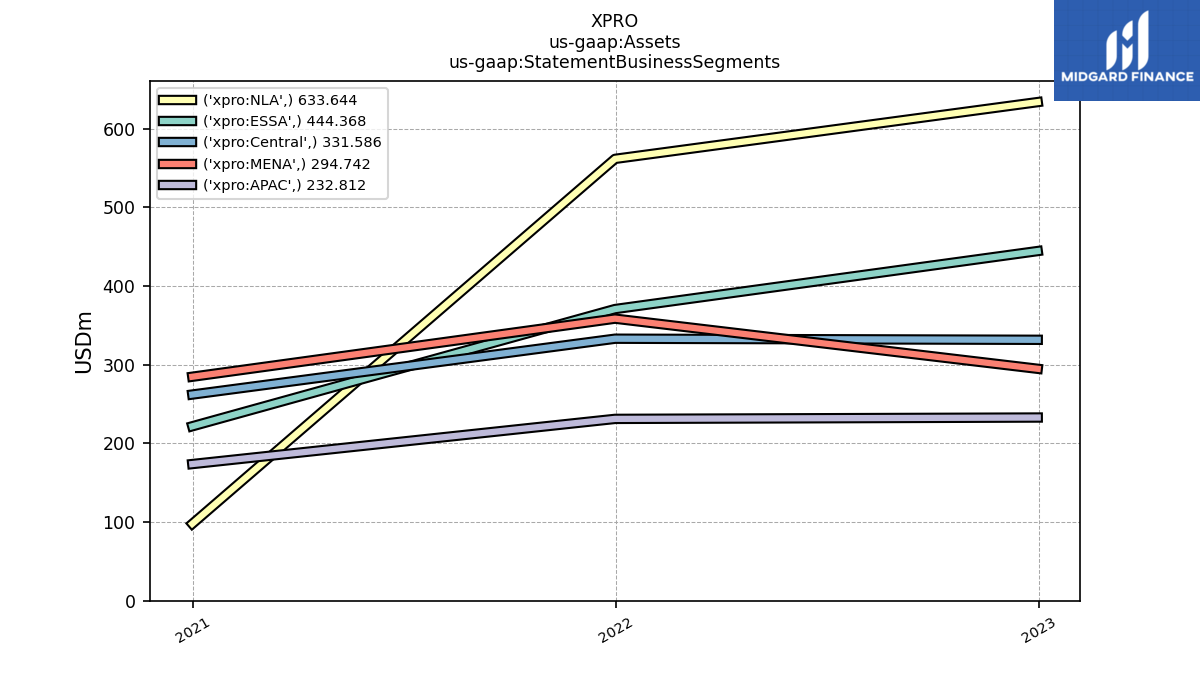
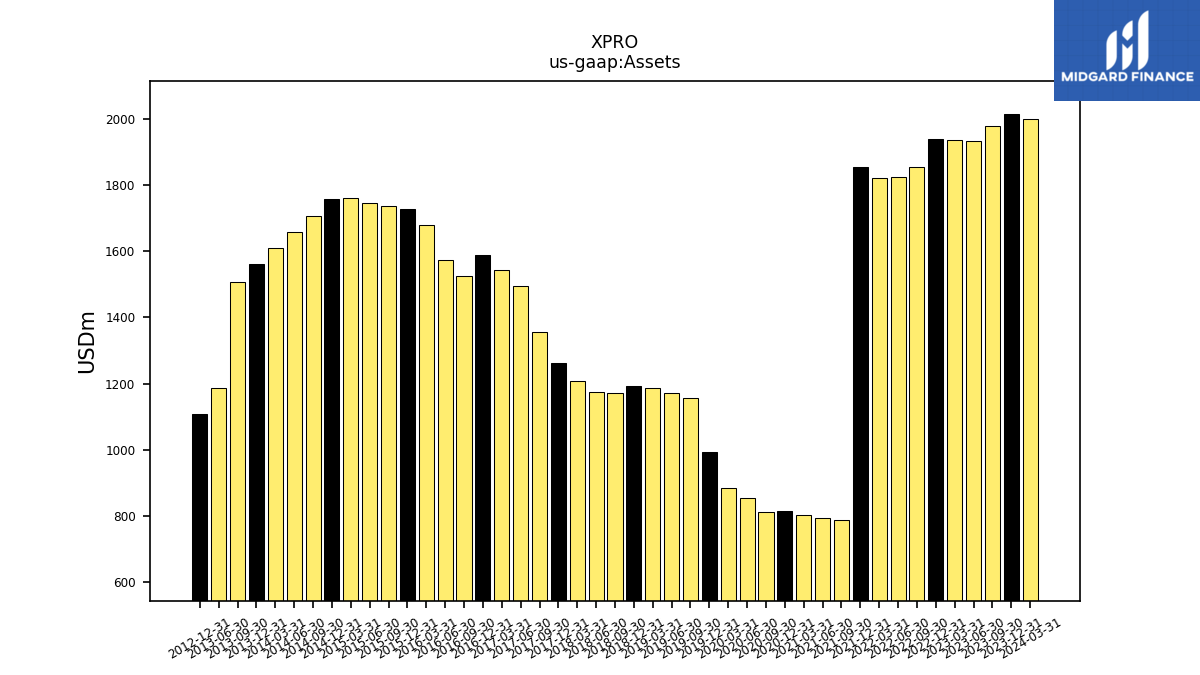
| Assets | 1976.90 | 1933.03 | 1936.50 | 1937.15 | 1854.29 | 1823.76 | 1821.93 | 1854.64 | 787.13 | 795.50 | 803.27 | 816.90 | 813.77 | 853.98 | 885.64 | 994.16 | 1157.57 | 1172.70 | 1188.18 | 1193.93 | 1172.40 | 1174.98 | 1209.31 | 1261.77 | 1357.32 | 1493.45 | 1541.55 | 1588.06 | 1526.38 | 1573.68 | 1677.83 | 1726.84 | 1736.14 | 1744.66 | 1760.12 | 1758.68 | 1705.94 | 1658.05 | 1608.63 | 1561.19 | 1507.25 | 1187.82 | NA | 1107.96 | NA | NA | NA | |
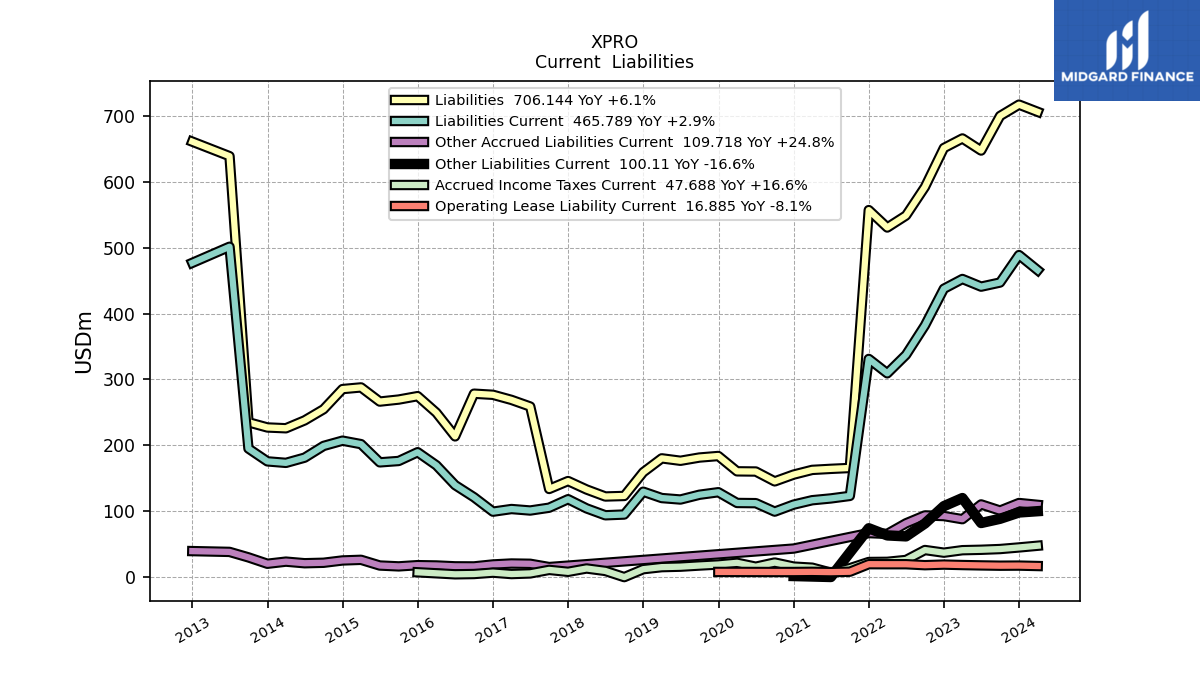
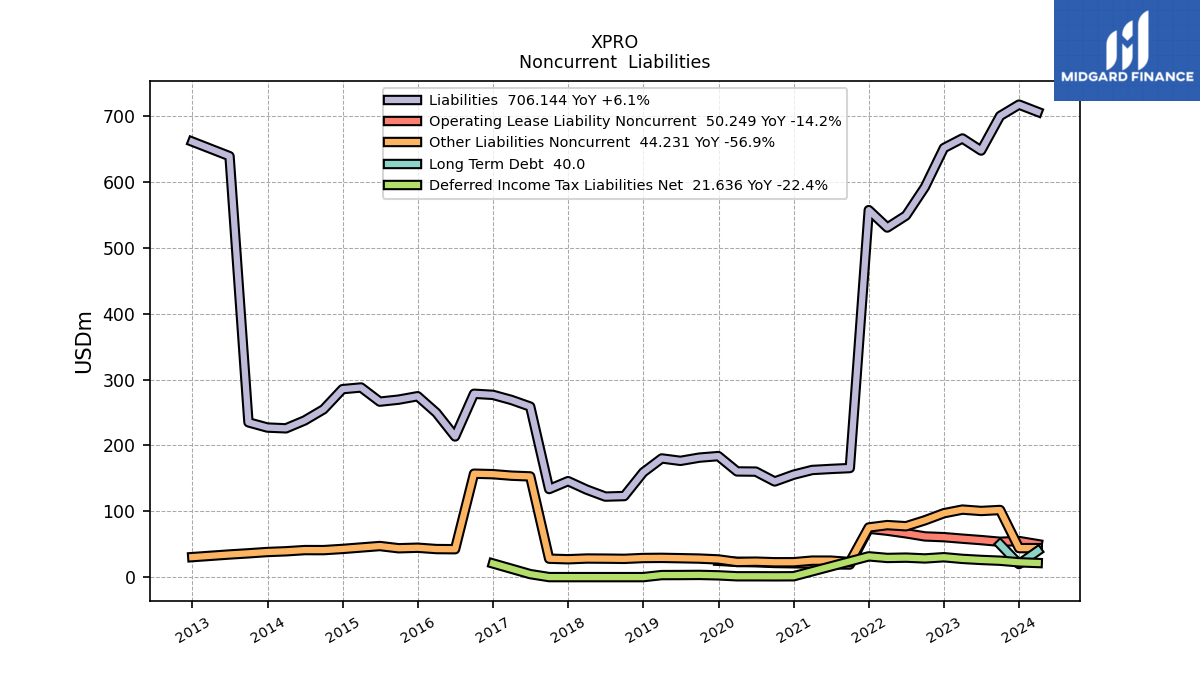
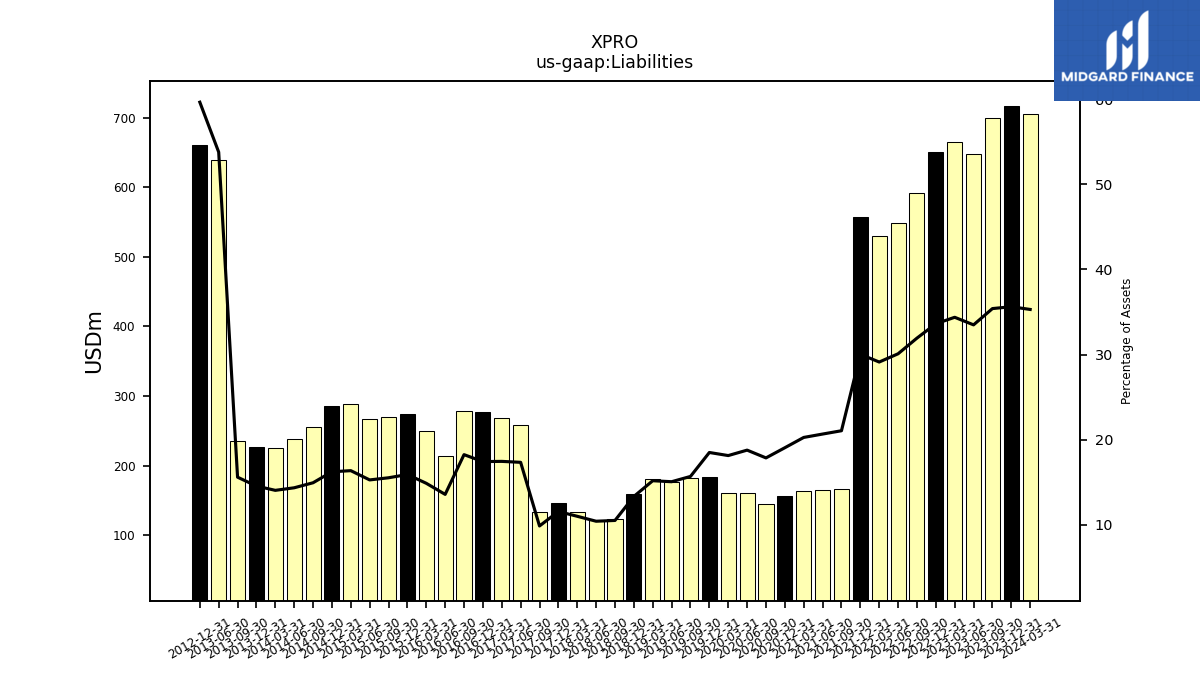
| Liabilities | 699.91 | 647.41 | 665.81 | 651.26 | 592.15 | 548.83 | 530.64 | 557.07 | 165.69 | 164.36 | 162.77 | 155.65 | 145.33 | 160.32 | 160.60 | 183.87 | 181.53 | 176.63 | 180.32 | 159.16 | 123.22 | 122.40 | 133.00 | 145.87 | 133.83 | 258.96 | 269.01 | 276.74 | 278.45 | 213.60 | 249.56 | 274.71 | 269.52 | 266.46 | 287.97 | 285.44 | 254.83 | 237.90 | 225.96 | 227.16 | 235.03 | 638.94 | NA | 660.97 | NA | NA | NA | |
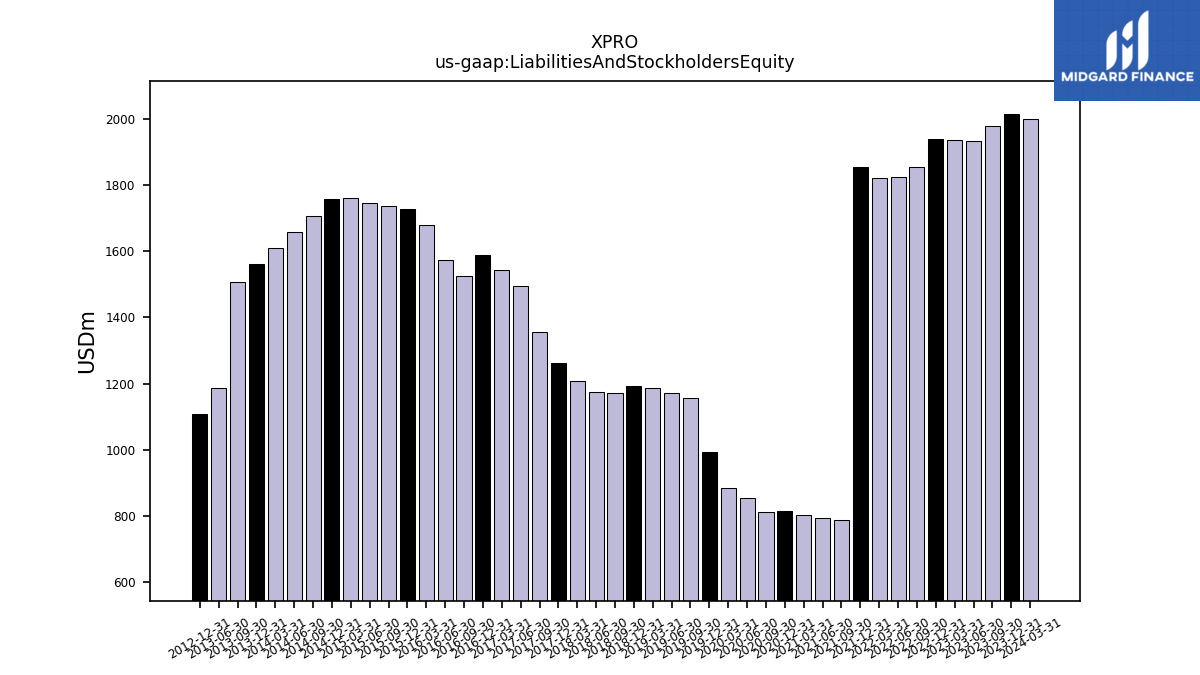
| Liabilities And Stockholders Equity | 1976.90 | 1933.03 | 1936.50 | 1937.15 | 1854.29 | 1823.76 | 1821.93 | 1854.64 | 787.13 | 795.50 | 803.27 | 816.90 | 813.77 | 853.98 | 885.64 | 994.16 | 1157.57 | 1172.70 | 1188.18 | 1193.93 | 1172.40 | 1174.98 | 1209.31 | 1261.77 | 1357.32 | 1493.45 | 1541.55 | 1588.06 | 1526.38 | 1573.68 | 1677.83 | 1726.84 | 1736.14 | 1744.66 | 1760.12 | 1758.68 | 1705.94 | 1658.05 | 1608.63 | 1561.19 | 1507.25 | 1187.82 | NA | 1107.96 | NA | NA | NA | |
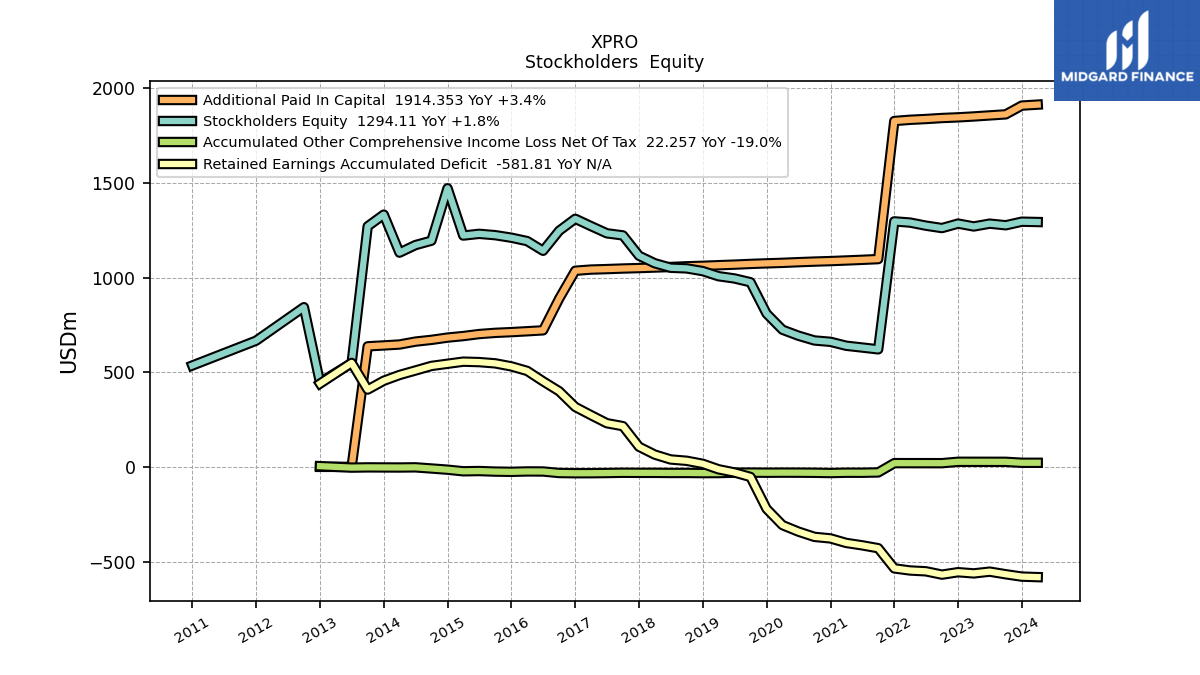
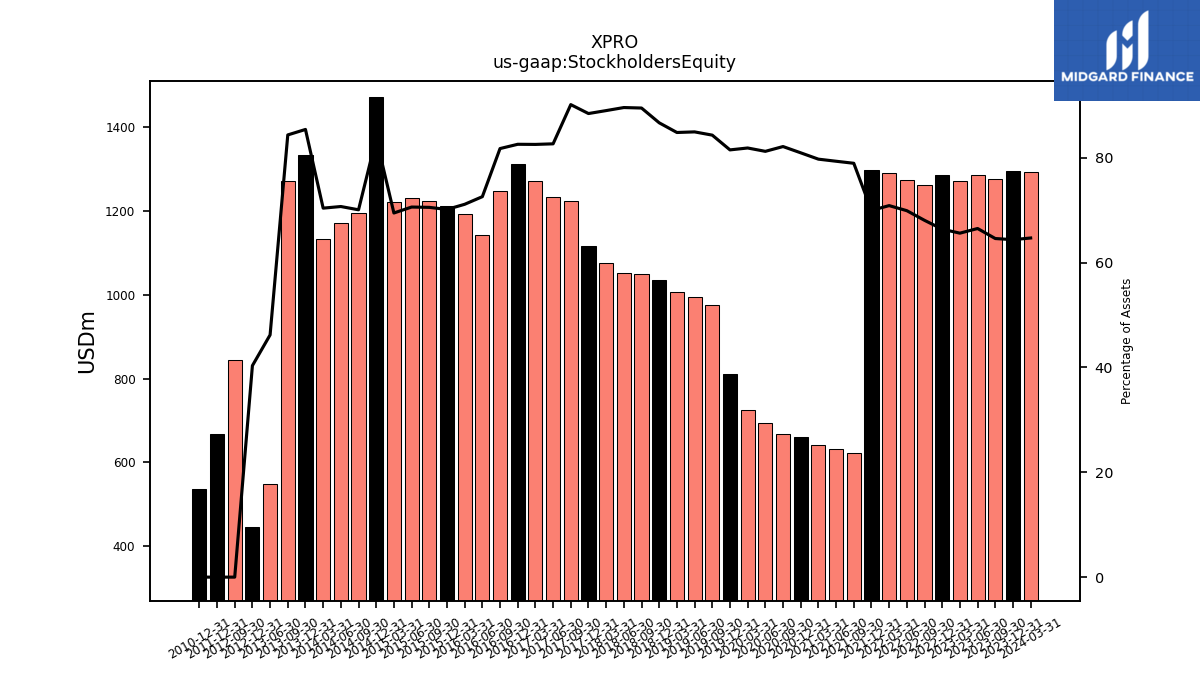
| Stockholders Equity | 1277.00 | 1285.62 | 1270.68 | 1285.89 | 1262.13 | 1274.93 | 1291.29 | 1297.57 | 621.44 | 631.14 | 640.50 | 661.25 | 668.44 | 693.66 | 725.04 | 810.29 | 976.03 | 996.08 | 1007.87 | 1034.77 | 1049.18 | 1052.58 | 1076.31 | 1115.90 | 1223.48 | 1234.49 | 1272.54 | 1311.32 | 1247.93 | 1142.19 | 1193.37 | 1211.30 | 1224.69 | 1231.74 | 1222.66 | 1472.54 | 1195.45 | 1172.26 | 1132.35 | 1333.33 | 1271.51 | 548.88 | NA | 446.99 | 844.28 | NA | NA |
| 2023-09-30 | 2023-06-30 | 2023-03-31 | 2022-12-31 | 2022-09-30 | 2022-06-30 | 2022-03-31 | 2021-12-31 | 2021-09-30 | 2021-06-30 | 2021-03-31 | 2020-12-31 | 2020-09-30 | 2020-06-30 | 2020-03-31 | 2019-12-31 | 2019-09-30 | 2019-06-30 | 2019-03-31 | 2018-12-31 | 2018-09-30 | 2018-06-30 | 2018-03-31 | 2017-12-31 | 2017-09-30 | 2017-06-30 | 2017-03-31 | 2016-12-31 | 2016-09-30 | 2016-06-30 | 2016-03-31 | 2015-12-31 | 2015-09-30 | 2015-06-30 | 2015-03-31 | 2014-12-31 | 2014-09-30 | 2014-06-30 | 2014-03-31 | 2013-12-31 | 2013-09-30 | 2013-06-30 | 2013-03-31 | 2012-12-31 | 2012-09-30 | 2012-06-30 | 2012-03-31 | ||
|---|---|---|---|---|---|---|---|---|---|---|---|---|---|---|---|---|---|---|---|---|---|---|---|---|---|---|---|---|---|---|---|---|---|---|---|---|---|---|---|---|---|---|---|---|---|---|---|---|
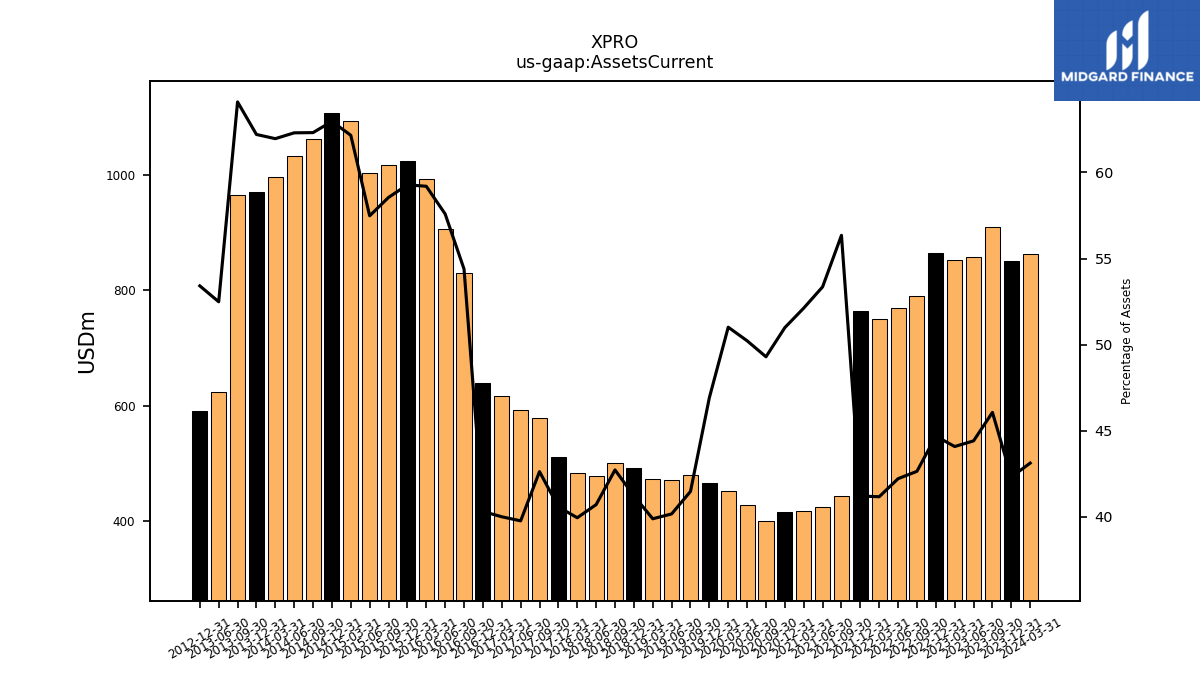
| Assets Current | 910.60 | 858.37 | 853.57 | 865.51 | 790.61 | 769.81 | 749.93 | 764.13 | 443.53 | 424.43 | 418.66 | 416.51 | 401.12 | 428.88 | 451.77 | 466.42 | 480.03 | 470.97 | 473.84 | 492.09 | 500.83 | 478.24 | 482.99 | 511.89 | 578.49 | 593.78 | 616.58 | 640.05 | 830.21 | 906.27 | 993.25 | 1023.74 | 1016.53 | 1002.88 | 1094.09 | 1107.42 | 1063.08 | 1033.02 | 996.78 | 971.20 | 966.11 | 623.46 | NA | 591.78 | NA | NA | NA | |
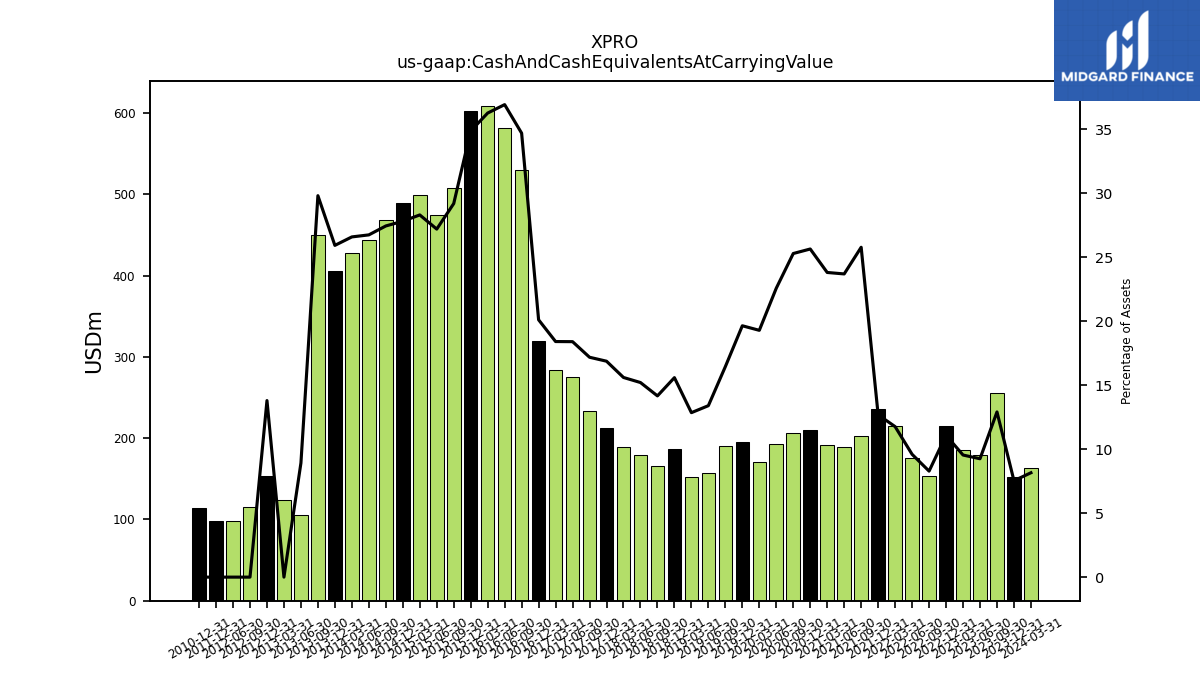
| Cash And Cash Equivalents At Carrying Value | 255.32 | 178.91 | 184.87 | 214.79 | 153.69 | 175.11 | 214.39 | 235.39 | 203.00 | 188.58 | 191.34 | 209.57 | 205.90 | 192.92 | 170.90 | 195.38 | 190.52 | 157.20 | 152.78 | 186.21 | 166.13 | 178.76 | 188.78 | 213.01 | 233.34 | 274.95 | 283.94 | 319.53 | 529.85 | 581.37 | 608.80 | 602.36 | 507.05 | 474.75 | 498.44 | 489.35 | 468.39 | 443.68 | 427.90 | 404.95 | 449.52 | 106.01 | 123.39 | 152.94 | 115.35 | 97.94 | NA | |
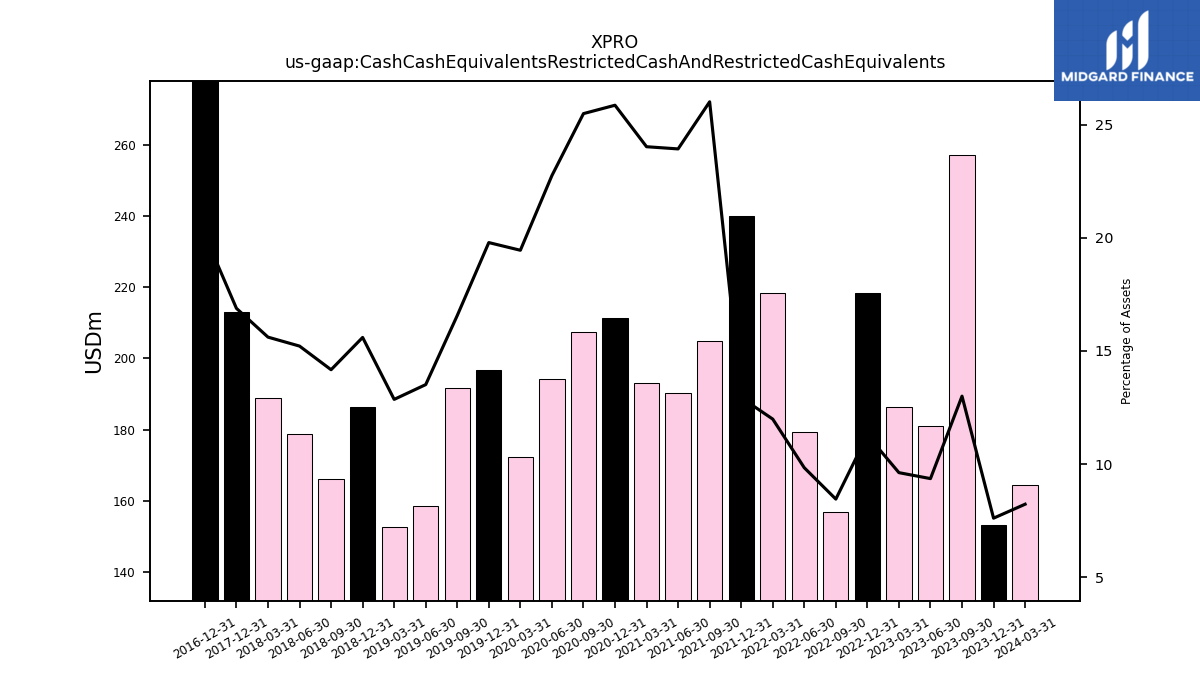
| Cash Cash Equivalents Restricted Cash And Restricted Cash Equivalents | 257.01 | 180.87 | 186.30 | 218.46 | 156.71 | 179.41 | 218.42 | 239.85 | 204.74 | 190.36 | 193.00 | 211.25 | 207.42 | 194.28 | 172.25 | 196.74 | 191.77 | 158.46 | 152.78 | 186.21 | 166.13 | 178.76 | 188.78 | 213.01 | NA | NA | NA | 319.53 | NA | NA | NA | NA | NA | NA | NA | NA | NA | NA | NA | NA | NA | NA | NA | NA | NA | NA | NA | |
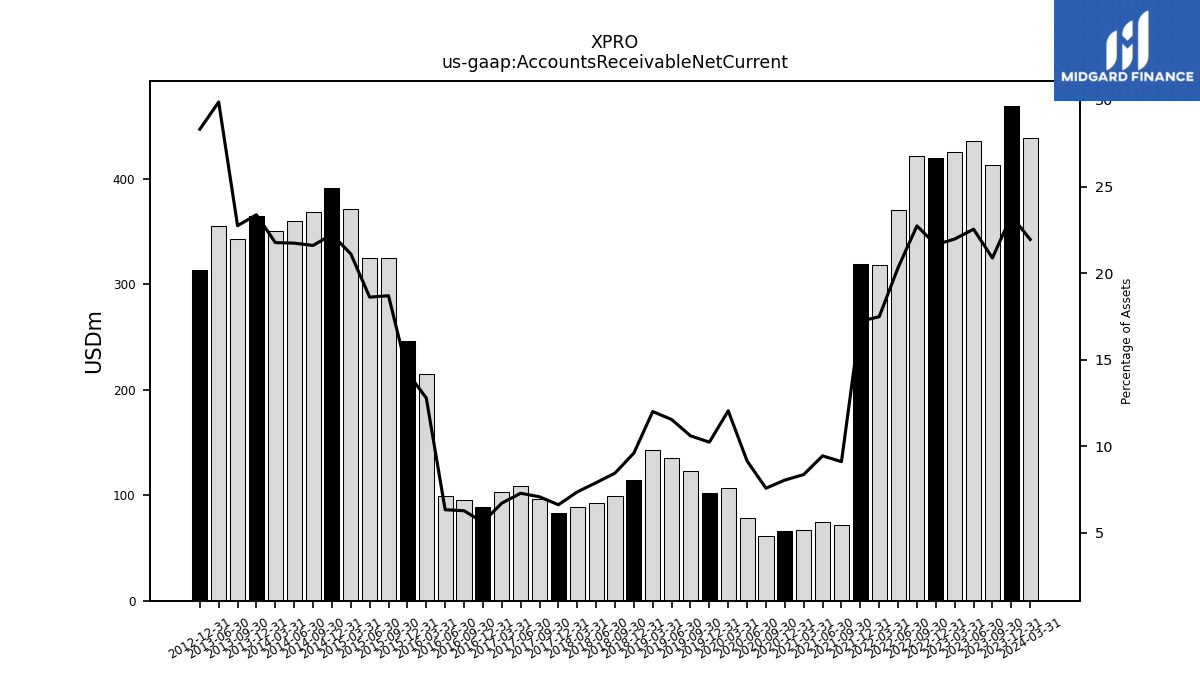
| Accounts Receivable Net Current | 412.64 | 435.62 | 425.41 | 419.24 | 421.40 | 370.46 | 318.50 | 319.29 | 71.68 | 75.10 | 67.17 | 65.68 | 61.62 | 78.08 | 106.66 | 101.72 | 122.68 | 135.34 | 142.61 | 114.63 | 99.00 | 92.72 | 88.99 | 83.48 | 96.03 | 108.75 | 103.39 | 89.10 | 95.71 | 99.62 | 214.46 | 246.19 | 324.53 | 324.69 | 371.56 | 390.98 | 368.43 | 360.30 | 350.09 | 364.82 | 342.71 | 354.96 | NA | 313.66 | NA | NA | NA | |
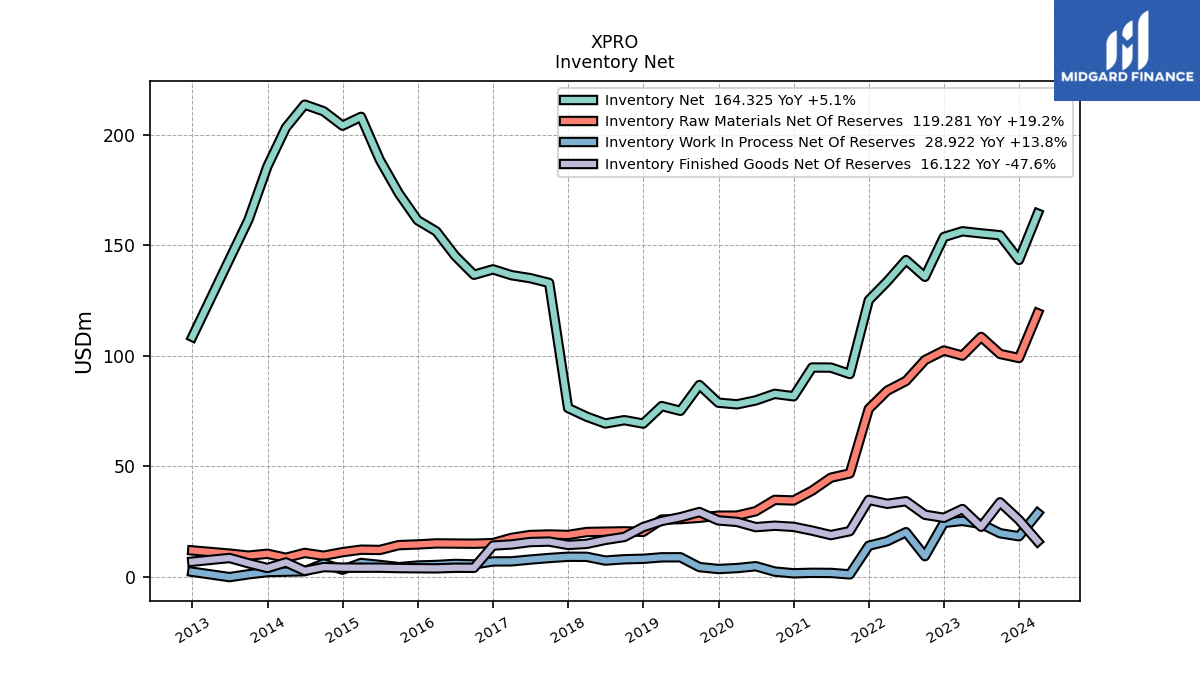
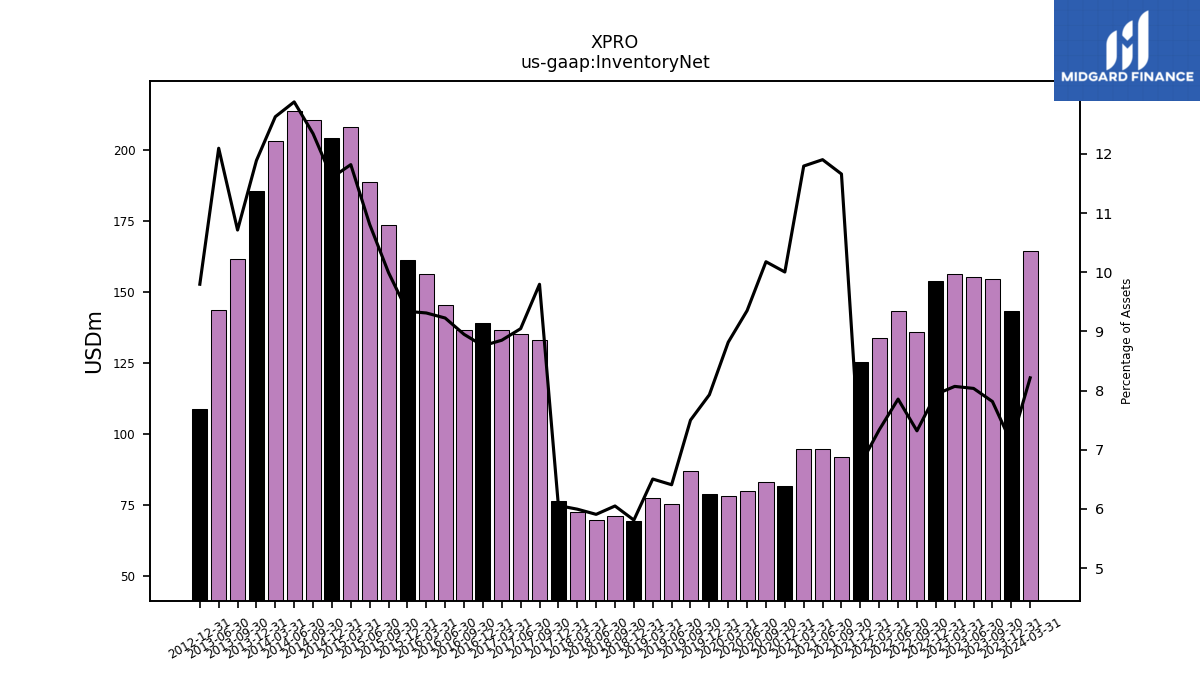
| Inventory Net | 154.49 | 155.34 | 156.28 | 153.72 | 135.72 | 143.27 | 133.66 | 125.12 | 91.78 | 94.68 | 94.74 | 81.72 | 82.82 | 79.86 | 78.09 | 78.83 | 86.82 | 75.15 | 77.29 | 69.38 | 70.92 | 69.42 | 72.51 | 76.42 | 132.96 | 135.10 | 136.44 | 139.08 | 136.62 | 145.19 | 156.23 | 161.26 | 173.50 | 188.57 | 208.01 | 204.01 | 210.54 | 213.52 | 203.13 | 185.59 | 161.47 | 143.67 | NA | 108.54 | NA | NA | NA | |
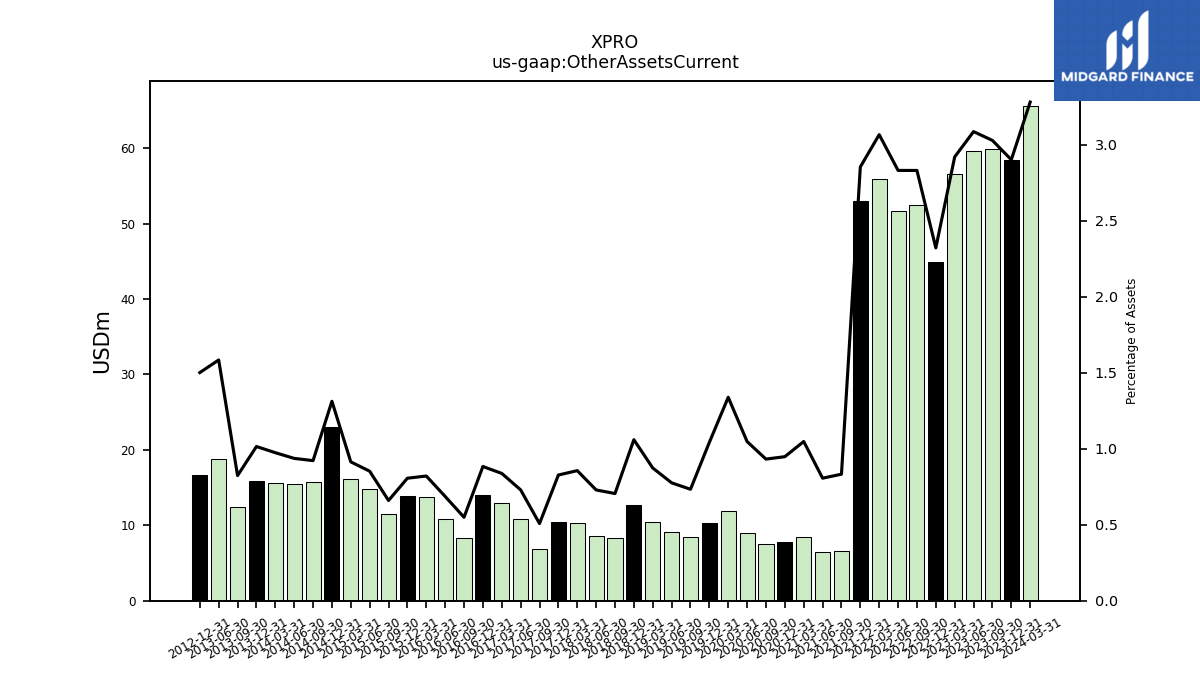
| Other Assets Current | 59.87 | 59.66 | 56.55 | 44.98 | 52.50 | 51.64 | 55.87 | 52.94 | 6.55 | 6.42 | 8.42 | 7.74 | 7.58 | 8.94 | 11.86 | 10.36 | 8.49 | 9.10 | 10.38 | 12.65 | 8.27 | 8.57 | 10.35 | 10.44 | 6.89 | 10.89 | 12.91 | 14.03 | 8.38 | 10.80 | 13.77 | 13.92 | 11.45 | 14.87 | 16.08 | 23.08 | 15.73 | 15.53 | 15.67 | 15.84 | 12.41 | 18.82 | NA | 16.63 | NA | NA | NA |
| 2023-09-30 | 2023-06-30 | 2023-03-31 | 2022-12-31 | 2022-09-30 | 2022-06-30 | 2022-03-31 | 2021-12-31 | 2021-09-30 | 2021-06-30 | 2021-03-31 | 2020-12-31 | 2020-09-30 | 2020-06-30 | 2020-03-31 | 2019-12-31 | 2019-09-30 | 2019-06-30 | 2019-03-31 | 2018-12-31 | 2018-09-30 | 2018-06-30 | 2018-03-31 | 2017-12-31 | 2017-09-30 | 2017-06-30 | 2017-03-31 | 2016-12-31 | 2016-09-30 | 2016-06-30 | 2016-03-31 | 2015-12-31 | 2015-09-30 | 2015-06-30 | 2015-03-31 | 2014-12-31 | 2014-09-30 | 2014-06-30 | 2014-03-31 | 2013-12-31 | 2013-09-30 | 2013-06-30 | 2013-03-31 | 2012-12-31 | 2012-09-30 | 2012-06-30 | 2012-03-31 | ||
|---|---|---|---|---|---|---|---|---|---|---|---|---|---|---|---|---|---|---|---|---|---|---|---|---|---|---|---|---|---|---|---|---|---|---|---|---|---|---|---|---|---|---|---|---|---|---|---|---|
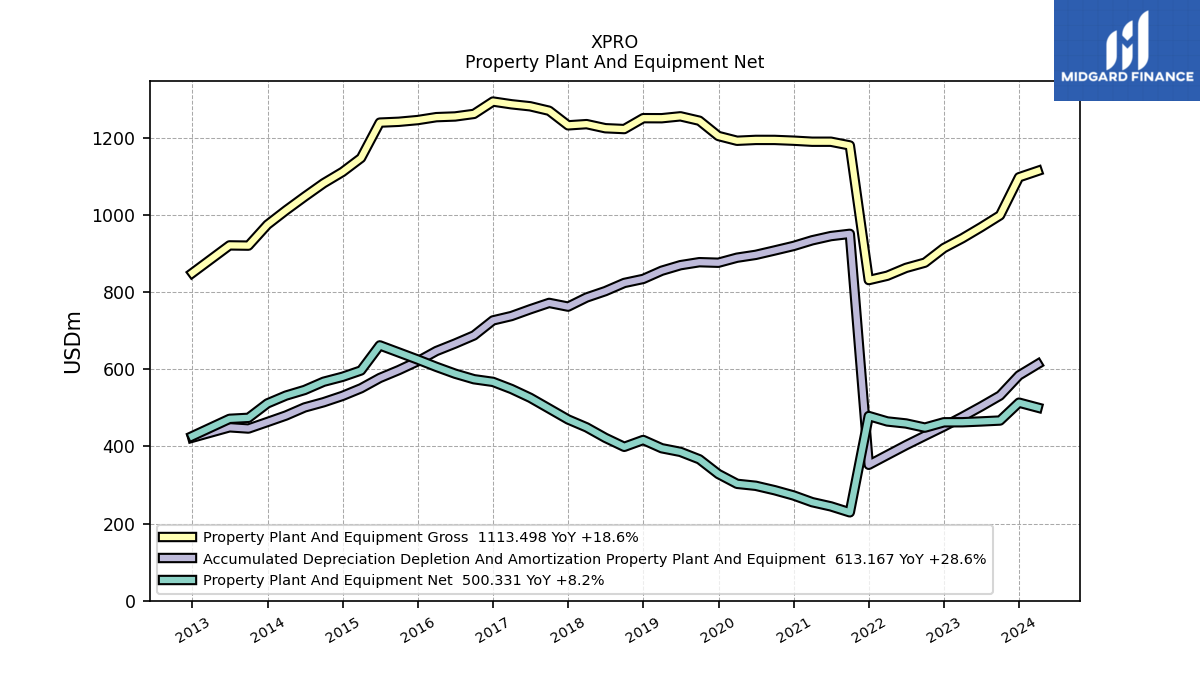
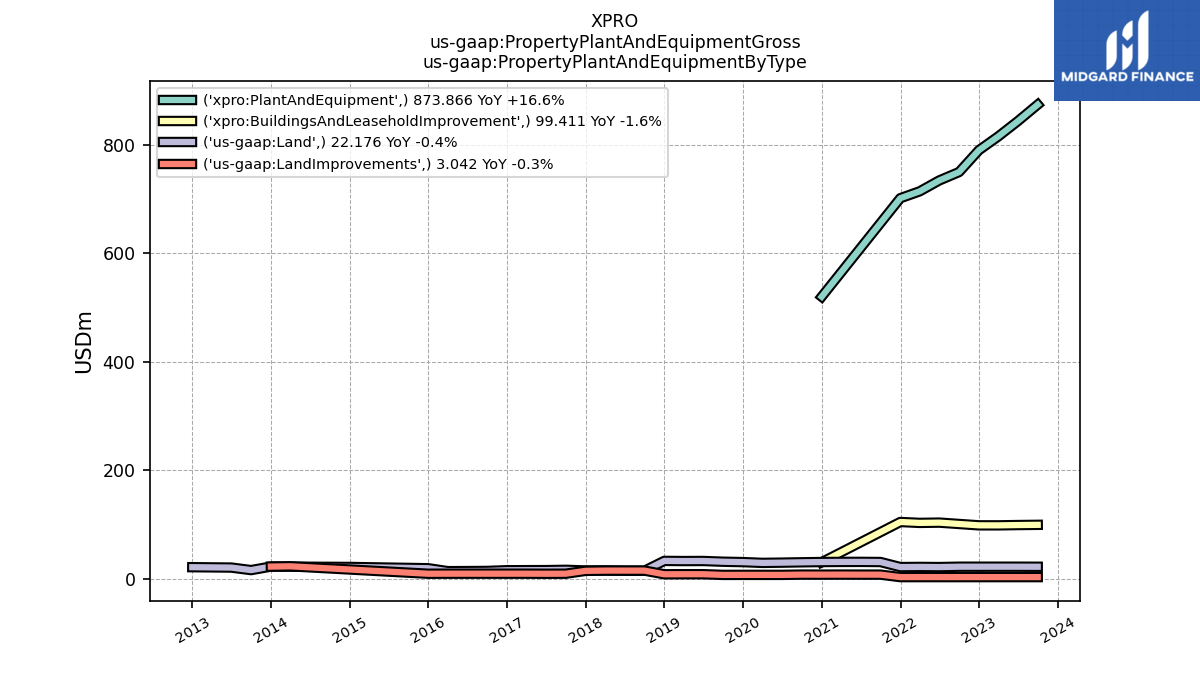
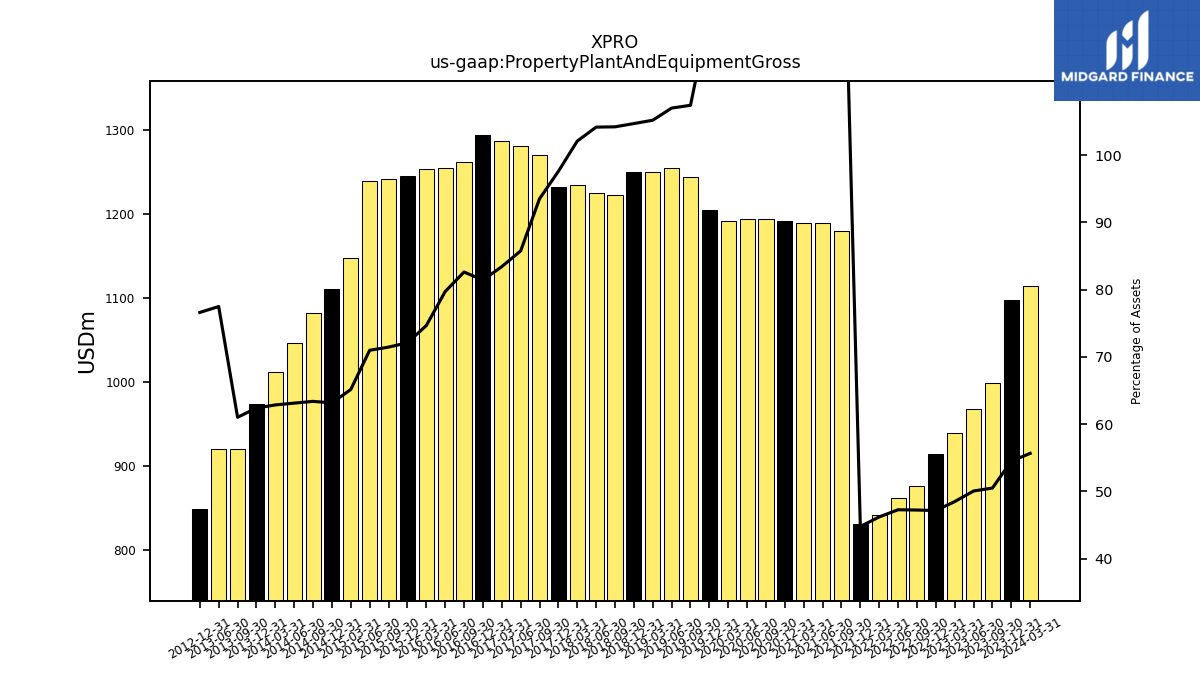
| Property Plant And Equipment Gross | 998.50 | 967.84 | 939.06 | 913.72 | 875.91 | 862.30 | 841.97 | 830.69 | 1179.56 | 1189.17 | 1189.16 | 1191.86 | 1193.82 | 1193.87 | 1191.65 | 1204.07 | 1243.58 | 1254.96 | 1250.06 | 1250.19 | 1221.95 | 1224.15 | 1234.76 | 1231.58 | 1269.41 | 1280.95 | 1286.16 | 1293.27 | 1261.27 | 1254.59 | 1252.82 | 1245.23 | 1240.79 | 1238.68 | 1147.05 | 1110.86 | 1081.58 | 1046.83 | 1011.32 | 974.22 | 919.97 | 920.62 | NA | 848.96 | NA | NA | NA | |
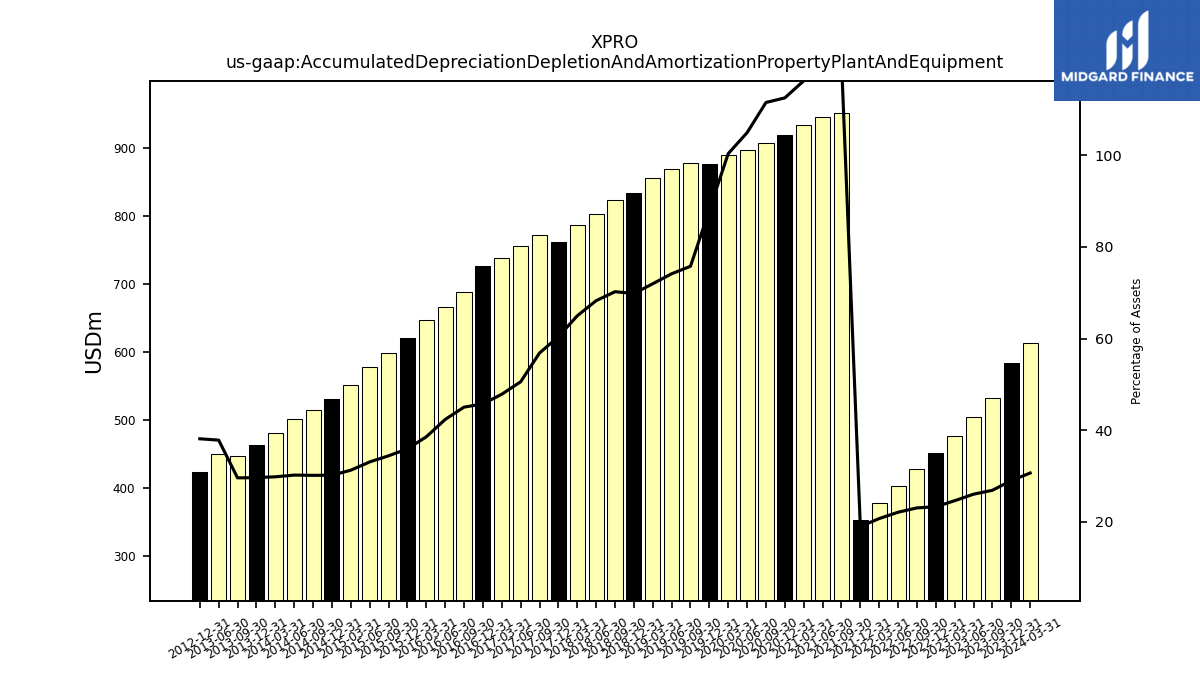
| Accumulated Depreciation Depletion And Amortization Property Plant And Equipment | 531.60 | 503.31 | 476.65 | 451.40 | 427.36 | 403.02 | 377.49 | 352.11 | 950.57 | 944.72 | 933.76 | 919.16 | 907.48 | 896.08 | 888.75 | 875.63 | 877.13 | 869.33 | 854.94 | 833.70 | 823.26 | 802.12 | 785.61 | 761.93 | 771.62 | 755.11 | 737.60 | 726.25 | 687.39 | 666.33 | 646.93 | 620.27 | 597.47 | 577.06 | 550.44 | 530.72 | 514.27 | 500.80 | 479.82 | 463.02 | 446.09 | 449.35 | NA | 422.46 | NA | NA | NA | |
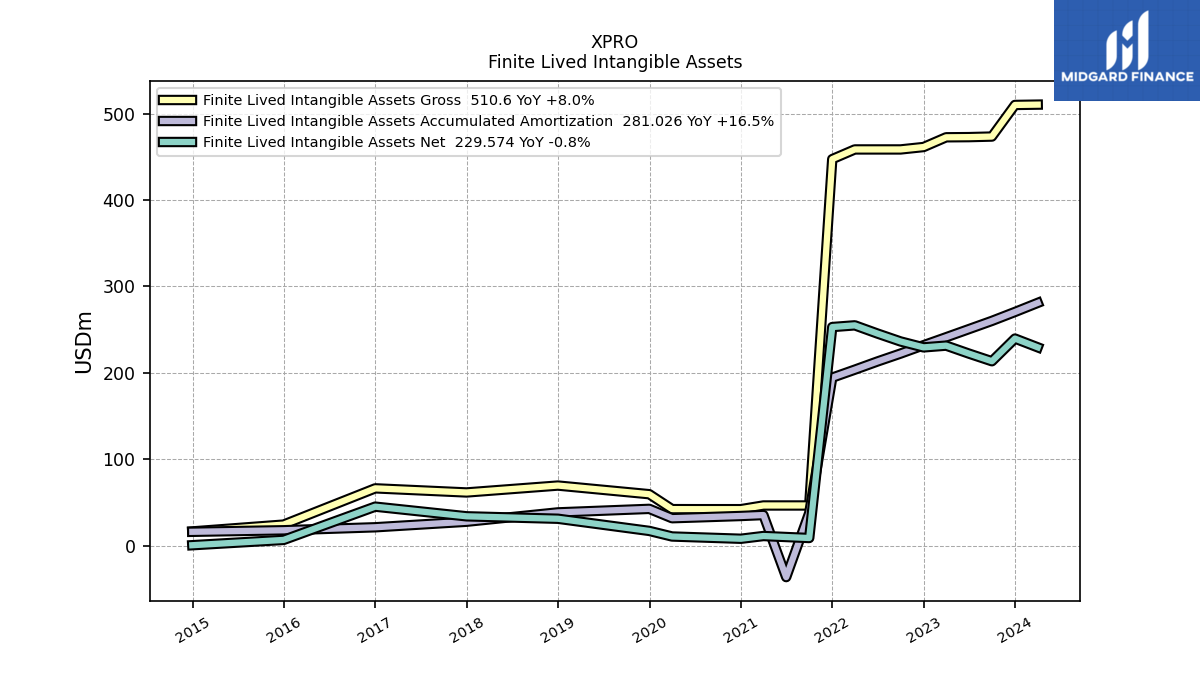
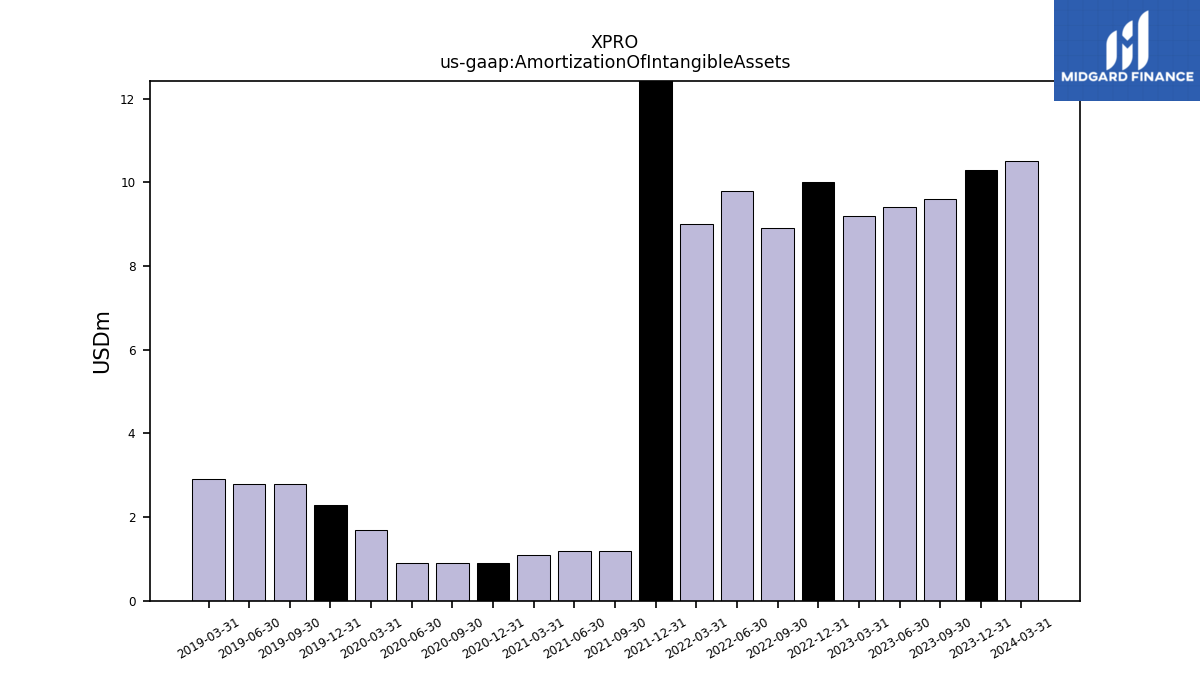
| Amortization Of Intangible Assets | 9.60 | 9.40 | 9.20 | 10.00 | 8.90 | 9.80 | 9.00 | 24.70 | 1.20 | 1.20 | 1.10 | 0.90 | 0.90 | 0.90 | 1.70 | 2.30 | 2.80 | 2.80 | 2.90 | NA | NA | NA | NA | NA | NA | NA | NA | NA | NA | NA | NA | NA | NA | NA | NA | NA | NA | NA | NA | NA | NA | NA | NA | NA | NA | NA | NA | |
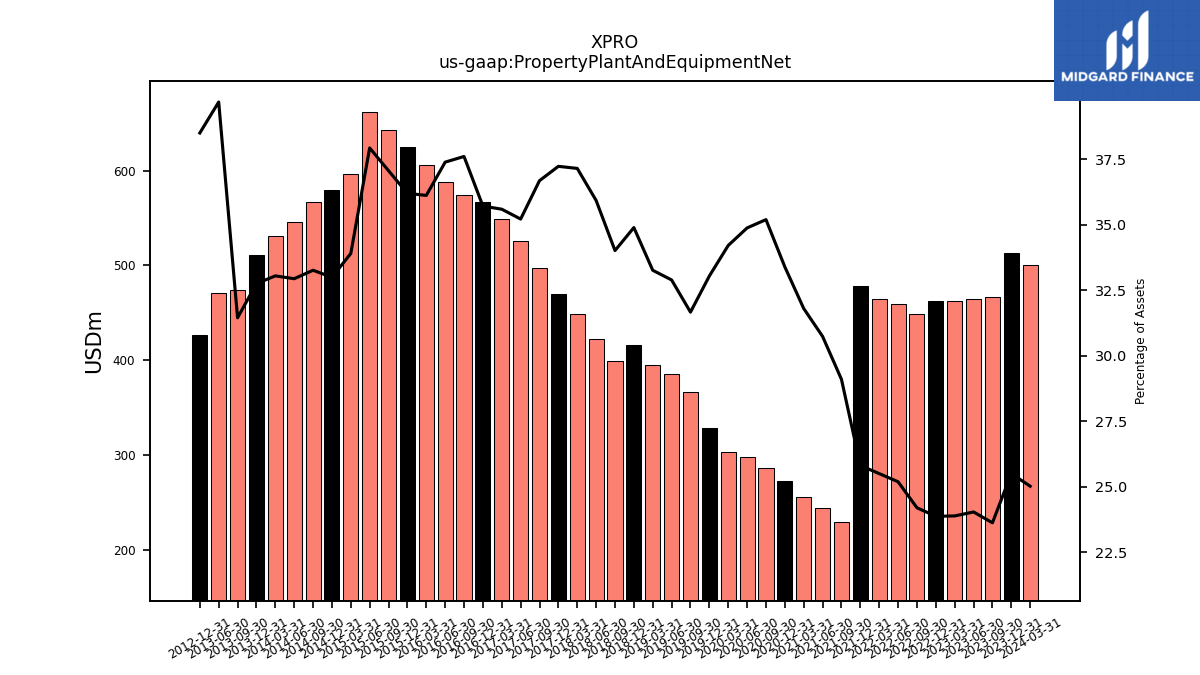
| Property Plant And Equipment Net | 466.89 | 464.52 | 462.41 | 462.32 | 448.56 | 459.28 | 464.48 | 478.58 | 228.99 | 244.46 | 255.40 | 272.71 | 286.34 | 297.79 | 302.90 | 328.43 | 366.45 | 385.64 | 395.12 | 416.49 | 398.69 | 422.03 | 449.15 | 469.65 | 497.78 | 525.84 | 548.56 | 567.02 | 573.87 | 588.26 | 605.88 | 624.96 | 643.31 | 661.63 | 596.61 | 580.14 | 567.31 | 546.03 | 531.50 | 511.20 | 473.88 | 471.27 | NA | 426.50 | NA | NA | NA | |
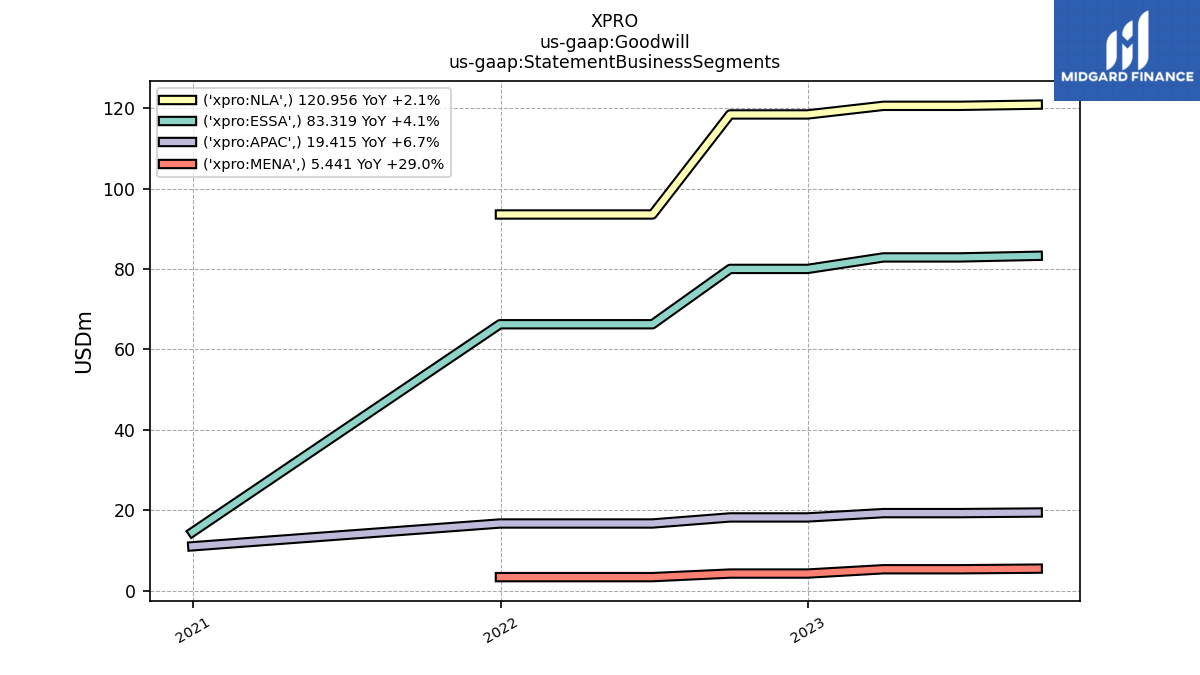
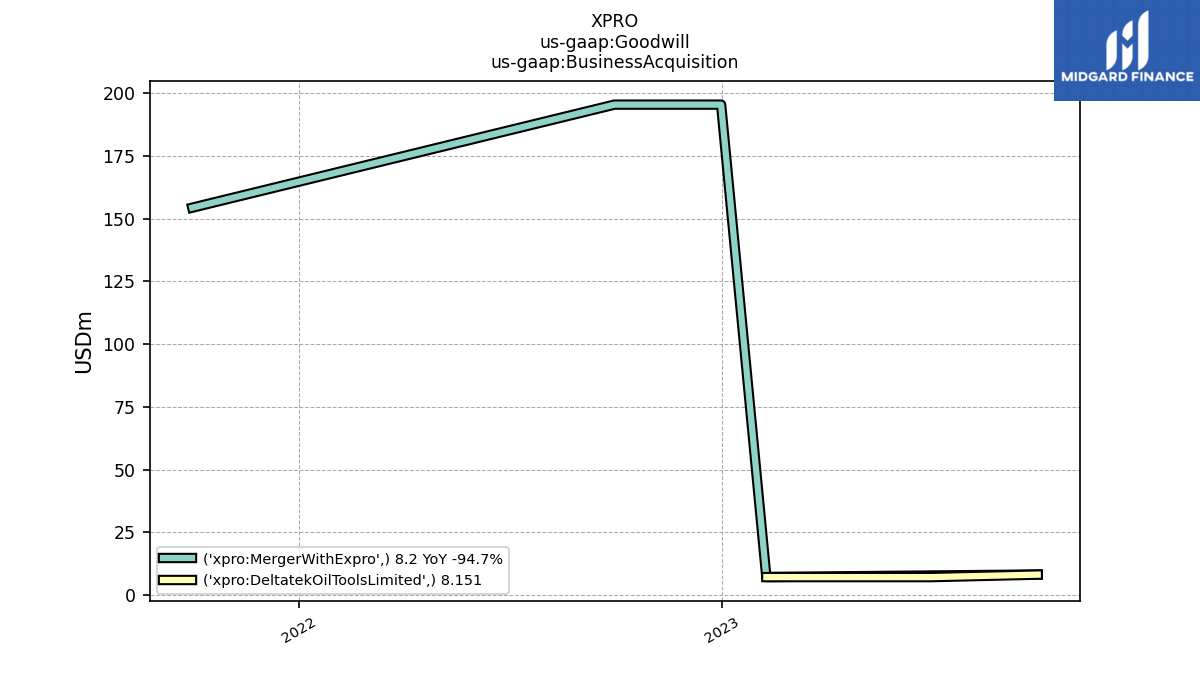
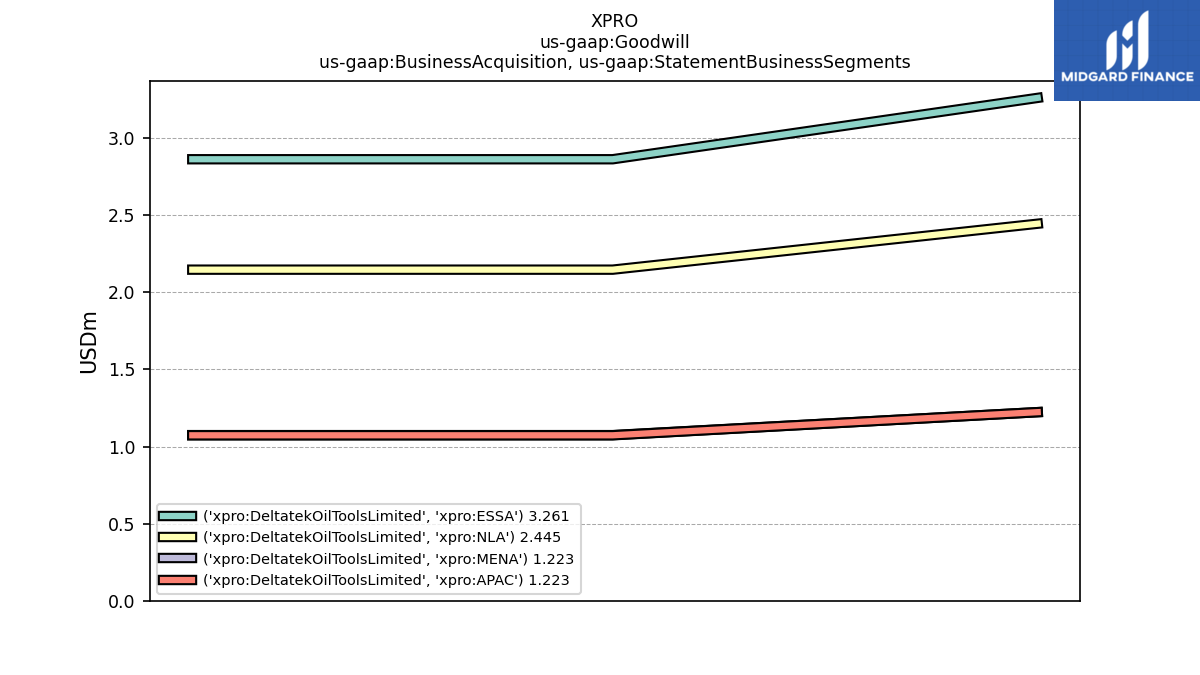
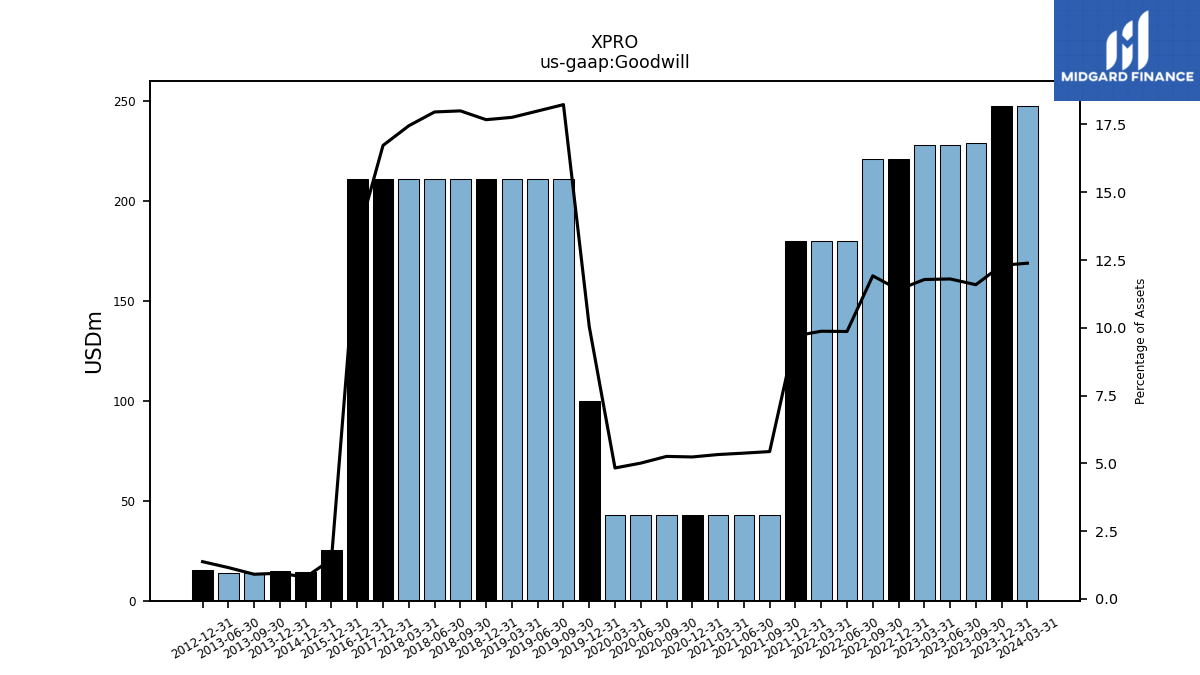
| Goodwill | 229.13 | 228.14 | 228.14 | 220.98 | 220.98 | 179.90 | 179.90 | 179.90 | 42.78 | 42.78 | 42.78 | 42.78 | 42.78 | 42.78 | 42.78 | 99.93 | 211.04 | 211.04 | 211.04 | 211.04 | 211.04 | 211.04 | 211.04 | 211.04 | NA | NA | NA | 211.06 | NA | NA | NA | 25.21 | NA | NA | NA | 14.16 | NA | NA | NA | 14.81 | 13.74 | 13.74 | NA | 15.24 | NA | NA | NA | |
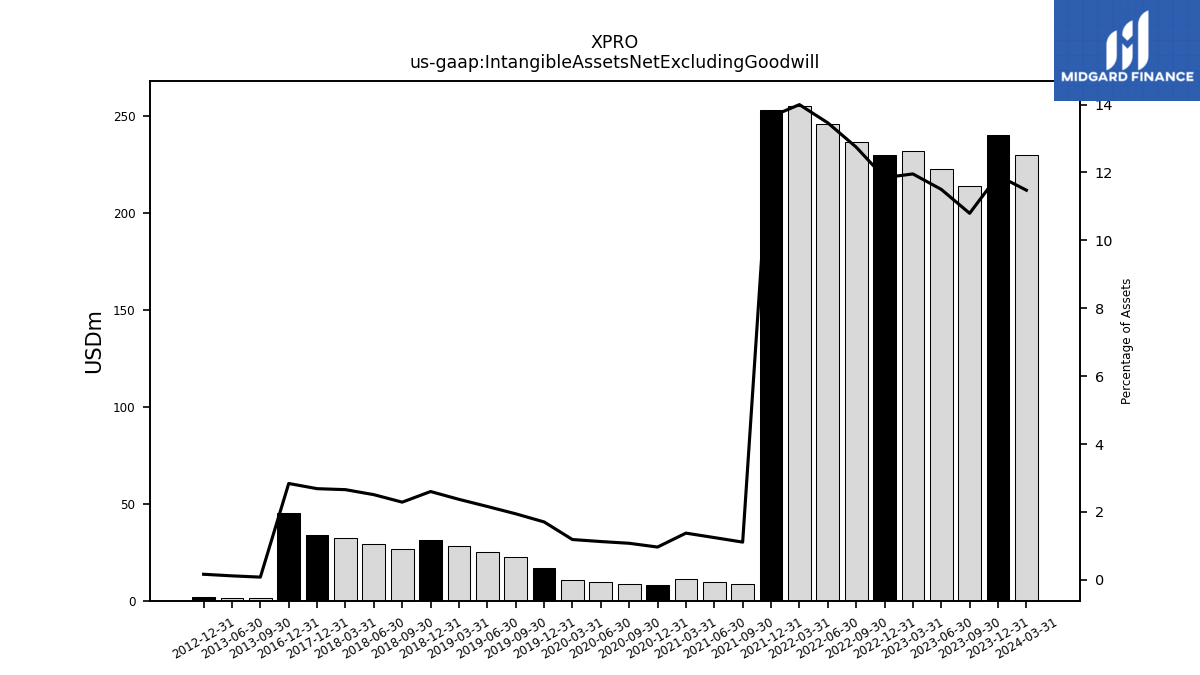
| Intangible Assets Net Excluding Goodwill | 213.45 | 222.31 | 231.53 | 229.50 | 236.36 | 245.49 | 255.02 | 253.05 | 8.76 | 9.91 | 11.06 | 7.90 | 8.77 | 9.64 | 10.52 | 16.97 | 22.53 | 25.35 | 28.18 | 31.07 | 26.84 | 29.49 | 32.13 | 33.90 | NA | NA | NA | 45.08 | NA | NA | NA | NA | NA | NA | NA | NA | NA | NA | NA | NA | 1.22 | 1.41 | NA | 1.83 | NA | NA | NA | |
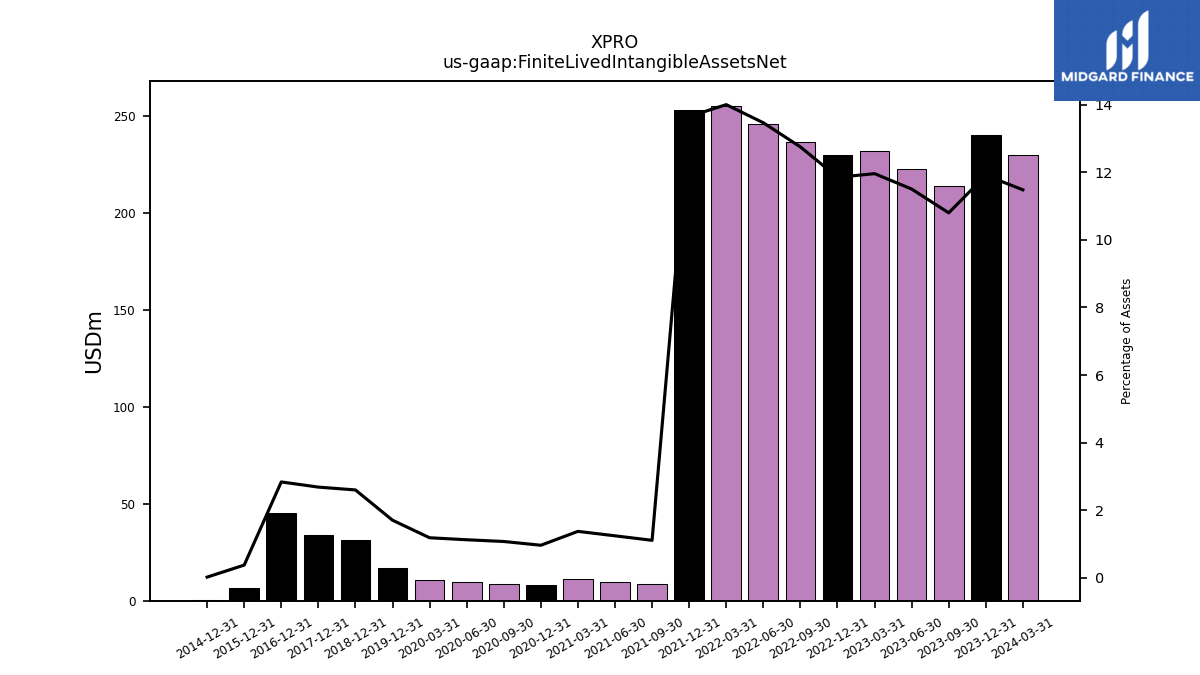
| Finite Lived Intangible Assets Net | 213.45 | 222.31 | 231.53 | 229.50 | 236.36 | 245.49 | 255.02 | 253.05 | 8.76 | 9.91 | 11.06 | 7.90 | 8.77 | 9.64 | 10.52 | 16.97 | NA | NA | NA | 31.07 | NA | NA | NA | 33.90 | NA | NA | NA | 45.08 | NA | NA | NA | 6.56 | NA | NA | NA | 0.42 | NA | NA | NA | NA | NA | NA | NA | NA | NA | NA | NA | |
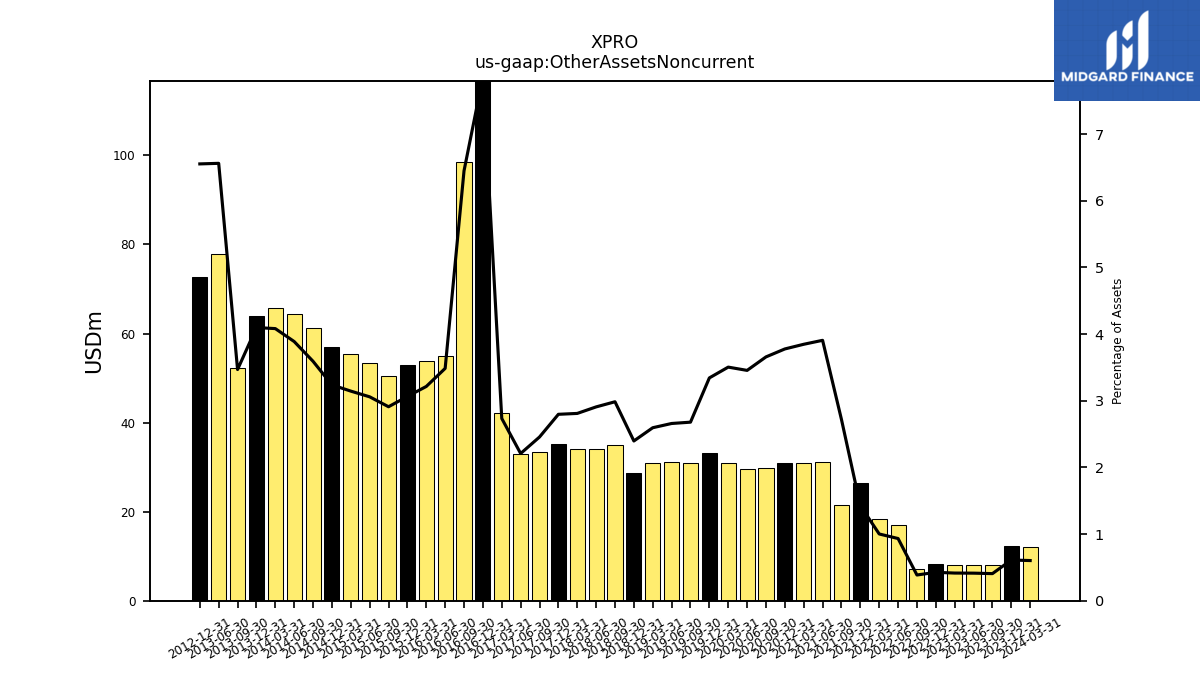
| Other Assets Noncurrent | 8.05 | 8.00 | 8.04 | 8.26 | 7.16 | 17.02 | 18.25 | 26.46 | 21.41 | 31.08 | 30.91 | 30.86 | 29.77 | 29.51 | 31.04 | 33.24 | 31.01 | 31.19 | 30.84 | 28.62 | 35.00 | 34.17 | 33.99 | 35.29 | 33.34 | 32.99 | 42.16 | 124.84 | 98.45 | 54.86 | 53.94 | 52.93 | 50.53 | 53.37 | 55.36 | 56.96 | 61.28 | 64.48 | 65.68 | 63.99 | 52.28 | 77.95 | NA | 72.61 | NA | NA | NA |
| 2023-09-30 | 2023-06-30 | 2023-03-31 | 2022-12-31 | 2022-09-30 | 2022-06-30 | 2022-03-31 | 2021-12-31 | 2021-09-30 | 2021-06-30 | 2021-03-31 | 2020-12-31 | 2020-09-30 | 2020-06-30 | 2020-03-31 | 2019-12-31 | 2019-09-30 | 2019-06-30 | 2019-03-31 | 2018-12-31 | 2018-09-30 | 2018-06-30 | 2018-03-31 | 2017-12-31 | 2017-09-30 | 2017-06-30 | 2017-03-31 | 2016-12-31 | 2016-09-30 | 2016-06-30 | 2016-03-31 | 2015-12-31 | 2015-09-30 | 2015-06-30 | 2015-03-31 | 2014-12-31 | 2014-09-30 | 2014-06-30 | 2014-03-31 | 2013-12-31 | 2013-09-30 | 2013-06-30 | 2013-03-31 | 2012-12-31 | 2012-09-30 | 2012-06-30 | 2012-03-31 | ||
|---|---|---|---|---|---|---|---|---|---|---|---|---|---|---|---|---|---|---|---|---|---|---|---|---|---|---|---|---|---|---|---|---|---|---|---|---|---|---|---|---|---|---|---|---|---|---|---|---|
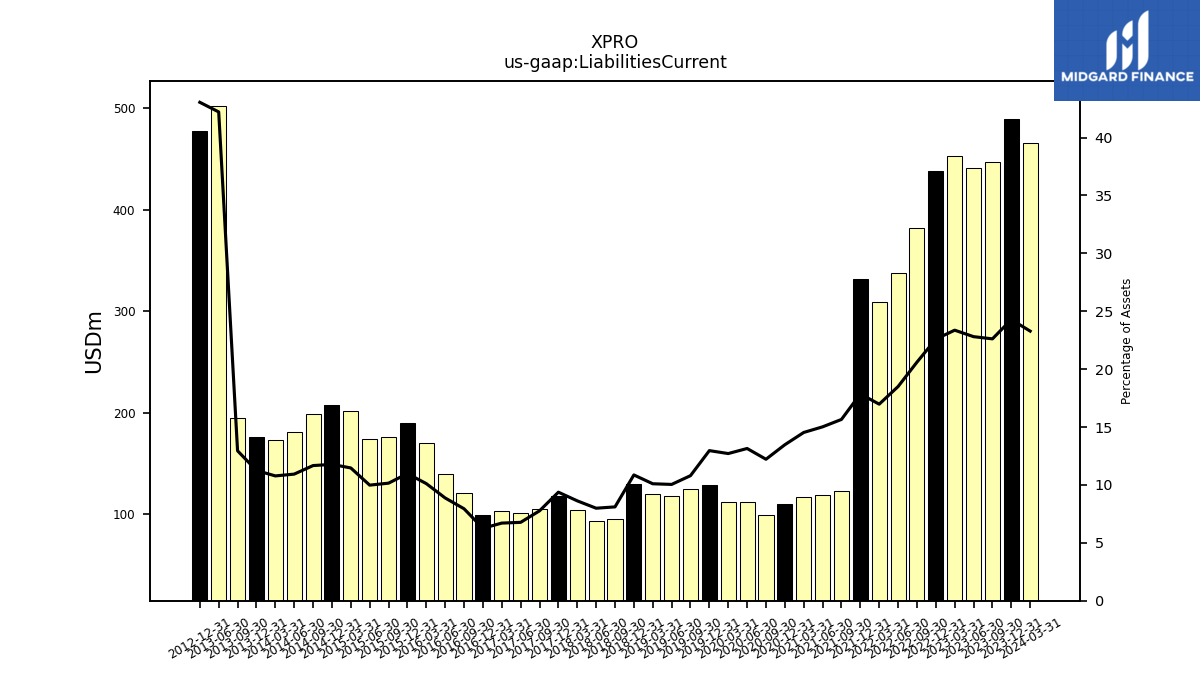
| Liabilities Current | 447.15 | 440.90 | 452.51 | 437.71 | 382.09 | 337.38 | 309.34 | 331.21 | 123.27 | 119.48 | 116.75 | 110.08 | 99.45 | 112.30 | 112.59 | 128.90 | 125.05 | 117.82 | 120.06 | 129.72 | 95.04 | 93.90 | 104.34 | 118.31 | 105.39 | 101.13 | 103.39 | 99.38 | 121.27 | 139.71 | 169.76 | 189.63 | 176.31 | 174.21 | 201.88 | 207.14 | 199.16 | 181.35 | 173.44 | 175.72 | 195.19 | 501.47 | NA | 476.97 | NA | NA | NA | |
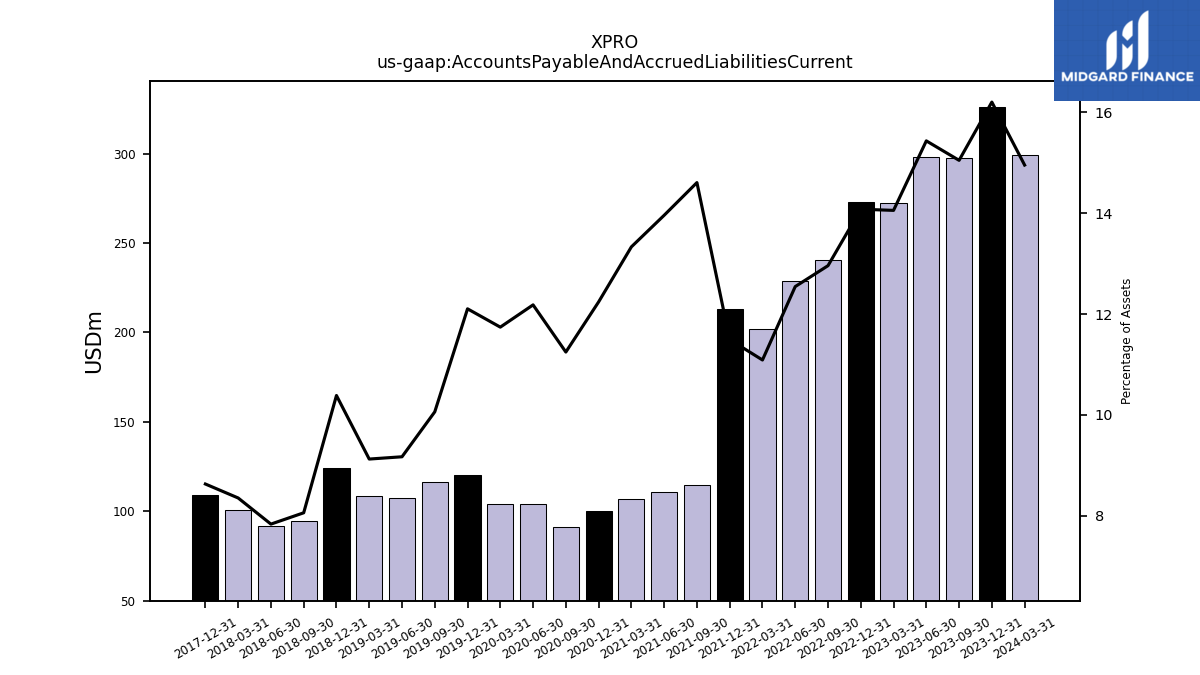
| Accounts Payable And Accrued Liabilities Current | 297.46 | 298.31 | 272.16 | 272.70 | 240.28 | 228.76 | 202.02 | 213.15 | 114.96 | 111.03 | 107.08 | 99.99 | 91.51 | 104.02 | 103.97 | 120.32 | 116.45 | 107.53 | 108.41 | 123.98 | 94.48 | 92.06 | 101.01 | 108.89 | NA | NA | NA | NA | NA | NA | NA | NA | NA | NA | NA | NA | NA | NA | NA | NA | NA | NA | NA | NA | NA | NA | NA | |
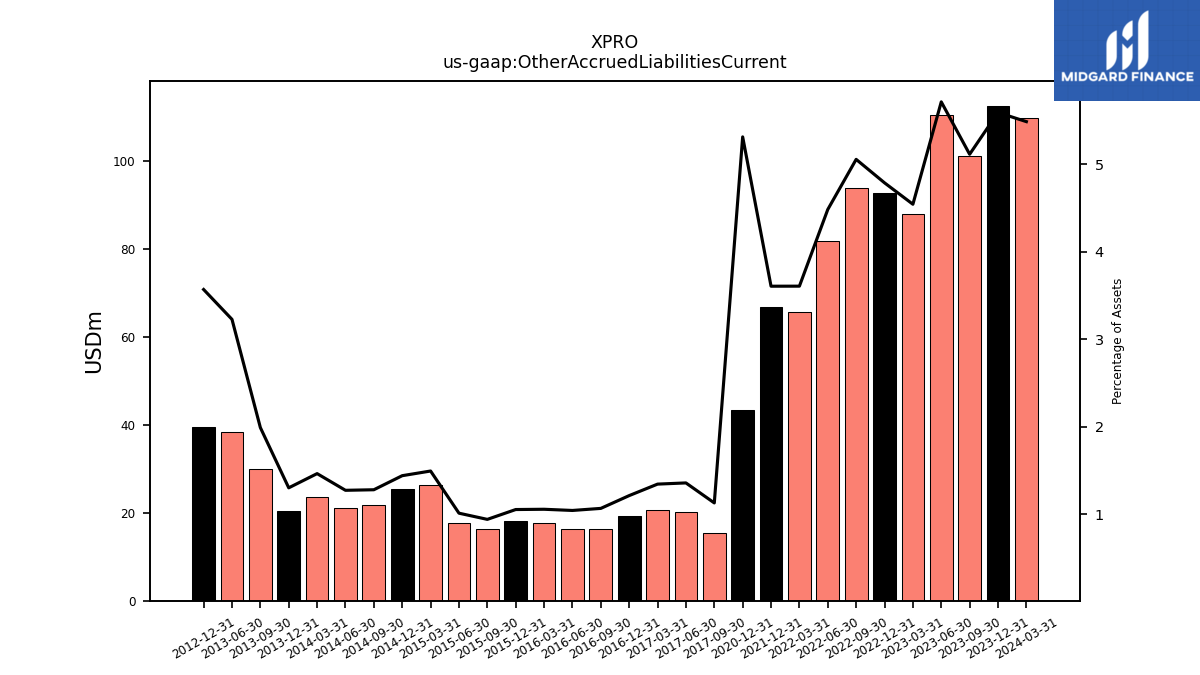
| Other Accrued Liabilities Current | 101.07 | 110.39 | 87.95 | 92.72 | 93.72 | 81.74 | 65.69 | 66.86 | NA | NA | NA | 43.39 | NA | NA | NA | NA | NA | NA | NA | NA | NA | NA | NA | NA | 15.33 | 20.28 | 20.72 | 19.27 | 16.29 | 16.42 | 17.73 | 18.20 | 16.35 | 17.66 | 26.30 | 25.34 | 21.84 | 21.12 | 23.55 | 20.33 | 30.00 | 38.32 | NA | 39.53 | NA | NA | NA | |
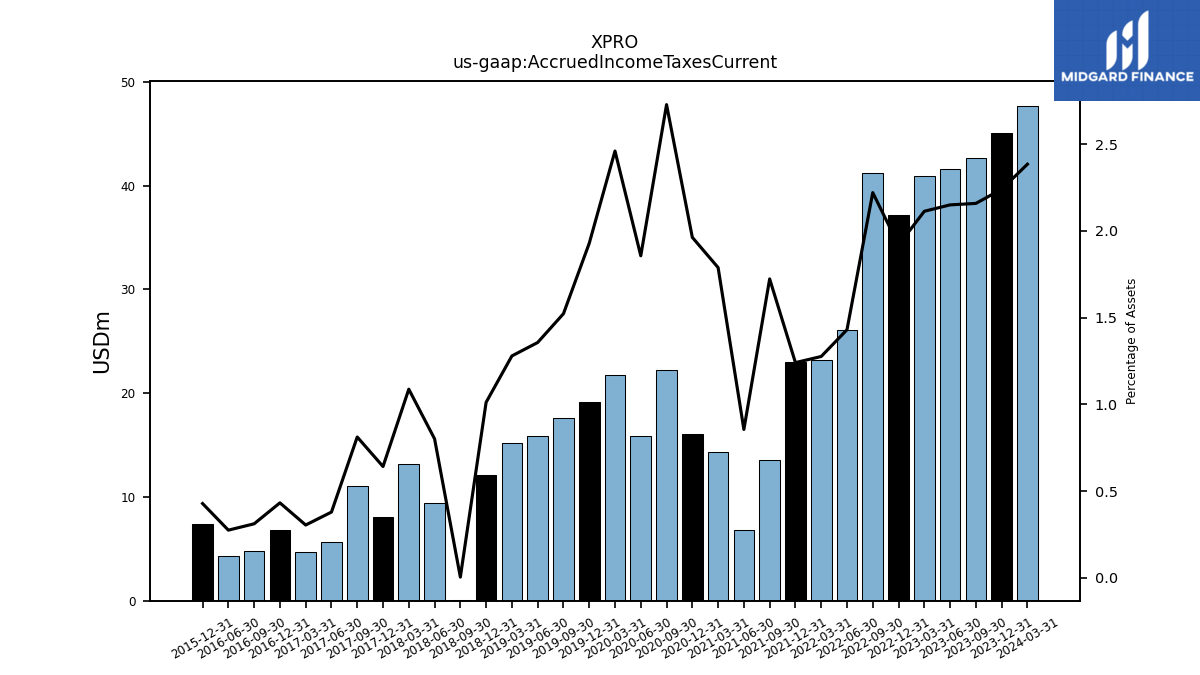
| Accrued Income Taxes Current | 42.66 | 41.55 | 40.91 | 37.15 | 41.17 | 26.08 | 23.24 | 23.00 | 13.56 | 6.80 | 14.36 | 16.03 | 22.20 | 15.85 | 21.79 | 19.17 | 17.62 | 15.90 | 15.19 | 12.07 | 0.04 | 9.41 | 13.14 | 8.09 | 11.01 | 5.65 | 4.68 | 6.86 | 4.75 | 4.32 | NA | 7.38 | NA | NA | NA | NA | NA | NA | NA | NA | NA | NA | NA | NA | NA | NA | NA | |
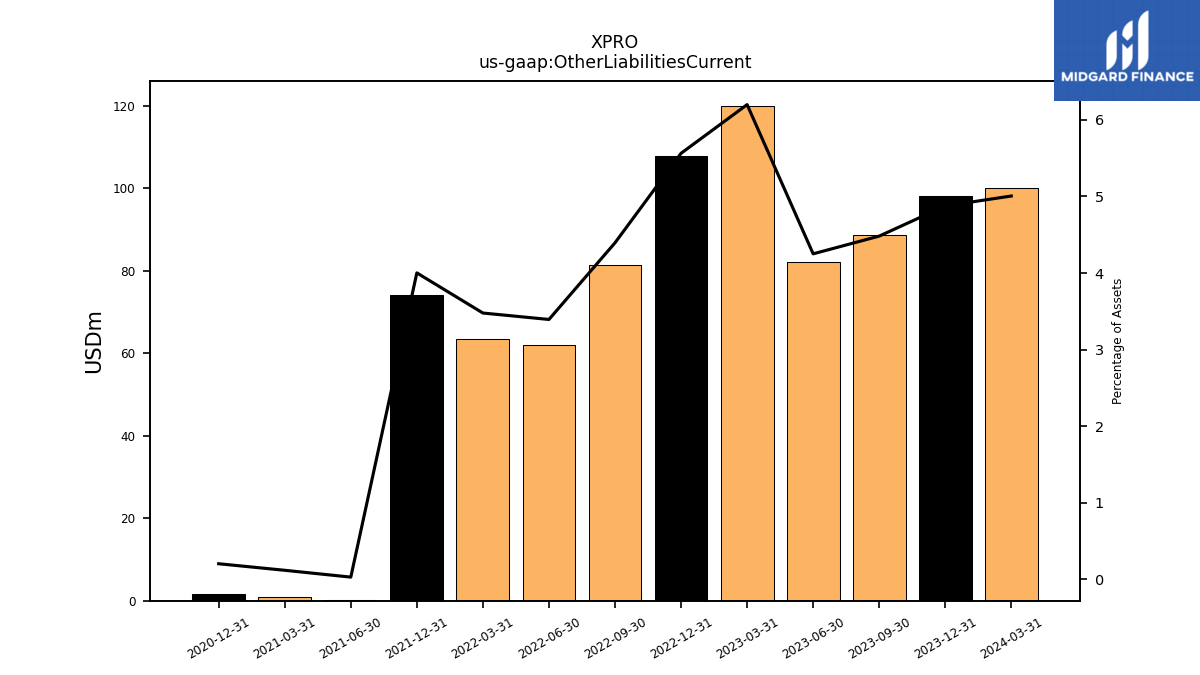
| Other Liabilities Current | 88.60 | 82.16 | 120.02 | 107.75 | 81.48 | 61.89 | 63.36 | 74.21 | NA | 0.24 | 0.96 | 1.67 | NA | NA | NA | NA | NA | NA | NA | NA | NA | NA | NA | NA | NA | NA | NA | NA | NA | NA | NA | NA | NA | NA | NA | NA | NA | NA | NA | NA | NA | NA | NA | NA | NA | NA | NA |
| 2023-09-30 | 2023-06-30 | 2023-03-31 | 2022-12-31 | 2022-09-30 | 2022-06-30 | 2022-03-31 | 2021-12-31 | 2021-09-30 | 2021-06-30 | 2021-03-31 | 2020-12-31 | 2020-09-30 | 2020-06-30 | 2020-03-31 | 2019-12-31 | 2019-09-30 | 2019-06-30 | 2019-03-31 | 2018-12-31 | 2018-09-30 | 2018-06-30 | 2018-03-31 | 2017-12-31 | 2017-09-30 | 2017-06-30 | 2017-03-31 | 2016-12-31 | 2016-09-30 | 2016-06-30 | 2016-03-31 | 2015-12-31 | 2015-09-30 | 2015-06-30 | 2015-03-31 | 2014-12-31 | 2014-09-30 | 2014-06-30 | 2014-03-31 | 2013-12-31 | 2013-09-30 | 2013-06-30 | 2013-03-31 | 2012-12-31 | 2012-09-30 | 2012-06-30 | 2012-03-31 | ||
|---|---|---|---|---|---|---|---|---|---|---|---|---|---|---|---|---|---|---|---|---|---|---|---|---|---|---|---|---|---|---|---|---|---|---|---|---|---|---|---|---|---|---|---|---|---|---|---|---|
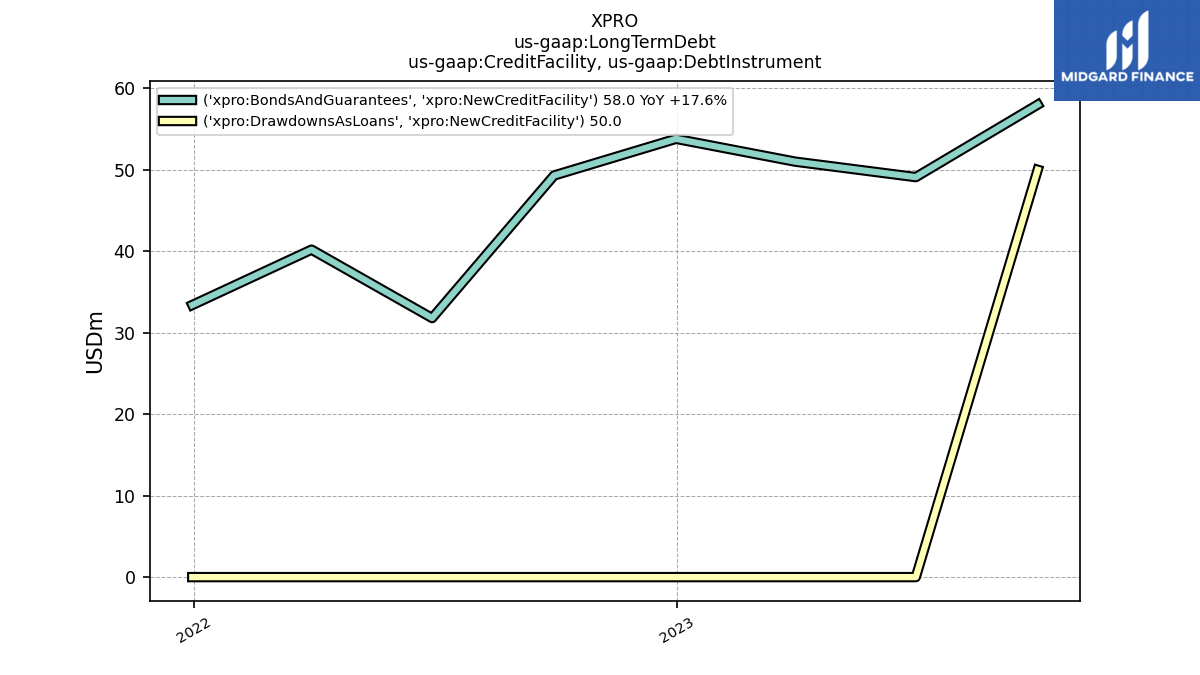
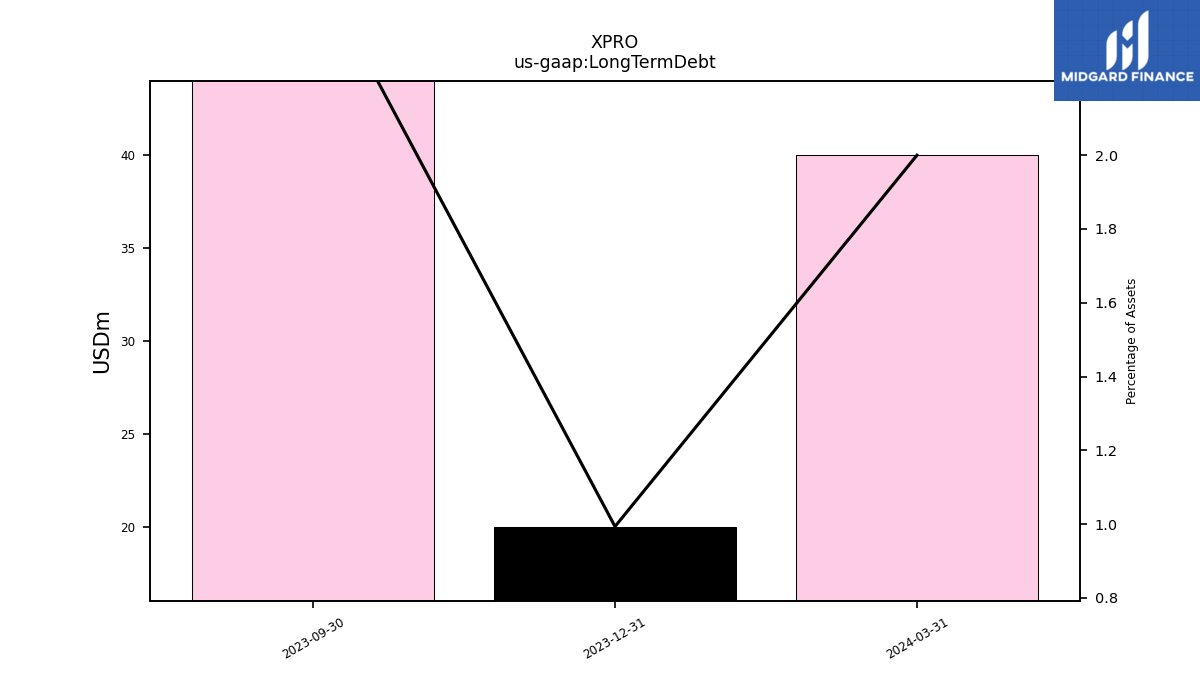
| Long Term Debt | 50.00 | NA | NA | NA | NA | NA | NA | NA | NA | NA | NA | NA | NA | NA | NA | NA | NA | NA | NA | NA | NA | NA | NA | NA | NA | NA | NA | NA | NA | NA | NA | NA | NA | NA | NA | NA | NA | NA | NA | NA | NA | NA | NA | NA | NA | NA | NA | |
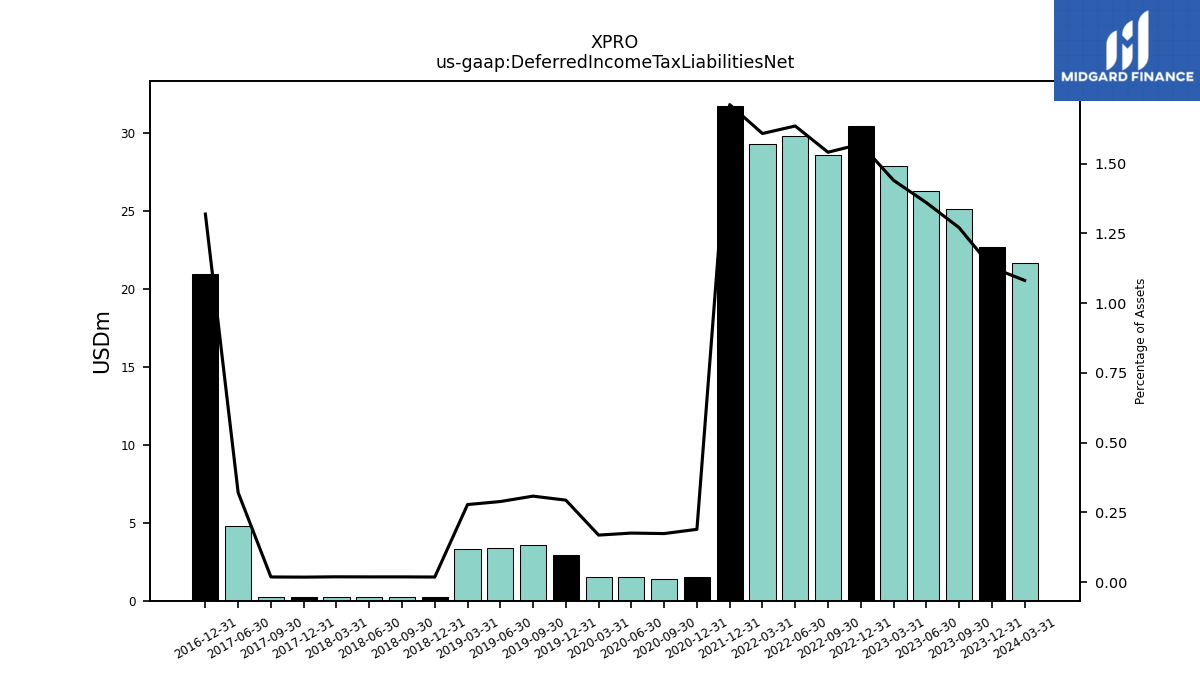
| Deferred Income Tax Liabilities Net | 25.12 | 26.30 | 27.89 | 30.42 | 28.57 | 29.82 | 29.30 | 31.74 | NA | NA | NA | 1.55 | 1.42 | 1.50 | 1.50 | 2.92 | 3.57 | 3.39 | 3.31 | 0.22 | 0.22 | 0.22 | 0.23 | 0.23 | 0.25 | 4.80 | NA | 20.95 | NA | NA | NA | NA | NA | NA | NA | NA | NA | NA | NA | NA | NA | NA | NA | NA | NA | NA | NA | |
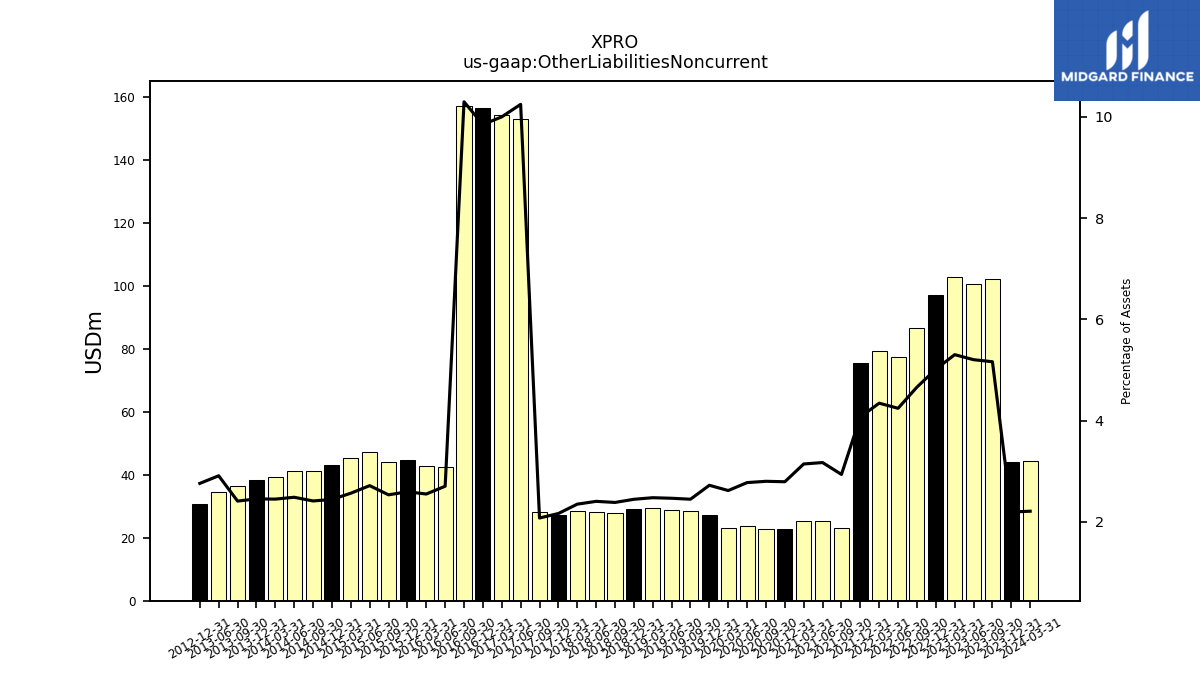
| Other Liabilities Noncurrent | 102.07 | 100.59 | 102.69 | 97.17 | 86.45 | 77.40 | 79.16 | 75.54 | 23.12 | 25.23 | 25.26 | 22.82 | 22.80 | 23.71 | 23.20 | 27.08 | 28.34 | 28.93 | 29.44 | 29.21 | 27.95 | 28.27 | 28.43 | 27.33 | 28.19 | 153.03 | 154.15 | 156.41 | 157.17 | 42.56 | 42.80 | 44.82 | 44.01 | 47.39 | 45.17 | 42.98 | 41.18 | 41.23 | 39.42 | 38.33 | 36.34 | 34.58 | NA | 30.59 | NA | NA | NA | |
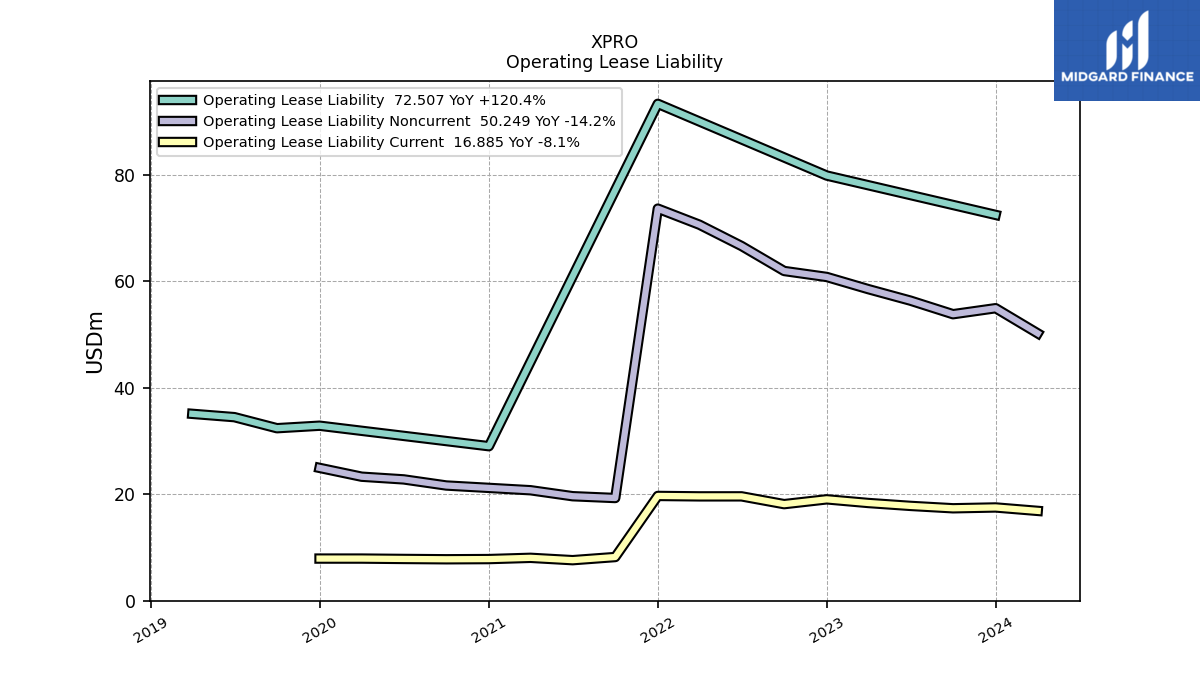
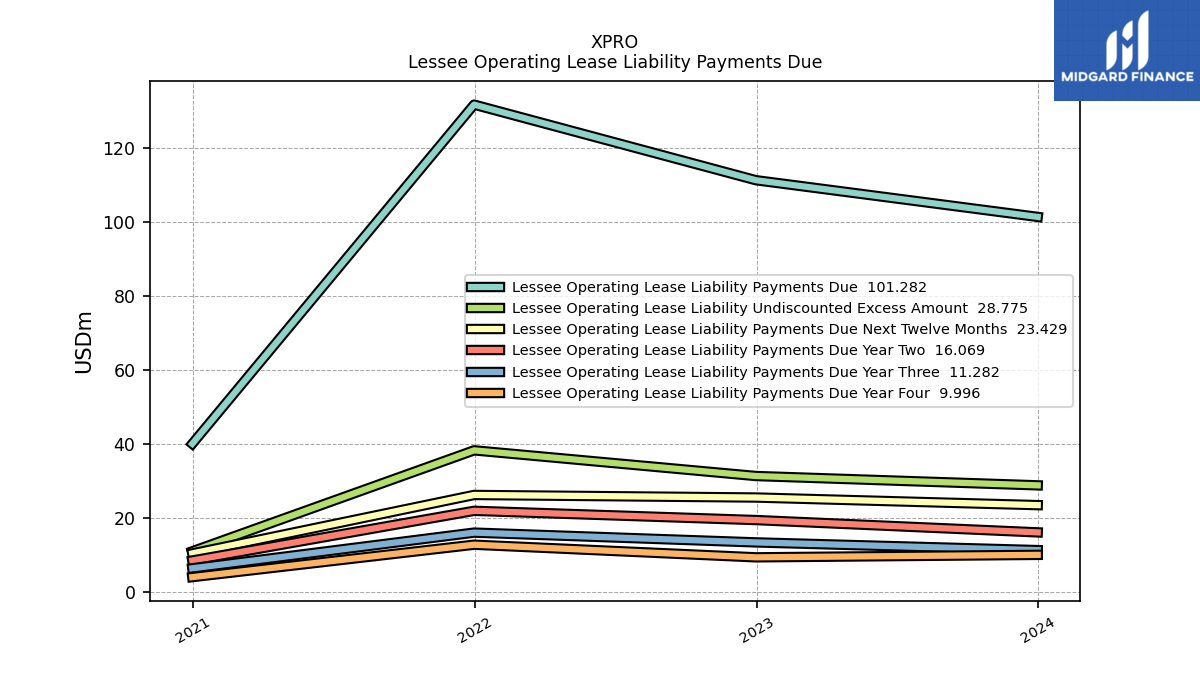
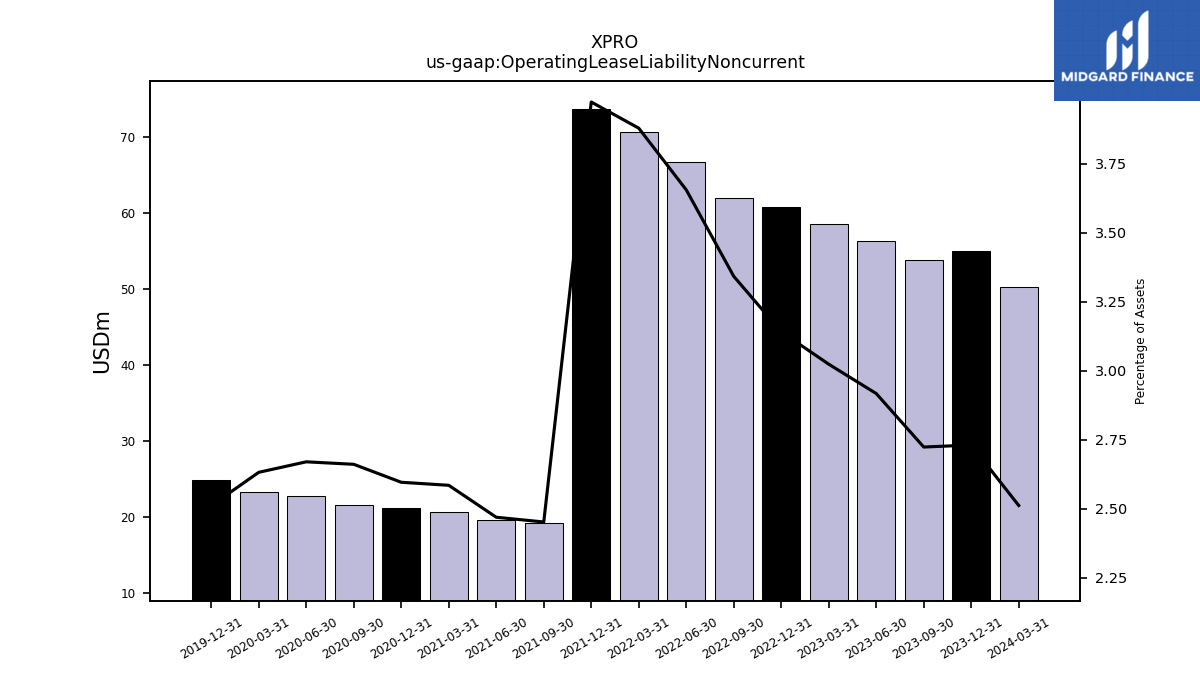
| Operating Lease Liability Noncurrent | 53.85 | 56.40 | 58.55 | 60.85 | 61.97 | 66.66 | 70.66 | 73.69 | 19.30 | 19.64 | 20.77 | 21.21 | 21.66 | 22.80 | 23.31 | 24.97 | NA | NA | NA | NA | NA | NA | NA | NA | NA | NA | NA | NA | NA | NA | NA | NA | NA | NA | NA | NA | NA | NA | NA | NA | NA | NA | NA | NA | NA | NA | NA |
| 2023-09-30 | 2023-06-30 | 2023-03-31 | 2022-12-31 | 2022-09-30 | 2022-06-30 | 2022-03-31 | 2021-12-31 | 2021-09-30 | 2021-06-30 | 2021-03-31 | 2020-12-31 | 2020-09-30 | 2020-06-30 | 2020-03-31 | 2019-12-31 | 2019-09-30 | 2019-06-30 | 2019-03-31 | 2018-12-31 | 2018-09-30 | 2018-06-30 | 2018-03-31 | 2017-12-31 | 2017-09-30 | 2017-06-30 | 2017-03-31 | 2016-12-31 | 2016-09-30 | 2016-06-30 | 2016-03-31 | 2015-12-31 | 2015-09-30 | 2015-06-30 | 2015-03-31 | 2014-12-31 | 2014-09-30 | 2014-06-30 | 2014-03-31 | 2013-12-31 | 2013-09-30 | 2013-06-30 | 2013-03-31 | 2012-12-31 | 2012-09-30 | 2012-06-30 | 2012-03-31 | ||
|---|---|---|---|---|---|---|---|---|---|---|---|---|---|---|---|---|---|---|---|---|---|---|---|---|---|---|---|---|---|---|---|---|---|---|---|---|---|---|---|---|---|---|---|---|---|---|---|---|
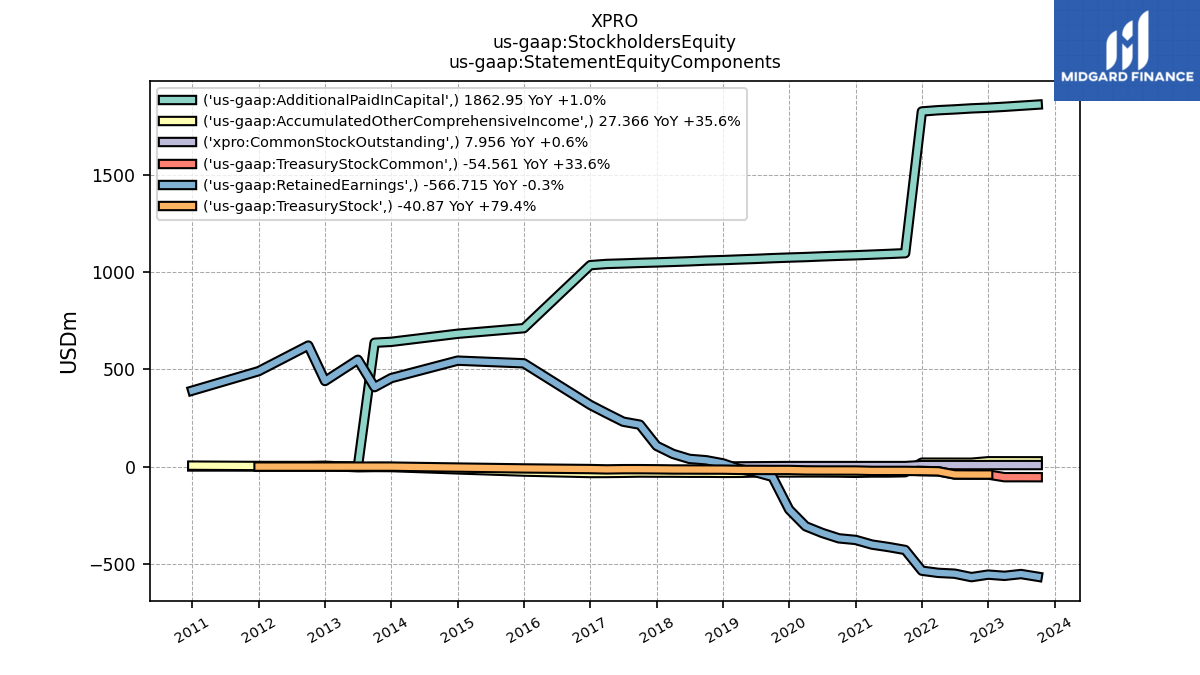
| Stockholders Equity | 1277.00 | 1285.62 | 1270.68 | 1285.89 | 1262.13 | 1274.93 | 1291.29 | 1297.57 | 621.44 | 631.14 | 640.50 | 661.25 | 668.44 | 693.66 | 725.04 | 810.29 | 976.03 | 996.08 | 1007.87 | 1034.77 | 1049.18 | 1052.58 | 1076.31 | 1115.90 | 1223.48 | 1234.49 | 1272.54 | 1311.32 | 1247.93 | 1142.19 | 1193.37 | 1211.30 | 1224.69 | 1231.74 | 1222.66 | 1472.54 | 1195.45 | 1172.26 | 1132.35 | 1333.33 | 1271.51 | 548.88 | NA | 446.99 | 844.28 | NA | NA | |
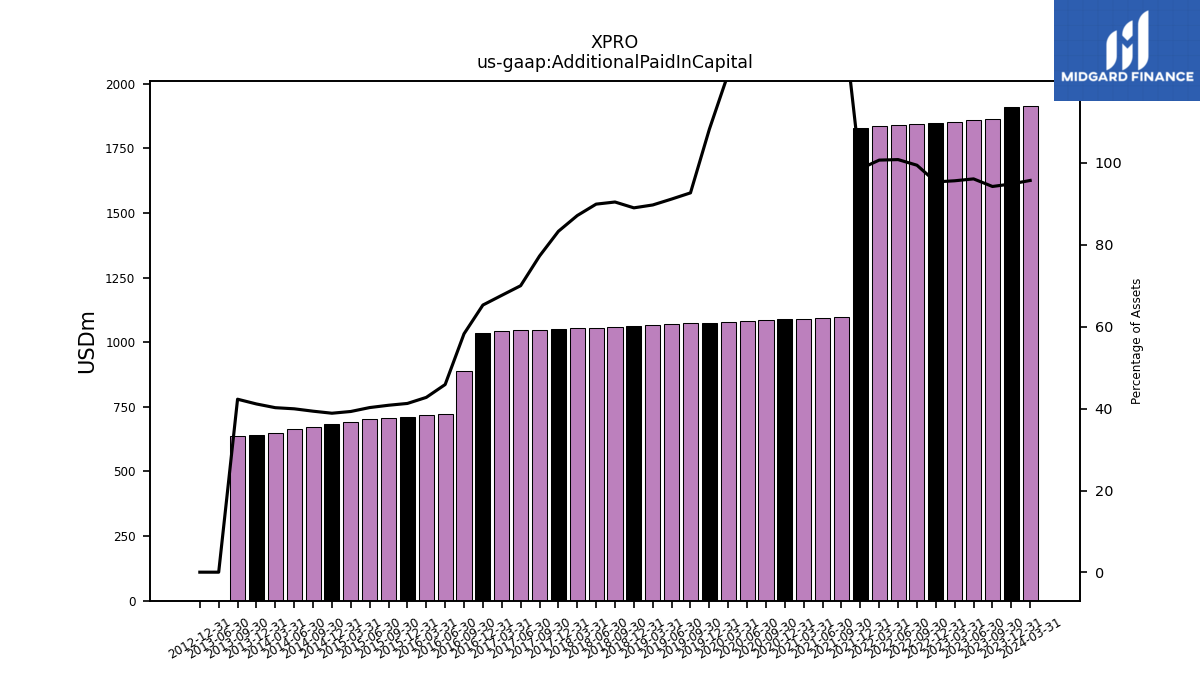
| Additional Paid In Capital | 1862.95 | 1857.39 | 1851.82 | 1847.08 | 1843.60 | 1838.37 | 1834.18 | 1827.78 | 1098.24 | 1094.45 | 1091.03 | 1087.73 | 1085.16 | 1082.01 | 1078.50 | 1075.81 | 1072.77 | 1069.07 | 1066.05 | 1062.79 | 1060.35 | 1056.59 | 1053.70 | 1050.87 | 1048.50 | 1045.49 | 1042.98 | 1036.79 | 889.38 | 721.98 | 717.08 | 712.49 | 708.64 | 702.27 | 691.68 | 683.61 | 671.60 | 662.40 | 647.05 | 642.16 | 637.46 | 0.69 | NA | 0.69 | NA | NA | NA | |
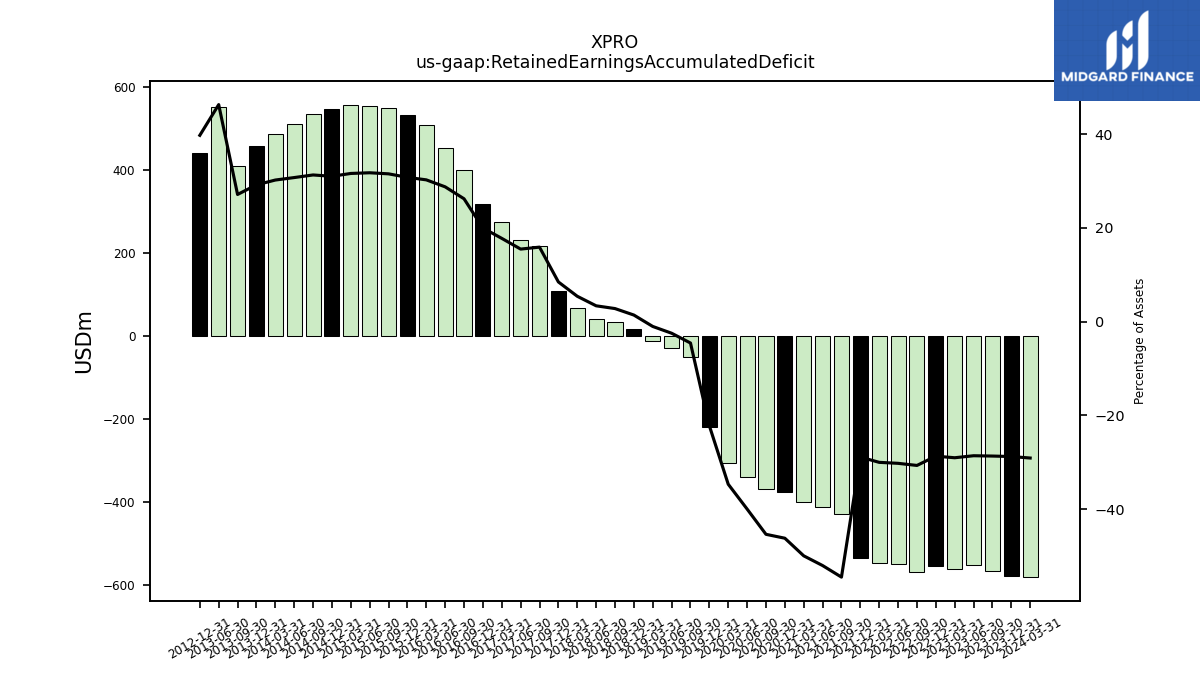
| Retained Earnings Accumulated Deficit | -566.72 | -552.83 | -562.12 | -555.77 | -568.70 | -551.11 | -546.76 | -535.63 | -428.93 | -413.85 | -401.23 | -377.35 | -369.14 | -341.35 | -307.10 | -220.81 | -52.71 | -28.92 | -12.13 | 16.86 | 32.76 | 39.76 | 65.52 | 106.92 | 215.79 | 231.23 | 273.90 | 317.27 | 400.13 | 452.61 | 507.55 | 531.62 | 547.46 | 554.16 | 556.49 | 545.36 | 533.89 | 509.68 | 485.98 | 455.63 | 408.97 | 549.95 | NA | 440.40 | NA | NA | NA | |
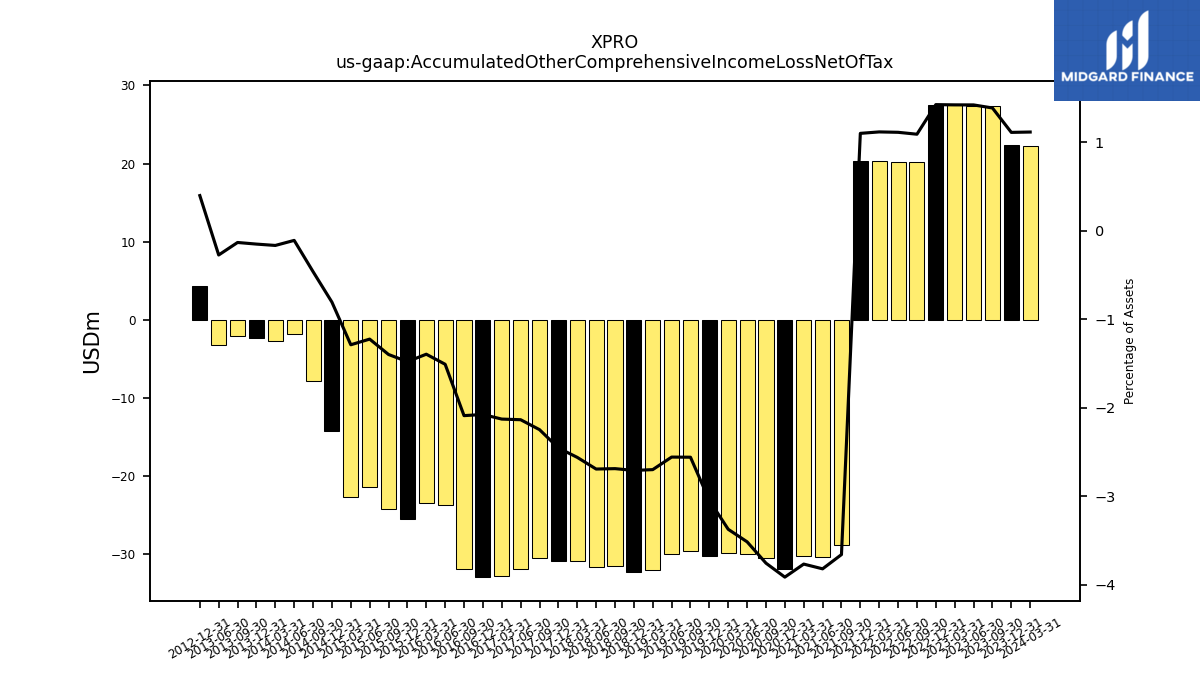
| Accumulated Other Comprehensive Income Loss Net Of Tax | 27.37 | 27.43 | 27.49 | 27.55 | 20.18 | 20.24 | 20.30 | 20.36 | -28.80 | -30.38 | -30.25 | -31.97 | -30.56 | -30.01 | -29.87 | -30.30 | -29.62 | -29.99 | -32.07 | -32.34 | -31.52 | -31.64 | -30.97 | -30.97 | -30.51 | -31.90 | -32.81 | -32.98 | -31.89 | -23.76 | -23.43 | -25.55 | -24.29 | -21.38 | -22.70 | -14.21 | -7.91 | -1.84 | -2.70 | -2.38 | -2.03 | -3.27 | NA | 4.38 | NA | NA | NA | |
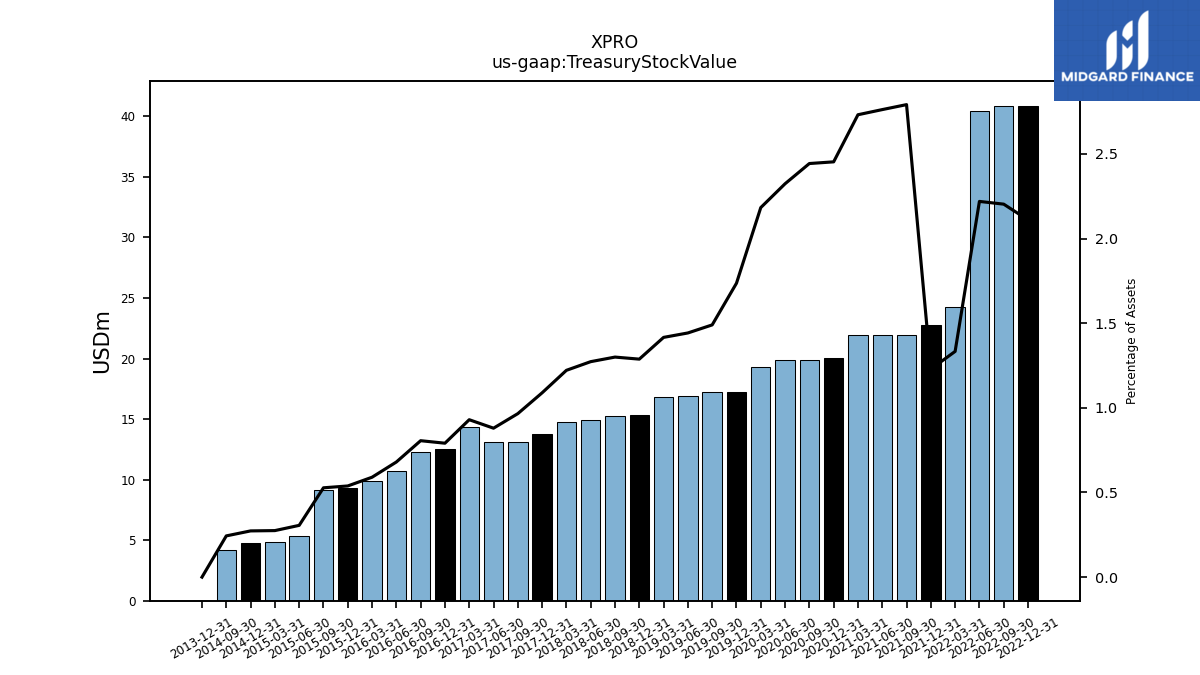
| Treasury Stock Value | NA | NA | NA | 40.87 | 40.85 | 40.47 | 24.29 | 22.79 | 21.97 | 21.97 | 21.94 | 20.04 | 19.88 | 19.84 | 19.33 | 17.26 | 17.25 | 16.91 | 16.82 | 15.37 | 15.24 | 14.95 | 14.77 | 13.74 | 13.11 | 13.14 | 14.33 | 12.56 | 12.30 | 10.70 | 9.90 | 9.30 | 9.16 | 5.33 | 4.84 | 4.80 | 4.15 | NA | NA | 0.00 | NA | NA | NA | NA | NA | NA | NA | |
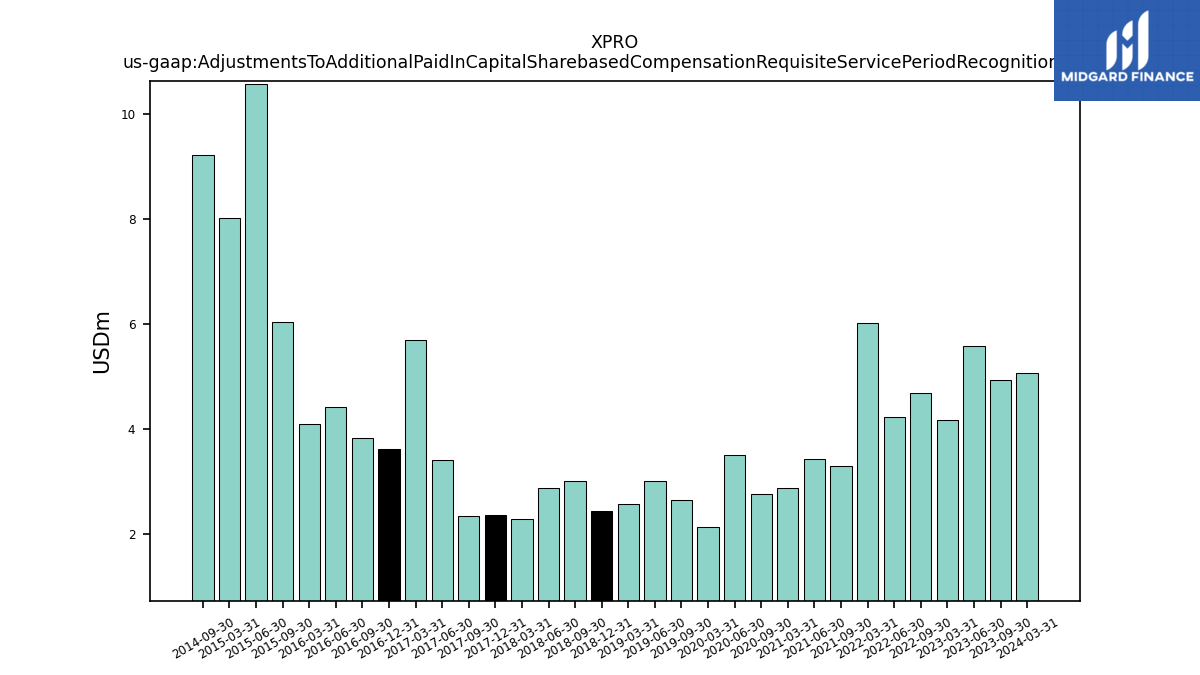
| Adjustments To Additional Paid In Capital Sharebased Compensation Requisite Service Period Recognition Value | 4.93 | 5.58 | 4.17 | NA | 4.68 | 4.23 | 6.02 | NA | 3.31 | 3.42 | 2.87 | NA | 2.77 | 3.52 | 2.15 | NA | 2.65 | 3.02 | 2.57 | 2.44 | 3.01 | 2.89 | 2.28 | 2.37 | 2.34 | 3.42 | 5.70 | 3.62 | 3.83 | 4.42 | 4.10 | NA | 6.04 | 10.56 | 8.01 | NA | 9.21 | NA | NA | NA | NA | NA | NA | NA | NA | NA | NA |
| 2023-09-30 | 2023-06-30 | 2023-03-31 | 2022-12-31 | 2022-09-30 | 2022-06-30 | 2022-03-31 | 2021-12-31 | 2021-09-30 | 2021-06-30 | 2021-03-31 | 2020-12-31 | 2020-09-30 | 2020-06-30 | 2020-03-31 | 2019-12-31 | 2019-09-30 | 2019-06-30 | 2019-03-31 | 2018-12-31 | 2018-09-30 | 2018-06-30 | 2018-03-31 | 2017-12-31 | 2017-09-30 | 2017-06-30 | 2017-03-31 | 2016-12-31 | 2016-09-30 | 2016-06-30 | 2016-03-31 | 2015-12-31 | 2015-09-30 | 2015-06-30 | 2015-03-31 | 2014-12-31 | 2014-09-30 | 2014-06-30 | 2014-03-31 | 2013-12-31 | 2013-09-30 | 2013-06-30 | 2013-03-31 | 2012-12-31 | 2012-09-30 | 2012-06-30 | 2012-03-31 | ||
|---|---|---|---|---|---|---|---|---|---|---|---|---|---|---|---|---|---|---|---|---|---|---|---|---|---|---|---|---|---|---|---|---|---|---|---|---|---|---|---|---|---|---|---|---|---|---|---|---|
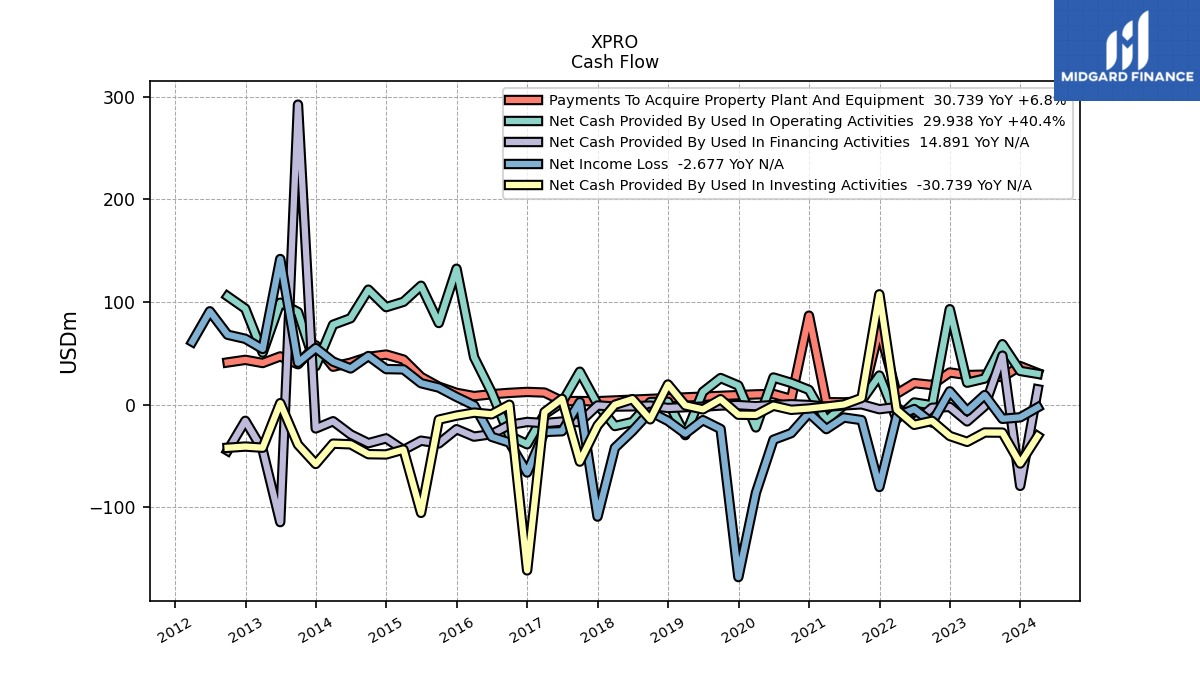
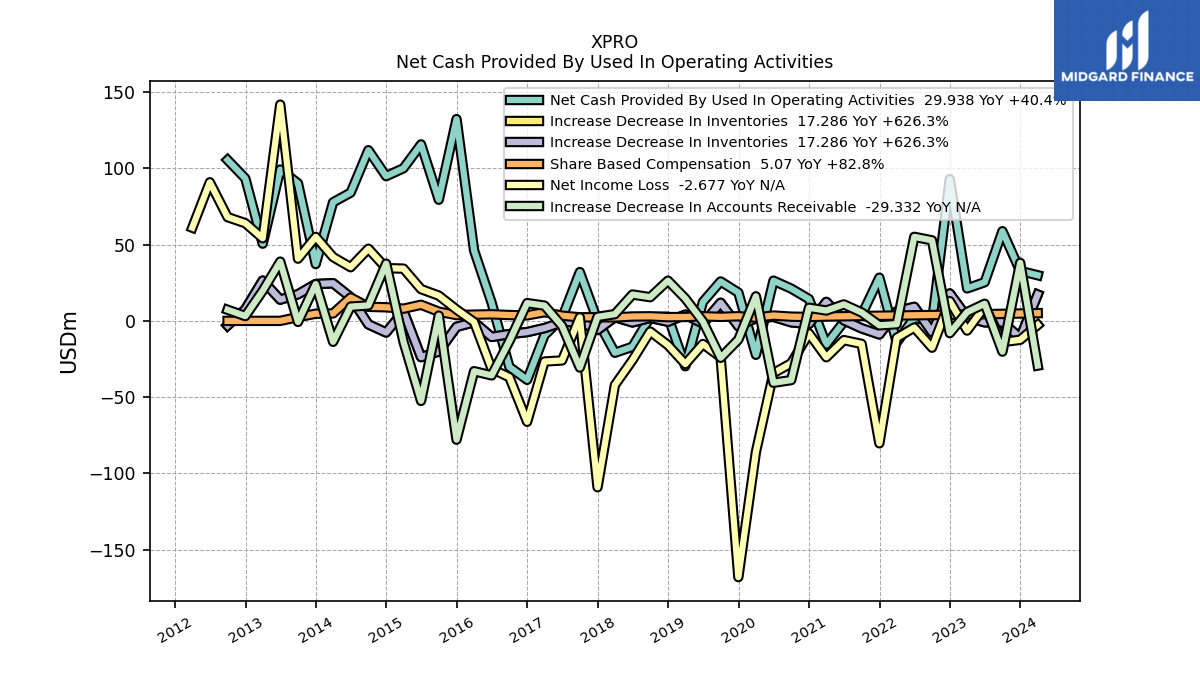
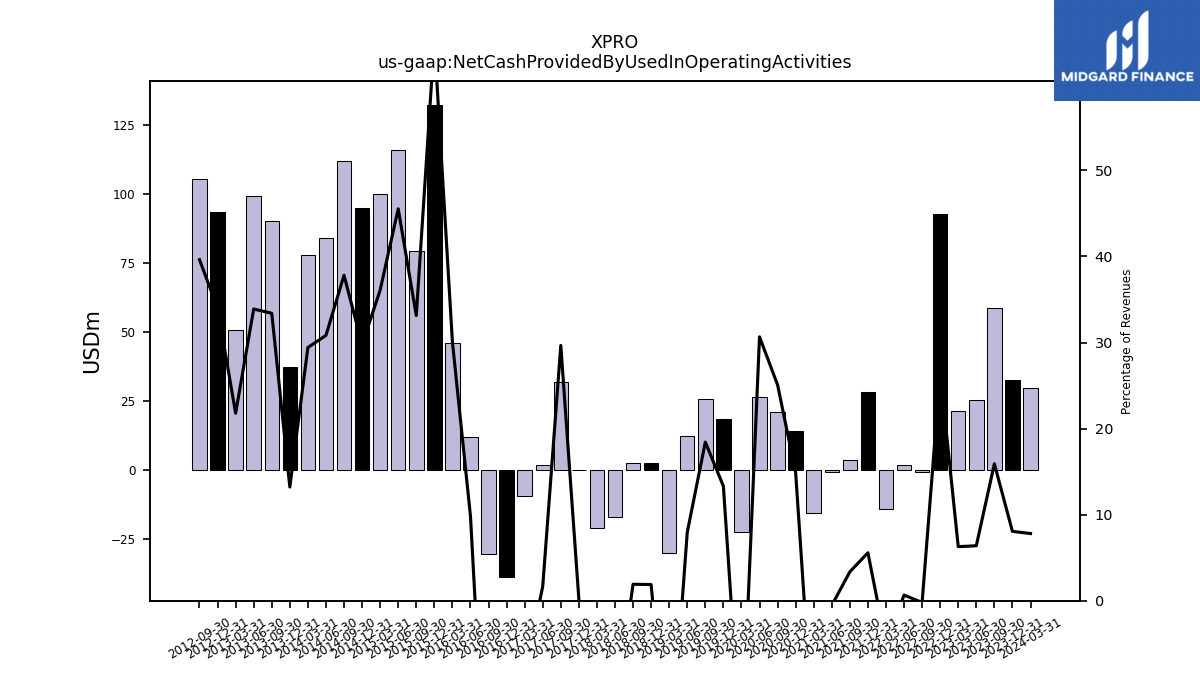
| Net Cash Provided By Used In Operating Activities | 58.85 | 25.36 | 21.32 | 92.94 | -0.67 | 2.06 | -14.16 | 28.34 | 3.86 | -0.58 | -15.48 | 14.34 | 21.17 | 26.40 | -22.25 | 18.56 | 25.87 | 12.38 | -29.77 | 2.75 | 2.47 | -16.95 | -20.91 | 0.19 | 32.05 | 1.97 | -9.44 | -38.68 | -30.19 | 11.87 | 46.16 | 132.37 | 79.47 | 115.78 | 100.13 | 94.93 | 111.98 | 84.14 | 77.81 | 37.27 | 90.20 | 99.29 | 50.66 | 93.45 | 105.56 | NA | NA | |
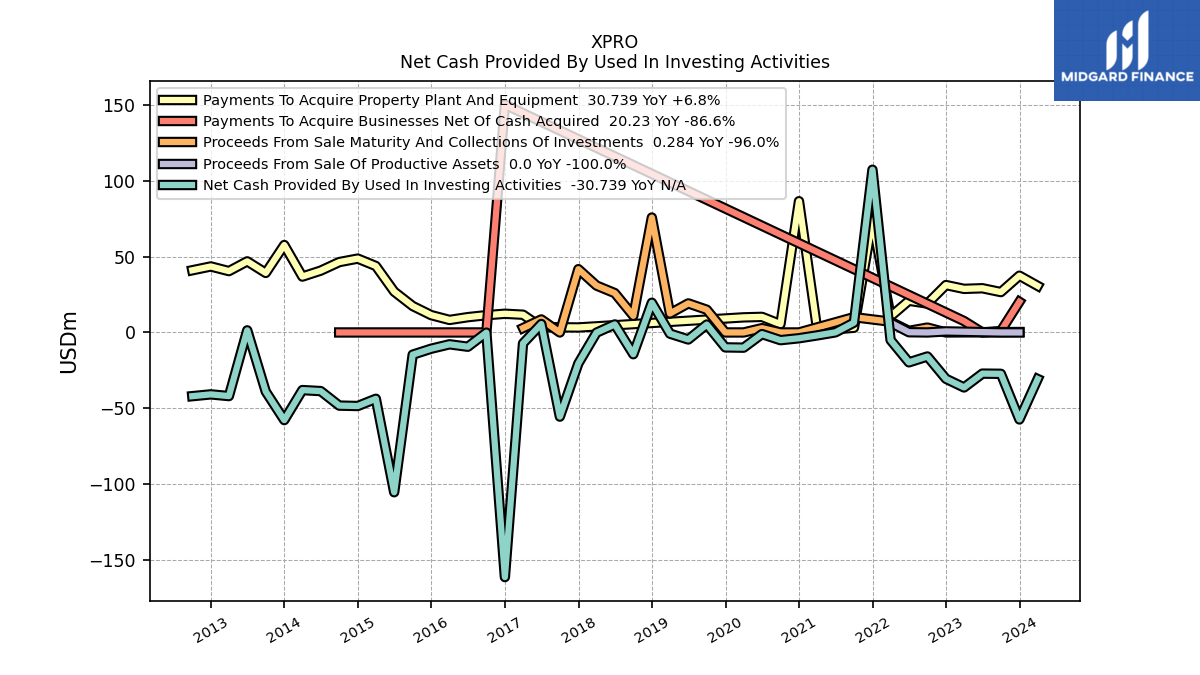
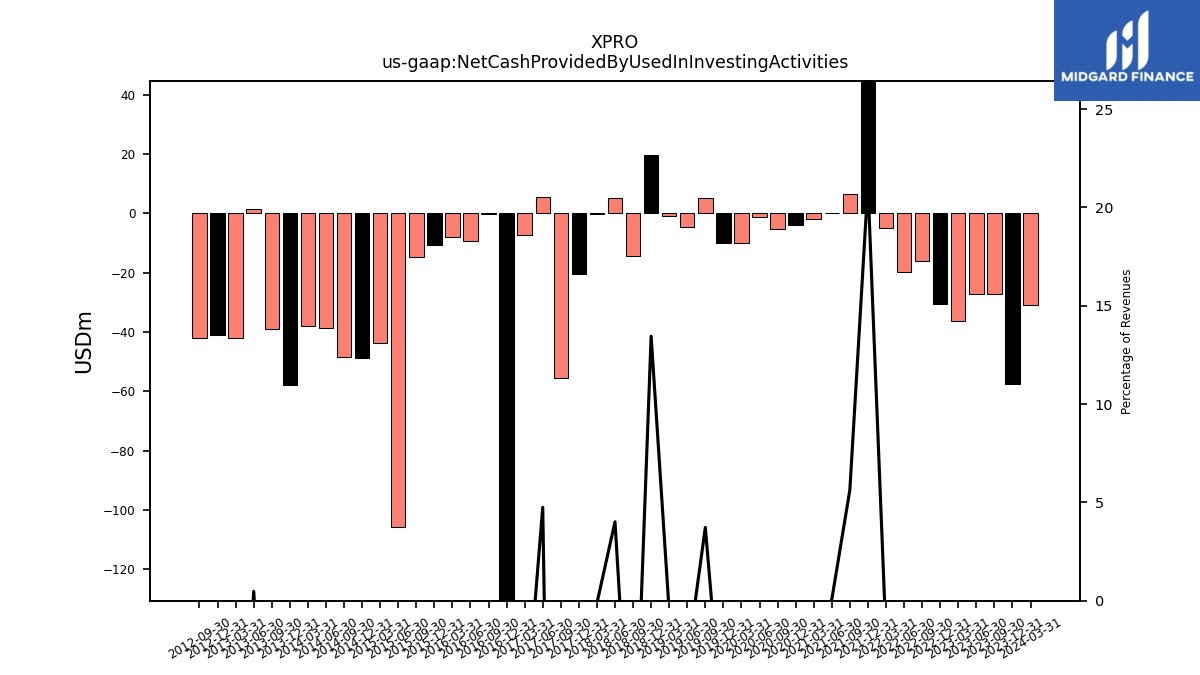
| Net Cash Provided By Used In Investing Activities | -27.31 | -27.18 | -36.31 | -30.60 | -15.86 | -19.74 | -5.01 | 107.46 | 6.48 | 0.07 | -1.96 | -3.83 | -5.09 | -1.08 | -10.04 | -9.86 | 5.24 | -4.64 | -0.79 | 19.62 | -14.37 | 5.30 | -0.14 | -20.47 | -55.58 | 5.58 | -7.24 | -161.55 | -0.11 | -9.43 | -7.82 | -10.72 | -14.66 | -105.51 | -43.80 | -48.57 | -48.30 | -38.72 | -38.05 | -57.88 | -39.02 | 1.41 | -42.01 | -40.88 | -42.07 | NA | NA | |
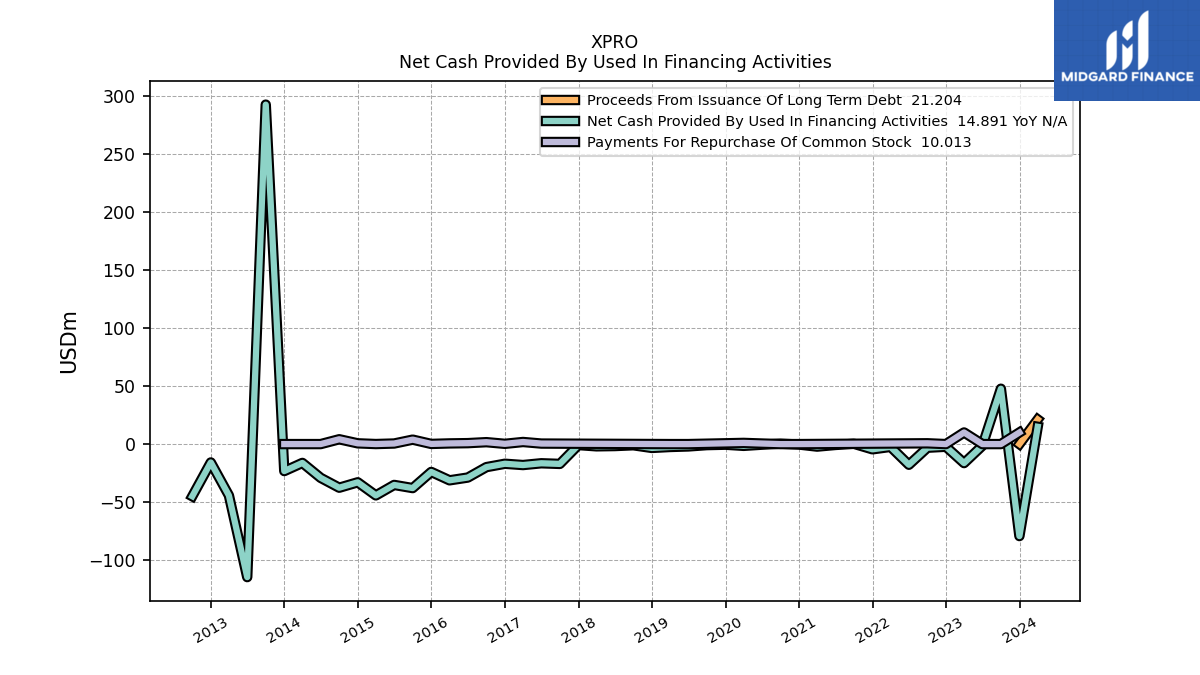
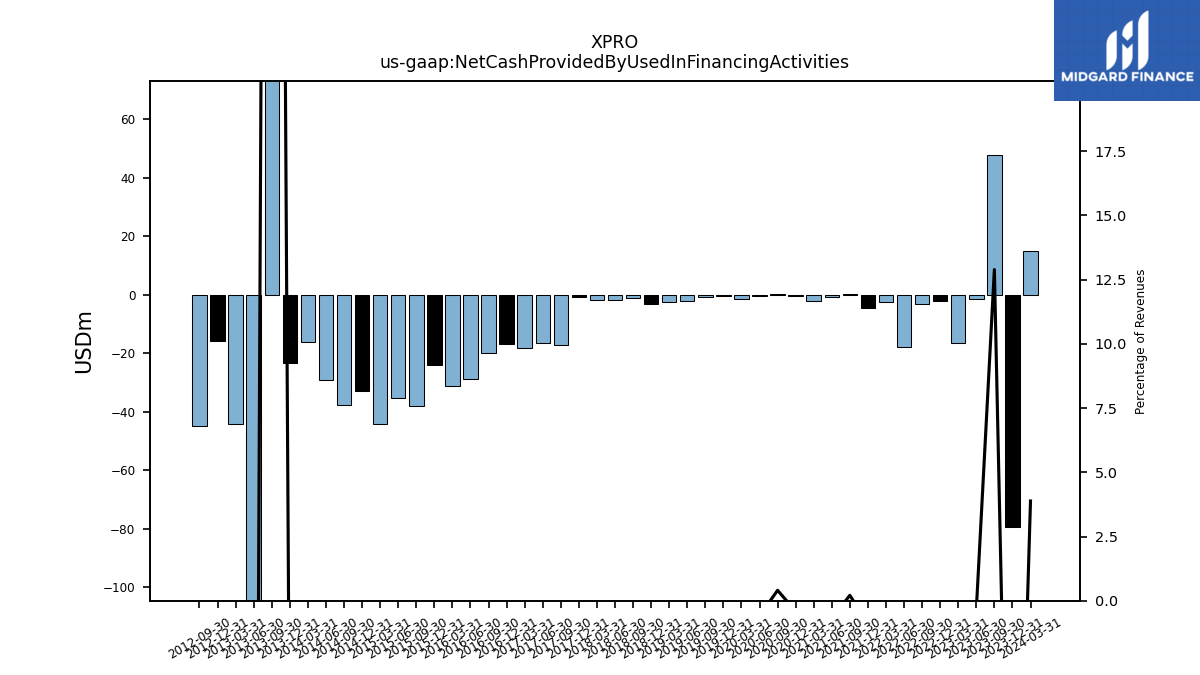
| Net Cash Provided By Used In Financing Activities | 47.67 | -1.42 | -16.37 | -2.28 | -3.13 | -17.81 | -2.39 | -4.50 | 0.24 | -0.75 | -2.17 | -0.39 | 0.34 | -0.51 | -1.52 | -0.53 | -0.89 | -2.03 | -2.50 | -3.31 | -1.01 | -1.70 | -1.93 | -0.84 | -17.07 | -16.52 | -18.05 | -16.93 | -19.83 | -28.80 | -31.19 | -23.97 | -37.88 | -35.17 | -44.19 | -32.90 | -37.56 | -29.08 | -16.21 | -23.24 | 292.25 | -114.54 | -44.23 | -15.80 | -44.91 | NA | NA |
| 2023-09-30 | 2023-06-30 | 2023-03-31 | 2022-12-31 | 2022-09-30 | 2022-06-30 | 2022-03-31 | 2021-12-31 | 2021-09-30 | 2021-06-30 | 2021-03-31 | 2020-12-31 | 2020-09-30 | 2020-06-30 | 2020-03-31 | 2019-12-31 | 2019-09-30 | 2019-06-30 | 2019-03-31 | 2018-12-31 | 2018-09-30 | 2018-06-30 | 2018-03-31 | 2017-12-31 | 2017-09-30 | 2017-06-30 | 2017-03-31 | 2016-12-31 | 2016-09-30 | 2016-06-30 | 2016-03-31 | 2015-12-31 | 2015-09-30 | 2015-06-30 | 2015-03-31 | 2014-12-31 | 2014-09-30 | 2014-06-30 | 2014-03-31 | 2013-12-31 | 2013-09-30 | 2013-06-30 | 2013-03-31 | 2012-12-31 | 2012-09-30 | 2012-06-30 | 2012-03-31 | ||
|---|---|---|---|---|---|---|---|---|---|---|---|---|---|---|---|---|---|---|---|---|---|---|---|---|---|---|---|---|---|---|---|---|---|---|---|---|---|---|---|---|---|---|---|---|---|---|---|---|
| Net Cash Provided By Used In Operating Activities | 58.85 | 25.36 | 21.32 | 92.94 | -0.67 | 2.06 | -14.16 | 28.34 | 3.86 | -0.58 | -15.48 | 14.34 | 21.17 | 26.40 | -22.25 | 18.56 | 25.87 | 12.38 | -29.77 | 2.75 | 2.47 | -16.95 | -20.91 | 0.19 | 32.05 | 1.97 | -9.44 | -38.68 | -30.19 | 11.87 | 46.16 | 132.37 | 79.47 | 115.78 | 100.13 | 94.93 | 111.98 | 84.14 | 77.81 | 37.27 | 90.20 | 99.29 | 50.66 | 93.45 | 105.56 | NA | NA | |
| Net Income Loss | -13.89 | 9.29 | -6.35 | 12.93 | -17.59 | -4.35 | -11.13 | -80.31 | -15.08 | -12.62 | -23.89 | -8.21 | -27.79 | -34.24 | -85.98 | -168.09 | -23.79 | -15.16 | -28.29 | -15.90 | -7.00 | -25.76 | -42.07 | -109.14 | 2.30 | -25.95 | -26.66 | -66.19 | -36.98 | -31.40 | -0.77 | 7.44 | 16.57 | 20.83 | 34.28 | 34.61 | 47.35 | 35.22 | 41.86 | 55.09 | 40.81 | 141.87 | 54.20 | 64.10 | 68.07 | 90.91 | 61.16 | |
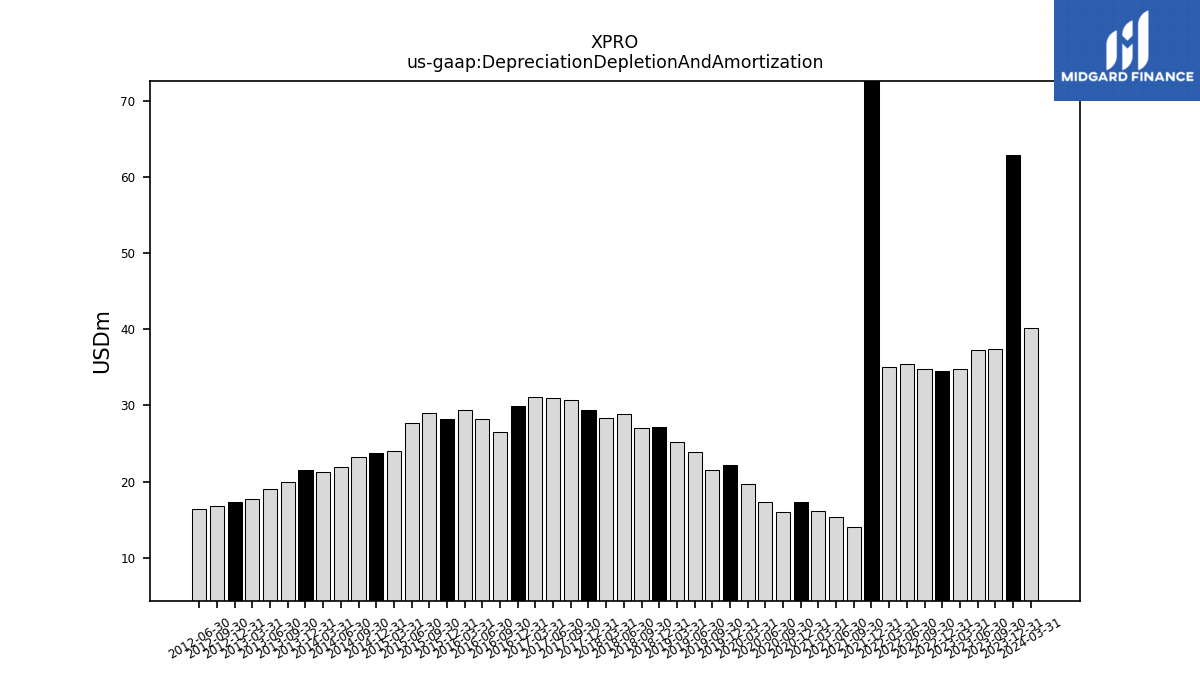
| Depreciation Depletion And Amortization | 37.41 | 37.23 | 34.74 | 34.54 | 34.83 | 35.39 | 35.01 | 78.33 | 14.09 | 15.33 | 16.11 | 17.25 | 15.95 | 17.25 | 19.72 | 22.16 | 21.48 | 23.91 | 25.24 | 27.13 | 27.00 | 28.86 | 28.30 | 29.40 | 30.65 | 30.95 | 31.10 | 29.94 | 26.55 | 28.28 | 29.45 | 28.22 | 29.03 | 27.71 | 24.00 | 23.70 | 23.25 | 21.89 | 21.19 | 21.49 | 19.89 | 19.01 | 17.69 | 17.34 | 16.83 | 16.33 | NA | |
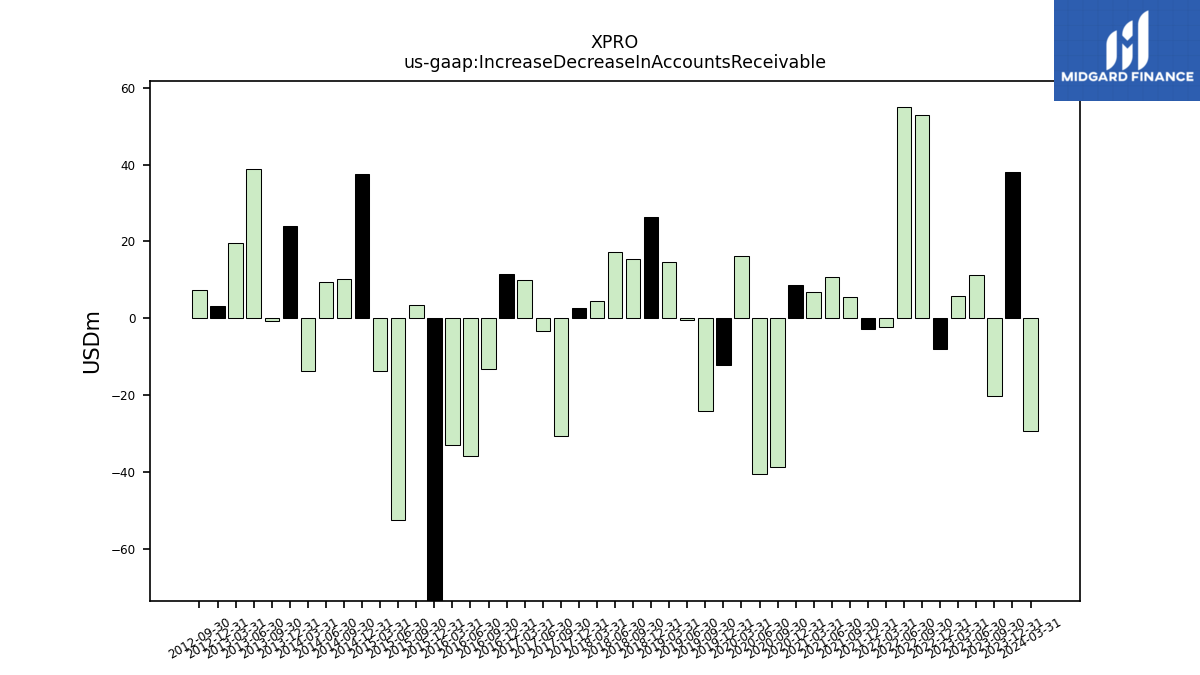
| Increase Decrease In Accounts Receivable | -20.20 | 11.24 | 5.76 | -8.06 | 52.84 | 55.13 | -2.16 | -2.89 | 5.53 | 10.81 | 6.81 | 8.60 | -38.84 | -40.59 | 16.13 | -12.28 | -24.21 | -0.40 | 14.73 | 26.40 | 15.54 | 17.29 | 4.43 | 2.65 | -30.61 | -3.33 | 10.03 | 11.65 | -13.28 | -35.76 | -33.01 | -77.95 | 3.48 | -52.50 | -13.69 | 37.57 | 10.15 | 9.35 | -13.72 | 24.13 | -0.69 | 38.88 | 19.71 | 3.15 | 7.31 | NA | NA | |
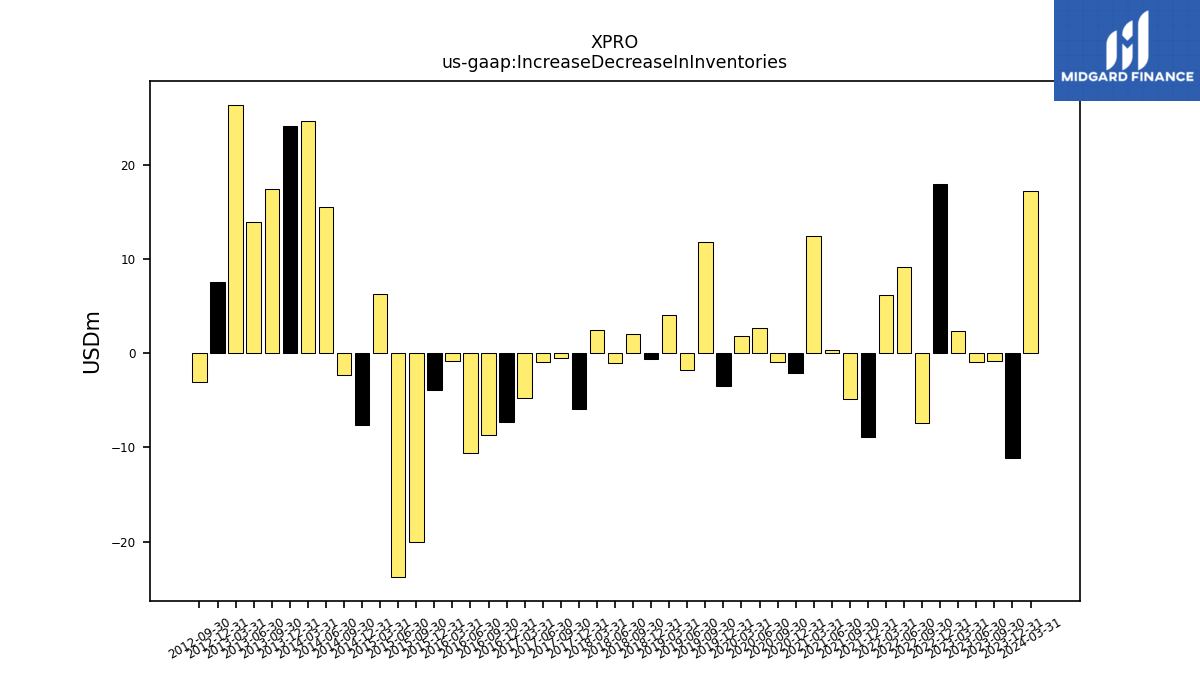
| Increase Decrease In Inventories | -0.85 | -0.94 | 2.38 | 17.99 | -7.40 | 9.21 | 6.23 | -8.88 | -4.89 | 0.40 | 12.46 | -2.05 | -0.91 | 2.68 | 1.85 | -3.50 | 11.87 | -1.76 | 4.08 | -0.55 | 2.01 | -1.01 | 2.47 | -5.96 | -0.52 | -0.90 | -4.73 | -7.35 | -8.65 | -10.55 | -0.83 | -3.93 | -20.08 | -23.77 | 6.28 | -7.61 | -2.29 | 15.49 | 24.68 | 24.15 | 17.47 | 13.94 | 26.42 | 7.60 | -3.02 | NA | NA |
| 2023-09-30 | 2023-06-30 | 2023-03-31 | 2022-12-31 | 2022-09-30 | 2022-06-30 | 2022-03-31 | 2021-12-31 | 2021-09-30 | 2021-06-30 | 2021-03-31 | 2020-12-31 | 2020-09-30 | 2020-06-30 | 2020-03-31 | 2019-12-31 | 2019-09-30 | 2019-06-30 | 2019-03-31 | 2018-12-31 | 2018-09-30 | 2018-06-30 | 2018-03-31 | 2017-12-31 | 2017-09-30 | 2017-06-30 | 2017-03-31 | 2016-12-31 | 2016-09-30 | 2016-06-30 | 2016-03-31 | 2015-12-31 | 2015-09-30 | 2015-06-30 | 2015-03-31 | 2014-12-31 | 2014-09-30 | 2014-06-30 | 2014-03-31 | 2013-12-31 | 2013-09-30 | 2013-06-30 | 2013-03-31 | 2012-12-31 | 2012-09-30 | 2012-06-30 | 2012-03-31 | ||
|---|---|---|---|---|---|---|---|---|---|---|---|---|---|---|---|---|---|---|---|---|---|---|---|---|---|---|---|---|---|---|---|---|---|---|---|---|---|---|---|---|---|---|---|---|---|---|---|---|
| Net Cash Provided By Used In Investing Activities | -27.31 | -27.18 | -36.31 | -30.60 | -15.86 | -19.74 | -5.01 | 107.46 | 6.48 | 0.07 | -1.96 | -3.83 | -5.09 | -1.08 | -10.04 | -9.86 | 5.24 | -4.64 | -0.79 | 19.62 | -14.37 | 5.30 | -0.14 | -20.47 | -55.58 | 5.58 | -7.24 | -161.55 | -0.11 | -9.43 | -7.82 | -10.72 | -14.66 | -105.51 | -43.80 | -48.57 | -48.30 | -38.72 | -38.05 | -57.88 | -39.02 | 1.41 | -42.01 | -40.88 | -42.07 | NA | NA | |
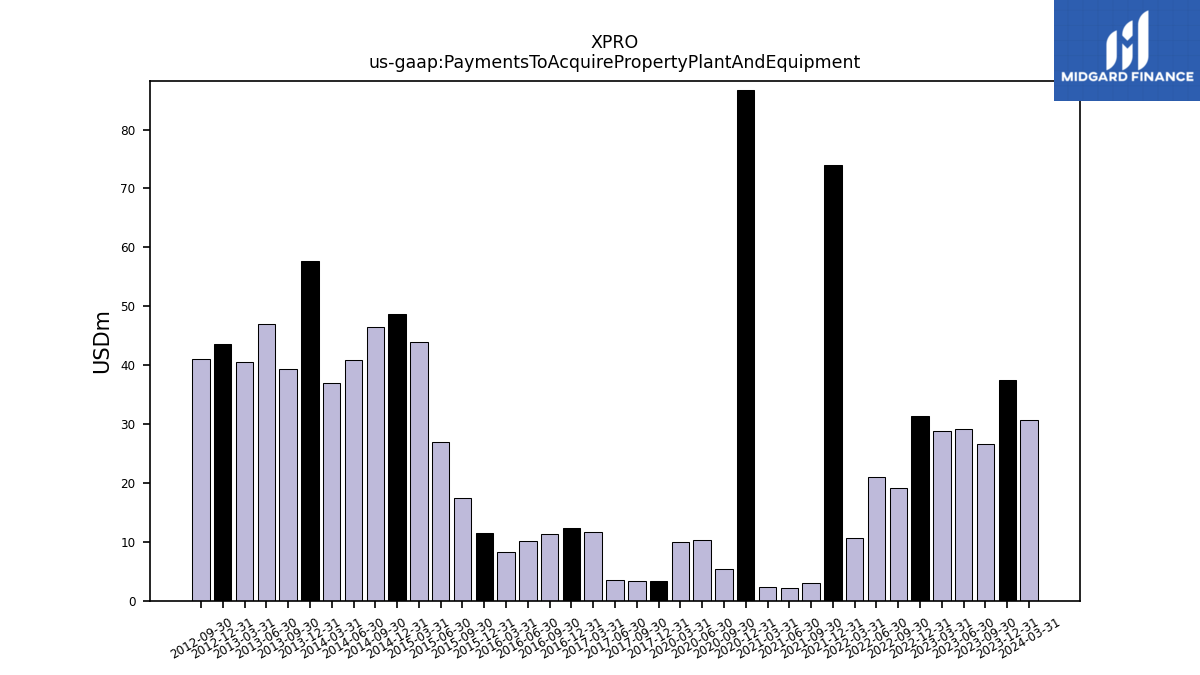
| Payments To Acquire Property Plant And Equipment | 26.66 | 29.19 | 28.78 | 31.30 | 19.08 | 20.95 | 10.58 | 73.90 | 3.10 | 2.17 | 2.35 | 86.67 | 5.46 | 10.29 | 9.97 | NA | NA | NA | NA | NA | NA | NA | NA | 3.30 | 3.41 | 3.48 | 11.72 | 12.35 | 11.41 | 10.10 | 8.27 | 11.43 | 17.45 | 26.97 | 43.87 | 48.77 | 46.47 | 40.82 | 36.90 | 57.74 | 39.30 | 46.96 | 40.51 | 43.58 | 41.06 | NA | NA |
| 2023-09-30 | 2023-06-30 | 2023-03-31 | 2022-12-31 | 2022-09-30 | 2022-06-30 | 2022-03-31 | 2021-12-31 | 2021-09-30 | 2021-06-30 | 2021-03-31 | 2020-12-31 | 2020-09-30 | 2020-06-30 | 2020-03-31 | 2019-12-31 | 2019-09-30 | 2019-06-30 | 2019-03-31 | 2018-12-31 | 2018-09-30 | 2018-06-30 | 2018-03-31 | 2017-12-31 | 2017-09-30 | 2017-06-30 | 2017-03-31 | 2016-12-31 | 2016-09-30 | 2016-06-30 | 2016-03-31 | 2015-12-31 | 2015-09-30 | 2015-06-30 | 2015-03-31 | 2014-12-31 | 2014-09-30 | 2014-06-30 | 2014-03-31 | 2013-12-31 | 2013-09-30 | 2013-06-30 | 2013-03-31 | 2012-12-31 | 2012-09-30 | 2012-06-30 | 2012-03-31 | ||
|---|---|---|---|---|---|---|---|---|---|---|---|---|---|---|---|---|---|---|---|---|---|---|---|---|---|---|---|---|---|---|---|---|---|---|---|---|---|---|---|---|---|---|---|---|---|---|---|---|
| Net Cash Provided By Used In Financing Activities | 47.67 | -1.42 | -16.37 | -2.28 | -3.13 | -17.81 | -2.39 | -4.50 | 0.24 | -0.75 | -2.17 | -0.39 | 0.34 | -0.51 | -1.52 | -0.53 | -0.89 | -2.03 | -2.50 | -3.31 | -1.01 | -1.70 | -1.93 | -0.84 | -17.07 | -16.52 | -18.05 | -16.93 | -19.83 | -28.80 | -31.19 | -23.97 | -37.88 | -35.17 | -44.19 | -32.90 | -37.56 | -29.08 | -16.21 | -23.24 | 292.25 | -114.54 | -44.23 | -15.80 | -44.91 | NA | NA | |
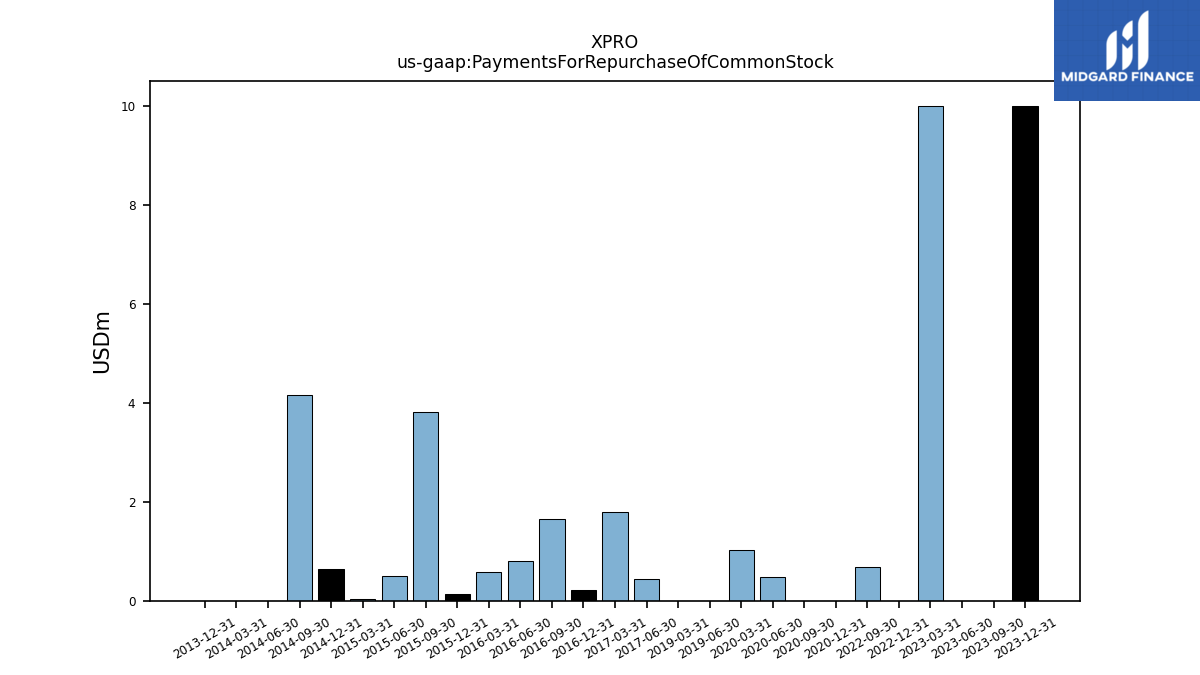
| Payments For Repurchase Of Common Stock | 0.00 | 0.00 | 10.01 | 0.00 | 0.69 | NA | NA | NA | NA | NA | NA | 0.00 | 0.00 | 0.48 | 1.02 | NA | NA | 0.00 | 0.00 | NA | NA | NA | NA | NA | NA | 0.45 | 1.80 | 0.22 | 1.65 | 0.81 | 0.58 | 0.14 | 3.83 | 0.50 | 0.04 | 0.65 | 4.15 | 0.00 | 0.00 | 0.00 | NA | NA | NA | NA | NA | NA | NA |
| 2023-09-30 | 2023-06-30 | 2023-03-31 | 2022-12-31 | 2022-09-30 | 2022-06-30 | 2022-03-31 | 2021-12-31 | 2021-09-30 | 2021-06-30 | 2021-03-31 | 2020-12-31 | 2020-09-30 | 2020-06-30 | 2020-03-31 | 2019-12-31 | 2019-09-30 | 2019-06-30 | 2019-03-31 | 2018-12-31 | 2018-09-30 | 2018-06-30 | 2018-03-31 | 2017-12-31 | 2017-09-30 | 2017-06-30 | 2017-03-31 | 2016-12-31 | 2016-09-30 | 2016-06-30 | 2016-03-31 | 2015-12-31 | 2015-09-30 | 2015-06-30 | 2015-03-31 | 2014-12-31 | 2014-09-30 | 2014-06-30 | 2014-03-31 | 2013-12-31 | 2013-09-30 | 2013-06-30 | 2013-03-31 | 2012-12-31 | 2012-09-30 | 2012-06-30 | 2012-03-31 | ||
|---|---|---|---|---|---|---|---|---|---|---|---|---|---|---|---|---|---|---|---|---|---|---|---|---|---|---|---|---|---|---|---|---|---|---|---|---|---|---|---|---|---|---|---|---|---|---|---|---|
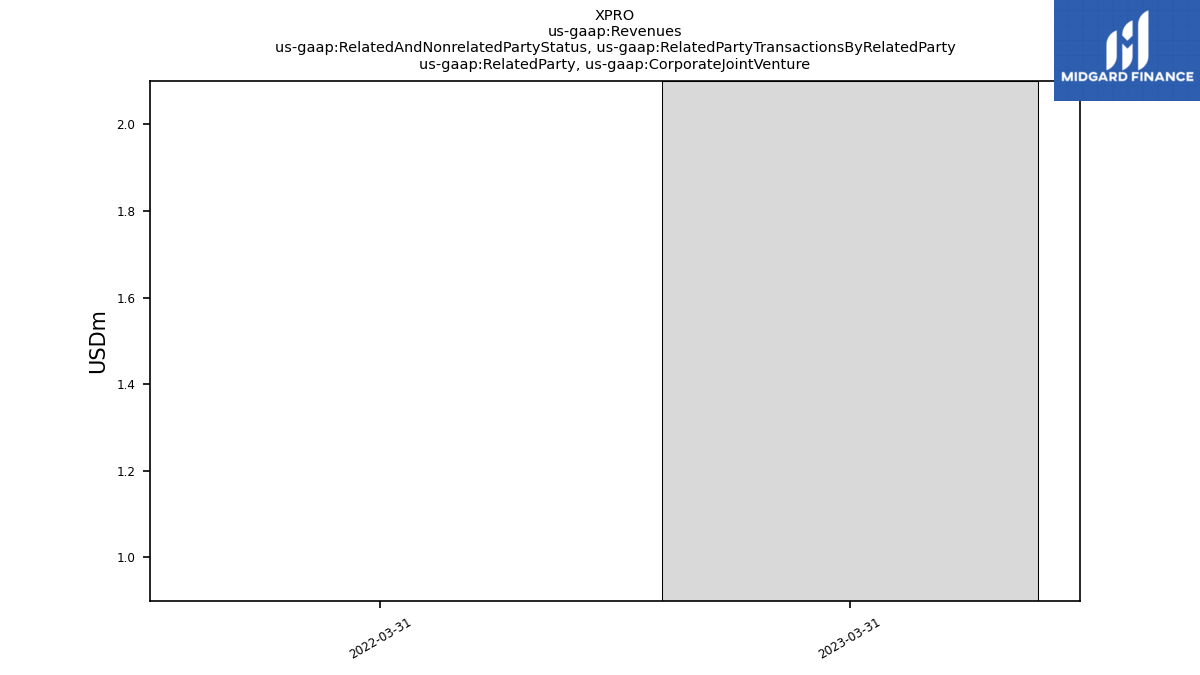
| Revenues | 369.82 | 396.92 | 339.28 | 350.97 | 334.35 | 313.62 | 280.48 | 508.17 | 114.94 | 107.84 | 94.81 | 96.35 | 84.42 | 86.10 | 123.49 | 139.44 | 140.42 | 155.65 | 144.41 | 145.85 | 128.99 | 132.09 | 115.57 | 118.32 | 108.08 | 117.66 | 110.73 | 107.98 | 105.11 | 120.95 | 153.49 | 202.98 | 239.88 | 254.30 | 277.44 | 319.02 | 296.18 | 272.94 | 264.49 | 282.07 | 270.10 | 292.98 | 232.57 | 274.86 | 266.41 | 262.69 | 235.09 | |
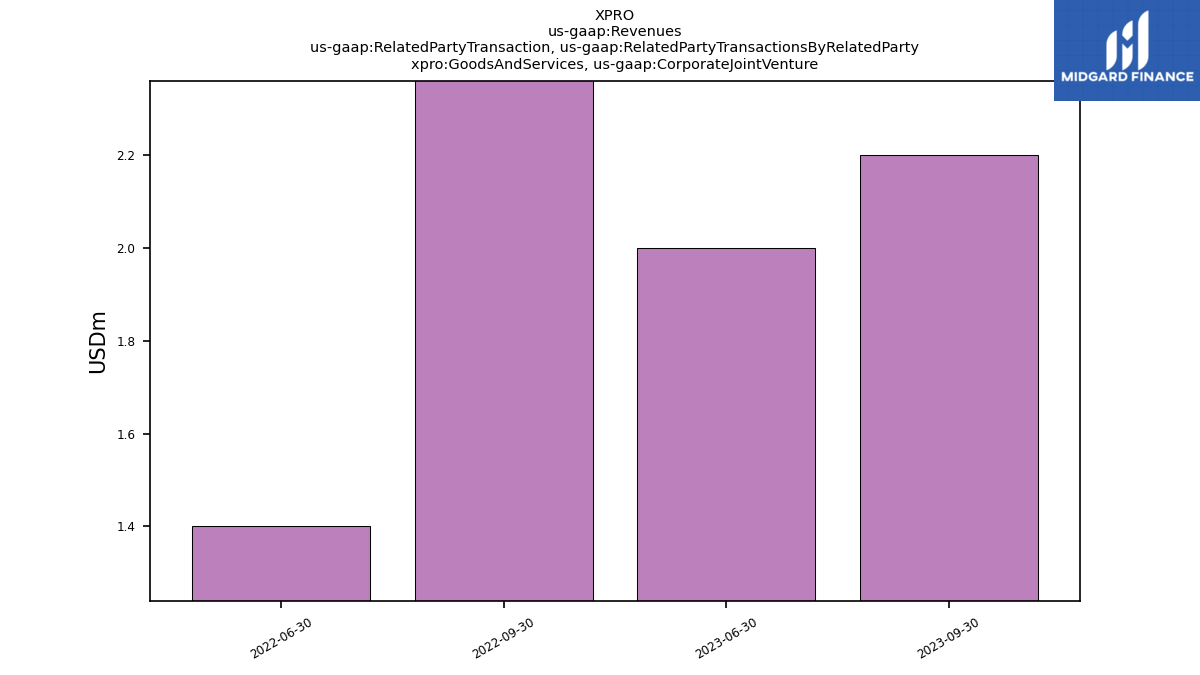
| Related Party, Corporate Joint Venture | NA | NA | 2.10 | NA | NA | NA | 0.90 | NA | NA | NA | NA | NA | NA | NA | NA | NA | NA | NA | NA | NA | NA | NA | NA | NA | NA | NA | NA | NA | NA | NA | NA | NA | NA | NA | NA | NA | NA | NA | NA | NA | NA | NA | NA | NA | NA | NA | NA | |
| Goods And Services, Corporate Joint Venture | 2.20 | 2.00 | NA | NA | 5.90 | 1.40 | NA | NA | NA | NA | NA | NA | NA | NA | NA | NA | NA | NA | NA | NA | NA | NA | NA | NA | NA | NA | NA | NA | NA | NA | NA | NA | NA | NA | NA | NA | NA | NA | NA | NA | NA | NA | NA | NA | NA | NA | NA | |
| Revenue From Contract With Customer Excluding Assessed Tax | 369.82 | 396.92 | 339.28 | 350.97 | 334.35 | 313.62 | 280.48 | 508.17 | 114.94 | 107.84 | 94.81 | 96.35 | 84.42 | 86.10 | 123.49 | 139.44 | 140.42 | 155.65 | 144.41 | 145.85 | 128.99 | 132.09 | 115.57 | 118.32 | 108.08 | 117.66 | 110.73 | 107.98 | 105.11 | 120.95 | 153.49 | 202.98 | 239.88 | 254.30 | 277.44 | 319.02 | 296.18 | 272.94 | 264.49 | 282.07 | 270.10 | 292.98 | 232.57 | 274.86 | 266.41 | 262.69 | 235.09 | |
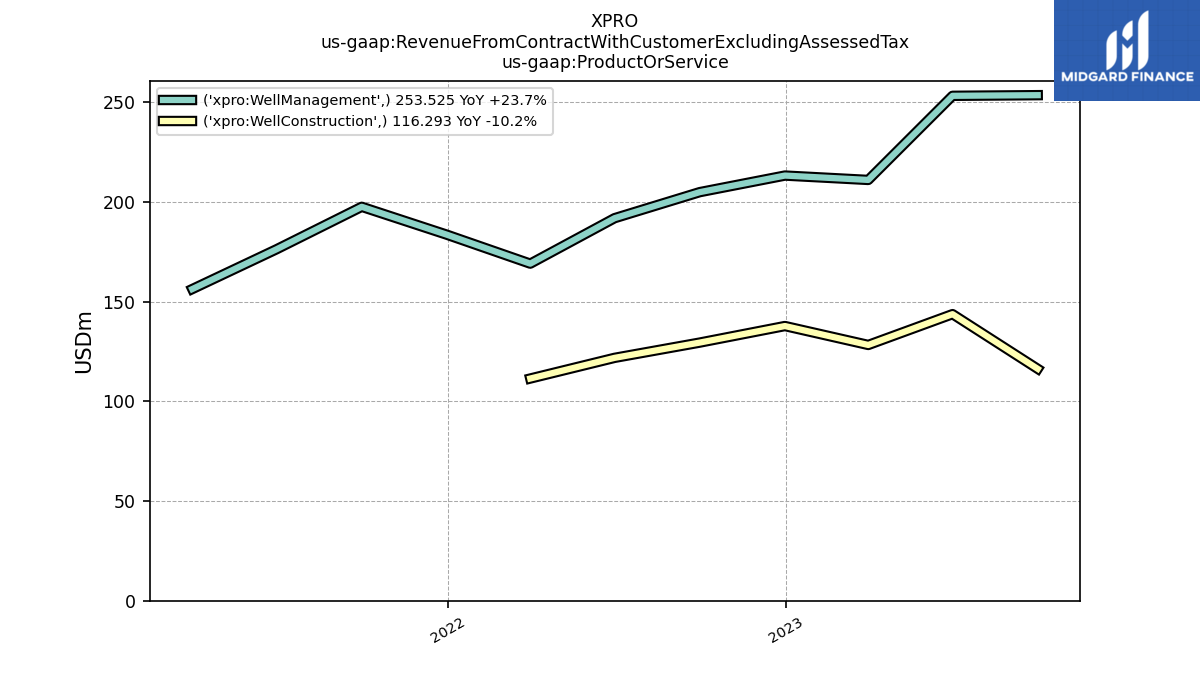
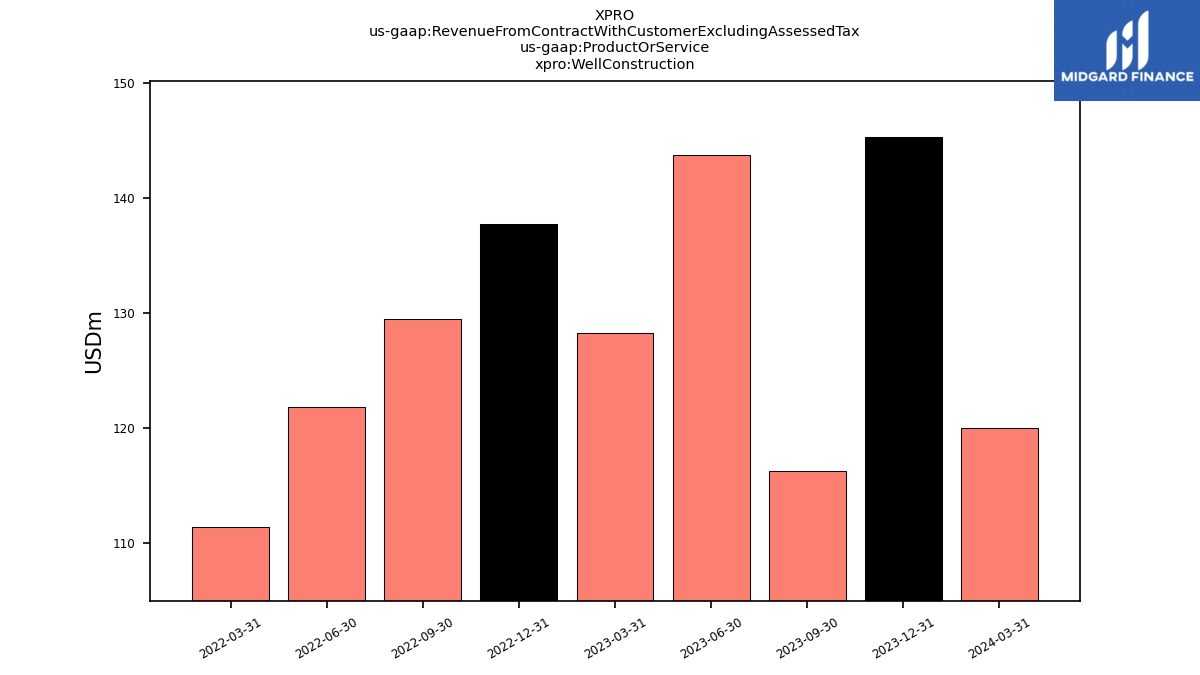
| Well Construction | 116.29 | 143.72 | 128.26 | 137.75 | 129.46 | 121.79 | 111.44 | NA | NA | NA | NA | NA | NA | NA | NA | NA | NA | NA | NA | NA | NA | NA | NA | NA | NA | NA | NA | NA | NA | NA | NA | NA | NA | NA | NA | NA | NA | NA | NA | NA | NA | NA | NA | NA | NA | NA | NA | |
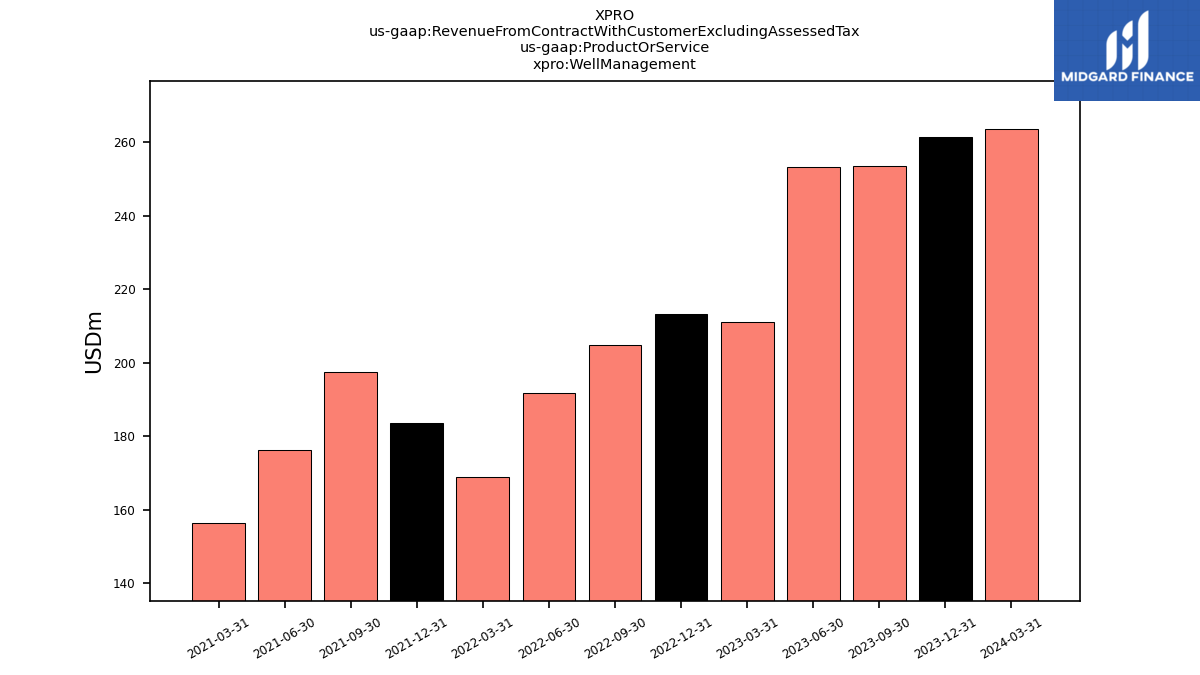
| Well Management | 253.53 | 253.20 | 211.01 | 213.21 | 204.90 | 191.83 | 169.04 | 183.54 | 197.55 | 176.25 | 156.29 | NA | NA | NA | NA | NA | NA | NA | NA | NA | NA | NA | NA | NA | NA | NA | NA | NA | NA | NA | NA | NA | NA | NA | NA | NA | NA | NA | NA | NA | NA | NA | NA | NA | NA | NA | NA | |
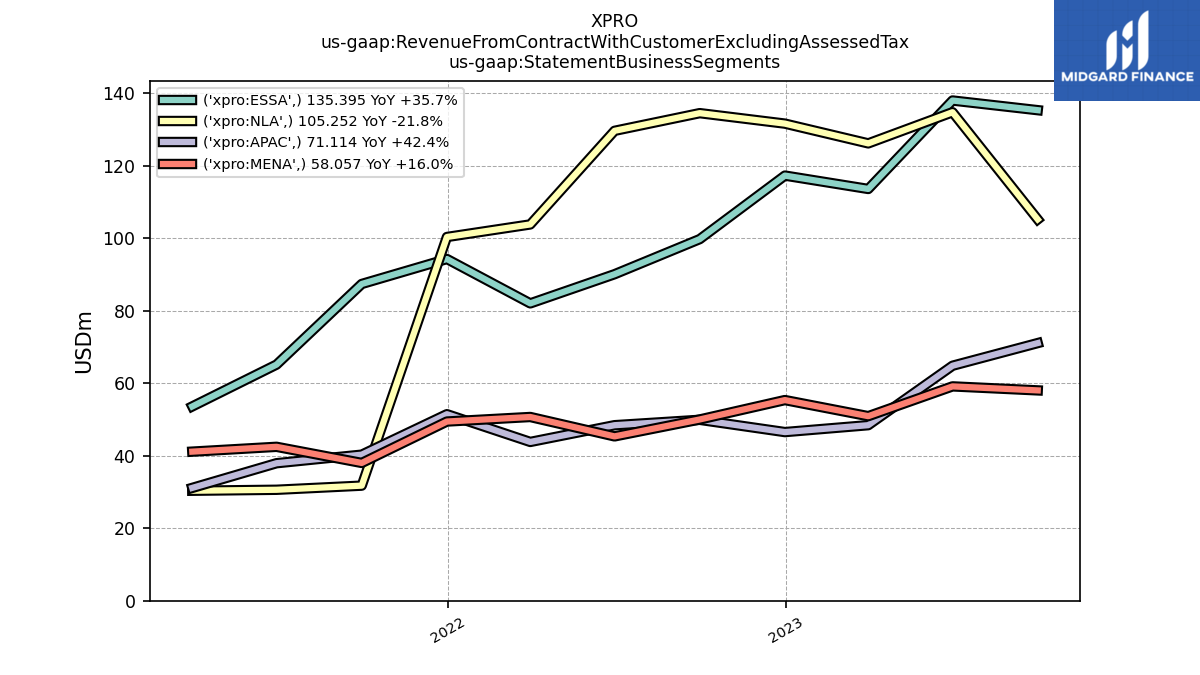
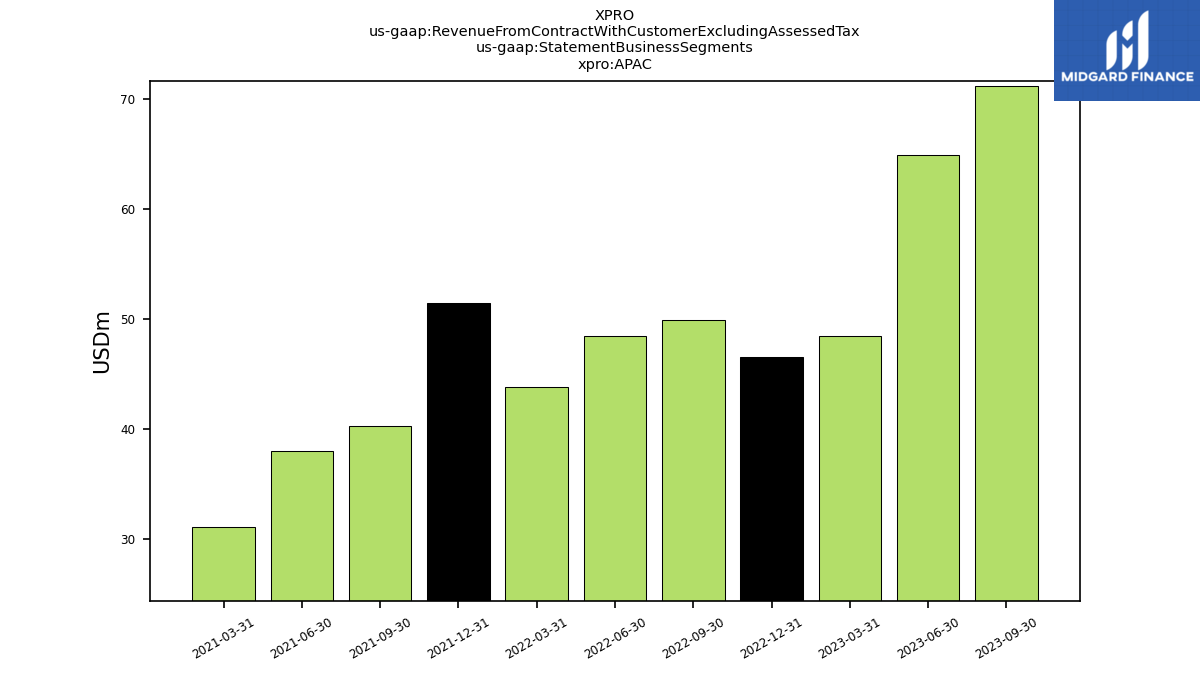
| APAC | 71.11 | 64.86 | 48.46 | 46.55 | 49.94 | 48.45 | 43.83 | 51.49 | 40.32 | 37.96 | 31.15 | NA | NA | NA | NA | NA | NA | NA | NA | NA | NA | NA | NA | NA | NA | NA | NA | NA | NA | NA | NA | NA | NA | NA | NA | NA | NA | NA | NA | NA | NA | NA | NA | NA | NA | NA | NA | |
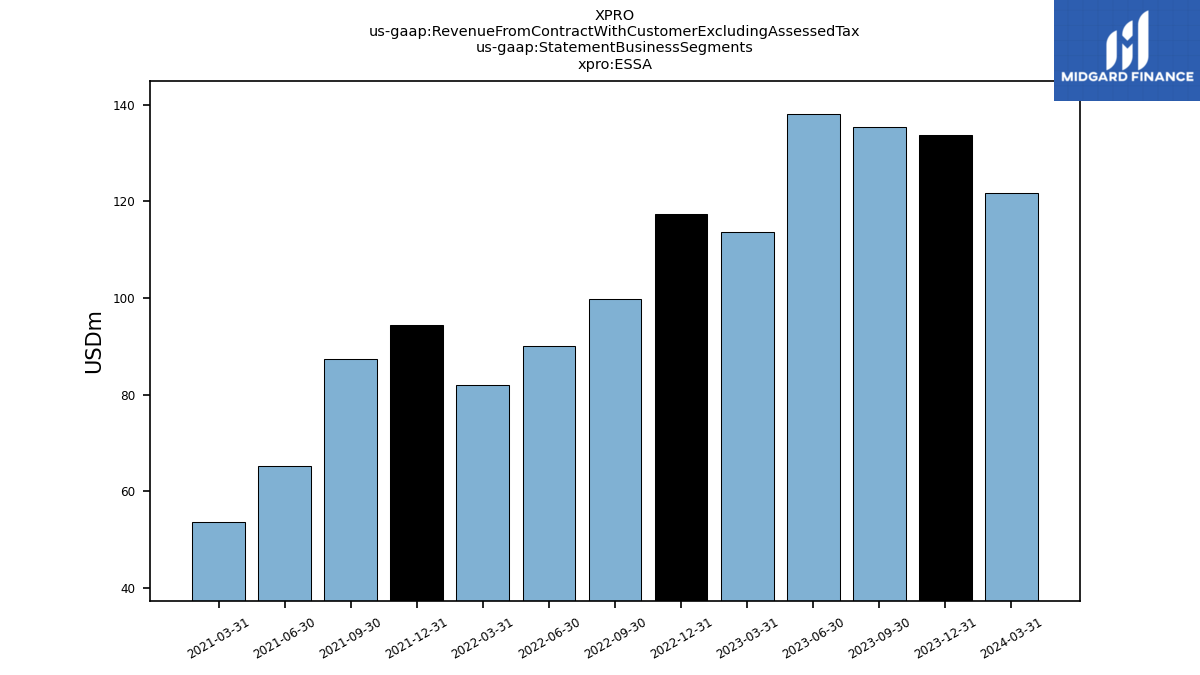
| ESSA | 135.40 | 138.06 | 113.65 | 117.34 | 99.81 | 90.12 | 82.07 | 94.32 | 87.43 | 65.18 | 53.63 | NA | NA | NA | NA | NA | NA | NA | NA | NA | NA | NA | NA | NA | NA | NA | NA | NA | NA | NA | NA | NA | NA | NA | NA | NA | NA | NA | NA | NA | NA | NA | NA | NA | NA | NA | NA | |
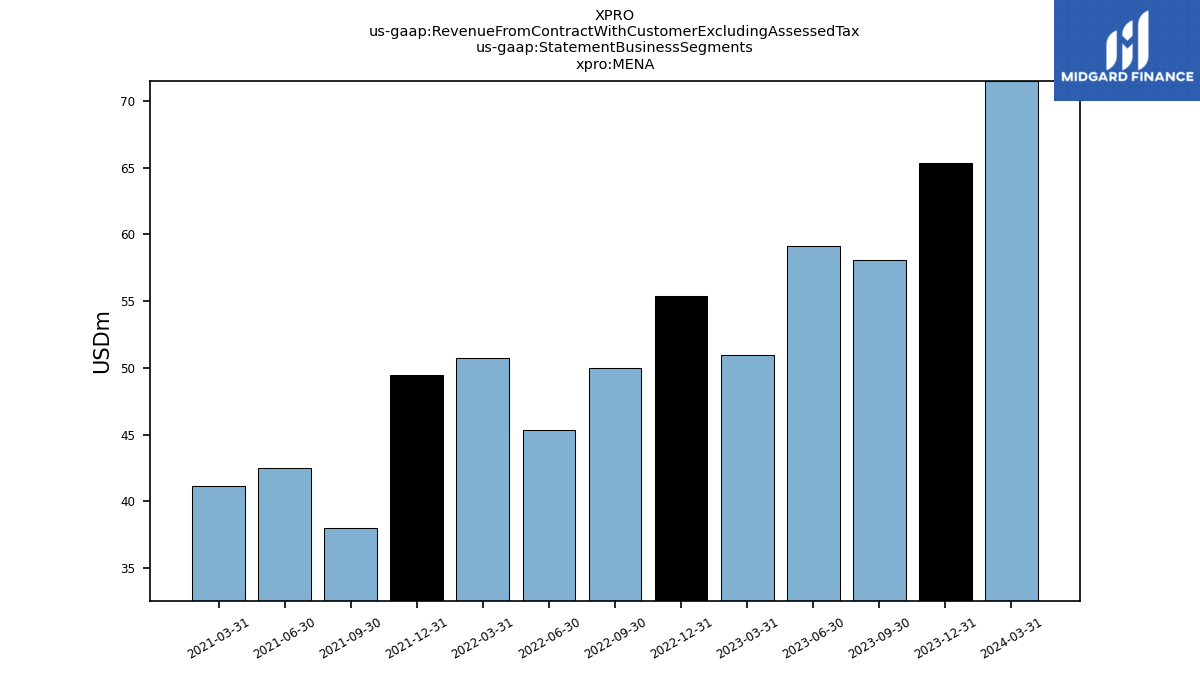
| MENA | 58.06 | 59.16 | 50.95 | 55.39 | 50.03 | 45.36 | 50.72 | 49.46 | 38.03 | 42.48 | 41.16 | NA | NA | NA | NA | NA | NA | NA | NA | NA | NA | NA | NA | NA | NA | NA | NA | NA | NA | NA | NA | NA | NA | NA | NA | NA | NA | NA | NA | NA | NA | NA | NA | NA | NA | NA | NA | |
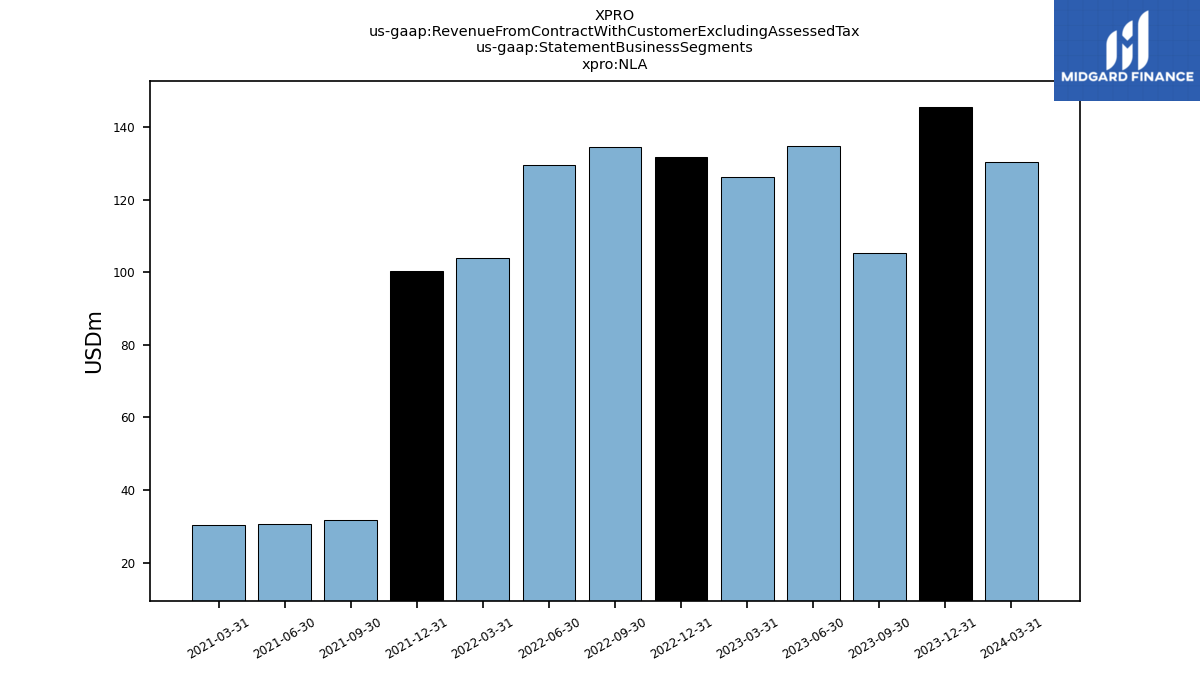
| NLA | 105.25 | 134.83 | 126.23 | 131.68 | 134.57 | 129.69 | 103.86 | 100.39 | 31.77 | 30.63 | 30.36 | NA | NA | NA | NA | NA | NA | NA | NA | NA | NA | NA | NA | NA | NA | NA | NA | NA | NA | NA | NA | NA | NA | NA | NA | NA | NA | NA | NA | NA | NA | NA | NA | NA | NA | NA | NA |
