
| 2023-12-30 | 2023-09-30 | 2023-07-01 | 2023-04-01 | 2022-12-31 | 2022-10-01 | 2022-07-02 | 2022-04-02 | 2022-01-01 | 2021-10-02 | 2021-07-03 | 2021-04-03 | 2021-01-02 | 2020-09-26 | 2020-06-27 | 2020-03-28 | 2019-12-28 | 2019-09-28 | 2019-06-29 | 2019-03-30 | 2018-12-29 | 2018-09-29 | 2018-06-30 | 2018-03-31 | 2017-12-30 | 2017-09-30 | 2017-07-01 | 2017-04-01 | ||
|---|---|---|---|---|---|---|---|---|---|---|---|---|---|---|---|---|---|---|---|---|---|---|---|---|---|---|---|---|---|
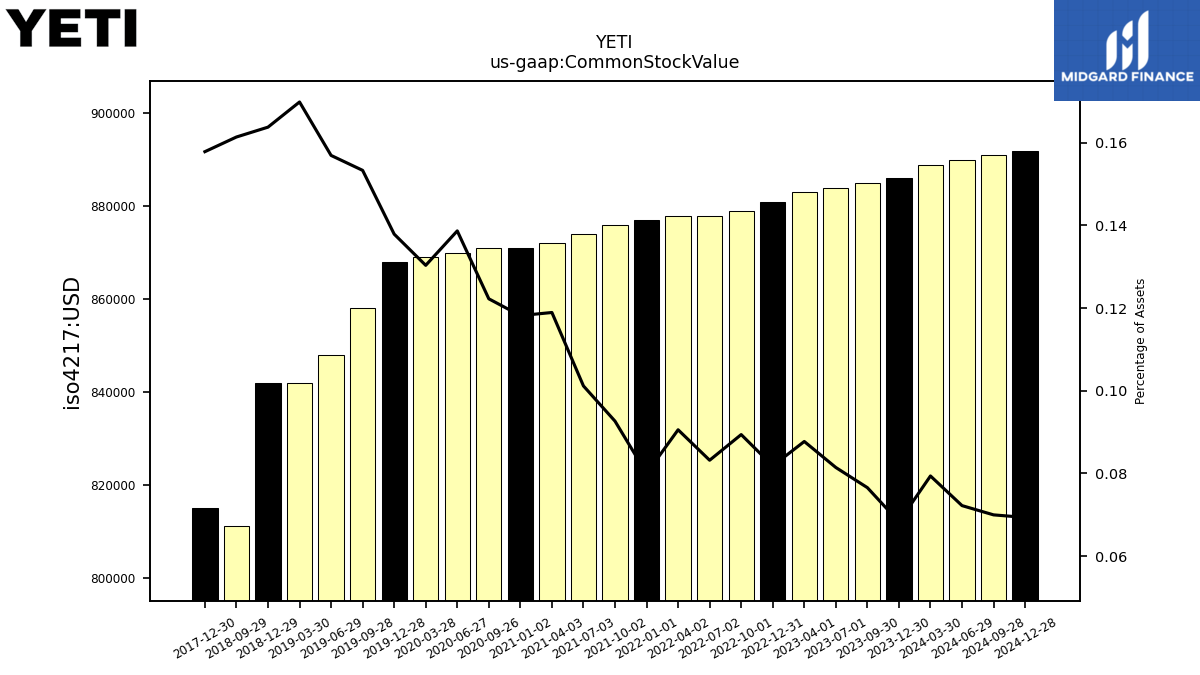
| Common Stock Value | 0.89 | 0.89 | 0.88 | 0.88 | 0.88 | 0.88 | 0.88 | 0.88 | 0.88 | 0.88 | 0.87 | 0.87 | 0.87 | 0.87 | 0.87 | 0.87 | 0.87 | 0.86 | 0.85 | 0.84 | 0.84 | 0.81 | NA | NA | 0.81 | NA | NA | NA | |
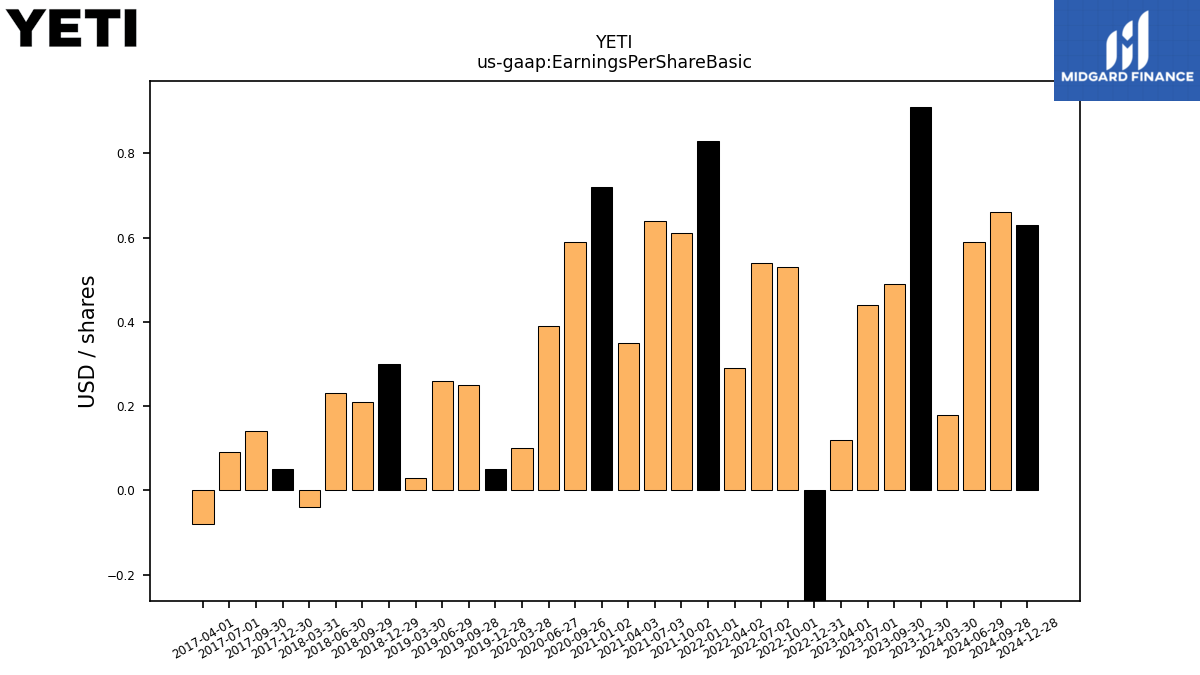
| Earnings Per Share Basic | 0.91 | 0.49 | 0.44 | 0.12 | -0.32 | 0.53 | 0.54 | 0.29 | 0.83 | 0.61 | 0.64 | 0.35 | 0.72 | 0.59 | 0.39 | 0.10 | 0.05 | 0.25 | 0.26 | 0.03 | 0.30 | 0.21 | 0.23 | -0.04 | 0.05 | 0.14 | 0.09 | -0.08 | |
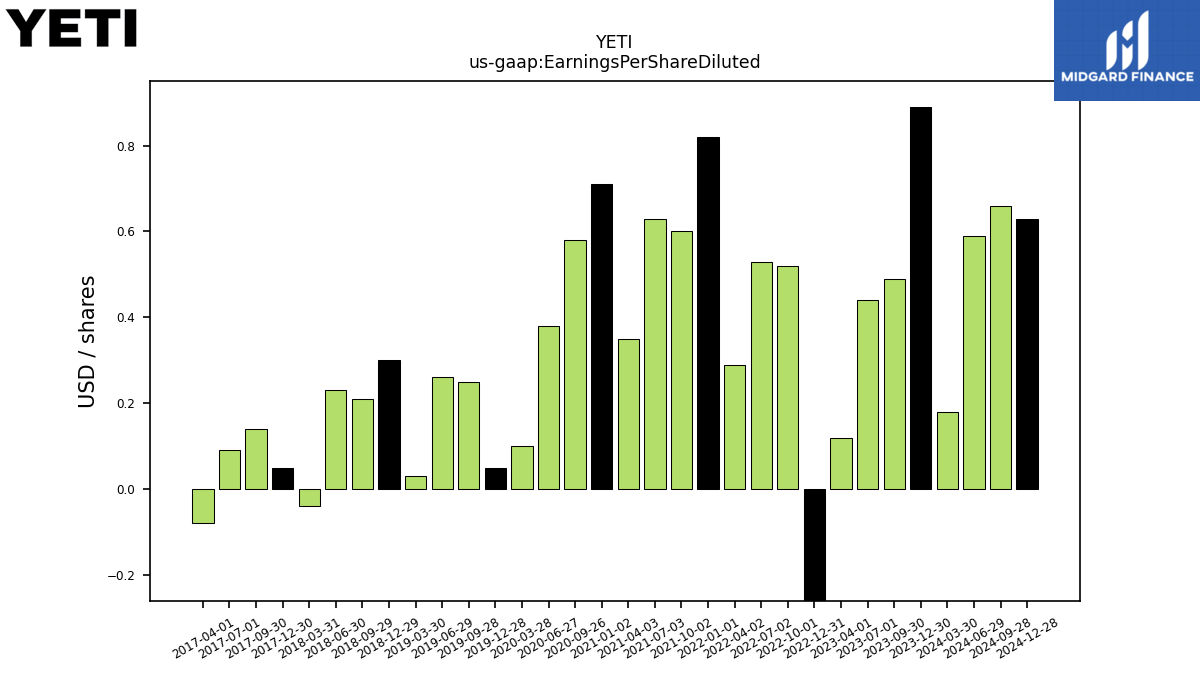
| Earnings Per Share Diluted | 0.89 | 0.49 | 0.44 | 0.12 | -0.32 | 0.52 | 0.53 | 0.29 | 0.82 | 0.60 | 0.63 | 0.35 | 0.71 | 0.58 | 0.38 | 0.10 | 0.05 | 0.25 | 0.26 | 0.03 | 0.30 | 0.21 | 0.23 | -0.04 | 0.05 | 0.14 | 0.09 | -0.08 |
| 2023-12-30 | 2023-09-30 | 2023-07-01 | 2023-04-01 | 2022-12-31 | 2022-10-01 | 2022-07-02 | 2022-04-02 | 2022-01-01 | 2021-10-02 | 2021-07-03 | 2021-04-03 | 2021-01-02 | 2020-09-26 | 2020-06-27 | 2020-03-28 | 2019-12-28 | 2019-09-28 | 2019-06-29 | 2019-03-30 | 2018-12-29 | 2018-09-29 | 2018-06-30 | 2018-03-31 | 2017-12-30 | 2017-09-30 | 2017-07-01 | 2017-04-01 | ||
|---|---|---|---|---|---|---|---|---|---|---|---|---|---|---|---|---|---|---|---|---|---|---|---|---|---|---|---|---|---|
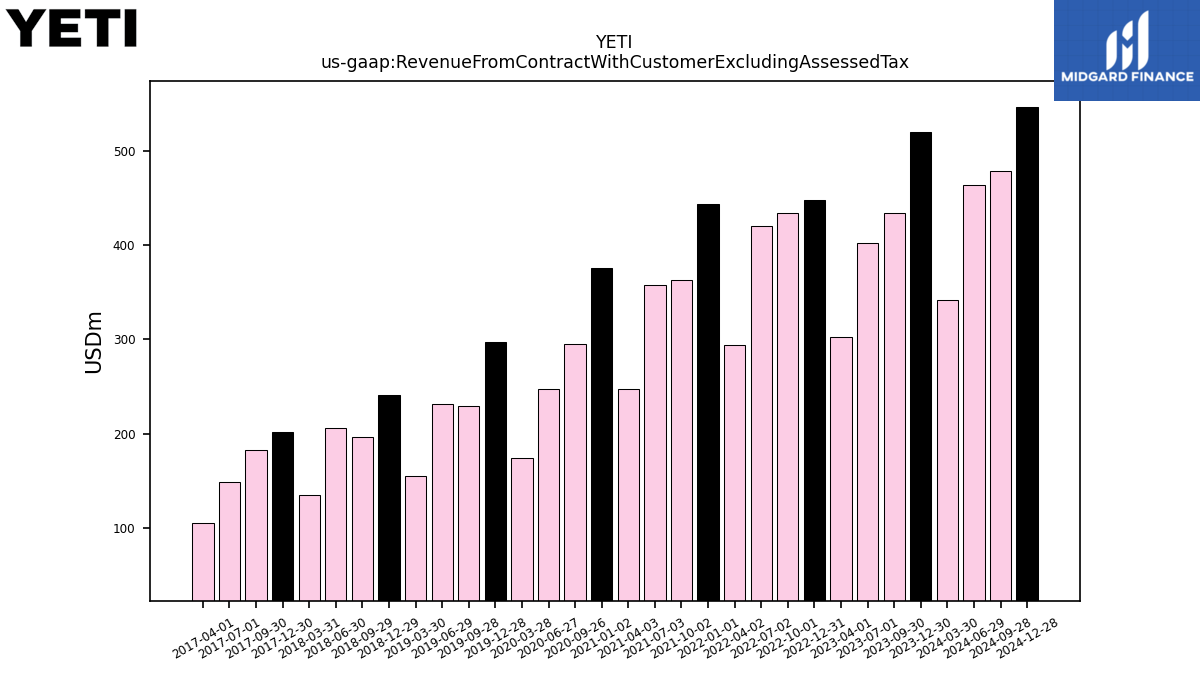
| Revenue From Contract With Customer Excluding Assessed Tax | 519.79 | 433.56 | 402.56 | 302.80 | 448.00 | 433.56 | 420.04 | 293.63 | 443.12 | 362.64 | 357.67 | 247.55 | 375.77 | 294.60 | 246.94 | 174.41 | 297.60 | 229.12 | 231.65 | 155.35 | 241.18 | 196.11 | 206.29 | 135.26 | 202.10 | 183.03 | 148.41 | 105.70 | |
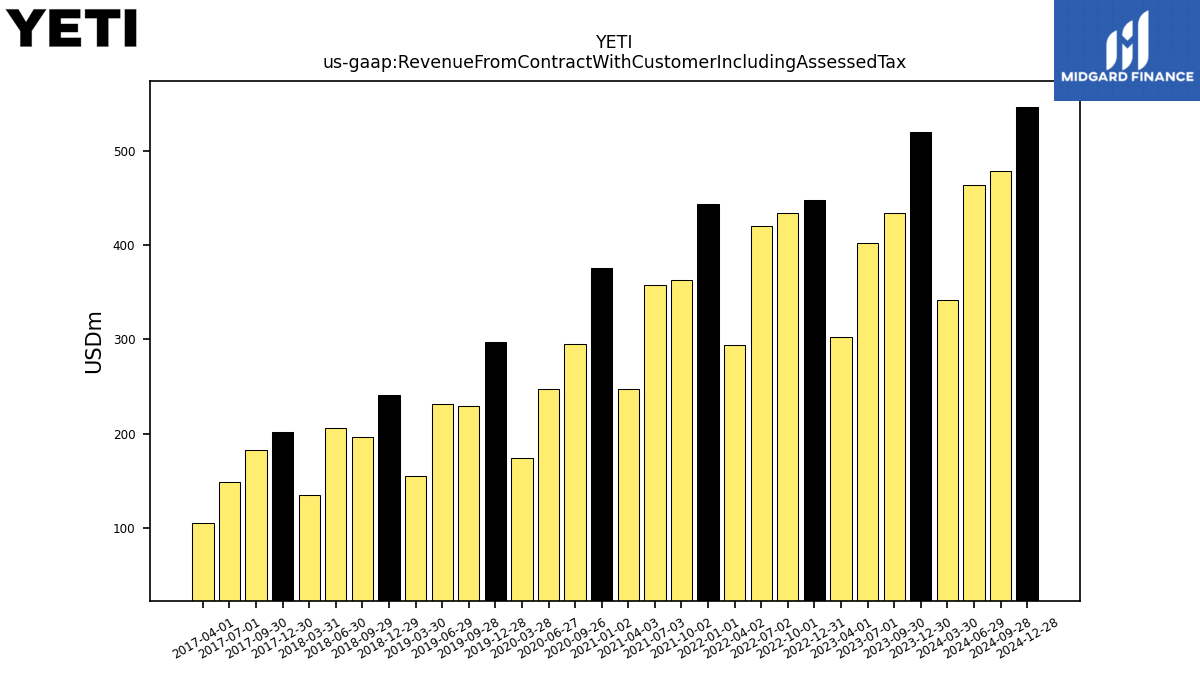
| Revenue From Contract With Customer Including Assessed Tax | 519.79 | 433.56 | 402.56 | 302.80 | 448.00 | 433.56 | 420.04 | 293.63 | 443.12 | 362.64 | 357.67 | 247.55 | 375.77 | 294.60 | 246.94 | 174.41 | 297.60 | 229.12 | 231.65 | 155.35 | 241.18 | 196.11 | 206.29 | 135.26 | 202.10 | 183.03 | 148.41 | 105.70 | |
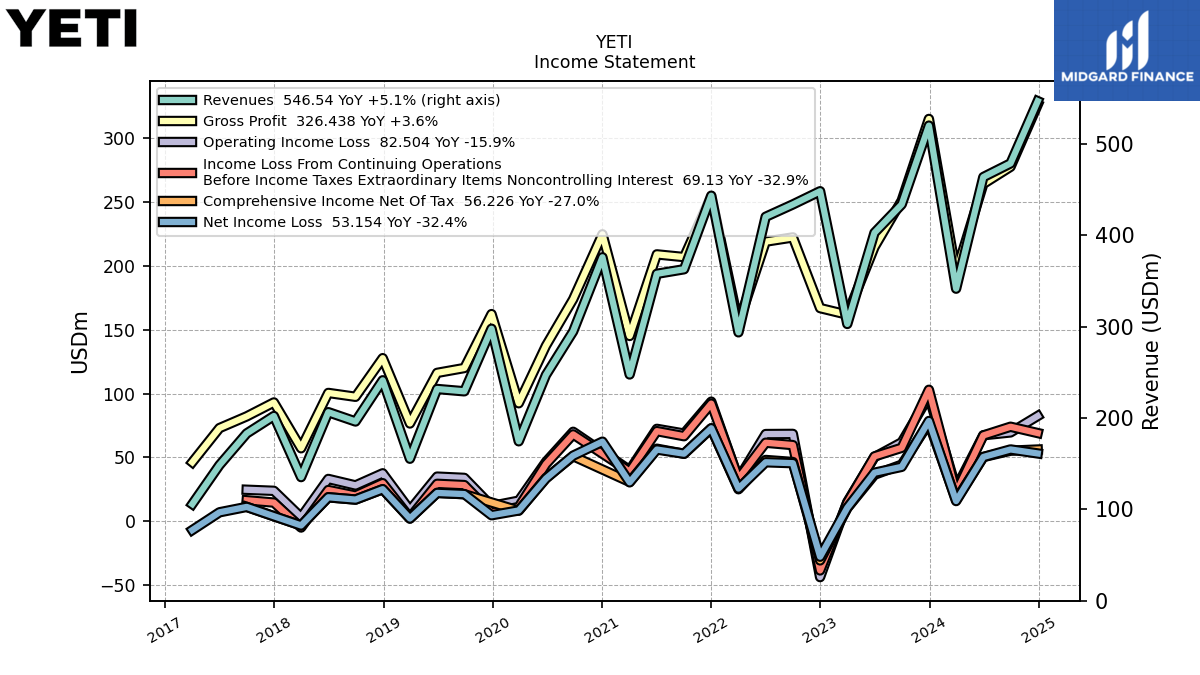
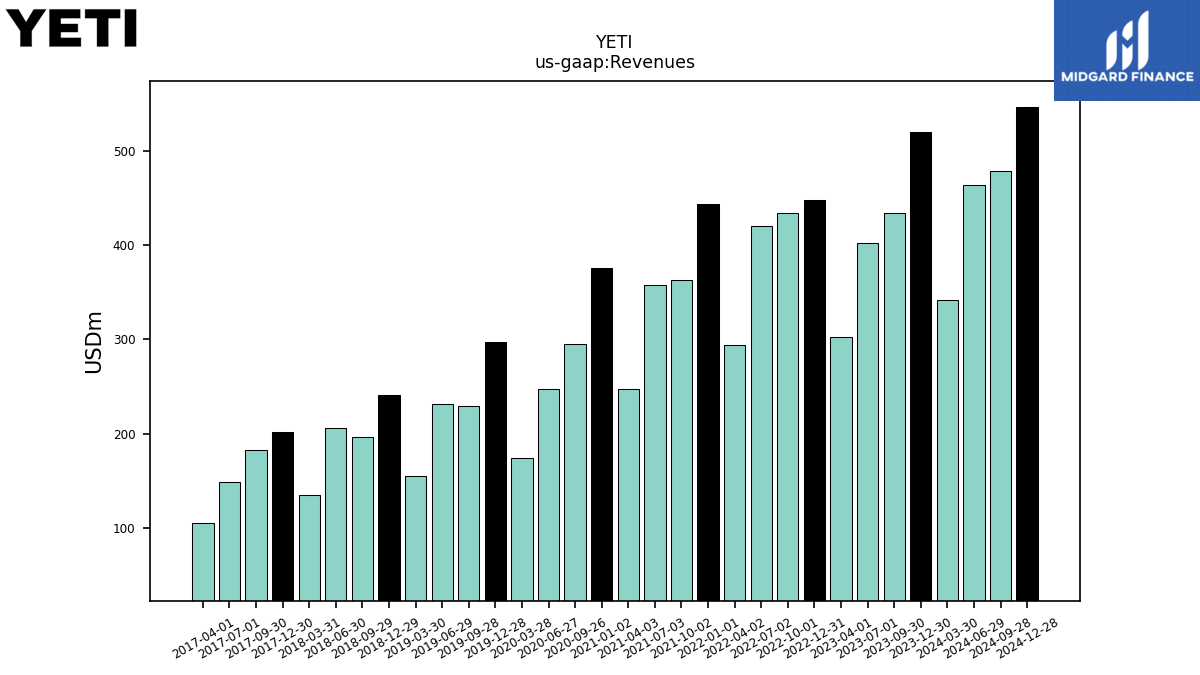
| Revenues | 519.79 | 433.56 | 402.56 | 302.80 | 448.00 | 433.56 | 420.04 | 293.63 | 443.12 | 362.64 | 357.67 | 247.55 | 375.77 | 294.60 | 246.94 | 174.41 | 297.60 | 229.12 | 231.65 | 155.35 | 241.18 | 196.11 | 206.29 | 135.26 | 202.10 | 183.03 | 148.41 | 105.70 | |
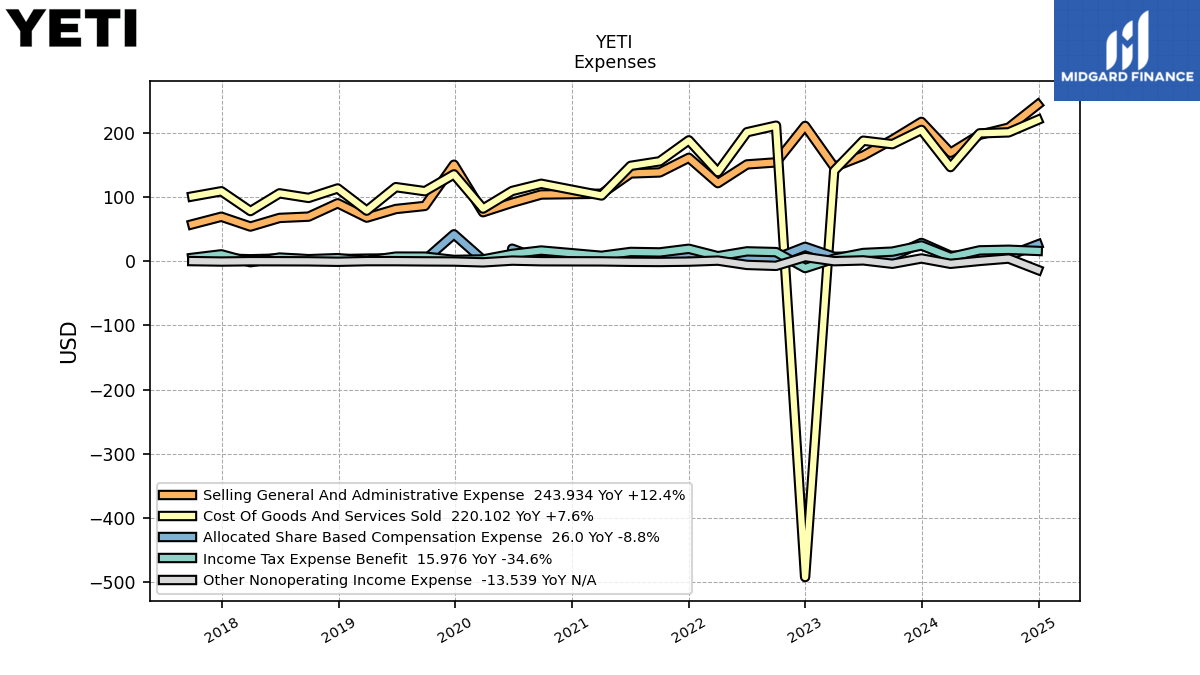
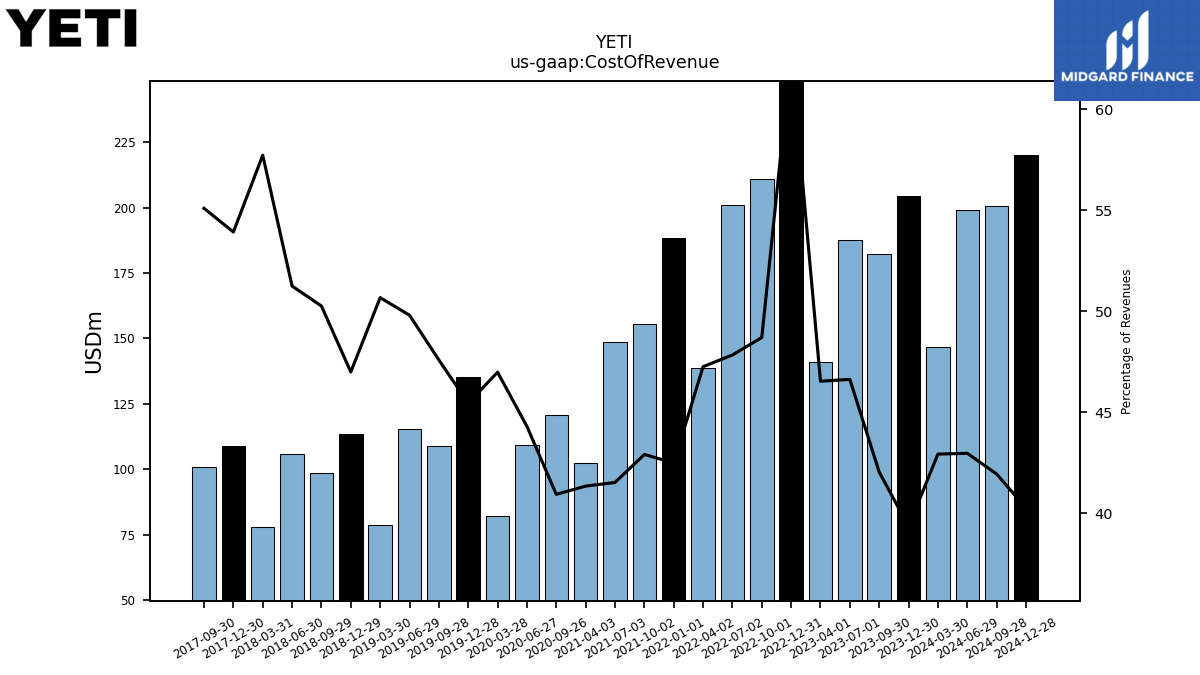
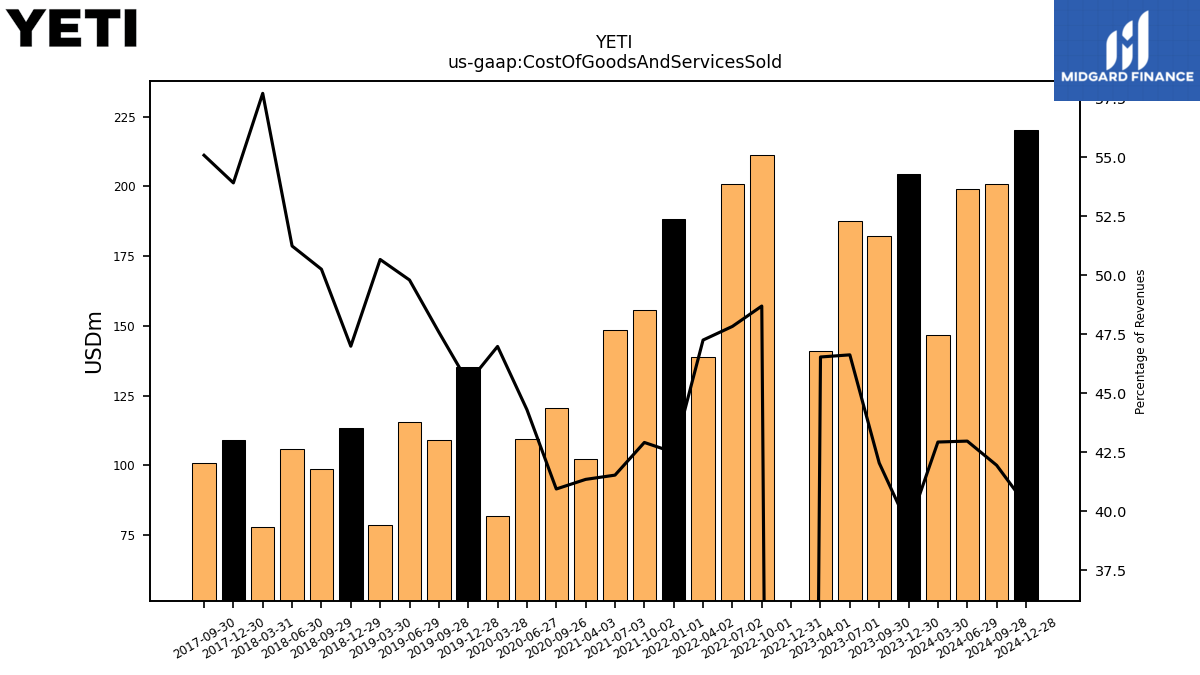
| Cost Of Revenue | 204.57 | 182.31 | 187.72 | 140.93 | 280.96 | 211.15 | 200.94 | 138.77 | 188.32 | 155.64 | 148.55 | 102.37 | NA | 120.63 | 109.41 | 81.95 | 135.27 | 109.05 | 115.38 | 78.73 | 113.35 | 98.57 | 105.72 | 78.07 | 108.98 | 100.84 | NA | NA | |
| Cost Of Goods And Services Sold | 204.57 | 182.31 | 187.72 | 140.93 | -492.26 | 211.15 | 200.94 | 138.77 | 188.32 | 155.64 | 148.55 | 102.37 | NA | 120.63 | 109.41 | 81.95 | 135.27 | 109.05 | 115.38 | 78.73 | 113.35 | 98.57 | 105.72 | 78.07 | 108.98 | 100.84 | NA | NA | |
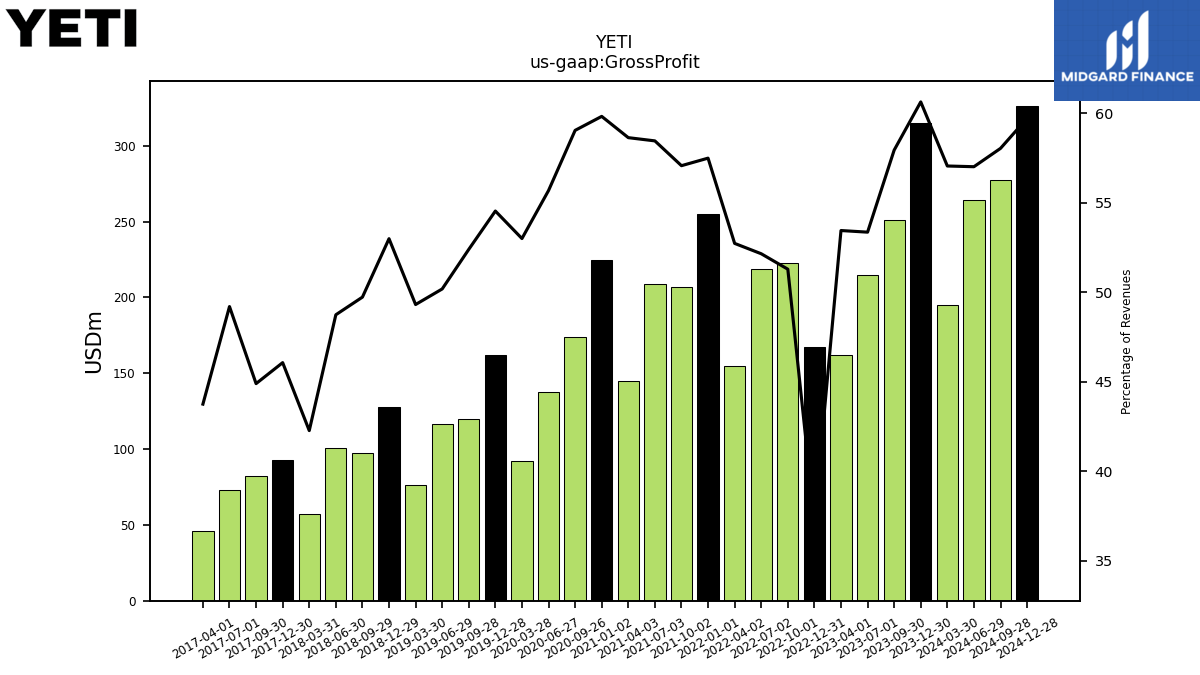
| Gross Profit | 315.23 | 251.25 | 214.84 | 161.87 | 167.03 | 222.41 | 219.10 | 154.86 | 254.81 | 207.00 | 209.12 | 145.18 | 224.84 | 173.98 | 137.53 | 92.46 | 162.33 | 120.08 | 116.28 | 76.63 | 127.83 | 97.54 | 100.57 | 57.19 | 93.12 | 82.19 | 73.03 | 46.26 | |
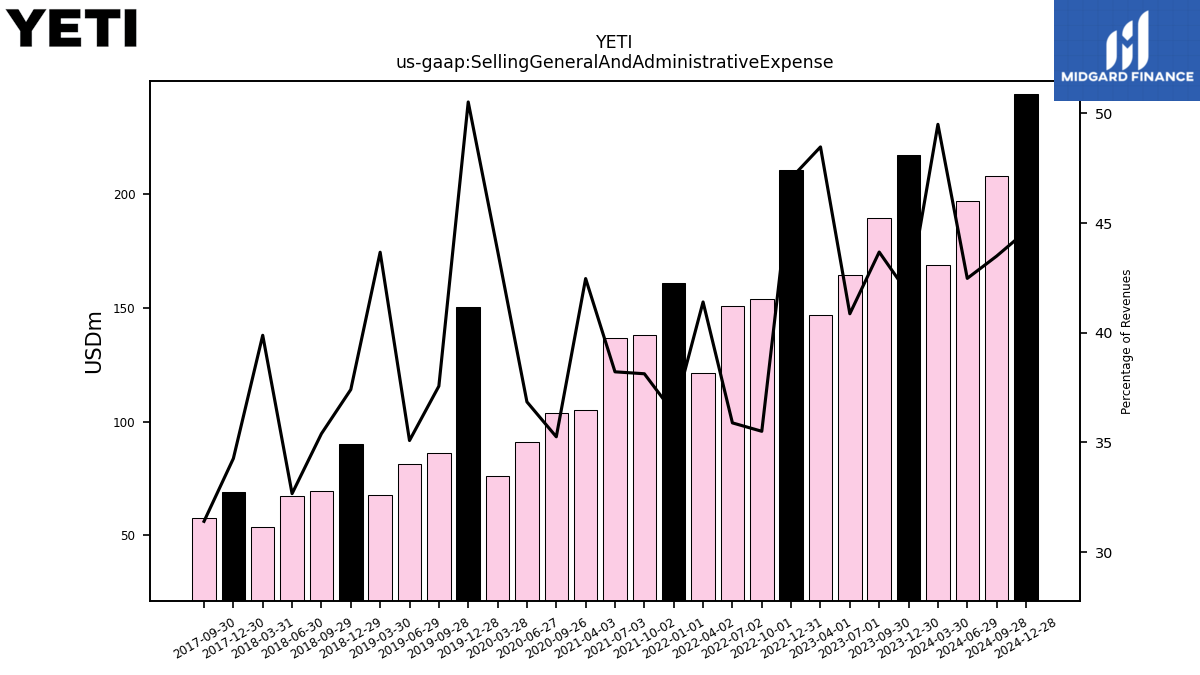
| Selling General And Administrative Expense | 217.07 | 189.37 | 164.51 | 146.77 | 210.78 | 153.94 | 150.75 | 121.57 | 161.07 | 138.27 | 136.69 | 105.14 | NA | 103.86 | 90.99 | 76.30 | 150.35 | 86.07 | 81.28 | 67.84 | 90.23 | 69.42 | 67.38 | 53.95 | 69.25 | 57.47 | NA | NA | |
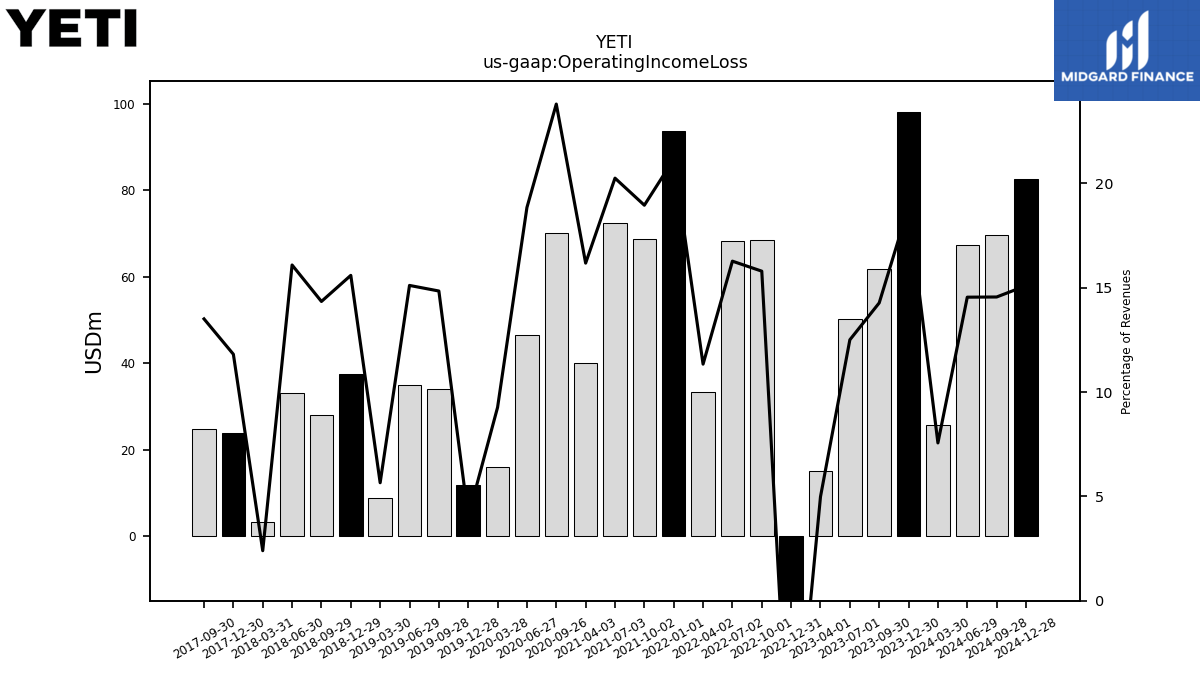
| Operating Income Loss | 98.15 | 61.88 | 50.33 | 15.10 | -43.74 | 68.47 | 68.35 | 33.29 | 93.73 | 68.73 | 72.42 | 40.05 | NA | 70.11 | 46.53 | 16.16 | 11.98 | 34.01 | 35.00 | 8.78 | 37.60 | 28.12 | 33.19 | 3.24 | 23.87 | 24.72 | NA | NA | |
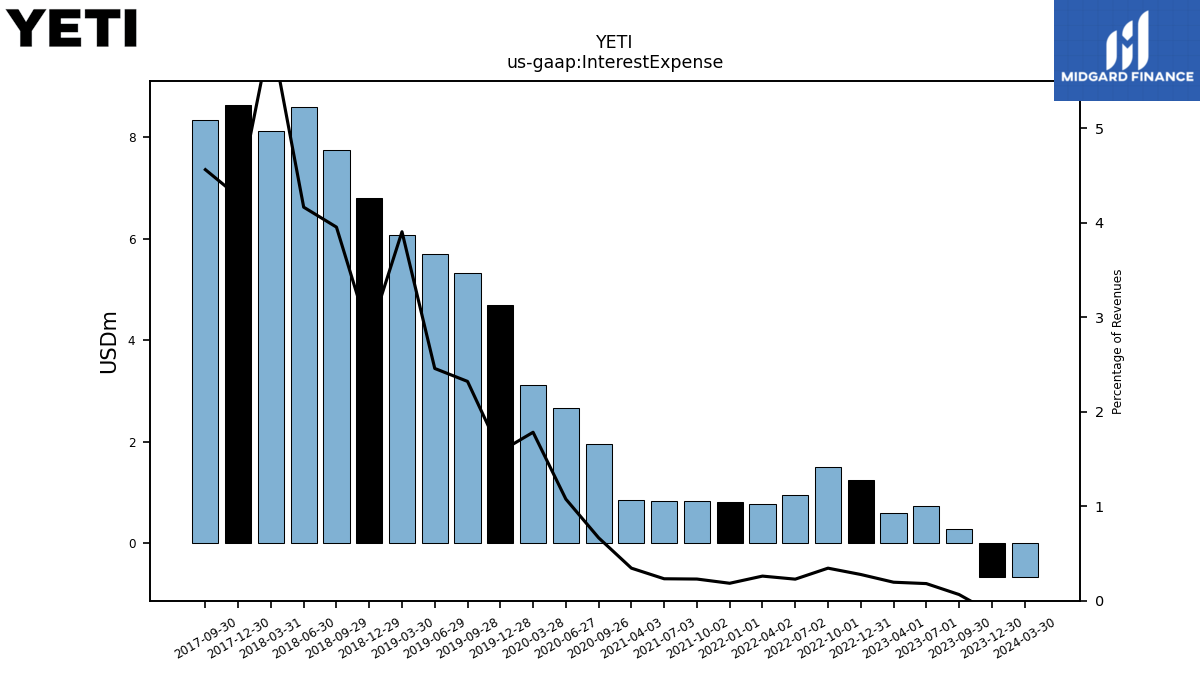
| Interest Expense | -0.67 | 0.28 | 0.73 | 0.59 | 1.25 | 1.50 | 0.96 | 0.77 | 0.82 | 0.83 | 0.83 | 0.85 | NA | 1.96 | 2.66 | 3.11 | 4.70 | 5.32 | 5.70 | 6.07 | 6.81 | 7.75 | 8.59 | 8.13 | 8.65 | 8.35 | NA | NA | |
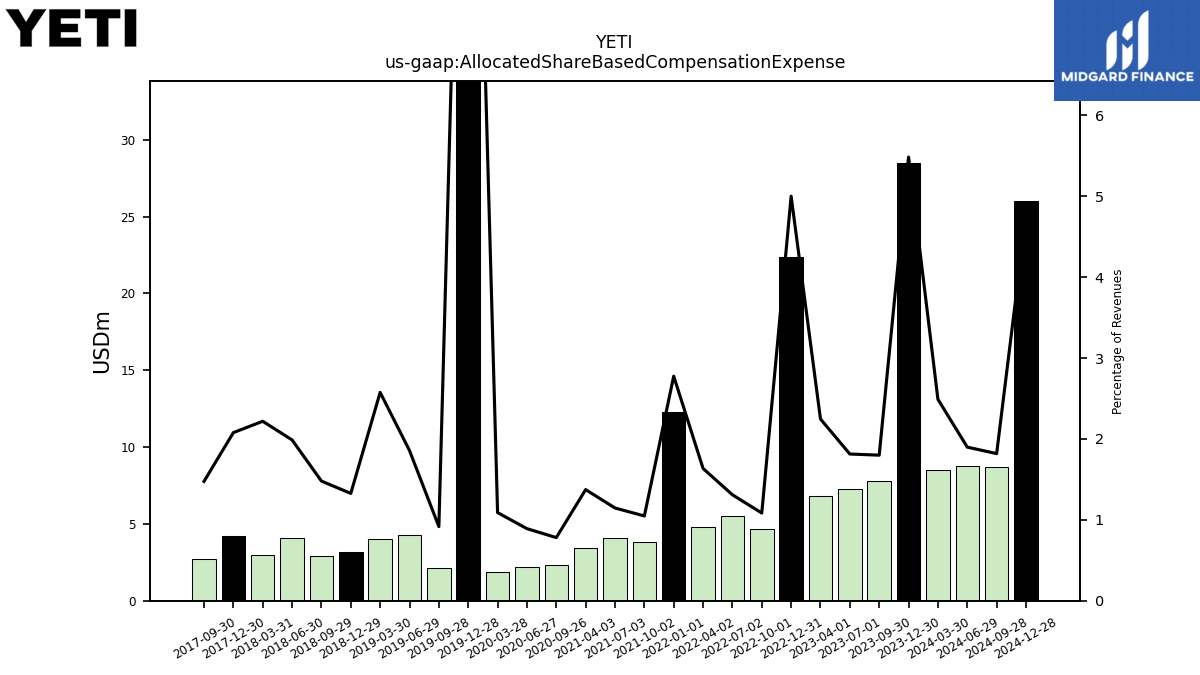
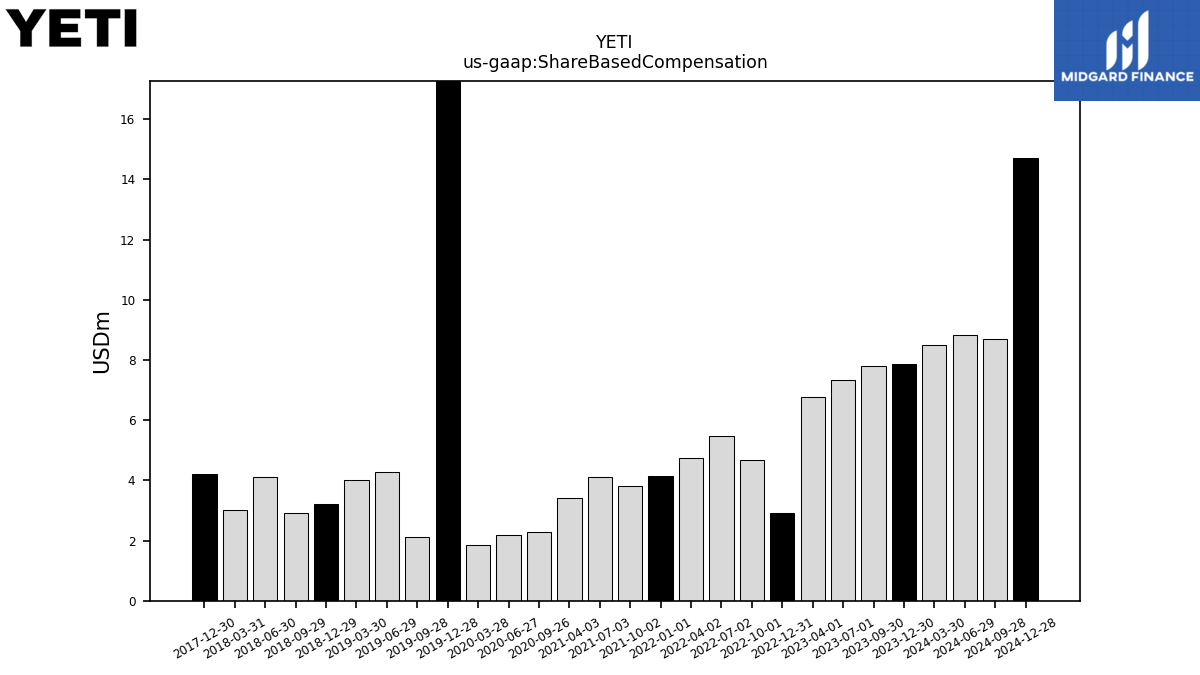
| Allocated Share Based Compensation Expense | 28.50 | 7.80 | 7.30 | 6.80 | 22.40 | 4.70 | 5.50 | 4.80 | 12.30 | 3.80 | 4.10 | 3.40 | NA | 2.30 | 2.20 | 1.90 | 41.90 | 2.10 | 4.30 | 4.00 | 3.20 | 2.90 | 4.10 | 3.00 | 4.20 | 2.70 | NA | NA | |
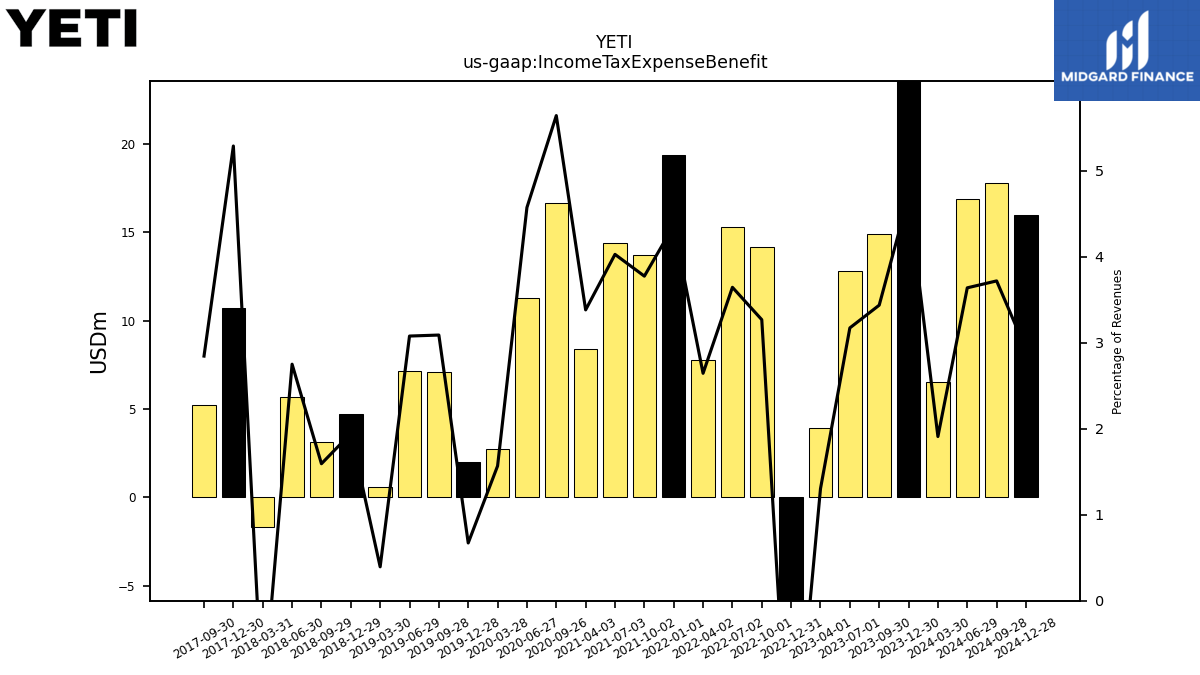
| Income Tax Expense Benefit | 24.44 | 14.90 | 12.77 | 3.95 | -10.77 | 14.17 | 15.31 | 7.77 | 19.34 | 13.69 | 14.41 | 8.37 | NA | 16.62 | 11.29 | 2.73 | 2.00 | 7.08 | 7.13 | 0.61 | 4.69 | 3.12 | 5.67 | -1.64 | 10.69 | 5.21 | NA | NA | |
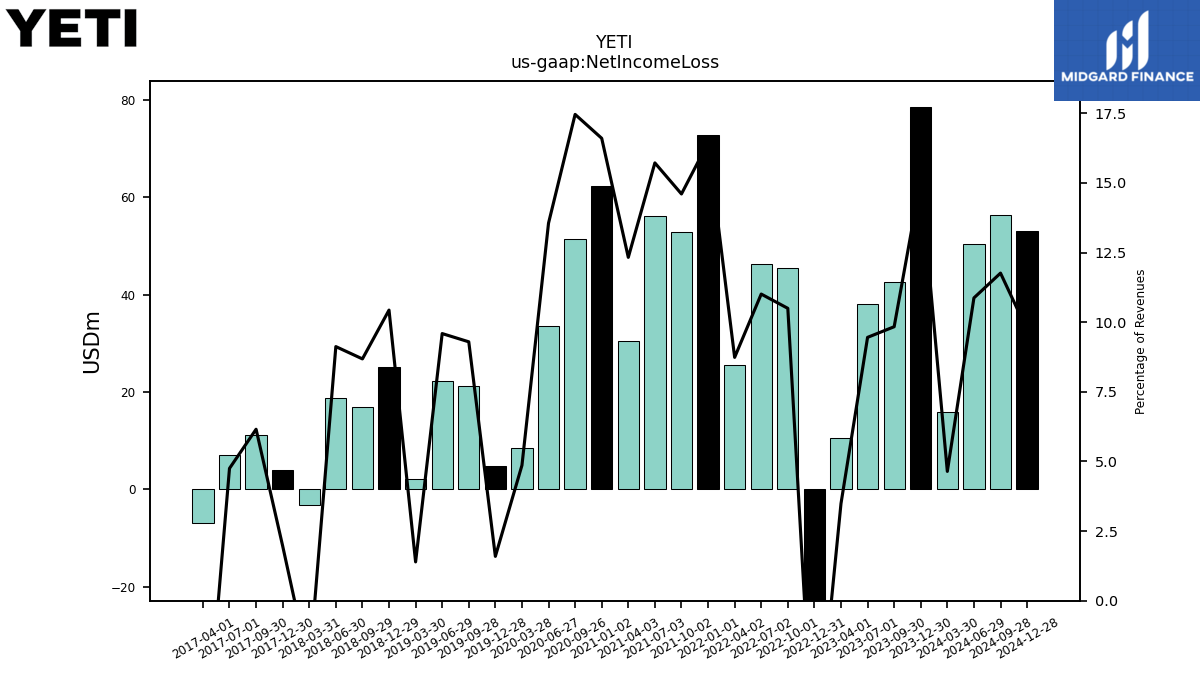
| Net Income Loss | 78.59 | 42.66 | 38.07 | 10.56 | -27.74 | 45.52 | 46.25 | 25.66 | 72.88 | 52.97 | 56.23 | 30.52 | 62.39 | 51.45 | 33.48 | 8.48 | 4.74 | 21.30 | 22.22 | 2.17 | 25.17 | 17.03 | 18.82 | -3.26 | 3.97 | 11.27 | 7.05 | -6.90 | |
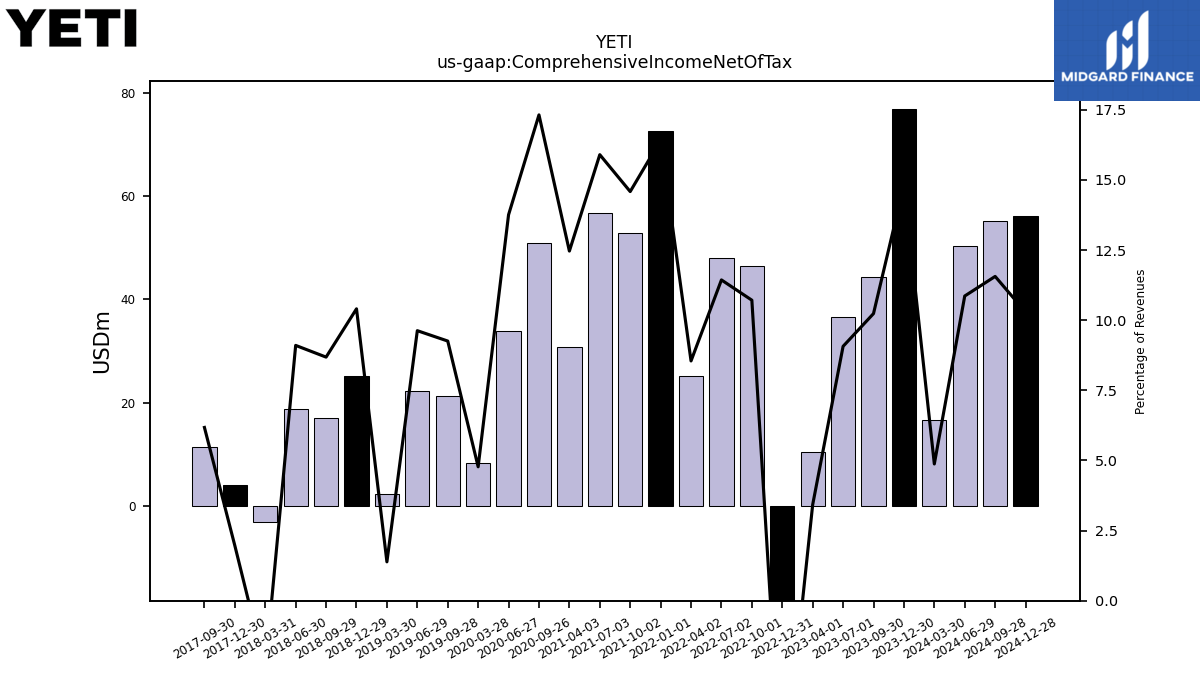
| Comprehensive Income Net Of Tax | 77.00 | 44.37 | 36.50 | 10.37 | -30.64 | 46.44 | 48.03 | 25.09 | 72.75 | 52.88 | 56.86 | 30.85 | NA | 51.01 | 33.97 | 8.33 | NA | 21.21 | 22.30 | 2.15 | 25.09 | 17.03 | 18.77 | -3.27 | 3.97 | 11.30 | NA | NA |
| 2023-12-30 | 2023-09-30 | 2023-07-01 | 2023-04-01 | 2022-12-31 | 2022-10-01 | 2022-07-02 | 2022-04-02 | 2022-01-01 | 2021-10-02 | 2021-07-03 | 2021-04-03 | 2021-01-02 | 2020-09-26 | 2020-06-27 | 2020-03-28 | 2019-12-28 | 2019-09-28 | 2019-06-29 | 2019-03-30 | 2018-12-29 | 2018-09-29 | 2018-06-30 | 2018-03-31 | 2017-12-30 | 2017-09-30 | 2017-07-01 | 2017-04-01 | ||
|---|---|---|---|---|---|---|---|---|---|---|---|---|---|---|---|---|---|---|---|---|---|---|---|---|---|---|---|---|---|
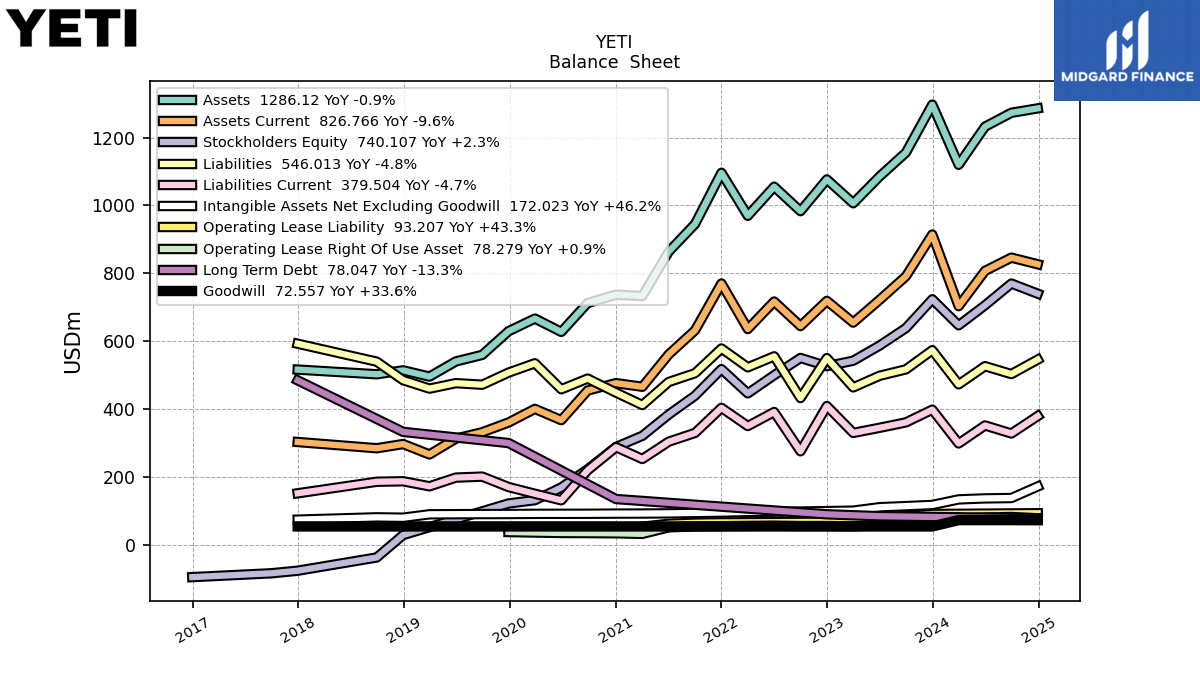
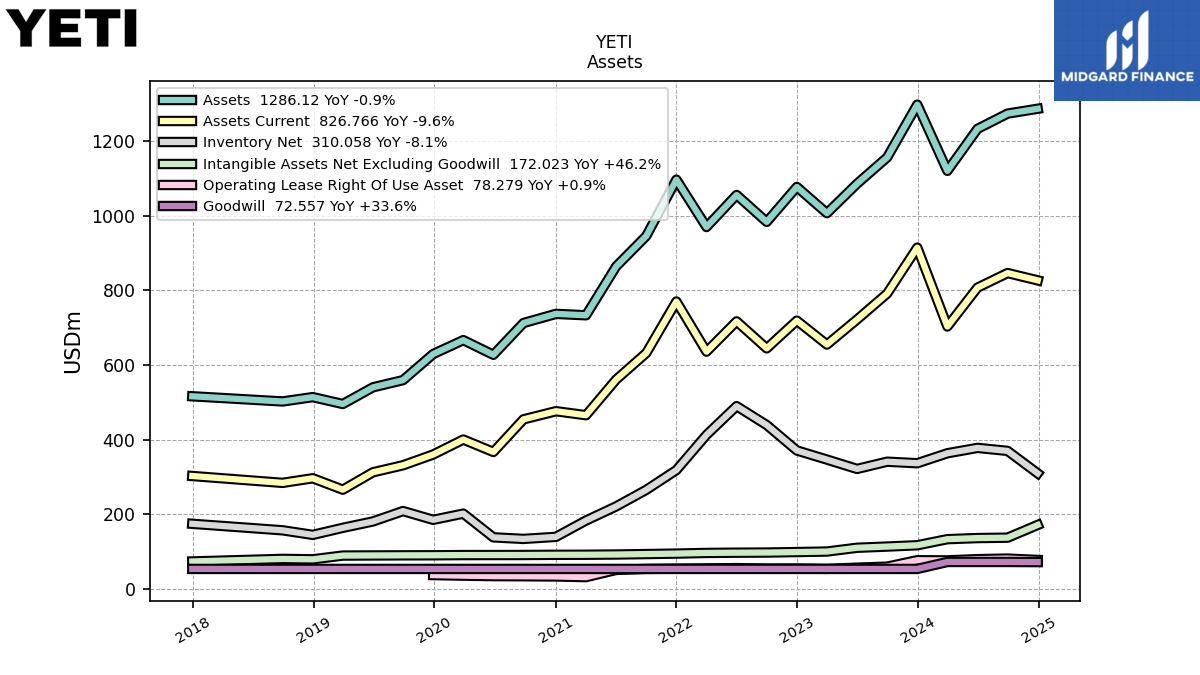
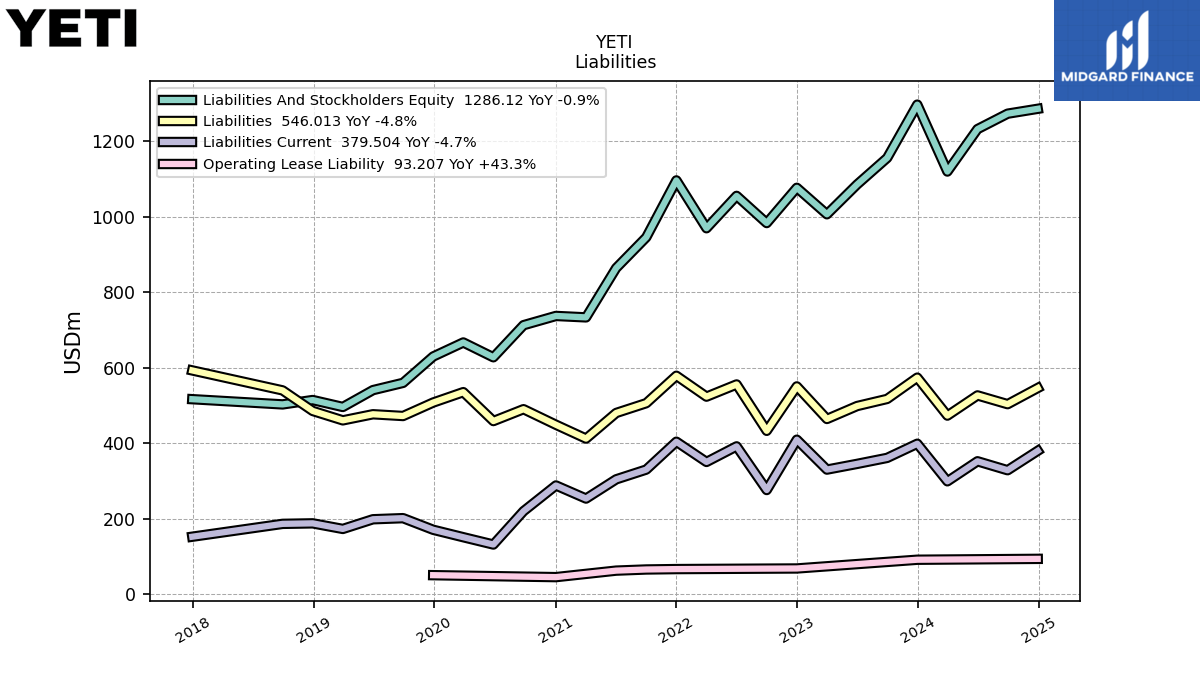
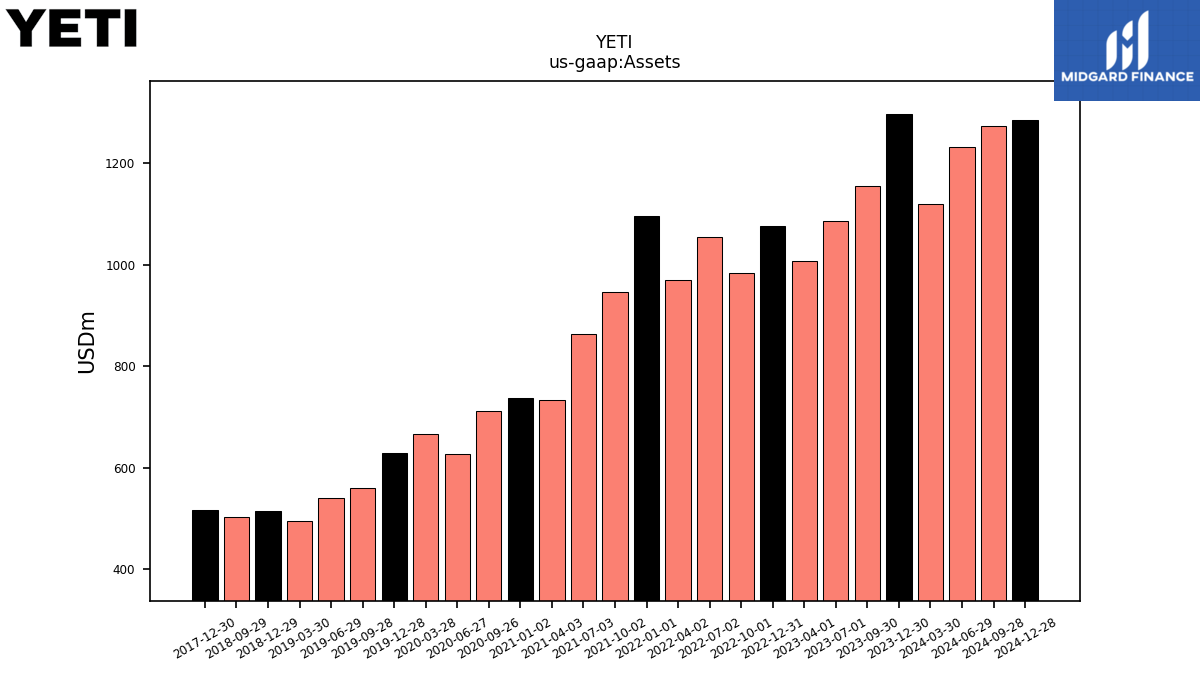
| Assets | 1297.19 | 1155.88 | 1085.44 | 1006.51 | 1076.77 | 983.23 | 1055.36 | 969.53 | 1096.36 | 945.51 | 863.98 | 733.25 | 737.07 | 712.57 | 627.45 | 666.77 | 629.54 | 559.70 | 540.44 | 495.79 | 514.21 | 502.59 | NA | NA | 516.43 | NA | NA | NA | |
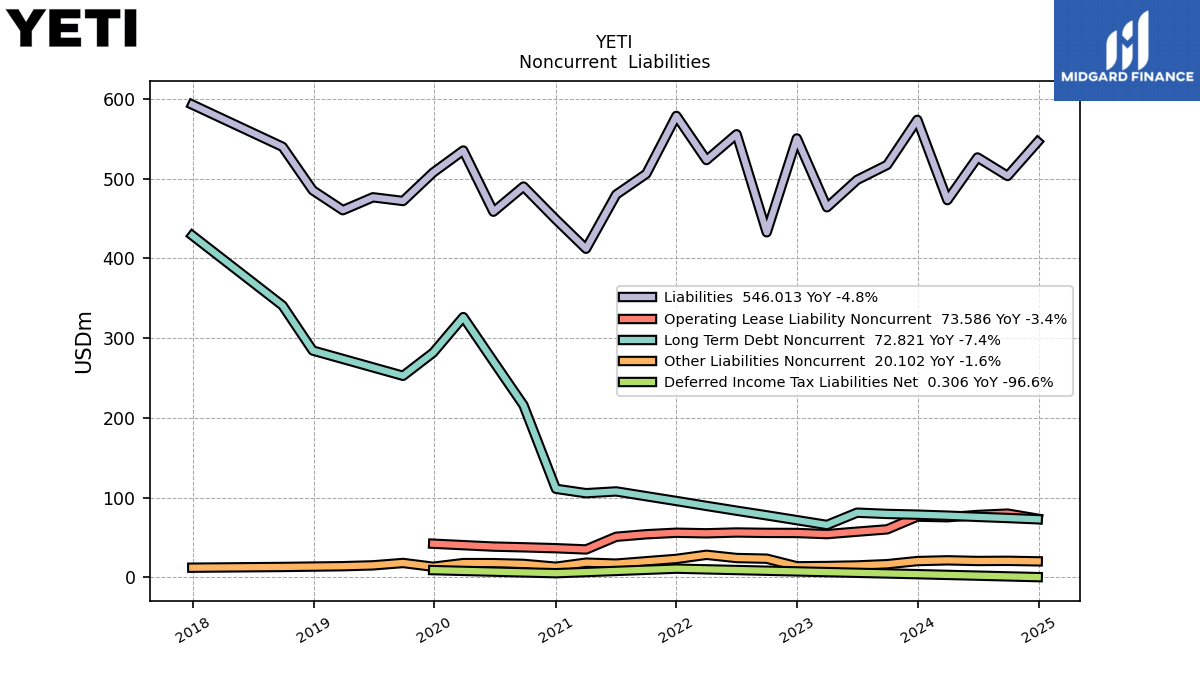
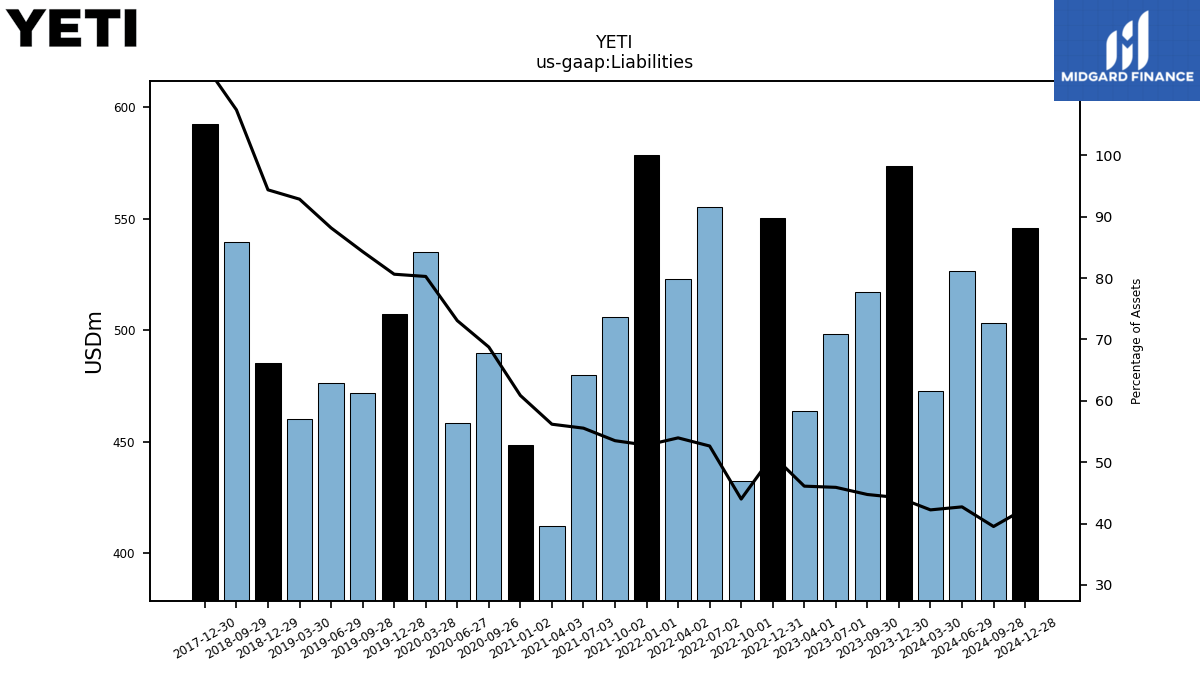
| Liabilities | 573.58 | 517.10 | 498.23 | 463.95 | 550.29 | 432.56 | 555.50 | 523.16 | 578.54 | 505.87 | 479.88 | 411.98 | 448.65 | 489.94 | 458.42 | 535.12 | 507.53 | 471.83 | 476.48 | 460.31 | 485.24 | 539.75 | NA | NA | 592.66 | NA | NA | NA | |
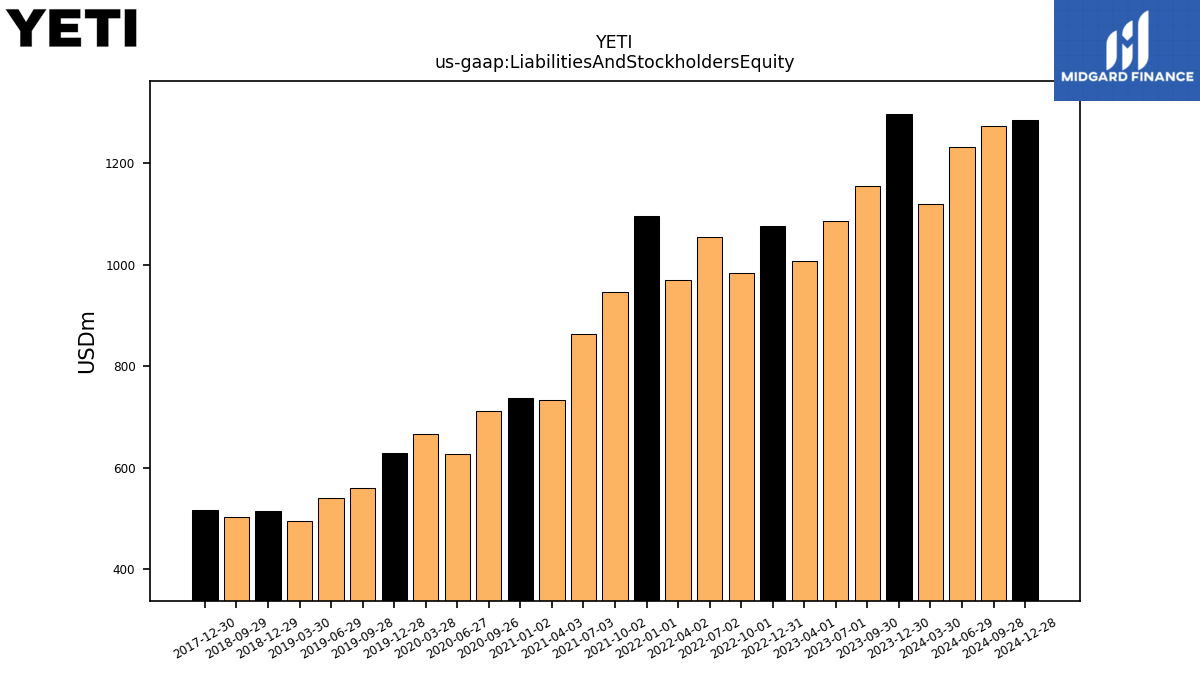
| Liabilities And Stockholders Equity | 1297.19 | 1155.88 | 1085.44 | 1006.51 | 1076.77 | 983.23 | 1055.36 | 969.53 | 1096.36 | 945.51 | 863.98 | 733.25 | 737.07 | 712.57 | 627.45 | 666.77 | 629.54 | 559.70 | 540.44 | 495.79 | 514.21 | 502.59 | NA | NA | 516.43 | NA | NA | NA | |
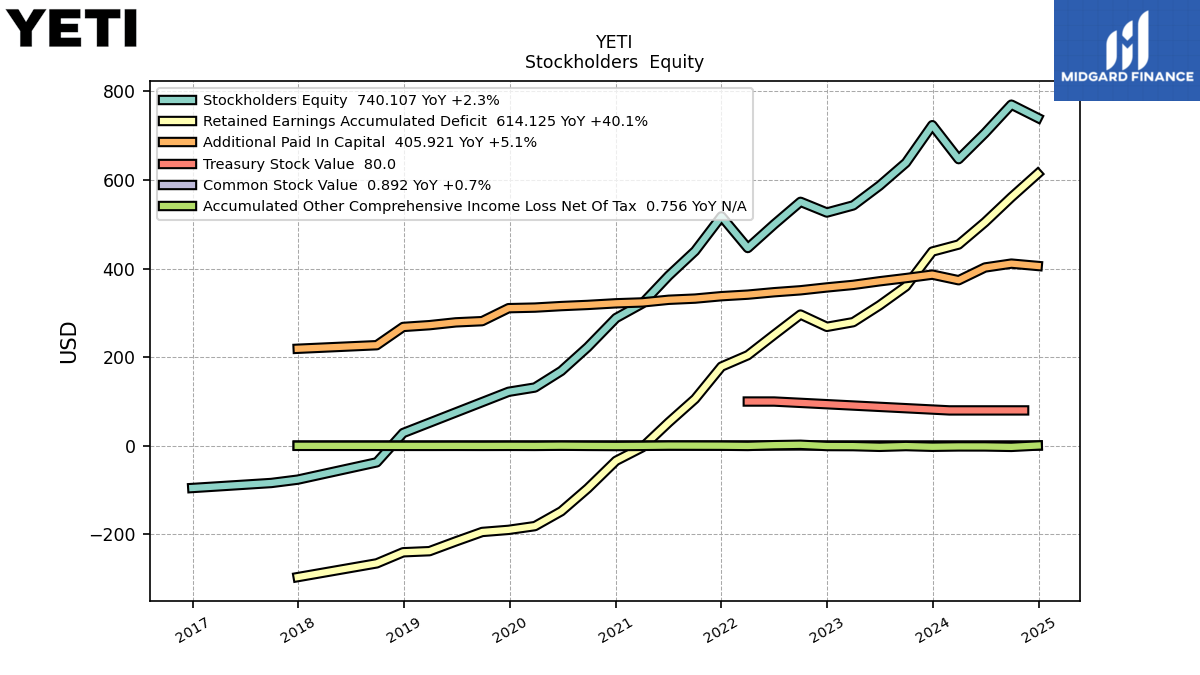
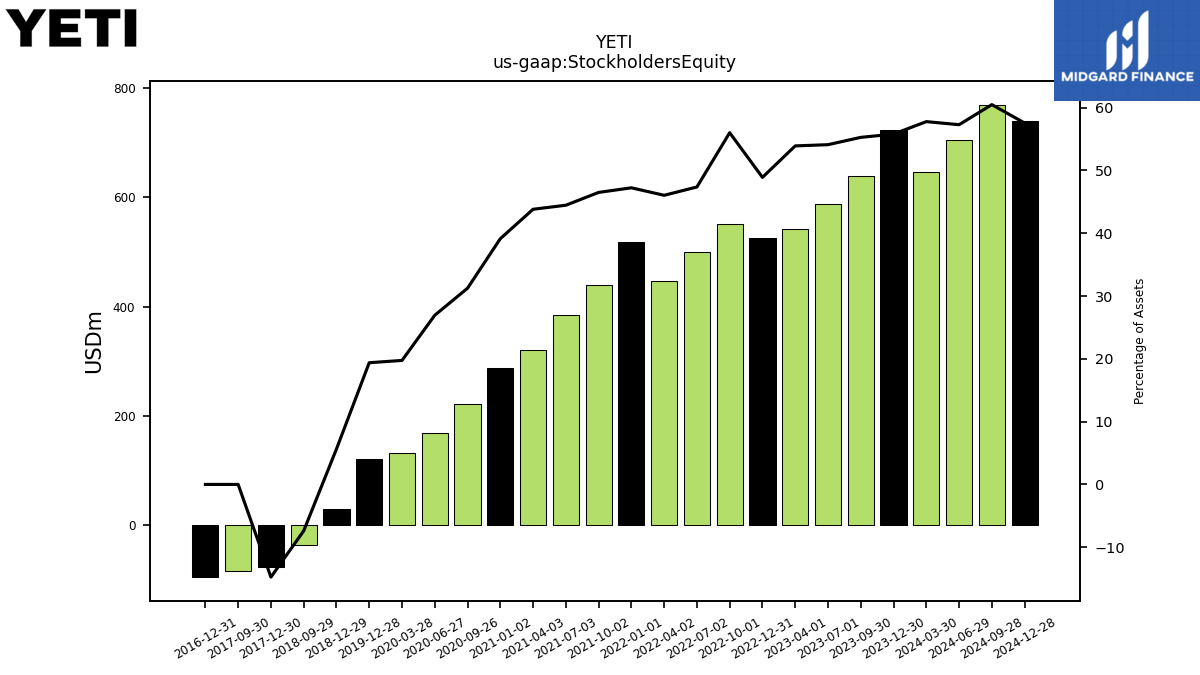
| Stockholders Equity | 723.61 | 638.78 | 587.21 | 542.56 | 526.48 | 550.66 | 499.86 | 446.37 | 517.82 | 439.64 | 384.09 | 321.27 | 288.42 | 222.63 | 169.03 | 131.65 | 122.00 | NA | NA | NA | 28.97 | -37.16 | NA | NA | -76.23 | -83.76 | NA | NA |
| 2023-12-30 | 2023-09-30 | 2023-07-01 | 2023-04-01 | 2022-12-31 | 2022-10-01 | 2022-07-02 | 2022-04-02 | 2022-01-01 | 2021-10-02 | 2021-07-03 | 2021-04-03 | 2021-01-02 | 2020-09-26 | 2020-06-27 | 2020-03-28 | 2019-12-28 | 2019-09-28 | 2019-06-29 | 2019-03-30 | 2018-12-29 | 2018-09-29 | 2018-06-30 | 2018-03-31 | 2017-12-30 | 2017-09-30 | 2017-07-01 | 2017-04-01 | ||
|---|---|---|---|---|---|---|---|---|---|---|---|---|---|---|---|---|---|---|---|---|---|---|---|---|---|---|---|---|---|
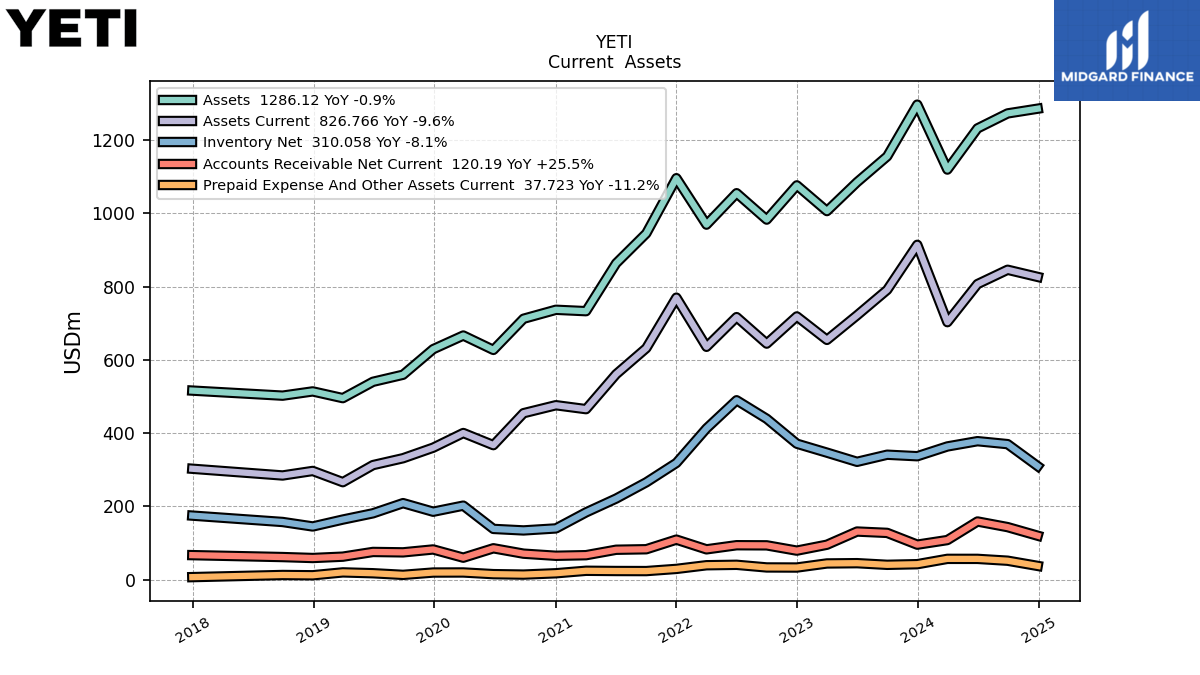
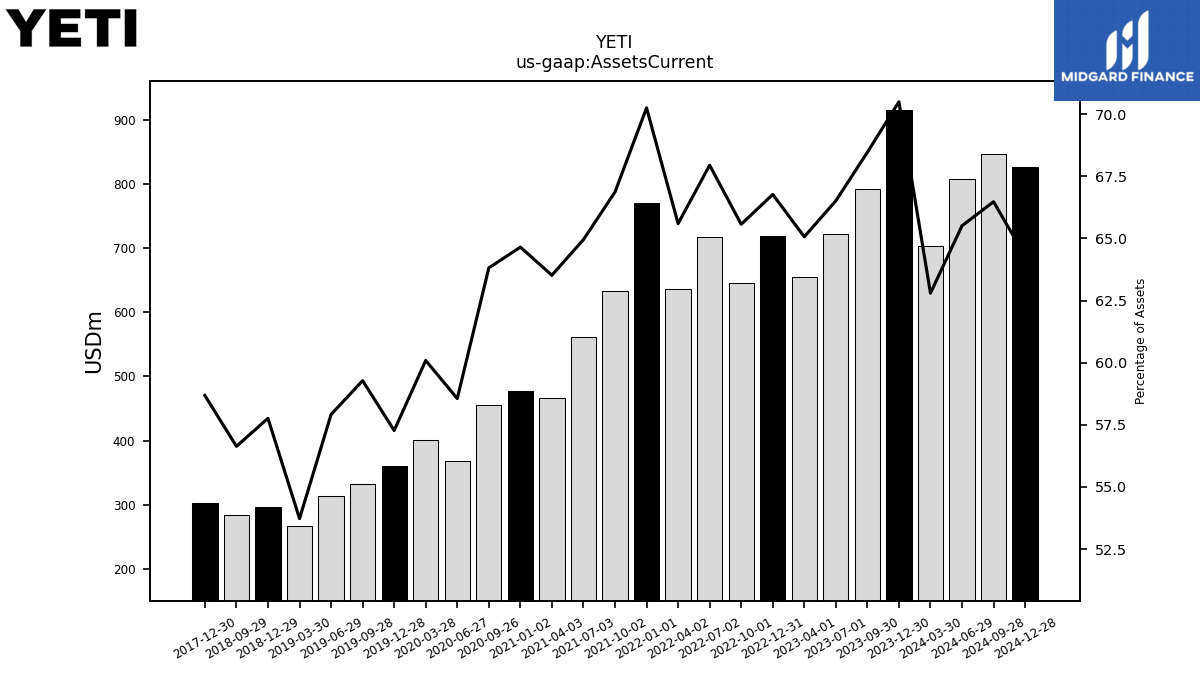
| Assets Current | 914.40 | 791.33 | 721.92 | 654.89 | 718.92 | 644.67 | 717.02 | 635.94 | 770.17 | 632.20 | 561.16 | 465.74 | 476.50 | 454.70 | 367.41 | 400.64 | 360.55 | 331.77 | 313.00 | 266.37 | 297.01 | 284.64 | NA | NA | 303.03 | NA | NA | NA | |
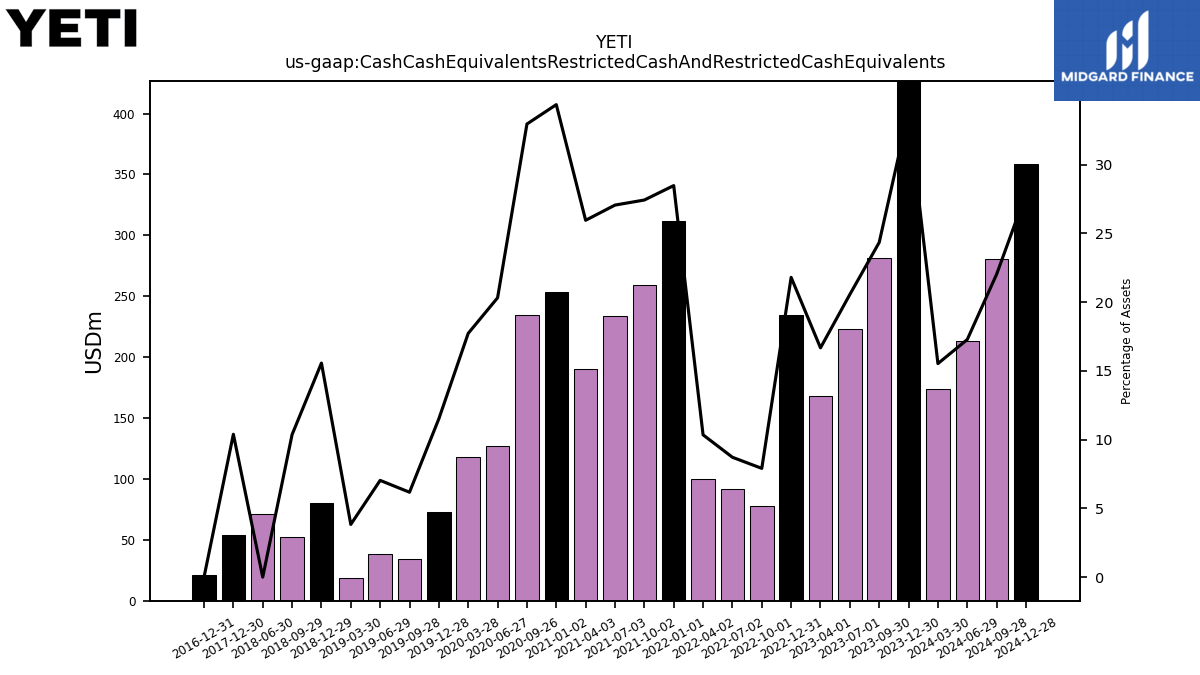
| Cash Cash Equivalents Restricted Cash And Restricted Cash Equivalents | 438.96 | 281.36 | 223.14 | 167.84 | 234.74 | 77.76 | 91.99 | 100.33 | 312.19 | 259.32 | 233.77 | 190.29 | 253.28 | 234.81 | 127.47 | 118.22 | 72.52 | 34.56 | 38.02 | 19.01 | 80.05 | 52.10 | 71.34 | NA | 53.65 | NA | NA | NA | |
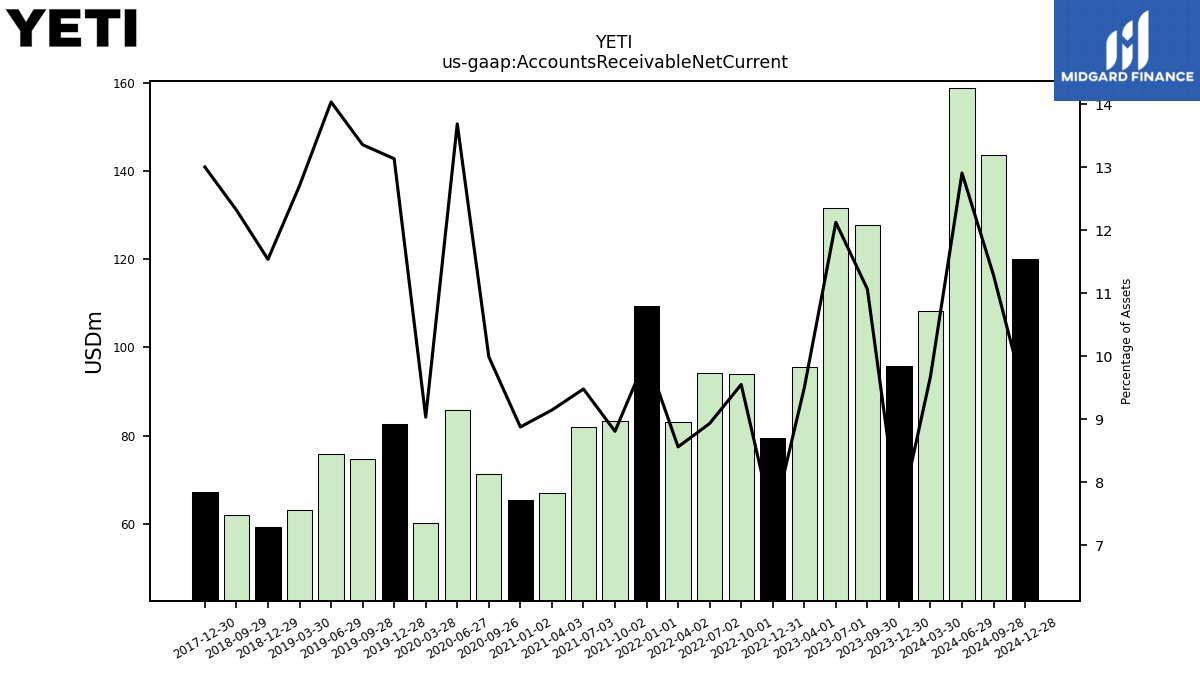
| Accounts Receivable Net Current | 95.77 | 127.90 | 131.60 | 95.58 | 79.45 | 93.90 | 94.25 | 82.99 | 109.53 | 83.27 | 81.89 | 67.05 | 65.42 | 71.19 | 85.89 | 60.22 | 82.69 | 74.76 | 75.86 | 63.00 | 59.33 | 61.91 | NA | NA | 67.15 | NA | NA | NA | |
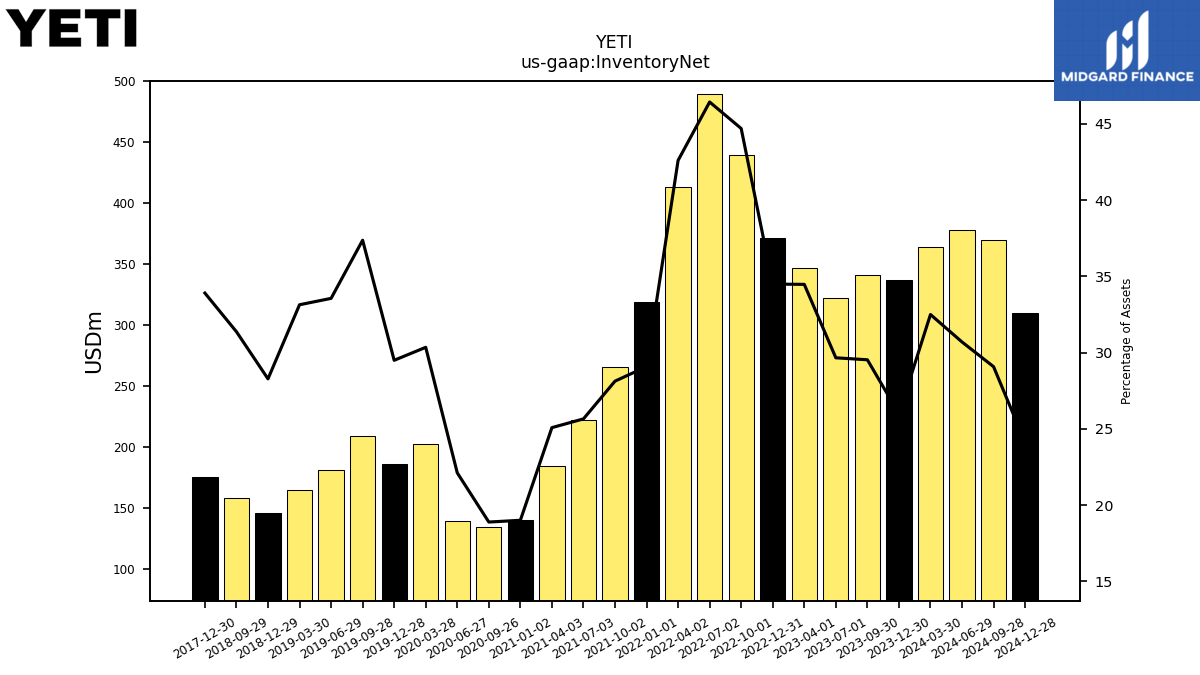
| Inventory Net | 337.21 | 341.35 | 321.95 | 347.00 | 371.41 | 439.44 | 490.01 | 413.04 | 318.86 | 265.97 | 221.66 | 183.92 | 140.11 | 134.63 | 138.78 | 202.35 | 185.70 | 209.15 | 181.35 | 164.30 | 145.42 | 157.67 | NA | NA | 175.10 | NA | NA | NA | |
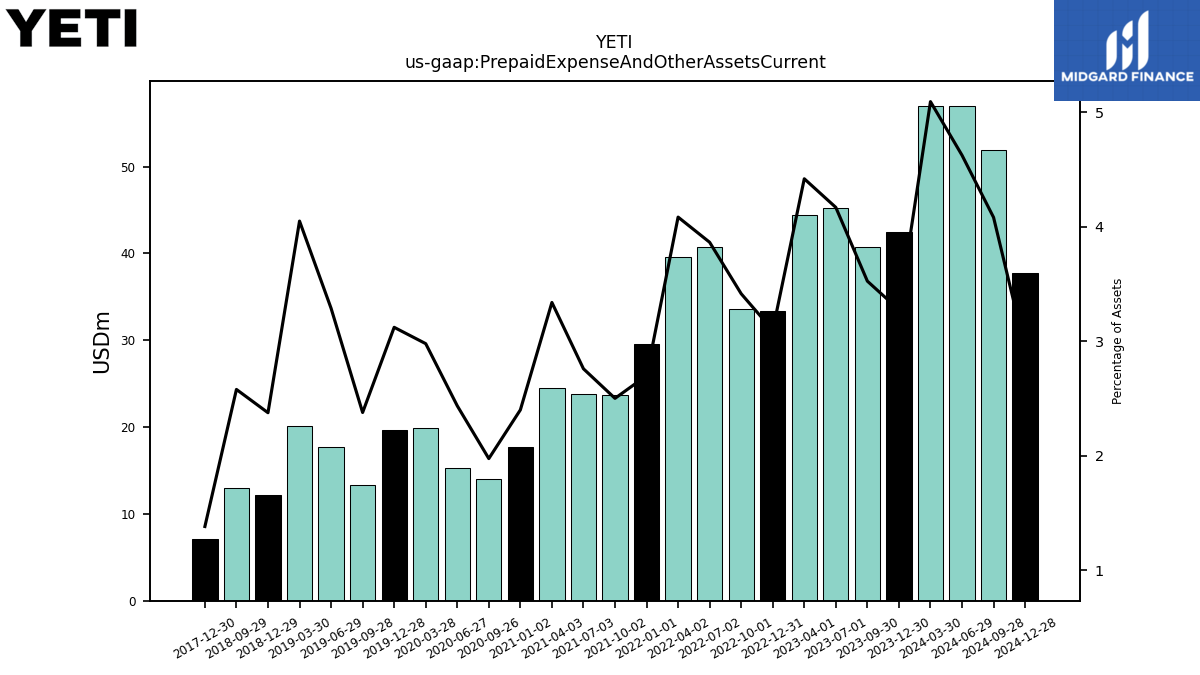
| Prepaid Expense And Other Assets Current | 42.46 | 40.73 | 45.23 | 44.46 | 33.32 | 33.56 | 40.77 | 39.58 | 29.58 | 23.64 | 23.83 | 24.47 | 17.69 | 14.07 | 15.28 | 19.86 | 19.64 | 13.30 | 17.76 | 20.07 | 12.21 | 12.96 | NA | NA | 7.13 | NA | NA | NA |
| 2023-12-30 | 2023-09-30 | 2023-07-01 | 2023-04-01 | 2022-12-31 | 2022-10-01 | 2022-07-02 | 2022-04-02 | 2022-01-01 | 2021-10-02 | 2021-07-03 | 2021-04-03 | 2021-01-02 | 2020-09-26 | 2020-06-27 | 2020-03-28 | 2019-12-28 | 2019-09-28 | 2019-06-29 | 2019-03-30 | 2018-12-29 | 2018-09-29 | 2018-06-30 | 2018-03-31 | 2017-12-30 | 2017-09-30 | 2017-07-01 | 2017-04-01 | ||
|---|---|---|---|---|---|---|---|---|---|---|---|---|---|---|---|---|---|---|---|---|---|---|---|---|---|---|---|---|---|
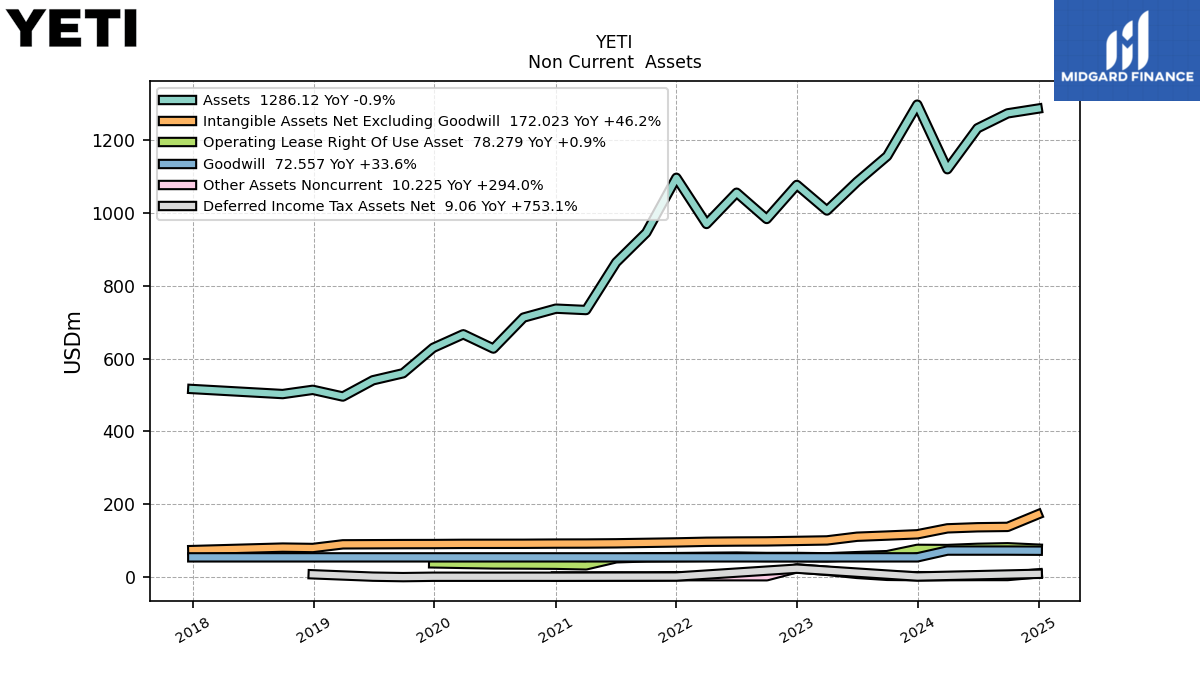
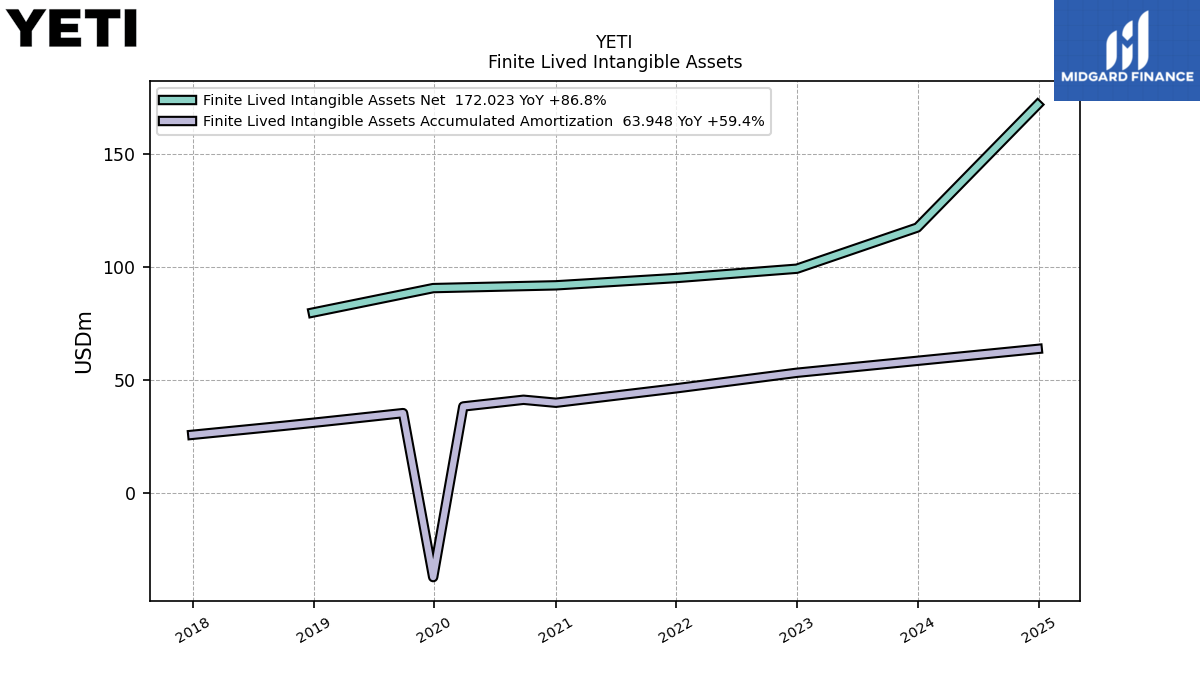
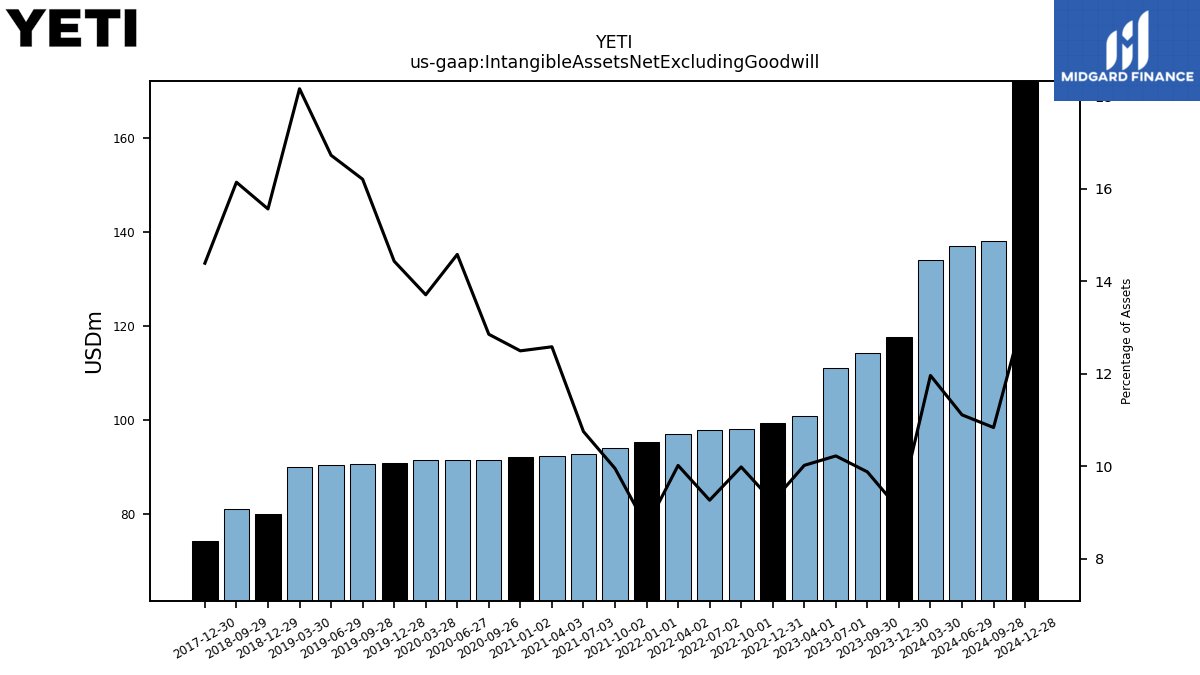
| Intangible Assets Net Excluding Goodwill | 117.63 | 114.14 | 110.93 | 100.81 | 99.43 | 98.14 | 97.76 | 97.09 | 95.31 | 94.07 | 92.86 | 92.25 | 92.08 | 91.57 | 91.47 | 91.38 | 90.85 | 90.69 | 90.38 | 90.04 | 80.02 | 81.11 | NA | NA | 74.30 | NA | NA | NA | |
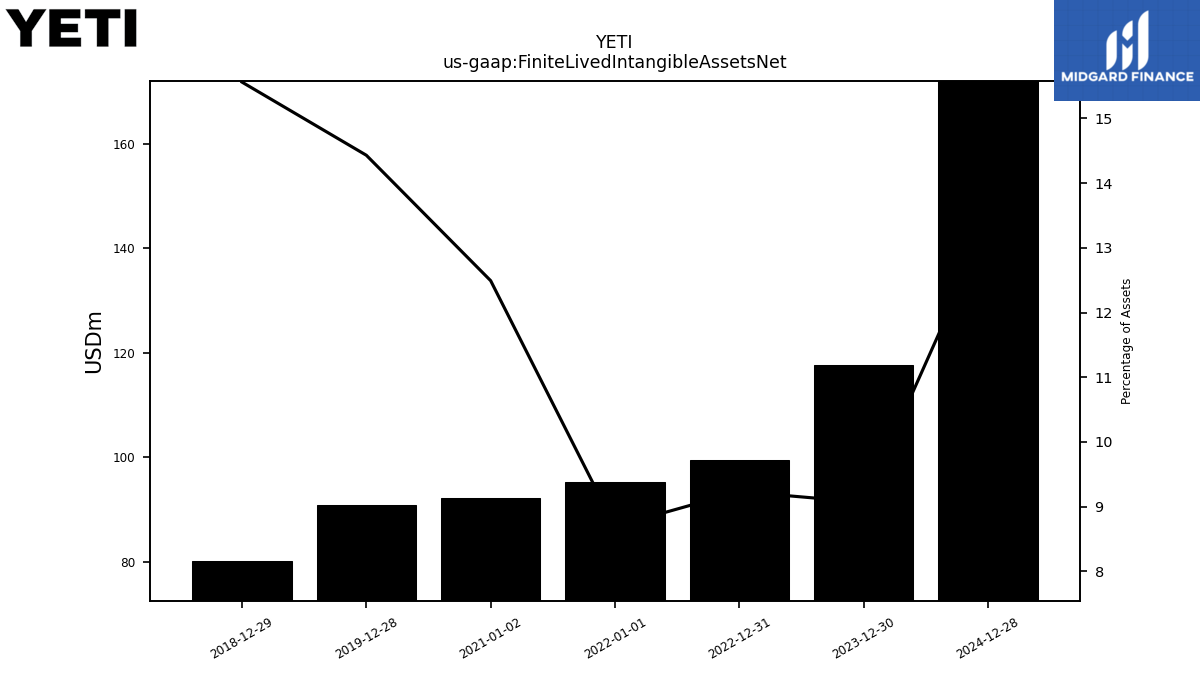
| Finite Lived Intangible Assets Net | 117.63 | NA | NA | NA | 99.43 | NA | NA | NA | 95.31 | NA | NA | NA | 92.08 | NA | NA | NA | 90.85 | NA | NA | NA | 80.02 | NA | NA | NA | NA | NA | NA | NA | |
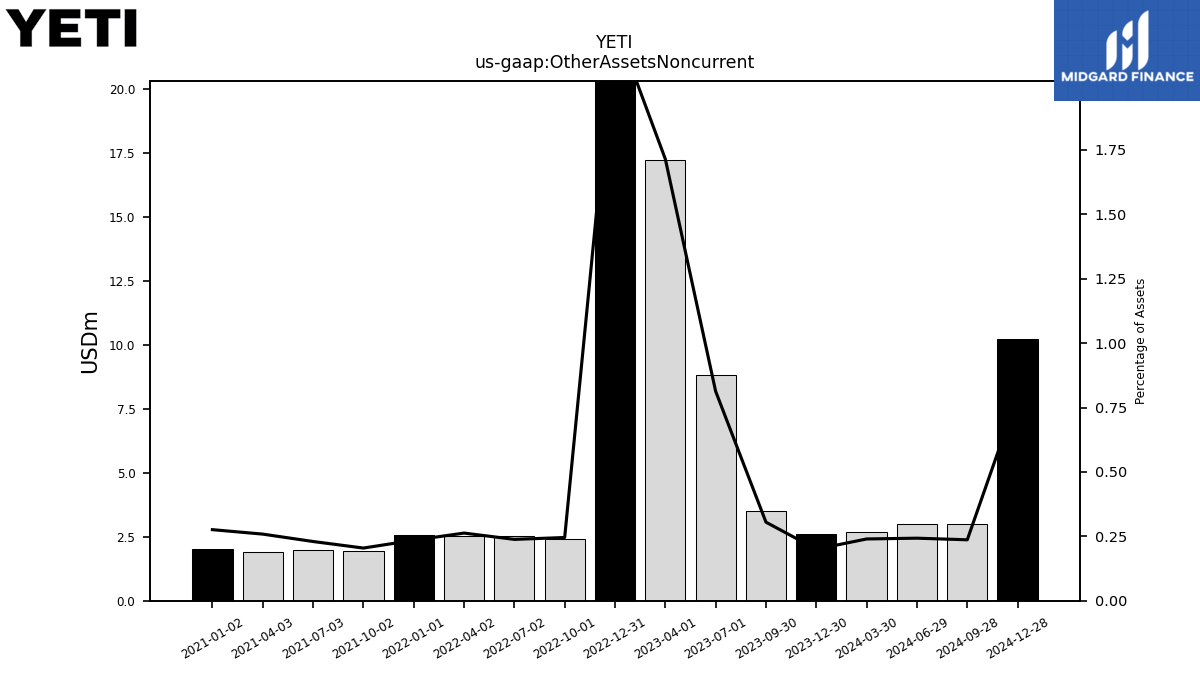
| Other Assets Noncurrent | 2.60 | 3.53 | 8.82 | 17.26 | 24.13 | 2.41 | 2.51 | 2.55 | 2.58 | 1.93 | 1.99 | 1.90 | 2.03 | NA | NA | NA | NA | NA | NA | NA | NA | NA | NA | NA | NA | NA | NA | NA |
| 2023-12-30 | 2023-09-30 | 2023-07-01 | 2023-04-01 | 2022-12-31 | 2022-10-01 | 2022-07-02 | 2022-04-02 | 2022-01-01 | 2021-10-02 | 2021-07-03 | 2021-04-03 | 2021-01-02 | 2020-09-26 | 2020-06-27 | 2020-03-28 | 2019-12-28 | 2019-09-28 | 2019-06-29 | 2019-03-30 | 2018-12-29 | 2018-09-29 | 2018-06-30 | 2018-03-31 | 2017-12-30 | 2017-09-30 | 2017-07-01 | 2017-04-01 | ||
|---|---|---|---|---|---|---|---|---|---|---|---|---|---|---|---|---|---|---|---|---|---|---|---|---|---|---|---|---|---|
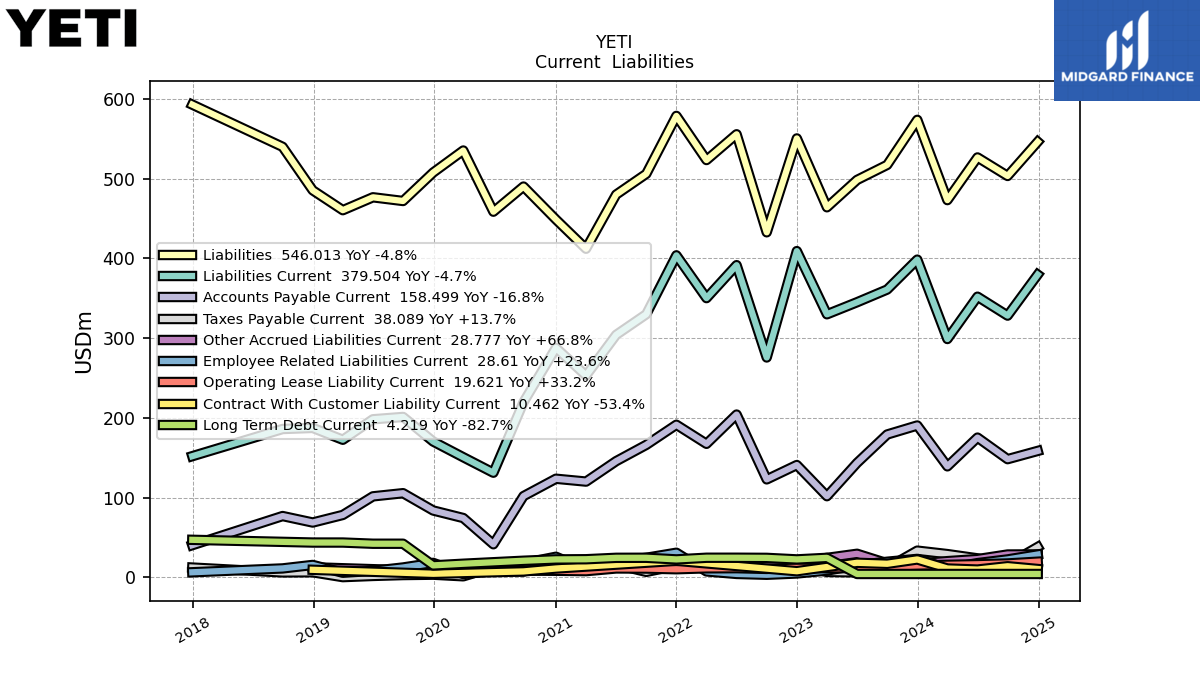
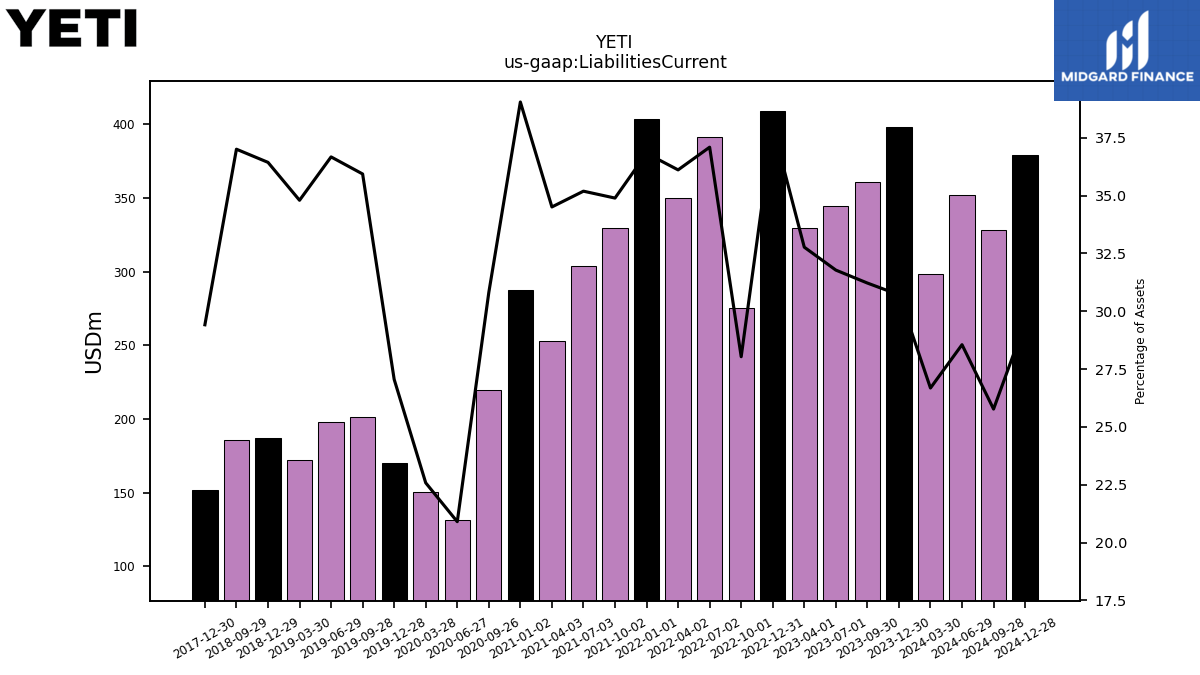
| Liabilities Current | 398.35 | 360.83 | 344.92 | 329.80 | 409.04 | 275.63 | 391.41 | 350.07 | 403.71 | 329.88 | 304.00 | 253.01 | 287.76 | 219.55 | 131.17 | 150.58 | 170.31 | 201.10 | 198.17 | 172.50 | 187.34 | 185.96 | NA | NA | 151.90 | NA | NA | NA | |
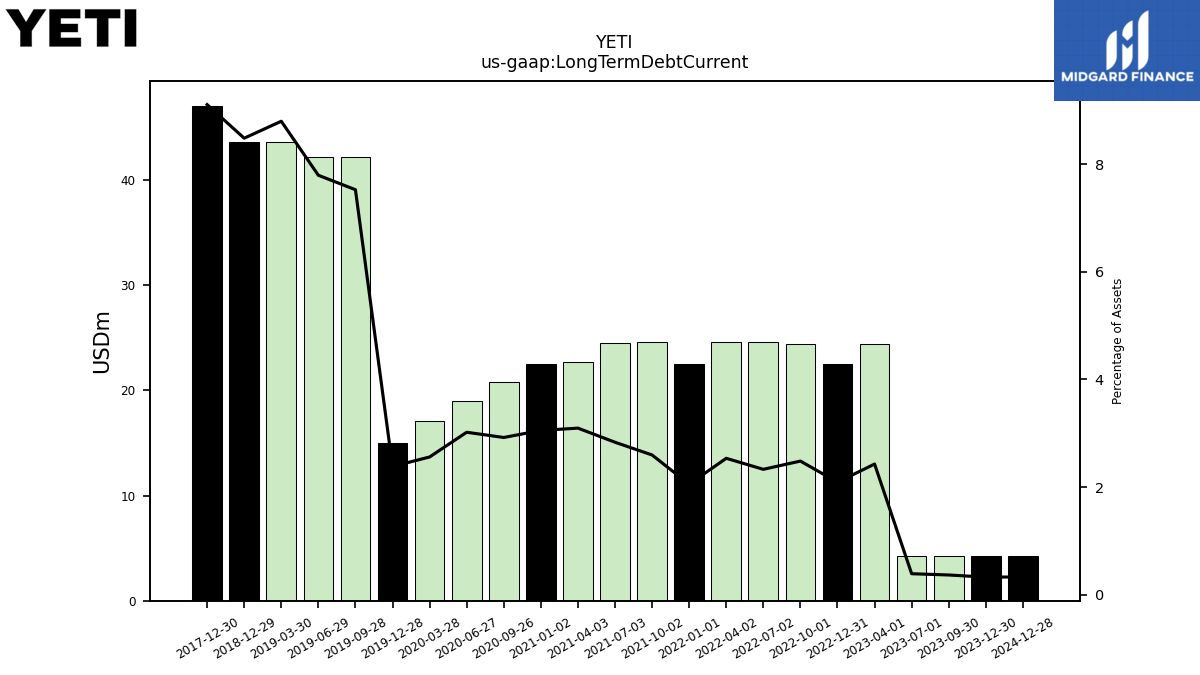
| Long Term Debt Current | 4.22 | 4.22 | 4.22 | 24.44 | 22.50 | 24.41 | 24.59 | 24.57 | 22.50 | 24.55 | 24.48 | 22.70 | 22.50 | 20.82 | 18.94 | 17.06 | 15.00 | 42.14 | 42.14 | 43.64 | 43.64 | NA | NA | NA | 47.05 | NA | NA | NA | |
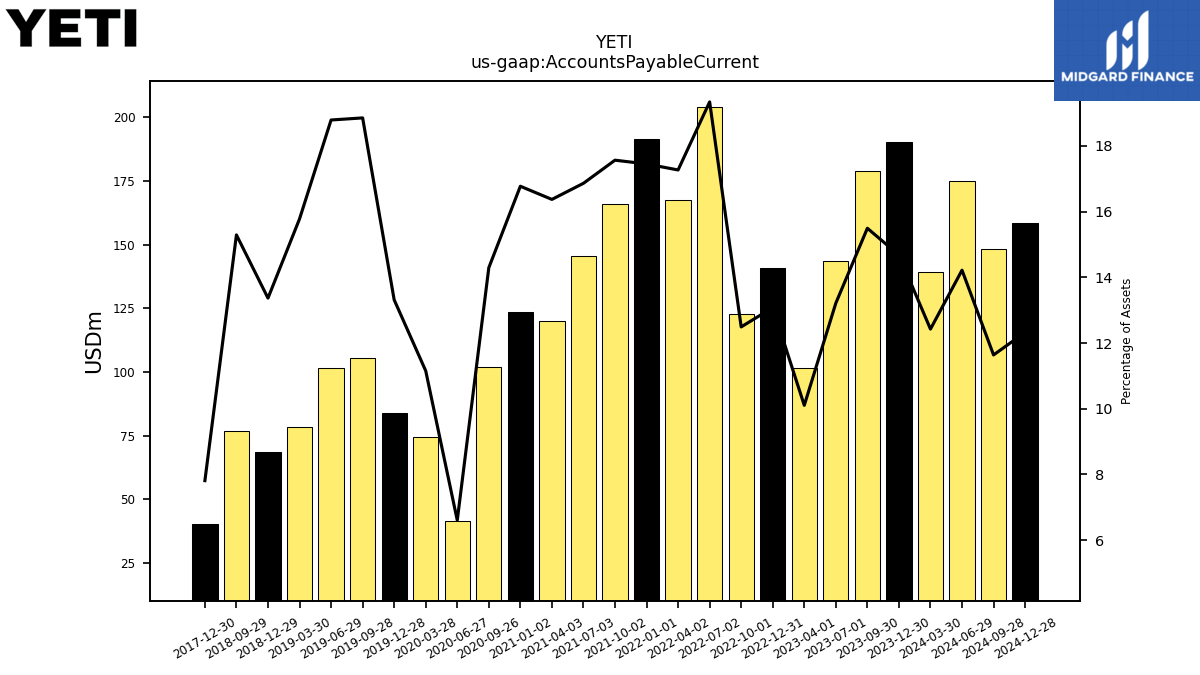
| Accounts Payable Current | 190.39 | 179.09 | 143.44 | 101.70 | 140.82 | 122.81 | 204.09 | 167.41 | 191.32 | 166.08 | 145.68 | 120.04 | 123.62 | 101.85 | 41.45 | 74.37 | 83.82 | 105.51 | 101.54 | 78.22 | 68.74 | 76.85 | NA | NA | 40.34 | NA | NA | NA | |
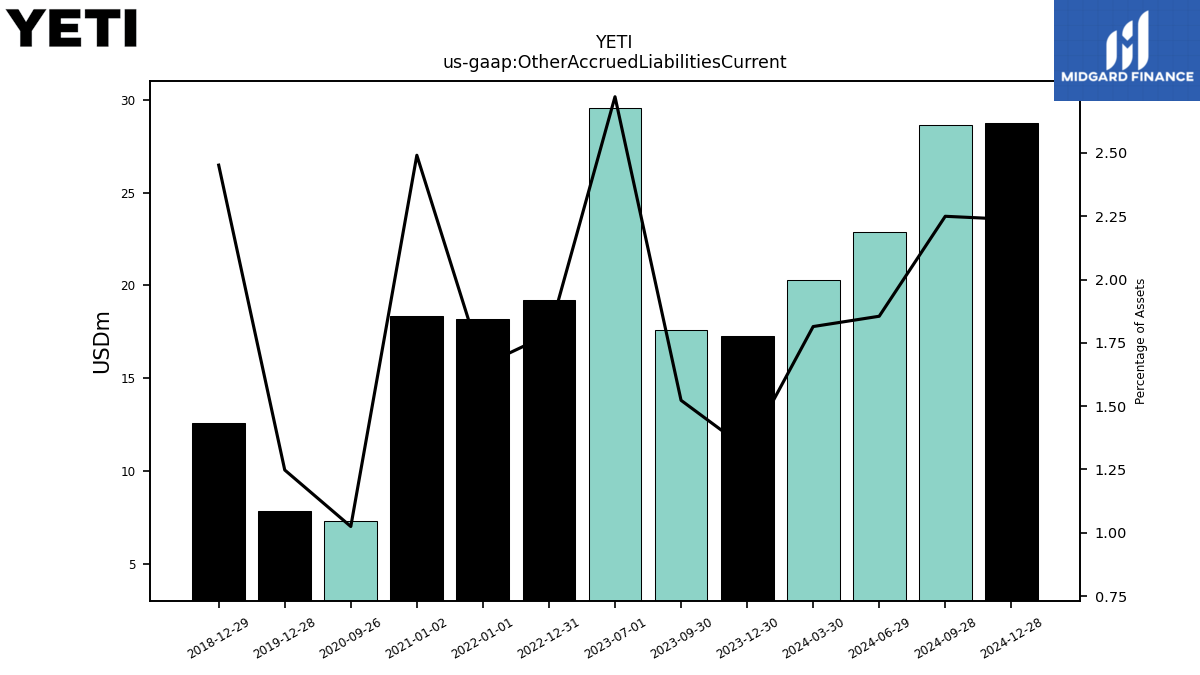
| Other Accrued Liabilities Current | 17.25 | 17.60 | 29.55 | NA | 19.21 | NA | NA | NA | 18.20 | NA | NA | NA | 18.36 | 7.30 | NA | NA | 7.86 | NA | NA | NA | 12.61 | NA | NA | NA | NA | NA | NA | NA | |
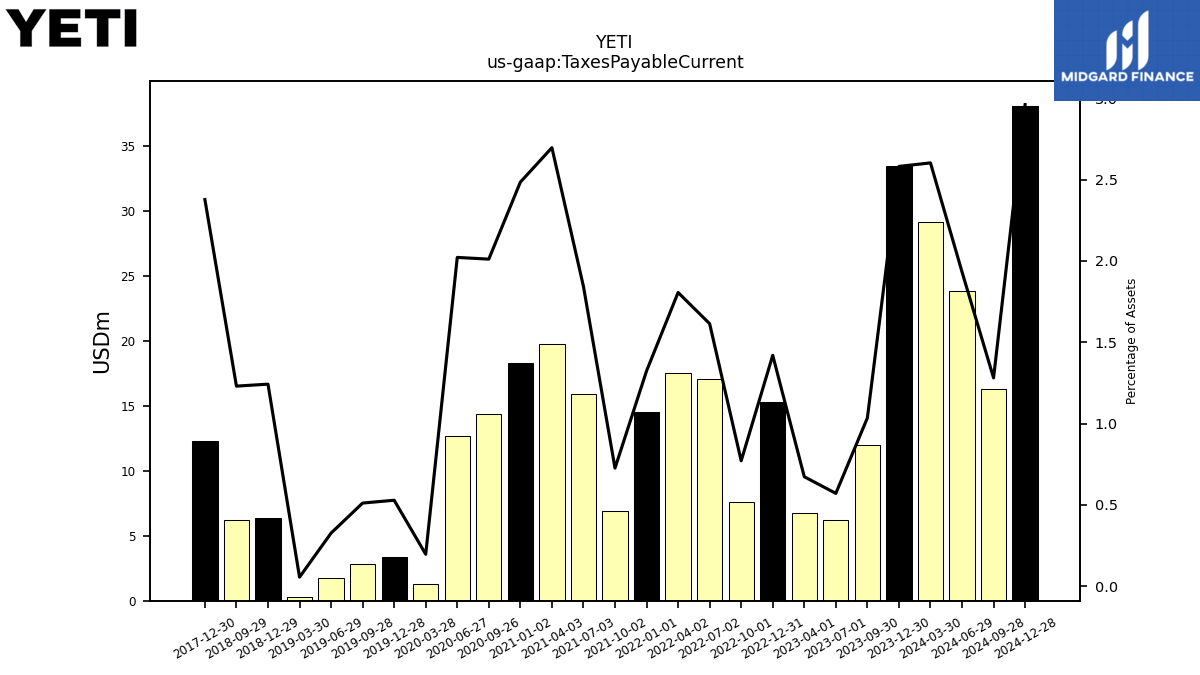
| Taxes Payable Current | 33.49 | 11.96 | 6.20 | 6.78 | 15.29 | 7.58 | 17.04 | 17.51 | 14.51 | 6.87 | 15.93 | 19.77 | 18.32 | 14.33 | 12.69 | 1.31 | 3.33 | 2.86 | 1.77 | 0.28 | 6.39 | 6.18 | NA | NA | 12.28 | NA | NA | NA | |
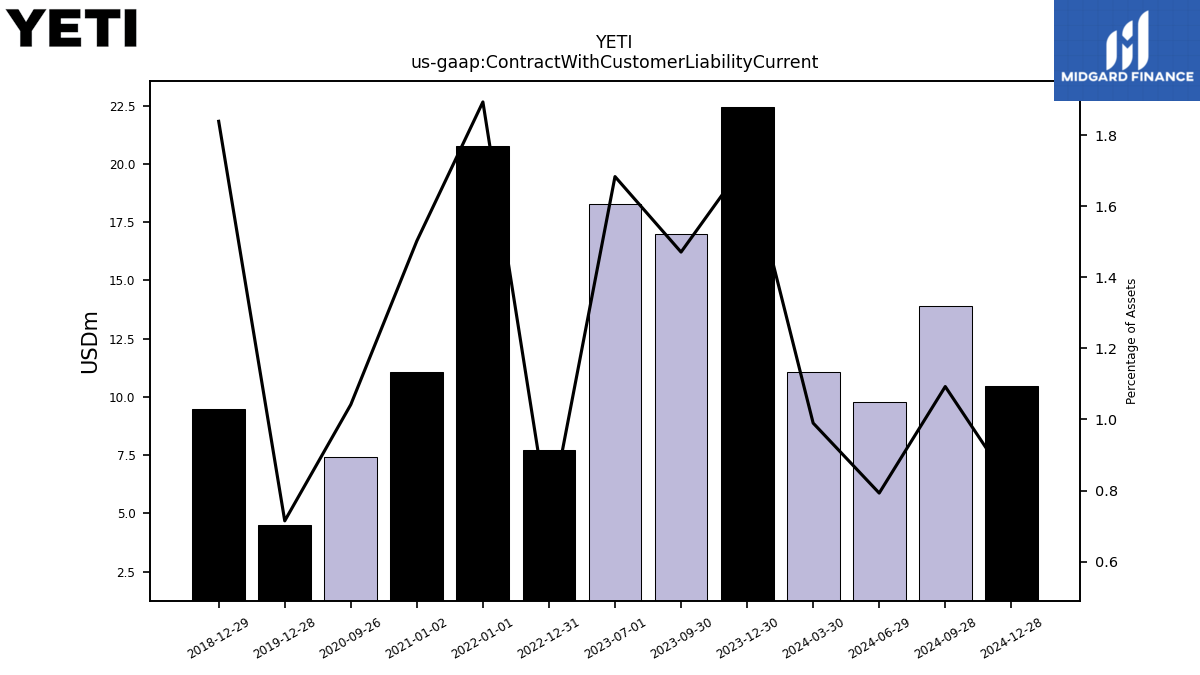
| Contract With Customer Liability Current | 22.44 | 17.00 | 18.27 | NA | 7.70 | NA | NA | NA | 20.76 | NA | NA | NA | 11.07 | 7.42 | NA | NA | 4.50 | NA | NA | NA | 9.46 | NA | NA | NA | NA | NA | NA | NA |
| 2023-12-30 | 2023-09-30 | 2023-07-01 | 2023-04-01 | 2022-12-31 | 2022-10-01 | 2022-07-02 | 2022-04-02 | 2022-01-01 | 2021-10-02 | 2021-07-03 | 2021-04-03 | 2021-01-02 | 2020-09-26 | 2020-06-27 | 2020-03-28 | 2019-12-28 | 2019-09-28 | 2019-06-29 | 2019-03-30 | 2018-12-29 | 2018-09-29 | 2018-06-30 | 2018-03-31 | 2017-12-30 | 2017-09-30 | 2017-07-01 | 2017-04-01 | ||
|---|---|---|---|---|---|---|---|---|---|---|---|---|---|---|---|---|---|---|---|---|---|---|---|---|---|---|---|---|---|
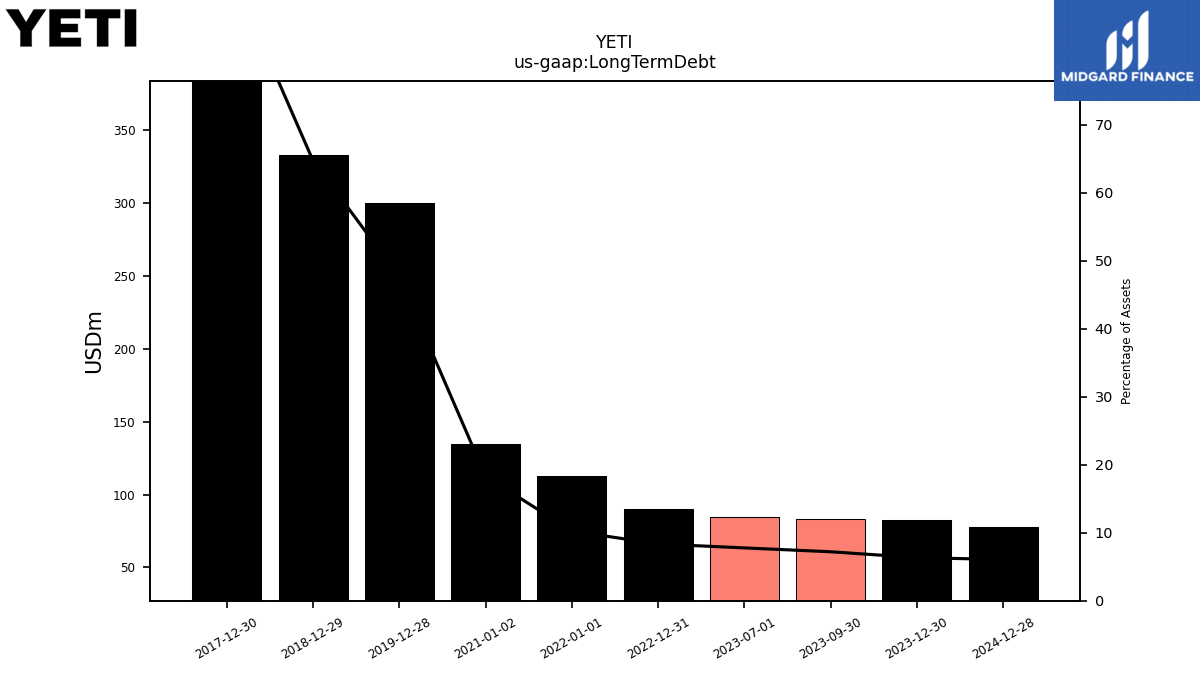
| Long Term Debt | 82.27 | 83.32 | 84.38 | NA | 90.00 | NA | NA | NA | 112.50 | NA | NA | NA | 135.00 | NA | NA | NA | 300.00 | NA | NA | NA | 332.89 | NA | NA | NA | 484.68 | NA | NA | NA | |
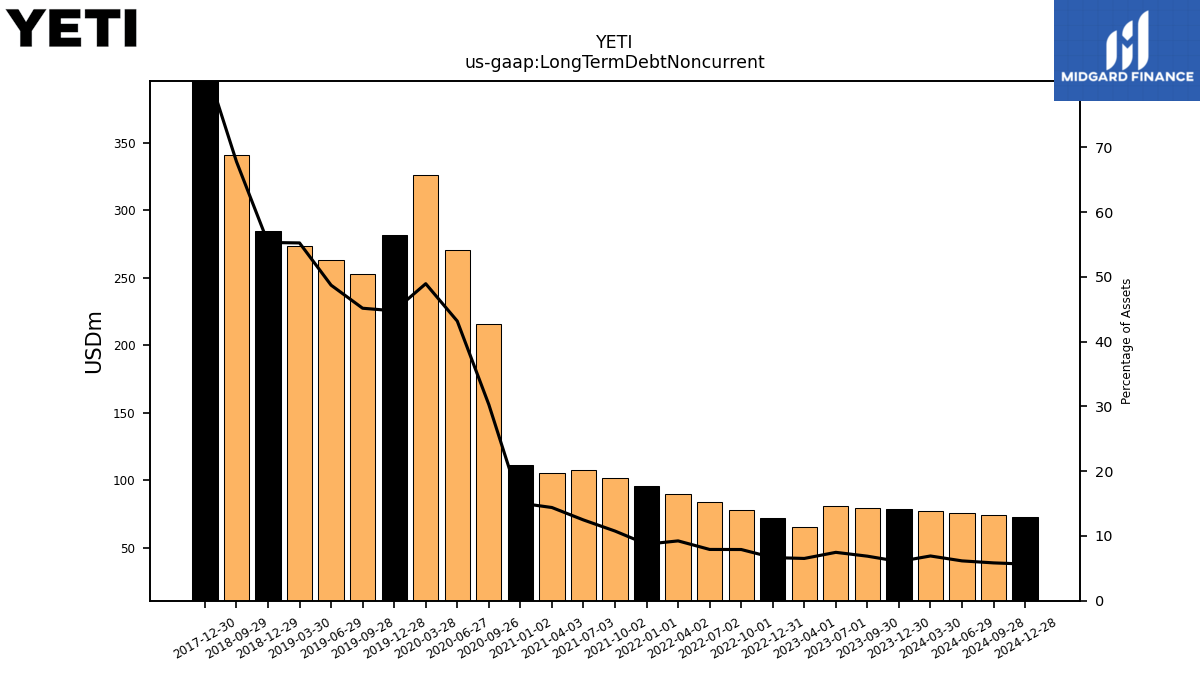
| Long Term Debt Noncurrent | 78.64 | 79.53 | 81.11 | 65.72 | 71.74 | 77.76 | 83.58 | 89.57 | 95.74 | 101.72 | 107.76 | 105.52 | 111.02 | 215.82 | 270.85 | 326.28 | 281.71 | 252.69 | 263.26 | 273.82 | 284.38 | 340.74 | NA | NA | 428.63 | NA | NA | NA | |
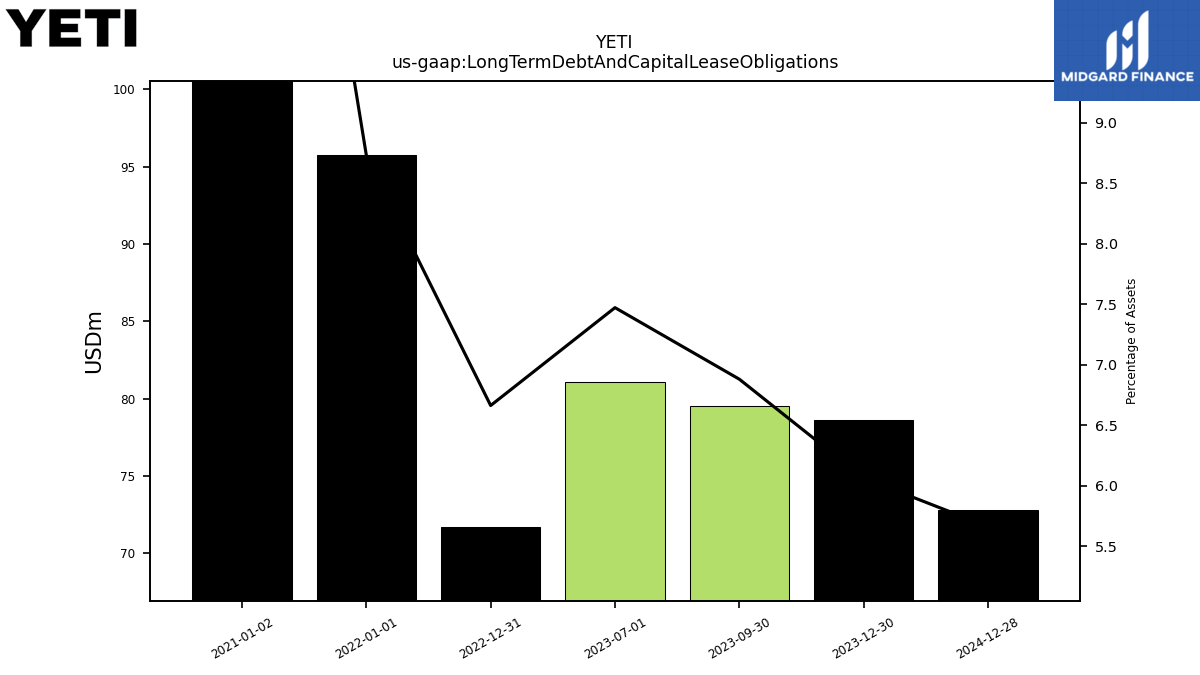
| Long Term Debt And Capital Lease Obligations | 78.64 | 79.53 | 81.11 | NA | 71.74 | NA | NA | NA | 95.74 | NA | NA | NA | 111.02 | NA | NA | NA | NA | NA | NA | NA | NA | NA | NA | NA | NA | NA | NA | NA | |
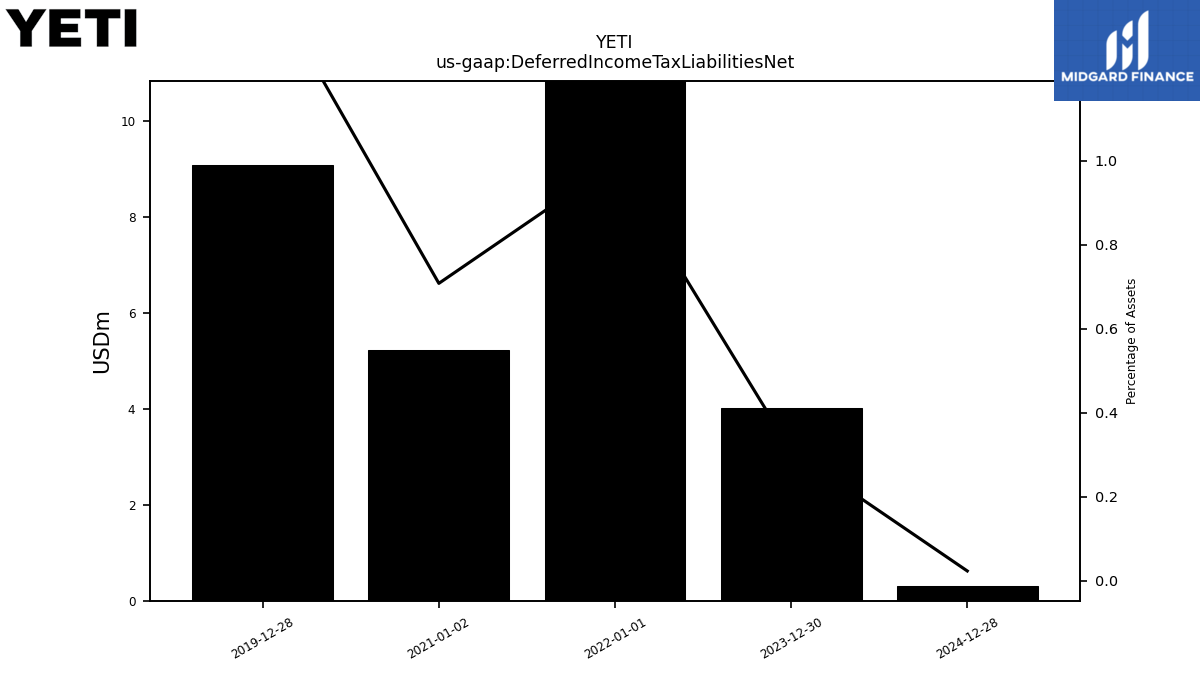
| Deferred Income Tax Liabilities Net | 4.02 | NA | NA | NA | NA | NA | NA | NA | 10.92 | NA | NA | NA | 5.22 | NA | NA | NA | 9.08 | NA | NA | NA | NA | NA | NA | NA | NA | NA | NA | NA | |
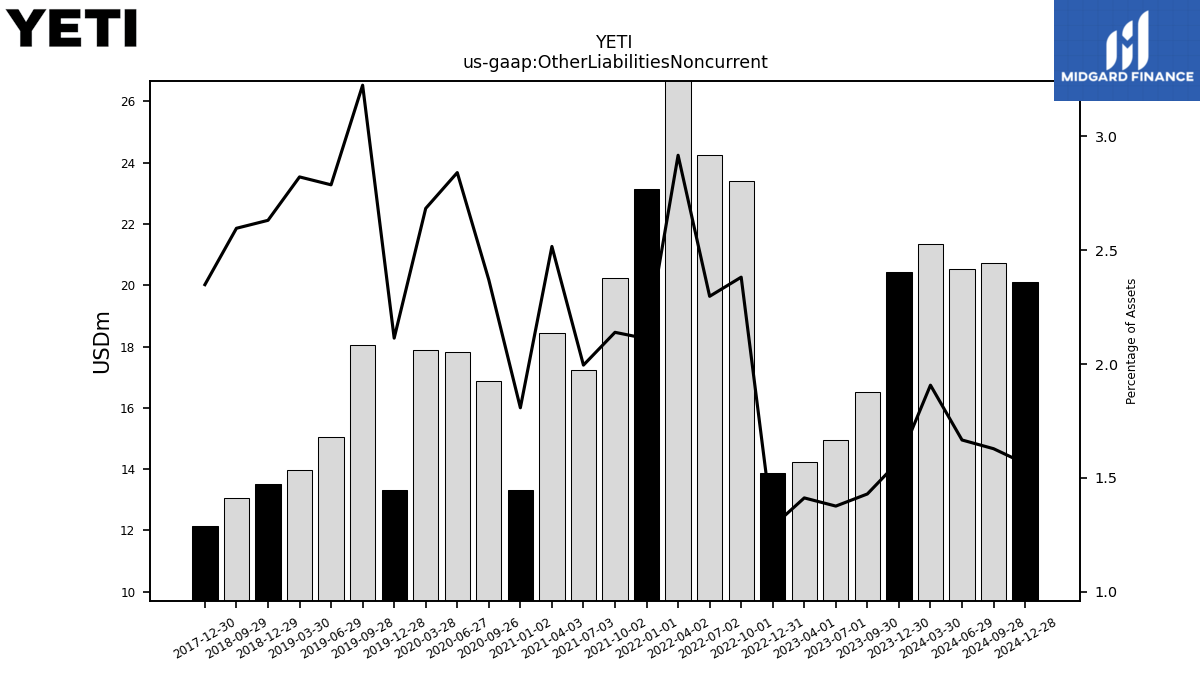
| Other Liabilities Noncurrent | 20.42 | 16.53 | 14.94 | 14.22 | 13.86 | 23.41 | 24.25 | 28.28 | 23.15 | 20.23 | 17.24 | 18.45 | 13.33 | 16.89 | 17.82 | 17.89 | 13.31 | 18.04 | 15.06 | 13.99 | 13.53 | 13.05 | NA | NA | 12.13 | NA | NA | NA | |
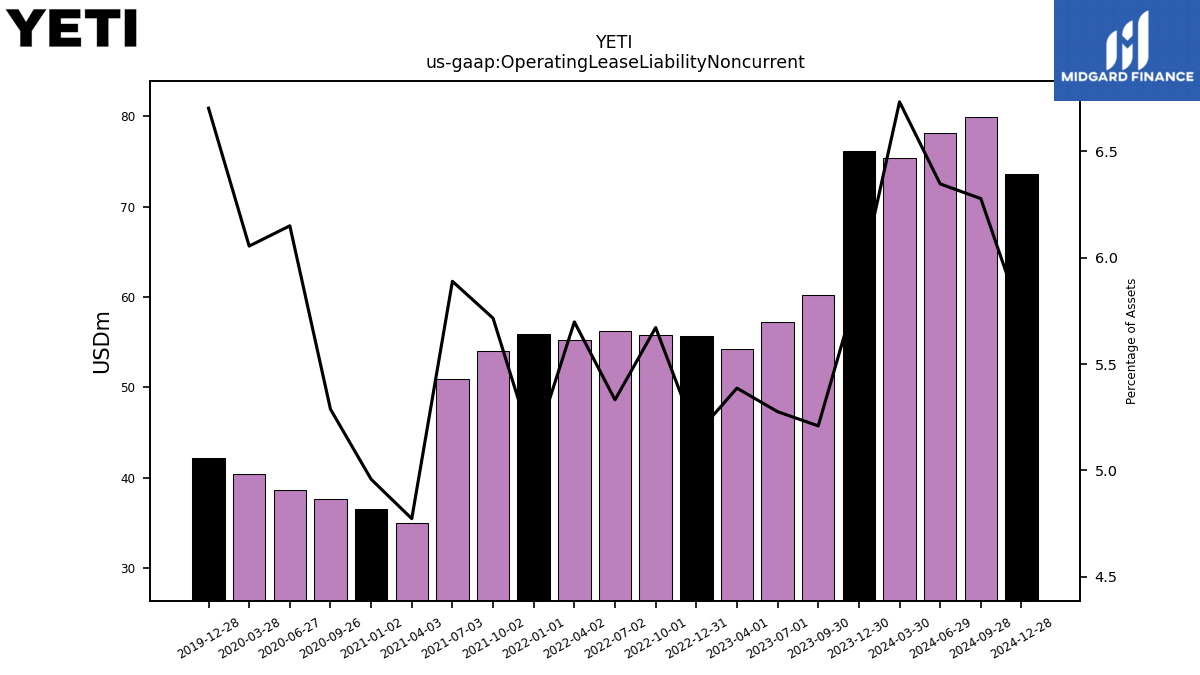
| Operating Lease Liability Noncurrent | 76.16 | 60.21 | 57.27 | 54.22 | 55.65 | 55.76 | 56.27 | 55.24 | 55.94 | 54.04 | 50.88 | 35.00 | 36.55 | 37.68 | 38.59 | 40.37 | 42.20 | NA | NA | NA | NA | NA | NA | NA | NA | NA | NA | NA |
| 2023-12-30 | 2023-09-30 | 2023-07-01 | 2023-04-01 | 2022-12-31 | 2022-10-01 | 2022-07-02 | 2022-04-02 | 2022-01-01 | 2021-10-02 | 2021-07-03 | 2021-04-03 | 2021-01-02 | 2020-09-26 | 2020-06-27 | 2020-03-28 | 2019-12-28 | 2019-09-28 | 2019-06-29 | 2019-03-30 | 2018-12-29 | 2018-09-29 | 2018-06-30 | 2018-03-31 | 2017-12-30 | 2017-09-30 | 2017-07-01 | 2017-04-01 | ||
|---|---|---|---|---|---|---|---|---|---|---|---|---|---|---|---|---|---|---|---|---|---|---|---|---|---|---|---|---|---|
| Stockholders Equity | 723.61 | 638.78 | 587.21 | 542.56 | 526.48 | 550.66 | 499.86 | 446.37 | 517.82 | 439.64 | 384.09 | 321.27 | 288.42 | 222.63 | 169.03 | 131.65 | 122.00 | NA | NA | NA | 28.97 | -37.16 | NA | NA | -76.23 | -83.76 | NA | NA | |
| Common Stock Value | 0.89 | 0.89 | 0.88 | 0.88 | 0.88 | 0.88 | 0.88 | 0.88 | 0.88 | 0.88 | 0.87 | 0.87 | 0.87 | 0.87 | 0.87 | 0.87 | 0.87 | 0.86 | 0.85 | 0.84 | 0.84 | 0.81 | NA | NA | 0.81 | NA | NA | NA | |
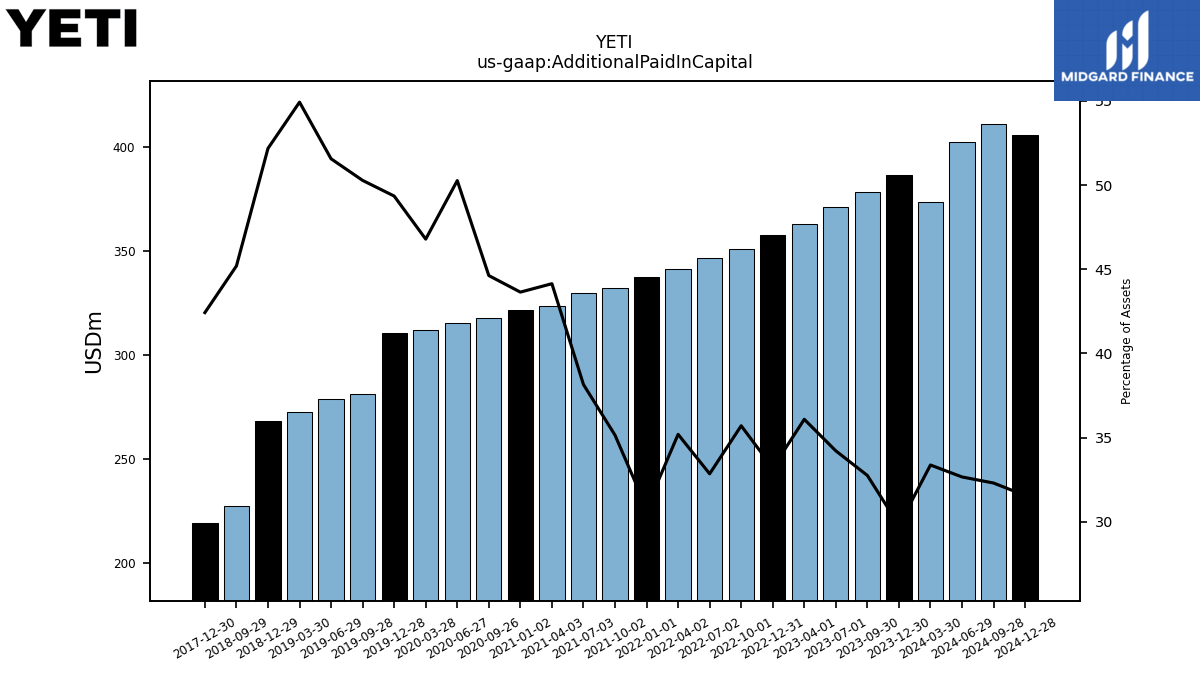
| Additional Paid In Capital | 386.38 | 378.56 | 371.35 | 363.20 | 357.49 | 351.03 | 346.68 | 341.21 | 337.74 | 332.30 | 329.64 | 323.68 | 321.68 | 318.00 | 315.40 | 311.99 | 310.68 | 281.42 | 278.67 | 272.33 | 268.33 | 227.16 | NA | NA | 219.09 | NA | NA | NA | |
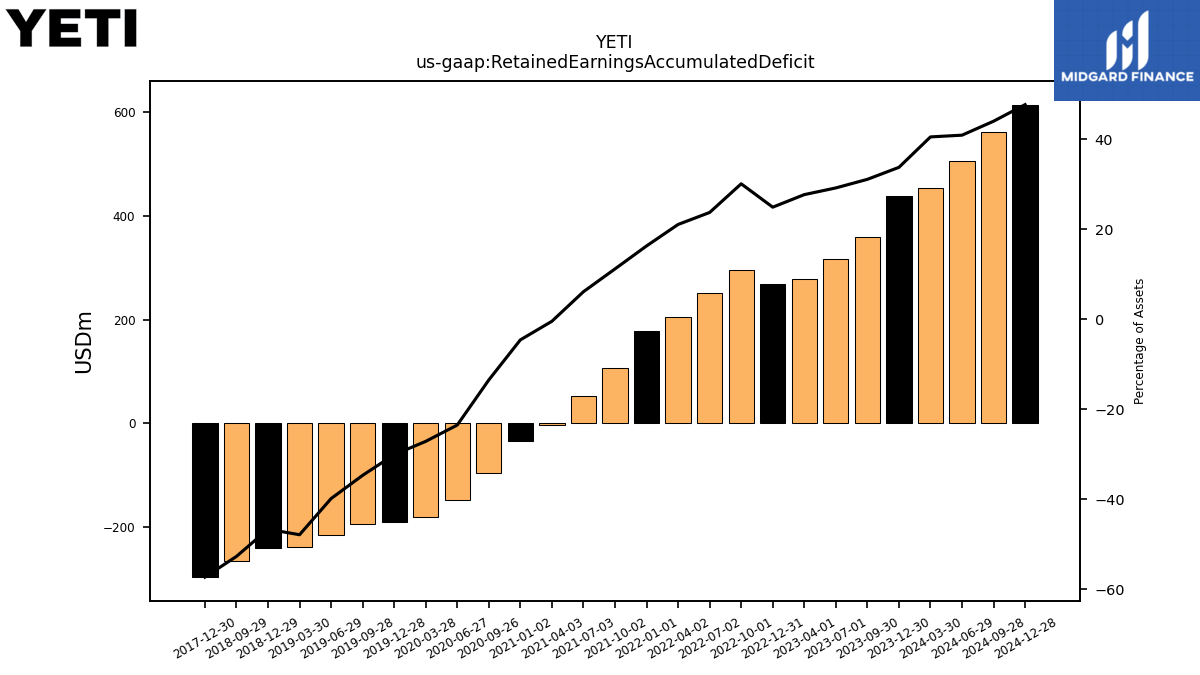
| Retained Earnings Accumulated Deficit | 438.44 | 359.84 | 317.19 | 279.12 | 268.55 | 296.29 | 250.77 | 204.52 | 178.86 | 105.98 | 53.01 | -3.22 | -33.74 | -96.14 | -147.58 | -181.06 | -189.54 | -194.29 | -215.53 | -237.60 | -240.10 | -265.11 | NA | NA | -296.18 | NA | NA | NA | |
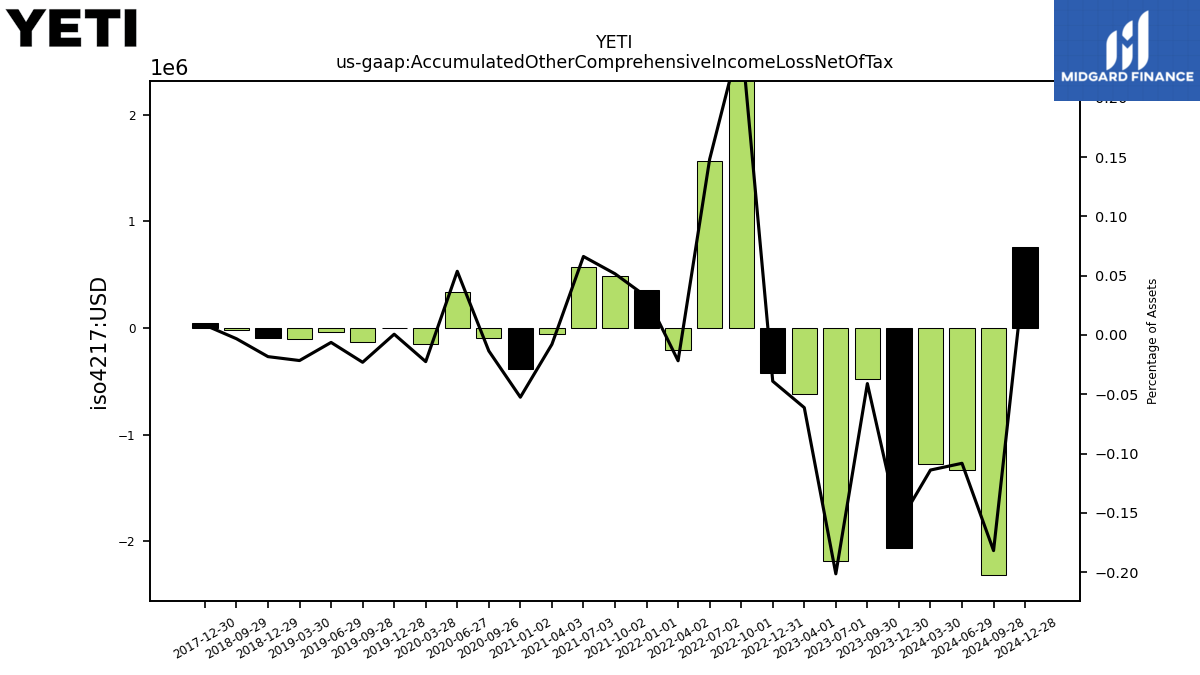
| Accumulated Other Comprehensive Income Loss Net Of Tax | -2.06 | -0.47 | -2.19 | -0.62 | -0.42 | 2.48 | 1.56 | -0.21 | 0.35 | 0.49 | 0.57 | -0.06 | -0.39 | -0.10 | 0.34 | -0.15 | 0.00 | -0.13 | -0.03 | -0.11 | -0.09 | -0.02 | NA | NA | 0.04 | NA | NA | NA | |
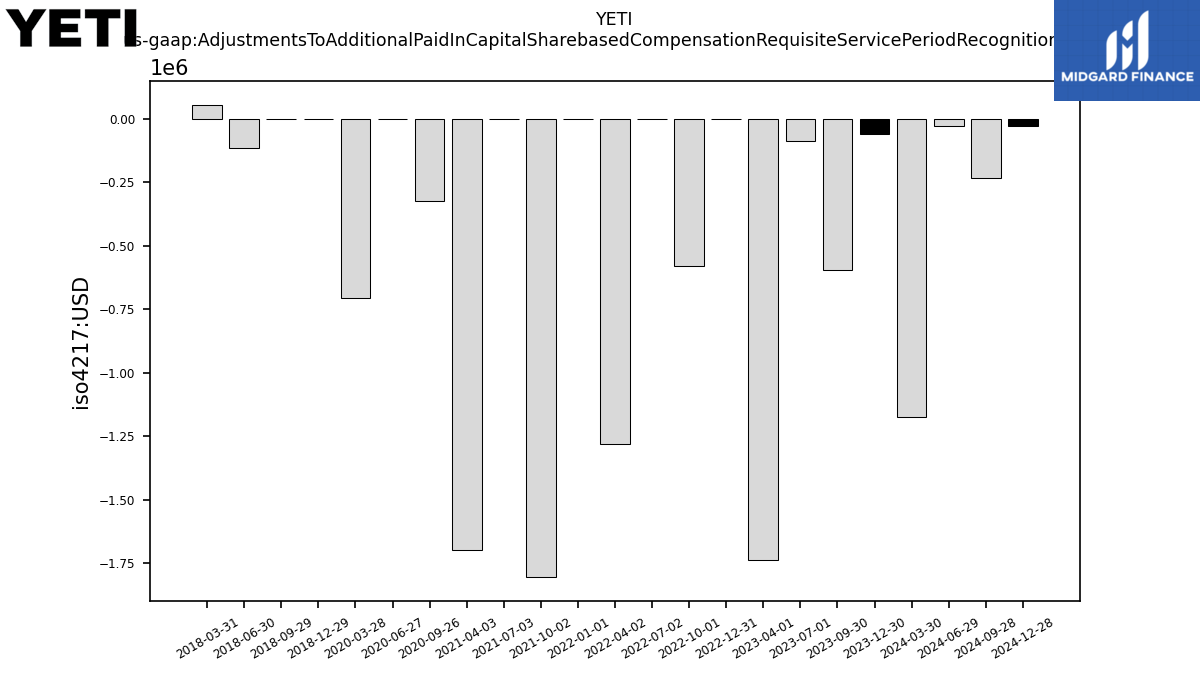
| Adjustments To Additional Paid In Capital Sharebased Compensation Requisite Service Period Recognition Value | -0.06 | -0.60 | -0.09 | -1.74 | 0.00 | -0.58 | 0.00 | -1.28 | 0.00 | -1.81 | 0.00 | -1.70 | NA | -0.32 | 0.00 | -0.70 | NA | NA | NA | NA | 0.00 | 0.00 | -0.11 | 0.06 | NA | NA | NA | NA |
| 2023-12-30 | 2023-09-30 | 2023-07-01 | 2023-04-01 | 2022-12-31 | 2022-10-01 | 2022-07-02 | 2022-04-02 | 2022-01-01 | 2021-10-02 | 2021-07-03 | 2021-04-03 | 2021-01-02 | 2020-09-26 | 2020-06-27 | 2020-03-28 | 2019-12-28 | 2019-09-28 | 2019-06-29 | 2019-03-30 | 2018-12-29 | 2018-09-29 | 2018-06-30 | 2018-03-31 | 2017-12-30 | 2017-09-30 | 2017-07-01 | 2017-04-01 | ||
|---|---|---|---|---|---|---|---|---|---|---|---|---|---|---|---|---|---|---|---|---|---|---|---|---|---|---|---|---|---|
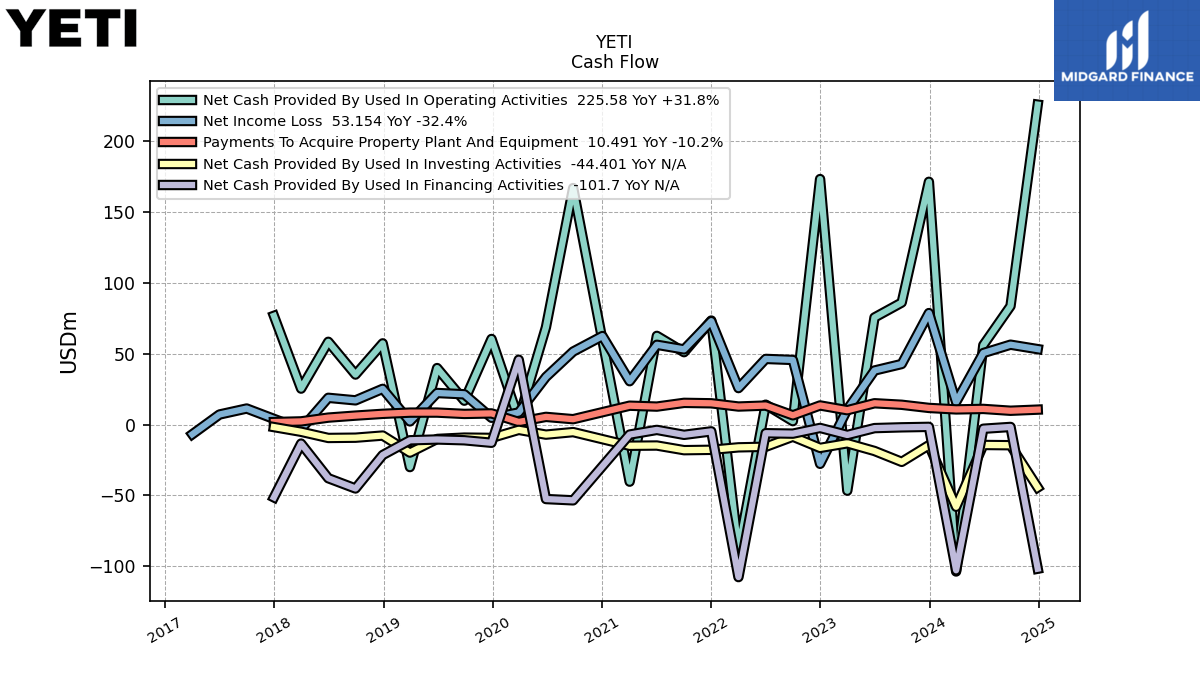
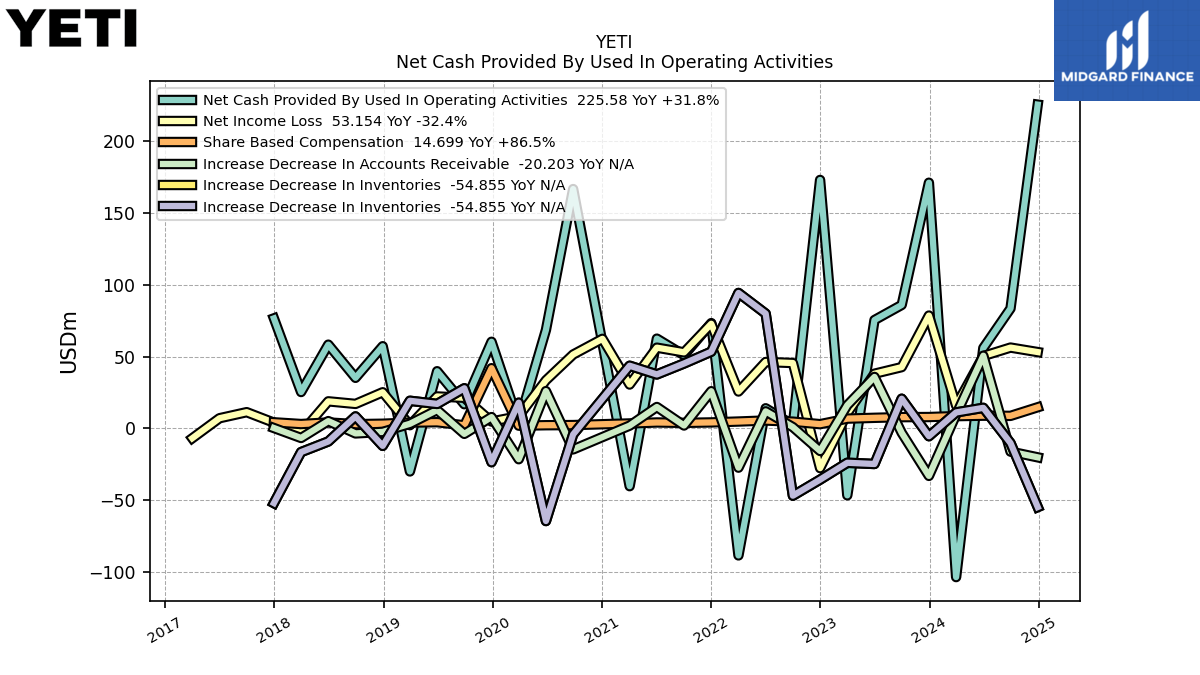
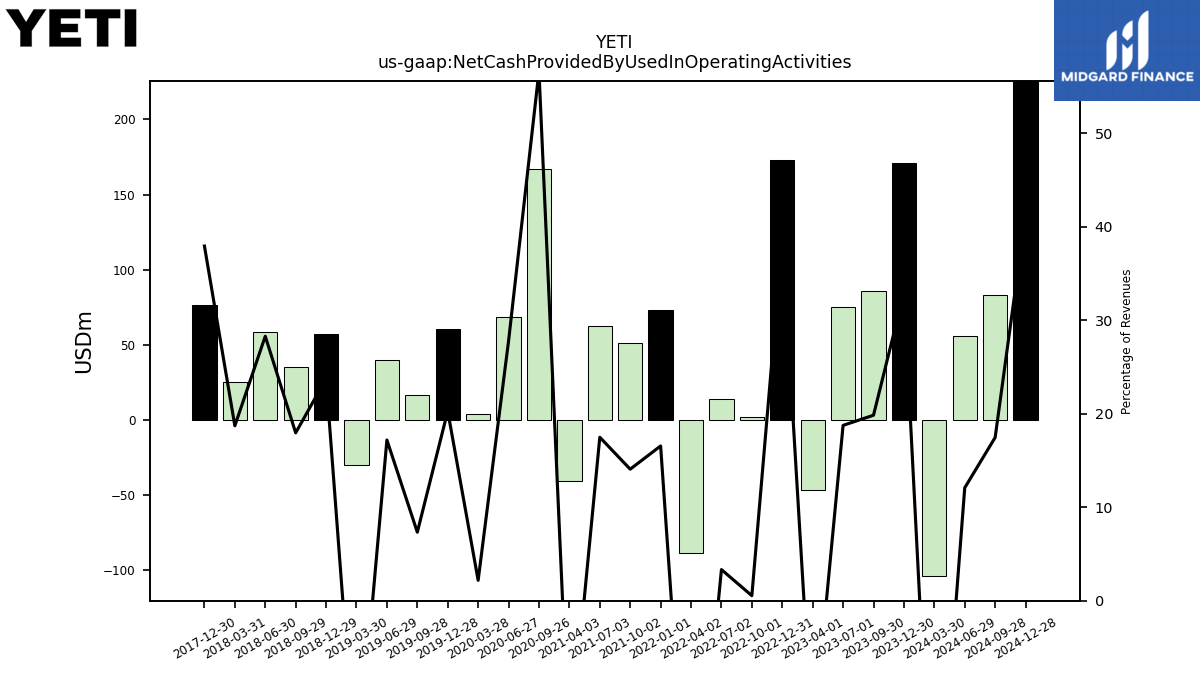
| Net Cash Provided By Used In Operating Activities | 171.17 | 85.99 | 75.47 | -46.69 | 173.11 | 2.35 | 13.99 | -88.56 | 73.32 | 51.01 | 62.51 | -40.32 | NA | 166.75 | 68.55 | 3.81 | 60.34 | 16.79 | 39.81 | -30.04 | 57.23 | 35.20 | 58.33 | 25.30 | 76.63 | NA | NA | NA | |
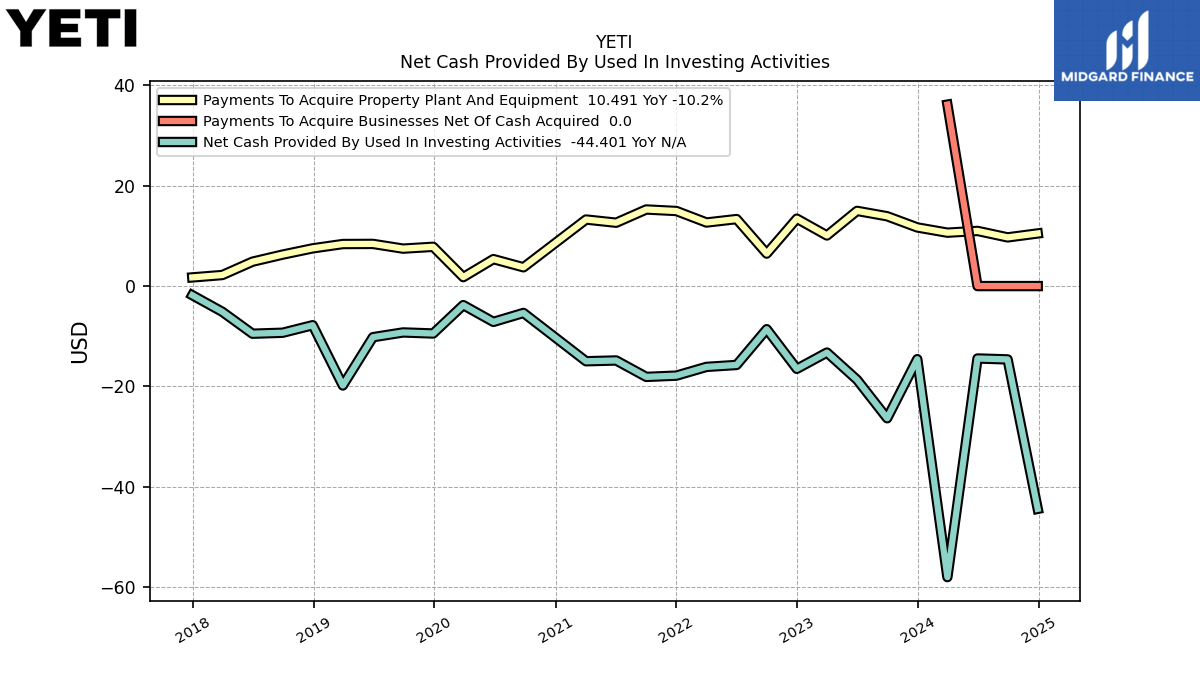
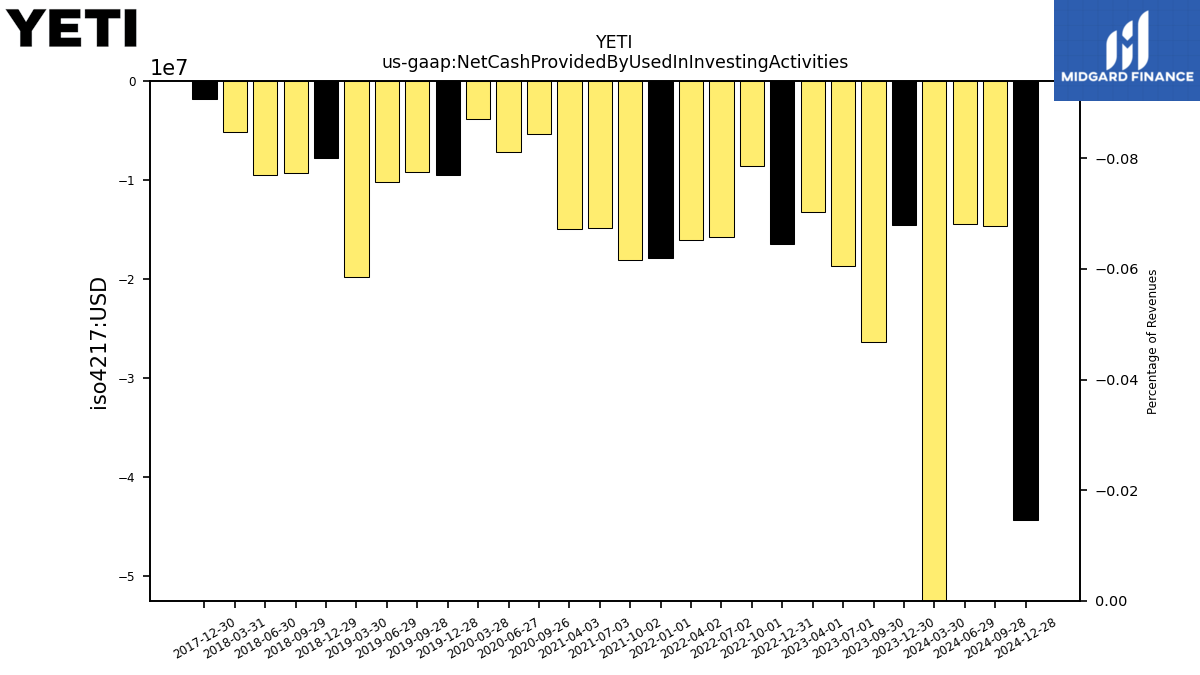
| Net Cash Provided By Used In Investing Activities | -14.56 | -26.35 | -18.67 | -13.25 | -16.49 | -8.59 | -15.72 | -16.11 | -17.85 | -18.10 | -14.83 | -14.98 | NA | -5.35 | -7.14 | -3.79 | -9.45 | -9.24 | -10.18 | -19.82 | -7.80 | -9.30 | -9.49 | -5.13 | -1.82 | NA | NA | NA | |
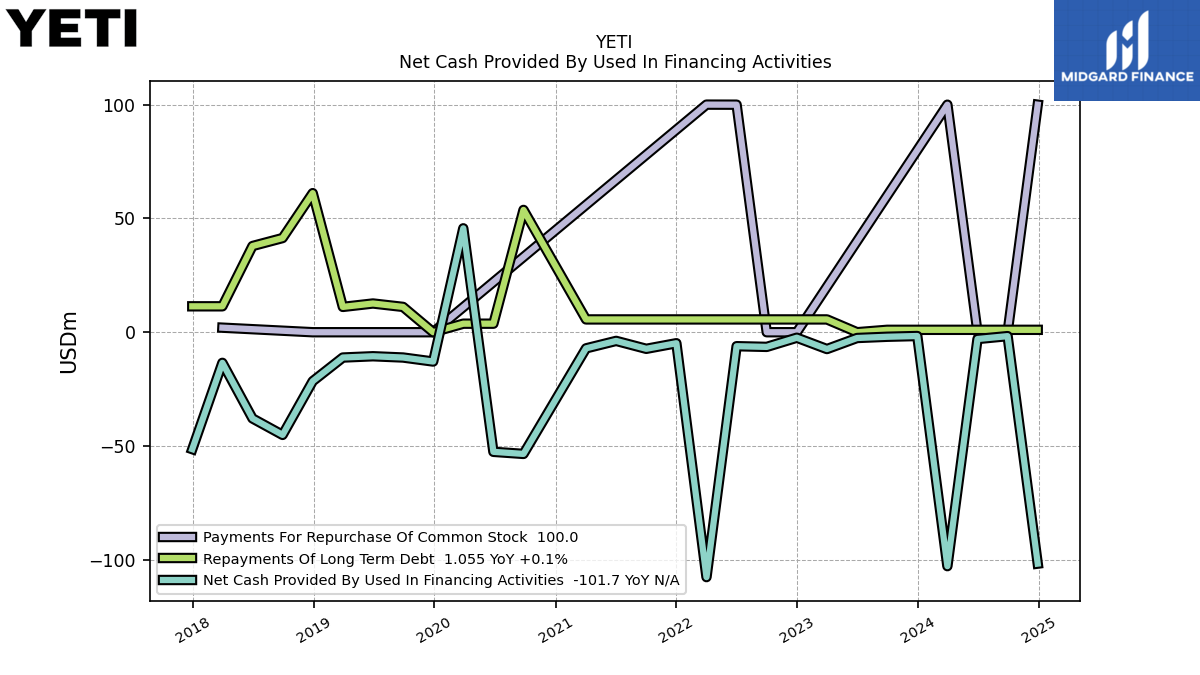
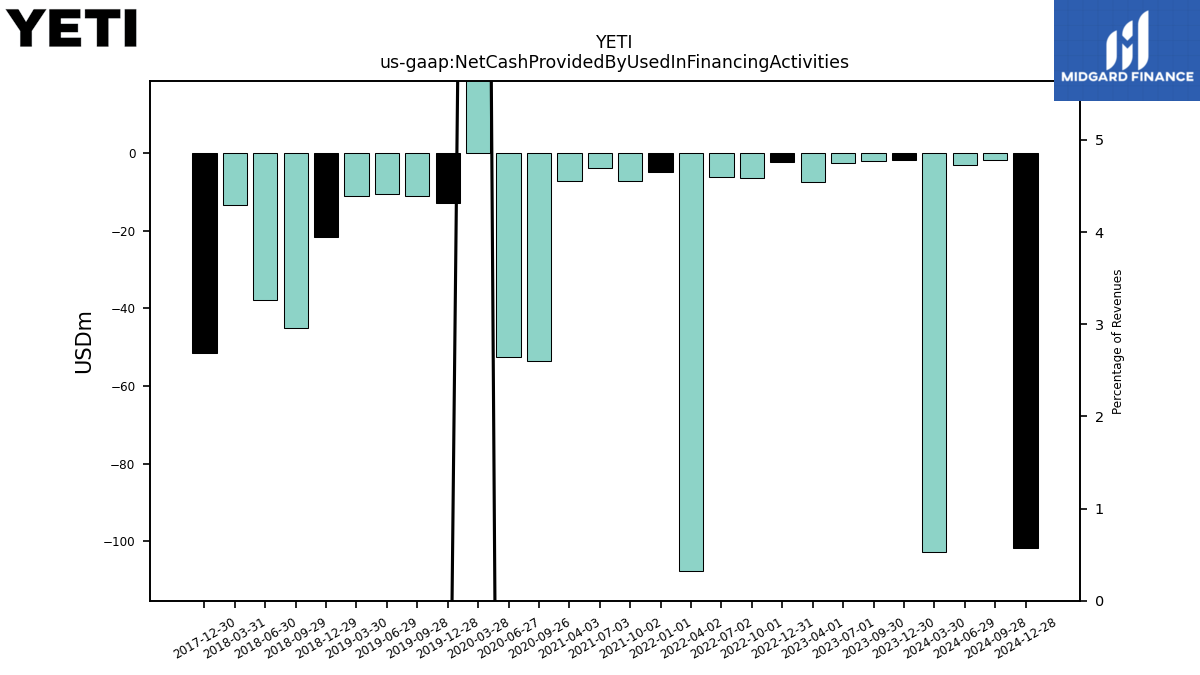
| Net Cash Provided By Used In Financing Activities | -1.67 | -1.99 | -2.54 | -7.39 | -2.42 | -6.45 | -6.14 | -107.63 | -4.83 | -7.29 | -3.81 | -7.09 | NA | -53.48 | -52.56 | 45.67 | -12.88 | -11.12 | -10.56 | -11.12 | -21.52 | -45.13 | -37.89 | -13.46 | -51.39 | NA | NA | NA |
| 2023-12-30 | 2023-09-30 | 2023-07-01 | 2023-04-01 | 2022-12-31 | 2022-10-01 | 2022-07-02 | 2022-04-02 | 2022-01-01 | 2021-10-02 | 2021-07-03 | 2021-04-03 | 2021-01-02 | 2020-09-26 | 2020-06-27 | 2020-03-28 | 2019-12-28 | 2019-09-28 | 2019-06-29 | 2019-03-30 | 2018-12-29 | 2018-09-29 | 2018-06-30 | 2018-03-31 | 2017-12-30 | 2017-09-30 | 2017-07-01 | 2017-04-01 | ||
|---|---|---|---|---|---|---|---|---|---|---|---|---|---|---|---|---|---|---|---|---|---|---|---|---|---|---|---|---|---|
| Net Cash Provided By Used In Operating Activities | 171.17 | 85.99 | 75.47 | -46.69 | 173.11 | 2.35 | 13.99 | -88.56 | 73.32 | 51.01 | 62.51 | -40.32 | NA | 166.75 | 68.55 | 3.81 | 60.34 | 16.79 | 39.81 | -30.04 | 57.23 | 35.20 | 58.33 | 25.30 | 76.63 | NA | NA | NA | |
| Net Income Loss | 78.59 | 42.66 | 38.07 | 10.56 | -27.74 | 45.52 | 46.25 | 25.66 | 72.88 | 52.97 | 56.23 | 30.52 | 62.39 | 51.45 | 33.48 | 8.48 | 4.74 | 21.30 | 22.22 | 2.17 | 25.17 | 17.03 | 18.82 | -3.26 | 3.97 | 11.27 | 7.05 | -6.90 | |
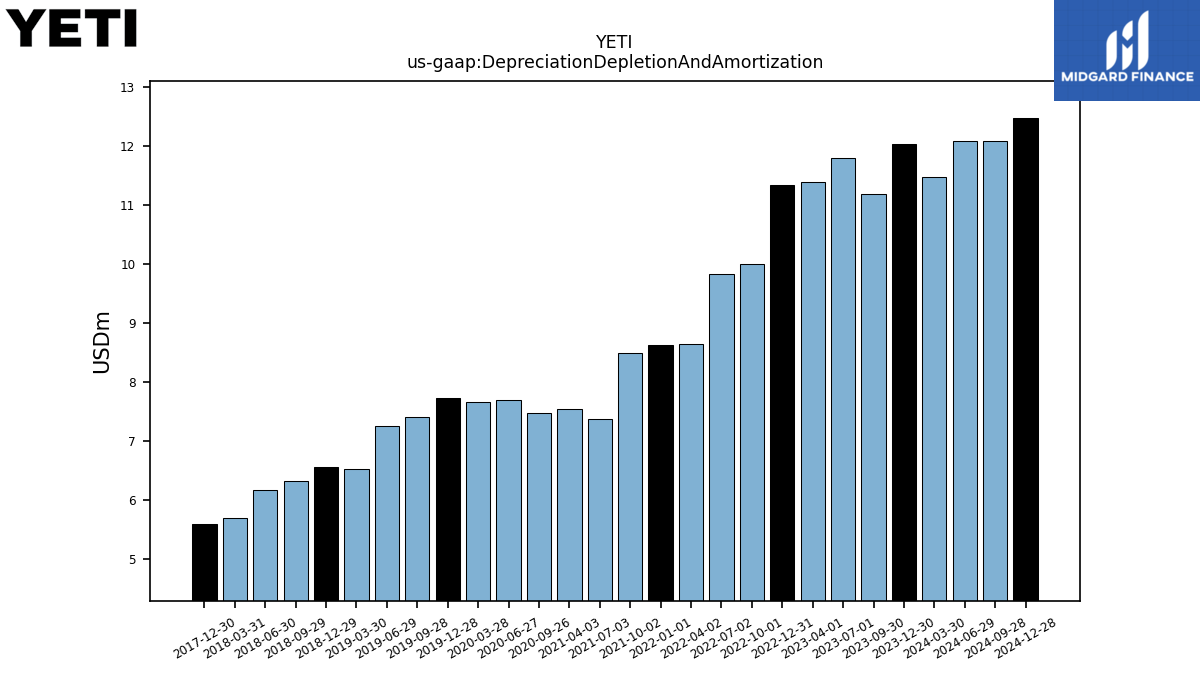
| Depreciation Depletion And Amortization | 12.04 | 11.19 | 11.79 | 11.40 | 11.34 | 10.02 | 9.84 | 8.65 | 8.63 | 8.50 | 7.38 | 7.56 | NA | 7.48 | 7.70 | 7.66 | 7.74 | 7.42 | 7.26 | 6.54 | 6.56 | 6.33 | 6.18 | 5.70 | 5.60 | NA | NA | NA | |
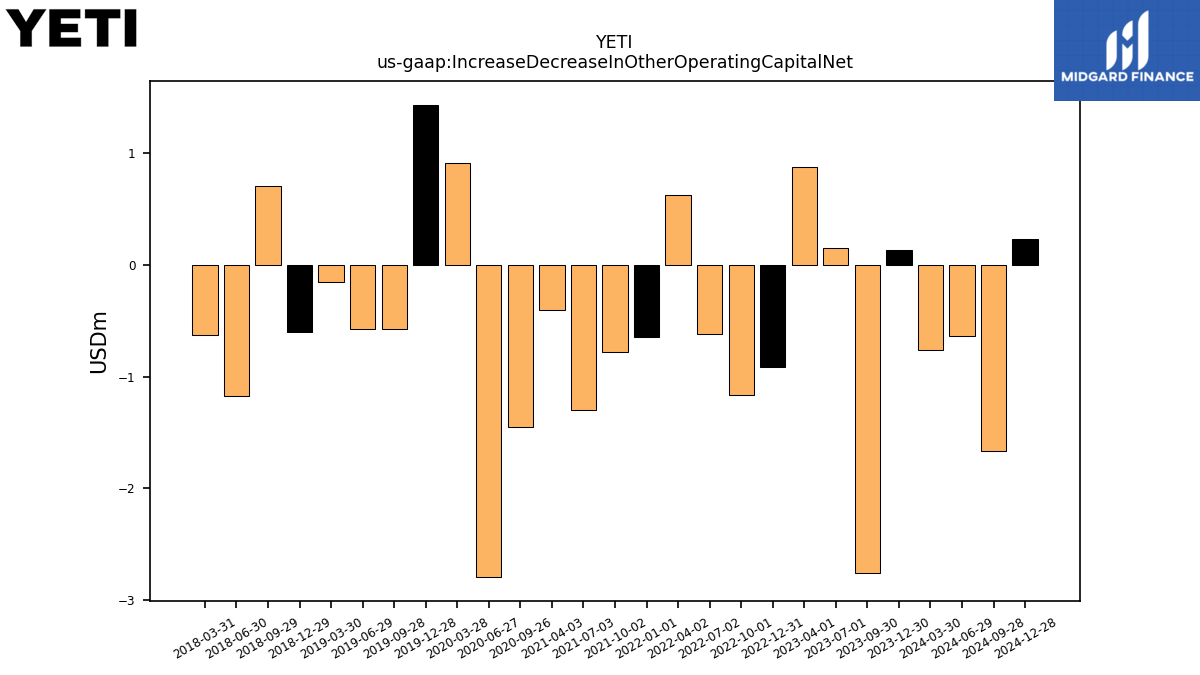
| Increase Decrease In Other Operating Capital Net | 0.13 | -2.75 | 0.15 | 0.87 | -0.91 | -1.17 | -0.62 | 0.62 | -0.64 | -0.79 | -1.30 | -0.41 | NA | -1.45 | -2.79 | 0.91 | 1.43 | -0.58 | -0.57 | -0.15 | -0.60 | 0.70 | -1.17 | -0.63 | NA | NA | NA | NA | |
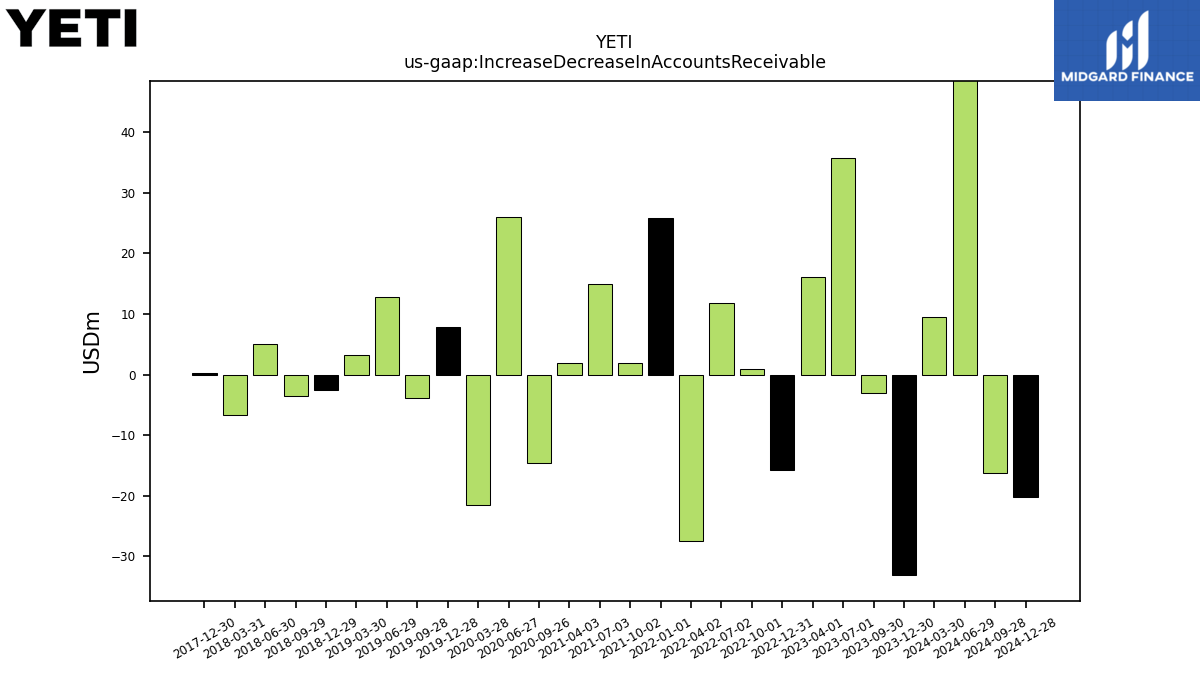
| Increase Decrease In Accounts Receivable | -33.15 | -3.10 | 35.83 | 16.11 | -15.77 | 0.86 | 11.86 | -27.40 | 25.91 | 1.97 | 14.89 | 1.91 | NA | -14.67 | 25.96 | -21.52 | 7.85 | -3.86 | 12.77 | 3.18 | -2.48 | -3.54 | 5.05 | -6.71 | 0.23 | NA | NA | NA | |
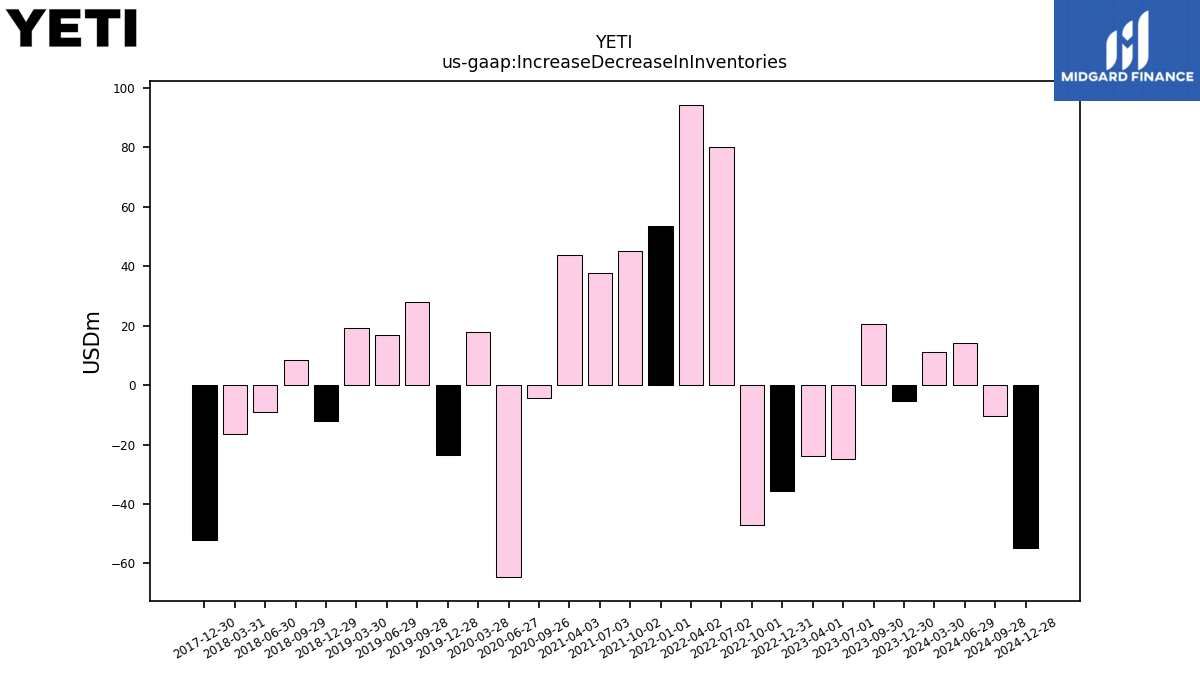
| Increase Decrease In Inventories | -5.50 | 20.65 | -24.84 | -23.99 | -35.74 | -46.93 | 79.95 | 94.34 | 53.42 | 45.19 | 37.56 | 43.63 | NA | -4.22 | -64.60 | 17.88 | -23.59 | 27.91 | 17.01 | 19.21 | -12.21 | 8.31 | -9.15 | -16.53 | -52.09 | NA | NA | NA | |
| Share Based Compensation | 7.88 | 7.80 | 7.34 | 6.78 | 2.92 | 4.66 | 5.47 | 4.75 | 4.13 | 3.82 | 4.10 | 3.42 | NA | 2.28 | 2.18 | 1.85 | 41.93 | 2.11 | 4.28 | 4.00 | 3.22 | 2.92 | 4.10 | 3.01 | 4.21 | NA | NA | NA | |
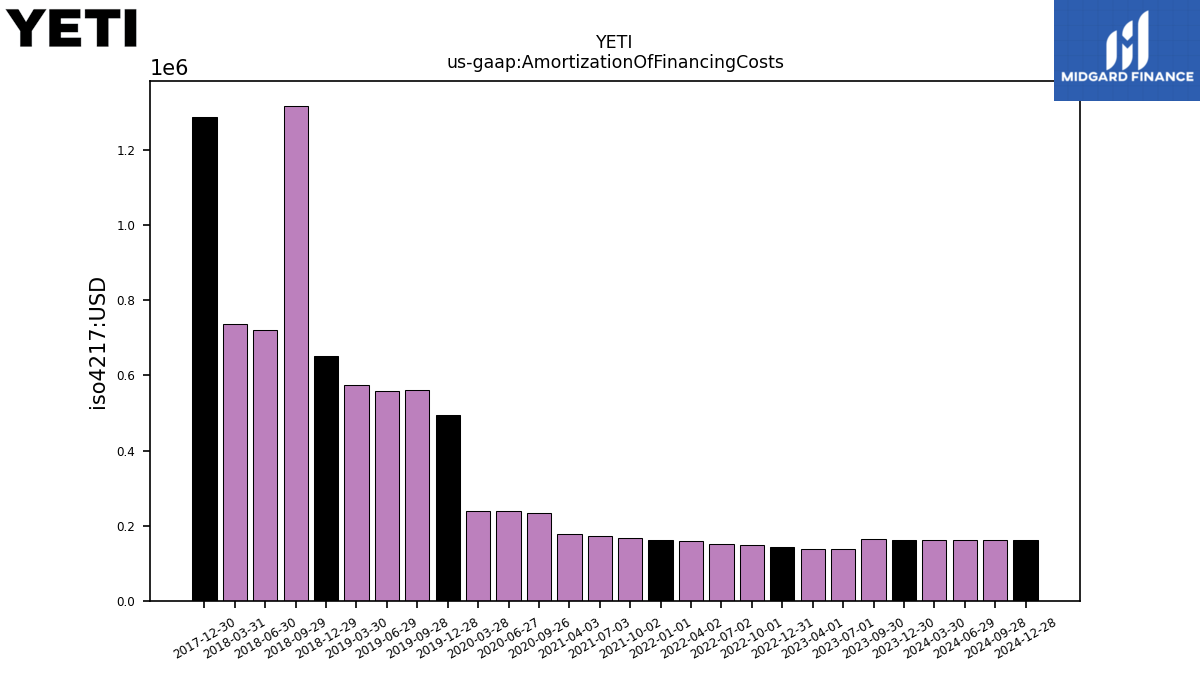
| Amortization Of Financing Costs | 0.16 | 0.17 | 0.14 | 0.14 | 0.14 | 0.15 | 0.15 | 0.16 | 0.16 | 0.17 | 0.17 | 0.18 | NA | 0.23 | 0.24 | 0.24 | 0.49 | 0.56 | 0.56 | 0.57 | 0.65 | 1.32 | 0.72 | 0.74 | 1.29 | NA | NA | NA |
| 2023-12-30 | 2023-09-30 | 2023-07-01 | 2023-04-01 | 2022-12-31 | 2022-10-01 | 2022-07-02 | 2022-04-02 | 2022-01-01 | 2021-10-02 | 2021-07-03 | 2021-04-03 | 2021-01-02 | 2020-09-26 | 2020-06-27 | 2020-03-28 | 2019-12-28 | 2019-09-28 | 2019-06-29 | 2019-03-30 | 2018-12-29 | 2018-09-29 | 2018-06-30 | 2018-03-31 | 2017-12-30 | 2017-09-30 | 2017-07-01 | 2017-04-01 | ||
|---|---|---|---|---|---|---|---|---|---|---|---|---|---|---|---|---|---|---|---|---|---|---|---|---|---|---|---|---|---|
| Net Cash Provided By Used In Investing Activities | -14.56 | -26.35 | -18.67 | -13.25 | -16.49 | -8.59 | -15.72 | -16.11 | -17.85 | -18.10 | -14.83 | -14.98 | NA | -5.35 | -7.14 | -3.79 | -9.45 | -9.24 | -10.18 | -19.82 | -7.80 | -9.30 | -9.49 | -5.13 | -1.82 | NA | NA | NA | |
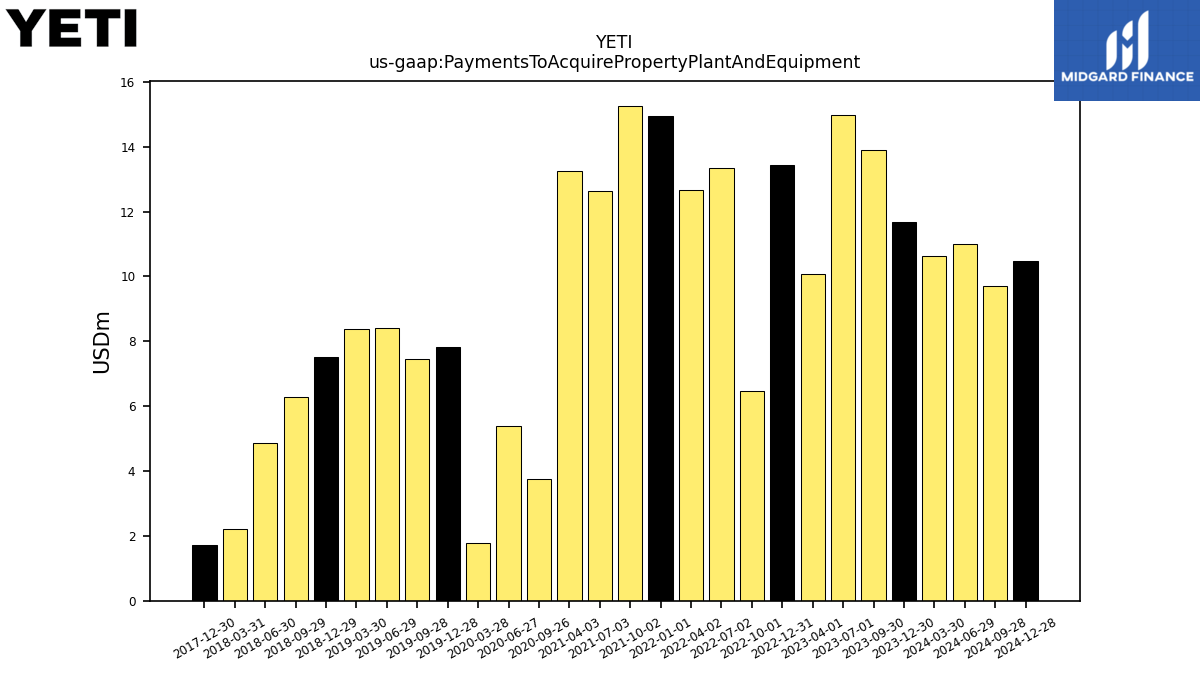
| Payments To Acquire Property Plant And Equipment | 11.69 | 13.91 | 14.99 | 10.08 | 13.44 | 6.47 | 13.35 | 12.67 | 14.96 | 15.27 | 12.63 | 13.27 | NA | 3.74 | 5.38 | 1.78 | 7.83 | 7.46 | 8.41 | 8.38 | 7.52 | 6.27 | 4.86 | 2.21 | 1.73 | NA | NA | NA |
| 2023-12-30 | 2023-09-30 | 2023-07-01 | 2023-04-01 | 2022-12-31 | 2022-10-01 | 2022-07-02 | 2022-04-02 | 2022-01-01 | 2021-10-02 | 2021-07-03 | 2021-04-03 | 2021-01-02 | 2020-09-26 | 2020-06-27 | 2020-03-28 | 2019-12-28 | 2019-09-28 | 2019-06-29 | 2019-03-30 | 2018-12-29 | 2018-09-29 | 2018-06-30 | 2018-03-31 | 2017-12-30 | 2017-09-30 | 2017-07-01 | 2017-04-01 | ||
|---|---|---|---|---|---|---|---|---|---|---|---|---|---|---|---|---|---|---|---|---|---|---|---|---|---|---|---|---|---|
| Net Cash Provided By Used In Financing Activities | -1.67 | -1.99 | -2.54 | -7.39 | -2.42 | -6.45 | -6.14 | -107.63 | -4.83 | -7.29 | -3.81 | -7.09 | NA | -53.48 | -52.56 | 45.67 | -12.88 | -11.12 | -10.56 | -11.12 | -21.52 | -45.13 | -37.89 | -13.46 | -51.39 | NA | NA | NA |
| 2023-12-30 | 2023-09-30 | 2023-07-01 | 2023-04-01 | 2022-12-31 | 2022-10-01 | 2022-07-02 | 2022-04-02 | 2022-01-01 | 2021-10-02 | 2021-07-03 | 2021-04-03 | 2021-01-02 | 2020-09-26 | 2020-06-27 | 2020-03-28 | 2019-12-28 | 2019-09-28 | 2019-06-29 | 2019-03-30 | 2018-12-29 | 2018-09-29 | 2018-06-30 | 2018-03-31 | 2017-12-30 | 2017-09-30 | 2017-07-01 | 2017-04-01 | ||
|---|---|---|---|---|---|---|---|---|---|---|---|---|---|---|---|---|---|---|---|---|---|---|---|---|---|---|---|---|---|
| Revenues | 519.79 | 433.56 | 402.56 | 302.80 | 448.00 | 433.56 | 420.04 | 293.63 | 443.12 | 362.64 | 357.67 | 247.55 | 375.77 | 294.60 | 246.94 | 174.41 | 297.60 | 229.12 | 231.65 | 155.35 | 241.18 | 196.11 | 206.29 | 135.26 | 202.10 | 183.03 | 148.41 | 105.70 | |
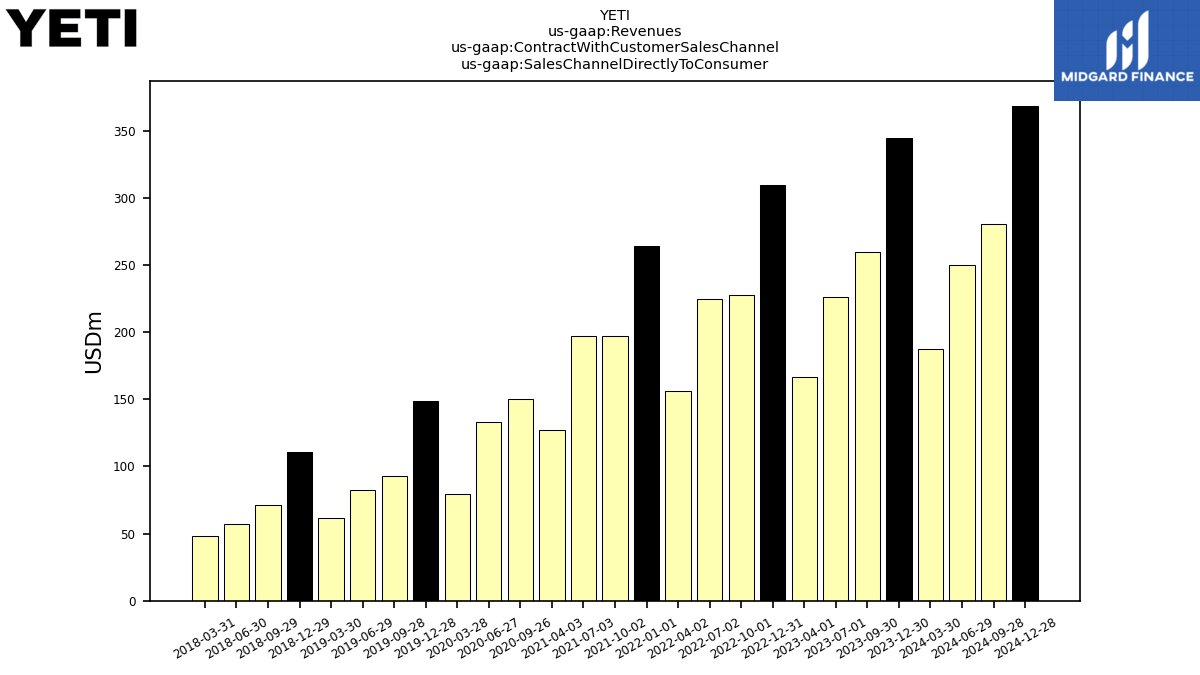
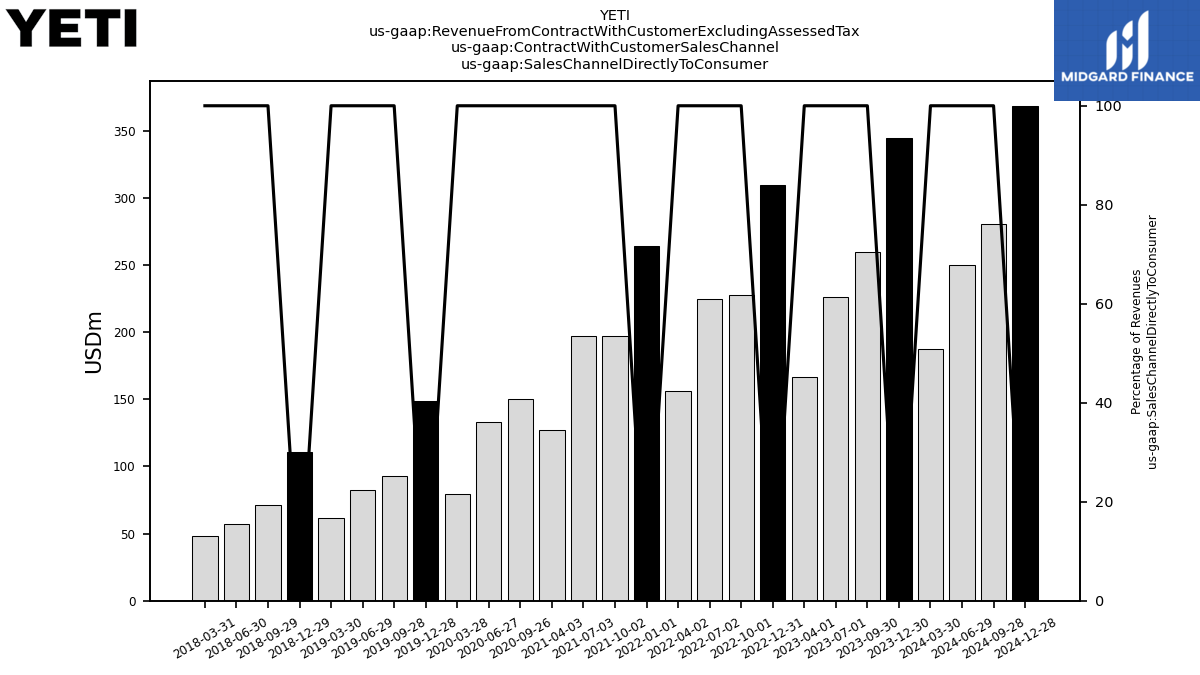
| Sales Channel Directly To Consumer | 344.86 | 259.50 | 226.39 | 166.97 | 309.49 | 227.40 | 224.85 | 155.96 | 263.93 | 197.14 | 196.88 | 126.77 | NA | 150.41 | 133.05 | 79.60 | 148.95 | 92.93 | 82.48 | 61.74 | 110.48 | 71.15 | 57.51 | 48.27 | NA | NA | NA | NA | |
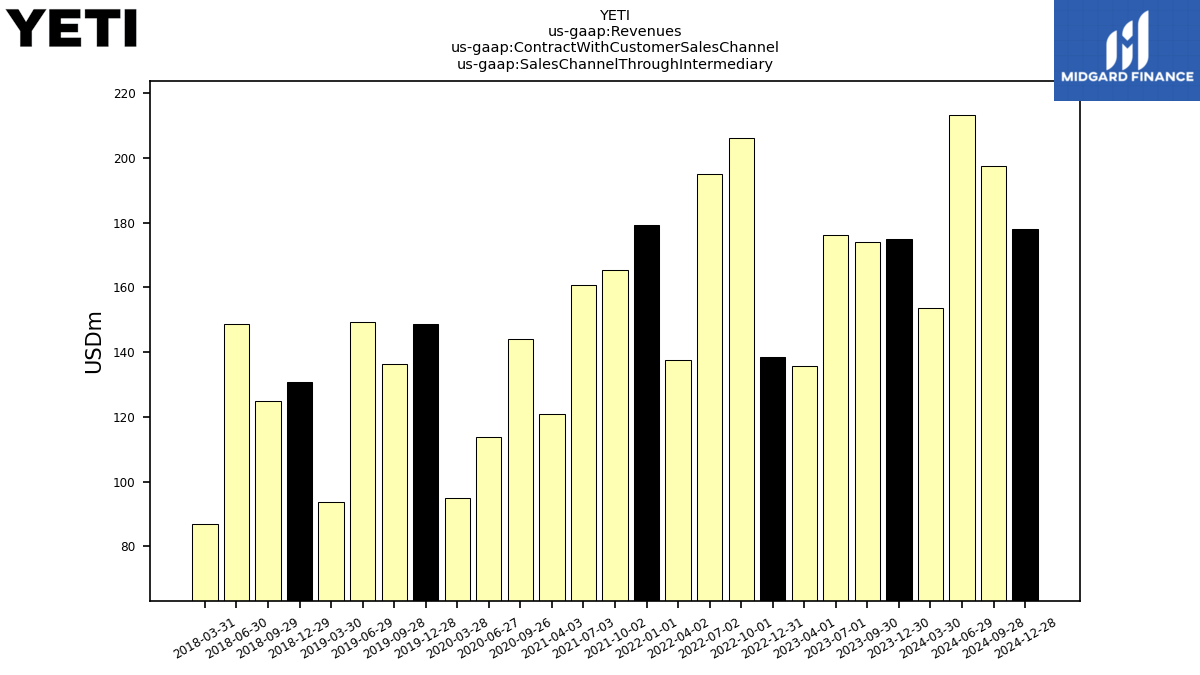
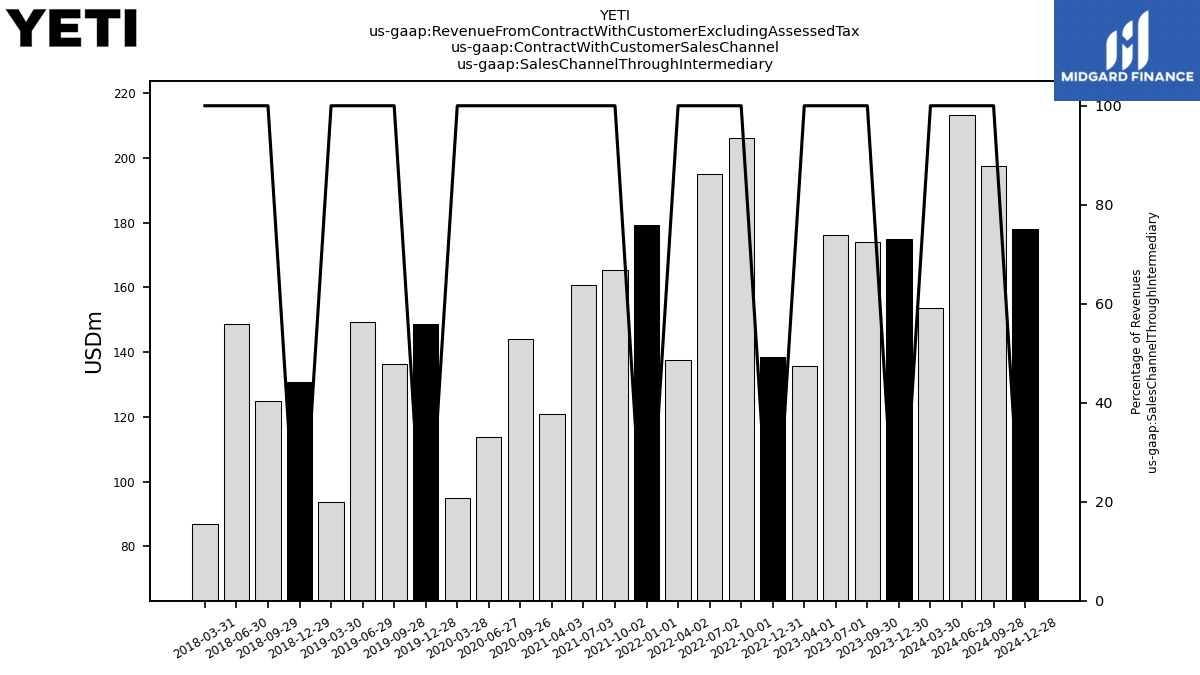
| Sales Channel Through Intermediary | 174.93 | 174.06 | 176.18 | 135.83 | 138.50 | 206.15 | 195.19 | 137.67 | 179.19 | 165.50 | 160.78 | 120.78 | NA | 144.19 | 113.89 | 94.82 | 148.65 | 136.20 | 149.18 | 93.61 | 130.70 | 124.96 | 148.78 | 86.99 | NA | NA | NA | NA | |
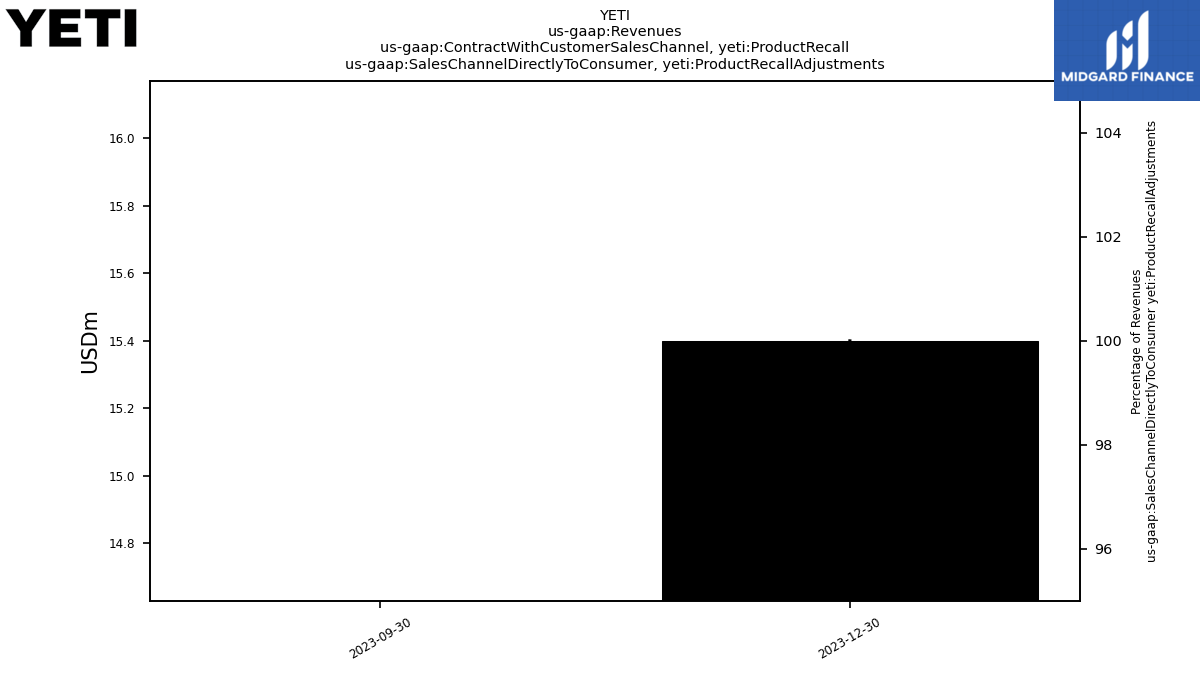
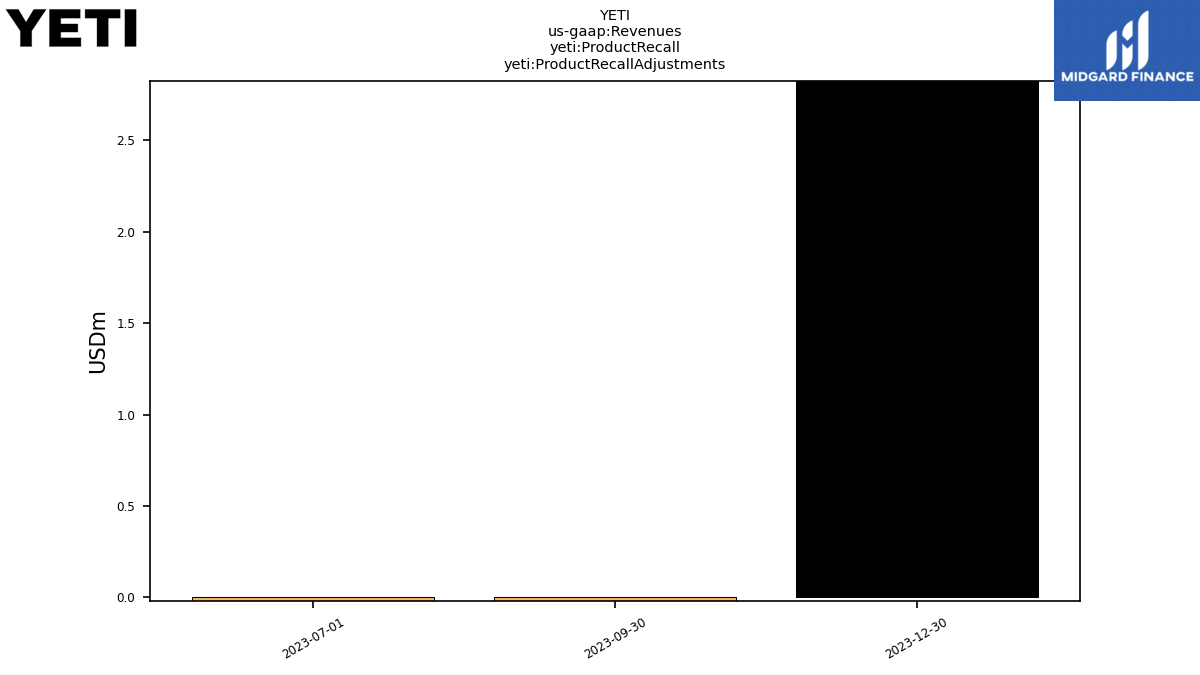
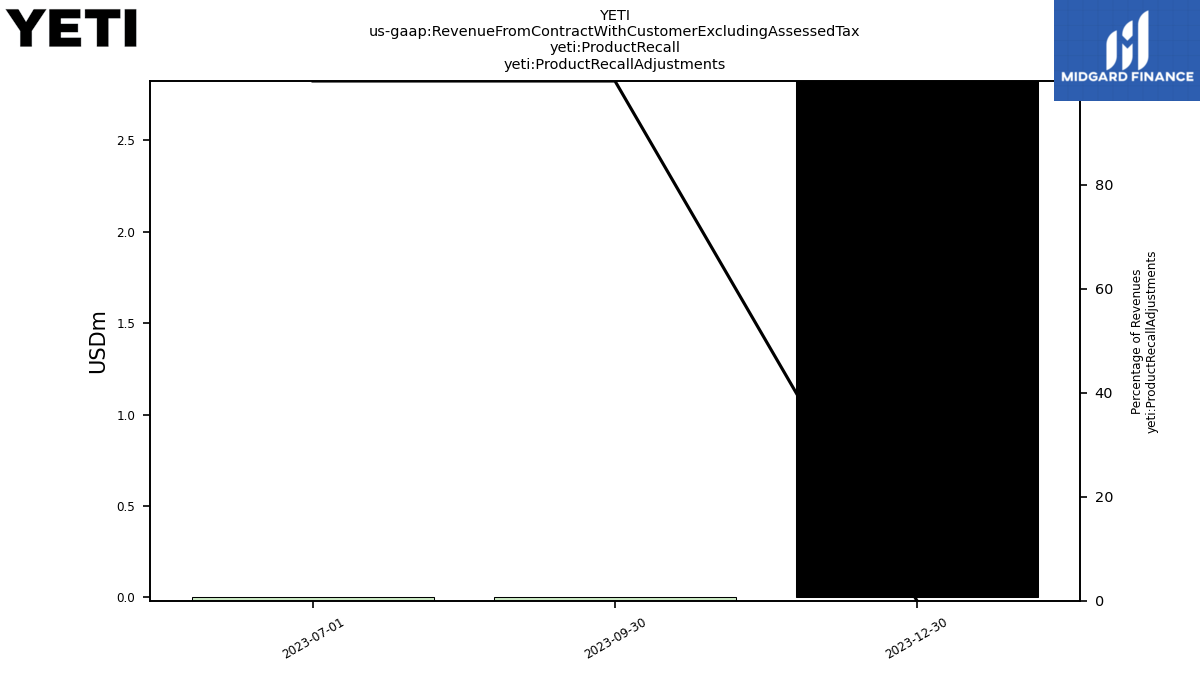
| Sales Channel Directly To Consumer, Product Recall Adjustments | 15.40 | 0.00 | NA | NA | NA | NA | NA | NA | NA | NA | NA | NA | NA | NA | NA | NA | NA | NA | NA | NA | NA | NA | NA | NA | NA | NA | NA | NA | |
| Sales Channel Through Intermediary, Product Recall Adjustments | 30.80 | 0.00 | NA | NA | NA | NA | NA | NA | NA | NA | NA | NA | NA | NA | NA | NA | NA | NA | NA | NA | NA | NA | NA | NA | NA | NA | NA | NA | |
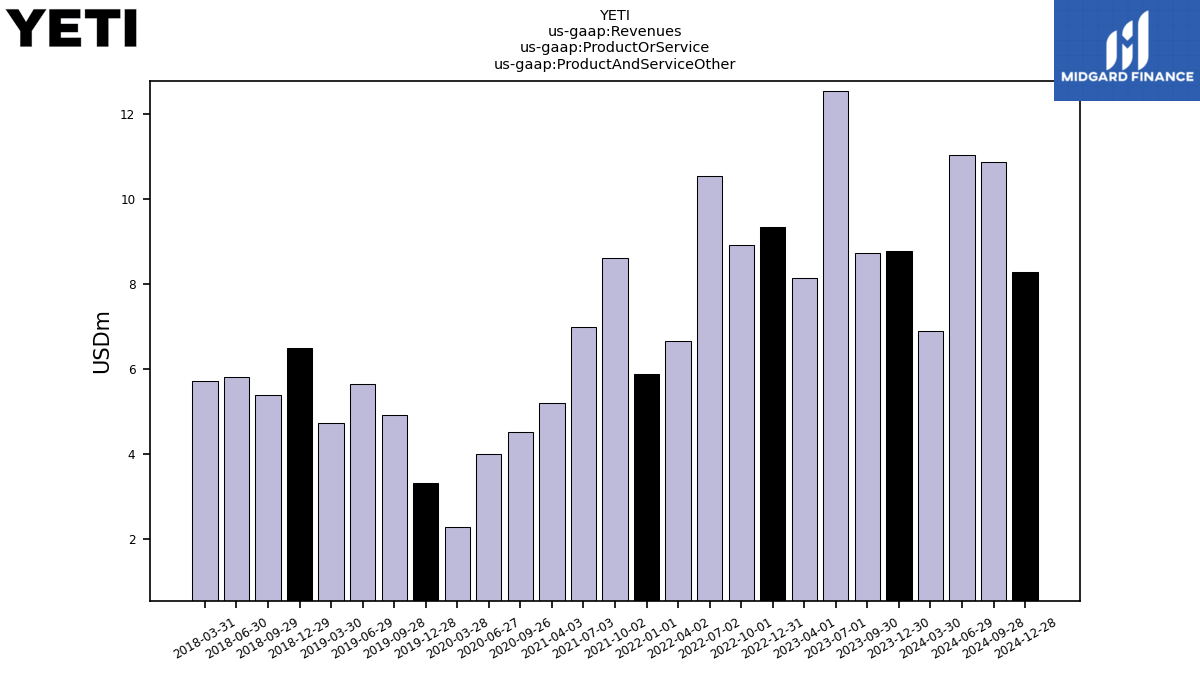
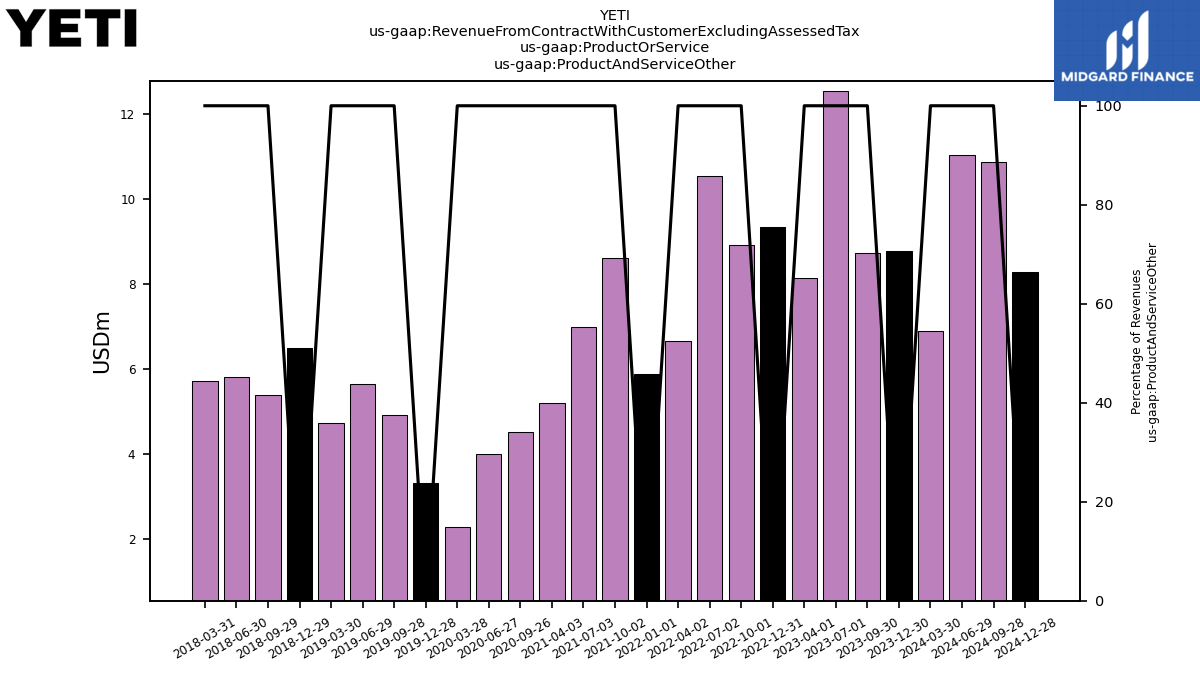
| Product And Service Other | 8.79 | 8.74 | 12.54 | 8.15 | 9.34 | 8.91 | 10.56 | 6.67 | 5.89 | 8.61 | 6.98 | 5.22 | NA | 4.51 | 4.00 | 2.30 | 3.32 | 4.91 | 5.64 | 4.75 | 6.50 | 5.39 | 5.82 | 5.73 | NA | NA | NA | NA | |
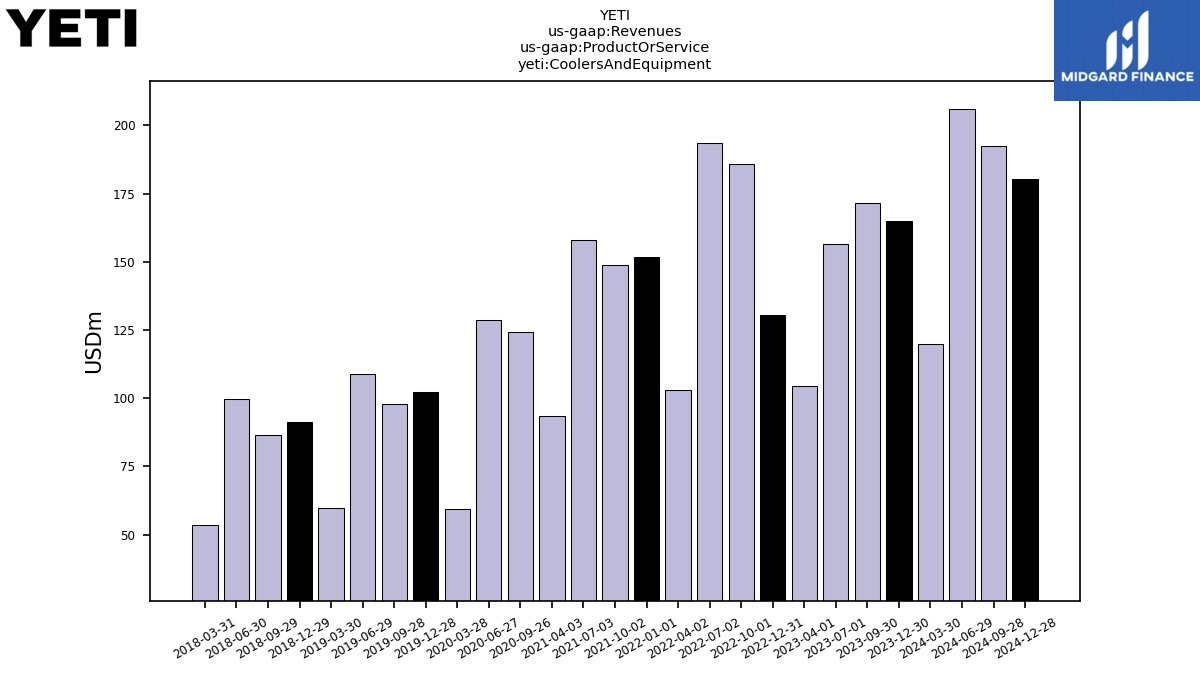
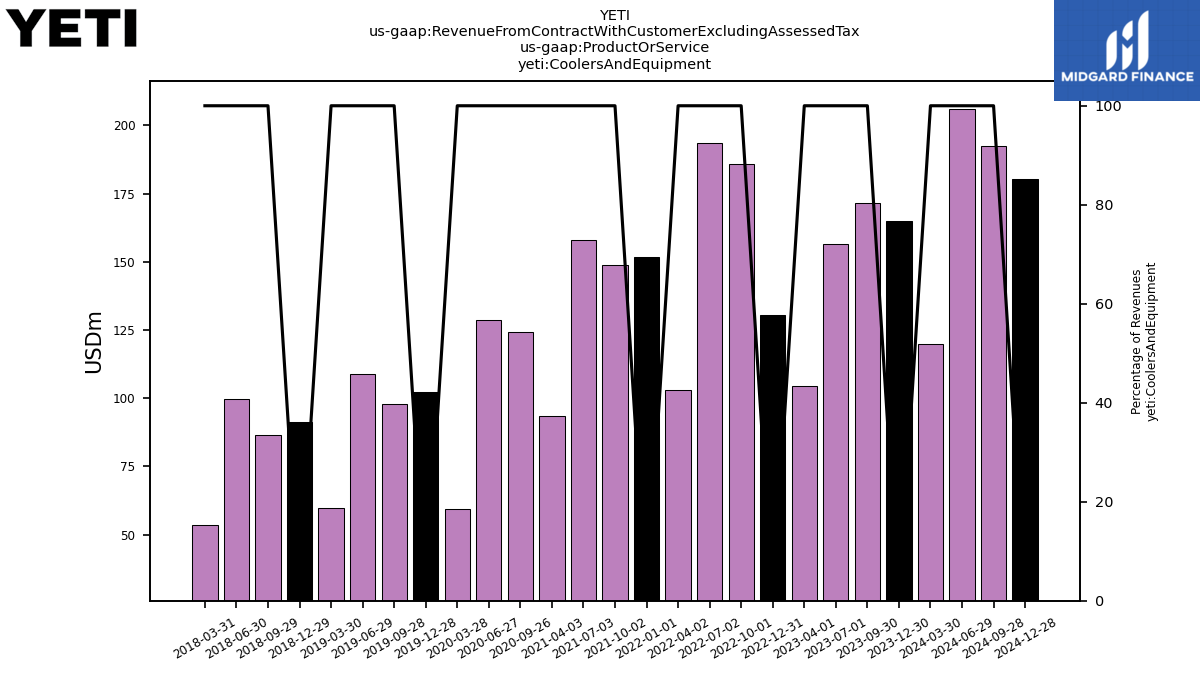
| Coolers And Equipment | 165.00 | 171.55 | 156.61 | 104.35 | 130.50 | 185.66 | 193.41 | 102.96 | 151.60 | 149.00 | 157.80 | 93.46 | NA | 124.16 | 128.61 | 59.49 | 102.32 | 97.84 | 109.06 | 59.65 | 91.22 | 86.67 | 99.60 | 53.74 | NA | NA | NA | NA | |
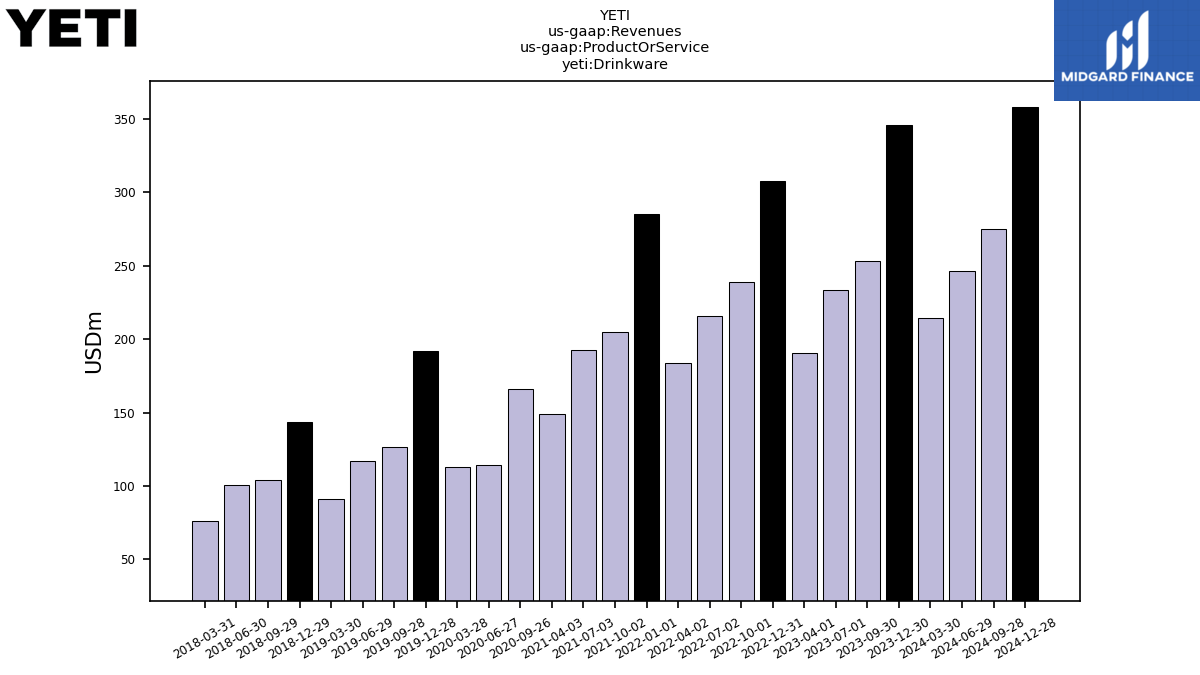
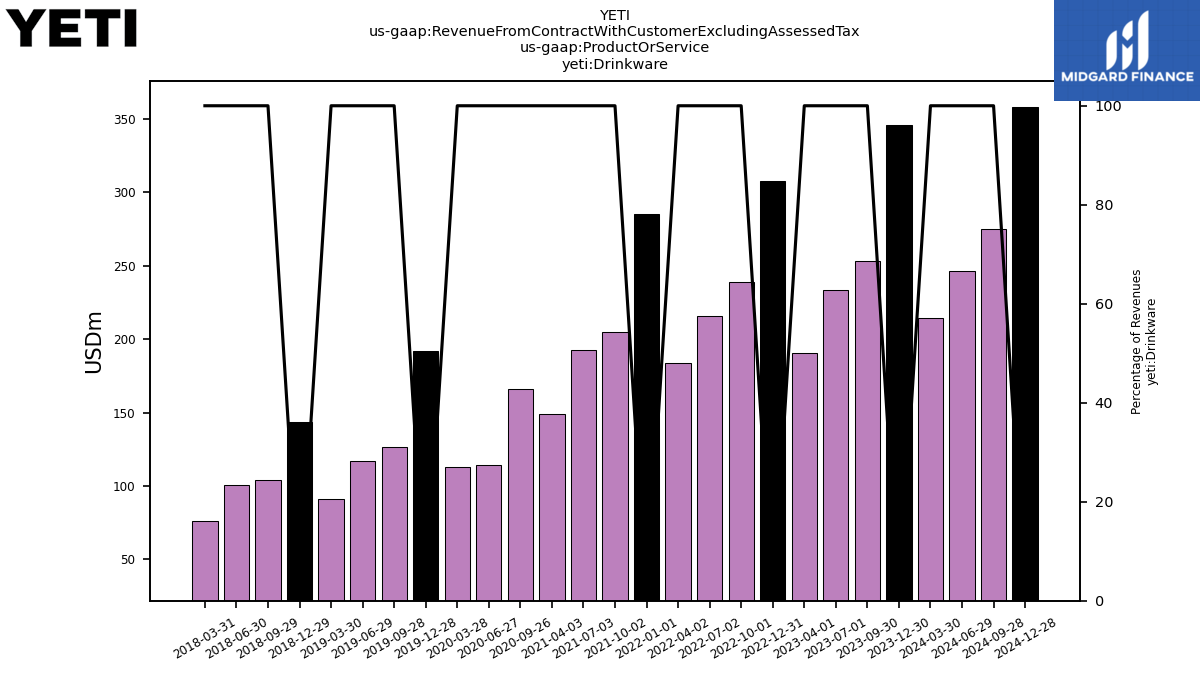
| Drinkware | 346.00 | 253.27 | 233.42 | 190.29 | 308.17 | 238.99 | 216.07 | 184.00 | 285.63 | 205.03 | 192.88 | 148.88 | NA | 165.93 | 114.33 | 112.62 | 191.96 | 126.37 | 116.95 | 90.95 | 143.46 | 104.05 | 100.87 | 75.79 | NA | NA | NA | NA | |
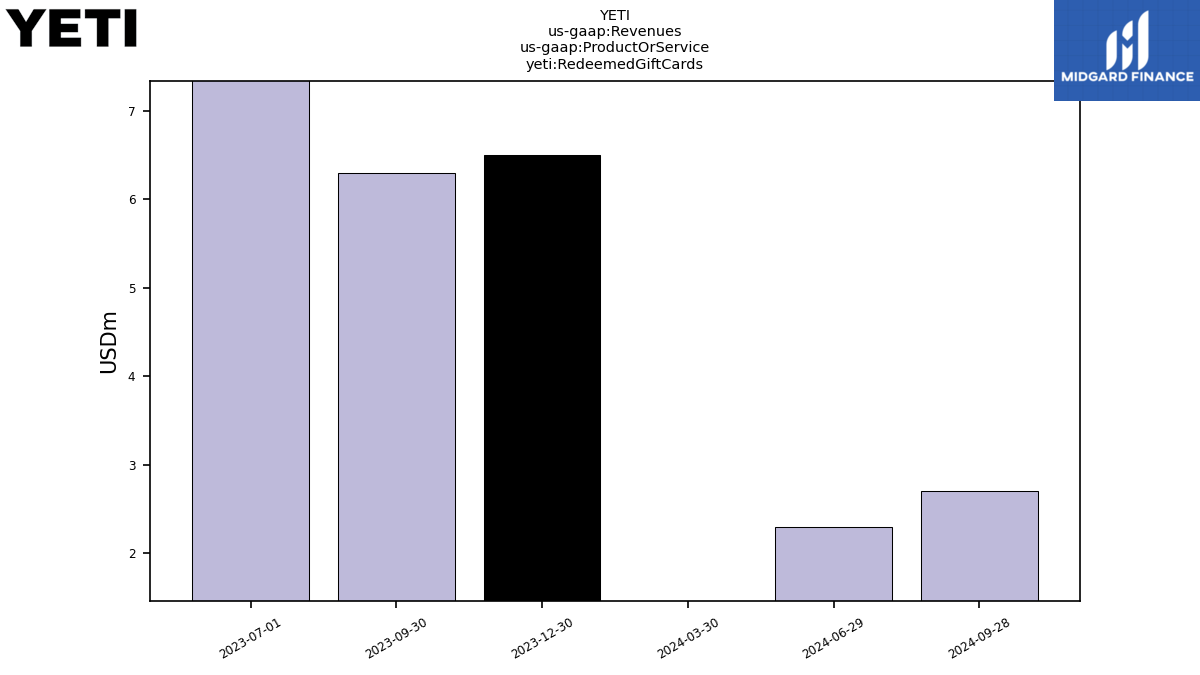
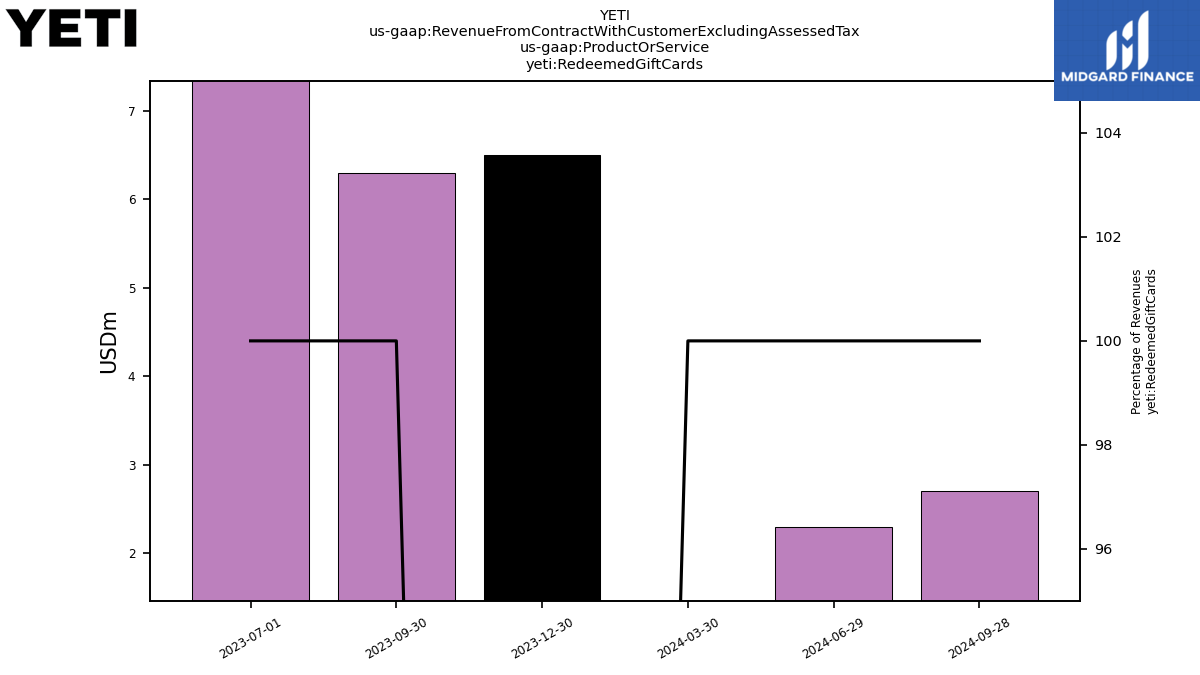
| Redeemed Gift Cards | 6.50 | 6.30 | 12.50 | NA | NA | NA | NA | NA | NA | NA | NA | NA | NA | NA | NA | NA | NA | NA | NA | NA | NA | NA | NA | NA | NA | NA | NA | NA | |
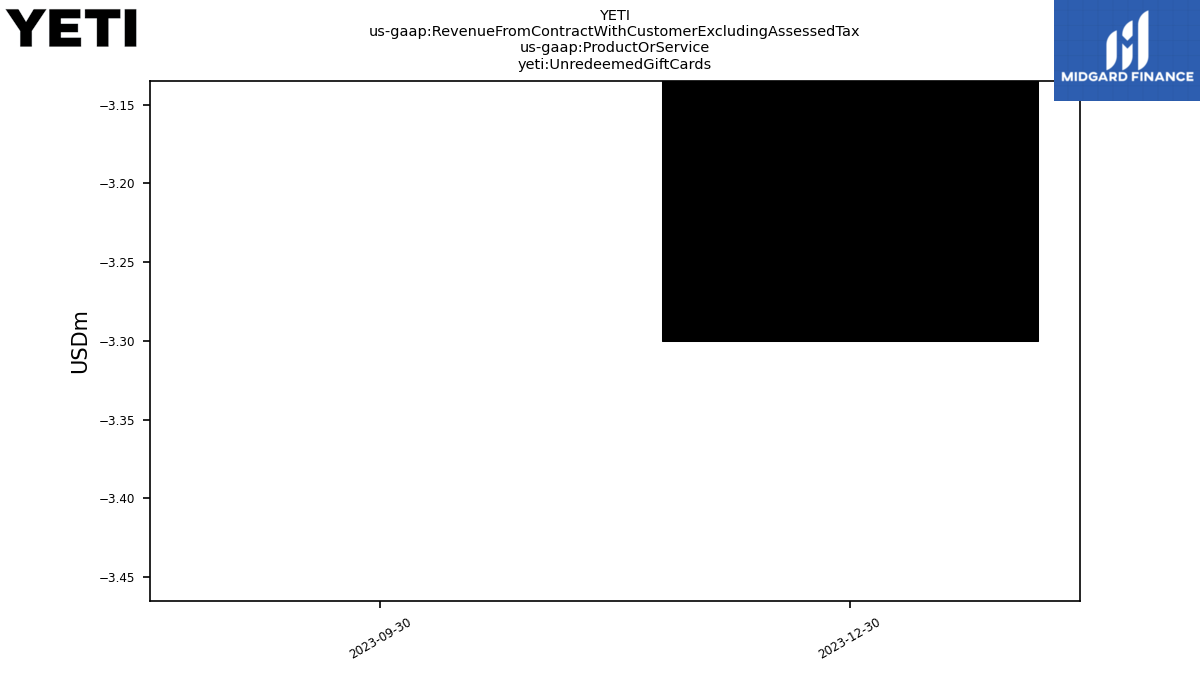
| Unredeemed Gift Cards | -3.30 | -1.80 | NA | NA | NA | NA | NA | NA | NA | NA | NA | NA | NA | NA | NA | NA | NA | NA | NA | NA | NA | NA | NA | NA | NA | NA | NA | NA | |
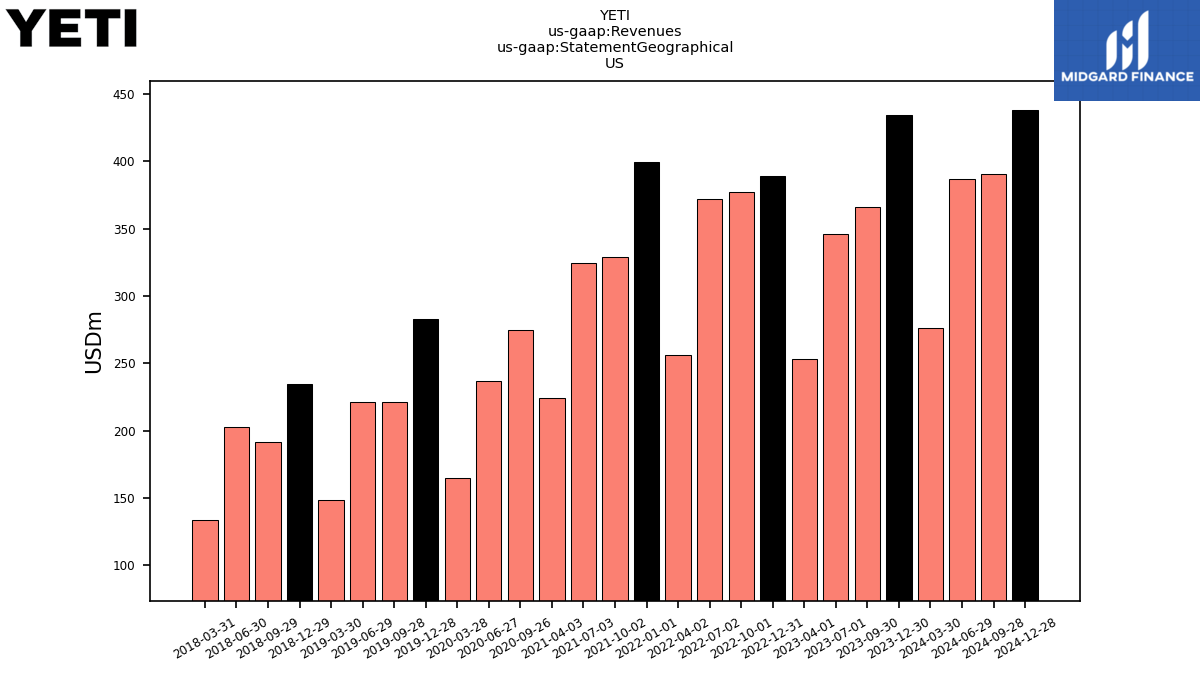
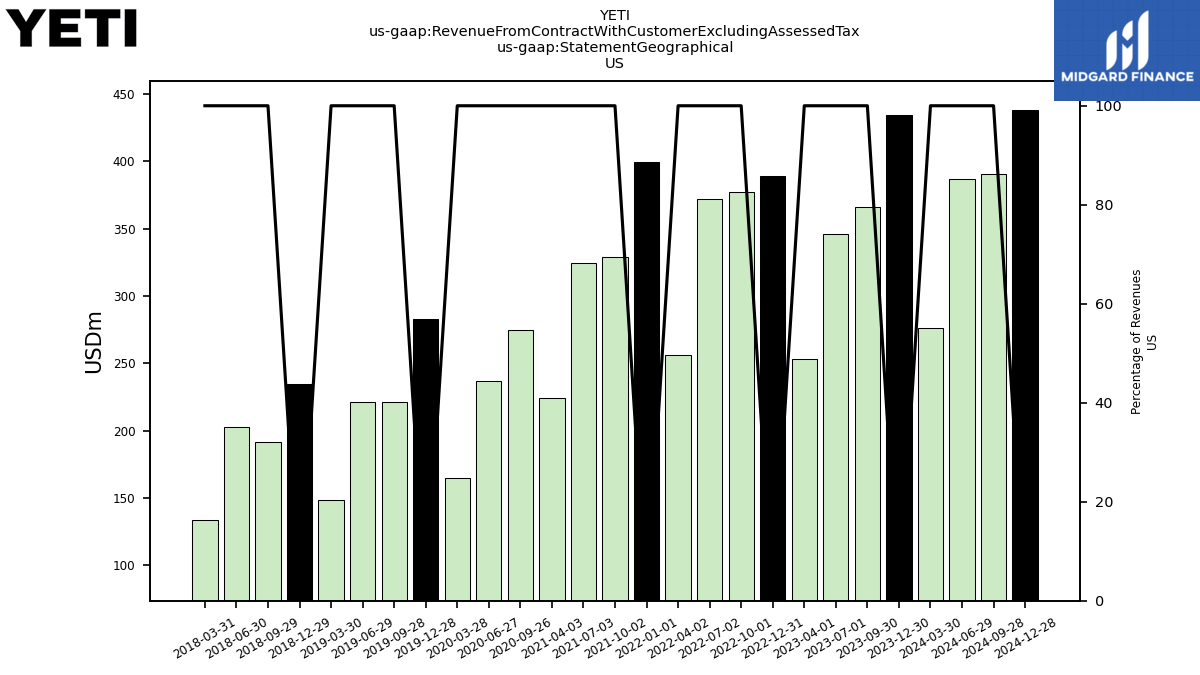
| US | 434.36 | 365.69 | 345.89 | 252.99 | 388.79 | 377.07 | 371.92 | 256.25 | 399.60 | 328.55 | 324.67 | 224.36 | NA | 274.42 | 237.13 | 165.00 | 282.72 | 221.50 | 220.98 | 148.67 | 234.53 | 191.28 | 202.28 | 133.79 | NA | NA | NA | NA | |
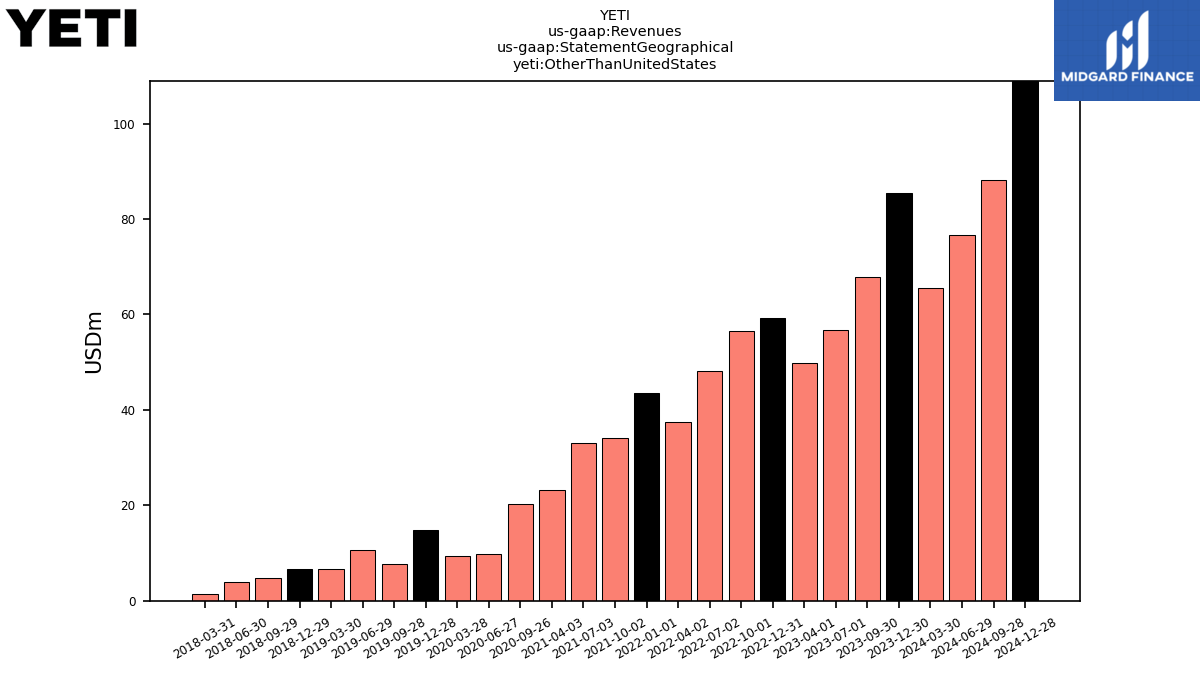
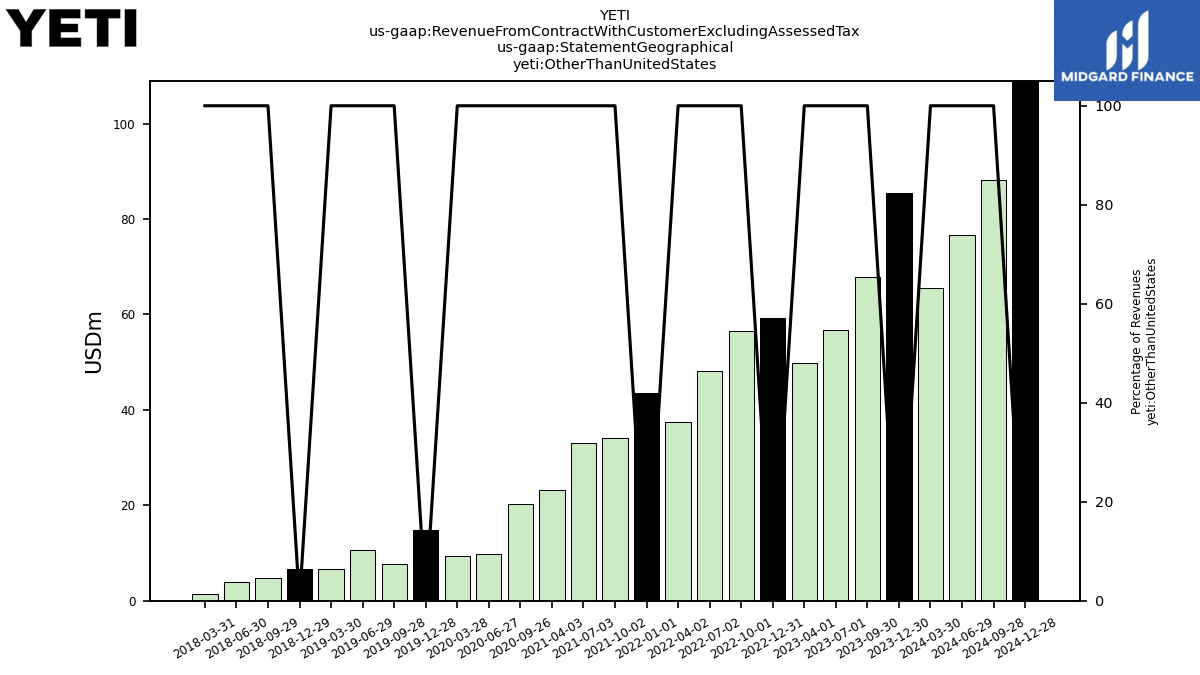
| Other Than United States | 85.44 | 67.87 | 56.67 | 49.81 | 59.21 | 56.49 | 48.12 | 37.38 | 43.52 | 34.10 | 32.99 | 23.20 | NA | 20.18 | 9.80 | 9.41 | 14.88 | 7.62 | 10.68 | 6.68 | 6.65 | 4.83 | 4.01 | 1.47 | NA | NA | NA | NA | |
| Product Recall Adjustments | 2.82 | -0.02 | -24.49 | NA | NA | NA | NA | NA | NA | NA | NA | NA | NA | NA | NA | NA | NA | NA | NA | NA | NA | NA | NA | NA | NA | NA | NA | NA | |
| Revenue From Contract With Customer Excluding Assessed Tax | 519.79 | 433.56 | 402.56 | 302.80 | 448.00 | 433.56 | 420.04 | 293.63 | 443.12 | 362.64 | 357.67 | 247.55 | 375.77 | 294.60 | 246.94 | 174.41 | 297.60 | 229.12 | 231.65 | 155.35 | 241.18 | 196.11 | 206.29 | 135.26 | 202.10 | 183.03 | 148.41 | 105.70 | |
| Sales Channel Directly To Consumer | 344.86 | 259.50 | 226.39 | 166.97 | 309.49 | 227.40 | 224.85 | 155.96 | 263.93 | 197.14 | 196.88 | 126.77 | NA | 150.41 | 133.05 | 79.60 | 148.95 | 92.93 | 82.48 | 61.74 | 110.48 | 71.15 | 57.51 | 48.27 | NA | NA | NA | NA | |
| Sales Channel Through Intermediary | 174.93 | 174.06 | 176.18 | 135.83 | 138.50 | 206.15 | 195.19 | 137.67 | 179.19 | 165.50 | 160.78 | 120.78 | NA | 144.19 | 113.89 | 94.82 | 148.65 | 136.20 | 149.18 | 93.61 | 130.70 | 124.96 | 148.78 | 86.99 | NA | NA | NA | NA | |
| Sales Channel Directly To Consumer, Product Recall Adjustments | 15.40 | 0.00 | NA | NA | NA | NA | NA | NA | NA | NA | NA | NA | NA | NA | NA | NA | NA | NA | NA | NA | NA | NA | NA | NA | NA | NA | NA | NA | |
| Sales Channel Through Intermediary, Product Recall Adjustments | 30.80 | 0.00 | NA | NA | NA | NA | NA | NA | NA | NA | NA | NA | NA | NA | NA | NA | NA | NA | NA | NA | NA | NA | NA | NA | NA | NA | NA | NA | |
| Product And Service Other | 8.79 | 8.74 | 12.54 | 8.15 | 9.34 | 8.91 | 10.56 | 6.67 | 5.89 | 8.61 | 6.98 | 5.22 | NA | 4.51 | 4.00 | 2.30 | 3.32 | 4.91 | 5.64 | 4.75 | 6.50 | 5.39 | 5.82 | 5.73 | NA | NA | NA | NA | |
| Coolers And Equipment | 165.00 | 171.55 | 156.61 | 104.35 | 130.50 | 185.66 | 193.41 | 102.96 | 151.60 | 149.00 | 157.80 | 93.46 | NA | 124.16 | 128.61 | 59.49 | 102.32 | 97.84 | 109.06 | 59.65 | 91.22 | 86.67 | 99.60 | 53.74 | NA | NA | NA | NA | |
| Drinkware | 346.00 | 253.27 | 233.42 | 190.29 | 308.17 | 238.99 | 216.07 | 184.00 | 285.63 | 205.03 | 192.88 | 148.88 | NA | 165.93 | 114.33 | 112.62 | 191.96 | 126.37 | 116.95 | 90.95 | 143.46 | 104.05 | 100.87 | 75.79 | NA | NA | NA | NA | |
| Redeemed Gift Cards | 6.50 | 6.30 | 12.50 | NA | NA | NA | NA | NA | NA | NA | NA | NA | NA | NA | NA | NA | NA | NA | NA | NA | NA | NA | NA | NA | NA | NA | NA | NA | |
| Unredeemed Gift Cards | -3.30 | -1.80 | NA | NA | NA | NA | NA | NA | NA | NA | NA | NA | NA | NA | NA | NA | NA | NA | NA | NA | NA | NA | NA | NA | NA | NA | NA | NA | |
| US | 434.36 | 365.69 | 345.89 | 252.99 | 388.79 | 377.07 | 371.92 | 256.25 | 399.60 | 328.55 | 324.67 | 224.36 | NA | 274.42 | 237.13 | 165.00 | 282.72 | 221.50 | 220.98 | 148.67 | 234.53 | 191.28 | 202.28 | 133.79 | NA | NA | NA | NA | |
| Other Than United States | 85.44 | 67.87 | 56.67 | 49.81 | 59.21 | 56.49 | 48.12 | 37.38 | 43.52 | 34.10 | 32.99 | 23.20 | NA | 20.18 | 9.80 | 9.41 | 14.88 | 7.62 | 10.68 | 6.68 | 6.65 | 4.83 | 4.01 | 1.47 | NA | NA | NA | NA | |
| Product Recall Adjustments | 2.82 | -0.02 | -24.49 | NA | NA | NA | NA | NA | NA | NA | NA | NA | NA | NA | NA | NA | NA | NA | NA | NA | NA | NA | NA | NA | NA | NA | NA | NA | |
| Revenue From Contract With Customer Including Assessed Tax | 519.79 | 433.56 | 402.56 | 302.80 | 448.00 | 433.56 | 420.04 | 293.63 | 443.12 | 362.64 | 357.67 | 247.55 | 375.77 | 294.60 | 246.94 | 174.41 | 297.60 | 229.12 | 231.65 | 155.35 | 241.18 | 196.11 | 206.29 | 135.26 | 202.10 | 183.03 | 148.41 | 105.70 |