

| 2023-10-31 | 2023-07-31 | 2023-04-30 | 2023-01-31 | 2022-10-31 | 2022-07-31 | 2022-04-30 | 2022-01-31 | 2021-10-31 | 2021-07-31 | 2021-04-30 | 2021-01-31 | 2020-10-31 | 2020-07-31 | 2020-04-30 | 2020-01-31 | 2019-10-31 | 2019-07-31 | 2019-04-30 | 2019-01-31 | 2018-10-31 | 2018-07-31 | 2018-04-30 | 2018-01-31 | 2017-10-31 | 2017-07-31 | 2017-04-30 | 2017-01-31 | 2016-10-31 | 2016-07-31 | 2016-04-30 | ||
|---|---|---|---|---|---|---|---|---|---|---|---|---|---|---|---|---|---|---|---|---|---|---|---|---|---|---|---|---|---|---|---|---|
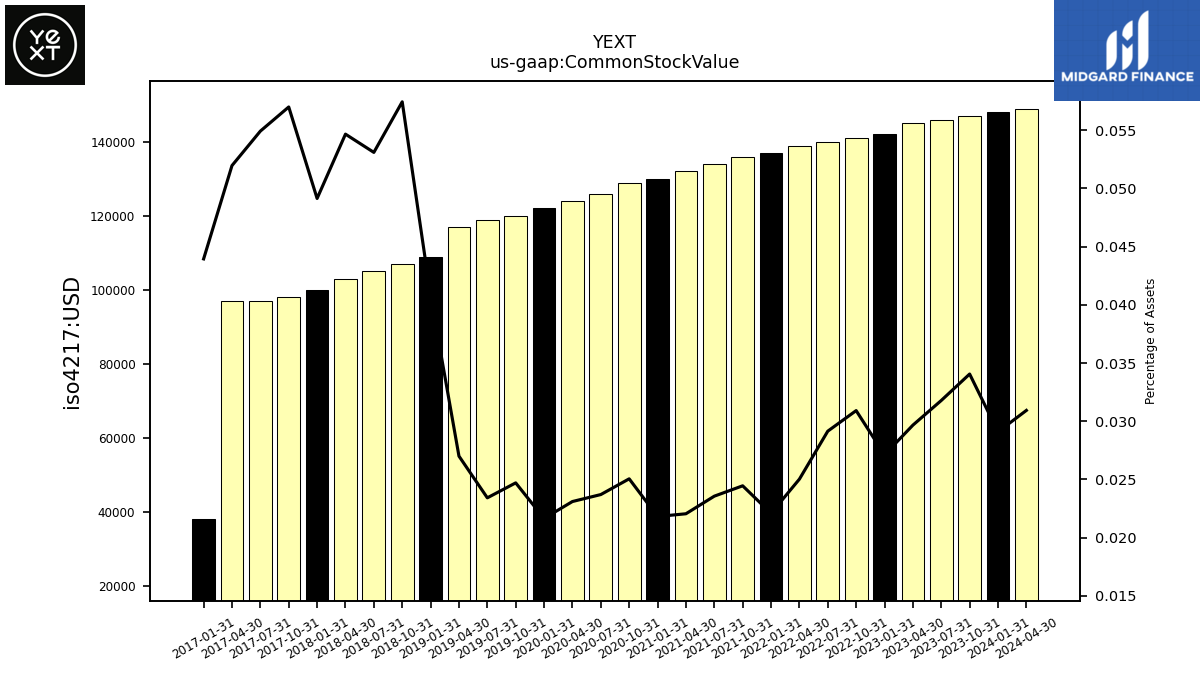
| Common Stock Value | 0.15 | 0.15 | 0.14 | 0.14 | 0.14 | 0.14 | 0.14 | 0.14 | 0.14 | 0.13 | 0.13 | 0.13 | 0.13 | 0.13 | 0.12 | 0.12 | 0.12 | 0.12 | 0.12 | 0.11 | 0.11 | 0.10 | 0.10 | 0.10 | 0.10 | 0.10 | 0.10 | 0.04 | NA | NA | NA | |
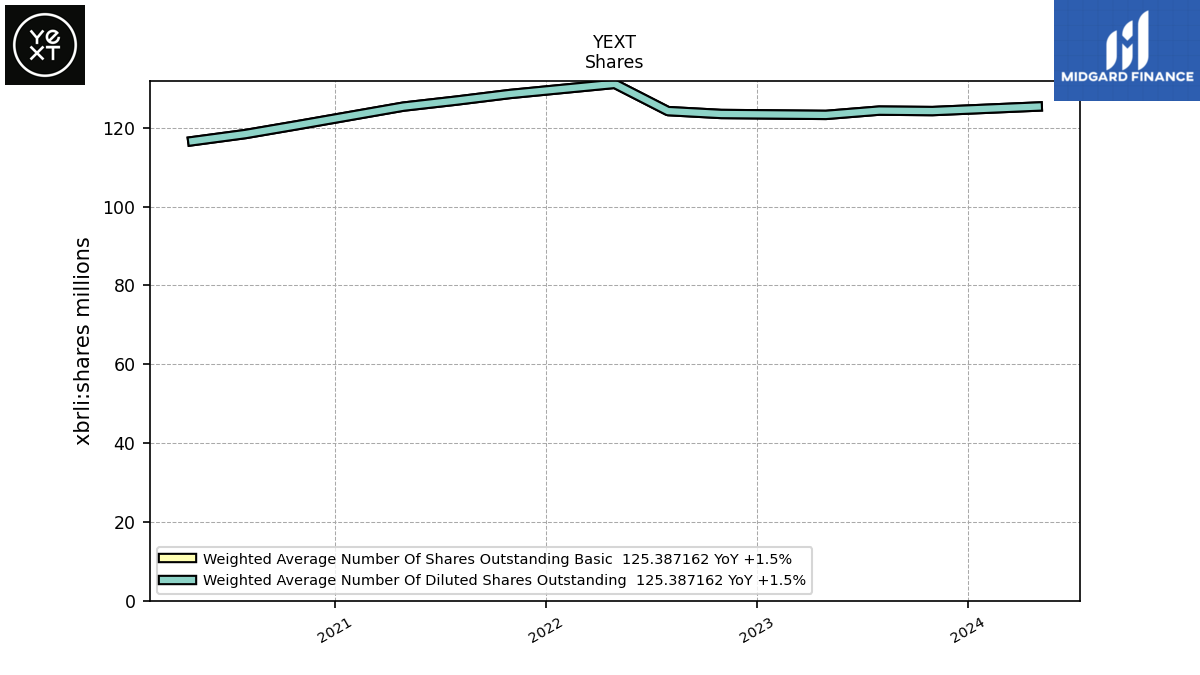
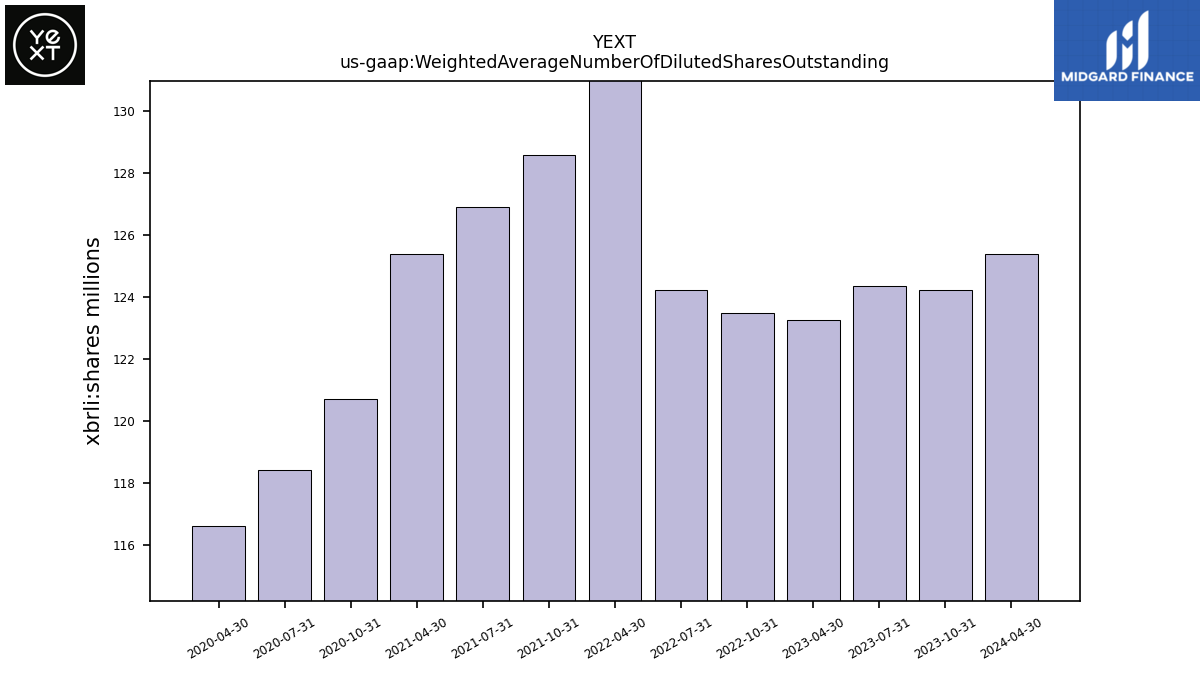
| Weighted Average Number Of Diluted Shares Outstanding | 124.24 | 124.36 | 123.27 | NA | 123.50 | 124.23 | 131.14 | NA | 128.57 | 126.91 | 125.37 | NA | 120.72 | 118.41 | 116.61 | NA | NA | NA | NA | NA | NA | NA | NA | NA | NA | NA | NA | NA | NA | NA | NA | |
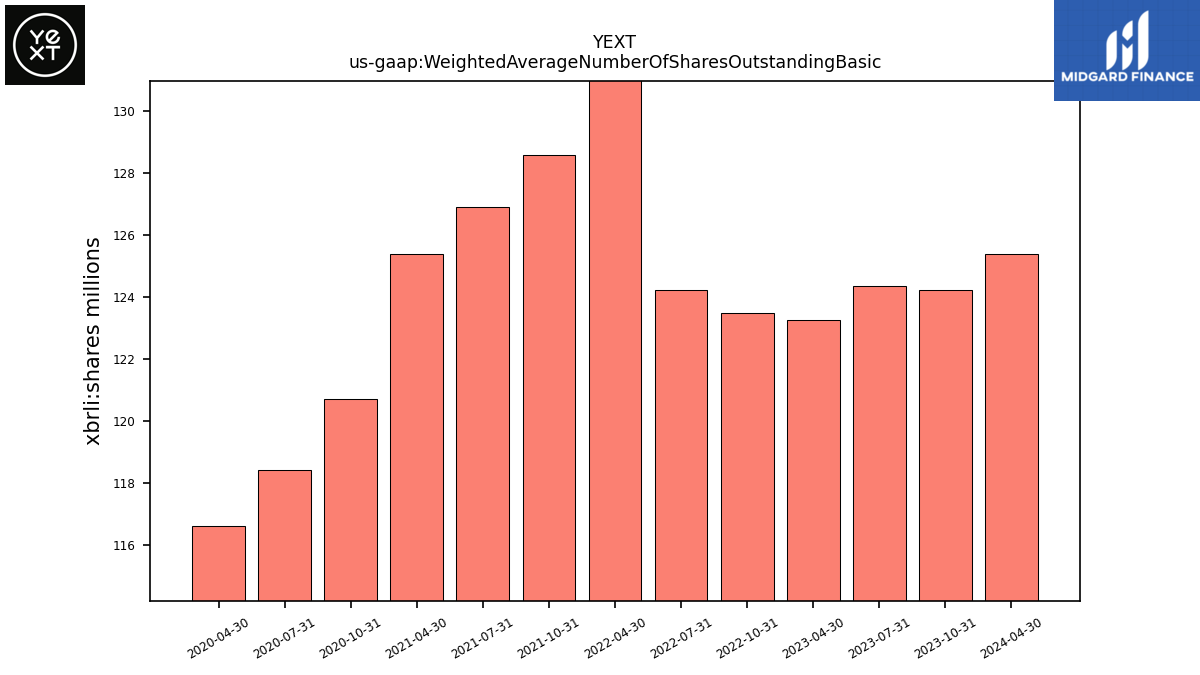
| Weighted Average Number Of Shares Outstanding Basic | 124.24 | 124.36 | 123.27 | NA | 123.50 | 124.23 | 131.14 | NA | 128.57 | 126.91 | 125.37 | NA | 120.72 | 118.41 | 116.61 | NA | NA | NA | NA | NA | NA | NA | NA | NA | NA | NA | NA | NA | NA | NA | NA | |
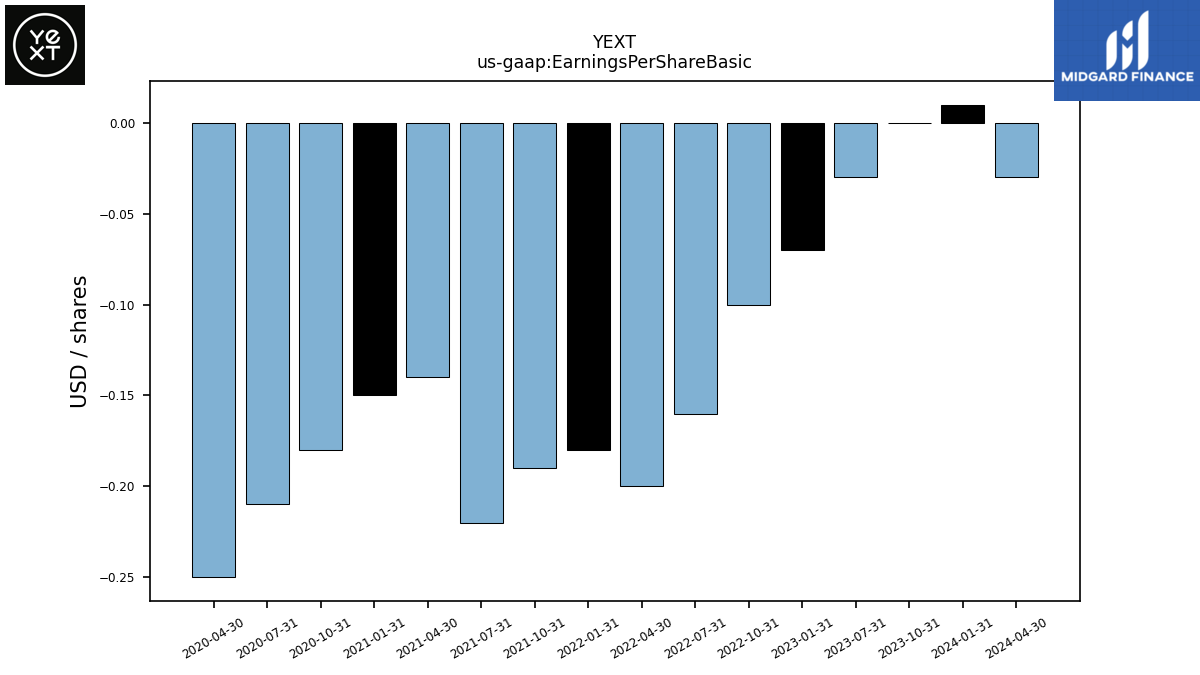
| Earnings Per Share Basic | 0.00 | -0.03 | NA | -0.07 | -0.10 | -0.16 | -0.20 | -0.18 | -0.19 | -0.22 | -0.14 | -0.15 | -0.18 | -0.21 | -0.25 | NA | NA | NA | NA | NA | NA | NA | NA | NA | NA | NA | NA | NA | NA | NA | NA | |
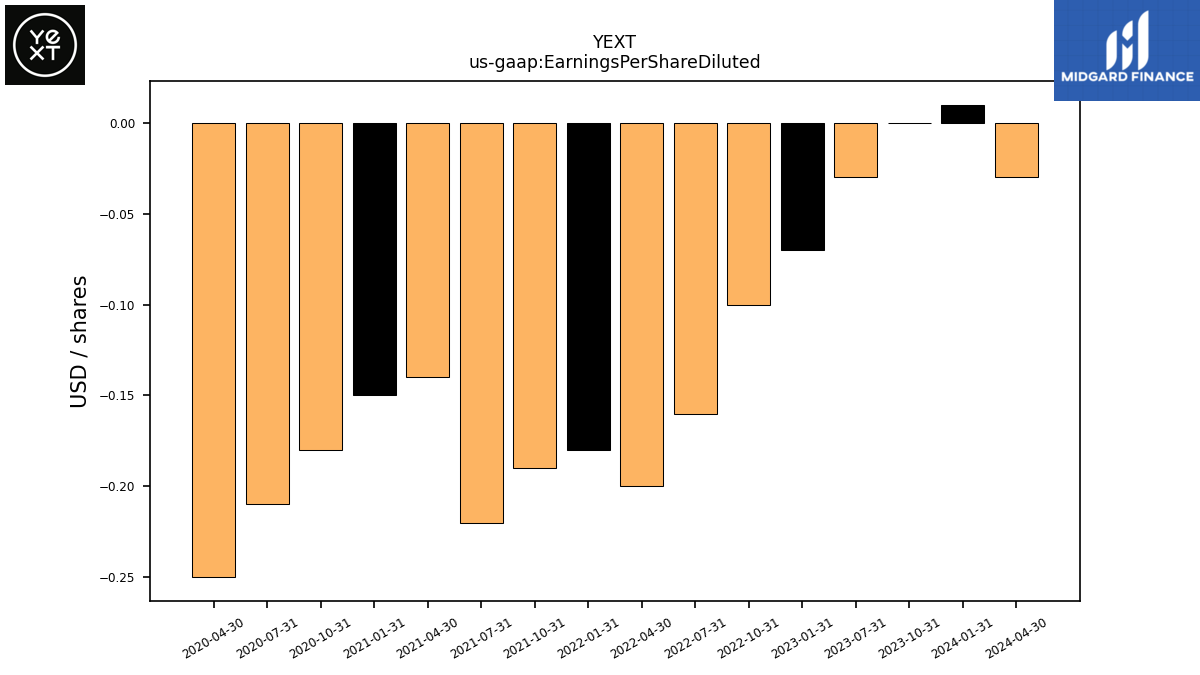
| Earnings Per Share Diluted | 0.00 | -0.03 | NA | -0.07 | -0.10 | -0.16 | -0.20 | -0.18 | -0.19 | -0.22 | -0.14 | -0.15 | -0.18 | -0.21 | -0.25 | NA | NA | NA | NA | NA | NA | NA | NA | NA | NA | NA | NA | NA | NA | NA | NA |
| 2023-10-31 | 2023-07-31 | 2023-04-30 | 2023-01-31 | 2022-10-31 | 2022-07-31 | 2022-04-30 | 2022-01-31 | 2021-10-31 | 2021-07-31 | 2021-04-30 | 2021-01-31 | 2020-10-31 | 2020-07-31 | 2020-04-30 | 2020-01-31 | 2019-10-31 | 2019-07-31 | 2019-04-30 | 2019-01-31 | 2018-10-31 | 2018-07-31 | 2018-04-30 | 2018-01-31 | 2017-10-31 | 2017-07-31 | 2017-04-30 | 2017-01-31 | 2016-10-31 | 2016-07-31 | 2016-04-30 | ||
|---|---|---|---|---|---|---|---|---|---|---|---|---|---|---|---|---|---|---|---|---|---|---|---|---|---|---|---|---|---|---|---|---|
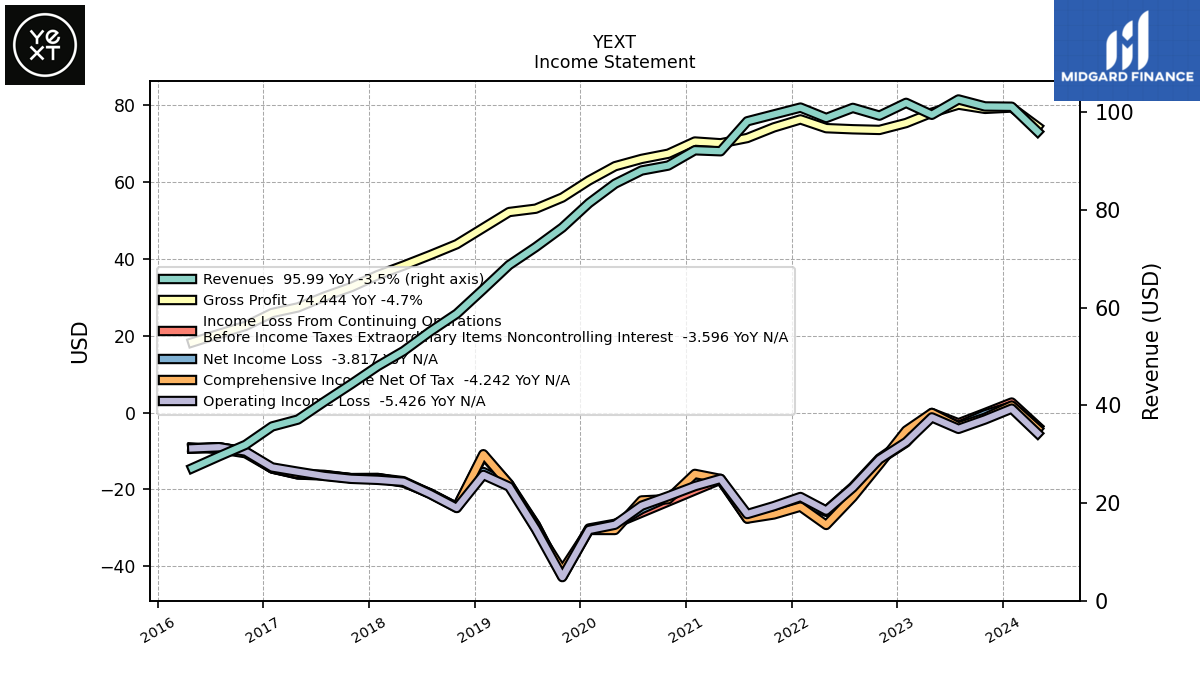
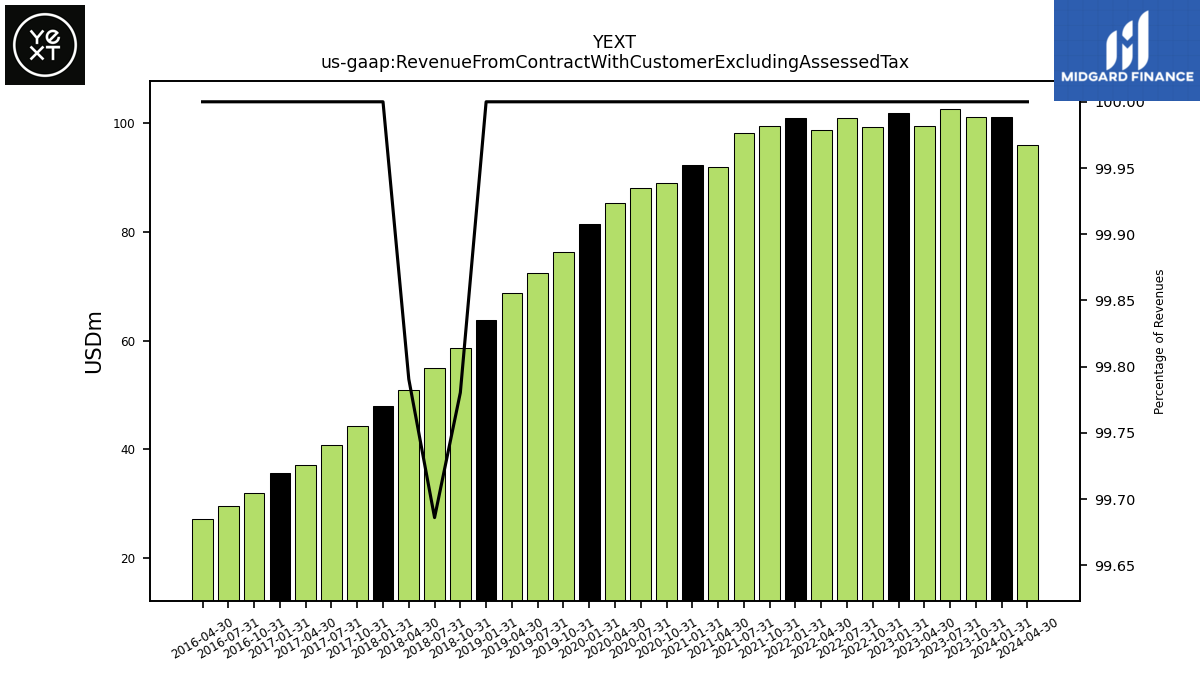
| Revenue From Contract With Customer Excluding Assessed Tax | 101.16 | 102.60 | 99.45 | 101.90 | 99.28 | 100.87 | 98.80 | 100.93 | 99.53 | 98.12 | 91.99 | 92.19 | 89.06 | 88.06 | 85.35 | 81.38 | 76.37 | 72.37 | 68.71 | 63.76 | 58.61 | 54.92 | 50.99 | 48.02 | 44.33 | 40.77 | 37.08 | 35.67 | 31.91 | 29.56 | 27.12 | |
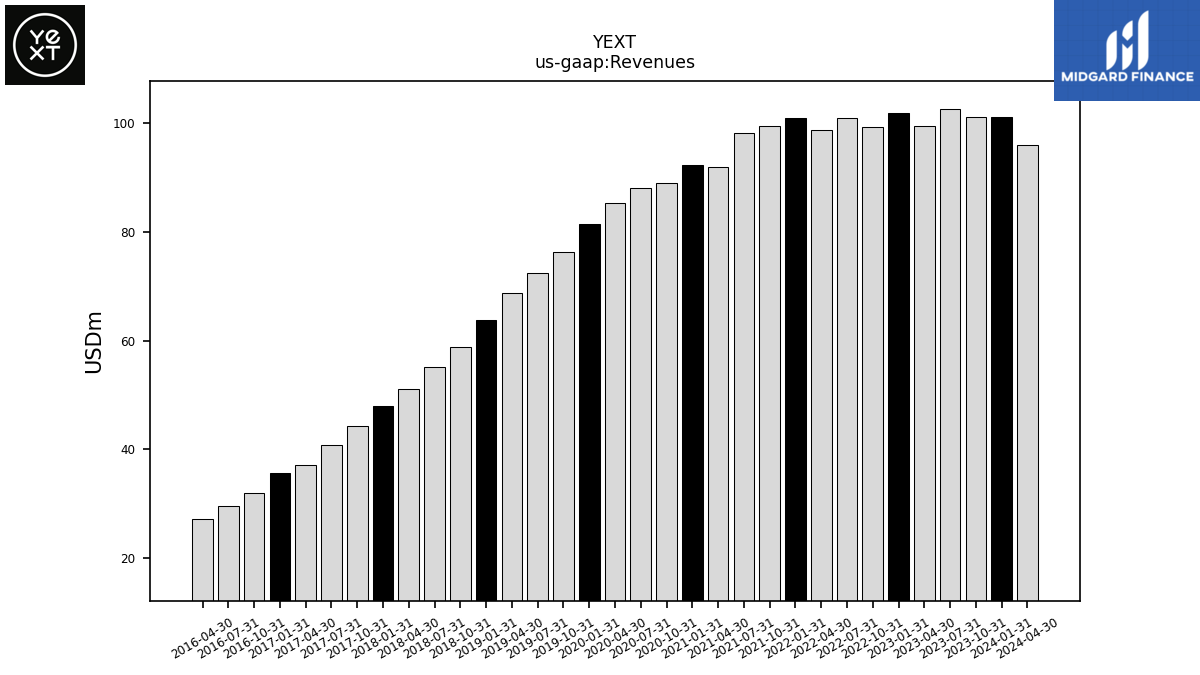
| Revenues | 101.16 | 102.60 | 99.45 | 101.90 | 99.28 | 100.87 | 98.80 | 100.93 | 99.53 | 98.12 | 91.99 | 92.19 | 89.06 | 88.06 | 85.35 | 81.38 | 76.37 | 72.37 | 68.71 | 63.76 | 58.74 | 55.10 | 51.09 | 48.02 | 44.33 | 40.77 | 37.08 | 35.67 | 31.91 | 29.56 | 27.12 | |
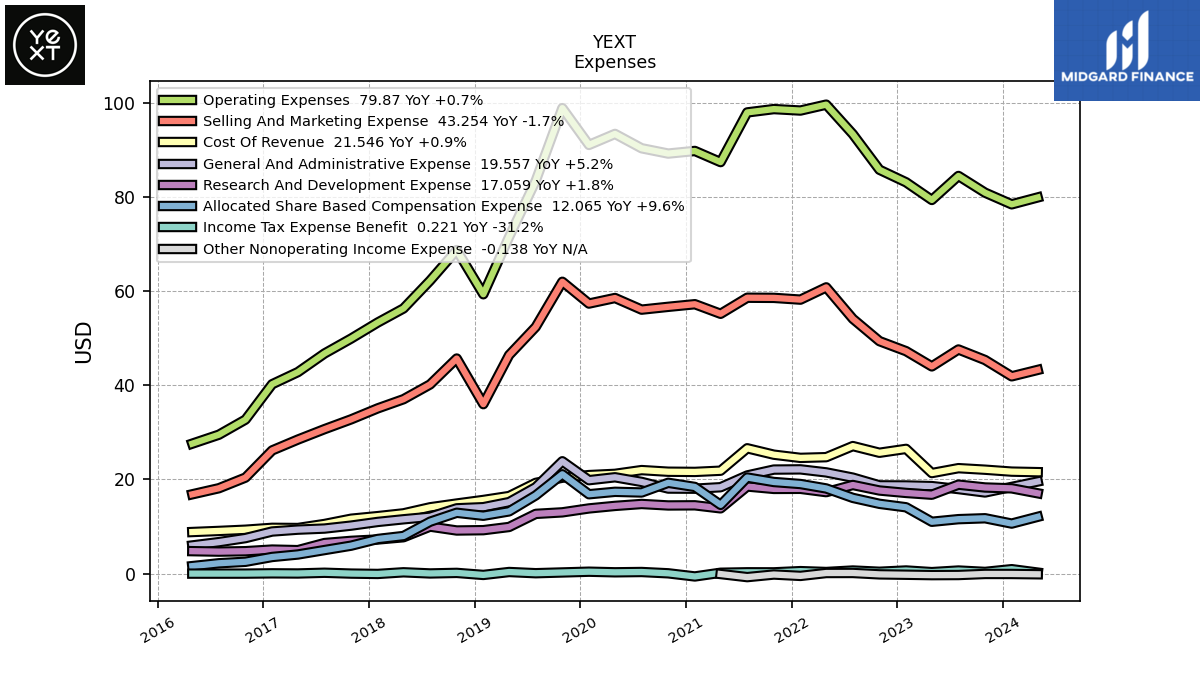
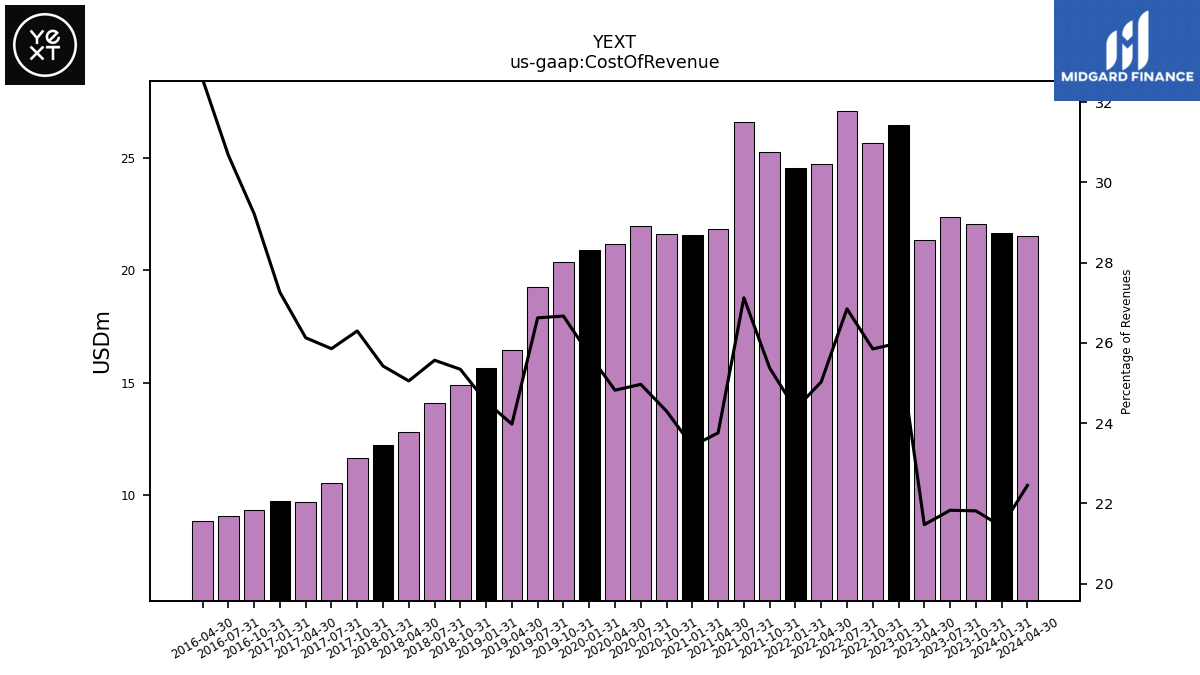
| Cost Of Revenue | 22.07 | 22.39 | 21.35 | 26.49 | 25.66 | 27.08 | 24.73 | 24.57 | 25.25 | 26.61 | 21.85 | 21.60 | 21.64 | 21.98 | 21.18 | 20.92 | 20.37 | 19.27 | 16.47 | 15.64 | 14.89 | 14.09 | 12.80 | 12.21 | 11.66 | 10.54 | 9.69 | 9.72 | 9.32 | 9.07 | 8.84 | |
| Gross Profit | 79.10 | 80.20 | 78.10 | 75.41 | 73.62 | 73.79 | 74.07 | 76.36 | 74.27 | 71.51 | 70.14 | 70.60 | 67.42 | 66.07 | 64.17 | 60.46 | 56.00 | 53.10 | 52.23 | 48.12 | 43.86 | 41.01 | 38.30 | 35.81 | 32.67 | 30.23 | 27.39 | 25.95 | 22.59 | 20.49 | 18.29 | |
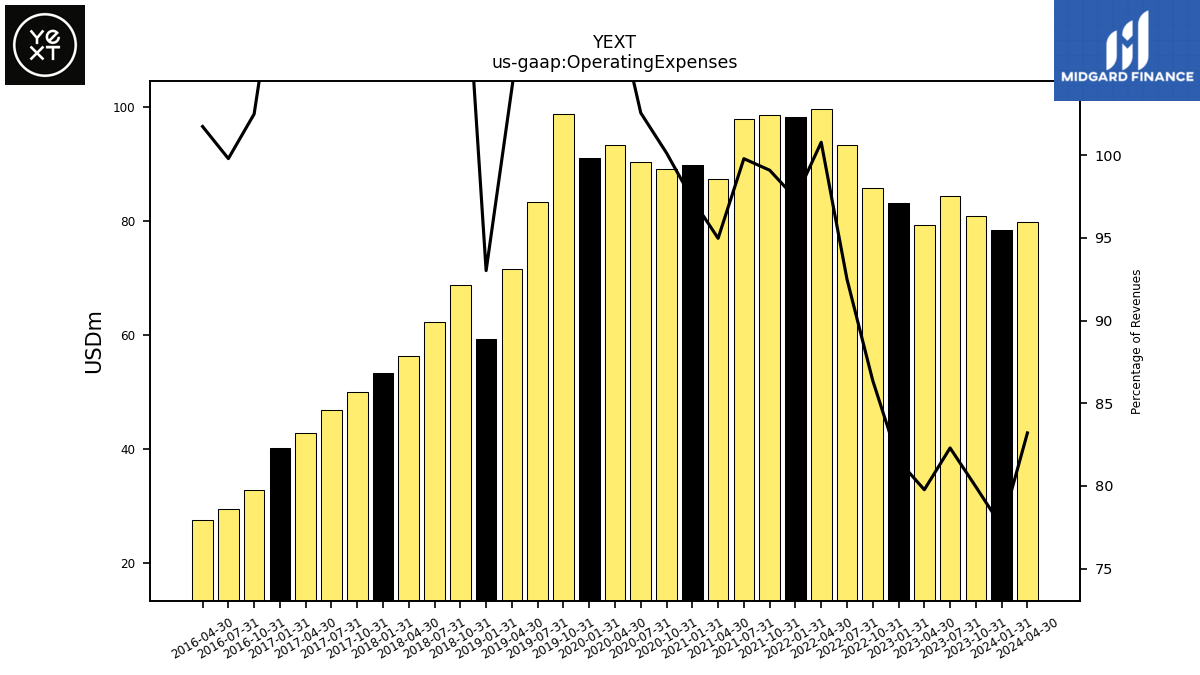
| Operating Expenses | 80.88 | 84.44 | 79.33 | 83.08 | 85.75 | 93.31 | 99.58 | 98.32 | 98.63 | 97.92 | 87.37 | 89.74 | 89.18 | 90.31 | 93.36 | 91.02 | 98.84 | 83.40 | 71.50 | 59.31 | 68.69 | 62.21 | 56.30 | 53.31 | 49.91 | 46.73 | 42.79 | 40.21 | 32.70 | 29.50 | 27.60 | |
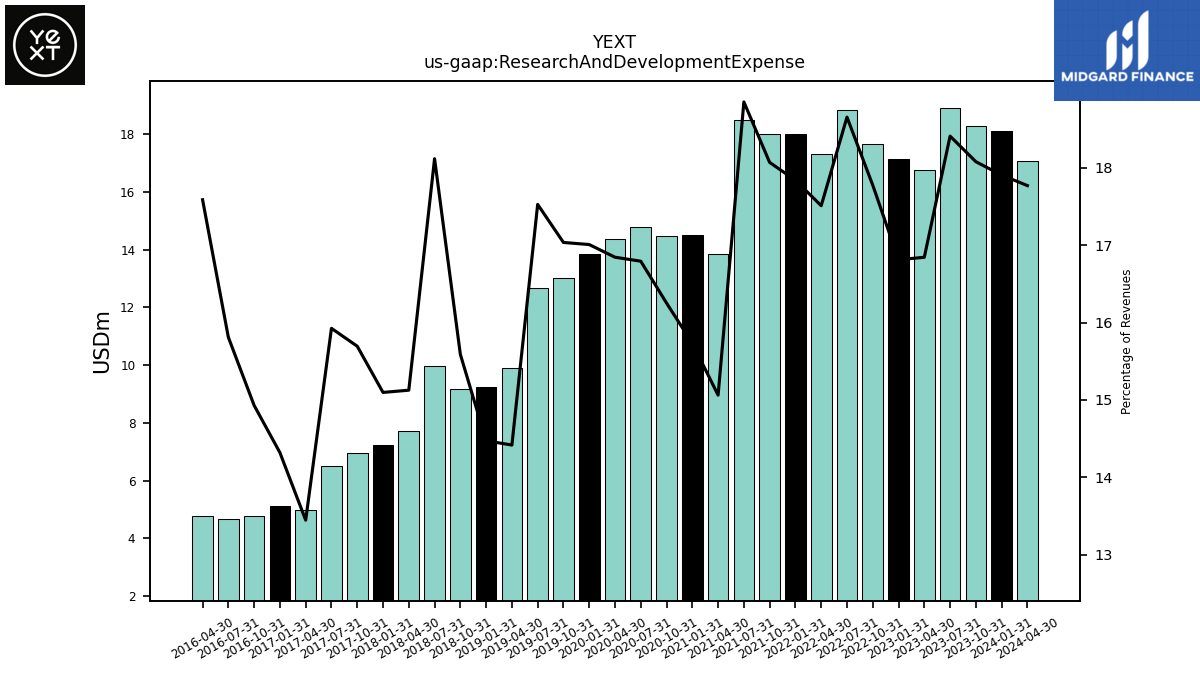
| Research And Development Expense | 18.29 | 18.89 | 16.75 | 17.13 | 17.65 | 18.82 | 17.30 | 18.01 | 17.99 | 18.50 | 13.86 | 14.51 | 14.47 | 14.79 | 14.38 | 13.84 | 13.01 | 12.69 | 9.91 | 9.23 | 9.16 | 9.98 | 7.73 | 7.25 | 6.96 | 6.49 | 4.99 | 5.11 | 4.76 | 4.67 | 4.77 | |
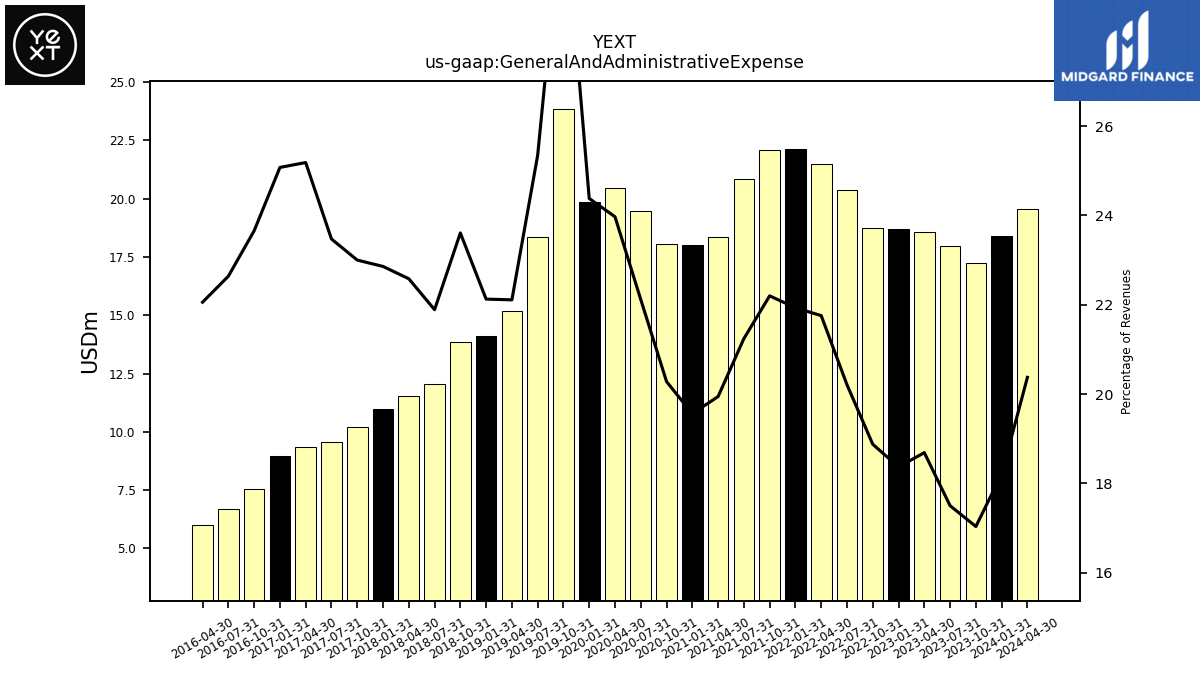
| General And Administrative Expense | 17.23 | 17.95 | 18.59 | 18.72 | 18.74 | 20.38 | 21.50 | 22.14 | 22.09 | 20.84 | 18.35 | 18.03 | 18.06 | 19.47 | 20.46 | 19.84 | 23.86 | 18.34 | 15.19 | 14.11 | 13.87 | 12.06 | 11.54 | 10.98 | 10.20 | 9.57 | 9.34 | 8.94 | 7.55 | 6.69 | 5.98 | |
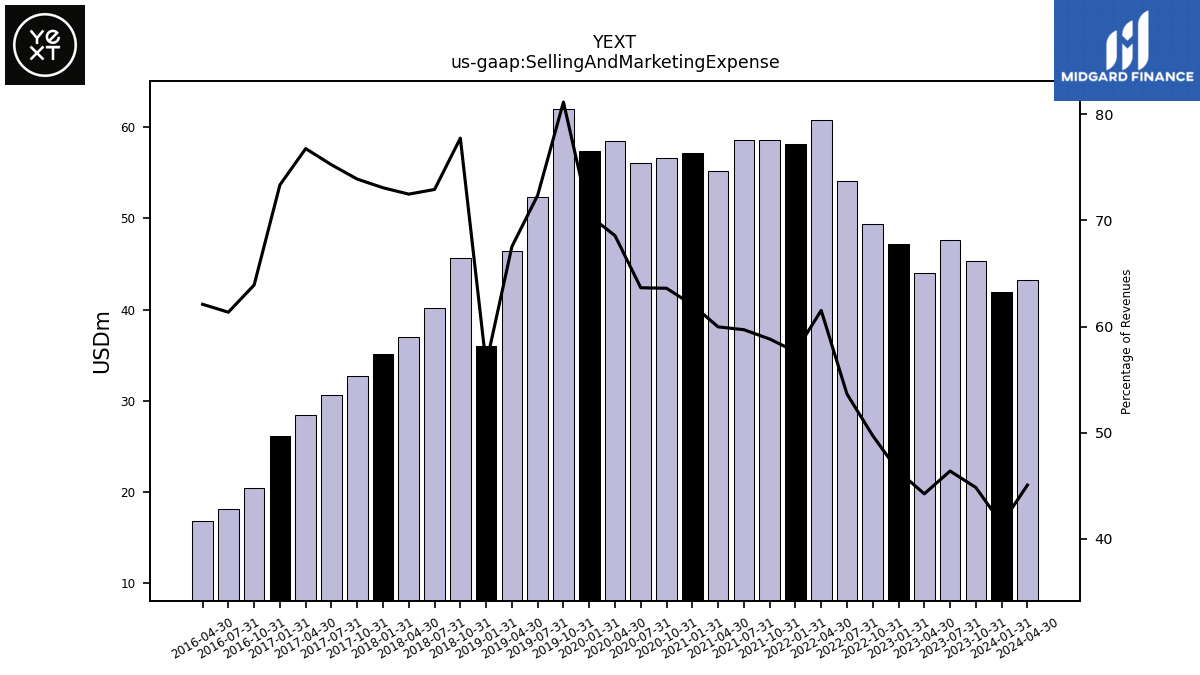
| Selling And Marketing Expense | 45.35 | 47.59 | 44.00 | 47.23 | 49.36 | 54.10 | 60.78 | 58.17 | 58.55 | 58.58 | 55.17 | 57.20 | 56.65 | 56.05 | 58.52 | 57.34 | 61.97 | 52.37 | 46.40 | 35.98 | 45.67 | 40.17 | 37.03 | 35.09 | 32.76 | 30.67 | 28.46 | 26.16 | 20.39 | 18.13 | 16.84 | |
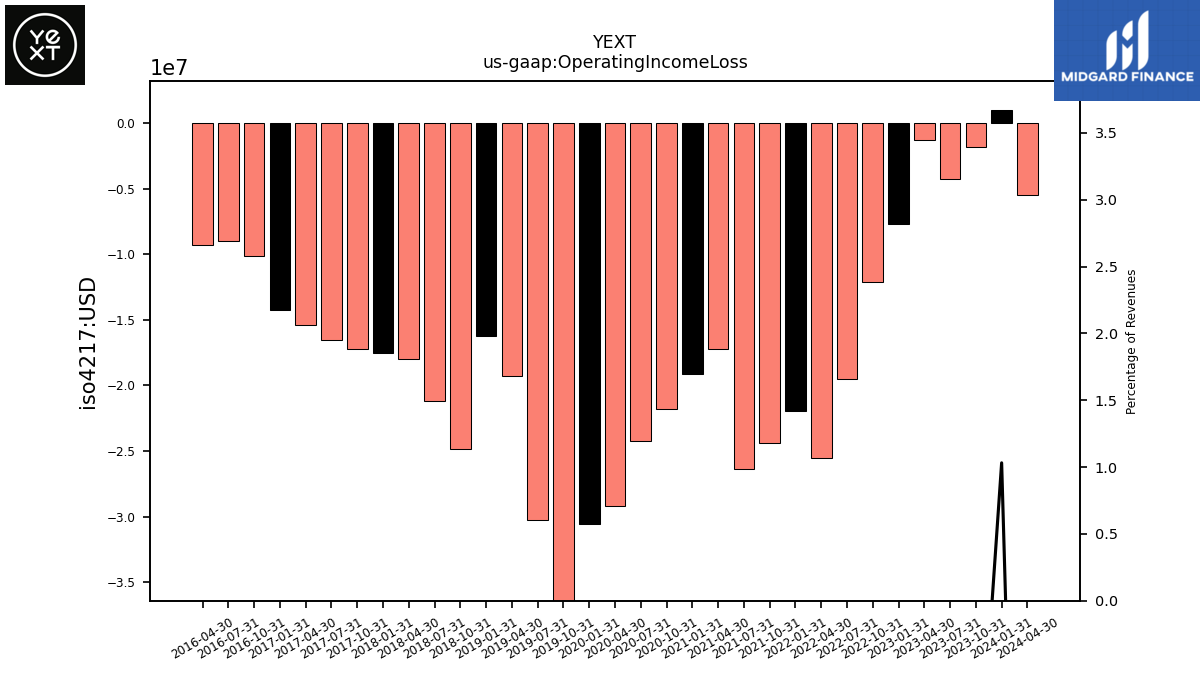
| Operating Income Loss | -1.78 | -4.23 | -1.23 | -7.67 | -12.13 | -19.52 | -25.50 | -21.96 | -24.35 | -26.41 | -17.23 | -19.14 | -21.76 | -24.24 | -29.19 | -30.56 | -42.83 | -30.30 | -19.26 | -16.22 | -24.84 | -21.20 | -18.00 | -17.50 | -17.24 | -16.51 | -15.39 | -14.27 | -10.12 | -9.01 | -9.31 | |
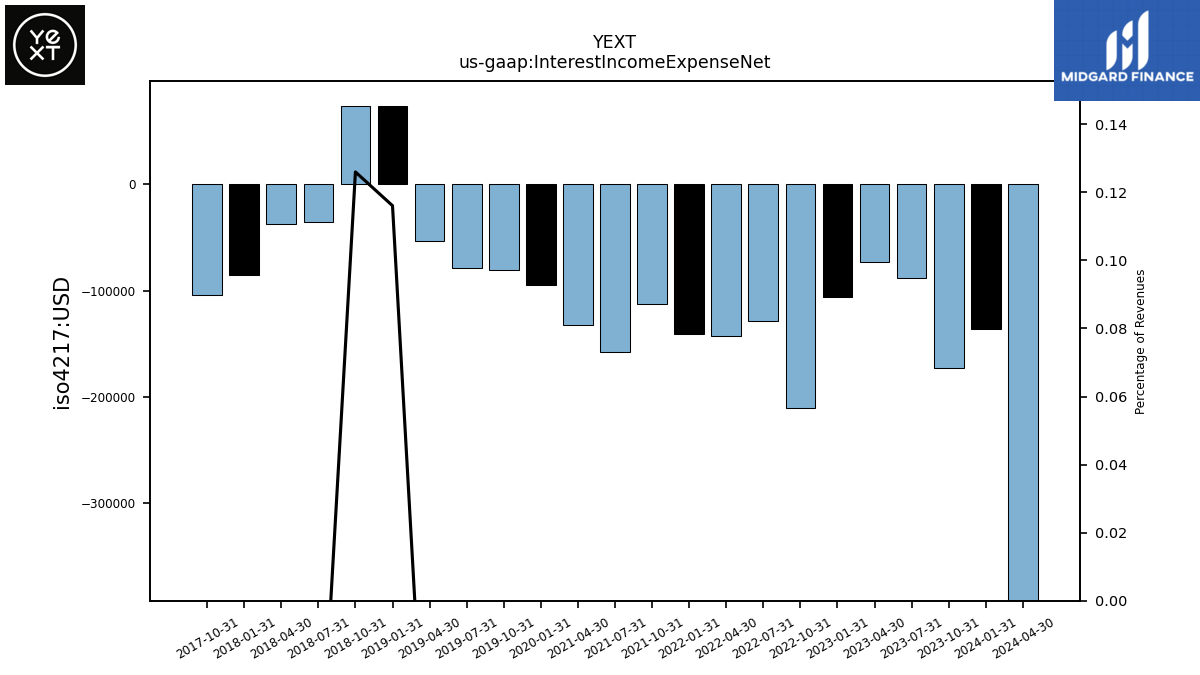
| Interest Income Expense Net | -0.17 | -0.09 | -0.07 | -0.11 | -0.21 | -0.13 | -0.14 | -0.14 | -0.11 | -0.16 | -0.13 | NA | NA | NA | NA | -0.10 | -0.08 | -0.08 | -0.05 | 0.07 | 0.07 | -0.04 | -0.04 | -0.09 | -0.10 | NA | NA | NA | NA | NA | NA | |
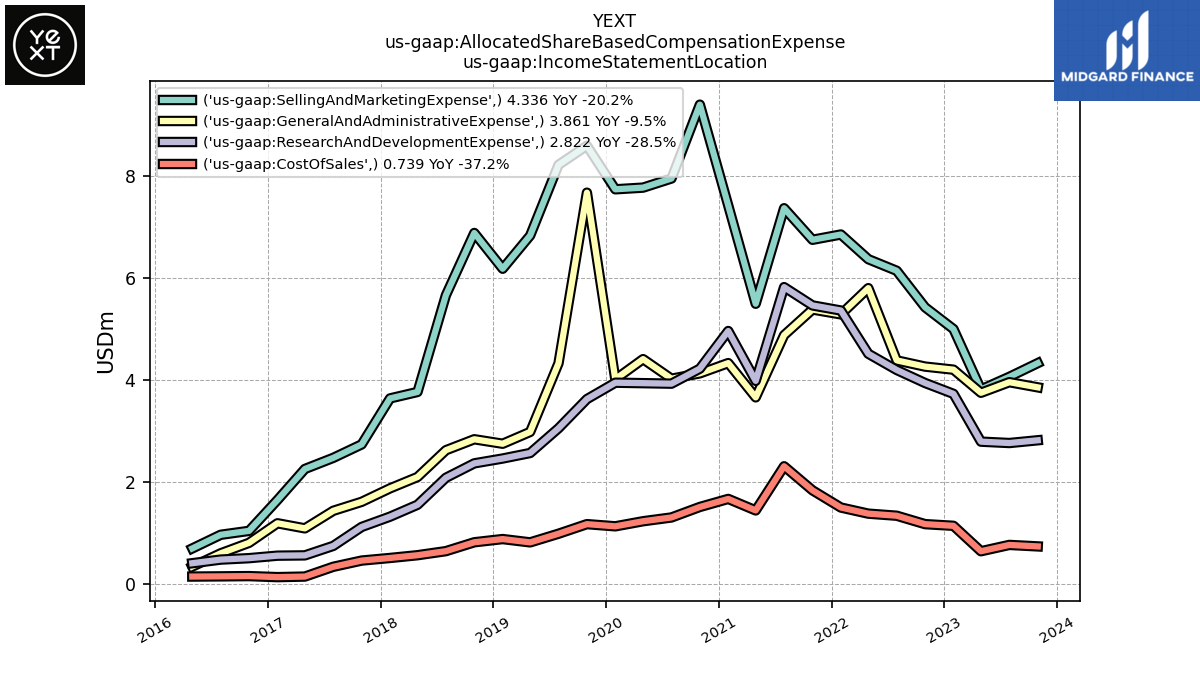
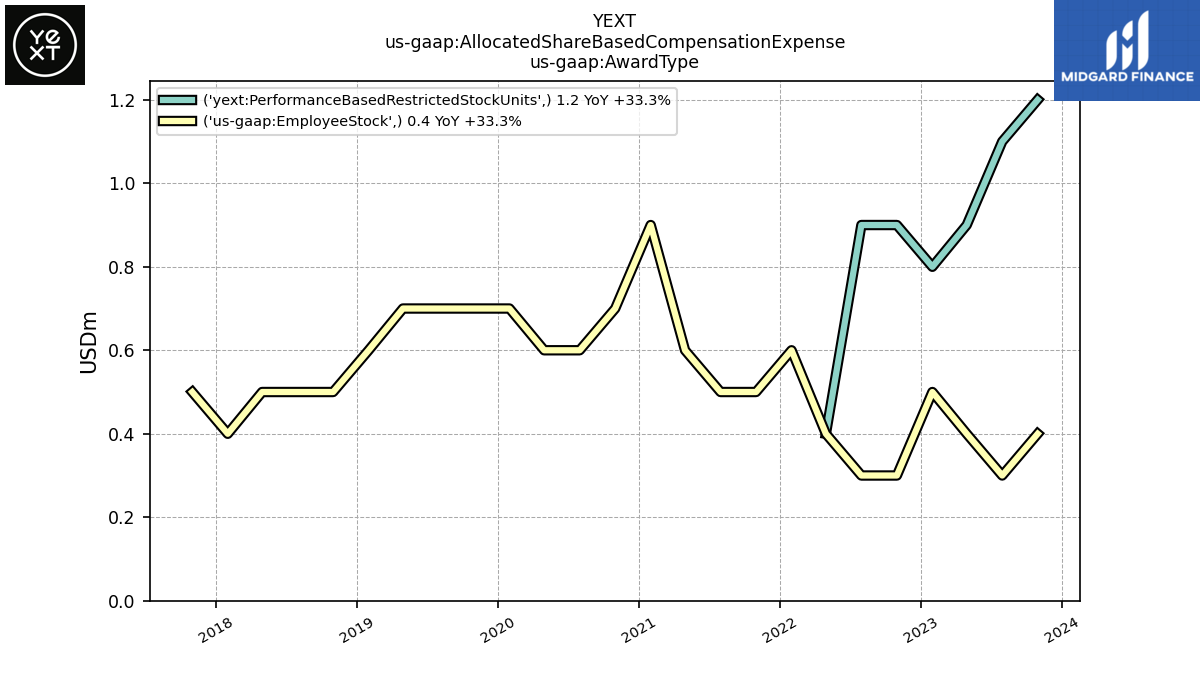
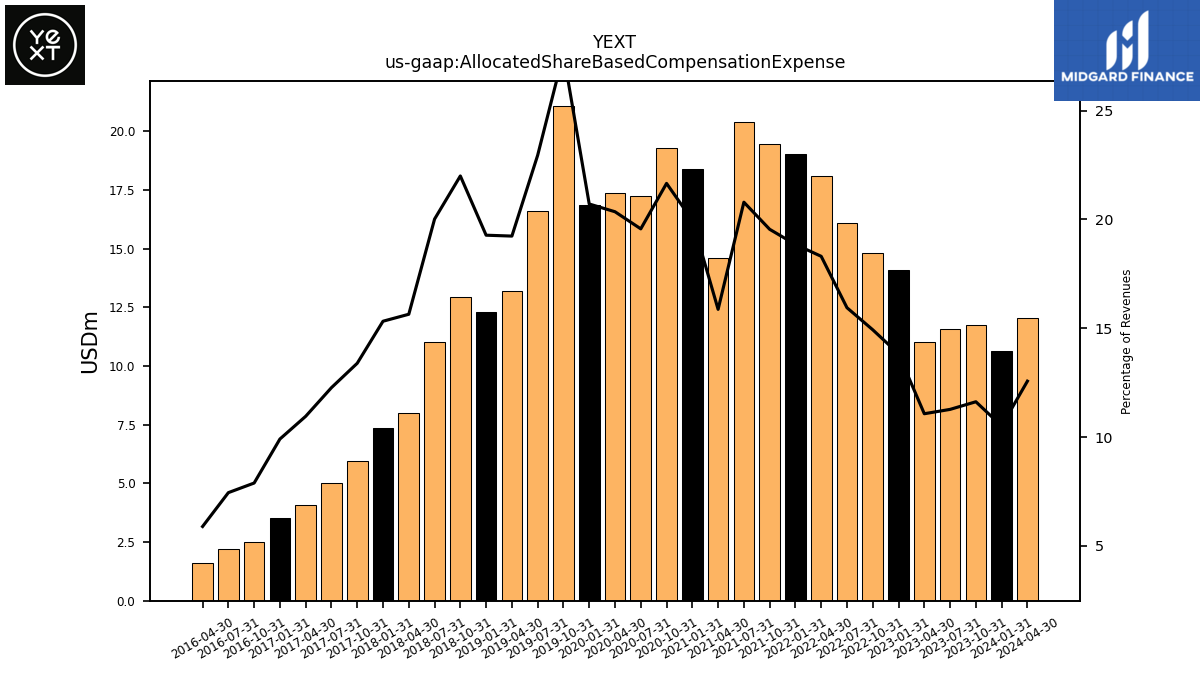
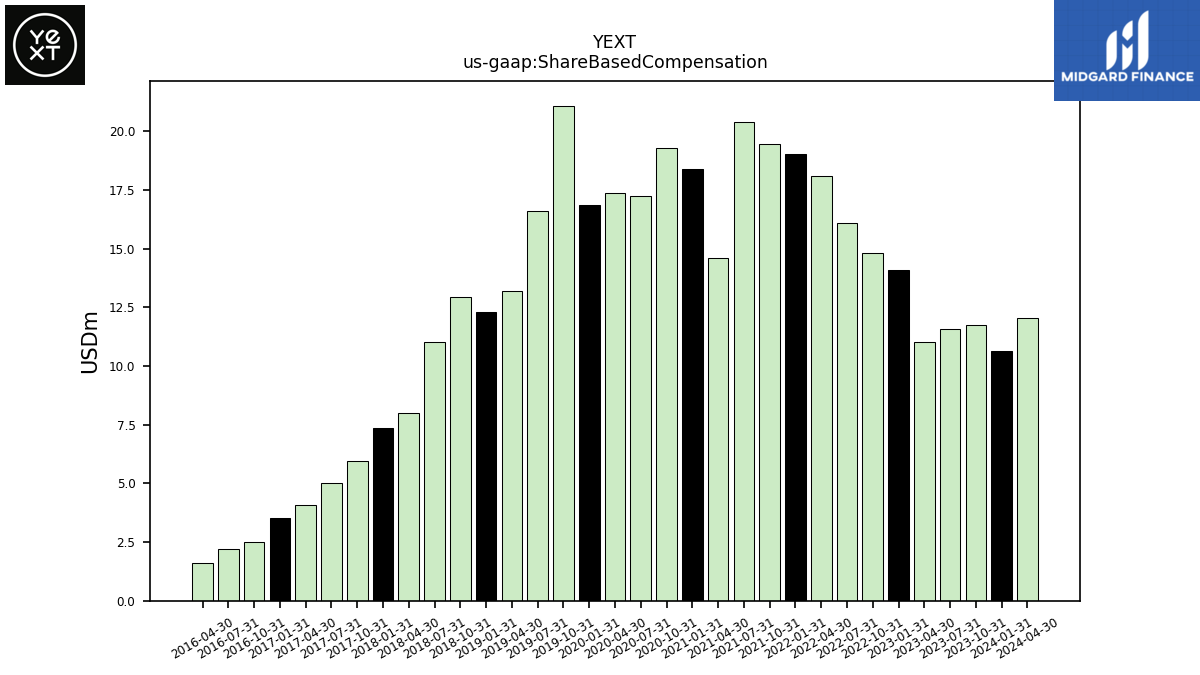
| Allocated Share Based Compensation Expense | 11.76 | 11.56 | 11.01 | 14.09 | 14.82 | 16.08 | 18.09 | 19.02 | 19.45 | 20.40 | 14.60 | 18.41 | 19.29 | 17.23 | 17.37 | 16.85 | 21.09 | 16.61 | 13.22 | 12.29 | 12.92 | 11.03 | 7.99 | 7.36 | 5.94 | 5.00 | 4.06 | 3.54 | 2.52 | 2.20 | 1.60 | |
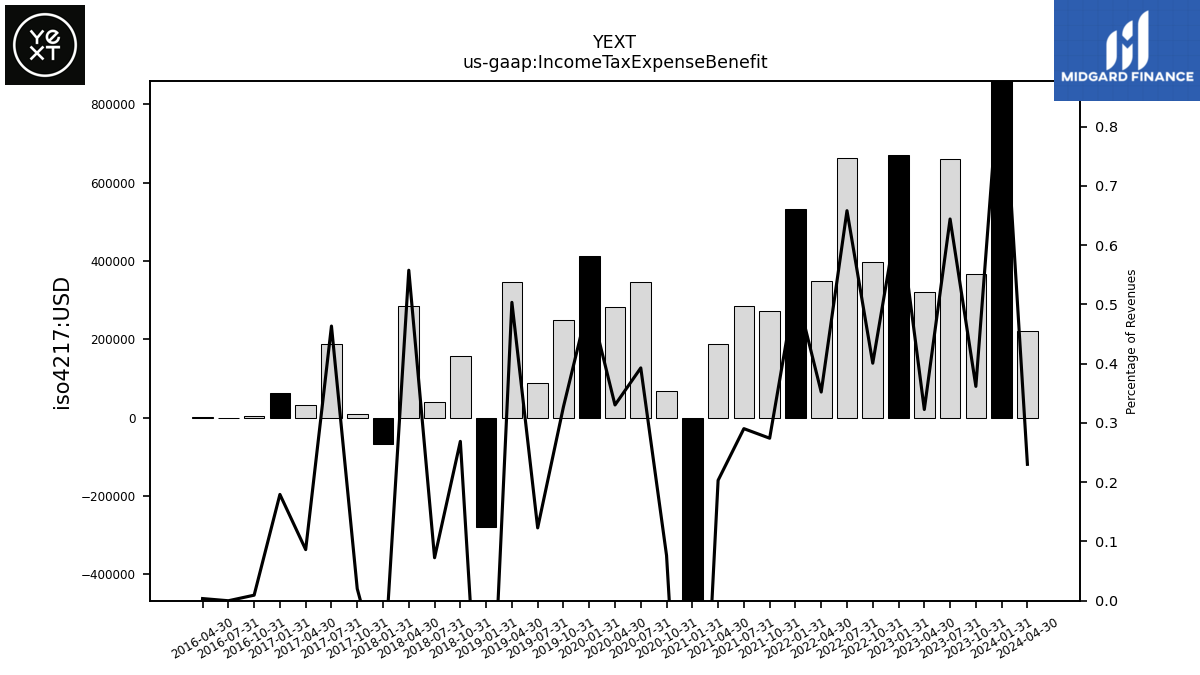
| Income Tax Expense Benefit | 0.37 | 0.66 | 0.32 | 0.67 | 0.40 | 0.66 | 0.35 | 0.53 | 0.27 | 0.28 | 0.19 | -0.60 | 0.07 | 0.35 | 0.28 | 0.41 | 0.25 | 0.09 | 0.35 | -0.28 | 0.16 | 0.04 | 0.28 | -0.07 | 0.01 | 0.19 | 0.03 | 0.06 | 0.00 | 0.00 | 0.00 | |
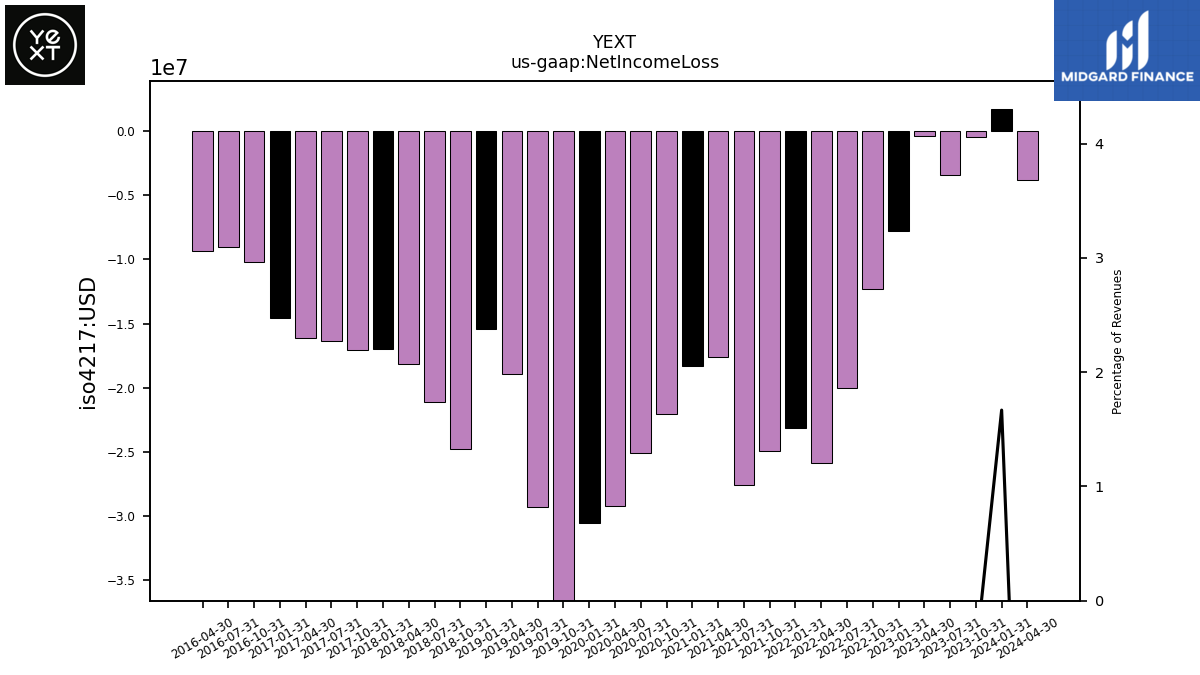
| Net Income Loss | -0.47 | -3.44 | -0.41 | -7.80 | -12.31 | -19.99 | -25.84 | -23.11 | -24.93 | -27.59 | -17.63 | -18.31 | -22.04 | -25.12 | -29.22 | -30.58 | -42.72 | -29.29 | -18.96 | -15.46 | -24.77 | -21.10 | -18.14 | -17.00 | -17.06 | -16.40 | -16.11 | -14.57 | -10.22 | -9.01 | -9.34 | |
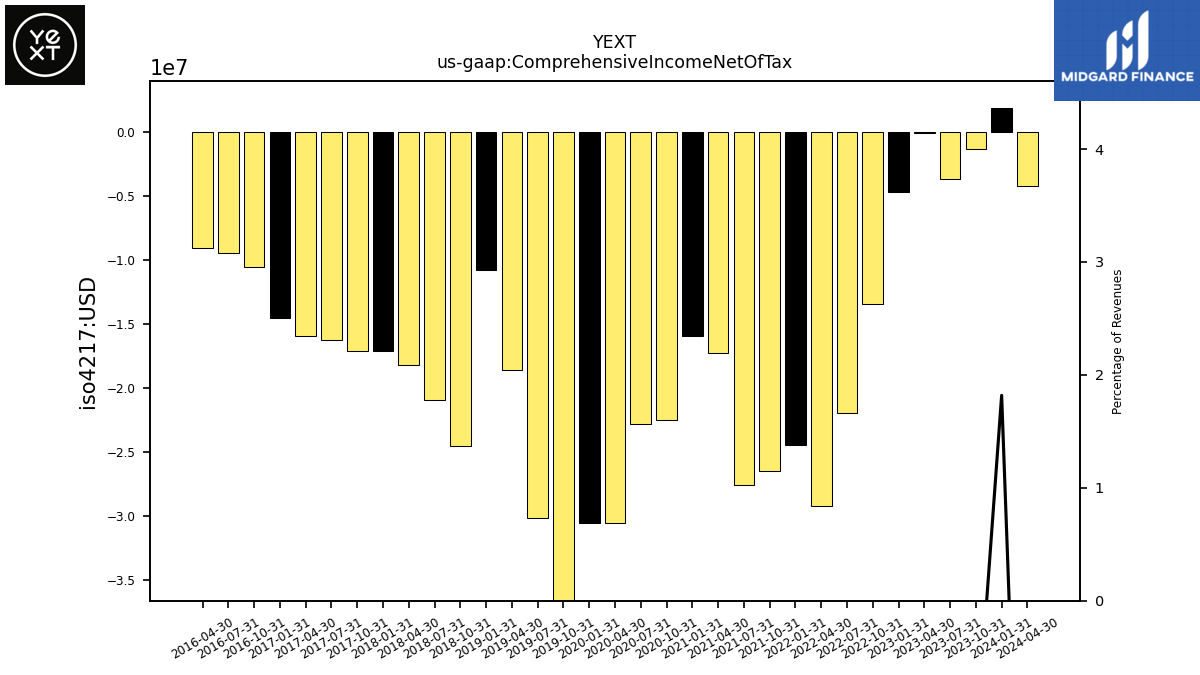
| Comprehensive Income Net Of Tax | -1.33 | -3.64 | -0.07 | -4.66 | -13.45 | -22.00 | -29.25 | -24.48 | -26.51 | -27.60 | -17.28 | -15.95 | -22.54 | -22.87 | -30.56 | -30.55 | -41.13 | -30.18 | -18.61 | -10.82 | -24.59 | -20.99 | -18.23 | -17.09 | -17.10 | -16.29 | -15.91 | -14.56 | -10.57 | -9.49 | -9.08 |
| 2023-10-31 | 2023-07-31 | 2023-04-30 | 2023-01-31 | 2022-10-31 | 2022-07-31 | 2022-04-30 | 2022-01-31 | 2021-10-31 | 2021-07-31 | 2021-04-30 | 2021-01-31 | 2020-10-31 | 2020-07-31 | 2020-04-30 | 2020-01-31 | 2019-10-31 | 2019-07-31 | 2019-04-30 | 2019-01-31 | 2018-10-31 | 2018-07-31 | 2018-04-30 | 2018-01-31 | 2017-10-31 | 2017-07-31 | 2017-04-30 | 2017-01-31 | 2016-10-31 | 2016-07-31 | 2016-04-30 | ||
|---|---|---|---|---|---|---|---|---|---|---|---|---|---|---|---|---|---|---|---|---|---|---|---|---|---|---|---|---|---|---|---|---|
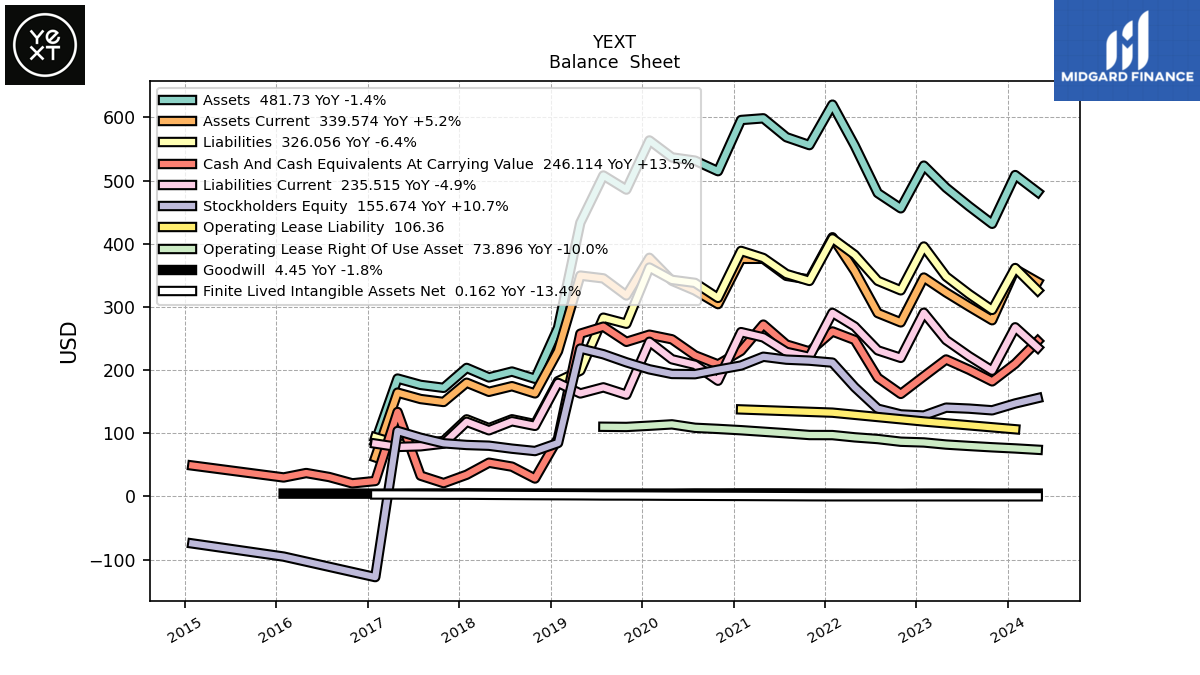
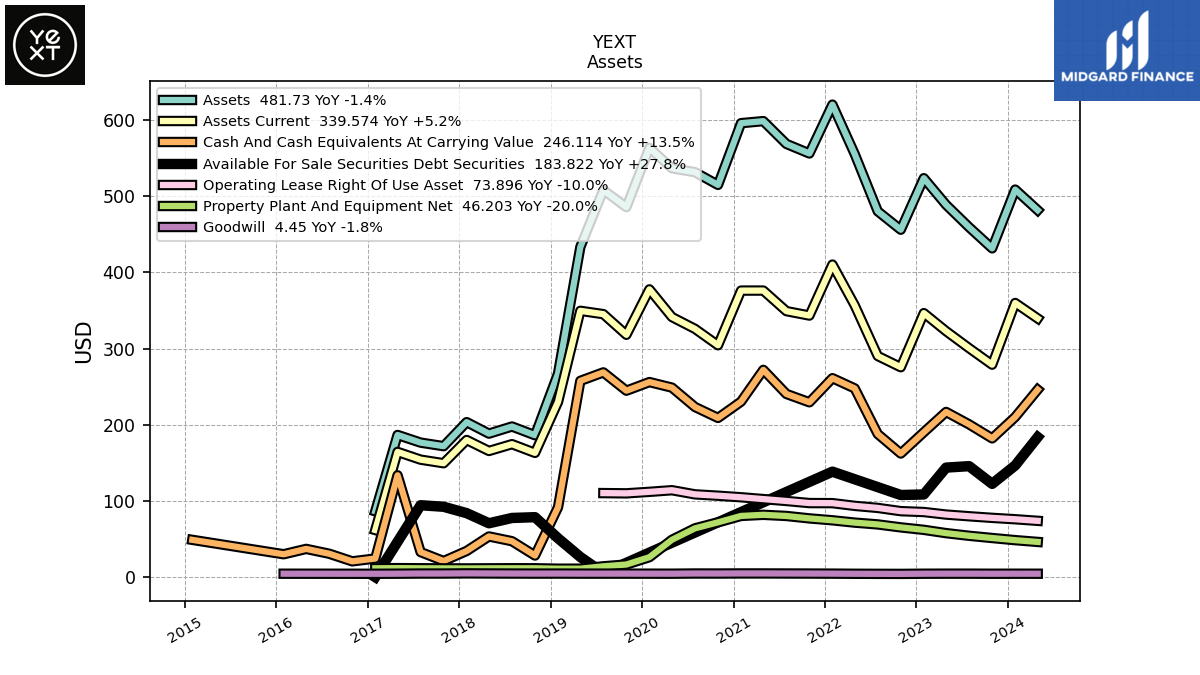
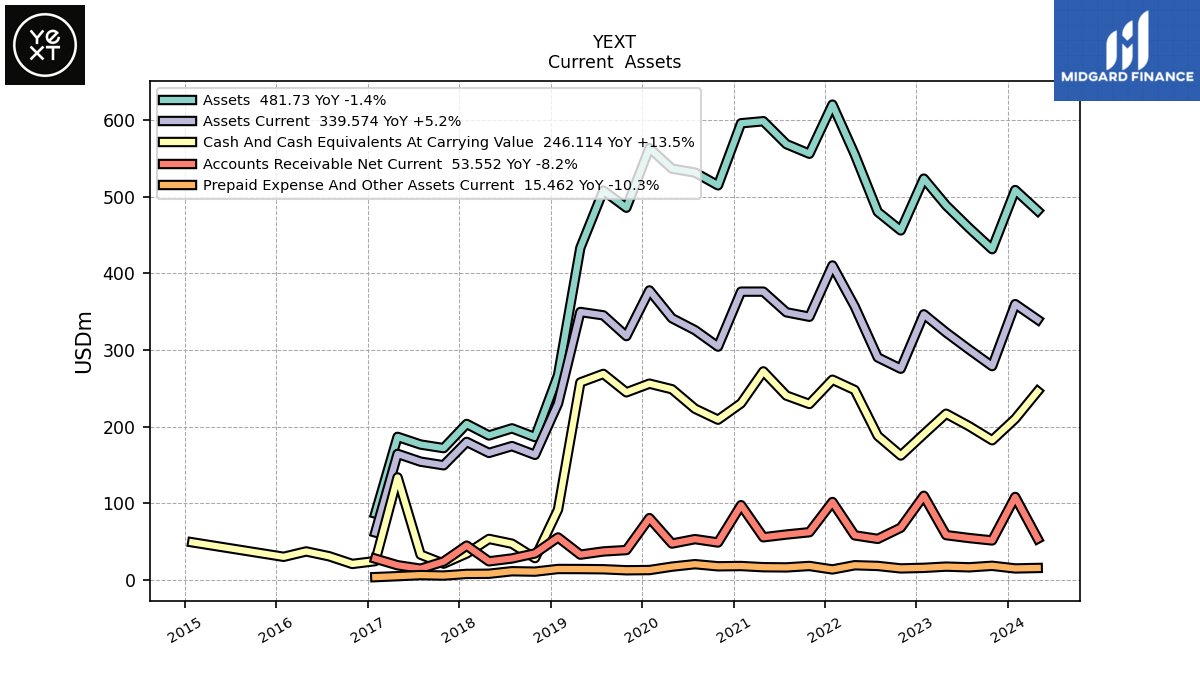
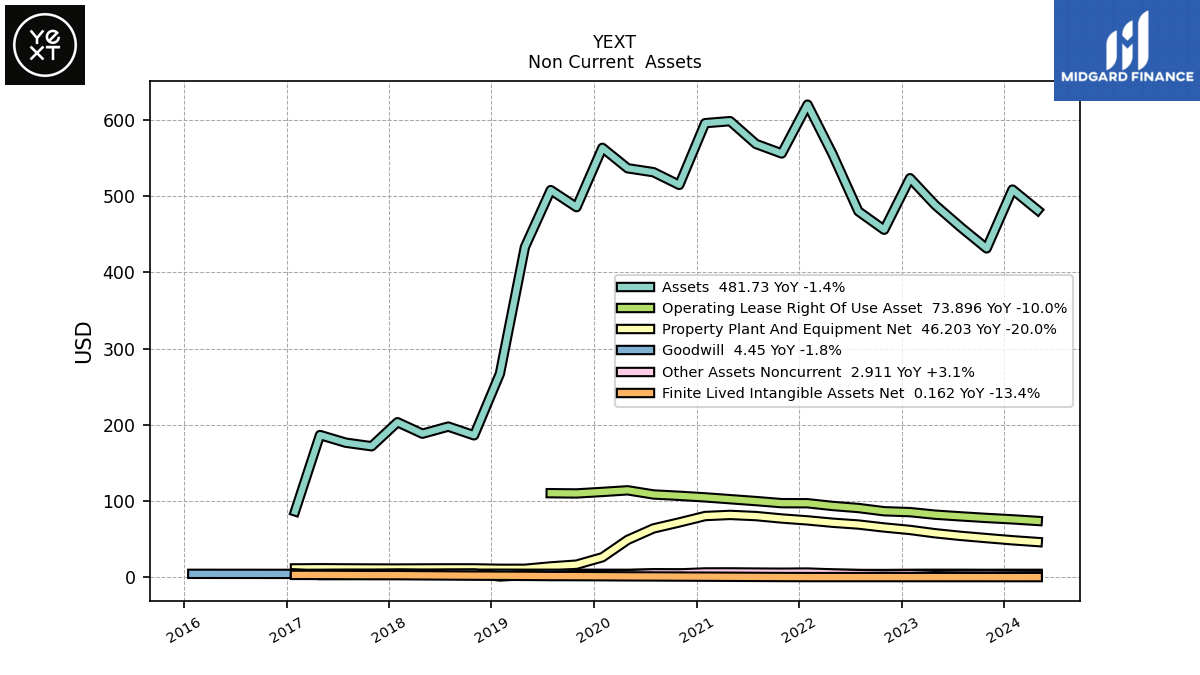
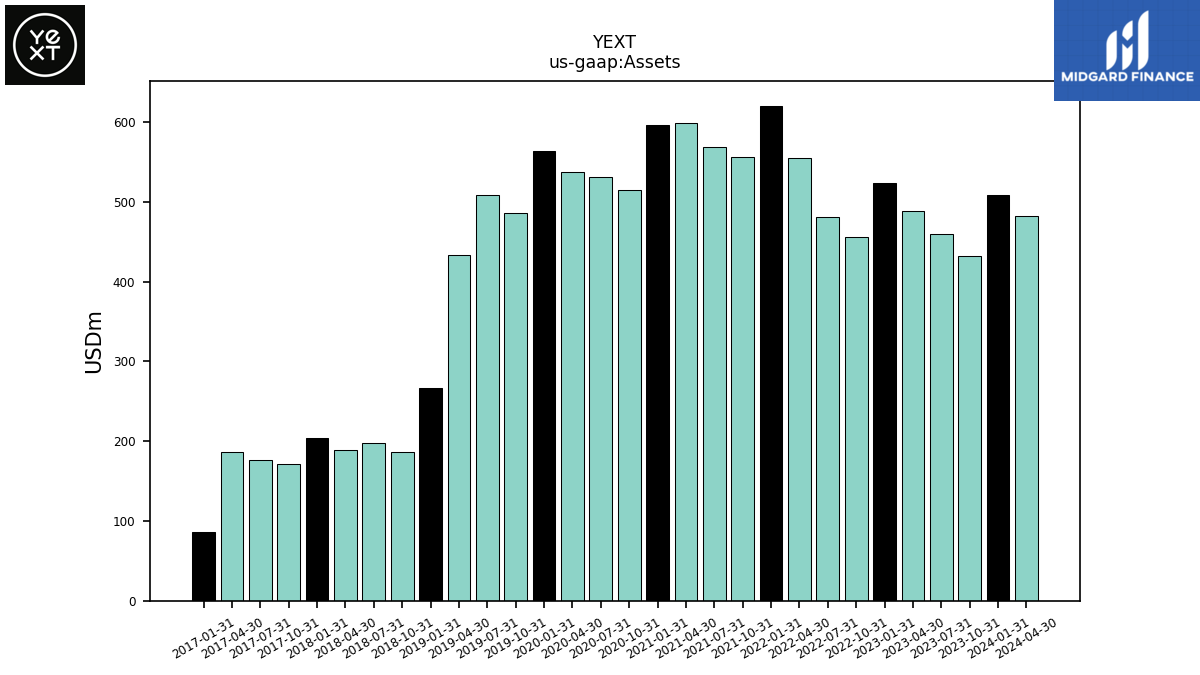
| Assets | 431.64 | 459.35 | 488.79 | 523.76 | 456.11 | 480.32 | 555.43 | 620.34 | 556.21 | 568.74 | 598.67 | 595.99 | 514.94 | 531.66 | 536.79 | 563.62 | 485.76 | 508.15 | 433.30 | 267.13 | 186.26 | 197.73 | 188.41 | 203.49 | 171.92 | 176.59 | 186.65 | 86.47 | NA | NA | NA | |
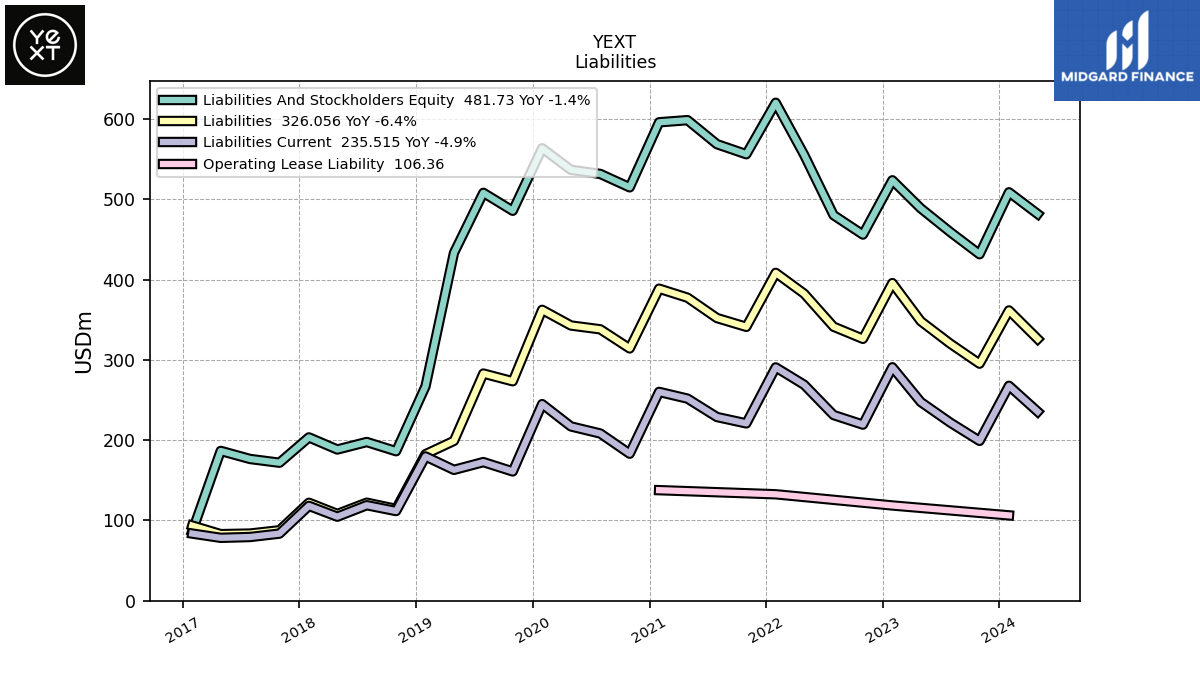
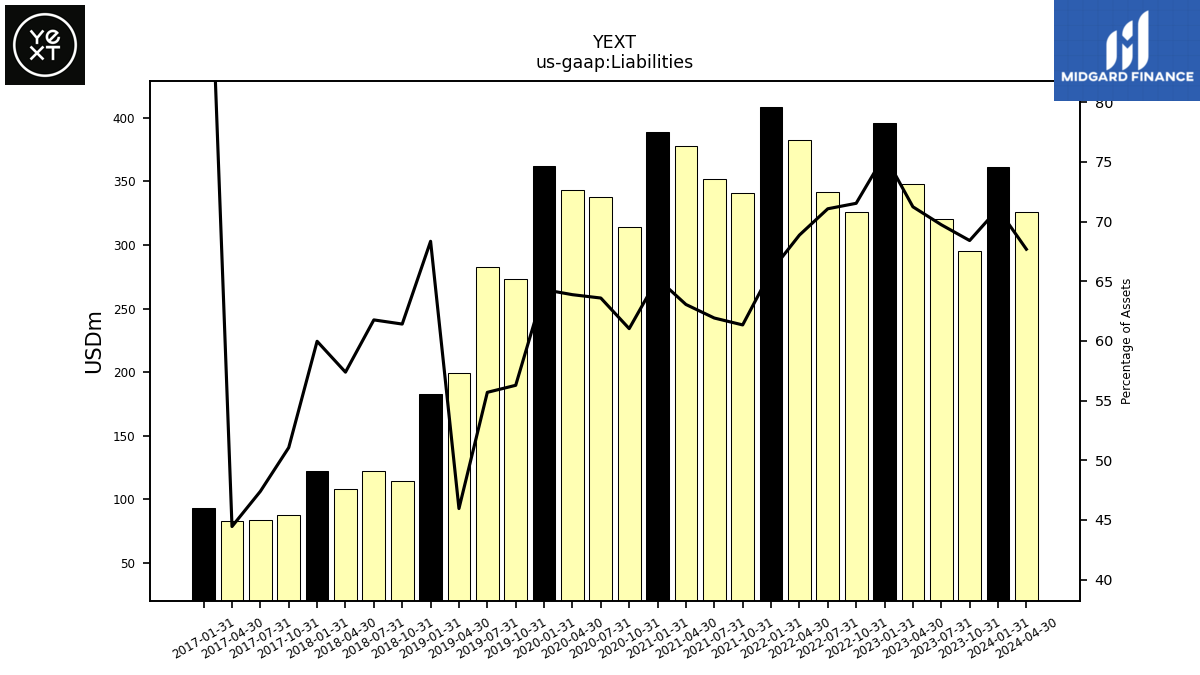
| Liabilities | 295.29 | 320.33 | 348.20 | 395.74 | 326.25 | 341.38 | 382.51 | 408.46 | 341.19 | 352.17 | 377.50 | 388.75 | 314.28 | 338.11 | 342.88 | 362.41 | 273.41 | 283.01 | 199.14 | 182.58 | 114.39 | 122.13 | 108.12 | 122.04 | 87.79 | 83.70 | 82.97 | 93.61 | NA | NA | NA | |
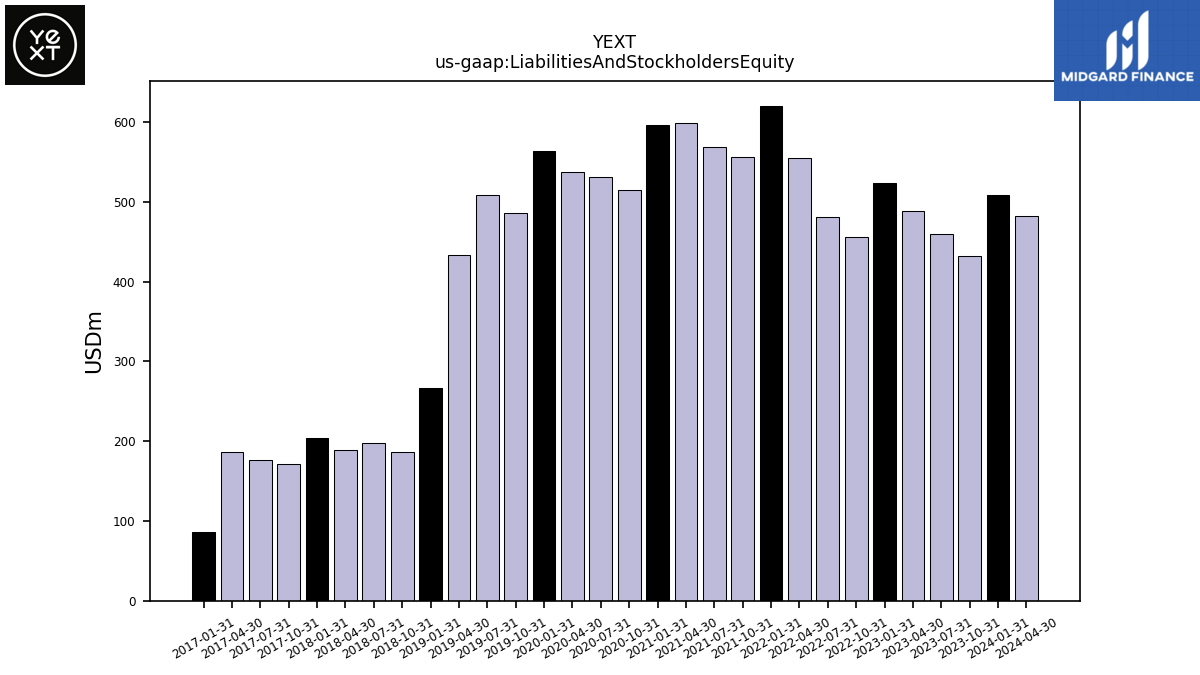
| Liabilities And Stockholders Equity | 431.64 | 459.35 | 488.79 | 523.76 | 456.11 | 480.32 | 555.43 | 620.34 | 556.21 | 568.74 | 598.67 | 595.99 | 514.94 | 531.66 | 536.79 | 563.62 | 485.76 | 508.15 | 433.30 | 267.13 | 186.26 | 197.73 | 188.41 | 203.49 | 171.92 | 176.59 | 186.65 | 86.47 | NA | NA | NA | |
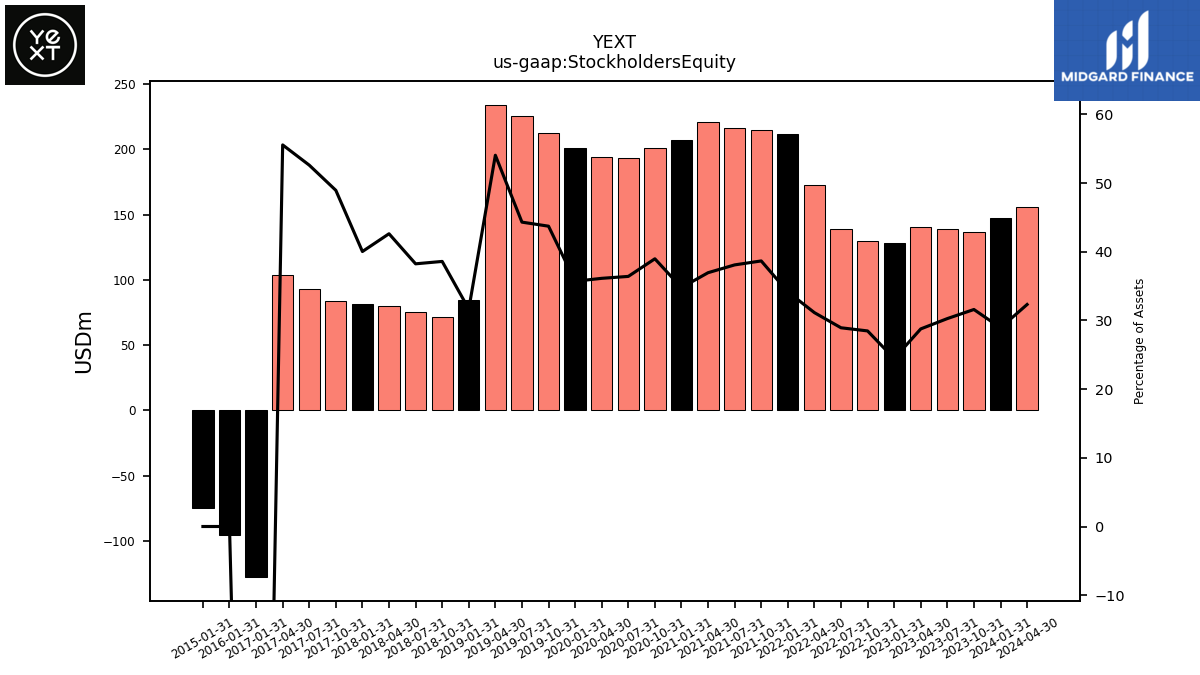
| Stockholders Equity | 136.35 | 139.02 | 140.59 | 128.02 | 129.85 | 138.95 | 172.92 | 211.87 | 215.01 | 216.58 | 221.18 | 207.24 | 200.66 | 193.55 | 193.91 | 201.21 | 212.36 | 225.14 | 234.16 | 84.55 | 71.87 | 75.61 | 80.29 | 81.45 | 84.12 | 92.88 | 103.68 | -127.75 | NA | NA | NA |
| 2023-10-31 | 2023-07-31 | 2023-04-30 | 2023-01-31 | 2022-10-31 | 2022-07-31 | 2022-04-30 | 2022-01-31 | 2021-10-31 | 2021-07-31 | 2021-04-30 | 2021-01-31 | 2020-10-31 | 2020-07-31 | 2020-04-30 | 2020-01-31 | 2019-10-31 | 2019-07-31 | 2019-04-30 | 2019-01-31 | 2018-10-31 | 2018-07-31 | 2018-04-30 | 2018-01-31 | 2017-10-31 | 2017-07-31 | 2017-04-30 | 2017-01-31 | 2016-10-31 | 2016-07-31 | 2016-04-30 | ||
|---|---|---|---|---|---|---|---|---|---|---|---|---|---|---|---|---|---|---|---|---|---|---|---|---|---|---|---|---|---|---|---|---|
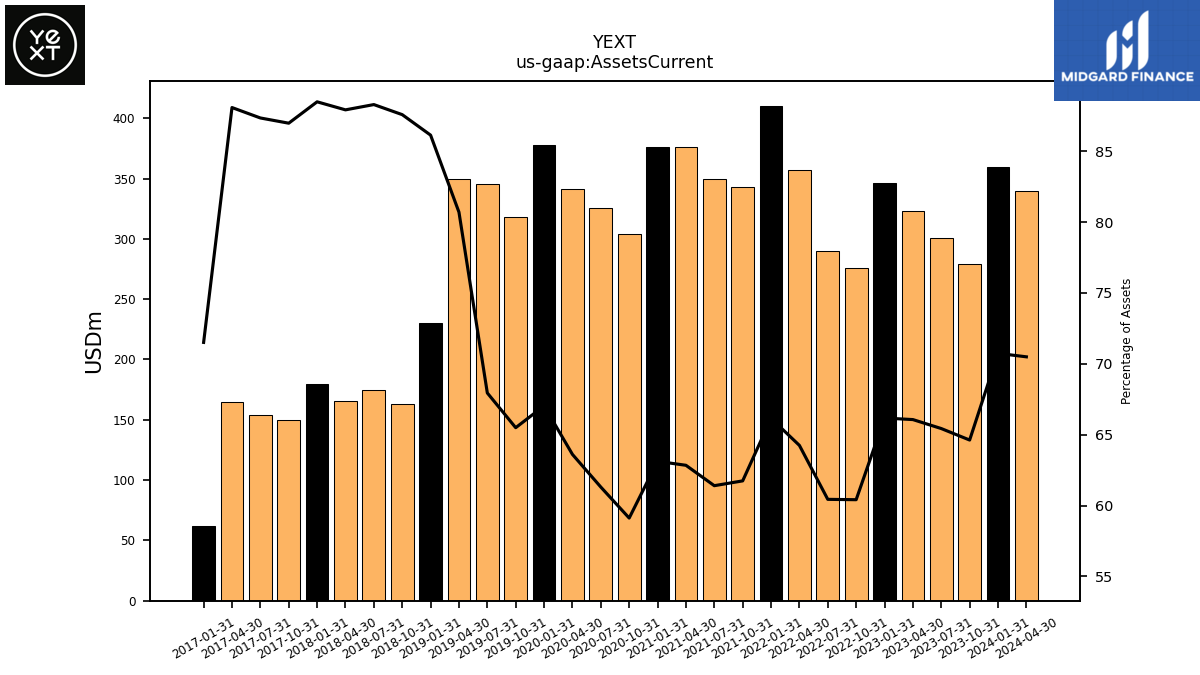
| Assets Current | 278.93 | 300.56 | 322.92 | 346.59 | 275.55 | 290.30 | 356.83 | 410.35 | 343.41 | 349.22 | 376.21 | 376.18 | 304.43 | 325.93 | 341.45 | 377.81 | 318.14 | 345.25 | 349.64 | 230.07 | 163.12 | 174.56 | 165.63 | 180.04 | 149.51 | 154.23 | 164.39 | 61.83 | NA | NA | NA | |
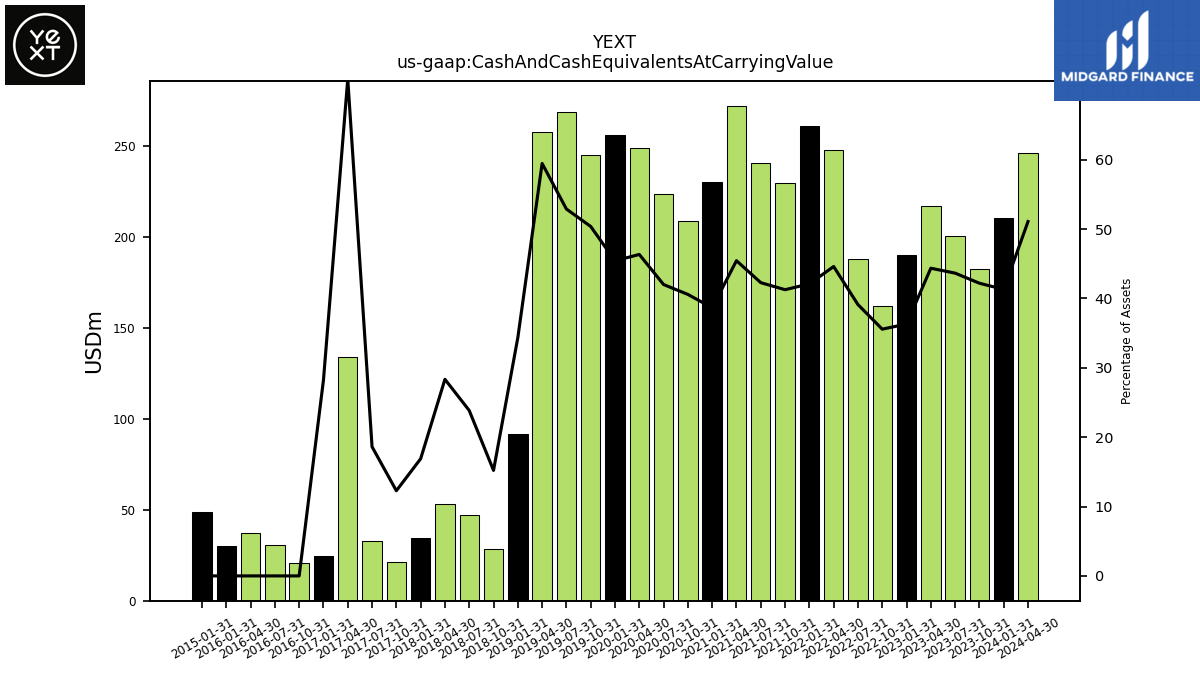
| Cash And Cash Equivalents At Carrying Value | 182.16 | 200.53 | 216.85 | 190.21 | 162.27 | 187.91 | 247.77 | 261.21 | 229.53 | 240.49 | 272.10 | 230.41 | 209.00 | 223.35 | 248.80 | 256.08 | 244.75 | 268.80 | 257.66 | 91.75 | 28.34 | 47.16 | 53.40 | 34.37 | 21.11 | 32.88 | 133.74 | 24.42 | 20.73 | 30.71 | 37.05 | |
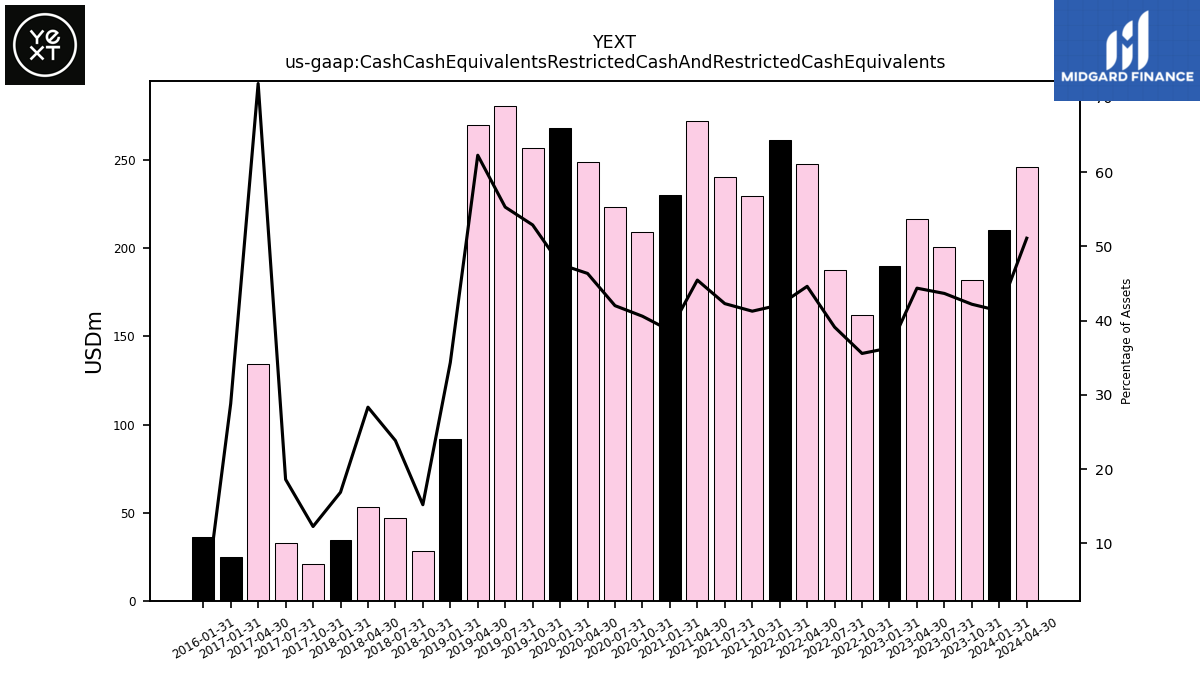
| Cash Cash Equivalents Restricted Cash And Restricted Cash Equivalents | 182.16 | 200.53 | 216.85 | 190.21 | 162.27 | 187.91 | 247.77 | 261.21 | 229.53 | 240.49 | 272.10 | 230.41 | 209.00 | 223.35 | 248.80 | 268.18 | 256.85 | 280.90 | 269.76 | 91.75 | 28.34 | 47.16 | 53.40 | 34.37 | 21.11 | 32.88 | 134.24 | 24.92 | NA | NA | NA | |
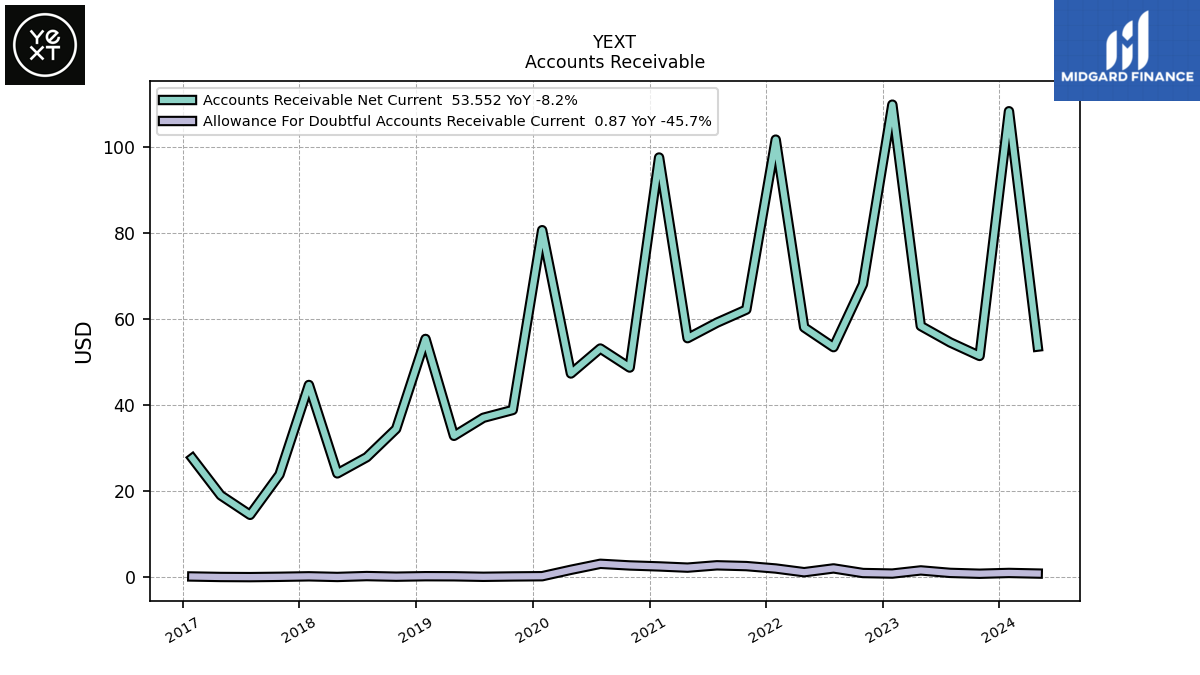
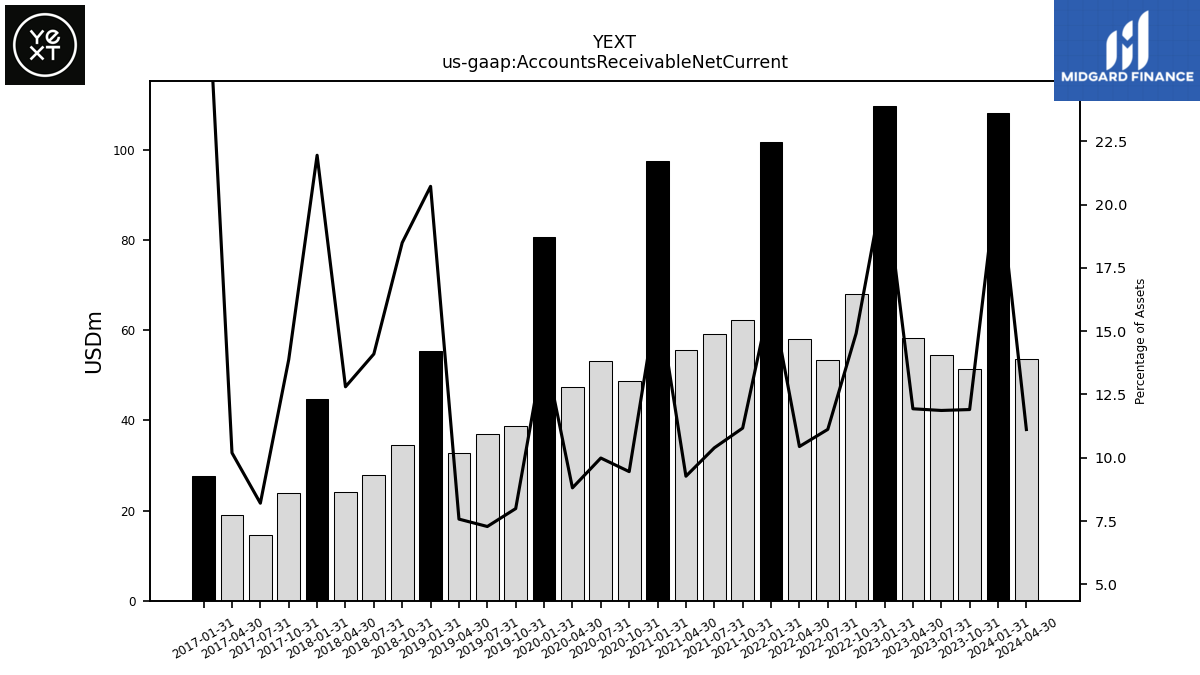
| Accounts Receivable Net Current | 51.39 | 54.52 | 58.34 | 109.73 | 68.03 | 53.42 | 58.01 | 101.61 | 62.14 | 59.11 | 55.51 | 97.45 | 48.69 | 53.12 | 47.31 | 80.58 | 38.84 | 37.03 | 32.84 | 55.34 | 34.45 | 27.88 | 24.12 | 44.66 | 23.86 | 14.49 | 19.03 | 27.65 | NA | NA | NA | |
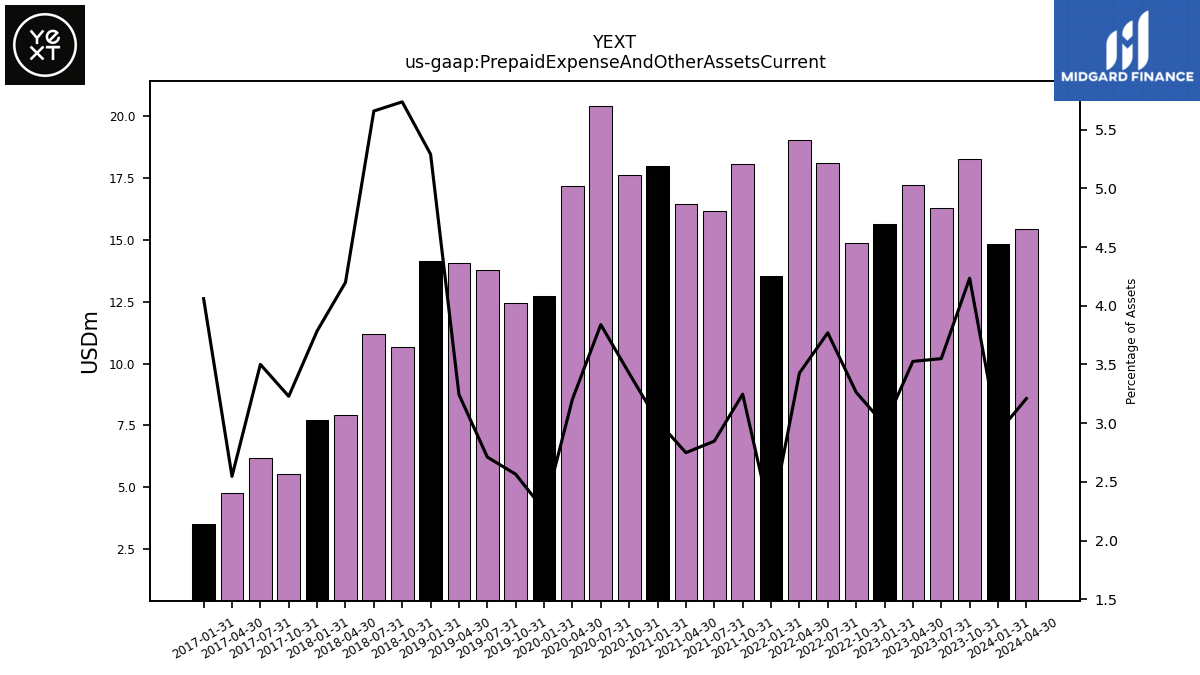
| Prepaid Expense And Other Assets Current | 18.28 | 16.31 | 17.24 | 15.63 | 14.89 | 18.11 | 19.04 | 13.54 | 18.06 | 16.19 | 16.45 | 17.99 | 17.63 | 20.41 | 17.20 | 12.73 | 12.46 | 13.78 | 14.06 | 14.13 | 10.69 | 11.19 | 7.91 | 7.70 | 5.55 | 6.18 | 4.75 | 3.51 | NA | NA | NA | |
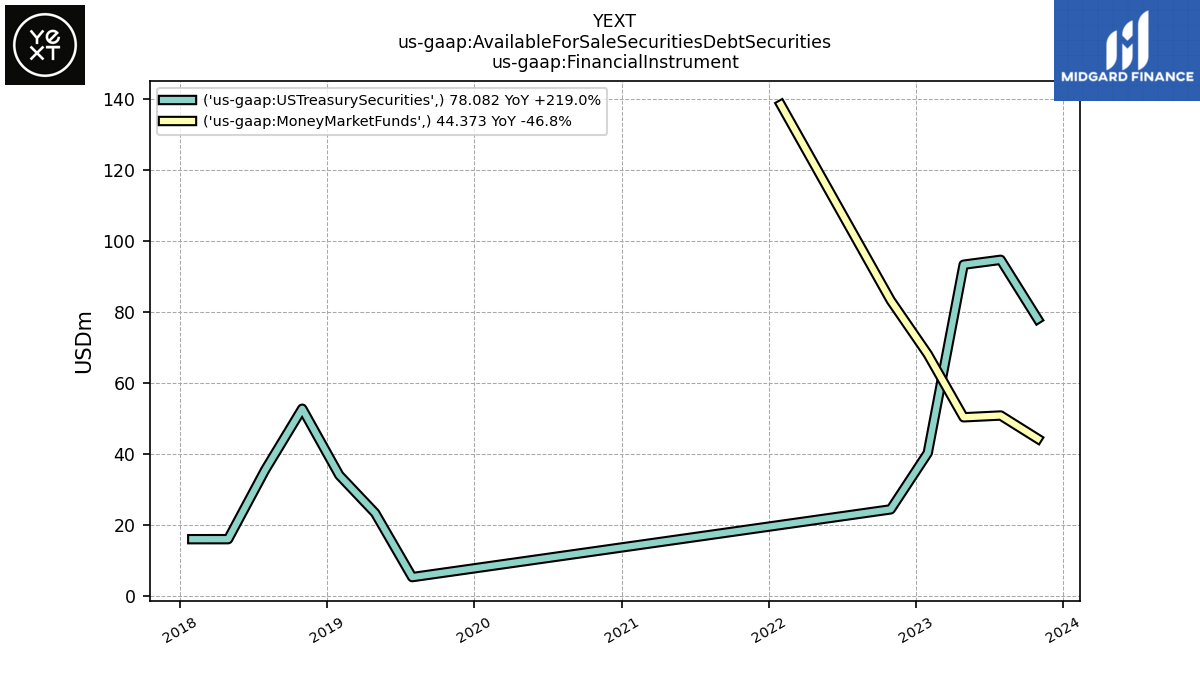
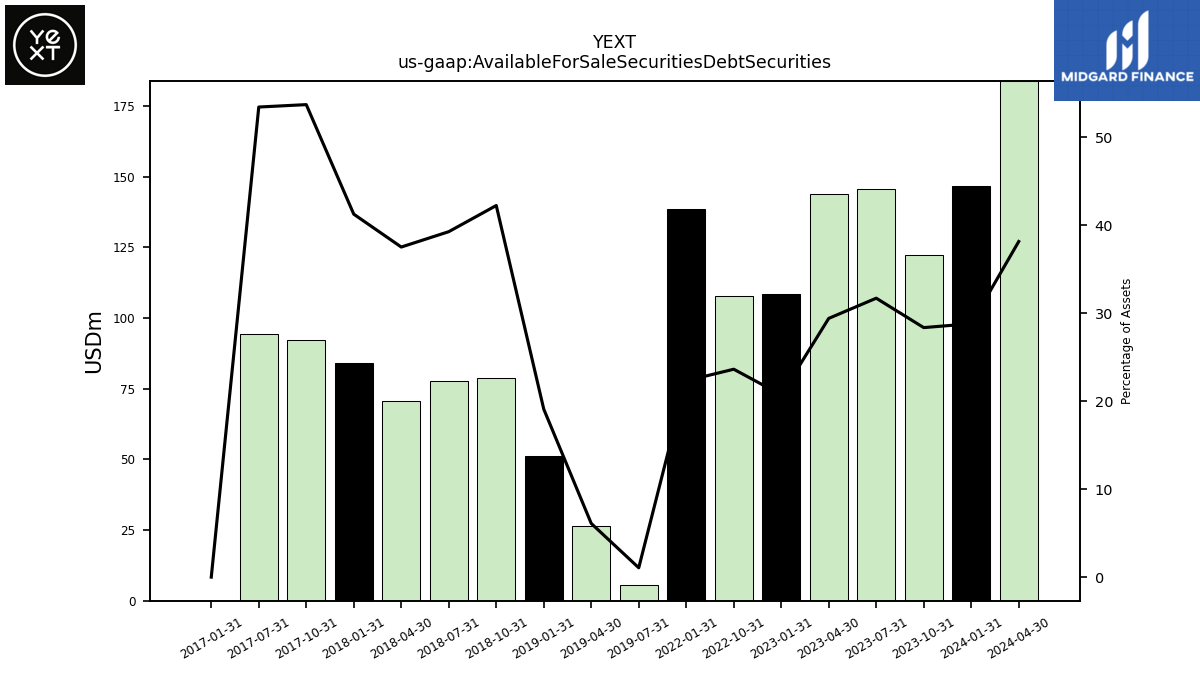
| Available For Sale Securities Debt Securities | 122.45 | 145.68 | 143.80 | 108.53 | 107.82 | NA | NA | 138.47 | NA | NA | NA | NA | NA | NA | NA | NA | NA | 5.39 | 26.44 | 51.02 | 78.70 | 77.66 | 70.71 | 83.97 | 92.36 | 94.39 | NA | 0.00 | NA | NA | NA |
| 2023-10-31 | 2023-07-31 | 2023-04-30 | 2023-01-31 | 2022-10-31 | 2022-07-31 | 2022-04-30 | 2022-01-31 | 2021-10-31 | 2021-07-31 | 2021-04-30 | 2021-01-31 | 2020-10-31 | 2020-07-31 | 2020-04-30 | 2020-01-31 | 2019-10-31 | 2019-07-31 | 2019-04-30 | 2019-01-31 | 2018-10-31 | 2018-07-31 | 2018-04-30 | 2018-01-31 | 2017-10-31 | 2017-07-31 | 2017-04-30 | 2017-01-31 | 2016-10-31 | 2016-07-31 | 2016-04-30 | ||
|---|---|---|---|---|---|---|---|---|---|---|---|---|---|---|---|---|---|---|---|---|---|---|---|---|---|---|---|---|---|---|---|---|
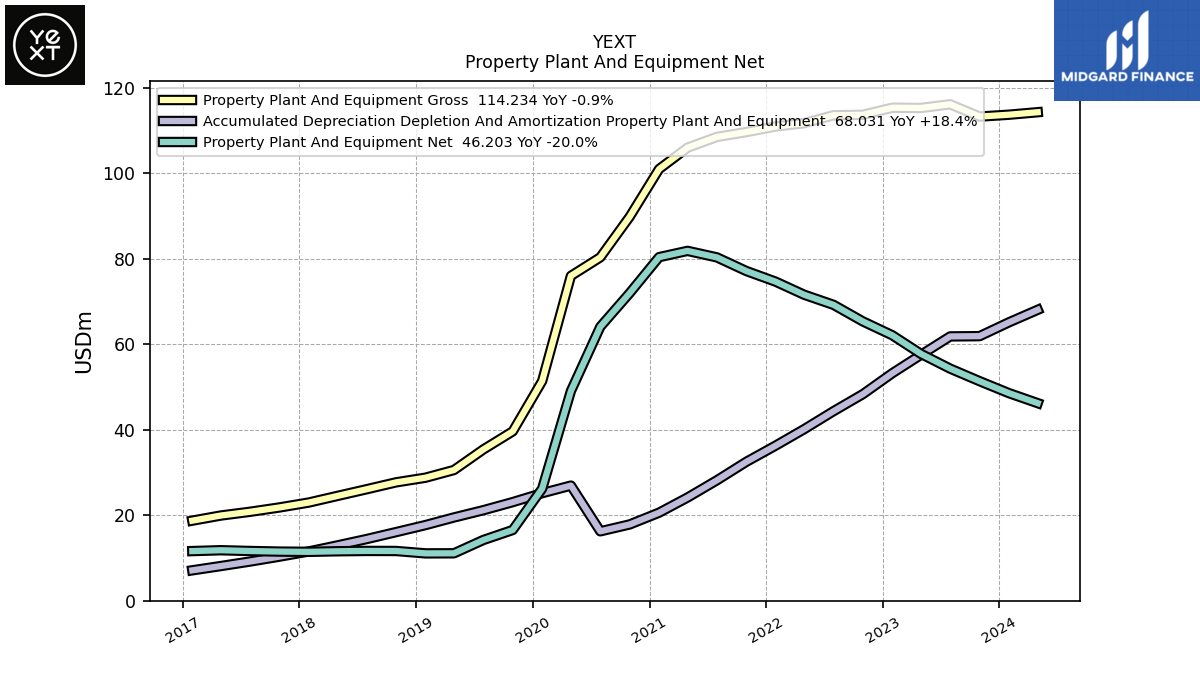
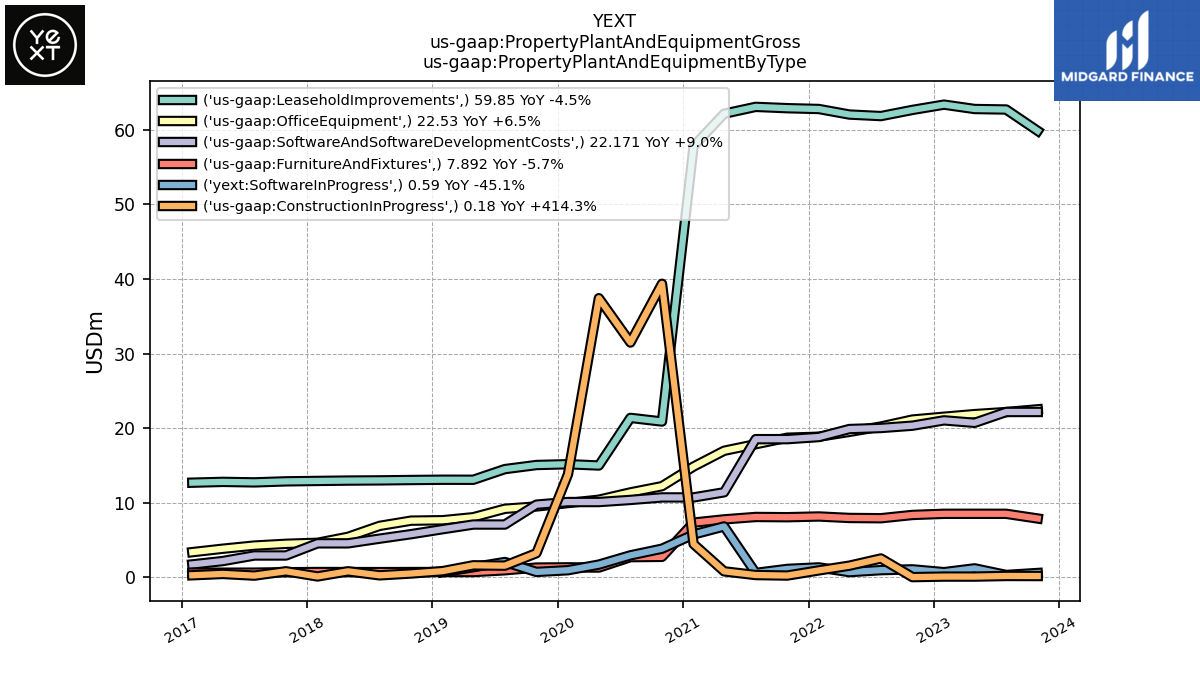
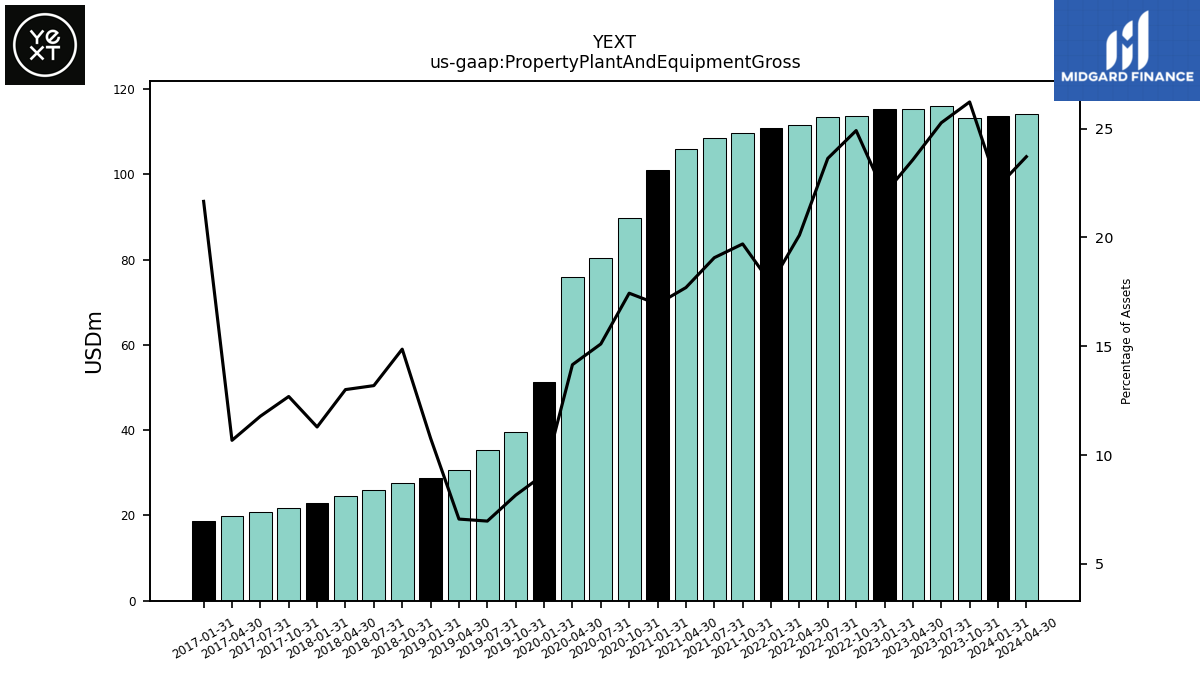
| Property Plant And Equipment Gross | 113.21 | 116.08 | 115.22 | 115.28 | 113.63 | 113.52 | 111.67 | 110.89 | 109.59 | 108.46 | 105.94 | 100.94 | 89.79 | 80.30 | 75.96 | 51.35 | 39.61 | 35.38 | 30.57 | 28.77 | 27.69 | 26.08 | 24.51 | 22.97 | 21.82 | 20.81 | 19.92 | 18.73 | NA | NA | NA | |
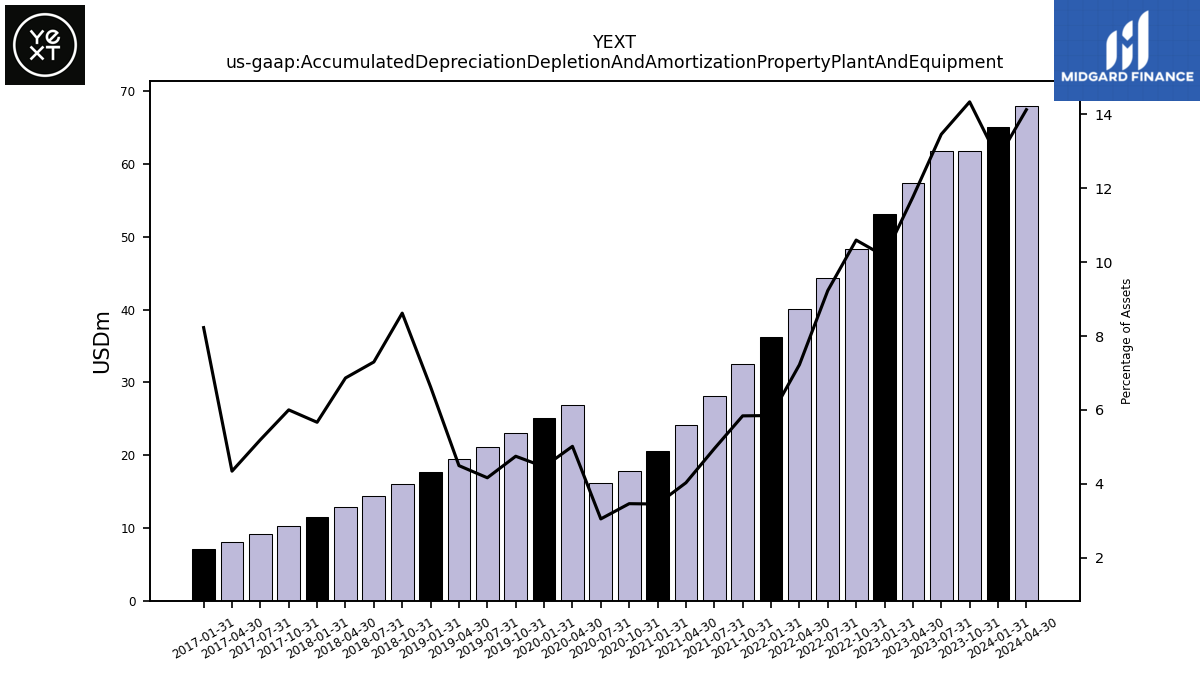
| Accumulated Depreciation Depletion And Amortization Property Plant And Equipment | 61.87 | 61.81 | 57.48 | 53.21 | 48.32 | 44.33 | 40.12 | 36.29 | 32.49 | 28.17 | 24.14 | 20.60 | 17.85 | 16.24 | 26.93 | 25.16 | 23.07 | 21.17 | 19.48 | 17.70 | 16.05 | 14.43 | 12.93 | 11.53 | 10.32 | 9.17 | 8.11 | 7.11 | NA | NA | NA | |
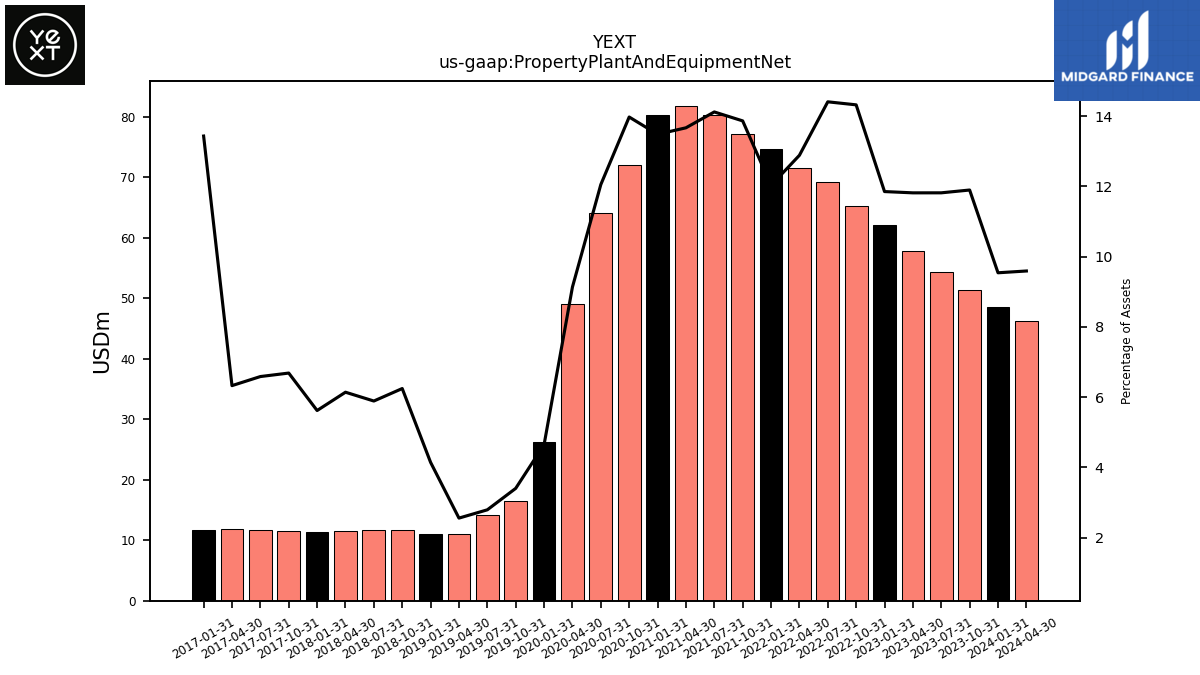
| Property Plant And Equipment Net | 51.34 | 54.27 | 57.75 | 62.07 | 65.31 | 69.19 | 71.56 | 74.60 | 77.10 | 80.29 | 81.81 | 80.34 | 71.95 | 64.07 | 49.03 | 26.20 | 16.55 | 14.21 | 11.09 | 11.08 | 11.63 | 11.65 | 11.57 | 11.44 | 11.50 | 11.63 | 11.81 | 11.61 | NA | NA | NA | |
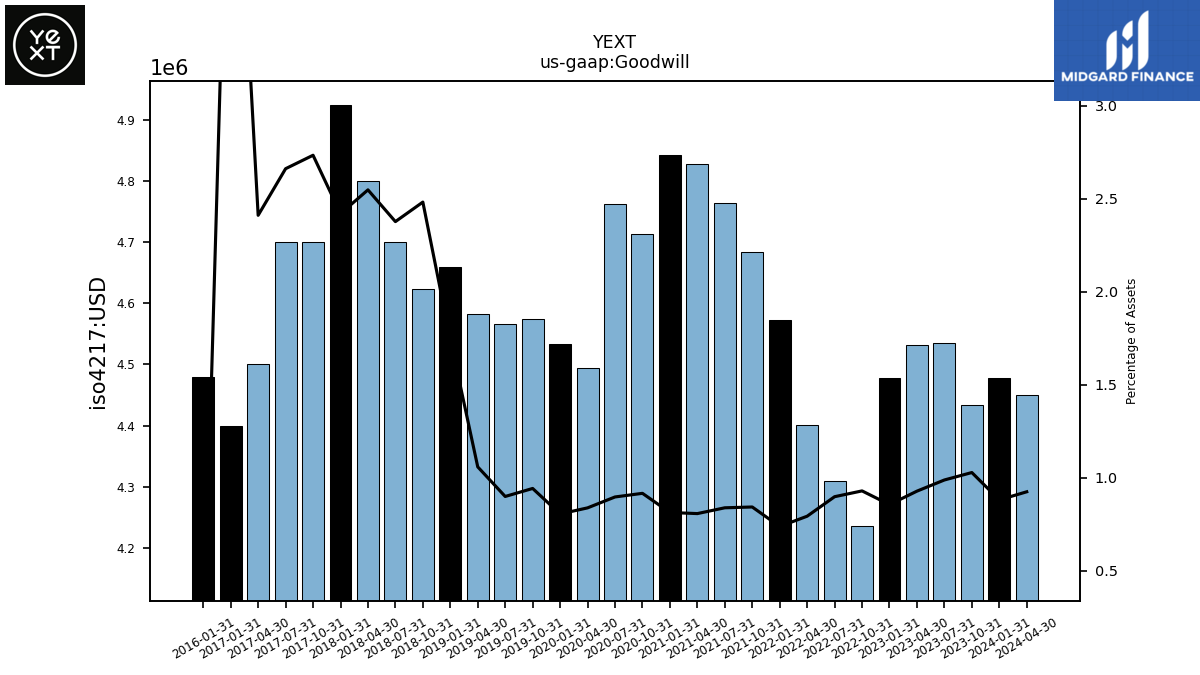
| Goodwill | 4.43 | 4.54 | 4.53 | 4.48 | 4.24 | 4.31 | 4.40 | 4.57 | 4.68 | 4.76 | 4.83 | 4.84 | 4.71 | 4.76 | 4.49 | 4.53 | 4.57 | 4.57 | 4.58 | 4.66 | 4.62 | 4.70 | 4.80 | 4.92 | 4.70 | 4.70 | 4.50 | 4.40 | NA | NA | NA | |
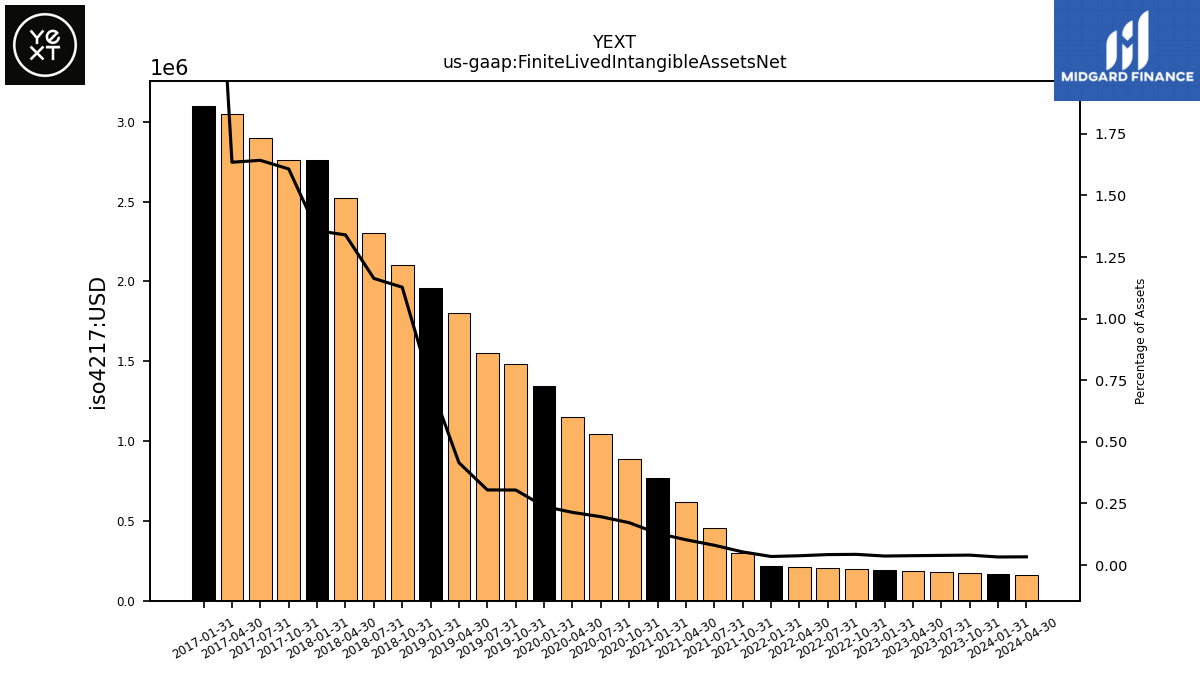
| Finite Lived Intangible Assets Net | 0.17 | 0.18 | 0.19 | 0.19 | 0.20 | 0.20 | 0.21 | 0.22 | 0.30 | 0.46 | 0.62 | 0.77 | 0.89 | 1.04 | 1.15 | 1.34 | 1.48 | 1.55 | 1.80 | 1.96 | 2.10 | 2.30 | 2.52 | 2.76 | 2.76 | 2.90 | 3.05 | 3.10 | NA | NA | NA | |
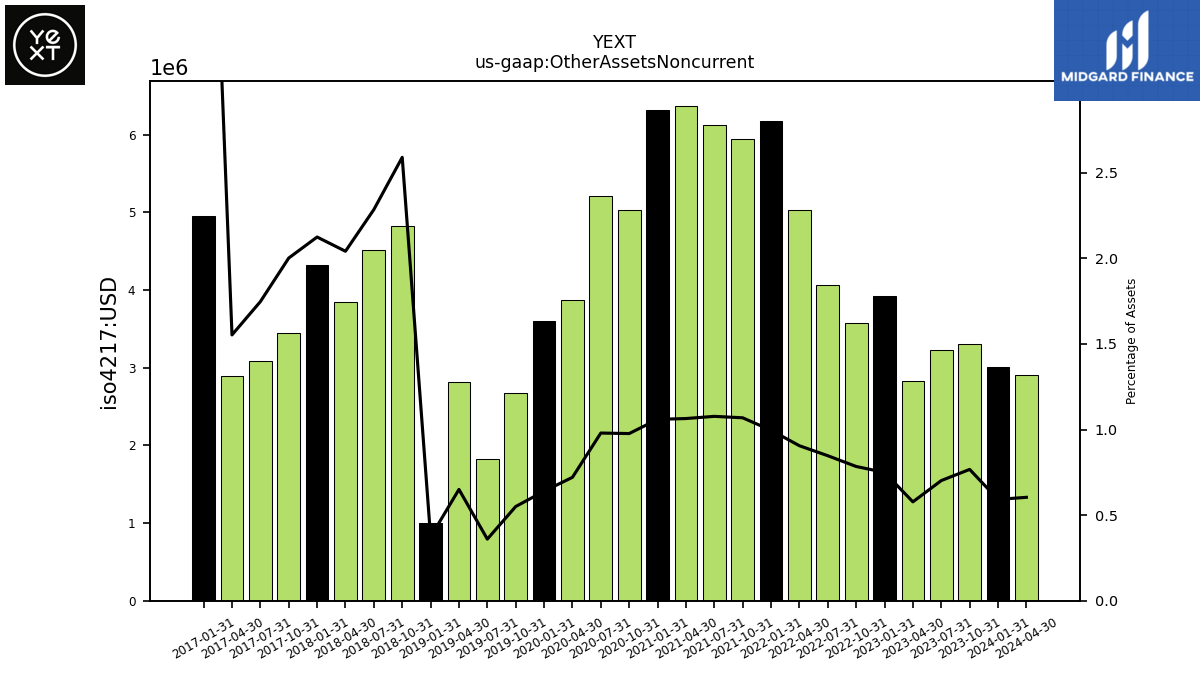
| Other Assets Noncurrent | 3.31 | 3.23 | 2.82 | 3.93 | 3.58 | 4.07 | 5.03 | 6.18 | 5.95 | 6.13 | 6.37 | 6.32 | 5.03 | 5.21 | 3.87 | 3.61 | 2.67 | 1.83 | 2.82 | 1.00 | 4.83 | 4.52 | 3.85 | 4.32 | 3.44 | 3.09 | 2.90 | 4.95 | NA | NA | NA | |
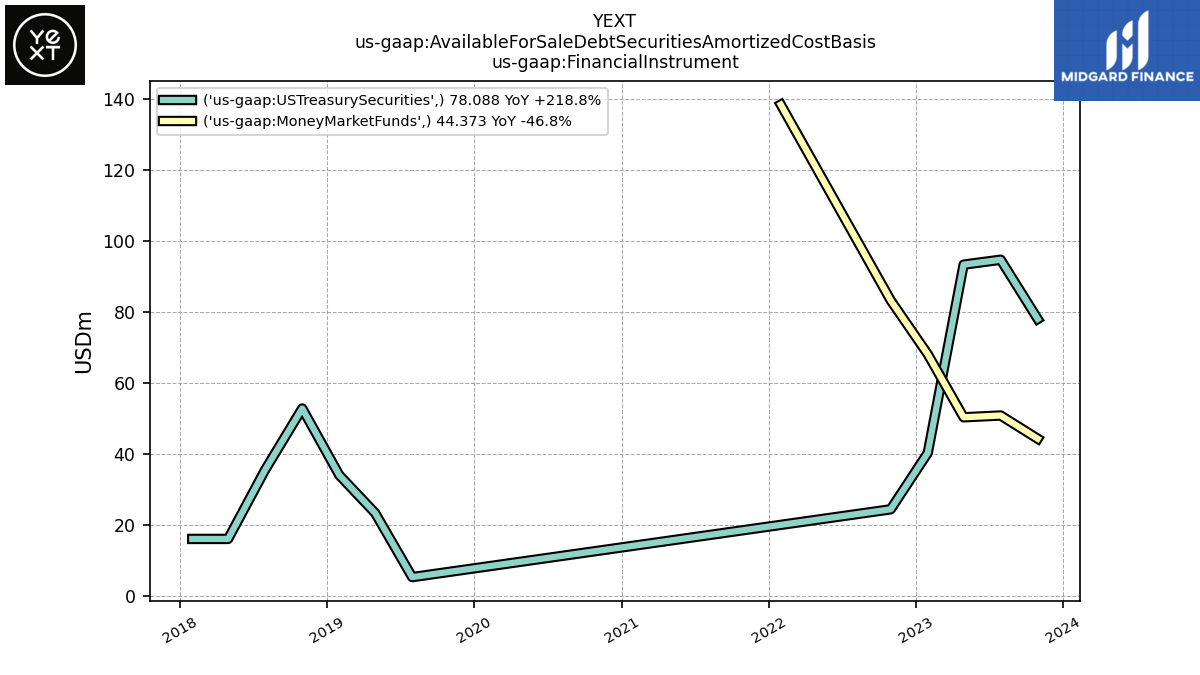
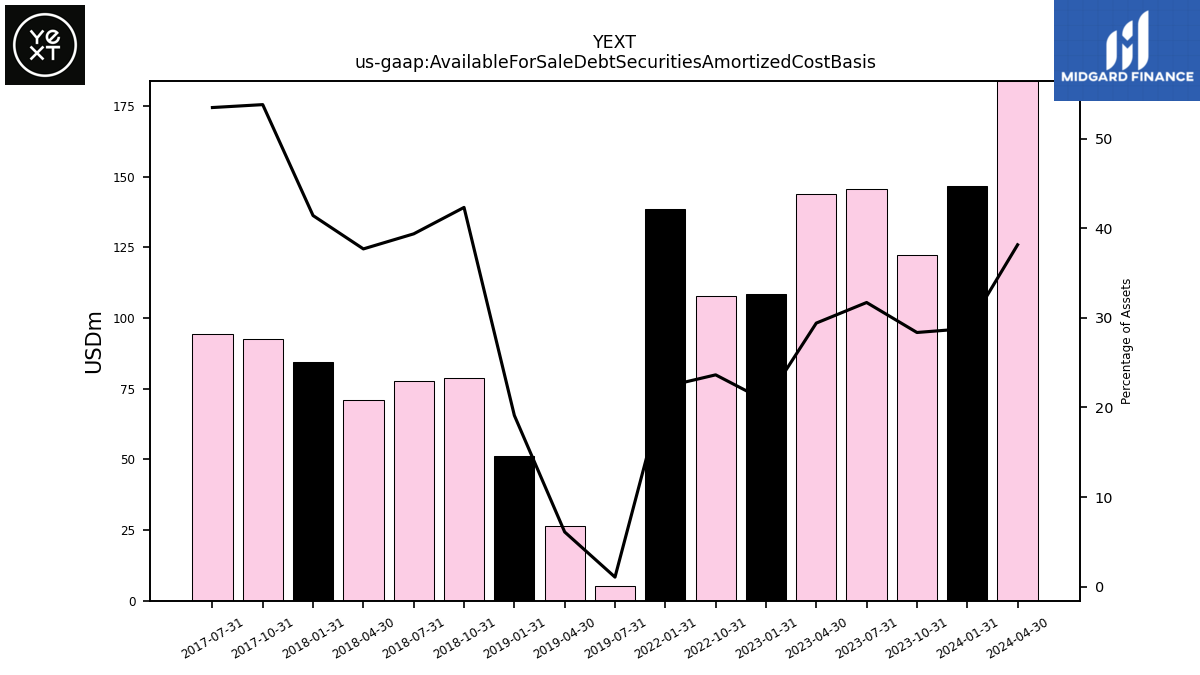
| Available For Sale Debt Securities Amortized Cost Basis | 122.46 | 145.70 | 143.81 | 108.54 | 107.83 | NA | NA | 138.47 | NA | NA | NA | NA | NA | NA | NA | NA | NA | 5.39 | 26.45 | 51.06 | 78.85 | 77.87 | 71.03 | 84.29 | 92.51 | 94.45 | NA | NA | NA | NA | NA |
| 2023-10-31 | 2023-07-31 | 2023-04-30 | 2023-01-31 | 2022-10-31 | 2022-07-31 | 2022-04-30 | 2022-01-31 | 2021-10-31 | 2021-07-31 | 2021-04-30 | 2021-01-31 | 2020-10-31 | 2020-07-31 | 2020-04-30 | 2020-01-31 | 2019-10-31 | 2019-07-31 | 2019-04-30 | 2019-01-31 | 2018-10-31 | 2018-07-31 | 2018-04-30 | 2018-01-31 | 2017-10-31 | 2017-07-31 | 2017-04-30 | 2017-01-31 | 2016-10-31 | 2016-07-31 | 2016-04-30 | ||
|---|---|---|---|---|---|---|---|---|---|---|---|---|---|---|---|---|---|---|---|---|---|---|---|---|---|---|---|---|---|---|---|---|
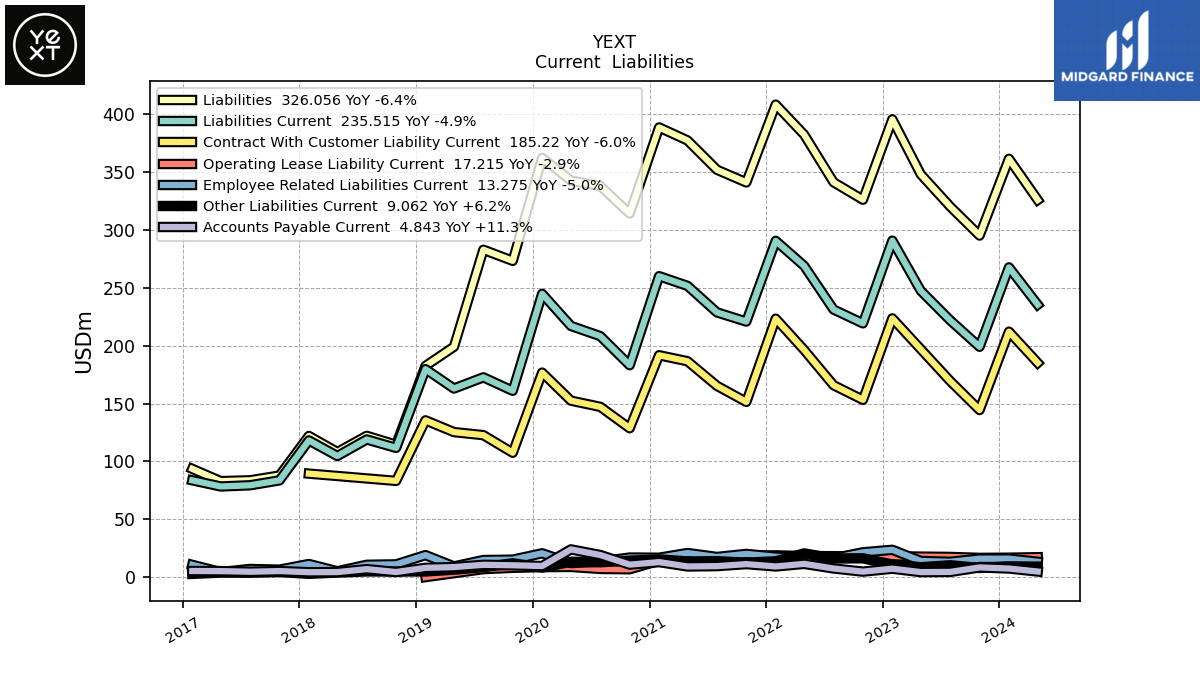
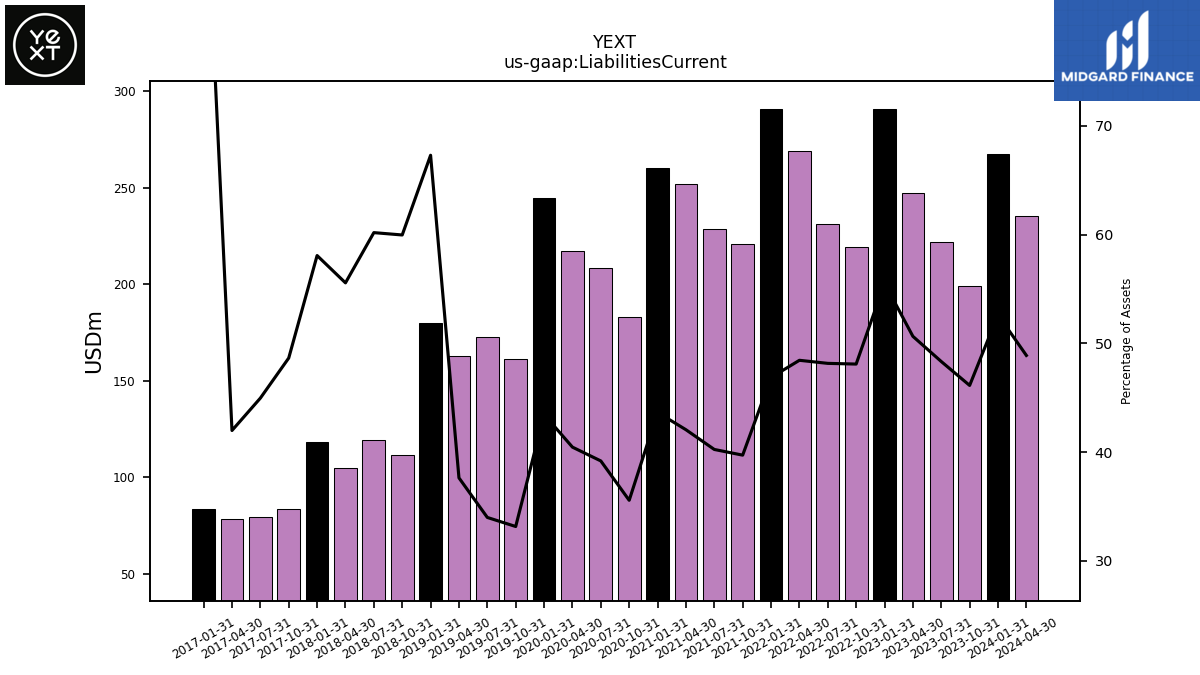
| Liabilities Current | 199.12 | 222.00 | 247.55 | 290.88 | 219.37 | 231.32 | 269.06 | 290.70 | 220.91 | 228.88 | 251.78 | 260.16 | 183.14 | 208.33 | 217.16 | 244.93 | 161.06 | 172.71 | 163.05 | 179.78 | 111.70 | 119.00 | 104.69 | 118.18 | 83.64 | 79.40 | 78.37 | 83.68 | NA | NA | NA | |
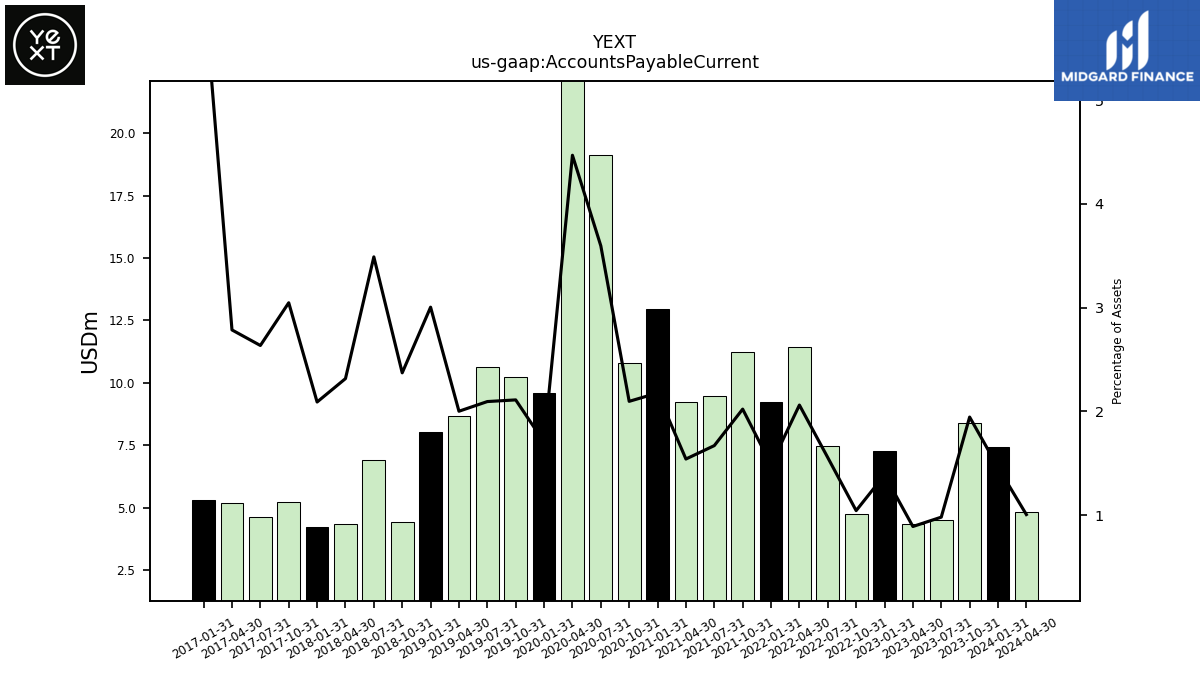
| Accounts Payable Current | 8.39 | 4.50 | 4.35 | 7.26 | 4.76 | 7.47 | 11.45 | 9.22 | 11.24 | 9.50 | 9.22 | 12.97 | 10.80 | 19.11 | 23.99 | 9.60 | 10.25 | 10.64 | 8.67 | 8.03 | 4.42 | 6.90 | 4.36 | 4.25 | 5.24 | 4.65 | 5.20 | 5.30 | NA | NA | NA | |
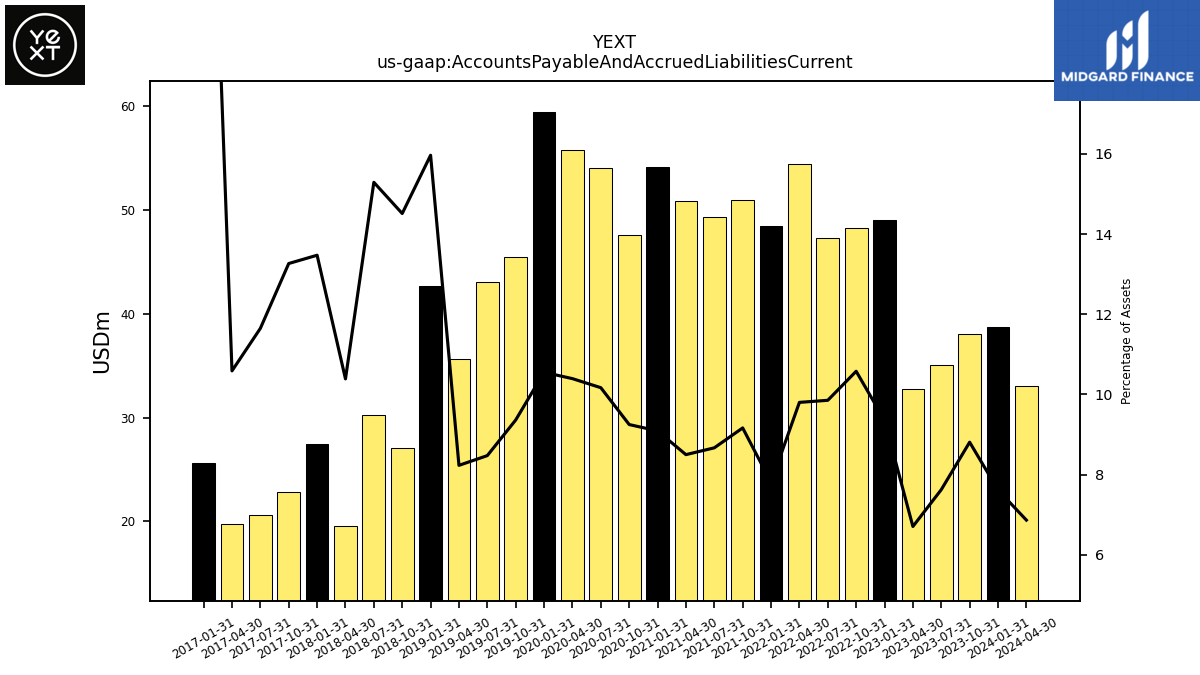
| Accounts Payable And Accrued Liabilities Current | 38.03 | 35.03 | 32.78 | 49.02 | 48.25 | 47.34 | 54.45 | 48.43 | 50.98 | 49.31 | 50.88 | 54.19 | 47.63 | 54.07 | 55.80 | 59.48 | 45.49 | 43.07 | 35.67 | 42.65 | 27.03 | 30.24 | 19.57 | 27.42 | 22.81 | 20.57 | 19.76 | 25.63 | NA | NA | NA | |
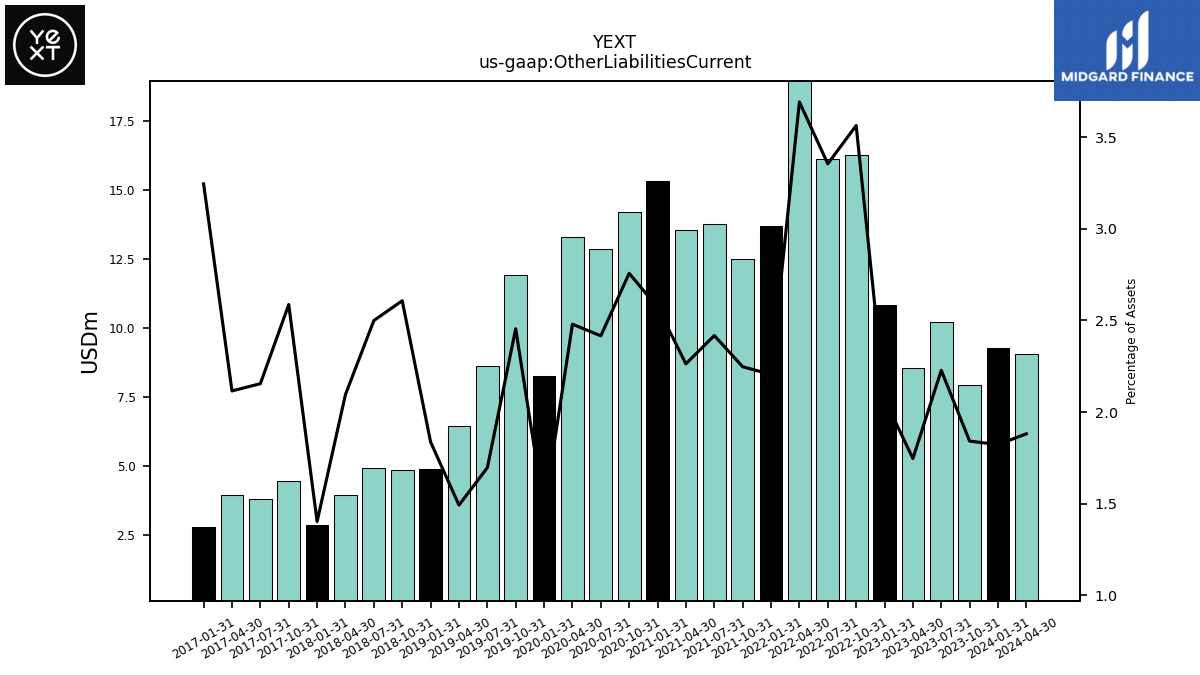
| Other Liabilities Current | 7.95 | 10.23 | 8.54 | 10.85 | 16.25 | 16.11 | 20.51 | 13.68 | 12.50 | 13.75 | 13.55 | 15.33 | 14.20 | 12.85 | 13.31 | 8.26 | 11.92 | 8.62 | 6.46 | 4.91 | 4.86 | 4.94 | 3.95 | 2.85 | 4.45 | 3.81 | 3.95 | 2.81 | NA | NA | NA | |
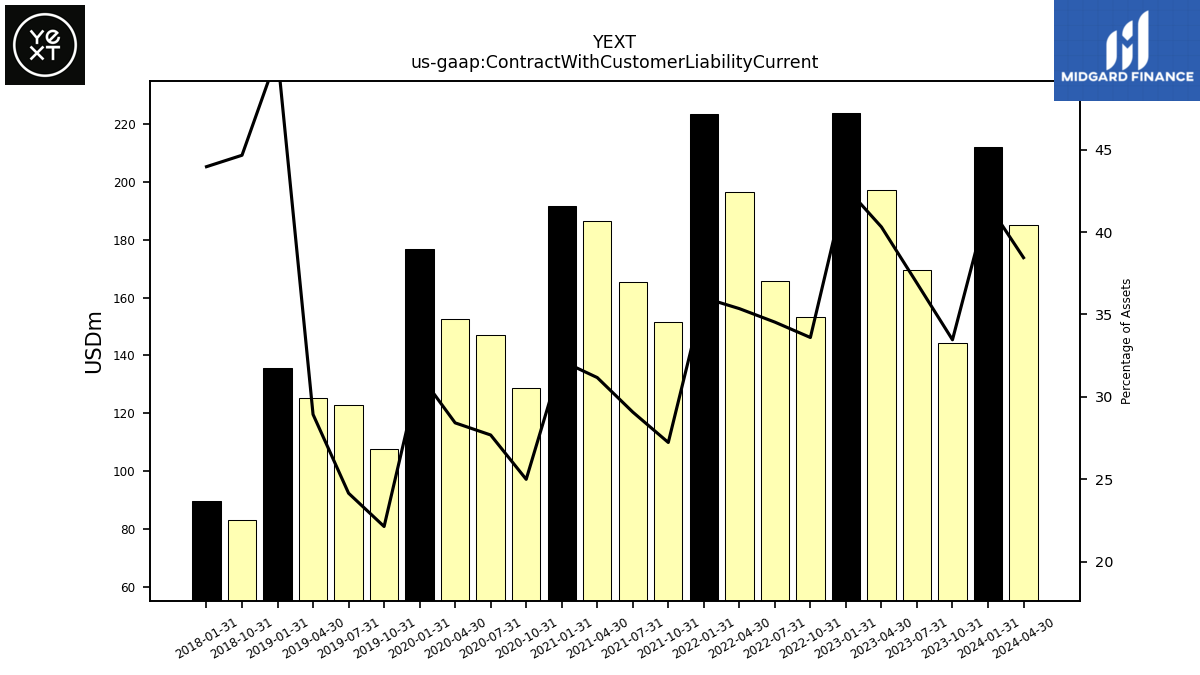
| Contract With Customer Liability Current | 144.45 | 169.50 | 197.05 | 223.71 | 153.27 | 165.89 | 196.38 | 223.43 | 151.46 | 165.38 | 186.61 | 191.81 | 128.71 | 147.19 | 152.56 | 176.81 | 107.51 | 122.73 | 125.37 | 135.54 | 83.19 | NA | NA | 89.47 | NA | NA | NA | NA | NA | NA | NA |
| 2023-10-31 | 2023-07-31 | 2023-04-30 | 2023-01-31 | 2022-10-31 | 2022-07-31 | 2022-04-30 | 2022-01-31 | 2021-10-31 | 2021-07-31 | 2021-04-30 | 2021-01-31 | 2020-10-31 | 2020-07-31 | 2020-04-30 | 2020-01-31 | 2019-10-31 | 2019-07-31 | 2019-04-30 | 2019-01-31 | 2018-10-31 | 2018-07-31 | 2018-04-30 | 2018-01-31 | 2017-10-31 | 2017-07-31 | 2017-04-30 | 2017-01-31 | 2016-10-31 | 2016-07-31 | 2016-04-30 | ||
|---|---|---|---|---|---|---|---|---|---|---|---|---|---|---|---|---|---|---|---|---|---|---|---|---|---|---|---|---|---|---|---|---|
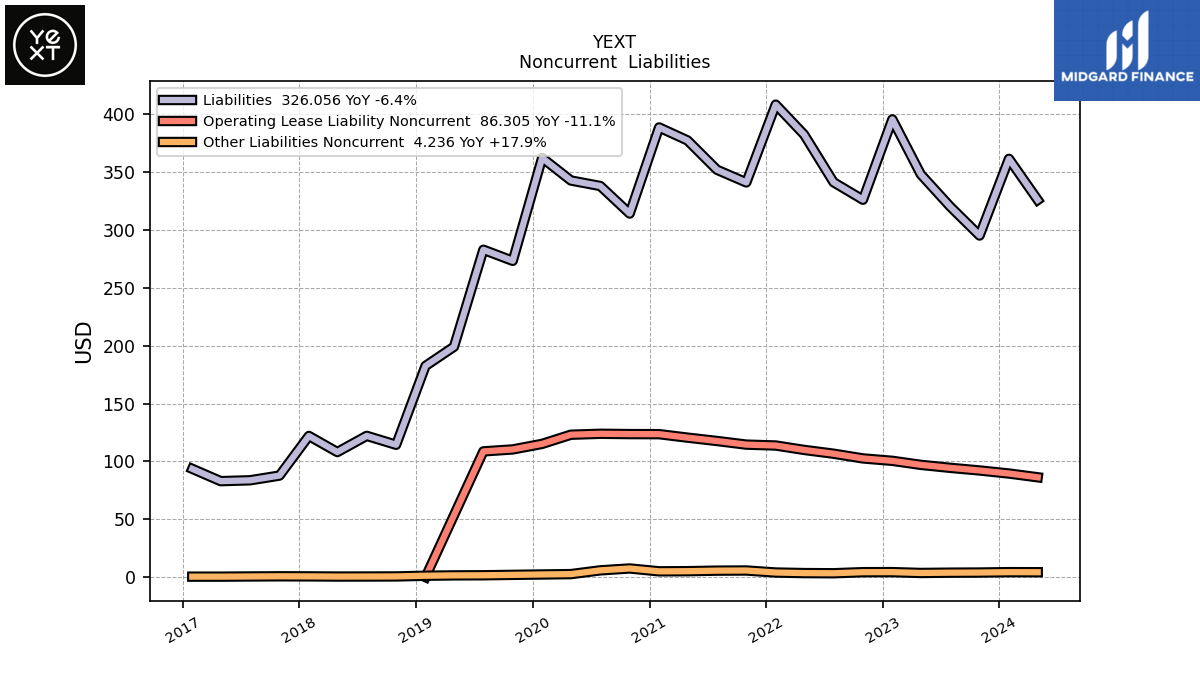
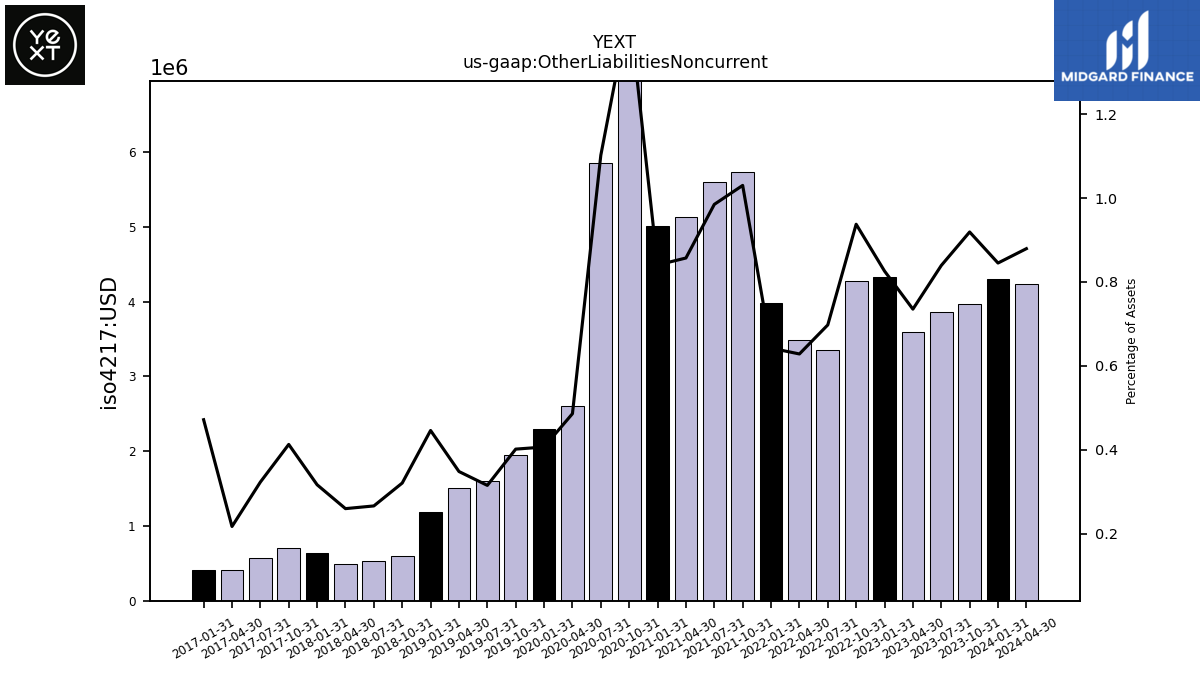
| Other Liabilities Noncurrent | 3.97 | 3.85 | 3.59 | 4.33 | 4.28 | 3.35 | 3.49 | 3.98 | 5.73 | 5.60 | 5.13 | 5.01 | 7.48 | 5.86 | 2.61 | 2.29 | 1.95 | 1.60 | 1.51 | 1.19 | 0.60 | 0.53 | 0.49 | 0.65 | 0.71 | 0.57 | 0.41 | 0.41 | NA | NA | NA | |
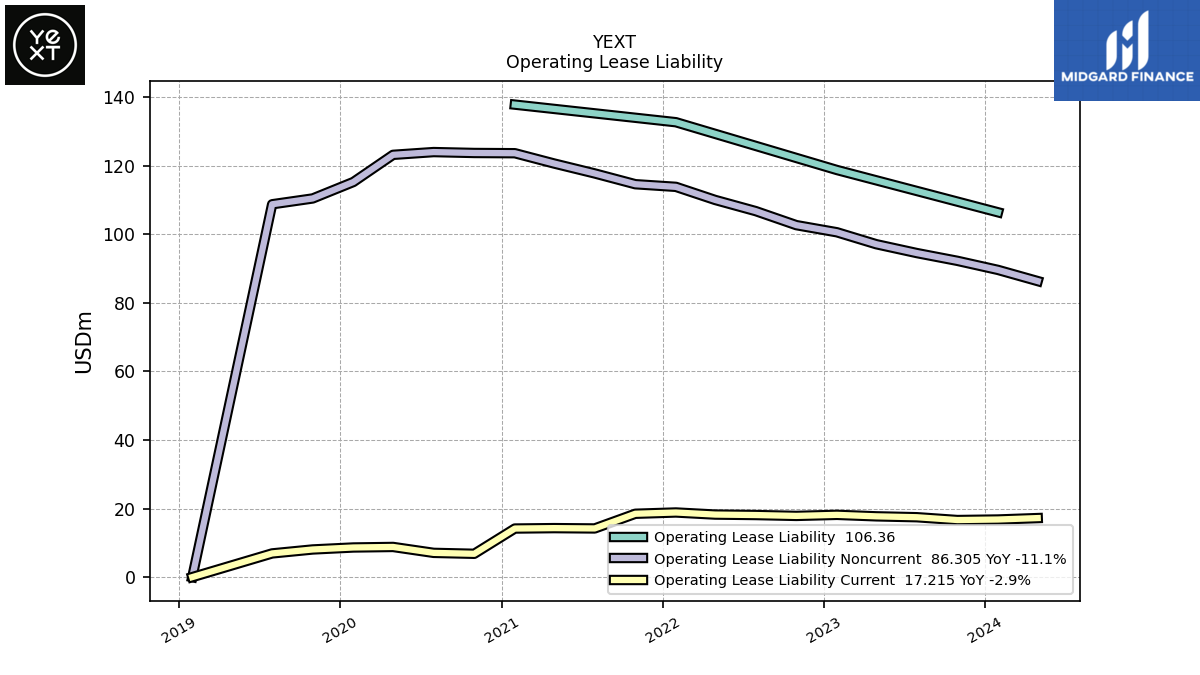
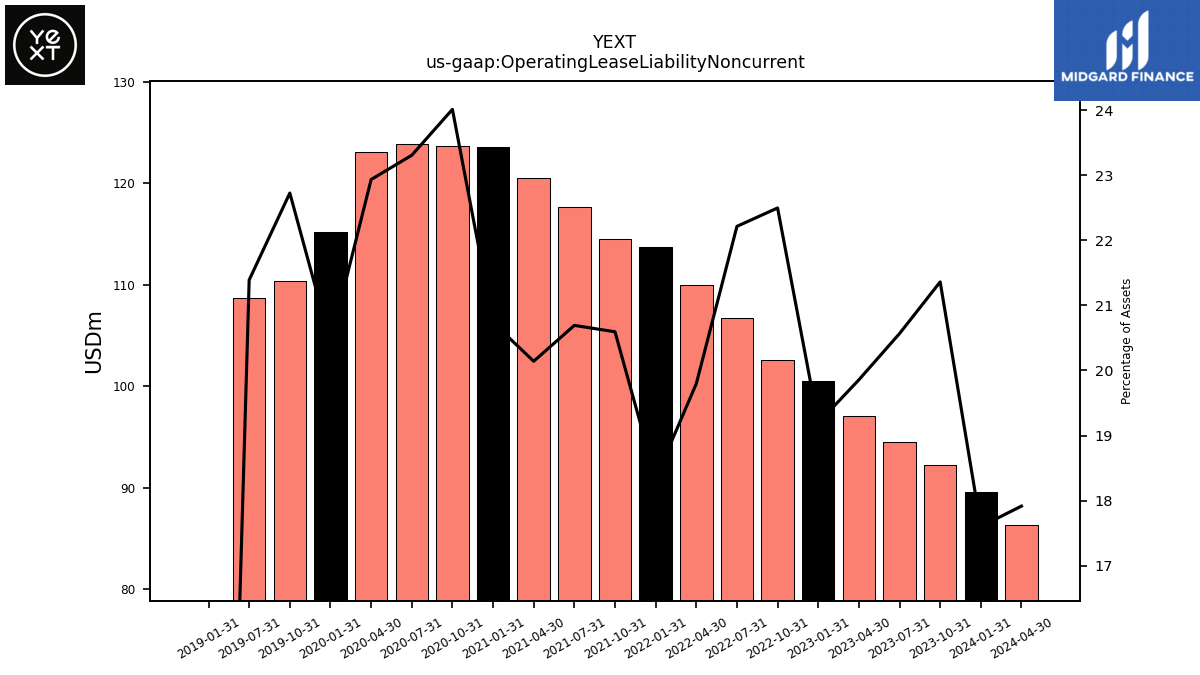
| Operating Lease Liability Noncurrent | 92.20 | 94.48 | 97.06 | 100.53 | 102.61 | 106.70 | 109.96 | 113.78 | 114.55 | 117.69 | 120.58 | 123.58 | 123.65 | 123.92 | 123.11 | 115.19 | 110.40 | 108.70 | NA | 0.00 | NA | NA | NA | NA | NA | NA | NA | NA | NA | NA | NA |
| 2023-10-31 | 2023-07-31 | 2023-04-30 | 2023-01-31 | 2022-10-31 | 2022-07-31 | 2022-04-30 | 2022-01-31 | 2021-10-31 | 2021-07-31 | 2021-04-30 | 2021-01-31 | 2020-10-31 | 2020-07-31 | 2020-04-30 | 2020-01-31 | 2019-10-31 | 2019-07-31 | 2019-04-30 | 2019-01-31 | 2018-10-31 | 2018-07-31 | 2018-04-30 | 2018-01-31 | 2017-10-31 | 2017-07-31 | 2017-04-30 | 2017-01-31 | 2016-10-31 | 2016-07-31 | 2016-04-30 | ||
|---|---|---|---|---|---|---|---|---|---|---|---|---|---|---|---|---|---|---|---|---|---|---|---|---|---|---|---|---|---|---|---|---|
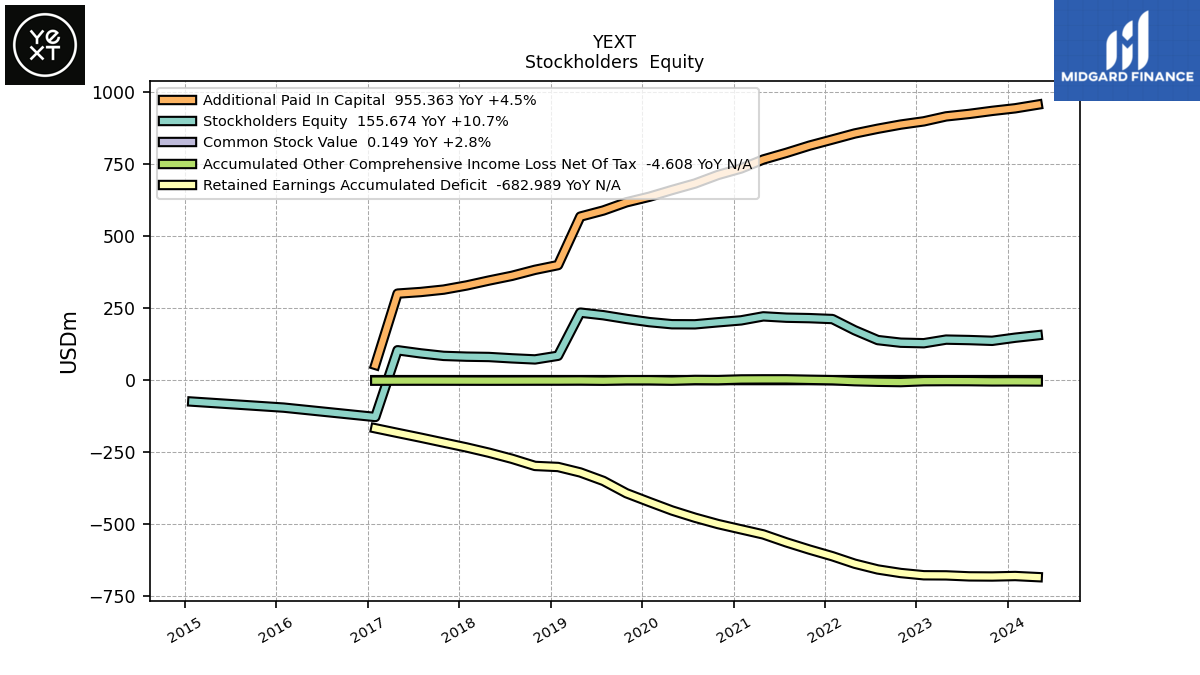
| Stockholders Equity | 136.35 | 139.02 | 140.59 | 128.02 | 129.85 | 138.95 | 172.92 | 211.87 | 215.01 | 216.58 | 221.18 | 207.24 | 200.66 | 193.55 | 193.91 | 201.21 | 212.36 | 225.14 | 234.16 | 84.55 | 71.87 | 75.61 | 80.29 | 81.45 | 84.12 | 92.88 | 103.68 | -127.75 | NA | NA | NA | |
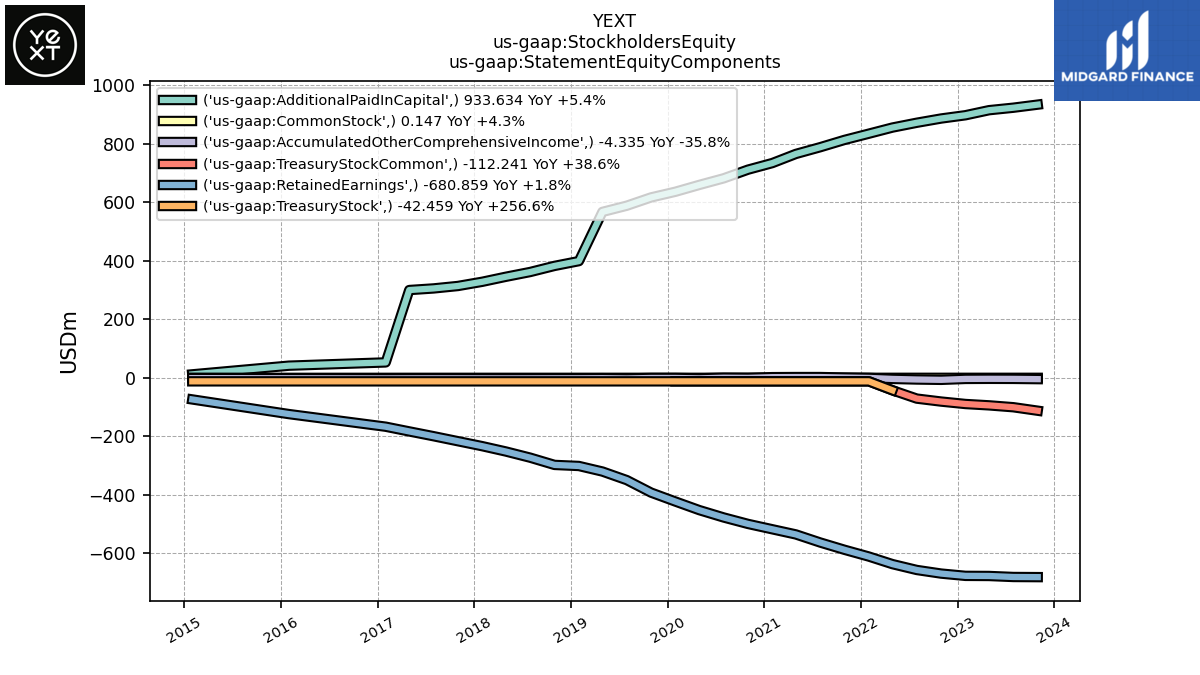
| Common Stock Value | 0.15 | 0.15 | 0.14 | 0.14 | 0.14 | 0.14 | 0.14 | 0.14 | 0.14 | 0.13 | 0.13 | 0.13 | 0.13 | 0.13 | 0.12 | 0.12 | 0.12 | 0.12 | 0.12 | 0.11 | 0.11 | 0.10 | 0.10 | 0.10 | 0.10 | 0.10 | 0.10 | 0.04 | NA | NA | NA | |
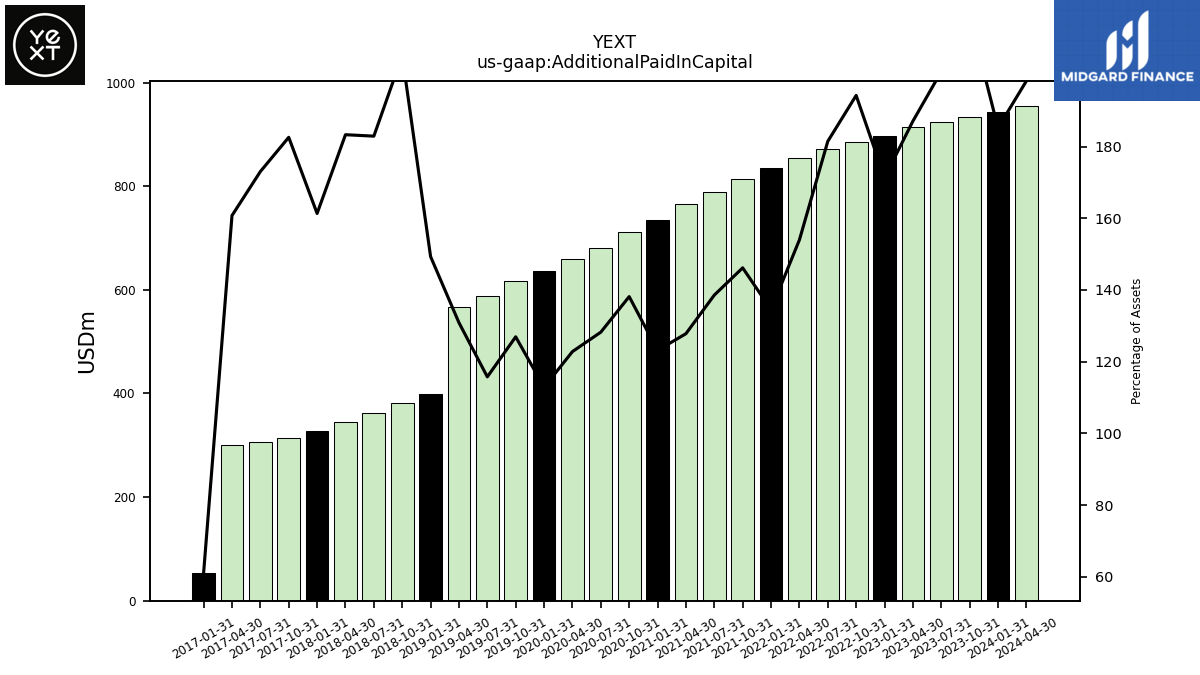
| Additional Paid In Capital | 933.63 | 923.09 | 914.61 | 897.37 | 886.18 | 871.70 | 855.28 | 834.43 | 813.09 | 788.15 | 765.15 | 733.93 | 711.41 | 681.76 | 659.26 | 636.01 | 616.61 | 588.25 | 567.10 | 398.88 | 382.56 | 361.72 | 345.41 | 328.34 | 313.93 | 305.59 | 300.09 | 52.80 | NA | NA | NA | |
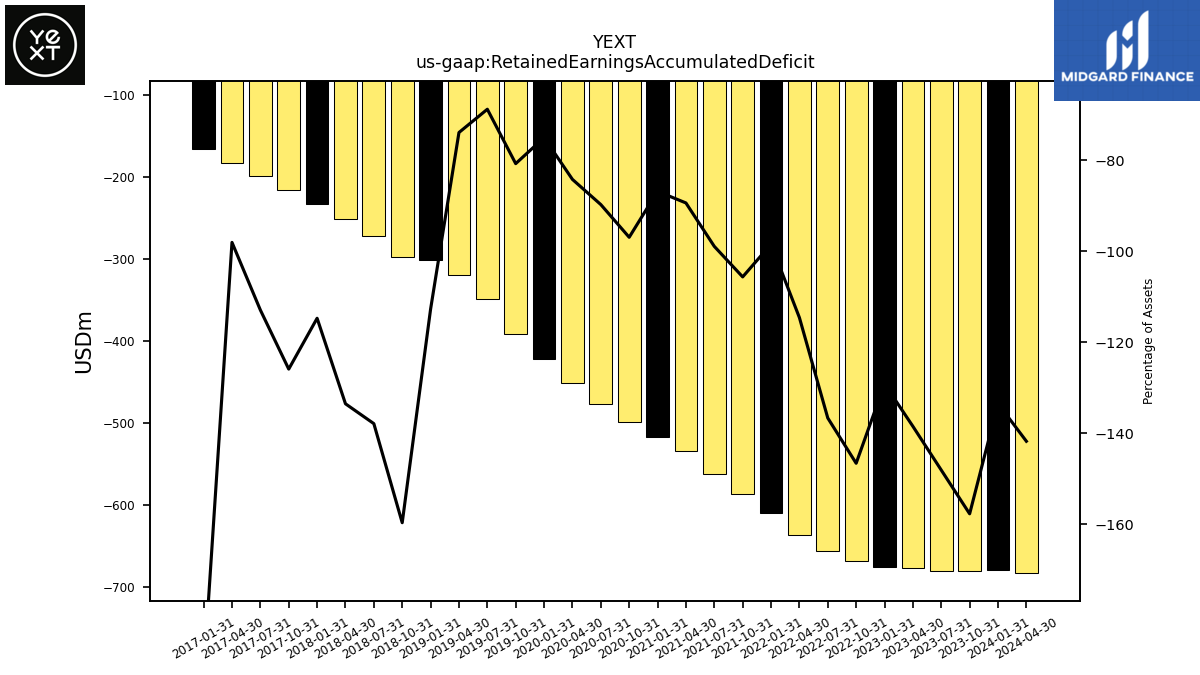
| Retained Earnings Accumulated Deficit | -680.86 | -680.39 | -676.95 | -676.54 | -668.74 | -656.43 | -636.44 | -610.60 | -587.49 | -562.57 | -534.98 | -517.35 | -499.03 | -476.99 | -451.88 | -422.65 | -392.08 | -349.36 | -320.07 | -301.11 | -297.45 | -272.68 | -251.59 | -233.45 | -216.45 | -199.39 | -182.99 | -166.88 | NA | NA | NA | |
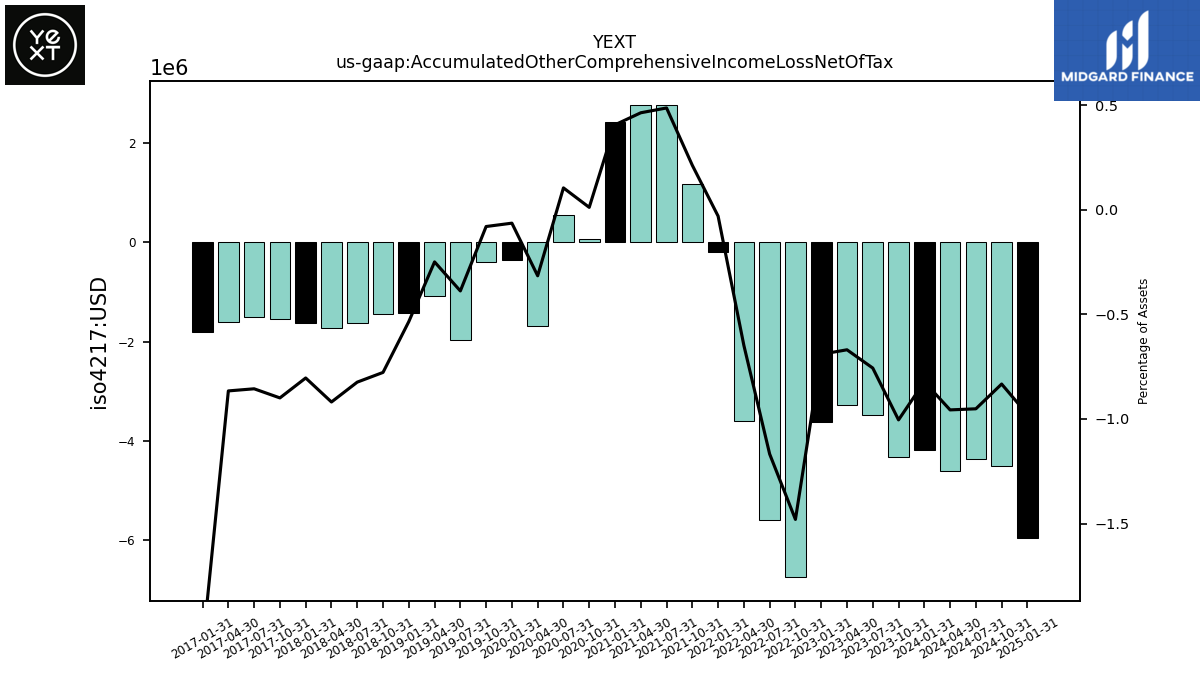
| Accumulated Other Comprehensive Income Loss Net Of Tax | -4.33 | -3.48 | -3.27 | -3.62 | -6.75 | -5.61 | -3.60 | -0.19 | 1.18 | 2.77 | 2.78 | 2.42 | 0.06 | 0.56 | -1.69 | -0.36 | -0.39 | -1.97 | -1.08 | -1.43 | -1.45 | -1.63 | -1.73 | -1.64 | -1.55 | -1.51 | -1.62 | -1.81 | NA | NA | NA | |
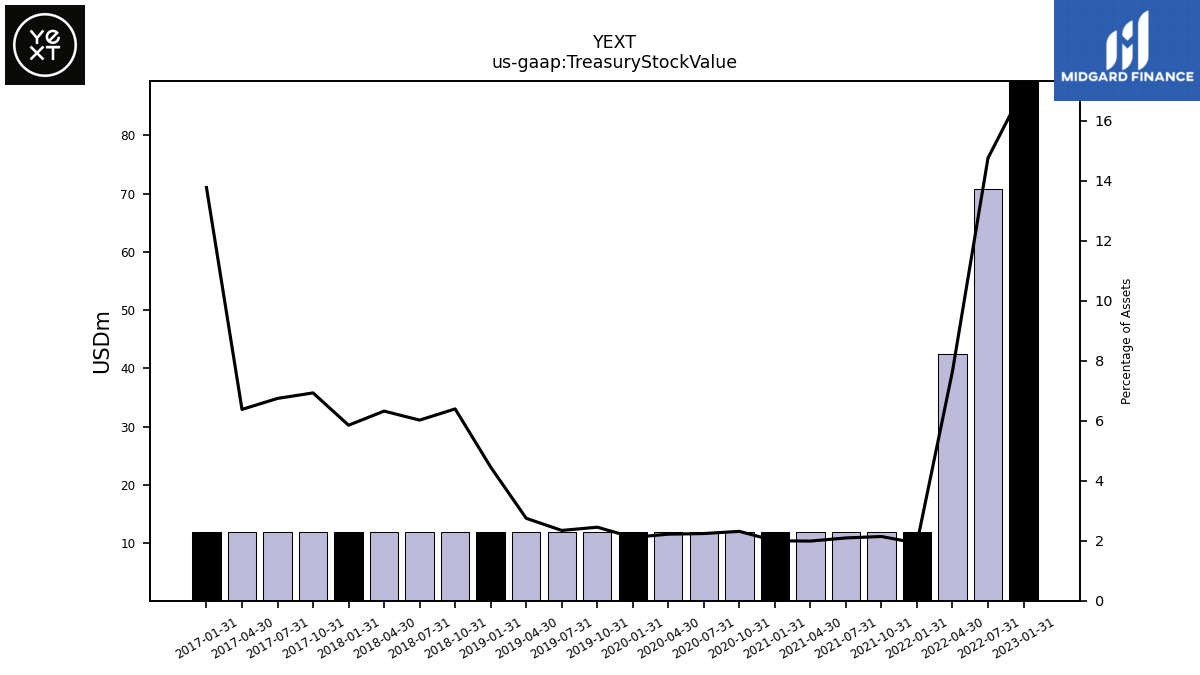
| Treasury Stock Value | NA | NA | NA | 89.33 | NA | 70.85 | 42.46 | 11.90 | 11.90 | 11.90 | 11.90 | 11.90 | 11.90 | 11.90 | 11.90 | 11.90 | 11.90 | 11.90 | 11.90 | 11.90 | 11.90 | 11.90 | 11.90 | 11.90 | 11.90 | 11.90 | 11.90 | 11.90 | NA | NA | NA | |
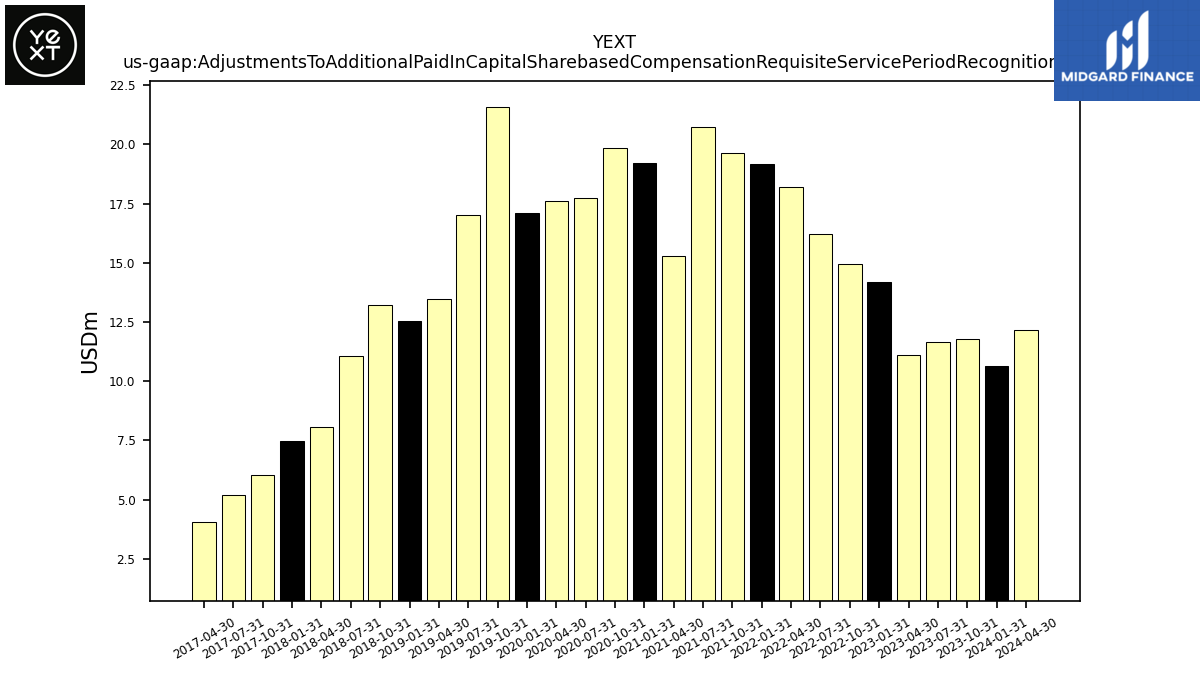
| Adjustments To Additional Paid In Capital Sharebased Compensation Requisite Service Period Recognition Value | 11.80 | 11.66 | 11.12 | 14.18 | 14.95 | 16.23 | 18.20 | 19.17 | 19.64 | 20.73 | 15.29 | 19.22 | 19.83 | 17.75 | 17.62 | 17.09 | 21.60 | 17.02 | 13.47 | 12.54 | 13.22 | 11.08 | 8.07 | 7.49 | 6.03 | 5.18 | 4.06 | NA | NA | NA | NA |
| 2023-10-31 | 2023-07-31 | 2023-04-30 | 2023-01-31 | 2022-10-31 | 2022-07-31 | 2022-04-30 | 2022-01-31 | 2021-10-31 | 2021-07-31 | 2021-04-30 | 2021-01-31 | 2020-10-31 | 2020-07-31 | 2020-04-30 | 2020-01-31 | 2019-10-31 | 2019-07-31 | 2019-04-30 | 2019-01-31 | 2018-10-31 | 2018-07-31 | 2018-04-30 | 2018-01-31 | 2017-10-31 | 2017-07-31 | 2017-04-30 | 2017-01-31 | 2016-10-31 | 2016-07-31 | 2016-04-30 | ||
|---|---|---|---|---|---|---|---|---|---|---|---|---|---|---|---|---|---|---|---|---|---|---|---|---|---|---|---|---|---|---|---|---|
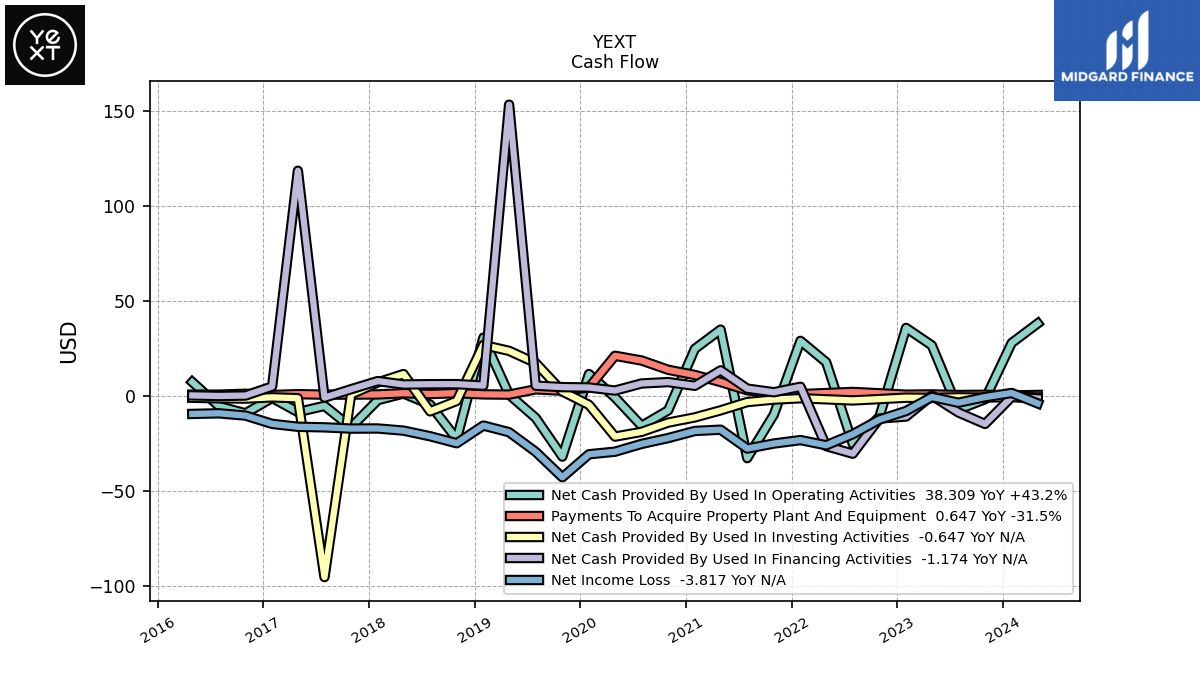
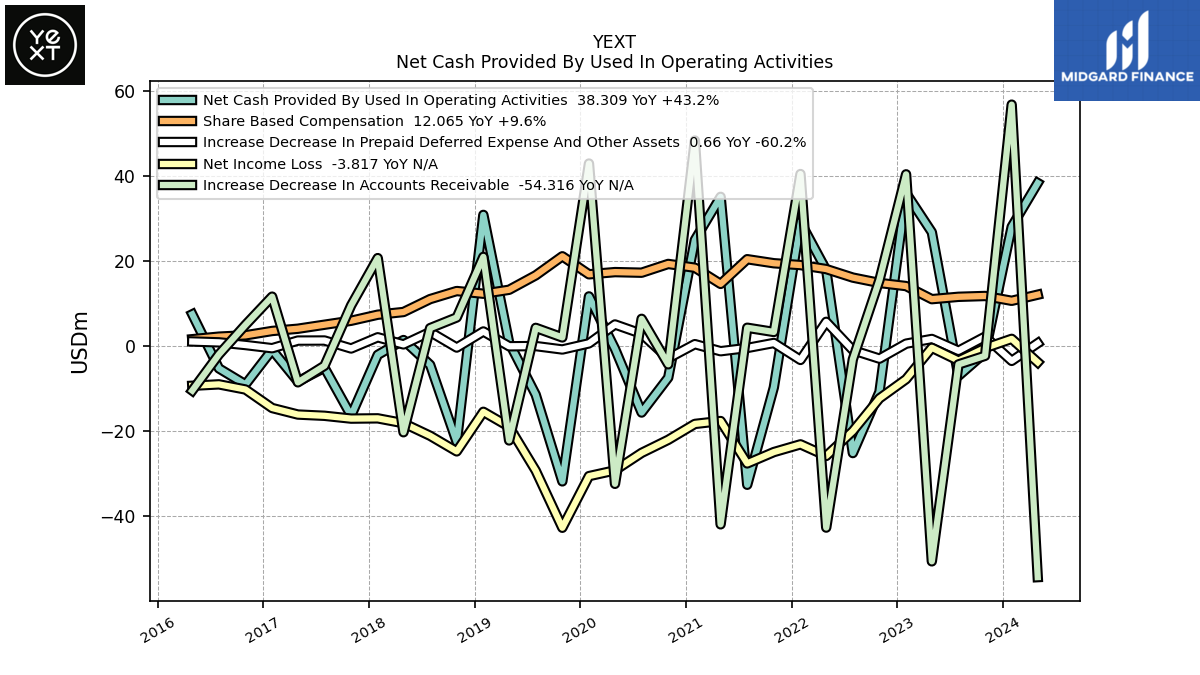
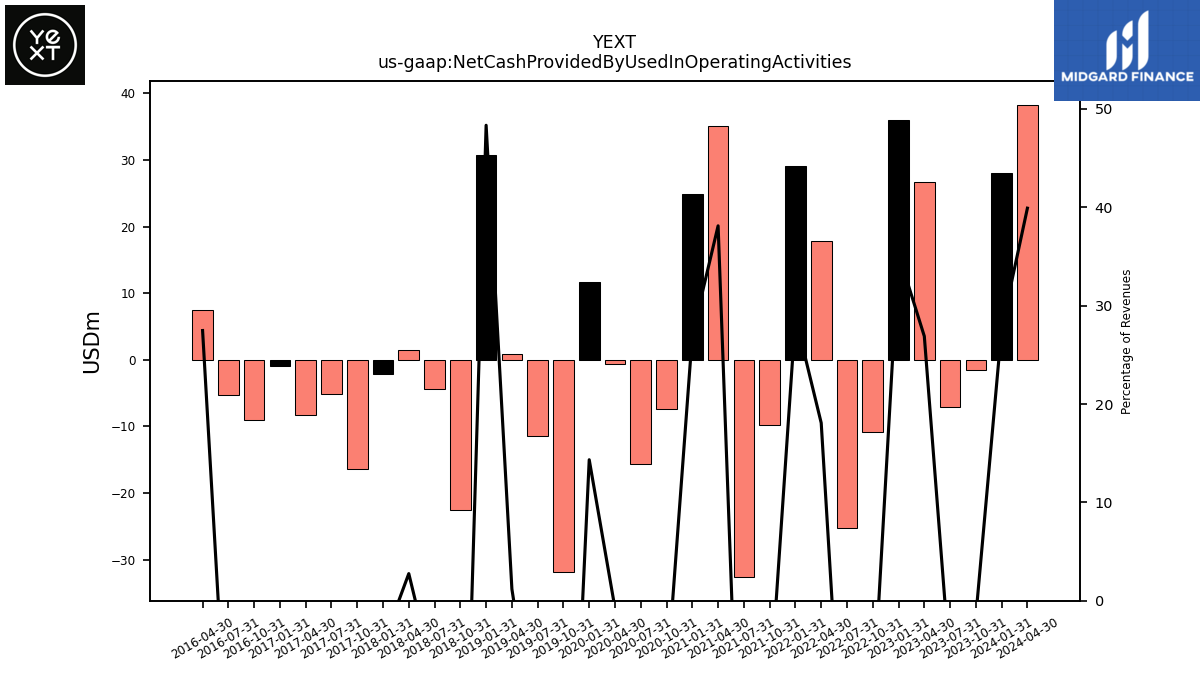
| Net Cash Provided By Used In Operating Activities | -1.57 | -7.03 | 26.74 | 35.95 | -10.79 | -25.17 | 17.86 | 29.12 | -9.72 | -32.61 | 35.06 | 24.93 | -7.43 | -15.64 | -0.66 | 11.67 | -31.82 | -11.44 | 0.82 | 30.82 | -22.56 | -4.42 | 1.41 | -2.08 | -16.38 | -5.10 | -8.35 | -0.91 | -9.03 | -5.26 | 7.45 | |
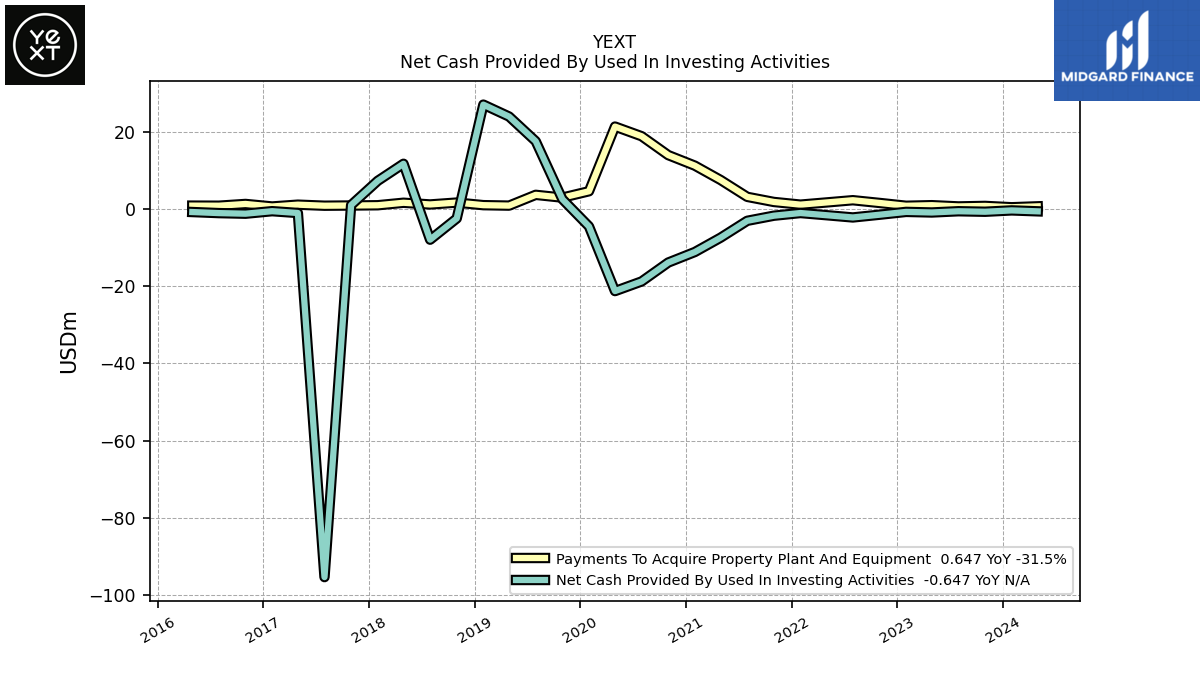
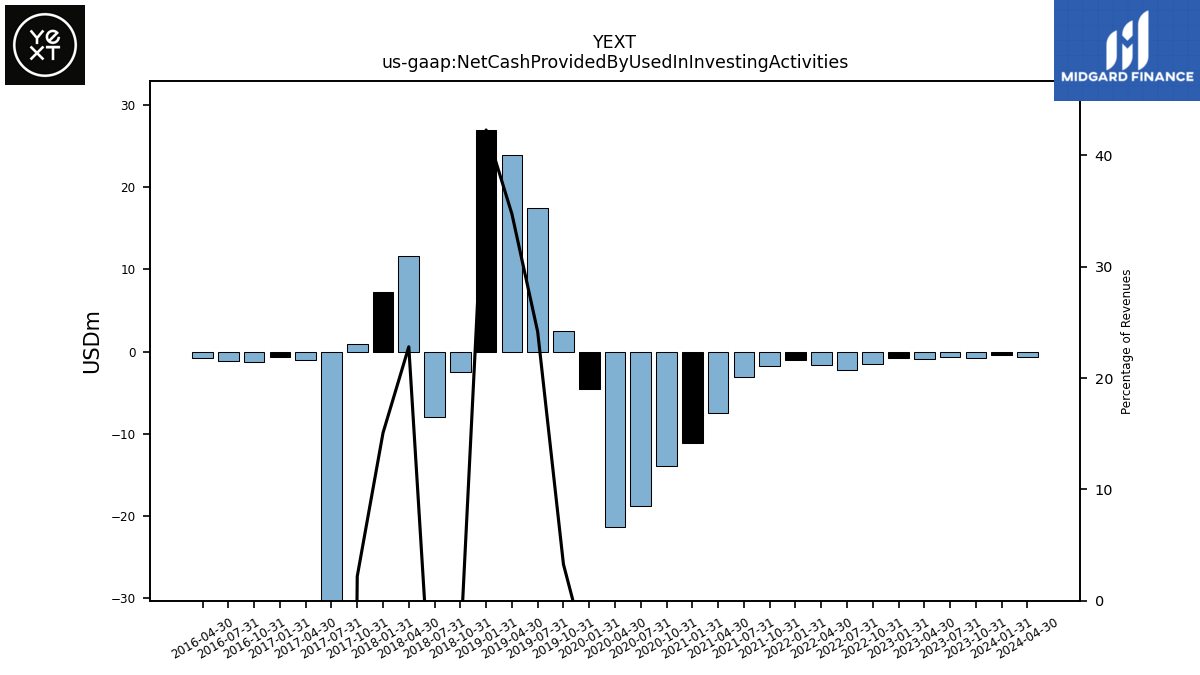
| Net Cash Provided By Used In Investing Activities | -0.75 | -0.62 | -0.94 | -0.79 | -1.52 | -2.23 | -1.64 | -1.08 | -1.78 | -3.10 | -7.46 | -11.16 | -13.89 | -18.78 | -21.27 | -4.54 | 2.50 | 17.48 | 23.87 | 26.95 | -2.49 | -7.98 | 11.65 | 7.24 | 0.97 | -95.25 | -1.08 | -0.61 | -1.26 | -1.11 | -0.83 | |
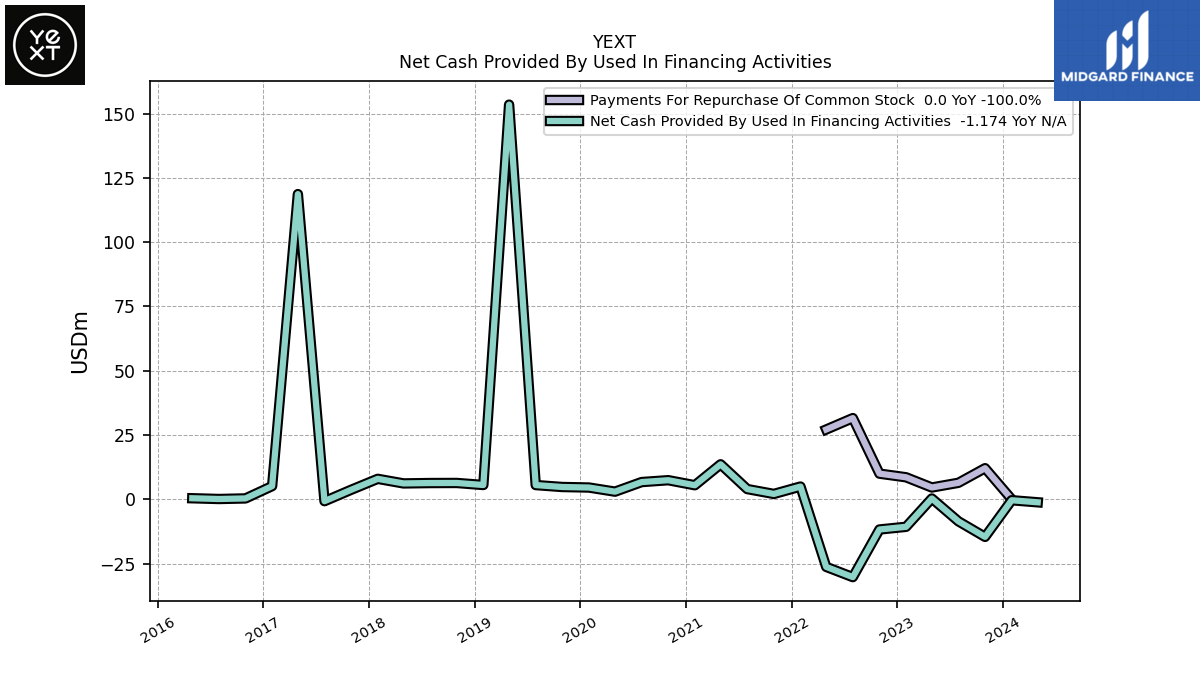
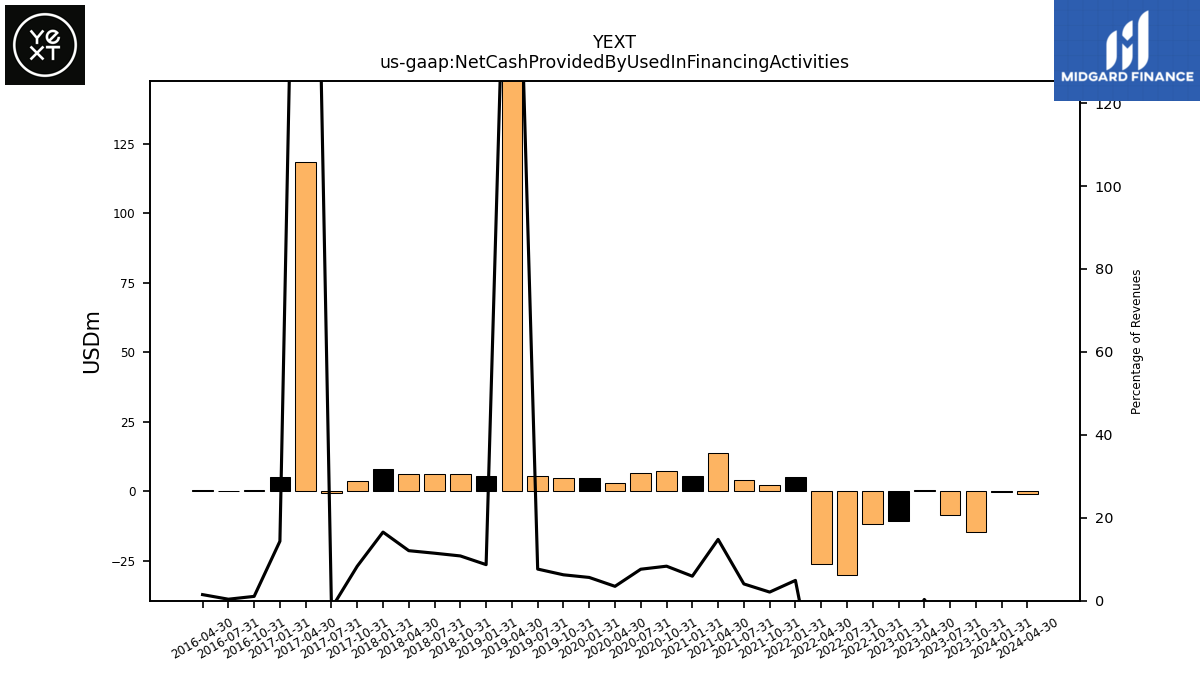
| Net Cash Provided By Used In Financing Activities | -14.62 | -8.57 | 0.31 | -10.70 | -11.75 | -30.27 | -26.29 | 4.95 | 2.08 | 3.98 | 13.61 | 5.46 | 7.42 | 6.70 | 2.97 | 4.57 | 4.78 | 5.53 | 153.50 | 5.55 | 6.35 | 6.32 | 6.17 | 7.95 | 3.69 | -0.74 | 118.70 | 5.12 | 0.34 | 0.11 | 0.40 |
| 2023-10-31 | 2023-07-31 | 2023-04-30 | 2023-01-31 | 2022-10-31 | 2022-07-31 | 2022-04-30 | 2022-01-31 | 2021-10-31 | 2021-07-31 | 2021-04-30 | 2021-01-31 | 2020-10-31 | 2020-07-31 | 2020-04-30 | 2020-01-31 | 2019-10-31 | 2019-07-31 | 2019-04-30 | 2019-01-31 | 2018-10-31 | 2018-07-31 | 2018-04-30 | 2018-01-31 | 2017-10-31 | 2017-07-31 | 2017-04-30 | 2017-01-31 | 2016-10-31 | 2016-07-31 | 2016-04-30 | ||
|---|---|---|---|---|---|---|---|---|---|---|---|---|---|---|---|---|---|---|---|---|---|---|---|---|---|---|---|---|---|---|---|---|
| Net Cash Provided By Used In Operating Activities | -1.57 | -7.03 | 26.74 | 35.95 | -10.79 | -25.17 | 17.86 | 29.12 | -9.72 | -32.61 | 35.06 | 24.93 | -7.43 | -15.64 | -0.66 | 11.67 | -31.82 | -11.44 | 0.82 | 30.82 | -22.56 | -4.42 | 1.41 | -2.08 | -16.38 | -5.10 | -8.35 | -0.91 | -9.03 | -5.26 | 7.45 | |
| Net Income Loss | -0.47 | -3.44 | -0.41 | -7.80 | -12.31 | -19.99 | -25.84 | -23.11 | -24.93 | -27.59 | -17.63 | -18.31 | -22.04 | -25.12 | -29.22 | -30.58 | -42.72 | -29.29 | -18.96 | -15.46 | -24.77 | -21.10 | -18.14 | -17.00 | -17.06 | -16.40 | -16.11 | -14.57 | -10.22 | -9.01 | -9.34 | |
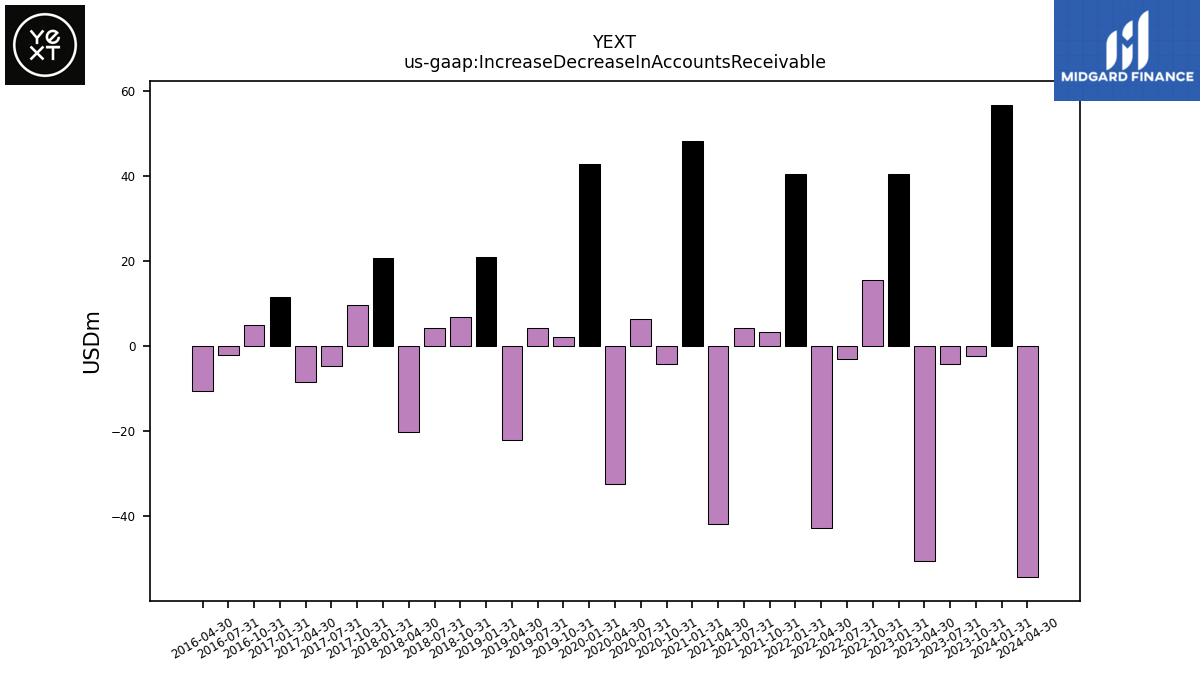
| Increase Decrease In Accounts Receivable | -2.31 | -4.33 | -50.61 | 40.35 | 15.51 | -3.13 | -42.68 | 40.42 | 3.30 | 4.30 | -41.91 | 48.29 | -4.30 | 6.39 | -32.40 | 42.89 | 2.02 | 4.27 | -22.20 | 20.95 | 6.71 | 4.20 | -20.27 | 20.66 | 9.54 | -4.63 | -8.54 | 11.61 | 4.98 | -1.99 | -10.47 | |
| Share Based Compensation | 11.76 | 11.56 | 11.01 | 14.09 | 14.82 | 16.08 | 18.09 | 19.02 | 19.45 | 20.40 | 14.60 | 18.41 | 19.29 | 17.23 | 17.37 | 16.85 | 21.09 | 16.61 | 13.22 | 12.29 | 12.92 | 11.03 | 7.99 | 7.36 | 5.94 | 5.00 | 4.06 | 3.54 | 2.52 | 2.20 | 1.60 |
| 2023-10-31 | 2023-07-31 | 2023-04-30 | 2023-01-31 | 2022-10-31 | 2022-07-31 | 2022-04-30 | 2022-01-31 | 2021-10-31 | 2021-07-31 | 2021-04-30 | 2021-01-31 | 2020-10-31 | 2020-07-31 | 2020-04-30 | 2020-01-31 | 2019-10-31 | 2019-07-31 | 2019-04-30 | 2019-01-31 | 2018-10-31 | 2018-07-31 | 2018-04-30 | 2018-01-31 | 2017-10-31 | 2017-07-31 | 2017-04-30 | 2017-01-31 | 2016-10-31 | 2016-07-31 | 2016-04-30 | ||
|---|---|---|---|---|---|---|---|---|---|---|---|---|---|---|---|---|---|---|---|---|---|---|---|---|---|---|---|---|---|---|---|---|
| Net Cash Provided By Used In Investing Activities | -0.75 | -0.62 | -0.94 | -0.79 | -1.52 | -2.23 | -1.64 | -1.08 | -1.78 | -3.10 | -7.46 | -11.16 | -13.89 | -18.78 | -21.27 | -4.54 | 2.50 | 17.48 | 23.87 | 26.95 | -2.49 | -7.98 | 11.65 | 7.24 | 0.97 | -95.25 | -1.08 | -0.61 | -1.26 | -1.11 | -0.83 | |
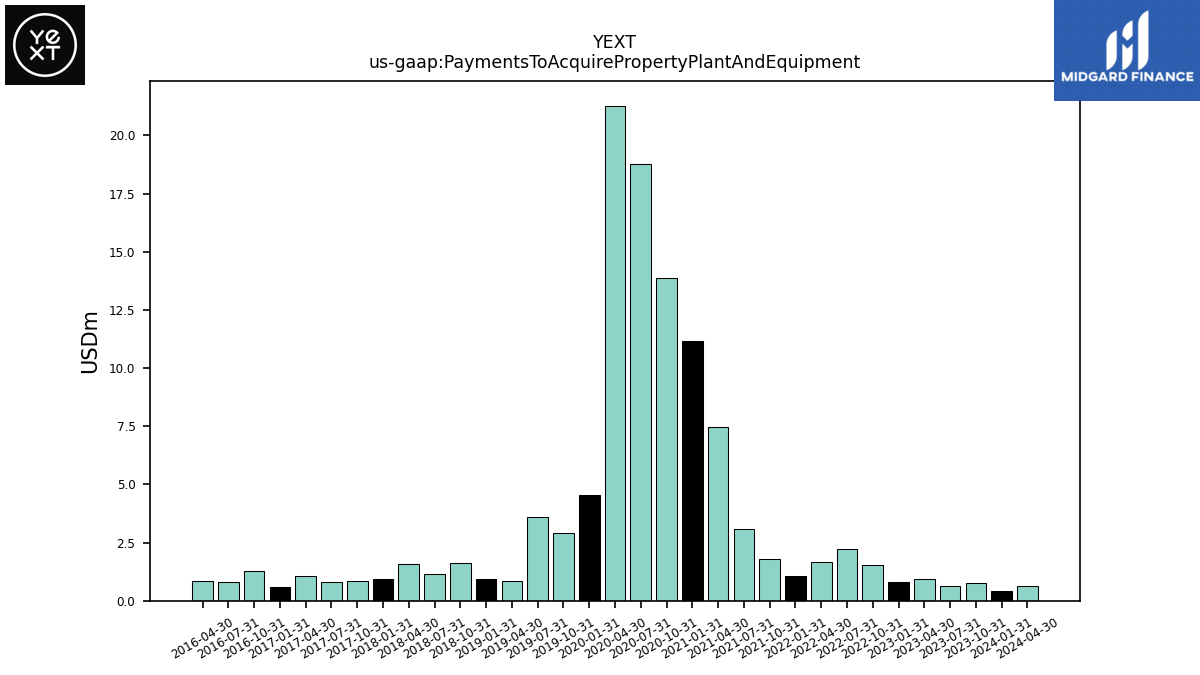
| Payments To Acquire Property Plant And Equipment | 0.75 | 0.62 | 0.94 | 0.79 | 1.52 | 2.23 | 1.64 | 1.08 | 1.78 | 3.10 | 7.46 | 11.16 | 13.89 | 18.78 | 21.27 | 4.54 | 2.90 | 3.62 | 0.83 | 0.95 | 1.62 | 1.13 | 1.57 | 0.93 | 0.86 | 0.81 | 1.08 | 0.61 | 1.26 | 0.81 | 0.83 |
| 2023-10-31 | 2023-07-31 | 2023-04-30 | 2023-01-31 | 2022-10-31 | 2022-07-31 | 2022-04-30 | 2022-01-31 | 2021-10-31 | 2021-07-31 | 2021-04-30 | 2021-01-31 | 2020-10-31 | 2020-07-31 | 2020-04-30 | 2020-01-31 | 2019-10-31 | 2019-07-31 | 2019-04-30 | 2019-01-31 | 2018-10-31 | 2018-07-31 | 2018-04-30 | 2018-01-31 | 2017-10-31 | 2017-07-31 | 2017-04-30 | 2017-01-31 | 2016-10-31 | 2016-07-31 | 2016-04-30 | ||
|---|---|---|---|---|---|---|---|---|---|---|---|---|---|---|---|---|---|---|---|---|---|---|---|---|---|---|---|---|---|---|---|---|
| Net Cash Provided By Used In Financing Activities | -14.62 | -8.57 | 0.31 | -10.70 | -11.75 | -30.27 | -26.29 | 4.95 | 2.08 | 3.98 | 13.61 | 5.46 | 7.42 | 6.70 | 2.97 | 4.57 | 4.78 | 5.53 | 153.50 | 5.55 | 6.35 | 6.32 | 6.17 | 7.95 | 3.69 | -0.74 | 118.70 | 5.12 | 0.34 | 0.11 | 0.40 | |
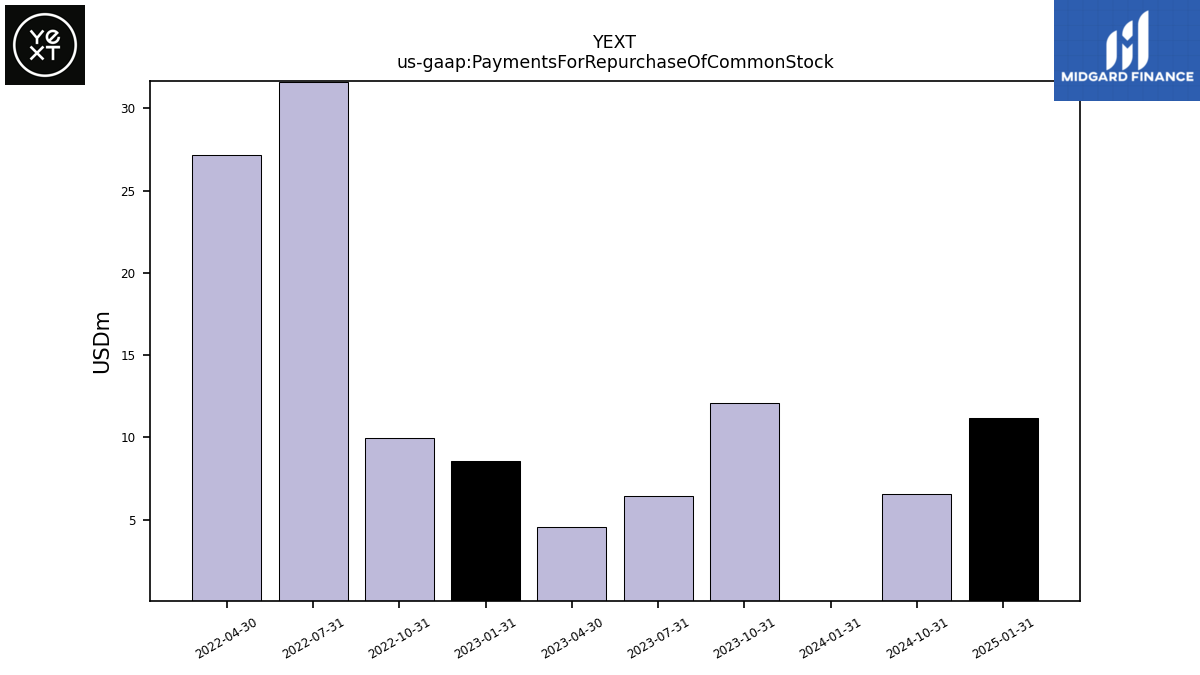
| Payments For Repurchase Of Common Stock | 12.09 | 6.41 | 4.58 | 8.55 | 9.97 | 31.58 | 27.14 | NA | NA | NA | NA | NA | NA | NA | NA | NA | NA | NA | NA | NA | NA | NA | NA | NA | NA | NA | NA | NA | NA | NA | NA |
| 2023-10-31 | 2023-07-31 | 2023-04-30 | 2023-01-31 | 2022-10-31 | 2022-07-31 | 2022-04-30 | 2022-01-31 | 2021-10-31 | 2021-07-31 | 2021-04-30 | 2021-01-31 | 2020-10-31 | 2020-07-31 | 2020-04-30 | 2020-01-31 | 2019-10-31 | 2019-07-31 | 2019-04-30 | 2019-01-31 | 2018-10-31 | 2018-07-31 | 2018-04-30 | 2018-01-31 | 2017-10-31 | 2017-07-31 | 2017-04-30 | 2017-01-31 | 2016-10-31 | 2016-07-31 | 2016-04-30 | ||
|---|---|---|---|---|---|---|---|---|---|---|---|---|---|---|---|---|---|---|---|---|---|---|---|---|---|---|---|---|---|---|---|---|
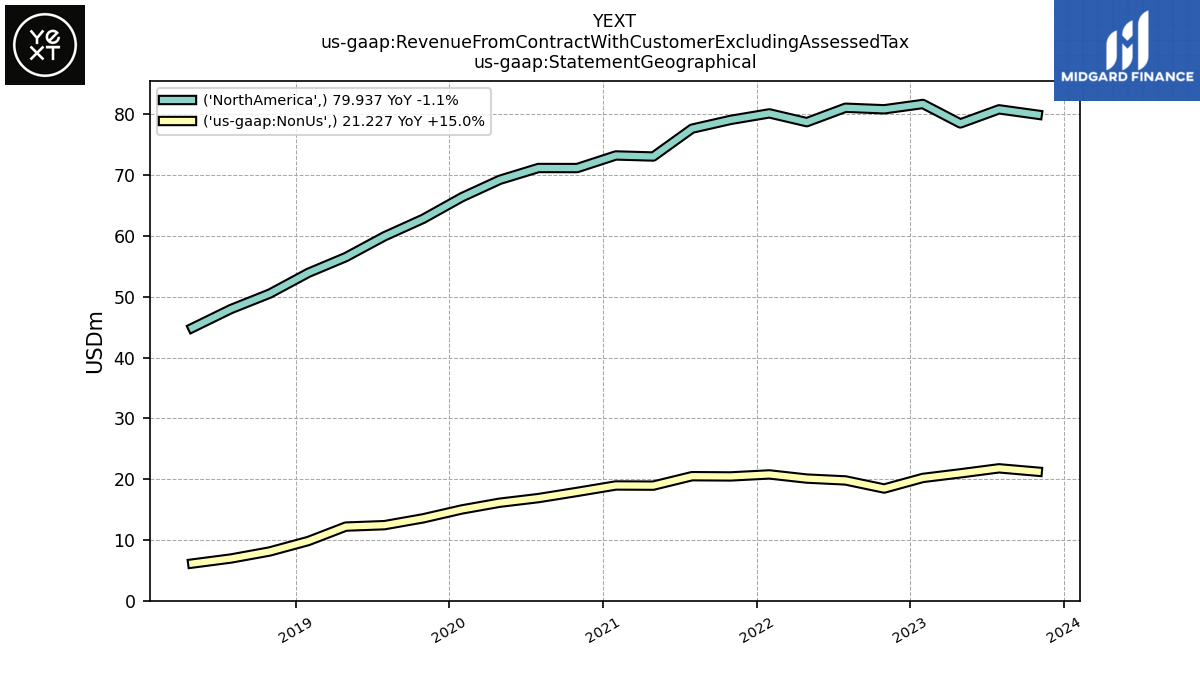
| Revenues | 101.16 | 102.60 | 99.45 | 101.90 | 99.28 | 100.87 | 98.80 | 100.93 | 99.53 | 98.12 | 91.99 | 92.19 | 89.06 | 88.06 | 85.35 | 81.38 | 76.37 | 72.37 | 68.71 | 63.76 | 58.74 | 55.10 | 51.09 | 48.02 | 44.33 | 40.77 | 37.08 | 35.67 | 31.91 | 29.56 | 27.12 | |
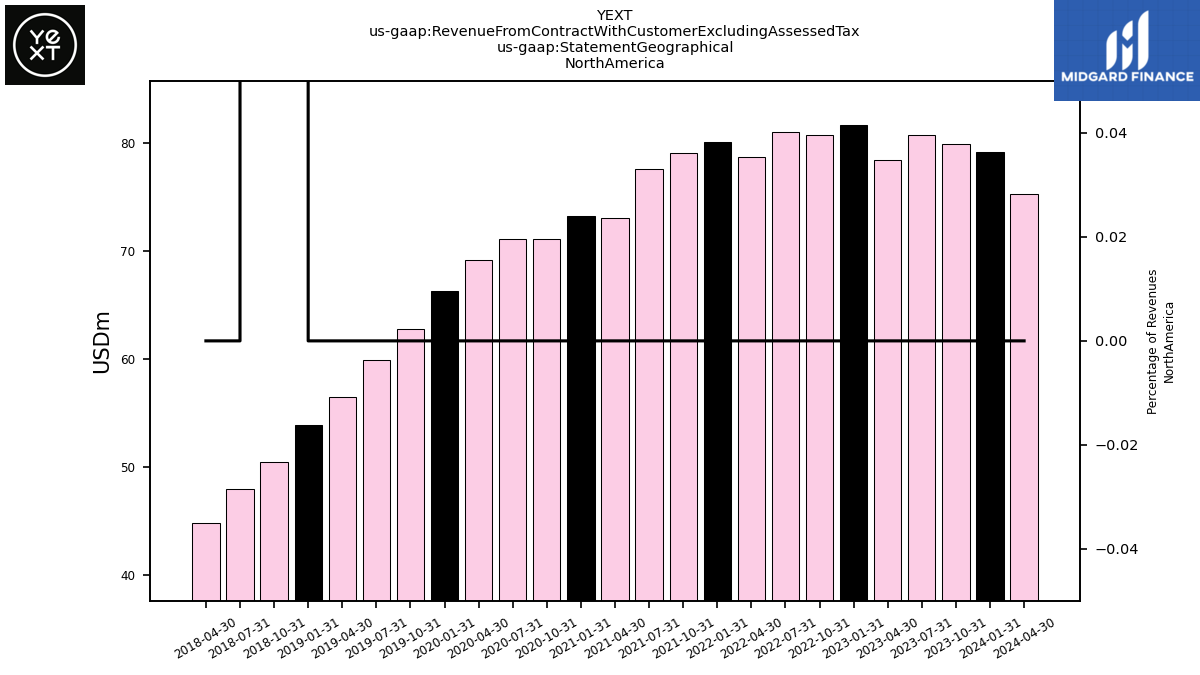
| Revenue From Contract With Customer Excluding Assessed Tax | 101.16 | 102.60 | 99.45 | 101.90 | 99.28 | 100.87 | 98.80 | 100.93 | 99.53 | 98.12 | 91.99 | 92.19 | 89.06 | 88.06 | 85.35 | 81.38 | 76.37 | 72.37 | 68.71 | 63.76 | 58.61 | 54.92 | 50.99 | 48.02 | 44.33 | 40.77 | 37.08 | 35.67 | 31.91 | 29.56 | 27.12 | |
| 79.94 | 80.82 | 78.50 | 81.70 | 80.83 | 81.08 | 78.71 | 80.16 | 79.08 | 77.64 | 73.06 | 73.23 | 71.16 | 71.17 | 69.23 | 66.36 | 62.81 | 59.94 | 56.51 | 53.93 | 50.51 | 47.98 | 44.87 | NA | NA | NA | NA | NA | NA | NA | NA | ||
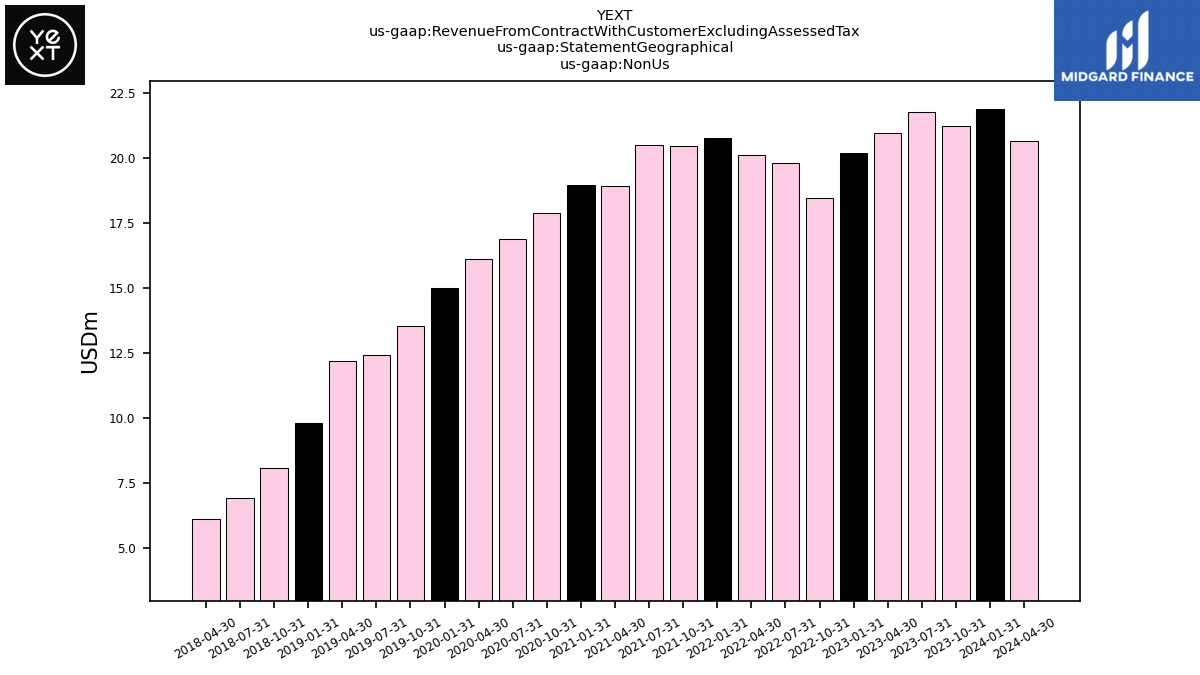
| Non Us | 21.23 | 21.78 | 20.95 | 20.20 | 18.45 | 19.79 | 20.09 | 20.78 | 20.45 | 20.48 | 18.93 | 18.96 | 17.90 | 16.88 | 16.12 | 15.02 | 13.55 | 12.43 | 12.20 | 9.83 | 8.10 | 6.95 | 6.12 | NA | NA | NA | NA | NA | NA | NA | NA |