
| 2023-09-30 | 2023-06-30 | 2023-03-31 | 2022-12-31 | 2022-09-30 | 2022-06-30 | 2022-03-31 | 2021-12-31 | 2021-09-30 | 2021-06-30 | 2021-03-31 | 2020-12-31 | 2020-09-30 | 2020-06-30 | ||
|---|---|---|---|---|---|---|---|---|---|---|---|---|---|---|---|
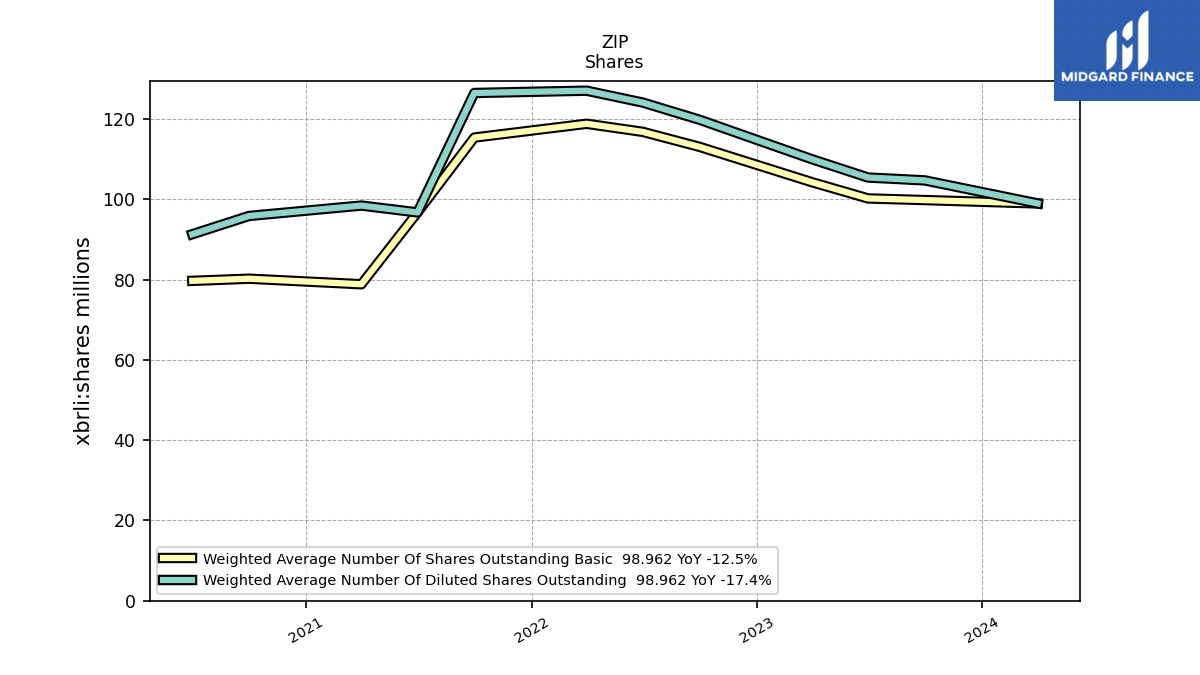
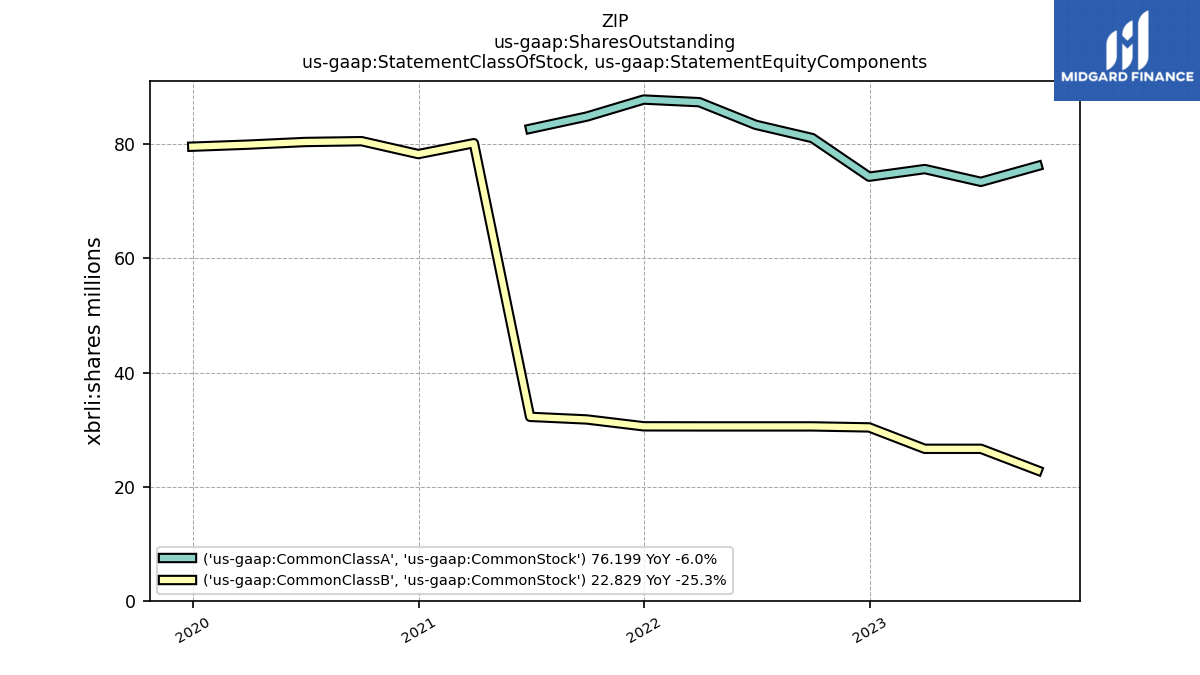
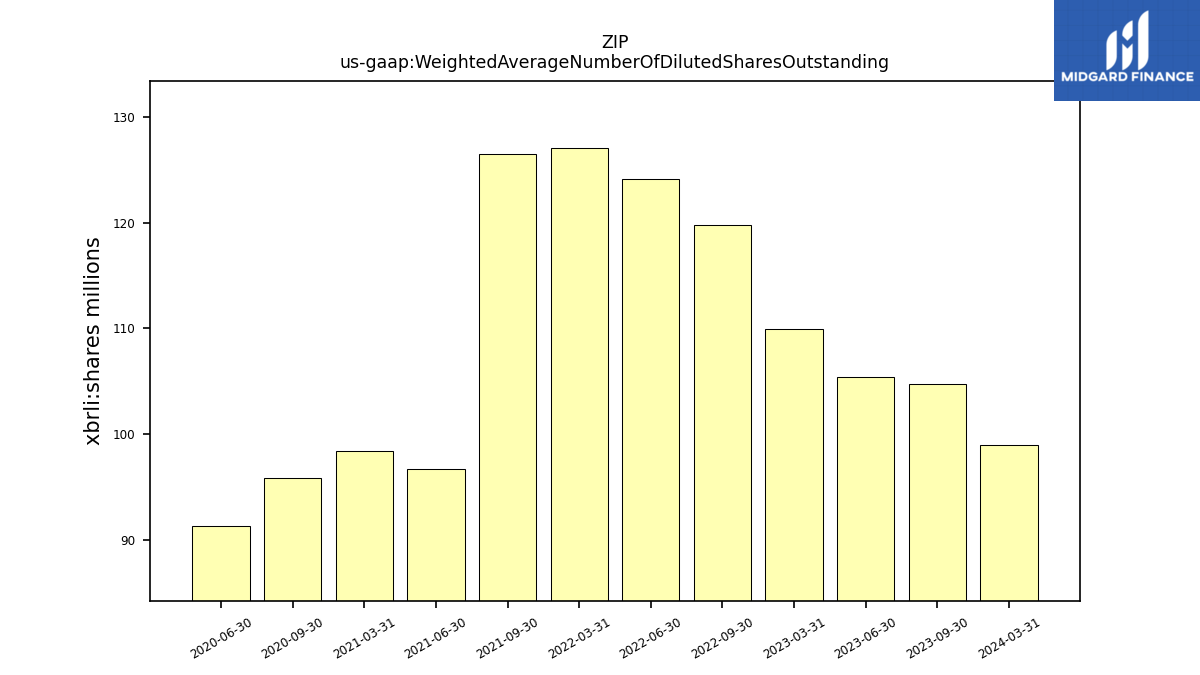
| Weighted Average Number Of Diluted Shares Outstanding | 104.71 | 105.42 | 109.98 | NA | 119.81 | 124.09 | 127.05 | NA | 126.47 | 96.73 | 98.44 | NA | 95.84 | 91.29 | |
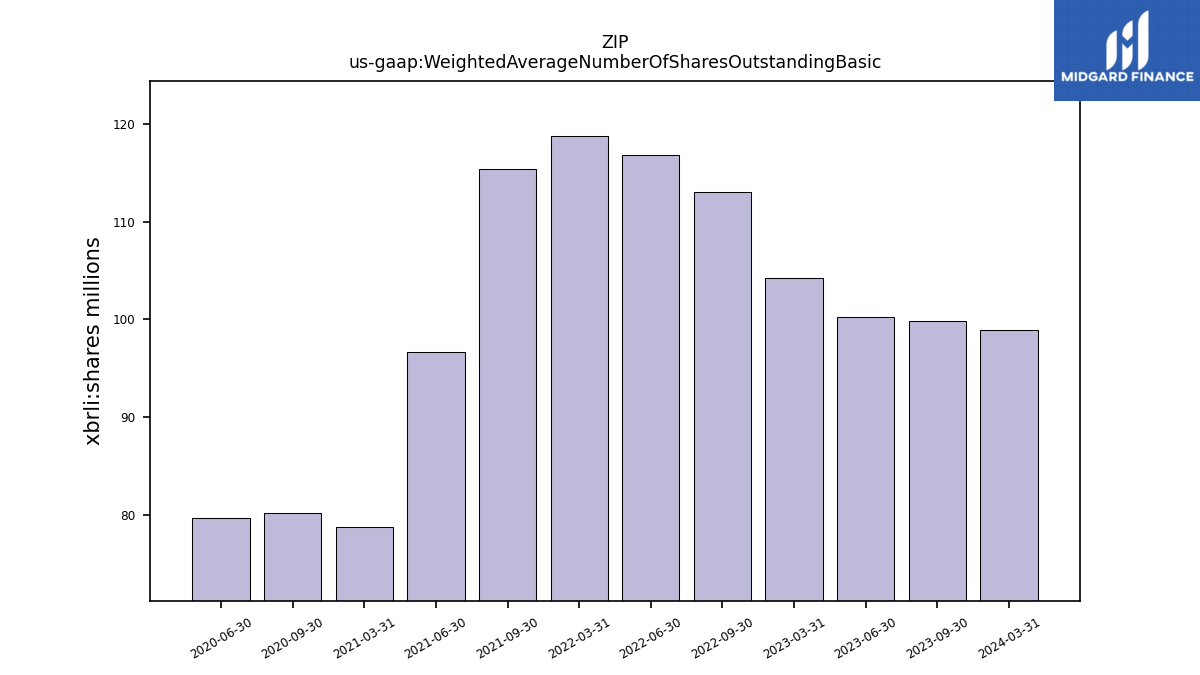
| Weighted Average Number Of Shares Outstanding Basic | 99.80 | 100.21 | 104.26 | NA | 113.06 | 116.79 | 118.81 | NA | 115.37 | 96.73 | 78.83 | NA | 80.22 | 79.68 | |
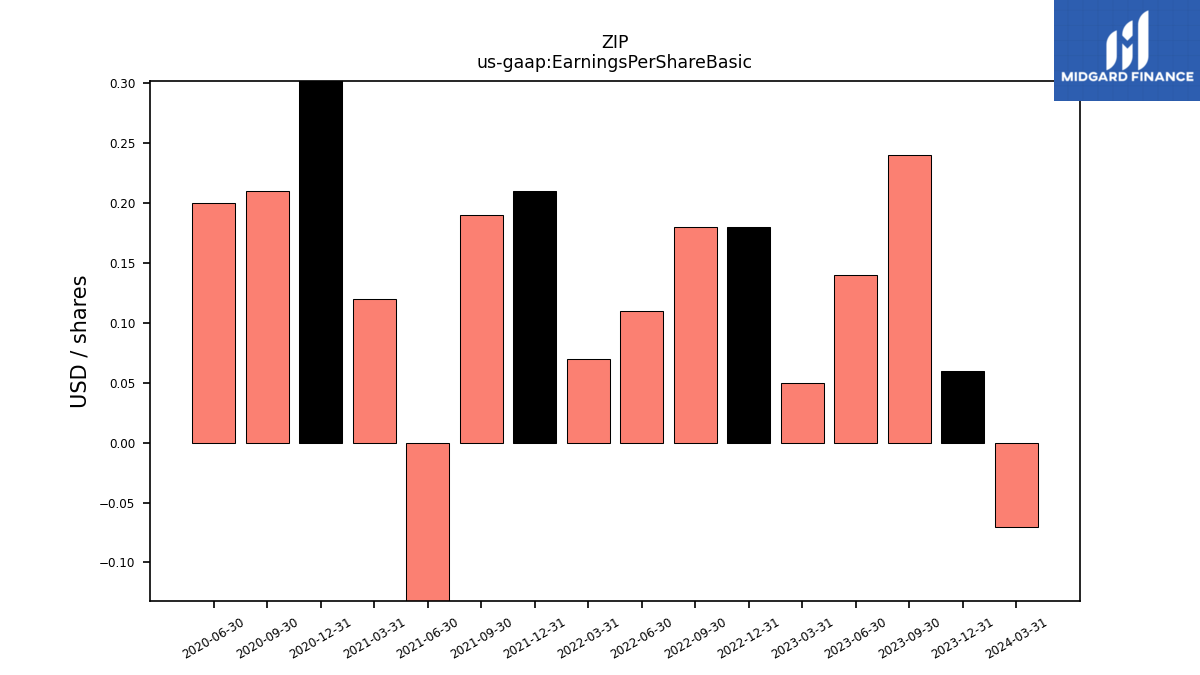
| Earnings Per Share Basic | 0.24 | 0.14 | 0.05 | 0.18 | 0.18 | 0.11 | 0.07 | 0.21 | 0.19 | -0.55 | 0.12 | 0.50 | 0.21 | 0.20 | |
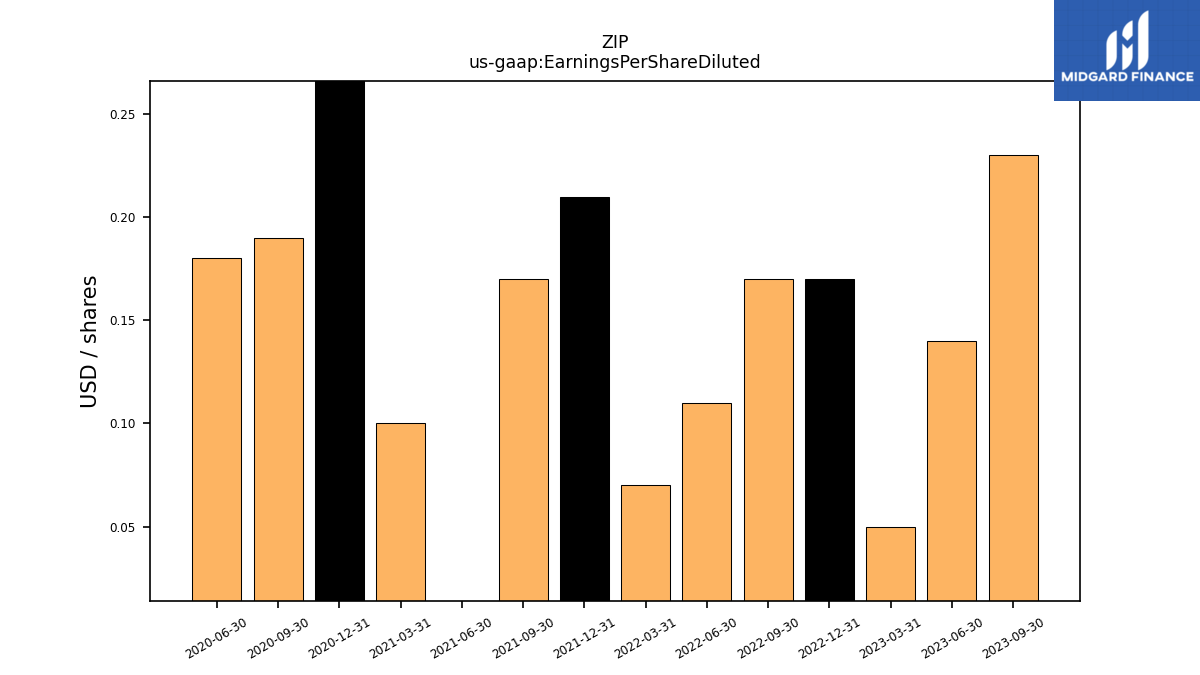
| Earnings Per Share Diluted | 0.23 | 0.14 | 0.05 | 0.17 | 0.17 | 0.11 | 0.07 | 0.21 | 0.17 | -0.55 | 0.10 | 0.44 | 0.19 | 0.18 |
| 2023-09-30 | 2023-06-30 | 2023-03-31 | 2022-12-31 | 2022-09-30 | 2022-06-30 | 2022-03-31 | 2021-12-31 | 2021-09-30 | 2021-06-30 | 2021-03-31 | 2020-12-31 | 2020-09-30 | 2020-06-30 | ||
|---|---|---|---|---|---|---|---|---|---|---|---|---|---|---|---|
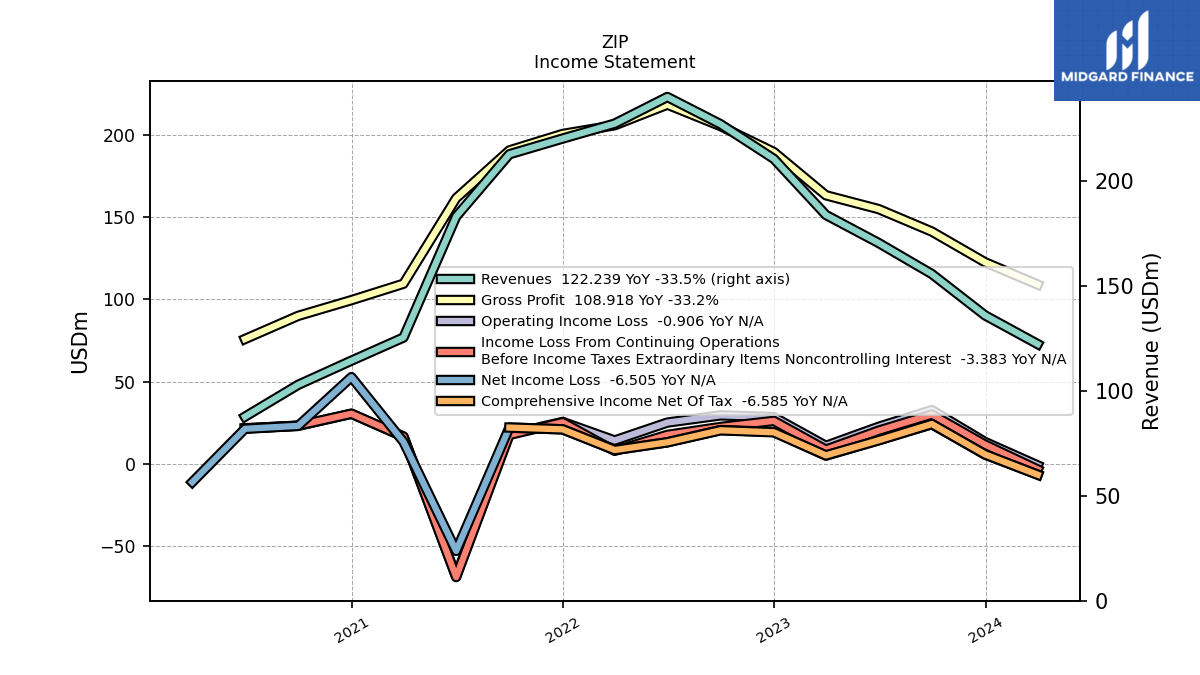
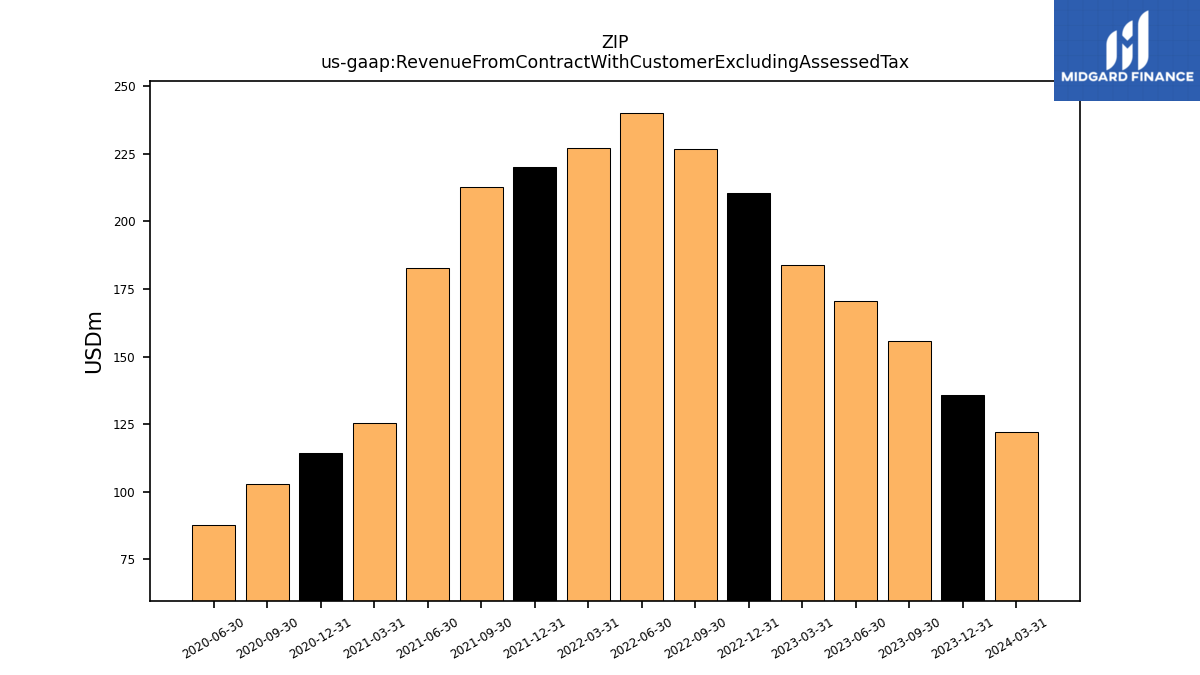
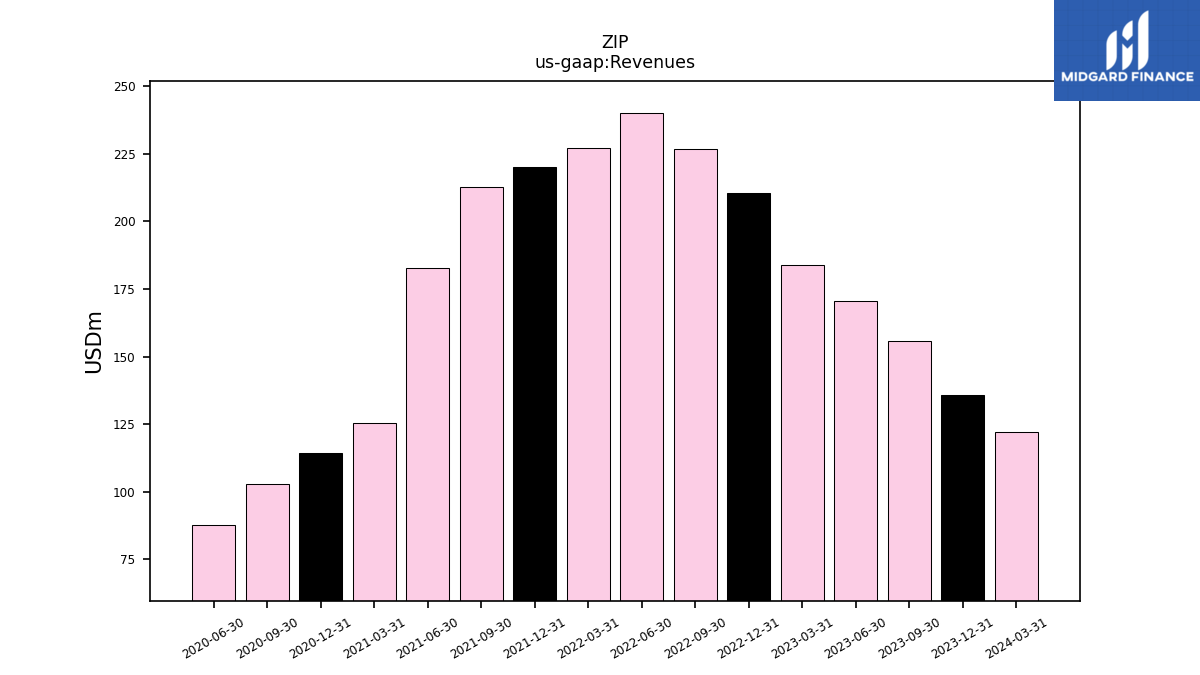
| Revenue From Contract With Customer Excluding Assessed Tax | 155.63 | 170.42 | 183.75 | 210.48 | 226.97 | 239.94 | 227.26 | 220.14 | 212.67 | 182.96 | 125.37 | 114.34 | 102.85 | 87.66 | |
| Revenues | 155.63 | 170.42 | 183.75 | 210.48 | 226.97 | 239.94 | 227.26 | 220.14 | 212.67 | 182.96 | 125.37 | 114.34 | 102.85 | 87.66 | |
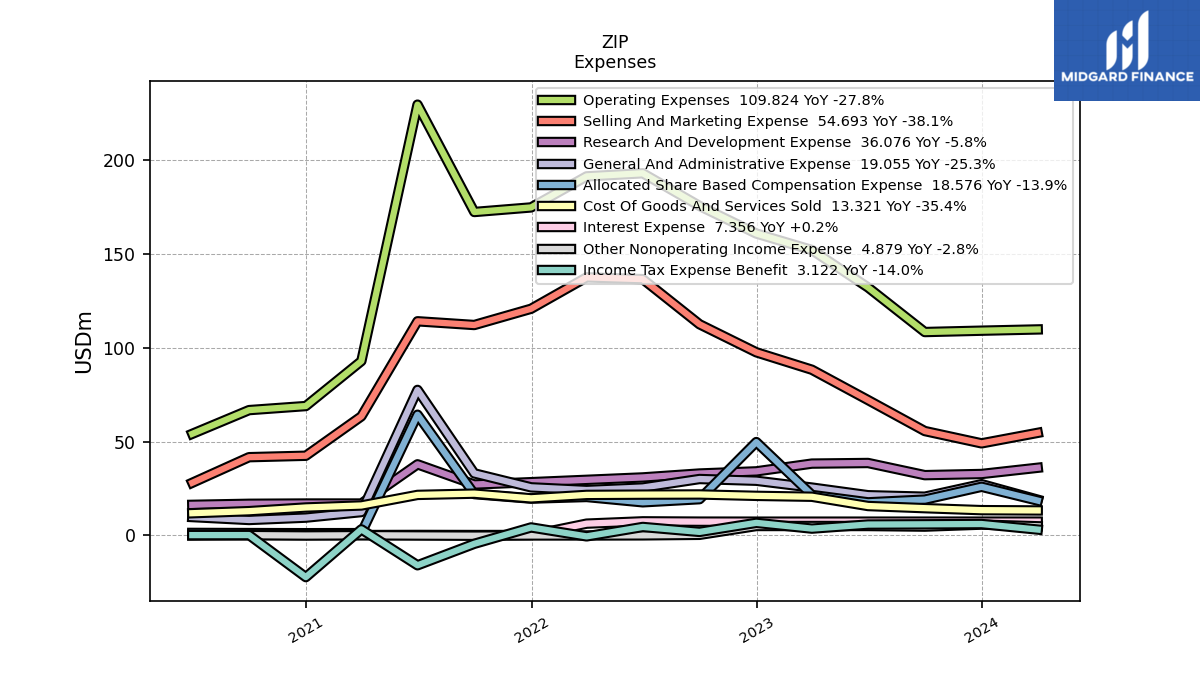
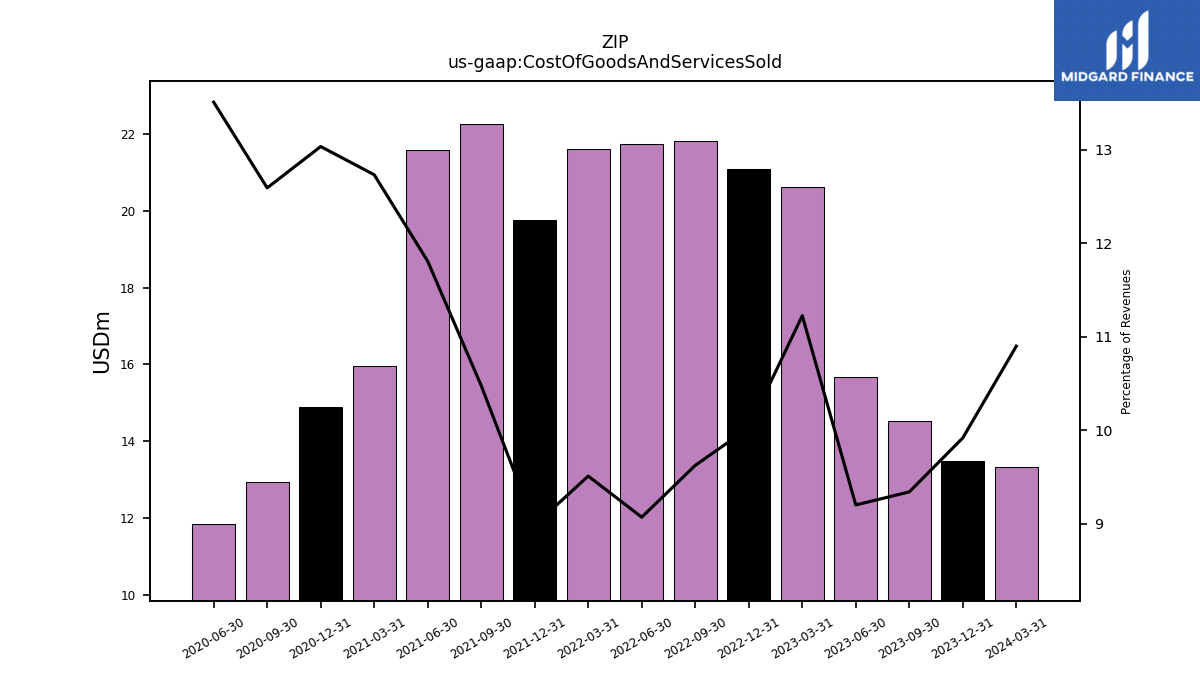
| Cost Of Goods And Services Sold | 14.53 | 15.68 | 20.62 | 21.10 | 21.84 | 21.76 | 21.61 | 19.78 | 22.28 | 21.60 | 15.96 | 14.90 | 12.95 | 11.84 | |
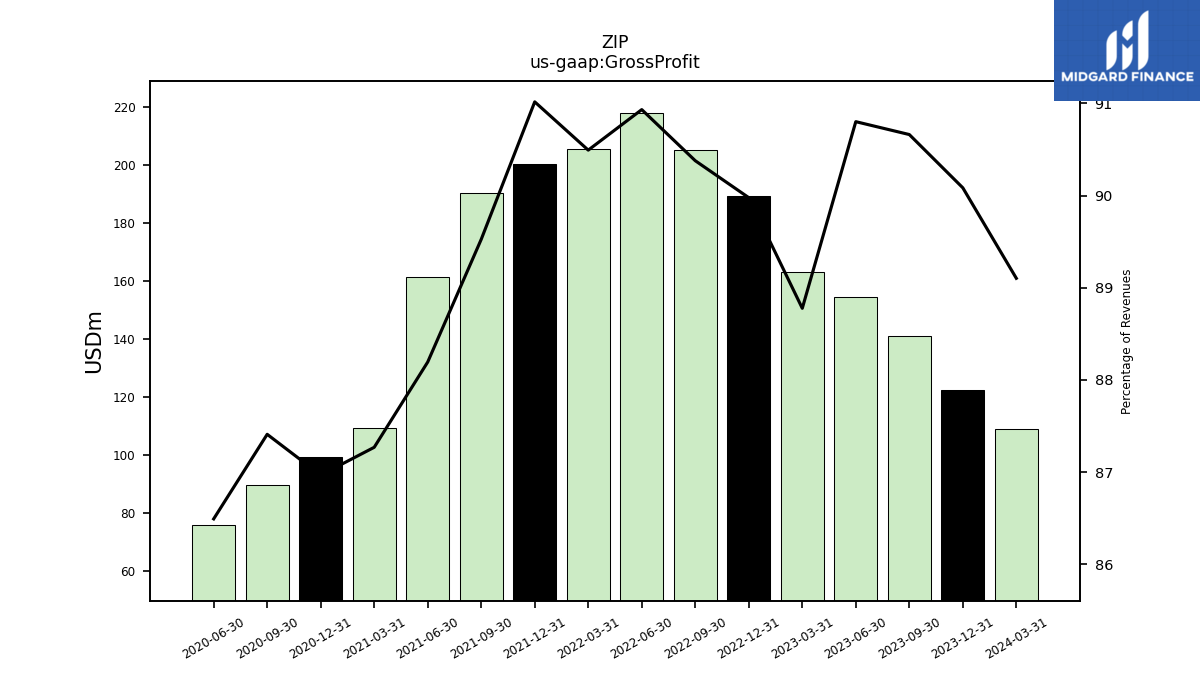
| Gross Profit | 141.10 | 154.75 | 163.13 | 189.38 | 205.13 | 218.19 | 205.65 | 200.36 | 190.40 | 161.36 | 109.41 | 99.44 | 89.90 | 75.81 | |
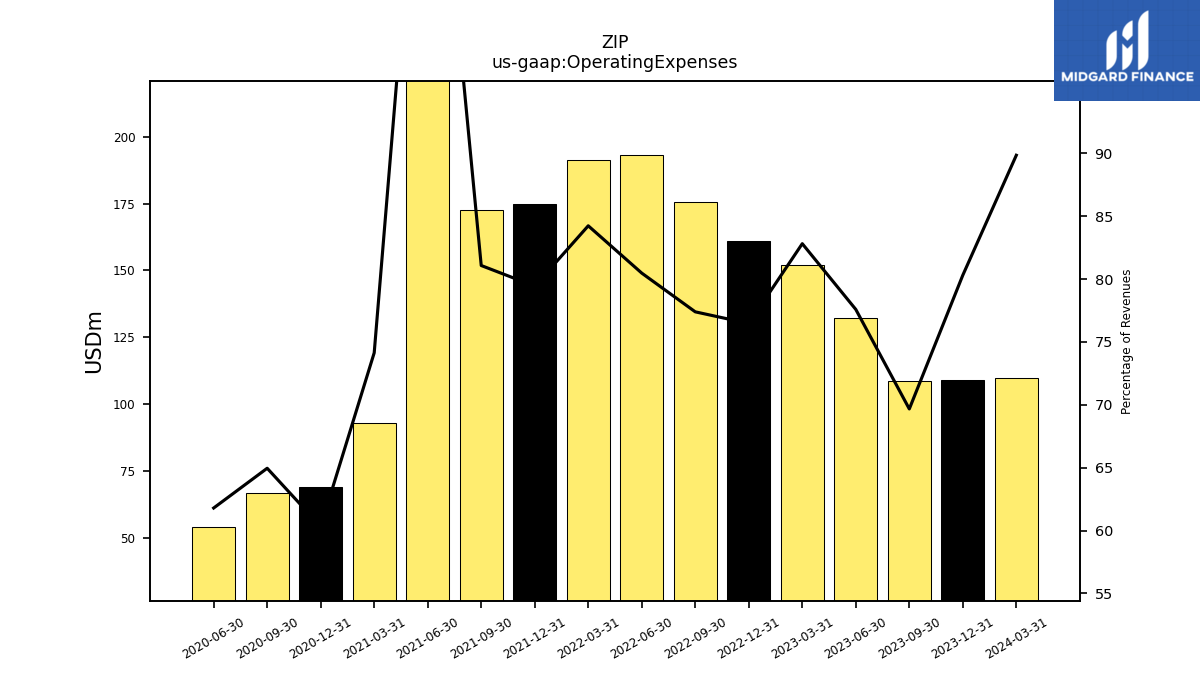
| Operating Expenses | 108.43 | 132.22 | 152.17 | 160.95 | 175.66 | 193.09 | 191.43 | 174.87 | 172.43 | 229.68 | 92.94 | 68.98 | 66.81 | 54.17 | |
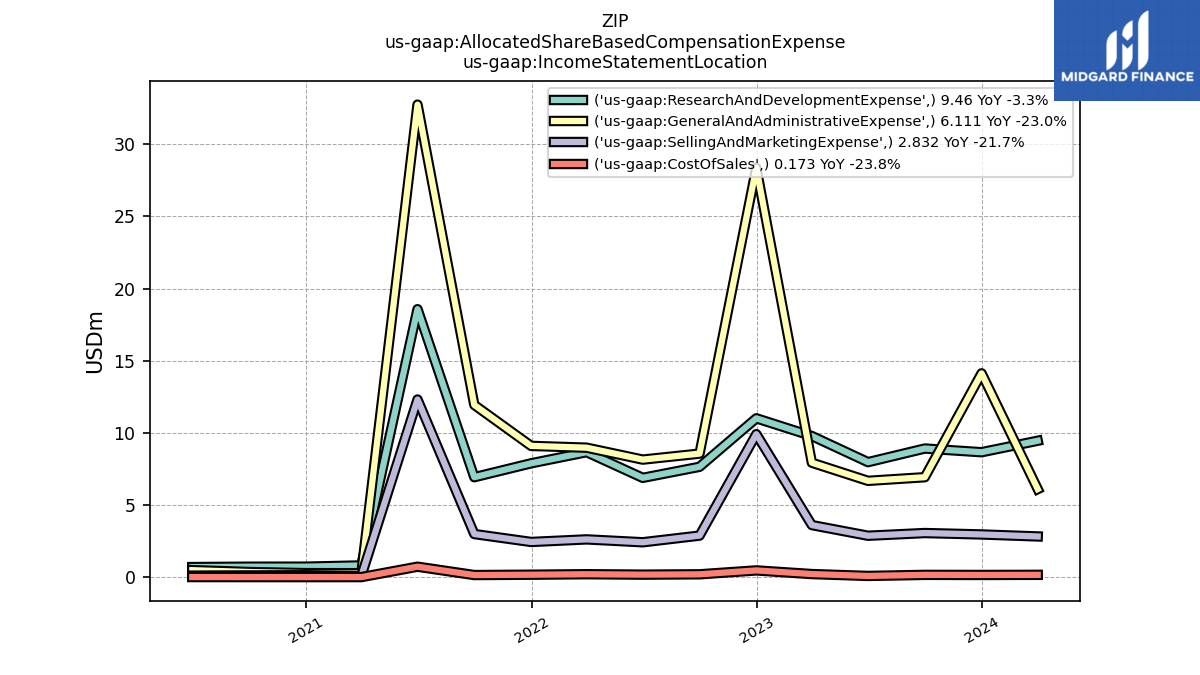
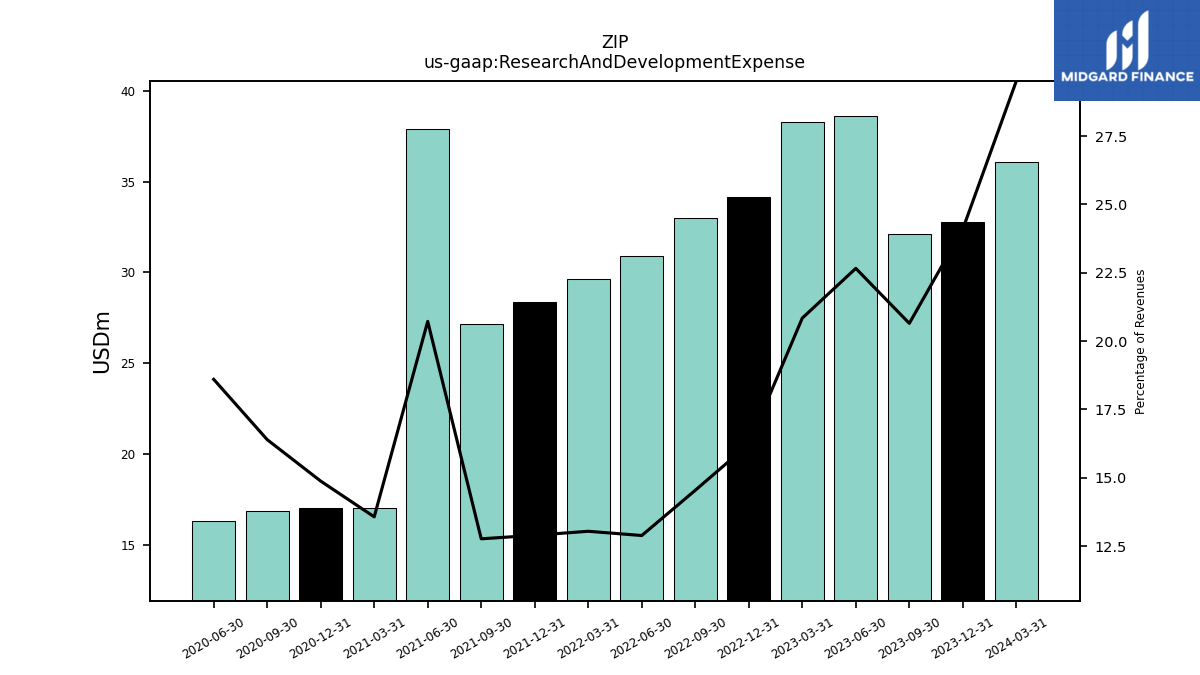
| Research And Development Expense | 32.14 | 38.62 | 38.29 | 34.16 | 33.01 | 30.93 | 29.64 | 28.39 | 27.16 | 37.91 | 17.02 | 17.01 | 16.86 | 16.31 | |
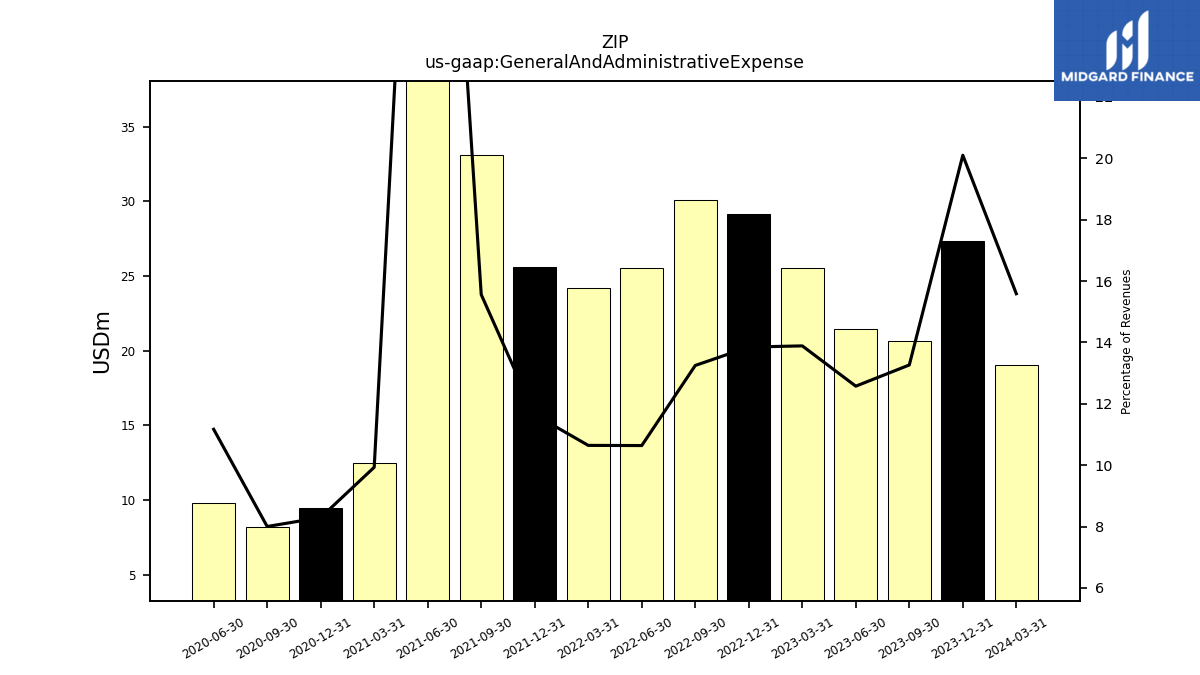
| General And Administrative Expense | 20.65 | 21.43 | 25.52 | 29.15 | 30.08 | 25.53 | 24.20 | 25.64 | 33.09 | 77.60 | 12.45 | 9.49 | 8.23 | 9.79 | |
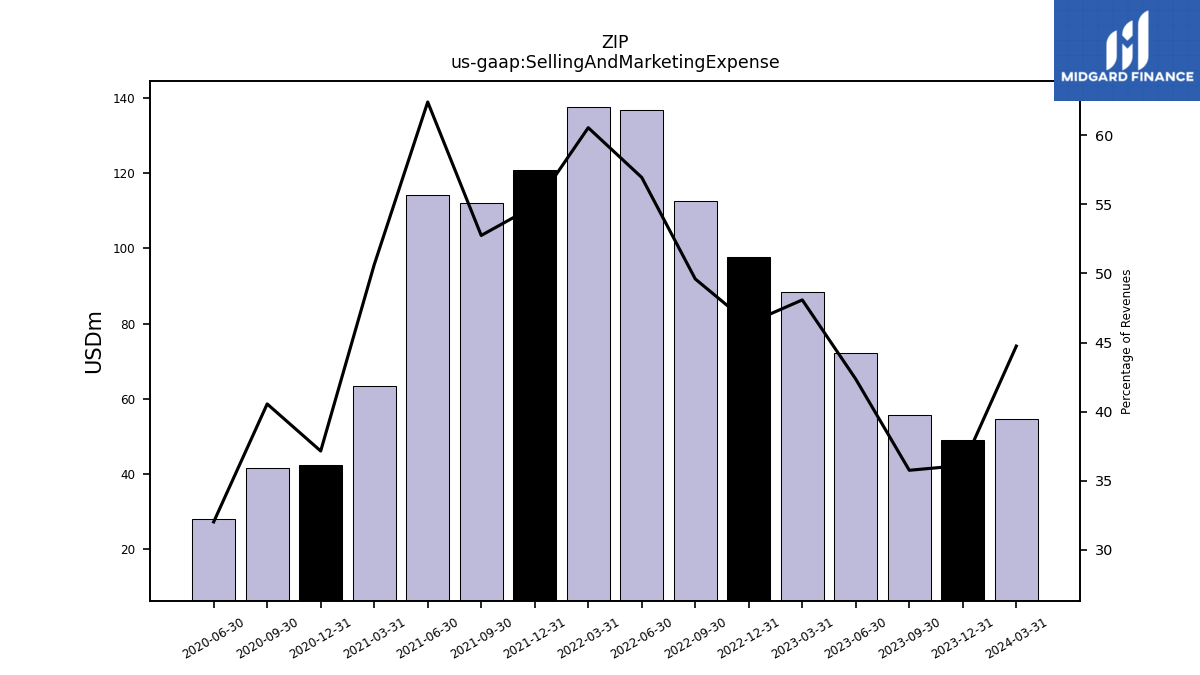
| Selling And Marketing Expense | 55.65 | 72.17 | 88.35 | 97.63 | 112.57 | 136.63 | 137.59 | 120.84 | 112.18 | 114.17 | 63.48 | 42.48 | 41.71 | 28.07 | |
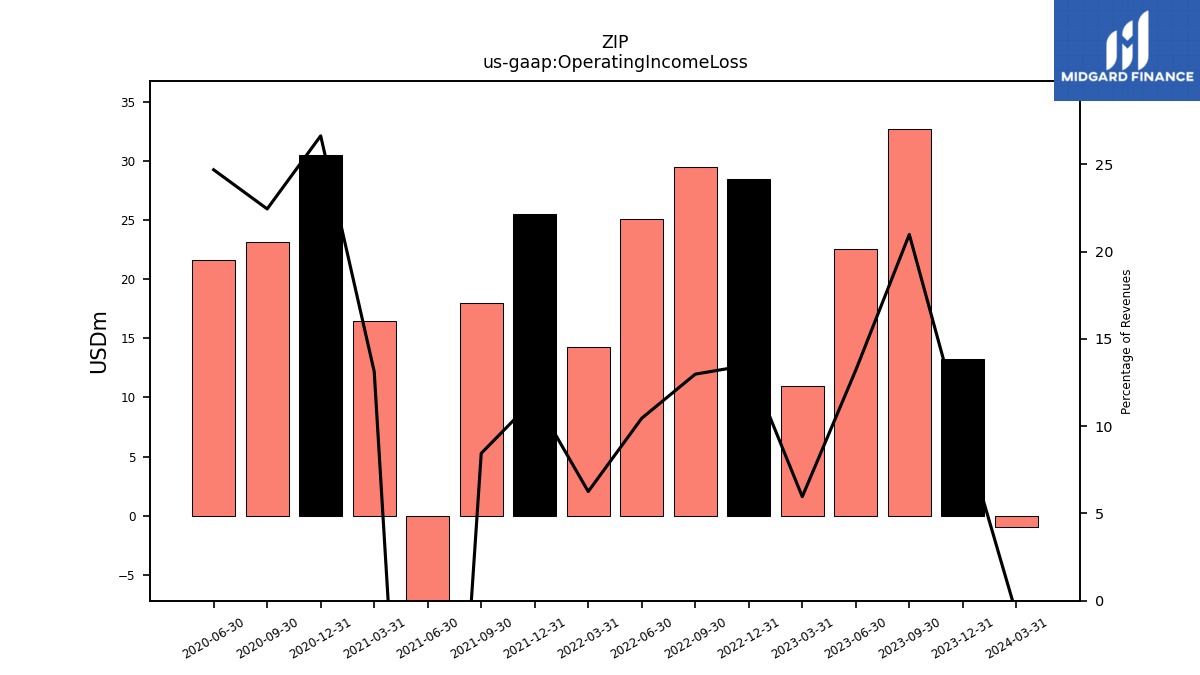
| Operating Income Loss | 32.67 | 22.52 | 10.96 | 28.44 | 29.47 | 25.10 | 14.22 | 25.49 | 17.97 | -68.32 | 16.47 | 30.46 | 23.09 | 21.65 | |
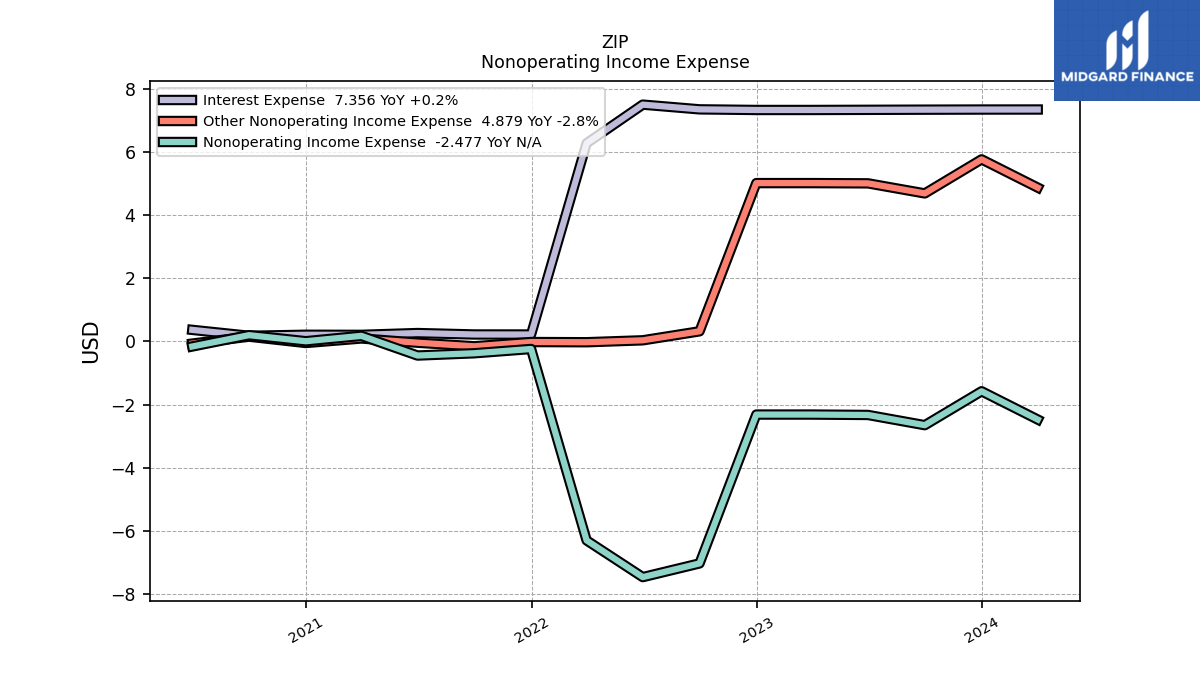
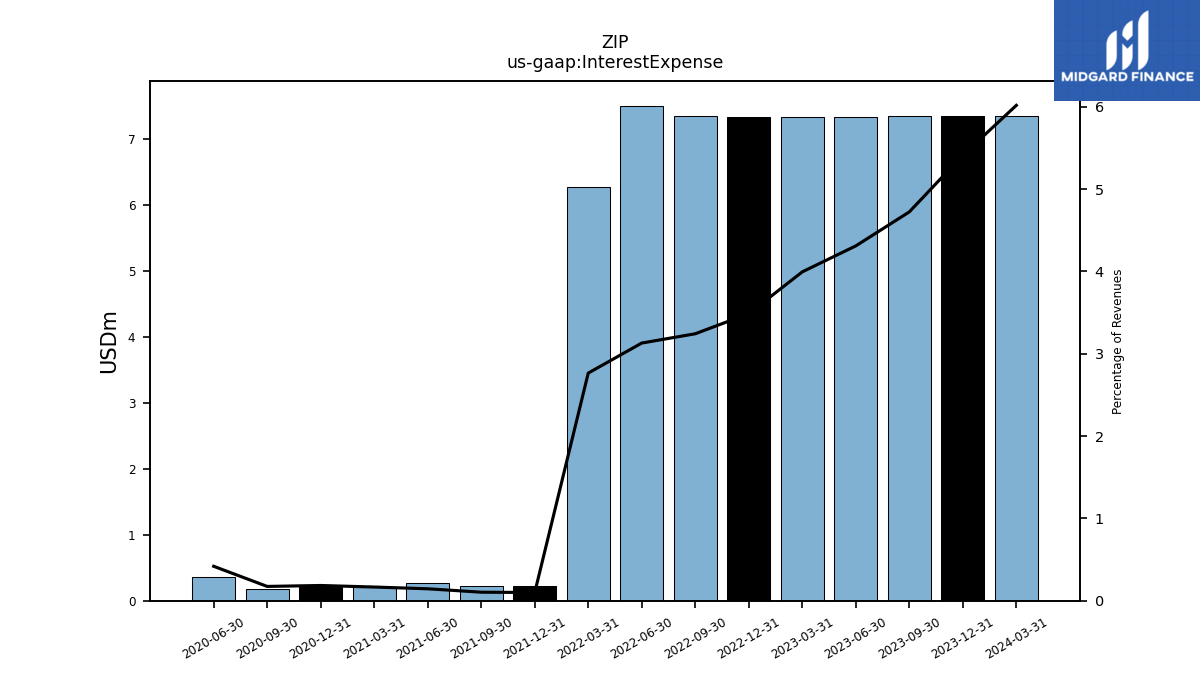
| Interest Expense | 7.35 | 7.35 | 7.34 | 7.34 | 7.36 | 7.51 | 6.29 | 0.22 | 0.22 | 0.27 | 0.21 | 0.21 | 0.18 | 0.37 | |
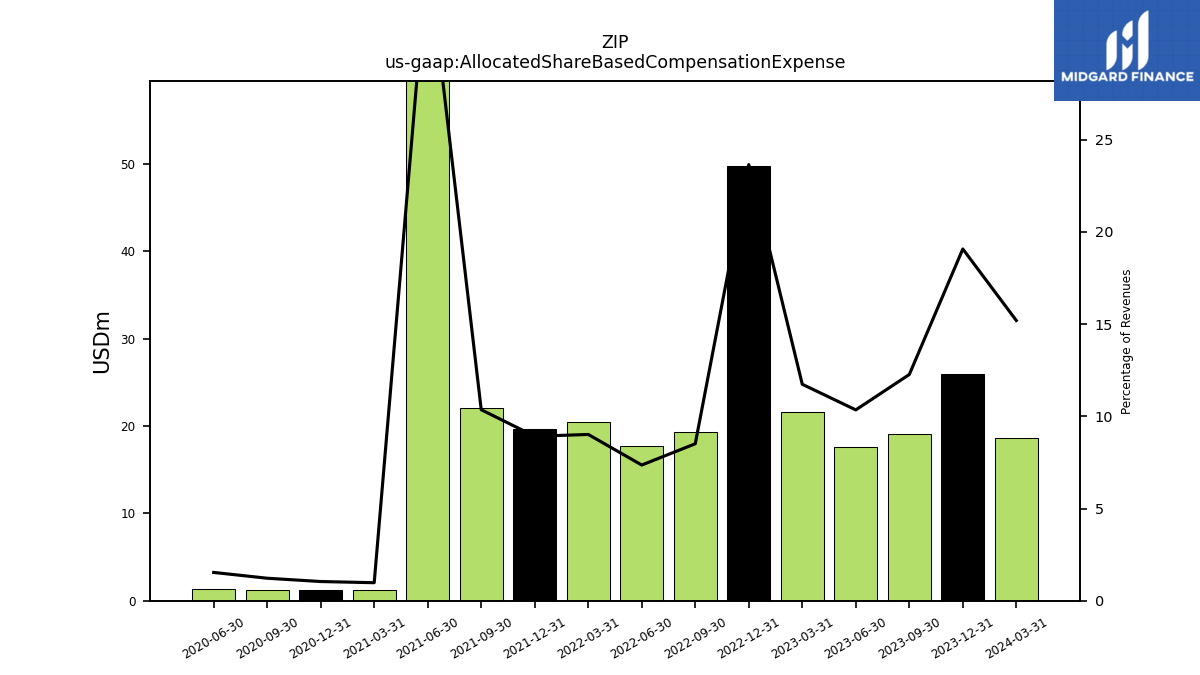
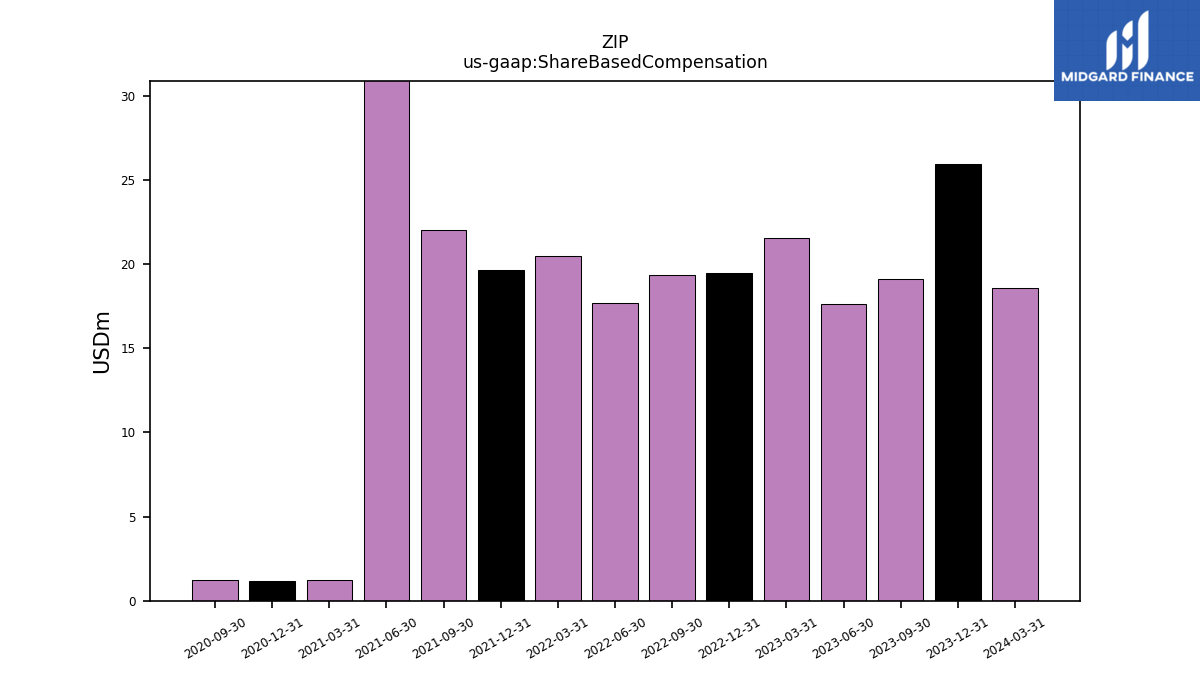
| Allocated Share Based Compensation Expense | 19.09 | 17.64 | 21.57 | 49.78 | 19.32 | 17.66 | 20.49 | 19.63 | 22.03 | 64.37 | 1.23 | 1.19 | 1.26 | 1.35 | |
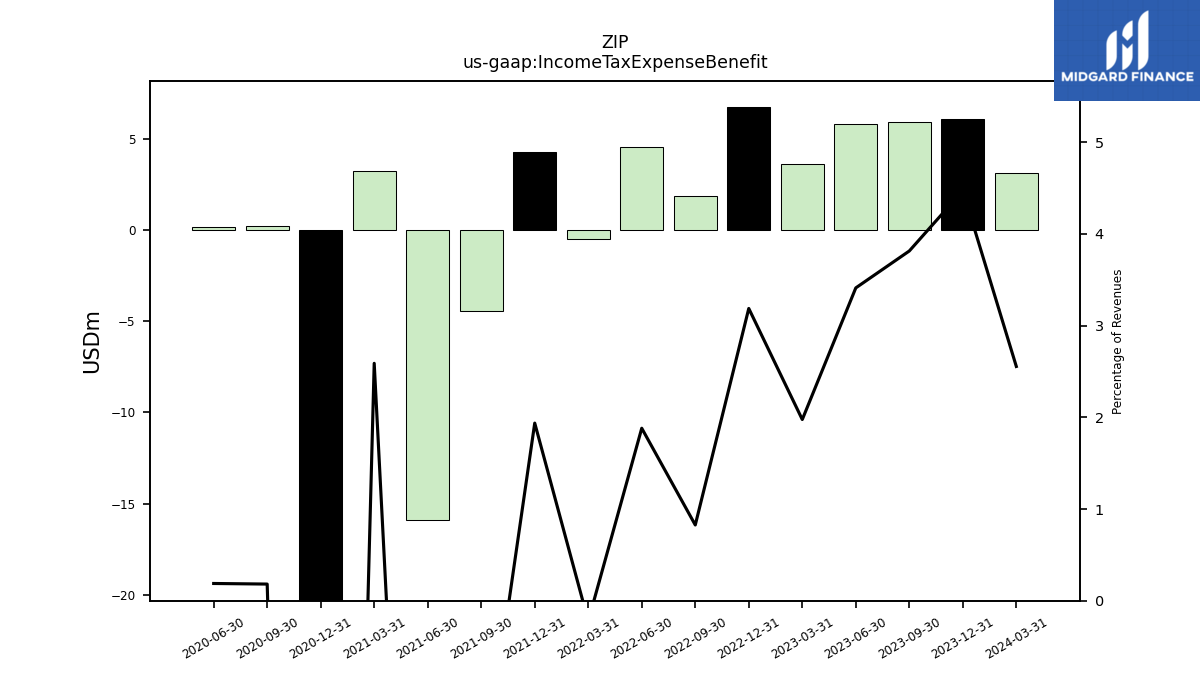
| Income Tax Expense Benefit | 5.93 | 5.81 | 3.63 | 6.71 | 1.88 | 4.51 | -0.50 | 4.26 | -4.47 | -15.92 | 3.25 | -22.23 | 0.19 | 0.17 | |
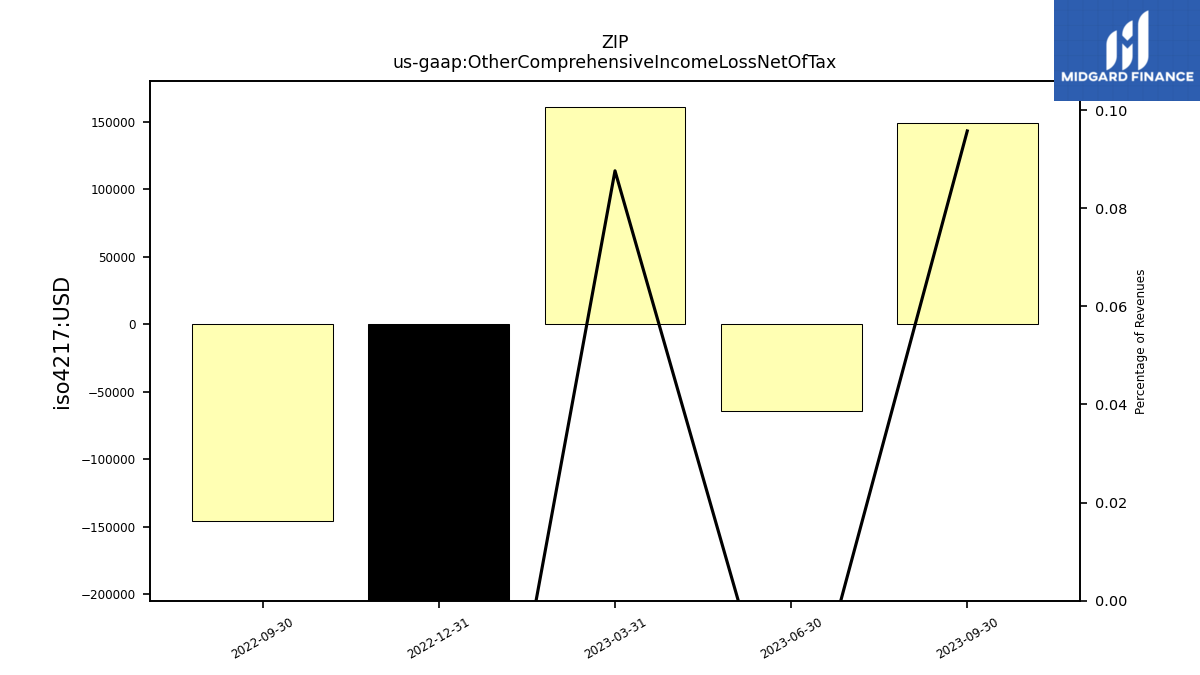
| Other Comprehensive Income Loss Net Of Tax | 0.15 | -0.06 | 0.16 | -0.23 | -0.15 | NA | NA | NA | NA | NA | NA | NA | NA | NA | |
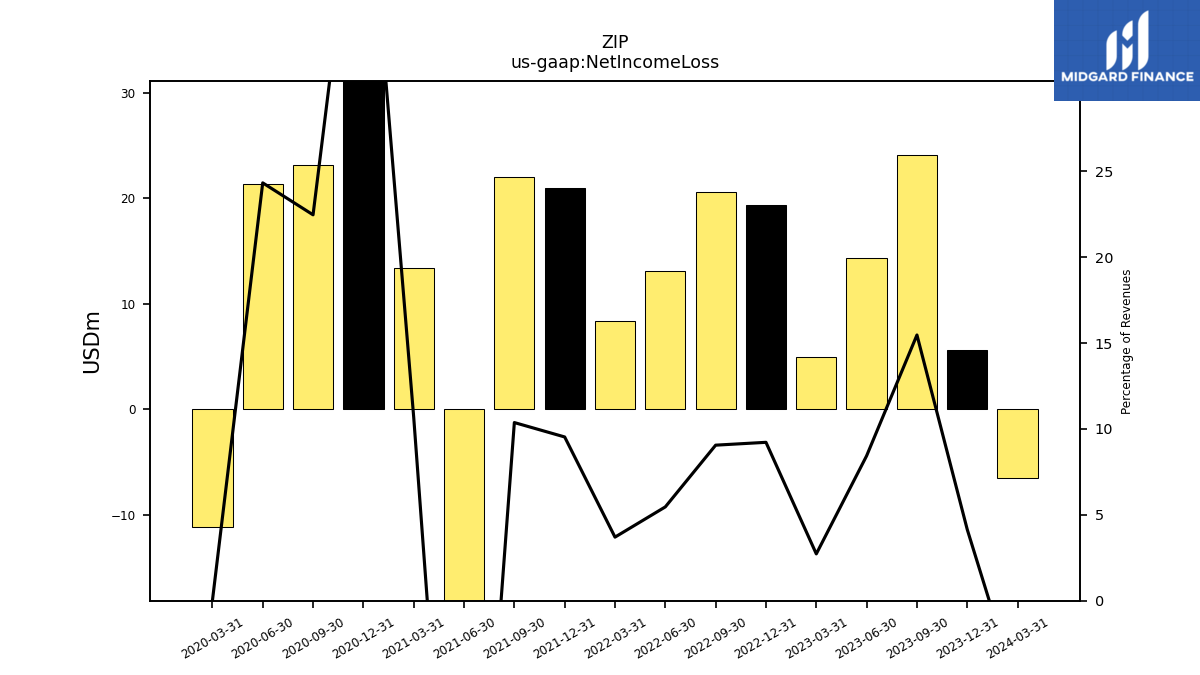
| Net Income Loss | 24.08 | 14.38 | 5.01 | 19.41 | 20.56 | 13.11 | 8.42 | 20.99 | 22.06 | -52.85 | 13.40 | 52.70 | 23.11 | 21.32 | |
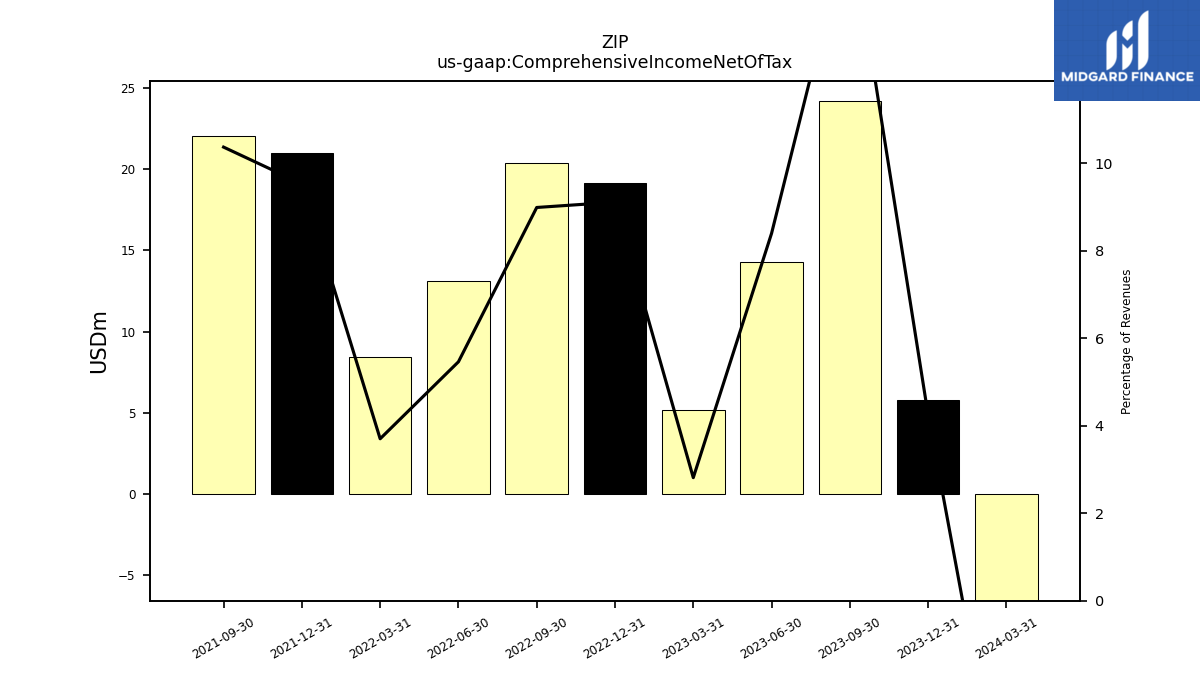
| Comprehensive Income Net Of Tax | 24.23 | 14.32 | 5.17 | 19.18 | 20.41 | 13.11 | 8.42 | 20.99 | 22.06 | NA | NA | NA | NA | NA | |
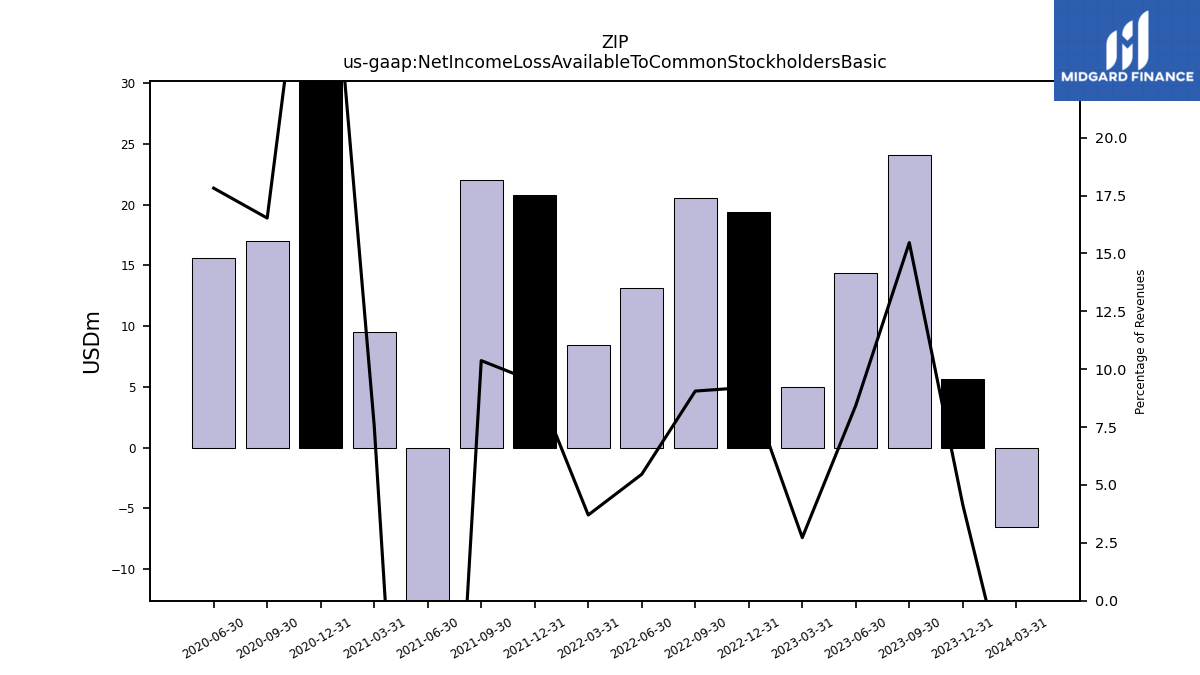
| Net Income Loss Available To Common Stockholders Basic | 24.08 | 14.38 | 5.01 | 19.41 | 20.56 | 13.11 | 8.42 | 20.82 | 22.06 | -53.33 | 9.49 | 39.65 | 17.00 | 15.62 | |
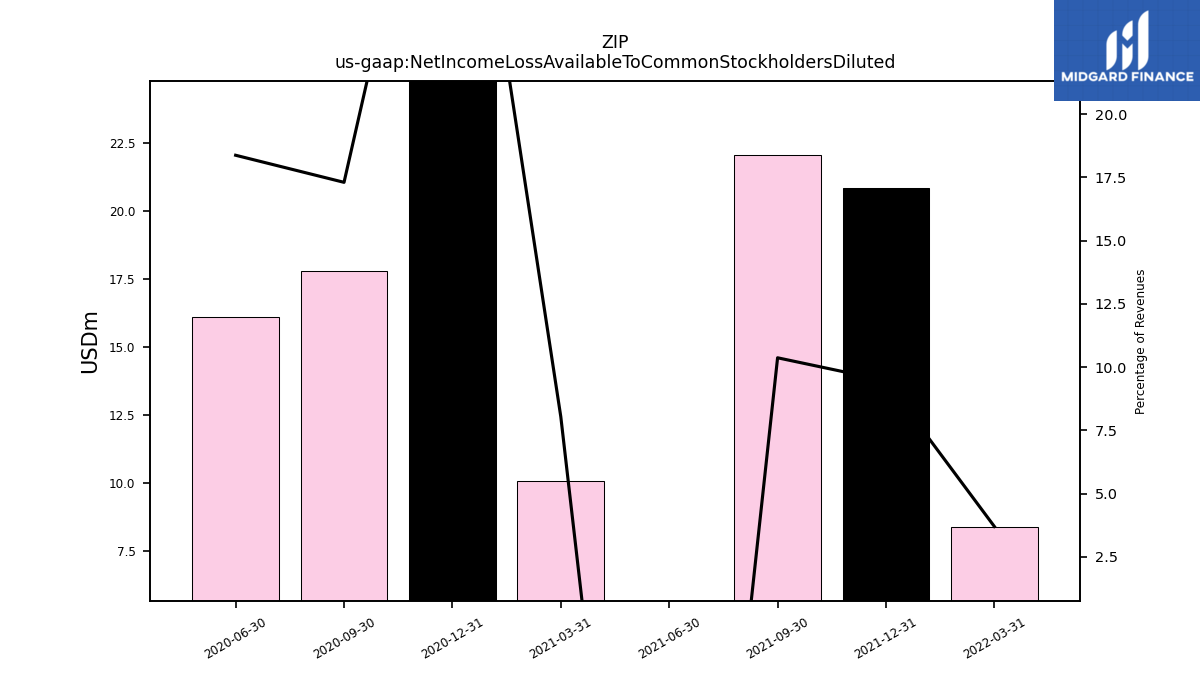
| Net Income Loss Available To Common Stockholders Diluted | NA | NA | NA | NA | NA | NA | 8.42 | 20.84 | 22.06 | -53.33 | 10.08 | 41.32 | 17.80 | 16.11 |
| 2023-09-30 | 2023-06-30 | 2023-03-31 | 2022-12-31 | 2022-09-30 | 2022-06-30 | 2022-03-31 | 2021-12-31 | 2021-09-30 | 2021-06-30 | 2021-03-31 | 2020-12-31 | 2020-09-30 | 2020-06-30 | ||
|---|---|---|---|---|---|---|---|---|---|---|---|---|---|---|---|
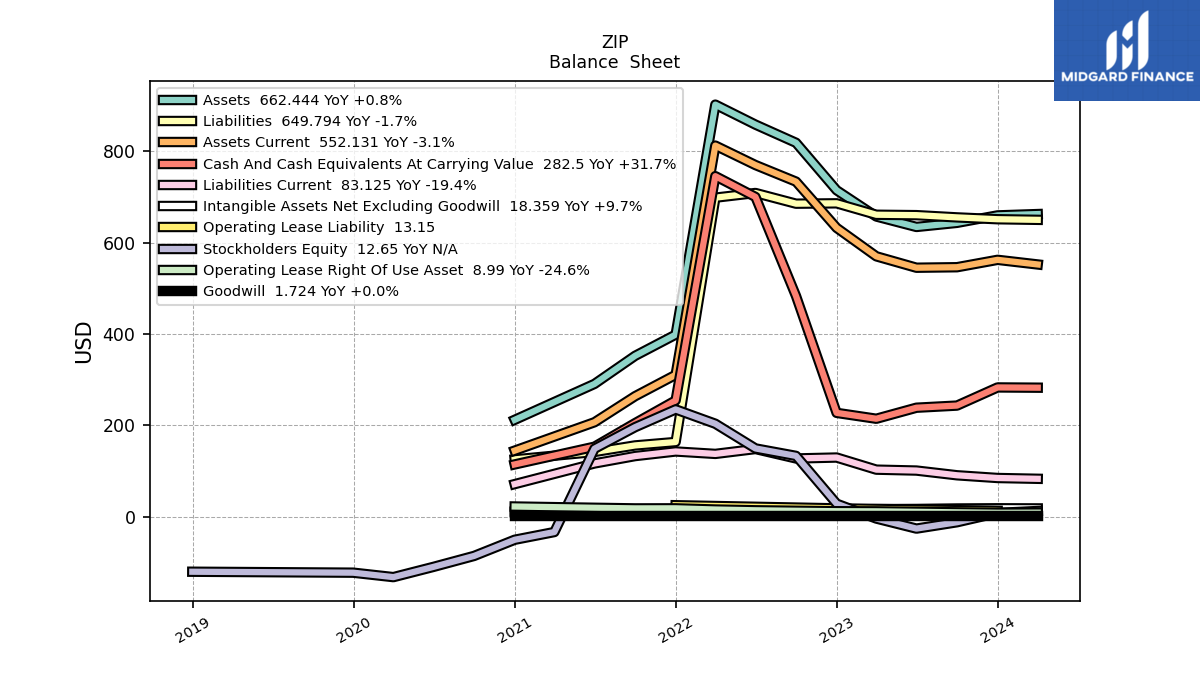
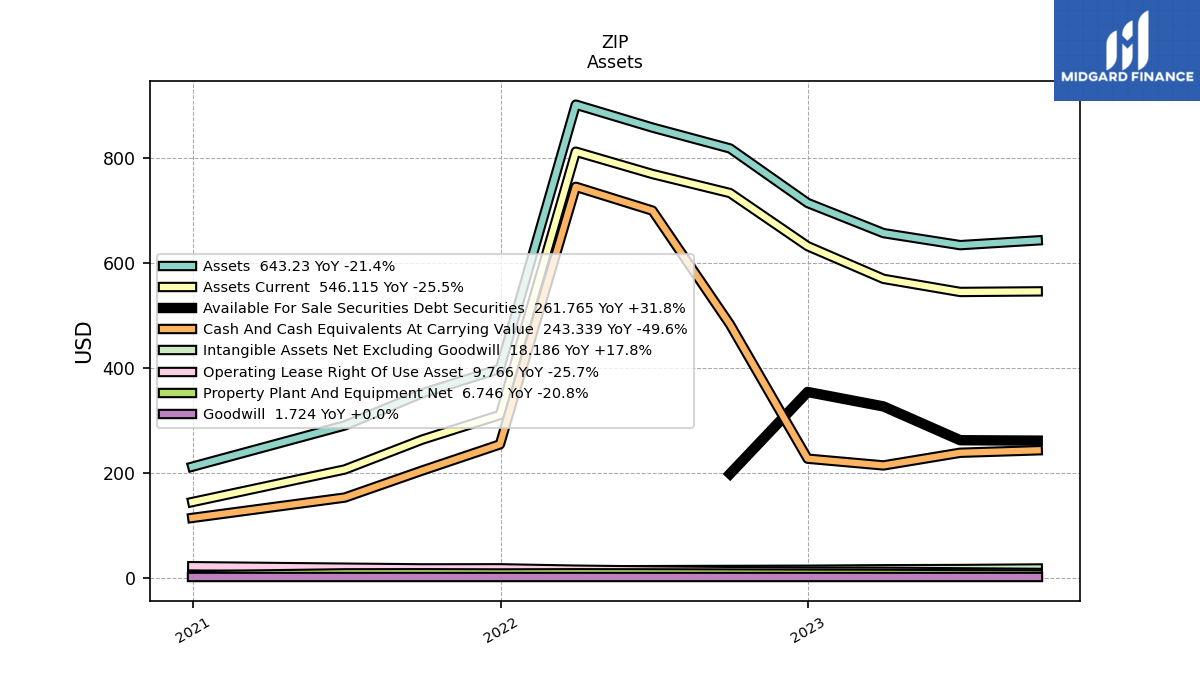
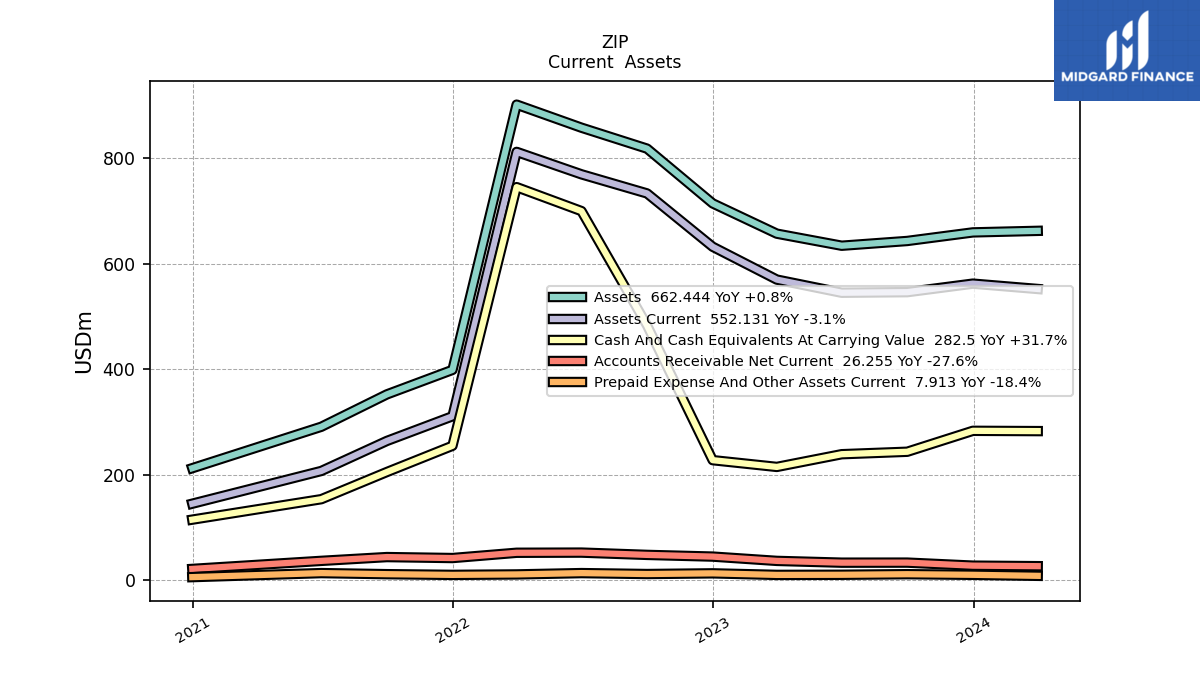
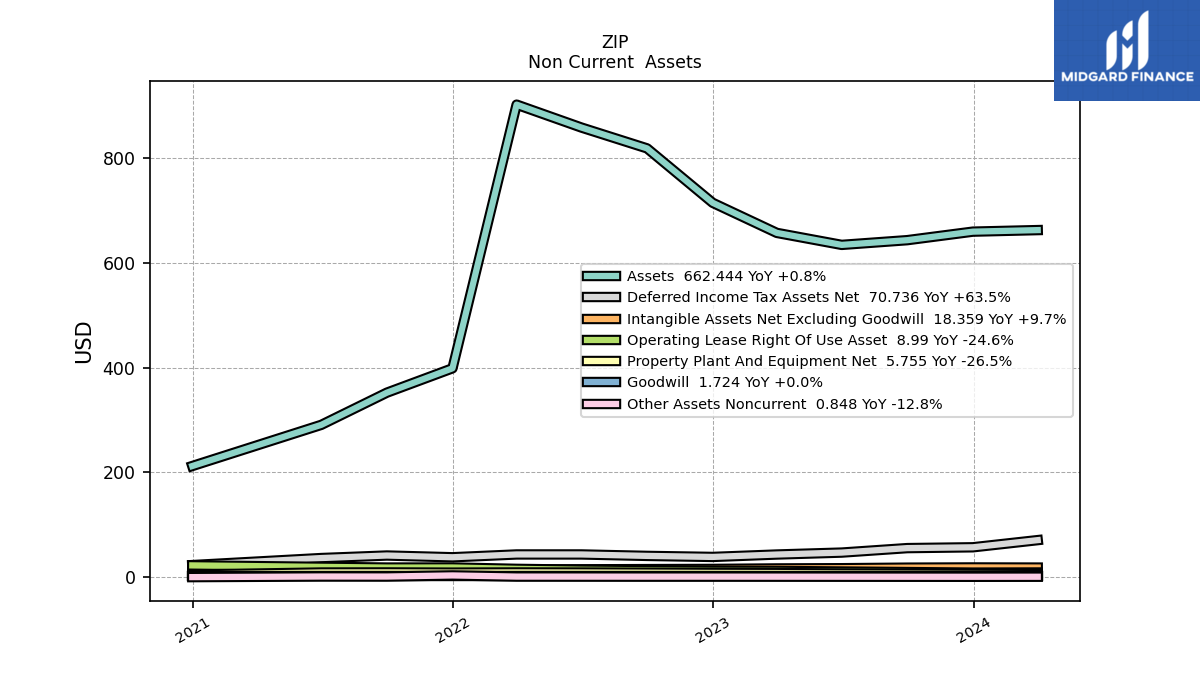
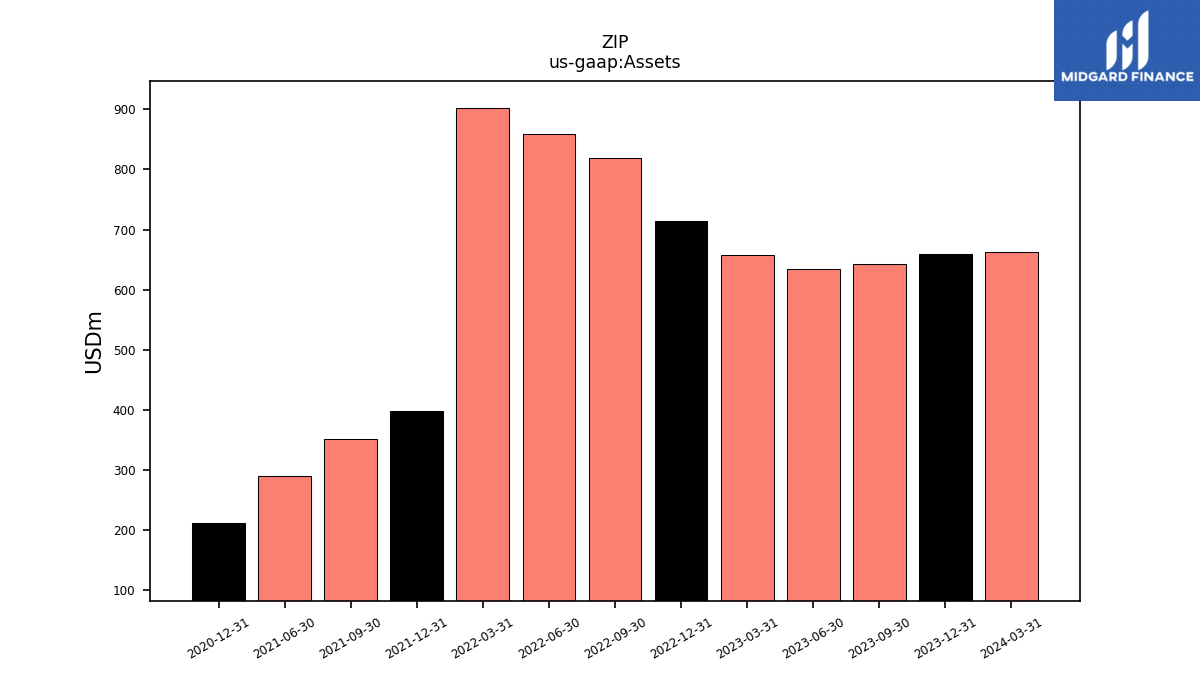
| Assets | 643.23 | 634.21 | 657.11 | 714.56 | 818.41 | 858.13 | 901.92 | 398.62 | 352.17 | 290.74 | NA | 212.13 | NA | NA | |
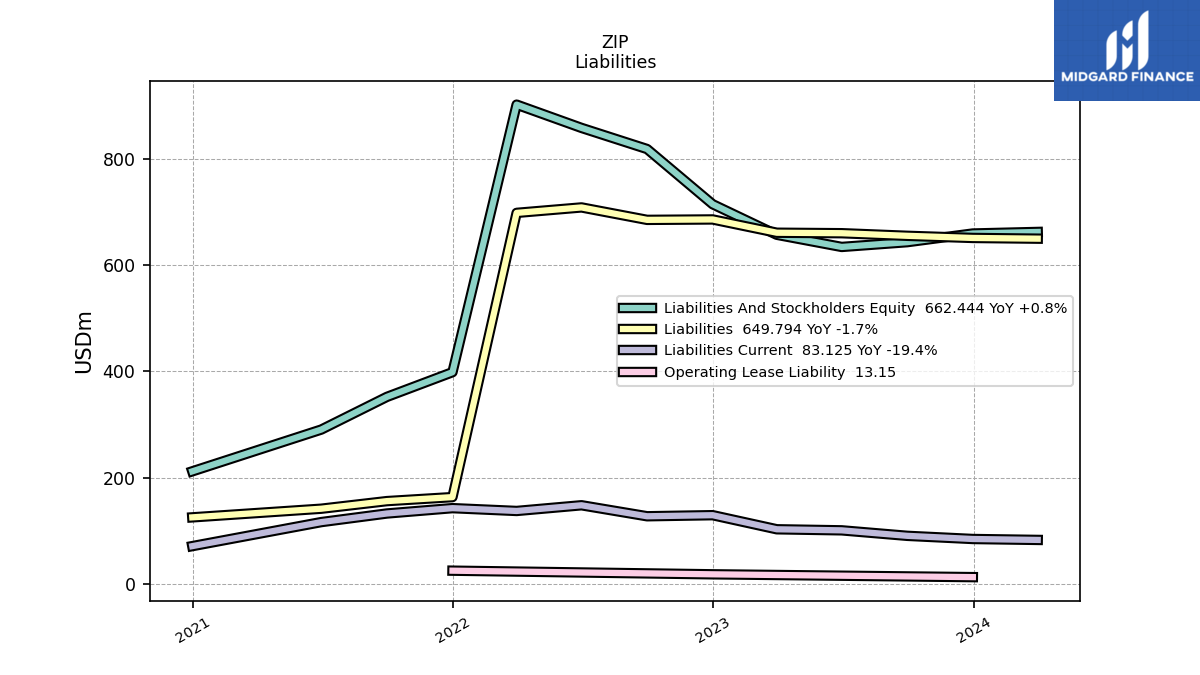
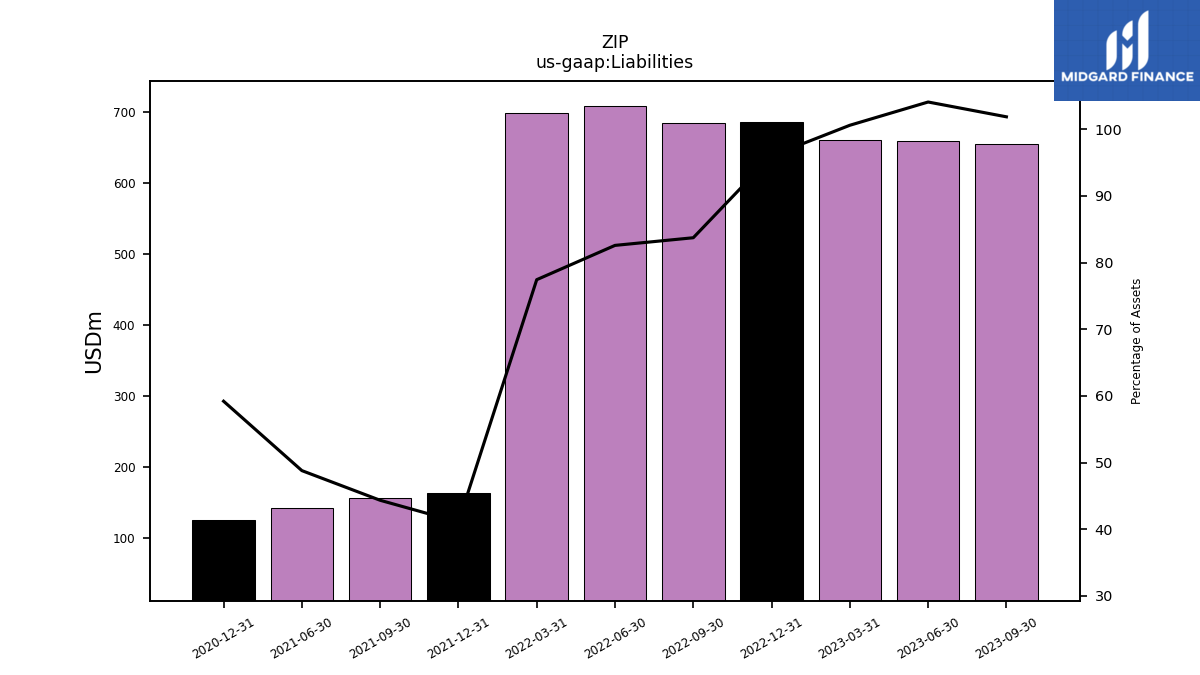
| Liabilities | 655.16 | 660.06 | 660.97 | 685.94 | 685.15 | 708.55 | 698.30 | 163.65 | 156.14 | 141.84 | NA | 125.57 | NA | NA | |
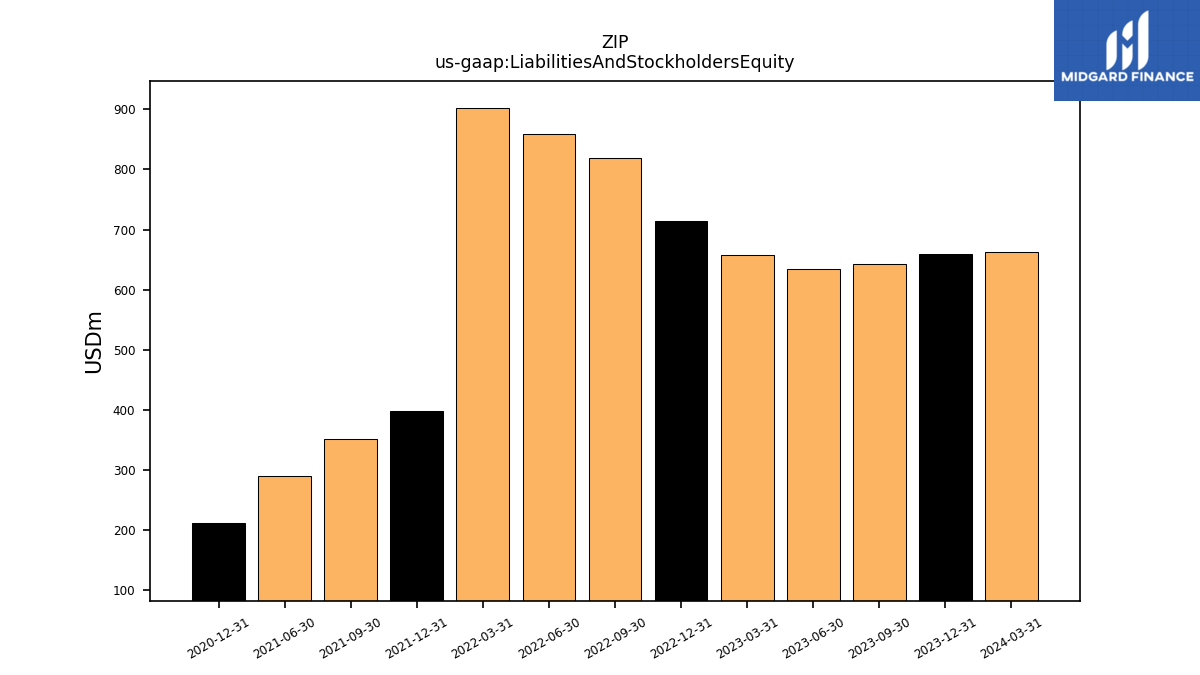
| Liabilities And Stockholders Equity | 643.23 | 634.21 | 657.11 | 714.56 | 818.41 | 858.13 | 901.92 | 398.62 | 352.17 | 290.74 | NA | 212.13 | NA | NA | |
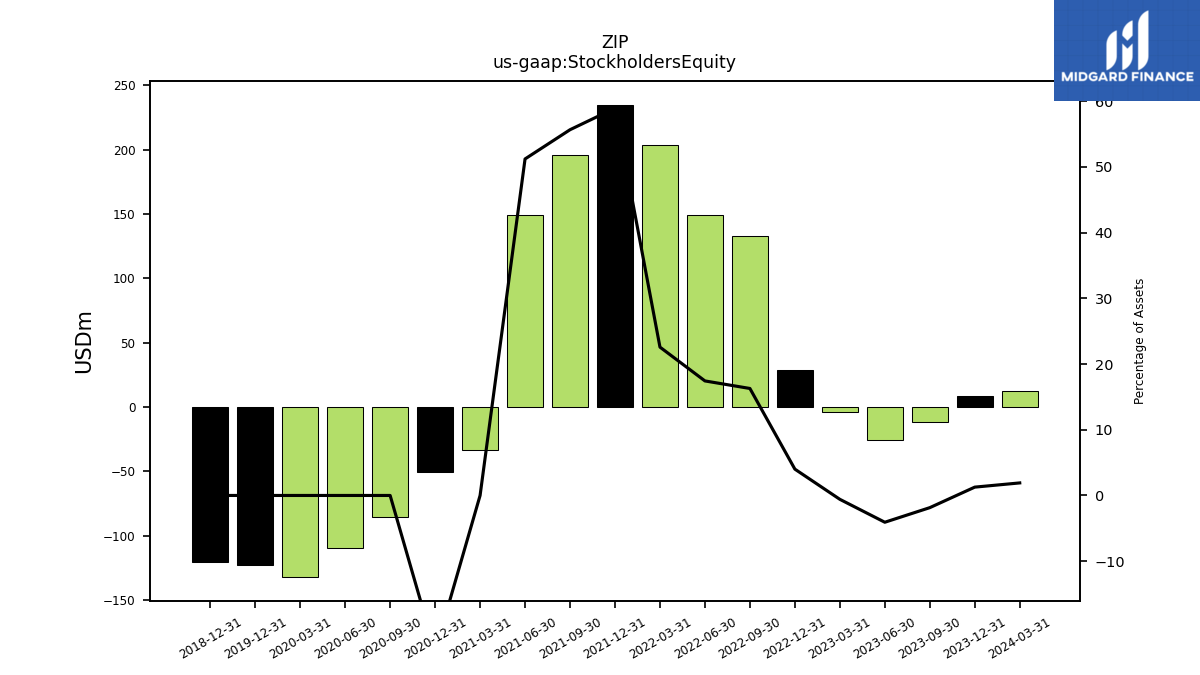
| Stockholders Equity | -11.93 | -25.85 | -3.86 | 28.62 | 133.26 | 149.58 | 203.62 | 234.97 | 196.03 | 148.90 | -33.40 | -50.30 | -85.68 | -109.60 |
| 2023-09-30 | 2023-06-30 | 2023-03-31 | 2022-12-31 | 2022-09-30 | 2022-06-30 | 2022-03-31 | 2021-12-31 | 2021-09-30 | 2021-06-30 | 2021-03-31 | 2020-12-31 | 2020-09-30 | 2020-06-30 | ||
|---|---|---|---|---|---|---|---|---|---|---|---|---|---|---|---|
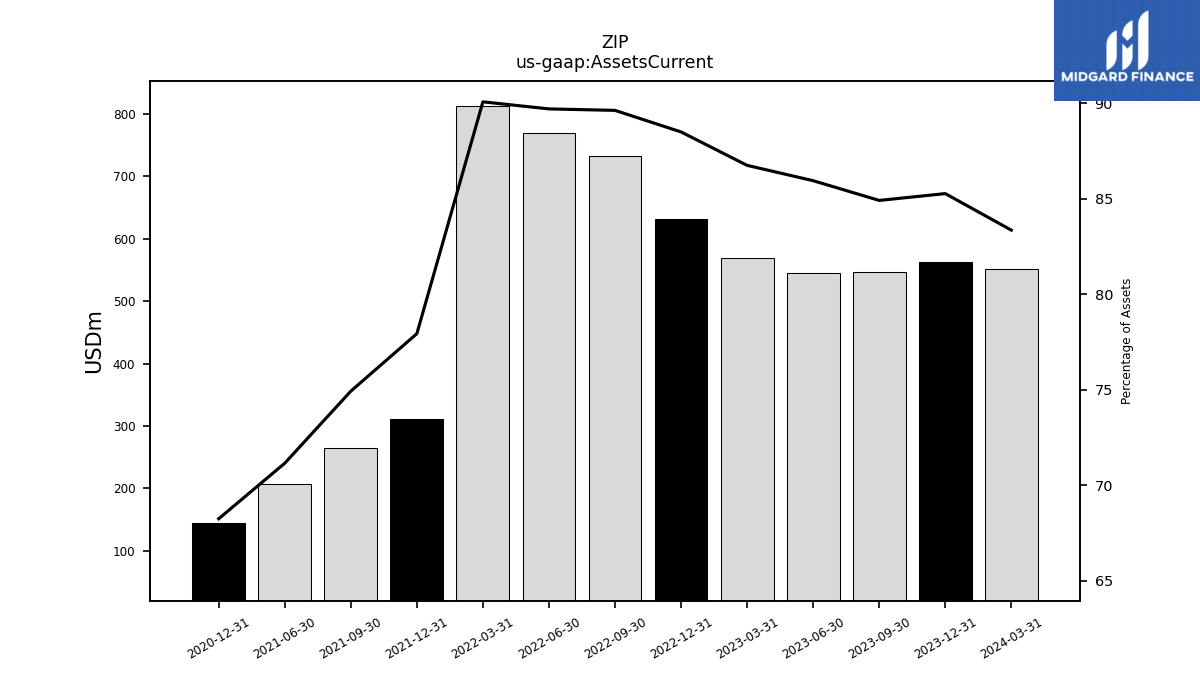
| Assets Current | 546.12 | 545.01 | 569.96 | 632.29 | 733.41 | 769.67 | 812.28 | 310.64 | 263.85 | 206.86 | NA | 144.76 | NA | NA | |
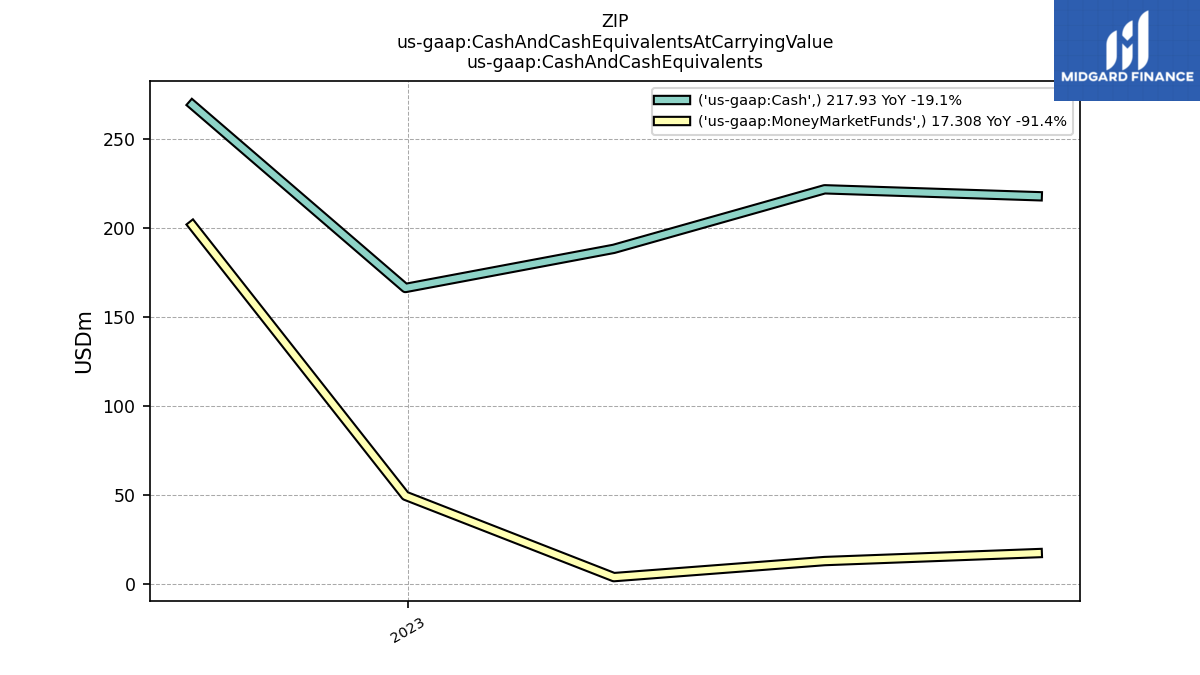
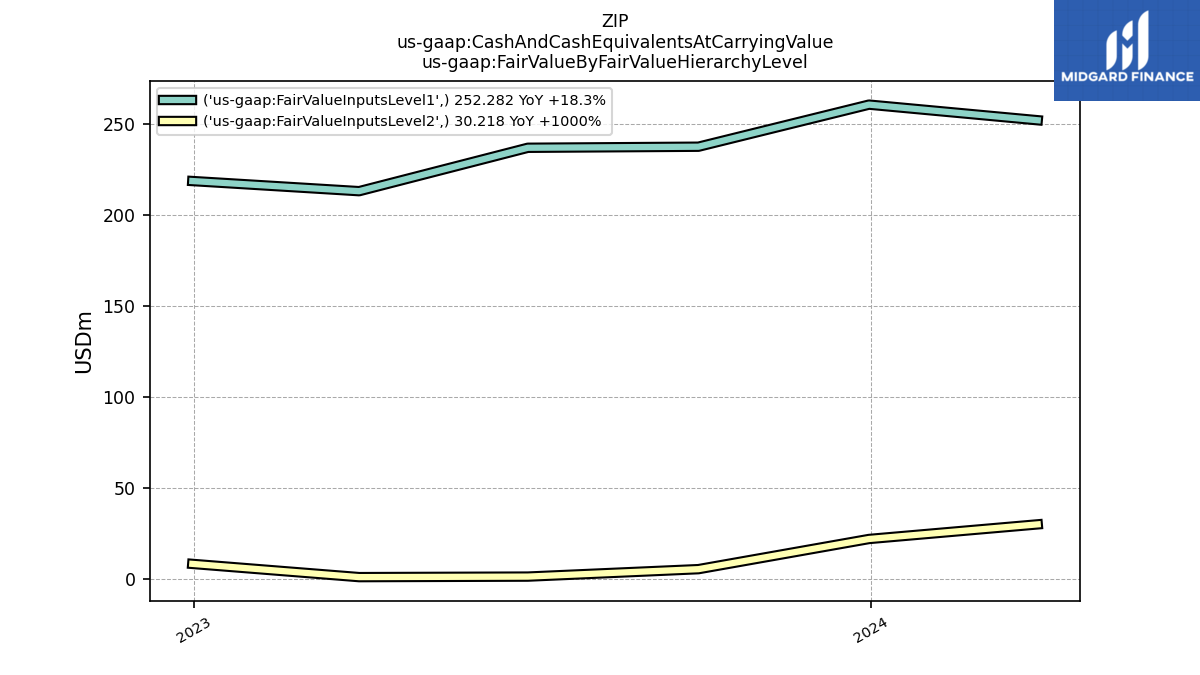
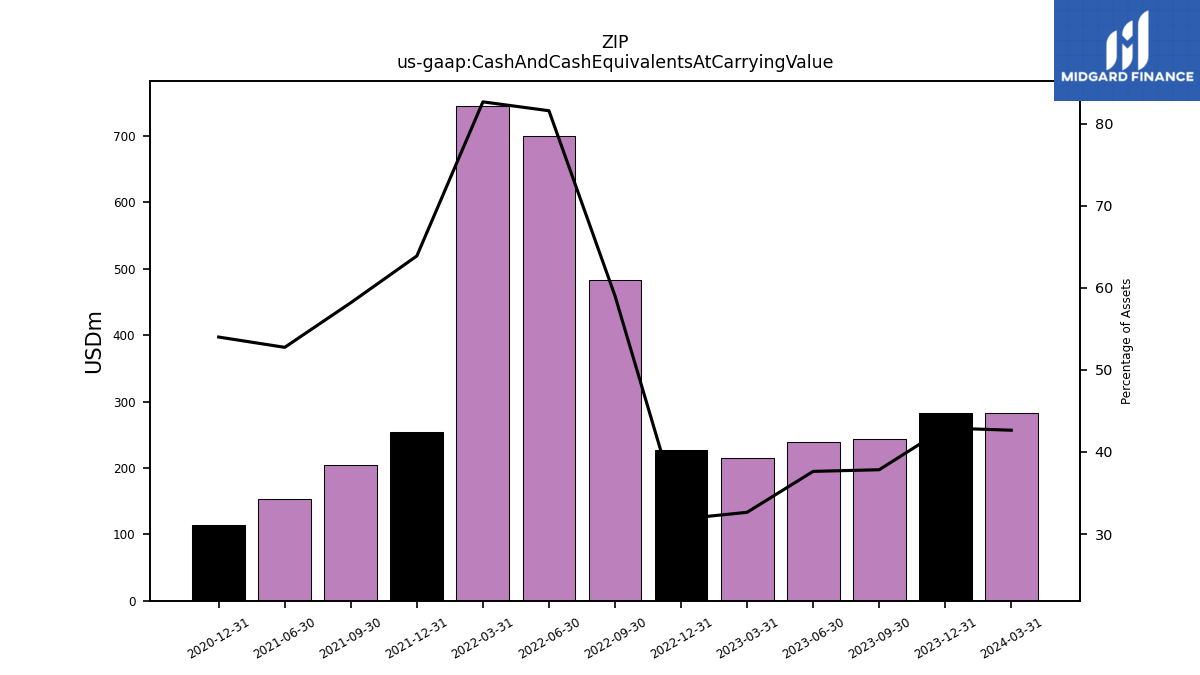
| Cash And Cash Equivalents At Carrying Value | 243.34 | 238.66 | 214.53 | 227.38 | 482.98 | 699.92 | 745.39 | 254.62 | 204.88 | 153.34 | NA | 114.54 | NA | NA | |
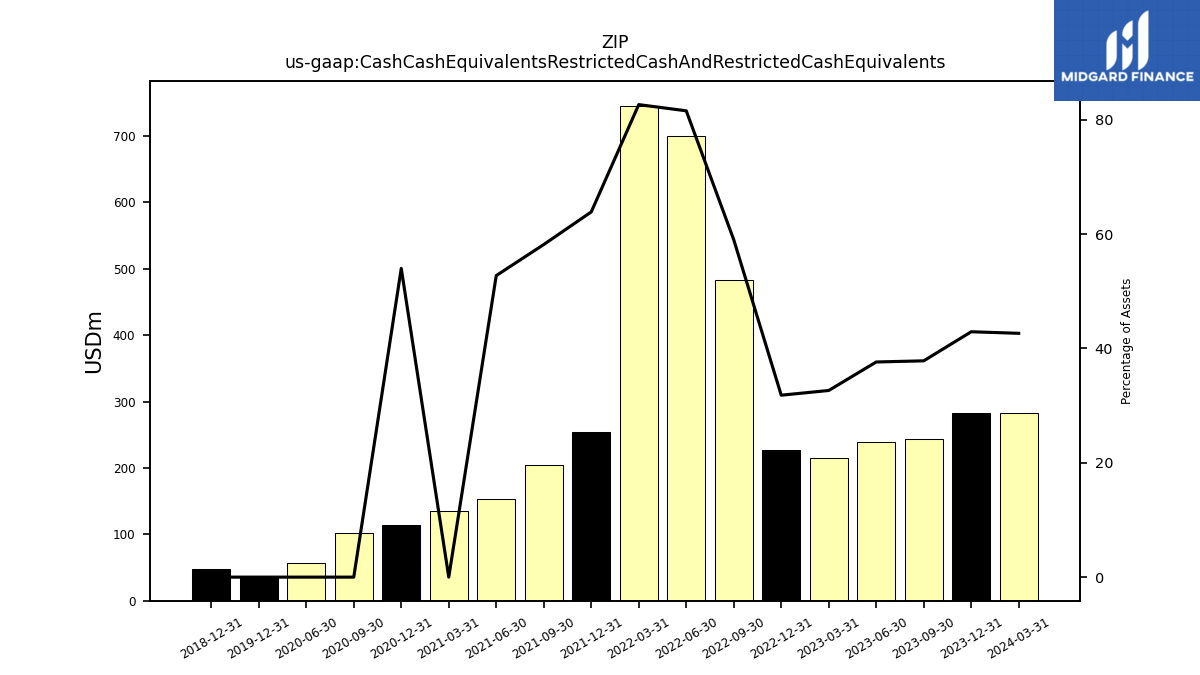
| Cash Cash Equivalents Restricted Cash And Restricted Cash Equivalents | 243.34 | 238.66 | 214.53 | 227.38 | 482.98 | 699.92 | 745.39 | 254.62 | 204.88 | 153.34 | 135.06 | 114.54 | 102.29 | 56.20 | |
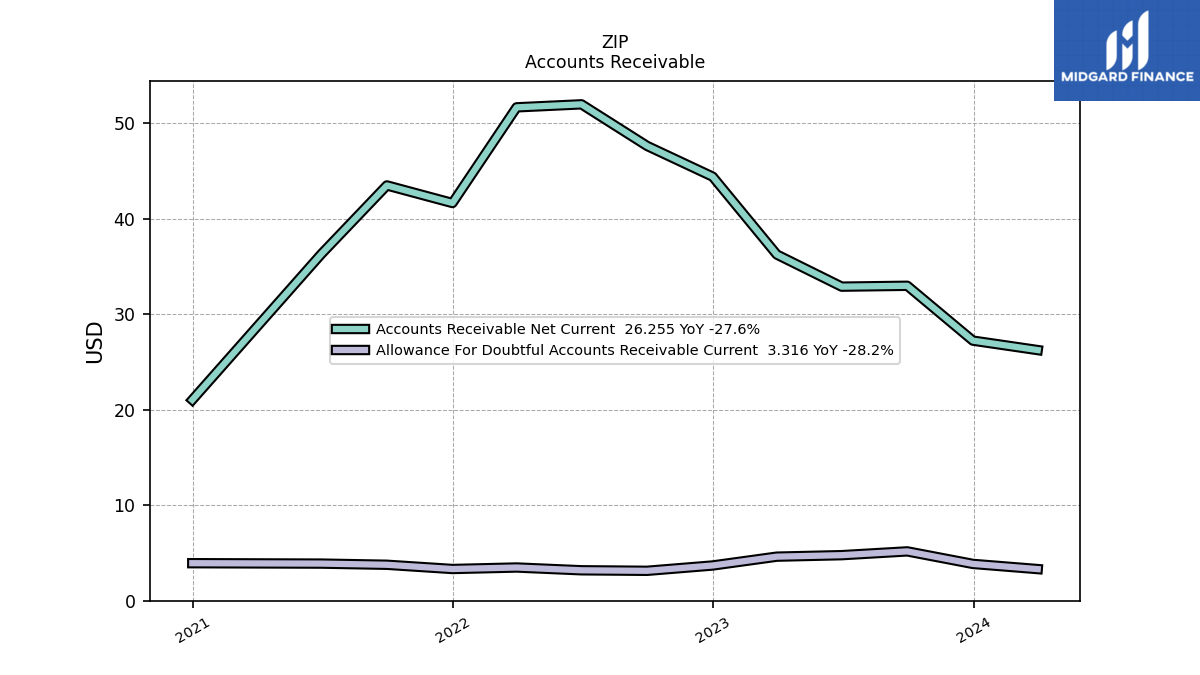
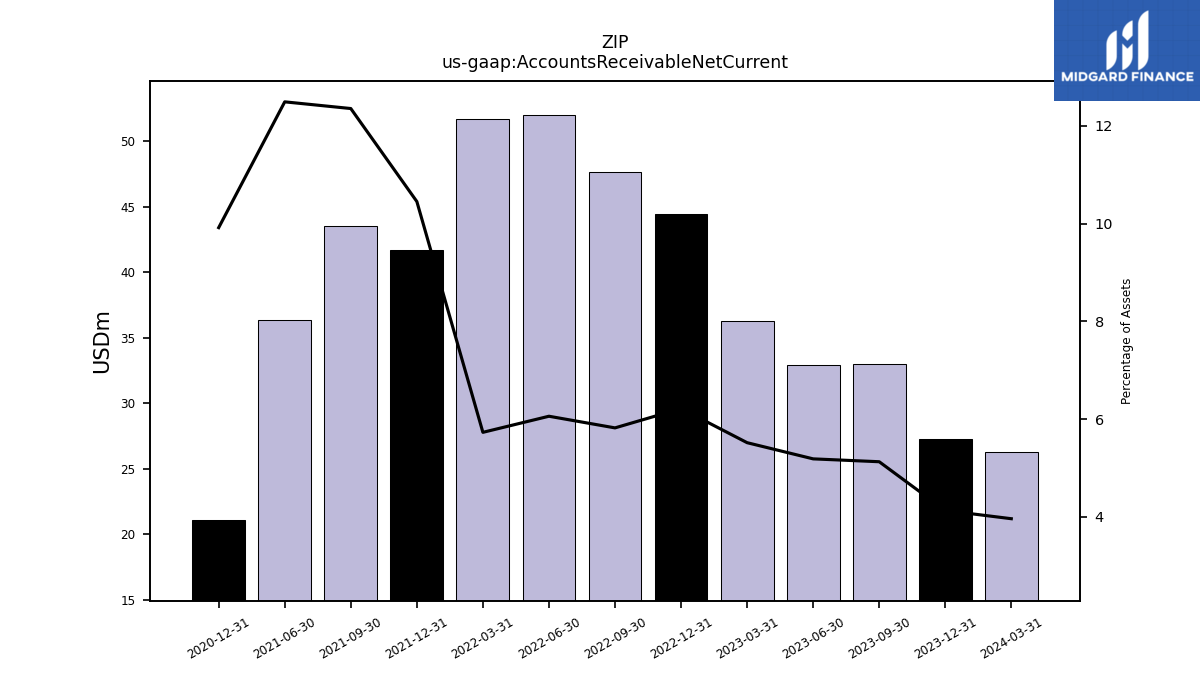
| Accounts Receivable Net Current | 32.99 | 32.90 | 36.26 | 44.42 | 47.64 | 52.00 | 51.68 | 41.66 | 43.50 | 36.31 | NA | 21.04 | NA | NA | |
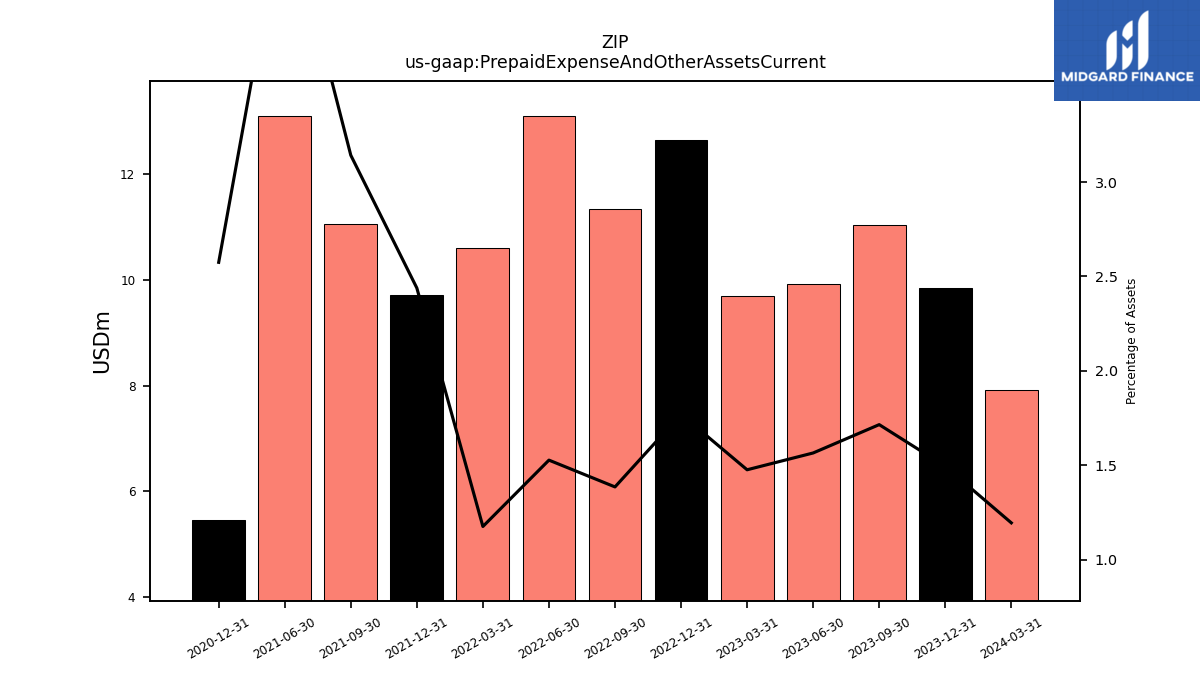
| Prepaid Expense And Other Assets Current | 11.03 | 9.92 | 9.70 | 12.65 | 11.33 | 13.10 | 10.60 | 9.72 | 11.07 | 13.11 | NA | 5.46 | NA | NA | |
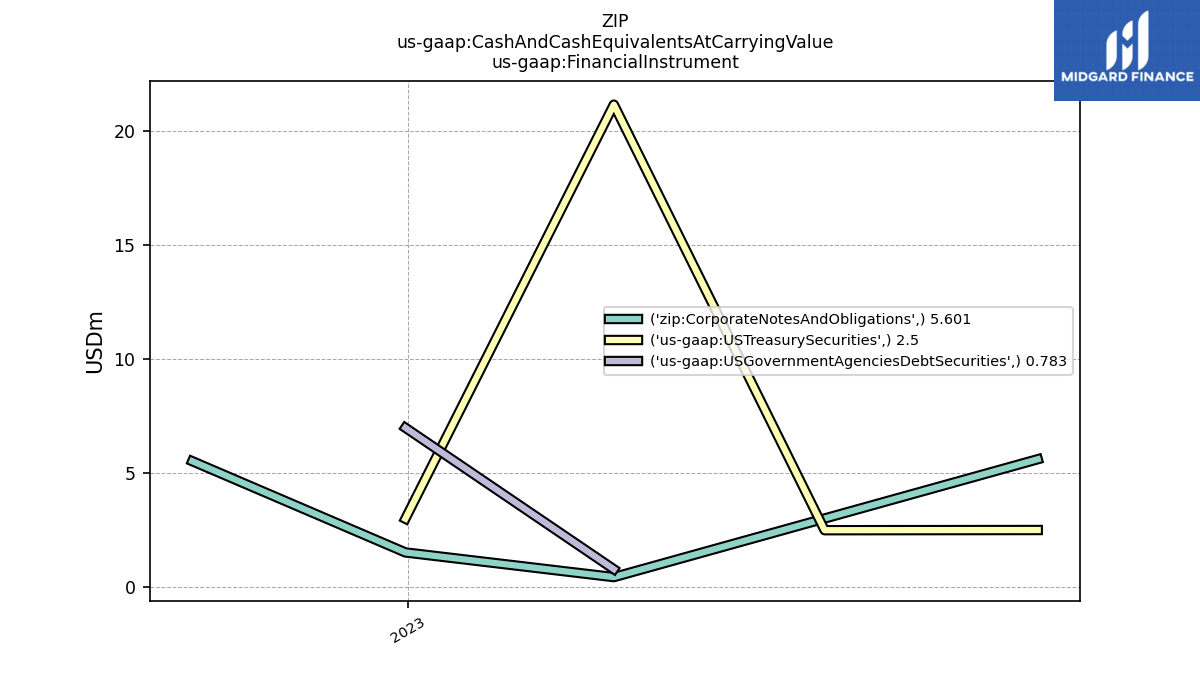
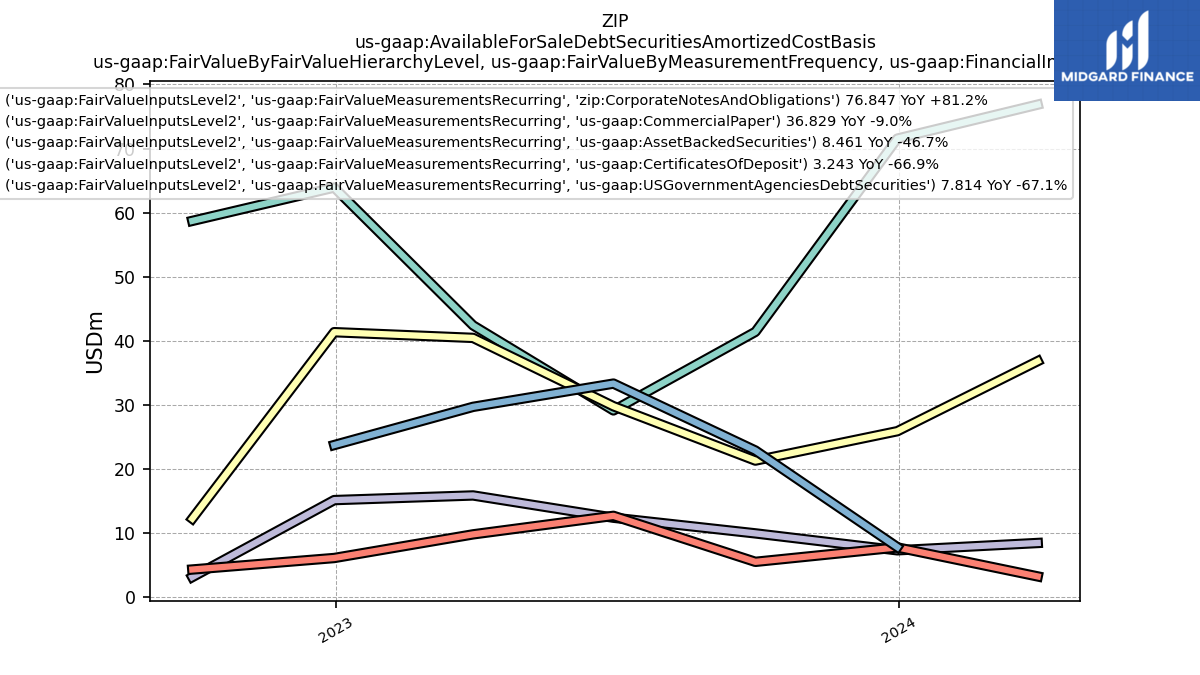
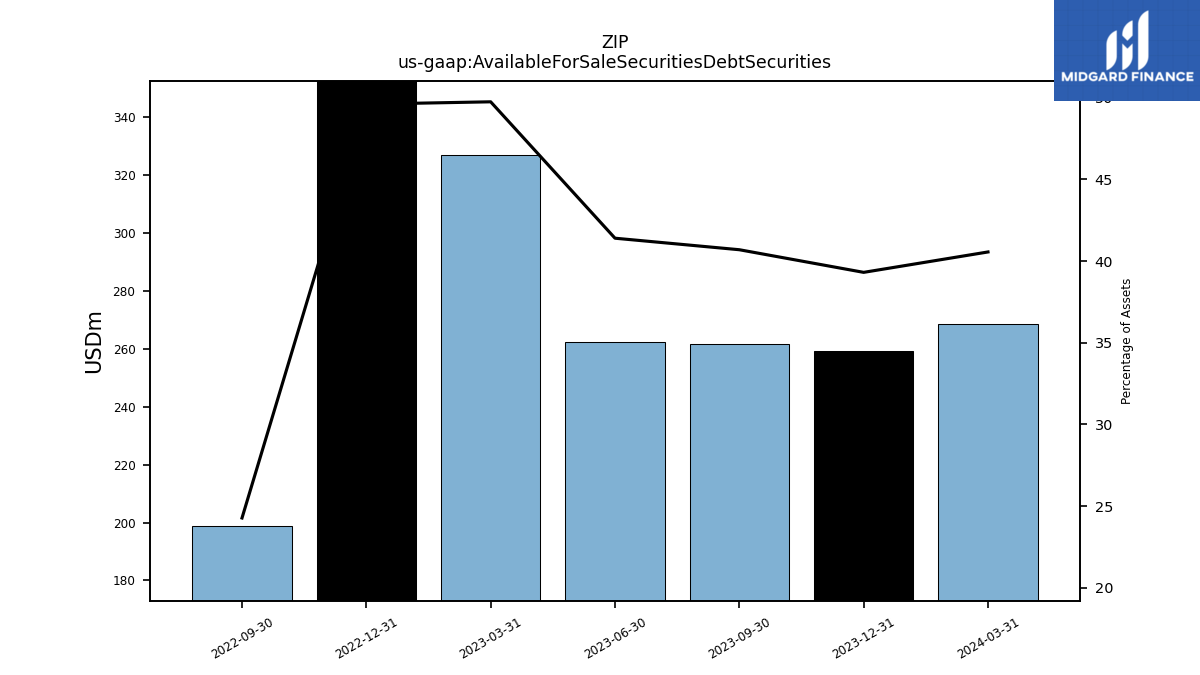
| Available For Sale Securities Debt Securities | 261.76 | 262.57 | 326.92 | 354.47 | 198.65 | NA | NA | NA | NA | NA | NA | NA | NA | NA |
| 2023-09-30 | 2023-06-30 | 2023-03-31 | 2022-12-31 | 2022-09-30 | 2022-06-30 | 2022-03-31 | 2021-12-31 | 2021-09-30 | 2021-06-30 | 2021-03-31 | 2020-12-31 | 2020-09-30 | 2020-06-30 | ||
|---|---|---|---|---|---|---|---|---|---|---|---|---|---|---|---|
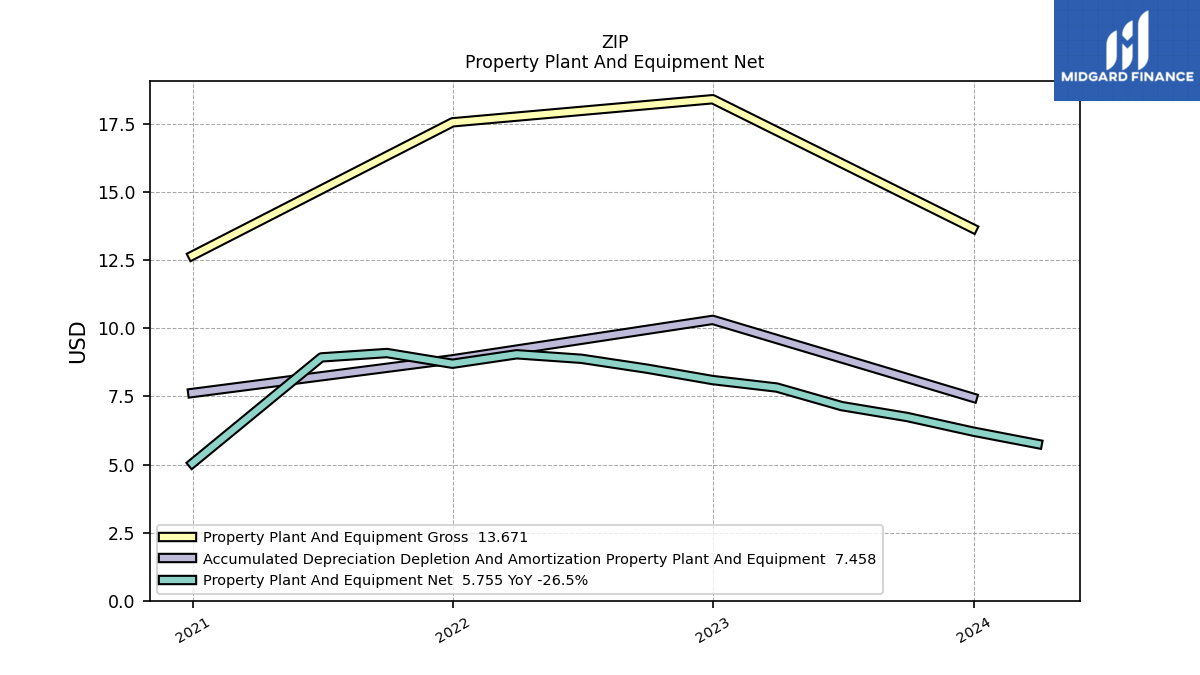
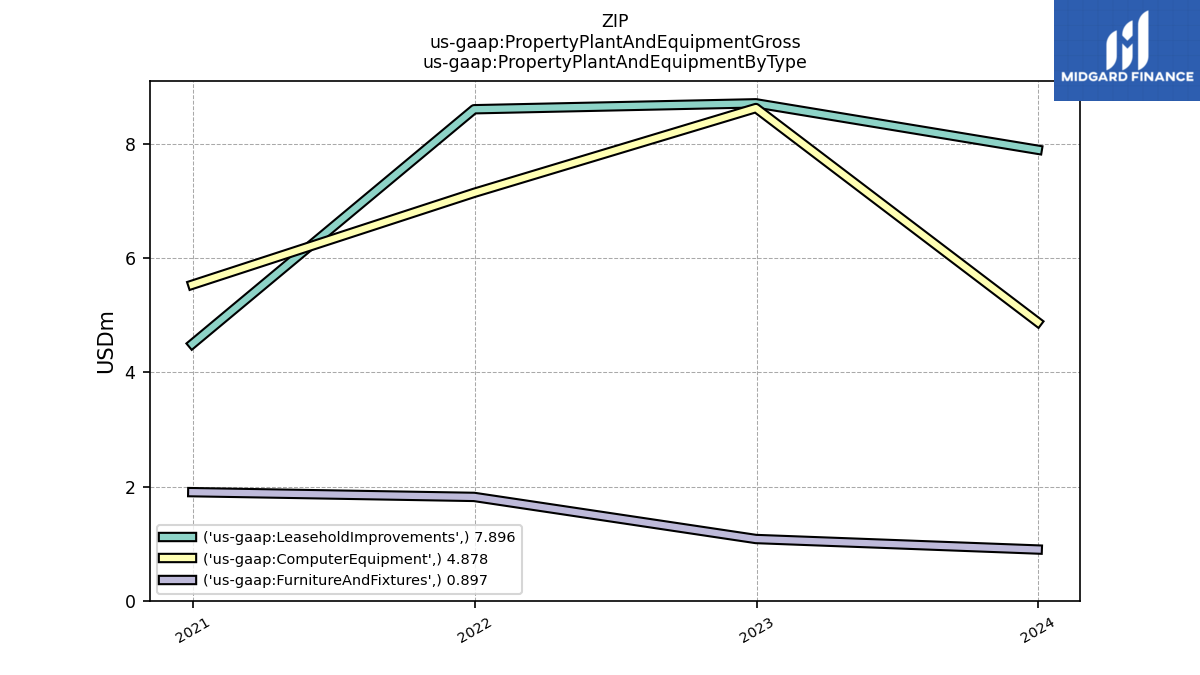
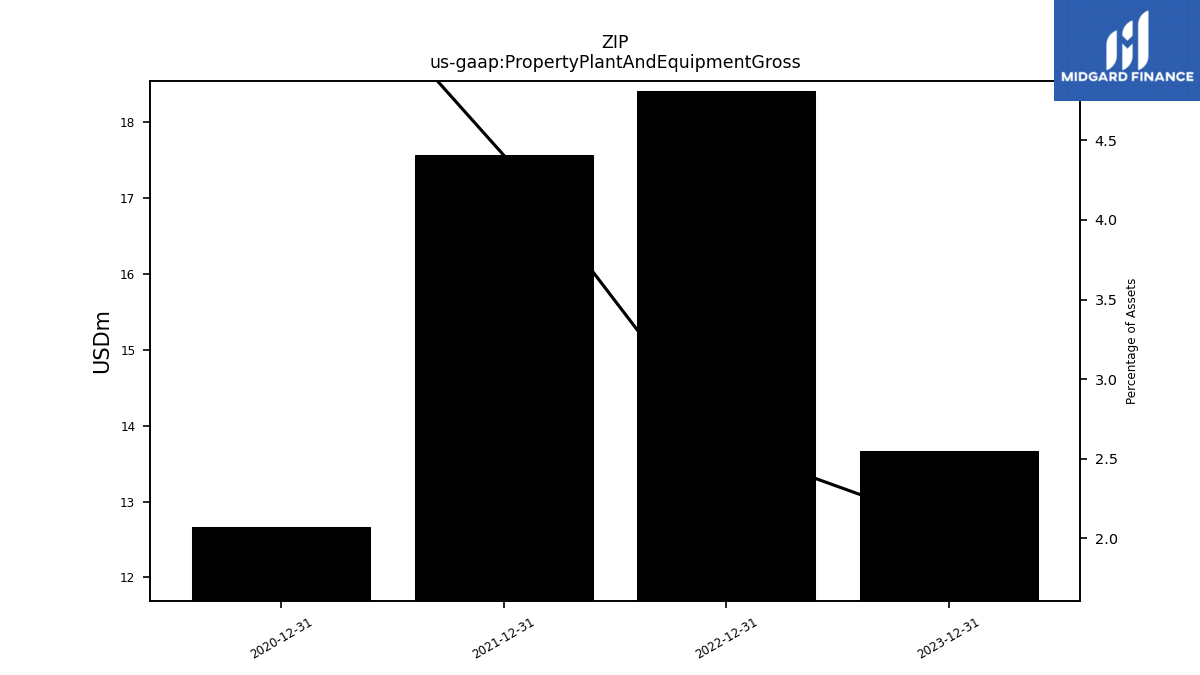
| Property Plant And Equipment Gross | NA | NA | NA | 18.42 | NA | NA | NA | 17.57 | NA | NA | NA | 12.67 | NA | NA | |
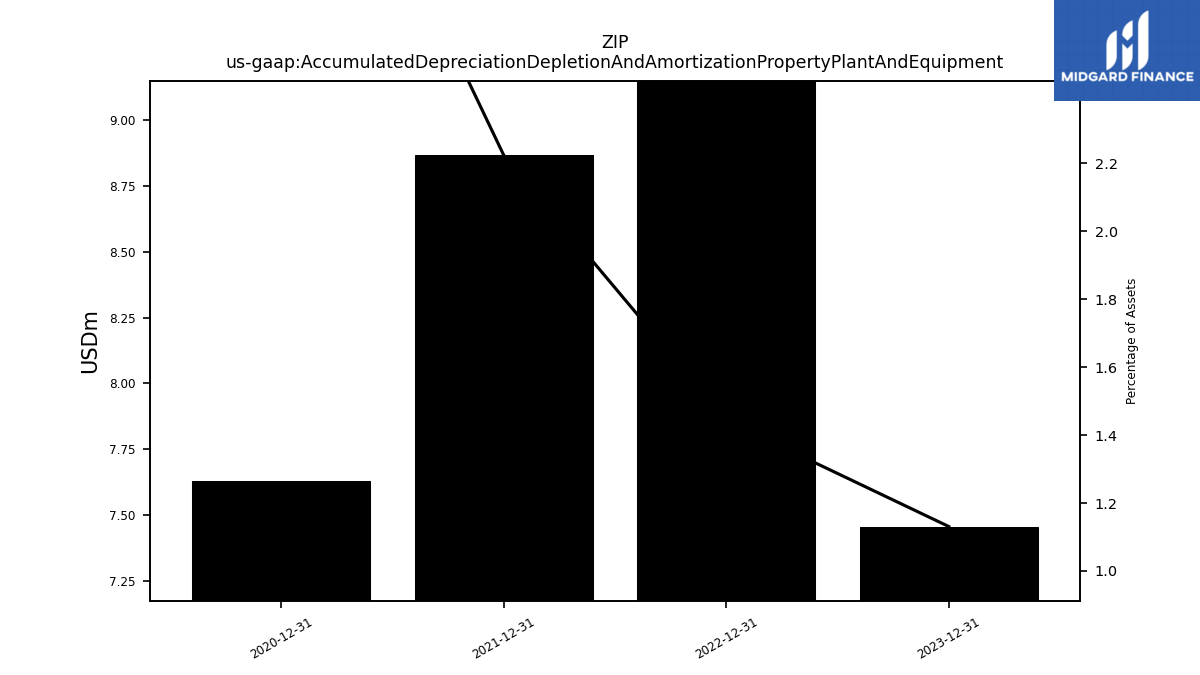
| Accumulated Depreciation Depletion And Amortization Property Plant And Equipment | NA | NA | NA | 10.31 | NA | NA | NA | 8.87 | NA | NA | NA | 7.63 | NA | NA | |
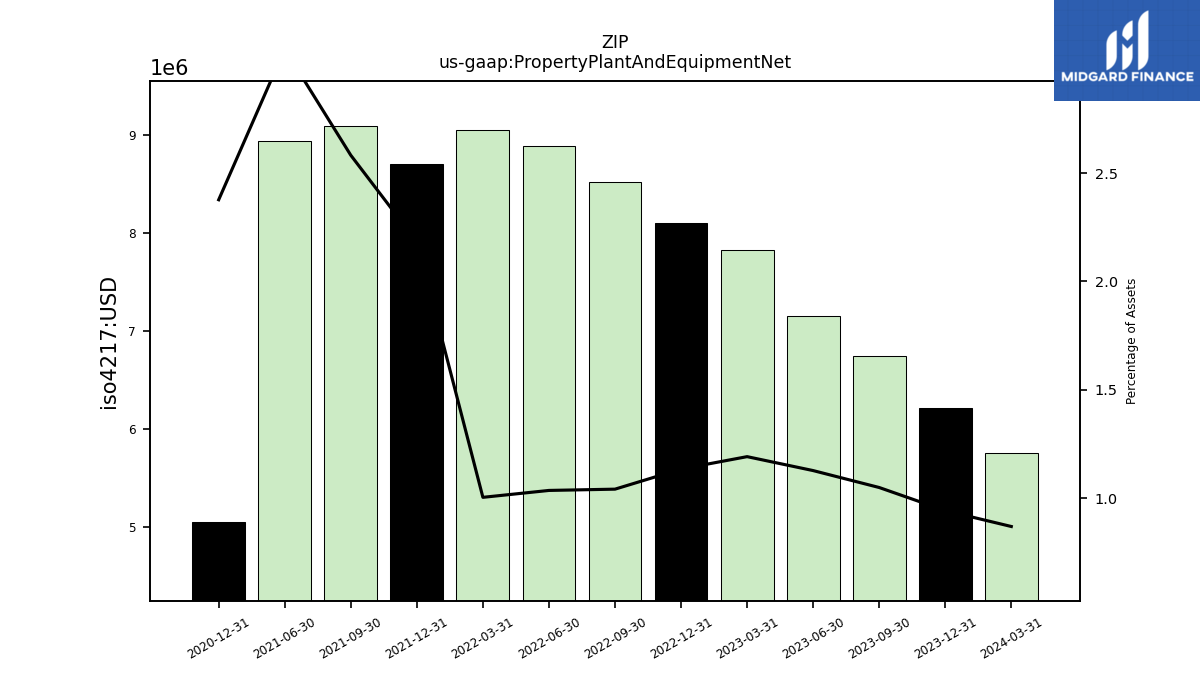
| Property Plant And Equipment Net | 6.75 | 7.15 | 7.83 | 8.10 | 8.52 | 8.88 | 9.05 | 8.70 | 9.10 | 8.94 | NA | 5.04 | NA | NA | |
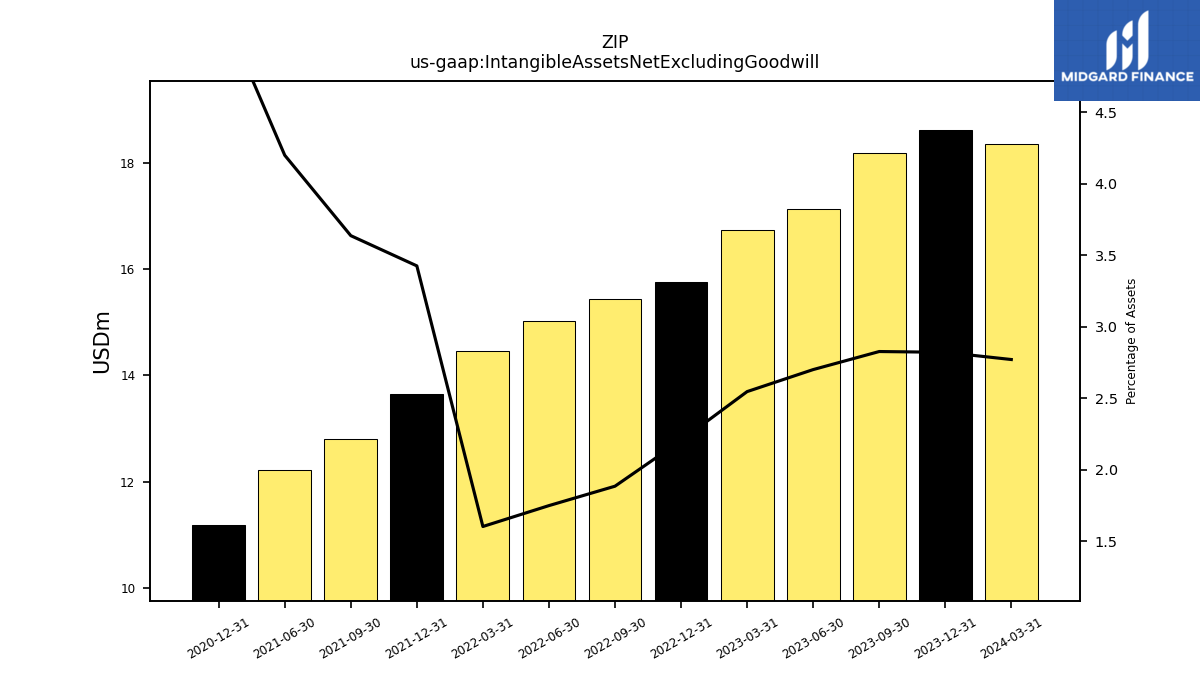
| Intangible Assets Net Excluding Goodwill | 18.19 | 17.13 | 16.74 | 15.76 | 15.43 | 15.02 | 14.47 | 13.66 | 12.81 | 12.21 | NA | 11.19 | NA | NA | |
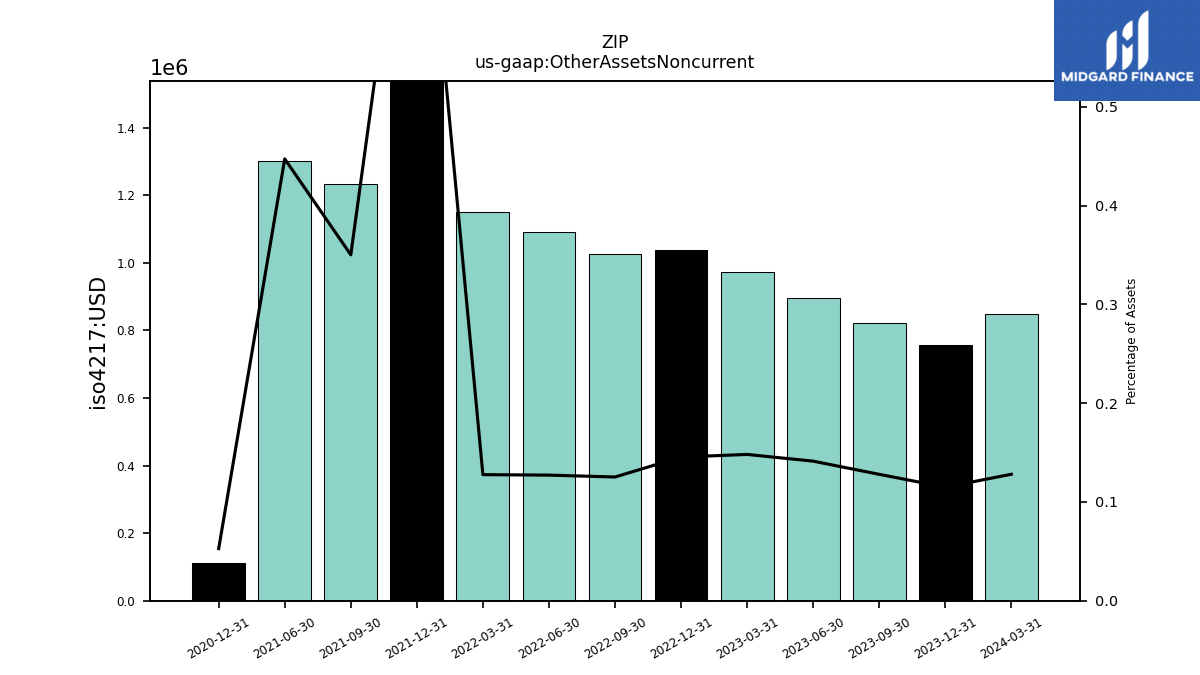
| Other Assets Noncurrent | 0.82 | 0.90 | 0.97 | 1.04 | 1.02 | 1.09 | 1.15 | 3.34 | 1.23 | 1.30 | NA | 0.11 | NA | NA |
| 2023-09-30 | 2023-06-30 | 2023-03-31 | 2022-12-31 | 2022-09-30 | 2022-06-30 | 2022-03-31 | 2021-12-31 | 2021-09-30 | 2021-06-30 | 2021-03-31 | 2020-12-31 | 2020-09-30 | 2020-06-30 | ||
|---|---|---|---|---|---|---|---|---|---|---|---|---|---|---|---|
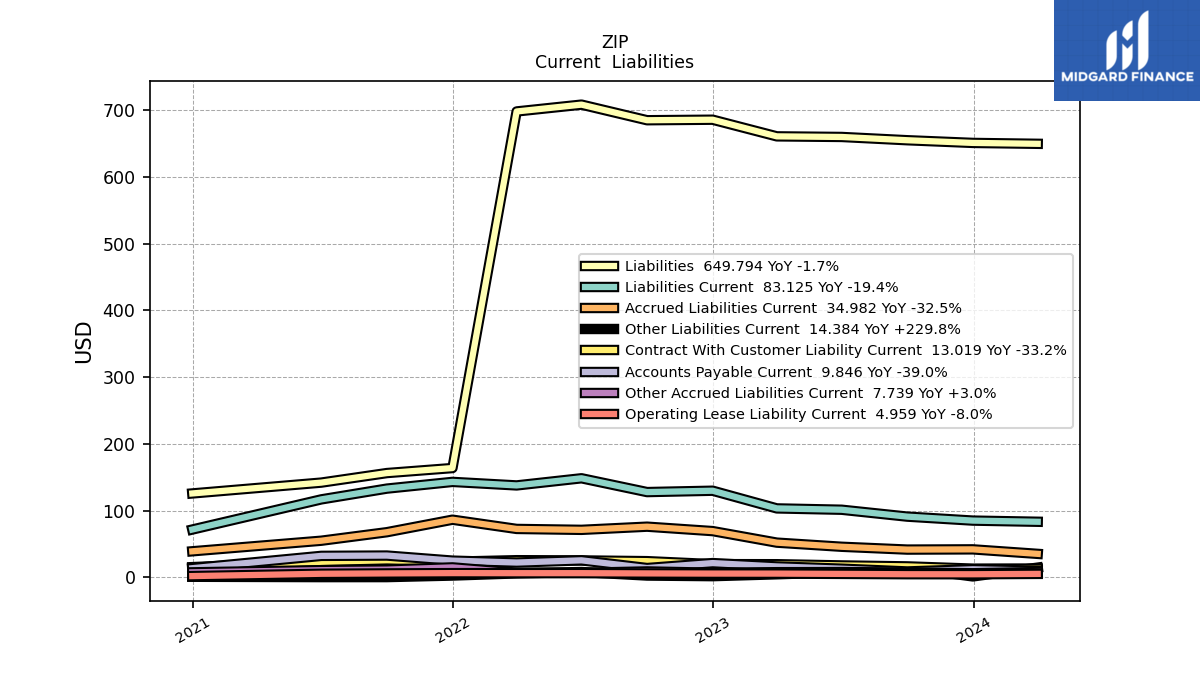
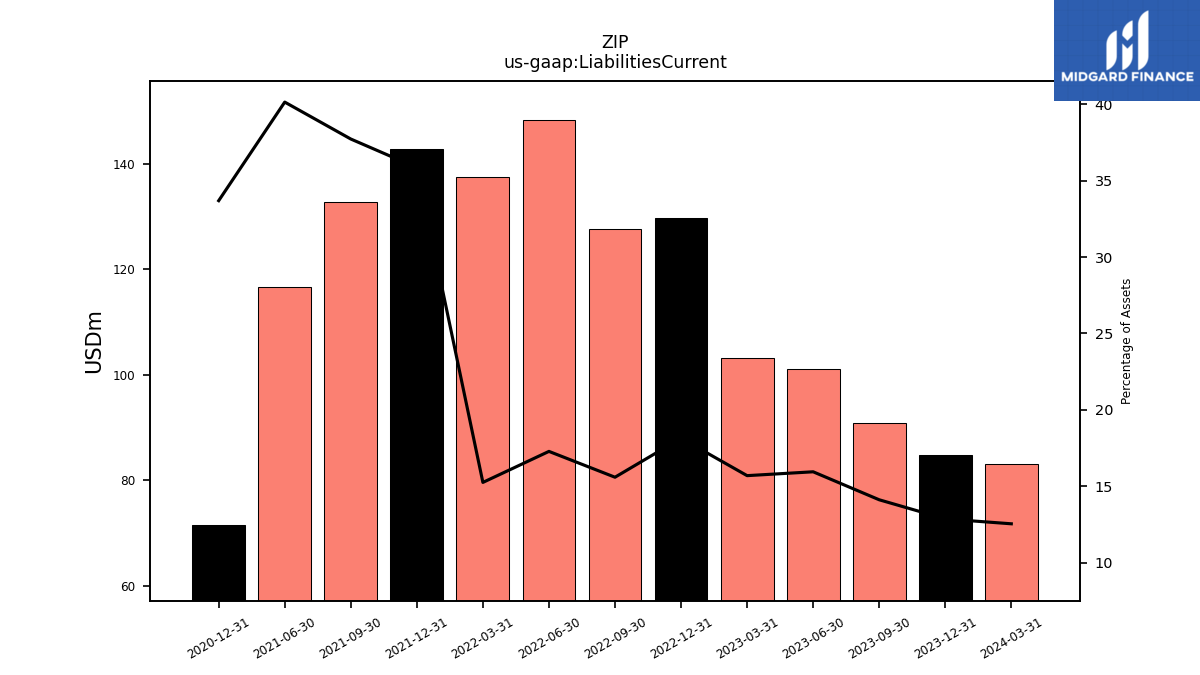
| Liabilities Current | 90.82 | 101.16 | 103.15 | 129.66 | 127.63 | 148.32 | 137.59 | 142.89 | 132.83 | 116.69 | NA | 71.45 | NA | NA | |
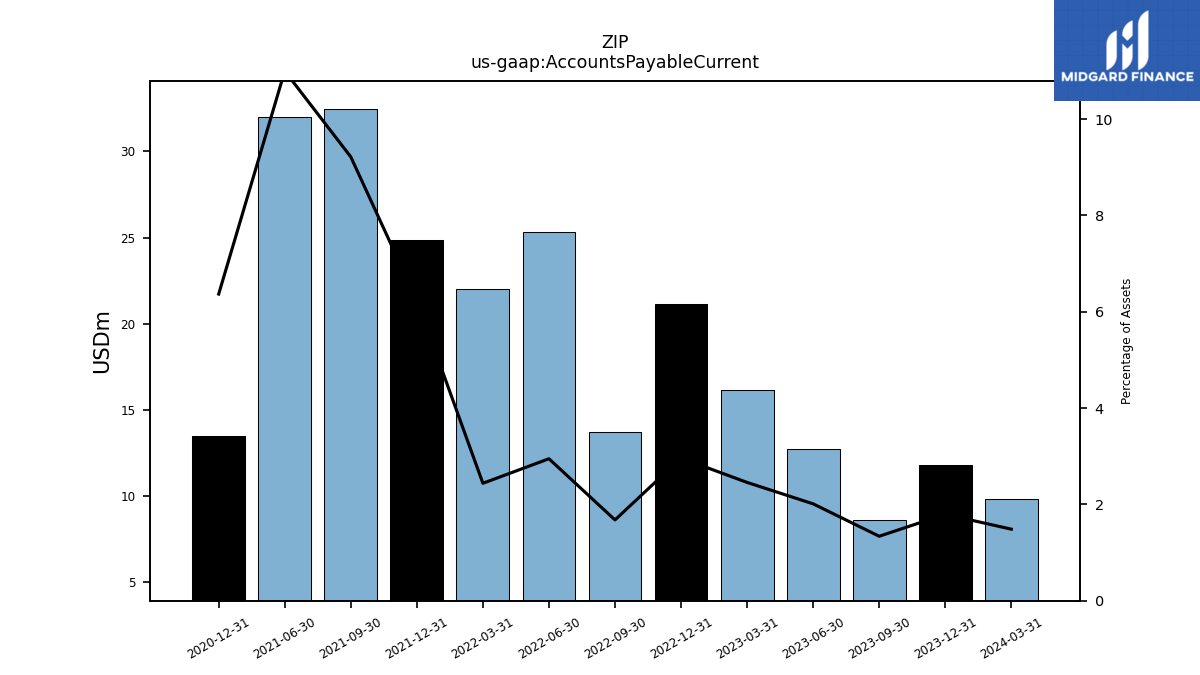
| Accounts Payable Current | 8.61 | 12.76 | 16.14 | 21.18 | 13.74 | 25.30 | 22.00 | 24.86 | 32.46 | 31.98 | NA | 13.51 | NA | NA | |
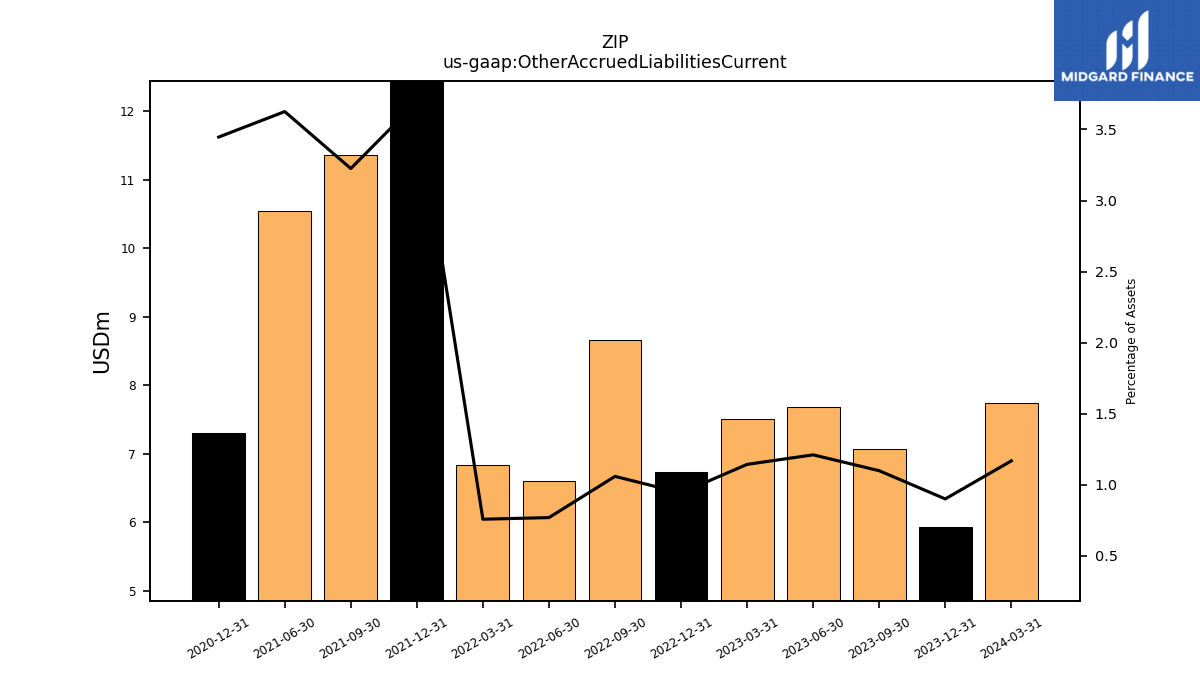
| Other Accrued Liabilities Current | 7.07 | 7.68 | 7.52 | 6.74 | 8.67 | 6.60 | 6.83 | 14.73 | 11.36 | 10.54 | NA | 7.31 | NA | NA | |
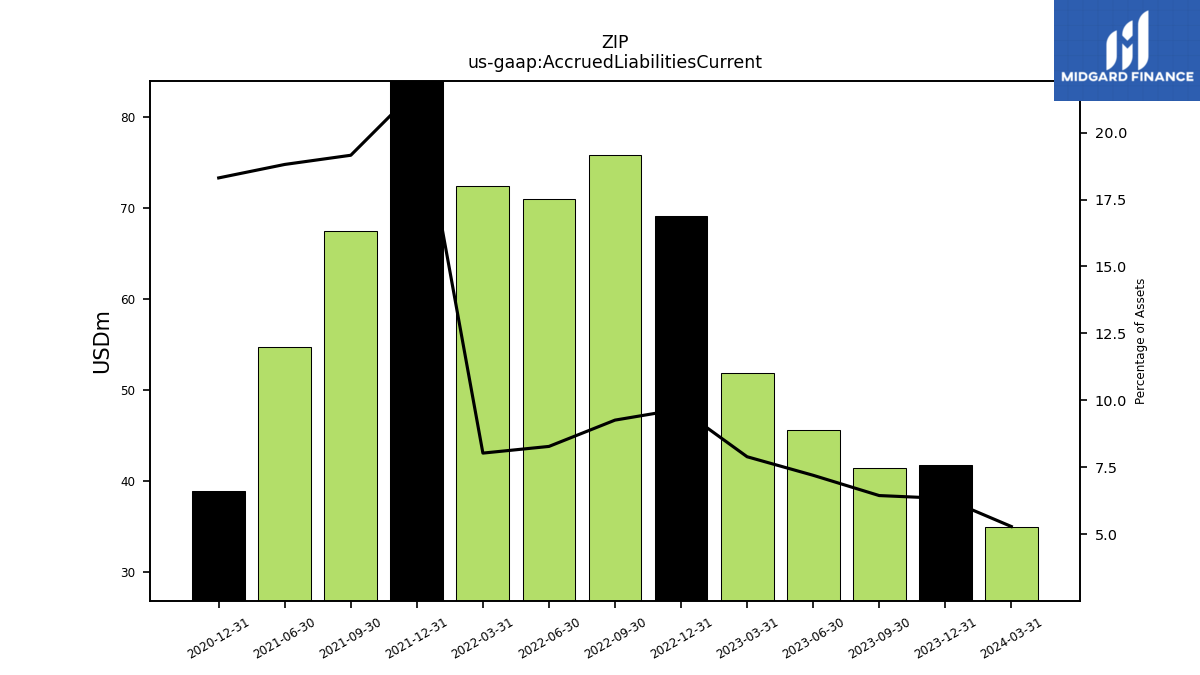
| Accrued Liabilities Current | 41.41 | 45.63 | 51.83 | 69.11 | 75.76 | 71.00 | 72.37 | 86.21 | 67.47 | 54.70 | NA | 38.84 | NA | NA | |
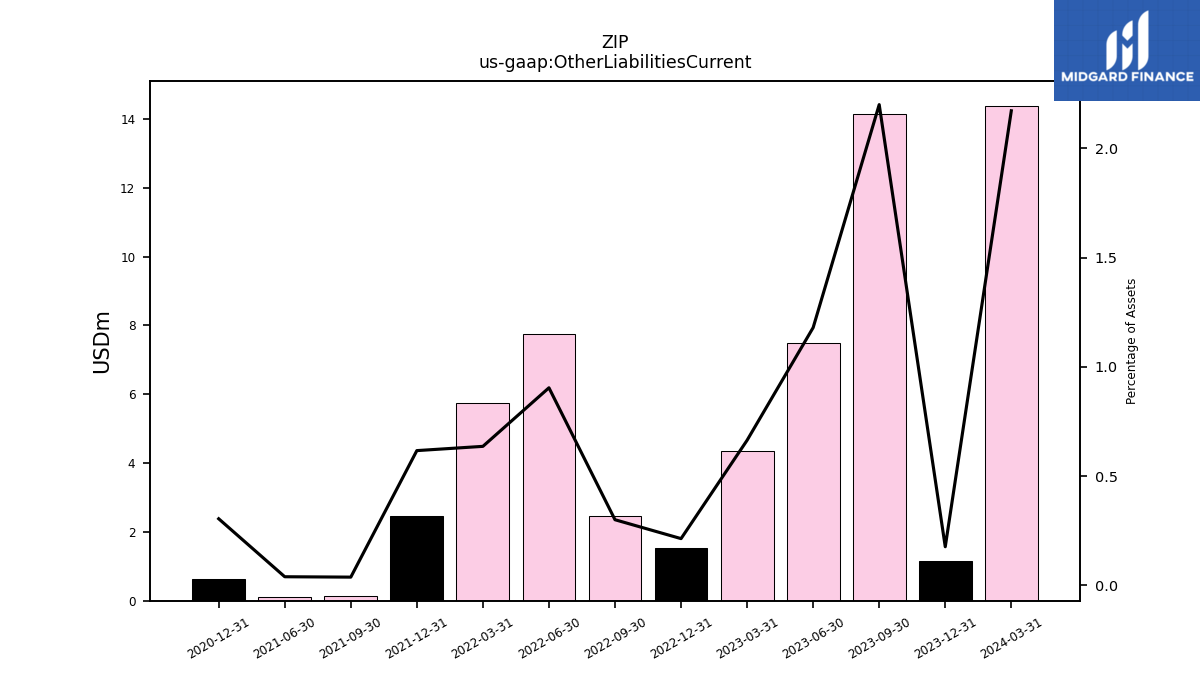
| Other Liabilities Current | 14.15 | 7.48 | 4.36 | 1.53 | 2.46 | 7.76 | 5.74 | 2.46 | 0.13 | 0.11 | NA | 0.65 | NA | NA | |
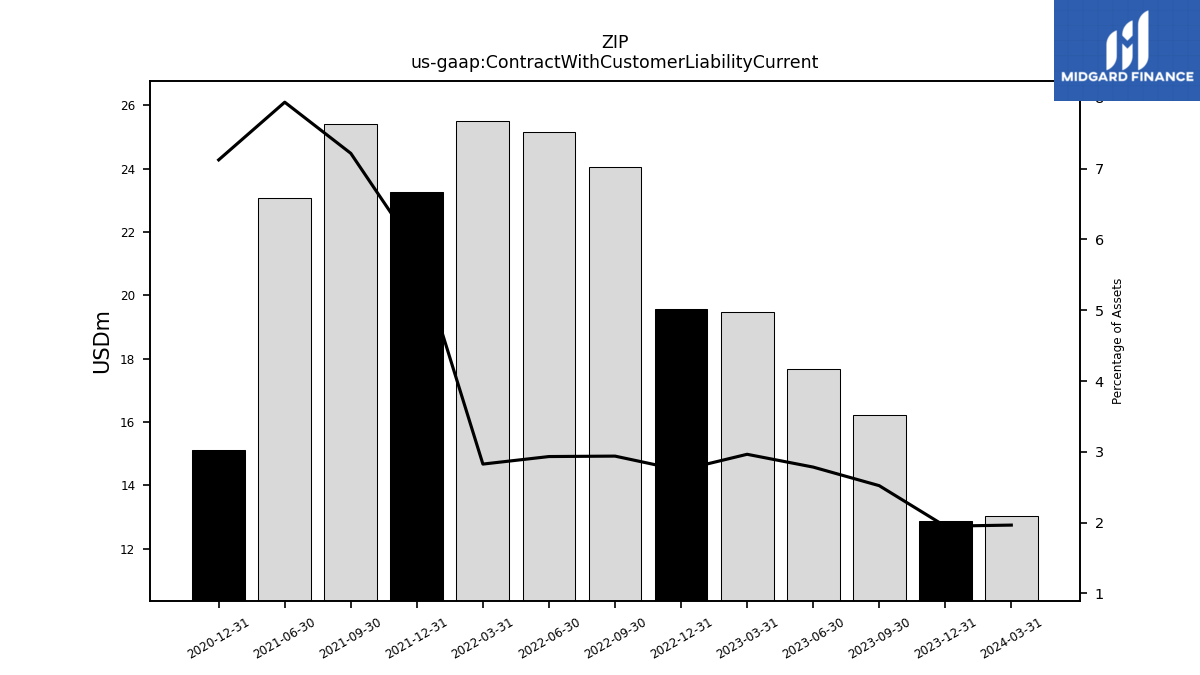
| Contract With Customer Liability Current | 16.22 | 17.66 | 19.49 | 19.58 | 24.06 | 25.17 | 25.50 | 23.25 | 25.41 | 23.08 | NA | 15.11 | NA | NA |
| 2023-09-30 | 2023-06-30 | 2023-03-31 | 2022-12-31 | 2022-09-30 | 2022-06-30 | 2022-03-31 | 2021-12-31 | 2021-09-30 | 2021-06-30 | 2021-03-31 | 2020-12-31 | 2020-09-30 | 2020-06-30 | ||
|---|---|---|---|---|---|---|---|---|---|---|---|---|---|---|---|
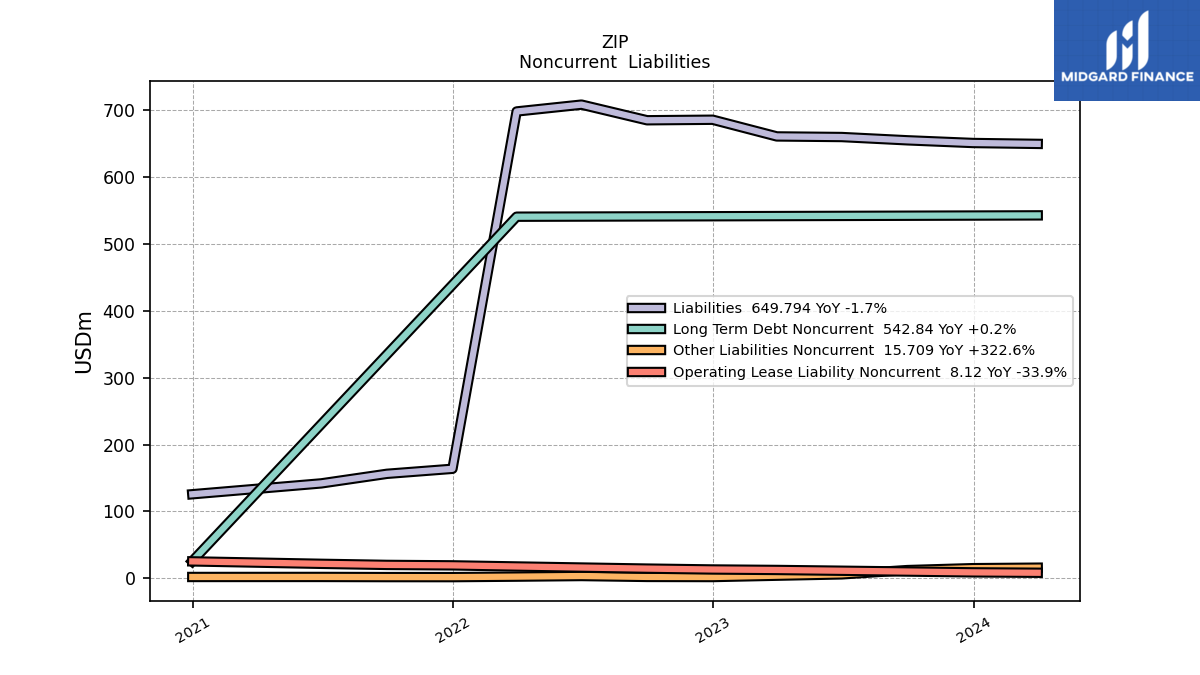
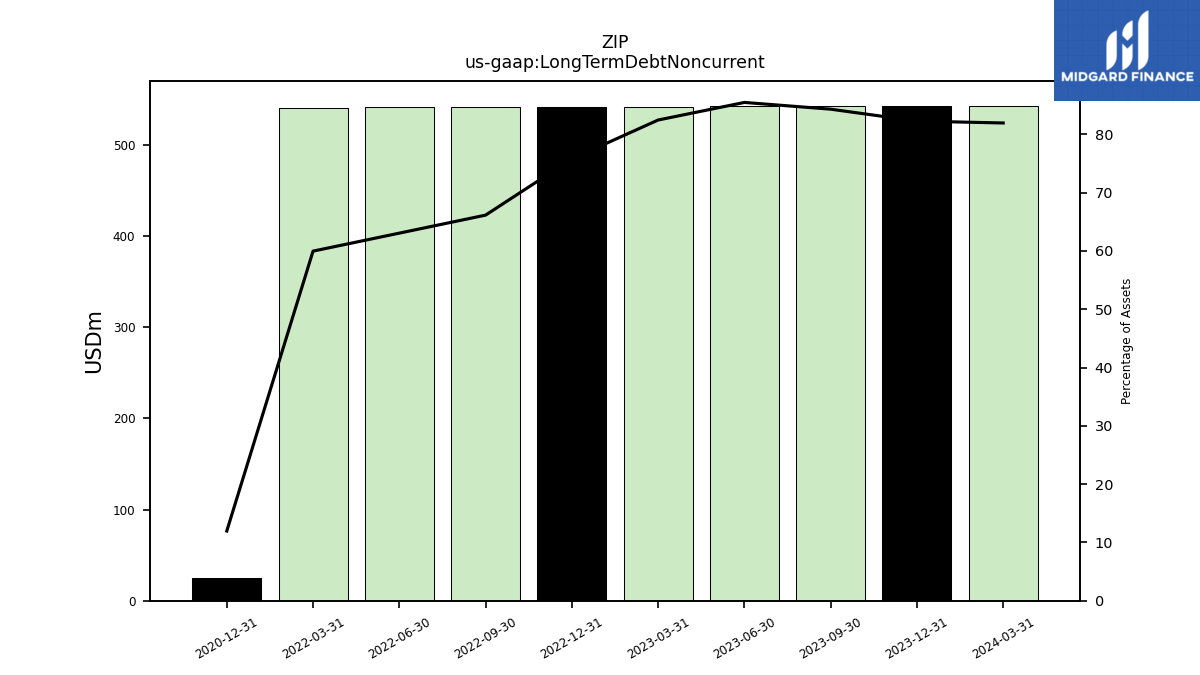
| Long Term Debt Noncurrent | 542.32 | 542.06 | 541.81 | 541.56 | 541.31 | 541.07 | 540.86 | NA | NA | NA | NA | 25.37 | NA | NA | |
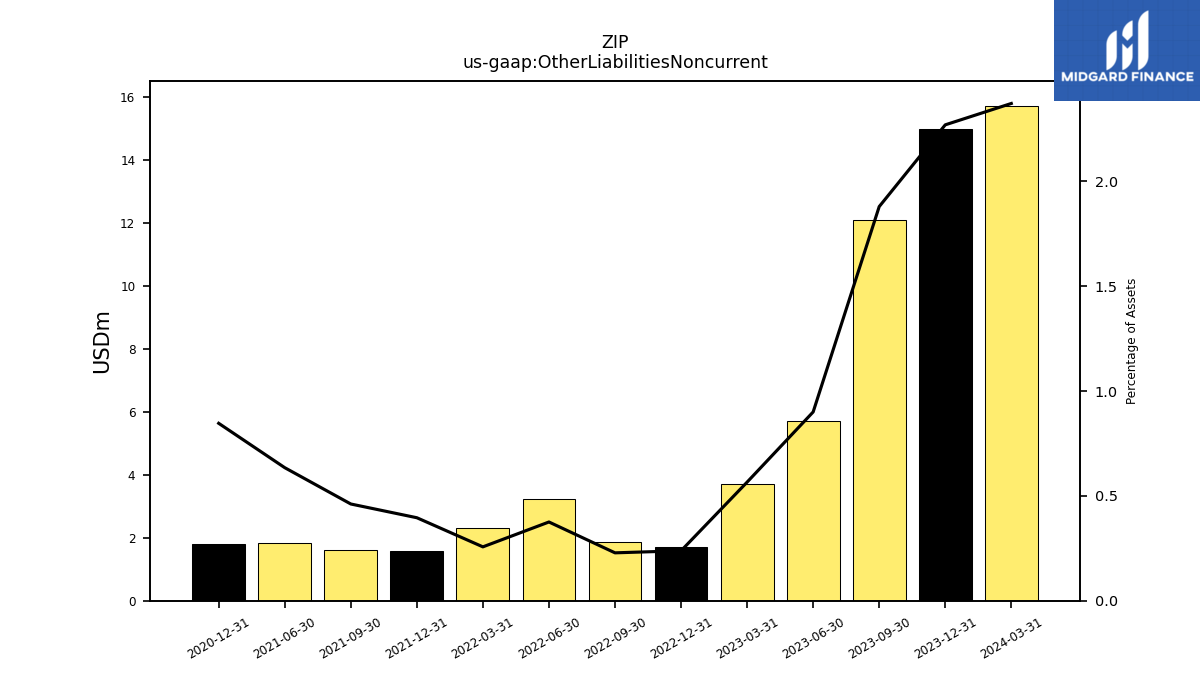
| Other Liabilities Noncurrent | 12.09 | 5.71 | 3.72 | 1.70 | 1.87 | 3.22 | 2.32 | 1.58 | 1.62 | 1.84 | NA | 1.79 | NA | NA | |
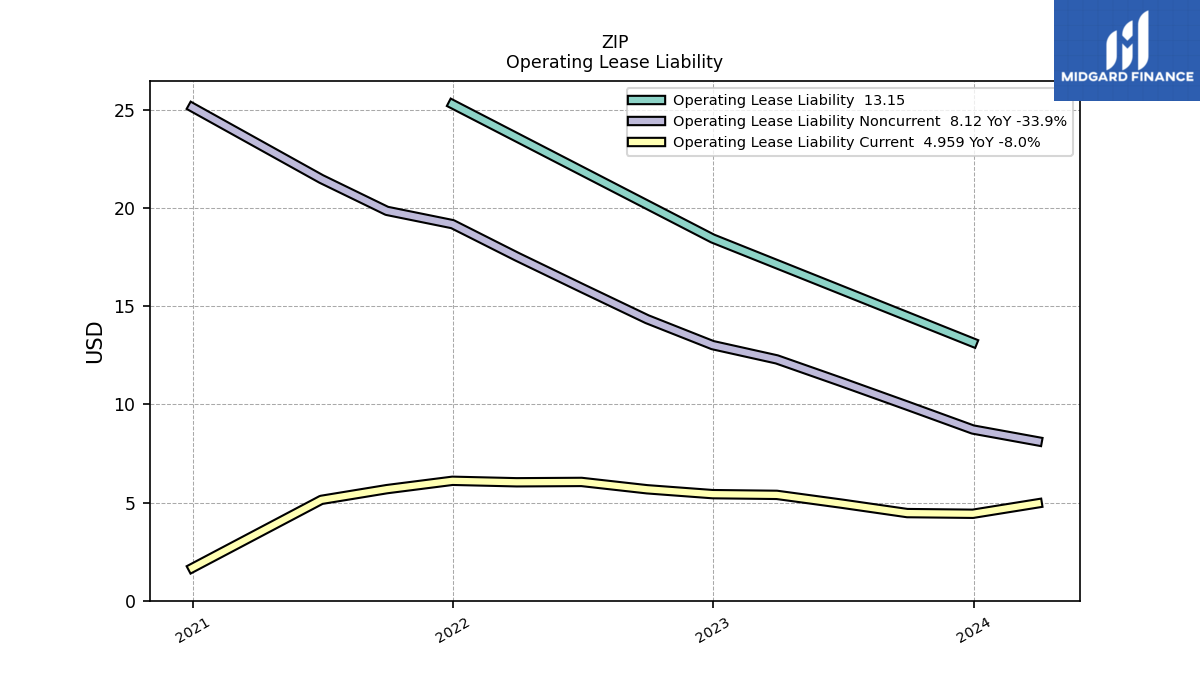
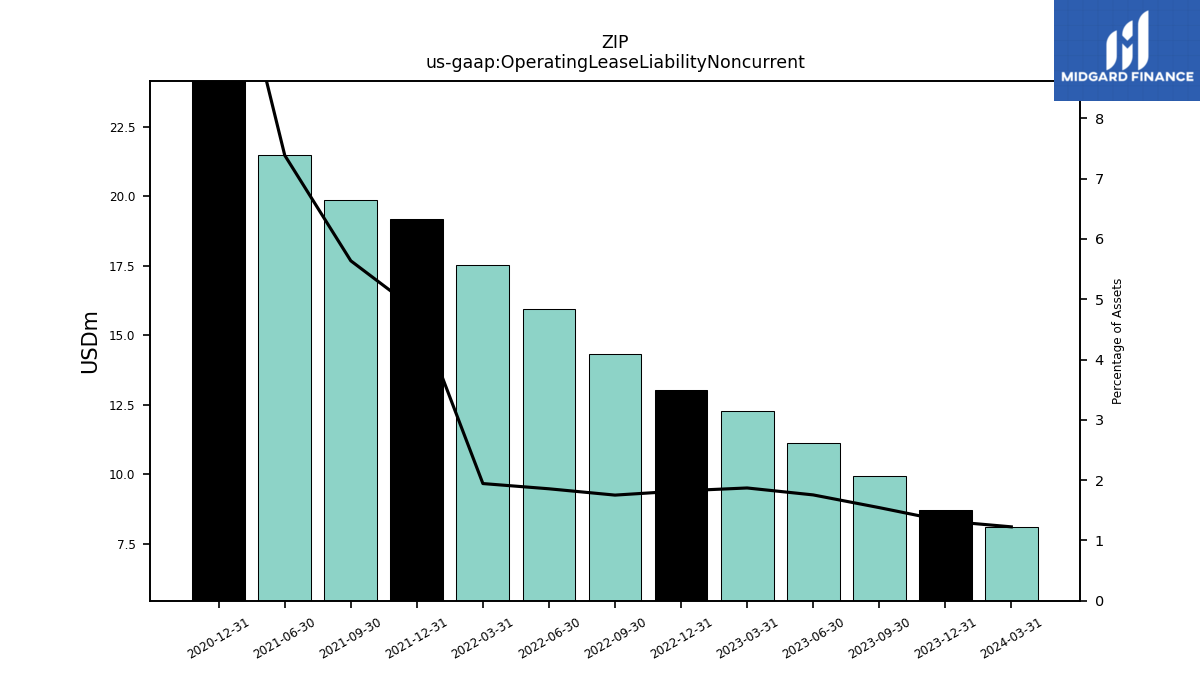
| Operating Lease Liability Noncurrent | 9.94 | 11.13 | 12.29 | 13.02 | 14.34 | 15.93 | 17.53 | 19.18 | 19.86 | 21.48 | NA | 25.13 | NA | NA |
| 2023-09-30 | 2023-06-30 | 2023-03-31 | 2022-12-31 | 2022-09-30 | 2022-06-30 | 2022-03-31 | 2021-12-31 | 2021-09-30 | 2021-06-30 | 2021-03-31 | 2020-12-31 | 2020-09-30 | 2020-06-30 | ||
|---|---|---|---|---|---|---|---|---|---|---|---|---|---|---|---|
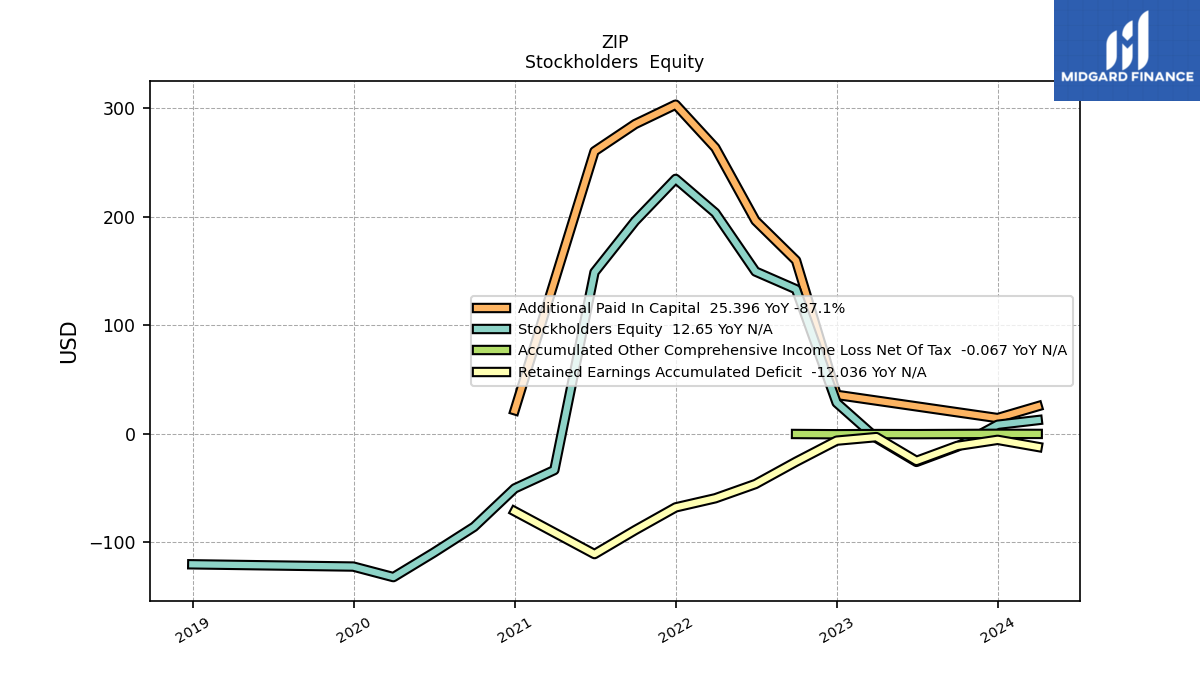
| Stockholders Equity | -11.93 | -25.85 | -3.86 | 28.62 | 133.26 | 149.58 | 203.62 | 234.97 | 196.03 | 148.90 | -33.40 | -50.30 | -85.68 | -109.60 | |
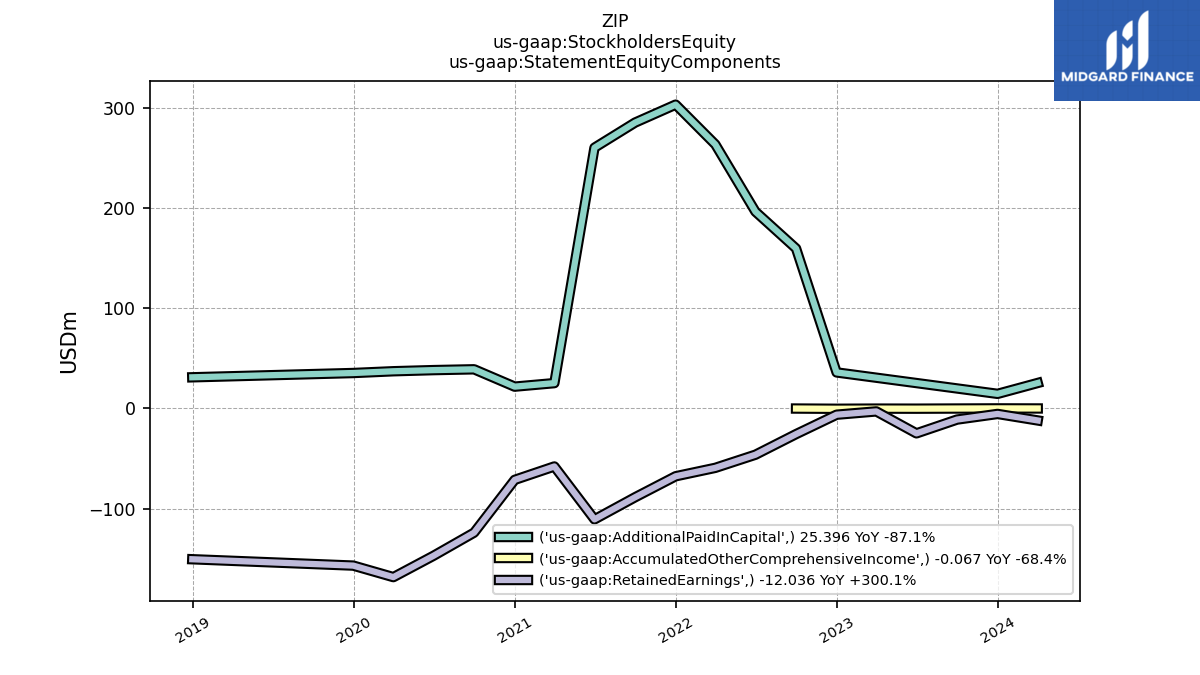
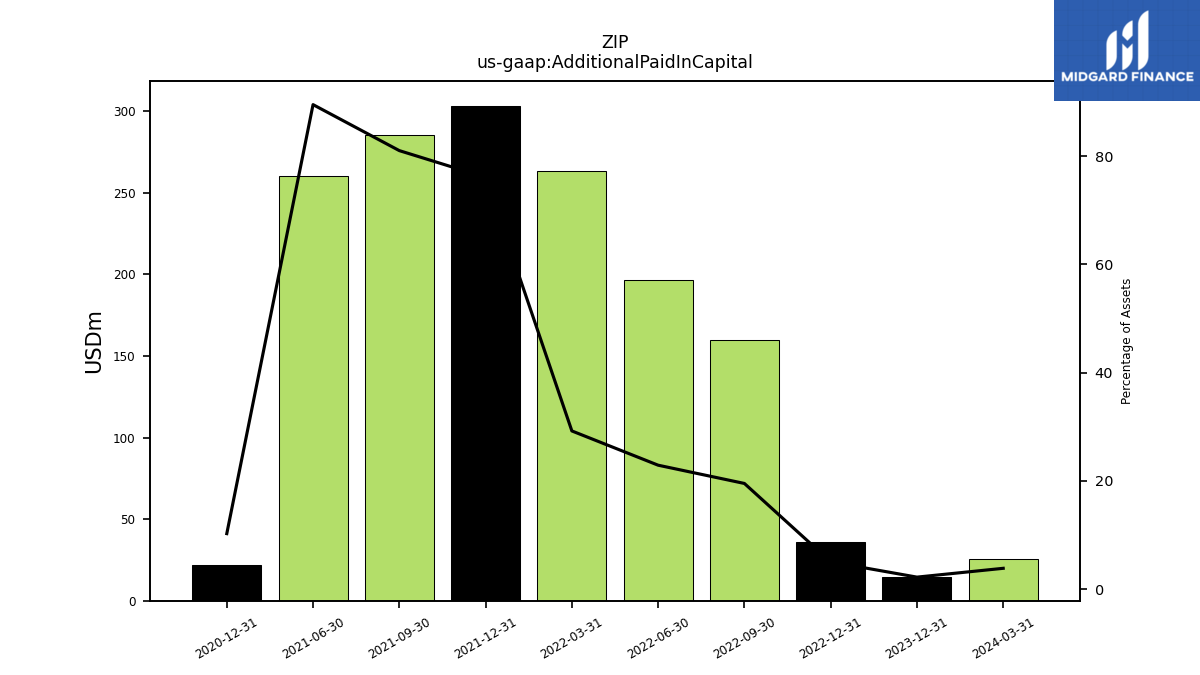
| Additional Paid In Capital | NA | NA | NA | 35.93 | 159.75 | 196.48 | 263.63 | 303.39 | 285.44 | 260.38 | NA | 21.73 | NA | NA | |
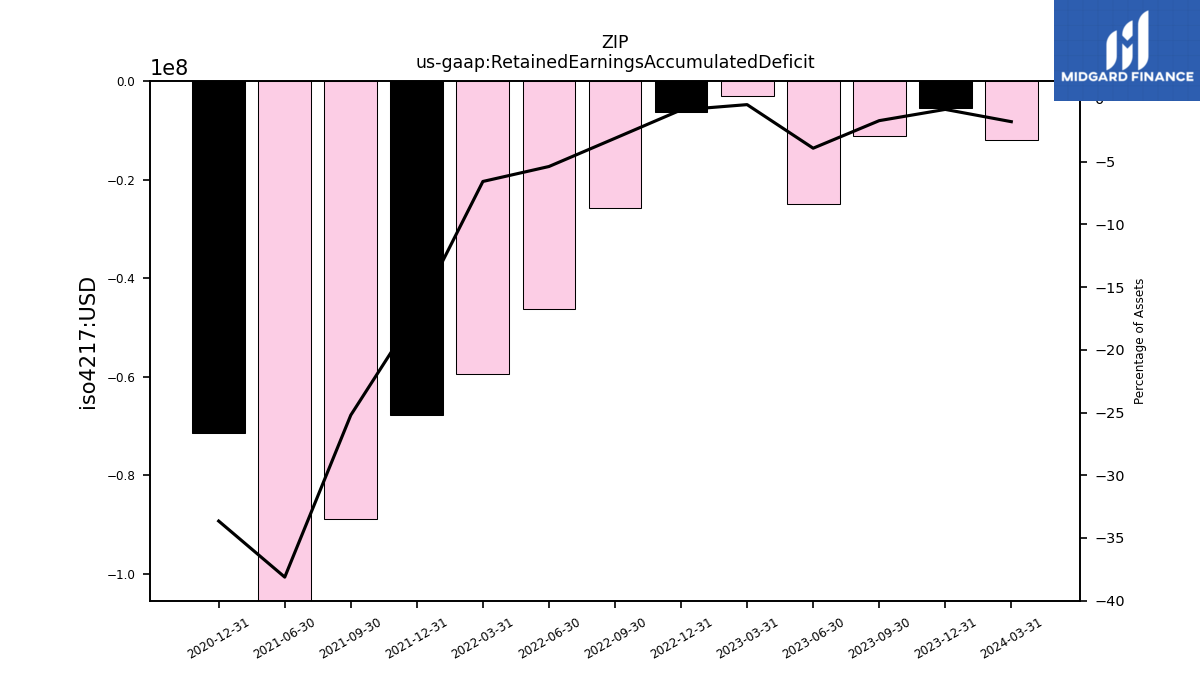
| Retained Earnings Accumulated Deficit | -11.16 | -24.93 | -3.01 | -6.29 | -25.70 | -46.26 | -59.37 | -67.78 | -88.77 | -110.83 | NA | -71.38 | NA | NA | |
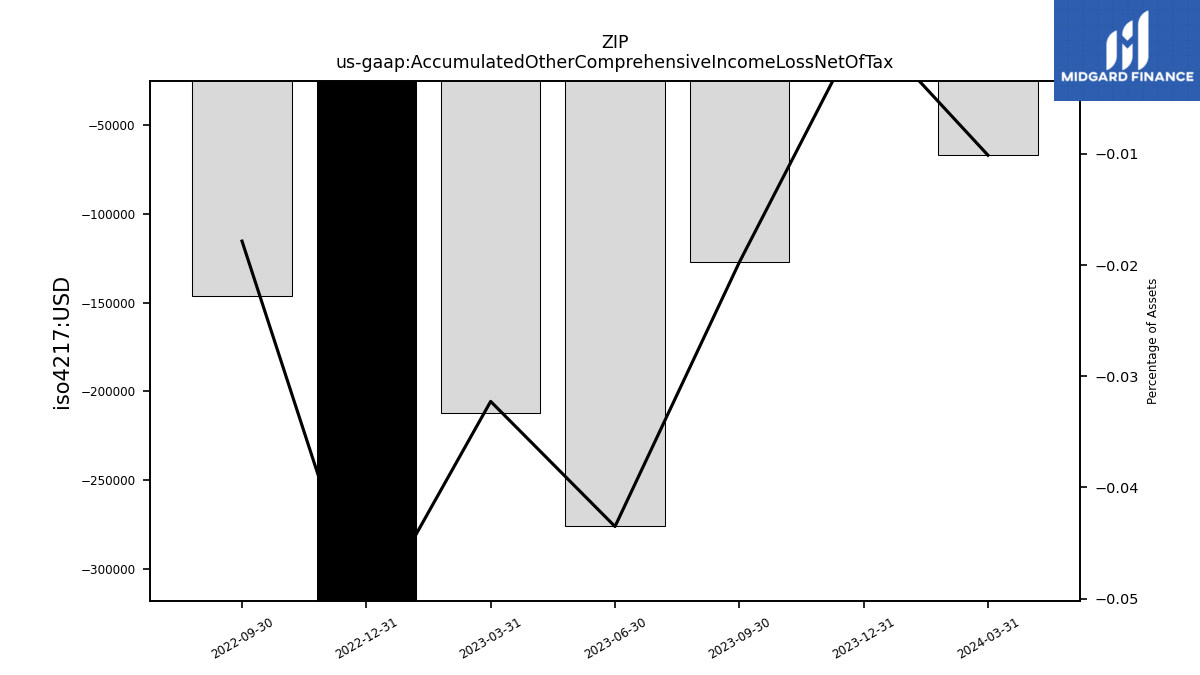
| Accumulated Other Comprehensive Income Loss Net Of Tax | -0.13 | -0.28 | -0.21 | -0.37 | -0.15 | NA | NA | NA | NA | NA | NA | NA | NA | NA | |
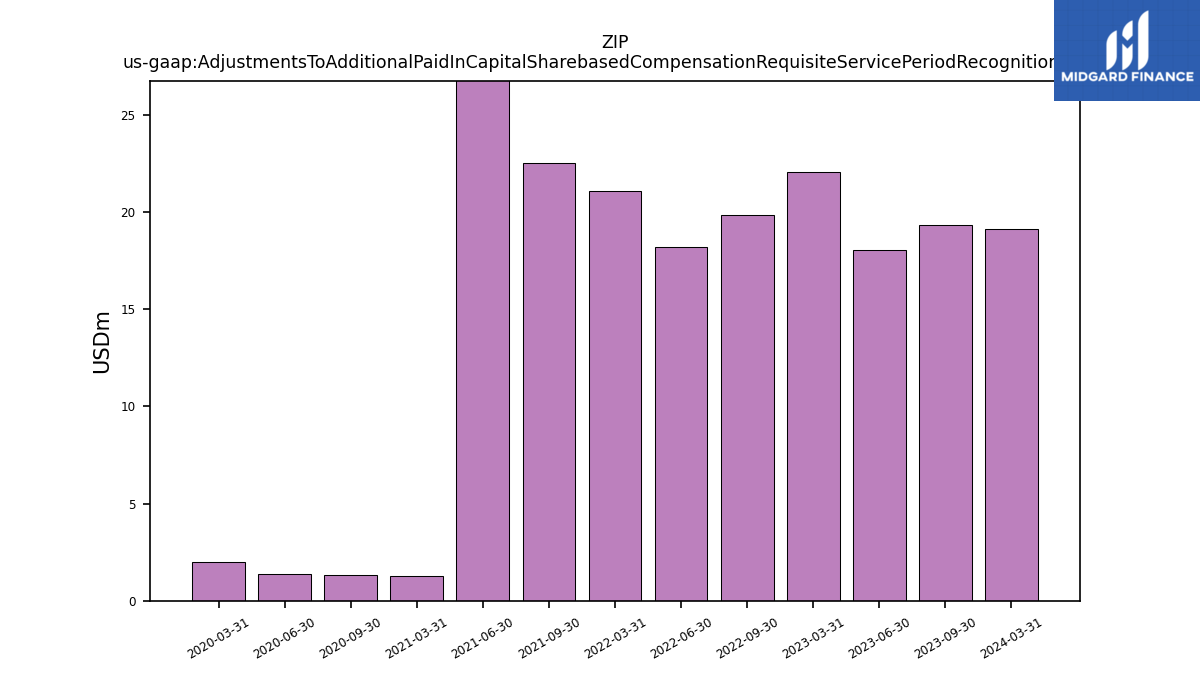
| Adjustments To Additional Paid In Capital Sharebased Compensation Requisite Service Period Recognition Value | 19.33 | 18.04 | 22.09 | NA | 19.84 | 18.20 | 21.11 | NA | 22.51 | 65.12 | 1.29 | NA | 1.30 | 1.39 |
| 2023-09-30 | 2023-06-30 | 2023-03-31 | 2022-12-31 | 2022-09-30 | 2022-06-30 | 2022-03-31 | 2021-12-31 | 2021-09-30 | 2021-06-30 | 2021-03-31 | 2020-12-31 | 2020-09-30 | 2020-06-30 | ||
|---|---|---|---|---|---|---|---|---|---|---|---|---|---|---|---|
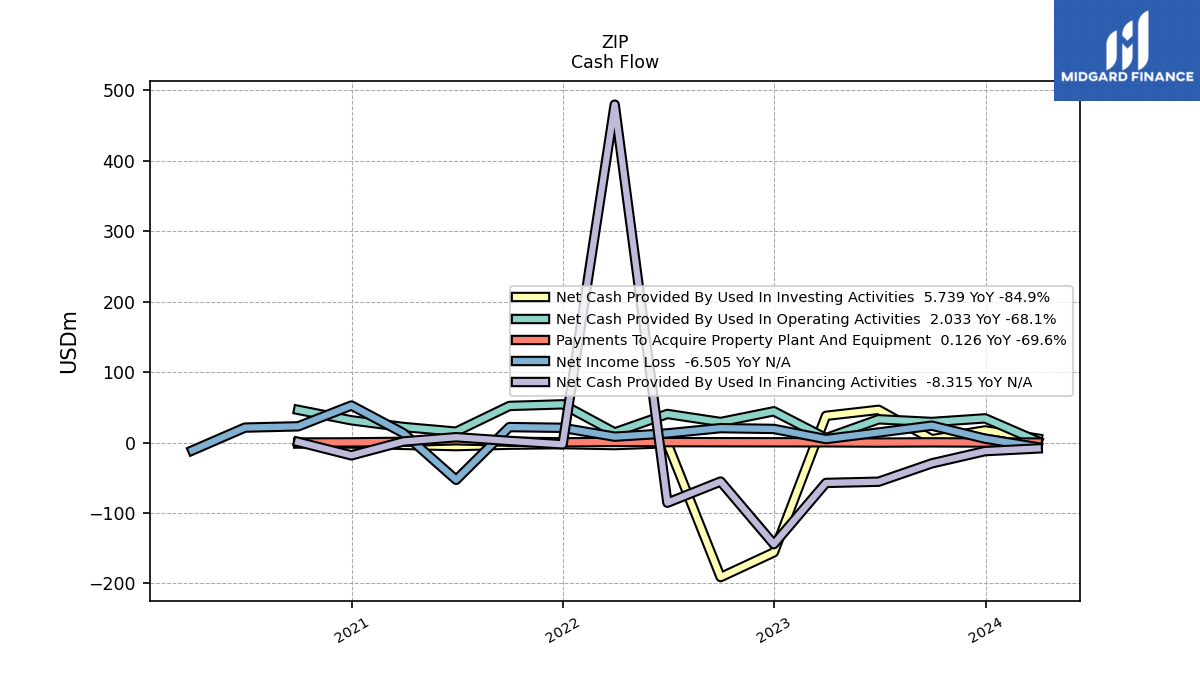
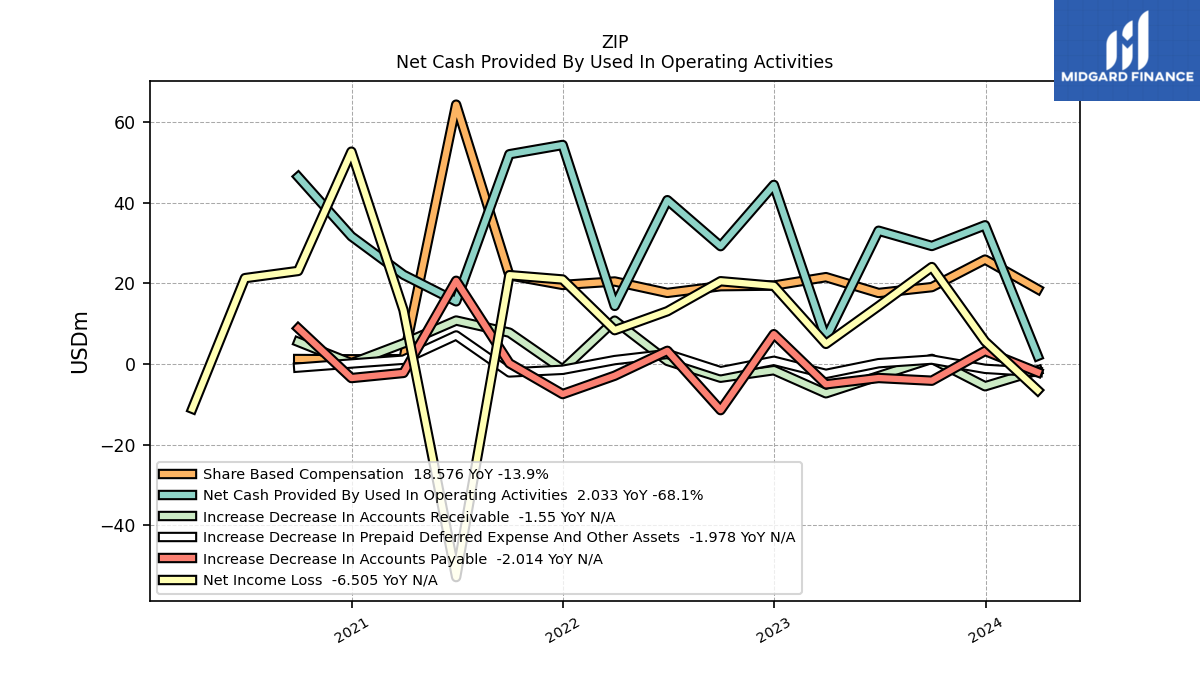
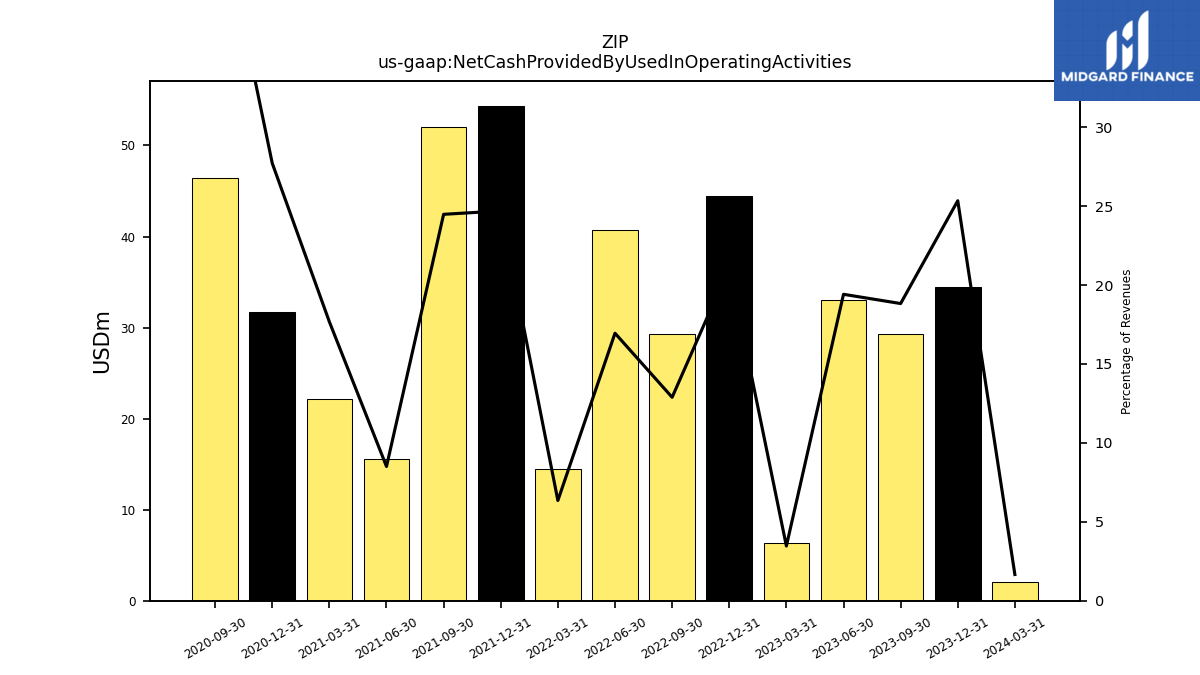
| Net Cash Provided By Used In Operating Activities | 29.30 | 33.08 | 6.37 | 44.46 | 29.25 | 40.66 | 14.43 | 54.36 | 52.06 | 15.56 | 22.15 | 31.69 | 46.45 | NA | |
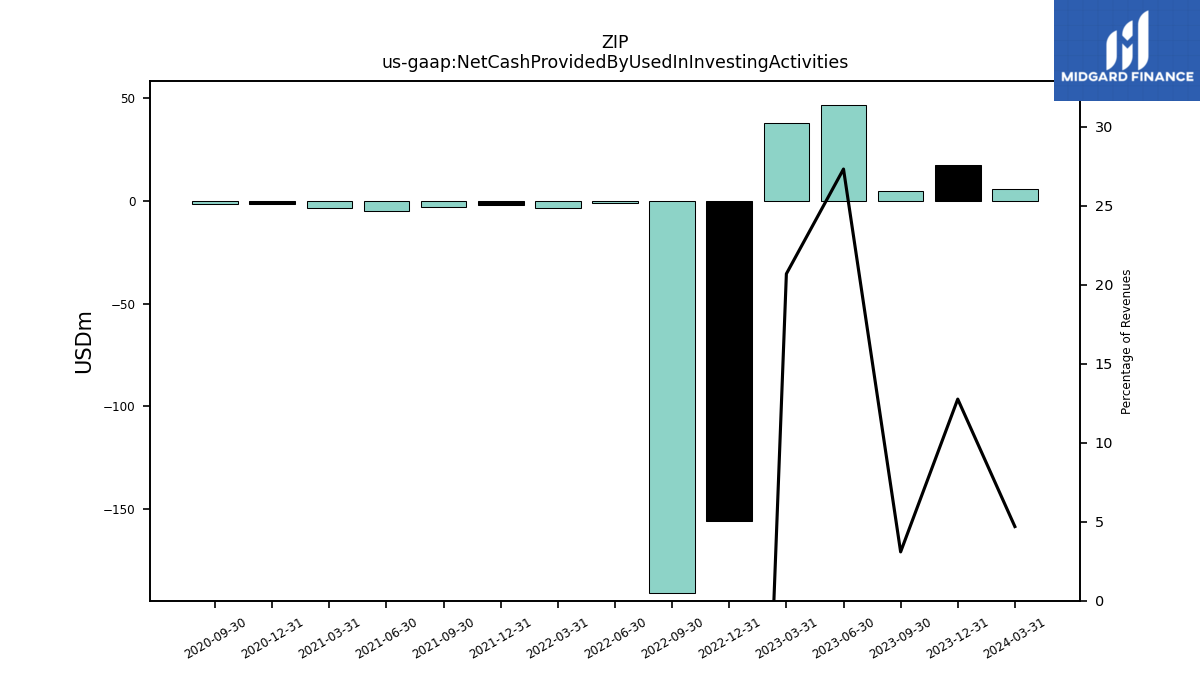
| Net Cash Provided By Used In Investing Activities | 4.81 | 46.56 | 38.02 | -155.85 | -190.97 | -0.80 | -3.52 | -2.17 | -2.95 | -4.96 | -3.25 | -1.32 | -1.36 | NA | |
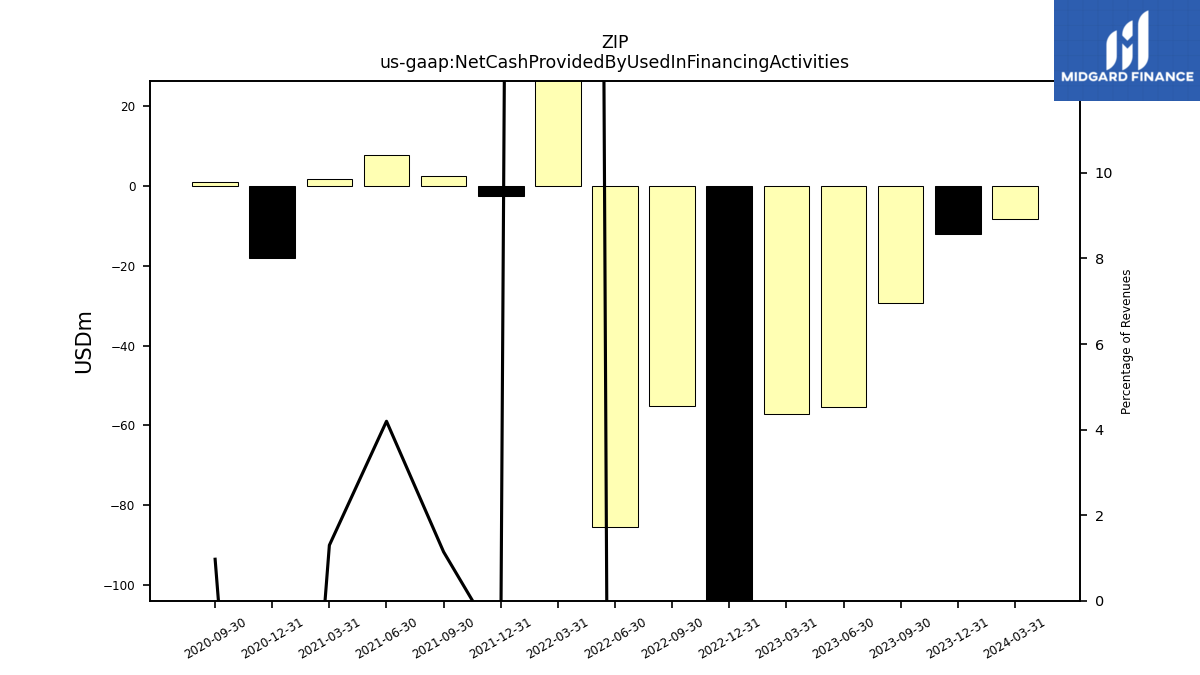
| Net Cash Provided By Used In Financing Activities | -29.44 | -55.51 | -57.24 | -144.20 | -55.23 | -85.34 | 479.86 | -2.45 | 2.43 | 7.68 | 1.63 | -18.11 | 1.00 | NA |
| 2023-09-30 | 2023-06-30 | 2023-03-31 | 2022-12-31 | 2022-09-30 | 2022-06-30 | 2022-03-31 | 2021-12-31 | 2021-09-30 | 2021-06-30 | 2021-03-31 | 2020-12-31 | 2020-09-30 | 2020-06-30 | ||
|---|---|---|---|---|---|---|---|---|---|---|---|---|---|---|---|
| Net Cash Provided By Used In Operating Activities | 29.30 | 33.08 | 6.37 | 44.46 | 29.25 | 40.66 | 14.43 | 54.36 | 52.06 | 15.56 | 22.15 | 31.69 | 46.45 | NA | |
| Net Income Loss | 24.08 | 14.38 | 5.01 | 19.41 | 20.56 | 13.11 | 8.42 | 20.99 | 22.06 | -52.85 | 13.40 | 52.70 | 23.11 | 21.32 | |
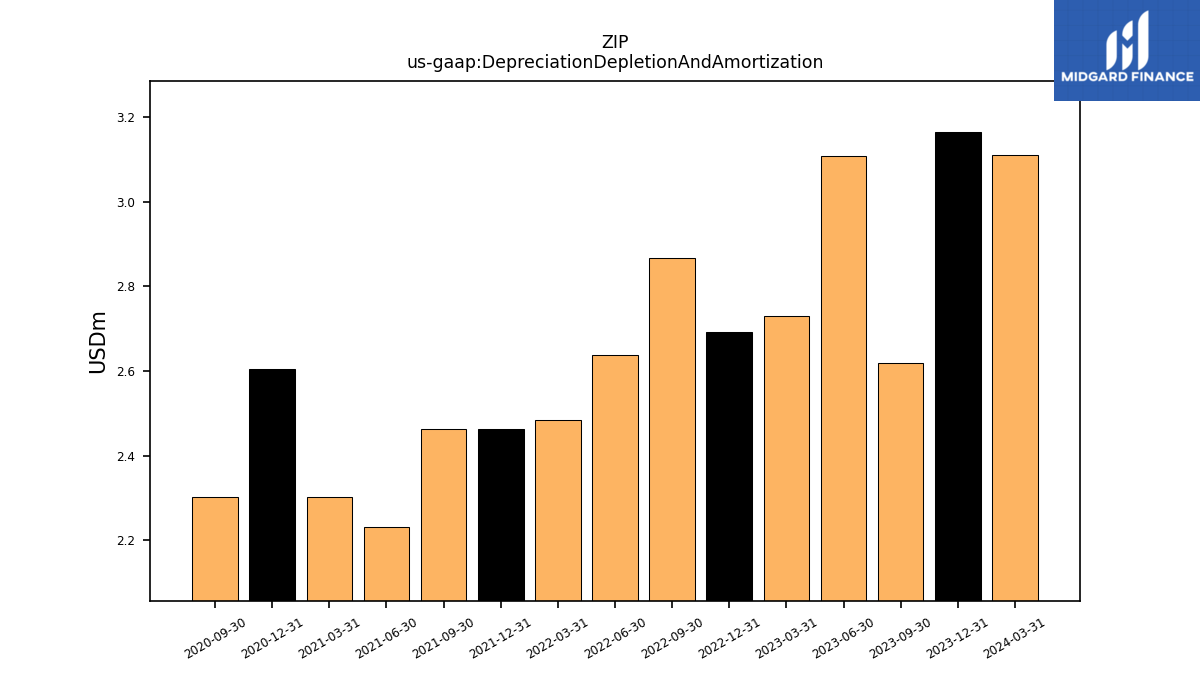
| Depreciation Depletion And Amortization | 2.62 | 3.11 | 2.73 | 2.69 | 2.87 | 2.64 | 2.48 | 2.46 | 2.46 | 2.23 | 2.30 | 2.60 | 2.30 | NA | |
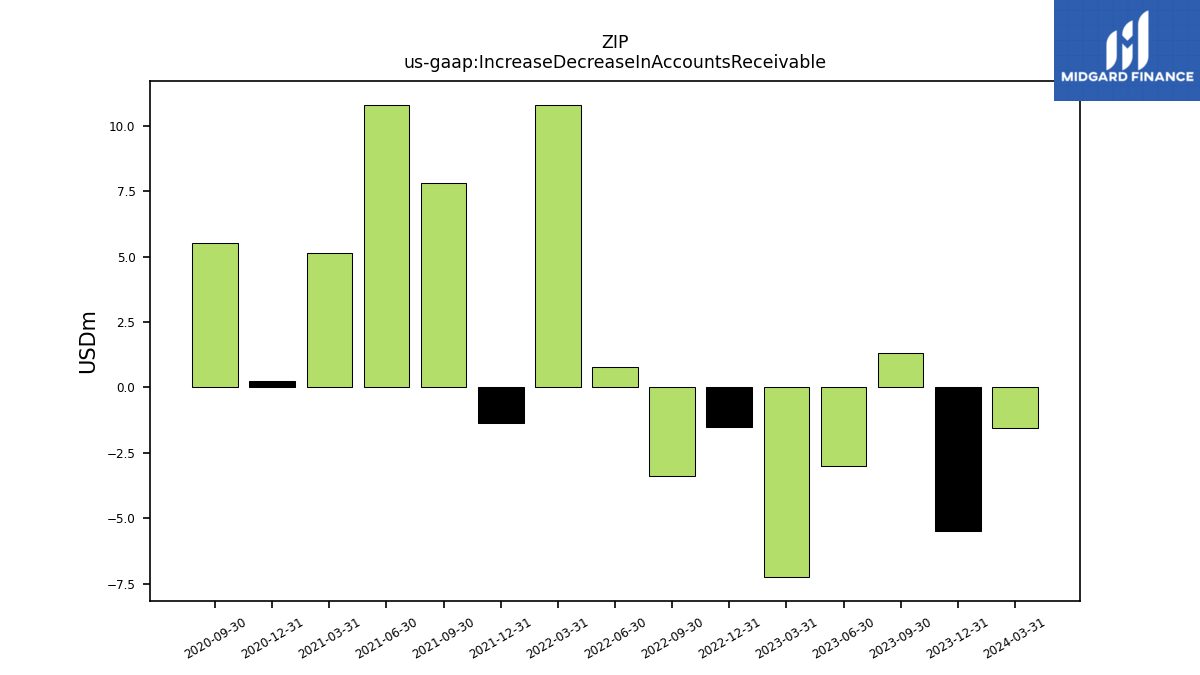
| Increase Decrease In Accounts Receivable | 1.30 | -2.99 | -7.25 | -1.52 | -3.38 | 0.79 | 10.78 | -1.34 | 7.81 | 10.81 | 5.15 | 0.23 | 5.51 | NA | |
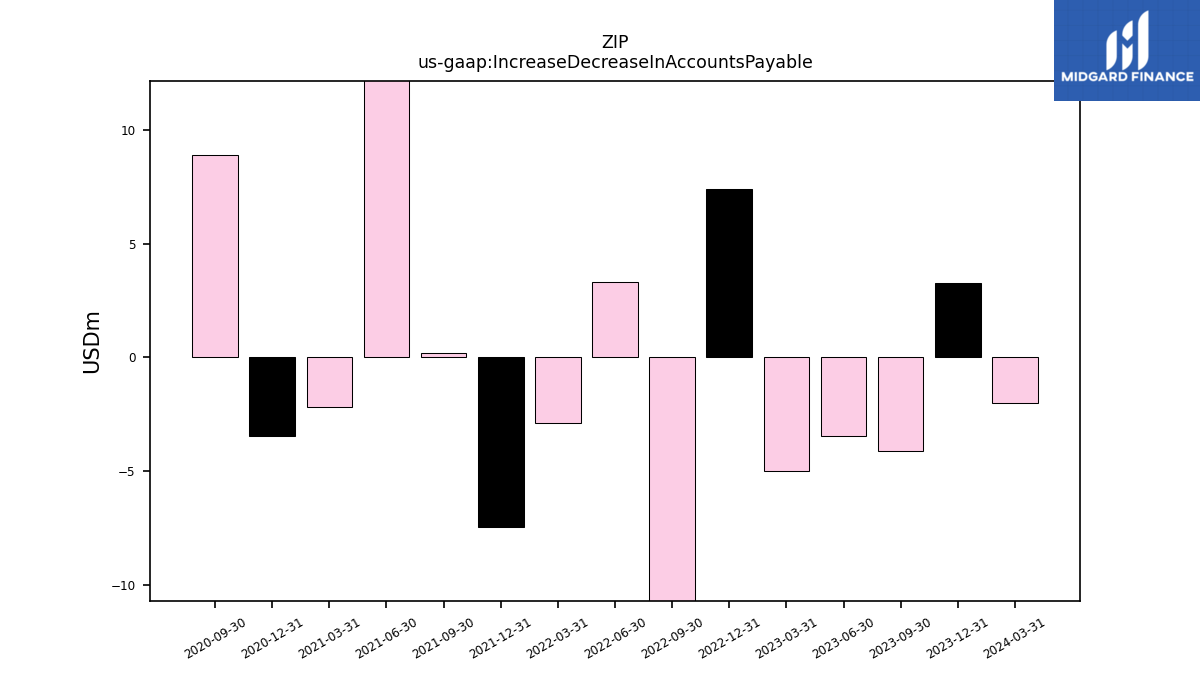
| Increase Decrease In Accounts Payable | -4.12 | -3.45 | -5.02 | 7.43 | -11.43 | 3.30 | -2.88 | -7.45 | 0.19 | 20.67 | -2.19 | -3.47 | 8.90 | NA | |
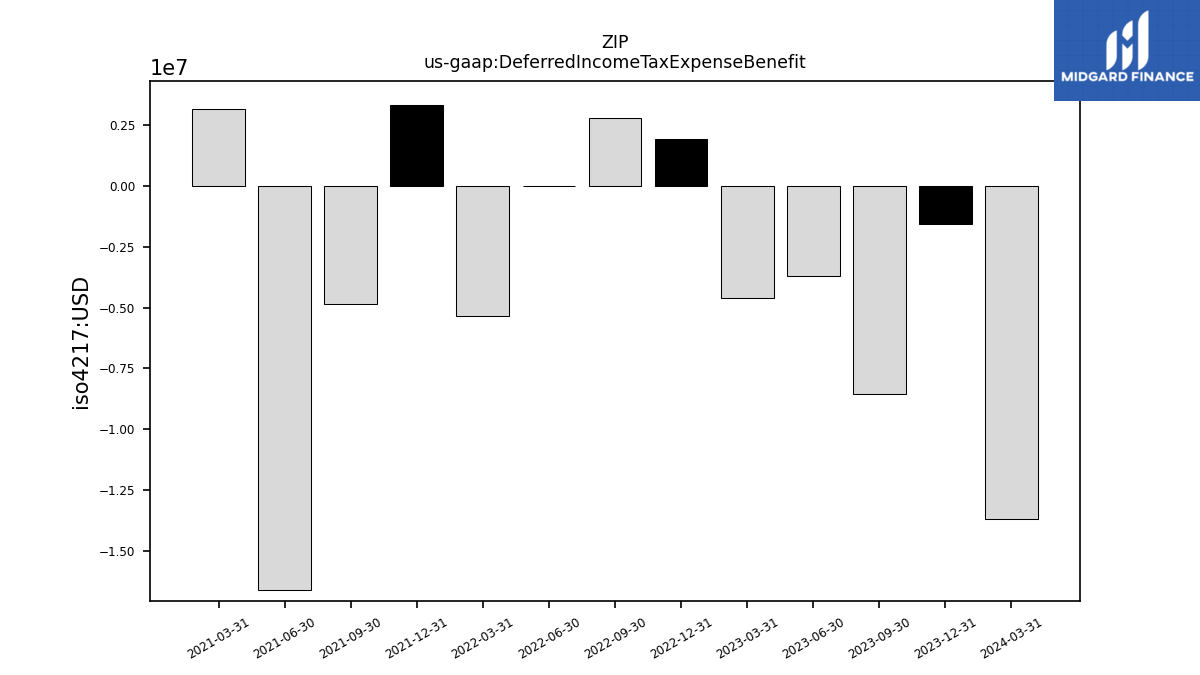
| Deferred Income Tax Expense Benefit | -8.53 | -3.69 | -4.61 | 1.92 | 2.81 | 0.00 | -5.36 | 3.33 | -4.83 | -16.59 | 3.15 | NA | NA | NA | |
| Share Based Compensation | 19.09 | 17.64 | 21.57 | 19.48 | 19.32 | 17.66 | 20.49 | 19.63 | 22.03 | 64.37 | 1.23 | 1.19 | 1.26 | NA |
| 2023-09-30 | 2023-06-30 | 2023-03-31 | 2022-12-31 | 2022-09-30 | 2022-06-30 | 2022-03-31 | 2021-12-31 | 2021-09-30 | 2021-06-30 | 2021-03-31 | 2020-12-31 | 2020-09-30 | 2020-06-30 | ||
|---|---|---|---|---|---|---|---|---|---|---|---|---|---|---|---|
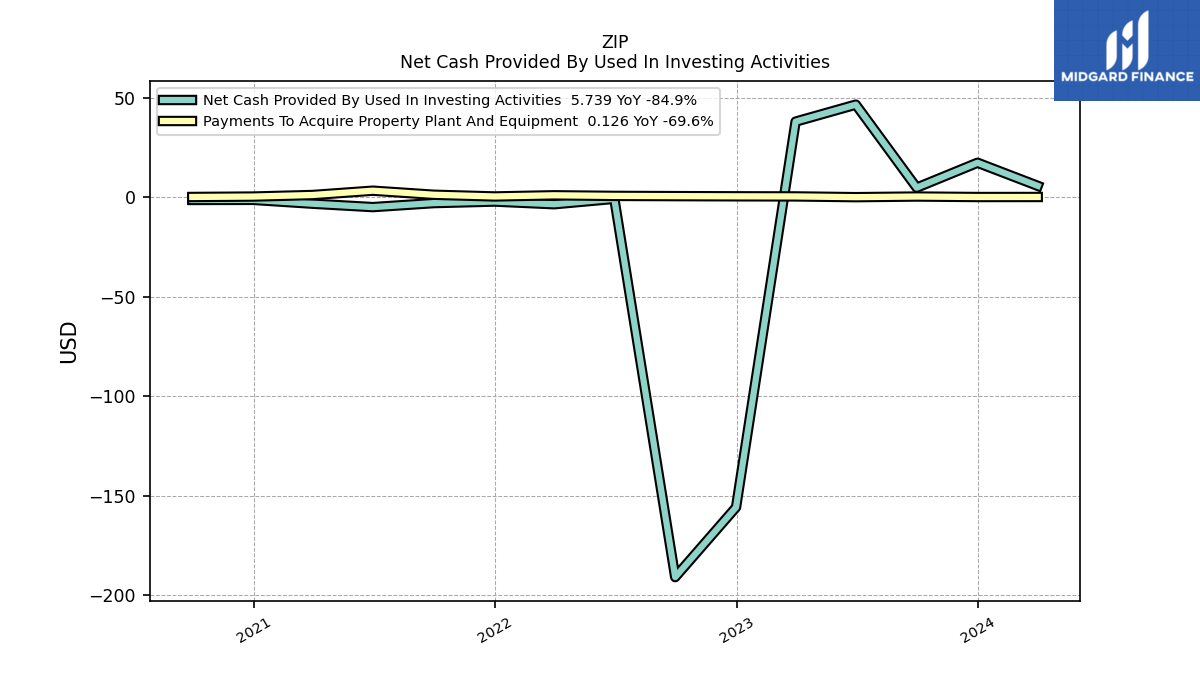
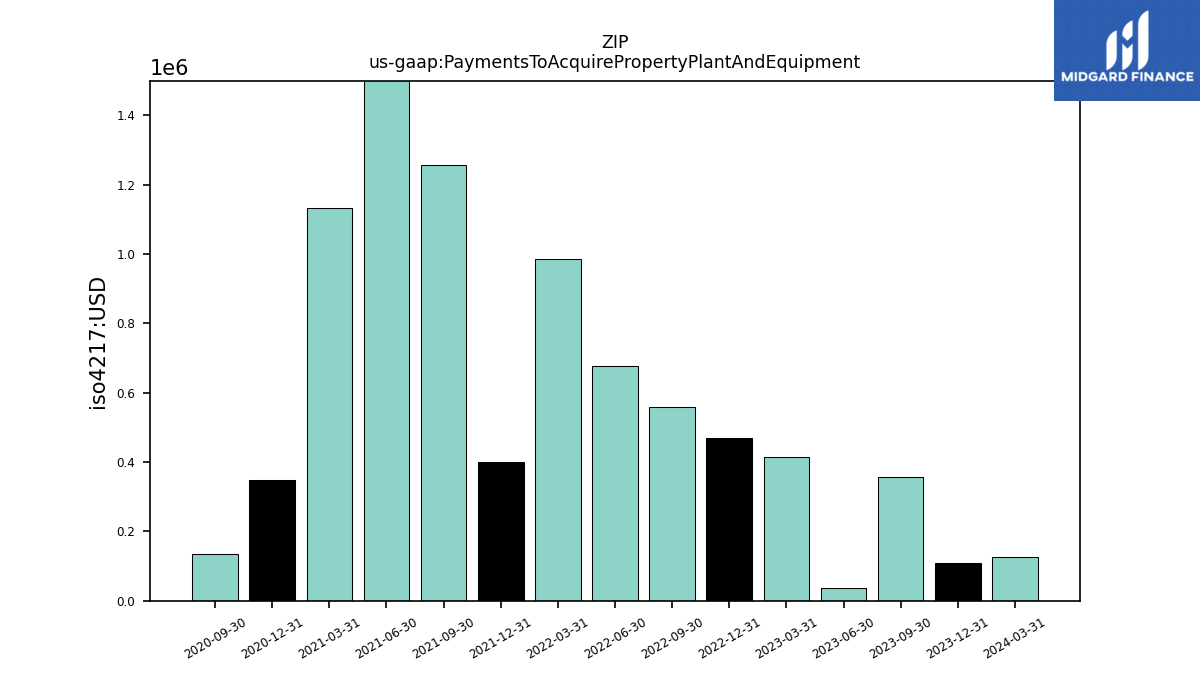
| Net Cash Provided By Used In Investing Activities | 4.81 | 46.56 | 38.02 | -155.85 | -190.97 | -0.80 | -3.52 | -2.17 | -2.95 | -4.96 | -3.25 | -1.32 | -1.36 | NA | |
| Payments To Acquire Property Plant And Equipment | 0.36 | 0.04 | 0.41 | 0.47 | 0.56 | 0.68 | 0.99 | 0.40 | 1.25 | 3.30 | 1.13 | 0.35 | 0.14 | NA |
| 2023-09-30 | 2023-06-30 | 2023-03-31 | 2022-12-31 | 2022-09-30 | 2022-06-30 | 2022-03-31 | 2021-12-31 | 2021-09-30 | 2021-06-30 | 2021-03-31 | 2020-12-31 | 2020-09-30 | 2020-06-30 | ||
|---|---|---|---|---|---|---|---|---|---|---|---|---|---|---|---|
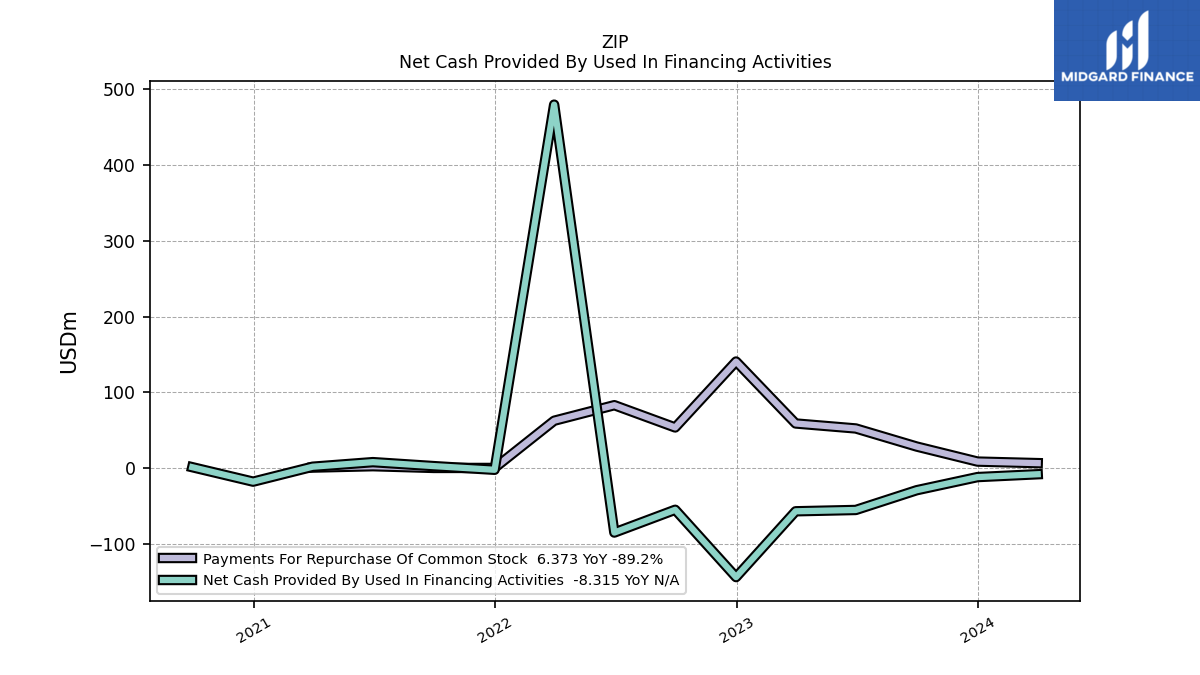
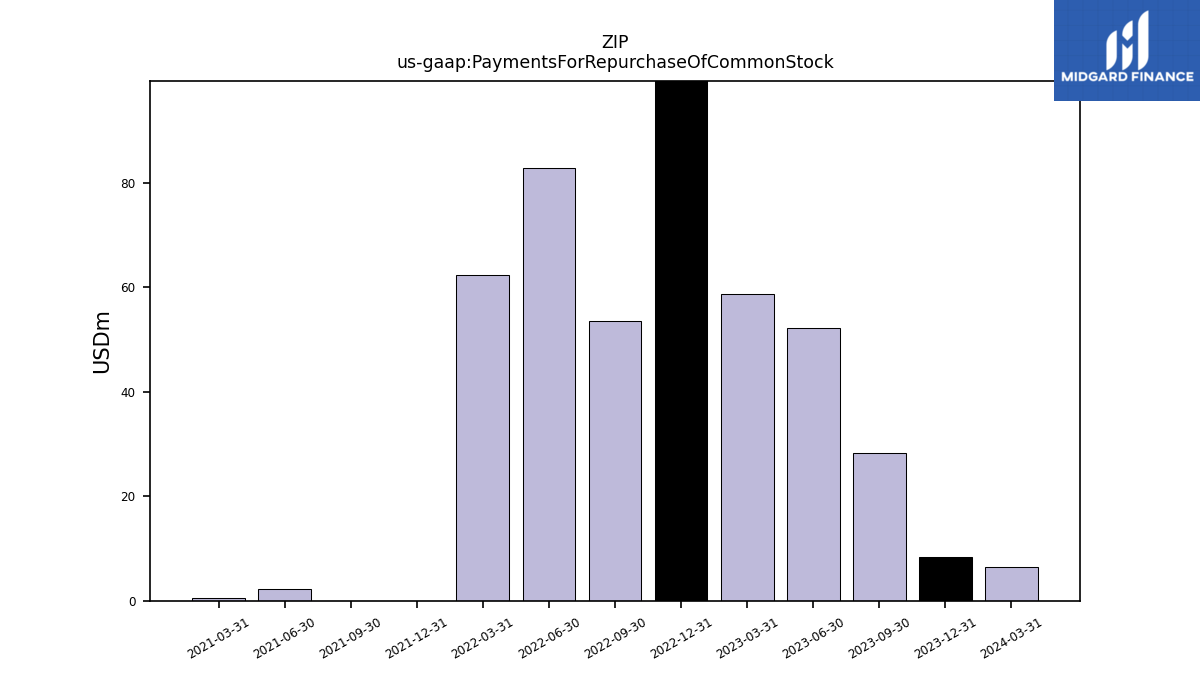
| Net Cash Provided By Used In Financing Activities | -29.44 | -55.51 | -57.24 | -144.20 | -55.23 | -85.34 | 479.86 | -2.45 | 2.43 | 7.68 | 1.63 | -18.11 | 1.00 | NA | |
| Payments For Repurchase Of Common Stock | 28.27 | 52.14 | 58.74 | 140.58 | 53.45 | 82.88 | 62.35 | 0.00 | 0.00 | 2.30 | 0.45 | NA | NA | NA |
| 2023-09-30 | 2023-06-30 | 2023-03-31 | 2022-12-31 | 2022-09-30 | 2022-06-30 | 2022-03-31 | 2021-12-31 | 2021-09-30 | 2021-06-30 | 2021-03-31 | 2020-12-31 | 2020-09-30 | 2020-06-30 | ||
|---|---|---|---|---|---|---|---|---|---|---|---|---|---|---|---|
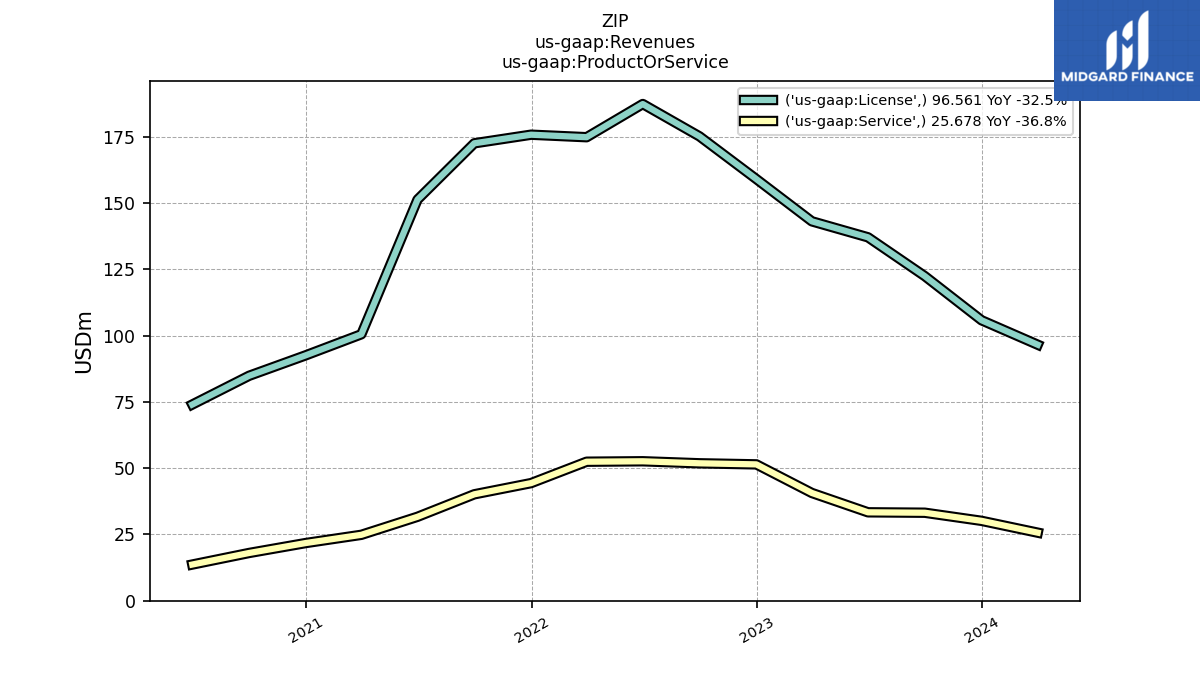
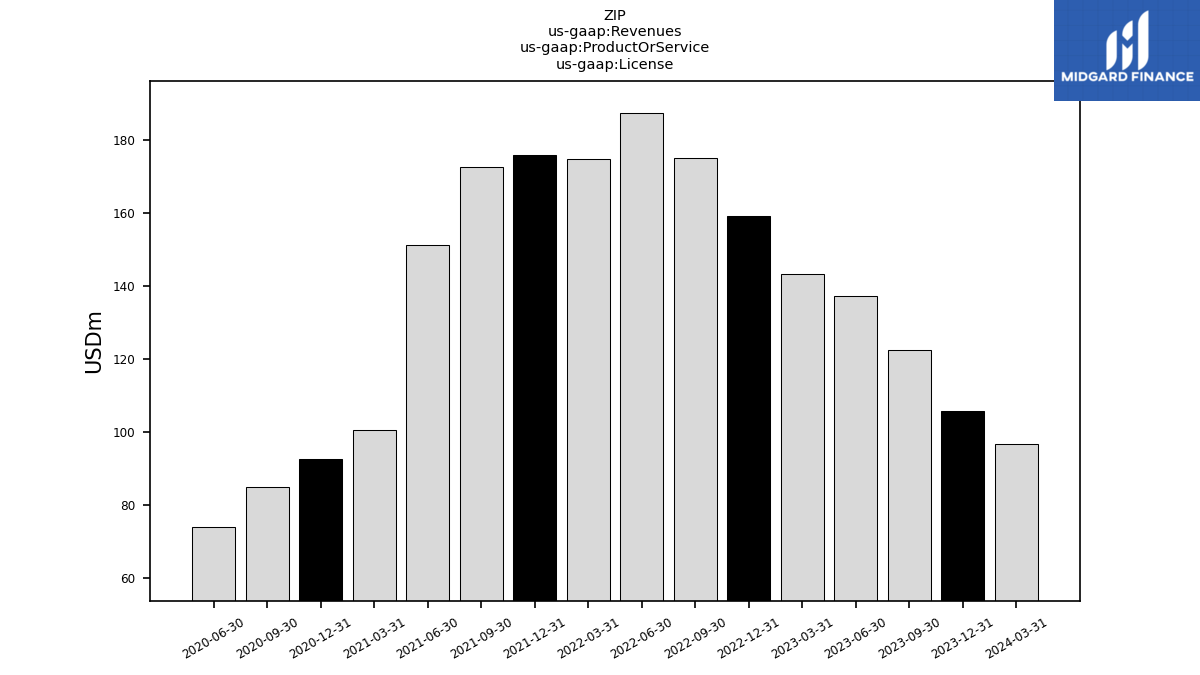
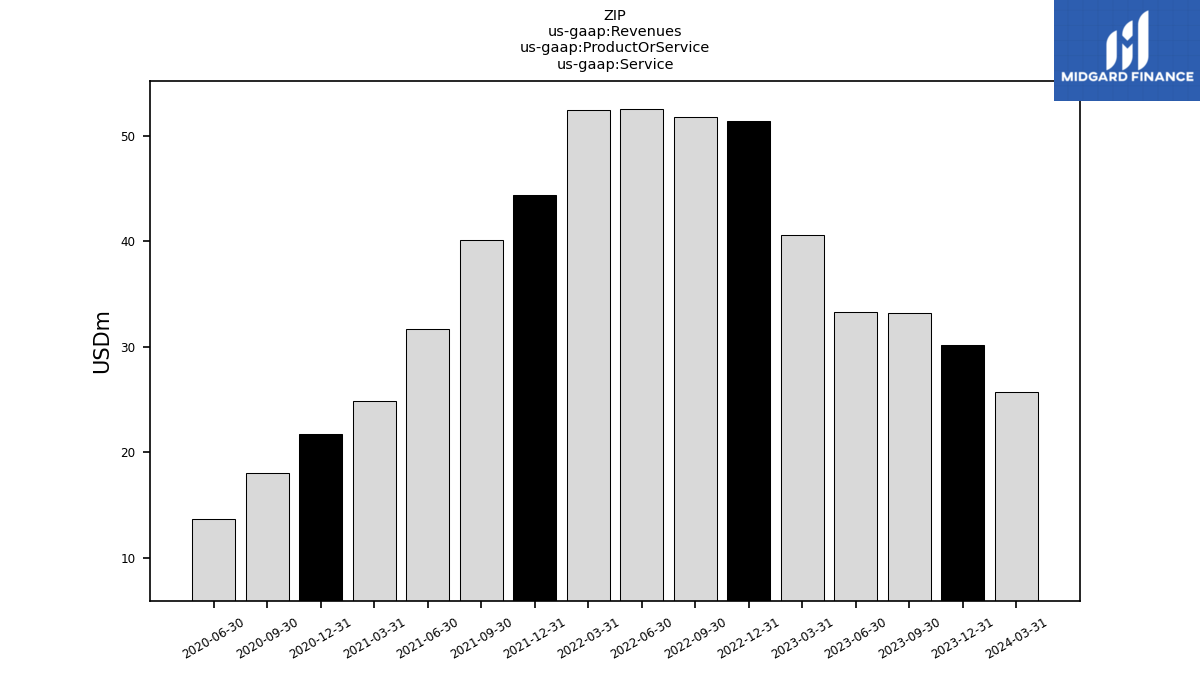
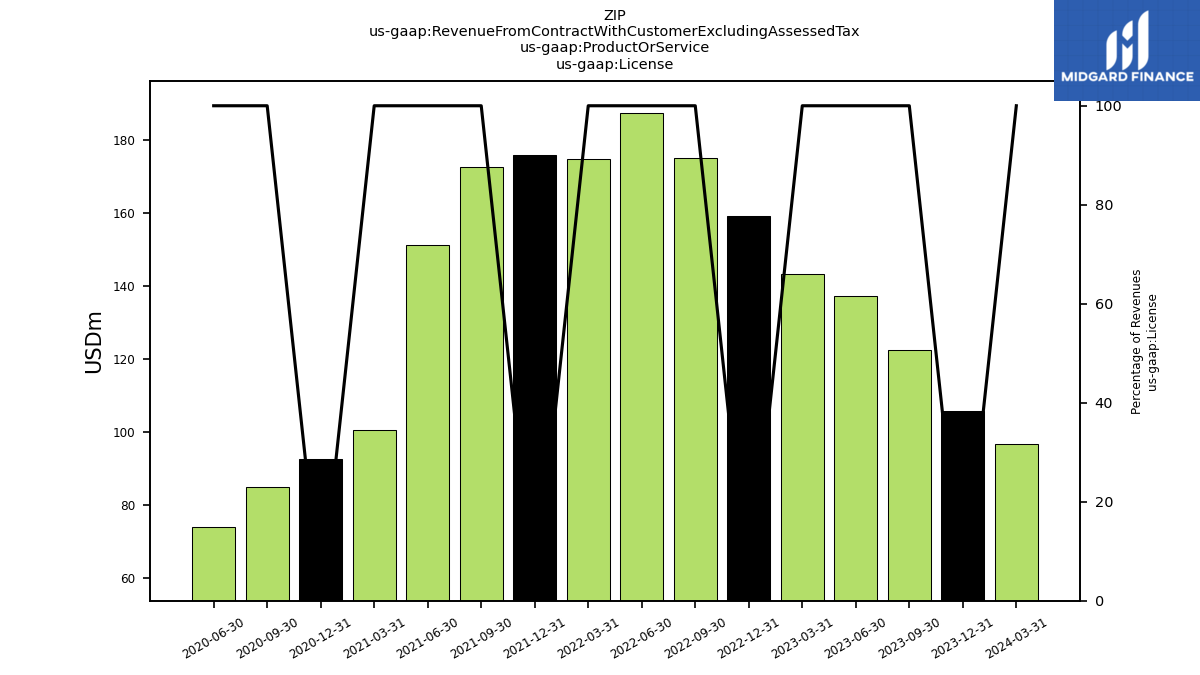
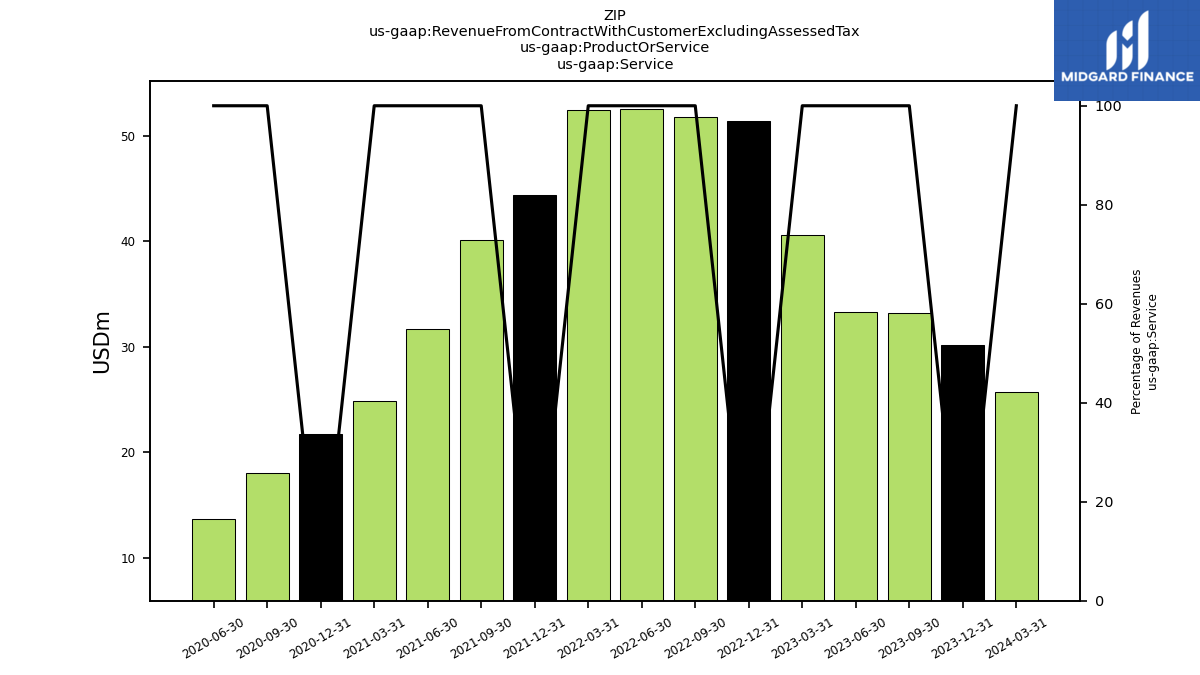
| Revenues | 155.63 | 170.42 | 183.75 | 210.48 | 226.97 | 239.94 | 227.26 | 220.14 | 212.67 | 182.96 | 125.37 | 114.34 | 102.85 | 87.66 | |
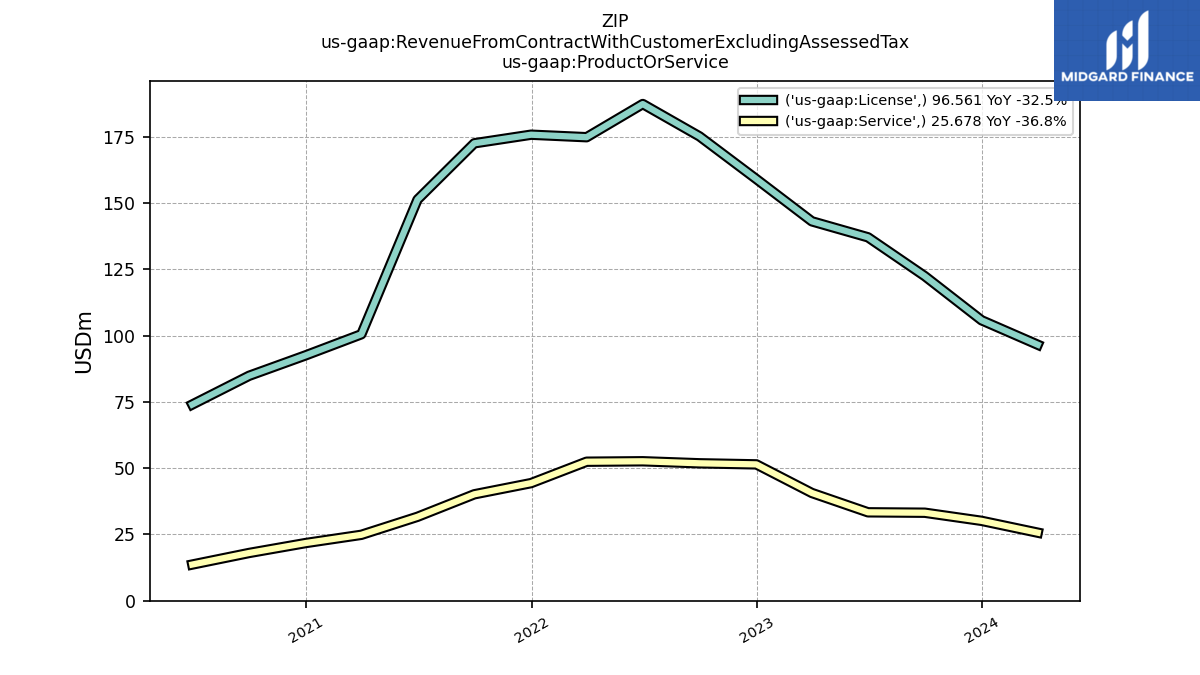
| License | 122.43 | 137.07 | 143.10 | 159.04 | 175.13 | 187.34 | 174.82 | 175.77 | 172.53 | 151.29 | 100.50 | 92.58 | 84.84 | 74.00 | |
| Service | 33.20 | 33.35 | 40.65 | 51.43 | 51.84 | 52.60 | 52.44 | 44.37 | 40.15 | 31.67 | 24.87 | 21.77 | 18.01 | 13.65 | |
| Revenue From Contract With Customer Excluding Assessed Tax | 155.63 | 170.42 | 183.75 | 210.48 | 226.97 | 239.94 | 227.26 | 220.14 | 212.67 | 182.96 | 125.37 | 114.34 | 102.85 | 87.66 | |
| License | 122.43 | 137.07 | 143.10 | 159.04 | 175.13 | 187.34 | 174.82 | 175.77 | 172.53 | 151.29 | 100.50 | 92.58 | 84.84 | 74.00 | |
| Service | 33.20 | 33.35 | 40.65 | 51.43 | 51.84 | 52.60 | 52.44 | 44.37 | 40.15 | 31.67 | 24.87 | 21.77 | 18.01 | 13.65 |
