
| 2023-09-30 | 2023-06-30 | 2023-03-31 | 2022-12-31 | 2022-09-30 | 2022-06-30 | 2022-03-31 | 2021-12-31 | 2021-09-30 | 2021-06-30 | 2021-03-31 | 2020-12-31 | 2020-09-30 | 2020-06-30 | 2020-03-31 | 2019-12-31 | 2019-09-30 | 2019-06-30 | 2019-03-31 | 2018-12-31 | 2018-09-30 | 2018-06-30 | 2018-03-31 | 2017-12-31 | 2017-09-30 | 2017-06-30 | 2017-03-31 | 2016-12-31 | 2016-09-30 | 2016-06-30 | 2016-03-31 | 2015-12-31 | 2015-09-30 | 2015-06-30 | 2015-03-31 | 2014-12-31 | 2014-09-30 | 2014-06-30 | 2014-03-31 | 2013-12-28 | 2013-09-28 | 2013-06-29 | 2013-03-31 | 2012-12-29 | 2012-09-29 | 2012-06-30 | 2012-03-31 | 2011-12-31 | 2011-10-01 | 2011-07-02 | ||
|---|---|---|---|---|---|---|---|---|---|---|---|---|---|---|---|---|---|---|---|---|---|---|---|---|---|---|---|---|---|---|---|---|---|---|---|---|---|---|---|---|---|---|---|---|---|---|---|---|---|---|---|
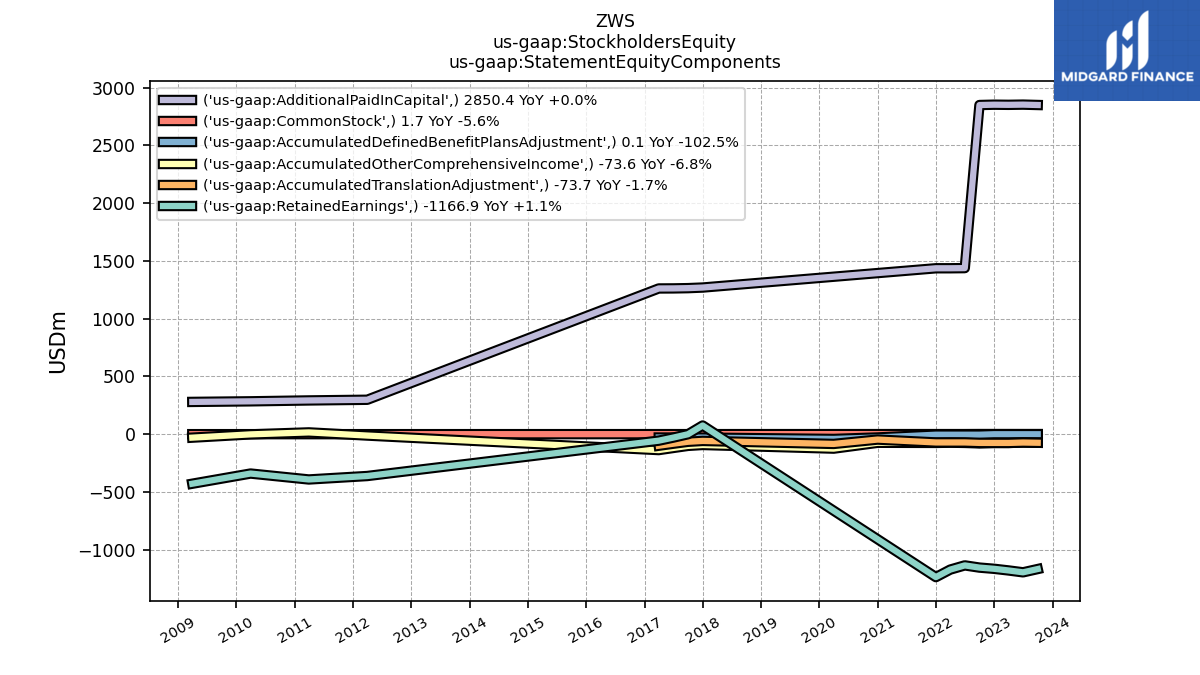
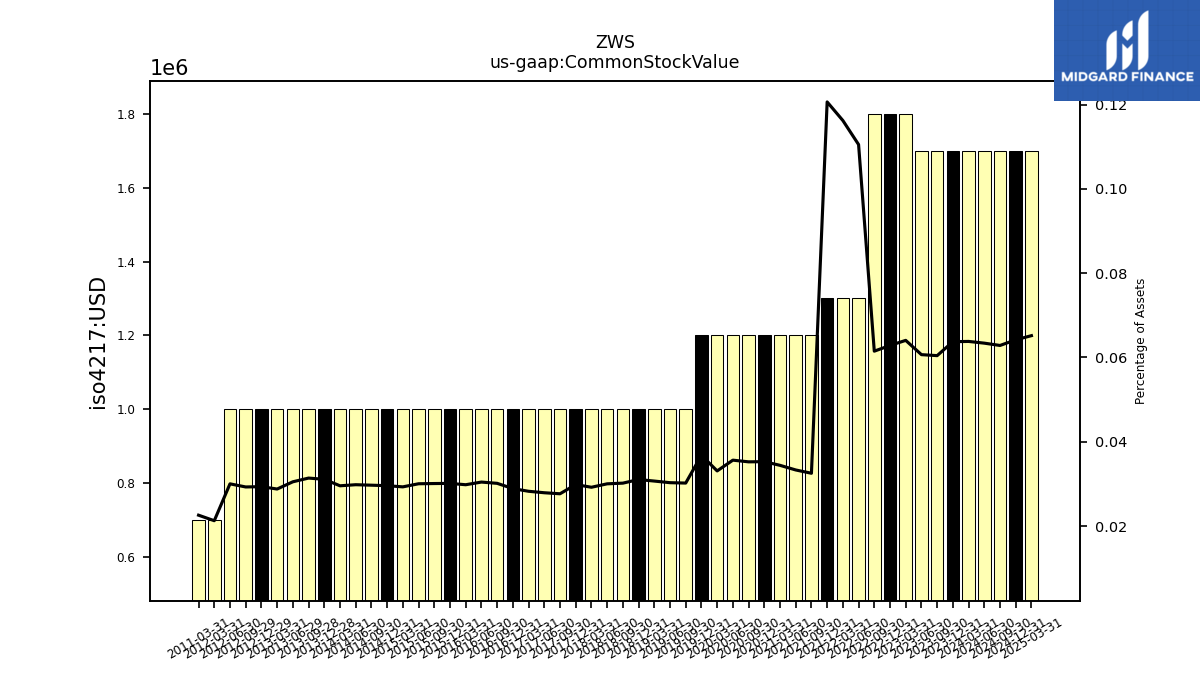
| Common Stock Value | 1.70 | 1.70 | 1.80 | 1.80 | 1.80 | 1.30 | 1.30 | 1.30 | 1.20 | 1.20 | 1.20 | 1.20 | 1.20 | 1.20 | 1.20 | 1.20 | 1.00 | 1.00 | 1.00 | 1.00 | 1.00 | 1.00 | 1.00 | 1.00 | 1.00 | 1.00 | 1.00 | 1.00 | 1.00 | 1.00 | 1.00 | 1.00 | 1.00 | 1.00 | 1.00 | 1.00 | 1.00 | 1.00 | 1.00 | 1.00 | 1.00 | 1.00 | 1.00 | 1.00 | 1.00 | 1.00 | 0.70 | NA | NA | NA | |
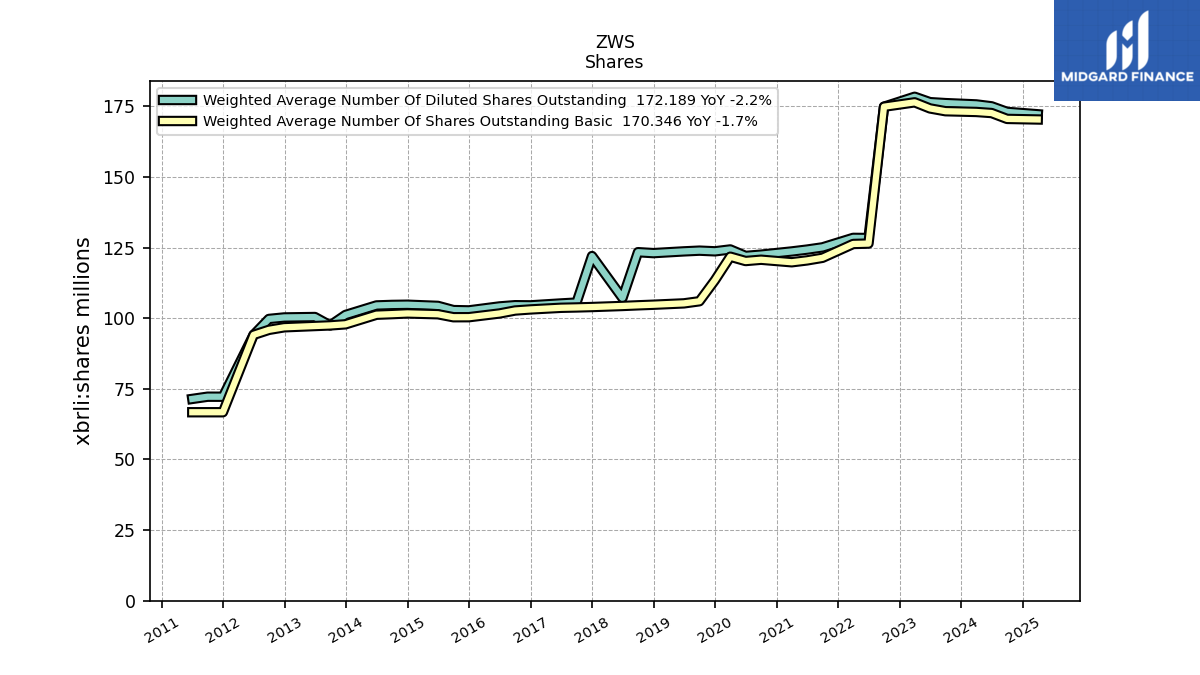
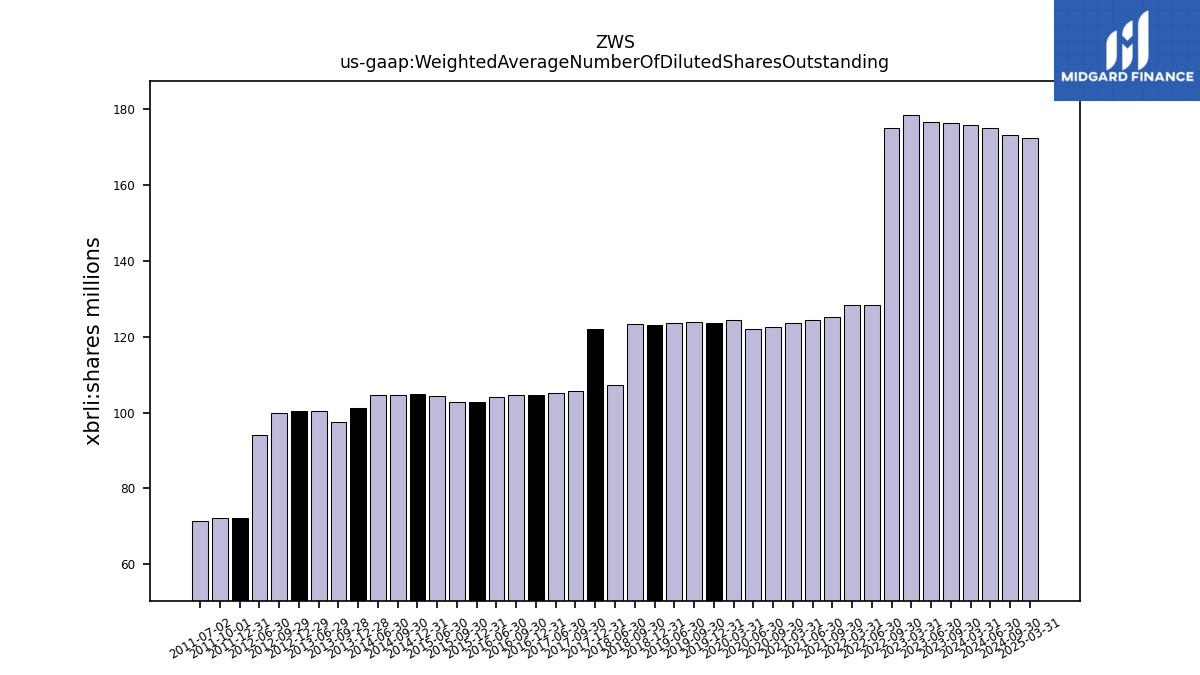
| Weighted Average Number Of Diluted Shares Outstanding | 176.14 | 176.48 | 178.38 | NA | 174.87 | 128.39 | 128.44 | NA | 125.09 | 124.30 | 123.64 | NA | 122.51 | 122.05 | 124.34 | 123.68 | 123.92 | 123.66 | NA | 123.05 | 123.38 | 107.14 | NA | 122.02 | 105.54 | 105.23 | NA | 104.56 | 104.61 | 104.18 | NA | 102.78 | 102.88 | 104.37 | NA | 104.78 | 104.71 | 104.53 | NA | 101.16 | 97.46 | 100.43 | NA | 100.28 | 99.75 | 94.10 | NA | 72.22 | 72.22 | 71.44 | |
| Weighted Average Number Of Shares Outstanding Basic | 173.28 | 174.26 | 176.42 | NA | 174.87 | 126.42 | 126.28 | NA | 121.39 | 120.47 | 119.81 | NA | 120.70 | 120.25 | 121.78 | 113.45 | 106.01 | 105.26 | NA | 104.78 | 104.57 | 104.34 | NA | 103.96 | 103.81 | 103.69 | NA | 103.11 | 102.73 | 101.69 | NA | 100.37 | 100.35 | 101.41 | NA | 101.69 | 101.45 | 101.23 | NA | 97.84 | 97.46 | 97.24 | NA | 96.79 | 95.88 | 94.10 | NA | 66.72 | 66.72 | 66.72 | |
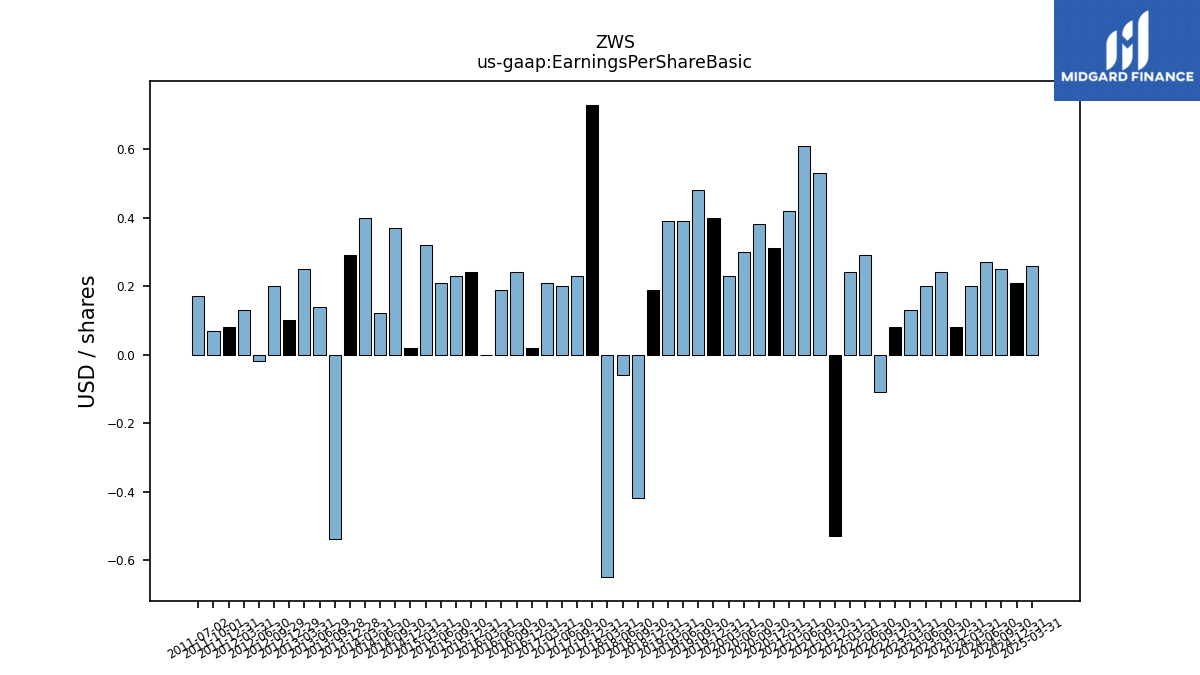
| Earnings Per Share Basic | 0.24 | 0.20 | 0.13 | 0.08 | -0.11 | 0.29 | 0.24 | -0.53 | 0.53 | 0.61 | 0.42 | 0.31 | 0.38 | 0.30 | 0.23 | 0.40 | 0.48 | 0.39 | 0.39 | 0.19 | -0.42 | -0.06 | -0.65 | 0.73 | 0.23 | 0.20 | 0.21 | 0.02 | 0.24 | 0.19 | 0.00 | 0.24 | 0.23 | 0.21 | 0.32 | 0.02 | 0.37 | 0.12 | 0.40 | 0.29 | -0.54 | 0.14 | 0.25 | 0.10 | 0.20 | -0.02 | 0.13 | 0.08 | 0.07 | 0.17 | |
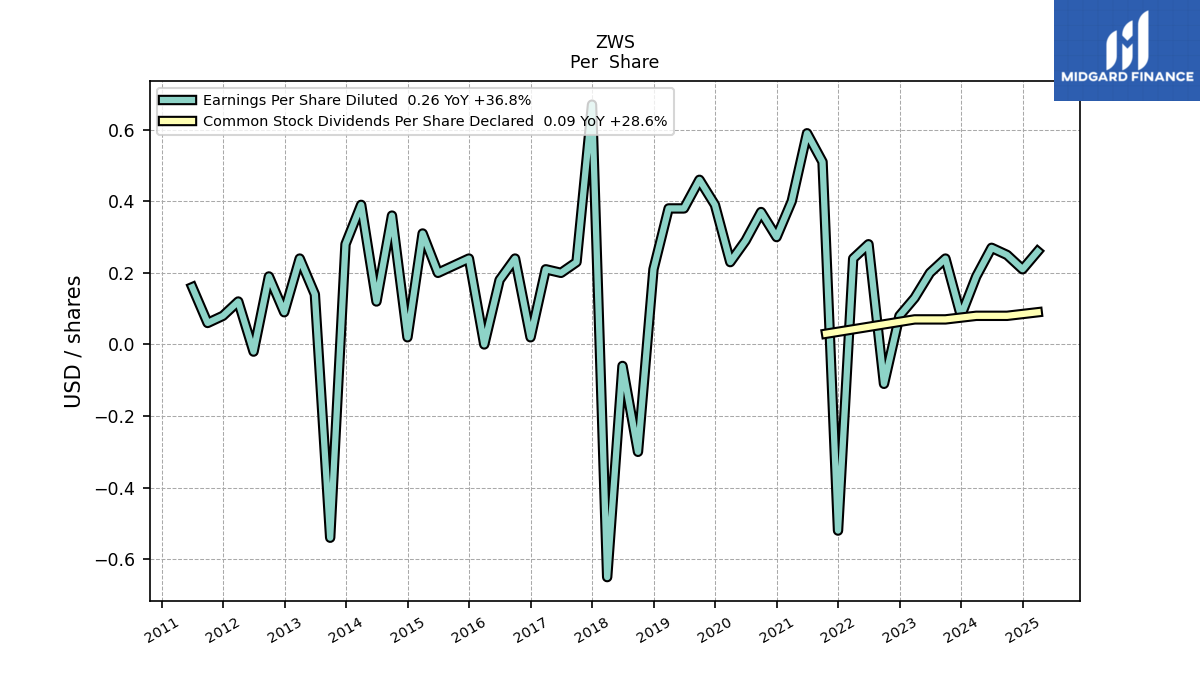
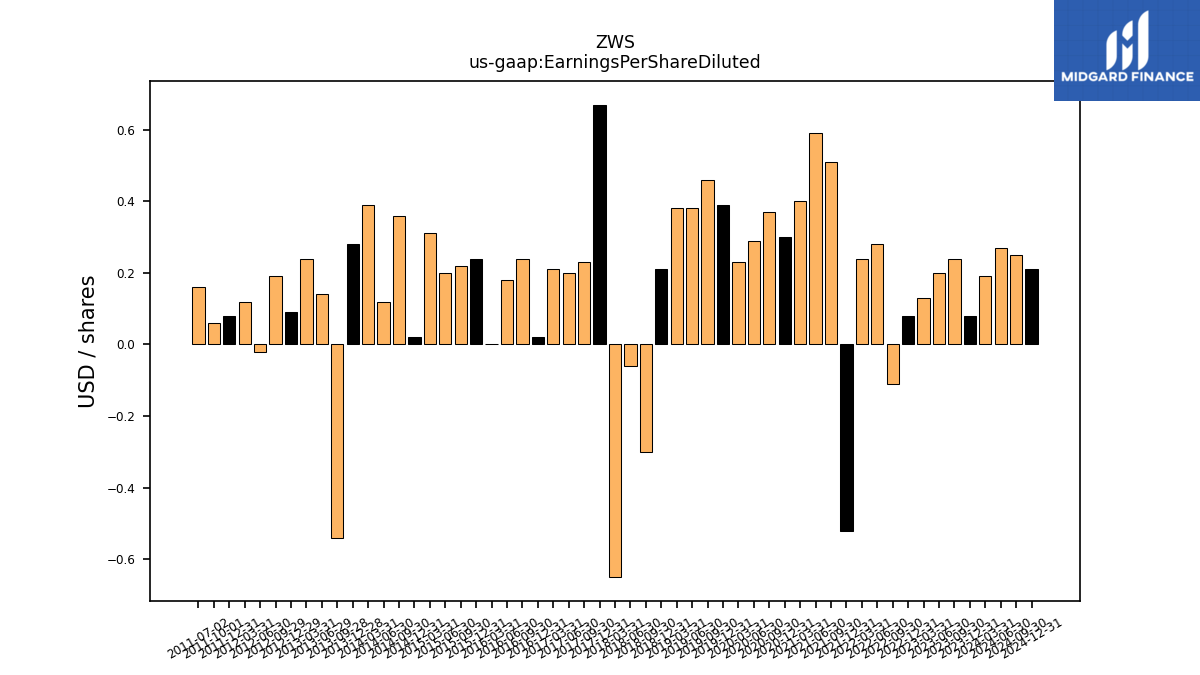
| Earnings Per Share Diluted | 0.24 | 0.20 | 0.13 | 0.08 | -0.11 | 0.28 | 0.24 | -0.52 | 0.51 | 0.59 | 0.40 | 0.30 | 0.37 | 0.29 | 0.23 | 0.39 | 0.46 | 0.38 | 0.38 | 0.21 | -0.30 | -0.06 | -0.65 | 0.67 | 0.23 | 0.20 | 0.21 | 0.02 | 0.24 | 0.18 | 0.00 | 0.24 | 0.22 | 0.20 | 0.31 | 0.02 | 0.36 | 0.12 | 0.39 | 0.28 | -0.54 | 0.14 | 0.24 | 0.09 | 0.19 | -0.02 | 0.12 | 0.08 | 0.06 | 0.16 | |
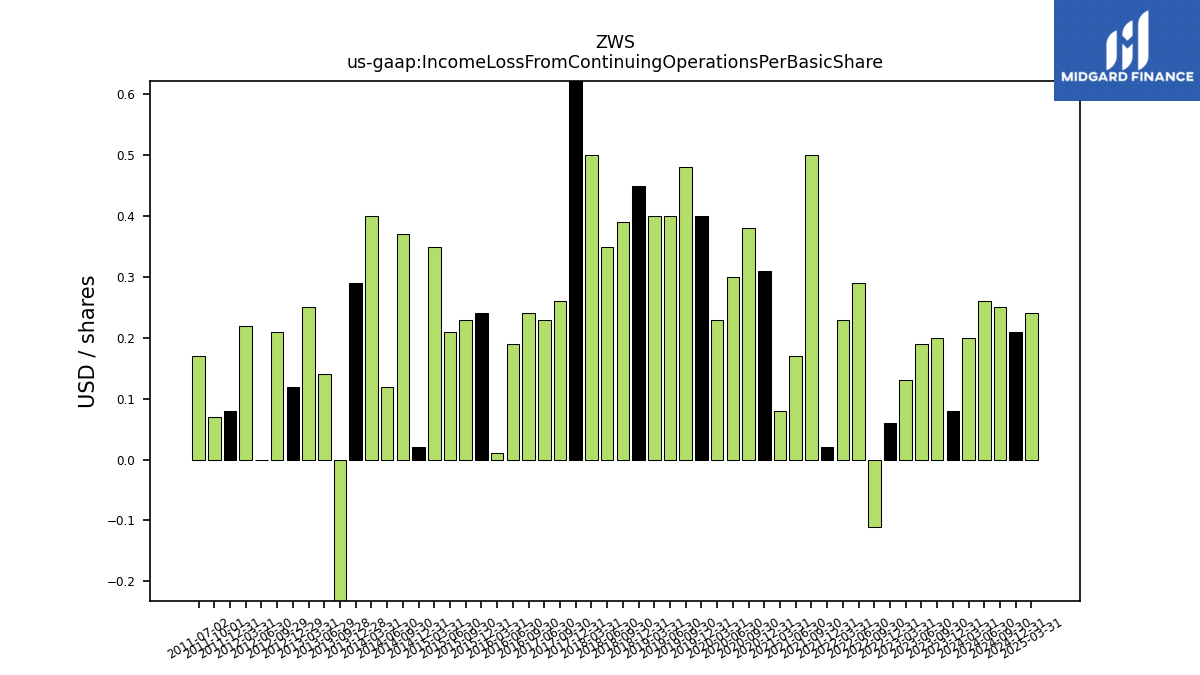
| Income Loss From Continuing Operations Per Basic Share | 0.00 | 0.00 | 0.00 | 0.00 | -0.00 | 0.00 | 0.00 | 0.00 | 0.00 | 0.00 | 0.00 | 0.00 | 0.00 | 0.00 | 0.00 | 0.00 | 0.00 | 0.00 | 0.00 | 0.00 | 0.00 | 0.00 | 0.00 | 0.00 | 0.00 | 0.00 | NA | NA | 0.00 | 0.00 | 0.00 | 0.00 | 0.00 | 0.00 | 0.00 | 0.00 | 0.00 | 0.00 | 0.00 | 0.00 | -0.00 | 0.00 | 0.00 | 0.00 | 0.00 | 0.00 | 0.00 | 0.00 | 0.00 | 0.00 | |
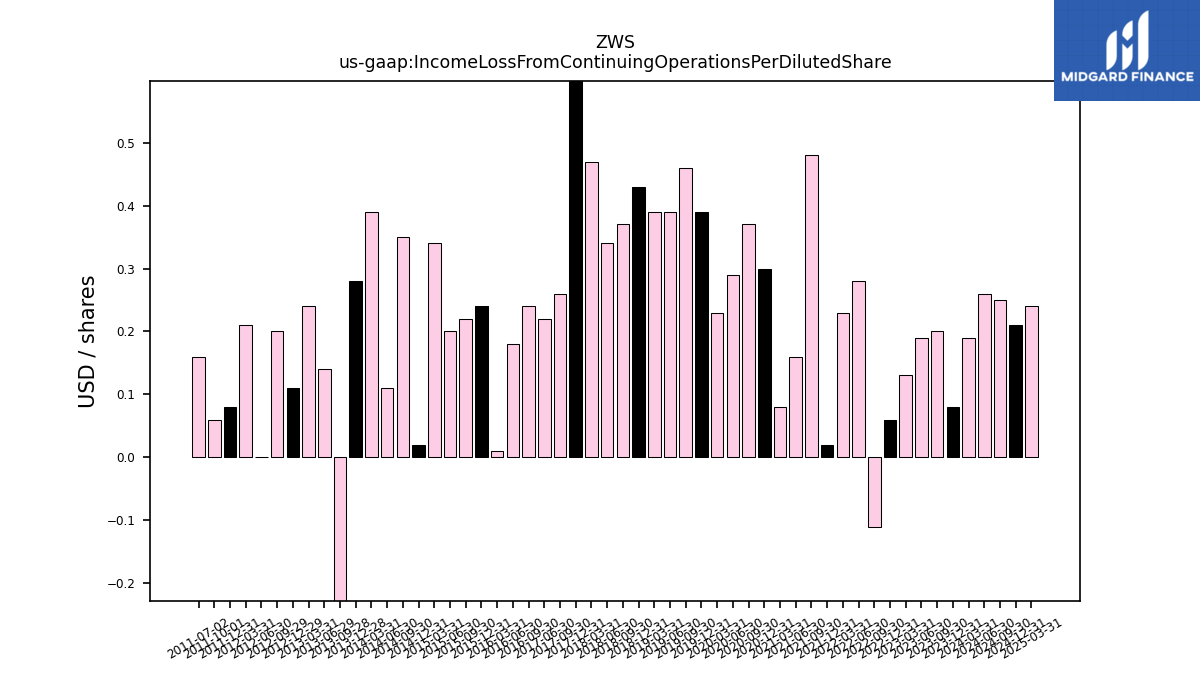
| Income Loss From Continuing Operations Per Diluted Share | 0.00 | 0.00 | 0.00 | 0.00 | -0.00 | 0.00 | 0.00 | 0.00 | 0.00 | 0.00 | 0.00 | 0.00 | 0.00 | 0.00 | 0.00 | 0.00 | 0.00 | 0.00 | 0.00 | 0.00 | 0.00 | 0.00 | 0.00 | 0.00 | 0.00 | 0.00 | NA | NA | 0.00 | 0.00 | 0.00 | 0.00 | 0.00 | 0.00 | 0.00 | 0.00 | 0.00 | 0.00 | 0.00 | 0.00 | -0.00 | 0.00 | 0.00 | 0.00 | 0.00 | 0.00 | 0.00 | 0.00 | 0.00 | 0.00 |
| 2023-09-30 | 2023-06-30 | 2023-03-31 | 2022-12-31 | 2022-09-30 | 2022-06-30 | 2022-03-31 | 2021-12-31 | 2021-09-30 | 2021-06-30 | 2021-03-31 | 2020-12-31 | 2020-09-30 | 2020-06-30 | 2020-03-31 | 2019-12-31 | 2019-09-30 | 2019-06-30 | 2019-03-31 | 2018-12-31 | 2018-09-30 | 2018-06-30 | 2018-03-31 | 2017-12-31 | 2017-09-30 | 2017-06-30 | 2017-03-31 | 2016-12-31 | 2016-09-30 | 2016-06-30 | 2016-03-31 | 2015-12-31 | 2015-09-30 | 2015-06-30 | 2015-03-31 | 2014-12-31 | 2014-09-30 | 2014-06-30 | 2014-03-31 | 2013-12-28 | 2013-09-28 | 2013-06-29 | 2013-03-31 | 2012-12-29 | 2012-09-29 | 2012-06-30 | 2012-03-31 | 2011-12-31 | 2011-10-01 | 2011-07-02 | ||
|---|---|---|---|---|---|---|---|---|---|---|---|---|---|---|---|---|---|---|---|---|---|---|---|---|---|---|---|---|---|---|---|---|---|---|---|---|---|---|---|---|---|---|---|---|---|---|---|---|---|---|---|
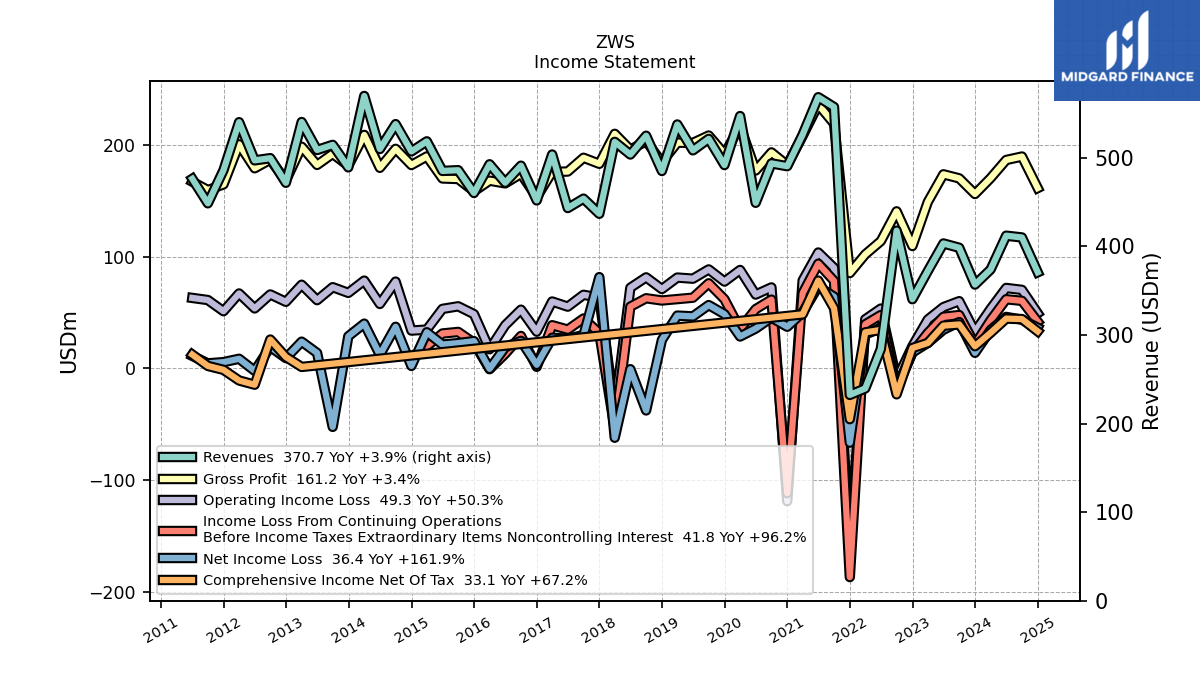
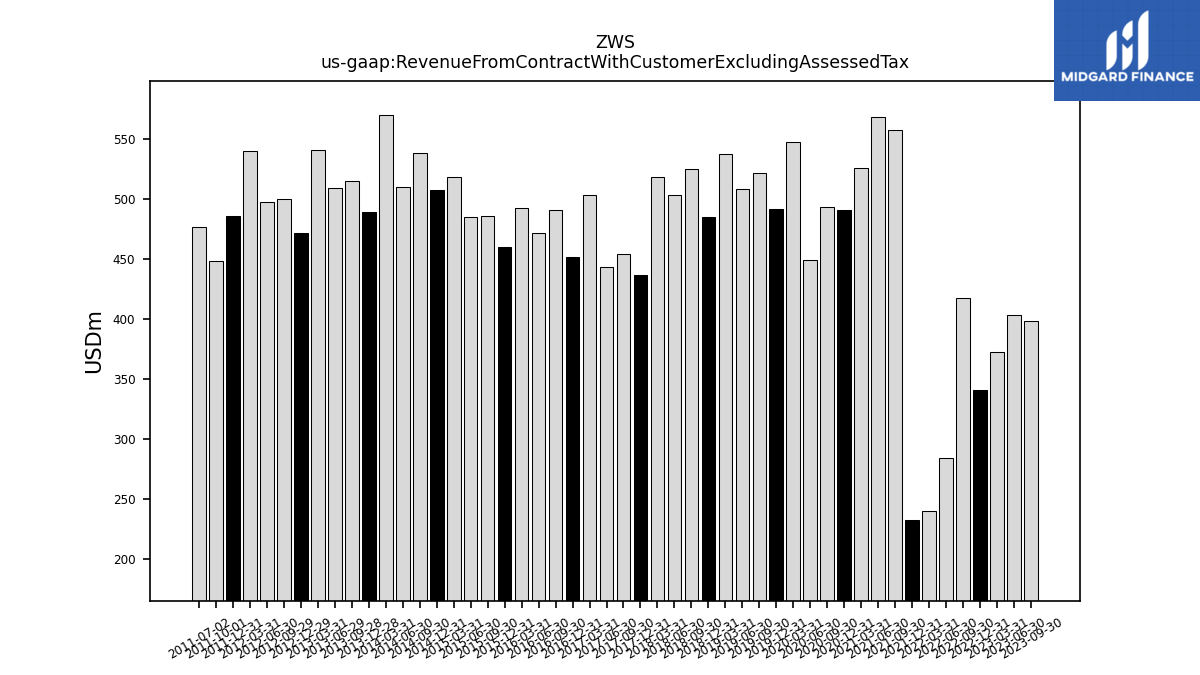
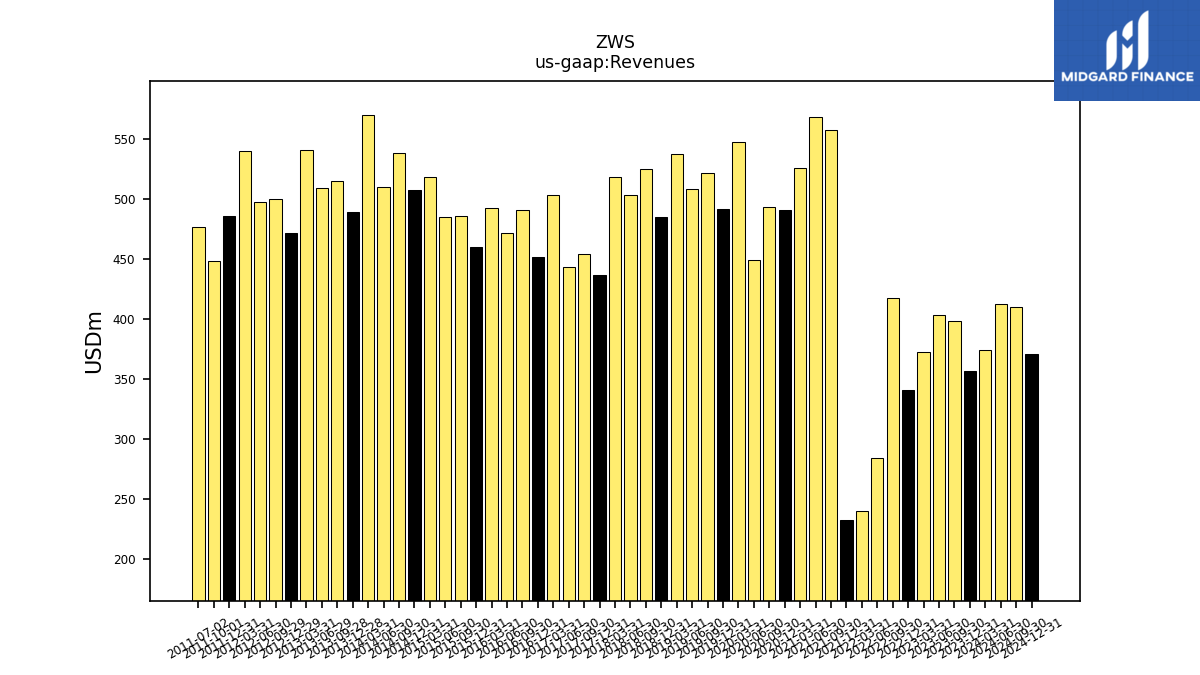
| Revenue From Contract With Customer Excluding Assessed Tax | 398.40 | 403.20 | 372.10 | 340.30 | 417.70 | 284.20 | 239.60 | 232.30 | 557.20 | 568.30 | 526.10 | 490.40 | 493.60 | 449.10 | 547.00 | 491.70 | 521.30 | 508.30 | 537.50 | 485.00 | 524.80 | 503.60 | 517.90 | 436.70 | 453.80 | 443.20 | 503.60 | 451.80 | 491.00 | 471.80 | 492.60 | 460.20 | 485.90 | 485.10 | 518.50 | 507.10 | 537.90 | 509.80 | 569.70 | 489.10 | 514.50 | 508.70 | 540.30 | 471.70 | 499.50 | 497.00 | 540.10 | 485.90 | 448.50 | 476.20 | |
| Revenues | 398.40 | 403.20 | 372.10 | 340.30 | 417.70 | 284.20 | 239.60 | 232.30 | 557.20 | 568.30 | 526.10 | 490.40 | 493.60 | 449.10 | 547.00 | 491.70 | 521.30 | 508.30 | 537.50 | 485.00 | 524.80 | 503.60 | 517.90 | 436.70 | 453.80 | 443.20 | 503.60 | 451.80 | 491.00 | 471.80 | 492.60 | 460.20 | 485.90 | 485.10 | 518.50 | 507.10 | 537.90 | 509.80 | 569.70 | 489.10 | 514.50 | 508.70 | 540.30 | 471.70 | 499.50 | 497.00 | 540.10 | 485.90 | 448.50 | 476.20 | |
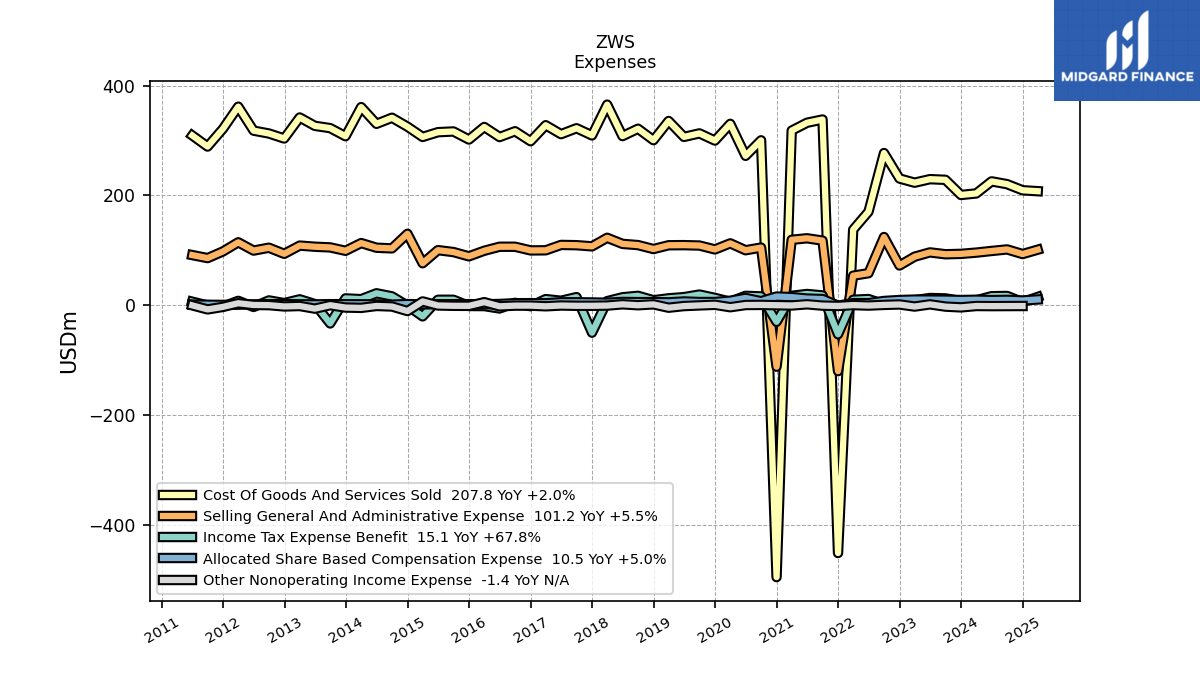
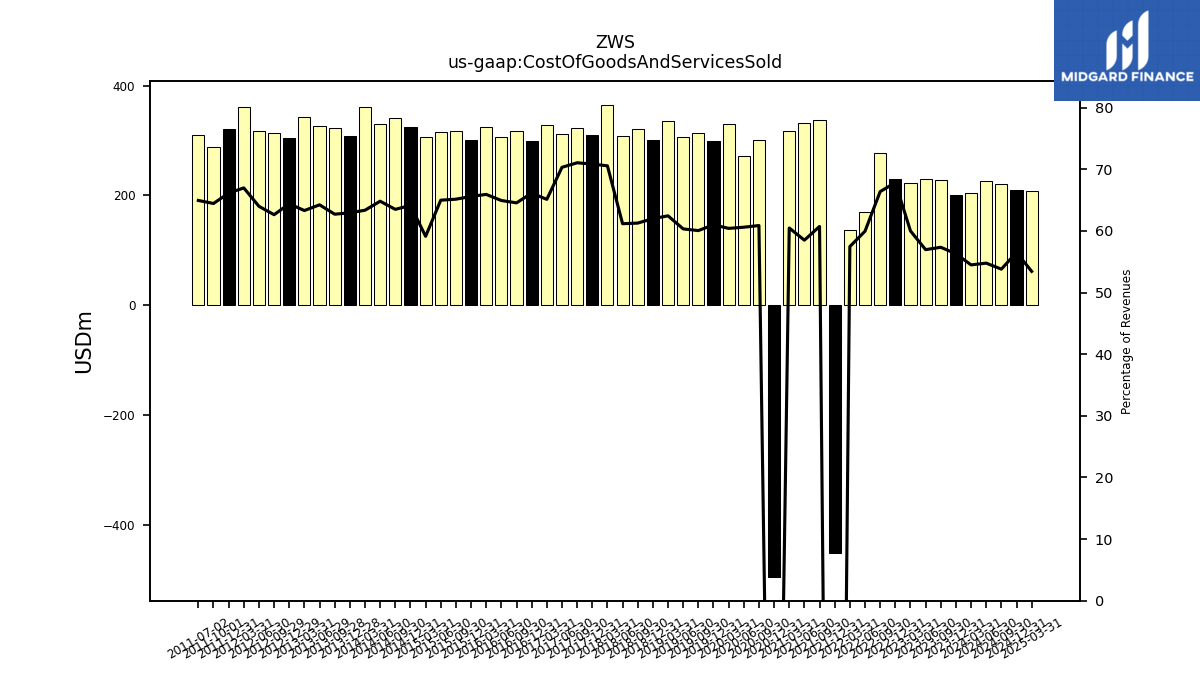
| Cost Of Goods And Services Sold | 228.50 | 229.70 | 223.30 | 230.90 | 277.30 | 170.40 | 137.70 | -451.40 | 338.40 | 332.50 | 318.20 | -495.30 | 300.50 | 272.20 | 330.50 | 300.00 | 313.10 | 306.70 | 335.70 | 300.70 | 321.60 | 308.10 | 365.50 | 309.40 | 322.50 | 311.70 | 328.00 | 298.80 | 317.00 | 306.40 | 324.80 | 301.90 | 316.60 | 315.30 | 306.60 | 325.30 | 341.60 | 330.50 | 361.00 | 307.90 | 322.70 | 326.80 | 342.10 | 303.80 | 312.90 | 318.10 | 361.80 | 321.40 | 289.10 | 309.30 | |
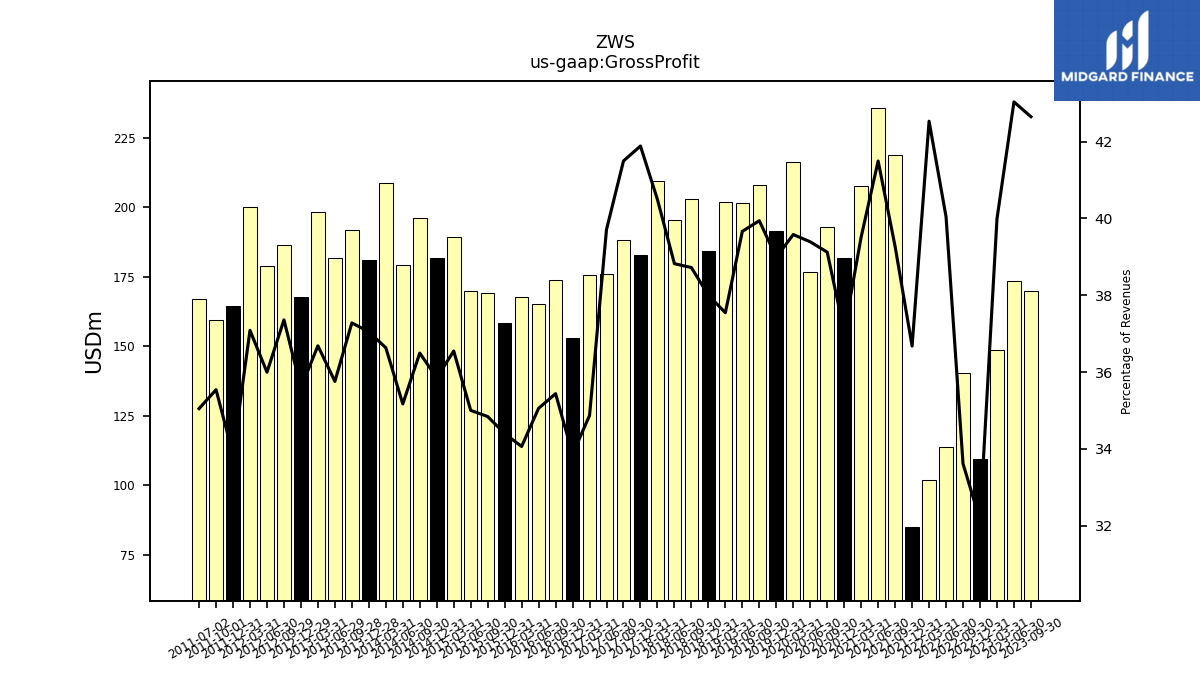
| Gross Profit | 169.90 | 173.50 | 148.80 | 109.40 | 140.40 | 113.80 | 101.90 | 85.20 | 218.80 | 235.80 | 207.90 | 181.70 | 193.10 | 176.90 | 216.50 | 191.70 | 208.20 | 201.60 | 201.80 | 184.30 | 203.20 | 195.50 | 209.70 | 182.90 | 188.30 | 176.00 | 175.60 | 153.00 | 174.00 | 165.40 | 167.80 | 158.30 | 169.30 | 169.80 | 189.50 | 181.80 | 196.30 | 179.30 | 208.70 | 181.20 | 191.80 | 181.90 | 198.20 | 167.90 | 186.60 | 178.90 | 200.30 | 164.50 | 159.40 | 166.90 | |
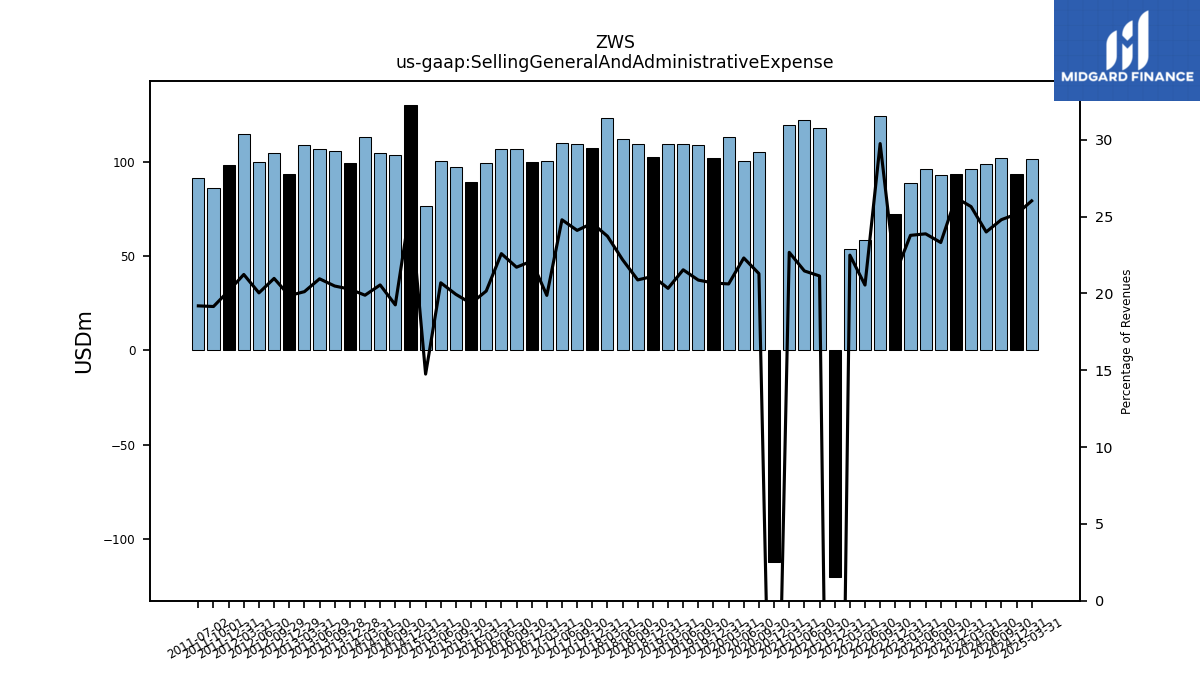
| Selling General And Administrative Expense | 92.90 | 96.30 | 88.50 | 72.40 | 124.30 | 58.40 | 53.90 | -120.10 | 117.80 | 122.00 | 119.30 | -112.00 | 105.10 | 100.20 | 112.80 | 101.70 | 108.80 | 109.50 | 109.30 | 102.40 | 109.60 | 111.80 | 122.90 | 107.30 | 109.40 | 109.90 | 100.10 | 99.90 | 106.60 | 106.60 | 99.30 | 89.10 | 96.90 | 100.40 | 76.50 | 130.20 | 103.60 | 104.80 | 113.30 | 99.20 | 105.40 | 106.60 | 108.70 | 93.70 | 104.80 | 99.60 | 114.70 | 98.00 | 85.90 | 91.40 | |
| Operating Income Loss | 60.10 | 54.80 | 43.70 | 19.80 | -10.10 | 53.50 | 43.90 | -165.10 | 89.90 | 103.60 | 78.60 | -118.70 | 72.40 | 66.00 | 88.00 | 77.60 | 88.50 | 80.20 | 81.20 | 70.90 | 81.40 | 72.10 | -37.10 | 63.20 | 65.80 | 55.20 | 59.80 | 32.80 | 52.50 | 38.60 | 17.10 | 48.50 | 55.50 | 53.20 | 34.70 | 33.80 | 77.60 | 57.60 | 78.50 | 67.50 | 72.60 | 61.00 | 74.80 | 59.50 | 66.10 | 53.60 | 67.00 | 51.10 | 61.10 | 63.00 | |
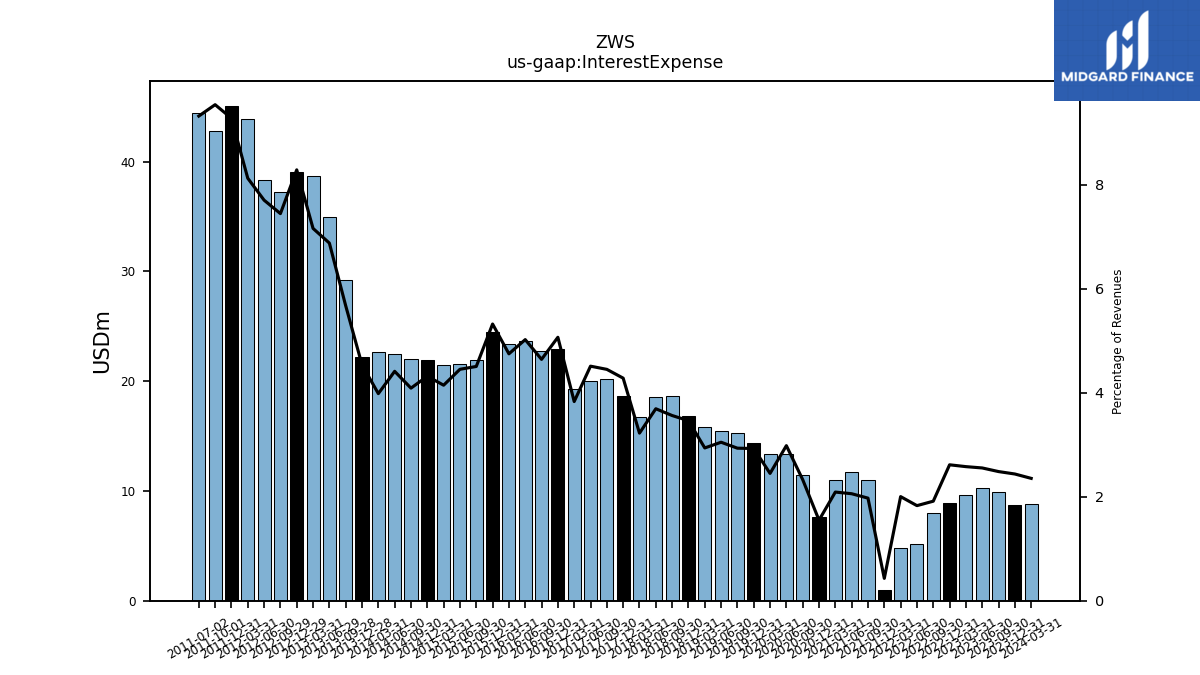
| Interest Expense | 9.90 | 10.30 | 9.60 | 8.90 | 8.00 | 5.20 | 4.80 | 1.00 | 11.00 | 11.70 | 11.00 | 7.60 | 11.50 | 13.40 | 13.40 | 14.40 | 15.30 | 15.50 | 15.80 | 16.80 | 18.70 | 18.60 | 16.70 | 18.70 | 20.20 | 20.00 | 19.30 | 22.90 | 22.80 | 23.70 | 23.40 | 24.50 | 21.90 | 21.60 | 21.50 | 21.90 | 22.00 | 22.50 | 22.70 | 22.20 | 29.20 | 35.00 | 38.70 | 39.10 | 37.20 | 38.30 | 43.90 | 45.10 | 42.80 | 44.40 | |
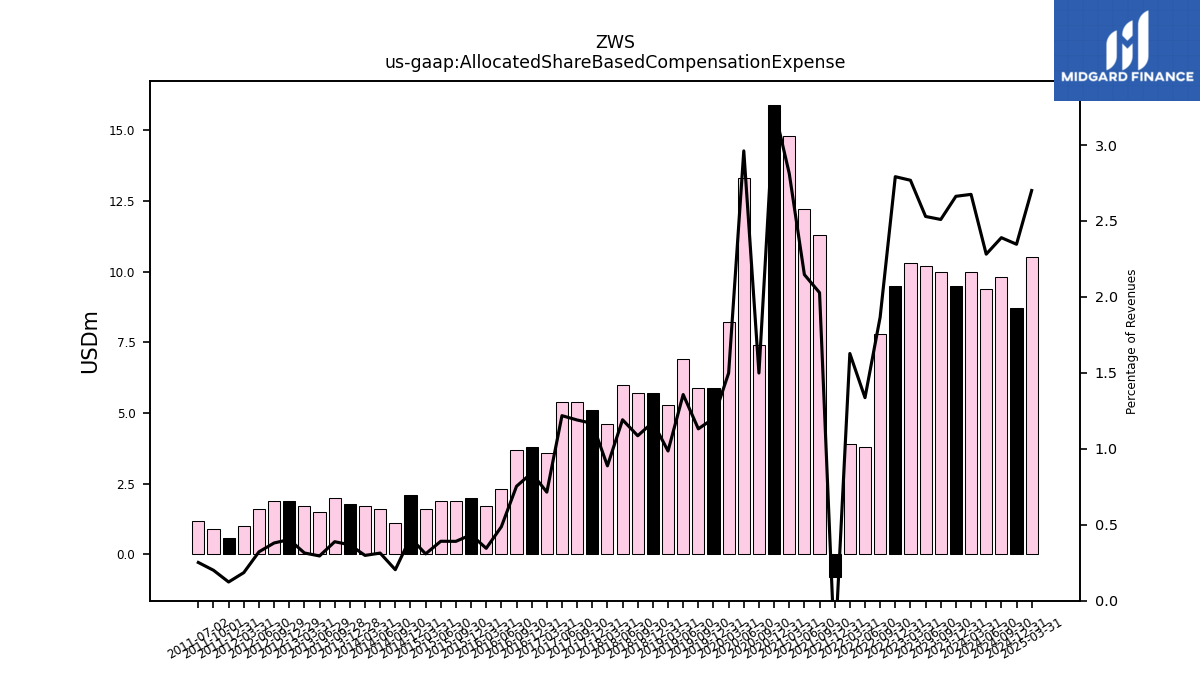
| Allocated Share Based Compensation Expense | 10.00 | 10.20 | 10.30 | 9.50 | 7.80 | 3.80 | 3.90 | -0.80 | 11.30 | 12.20 | 14.80 | 15.90 | 7.40 | 13.30 | 8.20 | 5.90 | 5.90 | 6.90 | 5.30 | 5.70 | 5.70 | 6.00 | 4.60 | 5.10 | 5.40 | 5.40 | 3.60 | 3.80 | 3.70 | 2.30 | 1.70 | 2.00 | 1.90 | 1.90 | 1.60 | 2.10 | 1.10 | 1.60 | 1.70 | 1.80 | 2.00 | 1.50 | 1.70 | 1.90 | 1.90 | 1.60 | 1.00 | 0.60 | 0.90 | 1.20 | |
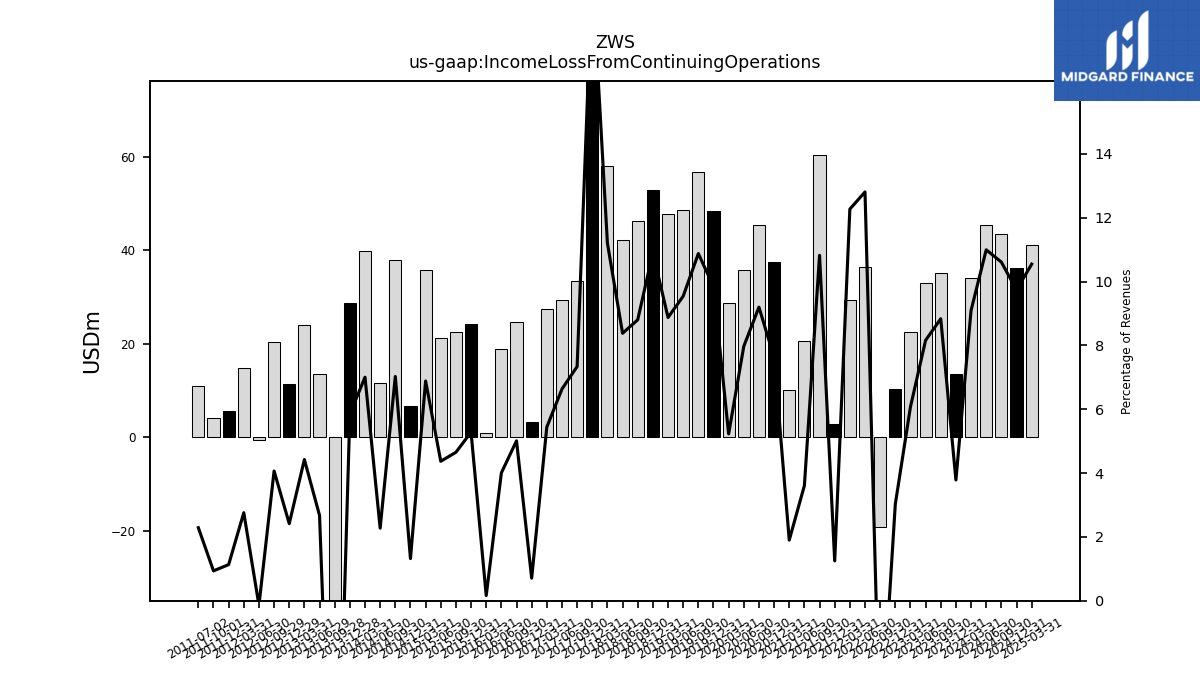
| Income Loss From Continuing Operations | 35.20 | 32.90 | 22.60 | 10.30 | -19.10 | 36.40 | 29.40 | 2.90 | 60.30 | 20.50 | 10.00 | 37.40 | 45.40 | 35.80 | 28.60 | 48.40 | 56.70 | 48.50 | 47.70 | 52.90 | 46.20 | 42.20 | 58.00 | 85.90 | 33.30 | 29.40 | 27.40 | 3.20 | 24.60 | 18.90 | 0.80 | 24.30 | 22.60 | 21.20 | 35.70 | 6.70 | 37.80 | 11.60 | 39.90 | 28.60 | -52.50 | 13.60 | 23.90 | 11.40 | 20.30 | -0.70 | 14.90 | 5.50 | 4.20 | 10.90 | |
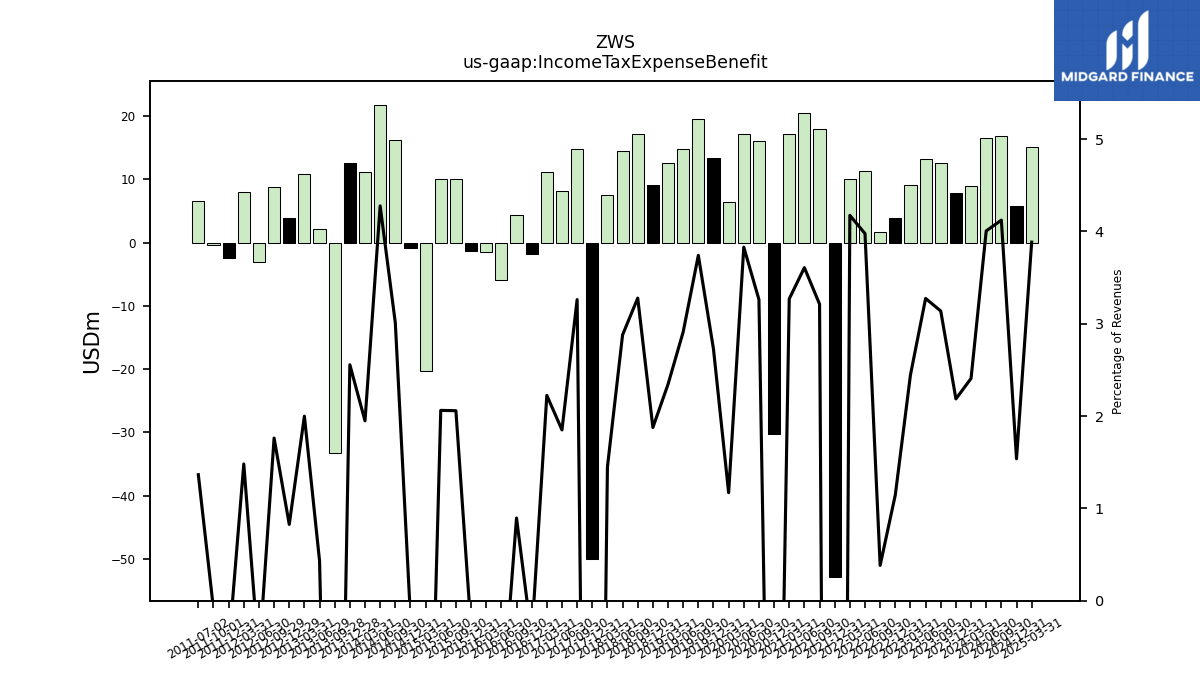
| Income Tax Expense Benefit | 12.50 | 13.20 | 9.10 | 3.90 | 1.60 | 11.30 | 10.00 | -52.90 | 17.90 | 20.50 | 17.20 | -30.20 | 16.10 | 17.20 | 6.40 | 13.40 | 19.50 | 14.80 | 12.60 | 9.10 | 17.20 | 14.50 | 7.50 | -50.00 | 14.80 | 8.20 | 11.20 | -1.80 | 4.40 | -5.90 | -1.50 | -1.40 | 10.00 | 10.00 | -20.30 | -0.90 | 16.20 | 21.80 | 11.10 | 12.50 | -33.20 | 2.20 | 10.80 | 3.90 | 8.80 | -3.10 | 8.00 | -2.50 | -0.40 | 6.50 | |
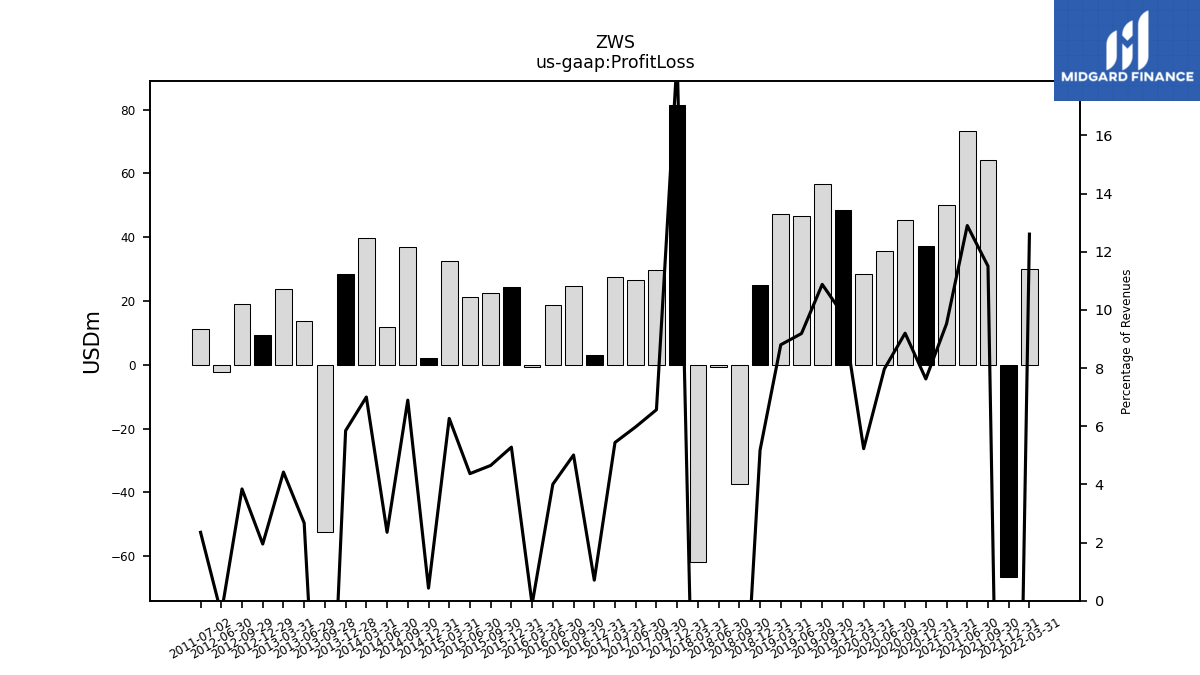
| Profit Loss | NA | NA | NA | NA | NA | NA | 30.20 | -66.60 | 64.10 | 73.30 | 50.10 | 37.40 | 45.40 | 35.80 | 28.60 | 48.40 | 56.70 | 46.70 | 47.30 | 25.10 | -37.50 | -0.60 | -61.90 | 81.60 | 29.80 | 26.50 | 27.40 | 3.20 | 24.60 | 18.90 | -0.60 | 24.30 | 22.60 | 21.20 | 32.50 | 2.20 | 37.10 | 12.00 | 39.90 | 28.60 | -52.50 | 13.60 | 23.90 | 9.20 | 19.20 | -2.20 | NA | NA | NA | 11.20 | |
| Other Comprehensive Income Loss Net Of Tax | NA | NA | NA | NA | NA | NA | 2.00 | NA | NA | NA | NA | NA | NA | NA | NA | NA | NA | NA | NA | NA | NA | NA | NA | NA | NA | NA | NA | NA | NA | NA | NA | NA | NA | NA | NA | NA | NA | NA | NA | NA | NA | NA | NA | NA | NA | NA | NA | NA | NA | NA | |
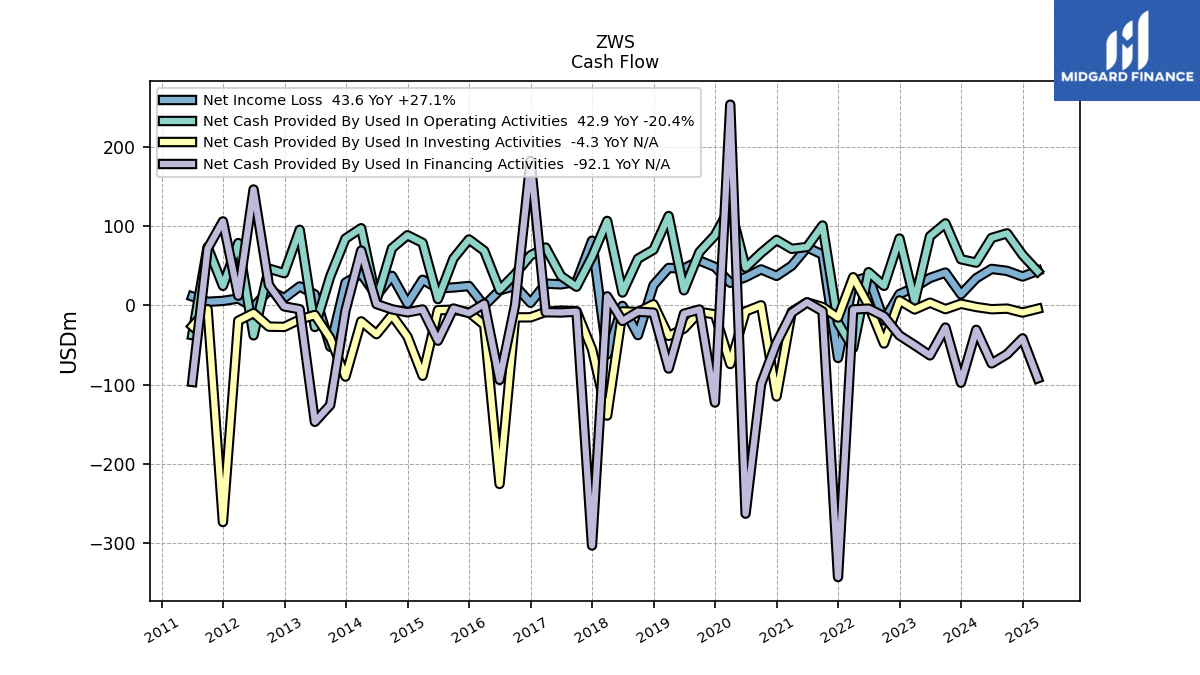
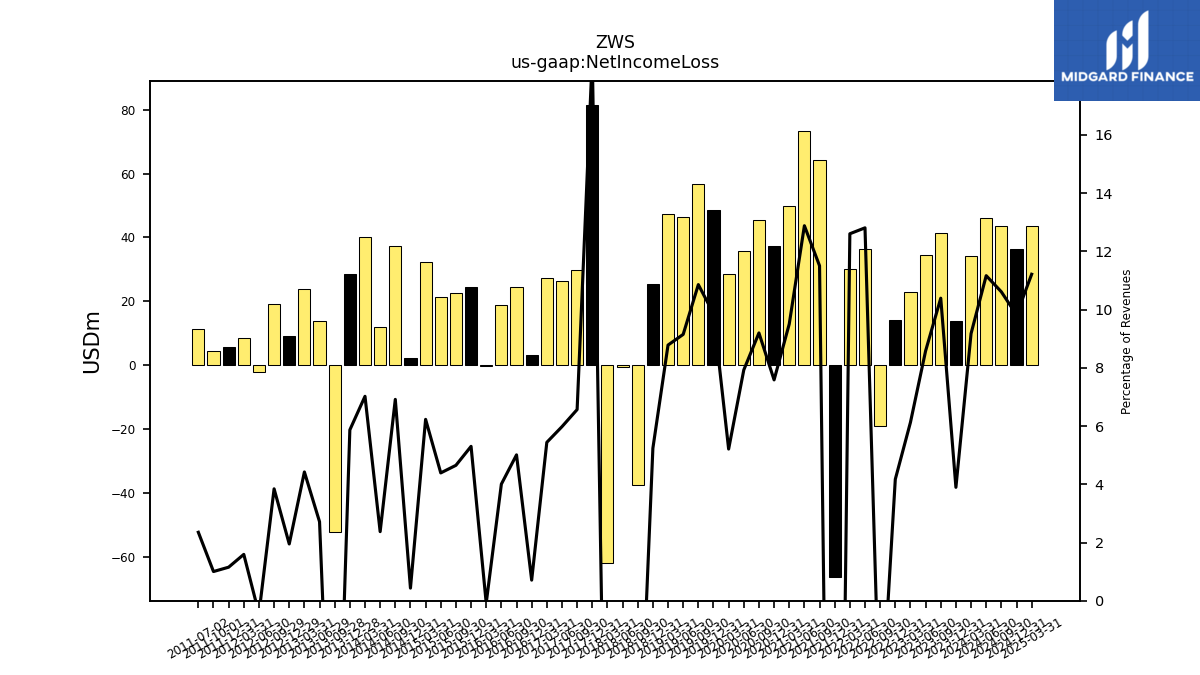
| Net Income Loss | 41.40 | 34.60 | 22.80 | 14.20 | -19.10 | 36.40 | 30.20 | -66.40 | 64.10 | 73.20 | 50.00 | 37.20 | 45.40 | 35.60 | 28.50 | 48.50 | 56.60 | 46.50 | 47.20 | 25.40 | -37.60 | -0.70 | -62.00 | 81.60 | 29.80 | 26.50 | 27.40 | 3.20 | 24.60 | 18.90 | -0.40 | 24.40 | 22.60 | 21.30 | 32.30 | 2.20 | 37.20 | 12.10 | 40.00 | 28.70 | -52.30 | 13.80 | 23.90 | 9.20 | 19.20 | -2.20 | 8.60 | 5.60 | 4.50 | 11.20 | |
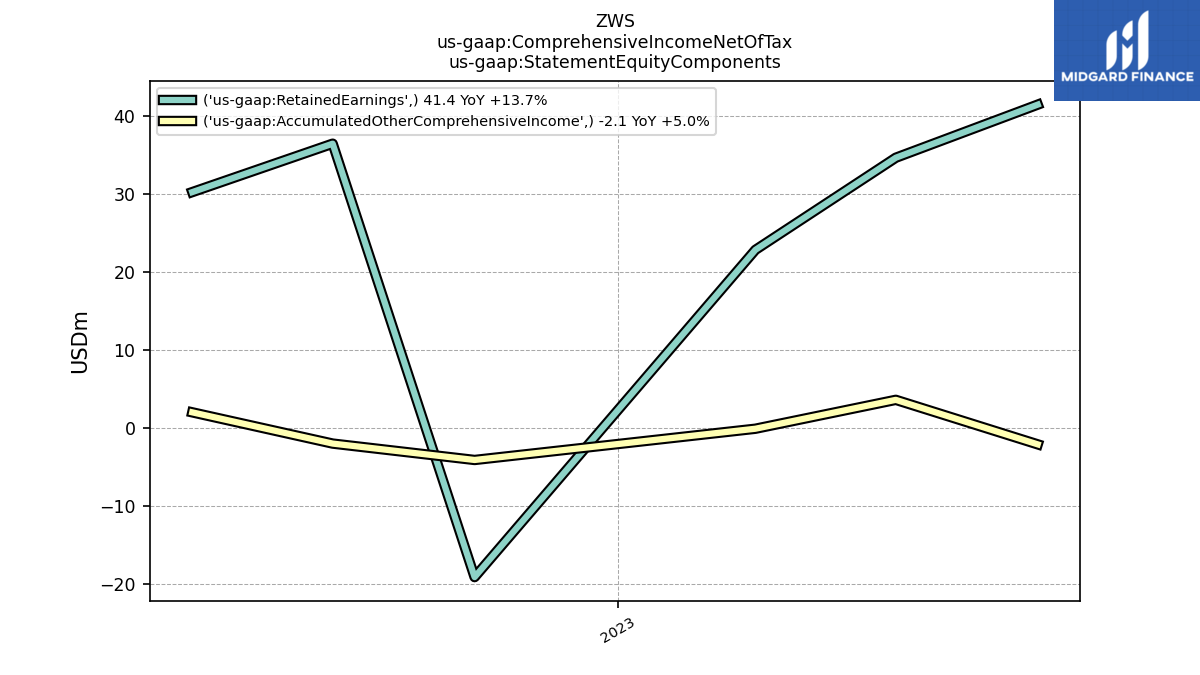
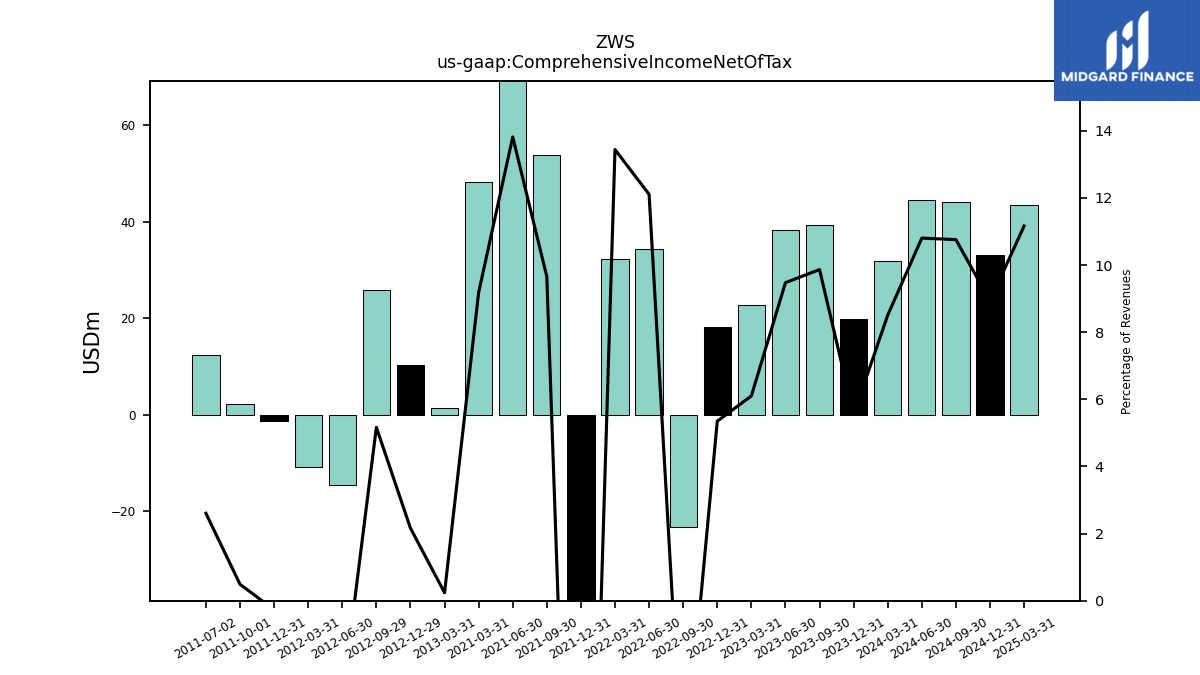
| Comprehensive Income Net Of Tax | 39.30 | 38.20 | 22.70 | 18.20 | -23.20 | 34.40 | 32.20 | -45.40 | 53.80 | 78.50 | 48.30 | NA | NA | NA | NA | NA | NA | NA | NA | NA | NA | NA | NA | NA | NA | NA | NA | NA | NA | NA | NA | NA | NA | NA | NA | NA | NA | NA | NA | NA | NA | NA | 1.30 | 10.20 | 25.80 | -14.60 | -10.80 | -1.30 | 2.20 | 12.40 |
| 2023-09-30 | 2023-06-30 | 2023-03-31 | 2022-12-31 | 2022-09-30 | 2022-06-30 | 2022-03-31 | 2021-12-31 | 2021-09-30 | 2021-06-30 | 2021-03-31 | 2020-12-31 | 2020-09-30 | 2020-06-30 | 2020-03-31 | 2019-12-31 | 2019-09-30 | 2019-06-30 | 2019-03-31 | 2018-12-31 | 2018-09-30 | 2018-06-30 | 2018-03-31 | 2017-12-31 | 2017-09-30 | 2017-06-30 | 2017-03-31 | 2016-12-31 | 2016-09-30 | 2016-06-30 | 2016-03-31 | 2015-12-31 | 2015-09-30 | 2015-06-30 | 2015-03-31 | 2014-12-31 | 2014-09-30 | 2014-06-30 | 2014-03-31 | 2013-12-28 | 2013-09-28 | 2013-06-29 | 2013-03-31 | 2012-12-29 | 2012-09-29 | 2012-06-30 | 2012-03-31 | 2011-12-31 | 2011-10-01 | 2011-07-02 | ||
|---|---|---|---|---|---|---|---|---|---|---|---|---|---|---|---|---|---|---|---|---|---|---|---|---|---|---|---|---|---|---|---|---|---|---|---|---|---|---|---|---|---|---|---|---|---|---|---|---|---|---|---|
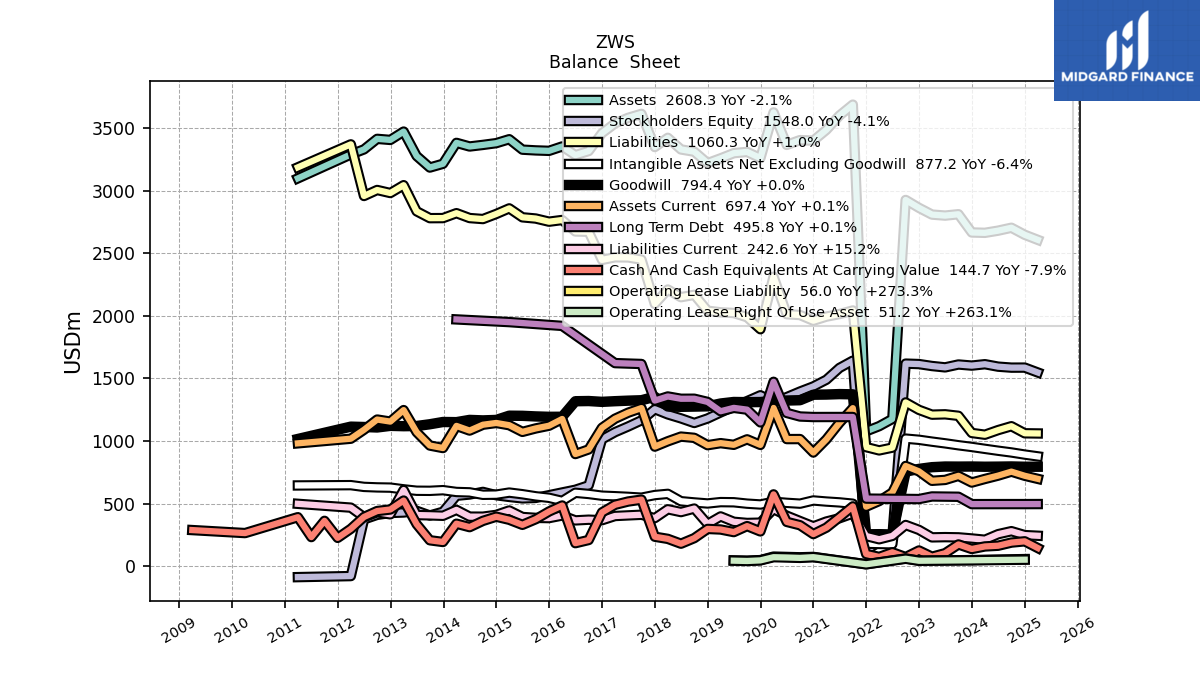
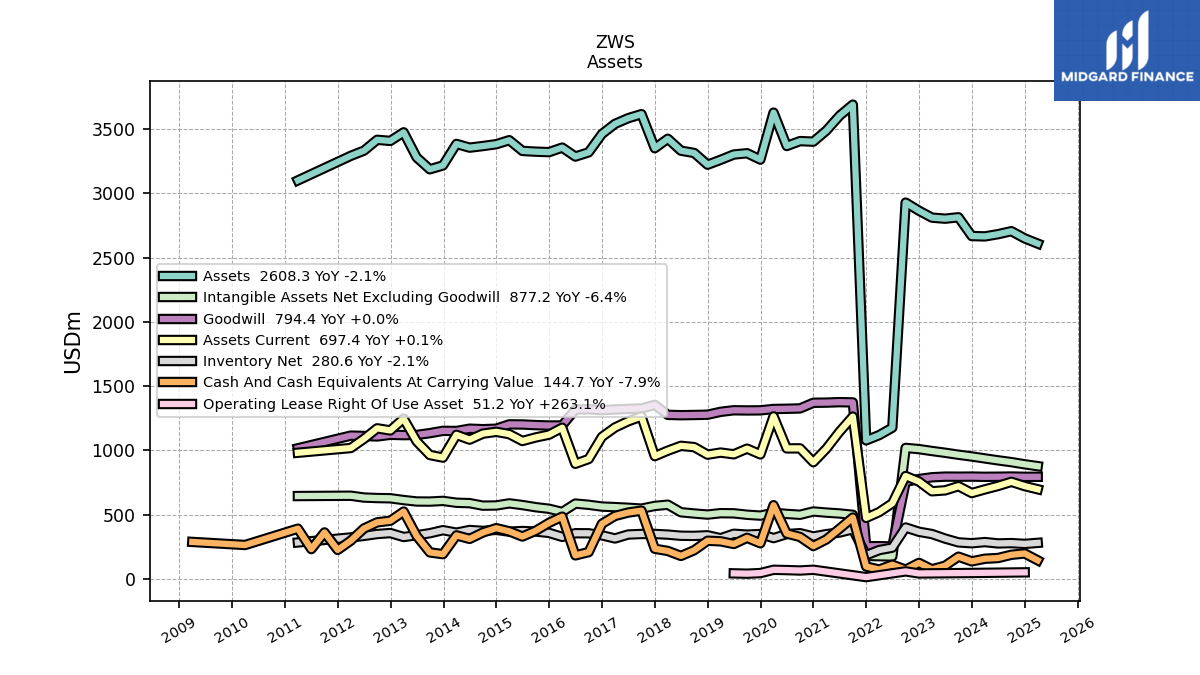
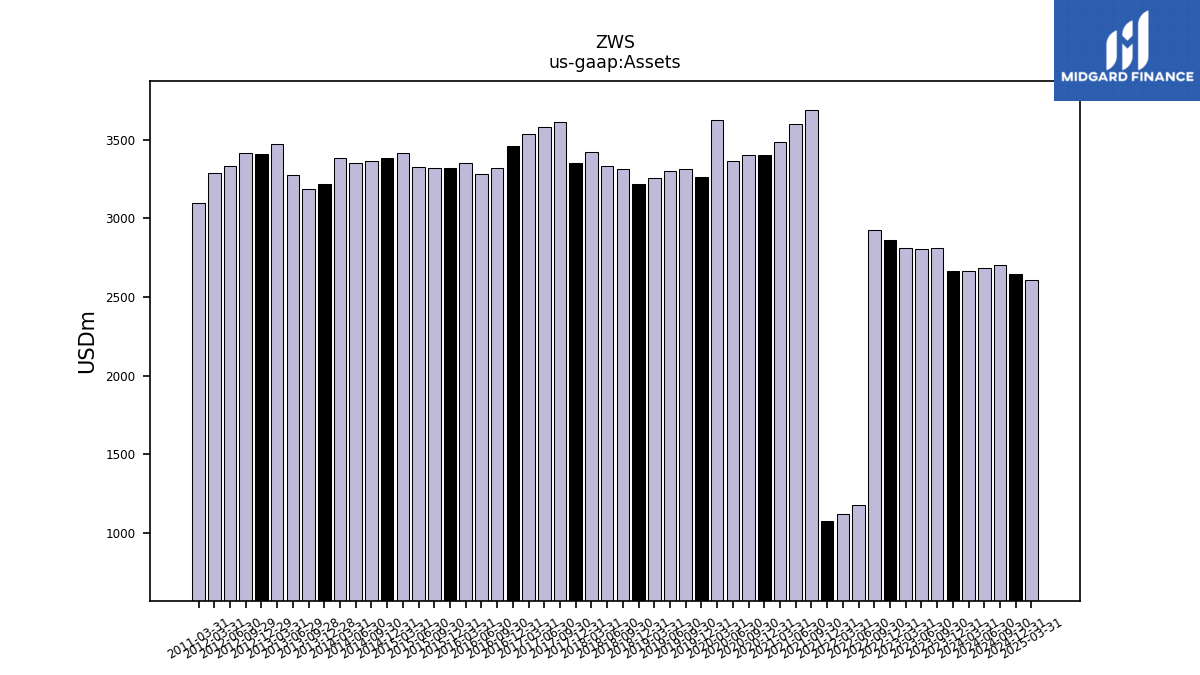
| Assets | 2812.90 | 2802.00 | 2810.00 | 2864.00 | 2927.00 | 1176.30 | 1118.60 | 1077.70 | 3689.10 | 3602.30 | 3487.30 | 3401.10 | 3405.40 | 3367.20 | 3627.10 | 3261.60 | 3311.00 | 3301.00 | 3259.70 | 3221.50 | 3312.90 | 3330.80 | 3423.70 | 3350.00 | 3615.20 | 3583.50 | 3539.30 | 3461.00 | 3318.00 | 3285.20 | 3354.80 | 3319.60 | 3323.20 | 3329.10 | 3412.50 | 3381.10 | 3367.00 | 3354.40 | 3383.50 | 3216.10 | 3186.10 | 3278.30 | 3473.80 | 3406.90 | 3415.50 | 3331.20 | 3290.90 | NA | NA | NA | |
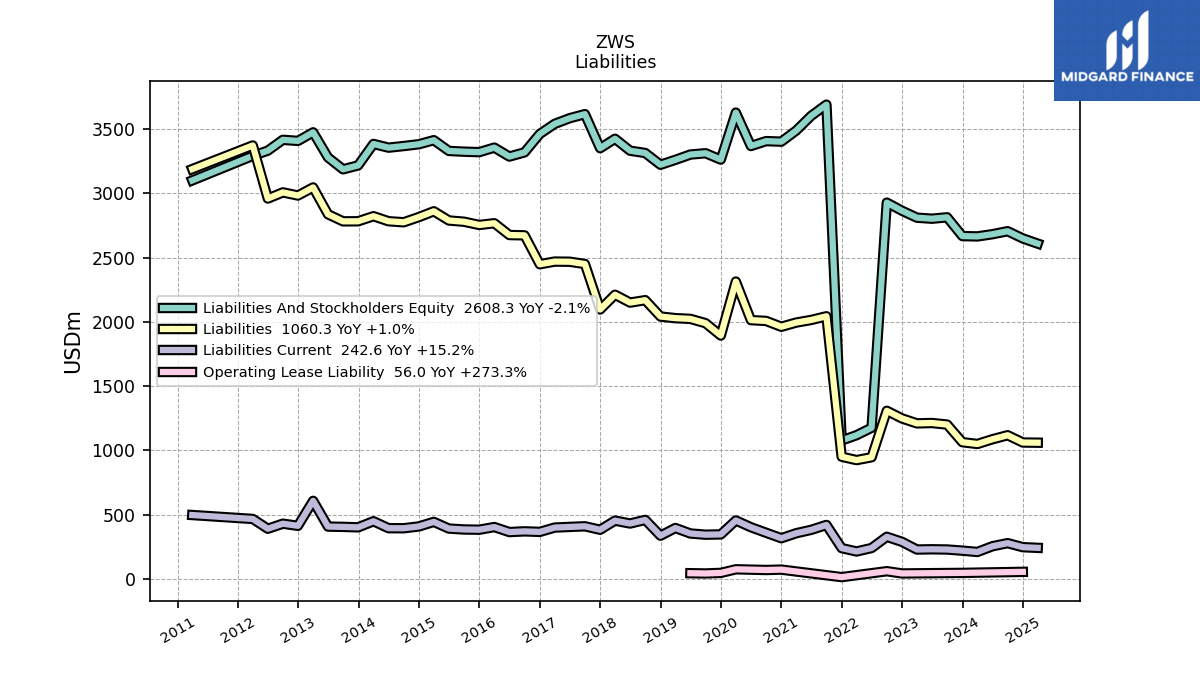
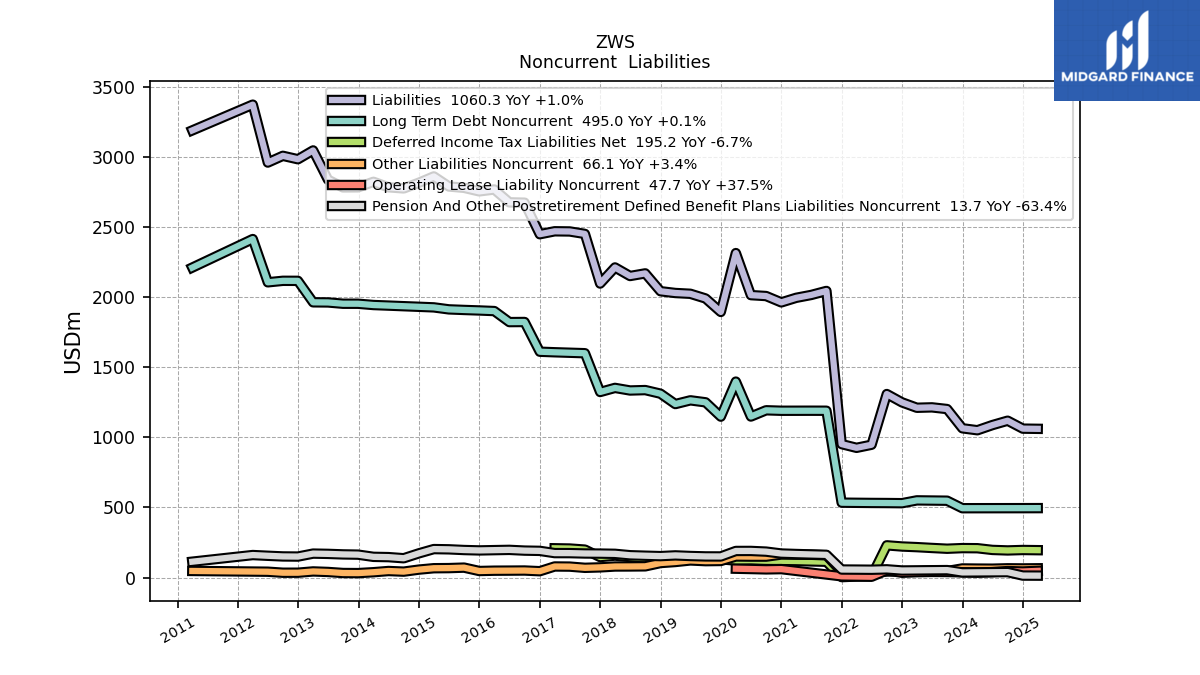
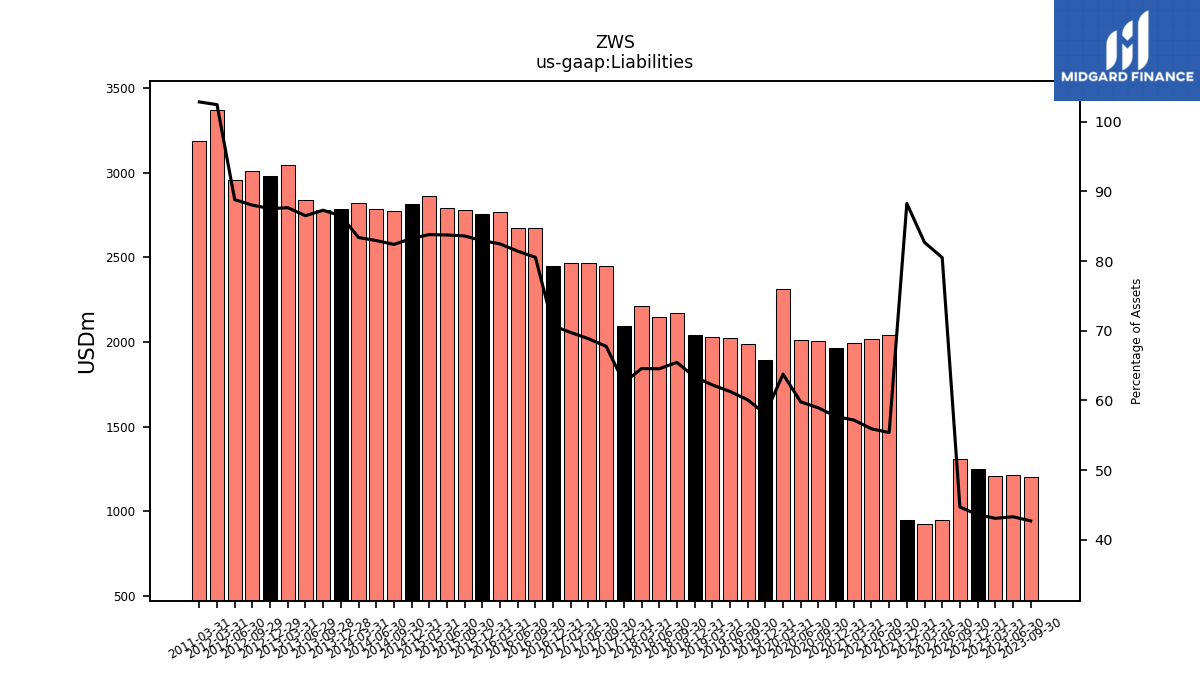
| Liabilities | 1201.30 | 1213.40 | 1210.50 | 1249.00 | 1308.40 | 946.90 | 924.90 | 951.30 | 2043.40 | 2014.80 | 1994.40 | 1961.80 | 2007.00 | 2013.50 | 2313.40 | 1893.40 | 1989.60 | 2023.10 | 2028.70 | 2041.40 | 2168.60 | 2149.80 | 2210.90 | 2095.90 | 2449.90 | 2467.50 | 2468.70 | 2447.70 | 2672.60 | 2675.00 | 2766.80 | 2753.30 | 2778.50 | 2788.20 | 2859.80 | 2814.90 | 2774.30 | 2782.40 | 2821.40 | 2782.00 | 2781.50 | 2836.30 | 3045.30 | 2982.30 | 3006.70 | 2958.70 | 3371.70 | NA | NA | NA | |
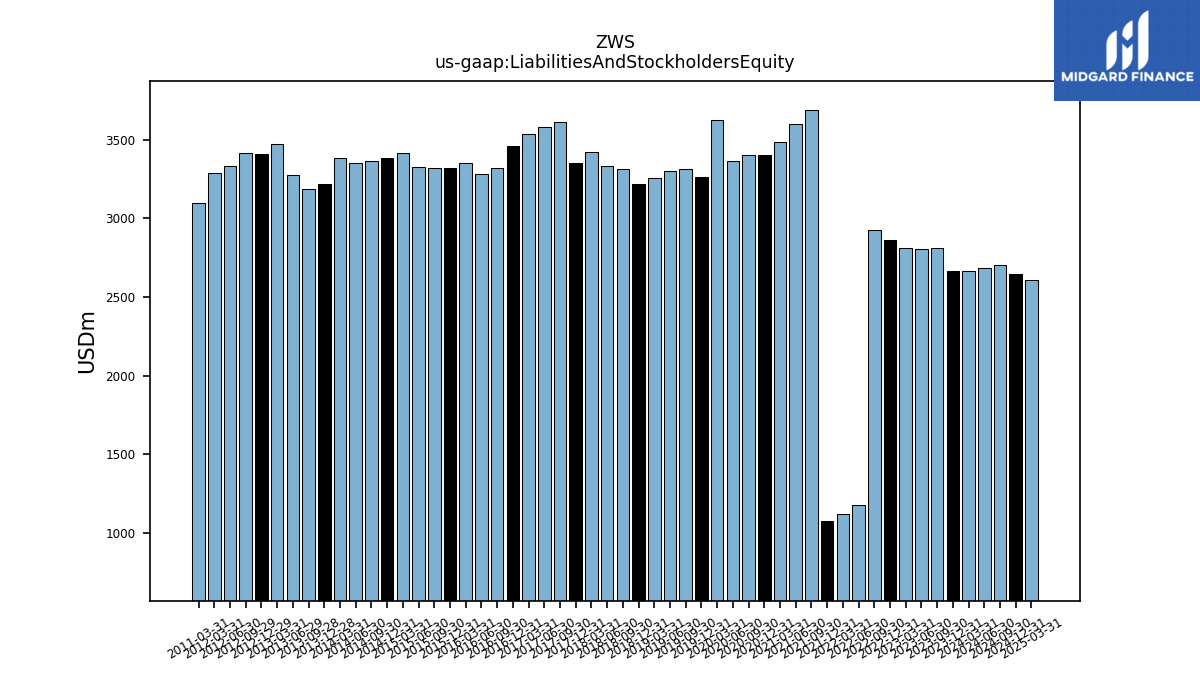
| Liabilities And Stockholders Equity | 2812.90 | 2802.00 | 2810.00 | 2864.00 | 2927.00 | 1176.30 | 1118.60 | 1077.70 | 3689.10 | 3602.30 | 3487.30 | 3401.10 | 3405.40 | 3367.20 | 3627.10 | 3261.60 | 3311.00 | 3301.00 | 3259.70 | 3221.50 | 3312.90 | 3330.80 | 3423.70 | 3350.00 | 3615.20 | 3583.50 | 3539.30 | 3461.00 | 3318.00 | 3285.20 | 3354.80 | 3319.60 | 3323.20 | 3329.10 | 3412.50 | 3381.10 | 3367.00 | 3354.40 | 3383.50 | 3216.10 | 3186.10 | 3278.30 | 3473.80 | 3406.90 | 3415.50 | 3331.20 | 3290.90 | NA | NA | NA | |
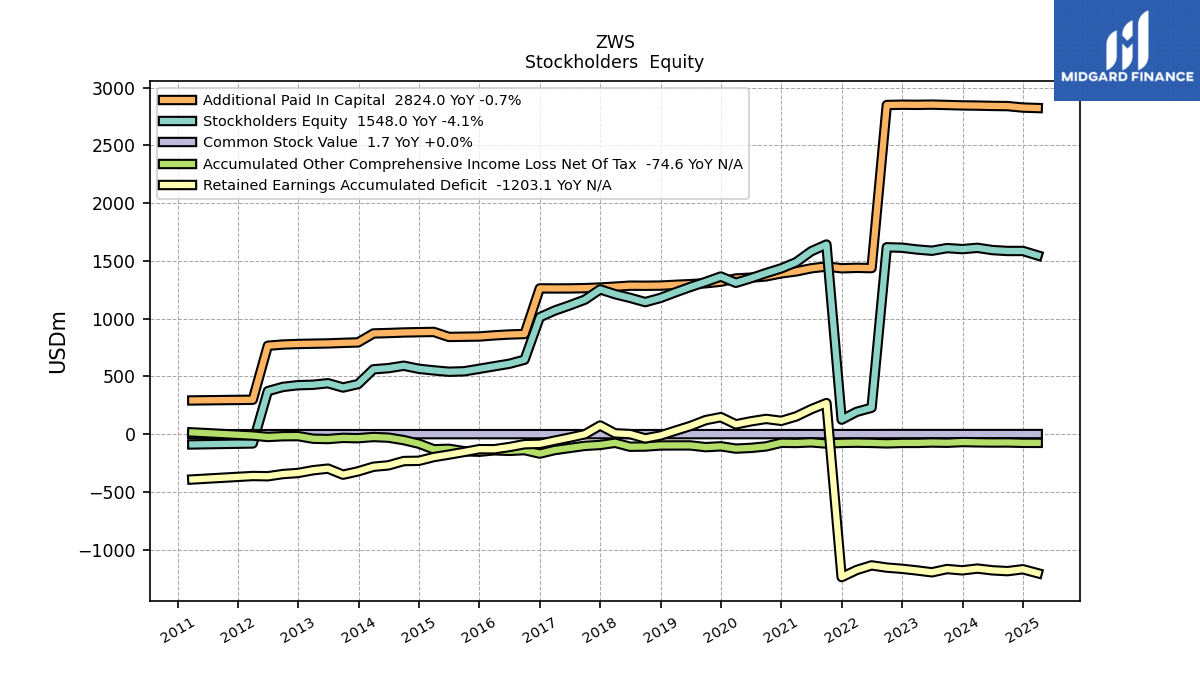
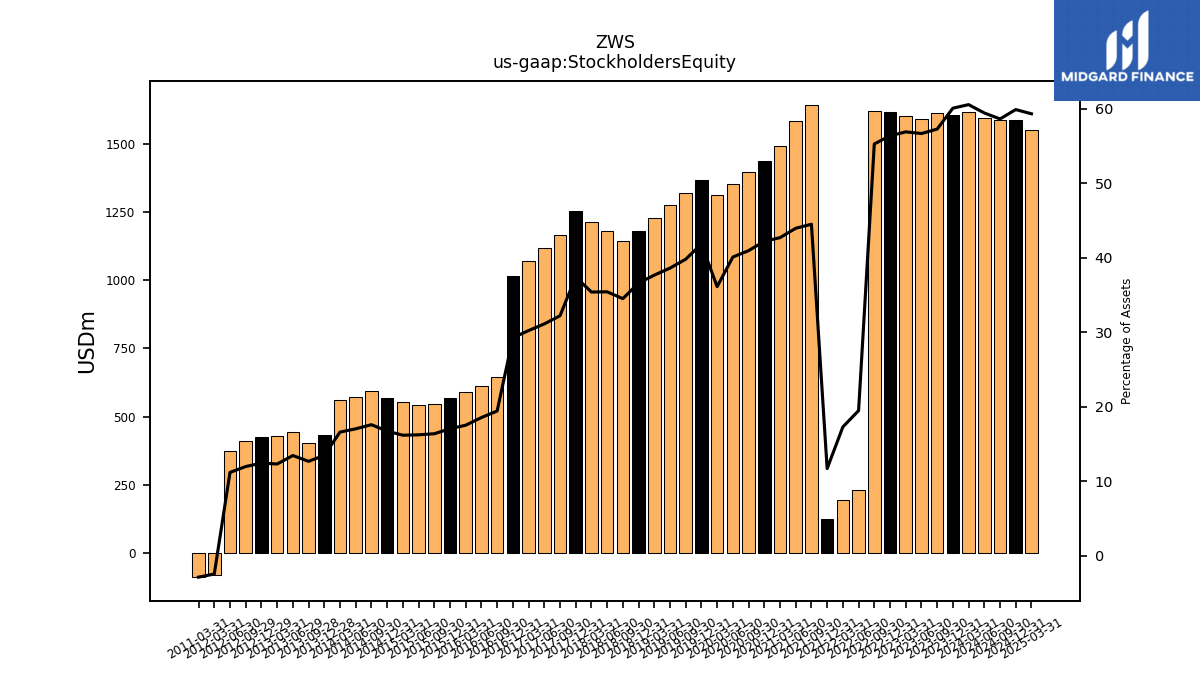
| Stockholders Equity | 1611.60 | 1588.60 | 1599.50 | 1615.00 | 1618.60 | 229.40 | 193.70 | 126.40 | 1642.50 | 1584.30 | 1489.80 | 1436.30 | 1395.50 | 1350.80 | 1311.00 | 1365.60 | 1318.70 | 1275.30 | 1228.60 | 1180.10 | 1144.00 | 1180.80 | 1212.70 | 1254.10 | 1165.30 | 1116.00 | 1070.60 | 1013.30 | 645.40 | 610.20 | 588.60 | 566.70 | 545.00 | 541.20 | 552.90 | 566.60 | 593.10 | 572.30 | 562.30 | 434.20 | 404.60 | 441.80 | 428.50 | 424.60 | 409.70 | 373.40 | -79.90 | NA | NA | NA |
| 2023-09-30 | 2023-06-30 | 2023-03-31 | 2022-12-31 | 2022-09-30 | 2022-06-30 | 2022-03-31 | 2021-12-31 | 2021-09-30 | 2021-06-30 | 2021-03-31 | 2020-12-31 | 2020-09-30 | 2020-06-30 | 2020-03-31 | 2019-12-31 | 2019-09-30 | 2019-06-30 | 2019-03-31 | 2018-12-31 | 2018-09-30 | 2018-06-30 | 2018-03-31 | 2017-12-31 | 2017-09-30 | 2017-06-30 | 2017-03-31 | 2016-12-31 | 2016-09-30 | 2016-06-30 | 2016-03-31 | 2015-12-31 | 2015-09-30 | 2015-06-30 | 2015-03-31 | 2014-12-31 | 2014-09-30 | 2014-06-30 | 2014-03-31 | 2013-12-28 | 2013-09-28 | 2013-06-29 | 2013-03-31 | 2012-12-29 | 2012-09-29 | 2012-06-30 | 2012-03-31 | 2011-12-31 | 2011-10-01 | 2011-07-02 | ||
|---|---|---|---|---|---|---|---|---|---|---|---|---|---|---|---|---|---|---|---|---|---|---|---|---|---|---|---|---|---|---|---|---|---|---|---|---|---|---|---|---|---|---|---|---|---|---|---|---|---|---|---|
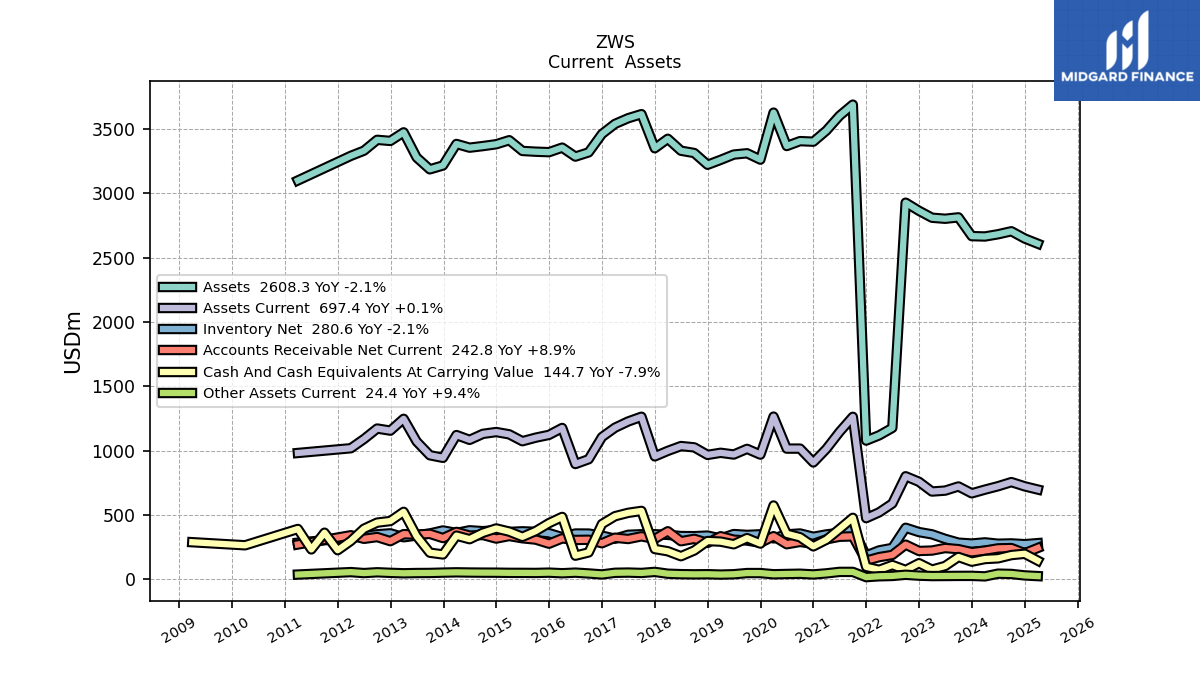
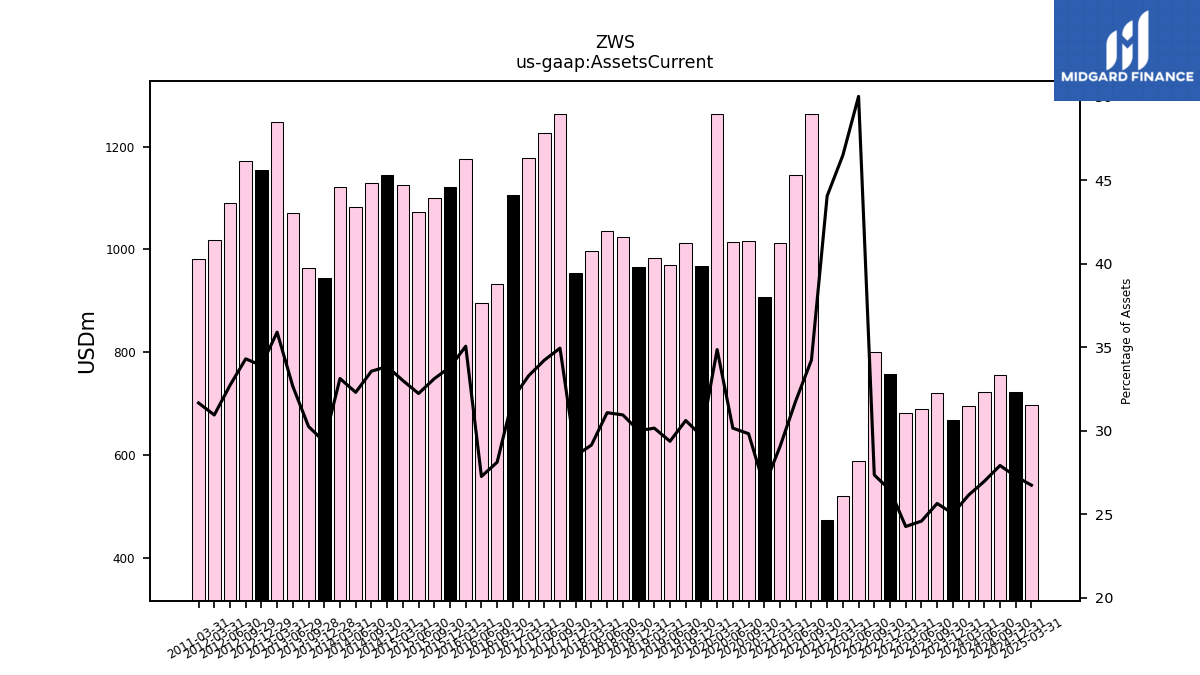
| Assets Current | 721.30 | 688.90 | 681.80 | 757.50 | 800.50 | 588.40 | 520.10 | 474.80 | 1262.70 | 1144.90 | 1013.00 | 907.70 | 1015.50 | 1015.30 | 1264.30 | 968.60 | 1013.50 | 969.40 | 982.90 | 966.50 | 1025.20 | 1035.20 | 997.70 | 954.90 | 1263.30 | 1226.30 | 1178.10 | 1105.50 | 932.80 | 895.50 | 1176.10 | 1122.20 | 1100.50 | 1072.90 | 1126.30 | 1144.20 | 1130.10 | 1083.40 | 1120.80 | 943.60 | 963.80 | 1070.40 | 1247.10 | 1155.10 | 1171.60 | 1089.90 | 1018.30 | NA | NA | NA | |
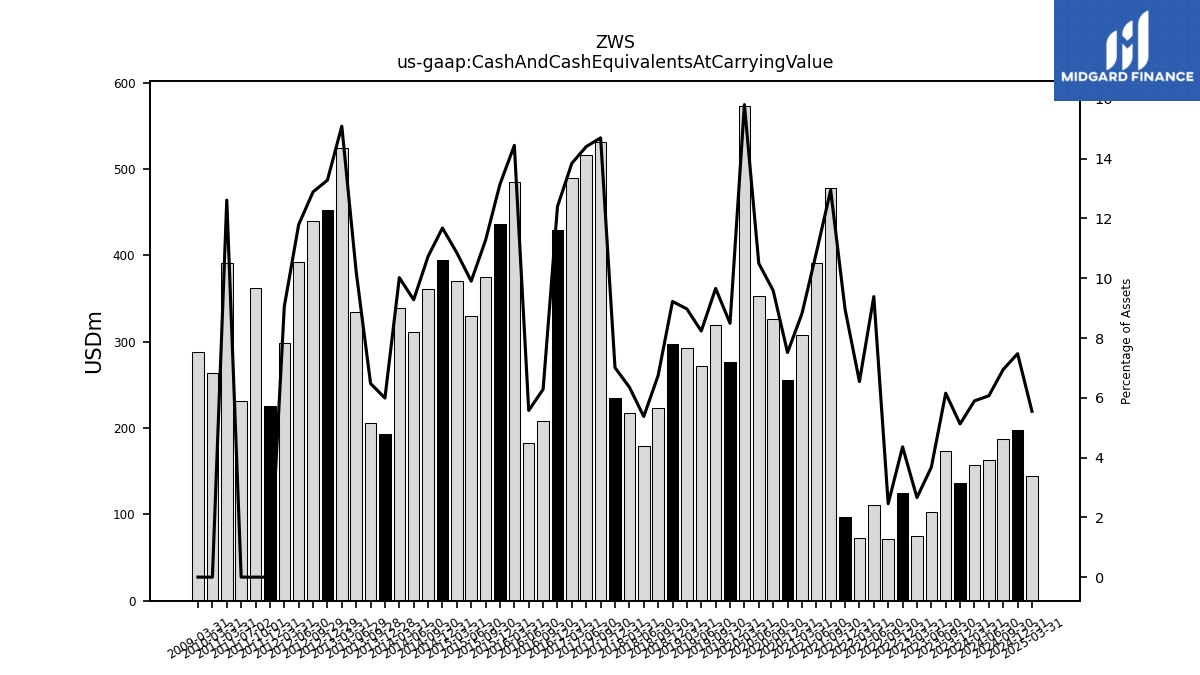
| Cash And Cash Equivalents At Carrying Value | 173.10 | 103.00 | 74.80 | 124.80 | 71.90 | 110.40 | 73.20 | 96.60 | 477.60 | 390.70 | 307.30 | 255.60 | 326.60 | 353.40 | 573.40 | 277.00 | 319.80 | 271.80 | 292.50 | 297.10 | 223.50 | 179.00 | 217.60 | 234.80 | 531.30 | 516.20 | 490.10 | 429.30 | 208.50 | 183.20 | 484.60 | 436.40 | 374.70 | 329.70 | 370.30 | 394.90 | 361.30 | 311.30 | 339.00 | 192.70 | 206.40 | 334.90 | 524.10 | 452.50 | 440.20 | 392.90 | 298.00 | 225.60 | 361.80 | 231.80 | |
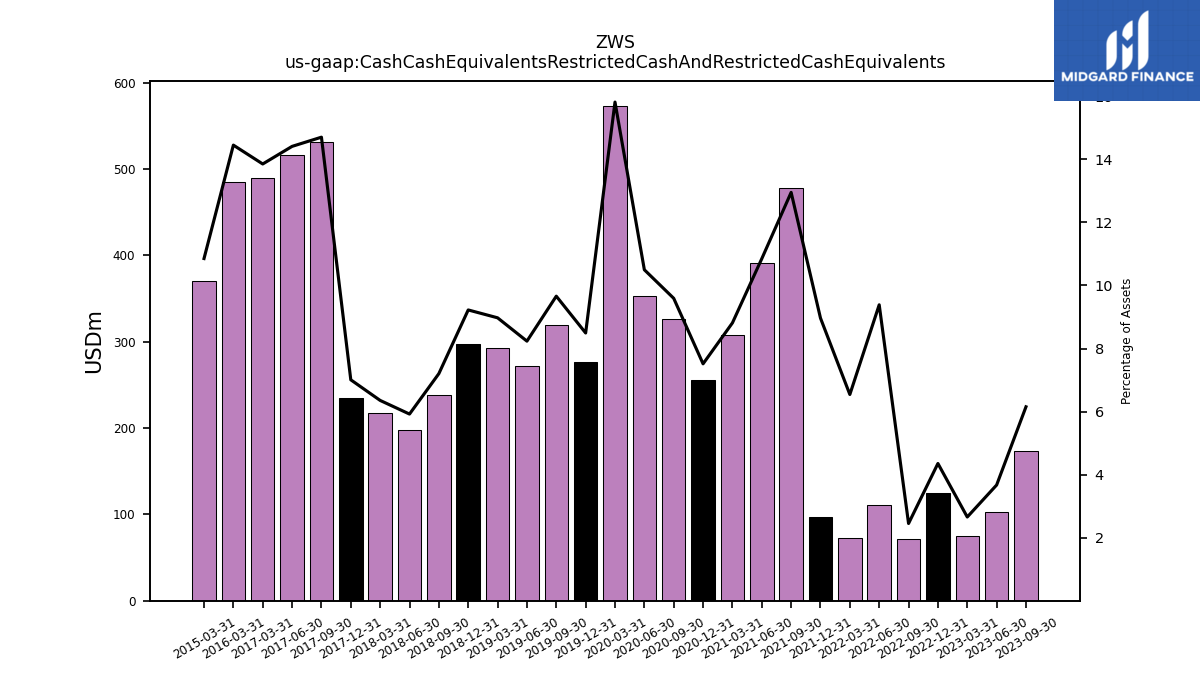
| Cash Cash Equivalents Restricted Cash And Restricted Cash Equivalents | 173.10 | 103.00 | 74.80 | 124.80 | 71.90 | 110.40 | 73.20 | 96.60 | 477.60 | 390.70 | 307.30 | 255.60 | 326.60 | 353.40 | 573.40 | 277.00 | 319.80 | 271.80 | 292.50 | 297.10 | 238.70 | 197.30 | 217.60 | 234.80 | 531.30 | 516.20 | 490.10 | NA | NA | NA | 484.60 | NA | NA | NA | 370.30 | NA | NA | NA | NA | NA | NA | NA | NA | NA | NA | NA | NA | NA | NA | NA | |
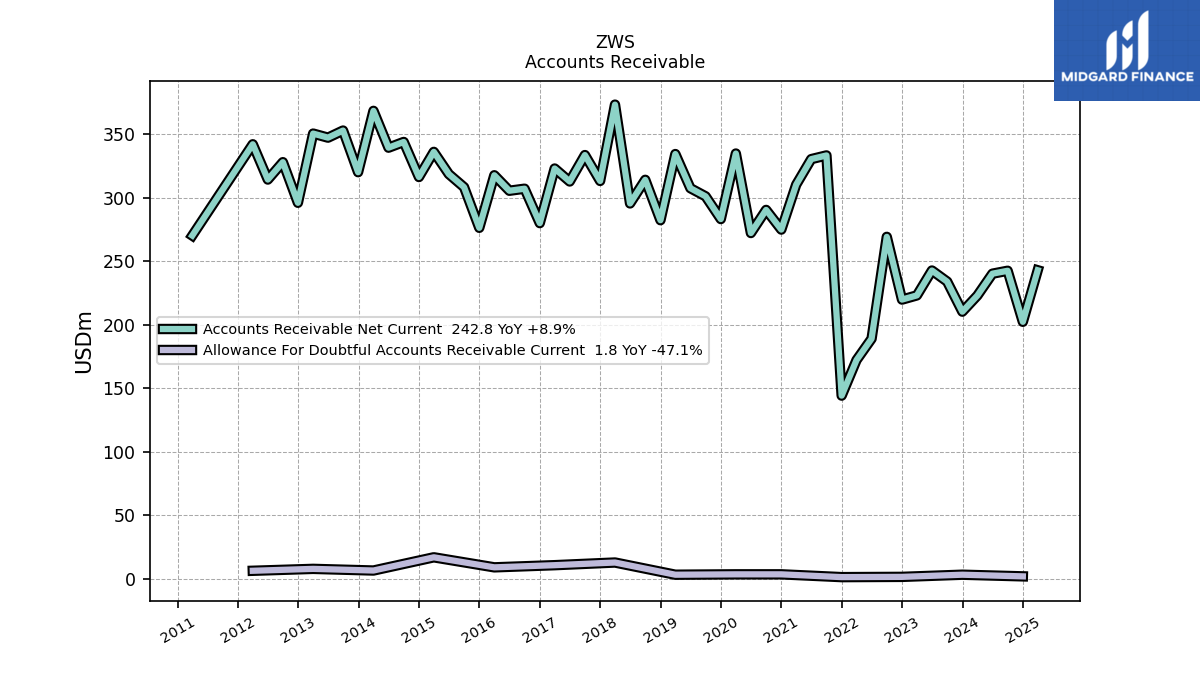
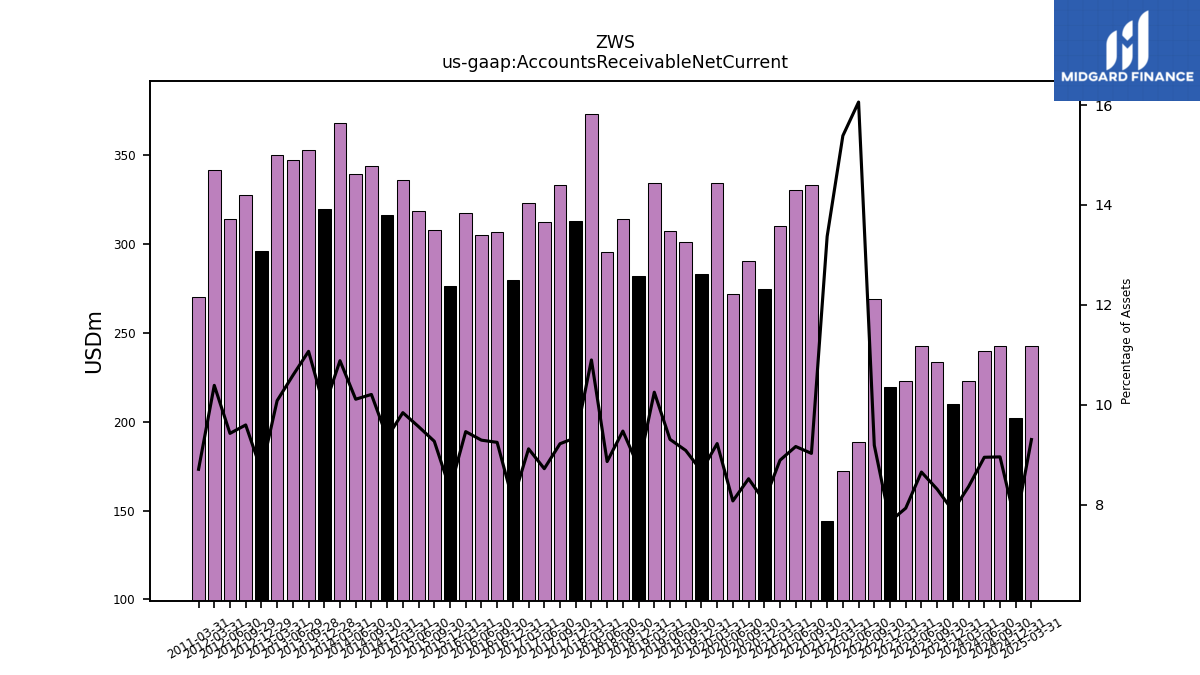
| Accounts Receivable Net Current | 233.90 | 242.60 | 223.00 | 219.70 | 269.10 | 188.90 | 172.10 | 144.10 | 333.20 | 330.30 | 310.20 | 274.80 | 290.30 | 272.10 | 334.70 | 283.10 | 301.00 | 307.40 | 334.30 | 282.20 | 314.00 | 295.40 | 373.20 | 313.10 | 333.50 | 312.70 | 322.90 | 279.90 | 307.00 | 305.40 | 317.60 | 276.20 | 308.20 | 318.50 | 336.00 | 316.20 | 343.80 | 339.30 | 368.30 | 320.00 | 352.80 | 347.20 | 350.40 | 295.90 | 327.90 | 314.20 | 342.00 | NA | NA | NA | |
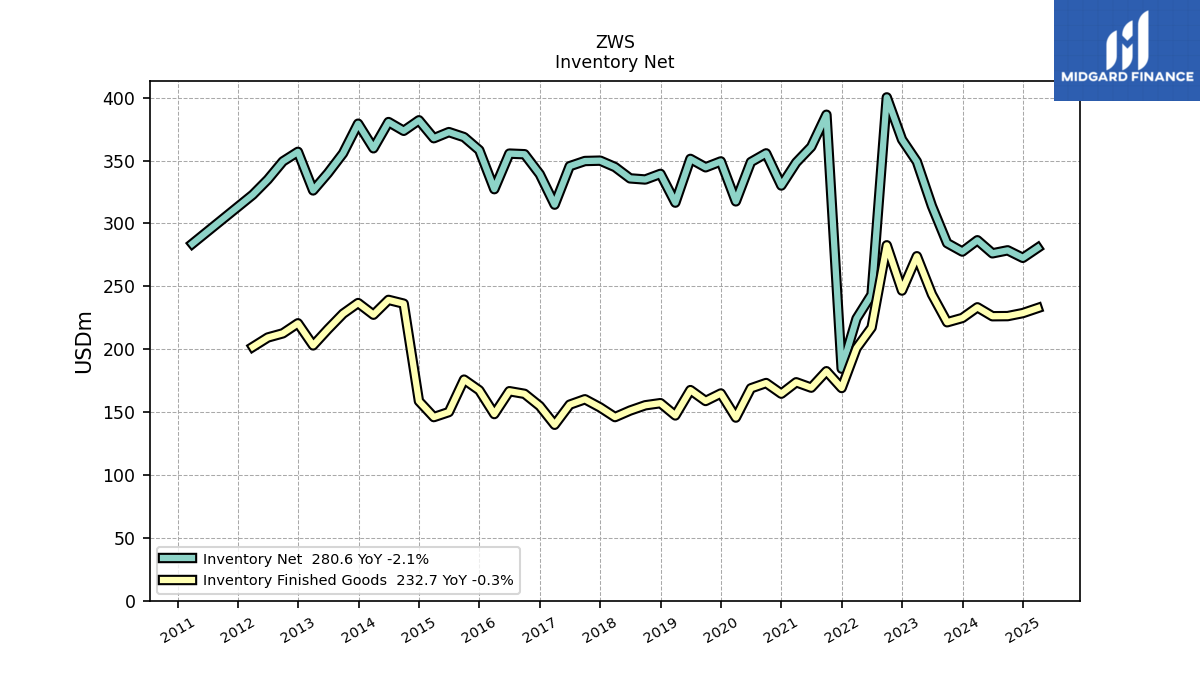
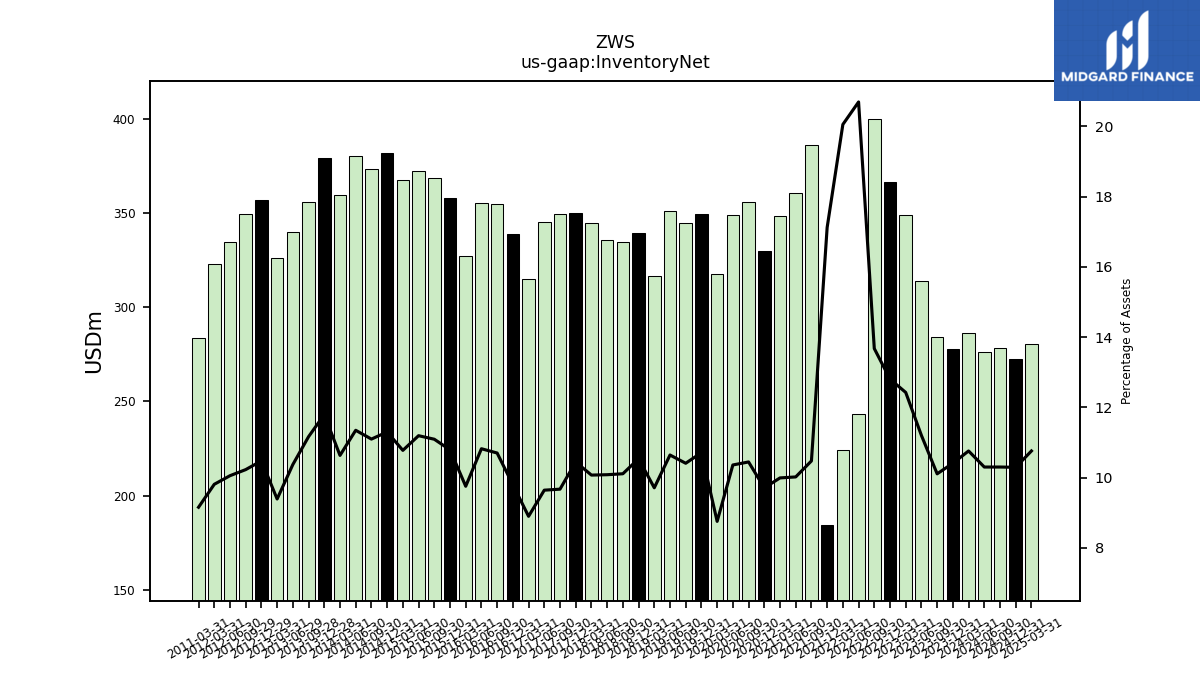
| Inventory Net | 284.30 | 313.80 | 349.10 | 366.70 | 400.20 | 243.40 | 224.30 | 184.50 | 386.40 | 360.90 | 348.40 | 330.10 | 355.70 | 348.80 | 317.50 | 349.30 | 344.60 | 351.30 | 316.50 | 339.40 | 334.90 | 335.80 | 344.80 | 349.90 | 349.60 | 345.50 | 314.90 | 339.10 | 355.00 | 355.50 | 327.20 | 358.20 | 368.60 | 372.60 | 367.70 | 382.00 | 373.60 | 380.60 | 359.70 | 379.30 | 355.70 | 340.00 | 326.20 | 356.90 | 349.30 | 334.90 | 322.80 | NA | NA | NA | |
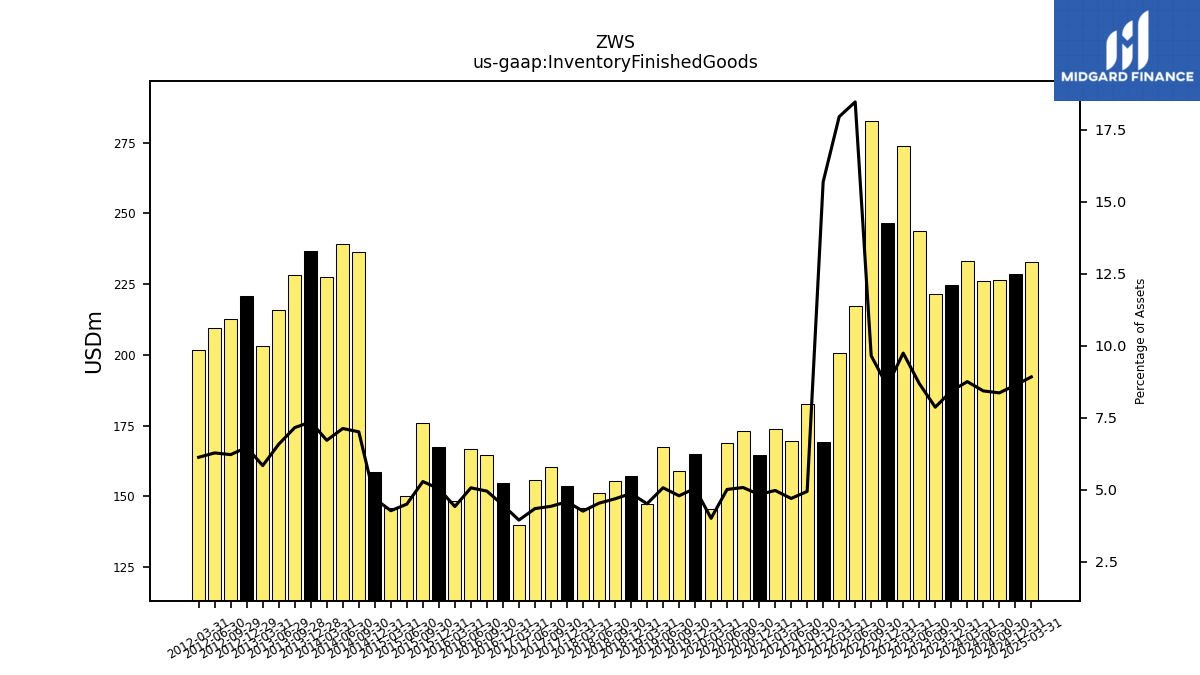
| Inventory Finished Goods | 221.40 | 243.60 | 273.90 | 246.60 | 282.60 | 217.20 | 200.80 | 169.10 | 182.50 | 169.40 | 173.70 | 164.60 | 173.10 | 168.90 | 145.60 | 164.80 | 158.80 | 167.50 | 147.30 | 157.10 | 155.40 | 151.20 | 146.00 | 153.70 | 160.20 | 155.90 | 139.90 | 154.80 | 164.50 | 166.60 | 148.40 | 167.30 | 175.80 | 150.00 | 146.00 | 158.70 | 236.20 | 239.20 | 227.40 | 236.70 | 228.20 | 215.90 | 203.00 | 220.60 | 212.60 | 209.30 | 201.80 | NA | NA | NA | |
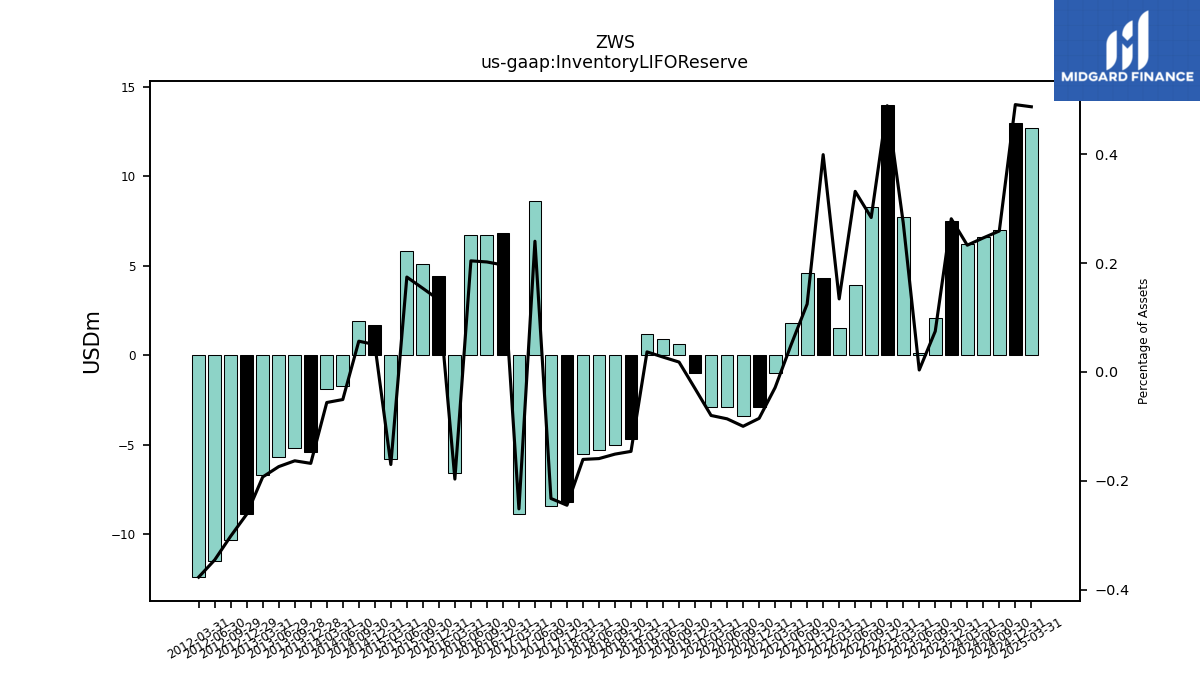
| Inventory L I F O Reserve | 2.10 | 0.10 | 7.70 | 14.00 | 8.30 | 3.90 | 1.50 | 4.30 | 4.60 | 1.80 | -1.00 | -2.90 | -3.40 | -2.90 | -2.90 | -1.00 | 0.60 | 0.90 | 1.20 | -4.70 | -5.00 | -5.30 | -5.50 | -8.20 | -8.40 | 8.60 | -8.90 | 6.80 | 6.70 | 6.70 | -6.60 | 4.40 | 5.10 | 5.80 | -5.80 | 1.70 | 1.90 | -1.70 | -1.90 | -5.40 | -5.20 | -5.70 | -6.70 | -8.90 | -10.30 | -11.50 | -12.40 | NA | NA | NA | |
| Other Assets Current | 26.00 | 25.30 | 24.70 | 28.00 | 34.80 | 25.60 | 23.10 | 16.50 | 57.10 | 57.20 | 45.70 | 37.40 | 42.90 | 41.00 | 38.70 | 48.00 | 48.10 | 38.90 | 36.30 | 39.10 | 38.20 | 39.50 | 43.00 | 57.10 | 48.90 | 51.90 | 50.20 | 37.40 | 45.00 | 51.40 | 46.70 | 51.40 | 49.00 | 49.50 | 49.70 | 51.10 | 51.40 | 52.20 | 53.80 | 51.60 | 48.90 | 48.30 | 46.40 | 49.80 | 54.20 | 47.90 | 55.50 | NA | NA | NA |
| 2023-09-30 | 2023-06-30 | 2023-03-31 | 2022-12-31 | 2022-09-30 | 2022-06-30 | 2022-03-31 | 2021-12-31 | 2021-09-30 | 2021-06-30 | 2021-03-31 | 2020-12-31 | 2020-09-30 | 2020-06-30 | 2020-03-31 | 2019-12-31 | 2019-09-30 | 2019-06-30 | 2019-03-31 | 2018-12-31 | 2018-09-30 | 2018-06-30 | 2018-03-31 | 2017-12-31 | 2017-09-30 | 2017-06-30 | 2017-03-31 | 2016-12-31 | 2016-09-30 | 2016-06-30 | 2016-03-31 | 2015-12-31 | 2015-09-30 | 2015-06-30 | 2015-03-31 | 2014-12-31 | 2014-09-30 | 2014-06-30 | 2014-03-31 | 2013-12-28 | 2013-09-28 | 2013-06-29 | 2013-03-31 | 2012-12-29 | 2012-09-29 | 2012-06-30 | 2012-03-31 | 2011-12-31 | 2011-10-01 | 2011-07-02 | ||
|---|---|---|---|---|---|---|---|---|---|---|---|---|---|---|---|---|---|---|---|---|---|---|---|---|---|---|---|---|---|---|---|---|---|---|---|---|---|---|---|---|---|---|---|---|---|---|---|---|---|---|---|
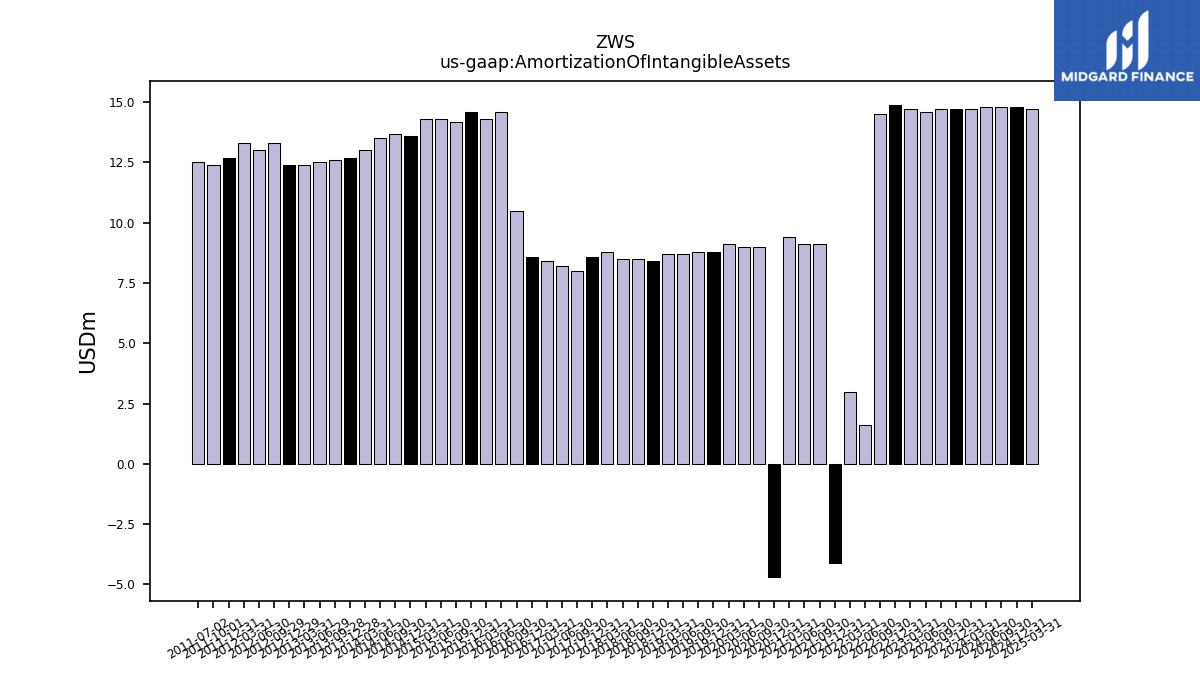
| Amortization Of Intangible Assets | 14.70 | 14.60 | 14.70 | 14.90 | 14.50 | 1.60 | 3.00 | -4.10 | 9.10 | 9.10 | 9.40 | -4.70 | 9.00 | 9.00 | 9.10 | 8.80 | 8.80 | 8.70 | 8.70 | 8.40 | 8.50 | 8.50 | 8.80 | 8.60 | 8.00 | 8.20 | 8.40 | 8.60 | 10.50 | 14.60 | 14.30 | 14.60 | 14.20 | 14.30 | 14.30 | 13.60 | 13.70 | 13.50 | 13.00 | 12.70 | 12.60 | 12.50 | 12.40 | 12.40 | 13.30 | 13.00 | 13.30 | 12.70 | 12.40 | 12.50 | |
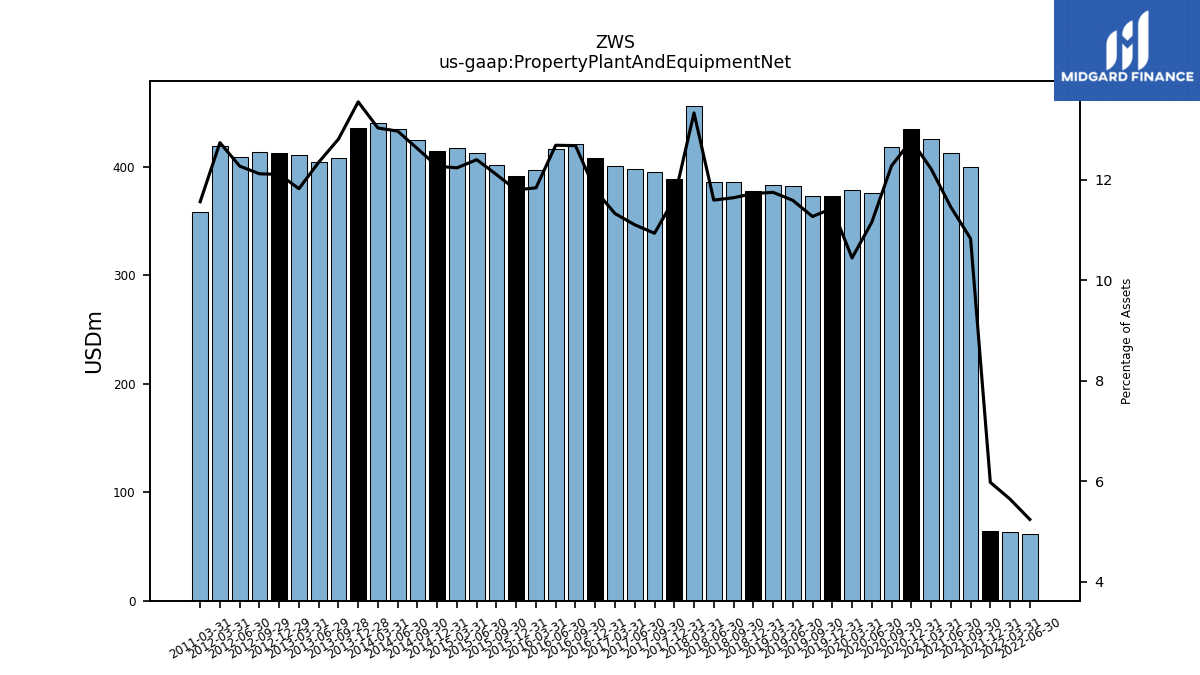
| Property Plant And Equipment Net | NA | NA | NA | NA | NA | 61.60 | 63.10 | 64.40 | 399.50 | 412.70 | 426.10 | 434.80 | 418.10 | 375.60 | 378.80 | 372.80 | 373.10 | 382.60 | 383.00 | 377.70 | 385.70 | 386.20 | 456.40 | 389.30 | 395.30 | 397.90 | 400.90 | 408.10 | 420.70 | 416.80 | 397.20 | 391.60 | 402.20 | 412.80 | 417.60 | 414.80 | 424.90 | 435.00 | 440.90 | 435.80 | 408.10 | 404.80 | 410.70 | 412.50 | 413.90 | 408.80 | 419.20 | NA | NA | NA | |
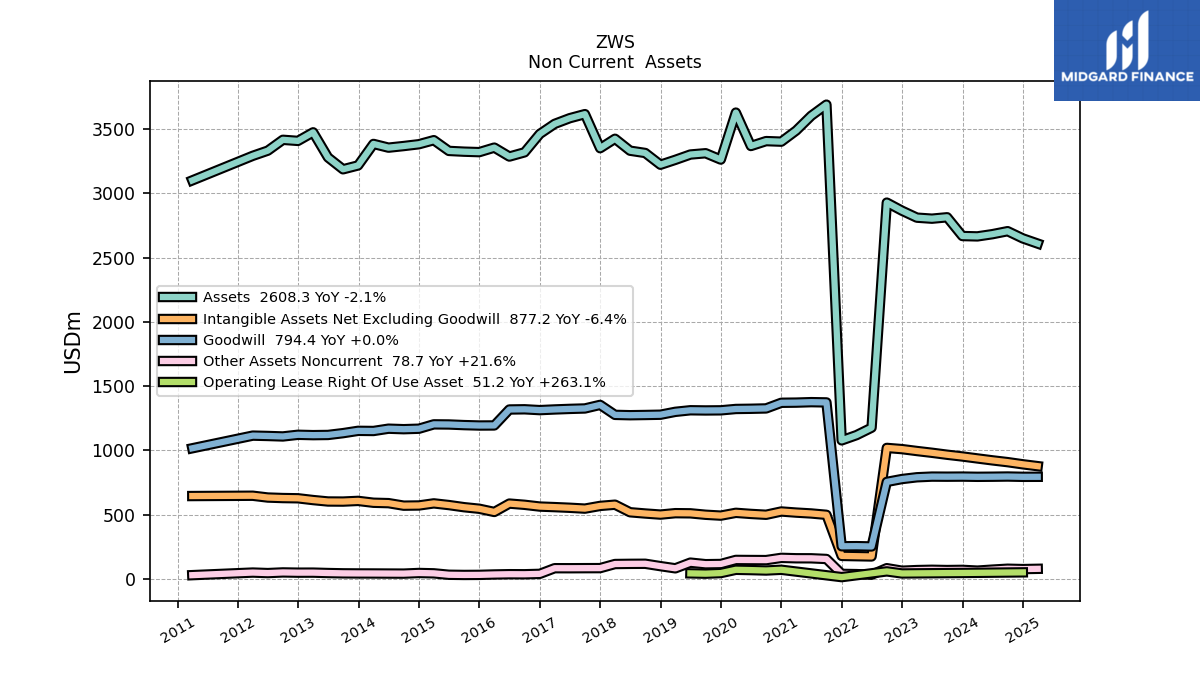
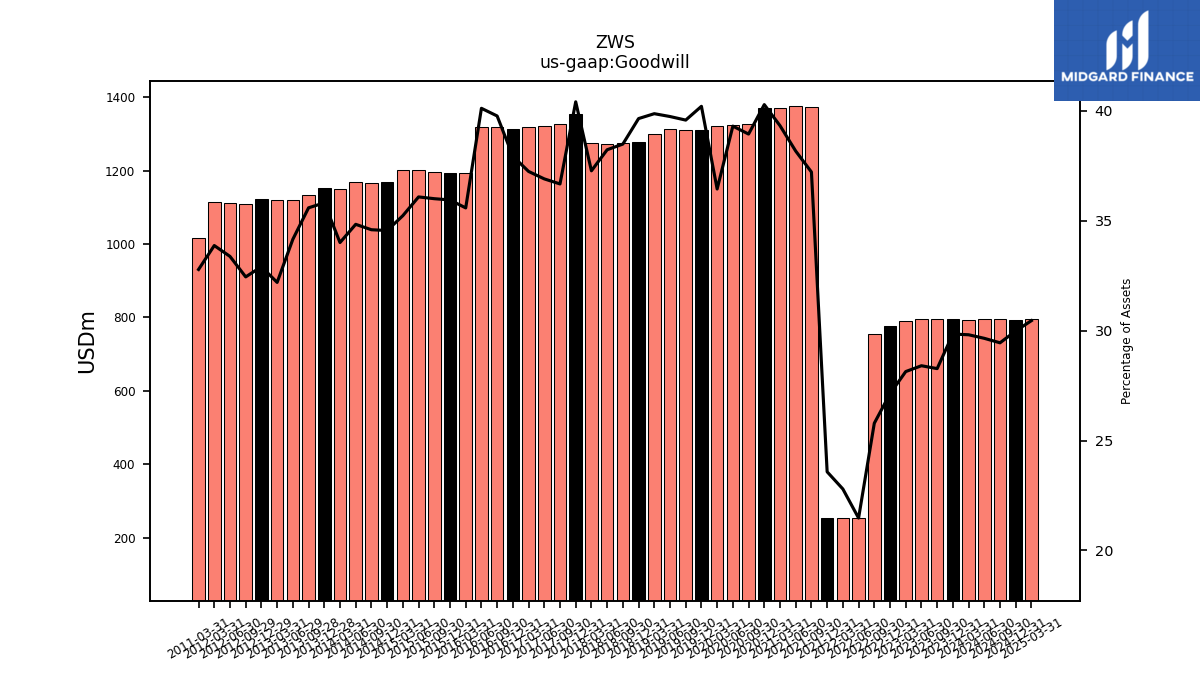
| Goodwill | 795.30 | 795.90 | 790.70 | 777.00 | 754.80 | 252.60 | 255.00 | 254.10 | 1373.00 | 1375.00 | 1371.40 | 1370.10 | 1326.20 | 1323.50 | 1321.90 | 1311.40 | 1310.50 | 1311.90 | 1299.70 | 1277.30 | 1275.10 | 1273.40 | 1276.10 | 1353.80 | 1325.90 | 1322.50 | 1318.20 | 1313.00 | 1319.50 | 1317.90 | 1193.80 | 1193.30 | 1196.50 | 1201.30 | 1202.30 | 1168.40 | 1164.70 | 1168.60 | 1150.70 | 1151.90 | 1133.90 | 1119.80 | 1118.40 | 1121.20 | 1108.20 | 1111.90 | 1114.70 | NA | NA | NA | |
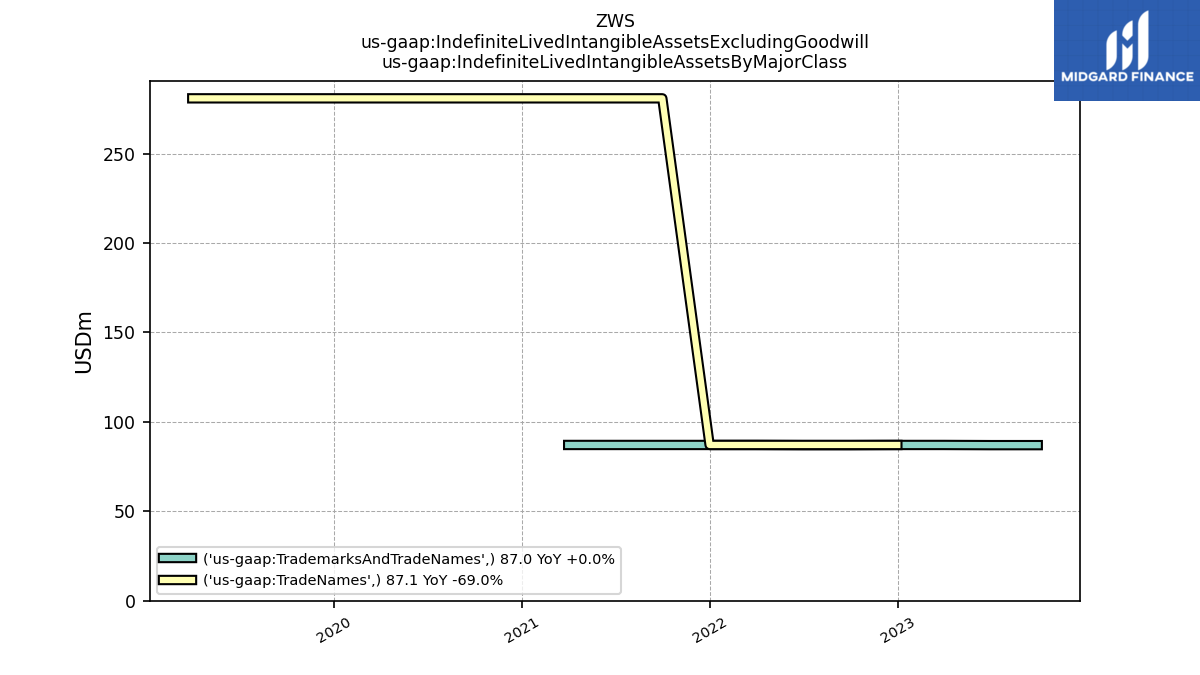
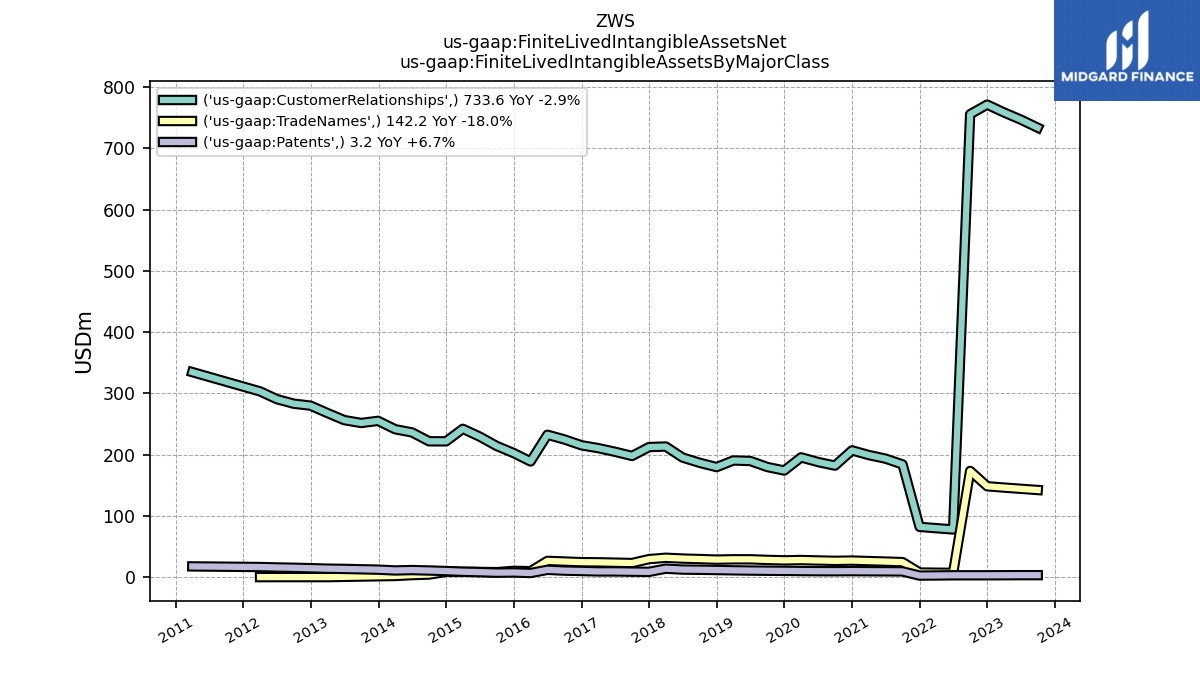
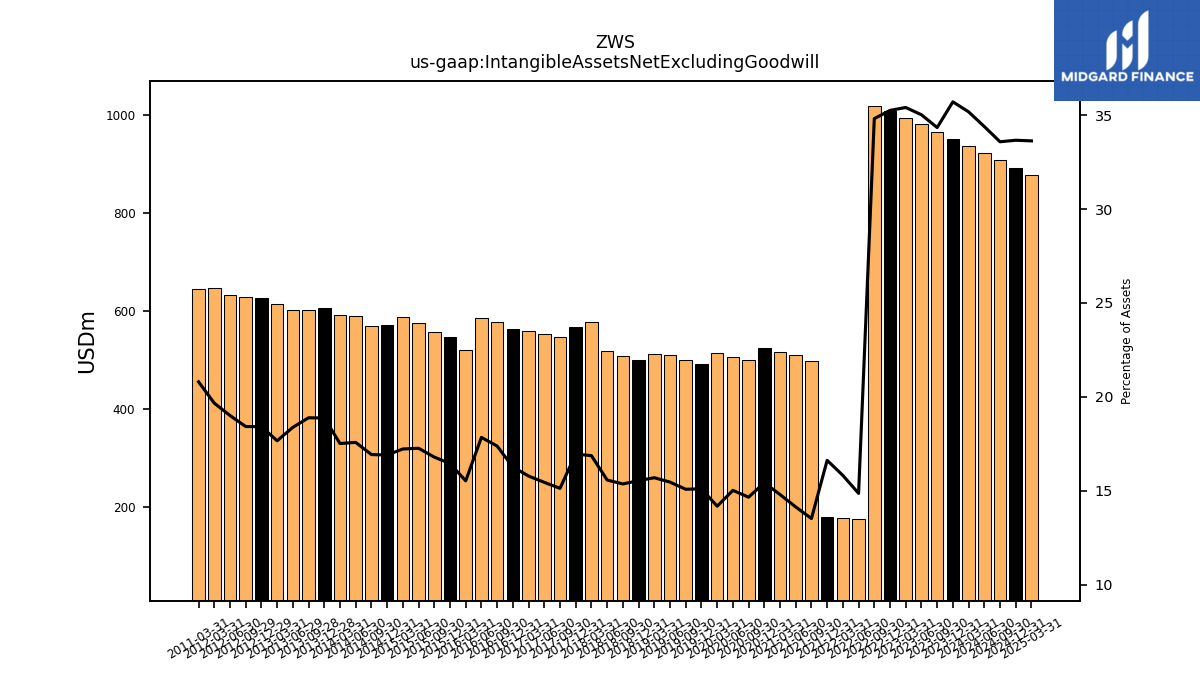
| Intangible Assets Net Excluding Goodwill | 966.00 | 981.30 | 995.00 | 1009.70 | 1019.10 | 174.80 | 176.90 | 179.10 | 498.70 | 509.20 | 516.00 | 524.60 | 499.10 | 505.70 | 514.20 | 492.50 | 499.20 | 510.30 | 511.50 | 500.50 | 508.90 | 518.60 | 577.50 | 567.90 | 546.90 | 553.50 | 558.60 | 562.90 | 576.60 | 586.10 | 520.90 | 545.90 | 558.00 | 574.60 | 587.70 | 571.40 | 569.90 | 589.50 | 592.60 | 607.00 | 601.70 | 602.40 | 613.50 | 627.30 | 629.10 | 633.10 | 647.10 | NA | NA | NA | |
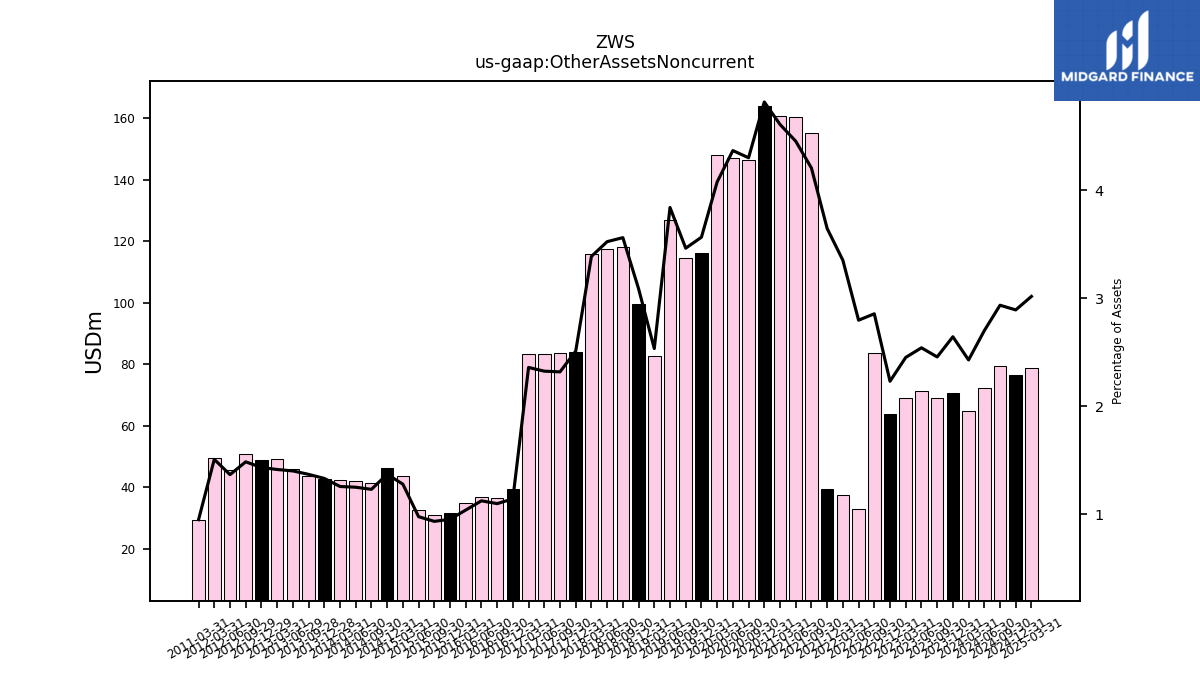
| Other Assets Noncurrent | 69.10 | 71.20 | 68.90 | 63.90 | 83.60 | 32.90 | 37.50 | 39.30 | 155.20 | 160.50 | 160.80 | 163.90 | 146.50 | 147.10 | 147.90 | 116.30 | 114.70 | 126.80 | 82.60 | 99.50 | 118.00 | 117.40 | 116.00 | 84.10 | 83.80 | 83.30 | 83.50 | 39.50 | 36.40 | 36.90 | 34.80 | 31.60 | 31.00 | 32.50 | 43.60 | 46.30 | 41.40 | 41.90 | 42.50 | 42.80 | 43.60 | 45.90 | 49.10 | 48.80 | 50.70 | 45.50 | 49.60 | NA | NA | NA |
| 2023-09-30 | 2023-06-30 | 2023-03-31 | 2022-12-31 | 2022-09-30 | 2022-06-30 | 2022-03-31 | 2021-12-31 | 2021-09-30 | 2021-06-30 | 2021-03-31 | 2020-12-31 | 2020-09-30 | 2020-06-30 | 2020-03-31 | 2019-12-31 | 2019-09-30 | 2019-06-30 | 2019-03-31 | 2018-12-31 | 2018-09-30 | 2018-06-30 | 2018-03-31 | 2017-12-31 | 2017-09-30 | 2017-06-30 | 2017-03-31 | 2016-12-31 | 2016-09-30 | 2016-06-30 | 2016-03-31 | 2015-12-31 | 2015-09-30 | 2015-06-30 | 2015-03-31 | 2014-12-31 | 2014-09-30 | 2014-06-30 | 2014-03-31 | 2013-12-28 | 2013-09-28 | 2013-06-29 | 2013-03-31 | 2012-12-29 | 2012-09-29 | 2012-06-30 | 2012-03-31 | 2011-12-31 | 2011-10-01 | 2011-07-02 | ||
|---|---|---|---|---|---|---|---|---|---|---|---|---|---|---|---|---|---|---|---|---|---|---|---|---|---|---|---|---|---|---|---|---|---|---|---|---|---|---|---|---|---|---|---|---|---|---|---|---|---|---|---|
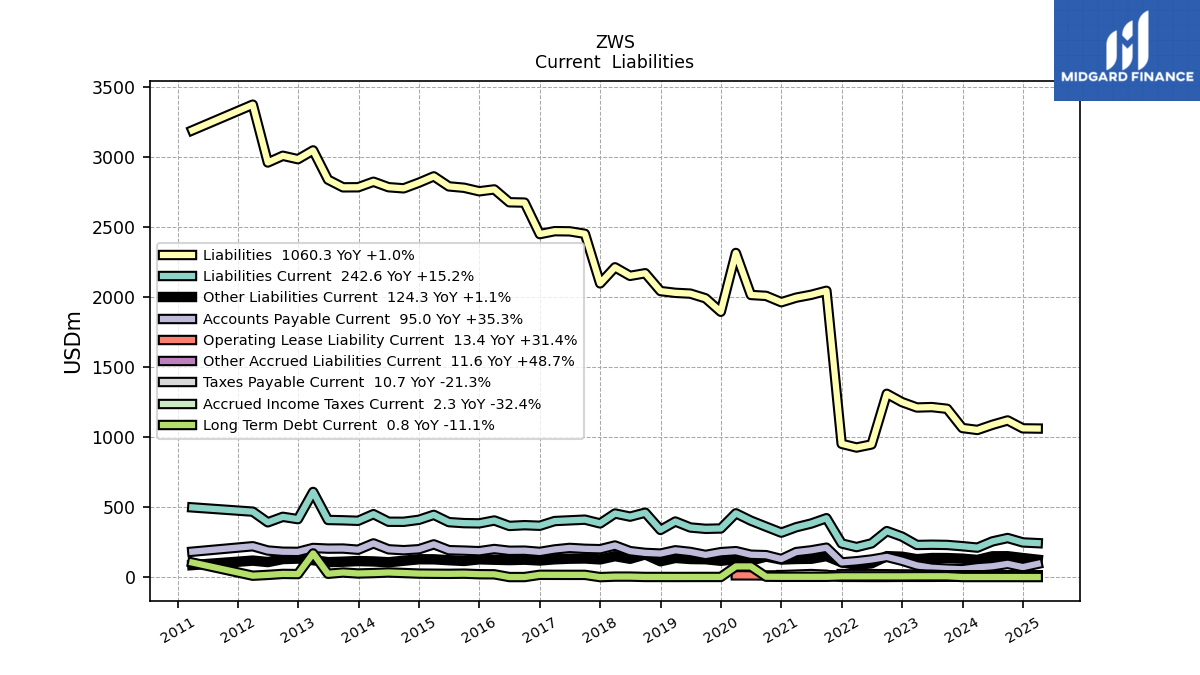
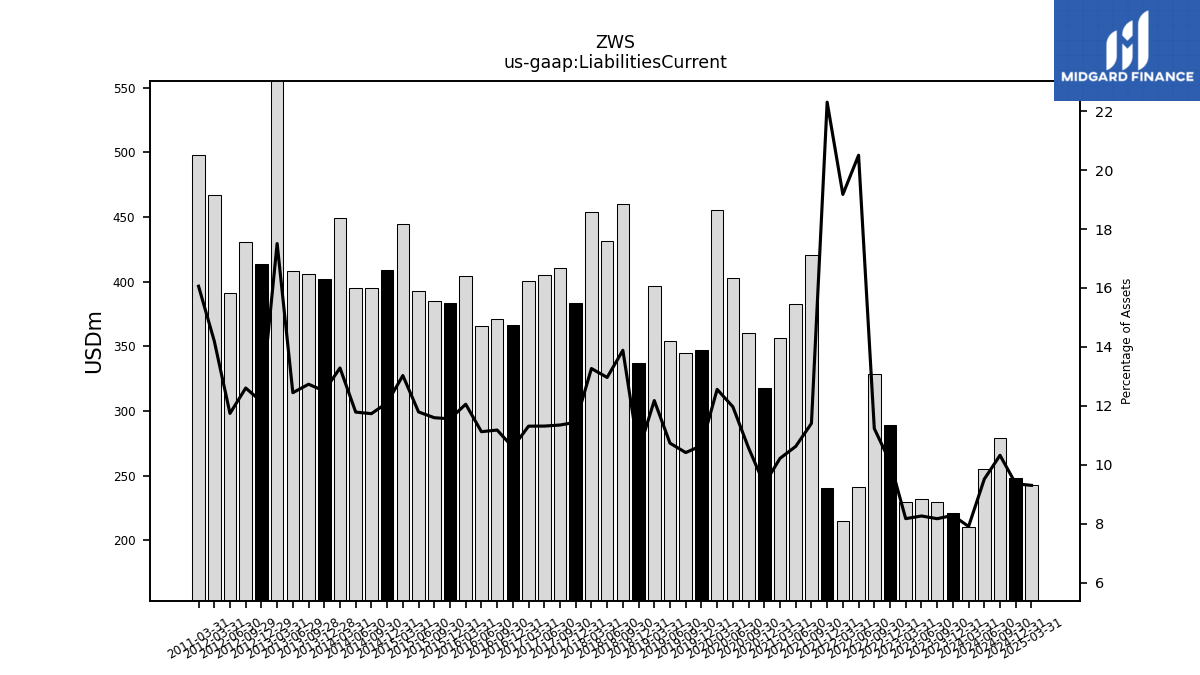
| Liabilities Current | 229.80 | 231.50 | 229.60 | 289.30 | 328.70 | 241.20 | 214.50 | 240.40 | 420.70 | 382.70 | 356.30 | 317.50 | 360.00 | 403.00 | 455.50 | 347.30 | 344.80 | 354.30 | 397.00 | 336.90 | 460.00 | 431.80 | 454.20 | 383.30 | 410.30 | 405.40 | 400.30 | 366.70 | 370.90 | 365.40 | 404.40 | 383.70 | 385.40 | 392.60 | 444.60 | 409.20 | 395.10 | 395.40 | 449.50 | 402.10 | 405.70 | 408.00 | 608.20 | 413.80 | 430.50 | 391.20 | 467.30 | NA | NA | NA | |
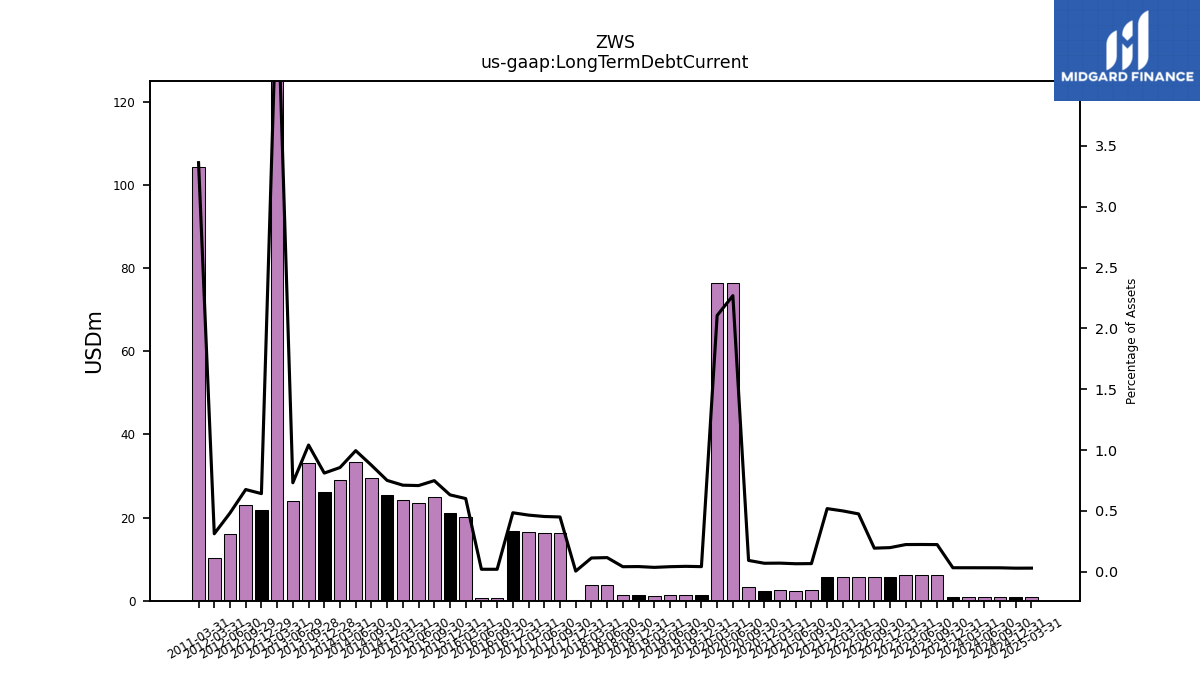
| Long Term Debt Current | 6.30 | 6.30 | 6.30 | 5.70 | 5.70 | 5.60 | 5.60 | 5.60 | 2.50 | 2.40 | 2.50 | 2.40 | 3.20 | 76.40 | 76.40 | 1.40 | 1.50 | 1.40 | 1.20 | 1.40 | 1.40 | 3.90 | 3.90 | 0.20 | 16.30 | 16.30 | 16.50 | 16.80 | 0.70 | 0.70 | 20.20 | 21.00 | 24.90 | 23.60 | 24.30 | 25.40 | 29.50 | 33.40 | 29.00 | 26.10 | 33.20 | 24.00 | 169.30 | 21.90 | 23.10 | 16.10 | 10.30 | NA | NA | NA | |
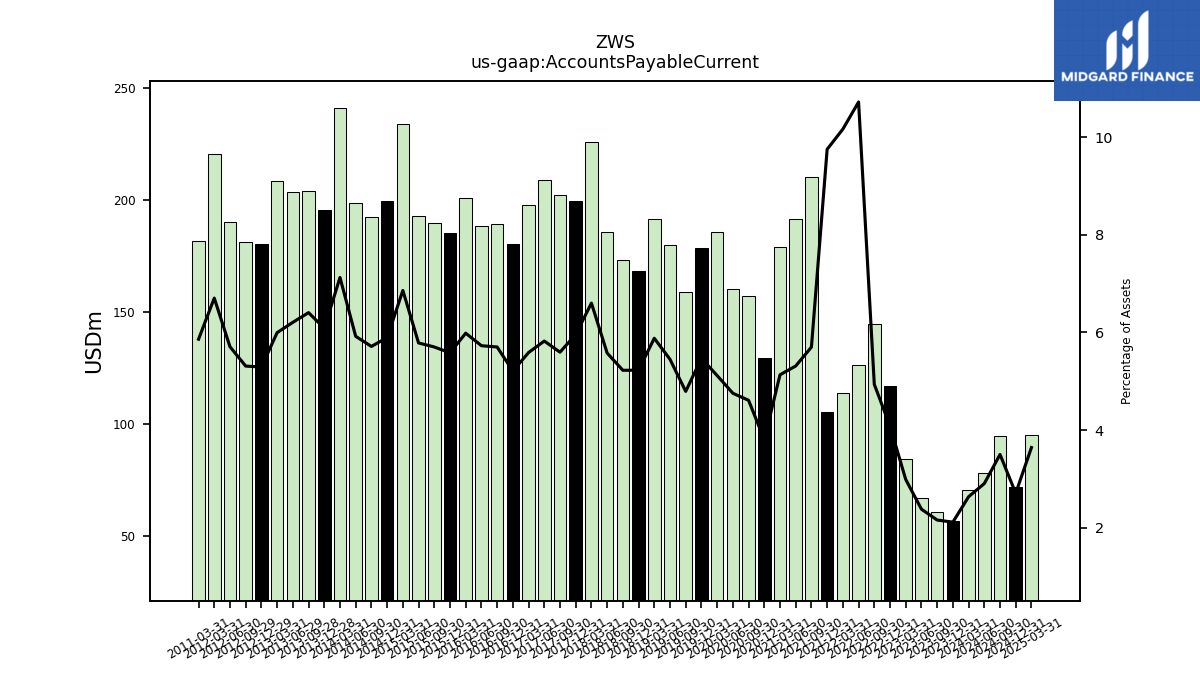
| Accounts Payable Current | 60.70 | 66.70 | 84.00 | 116.90 | 144.50 | 126.10 | 113.70 | 105.10 | 210.30 | 191.40 | 179.00 | 129.40 | 157.00 | 160.10 | 185.60 | 178.40 | 158.70 | 179.90 | 191.70 | 168.40 | 173.10 | 185.80 | 226.00 | 199.60 | 202.30 | 208.70 | 197.80 | 180.30 | 189.20 | 188.20 | 200.80 | 185.30 | 189.50 | 192.60 | 234.10 | 199.30 | 192.40 | 198.60 | 241.10 | 195.70 | 204.10 | 203.50 | 208.30 | 180.30 | 181.40 | 190.10 | 220.60 | NA | NA | NA | |
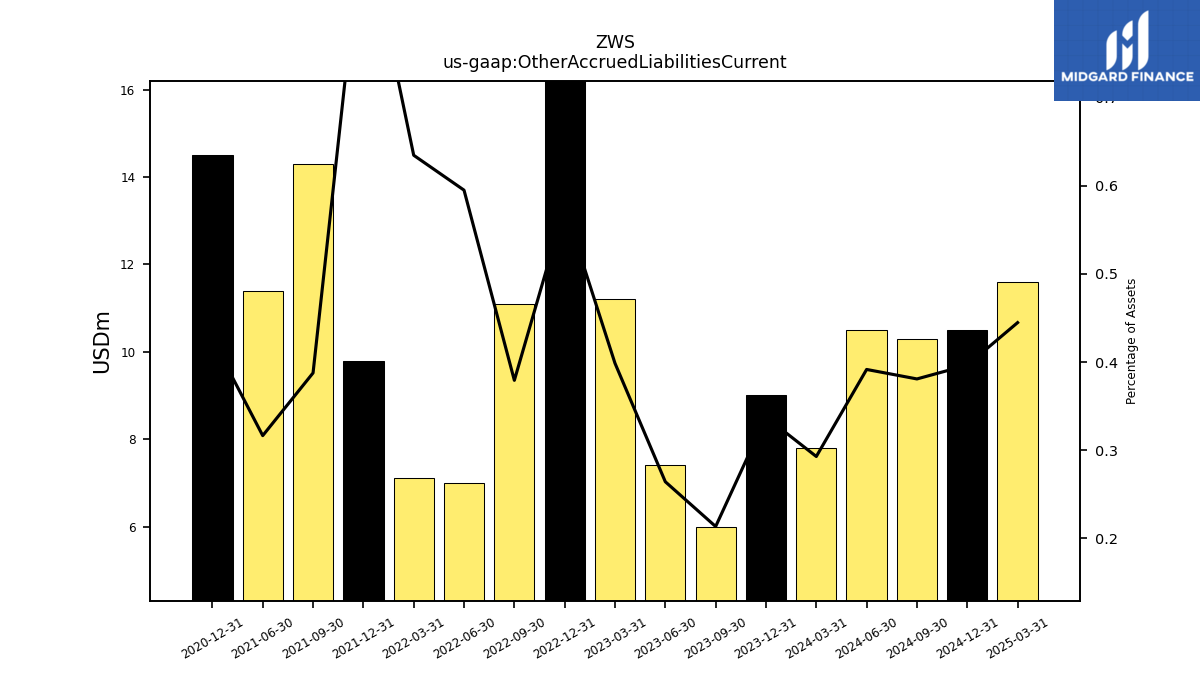
| Other Accrued Liabilities Current | 6.00 | 7.40 | 11.20 | 16.50 | 11.10 | 7.00 | 7.10 | 9.80 | 14.30 | 11.40 | NA | 14.50 | NA | NA | NA | NA | NA | NA | NA | NA | NA | NA | NA | NA | NA | NA | NA | NA | NA | NA | NA | NA | NA | NA | NA | NA | NA | NA | NA | NA | NA | NA | NA | NA | NA | NA | NA | NA | NA | NA | |
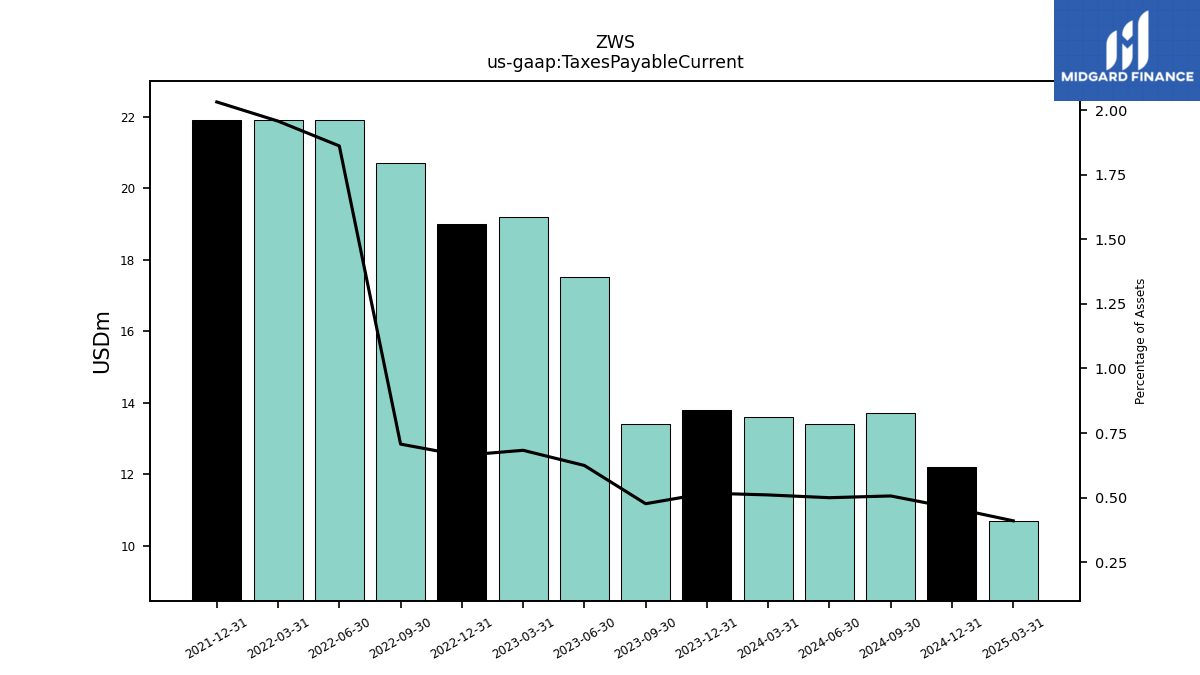
| Taxes Payable Current | 13.40 | 17.50 | 19.20 | 19.00 | 20.70 | 21.90 | 21.90 | 21.90 | NA | NA | NA | NA | NA | NA | NA | NA | NA | NA | NA | NA | NA | NA | NA | NA | NA | NA | NA | NA | NA | NA | NA | NA | NA | NA | NA | NA | NA | NA | NA | NA | NA | NA | NA | NA | NA | NA | NA | NA | NA | NA | |
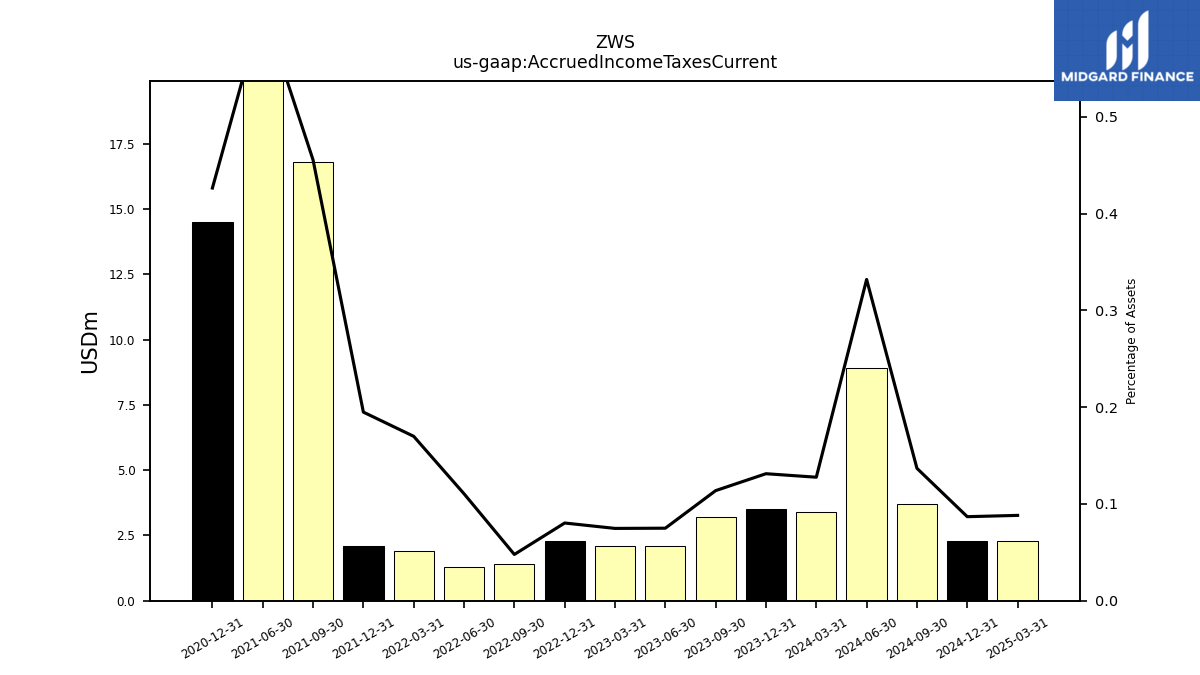
| Accrued Income Taxes Current | 3.20 | 2.10 | 2.10 | 2.30 | 1.40 | 1.30 | 1.90 | 2.10 | 16.80 | 22.10 | NA | 14.50 | NA | NA | NA | NA | NA | NA | NA | NA | NA | NA | NA | NA | NA | NA | NA | NA | NA | NA | NA | NA | NA | NA | NA | NA | NA | NA | NA | NA | NA | NA | NA | NA | NA | NA | NA | NA | NA | NA | |
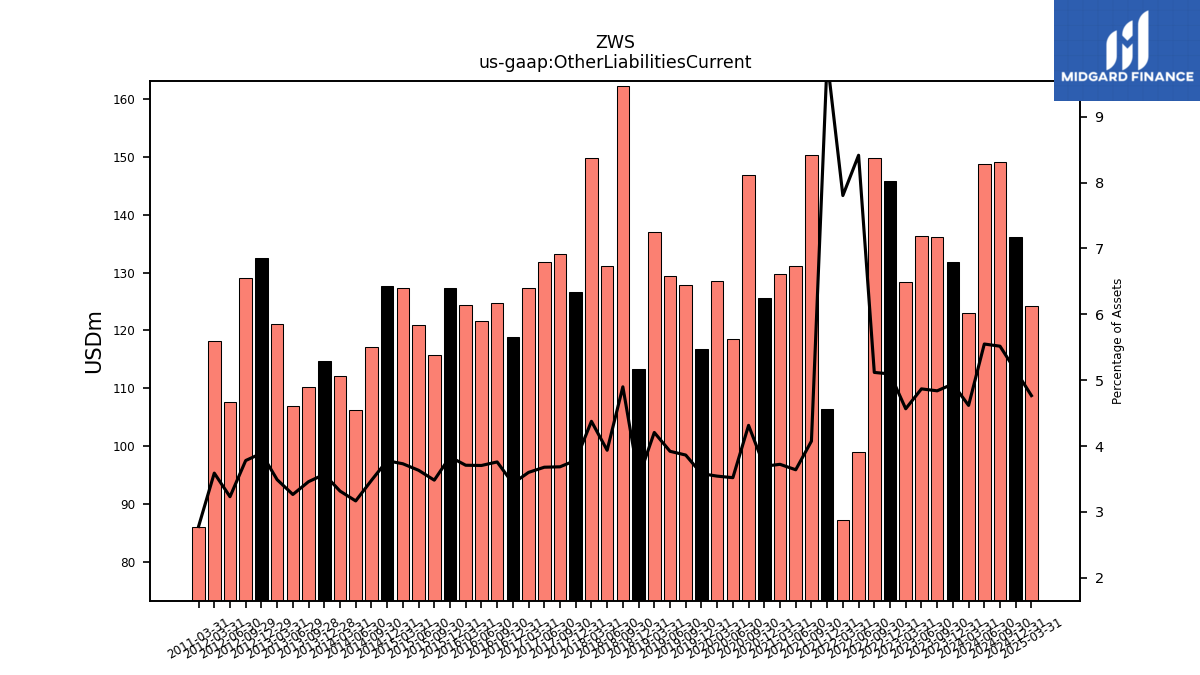
| Other Liabilities Current | 136.10 | 136.40 | 128.30 | 145.90 | 149.80 | 99.00 | 87.30 | 106.40 | 150.30 | 131.10 | 129.80 | 125.60 | 146.90 | 118.50 | 128.50 | 116.80 | 127.90 | 129.40 | 137.10 | 113.30 | 162.30 | 131.10 | 149.80 | 126.70 | 133.20 | 131.80 | 127.40 | 118.80 | 124.70 | 121.70 | 124.40 | 127.30 | 115.70 | 120.90 | 127.30 | 127.70 | 117.10 | 106.20 | 112.20 | 114.80 | 110.20 | 107.00 | 121.20 | 132.50 | 129.10 | 107.60 | 118.10 | NA | NA | NA |
| 2023-09-30 | 2023-06-30 | 2023-03-31 | 2022-12-31 | 2022-09-30 | 2022-06-30 | 2022-03-31 | 2021-12-31 | 2021-09-30 | 2021-06-30 | 2021-03-31 | 2020-12-31 | 2020-09-30 | 2020-06-30 | 2020-03-31 | 2019-12-31 | 2019-09-30 | 2019-06-30 | 2019-03-31 | 2018-12-31 | 2018-09-30 | 2018-06-30 | 2018-03-31 | 2017-12-31 | 2017-09-30 | 2017-06-30 | 2017-03-31 | 2016-12-31 | 2016-09-30 | 2016-06-30 | 2016-03-31 | 2015-12-31 | 2015-09-30 | 2015-06-30 | 2015-03-31 | 2014-12-31 | 2014-09-30 | 2014-06-30 | 2014-03-31 | 2013-12-28 | 2013-09-28 | 2013-06-29 | 2013-03-31 | 2012-12-29 | 2012-09-29 | 2012-06-30 | 2012-03-31 | 2011-12-31 | 2011-10-01 | 2011-07-02 | ||
|---|---|---|---|---|---|---|---|---|---|---|---|---|---|---|---|---|---|---|---|---|---|---|---|---|---|---|---|---|---|---|---|---|---|---|---|---|---|---|---|---|---|---|---|---|---|---|---|---|---|---|---|
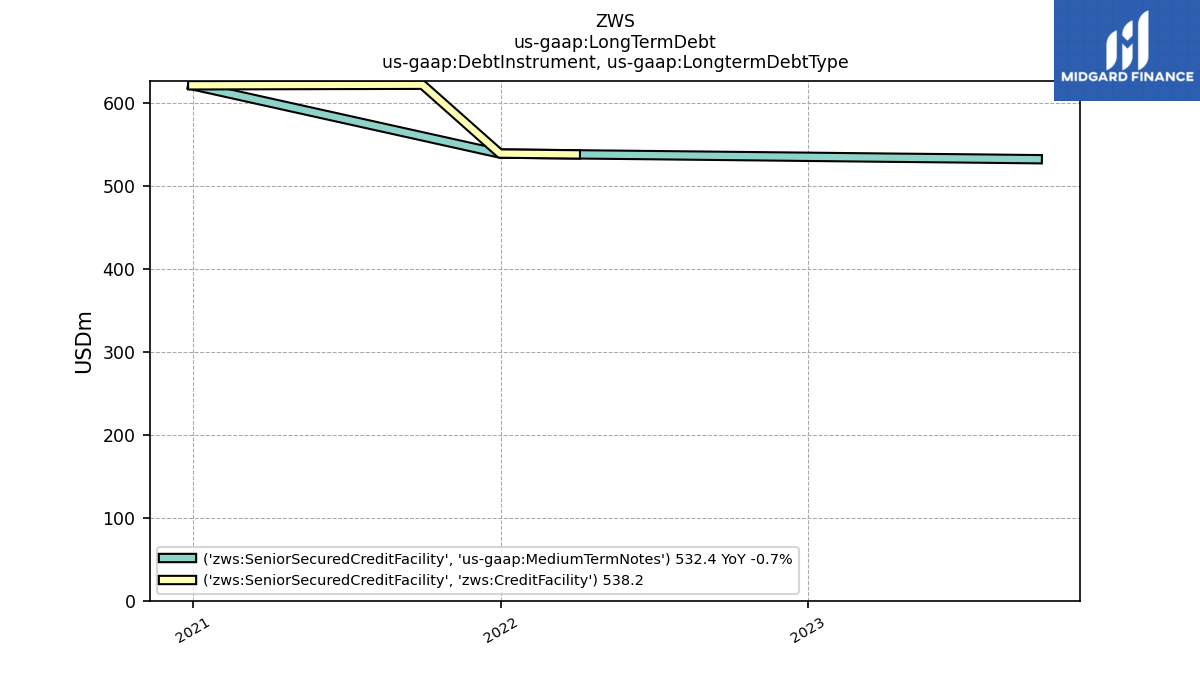
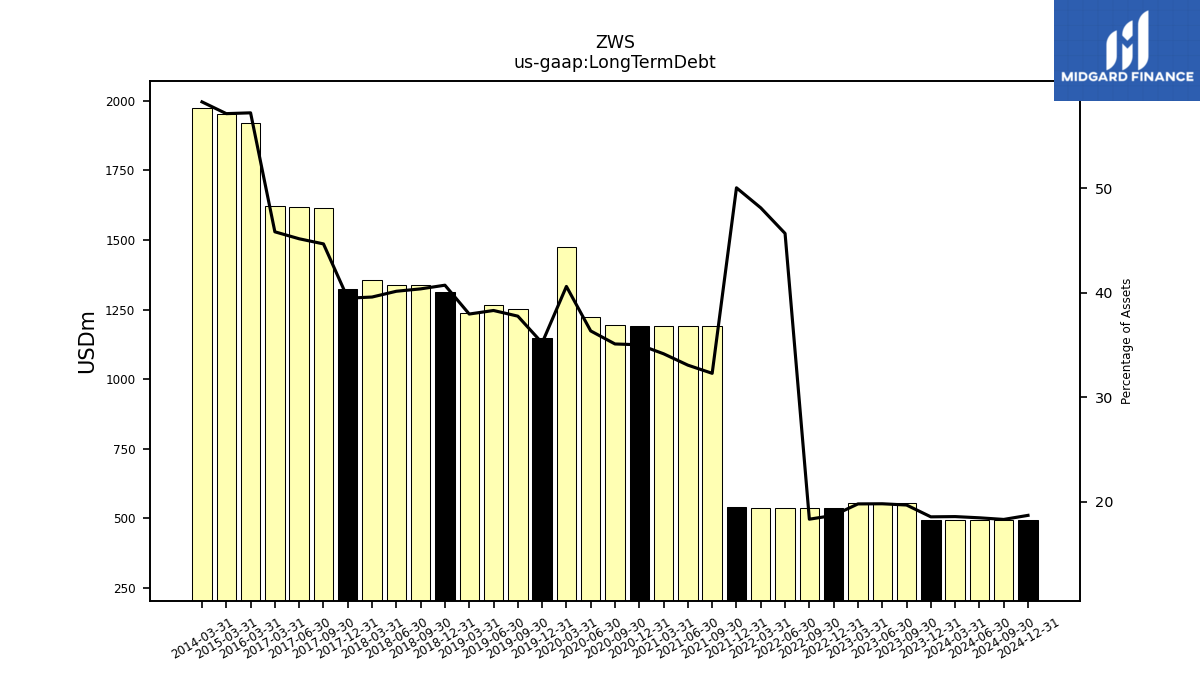
| Long Term Debt | 554.20 | 555.40 | 556.60 | 535.90 | 537.00 | 537.50 | 538.50 | 539.50 | 1191.80 | 1191.90 | 1191.80 | 1191.60 | 1195.80 | 1224.40 | 1473.40 | 1148.60 | 1250.80 | 1264.90 | 1238.00 | 1312.40 | 1338.00 | 1337.60 | 1356.00 | 1323.10 | 1615.70 | 1619.10 | 1622.70 | NA | NA | NA | 1920.10 | NA | NA | NA | 1950.50 | NA | NA | NA | 1972.00 | NA | NA | NA | NA | NA | NA | NA | NA | NA | NA | NA | |
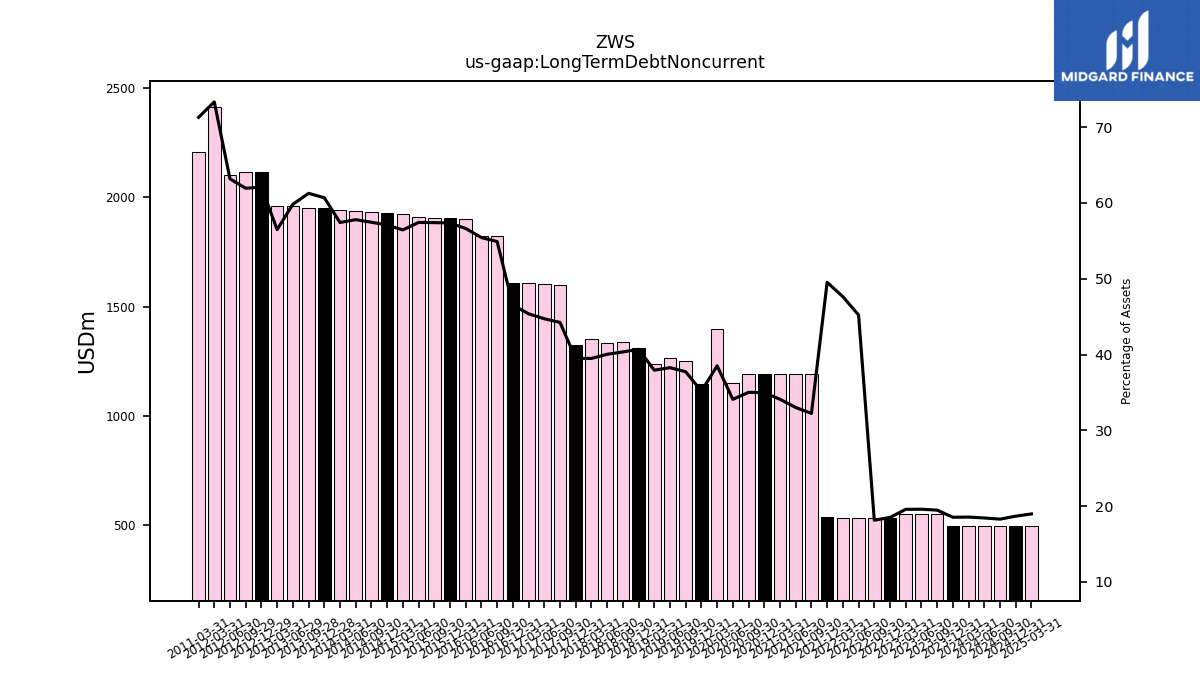
| Long Term Debt Noncurrent | 547.90 | 549.10 | 550.30 | 530.20 | 531.30 | 531.90 | 532.90 | 533.90 | 1189.30 | 1189.50 | 1189.30 | 1189.20 | 1192.60 | 1148.00 | 1397.00 | 1147.20 | 1249.30 | 1263.50 | 1236.80 | 1311.00 | 1336.60 | 1333.70 | 1352.10 | 1322.90 | 1599.40 | 1602.80 | 1606.20 | 1610.10 | 1822.00 | 1821.30 | 1899.90 | 1904.20 | 1907.80 | 1912.00 | 1926.20 | 1930.40 | 1934.60 | 1938.90 | 1943.00 | 1952.10 | 1952.20 | 1961.40 | 1962.30 | 2115.40 | 2115.60 | 2104.90 | 2413.40 | NA | NA | NA | |
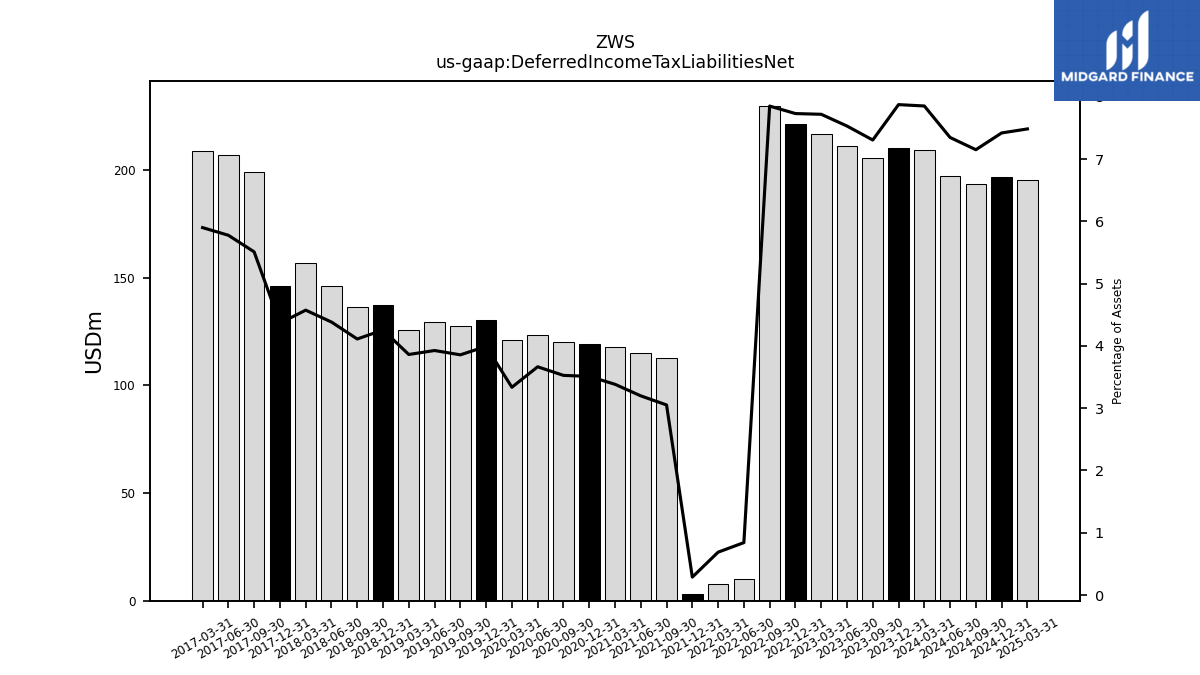
| Deferred Income Tax Liabilities Net | 205.50 | 211.00 | 216.90 | 221.40 | 229.80 | 9.90 | 7.70 | 3.10 | 112.60 | 115.20 | 118.00 | 119.40 | 120.10 | 123.40 | 121.00 | 130.20 | 127.70 | 129.60 | 125.90 | 137.10 | 136.20 | 146.00 | 156.60 | 146.20 | 199.20 | 207.00 | 208.80 | NA | NA | NA | NA | NA | NA | NA | NA | NA | NA | NA | NA | NA | NA | NA | NA | NA | NA | NA | NA | NA | NA | NA | |
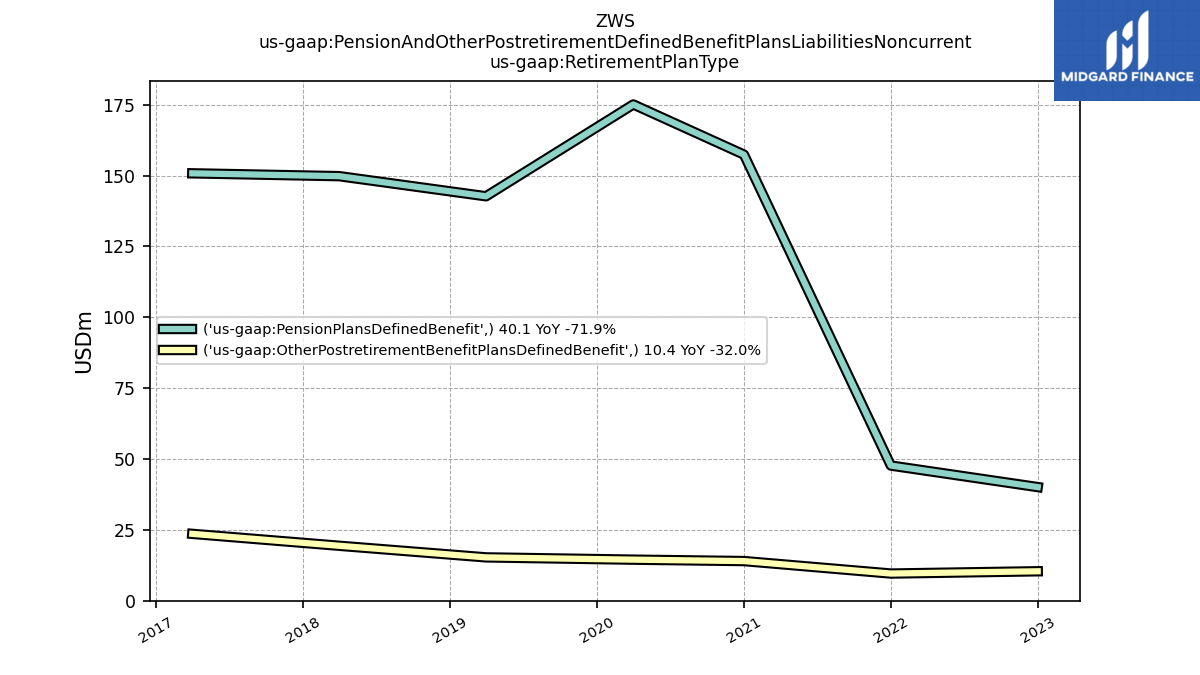
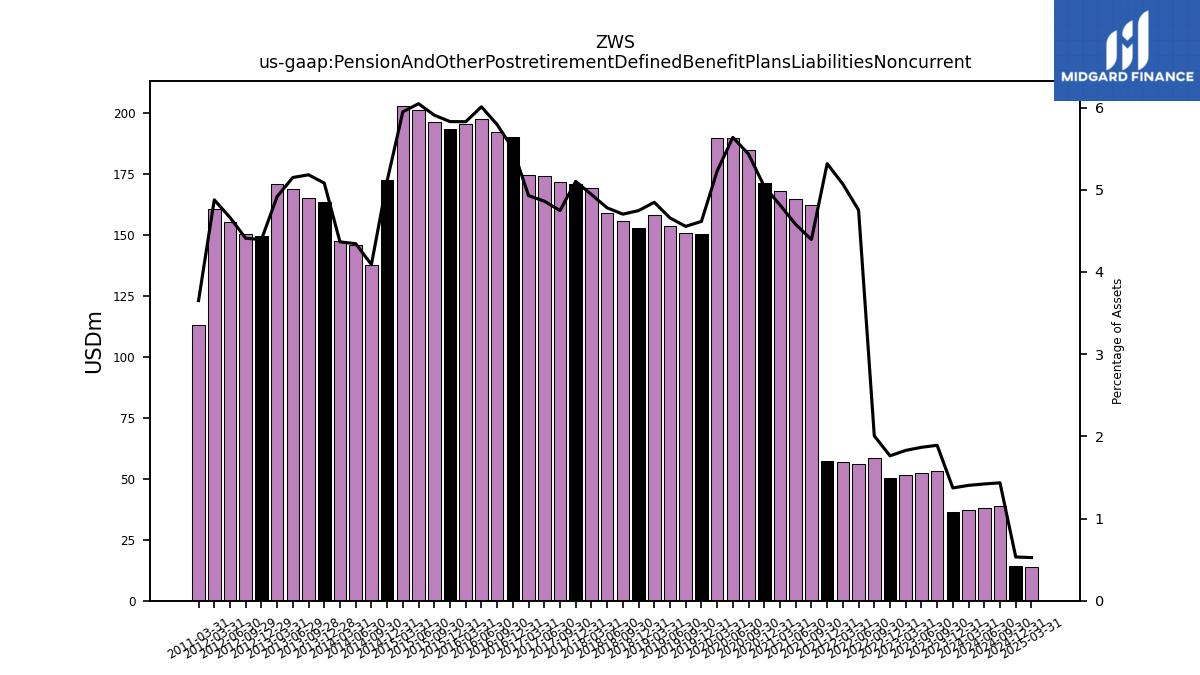
| Pension And Other Postretirement Defined Benefit Plans Liabilities Noncurrent | 53.20 | 52.30 | 51.40 | 50.50 | 58.70 | 55.90 | 56.70 | 57.30 | 162.10 | 164.90 | 167.90 | 171.40 | 185.00 | 189.80 | 189.60 | 150.50 | 150.80 | 153.70 | 158.00 | 152.90 | 155.80 | 159.20 | 169.20 | 170.90 | 171.60 | 174.20 | 174.40 | 190.30 | 192.20 | 197.40 | 195.50 | 193.50 | 196.30 | 201.30 | 203.00 | 172.70 | 137.70 | 145.70 | 147.70 | 163.40 | 165.10 | 168.80 | 170.80 | 149.70 | 150.60 | 155.30 | 160.50 | NA | NA | NA | |
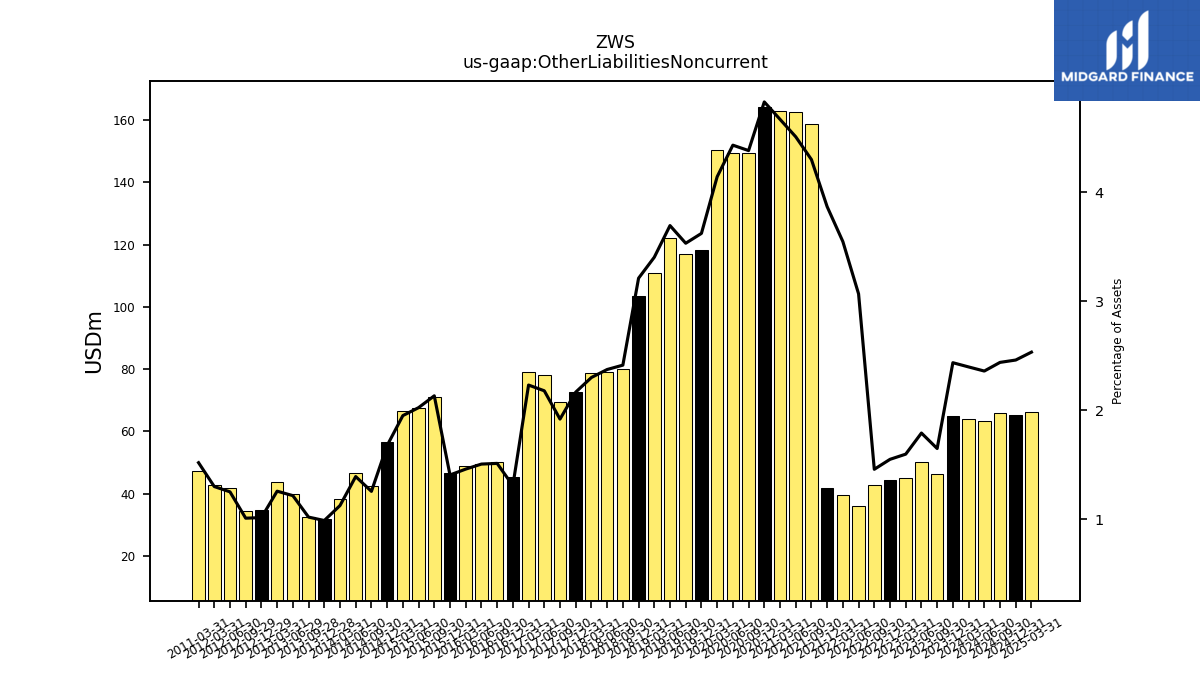
| Other Liabilities Noncurrent | 46.40 | 50.20 | 44.90 | 44.40 | 42.70 | 36.10 | 39.70 | 41.70 | 158.70 | 162.50 | 162.90 | 164.30 | 149.30 | 149.30 | 150.30 | 118.20 | 117.00 | 122.00 | 111.00 | 103.50 | 80.00 | 79.10 | 78.80 | 72.60 | 69.40 | 78.10 | 79.00 | 45.30 | 50.20 | 49.50 | 49.00 | 46.70 | 70.90 | 67.40 | 66.60 | 56.70 | 42.30 | 46.70 | 38.10 | 31.80 | 32.50 | 39.90 | 43.70 | 34.60 | 34.50 | 41.70 | 42.80 | NA | NA | NA | |
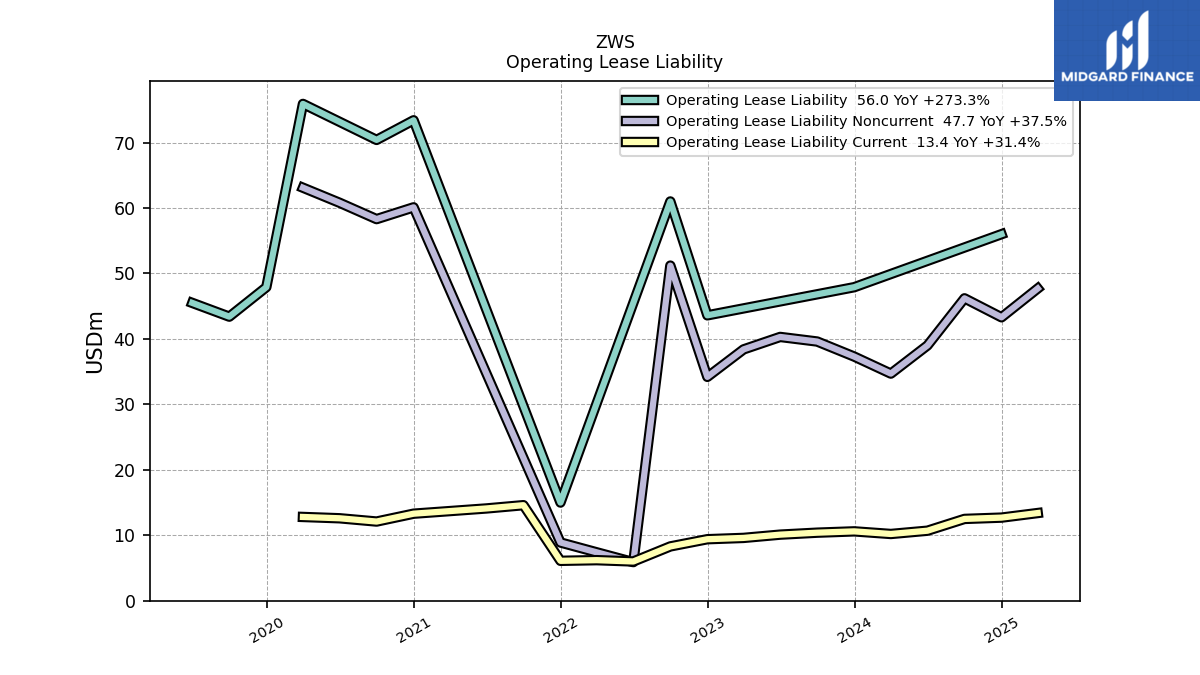
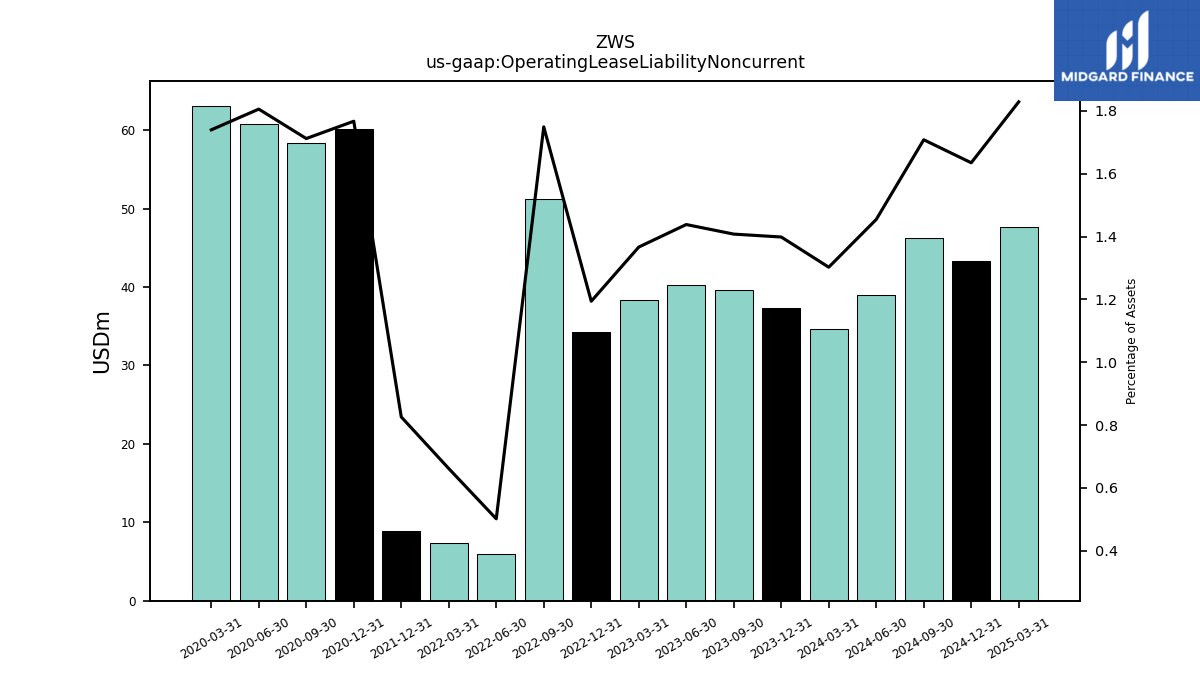
| Operating Lease Liability Noncurrent | 39.60 | 40.30 | 38.40 | 34.20 | 51.20 | 5.90 | 7.40 | 8.90 | NA | NA | NA | 60.10 | 58.30 | 60.80 | 63.10 | NA | NA | NA | NA | NA | NA | NA | NA | NA | NA | NA | NA | NA | NA | NA | NA | NA | NA | NA | NA | NA | NA | NA | NA | NA | NA | NA | NA | NA | NA | NA | NA | NA | NA | NA |
| 2023-09-30 | 2023-06-30 | 2023-03-31 | 2022-12-31 | 2022-09-30 | 2022-06-30 | 2022-03-31 | 2021-12-31 | 2021-09-30 | 2021-06-30 | 2021-03-31 | 2020-12-31 | 2020-09-30 | 2020-06-30 | 2020-03-31 | 2019-12-31 | 2019-09-30 | 2019-06-30 | 2019-03-31 | 2018-12-31 | 2018-09-30 | 2018-06-30 | 2018-03-31 | 2017-12-31 | 2017-09-30 | 2017-06-30 | 2017-03-31 | 2016-12-31 | 2016-09-30 | 2016-06-30 | 2016-03-31 | 2015-12-31 | 2015-09-30 | 2015-06-30 | 2015-03-31 | 2014-12-31 | 2014-09-30 | 2014-06-30 | 2014-03-31 | 2013-12-28 | 2013-09-28 | 2013-06-29 | 2013-03-31 | 2012-12-29 | 2012-09-29 | 2012-06-30 | 2012-03-31 | 2011-12-31 | 2011-10-01 | 2011-07-02 | ||
|---|---|---|---|---|---|---|---|---|---|---|---|---|---|---|---|---|---|---|---|---|---|---|---|---|---|---|---|---|---|---|---|---|---|---|---|---|---|---|---|---|---|---|---|---|---|---|---|---|---|---|---|
| Stockholders Equity | 1611.60 | 1588.60 | 1599.50 | 1615.00 | 1618.60 | 229.40 | 193.70 | 126.40 | 1642.50 | 1584.30 | 1489.80 | 1436.30 | 1395.50 | 1350.80 | 1311.00 | 1365.60 | 1318.70 | 1275.30 | 1228.60 | 1180.10 | 1144.00 | 1180.80 | 1212.70 | 1254.10 | 1165.30 | 1116.00 | 1070.60 | 1013.30 | 645.40 | 610.20 | 588.60 | 566.70 | 545.00 | 541.20 | 552.90 | 566.60 | 593.10 | 572.30 | 562.30 | 434.20 | 404.60 | 441.80 | 428.50 | 424.60 | 409.70 | 373.40 | -79.90 | NA | NA | NA | |
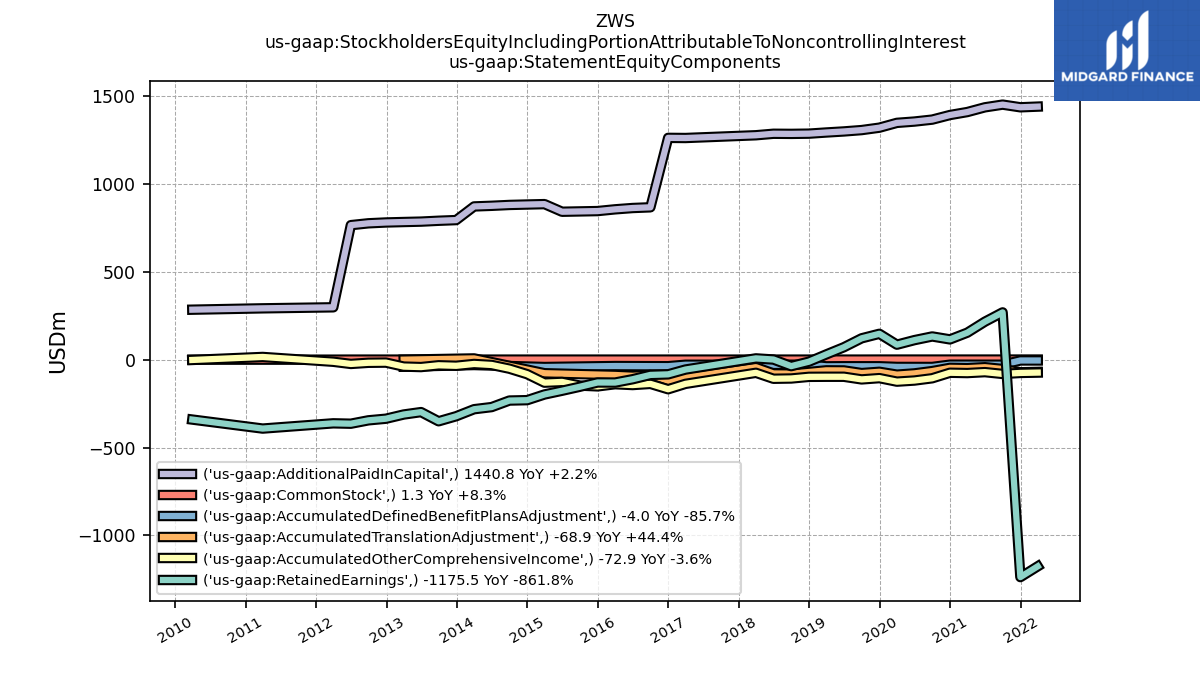
| Stockholders Equity Including Portion Attributable To Noncontrolling Interest | NA | NA | NA | NA | NA | NA | 193.70 | 126.40 | 1645.70 | 1587.50 | 1492.90 | 1439.30 | 1398.40 | 1353.70 | 1313.70 | 1368.20 | 1321.40 | 1277.90 | 1231.00 | 1180.10 | 1144.30 | 1181.00 | 1212.80 | NA | NA | NA | 1070.60 | 1013.30 | 645.40 | 610.20 | 588.00 | 566.30 | 544.70 | 540.90 | 552.70 | 566.20 | 592.70 | 572.00 | 562.10 | 434.10 | 404.60 | 442.00 | 428.50 | 424.60 | 408.80 | 372.50 | -80.80 | NA | NA | NA | |
| Common Stock Value | 1.70 | 1.70 | 1.80 | 1.80 | 1.80 | 1.30 | 1.30 | 1.30 | 1.20 | 1.20 | 1.20 | 1.20 | 1.20 | 1.20 | 1.20 | 1.20 | 1.00 | 1.00 | 1.00 | 1.00 | 1.00 | 1.00 | 1.00 | 1.00 | 1.00 | 1.00 | 1.00 | 1.00 | 1.00 | 1.00 | 1.00 | 1.00 | 1.00 | 1.00 | 1.00 | 1.00 | 1.00 | 1.00 | 1.00 | 1.00 | 1.00 | 1.00 | 1.00 | 1.00 | 1.00 | 1.00 | 0.70 | NA | NA | NA | |
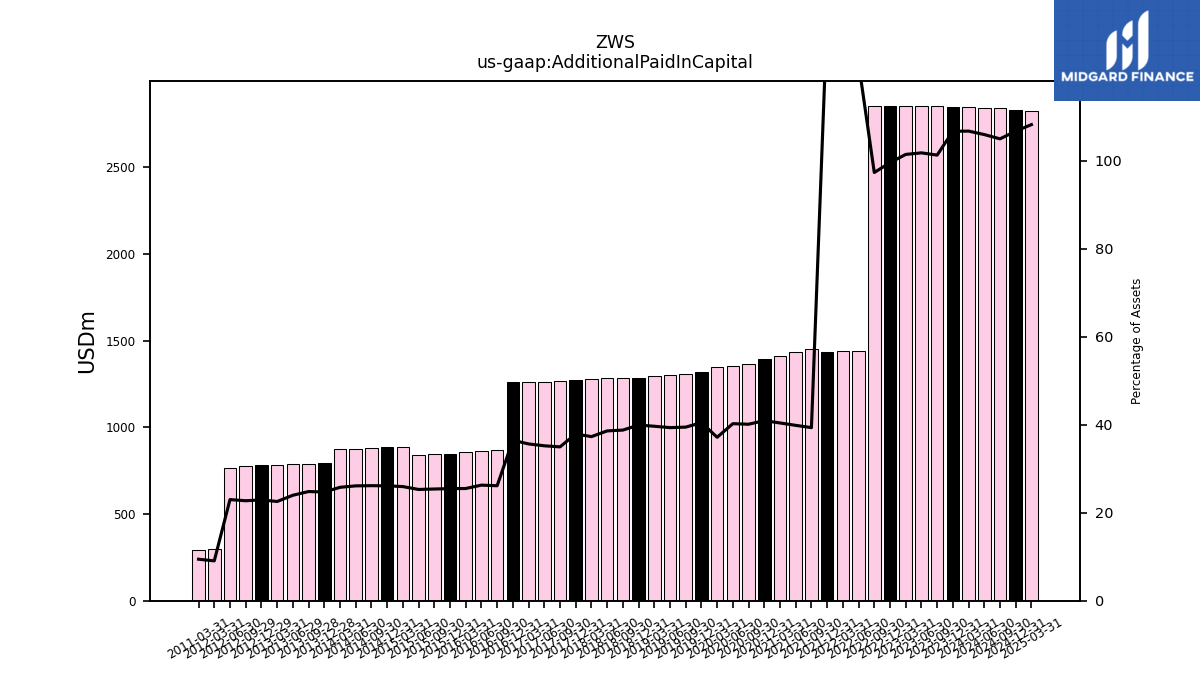
| Additional Paid In Capital | 2850.40 | 2853.70 | 2851.90 | 2853.10 | 2850.20 | 1438.30 | 1440.80 | 1436.90 | 1452.10 | 1436.70 | 1409.90 | 1392.90 | 1366.80 | 1355.80 | 1348.30 | 1320.90 | 1307.20 | 1299.50 | 1293.50 | 1286.90 | 1285.60 | 1286.30 | 1277.80 | 1270.10 | 1264.90 | 1262.70 | 1262.10 | 1262.90 | 867.70 | 863.70 | 856.20 | 846.30 | 844.40 | 842.50 | 885.90 | 883.60 | 881.10 | 876.30 | 872.70 | 795.00 | 791.20 | 786.30 | 784.00 | 781.40 | 776.70 | 766.20 | 298.60 | NA | NA | NA | |
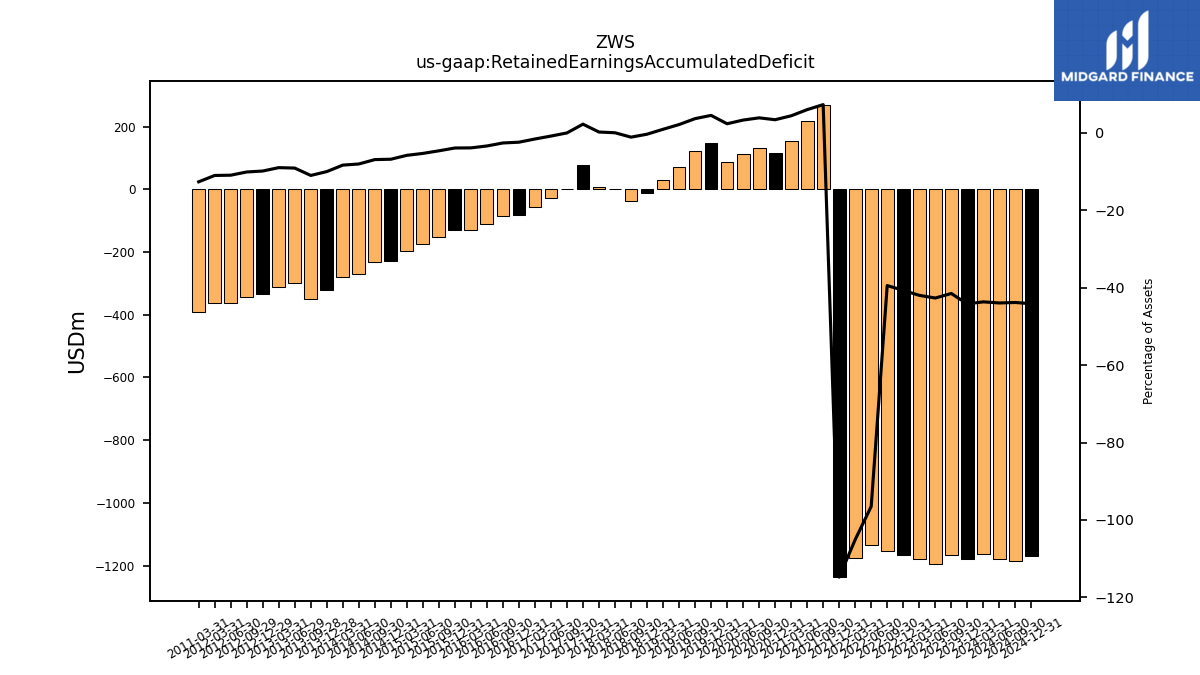
| Retained Earnings Accumulated Deficit | -1166.90 | -1195.30 | -1179.10 | -1164.90 | -1154.40 | -1135.30 | -1175.50 | -1236.90 | 269.80 | 216.70 | 154.30 | 116.00 | 132.70 | 111.90 | 85.90 | 147.90 | 122.20 | 71.40 | 30.70 | -10.70 | -36.10 | 1.50 | 8.00 | 75.80 | 0.00 | -29.00 | -55.50 | -82.90 | -86.10 | -110.70 | -129.60 | -129.20 | -153.60 | -176.20 | -197.50 | -229.80 | -232.00 | -269.20 | -281.30 | -321.30 | -350.00 | -297.70 | -311.50 | -335.40 | -344.60 | -363.80 | -361.60 | NA | NA | NA | |
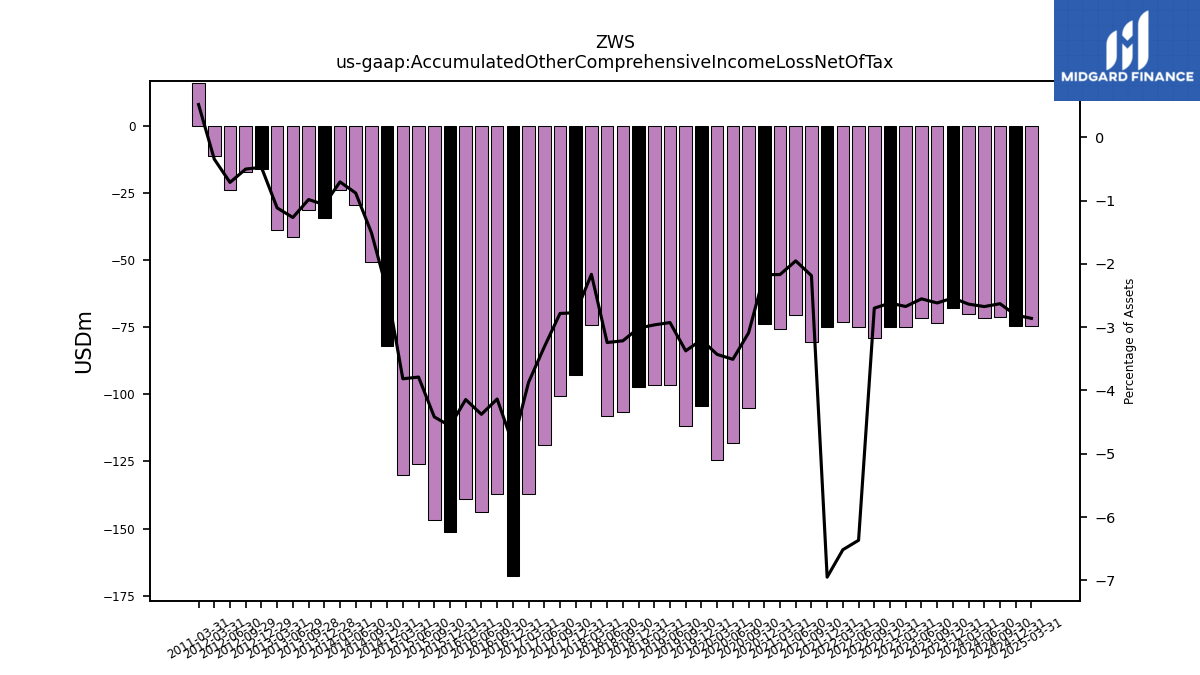
| Accumulated Other Comprehensive Income Loss Net Of Tax | -73.60 | -71.50 | -75.10 | -75.00 | -79.00 | -74.90 | -72.90 | -74.90 | -80.60 | -70.30 | -75.60 | -73.80 | -105.20 | -118.10 | -124.40 | -104.40 | -111.70 | -96.60 | -96.60 | -97.10 | -106.50 | -108.00 | -74.10 | -92.80 | -100.60 | -118.70 | -137.00 | -167.70 | -137.20 | -143.80 | -139.00 | -151.40 | -146.80 | -126.10 | -130.20 | -81.90 | -50.70 | -29.50 | -23.80 | -34.20 | -31.30 | -41.50 | -38.70 | -16.10 | -17.10 | -23.70 | -11.30 | NA | NA | NA | |
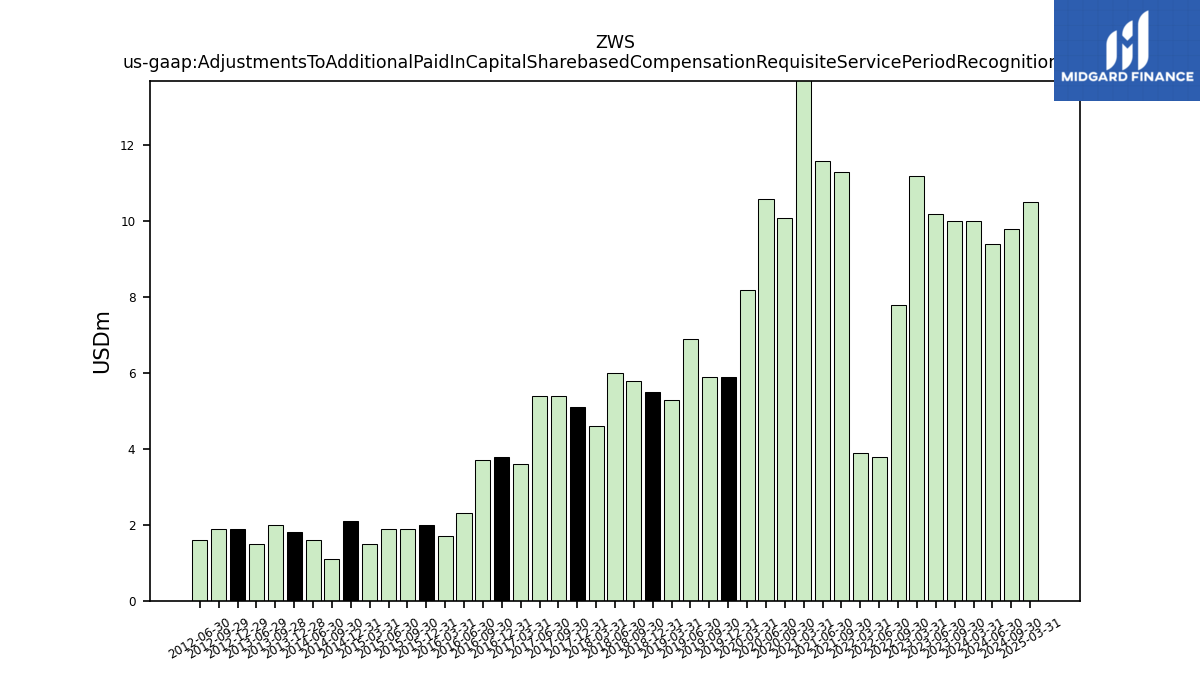
| Adjustments To Additional Paid In Capital Sharebased Compensation Requisite Service Period Recognition Value | 10.00 | 10.20 | 11.20 | NA | 7.80 | 3.80 | 3.90 | NA | 11.30 | 11.60 | 14.20 | NA | 10.10 | 10.60 | 8.20 | 5.90 | 5.90 | 6.90 | 5.30 | 5.50 | 5.80 | 6.00 | 4.60 | 5.10 | 5.40 | 5.40 | 3.60 | 3.80 | 3.70 | 2.30 | 1.70 | 2.00 | 1.90 | 1.90 | 1.50 | 2.10 | 1.10 | 1.60 | NA | 1.80 | 2.00 | 1.50 | NA | 1.90 | 1.90 | 1.60 | NA | NA | NA | NA |
| 2023-09-30 | 2023-06-30 | 2023-03-31 | 2022-12-31 | 2022-09-30 | 2022-06-30 | 2022-03-31 | 2021-12-31 | 2021-09-30 | 2021-06-30 | 2021-03-31 | 2020-12-31 | 2020-09-30 | 2020-06-30 | 2020-03-31 | 2019-12-31 | 2019-09-30 | 2019-06-30 | 2019-03-31 | 2018-12-31 | 2018-09-30 | 2018-06-30 | 2018-03-31 | 2017-12-31 | 2017-09-30 | 2017-06-30 | 2017-03-31 | 2016-12-31 | 2016-09-30 | 2016-06-30 | 2016-03-31 | 2015-12-31 | 2015-09-30 | 2015-06-30 | 2015-03-31 | 2014-12-31 | 2014-09-30 | 2014-06-30 | 2014-03-31 | 2013-12-28 | 2013-09-28 | 2013-06-29 | 2013-03-31 | 2012-12-29 | 2012-09-29 | 2012-06-30 | 2012-03-31 | 2011-12-31 | 2011-10-01 | 2011-07-02 | ||
|---|---|---|---|---|---|---|---|---|---|---|---|---|---|---|---|---|---|---|---|---|---|---|---|---|---|---|---|---|---|---|---|---|---|---|---|---|---|---|---|---|---|---|---|---|---|---|---|---|---|---|---|
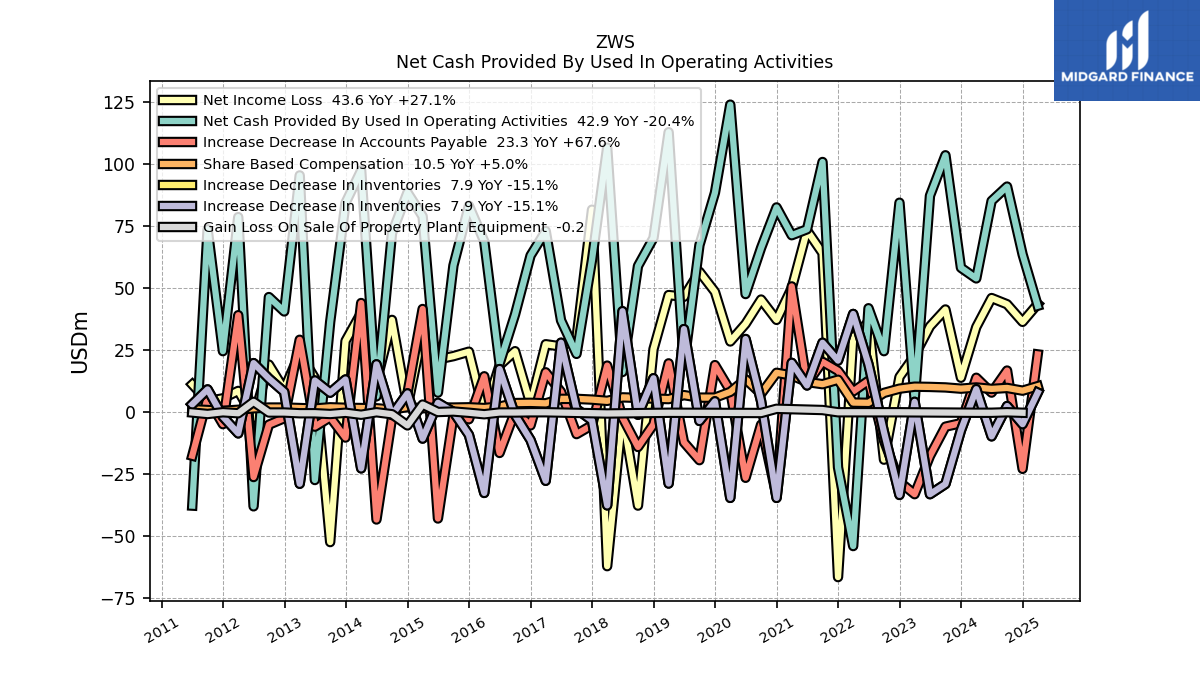
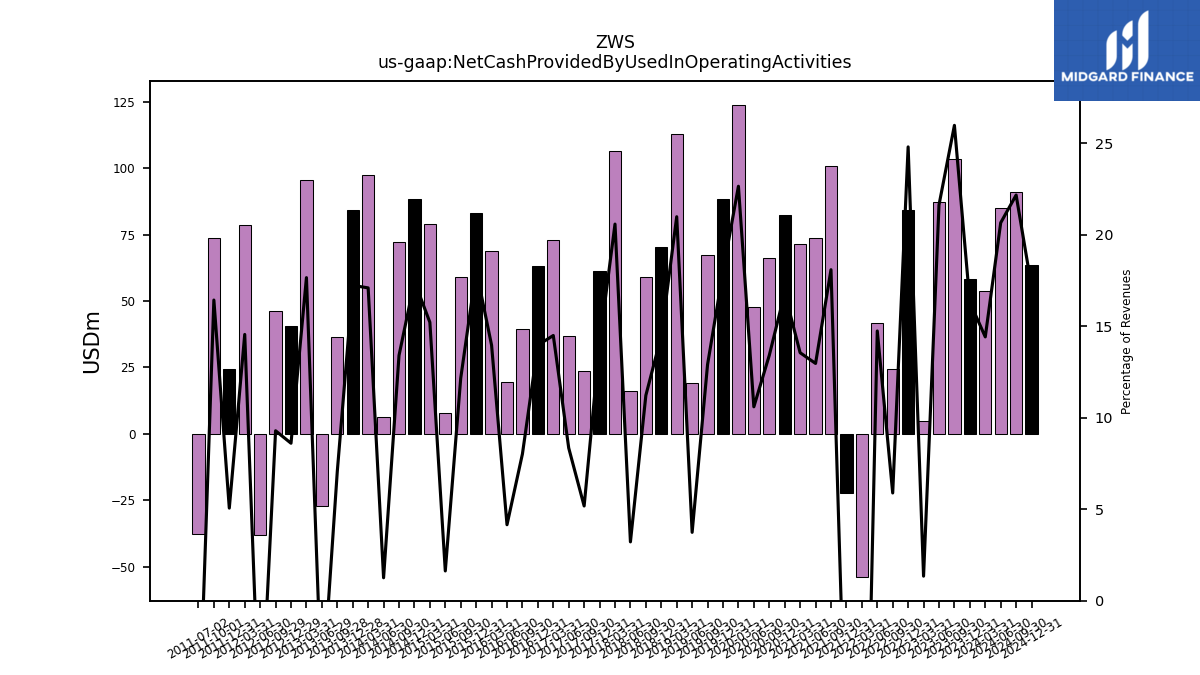
| Net Cash Provided By Used In Operating Activities | 103.50 | 87.20 | 5.00 | 84.40 | 24.60 | 41.90 | -53.90 | -22.20 | 100.80 | 73.70 | 71.30 | 82.50 | 66.20 | 47.60 | 123.90 | 88.40 | 67.30 | 19.00 | 112.80 | 70.20 | 58.90 | 16.20 | 106.60 | 61.40 | 23.50 | 37.00 | 73.00 | 63.10 | 39.40 | 19.60 | 68.80 | 83.20 | 59.10 | 7.90 | 78.90 | 88.50 | 72.10 | 6.40 | 97.40 | 84.30 | 36.40 | -27.30 | 95.40 | 40.60 | 46.40 | -37.90 | 78.60 | 24.60 | 73.70 | -37.60 | |
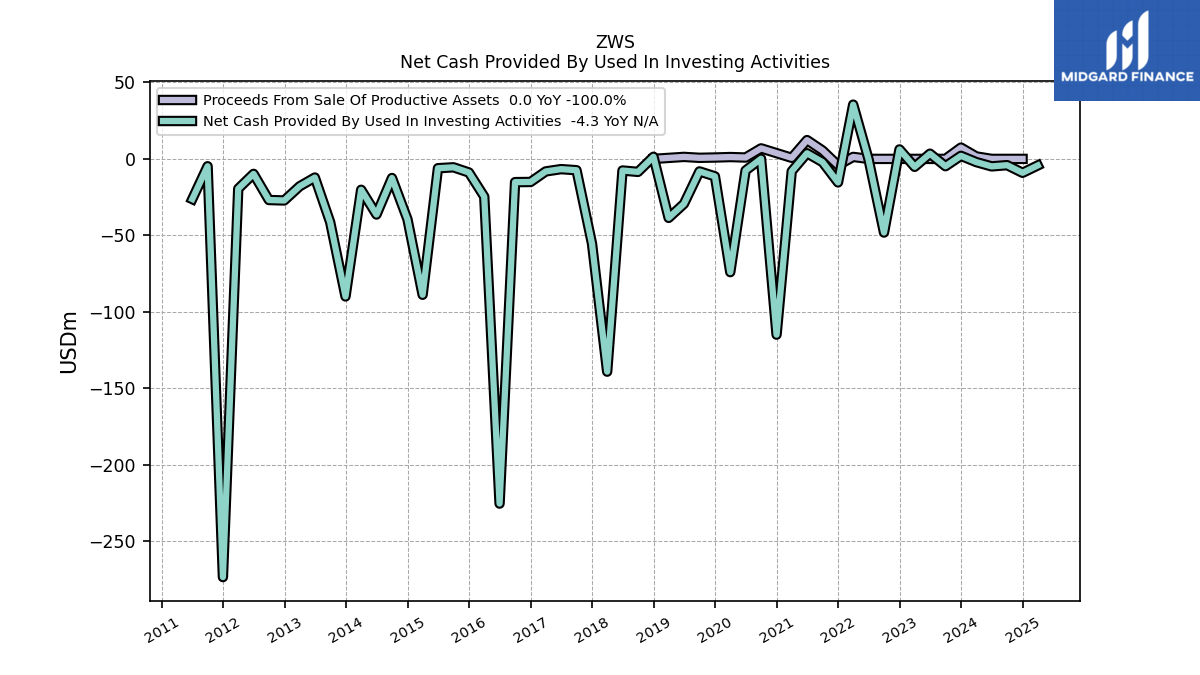
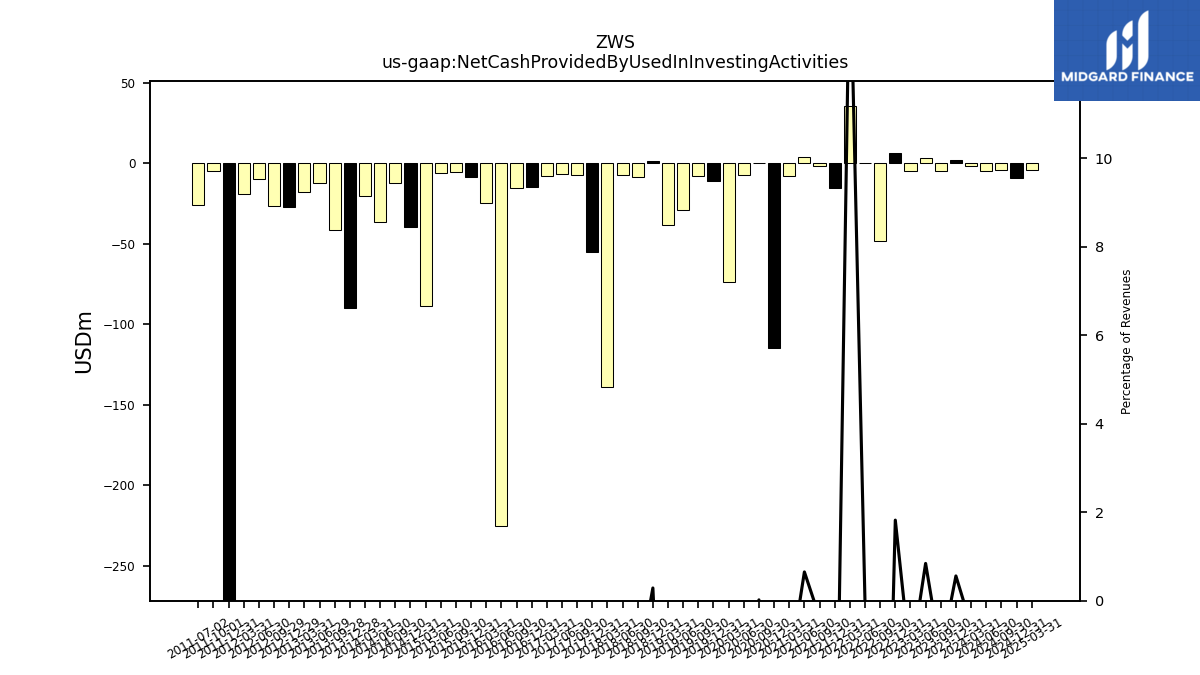
| Net Cash Provided By Used In Investing Activities | -4.80 | 3.40 | -5.20 | 6.20 | -48.20 | -0.10 | 35.50 | -15.40 | -2.10 | 3.70 | -8.10 | -115.00 | 0.10 | -7.60 | -74.10 | -11.40 | -8.20 | -29.40 | -38.60 | 1.40 | -8.50 | -7.60 | -139.20 | -55.50 | -7.40 | -6.70 | -8.20 | -15.10 | -15.20 | -225.50 | -24.70 | -8.90 | -5.50 | -6.10 | -88.90 | -39.50 | -12.50 | -36.40 | -20.20 | -90.00 | -41.40 | -12.20 | -17.90 | -27.20 | -26.90 | -9.80 | -19.50 | -273.60 | -4.80 | -26.30 | |
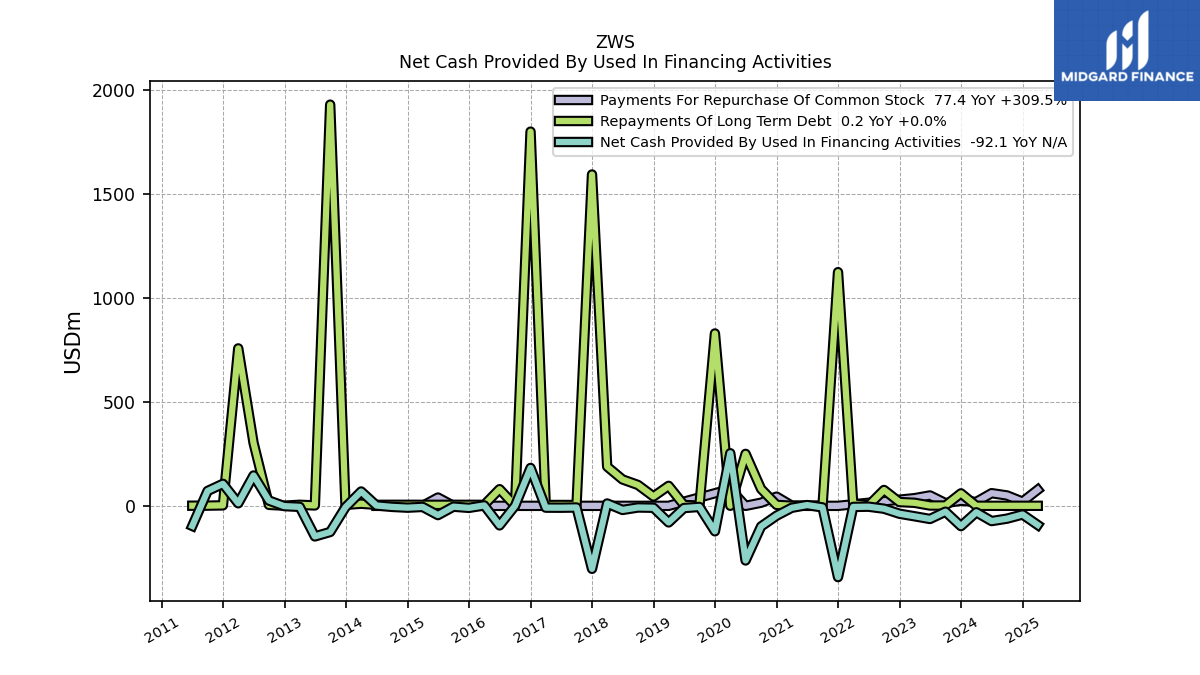
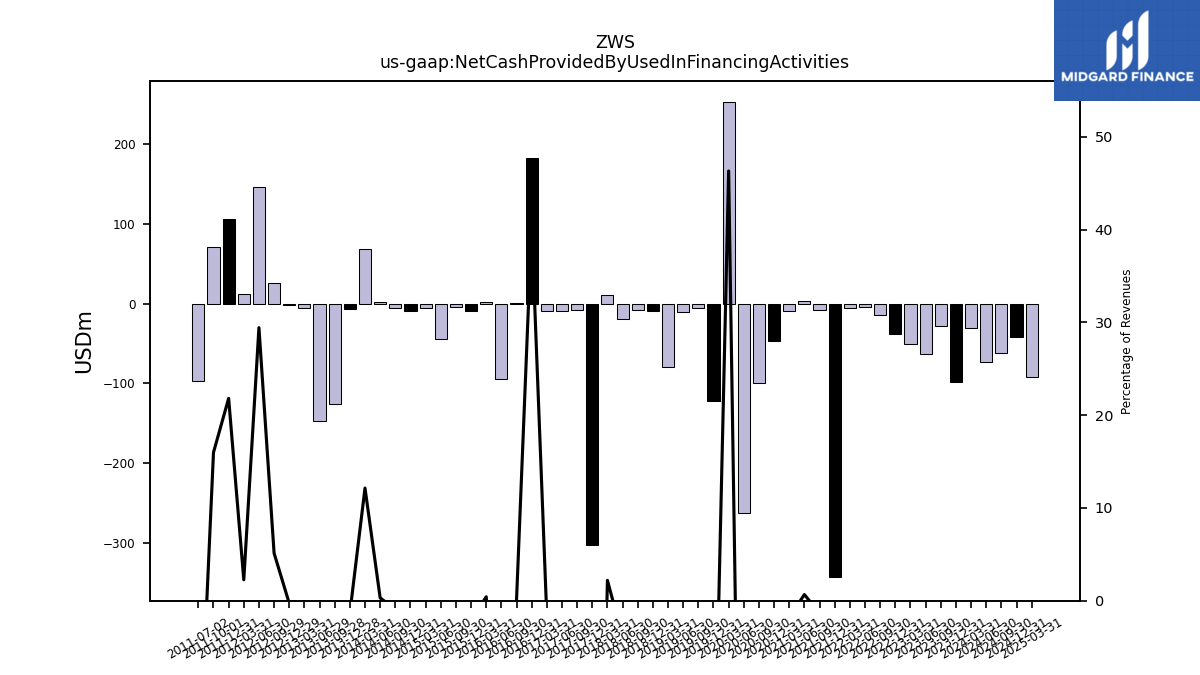
| Net Cash Provided By Used In Financing Activities | -28.00 | -63.20 | -50.30 | -38.00 | -13.80 | -4.10 | -5.20 | -343.10 | -7.50 | 3.80 | -9.40 | -47.40 | -99.20 | -263.00 | 253.40 | -122.70 | -5.20 | -10.60 | -79.80 | -9.20 | -8.00 | -19.70 | 11.40 | -303.20 | -8.00 | -9.00 | -8.70 | 182.40 | 0.30 | -94.10 | 2.10 | -9.80 | -4.00 | -44.60 | -5.20 | -8.80 | -5.00 | 1.60 | 69.20 | -6.50 | -125.90 | -147.10 | -4.90 | -1.30 | 25.60 | 146.30 | 12.20 | 106.00 | 71.70 | -96.70 |
| 2023-09-30 | 2023-06-30 | 2023-03-31 | 2022-12-31 | 2022-09-30 | 2022-06-30 | 2022-03-31 | 2021-12-31 | 2021-09-30 | 2021-06-30 | 2021-03-31 | 2020-12-31 | 2020-09-30 | 2020-06-30 | 2020-03-31 | 2019-12-31 | 2019-09-30 | 2019-06-30 | 2019-03-31 | 2018-12-31 | 2018-09-30 | 2018-06-30 | 2018-03-31 | 2017-12-31 | 2017-09-30 | 2017-06-30 | 2017-03-31 | 2016-12-31 | 2016-09-30 | 2016-06-30 | 2016-03-31 | 2015-12-31 | 2015-09-30 | 2015-06-30 | 2015-03-31 | 2014-12-31 | 2014-09-30 | 2014-06-30 | 2014-03-31 | 2013-12-28 | 2013-09-28 | 2013-06-29 | 2013-03-31 | 2012-12-29 | 2012-09-29 | 2012-06-30 | 2012-03-31 | 2011-12-31 | 2011-10-01 | 2011-07-02 | ||
|---|---|---|---|---|---|---|---|---|---|---|---|---|---|---|---|---|---|---|---|---|---|---|---|---|---|---|---|---|---|---|---|---|---|---|---|---|---|---|---|---|---|---|---|---|---|---|---|---|---|---|---|
| Net Cash Provided By Used In Operating Activities | 103.50 | 87.20 | 5.00 | 84.40 | 24.60 | 41.90 | -53.90 | -22.20 | 100.80 | 73.70 | 71.30 | 82.50 | 66.20 | 47.60 | 123.90 | 88.40 | 67.30 | 19.00 | 112.80 | 70.20 | 58.90 | 16.20 | 106.60 | 61.40 | 23.50 | 37.00 | 73.00 | 63.10 | 39.40 | 19.60 | 68.80 | 83.20 | 59.10 | 7.90 | 78.90 | 88.50 | 72.10 | 6.40 | 97.40 | 84.30 | 36.40 | -27.30 | 95.40 | 40.60 | 46.40 | -37.90 | 78.60 | 24.60 | 73.70 | -37.60 | |
| Net Income Loss | 41.40 | 34.60 | 22.80 | 14.20 | -19.10 | 36.40 | 30.20 | -66.40 | 64.10 | 73.20 | 50.00 | 37.20 | 45.40 | 35.60 | 28.50 | 48.50 | 56.60 | 46.50 | 47.20 | 25.40 | -37.60 | -0.70 | -62.00 | 81.60 | 29.80 | 26.50 | 27.40 | 3.20 | 24.60 | 18.90 | -0.40 | 24.40 | 22.60 | 21.30 | 32.30 | 2.20 | 37.20 | 12.10 | 40.00 | 28.70 | -52.30 | 13.80 | 23.90 | 9.20 | 19.20 | -2.20 | 8.60 | 5.60 | 4.50 | 11.20 | |
| Profit Loss | NA | NA | NA | NA | NA | NA | 30.20 | -66.60 | 64.10 | 73.30 | 50.10 | 37.40 | 45.40 | 35.80 | 28.60 | 48.40 | 56.70 | 46.70 | 47.30 | 25.10 | -37.50 | -0.60 | -61.90 | 81.60 | 29.80 | 26.50 | 27.40 | 3.20 | 24.60 | 18.90 | -0.60 | 24.30 | 22.60 | 21.20 | 32.50 | 2.20 | 37.10 | 12.00 | 39.90 | 28.60 | -52.50 | 13.60 | 23.90 | 9.20 | 19.20 | -2.20 | NA | NA | NA | 11.20 | |
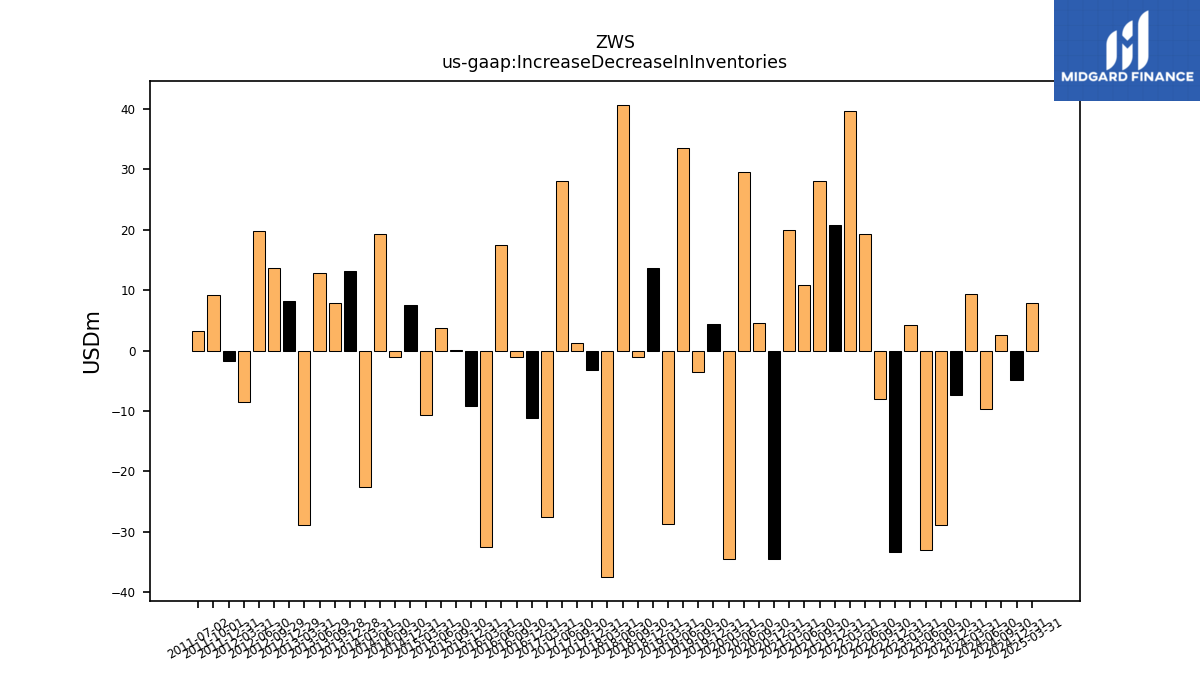
| Increase Decrease In Inventories | -28.90 | -33.00 | 4.20 | -33.30 | -8.00 | 19.30 | 39.60 | 20.80 | 28.00 | 10.80 | 19.90 | -34.50 | 4.50 | 29.50 | -34.50 | 4.40 | -3.50 | 33.50 | -28.70 | 13.70 | -1.00 | 40.70 | -37.50 | -3.30 | 1.30 | 28.00 | -27.60 | -11.20 | -1.10 | 17.40 | -32.50 | -9.10 | 0.10 | 3.80 | -10.60 | 7.60 | -1.10 | 19.30 | -22.60 | 13.20 | 7.90 | 12.80 | -28.80 | 8.20 | 13.60 | 19.80 | -8.50 | -1.80 | 9.20 | 3.20 | |
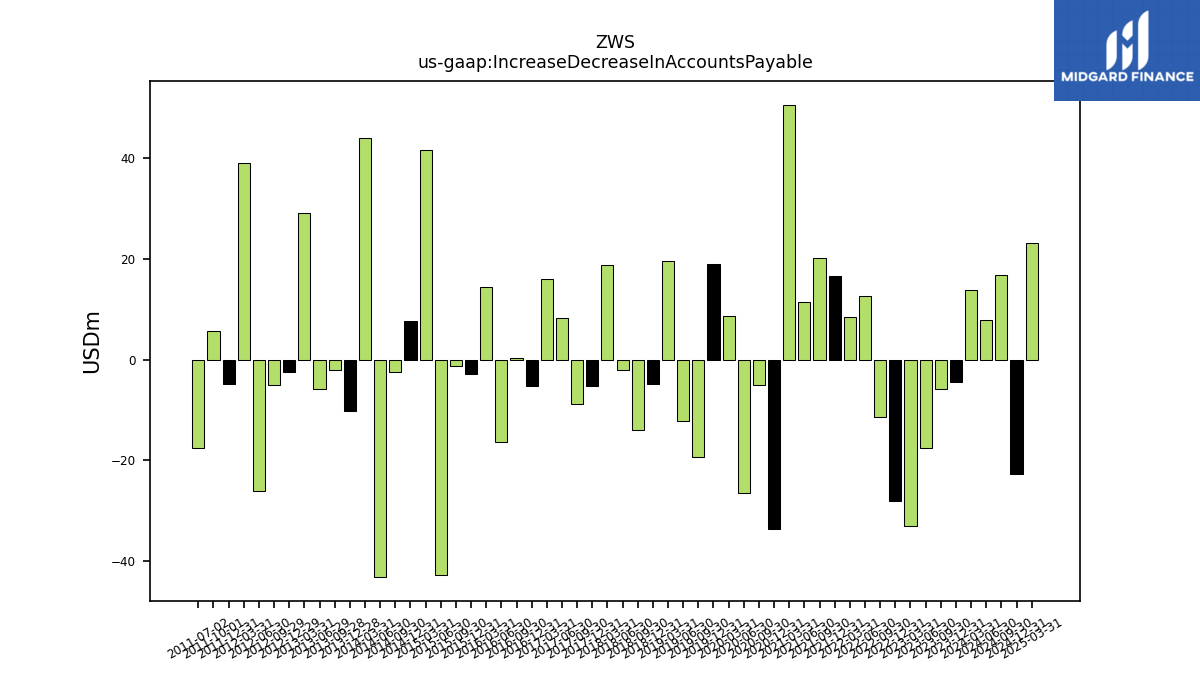
| Increase Decrease In Accounts Payable | -5.80 | -17.60 | -33.00 | -28.00 | -11.40 | 12.70 | 8.40 | 16.70 | 20.30 | 11.40 | 50.70 | -33.70 | -5.00 | -26.40 | 8.70 | 19.00 | -19.30 | -12.10 | 19.70 | -4.90 | -14.00 | -2.10 | 18.80 | -5.20 | -8.80 | 8.20 | 16.10 | -5.30 | 0.30 | -16.40 | 14.50 | -2.80 | -1.30 | -42.80 | 41.60 | 7.70 | -2.40 | -43.20 | 44.00 | -10.20 | -2.00 | -5.80 | 29.20 | -2.40 | -5.00 | -26.10 | 39.10 | -4.80 | 5.70 | -17.50 | |
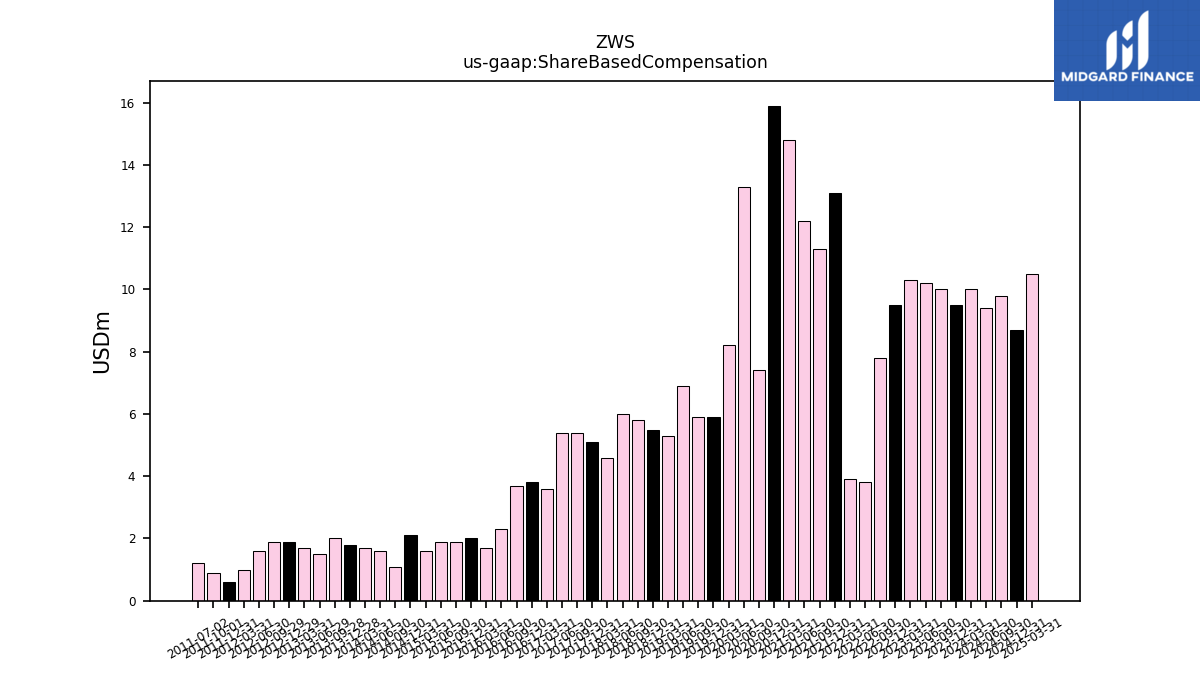
| Share Based Compensation | 10.00 | 10.20 | 10.30 | 9.50 | 7.80 | 3.80 | 3.90 | 13.10 | 11.30 | 12.20 | 14.80 | 15.90 | 7.40 | 13.30 | 8.20 | 5.90 | 5.90 | 6.90 | 5.30 | 5.50 | 5.80 | 6.00 | 4.60 | 5.10 | 5.40 | 5.40 | 3.60 | 3.80 | 3.70 | 2.30 | 1.70 | 2.00 | 1.90 | 1.90 | 1.60 | 2.10 | 1.10 | 1.60 | 1.70 | 1.80 | 2.00 | 1.50 | 1.70 | 1.90 | 1.90 | 1.60 | 1.00 | 0.60 | 0.90 | 1.20 |
| 2023-09-30 | 2023-06-30 | 2023-03-31 | 2022-12-31 | 2022-09-30 | 2022-06-30 | 2022-03-31 | 2021-12-31 | 2021-09-30 | 2021-06-30 | 2021-03-31 | 2020-12-31 | 2020-09-30 | 2020-06-30 | 2020-03-31 | 2019-12-31 | 2019-09-30 | 2019-06-30 | 2019-03-31 | 2018-12-31 | 2018-09-30 | 2018-06-30 | 2018-03-31 | 2017-12-31 | 2017-09-30 | 2017-06-30 | 2017-03-31 | 2016-12-31 | 2016-09-30 | 2016-06-30 | 2016-03-31 | 2015-12-31 | 2015-09-30 | 2015-06-30 | 2015-03-31 | 2014-12-31 | 2014-09-30 | 2014-06-30 | 2014-03-31 | 2013-12-28 | 2013-09-28 | 2013-06-29 | 2013-03-31 | 2012-12-29 | 2012-09-29 | 2012-06-30 | 2012-03-31 | 2011-12-31 | 2011-10-01 | 2011-07-02 | ||
|---|---|---|---|---|---|---|---|---|---|---|---|---|---|---|---|---|---|---|---|---|---|---|---|---|---|---|---|---|---|---|---|---|---|---|---|---|---|---|---|---|---|---|---|---|---|---|---|---|---|---|---|
| Net Cash Provided By Used In Investing Activities | -4.80 | 3.40 | -5.20 | 6.20 | -48.20 | -0.10 | 35.50 | -15.40 | -2.10 | 3.70 | -8.10 | -115.00 | 0.10 | -7.60 | -74.10 | -11.40 | -8.20 | -29.40 | -38.60 | 1.40 | -8.50 | -7.60 | -139.20 | -55.50 | -7.40 | -6.70 | -8.20 | -15.10 | -15.20 | -225.50 | -24.70 | -8.90 | -5.50 | -6.10 | -88.90 | -39.50 | -12.50 | -36.40 | -20.20 | -90.00 | -41.40 | -12.20 | -17.90 | -27.20 | -26.90 | -9.80 | -19.50 | -273.60 | -4.80 | -26.30 | |
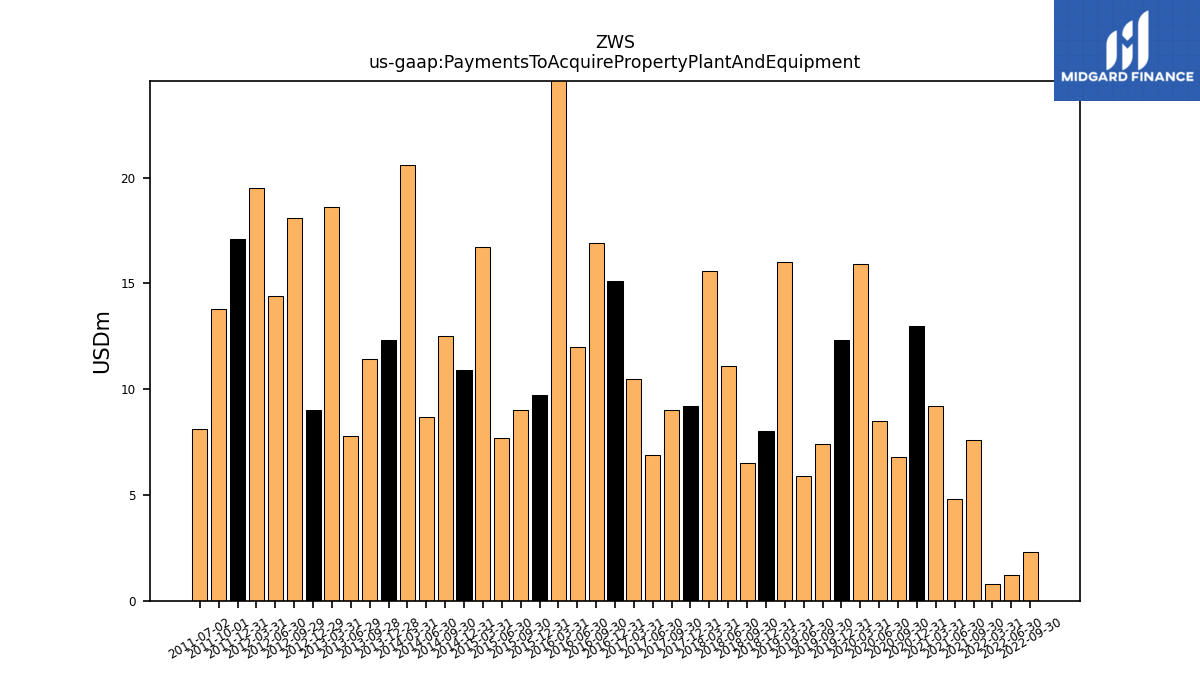
| Payments To Acquire Property Plant And Equipment | NA | NA | NA | NA | 2.30 | 1.20 | 0.80 | NA | 7.60 | 4.80 | 9.20 | 13.00 | 6.80 | 8.50 | 15.90 | 12.30 | 7.40 | 5.90 | 16.00 | 8.00 | 6.50 | 11.10 | 15.60 | 9.20 | 9.00 | 6.90 | 10.50 | 15.10 | 16.90 | 12.00 | 25.70 | 9.70 | 9.00 | 7.70 | 16.70 | 10.90 | 12.50 | 8.70 | 20.60 | 12.30 | 11.40 | 7.80 | 18.60 | 9.00 | 18.10 | 14.40 | 19.50 | 17.10 | 13.80 | 8.10 |
| 2023-09-30 | 2023-06-30 | 2023-03-31 | 2022-12-31 | 2022-09-30 | 2022-06-30 | 2022-03-31 | 2021-12-31 | 2021-09-30 | 2021-06-30 | 2021-03-31 | 2020-12-31 | 2020-09-30 | 2020-06-30 | 2020-03-31 | 2019-12-31 | 2019-09-30 | 2019-06-30 | 2019-03-31 | 2018-12-31 | 2018-09-30 | 2018-06-30 | 2018-03-31 | 2017-12-31 | 2017-09-30 | 2017-06-30 | 2017-03-31 | 2016-12-31 | 2016-09-30 | 2016-06-30 | 2016-03-31 | 2015-12-31 | 2015-09-30 | 2015-06-30 | 2015-03-31 | 2014-12-31 | 2014-09-30 | 2014-06-30 | 2014-03-31 | 2013-12-28 | 2013-09-28 | 2013-06-29 | 2013-03-31 | 2012-12-29 | 2012-09-29 | 2012-06-30 | 2012-03-31 | 2011-12-31 | 2011-10-01 | 2011-07-02 | ||
|---|---|---|---|---|---|---|---|---|---|---|---|---|---|---|---|---|---|---|---|---|---|---|---|---|---|---|---|---|---|---|---|---|---|---|---|---|---|---|---|---|---|---|---|---|---|---|---|---|---|---|---|
| Net Cash Provided By Used In Financing Activities | -28.00 | -63.20 | -50.30 | -38.00 | -13.80 | -4.10 | -5.20 | -343.10 | -7.50 | 3.80 | -9.40 | -47.40 | -99.20 | -263.00 | 253.40 | -122.70 | -5.20 | -10.60 | -79.80 | -9.20 | -8.00 | -19.70 | 11.40 | -303.20 | -8.00 | -9.00 | -8.70 | 182.40 | 0.30 | -94.10 | 2.10 | -9.80 | -4.00 | -44.60 | -5.20 | -8.80 | -5.00 | 1.60 | 69.20 | -6.50 | -125.90 | -147.10 | -4.90 | -1.30 | 25.60 | 146.30 | 12.20 | 106.00 | 71.70 | -96.70 | |
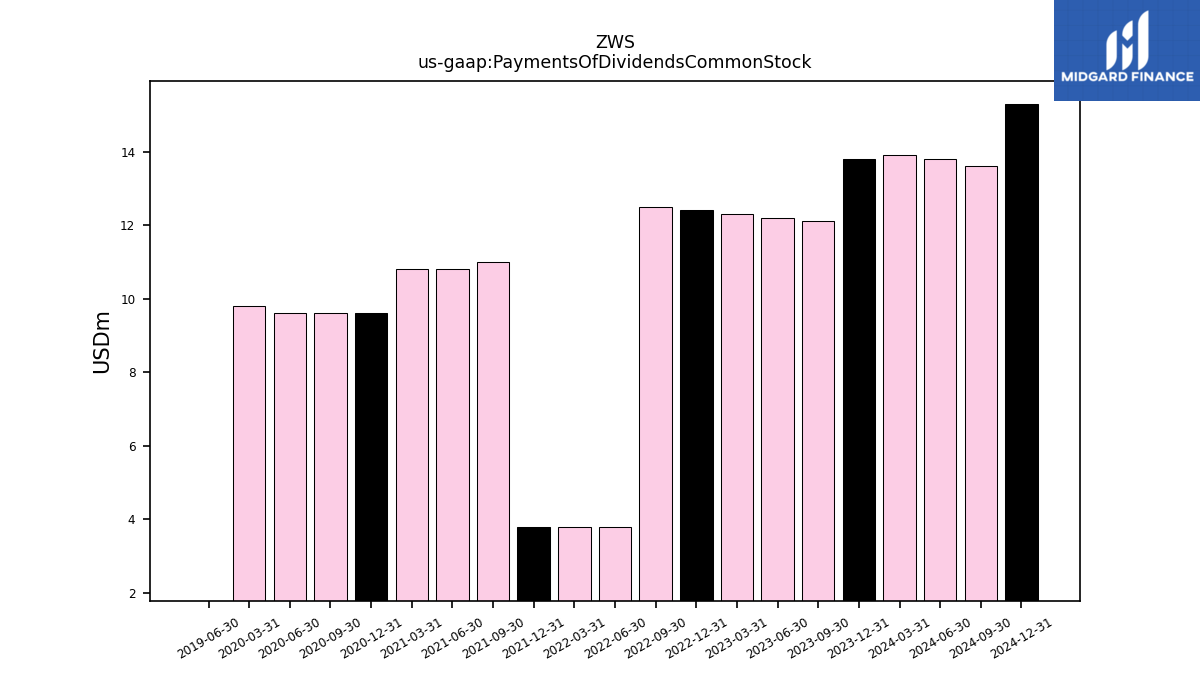
| Payments Of Dividends Common Stock | 12.10 | 12.20 | 12.30 | 12.40 | 12.50 | 3.80 | 3.80 | 3.80 | 11.00 | 10.80 | 10.80 | 9.60 | 9.60 | 9.60 | 9.80 | NA | NA | 0.00 | NA | NA | NA | NA | NA | NA | NA | NA | NA | NA | NA | NA | NA | NA | NA | NA | NA | NA | NA | NA | NA | NA | NA | NA | NA | NA | NA | NA | NA | NA | NA | NA | |
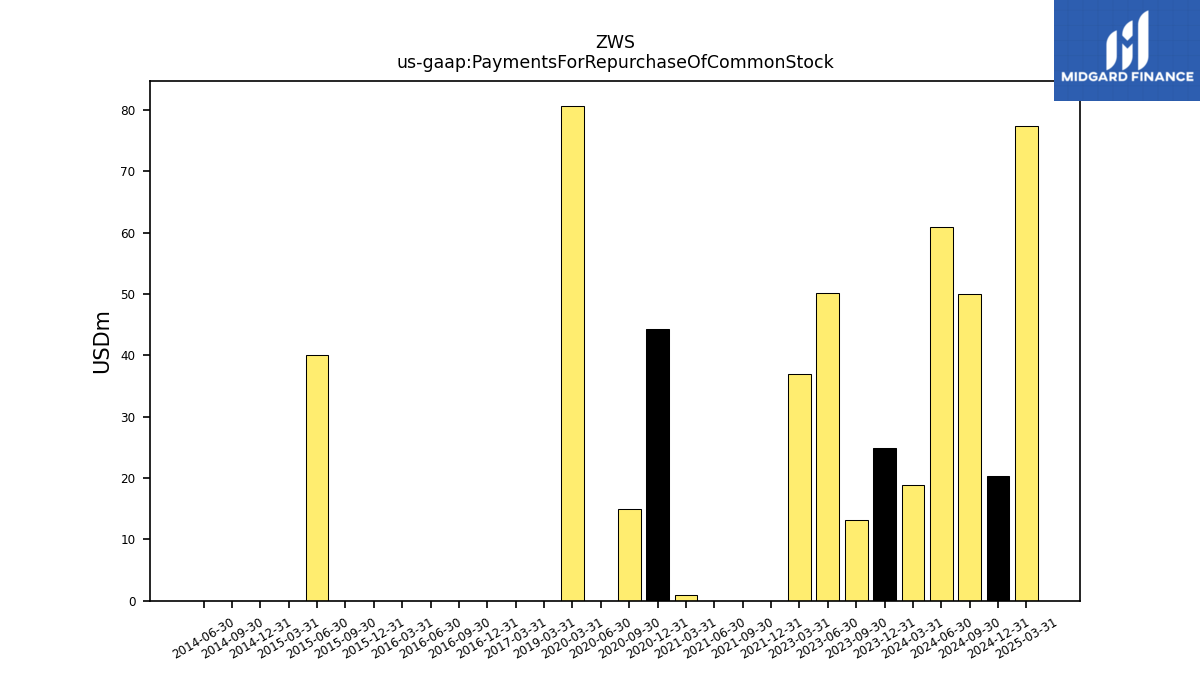
| Payments For Repurchase Of Common Stock | 13.10 | 50.10 | 37.00 | NA | NA | NA | NA | 0.00 | 0.00 | 0.00 | 0.90 | 44.30 | 15.00 | 0.00 | 80.70 | NA | NA | NA | 0.00 | NA | NA | NA | NA | NA | NA | NA | 0.00 | 0.00 | 0.00 | 0.00 | 0.00 | 0.00 | 0.00 | 40.00 | 0.00 | 0.00 | 0.00 | 0.00 | NA | NA | NA | NA | NA | NA | NA | NA | NA | NA | NA | NA |
| 2023-09-30 | 2023-06-30 | 2023-03-31 | 2022-12-31 | 2022-09-30 | 2022-06-30 | 2022-03-31 | 2021-12-31 | 2021-09-30 | 2021-06-30 | 2021-03-31 | 2020-12-31 | 2020-09-30 | 2020-06-30 | 2020-03-31 | 2019-12-31 | 2019-09-30 | 2019-06-30 | 2019-03-31 | 2018-12-31 | 2018-09-30 | 2018-06-30 | 2018-03-31 | 2017-12-31 | 2017-09-30 | 2017-06-30 | 2017-03-31 | 2016-12-31 | 2016-09-30 | 2016-06-30 | 2016-03-31 | 2015-12-31 | 2015-09-30 | 2015-06-30 | 2015-03-31 | 2014-12-31 | 2014-09-30 | 2014-06-30 | 2014-03-31 | 2013-12-28 | 2013-09-28 | 2013-06-29 | 2013-03-31 | 2012-12-29 | 2012-09-29 | 2012-06-30 | 2012-03-31 | 2011-12-31 | 2011-10-01 | 2011-07-02 | ||
|---|---|---|---|---|---|---|---|---|---|---|---|---|---|---|---|---|---|---|---|---|---|---|---|---|---|---|---|---|---|---|---|---|---|---|---|---|---|---|---|---|---|---|---|---|---|---|---|---|---|---|---|
| Revenues | 398.40 | 403.20 | 372.10 | 340.30 | 417.70 | 284.20 | 239.60 | 232.30 | 557.20 | 568.30 | 526.10 | 490.40 | 493.60 | 449.10 | 547.00 | 491.70 | 521.30 | 508.30 | 537.50 | 485.00 | 524.80 | 503.60 | 517.90 | 436.70 | 453.80 | 443.20 | 503.60 | 451.80 | 491.00 | 471.80 | 492.60 | 460.20 | 485.90 | 485.10 | 518.50 | 507.10 | 537.90 | 509.80 | 569.70 | 489.10 | 514.50 | 508.70 | 540.30 | 471.70 | 499.50 | 497.00 | 540.10 | 485.90 | 448.50 | 476.20 | |
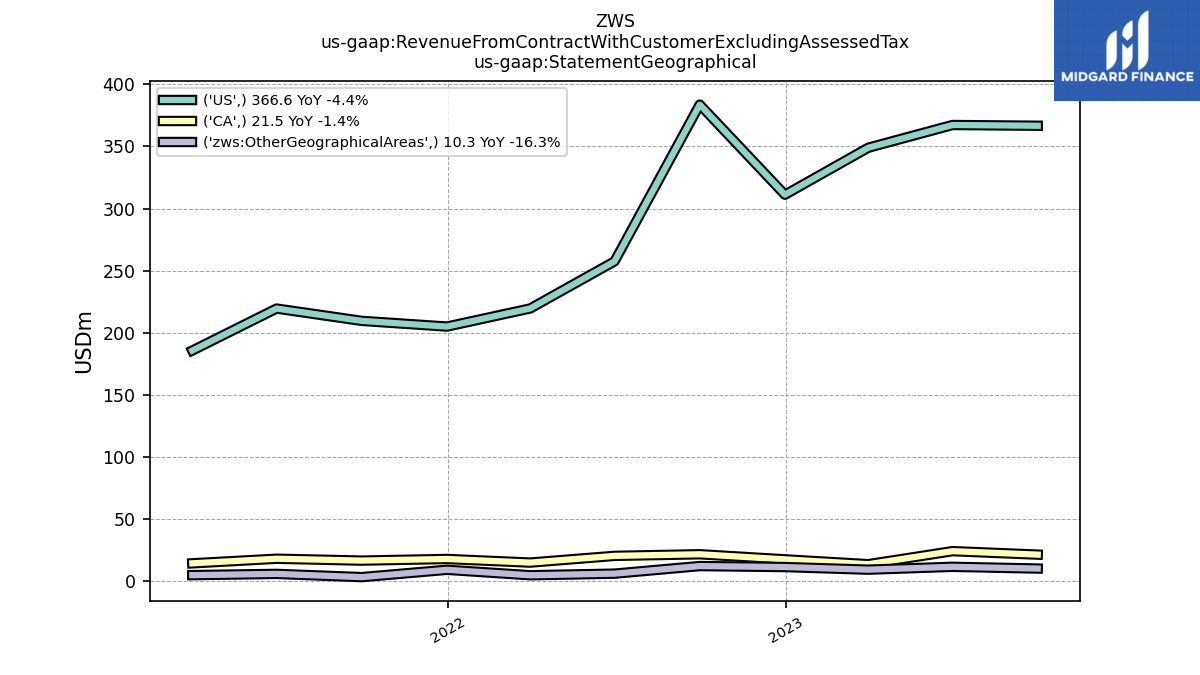
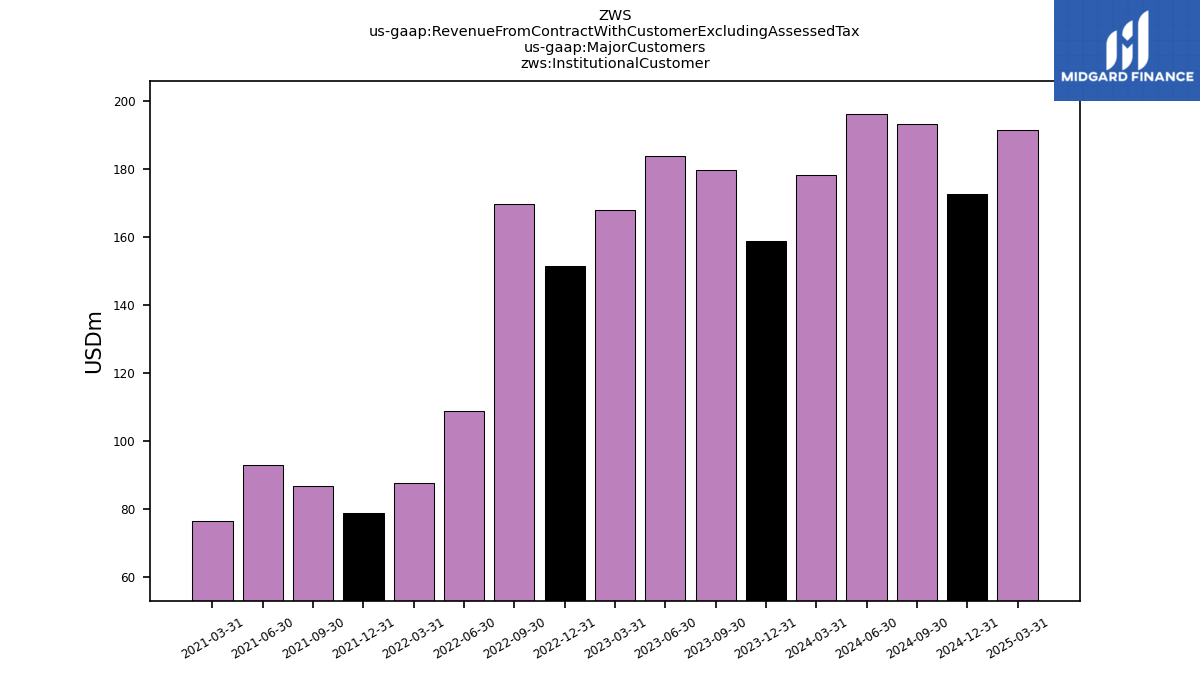
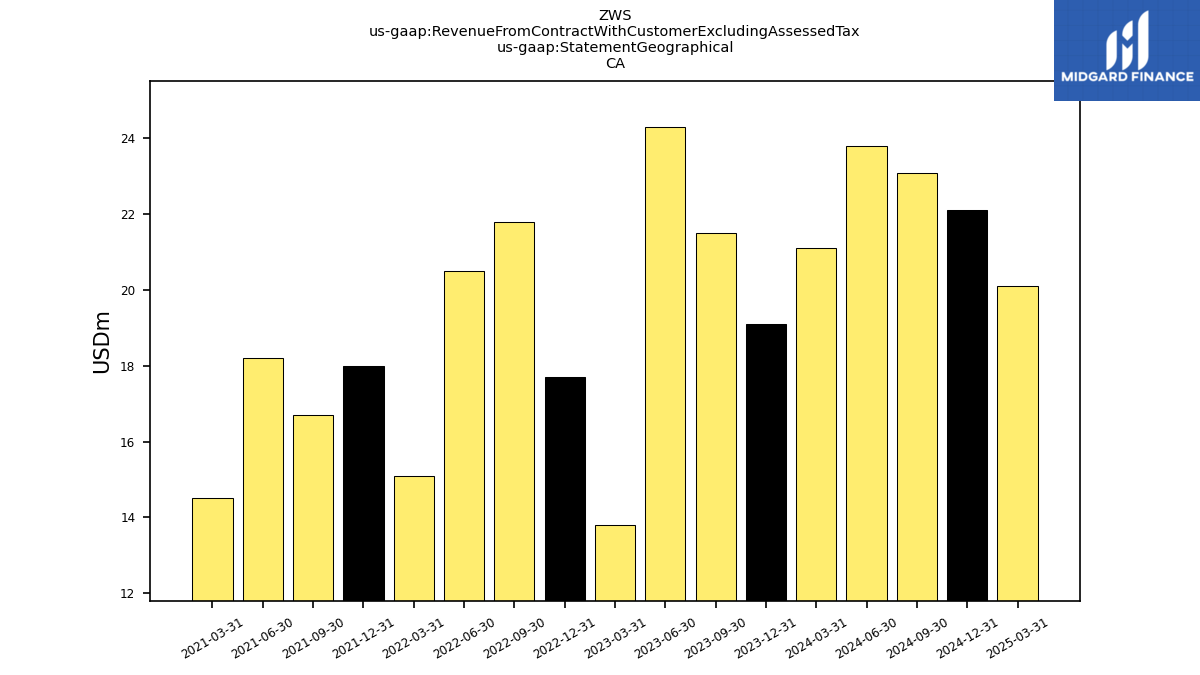
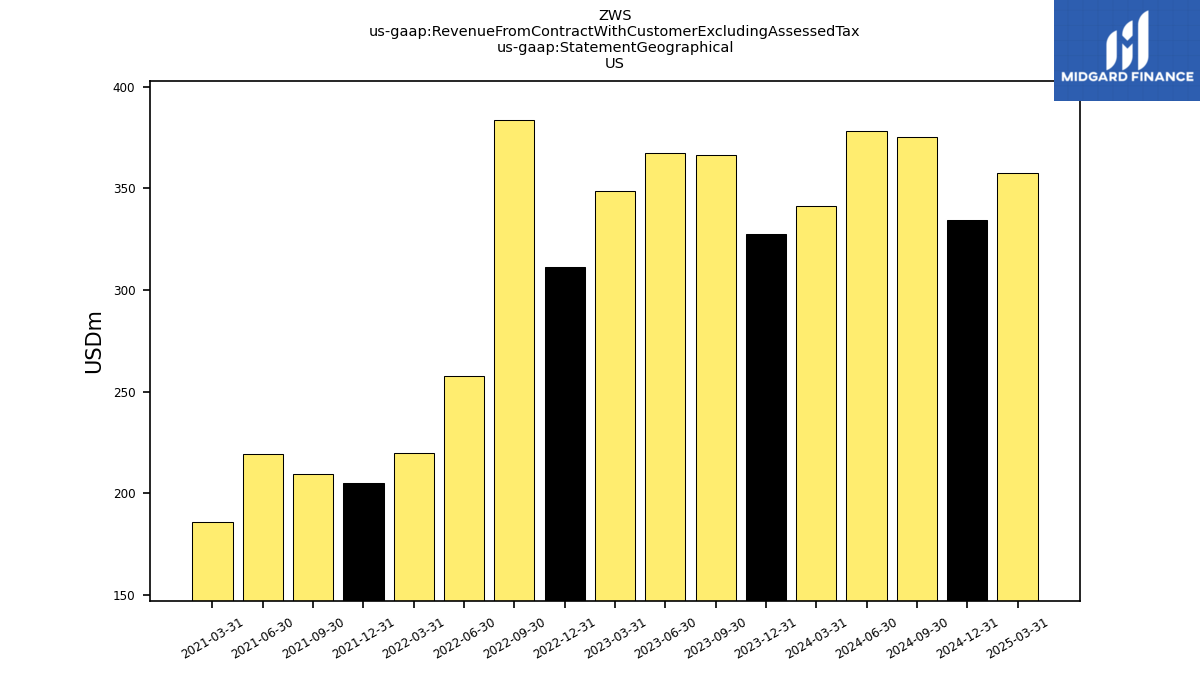
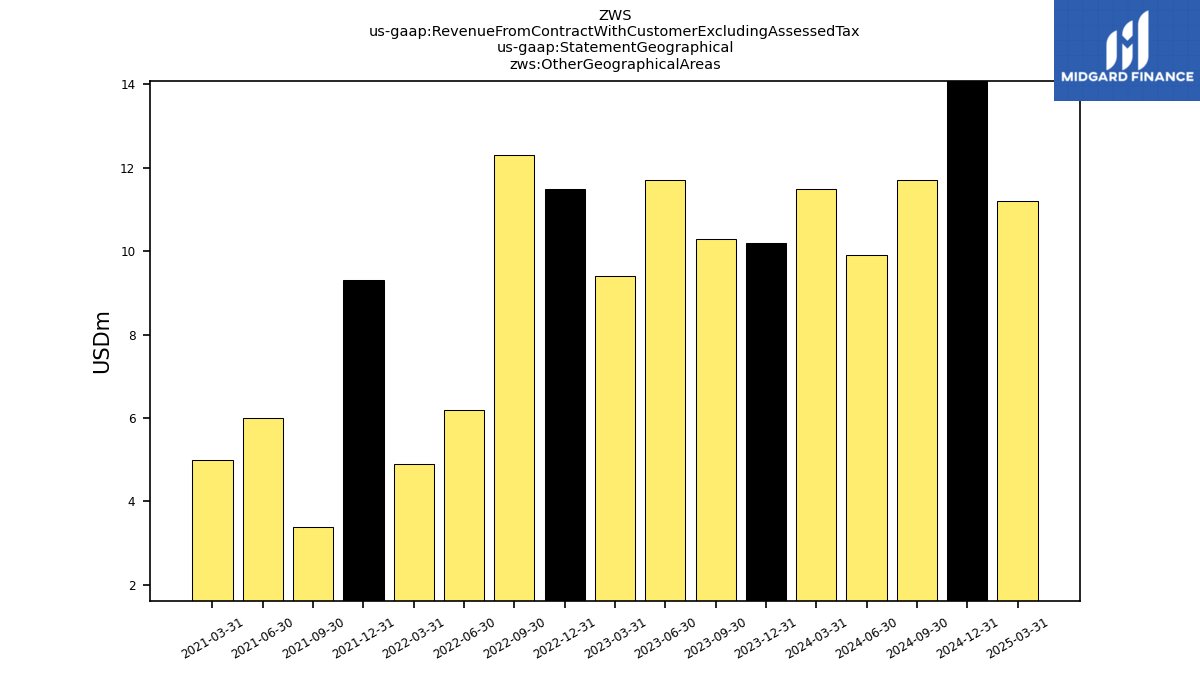
| Revenue From Contract With Customer Excluding Assessed Tax | 398.40 | 403.20 | 372.10 | 340.30 | 417.70 | 284.20 | 239.60 | 232.30 | 557.20 | 568.30 | 526.10 | 490.40 | 493.60 | 449.10 | 547.00 | 491.70 | 521.30 | 508.30 | 537.50 | 485.00 | 524.80 | 503.60 | 517.90 | 436.70 | 453.80 | 443.20 | 503.60 | 451.80 | 491.00 | 471.80 | 492.60 | 460.20 | 485.90 | 485.10 | 518.50 | 507.10 | 537.90 | 509.80 | 569.70 | 489.10 | 514.50 | 508.70 | 540.30 | 471.70 | 499.50 | 497.00 | 540.10 | 485.90 | 448.50 | 476.20 | |
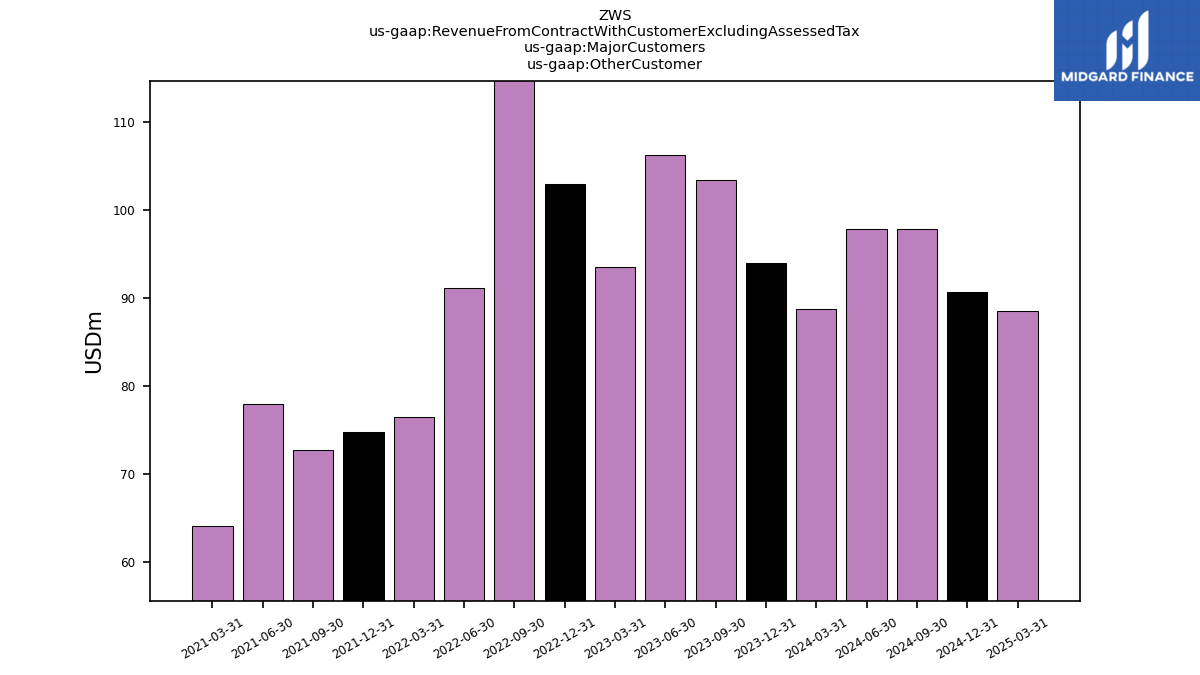
| Other Customer | 103.40 | 106.20 | 93.50 | 102.90 | 120.00 | 91.10 | 76.50 | 74.70 | 72.70 | 77.90 | 64.00 | NA | NA | NA | NA | NA | NA | NA | NA | NA | NA | NA | NA | NA | NA | NA | NA | NA | NA | NA | NA | NA | NA | NA | NA | NA | NA | NA | NA | NA | NA | NA | NA | NA | NA | NA | NA | NA | NA | NA | |
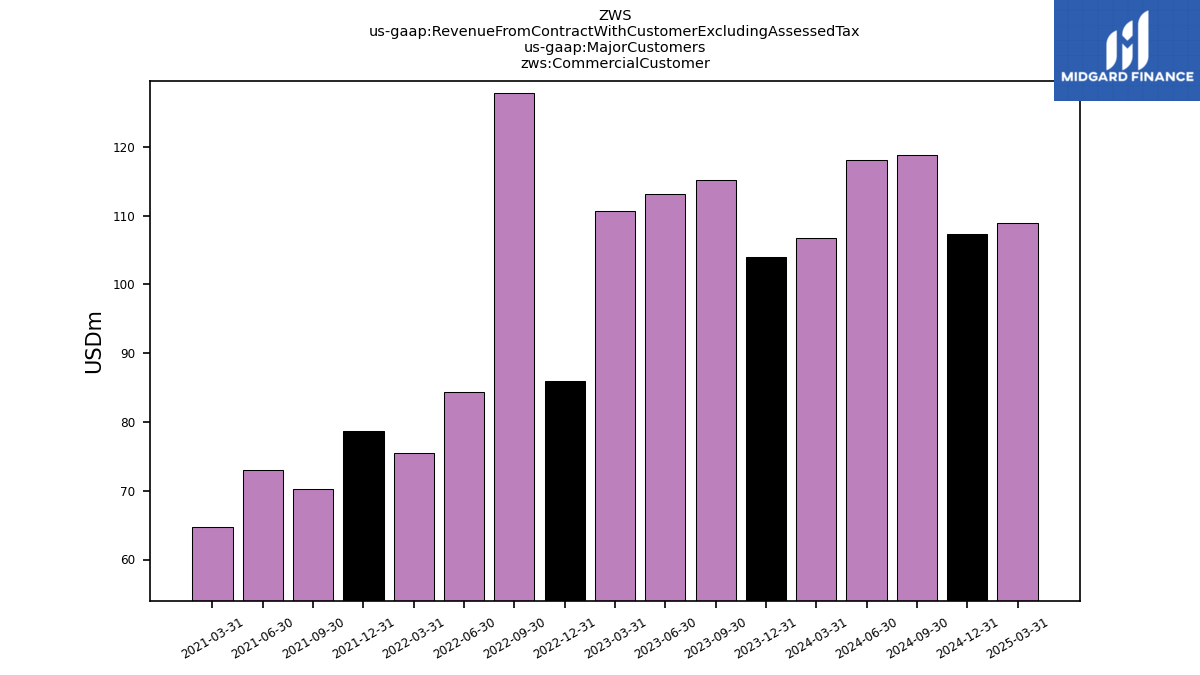
| Commercial Customer | 115.20 | 113.20 | 110.70 | 85.90 | 127.90 | 84.30 | 75.50 | 78.70 | 70.20 | 73.00 | 64.80 | NA | NA | NA | NA | NA | NA | NA | NA | NA | NA | NA | NA | NA | NA | NA | NA | NA | NA | NA | NA | NA | NA | NA | NA | NA | NA | NA | NA | NA | NA | NA | NA | NA | NA | NA | NA | NA | NA | NA | |
| Institutional Customer | 179.80 | 183.80 | 167.90 | 151.50 | 169.80 | 108.80 | 87.60 | 78.90 | 86.80 | 92.80 | 76.40 | NA | NA | NA | NA | NA | NA | NA | NA | NA | NA | NA | NA | NA | NA | NA | NA | NA | NA | NA | NA | NA | NA | NA | NA | NA | NA | NA | NA | NA | NA | NA | NA | NA | NA | NA | NA | NA | NA | NA | |
| 21.50 | 24.30 | 13.80 | 17.70 | 21.80 | 20.50 | 15.10 | 18.00 | 16.70 | 18.20 | 14.50 | NA | NA | NA | NA | NA | NA | NA | NA | NA | NA | NA | NA | NA | NA | NA | NA | NA | NA | NA | NA | NA | NA | NA | NA | NA | NA | NA | NA | NA | NA | NA | NA | NA | NA | NA | NA | NA | NA | NA | ||
| US | 366.60 | 367.20 | 348.90 | 311.10 | 383.60 | 257.50 | 219.60 | 205.00 | 209.60 | 219.50 | 185.70 | NA | NA | NA | NA | NA | NA | NA | NA | NA | NA | NA | NA | NA | NA | NA | NA | NA | NA | NA | NA | NA | NA | NA | NA | NA | NA | NA | NA | NA | NA | NA | NA | NA | NA | NA | NA | NA | NA | NA | |
| Other Geographical Areas | 10.30 | 11.70 | 9.40 | 11.50 | 12.30 | 6.20 | 4.90 | 9.30 | 3.40 | 6.00 | 5.00 | NA | NA | NA | NA | NA | NA | NA | NA | NA | NA | NA | NA | NA | NA | NA | NA | NA | NA | NA | NA | NA | NA | NA | NA | NA | NA | NA | NA | NA | NA | NA | NA | NA | NA | NA | NA | NA | NA | NA |
