
| 2024-01-31 | 2023-10-31 | 2023-07-31 | 2023-04-30 | 2023-01-31 | 2022-10-31 | 2022-07-31 | 2022-04-30 | 2022-01-31 | 2021-10-31 | 2021-07-31 | 2021-04-30 | 2021-01-31 | 2020-10-31 | 2020-07-31 | 2020-04-30 | 2020-01-31 | 2019-10-31 | 2019-07-31 | 2019-04-30 | 2019-01-31 | 2018-10-31 | 2018-07-31 | 2018-04-30 | 2018-01-31 | 2017-10-31 | 2017-07-31 | 2017-04-30 | 2017-01-31 | 2016-10-31 | 2016-07-31 | 2016-04-30 | 2016-01-31 | 2015-10-31 | 2015-07-31 | 2015-04-30 | 2015-01-31 | 2014-10-31 | 2014-07-31 | 2014-04-30 | 2014-01-31 | 2013-10-31 | 2013-07-31 | 2013-04-30 | 2013-01-31 | 2012-10-31 | 2012-07-31 | 2012-04-30 | 2012-01-31 | 2011-10-31 | 2011-07-31 | 2011-04-30 | 2011-01-31 | 2010-10-31 | 2010-07-31 | 2010-04-30 | 2010-01-31 | ||
|---|---|---|---|---|---|---|---|---|---|---|---|---|---|---|---|---|---|---|---|---|---|---|---|---|---|---|---|---|---|---|---|---|---|---|---|---|---|---|---|---|---|---|---|---|---|---|---|---|---|---|---|---|---|---|---|---|---|---|
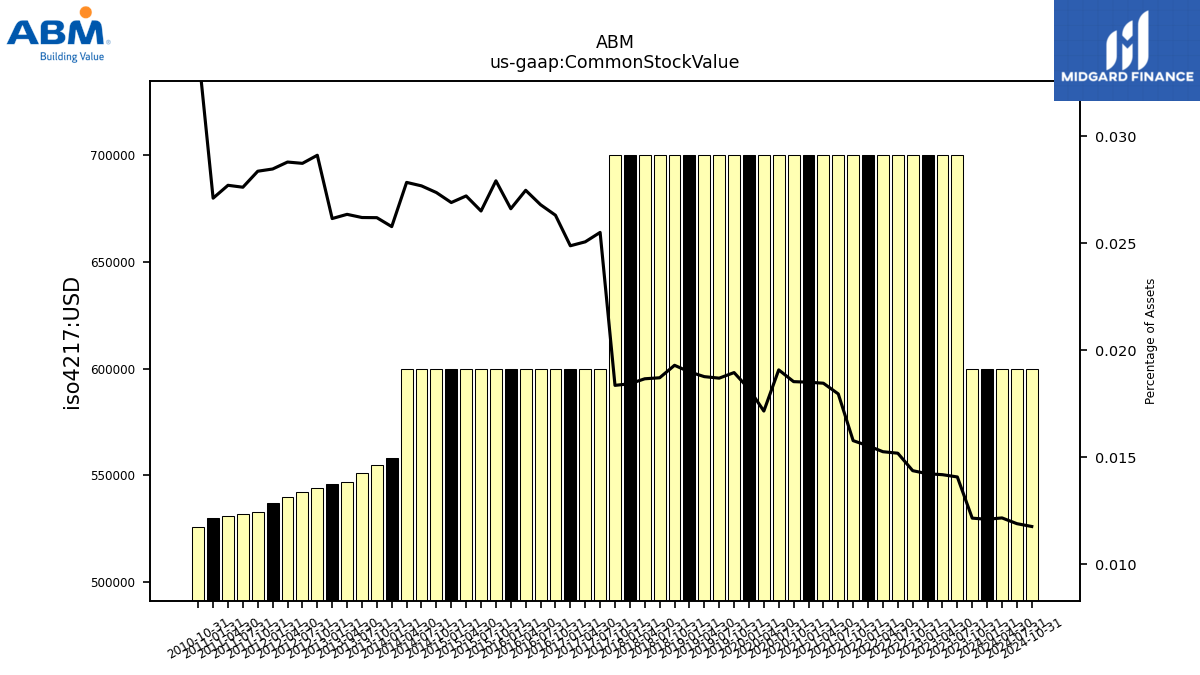
| Common Stock Value | 0.60 | 0.60 | 0.70 | 0.70 | 0.70 | 0.70 | 0.70 | 0.70 | 0.70 | 0.70 | 0.70 | 0.70 | 0.70 | 0.70 | 0.70 | 0.70 | 0.70 | 0.70 | 0.70 | 0.70 | 0.70 | 0.70 | 0.70 | 0.70 | 0.70 | 0.70 | 0.60 | 0.60 | 0.60 | 0.60 | 0.60 | 0.60 | 0.60 | 0.60 | 0.60 | 0.60 | 0.60 | 0.60 | 0.60 | 0.60 | 0.56 | 0.56 | 0.55 | 0.55 | 0.55 | 0.54 | 0.54 | 0.54 | 0.54 | 0.53 | 0.53 | 0.53 | 0.53 | 0.53 | NA | NA | NA | |
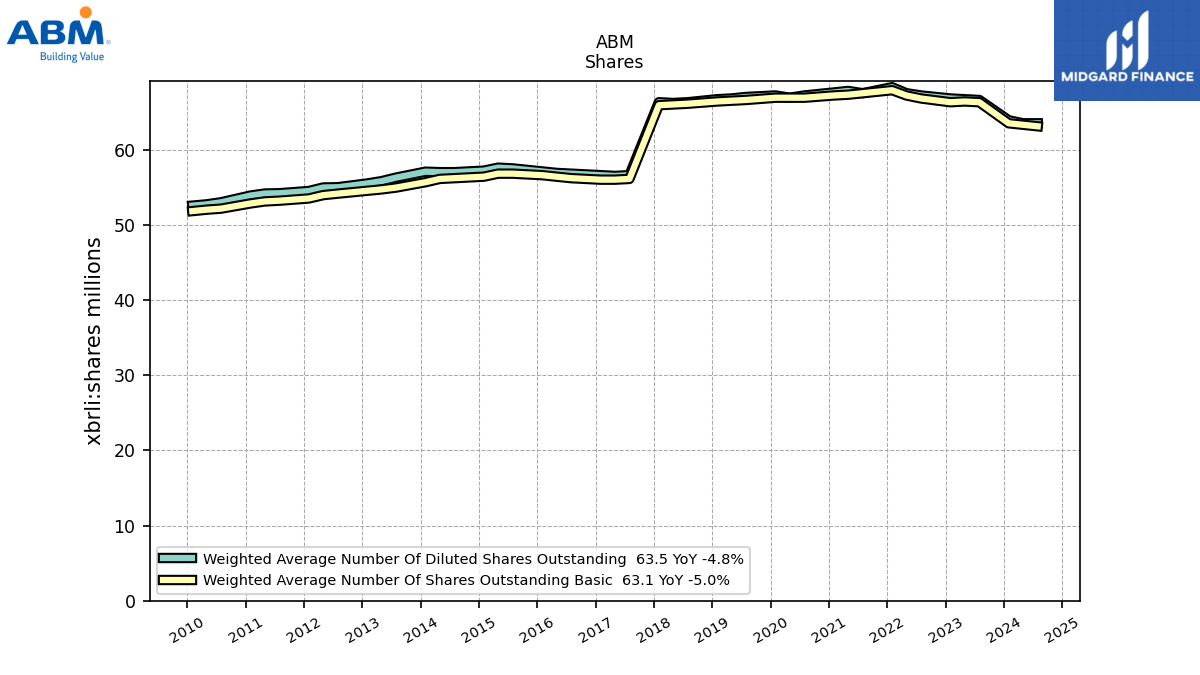
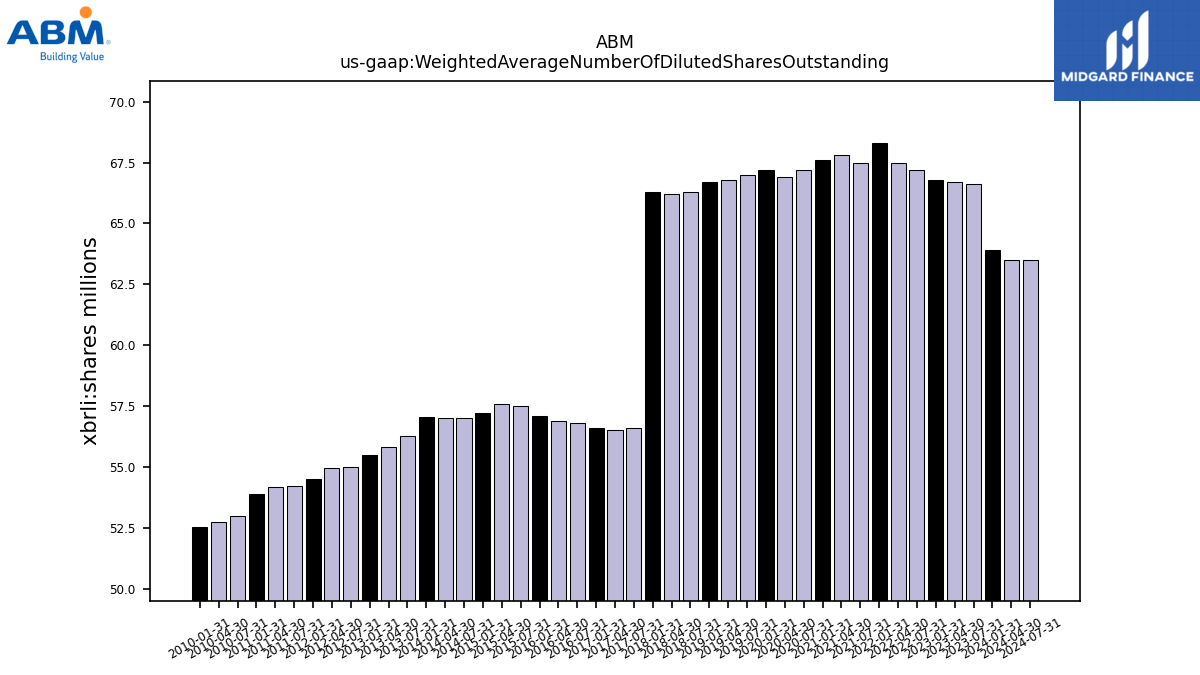
| Weighted Average Number Of Diluted Shares Outstanding | 63.90 | NA | 66.60 | 66.70 | 66.80 | NA | 67.20 | 67.50 | 68.30 | NA | 67.50 | 67.80 | 67.60 | NA | 67.20 | 66.90 | 67.20 | NA | 67.00 | 66.80 | 66.70 | NA | 66.30 | 66.20 | 66.30 | NA | 56.60 | 56.50 | 56.60 | NA | 56.80 | 56.90 | 57.10 | NA | 57.50 | 57.60 | 57.20 | NA | 57.00 | 57.00 | 57.06 | NA | 56.28 | 55.80 | 55.50 | NA | 55.00 | 54.96 | 54.49 | NA | 54.20 | 54.16 | 53.89 | NA | 53.00 | 52.72 | 52.55 | |
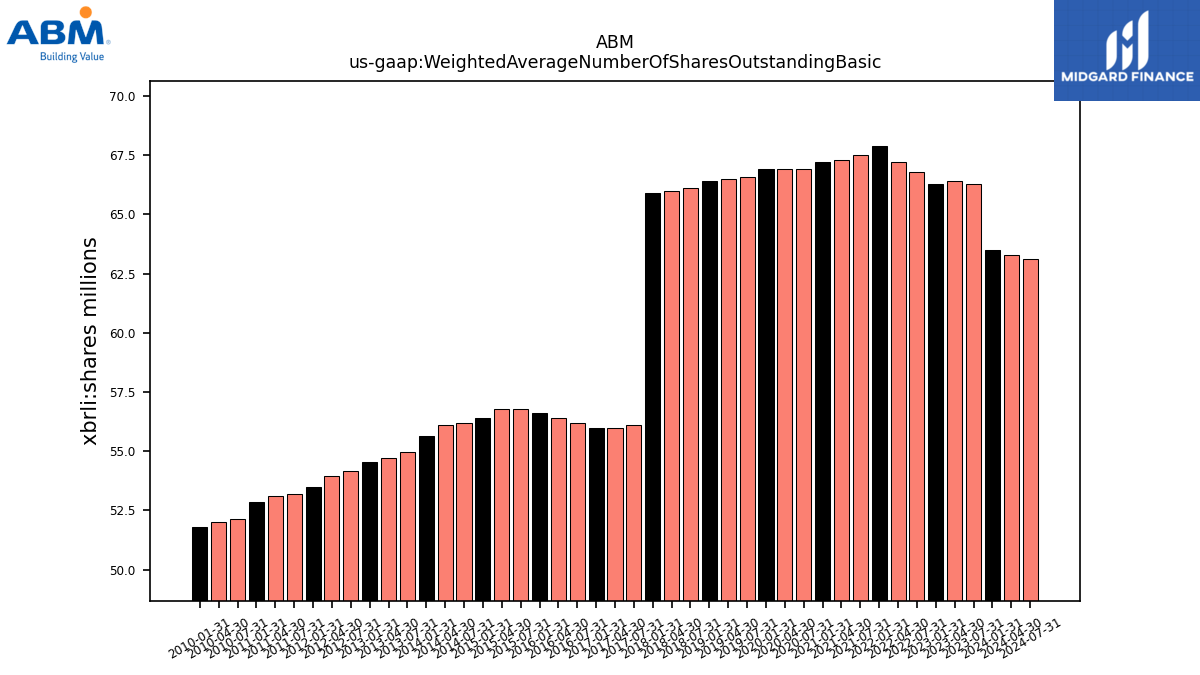
| Weighted Average Number Of Shares Outstanding Basic | 63.50 | NA | 66.30 | 66.40 | 66.30 | NA | 66.80 | 67.20 | 67.90 | NA | 67.50 | 67.30 | 67.20 | NA | 66.90 | 66.90 | 66.90 | NA | 66.60 | 66.50 | 66.40 | NA | 66.10 | 66.00 | 65.90 | NA | 56.10 | 56.00 | 56.00 | NA | 56.20 | 56.40 | 56.60 | NA | 56.80 | 56.80 | 56.40 | NA | 56.20 | 56.10 | 55.66 | NA | 54.95 | 54.70 | 54.52 | NA | 54.15 | 53.94 | 53.50 | NA | 53.21 | 53.11 | 52.84 | NA | 52.15 | 52.01 | 51.82 | |
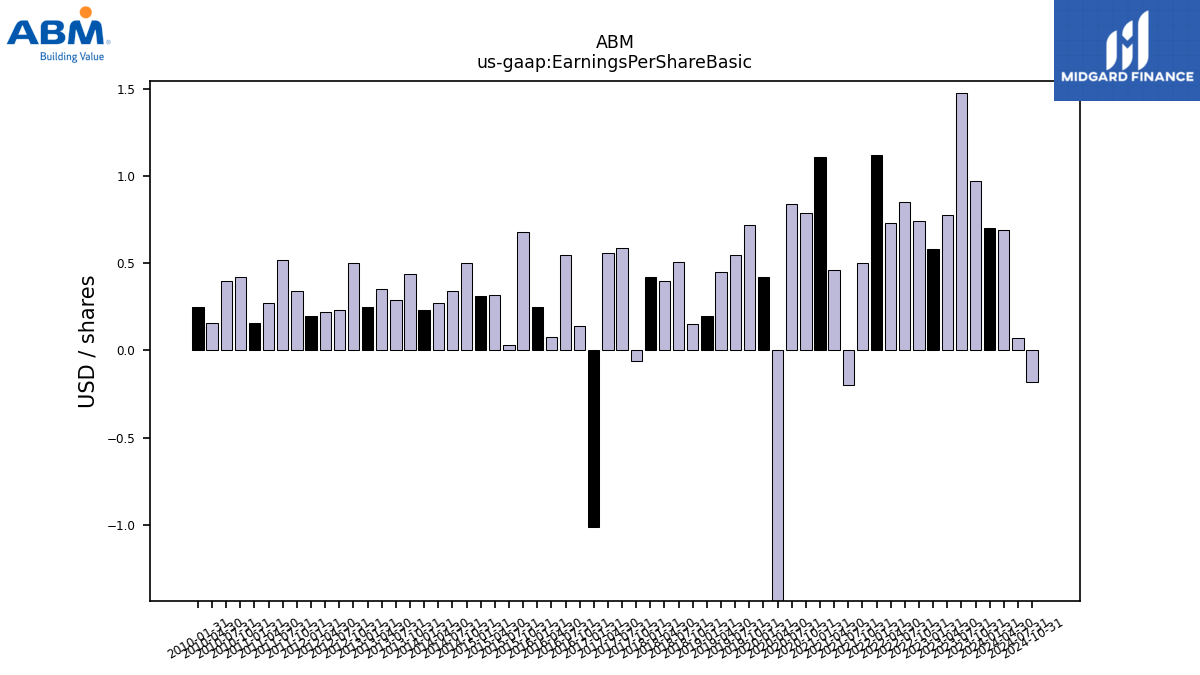
| Earnings Per Share Basic | 0.70 | 0.97 | 1.48 | 0.78 | 0.58 | 0.74 | 0.85 | 0.73 | 1.12 | 0.50 | -0.20 | 0.46 | 1.11 | 0.79 | 0.84 | -2.05 | 0.42 | 0.72 | 0.55 | 0.45 | 0.20 | 0.15 | 0.51 | 0.40 | 0.42 | -0.06 | 0.59 | 0.56 | -1.01 | 0.14 | 0.55 | 0.08 | 0.25 | 0.68 | 0.03 | 0.32 | 0.31 | 0.50 | 0.34 | 0.27 | 0.23 | 0.44 | 0.29 | 0.35 | 0.25 | 0.50 | 0.23 | 0.22 | 0.20 | 0.34 | 0.52 | 0.27 | 0.16 | 0.42 | 0.40 | 0.16 | 0.25 | |
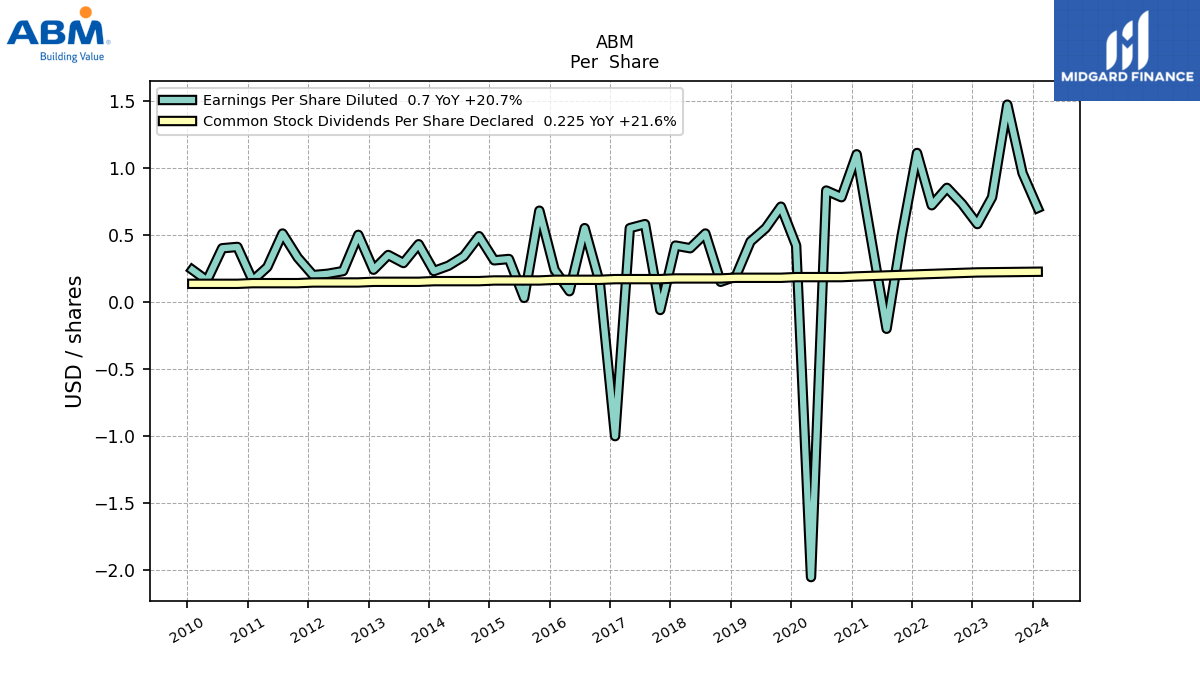
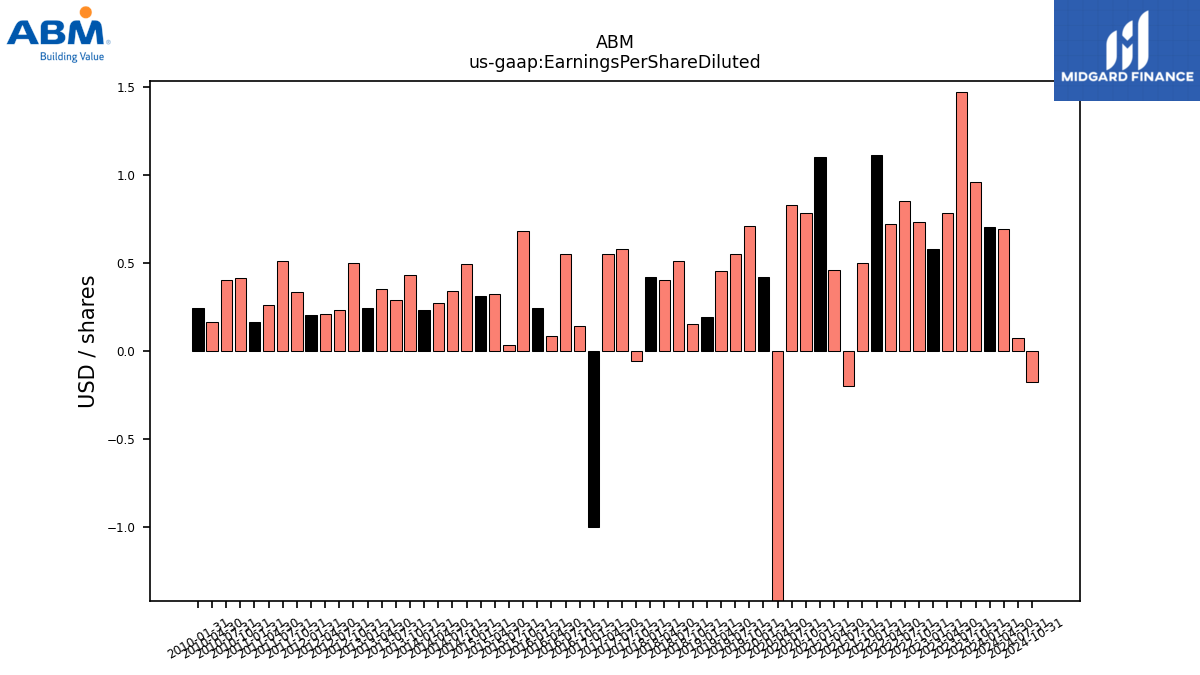
| Earnings Per Share Diluted | 0.70 | 0.96 | 1.47 | 0.78 | 0.58 | 0.73 | 0.85 | 0.72 | 1.11 | 0.50 | -0.20 | 0.46 | 1.10 | 0.78 | 0.83 | -2.05 | 0.42 | 0.71 | 0.55 | 0.45 | 0.19 | 0.15 | 0.51 | 0.40 | 0.42 | -0.06 | 0.58 | 0.55 | -1.00 | 0.14 | 0.55 | 0.08 | 0.24 | 0.68 | 0.03 | 0.32 | 0.31 | 0.49 | 0.34 | 0.27 | 0.23 | 0.43 | 0.29 | 0.35 | 0.24 | 0.50 | 0.23 | 0.21 | 0.20 | 0.33 | 0.51 | 0.26 | 0.16 | 0.41 | 0.40 | 0.16 | 0.24 |
| 2024-01-31 | 2023-10-31 | 2023-07-31 | 2023-04-30 | 2023-01-31 | 2022-10-31 | 2022-07-31 | 2022-04-30 | 2022-01-31 | 2021-10-31 | 2021-07-31 | 2021-04-30 | 2021-01-31 | 2020-10-31 | 2020-07-31 | 2020-04-30 | 2020-01-31 | 2019-10-31 | 2019-07-31 | 2019-04-30 | 2019-01-31 | 2018-10-31 | 2018-07-31 | 2018-04-30 | 2018-01-31 | 2017-10-31 | 2017-07-31 | 2017-04-30 | 2017-01-31 | 2016-10-31 | 2016-07-31 | 2016-04-30 | 2016-01-31 | 2015-10-31 | 2015-07-31 | 2015-04-30 | 2015-01-31 | 2014-10-31 | 2014-07-31 | 2014-04-30 | 2014-01-31 | 2013-10-31 | 2013-07-31 | 2013-04-30 | 2013-01-31 | 2012-10-31 | 2012-07-31 | 2012-04-30 | 2012-01-31 | 2011-10-31 | 2011-07-31 | 2011-04-30 | 2011-01-31 | 2010-10-31 | 2010-07-31 | 2010-04-30 | 2010-01-31 | ||
|---|---|---|---|---|---|---|---|---|---|---|---|---|---|---|---|---|---|---|---|---|---|---|---|---|---|---|---|---|---|---|---|---|---|---|---|---|---|---|---|---|---|---|---|---|---|---|---|---|---|---|---|---|---|---|---|---|---|---|
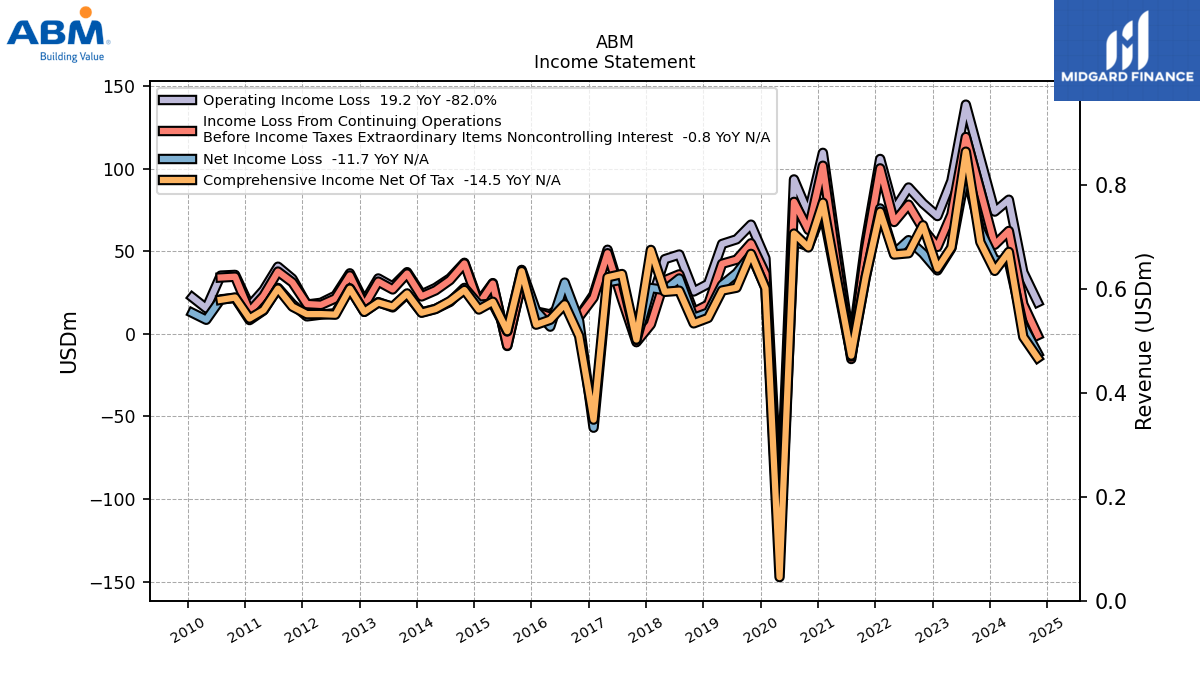
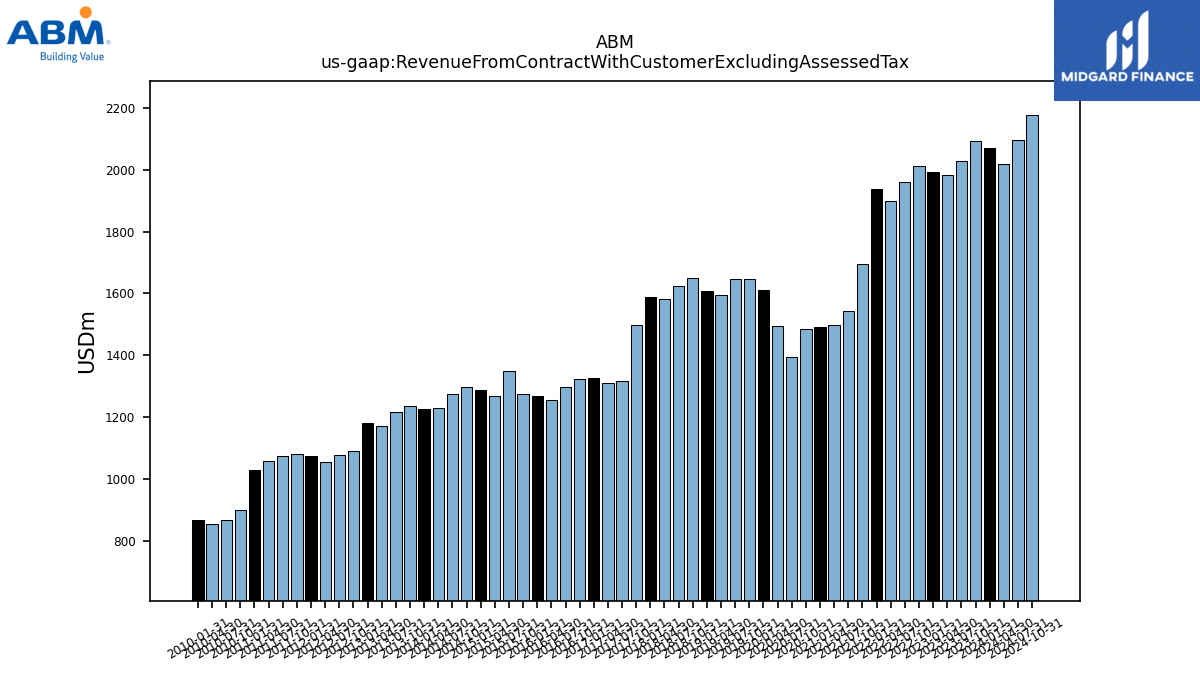
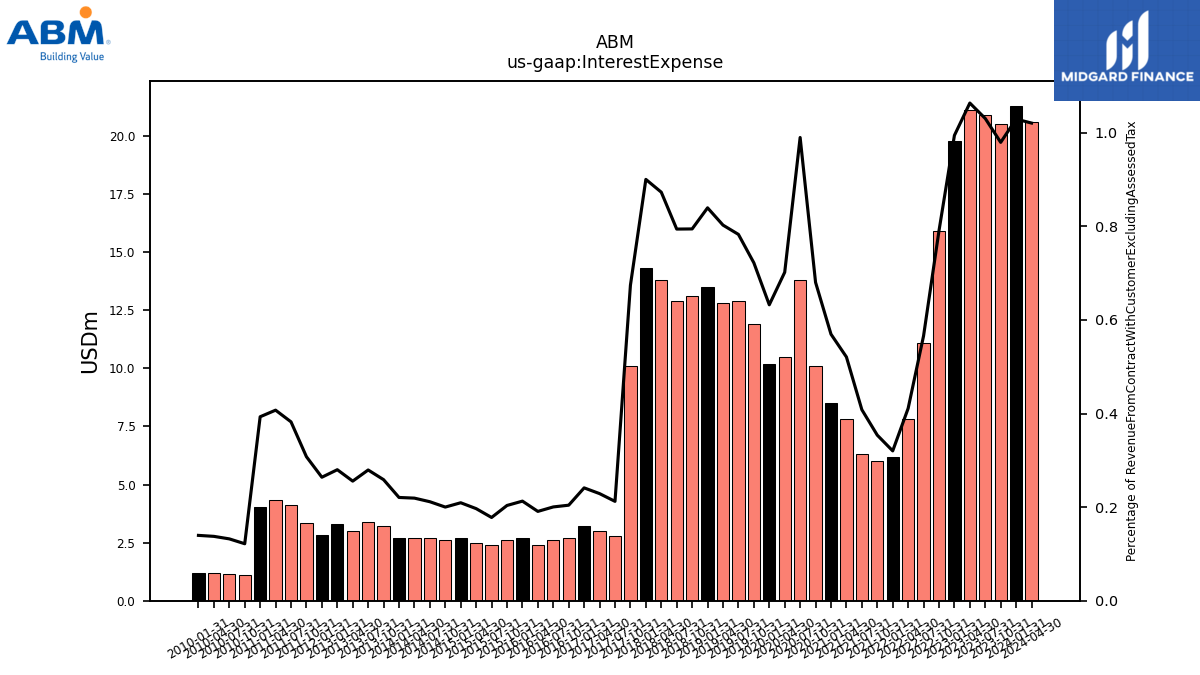
| Revenue From Contract With Customer Excluding Assessed Tax | 2069.60 | 2092.90 | 2028.20 | 1984.00 | 1991.30 | 2011.10 | 1961.40 | 1897.80 | 1936.20 | 1695.60 | 1543.10 | 1497.40 | 1492.40 | 1484.60 | 1394.10 | 1496.00 | 1612.90 | 1648.00 | 1647.90 | 1594.70 | 1607.90 | 1648.80 | 1624.30 | 1580.80 | 1588.30 | 1497.90 | 1318.40 | 1310.50 | 1326.70 | 1322.30 | 1296.90 | 1257.10 | 1268.40 | 1277.00 | 1348.80 | 1270.10 | 1289.40 | 1298.90 | 1276.10 | 1231.30 | 1226.47 | 1236.77 | 1216.77 | 1173.62 | 1182.12 | 1090.00 | 1079.23 | 1057.24 | 1073.79 | 1081.34 | 1076.25 | 1060.08 | 1029.17 | 901.37 | 869.03 | 855.46 | 869.88 | |
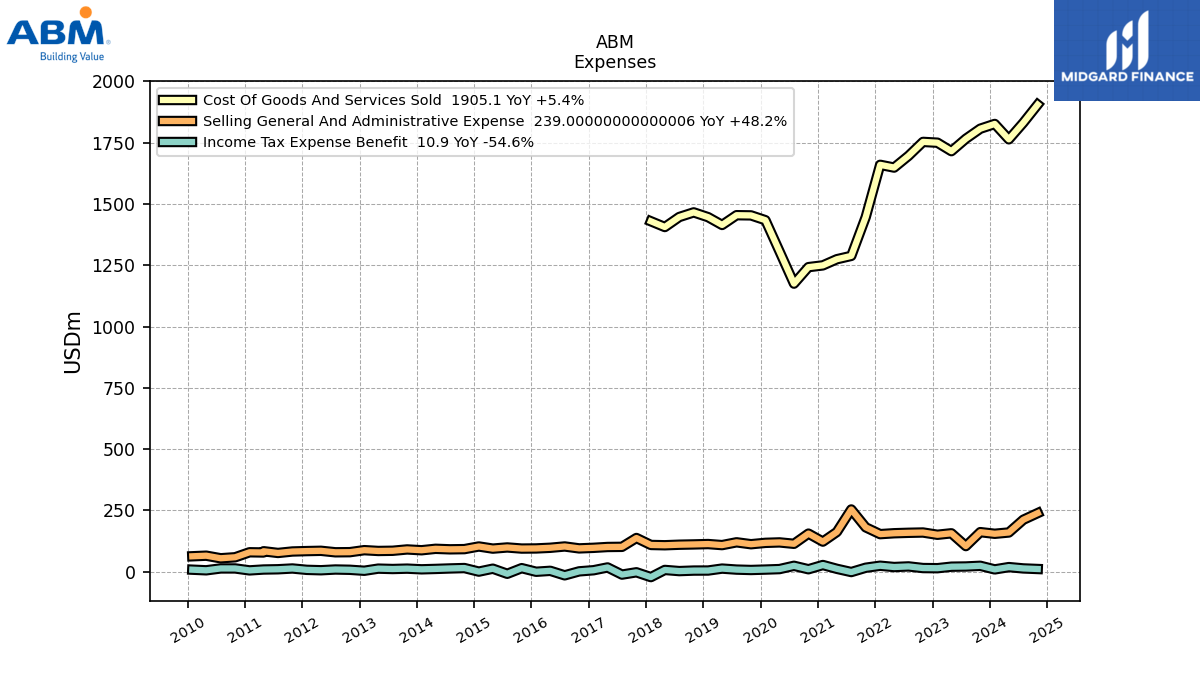
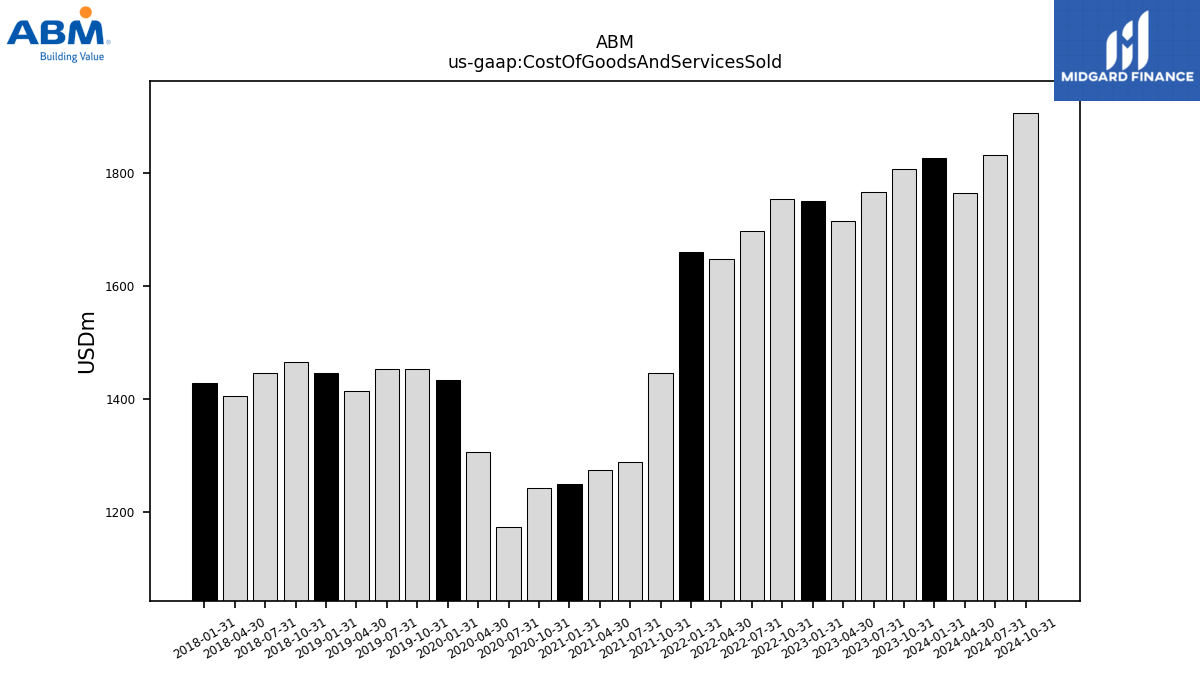
| Cost Of Goods And Services Sold | 1826.30 | 1806.90 | 1765.80 | 1715.20 | 1749.80 | 1753.10 | 1696.40 | 1648.30 | 1659.60 | 1446.20 | 1288.10 | 1274.50 | 1249.40 | 1242.20 | 1174.90 | 1306.10 | 1433.70 | 1453.30 | 1454.10 | 1414.20 | 1446.00 | 1465.60 | 1446.70 | 1405.80 | 1429.30 | NA | NA | NA | NA | NA | NA | NA | NA | NA | NA | NA | NA | NA | NA | NA | NA | NA | NA | NA | NA | NA | NA | NA | NA | NA | NA | NA | NA | NA | NA | NA | NA | |
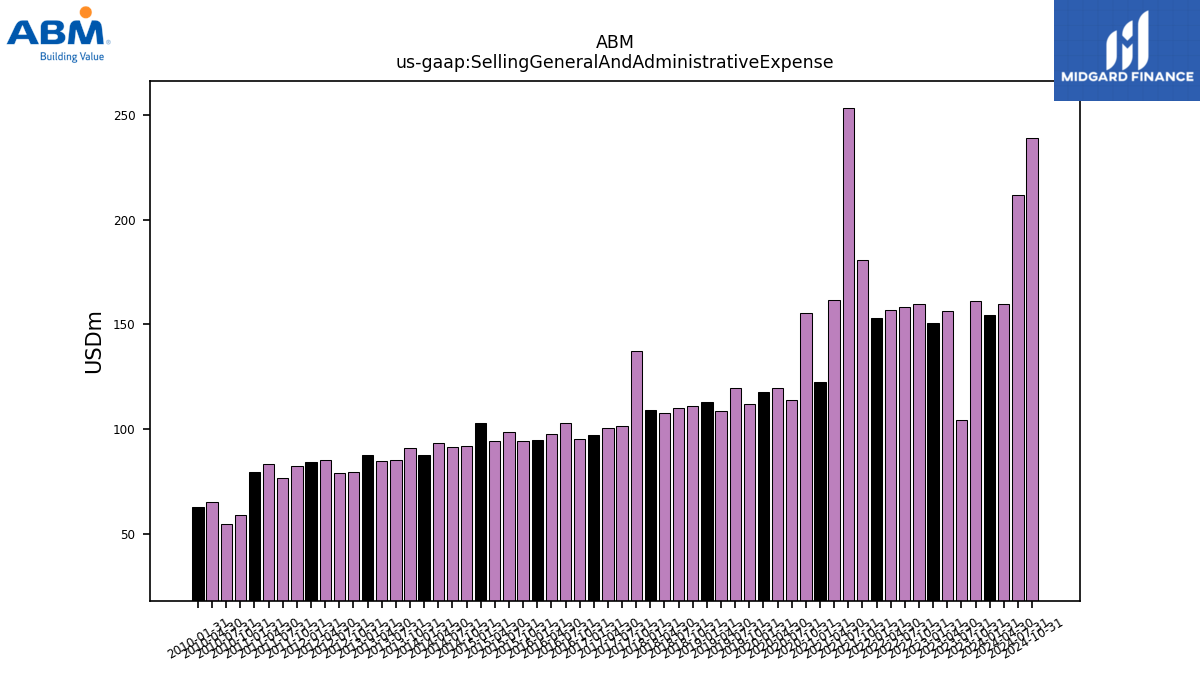
| Selling General And Administrative Expense | 154.60 | 161.30 | 104.30 | 156.60 | 150.60 | 159.80 | 158.60 | 156.80 | 153.10 | 180.90 | 253.80 | 161.90 | 122.60 | 155.30 | 113.70 | 119.40 | 117.60 | 112.00 | 119.80 | 108.40 | 112.70 | 111.20 | 110.00 | 107.80 | 109.00 | 137.40 | 101.30 | 100.70 | 97.30 | 95.00 | 102.80 | 97.50 | 94.80 | 94.30 | 98.80 | 94.10 | 102.80 | 92.00 | 91.20 | 93.30 | 87.42 | 90.71 | 85.33 | 84.48 | 87.75 | 79.57 | 79.10 | 85.16 | 84.02 | 82.36 | 76.36 | 83.39 | 79.20 | 58.78 | 54.70 | 65.24 | 62.80 | |
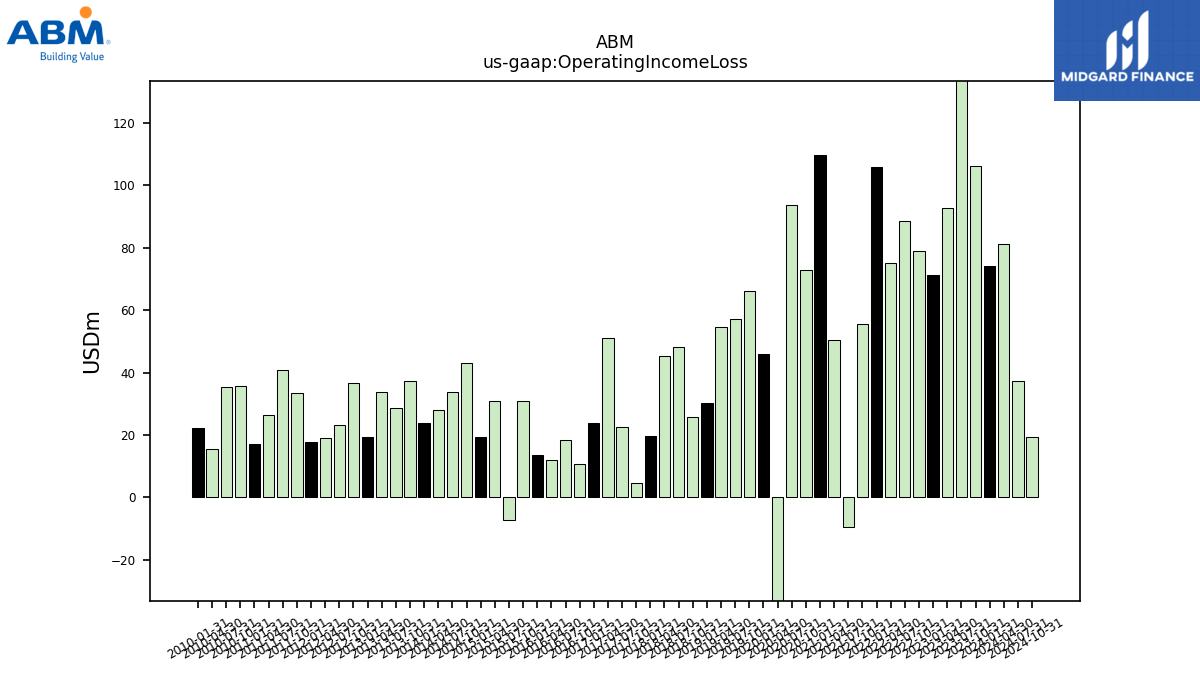
| Operating Income Loss | 74.10 | 106.40 | 138.90 | 92.70 | 71.40 | 79.10 | 88.70 | 75.00 | 106.00 | 55.70 | -9.40 | 50.30 | 109.70 | 72.90 | 93.60 | -116.70 | 45.80 | 66.20 | 57.30 | 54.50 | 30.30 | 25.70 | 48.10 | 45.30 | 19.50 | 4.50 | 22.60 | 51.00 | 23.80 | 10.70 | 18.50 | 11.80 | 13.60 | 30.90 | -7.30 | 30.80 | 19.20 | 43.10 | 33.70 | 27.90 | 23.93 | 37.40 | 28.70 | 33.62 | 19.31 | 36.73 | 23.17 | 18.86 | 17.80 | 33.42 | 40.73 | 26.50 | 16.92 | 35.76 | 35.33 | 15.55 | 22.21 | |
| Interest Expense | 21.30 | 20.50 | 20.90 | 21.10 | 19.80 | 15.90 | 11.10 | 7.80 | 6.20 | 6.00 | 6.30 | 7.80 | 8.50 | 10.10 | 13.80 | 10.50 | 10.20 | 11.90 | 12.90 | 12.80 | 13.50 | 13.10 | 12.90 | 13.80 | 14.30 | 10.10 | 2.80 | 3.00 | 3.20 | 2.70 | 2.60 | 2.40 | 2.70 | 2.60 | 2.40 | 2.50 | 2.70 | 2.60 | 2.70 | 2.70 | 2.71 | 3.20 | 3.40 | 3.00 | 3.31 | NA | NA | NA | 2.83 | 3.33 | 4.11 | 4.32 | 4.05 | 1.10 | 1.15 | 1.18 | 1.22 | |
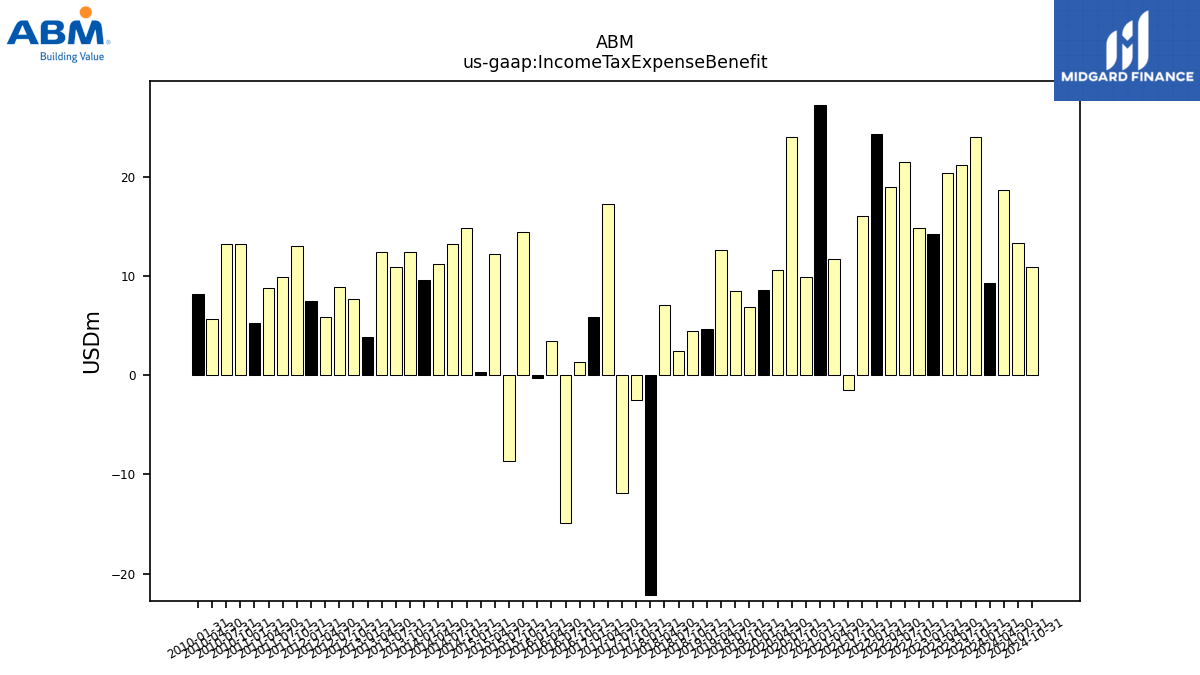
| Income Tax Expense Benefit | 9.30 | 24.00 | 21.20 | 20.40 | 14.20 | 14.80 | 21.50 | 19.00 | 24.30 | 16.10 | -1.50 | 11.70 | 27.20 | 9.90 | 24.00 | 10.60 | 8.60 | 6.90 | 8.50 | 12.60 | 4.70 | 4.50 | 2.40 | 7.10 | -22.20 | -2.50 | -11.90 | 17.30 | 5.90 | 1.30 | -14.90 | 3.50 | -0.30 | 14.40 | -8.60 | 12.20 | 0.30 | 14.80 | 13.20 | 11.20 | 9.65 | 12.42 | 10.88 | 12.44 | 3.81 | 7.73 | 8.89 | 5.86 | 7.45 | 13.04 | 9.87 | 8.81 | 5.25 | 13.22 | 13.20 | 5.62 | 8.15 | |
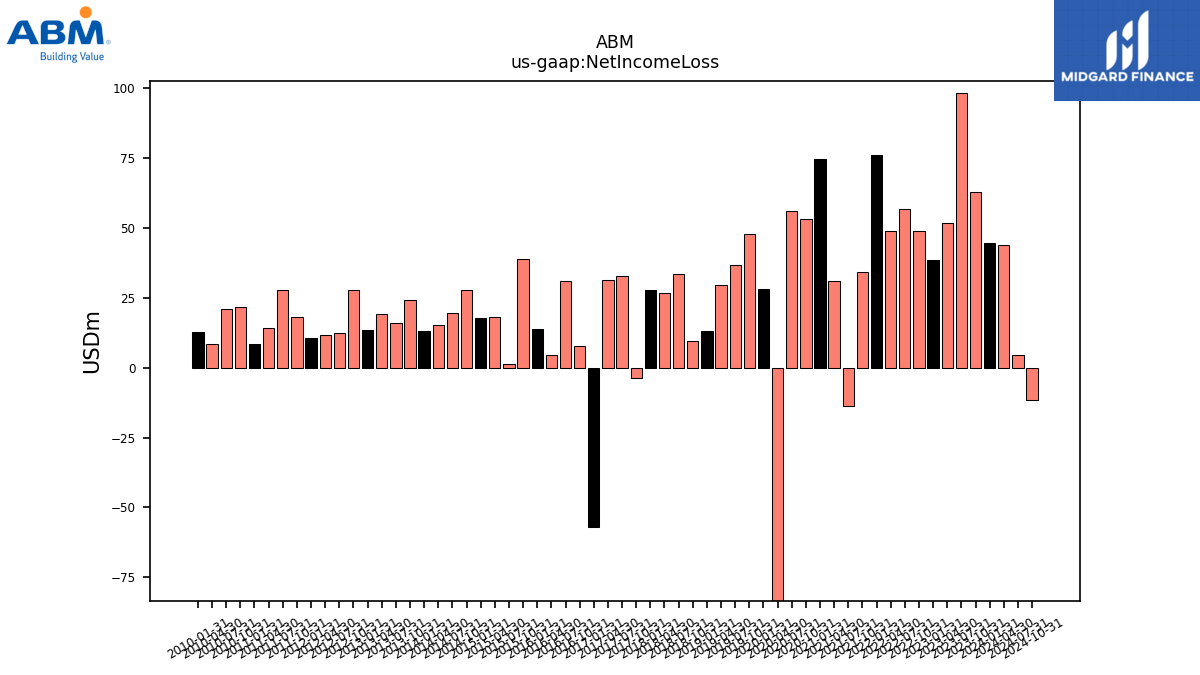
| Net Income Loss | 44.70 | 62.80 | 98.10 | 51.90 | 38.50 | 48.80 | 56.80 | 48.80 | 76.00 | 34.30 | -13.70 | 31.10 | 74.60 | 53.10 | 56.00 | -136.80 | 28.00 | 47.90 | 36.80 | 29.70 | 13.00 | 9.70 | 33.60 | 26.60 | 27.80 | -3.60 | 32.90 | 31.30 | -56.80 | 7.80 | 31.10 | 4.40 | 14.00 | 38.80 | 1.50 | 18.30 | 17.70 | 27.90 | 19.40 | 15.20 | 13.07 | 24.17 | 16.08 | 19.27 | 13.38 | 27.66 | 12.58 | 11.71 | 10.63 | 18.05 | 27.88 | 14.19 | 8.39 | 21.81 | 20.96 | 8.58 | 12.78 | |
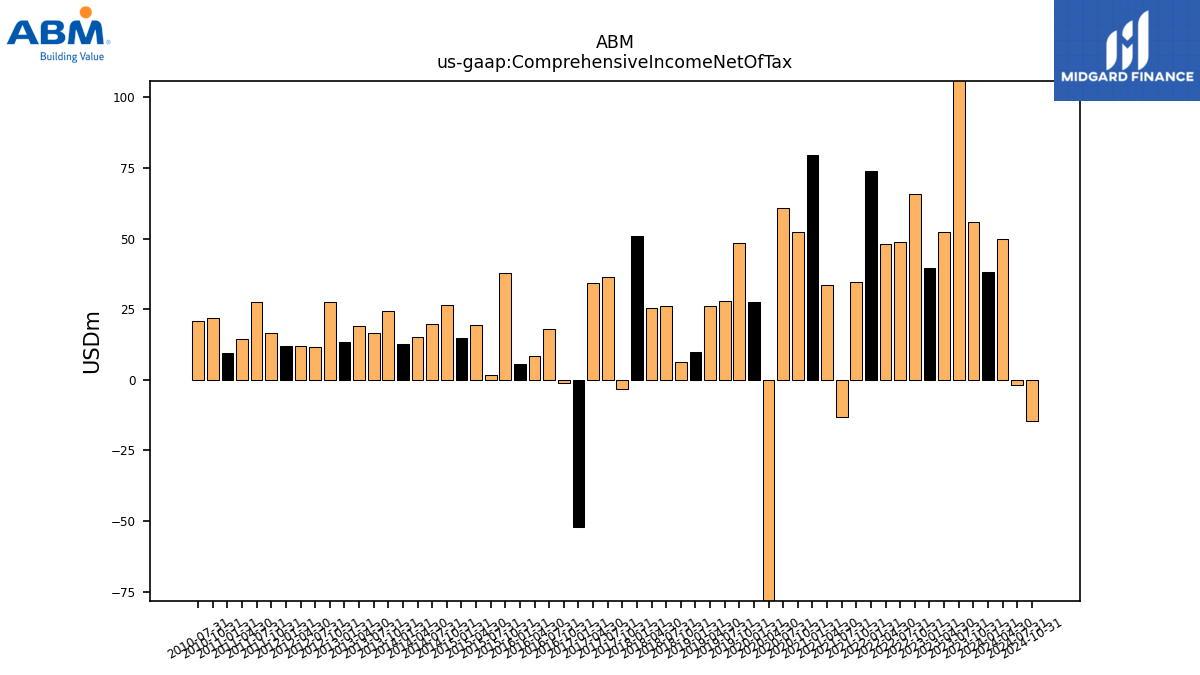
| Comprehensive Income Net Of Tax | 38.20 | 55.70 | 110.40 | 52.40 | 39.60 | 65.80 | 48.90 | 48.10 | 74.00 | 34.60 | -13.10 | 33.40 | 79.50 | 52.40 | 60.80 | -147.30 | 27.60 | 48.50 | 28.00 | 26.30 | 9.70 | 6.40 | 26.20 | 25.50 | 50.90 | -3.40 | 36.30 | 34.30 | -51.90 | -1.20 | 17.90 | 8.60 | 5.60 | 38.00 | 1.70 | 19.50 | 14.80 | 26.60 | 19.90 | 15.10 | 12.85 | 24.53 | 16.50 | 19.02 | 13.36 | 27.41 | 11.67 | 12.01 | 11.99 | 16.52 | 27.45 | 14.38 | 9.36 | 22.07 | 20.67 | NA | NA |
| 2024-01-31 | 2023-10-31 | 2023-07-31 | 2023-04-30 | 2023-01-31 | 2022-10-31 | 2022-07-31 | 2022-04-30 | 2022-01-31 | 2021-10-31 | 2021-07-31 | 2021-04-30 | 2021-01-31 | 2020-10-31 | 2020-07-31 | 2020-04-30 | 2020-01-31 | 2019-10-31 | 2019-07-31 | 2019-04-30 | 2019-01-31 | 2018-10-31 | 2018-07-31 | 2018-04-30 | 2018-01-31 | 2017-10-31 | 2017-07-31 | 2017-04-30 | 2017-01-31 | 2016-10-31 | 2016-07-31 | 2016-04-30 | 2016-01-31 | 2015-10-31 | 2015-07-31 | 2015-04-30 | 2015-01-31 | 2014-10-31 | 2014-07-31 | 2014-04-30 | 2014-01-31 | 2013-10-31 | 2013-07-31 | 2013-04-30 | 2013-01-31 | 2012-10-31 | 2012-07-31 | 2012-04-30 | 2012-01-31 | 2011-10-31 | 2011-07-31 | 2011-04-30 | 2011-01-31 | 2010-10-31 | 2010-07-31 | 2010-04-30 | 2010-01-31 | ||
|---|---|---|---|---|---|---|---|---|---|---|---|---|---|---|---|---|---|---|---|---|---|---|---|---|---|---|---|---|---|---|---|---|---|---|---|---|---|---|---|---|---|---|---|---|---|---|---|---|---|---|---|---|---|---|---|---|---|---|
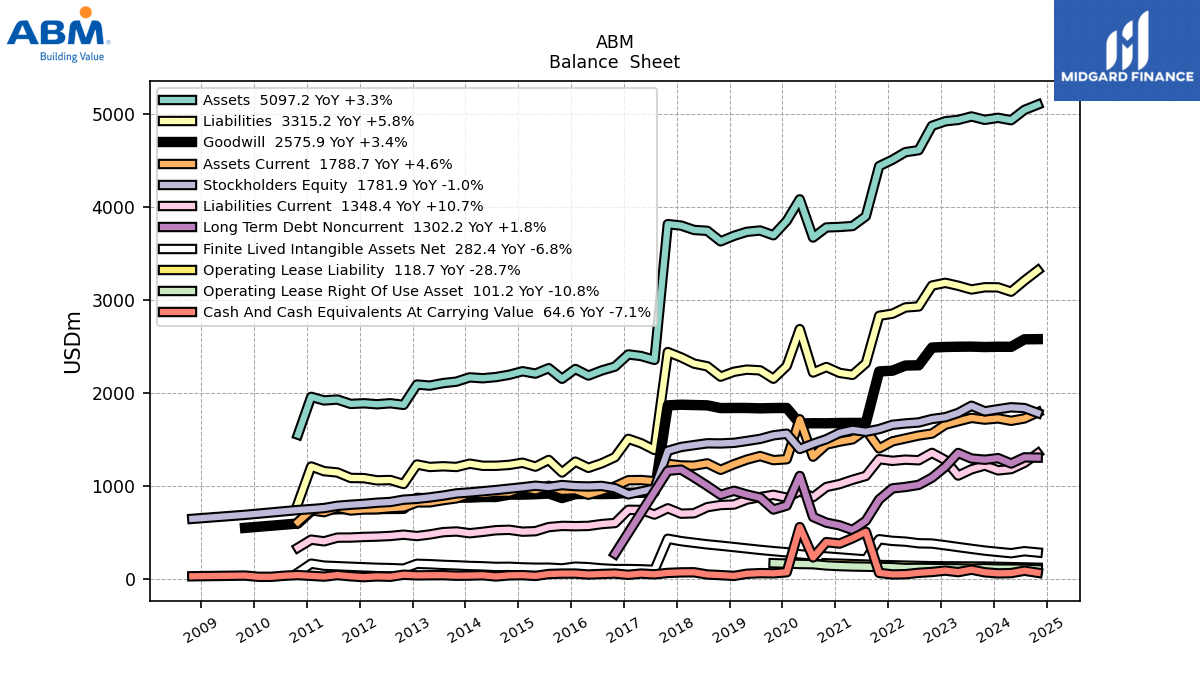
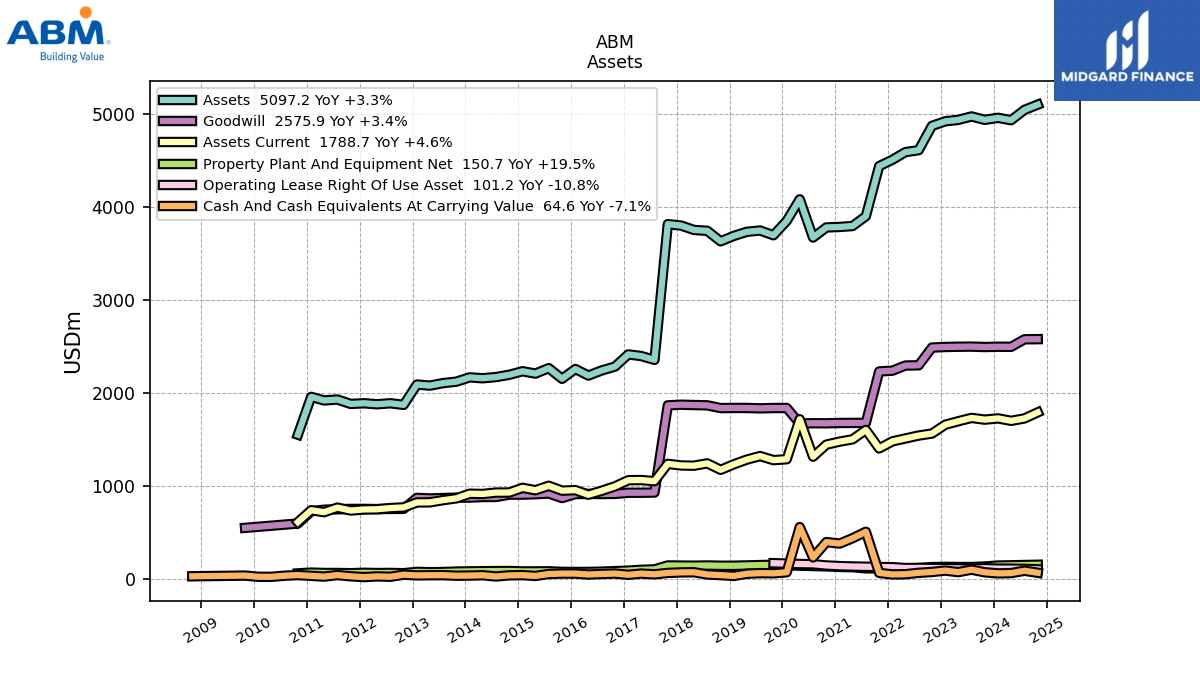
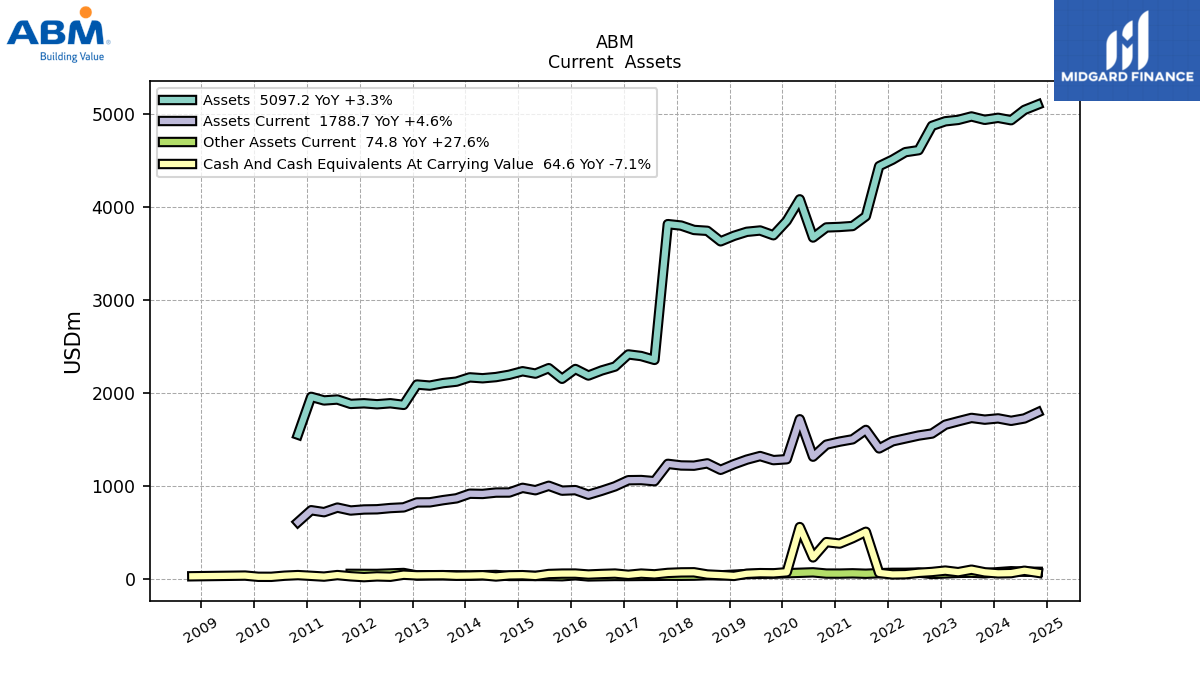
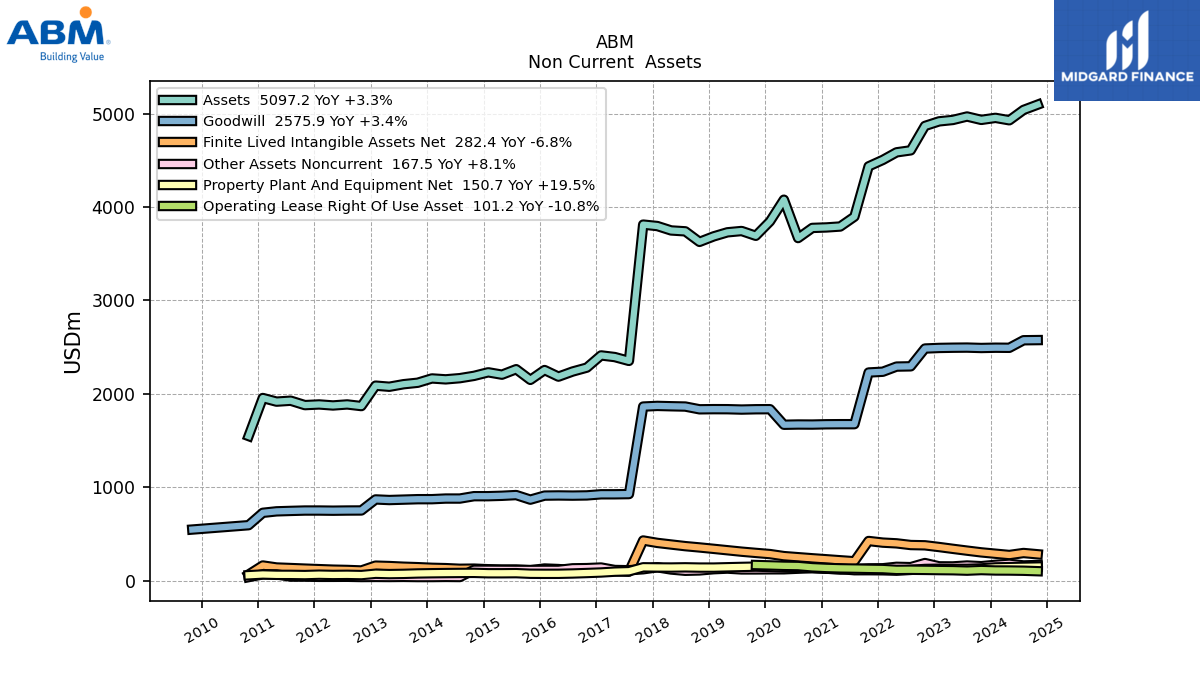
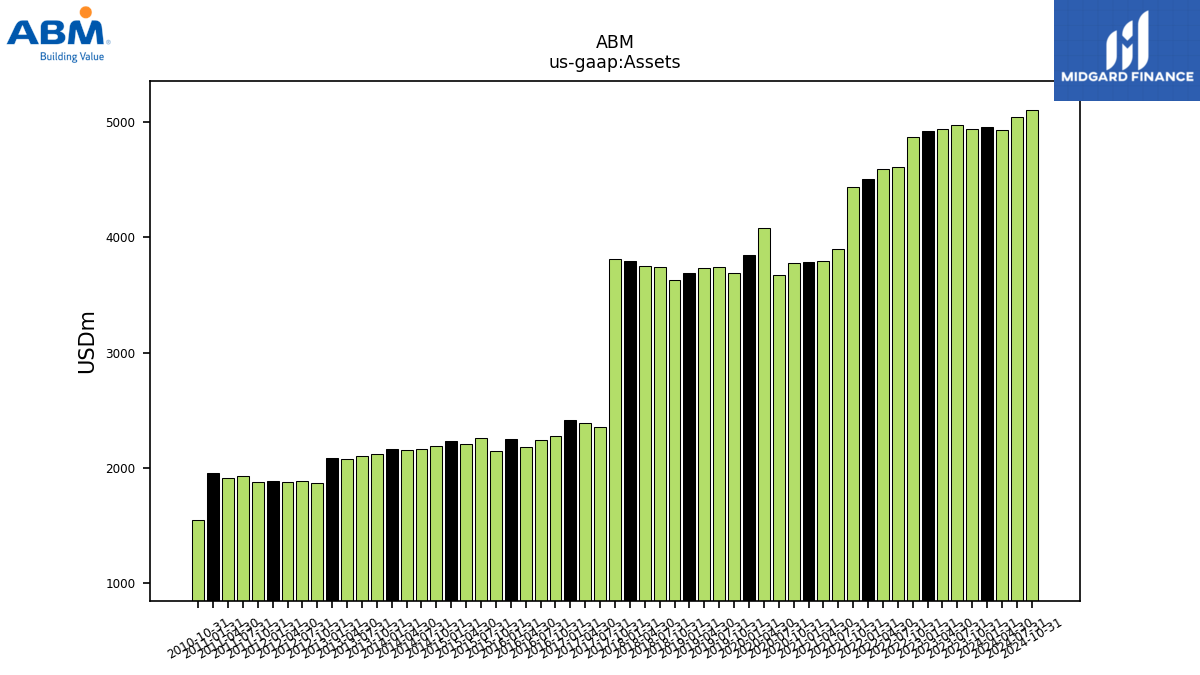
| Assets | 4955.40 | 4933.70 | 4970.00 | 4932.90 | 4918.00 | 4868.90 | 4607.60 | 4586.30 | 4504.90 | 4436.20 | 3897.40 | 3792.00 | 3782.20 | 3776.90 | 3668.30 | 4079.20 | 3847.10 | 3692.60 | 3744.00 | 3729.90 | 3686.40 | 3627.50 | 3740.40 | 3749.90 | 3797.00 | 3812.60 | 2352.90 | 2394.20 | 2411.90 | 2281.20 | 2239.40 | 2184.50 | 2255.20 | 2149.80 | 2264.20 | 2205.60 | 2230.90 | 2192.90 | 2168.20 | 2155.50 | 2165.21 | 2119.24 | 2103.40 | 2076.39 | 2088.15 | 1869.25 | 1886.89 | 1875.94 | 1886.80 | 1879.60 | 1926.84 | 1916.99 | 1955.84 | 1548.67 | NA | NA | NA | |
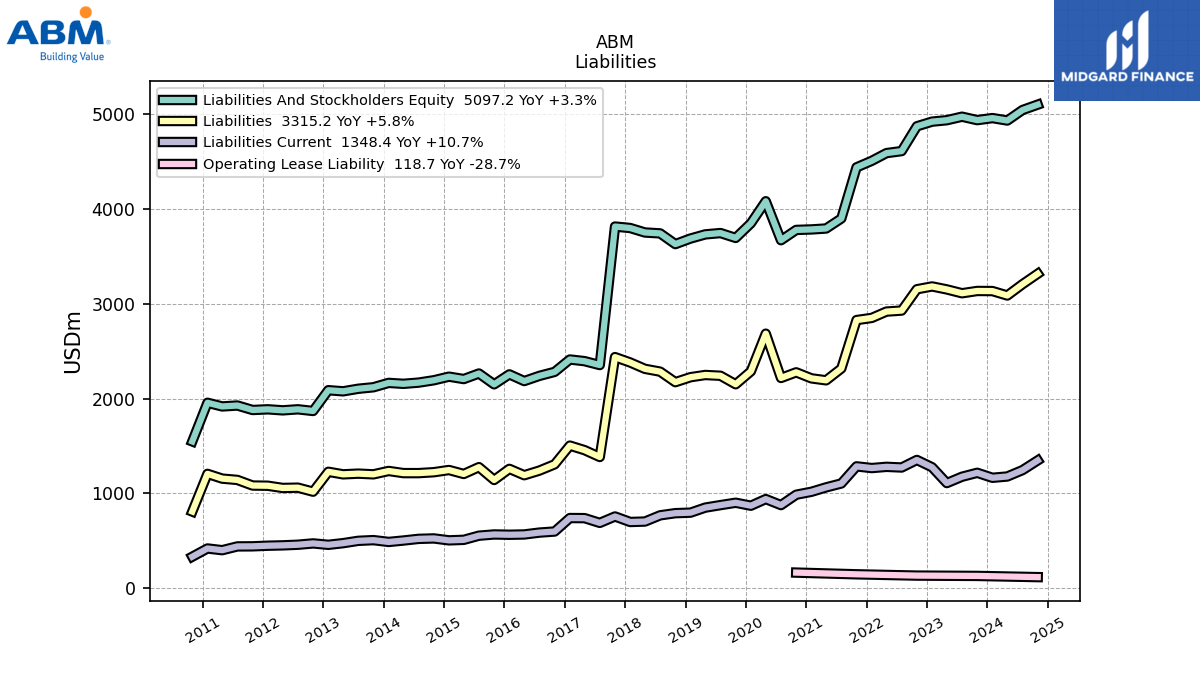
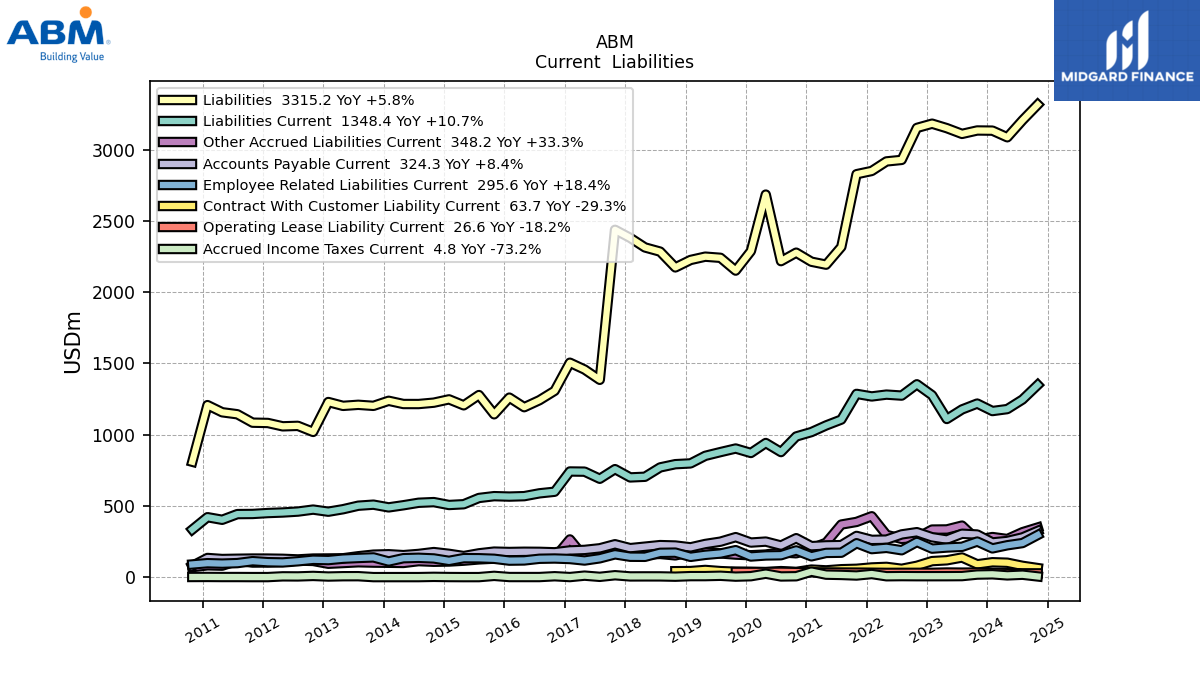
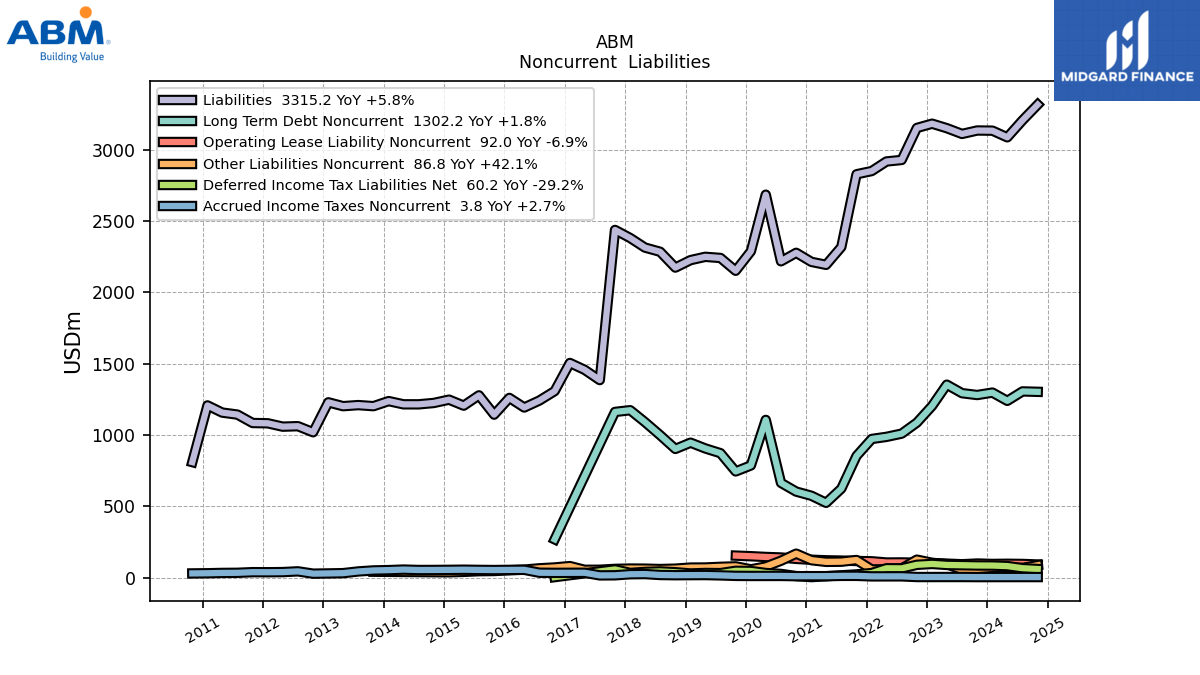
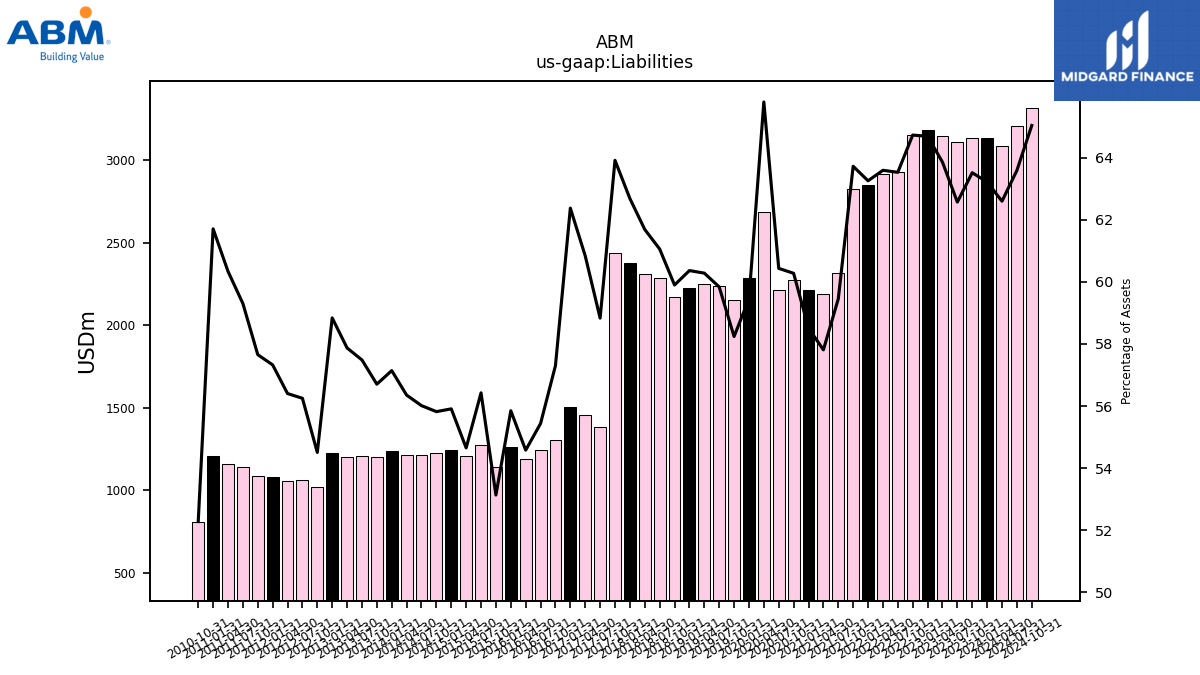
| Liabilities | 3132.70 | 3133.80 | 3109.80 | 3150.10 | 3181.50 | 3151.70 | 2927.30 | 2916.70 | 2849.70 | 2827.00 | 2317.10 | 2192.20 | 2213.10 | 2276.60 | 2217.00 | 2684.00 | 2287.40 | 2150.60 | 2240.40 | 2248.50 | 2225.30 | 2172.90 | 2283.90 | 2313.30 | 2380.20 | 2436.90 | 1384.30 | 1456.60 | 1504.50 | 1307.20 | 1241.50 | 1192.30 | 1259.50 | 1142.30 | 1277.60 | 1205.40 | 1247.30 | 1224.10 | 1214.50 | 1214.70 | 1237.26 | 1201.73 | 1209.16 | 1201.66 | 1228.68 | 1018.85 | 1061.40 | 1058.10 | 1081.64 | 1083.71 | 1142.70 | 1156.73 | 1206.95 | 809.64 | NA | NA | NA | |
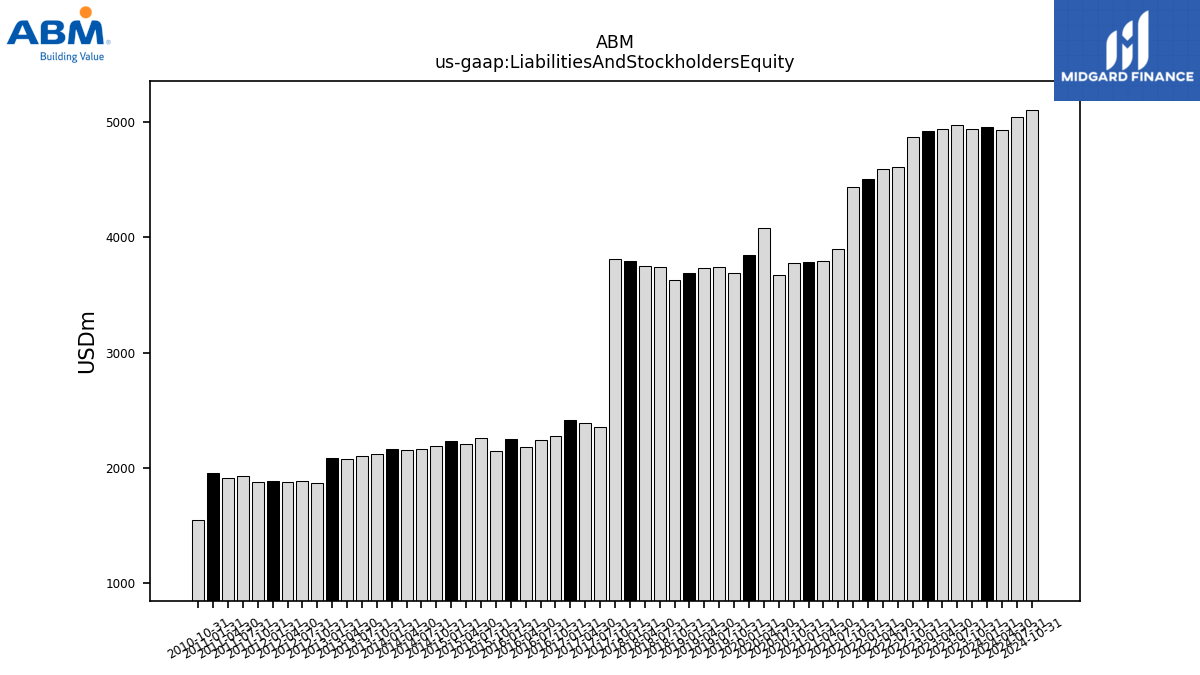
| Liabilities And Stockholders Equity | 4955.40 | 4933.70 | 4970.00 | 4932.90 | 4918.00 | 4868.90 | 4607.60 | 4586.30 | 4504.90 | 4436.20 | 3897.40 | 3792.00 | 3782.20 | 3776.90 | 3668.30 | 4079.20 | 3847.10 | 3692.60 | 3744.00 | 3729.90 | 3686.40 | 3627.50 | 3740.40 | 3749.90 | 3797.00 | 3812.60 | 2352.90 | 2394.20 | 2411.90 | 2281.20 | 2239.40 | 2184.50 | 2255.20 | 2149.80 | 2264.20 | 2205.60 | 2230.90 | 2192.90 | 2168.20 | 2155.50 | 2165.21 | 2119.24 | 2103.40 | 2076.39 | 2088.15 | 1869.25 | 1886.89 | 1875.94 | 1886.80 | 1879.60 | 1926.84 | 1916.99 | 1955.84 | 1548.67 | NA | NA | NA | |
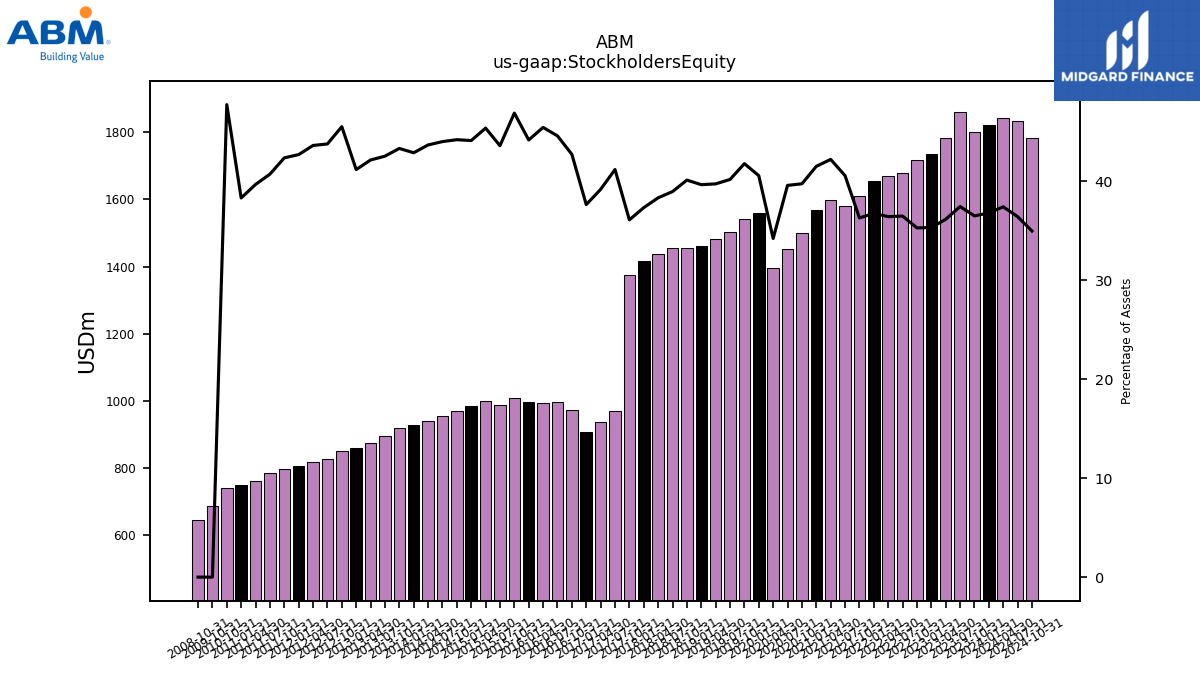
| Stockholders Equity | 1822.70 | 1799.90 | 1860.10 | 1782.80 | 1736.50 | 1717.20 | 1680.30 | 1669.60 | 1655.20 | 1609.20 | 1580.30 | 1599.80 | 1569.10 | 1500.30 | 1451.30 | 1395.20 | 1559.70 | 1542.00 | 1503.60 | 1481.40 | 1461.10 | 1454.60 | 1456.40 | 1436.60 | 1416.80 | 1375.70 | 968.60 | 937.60 | 907.40 | 974.00 | 997.90 | 992.20 | 995.70 | 1007.50 | 986.60 | 1000.20 | 983.60 | 968.80 | 953.70 | 940.80 | 927.96 | 917.51 | 894.24 | 874.73 | 859.46 | 850.40 | 825.49 | 817.84 | 805.16 | 795.89 | 784.14 | 760.26 | 748.89 | 739.02 | NA | NA | NA |
| 2024-01-31 | 2023-10-31 | 2023-07-31 | 2023-04-30 | 2023-01-31 | 2022-10-31 | 2022-07-31 | 2022-04-30 | 2022-01-31 | 2021-10-31 | 2021-07-31 | 2021-04-30 | 2021-01-31 | 2020-10-31 | 2020-07-31 | 2020-04-30 | 2020-01-31 | 2019-10-31 | 2019-07-31 | 2019-04-30 | 2019-01-31 | 2018-10-31 | 2018-07-31 | 2018-04-30 | 2018-01-31 | 2017-10-31 | 2017-07-31 | 2017-04-30 | 2017-01-31 | 2016-10-31 | 2016-07-31 | 2016-04-30 | 2016-01-31 | 2015-10-31 | 2015-07-31 | 2015-04-30 | 2015-01-31 | 2014-10-31 | 2014-07-31 | 2014-04-30 | 2014-01-31 | 2013-10-31 | 2013-07-31 | 2013-04-30 | 2013-01-31 | 2012-10-31 | 2012-07-31 | 2012-04-30 | 2012-01-31 | 2011-10-31 | 2011-07-31 | 2011-04-30 | 2011-01-31 | 2010-10-31 | 2010-07-31 | 2010-04-30 | 2010-01-31 | ||
|---|---|---|---|---|---|---|---|---|---|---|---|---|---|---|---|---|---|---|---|---|---|---|---|---|---|---|---|---|---|---|---|---|---|---|---|---|---|---|---|---|---|---|---|---|---|---|---|---|---|---|---|---|---|---|---|---|---|---|
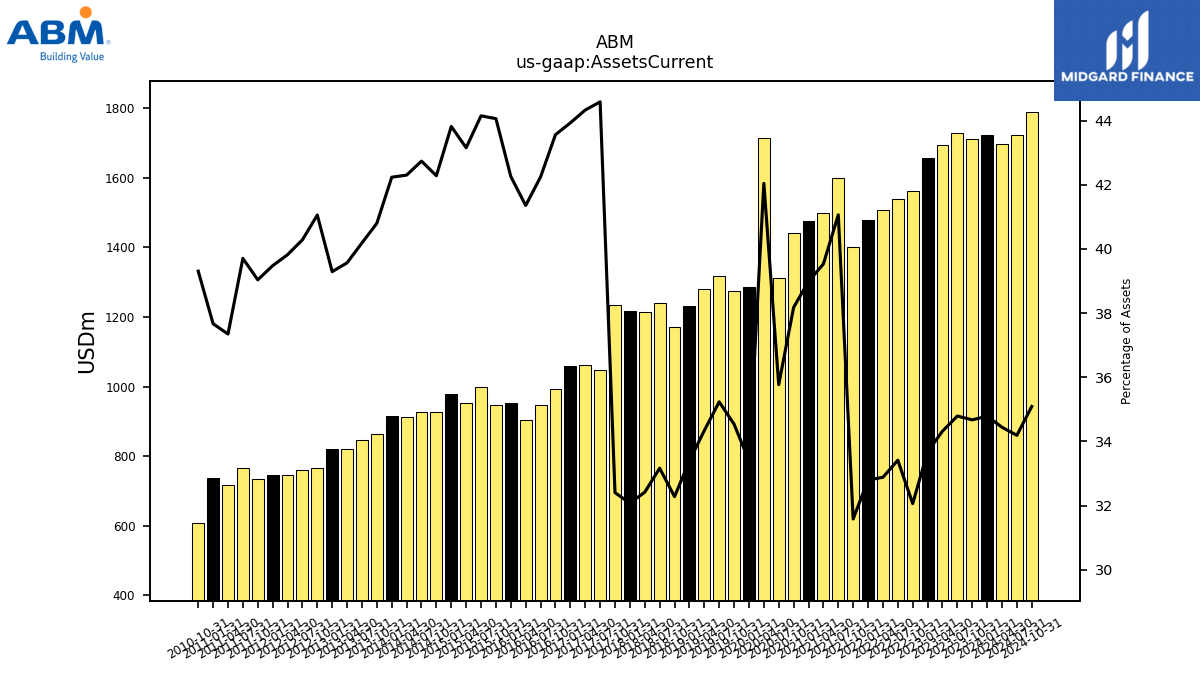
| Assets Current | 1723.90 | 1710.70 | 1729.20 | 1693.00 | 1656.30 | 1561.20 | 1539.70 | 1508.20 | 1477.50 | 1401.20 | 1600.30 | 1499.00 | 1474.60 | 1441.90 | 1312.20 | 1715.00 | 1284.90 | 1275.40 | 1319.20 | 1280.90 | 1231.10 | 1171.00 | 1240.60 | 1215.70 | 1218.10 | 1235.50 | 1049.00 | 1061.30 | 1059.50 | 993.70 | 946.00 | 903.40 | 953.00 | 947.20 | 999.60 | 951.80 | 977.50 | 927.20 | 926.60 | 911.80 | 914.47 | 864.63 | 845.29 | 821.58 | 820.48 | 767.43 | 760.11 | 747.01 | 744.87 | 733.76 | 765.06 | 715.97 | 736.75 | 608.76 | NA | NA | NA | |
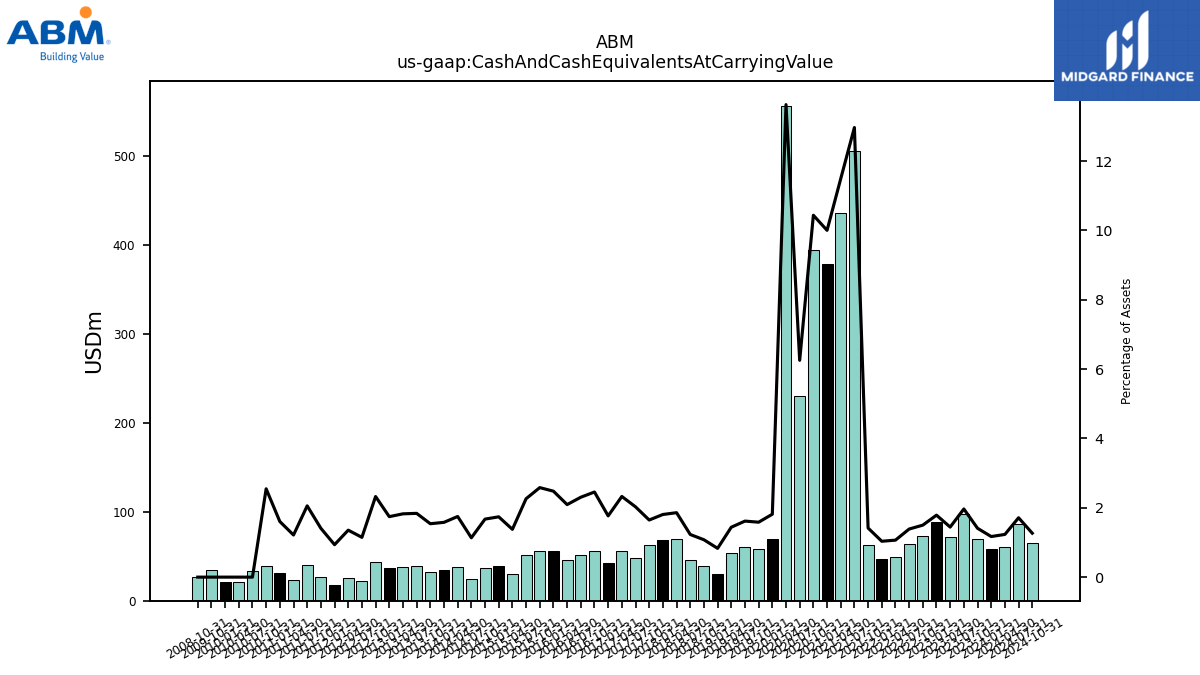
| Cash And Cash Equivalents At Carrying Value | 58.00 | 69.50 | 97.70 | 71.20 | 87.90 | 73.00 | 63.90 | 48.90 | 46.60 | 62.80 | 505.40 | 435.70 | 378.30 | 394.20 | 229.40 | 555.90 | 69.80 | 58.50 | 60.50 | 53.70 | 30.60 | 39.10 | 46.00 | 69.70 | 68.60 | 62.80 | 47.70 | 55.70 | 42.60 | 56.00 | 51.60 | 45.70 | 55.90 | 55.50 | 51.20 | 30.40 | 38.80 | 36.70 | 24.60 | 37.70 | 34.21 | 32.64 | 38.69 | 37.91 | 36.43 | 43.46 | 21.65 | 25.41 | 17.65 | 26.47 | 39.61 | 23.29 | 31.36 | 39.45 | 32.90 | 20.94 | 21.18 | |
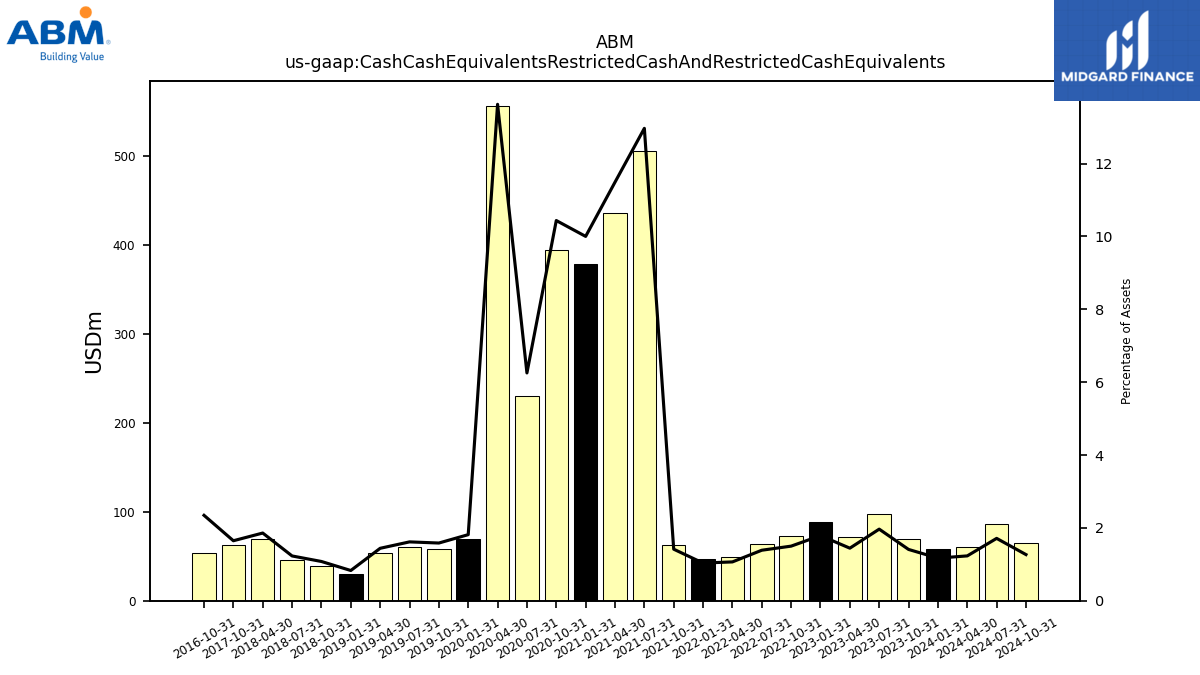
| Cash Cash Equivalents Restricted Cash And Restricted Cash Equivalents | 58.00 | 69.50 | 97.70 | 71.20 | 87.90 | 73.00 | 63.90 | 48.90 | 46.60 | 62.80 | 505.40 | 435.70 | 378.30 | 394.20 | 229.40 | 555.90 | 69.80 | 58.50 | 60.50 | 53.70 | 30.60 | 39.10 | 46.00 | 69.70 | NA | 62.80 | NA | NA | NA | 53.50 | NA | NA | NA | NA | NA | NA | NA | NA | NA | NA | NA | NA | NA | NA | NA | NA | NA | NA | NA | NA | NA | NA | NA | NA | NA | NA | NA | |
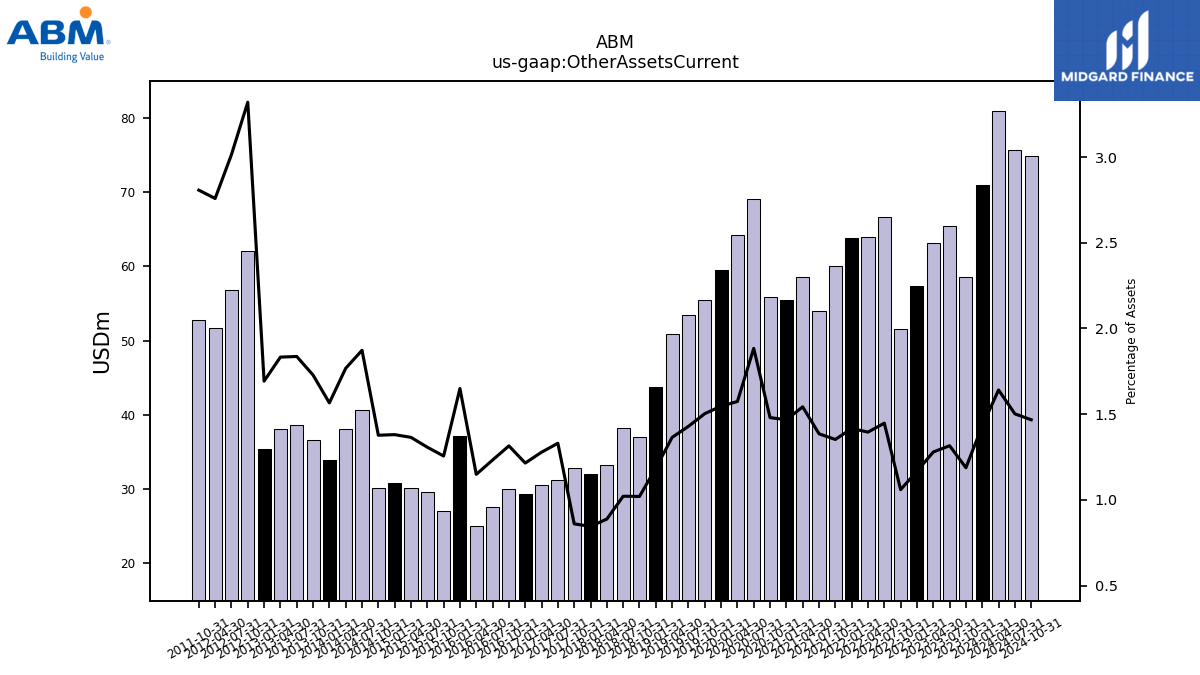
| Other Assets Current | 70.90 | 58.60 | 65.40 | 63.10 | 57.40 | 51.60 | 66.70 | 64.00 | 63.80 | 60.00 | 54.00 | 58.50 | 55.50 | 55.90 | 69.10 | 64.20 | 59.50 | 55.50 | 53.50 | 50.90 | 43.70 | 37.00 | 38.20 | 33.30 | 32.10 | 32.80 | 31.30 | 30.60 | 29.30 | 30.00 | 27.60 | 25.10 | 37.20 | 27.00 | 29.60 | 30.10 | 30.80 | 30.20 | 40.60 | 38.10 | 33.91 | 36.62 | 38.63 | 38.06 | 35.35 | 62.05 | 56.87 | 51.74 | NA | 52.76 | NA | NA | NA | NA | NA | NA | NA |
| 2024-01-31 | 2023-10-31 | 2023-07-31 | 2023-04-30 | 2023-01-31 | 2022-10-31 | 2022-07-31 | 2022-04-30 | 2022-01-31 | 2021-10-31 | 2021-07-31 | 2021-04-30 | 2021-01-31 | 2020-10-31 | 2020-07-31 | 2020-04-30 | 2020-01-31 | 2019-10-31 | 2019-07-31 | 2019-04-30 | 2019-01-31 | 2018-10-31 | 2018-07-31 | 2018-04-30 | 2018-01-31 | 2017-10-31 | 2017-07-31 | 2017-04-30 | 2017-01-31 | 2016-10-31 | 2016-07-31 | 2016-04-30 | 2016-01-31 | 2015-10-31 | 2015-07-31 | 2015-04-30 | 2015-01-31 | 2014-10-31 | 2014-07-31 | 2014-04-30 | 2014-01-31 | 2013-10-31 | 2013-07-31 | 2013-04-30 | 2013-01-31 | 2012-10-31 | 2012-07-31 | 2012-04-30 | 2012-01-31 | 2011-10-31 | 2011-07-31 | 2011-04-30 | 2011-01-31 | 2010-10-31 | 2010-07-31 | 2010-04-30 | 2010-01-31 | ||
|---|---|---|---|---|---|---|---|---|---|---|---|---|---|---|---|---|---|---|---|---|---|---|---|---|---|---|---|---|---|---|---|---|---|---|---|---|---|---|---|---|---|---|---|---|---|---|---|---|---|---|---|---|---|---|---|---|---|---|
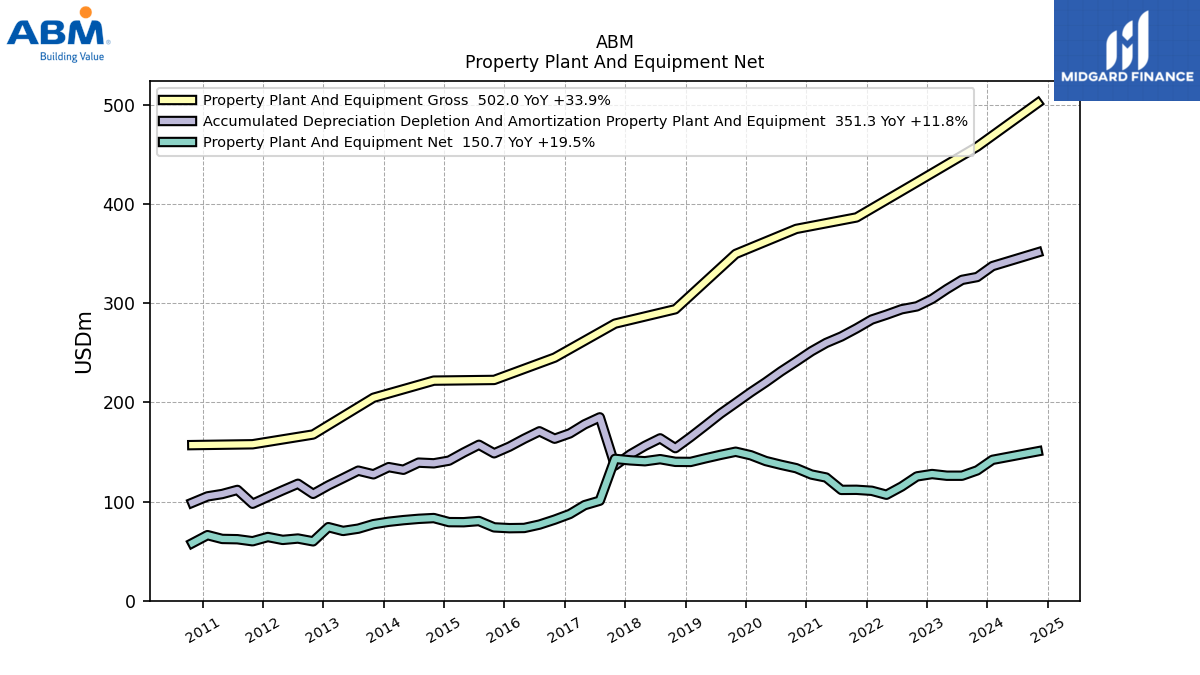
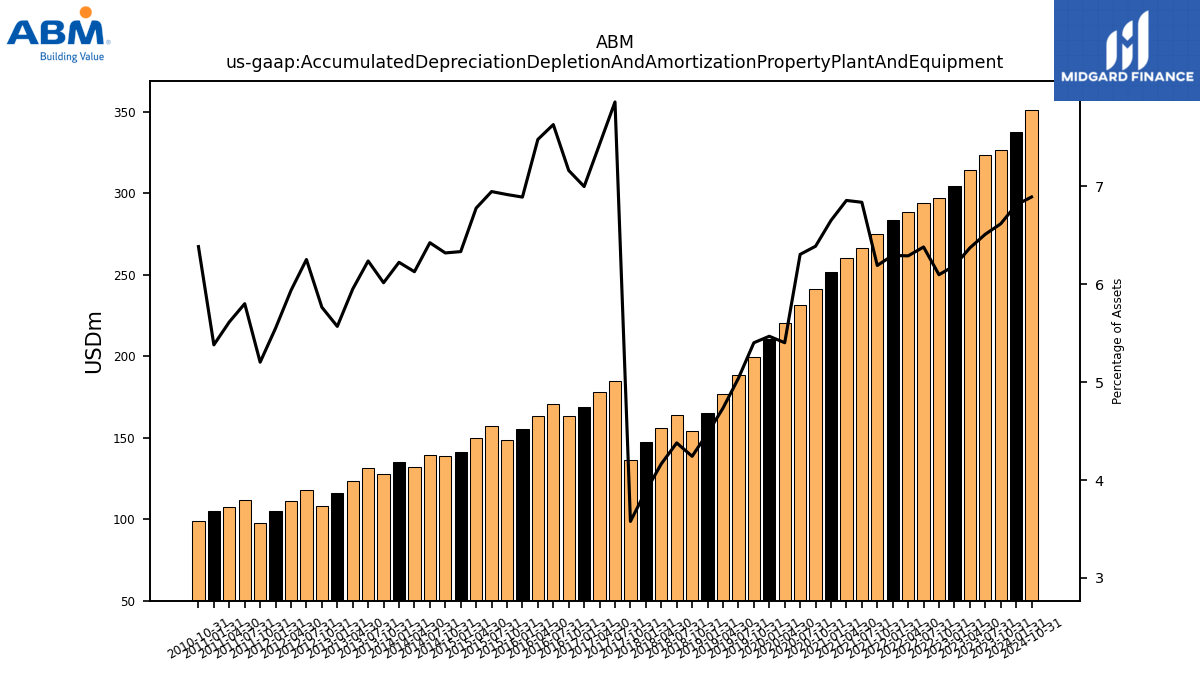
| Accumulated Depreciation Depletion And Amortization Property Plant And Equipment | 337.50 | 326.50 | 323.60 | 314.30 | 304.40 | 296.90 | 294.00 | 288.50 | 283.60 | 274.70 | 266.50 | 260.00 | 251.60 | 241.30 | 231.30 | 220.40 | 210.40 | 199.50 | 188.70 | 176.60 | 165.10 | 153.90 | 163.80 | 156.20 | 147.60 | 136.40 | 185.00 | 177.90 | 168.80 | 163.40 | 170.90 | 163.40 | 155.40 | 148.70 | 157.30 | 149.50 | 141.30 | 138.60 | 139.30 | 132.10 | 134.77 | 127.49 | 131.21 | 123.57 | 116.31 | 107.77 | 117.98 | 111.39 | 104.75 | 97.82 | 111.79 | 107.64 | 105.25 | 98.88 | NA | NA | NA | |
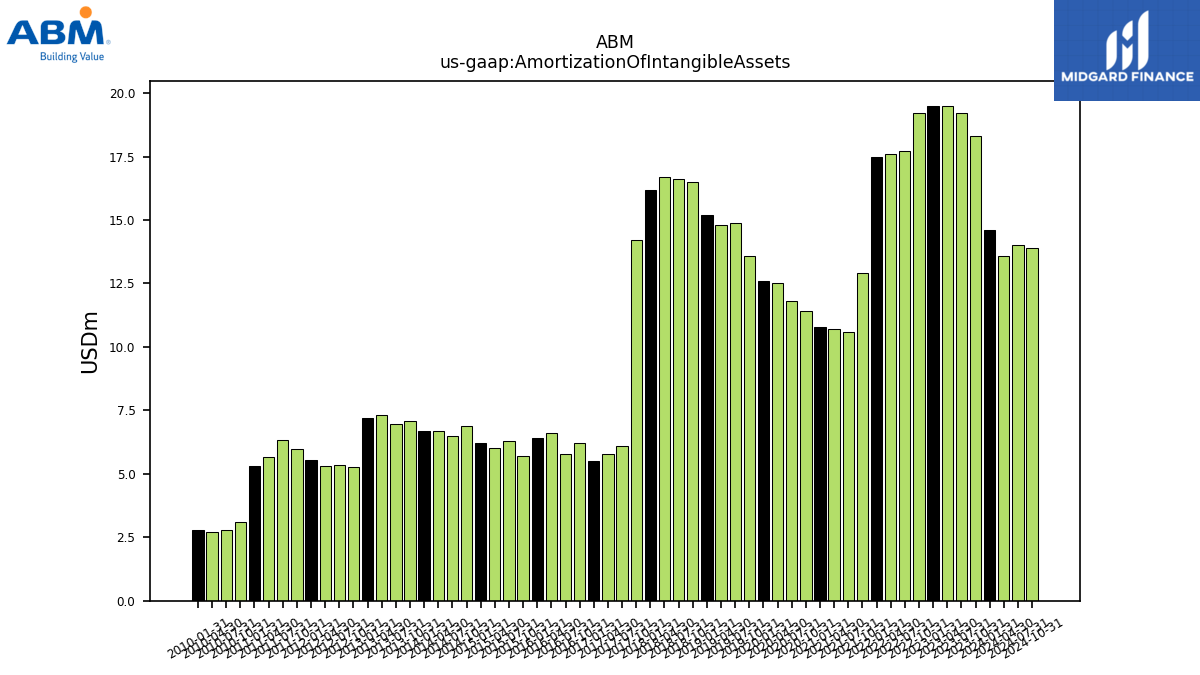
| Amortization Of Intangible Assets | 14.60 | 18.30 | 19.20 | 19.50 | 19.50 | 19.20 | 17.70 | 17.60 | 17.50 | 12.90 | 10.60 | 10.70 | 10.80 | 11.40 | 11.80 | 12.50 | 12.60 | 13.60 | 14.90 | 14.80 | 15.20 | 16.50 | 16.60 | 16.70 | 16.20 | 14.20 | 6.10 | 5.80 | 5.50 | 6.20 | 5.80 | 6.60 | 6.40 | 5.70 | 6.30 | 6.00 | 6.20 | 6.90 | 6.50 | 6.70 | 6.70 | 7.08 | 6.97 | 7.30 | 7.19 | 5.28 | 5.33 | 5.30 | 5.55 | 5.97 | 6.31 | 5.67 | 5.29 | 3.11 | 2.78 | 2.69 | 2.77 | |
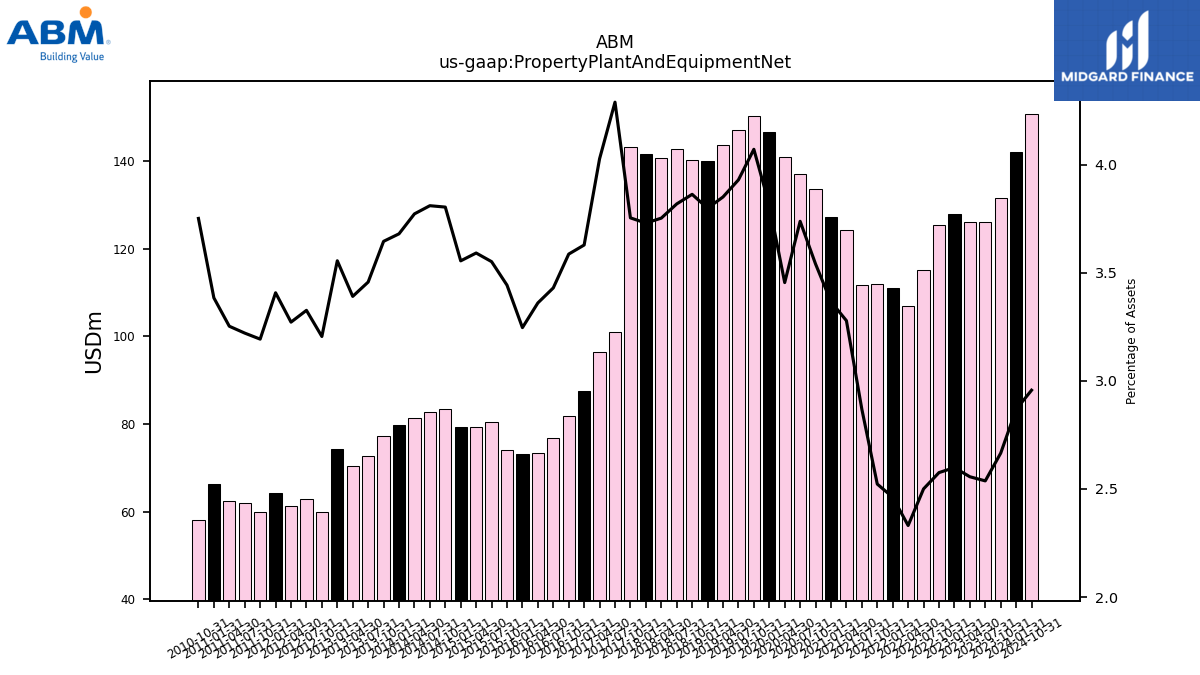
| Property Plant And Equipment Net | 142.10 | 131.50 | 126.10 | 126.10 | 127.80 | 125.40 | 115.20 | 106.90 | 110.90 | 111.90 | 111.80 | 124.30 | 127.30 | 133.70 | 137.10 | 140.90 | 146.70 | 150.30 | 147.10 | 143.60 | 140.00 | 140.10 | 142.80 | 140.70 | 141.60 | 143.10 | 100.90 | 96.40 | 87.50 | 81.80 | 76.80 | 73.40 | 73.20 | 74.00 | 80.40 | 79.20 | 79.30 | 83.40 | 82.60 | 81.30 | 79.67 | 77.24 | 72.70 | 70.40 | 74.23 | 59.91 | 62.75 | 61.37 | 64.28 | 60.01 | 62.05 | 62.35 | 66.18 | 58.09 | NA | NA | NA | |
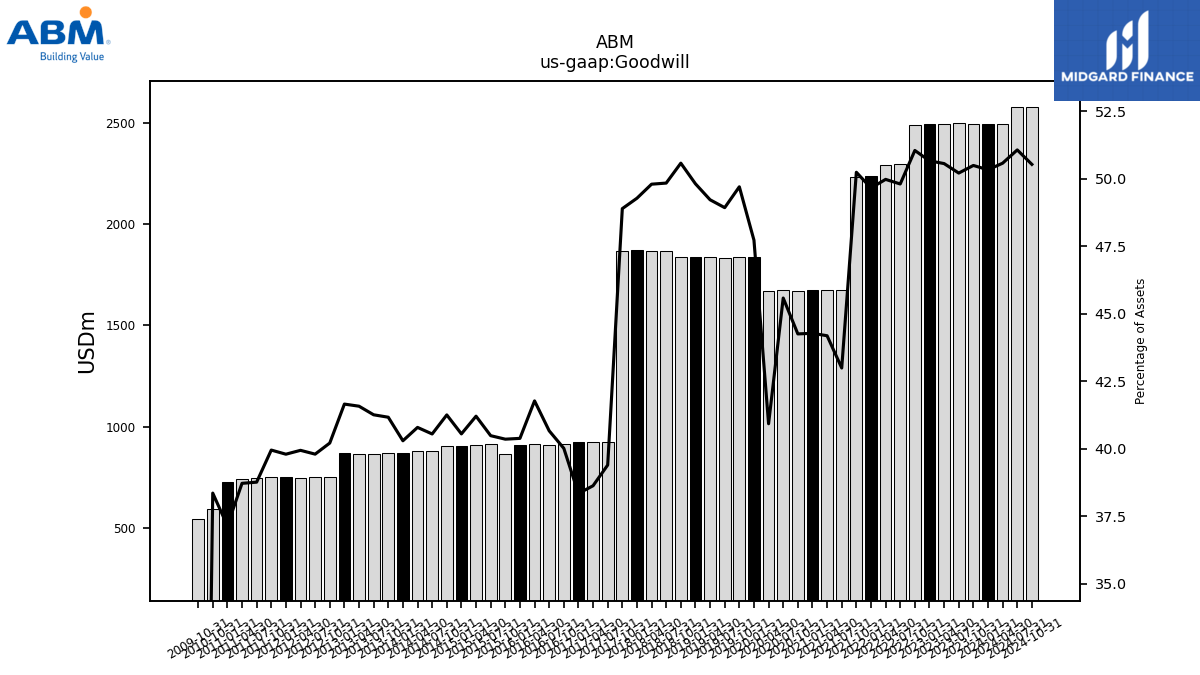
| Goodwill | 2494.30 | 2491.30 | 2495.60 | 2494.30 | 2491.80 | 2485.60 | 2295.00 | 2292.20 | 2237.10 | 2228.90 | 1675.50 | 1675.50 | 1674.60 | 1671.40 | 1672.10 | 1669.40 | 1836.10 | 1835.40 | 1832.00 | 1836.00 | 1836.40 | 1834.80 | 1864.30 | 1867.50 | 1871.20 | 1864.20 | 926.90 | 924.80 | 924.70 | 912.80 | 910.60 | 912.50 | 910.70 | 867.50 | 916.60 | 908.80 | 904.60 | 904.60 | 879.10 | 879.20 | 872.44 | 872.40 | 867.78 | 863.25 | 869.77 | 751.61 | 750.94 | 749.23 | 750.87 | 750.87 | 746.83 | 742.18 | 726.52 | 593.98 | NA | NA | NA | |
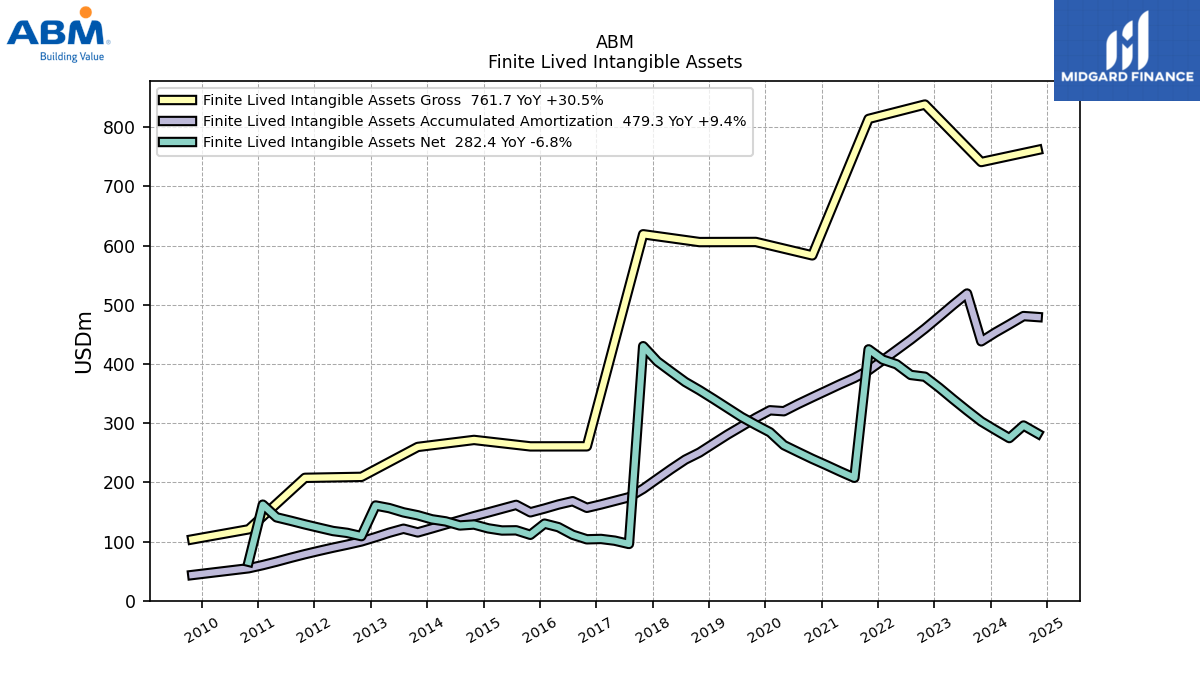
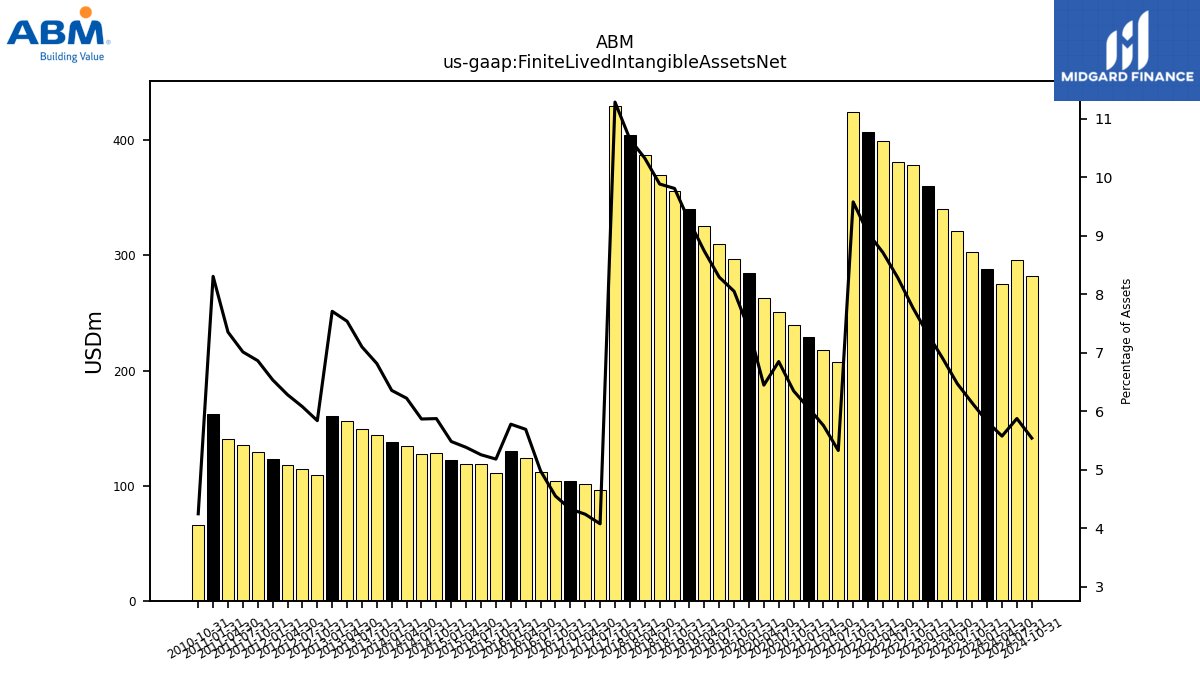
| Finite Lived Intangible Assets Net | 288.50 | 302.90 | 321.50 | 340.80 | 360.10 | 378.50 | 381.50 | 399.50 | 407.30 | 424.80 | 207.70 | 218.30 | 229.00 | 239.70 | 251.20 | 262.90 | 284.60 | 297.20 | 310.40 | 325.80 | 340.70 | 355.70 | 369.60 | 387.10 | 404.30 | 430.10 | 95.90 | 101.50 | 104.40 | 103.80 | 111.50 | 124.30 | 130.30 | 111.40 | 119.00 | 118.70 | 122.30 | 128.80 | 127.20 | 134.10 | 137.59 | 144.40 | 149.31 | 156.49 | 160.92 | 109.14 | 114.66 | 117.83 | 123.31 | 128.99 | 135.12 | 140.92 | 162.40 | 65.77 | NA | NA | NA | |
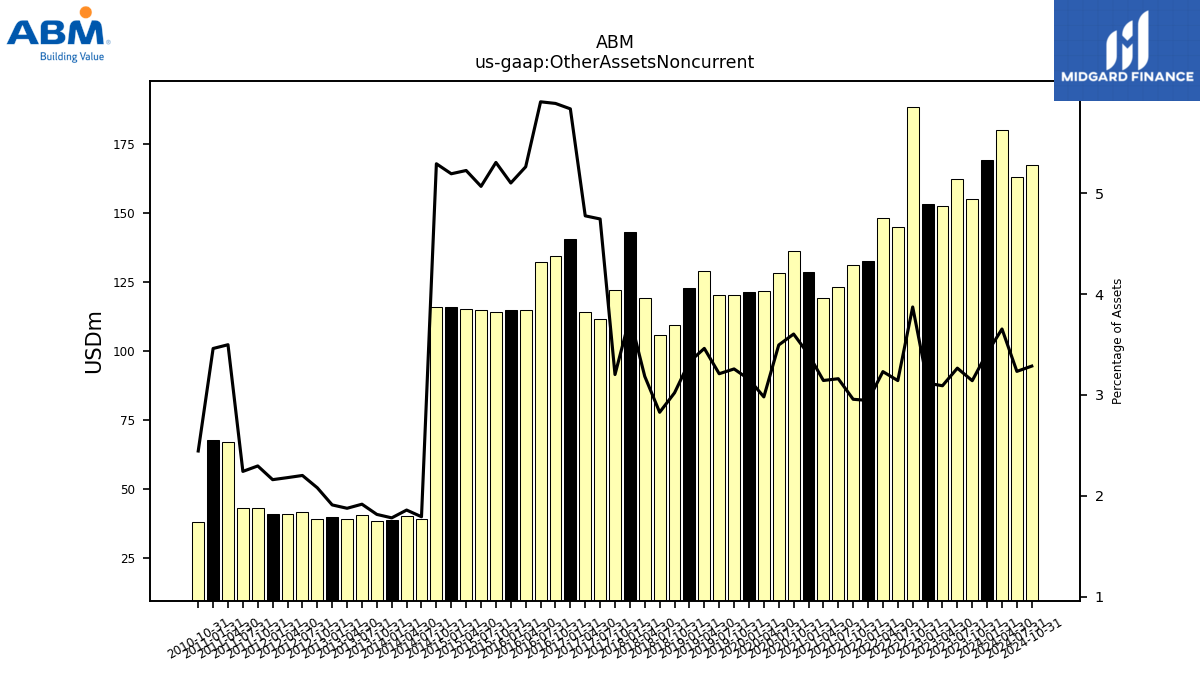
| Other Assets Noncurrent | 169.30 | 155.00 | 162.30 | 152.50 | 153.30 | 188.50 | 144.80 | 148.20 | 132.70 | 131.20 | 123.20 | 119.20 | 128.70 | 136.10 | 128.20 | 121.60 | 121.40 | 120.30 | 120.20 | 129.10 | 122.70 | 109.60 | 105.80 | 119.40 | 143.10 | 122.10 | 111.60 | 114.30 | 140.70 | 134.30 | 132.20 | 114.90 | 115.00 | 114.00 | 114.70 | 115.20 | 115.80 | 116.00 | 38.90 | 40.10 | 38.61 | 38.51 | 40.35 | 38.99 | 39.91 | 38.90 | 41.57 | 40.93 | 40.78 | 43.18 | 43.22 | 67.05 | 67.68 | 37.87 | NA | NA | NA |
| 2024-01-31 | 2023-10-31 | 2023-07-31 | 2023-04-30 | 2023-01-31 | 2022-10-31 | 2022-07-31 | 2022-04-30 | 2022-01-31 | 2021-10-31 | 2021-07-31 | 2021-04-30 | 2021-01-31 | 2020-10-31 | 2020-07-31 | 2020-04-30 | 2020-01-31 | 2019-10-31 | 2019-07-31 | 2019-04-30 | 2019-01-31 | 2018-10-31 | 2018-07-31 | 2018-04-30 | 2018-01-31 | 2017-10-31 | 2017-07-31 | 2017-04-30 | 2017-01-31 | 2016-10-31 | 2016-07-31 | 2016-04-30 | 2016-01-31 | 2015-10-31 | 2015-07-31 | 2015-04-30 | 2015-01-31 | 2014-10-31 | 2014-07-31 | 2014-04-30 | 2014-01-31 | 2013-10-31 | 2013-07-31 | 2013-04-30 | 2013-01-31 | 2012-10-31 | 2012-07-31 | 2012-04-30 | 2012-01-31 | 2011-10-31 | 2011-07-31 | 2011-04-30 | 2011-01-31 | 2010-10-31 | 2010-07-31 | 2010-04-30 | 2010-01-31 | ||
|---|---|---|---|---|---|---|---|---|---|---|---|---|---|---|---|---|---|---|---|---|---|---|---|---|---|---|---|---|---|---|---|---|---|---|---|---|---|---|---|---|---|---|---|---|---|---|---|---|---|---|---|---|---|---|---|---|---|---|
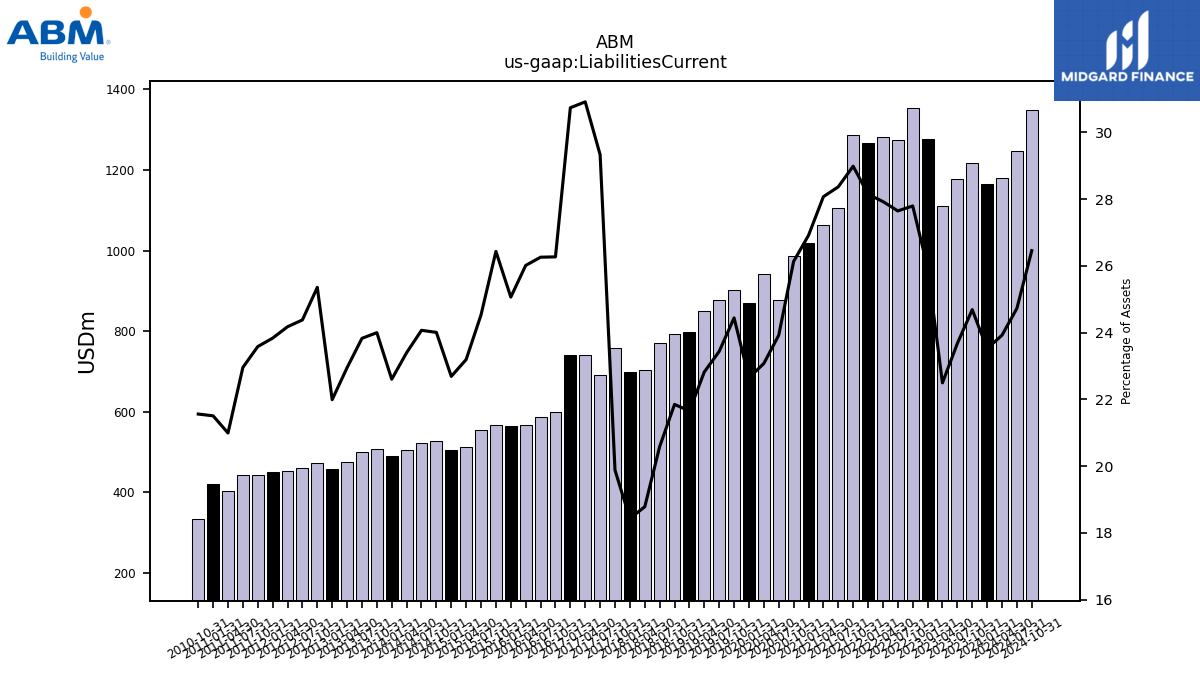
| Liabilities Current | 1165.30 | 1217.90 | 1176.50 | 1109.50 | 1276.30 | 1353.20 | 1273.70 | 1280.70 | 1267.80 | 1285.80 | 1105.50 | 1064.40 | 1017.80 | 986.90 | 877.40 | 941.20 | 871.10 | 902.40 | 877.40 | 851.10 | 798.00 | 792.50 | 769.80 | 704.20 | 699.60 | 757.80 | 690.10 | 740.10 | 741.30 | 599.20 | 588.00 | 568.20 | 565.20 | 568.20 | 555.40 | 511.50 | 506.10 | 526.40 | 521.80 | 504.30 | 489.35 | 508.52 | 501.15 | 476.46 | 459.15 | 473.91 | 459.98 | 453.48 | 449.66 | 443.20 | 442.31 | 402.36 | 420.58 | 333.85 | NA | NA | NA | |
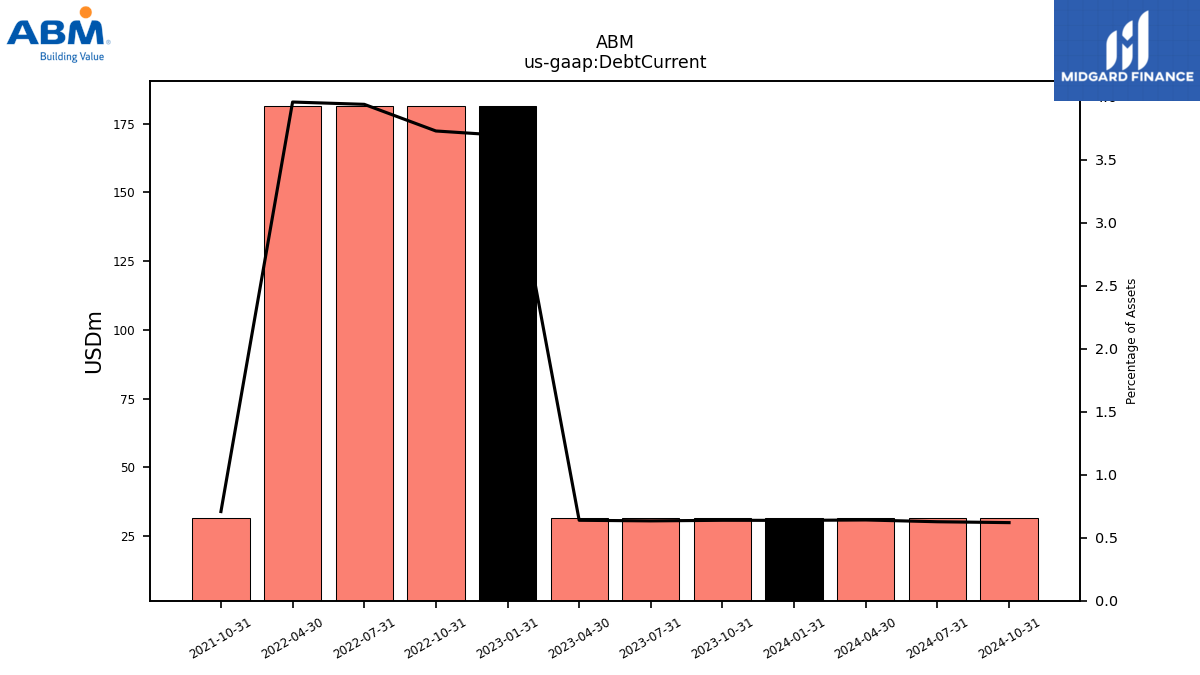
| Debt Current | 31.60 | 31.50 | 31.50 | 31.50 | 181.50 | 181.50 | 181.50 | 181.50 | NA | 31.40 | NA | NA | NA | NA | NA | NA | NA | NA | NA | NA | NA | NA | NA | NA | NA | NA | NA | NA | NA | NA | NA | NA | NA | NA | NA | NA | NA | NA | NA | NA | NA | NA | NA | NA | NA | NA | NA | NA | NA | NA | NA | NA | NA | NA | NA | NA | NA | |
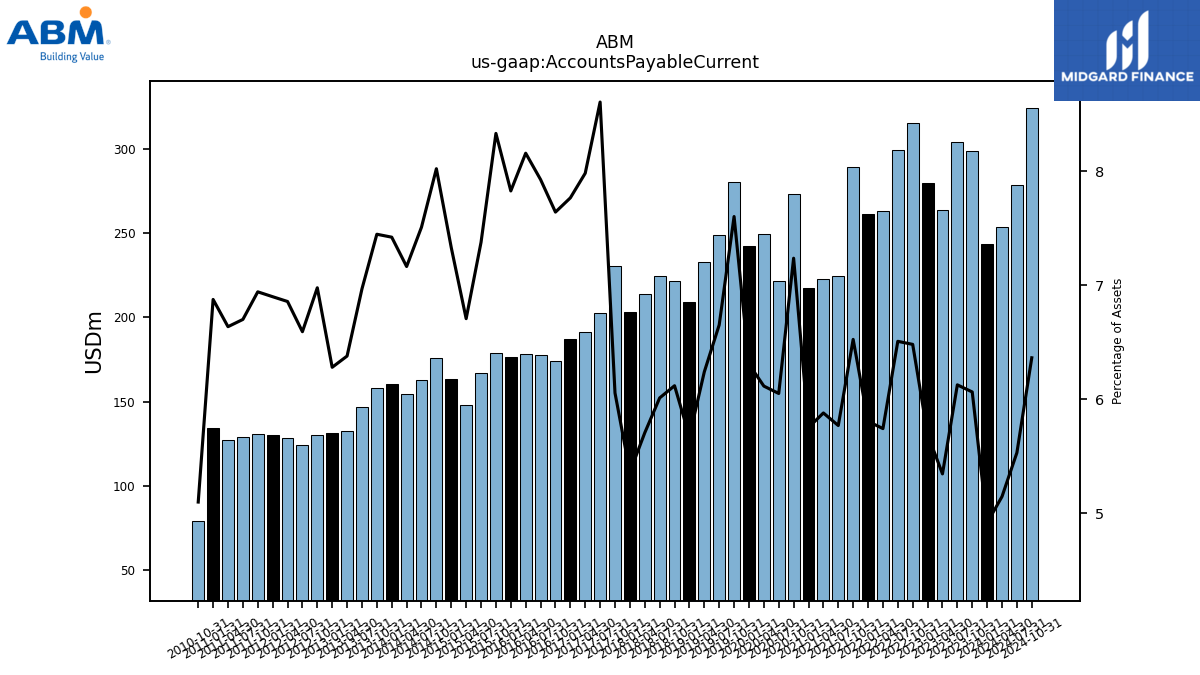
| Accounts Payable Current | 243.50 | 299.10 | 304.40 | 263.60 | 279.90 | 315.50 | 299.80 | 263.30 | 261.50 | 289.40 | 224.80 | 222.90 | 217.50 | 273.30 | 221.90 | 249.40 | 242.60 | 280.70 | 249.00 | 232.70 | 209.10 | 221.90 | 224.80 | 213.90 | 203.50 | 230.80 | 202.50 | 191.10 | 187.30 | 174.30 | 177.50 | 178.20 | 176.50 | 179.10 | 167.00 | 147.90 | 163.50 | 175.90 | 162.80 | 154.40 | 160.67 | 157.81 | 146.54 | 132.42 | 131.11 | 130.41 | 124.37 | 128.62 | 130.16 | 130.46 | 129.08 | 127.20 | 134.45 | 78.93 | NA | NA | NA | |
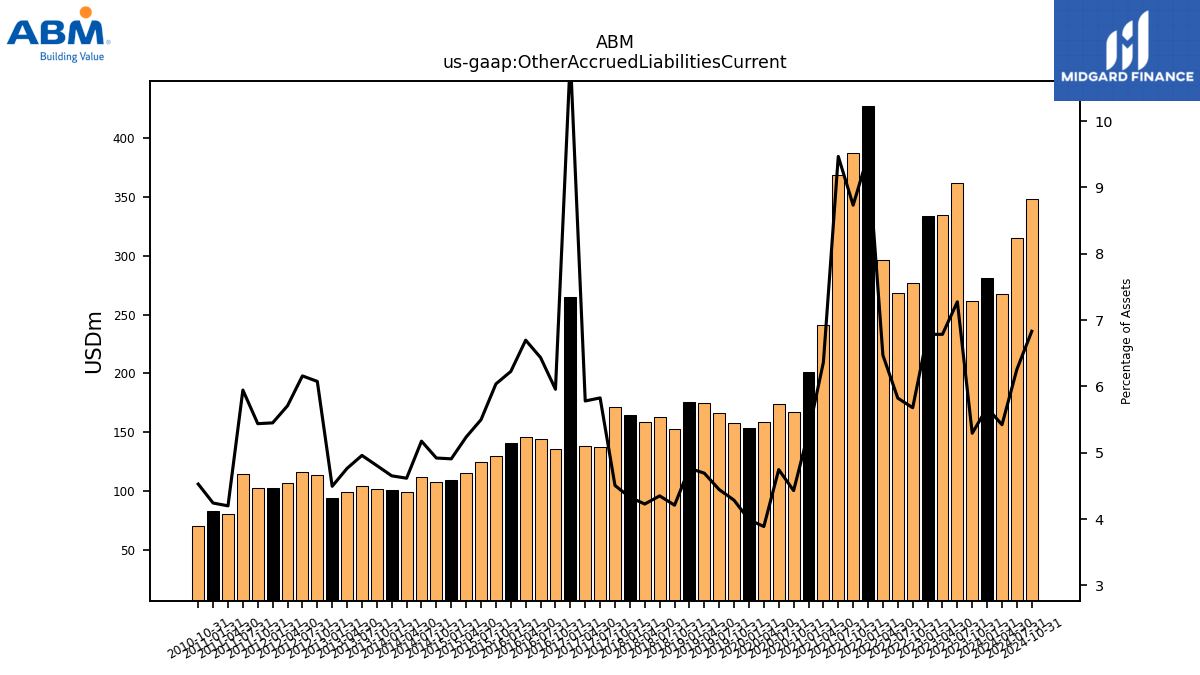
| Other Accrued Liabilities Current | 281.30 | 261.20 | 361.60 | 334.70 | 333.70 | 276.50 | 268.30 | 296.70 | 427.30 | 387.40 | 369.00 | 241.30 | 200.80 | 167.30 | 174.10 | 158.60 | 153.50 | 158.20 | 166.40 | 175.00 | 175.70 | 152.70 | 162.70 | 158.50 | 164.40 | 171.80 | 137.10 | 138.40 | 264.60 | 135.90 | 144.10 | 146.30 | 140.40 | 129.80 | 124.50 | 115.50 | 109.50 | 107.90 | 112.20 | 99.50 | 100.73 | 101.86 | 104.32 | 98.93 | 93.85 | 113.57 | 116.20 | 107.09 | 102.84 | 102.22 | 114.55 | 80.50 | 82.96 | 70.12 | NA | NA | NA | |
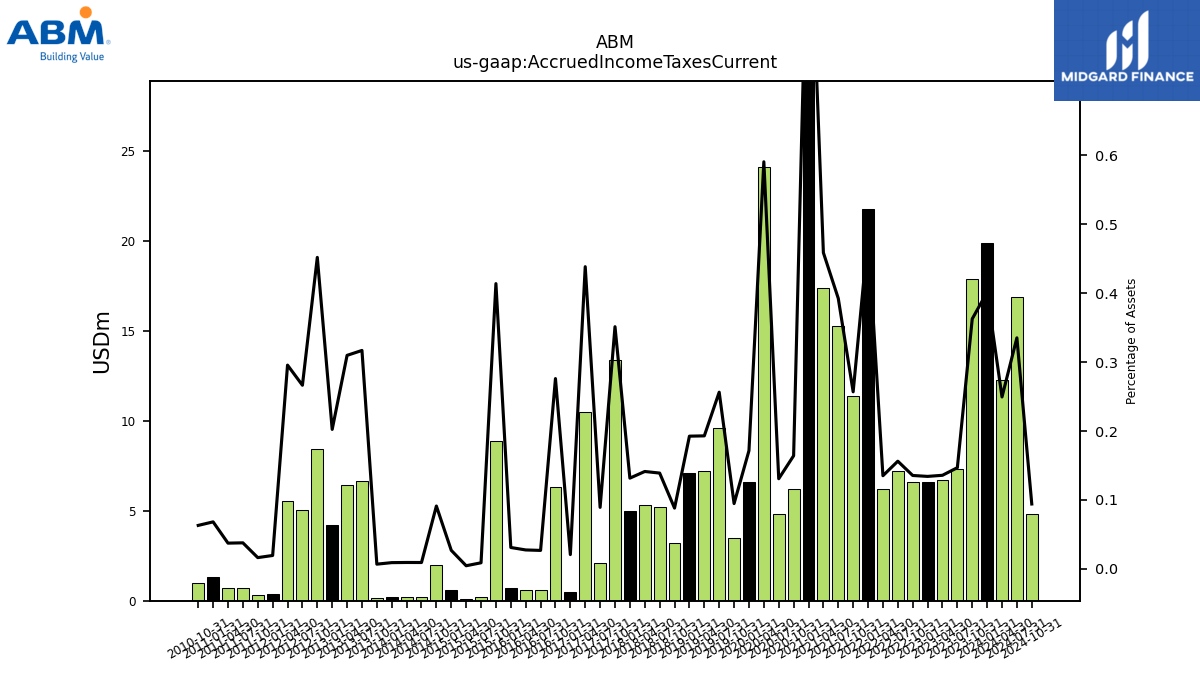
| Accrued Income Taxes Current | 19.90 | 17.90 | 7.30 | 6.70 | 6.60 | 6.60 | 7.20 | 6.20 | 21.80 | 11.40 | 15.30 | 17.40 | 38.60 | 6.20 | 4.80 | 24.10 | 6.60 | 3.50 | 9.60 | 7.20 | 7.10 | 3.20 | 5.20 | 5.30 | 5.00 | 13.40 | 2.10 | 10.50 | 0.50 | 6.30 | 0.60 | 0.60 | 0.70 | 8.90 | 0.20 | 0.10 | 0.60 | 2.00 | 0.20 | 0.20 | 0.20 | 0.14 | 6.67 | 6.43 | 4.23 | 8.45 | 5.03 | 5.55 | 0.37 | 0.31 | 0.73 | 0.72 | 1.33 | 0.98 | NA | NA | NA | |
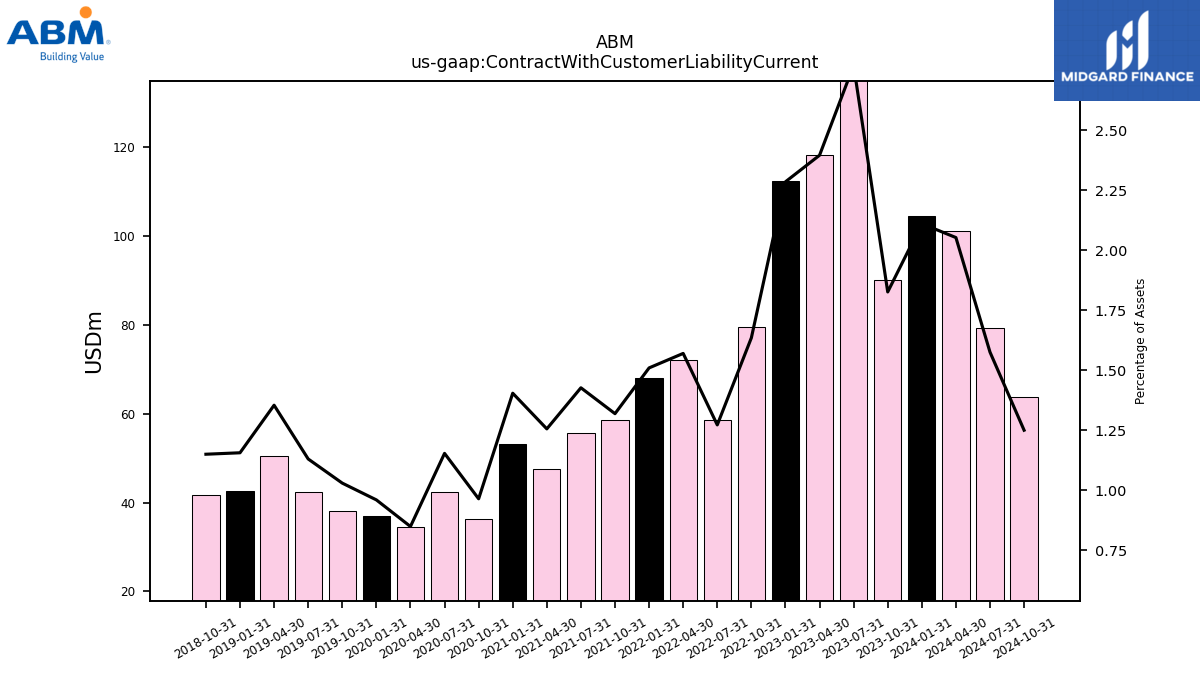
| Contract With Customer Liability Current | 104.60 | 90.10 | 137.70 | 118.20 | 112.40 | 79.60 | 58.60 | 72.00 | 68.00 | 58.50 | 55.60 | 47.60 | 53.10 | 36.40 | 42.30 | 34.60 | 36.90 | 38.00 | 42.30 | 50.50 | 42.60 | 41.70 | NA | NA | NA | NA | NA | NA | NA | NA | NA | NA | NA | NA | NA | NA | NA | NA | NA | NA | NA | NA | NA | NA | NA | NA | NA | NA | NA | NA | NA | NA | NA | NA | NA | NA | NA |
| 2024-01-31 | 2023-10-31 | 2023-07-31 | 2023-04-30 | 2023-01-31 | 2022-10-31 | 2022-07-31 | 2022-04-30 | 2022-01-31 | 2021-10-31 | 2021-07-31 | 2021-04-30 | 2021-01-31 | 2020-10-31 | 2020-07-31 | 2020-04-30 | 2020-01-31 | 2019-10-31 | 2019-07-31 | 2019-04-30 | 2019-01-31 | 2018-10-31 | 2018-07-31 | 2018-04-30 | 2018-01-31 | 2017-10-31 | 2017-07-31 | 2017-04-30 | 2017-01-31 | 2016-10-31 | 2016-07-31 | 2016-04-30 | 2016-01-31 | 2015-10-31 | 2015-07-31 | 2015-04-30 | 2015-01-31 | 2014-10-31 | 2014-07-31 | 2014-04-30 | 2014-01-31 | 2013-10-31 | 2013-07-31 | 2013-04-30 | 2013-01-31 | 2012-10-31 | 2012-07-31 | 2012-04-30 | 2012-01-31 | 2011-10-31 | 2011-07-31 | 2011-04-30 | 2011-01-31 | 2010-10-31 | 2010-07-31 | 2010-04-30 | 2010-01-31 | ||
|---|---|---|---|---|---|---|---|---|---|---|---|---|---|---|---|---|---|---|---|---|---|---|---|---|---|---|---|---|---|---|---|---|---|---|---|---|---|---|---|---|---|---|---|---|---|---|---|---|---|---|---|---|---|---|---|---|---|---|
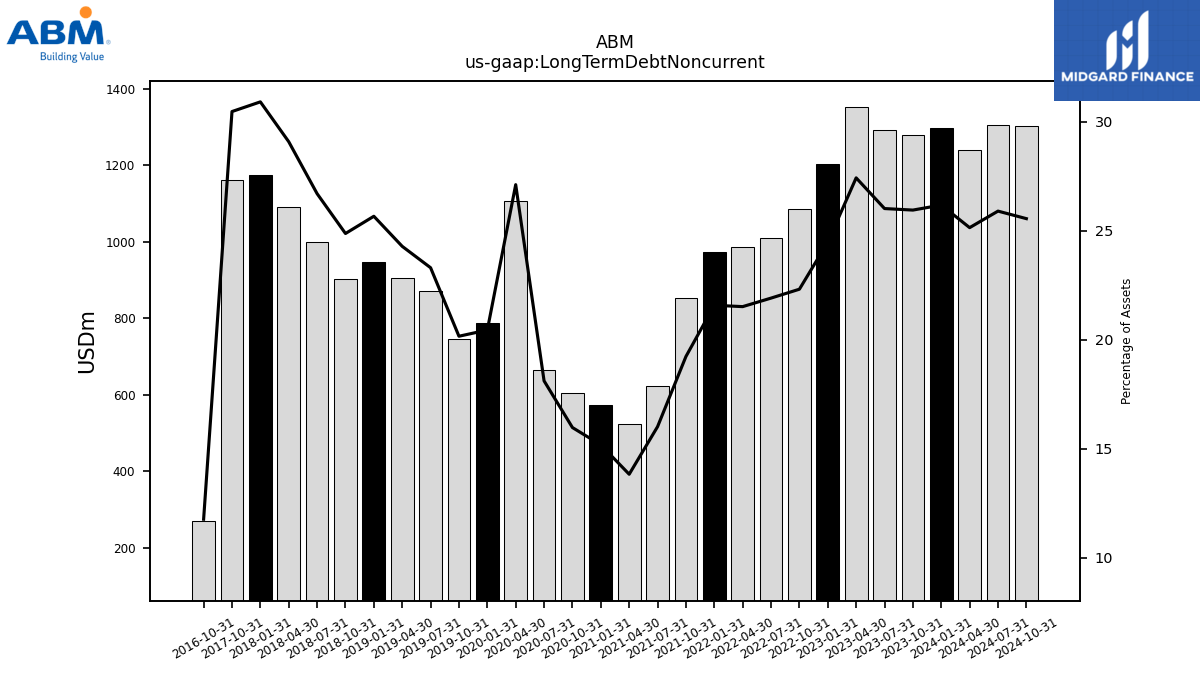
| Long Term Debt Noncurrent | 1296.90 | 1279.80 | 1292.70 | 1352.50 | 1203.40 | 1086.30 | 1009.20 | 986.60 | 971.90 | 852.80 | 623.80 | 524.20 | 573.80 | 603.00 | 664.20 | 1105.70 | 786.30 | 744.20 | 872.20 | 905.50 | 945.80 | 902.00 | 998.40 | 1090.30 | 1173.40 | 1161.30 | NA | NA | NA | 268.30 | NA | NA | NA | NA | NA | NA | NA | NA | NA | NA | NA | NA | NA | NA | NA | NA | NA | NA | NA | NA | NA | NA | NA | NA | NA | NA | NA | |
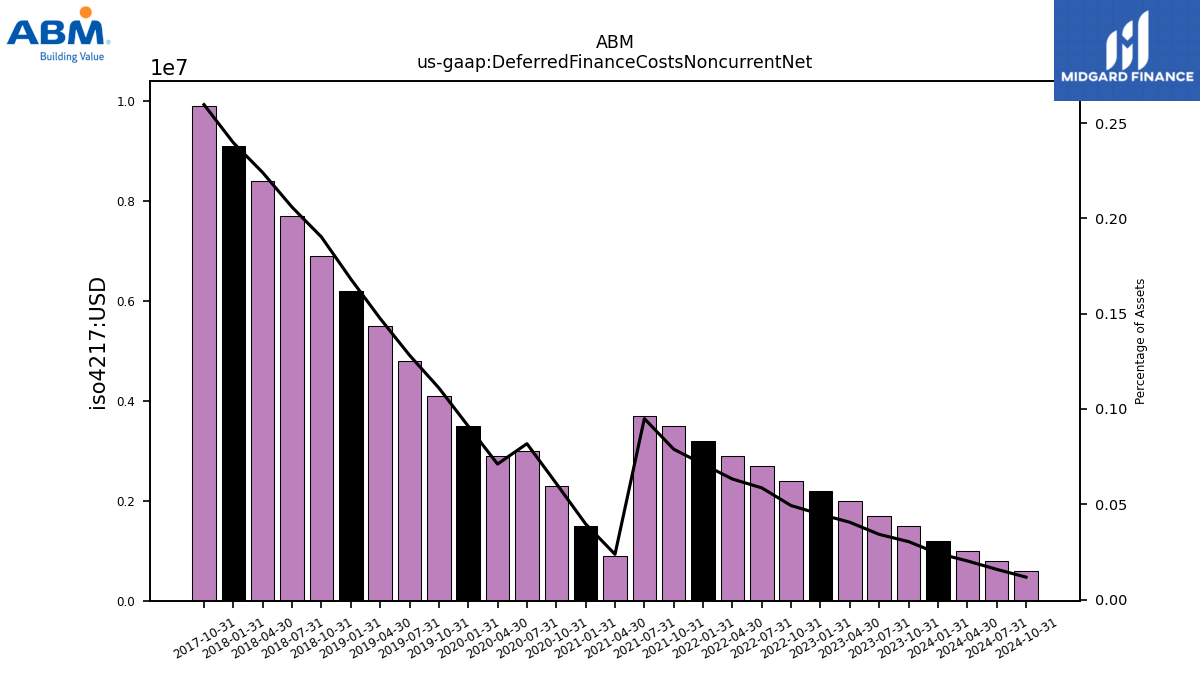
| Deferred Finance Costs Noncurrent Net | 1.20 | 1.50 | 1.70 | 2.00 | 2.20 | 2.40 | 2.70 | 2.90 | 3.20 | 3.50 | 3.70 | 0.90 | 1.50 | 2.30 | 3.00 | 2.90 | 3.50 | 4.10 | 4.80 | 5.50 | 6.20 | 6.90 | 7.70 | 8.40 | 9.10 | 9.90 | NA | NA | NA | NA | NA | NA | NA | NA | NA | NA | NA | NA | NA | NA | NA | NA | NA | NA | NA | NA | NA | NA | NA | NA | NA | NA | NA | NA | NA | NA | NA | |
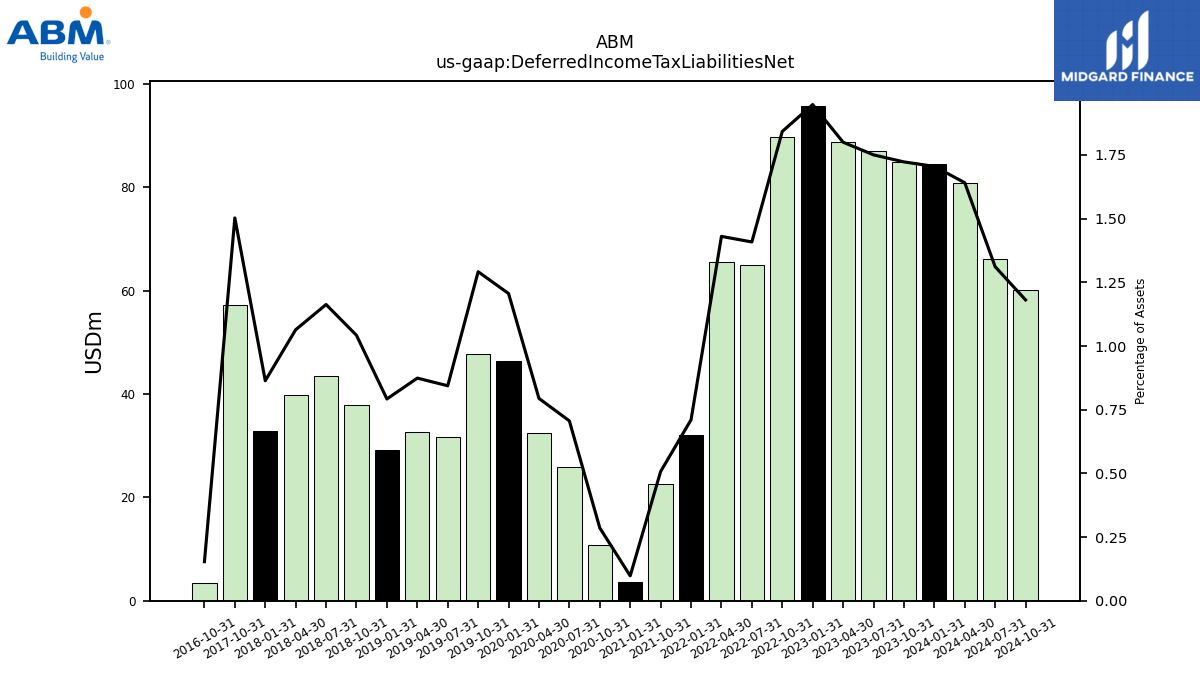
| Deferred Income Tax Liabilities Net | 84.50 | 85.00 | 87.00 | 88.80 | 95.80 | 89.70 | 64.90 | 65.60 | 32.00 | 22.50 | NA | NA | 3.70 | 10.80 | 25.90 | 32.40 | 46.40 | 47.70 | 31.60 | 32.60 | 29.20 | 37.80 | 43.50 | 39.90 | 32.80 | 57.30 | NA | NA | NA | 3.50 | NA | NA | NA | NA | NA | NA | NA | NA | NA | NA | NA | NA | NA | NA | NA | NA | NA | NA | NA | NA | NA | NA | NA | NA | NA | NA | NA | |
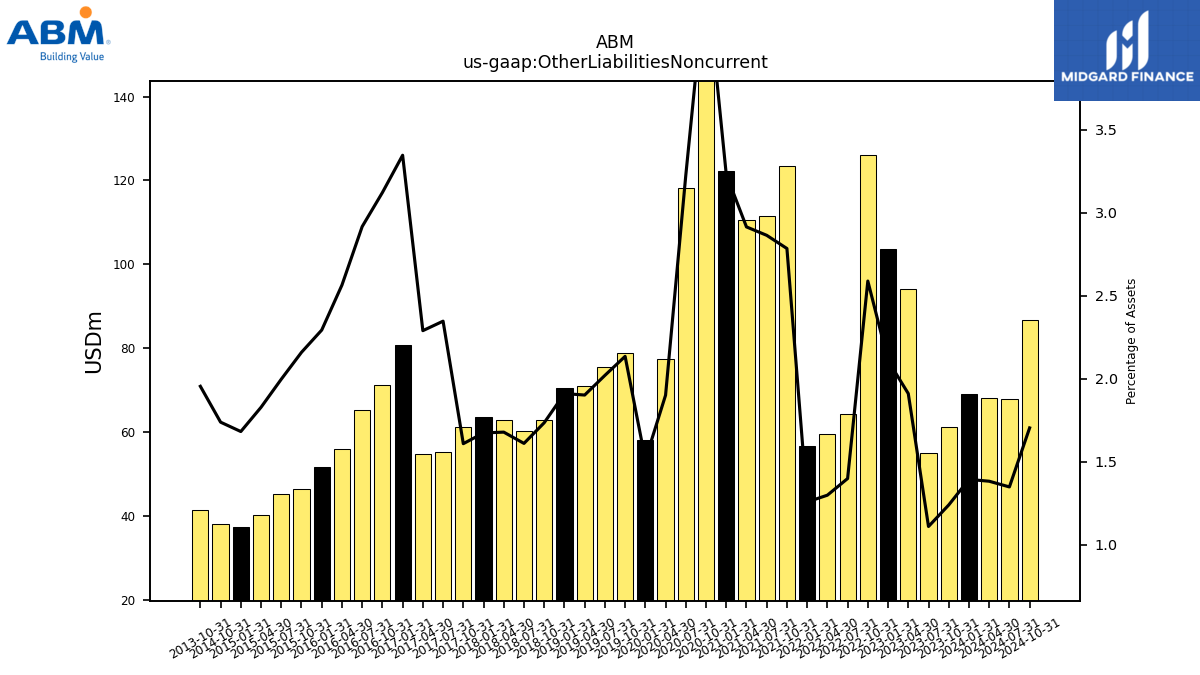
| Other Liabilities Noncurrent | 69.00 | 61.10 | 55.10 | 94.20 | 103.70 | 126.00 | 64.40 | 59.50 | 56.60 | 123.50 | 111.60 | 110.50 | 122.20 | 168.10 | 118.30 | 77.50 | 58.10 | 78.80 | 75.60 | 70.90 | 70.40 | 62.90 | 60.20 | 62.90 | 63.50 | 61.30 | 55.20 | 54.80 | 80.70 | 71.20 | 65.30 | 56.00 | 51.70 | 46.40 | 45.20 | 40.30 | 37.50 | 38.10 | NA | NA | NA | 41.40 | NA | NA | NA | NA | NA | NA | NA | NA | NA | NA | NA | NA | NA | NA | NA | |
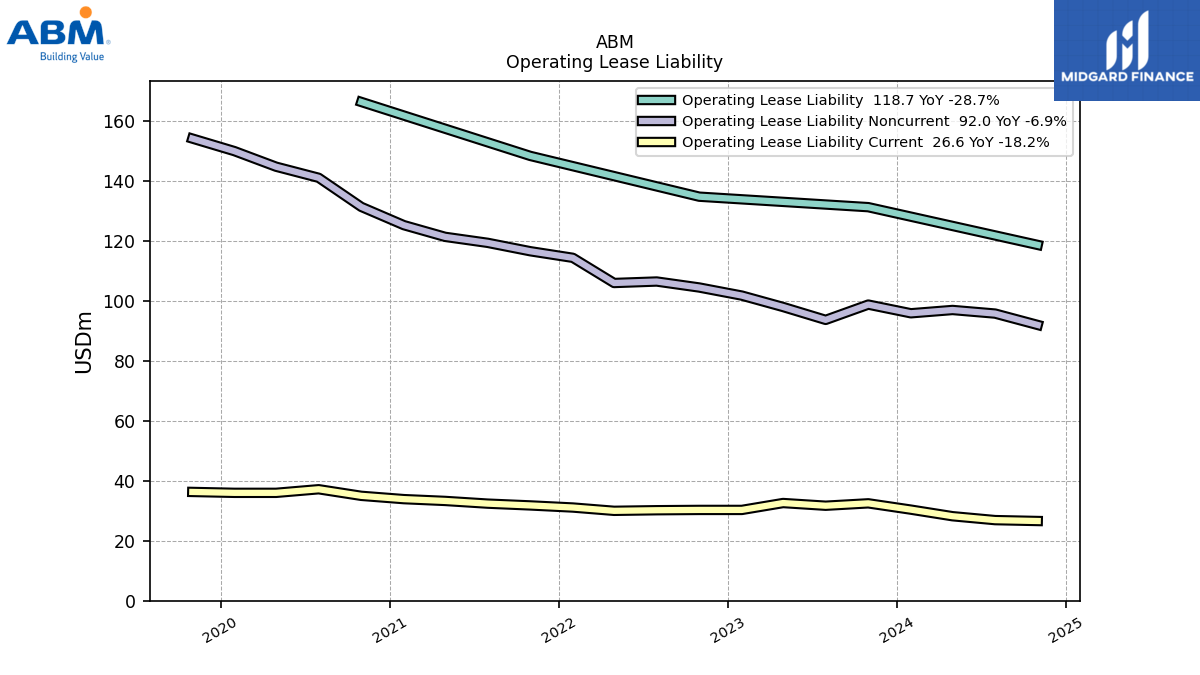
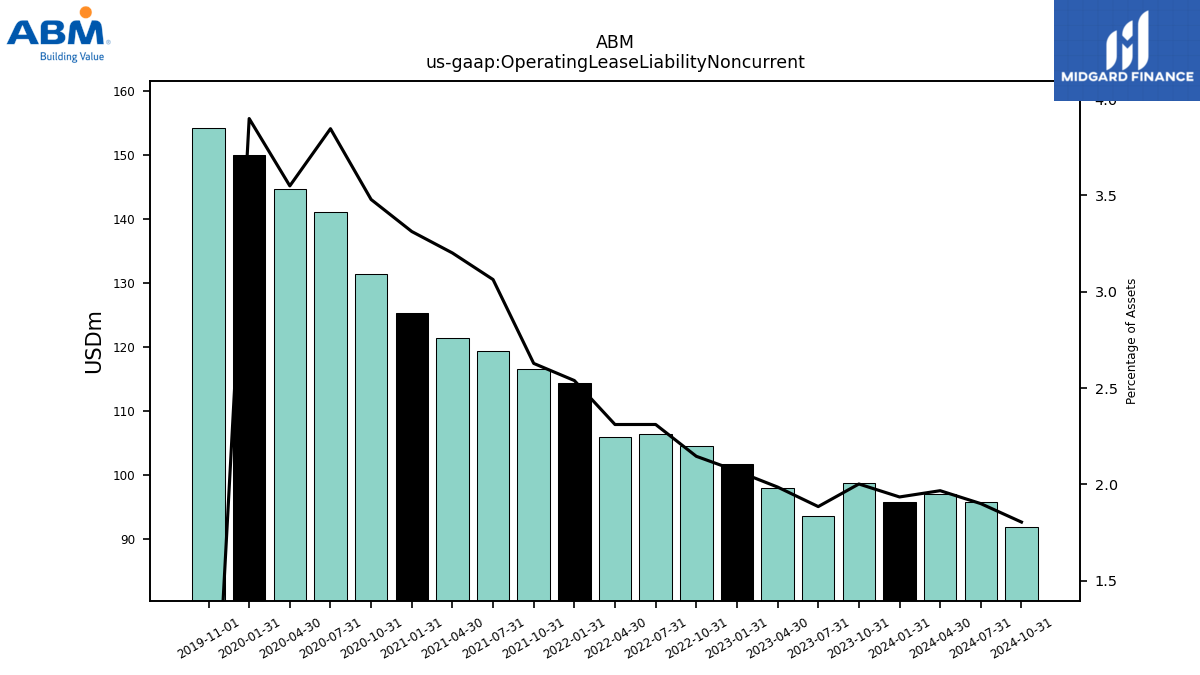
| Operating Lease Liability Noncurrent | 95.90 | 98.80 | 93.70 | 98.00 | 101.80 | 104.50 | 106.50 | 106.00 | 114.40 | 116.60 | 119.40 | 121.40 | 125.30 | 131.40 | 141.10 | 144.80 | 150.00 | NA | NA | NA | NA | NA | NA | NA | NA | NA | NA | NA | NA | NA | NA | NA | NA | NA | NA | NA | NA | NA | NA | NA | NA | NA | NA | NA | NA | NA | NA | NA | NA | NA | NA | NA | NA | NA | NA | NA | NA |
| 2024-01-31 | 2023-10-31 | 2023-07-31 | 2023-04-30 | 2023-01-31 | 2022-10-31 | 2022-07-31 | 2022-04-30 | 2022-01-31 | 2021-10-31 | 2021-07-31 | 2021-04-30 | 2021-01-31 | 2020-10-31 | 2020-07-31 | 2020-04-30 | 2020-01-31 | 2019-10-31 | 2019-07-31 | 2019-04-30 | 2019-01-31 | 2018-10-31 | 2018-07-31 | 2018-04-30 | 2018-01-31 | 2017-10-31 | 2017-07-31 | 2017-04-30 | 2017-01-31 | 2016-10-31 | 2016-07-31 | 2016-04-30 | 2016-01-31 | 2015-10-31 | 2015-07-31 | 2015-04-30 | 2015-01-31 | 2014-10-31 | 2014-07-31 | 2014-04-30 | 2014-01-31 | 2013-10-31 | 2013-07-31 | 2013-04-30 | 2013-01-31 | 2012-10-31 | 2012-07-31 | 2012-04-30 | 2012-01-31 | 2011-10-31 | 2011-07-31 | 2011-04-30 | 2011-01-31 | 2010-10-31 | 2010-07-31 | 2010-04-30 | 2010-01-31 | ||
|---|---|---|---|---|---|---|---|---|---|---|---|---|---|---|---|---|---|---|---|---|---|---|---|---|---|---|---|---|---|---|---|---|---|---|---|---|---|---|---|---|---|---|---|---|---|---|---|---|---|---|---|---|---|---|---|---|---|---|
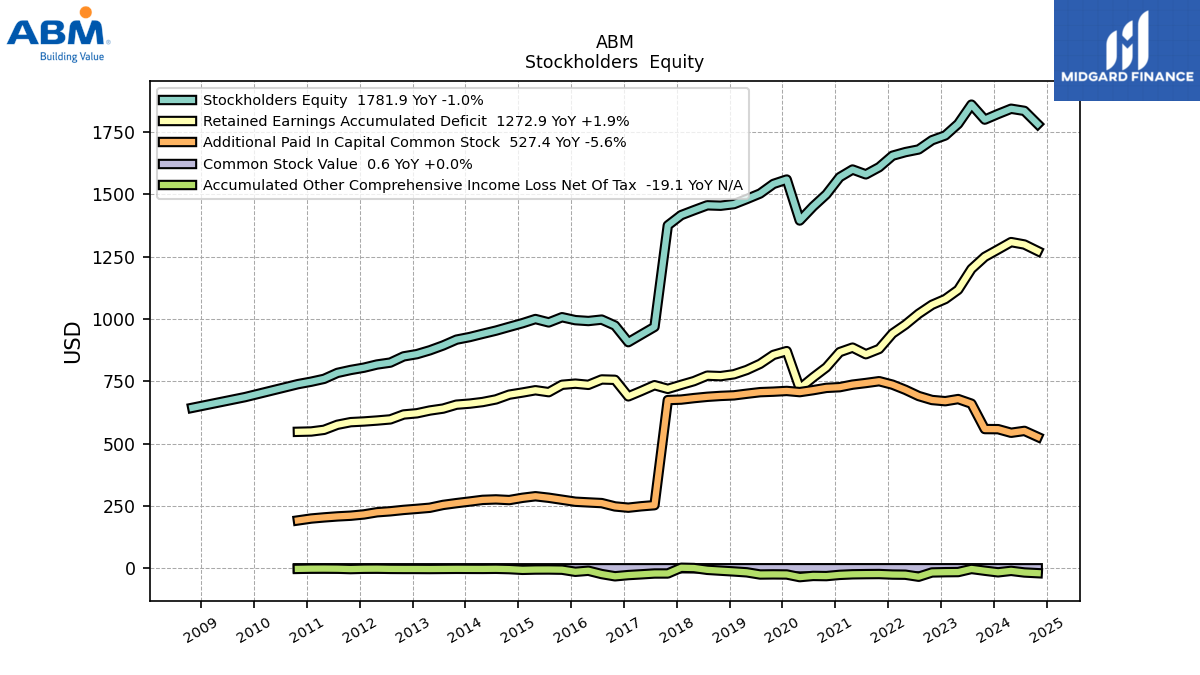
| Stockholders Equity | 1822.70 | 1799.90 | 1860.10 | 1782.80 | 1736.50 | 1717.20 | 1680.30 | 1669.60 | 1655.20 | 1609.20 | 1580.30 | 1599.80 | 1569.10 | 1500.30 | 1451.30 | 1395.20 | 1559.70 | 1542.00 | 1503.60 | 1481.40 | 1461.10 | 1454.60 | 1456.40 | 1436.60 | 1416.80 | 1375.70 | 968.60 | 937.60 | 907.40 | 974.00 | 997.90 | 992.20 | 995.70 | 1007.50 | 986.60 | 1000.20 | 983.60 | 968.80 | 953.70 | 940.80 | 927.96 | 917.51 | 894.24 | 874.73 | 859.46 | 850.40 | 825.49 | 817.84 | 805.16 | 795.89 | 784.14 | 760.26 | 748.89 | 739.02 | NA | NA | NA | |
| Common Stock Value | 0.60 | 0.60 | 0.70 | 0.70 | 0.70 | 0.70 | 0.70 | 0.70 | 0.70 | 0.70 | 0.70 | 0.70 | 0.70 | 0.70 | 0.70 | 0.70 | 0.70 | 0.70 | 0.70 | 0.70 | 0.70 | 0.70 | 0.70 | 0.70 | 0.70 | 0.70 | 0.60 | 0.60 | 0.60 | 0.60 | 0.60 | 0.60 | 0.60 | 0.60 | 0.60 | 0.60 | 0.60 | 0.60 | 0.60 | 0.60 | 0.56 | 0.56 | 0.55 | 0.55 | 0.55 | 0.54 | 0.54 | 0.54 | 0.54 | 0.53 | 0.53 | 0.53 | 0.53 | 0.53 | NA | NA | NA | |
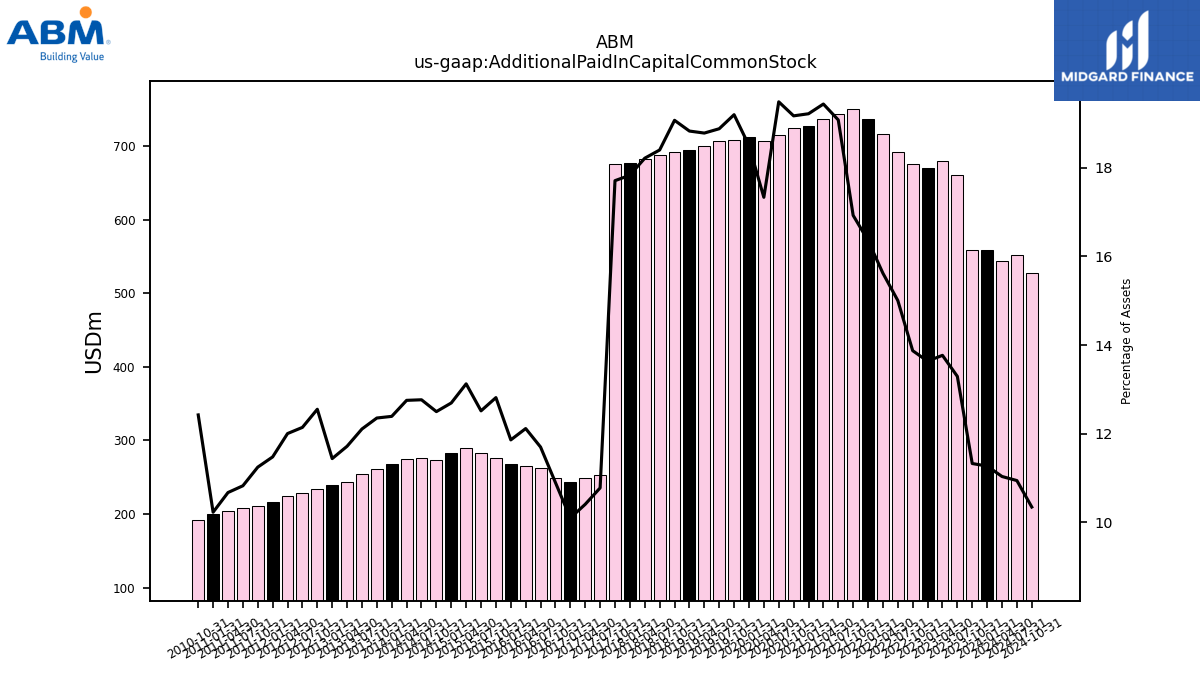
| Additional Paid In Capital Common Stock | 558.50 | 558.90 | 660.70 | 679.20 | 670.70 | 675.50 | 691.40 | 716.40 | 737.00 | 750.90 | 743.60 | 737.10 | 726.90 | 724.10 | 714.90 | 707.10 | 711.80 | 708.90 | 706.90 | 700.60 | 694.10 | 691.80 | 688.30 | 683.10 | 677.10 | 675.20 | 253.60 | 249.20 | 243.60 | 248.60 | 262.00 | 264.70 | 267.50 | 275.50 | 283.40 | 289.50 | 283.20 | 274.10 | 276.80 | 274.90 | 268.31 | 261.83 | 254.66 | 243.30 | 238.87 | 234.64 | 229.13 | 225.19 | 216.56 | 211.39 | 208.60 | 204.61 | 200.08 | 192.42 | NA | NA | NA | |
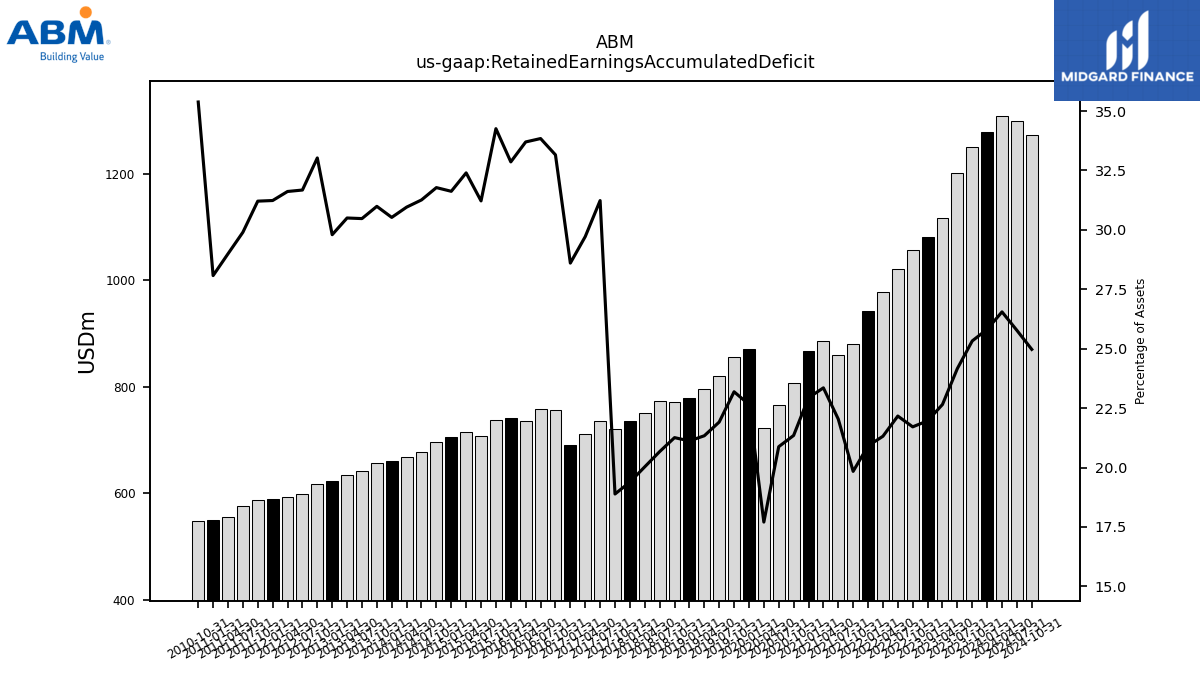
| Retained Earnings Accumulated Deficit | 1279.30 | 1249.60 | 1201.00 | 1117.50 | 1080.30 | 1057.20 | 1021.40 | 977.70 | 942.10 | 880.20 | 859.00 | 885.60 | 867.50 | 806.40 | 765.90 | 722.30 | 871.60 | 856.30 | 820.50 | 795.90 | 778.60 | 771.20 | 773.20 | 751.20 | 736.20 | 720.10 | 734.90 | 711.50 | 689.90 | 756.40 | 757.90 | 736.20 | 741.10 | 736.50 | 706.90 | 714.60 | 705.50 | 696.90 | 677.80 | 667.30 | 660.96 | 656.77 | 641.04 | 633.32 | 622.23 | 617.37 | 597.72 | 593.11 | 589.37 | 586.62 | 576.14 | 555.82 | 549.18 | 547.94 | NA | NA | NA | |
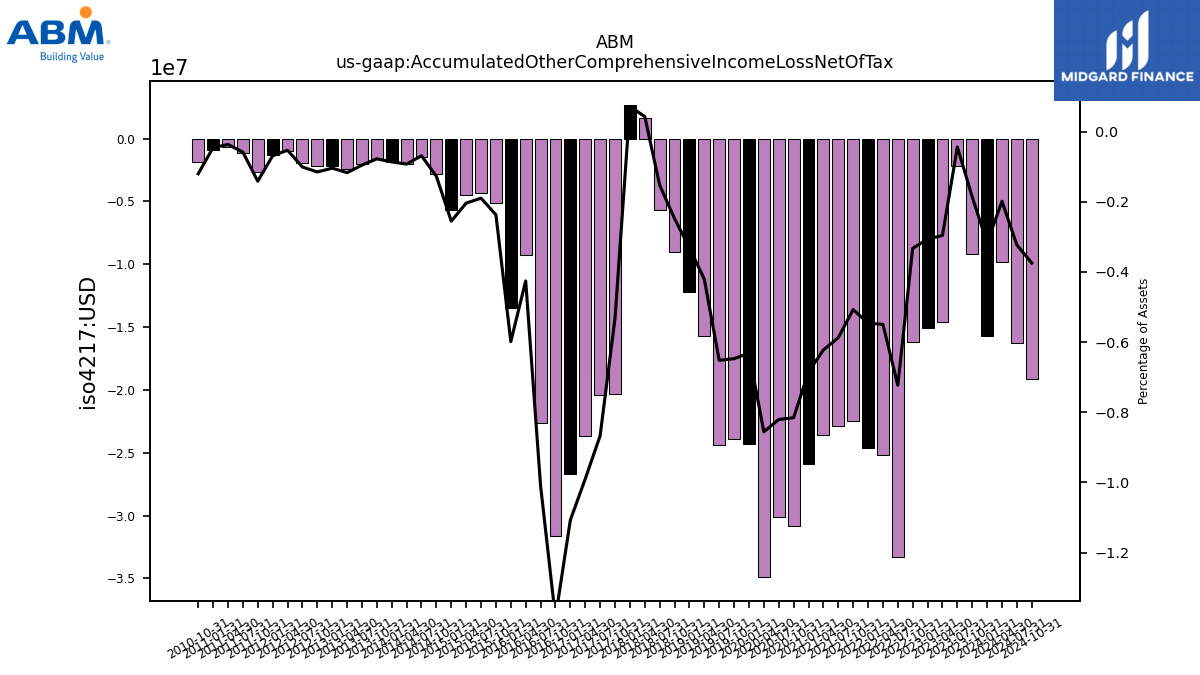
| Accumulated Other Comprehensive Income Loss Net Of Tax | -15.70 | -9.20 | -2.20 | -14.60 | -15.10 | -16.20 | -33.30 | -25.20 | -24.60 | -22.50 | -22.90 | -23.60 | -25.90 | -30.80 | -30.10 | -34.90 | -24.30 | -23.90 | -24.40 | -15.70 | -12.20 | -9.00 | -5.70 | 1.60 | 2.70 | -20.30 | -20.40 | -23.70 | -26.70 | -31.60 | -22.60 | -9.30 | -13.50 | -5.10 | -4.30 | -4.50 | -5.70 | -2.80 | -1.50 | -2.00 | -1.87 | -1.65 | -2.01 | -2.44 | -2.18 | -2.15 | -1.91 | -1.00 | -1.30 | -2.66 | -1.13 | -0.71 | -0.90 | -1.86 | NA | NA | NA |
| 2024-01-31 | 2023-10-31 | 2023-07-31 | 2023-04-30 | 2023-01-31 | 2022-10-31 | 2022-07-31 | 2022-04-30 | 2022-01-31 | 2021-10-31 | 2021-07-31 | 2021-04-30 | 2021-01-31 | 2020-10-31 | 2020-07-31 | 2020-04-30 | 2020-01-31 | 2019-10-31 | 2019-07-31 | 2019-04-30 | 2019-01-31 | 2018-10-31 | 2018-07-31 | 2018-04-30 | 2018-01-31 | 2017-10-31 | 2017-07-31 | 2017-04-30 | 2017-01-31 | 2016-10-31 | 2016-07-31 | 2016-04-30 | 2016-01-31 | 2015-10-31 | 2015-07-31 | 2015-04-30 | 2015-01-31 | 2014-10-31 | 2014-07-31 | 2014-04-30 | 2014-01-31 | 2013-10-31 | 2013-07-31 | 2013-04-30 | 2013-01-31 | 2012-10-31 | 2012-07-31 | 2012-04-30 | 2012-01-31 | 2011-10-31 | 2011-07-31 | 2011-04-30 | 2011-01-31 | 2010-10-31 | 2010-07-31 | 2010-04-30 | 2010-01-31 | ||
|---|---|---|---|---|---|---|---|---|---|---|---|---|---|---|---|---|---|---|---|---|---|---|---|---|---|---|---|---|---|---|---|---|---|---|---|---|---|---|---|---|---|---|---|---|---|---|---|---|---|---|---|---|---|---|---|---|---|---|
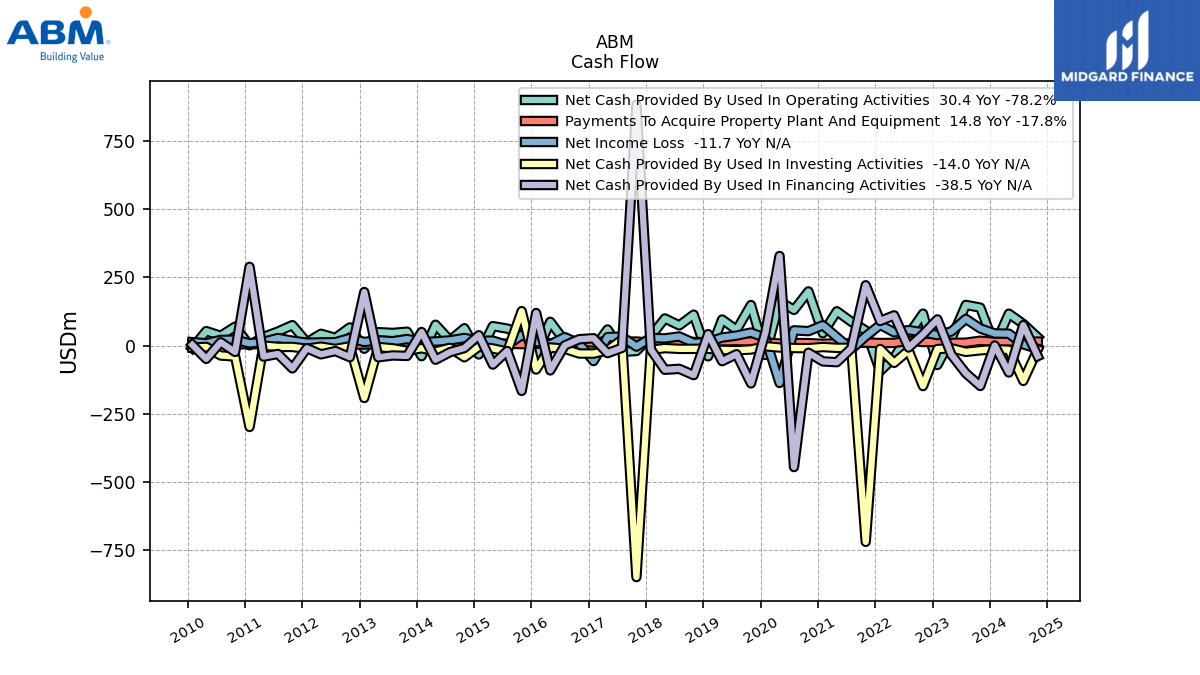
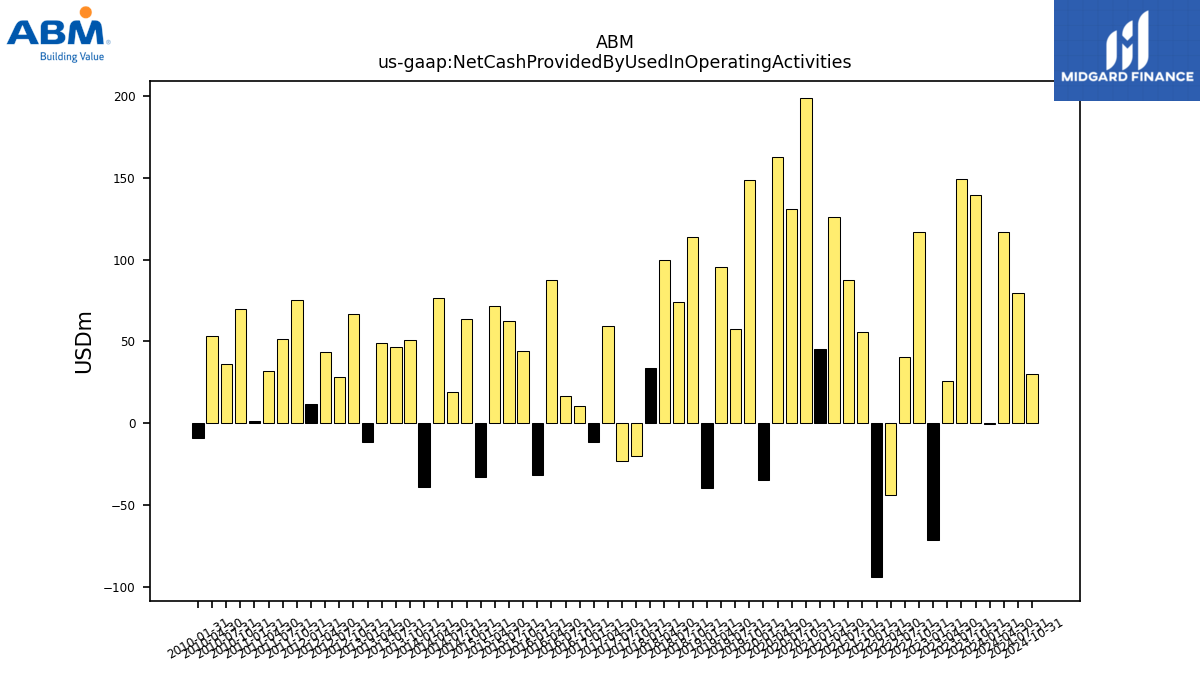
| Net Cash Provided By Used In Operating Activities | -0.10 | 139.20 | 149.10 | 25.90 | -70.90 | 117.10 | 40.80 | -43.90 | -93.60 | 55.50 | 87.60 | 125.90 | 45.30 | 198.70 | 130.80 | 162.30 | -34.30 | 148.70 | 57.70 | 95.60 | -39.30 | 113.50 | 74.10 | 99.60 | 33.70 | -19.70 | -22.80 | 59.20 | -11.10 | 10.60 | 16.90 | 87.40 | -31.40 | 43.90 | 62.40 | 71.40 | -32.40 | 63.70 | 19.30 | 76.58 | -38.88 | 51.01 | 46.48 | 49.31 | -11.49 | 66.83 | 28.26 | 43.53 | 11.99 | 75.15 | 51.66 | 31.88 | 1.30 | 69.57 | 35.97 | 53.24 | -8.91 | |
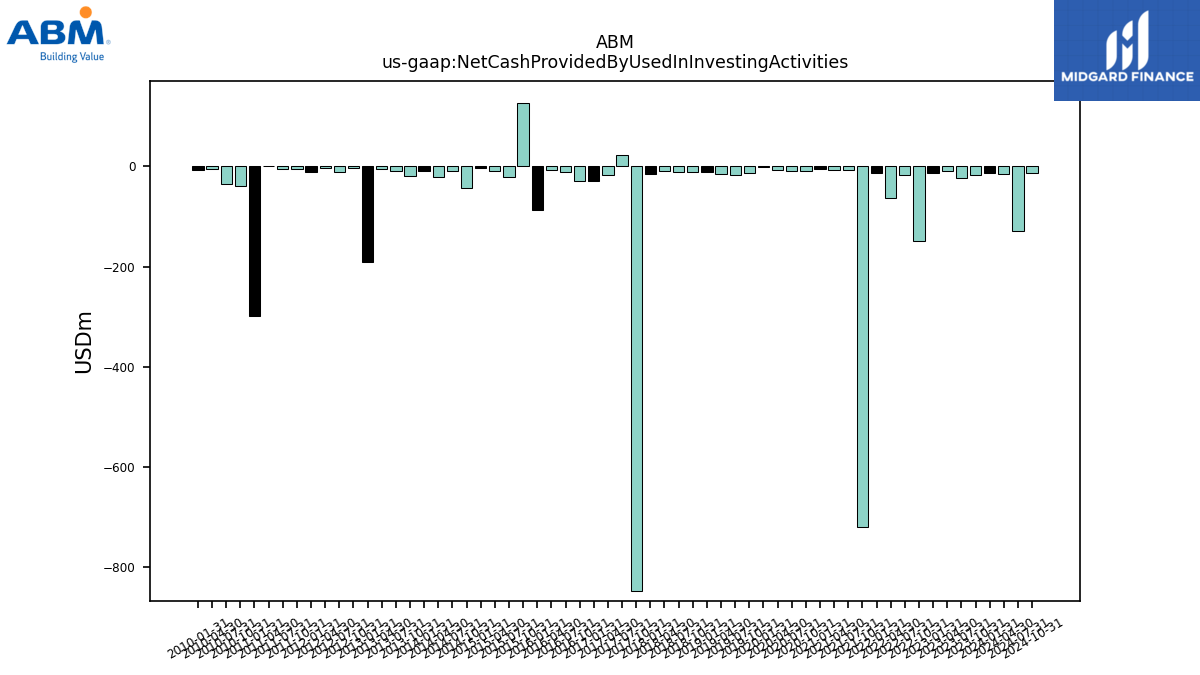
| Net Cash Provided By Used In Investing Activities | -13.10 | -17.10 | -22.80 | -9.70 | -12.50 | -148.20 | -17.80 | -63.10 | -12.40 | -718.80 | -7.80 | -8.20 | -5.20 | -9.40 | -8.80 | -7.00 | -2.30 | -14.20 | -17.00 | -15.70 | -11.40 | -11.80 | -11.90 | -9.10 | -15.30 | -847.90 | 22.10 | -16.90 | -29.10 | -28.90 | -11.50 | -6.80 | -87.60 | 126.30 | -22.00 | -10.30 | -3.60 | -42.80 | -8.40 | -21.32 | -9.48 | -19.27 | -9.71 | -5.08 | -191.82 | -2.62 | -12.14 | -3.84 | -11.24 | -4.85 | -4.84 | 0.26 | -297.99 | -39.93 | -36.19 | -4.82 | -6.92 | |
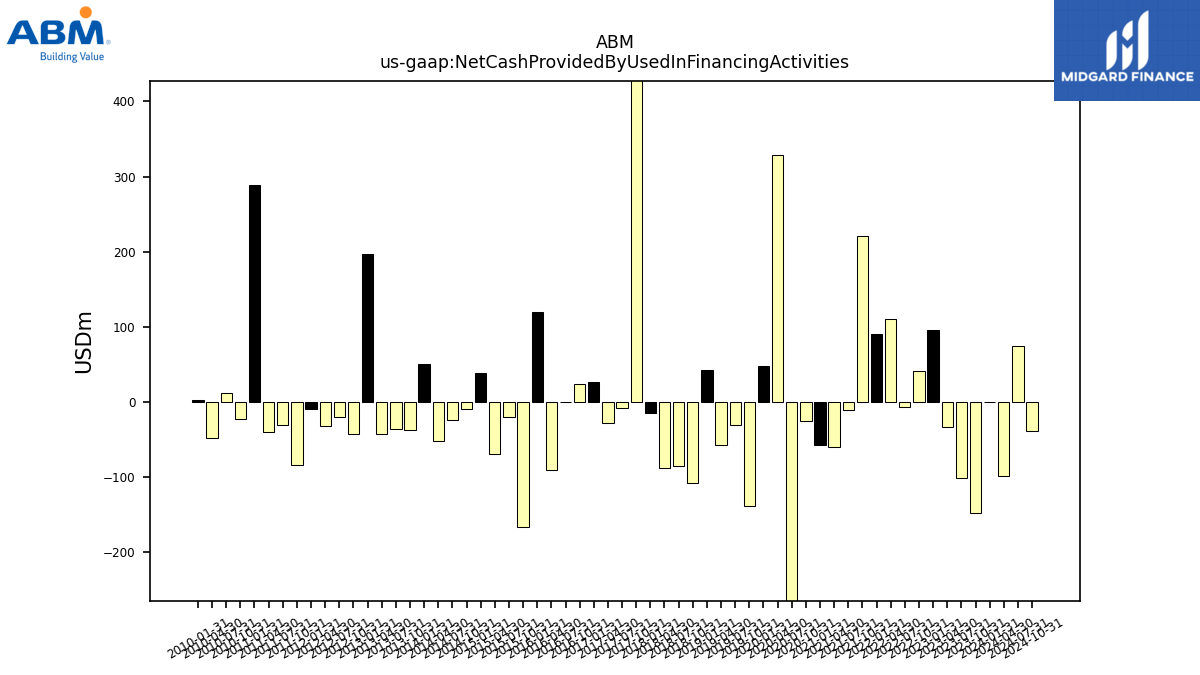
| Net Cash Provided By Used In Financing Activities | 0.50 | -147.90 | -101.20 | -33.40 | 96.20 | 41.30 | -7.00 | 110.90 | 90.30 | 221.10 | -10.20 | -60.70 | -57.80 | -26.00 | -444.90 | 328.40 | 48.40 | -138.40 | -31.40 | -57.00 | 42.00 | -108.10 | -85.00 | -88.40 | -14.30 | 882.70 | -8.20 | -27.50 | 27.00 | 23.50 | 0.50 | -90.80 | 119.40 | -165.90 | -19.60 | -69.50 | 38.10 | -8.80 | -24.00 | -51.73 | 49.93 | -37.79 | -35.98 | -42.75 | 196.28 | -42.41 | -19.88 | -31.93 | -9.56 | -83.45 | -30.50 | -40.22 | 288.61 | -23.10 | 12.19 | -48.66 | 2.86 |
| 2024-01-31 | 2023-10-31 | 2023-07-31 | 2023-04-30 | 2023-01-31 | 2022-10-31 | 2022-07-31 | 2022-04-30 | 2022-01-31 | 2021-10-31 | 2021-07-31 | 2021-04-30 | 2021-01-31 | 2020-10-31 | 2020-07-31 | 2020-04-30 | 2020-01-31 | 2019-10-31 | 2019-07-31 | 2019-04-30 | 2019-01-31 | 2018-10-31 | 2018-07-31 | 2018-04-30 | 2018-01-31 | 2017-10-31 | 2017-07-31 | 2017-04-30 | 2017-01-31 | 2016-10-31 | 2016-07-31 | 2016-04-30 | 2016-01-31 | 2015-10-31 | 2015-07-31 | 2015-04-30 | 2015-01-31 | 2014-10-31 | 2014-07-31 | 2014-04-30 | 2014-01-31 | 2013-10-31 | 2013-07-31 | 2013-04-30 | 2013-01-31 | 2012-10-31 | 2012-07-31 | 2012-04-30 | 2012-01-31 | 2011-10-31 | 2011-07-31 | 2011-04-30 | 2011-01-31 | 2010-10-31 | 2010-07-31 | 2010-04-30 | 2010-01-31 | ||
|---|---|---|---|---|---|---|---|---|---|---|---|---|---|---|---|---|---|---|---|---|---|---|---|---|---|---|---|---|---|---|---|---|---|---|---|---|---|---|---|---|---|---|---|---|---|---|---|---|---|---|---|---|---|---|---|---|---|---|
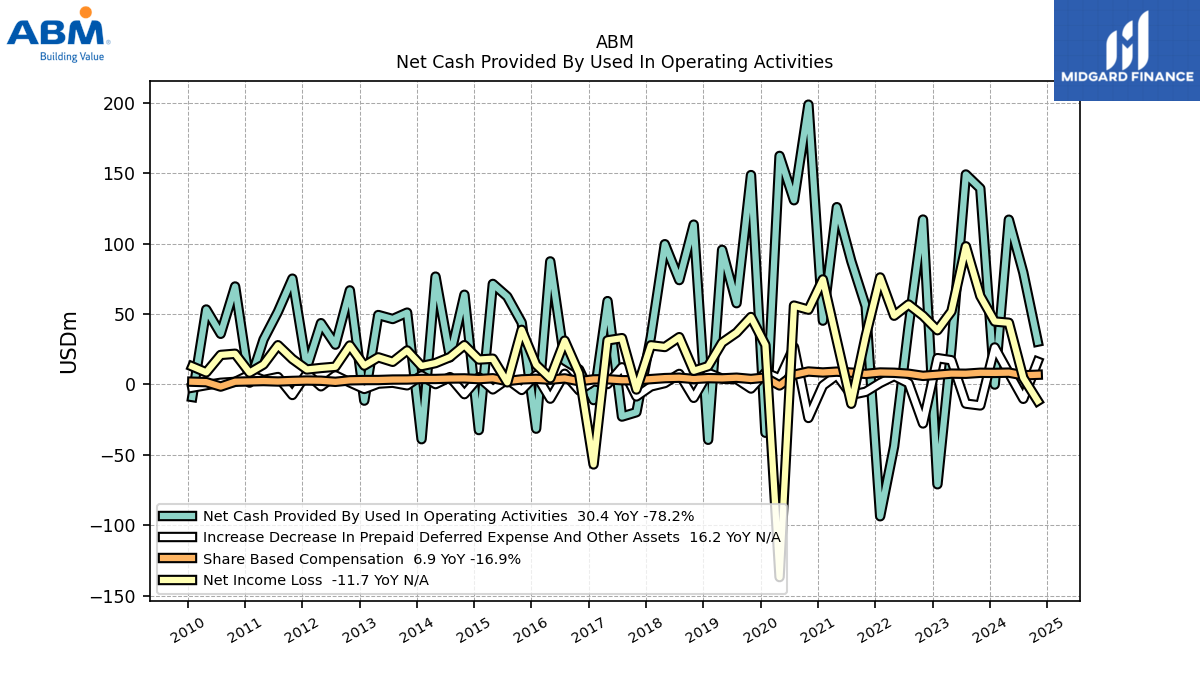
| Net Cash Provided By Used In Operating Activities | -0.10 | 139.20 | 149.10 | 25.90 | -70.90 | 117.10 | 40.80 | -43.90 | -93.60 | 55.50 | 87.60 | 125.90 | 45.30 | 198.70 | 130.80 | 162.30 | -34.30 | 148.70 | 57.70 | 95.60 | -39.30 | 113.50 | 74.10 | 99.60 | 33.70 | -19.70 | -22.80 | 59.20 | -11.10 | 10.60 | 16.90 | 87.40 | -31.40 | 43.90 | 62.40 | 71.40 | -32.40 | 63.70 | 19.30 | 76.58 | -38.88 | 51.01 | 46.48 | 49.31 | -11.49 | 66.83 | 28.26 | 43.53 | 11.99 | 75.15 | 51.66 | 31.88 | 1.30 | 69.57 | 35.97 | 53.24 | -8.91 | |
| Net Income Loss | 44.70 | 62.80 | 98.10 | 51.90 | 38.50 | 48.80 | 56.80 | 48.80 | 76.00 | 34.30 | -13.70 | 31.10 | 74.60 | 53.10 | 56.00 | -136.80 | 28.00 | 47.90 | 36.80 | 29.70 | 13.00 | 9.70 | 33.60 | 26.60 | 27.80 | -3.60 | 32.90 | 31.30 | -56.80 | 7.80 | 31.10 | 4.40 | 14.00 | 38.80 | 1.50 | 18.30 | 17.70 | 27.90 | 19.40 | 15.20 | 13.07 | 24.17 | 16.08 | 19.27 | 13.38 | 27.66 | 12.58 | 11.71 | 10.63 | 18.05 | 27.88 | 14.19 | 8.39 | 21.81 | 20.96 | 8.58 | 12.78 | |
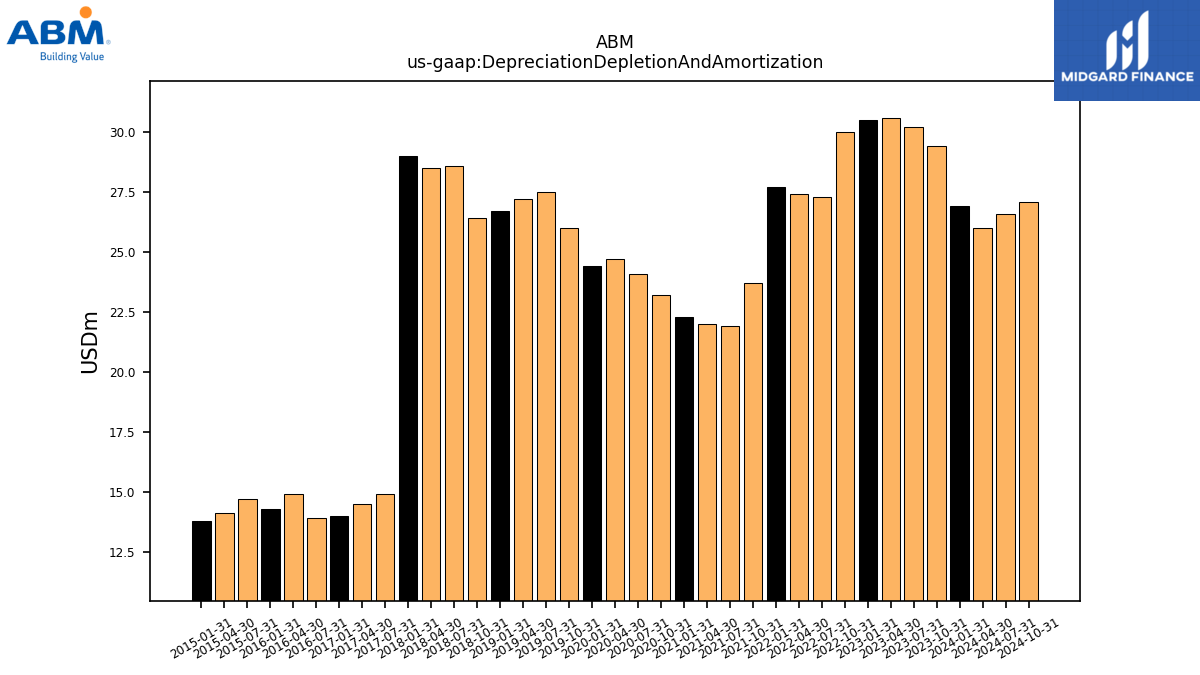
| Depreciation Depletion And Amortization | 26.90 | 29.40 | 30.20 | 30.60 | 30.50 | 30.00 | 27.30 | 27.40 | 27.70 | 23.70 | 21.90 | 22.00 | 22.30 | 23.20 | 24.10 | 24.70 | 24.40 | 26.00 | 27.50 | 27.20 | 26.70 | 26.40 | 28.60 | 28.50 | 29.00 | NA | 14.90 | 14.50 | 14.00 | NA | 13.90 | 14.90 | 14.30 | NA | 14.70 | 14.10 | 13.80 | NA | NA | NA | NA | NA | NA | NA | NA | NA | NA | NA | NA | NA | NA | NA | NA | NA | NA | NA | NA | |
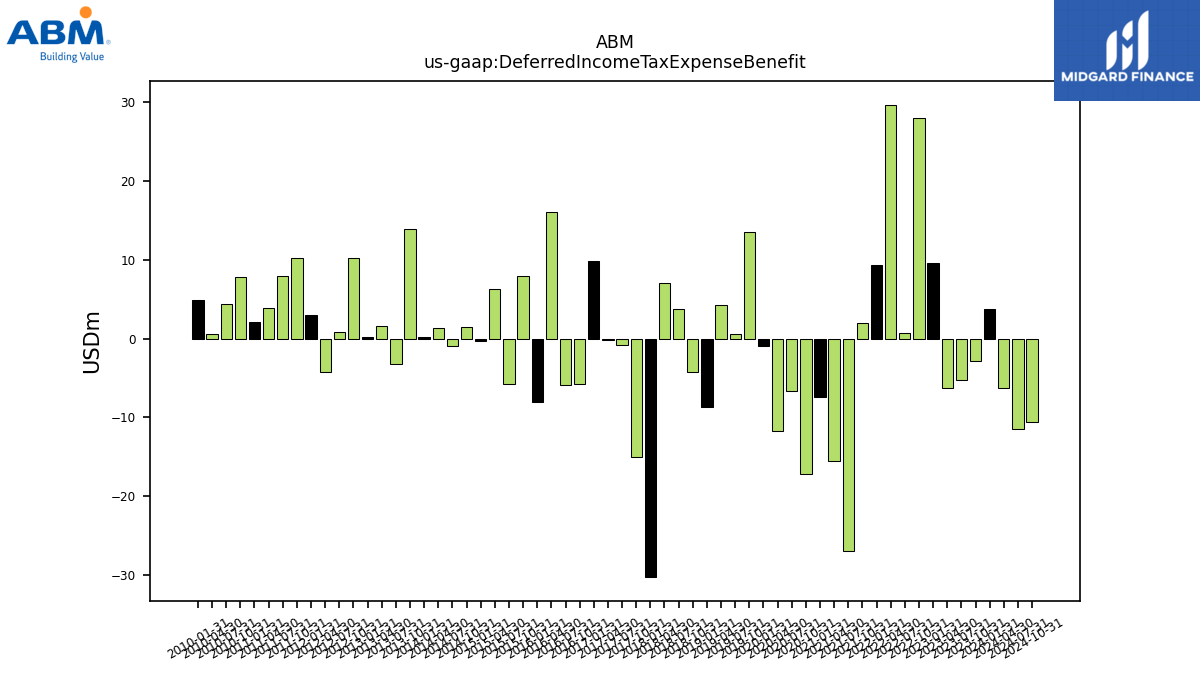
| Deferred Income Tax Expense Benefit | 3.70 | -2.90 | -5.30 | -6.30 | 9.60 | 28.00 | 0.70 | 29.70 | 9.30 | 2.00 | -27.00 | -15.60 | -7.40 | -17.20 | -6.70 | -11.70 | -1.00 | 13.50 | 0.60 | 4.30 | -8.70 | -4.20 | 3.80 | 7.00 | -30.30 | -15.00 | -0.80 | -0.20 | 9.90 | -5.80 | -5.90 | 16.10 | -8.10 | 7.90 | -5.80 | 6.30 | -0.30 | 1.50 | -0.90 | 1.39 | 0.21 | 13.90 | -3.18 | 1.61 | 0.14 | 10.19 | 0.83 | -4.19 | 2.94 | 10.27 | 7.96 | 3.91 | 2.09 | 7.79 | 4.42 | 0.58 | 4.87 | |
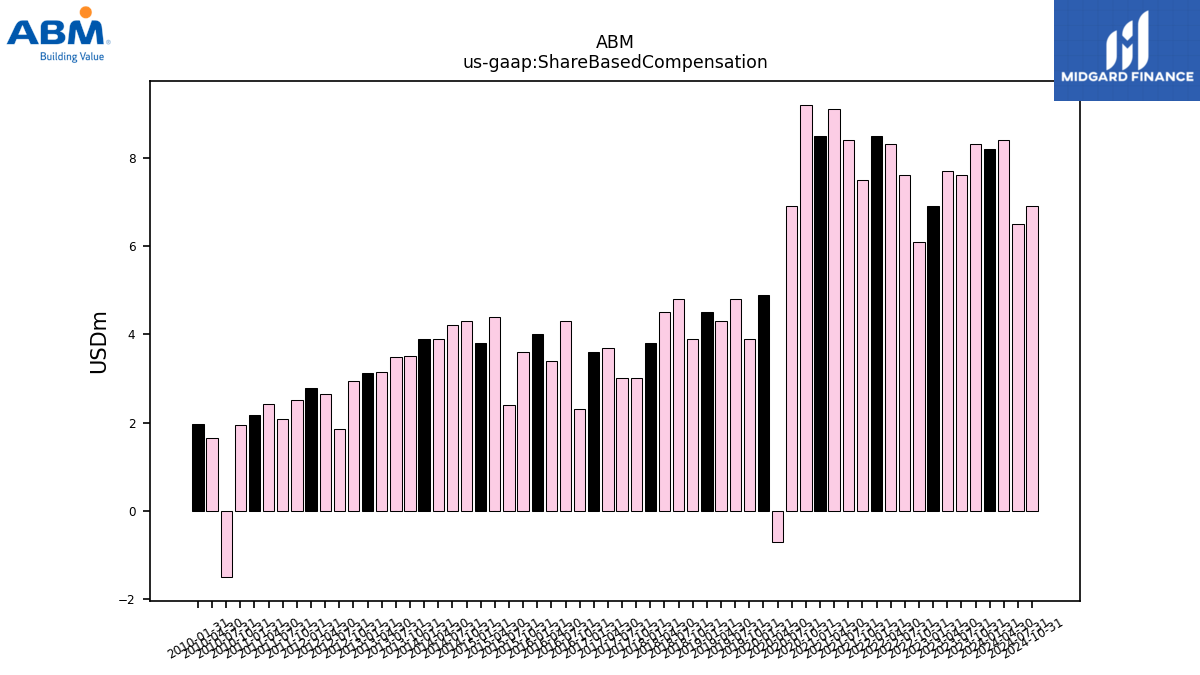
| Share Based Compensation | 8.20 | 8.30 | 7.60 | 7.70 | 6.90 | 6.10 | 7.60 | 8.30 | 8.50 | 7.50 | 8.40 | 9.10 | 8.50 | 9.20 | 6.90 | -0.70 | 4.90 | 3.90 | 4.80 | 4.30 | 4.50 | 3.90 | 4.80 | 4.50 | 3.80 | 3.00 | 3.00 | 3.70 | 3.60 | 2.30 | 4.30 | 3.40 | 4.00 | 3.60 | 2.40 | 4.40 | 3.80 | 4.30 | 4.20 | 3.90 | 3.90 | 3.52 | 3.48 | 3.15 | 3.13 | 2.93 | 1.87 | 2.65 | 2.79 | 2.50 | 2.09 | 2.43 | 2.17 | 1.96 | -1.50 | 1.65 | 1.96 |
| 2024-01-31 | 2023-10-31 | 2023-07-31 | 2023-04-30 | 2023-01-31 | 2022-10-31 | 2022-07-31 | 2022-04-30 | 2022-01-31 | 2021-10-31 | 2021-07-31 | 2021-04-30 | 2021-01-31 | 2020-10-31 | 2020-07-31 | 2020-04-30 | 2020-01-31 | 2019-10-31 | 2019-07-31 | 2019-04-30 | 2019-01-31 | 2018-10-31 | 2018-07-31 | 2018-04-30 | 2018-01-31 | 2017-10-31 | 2017-07-31 | 2017-04-30 | 2017-01-31 | 2016-10-31 | 2016-07-31 | 2016-04-30 | 2016-01-31 | 2015-10-31 | 2015-07-31 | 2015-04-30 | 2015-01-31 | 2014-10-31 | 2014-07-31 | 2014-04-30 | 2014-01-31 | 2013-10-31 | 2013-07-31 | 2013-04-30 | 2013-01-31 | 2012-10-31 | 2012-07-31 | 2012-04-30 | 2012-01-31 | 2011-10-31 | 2011-07-31 | 2011-04-30 | 2011-01-31 | 2010-10-31 | 2010-07-31 | 2010-04-30 | 2010-01-31 | ||
|---|---|---|---|---|---|---|---|---|---|---|---|---|---|---|---|---|---|---|---|---|---|---|---|---|---|---|---|---|---|---|---|---|---|---|---|---|---|---|---|---|---|---|---|---|---|---|---|---|---|---|---|---|---|---|---|---|---|---|
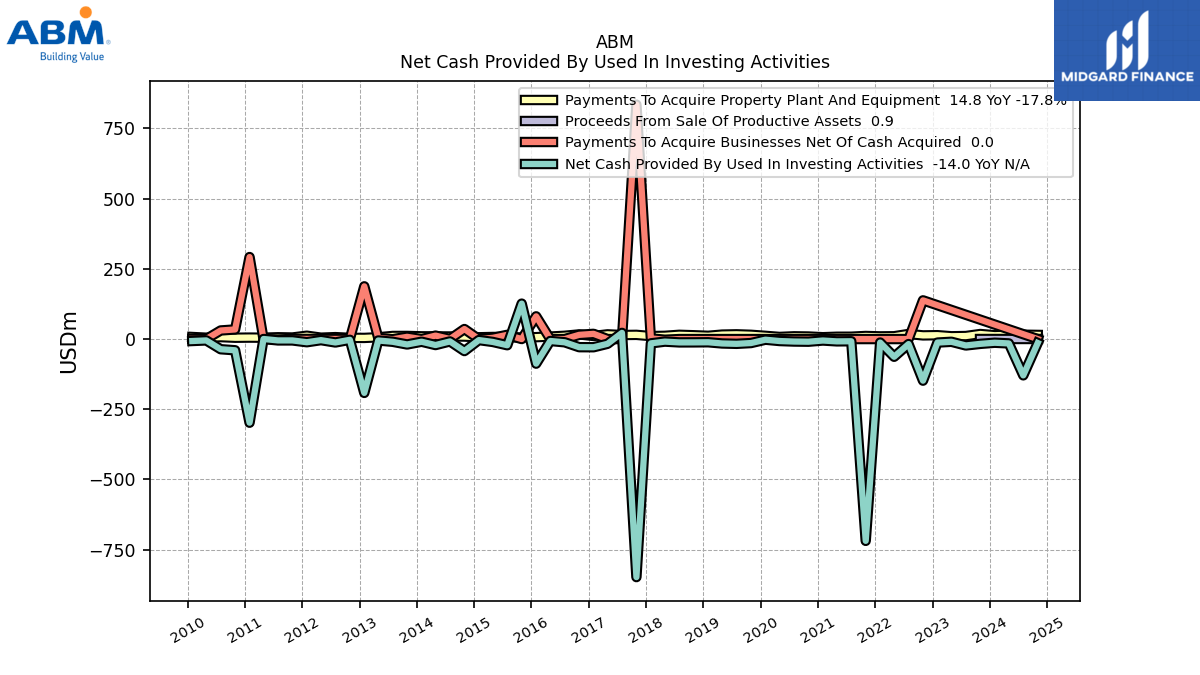
| Net Cash Provided By Used In Investing Activities | -13.10 | -17.10 | -22.80 | -9.70 | -12.50 | -148.20 | -17.80 | -63.10 | -12.40 | -718.80 | -7.80 | -8.20 | -5.20 | -9.40 | -8.80 | -7.00 | -2.30 | -14.20 | -17.00 | -15.70 | -11.40 | -11.80 | -11.90 | -9.10 | -15.30 | -847.90 | 22.10 | -16.90 | -29.10 | -28.90 | -11.50 | -6.80 | -87.60 | 126.30 | -22.00 | -10.30 | -3.60 | -42.80 | -8.40 | -21.32 | -9.48 | -19.27 | -9.71 | -5.08 | -191.82 | -2.62 | -12.14 | -3.84 | -11.24 | -4.85 | -4.84 | 0.26 | -297.99 | -39.93 | -36.19 | -4.82 | -6.92 | |
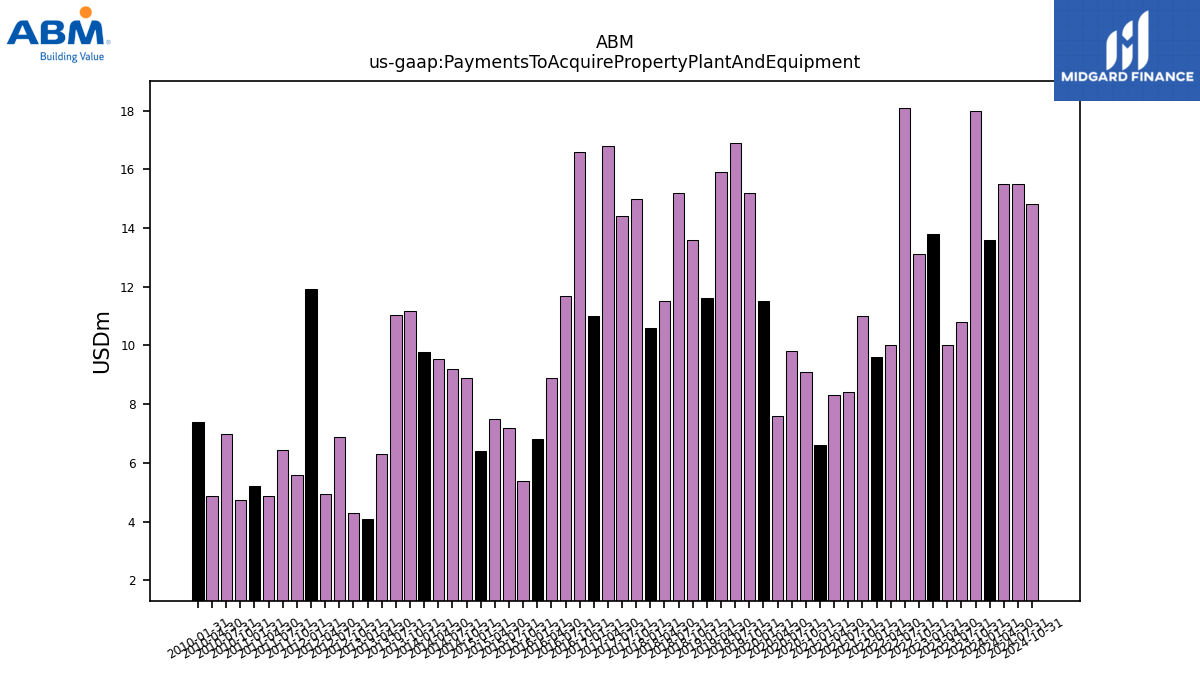
| Payments To Acquire Property Plant And Equipment | 13.60 | 18.00 | 10.80 | 10.00 | 13.80 | 13.10 | 18.10 | 10.00 | 9.60 | 11.00 | 8.40 | 8.30 | 6.60 | 9.10 | 9.80 | 7.60 | 11.50 | 15.20 | 16.90 | 15.90 | 11.60 | 13.60 | 15.20 | 11.50 | 10.60 | 15.00 | 14.40 | 16.80 | 11.00 | 16.60 | 11.70 | 8.90 | 6.80 | 5.40 | 7.20 | 7.50 | 6.40 | 8.90 | 9.20 | 9.54 | 9.76 | 11.17 | 11.04 | 6.30 | 4.09 | 4.29 | 6.89 | 4.95 | 11.93 | 5.58 | 6.45 | 4.88 | 5.21 | 4.72 | 6.98 | 4.86 | 7.38 |
| 2024-01-31 | 2023-10-31 | 2023-07-31 | 2023-04-30 | 2023-01-31 | 2022-10-31 | 2022-07-31 | 2022-04-30 | 2022-01-31 | 2021-10-31 | 2021-07-31 | 2021-04-30 | 2021-01-31 | 2020-10-31 | 2020-07-31 | 2020-04-30 | 2020-01-31 | 2019-10-31 | 2019-07-31 | 2019-04-30 | 2019-01-31 | 2018-10-31 | 2018-07-31 | 2018-04-30 | 2018-01-31 | 2017-10-31 | 2017-07-31 | 2017-04-30 | 2017-01-31 | 2016-10-31 | 2016-07-31 | 2016-04-30 | 2016-01-31 | 2015-10-31 | 2015-07-31 | 2015-04-30 | 2015-01-31 | 2014-10-31 | 2014-07-31 | 2014-04-30 | 2014-01-31 | 2013-10-31 | 2013-07-31 | 2013-04-30 | 2013-01-31 | 2012-10-31 | 2012-07-31 | 2012-04-30 | 2012-01-31 | 2011-10-31 | 2011-07-31 | 2011-04-30 | 2011-01-31 | 2010-10-31 | 2010-07-31 | 2010-04-30 | 2010-01-31 | ||
|---|---|---|---|---|---|---|---|---|---|---|---|---|---|---|---|---|---|---|---|---|---|---|---|---|---|---|---|---|---|---|---|---|---|---|---|---|---|---|---|---|---|---|---|---|---|---|---|---|---|---|---|---|---|---|---|---|---|---|
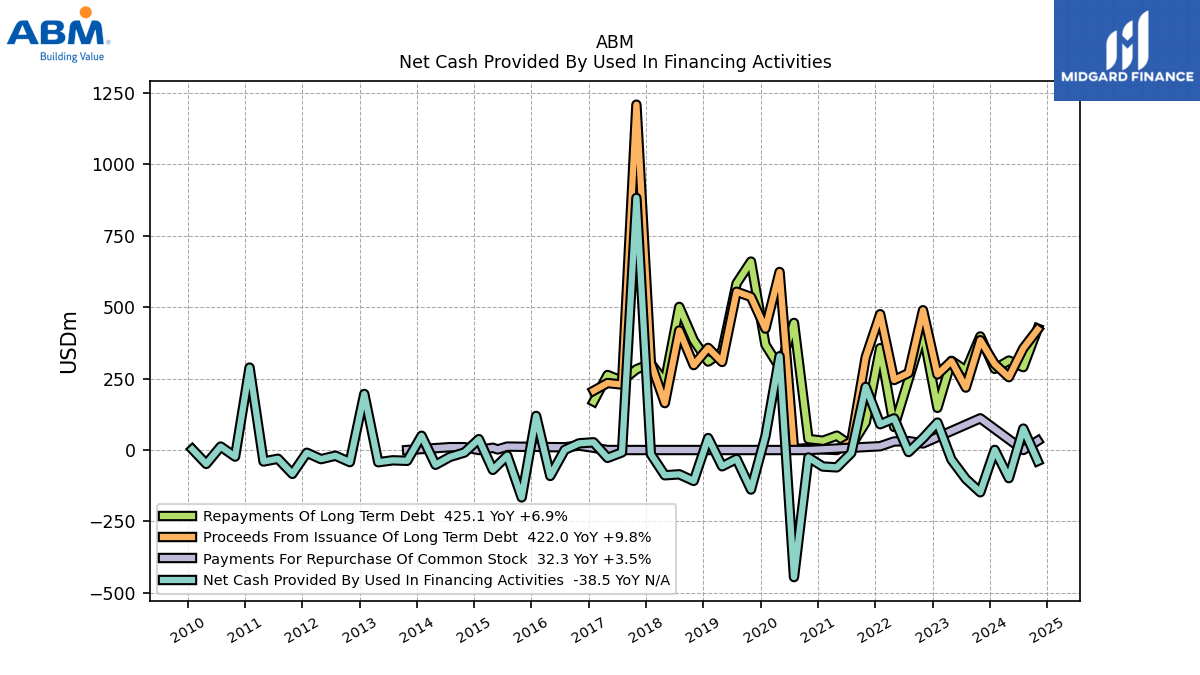
| Net Cash Provided By Used In Financing Activities | 0.50 | -147.90 | -101.20 | -33.40 | 96.20 | 41.30 | -7.00 | 110.90 | 90.30 | 221.10 | -10.20 | -60.70 | -57.80 | -26.00 | -444.90 | 328.40 | 48.40 | -138.40 | -31.40 | -57.00 | 42.00 | -108.10 | -85.00 | -88.40 | -14.30 | 882.70 | -8.20 | -27.50 | 27.00 | 23.50 | 0.50 | -90.80 | 119.40 | -165.90 | -19.60 | -69.50 | 38.10 | -8.80 | -24.00 | -51.73 | 49.93 | -37.79 | -35.98 | -42.75 | 196.28 | -42.41 | -19.88 | -31.93 | -9.56 | -83.45 | -30.50 | -40.22 | 288.61 | -23.10 | 12.19 | -48.66 | 2.86 | |
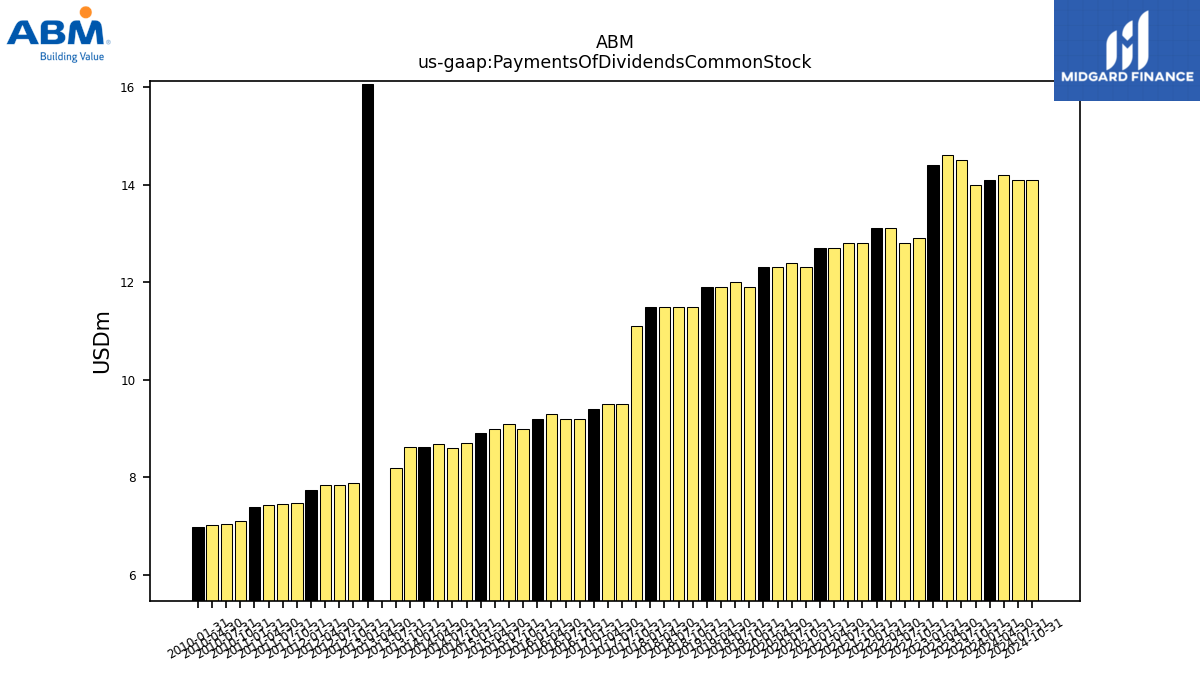
| Payments Of Dividends Common Stock | 14.10 | 14.00 | 14.50 | 14.60 | 14.40 | 12.90 | 12.80 | 13.10 | 13.10 | 12.80 | 12.80 | 12.70 | 12.70 | 12.30 | 12.40 | 12.30 | 12.30 | 11.90 | 12.00 | 11.90 | 11.90 | 11.50 | 11.50 | 11.50 | 11.50 | 11.10 | 9.50 | 9.50 | 9.40 | 9.20 | 9.20 | 9.30 | 9.20 | 9.00 | 9.10 | 9.00 | 8.90 | 8.70 | 8.60 | 8.68 | 8.62 | 8.62 | 8.20 | 0.00 | 16.05 | 7.88 | 7.85 | 7.83 | 7.75 | 7.47 | 7.44 | 7.44 | 7.40 | 7.10 | 7.04 | 7.02 | 6.99 |
| 2024-01-31 | 2023-10-31 | 2023-07-31 | 2023-04-30 | 2023-01-31 | 2022-10-31 | 2022-07-31 | 2022-04-30 | 2022-01-31 | 2021-10-31 | 2021-07-31 | 2021-04-30 | 2021-01-31 | 2020-10-31 | 2020-07-31 | 2020-04-30 | 2020-01-31 | 2019-10-31 | 2019-07-31 | 2019-04-30 | 2019-01-31 | 2018-10-31 | 2018-07-31 | 2018-04-30 | 2018-01-31 | 2017-10-31 | 2017-07-31 | 2017-04-30 | 2017-01-31 | 2016-10-31 | 2016-07-31 | 2016-04-30 | 2016-01-31 | 2015-10-31 | 2015-07-31 | 2015-04-30 | 2015-01-31 | 2014-10-31 | 2014-07-31 | 2014-04-30 | 2014-01-31 | 2013-10-31 | 2013-07-31 | 2013-04-30 | 2013-01-31 | 2012-10-31 | 2012-07-31 | 2012-04-30 | 2012-01-31 | 2011-10-31 | 2011-07-31 | 2011-04-30 | 2011-01-31 | 2010-10-31 | 2010-07-31 | 2010-04-30 | 2010-01-31 | ||
|---|---|---|---|---|---|---|---|---|---|---|---|---|---|---|---|---|---|---|---|---|---|---|---|---|---|---|---|---|---|---|---|---|---|---|---|---|---|---|---|---|---|---|---|---|---|---|---|---|---|---|---|---|---|---|---|---|---|---|
| Revenue From Contract With Customer Excluding Assessed Tax | 2069.60 | 2092.90 | 2028.20 | 1984.00 | 1991.30 | 2011.10 | 1961.40 | 1897.80 | 1936.20 | 1695.60 | 1543.10 | 1497.40 | 1492.40 | 1484.60 | 1394.10 | 1496.00 | 1612.90 | 1648.00 | 1647.90 | 1594.70 | 1607.90 | 1648.80 | 1624.30 | 1580.80 | 1588.30 | 1497.90 | 1318.40 | 1310.50 | 1326.70 | 1322.30 | 1296.90 | 1257.10 | 1268.40 | 1277.00 | 1348.80 | 1270.10 | 1289.40 | 1298.90 | 1276.10 | 1231.30 | 1226.47 | 1236.77 | 1216.77 | 1173.62 | 1182.12 | 1090.00 | 1079.23 | 1057.24 | 1073.79 | 1081.34 | 1076.25 | 1060.08 | 1029.17 | 901.37 | 869.03 | 855.46 | 869.88 | |
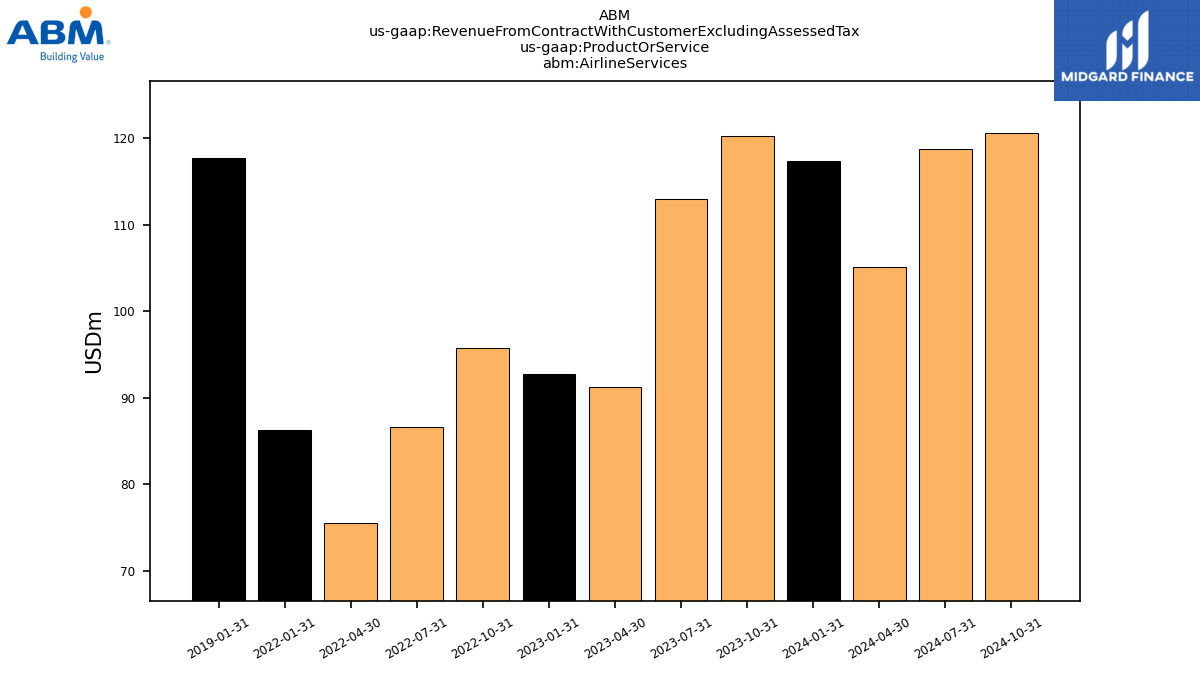
| Airline Services | 117.40 | 120.30 | 113.00 | 91.30 | 92.80 | 95.80 | 86.60 | 75.50 | 86.30 | NA | NA | NA | NA | NA | NA | NA | NA | NA | NA | NA | 117.70 | NA | NA | NA | NA | NA | NA | NA | NA | NA | NA | NA | NA | NA | NA | NA | NA | NA | NA | NA | NA | NA | NA | NA | NA | NA | NA | NA | NA | NA | NA | NA | NA | NA | NA | NA | NA | |
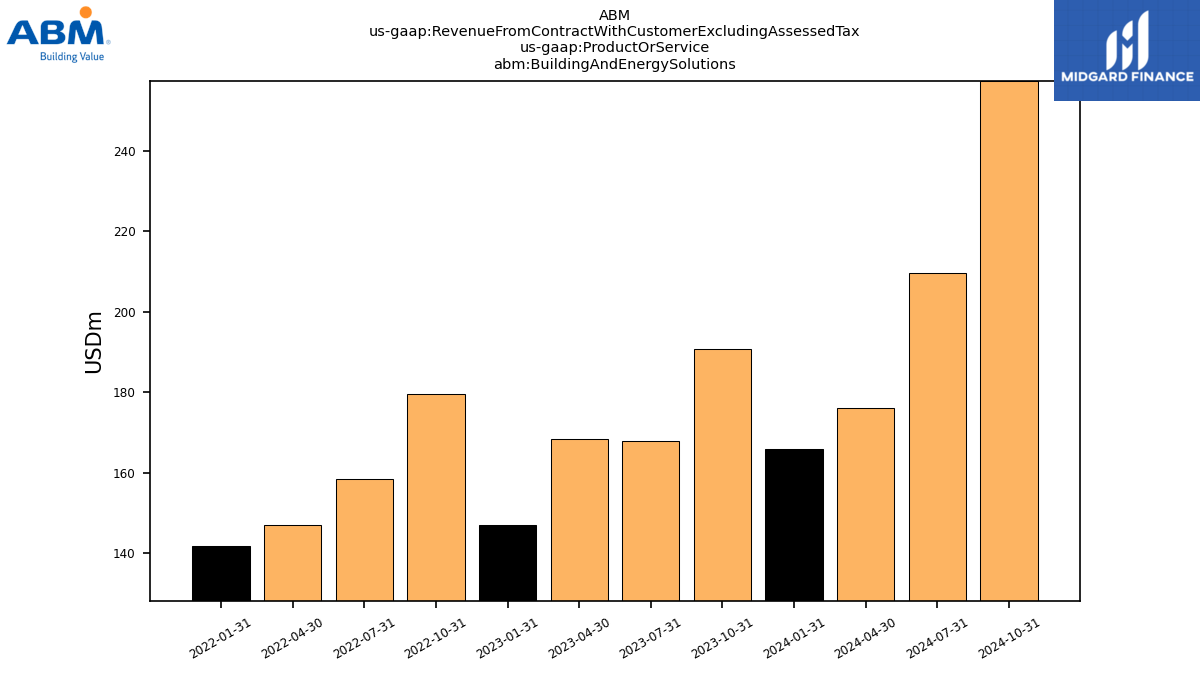
| Building And Energy Solutions | 165.90 | 190.80 | 167.90 | 168.40 | 147.00 | 179.60 | 158.40 | 147.00 | 141.80 | NA | NA | NA | NA | NA | NA | NA | NA | NA | NA | NA | NA | NA | NA | NA | NA | NA | NA | NA | NA | NA | NA | NA | NA | NA | NA | NA | NA | NA | NA | NA | NA | NA | NA | NA | NA | NA | NA | NA | NA | NA | NA | NA | NA | NA | NA | NA | NA | |
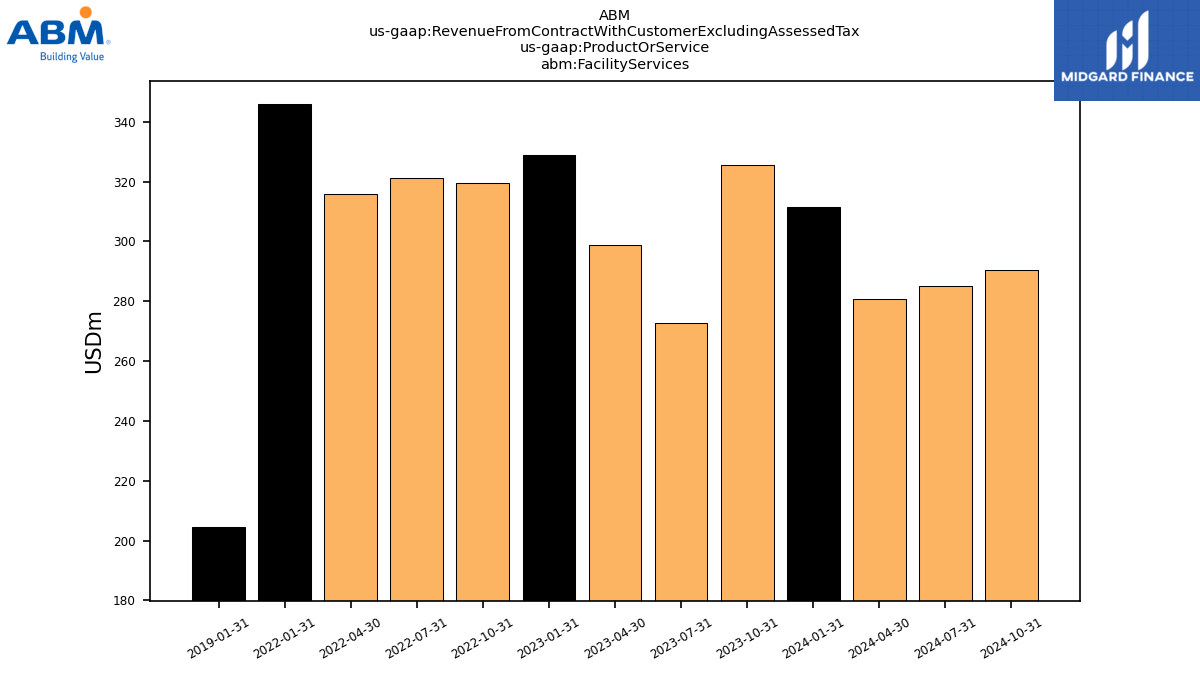
| Facility Services | 311.40 | 325.60 | 272.60 | 298.90 | 328.80 | 319.50 | 321.30 | 315.80 | 346.00 | NA | NA | NA | NA | NA | NA | NA | NA | NA | NA | NA | 204.70 | NA | NA | NA | NA | NA | NA | NA | NA | NA | NA | NA | NA | NA | NA | NA | NA | NA | NA | NA | NA | NA | NA | NA | NA | NA | NA | NA | NA | NA | NA | NA | NA | NA | NA | NA | NA | |
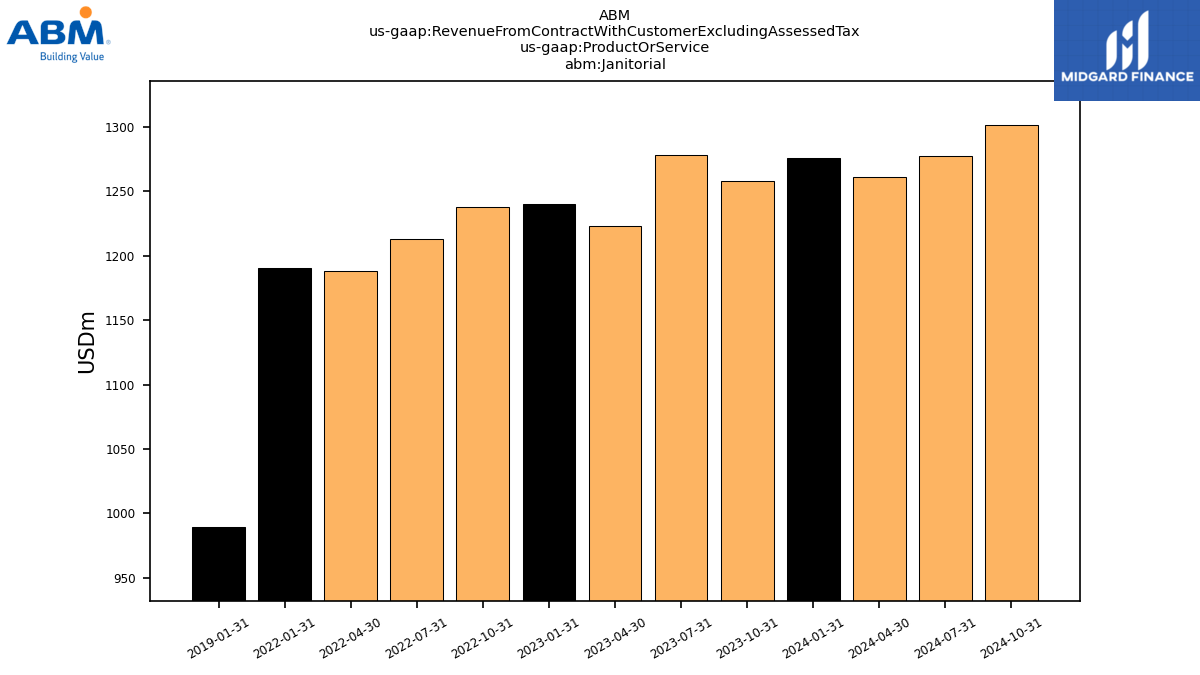
| Janitorial | 1275.80 | 1257.70 | 1277.80 | 1223.20 | 1239.90 | 1237.90 | 1213.10 | 1188.20 | 1190.20 | NA | NA | NA | NA | NA | NA | NA | NA | NA | NA | NA | 989.90 | NA | NA | NA | NA | NA | NA | NA | NA | NA | NA | NA | NA | NA | NA | NA | NA | NA | NA | NA | NA | NA | NA | NA | NA | NA | NA | NA | NA | NA | NA | NA | NA | NA | NA | NA | NA | |
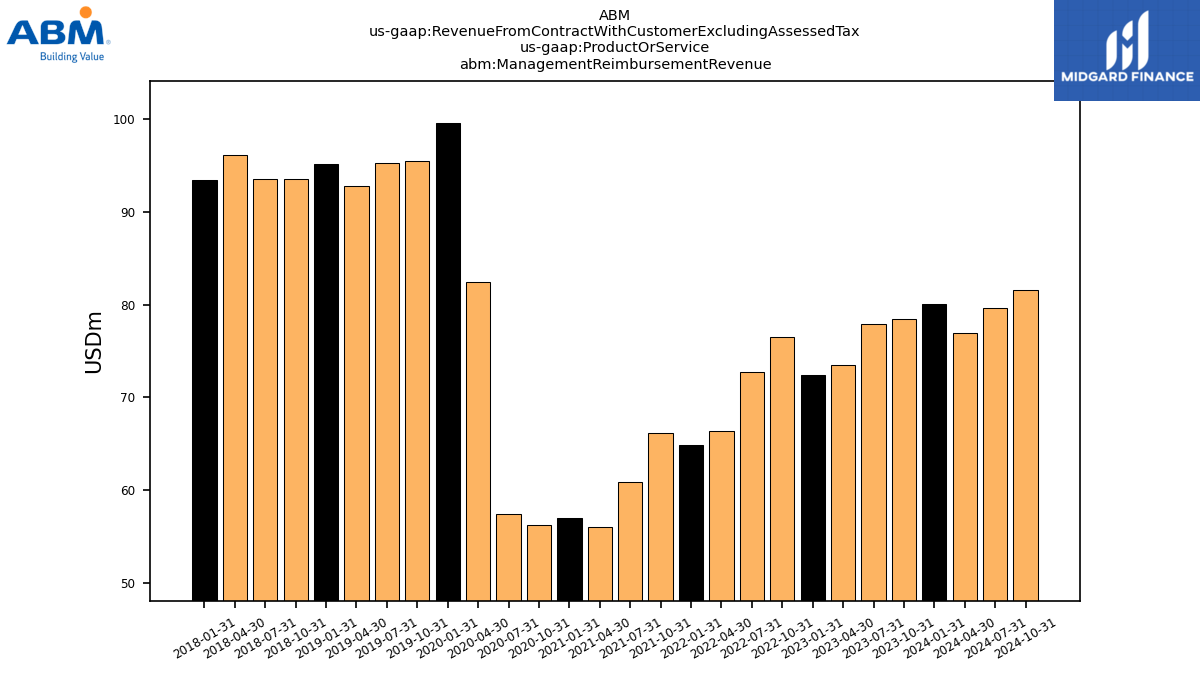
| Management Reimbursement Revenue | 80.10 | 78.50 | 77.90 | 73.50 | 72.40 | 76.50 | 72.80 | 66.40 | 64.90 | 66.20 | 60.90 | 56.10 | 57.00 | 56.30 | 57.40 | 82.40 | 99.60 | 95.50 | 95.30 | 92.80 | 95.20 | 93.50 | 93.50 | 96.10 | 93.40 | NA | NA | NA | NA | NA | NA | NA | NA | NA | NA | NA | NA | NA | NA | NA | NA | NA | NA | NA | NA | NA | NA | NA | NA | NA | NA | NA | NA | NA | NA | NA | NA | |
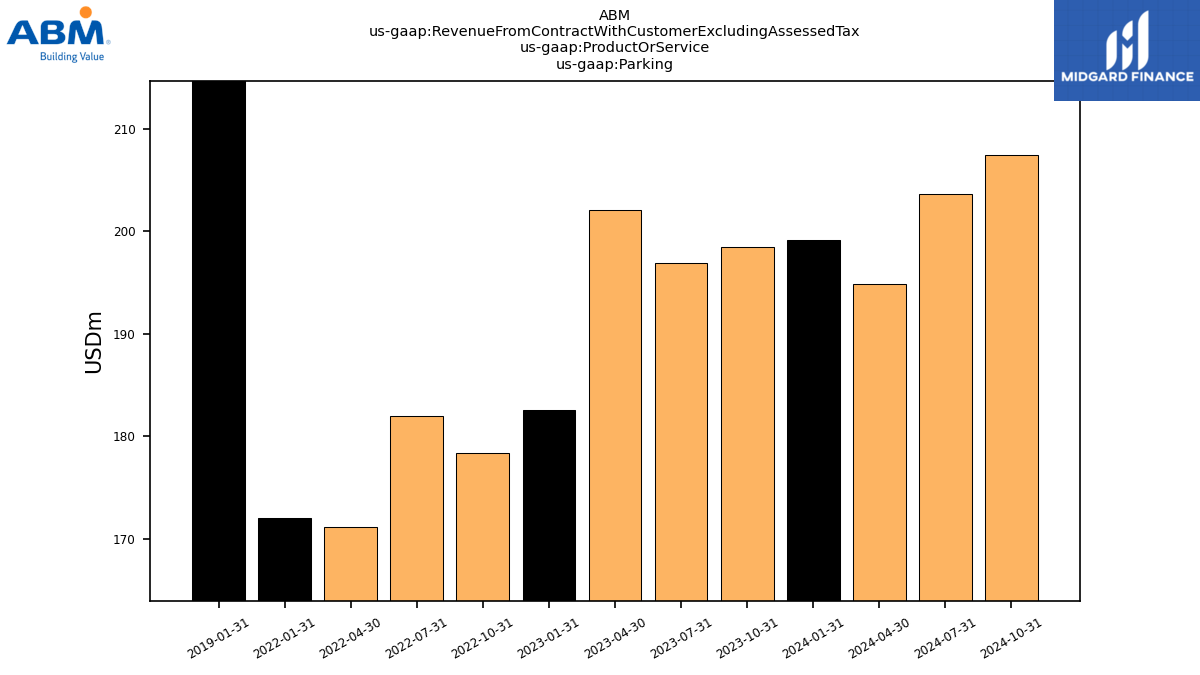
| Parking | 199.10 | 198.50 | 196.90 | 202.10 | 182.60 | 178.40 | 182.00 | 171.20 | 172.00 | NA | NA | NA | NA | NA | NA | NA | NA | NA | NA | NA | 222.10 | NA | NA | NA | NA | NA | NA | NA | NA | NA | NA | NA | NA | NA | NA | NA | NA | NA | NA | NA | NA | NA | NA | NA | NA | NA | NA | NA | NA | NA | NA | NA | NA | NA | NA | NA | NA | |
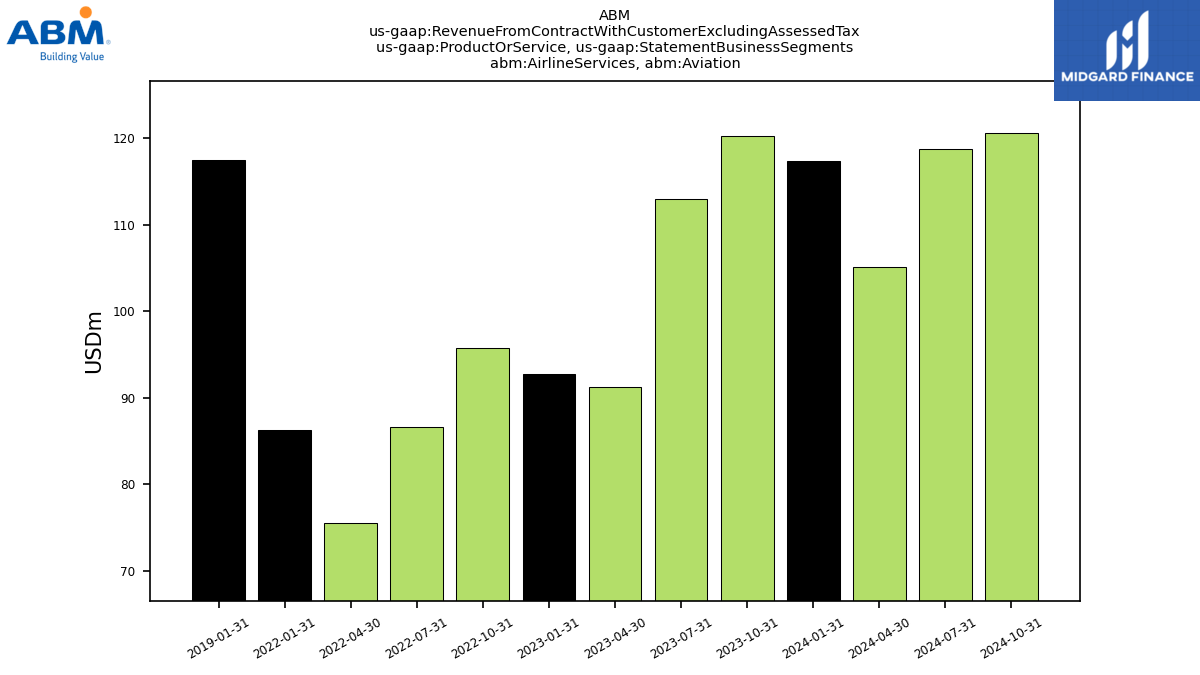
| Airline Services, Aviation | 117.40 | 120.30 | 113.00 | 91.30 | 92.80 | 95.80 | 86.60 | 75.50 | 86.30 | NA | NA | NA | NA | NA | NA | NA | NA | NA | NA | NA | 117.50 | NA | NA | NA | NA | NA | NA | NA | NA | NA | NA | NA | NA | NA | NA | NA | NA | NA | NA | NA | NA | NA | NA | NA | NA | NA | NA | NA | NA | NA | NA | NA | NA | NA | NA | NA | NA | |
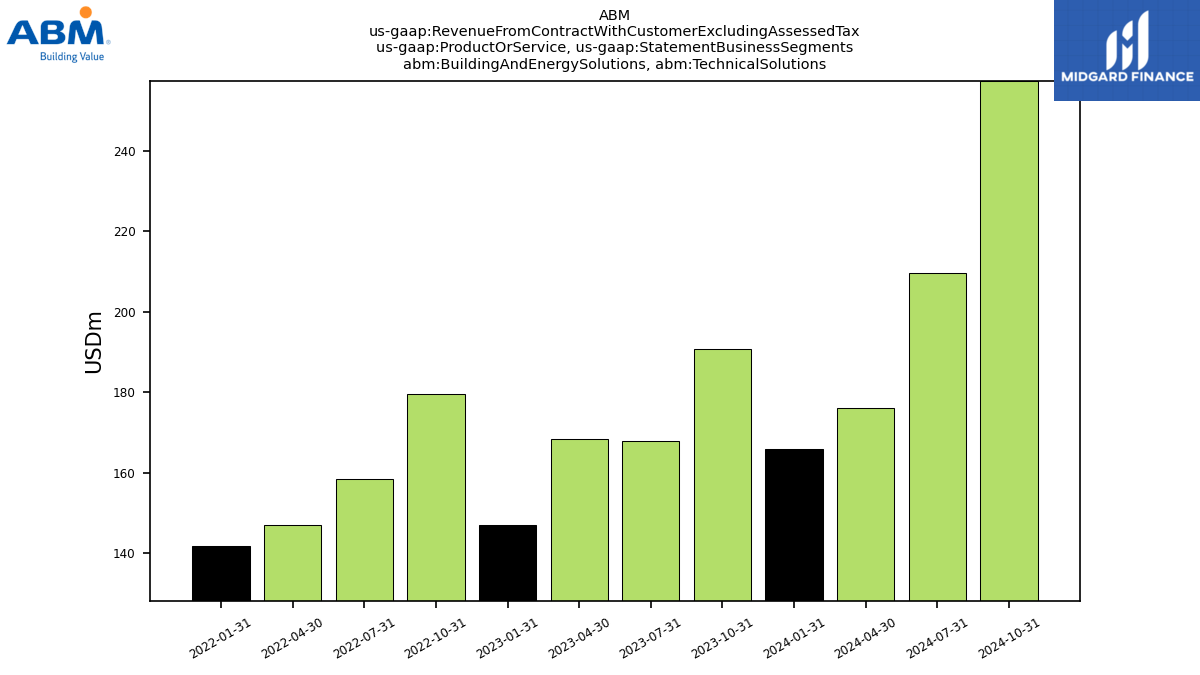
| Building And Energy Solutions, Technical Solutions | 165.90 | 190.80 | 167.90 | 168.40 | 147.00 | 179.60 | 158.40 | 147.00 | 141.80 | NA | NA | NA | NA | NA | NA | NA | NA | NA | NA | NA | NA | NA | NA | NA | NA | NA | NA | NA | NA | NA | NA | NA | NA | NA | NA | NA | NA | NA | NA | NA | NA | NA | NA | NA | NA | NA | NA | NA | NA | NA | NA | NA | NA | NA | NA | NA | NA | |
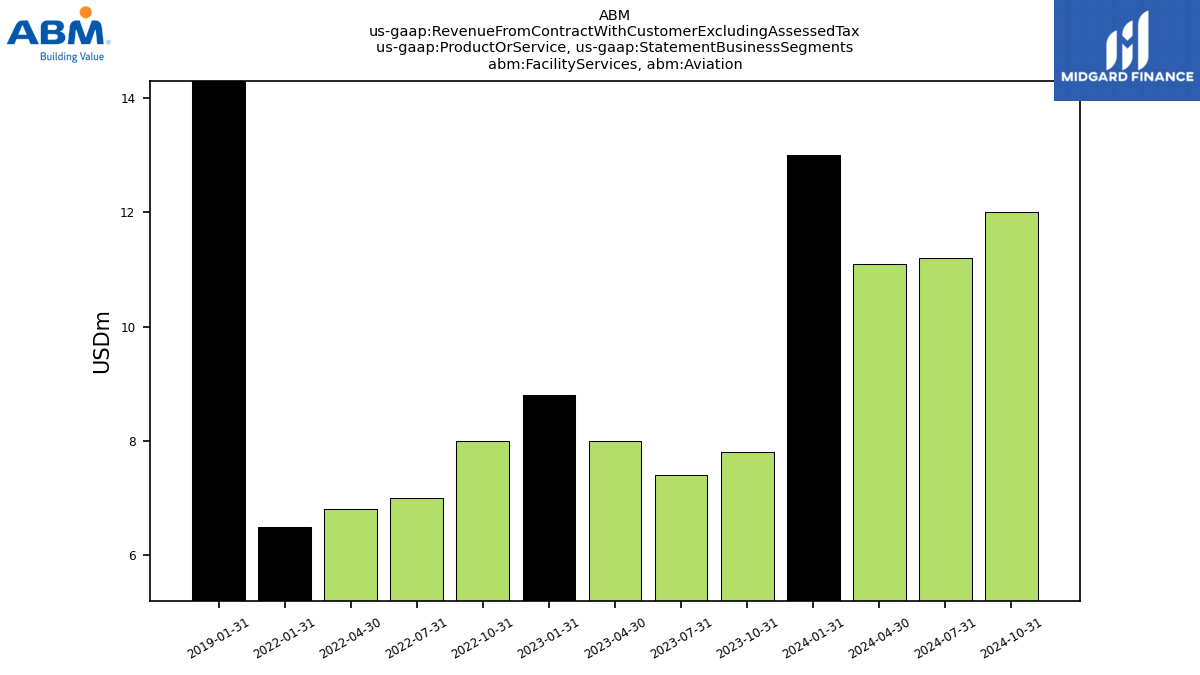
| Facility Services, Aviation | 13.00 | 7.80 | 7.40 | 8.00 | 8.80 | 8.00 | 7.00 | 6.80 | 6.50 | NA | NA | NA | NA | NA | NA | NA | NA | NA | NA | NA | 18.00 | NA | NA | NA | NA | NA | NA | NA | NA | NA | NA | NA | NA | NA | NA | NA | NA | NA | NA | NA | NA | NA | NA | NA | NA | NA | NA | NA | NA | NA | NA | NA | NA | NA | NA | NA | NA | |
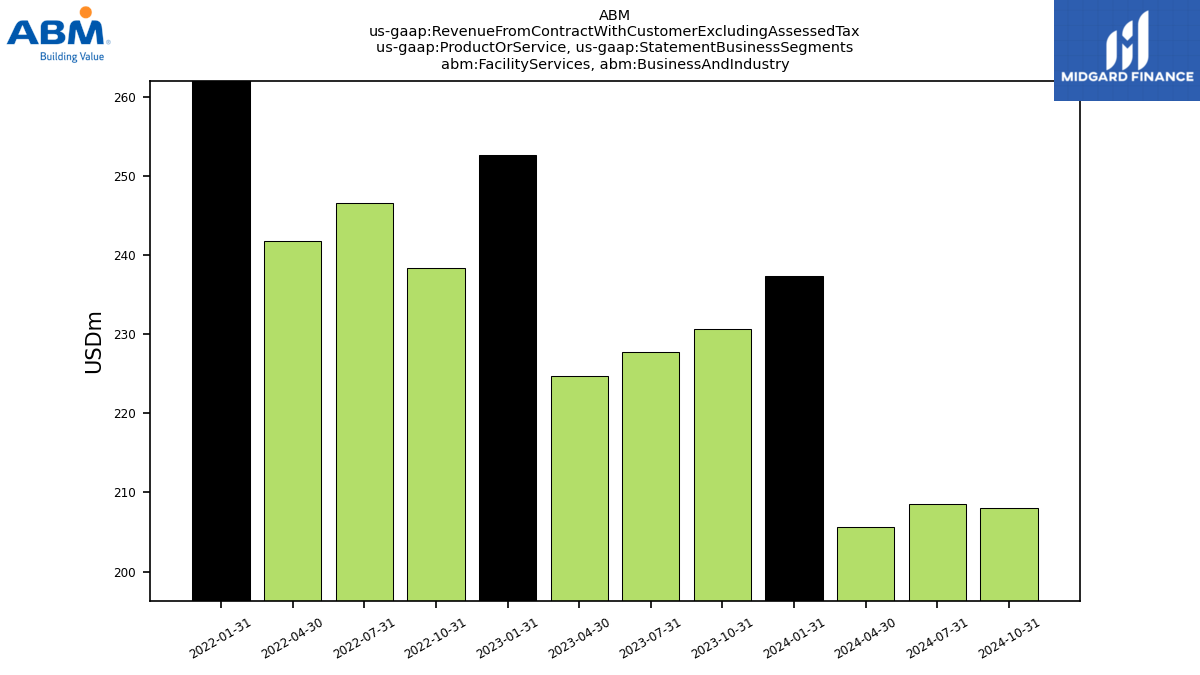
| Facility Services, Business And Industry | 237.40 | 230.70 | 227.70 | 224.70 | 252.60 | 238.30 | 246.60 | 241.80 | 268.40 | NA | NA | NA | NA | NA | NA | NA | NA | NA | NA | NA | NA | NA | NA | NA | NA | NA | NA | NA | NA | NA | NA | NA | NA | NA | NA | NA | NA | NA | NA | NA | NA | NA | NA | NA | NA | NA | NA | NA | NA | NA | NA | NA | NA | NA | NA | NA | NA | |
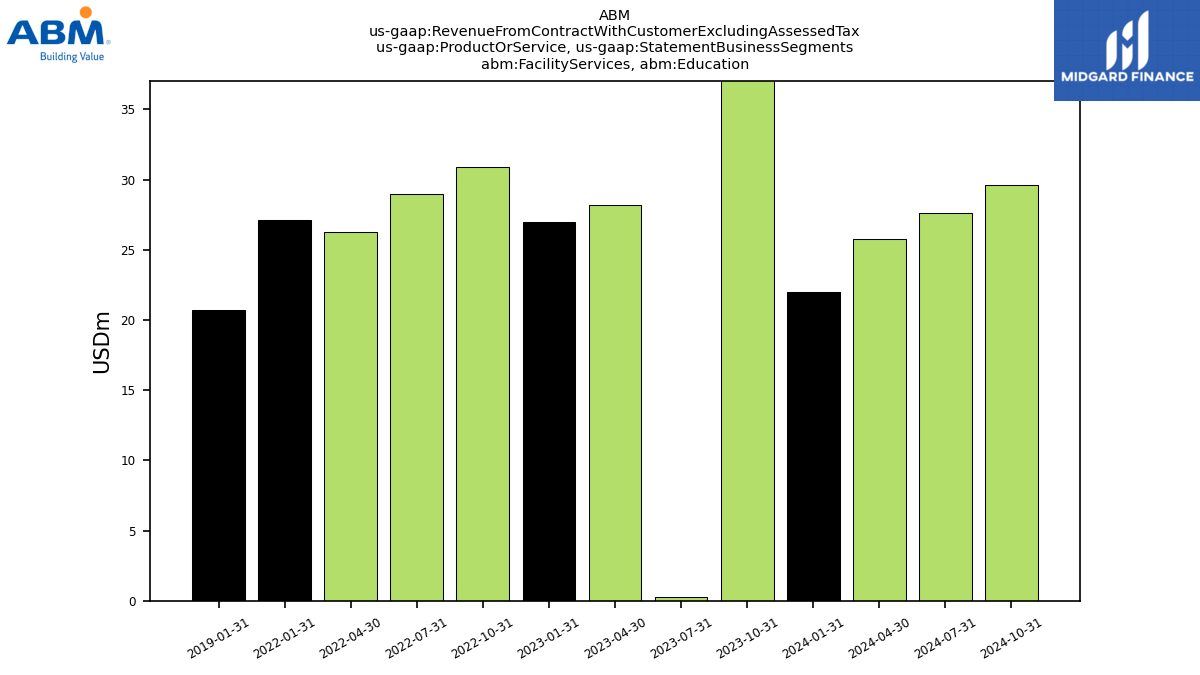
| Facility Services, Education | 22.00 | 49.30 | 0.30 | 28.20 | 27.00 | 30.90 | 29.00 | 26.30 | 27.10 | NA | NA | NA | NA | NA | NA | NA | NA | NA | NA | NA | 20.70 | NA | NA | NA | NA | NA | NA | NA | NA | NA | NA | NA | NA | NA | NA | NA | NA | NA | NA | NA | NA | NA | NA | NA | NA | NA | NA | NA | NA | NA | NA | NA | NA | NA | NA | NA | NA | |
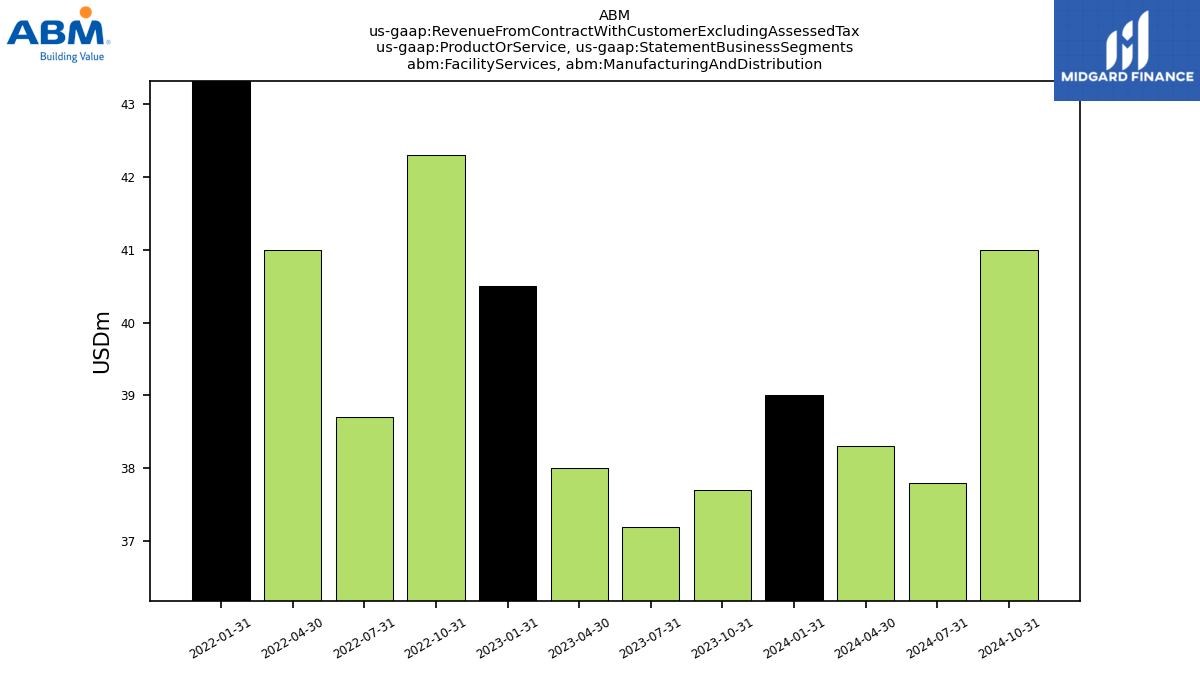
| Facility Services, Manufacturing And Distribution | 39.00 | 37.70 | 37.20 | 38.00 | 40.50 | 42.30 | 38.70 | 41.00 | 44.10 | NA | NA | NA | NA | NA | NA | NA | NA | NA | NA | NA | NA | NA | NA | NA | NA | NA | NA | NA | NA | NA | NA | NA | NA | NA | NA | NA | NA | NA | NA | NA | NA | NA | NA | NA | NA | NA | NA | NA | NA | NA | NA | NA | NA | NA | NA | NA | NA | |
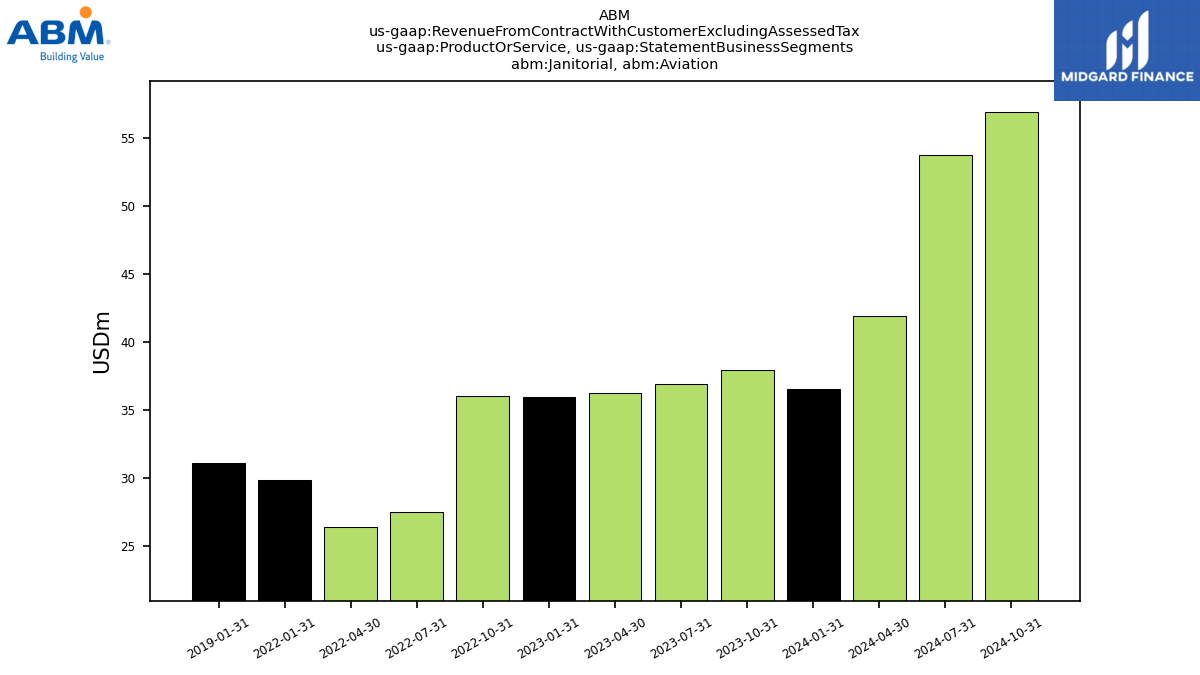
| Janitorial, Aviation | 36.50 | 37.90 | 36.90 | 36.20 | 35.90 | 36.00 | 27.50 | 26.40 | 29.80 | NA | NA | NA | NA | NA | NA | NA | NA | NA | NA | NA | 31.10 | NA | NA | NA | NA | NA | NA | NA | NA | NA | NA | NA | NA | NA | NA | NA | NA | NA | NA | NA | NA | NA | NA | NA | NA | NA | NA | NA | NA | NA | NA | NA | NA | NA | NA | NA | NA | |
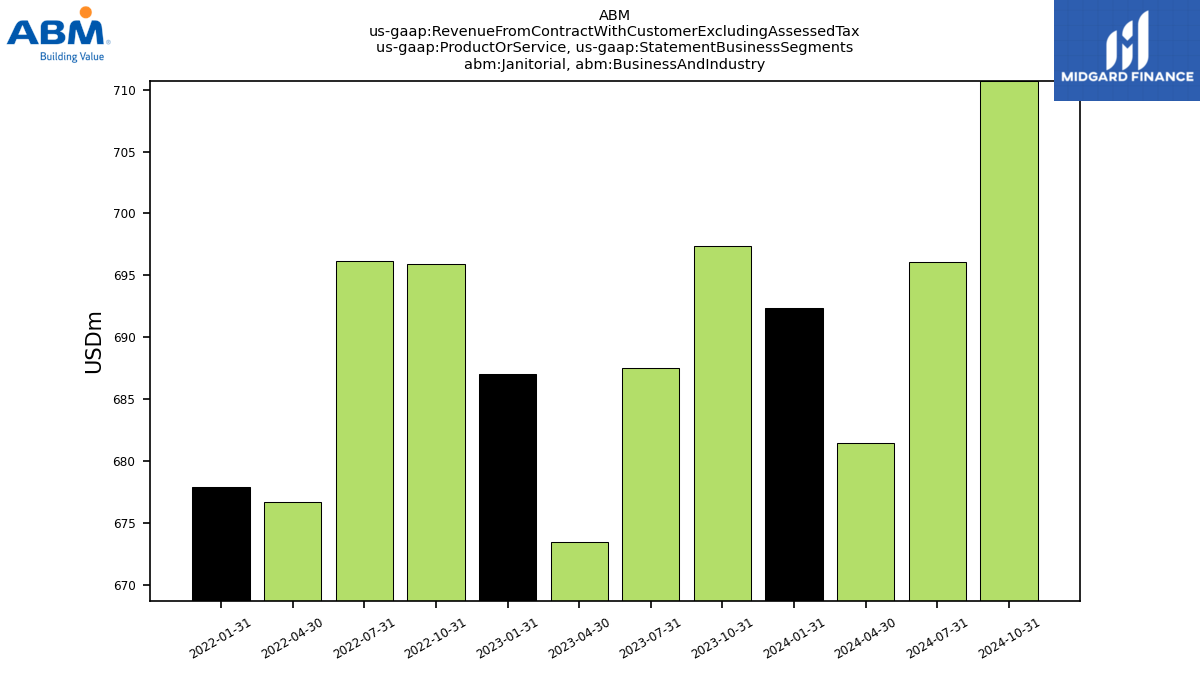
| Janitorial, Business And Industry | 692.40 | 697.40 | 687.50 | 673.50 | 687.00 | 695.90 | 696.20 | 676.70 | 677.90 | NA | NA | NA | NA | NA | NA | NA | NA | NA | NA | NA | NA | NA | NA | NA | NA | NA | NA | NA | NA | NA | NA | NA | NA | NA | NA | NA | NA | NA | NA | NA | NA | NA | NA | NA | NA | NA | NA | NA | NA | NA | NA | NA | NA | NA | NA | NA | NA | |
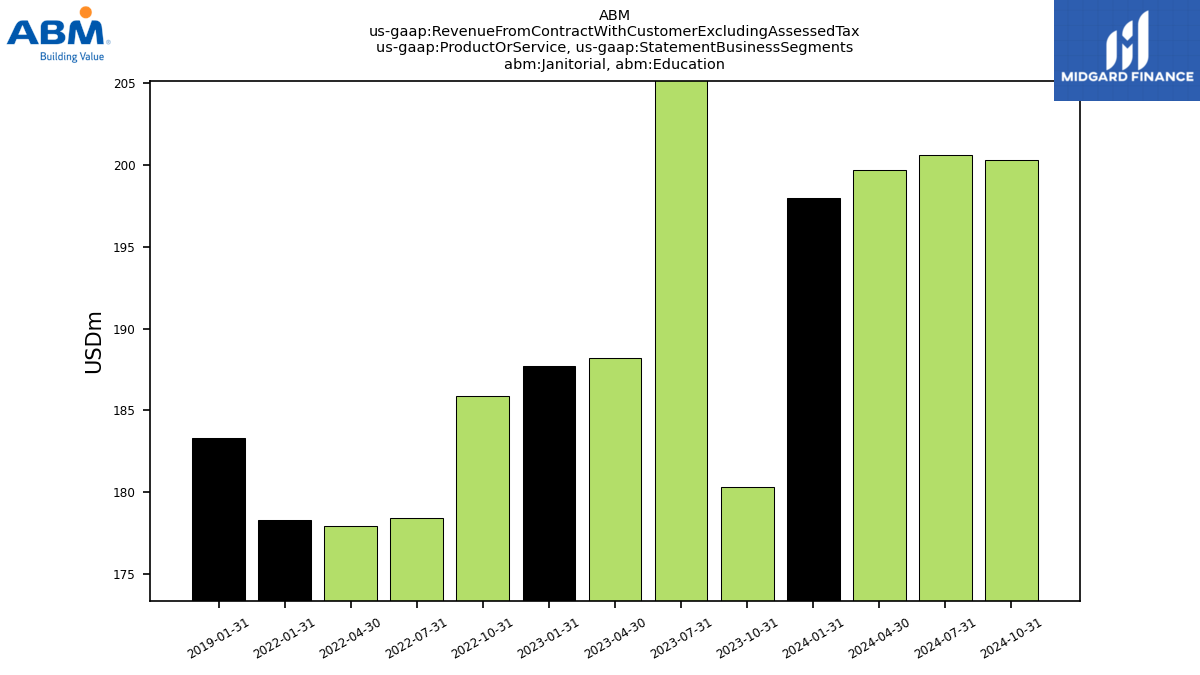
| Janitorial, Education | 198.00 | 180.30 | 218.60 | 188.20 | 187.70 | 185.90 | 178.40 | 177.90 | 178.30 | NA | NA | NA | NA | NA | NA | NA | NA | NA | NA | NA | 183.30 | NA | NA | NA | NA | NA | NA | NA | NA | NA | NA | NA | NA | NA | NA | NA | NA | NA | NA | NA | NA | NA | NA | NA | NA | NA | NA | NA | NA | NA | NA | NA | NA | NA | NA | NA | NA | |
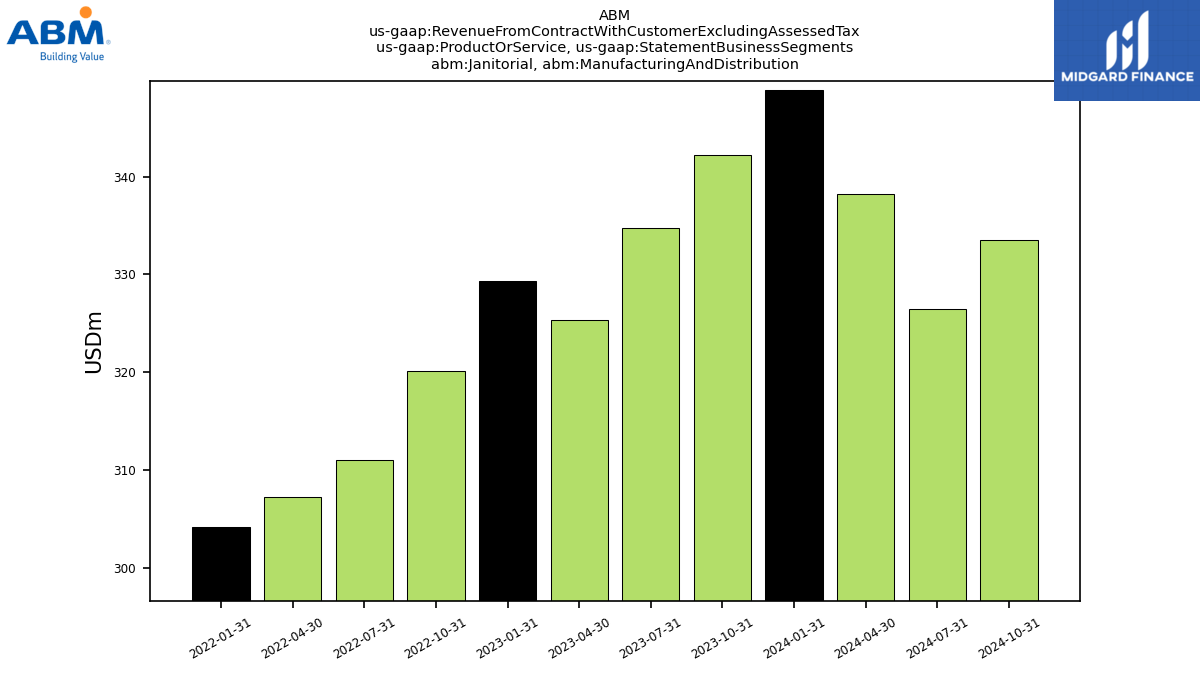
| Janitorial, Manufacturing And Distribution | 348.90 | 342.20 | 334.80 | 325.30 | 329.30 | 320.10 | 311.00 | 307.20 | 304.20 | NA | NA | NA | NA | NA | NA | NA | NA | NA | NA | NA | NA | NA | NA | NA | NA | NA | NA | NA | NA | NA | NA | NA | NA | NA | NA | NA | NA | NA | NA | NA | NA | NA | NA | NA | NA | NA | NA | NA | NA | NA | NA | NA | NA | NA | NA | NA | NA | |
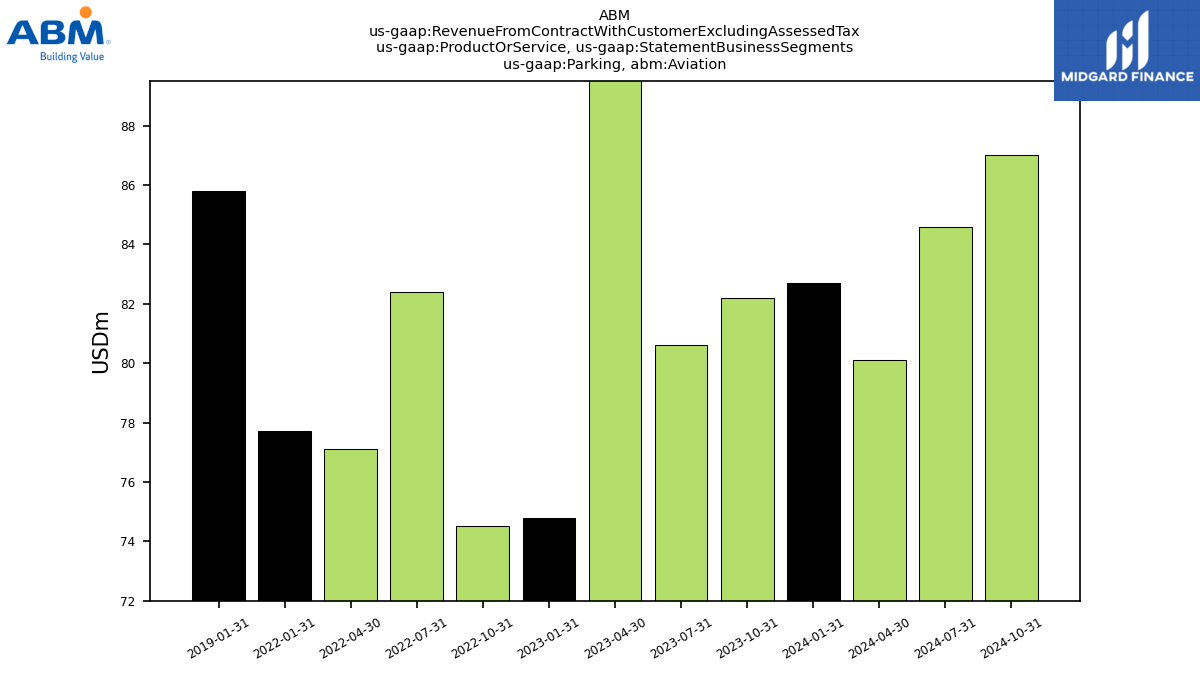
| Parking, Aviation | 82.70 | 82.20 | 80.60 | 91.70 | 74.80 | 74.50 | 82.40 | 77.10 | 77.70 | NA | NA | NA | NA | NA | NA | NA | NA | NA | NA | NA | 85.80 | NA | NA | NA | NA | NA | NA | NA | NA | NA | NA | NA | NA | NA | NA | NA | NA | NA | NA | NA | NA | NA | NA | NA | NA | NA | NA | NA | NA | NA | NA | NA | NA | NA | NA | NA | NA | |
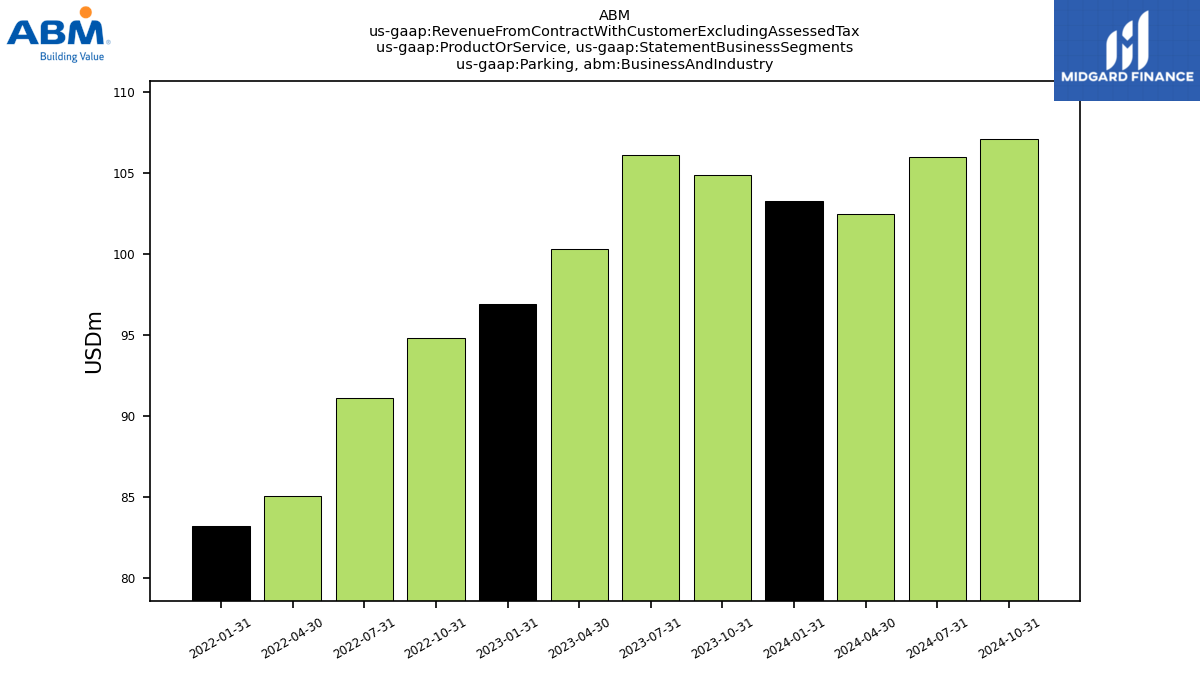
| Parking, Business And Industry | 103.30 | 104.90 | 106.10 | 100.30 | 96.90 | 94.80 | 91.10 | 85.10 | 83.20 | NA | NA | NA | NA | NA | NA | NA | NA | NA | NA | NA | NA | NA | NA | NA | NA | NA | NA | NA | NA | NA | NA | NA | NA | NA | NA | NA | NA | NA | NA | NA | NA | NA | NA | NA | NA | NA | NA | NA | NA | NA | NA | NA | NA | NA | NA | NA | NA | |
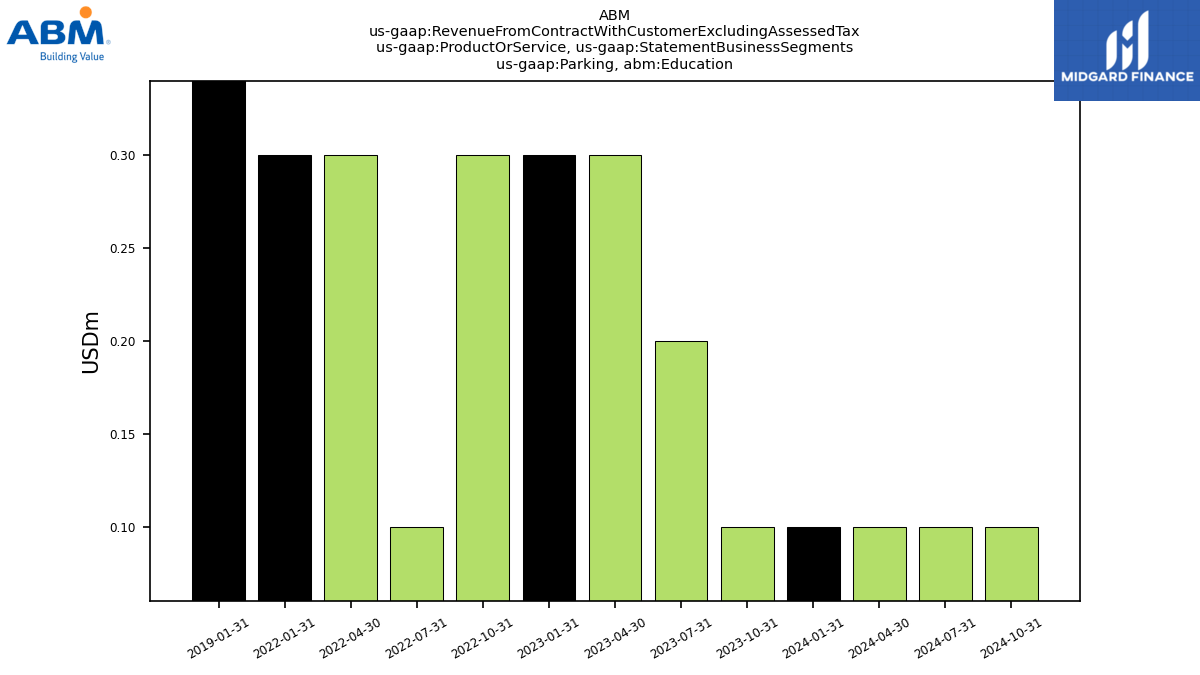
| Parking, Education | 0.10 | 0.10 | 0.20 | 0.30 | 0.30 | 0.30 | 0.10 | 0.30 | 0.30 | NA | NA | NA | NA | NA | NA | NA | NA | NA | NA | NA | 0.80 | NA | NA | NA | NA | NA | NA | NA | NA | NA | NA | NA | NA | NA | NA | NA | NA | NA | NA | NA | NA | NA | NA | NA | NA | NA | NA | NA | NA | NA | NA | NA | NA | NA | NA | NA | NA | |
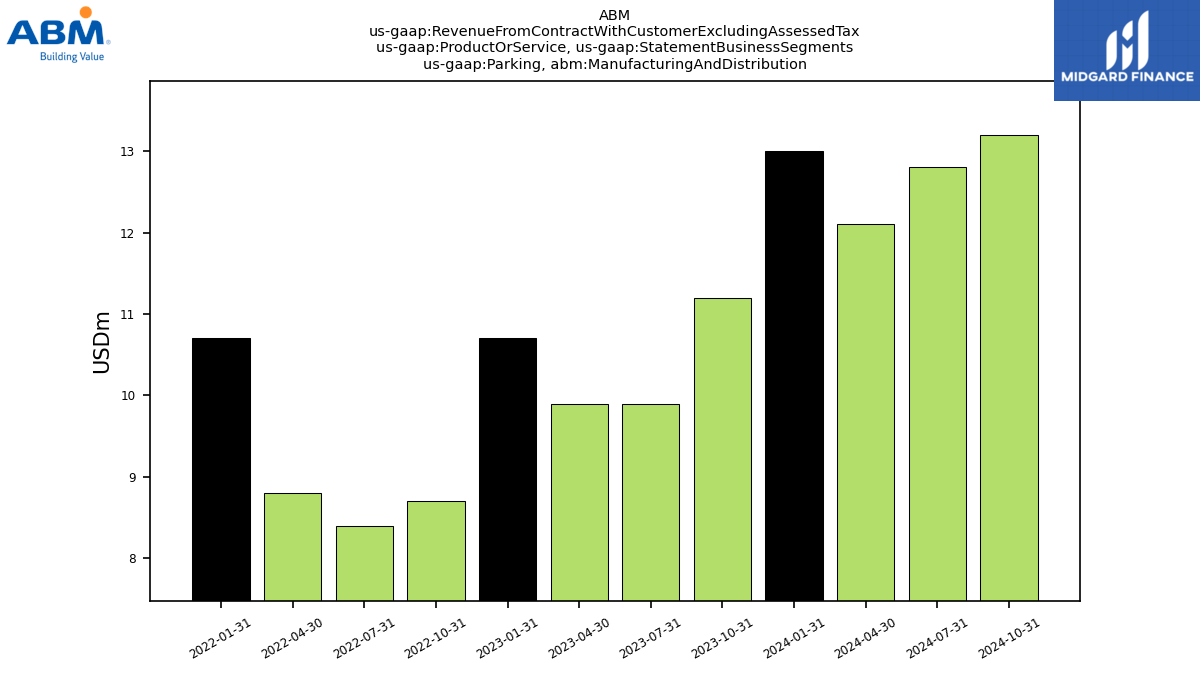
| Parking, Manufacturing And Distribution | 13.00 | 11.20 | 9.90 | 9.90 | 10.70 | 8.70 | 8.40 | 8.80 | 10.70 | NA | NA | NA | NA | NA | NA | NA | NA | NA | NA | NA | NA | NA | NA | NA | NA | NA | NA | NA | NA | NA | NA | NA | NA | NA | NA | NA | NA | NA | NA | NA | NA | NA | NA | NA | NA | NA | NA | NA | NA | NA | NA | NA | NA | NA | NA | NA | NA | |
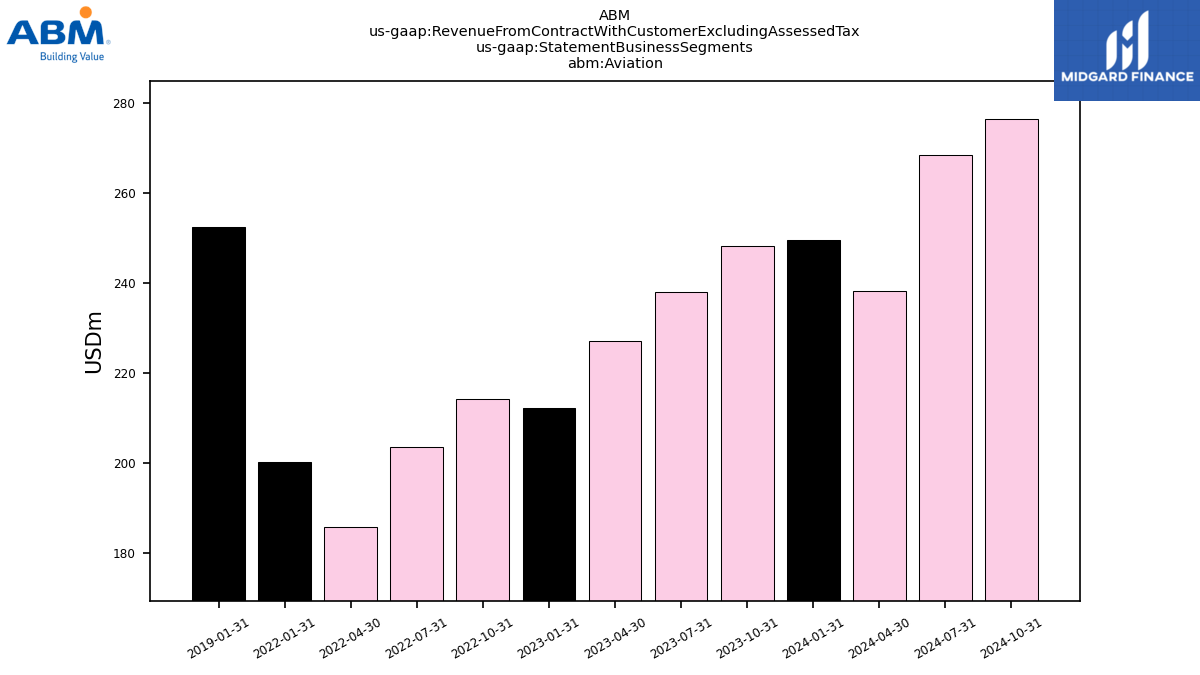
| Aviation | 249.50 | 248.20 | 238.00 | 227.20 | 212.30 | 214.30 | 203.50 | 185.90 | 200.30 | NA | NA | NA | NA | NA | NA | NA | NA | NA | NA | NA | 252.40 | NA | NA | NA | NA | NA | NA | NA | NA | NA | NA | NA | NA | NA | NA | NA | NA | NA | NA | NA | NA | NA | NA | NA | NA | NA | NA | NA | NA | NA | NA | NA | NA | NA | NA | NA | NA | |
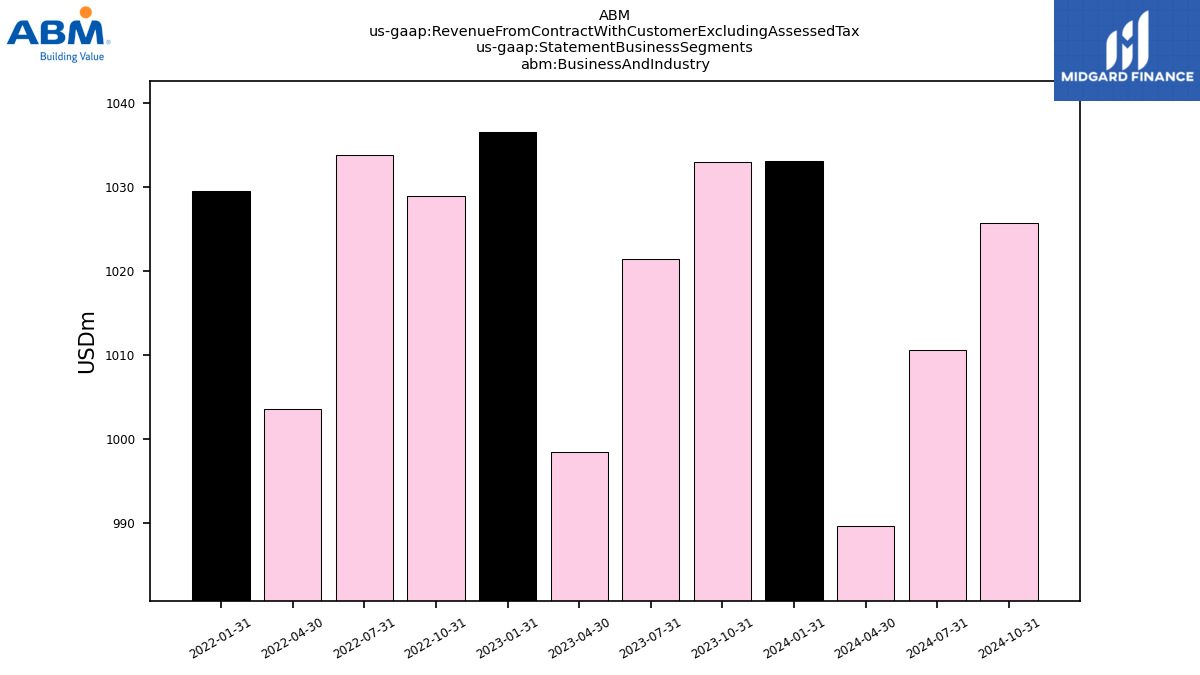
| Business And Industry | 1033.10 | 1033.00 | 1021.40 | 998.50 | 1036.60 | 1028.90 | 1033.80 | 1003.60 | 1029.50 | NA | NA | NA | NA | NA | NA | NA | NA | NA | NA | NA | NA | NA | NA | NA | NA | NA | NA | NA | NA | NA | NA | NA | NA | NA | NA | NA | NA | NA | NA | NA | NA | NA | NA | NA | NA | NA | NA | NA | NA | NA | NA | NA | NA | NA | NA | NA | NA | |
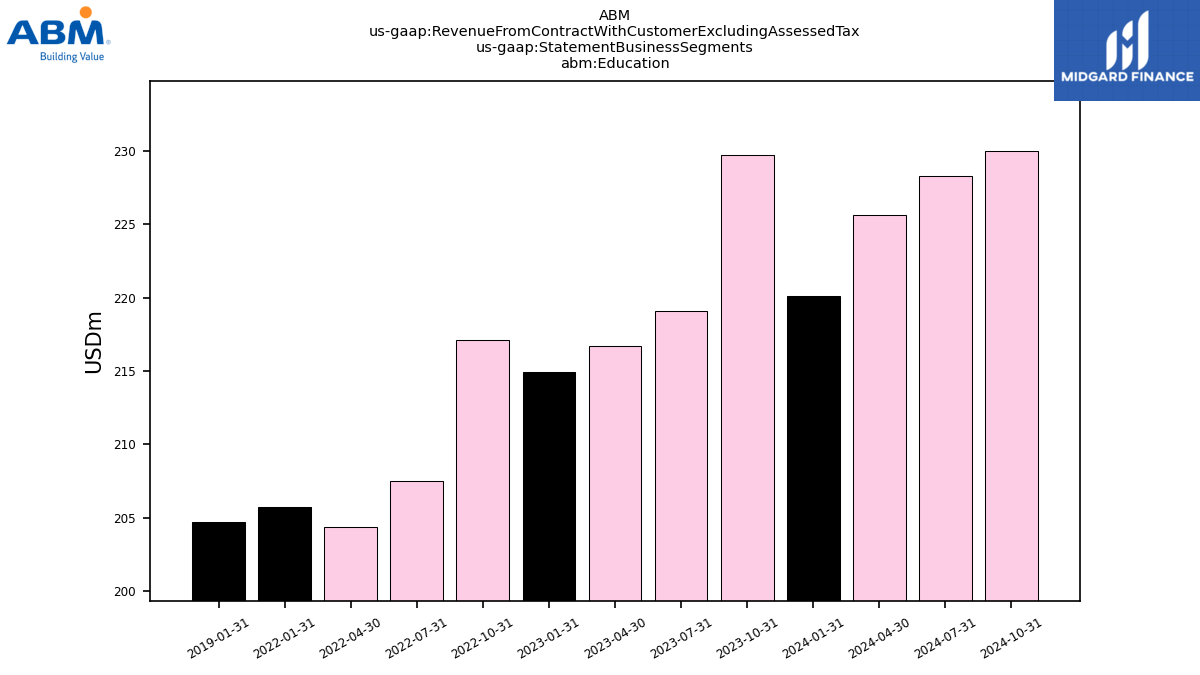
| Education | 220.10 | 229.70 | 219.10 | 216.70 | 214.90 | 217.10 | 207.50 | 204.40 | 205.70 | NA | NA | NA | NA | NA | NA | NA | NA | NA | NA | NA | 204.70 | NA | NA | NA | NA | NA | NA | NA | NA | NA | NA | NA | NA | NA | NA | NA | NA | NA | NA | NA | NA | NA | NA | NA | NA | NA | NA | NA | NA | NA | NA | NA | NA | NA | NA | NA | NA | |
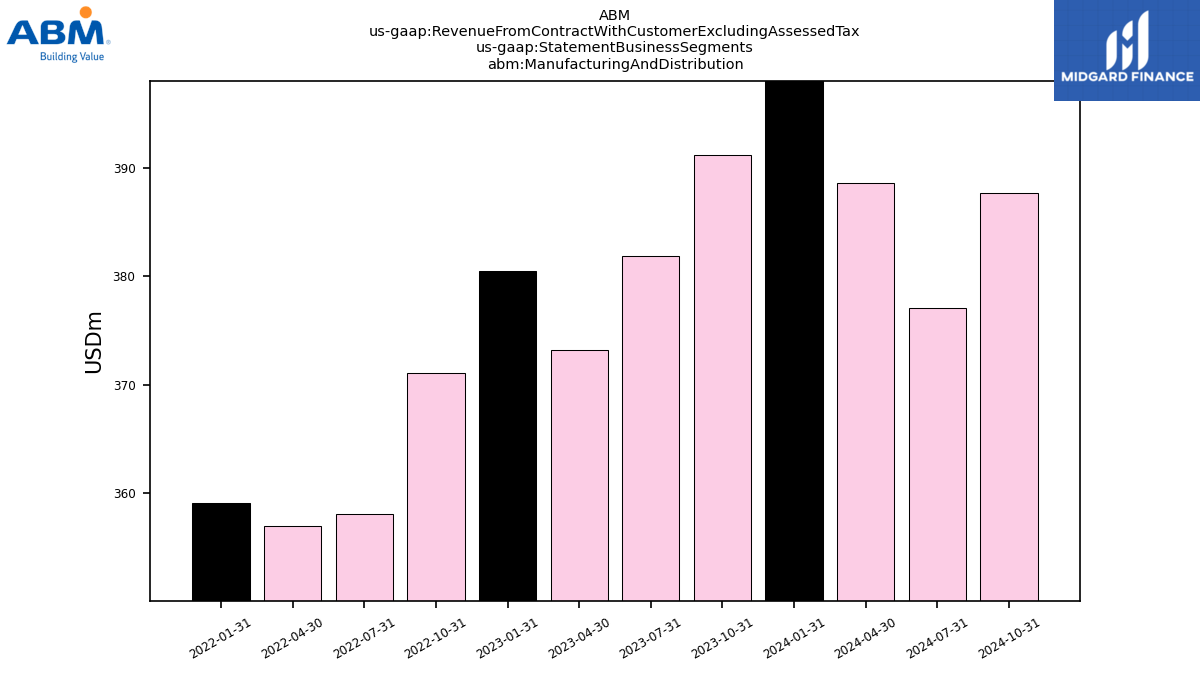
| Manufacturing And Distribution | 400.90 | 391.20 | 381.90 | 373.20 | 380.50 | 371.10 | 358.10 | 356.90 | 359.10 | NA | NA | NA | NA | NA | NA | NA | NA | NA | NA | NA | NA | NA | NA | NA | NA | NA | NA | NA | NA | NA | NA | NA | NA | NA | NA | NA | NA | NA | NA | NA | NA | NA | NA | NA | NA | NA | NA | NA | NA | NA | NA | NA | NA | NA | NA | NA | NA | |
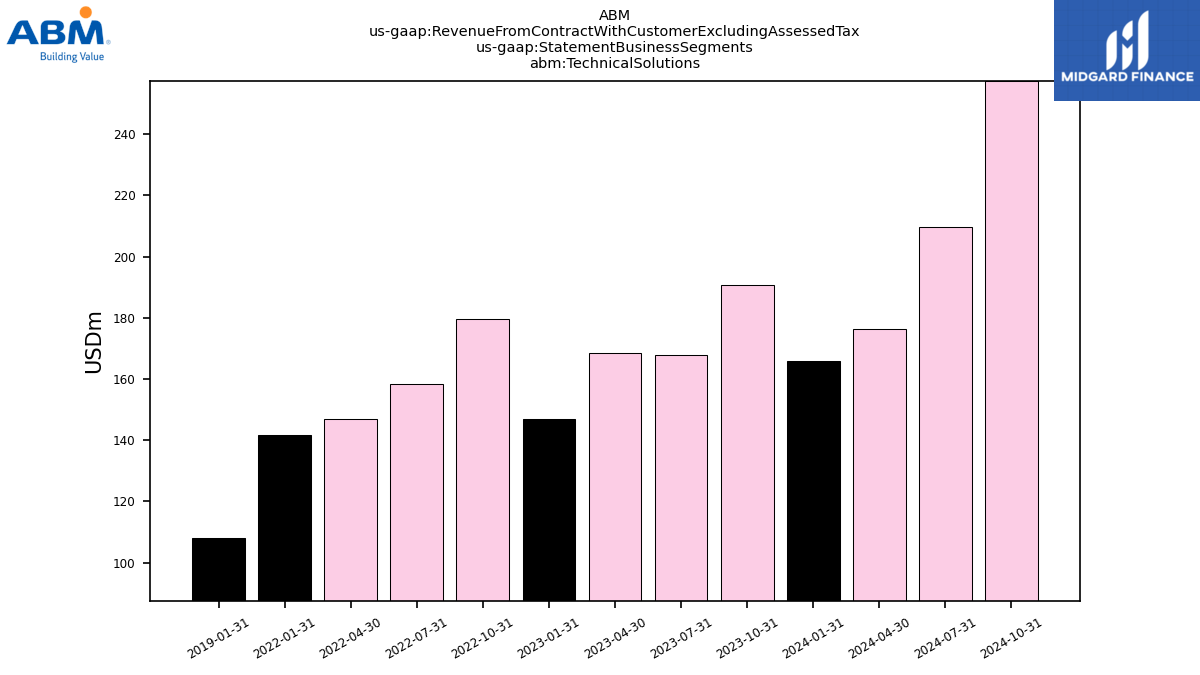
| Technical Solutions | 165.90 | 190.80 | 167.90 | 168.40 | 147.00 | 179.60 | 158.40 | 147.00 | 141.80 | NA | NA | NA | NA | NA | NA | NA | NA | NA | NA | NA | 107.90 | NA | NA | NA | NA | NA | NA | NA | NA | NA | NA | NA | NA | NA | NA | NA | NA | NA | NA | NA | NA | NA | NA | NA | NA | NA | NA | NA | NA | NA | NA | NA | NA | NA | NA | NA | NA |