
| 2024-03-31 | 2023-12-31 | 2023-09-30 | 2023-06-30 | 2023-03-31 | 2022-12-31 | 2022-09-30 | 2022-06-30 | 2022-03-31 | 2021-12-31 | 2021-09-30 | 2021-06-30 | 2021-03-31 | 2020-12-31 | 2020-09-30 | 2020-06-30 | 2020-03-31 | 2019-12-31 | 2019-09-30 | 2019-06-30 | 2019-03-31 | 2018-12-31 | 2018-09-30 | 2018-06-30 | 2018-03-31 | 2017-12-31 | 2017-09-30 | 2017-06-30 | 2017-03-31 | ||
|---|---|---|---|---|---|---|---|---|---|---|---|---|---|---|---|---|---|---|---|---|---|---|---|---|---|---|---|---|---|---|
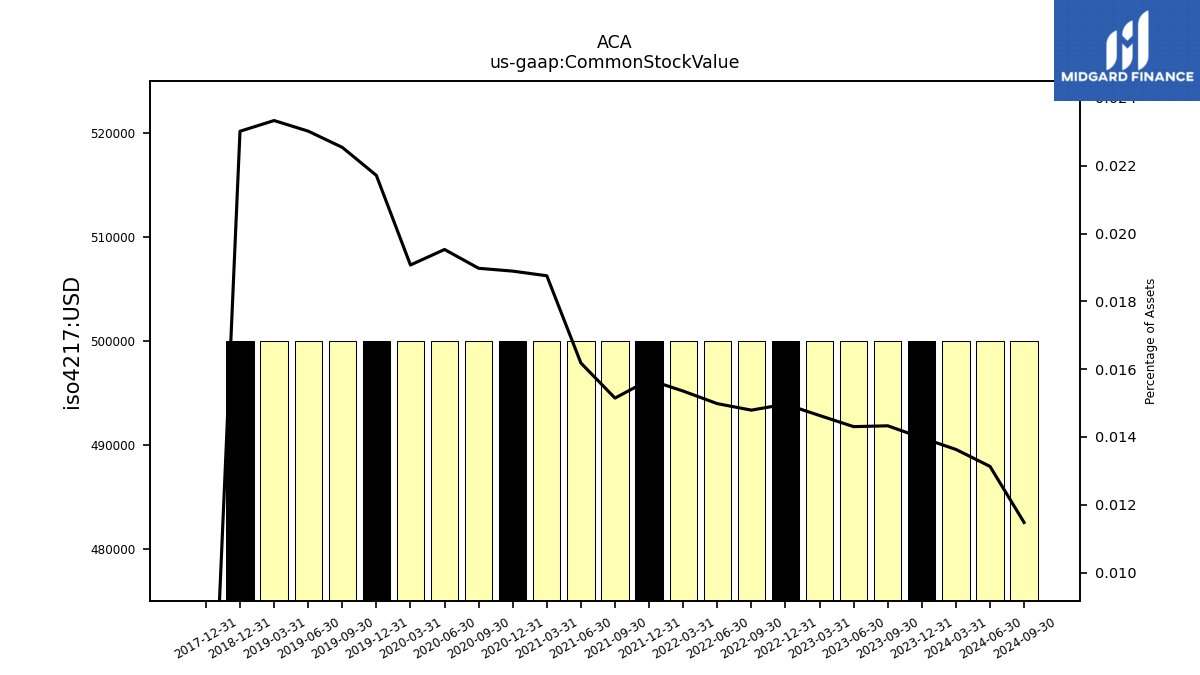
| Common Stock Value | 0.50 | 0.50 | 0.50 | 0.50 | 0.50 | 0.50 | 0.50 | 0.50 | 0.50 | 0.50 | 0.50 | 0.50 | 0.50 | 0.50 | 0.50 | 0.50 | 0.50 | 0.50 | 0.50 | 0.50 | 0.50 | 0.50 | NA | NA | NA | 0.00 | NA | NA | NA | |
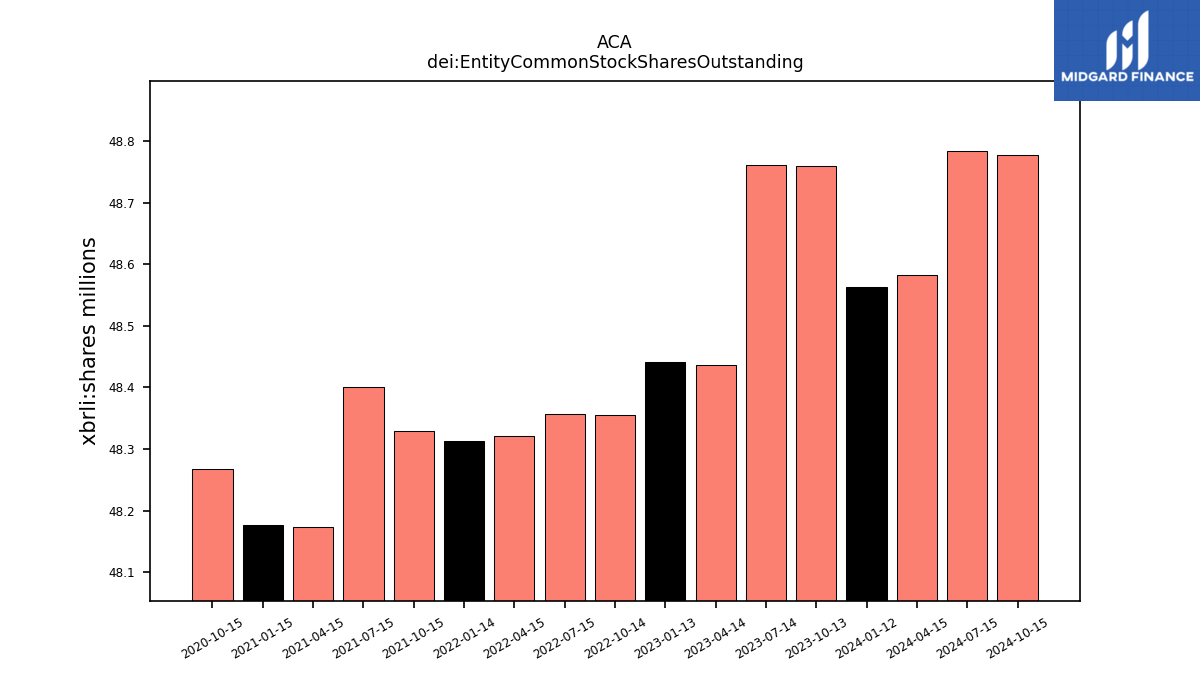
| dei: Entity Common Stock Shares Outstanding | NA | NA | NA | NA | NA | NA | NA | NA | NA | NA | NA | NA | NA | NA | NA | NA | NA | NA | NA | NA | NA | NA | NA | NA | NA | NA | NA | NA | NA | |
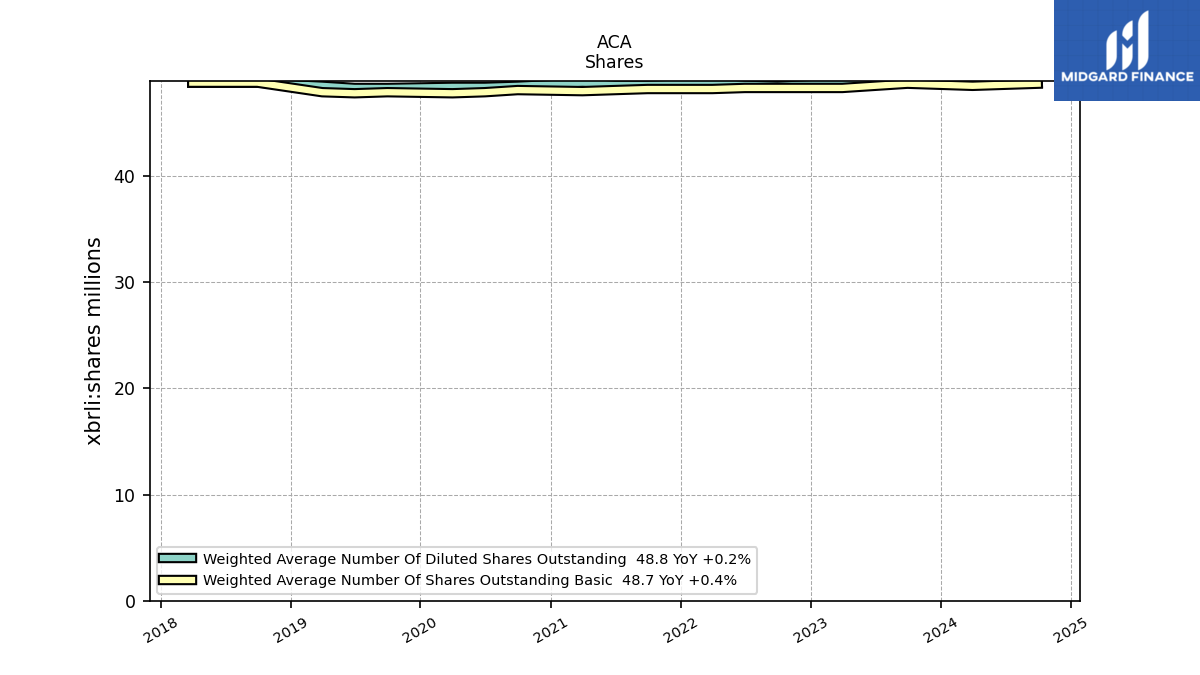
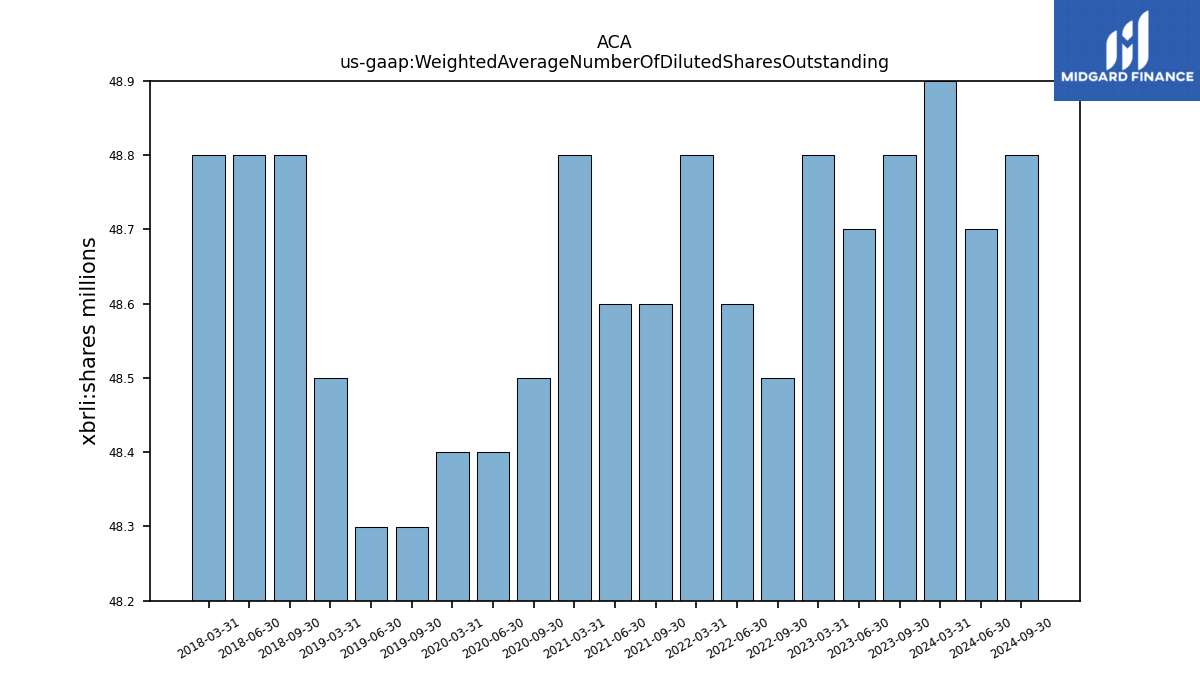
| Weighted Average Number Of Diluted Shares Outstanding | 48.90 | NA | 48.80 | 48.70 | 48.80 | NA | 48.50 | 48.60 | 48.80 | NA | 48.60 | 48.60 | 48.80 | NA | 48.50 | 48.40 | 48.40 | NA | 48.30 | 48.30 | 48.50 | NA | 48.80 | 48.80 | 48.80 | NA | NA | NA | NA | |
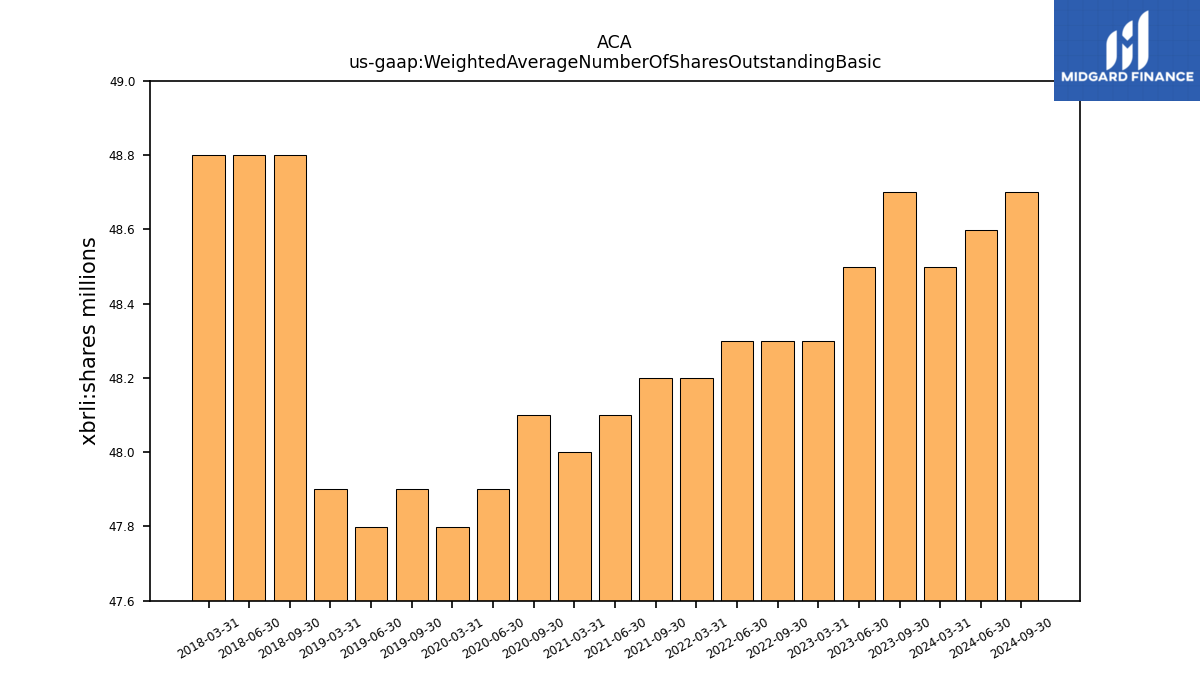
| Weighted Average Number Of Shares Outstanding Basic | 48.50 | NA | 48.70 | 48.50 | 48.30 | NA | 48.30 | 48.30 | 48.20 | NA | 48.20 | 48.10 | 48.00 | NA | 48.10 | 47.90 | 47.80 | NA | 47.90 | 47.80 | 47.90 | NA | 48.80 | 48.80 | 48.80 | NA | NA | NA | NA | |
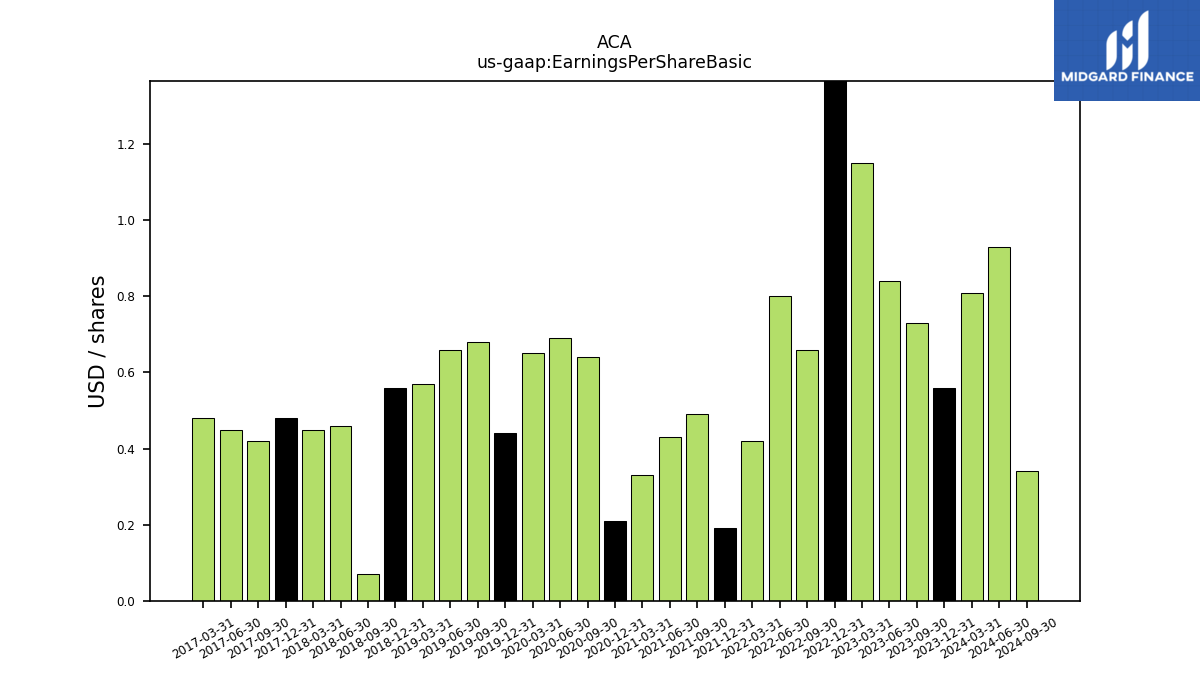
| Earnings Per Share Basic | 0.81 | 0.56 | 0.73 | 0.84 | 1.15 | 3.20 | 0.66 | 0.80 | 0.42 | 0.19 | 0.49 | 0.43 | 0.33 | 0.21 | 0.64 | 0.69 | 0.65 | 0.44 | 0.68 | 0.66 | 0.57 | 0.56 | 0.07 | 0.46 | 0.45 | 0.48 | 0.42 | 0.45 | 0.48 | |
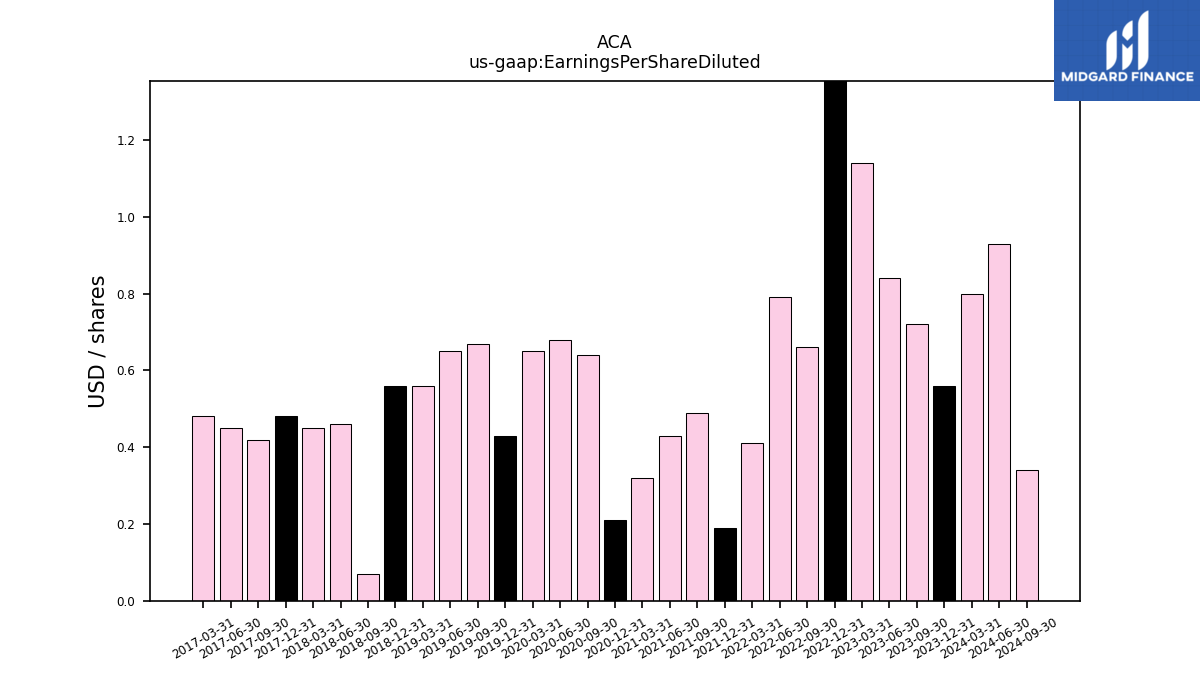
| Earnings Per Share Diluted | 0.80 | 0.56 | 0.72 | 0.84 | 1.14 | 3.18 | 0.66 | 0.79 | 0.41 | 0.19 | 0.49 | 0.43 | 0.32 | 0.21 | 0.64 | 0.68 | 0.65 | 0.43 | 0.67 | 0.65 | 0.56 | 0.56 | 0.07 | 0.46 | 0.45 | 0.48 | 0.42 | 0.45 | 0.48 |
| 2024-03-31 | 2023-12-31 | 2023-09-30 | 2023-06-30 | 2023-03-31 | 2022-12-31 | 2022-09-30 | 2022-06-30 | 2022-03-31 | 2021-12-31 | 2021-09-30 | 2021-06-30 | 2021-03-31 | 2020-12-31 | 2020-09-30 | 2020-06-30 | 2020-03-31 | 2019-12-31 | 2019-09-30 | 2019-06-30 | 2019-03-31 | 2018-12-31 | 2018-09-30 | 2018-06-30 | 2018-03-31 | 2017-12-31 | 2017-09-30 | 2017-06-30 | 2017-03-31 | ||
|---|---|---|---|---|---|---|---|---|---|---|---|---|---|---|---|---|---|---|---|---|---|---|---|---|---|---|---|---|---|---|
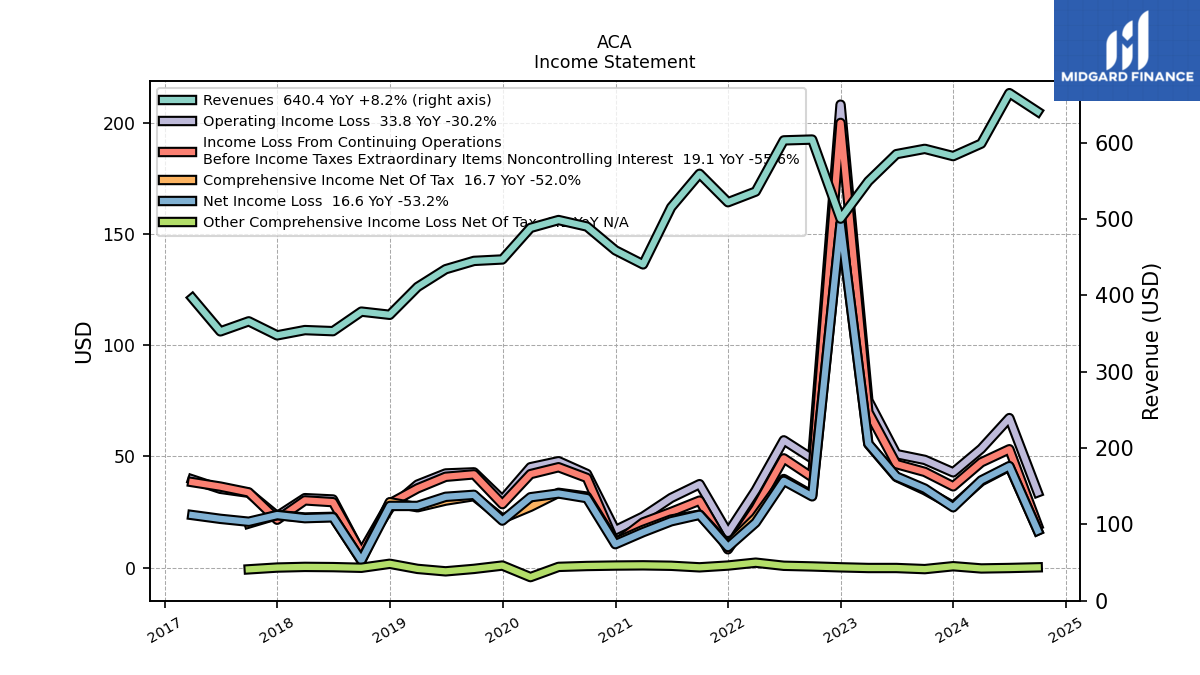
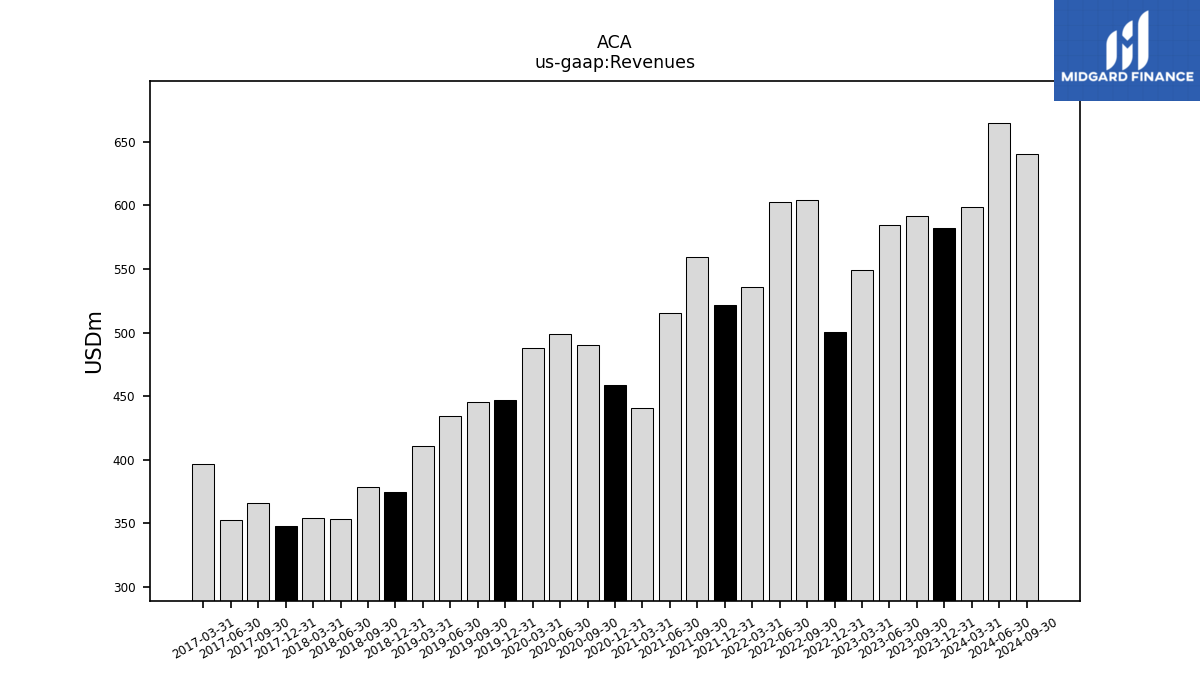
| Revenues | 598.60 | 582.20 | 591.70 | 584.80 | 549.20 | 500.30 | 603.90 | 602.80 | 535.80 | 521.80 | 559.10 | 515.10 | 440.40 | 458.90 | 490.00 | 498.50 | 488.20 | 446.90 | 445.00 | 434.10 | 410.90 | 374.40 | 378.60 | 353.00 | 354.40 | 347.50 | 365.90 | 352.70 | 396.30 | |
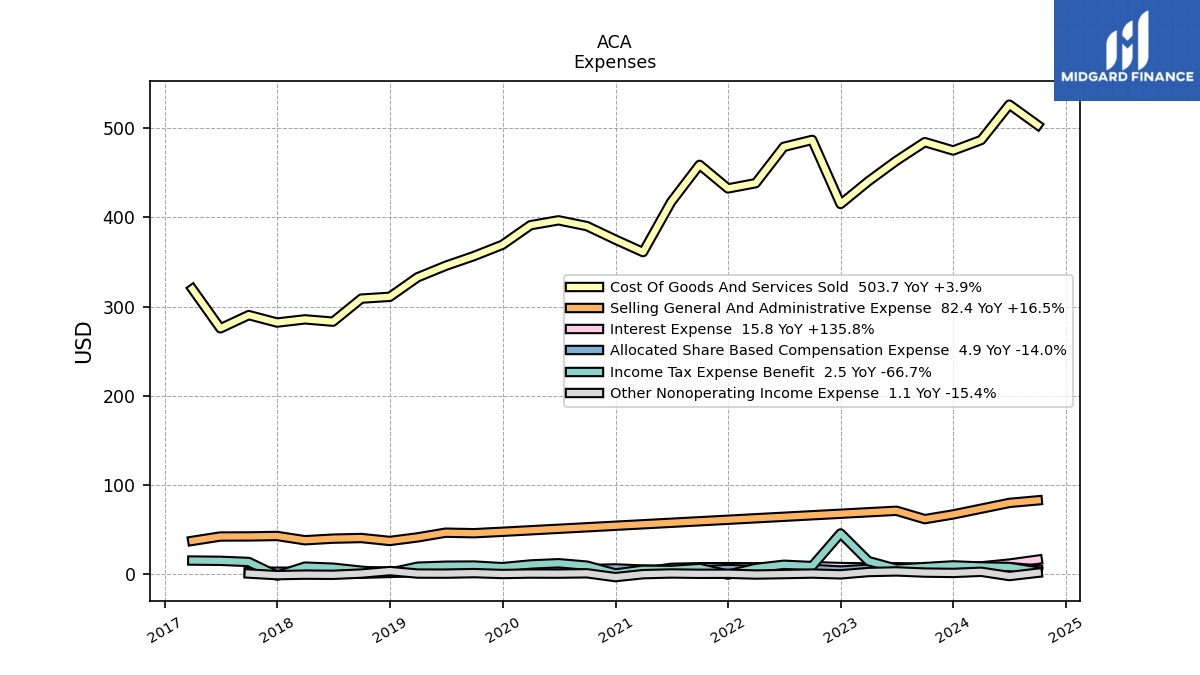
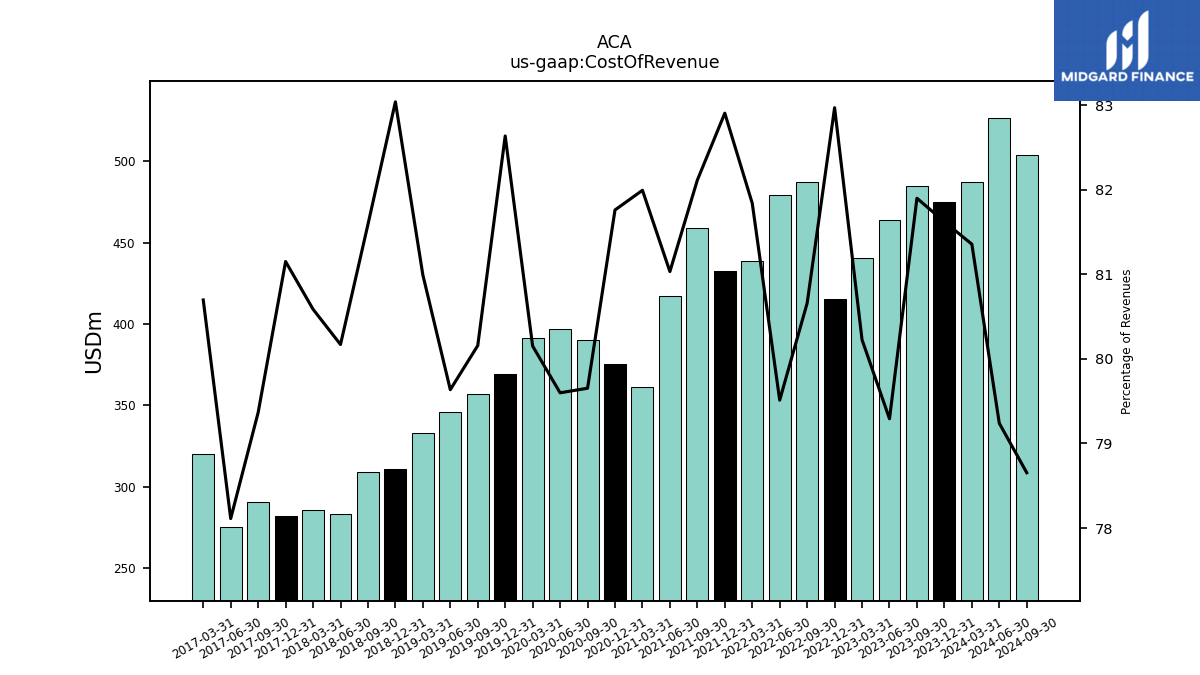
| Cost Of Revenue | 487.00 | 475.20 | 484.60 | 463.70 | 440.60 | 415.10 | 487.10 | 479.30 | 438.50 | 432.60 | 459.10 | 417.40 | 361.10 | 375.20 | 390.30 | 396.80 | 391.30 | 369.30 | 356.70 | 345.70 | 332.80 | 310.90 | 308.90 | 283.00 | 285.60 | 282.00 | 290.40 | 275.50 | 319.80 | |
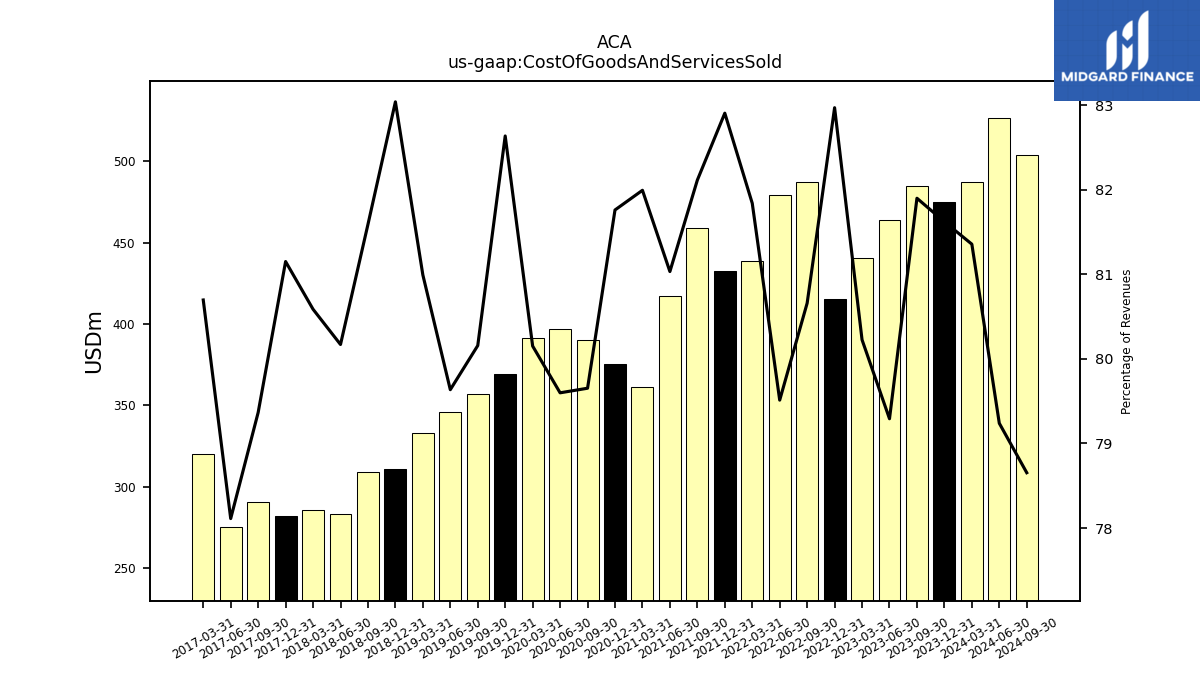
| Cost Of Goods And Services Sold | 487.00 | 475.20 | 484.60 | 463.70 | 440.60 | 415.10 | 487.10 | 479.30 | 438.50 | 432.60 | 459.10 | 417.40 | 361.10 | 375.20 | 390.30 | 396.80 | 391.30 | 369.30 | 356.70 | 345.70 | 332.80 | 310.90 | 308.90 | 283.00 | 285.60 | 282.00 | 290.40 | 275.50 | 319.80 | |
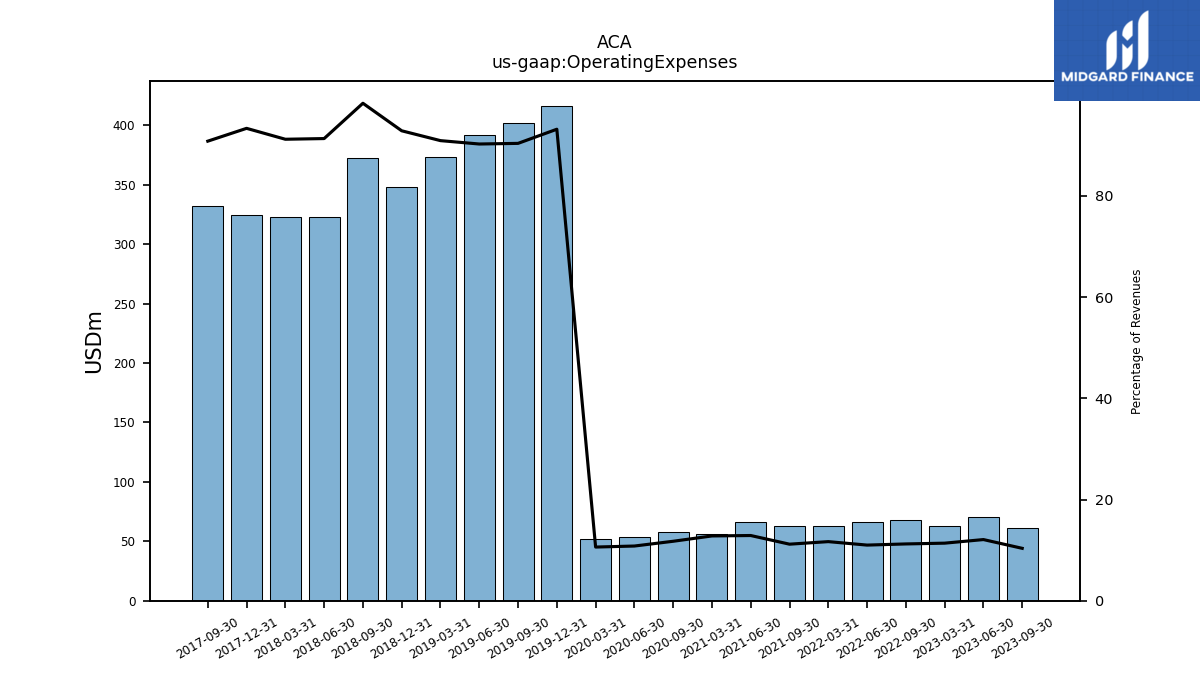
| Operating Expenses | 69.10 | NA | 61.30 | 70.70 | 62.50 | NA | 67.80 | 66.30 | 62.60 | NA | 62.50 | 66.40 | 56.40 | NA | 57.60 | 53.90 | 51.80 | 416.40 | 402.20 | 391.80 | 373.60 | 347.70 | 372.20 | 322.40 | 323.20 | 324.40 | 332.30 | NA | NA | |
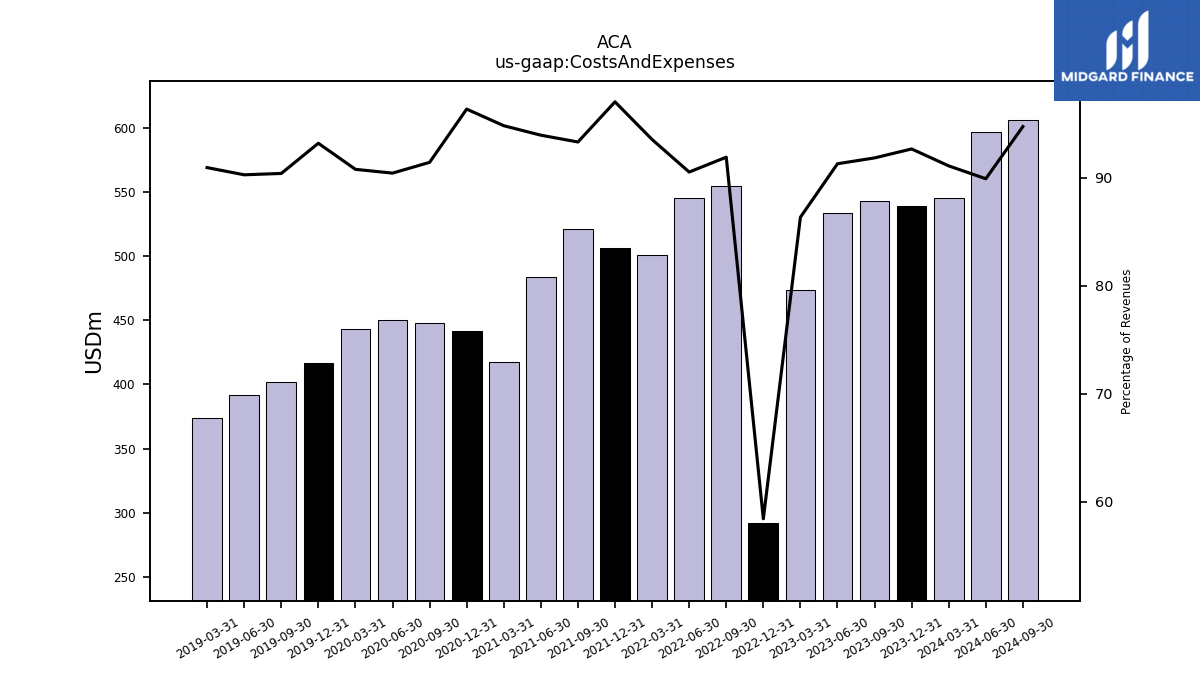
| Costs And Expenses | 545.20 | 539.40 | 543.30 | 533.80 | 474.10 | 292.20 | 554.90 | 545.60 | 501.10 | 506.20 | 521.60 | 483.80 | 417.50 | 442.10 | 447.90 | 450.70 | 443.10 | 416.40 | 402.20 | 391.80 | 373.60 | NA | NA | NA | NA | NA | NA | NA | NA | |
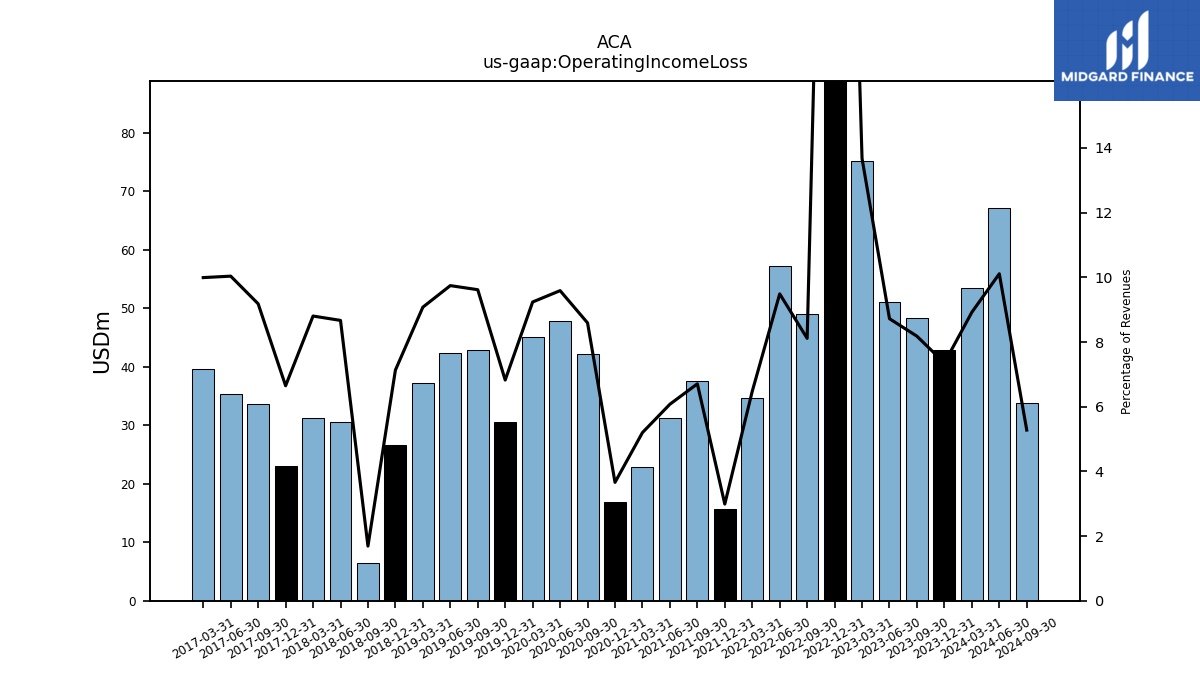
| Operating Income Loss | 53.40 | 42.80 | 48.40 | 51.00 | 75.10 | 208.10 | 49.00 | 57.20 | 34.70 | 15.60 | 37.50 | 31.30 | 22.90 | 16.80 | 42.10 | 47.80 | 45.10 | 30.50 | 42.80 | 42.30 | 37.30 | 26.70 | 6.40 | 30.60 | 31.20 | 23.10 | 33.60 | 35.40 | 39.60 | |
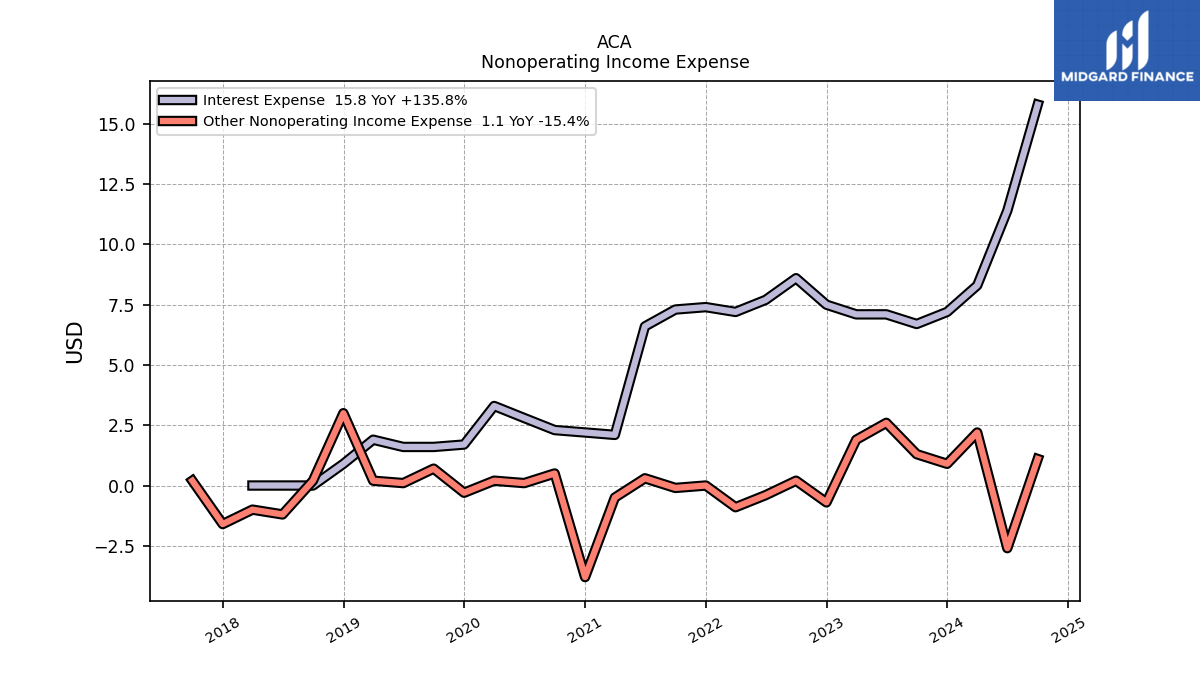
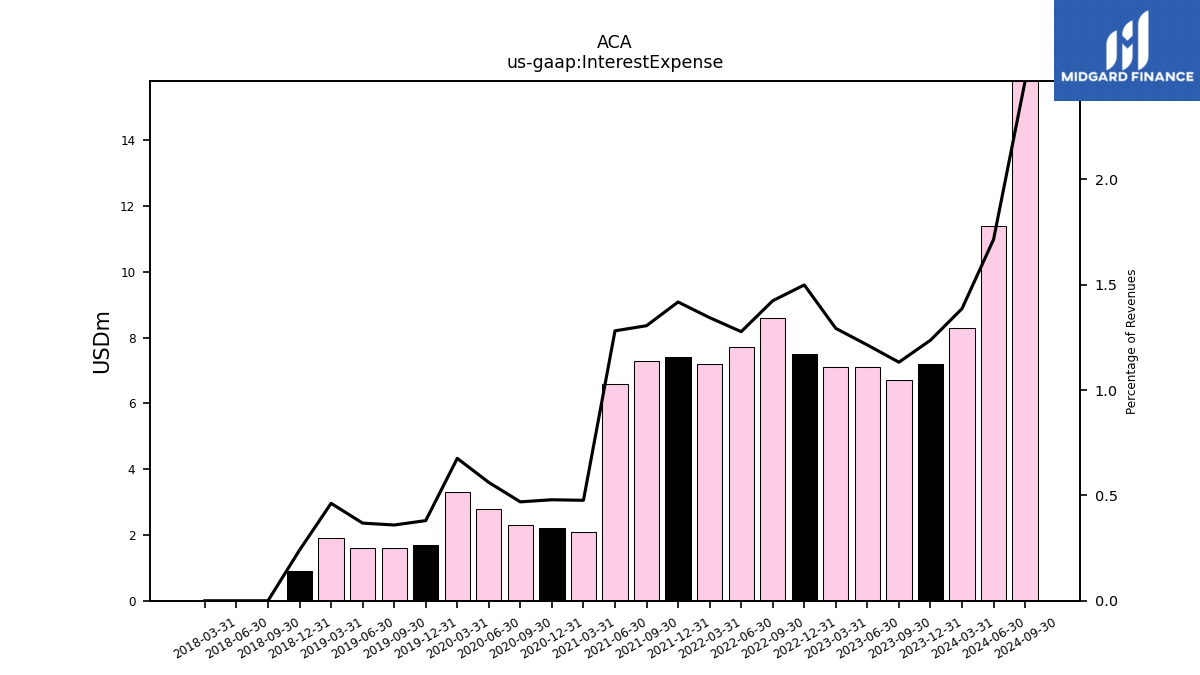
| Interest Expense | 8.30 | 7.20 | 6.70 | 7.10 | 7.10 | 7.50 | 8.60 | 7.70 | 7.20 | 7.40 | 7.30 | 6.60 | 2.10 | 2.20 | 2.30 | 2.80 | 3.30 | 1.70 | 1.60 | 1.60 | 1.90 | 0.90 | 0.00 | 0.00 | 0.00 | NA | NA | NA | NA | |
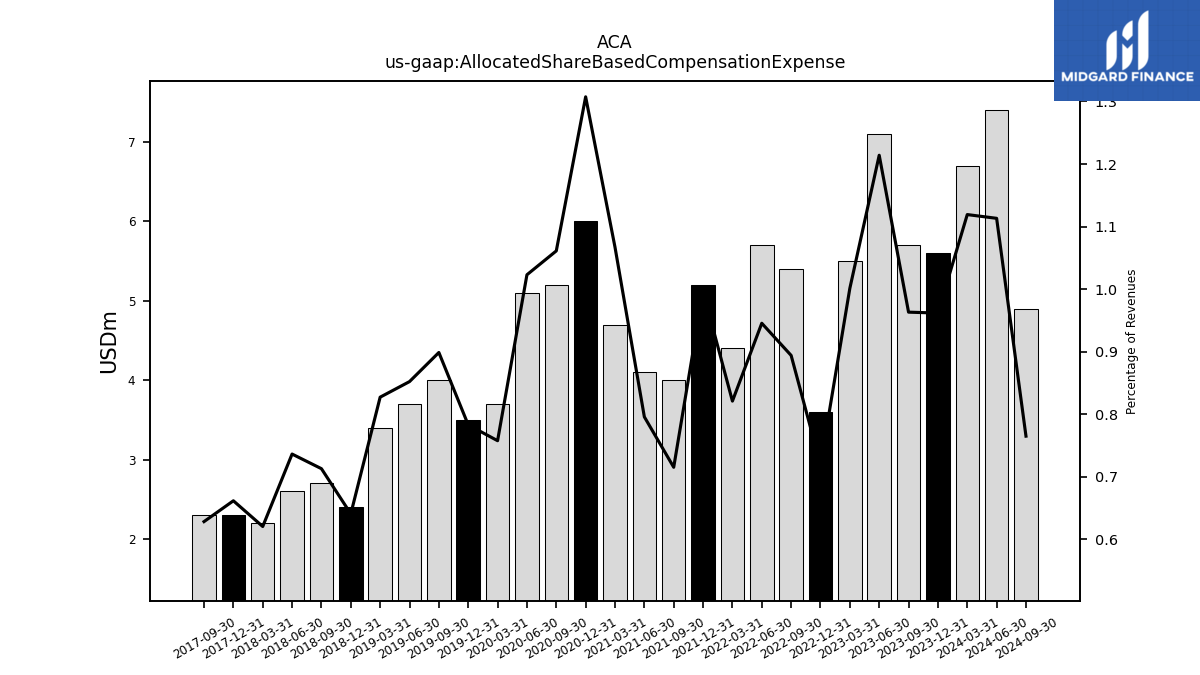
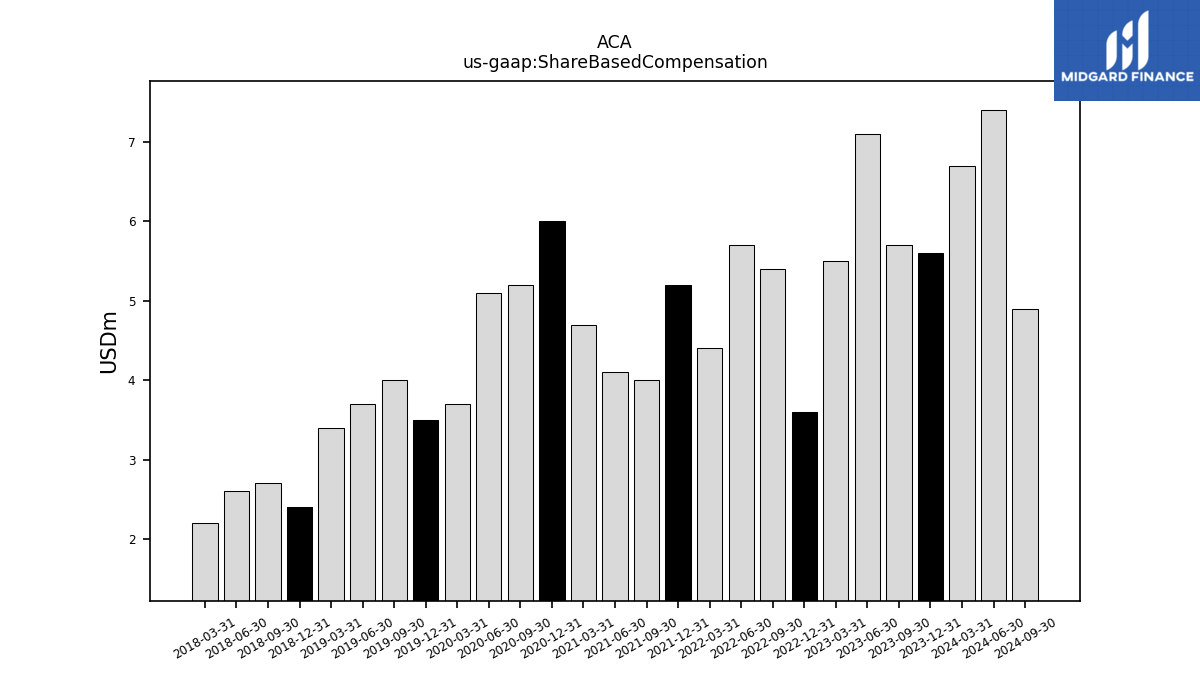
| Allocated Share Based Compensation Expense | 6.70 | 5.60 | 5.70 | 7.10 | 5.50 | 3.60 | 5.40 | 5.70 | 4.40 | 5.20 | 4.00 | 4.10 | 4.70 | 6.00 | 5.20 | 5.10 | 3.70 | 3.50 | 4.00 | 3.70 | 3.40 | 2.40 | 2.70 | 2.60 | 2.20 | 2.30 | 2.30 | NA | NA | |
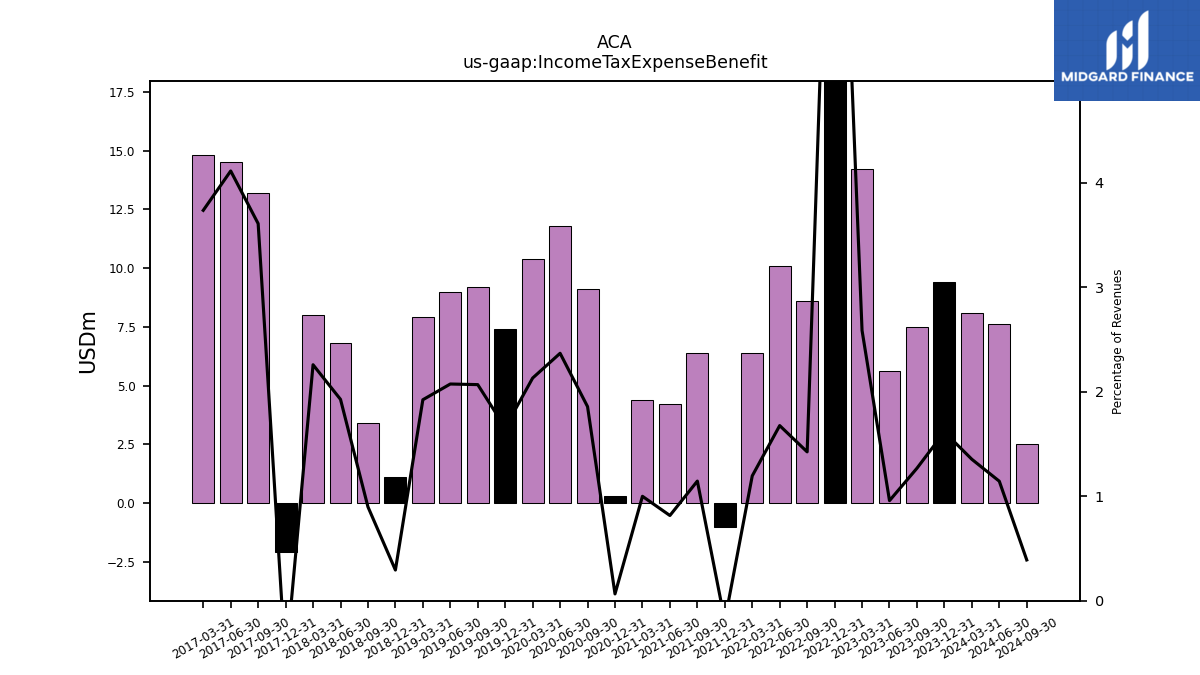
| Income Tax Expense Benefit | 8.10 | 9.40 | 7.50 | 5.60 | 14.20 | 45.30 | 8.60 | 10.10 | 6.40 | -1.00 | 6.40 | 4.20 | 4.40 | 0.30 | 9.10 | 11.80 | 10.40 | 7.40 | 9.20 | 9.00 | 7.90 | 1.10 | 3.40 | 6.80 | 8.00 | -2.10 | 13.20 | 14.50 | 14.80 | |
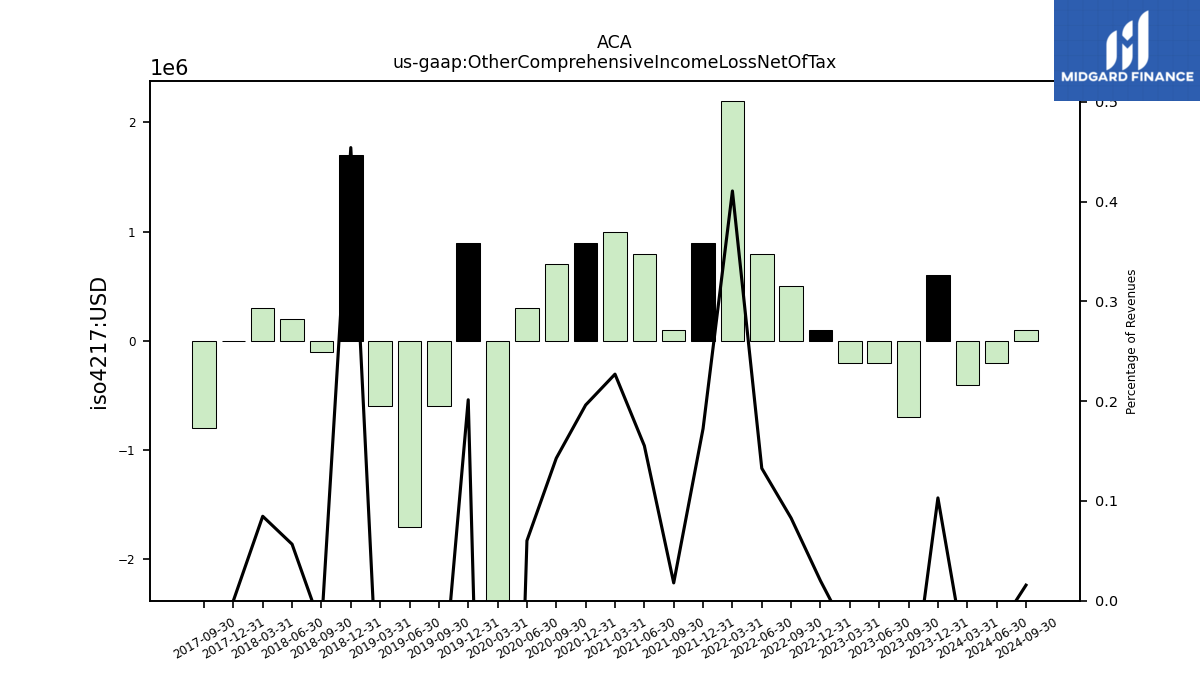
| Other Comprehensive Income Loss Net Of Tax | -0.40 | 0.60 | -0.70 | -0.20 | -0.20 | 0.10 | 0.50 | 0.80 | 2.20 | 0.90 | 0.10 | 0.80 | 1.00 | 0.90 | 0.70 | 0.30 | -4.30 | 0.90 | -0.60 | -1.70 | -0.60 | 1.70 | -0.10 | 0.20 | 0.30 | 0.00 | -0.80 | NA | NA | |
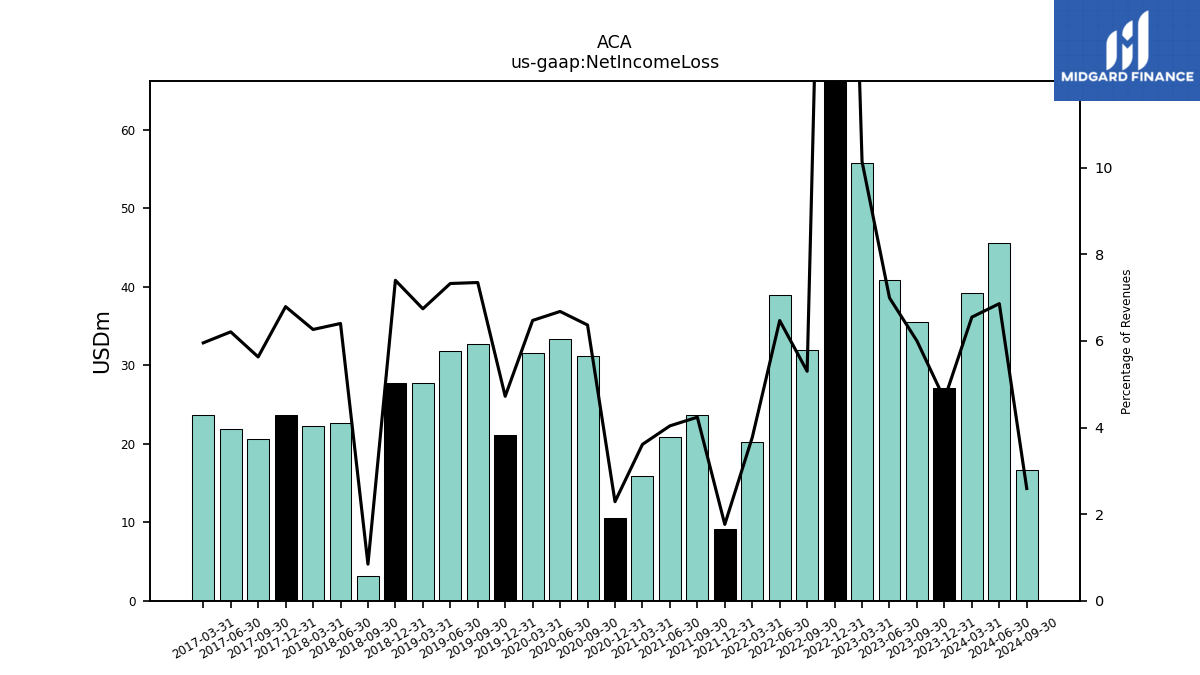
| Net Income Loss | 39.20 | 27.10 | 35.50 | 40.90 | 55.70 | 154.60 | 32.00 | 39.00 | 20.20 | 9.20 | 23.70 | 20.80 | 15.90 | 10.50 | 31.20 | 33.30 | 31.60 | 21.10 | 32.70 | 31.80 | 27.70 | 27.70 | 3.20 | 22.60 | 22.20 | 23.60 | 20.60 | 21.90 | 23.60 | |
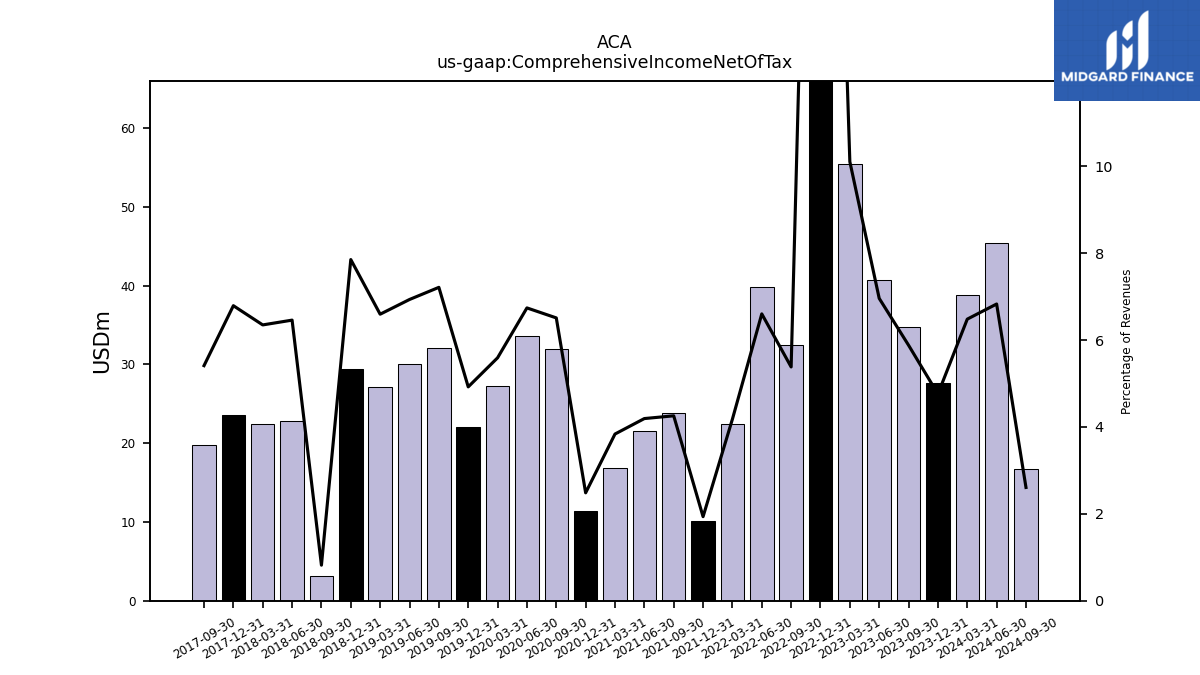
| Comprehensive Income Net Of Tax | 38.80 | 27.70 | 34.80 | 40.70 | 55.50 | 154.70 | 32.50 | 39.80 | 22.40 | 10.10 | 23.80 | 21.60 | 16.90 | 11.40 | 31.90 | 33.60 | 27.30 | 22.00 | 32.10 | 30.10 | 27.10 | 29.40 | 3.10 | 22.80 | 22.50 | 23.60 | 19.80 | NA | NA | |
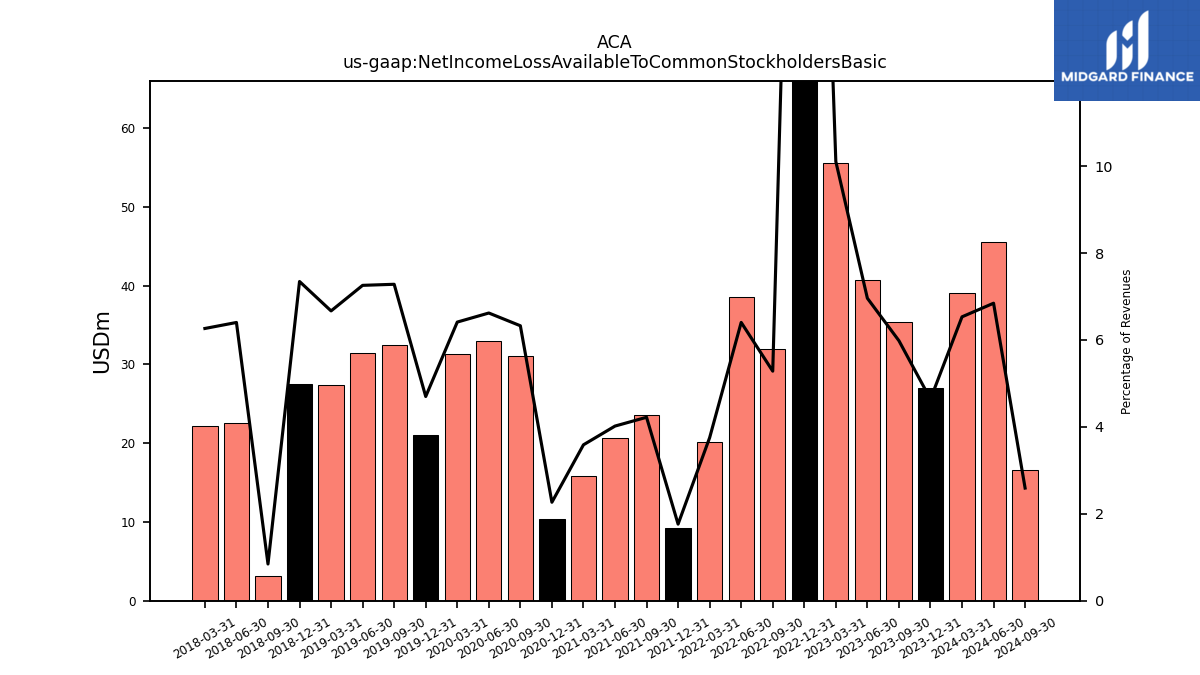
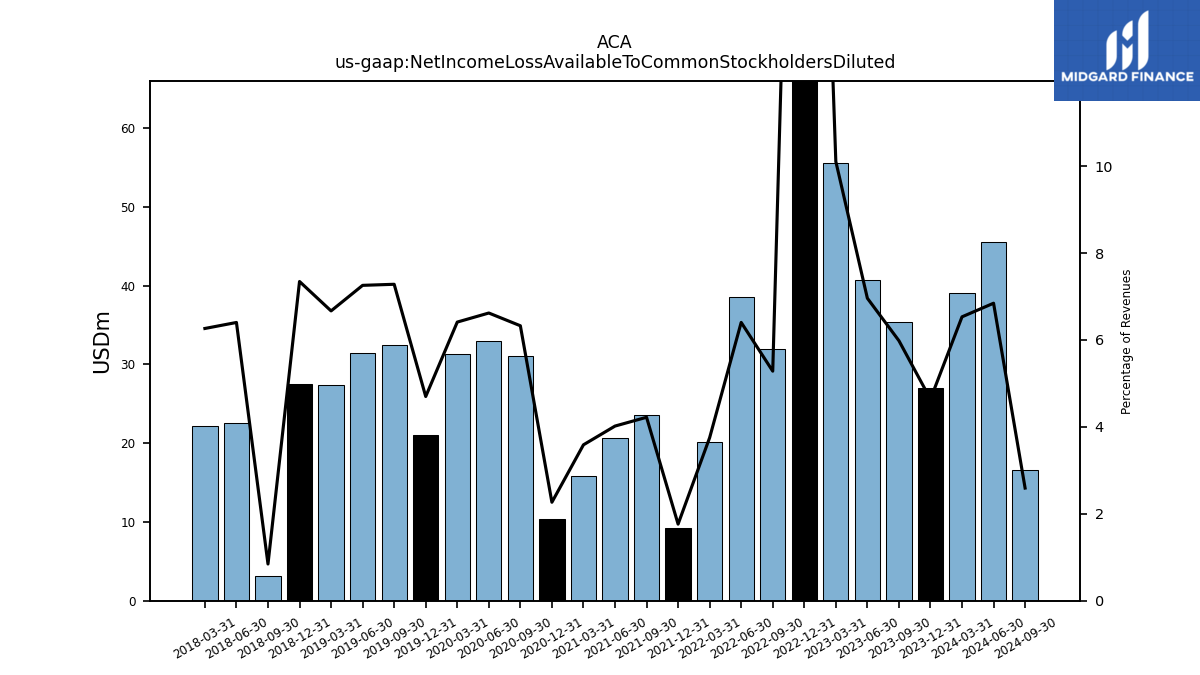
| Net Income Loss Available To Common Stockholders Basic | 39.10 | 27.00 | 35.40 | 40.70 | 55.50 | 154.00 | 31.90 | 38.60 | 20.10 | 9.20 | 23.60 | 20.70 | 15.80 | 10.40 | 31.00 | 33.00 | 31.30 | 21.00 | 32.40 | 31.50 | 27.40 | 27.50 | 3.20 | 22.60 | 22.20 | NA | NA | NA | NA | |
| Net Income Loss Available To Common Stockholders Diluted | 39.10 | 27.00 | 35.40 | 40.70 | 55.50 | 154.00 | 31.90 | 38.60 | 20.10 | 9.20 | 23.60 | 20.70 | 15.80 | 10.40 | 31.00 | 33.00 | 31.30 | 21.00 | 32.40 | 31.50 | 27.40 | 27.50 | 3.20 | 22.60 | 22.20 | NA | NA | NA | NA |
| 2024-03-31 | 2023-12-31 | 2023-09-30 | 2023-06-30 | 2023-03-31 | 2022-12-31 | 2022-09-30 | 2022-06-30 | 2022-03-31 | 2021-12-31 | 2021-09-30 | 2021-06-30 | 2021-03-31 | 2020-12-31 | 2020-09-30 | 2020-06-30 | 2020-03-31 | 2019-12-31 | 2019-09-30 | 2019-06-30 | 2019-03-31 | 2018-12-31 | 2018-09-30 | 2018-06-30 | 2018-03-31 | 2017-12-31 | 2017-09-30 | 2017-06-30 | 2017-03-31 | ||
|---|---|---|---|---|---|---|---|---|---|---|---|---|---|---|---|---|---|---|---|---|---|---|---|---|---|---|---|---|---|---|
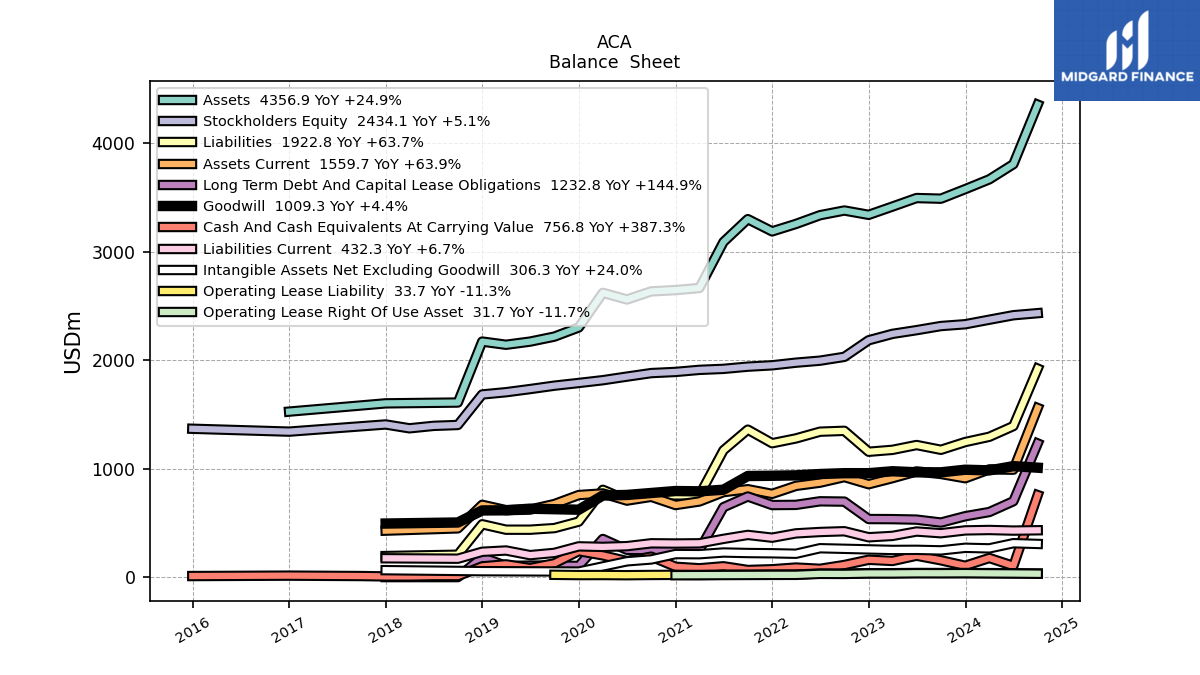
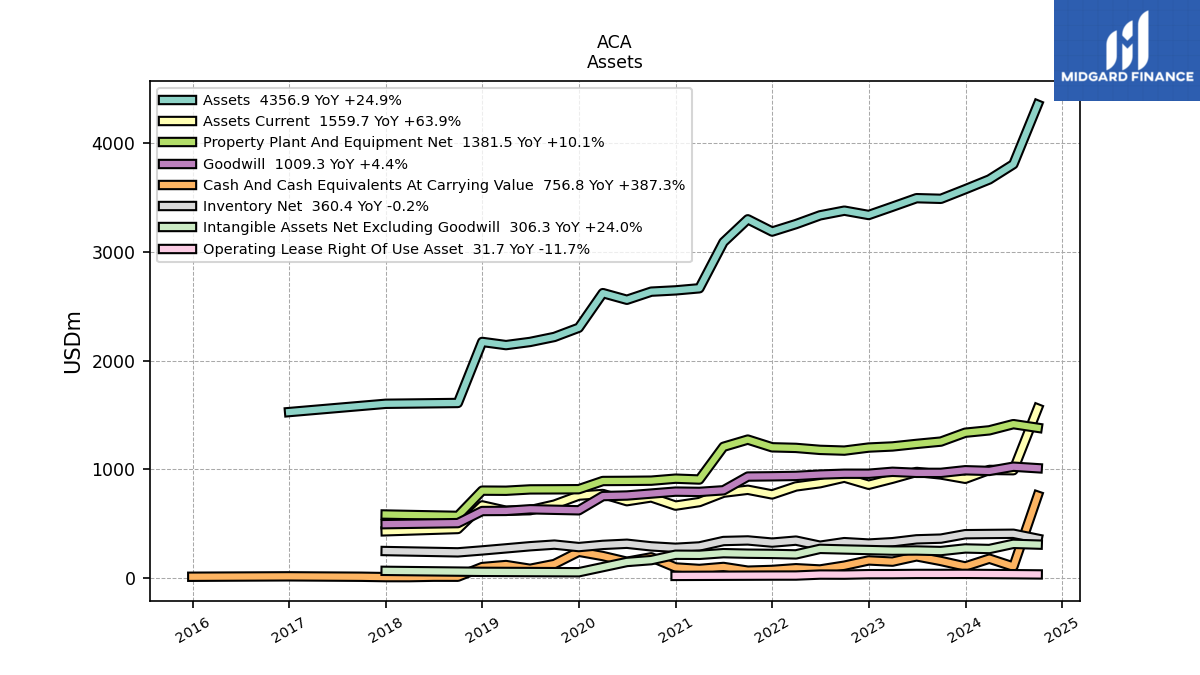
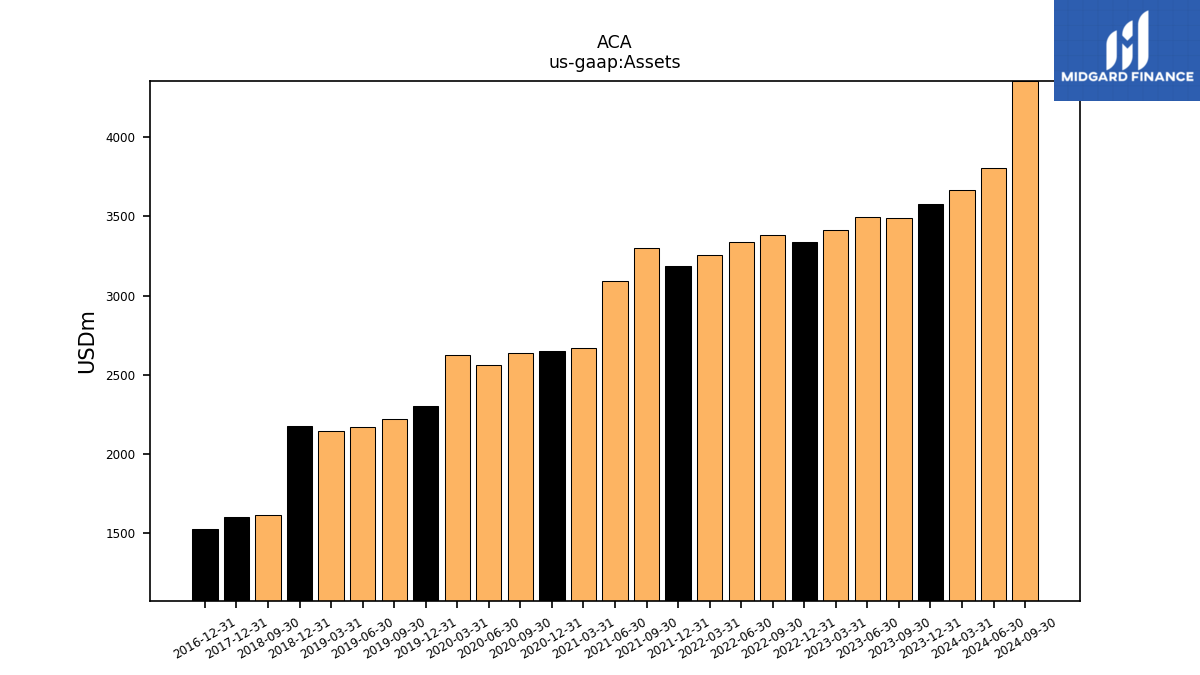
| Assets | 3668.10 | 3577.90 | 3489.60 | 3495.60 | 3417.10 | 3340.60 | 3380.60 | 3337.30 | 3256.80 | 3188.10 | 3301.20 | 3090.20 | 2666.00 | 2646.70 | 2635.00 | 2560.20 | 2621.60 | 2302.50 | 2218.00 | 2171.90 | 2142.80 | 2172.20 | 1610.00 | NA | NA | 1602.50 | NA | NA | NA | |
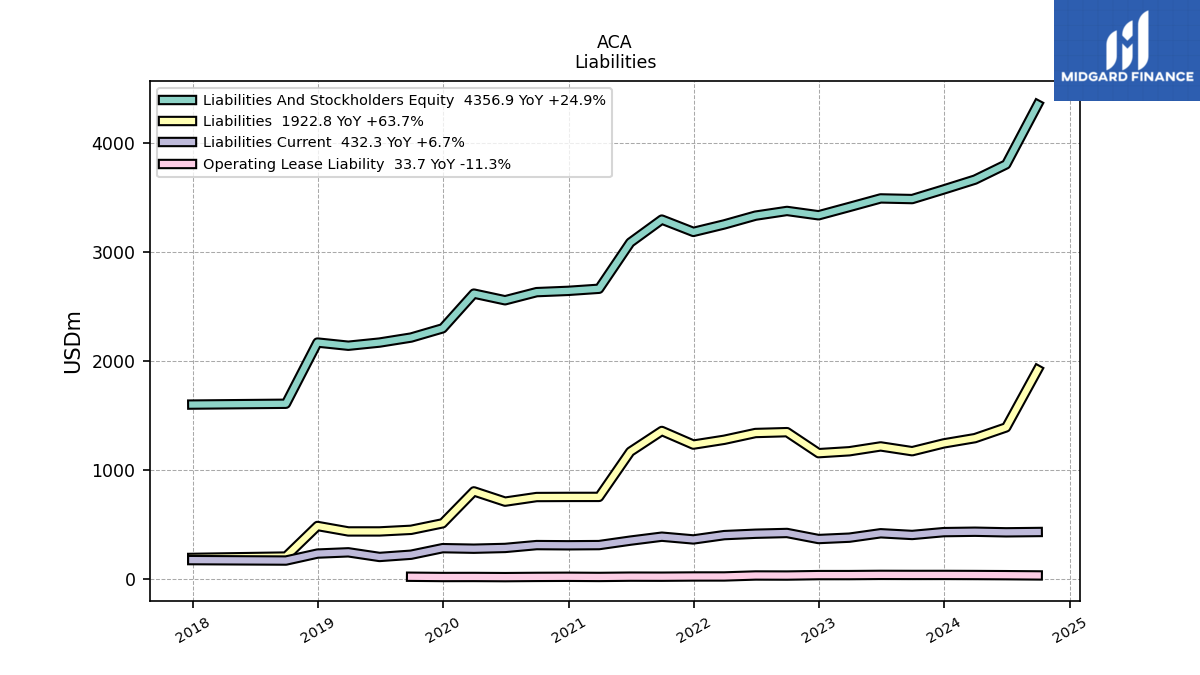
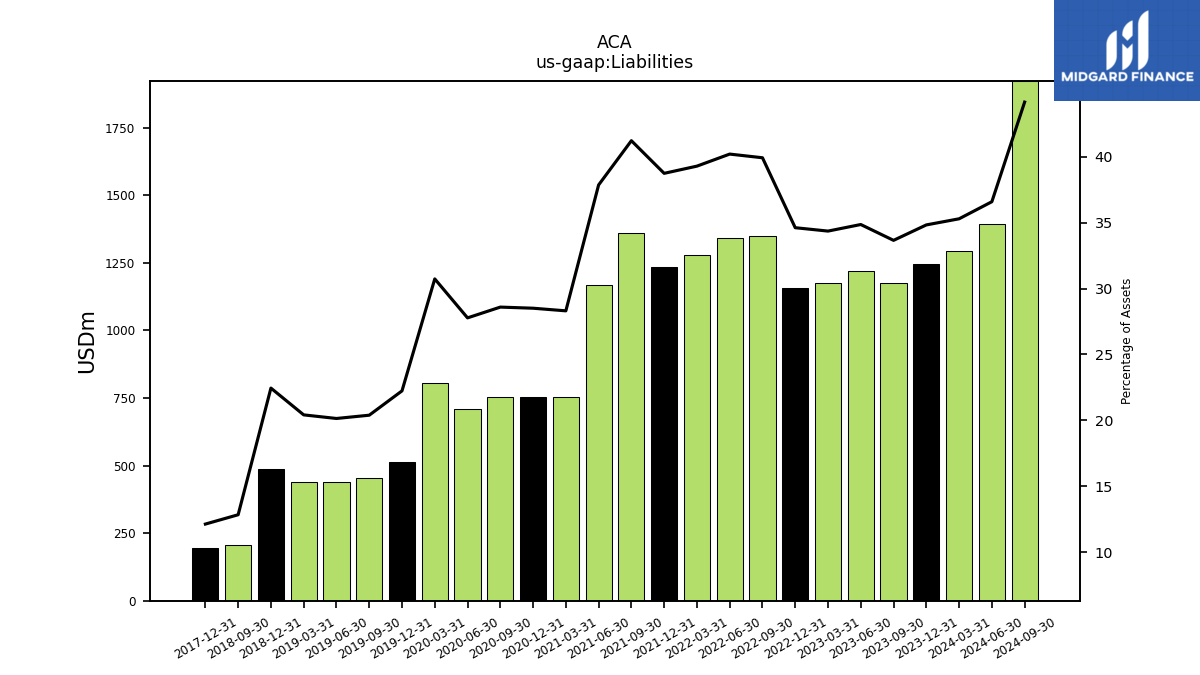
| Liabilities | 1294.30 | 1245.90 | 1174.30 | 1218.30 | 1173.90 | 1156.20 | 1349.30 | 1341.30 | 1279.20 | 1234.80 | 1360.30 | 1169.70 | 754.70 | 754.50 | 753.40 | 711.10 | 805.60 | 512.10 | 452.40 | 437.60 | 437.60 | 487.70 | 206.90 | NA | NA | 194.60 | NA | NA | NA | |
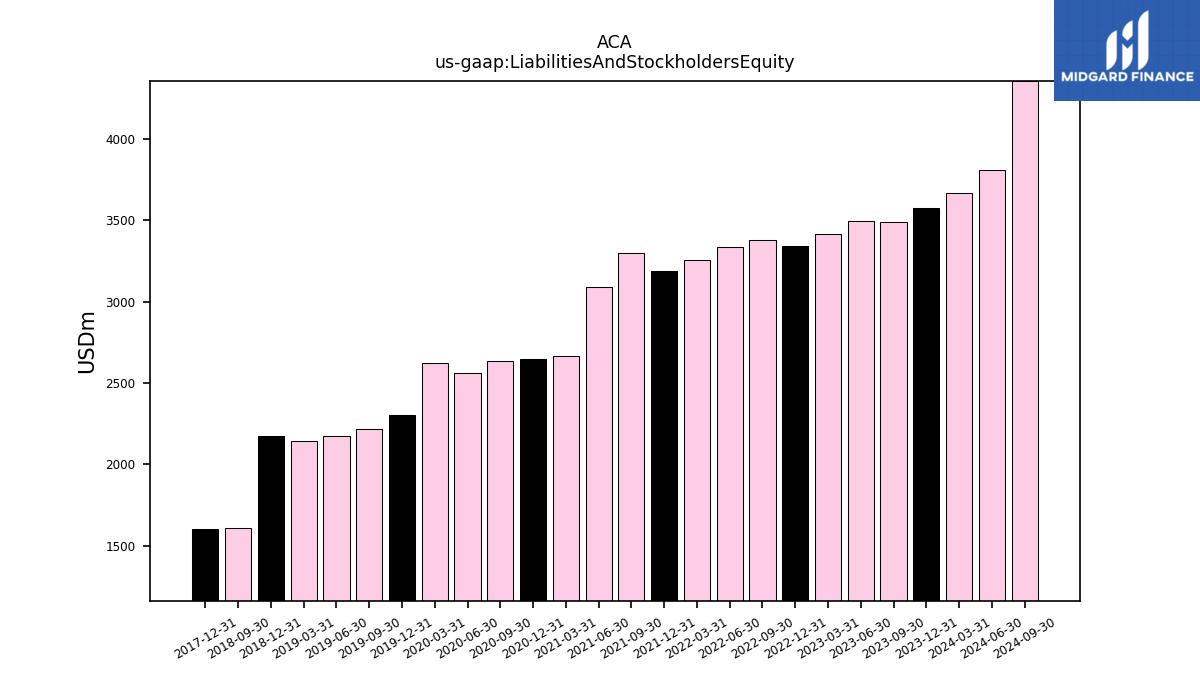
| Liabilities And Stockholders Equity | 3668.10 | 3577.90 | 3489.60 | 3495.60 | 3417.10 | 3340.60 | 3380.60 | 3337.30 | 3256.80 | 3188.10 | 3301.20 | 3090.20 | 2666.00 | 2646.70 | 2635.00 | 2560.20 | 2621.60 | 2302.50 | 2218.00 | 2171.90 | 2142.80 | 2172.20 | 1610.00 | NA | NA | 1602.50 | NA | NA | NA | |
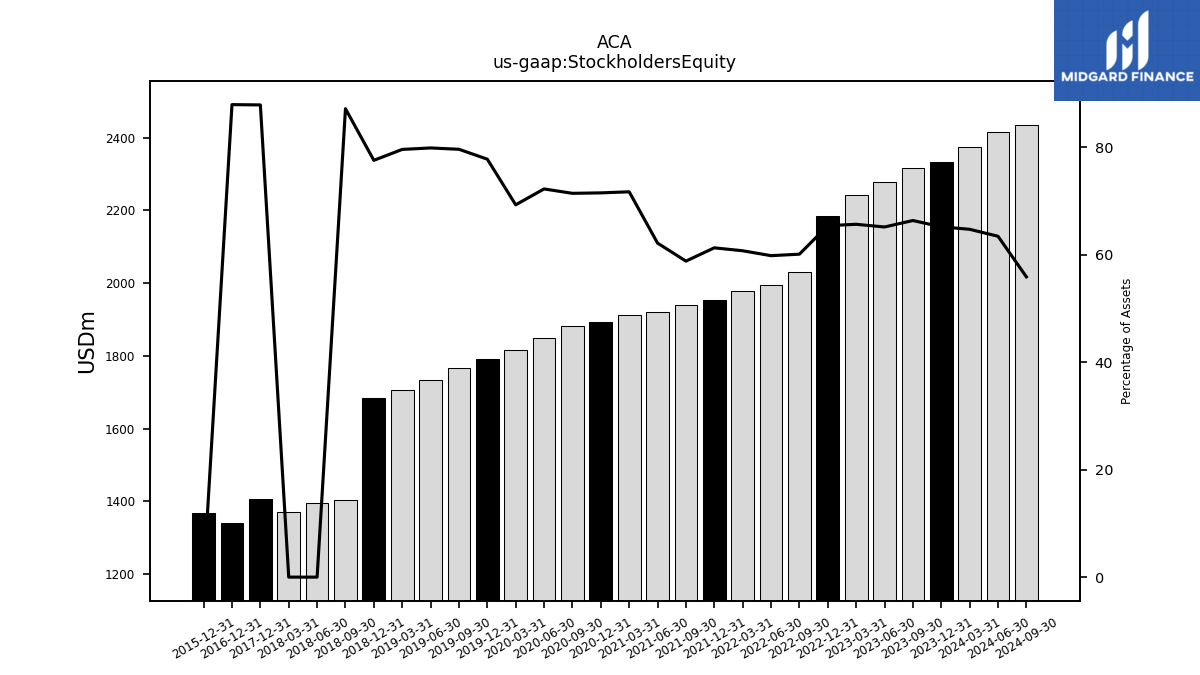
| Stockholders Equity | 2373.80 | 2332.00 | 2315.30 | 2277.30 | 2243.20 | 2184.40 | 2031.30 | 1996.00 | 1977.60 | 1953.30 | 1940.90 | 1920.50 | 1911.30 | 1892.20 | 1881.60 | 1849.10 | 1816.00 | 1790.40 | 1765.60 | 1734.30 | 1705.20 | 1684.50 | 1403.10 | 1394.90 | 1372.40 | 1407.90 | NA | NA | NA |
| 2024-03-31 | 2023-12-31 | 2023-09-30 | 2023-06-30 | 2023-03-31 | 2022-12-31 | 2022-09-30 | 2022-06-30 | 2022-03-31 | 2021-12-31 | 2021-09-30 | 2021-06-30 | 2021-03-31 | 2020-12-31 | 2020-09-30 | 2020-06-30 | 2020-03-31 | 2019-12-31 | 2019-09-30 | 2019-06-30 | 2019-03-31 | 2018-12-31 | 2018-09-30 | 2018-06-30 | 2018-03-31 | 2017-12-31 | 2017-09-30 | 2017-06-30 | 2017-03-31 | ||
|---|---|---|---|---|---|---|---|---|---|---|---|---|---|---|---|---|---|---|---|---|---|---|---|---|---|---|---|---|---|---|
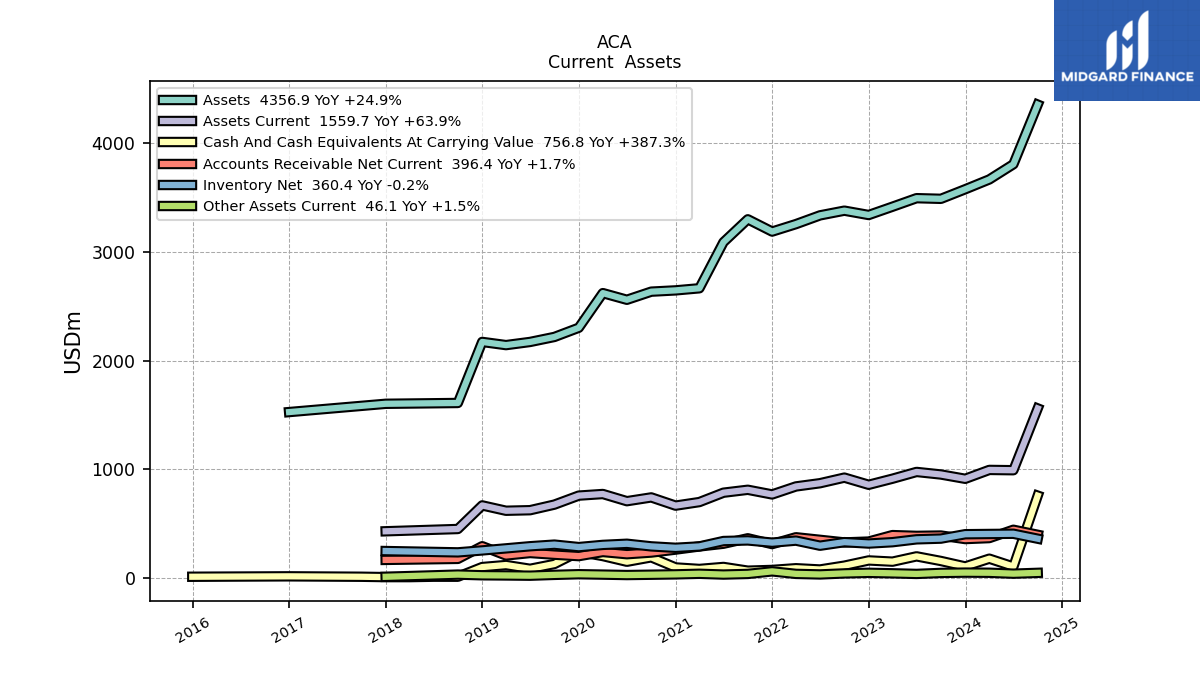
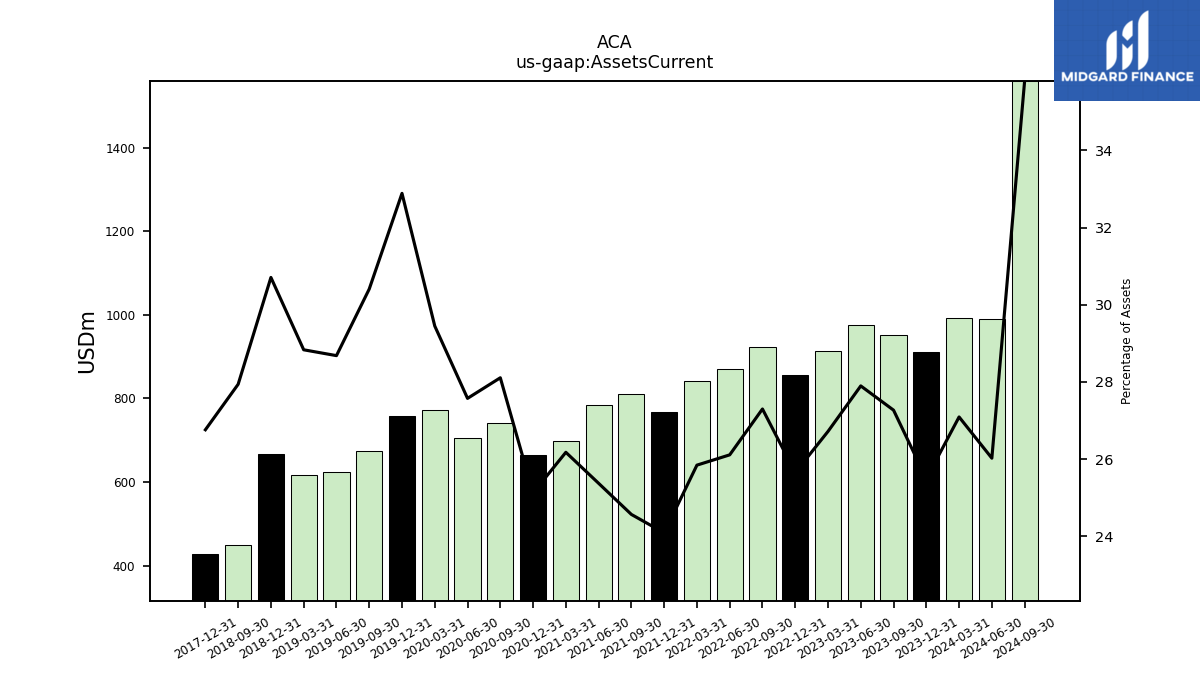
| Assets Current | 993.70 | 912.00 | 951.50 | 975.10 | 912.90 | 856.80 | 922.80 | 871.30 | 841.60 | 767.90 | 810.90 | 784.00 | 697.80 | 664.90 | 740.60 | 705.90 | 772.00 | 757.20 | 674.40 | 622.90 | 617.80 | 667.00 | 449.80 | NA | NA | 428.80 | NA | NA | NA | |
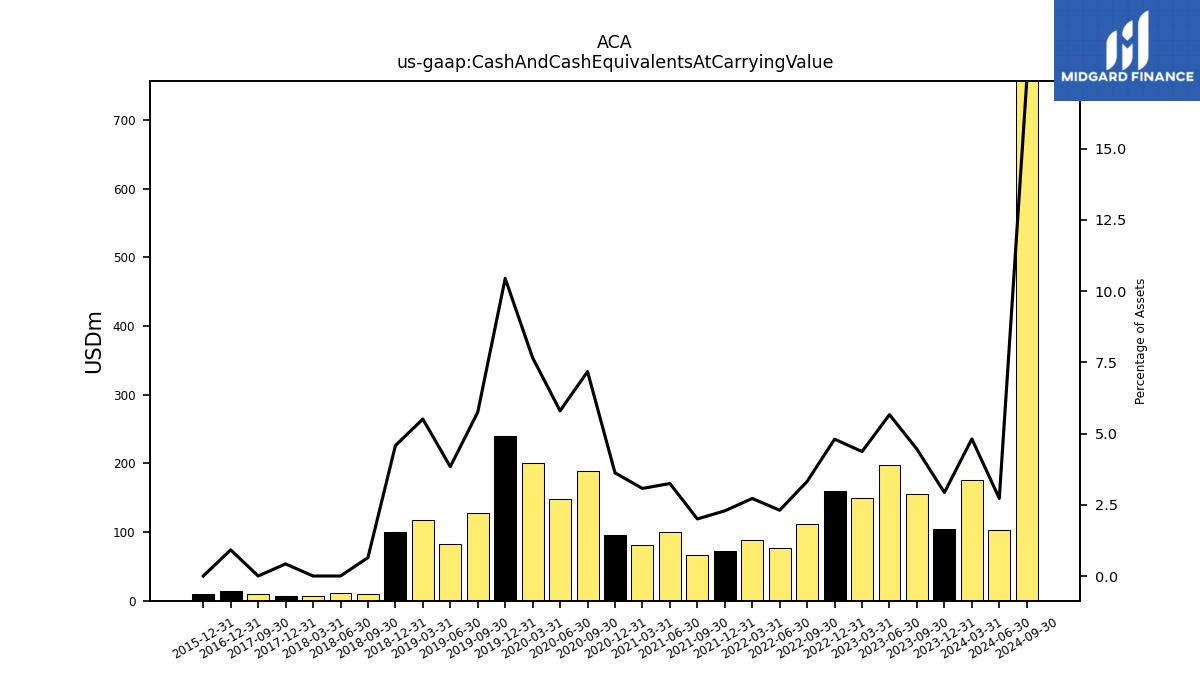
| Cash And Cash Equivalents At Carrying Value | 176.50 | 104.80 | 155.30 | 197.90 | 149.20 | 160.40 | 112.20 | 77.00 | 88.60 | 72.90 | 66.10 | 100.30 | 81.90 | 95.80 | 189.00 | 148.40 | 200.70 | 240.40 | 127.50 | 83.30 | 118.00 | 99.40 | 10.40 | 10.60 | 6.70 | 6.80 | 10.20 | NA | NA | |
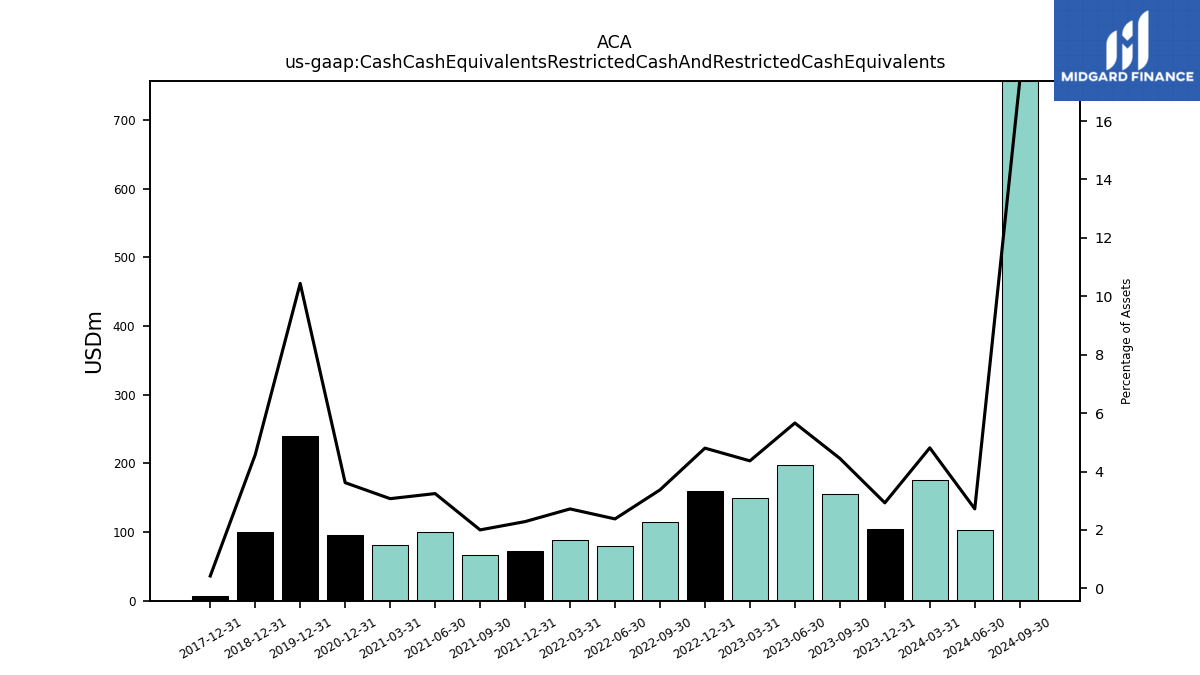
| Cash Cash Equivalents Restricted Cash And Restricted Cash Equivalents | 176.50 | 104.80 | 155.30 | 197.90 | 149.20 | 160.40 | 114.00 | 79.40 | 88.60 | 72.90 | 66.10 | 100.30 | 81.90 | 95.80 | NA | NA | NA | 240.40 | NA | NA | NA | 99.40 | NA | NA | NA | 6.80 | NA | NA | NA | |
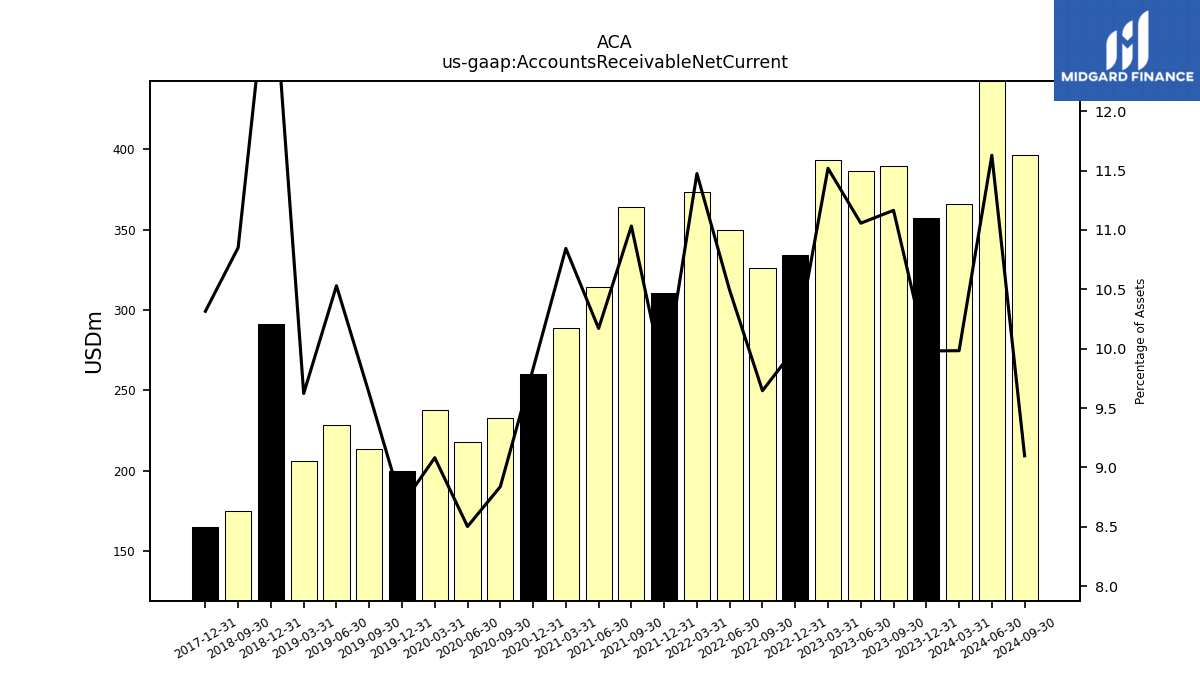
| Accounts Receivable Net Current | 366.20 | 357.10 | 389.60 | 386.50 | 393.60 | 334.20 | 326.10 | 350.10 | 373.70 | 310.80 | 364.20 | 314.30 | 289.10 | 260.20 | 232.90 | 217.70 | 238.10 | 200.00 | 213.40 | 228.70 | 206.20 | 291.40 | 174.70 | NA | NA | 165.30 | NA | NA | NA | |
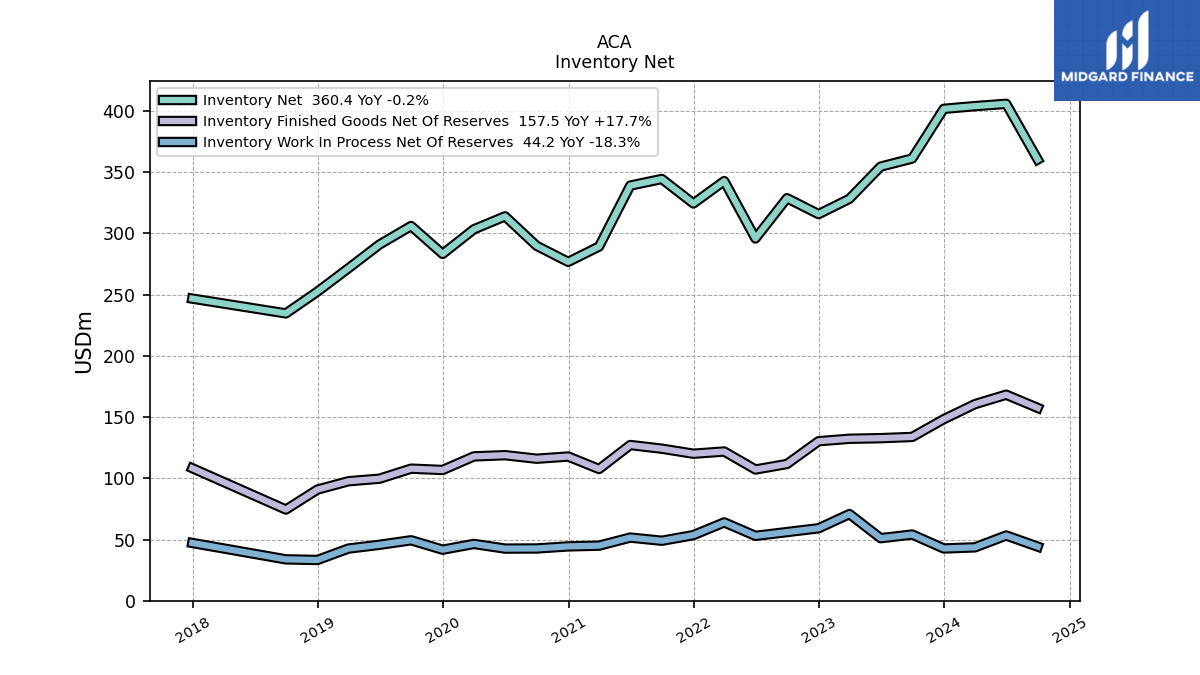
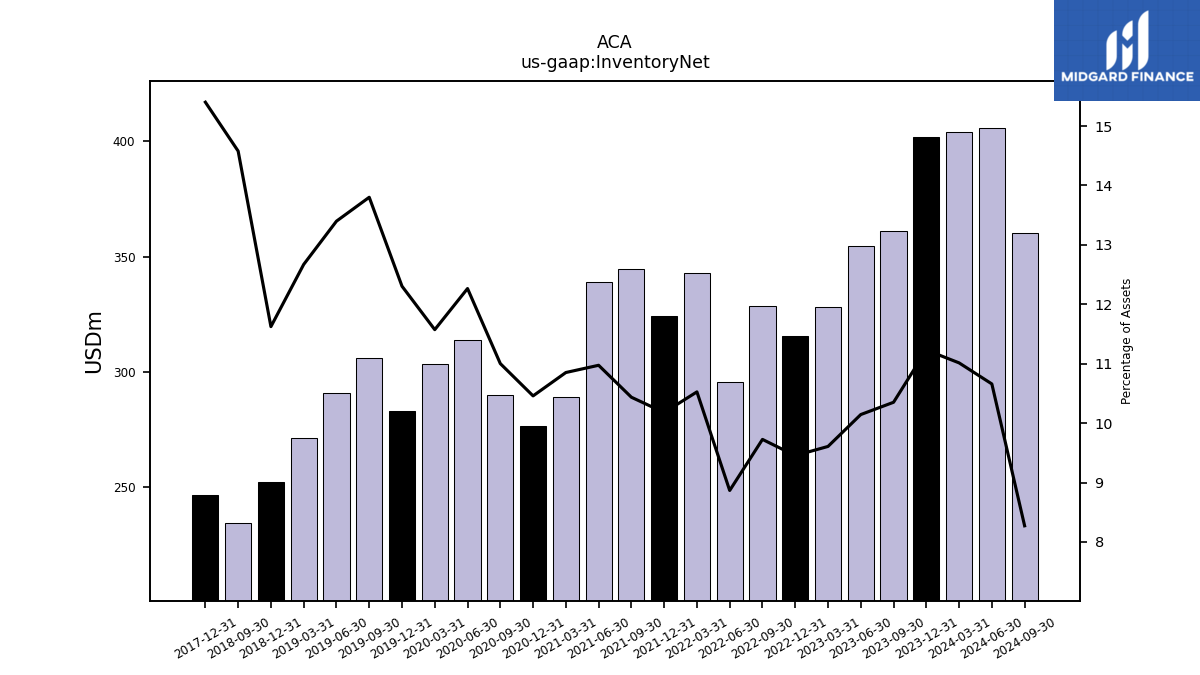
| Inventory Net | 404.00 | 401.80 | 361.20 | 354.60 | 328.30 | 315.80 | 328.80 | 295.90 | 342.80 | 324.50 | 344.50 | 339.10 | 289.30 | 276.80 | 289.90 | 314.00 | 303.40 | 283.30 | 306.10 | 291.00 | 271.50 | 252.50 | 234.70 | NA | NA | 246.80 | NA | NA | NA | |
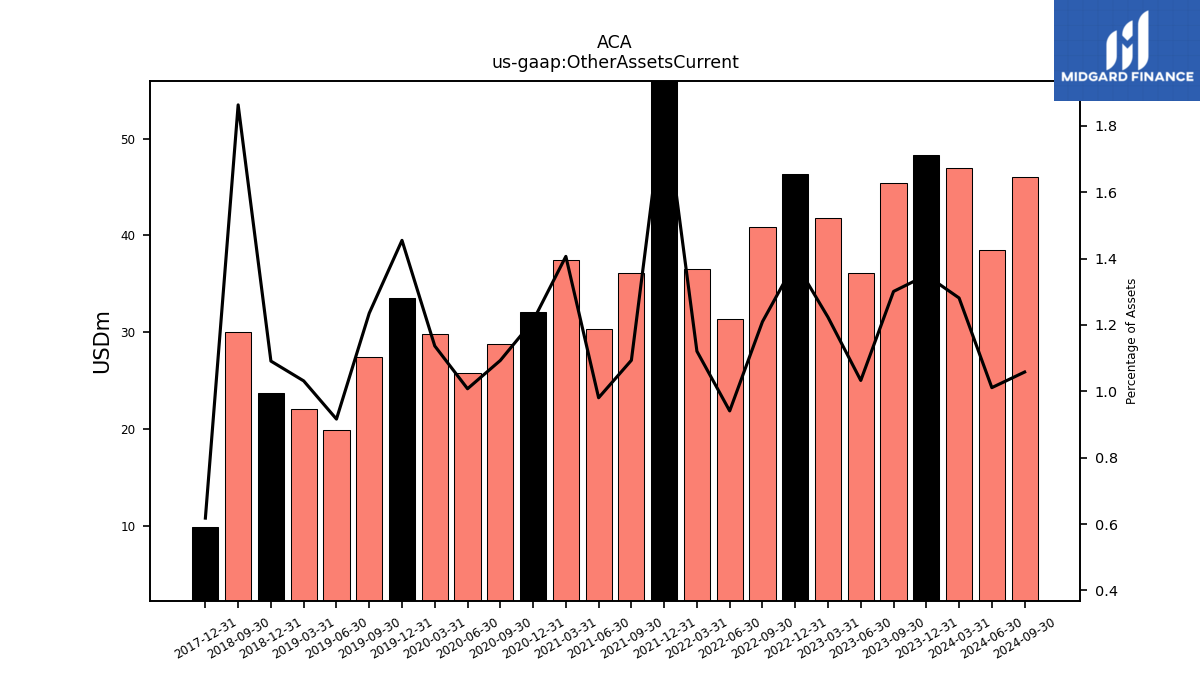
| Other Assets Current | 47.00 | 48.30 | 45.40 | 36.10 | 41.80 | 46.40 | 40.90 | 31.40 | 36.50 | 59.70 | 36.10 | 30.30 | 37.50 | 32.10 | 28.80 | 25.80 | 29.80 | 33.50 | 27.40 | 19.90 | 22.10 | 23.70 | 30.00 | NA | NA | 9.90 | NA | NA | NA |
| 2024-03-31 | 2023-12-31 | 2023-09-30 | 2023-06-30 | 2023-03-31 | 2022-12-31 | 2022-09-30 | 2022-06-30 | 2022-03-31 | 2021-12-31 | 2021-09-30 | 2021-06-30 | 2021-03-31 | 2020-12-31 | 2020-09-30 | 2020-06-30 | 2020-03-31 | 2019-12-31 | 2019-09-30 | 2019-06-30 | 2019-03-31 | 2018-12-31 | 2018-09-30 | 2018-06-30 | 2018-03-31 | 2017-12-31 | 2017-09-30 | 2017-06-30 | 2017-03-31 | ||
|---|---|---|---|---|---|---|---|---|---|---|---|---|---|---|---|---|---|---|---|---|---|---|---|---|---|---|---|---|---|---|
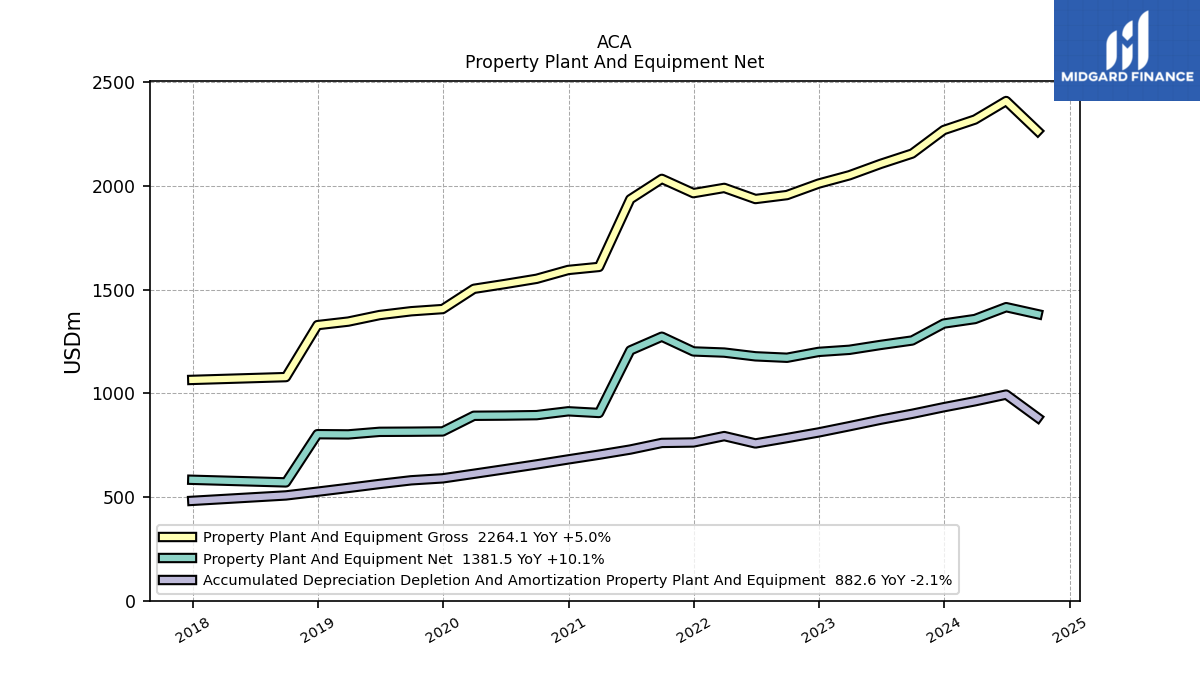
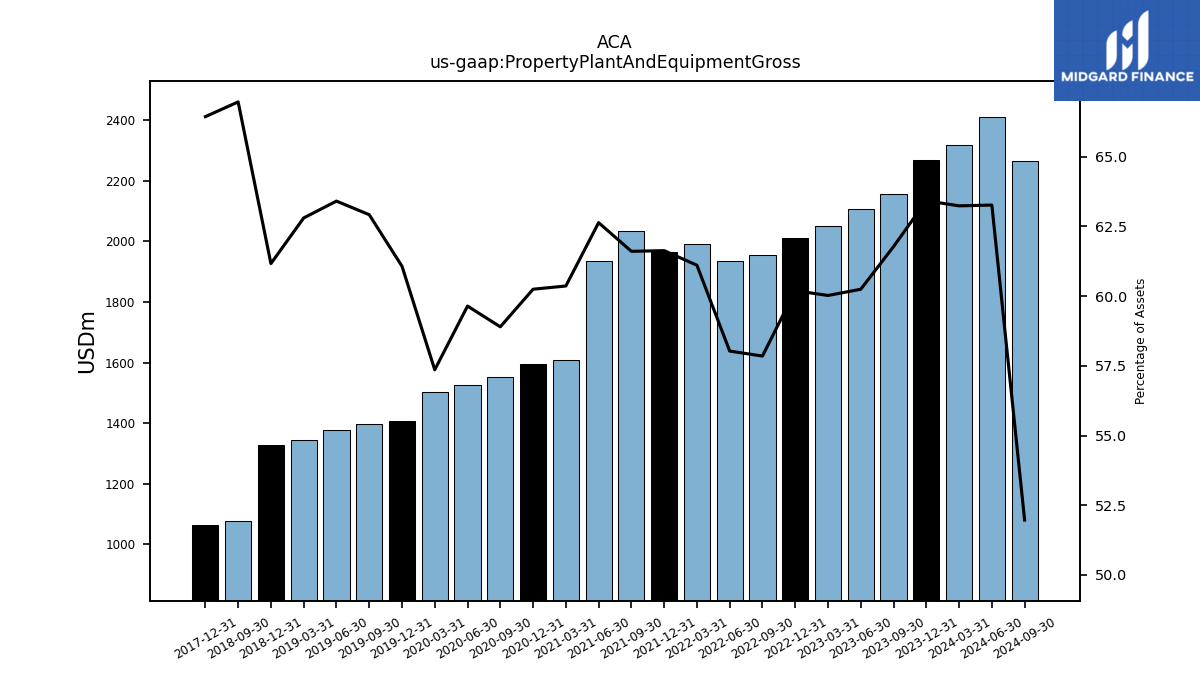
| Property Plant And Equipment Gross | 2319.70 | 2269.20 | 2155.80 | 2106.00 | 2051.10 | 2010.90 | 1955.70 | 1936.60 | 1990.20 | 1964.90 | 2033.80 | 1935.60 | 1609.30 | 1594.60 | 1552.00 | 1527.00 | 1503.70 | 1406.20 | 1395.60 | 1377.20 | 1345.80 | 1328.70 | 1078.20 | NA | NA | 1064.70 | NA | NA | NA | |
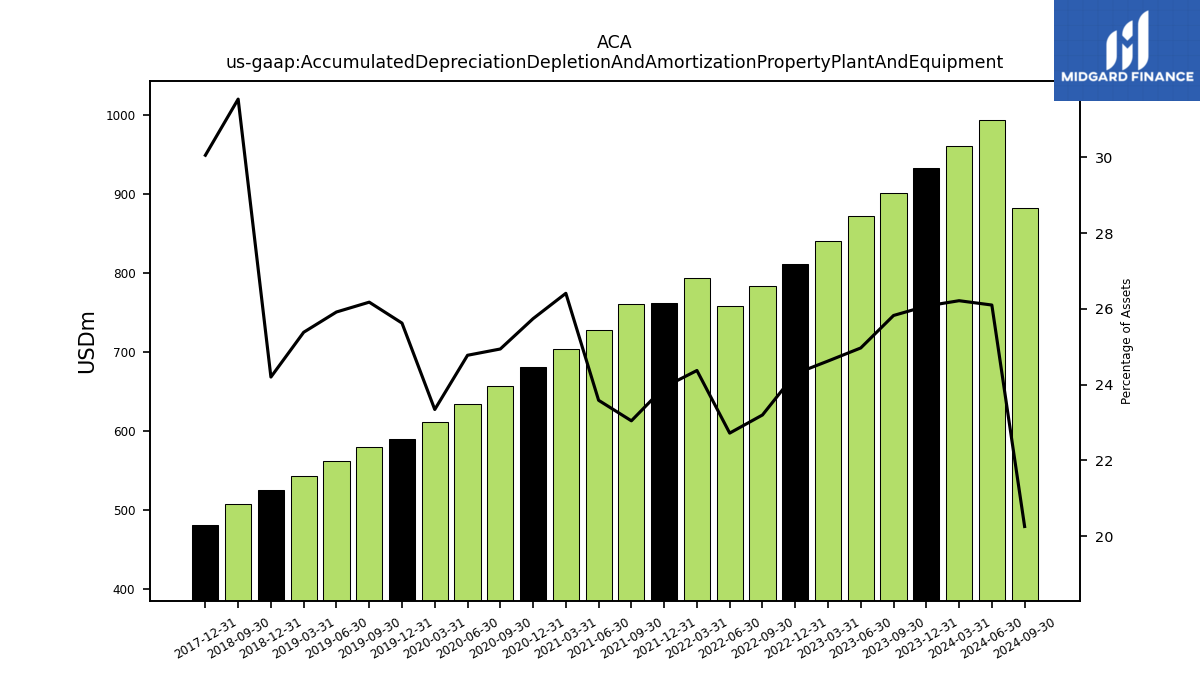
| Accumulated Depreciation Depletion And Amortization Property Plant And Equipment | 961.60 | 932.90 | 901.20 | 872.80 | 841.40 | 811.30 | 784.30 | 758.30 | 793.80 | 763.00 | 760.80 | 728.90 | 704.10 | 681.30 | 657.20 | 634.30 | 612.00 | 590.00 | 580.60 | 562.90 | 543.90 | 525.70 | 507.70 | NA | NA | 481.60 | NA | NA | NA | |
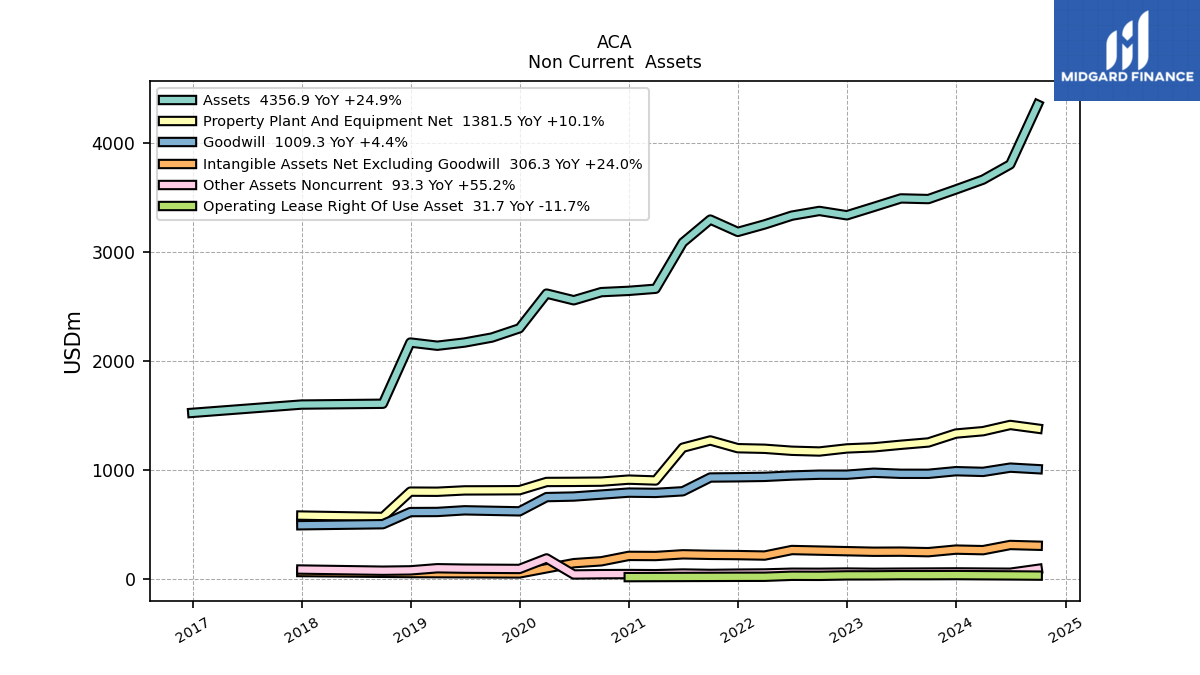
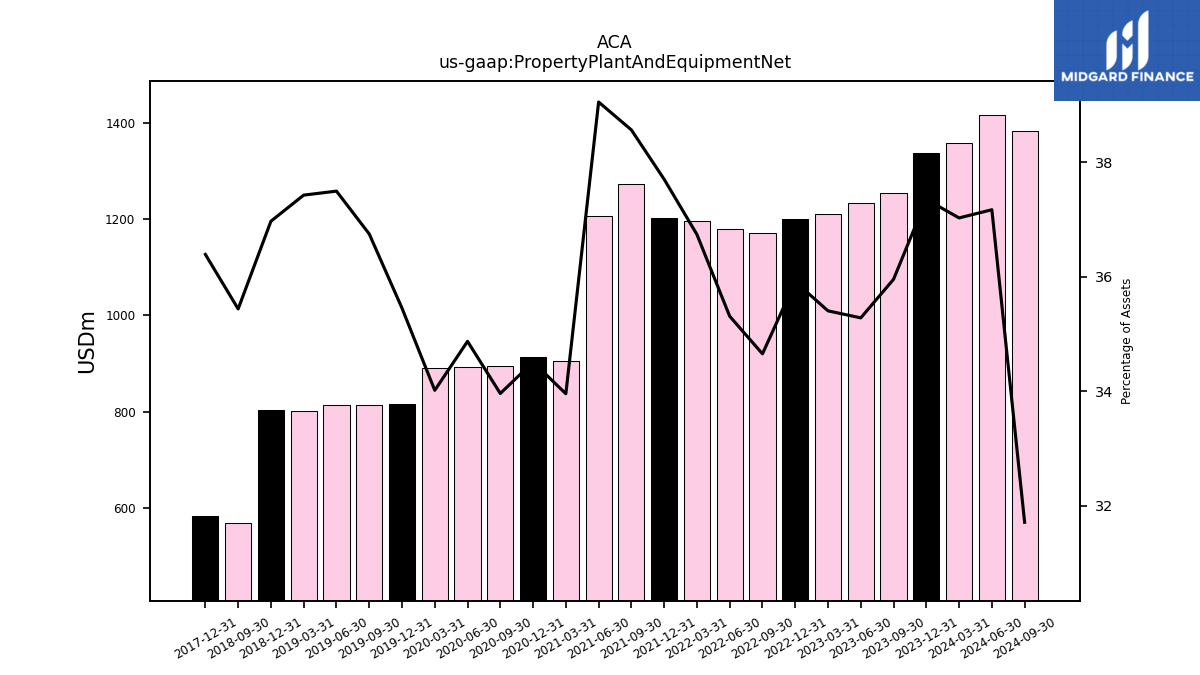
| Property Plant And Equipment Net | 1358.10 | 1336.30 | 1254.60 | 1233.20 | 1209.70 | 1199.60 | 1171.40 | 1178.30 | 1196.40 | 1201.90 | 1273.00 | 1206.70 | 905.20 | 913.30 | 894.80 | 892.70 | 891.70 | 816.20 | 815.00 | 814.30 | 801.90 | 803.00 | 570.50 | NA | NA | 583.10 | NA | NA | NA | |
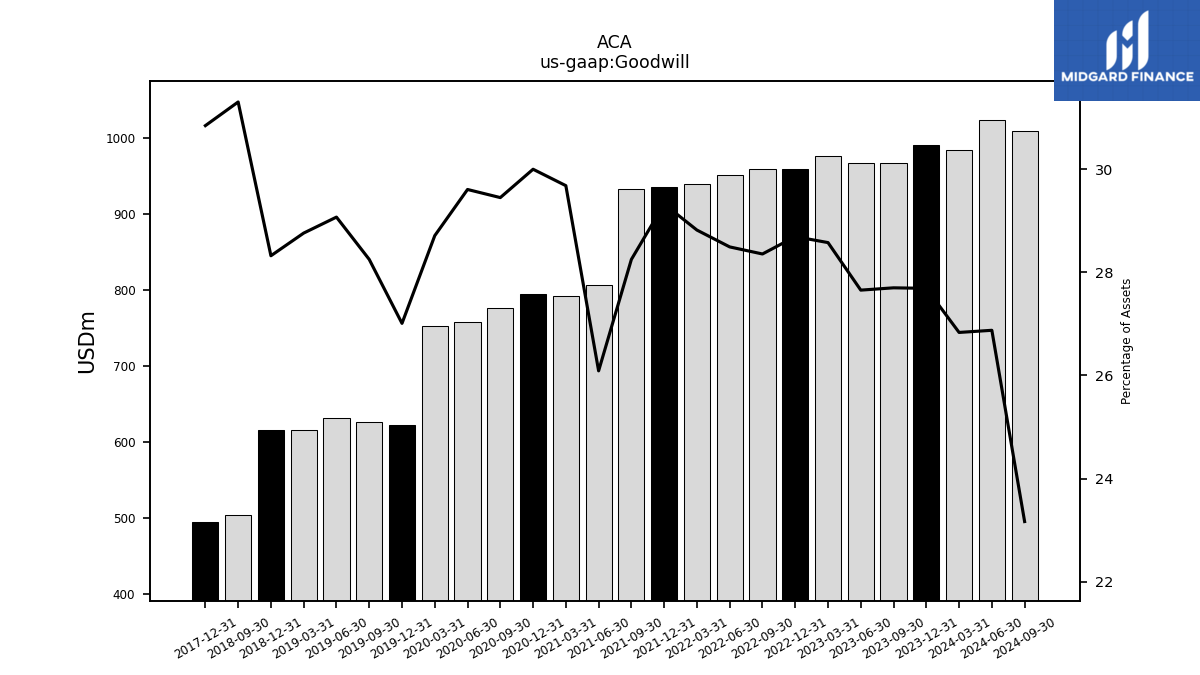
| Goodwill | 984.30 | 990.70 | 966.60 | 966.70 | 976.50 | 958.50 | 958.60 | 950.90 | 938.60 | 934.90 | 932.60 | 806.20 | 791.30 | 794.00 | 776.00 | 758.00 | 752.70 | 621.90 | 626.60 | 631.40 | 616.30 | 615.20 | 504.00 | NA | NA | 494.30 | NA | NA | NA | |
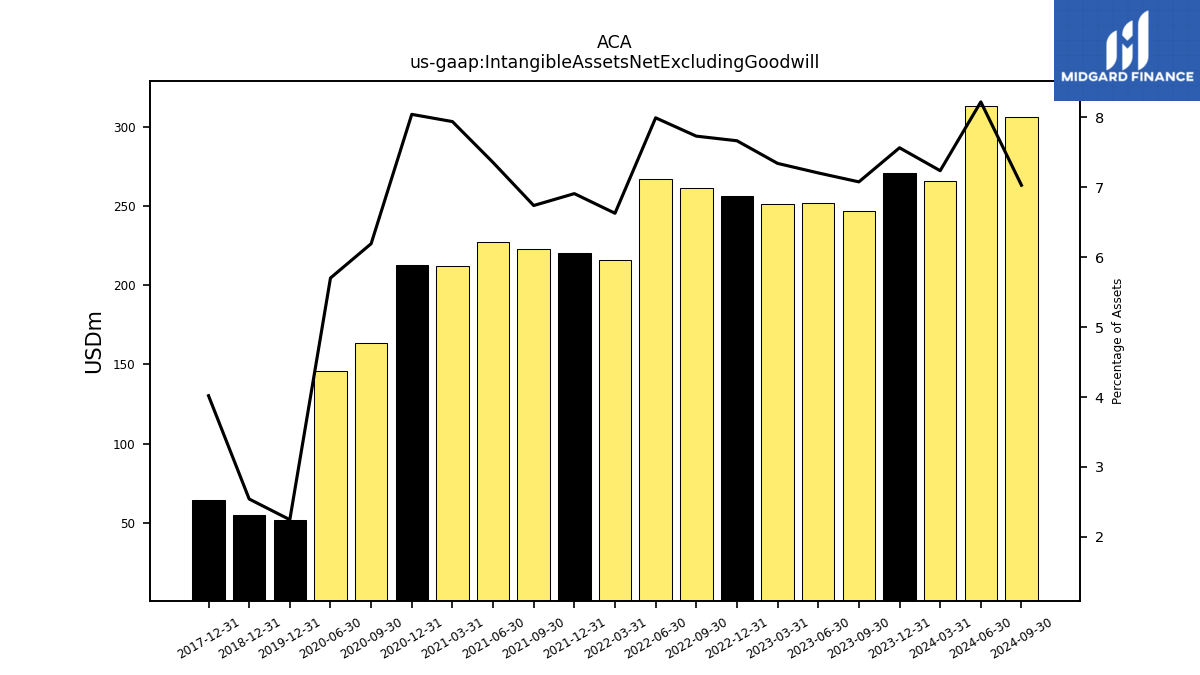
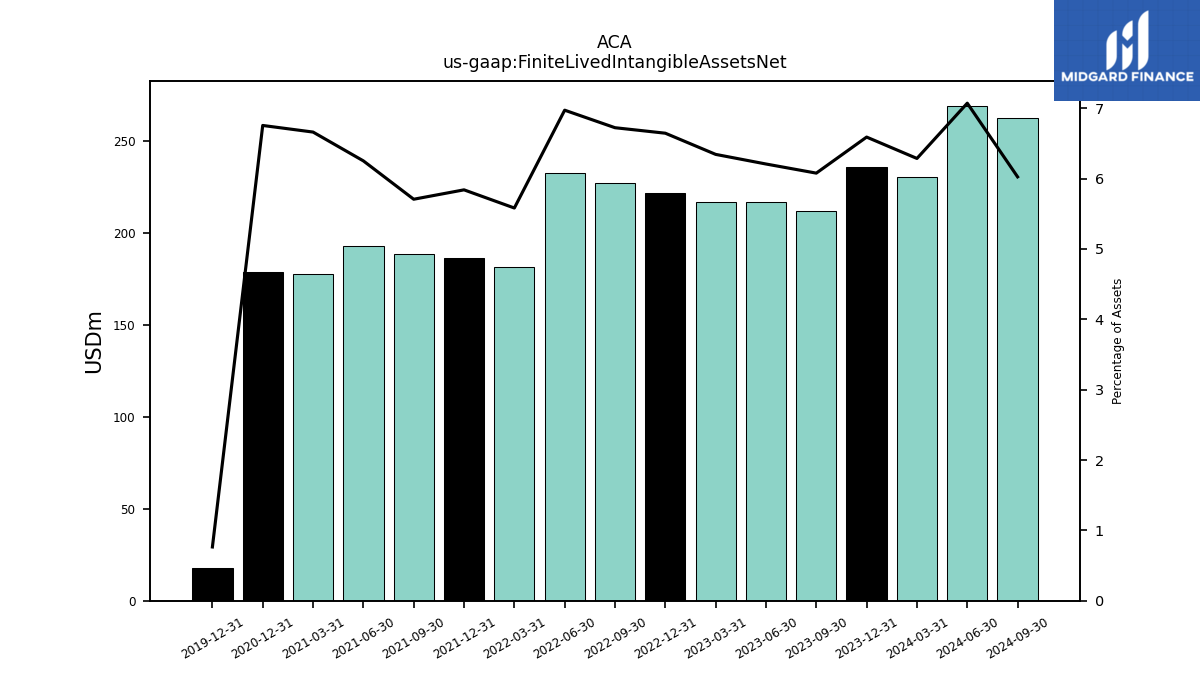
| Intangible Assets Net Excluding Goodwill | 265.50 | 270.70 | 247.00 | 251.90 | 250.90 | 256.10 | 261.40 | 266.80 | 215.90 | 220.30 | 222.50 | 227.30 | 211.70 | 212.90 | 163.20 | 146.00 | NA | 51.70 | NA | NA | NA | 55.20 | NA | NA | NA | 64.40 | NA | NA | NA | |
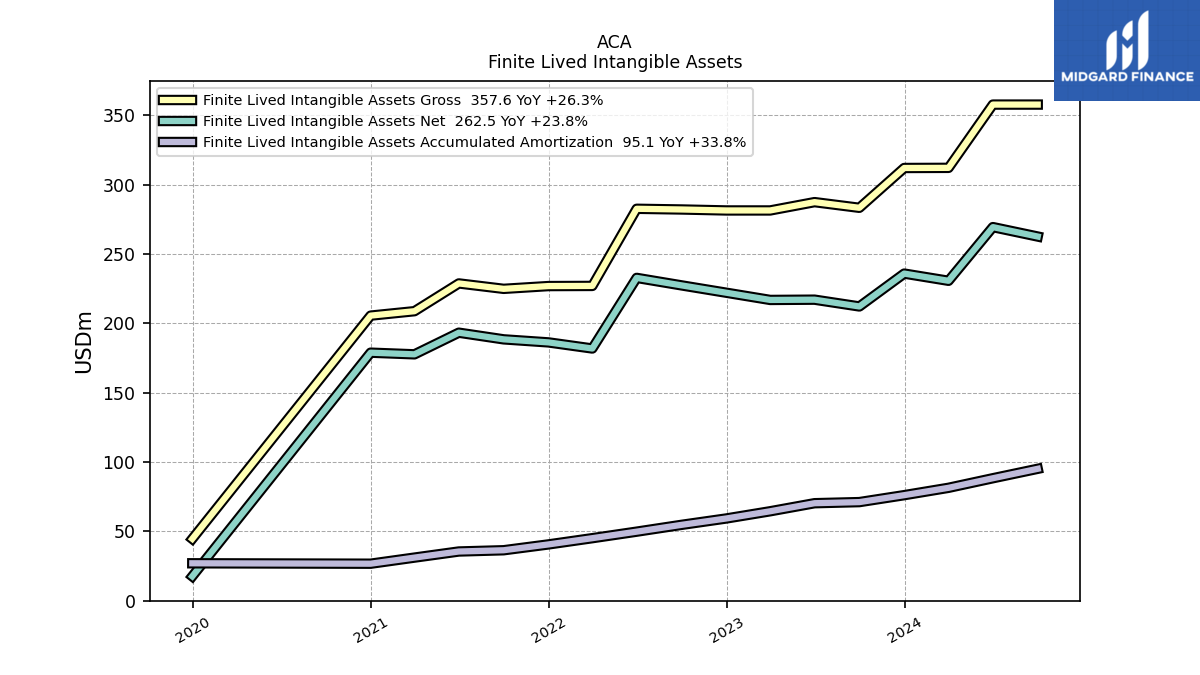
| Finite Lived Intangible Assets Net | 230.60 | 235.80 | 212.10 | 217.00 | 216.80 | 222.00 | 227.30 | 232.70 | 181.80 | 186.20 | 188.40 | 193.20 | 177.60 | 178.80 | NA | NA | NA | 17.60 | NA | NA | NA | NA | NA | NA | NA | NA | NA | NA | NA | |
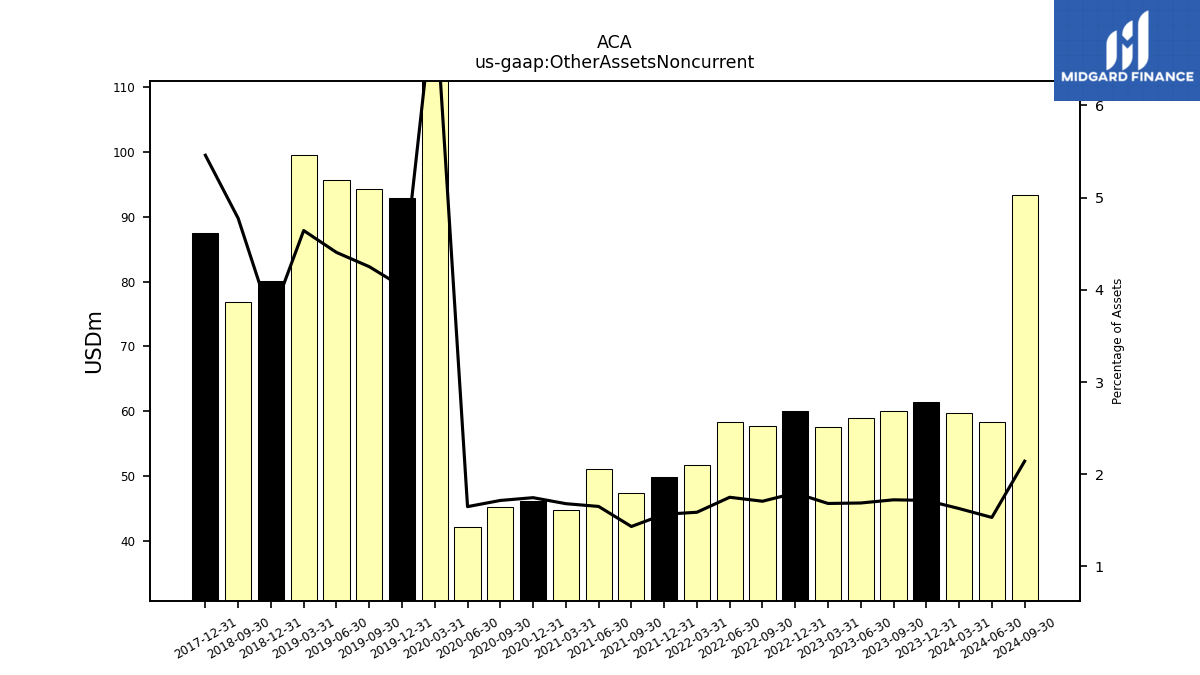
| Other Assets Noncurrent | 59.70 | 61.40 | 60.10 | 59.00 | 57.50 | 60.00 | 57.70 | 58.40 | 51.70 | 49.90 | 47.30 | 51.00 | 44.80 | 46.20 | 45.20 | 42.20 | 189.80 | 92.90 | 94.30 | 95.70 | 99.50 | 80.10 | 76.90 | NA | NA | 87.50 | NA | NA | NA |
| 2024-03-31 | 2023-12-31 | 2023-09-30 | 2023-06-30 | 2023-03-31 | 2022-12-31 | 2022-09-30 | 2022-06-30 | 2022-03-31 | 2021-12-31 | 2021-09-30 | 2021-06-30 | 2021-03-31 | 2020-12-31 | 2020-09-30 | 2020-06-30 | 2020-03-31 | 2019-12-31 | 2019-09-30 | 2019-06-30 | 2019-03-31 | 2018-12-31 | 2018-09-30 | 2018-06-30 | 2018-03-31 | 2017-12-31 | 2017-09-30 | 2017-06-30 | 2017-03-31 | ||
|---|---|---|---|---|---|---|---|---|---|---|---|---|---|---|---|---|---|---|---|---|---|---|---|---|---|---|---|---|---|---|
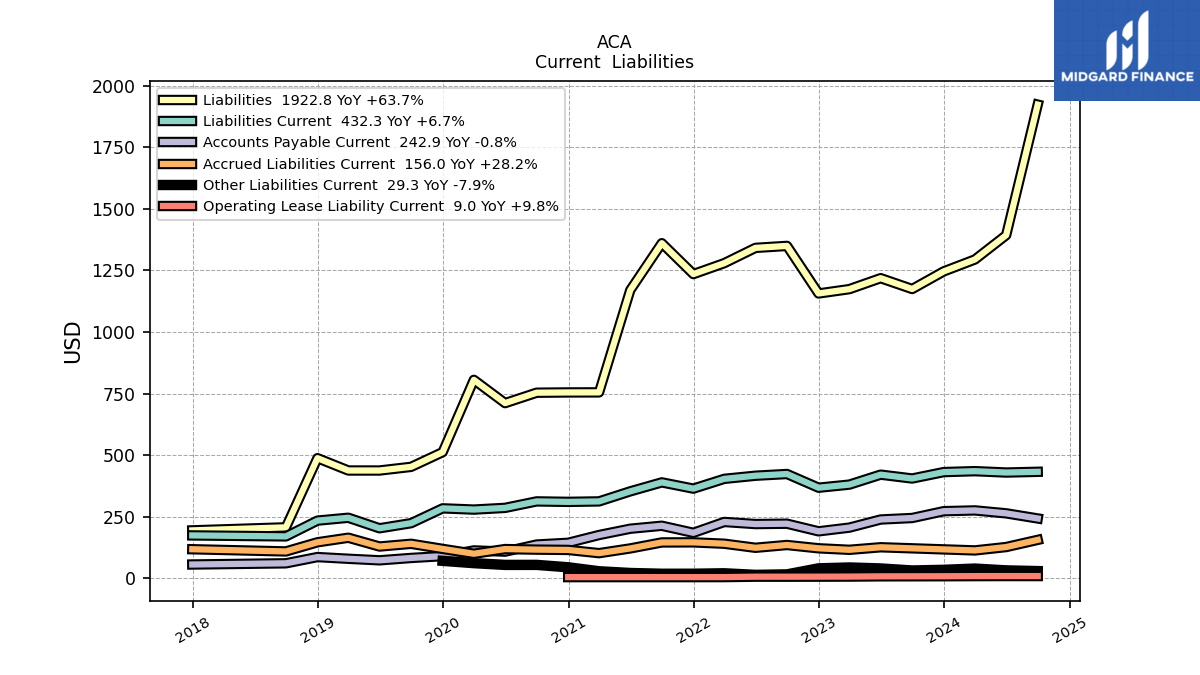
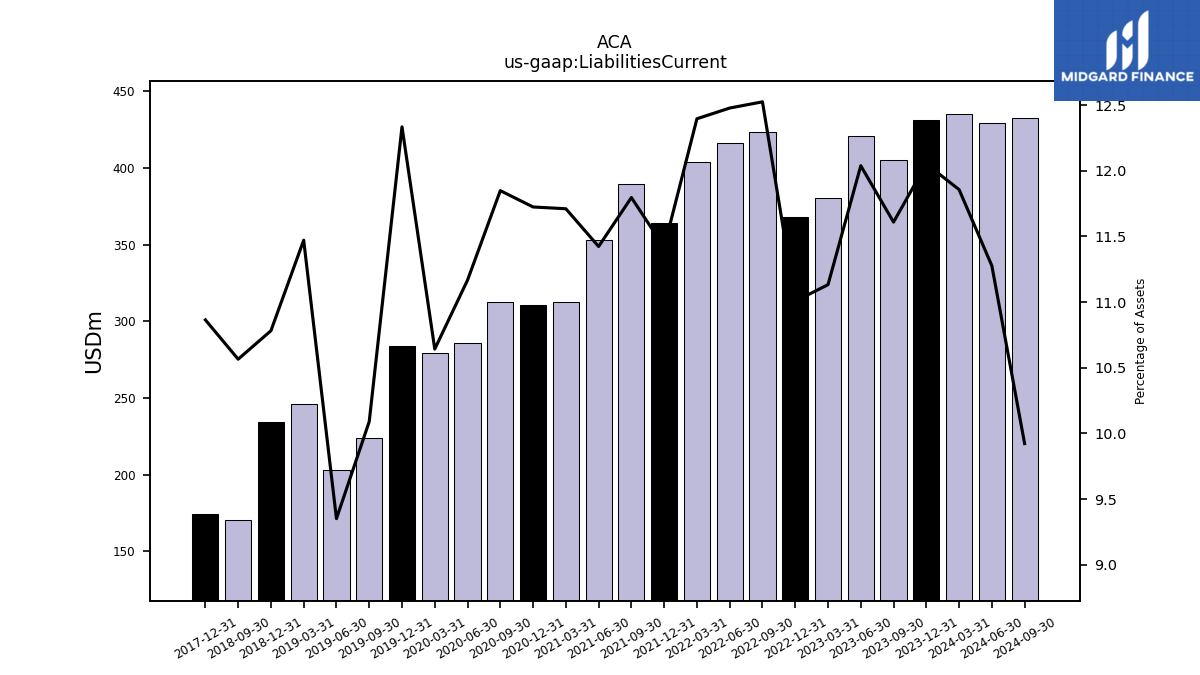
| Liabilities Current | 434.90 | 431.20 | 405.10 | 420.80 | 380.40 | 367.70 | 423.40 | 416.40 | 403.70 | 364.00 | 389.40 | 353.00 | 312.20 | 310.30 | 312.20 | 285.90 | 279.00 | 284.00 | 223.80 | 203.10 | 245.80 | 234.20 | 170.10 | NA | NA | 174.10 | NA | NA | NA | |
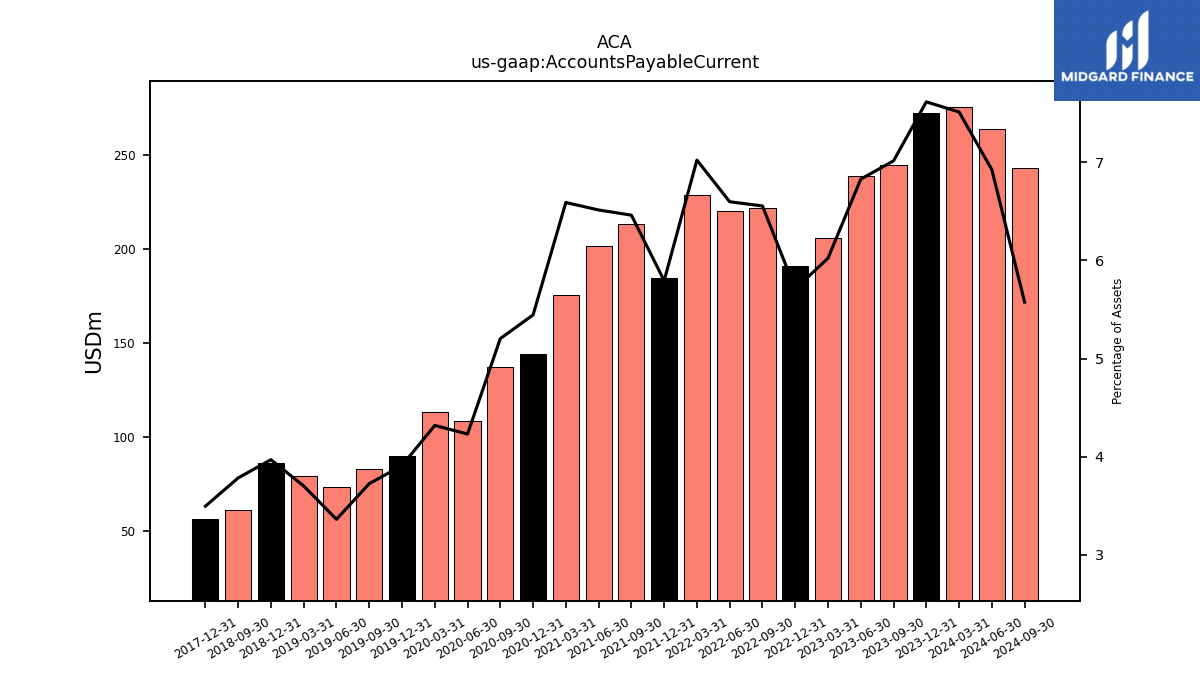
| Accounts Payable Current | 275.60 | 272.50 | 244.80 | 238.70 | 205.80 | 190.70 | 221.60 | 220.20 | 228.70 | 184.70 | 213.30 | 201.30 | 175.70 | 144.10 | 137.10 | 108.30 | 113.20 | 90.00 | 82.60 | 73.00 | 79.30 | 86.20 | 60.90 | NA | NA | 56.00 | NA | NA | NA | |
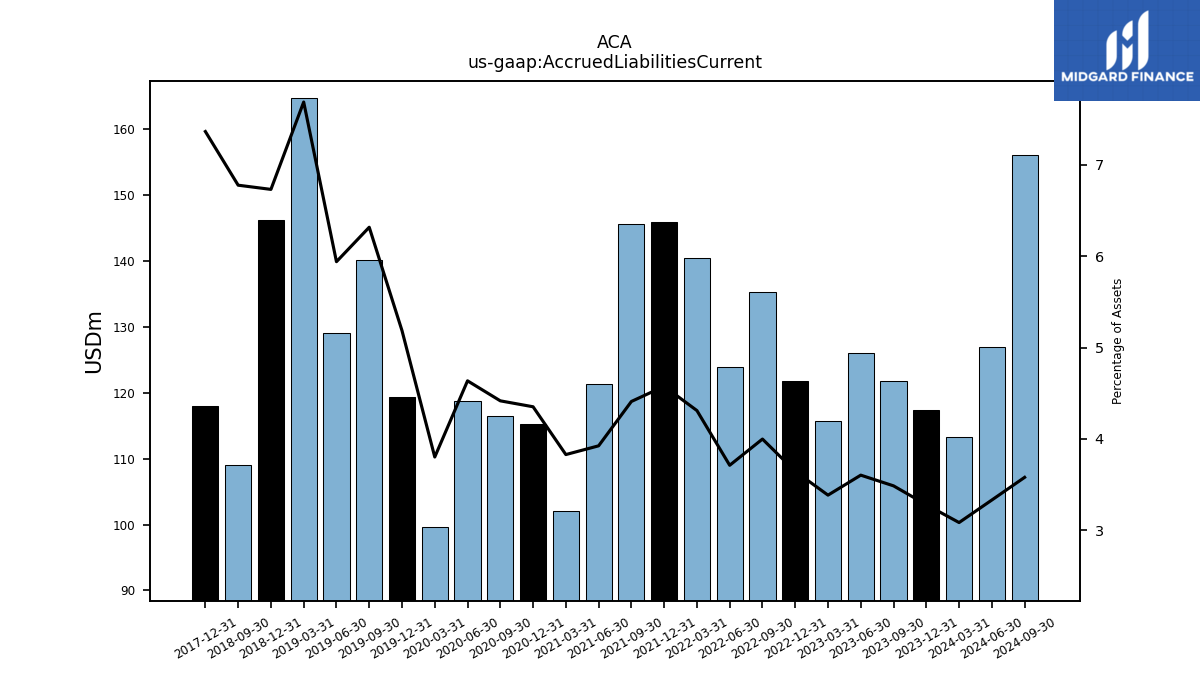
| Accrued Liabilities Current | 113.20 | 117.40 | 121.70 | 126.00 | 115.70 | 121.80 | 135.20 | 123.90 | 140.40 | 145.90 | 145.60 | 121.30 | 102.10 | 115.20 | 116.40 | 118.70 | 99.70 | 119.40 | 140.10 | 129.00 | 164.70 | 146.20 | 109.10 | NA | NA | 118.00 | NA | NA | NA | |
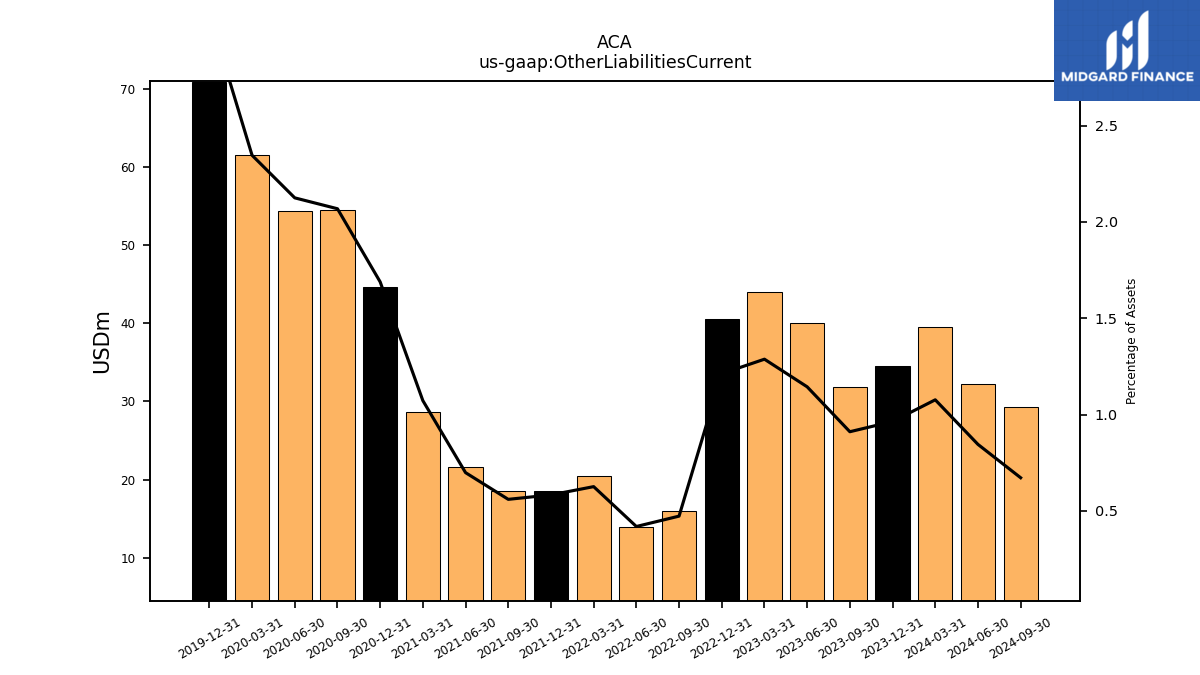
| Other Liabilities Current | 39.50 | 34.50 | 31.80 | 40.00 | 44.00 | 40.50 | 16.00 | 14.00 | 20.40 | 18.60 | 18.50 | 21.60 | 28.60 | 44.70 | 54.50 | 54.40 | 61.50 | 70.90 | NA | NA | NA | NA | NA | NA | NA | NA | NA | NA | NA |
| 2024-03-31 | 2023-12-31 | 2023-09-30 | 2023-06-30 | 2023-03-31 | 2022-12-31 | 2022-09-30 | 2022-06-30 | 2022-03-31 | 2021-12-31 | 2021-09-30 | 2021-06-30 | 2021-03-31 | 2020-12-31 | 2020-09-30 | 2020-06-30 | 2020-03-31 | 2019-12-31 | 2019-09-30 | 2019-06-30 | 2019-03-31 | 2018-12-31 | 2018-09-30 | 2018-06-30 | 2018-03-31 | 2017-12-31 | 2017-09-30 | 2017-06-30 | 2017-03-31 | ||
|---|---|---|---|---|---|---|---|---|---|---|---|---|---|---|---|---|---|---|---|---|---|---|---|---|---|---|---|---|---|---|
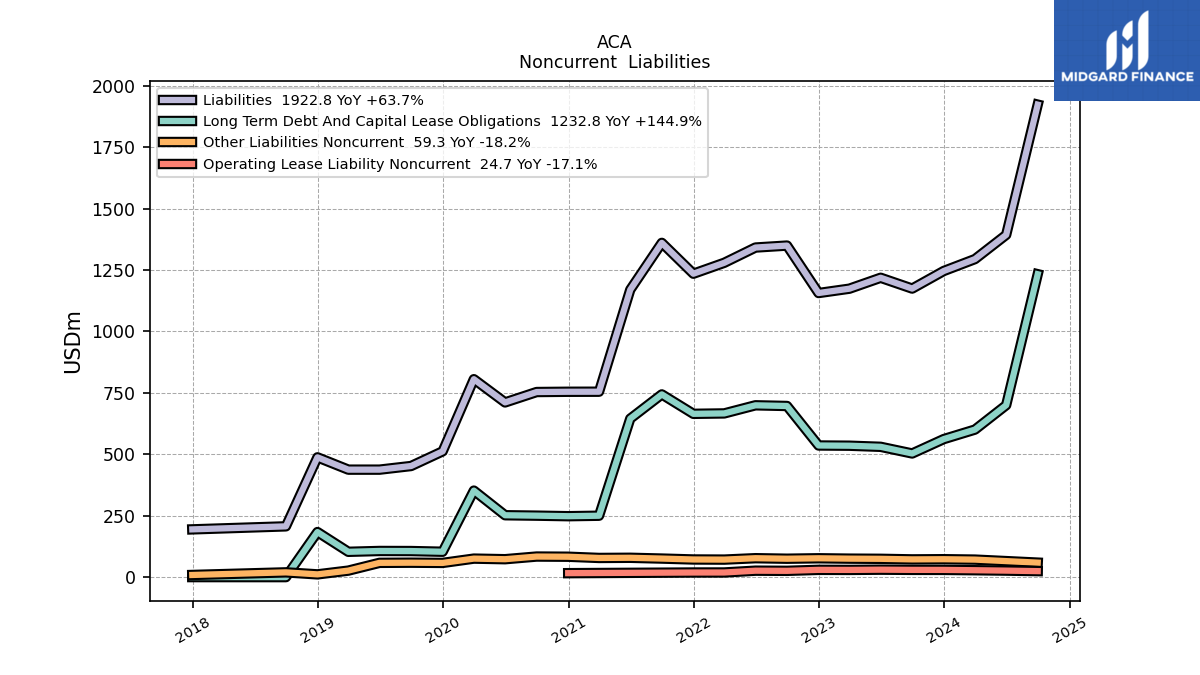
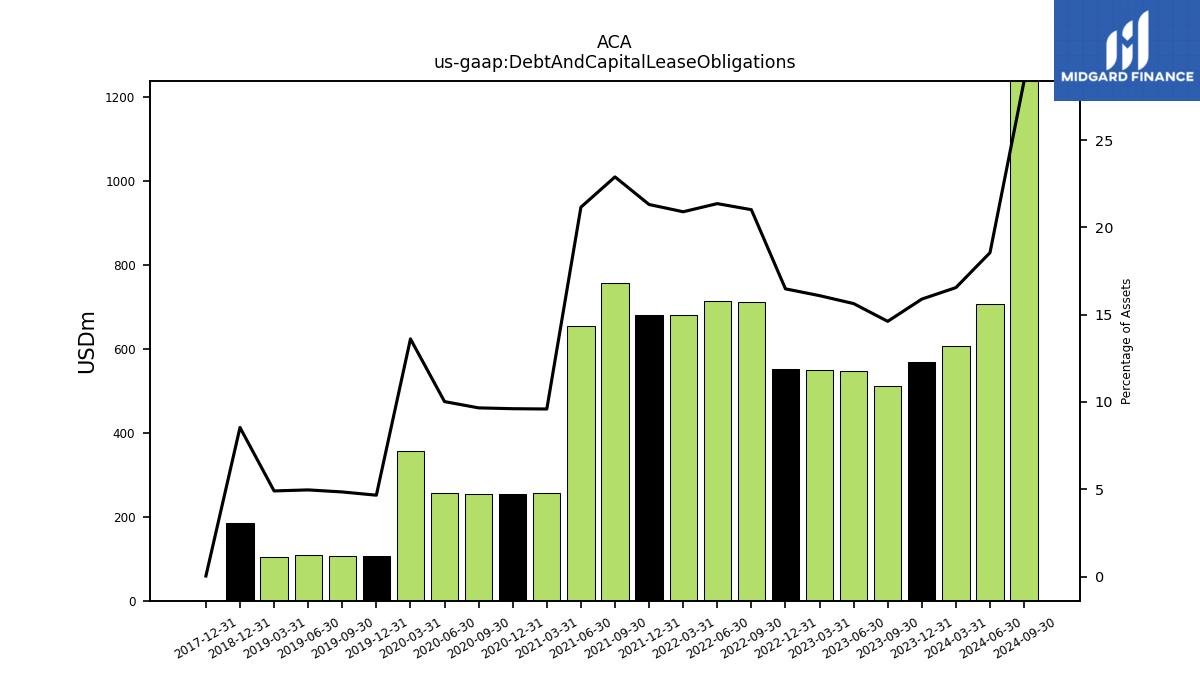
| Debt And Capital Lease Obligations | 607.20 | 568.70 | 510.20 | 546.60 | 549.90 | 550.60 | 710.50 | 713.00 | 680.60 | 679.50 | 755.80 | 653.90 | 255.90 | 254.50 | 254.60 | 256.60 | 356.90 | 107.30 | 107.50 | 107.80 | 105.10 | 185.50 | NA | NA | NA | 0.50 | NA | NA | NA | |
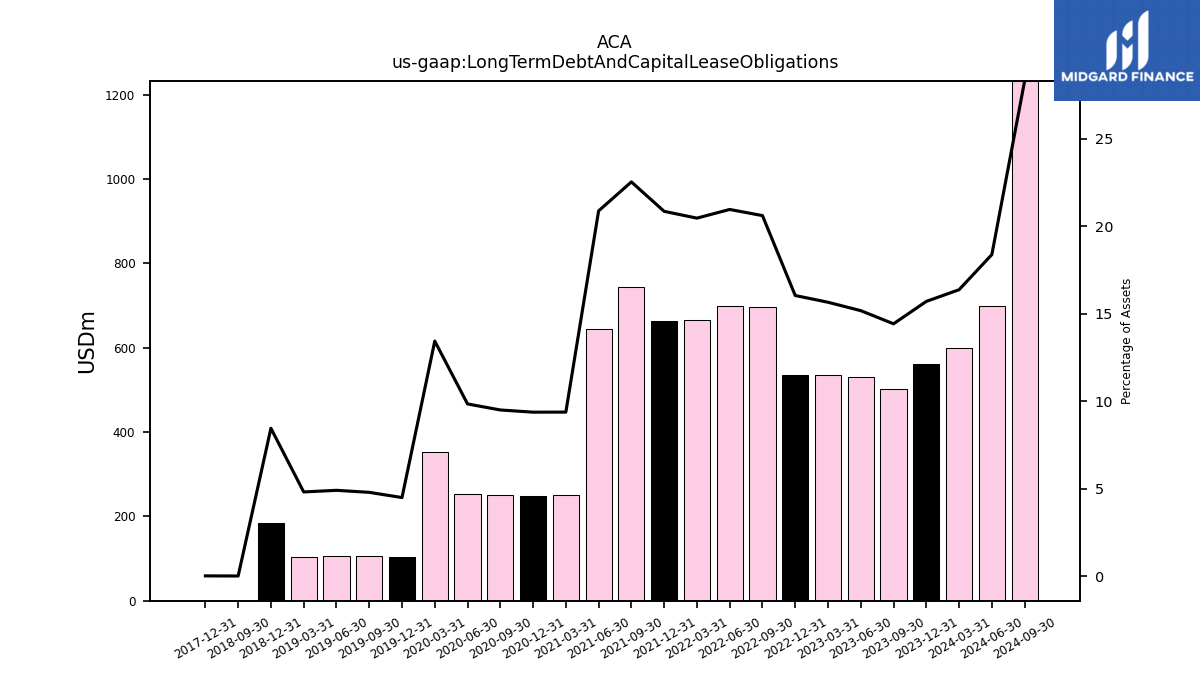
| Long Term Debt And Capital Lease Obligations | 600.60 | 561.90 | 503.40 | 530.50 | 535.00 | 535.90 | 696.60 | 699.40 | 666.40 | 664.70 | 743.80 | 645.10 | 250.10 | 248.20 | 250.40 | 252.10 | 352.30 | 103.60 | 106.40 | 106.70 | 103.30 | 183.70 | 0.30 | NA | NA | 0.40 | NA | NA | NA | |
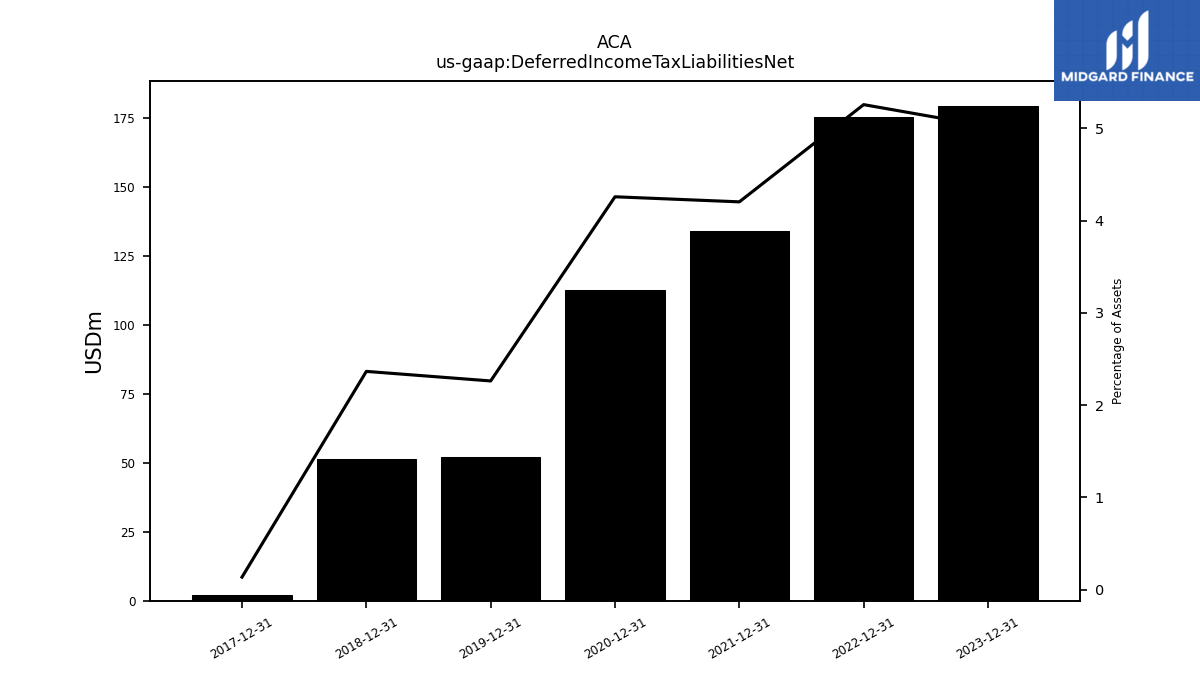
| Deferred Income Tax Liabilities Net | NA | 179.60 | NA | NA | NA | 175.60 | NA | NA | NA | 134.00 | NA | NA | NA | 112.70 | NA | NA | NA | 52.10 | NA | NA | NA | 51.40 | NA | NA | NA | 2.20 | NA | NA | NA | |
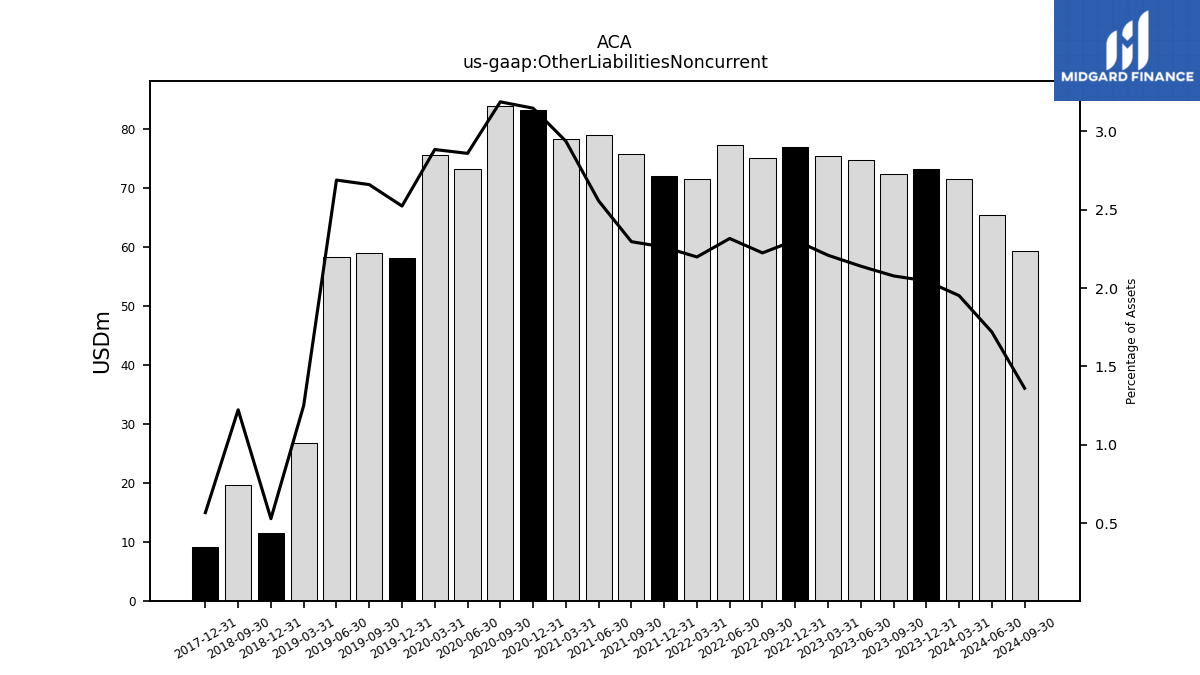
| Other Liabilities Noncurrent | 71.60 | 73.20 | 72.50 | 74.80 | 75.50 | 77.00 | 75.20 | 77.30 | 71.60 | 72.10 | 75.80 | 79.00 | 78.30 | 83.30 | 84.00 | 73.20 | 75.60 | 58.10 | 59.00 | 58.40 | 26.80 | 11.50 | 19.70 | NA | NA | 9.10 | NA | NA | NA | |
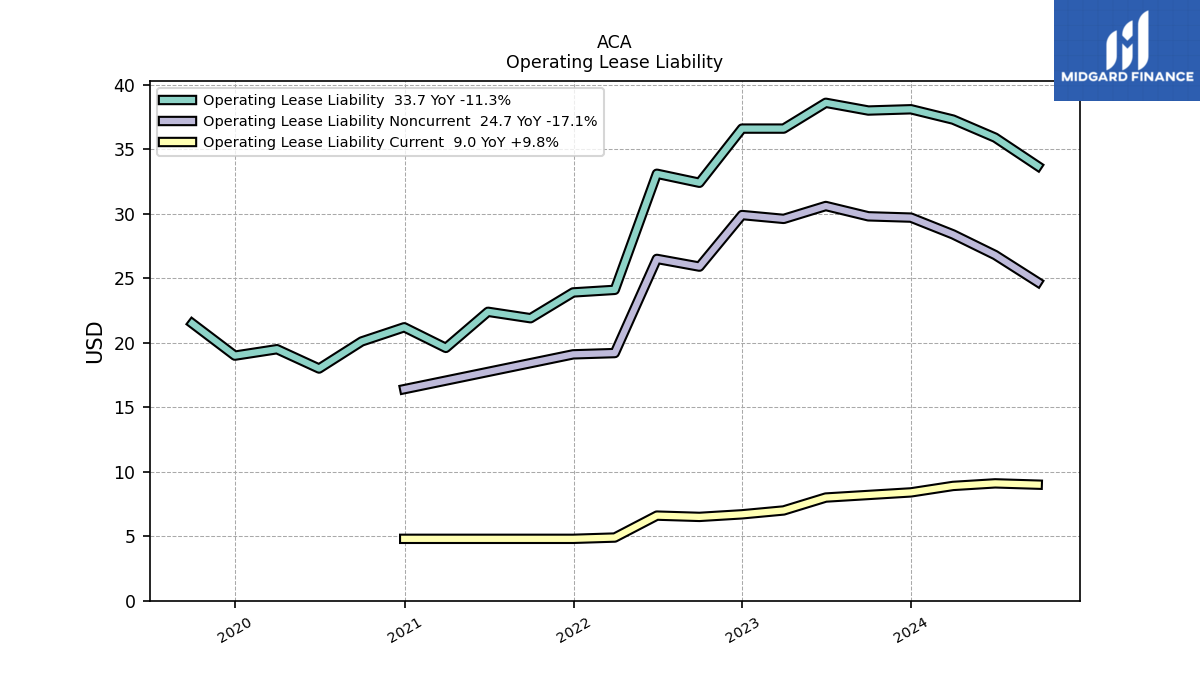
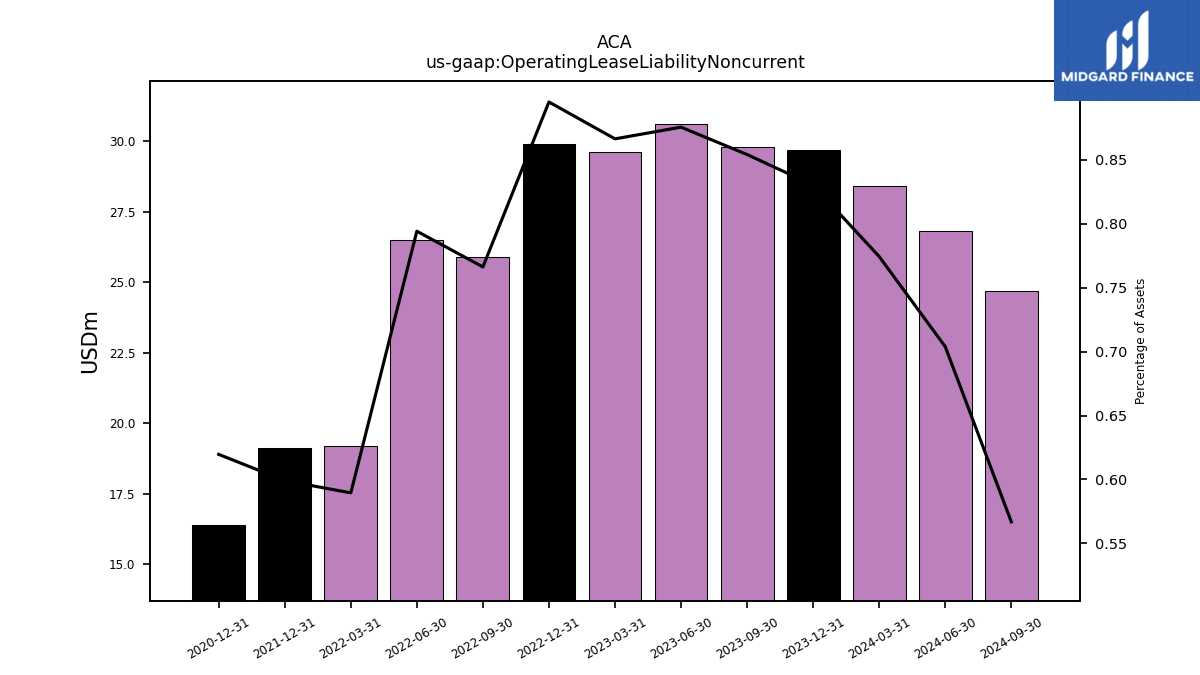
| Operating Lease Liability Noncurrent | 28.40 | 29.70 | 29.80 | 30.60 | 29.60 | 29.90 | 25.90 | 26.50 | 19.20 | 19.10 | NA | NA | NA | 16.40 | NA | NA | NA | NA | NA | NA | NA | NA | NA | NA | NA | NA | NA | NA | NA |
| 2024-03-31 | 2023-12-31 | 2023-09-30 | 2023-06-30 | 2023-03-31 | 2022-12-31 | 2022-09-30 | 2022-06-30 | 2022-03-31 | 2021-12-31 | 2021-09-30 | 2021-06-30 | 2021-03-31 | 2020-12-31 | 2020-09-30 | 2020-06-30 | 2020-03-31 | 2019-12-31 | 2019-09-30 | 2019-06-30 | 2019-03-31 | 2018-12-31 | 2018-09-30 | 2018-06-30 | 2018-03-31 | 2017-12-31 | 2017-09-30 | 2017-06-30 | 2017-03-31 | ||
|---|---|---|---|---|---|---|---|---|---|---|---|---|---|---|---|---|---|---|---|---|---|---|---|---|---|---|---|---|---|---|
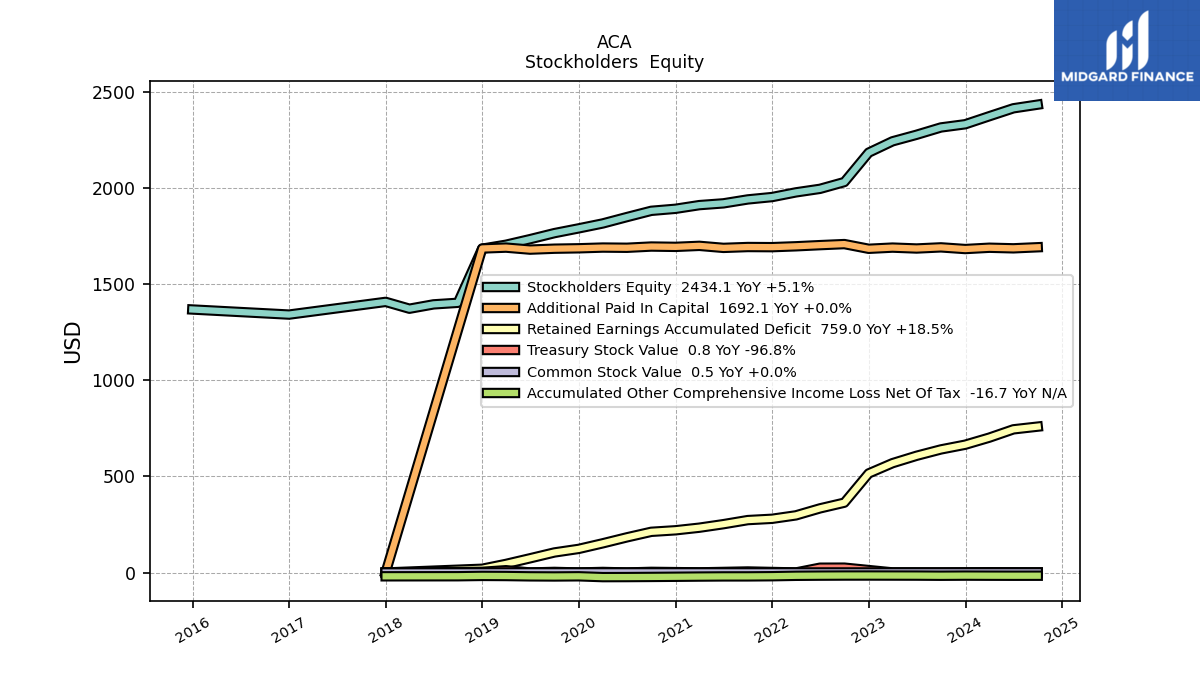
| Stockholders Equity | 2373.80 | 2332.00 | 2315.30 | 2277.30 | 2243.20 | 2184.40 | 2031.30 | 1996.00 | 1977.60 | 1953.30 | 1940.90 | 1920.50 | 1911.30 | 1892.20 | 1881.60 | 1849.10 | 1816.00 | 1790.40 | 1765.60 | 1734.30 | 1705.20 | 1684.50 | 1403.10 | 1394.90 | 1372.40 | 1407.90 | NA | NA | NA | |
| Common Stock Value | 0.50 | 0.50 | 0.50 | 0.50 | 0.50 | 0.50 | 0.50 | 0.50 | 0.50 | 0.50 | 0.50 | 0.50 | 0.50 | 0.50 | 0.50 | 0.50 | 0.50 | 0.50 | 0.50 | 0.50 | 0.50 | 0.50 | NA | NA | NA | 0.00 | NA | NA | NA | |
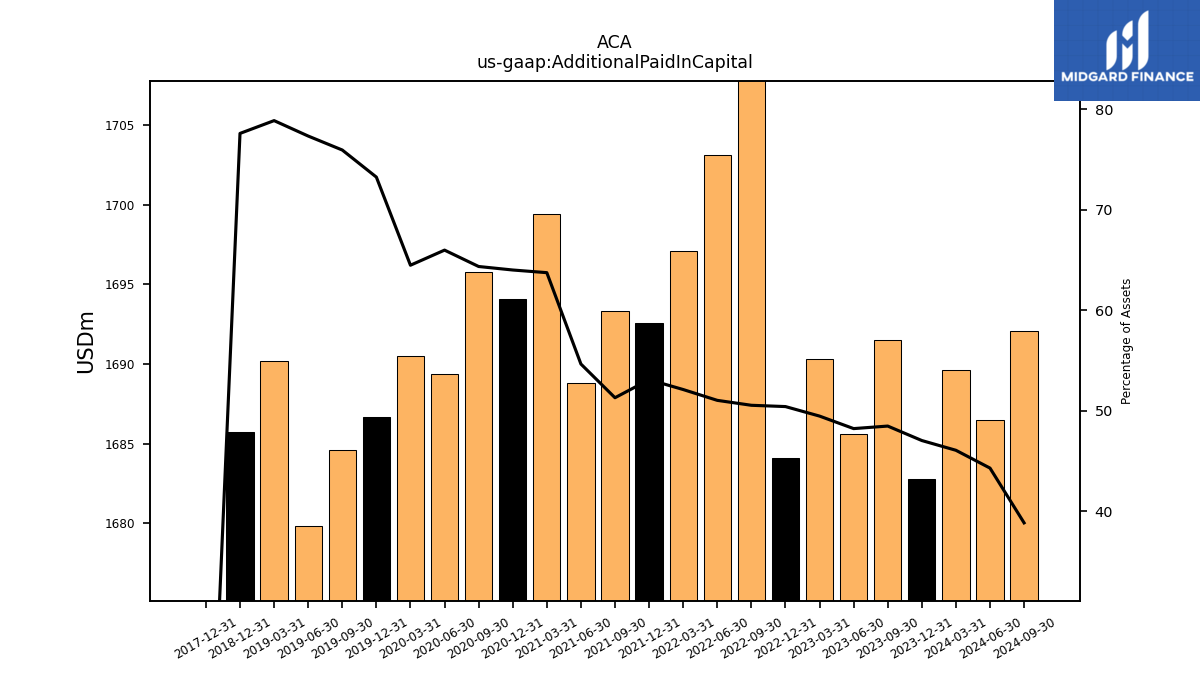
| Additional Paid In Capital | 1689.60 | 1682.80 | 1691.50 | 1685.60 | 1690.30 | 1684.10 | 1708.60 | 1703.10 | 1697.10 | 1692.60 | 1693.30 | 1688.80 | 1699.40 | 1694.10 | 1695.80 | 1689.40 | 1690.50 | 1686.70 | 1684.60 | 1679.80 | 1690.20 | 1685.70 | NA | NA | NA | 0.00 | NA | NA | NA | |
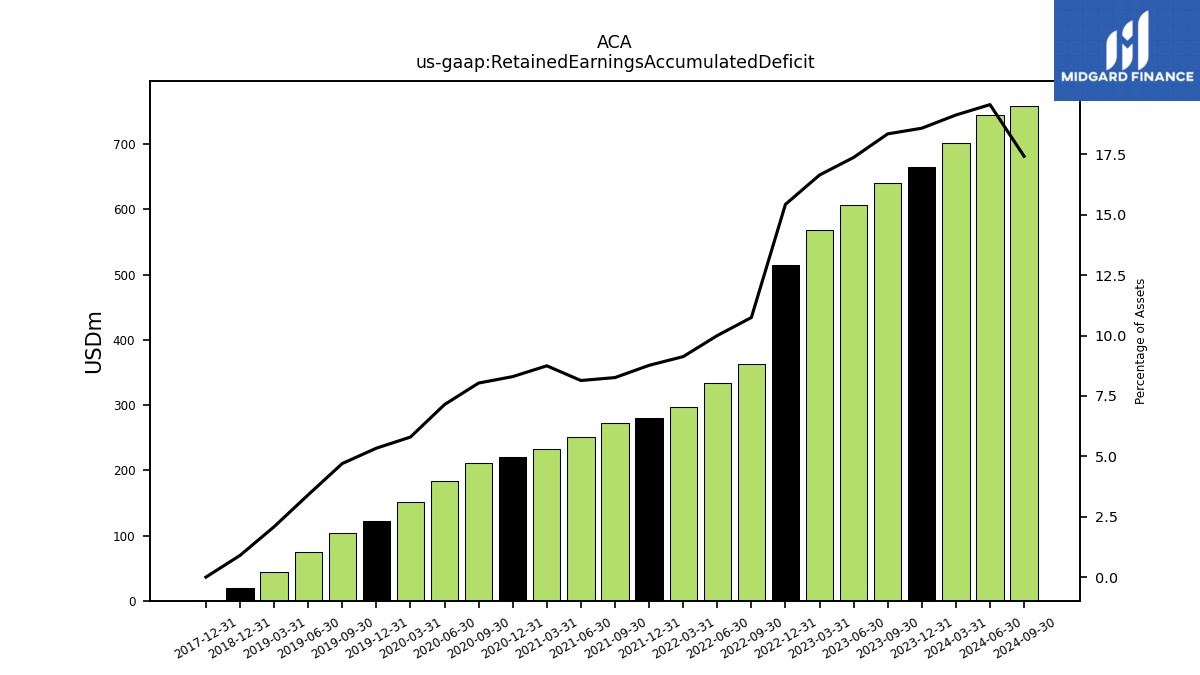
| Retained Earnings Accumulated Deficit | 701.70 | 664.90 | 640.30 | 607.30 | 568.80 | 515.50 | 363.30 | 333.70 | 297.30 | 279.50 | 272.70 | 251.50 | 233.20 | 219.70 | 211.70 | 182.90 | 152.00 | 122.90 | 104.30 | 74.00 | 44.70 | 19.50 | NA | NA | NA | 0.00 | NA | NA | NA | |
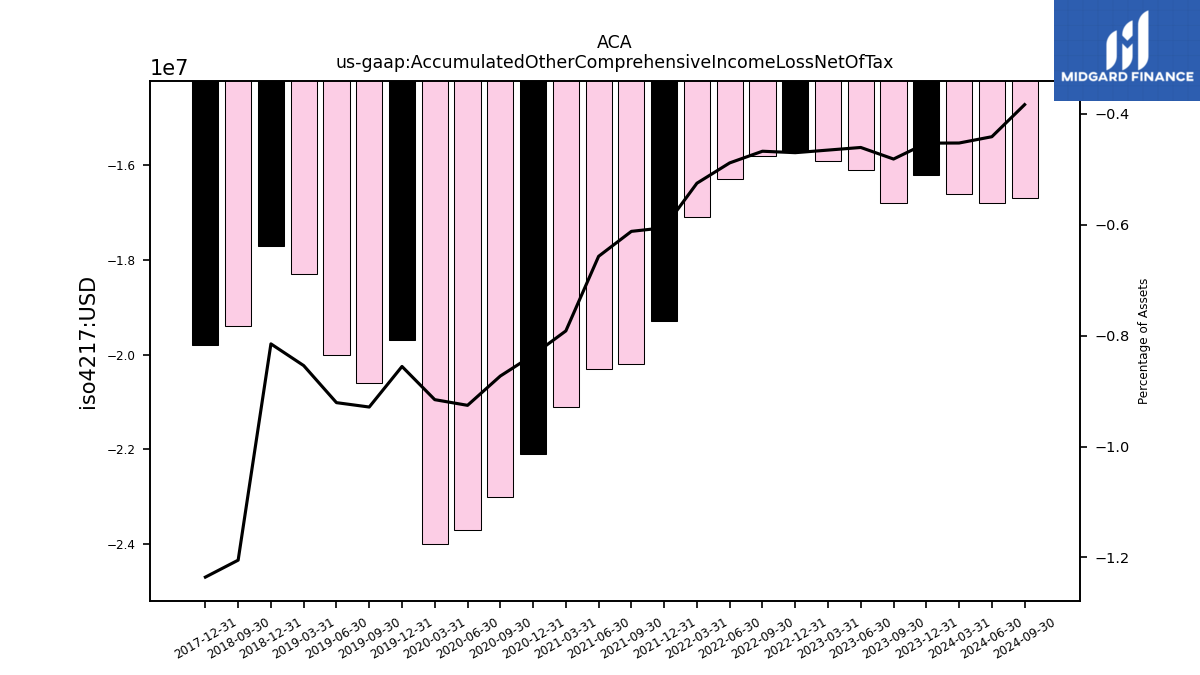
| Accumulated Other Comprehensive Income Loss Net Of Tax | -16.60 | -16.20 | -16.80 | -16.10 | -15.90 | -15.70 | -15.80 | -16.30 | -17.10 | -19.30 | -20.20 | -20.30 | -21.10 | -22.10 | -23.00 | -23.70 | -24.00 | -19.70 | -20.60 | -20.00 | -18.30 | -17.70 | -19.40 | NA | NA | -19.80 | NA | NA | NA | |
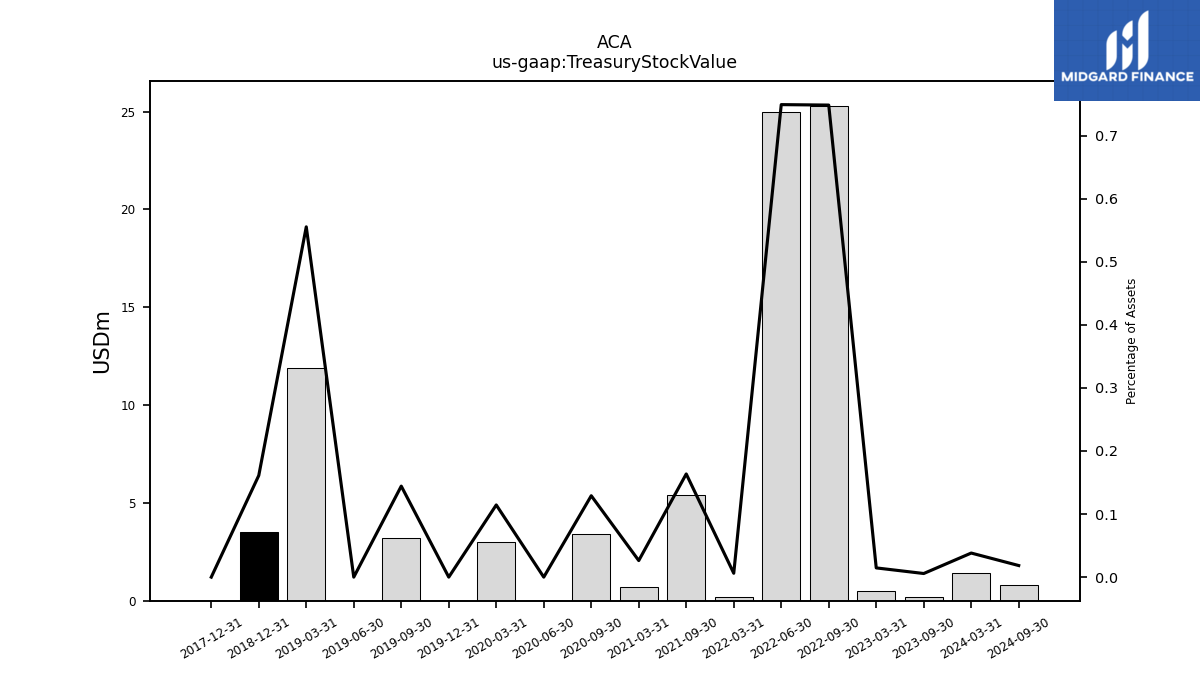
| Treasury Stock Value | 1.40 | NA | 0.20 | NA | 0.50 | NA | 25.30 | 25.00 | 0.20 | NA | 5.40 | NA | 0.70 | NA | 3.40 | 0.00 | 3.00 | 0.00 | 3.20 | 0.00 | 11.90 | 3.50 | NA | NA | NA | 0.00 | NA | NA | NA |
| 2024-03-31 | 2023-12-31 | 2023-09-30 | 2023-06-30 | 2023-03-31 | 2022-12-31 | 2022-09-30 | 2022-06-30 | 2022-03-31 | 2021-12-31 | 2021-09-30 | 2021-06-30 | 2021-03-31 | 2020-12-31 | 2020-09-30 | 2020-06-30 | 2020-03-31 | 2019-12-31 | 2019-09-30 | 2019-06-30 | 2019-03-31 | 2018-12-31 | 2018-09-30 | 2018-06-30 | 2018-03-31 | 2017-12-31 | 2017-09-30 | 2017-06-30 | 2017-03-31 | ||
|---|---|---|---|---|---|---|---|---|---|---|---|---|---|---|---|---|---|---|---|---|---|---|---|---|---|---|---|---|---|---|
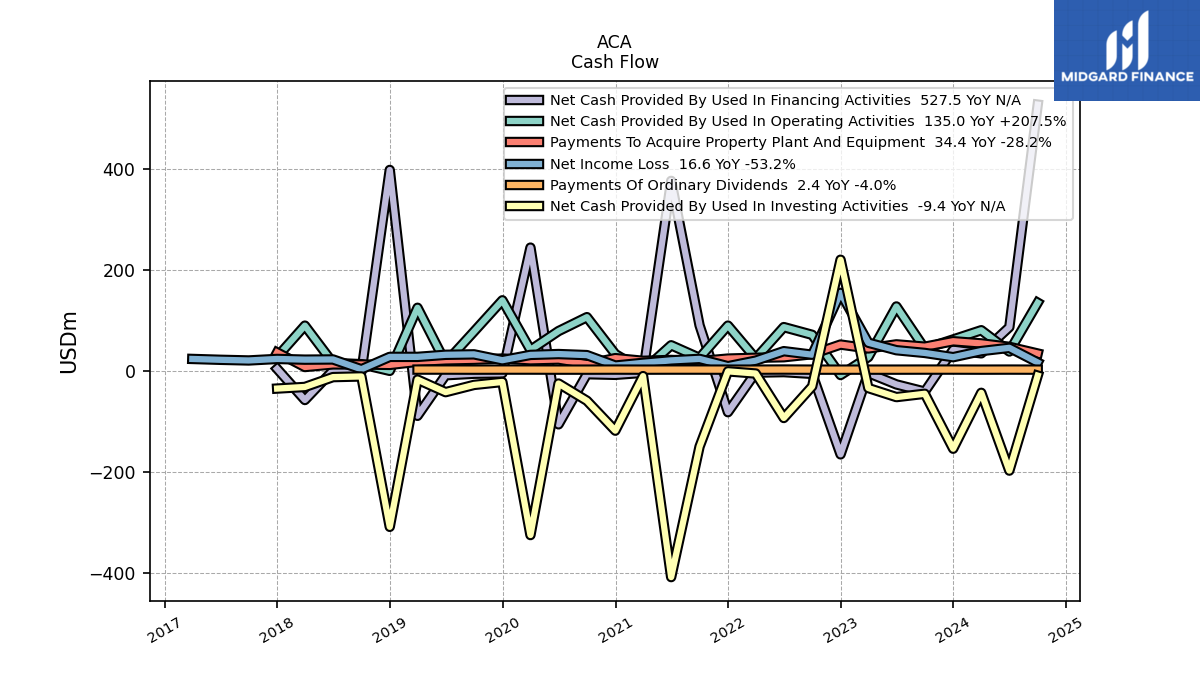
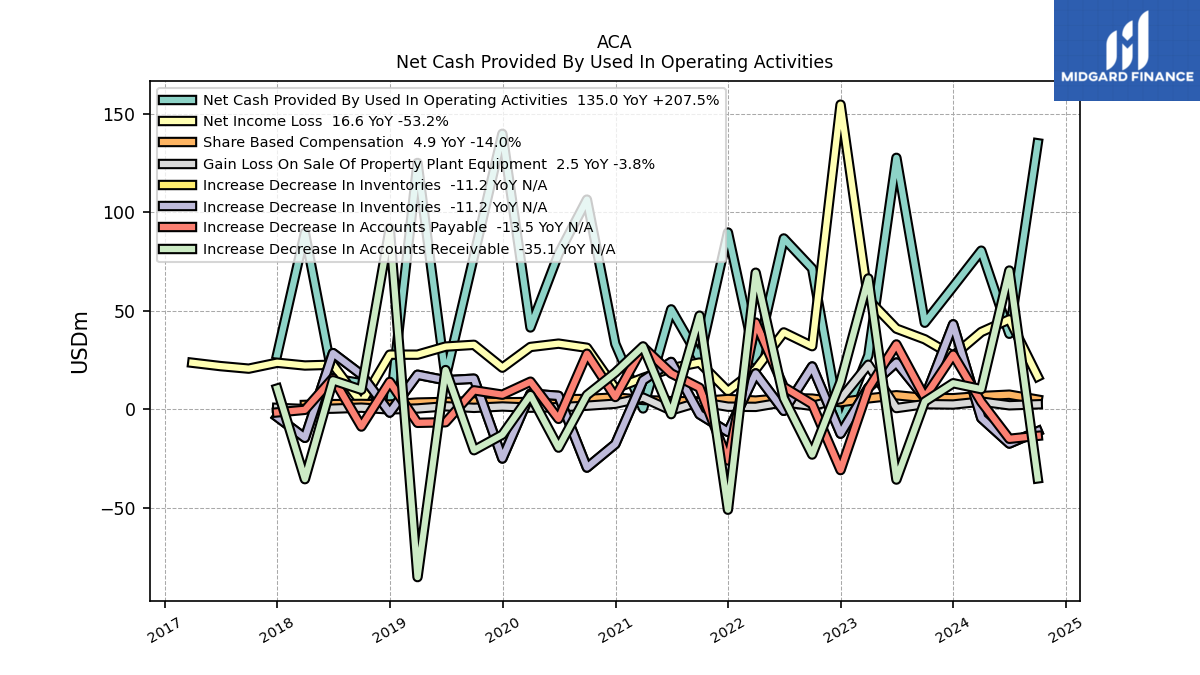
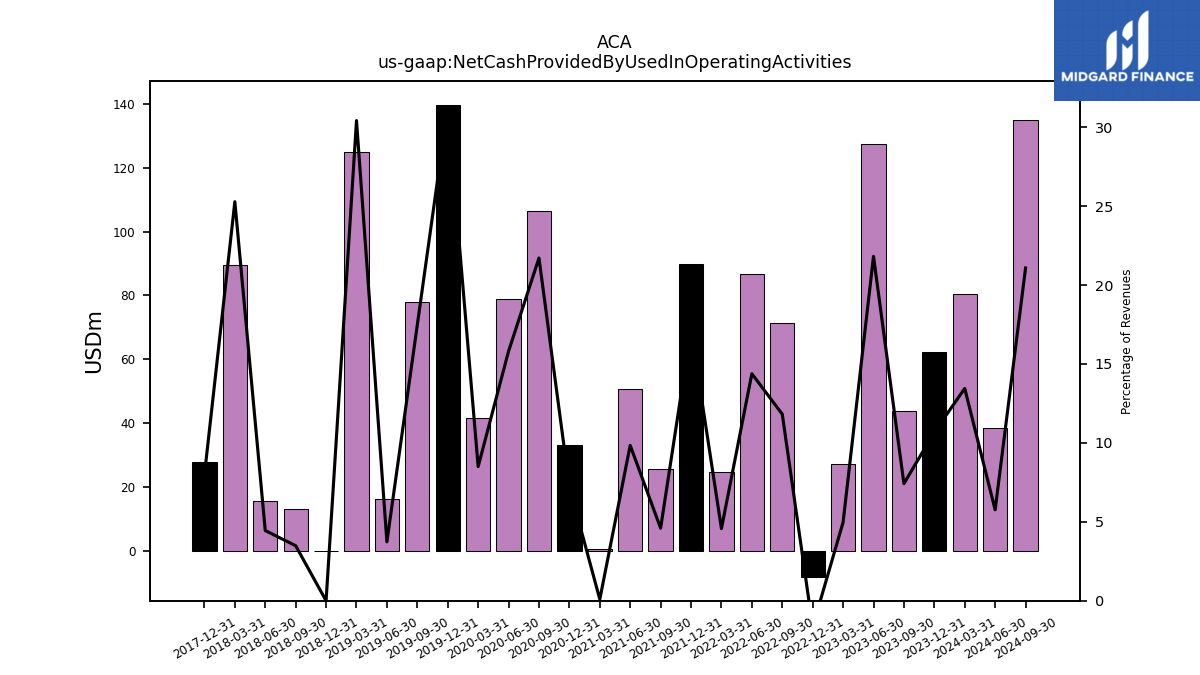
| Net Cash Provided By Used In Operating Activities | 80.50 | 62.20 | 43.90 | 127.60 | 27.30 | -8.30 | 71.40 | 86.70 | 24.50 | 89.70 | 25.70 | 50.70 | 0.40 | 33.20 | 106.40 | 78.80 | 41.50 | 139.80 | 77.80 | 16.20 | 125.00 | 0.00 | 13.20 | 15.70 | 89.60 | 27.70 | NA | NA | NA | |
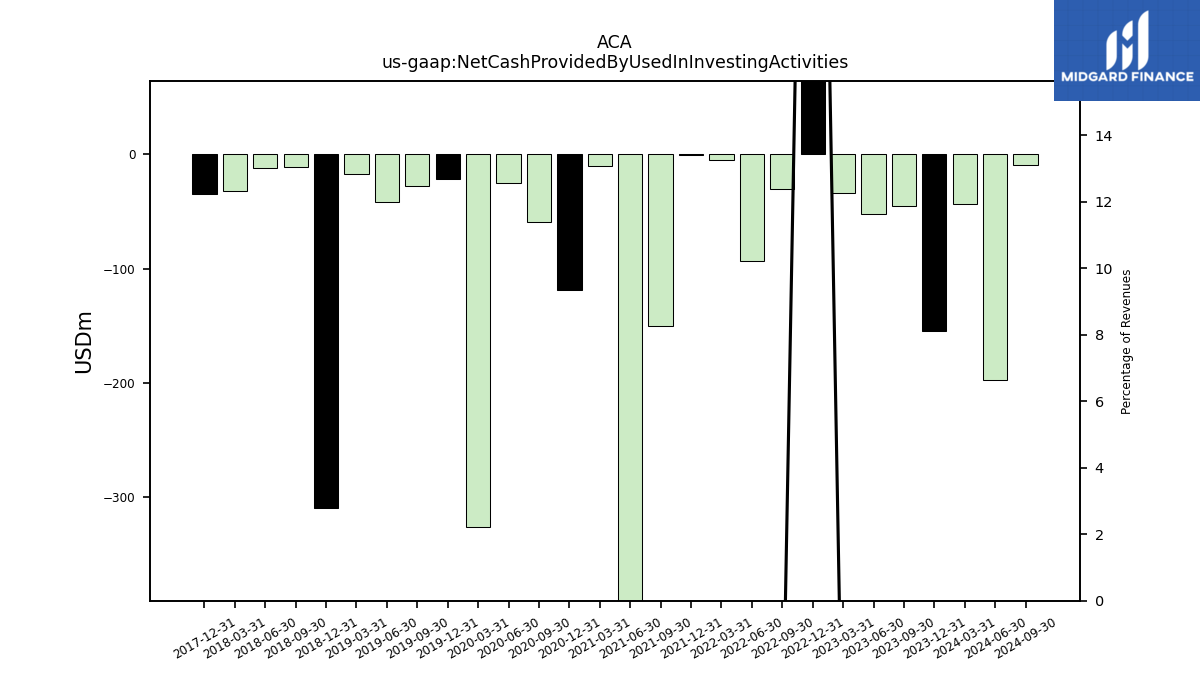
| Net Cash Provided By Used In Investing Activities | -43.50 | -154.30 | -45.40 | -52.00 | -34.10 | 220.20 | -30.80 | -93.40 | -5.30 | -1.00 | -150.20 | -408.70 | -10.40 | -118.50 | -59.20 | -25.10 | -325.40 | -22.00 | -27.90 | -42.20 | -17.30 | -309.10 | -11.10 | -12.40 | -31.90 | -35.10 | NA | NA | NA | |
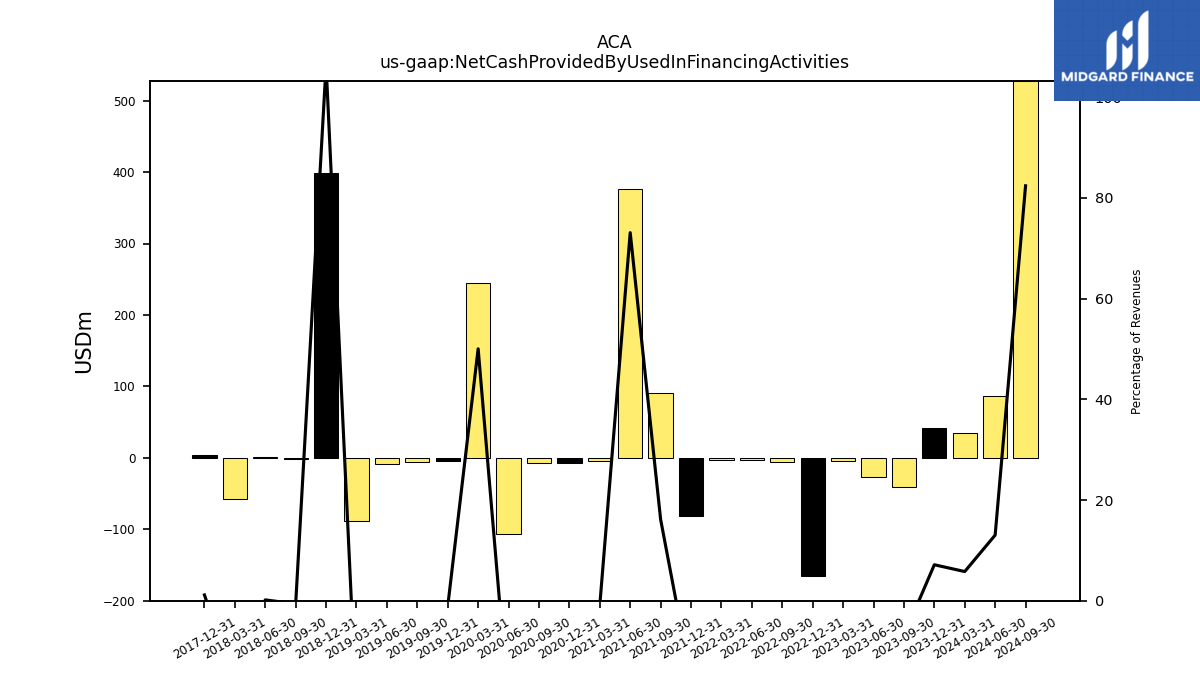
| Net Cash Provided By Used In Financing Activities | 34.70 | 41.60 | -41.10 | -26.90 | -4.40 | -165.50 | -6.00 | -2.50 | -3.50 | -81.90 | 90.30 | 376.40 | -3.90 | -7.90 | -6.60 | -106.00 | 244.20 | -4.90 | -5.70 | -8.70 | -89.10 | 398.10 | -2.30 | 0.60 | -57.80 | 4.00 | NA | NA | NA |
| 2024-03-31 | 2023-12-31 | 2023-09-30 | 2023-06-30 | 2023-03-31 | 2022-12-31 | 2022-09-30 | 2022-06-30 | 2022-03-31 | 2021-12-31 | 2021-09-30 | 2021-06-30 | 2021-03-31 | 2020-12-31 | 2020-09-30 | 2020-06-30 | 2020-03-31 | 2019-12-31 | 2019-09-30 | 2019-06-30 | 2019-03-31 | 2018-12-31 | 2018-09-30 | 2018-06-30 | 2018-03-31 | 2017-12-31 | 2017-09-30 | 2017-06-30 | 2017-03-31 | ||
|---|---|---|---|---|---|---|---|---|---|---|---|---|---|---|---|---|---|---|---|---|---|---|---|---|---|---|---|---|---|---|
| Net Cash Provided By Used In Operating Activities | 80.50 | 62.20 | 43.90 | 127.60 | 27.30 | -8.30 | 71.40 | 86.70 | 24.50 | 89.70 | 25.70 | 50.70 | 0.40 | 33.20 | 106.40 | 78.80 | 41.50 | 139.80 | 77.80 | 16.20 | 125.00 | 0.00 | 13.20 | 15.70 | 89.60 | 27.70 | NA | NA | NA | |
| Net Income Loss | 39.20 | 27.10 | 35.50 | 40.90 | 55.70 | 154.60 | 32.00 | 39.00 | 20.20 | 9.20 | 23.70 | 20.80 | 15.90 | 10.50 | 31.20 | 33.30 | 31.60 | 21.10 | 32.70 | 31.80 | 27.70 | 27.70 | 3.20 | 22.60 | 22.20 | 23.60 | 20.60 | 21.90 | 23.60 | |
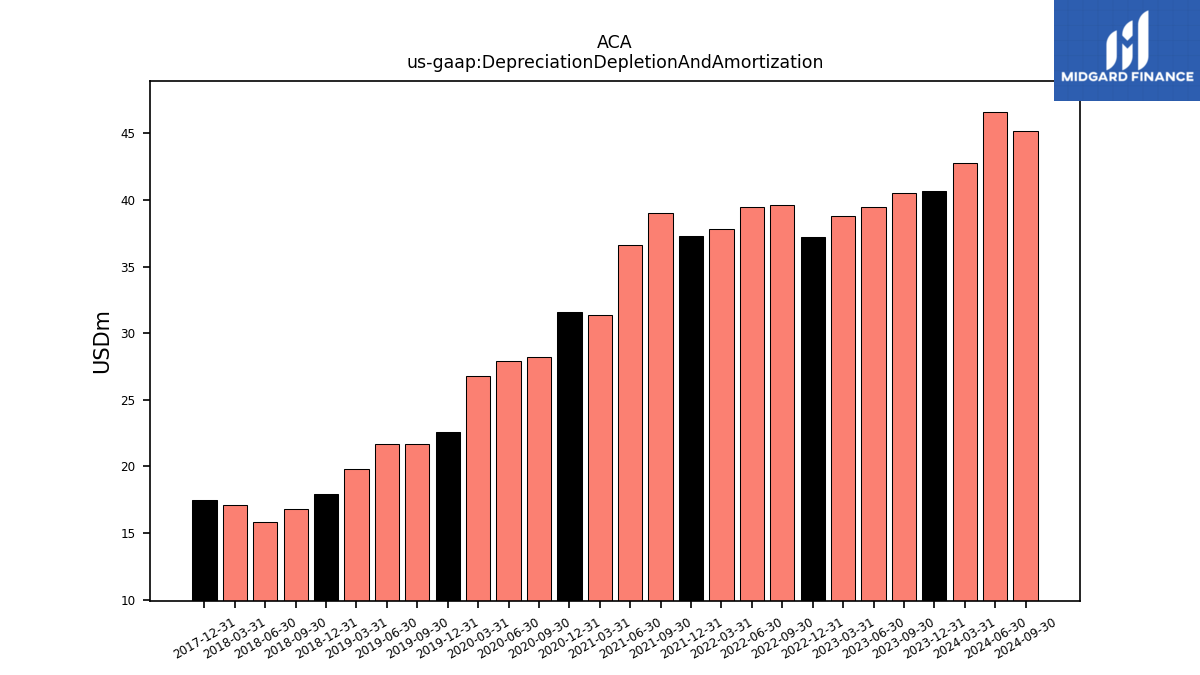
| Depreciation Depletion And Amortization | 42.80 | 40.70 | 40.50 | 39.50 | 38.80 | 37.20 | 39.60 | 39.50 | 37.80 | 37.30 | 39.00 | 36.60 | 31.40 | 31.60 | 28.20 | 27.90 | 26.80 | 22.60 | 21.70 | 21.70 | 19.80 | 17.90 | 16.80 | 15.80 | 17.10 | 17.50 | NA | NA | NA | |
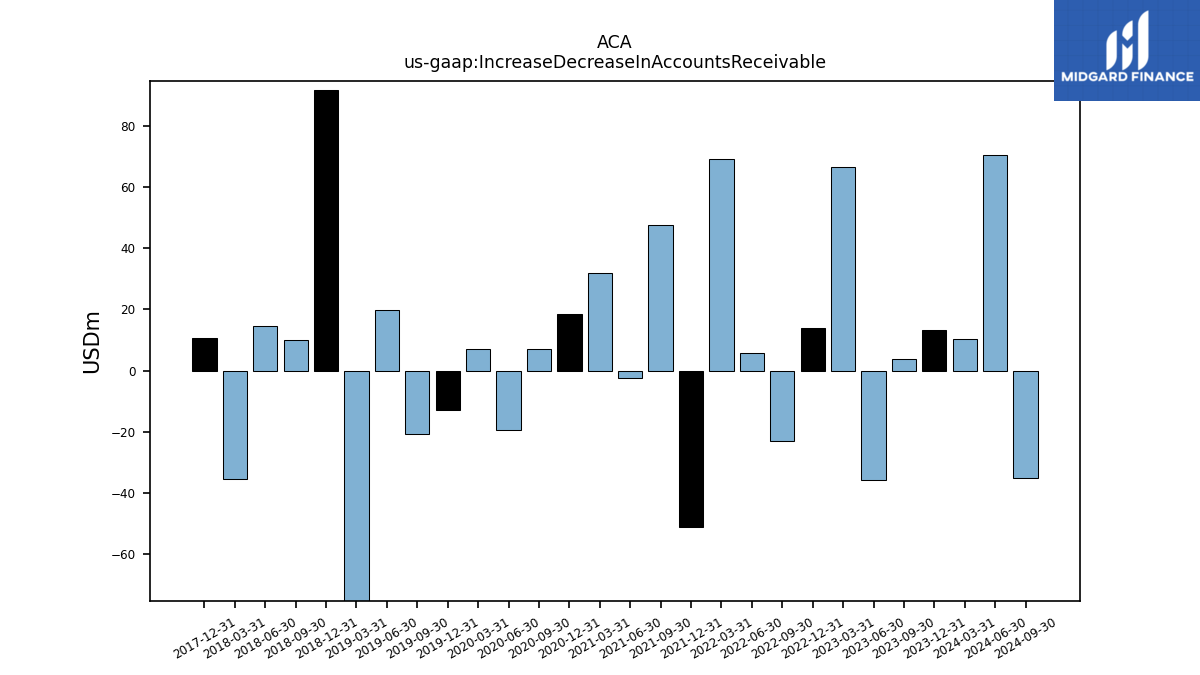
| Increase Decrease In Accounts Receivable | 10.20 | 13.20 | 3.90 | -35.70 | 66.40 | 13.90 | -23.00 | 5.70 | 69.30 | -51.00 | 47.50 | -2.50 | 31.90 | 18.60 | 7.20 | -19.50 | 7.20 | -12.90 | -20.80 | 19.90 | -85.20 | 91.80 | 9.90 | 14.70 | -35.50 | 10.50 | NA | NA | NA | |
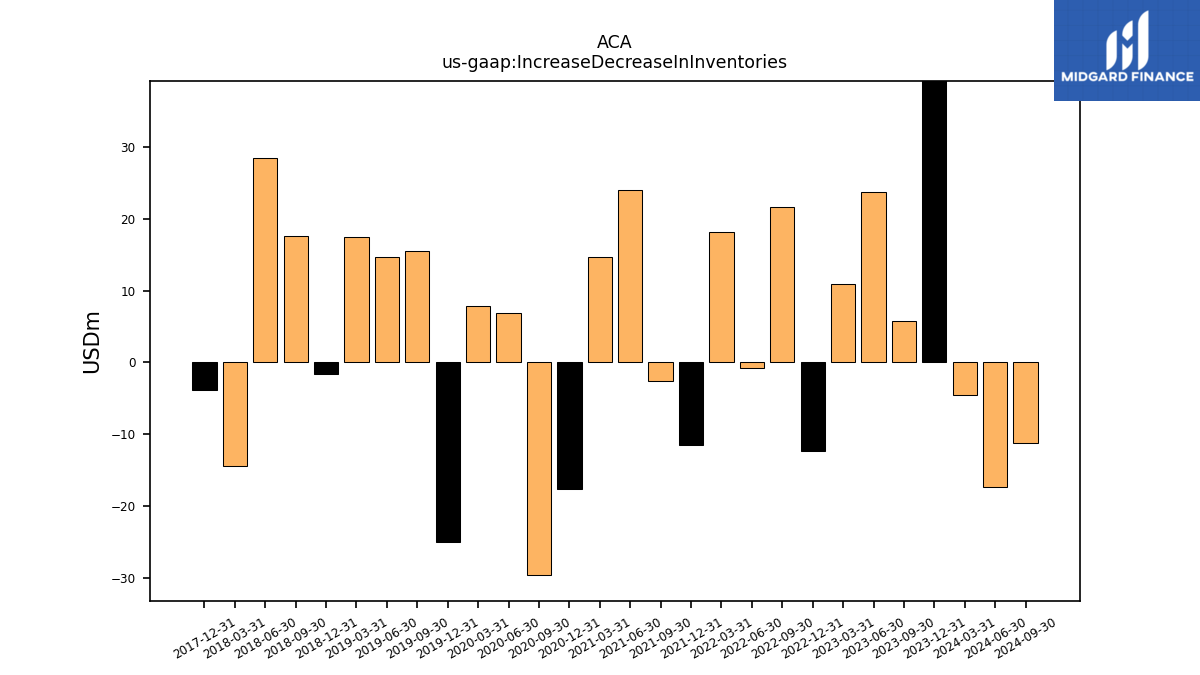
| Increase Decrease In Inventories | -4.50 | 43.10 | 5.80 | 23.70 | 10.90 | -12.40 | 21.70 | -0.80 | 18.20 | -11.50 | -2.60 | 24.00 | 14.70 | -17.70 | -29.60 | 6.80 | 7.90 | -25.00 | 15.50 | 14.70 | 17.50 | -1.70 | 17.60 | 28.50 | -14.50 | -3.90 | NA | NA | NA | |
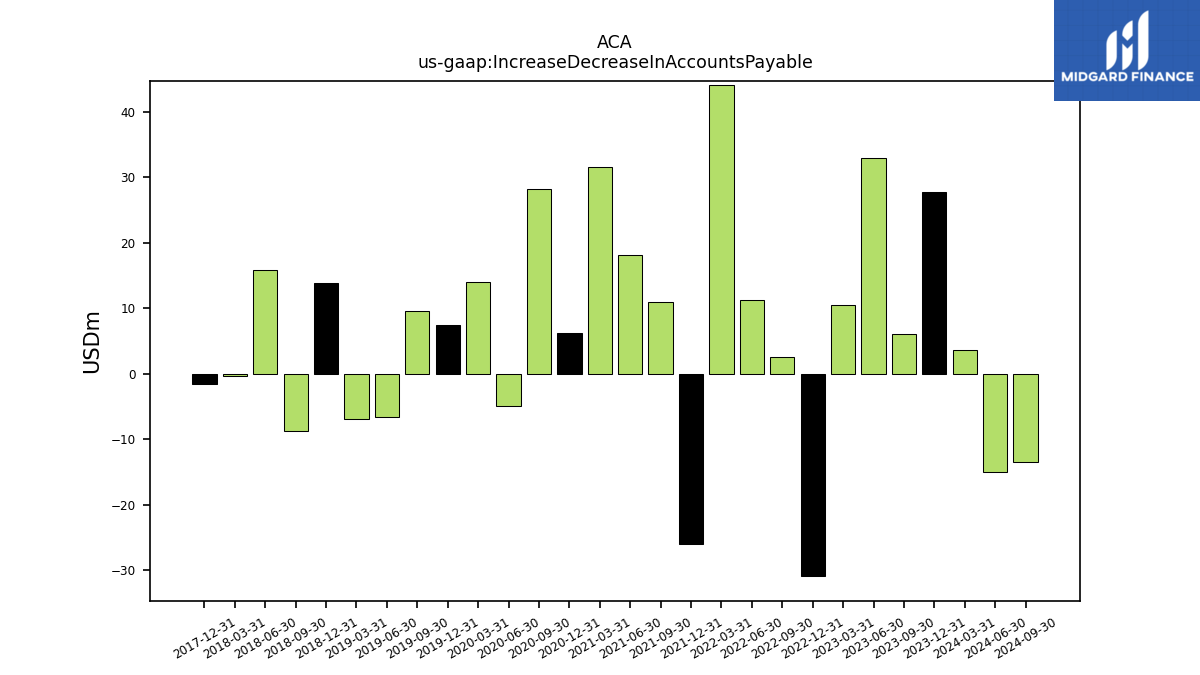
| Increase Decrease In Accounts Payable | 3.70 | 27.70 | 6.10 | 32.90 | 10.50 | -30.90 | 2.60 | 11.30 | 44.00 | -26.00 | 10.90 | 18.20 | 31.60 | 6.20 | 28.20 | -4.90 | 14.00 | 7.40 | 9.60 | -6.60 | -6.90 | 13.90 | -8.80 | 15.80 | -0.30 | -1.60 | NA | NA | NA | |
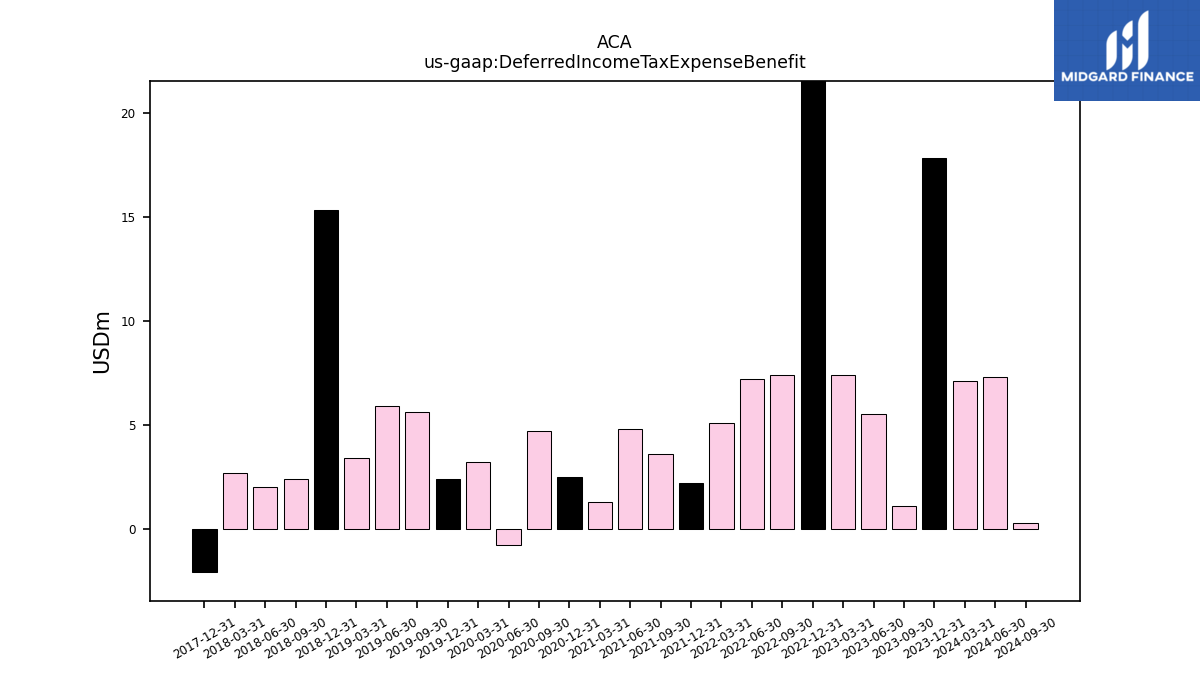
| Deferred Income Tax Expense Benefit | 7.10 | 17.80 | 1.10 | 5.50 | 7.40 | 25.10 | 7.40 | 7.20 | 5.10 | 2.20 | 3.60 | 4.80 | 1.30 | 2.50 | 4.70 | -0.80 | 3.20 | 2.40 | 5.60 | 5.90 | 3.40 | 15.30 | 2.40 | 2.00 | 2.70 | -2.10 | NA | NA | NA | |
| Share Based Compensation | 6.70 | 5.60 | 5.70 | 7.10 | 5.50 | 3.60 | 5.40 | 5.70 | 4.40 | 5.20 | 4.00 | 4.10 | 4.70 | 6.00 | 5.20 | 5.10 | 3.70 | 3.50 | 4.00 | 3.70 | 3.40 | 2.40 | 2.70 | 2.60 | 2.20 | NA | NA | NA | NA |
| 2024-03-31 | 2023-12-31 | 2023-09-30 | 2023-06-30 | 2023-03-31 | 2022-12-31 | 2022-09-30 | 2022-06-30 | 2022-03-31 | 2021-12-31 | 2021-09-30 | 2021-06-30 | 2021-03-31 | 2020-12-31 | 2020-09-30 | 2020-06-30 | 2020-03-31 | 2019-12-31 | 2019-09-30 | 2019-06-30 | 2019-03-31 | 2018-12-31 | 2018-09-30 | 2018-06-30 | 2018-03-31 | 2017-12-31 | 2017-09-30 | 2017-06-30 | 2017-03-31 | ||
|---|---|---|---|---|---|---|---|---|---|---|---|---|---|---|---|---|---|---|---|---|---|---|---|---|---|---|---|---|---|---|
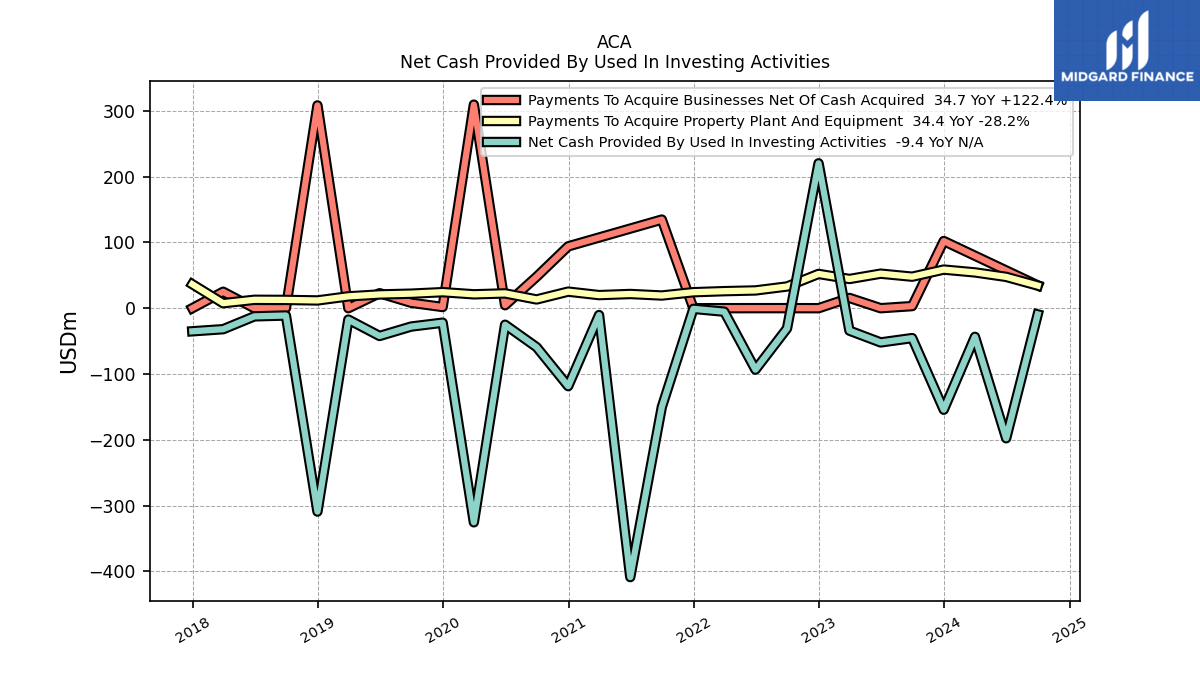
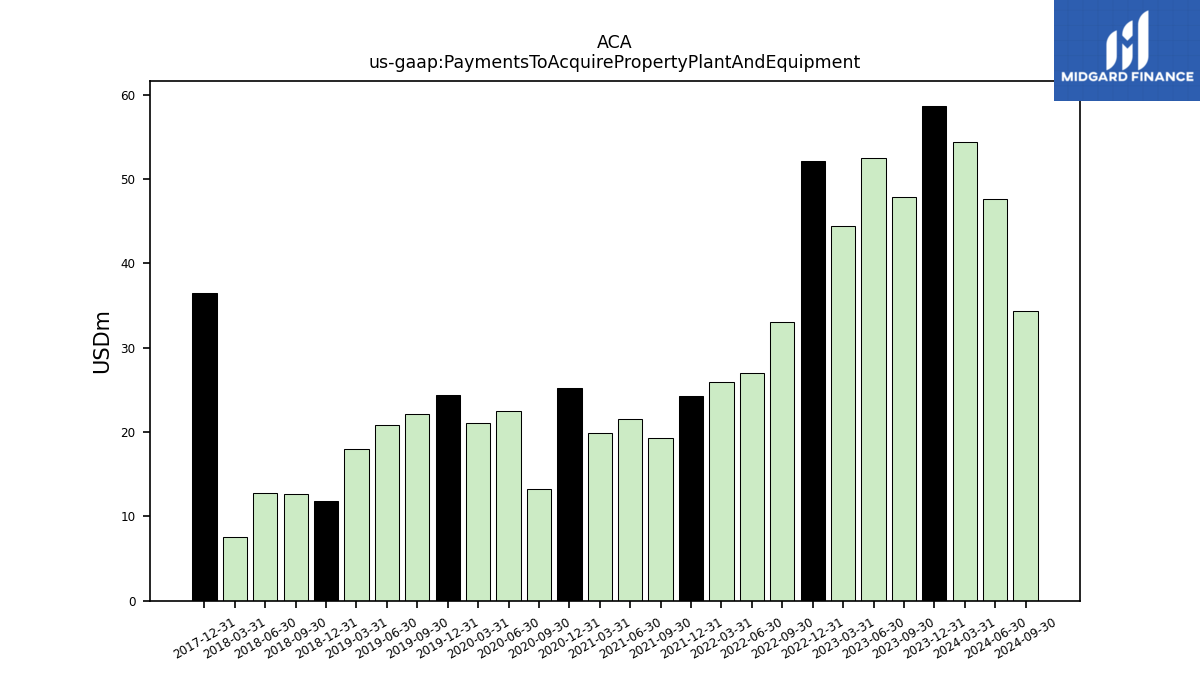
| Net Cash Provided By Used In Investing Activities | -43.50 | -154.30 | -45.40 | -52.00 | -34.10 | 220.20 | -30.80 | -93.40 | -5.30 | -1.00 | -150.20 | -408.70 | -10.40 | -118.50 | -59.20 | -25.10 | -325.40 | -22.00 | -27.90 | -42.20 | -17.30 | -309.10 | -11.10 | -12.40 | -31.90 | -35.10 | NA | NA | NA | |
| Payments To Acquire Property Plant And Equipment | 54.40 | 58.70 | 47.90 | 52.50 | 44.40 | 52.10 | 33.00 | 27.00 | 25.90 | 24.30 | 19.30 | 21.60 | 19.90 | 25.20 | 13.30 | 22.50 | 21.10 | 24.40 | 22.10 | 20.90 | 18.00 | 11.80 | 12.60 | 12.80 | 7.60 | 36.50 | NA | NA | NA |
| 2024-03-31 | 2023-12-31 | 2023-09-30 | 2023-06-30 | 2023-03-31 | 2022-12-31 | 2022-09-30 | 2022-06-30 | 2022-03-31 | 2021-12-31 | 2021-09-30 | 2021-06-30 | 2021-03-31 | 2020-12-31 | 2020-09-30 | 2020-06-30 | 2020-03-31 | 2019-12-31 | 2019-09-30 | 2019-06-30 | 2019-03-31 | 2018-12-31 | 2018-09-30 | 2018-06-30 | 2018-03-31 | 2017-12-31 | 2017-09-30 | 2017-06-30 | 2017-03-31 | ||
|---|---|---|---|---|---|---|---|---|---|---|---|---|---|---|---|---|---|---|---|---|---|---|---|---|---|---|---|---|---|---|
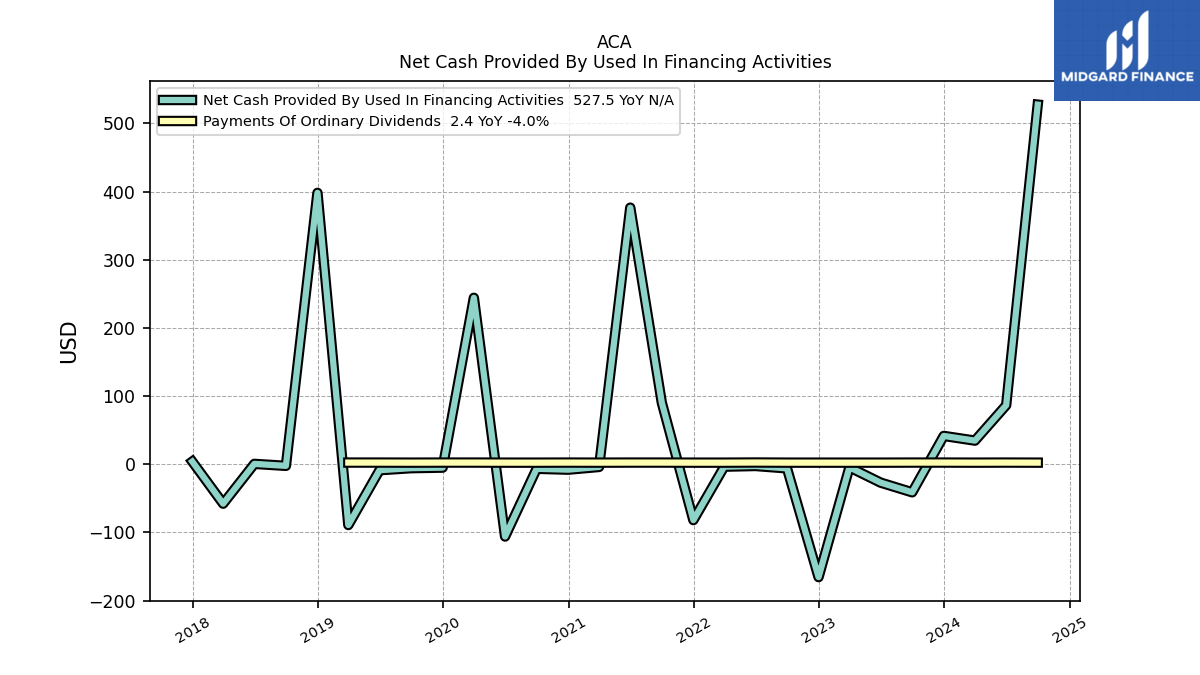
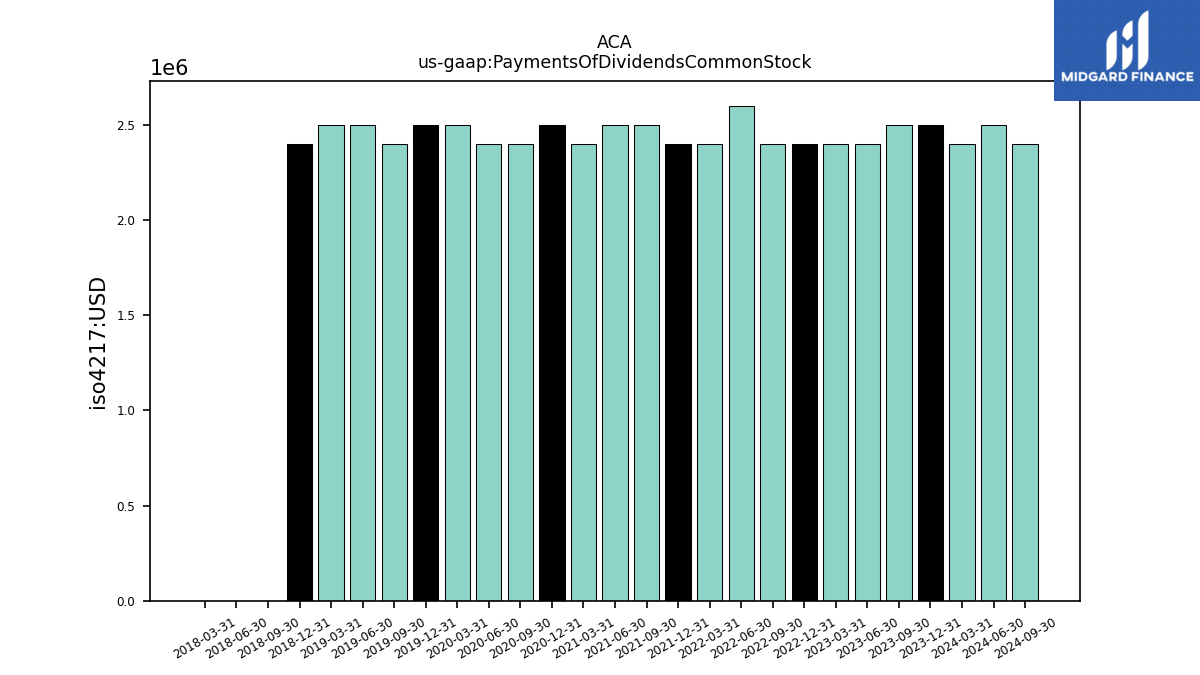
| Net Cash Provided By Used In Financing Activities | 34.70 | 41.60 | -41.10 | -26.90 | -4.40 | -165.50 | -6.00 | -2.50 | -3.50 | -81.90 | 90.30 | 376.40 | -3.90 | -7.90 | -6.60 | -106.00 | 244.20 | -4.90 | -5.70 | -8.70 | -89.10 | 398.10 | -2.30 | 0.60 | -57.80 | 4.00 | NA | NA | NA | |
| Payments Of Dividends Common Stock | 2.40 | 2.50 | 2.50 | 2.40 | 2.40 | 2.40 | 2.40 | 2.60 | 2.40 | 2.40 | 2.50 | 2.50 | 2.40 | 2.50 | 2.40 | 2.40 | 2.50 | 2.50 | 2.40 | 2.50 | 2.50 | 2.40 | 0.00 | 0.00 | 0.00 | NA | NA | NA | NA |
| 2024-03-31 | 2023-12-31 | 2023-09-30 | 2023-06-30 | 2023-03-31 | 2022-12-31 | 2022-09-30 | 2022-06-30 | 2022-03-31 | 2021-12-31 | 2021-09-30 | 2021-06-30 | 2021-03-31 | 2020-12-31 | 2020-09-30 | 2020-06-30 | 2020-03-31 | 2019-12-31 | 2019-09-30 | 2019-06-30 | 2019-03-31 | 2018-12-31 | 2018-09-30 | 2018-06-30 | 2018-03-31 | 2017-12-31 | 2017-09-30 | 2017-06-30 | 2017-03-31 | ||
|---|---|---|---|---|---|---|---|---|---|---|---|---|---|---|---|---|---|---|---|---|---|---|---|---|---|---|---|---|---|---|
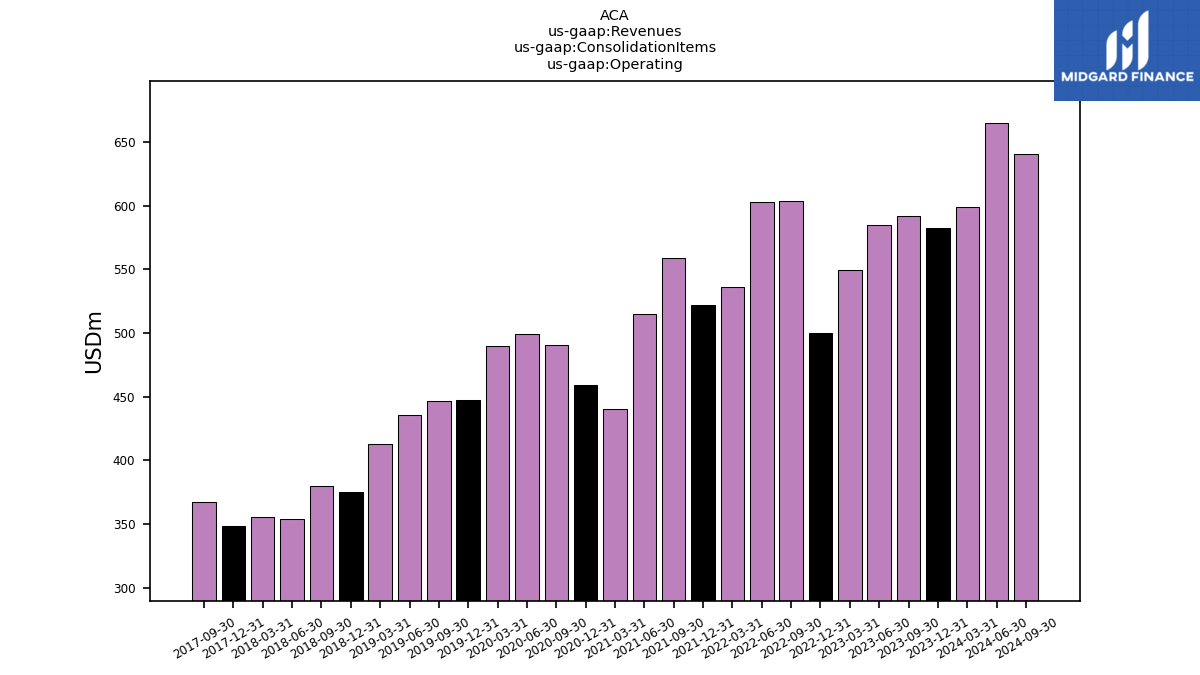
| Revenues | 598.60 | 582.20 | 591.70 | 584.80 | 549.20 | 500.30 | 603.90 | 602.80 | 535.80 | 521.80 | 559.10 | 515.10 | 440.40 | 458.90 | 490.00 | 498.50 | 488.20 | 446.90 | 445.00 | 434.10 | 410.90 | 374.40 | 378.60 | 353.00 | 354.40 | 347.50 | 365.90 | 352.70 | 396.30 | |
| Operating | 598.60 | 582.60 | 591.70 | 584.80 | 549.20 | 500.30 | 603.90 | 602.80 | 535.80 | 521.80 | 559.10 | 515.20 | 440.40 | 458.80 | 490.20 | 499.20 | 489.60 | 447.50 | 446.70 | 435.20 | 412.60 | 374.70 | 379.50 | 353.80 | 355.80 | 348.10 | 367.20 | NA | NA | |
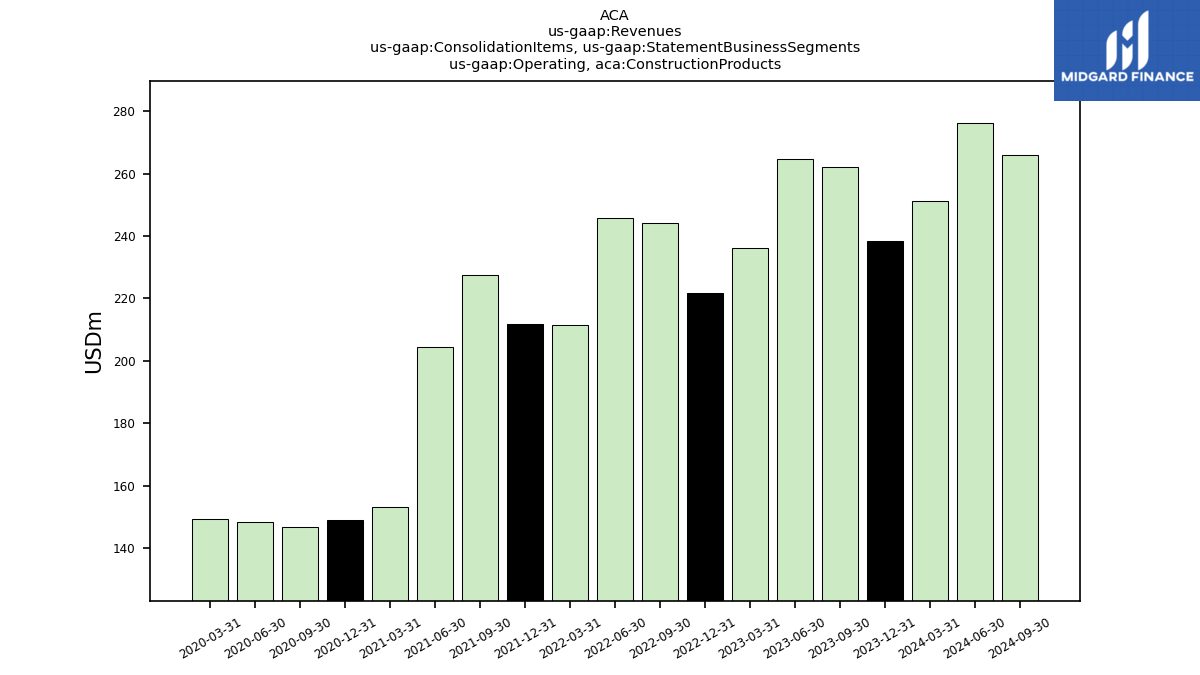
| Operating, Construction Products | 251.20 | 238.30 | 262.10 | 264.80 | 236.10 | 221.90 | 244.20 | 245.90 | 211.50 | 211.70 | 227.40 | 204.50 | 153.20 | 149.10 | 146.90 | 148.20 | 149.40 | NA | NA | NA | NA | NA | NA | NA | NA | NA | NA | NA | NA | |
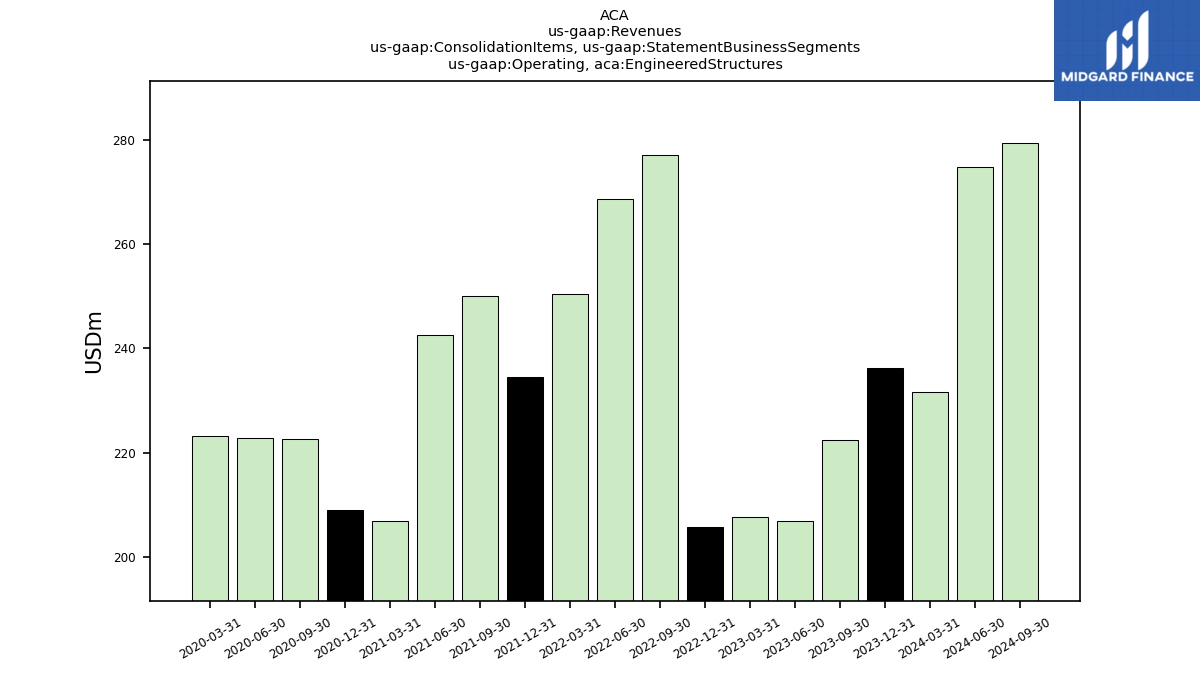
| Operating, Engineered Structures | 231.60 | 236.30 | 222.50 | 207.00 | 207.70 | 205.90 | 277.00 | 268.60 | 250.50 | 234.50 | 250.10 | 242.50 | 207.00 | 209.10 | 222.60 | 222.80 | 223.20 | NA | NA | NA | NA | NA | NA | NA | NA | NA | NA | NA | NA | |
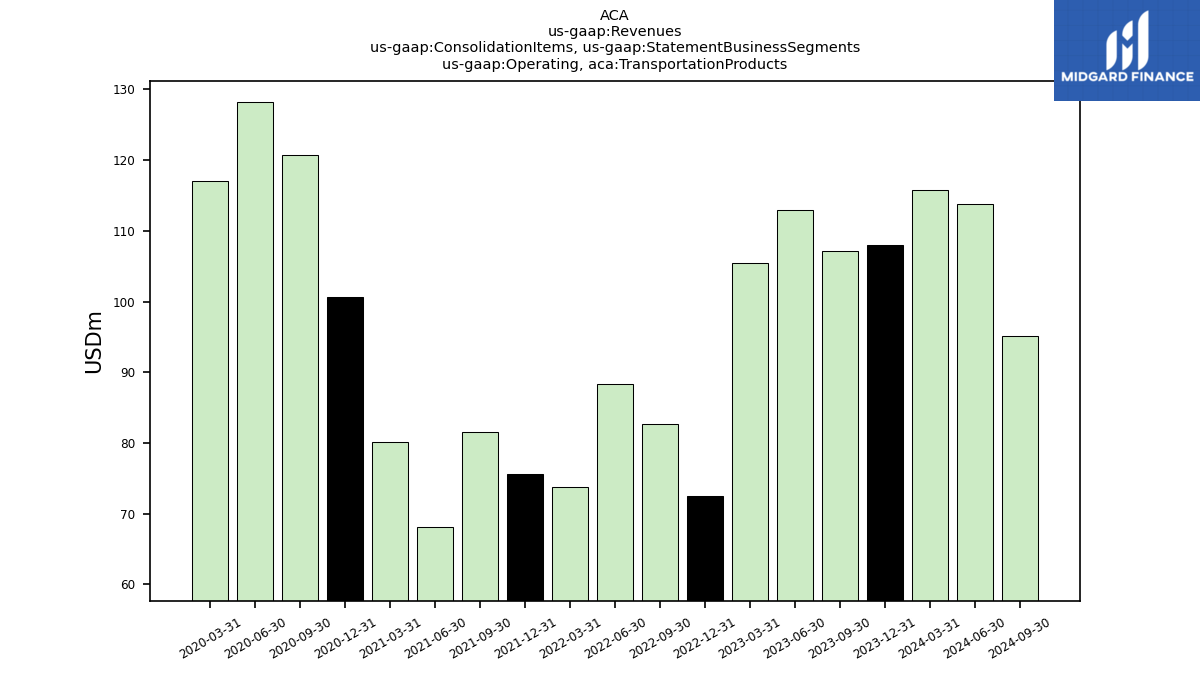
| Operating, Transportation Products | 115.80 | 108.00 | 107.10 | 113.00 | 105.40 | 72.50 | 82.70 | 88.30 | 73.80 | 75.60 | 81.60 | 68.20 | 80.20 | 100.60 | 120.70 | 128.20 | 117.00 | NA | NA | NA | NA | NA | NA | NA | NA | NA | NA | NA | NA | |
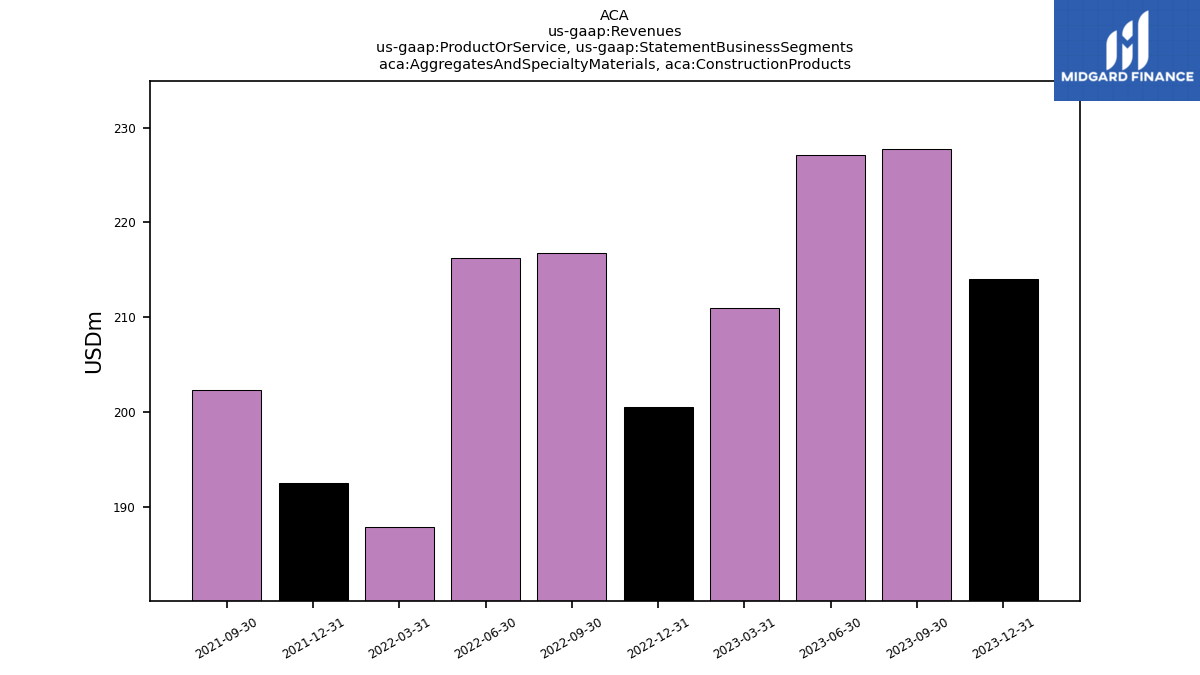
| Aggregates And Specialty Materials, Construction Products | 221.70 | 214.00 | 227.80 | 227.10 | 211.00 | 200.50 | 216.80 | 216.20 | 187.90 | 192.50 | 202.30 | NA | NA | NA | NA | NA | NA | NA | NA | NA | NA | NA | NA | NA | NA | NA | NA | NA | NA | |
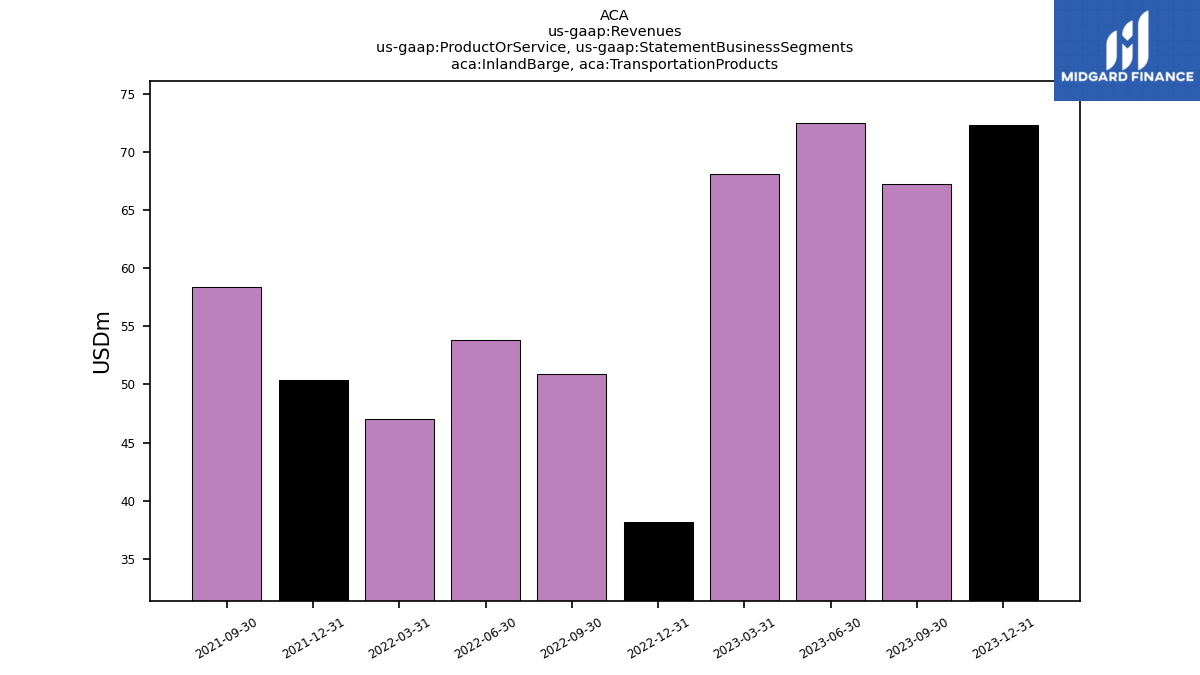
| Inland Barge, Transportation Products | 79.70 | 72.30 | 67.30 | 72.50 | 68.10 | 38.20 | 50.90 | 53.80 | 47.00 | 50.40 | 58.40 | NA | NA | NA | NA | NA | NA | NA | NA | NA | NA | NA | NA | NA | NA | NA | NA | NA | NA | |
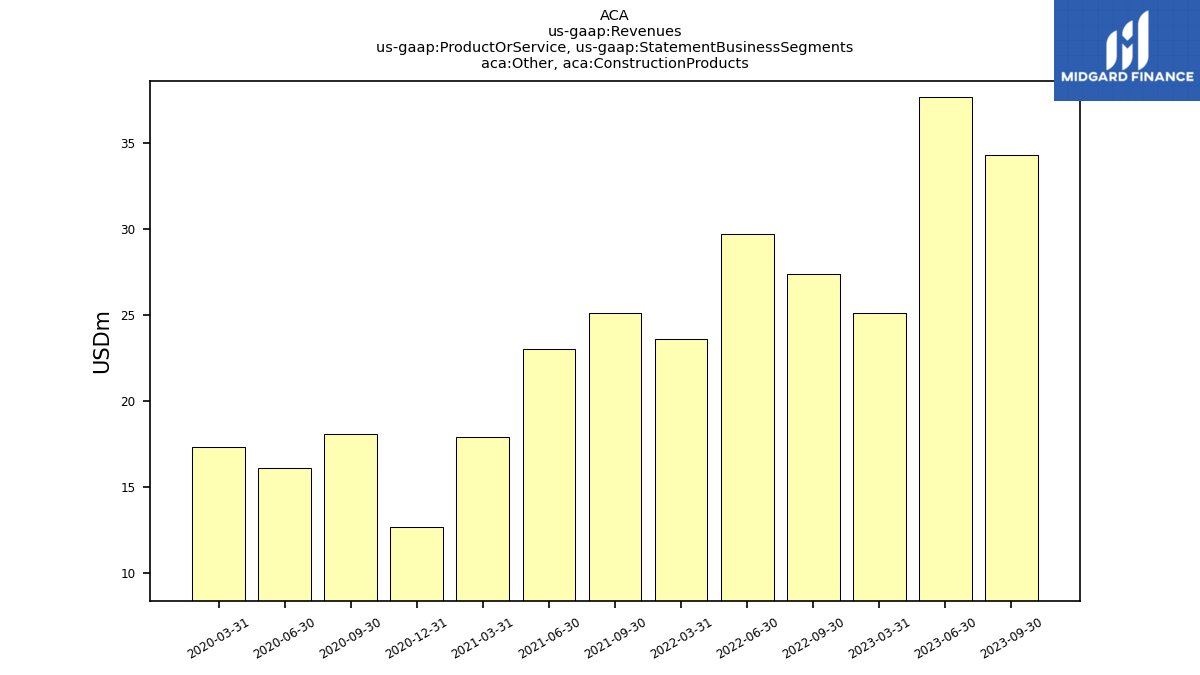
| Other, Construction Products | 29.50 | NA | 34.30 | 37.70 | 25.10 | NA | 27.40 | 29.70 | 23.60 | NA | 25.10 | 23.00 | 17.90 | 12.70 | 18.10 | 16.10 | 17.30 | NA | NA | NA | NA | NA | NA | NA | NA | NA | NA | NA | NA | |
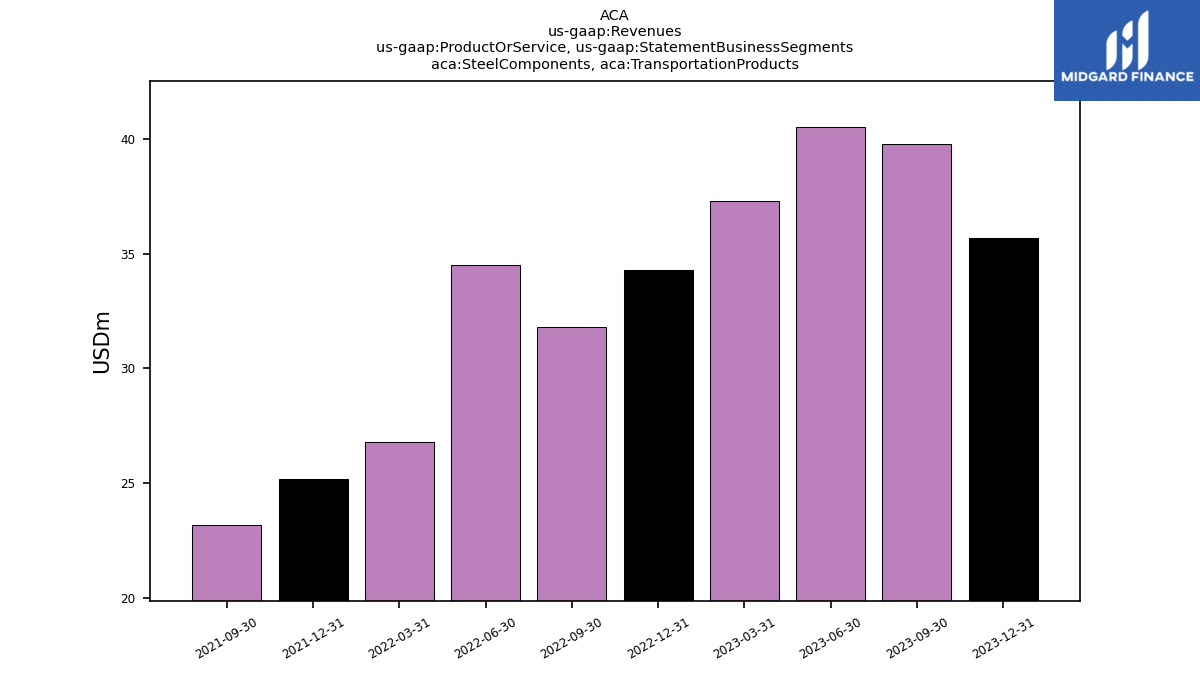
| Steel Components, Transportation Products | 36.10 | 35.70 | 39.80 | 40.50 | 37.30 | 34.30 | 31.80 | 34.50 | 26.80 | 25.20 | 23.20 | NA | NA | NA | NA | NA | NA | NA | NA | NA | NA | NA | NA | NA | NA | NA | NA | NA | NA | |
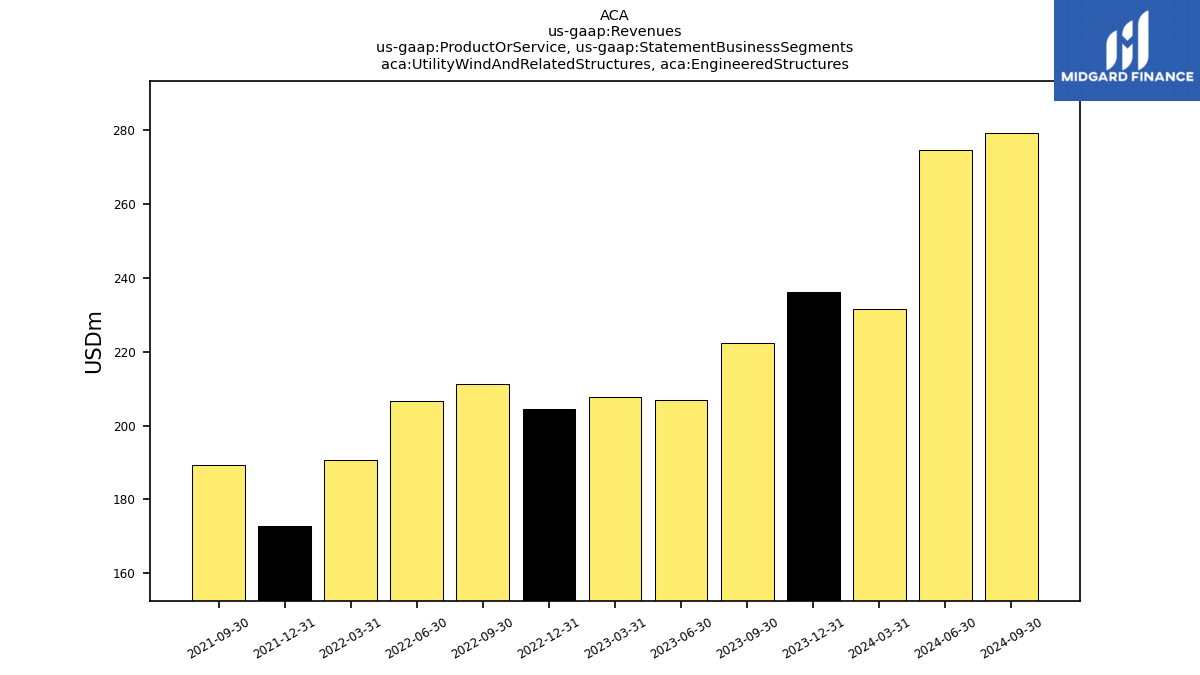
| Utility Wind And Related Structures, Engineered Structures | 231.60 | 236.30 | 222.50 | 207.00 | 207.70 | 204.60 | 211.20 | 206.70 | 190.60 | 172.90 | 189.40 | NA | NA | NA | NA | NA | NA | NA | NA | NA | NA | NA | NA | NA | NA | NA | NA | NA | NA |
