
| 2023-09-30 | 2023-06-30 | 2023-03-31 | 2022-12-31 | 2022-09-30 | 2022-06-30 | 2022-03-31 | 2021-12-31 | 2021-09-30 | 2021-06-30 | 2021-03-31 | 2020-12-31 | 2020-09-30 | 2020-06-30 | 2020-03-31 | ||
|---|---|---|---|---|---|---|---|---|---|---|---|---|---|---|---|---|
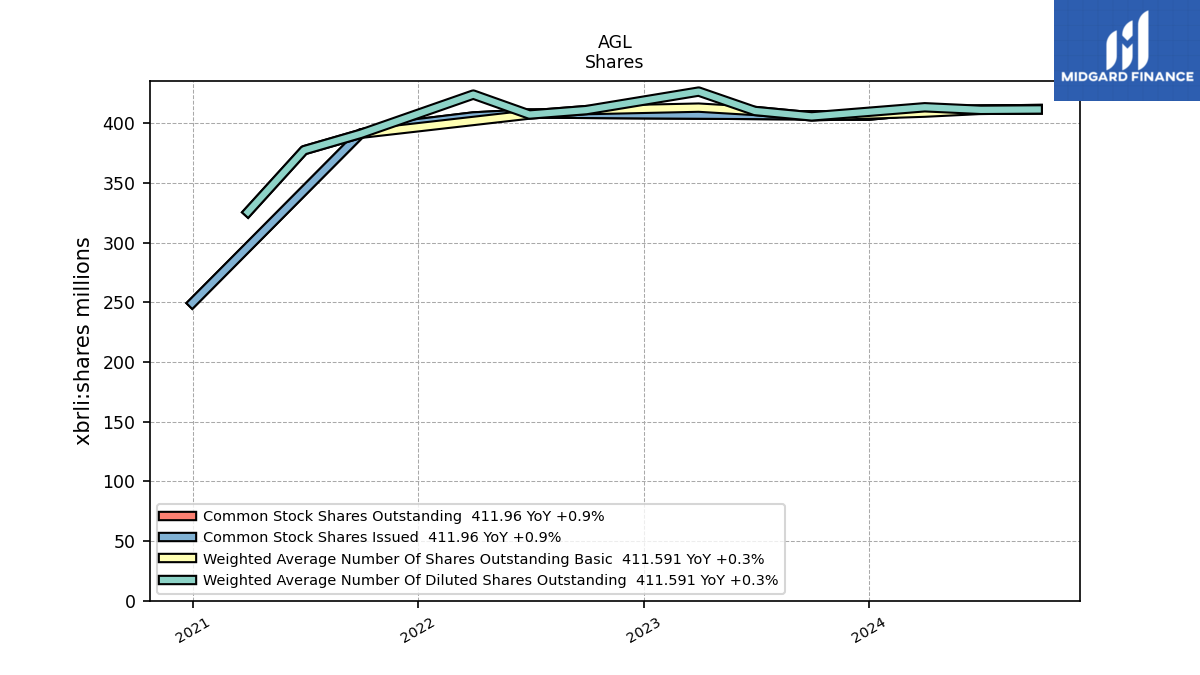
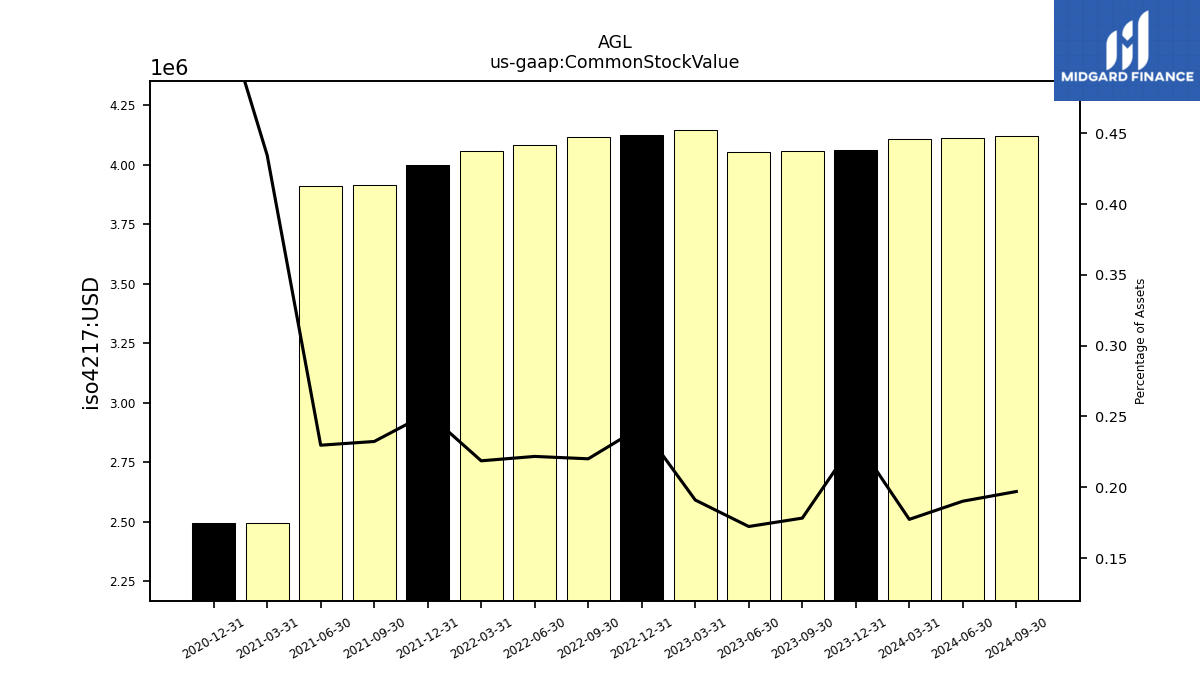
| Common Stock Value | 4.06 | 4.05 | 4.14 | 4.12 | 4.12 | 4.08 | 4.06 | 4.00 | 3.92 | 3.91 | 2.49 | 2.49 | NA | NA | NA | |
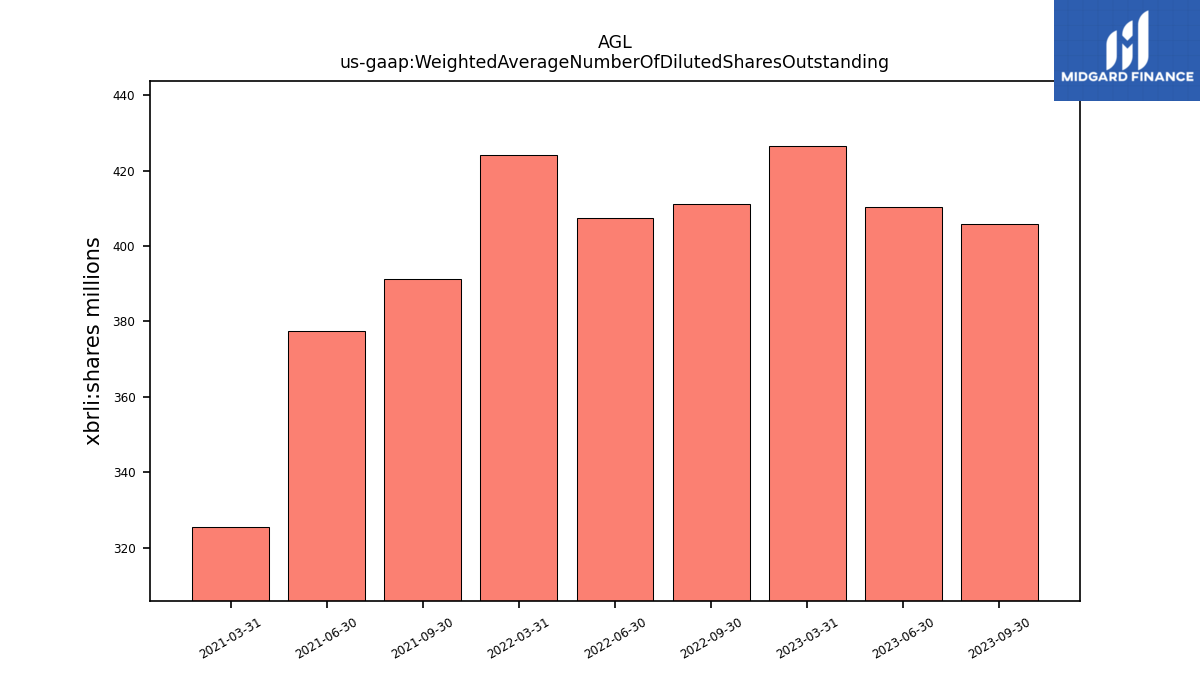
| Weighted Average Number Of Diluted Shares Outstanding | 405.79 | 410.34 | 426.59 | NA | 411.06 | 407.34 | 424.06 | NA | 391.23 | 377.44 | 325.66 | NA | NA | NA | NA | |
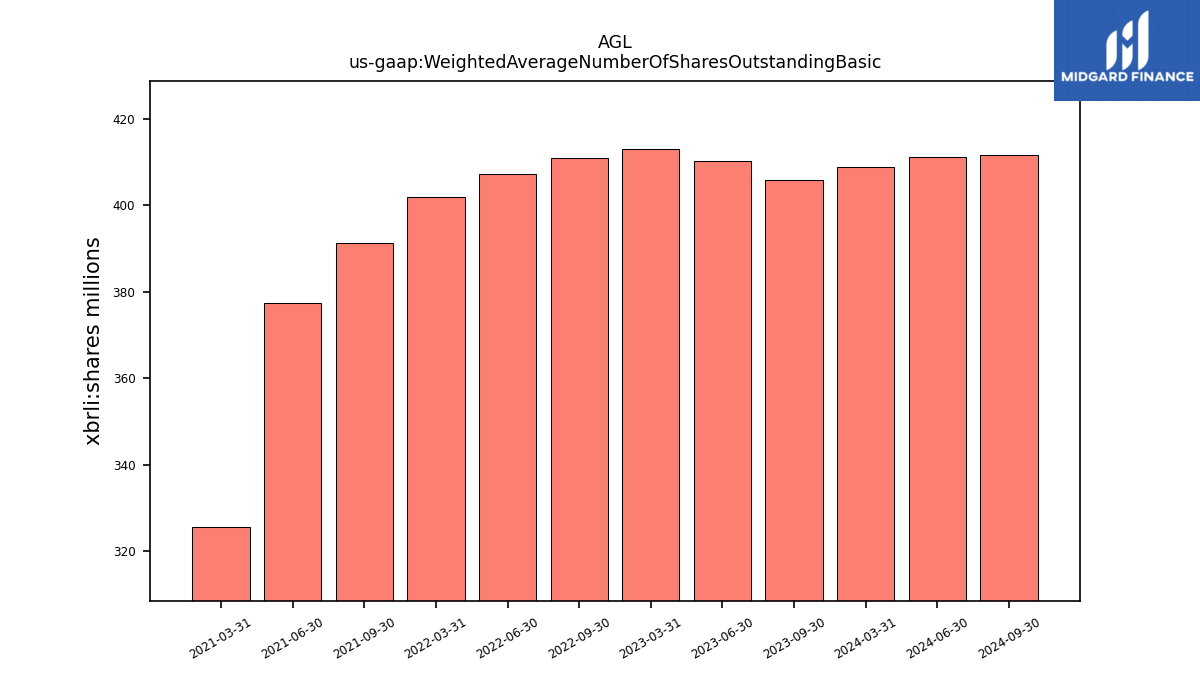
| Weighted Average Number Of Shares Outstanding Basic | 405.79 | 410.34 | 413.14 | NA | 411.06 | 407.34 | 401.96 | NA | 391.23 | 377.44 | 325.66 | NA | NA | NA | NA | |
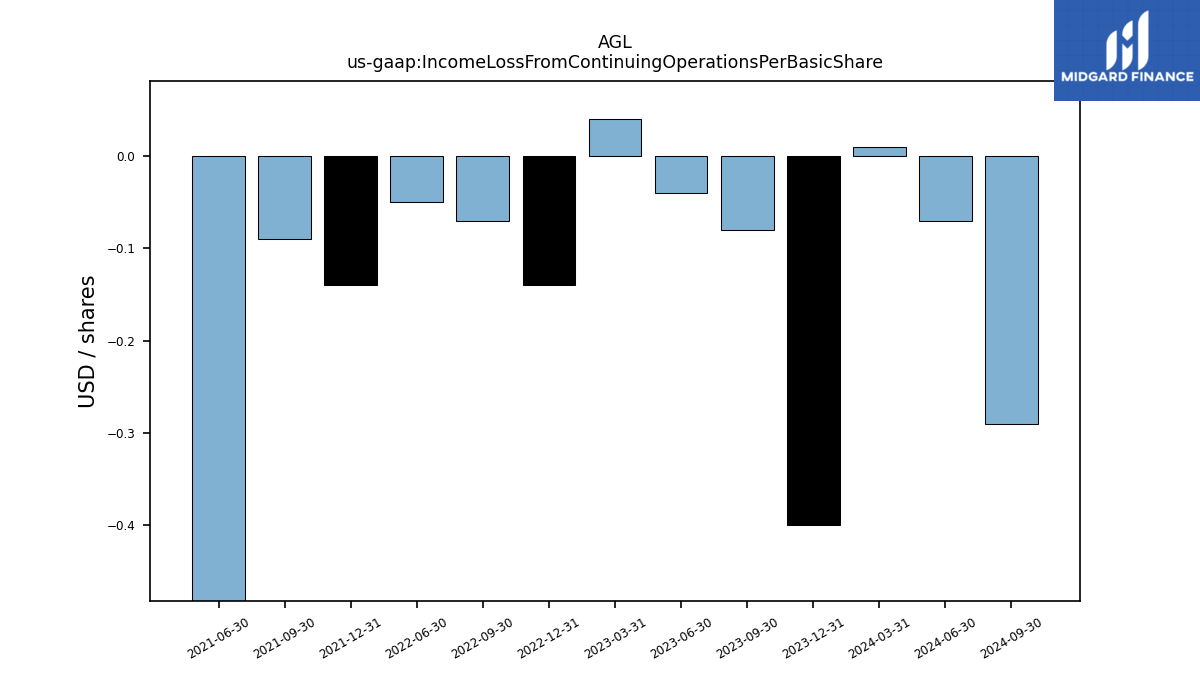
| Income Loss From Continuing Operations Per Basic Share | -0.00 | -0.00 | 0.00 | -0.00 | -0.00 | -0.00 | NA | -0.00 | -0.00 | -0.00 | NA | NA | NA | NA | NA | |
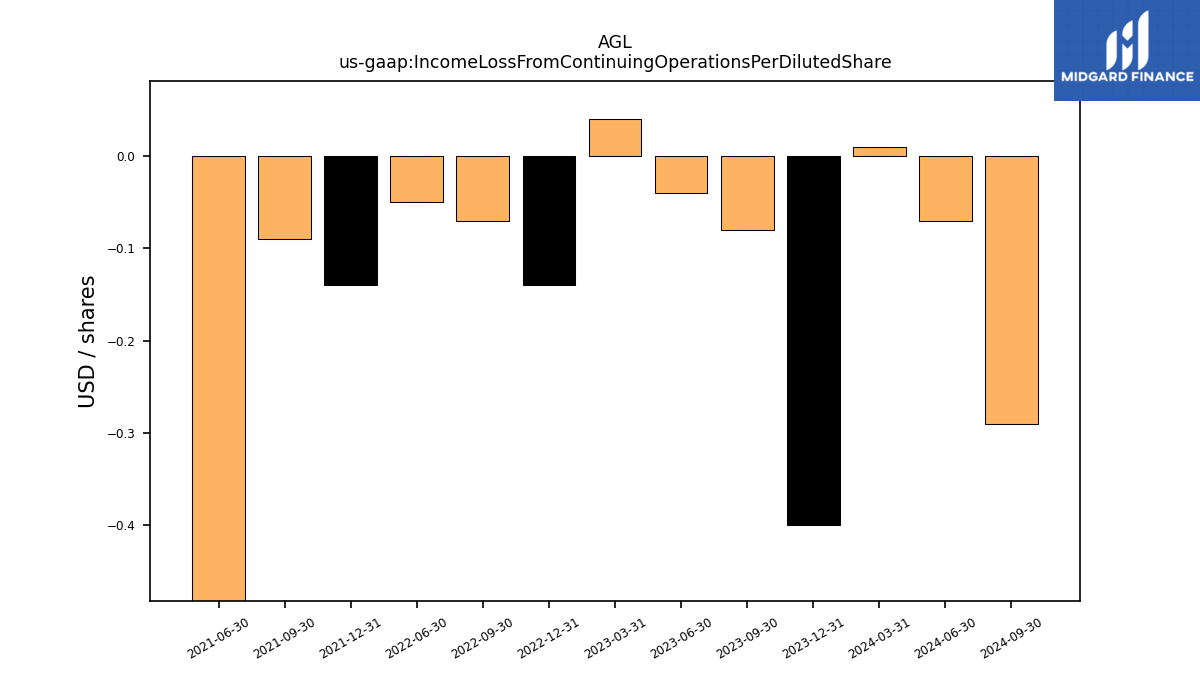
| Income Loss From Continuing Operations Per Diluted Share | -0.00 | -0.00 | 0.00 | -0.00 | -0.00 | -0.00 | NA | -0.00 | -0.00 | -0.00 | NA | NA | NA | NA | NA |
| 2023-09-30 | 2023-06-30 | 2023-03-31 | 2022-12-31 | 2022-09-30 | 2022-06-30 | 2022-03-31 | 2021-12-31 | 2021-09-30 | 2021-06-30 | 2021-03-31 | 2020-12-31 | 2020-09-30 | 2020-06-30 | 2020-03-31 | ||
|---|---|---|---|---|---|---|---|---|---|---|---|---|---|---|---|---|
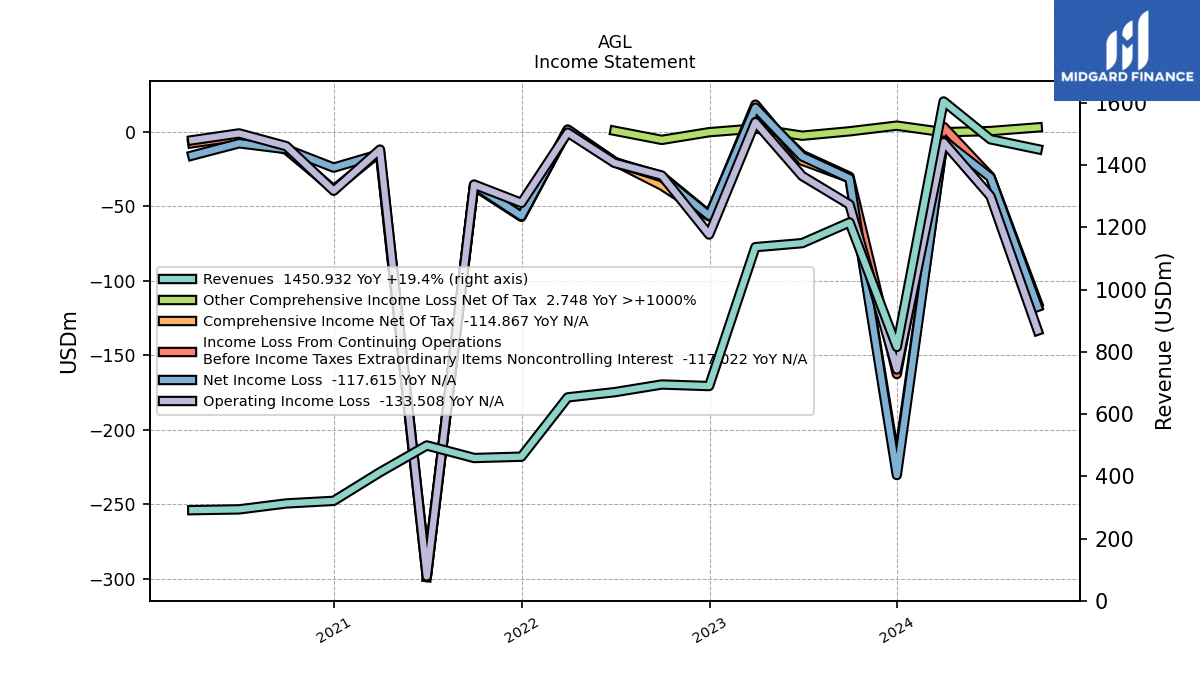
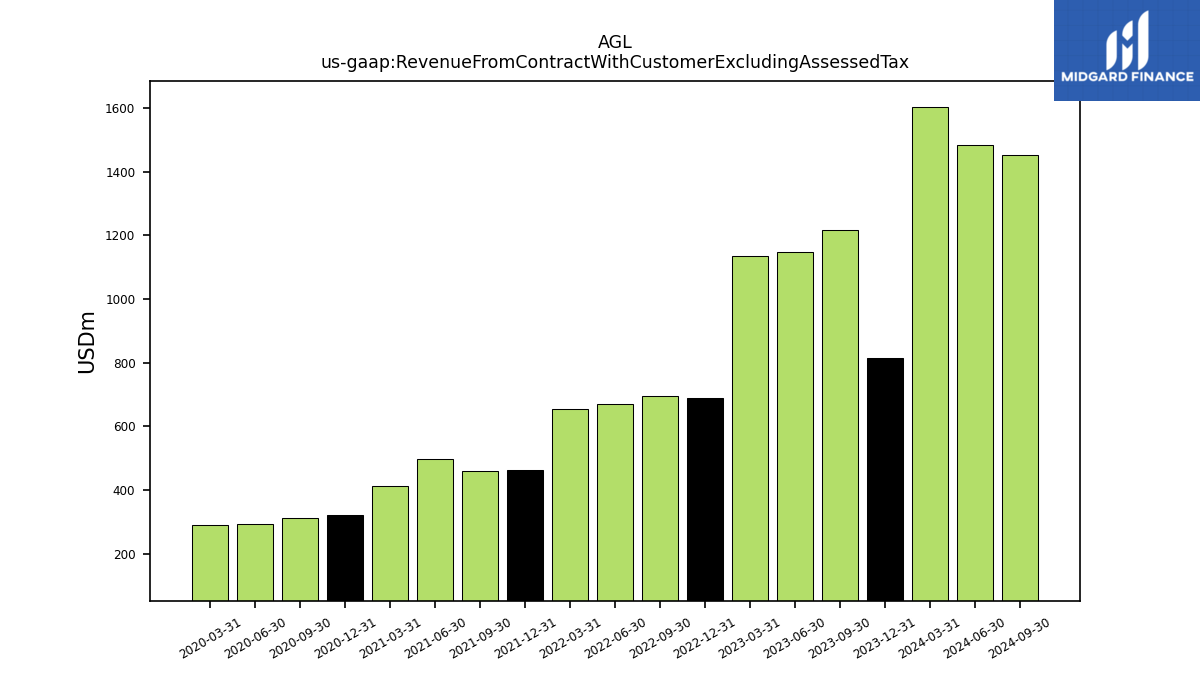
| Revenue From Contract With Customer Excluding Assessed Tax | 1215.66 | 1149.05 | 1136.15 | 689.77 | 694.86 | 670.13 | 653.45 | 462.89 | 458.61 | 498.96 | 413.10 | 321.01 | 312.68 | 293.59 | 291.05 | |
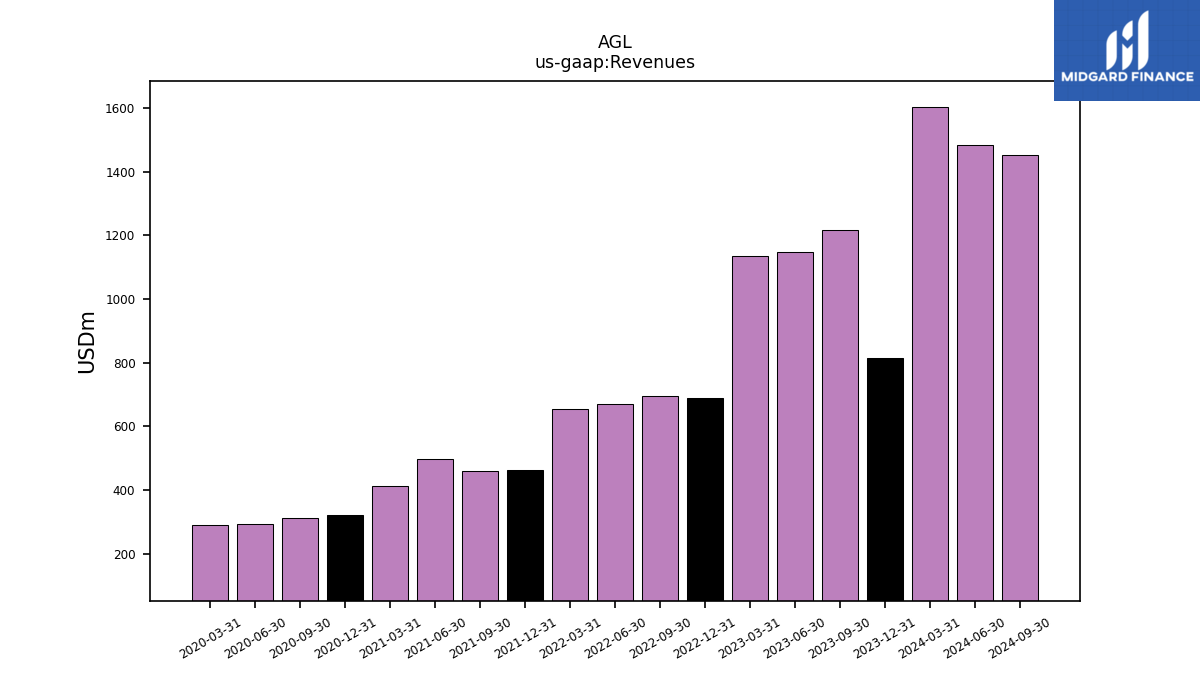
| Revenues | 1215.66 | 1149.05 | 1136.15 | 689.77 | 694.86 | 670.13 | 653.45 | 462.89 | 458.61 | 498.96 | 413.10 | 321.01 | 312.68 | 293.59 | 291.05 | |
| Operating Expenses | NA | NA | 1129.89 | 758.89 | 724.38 | 691.19 | 654.19 | 510.76 | 494.21 | 797.32 | 425.22 | 360.75 | 322.53 | 294.85 | 296.88 | |
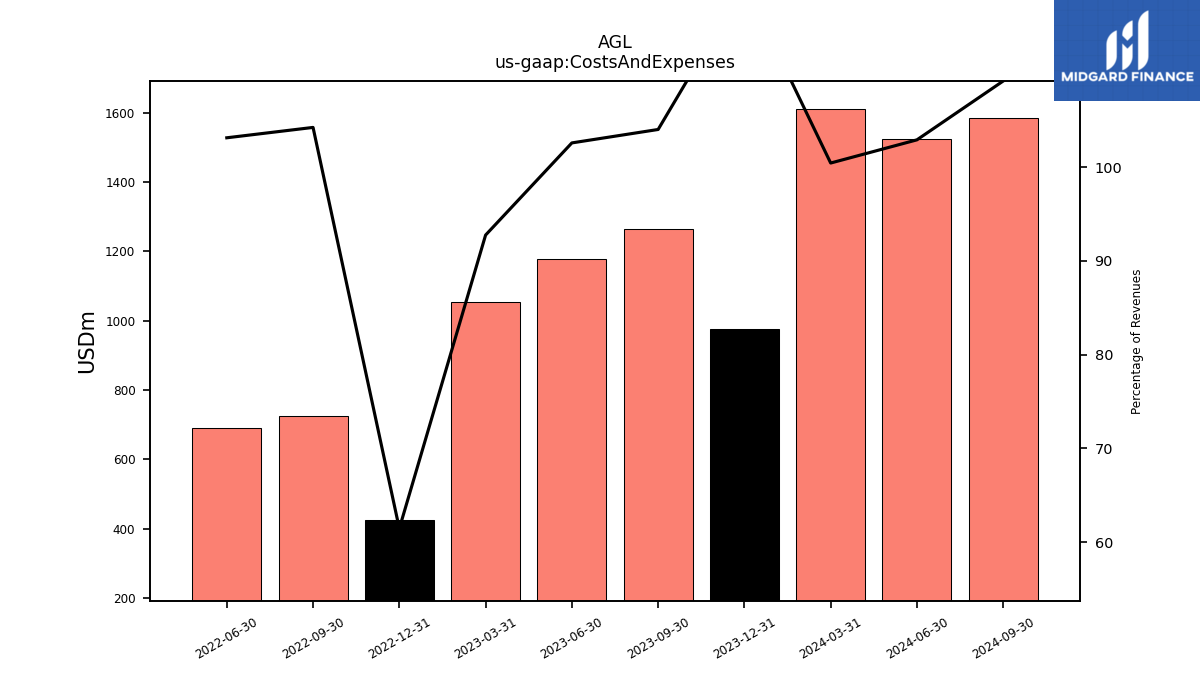
| Costs And Expenses | 1264.63 | 1178.87 | NA | NA | 724.38 | 691.19 | NA | NA | NA | NA | NA | NA | NA | NA | NA | |
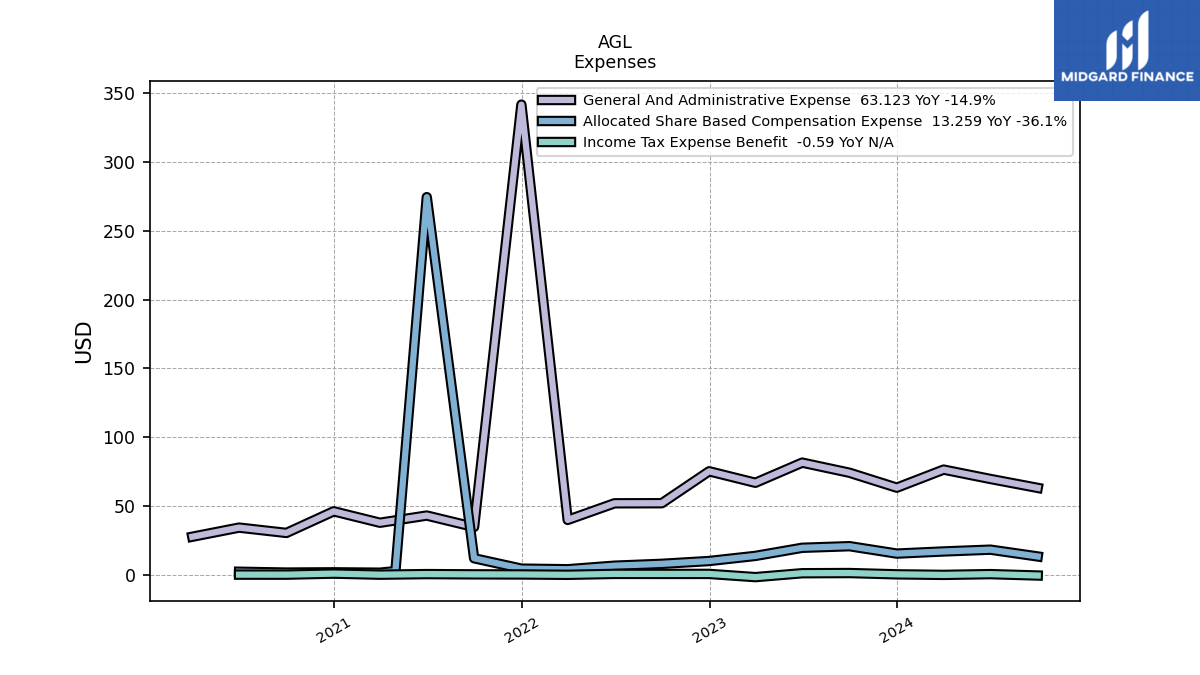
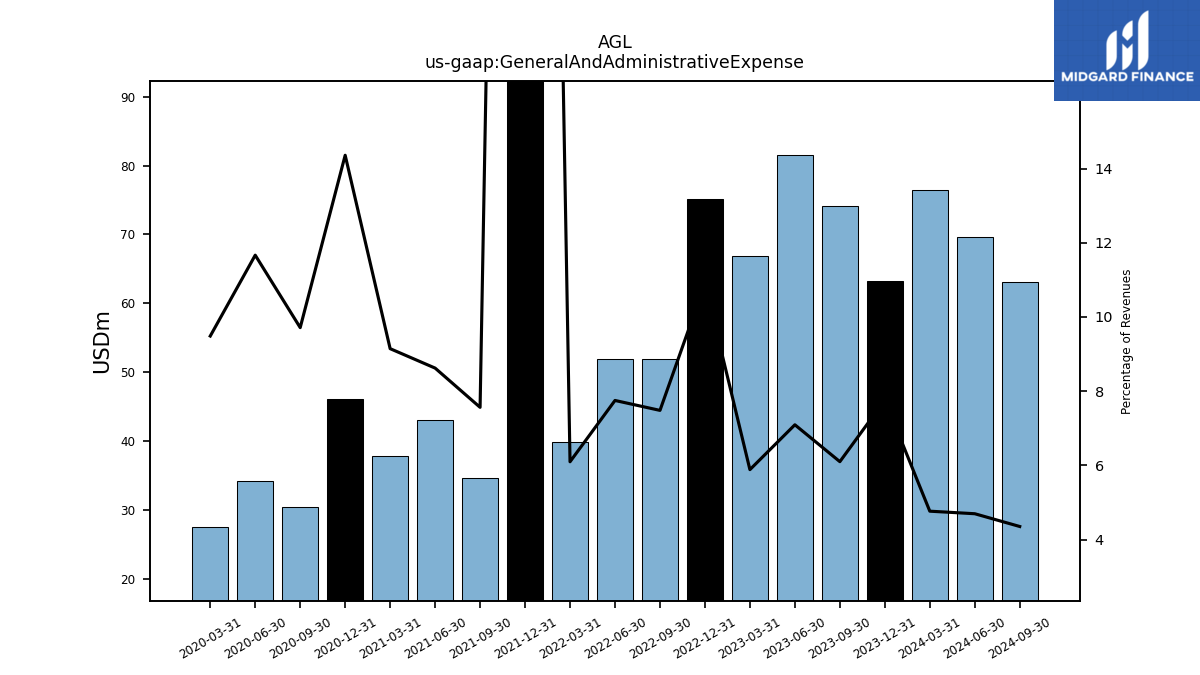
| General And Administrative Expense | 74.14 | 81.50 | 66.85 | 75.21 | 51.98 | 51.92 | 39.83 | 341.82 | 34.68 | 43.01 | 37.78 | 46.09 | 30.37 | 34.25 | 27.61 | |
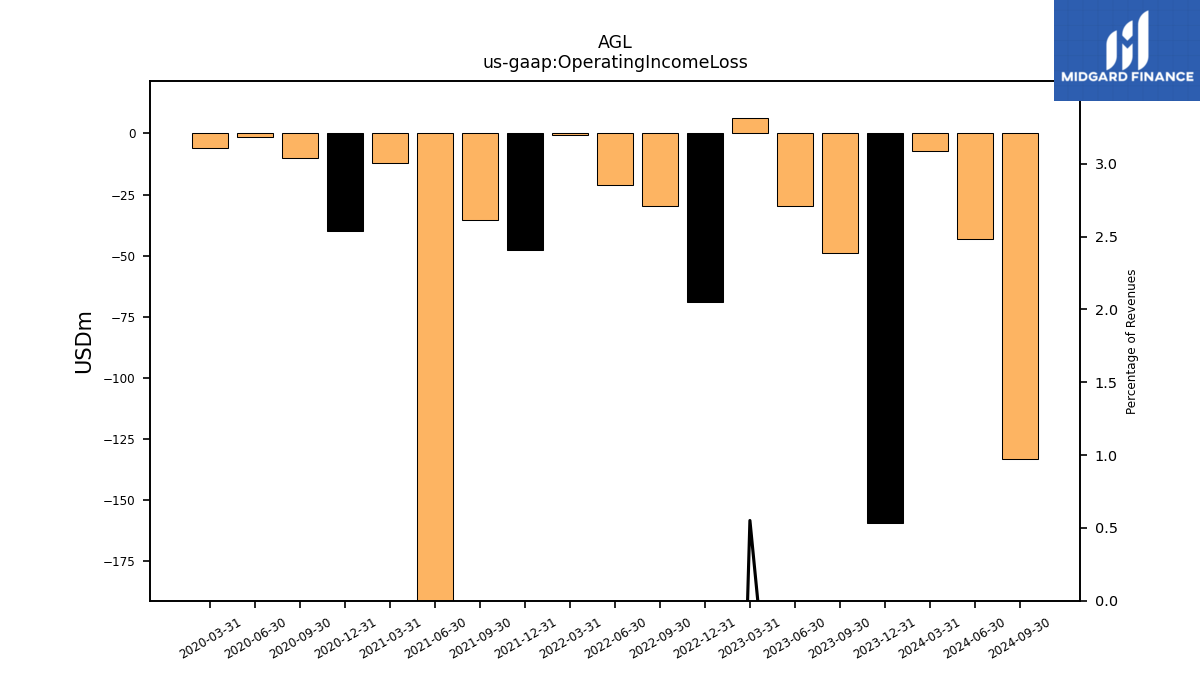
| Operating Income Loss | -48.97 | -29.82 | 6.26 | -69.12 | -29.52 | -21.05 | -0.74 | -47.87 | -35.60 | -298.36 | -12.12 | -39.74 | -9.84 | -1.25 | -5.83 | |
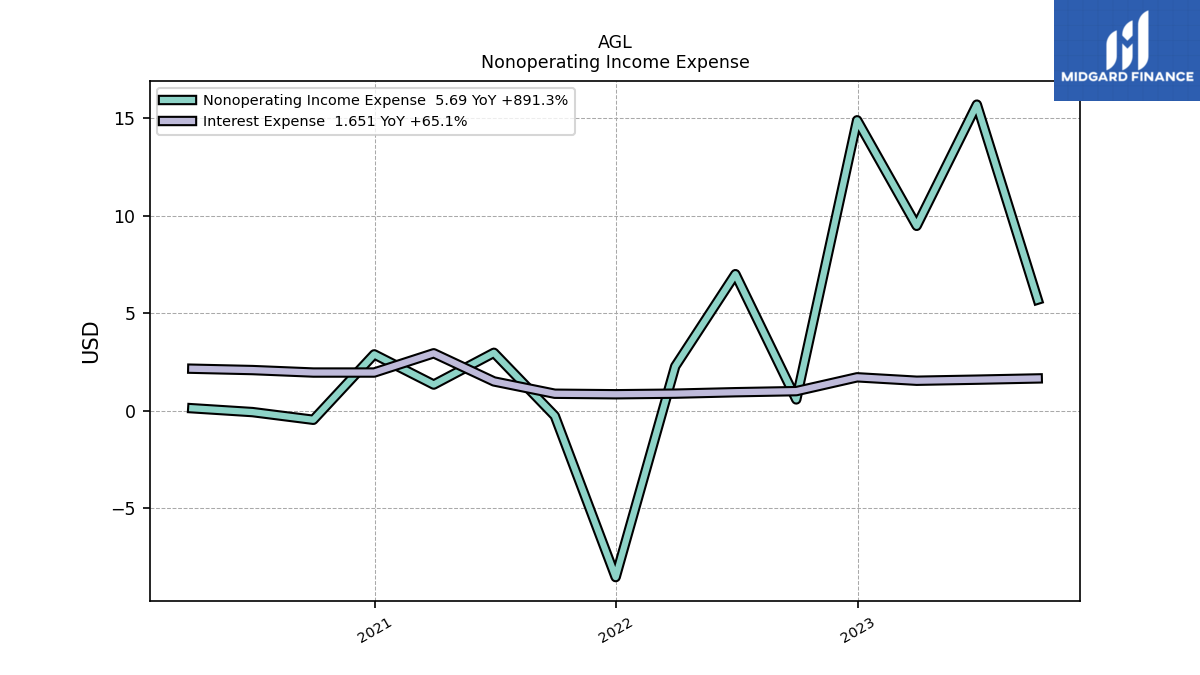
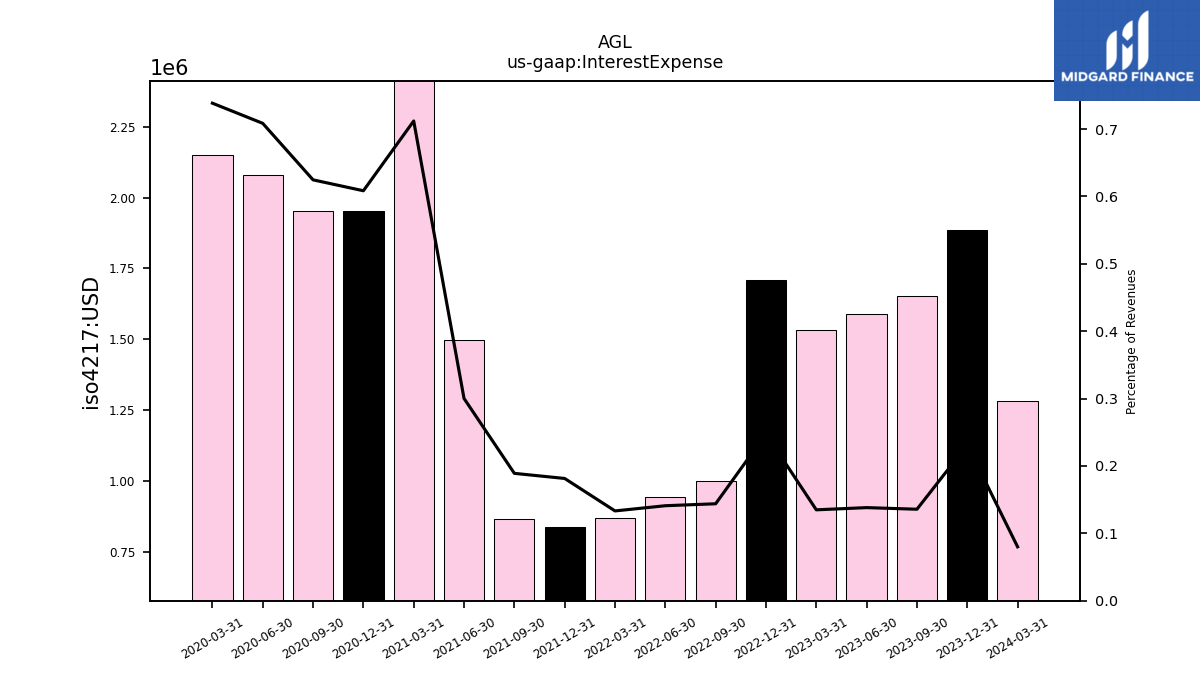
| Interest Expense | 1.65 | 1.59 | 1.53 | 1.71 | 1.00 | 0.94 | 0.87 | 0.84 | 0.87 | 1.50 | 2.94 | 1.95 | 1.95 | 2.08 | 2.15 | |
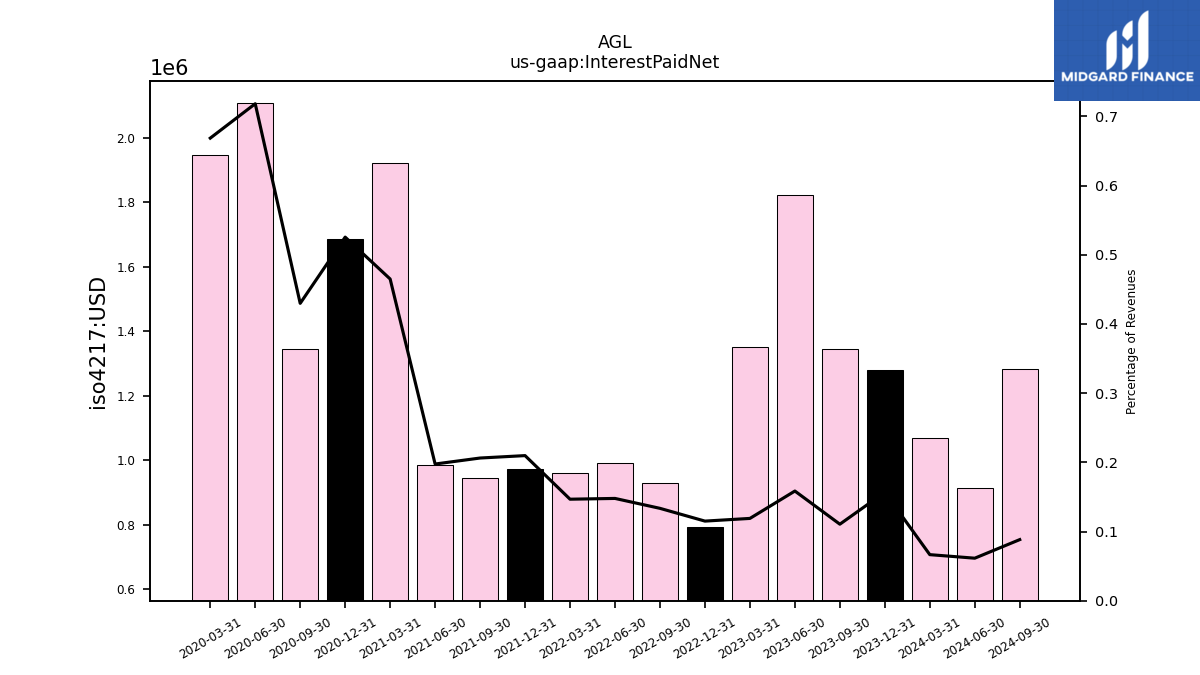
| Interest Paid Net | 1.34 | 1.82 | 1.35 | 0.79 | 0.93 | 0.99 | 0.96 | 0.97 | 0.95 | 0.99 | 1.92 | 1.69 | 1.34 | 2.11 | 1.95 | |
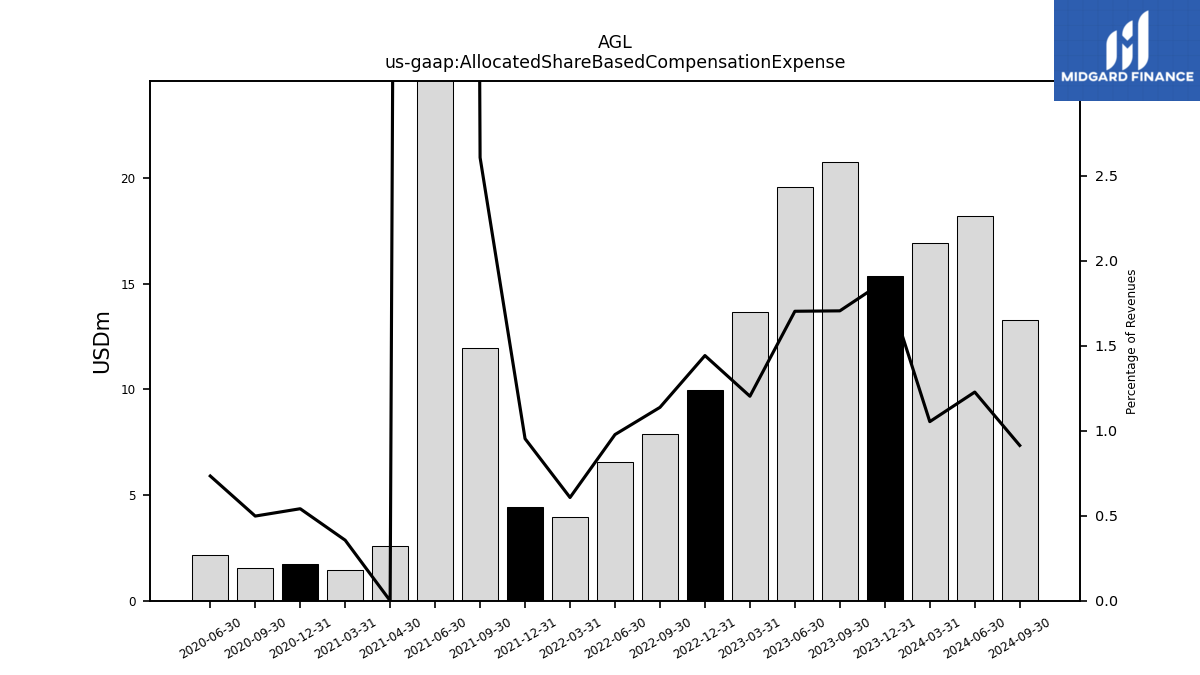
| Allocated Share Based Compensation Expense | 20.74 | 19.57 | 13.67 | 9.95 | 7.91 | 6.55 | 3.97 | 4.41 | 11.96 | 274.55 | 1.47 | 1.74 | 1.56 | 2.15 | NA | |
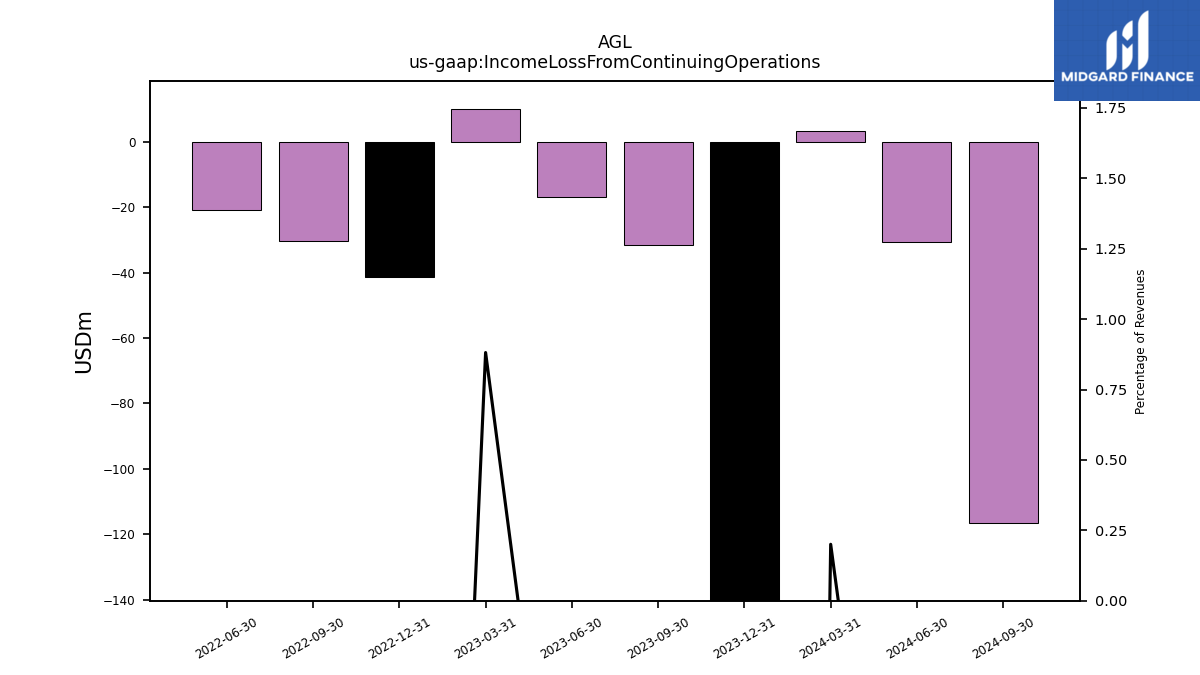
| Income Loss From Continuing Operations | -31.44 | -16.75 | NA | NA | -30.43 | -20.96 | NA | NA | NA | NA | NA | NA | NA | NA | NA | |
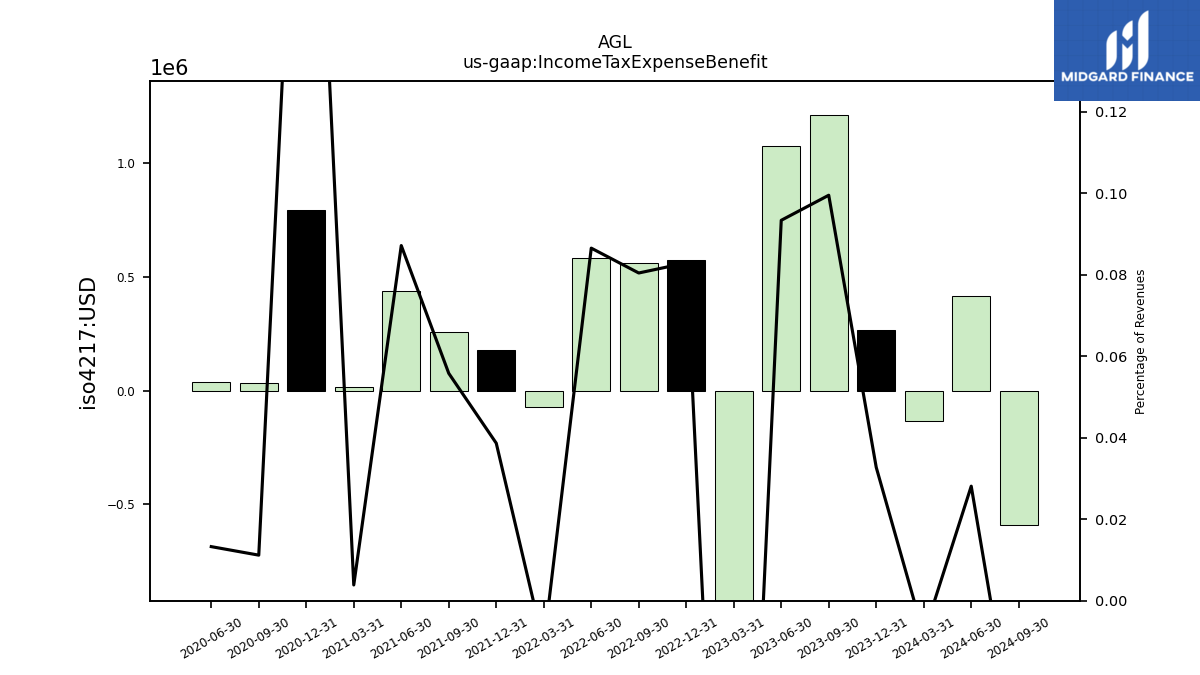
| Income Tax Expense Benefit | 1.21 | 1.07 | -1.76 | 0.57 | 0.56 | 0.58 | -0.07 | 0.18 | 0.26 | 0.43 | 0.02 | 0.79 | 0.04 | 0.04 | NA | |
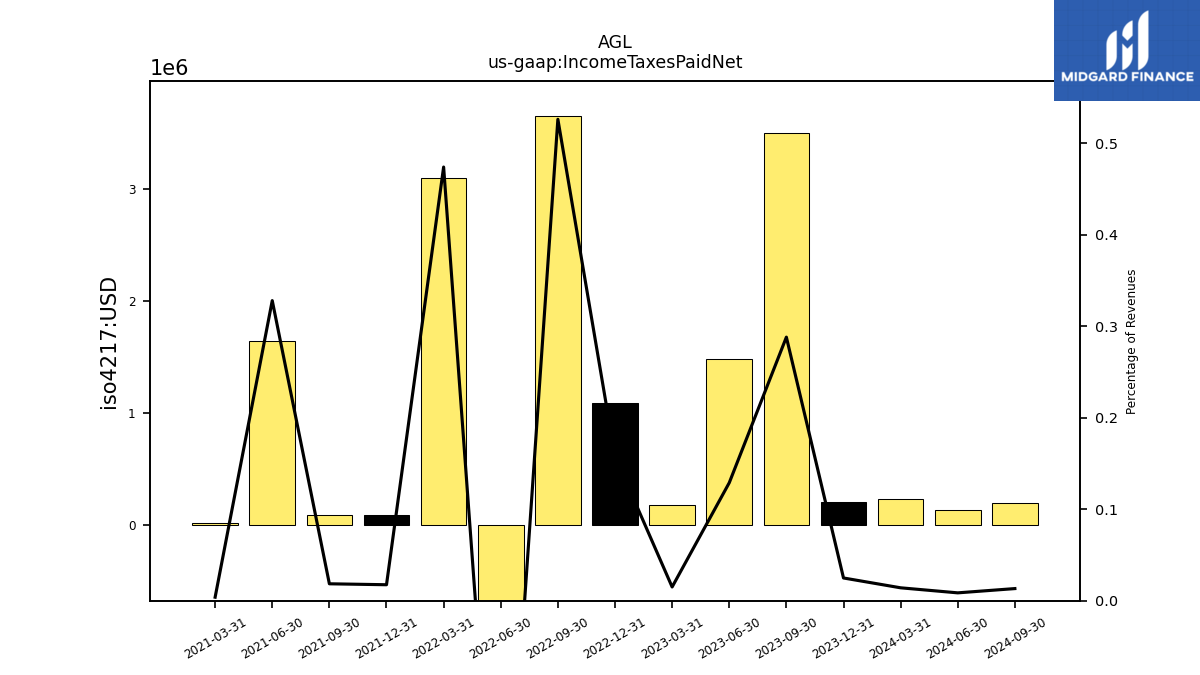
| Income Taxes Paid Net | 3.50 | 1.48 | 0.17 | 1.09 | 3.66 | -2.53 | 3.10 | 0.08 | 0.09 | 1.64 | 0.02 | NA | NA | NA | NA | |
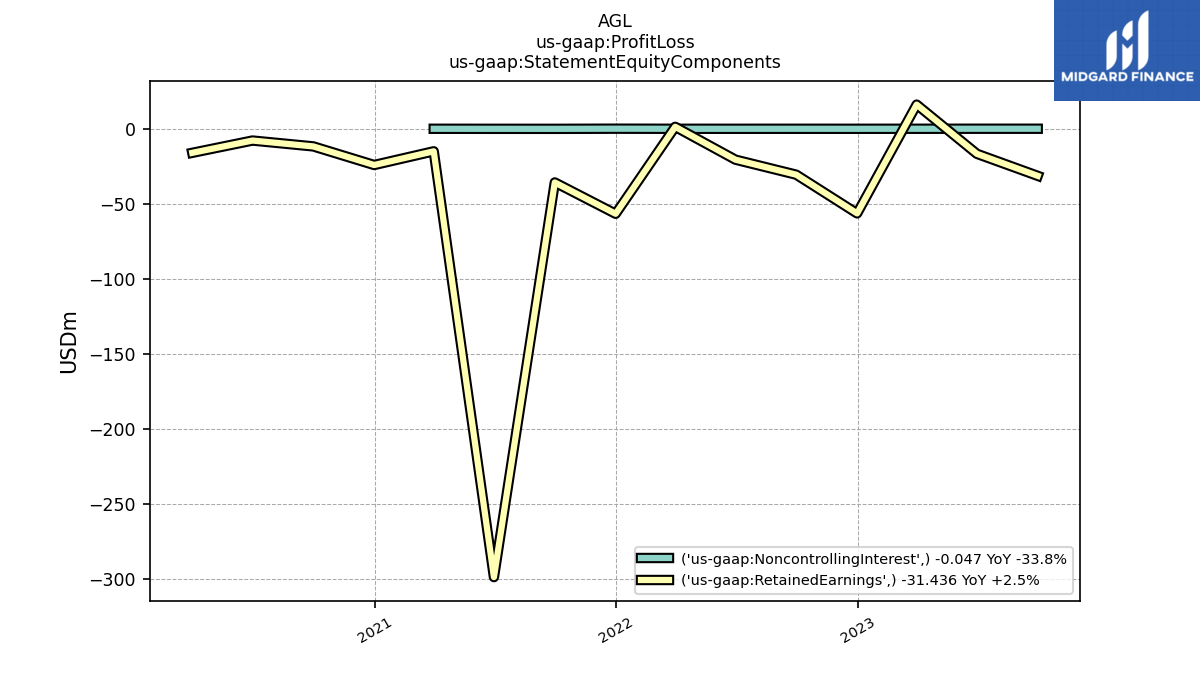
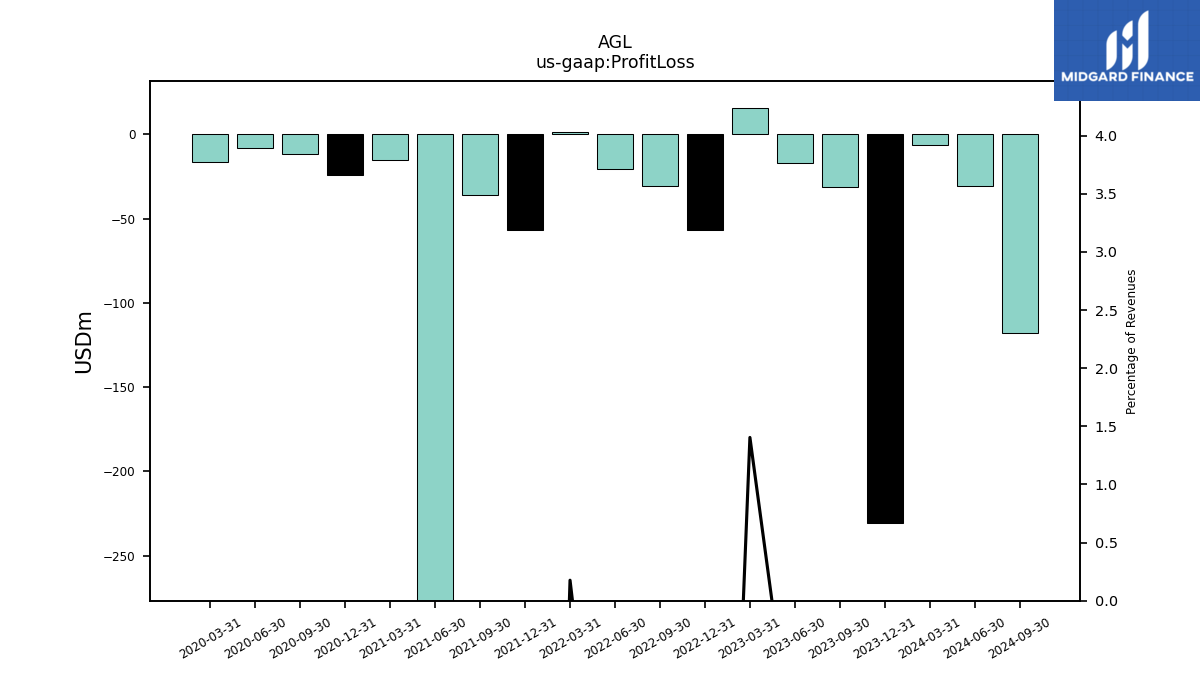
| Profit Loss | -31.48 | -16.80 | 15.96 | -56.55 | -30.74 | -20.73 | 1.16 | -56.74 | -35.96 | -298.94 | -15.15 | -24.21 | -11.83 | -7.91 | -16.10 | |
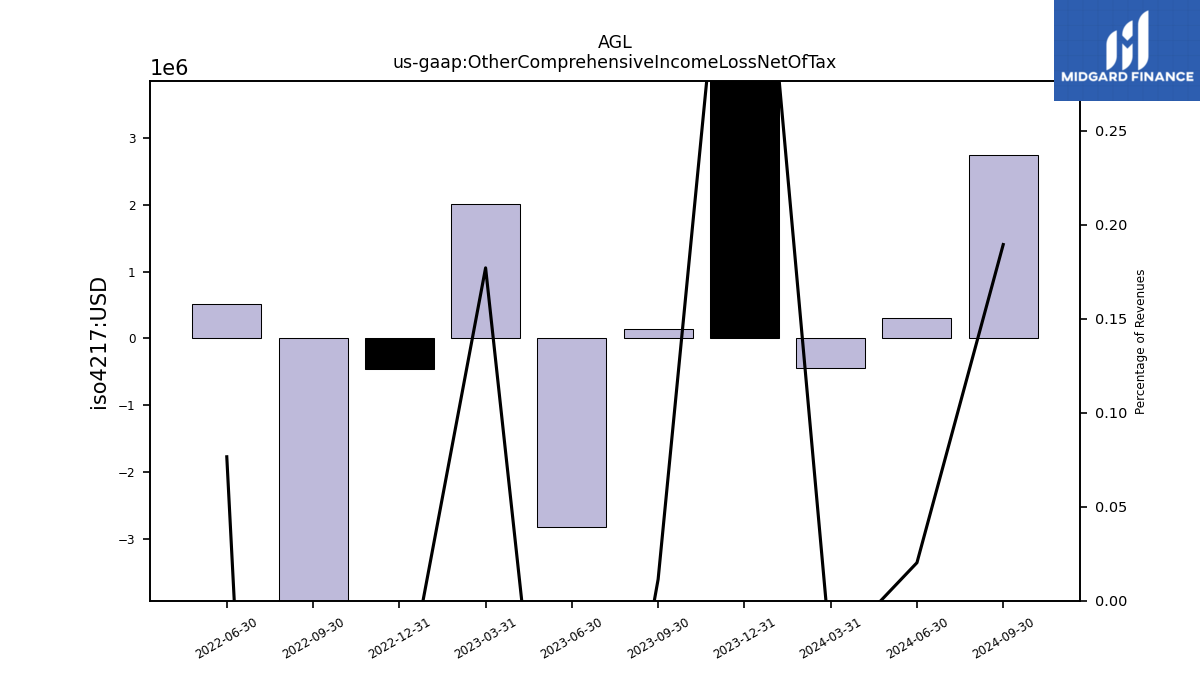
| Other Comprehensive Income Loss Net Of Tax | 0.14 | -2.82 | 2.01 | -0.46 | -5.61 | 0.51 | NA | NA | NA | NA | NA | NA | NA | NA | NA | |
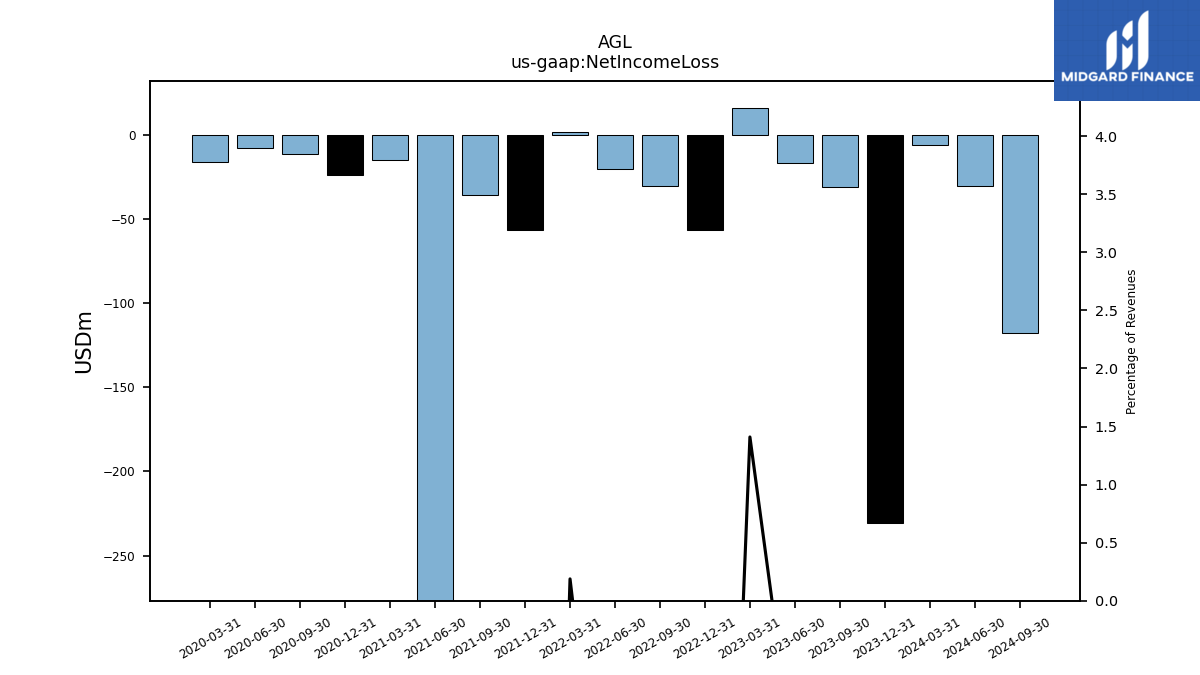
| Net Income Loss | -31.44 | -16.75 | 16.02 | -56.47 | -30.67 | -20.65 | 1.23 | -56.72 | -35.84 | -298.85 | -15.08 | -24.21 | -11.83 | -7.91 | -16.10 | |
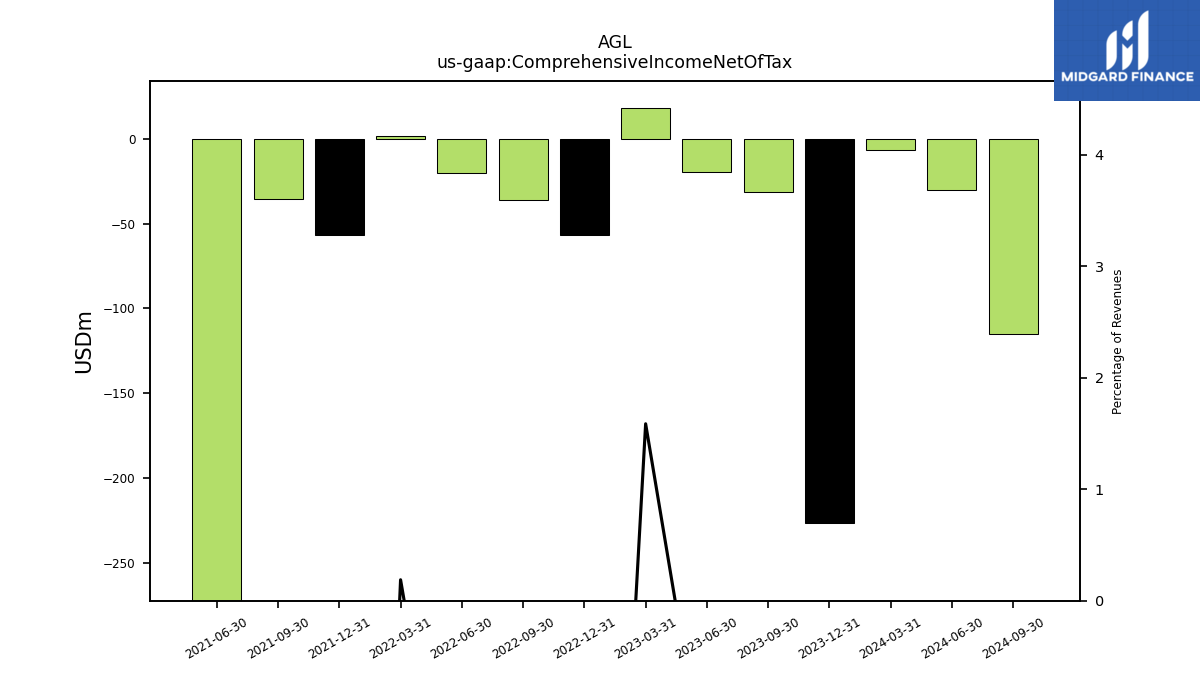
| Comprehensive Income Net Of Tax | -31.30 | -19.57 | 18.03 | -56.93 | -36.28 | -20.14 | 1.23 | -56.72 | -35.84 | -298.85 | NA | NA | NA | NA | NA |
| 2023-09-30 | 2023-06-30 | 2023-03-31 | 2022-12-31 | 2022-09-30 | 2022-06-30 | 2022-03-31 | 2021-12-31 | 2021-09-30 | 2021-06-30 | 2021-03-31 | 2020-12-31 | 2020-09-30 | 2020-06-30 | 2020-03-31 | ||
|---|---|---|---|---|---|---|---|---|---|---|---|---|---|---|---|---|
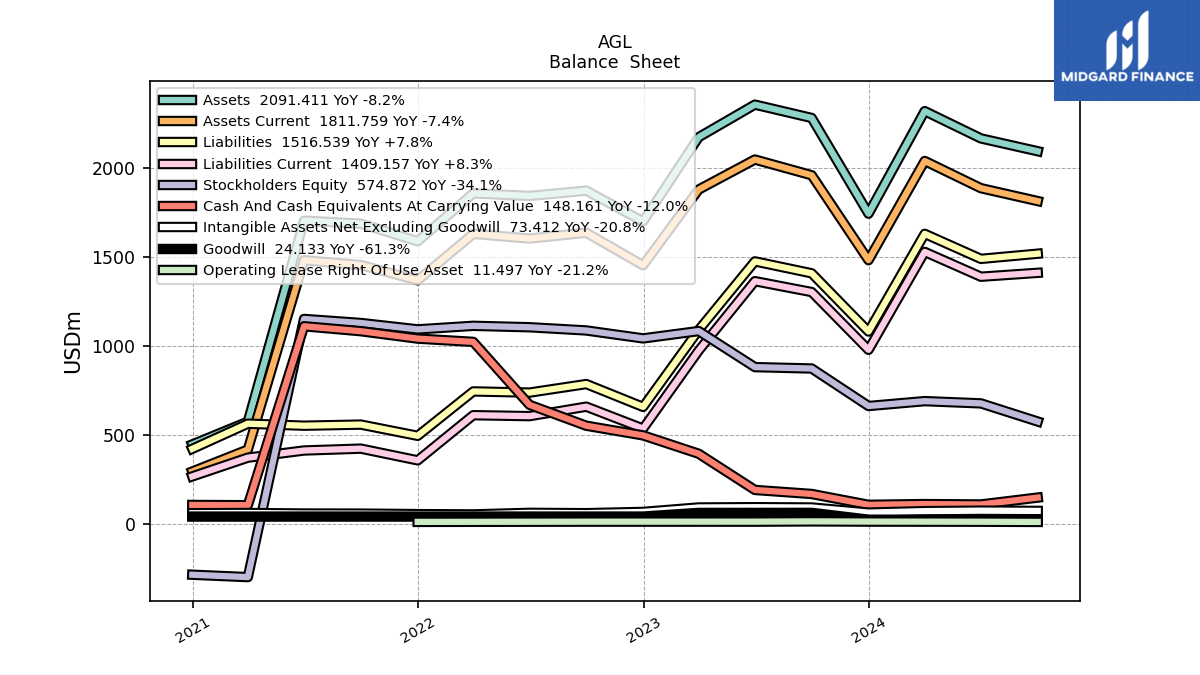
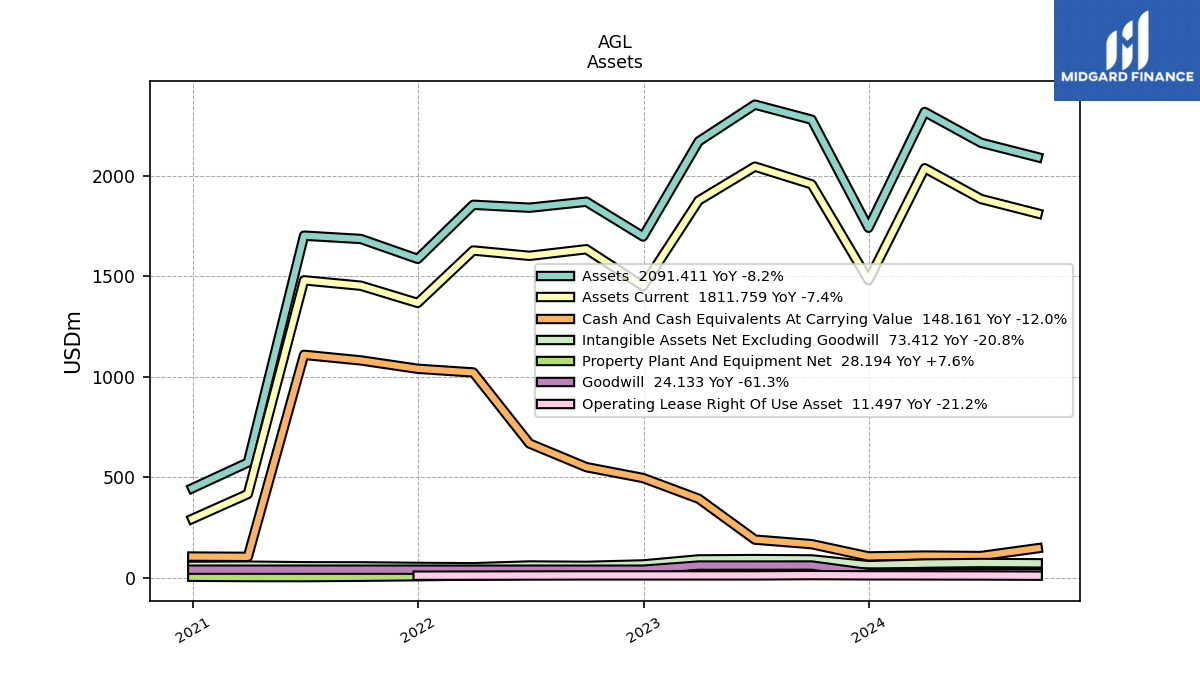
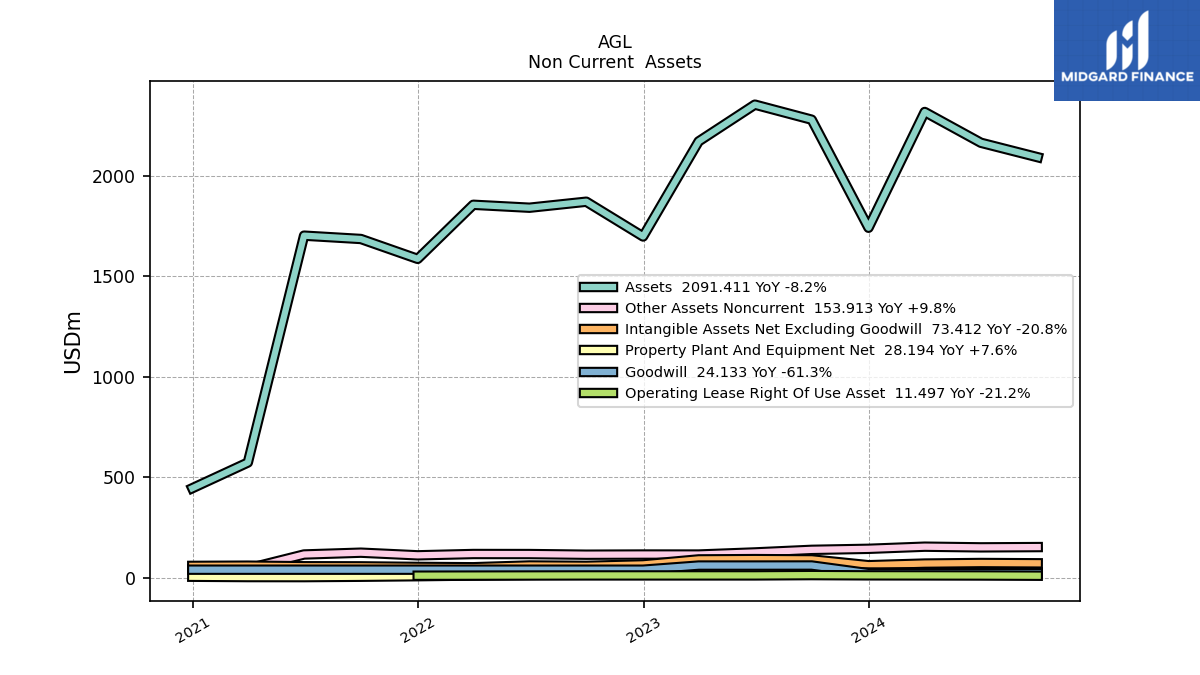
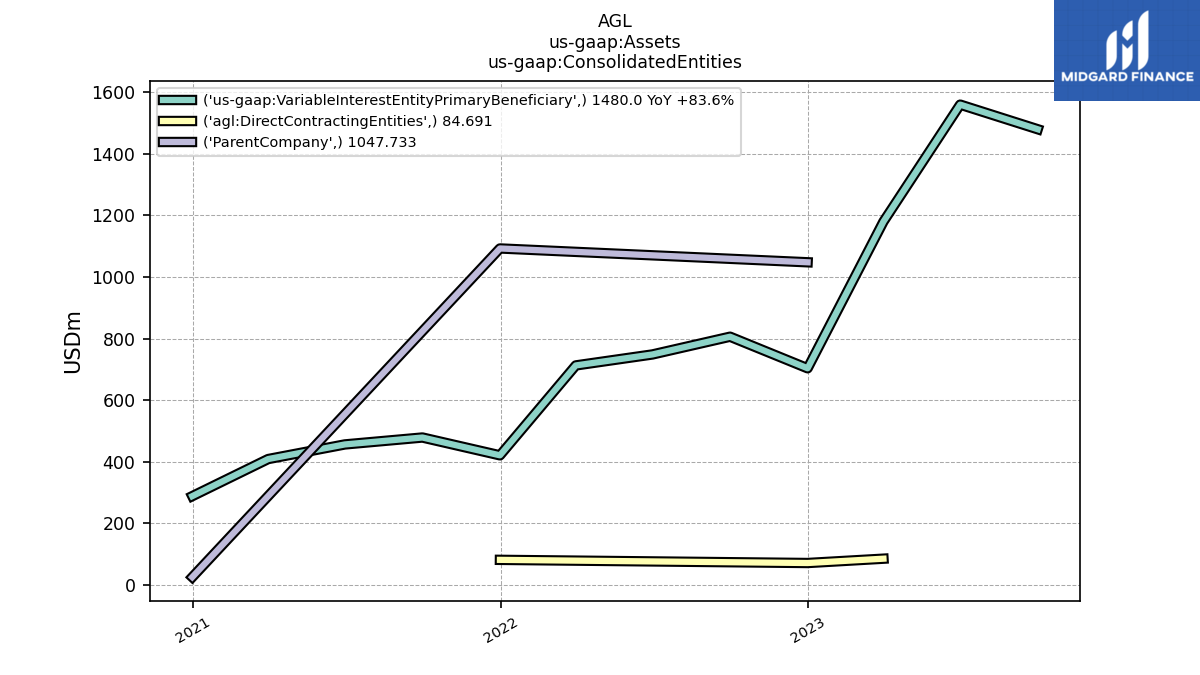
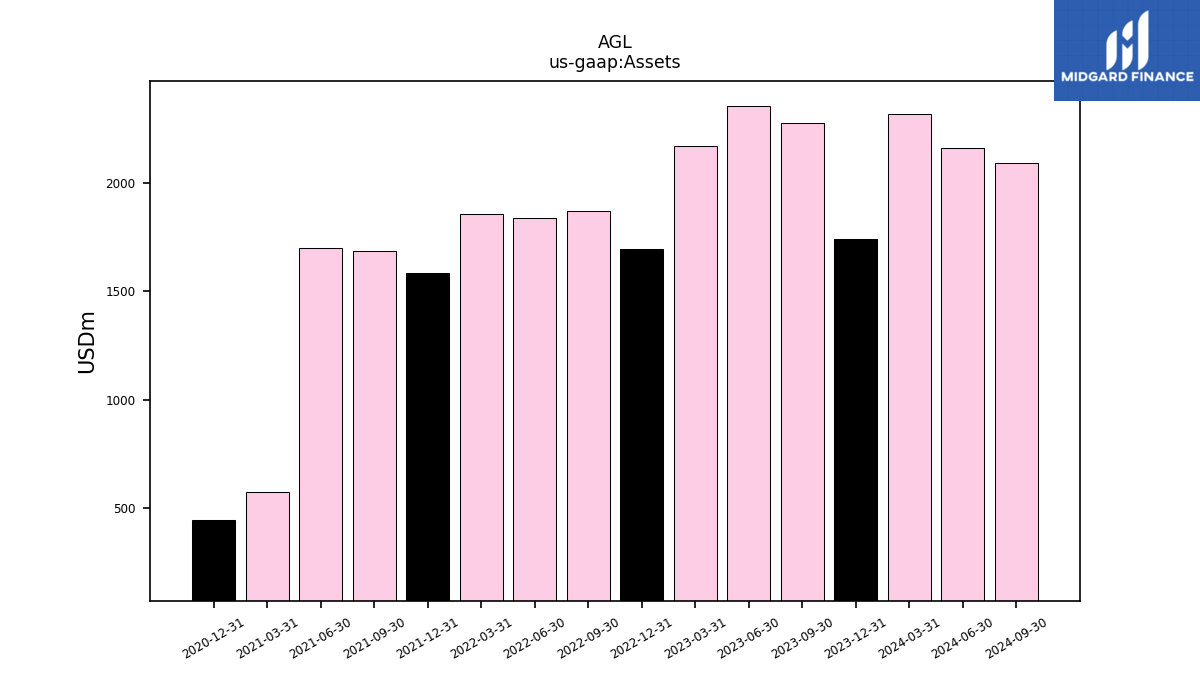
| Assets | 2278.07 | 2352.92 | 2170.27 | 1697.47 | 1870.43 | 1840.52 | 1855.21 | 1586.25 | 1685.12 | 1701.73 | 574.04 | 446.36 | NA | NA | NA | |
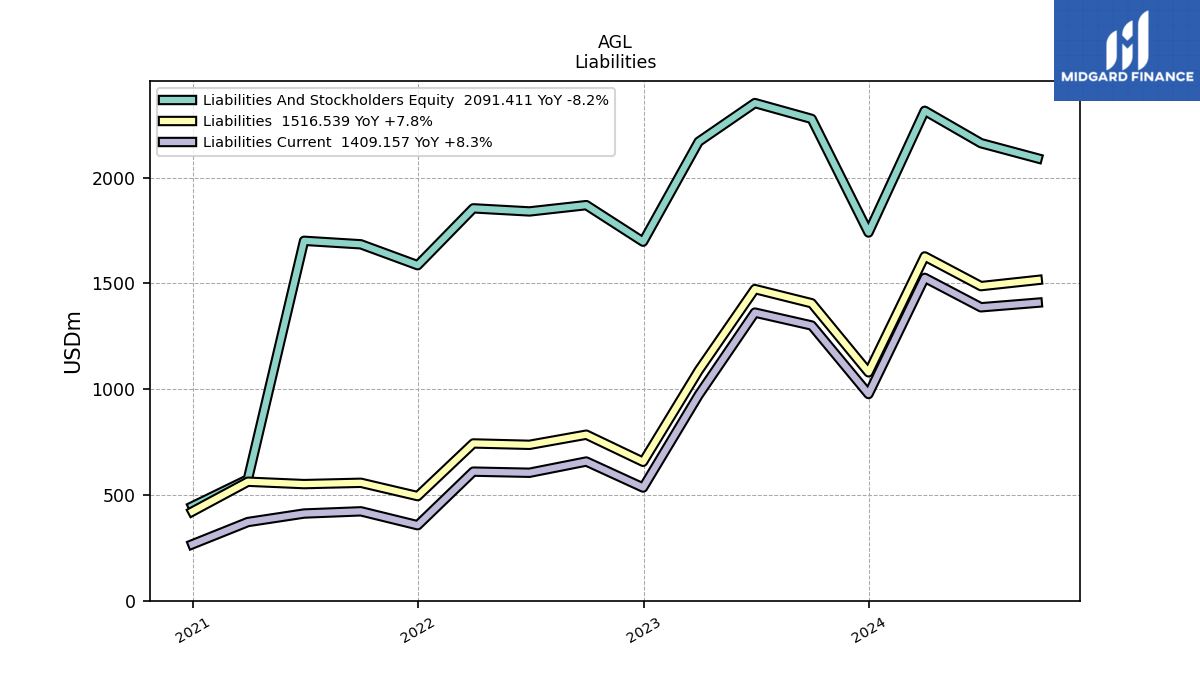
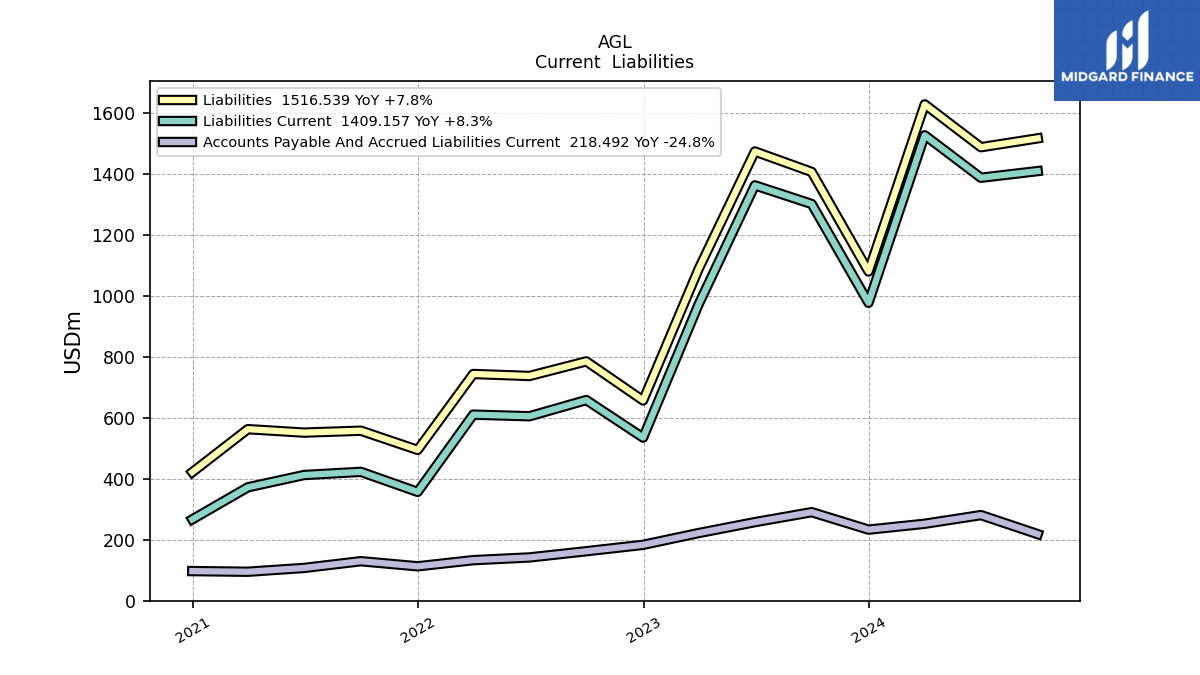
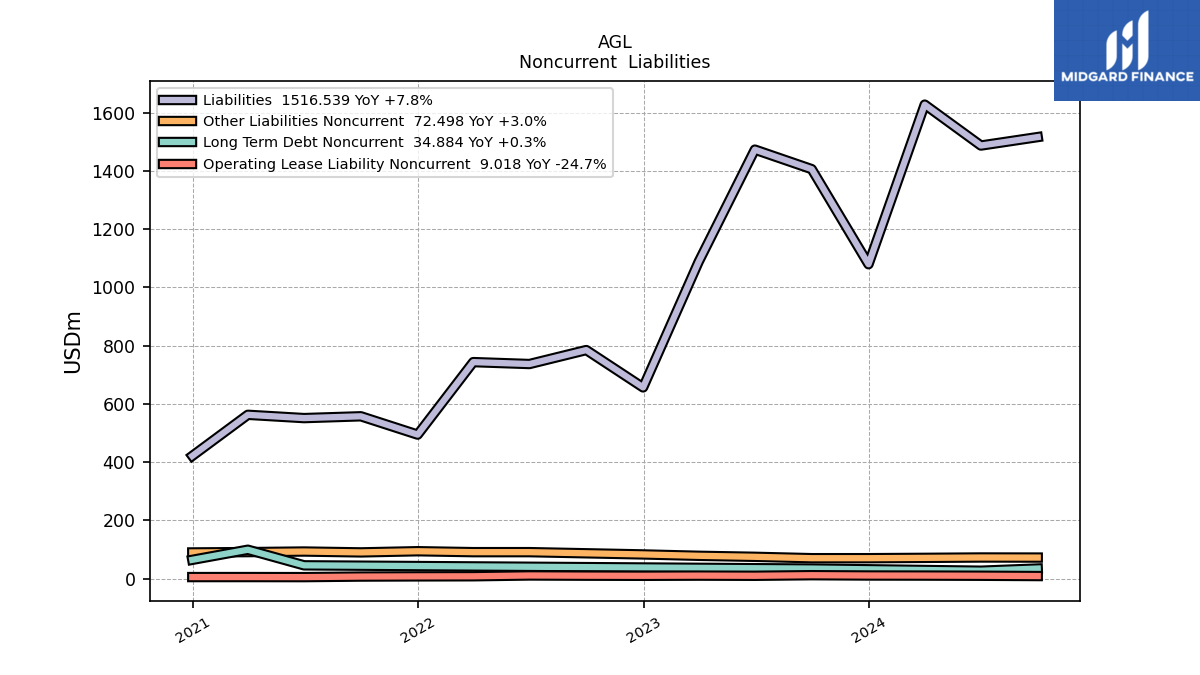
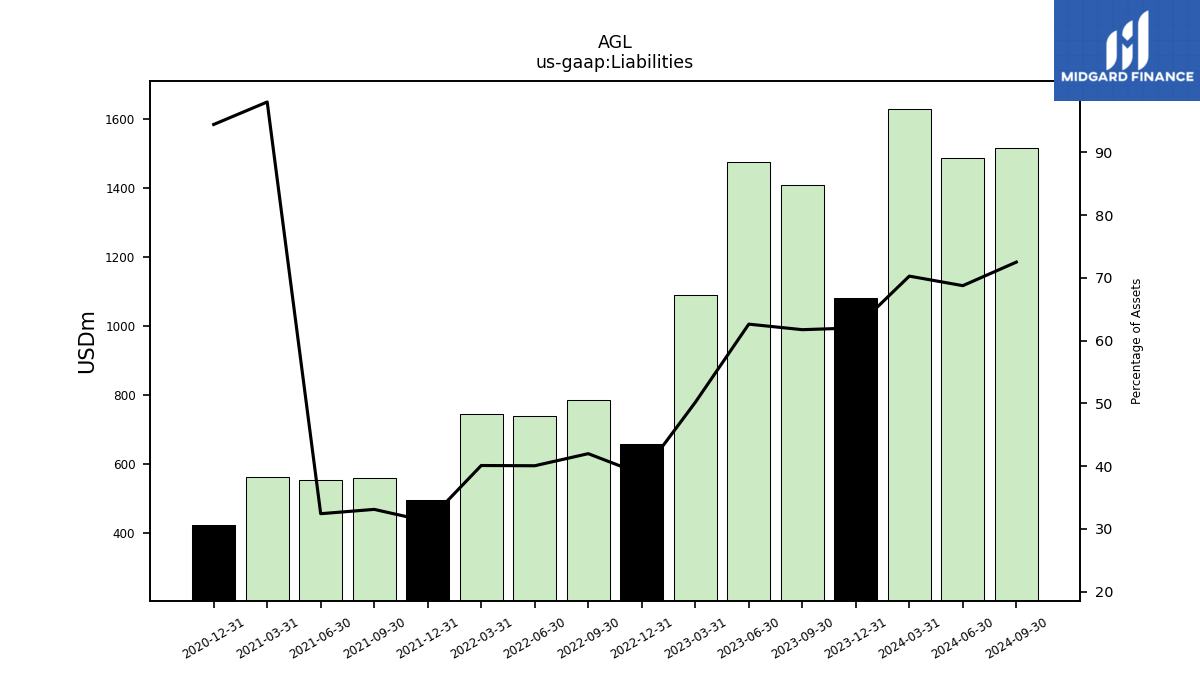
| Liabilities | 1406.47 | 1473.47 | 1088.43 | 656.86 | 785.15 | 737.15 | 743.73 | 494.66 | 557.68 | 551.46 | 562.78 | 421.59 | NA | NA | NA | |
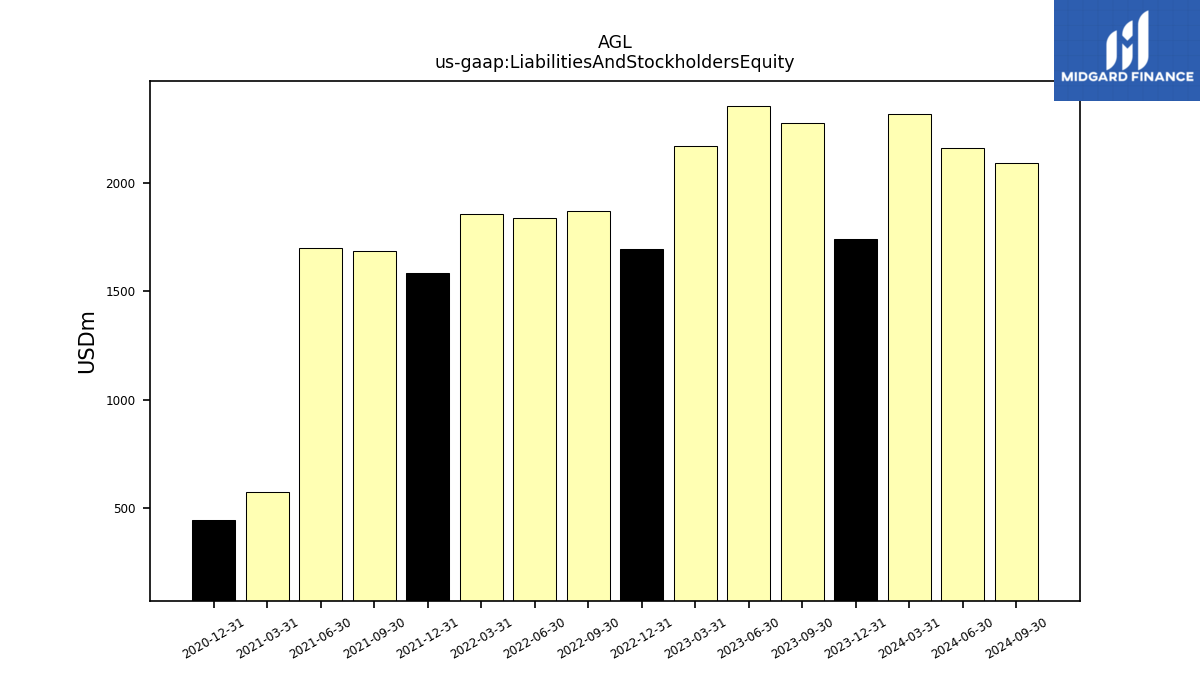
| Liabilities And Stockholders Equity | 2278.07 | 2352.92 | 2170.27 | 1697.47 | 1870.43 | 1840.52 | 1855.21 | 1586.25 | 1685.12 | 1701.73 | 574.04 | 446.36 | NA | NA | NA | |
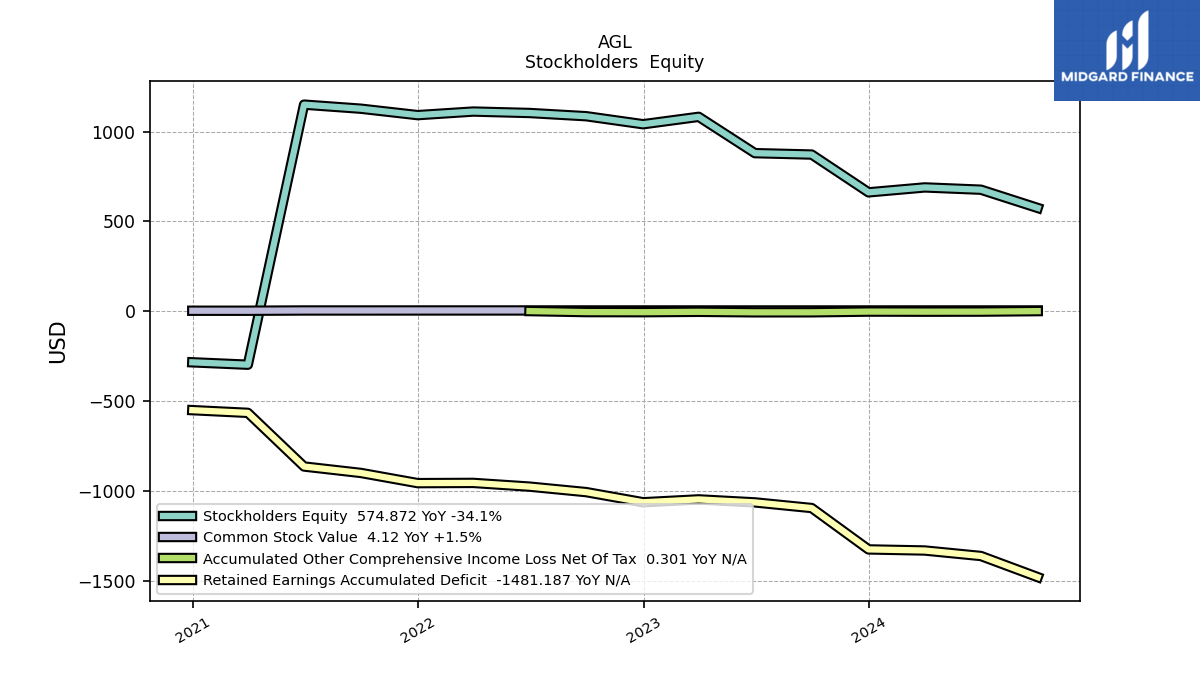
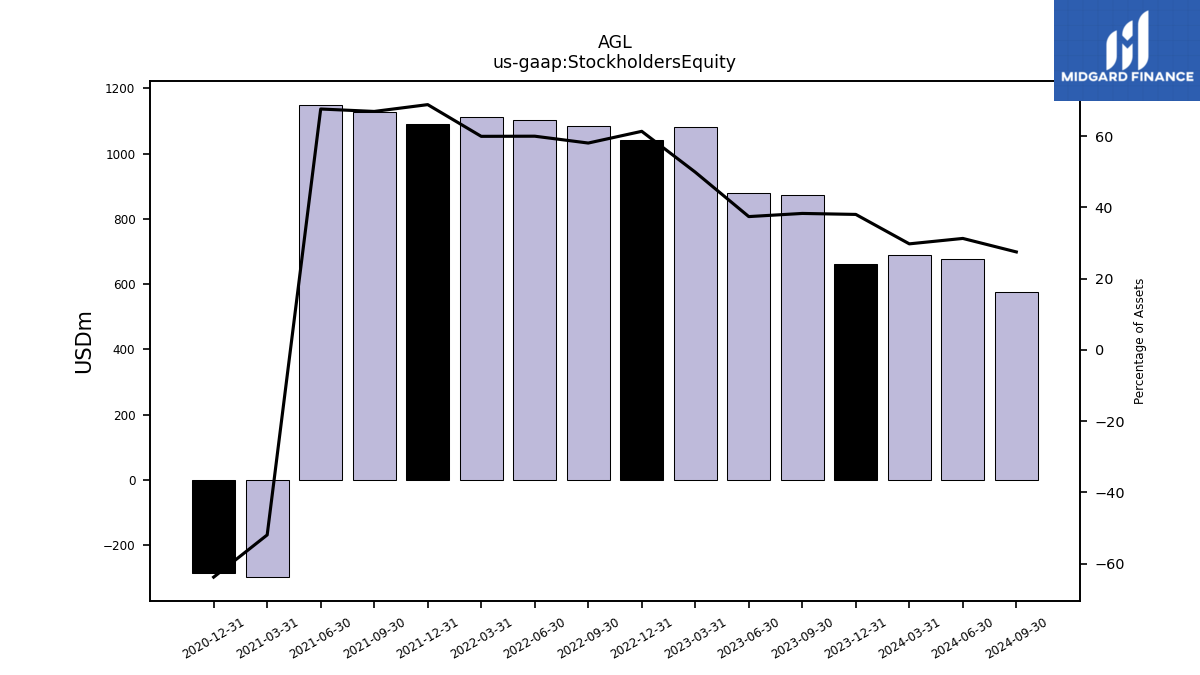
| Stockholders Equity | 872.37 | 880.17 | 1082.51 | 1041.22 | 1085.82 | 1103.83 | 1111.85 | 1091.90 | 1127.72 | 1150.45 | -298.17 | -284.73 | NA | NA | NA |
| 2023-09-30 | 2023-06-30 | 2023-03-31 | 2022-12-31 | 2022-09-30 | 2022-06-30 | 2022-03-31 | 2021-12-31 | 2021-09-30 | 2021-06-30 | 2021-03-31 | 2020-12-31 | 2020-09-30 | 2020-06-30 | 2020-03-31 | ||
|---|---|---|---|---|---|---|---|---|---|---|---|---|---|---|---|---|
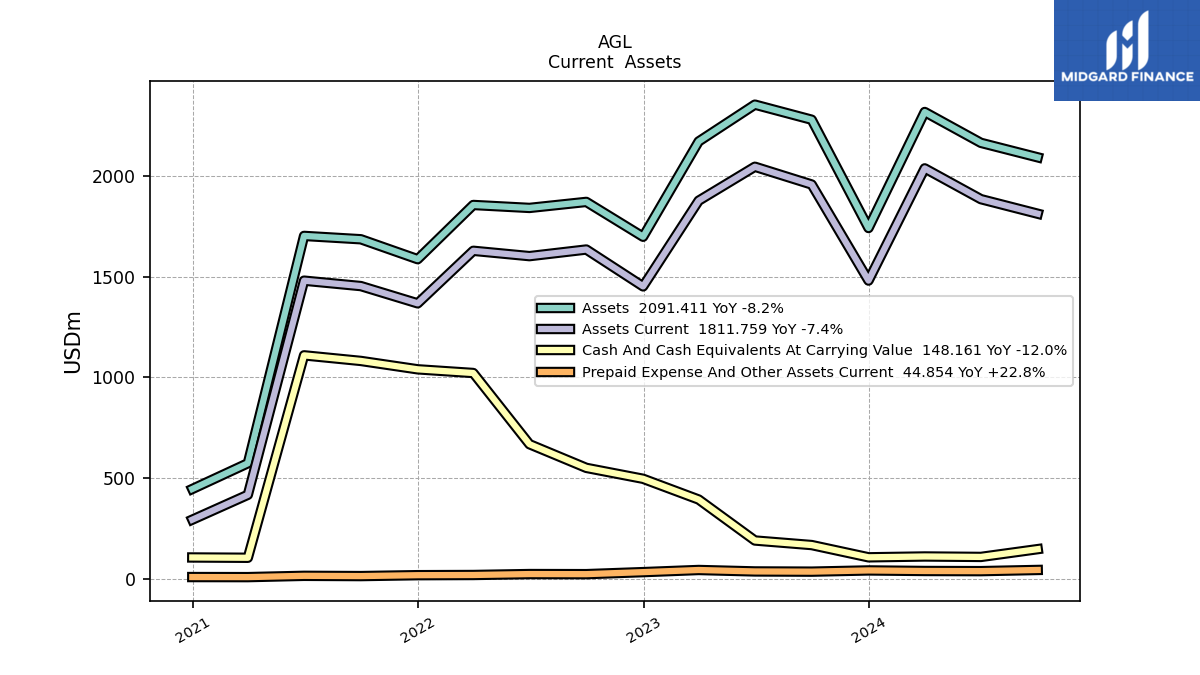
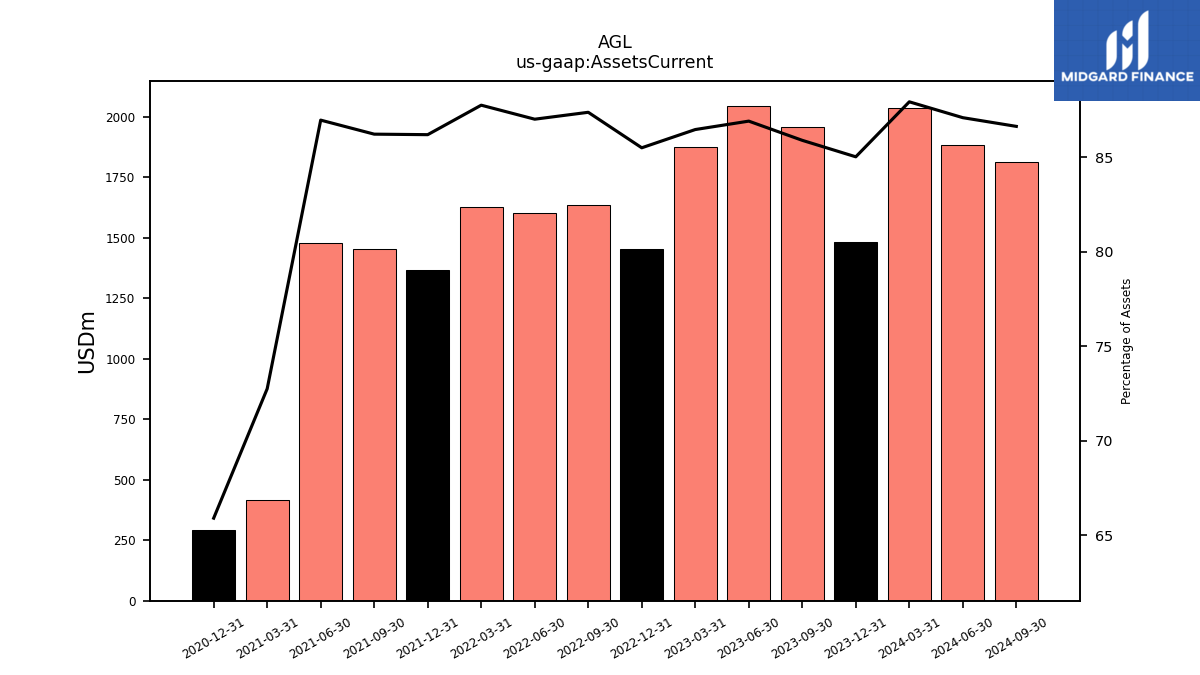
| Assets Current | 1956.64 | 2044.84 | 1876.44 | 1451.27 | 1634.27 | 1601.41 | 1627.94 | 1367.19 | 1452.87 | 1479.81 | 417.63 | 294.20 | NA | NA | NA | |
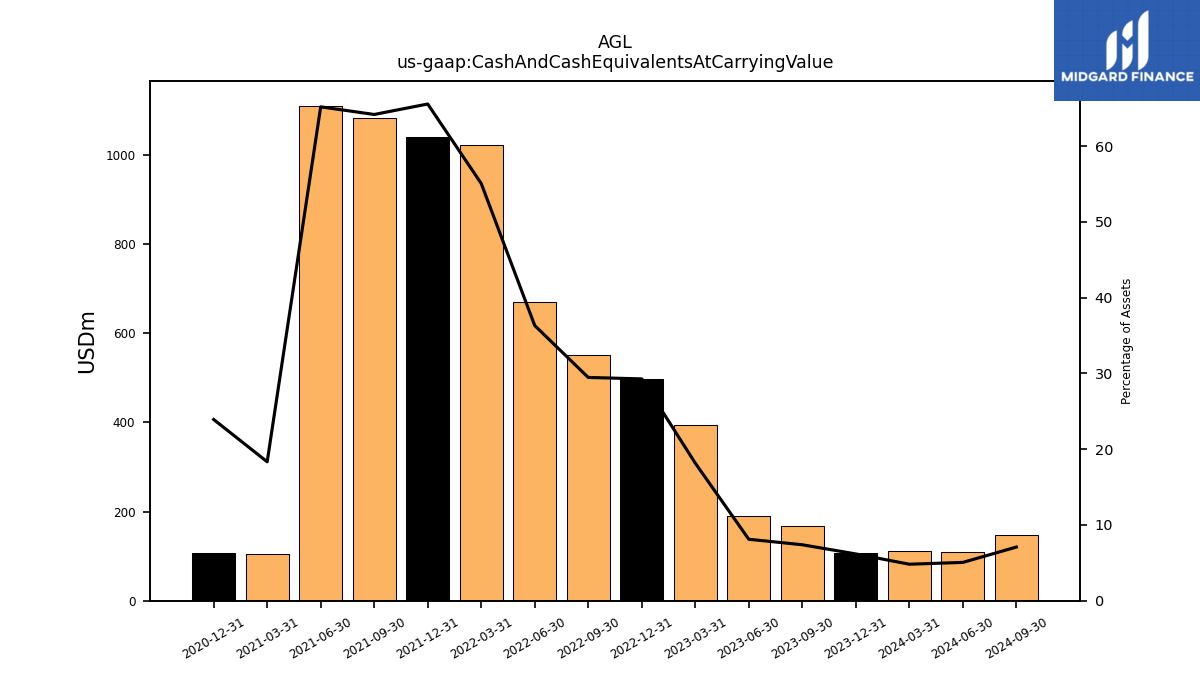
| Cash And Cash Equivalents At Carrying Value | 168.34 | 190.98 | 394.19 | 497.07 | 551.29 | 668.57 | 1021.75 | 1040.04 | 1081.60 | 1109.37 | 105.29 | 106.80 | NA | NA | NA | |
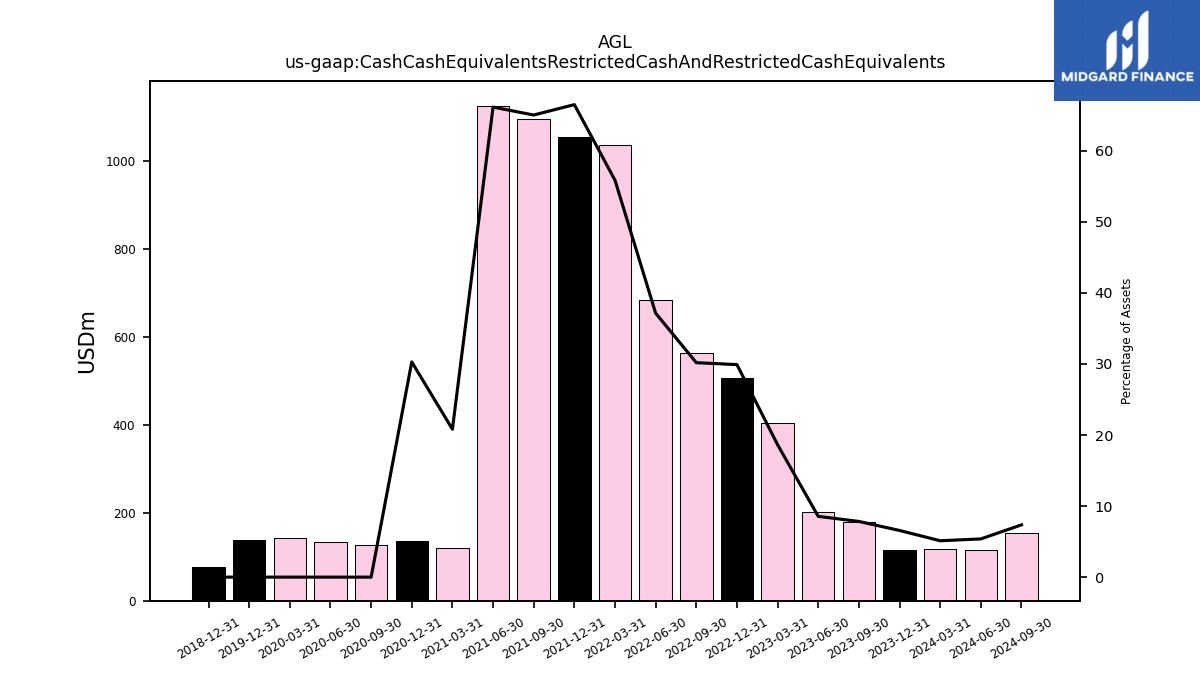
| Cash Cash Equivalents Restricted Cash And Restricted Cash Equivalents | 178.54 | 201.19 | 404.39 | 507.68 | 564.48 | 683.66 | 1036.22 | 1054.82 | 1095.90 | 1125.71 | 119.49 | 135.18 | 126.49 | 134.55 | 142.56 | |
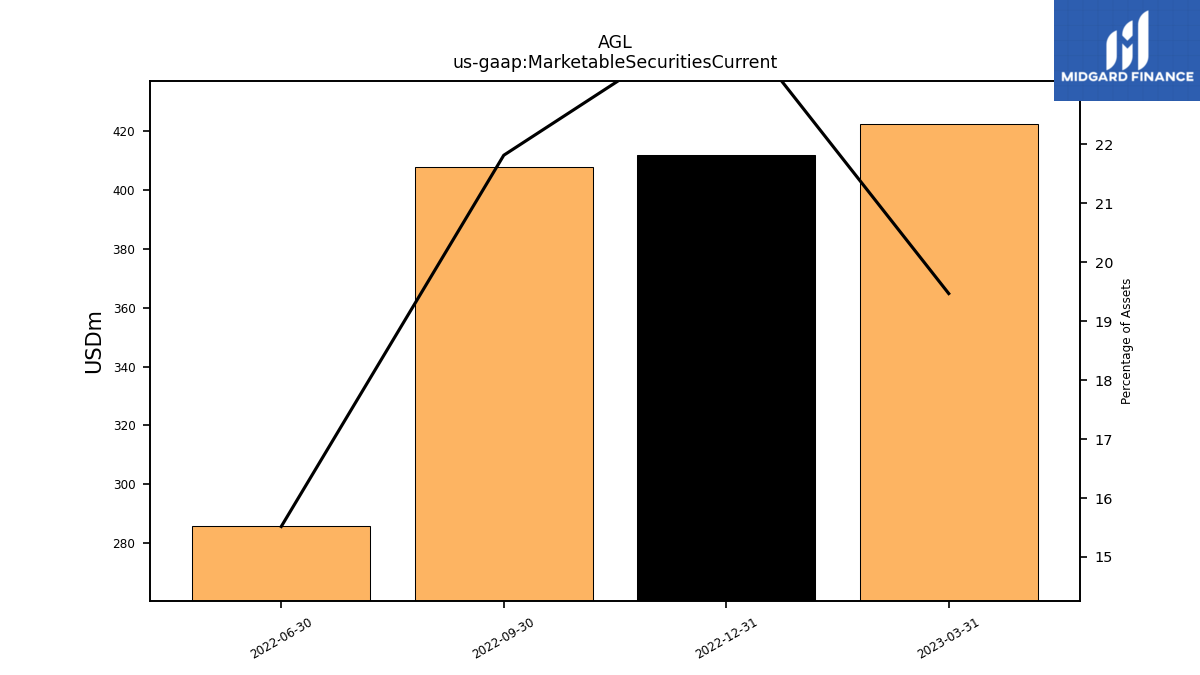
| Marketable Securities Current | NA | NA | 422.49 | 411.90 | 407.99 | 285.59 | NA | NA | NA | NA | NA | NA | NA | NA | NA | |
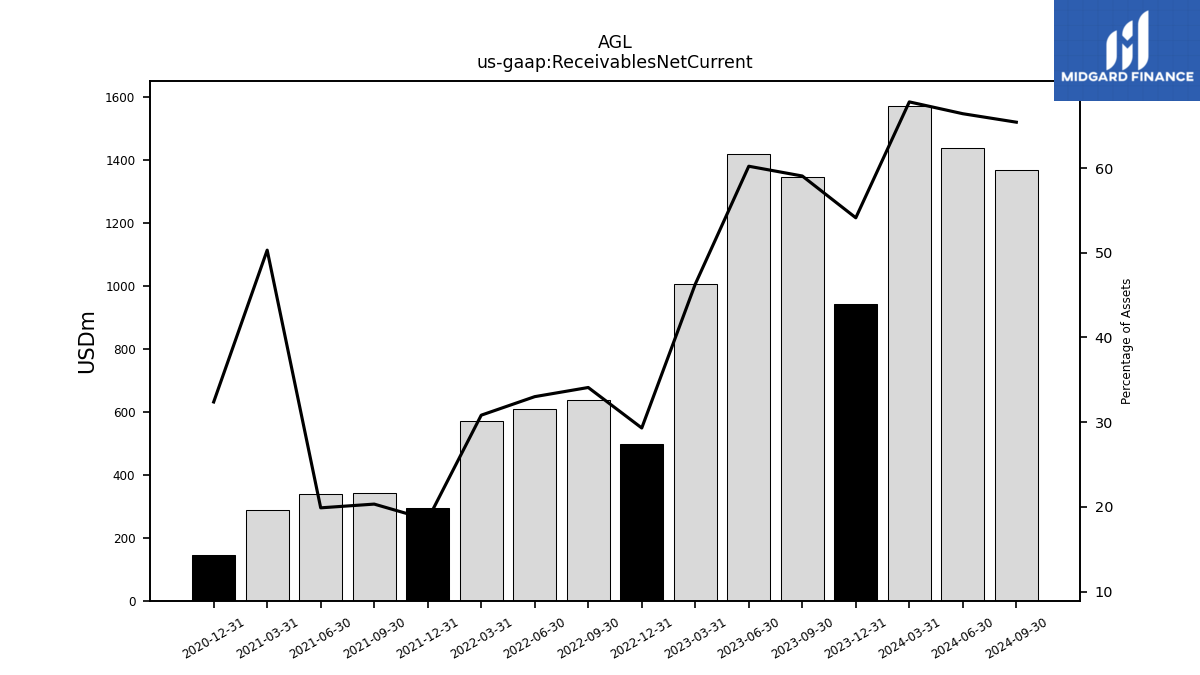
| Receivables Net Current | 1345.71 | 1417.05 | 1004.86 | 497.57 | 637.73 | 607.63 | 571.87 | 293.41 | 342.50 | 338.36 | 288.83 | 144.56 | NA | NA | NA | |
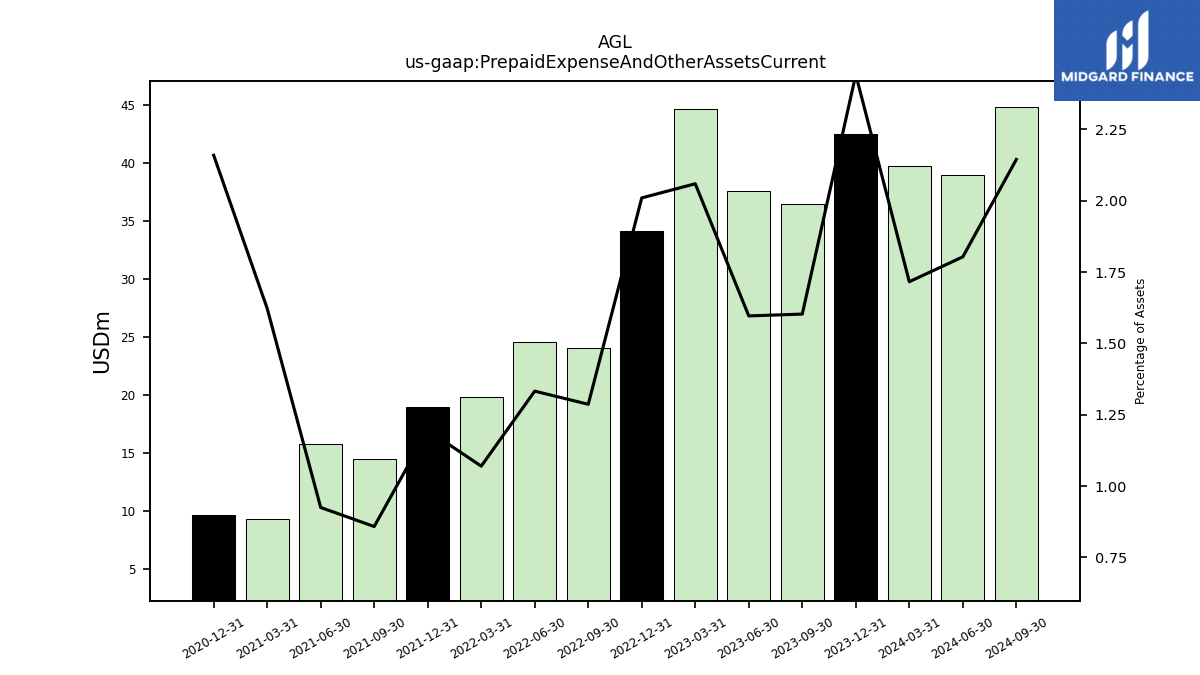
| Prepaid Expense And Other Assets Current | 36.51 | 37.56 | 44.70 | 34.12 | 24.07 | 24.53 | 19.85 | 18.97 | 14.46 | 15.74 | 9.31 | 9.64 | NA | NA | NA |
| 2023-09-30 | 2023-06-30 | 2023-03-31 | 2022-12-31 | 2022-09-30 | 2022-06-30 | 2022-03-31 | 2021-12-31 | 2021-09-30 | 2021-06-30 | 2021-03-31 | 2020-12-31 | 2020-09-30 | 2020-06-30 | 2020-03-31 | ||
|---|---|---|---|---|---|---|---|---|---|---|---|---|---|---|---|---|
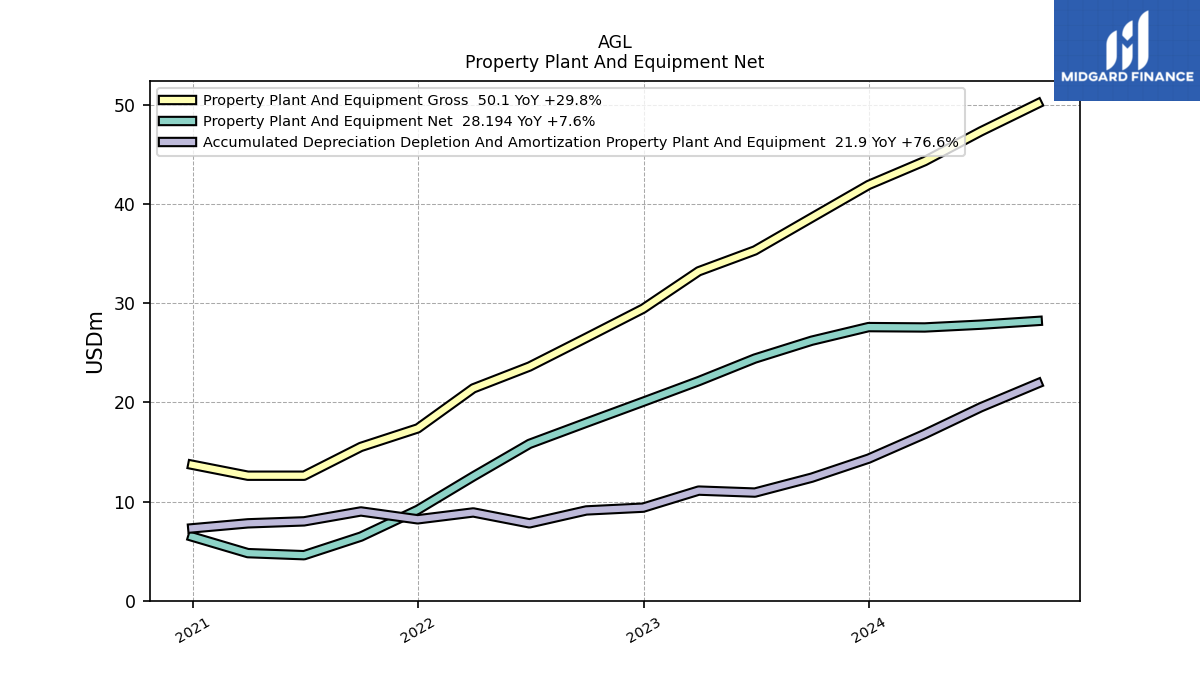
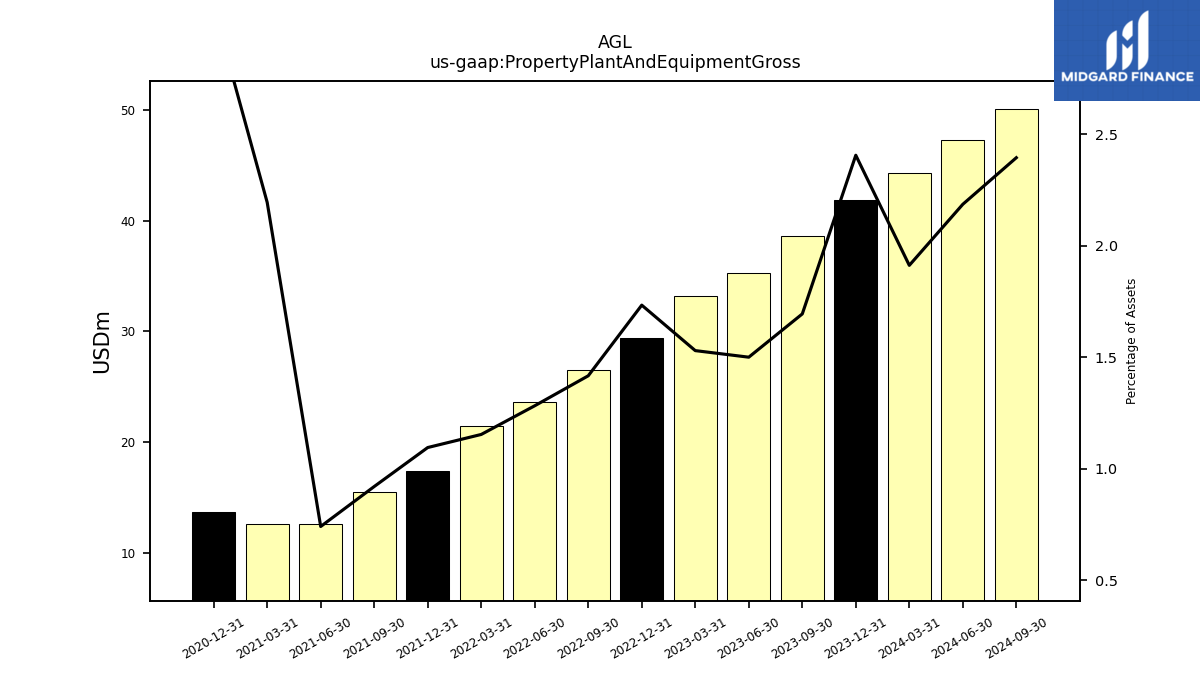
| Property Plant And Equipment Gross | 38.60 | 35.30 | 33.20 | 29.43 | 26.50 | 23.60 | 21.40 | 17.37 | 15.50 | 12.60 | 12.60 | 13.70 | NA | NA | NA | |
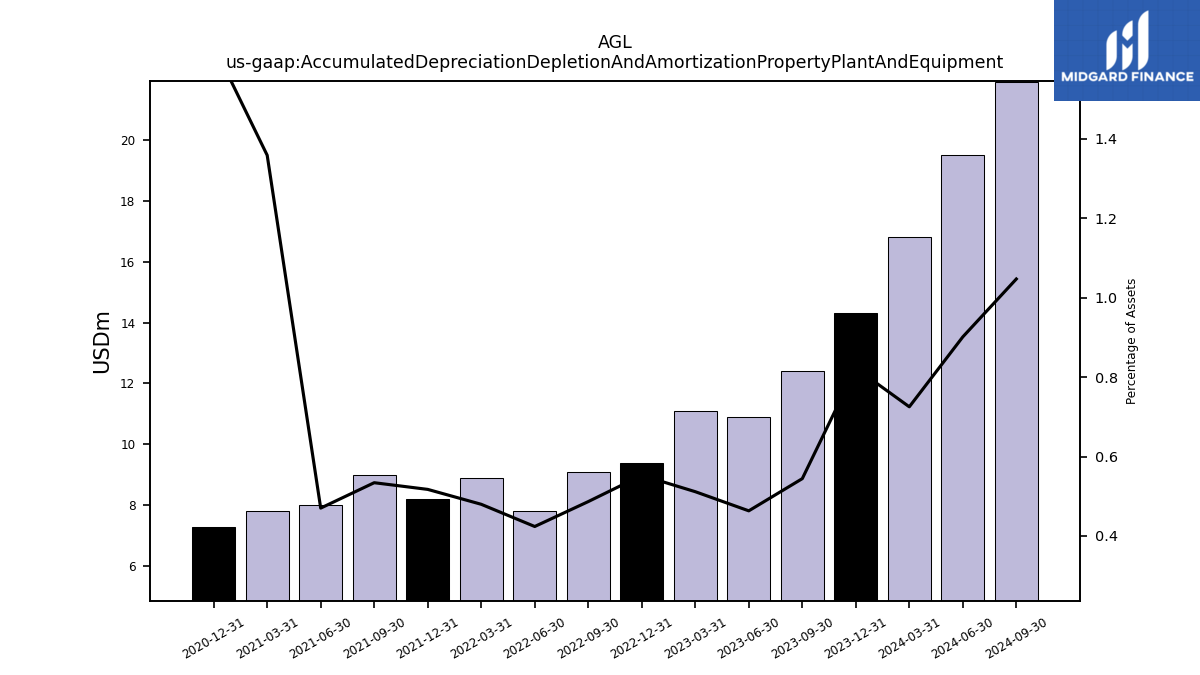
| Accumulated Depreciation Depletion And Amortization Property Plant And Equipment | 12.40 | 10.90 | 11.10 | 9.38 | 9.10 | 7.80 | 8.90 | 8.21 | 9.00 | 8.00 | 7.80 | 7.30 | NA | NA | NA | |
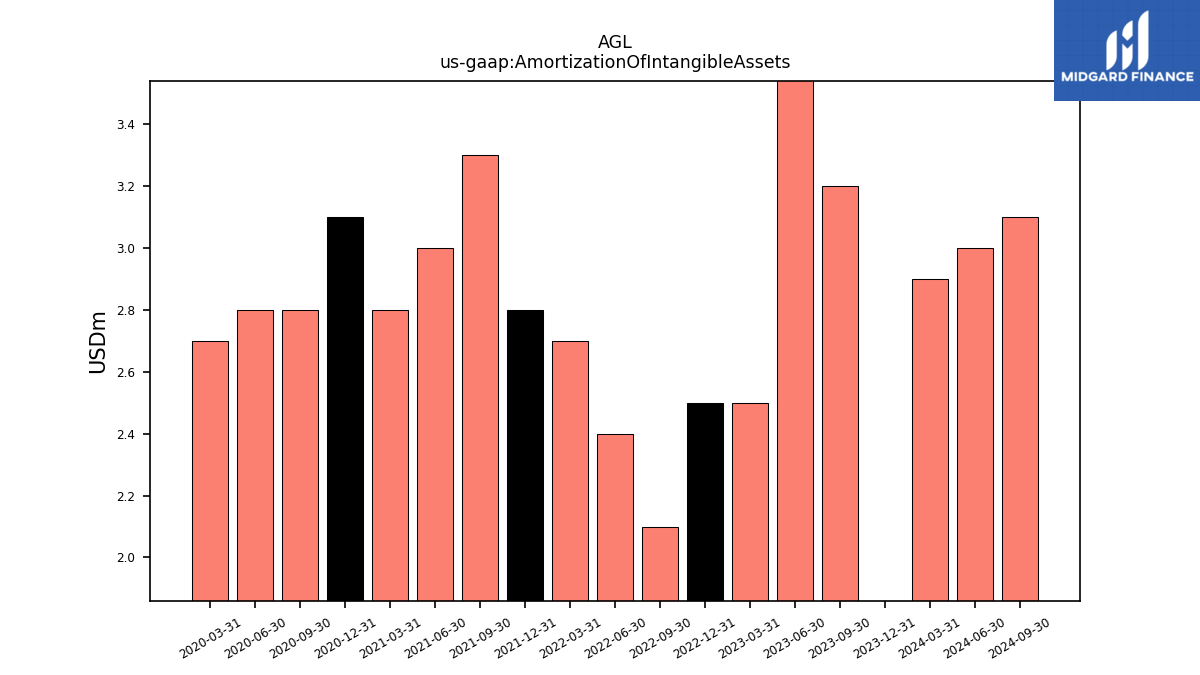
| Amortization Of Intangible Assets | 3.20 | 3.70 | 2.50 | 2.50 | 2.10 | 2.40 | 2.70 | 2.80 | 3.30 | 3.00 | 2.80 | 3.10 | 2.80 | 2.80 | 2.70 | |
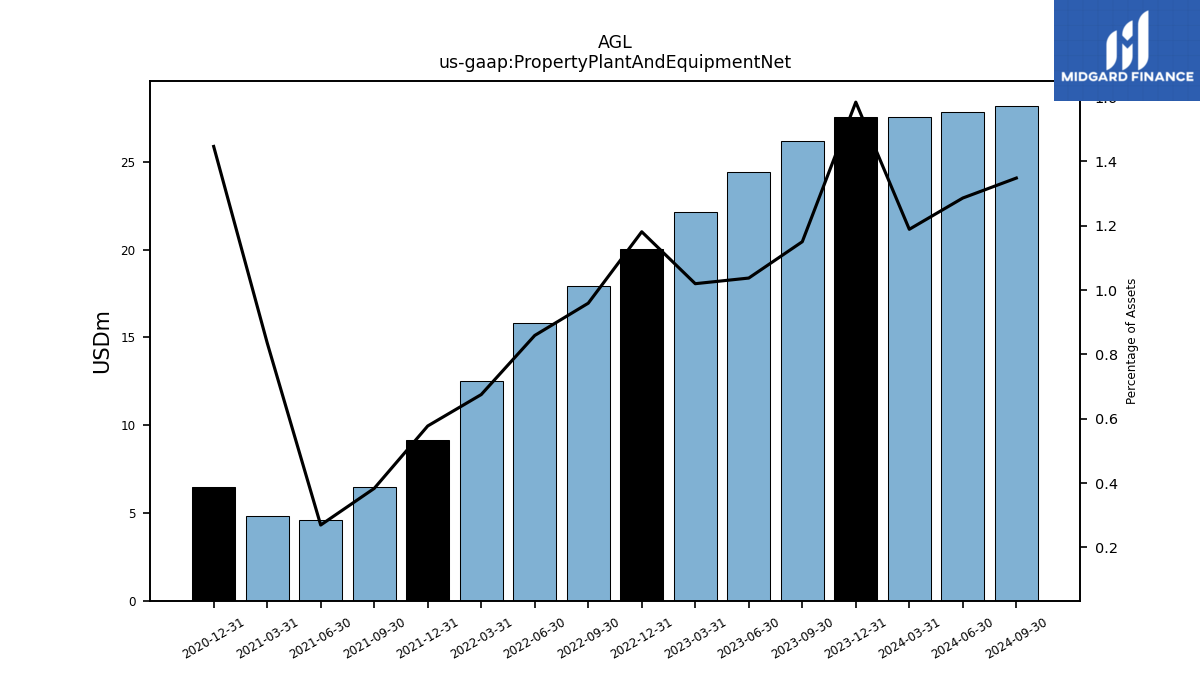
| Property Plant And Equipment Net | 26.20 | 24.41 | 22.13 | 20.05 | 17.94 | 15.81 | 12.53 | 9.16 | 6.46 | 4.59 | 4.80 | 6.46 | NA | NA | NA | |
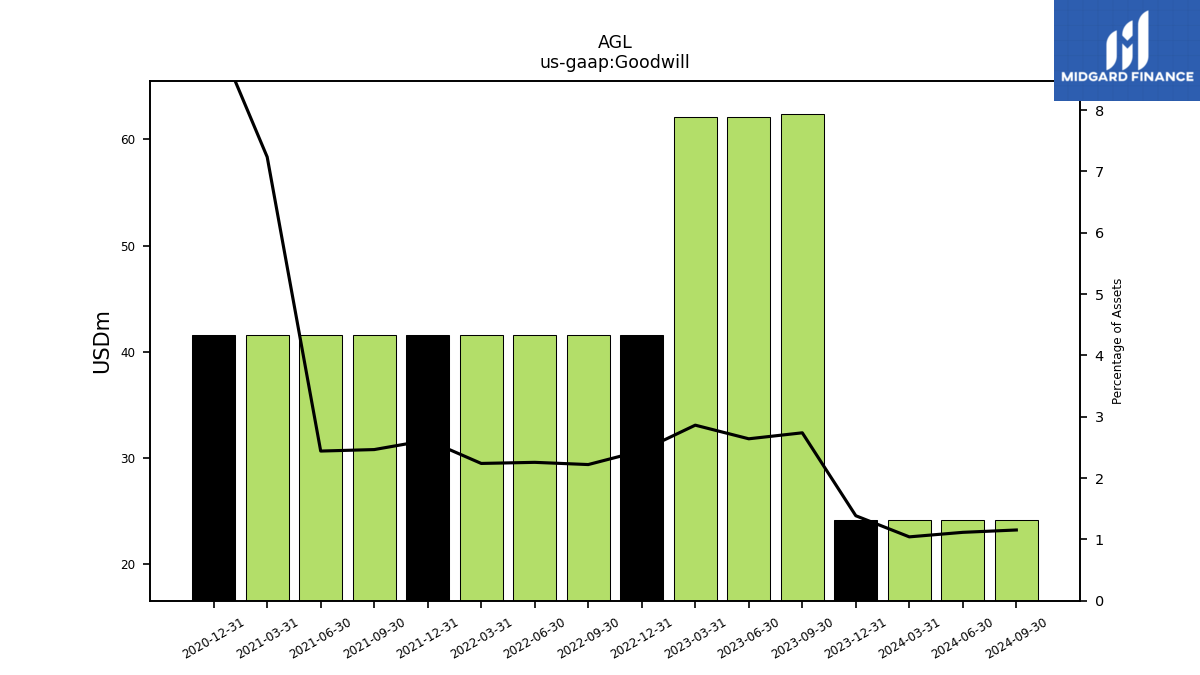
| Goodwill | 62.39 | 62.14 | 62.14 | 41.54 | 41.54 | 41.54 | 41.54 | 41.54 | 41.54 | 41.54 | 41.54 | 41.54 | NA | NA | NA | |
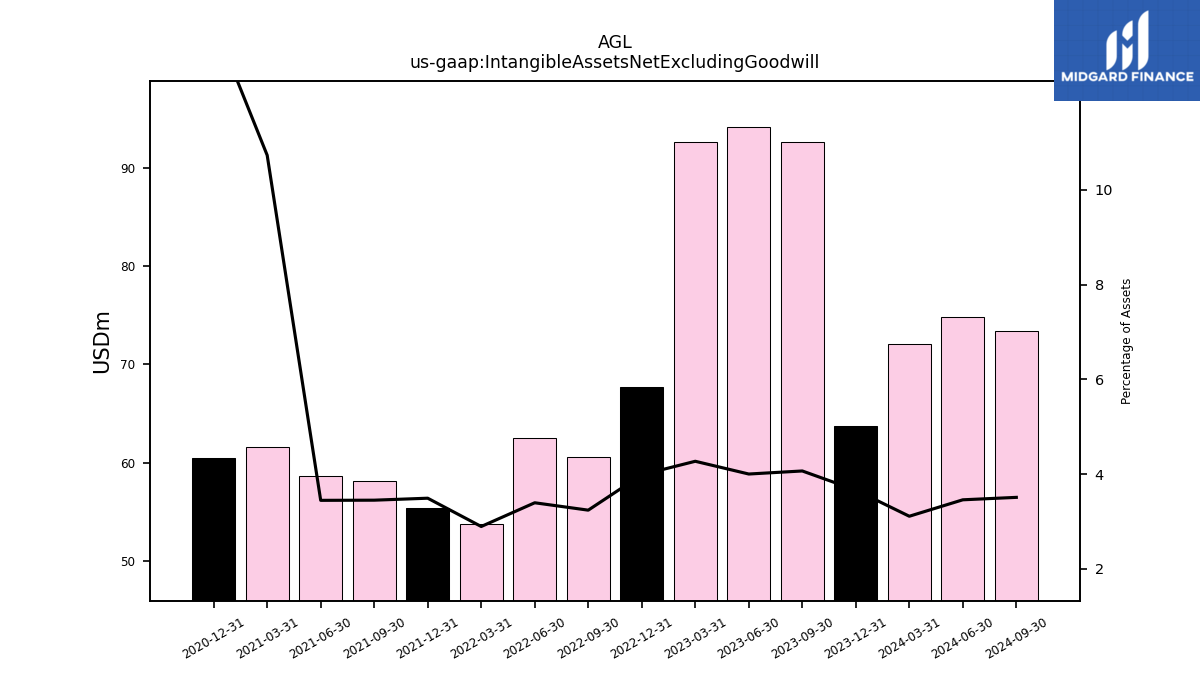
| Intangible Assets Net Excluding Goodwill | 92.66 | 94.19 | 92.71 | 67.68 | 60.60 | 62.51 | 53.71 | 55.40 | 58.15 | 58.66 | 61.61 | 60.47 | NA | NA | NA | |
| Finite Lived Intangible Assets Net | NA | NA | NA | 67.68 | NA | NA | NA | 55.40 | NA | NA | NA | 60.47 | NA | NA | NA | |
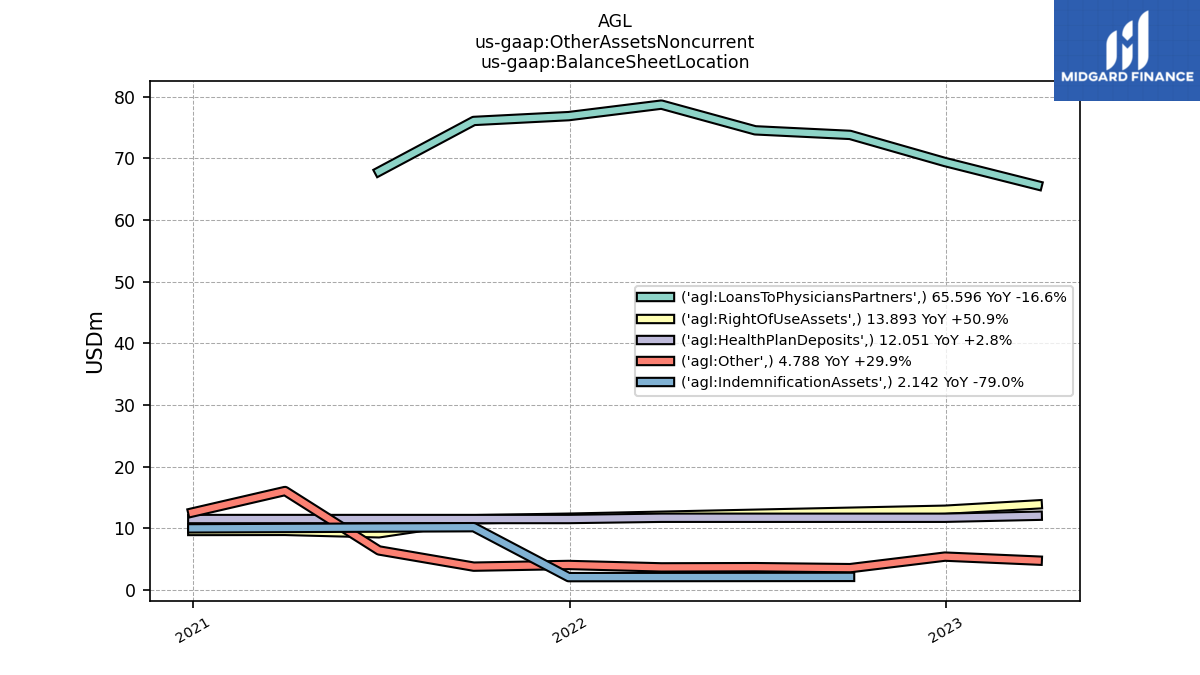
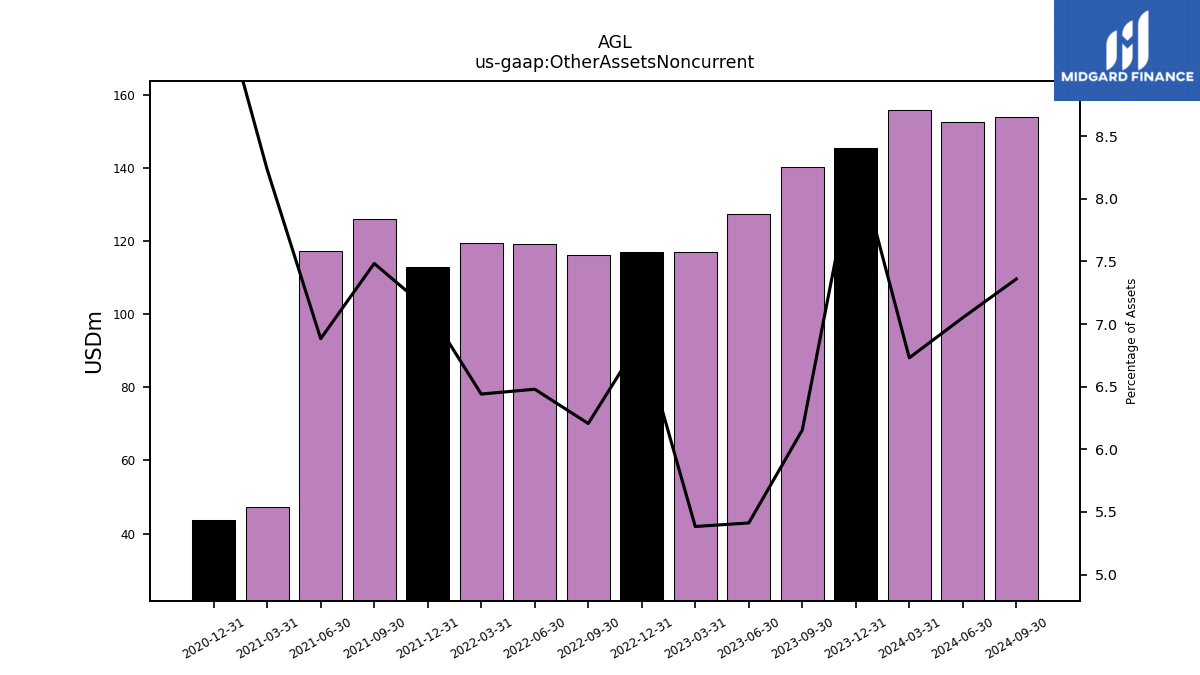
| Other Assets Noncurrent | 140.18 | 127.35 | 116.85 | 116.92 | 116.08 | 119.26 | 119.50 | 112.96 | 126.11 | 117.13 | 47.26 | 43.70 | NA | NA | NA | |
| Available For Sale Debt Securities Amortized Cost Basis | NA | NA | NA | NA | 413.09 | 285.08 | NA | NA | NA | NA | NA | NA | NA | NA | NA | |
| Held To Maturity Securities Debt Maturities After One Through Five Years Fair Value | NA | NA | 143.29 | 139.33 | NA | NA | NA | NA | NA | NA | NA | NA | NA | NA | NA | |
| Held To Maturity Securities Debt Maturities Within One Year Fair Value | NA | NA | 105.73 | 127.52 | NA | NA | NA | NA | NA | NA | NA | NA | NA | NA | NA | |
| Held To Maturity Securities Debt Maturities After Five Through Ten Years Fair Value | NA | NA | 161.65 | 145.05 | NA | NA | NA | NA | NA | NA | NA | NA | NA | NA | NA | |
| Held To Maturity Securities Debt Maturities After Ten Years Fair Value | NA | NA | 11.81 | NA | NA | NA | NA | NA | NA | NA | NA | NA | NA | NA | NA |
| 2023-09-30 | 2023-06-30 | 2023-03-31 | 2022-12-31 | 2022-09-30 | 2022-06-30 | 2022-03-31 | 2021-12-31 | 2021-09-30 | 2021-06-30 | 2021-03-31 | 2020-12-31 | 2020-09-30 | 2020-06-30 | 2020-03-31 | ||
|---|---|---|---|---|---|---|---|---|---|---|---|---|---|---|---|---|
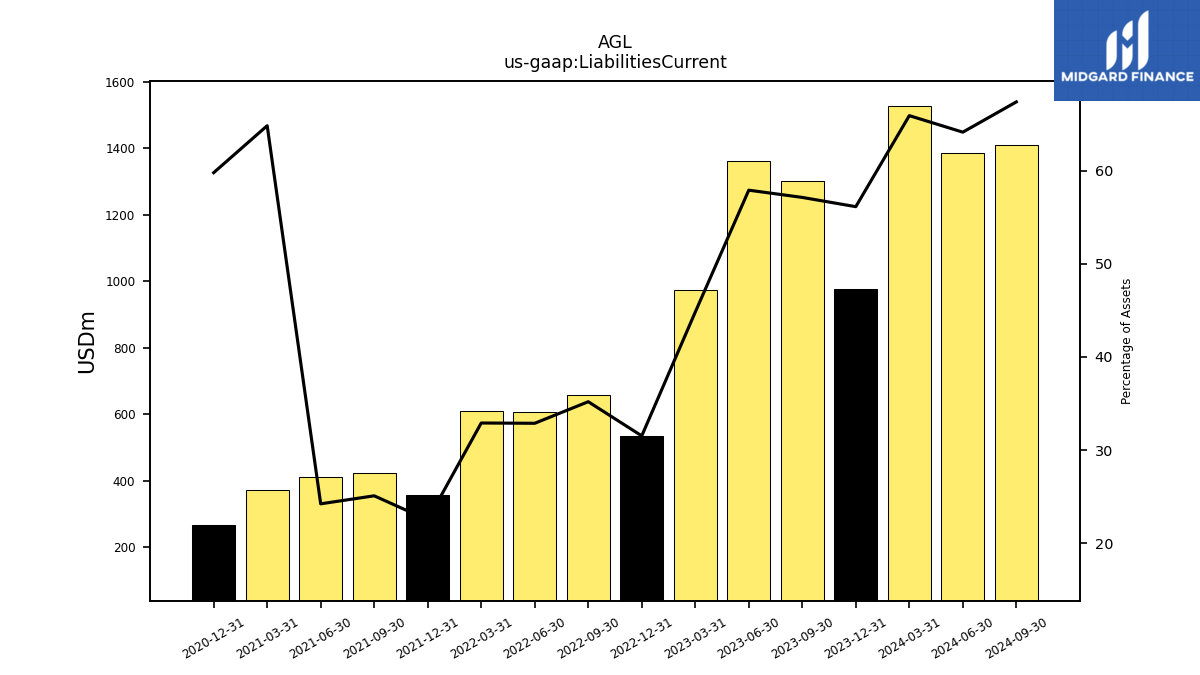
| Liabilities Current | 1301.33 | 1362.35 | 972.61 | 535.09 | 658.23 | 605.09 | 610.46 | 356.96 | 422.78 | 412.33 | 372.11 | 266.83 | NA | NA | NA | |
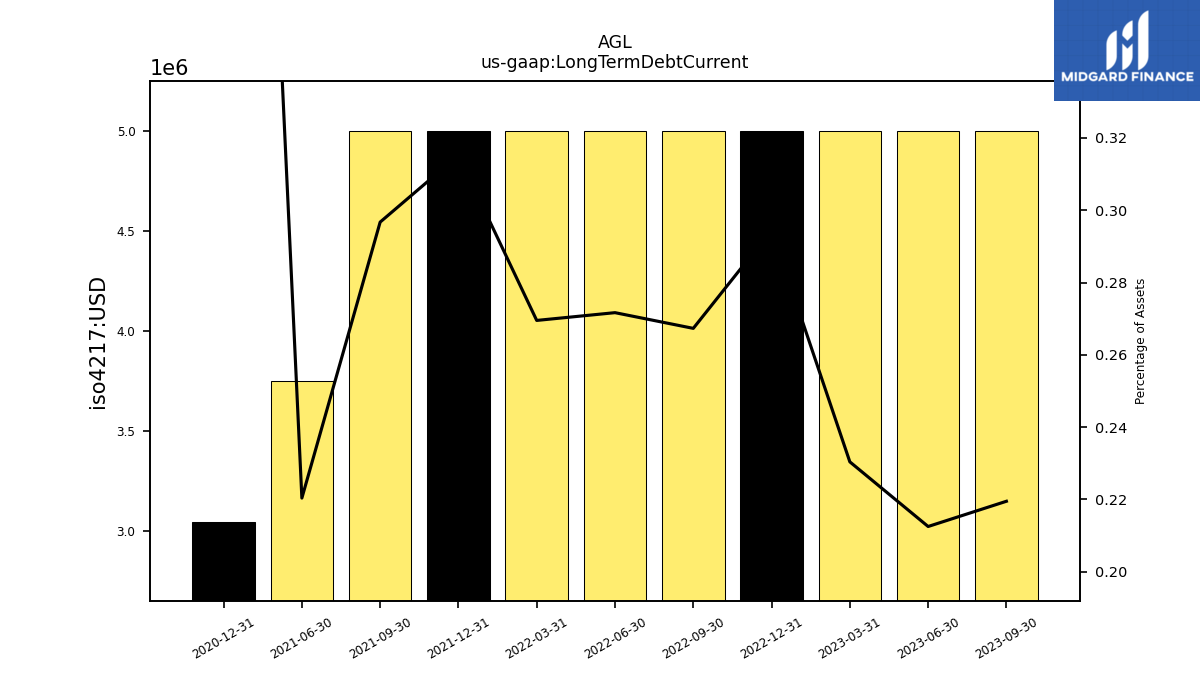
| Long Term Debt Current | 5.00 | 5.00 | 5.00 | 5.00 | 5.00 | 5.00 | 5.00 | 5.00 | 5.00 | 3.75 | NA | 3.04 | NA | NA | NA | |
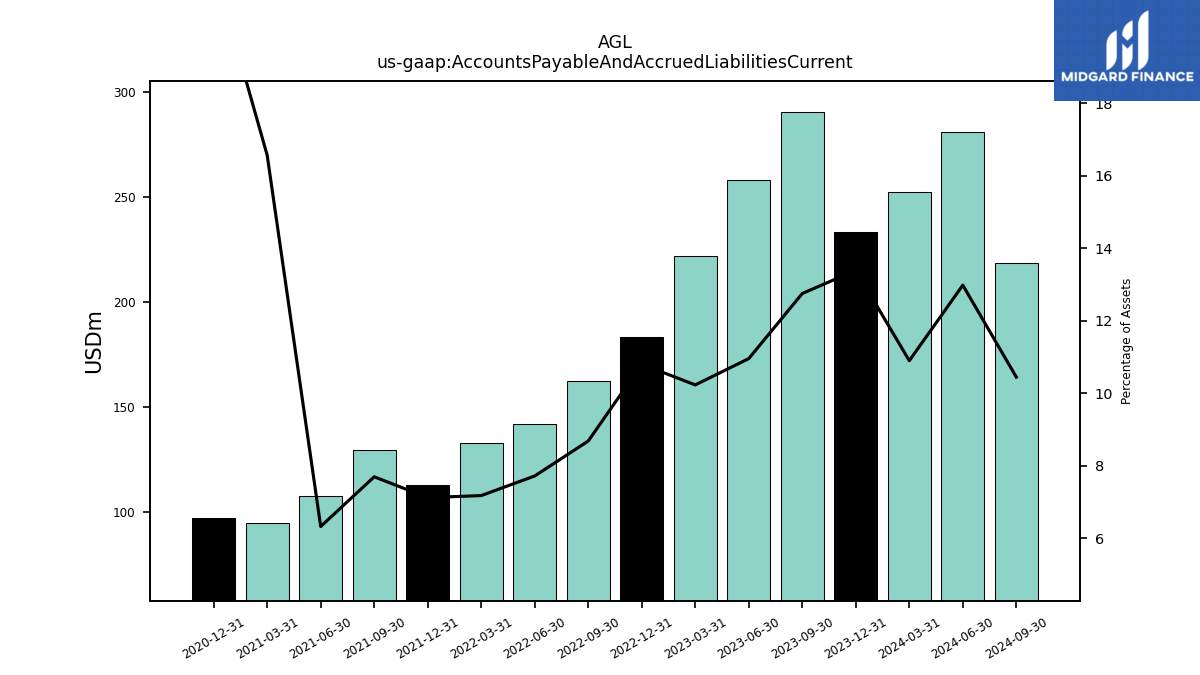
| Accounts Payable And Accrued Liabilities Current | 290.56 | 257.82 | 222.05 | 183.36 | 162.39 | 142.05 | 133.14 | 112.95 | 129.66 | 107.60 | 95.12 | 97.24 | NA | NA | NA |
| 2023-09-30 | 2023-06-30 | 2023-03-31 | 2022-12-31 | 2022-09-30 | 2022-06-30 | 2022-03-31 | 2021-12-31 | 2021-09-30 | 2021-06-30 | 2021-03-31 | 2020-12-31 | 2020-09-30 | 2020-06-30 | 2020-03-31 | ||
|---|---|---|---|---|---|---|---|---|---|---|---|---|---|---|---|---|
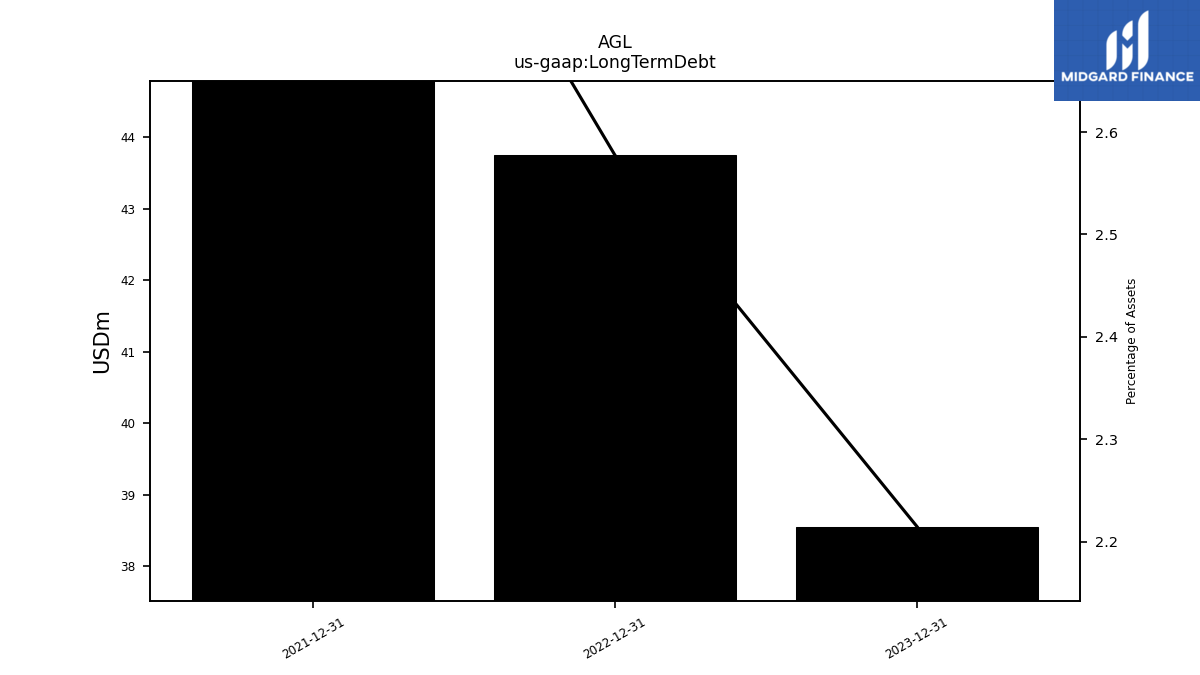
| Long Term Debt | NA | NA | NA | 43.75 | NA | NA | NA | 48.75 | NA | NA | NA | NA | NA | NA | NA | |
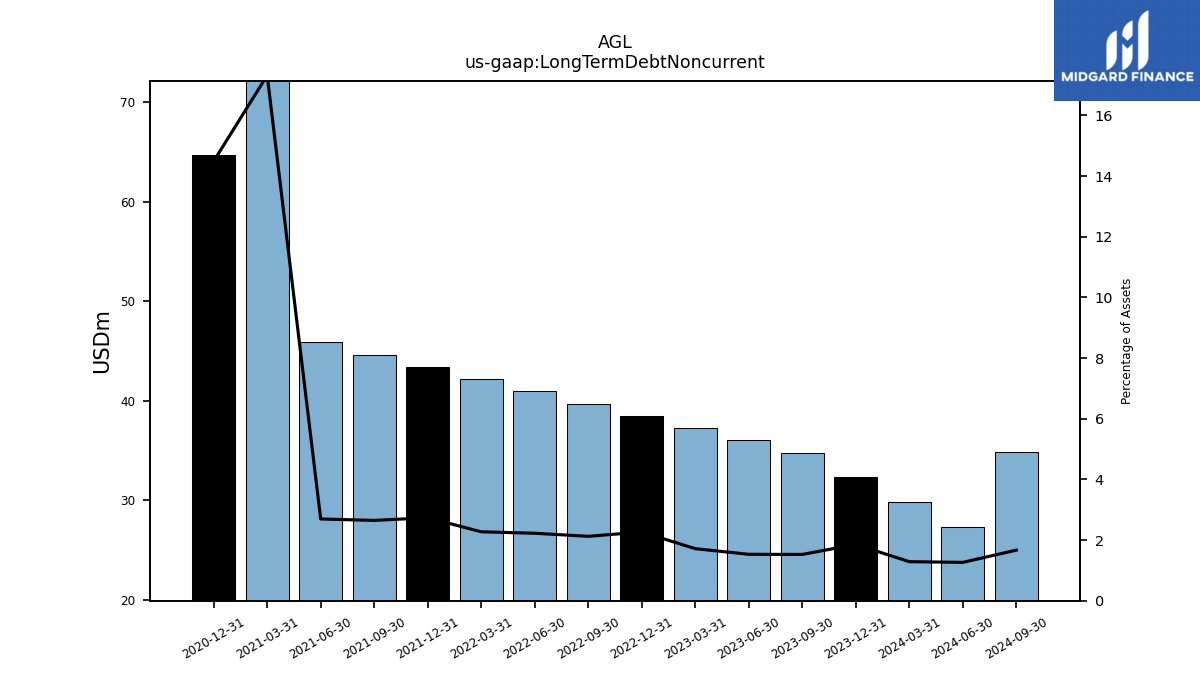
| Long Term Debt Noncurrent | 34.78 | 36.02 | 37.25 | 38.48 | 39.71 | 40.94 | 42.17 | 43.40 | 44.63 | 45.86 | 99.41 | 64.67 | NA | NA | NA | |
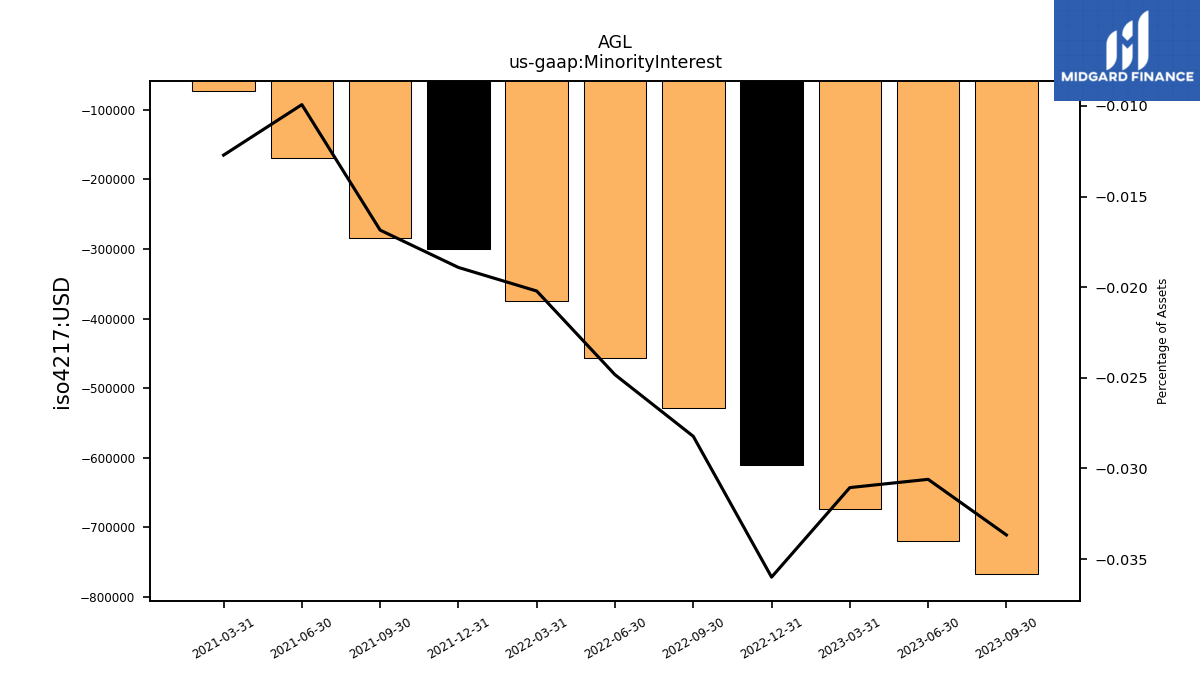
| Minority Interest | -0.77 | -0.72 | -0.67 | -0.61 | -0.53 | -0.46 | -0.38 | -0.30 | -0.28 | -0.17 | -0.07 | NA | NA | NA | NA | |
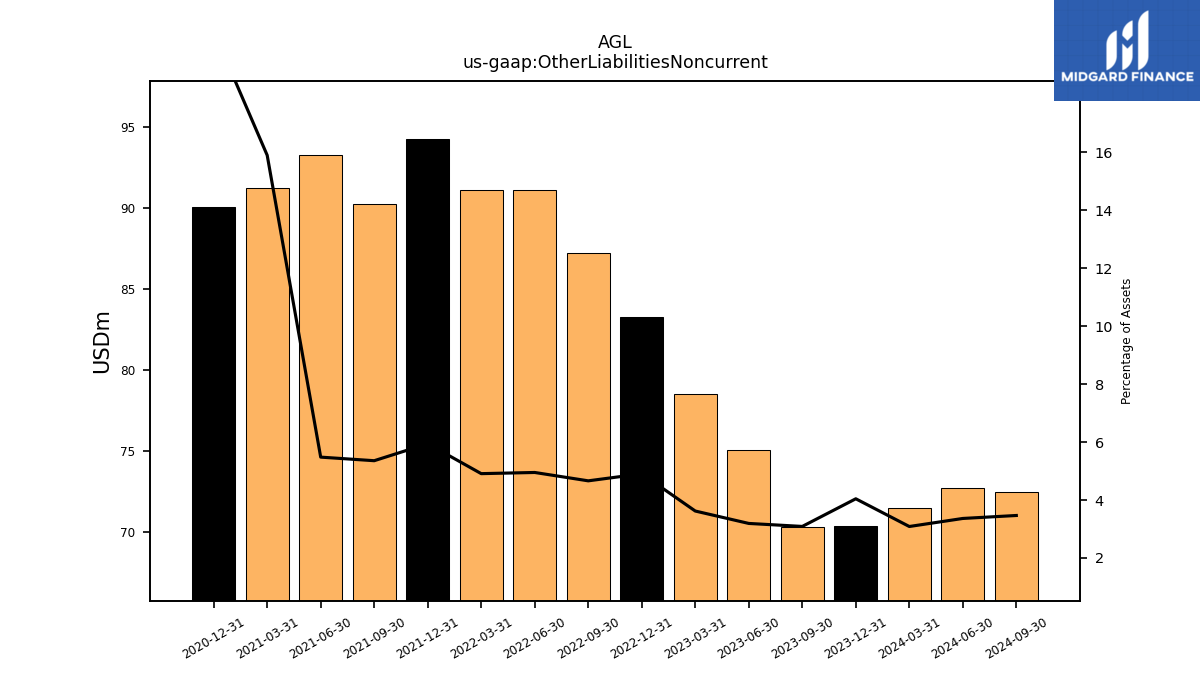
| Other Liabilities Noncurrent | 70.37 | 75.11 | 78.57 | 83.29 | 87.21 | 91.12 | 91.10 | 94.30 | 90.27 | 93.26 | 91.26 | 90.09 | NA | NA | NA | |
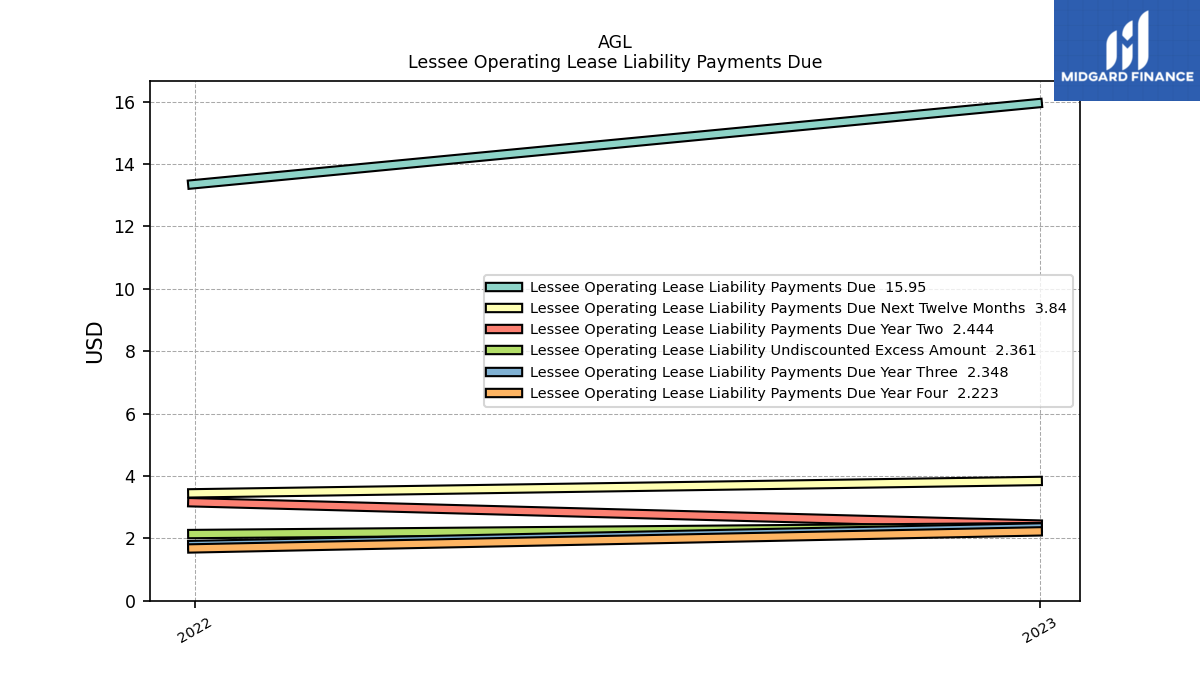
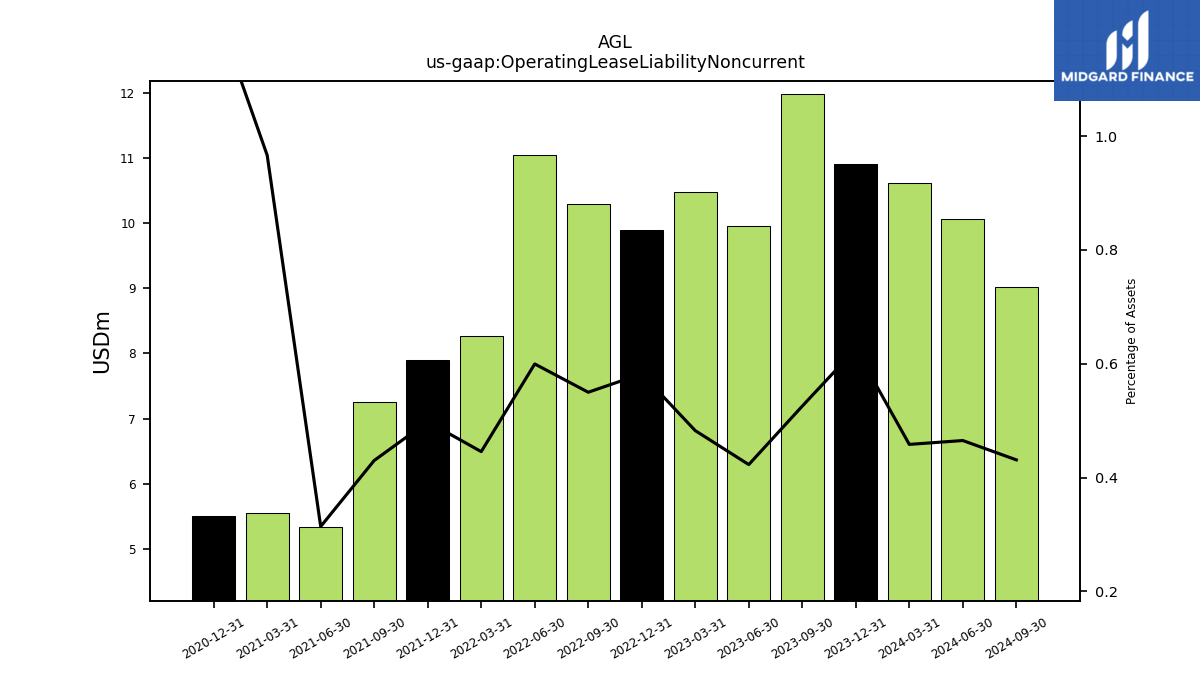
| Operating Lease Liability Noncurrent | 11.97 | 9.95 | 10.47 | 9.88 | 10.29 | 11.04 | 8.27 | 7.90 | 7.25 | 5.34 | 5.55 | 5.51 | NA | NA | NA |
| 2023-09-30 | 2023-06-30 | 2023-03-31 | 2022-12-31 | 2022-09-30 | 2022-06-30 | 2022-03-31 | 2021-12-31 | 2021-09-30 | 2021-06-30 | 2021-03-31 | 2020-12-31 | 2020-09-30 | 2020-06-30 | 2020-03-31 | ||
|---|---|---|---|---|---|---|---|---|---|---|---|---|---|---|---|---|
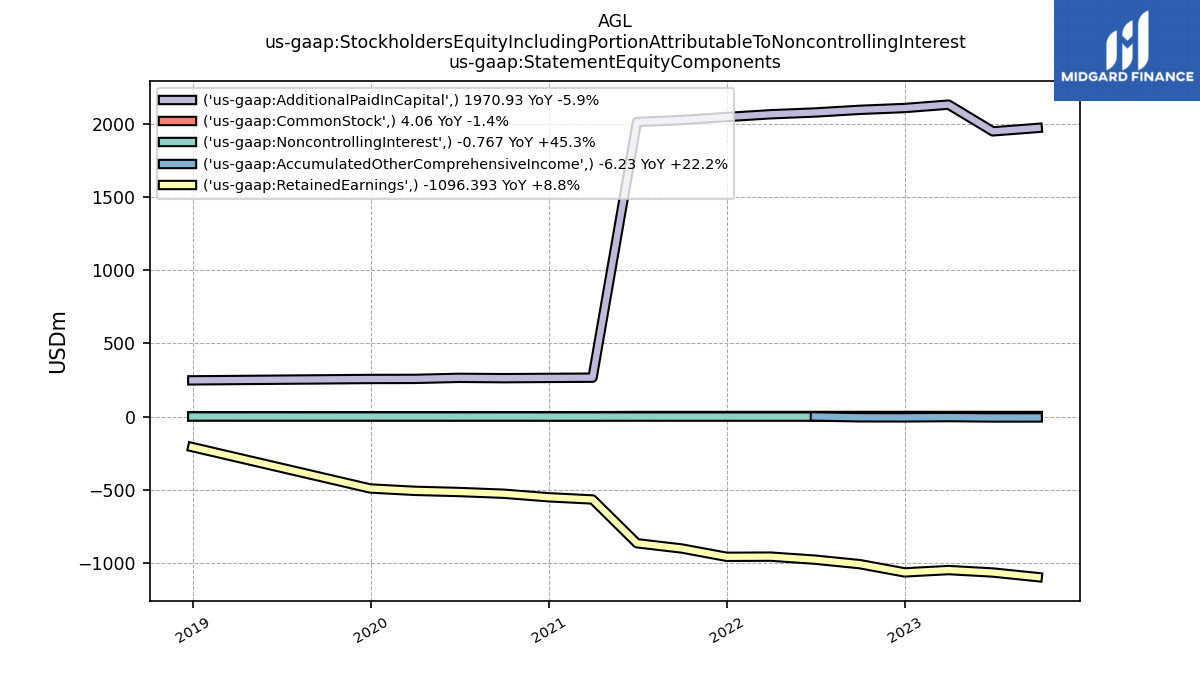
| Stockholders Equity | 872.37 | 880.17 | 1082.51 | 1041.22 | 1085.82 | 1103.83 | 1111.85 | 1091.90 | 1127.72 | 1150.45 | -298.17 | -284.73 | NA | NA | NA | |
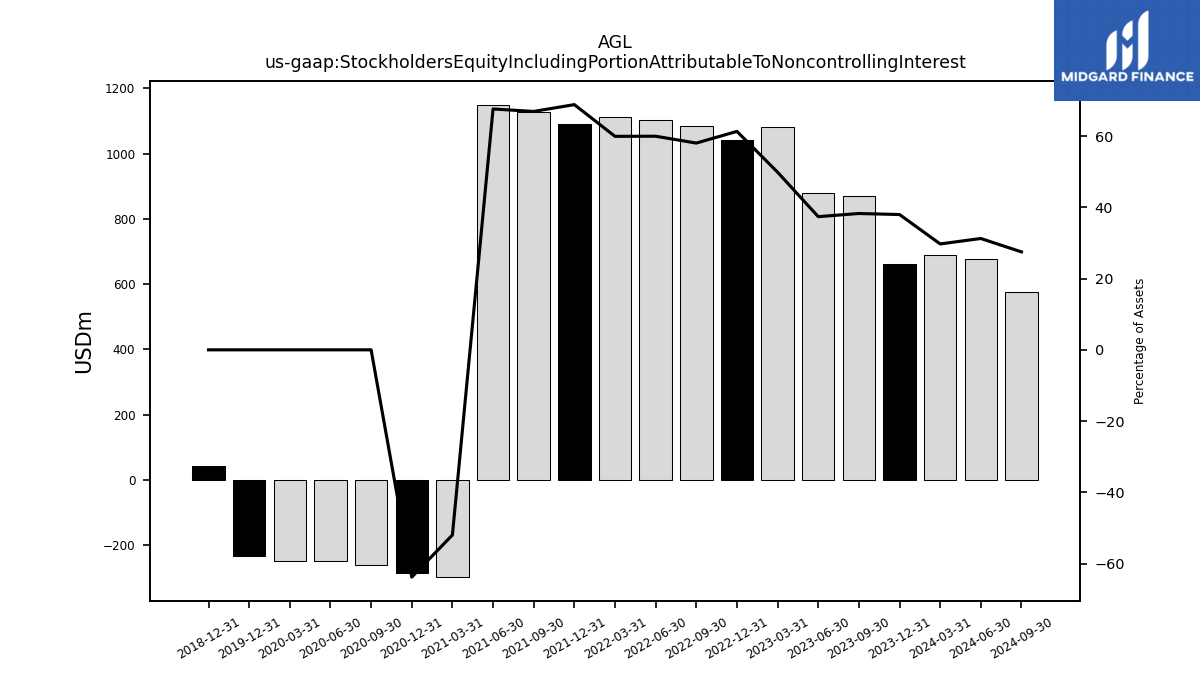
| Stockholders Equity Including Portion Attributable To Noncontrolling Interest | 871.60 | 879.45 | 1081.84 | 1040.61 | 1085.29 | 1103.37 | 1111.48 | 1091.60 | 1127.44 | 1150.28 | -298.24 | -284.73 | -262.29 | -248.28 | -247.51 | |
| Common Stock Value | 4.06 | 4.05 | 4.14 | 4.12 | 4.12 | 4.08 | 4.06 | 4.00 | 3.92 | 3.91 | 2.49 | 2.49 | NA | NA | NA | |
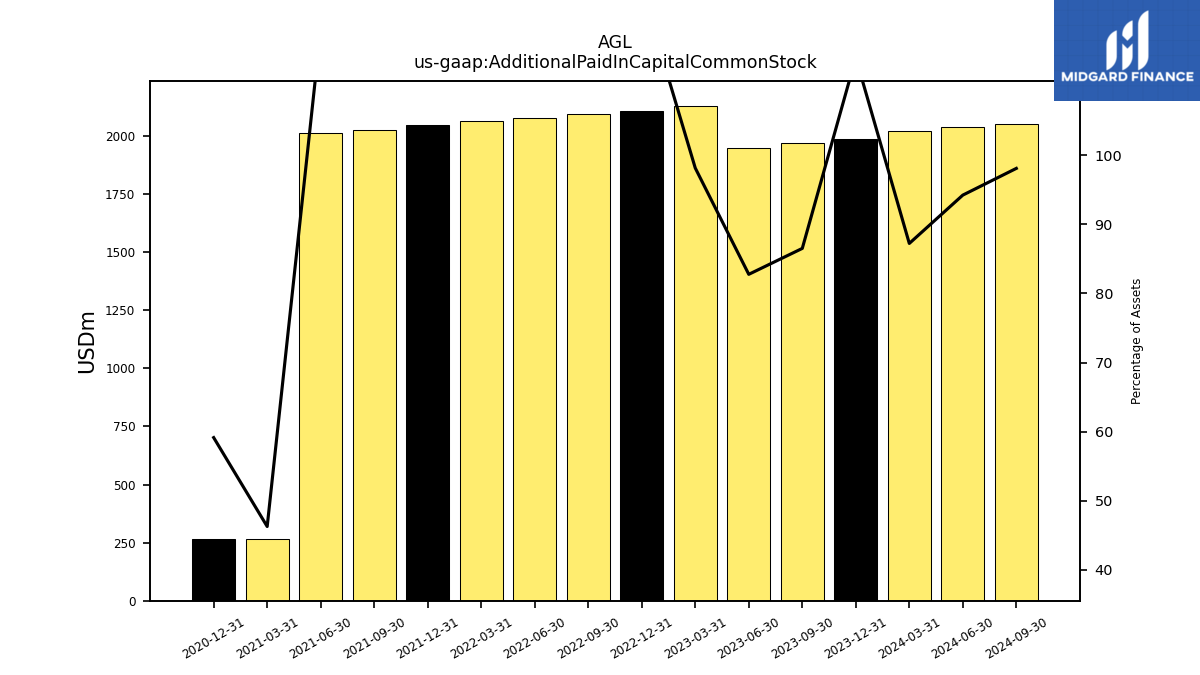
| Additional Paid In Capital Common Stock | 1970.93 | 1947.44 | 2130.13 | 2106.89 | 2094.56 | 2076.33 | 2064.24 | 2045.57 | 2024.76 | 2011.65 | 265.60 | 263.97 | NA | NA | NA | |
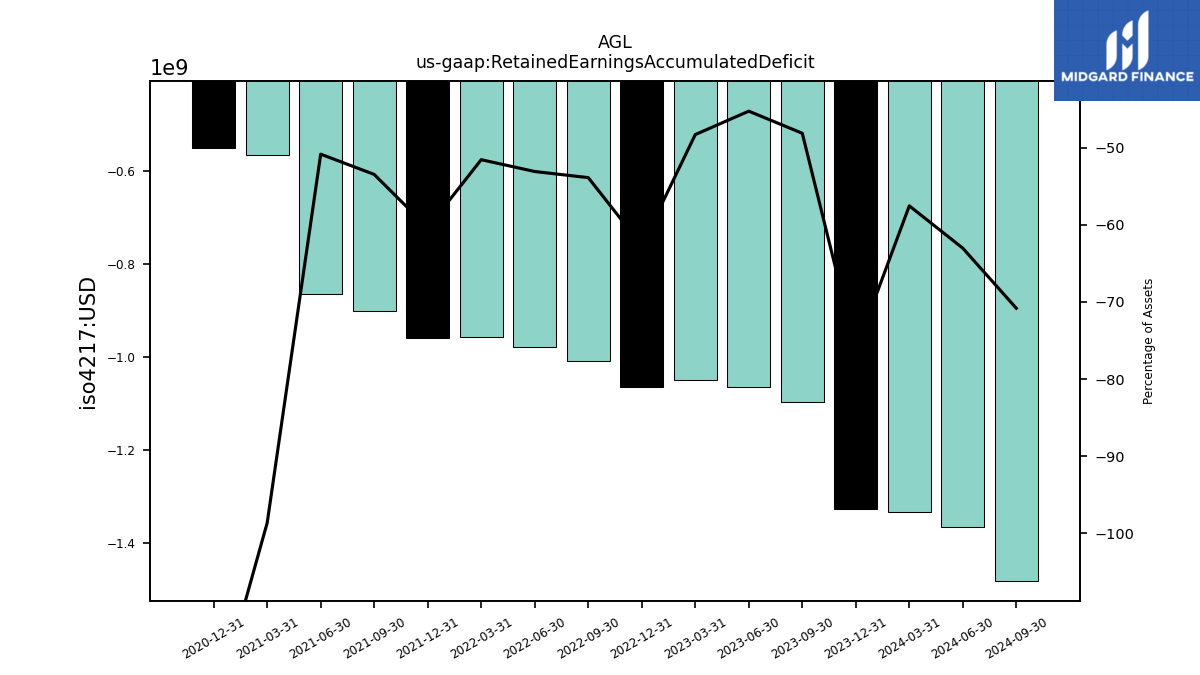
| Retained Earnings Accumulated Deficit | -1096.39 | -1064.96 | -1048.21 | -1064.23 | -1007.76 | -977.10 | -956.45 | -957.68 | -900.96 | -865.11 | -566.27 | -551.19 | NA | NA | NA | |
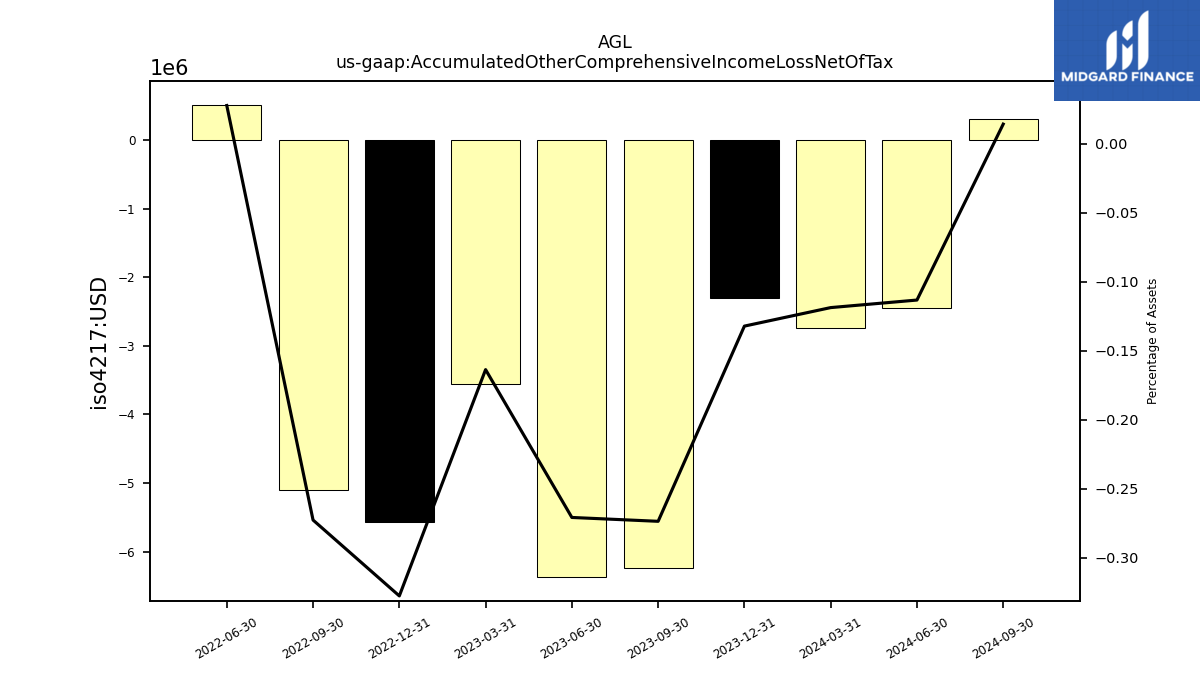
| Accumulated Other Comprehensive Income Loss Net Of Tax | -6.23 | -6.37 | -3.55 | -5.56 | -5.10 | 0.51 | NA | NA | NA | NA | NA | NA | NA | NA | NA | |
| Minority Interest | -0.77 | -0.72 | -0.67 | -0.61 | -0.53 | -0.46 | -0.38 | -0.30 | -0.28 | -0.17 | -0.07 | NA | NA | NA | NA | |
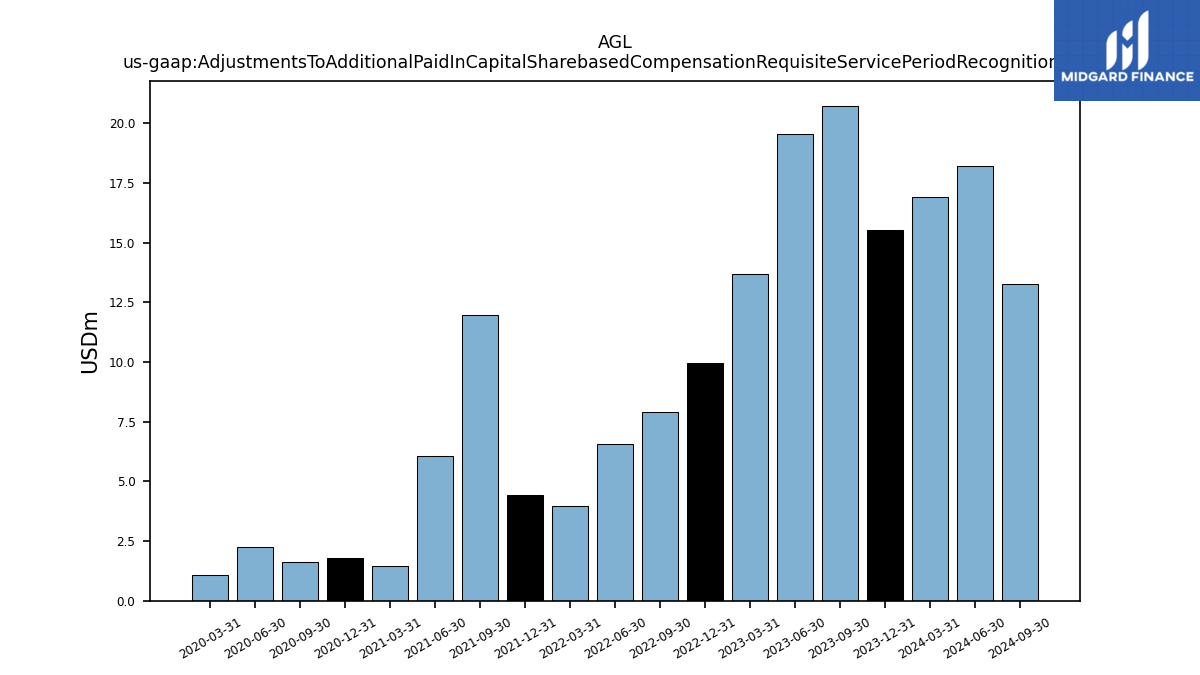
| Adjustments To Additional Paid In Capital Sharebased Compensation Requisite Service Period Recognition Value | 20.74 | 19.57 | 13.67 | 9.95 | 7.91 | 6.55 | 3.97 | 4.41 | 11.96 | 6.08 | 1.47 | 1.77 | 1.62 | 2.23 | 1.07 |
| 2023-09-30 | 2023-06-30 | 2023-03-31 | 2022-12-31 | 2022-09-30 | 2022-06-30 | 2022-03-31 | 2021-12-31 | 2021-09-30 | 2021-06-30 | 2021-03-31 | 2020-12-31 | 2020-09-30 | 2020-06-30 | 2020-03-31 | ||
|---|---|---|---|---|---|---|---|---|---|---|---|---|---|---|---|---|
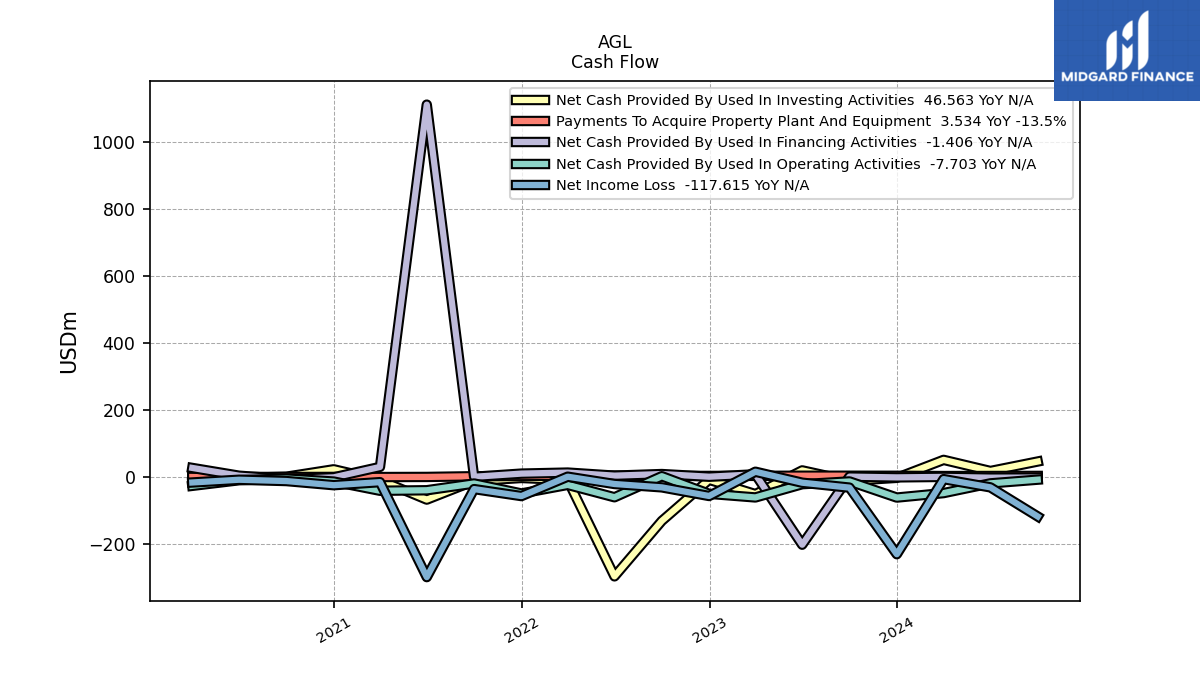
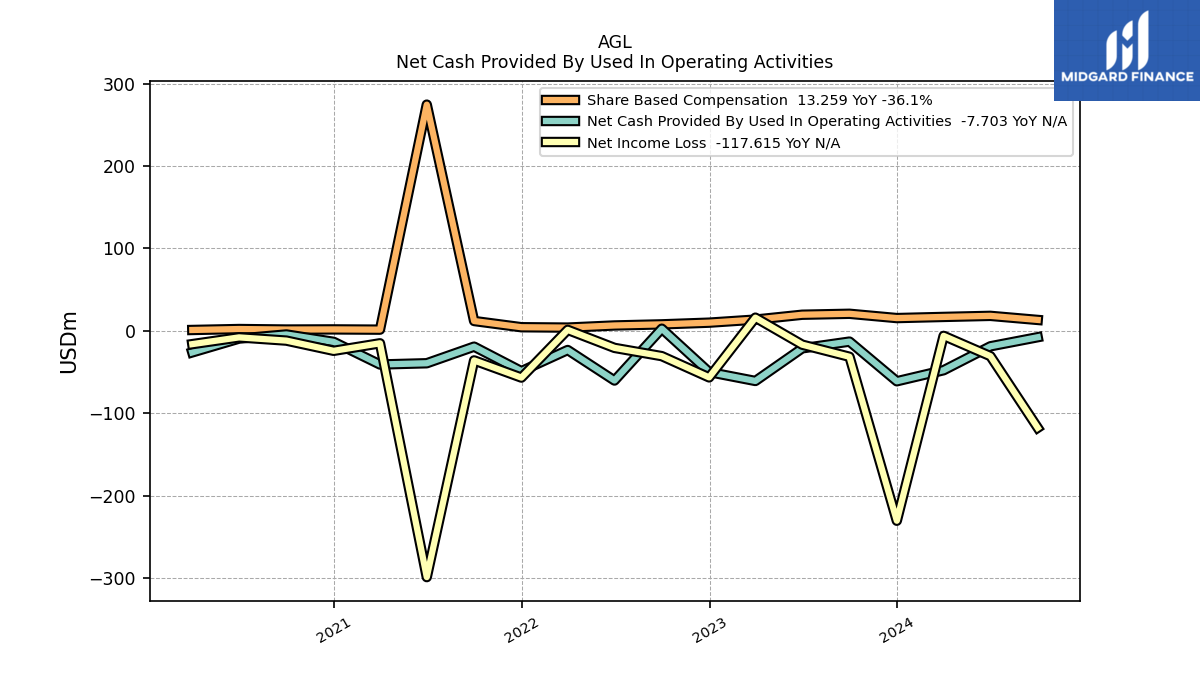
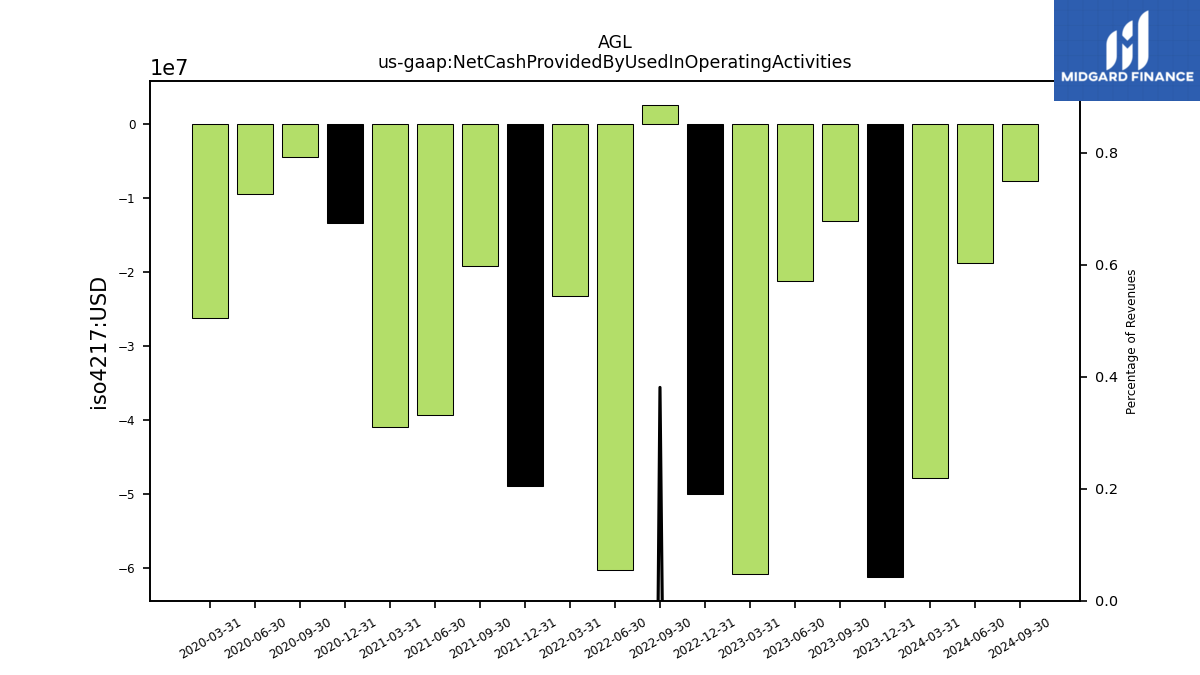
| Net Cash Provided By Used In Operating Activities | -13.02 | -21.20 | -60.81 | -49.96 | 2.65 | -60.26 | -23.23 | -48.90 | -19.14 | -39.29 | -40.83 | -13.34 | -4.37 | -9.37 | -26.13 | |
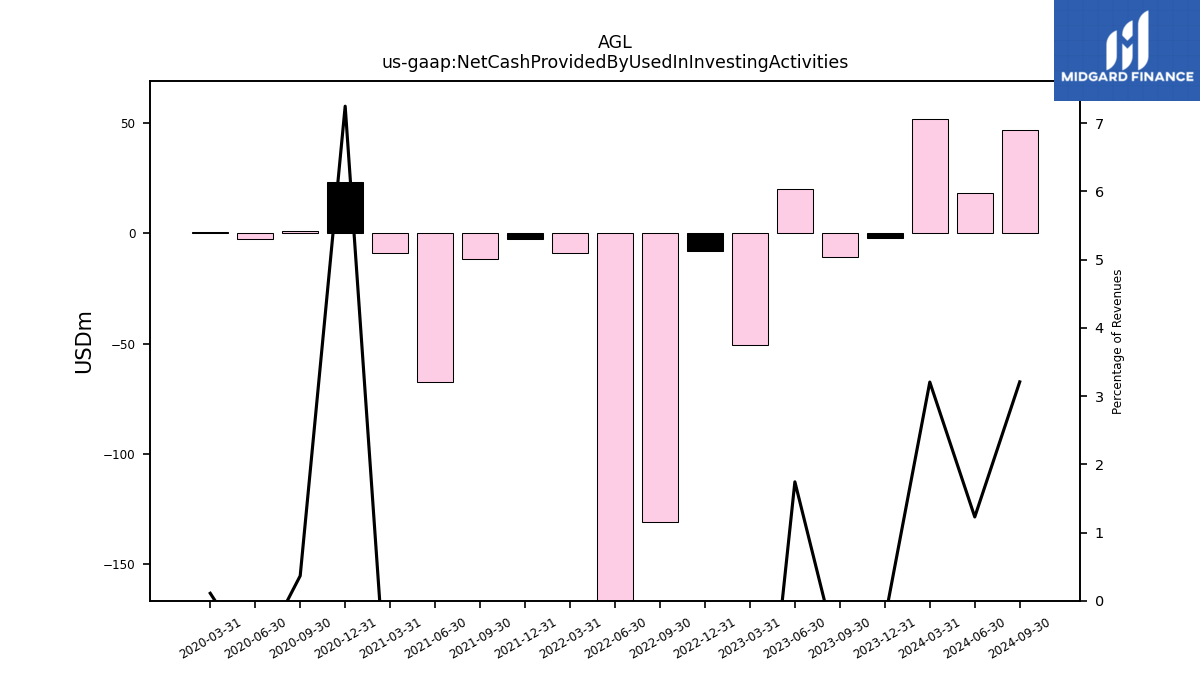
| Net Cash Provided By Used In Investing Activities | -11.03 | 20.03 | -50.81 | -7.97 | -130.94 | -296.61 | -8.87 | -2.60 | -11.56 | -67.26 | -9.07 | 23.27 | 1.14 | -2.67 | 0.32 | |
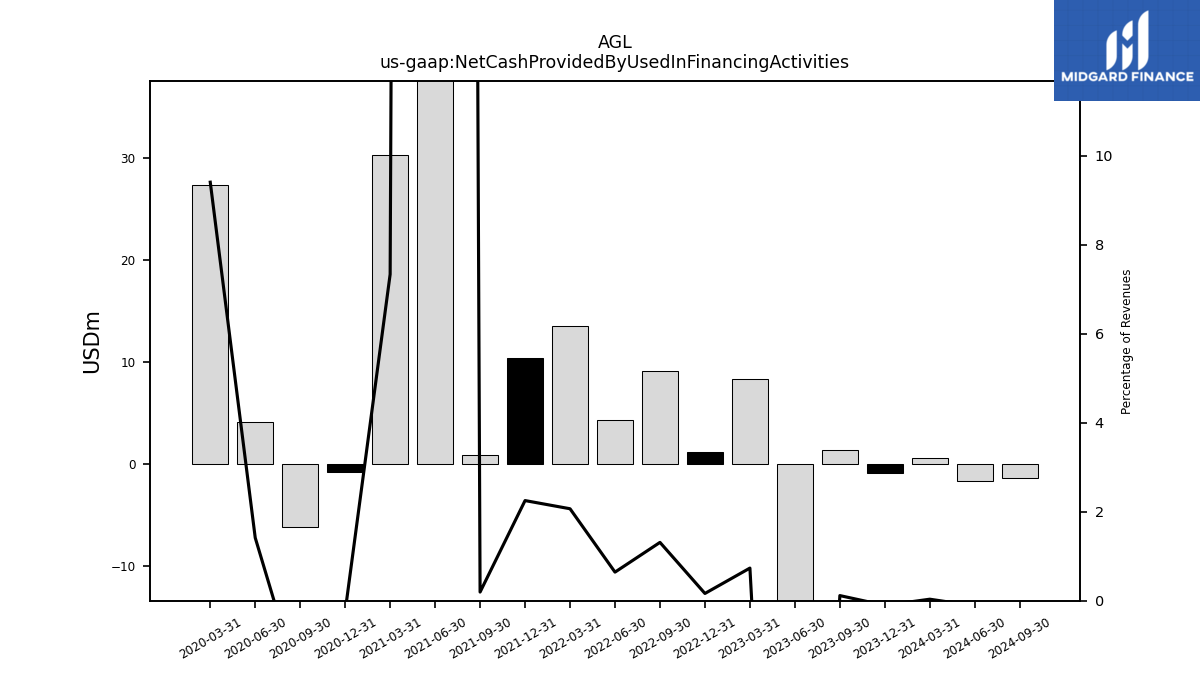
| Net Cash Provided By Used In Financing Activities | 1.41 | -202.04 | 8.34 | 1.13 | 9.11 | 4.31 | 13.51 | 10.42 | 0.90 | 1112.78 | 30.30 | -0.76 | -6.14 | 4.15 | 27.37 |
| 2023-09-30 | 2023-06-30 | 2023-03-31 | 2022-12-31 | 2022-09-30 | 2022-06-30 | 2022-03-31 | 2021-12-31 | 2021-09-30 | 2021-06-30 | 2021-03-31 | 2020-12-31 | 2020-09-30 | 2020-06-30 | 2020-03-31 | ||
|---|---|---|---|---|---|---|---|---|---|---|---|---|---|---|---|---|
| Net Cash Provided By Used In Operating Activities | -13.02 | -21.20 | -60.81 | -49.96 | 2.65 | -60.26 | -23.23 | -48.90 | -19.14 | -39.29 | -40.83 | -13.34 | -4.37 | -9.37 | -26.13 | |
| Net Income Loss | -31.44 | -16.75 | 16.02 | -56.47 | -30.67 | -20.65 | 1.23 | -56.72 | -35.84 | -298.85 | -15.08 | -24.21 | -11.83 | -7.91 | -16.10 | |
| Profit Loss | -31.48 | -16.80 | 15.96 | -56.55 | -30.74 | -20.73 | 1.16 | -56.74 | -35.96 | -298.94 | -15.15 | -24.21 | -11.83 | -7.91 | -16.10 | |
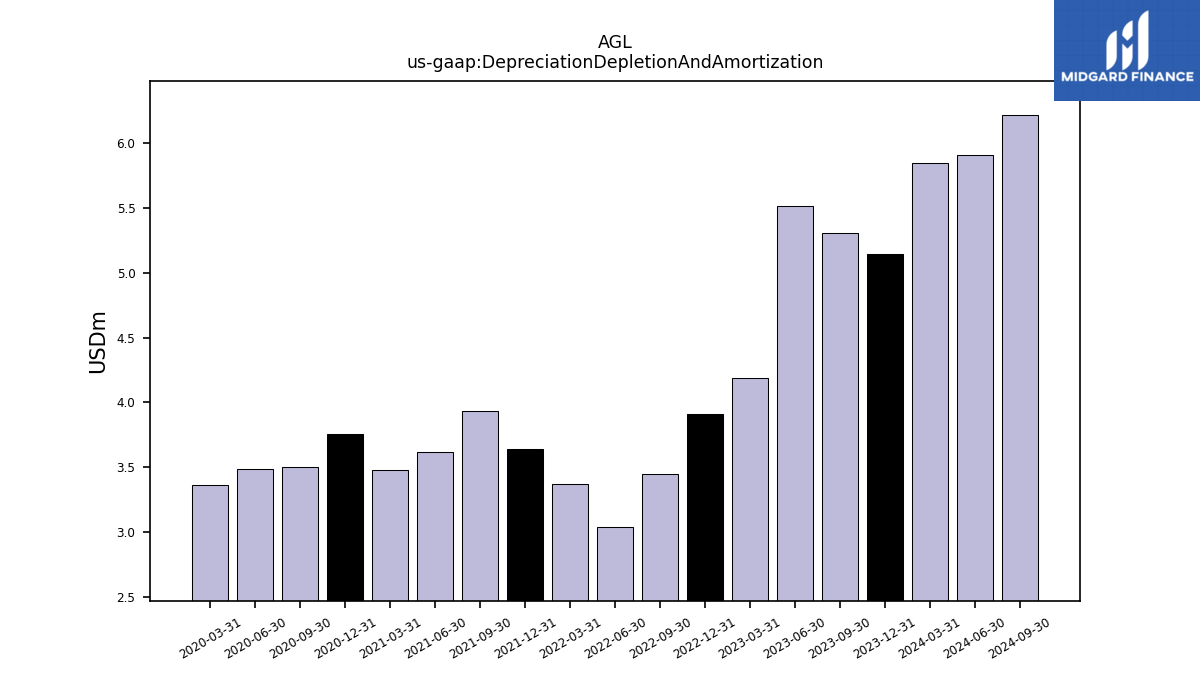
| Depreciation Depletion And Amortization | 5.31 | 5.51 | 4.19 | 3.91 | 3.45 | 3.04 | 3.37 | 3.64 | 3.94 | 3.61 | 3.48 | 3.75 | 3.50 | 3.48 | 3.36 | |
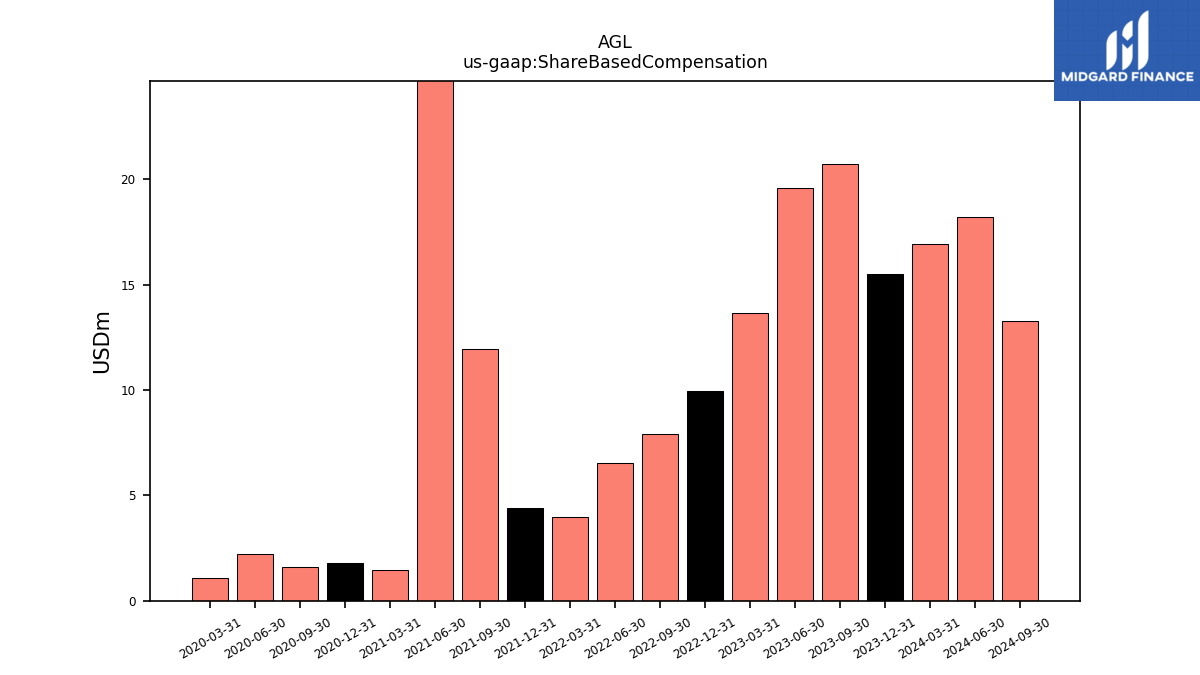
| Share Based Compensation | 20.74 | 19.57 | 13.67 | 9.95 | 7.91 | 6.55 | 3.97 | 4.41 | 11.96 | 274.55 | 1.47 | 1.77 | 1.62 | 2.23 | 1.07 |
| 2023-09-30 | 2023-06-30 | 2023-03-31 | 2022-12-31 | 2022-09-30 | 2022-06-30 | 2022-03-31 | 2021-12-31 | 2021-09-30 | 2021-06-30 | 2021-03-31 | 2020-12-31 | 2020-09-30 | 2020-06-30 | 2020-03-31 | ||
|---|---|---|---|---|---|---|---|---|---|---|---|---|---|---|---|---|
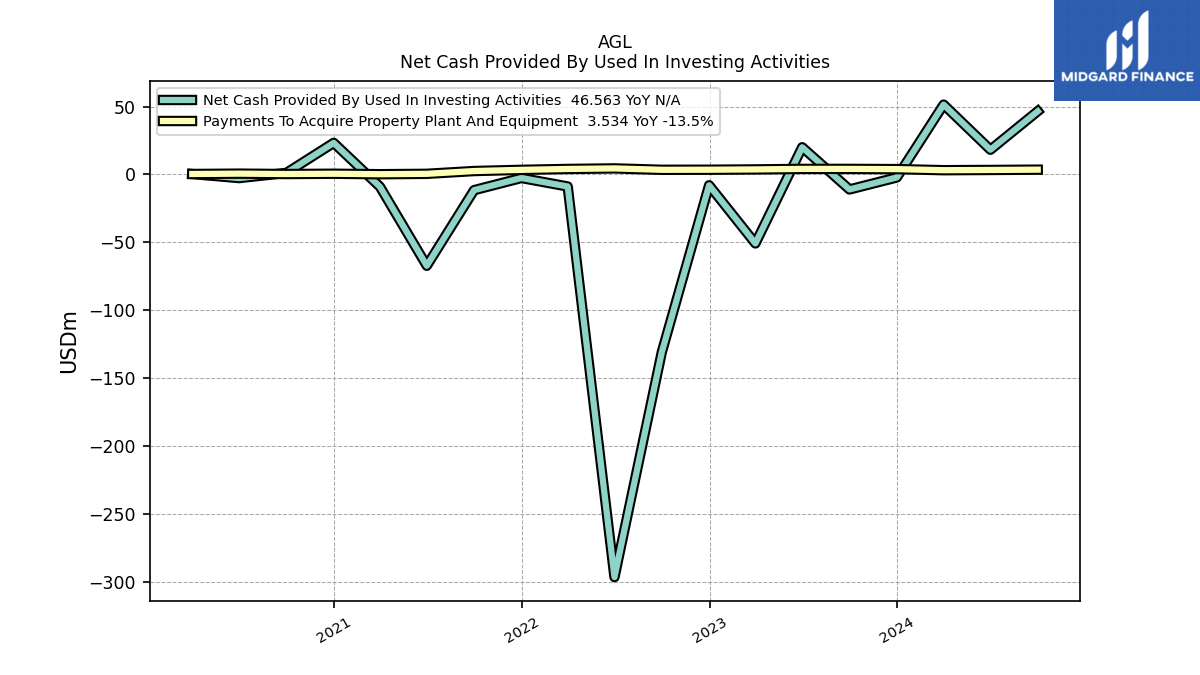
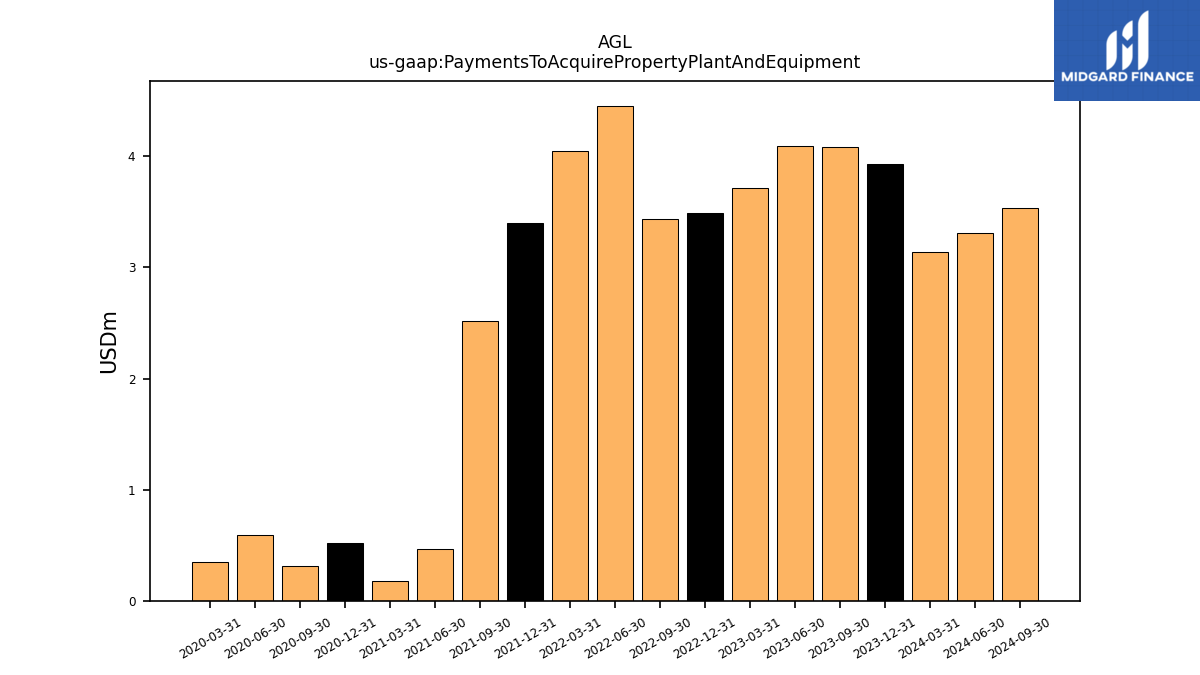
| Net Cash Provided By Used In Investing Activities | -11.03 | 20.03 | -50.81 | -7.97 | -130.94 | -296.61 | -8.87 | -2.60 | -11.56 | -67.26 | -9.07 | 23.27 | 1.14 | -2.67 | 0.32 | |
| Payments To Acquire Property Plant And Equipment | 4.09 | 4.09 | 3.72 | 3.49 | 3.43 | 4.46 | 4.05 | 3.40 | 2.52 | 0.47 | 0.18 | 0.52 | 0.32 | 0.60 | 0.34 |
| 2023-09-30 | 2023-06-30 | 2023-03-31 | 2022-12-31 | 2022-09-30 | 2022-06-30 | 2022-03-31 | 2021-12-31 | 2021-09-30 | 2021-06-30 | 2021-03-31 | 2020-12-31 | 2020-09-30 | 2020-06-30 | 2020-03-31 | ||
|---|---|---|---|---|---|---|---|---|---|---|---|---|---|---|---|---|
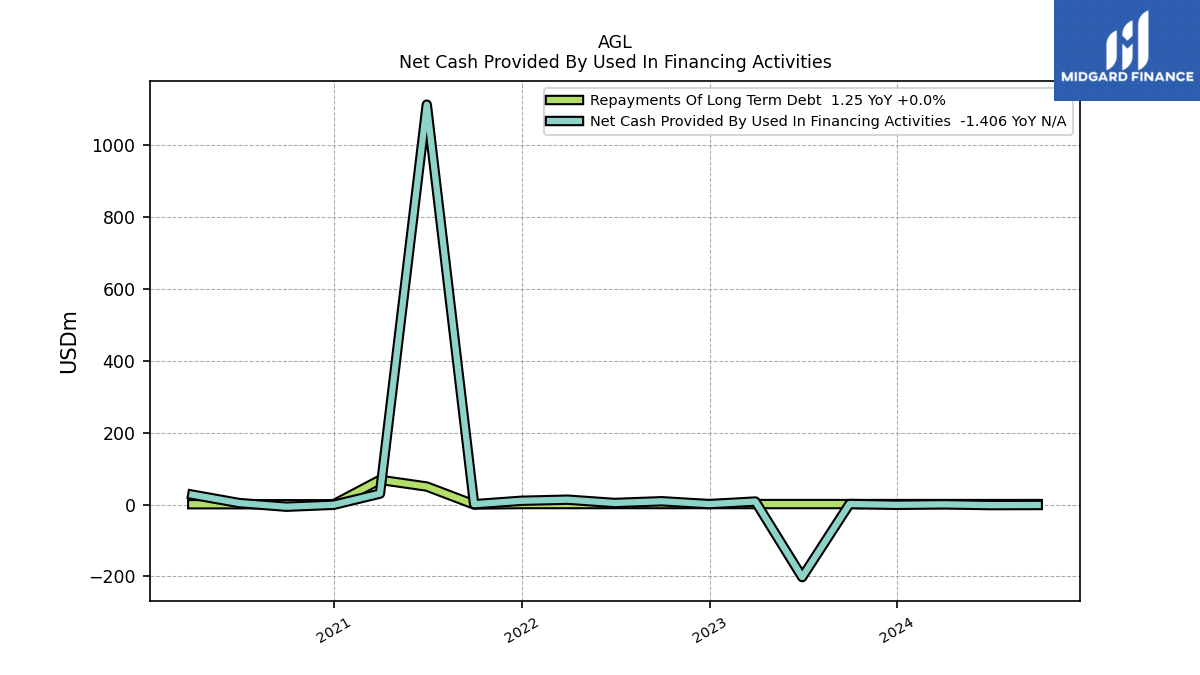
| Net Cash Provided By Used In Financing Activities | 1.41 | -202.04 | 8.34 | 1.13 | 9.11 | 4.31 | 13.51 | 10.42 | 0.90 | 1112.78 | 30.30 | -0.76 | -6.14 | 4.15 | 27.37 | |
| Payments For Repurchase Of Common Stock | 0.00 | NA | NA | NA | NA | NA | NA | NA | NA | NA | NA | NA | NA | NA | NA |
| 2023-09-30 | 2023-06-30 | 2023-03-31 | 2022-12-31 | 2022-09-30 | 2022-06-30 | 2022-03-31 | 2021-12-31 | 2021-09-30 | 2021-06-30 | 2021-03-31 | 2020-12-31 | 2020-09-30 | 2020-06-30 | 2020-03-31 | ||
|---|---|---|---|---|---|---|---|---|---|---|---|---|---|---|---|---|
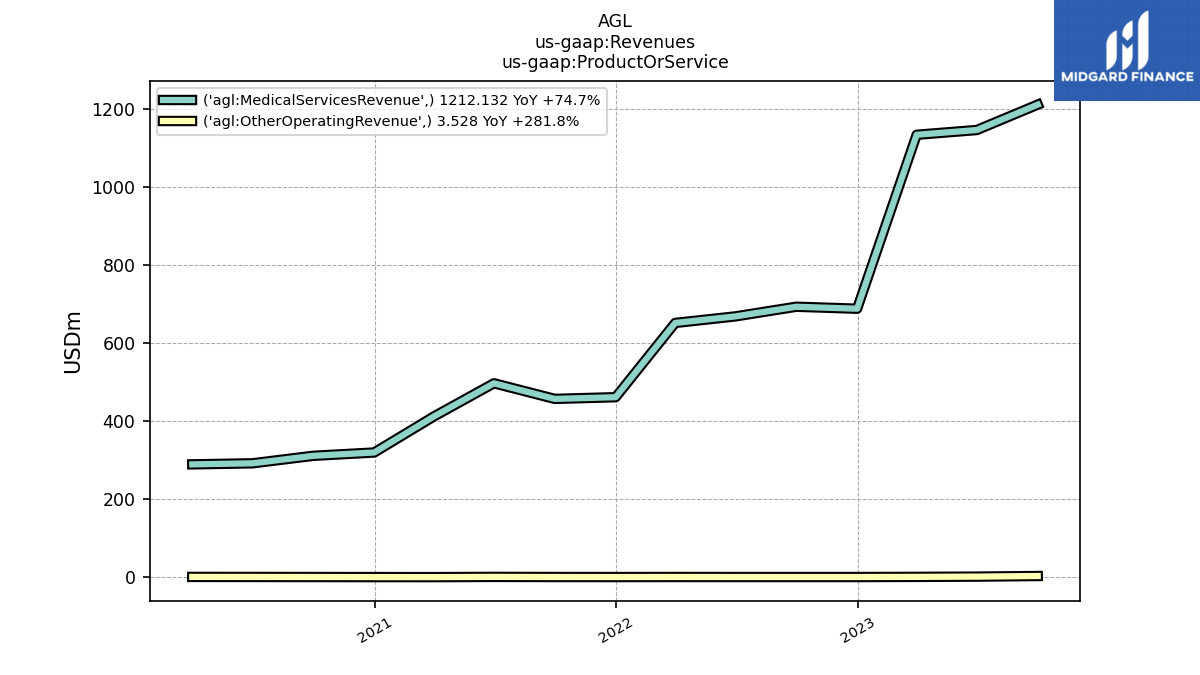
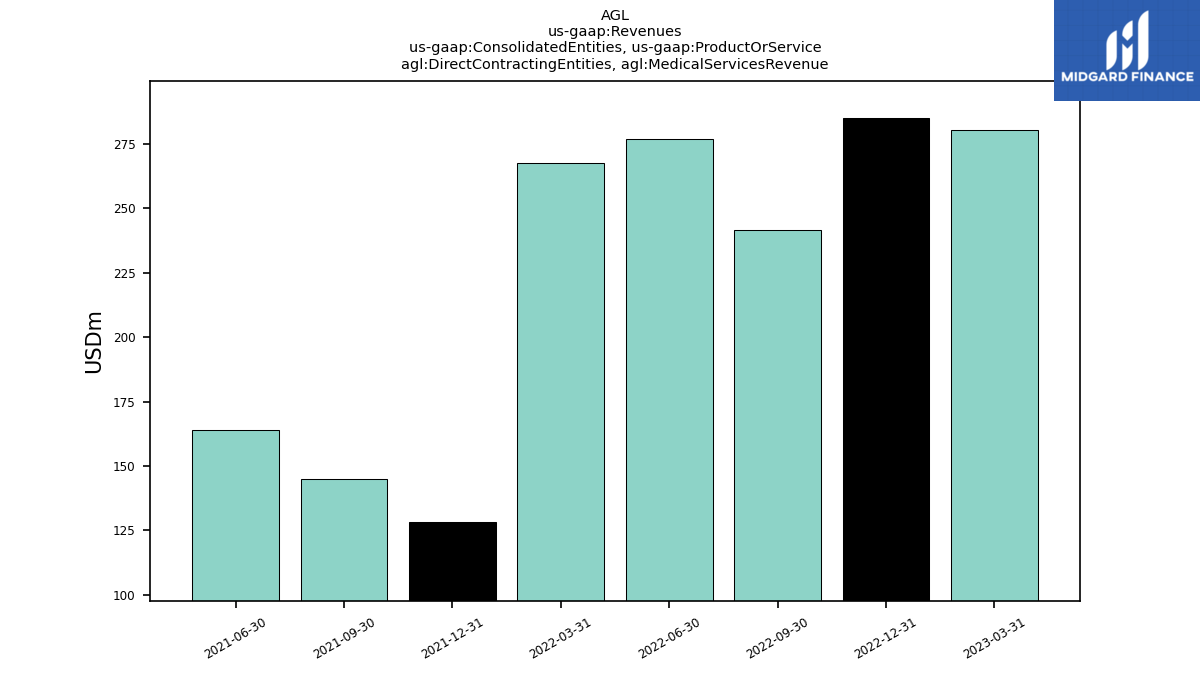
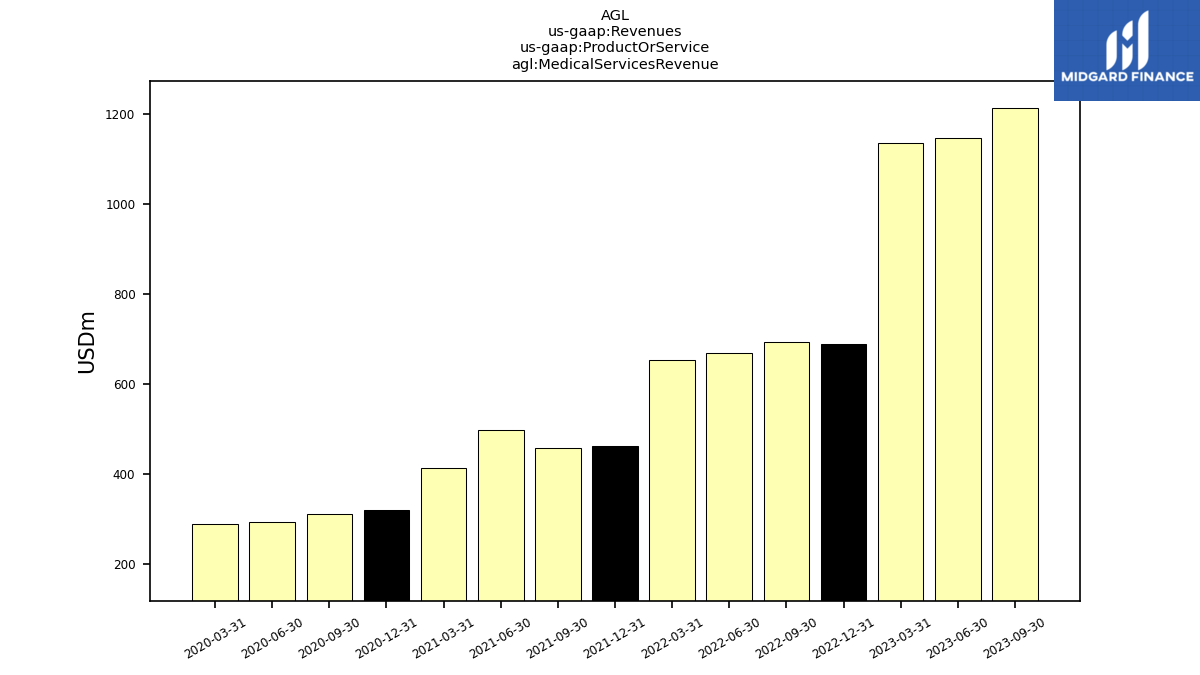
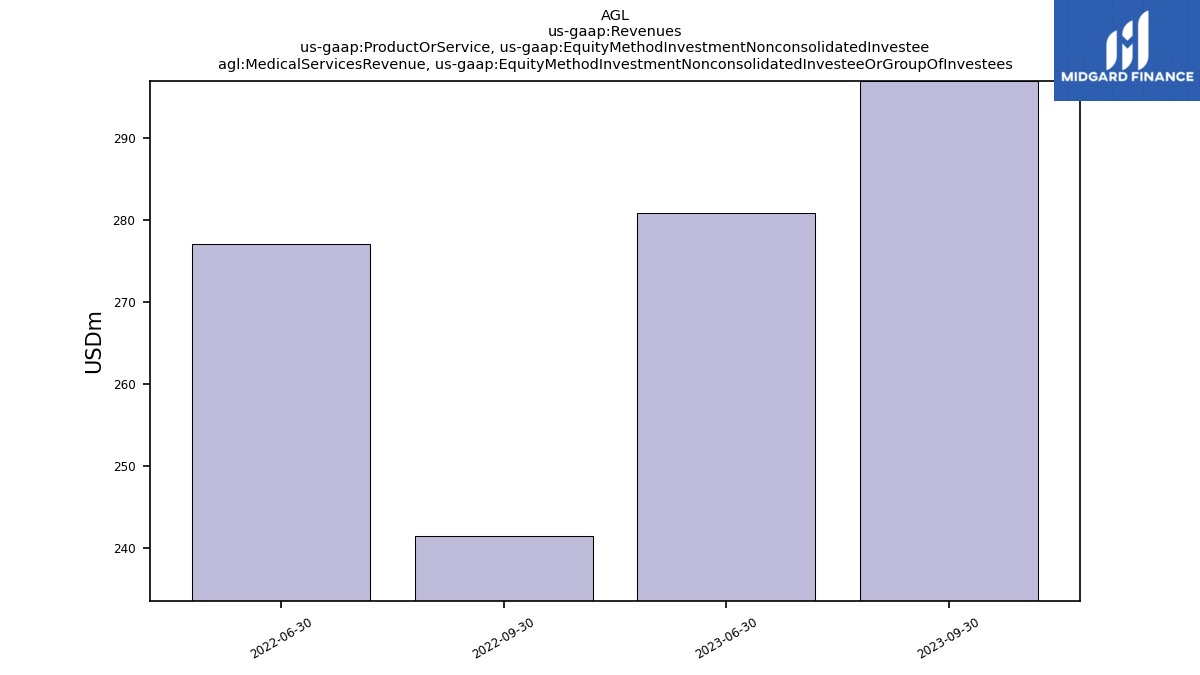
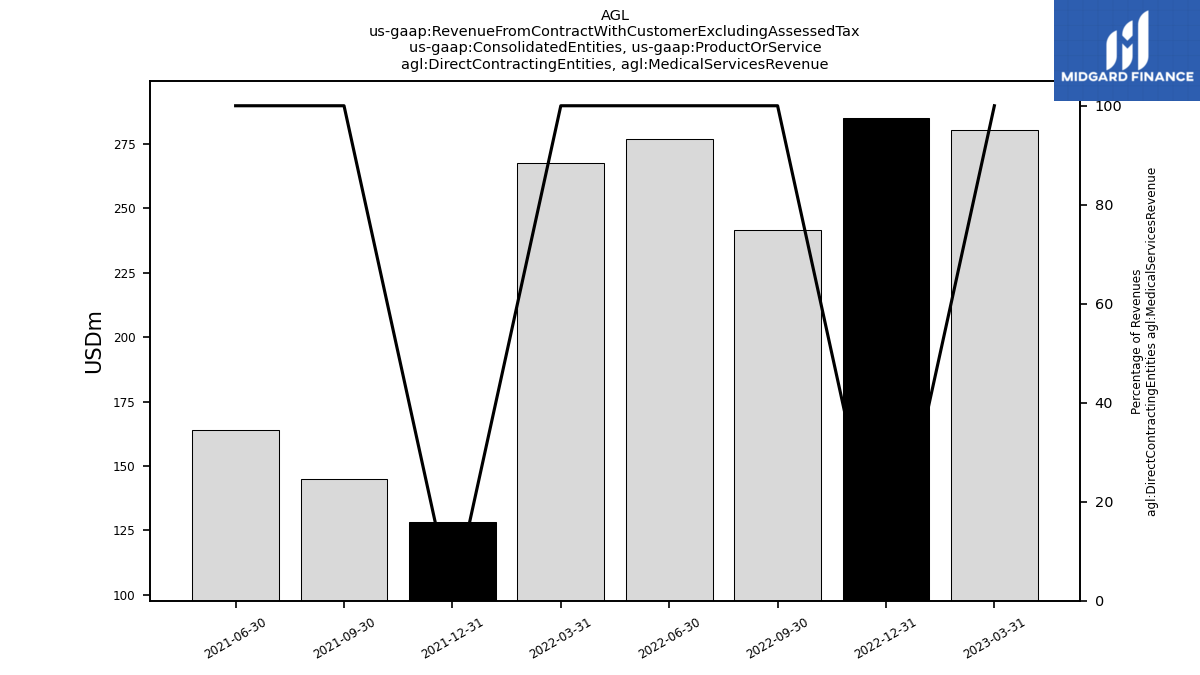
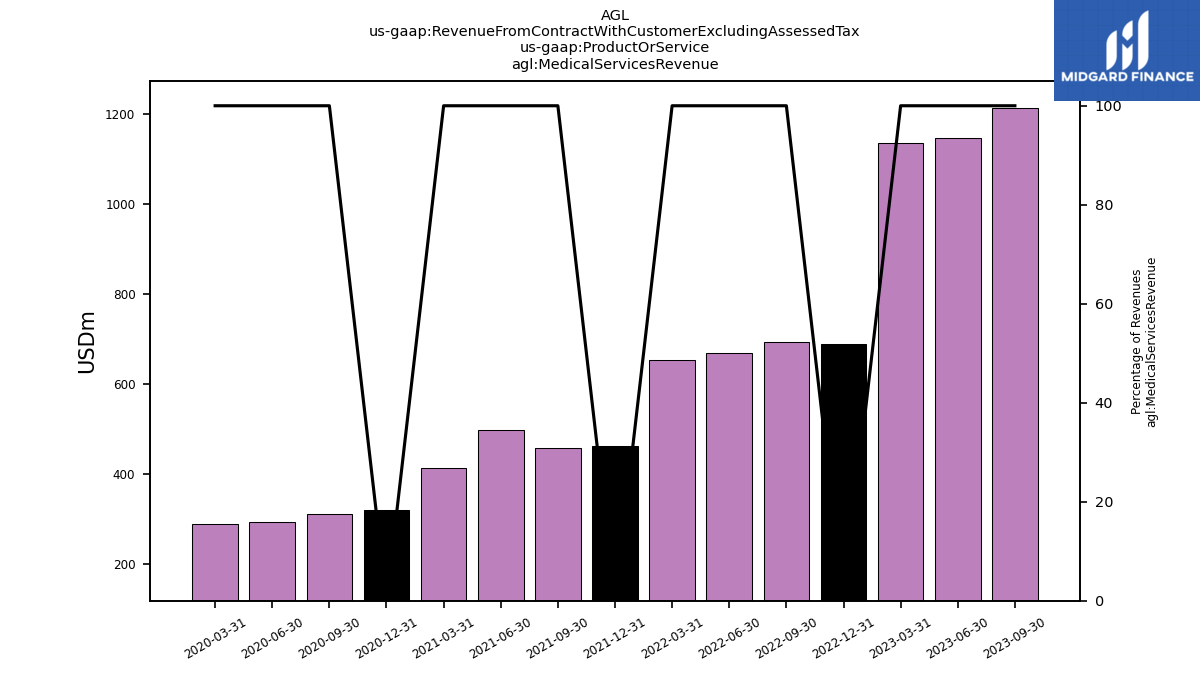
| Revenues | 1215.66 | 1149.05 | 1136.15 | 689.77 | 694.86 | 670.13 | 653.45 | 462.89 | 458.61 | 498.96 | 413.10 | 321.01 | 312.68 | 293.59 | 291.05 | |
| Direct Contracting Entities, Medical Services Revenue | NA | NA | 280.53 | 285.13 | 241.41 | 277.05 | 267.71 | 128.17 | 144.93 | 163.98 | NA | NA | NA | NA | NA | |
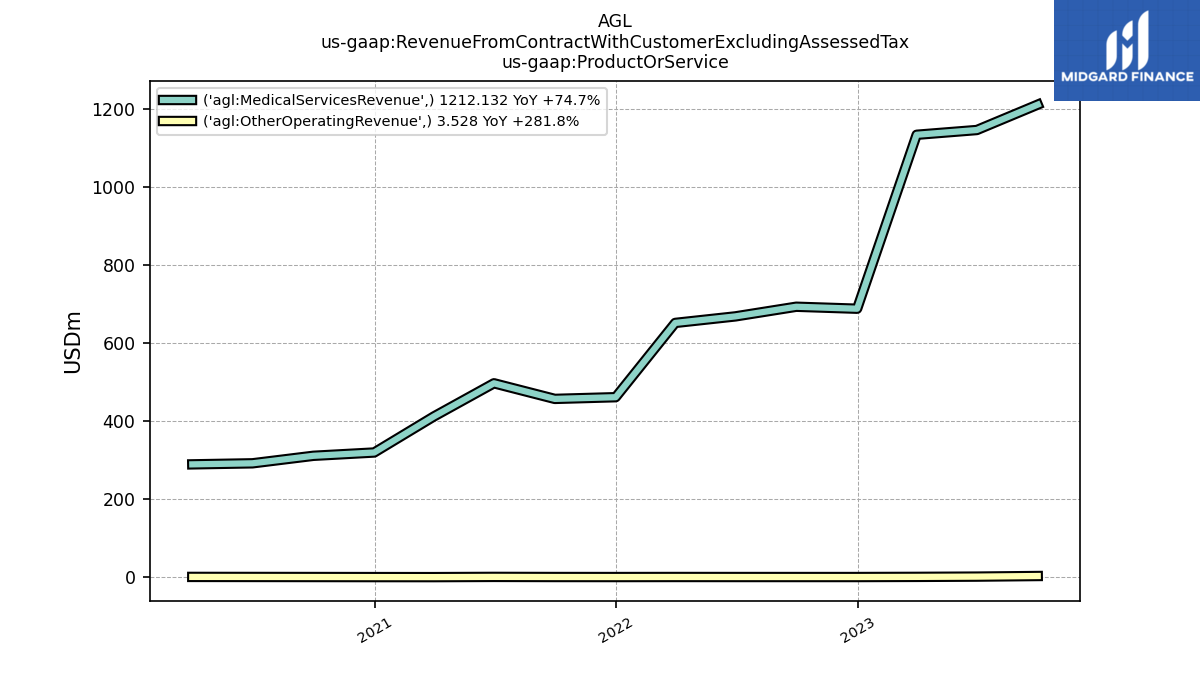
| Medical Services Revenue | 1212.13 | 1147.04 | 1134.83 | 688.86 | 693.93 | 669.18 | 652.42 | 462.00 | 457.65 | 497.68 | 412.41 | 320.23 | 311.73 | 292.50 | 289.81 | |
| Other Operating Revenue | 3.53 | 2.01 | 1.32 | 0.92 | 0.92 | 0.95 | 1.02 | 0.89 | 0.97 | 1.28 | 0.69 | 0.78 | 0.95 | 1.10 | 1.23 | |
| Medical Services Revenue, Equity Method Investment Nonconsolidated Investee Or Group Of Investees | 296.94 | 280.82 | NA | NA | 241.41 | 277.05 | NA | NA | NA | NA | NA | NA | NA | NA | NA | |
| Revenue From Contract With Customer Excluding Assessed Tax | 1215.66 | 1149.05 | 1136.15 | 689.77 | 694.86 | 670.13 | 653.45 | 462.89 | 458.61 | 498.96 | 413.10 | 321.01 | 312.68 | 293.59 | 291.05 | |
| Direct Contracting Entities, Medical Services Revenue | NA | NA | 280.53 | 285.13 | 241.41 | 277.05 | 267.71 | 128.17 | 144.93 | 163.98 | NA | NA | NA | NA | NA | |
| Medical Services Revenue | 1212.13 | 1147.04 | 1134.83 | 688.86 | 693.93 | 669.18 | 652.42 | 462.00 | 457.65 | 497.68 | 412.41 | 320.23 | 311.73 | 292.50 | 289.81 | |
| Other Operating Revenue | 3.53 | 2.01 | 1.32 | 0.92 | 0.92 | 0.95 | 1.02 | 0.89 | 0.97 | 1.28 | 0.69 | 0.78 | 0.95 | 1.10 | 1.23 | |
| Medical Services Revenue, Equity Method Investment Nonconsolidated Investee Or Group Of Investees | 296.94 | 280.82 | NA | NA | 241.41 | 277.05 | NA | NA | NA | NA | NA | NA | NA | NA | NA |


