
| 2023-12-31 | 2023-09-30 | 2023-06-30 | 2023-03-31 | 2022-12-31 | 2022-09-30 | 2022-06-30 | 2022-03-31 | 2021-12-31 | 2021-09-30 | 2021-06-30 | 2021-03-31 | 2020-12-31 | 2020-09-30 | 2020-06-30 | 2020-03-31 | 2019-12-31 | 2019-09-30 | 2019-06-30 | 2019-03-31 | 2018-12-31 | 2018-09-30 | 2018-06-30 | 2018-03-31 | 2017-12-31 | 2017-09-30 | 2017-06-30 | 2017-03-31 | 2016-12-31 | 2016-09-30 | 2016-06-30 | 2016-03-31 | 2015-12-31 | 2015-09-30 | 2015-06-30 | 2015-03-31 | 2014-12-31 | 2014-09-30 | 2014-06-30 | 2014-03-31 | 2013-12-31 | 2013-09-30 | 2013-06-30 | 2013-03-31 | 2012-12-31 | 2012-09-30 | 2012-06-30 | 2012-03-31 | 2011-12-31 | 2011-09-30 | 2011-06-30 | 2011-03-31 | 2010-12-31 | 2010-09-30 | 2010-06-30 | ||
|---|---|---|---|---|---|---|---|---|---|---|---|---|---|---|---|---|---|---|---|---|---|---|---|---|---|---|---|---|---|---|---|---|---|---|---|---|---|---|---|---|---|---|---|---|---|---|---|---|---|---|---|---|---|---|---|---|
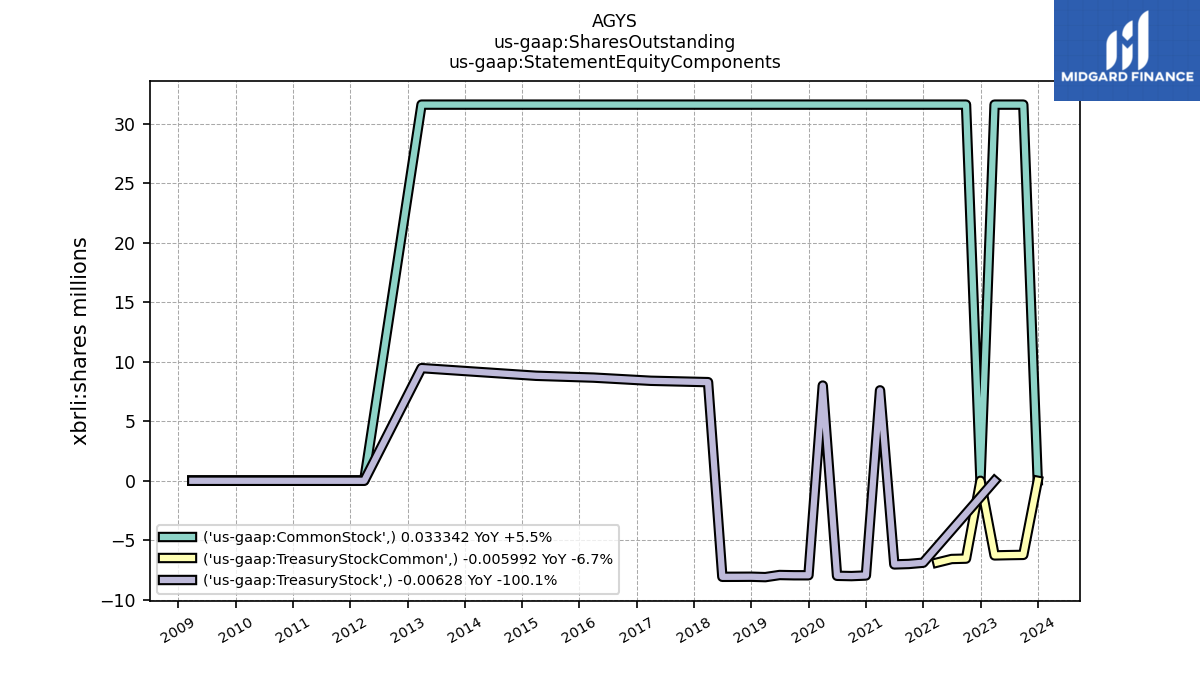
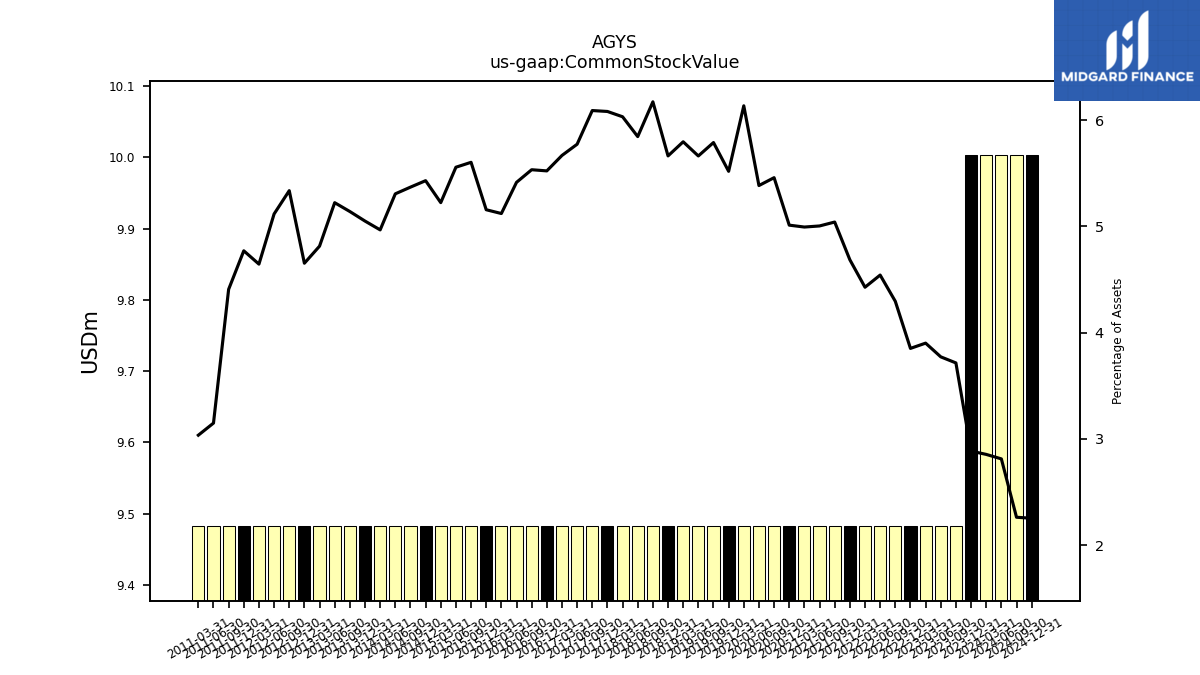
| Common Stock Value | 10.00 | 9.48 | 9.48 | 9.48 | 9.48 | 9.48 | 9.48 | 9.48 | 9.48 | 9.48 | 9.48 | 9.48 | 9.48 | 9.48 | 9.48 | 9.48 | 9.48 | 9.48 | 9.48 | 9.48 | 9.48 | 9.48 | 9.48 | 9.48 | 9.48 | 9.48 | 9.48 | 9.48 | 9.48 | 9.48 | 9.48 | 9.48 | 9.48 | 9.48 | 9.48 | 9.48 | 9.48 | 9.48 | 9.48 | 9.48 | 9.48 | 9.48 | 9.48 | 9.48 | 9.48 | 9.48 | 9.48 | 9.48 | 9.48 | 9.48 | 9.48 | 9.48 | NA | NA | NA | |
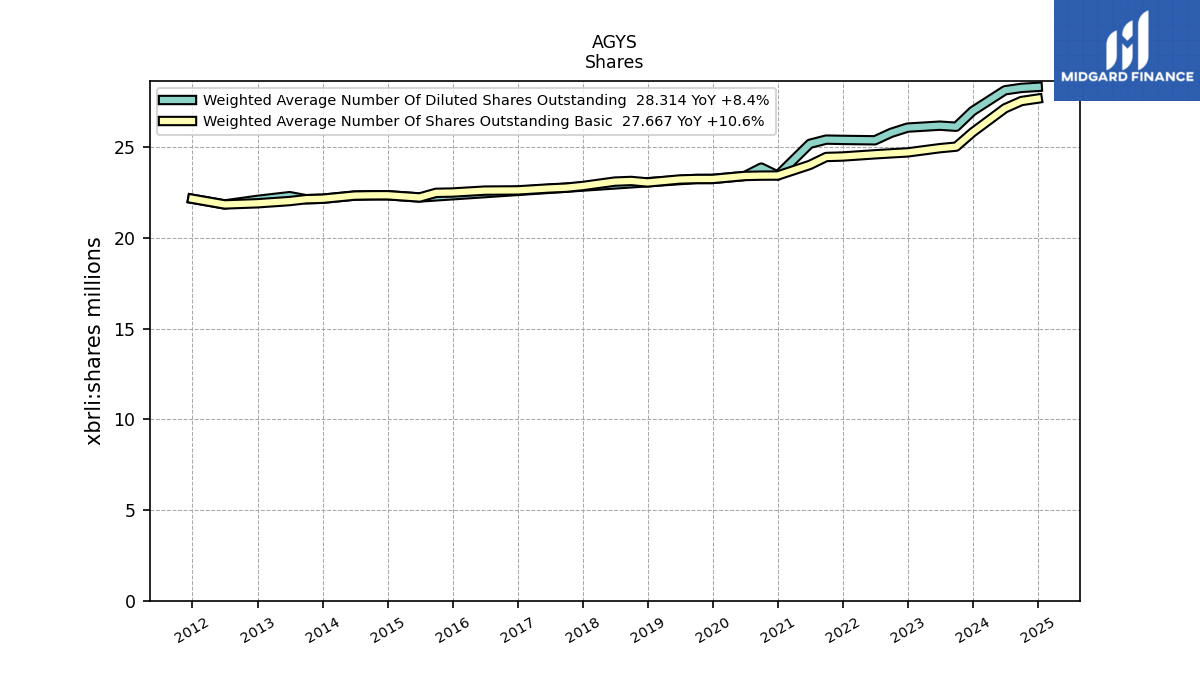
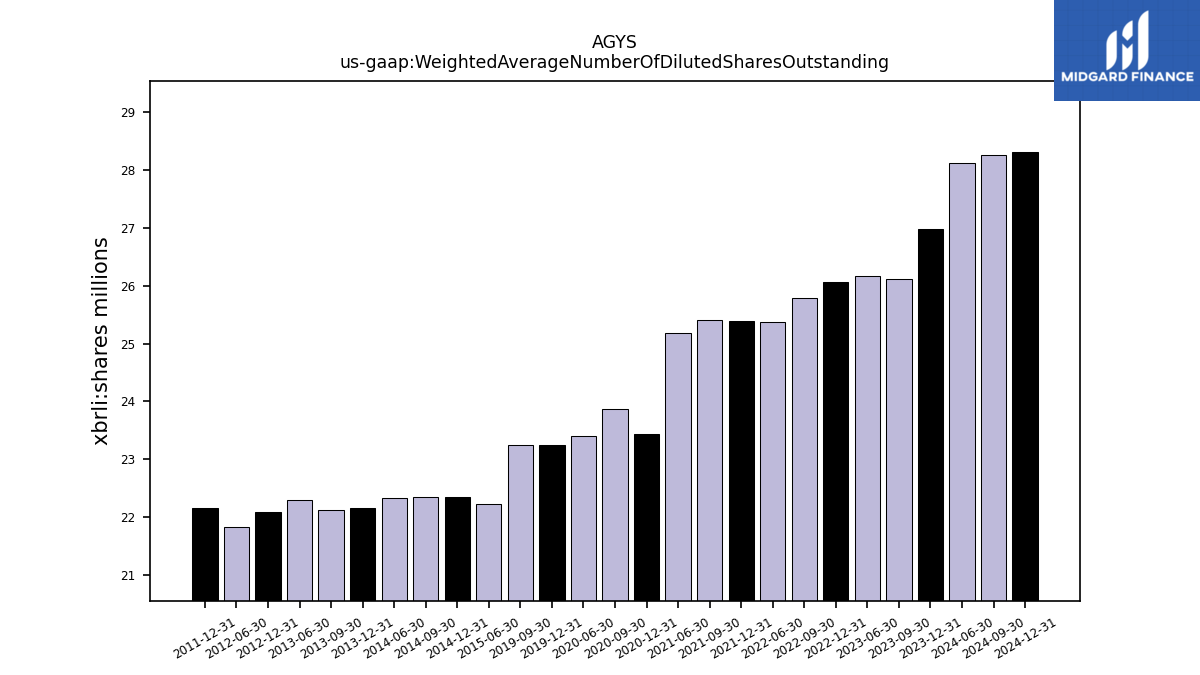
| Weighted Average Number Of Diluted Shares Outstanding | 26.98 | 26.12 | 26.18 | NA | 26.07 | 25.78 | 25.37 | NA | 25.39 | 25.41 | 25.18 | NA | 23.43 | 23.87 | 23.41 | NA | 23.24 | 23.24 | NA | NA | NA | NA | NA | NA | NA | NA | NA | NA | NA | NA | NA | NA | NA | NA | 22.22 | NA | 22.34 | 22.34 | 22.32 | NA | 22.15 | 22.12 | 22.29 | NA | 22.09 | NA | 21.84 | NA | 22.15 | NA | NA | NA | NA | NA | NA | |
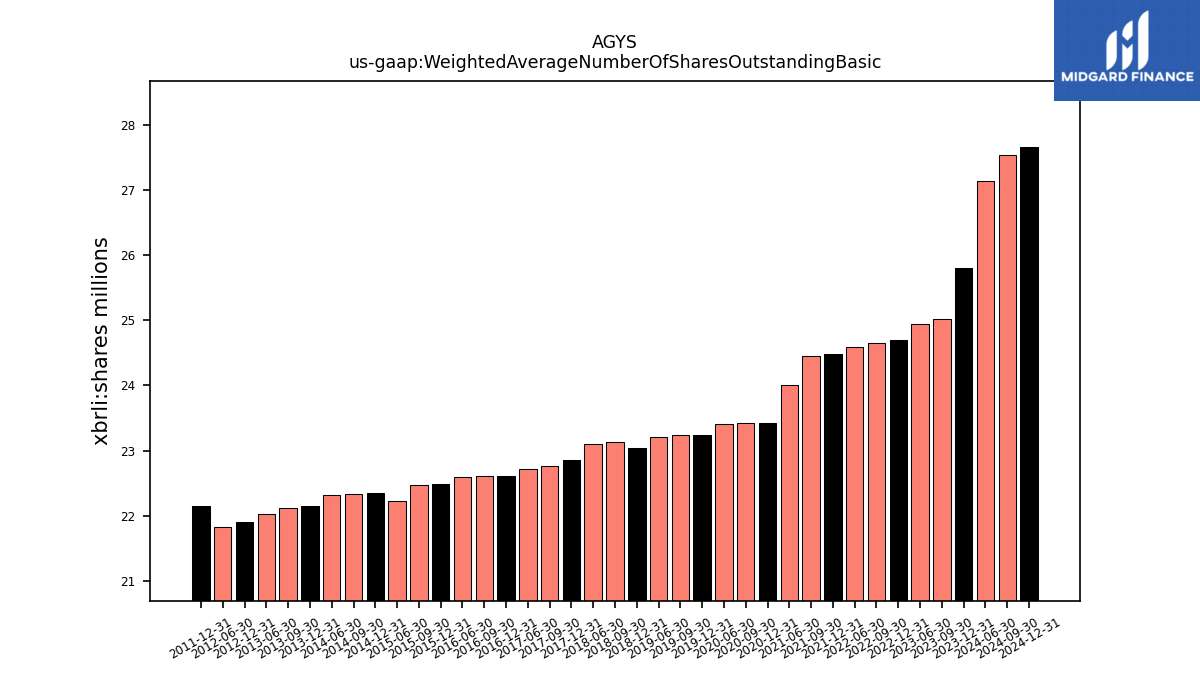
| Weighted Average Number Of Shares Outstanding Basic | 25.81 | 25.02 | 24.94 | NA | 24.70 | 24.65 | 24.60 | NA | 24.48 | 24.45 | 24.01 | NA | 23.43 | 23.42 | 23.41 | NA | 23.24 | 23.24 | 23.21 | NA | 23.05 | 23.13 | 23.09 | NA | 22.85 | 22.76 | 22.72 | NA | 22.61 | 22.61 | 22.60 | NA | 22.49 | 22.48 | 22.22 | NA | 22.34 | 22.34 | 22.32 | NA | 22.15 | 22.12 | 22.02 | NA | 21.90 | NA | 21.84 | NA | 22.15 | NA | NA | NA | NA | NA | NA | |
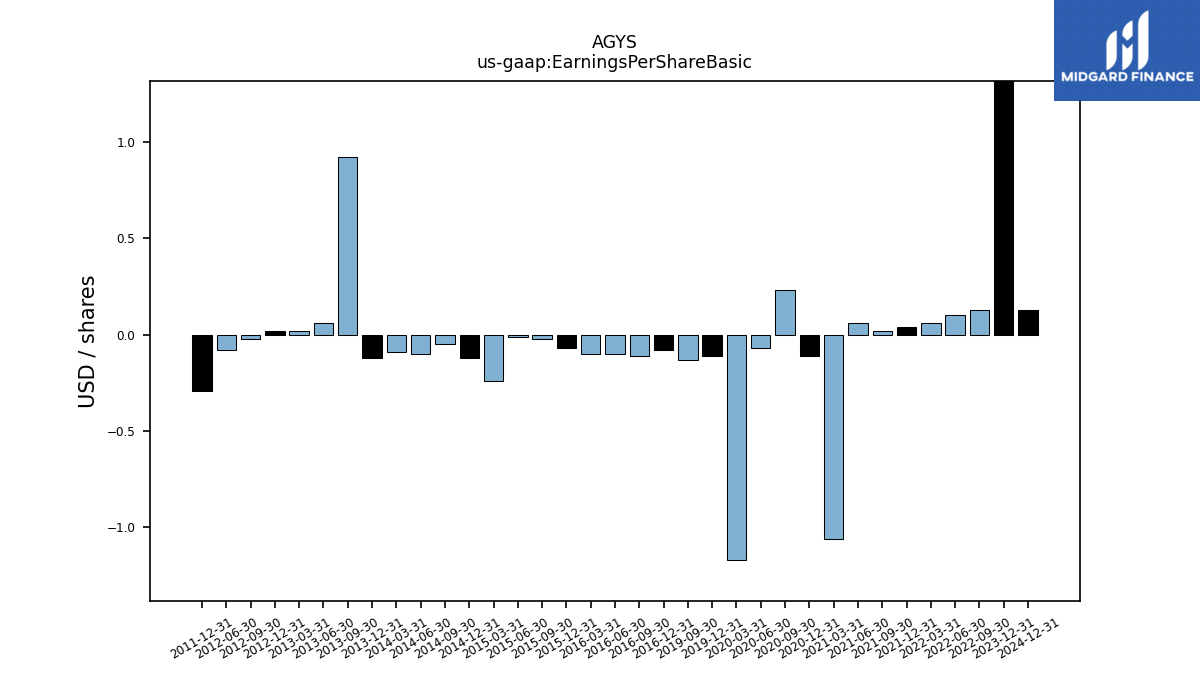
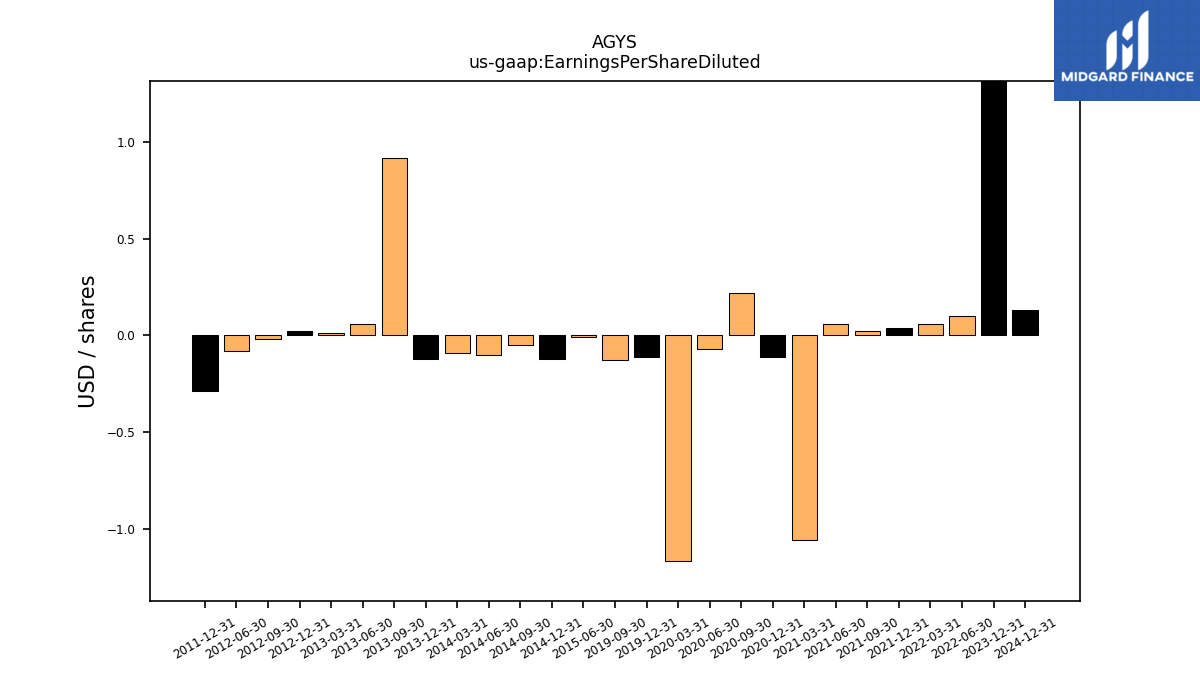
| Earnings Per Share Basic | NA | NA | NA | NA | NA | 0.13 | 0.10 | 0.06 | 0.04 | 0.02 | 0.06 | -1.06 | -0.11 | 0.23 | -0.07 | -1.17 | -0.11 | -0.13 | NA | NA | NA | NA | NA | NA | NA | NA | NA | NA | -0.08 | -0.11 | -0.10 | -0.10 | -0.07 | -0.02 | -0.01 | -0.24 | -0.12 | -0.05 | -0.10 | -0.09 | -0.12 | 0.92 | 0.06 | 0.02 | 0.02 | -0.02 | -0.08 | NA | -0.29 | NA | NA | NA | NA | NA | NA | |
| Earnings Per Share Diluted | NA | NA | NA | NA | NA | NA | 0.10 | 0.06 | 0.04 | 0.02 | 0.06 | -1.06 | -0.11 | 0.22 | -0.07 | -1.17 | -0.11 | -0.13 | NA | NA | NA | NA | NA | NA | NA | NA | NA | NA | NA | NA | NA | NA | NA | NA | -0.01 | NA | -0.12 | -0.05 | -0.10 | -0.09 | -0.12 | 0.92 | 0.06 | 0.01 | 0.02 | -0.02 | -0.08 | NA | -0.29 | NA | NA | NA | NA | NA | NA |
| 2023-12-31 | 2023-09-30 | 2023-06-30 | 2023-03-31 | 2022-12-31 | 2022-09-30 | 2022-06-30 | 2022-03-31 | 2021-12-31 | 2021-09-30 | 2021-06-30 | 2021-03-31 | 2020-12-31 | 2020-09-30 | 2020-06-30 | 2020-03-31 | 2019-12-31 | 2019-09-30 | 2019-06-30 | 2019-03-31 | 2018-12-31 | 2018-09-30 | 2018-06-30 | 2018-03-31 | 2017-12-31 | 2017-09-30 | 2017-06-30 | 2017-03-31 | 2016-12-31 | 2016-09-30 | 2016-06-30 | 2016-03-31 | 2015-12-31 | 2015-09-30 | 2015-06-30 | 2015-03-31 | 2014-12-31 | 2014-09-30 | 2014-06-30 | 2014-03-31 | 2013-12-31 | 2013-09-30 | 2013-06-30 | 2013-03-31 | 2012-12-31 | 2012-09-30 | 2012-06-30 | 2012-03-31 | 2011-12-31 | 2011-09-30 | 2011-06-30 | 2011-03-31 | 2010-12-31 | 2010-09-30 | 2010-06-30 | ||
|---|---|---|---|---|---|---|---|---|---|---|---|---|---|---|---|---|---|---|---|---|---|---|---|---|---|---|---|---|---|---|---|---|---|---|---|---|---|---|---|---|---|---|---|---|---|---|---|---|---|---|---|---|---|---|---|---|
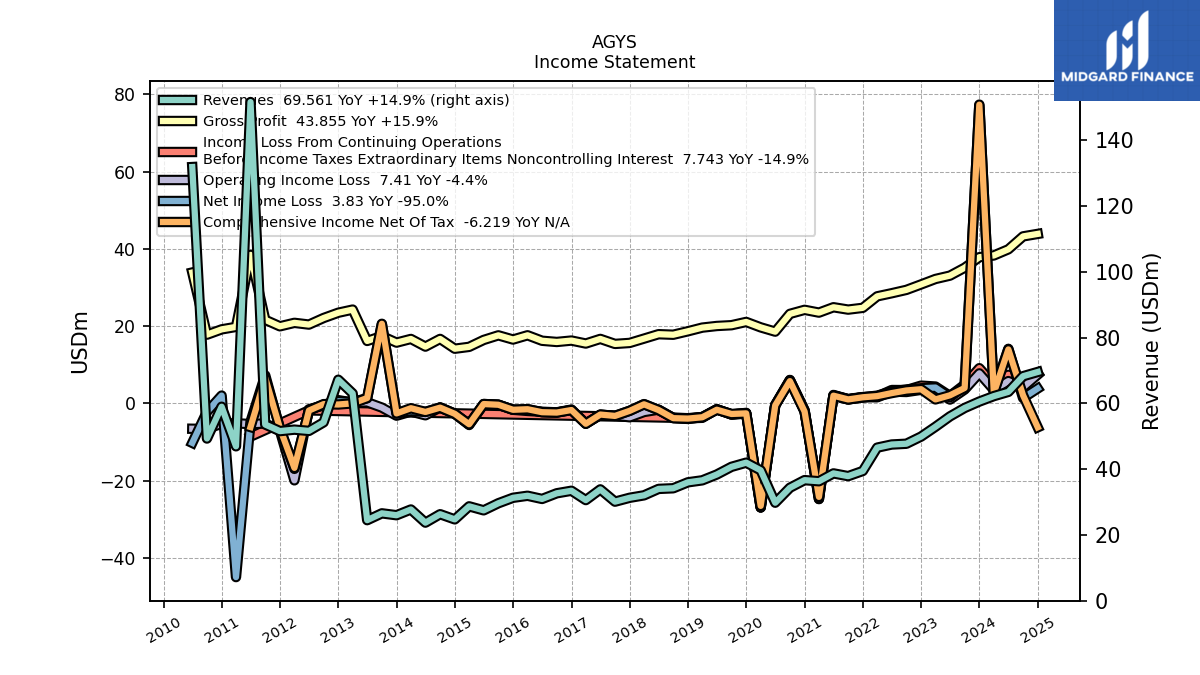
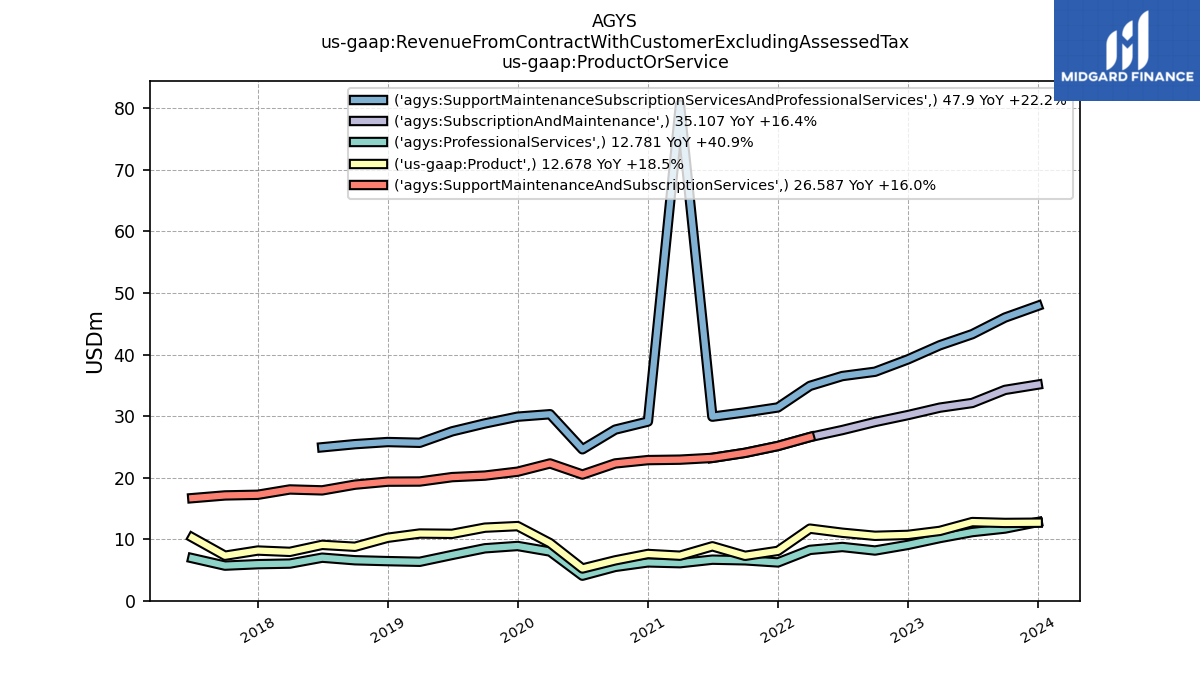
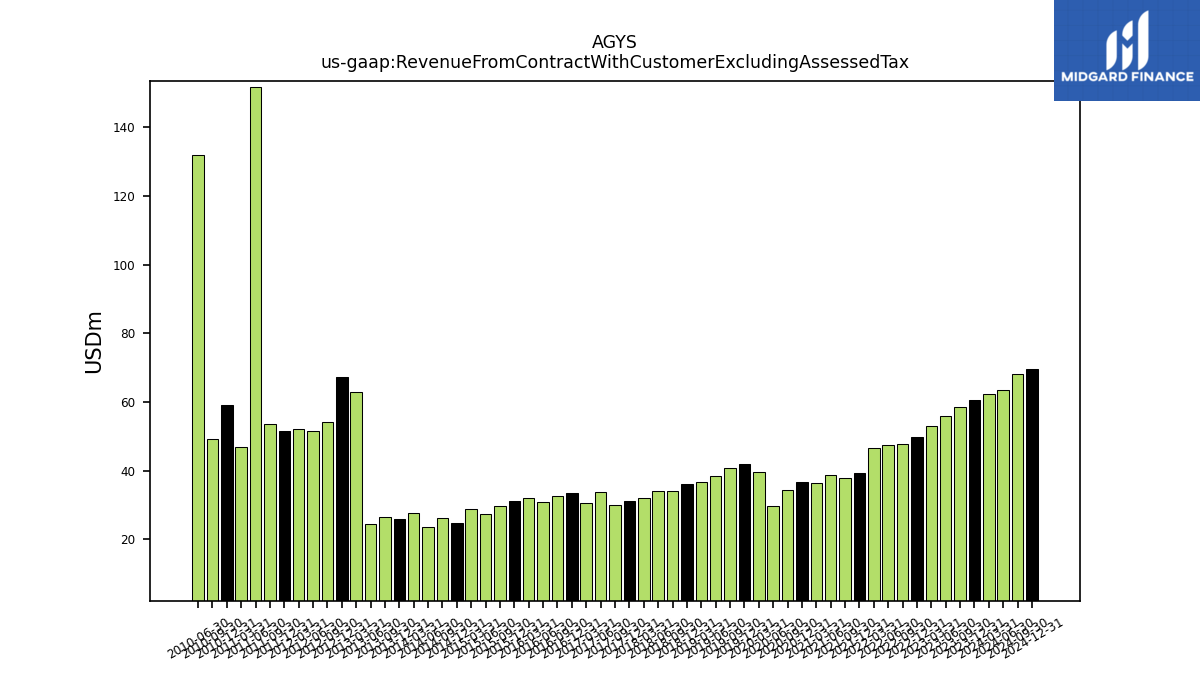
| Revenue From Contract With Customer Excluding Assessed Tax | 60.57 | 58.62 | 56.06 | 52.90 | 49.92 | 47.74 | 47.51 | 46.56 | 39.46 | 37.89 | 38.73 | 36.34 | 36.67 | 34.36 | 29.81 | 39.66 | 41.99 | 40.72 | 38.39 | 36.62 | 36.01 | 34.20 | 34.01 | 32.06 | 31.31 | 30.13 | 33.87 | 30.60 | 33.45 | 32.68 | 30.95 | 31.92 | 31.31 | 29.64 | 27.49 | 28.71 | 24.74 | 26.32 | 23.75 | 27.75 | 26.01 | 26.58 | 24.50 | 63.04 | 67.21 | 54.25 | 51.65 | 52.03 | 51.58 | 53.59 | 151.64 | 46.96 | 59.00 | 49.33 | 131.87 | |
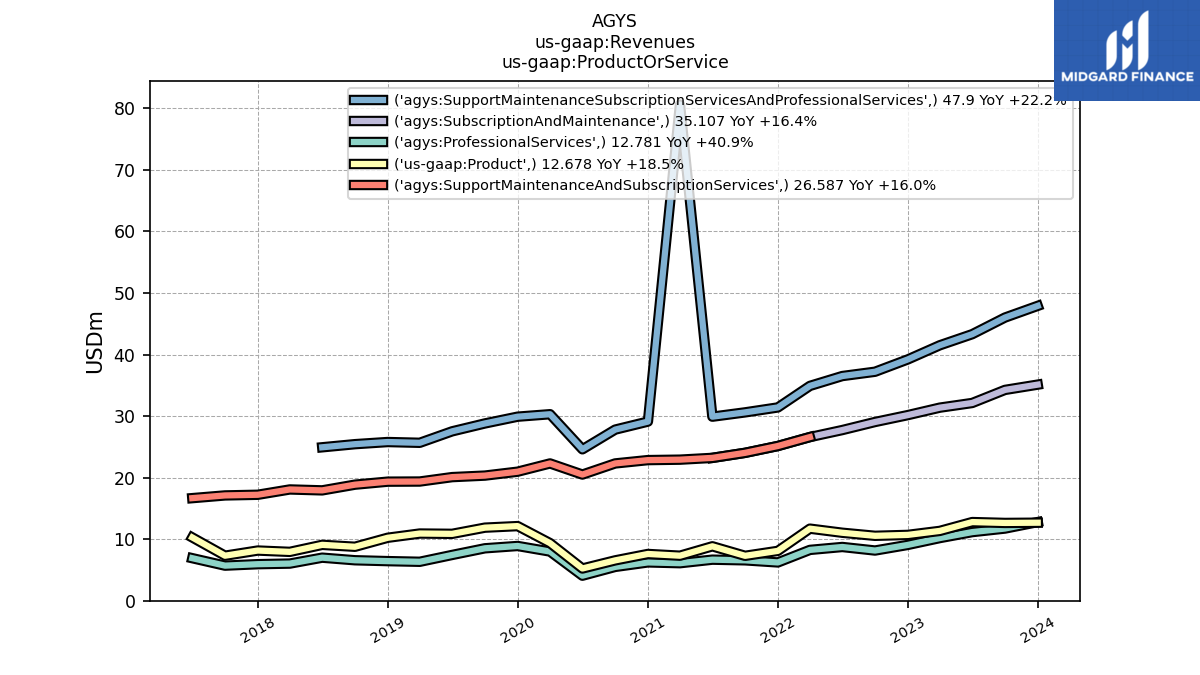
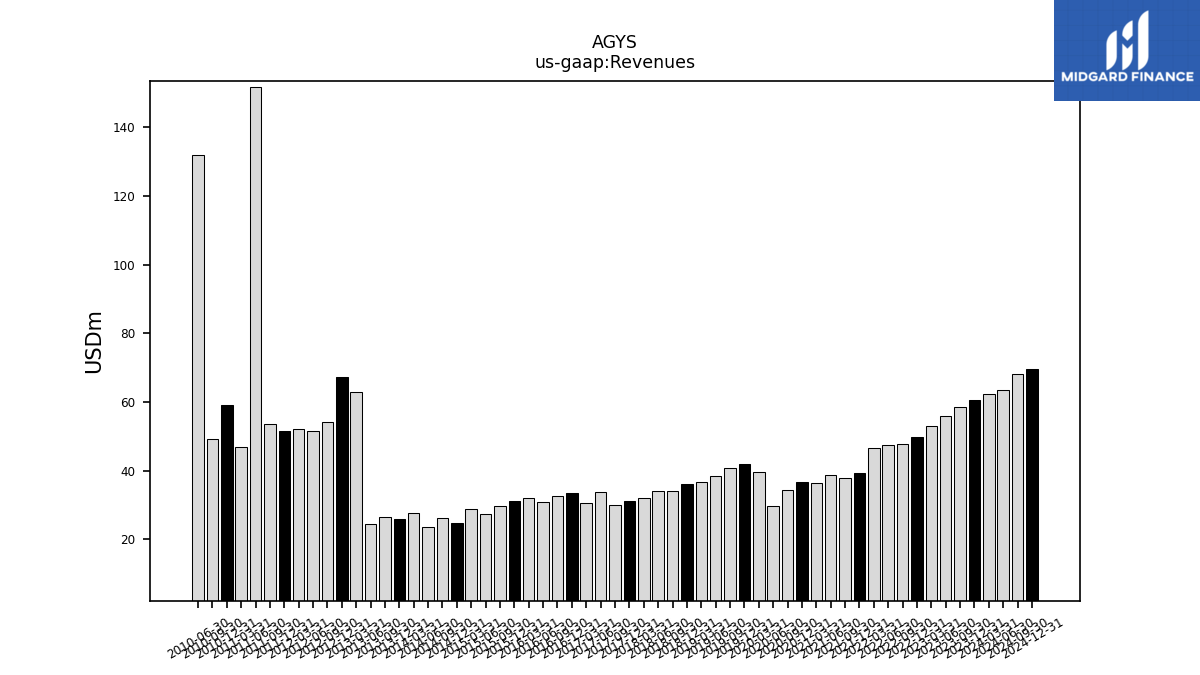
| Revenues | 60.57 | 58.62 | 56.06 | 52.90 | 49.92 | 47.74 | 47.51 | 46.56 | 39.46 | 37.89 | 38.73 | 36.34 | 36.67 | 34.36 | 29.81 | 39.66 | 41.99 | 40.72 | 38.39 | 36.62 | 36.01 | 34.20 | 34.01 | 32.06 | 31.31 | 30.13 | 33.87 | 30.60 | 33.45 | 32.68 | 30.95 | 31.92 | 31.31 | 29.64 | 27.49 | 28.71 | 24.74 | 26.32 | 23.75 | 27.75 | 26.01 | 26.58 | 24.50 | 63.04 | 67.21 | 54.25 | 51.65 | 52.03 | 51.58 | 53.59 | 151.64 | 46.96 | 59.00 | 49.33 | 131.87 | |
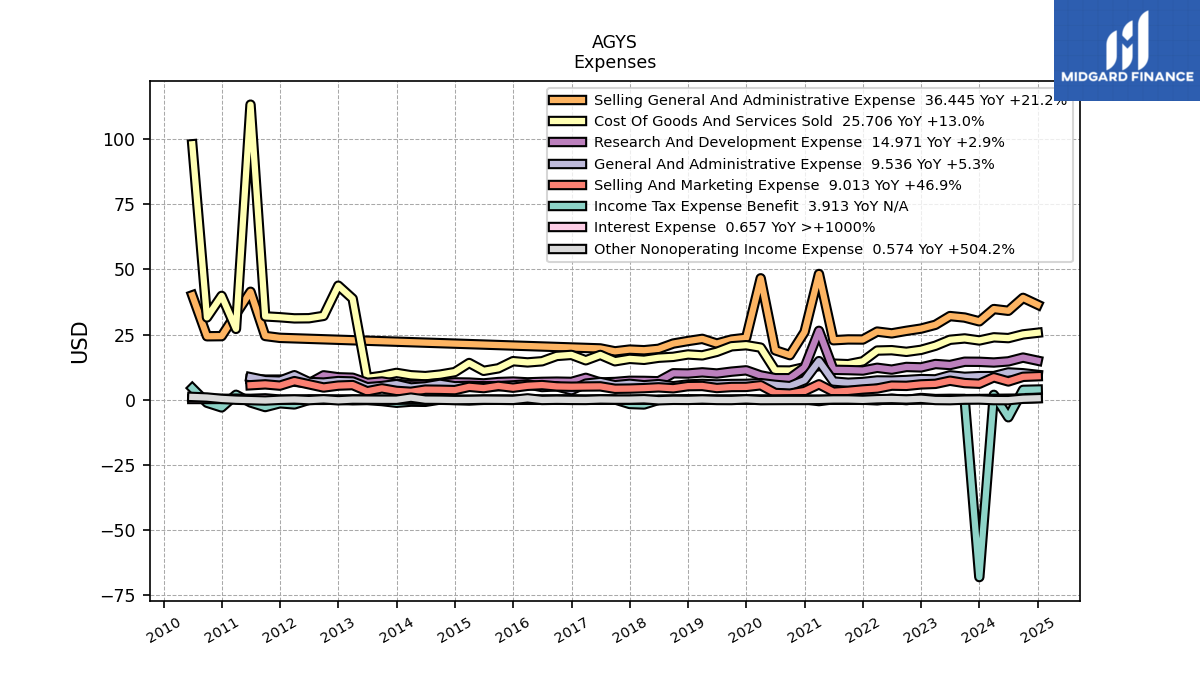
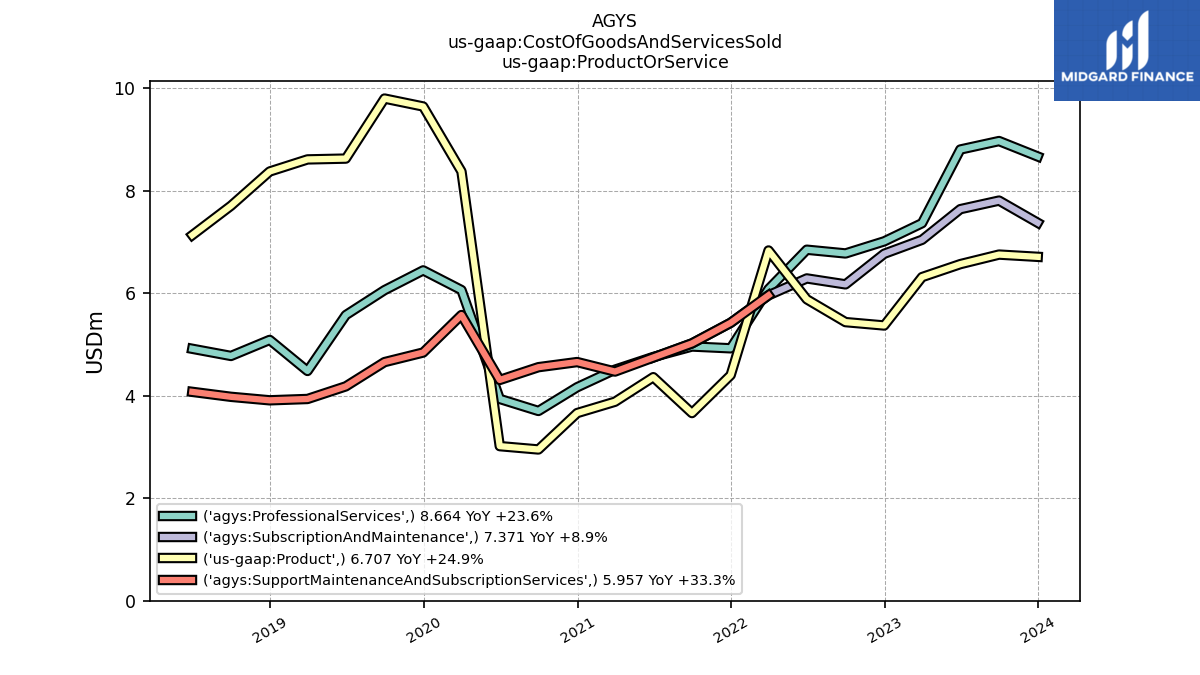
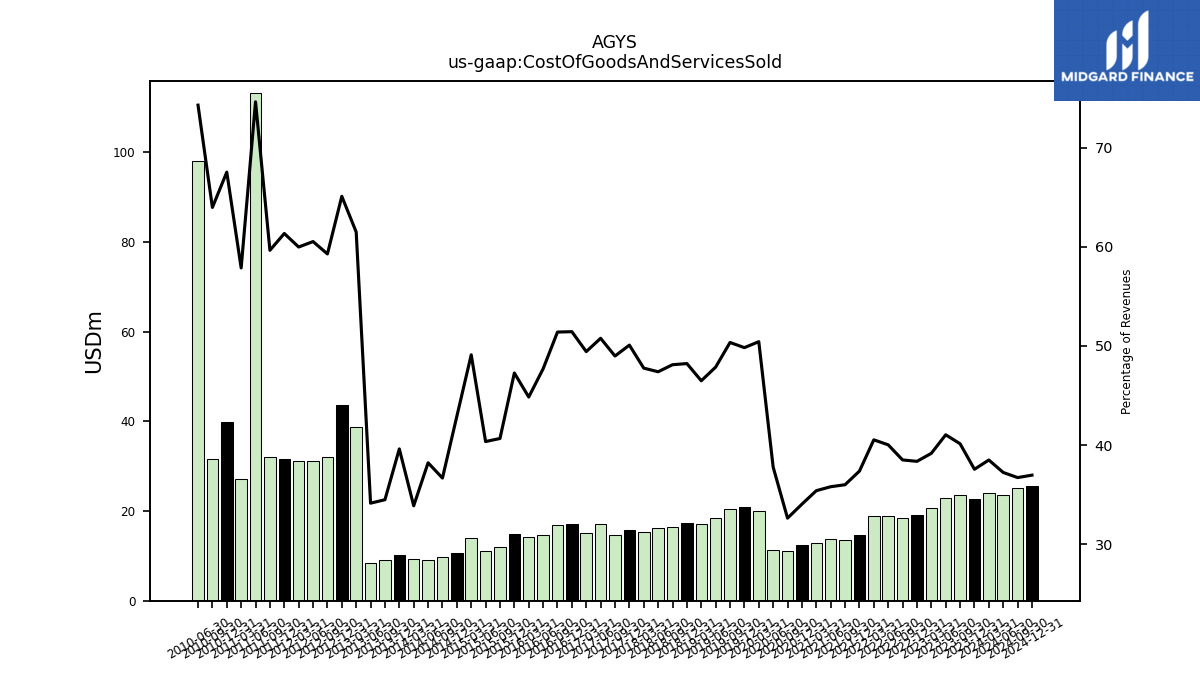
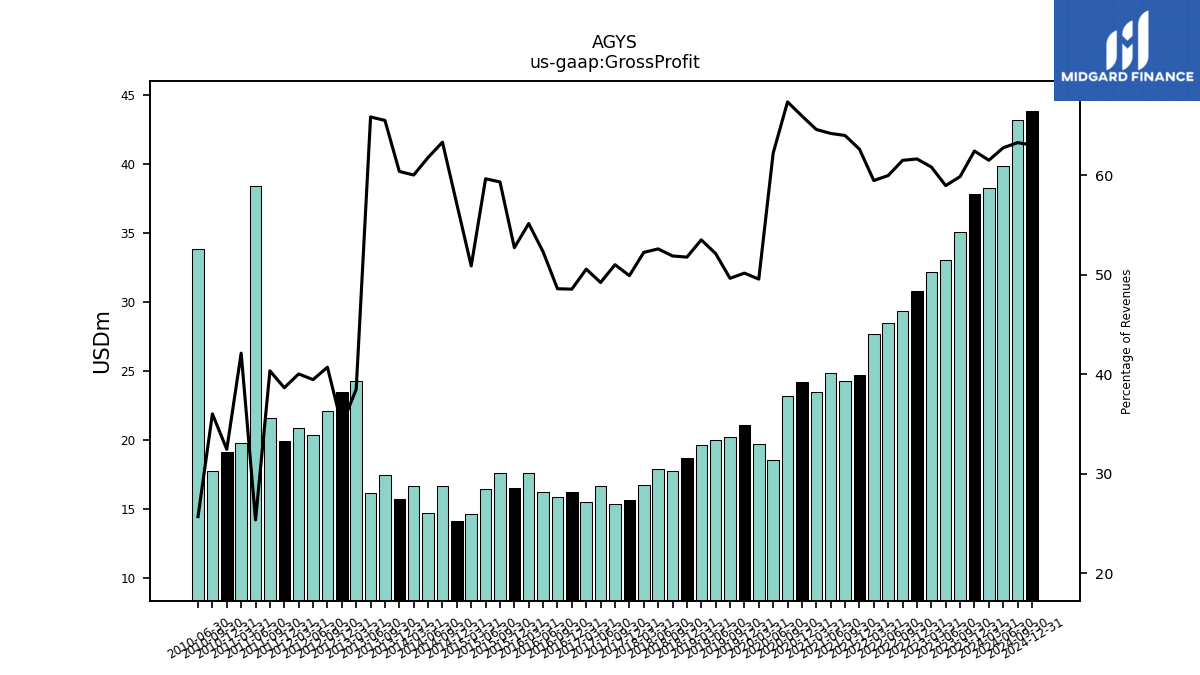
| Cost Of Goods And Services Sold | 22.74 | 23.52 | 23.00 | 20.71 | 19.14 | 18.38 | 19.01 | 18.87 | 14.74 | 13.64 | 13.86 | 12.86 | 12.48 | 11.21 | 11.26 | 20.00 | 20.92 | 20.50 | 18.38 | 17.02 | 17.37 | 16.45 | 16.12 | 15.31 | 15.68 | 14.76 | 17.20 | 15.13 | 17.21 | 16.80 | 14.76 | 14.32 | 14.80 | 12.05 | 11.09 | 14.10 | 10.61 | 9.65 | 9.07 | 9.40 | 10.30 | 9.16 | 8.36 | 38.77 | 43.76 | 32.16 | 31.27 | 31.21 | 31.65 | 31.97 | 113.21 | 27.18 | 39.86 | 31.56 | 98.01 | |
| Gross Profit | 37.82 | 35.10 | 33.06 | 32.18 | 30.78 | 29.36 | 28.50 | 27.69 | 24.72 | 24.25 | 24.87 | 23.48 | 24.20 | 23.15 | 18.55 | 19.66 | 21.06 | 20.22 | 20.01 | 19.59 | 18.65 | 17.75 | 17.89 | 16.75 | 15.63 | 15.37 | 16.67 | 15.47 | 16.24 | 15.88 | 16.19 | 17.61 | 16.51 | 17.59 | 16.40 | 14.61 | 14.13 | 16.67 | 14.67 | 16.66 | 15.71 | 17.42 | 16.14 | 24.26 | 23.45 | 22.08 | 20.38 | 20.83 | 19.93 | 21.62 | 38.43 | 19.78 | 19.14 | 17.76 | 33.87 | |
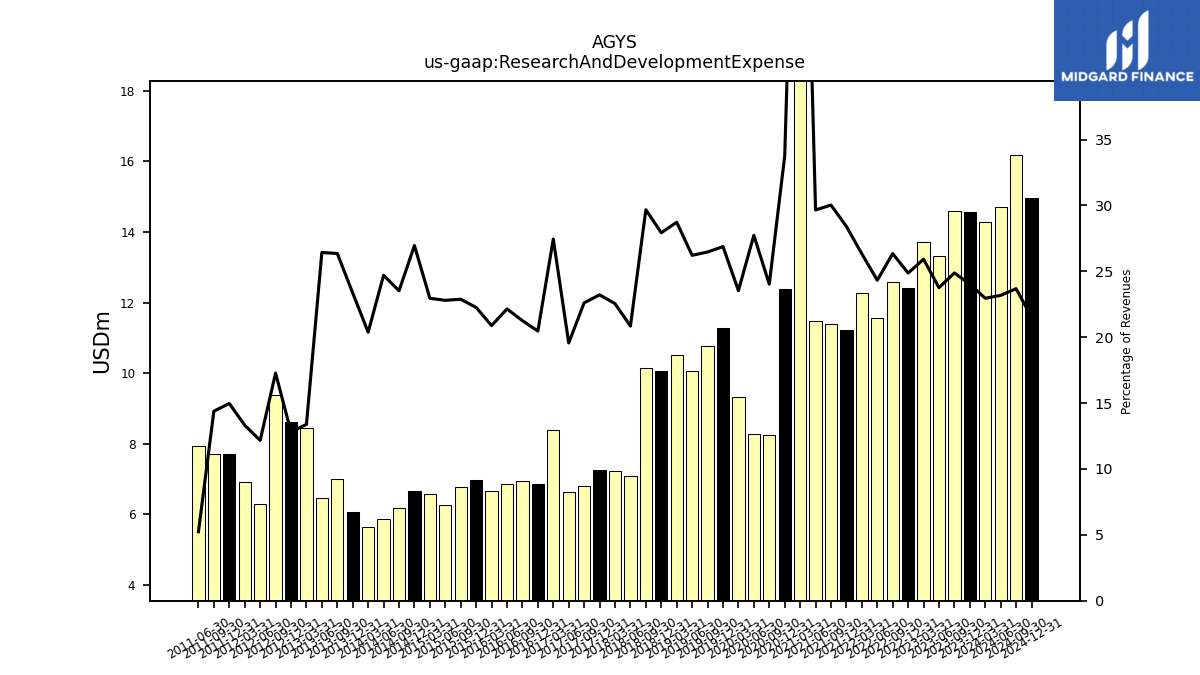
| Research And Development Expense | 14.55 | 14.58 | 13.32 | 13.71 | 12.42 | 12.58 | 11.56 | 12.26 | 11.21 | 11.38 | 11.48 | 26.45 | 12.38 | 8.26 | 8.27 | 9.34 | 11.29 | 10.78 | 10.06 | 10.52 | 10.06 | 10.15 | 7.09 | 7.23 | 7.27 | 6.81 | 6.63 | 8.40 | 6.85 | 6.95 | 6.86 | 6.67 | 6.97 | 6.78 | 6.27 | 6.59 | 6.67 | 6.19 | 5.87 | 5.66 | 6.07 | 7.00 | 6.48 | 8.44 | 8.61 | 9.37 | 6.29 | 6.93 | 7.72 | 7.71 | 7.95 | NA | NA | NA | NA | |
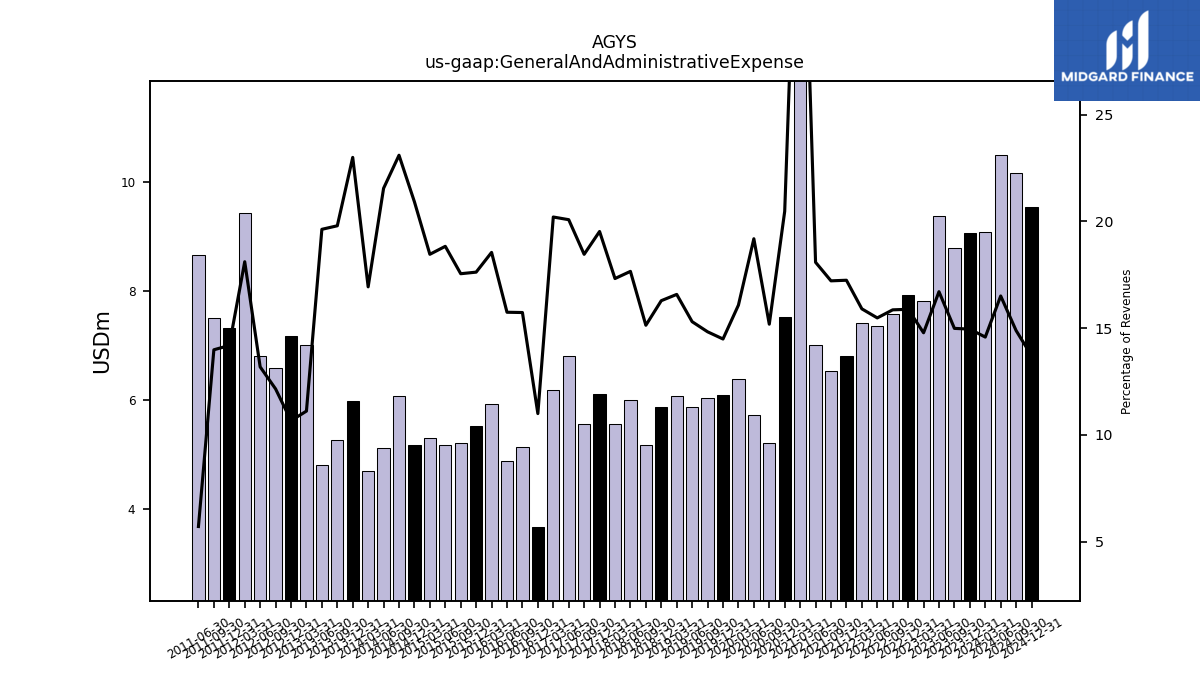
| General And Administrative Expense | 9.06 | 8.79 | 9.37 | 7.82 | 7.93 | 7.57 | 7.35 | 7.40 | 6.80 | 6.52 | 7.00 | 14.83 | 7.51 | 5.22 | 5.72 | 6.38 | 6.08 | 6.04 | 5.87 | 6.07 | 5.87 | 5.18 | 6.00 | 5.55 | 6.11 | 5.56 | 6.80 | 6.18 | 3.68 | 5.14 | 4.87 | 5.92 | 5.52 | 5.20 | 5.18 | 5.30 | 5.17 | 6.08 | 5.12 | 4.70 | 5.98 | 5.26 | 4.81 | 7.00 | 7.17 | 6.59 | 6.81 | 9.42 | 7.32 | 7.49 | 8.65 | NA | NA | NA | NA | |
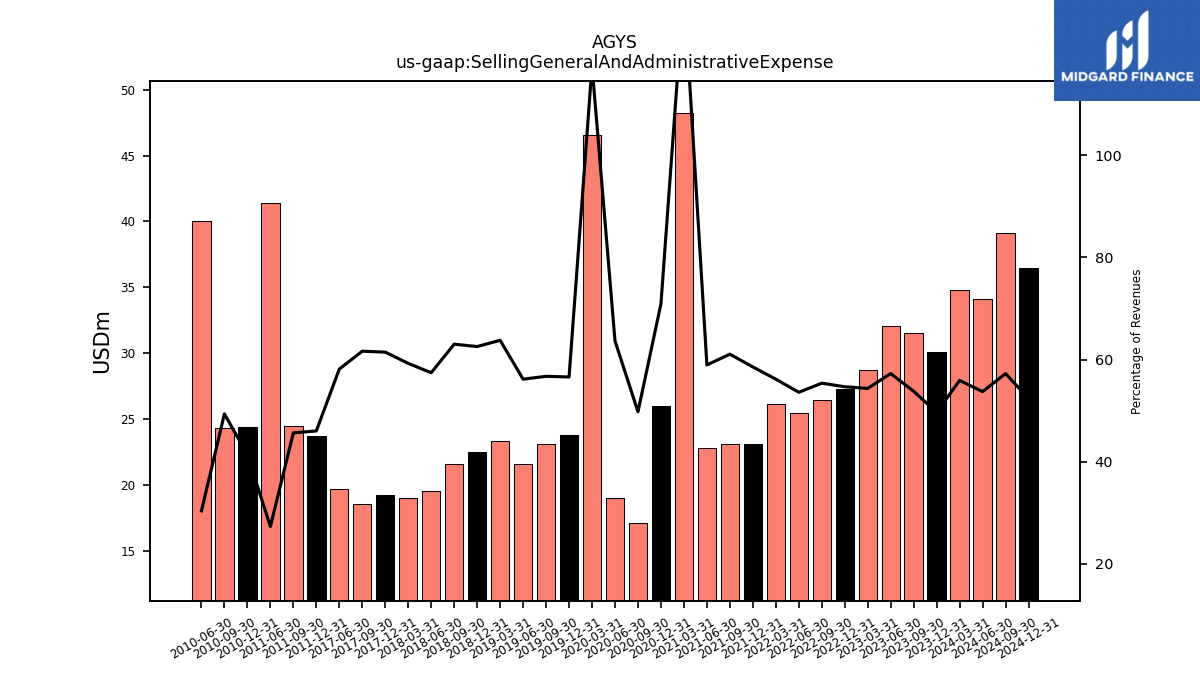
| Selling General And Administrative Expense | 30.07 | 31.53 | 32.10 | 28.75 | 27.29 | 26.44 | 25.46 | 26.15 | 23.10 | 23.14 | 22.83 | 48.25 | 26.01 | 17.10 | 18.97 | 46.59 | 23.76 | 23.10 | 21.56 | 23.35 | 22.52 | 21.55 | 19.53 | 18.99 | 19.24 | 18.57 | 19.69 | NA | NA | NA | NA | NA | NA | NA | NA | NA | NA | NA | NA | NA | NA | NA | NA | NA | NA | NA | NA | NA | 23.74 | 24.46 | 41.42 | NA | 24.40 | 24.35 | 40.06 | |
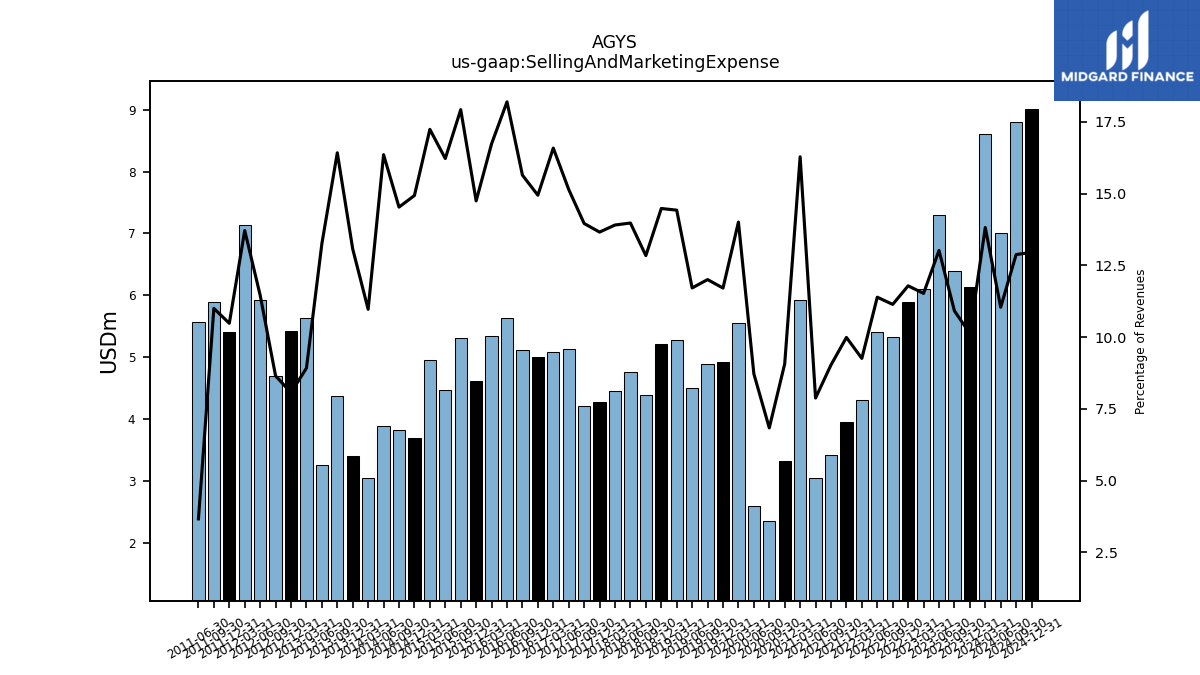
| Selling And Marketing Expense | 6.14 | 6.40 | 7.30 | 6.10 | 5.89 | 5.32 | 5.41 | 4.31 | 3.94 | 3.42 | 3.05 | 5.92 | 3.33 | 2.35 | 2.60 | 5.56 | 4.92 | 4.89 | 4.50 | 5.28 | 5.22 | 4.39 | 4.75 | 4.46 | 4.28 | 4.21 | 5.13 | 5.08 | 5.00 | 5.11 | 5.63 | 5.34 | 4.62 | 5.32 | 4.46 | 4.95 | 3.70 | 3.83 | 3.88 | 3.04 | 3.40 | 4.37 | 3.25 | 5.62 | 5.42 | 4.69 | 5.92 | 7.14 | 5.41 | 5.90 | 5.56 | NA | NA | NA | NA | |
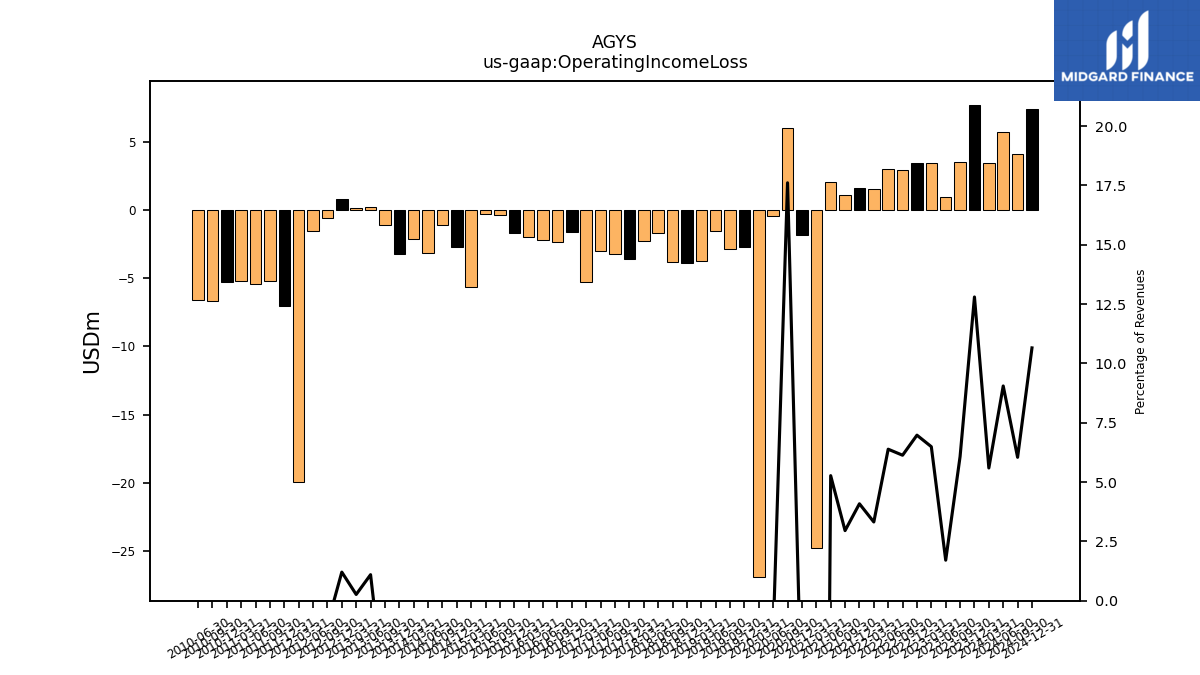
| Operating Income Loss | 7.75 | 3.56 | 0.96 | 3.43 | 3.48 | 2.93 | 3.03 | 1.54 | 1.61 | 1.12 | 2.04 | -24.77 | -1.81 | 6.05 | -0.42 | -26.94 | -2.70 | -2.88 | -1.54 | -3.76 | -3.88 | -3.80 | -1.64 | -2.25 | -3.61 | -3.20 | -3.02 | -5.24 | -1.63 | -2.34 | -2.19 | -1.98 | -1.68 | -0.38 | -0.28 | -5.62 | -2.68 | -1.05 | -3.11 | -2.14 | -3.21 | -1.11 | 0.27 | 0.17 | 0.81 | -0.54 | -1.55 | -19.95 | -7.05 | -5.21 | -5.39 | -5.17 | -5.26 | -6.65 | -6.59 | |
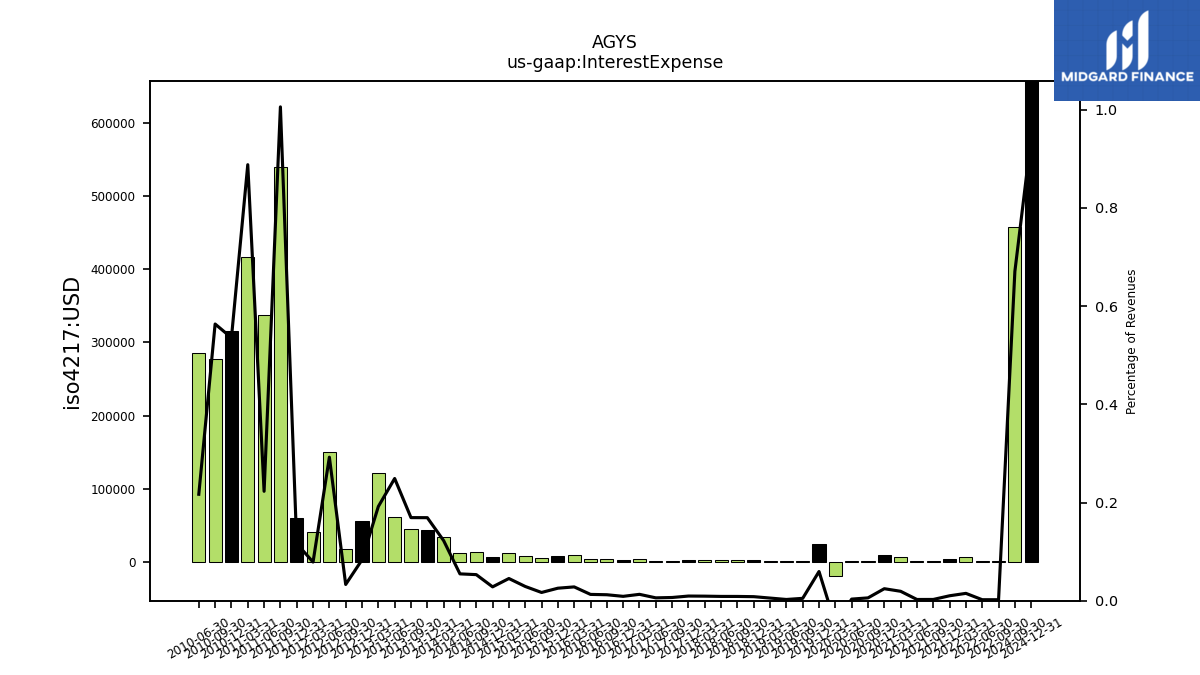
| Interest Expense | NA | NA | NA | NA | NA | 0.00 | 0.00 | 0.01 | 0.00 | 0.00 | 0.00 | 0.01 | 0.01 | 0.00 | 0.00 | -0.02 | 0.03 | 0.00 | 0.00 | 0.00 | 0.00 | 0.00 | 0.00 | 0.00 | 0.00 | 0.00 | 0.00 | 0.00 | 0.00 | 0.00 | 0.00 | 0.01 | 0.01 | 0.01 | 0.01 | 0.01 | 0.01 | 0.01 | 0.01 | 0.03 | 0.04 | 0.04 | 0.06 | 0.12 | 0.06 | 0.02 | 0.15 | 0.04 | 0.06 | 0.54 | 0.34 | 0.42 | 0.32 | 0.28 | 0.29 | |
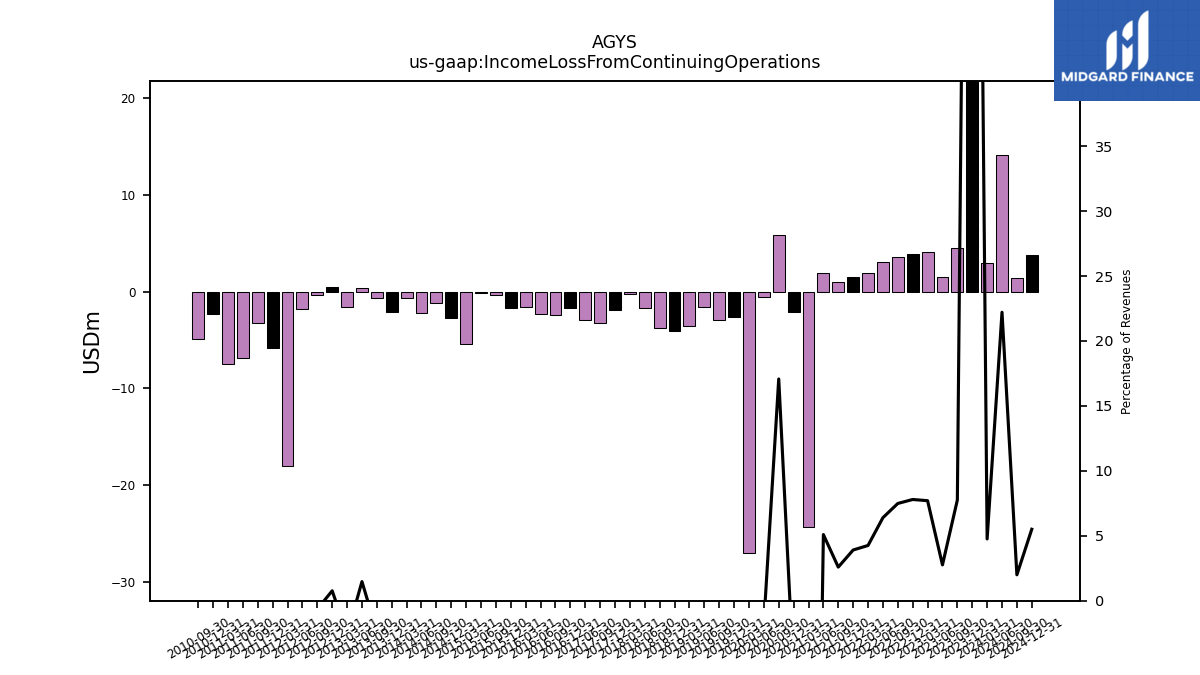
| Income Loss From Continuing Operations | 77.14 | 4.54 | 1.55 | 4.08 | 3.89 | 3.58 | 3.04 | 1.98 | 1.54 | 0.98 | 1.97 | -24.28 | -2.07 | 5.87 | -0.52 | -26.99 | -2.58 | -2.92 | -1.57 | -3.59 | -4.05 | -3.79 | -1.74 | -0.21 | -1.93 | -3.25 | -2.96 | NA | -1.74 | -2.40 | -2.30 | -1.54 | -1.67 | -0.37 | -0.18 | -5.43 | -2.71 | -1.13 | -2.23 | -0.66 | -2.08 | -0.63 | 0.36 | -1.63 | 0.52 | -0.35 | -1.79 | -18.03 | -5.77 | -3.24 | -6.88 | -7.48 | -2.29 | -4.92 | NA | |
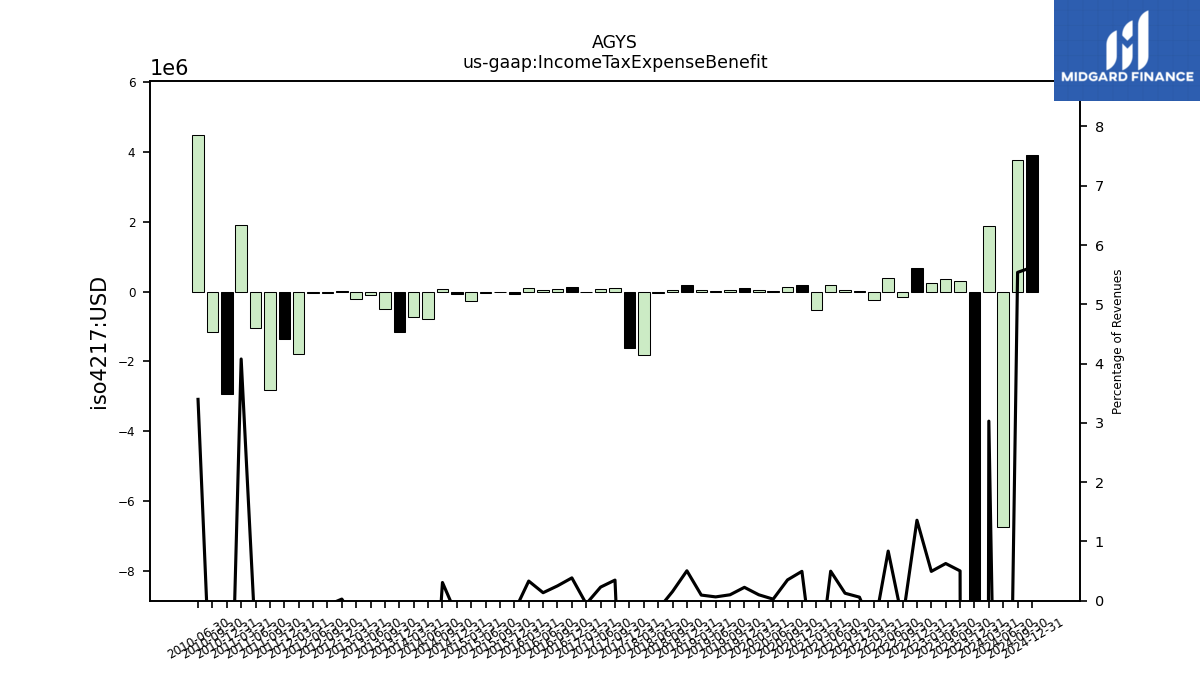
| Income Tax Expense Benefit | -68.04 | 0.29 | 0.35 | 0.26 | 0.68 | -0.16 | 0.40 | -0.23 | 0.02 | 0.05 | 0.19 | -0.52 | 0.18 | 0.12 | 0.01 | 0.04 | 0.10 | 0.04 | 0.03 | 0.04 | 0.18 | 0.05 | -0.05 | -1.81 | -1.62 | 0.10 | 0.08 | -0.02 | 0.13 | 0.08 | 0.04 | 0.11 | -0.06 | -0.02 | -0.02 | -0.28 | -0.06 | 0.08 | -0.80 | -0.73 | -1.15 | -0.50 | -0.10 | -0.21 | 0.02 | -0.04 | -0.05 | -1.80 | -1.35 | -2.81 | -1.04 | 1.92 | -2.95 | -1.14 | 4.48 | |
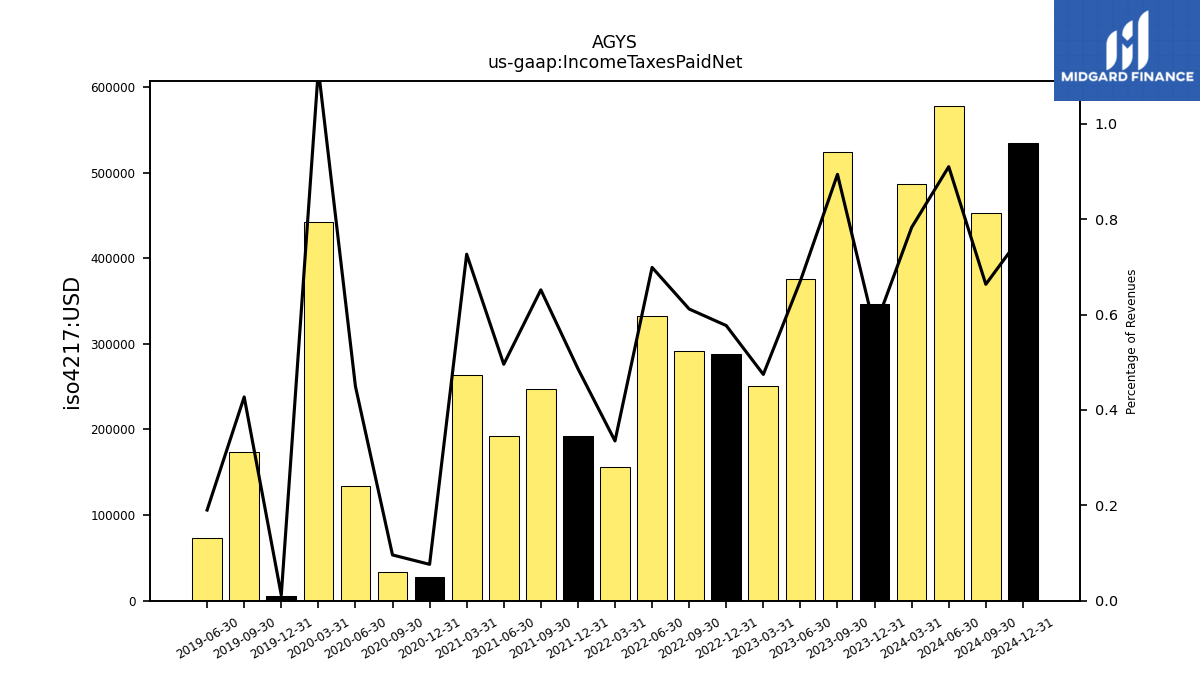
| Income Taxes Paid Net | 0.35 | 0.52 | 0.38 | 0.25 | 0.29 | 0.29 | 0.33 | 0.16 | 0.19 | 0.25 | 0.19 | 0.26 | 0.03 | 0.03 | 0.13 | 0.44 | 0.01 | 0.17 | 0.07 | NA | NA | NA | NA | NA | NA | NA | NA | NA | NA | NA | NA | NA | NA | NA | NA | NA | NA | NA | NA | NA | NA | NA | NA | NA | NA | NA | NA | NA | NA | NA | NA | NA | NA | NA | NA | |
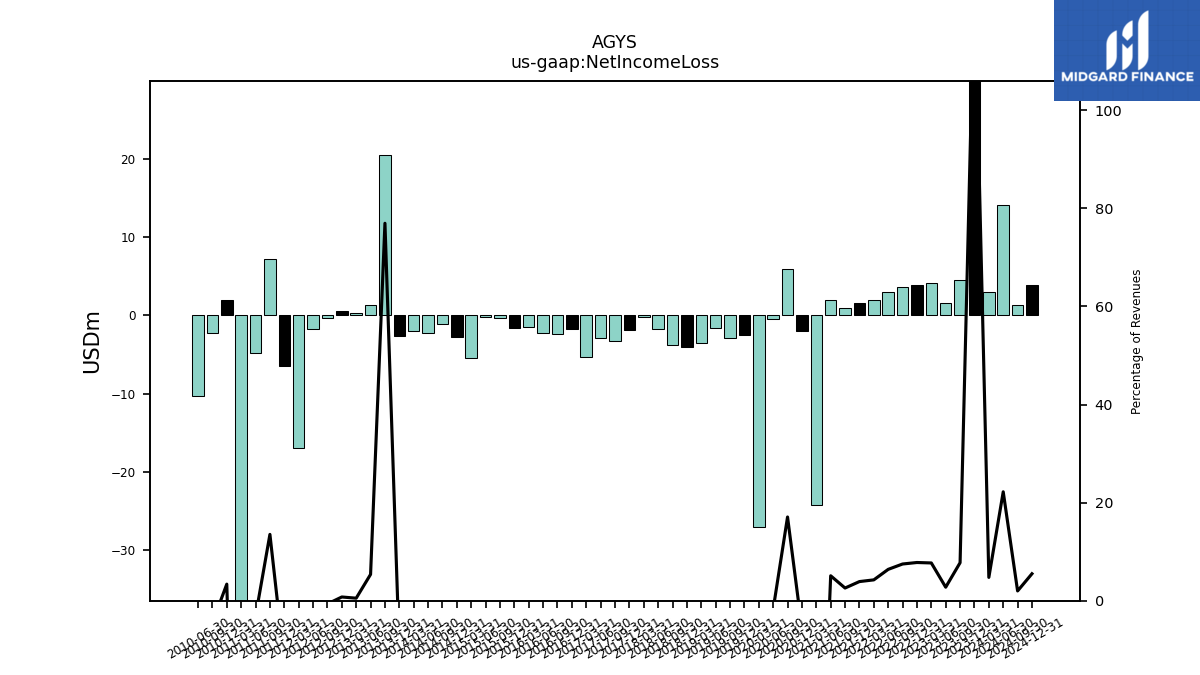
| Net Income Loss | 77.14 | 4.54 | 1.55 | 4.08 | 3.89 | 3.58 | 3.04 | 1.98 | 1.54 | 0.98 | 1.97 | -24.28 | -2.07 | 5.87 | -0.52 | -26.99 | -2.58 | -2.92 | -1.57 | -3.59 | -4.05 | -3.79 | -1.74 | -0.21 | -1.93 | -3.25 | -2.96 | -5.29 | -1.74 | -2.40 | -2.30 | -1.54 | -1.67 | -0.37 | -0.18 | -5.43 | -2.71 | -1.13 | -2.23 | -2.01 | -2.66 | 20.45 | 1.32 | 0.33 | 0.52 | -0.35 | -1.79 | -16.98 | -6.51 | 7.25 | -4.79 | -45.01 | 2.00 | -2.21 | -10.25 | |
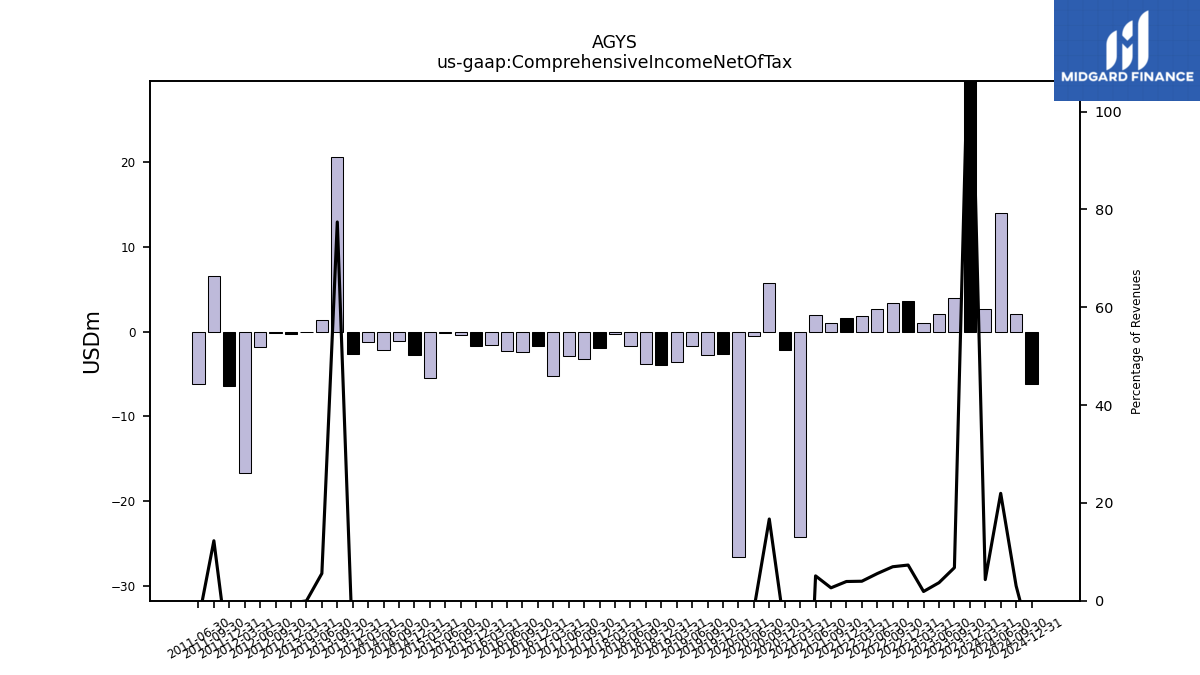
| Comprehensive Income Net Of Tax | 77.33 | 3.97 | 2.07 | 1.00 | 3.64 | 3.32 | 2.64 | 1.86 | 1.55 | 1.00 | 1.97 | -24.23 | -2.13 | 5.74 | -0.54 | -26.56 | -2.61 | -2.76 | -1.67 | -3.61 | -3.96 | -3.85 | -1.74 | -0.27 | -1.95 | -3.27 | -2.91 | -5.30 | -1.74 | -2.40 | -2.31 | -1.54 | -1.68 | -0.38 | -0.20 | -5.43 | -2.72 | -1.13 | -2.24 | -1.28 | -2.61 | 20.59 | 1.37 | -0.02 | -0.31 | -0.21 | -1.88 | -16.73 | -6.41 | 6.57 | -6.15 | NA | NA | NA | NA | |
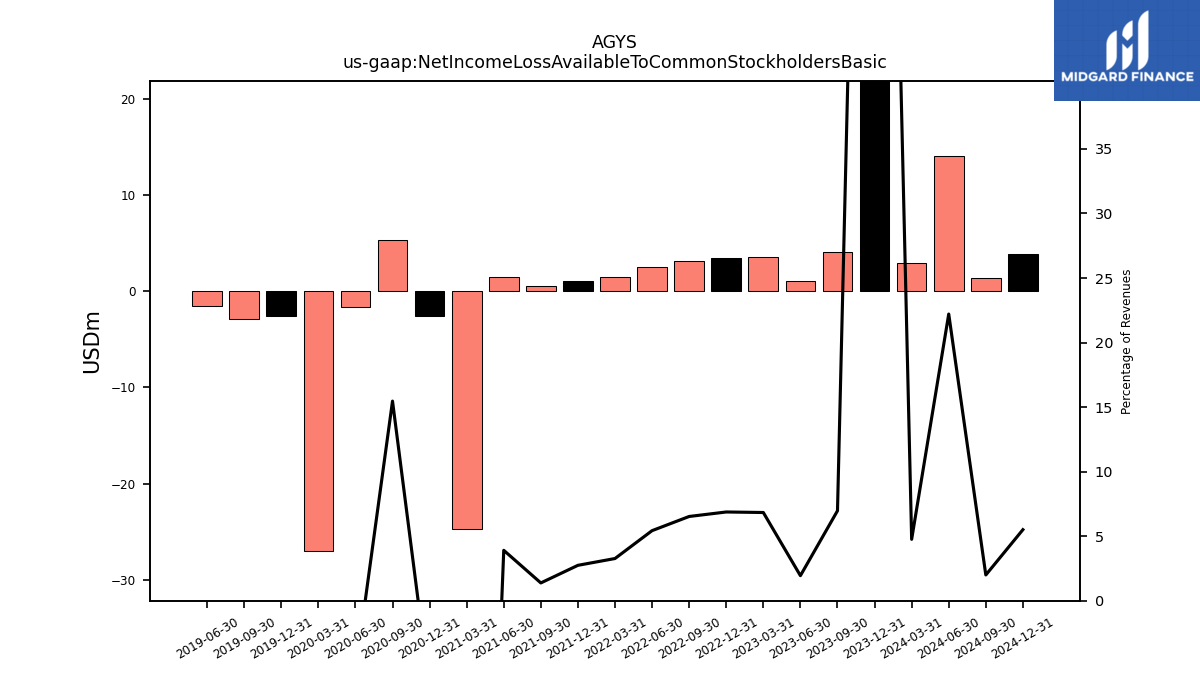
| Net Income Loss Available To Common Stockholders Basic | 76.86 | 4.09 | 1.09 | 3.62 | 3.43 | 3.12 | 2.58 | 1.52 | 1.08 | 0.52 | 1.51 | -24.74 | -2.53 | 5.31 | -1.65 | -26.99 | -2.58 | -2.92 | -1.57 | NA | NA | NA | NA | NA | NA | NA | NA | NA | NA | NA | NA | NA | NA | NA | NA | NA | NA | NA | NA | NA | NA | NA | NA | NA | NA | NA | NA | NA | NA | NA | NA | NA | NA | NA | NA |
| 2023-12-31 | 2023-09-30 | 2023-06-30 | 2023-03-31 | 2022-12-31 | 2022-09-30 | 2022-06-30 | 2022-03-31 | 2021-12-31 | 2021-09-30 | 2021-06-30 | 2021-03-31 | 2020-12-31 | 2020-09-30 | 2020-06-30 | 2020-03-31 | 2019-12-31 | 2019-09-30 | 2019-06-30 | 2019-03-31 | 2018-12-31 | 2018-09-30 | 2018-06-30 | 2018-03-31 | 2017-12-31 | 2017-09-30 | 2017-06-30 | 2017-03-31 | 2016-12-31 | 2016-09-30 | 2016-06-30 | 2016-03-31 | 2015-12-31 | 2015-09-30 | 2015-06-30 | 2015-03-31 | 2014-12-31 | 2014-09-30 | 2014-06-30 | 2014-03-31 | 2013-12-31 | 2013-09-30 | 2013-06-30 | 2013-03-31 | 2012-12-31 | 2012-09-30 | 2012-06-30 | 2012-03-31 | 2011-12-31 | 2011-09-30 | 2011-06-30 | 2011-03-31 | 2010-12-31 | 2010-09-30 | 2010-06-30 | ||
|---|---|---|---|---|---|---|---|---|---|---|---|---|---|---|---|---|---|---|---|---|---|---|---|---|---|---|---|---|---|---|---|---|---|---|---|---|---|---|---|---|---|---|---|---|---|---|---|---|---|---|---|---|---|---|---|---|
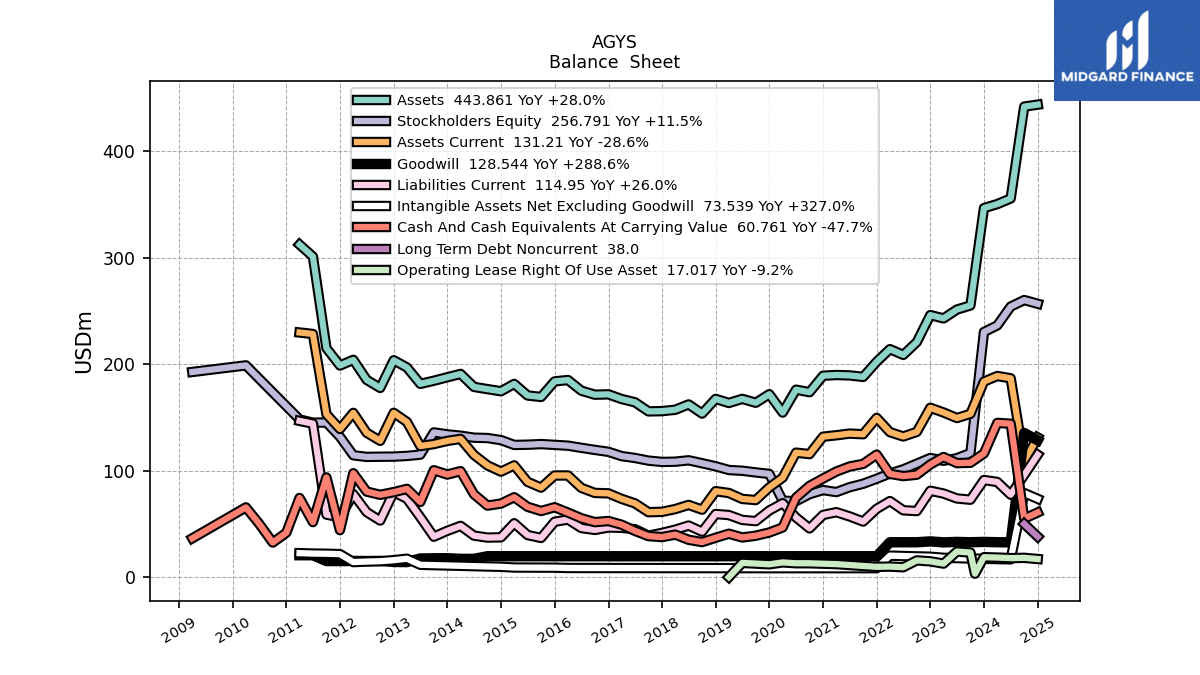
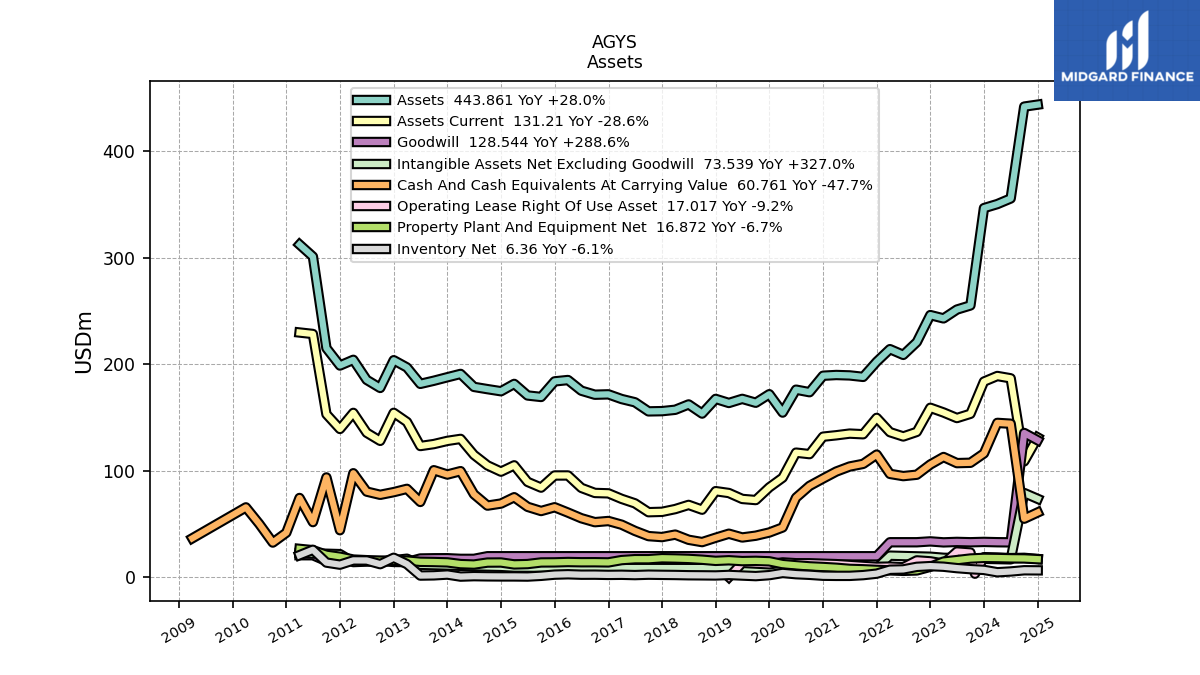
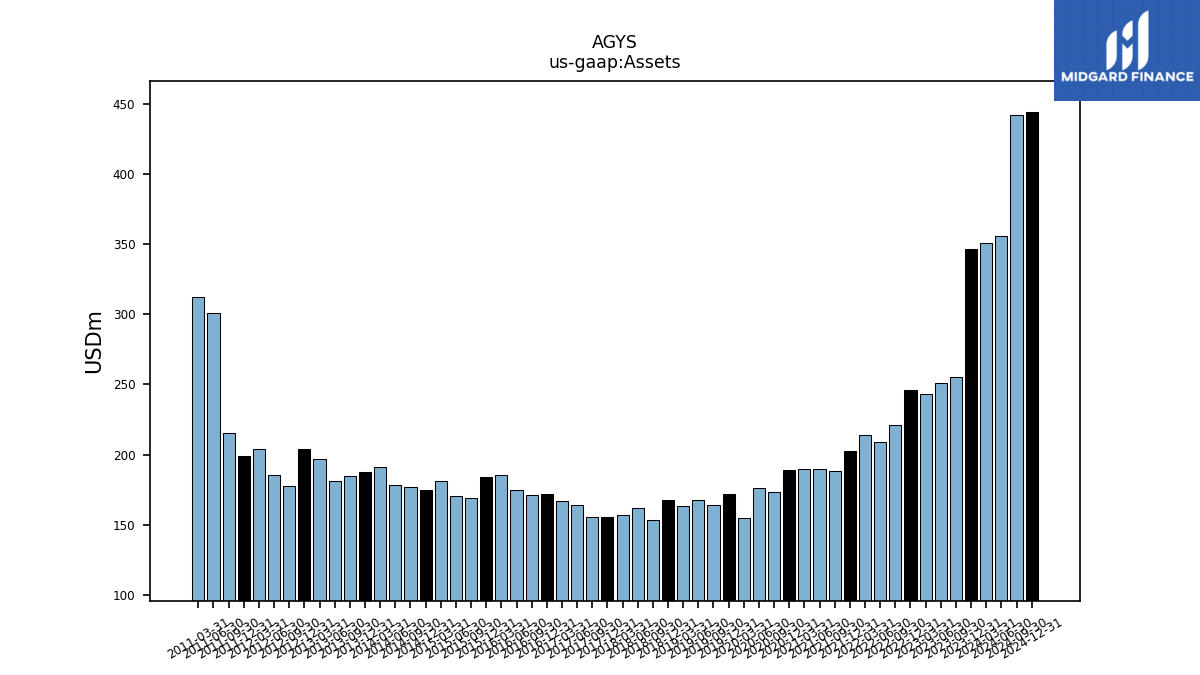
| Assets | 346.66 | 255.21 | 251.35 | 243.04 | 246.16 | 220.77 | 208.76 | 214.16 | 202.34 | 188.10 | 189.49 | 189.87 | 189.20 | 173.71 | 176.10 | 154.56 | 171.83 | 163.79 | 167.45 | 163.59 | 167.43 | 153.63 | 162.23 | 157.21 | 155.92 | 155.70 | 164.25 | 167.31 | 171.71 | 171.37 | 175.13 | 185.16 | 183.88 | 169.24 | 170.64 | 181.53 | 174.62 | 176.60 | 178.69 | 190.90 | 187.76 | 184.48 | 181.54 | 196.96 | 203.77 | 177.70 | 185.31 | 204.14 | 198.77 | 215.12 | 301.10 | 312.40 | NA | NA | NA | |
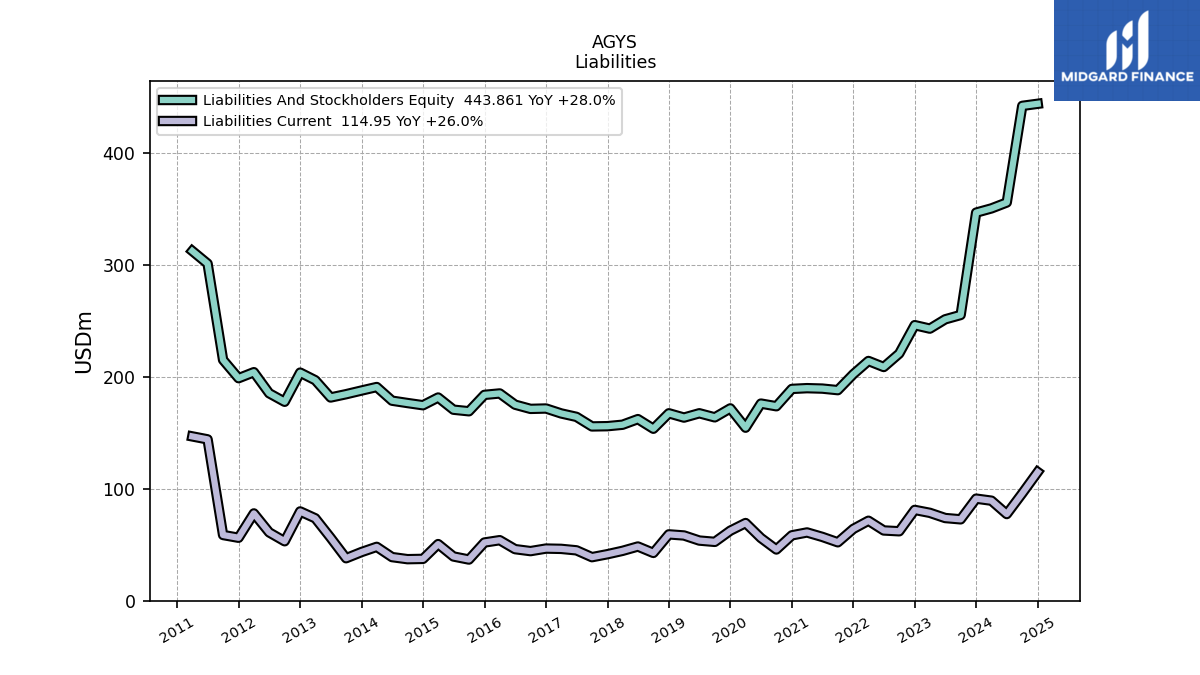
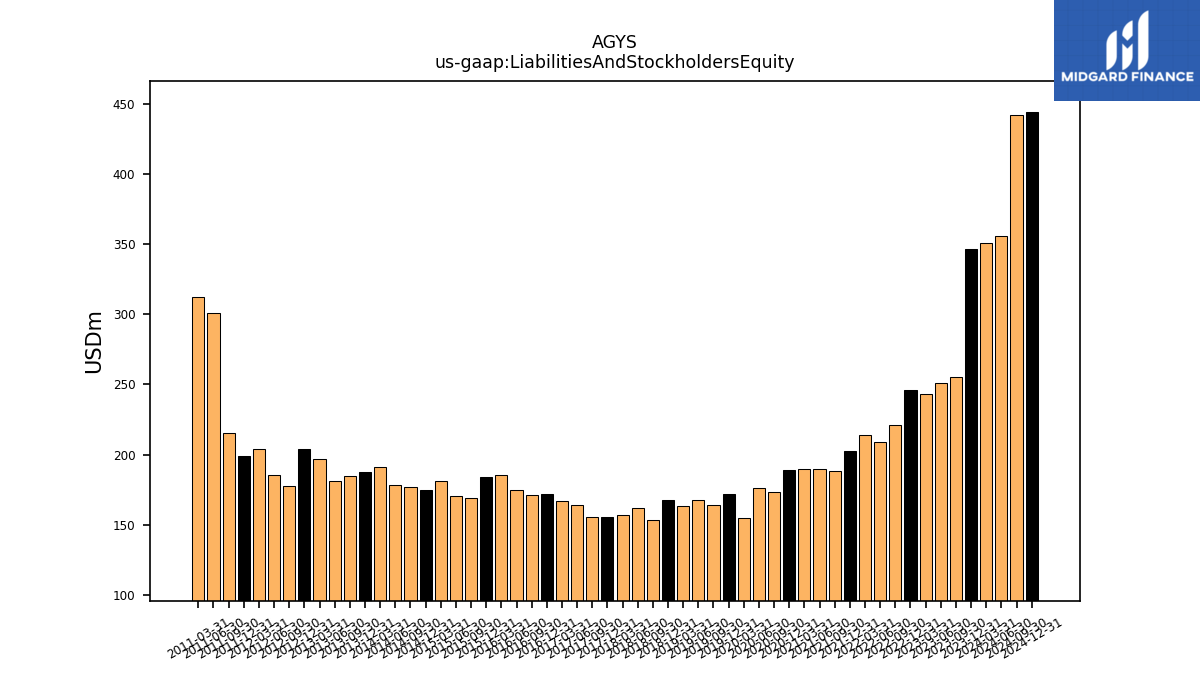
| Liabilities And Stockholders Equity | 346.66 | 255.21 | 251.35 | 243.04 | 246.16 | 220.77 | 208.76 | 214.16 | 202.34 | 188.10 | 189.49 | 189.87 | 189.20 | 173.71 | 176.10 | 154.56 | 171.83 | 163.79 | 167.45 | 163.59 | 167.43 | 153.63 | 162.23 | 157.21 | 155.92 | 155.70 | 164.25 | 167.31 | 171.71 | 171.37 | 175.13 | 185.16 | 183.88 | 169.24 | 170.64 | 181.53 | 174.62 | 176.60 | 178.69 | 190.90 | 187.76 | 184.48 | 181.54 | 196.96 | 203.77 | 177.70 | 185.31 | 204.14 | 198.77 | 215.12 | 301.10 | 312.40 | NA | NA | NA | |
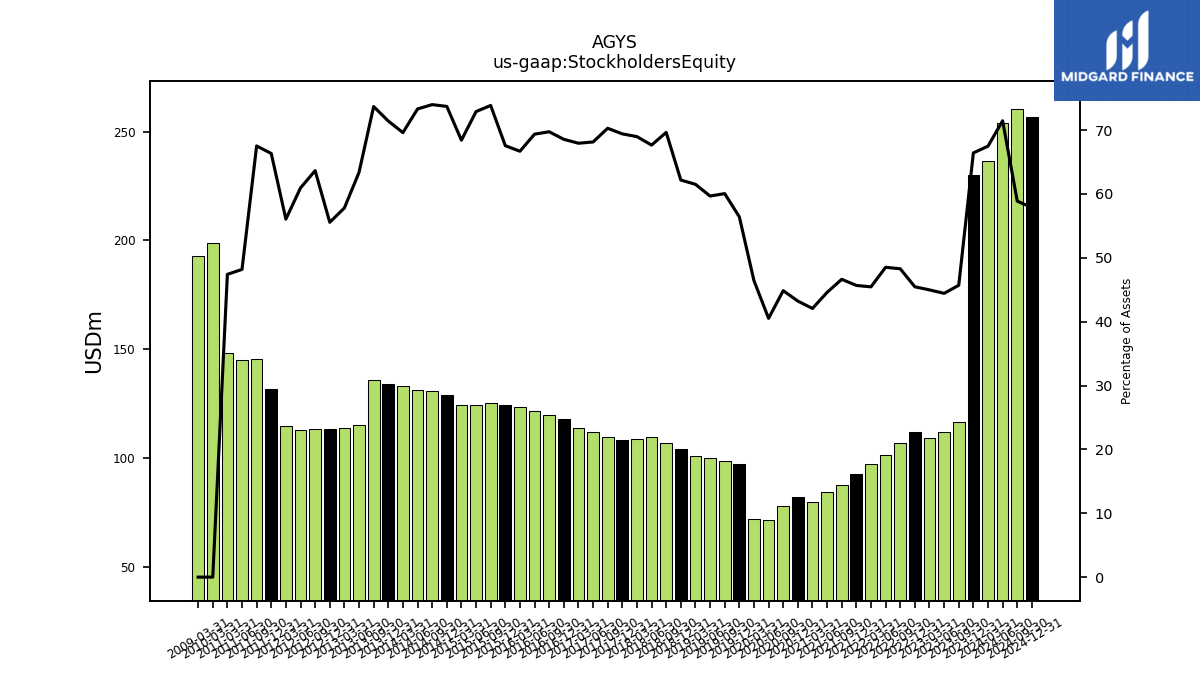
| Stockholders Equity | 230.27 | 116.62 | 111.69 | 109.31 | 111.91 | 106.59 | 101.28 | 97.34 | 92.41 | 87.72 | 84.49 | 79.88 | 81.78 | 77.92 | 71.35 | 71.76 | 96.94 | 98.36 | 99.92 | 100.62 | 104.11 | 106.97 | 109.75 | 108.43 | 108.21 | 109.43 | 111.92 | 113.67 | 117.71 | 119.51 | 121.47 | 123.47 | 124.22 | 124.99 | 124.39 | 124.19 | 128.71 | 130.66 | 130.99 | 132.87 | 134.09 | 135.94 | 115.06 | 113.86 | 113.22 | 113.10 | 112.93 | 114.44 | 131.84 | 145.24 | 145.08 | 148.10 | NA | NA | NA |
| 2023-12-31 | 2023-09-30 | 2023-06-30 | 2023-03-31 | 2022-12-31 | 2022-09-30 | 2022-06-30 | 2022-03-31 | 2021-12-31 | 2021-09-30 | 2021-06-30 | 2021-03-31 | 2020-12-31 | 2020-09-30 | 2020-06-30 | 2020-03-31 | 2019-12-31 | 2019-09-30 | 2019-06-30 | 2019-03-31 | 2018-12-31 | 2018-09-30 | 2018-06-30 | 2018-03-31 | 2017-12-31 | 2017-09-30 | 2017-06-30 | 2017-03-31 | 2016-12-31 | 2016-09-30 | 2016-06-30 | 2016-03-31 | 2015-12-31 | 2015-09-30 | 2015-06-30 | 2015-03-31 | 2014-12-31 | 2014-09-30 | 2014-06-30 | 2014-03-31 | 2013-12-31 | 2013-09-30 | 2013-06-30 | 2013-03-31 | 2012-12-31 | 2012-09-30 | 2012-06-30 | 2012-03-31 | 2011-12-31 | 2011-09-30 | 2011-06-30 | 2011-03-31 | 2010-12-31 | 2010-09-30 | 2010-06-30 | ||
|---|---|---|---|---|---|---|---|---|---|---|---|---|---|---|---|---|---|---|---|---|---|---|---|---|---|---|---|---|---|---|---|---|---|---|---|---|---|---|---|---|---|---|---|---|---|---|---|---|---|---|---|---|---|---|---|---|
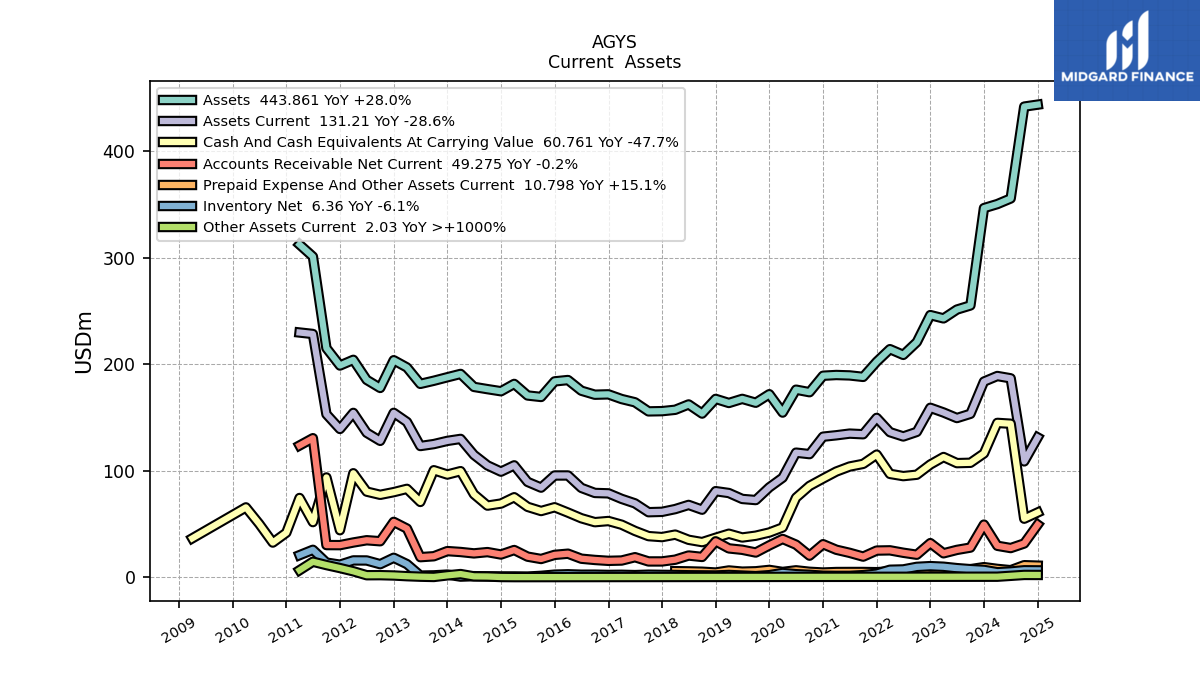
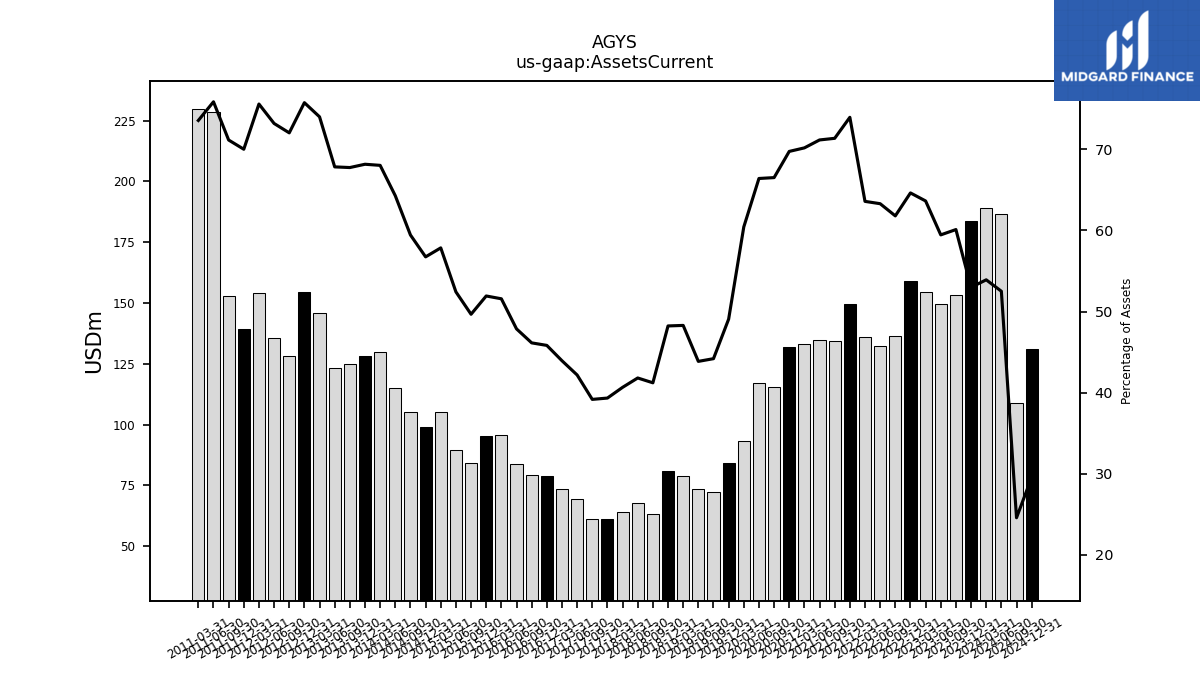
| Assets Current | 183.69 | 153.41 | 149.44 | 154.66 | 159.08 | 136.43 | 132.14 | 136.17 | 149.61 | 134.22 | 134.83 | 133.25 | 131.95 | 115.54 | 116.94 | 93.41 | 84.31 | 72.39 | 73.45 | 79.01 | 80.76 | 63.33 | 67.84 | 63.92 | 61.34 | 61.00 | 69.29 | 73.52 | 78.70 | 79.08 | 83.83 | 95.50 | 95.48 | 84.06 | 89.47 | 105.02 | 99.09 | 104.97 | 114.86 | 129.85 | 127.98 | 124.99 | 123.15 | 145.76 | 154.35 | 127.99 | 135.62 | 154.29 | 139.16 | 153.05 | 228.41 | 229.79 | NA | NA | NA | |
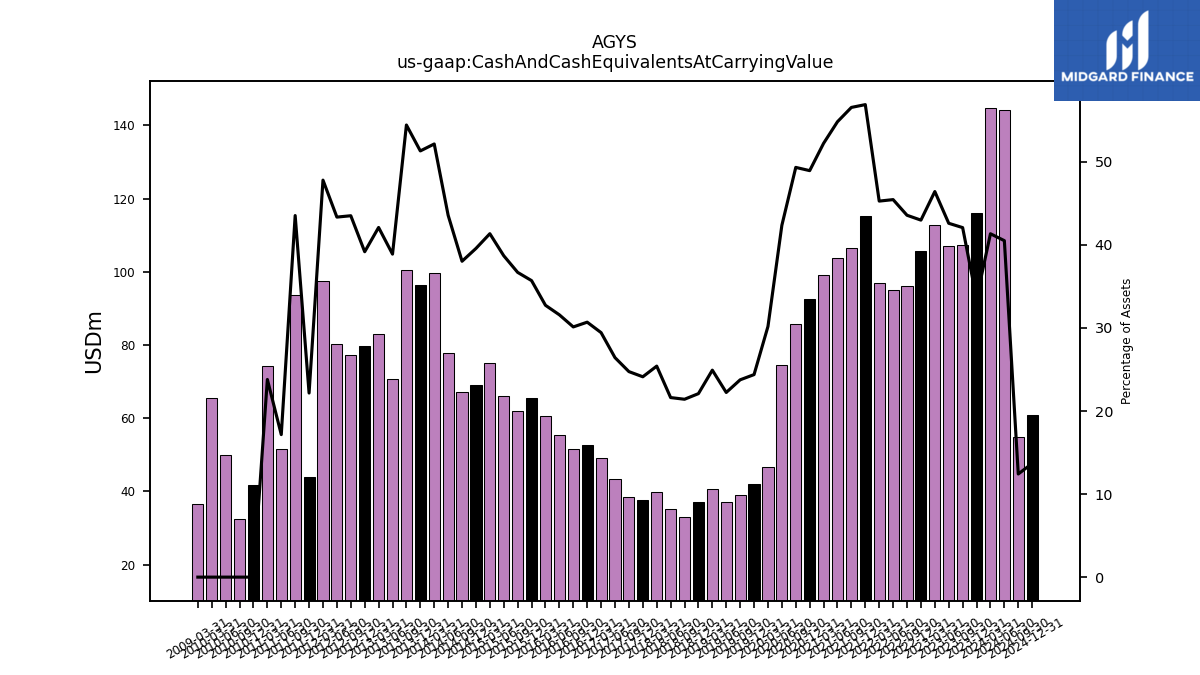
| Cash And Cash Equivalents At Carrying Value | 116.20 | 107.41 | 107.09 | 112.84 | 105.82 | 96.20 | 94.90 | 96.97 | 115.12 | 106.39 | 103.91 | 99.18 | 92.61 | 85.71 | 74.60 | 46.65 | 41.91 | 38.91 | 37.23 | 40.77 | 36.99 | 32.90 | 35.08 | 39.94 | 37.62 | 38.53 | 43.41 | 49.26 | 52.71 | 51.63 | 55.31 | 60.61 | 65.65 | 62.10 | 66.03 | 75.07 | 69.11 | 67.17 | 77.86 | 99.57 | 96.36 | 100.43 | 70.61 | 82.93 | 79.84 | 77.33 | 80.34 | 97.59 | 44.06 | 93.66 | 51.67 | 74.35 | 41.71 | 32.46 | 49.97 | |
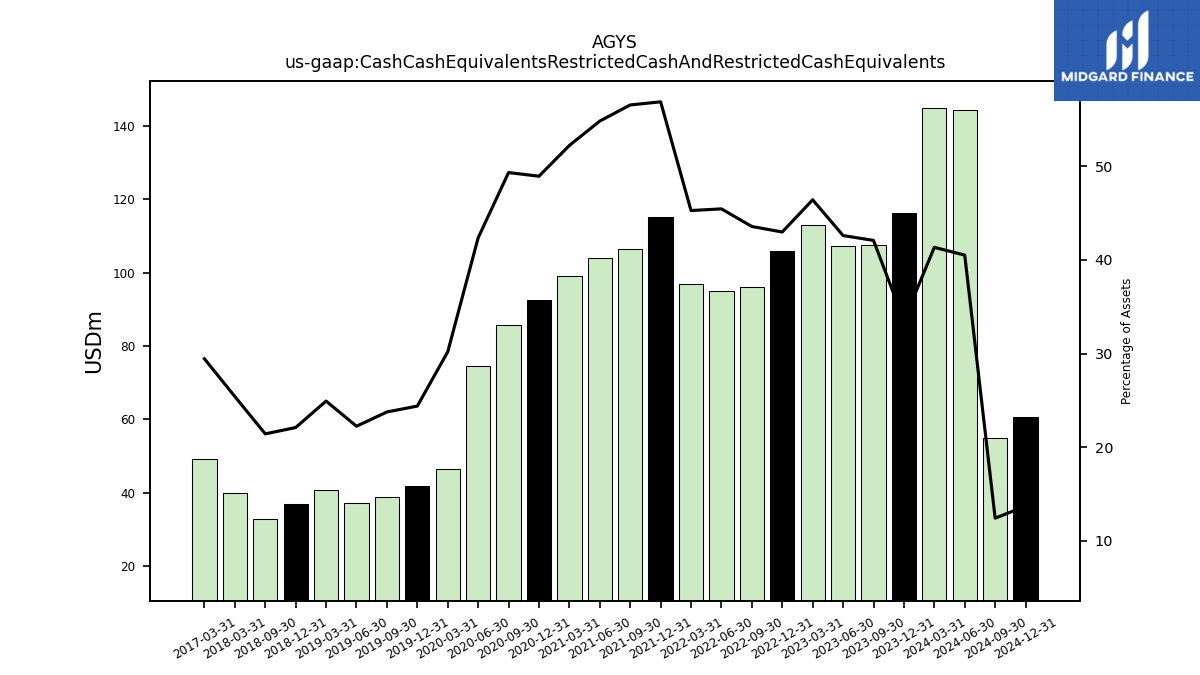
| Cash Cash Equivalents Restricted Cash And Restricted Cash Equivalents | 116.20 | 107.41 | 107.09 | 112.84 | 105.82 | 96.20 | 94.90 | 96.97 | 115.12 | 106.39 | 103.91 | 99.18 | 92.61 | 85.71 | 74.60 | 46.65 | 41.91 | 38.91 | 37.23 | 40.77 | 36.99 | 32.90 | NA | 39.94 | NA | NA | NA | 49.26 | NA | NA | NA | NA | NA | NA | NA | NA | NA | NA | NA | NA | NA | NA | NA | NA | NA | NA | NA | NA | NA | NA | NA | NA | NA | NA | NA | |
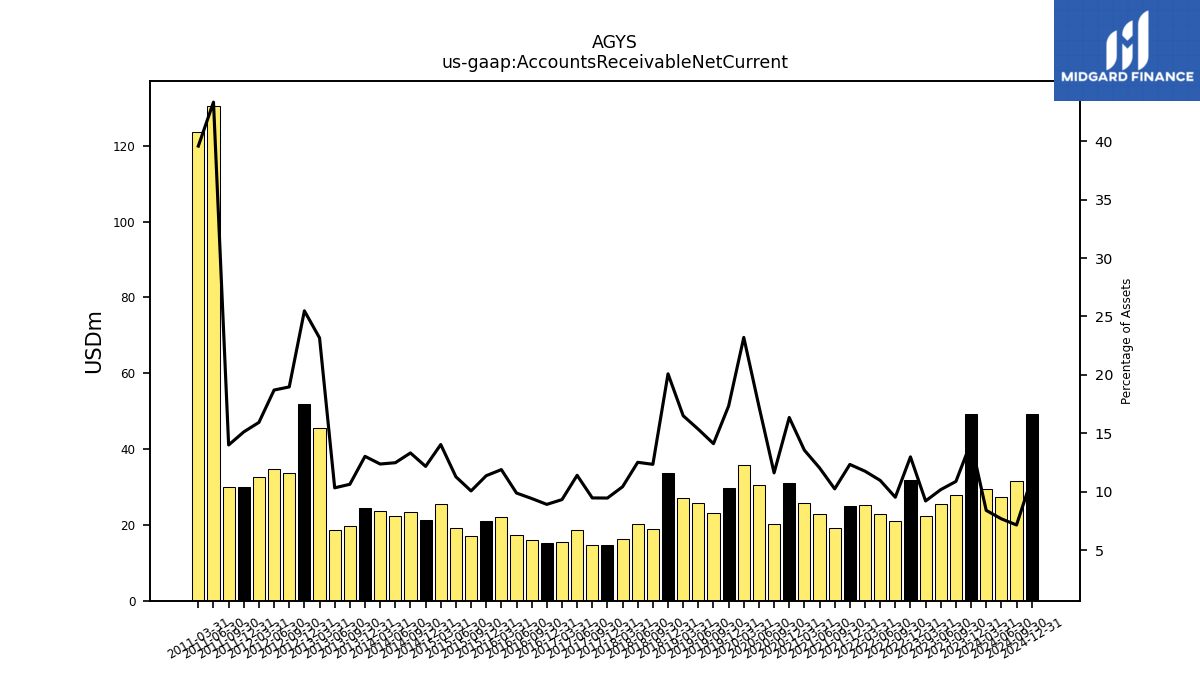
| Accounts Receivable Net Current | 49.37 | 27.76 | 25.58 | 22.38 | 31.95 | 21.03 | 22.90 | 25.18 | 24.96 | 19.27 | 22.81 | 25.73 | 30.94 | 20.17 | 30.49 | 35.87 | 29.79 | 23.12 | 25.69 | 27.00 | 33.64 | 18.96 | 20.31 | 16.39 | 14.75 | 14.74 | 18.73 | 15.60 | 15.31 | 16.14 | 17.31 | 22.02 | 20.91 | 17.03 | 19.24 | 25.48 | 21.25 | 23.52 | 22.30 | 23.61 | 24.46 | 19.62 | 18.76 | 45.63 | 51.92 | 33.71 | 34.66 | 32.53 | 30.05 | 30.11 | 130.52 | 123.67 | NA | NA | NA | |
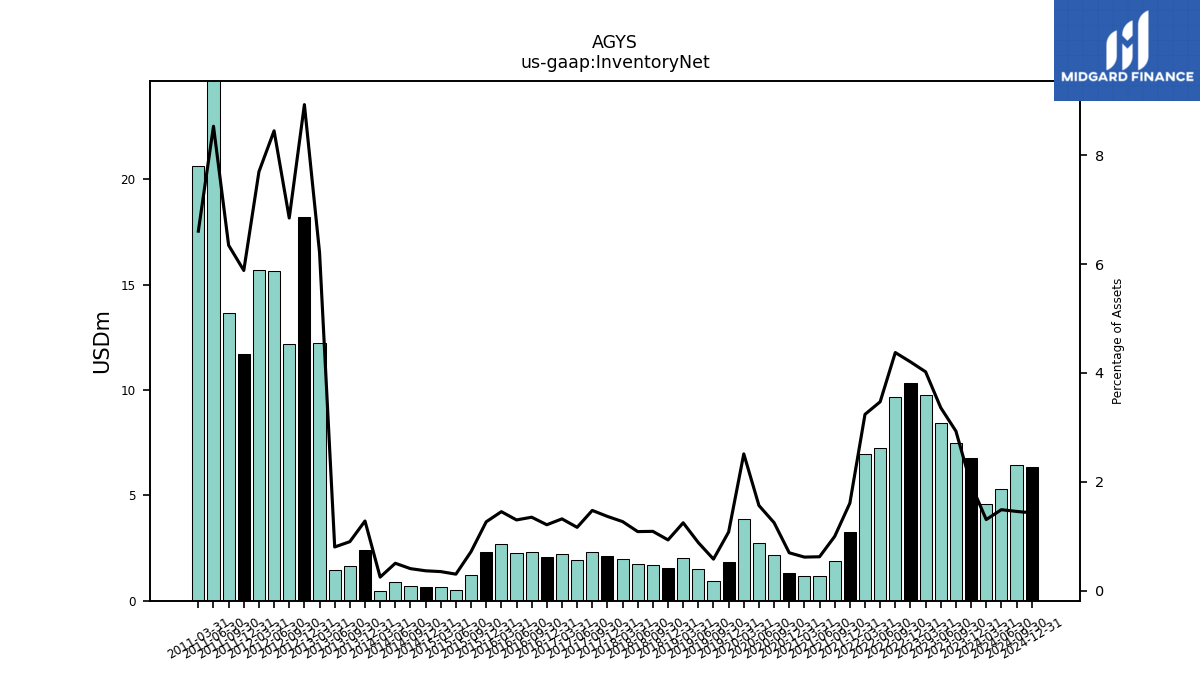
| Inventory Net | 6.77 | 7.49 | 8.45 | 9.77 | 10.35 | 9.66 | 7.25 | 6.94 | 3.26 | 1.88 | 1.19 | 1.18 | 1.32 | 2.17 | 2.76 | 3.89 | 1.86 | 0.95 | 1.48 | 2.04 | 1.57 | 1.68 | 1.76 | 2.00 | 2.13 | 2.30 | 1.92 | 2.21 | 2.08 | 2.32 | 2.28 | 2.69 | 2.33 | 1.22 | 0.52 | 0.64 | 0.64 | 0.72 | 0.91 | 0.48 | 2.41 | 1.67 | 1.46 | 12.24 | 18.19 | 12.16 | 15.65 | 15.71 | 11.69 | 13.65 | 25.69 | 20.63 | NA | NA | NA | |
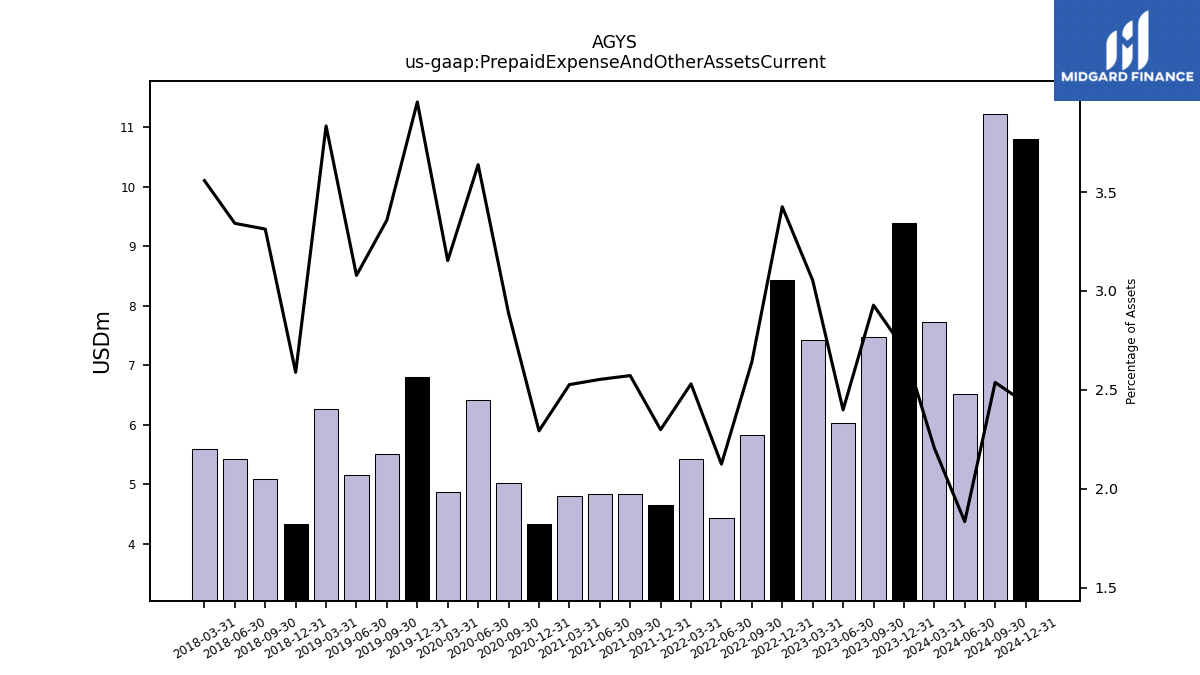
| Prepaid Expense And Other Assets Current | 9.38 | 7.47 | 6.03 | 7.42 | 8.43 | 5.83 | 4.43 | 5.42 | 4.65 | 4.84 | 4.84 | 4.80 | 4.34 | 5.02 | 6.41 | 4.87 | 6.80 | 5.50 | 5.16 | 6.27 | 4.33 | 5.09 | 5.42 | 5.59 | NA | NA | NA | NA | NA | NA | NA | NA | NA | NA | NA | NA | NA | NA | NA | NA | NA | NA | NA | NA | NA | NA | NA | NA | NA | NA | NA | NA | NA | NA | NA |
| 2023-12-31 | 2023-09-30 | 2023-06-30 | 2023-03-31 | 2022-12-31 | 2022-09-30 | 2022-06-30 | 2022-03-31 | 2021-12-31 | 2021-09-30 | 2021-06-30 | 2021-03-31 | 2020-12-31 | 2020-09-30 | 2020-06-30 | 2020-03-31 | 2019-12-31 | 2019-09-30 | 2019-06-30 | 2019-03-31 | 2018-12-31 | 2018-09-30 | 2018-06-30 | 2018-03-31 | 2017-12-31 | 2017-09-30 | 2017-06-30 | 2017-03-31 | 2016-12-31 | 2016-09-30 | 2016-06-30 | 2016-03-31 | 2015-12-31 | 2015-09-30 | 2015-06-30 | 2015-03-31 | 2014-12-31 | 2014-09-30 | 2014-06-30 | 2014-03-31 | 2013-12-31 | 2013-09-30 | 2013-06-30 | 2013-03-31 | 2012-12-31 | 2012-09-30 | 2012-06-30 | 2012-03-31 | 2011-12-31 | 2011-09-30 | 2011-06-30 | 2011-03-31 | 2010-12-31 | 2010-09-30 | 2010-06-30 | ||
|---|---|---|---|---|---|---|---|---|---|---|---|---|---|---|---|---|---|---|---|---|---|---|---|---|---|---|---|---|---|---|---|---|---|---|---|---|---|---|---|---|---|---|---|---|---|---|---|---|---|---|---|---|---|---|---|---|
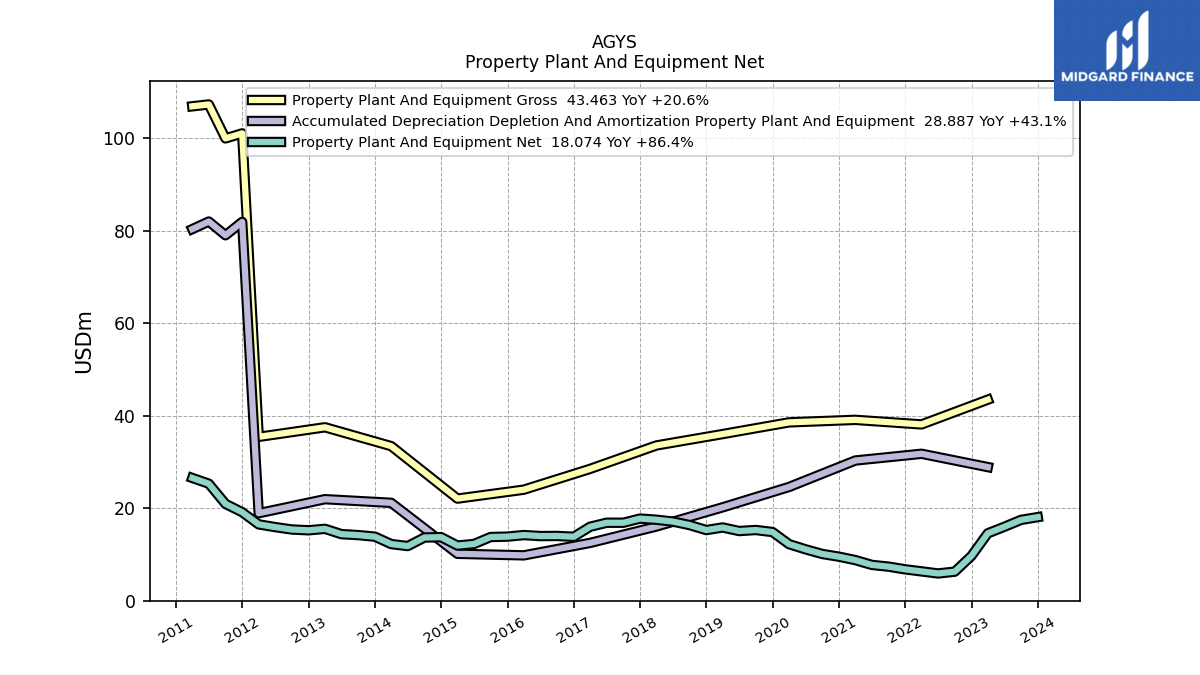
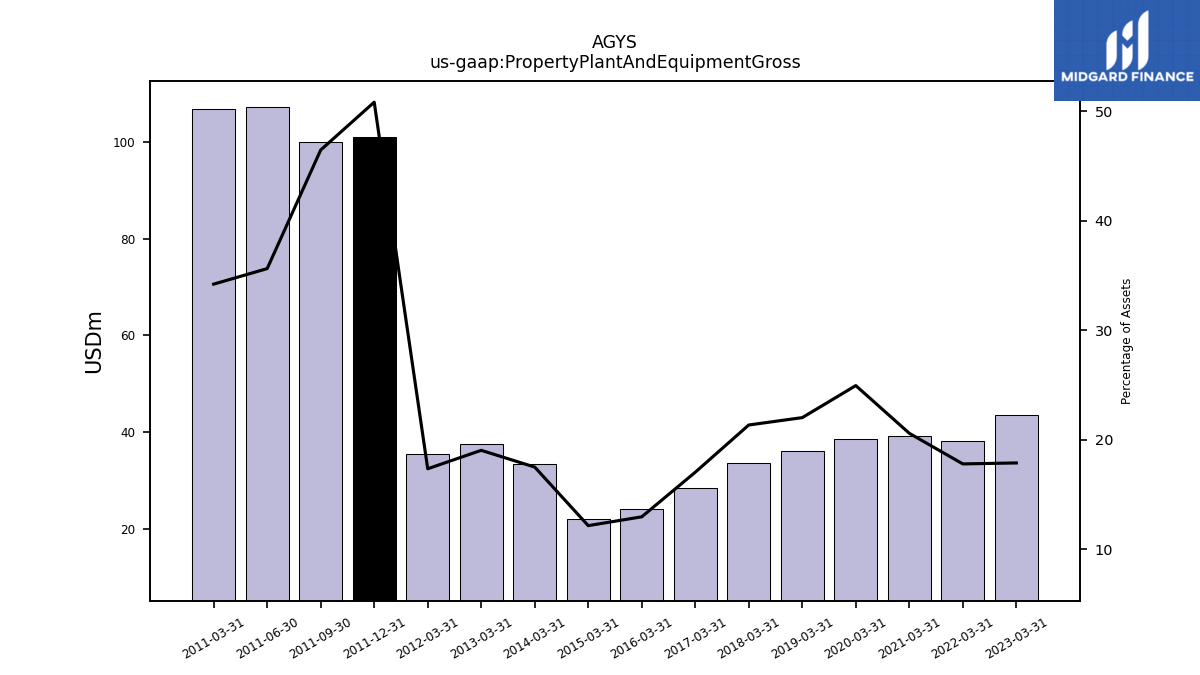
| Property Plant And Equipment Gross | NA | NA | NA | 43.46 | NA | NA | NA | 38.11 | NA | NA | NA | 39.10 | NA | NA | NA | 38.56 | NA | NA | NA | 36.03 | NA | NA | NA | 33.56 | NA | NA | NA | 28.50 | NA | NA | NA | 24.01 | NA | NA | NA | 22.08 | NA | NA | NA | 33.42 | NA | NA | NA | 37.49 | NA | NA | NA | 35.42 | 101.01 | 99.93 | 107.27 | 106.87 | NA | NA | NA | |
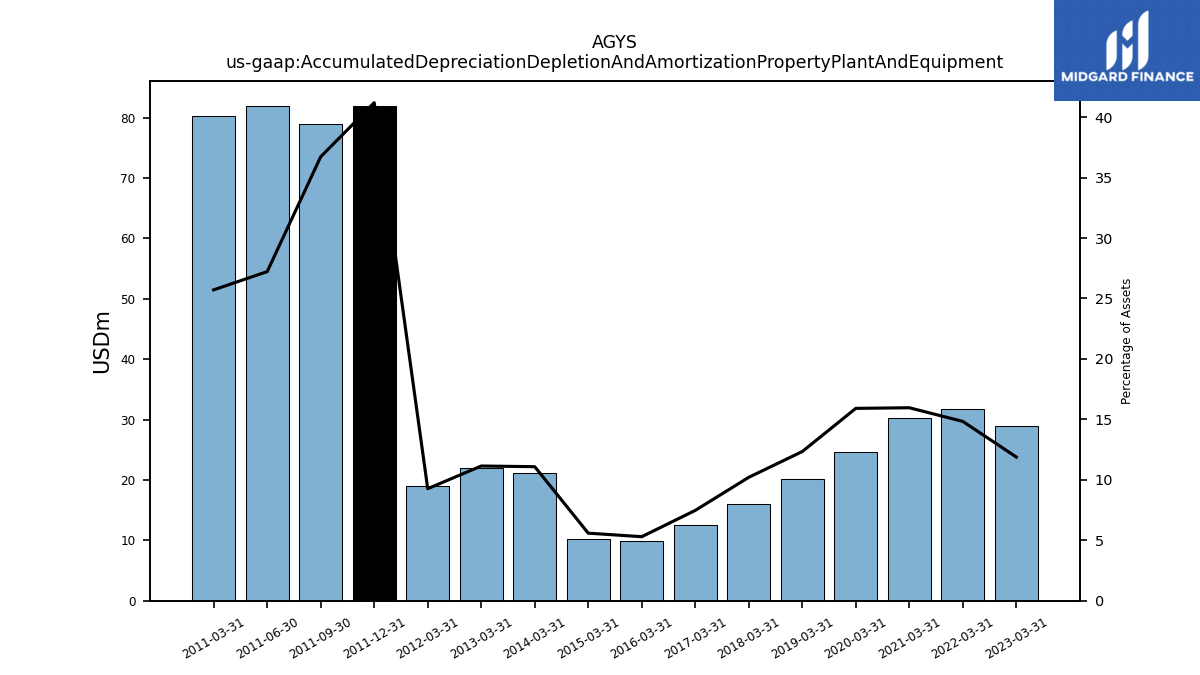
| Accumulated Depreciation Depletion And Amortization Property Plant And Equipment | NA | NA | NA | 28.89 | NA | NA | NA | 31.77 | NA | NA | NA | 30.31 | NA | NA | NA | 24.59 | NA | NA | NA | 20.19 | NA | NA | NA | 16.05 | NA | NA | NA | 12.50 | NA | NA | NA | 9.81 | NA | NA | NA | 10.15 | NA | NA | NA | 21.16 | NA | NA | NA | 21.95 | NA | NA | NA | 18.92 | 81.88 | 78.99 | 81.97 | 80.32 | NA | NA | NA | |
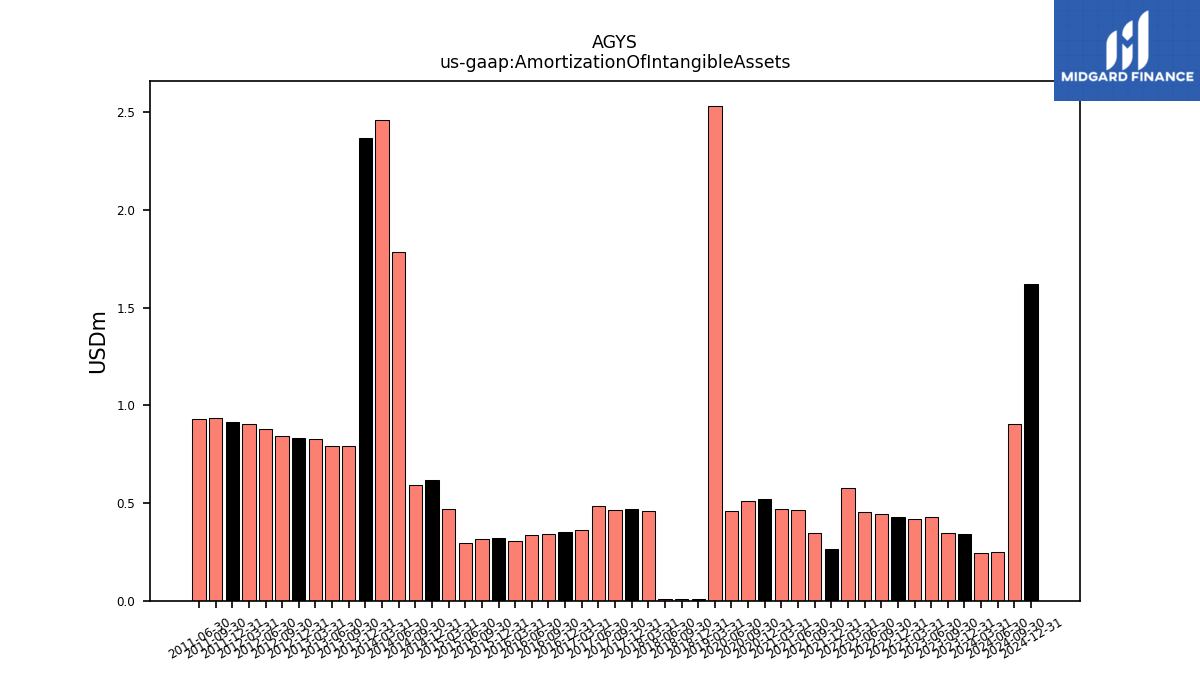
| Amortization Of Intangible Assets | 0.34 | 0.35 | 0.43 | 0.42 | 0.43 | 0.44 | 0.45 | 0.58 | 0.27 | 0.34 | 0.47 | 0.47 | 0.52 | 0.51 | 0.46 | NA | NA | NA | NA | 2.53 | 0.01 | 0.01 | 0.01 | 0.46 | 0.47 | 0.47 | 0.48 | 0.36 | 0.35 | 0.34 | 0.34 | 0.31 | 0.32 | 0.32 | 0.30 | 0.47 | 0.62 | 0.59 | 1.78 | 2.46 | 2.37 | 0.79 | 0.79 | 0.83 | 0.83 | 0.84 | 0.88 | 0.90 | 0.91 | 0.94 | 0.93 | NA | NA | NA | NA | |
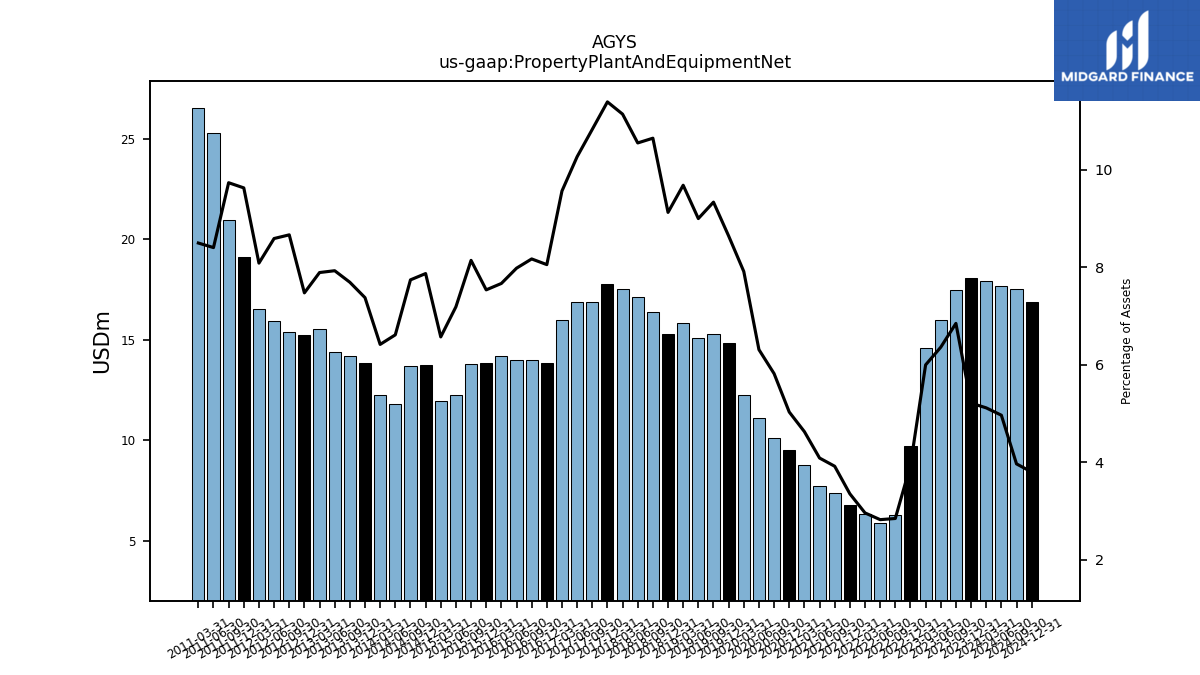
| Property Plant And Equipment Net | 18.07 | 17.48 | 15.99 | 14.58 | 9.70 | 6.29 | 5.90 | 6.34 | 6.79 | 7.37 | 7.75 | 8.79 | 9.52 | 10.11 | 11.11 | 12.23 | 14.85 | 15.29 | 15.07 | 15.84 | 15.28 | 16.36 | 17.11 | 17.51 | 17.76 | 16.86 | 16.86 | 16.00 | 13.83 | 14.00 | 13.98 | 14.20 | 13.86 | 13.78 | 12.27 | 11.93 | 13.74 | 13.67 | 11.82 | 12.25 | 13.85 | 14.19 | 14.39 | 15.54 | 15.23 | 15.40 | 15.92 | 16.50 | 19.14 | 20.94 | 25.30 | 26.54 | NA | NA | NA | |
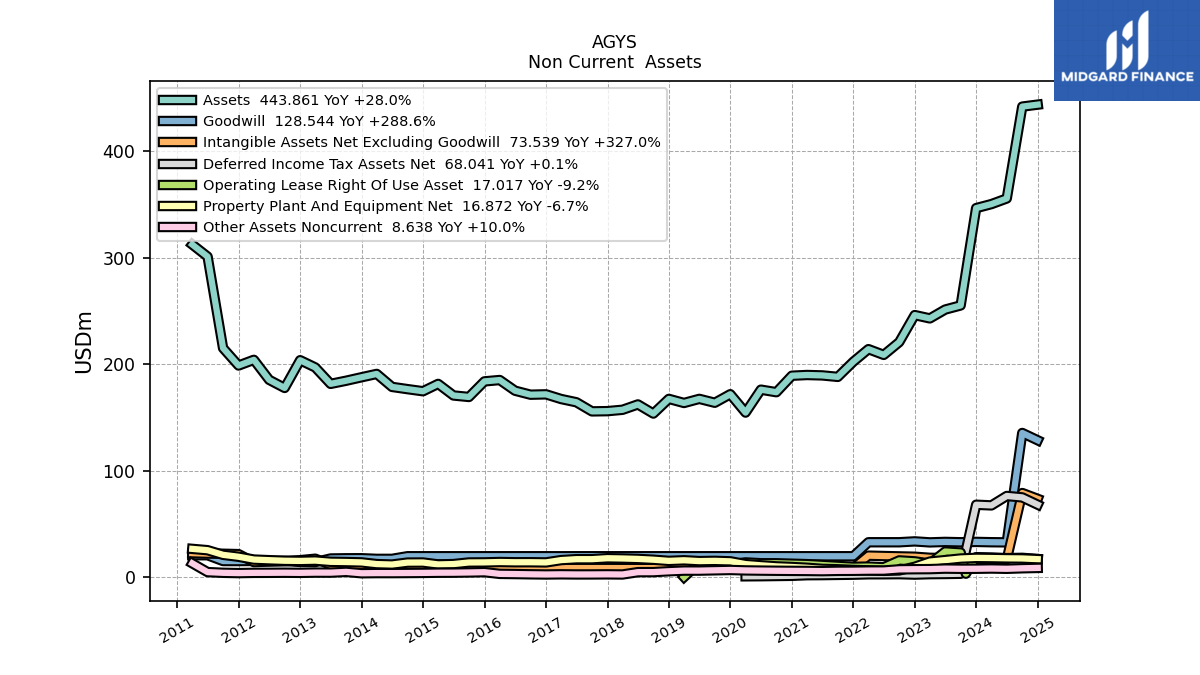
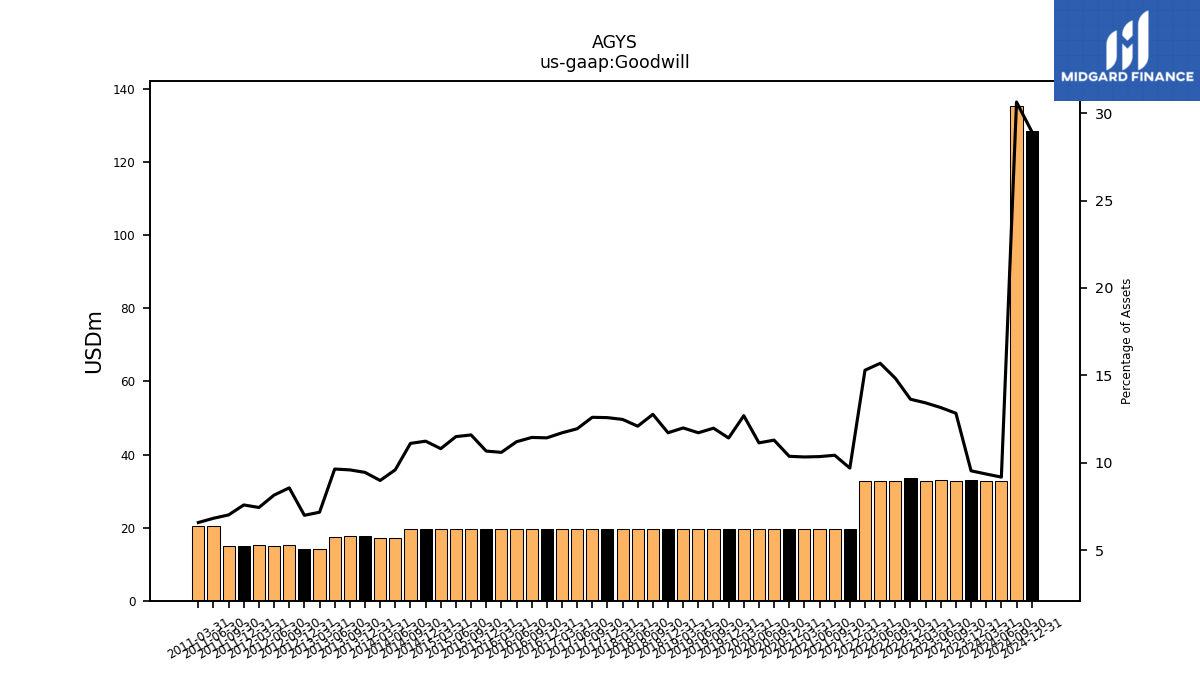
| Goodwill | 33.08 | 32.76 | 33.08 | 32.64 | 33.57 | 32.76 | 32.76 | 32.76 | 19.62 | 19.62 | 19.62 | 19.62 | 19.62 | 19.62 | 19.62 | 19.62 | 19.62 | 19.62 | 19.62 | 19.62 | 19.62 | 19.62 | 19.62 | 19.62 | 19.62 | 19.62 | 19.62 | 19.60 | 19.62 | 19.62 | 19.62 | 19.62 | 19.62 | 19.62 | 19.62 | 19.62 | 19.62 | 19.62 | 17.16 | 17.16 | 17.75 | 17.70 | 17.51 | 14.13 | 14.26 | 15.22 | 15.11 | 15.20 | 15.08 | 15.10 | 20.56 | 20.57 | NA | NA | NA | |
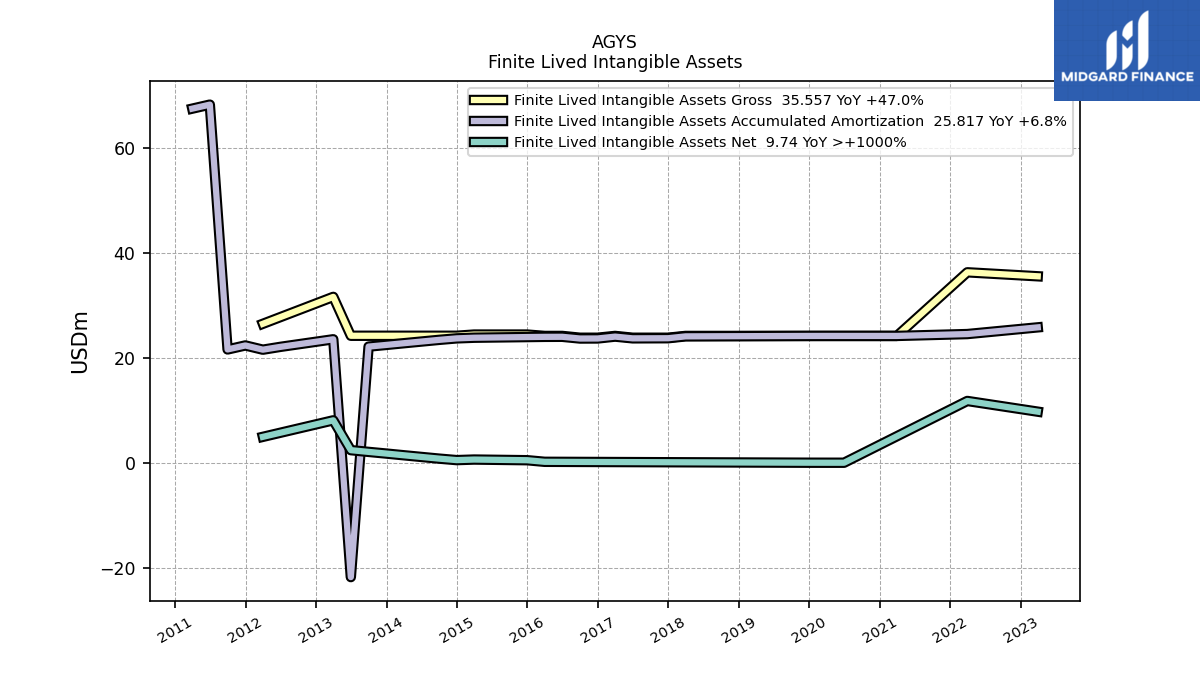
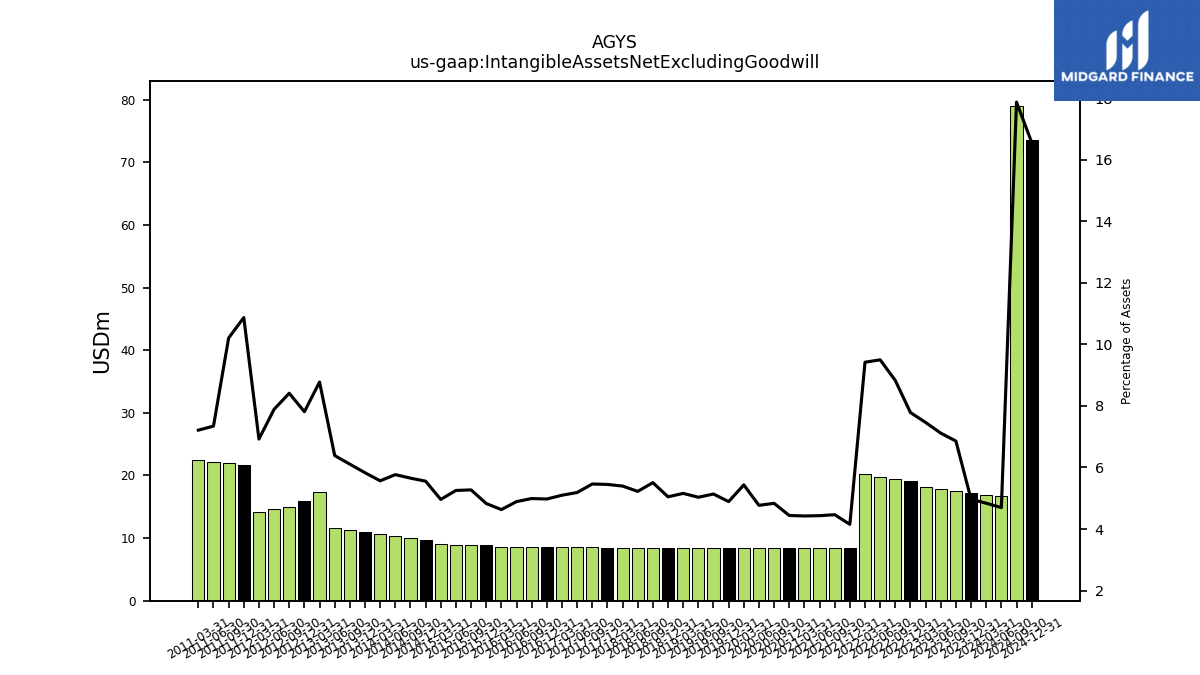
| Intangible Assets Net Excluding Goodwill | 17.22 | 17.50 | 17.89 | 18.14 | 19.16 | 19.49 | 19.83 | 20.18 | 8.40 | 8.40 | 8.40 | 8.40 | 8.40 | 8.40 | 8.40 | 8.40 | 8.40 | 8.41 | 8.43 | 8.44 | 8.45 | 8.46 | 8.47 | 8.48 | 8.50 | 8.51 | 8.52 | 8.53 | 8.54 | 8.55 | 8.56 | 8.58 | 8.88 | 8.92 | 8.96 | 9.01 | 9.70 | 9.98 | 10.31 | 10.63 | 10.95 | 11.27 | 11.60 | 17.29 | 15.92 | 14.95 | 14.62 | 14.13 | 21.61 | 21.96 | 22.12 | 22.54 | NA | NA | NA | |
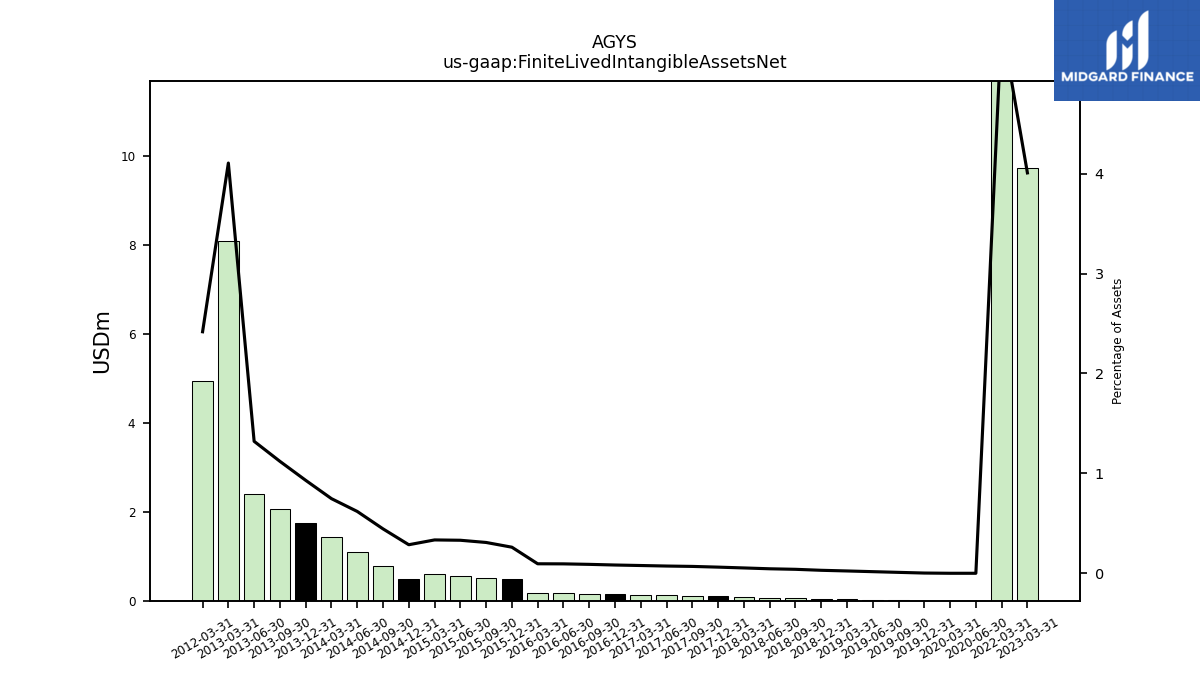
| Finite Lived Intangible Assets Net | NA | NA | NA | 9.74 | NA | NA | NA | 11.78 | NA | NA | NA | NA | NA | NA | 0.00 | 0.00 | 0.00 | 0.01 | 0.03 | 0.04 | 0.05 | 0.06 | 0.07 | 0.08 | 0.10 | 0.11 | 0.12 | 0.13 | 0.14 | 0.15 | 0.17 | 0.18 | 0.48 | 0.52 | 0.56 | 0.61 | 0.50 | 0.79 | 1.11 | 1.43 | 1.75 | 2.07 | 2.40 | 8.09 | NA | NA | NA | 4.93 | NA | NA | NA | NA | NA | NA | NA | |
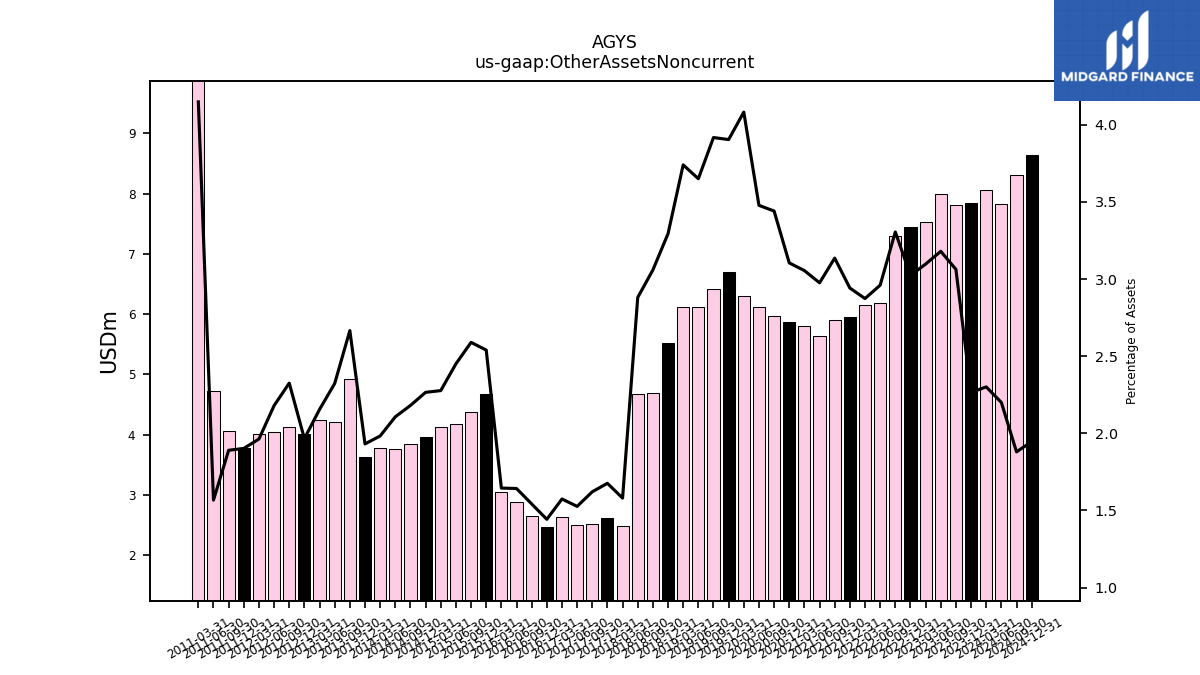
| Other Assets Noncurrent | 7.85 | 7.82 | 7.99 | 7.53 | 7.45 | 7.30 | 6.18 | 6.15 | 5.95 | 5.90 | 5.64 | 5.80 | 5.87 | 5.98 | 6.12 | 6.31 | 6.71 | 6.42 | 6.11 | 6.12 | 5.51 | 4.70 | 4.67 | 2.48 | 2.61 | 2.52 | 2.51 | 2.63 | 2.48 | 2.64 | 2.88 | 3.05 | 4.67 | 4.38 | 4.18 | 4.13 | 3.96 | 3.85 | 3.77 | 3.79 | 3.63 | 4.92 | 4.22 | 4.24 | 4.00 | 4.13 | 4.04 | 4.01 | 3.78 | 4.07 | 4.72 | 12.96 | NA | NA | NA |
| 2023-12-31 | 2023-09-30 | 2023-06-30 | 2023-03-31 | 2022-12-31 | 2022-09-30 | 2022-06-30 | 2022-03-31 | 2021-12-31 | 2021-09-30 | 2021-06-30 | 2021-03-31 | 2020-12-31 | 2020-09-30 | 2020-06-30 | 2020-03-31 | 2019-12-31 | 2019-09-30 | 2019-06-30 | 2019-03-31 | 2018-12-31 | 2018-09-30 | 2018-06-30 | 2018-03-31 | 2017-12-31 | 2017-09-30 | 2017-06-30 | 2017-03-31 | 2016-12-31 | 2016-09-30 | 2016-06-30 | 2016-03-31 | 2015-12-31 | 2015-09-30 | 2015-06-30 | 2015-03-31 | 2014-12-31 | 2014-09-30 | 2014-06-30 | 2014-03-31 | 2013-12-31 | 2013-09-30 | 2013-06-30 | 2013-03-31 | 2012-12-31 | 2012-09-30 | 2012-06-30 | 2012-03-31 | 2011-12-31 | 2011-09-30 | 2011-06-30 | 2011-03-31 | 2010-12-31 | 2010-09-30 | 2010-06-30 | ||
|---|---|---|---|---|---|---|---|---|---|---|---|---|---|---|---|---|---|---|---|---|---|---|---|---|---|---|---|---|---|---|---|---|---|---|---|---|---|---|---|---|---|---|---|---|---|---|---|---|---|---|---|---|---|---|---|---|
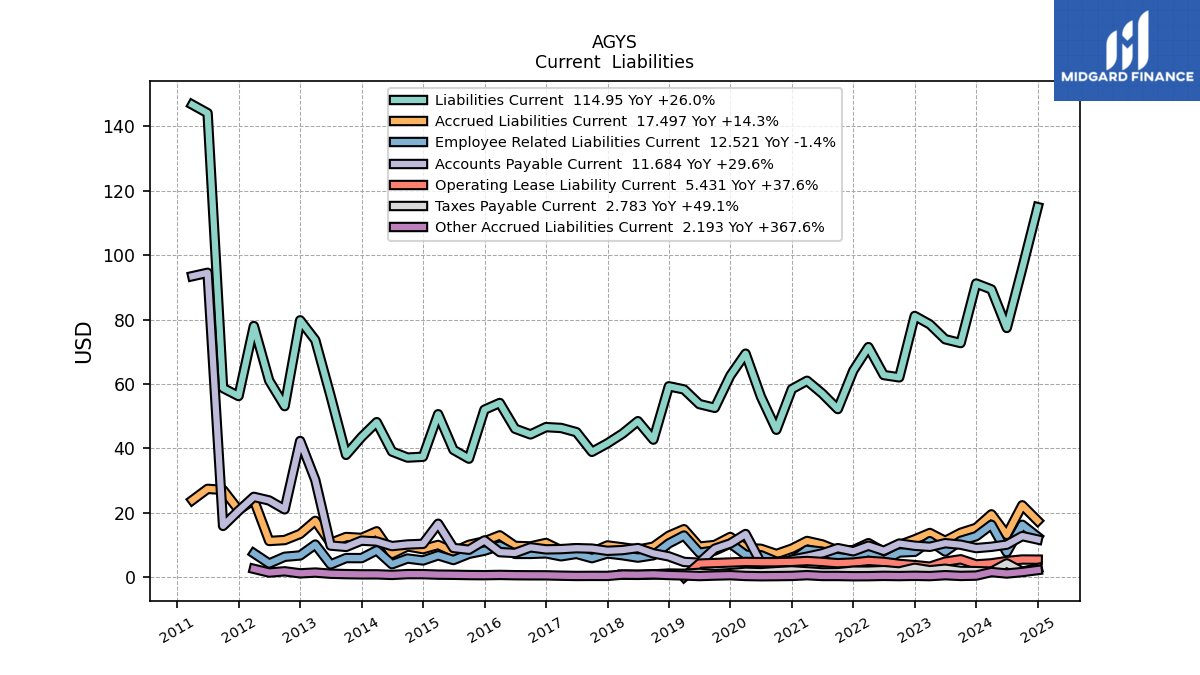
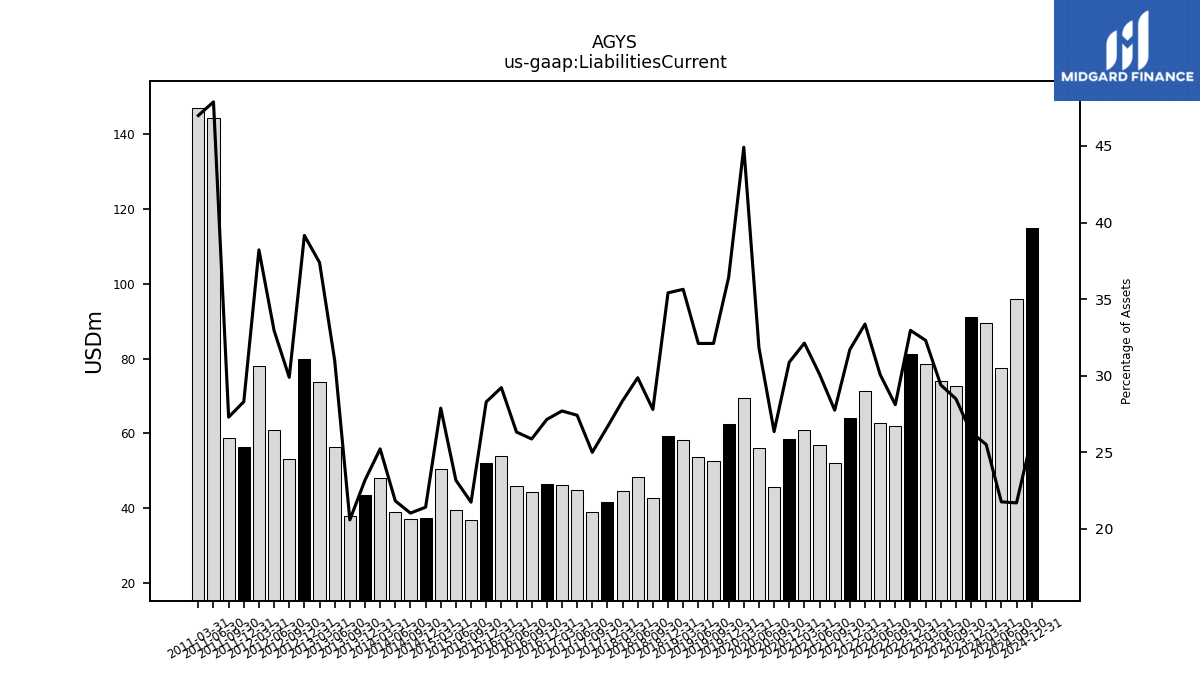
| Liabilities Current | 91.21 | 72.71 | 73.89 | 78.52 | 81.13 | 62.05 | 62.78 | 71.47 | 64.15 | 52.20 | 57.02 | 61.00 | 58.42 | 45.78 | 56.05 | 69.42 | 62.57 | 52.59 | 53.76 | 58.30 | 59.29 | 42.70 | 48.45 | 44.58 | 41.56 | 38.92 | 45.03 | 46.34 | 46.61 | 44.33 | 46.09 | 54.10 | 52.02 | 36.80 | 39.54 | 50.61 | 37.39 | 37.13 | 39.00 | 48.14 | 43.52 | 37.98 | 56.27 | 73.64 | 79.78 | 53.12 | 61.05 | 78.01 | 56.25 | 58.71 | 144.15 | 146.79 | NA | NA | NA | |
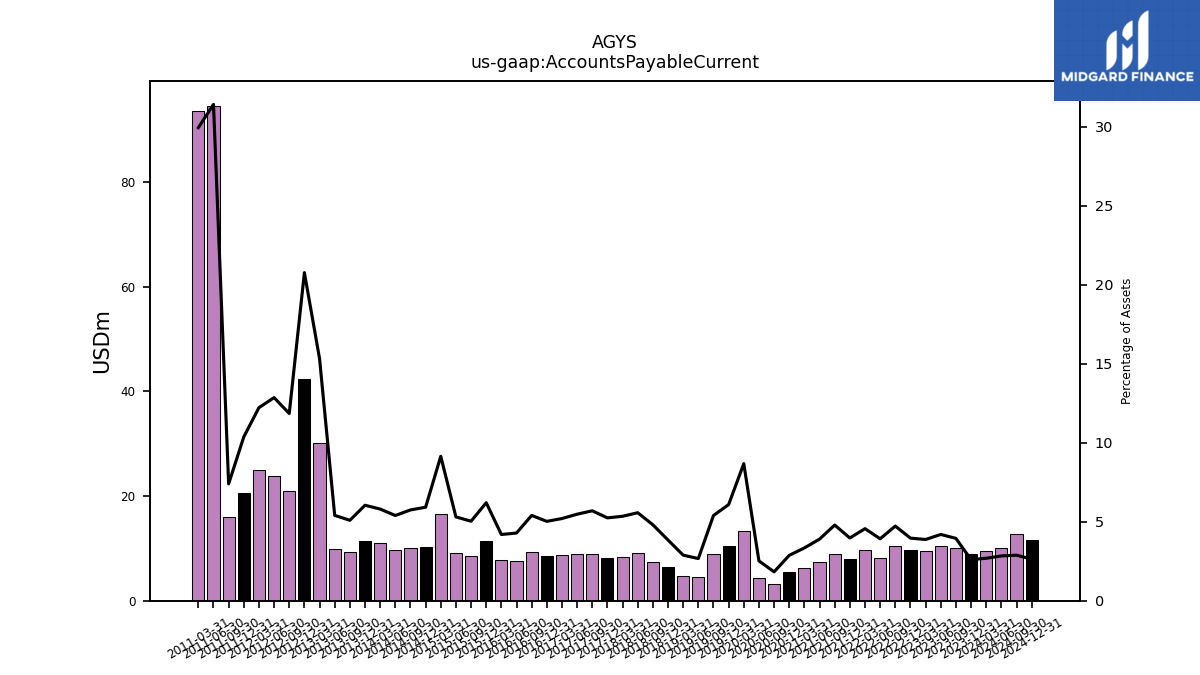
| Accounts Payable Current | 9.01 | 10.07 | 10.54 | 9.42 | 9.75 | 10.43 | 8.19 | 9.77 | 8.04 | 9.01 | 7.39 | 6.35 | 5.43 | 3.18 | 4.44 | 13.40 | 10.45 | 8.84 | 4.47 | 4.72 | 6.43 | 7.38 | 9.03 | 8.40 | 8.18 | 8.86 | 8.99 | 8.70 | 8.62 | 9.25 | 7.50 | 7.76 | 11.40 | 8.51 | 9.05 | 16.59 | 10.33 | 10.14 | 9.64 | 11.07 | 11.34 | 9.39 | 9.80 | 30.18 | 42.30 | 21.05 | 23.82 | 24.94 | 20.60 | 15.91 | 94.55 | 93.49 | NA | NA | NA | |
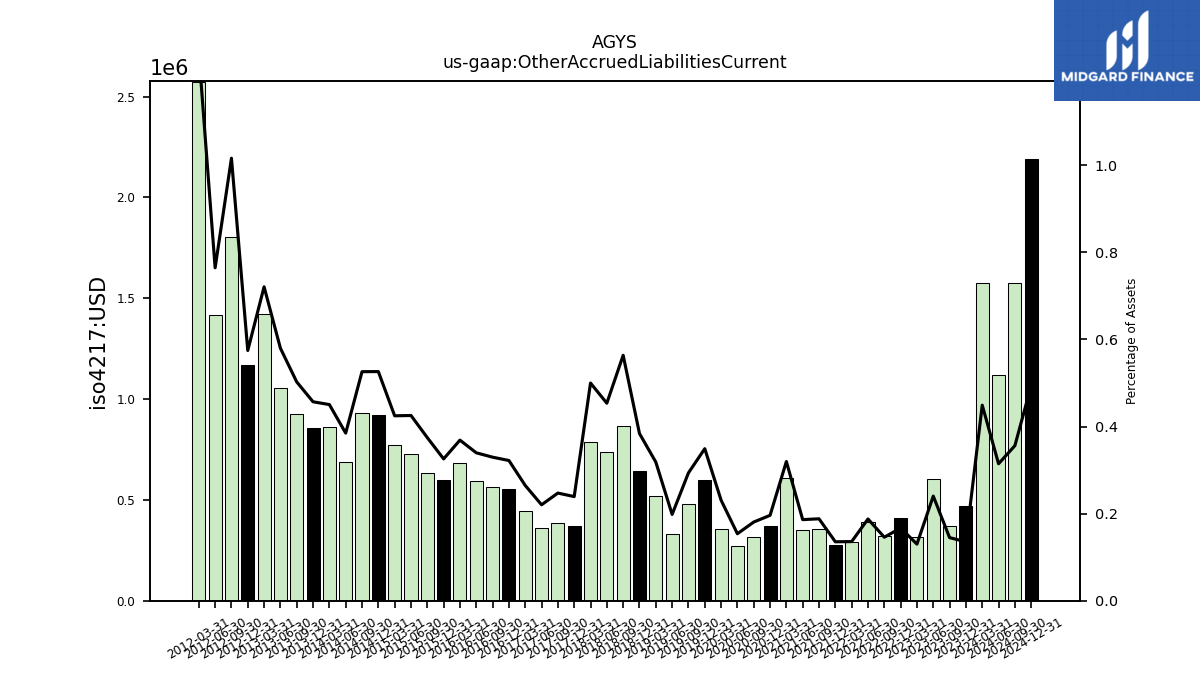
| Other Accrued Liabilities Current | 0.47 | 0.37 | 0.60 | 0.32 | 0.41 | 0.32 | 0.39 | 0.29 | 0.27 | 0.35 | 0.35 | 0.61 | 0.37 | 0.31 | 0.27 | 0.36 | 0.60 | 0.48 | 0.33 | 0.52 | 0.64 | 0.87 | 0.74 | 0.79 | 0.37 | 0.39 | 0.36 | 0.44 | 0.55 | 0.56 | 0.59 | 0.68 | 0.60 | 0.63 | 0.73 | 0.77 | 0.92 | 0.93 | 0.69 | 0.86 | 0.86 | 0.93 | 1.05 | 1.42 | 1.17 | 1.81 | 1.42 | 2.57 | NA | NA | NA | NA | NA | NA | NA | |
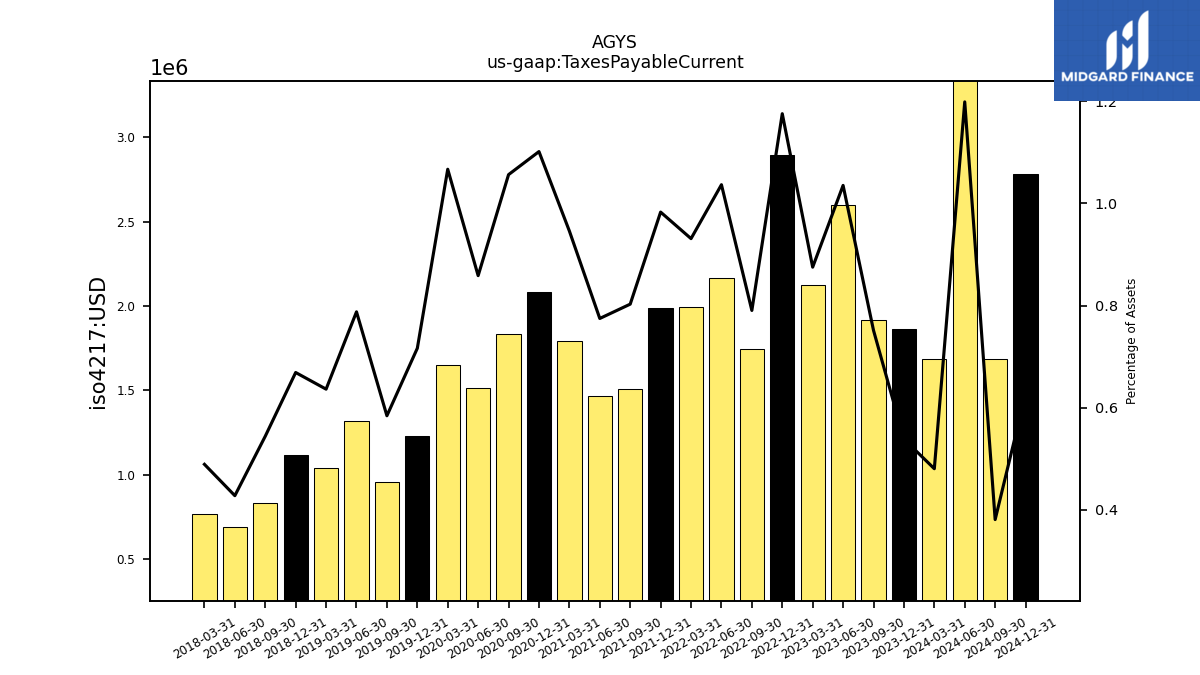
| Taxes Payable Current | 1.87 | 1.92 | 2.60 | 2.13 | 2.89 | 1.75 | 2.16 | 1.99 | 1.99 | 1.51 | 1.47 | 1.80 | 2.08 | 1.83 | 1.51 | 1.65 | 1.23 | 0.96 | 1.32 | 1.04 | 1.12 | 0.84 | 0.69 | 0.77 | NA | NA | NA | NA | NA | NA | NA | NA | NA | NA | NA | NA | NA | NA | NA | NA | NA | NA | NA | NA | NA | NA | NA | NA | NA | NA | NA | NA | NA | NA | NA | |
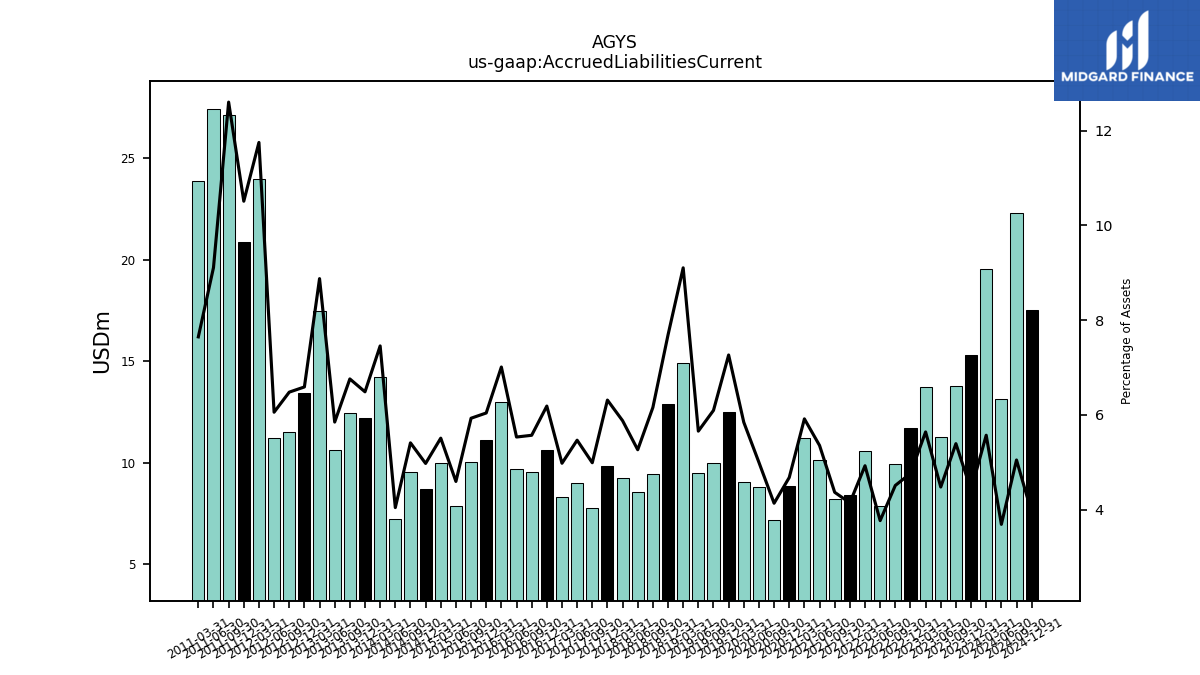
| Accrued Liabilities Current | 15.31 | 13.76 | 11.26 | 13.71 | 11.73 | 9.96 | 7.87 | 10.55 | 8.38 | 8.21 | 10.15 | 11.23 | 8.85 | 7.18 | 8.80 | 9.03 | 12.48 | 9.98 | 9.47 | 14.89 | 12.87 | 9.46 | 8.54 | 9.24 | 9.84 | 7.77 | 8.98 | 8.33 | 10.62 | 9.54 | 9.69 | 12.98 | 11.11 | 10.04 | 7.84 | 10.00 | 8.69 | 9.55 | 7.23 | 14.23 | 12.18 | 12.47 | 10.62 | 17.48 | 13.43 | 11.52 | 11.22 | 23.98 | 20.89 | 27.10 | 27.42 | 23.89 | NA | NA | NA |
| 2023-12-31 | 2023-09-30 | 2023-06-30 | 2023-03-31 | 2022-12-31 | 2022-09-30 | 2022-06-30 | 2022-03-31 | 2021-12-31 | 2021-09-30 | 2021-06-30 | 2021-03-31 | 2020-12-31 | 2020-09-30 | 2020-06-30 | 2020-03-31 | 2019-12-31 | 2019-09-30 | 2019-06-30 | 2019-03-31 | 2018-12-31 | 2018-09-30 | 2018-06-30 | 2018-03-31 | 2017-12-31 | 2017-09-30 | 2017-06-30 | 2017-03-31 | 2016-12-31 | 2016-09-30 | 2016-06-30 | 2016-03-31 | 2015-12-31 | 2015-09-30 | 2015-06-30 | 2015-03-31 | 2014-12-31 | 2014-09-30 | 2014-06-30 | 2014-03-31 | 2013-12-31 | 2013-09-30 | 2013-06-30 | 2013-03-31 | 2012-12-31 | 2012-09-30 | 2012-06-30 | 2012-03-31 | 2011-12-31 | 2011-09-30 | 2011-06-30 | 2011-03-31 | 2010-12-31 | 2010-09-30 | 2010-06-30 | ||
|---|---|---|---|---|---|---|---|---|---|---|---|---|---|---|---|---|---|---|---|---|---|---|---|---|---|---|---|---|---|---|---|---|---|---|---|---|---|---|---|---|---|---|---|---|---|---|---|---|---|---|---|---|---|---|---|---|
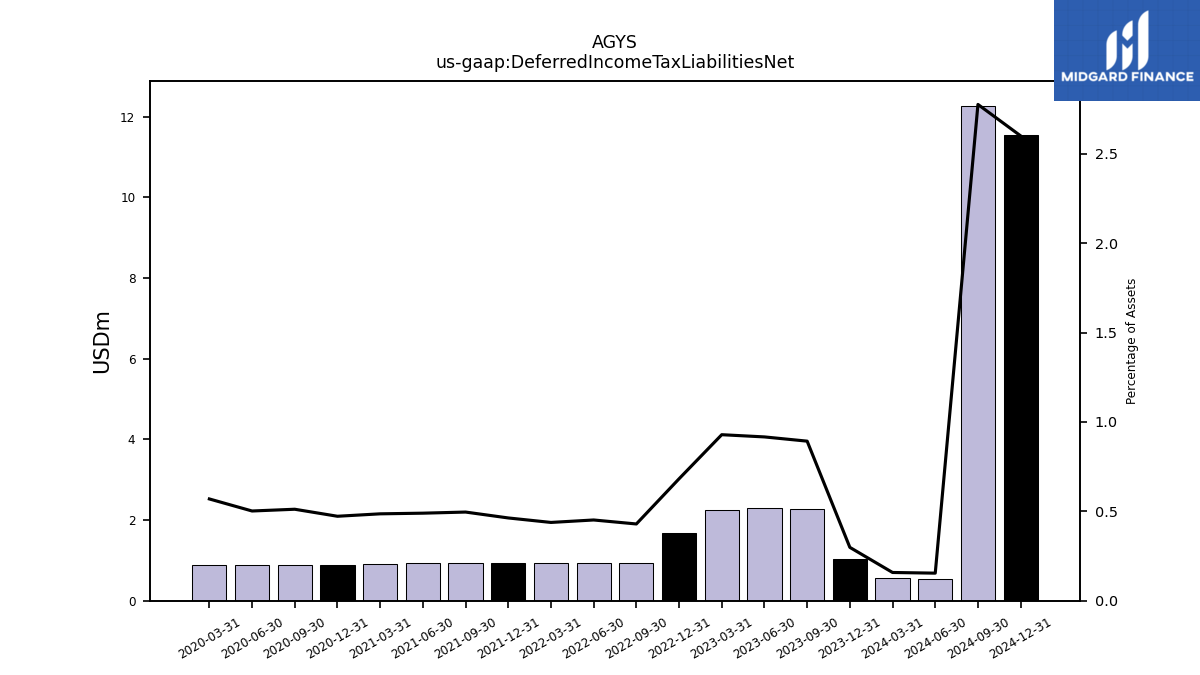
| Deferred Income Tax Liabilities Net | 1.03 | 2.28 | 2.30 | 2.26 | 1.68 | 0.95 | 0.94 | 0.94 | 0.94 | 0.93 | 0.93 | 0.92 | 0.89 | 0.89 | 0.88 | 0.88 | NA | NA | NA | NA | NA | NA | NA | NA | NA | NA | NA | NA | NA | NA | NA | NA | NA | NA | NA | NA | NA | NA | NA | NA | NA | NA | NA | NA | NA | NA | NA | NA | NA | NA | NA | NA | NA | NA | NA | |
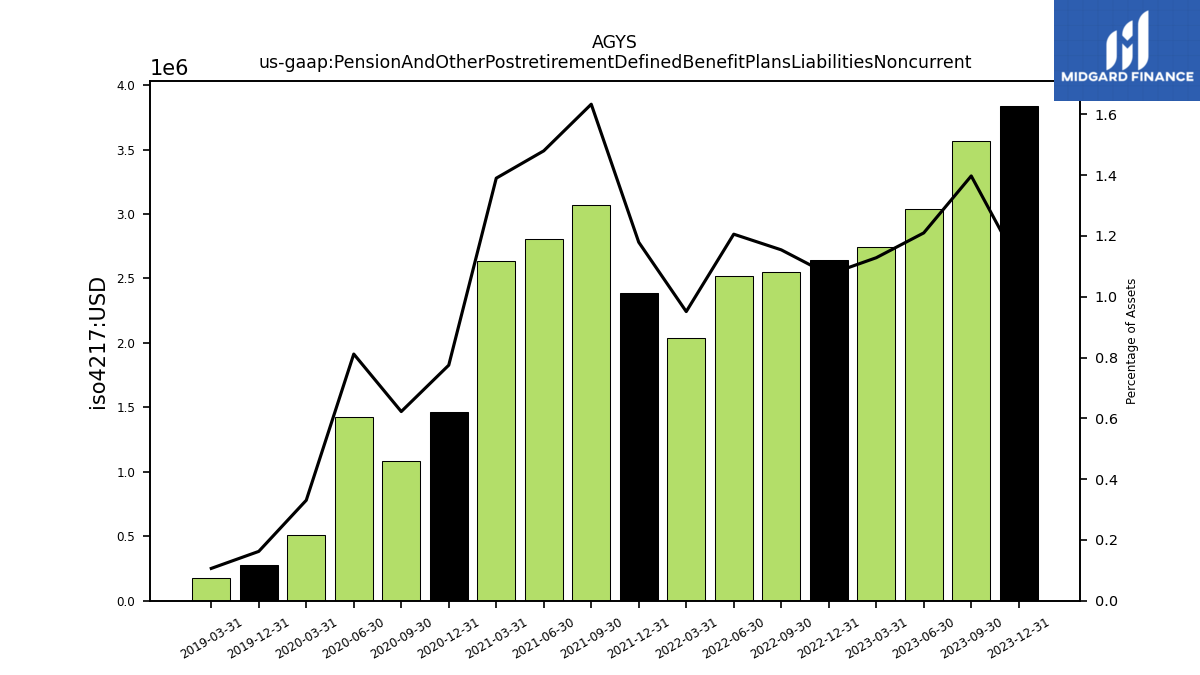
| Pension And Other Postretirement Defined Benefit Plans Liabilities Noncurrent | 3.84 | 3.57 | 3.04 | 2.74 | 2.64 | 2.55 | 2.52 | 2.04 | 2.39 | 3.07 | 2.80 | 2.64 | 1.47 | 1.08 | 1.43 | 0.51 | 0.28 | NA | NA | 0.17 | NA | NA | NA | NA | NA | NA | NA | NA | NA | NA | NA | NA | NA | NA | NA | NA | NA | NA | NA | NA | NA | NA | NA | NA | NA | NA | NA | NA | NA | NA | NA | NA | NA | NA | NA | |
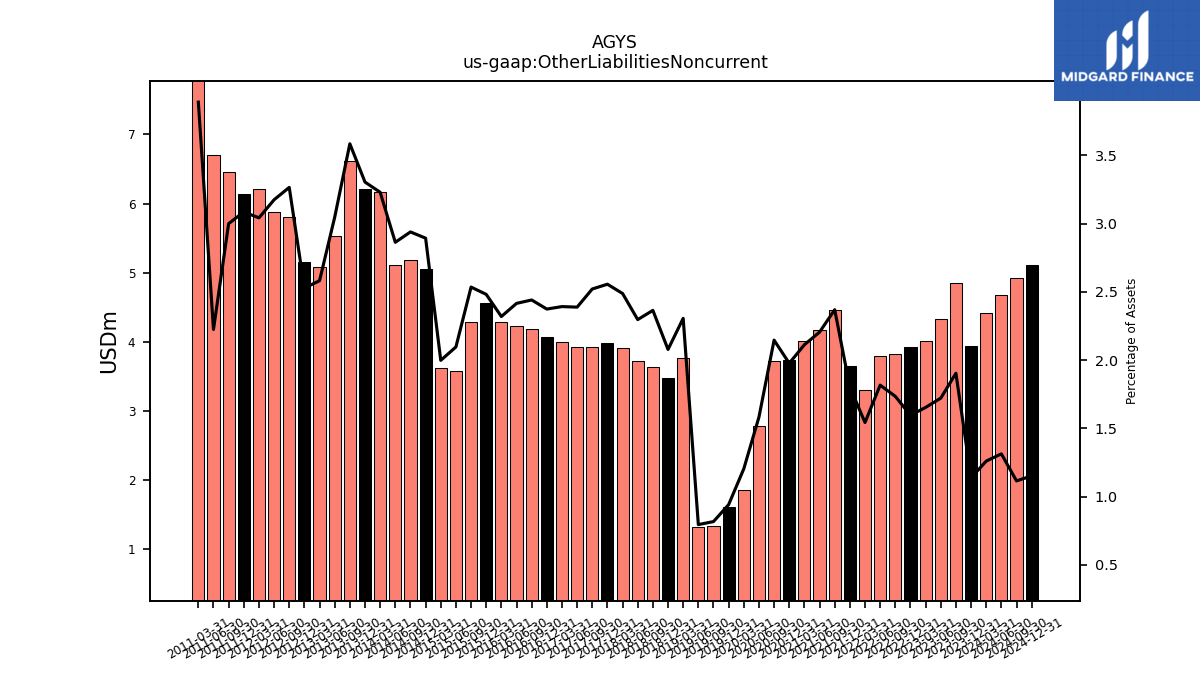
| Other Liabilities Noncurrent | 3.94 | 4.86 | 4.33 | 4.02 | 3.93 | 3.83 | 3.79 | 3.30 | 3.65 | 4.46 | 4.18 | 4.01 | 3.74 | 3.73 | 2.79 | 1.86 | 1.62 | 1.34 | 1.33 | 3.77 | 3.48 | 3.63 | 3.73 | 3.91 | 3.98 | 3.92 | 3.92 | 4.00 | 4.08 | 4.18 | 4.23 | 4.29 | 4.56 | 4.29 | 3.58 | 3.63 | 5.05 | 5.19 | 5.12 | 6.17 | 6.20 | 6.61 | 5.53 | 5.08 | 5.15 | 5.80 | 5.88 | 6.21 | 6.13 | 6.45 | 6.70 | 12.15 | NA | NA | NA | |
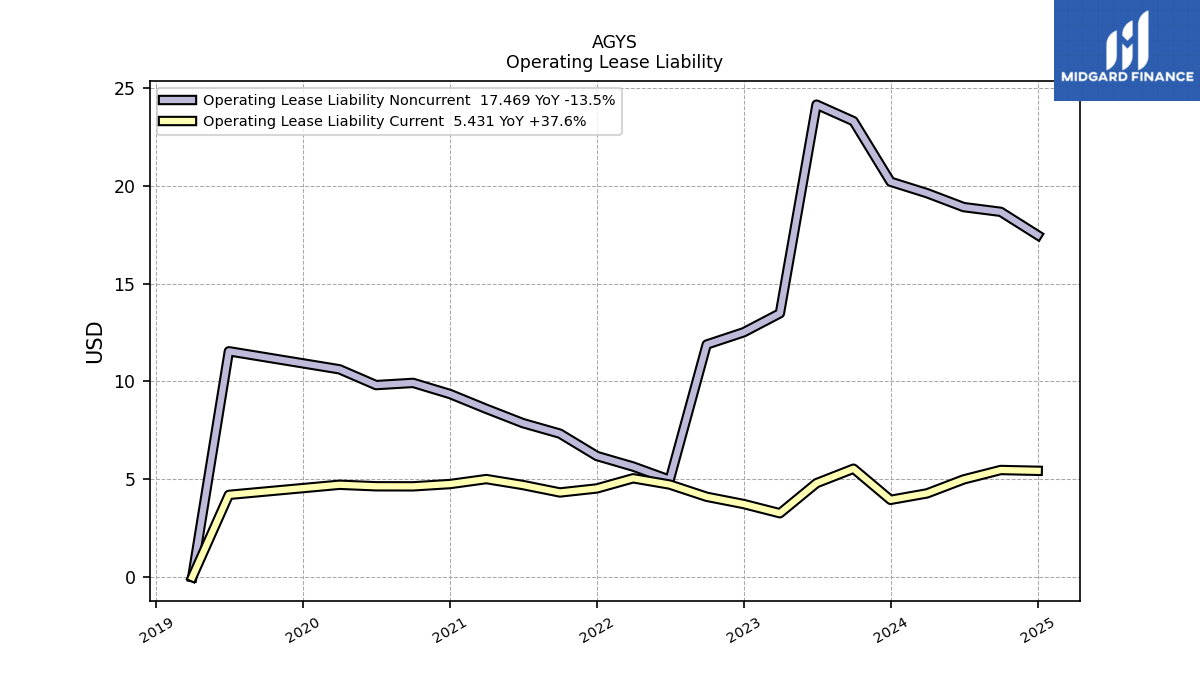
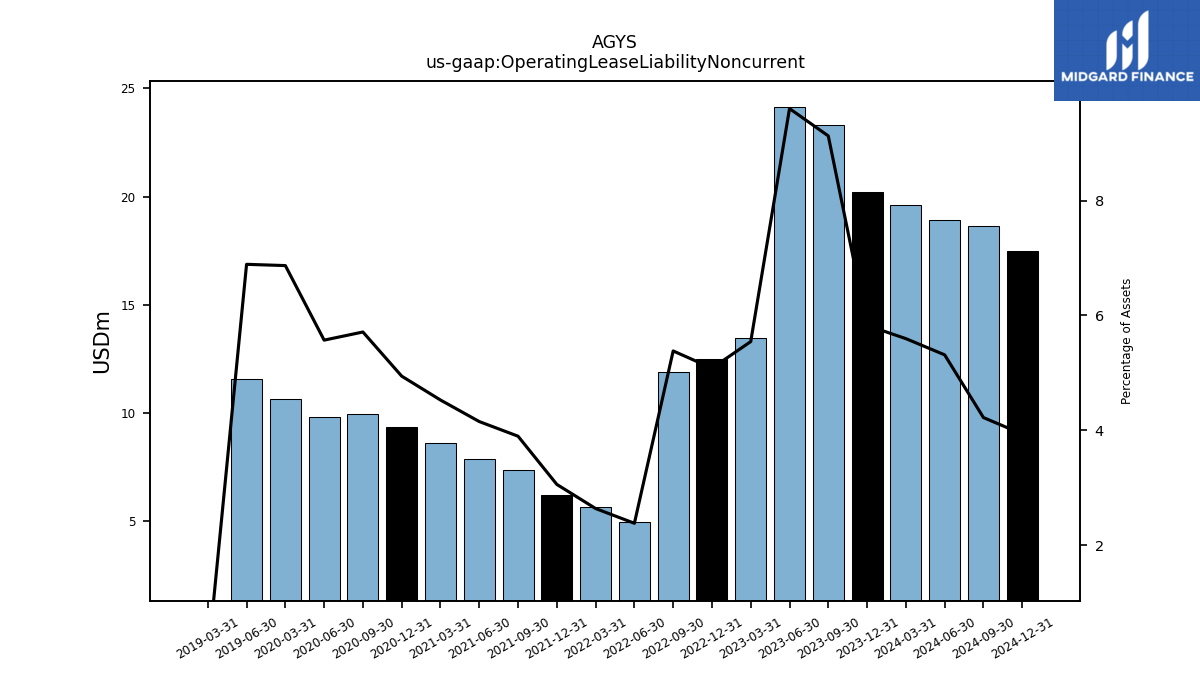
| Operating Lease Liability Noncurrent | 20.20 | 23.29 | 24.14 | 13.48 | 12.51 | 11.88 | 4.97 | 5.65 | 6.19 | 7.33 | 7.87 | 8.60 | 9.35 | 9.92 | 9.81 | 10.62 | NA | NA | 11.54 | 0.00 | NA | NA | NA | NA | NA | NA | NA | NA | NA | NA | NA | NA | NA | NA | NA | NA | NA | NA | NA | NA | NA | NA | NA | NA | NA | NA | NA | NA | NA | NA | NA | NA | NA | NA | NA |
| 2023-12-31 | 2023-09-30 | 2023-06-30 | 2023-03-31 | 2022-12-31 | 2022-09-30 | 2022-06-30 | 2022-03-31 | 2021-12-31 | 2021-09-30 | 2021-06-30 | 2021-03-31 | 2020-12-31 | 2020-09-30 | 2020-06-30 | 2020-03-31 | 2019-12-31 | 2019-09-30 | 2019-06-30 | 2019-03-31 | 2018-12-31 | 2018-09-30 | 2018-06-30 | 2018-03-31 | 2017-12-31 | 2017-09-30 | 2017-06-30 | 2017-03-31 | 2016-12-31 | 2016-09-30 | 2016-06-30 | 2016-03-31 | 2015-12-31 | 2015-09-30 | 2015-06-30 | 2015-03-31 | 2014-12-31 | 2014-09-30 | 2014-06-30 | 2014-03-31 | 2013-12-31 | 2013-09-30 | 2013-06-30 | 2013-03-31 | 2012-12-31 | 2012-09-30 | 2012-06-30 | 2012-03-31 | 2011-12-31 | 2011-09-30 | 2011-06-30 | 2011-03-31 | 2010-12-31 | 2010-09-30 | 2010-06-30 | ||
|---|---|---|---|---|---|---|---|---|---|---|---|---|---|---|---|---|---|---|---|---|---|---|---|---|---|---|---|---|---|---|---|---|---|---|---|---|---|---|---|---|---|---|---|---|---|---|---|---|---|---|---|---|---|---|---|---|
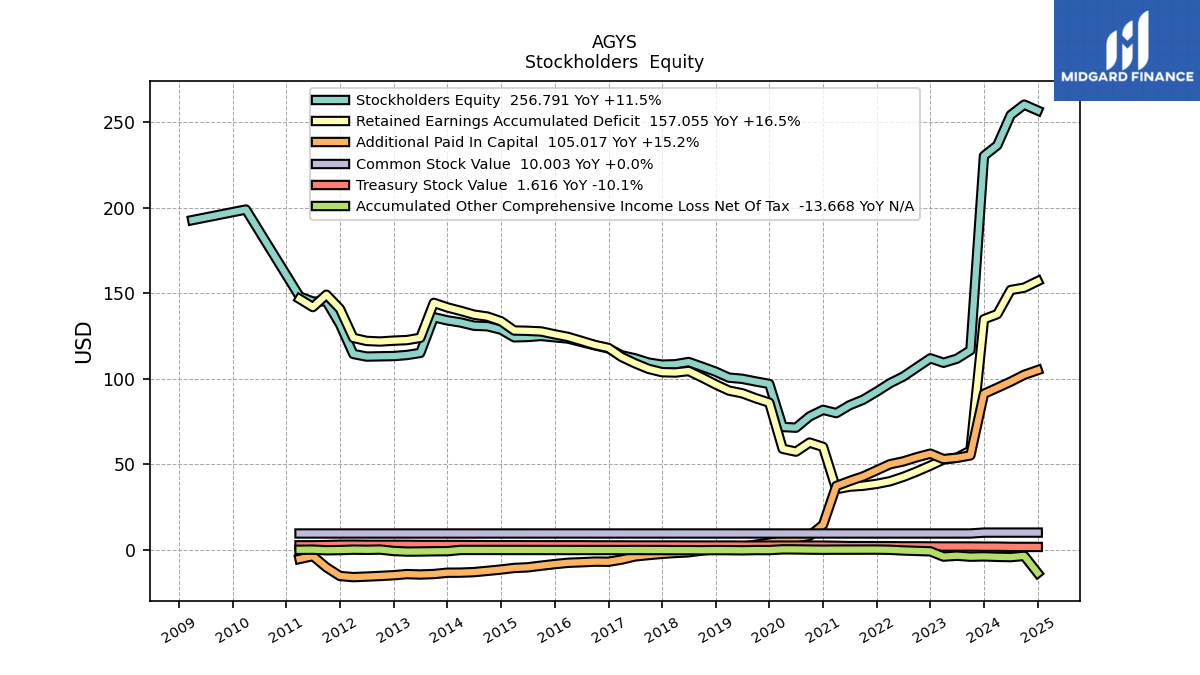
| Stockholders Equity | 230.27 | 116.62 | 111.69 | 109.31 | 111.91 | 106.59 | 101.28 | 97.34 | 92.41 | 87.72 | 84.49 | 79.88 | 81.78 | 77.92 | 71.35 | 71.76 | 96.94 | 98.36 | 99.92 | 100.62 | 104.11 | 106.97 | 109.75 | 108.43 | 108.21 | 109.43 | 111.92 | 113.67 | 117.71 | 119.51 | 121.47 | 123.47 | 124.22 | 124.99 | 124.39 | 124.19 | 128.71 | 130.66 | 130.99 | 132.87 | 134.09 | 135.94 | 115.06 | 113.86 | 113.22 | 113.10 | 112.93 | 114.44 | 131.84 | 145.24 | 145.08 | 148.10 | NA | NA | NA | |
| Common Stock Value | 10.00 | 9.48 | 9.48 | 9.48 | 9.48 | 9.48 | 9.48 | 9.48 | 9.48 | 9.48 | 9.48 | 9.48 | 9.48 | 9.48 | 9.48 | 9.48 | 9.48 | 9.48 | 9.48 | 9.48 | 9.48 | 9.48 | 9.48 | 9.48 | 9.48 | 9.48 | 9.48 | 9.48 | 9.48 | 9.48 | 9.48 | 9.48 | 9.48 | 9.48 | 9.48 | 9.48 | 9.48 | 9.48 | 9.48 | 9.48 | 9.48 | 9.48 | 9.48 | 9.48 | 9.48 | 9.48 | 9.48 | 9.48 | 9.48 | 9.48 | 9.48 | 9.48 | NA | NA | NA | |
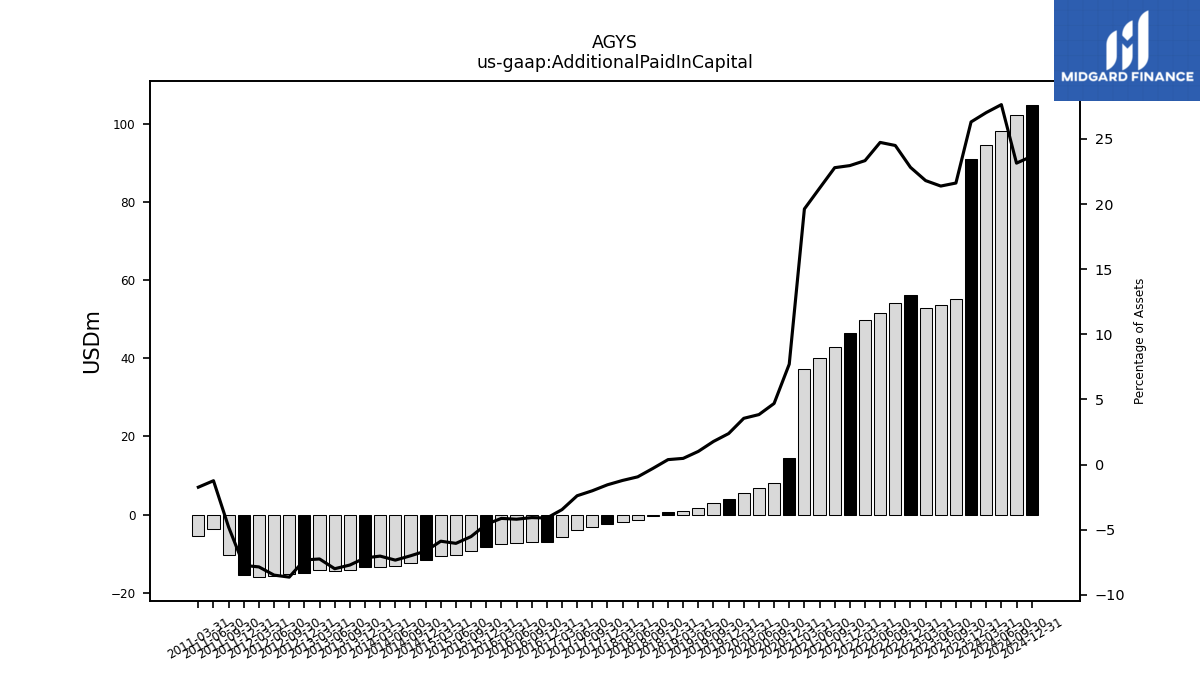
| Additional Paid In Capital | 91.17 | 55.15 | 53.73 | 52.98 | 56.17 | 54.07 | 51.62 | 49.96 | 46.44 | 42.87 | 40.19 | 37.26 | 14.58 | 8.15 | 6.76 | 5.49 | 4.09 | 2.91 | 1.70 | 0.78 | 0.64 | -0.45 | -1.52 | -1.91 | -2.42 | -3.13 | -3.93 | -5.78 | -7.04 | -6.97 | -7.34 | -7.64 | -8.43 | -9.35 | -10.32 | -10.68 | -11.59 | -12.36 | -13.10 | -13.41 | -13.45 | -14.22 | -14.51 | -14.27 | -14.92 | -15.35 | -15.72 | -16.03 | -15.38 | -10.32 | -3.73 | -5.42 | NA | NA | NA | |
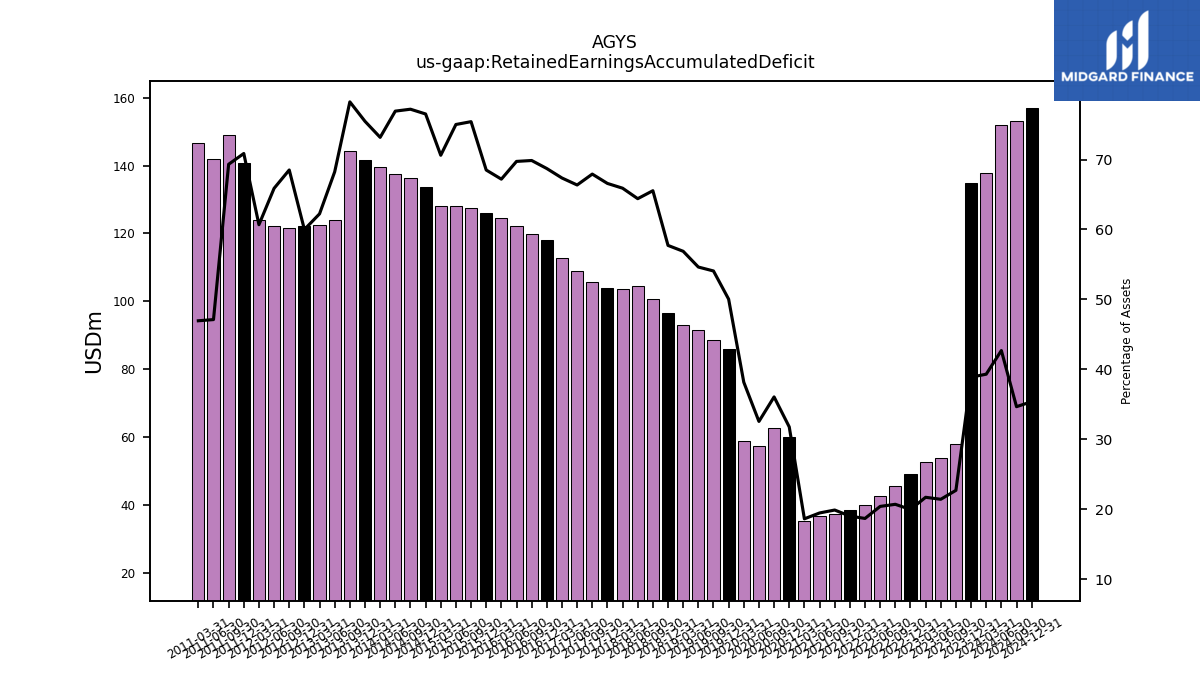
| Retained Earnings Accumulated Deficit | 134.79 | 57.94 | 53.85 | 52.76 | 49.15 | 45.72 | 42.60 | 40.02 | 38.49 | 37.41 | 36.89 | 35.38 | 60.12 | 62.65 | 57.33 | 58.98 | 85.98 | 88.56 | 91.48 | 93.05 | 96.64 | 100.69 | 104.48 | 103.60 | 103.81 | 105.75 | 108.99 | 112.69 | 117.98 | 119.72 | 122.12 | 124.41 | 125.95 | 127.62 | 127.99 | 128.18 | 133.60 | 136.32 | 137.45 | 139.68 | 141.68 | 144.35 | 123.89 | 122.58 | 122.25 | 121.73 | 122.08 | 123.88 | 140.85 | 149.12 | 141.87 | 146.66 | NA | NA | NA | |
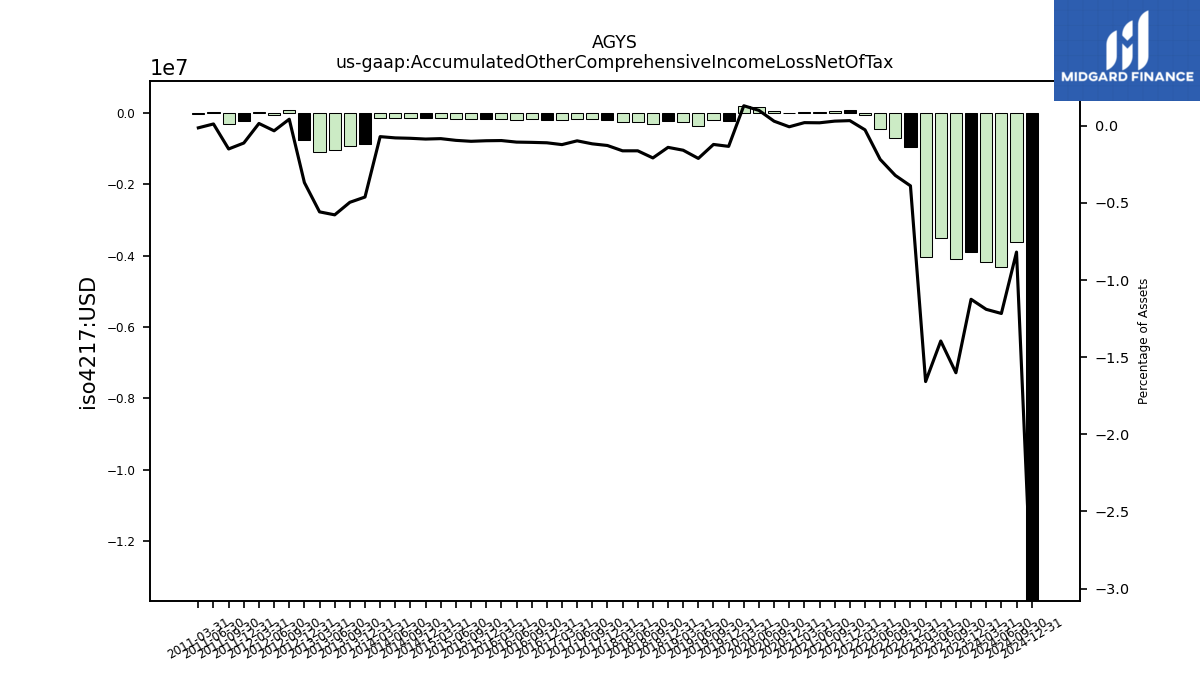
| Accumulated Other Comprehensive Income Loss Net Of Tax | -3.90 | -4.09 | -3.51 | -4.03 | -0.96 | -0.71 | -0.45 | -0.06 | 0.07 | 0.06 | 0.04 | 0.04 | -0.01 | 0.05 | 0.18 | 0.20 | -0.23 | -0.20 | -0.35 | -0.26 | -0.23 | -0.32 | -0.26 | -0.26 | -0.20 | -0.18 | -0.16 | -0.20 | -0.19 | -0.18 | -0.18 | -0.18 | -0.18 | -0.17 | -0.16 | -0.15 | -0.15 | -0.14 | -0.14 | -0.13 | -0.87 | -0.92 | -1.05 | -1.10 | -0.75 | 0.08 | -0.06 | 0.03 | -0.22 | -0.32 | 0.04 | -0.04 | NA | NA | NA | |
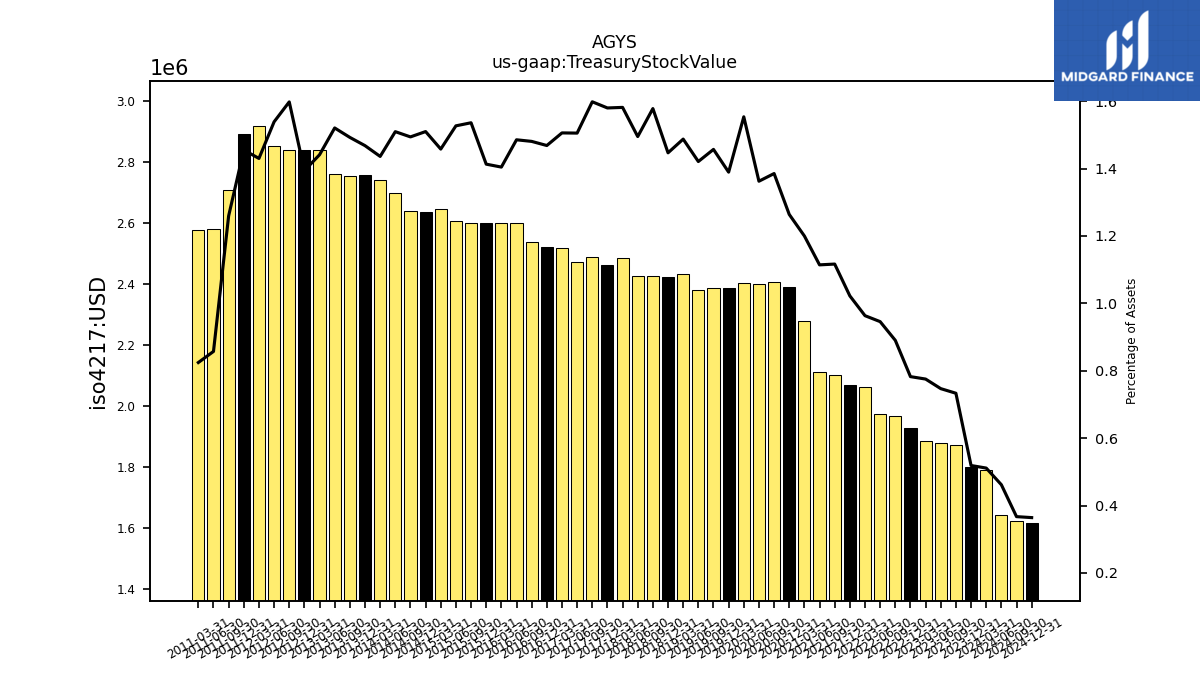
| Treasury Stock Value | 1.80 | 1.87 | 1.88 | 1.88 | 1.93 | 1.97 | 1.97 | 2.06 | 2.07 | 2.10 | 2.11 | 2.28 | 2.39 | 2.41 | 2.40 | 2.40 | 2.39 | 2.39 | 2.38 | 2.43 | 2.42 | 2.42 | 2.42 | 2.49 | 2.46 | 2.49 | 2.47 | 2.52 | 2.52 | 2.54 | 2.60 | 2.60 | 2.60 | 2.60 | 2.60 | 2.65 | 2.64 | 2.64 | 2.70 | 2.74 | 2.76 | 2.75 | 2.76 | 2.84 | 2.84 | 2.84 | 2.85 | 2.92 | 2.89 | 2.71 | 2.58 | 2.58 | NA | NA | NA | |
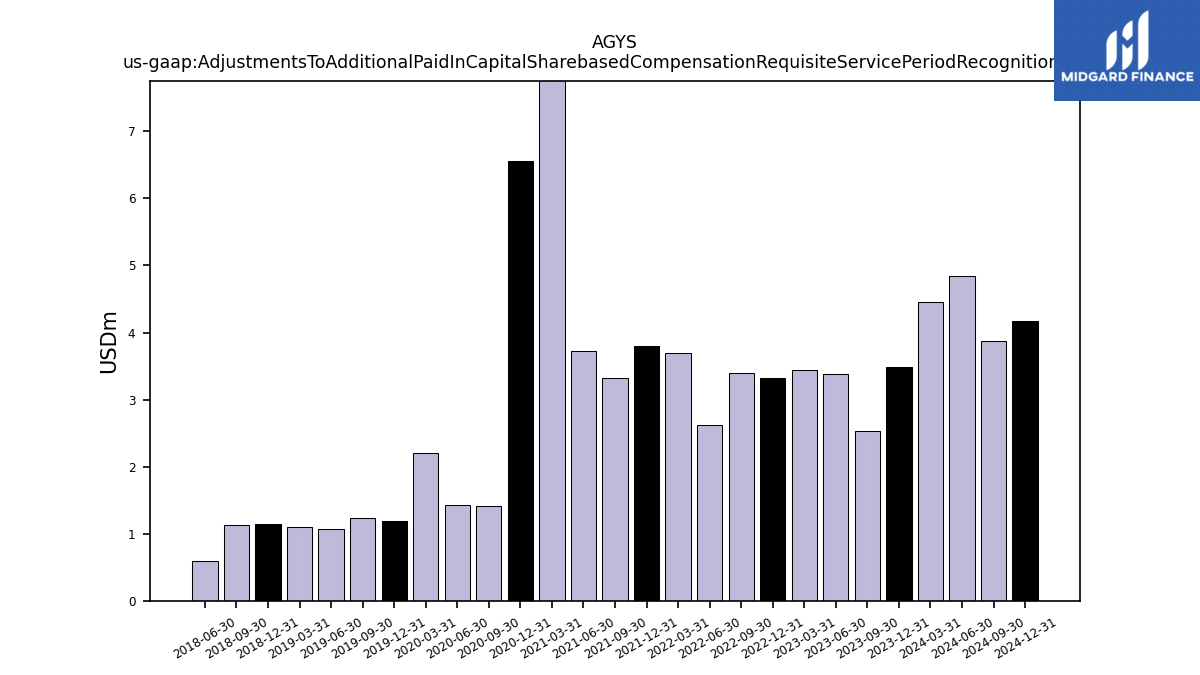
| Adjustments To Additional Paid In Capital Sharebased Compensation Requisite Service Period Recognition Value | 3.49 | 2.53 | 3.38 | 3.44 | 3.32 | 3.40 | 2.62 | 3.70 | 3.79 | 3.33 | 3.73 | 30.67 | 6.56 | 1.41 | 1.43 | 2.20 | 1.18 | 1.23 | 1.07 | 1.10 | 1.15 | 1.13 | 0.59 | NA | NA | NA | NA | NA | NA | NA | NA | NA | NA | NA | NA | NA | NA | NA | NA | NA | NA | NA | NA | NA | NA | NA | NA | NA | NA | NA | NA | NA | NA | NA | NA |
| 2023-12-31 | 2023-09-30 | 2023-06-30 | 2023-03-31 | 2022-12-31 | 2022-09-30 | 2022-06-30 | 2022-03-31 | 2021-12-31 | 2021-09-30 | 2021-06-30 | 2021-03-31 | 2020-12-31 | 2020-09-30 | 2020-06-30 | 2020-03-31 | 2019-12-31 | 2019-09-30 | 2019-06-30 | 2019-03-31 | 2018-12-31 | 2018-09-30 | 2018-06-30 | 2018-03-31 | 2017-12-31 | 2017-09-30 | 2017-06-30 | 2017-03-31 | 2016-12-31 | 2016-09-30 | 2016-06-30 | 2016-03-31 | 2015-12-31 | 2015-09-30 | 2015-06-30 | 2015-03-31 | 2014-12-31 | 2014-09-30 | 2014-06-30 | 2014-03-31 | 2013-12-31 | 2013-09-30 | 2013-06-30 | 2013-03-31 | 2012-12-31 | 2012-09-30 | 2012-06-30 | 2012-03-31 | 2011-12-31 | 2011-09-30 | 2011-06-30 | 2011-03-31 | 2010-12-31 | 2010-09-30 | 2010-06-30 | ||
|---|---|---|---|---|---|---|---|---|---|---|---|---|---|---|---|---|---|---|---|---|---|---|---|---|---|---|---|---|---|---|---|---|---|---|---|---|---|---|---|---|---|---|---|---|---|---|---|---|---|---|---|---|---|---|---|---|
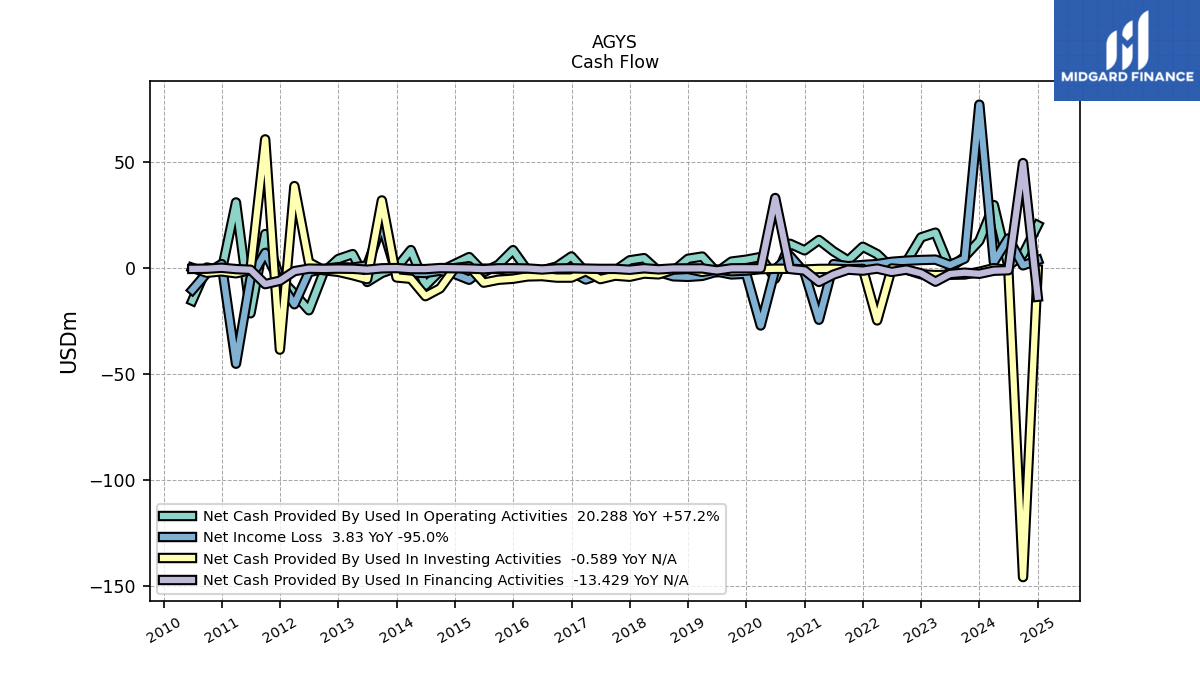
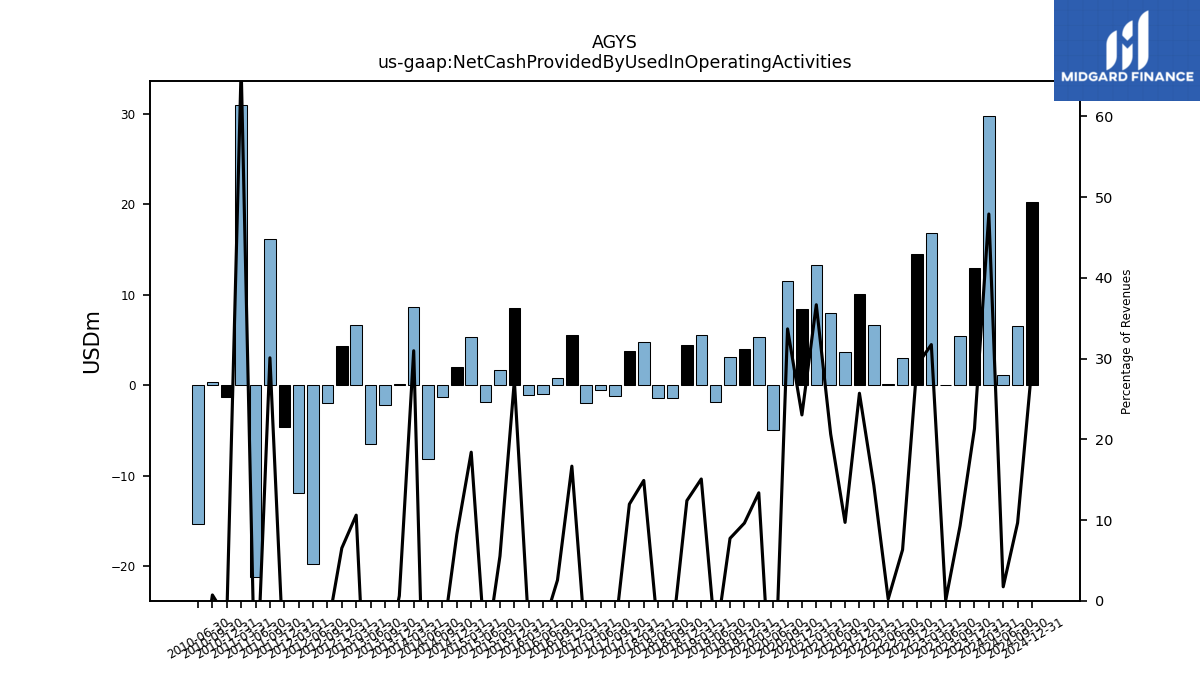
| Net Cash Provided By Used In Operating Activities | 12.91 | 5.45 | 0.02 | 16.78 | 14.56 | 3.02 | 0.10 | 6.66 | 10.14 | 3.68 | 8.00 | 13.32 | 8.44 | 11.57 | -4.93 | 5.30 | 4.04 | 3.15 | -1.91 | 5.52 | 4.47 | -1.39 | -1.36 | 4.78 | 3.75 | -1.16 | -0.48 | -1.96 | 5.58 | 0.83 | -1.02 | -1.10 | 8.54 | 1.64 | -1.86 | 5.28 | 2.04 | -1.32 | -8.19 | 8.59 | 0.16 | -2.21 | -6.46 | 6.68 | 4.38 | -1.97 | -19.81 | -11.93 | -4.66 | 16.13 | -21.23 | 31.04 | -1.29 | 0.35 | -15.32 | |
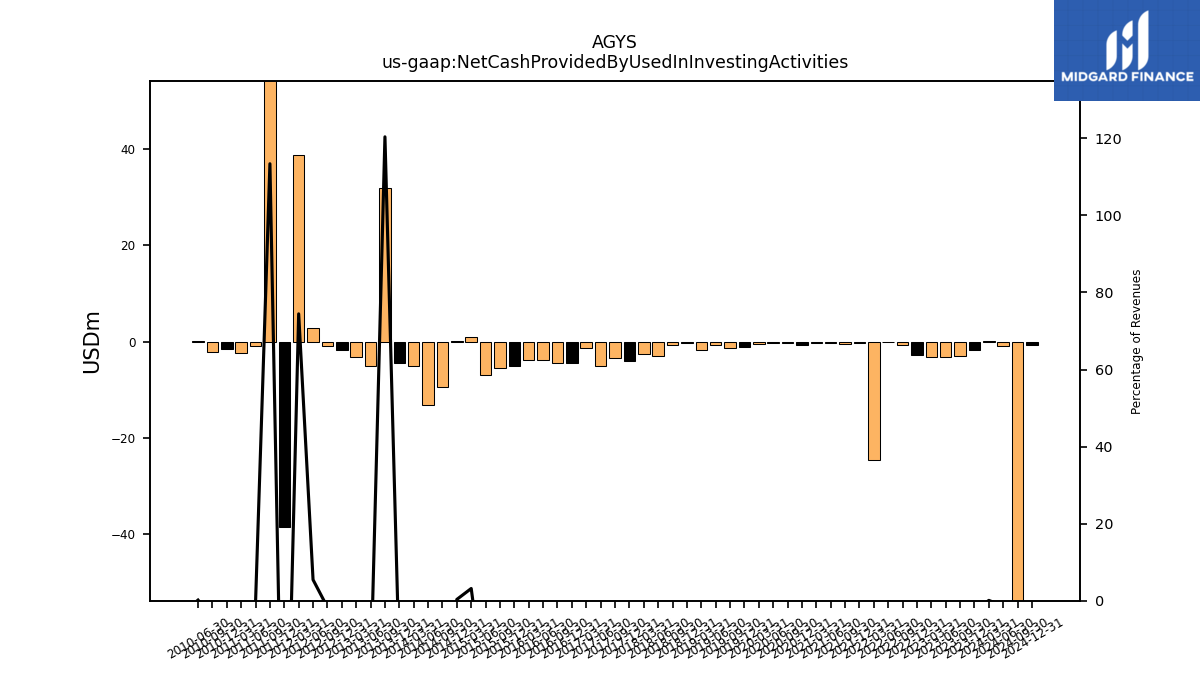
| Net Cash Provided By Used In Investing Activities | -1.66 | -2.94 | -3.07 | -3.23 | -2.84 | -0.69 | -0.10 | -24.60 | -0.29 | -0.51 | -0.28 | -0.31 | -0.60 | -0.23 | -0.24 | -0.41 | -1.09 | -1.37 | -0.57 | -1.71 | -0.30 | -0.65 | -2.88 | -2.50 | -4.00 | -3.47 | -5.12 | -1.36 | -4.41 | -4.41 | -3.69 | -3.84 | -4.94 | -5.43 | -6.80 | 0.91 | 0.09 | -9.47 | -13.16 | -4.97 | -4.33 | 32.00 | -5.13 | -3.26 | -1.69 | -0.92 | 2.82 | 38.74 | -38.37 | 60.77 | -0.80 | -2.38 | -1.45 | -2.11 | 0.23 | |
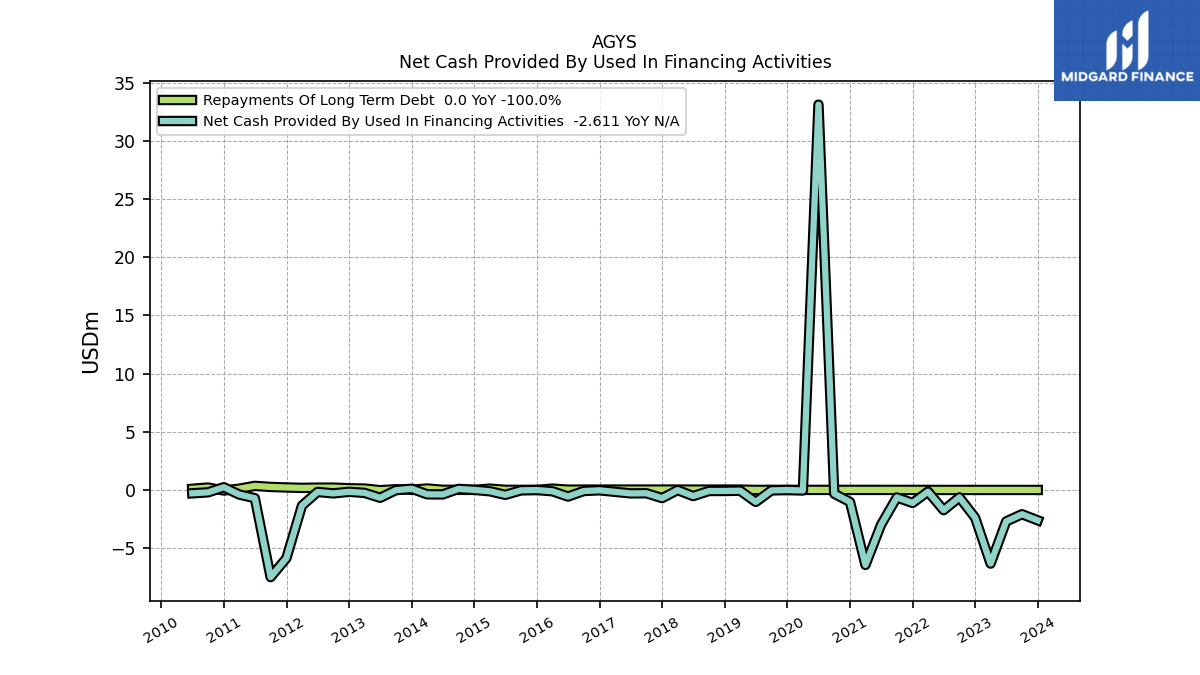
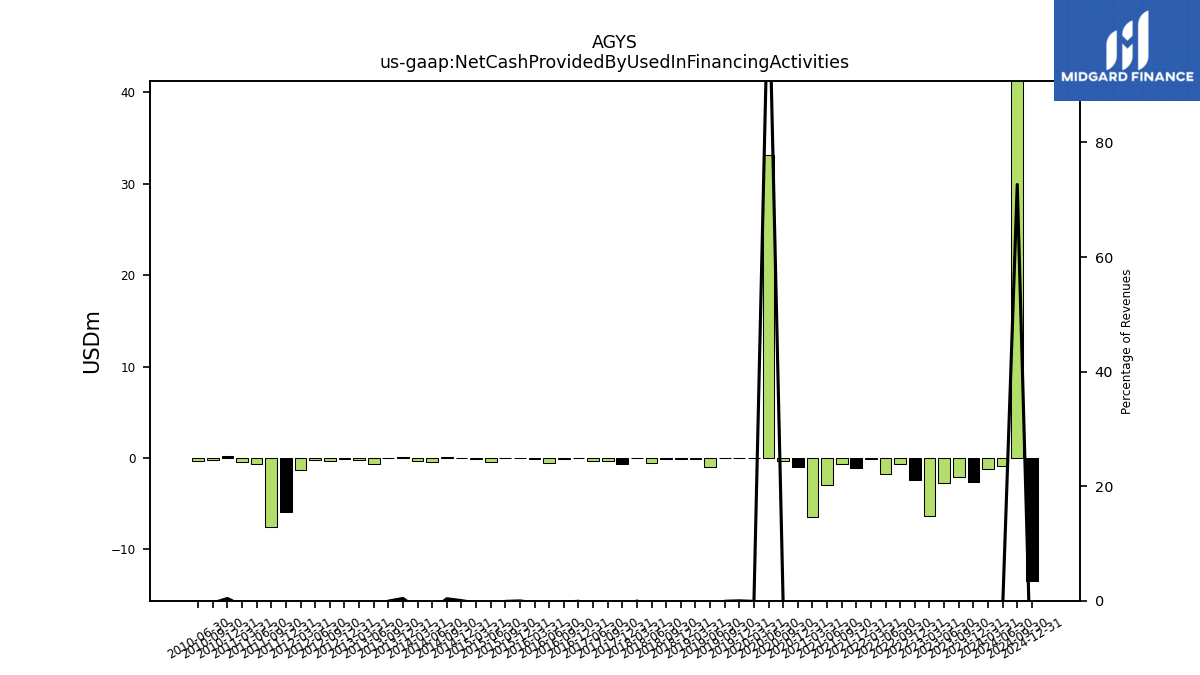
| Net Cash Provided By Used In Financing Activities | -2.61 | -2.09 | -2.70 | -6.33 | -2.39 | -0.64 | -1.74 | -0.15 | -1.12 | -0.64 | -2.99 | -6.45 | -1.03 | -0.32 | 33.12 | -0.04 | -0.01 | -0.04 | -1.03 | -0.07 | -0.09 | -0.09 | -0.53 | -0.01 | -0.70 | -0.28 | -0.30 | NA | -0.03 | -0.09 | -0.57 | -0.11 | -0.01 | -0.03 | -0.42 | -0.11 | 0.01 | 0.09 | -0.39 | -0.37 | 0.10 | -0.02 | -0.67 | -0.25 | -0.16 | -0.29 | -0.17 | -1.34 | -5.87 | -7.49 | -0.70 | -0.40 | 0.23 | -0.20 | -0.29 |
| 2023-12-31 | 2023-09-30 | 2023-06-30 | 2023-03-31 | 2022-12-31 | 2022-09-30 | 2022-06-30 | 2022-03-31 | 2021-12-31 | 2021-09-30 | 2021-06-30 | 2021-03-31 | 2020-12-31 | 2020-09-30 | 2020-06-30 | 2020-03-31 | 2019-12-31 | 2019-09-30 | 2019-06-30 | 2019-03-31 | 2018-12-31 | 2018-09-30 | 2018-06-30 | 2018-03-31 | 2017-12-31 | 2017-09-30 | 2017-06-30 | 2017-03-31 | 2016-12-31 | 2016-09-30 | 2016-06-30 | 2016-03-31 | 2015-12-31 | 2015-09-30 | 2015-06-30 | 2015-03-31 | 2014-12-31 | 2014-09-30 | 2014-06-30 | 2014-03-31 | 2013-12-31 | 2013-09-30 | 2013-06-30 | 2013-03-31 | 2012-12-31 | 2012-09-30 | 2012-06-30 | 2012-03-31 | 2011-12-31 | 2011-09-30 | 2011-06-30 | 2011-03-31 | 2010-12-31 | 2010-09-30 | 2010-06-30 | ||
|---|---|---|---|---|---|---|---|---|---|---|---|---|---|---|---|---|---|---|---|---|---|---|---|---|---|---|---|---|---|---|---|---|---|---|---|---|---|---|---|---|---|---|---|---|---|---|---|---|---|---|---|---|---|---|---|---|
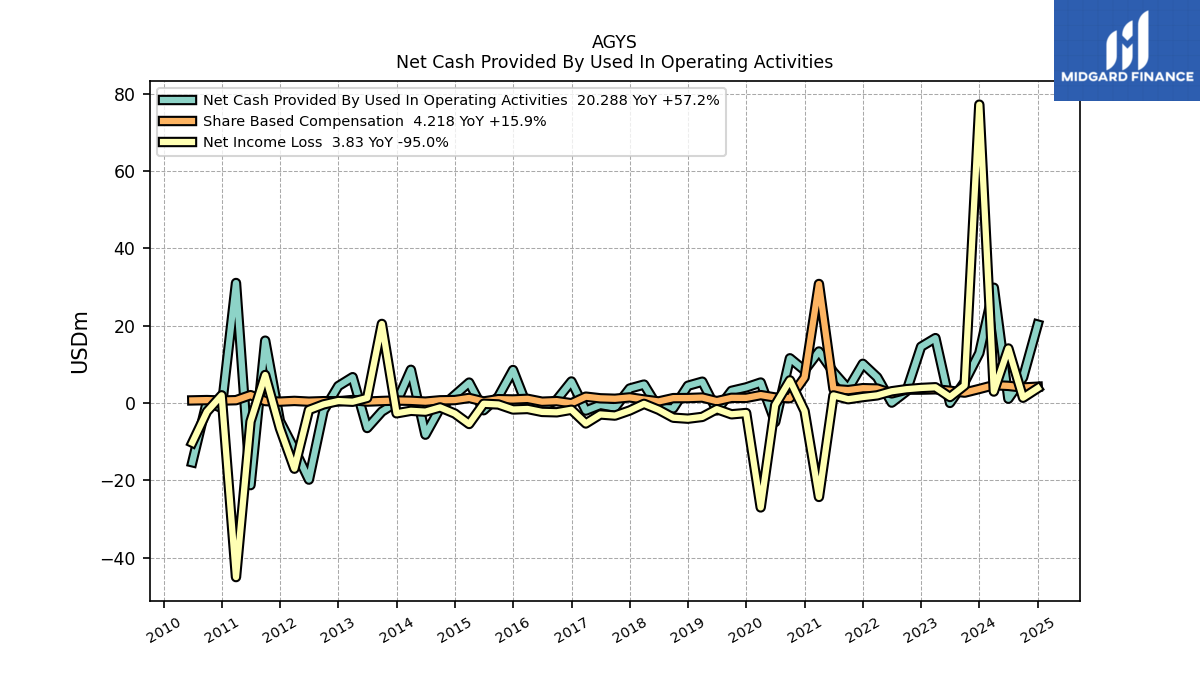
| Net Cash Provided By Used In Operating Activities | 12.91 | 5.45 | 0.02 | 16.78 | 14.56 | 3.02 | 0.10 | 6.66 | 10.14 | 3.68 | 8.00 | 13.32 | 8.44 | 11.57 | -4.93 | 5.30 | 4.04 | 3.15 | -1.91 | 5.52 | 4.47 | -1.39 | -1.36 | 4.78 | 3.75 | -1.16 | -0.48 | -1.96 | 5.58 | 0.83 | -1.02 | -1.10 | 8.54 | 1.64 | -1.86 | 5.28 | 2.04 | -1.32 | -8.19 | 8.59 | 0.16 | -2.21 | -6.46 | 6.68 | 4.38 | -1.97 | -19.81 | -11.93 | -4.66 | 16.13 | -21.23 | 31.04 | -1.29 | 0.35 | -15.32 | |
| Net Income Loss | 77.14 | 4.54 | 1.55 | 4.08 | 3.89 | 3.58 | 3.04 | 1.98 | 1.54 | 0.98 | 1.97 | -24.28 | -2.07 | 5.87 | -0.52 | -26.99 | -2.58 | -2.92 | -1.57 | -3.59 | -4.05 | -3.79 | -1.74 | -0.21 | -1.93 | -3.25 | -2.96 | -5.29 | -1.74 | -2.40 | -2.30 | -1.54 | -1.67 | -0.37 | -0.18 | -5.43 | -2.71 | -1.13 | -2.23 | -2.01 | -2.66 | 20.45 | 1.32 | 0.33 | 0.52 | -0.35 | -1.79 | -16.98 | -6.51 | 7.25 | -4.79 | -45.01 | 2.00 | -2.21 | -10.25 | |
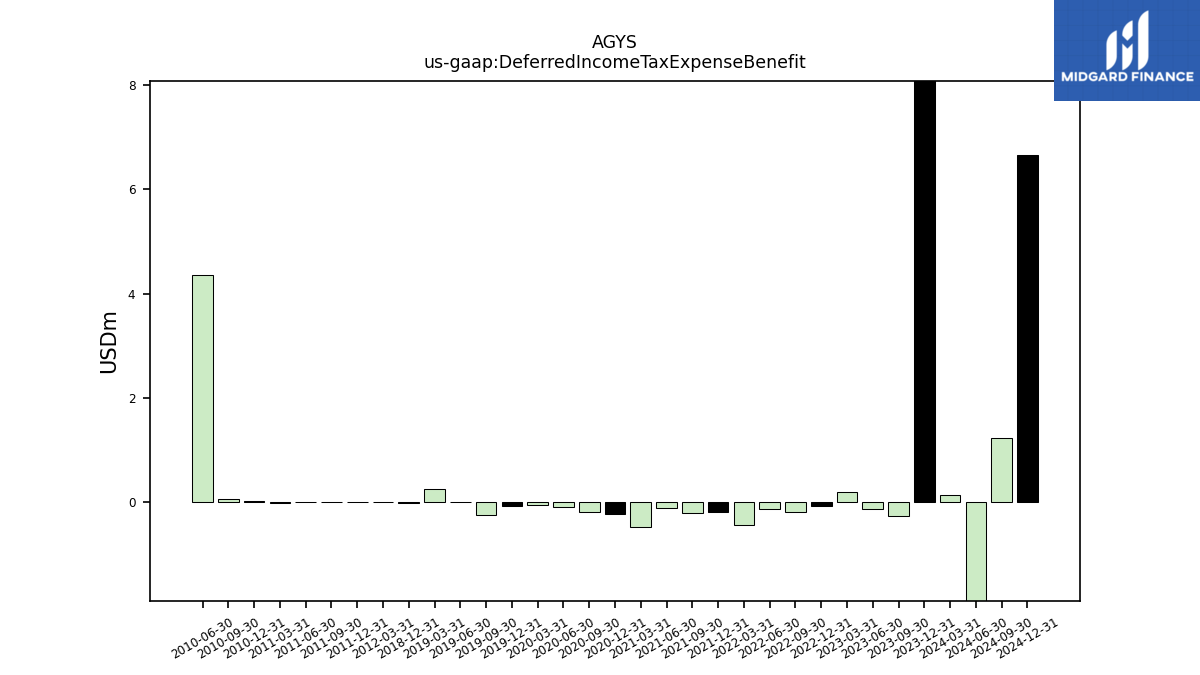
| Deferred Income Tax Expense Benefit | 65.10 | -0.26 | -0.13 | 0.20 | -0.07 | -0.19 | -0.12 | -0.43 | -0.19 | -0.20 | -0.11 | -0.46 | -0.23 | -0.18 | -0.08 | -0.04 | -0.07 | -0.24 | 0.01 | 0.27 | -0.01 | NA | NA | NA | NA | NA | NA | NA | NA | NA | NA | NA | NA | NA | NA | NA | NA | NA | NA | NA | NA | NA | NA | NA | NA | NA | NA | 0.01 | 0.02 | 0.02 | 0.02 | -0.01 | 0.03 | 0.07 | 4.36 | |
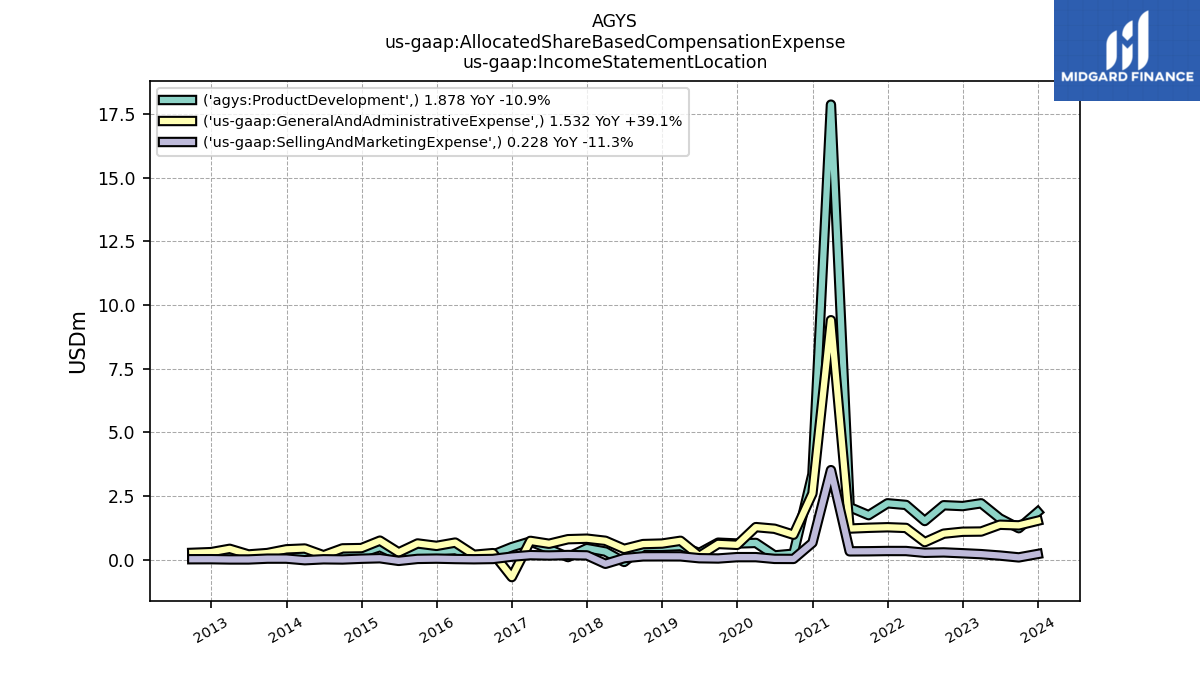
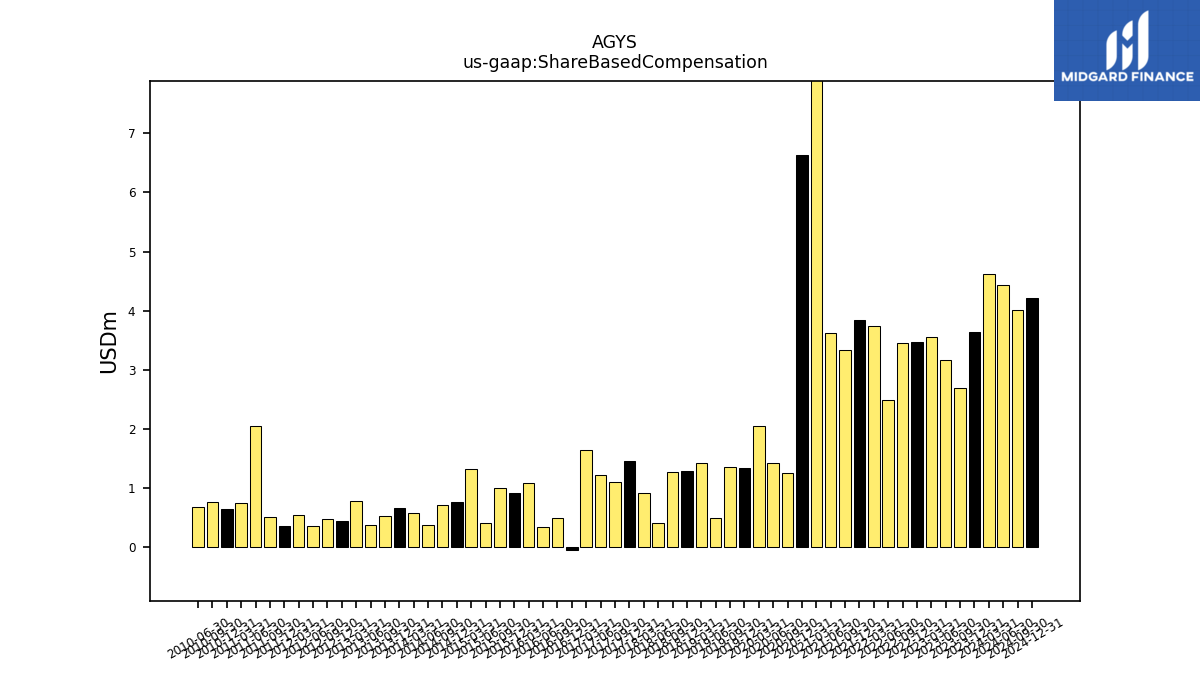
| Share Based Compensation | 3.64 | 2.68 | 3.17 | 3.55 | 3.47 | 3.46 | 2.49 | 3.75 | 3.84 | 3.34 | 3.62 | 30.78 | 6.63 | 1.26 | 1.43 | 2.05 | 1.33 | 1.34 | 0.48 | 1.42 | 1.28 | 1.26 | 0.41 | 0.91 | 1.46 | 1.10 | 1.22 | 1.65 | -0.06 | 0.49 | 0.35 | 1.09 | 0.92 | 1.00 | 0.40 | 1.31 | 0.76 | 0.70 | 0.36 | 0.58 | 0.65 | 0.53 | 0.37 | 0.78 | 0.44 | 0.48 | 0.35 | 0.55 | 0.36 | 0.51 | 2.04 | 0.74 | 0.64 | 0.76 | 0.68 |
| 2023-12-31 | 2023-09-30 | 2023-06-30 | 2023-03-31 | 2022-12-31 | 2022-09-30 | 2022-06-30 | 2022-03-31 | 2021-12-31 | 2021-09-30 | 2021-06-30 | 2021-03-31 | 2020-12-31 | 2020-09-30 | 2020-06-30 | 2020-03-31 | 2019-12-31 | 2019-09-30 | 2019-06-30 | 2019-03-31 | 2018-12-31 | 2018-09-30 | 2018-06-30 | 2018-03-31 | 2017-12-31 | 2017-09-30 | 2017-06-30 | 2017-03-31 | 2016-12-31 | 2016-09-30 | 2016-06-30 | 2016-03-31 | 2015-12-31 | 2015-09-30 | 2015-06-30 | 2015-03-31 | 2014-12-31 | 2014-09-30 | 2014-06-30 | 2014-03-31 | 2013-12-31 | 2013-09-30 | 2013-06-30 | 2013-03-31 | 2012-12-31 | 2012-09-30 | 2012-06-30 | 2012-03-31 | 2011-12-31 | 2011-09-30 | 2011-06-30 | 2011-03-31 | 2010-12-31 | 2010-09-30 | 2010-06-30 | ||
|---|---|---|---|---|---|---|---|---|---|---|---|---|---|---|---|---|---|---|---|---|---|---|---|---|---|---|---|---|---|---|---|---|---|---|---|---|---|---|---|---|---|---|---|---|---|---|---|---|---|---|---|---|---|---|---|---|
| Net Cash Provided By Used In Investing Activities | -1.66 | -2.94 | -3.07 | -3.23 | -2.84 | -0.69 | -0.10 | -24.60 | -0.29 | -0.51 | -0.28 | -0.31 | -0.60 | -0.23 | -0.24 | -0.41 | -1.09 | -1.37 | -0.57 | -1.71 | -0.30 | -0.65 | -2.88 | -2.50 | -4.00 | -3.47 | -5.12 | -1.36 | -4.41 | -4.41 | -3.69 | -3.84 | -4.94 | -5.43 | -6.80 | 0.91 | 0.09 | -9.47 | -13.16 | -4.97 | -4.33 | 32.00 | -5.13 | -3.26 | -1.69 | -0.92 | 2.82 | 38.74 | -38.37 | 60.77 | -0.80 | -2.38 | -1.45 | -2.11 | 0.23 | |
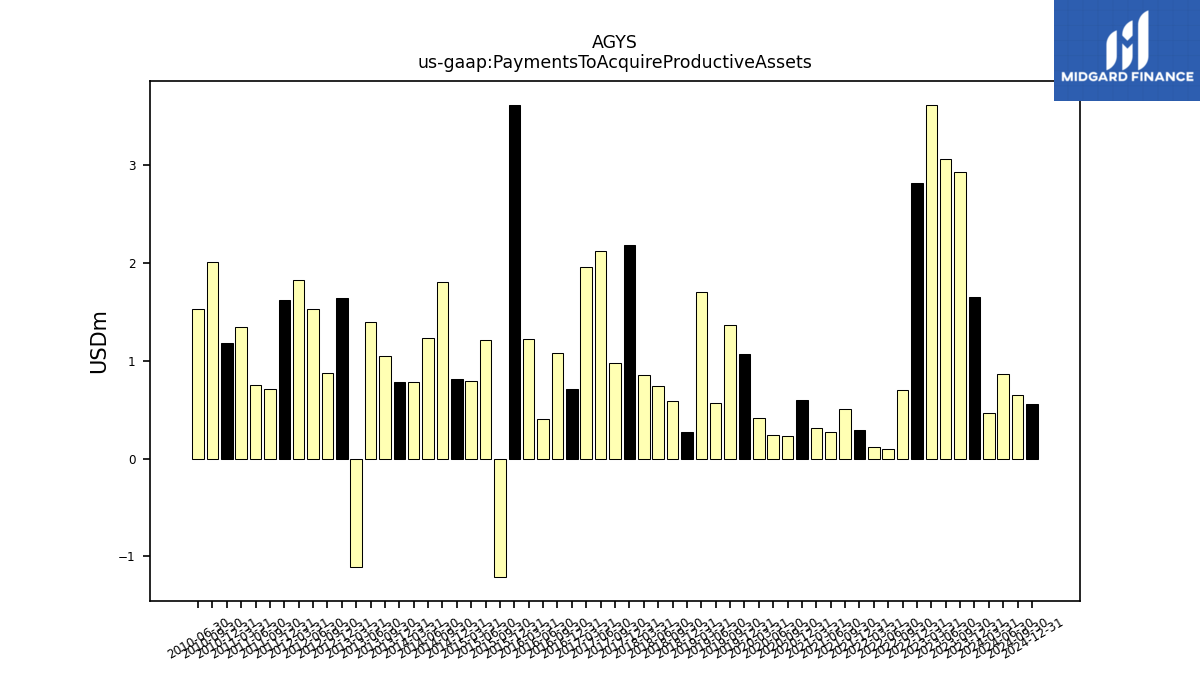
| Payments To Acquire Productive Assets | 1.66 | 2.94 | 3.06 | 3.62 | 2.82 | 0.70 | 0.10 | 0.12 | 0.29 | 0.51 | 0.27 | 0.31 | 0.60 | 0.23 | 0.24 | 0.41 | 1.07 | 1.37 | 0.57 | 1.71 | 0.28 | 0.59 | 0.74 | 0.85 | 2.18 | 0.98 | 2.12 | 1.96 | 0.71 | 1.08 | 0.41 | 1.23 | 3.62 | -1.21 | 1.21 | 0.79 | 0.82 | 1.80 | 1.23 | 0.79 | 0.79 | 1.05 | 1.40 | -1.11 | 1.65 | 0.88 | 1.53 | 1.83 | 1.62 | 0.71 | 0.76 | 1.35 | 1.19 | 2.01 | 1.53 |
| 2023-12-31 | 2023-09-30 | 2023-06-30 | 2023-03-31 | 2022-12-31 | 2022-09-30 | 2022-06-30 | 2022-03-31 | 2021-12-31 | 2021-09-30 | 2021-06-30 | 2021-03-31 | 2020-12-31 | 2020-09-30 | 2020-06-30 | 2020-03-31 | 2019-12-31 | 2019-09-30 | 2019-06-30 | 2019-03-31 | 2018-12-31 | 2018-09-30 | 2018-06-30 | 2018-03-31 | 2017-12-31 | 2017-09-30 | 2017-06-30 | 2017-03-31 | 2016-12-31 | 2016-09-30 | 2016-06-30 | 2016-03-31 | 2015-12-31 | 2015-09-30 | 2015-06-30 | 2015-03-31 | 2014-12-31 | 2014-09-30 | 2014-06-30 | 2014-03-31 | 2013-12-31 | 2013-09-30 | 2013-06-30 | 2013-03-31 | 2012-12-31 | 2012-09-30 | 2012-06-30 | 2012-03-31 | 2011-12-31 | 2011-09-30 | 2011-06-30 | 2011-03-31 | 2010-12-31 | 2010-09-30 | 2010-06-30 | ||
|---|---|---|---|---|---|---|---|---|---|---|---|---|---|---|---|---|---|---|---|---|---|---|---|---|---|---|---|---|---|---|---|---|---|---|---|---|---|---|---|---|---|---|---|---|---|---|---|---|---|---|---|---|---|---|---|---|
| Net Cash Provided By Used In Financing Activities | -2.61 | -2.09 | -2.70 | -6.33 | -2.39 | -0.64 | -1.74 | -0.15 | -1.12 | -0.64 | -2.99 | -6.45 | -1.03 | -0.32 | 33.12 | -0.04 | -0.01 | -0.04 | -1.03 | -0.07 | -0.09 | -0.09 | -0.53 | -0.01 | -0.70 | -0.28 | -0.30 | NA | -0.03 | -0.09 | -0.57 | -0.11 | -0.01 | -0.03 | -0.42 | -0.11 | 0.01 | 0.09 | -0.39 | -0.37 | 0.10 | -0.02 | -0.67 | -0.25 | -0.16 | -0.29 | -0.17 | -1.34 | -5.87 | -7.49 | -0.70 | -0.40 | 0.23 | -0.20 | -0.29 |
| 2023-12-31 | 2023-09-30 | 2023-06-30 | 2023-03-31 | 2022-12-31 | 2022-09-30 | 2022-06-30 | 2022-03-31 | 2021-12-31 | 2021-09-30 | 2021-06-30 | 2021-03-31 | 2020-12-31 | 2020-09-30 | 2020-06-30 | 2020-03-31 | 2019-12-31 | 2019-09-30 | 2019-06-30 | 2019-03-31 | 2018-12-31 | 2018-09-30 | 2018-06-30 | 2018-03-31 | 2017-12-31 | 2017-09-30 | 2017-06-30 | 2017-03-31 | 2016-12-31 | 2016-09-30 | 2016-06-30 | 2016-03-31 | 2015-12-31 | 2015-09-30 | 2015-06-30 | 2015-03-31 | 2014-12-31 | 2014-09-30 | 2014-06-30 | 2014-03-31 | 2013-12-31 | 2013-09-30 | 2013-06-30 | 2013-03-31 | 2012-12-31 | 2012-09-30 | 2012-06-30 | 2012-03-31 | 2011-12-31 | 2011-09-30 | 2011-06-30 | 2011-03-31 | 2010-12-31 | 2010-09-30 | 2010-06-30 | ||
|---|---|---|---|---|---|---|---|---|---|---|---|---|---|---|---|---|---|---|---|---|---|---|---|---|---|---|---|---|---|---|---|---|---|---|---|---|---|---|---|---|---|---|---|---|---|---|---|---|---|---|---|---|---|---|---|---|
| Revenues | 60.57 | 58.62 | 56.06 | 52.90 | 49.92 | 47.74 | 47.51 | 46.56 | 39.46 | 37.89 | 38.73 | 36.34 | 36.67 | 34.36 | 29.81 | 39.66 | 41.99 | 40.72 | 38.39 | 36.62 | 36.01 | 34.20 | 34.01 | 32.06 | 31.31 | 30.13 | 33.87 | 30.60 | 33.45 | 32.68 | 30.95 | 31.92 | 31.31 | 29.64 | 27.49 | 28.71 | 24.74 | 26.32 | 23.75 | 27.75 | 26.01 | 26.58 | 24.50 | 63.04 | 67.21 | 54.25 | 51.65 | 52.03 | 51.58 | 53.59 | 151.64 | 46.96 | 59.00 | 49.33 | 131.87 | |
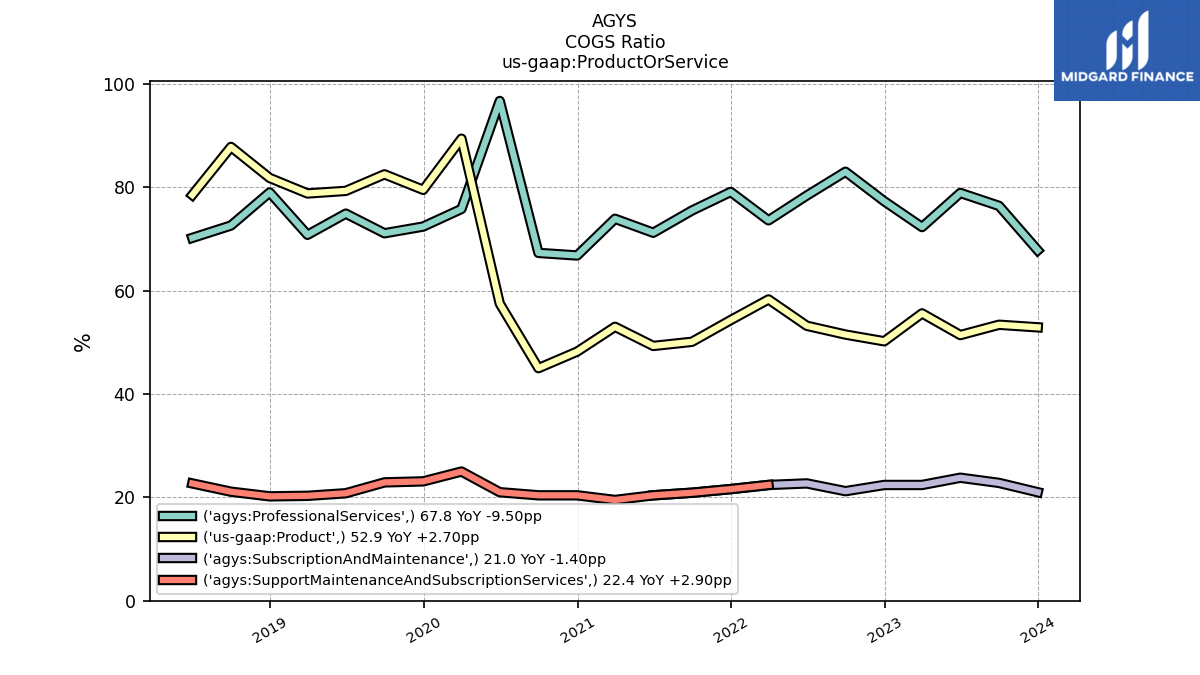
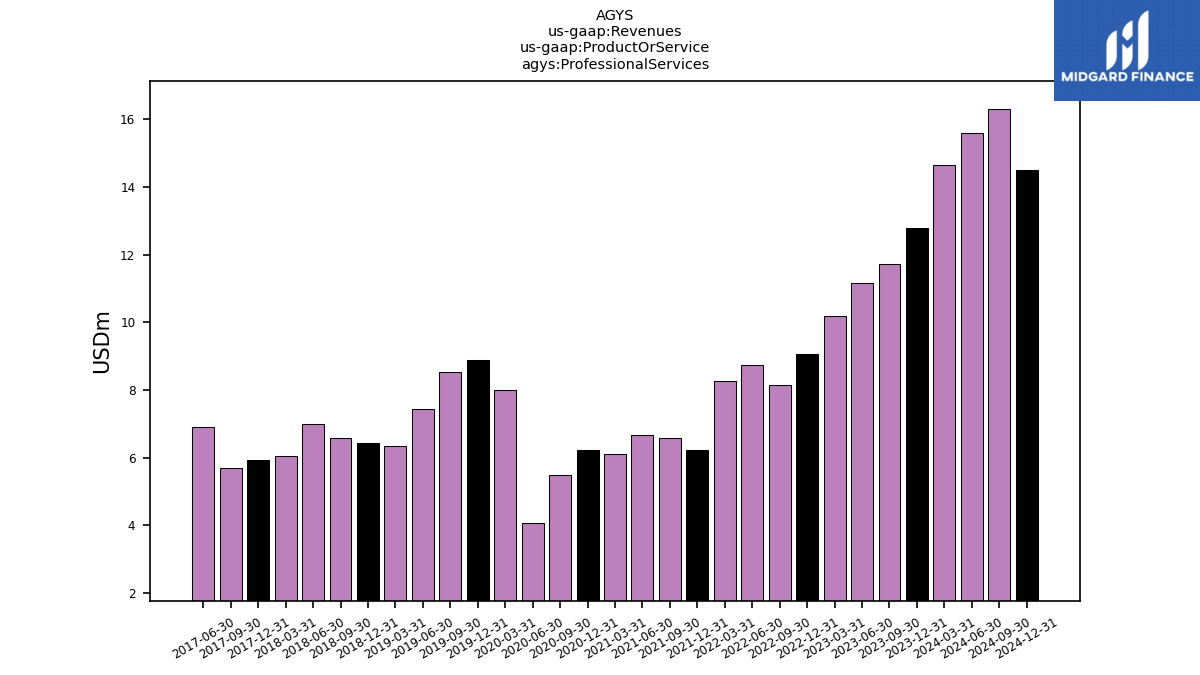
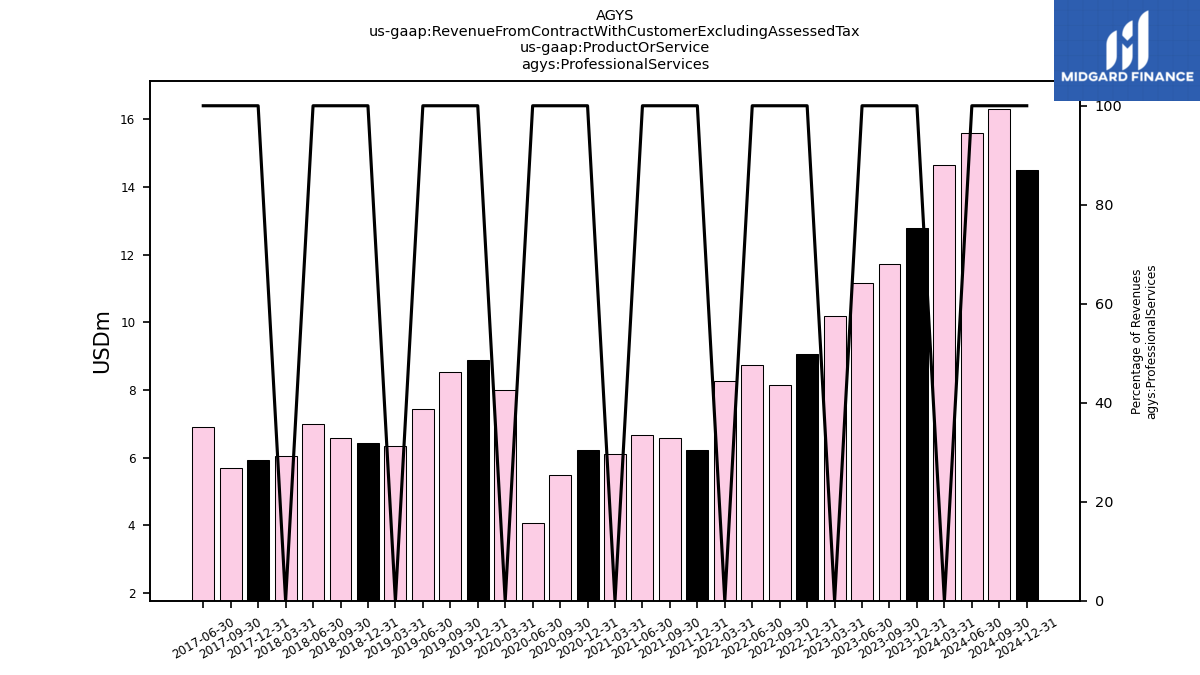
| Professional Services | 12.78 | 11.73 | 11.15 | 10.18 | 9.07 | 8.16 | 8.73 | 8.26 | 6.22 | 6.57 | 6.67 | 6.10 | 6.23 | 5.50 | 4.07 | 7.99 | 8.90 | 8.52 | 7.44 | 6.33 | 6.44 | 6.58 | 7.00 | 6.04 | 5.94 | 5.70 | 6.92 | NA | NA | NA | NA | NA | NA | NA | NA | NA | NA | NA | NA | NA | NA | NA | NA | NA | NA | NA | NA | NA | NA | NA | NA | NA | NA | NA | NA | |
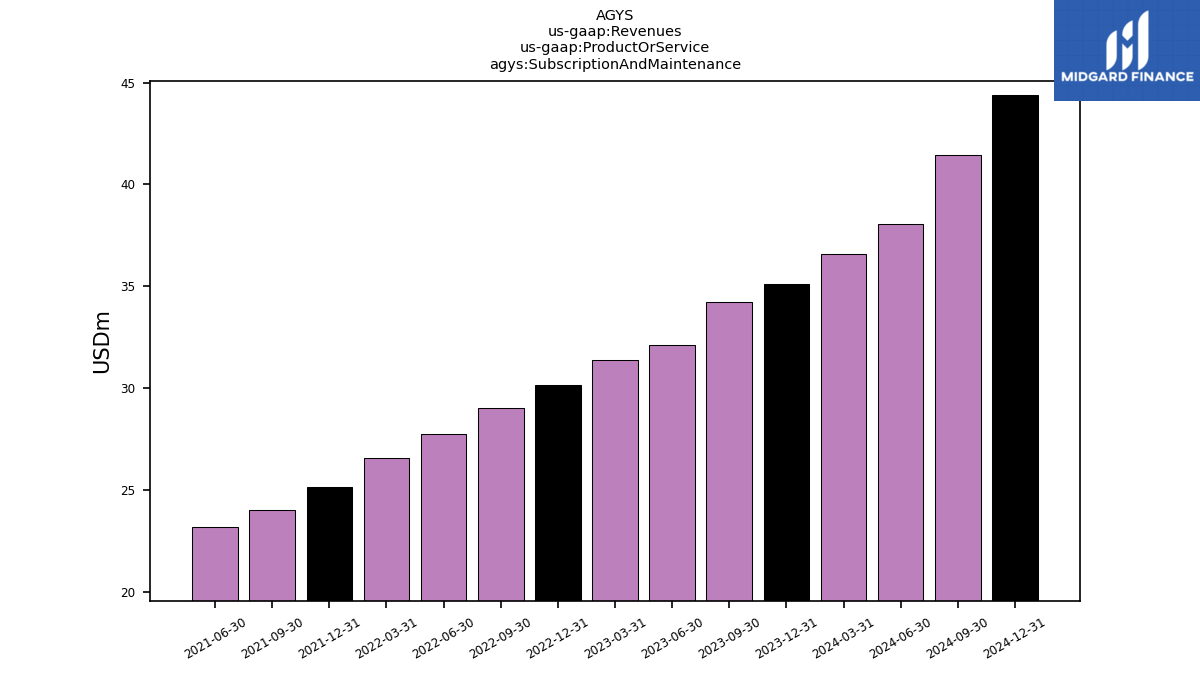
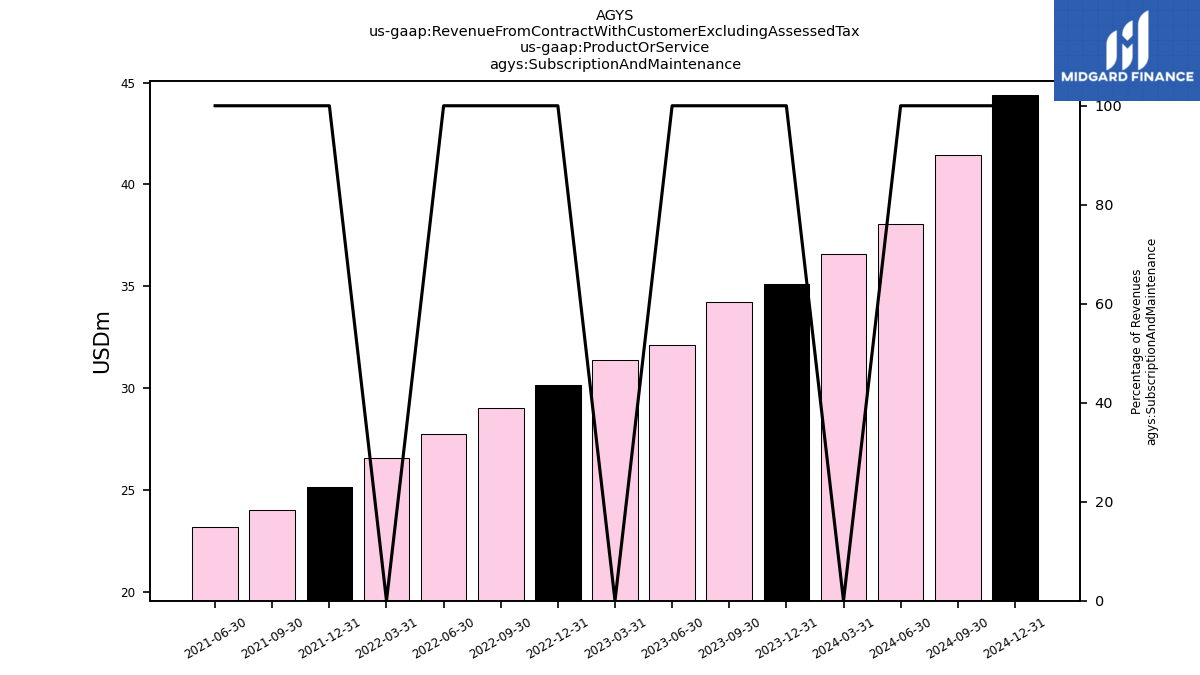
| Subscription And Maintenance | 35.11 | 34.25 | 32.12 | 31.37 | 30.15 | 29.04 | 27.73 | 26.59 | 25.14 | 24.03 | 23.21 | NA | NA | NA | NA | NA | NA | NA | NA | NA | NA | NA | NA | NA | NA | NA | NA | NA | NA | NA | NA | NA | NA | NA | NA | NA | NA | NA | NA | NA | NA | NA | NA | NA | NA | NA | NA | NA | NA | NA | NA | NA | NA | NA | NA | |
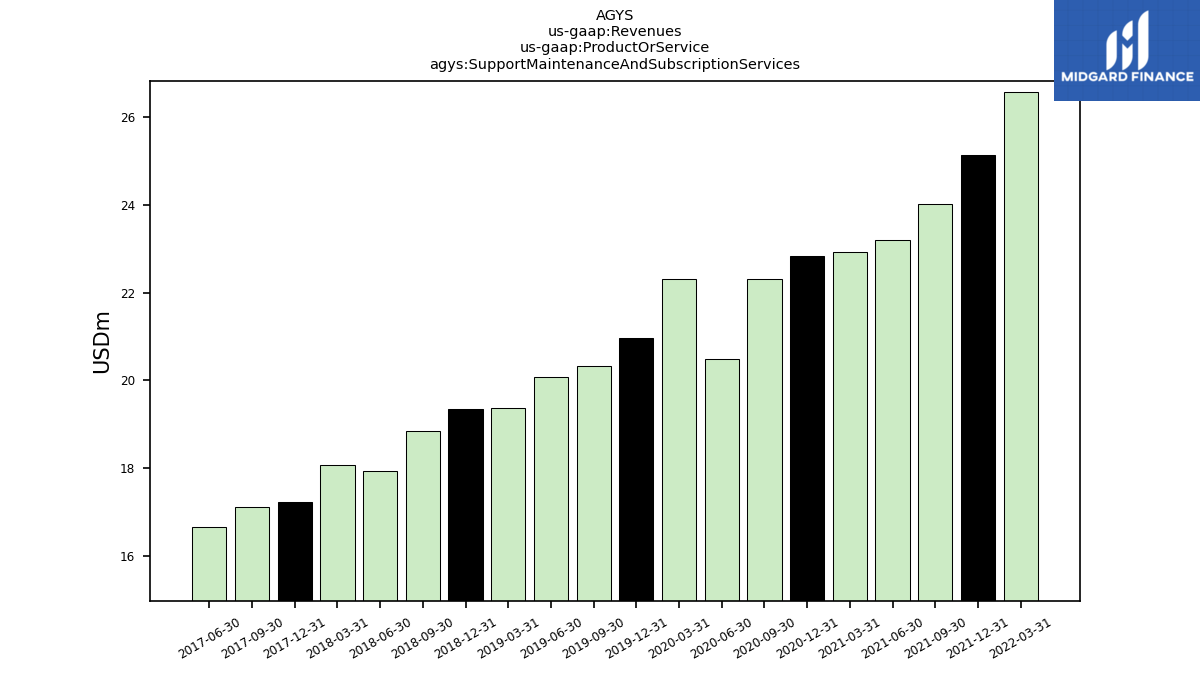
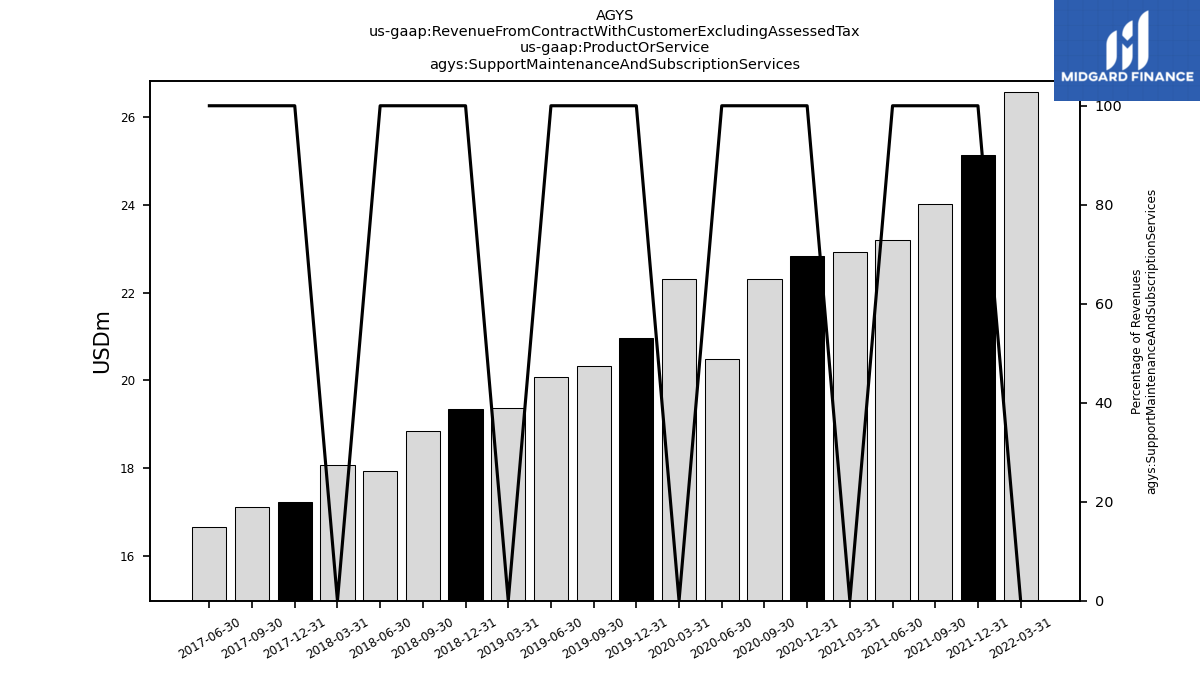
| Support Maintenance And Subscription Services | NA | NA | NA | NA | NA | NA | NA | 26.59 | 25.14 | 24.03 | 23.21 | 22.92 | 22.85 | 22.30 | 20.50 | 22.30 | 20.96 | 20.33 | 20.08 | 19.37 | 19.34 | 18.86 | 17.93 | 18.08 | 17.21 | 17.11 | 16.67 | NA | NA | NA | NA | NA | NA | NA | NA | NA | NA | NA | NA | NA | NA | NA | NA | NA | NA | NA | NA | NA | NA | NA | NA | NA | NA | NA | NA | |
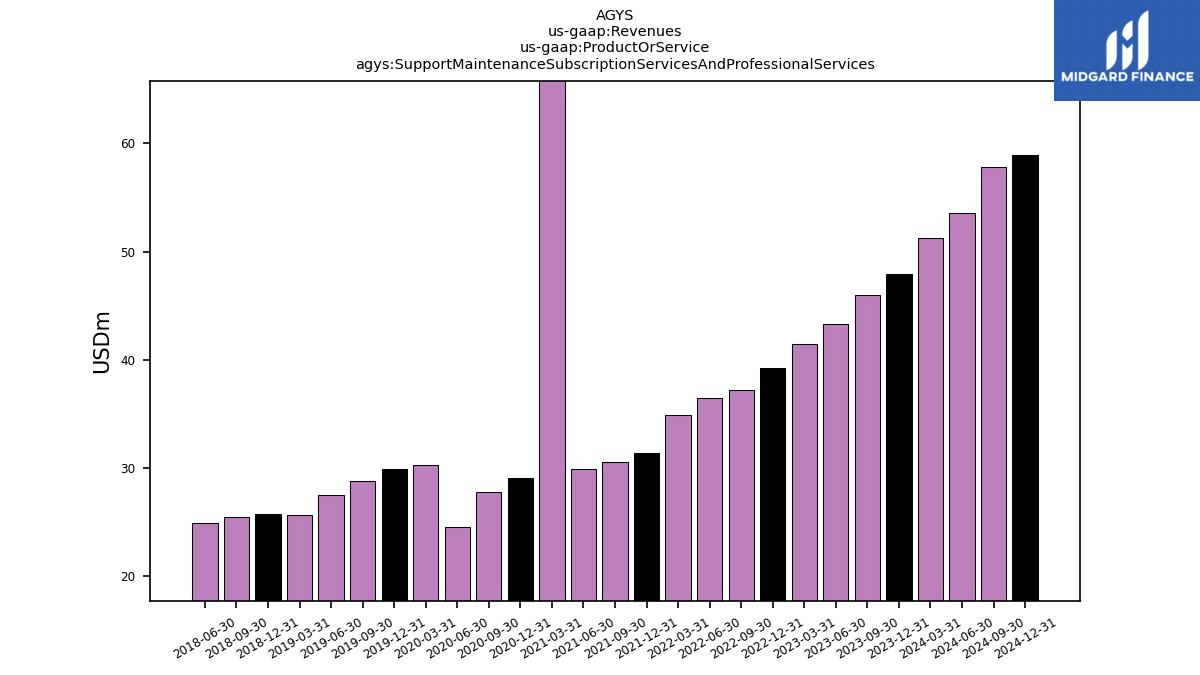
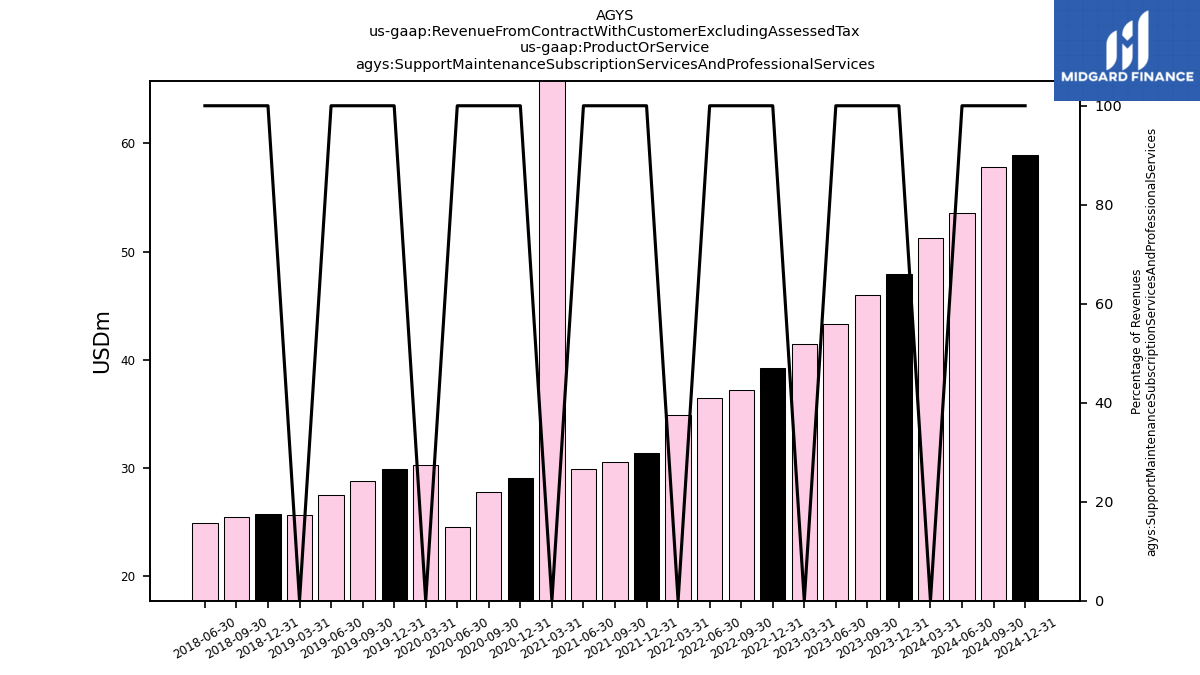
| Support Maintenance Subscription Services And Professional Services | 47.90 | 46.00 | 43.30 | 41.50 | 39.20 | 37.20 | 36.50 | 34.90 | 31.40 | 30.60 | 29.90 | 80.60 | 29.10 | 27.80 | 24.60 | 30.30 | 29.90 | 28.80 | 27.52 | 25.66 | 25.78 | 25.43 | 24.93 | NA | NA | NA | NA | NA | NA | NA | NA | NA | NA | NA | NA | NA | NA | NA | NA | NA | NA | NA | NA | NA | NA | NA | NA | NA | NA | NA | NA | NA | NA | NA | NA | |
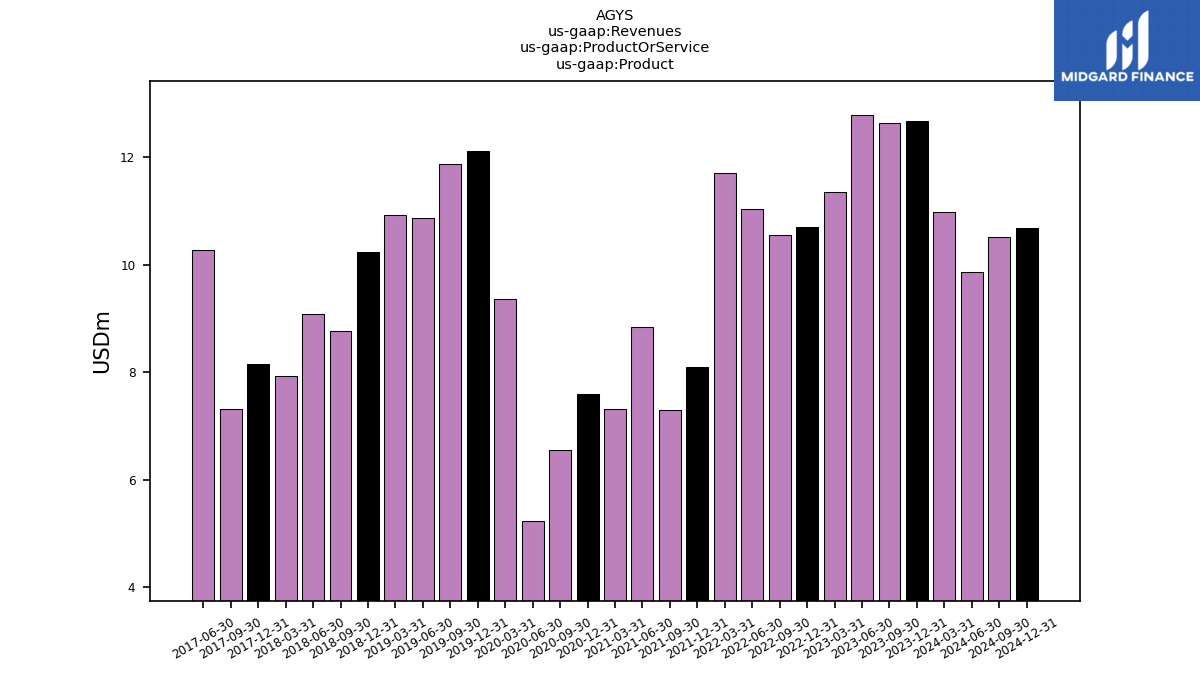
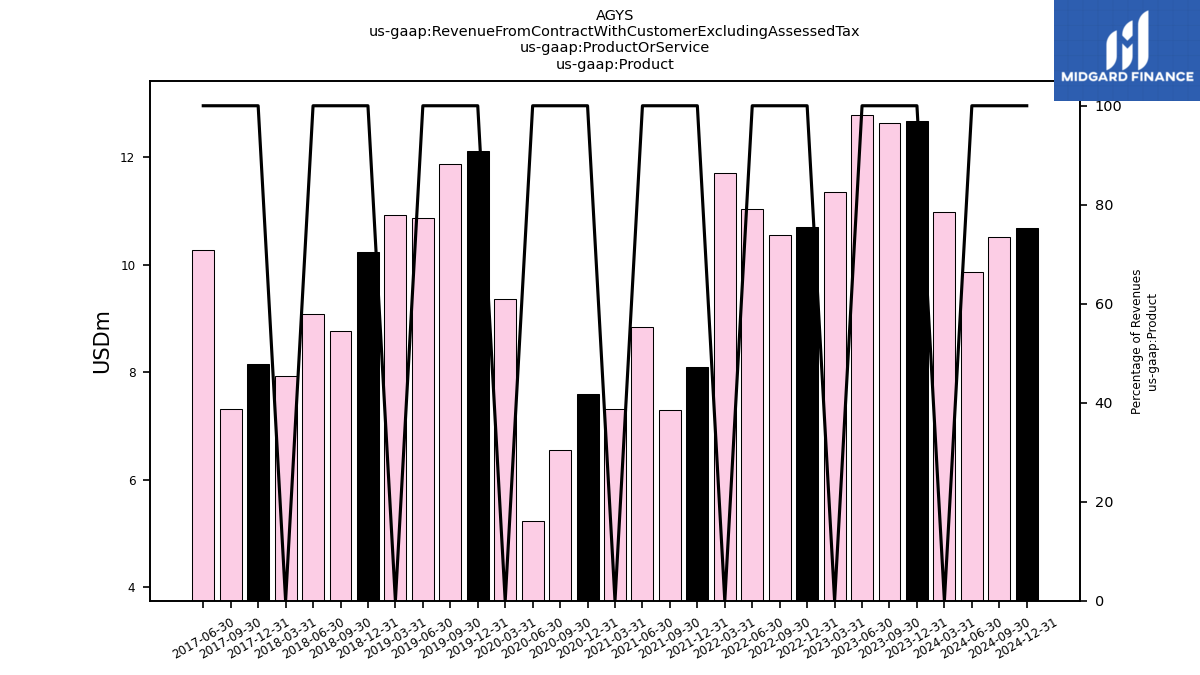
| Product | 12.68 | 12.64 | 12.78 | 11.35 | 10.70 | 10.55 | 11.05 | 11.71 | 8.10 | 7.30 | 8.84 | 7.32 | 7.60 | 6.56 | 5.24 | 9.36 | 12.13 | 11.87 | 10.87 | 10.92 | 10.23 | 8.77 | 9.08 | 7.94 | 8.16 | 7.32 | 10.28 | NA | NA | NA | NA | NA | NA | NA | NA | NA | NA | NA | NA | NA | NA | NA | NA | NA | NA | NA | NA | NA | NA | NA | NA | NA | NA | NA | NA | |
| Revenue From Contract With Customer Excluding Assessed Tax | 60.57 | 58.62 | 56.06 | 52.90 | 49.92 | 47.74 | 47.51 | 46.56 | 39.46 | 37.89 | 38.73 | 36.34 | 36.67 | 34.36 | 29.81 | 39.66 | 41.99 | 40.72 | 38.39 | 36.62 | 36.01 | 34.20 | 34.01 | 32.06 | 31.31 | 30.13 | 33.87 | 30.60 | 33.45 | 32.68 | 30.95 | 31.92 | 31.31 | 29.64 | 27.49 | 28.71 | 24.74 | 26.32 | 23.75 | 27.75 | 26.01 | 26.58 | 24.50 | 63.04 | 67.21 | 54.25 | 51.65 | 52.03 | 51.58 | 53.59 | 151.64 | 46.96 | 59.00 | 49.33 | 131.87 | |
| Professional Services | 12.78 | 11.73 | 11.15 | 10.18 | 9.07 | 8.16 | 8.73 | 8.26 | 6.22 | 6.57 | 6.67 | 6.10 | 6.23 | 5.50 | 4.07 | 7.99 | 8.90 | 8.52 | 7.44 | 6.33 | 6.44 | 6.58 | 7.00 | 6.04 | 5.94 | 5.70 | 6.92 | NA | NA | NA | NA | NA | NA | NA | NA | NA | NA | NA | NA | NA | NA | NA | NA | NA | NA | NA | NA | NA | NA | NA | NA | NA | NA | NA | NA | |
| Subscription And Maintenance | 35.11 | 34.25 | 32.12 | 31.37 | 30.15 | 29.04 | 27.73 | 26.59 | 25.14 | 24.03 | 23.21 | NA | NA | NA | NA | NA | NA | NA | NA | NA | NA | NA | NA | NA | NA | NA | NA | NA | NA | NA | NA | NA | NA | NA | NA | NA | NA | NA | NA | NA | NA | NA | NA | NA | NA | NA | NA | NA | NA | NA | NA | NA | NA | NA | NA | |
| Support Maintenance And Subscription Services | NA | NA | NA | NA | NA | NA | NA | 26.59 | 25.14 | 24.03 | 23.21 | 22.92 | 22.85 | 22.30 | 20.50 | 22.30 | 20.96 | 20.33 | 20.08 | 19.37 | 19.34 | 18.86 | 17.93 | 18.08 | 17.21 | 17.11 | 16.67 | NA | NA | NA | NA | NA | NA | NA | NA | NA | NA | NA | NA | NA | NA | NA | NA | NA | NA | NA | NA | NA | NA | NA | NA | NA | NA | NA | NA | |
| Support Maintenance Subscription Services And Professional Services | 47.90 | 46.00 | 43.30 | 41.50 | 39.20 | 37.20 | 36.50 | 34.90 | 31.40 | 30.60 | 29.90 | 80.60 | 29.10 | 27.80 | 24.60 | 30.30 | 29.90 | 28.80 | 27.52 | 25.66 | 25.78 | 25.43 | 24.93 | NA | NA | NA | NA | NA | NA | NA | NA | NA | NA | NA | NA | NA | NA | NA | NA | NA | NA | NA | NA | NA | NA | NA | NA | NA | NA | NA | NA | NA | NA | NA | NA | |
| Product | 12.68 | 12.64 | 12.78 | 11.35 | 10.70 | 10.55 | 11.05 | 11.71 | 8.10 | 7.30 | 8.84 | 7.32 | 7.60 | 6.56 | 5.24 | 9.36 | 12.13 | 11.87 | 10.87 | 10.92 | 10.23 | 8.77 | 9.08 | 7.94 | 8.16 | 7.32 | 10.28 | NA | NA | NA | NA | NA | NA | NA | NA | NA | NA | NA | NA | NA | NA | NA | NA | NA | NA | NA | NA | NA | NA | NA | NA | NA | NA | NA | NA |

