
| 2023-09-30 | 2023-06-30 | 2023-03-31 | 2022-12-31 | 2022-09-30 | 2022-06-30 | 2022-03-31 | 2021-12-31 | 2021-09-30 | 2021-06-30 | 2021-03-31 | 2020-12-31 | 2020-09-30 | 2020-06-30 | 2020-03-31 | 2019-12-31 | 2019-09-30 | 2019-06-30 | 2019-03-31 | 2018-12-31 | 2018-09-30 | 2018-06-30 | 2018-03-31 | 2017-12-31 | 2017-09-30 | 2017-06-30 | 2017-03-31 | ||
|---|---|---|---|---|---|---|---|---|---|---|---|---|---|---|---|---|---|---|---|---|---|---|---|---|---|---|---|---|
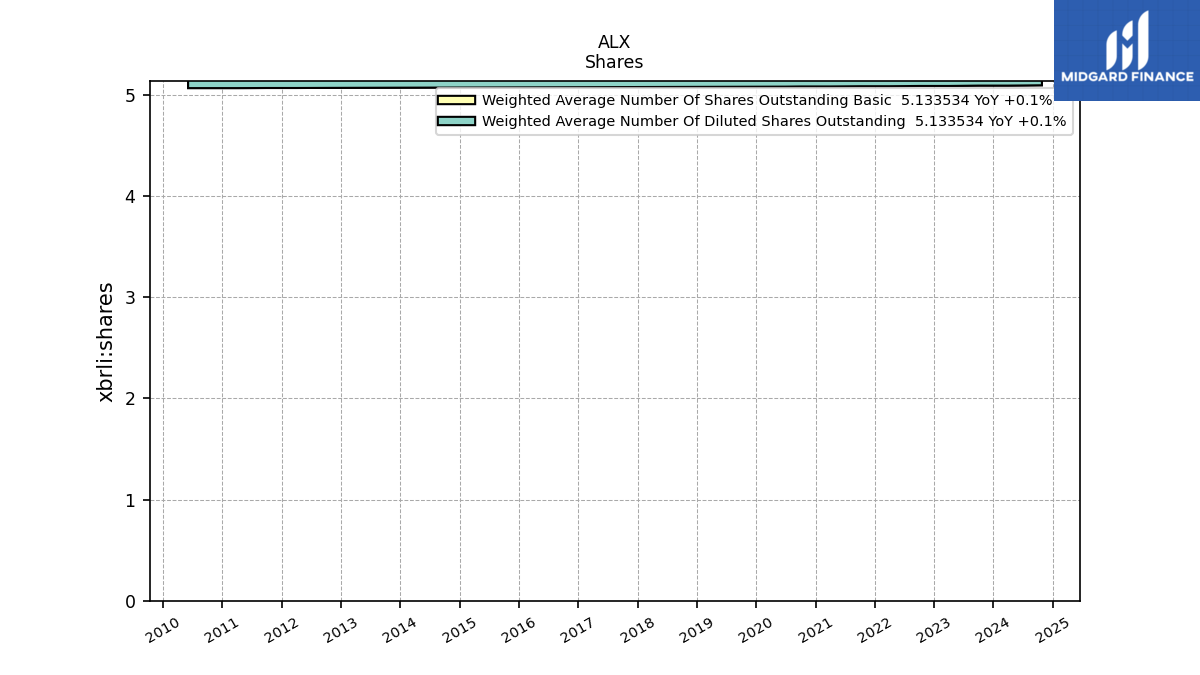
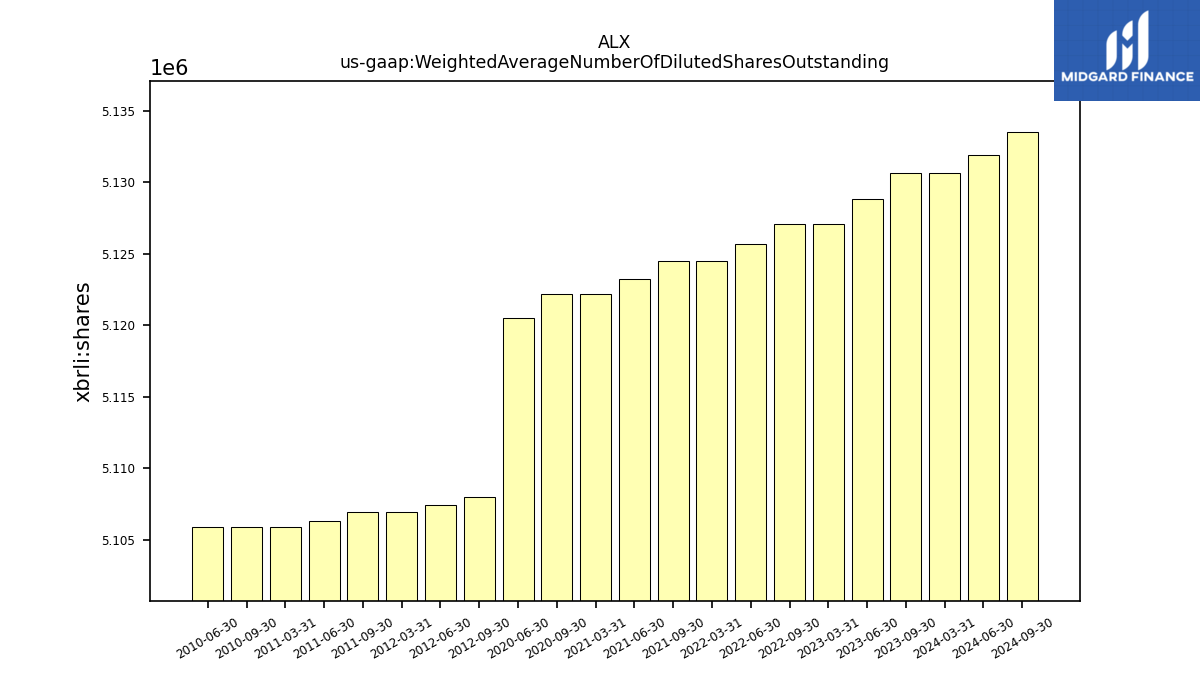
| Weighted Average Number Of Diluted Shares Outstanding | 5.13 | 5.13 | 5.13 | NA | 5.13 | 5.13 | 5.12 | NA | 5.12 | 5.12 | 5.12 | NA | 5.12 | 5.12 | NA | NA | NA | NA | NA | NA | NA | NA | NA | NA | NA | NA | NA | |
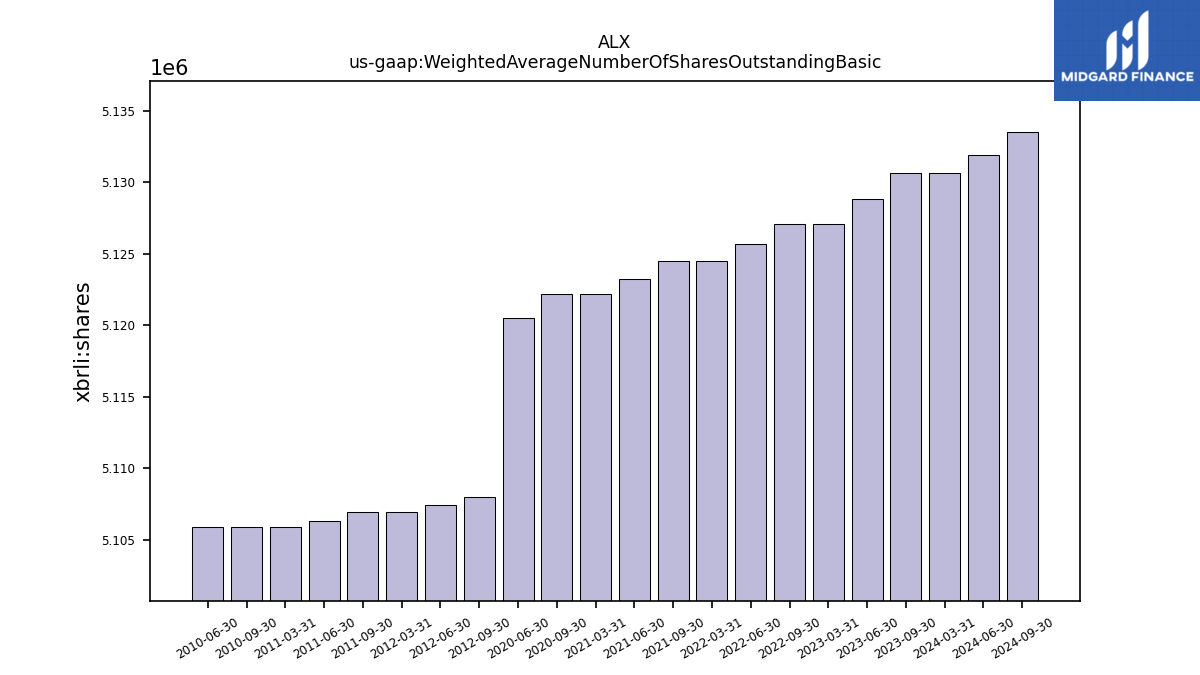
| Weighted Average Number Of Shares Outstanding Basic | 5.13 | 5.13 | 5.13 | NA | 5.13 | 5.13 | 5.12 | NA | 5.12 | 5.12 | 5.12 | NA | 5.12 | 5.12 | NA | NA | NA | NA | NA | NA | NA | NA | NA | NA | NA | NA | NA | |
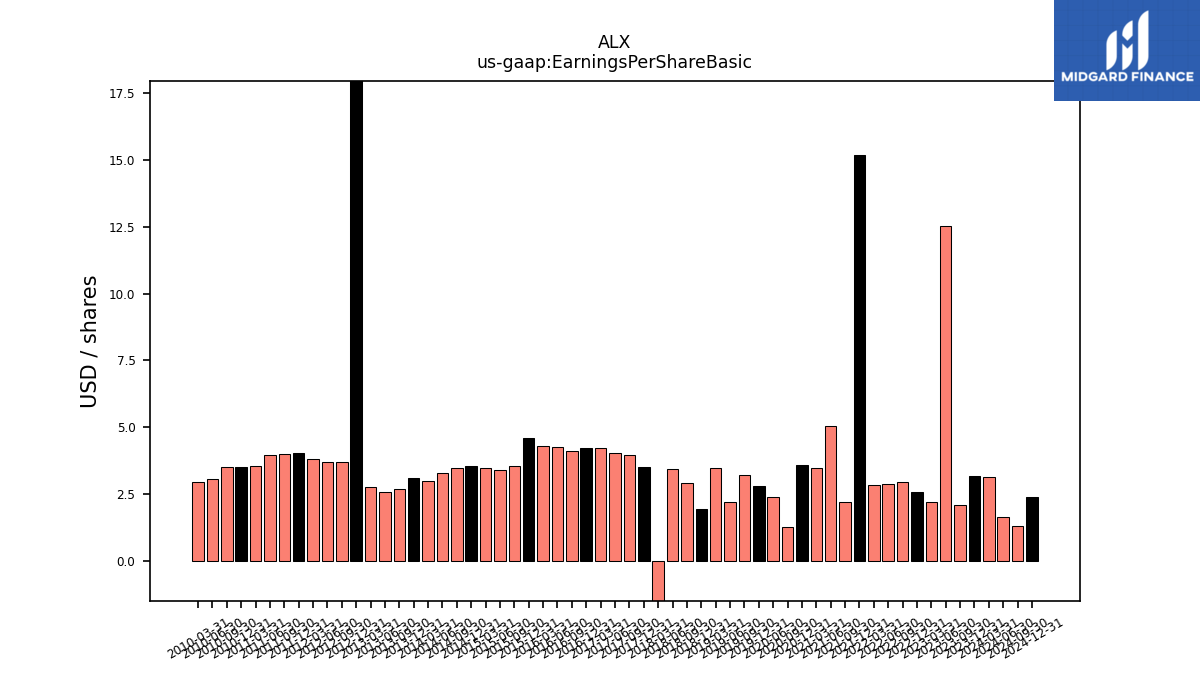
| Earnings Per Share Basic | 2.10 | 12.51 | 2.19 | 2.57 | 2.95 | 2.89 | 2.84 | 15.17 | 2.22 | 5.05 | 3.49 | 3.60 | 1.29 | 2.41 | NA | 2.82 | 3.22 | 2.20 | 3.49 | 1.95 | 2.93 | 3.43 | -1.90 | 3.50 | 3.97 | 4.04 | 4.24 | |
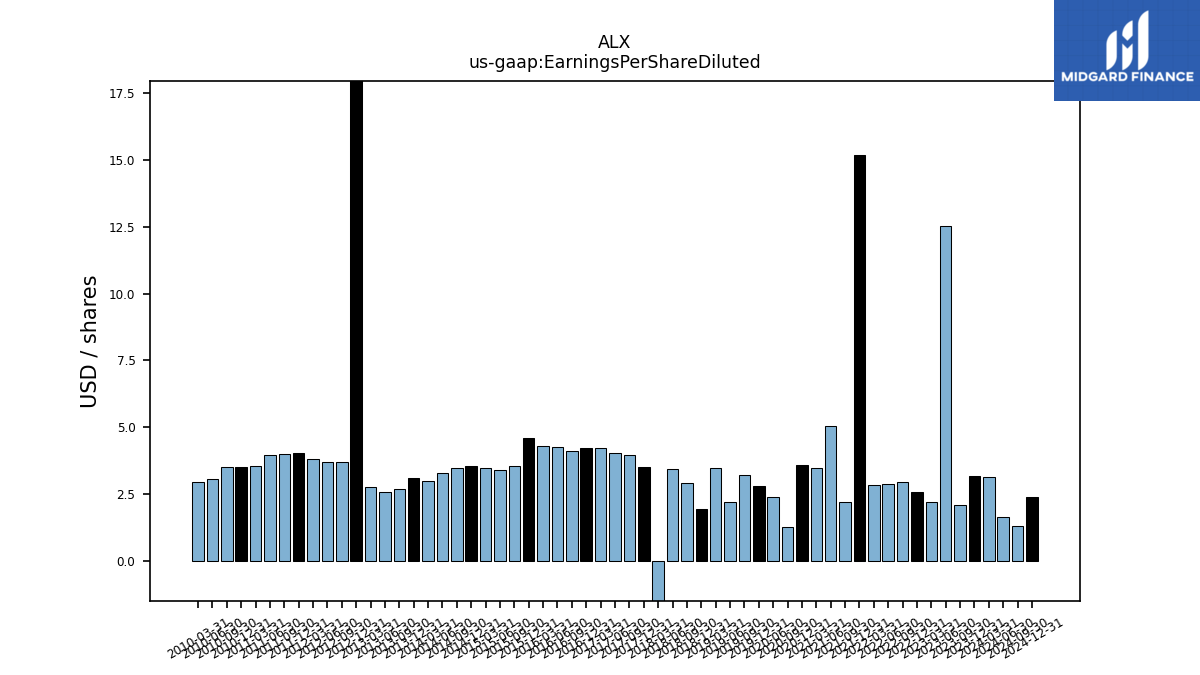
| Earnings Per Share Diluted | 2.10 | 12.51 | 2.19 | 2.57 | 2.95 | 2.89 | 2.84 | 15.17 | 2.22 | 5.05 | 3.49 | 3.60 | 1.29 | 2.41 | NA | 2.82 | 3.22 | 2.20 | 3.49 | 1.95 | 2.93 | 3.43 | -1.90 | 3.50 | 3.97 | 4.04 | 4.24 |
| 2023-09-30 | 2023-06-30 | 2023-03-31 | 2022-12-31 | 2022-09-30 | 2022-06-30 | 2022-03-31 | 2021-12-31 | 2021-09-30 | 2021-06-30 | 2021-03-31 | 2020-12-31 | 2020-09-30 | 2020-06-30 | 2020-03-31 | 2019-12-31 | 2019-09-30 | 2019-06-30 | 2019-03-31 | 2018-12-31 | 2018-09-30 | 2018-06-30 | 2018-03-31 | 2017-12-31 | 2017-09-30 | 2017-06-30 | 2017-03-31 | ||
|---|---|---|---|---|---|---|---|---|---|---|---|---|---|---|---|---|---|---|---|---|---|---|---|---|---|---|---|---|
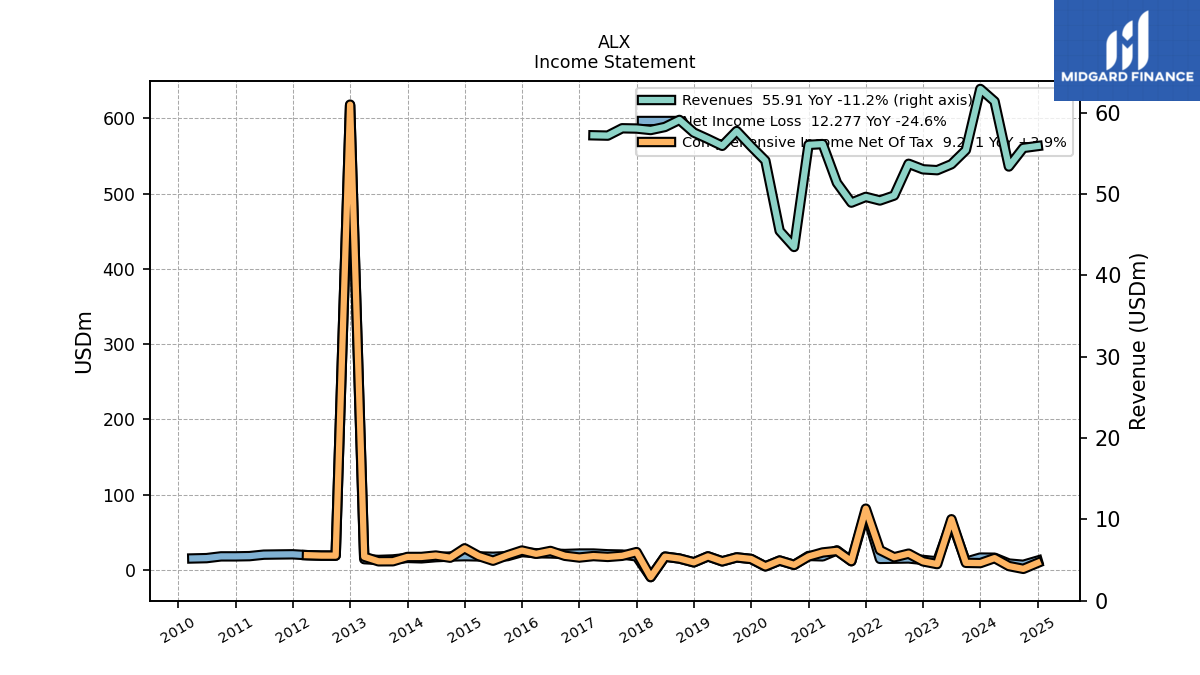
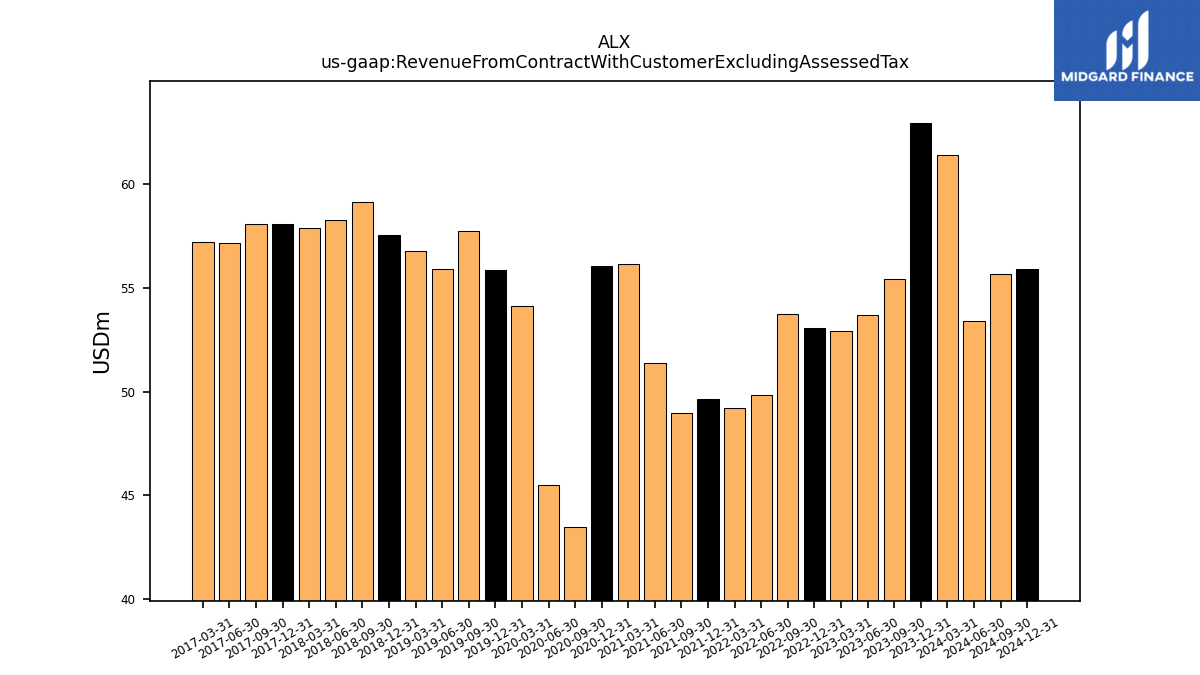
| Revenue From Contract With Customer Excluding Assessed Tax | 55.41 | 53.67 | 52.94 | 53.05 | 53.73 | 49.82 | 49.22 | 49.66 | 48.95 | 51.39 | 56.15 | 56.05 | 43.50 | 45.48 | 54.11 | 55.88 | 57.76 | 55.93 | 56.78 | 57.57 | 59.12 | 58.25 | 57.88 | 58.06 | 58.09 | 57.19 | 57.23 | |
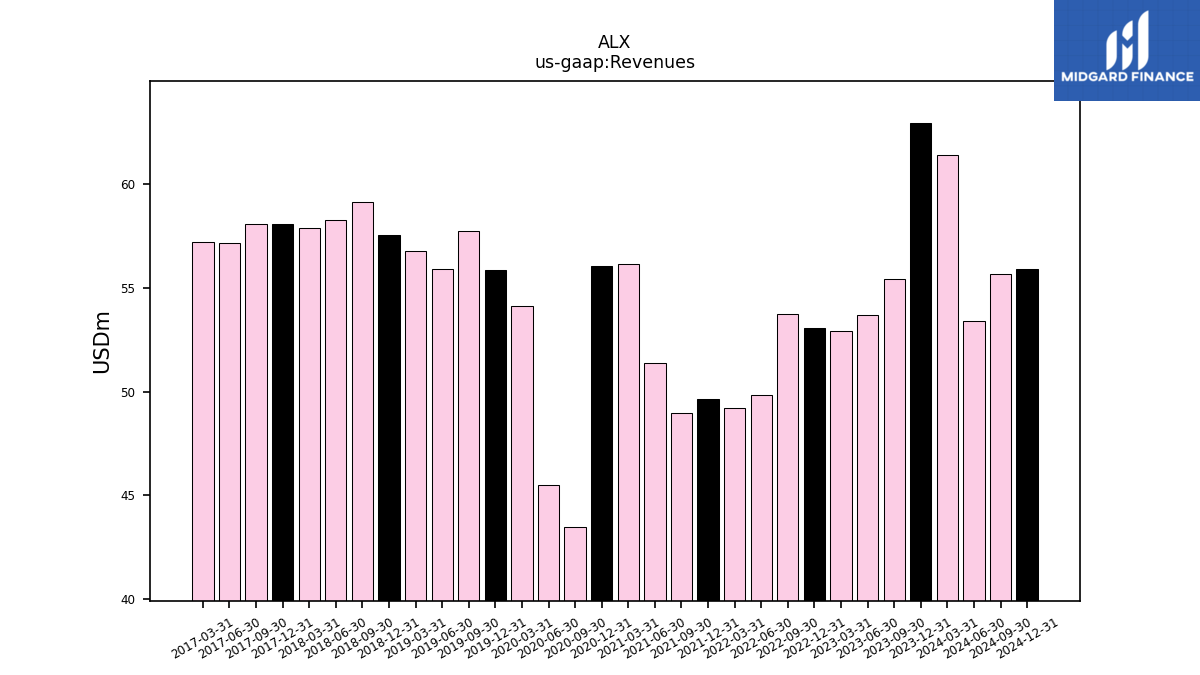
| Revenues | 55.41 | 53.67 | 52.94 | 53.05 | 53.73 | 49.82 | 49.22 | 49.66 | 48.95 | 51.39 | 56.15 | 56.05 | 43.50 | 45.48 | 54.11 | 55.88 | 57.76 | 55.93 | 56.78 | 57.57 | 59.12 | 58.25 | 57.88 | 58.06 | 58.09 | 57.19 | 57.23 | |
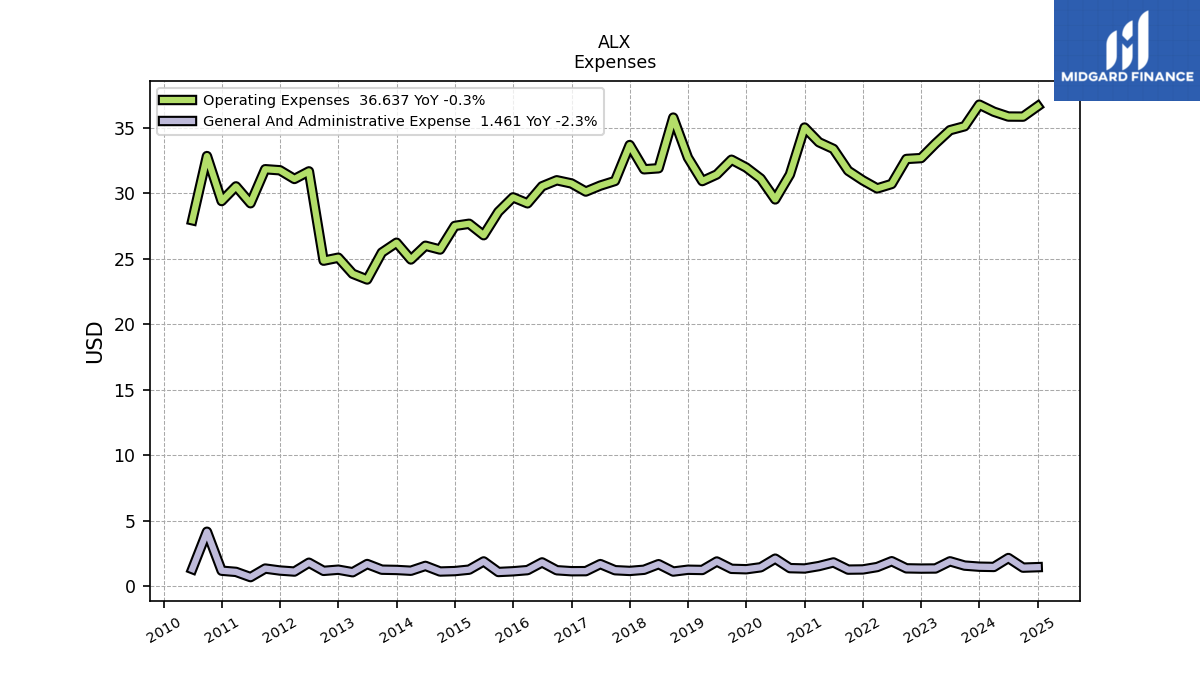
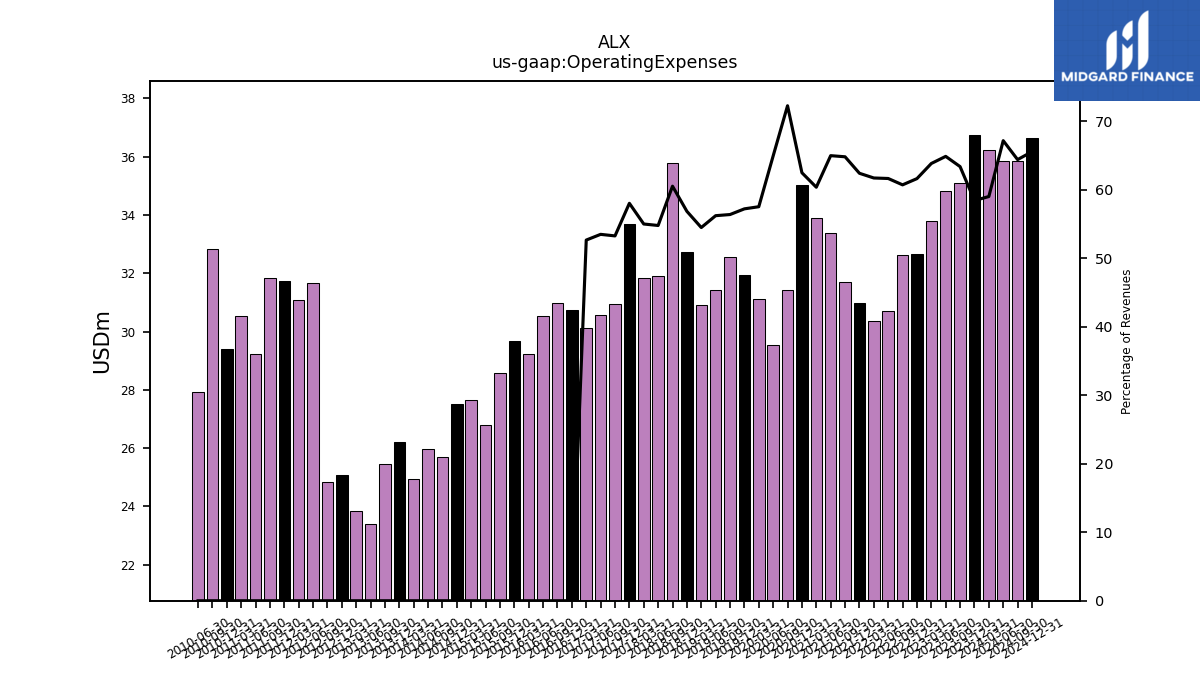
| Operating Expenses | 35.11 | 34.80 | 33.78 | 32.68 | 32.61 | 30.70 | 30.36 | 30.98 | 31.71 | 33.38 | 33.88 | 35.01 | 31.42 | 29.52 | 31.11 | 31.96 | 32.55 | 31.43 | 30.92 | 32.71 | 35.77 | 31.90 | 31.82 | 33.67 | 30.93 | 30.58 | 30.12 | |
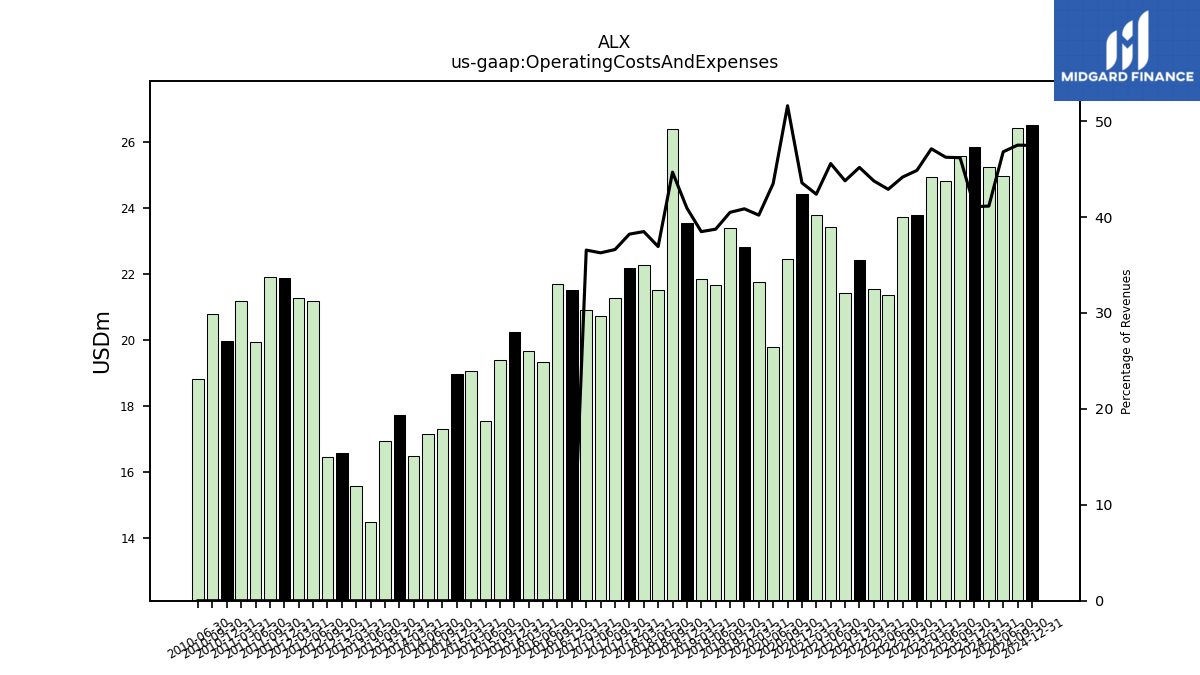
| Operating Costs And Expenses | 25.59 | 24.82 | 24.94 | 23.80 | 23.73 | 21.37 | 21.54 | 22.43 | 21.43 | 23.42 | 23.80 | 24.42 | 22.45 | 19.78 | 21.75 | 22.83 | 23.39 | 21.67 | 21.85 | 23.57 | 26.42 | 21.51 | 22.28 | 22.19 | 21.27 | 20.74 | 20.92 | |
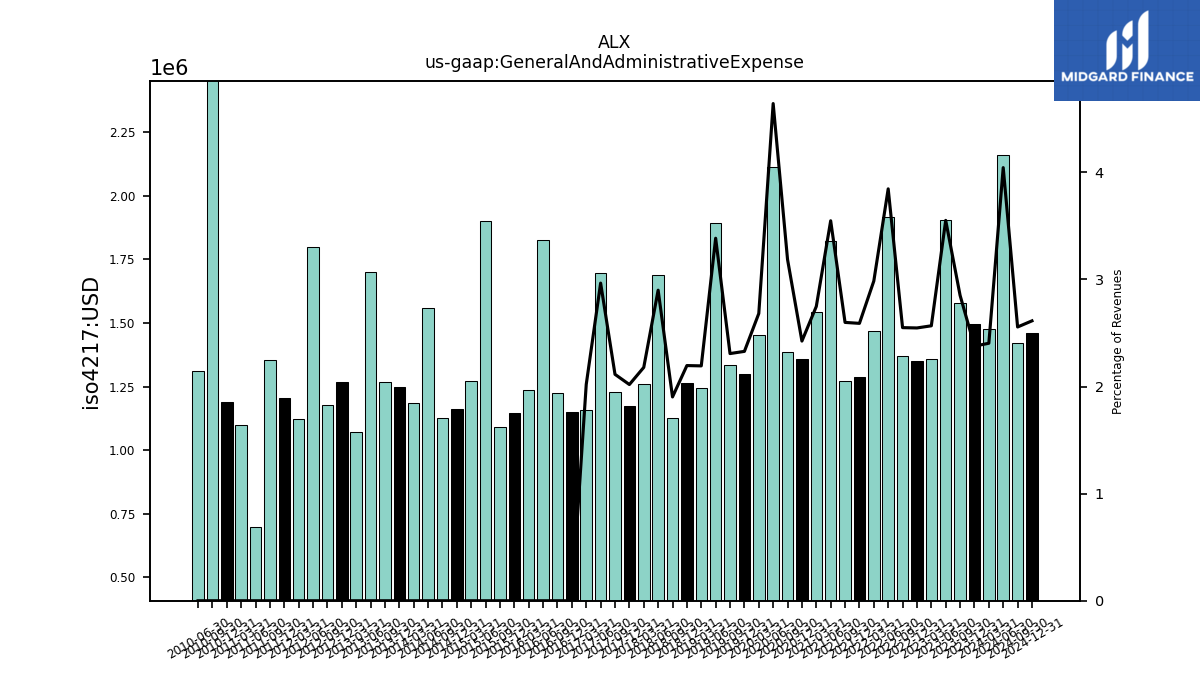
| General And Administrative Expense | 1.58 | 1.91 | 1.36 | 1.35 | 1.37 | 1.92 | 1.47 | 1.29 | 1.27 | 1.82 | 1.54 | 1.36 | 1.39 | 2.11 | 1.45 | 1.30 | 1.33 | 1.89 | 1.25 | 1.26 | 1.12 | 1.69 | 1.26 | 1.17 | 1.23 | 1.70 | 1.16 | |
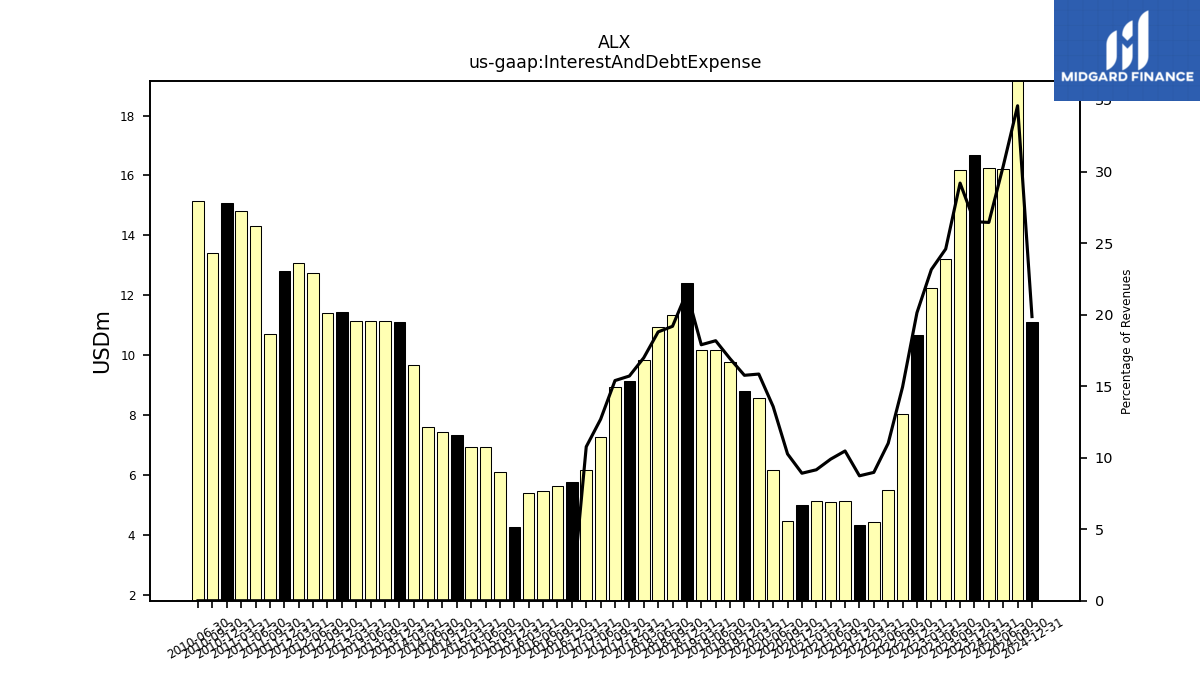
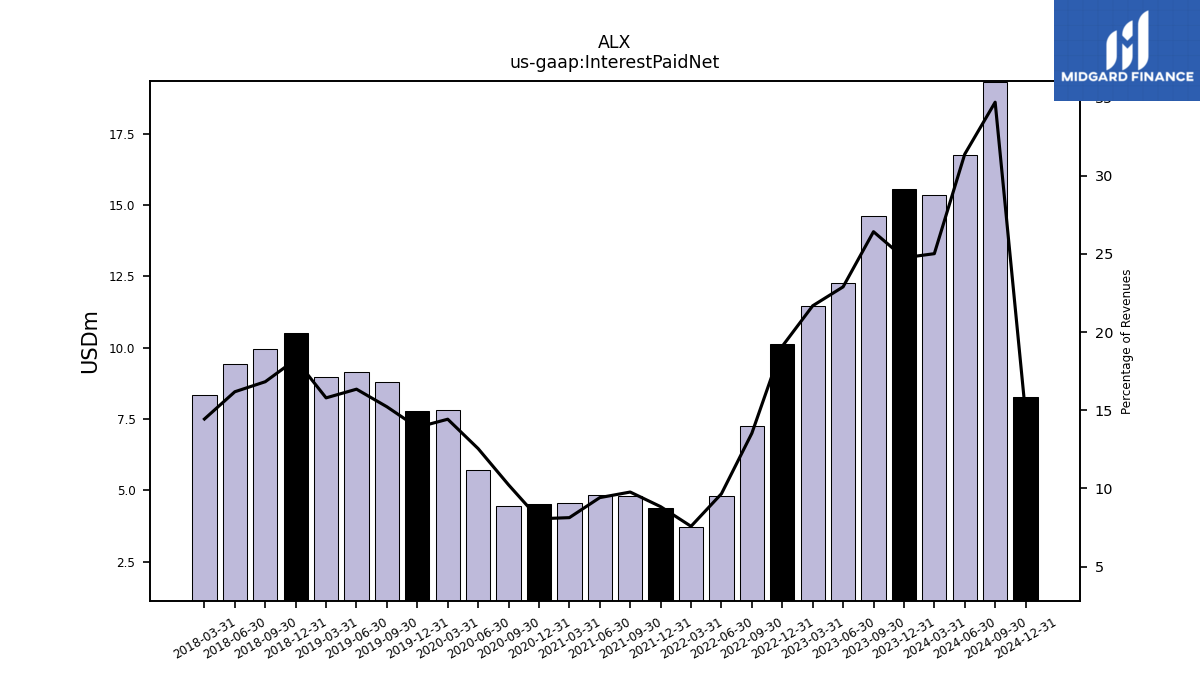
| Interest And Debt Expense | 16.18 | 13.20 | 12.25 | 10.68 | 8.03 | 5.48 | 4.42 | 4.34 | 5.12 | 5.09 | 5.14 | 5.00 | 4.46 | 6.17 | 8.57 | 8.80 | 9.77 | 10.16 | 10.16 | 12.42 | 11.34 | 10.95 | 9.83 | 9.12 | 8.94 | 7.25 | 6.16 | |
| Interest Paid Net | 14.64 | 12.29 | 11.48 | 10.13 | 7.27 | 4.81 | 3.73 | 4.39 | 4.78 | 4.84 | 4.57 | 4.52 | 4.45 | 5.71 | 7.80 | 7.77 | 8.79 | 9.14 | 8.96 | 10.50 | 9.95 | 9.43 | 8.36 | NA | NA | NA | NA | |
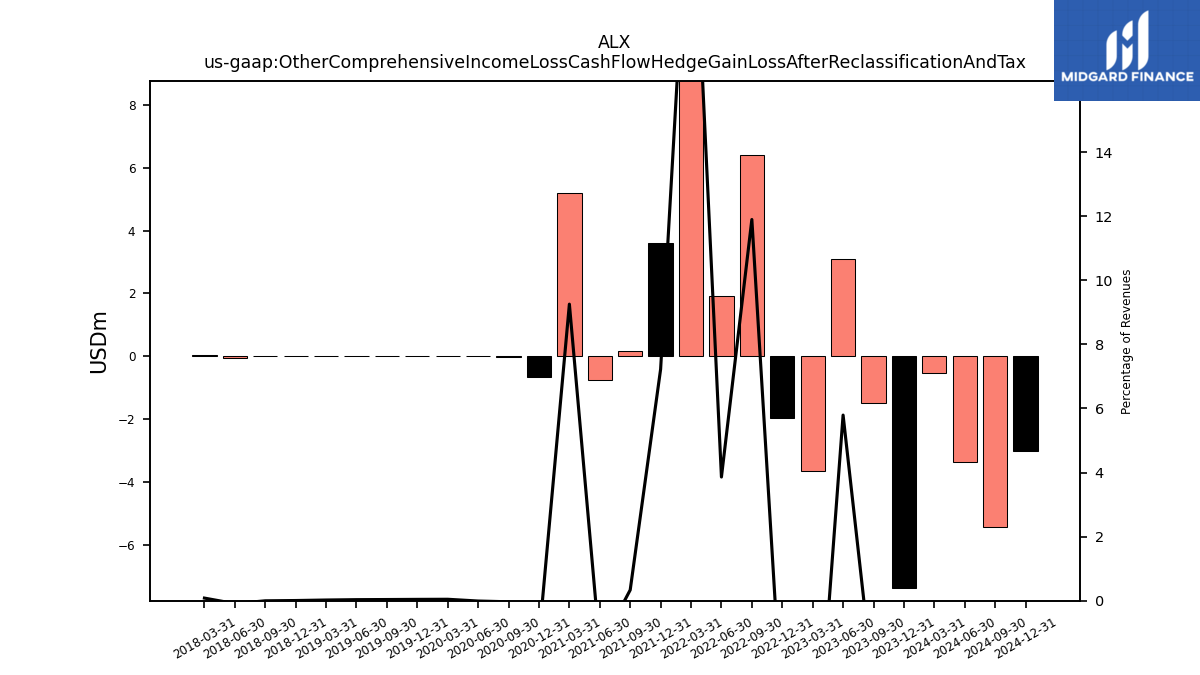
| Other Comprehensive Income Loss Cash Flow Hedge Gain Loss After Reclassification And Tax | -1.49 | 3.11 | -3.64 | -1.95 | 6.39 | 1.92 | 11.73 | 3.59 | 0.17 | -0.75 | 5.20 | -0.67 | -0.01 | -0.00 | 0.03 | 0.02 | 0.02 | 0.02 | 0.01 | 0.00 | -0.00 | -0.05 | 0.05 | NA | NA | NA | NA | |
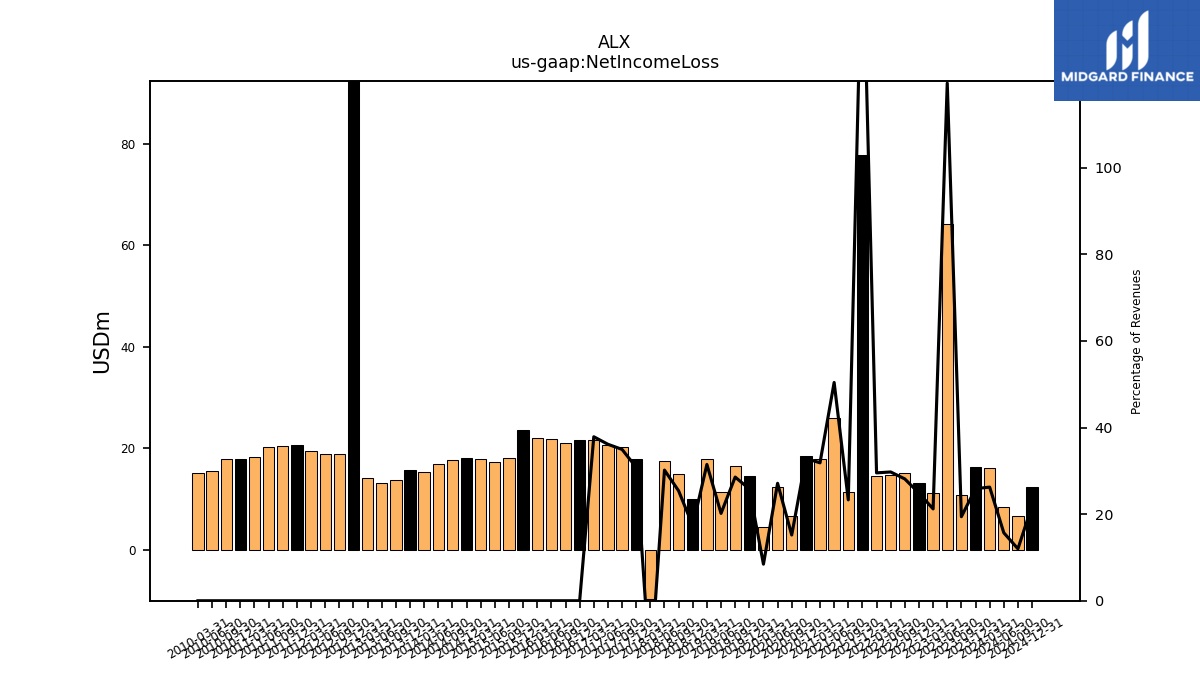
| Net Income Loss | 10.75 | 64.15 | 11.23 | 13.18 | 15.11 | 14.81 | 14.53 | 77.75 | 11.40 | 25.90 | 17.88 | 18.43 | 6.60 | 12.33 | 4.57 | 14.43 | 16.49 | 11.28 | 17.86 | 9.97 | 15.00 | 17.57 | -9.70 | 17.88 | 20.30 | 20.66 | 21.67 | |
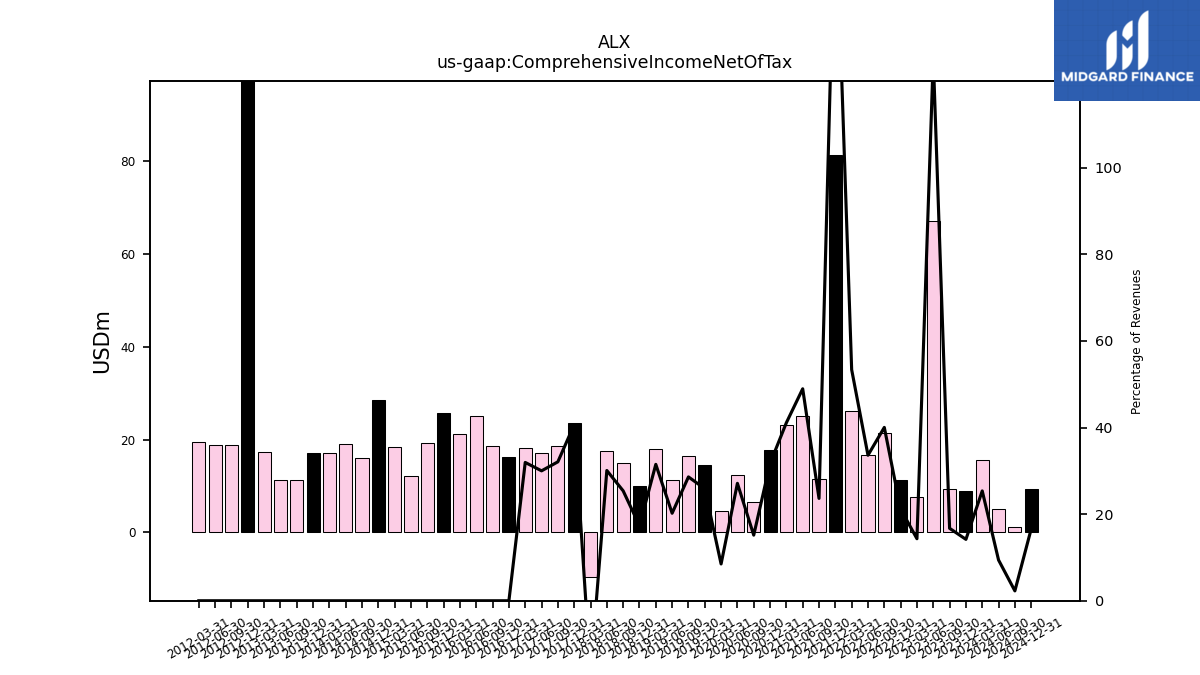
| Comprehensive Income Net Of Tax | 9.27 | 67.26 | 7.58 | 11.22 | 21.50 | 16.74 | 26.26 | 81.34 | 11.57 | 25.15 | 23.08 | 17.77 | 6.59 | 12.33 | 4.60 | 14.46 | 16.52 | 11.30 | 17.88 | 9.97 | 15.00 | 17.52 | -9.65 | 23.61 | 18.64 | 17.15 | 18.28 |
| 2023-09-30 | 2023-06-30 | 2023-03-31 | 2022-12-31 | 2022-09-30 | 2022-06-30 | 2022-03-31 | 2021-12-31 | 2021-09-30 | 2021-06-30 | 2021-03-31 | 2020-12-31 | 2020-09-30 | 2020-06-30 | 2020-03-31 | 2019-12-31 | 2019-09-30 | 2019-06-30 | 2019-03-31 | 2018-12-31 | 2018-09-30 | 2018-06-30 | 2018-03-31 | 2017-12-31 | 2017-09-30 | 2017-06-30 | 2017-03-31 | ||
|---|---|---|---|---|---|---|---|---|---|---|---|---|---|---|---|---|---|---|---|---|---|---|---|---|---|---|---|---|
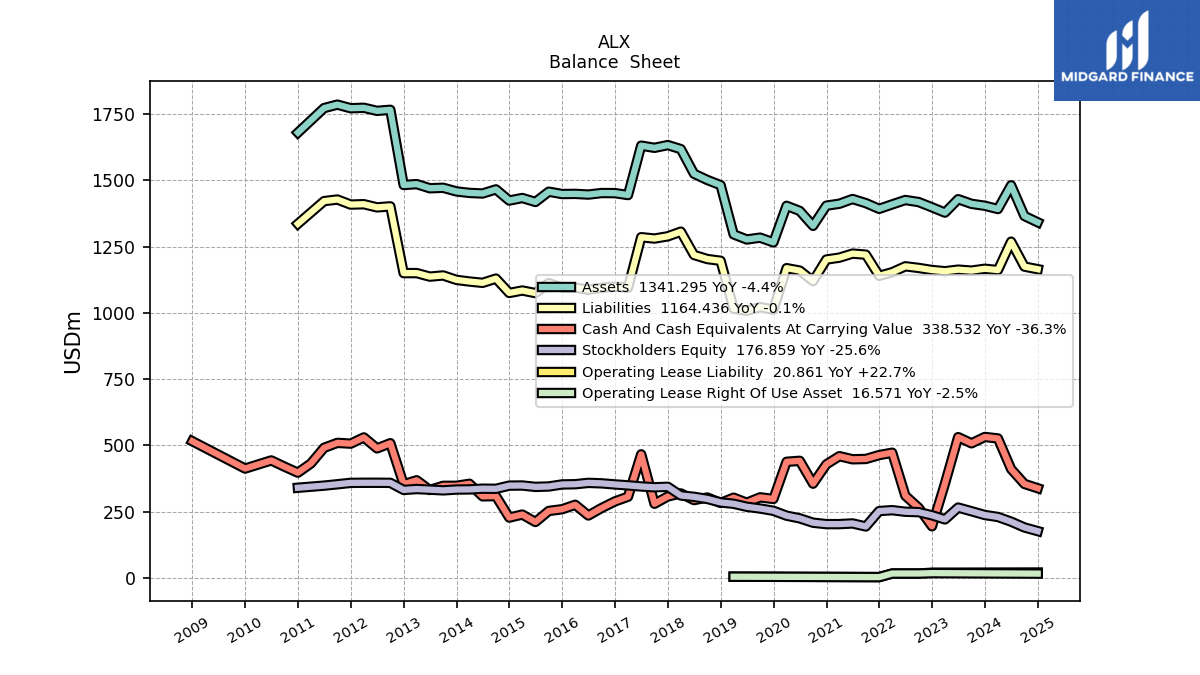
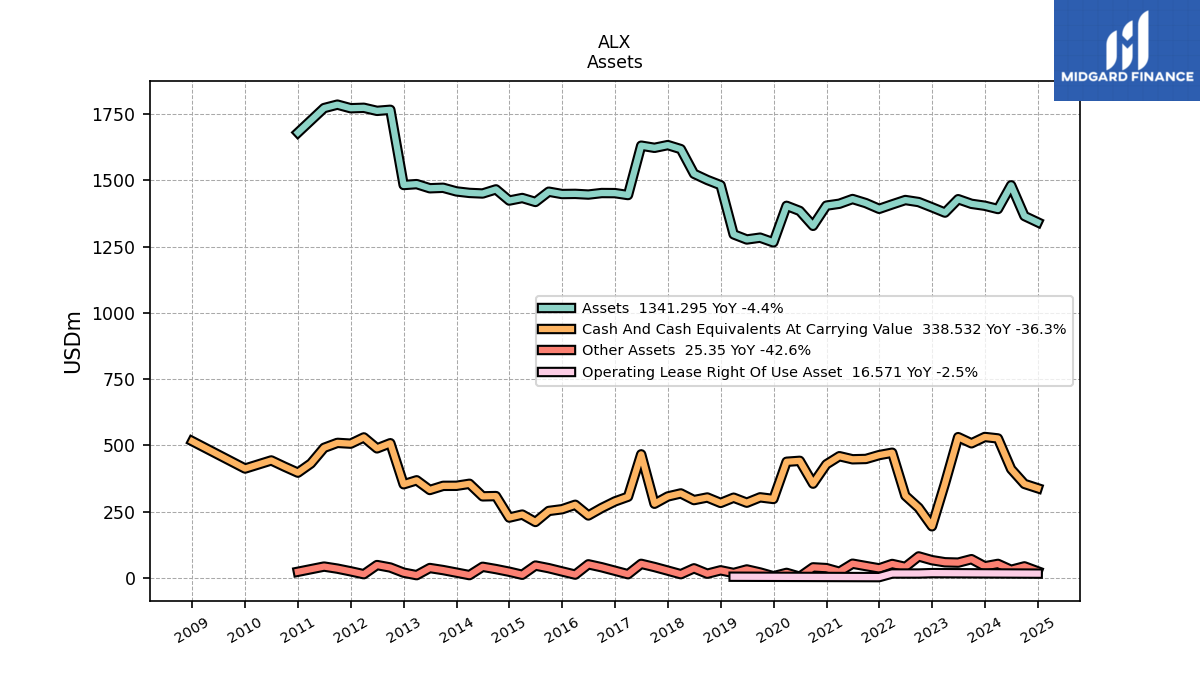
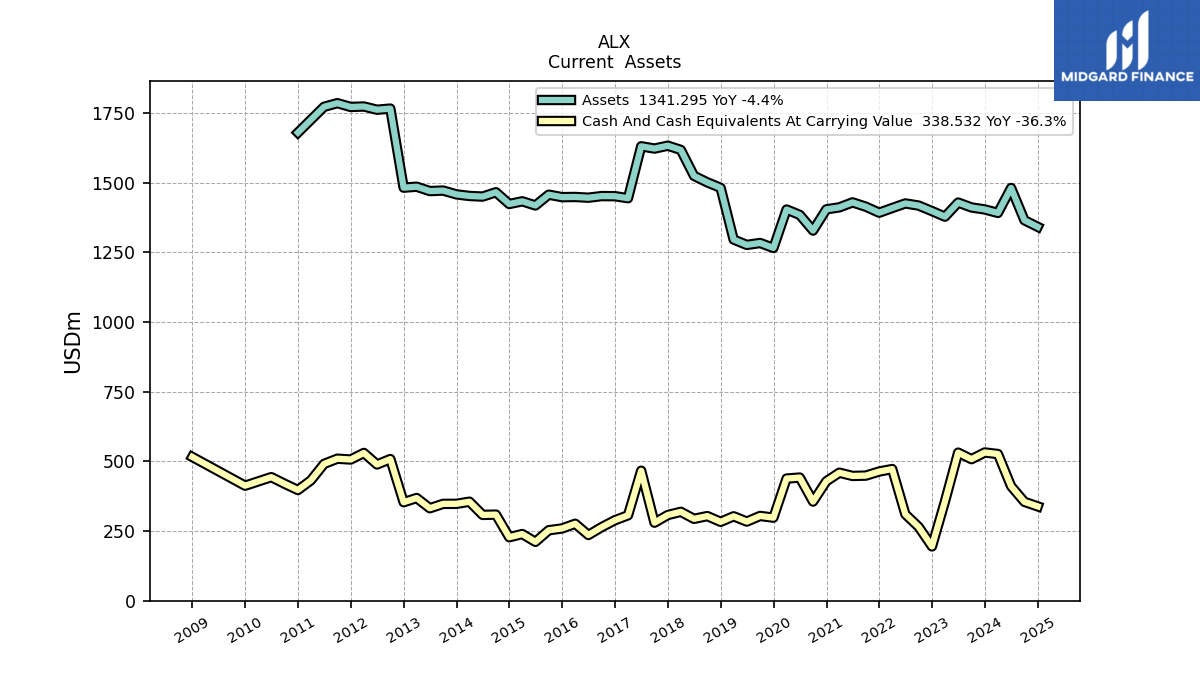
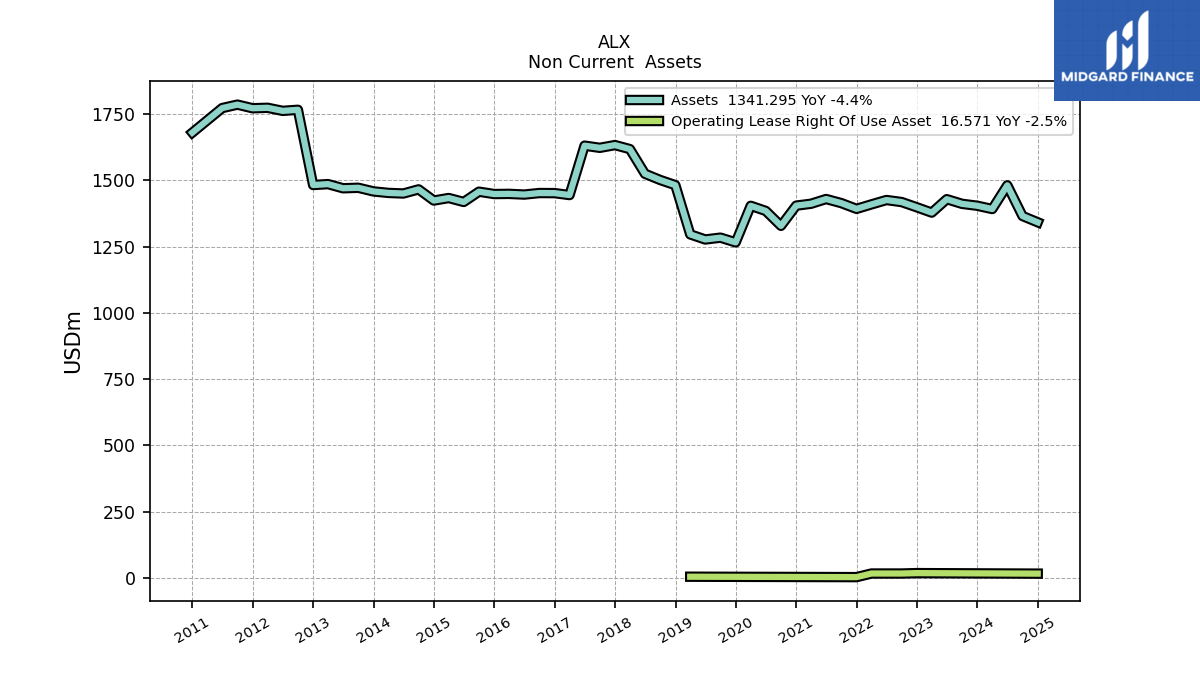
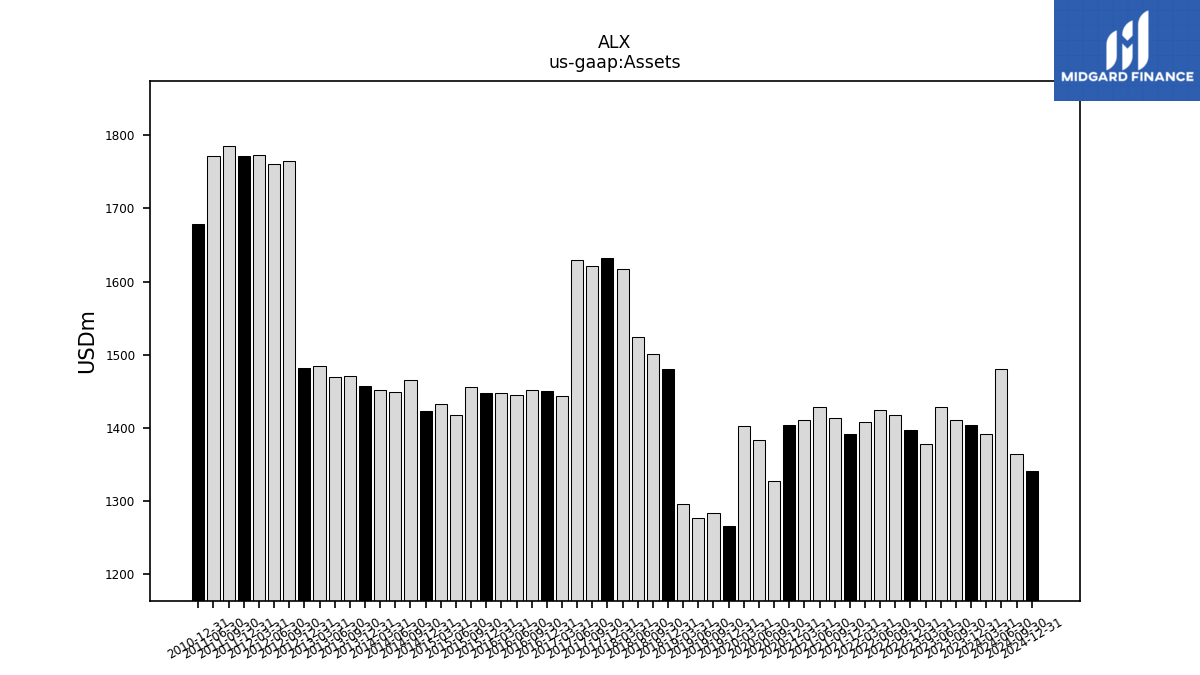
| Assets | 1410.90 | 1428.42 | 1377.76 | 1397.78 | 1417.54 | 1425.25 | 1408.77 | 1391.96 | 1413.59 | 1429.04 | 1411.23 | 1404.14 | 1327.90 | 1384.16 | 1403.43 | 1265.51 | 1283.38 | 1276.47 | 1295.71 | 1481.26 | 1500.87 | 1524.26 | 1617.27 | 1632.39 | 1622.06 | 1630.26 | 1443.93 | |
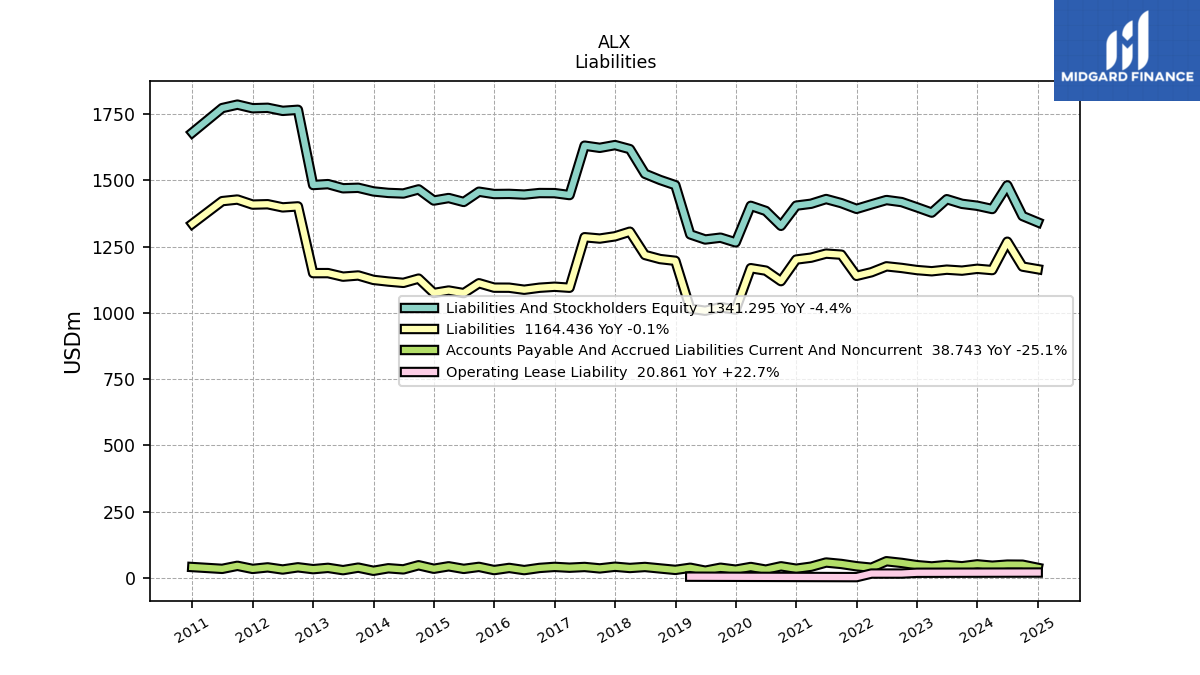
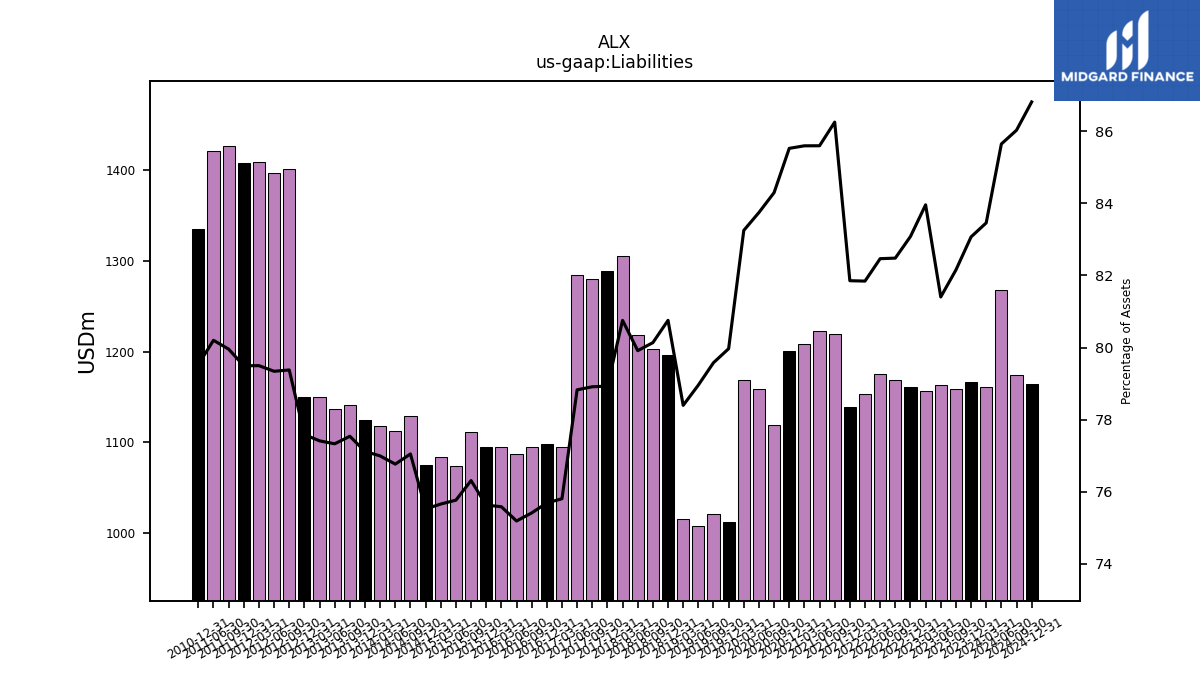
| Liabilities | 1159.07 | 1162.78 | 1156.75 | 1161.28 | 1169.20 | 1175.34 | 1152.98 | 1139.38 | 1219.28 | 1223.24 | 1207.98 | 1200.91 | 1119.39 | 1159.19 | 1168.36 | 1012.00 | 1021.29 | 1007.86 | 1015.77 | 1196.16 | 1202.73 | 1218.09 | 1305.99 | 1288.44 | 1279.97 | 1285.06 | 1094.55 | |
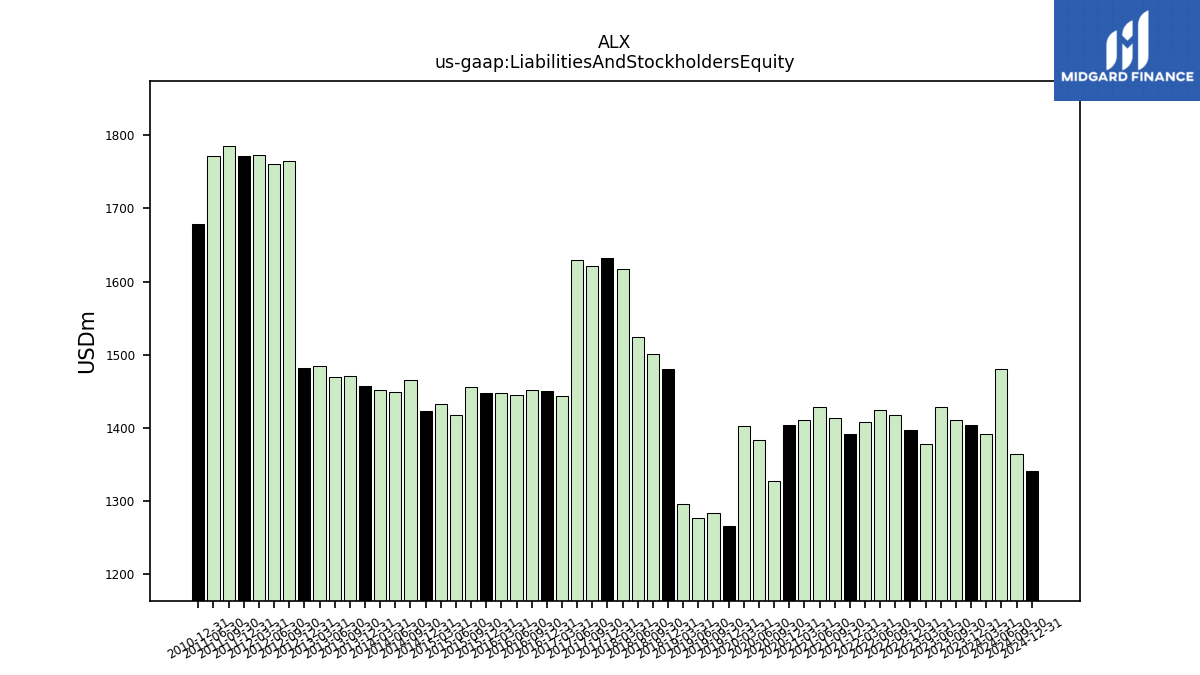
| Liabilities And Stockholders Equity | 1410.90 | 1428.42 | 1377.76 | 1397.78 | 1417.54 | 1425.25 | 1408.77 | 1391.96 | 1413.59 | 1429.04 | 1411.23 | 1404.14 | 1327.90 | 1384.16 | 1403.43 | 1265.51 | 1283.38 | 1276.47 | 1295.71 | 1481.26 | 1500.87 | 1524.26 | 1617.27 | 1632.39 | 1622.06 | 1630.26 | 1443.93 | |
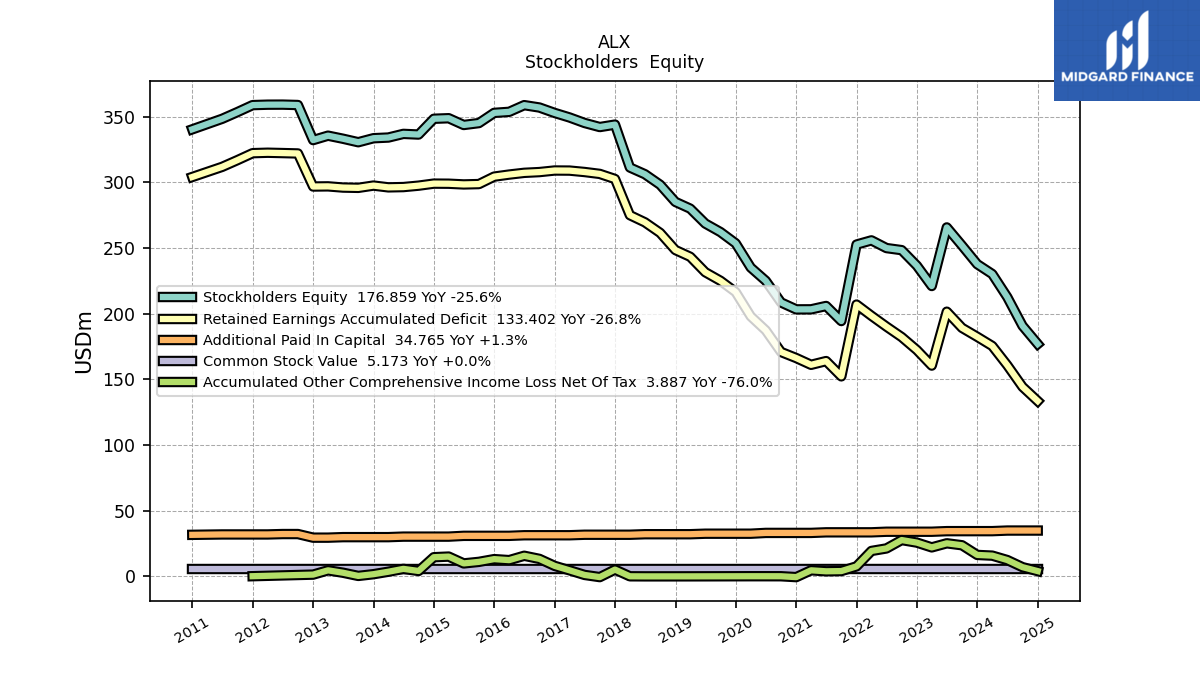
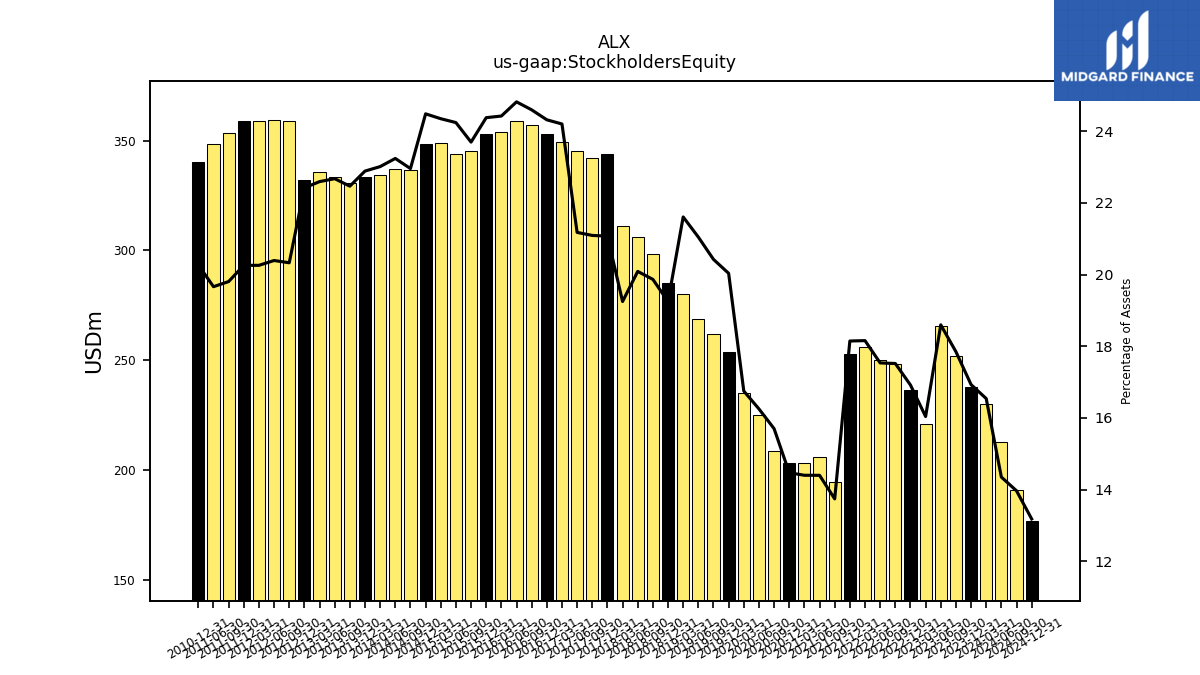
| Stockholders Equity | 251.82 | 265.64 | 221.01 | 236.50 | 248.35 | 249.92 | 255.79 | 252.59 | 194.31 | 205.81 | 203.26 | 203.23 | 208.51 | 224.97 | 235.08 | 253.51 | 262.09 | 268.61 | 279.94 | 285.09 | 298.14 | 306.17 | 311.28 | 343.95 | 342.09 | 345.19 | 349.38 |
| 2023-09-30 | 2023-06-30 | 2023-03-31 | 2022-12-31 | 2022-09-30 | 2022-06-30 | 2022-03-31 | 2021-12-31 | 2021-09-30 | 2021-06-30 | 2021-03-31 | 2020-12-31 | 2020-09-30 | 2020-06-30 | 2020-03-31 | 2019-12-31 | 2019-09-30 | 2019-06-30 | 2019-03-31 | 2018-12-31 | 2018-09-30 | 2018-06-30 | 2018-03-31 | 2017-12-31 | 2017-09-30 | 2017-06-30 | 2017-03-31 | ||
|---|---|---|---|---|---|---|---|---|---|---|---|---|---|---|---|---|---|---|---|---|---|---|---|---|---|---|---|---|
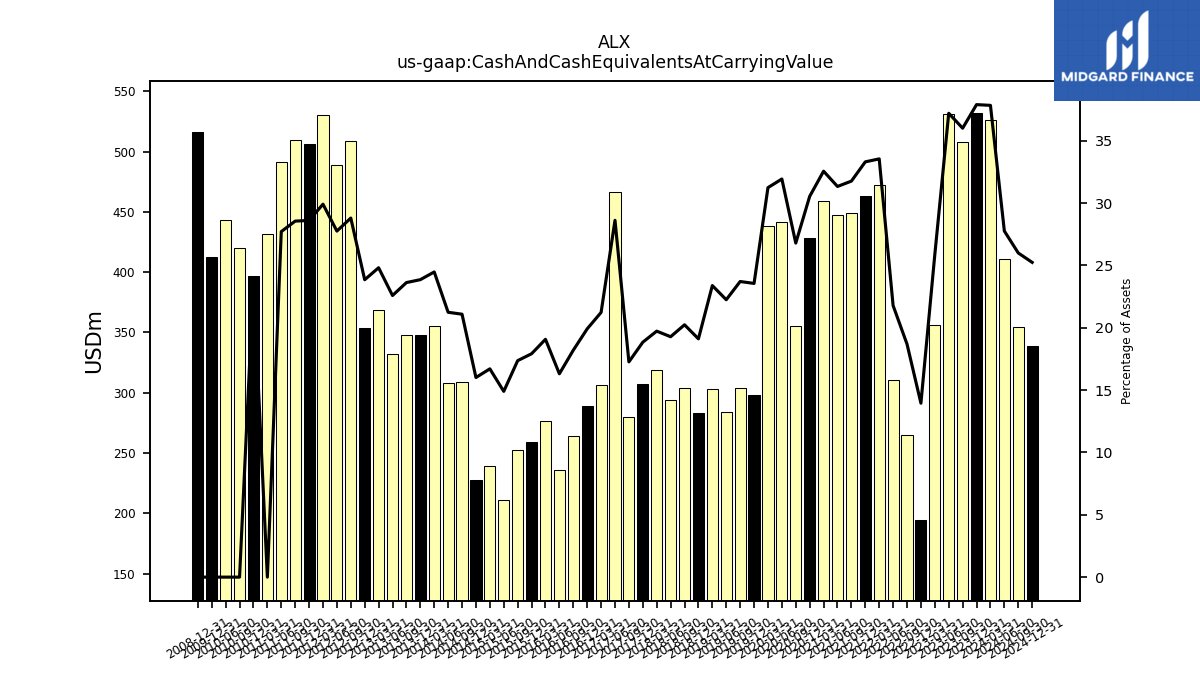
| Cash And Cash Equivalents At Carrying Value | 507.92 | 531.33 | 356.51 | 194.93 | 264.87 | 310.35 | 472.48 | 463.54 | 448.91 | 447.69 | 459.38 | 428.71 | 355.71 | 441.90 | 438.34 | 298.06 | 304.23 | 283.95 | 302.94 | 283.06 | 303.71 | 293.84 | 319.03 | 307.54 | 280.01 | 466.46 | 306.53 | |
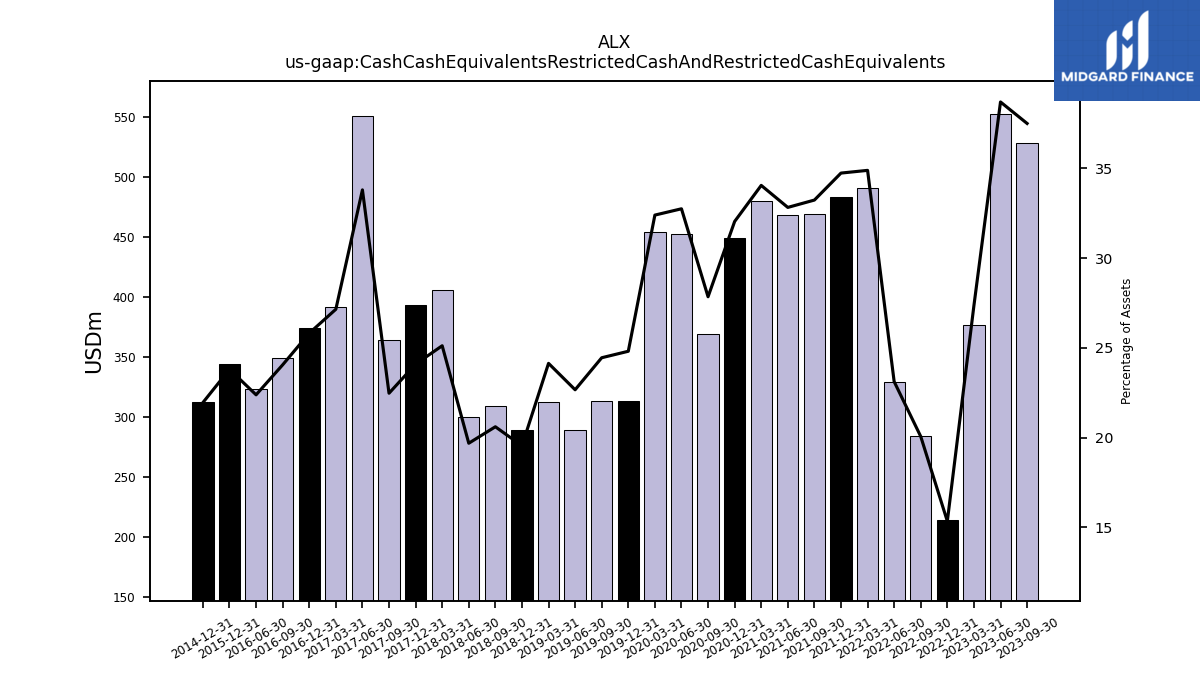
| Cash Cash Equivalents Restricted Cash And Restricted Cash Equivalents | 529.08 | 552.75 | 376.88 | 214.48 | 284.39 | 329.50 | 491.47 | 483.50 | 469.77 | 469.06 | 480.52 | 449.88 | 369.78 | 453.26 | 454.65 | 313.98 | 313.78 | 289.32 | 312.73 | 289.50 | 309.25 | 300.08 | 406.22 | 393.28 | 364.51 | 551.02 | 392.03 | |
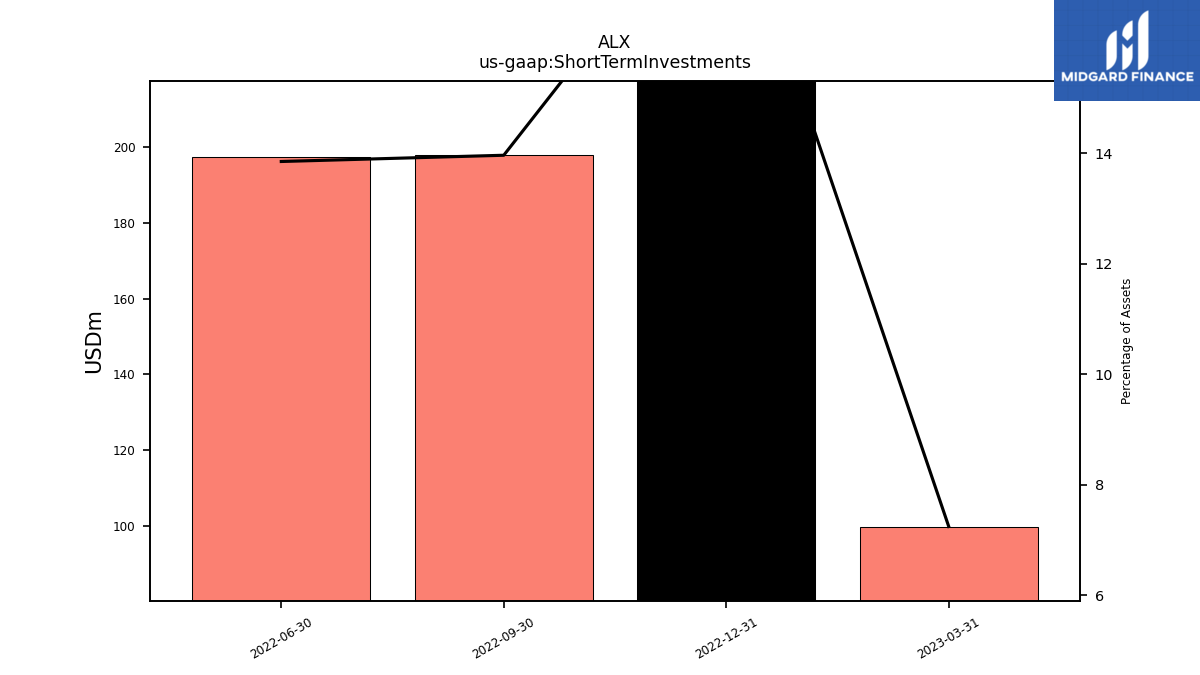
| Short Term Investments | NA | NA | 99.78 | 266.96 | 197.90 | 197.37 | NA | NA | NA | NA | NA | NA | NA | NA | NA | NA | NA | NA | NA | NA | NA | NA | NA | NA | NA | NA | NA | |
| Land | 32.27 | 32.27 | 32.27 | 33.05 | 33.05 | 33.05 | 33.05 | 33.05 | 44.80 | 44.80 | 44.97 | 44.97 | 44.97 | 44.97 | 44.97 | 44.97 | 44.97 | 44.97 | 44.97 | 44.97 | 44.97 | 44.97 | 44.97 | 44.97 | 44.97 | 44.97 | 44.97 |
| 2023-09-30 | 2023-06-30 | 2023-03-31 | 2022-12-31 | 2022-09-30 | 2022-06-30 | 2022-03-31 | 2021-12-31 | 2021-09-30 | 2021-06-30 | 2021-03-31 | 2020-12-31 | 2020-09-30 | 2020-06-30 | 2020-03-31 | 2019-12-31 | 2019-09-30 | 2019-06-30 | 2019-03-31 | 2018-12-31 | 2018-09-30 | 2018-06-30 | 2018-03-31 | 2017-12-31 | 2017-09-30 | 2017-06-30 | 2017-03-31 | ||
|---|---|---|---|---|---|---|---|---|---|---|---|---|---|---|---|---|---|---|---|---|---|---|---|---|---|---|---|---|
| Stockholders Equity | 251.82 | 265.64 | 221.01 | 236.50 | 248.35 | 249.92 | 255.79 | 252.59 | 194.31 | 205.81 | 203.26 | 203.23 | 208.51 | 224.97 | 235.08 | 253.51 | 262.09 | 268.61 | 279.94 | 285.09 | 298.14 | 306.17 | 311.28 | 343.95 | 342.09 | 345.19 | 349.38 | |
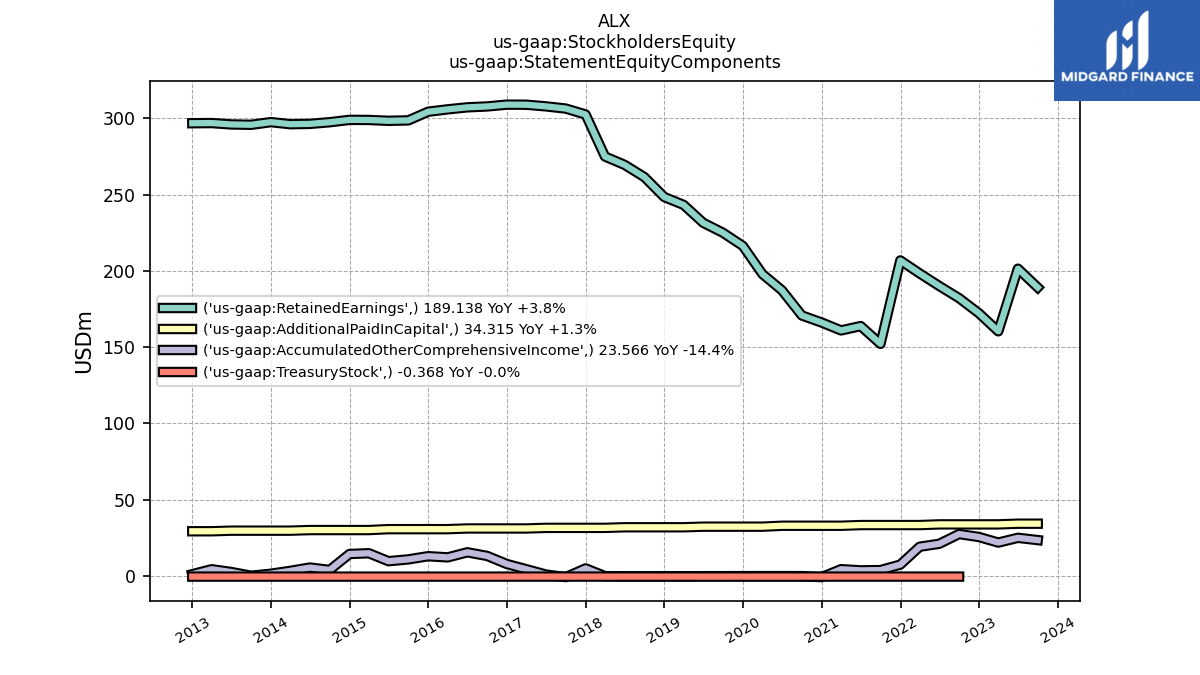
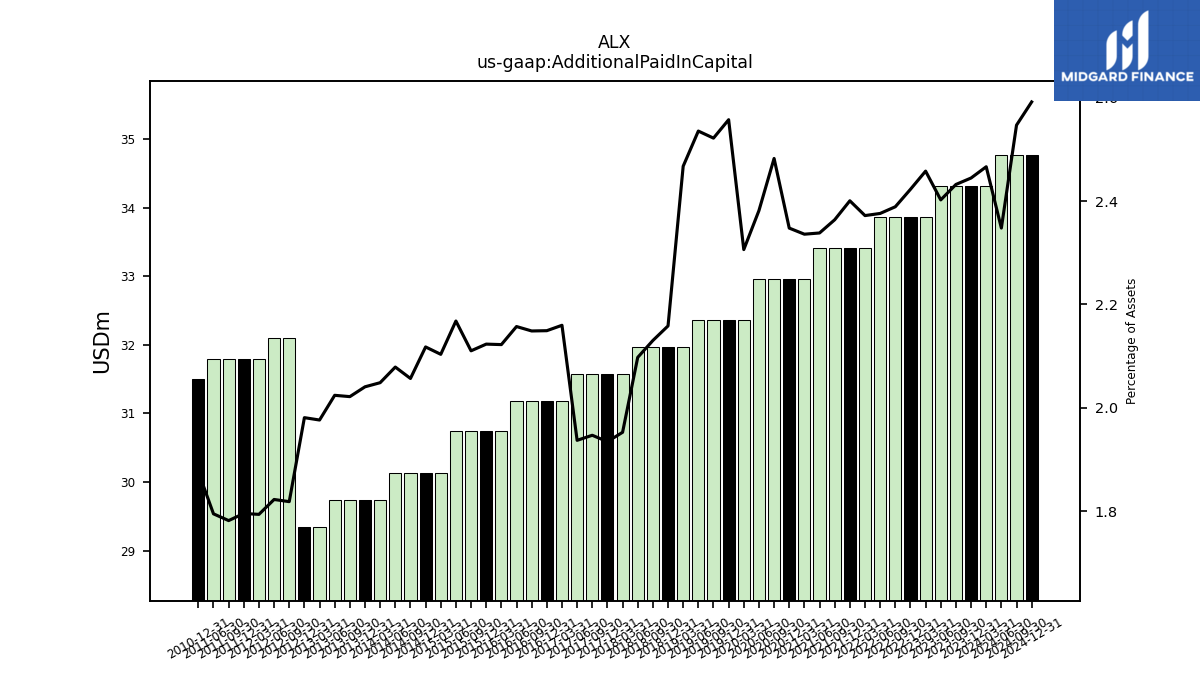
| Additional Paid In Capital | 34.31 | 34.31 | 33.87 | 33.87 | 33.87 | 33.87 | 33.41 | 33.41 | 33.41 | 33.41 | 32.97 | 32.97 | 32.97 | 32.97 | 32.37 | 32.37 | 32.37 | 32.37 | 31.97 | 31.97 | 31.97 | 31.97 | 31.58 | 31.58 | 31.58 | 31.58 | 31.18 | |
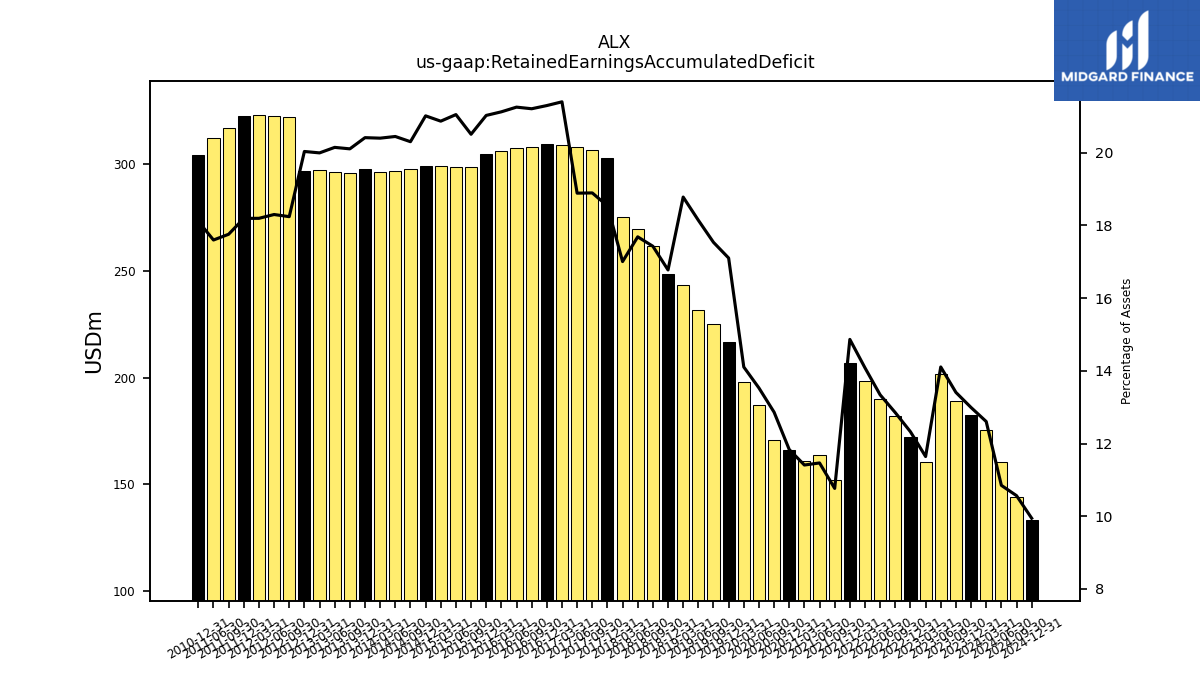
| Retained Earnings Accumulated Deficit | 189.14 | 201.47 | 160.40 | 172.24 | 182.14 | 190.10 | 198.35 | 206.88 | 152.19 | 163.84 | 161.00 | 166.16 | 170.78 | 187.23 | 197.93 | 216.39 | 224.99 | 231.53 | 243.28 | 248.44 | 261.50 | 269.52 | 274.98 | 302.54 | 306.40 | 307.85 | 308.93 | |
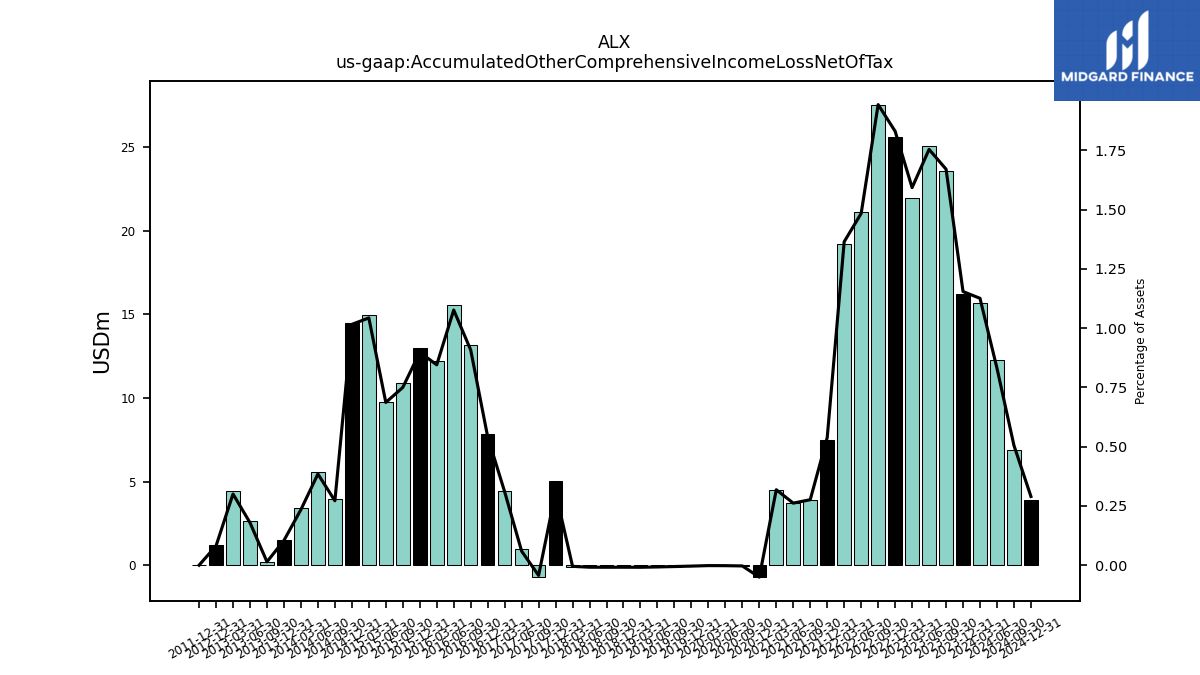
| Accumulated Other Comprehensive Income Loss Net Of Tax | 23.57 | 25.05 | 21.94 | 25.59 | 27.54 | 21.14 | 19.22 | 7.49 | 3.90 | 3.74 | 4.49 | -0.71 | -0.04 | -0.03 | -0.02 | -0.05 | -0.07 | -0.10 | -0.11 | -0.13 | -0.13 | -0.13 | -0.08 | 5.03 | -0.70 | 0.96 | 4.47 | |
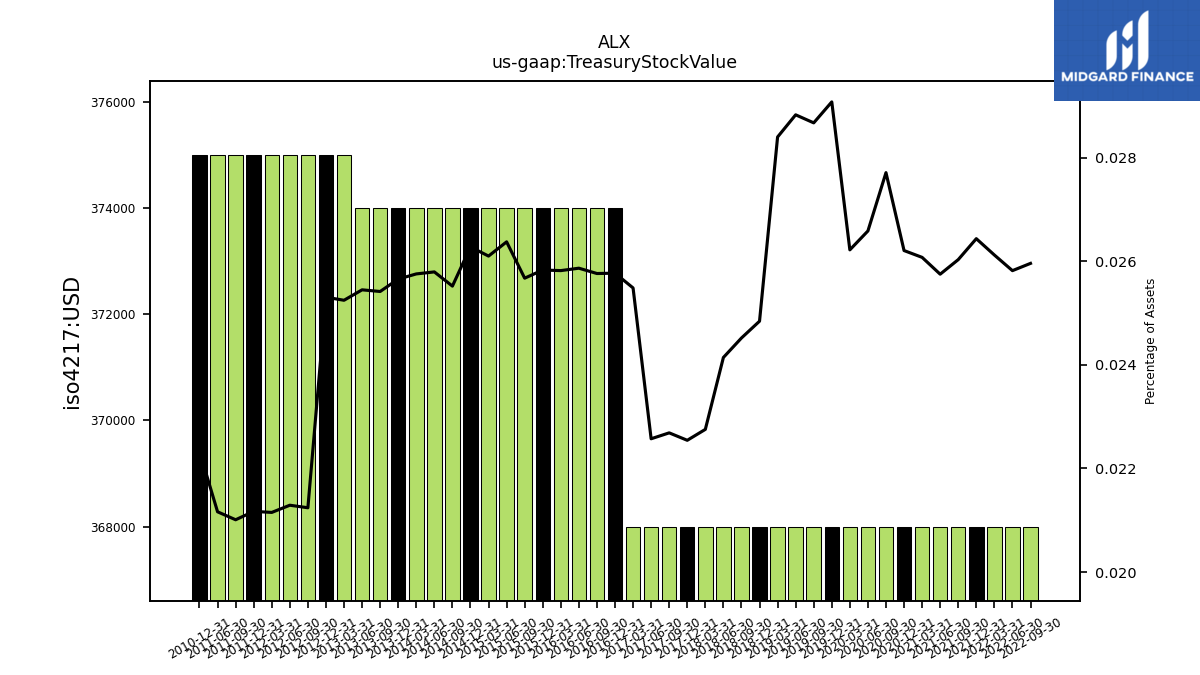
| Treasury Stock Value | NA | NA | NA | NA | 0.37 | 0.37 | 0.37 | 0.37 | 0.37 | 0.37 | 0.37 | 0.37 | 0.37 | 0.37 | 0.37 | 0.37 | 0.37 | 0.37 | 0.37 | 0.37 | 0.37 | 0.37 | 0.37 | 0.37 | 0.37 | 0.37 | 0.37 |
| 2023-09-30 | 2023-06-30 | 2023-03-31 | 2022-12-31 | 2022-09-30 | 2022-06-30 | 2022-03-31 | 2021-12-31 | 2021-09-30 | 2021-06-30 | 2021-03-31 | 2020-12-31 | 2020-09-30 | 2020-06-30 | 2020-03-31 | 2019-12-31 | 2019-09-30 | 2019-06-30 | 2019-03-31 | 2018-12-31 | 2018-09-30 | 2018-06-30 | 2018-03-31 | 2017-12-31 | 2017-09-30 | 2017-06-30 | 2017-03-31 | ||
|---|---|---|---|---|---|---|---|---|---|---|---|---|---|---|---|---|---|---|---|---|---|---|---|---|---|---|---|---|
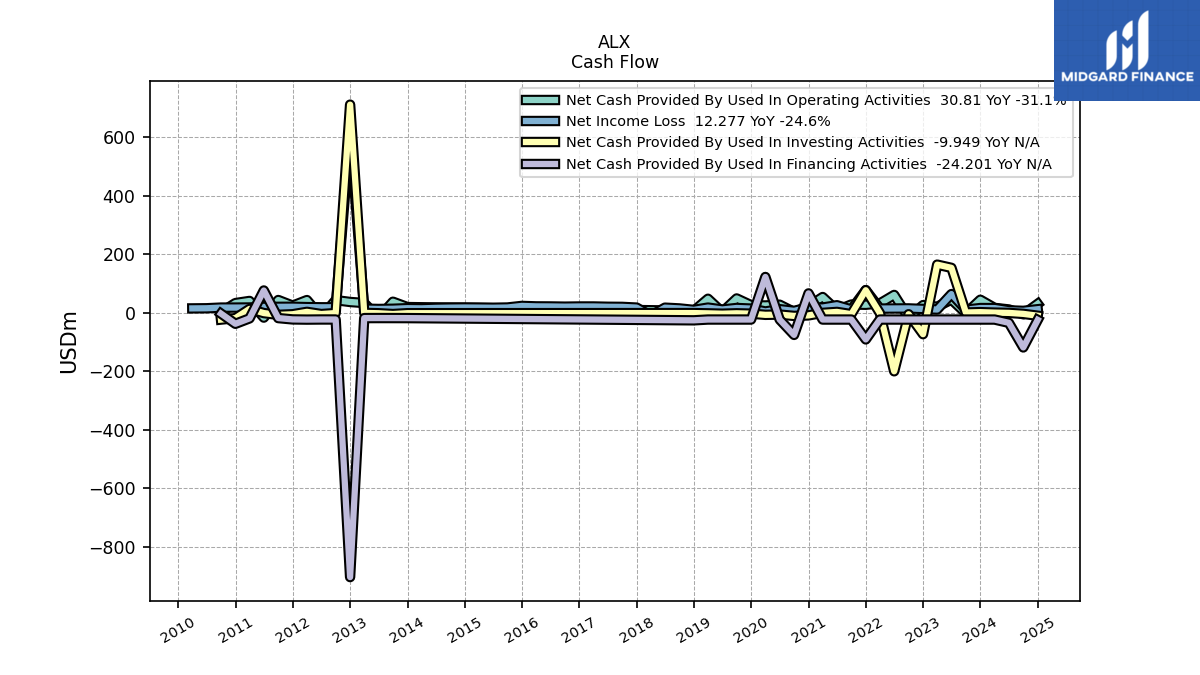
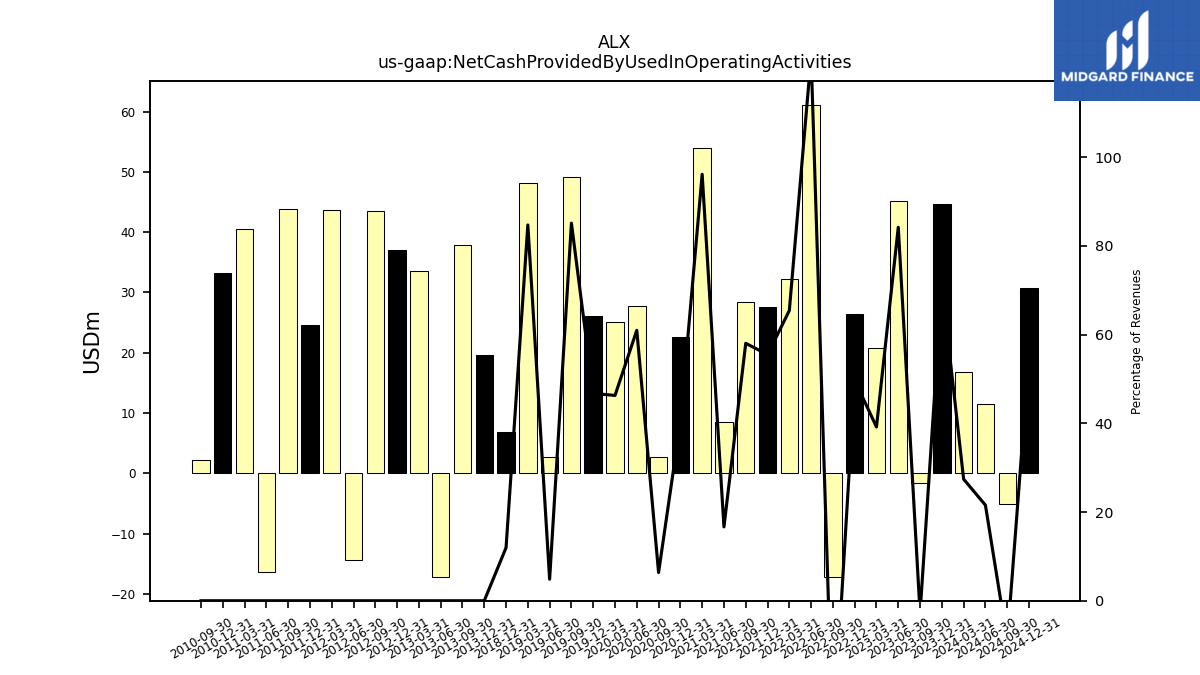
| Net Cash Provided By Used In Operating Activities | -1.54 | 45.17 | 20.74 | 26.35 | -17.12 | 61.14 | 32.19 | 27.55 | 28.40 | 8.55 | 53.97 | 22.55 | 2.77 | 27.72 | 25.04 | 26.12 | 49.16 | 2.71 | 48.08 | 6.88 | NA | NA | NA | NA | NA | NA | NA | |
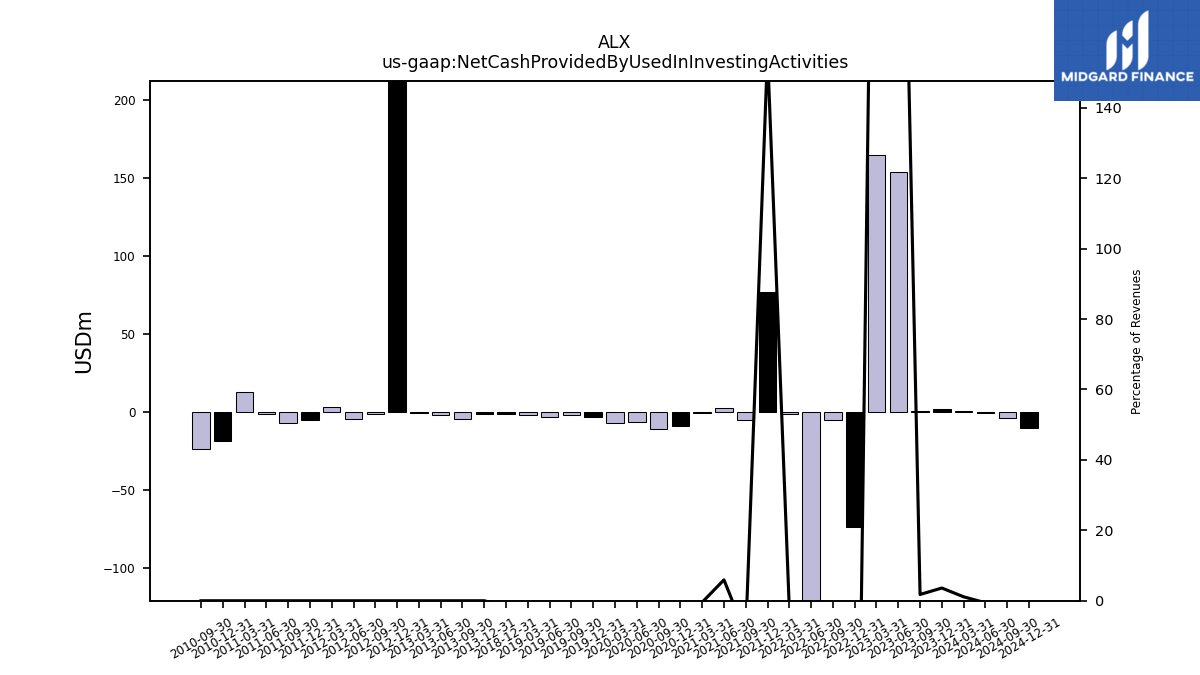
| Net Cash Provided By Used In Investing Activities | 0.99 | 153.78 | 164.77 | -73.15 | -4.91 | -200.05 | -1.16 | 77.28 | -4.62 | 3.05 | -0.24 | -8.83 | -10.62 | -6.05 | -6.96 | -2.88 | -1.67 | -3.08 | -1.82 | -0.92 | NA | NA | NA | NA | NA | NA | NA | |
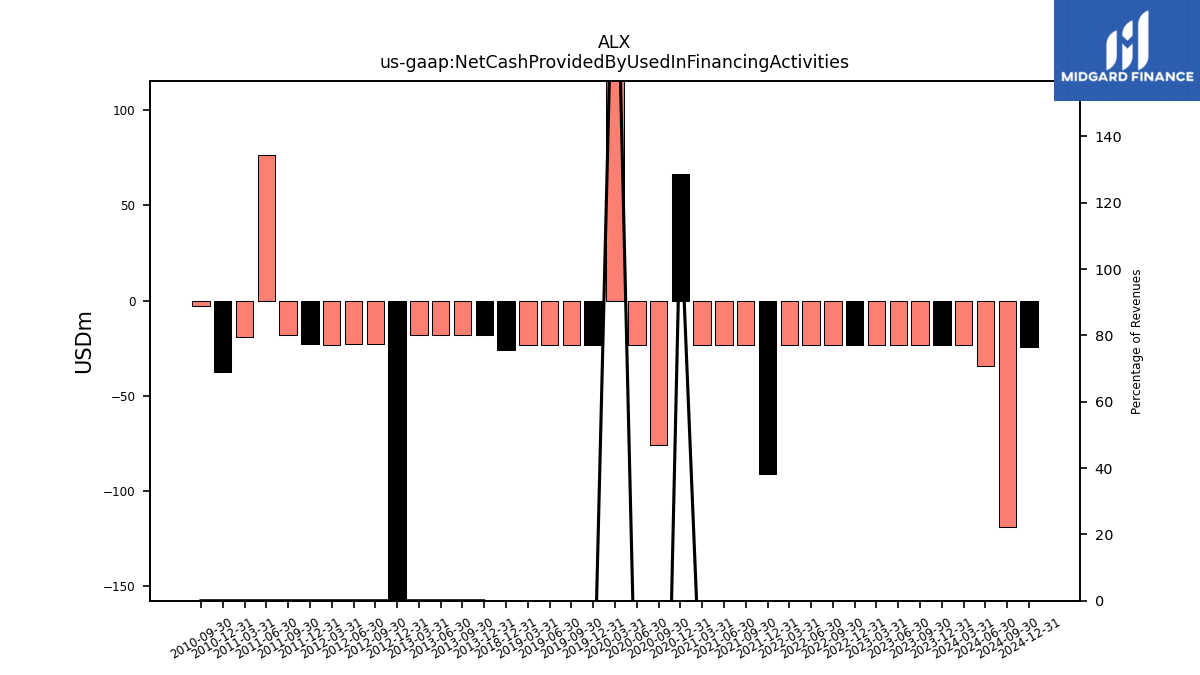
| Net Cash Provided By Used In Financing Activities | -23.12 | -23.07 | -23.11 | -23.11 | -23.07 | -23.07 | -23.06 | -91.09 | -23.06 | -23.06 | -23.09 | 66.38 | -75.63 | -23.05 | 122.59 | -23.03 | -23.04 | -23.04 | -23.03 | -25.71 | NA | NA | NA | NA | NA | NA | NA |
| 2023-09-30 | 2023-06-30 | 2023-03-31 | 2022-12-31 | 2022-09-30 | 2022-06-30 | 2022-03-31 | 2021-12-31 | 2021-09-30 | 2021-06-30 | 2021-03-31 | 2020-12-31 | 2020-09-30 | 2020-06-30 | 2020-03-31 | 2019-12-31 | 2019-09-30 | 2019-06-30 | 2019-03-31 | 2018-12-31 | 2018-09-30 | 2018-06-30 | 2018-03-31 | 2017-12-31 | 2017-09-30 | 2017-06-30 | 2017-03-31 | ||
|---|---|---|---|---|---|---|---|---|---|---|---|---|---|---|---|---|---|---|---|---|---|---|---|---|---|---|---|---|
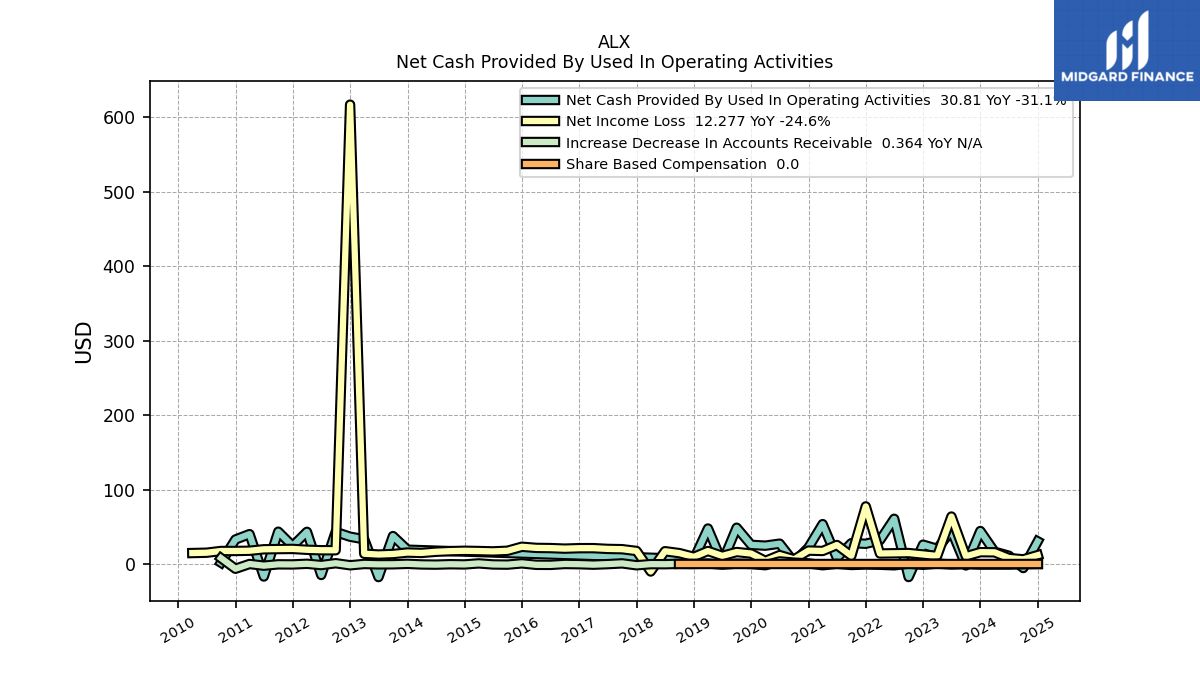
| Net Cash Provided By Used In Operating Activities | -1.54 | 45.17 | 20.74 | 26.35 | -17.12 | 61.14 | 32.19 | 27.55 | 28.40 | 8.55 | 53.97 | 22.55 | 2.77 | 27.72 | 25.04 | 26.12 | 49.16 | 2.71 | 48.08 | 6.88 | NA | NA | NA | NA | NA | NA | NA | |
| Net Income Loss | 10.75 | 64.15 | 11.23 | 13.18 | 15.11 | 14.81 | 14.53 | 77.75 | 11.40 | 25.90 | 17.88 | 18.43 | 6.60 | 12.33 | 4.57 | 14.43 | 16.49 | 11.28 | 17.86 | 9.97 | 15.00 | 17.57 | -9.70 | 17.88 | 20.30 | 20.66 | 21.67 | |
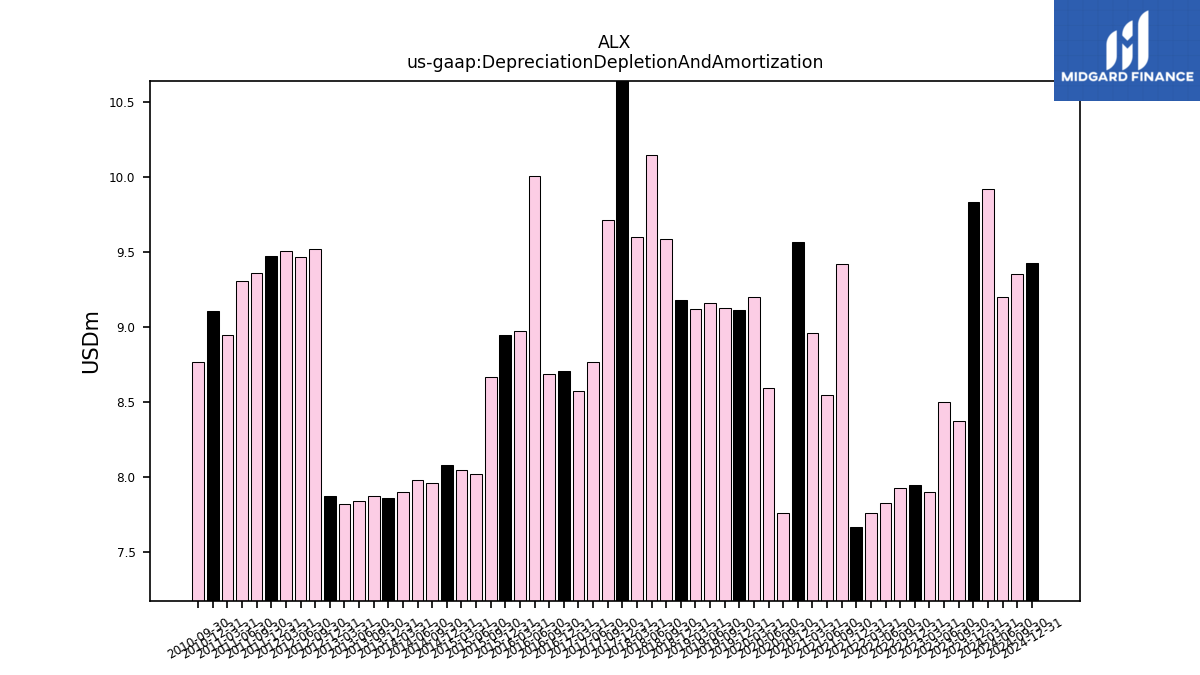
| Depreciation Depletion And Amortization | 8.37 | 8.50 | 7.90 | 7.94 | 7.92 | 7.83 | 7.76 | 7.67 | 9.42 | 8.54 | 8.96 | 9.57 | 7.76 | 8.59 | 9.20 | 9.11 | 9.12 | 9.16 | 9.12 | 9.18 | 9.58 | 10.14 | 9.60 | 11.63 | 9.71 | 8.77 | 8.57 | |
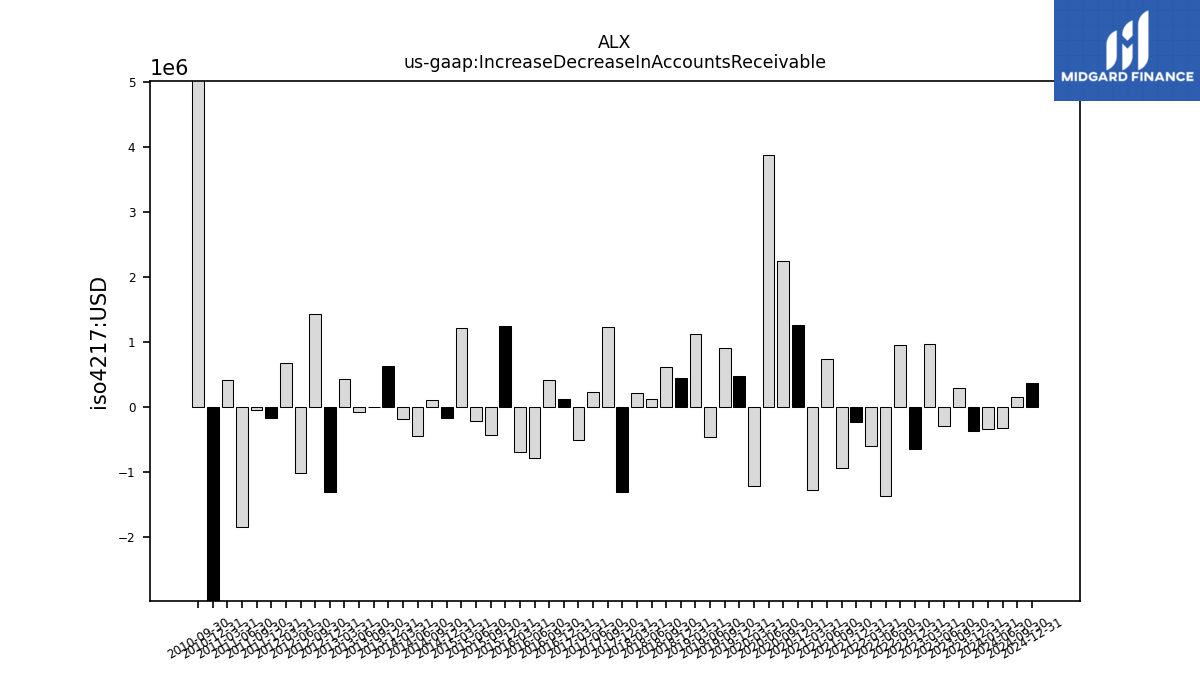
| Increase Decrease In Accounts Receivable | 0.28 | -0.29 | 0.96 | -0.65 | 0.95 | -1.37 | -0.61 | -0.23 | -0.94 | 0.73 | -1.29 | 1.26 | 2.24 | 3.87 | -1.23 | 0.47 | 0.90 | -0.47 | 1.12 | 0.44 | 0.61 | 0.12 | 0.21 | -1.31 | 1.23 | 0.23 | -0.51 |
| 2023-09-30 | 2023-06-30 | 2023-03-31 | 2022-12-31 | 2022-09-30 | 2022-06-30 | 2022-03-31 | 2021-12-31 | 2021-09-30 | 2021-06-30 | 2021-03-31 | 2020-12-31 | 2020-09-30 | 2020-06-30 | 2020-03-31 | 2019-12-31 | 2019-09-30 | 2019-06-30 | 2019-03-31 | 2018-12-31 | 2018-09-30 | 2018-06-30 | 2018-03-31 | 2017-12-31 | 2017-09-30 | 2017-06-30 | 2017-03-31 | ||
|---|---|---|---|---|---|---|---|---|---|---|---|---|---|---|---|---|---|---|---|---|---|---|---|---|---|---|---|---|
| Net Cash Provided By Used In Investing Activities | 0.99 | 153.78 | 164.77 | -73.15 | -4.91 | -200.05 | -1.16 | 77.28 | -4.62 | 3.05 | -0.24 | -8.83 | -10.62 | -6.05 | -6.96 | -2.88 | -1.67 | -3.08 | -1.82 | -0.92 | NA | NA | NA | NA | NA | NA | NA |
| 2023-09-30 | 2023-06-30 | 2023-03-31 | 2022-12-31 | 2022-09-30 | 2022-06-30 | 2022-03-31 | 2021-12-31 | 2021-09-30 | 2021-06-30 | 2021-03-31 | 2020-12-31 | 2020-09-30 | 2020-06-30 | 2020-03-31 | 2019-12-31 | 2019-09-30 | 2019-06-30 | 2019-03-31 | 2018-12-31 | 2018-09-30 | 2018-06-30 | 2018-03-31 | 2017-12-31 | 2017-09-30 | 2017-06-30 | 2017-03-31 | ||
|---|---|---|---|---|---|---|---|---|---|---|---|---|---|---|---|---|---|---|---|---|---|---|---|---|---|---|---|---|
| Net Cash Provided By Used In Financing Activities | -23.12 | -23.07 | -23.11 | -23.11 | -23.07 | -23.07 | -23.06 | -91.09 | -23.06 | -23.06 | -23.09 | 66.38 | -75.63 | -23.05 | 122.59 | -23.03 | -23.04 | -23.04 | -23.03 | -25.71 | NA | NA | NA | NA | NA | NA | NA | |
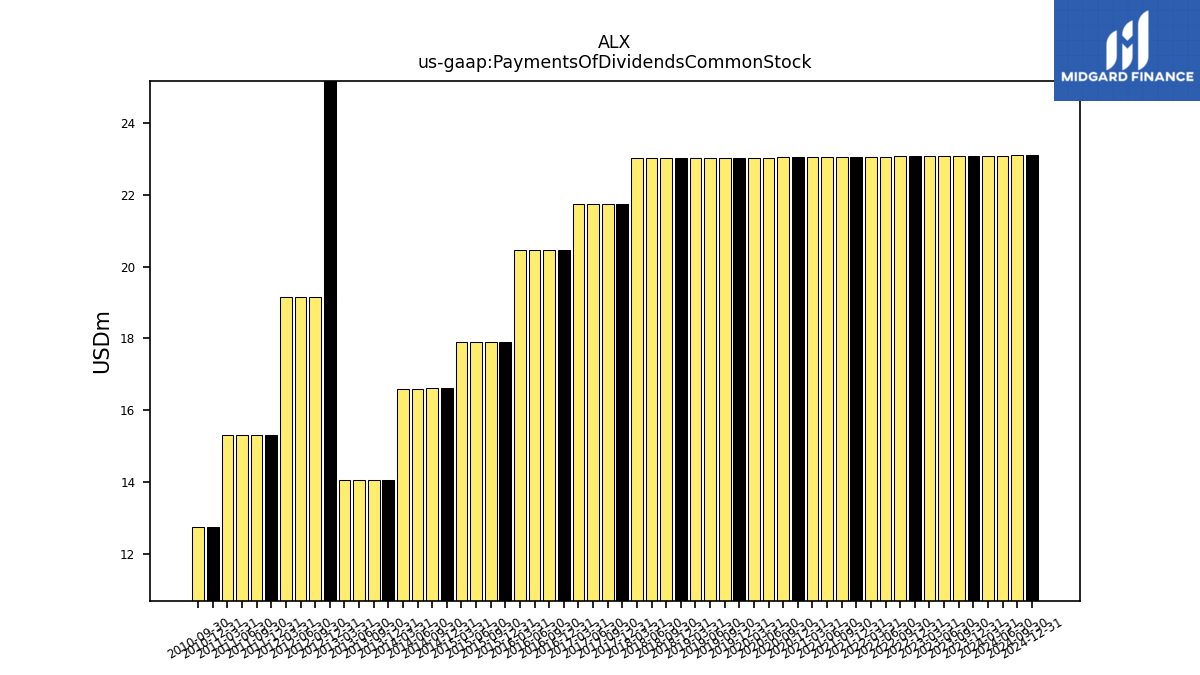
| Payments Of Dividends Common Stock | 23.09 | 23.07 | 23.07 | 23.07 | 23.07 | 23.06 | 23.06 | 23.06 | 23.06 | 23.05 | 23.05 | 23.05 | 23.05 | 23.03 | 23.03 | 23.03 | 23.03 | 23.03 | 23.03 | 23.03 | 23.03 | 23.02 | 23.02 | 21.74 | 21.74 | 21.74 | 21.74 |
| 2023-09-30 | 2023-06-30 | 2023-03-31 | 2022-12-31 | 2022-09-30 | 2022-06-30 | 2022-03-31 | 2021-12-31 | 2021-09-30 | 2021-06-30 | 2021-03-31 | 2020-12-31 | 2020-09-30 | 2020-06-30 | 2020-03-31 | 2019-12-31 | 2019-09-30 | 2019-06-30 | 2019-03-31 | 2018-12-31 | 2018-09-30 | 2018-06-30 | 2018-03-31 | 2017-12-31 | 2017-09-30 | 2017-06-30 | 2017-03-31 | ||
|---|---|---|---|---|---|---|---|---|---|---|---|---|---|---|---|---|---|---|---|---|---|---|---|---|---|---|---|---|
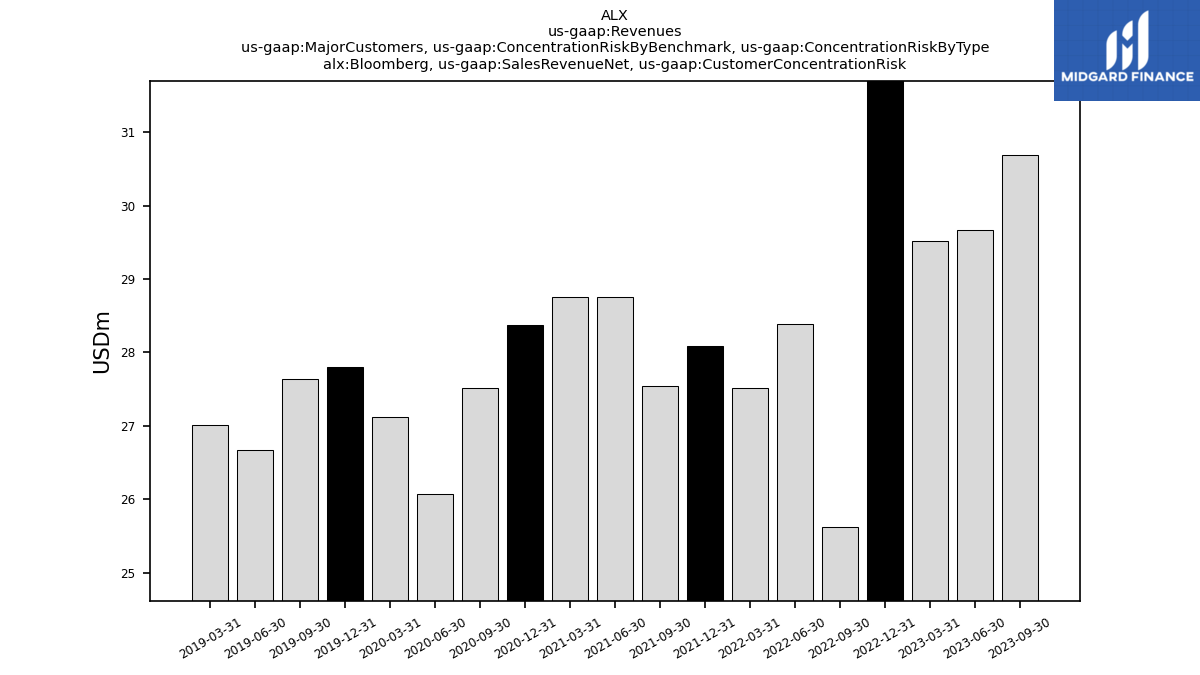
| Revenues | 55.41 | 53.67 | 52.94 | 53.05 | 53.73 | 49.82 | 49.22 | 49.66 | 48.95 | 51.39 | 56.15 | 56.05 | 43.50 | 45.48 | 54.11 | 55.88 | 57.76 | 55.93 | 56.78 | 57.57 | 59.12 | 58.25 | 57.88 | 58.06 | 58.09 | 57.19 | 57.23 | |
| Bloomberg, Sales Revenue Net, Customer Concentration Risk | 30.69 | 29.66 | 29.52 | 33.59 | 25.63 | 28.39 | 27.52 | 28.08 | 27.54 | 28.76 | 28.76 | 28.37 | 27.52 | 26.07 | 27.11 | 27.80 | 27.64 | 26.67 | 27.00 | NA | NA | NA | NA | NA | NA | NA | NA | |
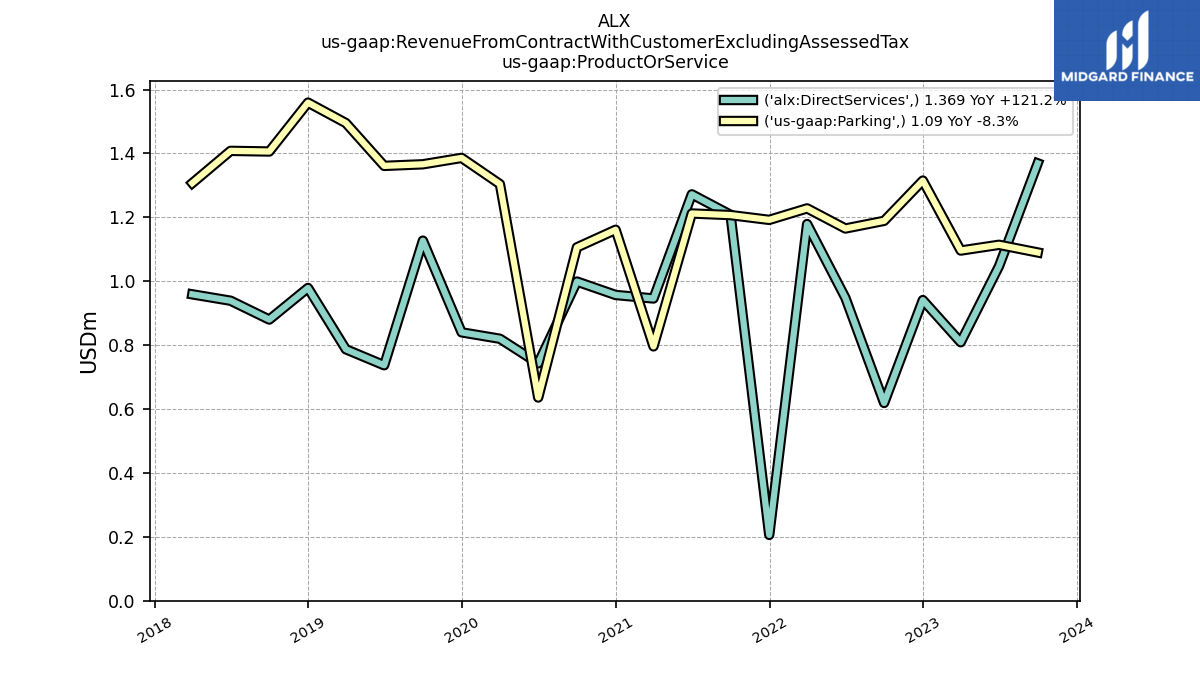
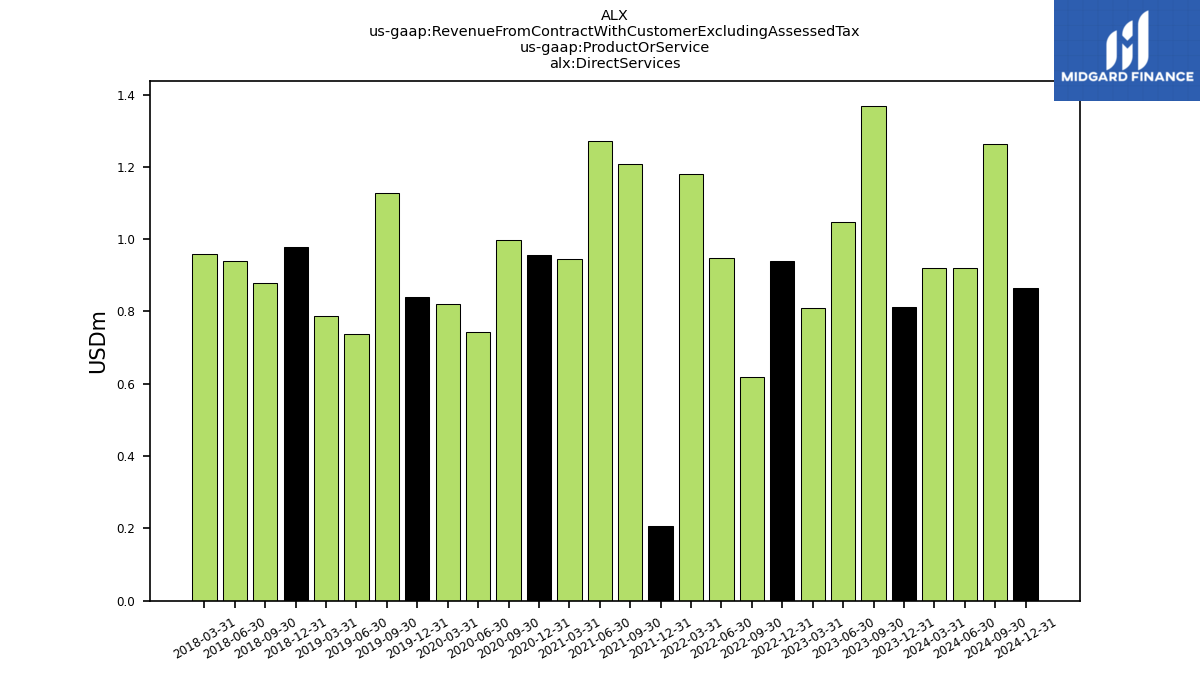
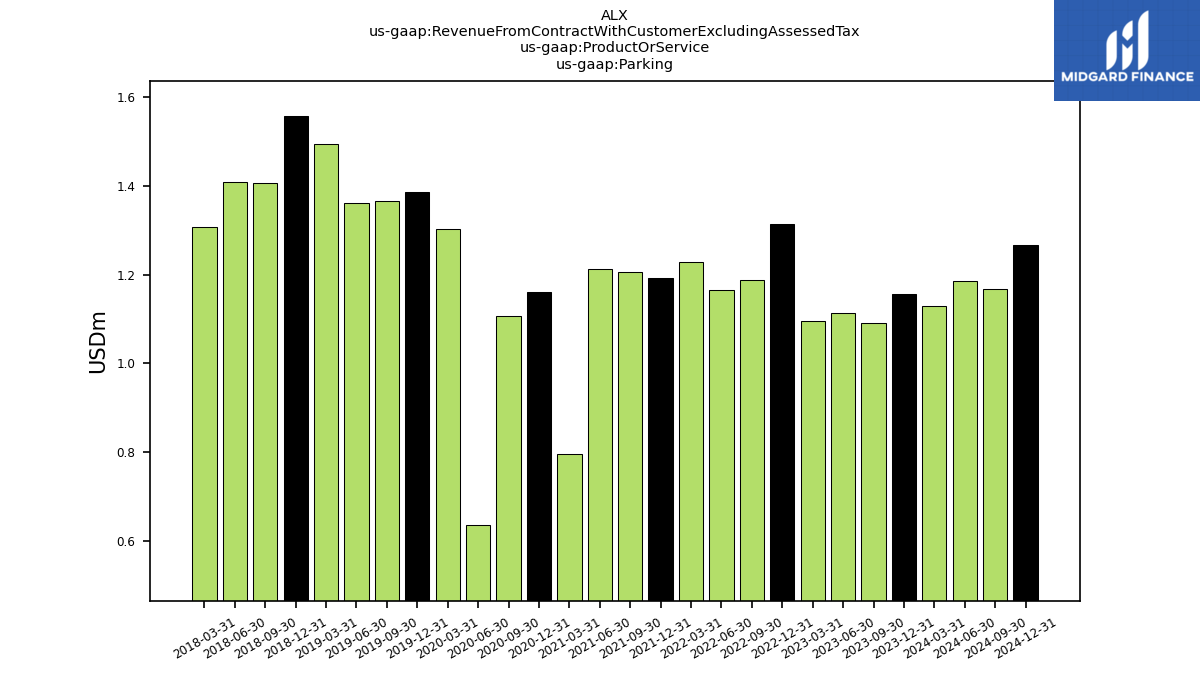
| Revenue From Contract With Customer Excluding Assessed Tax | 55.41 | 53.67 | 52.94 | 53.05 | 53.73 | 49.82 | 49.22 | 49.66 | 48.95 | 51.39 | 56.15 | 56.05 | 43.50 | 45.48 | 54.11 | 55.88 | 57.76 | 55.93 | 56.78 | 57.57 | 59.12 | 58.25 | 57.88 | 58.06 | 58.09 | 57.19 | 57.23 | |
| Direct Services | 1.37 | 1.05 | 0.81 | 0.94 | 0.62 | 0.95 | 1.18 | 0.21 | 1.21 | 1.27 | 0.95 | 0.96 | 1.00 | 0.74 | 0.82 | 0.84 | 1.13 | 0.74 | 0.79 | 0.98 | 0.88 | 0.94 | 0.96 | NA | NA | NA | NA | |
| Parking | 1.09 | 1.11 | 1.10 | 1.31 | 1.19 | 1.17 | 1.23 | 1.19 | 1.21 | 1.21 | 0.80 | 1.16 | 1.11 | 0.64 | 1.30 | 1.39 | 1.37 | 1.36 | 1.50 | 1.56 | 1.41 | 1.41 | 1.31 | NA | NA | NA | NA |