
| 2023-12-31 | 2023-09-30 | 2023-06-30 | 2023-03-31 | 2022-12-31 | 2022-09-30 | 2022-06-30 | 2022-03-31 | 2021-12-31 | 2021-09-30 | 2021-06-30 | 2021-03-31 | 2020-12-31 | 2020-09-30 | 2020-06-30 | 2020-03-31 | ||
|---|---|---|---|---|---|---|---|---|---|---|---|---|---|---|---|---|---|
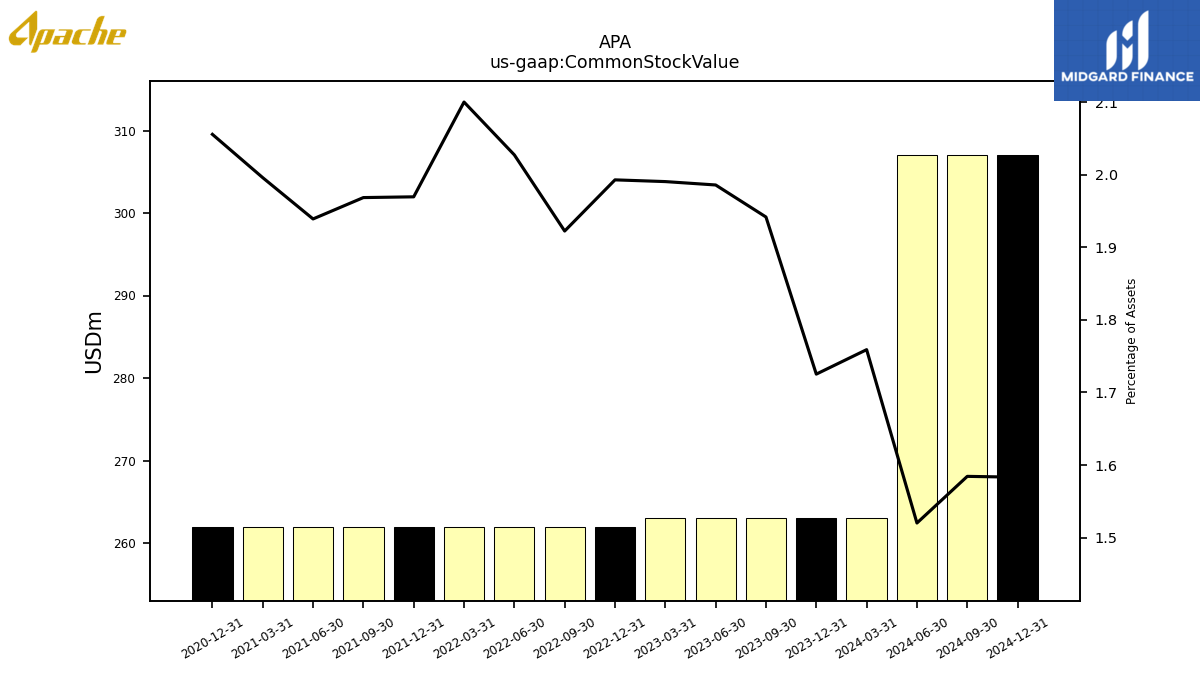
| Common Stock Value | 263.00 | 263.00 | 263.00 | 263.00 | 262.00 | 262.00 | 262.00 | 262.00 | 262.00 | 262.00 | 262.00 | 262.00 | 262.00 | NA | NA | NA | |
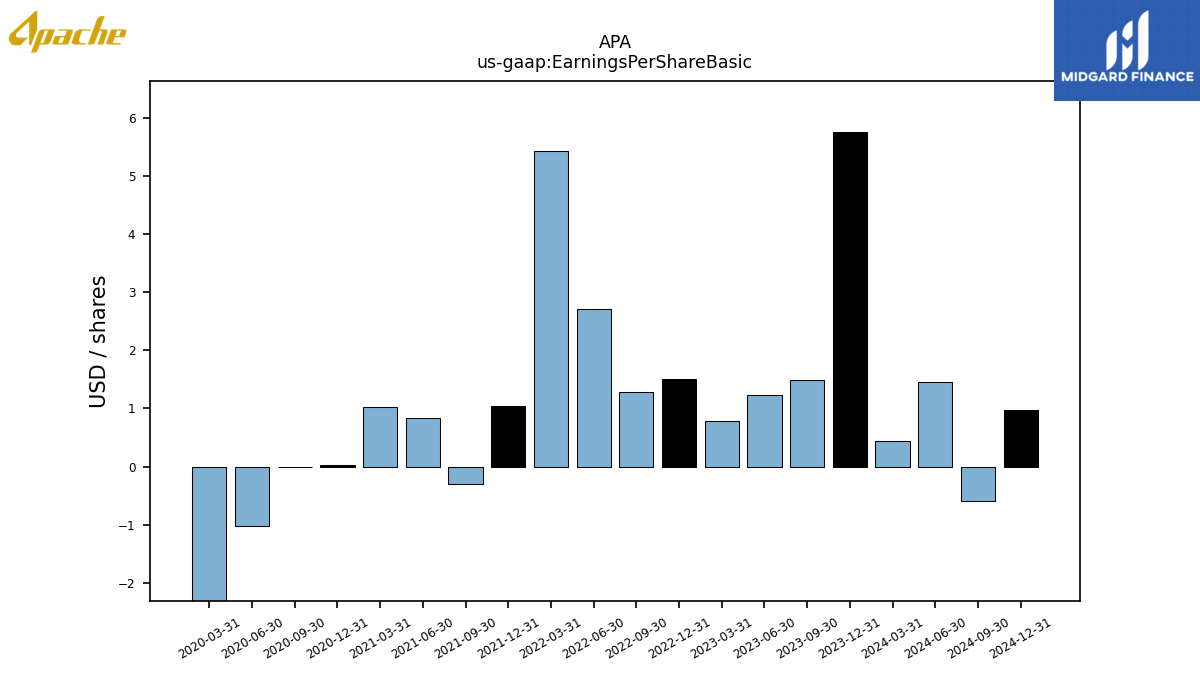
| Earnings Per Share Basic | 5.76 | 1.49 | 1.24 | 0.78 | 1.51 | 1.28 | 2.72 | 5.44 | 1.04 | -0.30 | 0.83 | 1.02 | 0.03 | -0.01 | -1.02 | -11.86 | |
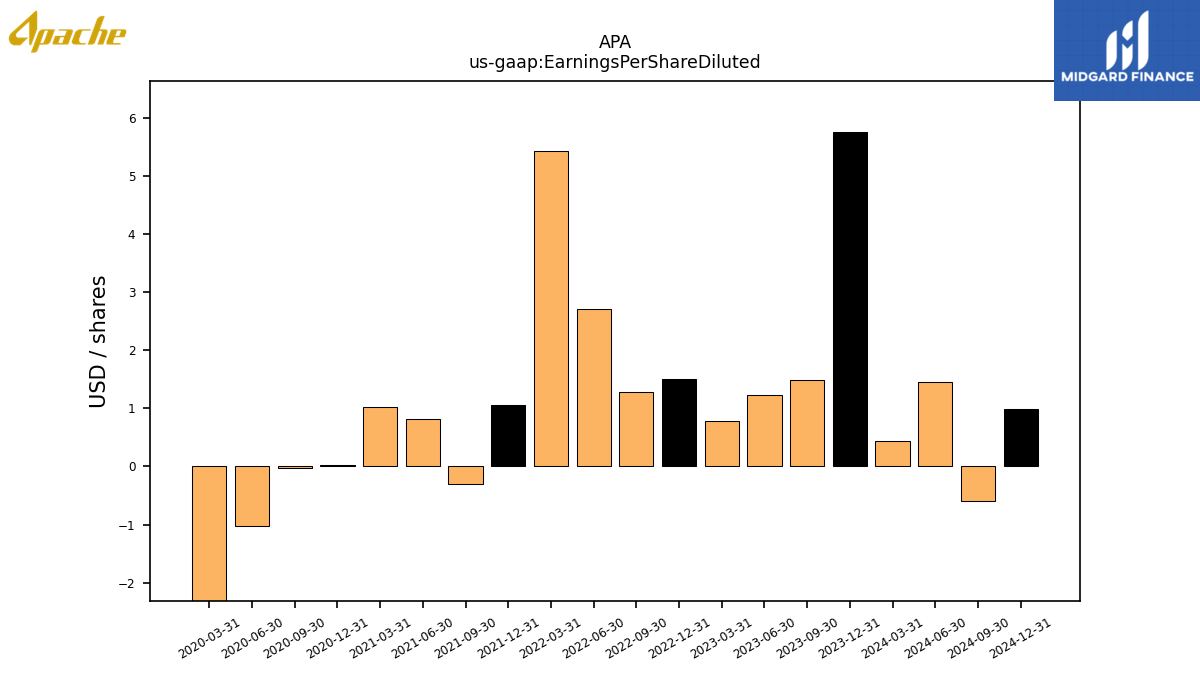
| Earnings Per Share Diluted | 5.75 | 1.49 | 1.23 | 0.78 | 1.51 | 1.28 | 2.71 | 5.43 | 1.06 | -0.30 | 0.82 | 1.02 | 0.03 | -0.02 | -1.02 | -11.86 |
| 2023-12-31 | 2023-09-30 | 2023-06-30 | 2023-03-31 | 2022-12-31 | 2022-09-30 | 2022-06-30 | 2022-03-31 | 2021-12-31 | 2021-09-30 | 2021-06-30 | 2021-03-31 | 2020-12-31 | 2020-09-30 | 2020-06-30 | 2020-03-31 | ||
|---|---|---|---|---|---|---|---|---|---|---|---|---|---|---|---|---|---|
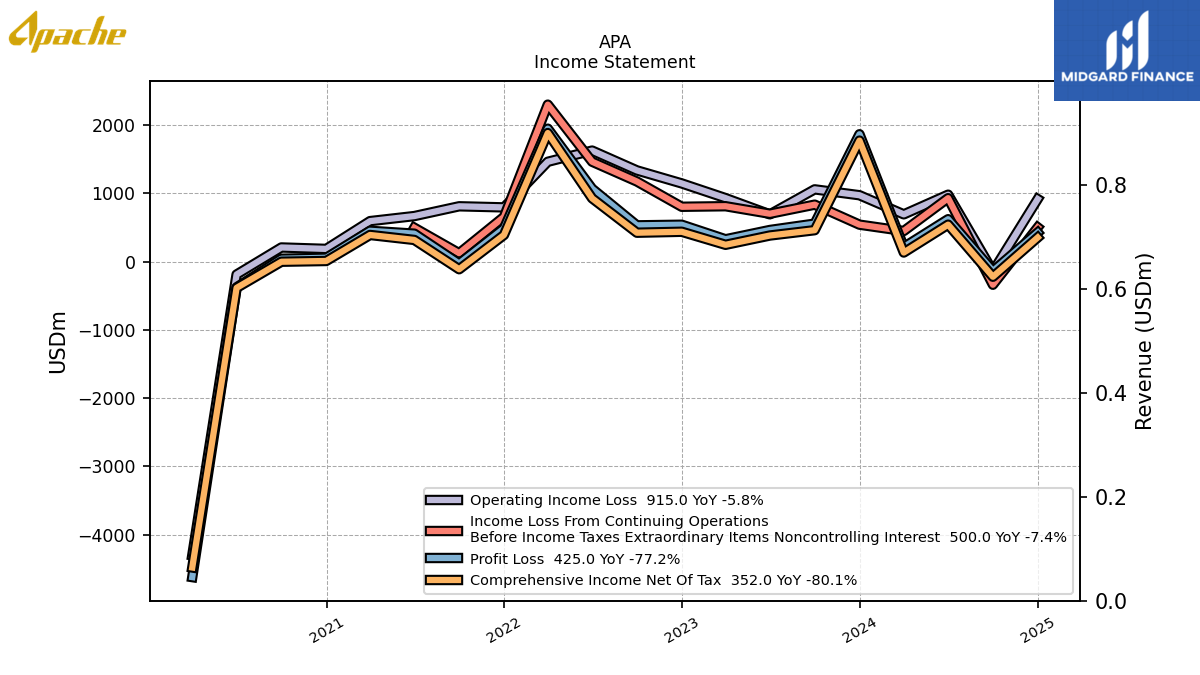
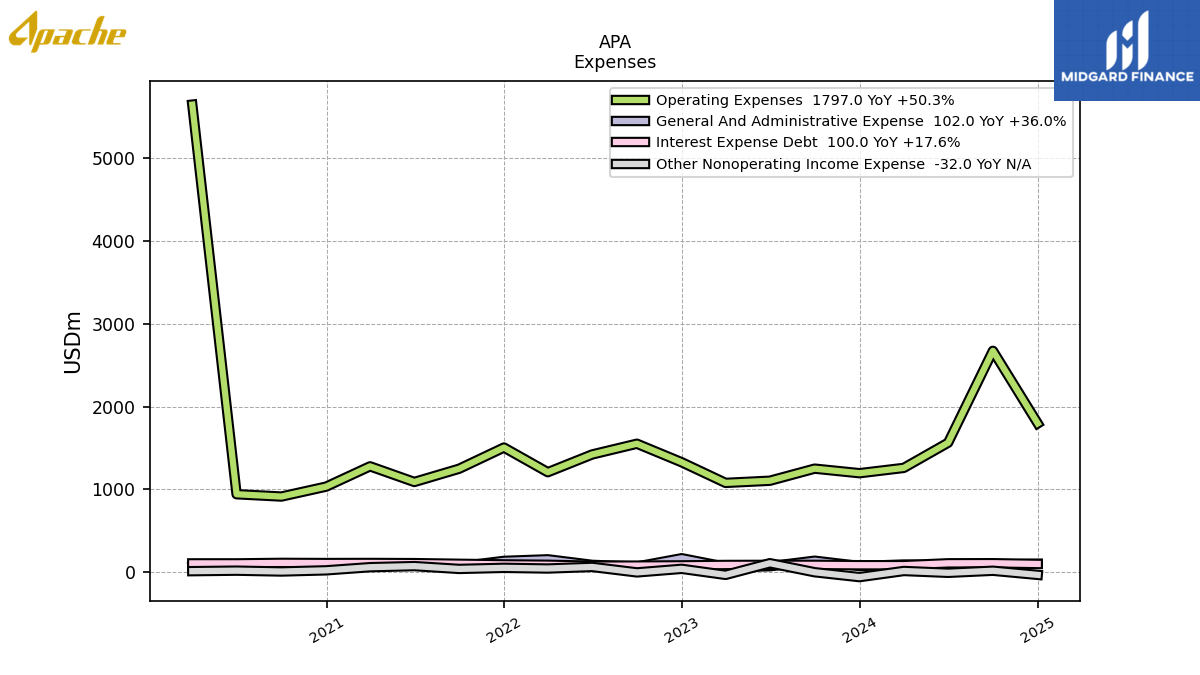
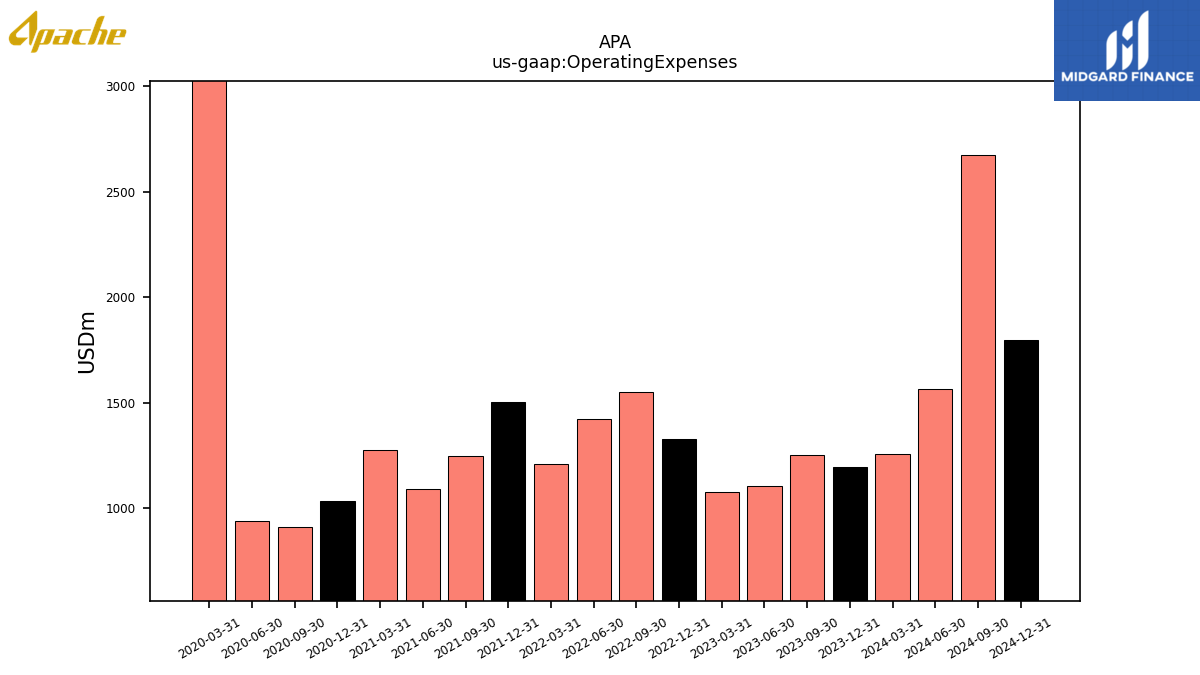
| Operating Expenses | 1196.00 | 1251.00 | 1105.00 | 1079.00 | 1328.00 | 1552.00 | 1422.00 | 1208.00 | 1506.00 | 1250.00 | 1090.00 | 1279.00 | 1034.00 | 914.00 | 942.00 | 5647.00 | |
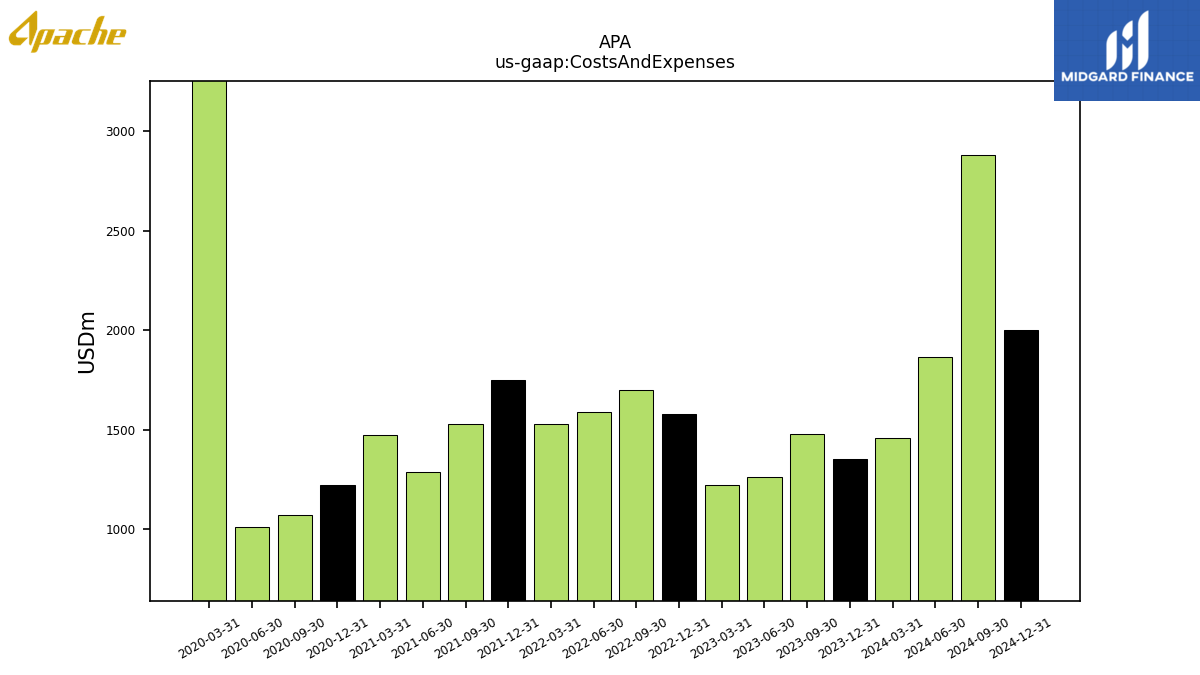
| Costs And Expenses | 1352.00 | 1476.00 | 1261.00 | 1220.00 | 1578.00 | 1700.00 | 1590.00 | 1530.00 | 1749.00 | 1529.00 | 1287.00 | 1472.00 | 1219.00 | 1072.00 | 1012.00 | 5845.00 | |
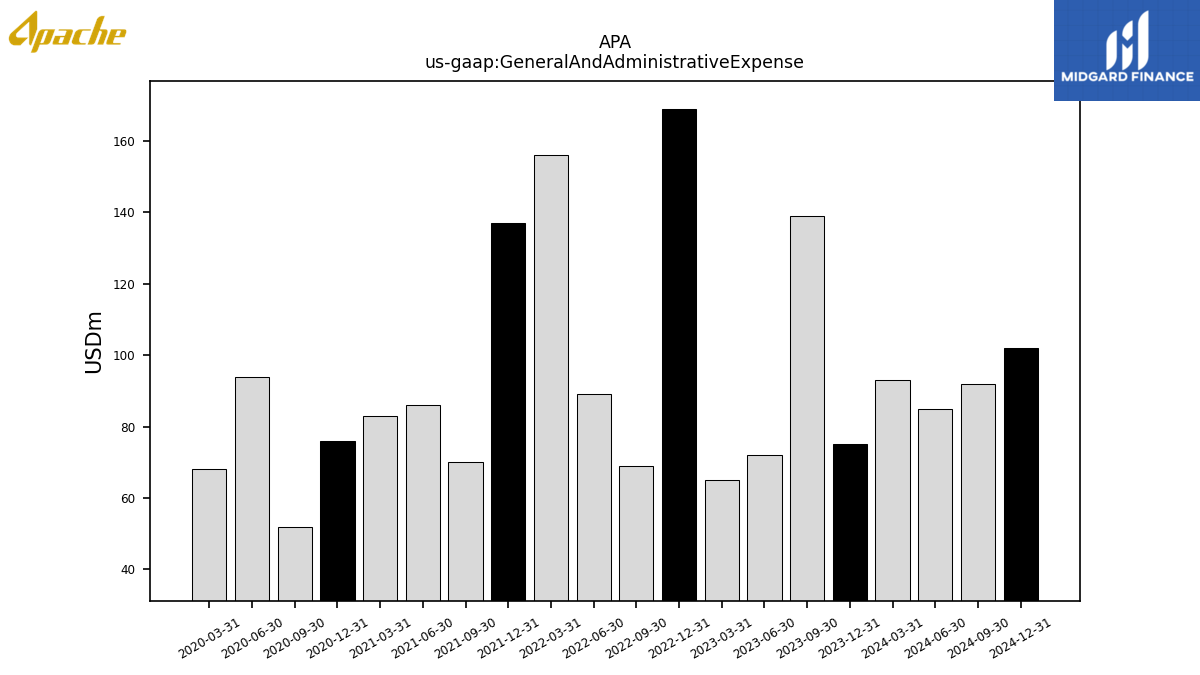
| General And Administrative Expense | 75.00 | 139.00 | 72.00 | 65.00 | 169.00 | 69.00 | 89.00 | 156.00 | 137.00 | 70.00 | 86.00 | 83.00 | 76.00 | 52.00 | 94.00 | 68.00 | |
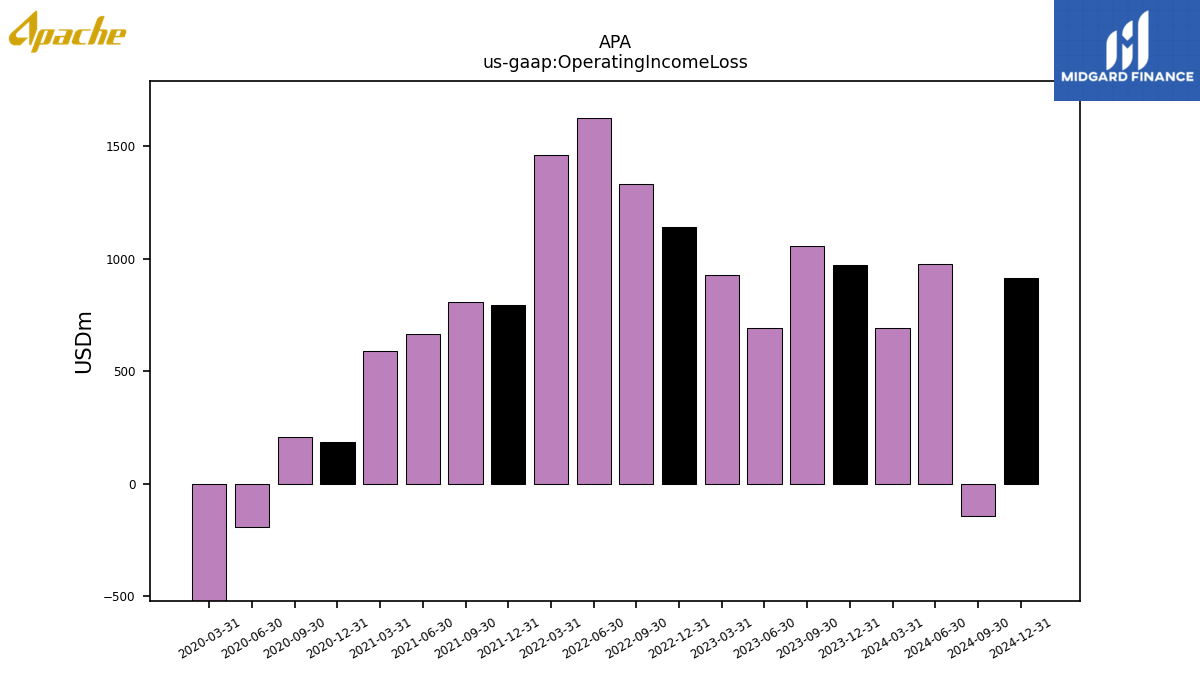
| Operating Income Loss | 971.00 | 1057.00 | 691.00 | 929.00 | 1144.00 | 1335.00 | 1625.00 | 1461.00 | 793.00 | 809.00 | 666.00 | 592.00 | 185.00 | 206.00 | -190.00 | -4303.00 | |
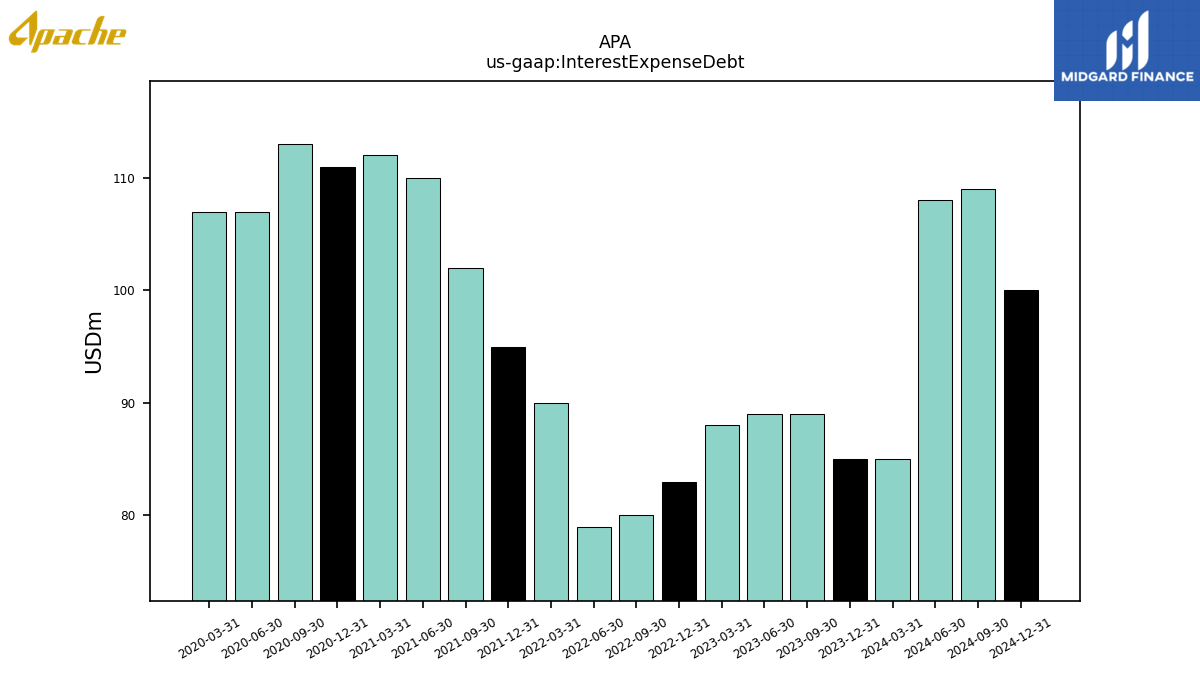
| Interest Expense Debt | 85.00 | 89.00 | 89.00 | 88.00 | 83.00 | 80.00 | 79.00 | 90.00 | 95.00 | 102.00 | 110.00 | 112.00 | 111.00 | 113.00 | 107.00 | 107.00 | |
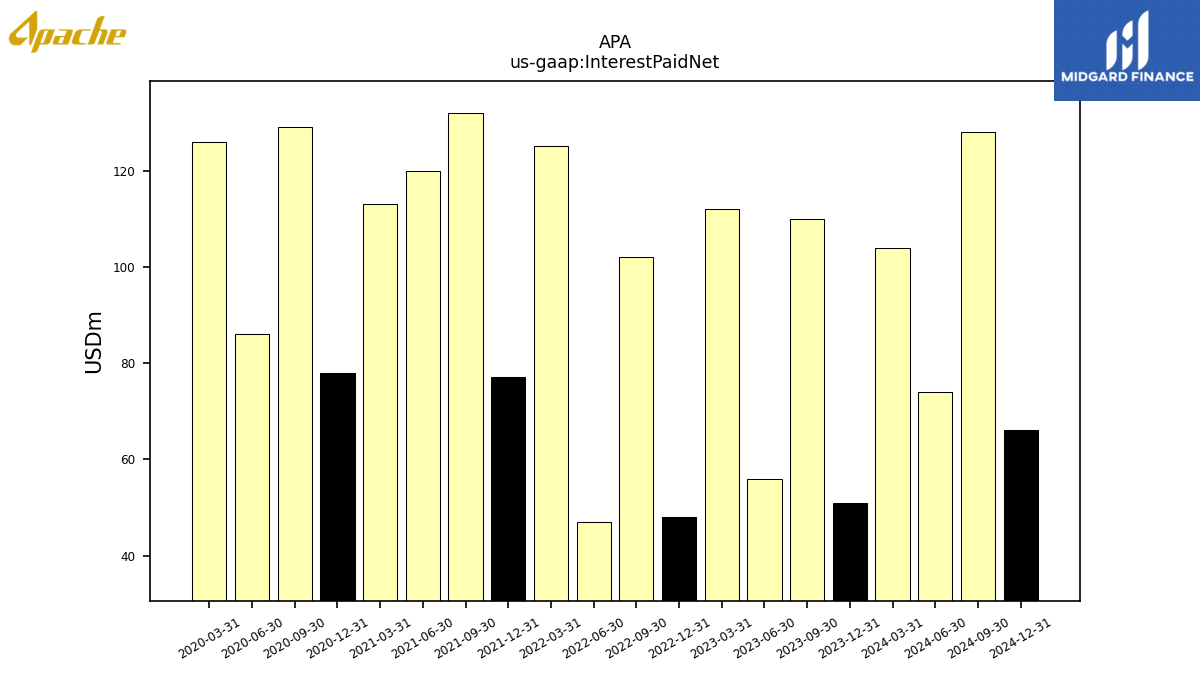
| Interest Paid Net | 51.00 | 110.00 | 56.00 | 112.00 | 48.00 | 102.00 | 47.00 | 125.00 | 77.00 | 132.00 | 120.00 | 113.00 | 78.00 | 129.00 | 86.00 | 126.00 | |
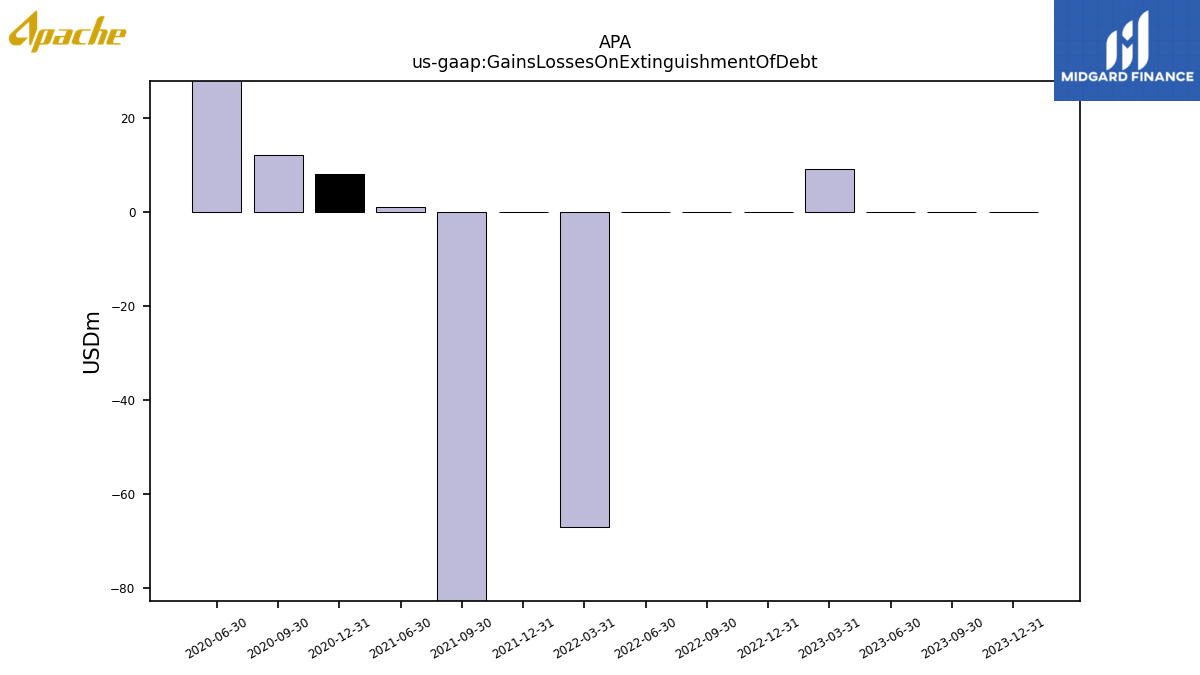
| Gains Losses On Extinguishment Of Debt | 0.00 | 0.00 | 0.00 | 9.00 | 0.00 | 0.00 | 0.00 | -67.00 | 0.00 | -105.00 | 1.00 | NA | 8.00 | 12.00 | 140.00 | NA | |
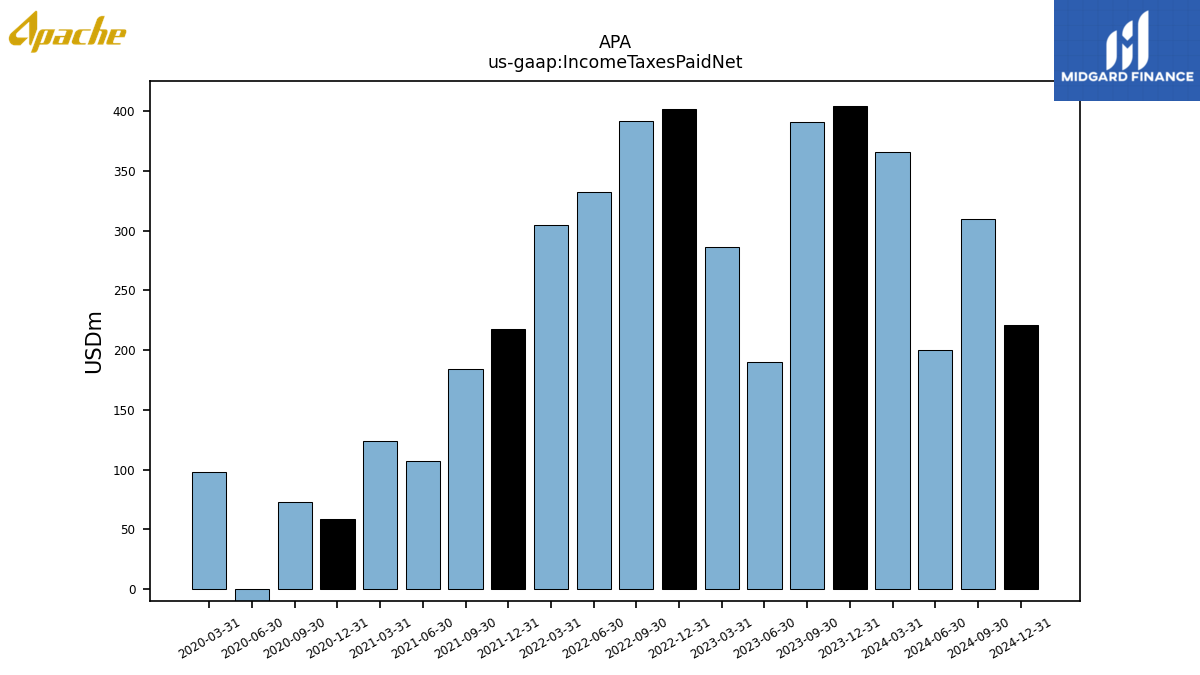
| Income Taxes Paid Net | 404.00 | 391.00 | 190.00 | 286.00 | 402.00 | 392.00 | 332.00 | 305.00 | 218.00 | 184.00 | 107.00 | 124.00 | 59.00 | 73.00 | -18.00 | 98.00 | |
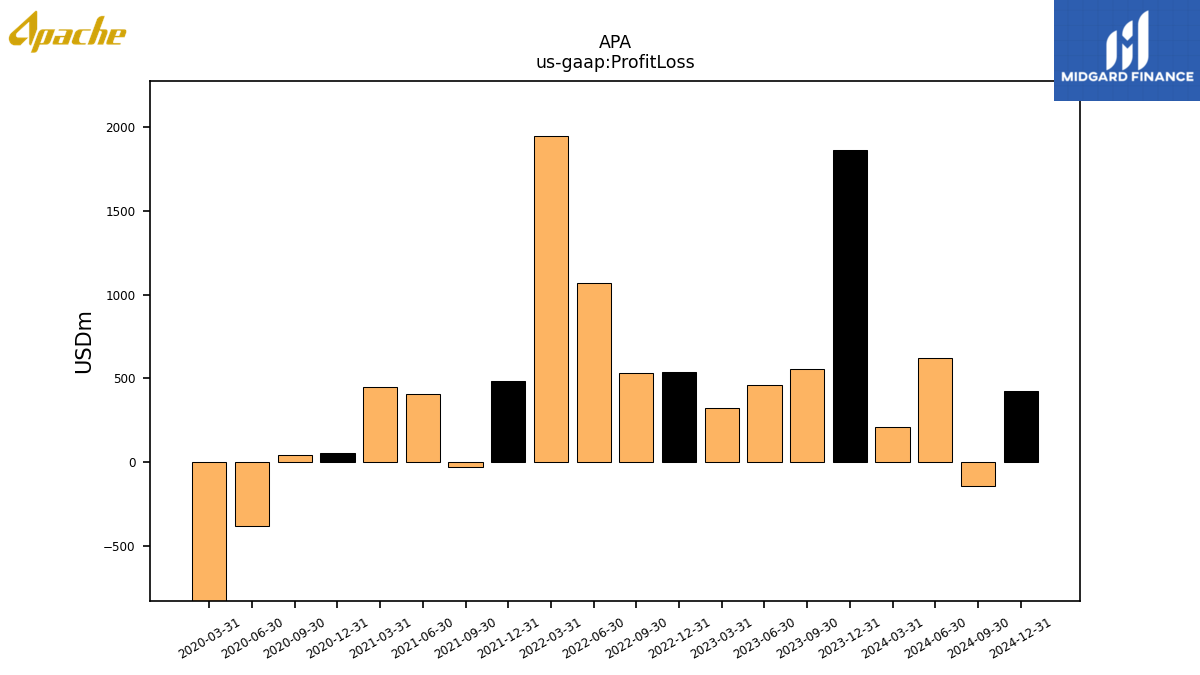
| Profit Loss | 1864.00 | 555.00 | 462.00 | 326.00 | 539.00 | 530.00 | 1067.00 | 1946.00 | 485.00 | -30.00 | 408.00 | 450.00 | 55.00 | 41.00 | -378.00 | -4622.00 | |
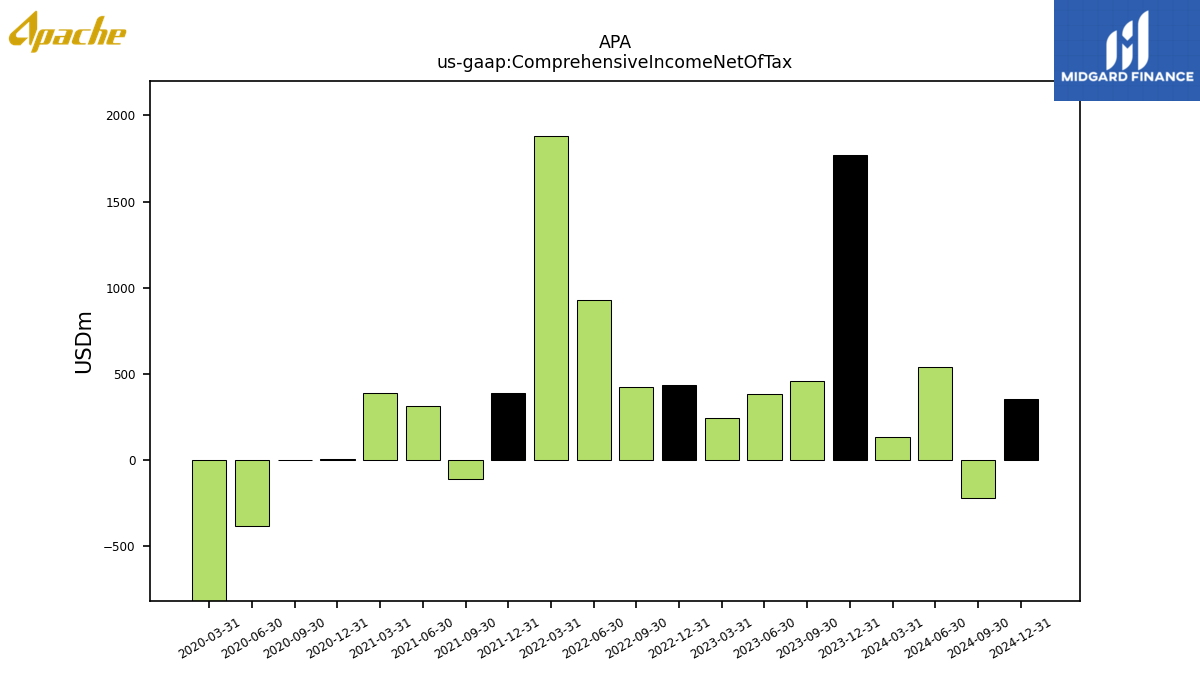
| Comprehensive Income Net Of Tax | 1771.00 | 459.00 | 381.00 | 245.00 | 436.00 | 422.00 | 926.00 | 1882.00 | 389.00 | -113.00 | 316.00 | 389.00 | 8.00 | -3.00 | -386.00 | -4481.00 | |
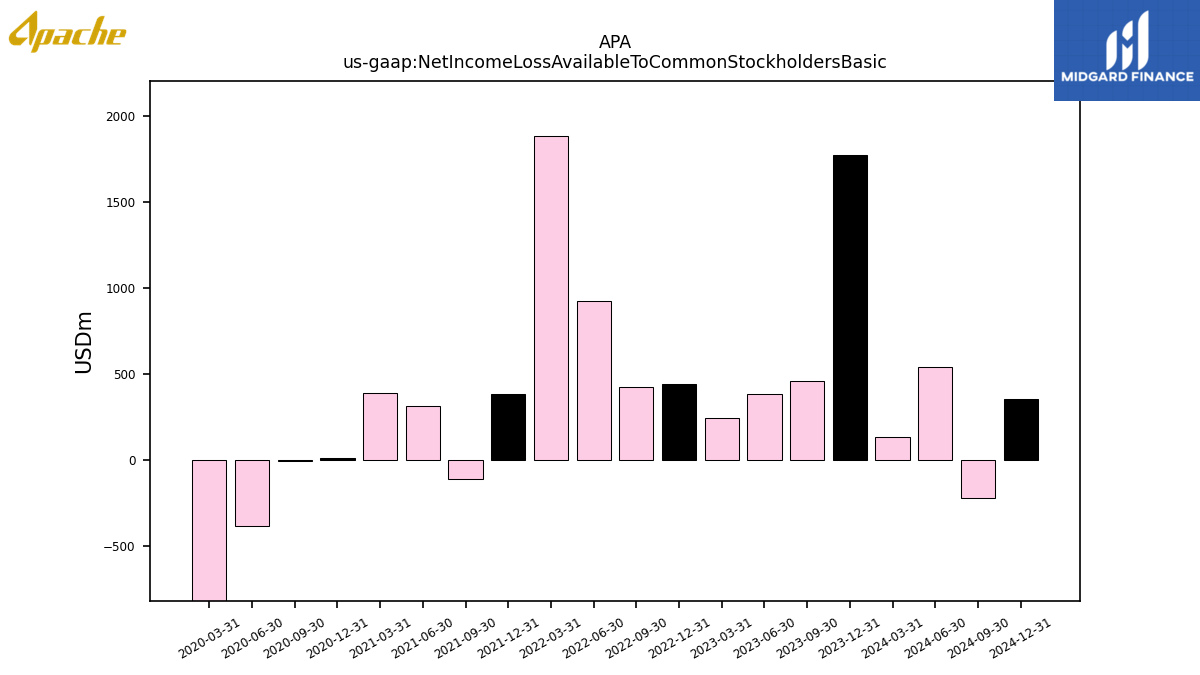
| Net Income Loss Available To Common Stockholders Basic | 1773.00 | 459.00 | 381.00 | 242.00 | 443.00 | 422.00 | 926.00 | 1883.00 | 382.00 | -113.00 | 316.00 | 388.00 | 10.00 | -4.00 | -386.00 | -4480.00 | |
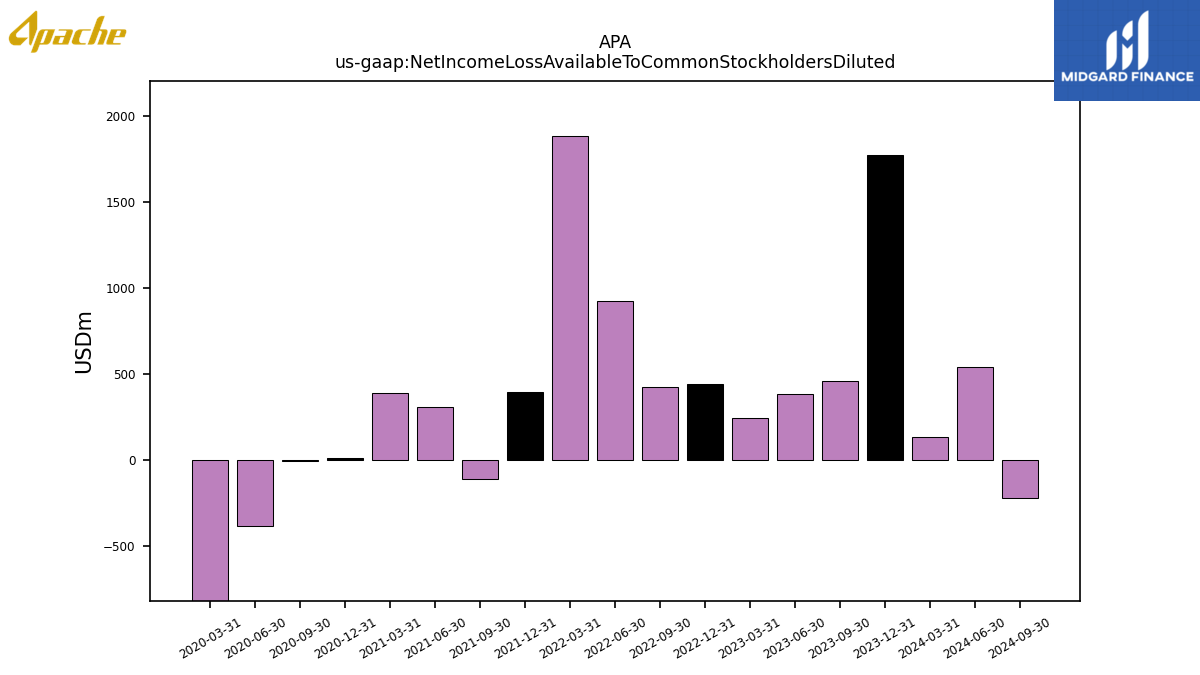
| Net Income Loss Available To Common Stockholders Diluted | 1773.00 | 459.00 | 381.00 | 242.00 | 443.00 | 422.00 | 926.00 | 1883.00 | 392.00 | -113.00 | 310.00 | 388.00 | 10.00 | -8.00 | -386.00 | -4480.00 |
| 2023-12-31 | 2023-09-30 | 2023-06-30 | 2023-03-31 | 2022-12-31 | 2022-09-30 | 2022-06-30 | 2022-03-31 | 2021-12-31 | 2021-09-30 | 2021-06-30 | 2021-03-31 | 2020-12-31 | 2020-09-30 | 2020-06-30 | 2020-03-31 | ||
|---|---|---|---|---|---|---|---|---|---|---|---|---|---|---|---|---|---|
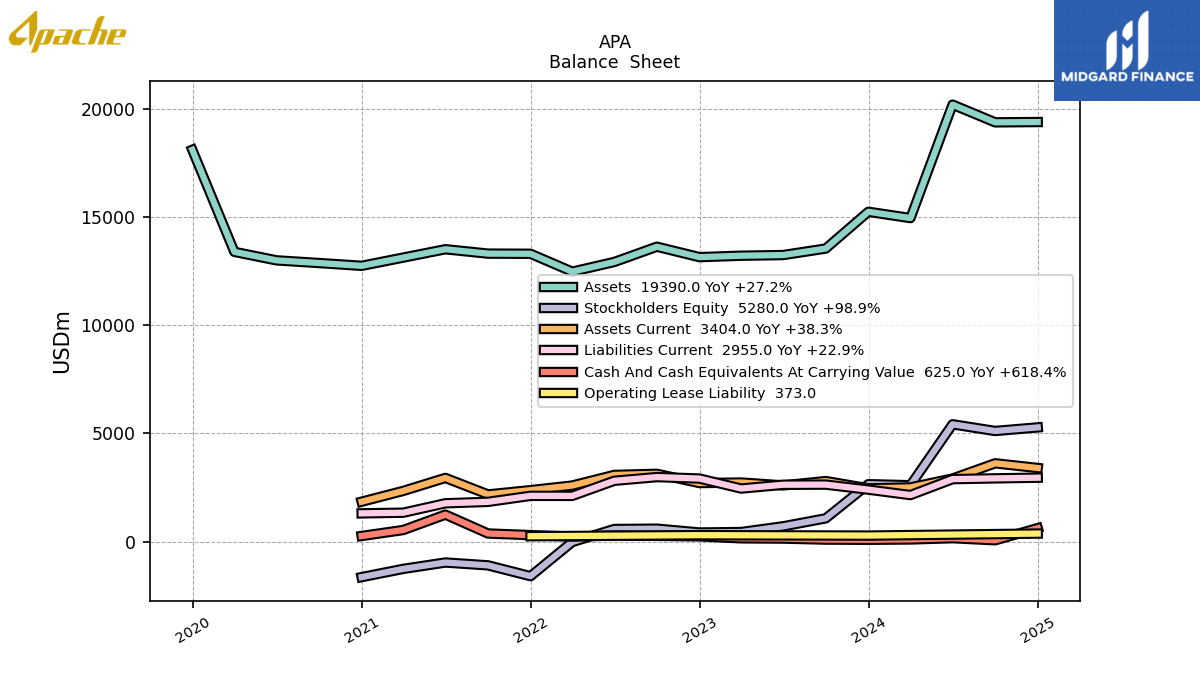
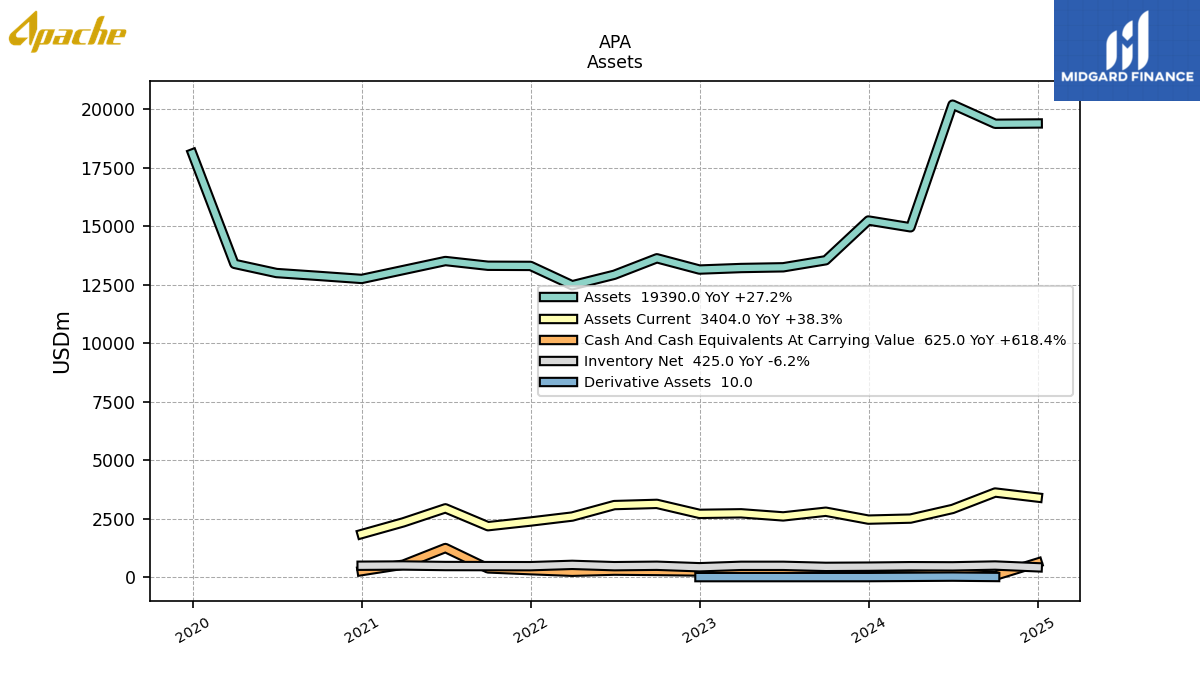
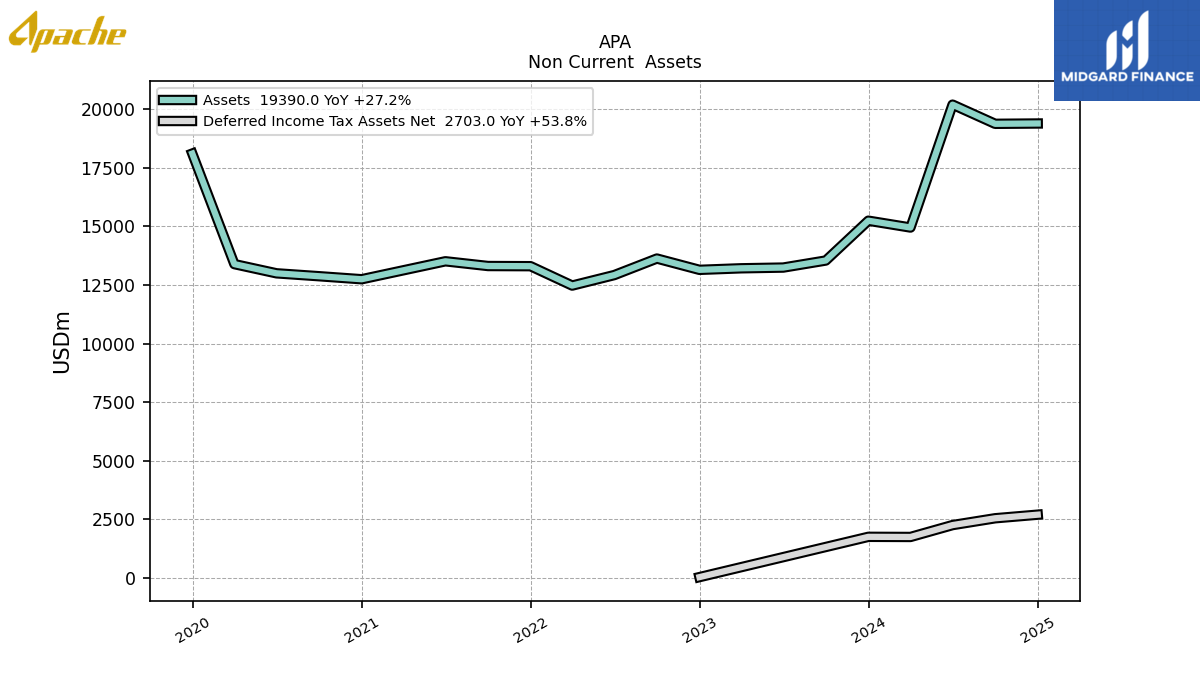
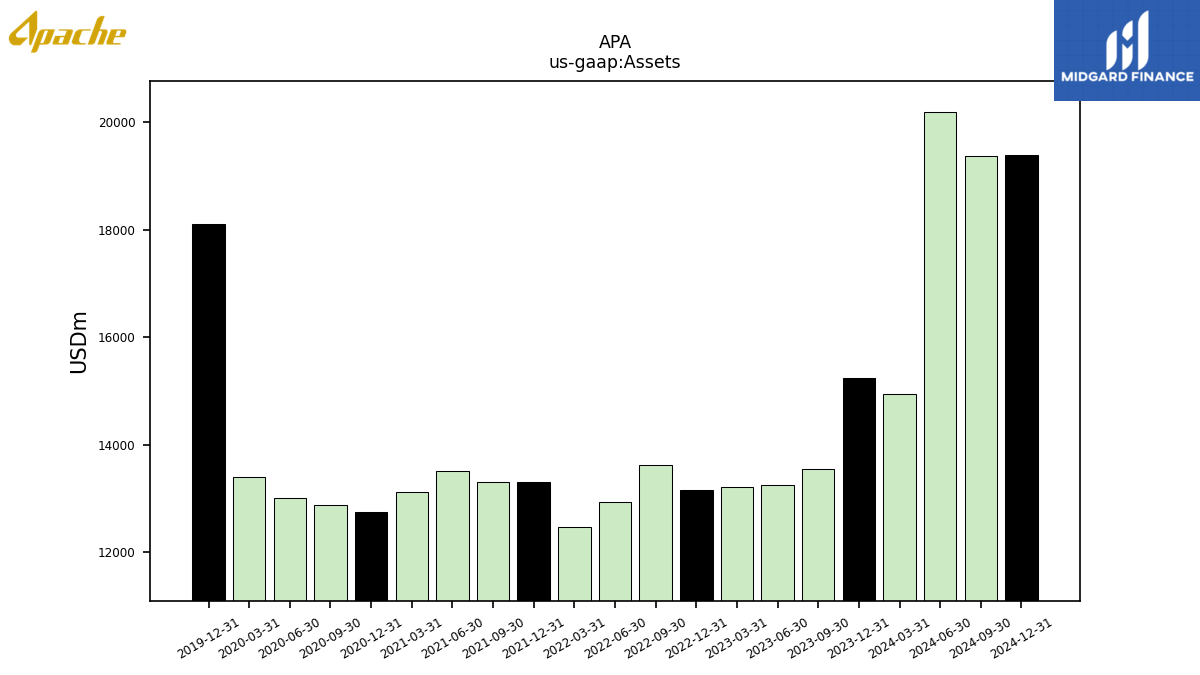
| Assets | 15244.00 | 13545.00 | 13244.00 | 13213.00 | 13147.00 | 13629.00 | 12924.00 | 12476.00 | 13303.00 | 13310.00 | 13512.00 | 13127.00 | 12746.00 | 12875.00 | 12999.00 | 13391.00 | |
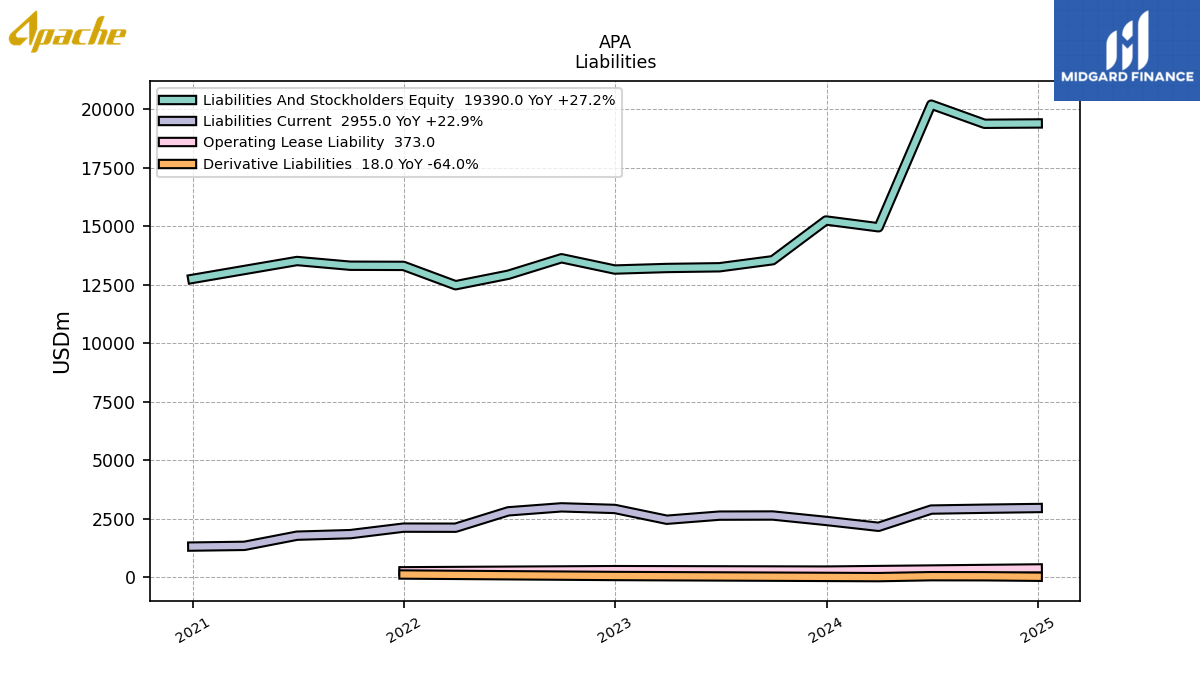
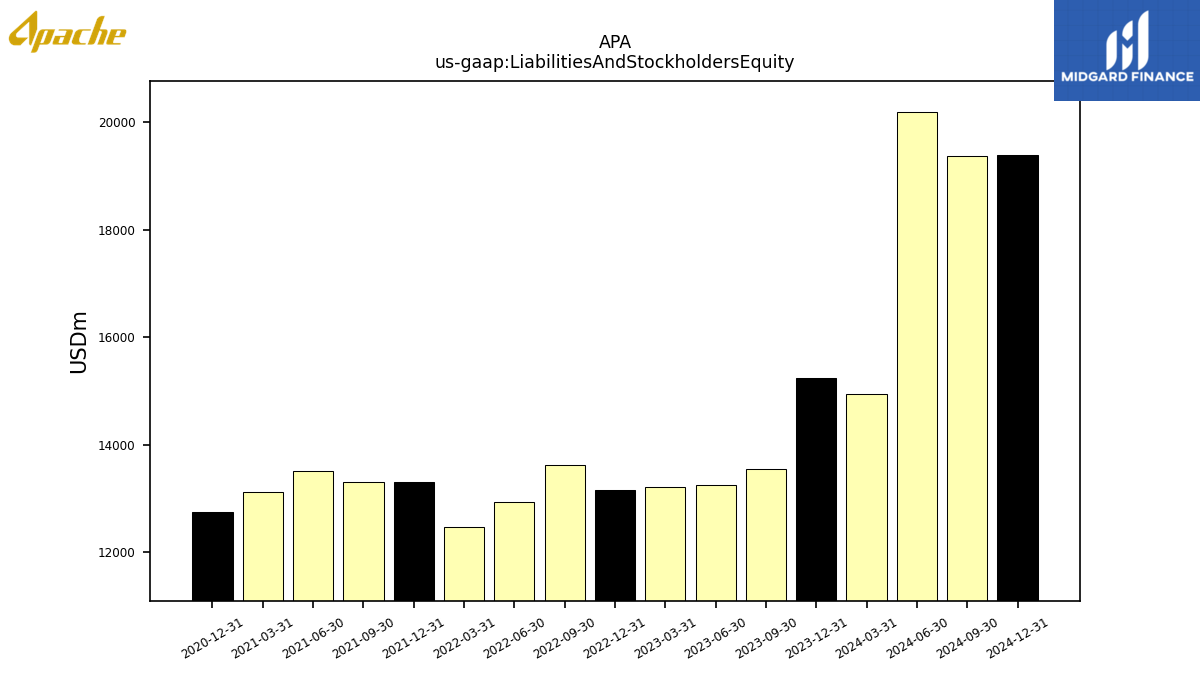
| Liabilities And Stockholders Equity | 15244.00 | 13545.00 | 13244.00 | 13213.00 | 13147.00 | 13629.00 | 12924.00 | 12476.00 | 13303.00 | 13310.00 | 13512.00 | 13127.00 | 12746.00 | NA | NA | NA | |
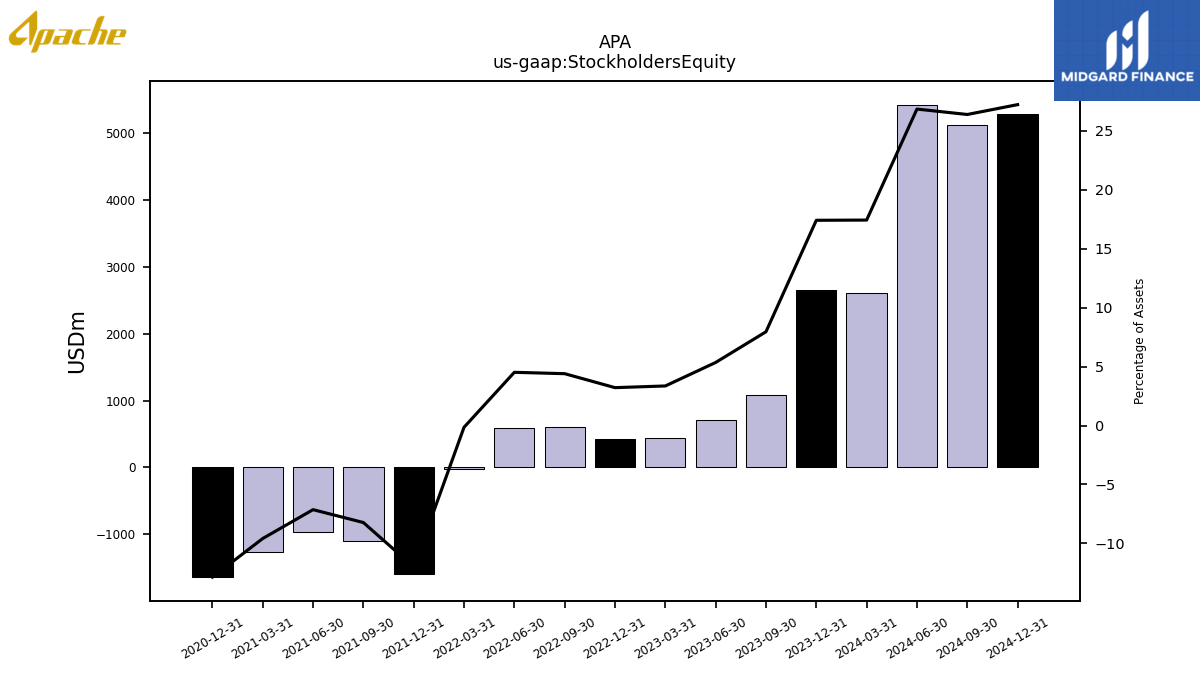
| Stockholders Equity | 2655.00 | 1078.00 | 709.00 | 444.00 | 423.00 | 600.00 | 584.00 | -18.00 | -1595.00 | -1095.00 | -964.00 | -1258.00 | -1639.00 | NA | NA | NA |
| 2023-12-31 | 2023-09-30 | 2023-06-30 | 2023-03-31 | 2022-12-31 | 2022-09-30 | 2022-06-30 | 2022-03-31 | 2021-12-31 | 2021-09-30 | 2021-06-30 | 2021-03-31 | 2020-12-31 | 2020-09-30 | 2020-06-30 | 2020-03-31 | ||
|---|---|---|---|---|---|---|---|---|---|---|---|---|---|---|---|---|---|
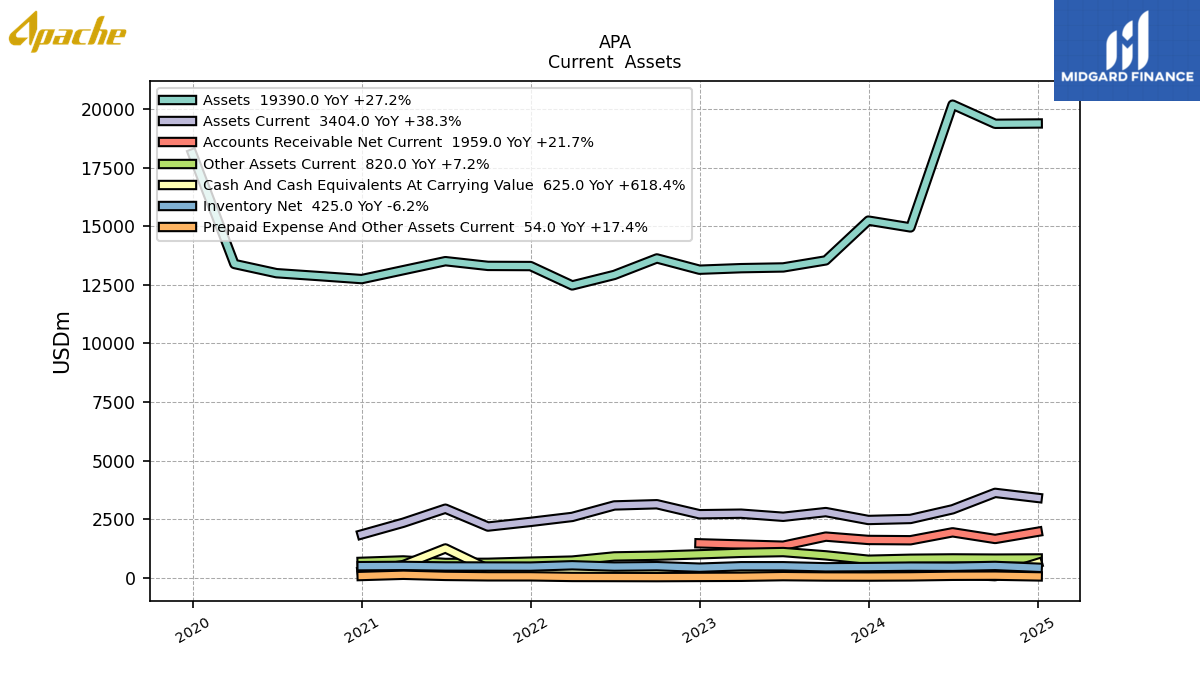
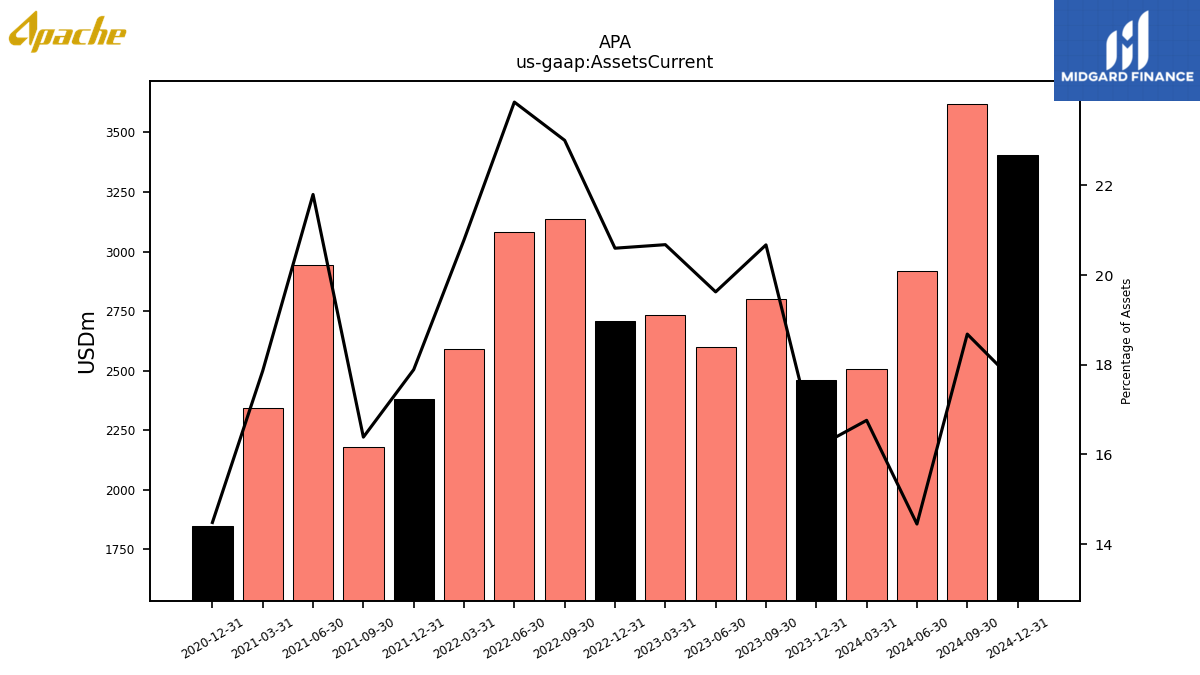
| Assets Current | 2462.00 | 2800.00 | 2599.00 | 2732.00 | 2708.00 | 3135.00 | 3083.00 | 2593.00 | 2380.00 | 2181.00 | 2945.00 | 2345.00 | 1846.00 | NA | NA | NA | |
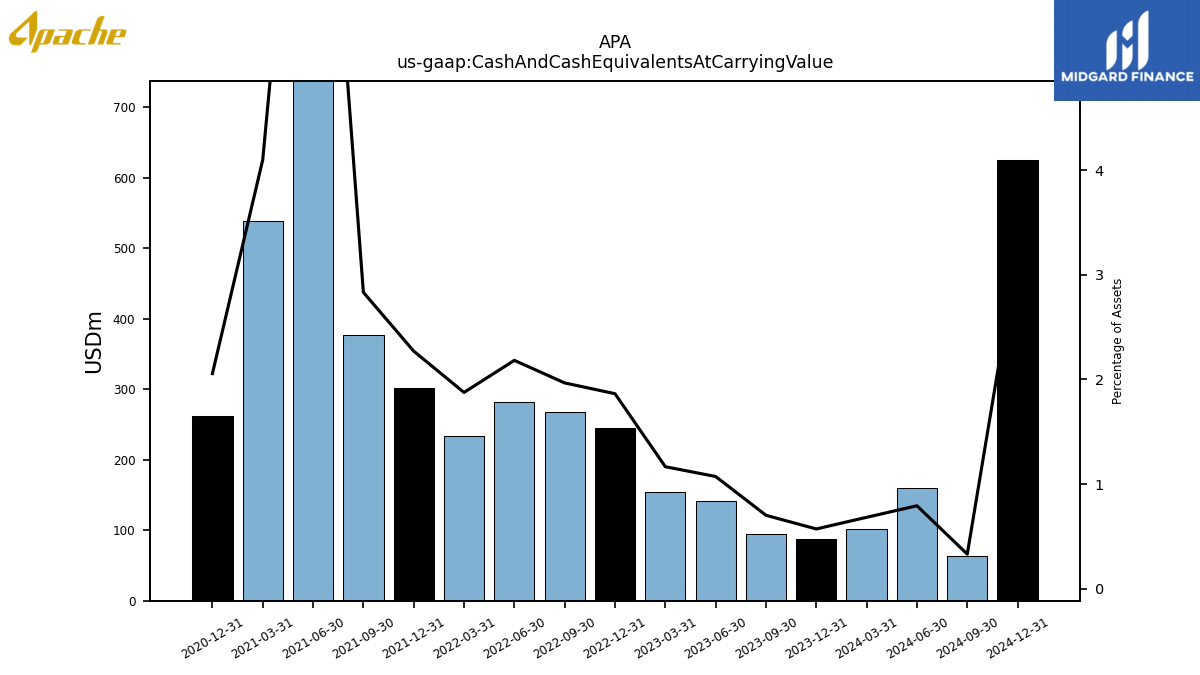
| Cash And Cash Equivalents At Carrying Value | 87.00 | 95.00 | 142.00 | 154.00 | 245.00 | 268.00 | 282.00 | 234.00 | 302.00 | 377.00 | 1249.00 | 538.00 | 262.00 | NA | NA | NA | |
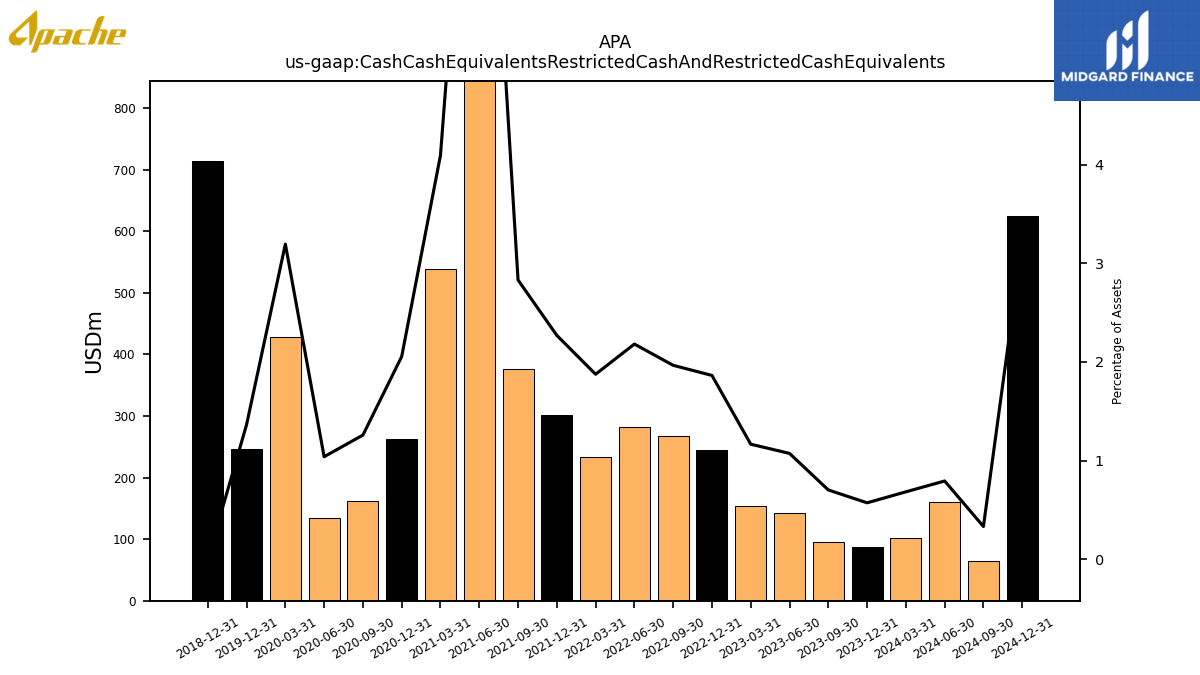
| Cash Cash Equivalents Restricted Cash And Restricted Cash Equivalents | 87.00 | 95.00 | 142.00 | 154.00 | 245.00 | 268.00 | 282.00 | 234.00 | 302.00 | 377.00 | 1249.00 | 538.00 | 262.00 | 162.00 | 135.00 | 428.00 | |
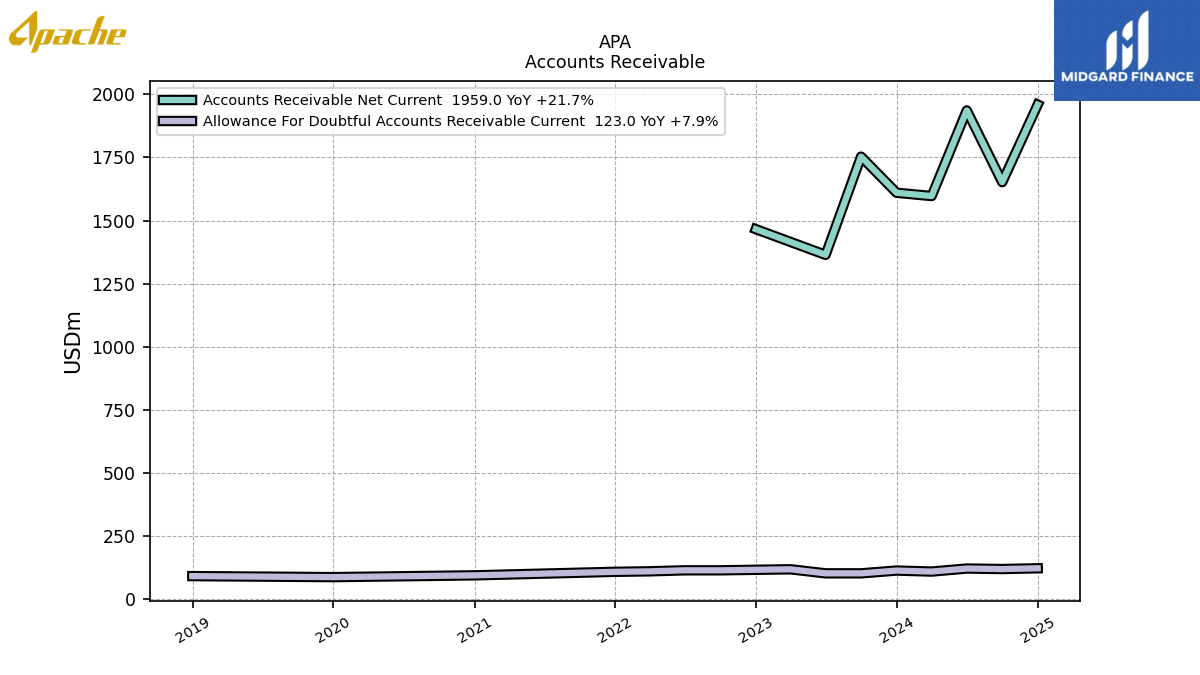
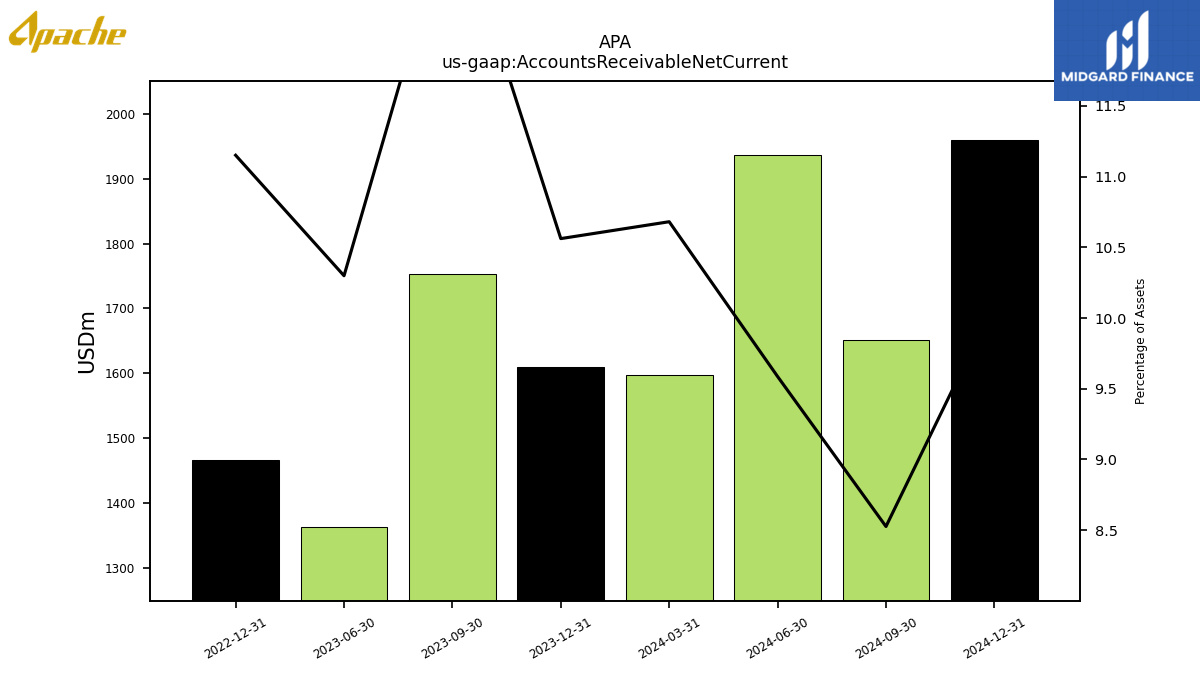
| Accounts Receivable Net Current | 1610.00 | 1753.00 | 1364.00 | NA | 1466.00 | NA | NA | NA | NA | NA | NA | NA | NA | NA | NA | NA | |
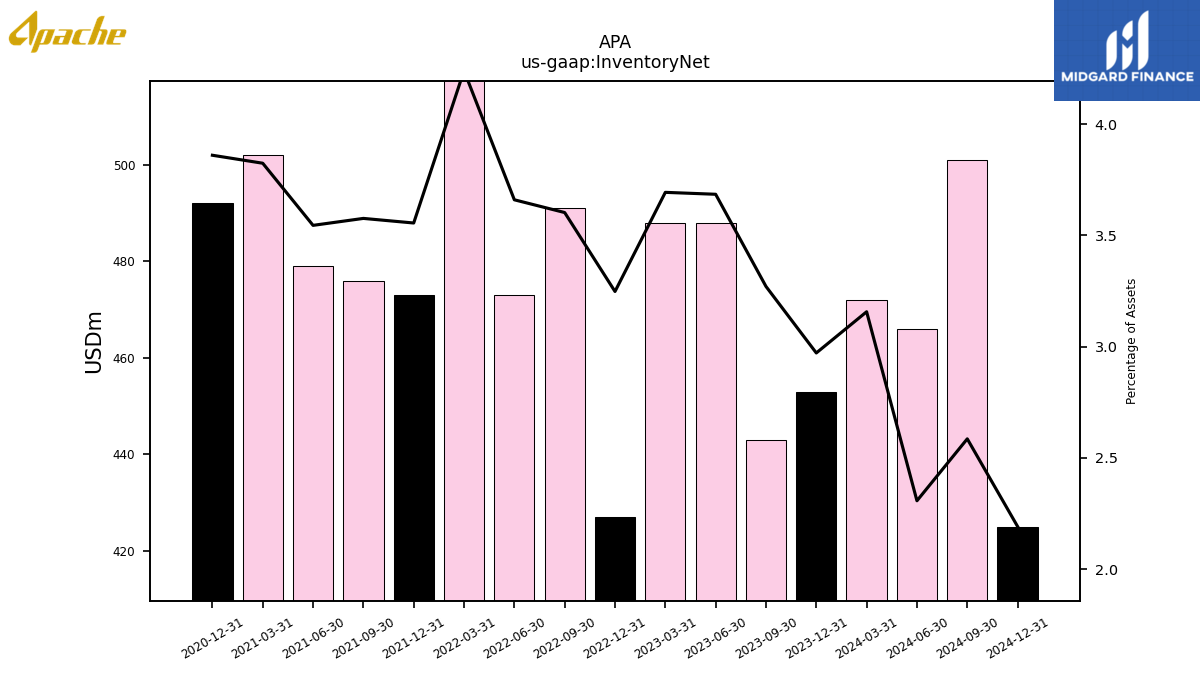
| Inventory Net | 453.00 | 443.00 | 488.00 | 488.00 | 427.00 | 491.00 | 473.00 | 529.00 | 473.00 | 476.00 | 479.00 | 502.00 | 492.00 | NA | NA | NA | |
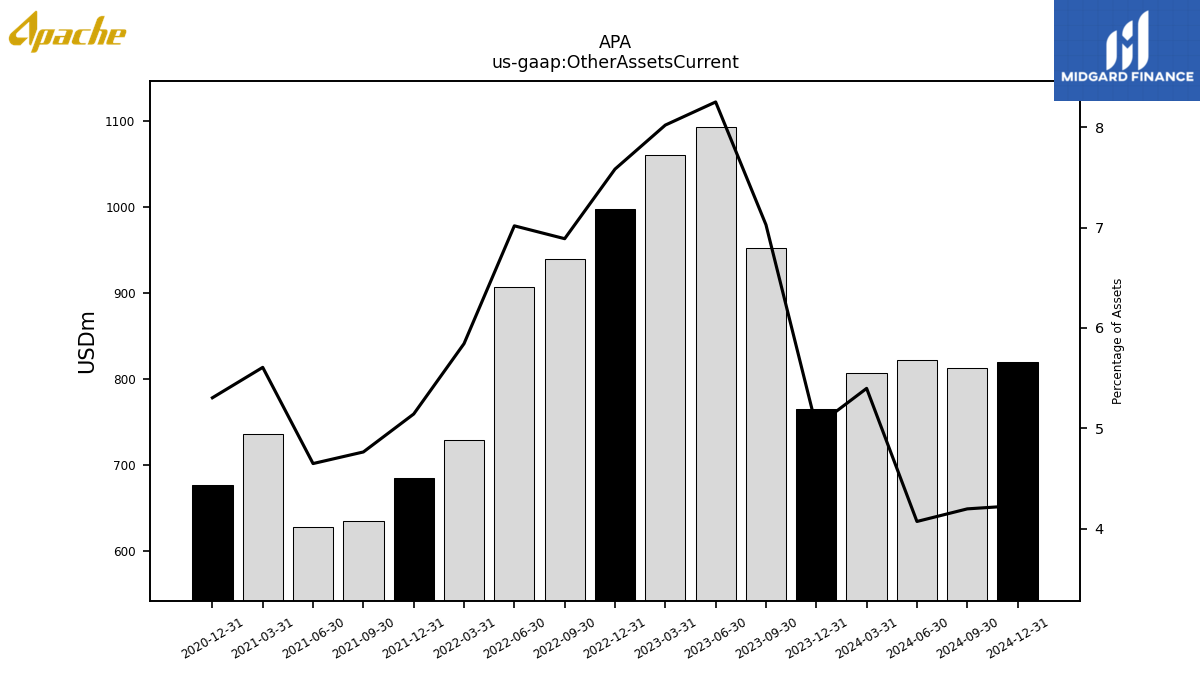
| Other Assets Current | 765.00 | 952.00 | 1093.00 | 1060.00 | 997.00 | 939.00 | 907.00 | 729.00 | 684.00 | 634.00 | 628.00 | 736.00 | 676.00 | NA | NA | NA | |
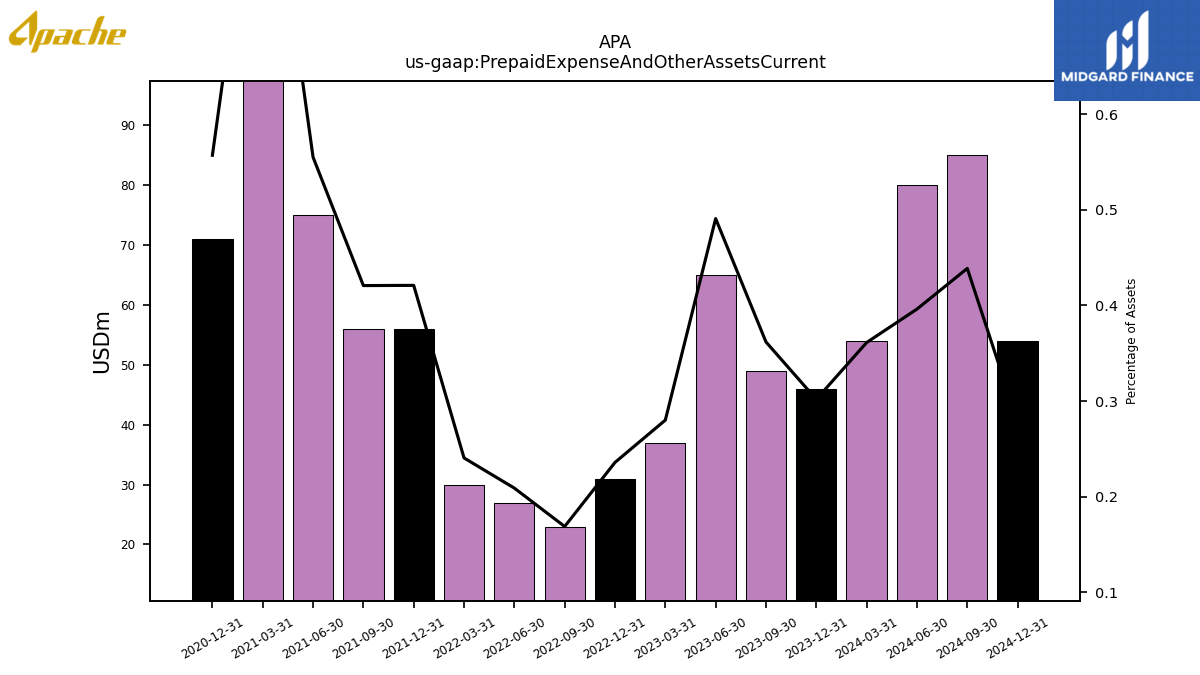
| Prepaid Expense And Other Assets Current | 46.00 | 49.00 | 65.00 | 37.00 | 31.00 | 23.00 | 27.00 | 30.00 | 56.00 | 56.00 | 75.00 | 123.00 | 71.00 | NA | NA | NA |
| 2023-12-31 | 2023-09-30 | 2023-06-30 | 2023-03-31 | 2022-12-31 | 2022-09-30 | 2022-06-30 | 2022-03-31 | 2021-12-31 | 2021-09-30 | 2021-06-30 | 2021-03-31 | 2020-12-31 | 2020-09-30 | 2020-06-30 | 2020-03-31 | ||
|---|---|---|---|---|---|---|---|---|---|---|---|---|---|---|---|---|---|
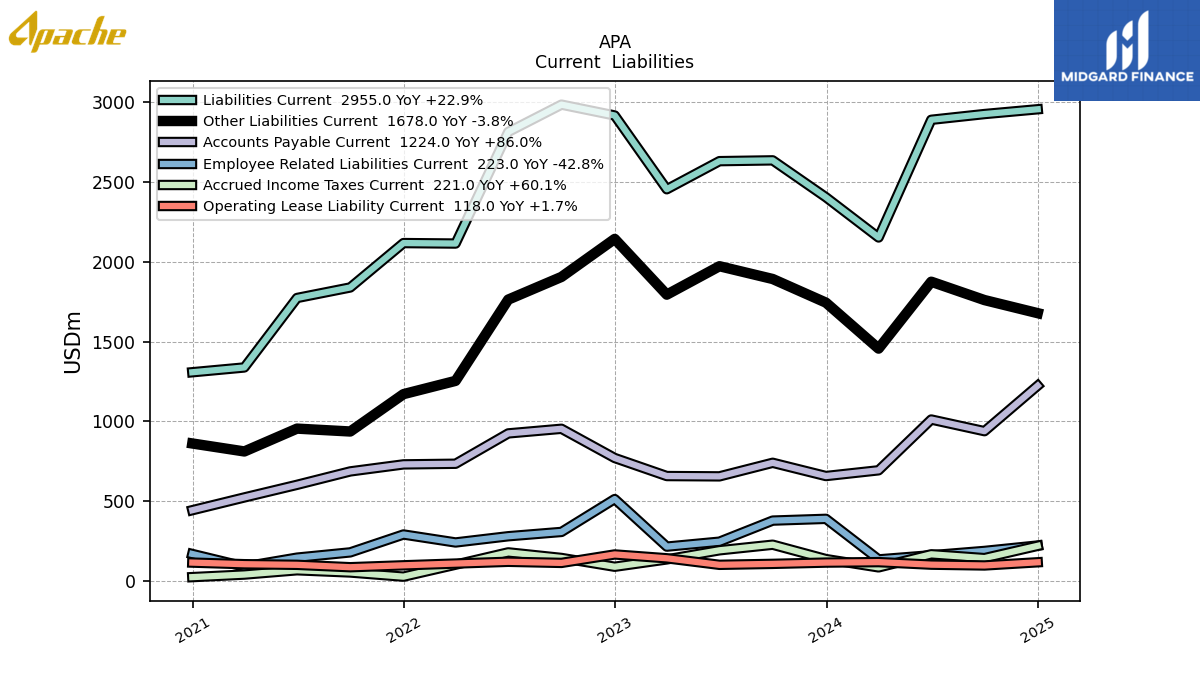
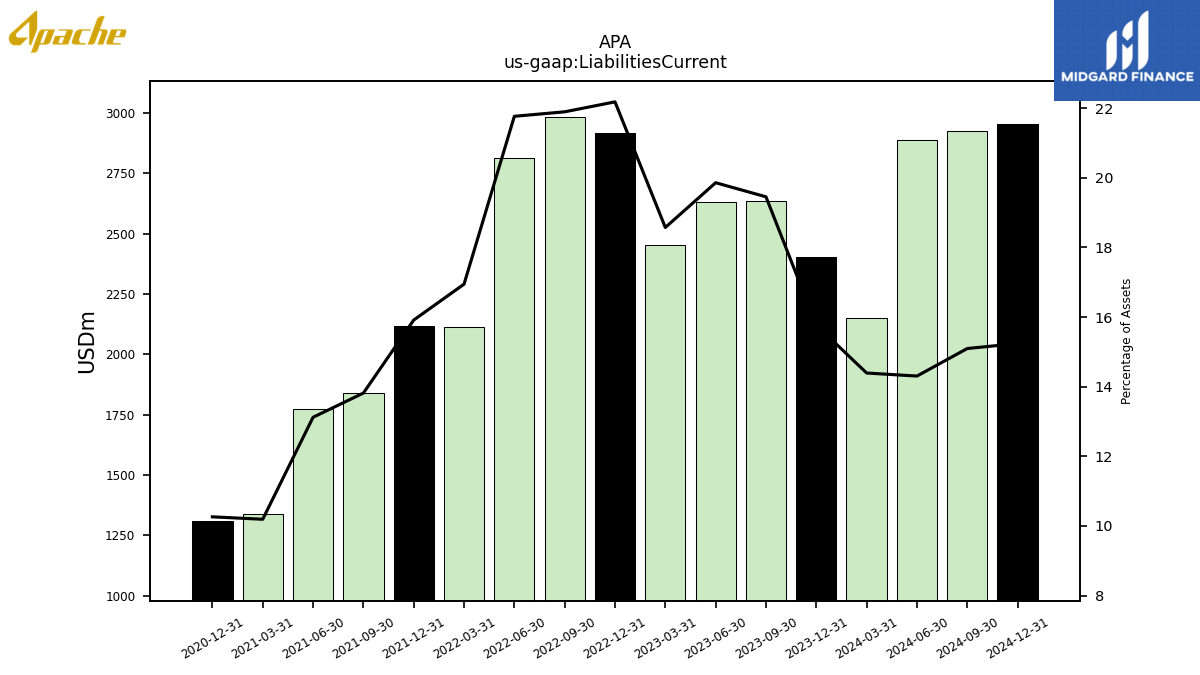
| Liabilities Current | 2404.00 | 2635.00 | 2630.00 | 2454.00 | 2916.00 | 2984.00 | 2813.00 | 2114.00 | 2117.00 | 1839.00 | 1773.00 | 1338.00 | 1308.00 | NA | NA | NA | |
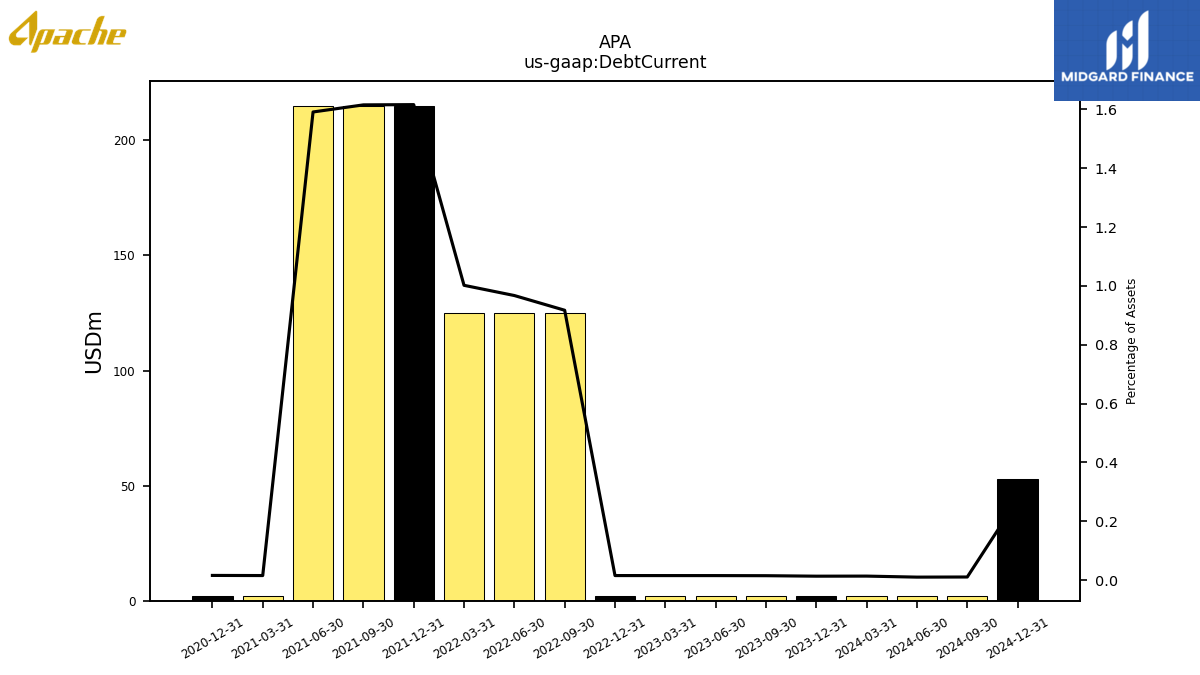
| Debt Current | 2.00 | 2.00 | 2.00 | 2.00 | 2.00 | 125.00 | 125.00 | 125.00 | 215.00 | 215.00 | 215.00 | 2.00 | 2.00 | NA | NA | NA | |
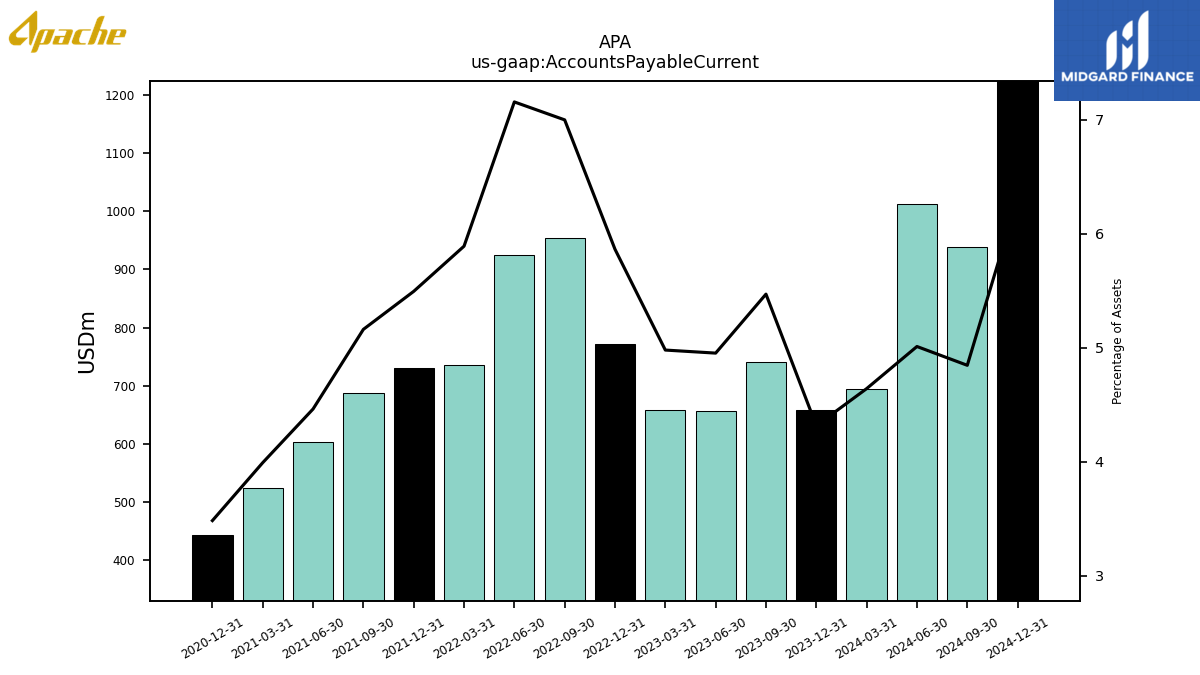
| Accounts Payable Current | 658.00 | 741.00 | 656.00 | 658.00 | 771.00 | 954.00 | 925.00 | 735.00 | 731.00 | 687.00 | 603.00 | 524.00 | 444.00 | NA | NA | NA | |
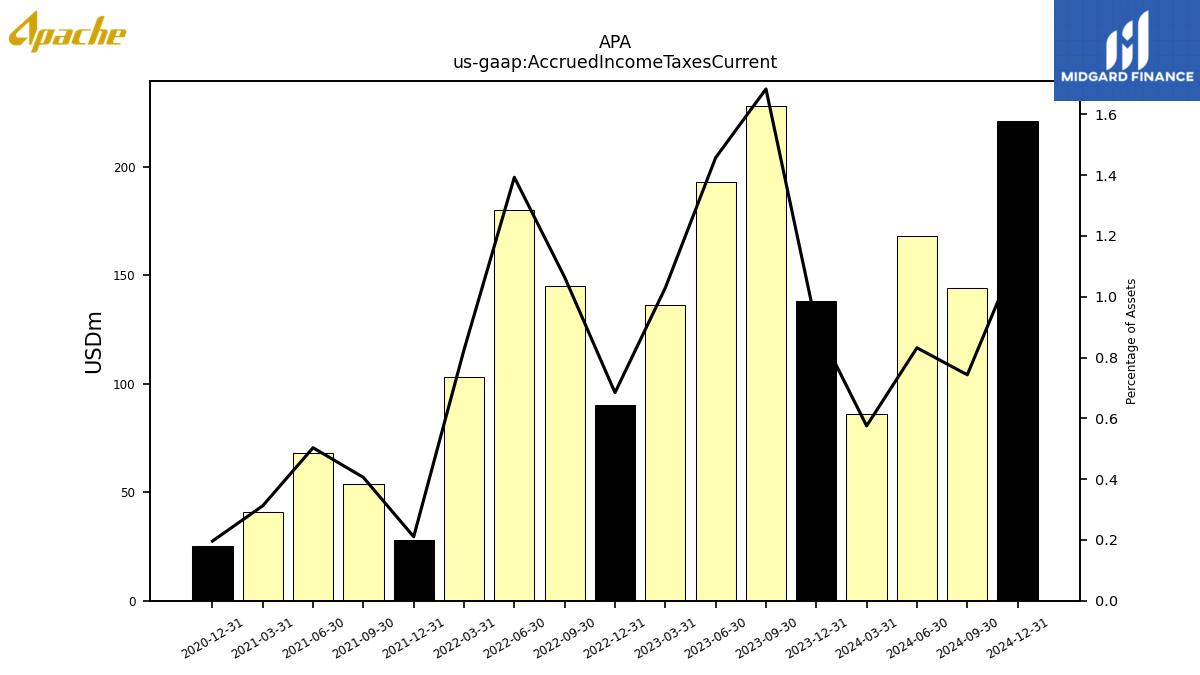
| Accrued Income Taxes Current | 138.00 | 228.00 | 193.00 | 136.00 | 90.00 | 145.00 | 180.00 | 103.00 | 28.00 | 54.00 | 68.00 | 41.00 | 25.00 | NA | NA | NA | |
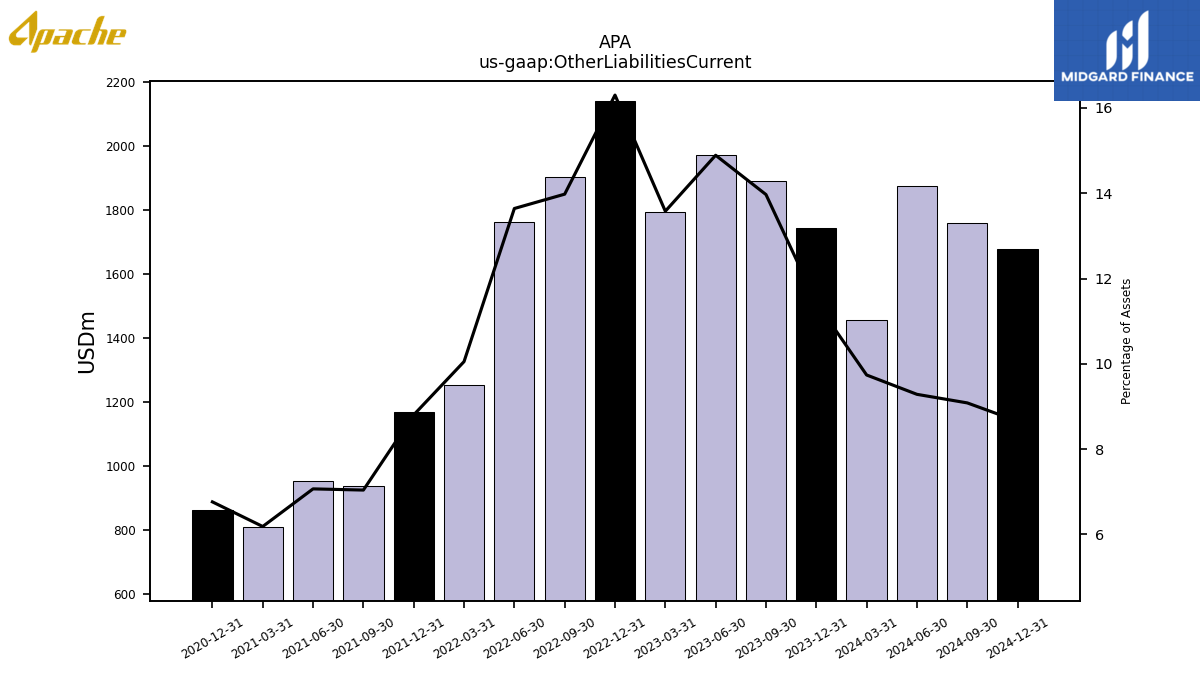
| Other Liabilities Current | 1744.00 | 1892.00 | 1972.00 | 1794.00 | 2143.00 | 1905.00 | 1763.00 | 1254.00 | 1171.00 | 937.00 | 955.00 | 812.00 | 862.00 | NA | NA | NA |
| 2023-12-31 | 2023-09-30 | 2023-06-30 | 2023-03-31 | 2022-12-31 | 2022-09-30 | 2022-06-30 | 2022-03-31 | 2021-12-31 | 2021-09-30 | 2021-06-30 | 2021-03-31 | 2020-12-31 | 2020-09-30 | 2020-06-30 | 2020-03-31 | ||
|---|---|---|---|---|---|---|---|---|---|---|---|---|---|---|---|---|---|
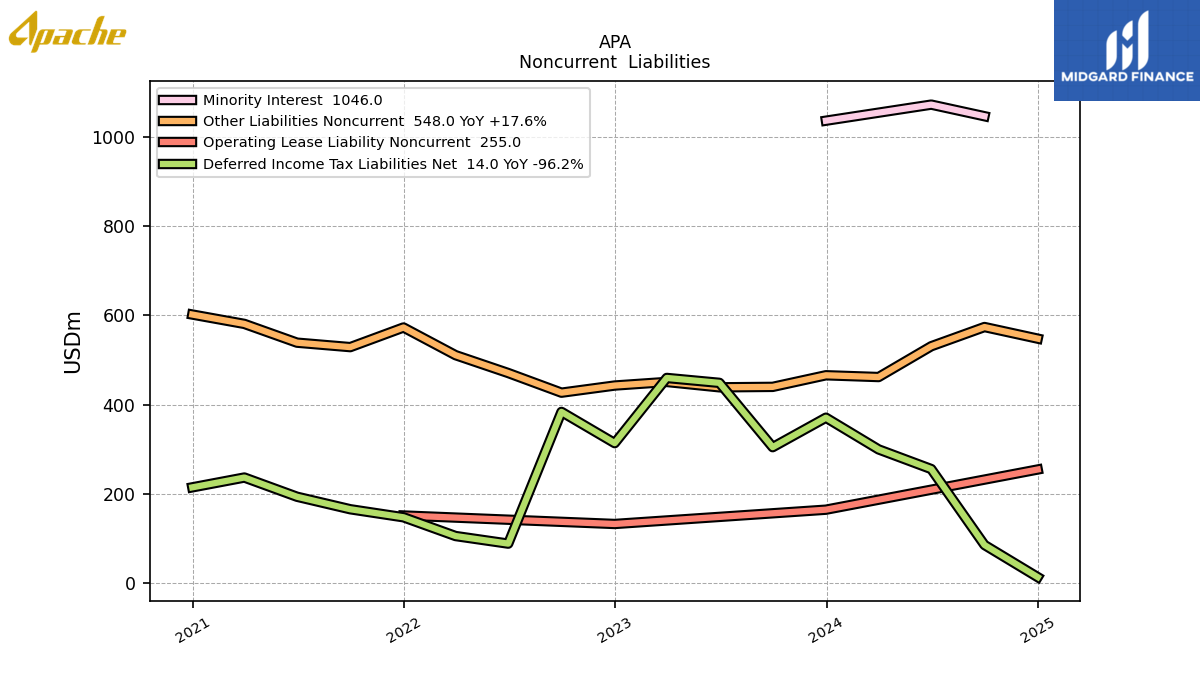
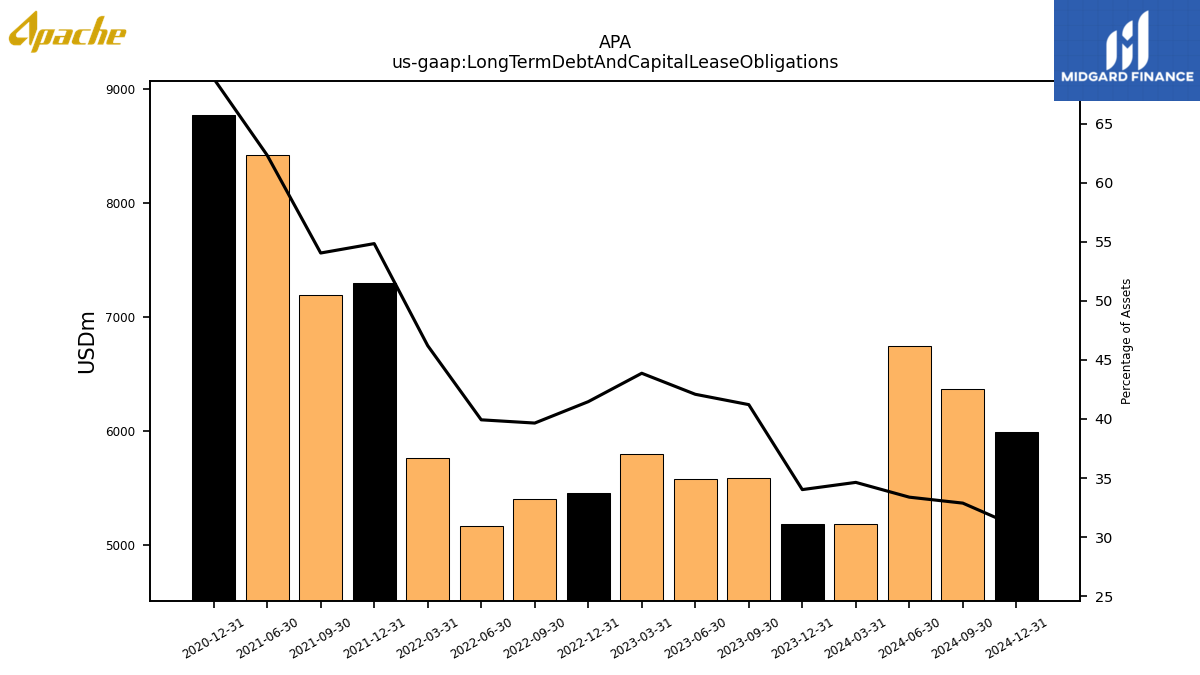
| Long Term Debt And Capital Lease Obligations | 5186.00 | 5582.00 | 5574.00 | 5796.00 | 5451.00 | 5404.00 | 5160.00 | 5764.00 | 7295.00 | 7193.00 | 8420.00 | NA | 8770.00 | NA | NA | NA | |
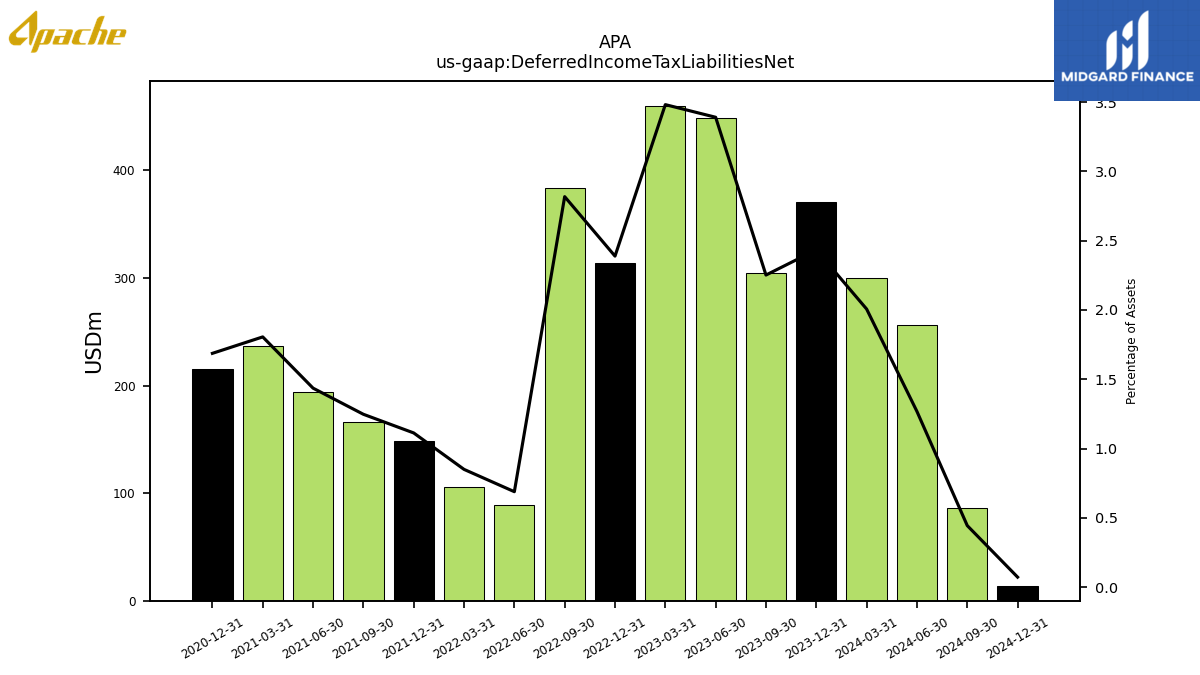
| Deferred Income Tax Liabilities Net | 371.00 | 305.00 | 449.00 | 460.00 | 314.00 | 384.00 | 89.00 | 106.00 | 148.00 | 166.00 | 194.00 | 237.00 | 215.00 | NA | NA | NA | |
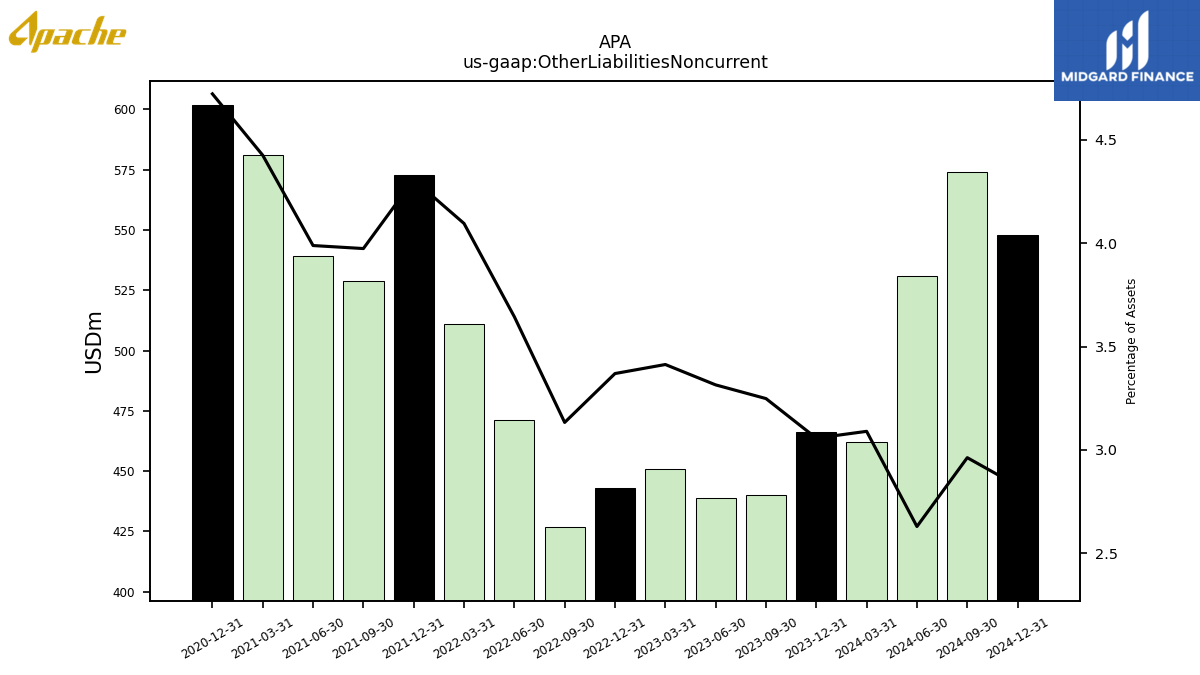
| Other Liabilities Noncurrent | 466.00 | 440.00 | 439.00 | 451.00 | 443.00 | 427.00 | 471.00 | 511.00 | 573.00 | 529.00 | 539.00 | 581.00 | 602.00 | NA | NA | NA | |
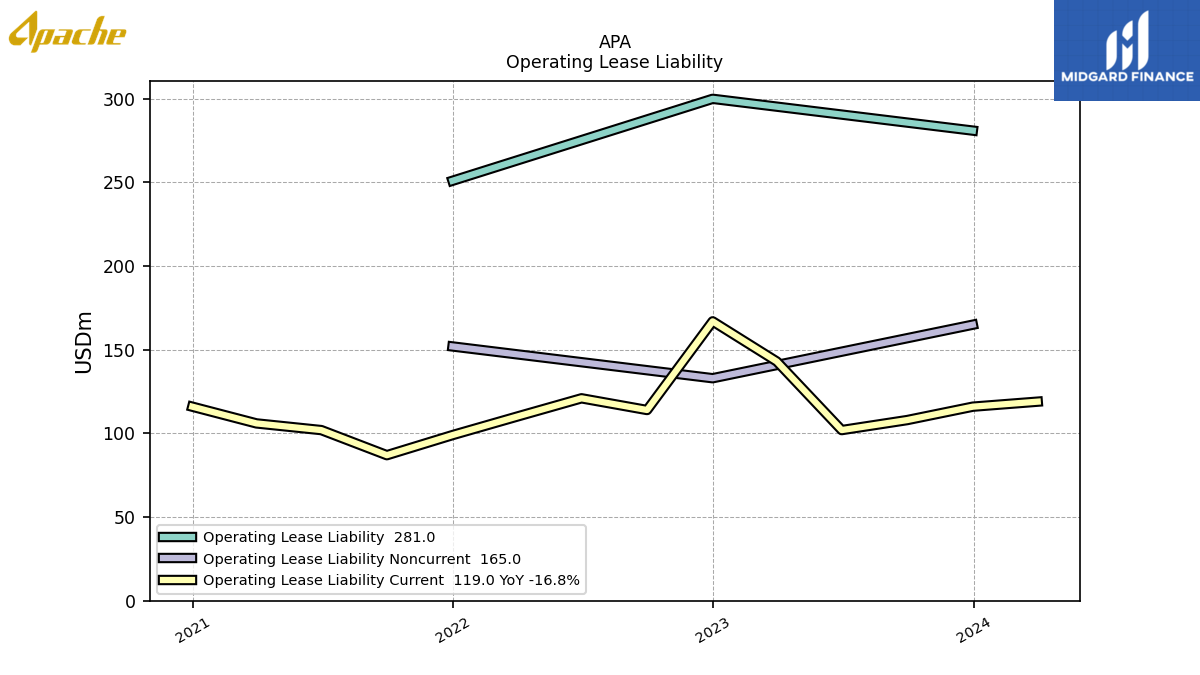
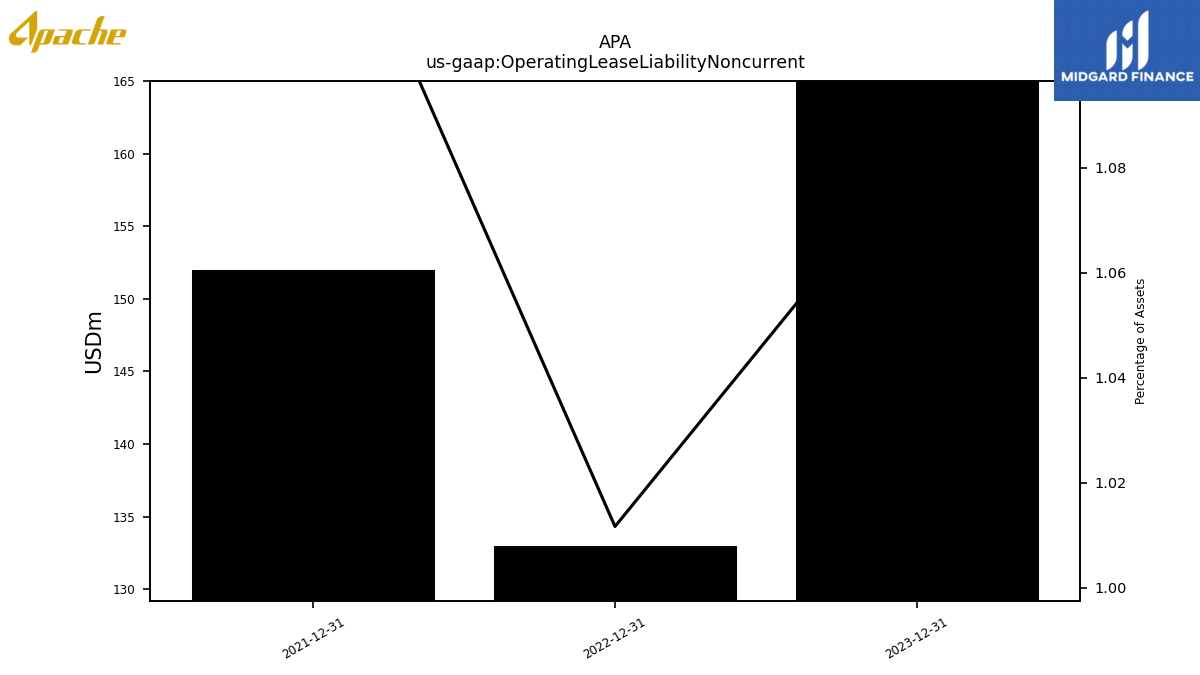
| Operating Lease Liability Noncurrent | 165.00 | NA | NA | NA | 133.00 | NA | NA | NA | 152.00 | NA | NA | NA | NA | NA | NA | NA |
| 2023-12-31 | 2023-09-30 | 2023-06-30 | 2023-03-31 | 2022-12-31 | 2022-09-30 | 2022-06-30 | 2022-03-31 | 2021-12-31 | 2021-09-30 | 2021-06-30 | 2021-03-31 | 2020-12-31 | 2020-09-30 | 2020-06-30 | 2020-03-31 | ||
|---|---|---|---|---|---|---|---|---|---|---|---|---|---|---|---|---|---|
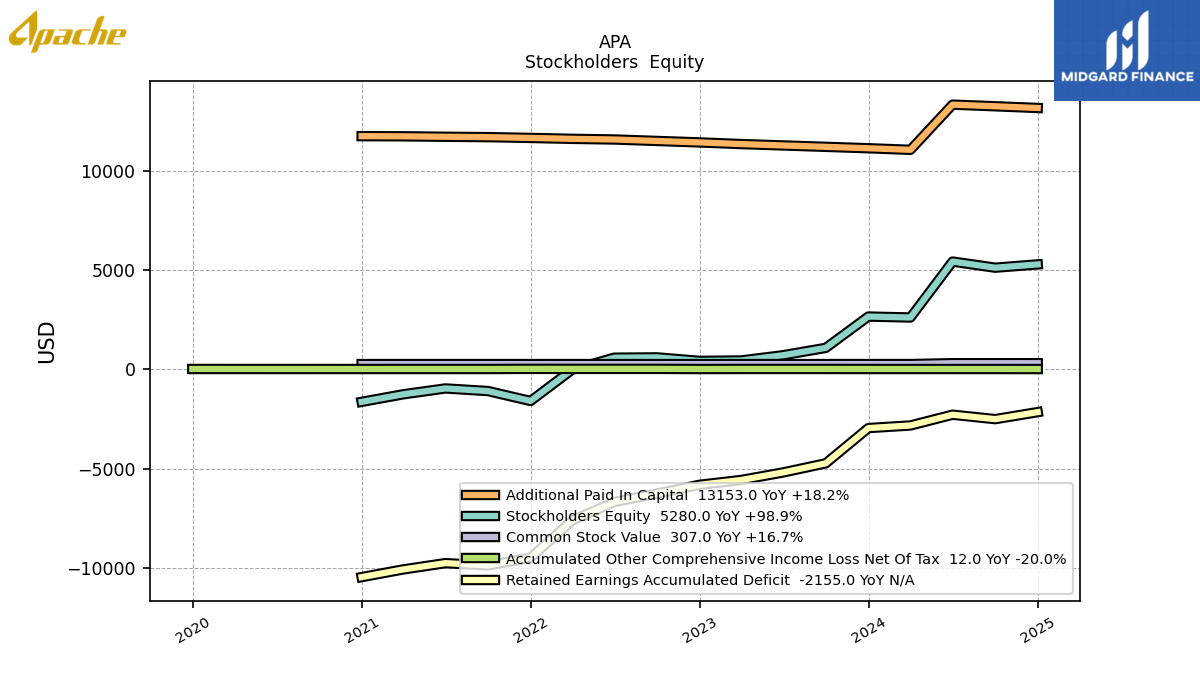
| Stockholders Equity | 2655.00 | 1078.00 | 709.00 | 444.00 | 423.00 | 600.00 | 584.00 | -18.00 | -1595.00 | -1095.00 | -964.00 | -1258.00 | -1639.00 | NA | NA | NA | |
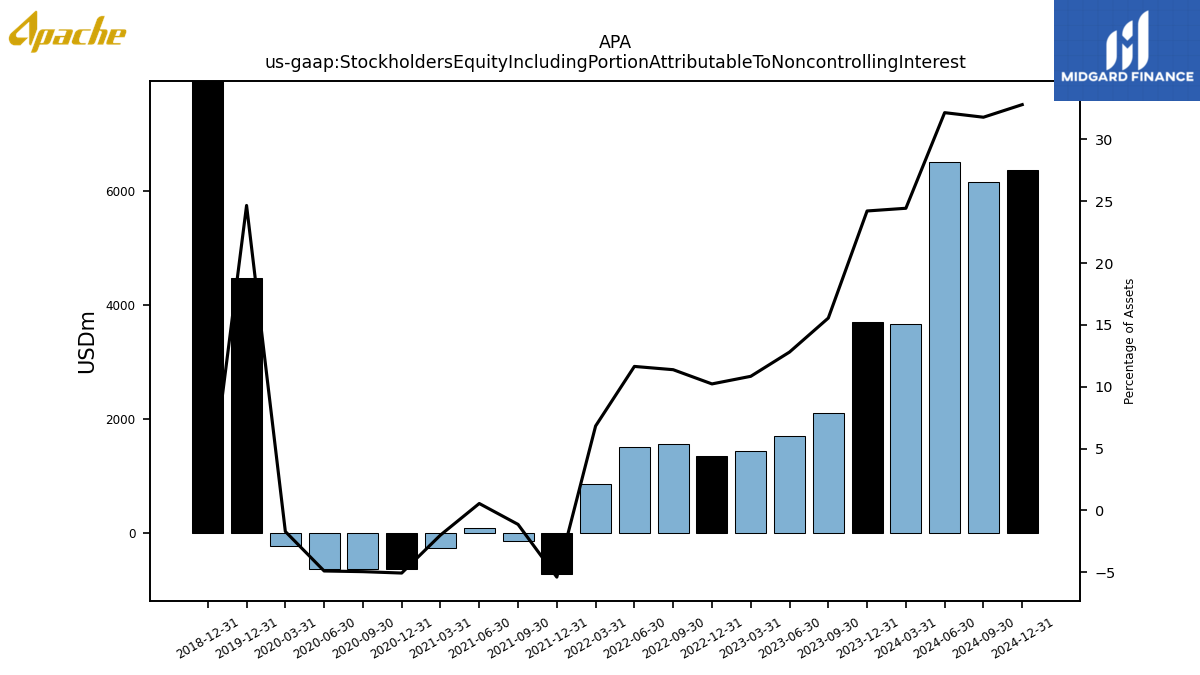
| Stockholders Equity Including Portion Attributable To Noncontrolling Interest | 3691.00 | 2107.00 | 1696.00 | 1433.00 | 1345.00 | 1551.00 | 1505.00 | 852.00 | -717.00 | -150.00 | 76.00 | -261.00 | -645.00 | -637.00 | -636.00 | -228.00 | |
| Common Stock Value | 263.00 | 263.00 | 263.00 | 263.00 | 262.00 | 262.00 | 262.00 | 262.00 | 262.00 | 262.00 | 262.00 | 262.00 | 262.00 | NA | NA | NA | |
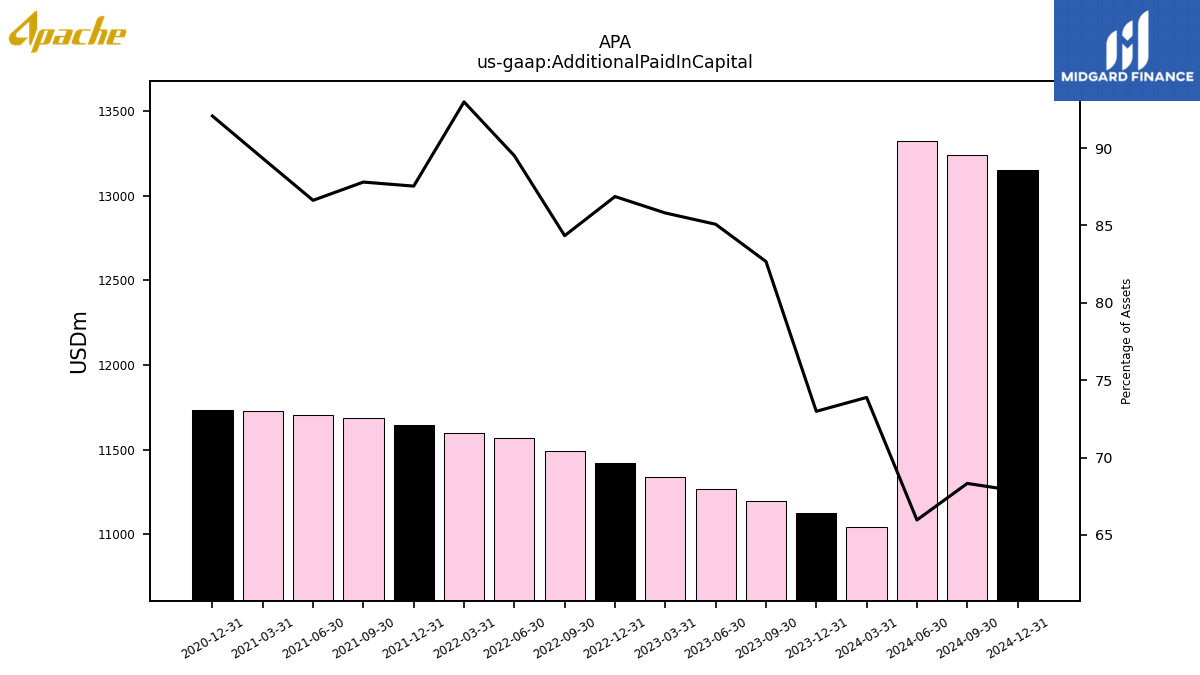
| Additional Paid In Capital | 11126.00 | 11197.00 | 11267.00 | 11337.00 | 11420.00 | 11494.00 | 11567.00 | 11600.00 | 11645.00 | 11686.00 | 11704.00 | 11727.00 | 11735.00 | NA | NA | NA | |
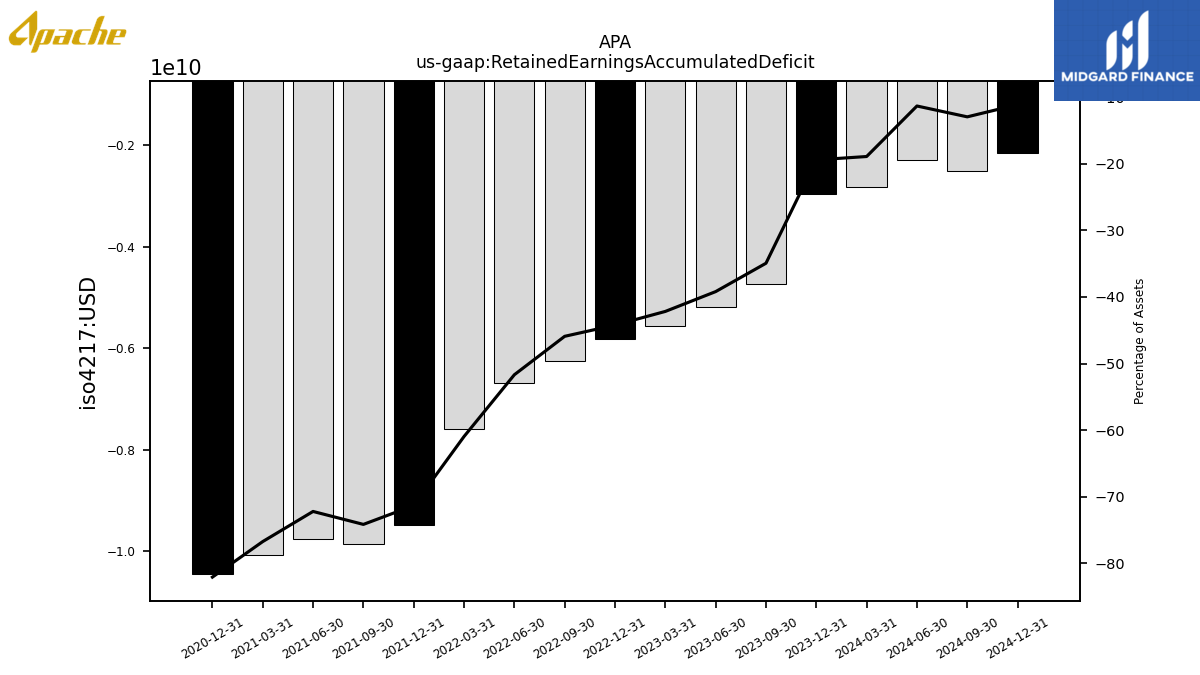
| Retained Earnings Accumulated Deficit | -2959.00 | -4732.00 | -5191.00 | -5572.00 | -5814.00 | -6257.00 | -6679.00 | -7605.00 | -9488.00 | -9870.00 | -9757.00 | -10073.00 | -10461.00 | NA | NA | NA | |
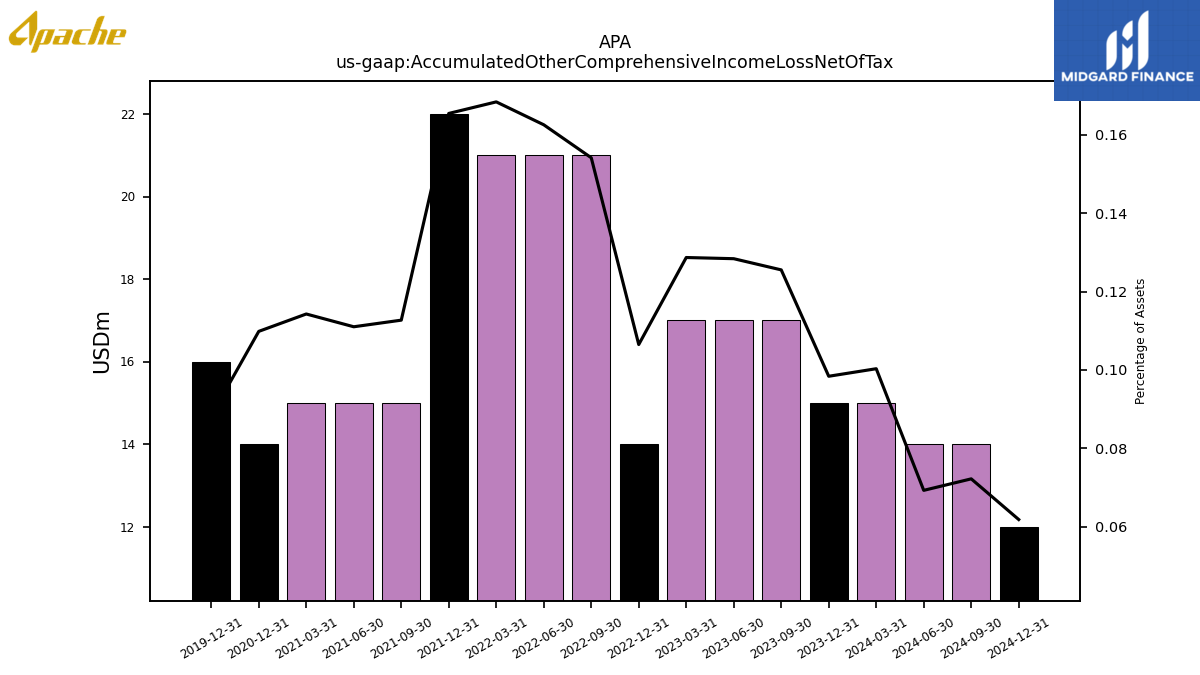
| Accumulated Other Comprehensive Income Loss Net Of Tax | 15.00 | 17.00 | 17.00 | 17.00 | 14.00 | 21.00 | 21.00 | 21.00 | 22.00 | 15.00 | 15.00 | 15.00 | 14.00 | NA | NA | NA |
| 2023-12-31 | 2023-09-30 | 2023-06-30 | 2023-03-31 | 2022-12-31 | 2022-09-30 | 2022-06-30 | 2022-03-31 | 2021-12-31 | 2021-09-30 | 2021-06-30 | 2021-03-31 | 2020-12-31 | 2020-09-30 | 2020-06-30 | 2020-03-31 | ||
|---|---|---|---|---|---|---|---|---|---|---|---|---|---|---|---|---|---|
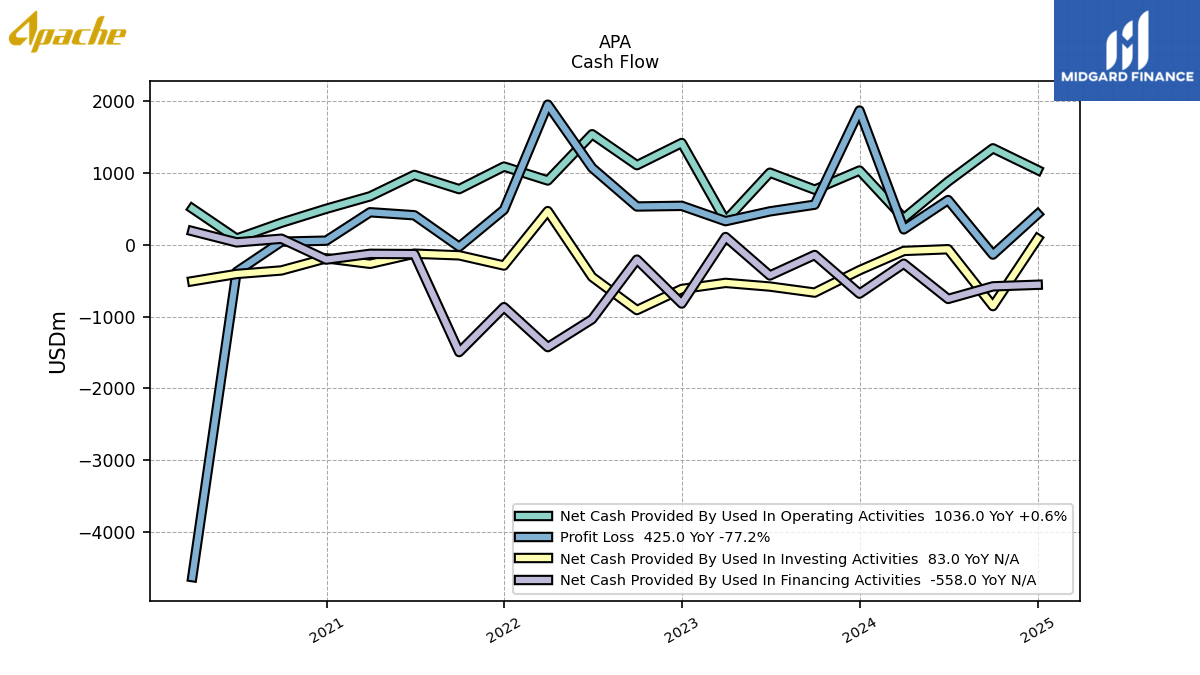
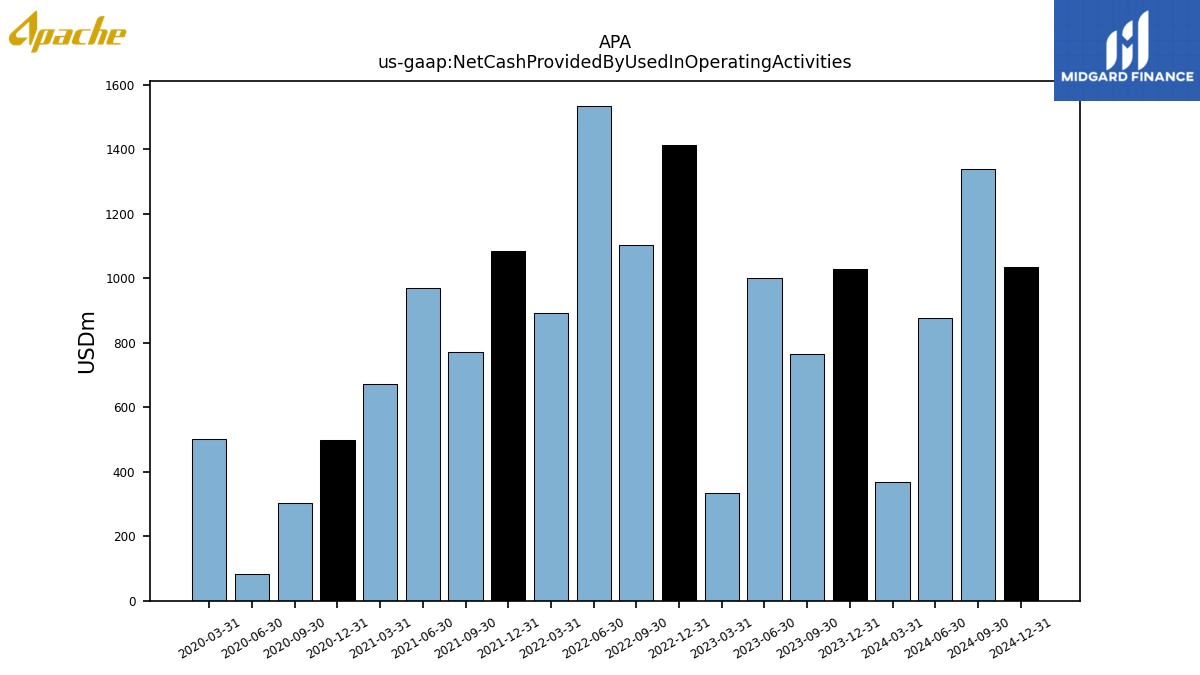
| Net Cash Provided By Used In Operating Activities | 1030.00 | 764.00 | 1000.00 | 335.00 | 1413.00 | 1104.00 | 1535.00 | 891.00 | 1085.00 | 771.00 | 969.00 | 671.00 | 498.00 | 304.00 | 84.00 | 502.00 | |
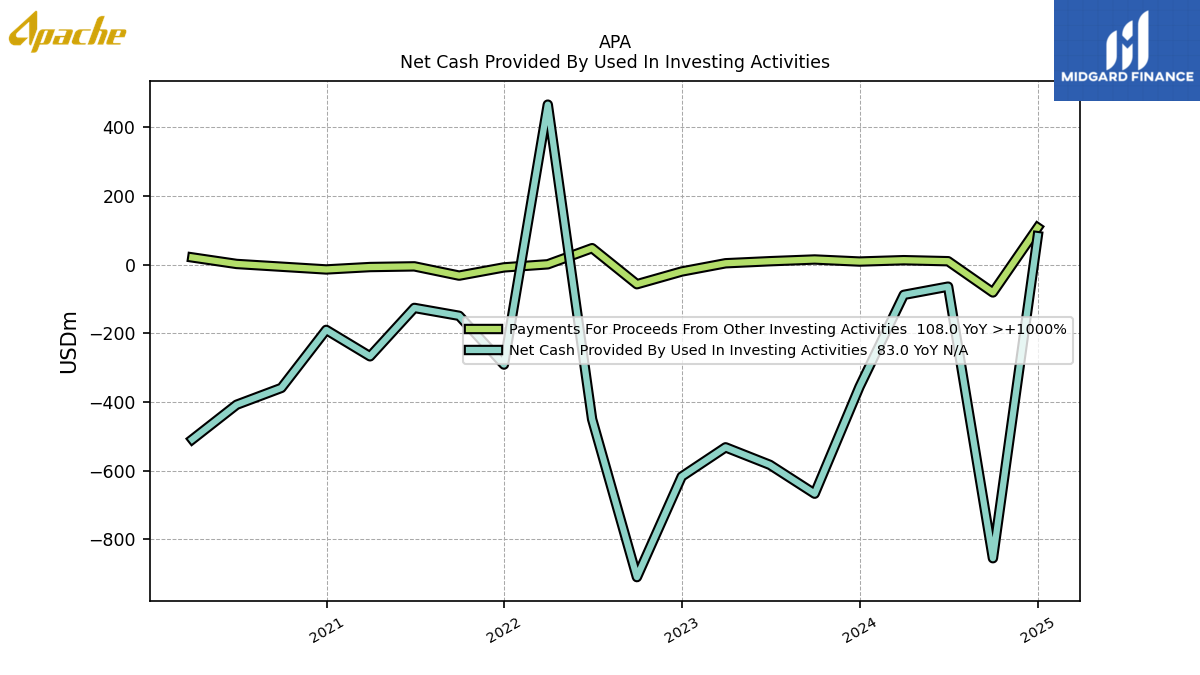
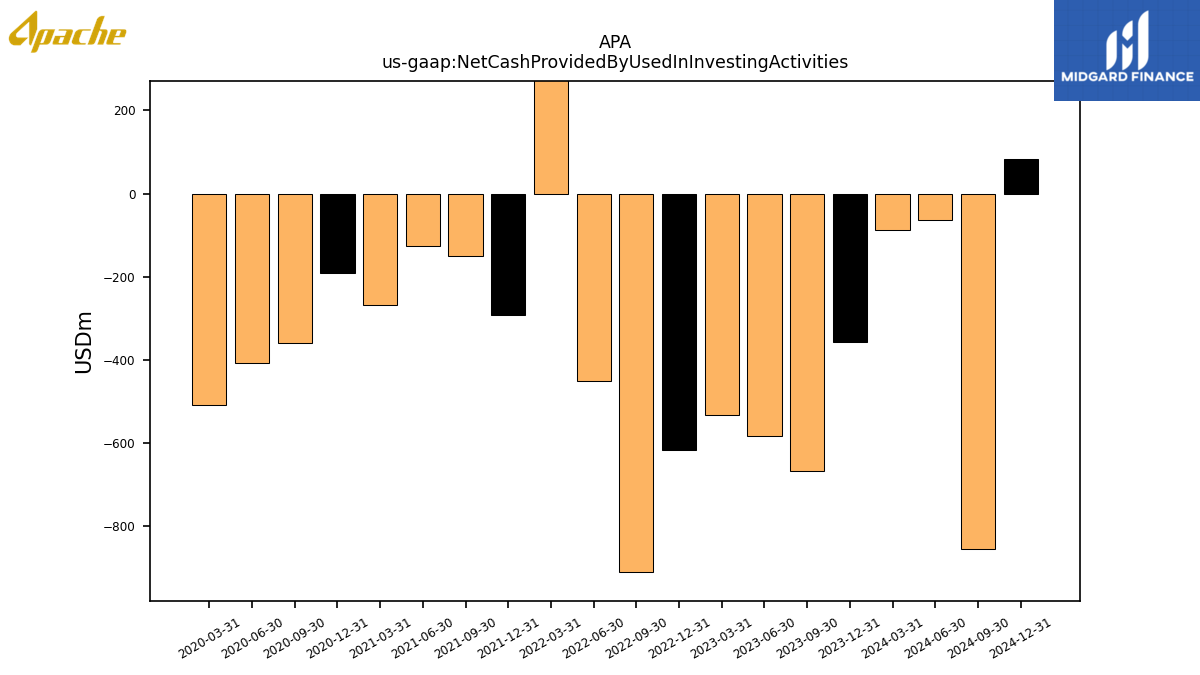
| Net Cash Provided By Used In Investing Activities | -356.00 | -667.00 | -583.00 | -532.00 | -617.00 | -910.00 | -450.00 | 466.00 | -291.00 | -149.00 | -126.00 | -267.00 | -190.00 | -359.00 | -408.00 | -509.00 | |
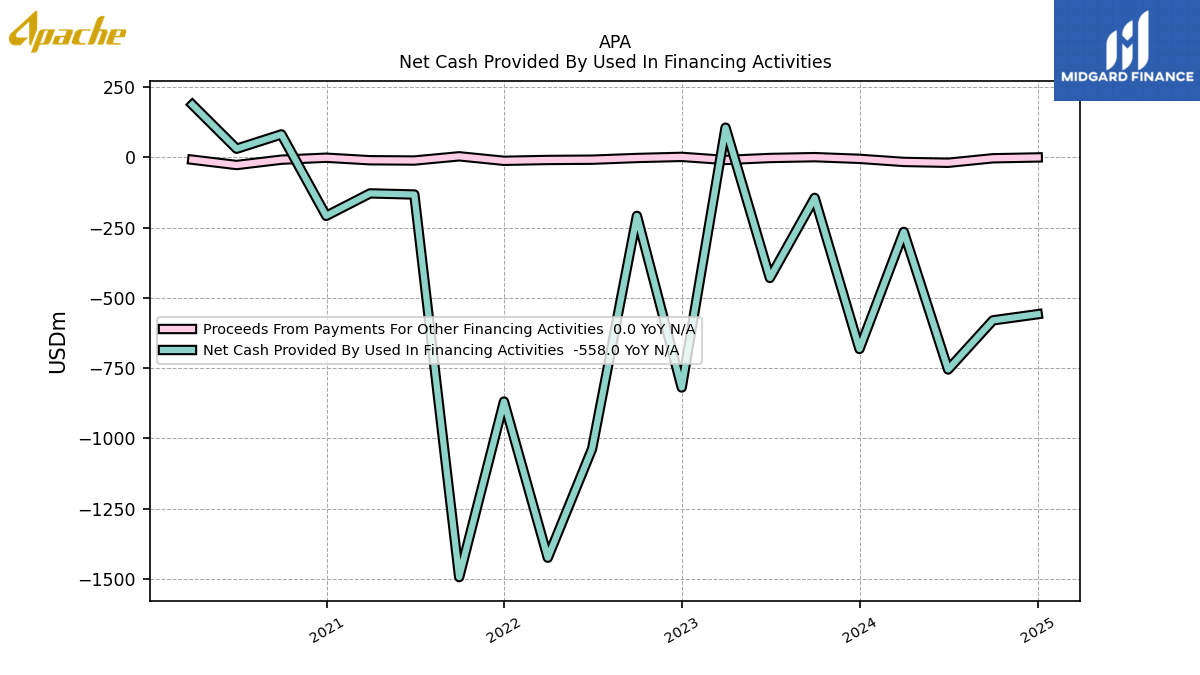
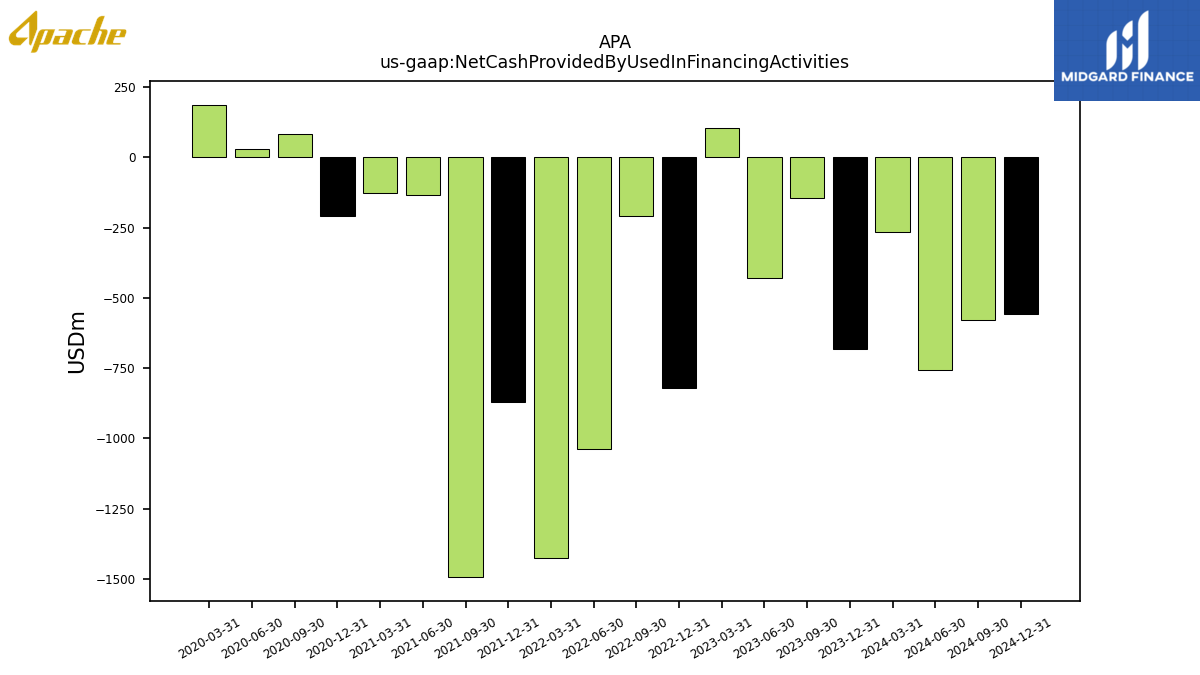
| Net Cash Provided By Used In Financing Activities | -682.00 | -144.00 | -429.00 | 106.00 | -819.00 | -208.00 | -1037.00 | -1425.00 | -869.00 | -1494.00 | -132.00 | -128.00 | -208.00 | 82.00 | 31.00 | 188.00 |
| 2023-12-31 | 2023-09-30 | 2023-06-30 | 2023-03-31 | 2022-12-31 | 2022-09-30 | 2022-06-30 | 2022-03-31 | 2021-12-31 | 2021-09-30 | 2021-06-30 | 2021-03-31 | 2020-12-31 | 2020-09-30 | 2020-06-30 | 2020-03-31 | ||
|---|---|---|---|---|---|---|---|---|---|---|---|---|---|---|---|---|---|
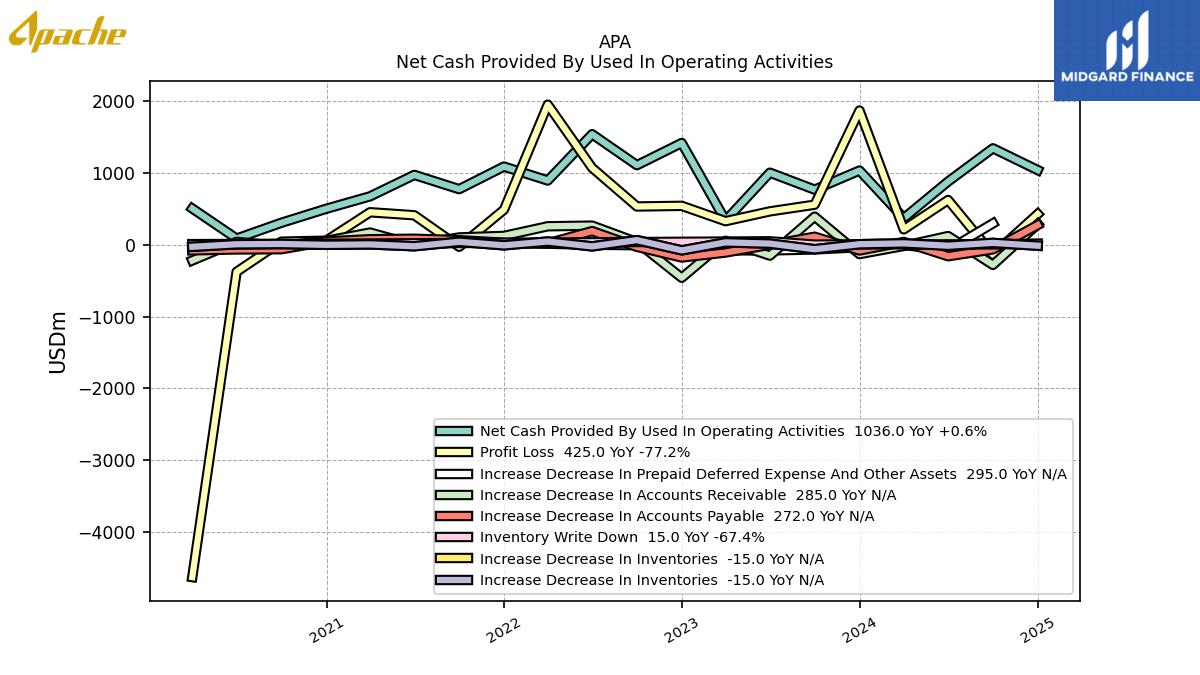
| Net Cash Provided By Used In Operating Activities | 1030.00 | 764.00 | 1000.00 | 335.00 | 1413.00 | 1104.00 | 1535.00 | 891.00 | 1085.00 | 771.00 | 969.00 | 671.00 | 498.00 | 304.00 | 84.00 | 502.00 | |
| Profit Loss | 1864.00 | 555.00 | 462.00 | 326.00 | 539.00 | 530.00 | 1067.00 | 1946.00 | 485.00 | -30.00 | 408.00 | 450.00 | 55.00 | 41.00 | -378.00 | -4622.00 | |
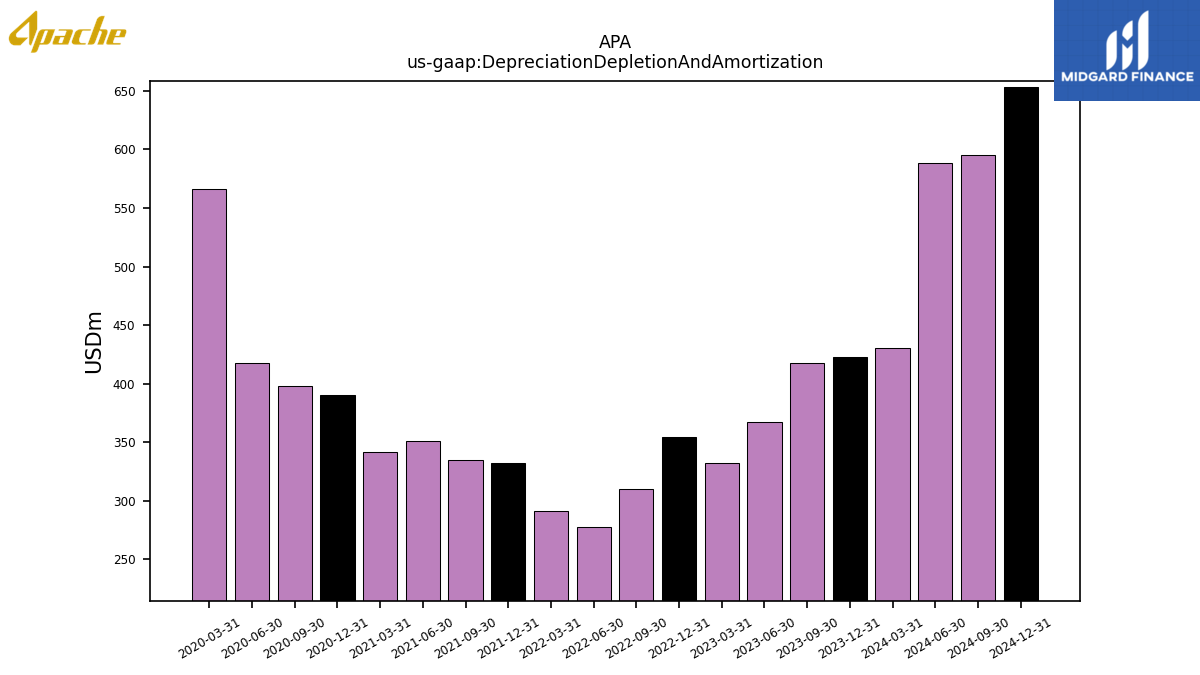
| Depreciation Depletion And Amortization | 423.00 | 418.00 | 367.00 | 332.00 | 354.00 | 310.00 | 278.00 | 291.00 | 332.00 | 335.00 | 351.00 | 342.00 | 390.00 | 398.00 | 418.00 | 566.00 | |
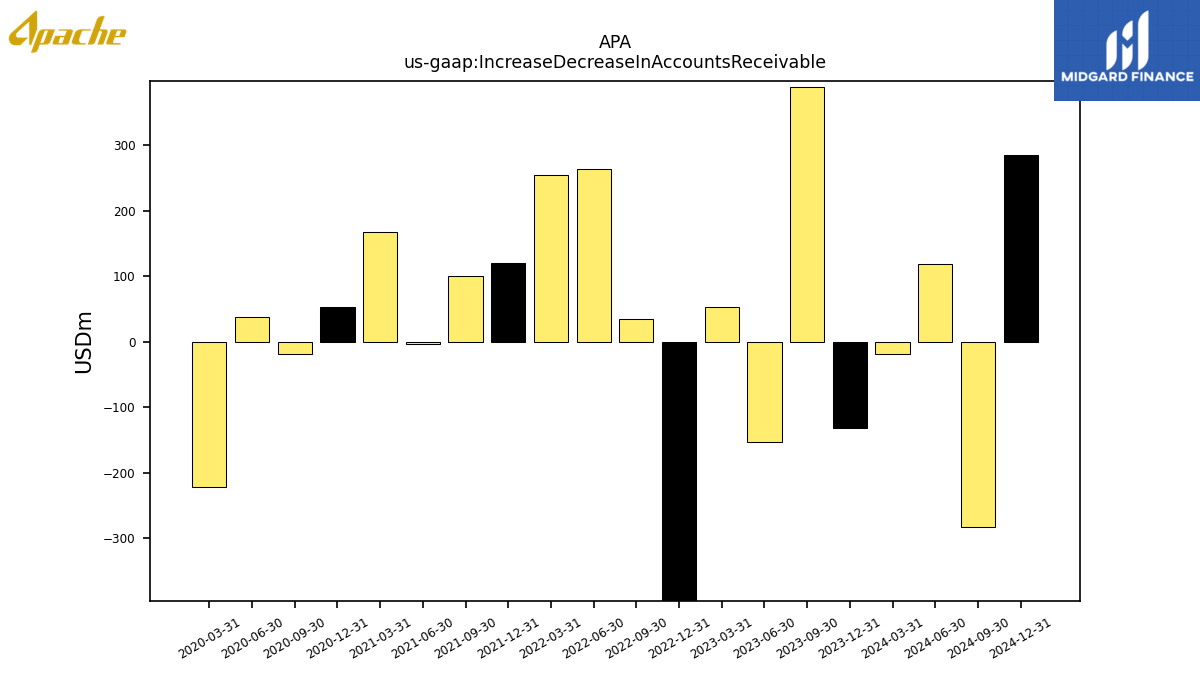
| Increase Decrease In Accounts Receivable | -132.00 | 389.00 | -153.00 | 53.00 | -461.00 | 35.00 | 264.00 | 255.00 | 121.00 | 100.00 | -3.00 | 168.00 | 53.00 | -19.00 | 38.00 | -221.00 | |
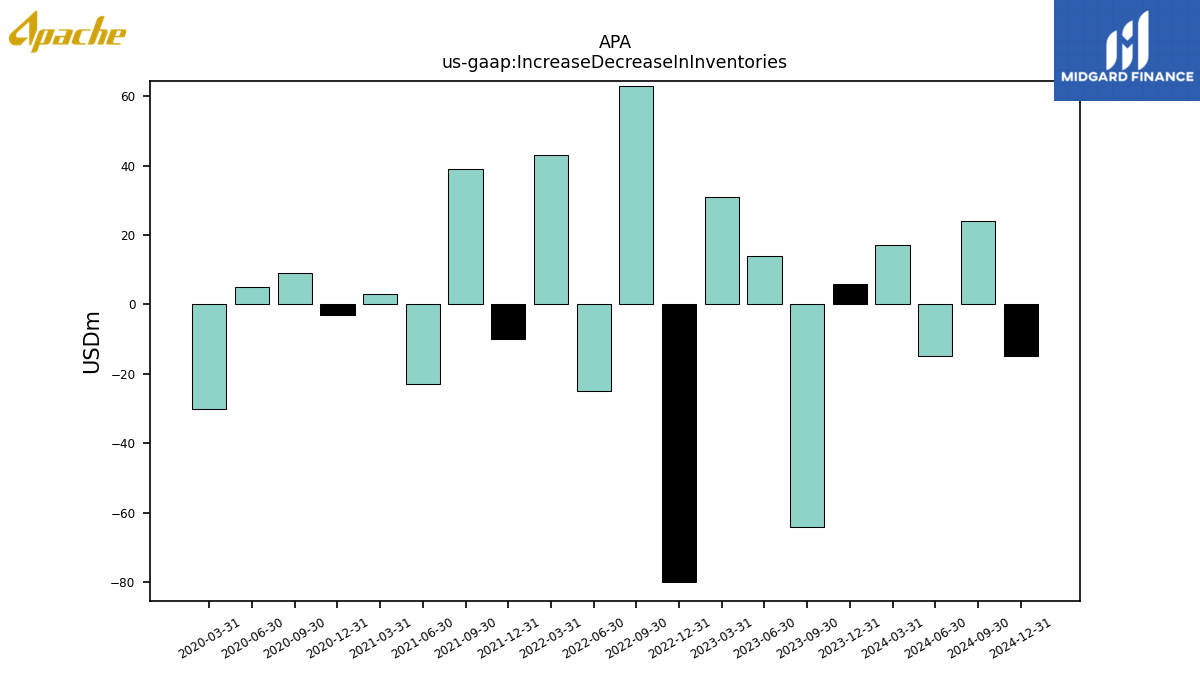
| Increase Decrease In Inventories | 6.00 | -64.00 | 14.00 | 31.00 | -80.00 | 63.00 | -25.00 | 43.00 | -10.00 | 39.00 | -23.00 | 3.00 | -3.00 | 9.00 | 5.00 | -30.00 | |
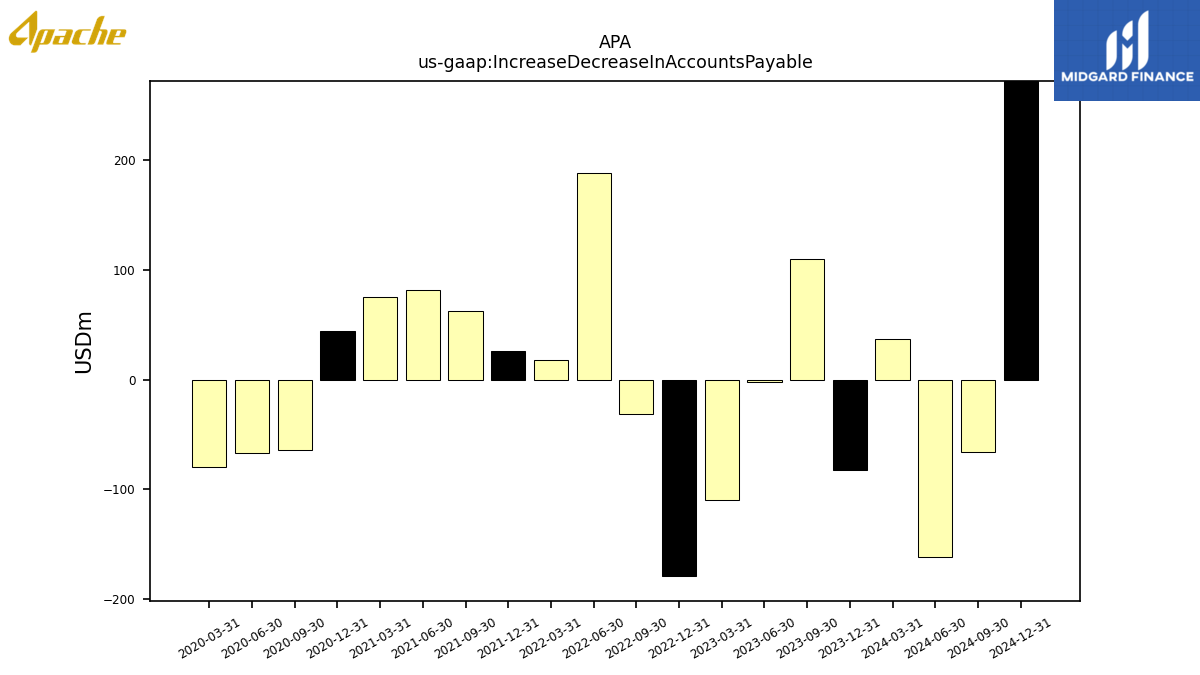
| Increase Decrease In Accounts Payable | -82.00 | 110.00 | -2.00 | -110.00 | -179.00 | -31.00 | 188.00 | 18.00 | 26.00 | 62.00 | 82.00 | 75.00 | 44.00 | -64.00 | -67.00 | -80.00 | |
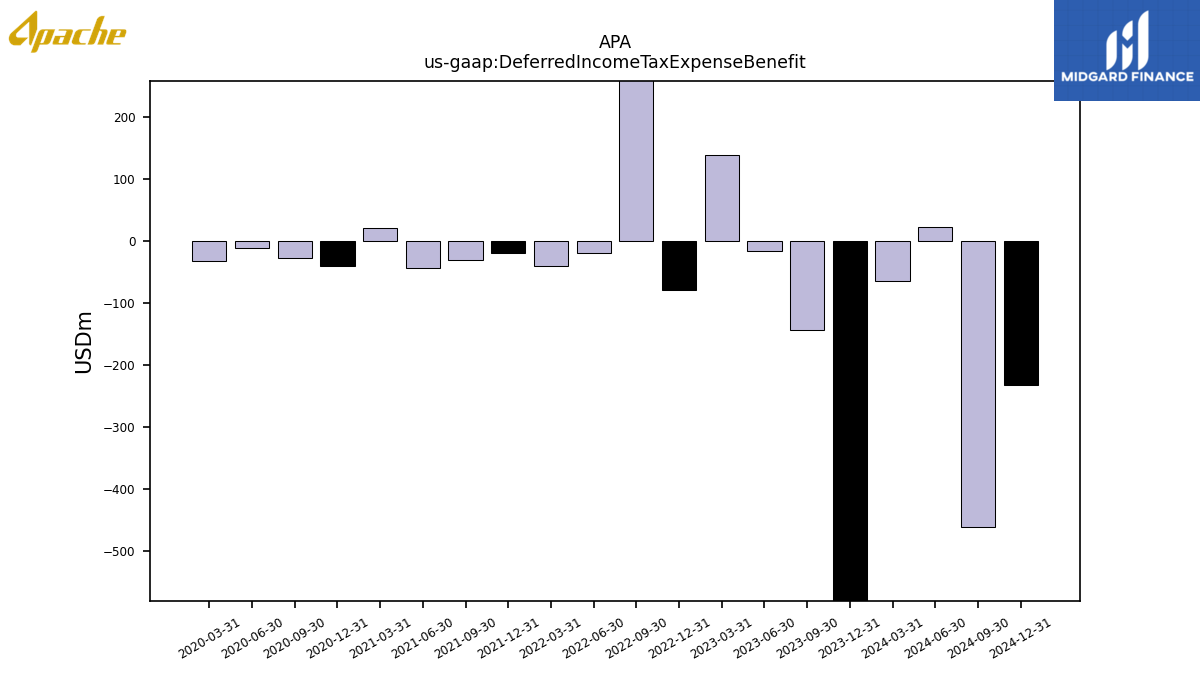
| Deferred Income Tax Expense Benefit | -1640.00 | -144.00 | -16.00 | 138.00 | -80.00 | 285.00 | -20.00 | -40.00 | -20.00 | -31.00 | -44.00 | 21.00 | -41.00 | -27.00 | -11.00 | -33.00 | |
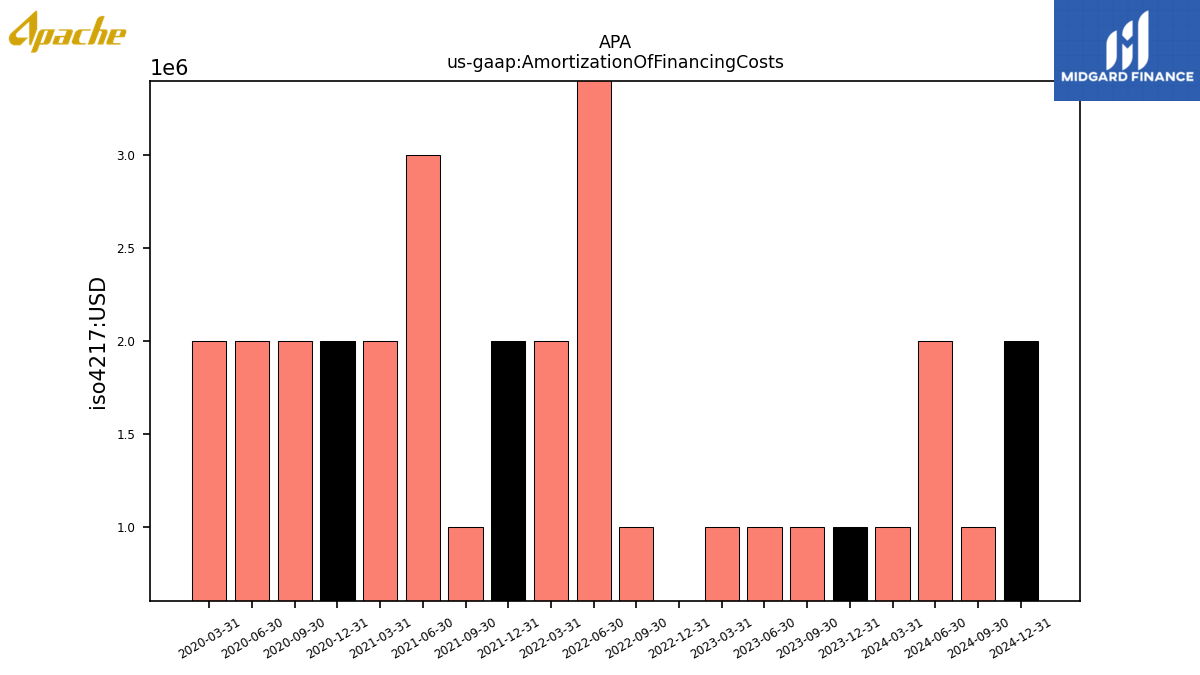
| Amortization Of Financing Costs | 1.00 | 1.00 | 1.00 | 1.00 | 0.00 | 1.00 | 5.00 | 2.00 | 2.00 | 1.00 | 3.00 | 2.00 | 2.00 | 2.00 | 2.00 | 2.00 |
| 2023-12-31 | 2023-09-30 | 2023-06-30 | 2023-03-31 | 2022-12-31 | 2022-09-30 | 2022-06-30 | 2022-03-31 | 2021-12-31 | 2021-09-30 | 2021-06-30 | 2021-03-31 | 2020-12-31 | 2020-09-30 | 2020-06-30 | 2020-03-31 | ||
|---|---|---|---|---|---|---|---|---|---|---|---|---|---|---|---|---|---|
| Net Cash Provided By Used In Investing Activities | -356.00 | -667.00 | -583.00 | -532.00 | -617.00 | -910.00 | -450.00 | 466.00 | -291.00 | -149.00 | -126.00 | -267.00 | -190.00 | -359.00 | -408.00 | -509.00 |
| 2023-12-31 | 2023-09-30 | 2023-06-30 | 2023-03-31 | 2022-12-31 | 2022-09-30 | 2022-06-30 | 2022-03-31 | 2021-12-31 | 2021-09-30 | 2021-06-30 | 2021-03-31 | 2020-12-31 | 2020-09-30 | 2020-06-30 | 2020-03-31 | ||
|---|---|---|---|---|---|---|---|---|---|---|---|---|---|---|---|---|---|
| Net Cash Provided By Used In Financing Activities | -682.00 | -144.00 | -429.00 | 106.00 | -819.00 | -208.00 | -1037.00 | -1425.00 | -869.00 | -1494.00 | -132.00 | -128.00 | -208.00 | 82.00 | 31.00 | 188.00 | |
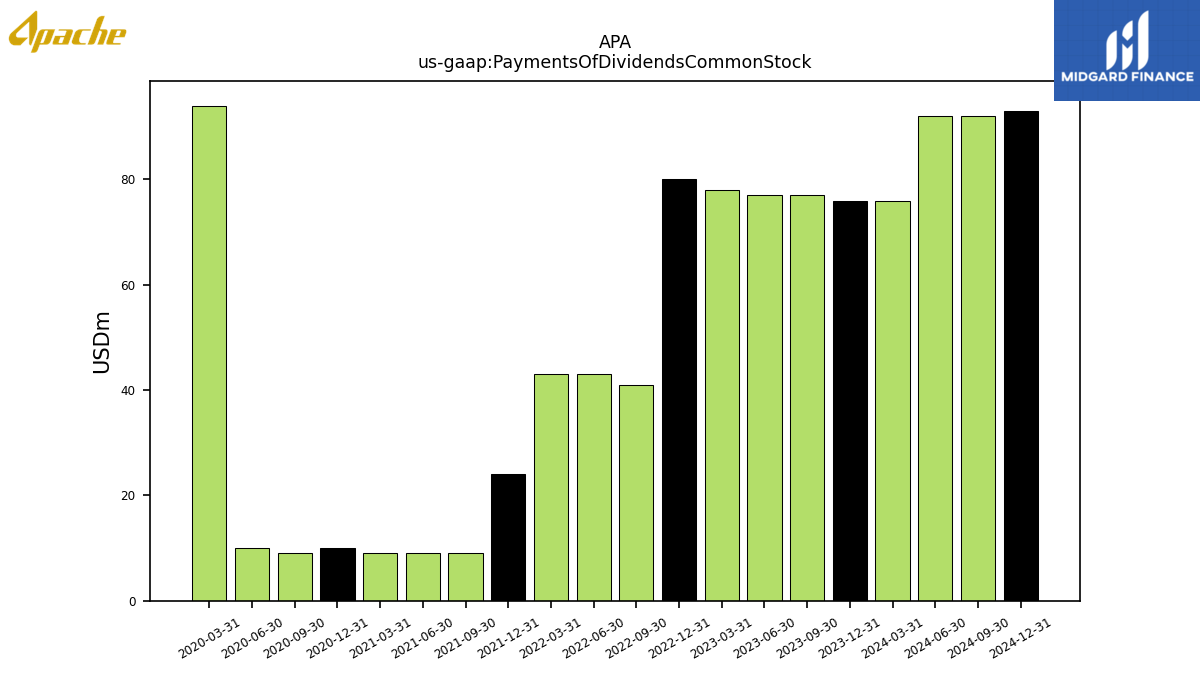
| Payments Of Dividends Common Stock | 76.00 | 77.00 | 77.00 | 78.00 | 80.00 | 41.00 | 43.00 | 43.00 | 24.00 | 9.00 | 9.00 | 9.00 | 10.00 | 9.00 | 10.00 | 94.00 |
| 2023-12-31 | 2023-09-30 | 2023-06-30 | 2023-03-31 | 2022-12-31 | 2022-09-30 | 2022-06-30 | 2022-03-31 | 2021-12-31 | 2021-09-30 | 2021-06-30 | 2021-03-31 | 2020-12-31 | 2020-09-30 | 2020-06-30 | 2020-03-31 | ||
|---|---|---|---|---|---|---|---|---|---|---|---|---|---|---|---|---|---|
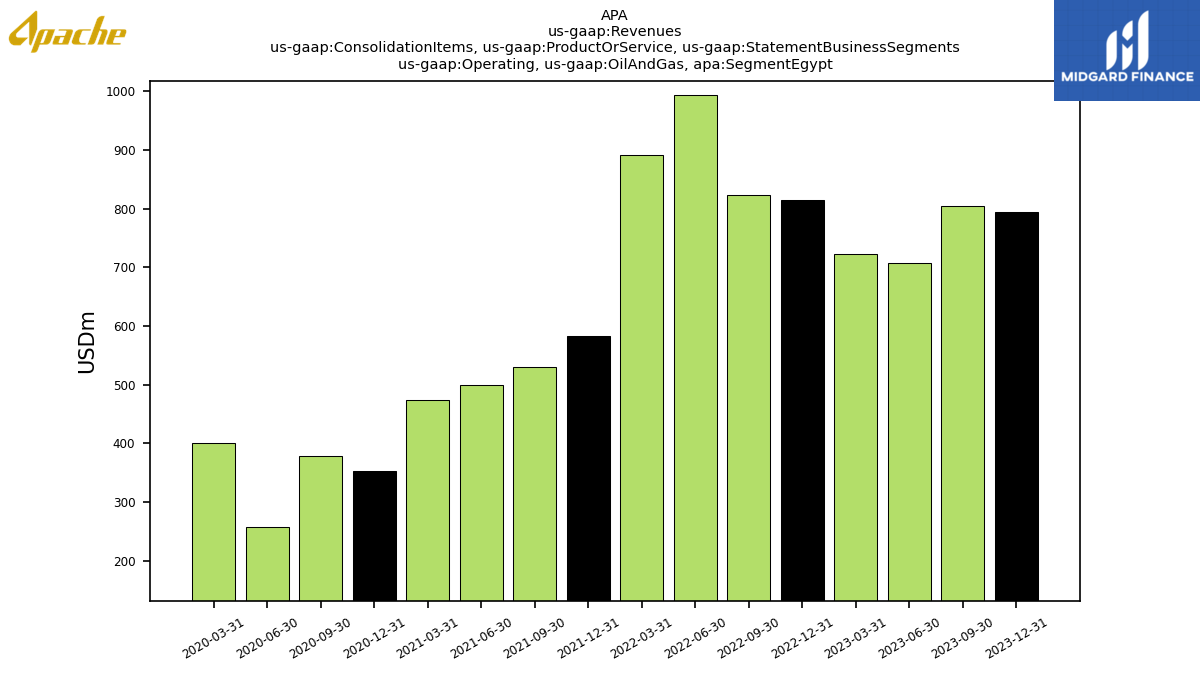
| Operating, Oil And Gas, Segment Egypt | 794.00 | 805.00 | 708.00 | 722.00 | 814.00 | 823.00 | 993.00 | 891.00 | 582.00 | 530.00 | 499.00 | 474.00 | 352.00 | 379.00 | 258.00 | 401.00 | |
| Operating, Oil And Gas, Segment North Sea | 289.00 | 419.00 | 278.00 | 352.00 | 380.00 | 352.00 | 383.00 | 443.00 | NA | NA | NA | NA | NA | NA | NA | NA | |
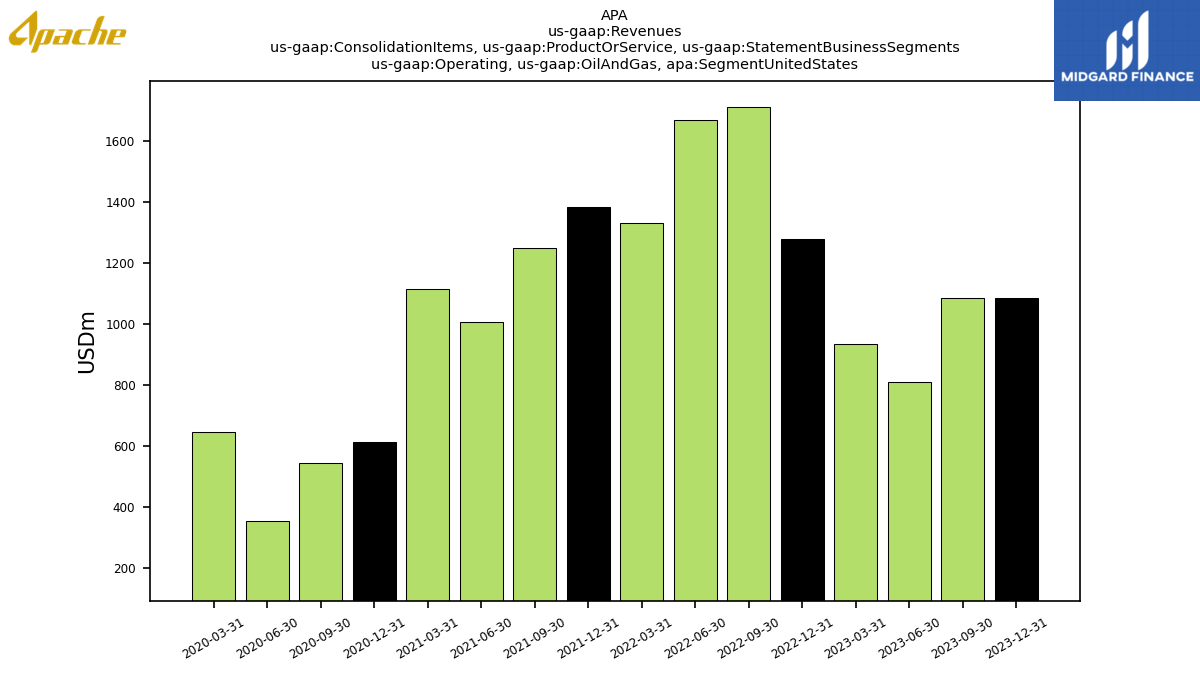
| Operating, Oil And Gas, Segment United States | 1084.00 | 1084.00 | 810.00 | 934.00 | 1278.00 | 1712.00 | 1671.00 | 1333.00 | 1385.00 | 1248.00 | 1007.00 | 1116.00 | 614.00 | 543.00 | 355.00 | 646.00 | |
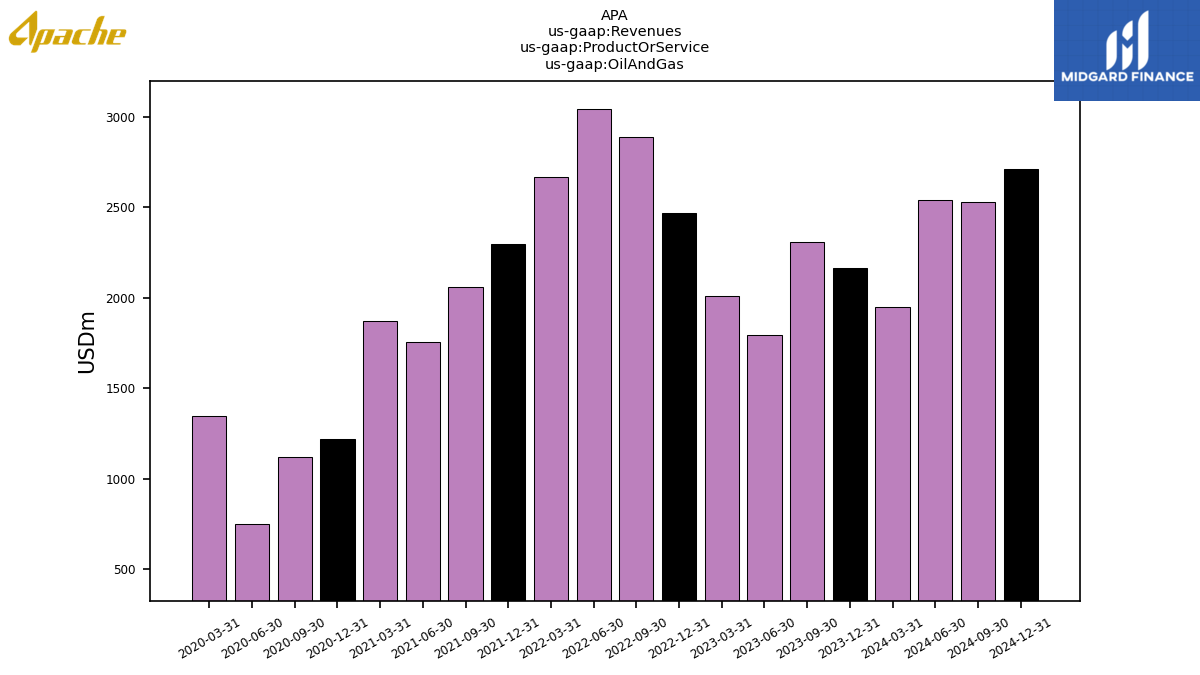
| Oil And Gas | 2167.00 | 2308.00 | 1796.00 | 2008.00 | 2472.00 | 2887.00 | 3047.00 | 2669.00 | 2299.00 | 2059.00 | 1756.00 | 1871.00 | 1219.00 | 1120.00 | 752.00 | 1344.00 | |
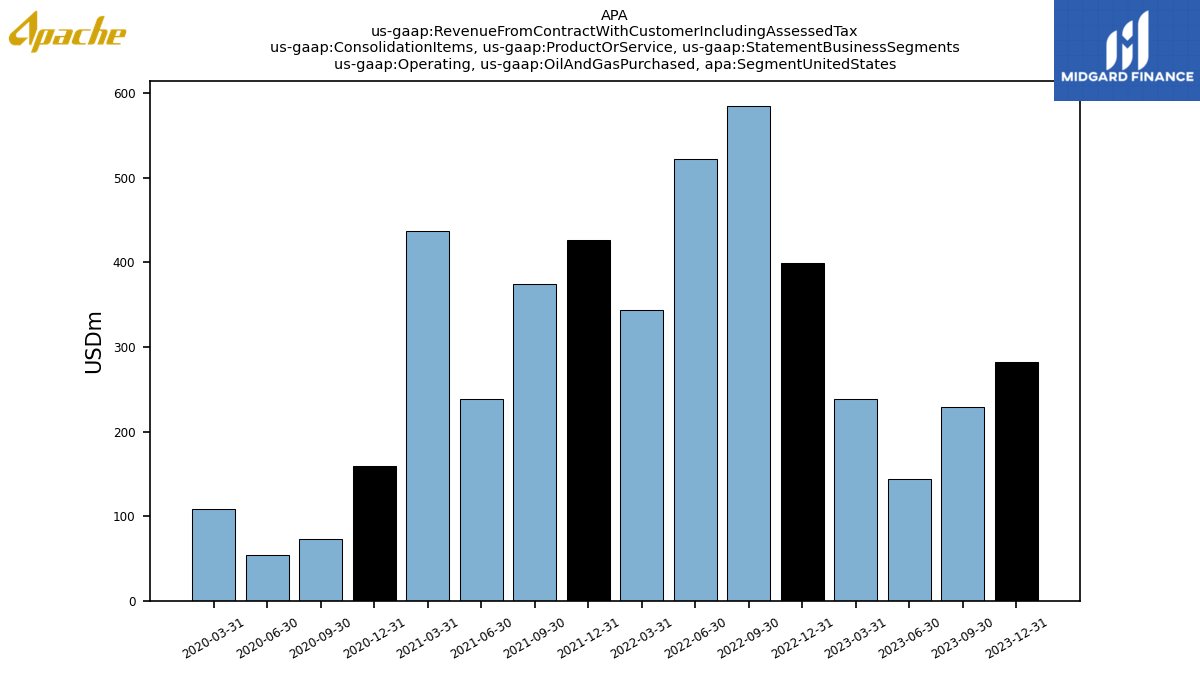
| Operating, Oil And Gas Purchased, Segment United States | 282.00 | 229.00 | 144.00 | 239.00 | 399.00 | 585.00 | 522.00 | 344.00 | 426.00 | 374.00 | 239.00 | 437.00 | 159.00 | 73.00 | 54.00 | 108.00 | |
| Oil And Gas Purchased | 282.00 | 229.00 | 144.00 | 239.00 | 399.00 | 585.00 | 522.00 | 349.00 | 431.00 | 374.00 | 242.00 | 440.00 | 161.00 | 74.00 | 55.00 | 108.00 |