
| 2024-03-31 | 2023-12-31 | 2023-09-30 | 2023-06-30 | 2023-03-31 | 2022-12-31 | 2022-09-30 | 2022-06-30 | 2022-03-31 | 2021-12-31 | 2021-09-30 | 2021-06-30 | 2021-03-31 | 2020-12-31 | 2020-09-30 | 2020-06-30 | 2020-03-31 | 2019-12-31 | 2019-09-30 | 2019-06-30 | 2019-03-31 | 2018-12-31 | 2018-09-30 | 2018-06-30 | 2018-03-31 | 2017-12-31 | 2017-09-30 | 2017-06-30 | 2017-03-31 | 2016-12-31 | 2016-09-30 | 2016-06-30 | 2016-03-31 | 2015-12-31 | 2015-09-30 | 2015-06-30 | 2015-03-31 | 2014-12-31 | 2014-09-30 | 2014-06-30 | 2014-03-31 | 2013-12-31 | 2013-09-30 | 2013-06-30 | 2013-03-31 | 2012-12-31 | 2012-09-30 | 2012-06-30 | 2012-03-31 | 2011-12-31 | 2011-09-30 | 2011-06-30 | 2011-03-31 | 2010-12-31 | 2010-09-30 | 2010-06-30 | ||
|---|---|---|---|---|---|---|---|---|---|---|---|---|---|---|---|---|---|---|---|---|---|---|---|---|---|---|---|---|---|---|---|---|---|---|---|---|---|---|---|---|---|---|---|---|---|---|---|---|---|---|---|---|---|---|---|---|---|
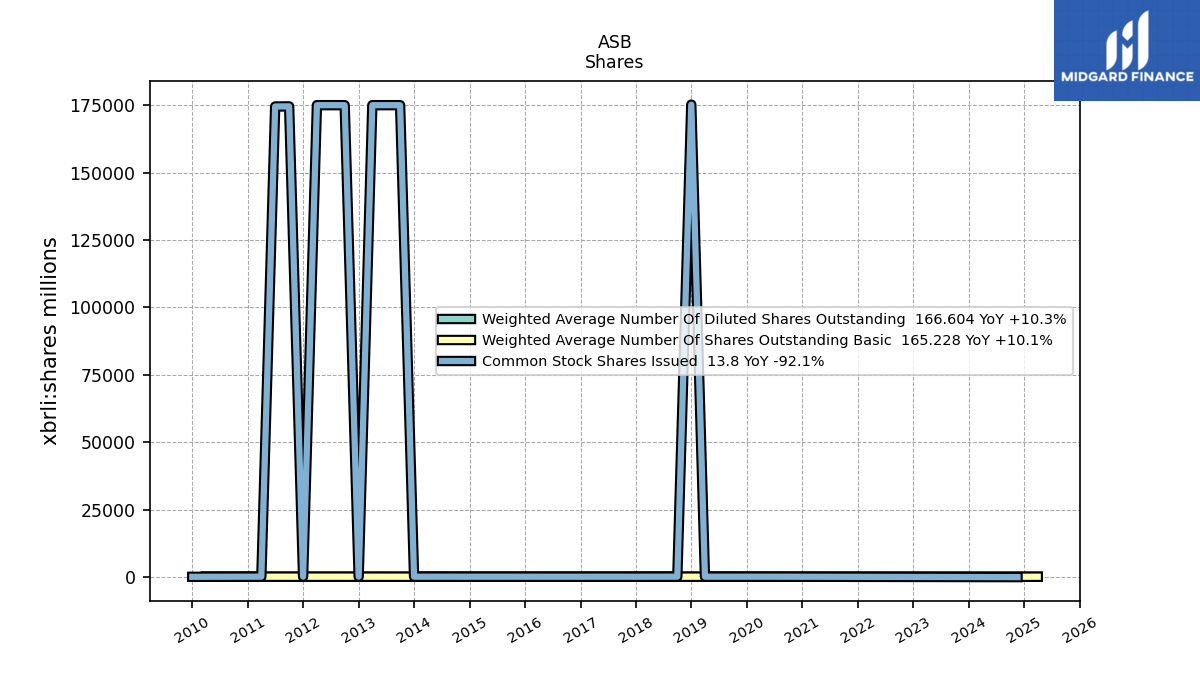
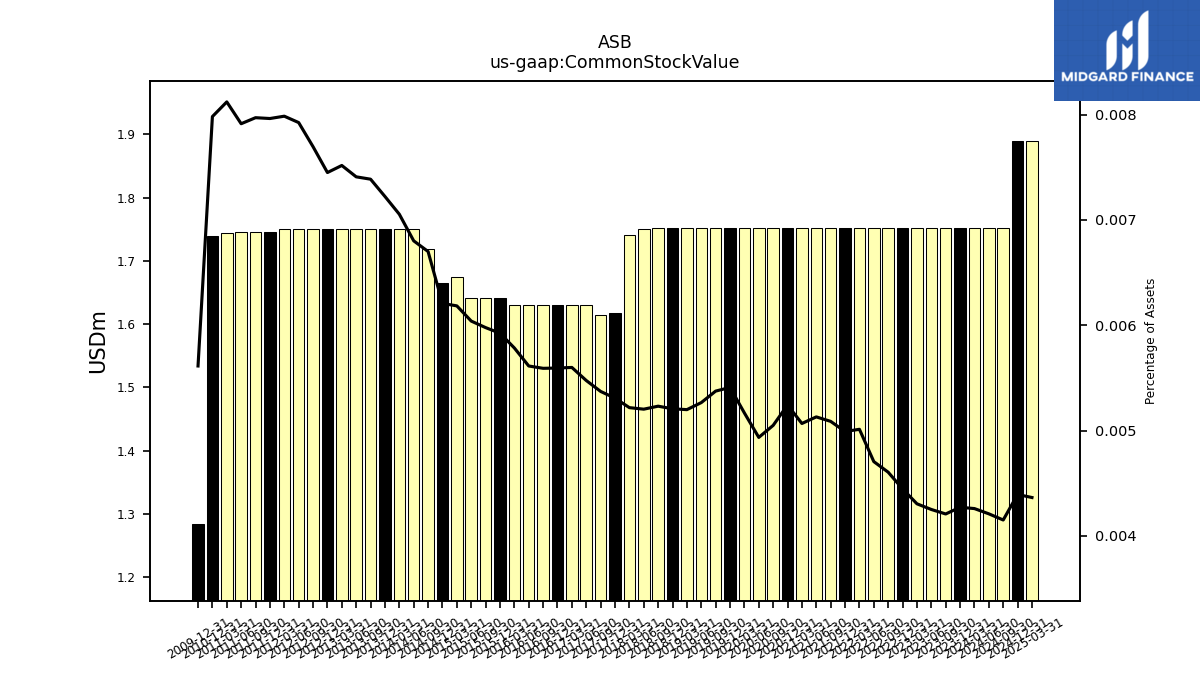
| Common Stock Value | 1.75 | 1.75 | 1.75 | 1.75 | 1.75 | 1.75 | 1.75 | 1.75 | 1.75 | 1.75 | 1.75 | 1.75 | 1.75 | 1.75 | 1.75 | 1.75 | 1.75 | 1.75 | 1.75 | 1.75 | 1.75 | 1.75 | 1.75 | 1.75 | 1.74 | 1.62 | 1.61 | 1.63 | 1.63 | 1.63 | 1.63 | 1.63 | 1.63 | 1.64 | 1.64 | 1.64 | 1.67 | 1.67 | 1.72 | 1.75 | 1.75 | 1.75 | 1.75 | 1.75 | 1.75 | 1.75 | 1.75 | 1.75 | 1.75 | 1.75 | 1.75 | 1.75 | 1.74 | 1.74 | NA | NA | |
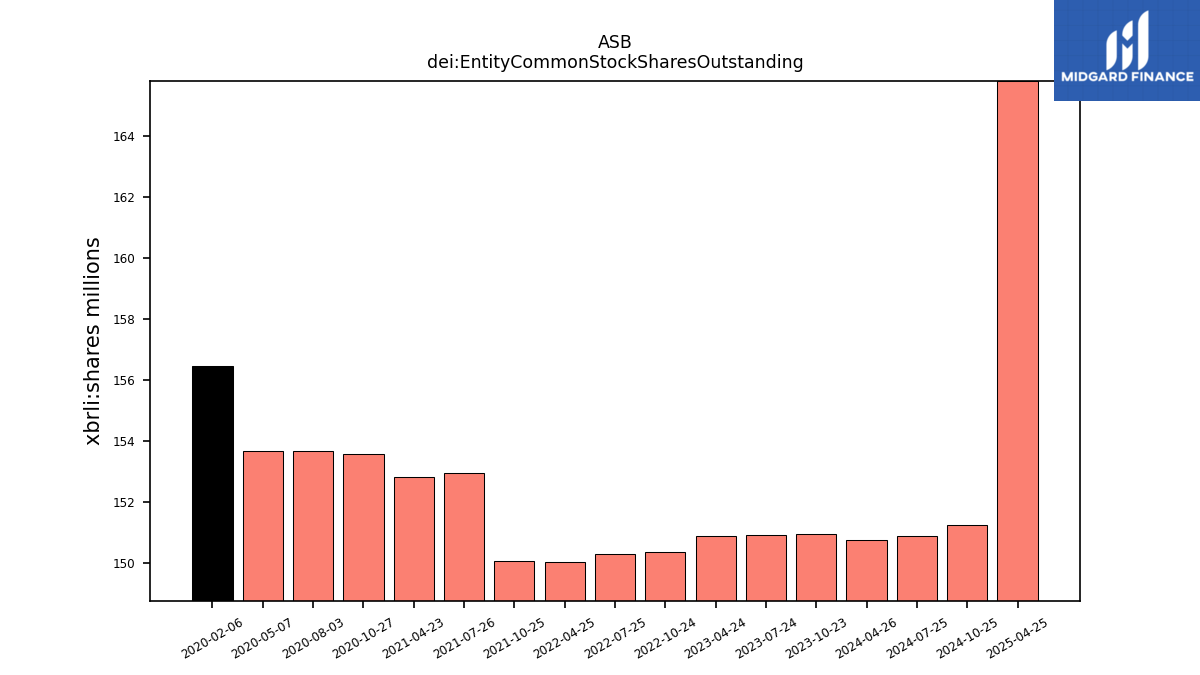
| dei: Entity Common Stock Shares Outstanding | NA | NA | NA | NA | NA | NA | NA | NA | NA | NA | NA | NA | NA | NA | NA | NA | NA | NA | NA | NA | NA | NA | NA | NA | NA | NA | NA | NA | NA | NA | NA | NA | NA | NA | NA | NA | NA | NA | NA | NA | NA | NA | NA | NA | NA | NA | NA | NA | NA | NA | NA | NA | NA | NA | NA | NA | |
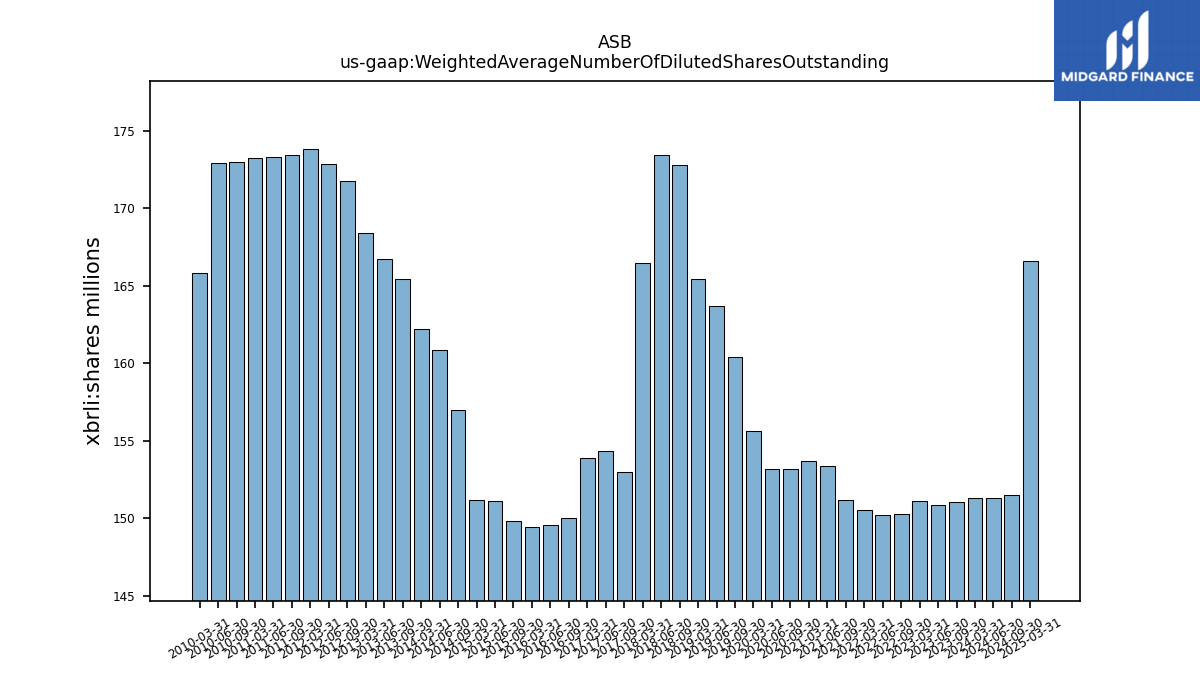
| Weighted Average Number Of Diluted Shares Outstanding | 151.29 | NA | 151.01 | 150.87 | 151.13 | NA | 150.26 | 150.20 | 150.49 | NA | 151.14 | 153.38 | 153.69 | NA | 153.19 | 153.15 | 155.62 | NA | 160.38 | 163.67 | 165.43 | NA | 172.80 | 173.41 | 166.43 | NA | 152.97 | 154.30 | 153.87 | NA | 149.97 | 149.53 | 149.45 | NA | 149.80 | 151.11 | 151.16 | NA | 156.99 | 160.84 | 162.19 | NA | 165.44 | 166.75 | 168.40 | NA | 171.78 | 172.84 | 173.85 | NA | 173.42 | 173.33 | 173.22 | NA | 172.99 | 172.92 | |
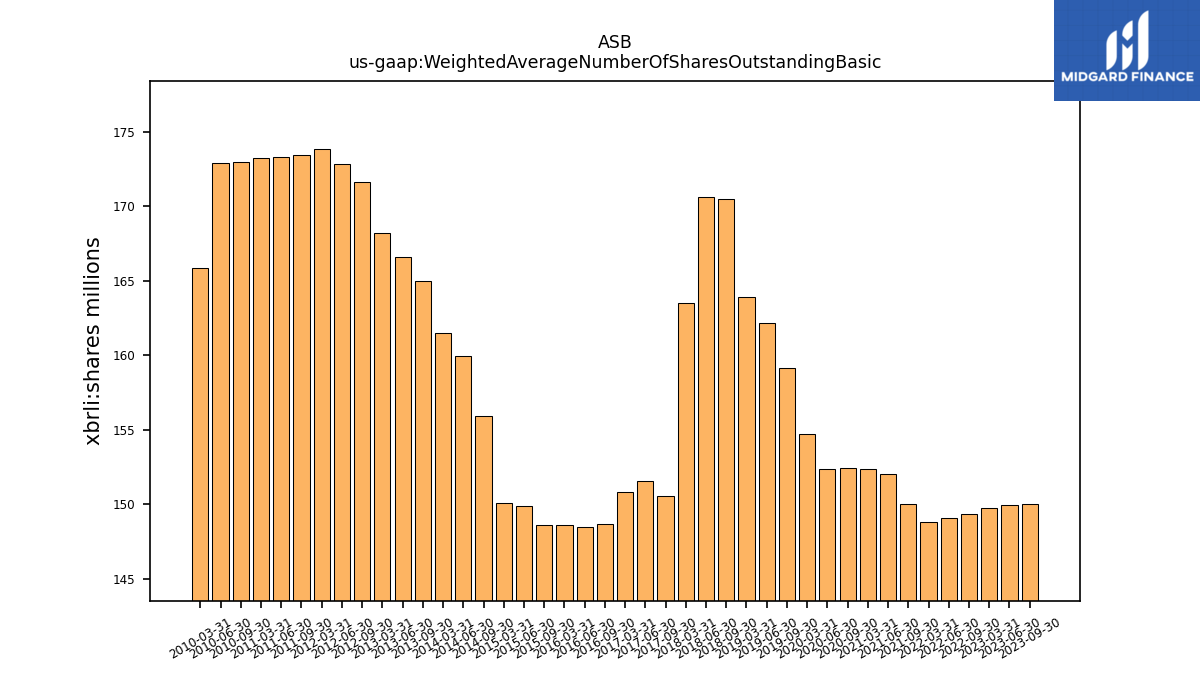
| Weighted Average Number Of Shares Outstanding Basic | 149.85 | NA | 150.03 | 149.99 | 149.76 | NA | 149.32 | 149.08 | 148.78 | NA | 150.05 | 152.04 | 152.35 | NA | 152.44 | 152.39 | 154.70 | NA | 159.13 | 162.18 | 163.93 | NA | 170.52 | 170.63 | 163.52 | NA | 150.56 | 151.57 | 150.81 | NA | 148.71 | 148.51 | 148.60 | NA | 148.61 | 149.90 | 150.07 | NA | 155.93 | 159.94 | 161.47 | NA | 164.95 | 166.60 | 168.23 | NA | 171.65 | 172.84 | 173.85 | NA | 173.42 | 173.32 | 173.21 | NA | 172.99 | 172.92 | |
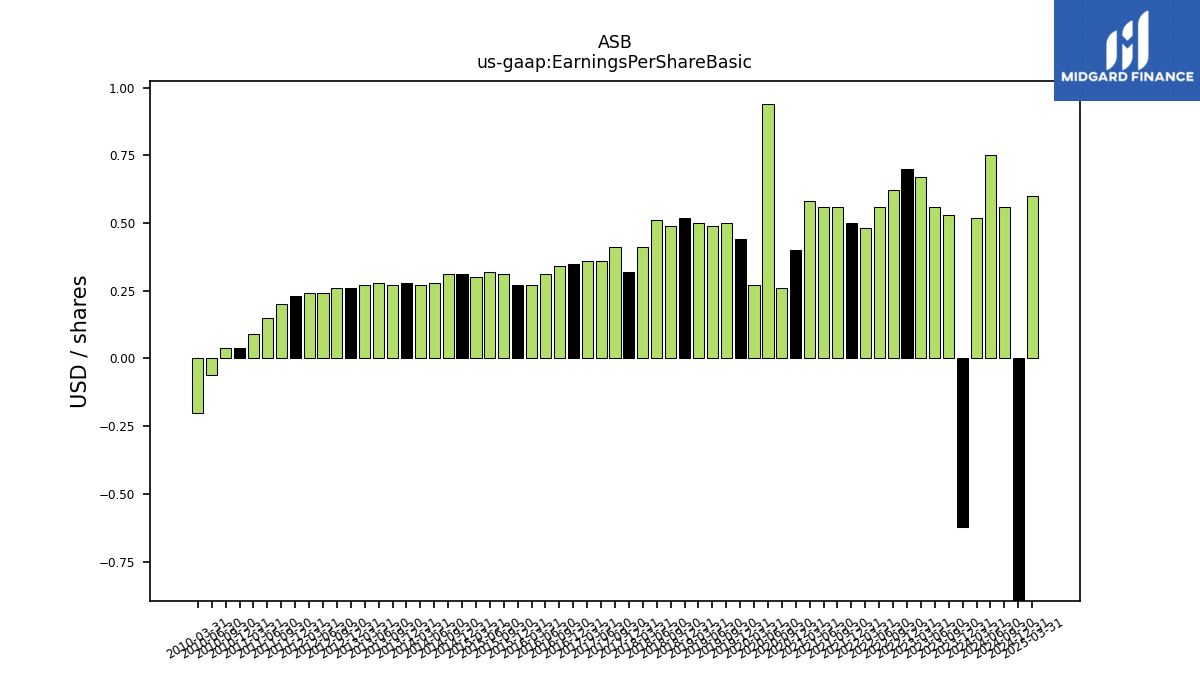
| Earnings Per Share Basic | 0.52 | -0.62 | 0.53 | 0.56 | 0.67 | 0.70 | 0.62 | 0.56 | 0.48 | 0.50 | 0.56 | 0.56 | 0.58 | 0.40 | 0.26 | 0.94 | 0.27 | 0.44 | 0.50 | 0.49 | 0.50 | 0.52 | 0.49 | 0.51 | 0.41 | 0.32 | 0.41 | 0.36 | 0.36 | 0.35 | 0.34 | 0.31 | 0.27 | 0.27 | 0.31 | 0.32 | 0.30 | 0.31 | 0.31 | 0.28 | 0.27 | 0.28 | 0.27 | 0.28 | 0.27 | 0.26 | 0.26 | 0.24 | 0.24 | 0.23 | 0.20 | 0.15 | 0.09 | 0.04 | 0.04 | -0.06 | |
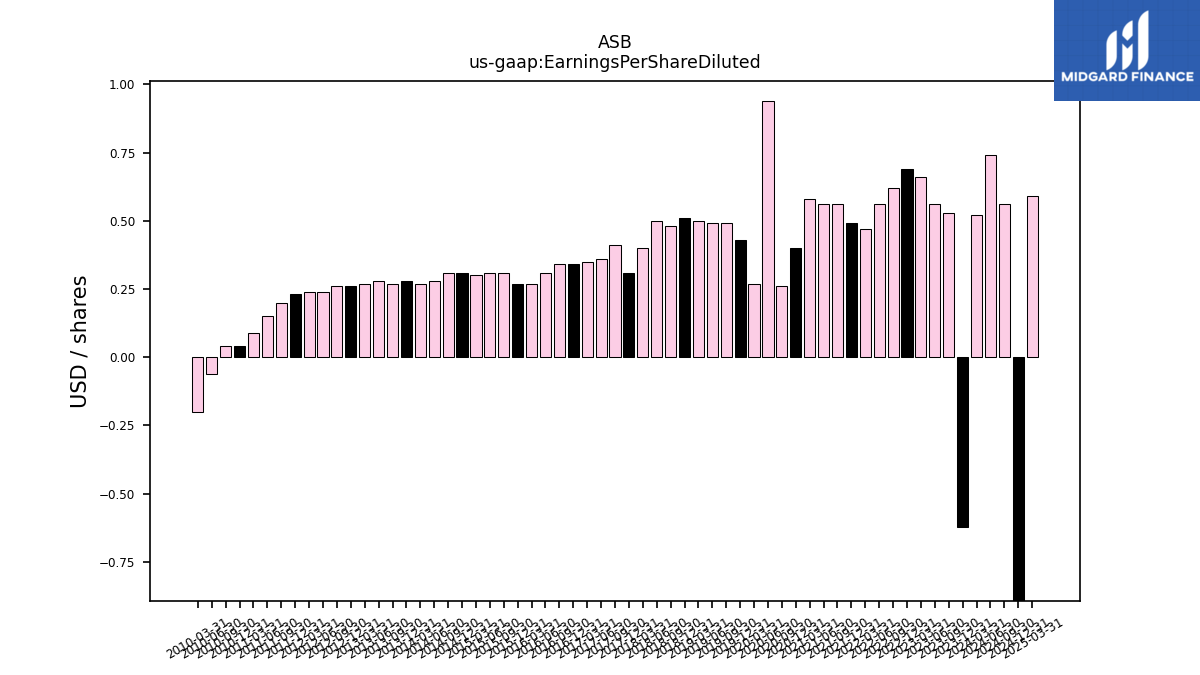
| Earnings Per Share Diluted | 0.52 | -0.62 | 0.53 | 0.56 | 0.66 | 0.69 | 0.62 | 0.56 | 0.47 | 0.49 | 0.56 | 0.56 | 0.58 | 0.40 | 0.26 | 0.94 | 0.27 | 0.43 | 0.49 | 0.49 | 0.50 | 0.51 | 0.48 | 0.50 | 0.40 | 0.31 | 0.41 | 0.36 | 0.35 | 0.34 | 0.34 | 0.31 | 0.27 | 0.27 | 0.31 | 0.31 | 0.30 | 0.31 | 0.31 | 0.28 | 0.27 | 0.28 | 0.27 | 0.28 | 0.27 | 0.26 | 0.26 | 0.24 | 0.24 | 0.23 | 0.20 | 0.15 | 0.09 | 0.04 | 0.04 | -0.06 |
| 2024-03-31 | 2023-12-31 | 2023-09-30 | 2023-06-30 | 2023-03-31 | 2022-12-31 | 2022-09-30 | 2022-06-30 | 2022-03-31 | 2021-12-31 | 2021-09-30 | 2021-06-30 | 2021-03-31 | 2020-12-31 | 2020-09-30 | 2020-06-30 | 2020-03-31 | 2019-12-31 | 2019-09-30 | 2019-06-30 | 2019-03-31 | 2018-12-31 | 2018-09-30 | 2018-06-30 | 2018-03-31 | 2017-12-31 | 2017-09-30 | 2017-06-30 | 2017-03-31 | 2016-12-31 | 2016-09-30 | 2016-06-30 | 2016-03-31 | 2015-12-31 | 2015-09-30 | 2015-06-30 | 2015-03-31 | 2014-12-31 | 2014-09-30 | 2014-06-30 | 2014-03-31 | 2013-12-31 | 2013-09-30 | 2013-06-30 | 2013-03-31 | 2012-12-31 | 2012-09-30 | 2012-06-30 | 2012-03-31 | 2011-12-31 | 2011-09-30 | 2011-06-30 | 2011-03-31 | 2010-12-31 | 2010-09-30 | 2010-06-30 | ||
|---|---|---|---|---|---|---|---|---|---|---|---|---|---|---|---|---|---|---|---|---|---|---|---|---|---|---|---|---|---|---|---|---|---|---|---|---|---|---|---|---|---|---|---|---|---|---|---|---|---|---|---|---|---|---|---|---|---|
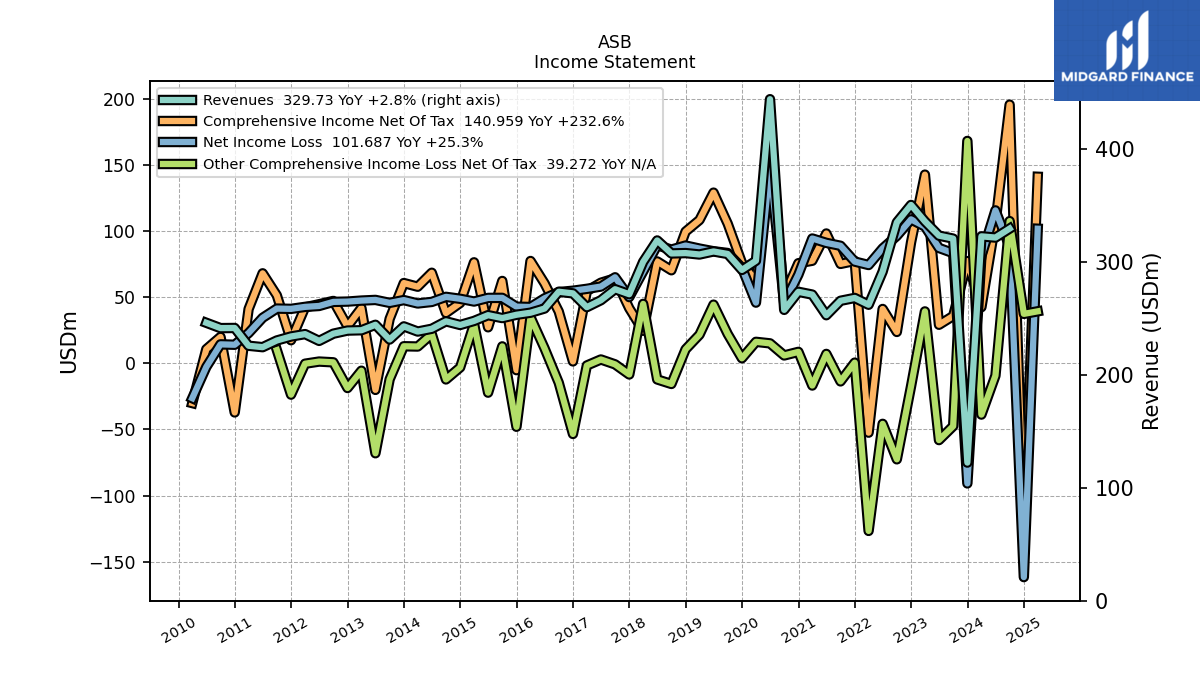
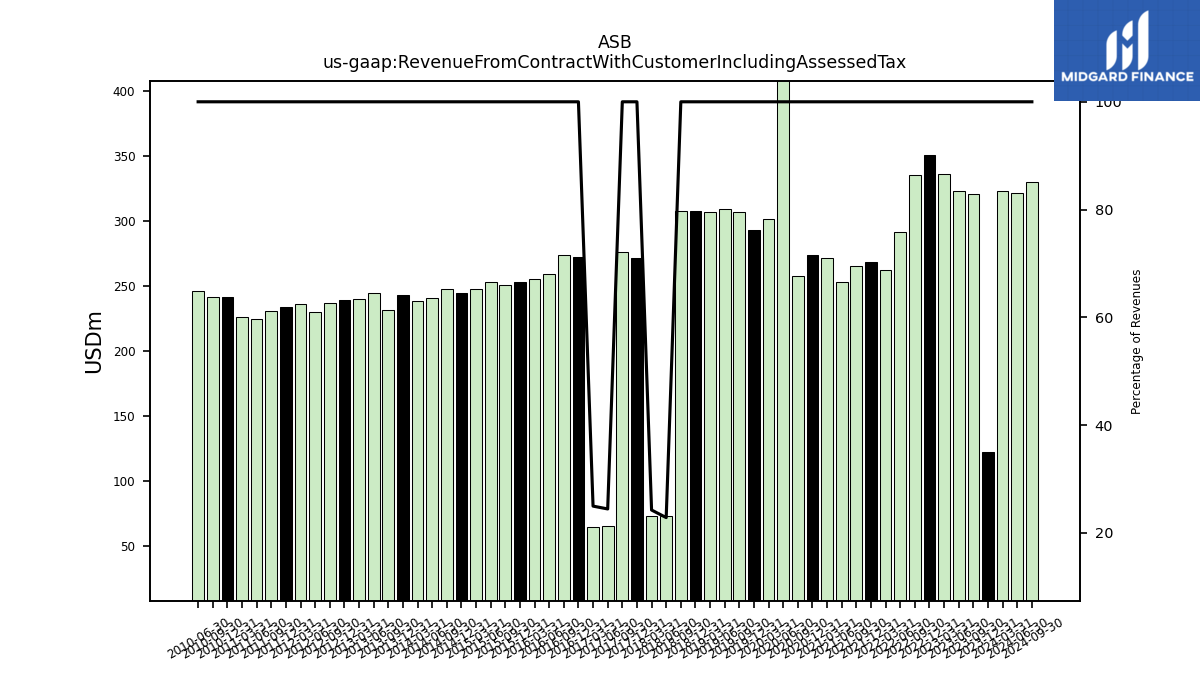
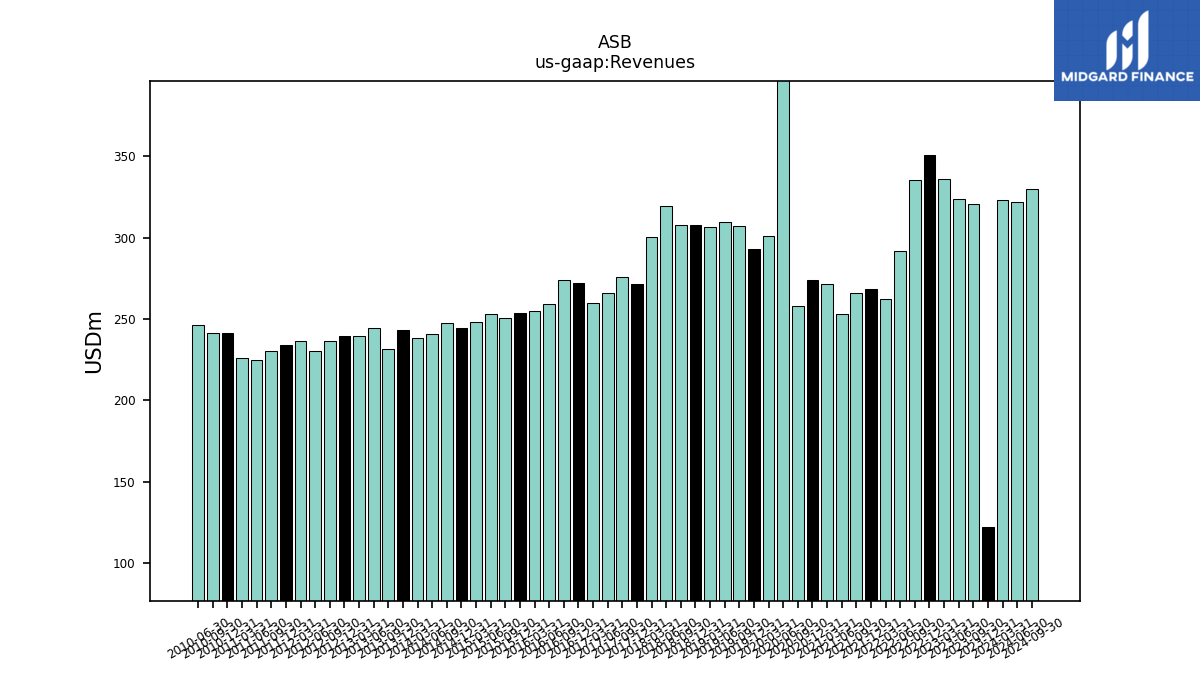
| Revenue From Contract With Customer Including Assessed Tax | 322.84 | 122.39 | 320.82 | 323.46 | 336.08 | 350.65 | 335.23 | 291.60 | 262.21 | 268.26 | 265.75 | 252.96 | 271.25 | 273.71 | 257.69 | 444.36 | 301.25 | 293.08 | 307.22 | 309.46 | 306.75 | 308.00 | 307.69 | 72.83 | 72.72 | 271.55 | 276.02 | 65.01 | 64.88 | 272.32 | 273.77 | 258.88 | 255.18 | 253.36 | 250.43 | 253.01 | 247.89 | 244.30 | 247.54 | 240.95 | 238.49 | 243.07 | 231.43 | 244.49 | 239.65 | 239.36 | 236.59 | 230.22 | 236.23 | 234.13 | 230.58 | 224.65 | 225.91 | 241.65 | 241.55 | 246.27 | |
| Revenues | 322.84 | 122.39 | 320.82 | 323.46 | 336.08 | 350.65 | 335.23 | 291.60 | 262.21 | 268.26 | 265.75 | 252.96 | 271.25 | 273.71 | 257.69 | 444.36 | 301.25 | 293.08 | 307.22 | 309.46 | 306.75 | 308.00 | 307.69 | 319.20 | 300.25 | 271.55 | 276.02 | 266.23 | 260.11 | 272.32 | 273.77 | 258.88 | 255.18 | 253.36 | 250.43 | 253.01 | 247.89 | 244.30 | 247.54 | 240.95 | 238.49 | 243.07 | 231.43 | 244.49 | 239.65 | 239.36 | 236.59 | 230.22 | 236.23 | 234.13 | 230.58 | 224.65 | 225.91 | 241.65 | 241.55 | 246.27 | |
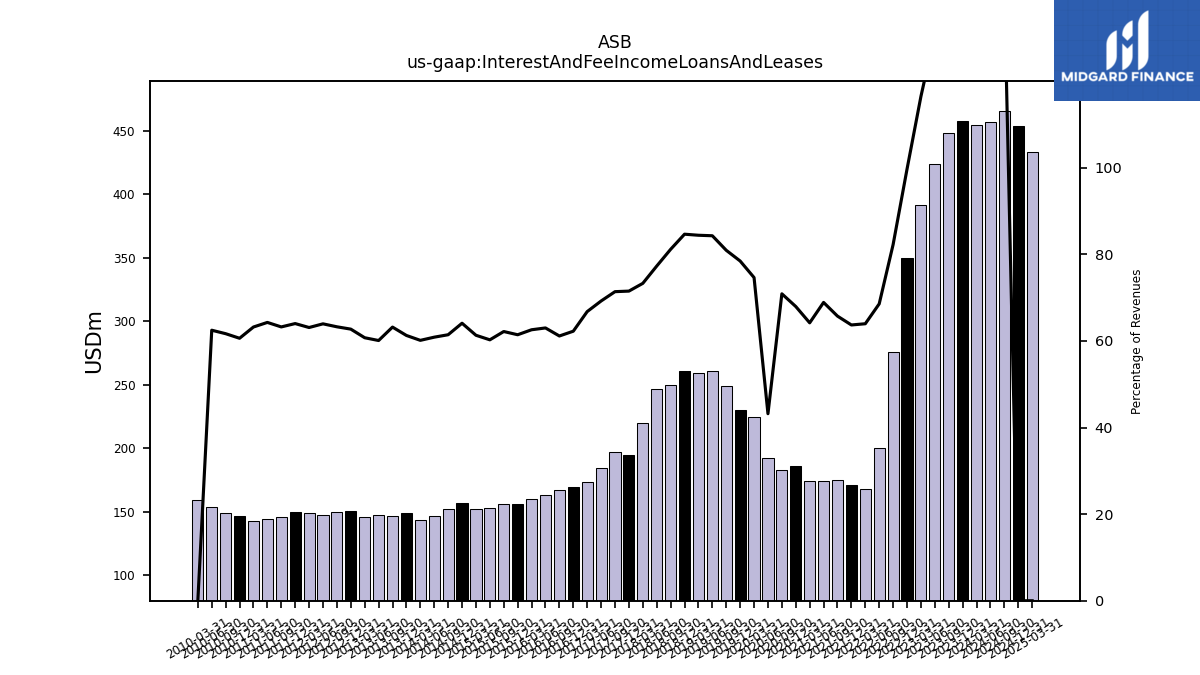
| Interest And Fee Income Loans And Leases | 454.47 | 457.87 | 447.91 | 423.31 | 391.32 | 349.40 | 275.67 | 199.88 | 167.70 | 170.81 | 174.64 | 174.23 | 174.05 | 185.94 | 182.62 | 191.90 | 224.79 | 229.88 | 248.58 | 260.78 | 258.85 | 260.66 | 249.65 | 246.65 | 220.03 | 194.13 | 196.97 | 184.25 | 173.65 | 169.47 | 167.35 | 163.06 | 159.66 | 155.60 | 155.66 | 152.42 | 151.94 | 156.54 | 152.03 | 146.63 | 143.39 | 148.88 | 146.22 | 146.90 | 145.53 | 150.11 | 149.65 | 147.19 | 149.02 | 149.83 | 145.78 | 144.36 | 142.77 | 146.44 | 148.94 | 153.81 | |
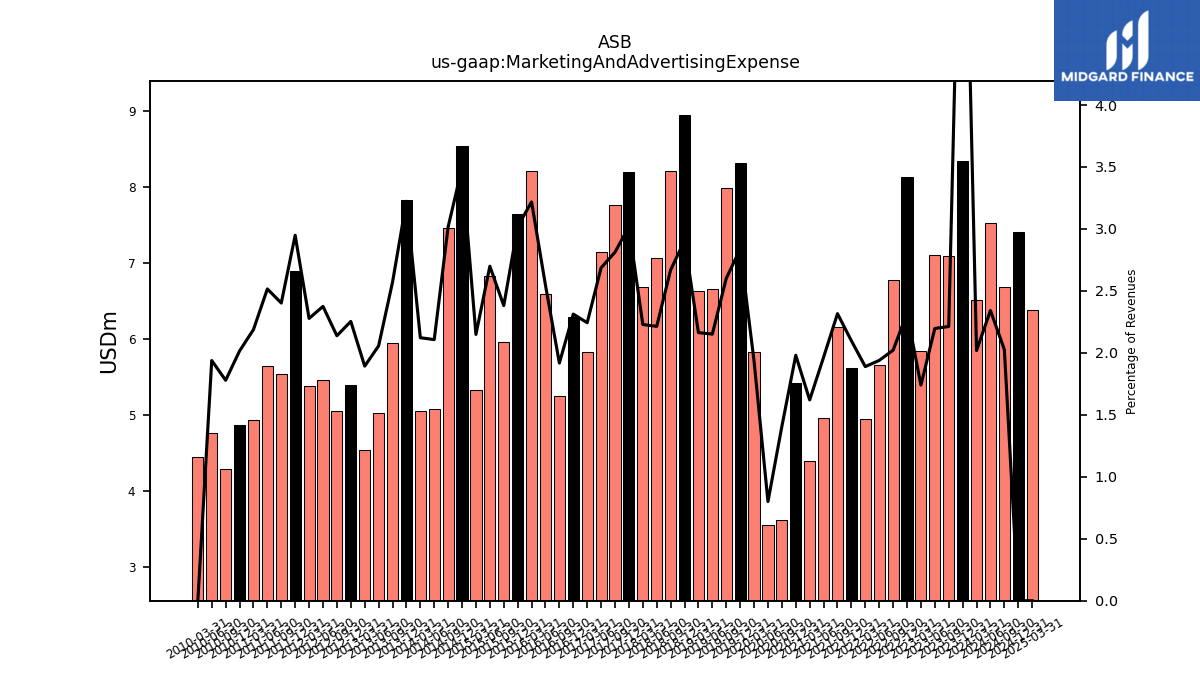
| Marketing And Advertising Expense | 6.52 | 8.35 | 7.10 | 7.11 | 5.85 | 8.14 | 6.78 | 5.66 | 4.95 | 5.63 | 6.16 | 4.97 | 4.39 | 5.42 | 3.63 | 3.56 | 5.83 | 8.32 | 7.99 | 6.66 | 6.64 | 8.95 | 8.21 | 7.07 | 6.69 | 8.20 | 7.76 | 7.15 | 5.83 | 6.30 | 5.25 | 6.59 | 8.21 | 7.65 | 5.96 | 6.83 | 5.33 | 8.54 | 7.47 | 5.08 | 5.06 | 7.83 | 5.95 | 5.03 | 4.54 | 5.39 | 5.06 | 5.47 | 5.38 | 6.90 | 5.54 | 5.65 | 4.94 | 4.87 | 4.30 | 4.77 | |
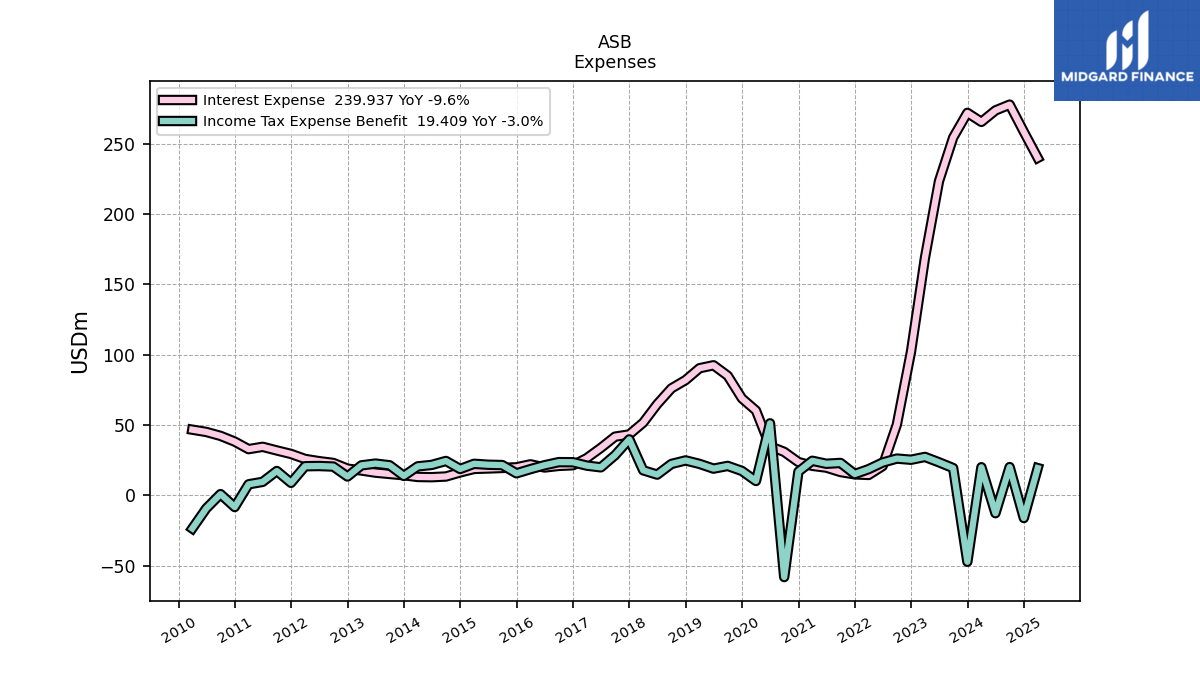
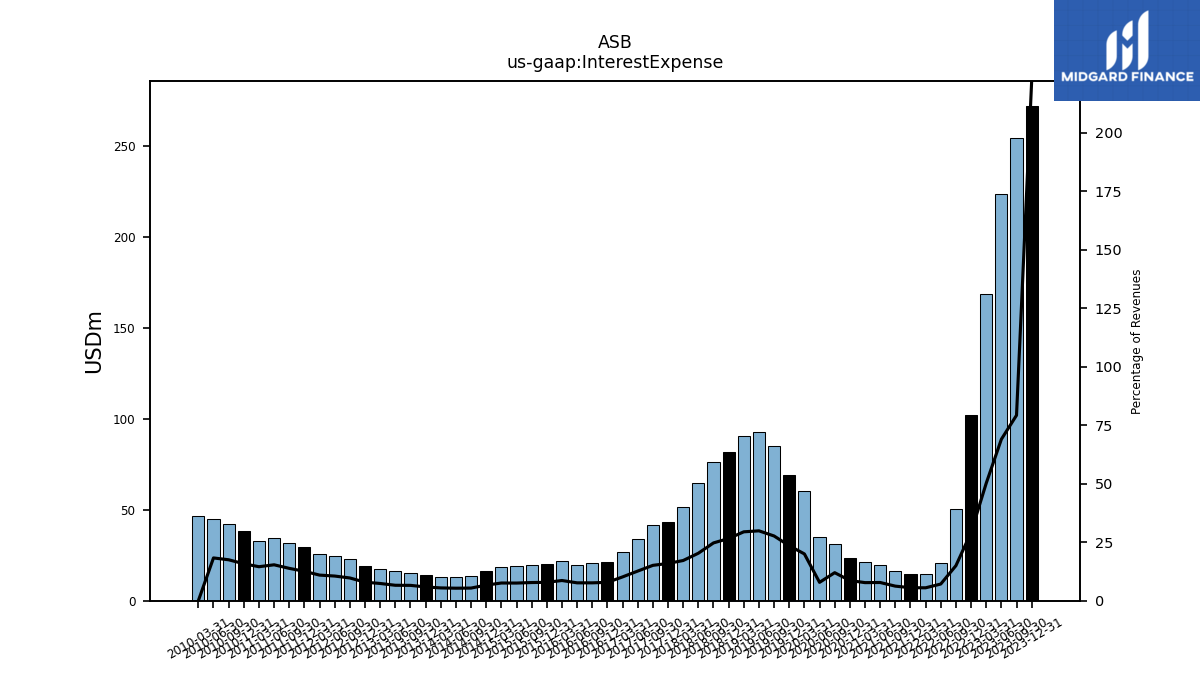
| Interest Expense | 265.53 | 271.96 | 254.39 | 223.31 | 168.81 | 102.29 | 50.27 | 20.84 | 14.52 | 14.96 | 16.61 | 19.75 | 21.02 | 23.68 | 30.93 | 34.97 | 60.30 | 68.97 | 85.05 | 92.51 | 90.40 | 81.98 | 76.07 | 64.84 | 51.66 | 43.32 | 41.77 | 33.78 | 26.52 | 21.42 | 20.97 | 19.82 | 22.08 | 19.95 | 19.50 | 19.13 | 18.80 | 16.34 | 13.42 | 12.93 | 13.09 | 14.34 | 15.22 | 16.18 | 17.70 | 19.02 | 23.05 | 24.32 | 25.91 | 29.46 | 31.93 | 34.53 | 32.87 | 38.23 | 42.31 | 45.09 | |
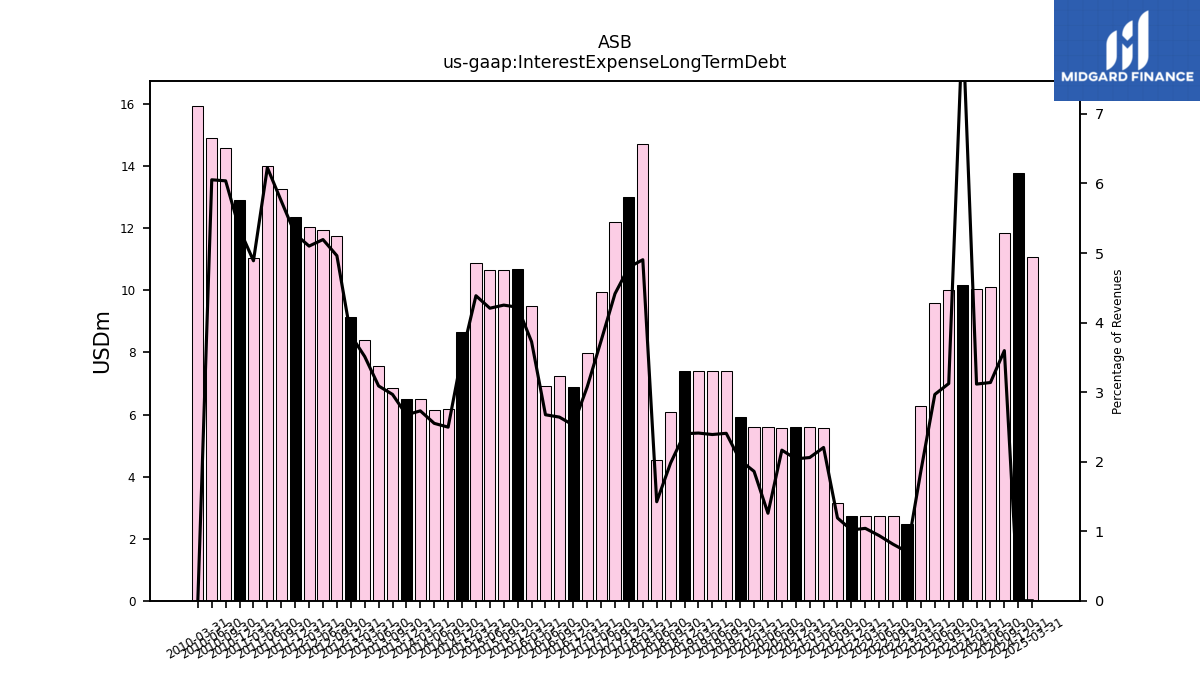
| Interest Expense Long Term Debt | 10.06 | 10.19 | 10.02 | 9.60 | 6.28 | 2.47 | 2.72 | 2.73 | 2.73 | 2.73 | 3.16 | 5.58 | 5.58 | 5.58 | 5.58 | 5.59 | 5.60 | 5.92 | 7.40 | 7.40 | 7.40 | 7.40 | 6.09 | 4.54 | 14.72 | 13.02 | 12.19 | 9.95 | 8.00 | 6.88 | 7.23 | 6.92 | 9.51 | 10.69 | 10.64 | 10.64 | 10.87 | 8.64 | 6.18 | 6.15 | 6.51 | 6.50 | 6.87 | 7.55 | 8.42 | 9.14 | 11.74 | 11.96 | 12.05 | 12.35 | 13.25 | 13.99 | 11.04 | 12.90 | 14.58 | 14.90 | |
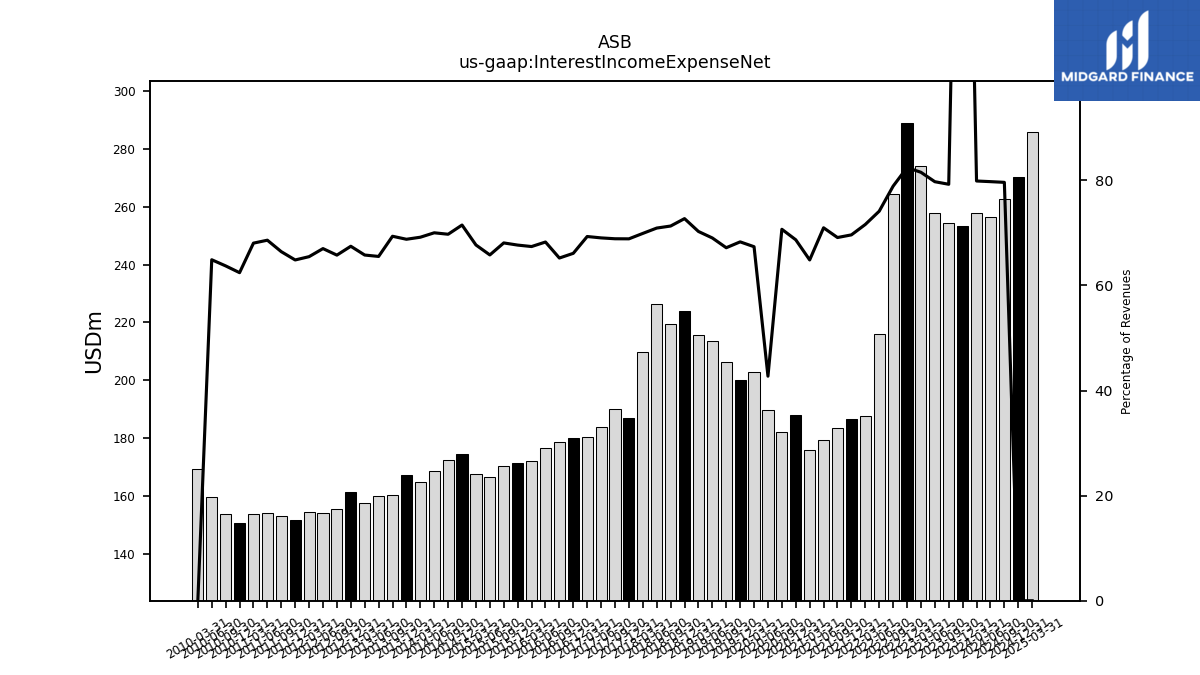
| Interest Income Expense Net | 257.86 | 253.40 | 254.24 | 257.92 | 274.01 | 288.99 | 264.44 | 216.15 | 187.75 | 186.76 | 183.68 | 179.51 | 175.90 | 187.99 | 182.15 | 189.87 | 202.94 | 200.14 | 206.37 | 213.62 | 215.55 | 223.96 | 219.39 | 226.36 | 209.87 | 187.00 | 190.12 | 183.82 | 180.27 | 180.03 | 178.53 | 176.72 | 171.99 | 171.47 | 170.51 | 166.49 | 167.81 | 174.66 | 172.63 | 168.70 | 164.97 | 167.20 | 160.51 | 160.18 | 157.65 | 161.46 | 155.60 | 154.27 | 154.67 | 151.82 | 153.16 | 154.12 | 153.72 | 150.86 | 153.90 | 159.79 | |
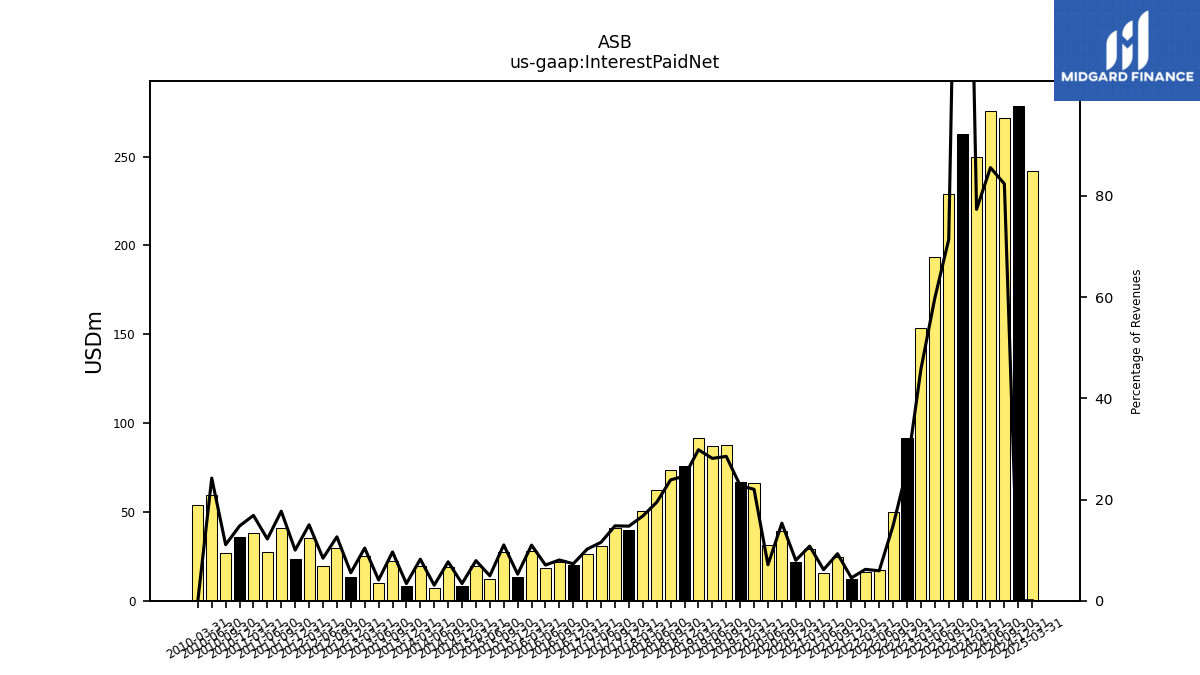
| Interest Paid Net | 249.66 | 262.61 | 229.02 | 193.44 | 153.76 | 91.34 | 49.80 | 17.27 | 16.27 | 12.13 | 24.69 | 15.52 | 29.26 | 21.87 | 39.49 | 31.61 | 66.32 | 66.73 | 87.64 | 87.03 | 91.52 | 75.85 | 73.48 | 62.11 | 50.29 | 40.02 | 40.84 | 30.77 | 26.53 | 19.90 | 22.05 | 18.27 | 28.04 | 13.30 | 27.63 | 12.48 | 19.64 | 8.30 | 19.05 | 7.39 | 19.58 | 8.24 | 22.31 | 10.05 | 24.95 | 13.24 | 29.89 | 19.35 | 35.46 | 23.42 | 40.78 | 27.43 | 38.09 | 35.71 | 26.75 | 59.68 | |
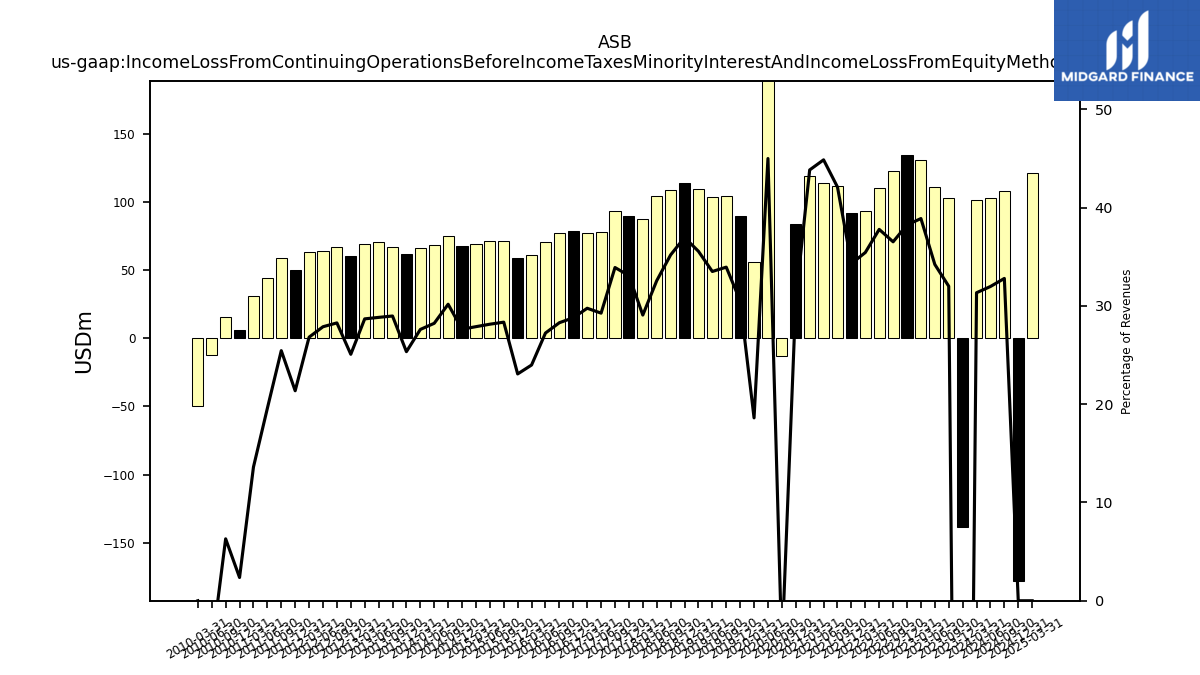
| Income Loss From Continuing Operations Before Income Taxes Minority Interest And Income Loss From Equity Method Investments | 101.19 | -138.01 | 102.67 | 110.69 | 130.70 | 134.09 | 122.44 | 110.19 | 92.91 | 92.05 | 111.87 | 113.49 | 118.90 | 83.86 | -12.90 | 199.96 | 56.06 | 89.47 | 104.29 | 103.68 | 109.08 | 113.84 | 108.28 | 103.95 | 87.28 | 89.85 | 93.59 | 77.91 | 77.41 | 78.41 | 77.45 | 70.53 | 61.21 | 58.47 | 70.99 | 71.19 | 69.13 | 67.50 | 74.69 | 68.03 | 65.84 | 61.60 | 67.05 | 70.50 | 68.74 | 60.03 | 66.89 | 64.19 | 63.35 | 50.03 | 58.68 | 43.99 | 30.73 | 5.71 | 15.22 | -12.02 | |
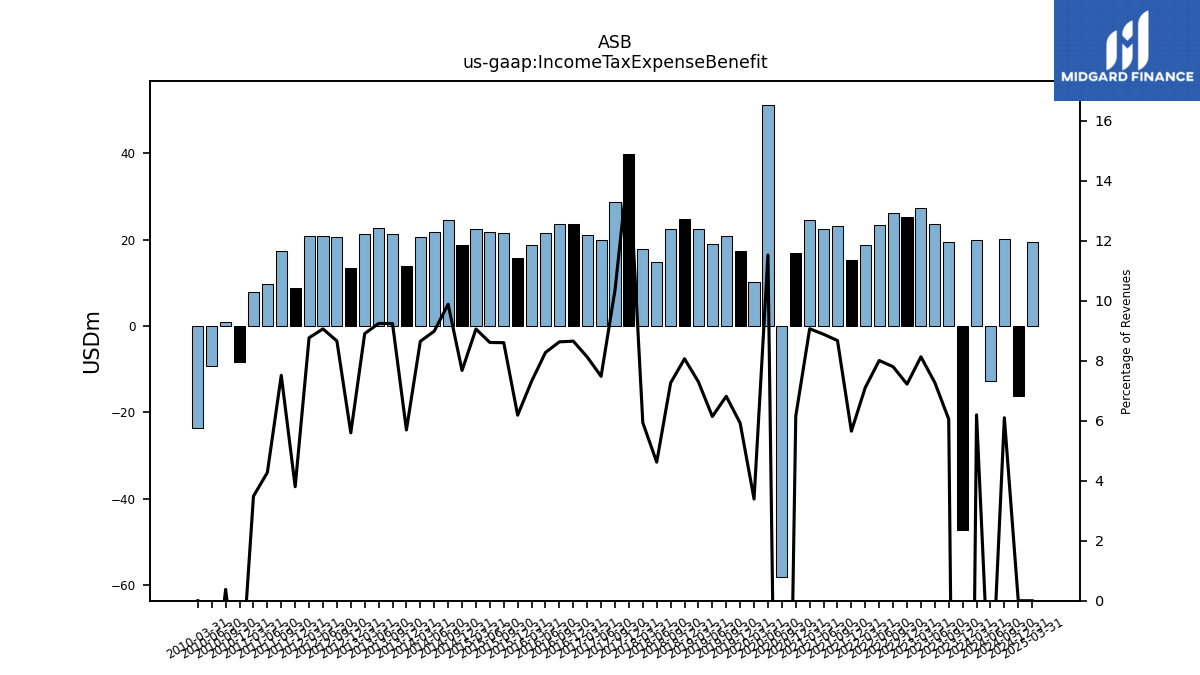
| Income Tax Expense Benefit | 20.02 | -47.20 | 19.43 | 23.53 | 27.34 | 25.33 | 26.16 | 23.36 | 18.65 | 15.17 | 23.06 | 22.48 | 24.60 | 16.86 | -58.11 | 51.24 | 10.22 | 17.36 | 20.95 | 19.02 | 22.39 | 24.85 | 22.35 | 14.75 | 17.83 | 39.84 | 28.59 | 19.93 | 21.14 | 23.58 | 23.64 | 21.43 | 18.67 | 15.68 | 21.55 | 21.79 | 22.46 | 18.76 | 24.48 | 21.66 | 20.64 | 13.85 | 21.40 | 22.61 | 21.35 | 13.40 | 20.49 | 20.87 | 20.72 | 8.90 | 17.34 | 9.61 | 7.88 | -8.29 | 0.92 | -9.24 | |
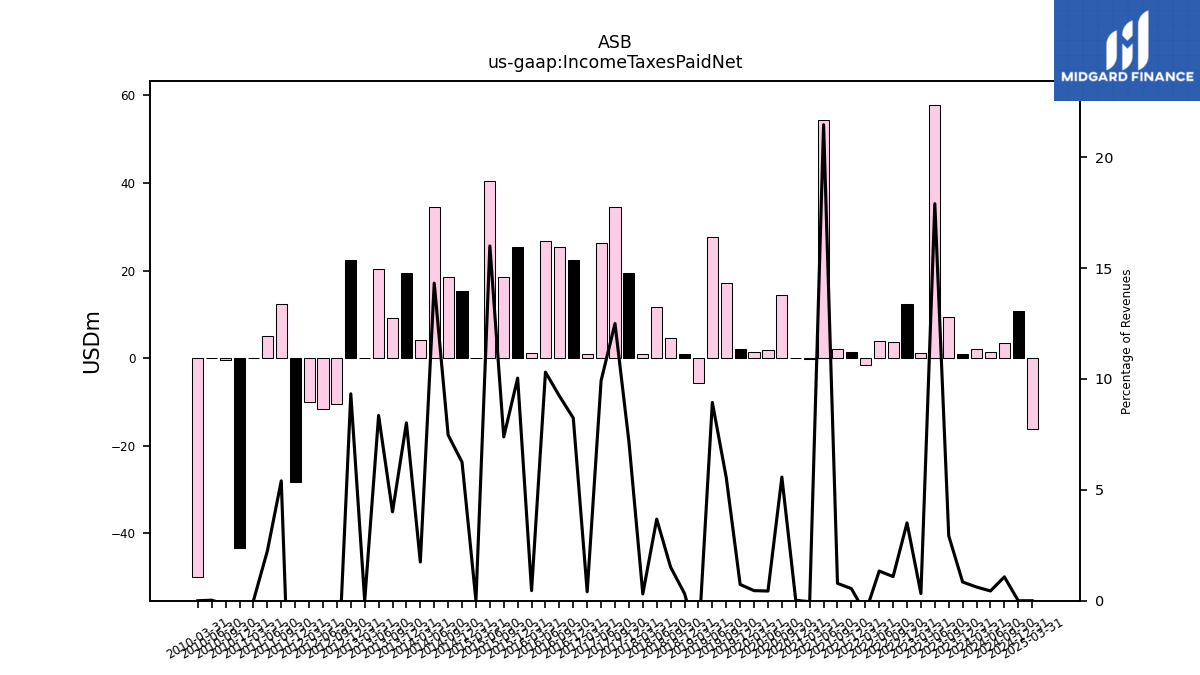
| Income Taxes Paid Net | 2.00 | 1.03 | 9.40 | 57.90 | 1.09 | 12.31 | 3.65 | 3.90 | -1.47 | 1.47 | 2.08 | 54.29 | -0.11 | 0.05 | 14.36 | 1.95 | 1.37 | 2.15 | 17.07 | 27.67 | -5.76 | 1.00 | 4.66 | 11.75 | 0.93 | 19.49 | 34.50 | 26.41 | 1.05 | 22.43 | 25.27 | 26.68 | 1.17 | 25.43 | 18.50 | 40.47 | 0.00 | 15.26 | 18.50 | 34.50 | 4.17 | 19.50 | 9.28 | 20.42 | 0.00 | 22.33 | -10.50 | -11.53 | -10.03 | -28.36 | 12.46 | 5.04 | 0.01 | -43.37 | -0.41 | 0.06 | |
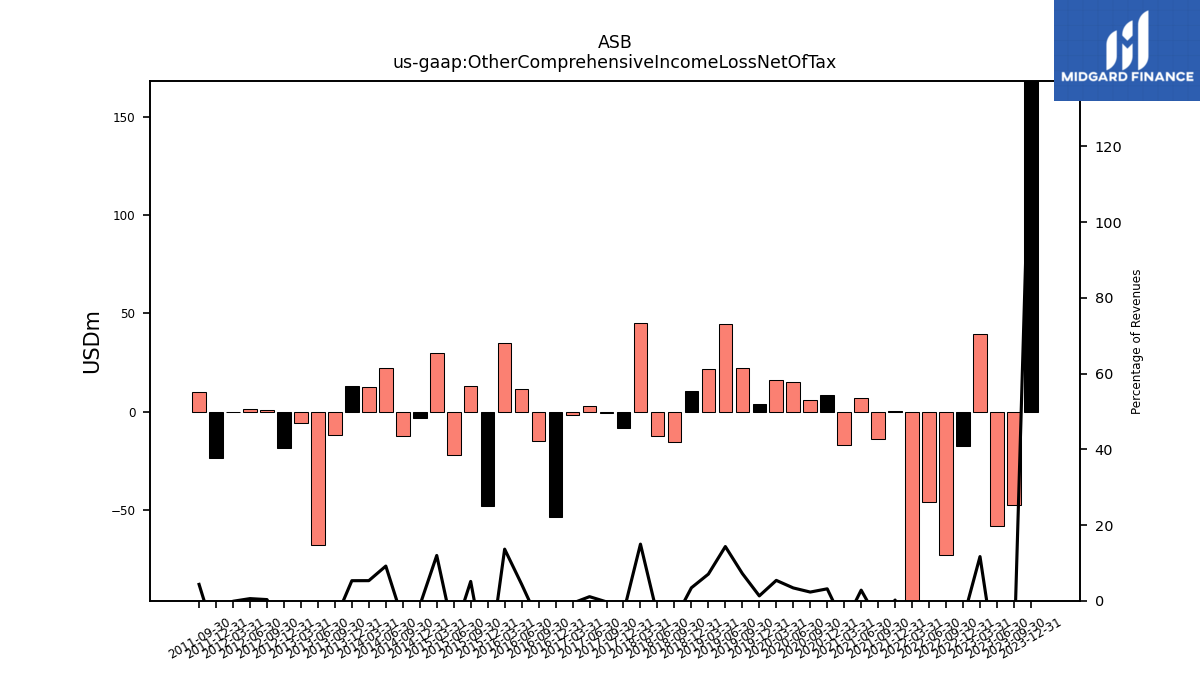
| Other Comprehensive Income Loss Net Of Tax | -38.78 | 168.04 | -47.50 | -58.05 | 39.21 | -17.41 | -72.60 | -45.76 | -126.71 | 0.50 | -13.70 | 7.08 | -16.81 | 8.62 | 5.92 | 15.05 | 16.21 | 3.77 | 22.11 | 44.31 | 21.60 | 10.55 | -15.63 | -12.21 | 44.91 | -8.47 | -0.82 | 2.87 | -1.67 | -53.42 | -14.71 | 11.29 | 34.78 | -47.99 | 12.78 | -22.21 | 29.65 | -3.12 | -12.22 | 22.07 | 12.67 | 12.88 | -12.11 | -68.01 | -5.61 | -18.70 | 0.72 | 1.30 | -0.32 | -23.71 | 9.97 | NA | NA | NA | NA | NA | |
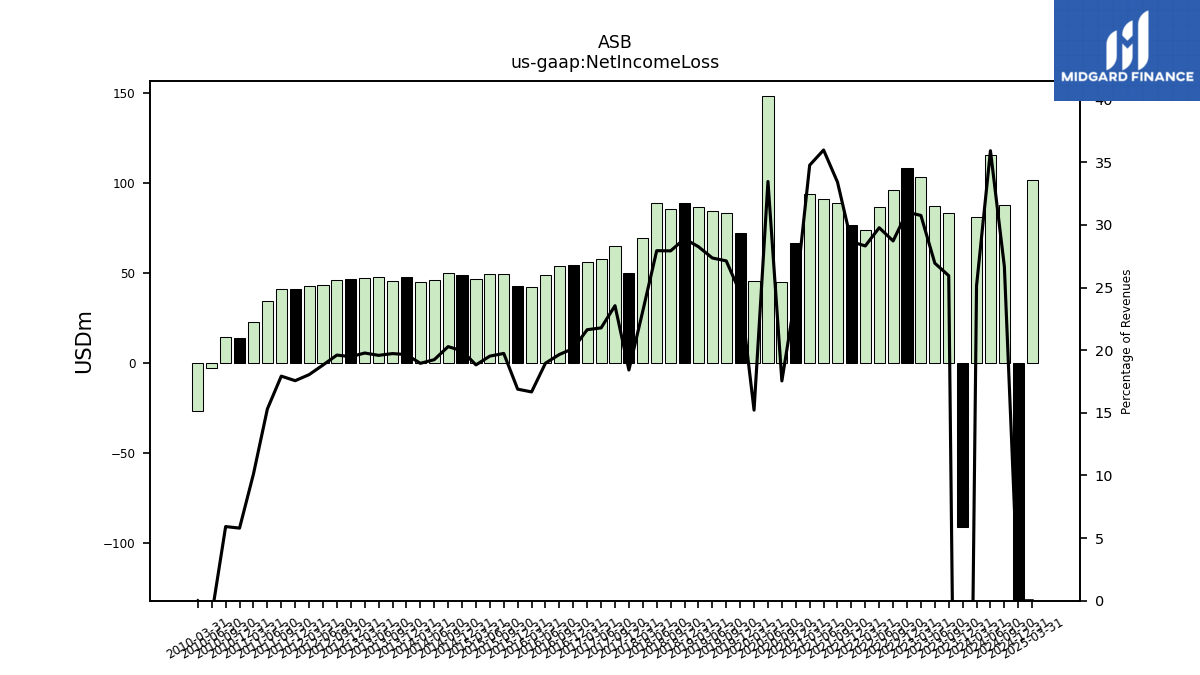
| Net Income Loss | 81.17 | -90.81 | 83.25 | 87.15 | 103.36 | 108.76 | 96.28 | 86.82 | 74.26 | 76.88 | 88.81 | 91.01 | 94.30 | 67.00 | 45.21 | 148.72 | 45.84 | 72.10 | 83.34 | 84.66 | 86.69 | 88.98 | 85.93 | 89.19 | 69.46 | 50.01 | 65.00 | 57.98 | 56.27 | 54.83 | 53.82 | 49.09 | 42.53 | 42.79 | 49.44 | 49.40 | 46.67 | 48.74 | 50.21 | 46.37 | 45.20 | 47.76 | 45.66 | 47.89 | 47.39 | 46.63 | 46.40 | 43.32 | 42.63 | 41.12 | 41.34 | 34.38 | 22.85 | 14.01 | 14.30 | -2.78 | |
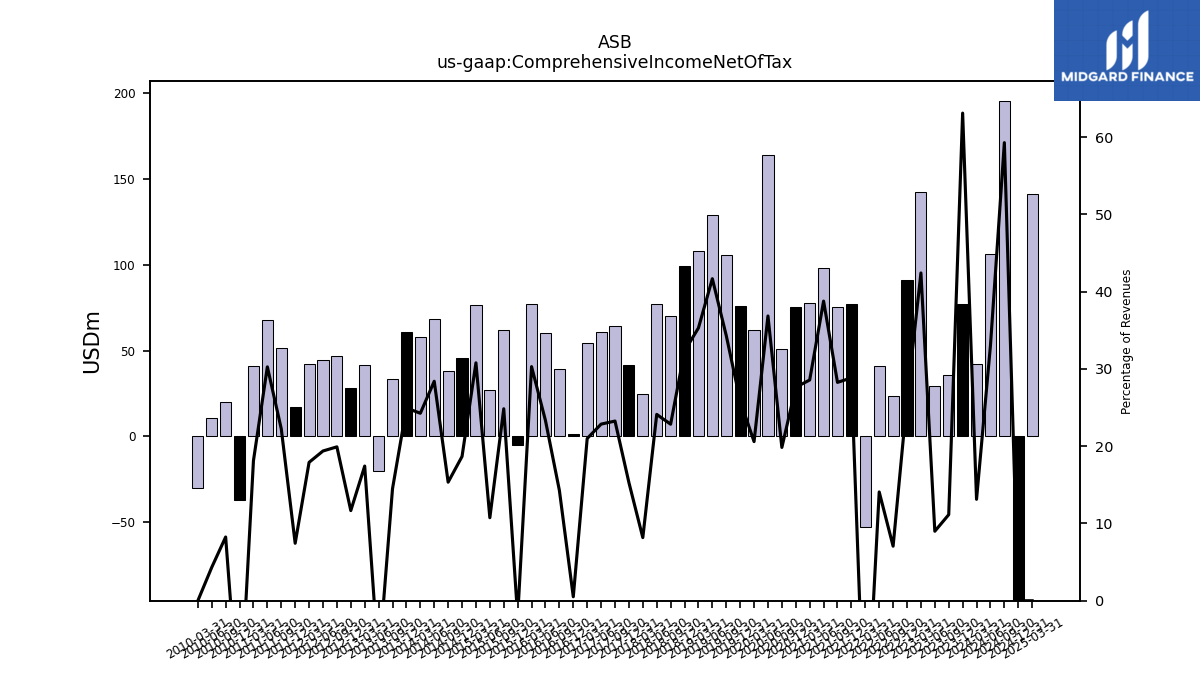
| Comprehensive Income Net Of Tax | 42.38 | 77.24 | 35.75 | 29.10 | 142.57 | 91.35 | 23.67 | 41.06 | -52.45 | 77.37 | 75.11 | 98.09 | 77.49 | 75.62 | 51.13 | 163.77 | 62.05 | 75.87 | 105.45 | 128.97 | 108.28 | 99.53 | 70.30 | 76.98 | 24.54 | 41.54 | 64.18 | 60.86 | 54.60 | 1.41 | 39.11 | 60.38 | 77.32 | -5.20 | 62.22 | 27.19 | 76.32 | 45.61 | 37.99 | 68.44 | 57.87 | 60.63 | 33.55 | -20.12 | 41.78 | 27.93 | 47.12 | 44.62 | 42.31 | 17.41 | 51.31 | 68.00 | 40.96 | -37.16 | 19.93 | 10.65 | |
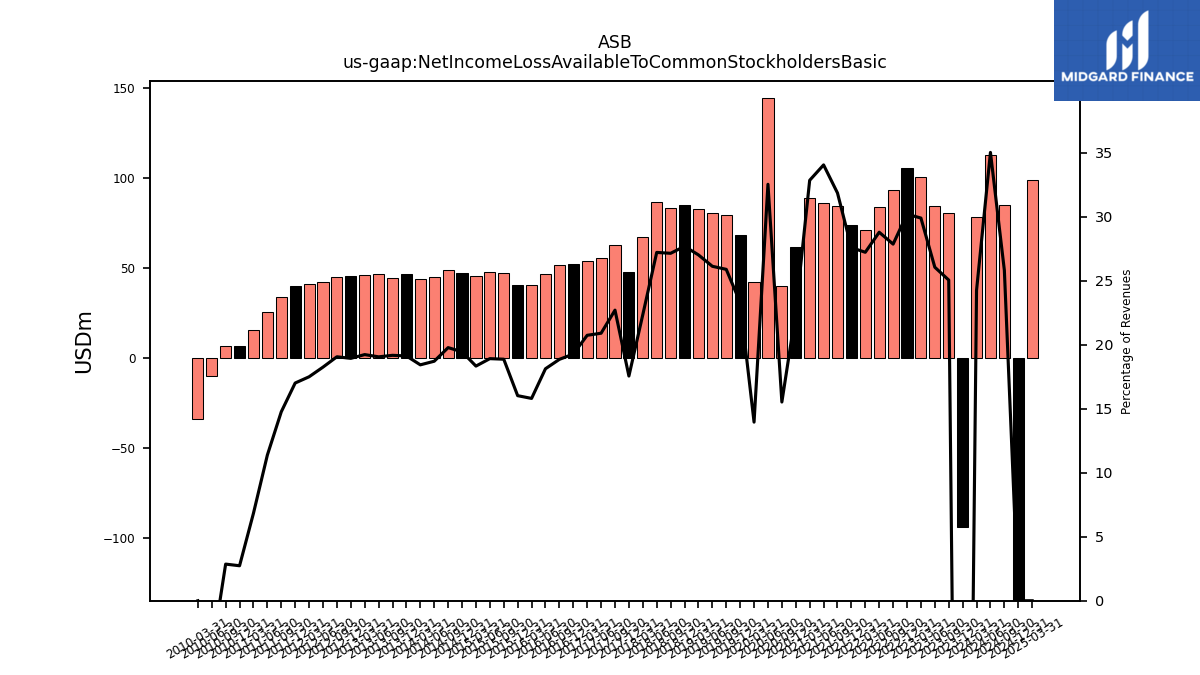
| Net Income Loss Available To Common Stockholders Basic | 78.29 | -93.68 | 80.37 | 84.28 | 100.48 | 105.89 | 93.40 | 83.95 | 71.39 | 74.00 | 84.66 | 86.13 | 89.09 | 61.80 | 40.01 | 144.57 | 42.04 | 68.30 | 79.54 | 80.86 | 82.89 | 85.28 | 83.52 | 86.86 | 67.12 | 47.67 | 62.66 | 55.64 | 53.94 | 52.48 | 51.63 | 46.92 | 40.34 | 40.59 | 47.25 | 47.85 | 45.44 | 47.51 | 48.95 | 45.09 | 43.95 | 46.48 | 44.37 | 46.59 | 46.09 | 45.33 | 45.09 | 42.02 | 41.33 | 39.83 | 34.03 | 25.57 | 15.44 | 6.61 | 6.92 | -10.16 | |
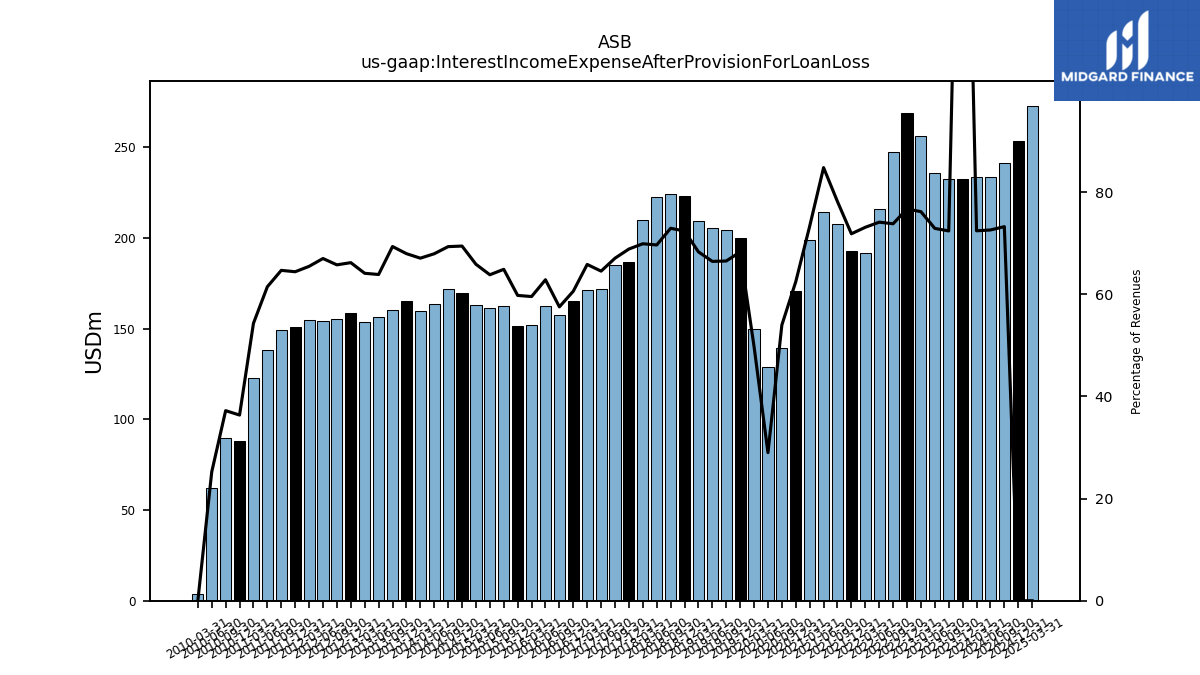
| Interest Income Expense After Provision For Loan Loss | 233.86 | 232.40 | 232.30 | 235.82 | 256.04 | 269.00 | 247.44 | 216.15 | 191.74 | 192.76 | 207.69 | 214.52 | 198.91 | 171.00 | 139.14 | 128.87 | 149.94 | 200.14 | 204.37 | 205.62 | 209.55 | 222.96 | 224.39 | 222.36 | 209.87 | 187.00 | 185.12 | 171.82 | 171.27 | 165.03 | 157.53 | 162.72 | 151.99 | 151.47 | 162.51 | 161.49 | 163.31 | 169.66 | 171.63 | 163.70 | 159.97 | 165.20 | 160.51 | 156.18 | 153.65 | 158.46 | 155.60 | 154.27 | 154.67 | 150.82 | 149.16 | 138.12 | 122.72 | 87.86 | 89.90 | 62.13 | |
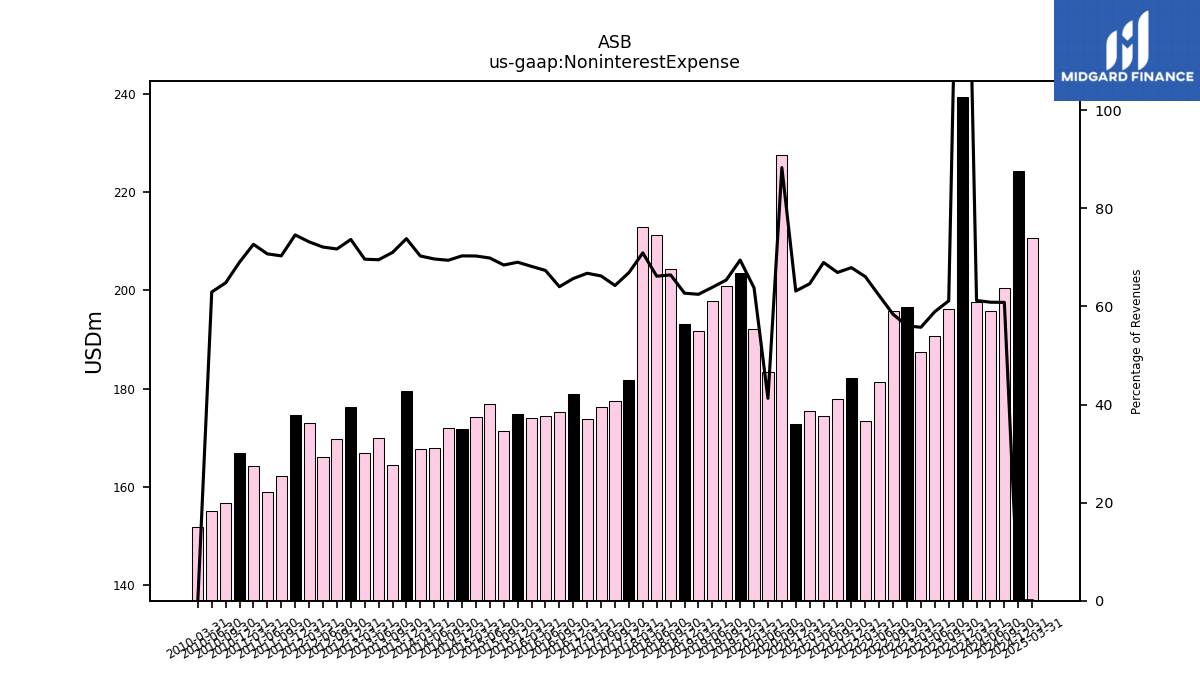
| Noninterest Expense | 197.66 | 239.39 | 196.21 | 190.67 | 187.41 | 196.56 | 195.79 | 181.42 | 173.29 | 182.21 | 177.89 | 174.47 | 175.35 | 172.85 | 227.59 | 183.41 | 192.19 | 203.61 | 200.93 | 197.78 | 191.67 | 193.16 | 204.41 | 211.26 | 212.97 | 181.70 | 177.43 | 176.32 | 173.69 | 178.91 | 175.31 | 174.36 | 173.97 | 174.89 | 171.44 | 176.82 | 174.25 | 171.81 | 171.85 | 167.93 | 167.66 | 179.47 | 164.37 | 170.00 | 166.91 | 176.33 | 169.70 | 166.03 | 172.88 | 174.65 | 162.16 | 158.89 | 164.18 | 166.84 | 156.58 | 155.04 | |
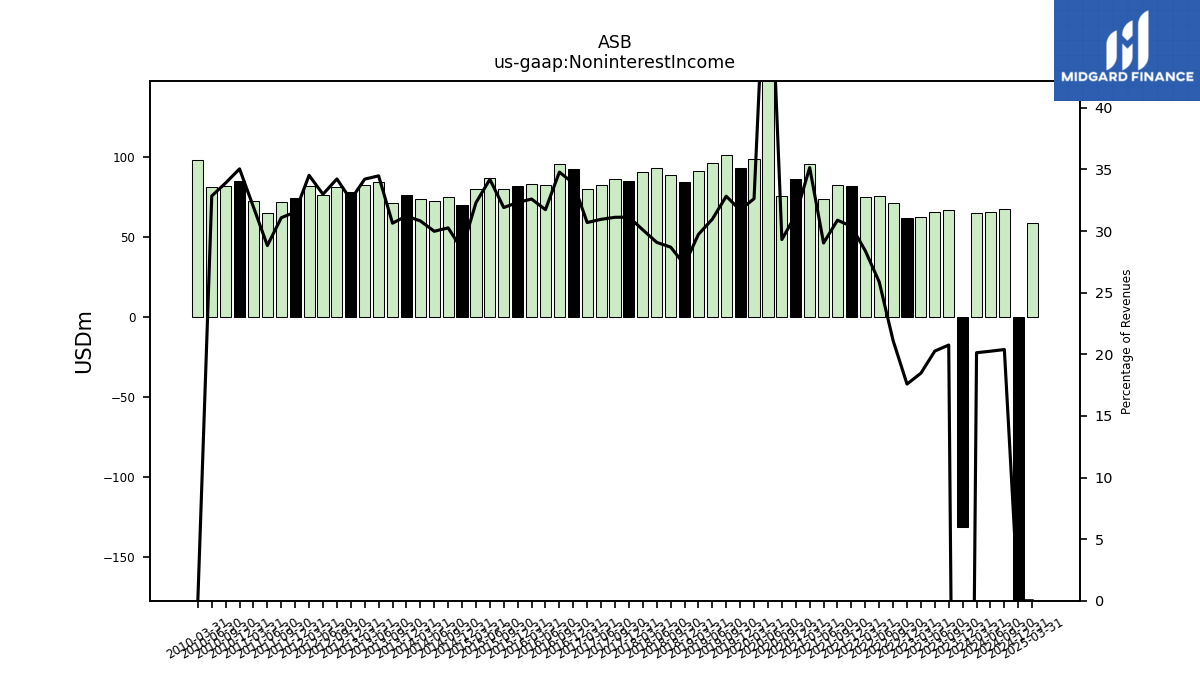
| Noninterest Income | 64.98 | -131.01 | 66.58 | 65.54 | 62.07 | 61.66 | 70.79 | 75.46 | 74.47 | 81.50 | 82.08 | 73.44 | 95.34 | 85.71 | 75.55 | 254.49 | 98.31 | 92.93 | 100.85 | 95.84 | 91.20 | 84.05 | 88.30 | 92.84 | 90.38 | 84.54 | 85.89 | 82.41 | 79.83 | 92.29 | 95.23 | 82.17 | 83.19 | 81.90 | 79.92 | 86.52 | 80.08 | 69.64 | 74.91 | 72.25 | 73.52 | 75.87 | 70.92 | 84.31 | 82.00 | 77.91 | 80.99 | 75.95 | 81.56 | 73.86 | 71.68 | 64.75 | 72.18 | 84.70 | 81.90 | 80.89 |
| 2024-03-31 | 2023-12-31 | 2023-09-30 | 2023-06-30 | 2023-03-31 | 2022-12-31 | 2022-09-30 | 2022-06-30 | 2022-03-31 | 2021-12-31 | 2021-09-30 | 2021-06-30 | 2021-03-31 | 2020-12-31 | 2020-09-30 | 2020-06-30 | 2020-03-31 | 2019-12-31 | 2019-09-30 | 2019-06-30 | 2019-03-31 | 2018-12-31 | 2018-09-30 | 2018-06-30 | 2018-03-31 | 2017-12-31 | 2017-09-30 | 2017-06-30 | 2017-03-31 | 2016-12-31 | 2016-09-30 | 2016-06-30 | 2016-03-31 | 2015-12-31 | 2015-09-30 | 2015-06-30 | 2015-03-31 | 2014-12-31 | 2014-09-30 | 2014-06-30 | 2014-03-31 | 2013-12-31 | 2013-09-30 | 2013-06-30 | 2013-03-31 | 2012-12-31 | 2012-09-30 | 2012-06-30 | 2012-03-31 | 2011-12-31 | 2011-09-30 | 2011-06-30 | 2011-03-31 | 2010-12-31 | 2010-09-30 | 2010-06-30 | ||
|---|---|---|---|---|---|---|---|---|---|---|---|---|---|---|---|---|---|---|---|---|---|---|---|---|---|---|---|---|---|---|---|---|---|---|---|---|---|---|---|---|---|---|---|---|---|---|---|---|---|---|---|---|---|---|---|---|---|
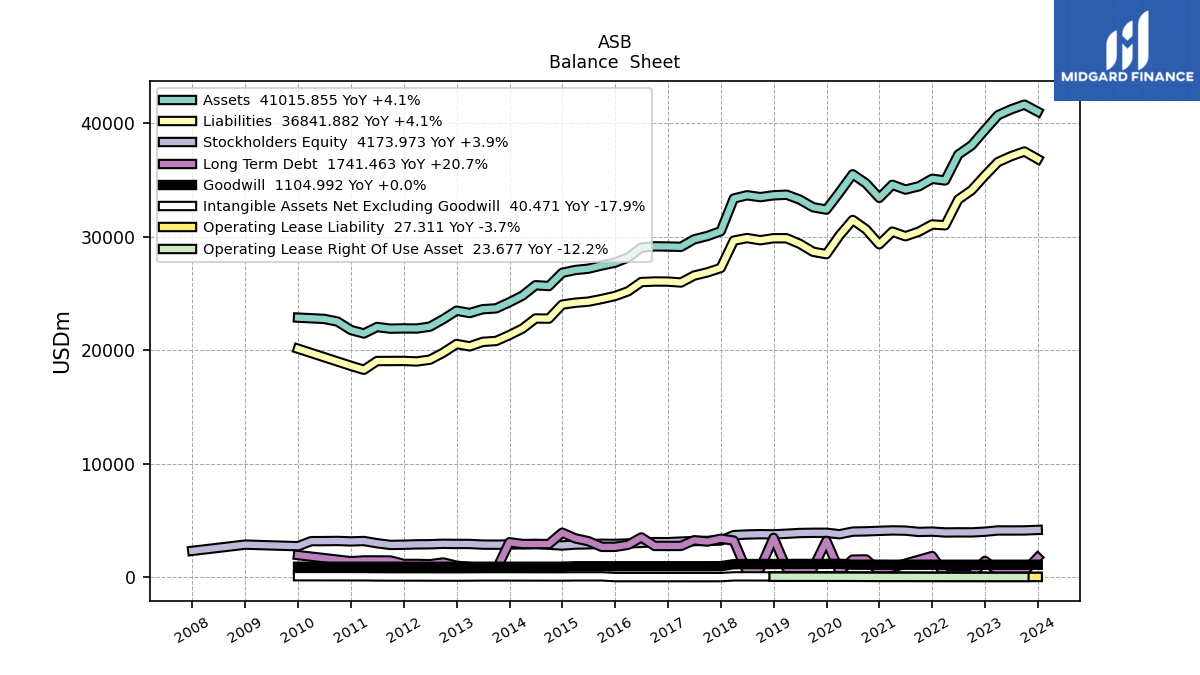
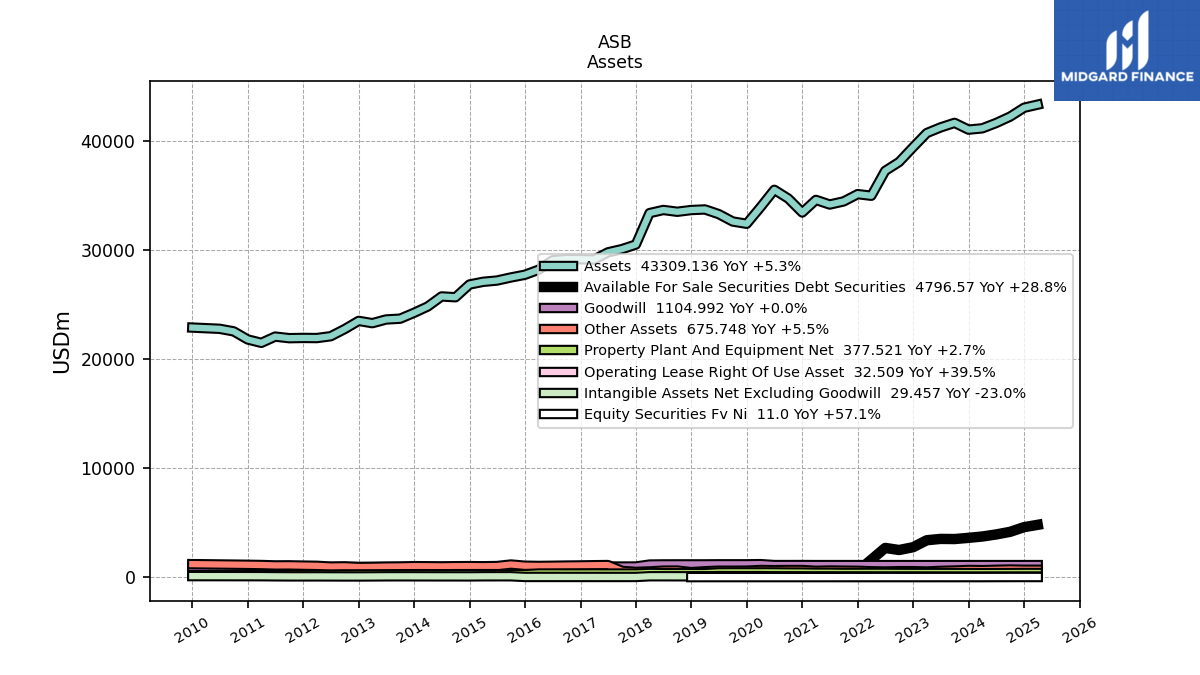
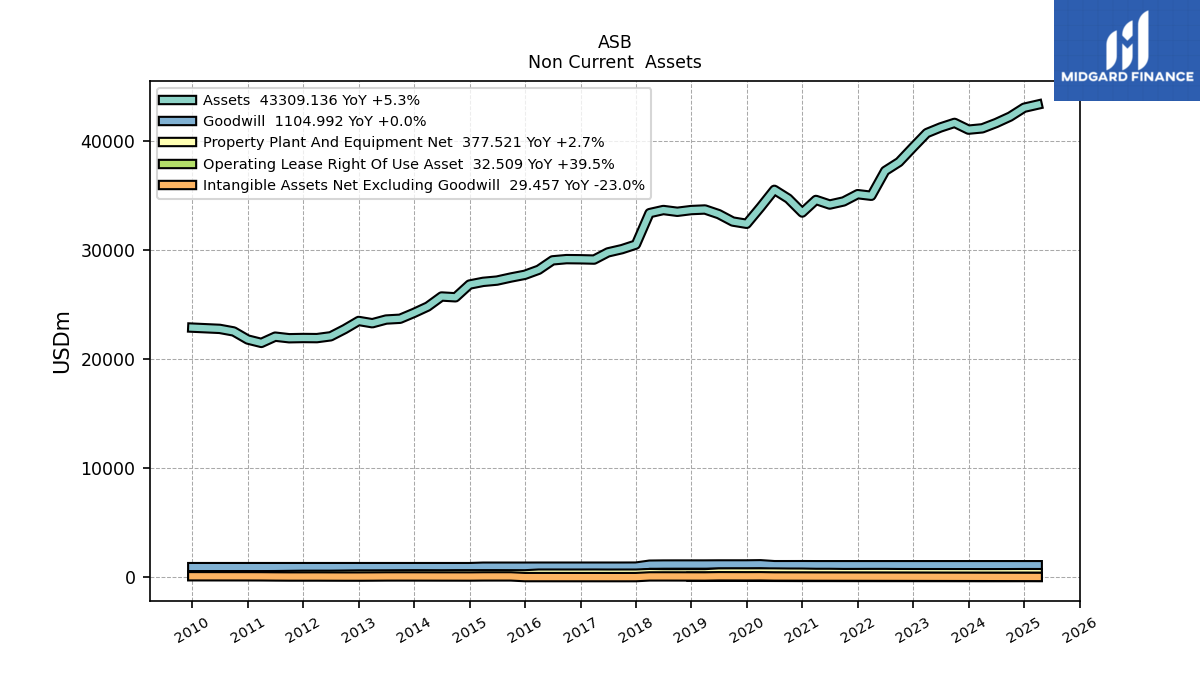
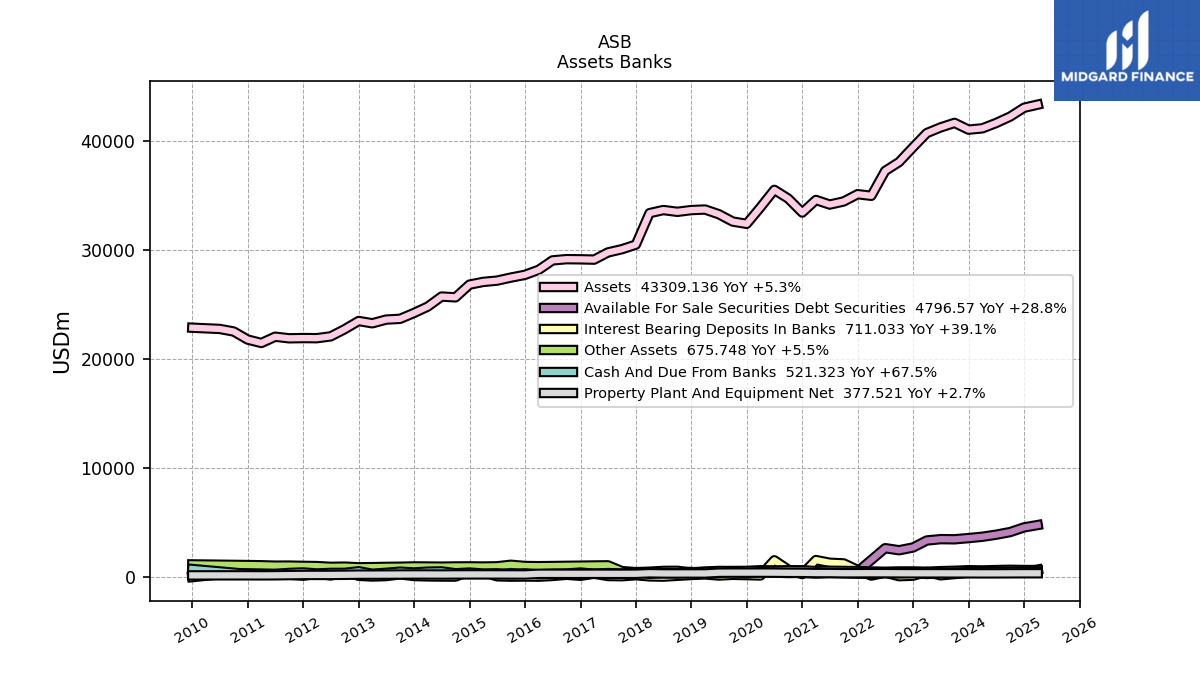
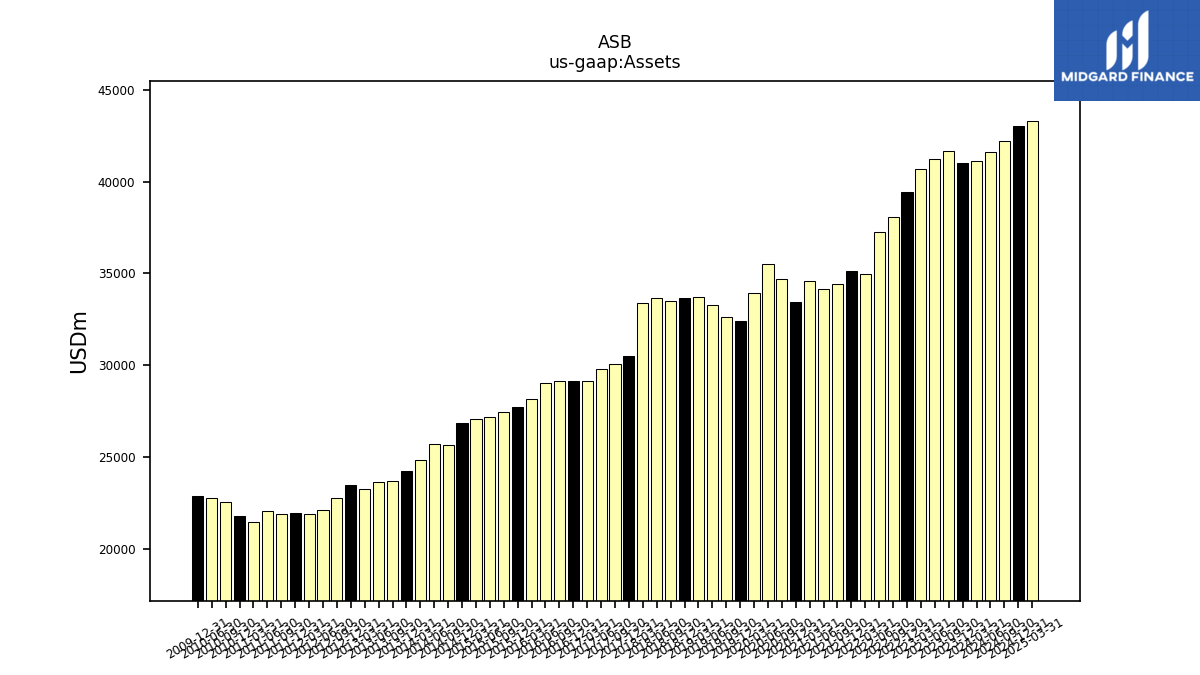
| Assets | 41137.08 | 41015.86 | 41637.38 | 41219.47 | 40702.52 | 39405.73 | 38049.61 | 37235.99 | 34955.90 | 35104.25 | 34439.67 | 34152.62 | 34575.25 | 33419.78 | 34698.75 | 35501.46 | 33908.06 | 32386.48 | 32596.46 | 33272.63 | 33700.87 | 33647.86 | 33489.00 | 33652.65 | 33366.50 | 30483.59 | 30064.55 | 29769.03 | 29109.86 | 29139.31 | 29152.76 | 29038.70 | 28178.87 | 27715.02 | 27467.24 | 27185.15 | 27068.74 | 26821.77 | 25653.82 | 25727.79 | 24806.20 | 24226.92 | 23688.67 | 23616.94 | 23277.77 | 23487.74 | 22738.35 | 22081.10 | 21913.67 | 21924.22 | 21902.65 | 22048.47 | 21473.56 | 21785.60 | 22525.29 | 22760.06 | |
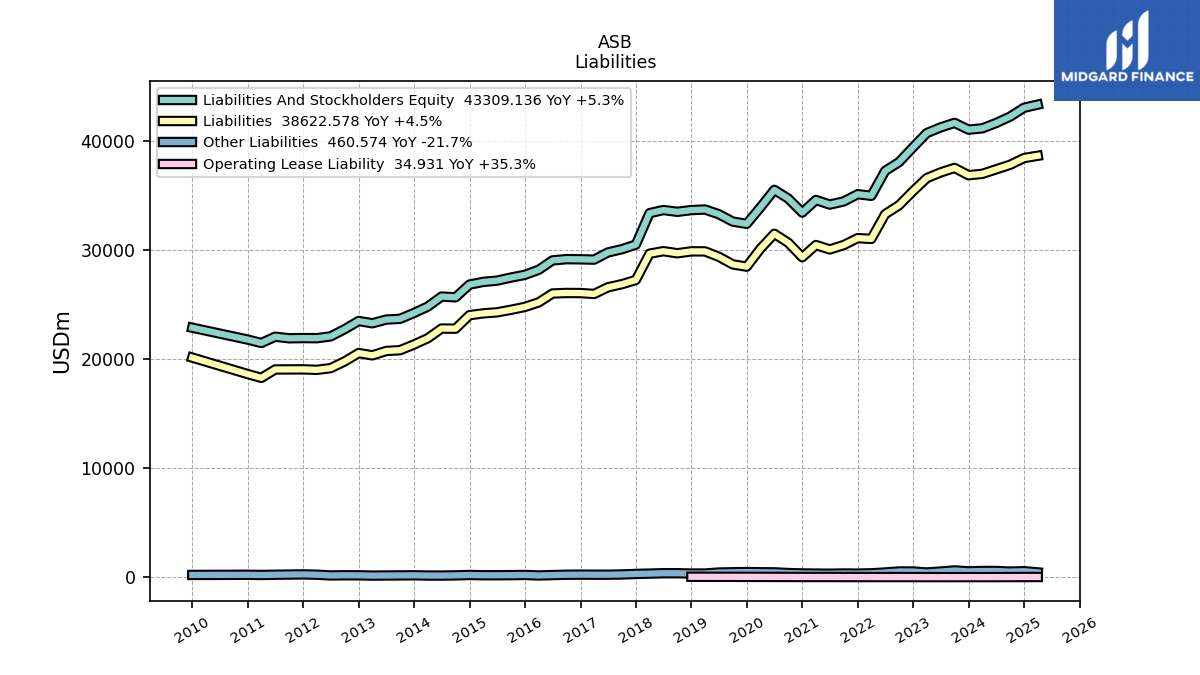
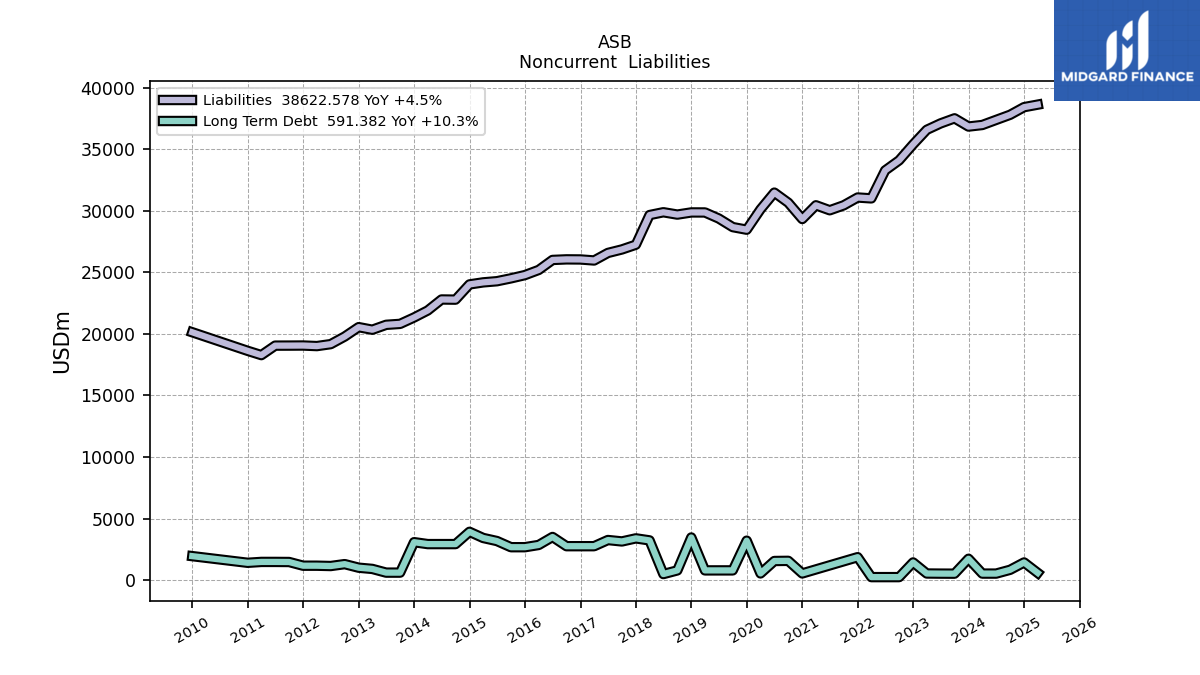
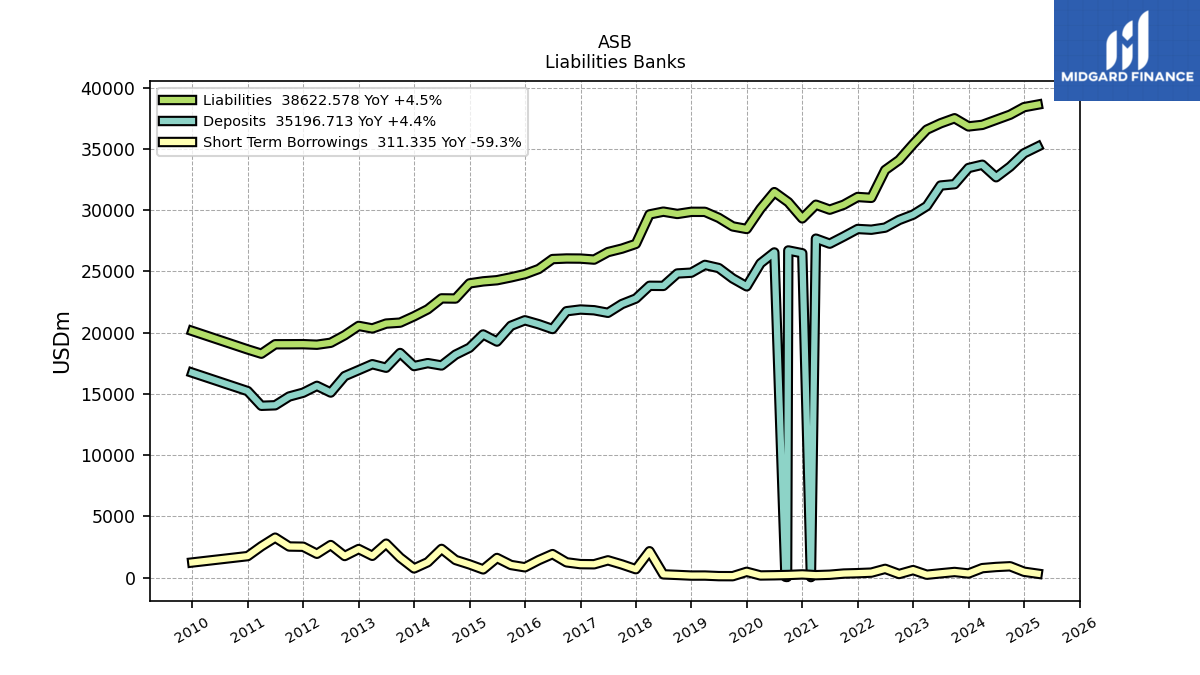
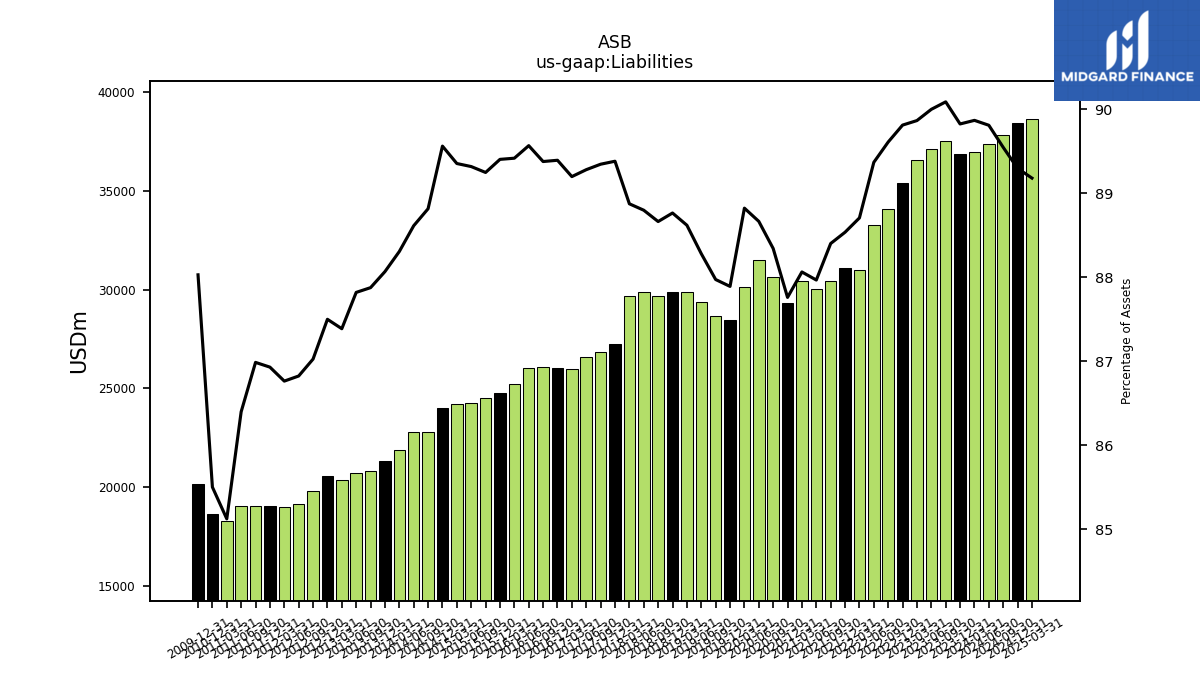
| Liabilities | 36968.41 | 36841.88 | 37509.74 | 37096.60 | 36576.86 | 35390.24 | 34095.66 | 33276.61 | 31007.61 | 31079.40 | 30444.71 | 30042.57 | 30447.47 | 29328.85 | 30653.31 | 31477.01 | 30117.58 | 28464.35 | 28675.60 | 29372.83 | 29865.00 | 29866.97 | 29691.96 | 29882.40 | 29653.81 | 27246.15 | 26860.95 | 26577.52 | 25965.06 | 26048.00 | 26055.65 | 26008.55 | 25196.37 | 24777.78 | 24513.45 | 24280.75 | 24186.60 | 24021.52 | 22784.24 | 22797.84 | 21905.17 | 21335.63 | 20816.39 | 20739.97 | 20341.50 | 20551.34 | 19787.90 | 19171.48 | 19012.80 | 19058.42 | 19052.03 | 19049.33 | 18278.85 | 18626.81 | NA | NA | |
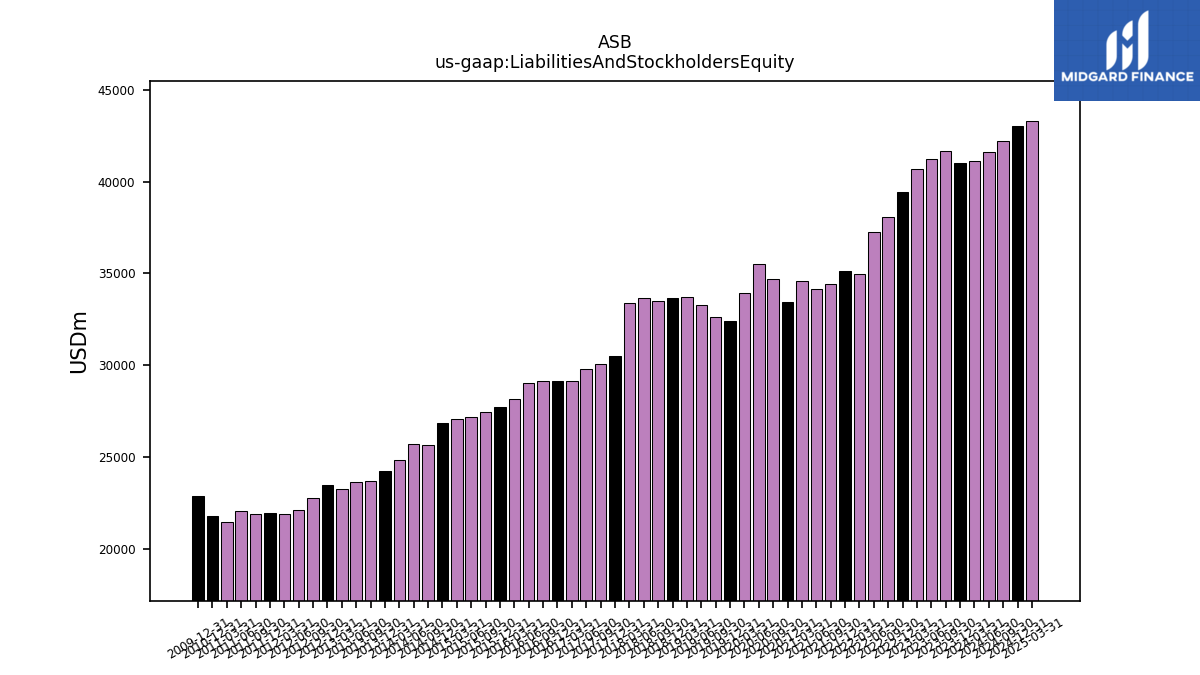
| Liabilities And Stockholders Equity | 41137.08 | 41015.86 | 41637.38 | 41219.47 | 40702.52 | 39405.73 | 38049.61 | 37235.99 | 34955.90 | 35104.25 | 34439.67 | 34152.62 | 34575.25 | 33419.78 | 34698.75 | 35501.46 | 33908.06 | 32386.48 | 32596.46 | 33272.63 | 33700.87 | 33647.86 | 33489.00 | 33652.65 | 33366.50 | 30483.59 | 30064.55 | 29769.03 | 29109.86 | 29139.31 | 29152.76 | 29038.70 | 28178.87 | 27715.02 | 27467.24 | 27185.15 | 27068.74 | 26821.77 | 25653.82 | 25727.79 | 24806.20 | 24226.92 | 23688.67 | 23616.94 | 23277.77 | 23487.74 | 22738.35 | 22081.10 | 21913.67 | 21924.22 | 21902.65 | 22048.47 | 21473.56 | 21785.60 | NA | NA | |
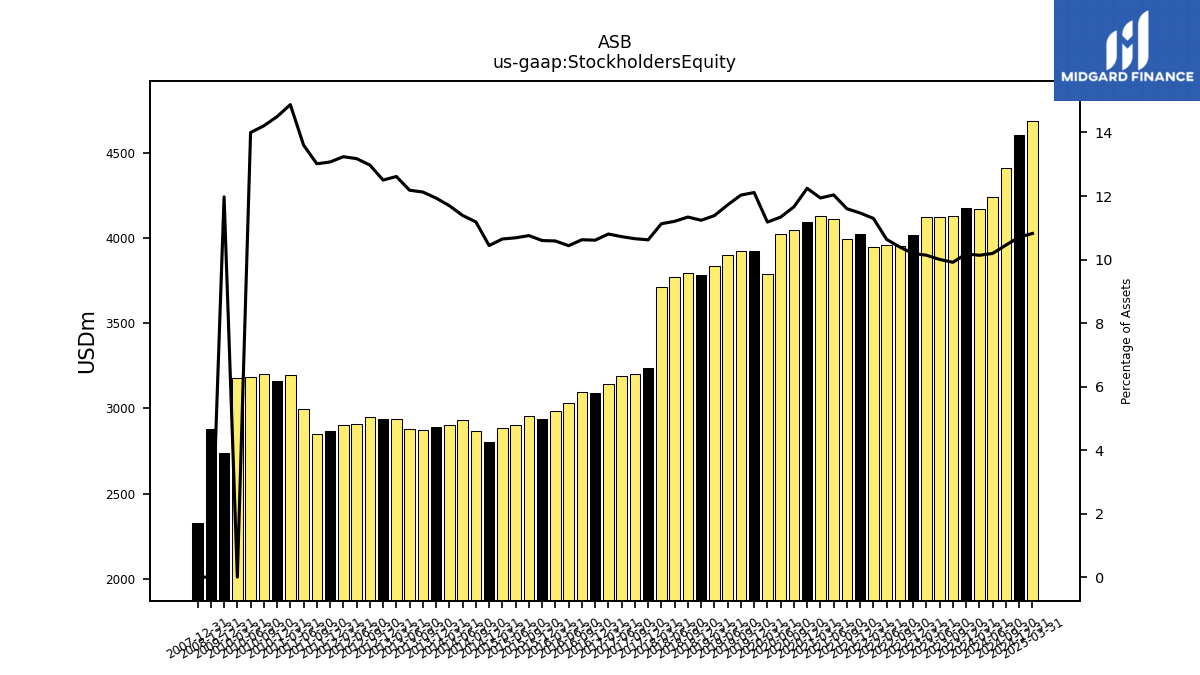
| Stockholders Equity | 4168.67 | 4173.97 | 4127.64 | 4122.87 | 4125.66 | 4015.49 | 3953.95 | 3959.38 | 3948.29 | 4024.85 | 3994.96 | 4110.05 | 4127.78 | 4090.93 | 4045.43 | 4024.46 | 3790.47 | 3922.12 | 3920.86 | 3899.79 | 3835.87 | 3780.89 | 3797.04 | 3770.24 | 3712.70 | 3237.44 | 3203.60 | 3191.50 | 3144.79 | 3091.31 | 3097.11 | 3030.15 | 2982.50 | 2937.25 | 2953.80 | 2904.39 | 2882.14 | 2800.25 | 2869.58 | 2929.95 | 2901.02 | 2891.29 | 2872.28 | 2876.98 | 2936.26 | 2936.40 | 2950.45 | 2909.62 | 2900.87 | 2865.79 | 2850.62 | 2999.15 | 3194.71 | 3158.79 | 3200.85 | 3186.13 |
| 2024-03-31 | 2023-12-31 | 2023-09-30 | 2023-06-30 | 2023-03-31 | 2022-12-31 | 2022-09-30 | 2022-06-30 | 2022-03-31 | 2021-12-31 | 2021-09-30 | 2021-06-30 | 2021-03-31 | 2020-12-31 | 2020-09-30 | 2020-06-30 | 2020-03-31 | 2019-12-31 | 2019-09-30 | 2019-06-30 | 2019-03-31 | 2018-12-31 | 2018-09-30 | 2018-06-30 | 2018-03-31 | 2017-12-31 | 2017-09-30 | 2017-06-30 | 2017-03-31 | 2016-12-31 | 2016-09-30 | 2016-06-30 | 2016-03-31 | 2015-12-31 | 2015-09-30 | 2015-06-30 | 2015-03-31 | 2014-12-31 | 2014-09-30 | 2014-06-30 | 2014-03-31 | 2013-12-31 | 2013-09-30 | 2013-06-30 | 2013-03-31 | 2012-12-31 | 2012-09-30 | 2012-06-30 | 2012-03-31 | 2011-12-31 | 2011-09-30 | 2011-06-30 | 2011-03-31 | 2010-12-31 | 2010-09-30 | 2010-06-30 | ||
|---|---|---|---|---|---|---|---|---|---|---|---|---|---|---|---|---|---|---|---|---|---|---|---|---|---|---|---|---|---|---|---|---|---|---|---|---|---|---|---|---|---|---|---|---|---|---|---|---|---|---|---|---|---|---|---|---|---|
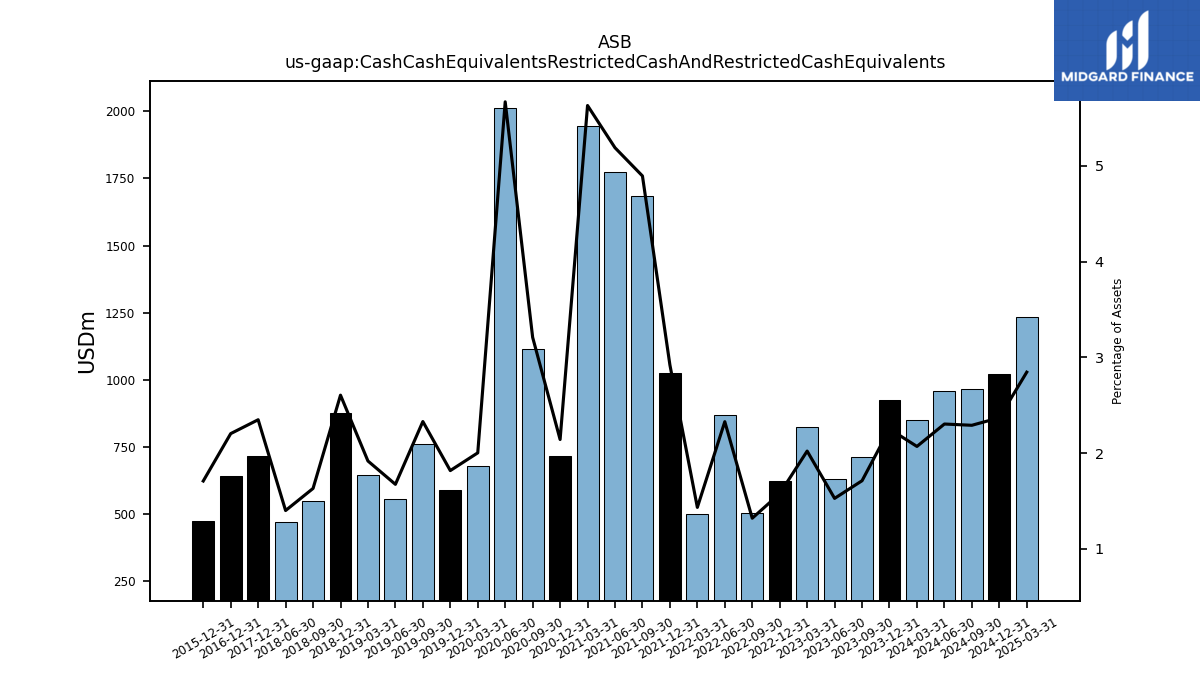
| Cash Cash Equivalents Restricted Cash And Restricted Cash Equivalents | 851.58 | 923.82 | 712.79 | 629.66 | 822.84 | 621.46 | 502.42 | 867.07 | 501.07 | 1025.52 | 1685.84 | 1772.38 | 1946.78 | 716.05 | 1113.66 | 2012.69 | 679.23 | 588.74 | 759.54 | 557.08 | 646.34 | 876.70 | 546.34 | 471.37 | NA | 716.02 | NA | NA | NA | 642.23 | NA | NA | NA | 473.69 | NA | NA | NA | NA | NA | NA | NA | NA | NA | NA | NA | NA | NA | NA | NA | NA | NA | NA | NA | NA | NA | NA | |
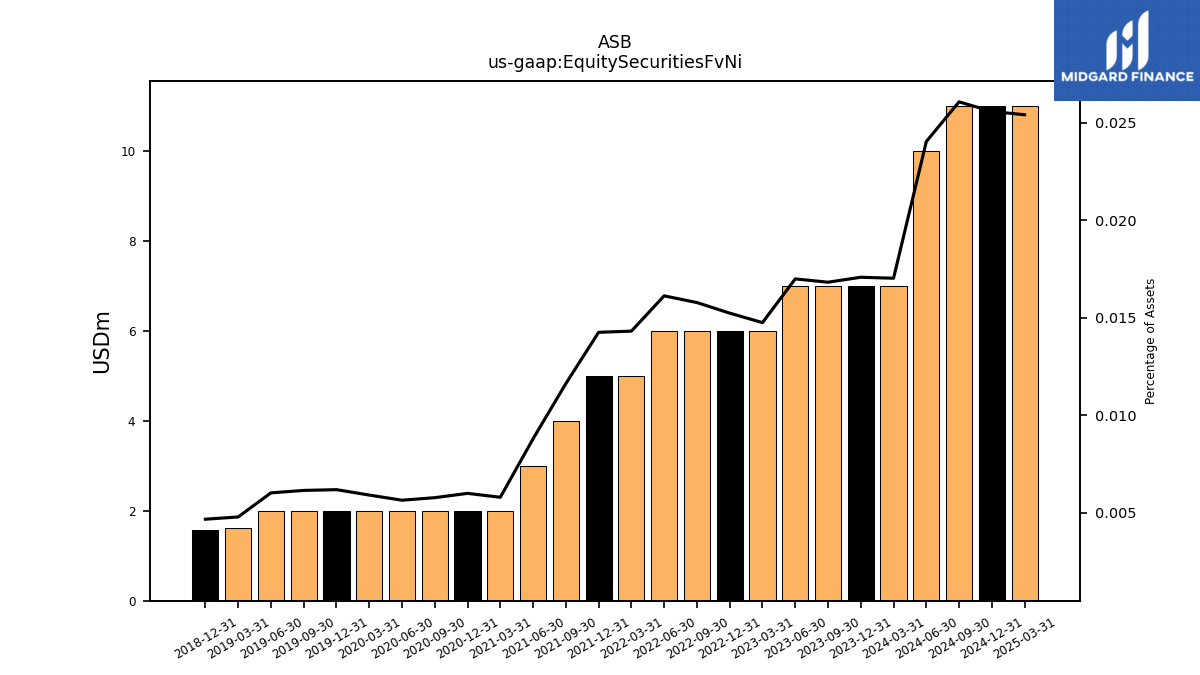
| Equity Securities Fv Ni | 7.00 | 7.00 | 7.00 | 7.00 | 6.00 | 6.00 | 6.00 | 6.00 | 5.00 | 5.00 | 4.00 | 3.00 | 2.00 | 2.00 | 2.00 | 2.00 | 2.00 | 2.00 | 2.00 | 2.00 | 1.61 | 1.57 | NA | NA | NA | NA | NA | NA | NA | NA | NA | NA | NA | NA | NA | NA | NA | NA | NA | NA | NA | NA | NA | NA | NA | NA | NA | NA | NA | NA | NA | NA | NA | NA | NA | NA | |
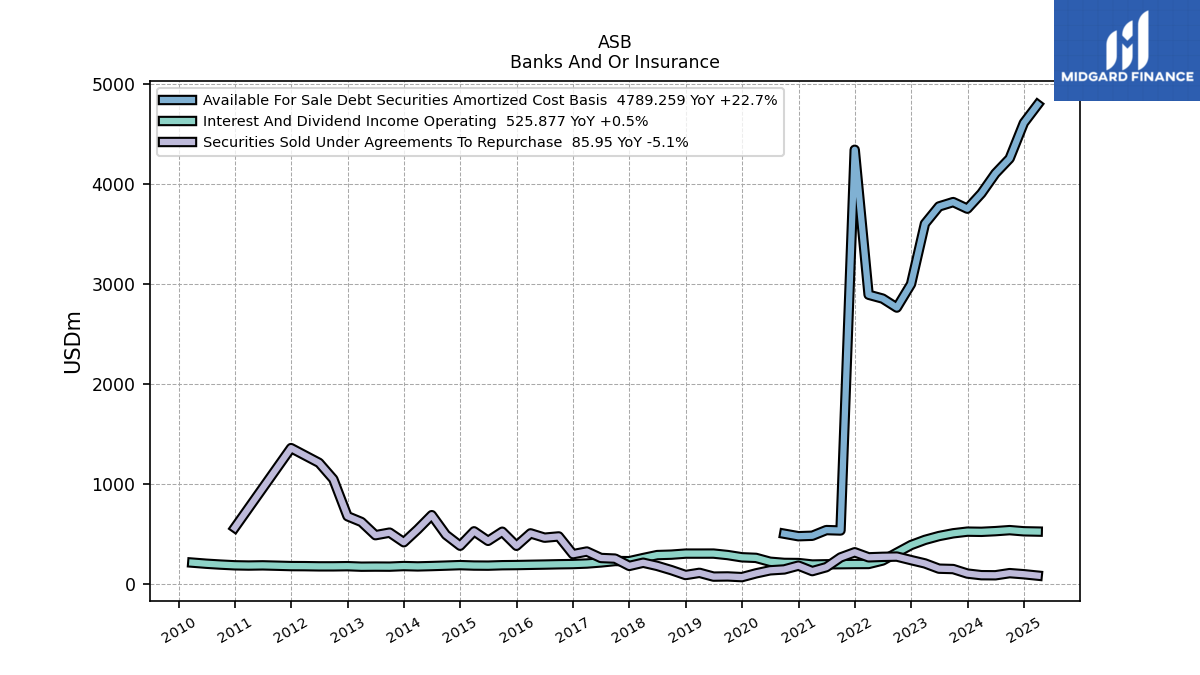
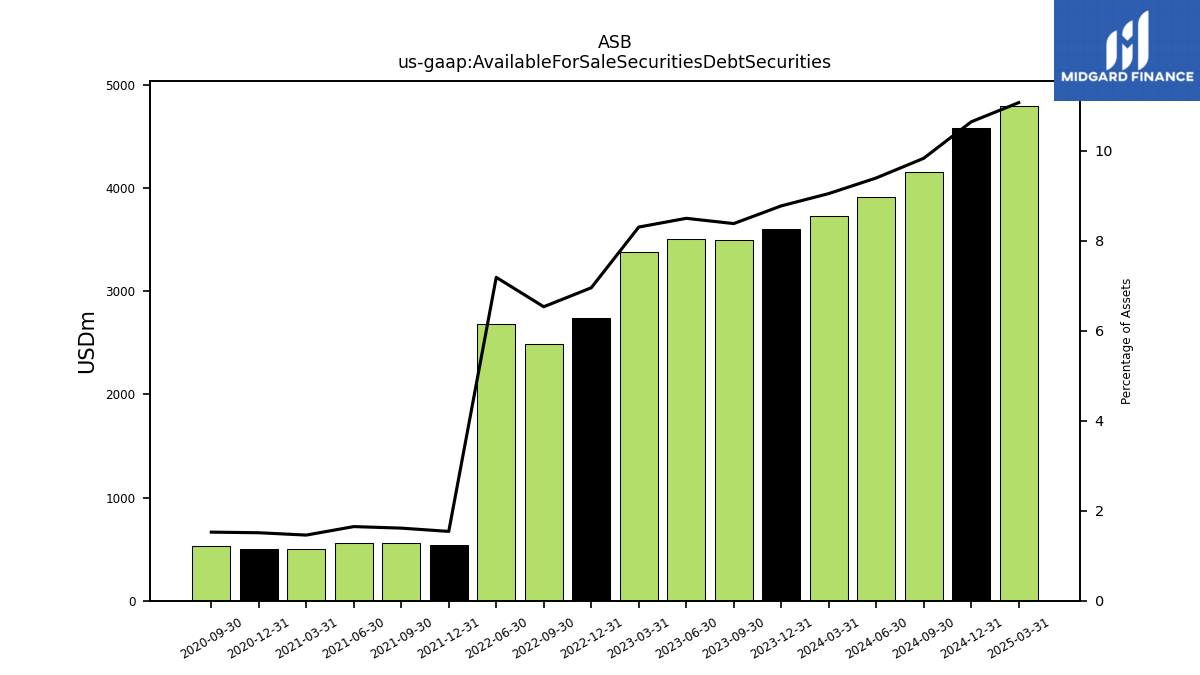
| Available For Sale Securities Debt Securities | 3724.15 | 3600.89 | 3491.68 | 3504.78 | 3381.61 | 2742.03 | 2487.31 | 2677.51 | NA | 541.30 | 556.00 | 563.13 | 504.78 | 505.23 | 529.38 | NA | NA | NA | NA | NA | NA | NA | NA | NA | NA | NA | NA | NA | NA | NA | NA | NA | NA | NA | NA | NA | NA | NA | NA | NA | NA | NA | NA | NA | NA | NA | NA | NA | NA | NA | NA | NA | NA | NA | NA | NA |
| 2024-03-31 | 2023-12-31 | 2023-09-30 | 2023-06-30 | 2023-03-31 | 2022-12-31 | 2022-09-30 | 2022-06-30 | 2022-03-31 | 2021-12-31 | 2021-09-30 | 2021-06-30 | 2021-03-31 | 2020-12-31 | 2020-09-30 | 2020-06-30 | 2020-03-31 | 2019-12-31 | 2019-09-30 | 2019-06-30 | 2019-03-31 | 2018-12-31 | 2018-09-30 | 2018-06-30 | 2018-03-31 | 2017-12-31 | 2017-09-30 | 2017-06-30 | 2017-03-31 | 2016-12-31 | 2016-09-30 | 2016-06-30 | 2016-03-31 | 2015-12-31 | 2015-09-30 | 2015-06-30 | 2015-03-31 | 2014-12-31 | 2014-09-30 | 2014-06-30 | 2014-03-31 | 2013-12-31 | 2013-09-30 | 2013-06-30 | 2013-03-31 | 2012-12-31 | 2012-09-30 | 2012-06-30 | 2012-03-31 | 2011-12-31 | 2011-09-30 | 2011-06-30 | 2011-03-31 | 2010-12-31 | 2010-09-30 | 2010-06-30 | ||
|---|---|---|---|---|---|---|---|---|---|---|---|---|---|---|---|---|---|---|---|---|---|---|---|---|---|---|---|---|---|---|---|---|---|---|---|---|---|---|---|---|---|---|---|---|---|---|---|---|---|---|---|---|---|---|---|---|---|
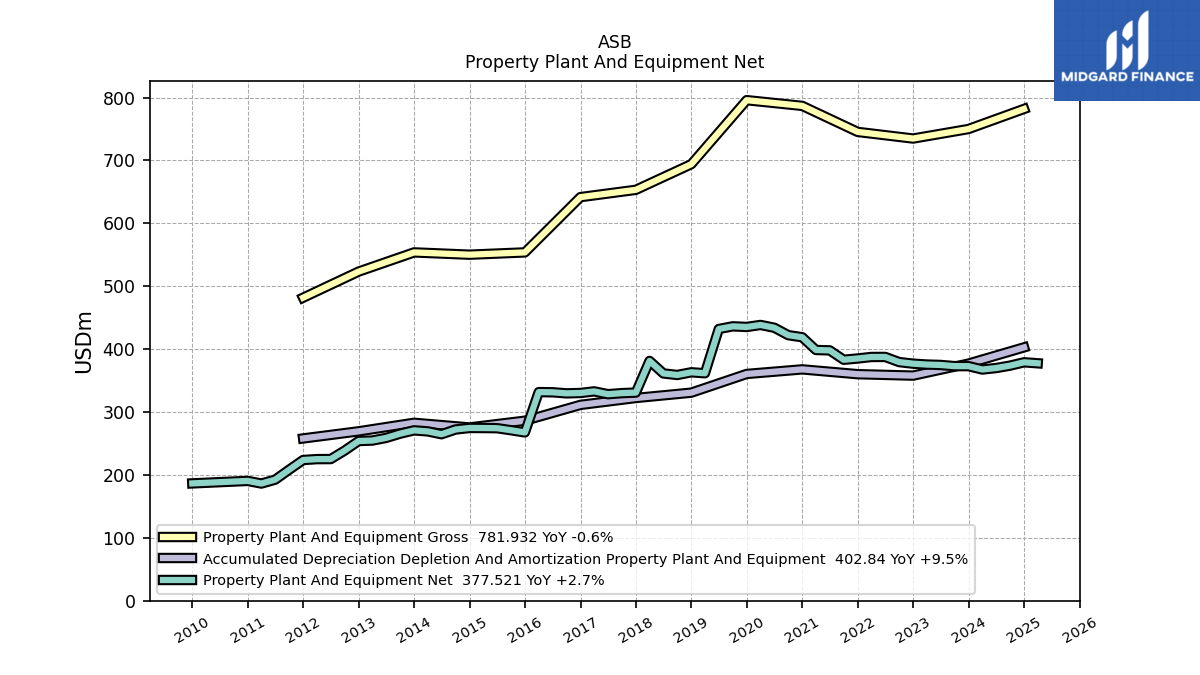
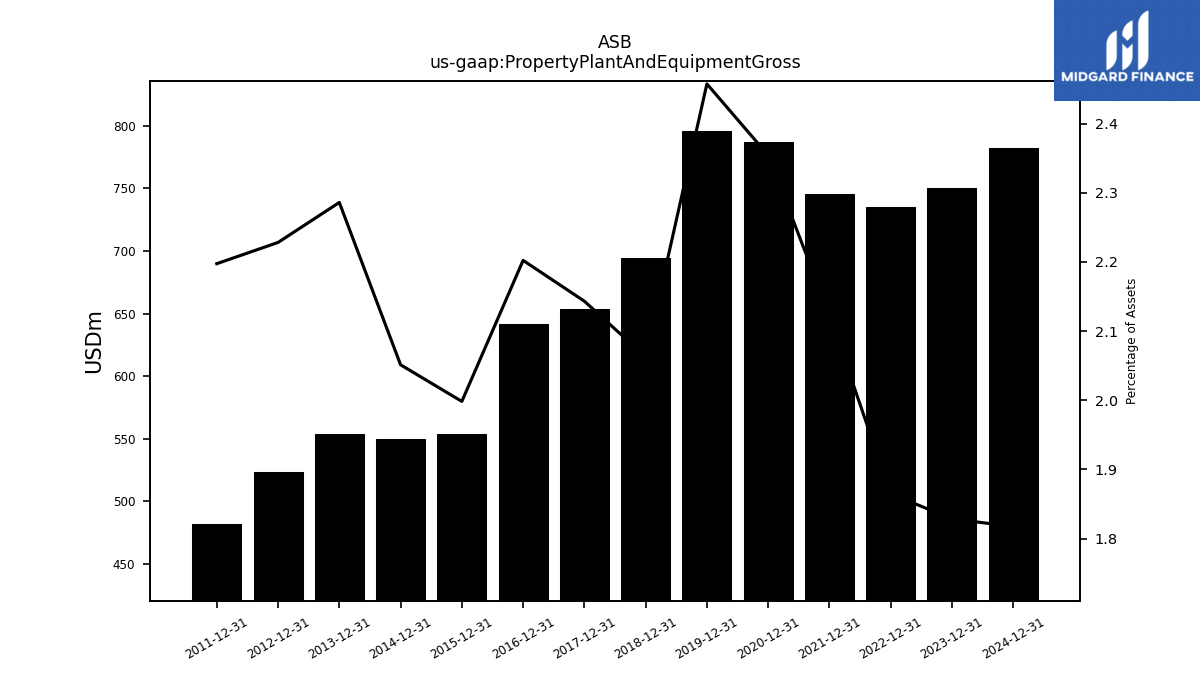
| Property Plant And Equipment Gross | NA | 749.98 | NA | NA | NA | 734.83 | NA | NA | NA | 745.38 | NA | NA | NA | 786.76 | NA | NA | NA | 795.85 | NA | NA | NA | 694.05 | NA | NA | NA | 653.32 | NA | NA | NA | 641.70 | NA | NA | NA | 553.83 | NA | NA | NA | 550.18 | NA | NA | NA | 553.81 | NA | NA | NA | 523.33 | NA | NA | NA | 481.77 | NA | NA | NA | NA | NA | NA | |
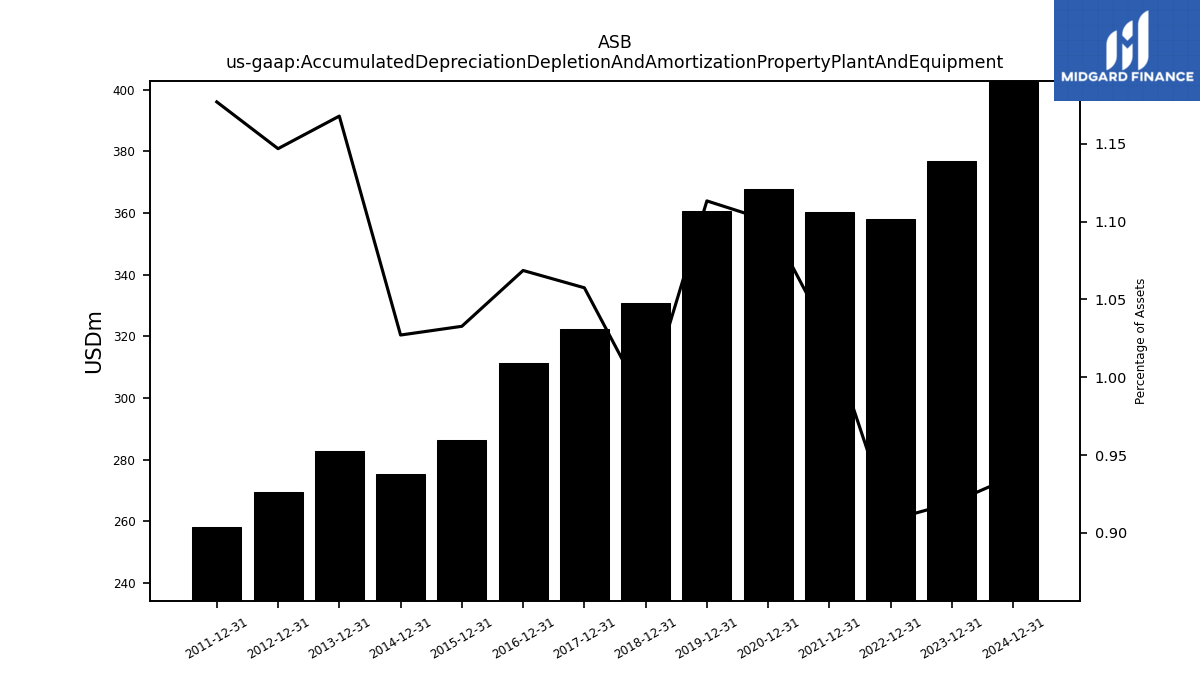
| Accumulated Depreciation Depletion And Amortization Property Plant And Equipment | NA | 377.00 | NA | NA | NA | 357.92 | NA | NA | NA | 360.20 | NA | NA | NA | 367.85 | NA | NA | NA | 360.56 | NA | NA | NA | 330.82 | NA | NA | NA | 322.36 | NA | NA | NA | 311.39 | NA | NA | NA | 286.22 | NA | NA | NA | 275.50 | NA | NA | NA | 282.92 | NA | NA | NA | 269.38 | NA | NA | NA | 258.03 | NA | NA | NA | NA | NA | NA | |
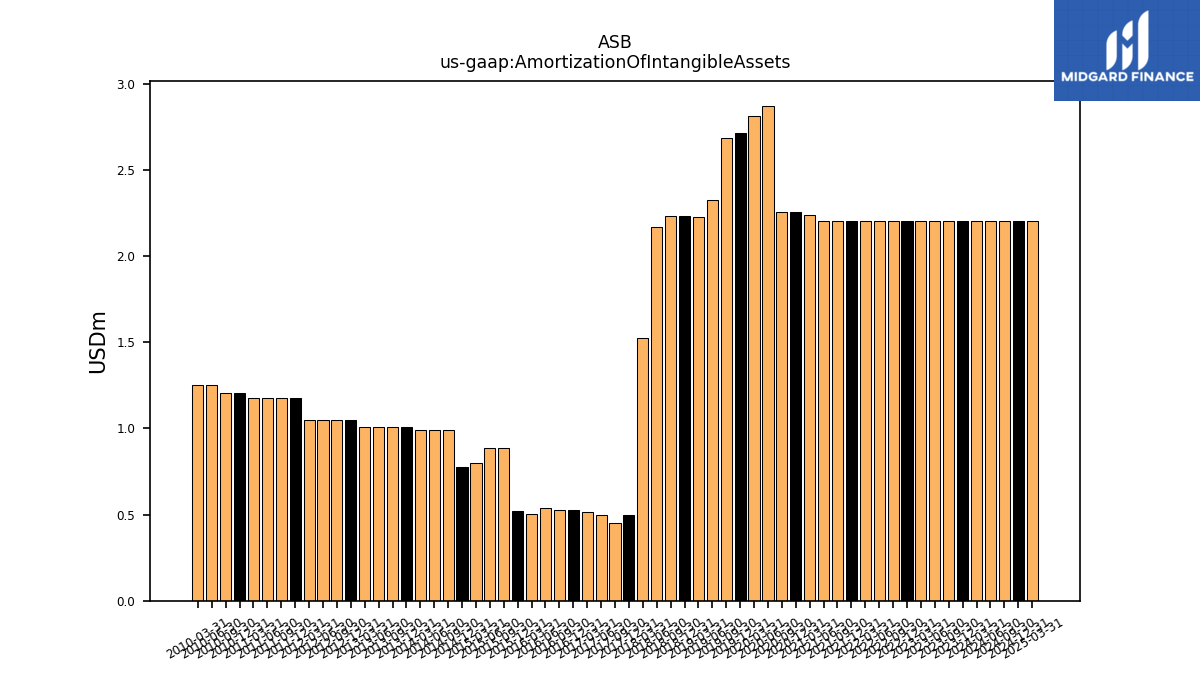
| Amortization Of Intangible Assets | 2.20 | 2.20 | 2.20 | 2.20 | 2.20 | 2.20 | 2.20 | 2.20 | 2.20 | 2.20 | 2.20 | 2.20 | 2.24 | 2.25 | 2.25 | 2.87 | 2.81 | 2.71 | 2.69 | 2.32 | 2.23 | 2.23 | 2.23 | 2.17 | 1.52 | 0.50 | 0.45 | 0.50 | 0.51 | 0.53 | 0.53 | 0.54 | 0.50 | 0.52 | 0.89 | 0.89 | 0.80 | 0.78 | 0.99 | 0.99 | 0.99 | 1.01 | 1.01 | 1.01 | 1.01 | 1.05 | 1.05 | 1.05 | 1.05 | 1.18 | 1.18 | 1.18 | 1.18 | 1.21 | 1.21 | 1.25 | |
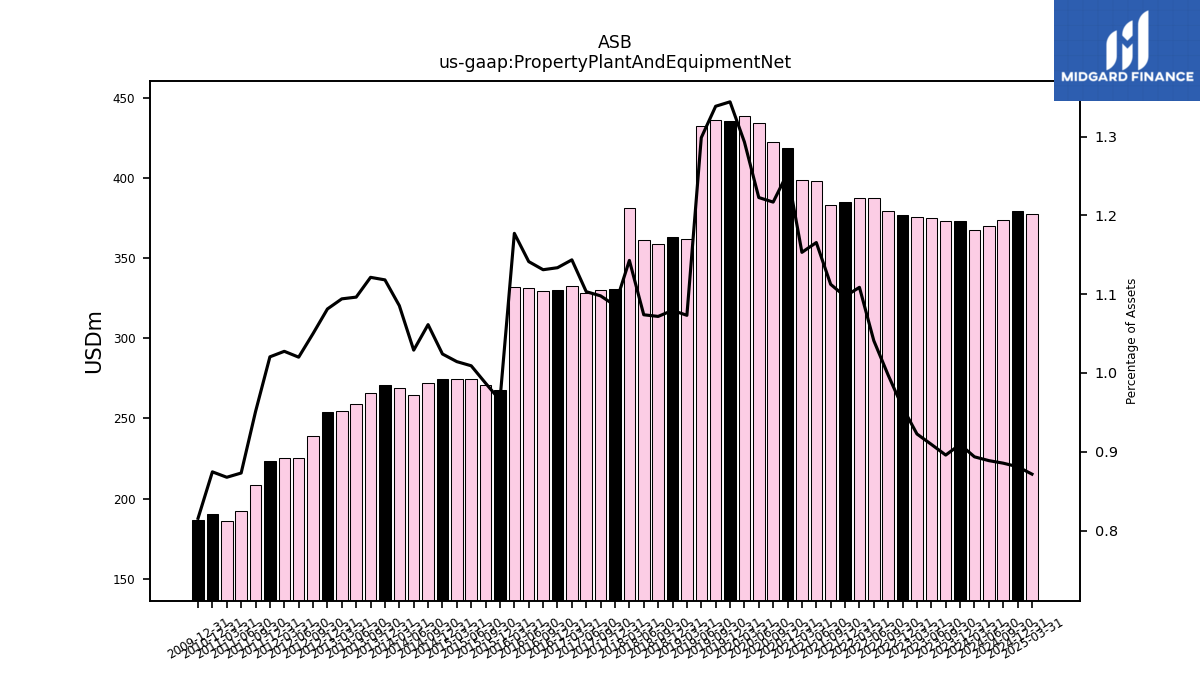
| Property Plant And Equipment Net | 367.62 | 372.98 | 373.02 | 374.87 | 375.54 | 376.91 | 379.46 | 387.63 | 387.55 | 385.17 | 383.13 | 398.05 | 398.67 | 418.91 | 422.22 | 434.04 | 438.47 | 435.28 | 436.27 | 432.06 | 361.67 | 363.23 | 358.93 | 361.38 | 381.33 | 330.96 | 330.06 | 328.40 | 332.88 | 330.31 | 329.73 | 331.43 | 331.71 | 267.61 | 271.12 | 274.34 | 274.59 | 274.69 | 272.28 | 264.74 | 269.26 | 270.89 | 265.64 | 258.90 | 254.67 | 253.96 | 238.76 | 225.25 | 225.16 | 223.74 | 208.30 | 192.51 | 186.33 | 190.53 | NA | NA | |
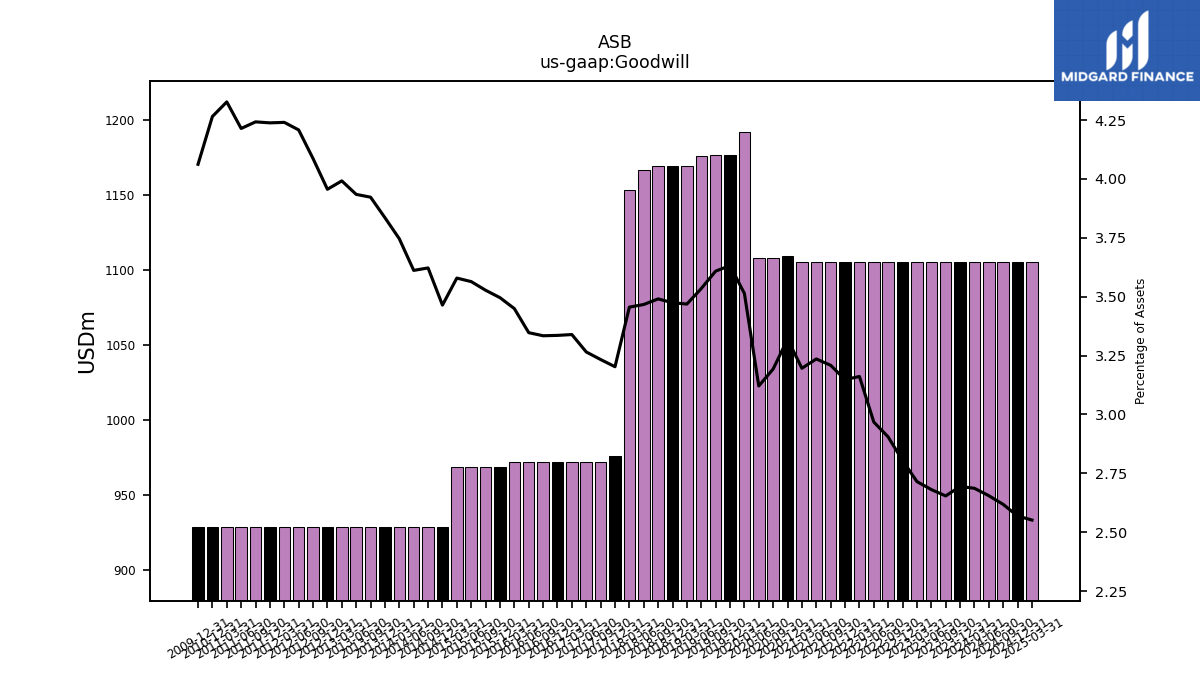
| Goodwill | 1104.99 | 1104.99 | 1104.99 | 1104.99 | 1104.99 | 1104.99 | 1104.99 | 1104.99 | 1104.99 | 1104.99 | 1104.99 | 1104.99 | 1104.99 | 1109.30 | 1107.90 | 1107.90 | 1191.39 | 1176.23 | 1176.23 | 1176.02 | 1168.94 | 1169.02 | 1168.92 | 1166.66 | 1153.00 | 976.24 | 972.01 | 972.00 | 972.00 | 971.95 | 971.95 | 971.95 | 971.95 | 968.84 | 968.84 | 968.84 | 968.77 | 929.17 | 929.17 | 929.17 | 929.17 | 929.17 | 929.17 | 929.17 | 929.17 | 929.17 | 929.17 | 929.17 | 929.17 | 929.17 | 929.17 | 929.17 | 929.17 | 929.17 | NA | NA | |
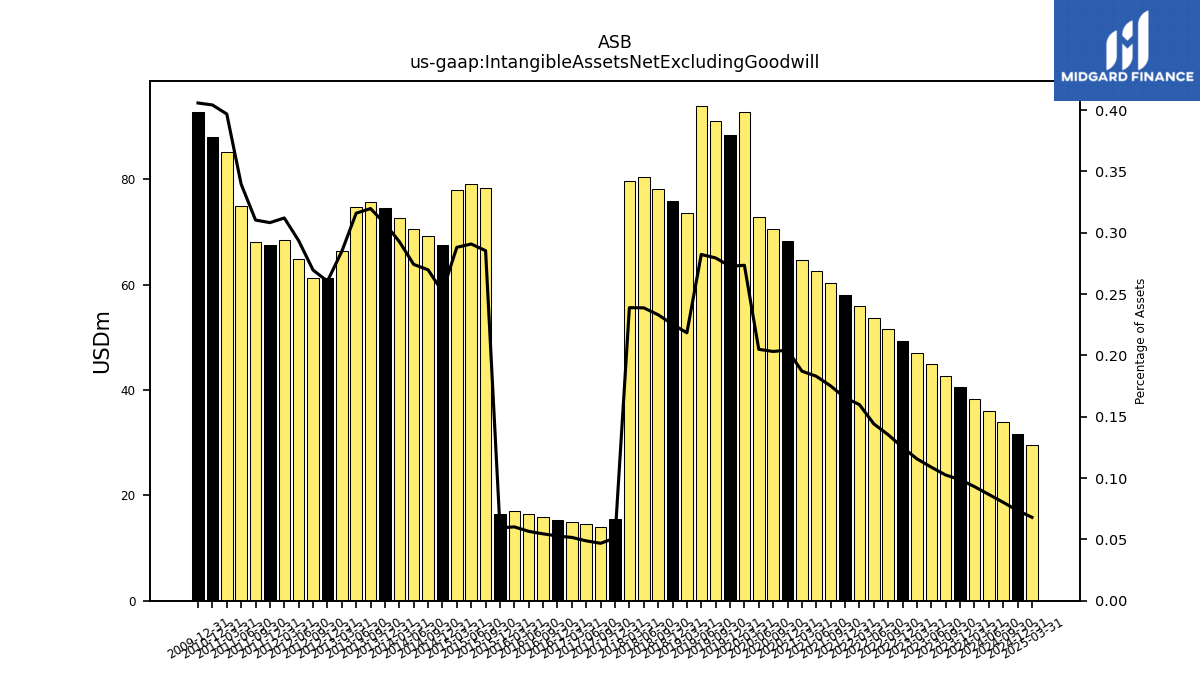
| Intangible Assets Net Excluding Goodwill | 38.27 | 40.47 | 42.67 | 44.88 | 47.08 | 49.28 | 51.48 | 53.69 | 55.89 | 58.09 | 60.30 | 62.50 | 64.70 | 68.25 | 70.51 | 72.76 | 92.72 | 88.30 | 91.09 | 93.92 | 73.61 | 75.84 | 78.07 | 80.35 | 79.71 | 15.58 | 14.08 | 14.53 | 15.03 | 15.38 | 15.90 | 16.43 | 16.97 | 16.46 | 78.38 | 79.06 | 77.98 | 67.58 | 69.20 | 70.54 | 72.63 | 74.46 | 75.73 | 74.61 | 66.29 | 61.18 | 61.29 | 64.81 | 68.37 | 67.57 | 67.97 | 74.87 | 85.20 | 88.04 | NA | NA | |
| Equity Securities Fv Ni | 7.00 | 7.00 | 7.00 | 7.00 | 6.00 | 6.00 | 6.00 | 6.00 | 5.00 | 5.00 | 4.00 | 3.00 | 2.00 | 2.00 | 2.00 | 2.00 | 2.00 | 2.00 | 2.00 | 2.00 | 1.61 | 1.57 | NA | NA | NA | NA | NA | NA | NA | NA | NA | NA | NA | NA | NA | NA | NA | NA | NA | NA | NA | NA | NA | NA | NA | NA | NA | NA | NA | NA | NA | NA | NA | NA | NA | NA | |
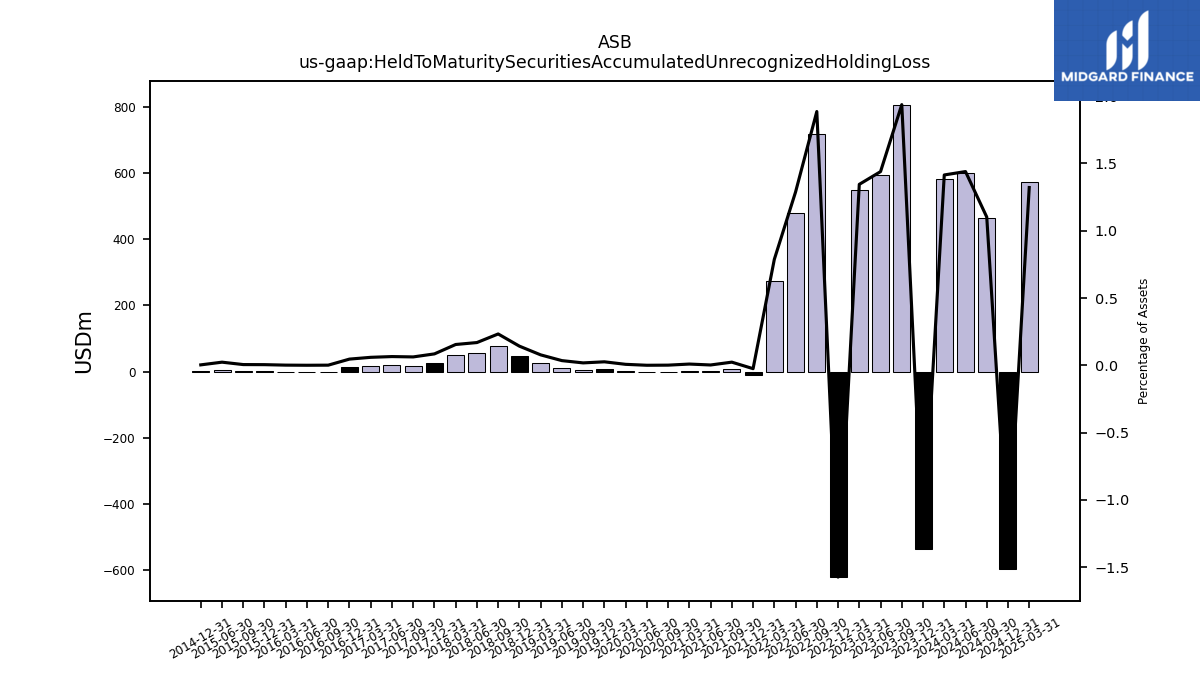
| Held To Maturity Securities Accumulated Unrecognized Holding Loss | 581.90 | -535.23 | 806.63 | 593.28 | 547.35 | -620.41 | 717.58 | 479.55 | 275.19 | -8.81 | 8.02 | 0.78 | 3.15 | NA | 0.37 | 0.05 | 2.41 | 8.36 | 5.80 | 11.54 | 26.11 | 47.84 | 77.96 | 56.86 | 51.56 | 25.82 | 18.68 | 19.28 | 17.23 | 13.38 | 0.27 | 0.05 | 0.33 | 1.29 | 1.45 | 6.29 | NA | 0.83 | NA | NA | NA | NA | NA | NA | NA | NA | NA | NA | NA | NA | NA | NA | NA | NA | NA | NA | |
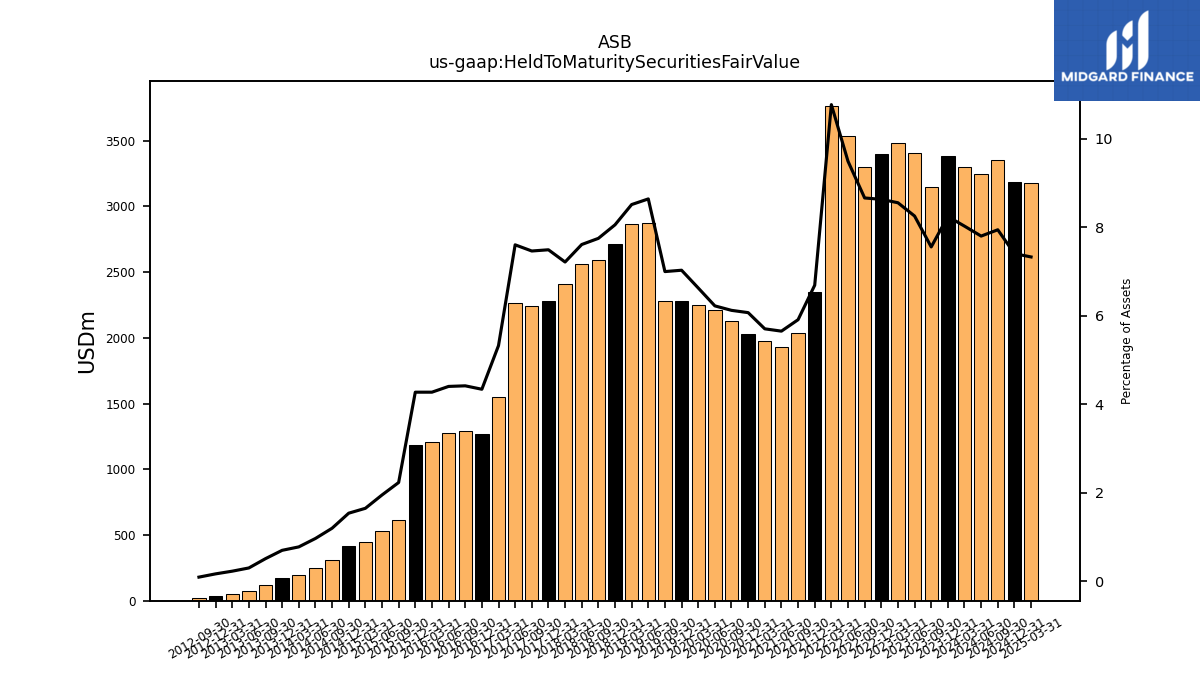
| Held To Maturity Securities Fair Value | 3301.28 | 3380.62 | 3145.90 | 3402.09 | 3481.50 | 3401.02 | 3295.76 | 3534.19 | 3764.90 | 2348.66 | 2035.86 | 1930.54 | 1972.54 | 2028.94 | 2124.45 | 2209.51 | 2247.55 | 2276.47 | 2281.28 | 2874.76 | 2868.87 | 2710.27 | 2595.02 | 2560.94 | 2407.20 | 2283.57 | 2243.84 | 2263.32 | 1550.32 | 1264.67 | 1287.83 | 1278.86 | 1204.35 | 1184.44 | 613.37 | 530.45 | 446.70 | 413.07 | 307.88 | 249.23 | 193.15 | 169.89 | 121.49 | 71.50 | 53.49 | 39.68 | 21.72 | NA | NA | NA | NA | NA | NA | NA | NA | NA | |
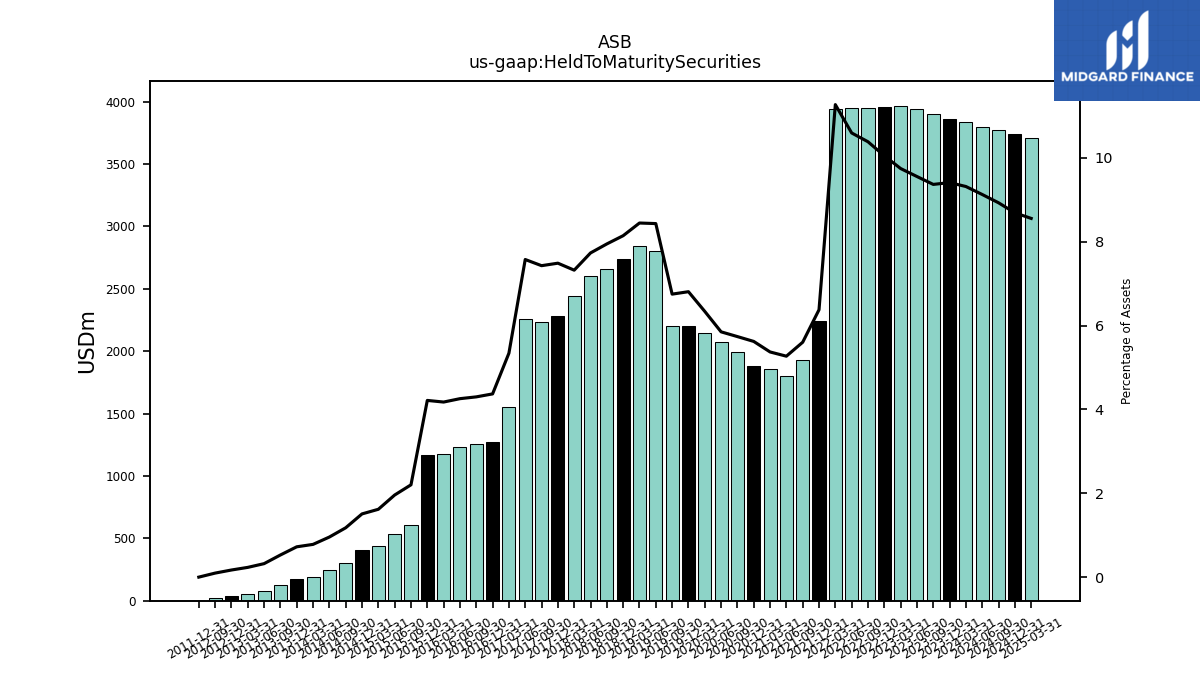
| Held To Maturity Securities | 3833.04 | 3860.24 | 3900.48 | 3939.00 | 3967.08 | 3960.45 | 3951.55 | 3945.27 | 3939.92 | 2239.00 | 1929.78 | 1799.89 | 1857.15 | 1879.01 | 1990.94 | 2077.29 | 2149.43 | 2205.08 | 2200.42 | 2806.06 | 2846.69 | 2740.51 | 2661.76 | 2602.25 | 2443.20 | 2282.85 | 2233.58 | 2255.39 | 1554.84 | 1273.54 | 1253.49 | 1236.14 | 1176.82 | 1168.23 | 604.80 | 532.38 | 438.05 | 404.45 | 301.94 | 246.05 | 193.76 | 175.21 | 125.09 | 75.95 | 54.12 | 39.88 | 21.85 | NA | NA | 0.00 | NA | NA | NA | NA | NA | NA | |
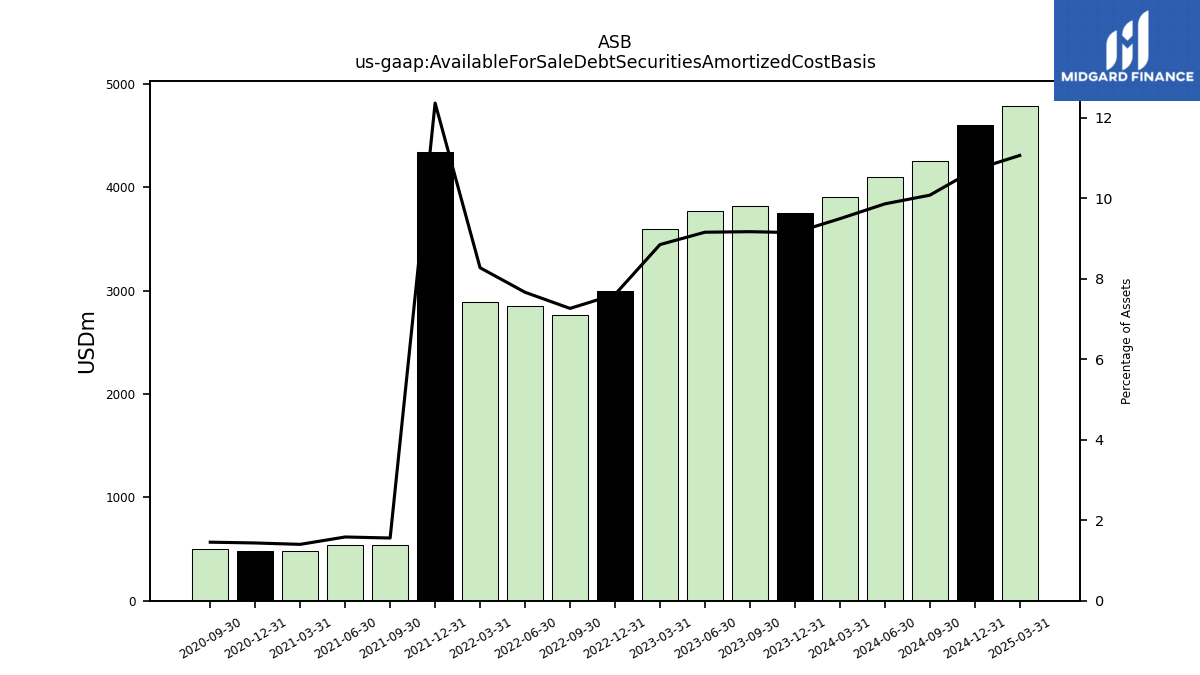
| Available For Sale Debt Securities Amortized Cost Basis | 3902.76 | 3749.81 | 3816.20 | 3772.37 | 3600.14 | 2997.03 | 2762.39 | 2852.50 | 2890.76 | 4338.67 | 536.56 | 540.83 | 484.20 | 479.48 | 504.70 | NA | NA | NA | NA | NA | NA | NA | NA | NA | NA | NA | NA | NA | NA | NA | NA | NA | NA | NA | NA | NA | NA | NA | NA | NA | NA | NA | NA | NA | NA | NA | NA | NA | NA | NA | NA | NA | NA | NA | NA | NA | |
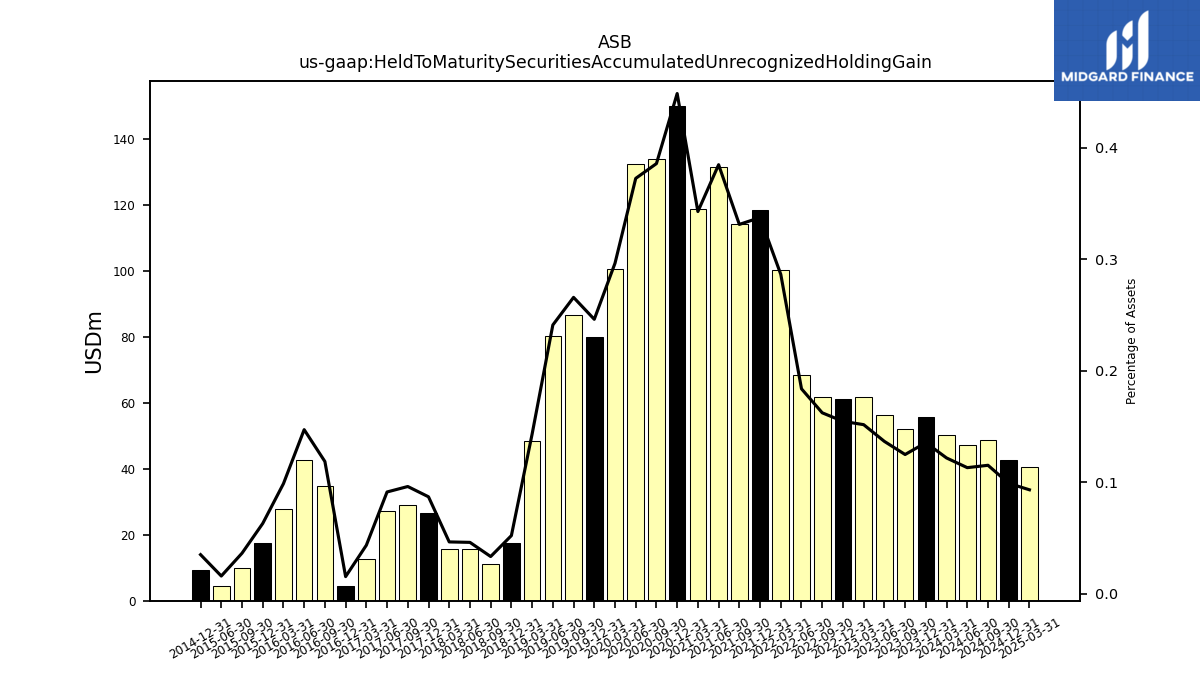
| Held To Maturity Securities Accumulated Unrecognized Holding Gain | 50.15 | 55.62 | 52.04 | 56.37 | 61.77 | 60.98 | 61.79 | 68.47 | 100.17 | 118.47 | 114.09 | 131.43 | 118.54 | 149.94 | 133.88 | 132.27 | 100.53 | 79.74 | 86.67 | 80.23 | 48.29 | 17.59 | 11.22 | 15.55 | 15.55 | 26.54 | 28.95 | 27.21 | 12.70 | 4.52 | 34.61 | 42.77 | 27.86 | 17.50 | 10.02 | 4.36 | NA | 9.44 | NA | NA | NA | NA | NA | NA | NA | NA | NA | NA | NA | NA | NA | NA | NA | NA | NA | NA | |
| Held To Maturity Securities Accumulated Unrecognized Holding Loss | 581.90 | -535.23 | 806.63 | 593.28 | 547.35 | -620.41 | 717.58 | 479.55 | 275.19 | -8.81 | 8.02 | 0.78 | 3.15 | NA | 0.37 | 0.05 | 2.41 | 8.36 | 5.80 | 11.54 | 26.11 | 47.84 | 77.96 | 56.86 | 51.56 | 25.82 | 18.68 | 19.28 | 17.23 | 13.38 | 0.27 | 0.05 | 0.33 | 1.29 | 1.45 | 6.29 | NA | 0.83 | NA | NA | NA | NA | NA | NA | NA | NA | NA | NA | NA | NA | NA | NA | NA | NA | NA | NA | |
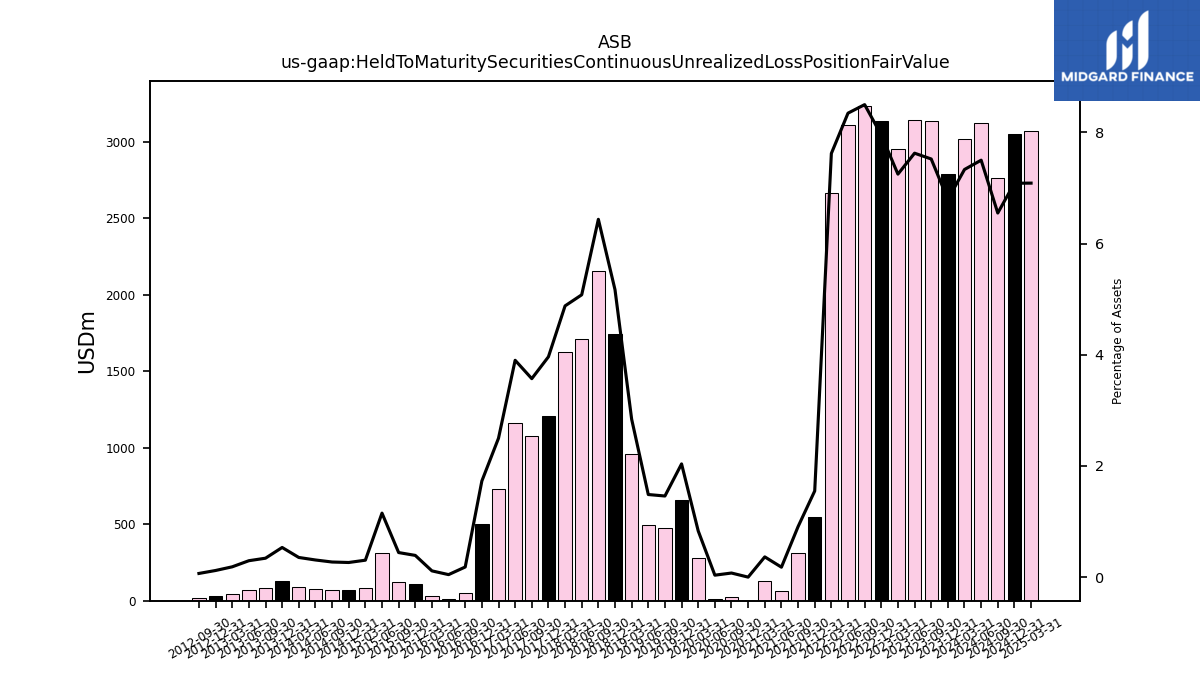
| Held To Maturity Securities Continuous Unrealized Loss Position Fair Value | 3016.64 | 2787.33 | 3131.98 | 3143.56 | 2950.81 | 3133.86 | 3234.18 | 3107.87 | 2664.26 | 544.35 | 313.10 | 61.42 | 126.22 | 0.33 | 25.89 | 12.80 | 282.12 | 659.80 | 475.94 | 494.63 | 957.88 | 1739.99 | 2155.69 | 1709.31 | 1628.22 | 1208.38 | 1073.62 | 1161.40 | 727.54 | 504.08 | 53.42 | 13.36 | 31.94 | 108.55 | 121.63 | 313.11 | 82.72 | 70.84 | 69.97 | 79.60 | 87.98 | 129.44 | 80.86 | 69.95 | 43.38 | 28.27 | 15.25 | NA | NA | NA | NA | NA | NA | NA | NA | NA | |
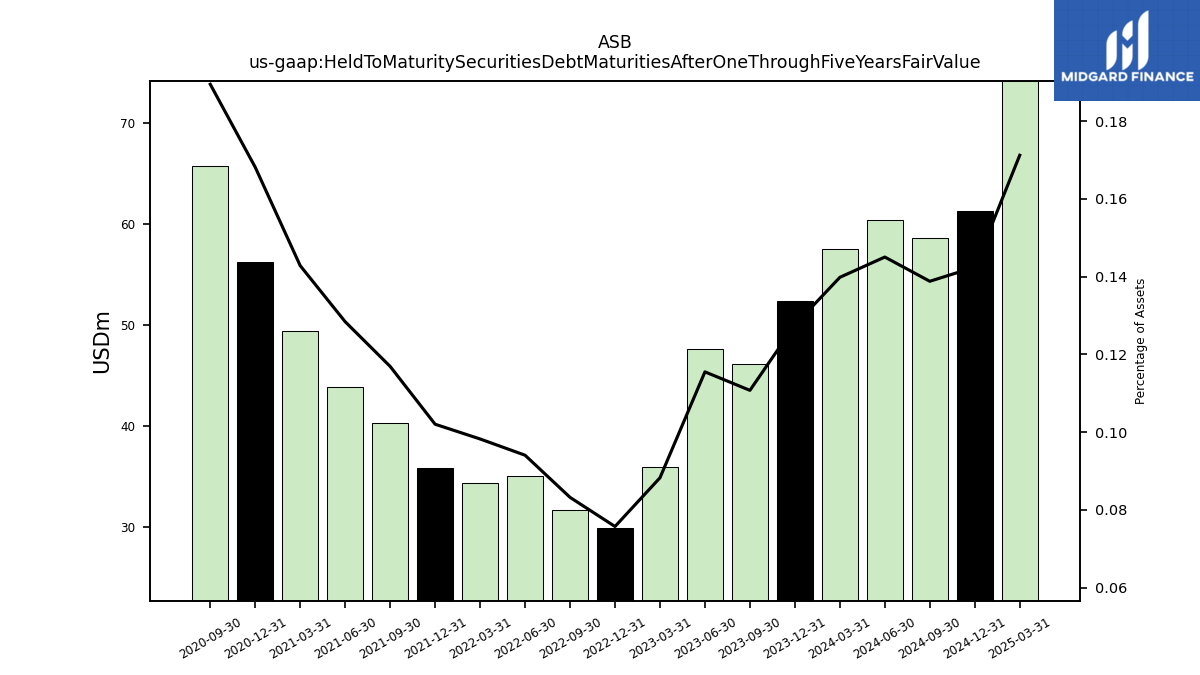
| Held To Maturity Securities Debt Maturities After One Through Five Years Fair Value | 57.52 | 52.33 | 46.12 | 47.61 | 35.93 | 29.84 | 31.67 | 35.03 | 34.34 | 35.82 | 40.27 | 43.85 | 49.38 | 56.20 | 65.75 | NA | NA | NA | NA | NA | NA | NA | NA | NA | NA | NA | NA | NA | NA | NA | NA | NA | NA | NA | NA | NA | NA | NA | NA | NA | NA | NA | NA | NA | NA | NA | NA | NA | NA | NA | NA | NA | NA | NA | NA | NA | |
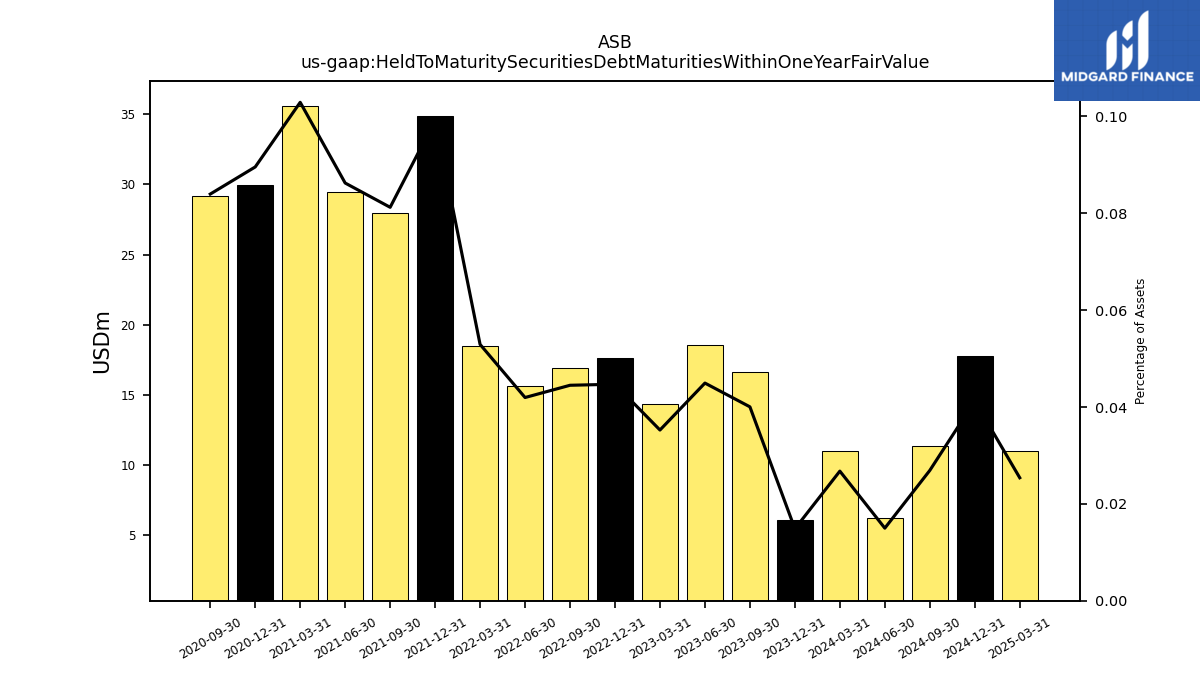
| Held To Maturity Securities Debt Maturities Within One Year Fair Value | 11.01 | 6.10 | 16.67 | 18.53 | 14.35 | 17.62 | 16.93 | 15.63 | 18.50 | 34.84 | 27.98 | 29.46 | 35.59 | 29.94 | 29.14 | NA | NA | NA | NA | NA | NA | NA | NA | NA | NA | NA | NA | NA | NA | NA | NA | NA | NA | NA | NA | NA | NA | NA | NA | NA | NA | NA | NA | NA | NA | NA | NA | NA | NA | NA | NA | NA | NA | NA | NA | NA | |
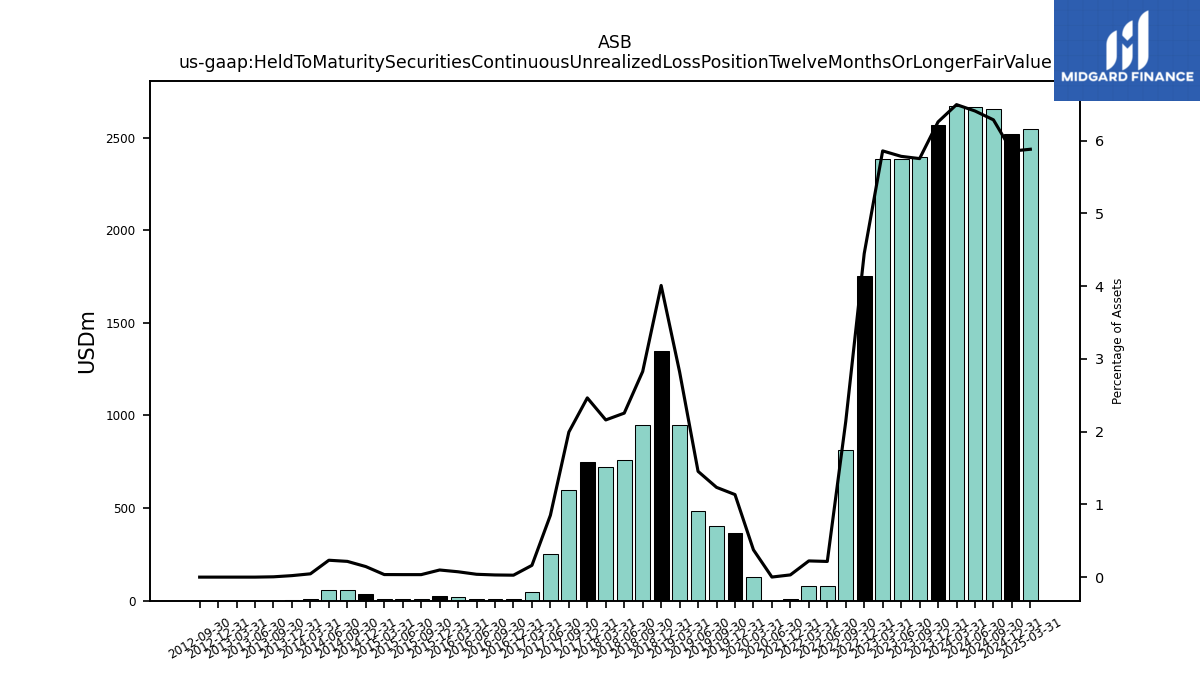
| Held To Maturity Securities Continuous Unrealized Loss Position Twelve Months Or Longer Fair Value | 2671.90 | 2566.47 | 2395.44 | 2384.25 | 2384.79 | 1752.35 | 813.87 | 80.22 | 77.89 | 10.78 | NA | NA | NA | NA | NA | 0.36 | 127.17 | 367.53 | 402.23 | 483.71 | 950.61 | 1349.06 | 946.64 | 758.63 | 720.96 | 751.09 | 599.48 | 253.10 | 47.12 | 7.78 | 8.68 | 11.36 | 20.73 | 27.16 | 9.40 | 9.35 | 9.55 | 38.91 | 55.52 | 59.72 | 11.27 | 5.01 | 1.03 | 0.00 | 0.00 | 0.00 | 0.00 | NA | NA | NA | NA | NA | NA | NA | NA | NA | |
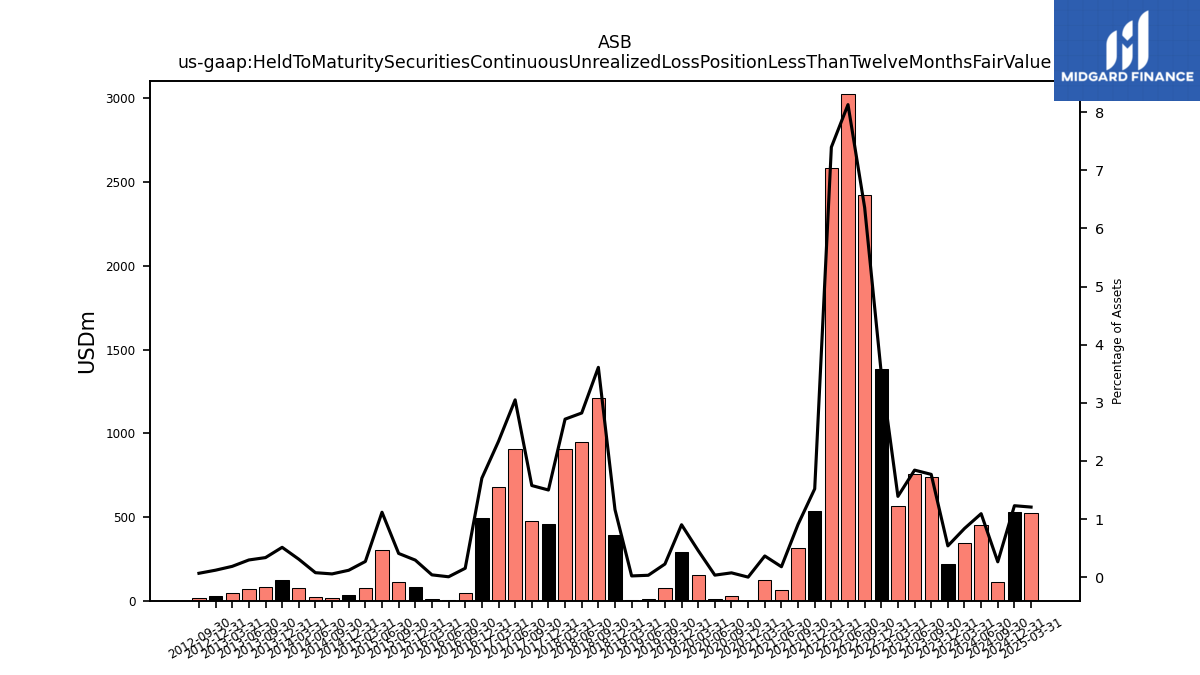
| Held To Maturity Securities Continuous Unrealized Loss Position Less Than Twelve Months Fair Value | 344.74 | 220.87 | 736.54 | 759.31 | 566.02 | 1381.51 | 2420.30 | 3027.65 | 2586.38 | 533.58 | 313.10 | 61.42 | 126.22 | 0.33 | 25.89 | 12.43 | 154.95 | 292.27 | 73.72 | 10.92 | 7.26 | 390.93 | 1209.06 | 950.68 | 907.26 | 457.29 | 474.13 | 908.29 | 680.42 | 496.30 | 44.74 | 2.00 | 11.21 | 81.39 | 112.22 | 303.77 | 73.16 | 31.92 | 14.44 | 19.88 | 76.71 | 124.44 | 79.83 | 69.95 | 43.38 | 28.27 | 15.25 | NA | NA | NA | NA | NA | NA | NA | NA | NA | |
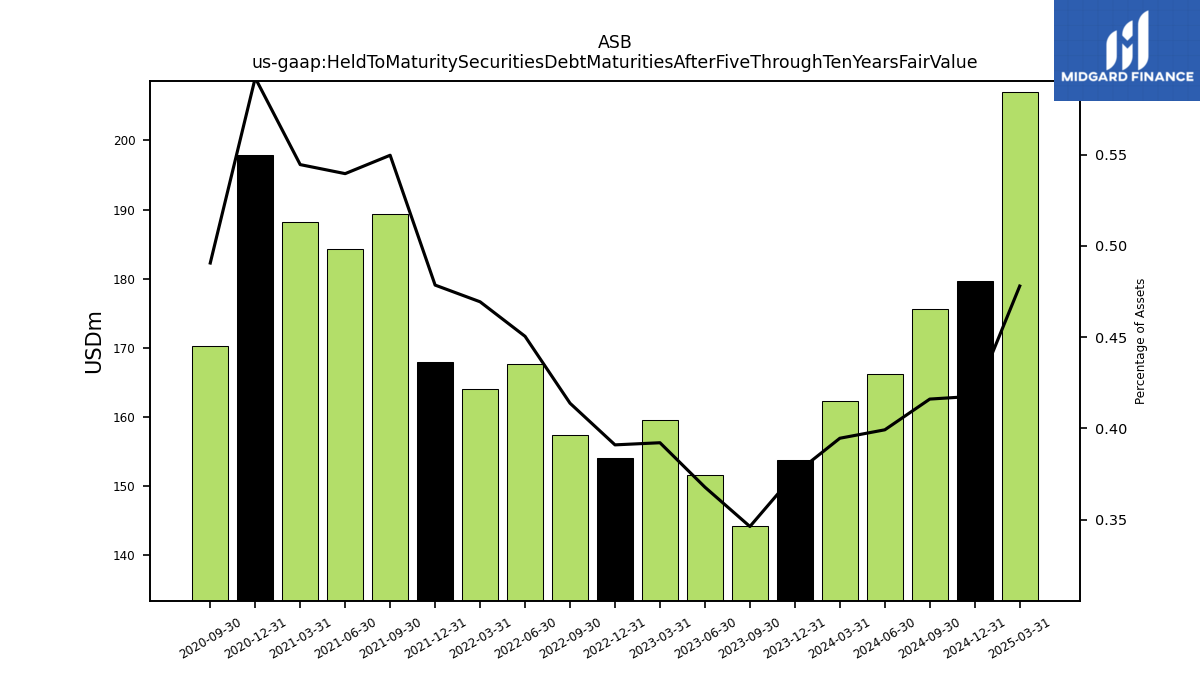
| Held To Maturity Securities Debt Maturities After Five Through Ten Years Fair Value | 162.31 | 153.79 | 144.15 | 151.58 | 159.59 | 154.05 | 157.43 | 167.71 | 164.06 | 167.97 | 189.29 | 184.27 | 188.26 | 197.85 | 170.22 | NA | NA | NA | NA | NA | NA | NA | NA | NA | NA | NA | NA | NA | NA | NA | NA | NA | NA | NA | NA | NA | NA | NA | NA | NA | NA | NA | NA | NA | NA | NA | NA | NA | NA | NA | NA | NA | NA | NA | NA | NA | |
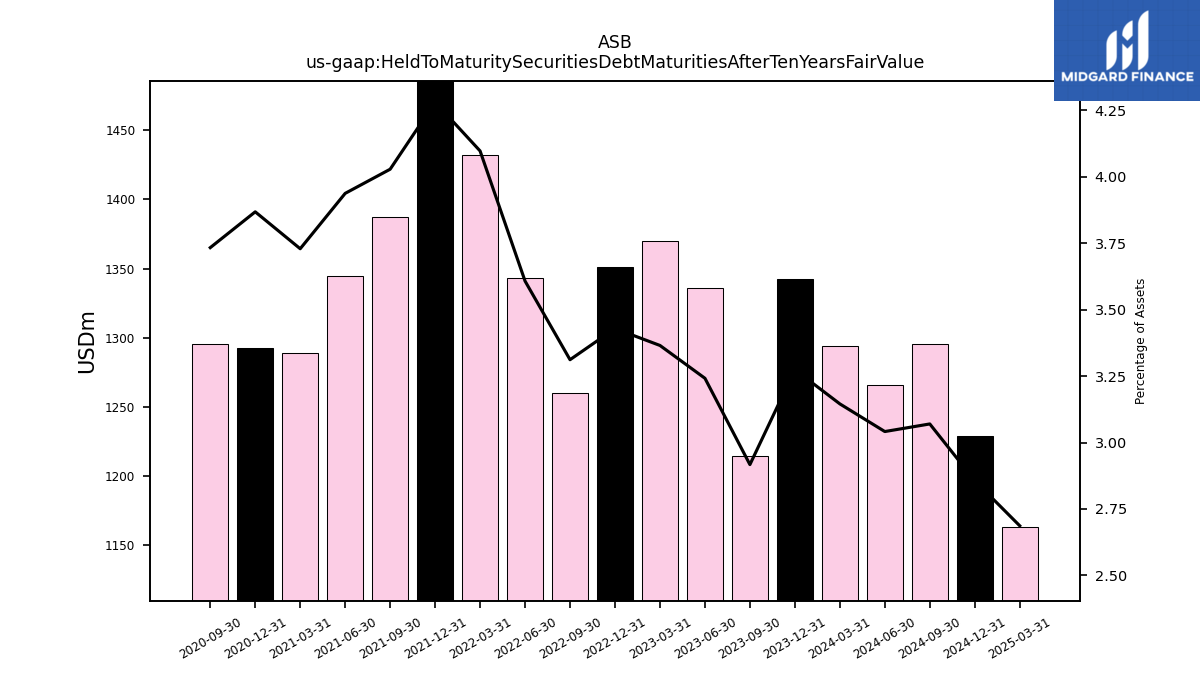
| Held To Maturity Securities Debt Maturities After Ten Years Fair Value | 1293.86 | 1342.80 | 1214.53 | 1336.12 | 1369.60 | 1351.08 | 1259.95 | 1343.10 | 1431.90 | 1502.36 | 1387.10 | 1344.52 | 1289.19 | 1292.48 | 1295.22 | NA | NA | NA | NA | NA | NA | NA | NA | NA | NA | NA | NA | NA | NA | NA | NA | NA | NA | NA | NA | NA | NA | NA | NA | NA | NA | NA | NA | NA | NA | NA | NA | NA | NA | NA | NA | NA | NA | NA | NA | NA |
| 2024-03-31 | 2023-12-31 | 2023-09-30 | 2023-06-30 | 2023-03-31 | 2022-12-31 | 2022-09-30 | 2022-06-30 | 2022-03-31 | 2021-12-31 | 2021-09-30 | 2021-06-30 | 2021-03-31 | 2020-12-31 | 2020-09-30 | 2020-06-30 | 2020-03-31 | 2019-12-31 | 2019-09-30 | 2019-06-30 | 2019-03-31 | 2018-12-31 | 2018-09-30 | 2018-06-30 | 2018-03-31 | 2017-12-31 | 2017-09-30 | 2017-06-30 | 2017-03-31 | 2016-12-31 | 2016-09-30 | 2016-06-30 | 2016-03-31 | 2015-12-31 | 2015-09-30 | 2015-06-30 | 2015-03-31 | 2014-12-31 | 2014-09-30 | 2014-06-30 | 2014-03-31 | 2013-12-31 | 2013-09-30 | 2013-06-30 | 2013-03-31 | 2012-12-31 | 2012-09-30 | 2012-06-30 | 2012-03-31 | 2011-12-31 | 2011-09-30 | 2011-06-30 | 2011-03-31 | 2010-12-31 | 2010-09-30 | 2010-06-30 | ||
|---|---|---|---|---|---|---|---|---|---|---|---|---|---|---|---|---|---|---|---|---|---|---|---|---|---|---|---|---|---|---|---|---|---|---|---|---|---|---|---|---|---|---|---|---|---|---|---|---|---|---|---|---|---|---|---|---|---|
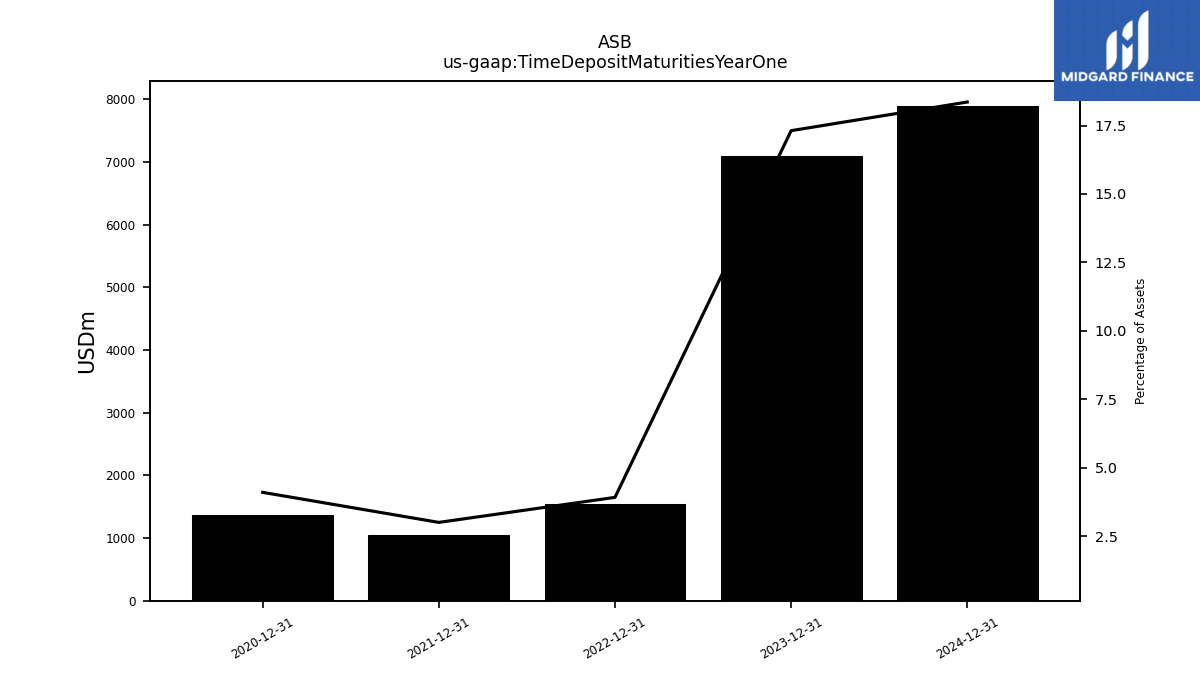
| Time Deposit Maturities Year One | NA | 7100.73 | NA | NA | NA | 1545.29 | NA | NA | NA | 1055.61 | NA | NA | NA | 1371.67 | NA | NA | NA | NA | NA | NA | NA | NA | NA | NA | NA | NA | NA | NA | NA | NA | NA | NA | NA | NA | NA | NA | NA | NA | NA | NA | NA | NA | NA | NA | NA | NA | NA | NA | NA | NA | NA | NA | NA | NA | NA | NA | |
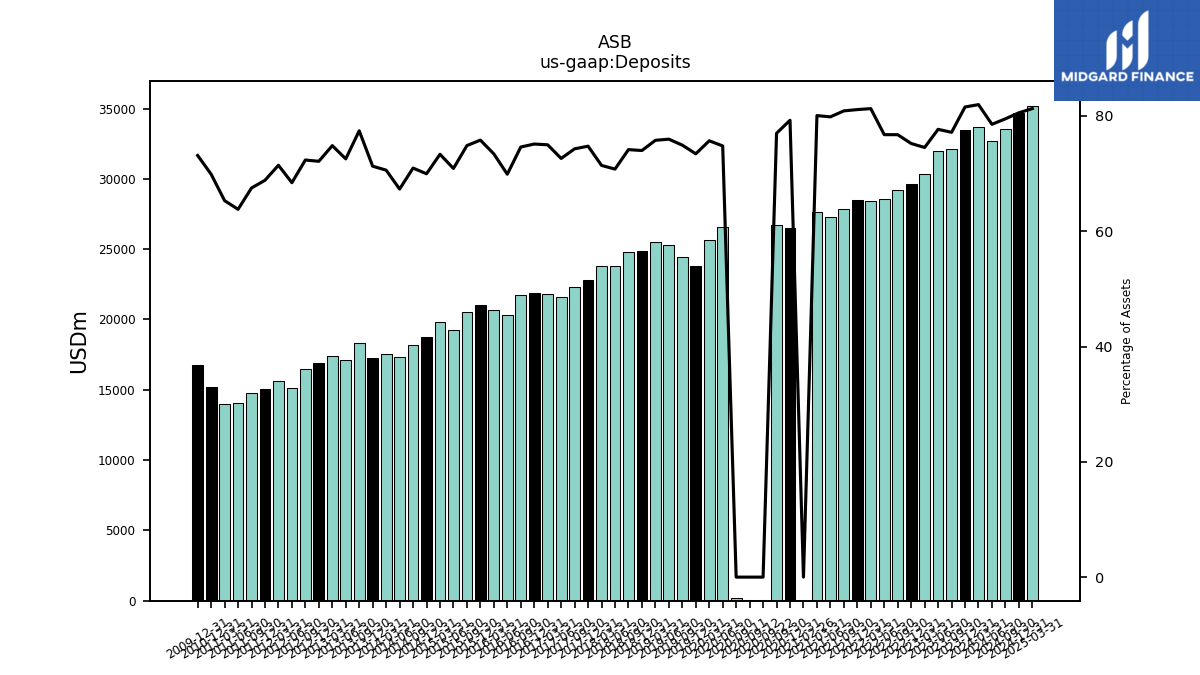
| Deposits | 33713.16 | 33446.05 | 32123.33 | 32014.41 | 30331.82 | 29636.15 | 29198.58 | 28576.58 | 28405.41 | 28466.43 | 27851.27 | 27264.30 | 27677.17 | 26482.48 | 26712.55 | 26551.44 | 25661.58 | 23779.06 | 24422.56 | 25274.22 | 25533.06 | 24897.39 | 24831.61 | 23816.31 | 23825.60 | 22785.96 | 22333.45 | 21618.18 | 21828.03 | 21888.45 | 21747.71 | 20292.85 | 20685.46 | 21007.67 | 20558.40 | 19269.56 | 19851.59 | 18763.50 | 18201.26 | 17316.26 | 17509.93 | 17267.17 | 18337.91 | 17132.44 | 17421.29 | 16939.87 | 16450.59 | 15106.87 | 15653.38 | 15090.66 | 14782.41 | 14066.05 | 14023.64 | 15225.39 | NA | NA |
| 2024-03-31 | 2023-12-31 | 2023-09-30 | 2023-06-30 | 2023-03-31 | 2022-12-31 | 2022-09-30 | 2022-06-30 | 2022-03-31 | 2021-12-31 | 2021-09-30 | 2021-06-30 | 2021-03-31 | 2020-12-31 | 2020-09-30 | 2020-06-30 | 2020-03-31 | 2019-12-31 | 2019-09-30 | 2019-06-30 | 2019-03-31 | 2018-12-31 | 2018-09-30 | 2018-06-30 | 2018-03-31 | 2017-12-31 | 2017-09-30 | 2017-06-30 | 2017-03-31 | 2016-12-31 | 2016-09-30 | 2016-06-30 | 2016-03-31 | 2015-12-31 | 2015-09-30 | 2015-06-30 | 2015-03-31 | 2014-12-31 | 2014-09-30 | 2014-06-30 | 2014-03-31 | 2013-12-31 | 2013-09-30 | 2013-06-30 | 2013-03-31 | 2012-12-31 | 2012-09-30 | 2012-06-30 | 2012-03-31 | 2011-12-31 | 2011-09-30 | 2011-06-30 | 2011-03-31 | 2010-12-31 | 2010-09-30 | 2010-06-30 | ||
|---|---|---|---|---|---|---|---|---|---|---|---|---|---|---|---|---|---|---|---|---|---|---|---|---|---|---|---|---|---|---|---|---|---|---|---|---|---|---|---|---|---|---|---|---|---|---|---|---|---|---|---|---|---|---|---|---|---|
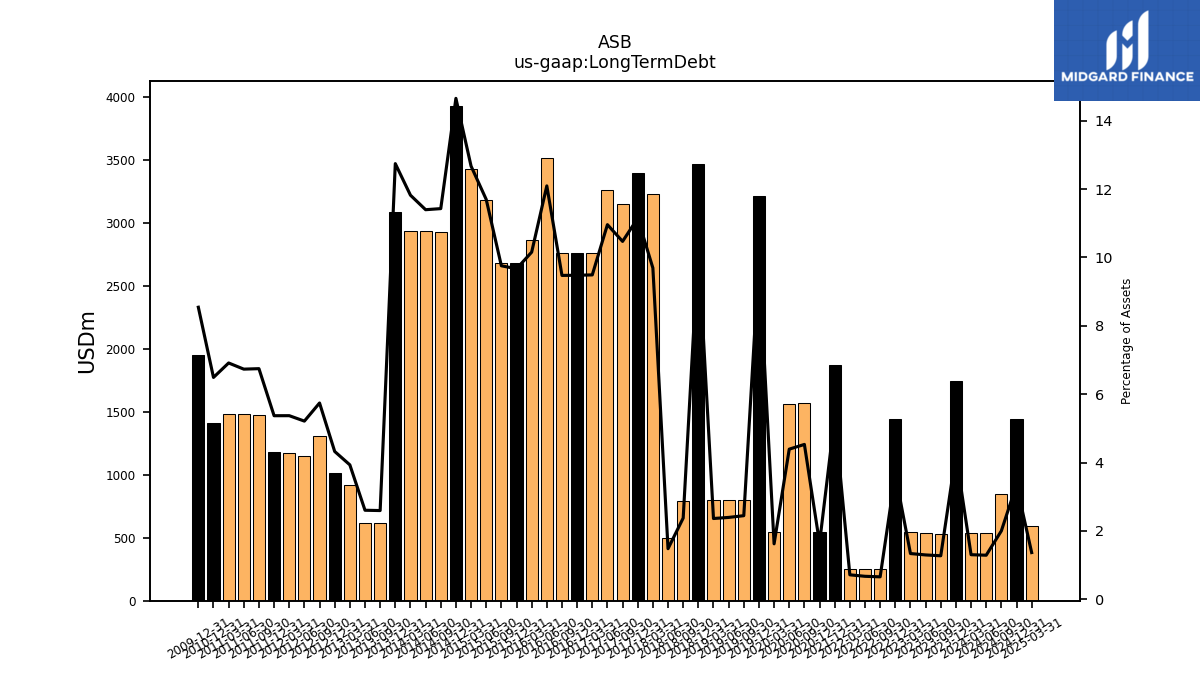
| Long Term Debt | 536.05 | 1741.46 | 529.46 | 534.27 | 544.10 | 1442.93 | 249.48 | 249.82 | 249.80 | 1870.37 | NA | NA | NA | 549.47 | 1571.42 | 1558.70 | 549.64 | 3210.31 | 796.80 | 796.40 | 796.01 | 3469.98 | 795.22 | 497.62 | 3233.34 | 3397.45 | 3147.28 | 3262.12 | 2761.95 | 2761.80 | 2761.64 | 3511.47 | 2861.32 | 2679.35 | 2679.54 | 3179.73 | 3429.93 | 3930.12 | 2931.55 | 2931.81 | 2932.04 | 3087.27 | 614.57 | 614.82 | 915.06 | 1015.35 | 1305.42 | 1150.73 | 1176.74 | 1177.07 | 1477.41 | 1484.17 | 1484.18 | 1413.61 | NA | NA |
| 2024-03-31 | 2023-12-31 | 2023-09-30 | 2023-06-30 | 2023-03-31 | 2022-12-31 | 2022-09-30 | 2022-06-30 | 2022-03-31 | 2021-12-31 | 2021-09-30 | 2021-06-30 | 2021-03-31 | 2020-12-31 | 2020-09-30 | 2020-06-30 | 2020-03-31 | 2019-12-31 | 2019-09-30 | 2019-06-30 | 2019-03-31 | 2018-12-31 | 2018-09-30 | 2018-06-30 | 2018-03-31 | 2017-12-31 | 2017-09-30 | 2017-06-30 | 2017-03-31 | 2016-12-31 | 2016-09-30 | 2016-06-30 | 2016-03-31 | 2015-12-31 | 2015-09-30 | 2015-06-30 | 2015-03-31 | 2014-12-31 | 2014-09-30 | 2014-06-30 | 2014-03-31 | 2013-12-31 | 2013-09-30 | 2013-06-30 | 2013-03-31 | 2012-12-31 | 2012-09-30 | 2012-06-30 | 2012-03-31 | 2011-12-31 | 2011-09-30 | 2011-06-30 | 2011-03-31 | 2010-12-31 | 2010-09-30 | 2010-06-30 | ||
|---|---|---|---|---|---|---|---|---|---|---|---|---|---|---|---|---|---|---|---|---|---|---|---|---|---|---|---|---|---|---|---|---|---|---|---|---|---|---|---|---|---|---|---|---|---|---|---|---|---|---|---|---|---|---|---|---|---|
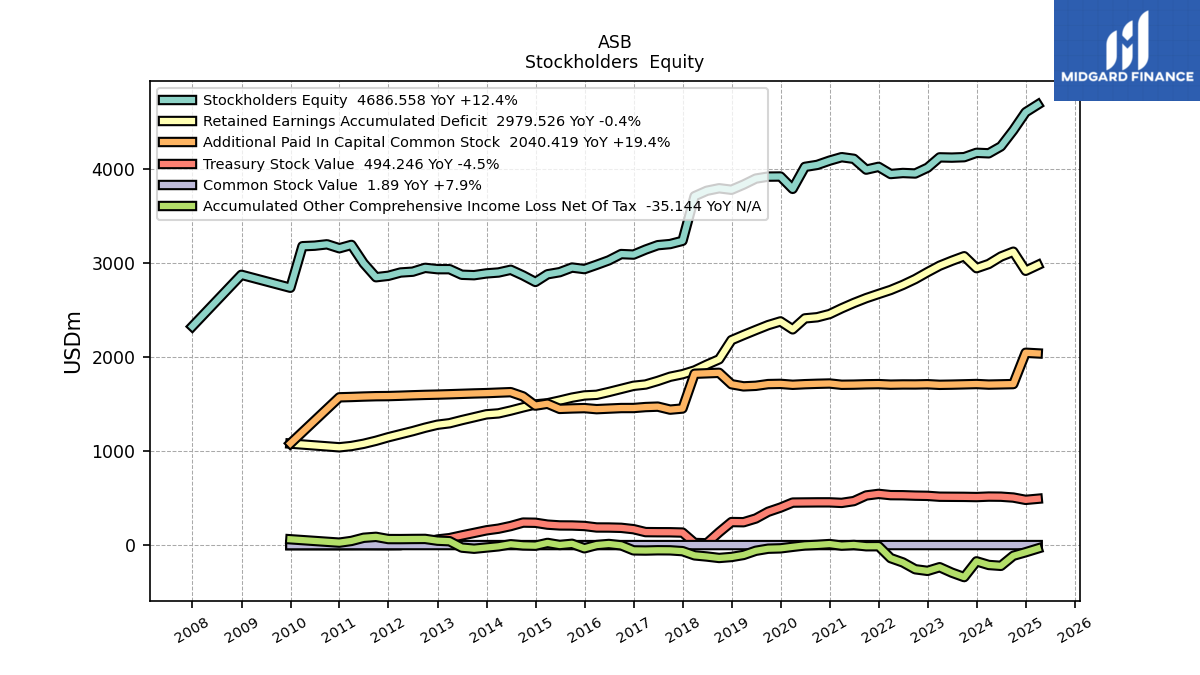
| Stockholders Equity | 4168.67 | 4173.97 | 4127.64 | 4122.87 | 4125.66 | 4015.49 | 3953.95 | 3959.38 | 3948.29 | 4024.85 | 3994.96 | 4110.05 | 4127.78 | 4090.93 | 4045.43 | 4024.46 | 3790.47 | 3922.12 | 3920.86 | 3899.79 | 3835.87 | 3780.89 | 3797.04 | 3770.24 | 3712.70 | 3237.44 | 3203.60 | 3191.50 | 3144.79 | 3091.31 | 3097.11 | 3030.15 | 2982.50 | 2937.25 | 2953.80 | 2904.39 | 2882.14 | 2800.25 | 2869.58 | 2929.95 | 2901.02 | 2891.29 | 2872.28 | 2876.98 | 2936.26 | 2936.40 | 2950.45 | 2909.62 | 2900.87 | 2865.79 | 2850.62 | 2999.15 | 3194.71 | 3158.79 | 3200.85 | 3186.13 | |
| Common Stock Value | 1.75 | 1.75 | 1.75 | 1.75 | 1.75 | 1.75 | 1.75 | 1.75 | 1.75 | 1.75 | 1.75 | 1.75 | 1.75 | 1.75 | 1.75 | 1.75 | 1.75 | 1.75 | 1.75 | 1.75 | 1.75 | 1.75 | 1.75 | 1.75 | 1.74 | 1.62 | 1.61 | 1.63 | 1.63 | 1.63 | 1.63 | 1.63 | 1.63 | 1.64 | 1.64 | 1.64 | 1.67 | 1.67 | 1.72 | 1.75 | 1.75 | 1.75 | 1.75 | 1.75 | 1.75 | 1.75 | 1.75 | 1.75 | 1.75 | 1.75 | 1.75 | 1.75 | 1.74 | 1.74 | NA | NA | |
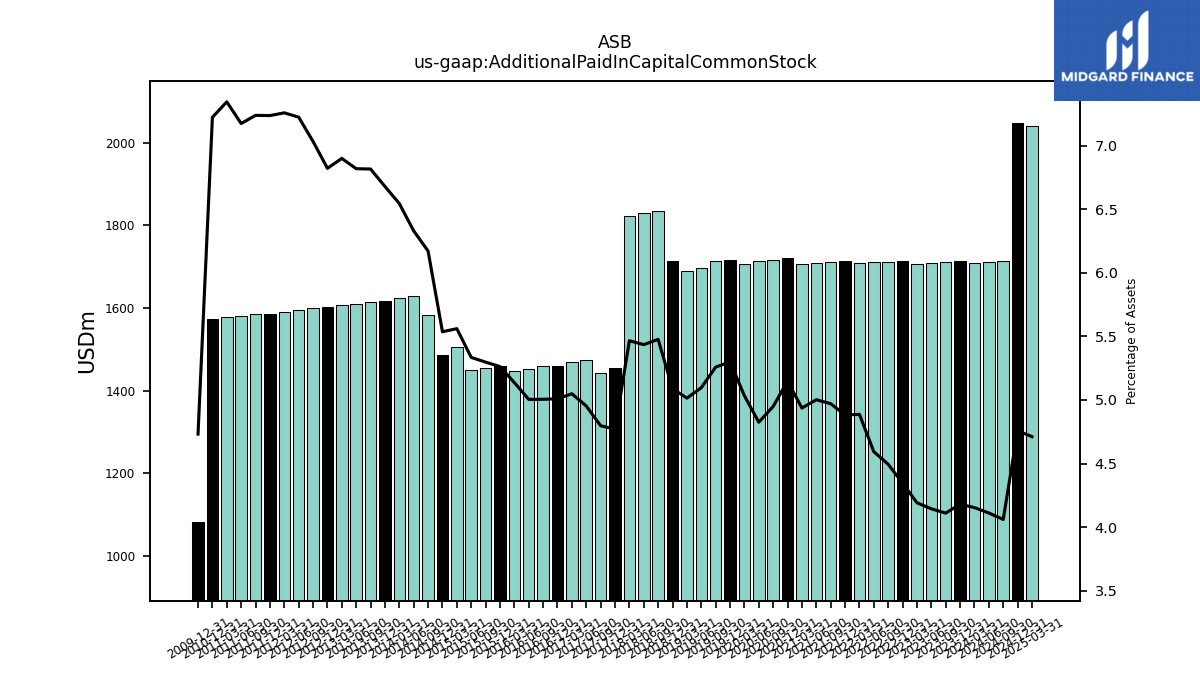
| Additional Paid In Capital Common Stock | 1708.65 | 1714.82 | 1711.45 | 1708.30 | 1706.21 | 1712.73 | 1710.08 | 1710.32 | 1708.10 | 1713.85 | 1711.87 | 1708.25 | 1706.79 | 1720.33 | 1717.19 | 1712.98 | 1706.52 | 1716.43 | 1713.97 | 1695.71 | 1689.79 | 1712.62 | 1834.02 | 1828.96 | 1823.80 | 1454.19 | 1442.33 | 1474.30 | 1469.74 | 1459.50 | 1459.16 | 1453.29 | 1447.37 | 1458.52 | 1455.03 | 1450.20 | 1505.17 | 1484.93 | 1583.03 | 1628.36 | 1623.32 | 1617.99 | 1614.52 | 1610.24 | 1605.97 | 1602.14 | 1599.07 | 1594.99 | 1590.34 | 1586.40 | 1585.21 | 1581.59 | 1576.90 | 1573.37 | NA | NA | |
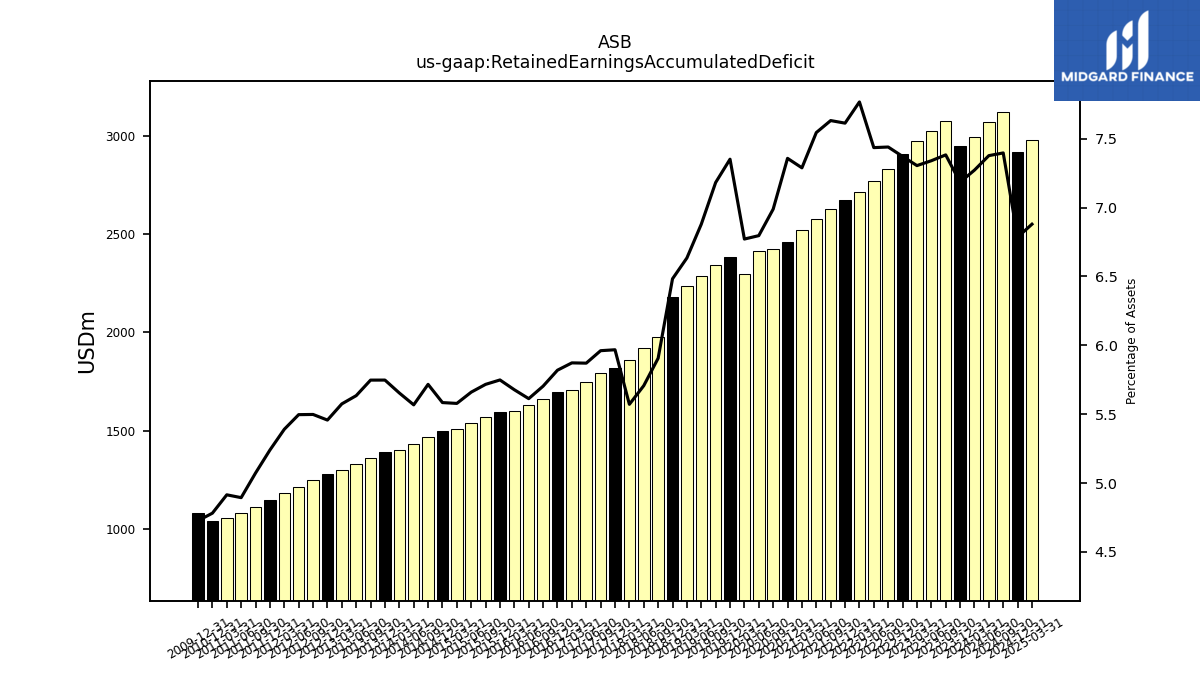
| Retained Earnings Accumulated Deficit | 2991.57 | 2946.80 | 3074.01 | 3025.64 | 2973.35 | 2904.88 | 2830.88 | 2768.74 | 2715.12 | 2672.60 | 2628.42 | 2576.77 | 2520.14 | 2458.92 | 2424.99 | 2412.86 | 2296.18 | 2380.87 | 2341.16 | 2288.91 | 2235.82 | 2181.41 | 1977.92 | 1920.58 | 1859.07 | 1819.23 | 1792.18 | 1747.63 | 1709.51 | 1695.76 | 1662.78 | 1629.91 | 1599.84 | 1593.24 | 1570.20 | 1538.68 | 1509.97 | 1497.82 | 1466.53 | 1432.52 | 1402.55 | 1392.51 | 1361.50 | 1330.74 | 1297.69 | 1281.81 | 1250.19 | 1213.73 | 1181.25 | 1148.77 | 1111.08 | 1079.08 | 1055.34 | 1041.67 | NA | NA | |
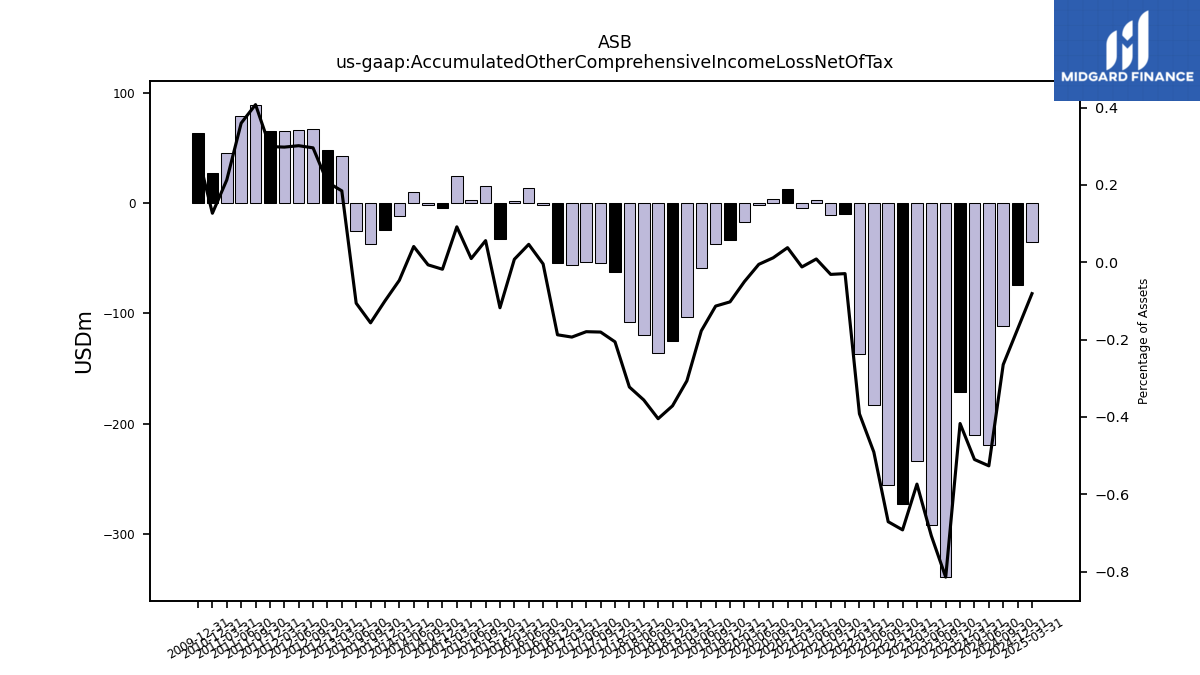
| Accumulated Other Comprehensive Income Loss Net Of Tax | -209.88 | -171.10 | -339.14 | -291.64 | -233.59 | -272.80 | -255.39 | -182.79 | -137.02 | -10.32 | -10.81 | 2.89 | -4.19 | 12.62 | 4.00 | -1.92 | -16.97 | -33.18 | -36.95 | -59.06 | -103.38 | -124.97 | -135.52 | -119.89 | -107.67 | -62.76 | -54.29 | -53.47 | -56.34 | -54.68 | -1.25 | 13.45 | 2.17 | -32.62 | 15.38 | 2.59 | 24.80 | -4.85 | -1.73 | 10.49 | -11.58 | -24.24 | -37.12 | -25.02 | 42.99 | 48.60 | 67.30 | 66.58 | 65.28 | 65.60 | 89.31 | 79.34 | 45.73 | 27.63 | NA | NA | |
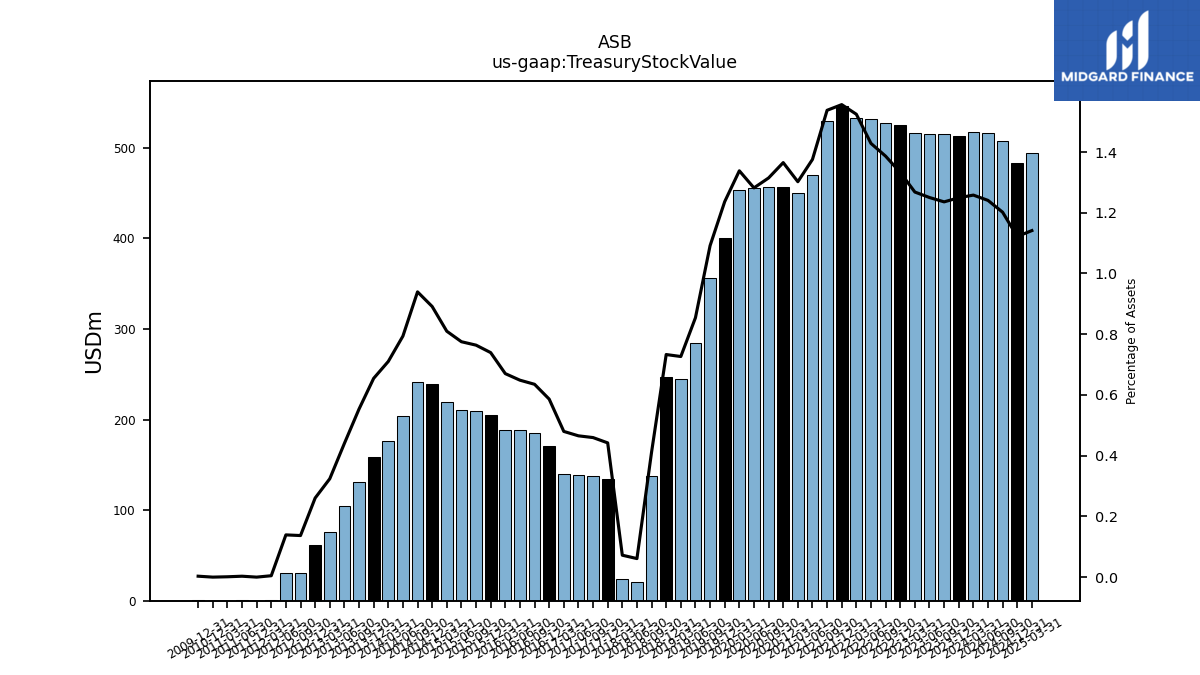
| Treasury Stock Value | 517.53 | 512.42 | 514.55 | 515.29 | 516.17 | 525.19 | 527.47 | 531.83 | 532.86 | 546.23 | 529.46 | 469.80 | 450.22 | 456.20 | 456.13 | 455.06 | 453.71 | 400.46 | 355.79 | 284.24 | 244.84 | 246.64 | 137.85 | 20.56 | 24.09 | 134.76 | 138.17 | 138.52 | 139.68 | 170.83 | 185.13 | 188.34 | 188.85 | 204.92 | 209.83 | 210.74 | 219.20 | 239.04 | 241.00 | 204.20 | 176.18 | 158.58 | 131.10 | 104.01 | 75.41 | 61.17 | 31.13 | 30.71 | 1.01 | 0.00 | NA | 0.66 | 0.25 | 0.00 | NA | NA | |
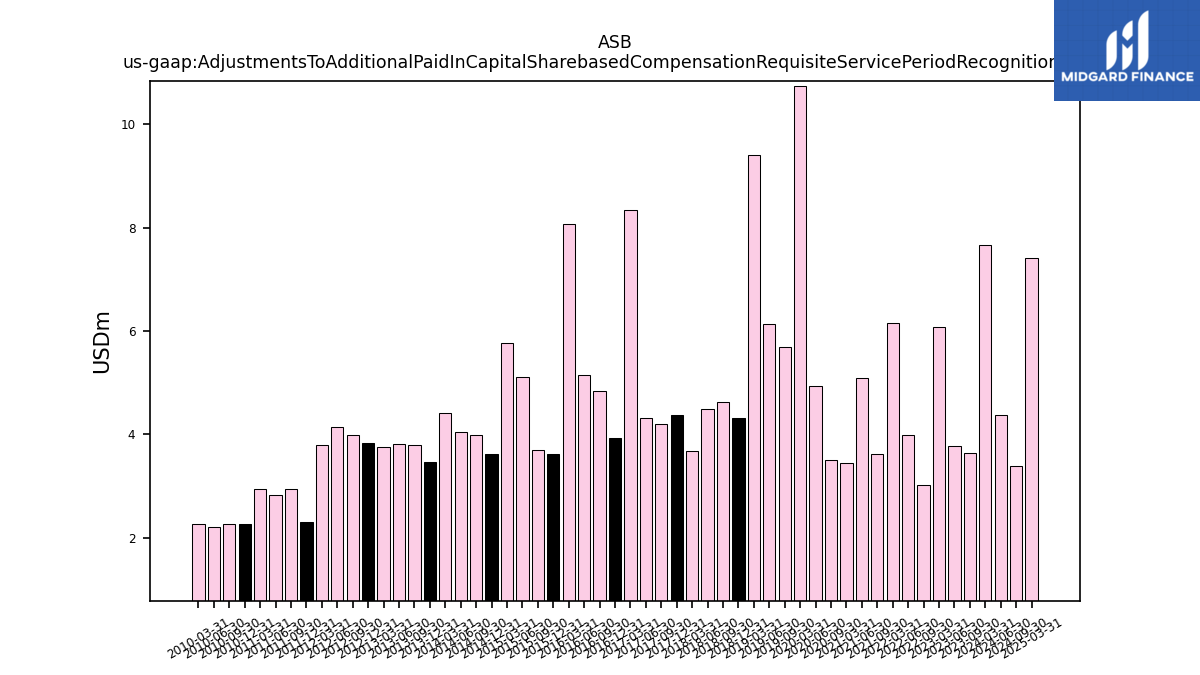
| Adjustments To Additional Paid In Capital Sharebased Compensation Requisite Service Period Recognition Value | 7.67 | NA | 3.65 | 3.77 | 6.09 | NA | 3.03 | 3.99 | 6.16 | NA | 3.62 | 5.09 | 3.44 | NA | 3.50 | 4.94 | 10.74 | NA | 5.70 | 6.13 | 9.40 | 4.32 | 4.62 | 4.50 | 3.67 | 4.37 | 4.19 | 4.32 | 8.34 | 3.92 | 4.84 | 5.14 | 8.07 | 3.63 | 3.70 | 5.11 | 5.77 | 3.63 | 3.99 | 4.06 | 4.41 | 3.47 | 3.80 | 3.81 | 3.76 | 3.84 | 3.98 | 4.14 | 3.79 | 2.30 | 2.95 | 2.83 | 2.95 | 2.27 | 2.27 | 2.22 |
| 2024-03-31 | 2023-12-31 | 2023-09-30 | 2023-06-30 | 2023-03-31 | 2022-12-31 | 2022-09-30 | 2022-06-30 | 2022-03-31 | 2021-12-31 | 2021-09-30 | 2021-06-30 | 2021-03-31 | 2020-12-31 | 2020-09-30 | 2020-06-30 | 2020-03-31 | 2019-12-31 | 2019-09-30 | 2019-06-30 | 2019-03-31 | 2018-12-31 | 2018-09-30 | 2018-06-30 | 2018-03-31 | 2017-12-31 | 2017-09-30 | 2017-06-30 | 2017-03-31 | 2016-12-31 | 2016-09-30 | 2016-06-30 | 2016-03-31 | 2015-12-31 | 2015-09-30 | 2015-06-30 | 2015-03-31 | 2014-12-31 | 2014-09-30 | 2014-06-30 | 2014-03-31 | 2013-12-31 | 2013-09-30 | 2013-06-30 | 2013-03-31 | 2012-12-31 | 2012-09-30 | 2012-06-30 | 2012-03-31 | 2011-12-31 | 2011-09-30 | 2011-06-30 | 2011-03-31 | 2010-12-31 | 2010-09-30 | 2010-06-30 | ||
|---|---|---|---|---|---|---|---|---|---|---|---|---|---|---|---|---|---|---|---|---|---|---|---|---|---|---|---|---|---|---|---|---|---|---|---|---|---|---|---|---|---|---|---|---|---|---|---|---|---|---|---|---|---|---|---|---|---|
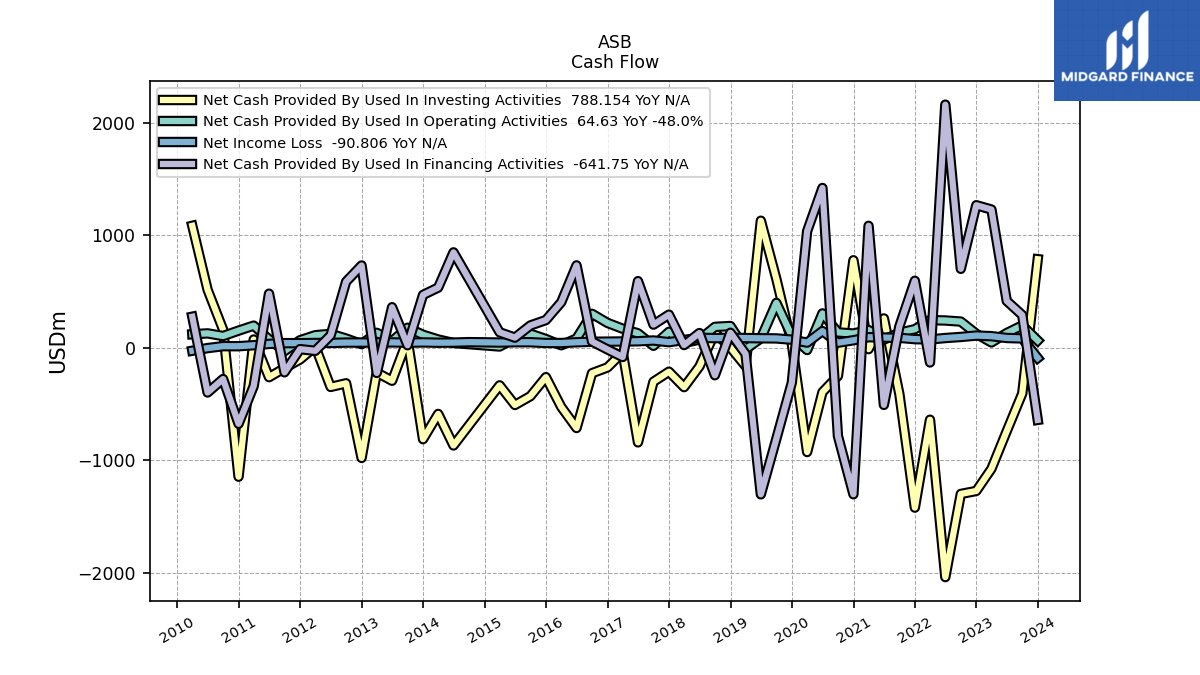
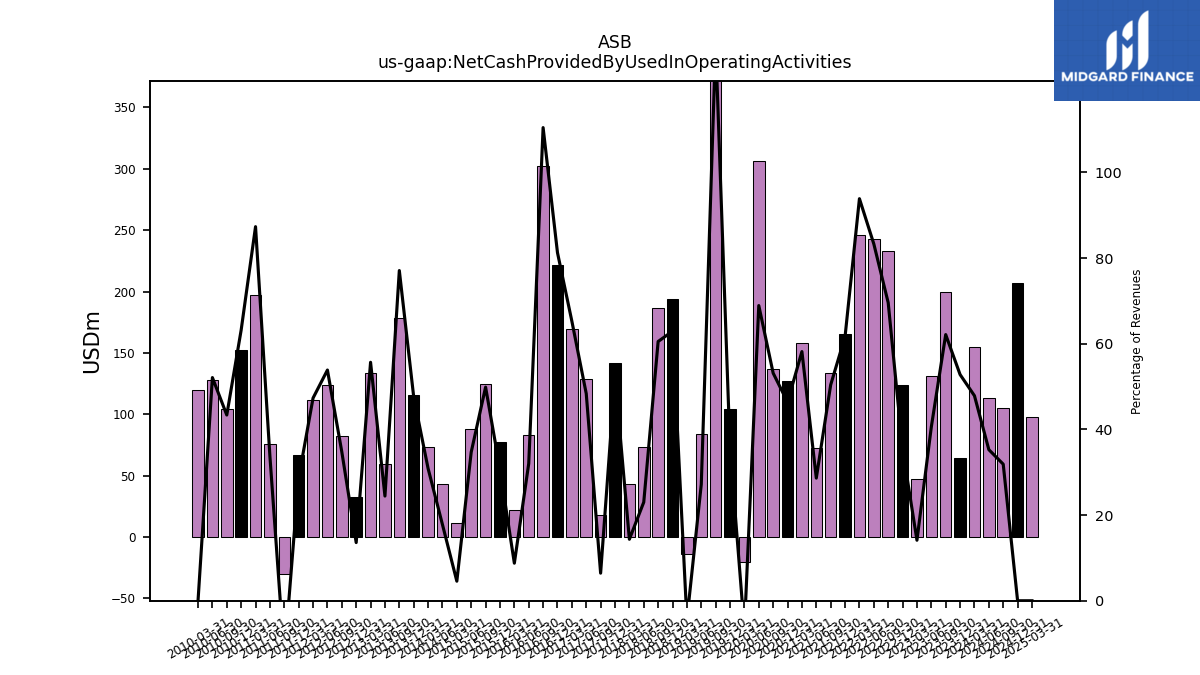
| Net Cash Provided By Used In Operating Activities | 154.50 | 64.63 | 199.34 | 131.30 | 47.47 | 124.24 | 233.29 | 242.92 | 246.12 | 165.41 | 133.94 | 72.43 | 157.77 | 126.96 | 136.94 | 306.20 | -20.08 | 104.27 | 399.52 | 84.07 | -13.60 | 193.82 | 186.21 | 73.44 | 43.09 | 142.09 | 17.77 | 128.75 | 169.75 | 221.27 | 302.39 | 82.91 | 22.37 | 77.74 | 124.88 | 87.81 | 11.31 | NA | NA | 42.85 | 73.67 | 115.71 | 178.40 | 59.75 | 133.41 | 32.51 | 82.22 | 123.99 | 111.77 | 67.12 | -30.35 | 75.73 | 197.28 | 152.72 | 104.72 | 128.31 | |
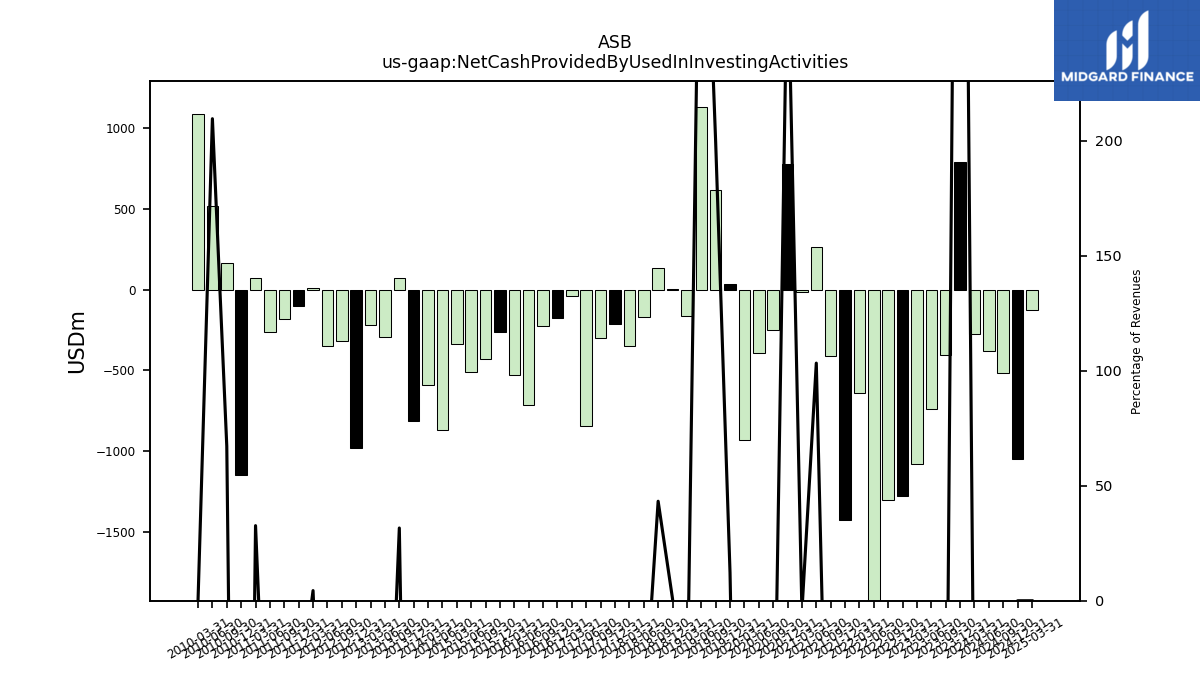
| Net Cash Provided By Used In Investing Activities | -275.32 | 788.15 | -407.09 | -741.00 | -1076.32 | -1273.86 | -1300.38 | -2040.52 | -640.04 | -1422.15 | -411.10 | 261.41 | -12.35 | 778.89 | -250.25 | -394.86 | -927.51 | 35.81 | 613.39 | 1130.76 | -162.52 | 2.83 | 133.15 | -166.51 | -350.34 | -212.65 | -302.10 | -841.68 | -40.43 | -174.62 | -225.97 | -713.86 | -526.13 | -261.21 | -430.32 | -508.85 | -333.98 | NA | NA | -869.19 | -588.33 | -813.17 | 73.22 | -293.35 | -219.94 | -980.18 | -315.73 | -348.24 | 10.43 | -103.88 | -180.80 | -261.65 | 73.79 | -1147.03 | 162.38 | 516.24 | |
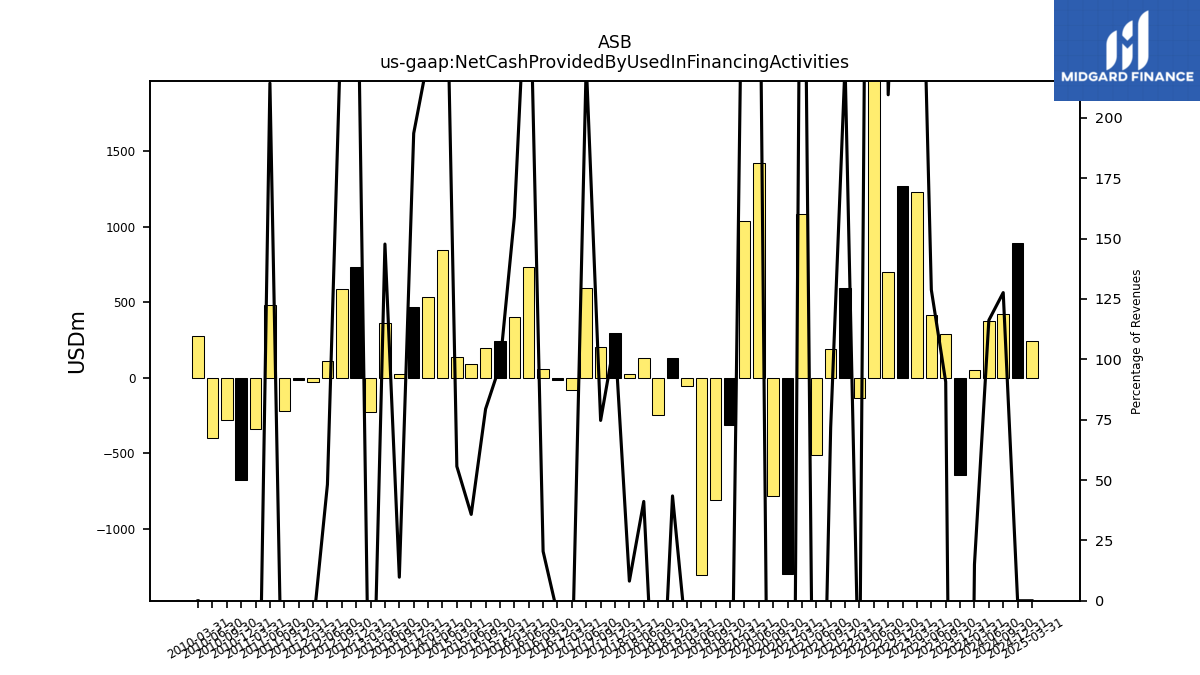
| Net Cash Provided By Used In Financing Activities | 48.58 | -641.75 | 290.88 | 416.52 | 1230.24 | 1268.66 | 702.44 | 2163.61 | -130.52 | 596.41 | 190.62 | -508.25 | 1085.32 | -1303.46 | -785.71 | 1422.12 | 1038.08 | -310.89 | -810.44 | -1304.10 | -54.23 | 133.71 | -244.39 | 131.27 | 24.40 | 294.96 | 206.12 | 593.28 | -82.09 | -14.73 | 56.00 | 733.43 | 405.48 | 246.94 | 198.86 | 90.48 | 137.95 | NA | NA | 849.17 | 535.84 | 470.53 | 22.58 | 361.17 | -223.94 | 732.26 | 588.19 | 110.89 | -26.82 | -12.12 | -218.13 | 481.53 | -340.08 | -676.25 | -277.80 | -397.77 |
| 2024-03-31 | 2023-12-31 | 2023-09-30 | 2023-06-30 | 2023-03-31 | 2022-12-31 | 2022-09-30 | 2022-06-30 | 2022-03-31 | 2021-12-31 | 2021-09-30 | 2021-06-30 | 2021-03-31 | 2020-12-31 | 2020-09-30 | 2020-06-30 | 2020-03-31 | 2019-12-31 | 2019-09-30 | 2019-06-30 | 2019-03-31 | 2018-12-31 | 2018-09-30 | 2018-06-30 | 2018-03-31 | 2017-12-31 | 2017-09-30 | 2017-06-30 | 2017-03-31 | 2016-12-31 | 2016-09-30 | 2016-06-30 | 2016-03-31 | 2015-12-31 | 2015-09-30 | 2015-06-30 | 2015-03-31 | 2014-12-31 | 2014-09-30 | 2014-06-30 | 2014-03-31 | 2013-12-31 | 2013-09-30 | 2013-06-30 | 2013-03-31 | 2012-12-31 | 2012-09-30 | 2012-06-30 | 2012-03-31 | 2011-12-31 | 2011-09-30 | 2011-06-30 | 2011-03-31 | 2010-12-31 | 2010-09-30 | 2010-06-30 | ||
|---|---|---|---|---|---|---|---|---|---|---|---|---|---|---|---|---|---|---|---|---|---|---|---|---|---|---|---|---|---|---|---|---|---|---|---|---|---|---|---|---|---|---|---|---|---|---|---|---|---|---|---|---|---|---|---|---|---|
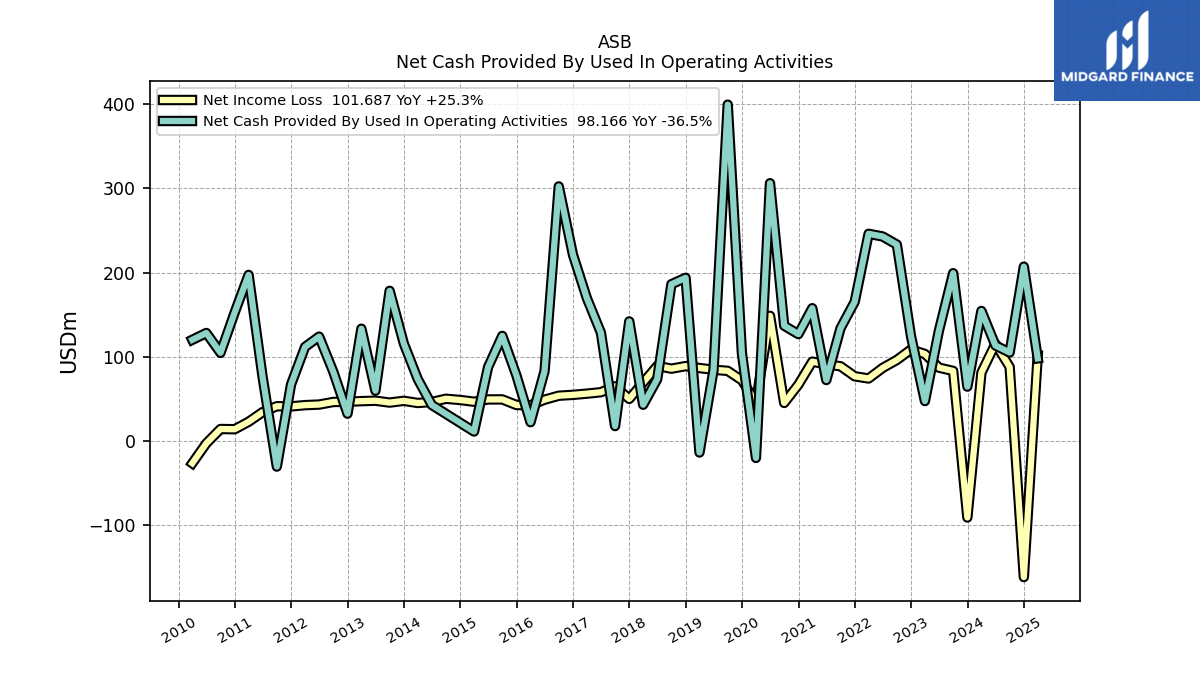
| Net Cash Provided By Used In Operating Activities | 154.50 | 64.63 | 199.34 | 131.30 | 47.47 | 124.24 | 233.29 | 242.92 | 246.12 | 165.41 | 133.94 | 72.43 | 157.77 | 126.96 | 136.94 | 306.20 | -20.08 | 104.27 | 399.52 | 84.07 | -13.60 | 193.82 | 186.21 | 73.44 | 43.09 | 142.09 | 17.77 | 128.75 | 169.75 | 221.27 | 302.39 | 82.91 | 22.37 | 77.74 | 124.88 | 87.81 | 11.31 | NA | NA | 42.85 | 73.67 | 115.71 | 178.40 | 59.75 | 133.41 | 32.51 | 82.22 | 123.99 | 111.77 | 67.12 | -30.35 | 75.73 | 197.28 | 152.72 | 104.72 | 128.31 | |
| Net Income Loss | 81.17 | -90.81 | 83.25 | 87.15 | 103.36 | 108.76 | 96.28 | 86.82 | 74.26 | 76.88 | 88.81 | 91.01 | 94.30 | 67.00 | 45.21 | 148.72 | 45.84 | 72.10 | 83.34 | 84.66 | 86.69 | 88.98 | 85.93 | 89.19 | 69.46 | 50.01 | 65.00 | 57.98 | 56.27 | 54.83 | 53.82 | 49.09 | 42.53 | 42.79 | 49.44 | 49.40 | 46.67 | 48.74 | 50.21 | 46.37 | 45.20 | 47.76 | 45.66 | 47.89 | 47.39 | 46.63 | 46.40 | 43.32 | 42.63 | 41.12 | 41.34 | 34.38 | 22.85 | 14.01 | 14.30 | -2.78 | |
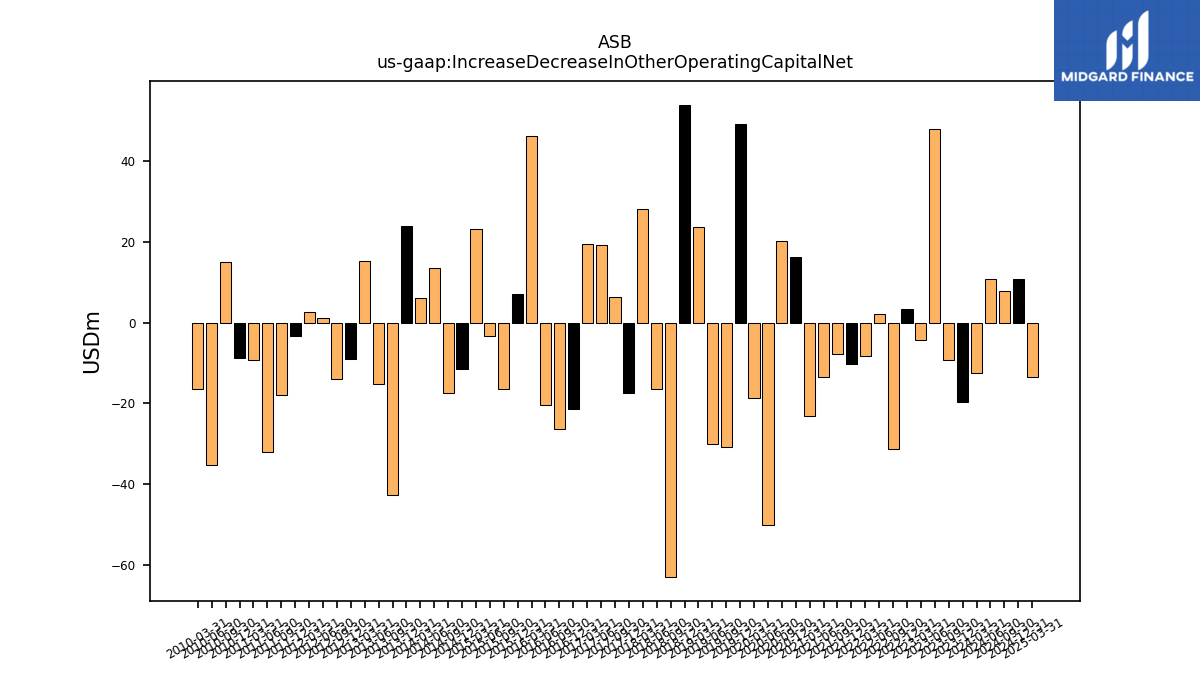
| Increase Decrease In Other Operating Capital Net | -12.45 | -19.58 | -9.37 | 47.84 | -4.34 | 3.36 | -31.38 | 2.24 | -8.29 | -10.15 | -7.89 | -13.46 | -23.01 | 16.25 | 20.23 | -50.11 | -18.64 | 49.07 | -30.69 | -29.98 | 23.54 | 53.93 | -62.98 | -16.31 | 28.11 | -17.39 | 6.23 | 19.12 | 19.53 | -21.34 | -26.41 | -20.32 | 46.16 | 7.02 | -16.33 | -3.24 | 23.06 | -11.36 | -17.34 | 13.51 | 6.17 | 23.84 | -42.61 | -15.25 | 15.34 | -9.02 | -14.08 | 1.03 | 2.60 | -3.44 | -17.90 | -32.05 | -9.14 | -8.70 | 15.03 | -35.33 |
| 2024-03-31 | 2023-12-31 | 2023-09-30 | 2023-06-30 | 2023-03-31 | 2022-12-31 | 2022-09-30 | 2022-06-30 | 2022-03-31 | 2021-12-31 | 2021-09-30 | 2021-06-30 | 2021-03-31 | 2020-12-31 | 2020-09-30 | 2020-06-30 | 2020-03-31 | 2019-12-31 | 2019-09-30 | 2019-06-30 | 2019-03-31 | 2018-12-31 | 2018-09-30 | 2018-06-30 | 2018-03-31 | 2017-12-31 | 2017-09-30 | 2017-06-30 | 2017-03-31 | 2016-12-31 | 2016-09-30 | 2016-06-30 | 2016-03-31 | 2015-12-31 | 2015-09-30 | 2015-06-30 | 2015-03-31 | 2014-12-31 | 2014-09-30 | 2014-06-30 | 2014-03-31 | 2013-12-31 | 2013-09-30 | 2013-06-30 | 2013-03-31 | 2012-12-31 | 2012-09-30 | 2012-06-30 | 2012-03-31 | 2011-12-31 | 2011-09-30 | 2011-06-30 | 2011-03-31 | 2010-12-31 | 2010-09-30 | 2010-06-30 | ||
|---|---|---|---|---|---|---|---|---|---|---|---|---|---|---|---|---|---|---|---|---|---|---|---|---|---|---|---|---|---|---|---|---|---|---|---|---|---|---|---|---|---|---|---|---|---|---|---|---|---|---|---|---|---|---|---|---|---|
| Net Cash Provided By Used In Investing Activities | -275.32 | 788.15 | -407.09 | -741.00 | -1076.32 | -1273.86 | -1300.38 | -2040.52 | -640.04 | -1422.15 | -411.10 | 261.41 | -12.35 | 778.89 | -250.25 | -394.86 | -927.51 | 35.81 | 613.39 | 1130.76 | -162.52 | 2.83 | 133.15 | -166.51 | -350.34 | -212.65 | -302.10 | -841.68 | -40.43 | -174.62 | -225.97 | -713.86 | -526.13 | -261.21 | -430.32 | -508.85 | -333.98 | NA | NA | -869.19 | -588.33 | -813.17 | 73.22 | -293.35 | -219.94 | -980.18 | -315.73 | -348.24 | 10.43 | -103.88 | -180.80 | -261.65 | 73.79 | -1147.03 | 162.38 | 516.24 |
| 2024-03-31 | 2023-12-31 | 2023-09-30 | 2023-06-30 | 2023-03-31 | 2022-12-31 | 2022-09-30 | 2022-06-30 | 2022-03-31 | 2021-12-31 | 2021-09-30 | 2021-06-30 | 2021-03-31 | 2020-12-31 | 2020-09-30 | 2020-06-30 | 2020-03-31 | 2019-12-31 | 2019-09-30 | 2019-06-30 | 2019-03-31 | 2018-12-31 | 2018-09-30 | 2018-06-30 | 2018-03-31 | 2017-12-31 | 2017-09-30 | 2017-06-30 | 2017-03-31 | 2016-12-31 | 2016-09-30 | 2016-06-30 | 2016-03-31 | 2015-12-31 | 2015-09-30 | 2015-06-30 | 2015-03-31 | 2014-12-31 | 2014-09-30 | 2014-06-30 | 2014-03-31 | 2013-12-31 | 2013-09-30 | 2013-06-30 | 2013-03-31 | 2012-12-31 | 2012-09-30 | 2012-06-30 | 2012-03-31 | 2011-12-31 | 2011-09-30 | 2011-06-30 | 2011-03-31 | 2010-12-31 | 2010-09-30 | 2010-06-30 | ||
|---|---|---|---|---|---|---|---|---|---|---|---|---|---|---|---|---|---|---|---|---|---|---|---|---|---|---|---|---|---|---|---|---|---|---|---|---|---|---|---|---|---|---|---|---|---|---|---|---|---|---|---|---|---|---|---|---|---|
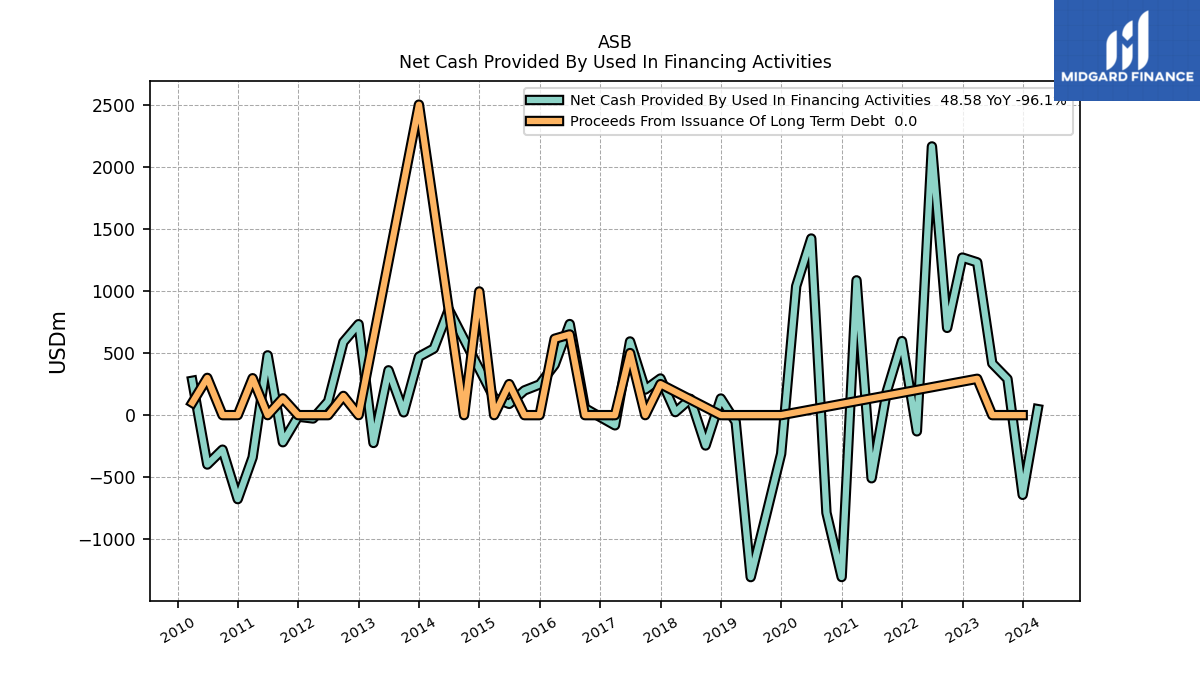
| Net Cash Provided By Used In Financing Activities | 48.58 | -641.75 | 290.88 | 416.52 | 1230.24 | 1268.66 | 702.44 | 2163.61 | -130.52 | 596.41 | 190.62 | -508.25 | 1085.32 | -1303.46 | -785.71 | 1422.12 | 1038.08 | -310.89 | -810.44 | -1304.10 | -54.23 | 133.71 | -244.39 | 131.27 | 24.40 | 294.96 | 206.12 | 593.28 | -82.09 | -14.73 | 56.00 | 733.43 | 405.48 | 246.94 | 198.86 | 90.48 | 137.95 | NA | NA | 849.17 | 535.84 | 470.53 | 22.58 | 361.17 | -223.94 | 732.26 | 588.19 | 110.89 | -26.82 | -12.12 | -218.13 | 481.53 | -340.08 | -676.25 | -277.80 | -397.77 | |
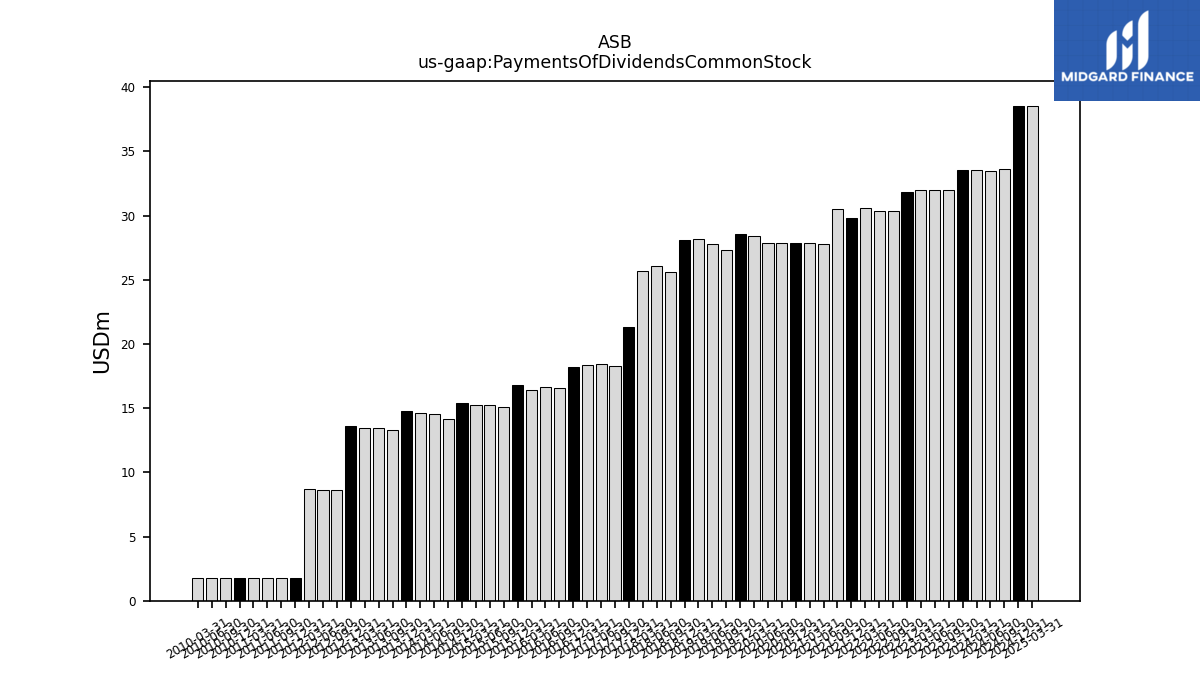
| Payments Of Dividends Common Stock | 33.53 | 33.53 | 32.00 | 32.00 | 32.01 | 31.88 | 30.34 | 30.33 | 30.58 | 29.82 | 30.55 | 27.82 | 27.87 | 27.87 | 27.88 | 27.89 | 28.39 | 28.56 | 27.29 | 27.78 | 28.18 | 28.09 | 25.61 | 26.11 | 25.71 | 21.36 | 18.25 | 18.44 | 18.37 | 18.21 | 16.61 | 16.62 | 16.41 | 16.80 | 15.09 | 15.23 | 15.28 | 15.41 | 14.12 | 14.54 | 14.64 | 14.77 | 13.27 | 13.47 | 13.48 | 13.62 | 8.63 | 8.64 | 8.73 | 1.75 | 1.74 | 1.75 | 1.74 | 1.74 | 1.74 | 1.74 |
| 2024-03-31 | 2023-12-31 | 2023-09-30 | 2023-06-30 | 2023-03-31 | 2022-12-31 | 2022-09-30 | 2022-06-30 | 2022-03-31 | 2021-12-31 | 2021-09-30 | 2021-06-30 | 2021-03-31 | 2020-12-31 | 2020-09-30 | 2020-06-30 | 2020-03-31 | 2019-12-31 | 2019-09-30 | 2019-06-30 | 2019-03-31 | 2018-12-31 | 2018-09-30 | 2018-06-30 | 2018-03-31 | 2017-12-31 | 2017-09-30 | 2017-06-30 | 2017-03-31 | 2016-12-31 | 2016-09-30 | 2016-06-30 | 2016-03-31 | 2015-12-31 | 2015-09-30 | 2015-06-30 | 2015-03-31 | 2014-12-31 | 2014-09-30 | 2014-06-30 | 2014-03-31 | 2013-12-31 | 2013-09-30 | 2013-06-30 | 2013-03-31 | 2012-12-31 | 2012-09-30 | 2012-06-30 | 2012-03-31 | 2011-12-31 | 2011-09-30 | 2011-06-30 | 2011-03-31 | 2010-12-31 | 2010-09-30 | 2010-06-30 | ||
|---|---|---|---|---|---|---|---|---|---|---|---|---|---|---|---|---|---|---|---|---|---|---|---|---|---|---|---|---|---|---|---|---|---|---|---|---|---|---|---|---|---|---|---|---|---|---|---|---|---|---|---|---|---|---|---|---|---|
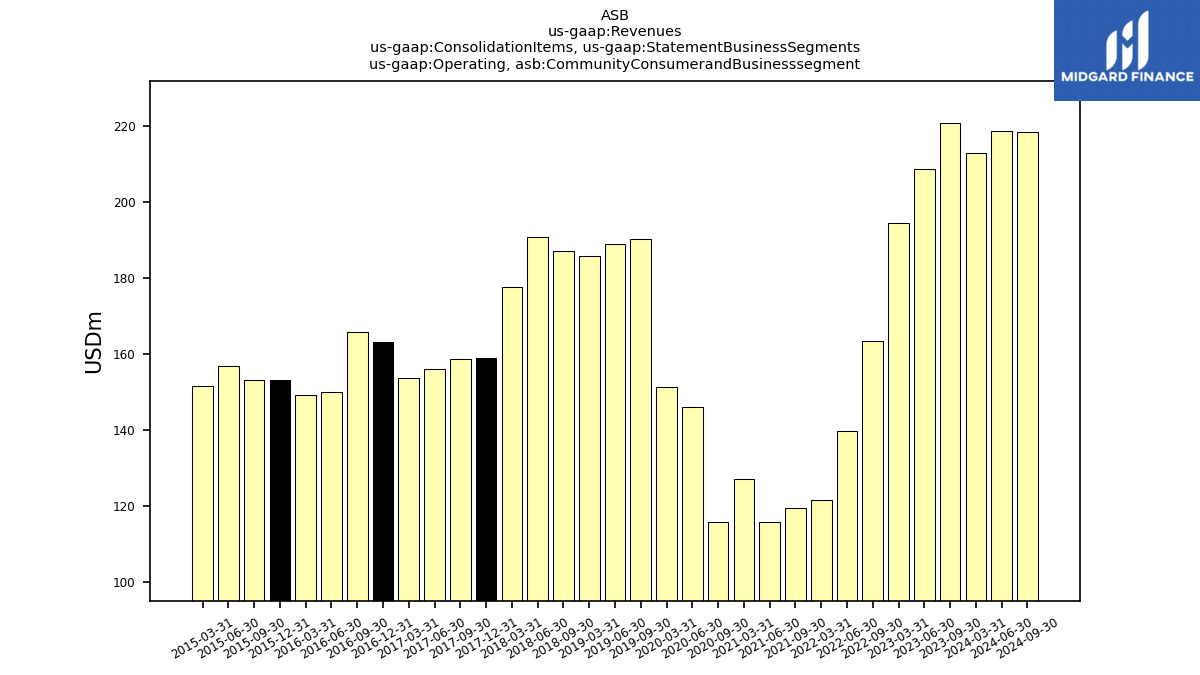
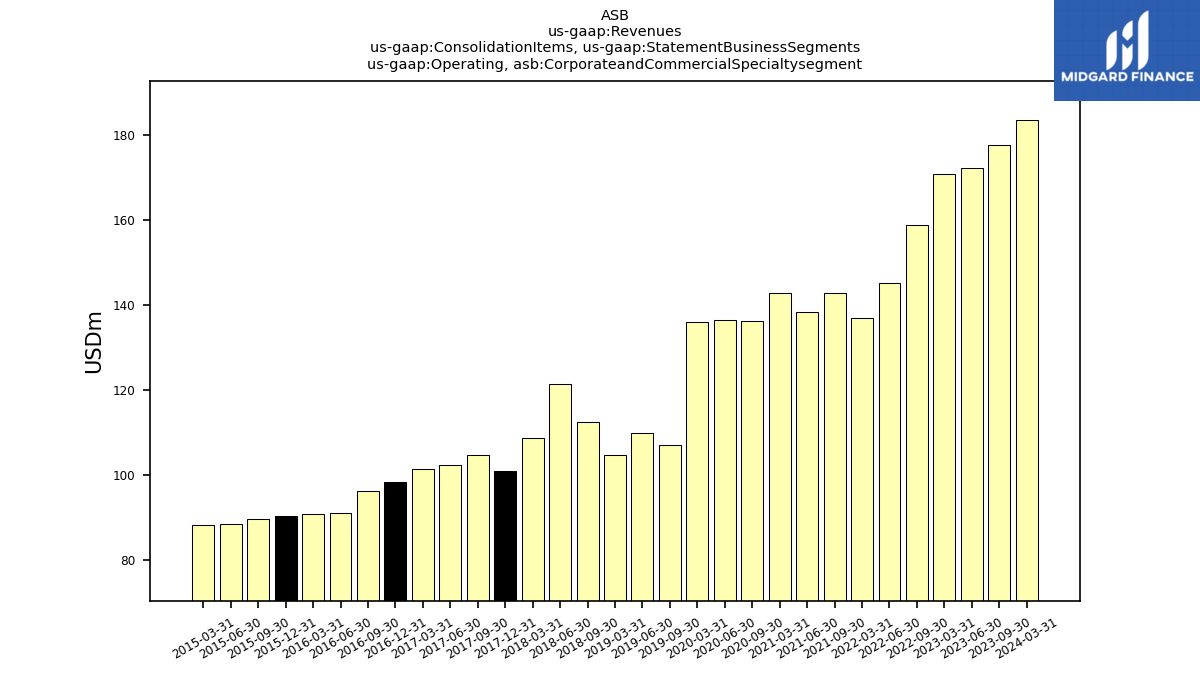
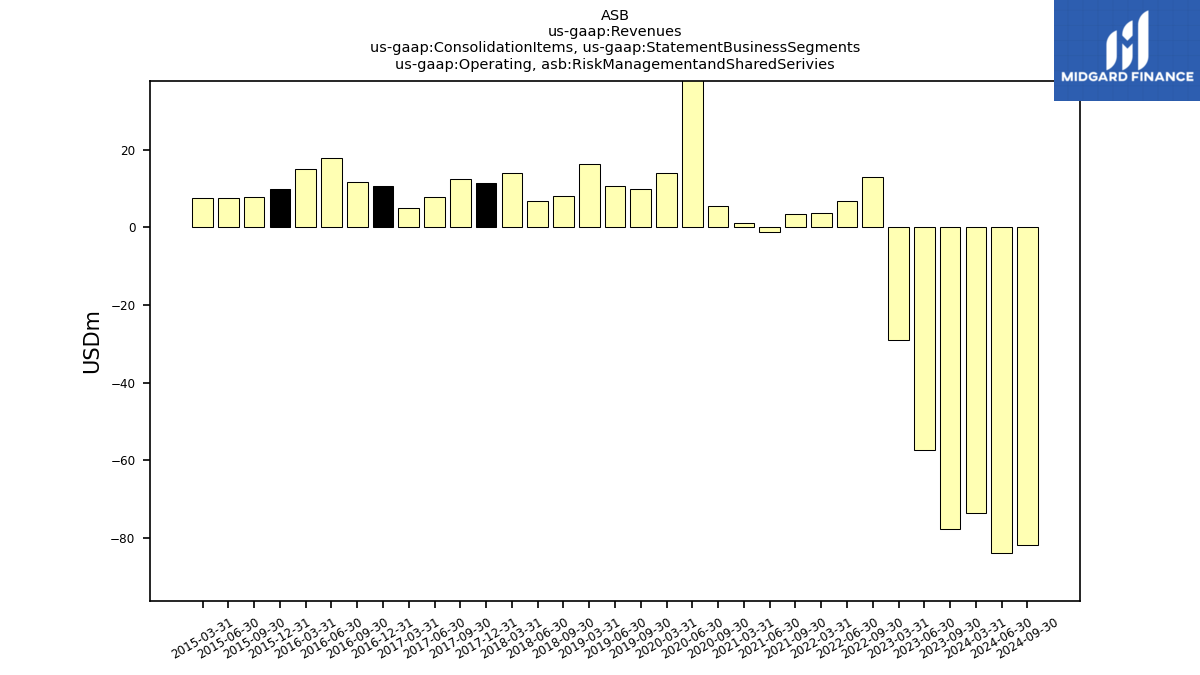
| Revenues | 322.84 | 122.39 | 320.82 | 323.46 | 336.08 | 350.65 | 335.23 | 291.60 | 262.21 | 268.26 | 265.75 | 252.96 | 271.25 | 273.71 | 257.69 | 444.36 | 301.25 | 293.08 | 307.22 | 309.46 | 306.75 | 308.00 | 307.69 | 319.20 | 300.25 | 271.55 | 276.02 | 266.23 | 260.11 | 272.32 | 273.77 | 258.88 | 255.18 | 253.36 | 250.43 | 253.01 | 247.89 | 244.30 | 247.54 | 240.95 | 238.49 | 243.07 | 231.43 | 244.49 | 239.65 | 239.36 | 236.59 | 230.22 | 236.23 | 234.13 | 230.58 | 224.65 | 225.91 | 241.65 | 241.55 | 246.27 | |
| Operating, Community Consumerand Businesssegment | 212.84 | NA | 220.71 | 208.56 | 194.31 | NA | 163.48 | 139.76 | 121.58 | NA | 119.54 | 115.73 | 127.28 | NA | 115.83 | 146.02 | 151.26 | NA | 190.30 | 188.80 | 185.74 | NA | 187.11 | 190.87 | 177.58 | 159.05 | 158.82 | 155.94 | 153.80 | 163.19 | 165.85 | 150.10 | 149.35 | 153.07 | 153.09 | 156.91 | 151.70 | NA | NA | NA | NA | NA | NA | NA | NA | NA | NA | NA | NA | NA | NA | NA | NA | NA | NA | NA | |
| Operating, Corporateand Commercial Specialtysegment | 183.62 | NA | 177.77 | 172.28 | 170.86 | NA | 158.81 | 145.19 | 136.95 | NA | 142.88 | 138.35 | 142.88 | NA | 136.38 | 136.41 | 135.94 | NA | 107.06 | 109.90 | 104.73 | NA | 112.56 | 121.52 | 108.64 | 100.97 | 104.63 | 102.37 | 101.38 | 98.41 | 96.19 | 91.00 | 90.78 | 90.46 | 89.59 | 88.46 | 88.30 | NA | NA | NA | NA | NA | NA | NA | NA | NA | NA | NA | NA | NA | NA | NA | NA | NA | NA | NA | |
| Operating, Risk Managementand Shared Serivies | -73.62 | NA | -77.66 | -57.38 | -29.09 | NA | 12.94 | 6.66 | 3.68 | NA | 3.33 | -1.12 | 1.09 | NA | 5.49 | 161.94 | 14.04 | NA | 9.85 | 10.76 | 16.28 | NA | 8.02 | 6.81 | 14.03 | 11.53 | 12.56 | 7.92 | 4.93 | 10.73 | 11.72 | 17.78 | 15.05 | 9.99 | 7.90 | 7.59 | 7.62 | NA | NA | NA | NA | NA | NA | NA | NA | NA | NA | NA | NA | NA | NA | NA | NA | NA | NA | NA | |
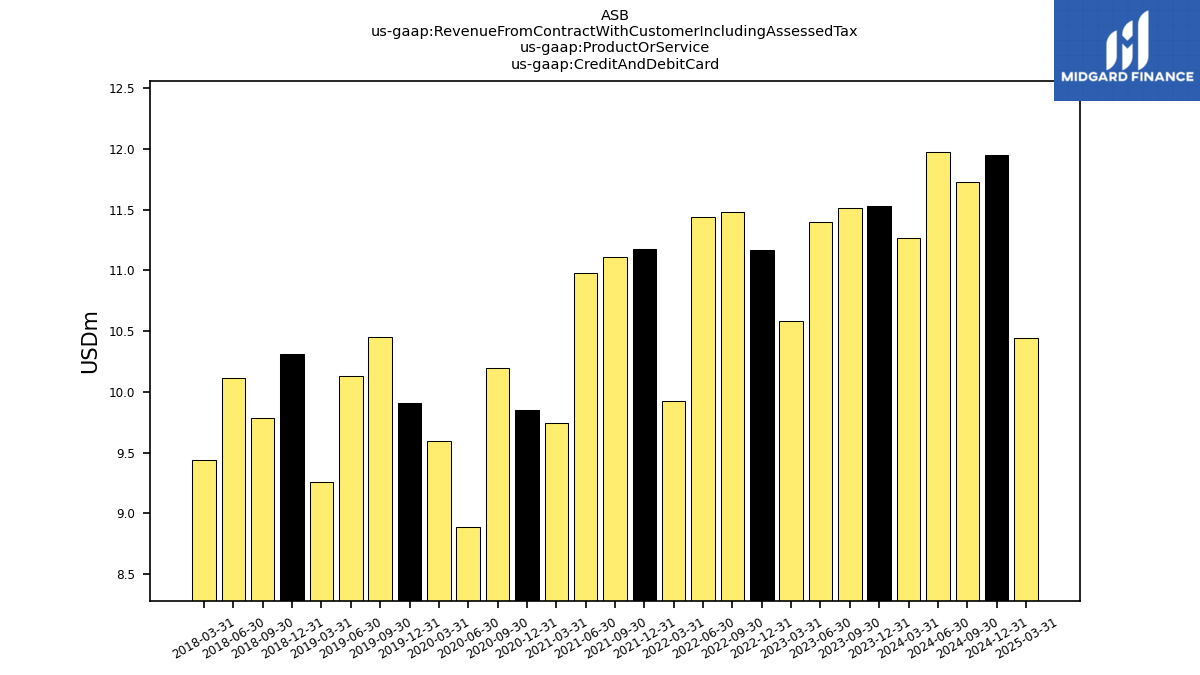
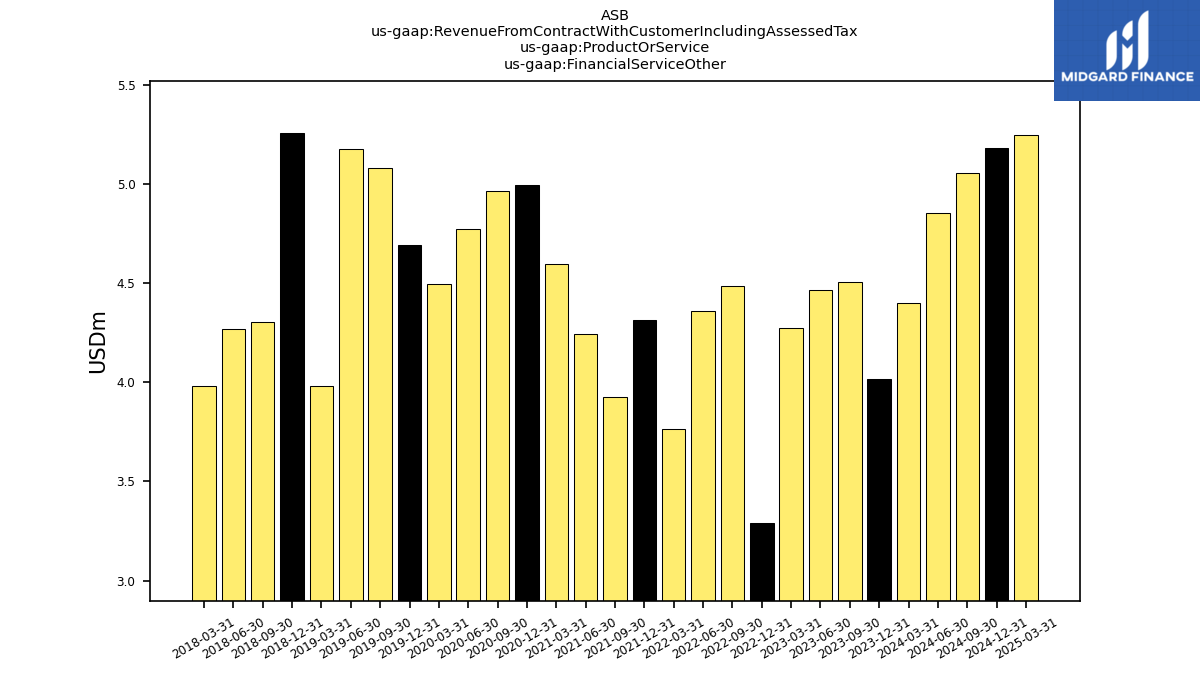
| Revenue From Contract With Customer Including Assessed Tax | 322.84 | 122.39 | 320.82 | 323.46 | 336.08 | 350.65 | 335.23 | 291.60 | 262.21 | 268.26 | 265.75 | 252.96 | 271.25 | 273.71 | 257.69 | 444.36 | 301.25 | 293.08 | 307.22 | 309.46 | 306.75 | 308.00 | 307.69 | 72.83 | 72.72 | 271.55 | 276.02 | 65.01 | 64.88 | 272.32 | 273.77 | 258.88 | 255.18 | 253.36 | 250.43 | 253.01 | 247.89 | 244.30 | 247.54 | 240.95 | 238.49 | 243.07 | 231.43 | 244.49 | 239.65 | 239.36 | 236.59 | 230.22 | 236.23 | 234.13 | 230.58 | 224.65 | 225.91 | 241.65 | 241.55 | 246.27 | |
| Credit And Debit Card | 11.27 | 11.53 | 11.51 | 11.40 | 10.59 | 11.17 | 11.48 | 11.44 | 9.93 | 11.18 | 11.11 | 10.98 | 9.74 | 9.85 | 10.20 | 8.89 | 9.60 | 9.91 | 10.46 | 10.13 | 9.26 | 10.31 | 9.78 | 10.12 | 9.44 | NA | NA | NA | NA | NA | NA | NA | NA | NA | NA | NA | NA | NA | NA | NA | NA | NA | NA | NA | NA | NA | NA | NA | NA | NA | NA | NA | NA | NA | NA | NA | |
| Financial Service Other | 4.40 | 4.02 | 4.51 | 4.46 | 4.28 | 3.29 | 4.49 | 4.36 | 3.77 | 4.32 | 3.93 | 4.24 | 4.60 | 5.00 | 4.97 | 4.77 | 4.50 | 4.70 | 5.08 | 5.18 | 3.98 | 5.26 | 4.31 | 4.27 | 3.98 | NA | NA | NA | NA | NA | NA | NA | NA | NA | NA | NA | NA | NA | NA | NA | NA | NA | NA | NA | NA | NA | NA | NA | NA | NA | NA | NA | NA | NA | NA | NA |