
| 2024-03-31 | 2023-12-31 | 2023-09-30 | 2023-06-30 | 2023-03-31 | 2022-12-31 | 2022-09-30 | 2022-06-30 | 2022-03-31 | 2021-12-31 | 2021-09-30 | 2021-06-30 | 2021-03-31 | 2020-12-31 | 2020-09-30 | 2020-06-30 | 2020-03-31 | 2019-12-31 | 2019-09-30 | 2019-06-30 | 2019-03-31 | 2018-12-31 | 2018-09-30 | 2018-06-30 | 2018-03-31 | 2017-12-31 | 2017-09-30 | 2017-06-30 | 2017-03-31 | 2016-12-31 | 2016-09-30 | 2016-06-30 | 2016-03-31 | 2015-12-31 | 2015-09-30 | 2015-06-30 | 2015-03-31 | ||
|---|---|---|---|---|---|---|---|---|---|---|---|---|---|---|---|---|---|---|---|---|---|---|---|---|---|---|---|---|---|---|---|---|---|---|---|---|---|---|
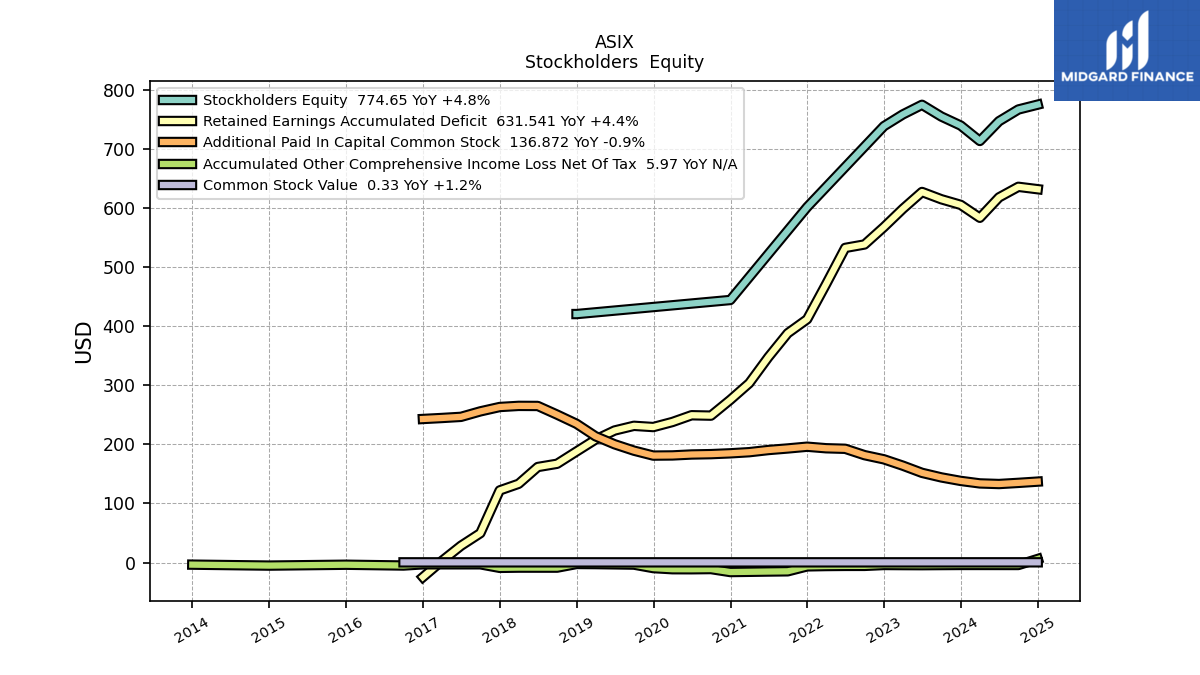
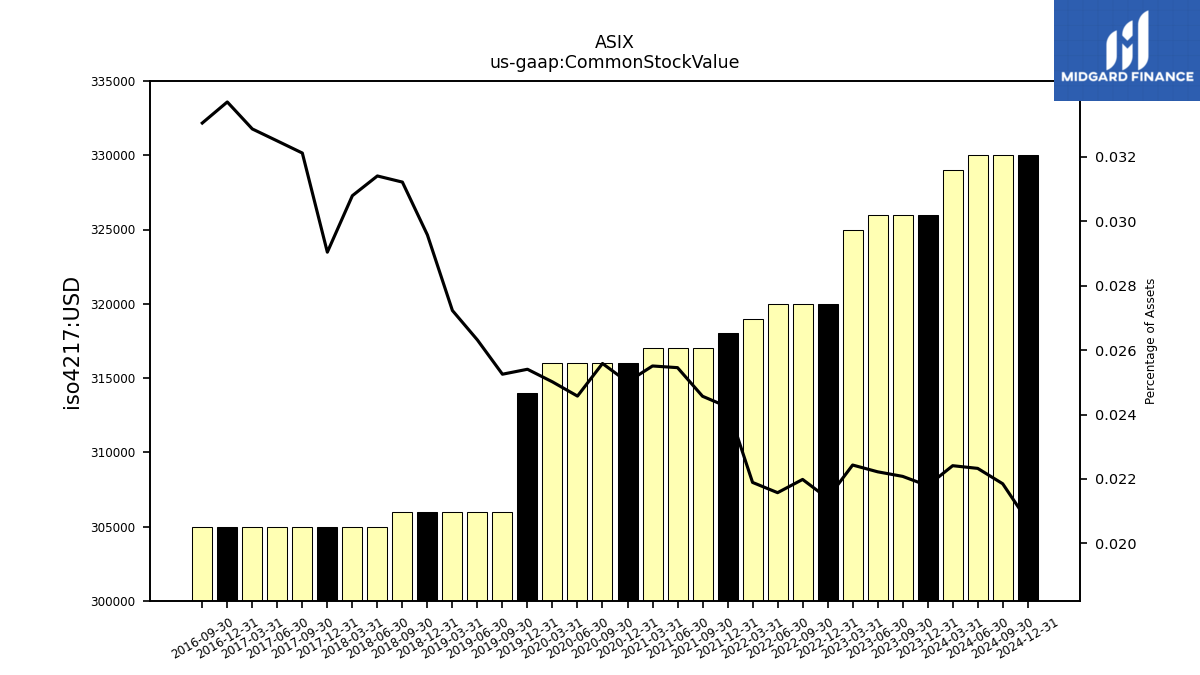
| Common Stock Value | 0.33 | 0.33 | 0.33 | 0.33 | 0.33 | 0.32 | 0.32 | 0.32 | 0.32 | 0.32 | 0.32 | 0.32 | 0.32 | 0.32 | 0.32 | 0.32 | 0.32 | 0.31 | 0.31 | 0.31 | 0.31 | 0.31 | 0.31 | 0.30 | 0.30 | 0.30 | 0.30 | 0.30 | 0.30 | 0.30 | 0.30 | NA | NA | NA | NA | NA | NA | |
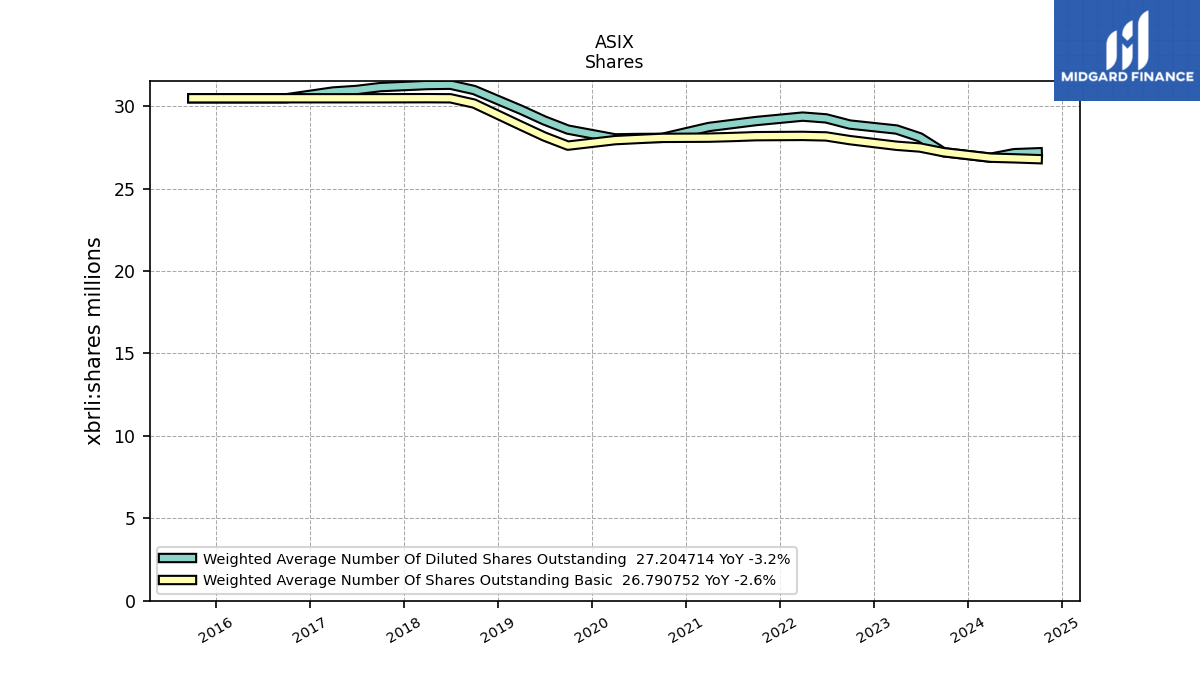
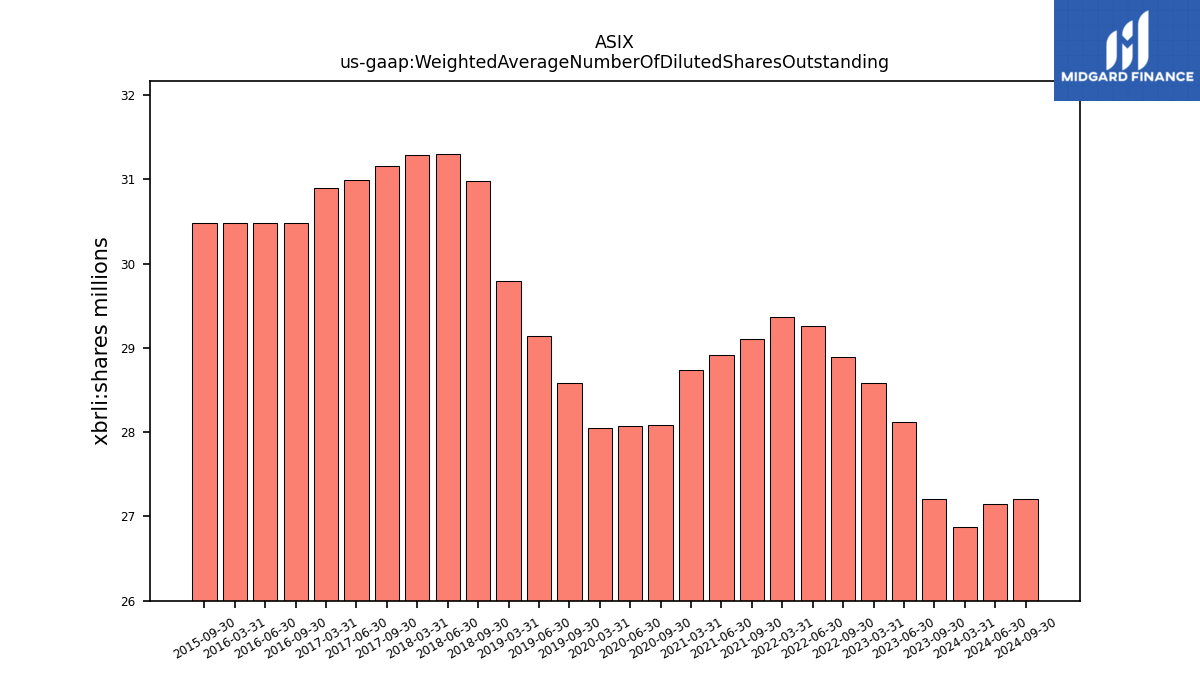
| Weighted Average Number Of Diluted Shares Outstanding | 26.88 | NA | 27.21 | 28.11 | 28.59 | NA | 28.89 | 29.26 | 29.37 | NA | 29.10 | 28.92 | 28.74 | NA | 28.08 | 28.07 | 28.05 | NA | 28.58 | 29.14 | 29.79 | NA | 30.98 | 31.31 | 31.29 | NA | 31.16 | 30.99 | 30.89 | NA | 30.48 | 30.48 | 30.48 | NA | 30.48 | NA | NA | |
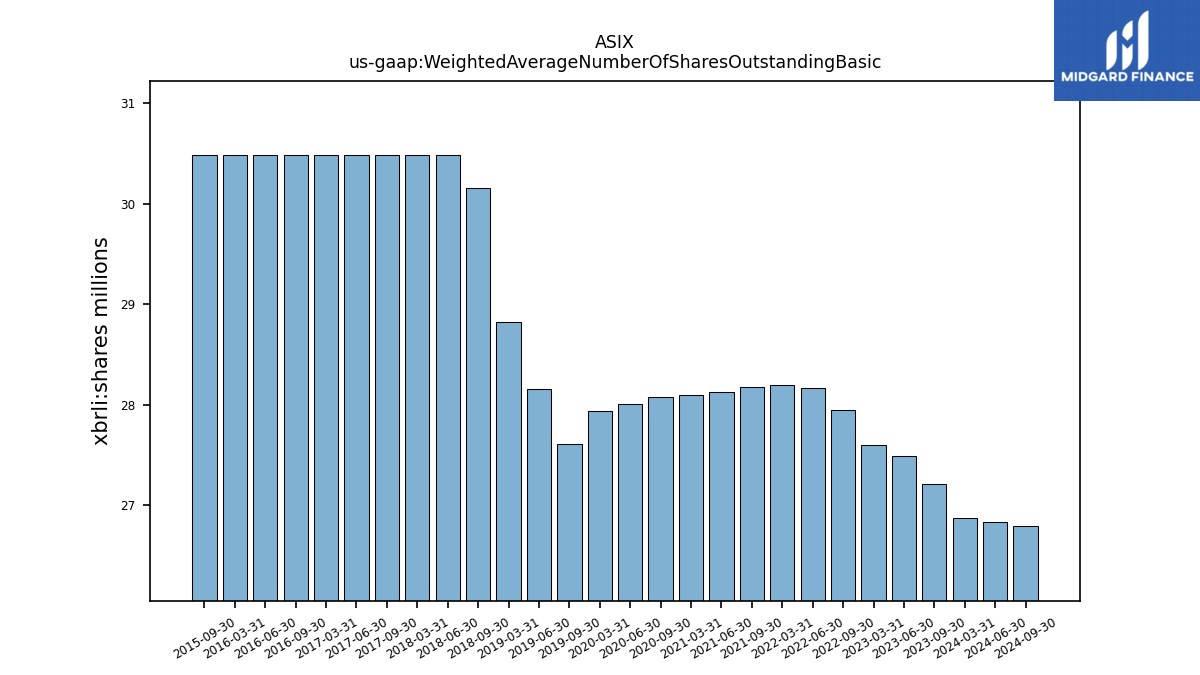
| Weighted Average Number Of Shares Outstanding Basic | 26.88 | NA | 27.21 | 27.49 | 27.60 | NA | 27.94 | 28.17 | 28.20 | NA | 28.18 | 28.13 | 28.09 | NA | 28.08 | 28.01 | 27.94 | NA | 27.61 | 28.16 | 28.82 | NA | 30.16 | 30.48 | 30.49 | NA | 30.48 | 30.48 | 30.48 | NA | 30.48 | 30.48 | 30.48 | NA | 30.48 | NA | NA | |
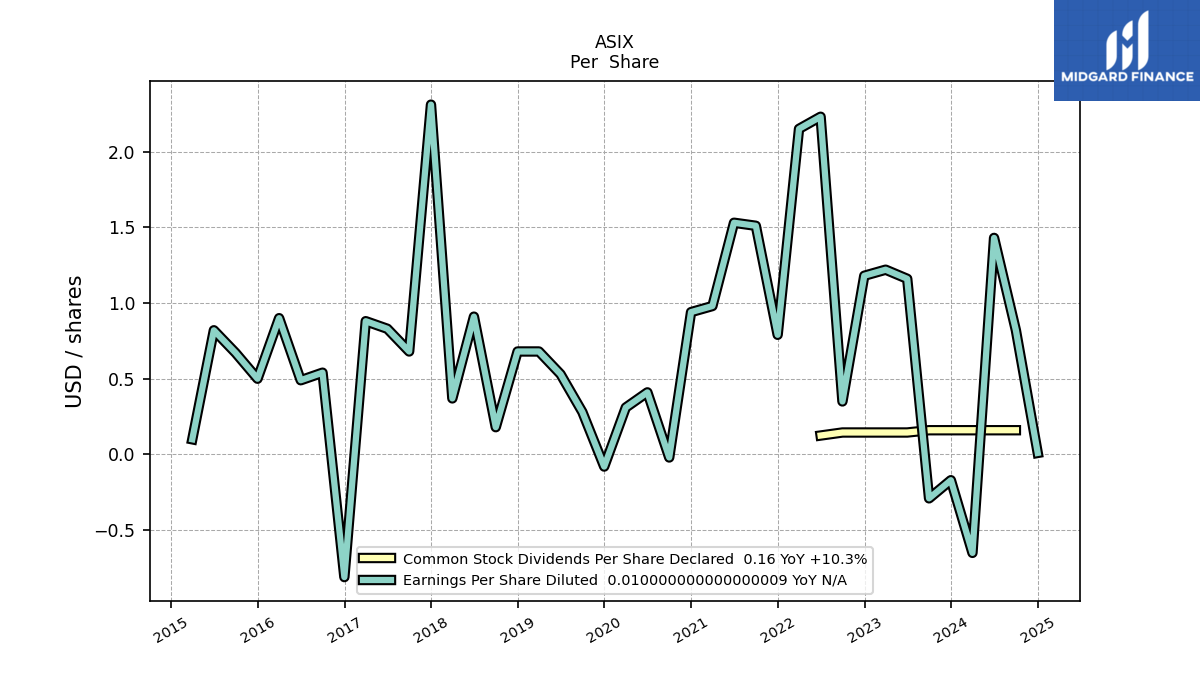
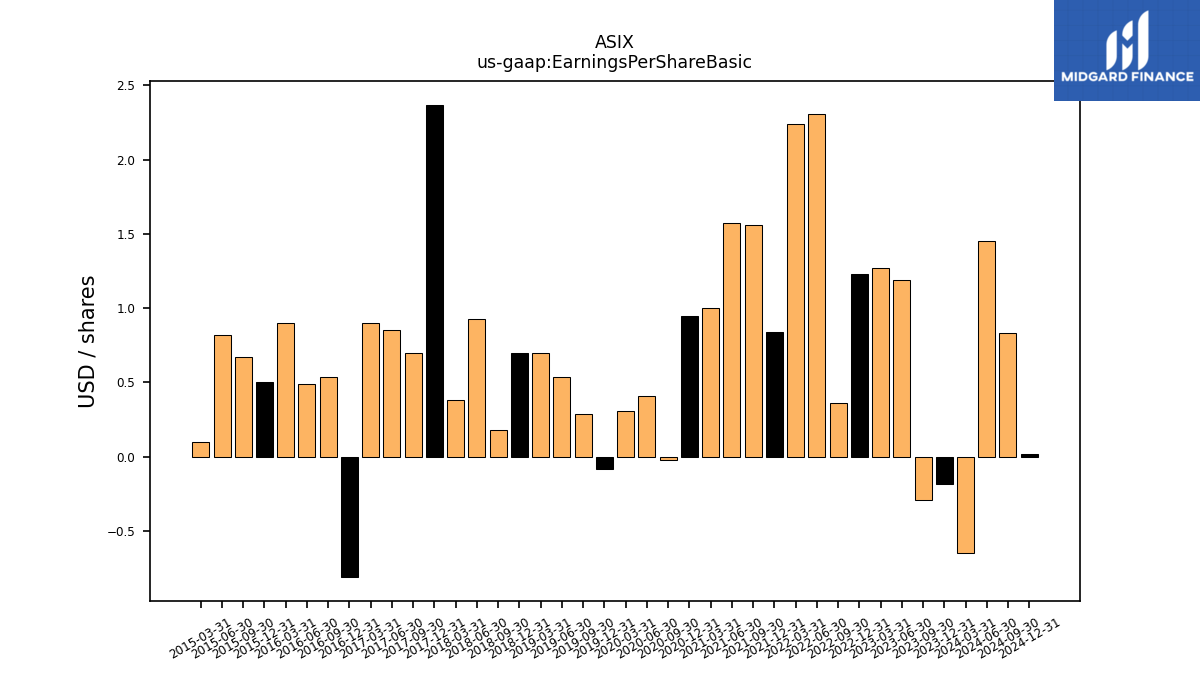
| Earnings Per Share Basic | -0.65 | -0.18 | -0.29 | 1.19 | 1.27 | 1.23 | 0.36 | 2.31 | 2.24 | 0.84 | 1.56 | 1.57 | 1.00 | 0.95 | -0.02 | 0.41 | 0.31 | -0.08 | 0.29 | 0.54 | 0.70 | 0.70 | 0.18 | 0.93 | 0.38 | 2.37 | 0.70 | 0.85 | 0.90 | -0.81 | 0.54 | 0.49 | 0.90 | 0.50 | 0.67 | 0.82 | 0.10 | |
| Earnings Per Share Diluted | -0.65 | -0.17 | -0.29 | 1.16 | 1.22 | 1.18 | 0.35 | 2.23 | 2.15 | 0.79 | 1.51 | 1.53 | 0.98 | 0.94 | -0.02 | 0.41 | 0.31 | -0.08 | 0.28 | 0.53 | 0.68 | 0.68 | 0.18 | 0.91 | 0.37 | 2.31 | 0.68 | 0.83 | 0.88 | -0.81 | 0.54 | 0.49 | 0.90 | 0.50 | 0.67 | 0.82 | 0.10 |
| 2024-03-31 | 2023-12-31 | 2023-09-30 | 2023-06-30 | 2023-03-31 | 2022-12-31 | 2022-09-30 | 2022-06-30 | 2022-03-31 | 2021-12-31 | 2021-09-30 | 2021-06-30 | 2021-03-31 | 2020-12-31 | 2020-09-30 | 2020-06-30 | 2020-03-31 | 2019-12-31 | 2019-09-30 | 2019-06-30 | 2019-03-31 | 2018-12-31 | 2018-09-30 | 2018-06-30 | 2018-03-31 | 2017-12-31 | 2017-09-30 | 2017-06-30 | 2017-03-31 | 2016-12-31 | 2016-09-30 | 2016-06-30 | 2016-03-31 | 2015-12-31 | 2015-09-30 | 2015-06-30 | 2015-03-31 | ||
|---|---|---|---|---|---|---|---|---|---|---|---|---|---|---|---|---|---|---|---|---|---|---|---|---|---|---|---|---|---|---|---|---|---|---|---|---|---|---|
| Revenue From Contract With Customer Excluding Assessed Tax | 336.83 | 382.21 | 322.91 | 427.94 | 400.54 | 404.06 | 478.77 | 583.74 | 479.07 | 424.06 | 446.50 | 437.68 | 376.38 | 340.27 | 281.91 | 233.02 | 302.71 | 326.65 | 310.63 | 345.21 | 314.89 | 386.63 | 368.65 | 400.46 | 359.24 | 370.39 | 366.66 | 361.44 | 376.70 | 259.32 | 323.95 | 308.42 | 299.83 | 315.87 | 335.87 | 367.44 | 310.23 | |
| Revenue From Contract With Customer Including Assessed Tax | 336.83 | 382.21 | 322.91 | 427.94 | 400.54 | 404.06 | 478.77 | 583.74 | 479.07 | 424.06 | 446.50 | 437.68 | 376.38 | 340.27 | 281.91 | 233.02 | 302.71 | 326.65 | 310.63 | 345.21 | 314.89 | 386.63 | 368.65 | 400.46 | 359.24 | 370.39 | 366.66 | 361.44 | 376.70 | 259.32 | 323.95 | 308.42 | 299.83 | 315.87 | 335.87 | 367.44 | 310.23 | |
| Revenues | 336.83 | 382.21 | 322.91 | 427.94 | 400.54 | 404.06 | 478.77 | 583.74 | 479.07 | 424.06 | 446.50 | 437.68 | 376.38 | 340.27 | 281.91 | 233.02 | 302.71 | 326.65 | 310.63 | 345.21 | 314.89 | 386.63 | 368.65 | 400.46 | 359.24 | 370.39 | 366.66 | 361.44 | 376.70 | 259.32 | 323.95 | 308.42 | 299.83 | 315.87 | 335.87 | 367.44 | 310.23 | |
| Cost Of Goods And Services Sold | 333.86 | 363.67 | 314.79 | 360.02 | 330.04 | 335.03 | 443.65 | 476.83 | 375.65 | 369.54 | 366.18 | 356.88 | 317.90 | 287.67 | 265.76 | 198.74 | 272.01 | 311.79 | 280.12 | 303.13 | 266.88 | 332.79 | 343.43 | 342.96 | 321.32 | 325.52 | 309.41 | 299.30 | NA | NA | NA | NA | NA | NA | NA | NA | NA | |
| Selling General And Administrative Expense | 23.59 | 24.83 | 21.59 | 24.01 | 25.11 | 22.63 | 23.07 | 20.84 | 21.21 | 20.87 | 21.12 | 21.68 | 19.31 | 20.04 | 16.18 | 17.91 | 16.74 | 16.69 | 19.26 | 20.01 | 19.41 | 26.04 | 18.06 | 17.92 | 19.21 | 18.79 | 19.09 | 18.13 | 16.81 | 19.80 | 11.70 | 10.88 | 11.38 | 13.19 | 14.61 | NA | NA | |
| Interest Income Expense Net | -2.70 | -2.19 | -2.08 | -1.95 | -1.27 | -0.76 | -0.69 | -0.77 | -0.56 | -0.93 | -1.17 | -1.38 | -1.54 | -1.97 | -1.98 | -1.89 | -1.96 | -1.73 | -1.29 | -1.33 | NA | NA | NA | NA | NA | NA | NA | NA | NA | NA | NA | NA | NA | NA | NA | NA | NA | |
| Interest Paid Net | 2.59 | 2.09 | 1.97 | 1.84 | 1.19 | 0.66 | 0.56 | 0.62 | 0.41 | 0.67 | 1.03 | 1.24 | 1.52 | 2.80 | 1.63 | 2.13 | 0.73 | 1.68 | 1.22 | 1.25 | 1.04 | 1.45 | 1.20 | 1.43 | 1.78 | -0.74 | NA | NA | NA | NA | NA | NA | NA | NA | NA | NA | NA | |
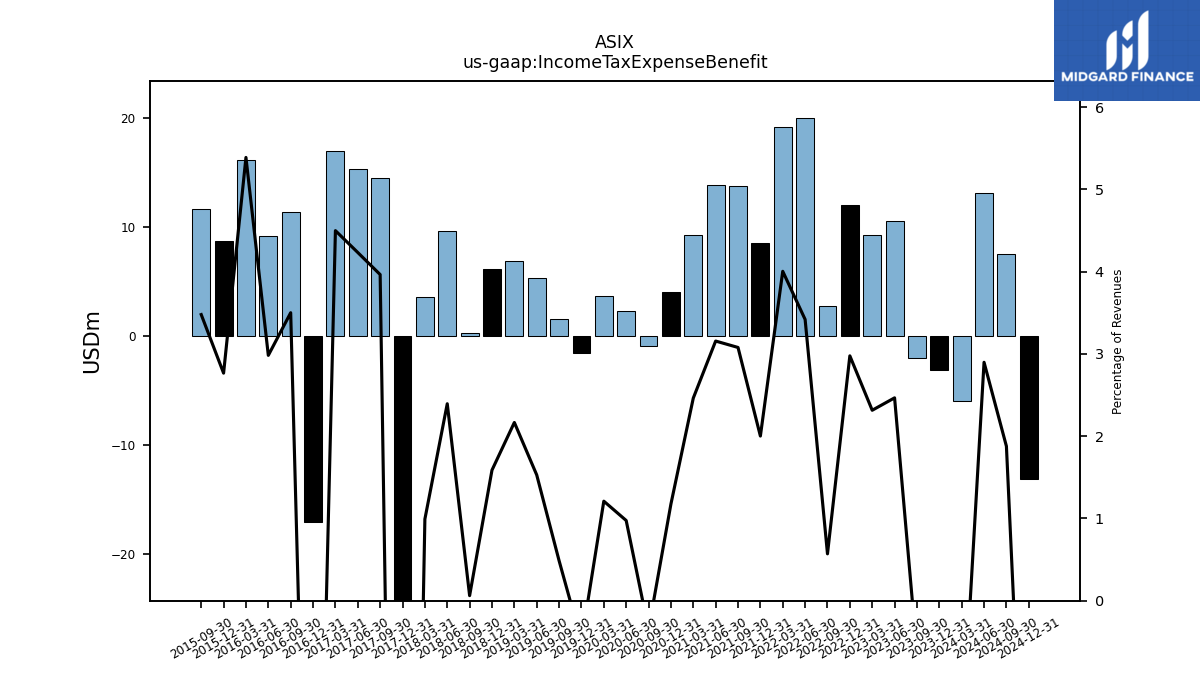
| Income Tax Expense Benefit | -6.02 | -3.15 | -2.08 | 10.55 | 9.28 | 12.03 | 2.73 | 19.96 | 19.18 | 8.49 | 13.75 | 13.82 | 9.27 | 4.00 | -0.98 | 2.27 | 3.66 | -1.62 | 1.51 | 5.28 | 6.82 | 6.14 | 0.23 | 9.59 | 3.57 | -48.87 | 14.54 | 15.30 | 16.95 | -17.08 | 11.34 | 9.20 | 16.16 | 8.74 | 11.68 | NA | NA | |
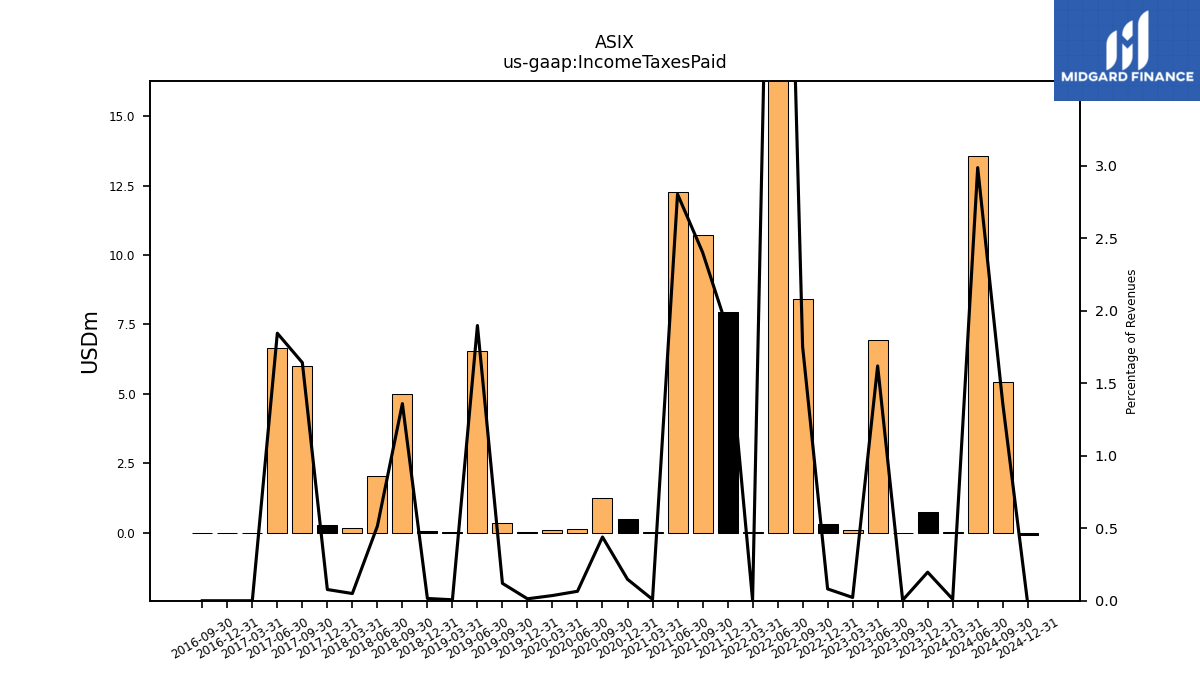
| Income Taxes Paid | 0.04 | 0.75 | 0.01 | 6.93 | 0.09 | 0.33 | 8.40 | 47.42 | 0.02 | 7.95 | 10.74 | 12.28 | 0.04 | 0.50 | 1.24 | 0.15 | 0.11 | 0.04 | 0.37 | 6.55 | 0.02 | 0.06 | 5.01 | 2.06 | 0.18 | 0.29 | 6.02 | 6.67 | 0.00 | 0.00 | 0.00 | NA | NA | NA | NA | NA | NA | |
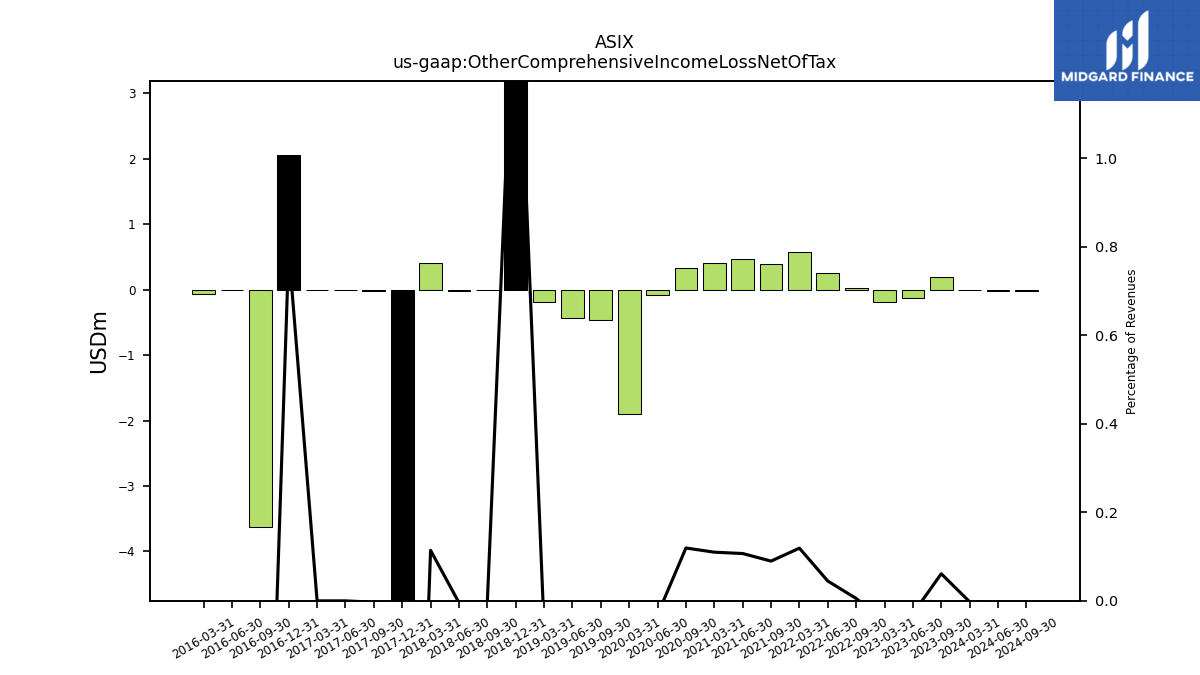
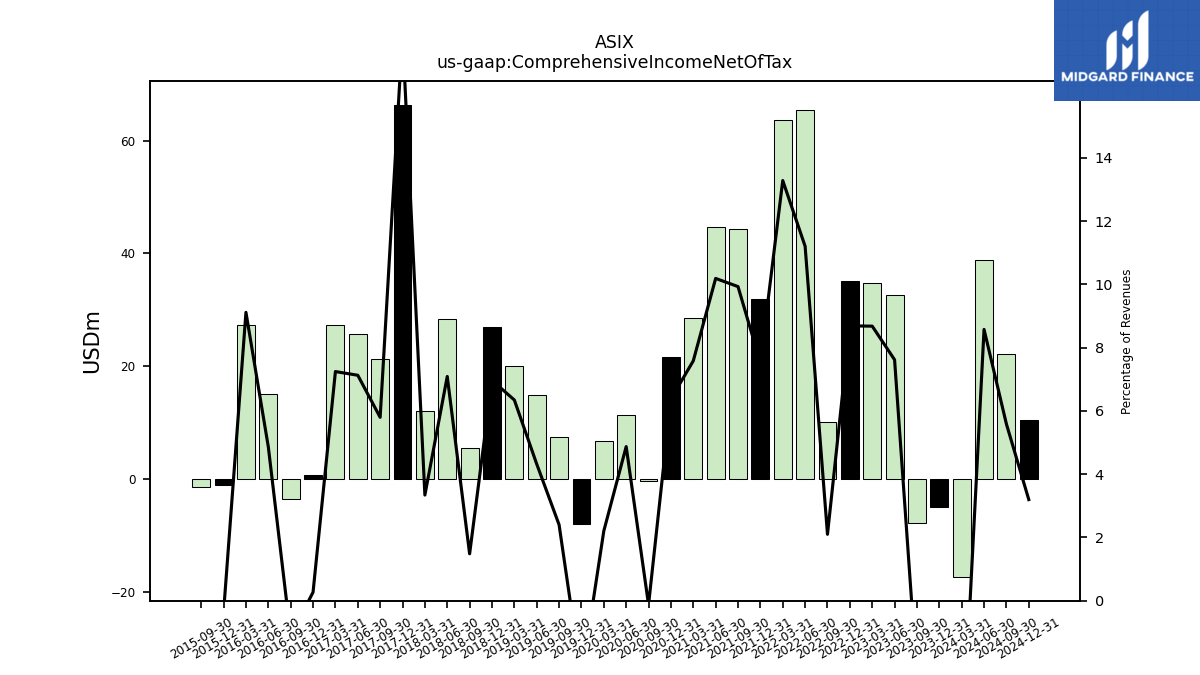
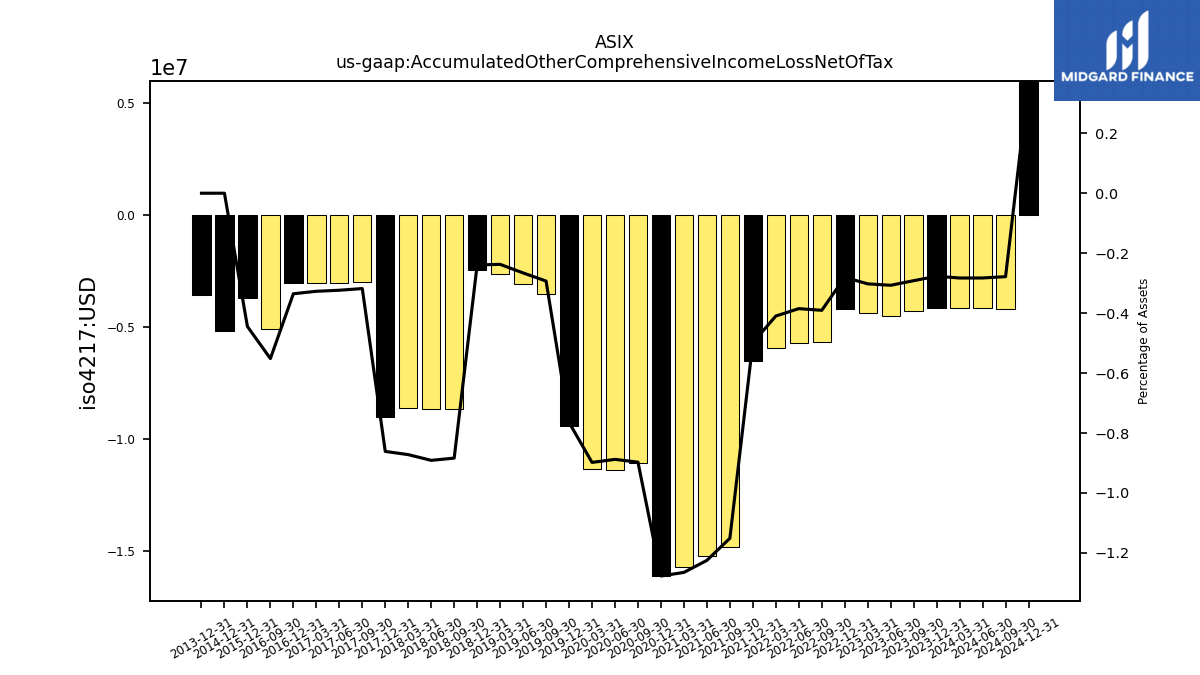
| Other Comprehensive Income Loss Net Of Tax | -0.01 | NA | 0.20 | -0.12 | -0.18 | NA | 0.03 | 0.26 | 0.57 | NA | 0.40 | 0.47 | 0.41 | NA | 0.34 | -0.07 | -1.89 | NA | -0.46 | -0.42 | -0.19 | 5.78 | -0.01 | -0.02 | 0.41 | -6.00 | -0.01 | -0.00 | -0.00 | 2.06 | -3.62 | -0.01 | -0.06 | NA | NA | NA | NA | |
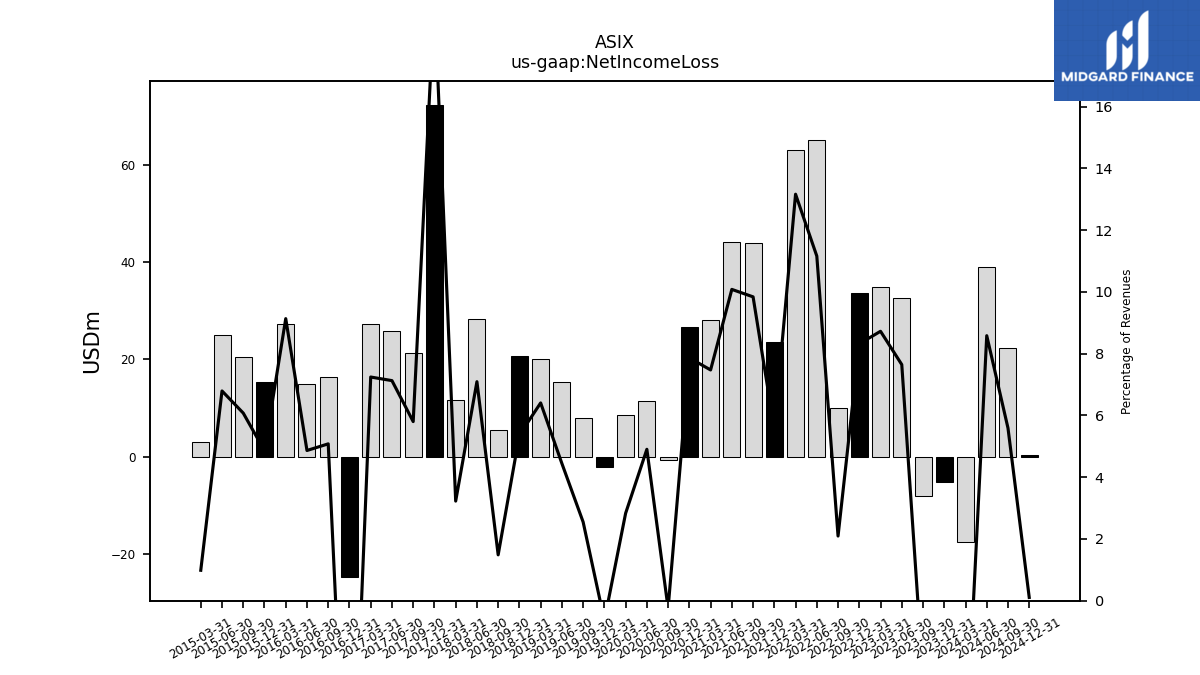
| Net Income Loss | -17.40 | -5.08 | -7.98 | 32.73 | 34.95 | 33.62 | 10.03 | 65.16 | 63.07 | 23.59 | 43.94 | 44.13 | 28.13 | 26.76 | -0.69 | 11.43 | 8.58 | -2.09 | 7.92 | 15.35 | 20.17 | 20.76 | 5.48 | 28.41 | 11.59 | 72.37 | 21.27 | 25.77 | 27.29 | -24.71 | 16.46 | 15.01 | 27.39 | 15.34 | 20.41 | 24.96 | 3.06 | |
| Comprehensive Income Net Of Tax | -17.40 | -4.92 | -7.78 | 32.60 | 34.77 | 35.11 | 10.06 | 65.42 | 63.64 | 31.90 | 44.34 | 44.60 | 28.54 | 21.71 | -0.36 | 11.36 | 6.68 | -7.99 | 7.46 | 14.92 | 19.98 | 26.95 | 5.47 | 28.39 | 12.00 | 66.37 | 21.26 | 25.77 | 27.29 | 0.70 | -3.62 | 15.00 | 27.34 | -1.13 | -1.35 | NA | NA |
| 2024-03-31 | 2023-12-31 | 2023-09-30 | 2023-06-30 | 2023-03-31 | 2022-12-31 | 2022-09-30 | 2022-06-30 | 2022-03-31 | 2021-12-31 | 2021-09-30 | 2021-06-30 | 2021-03-31 | 2020-12-31 | 2020-09-30 | 2020-06-30 | 2020-03-31 | 2019-12-31 | 2019-09-30 | 2019-06-30 | 2019-03-31 | 2018-12-31 | 2018-09-30 | 2018-06-30 | 2018-03-31 | 2017-12-31 | 2017-09-30 | 2017-06-30 | 2017-03-31 | 2016-12-31 | 2016-09-30 | 2016-06-30 | 2016-03-31 | 2015-12-31 | 2015-09-30 | 2015-06-30 | 2015-03-31 | ||
|---|---|---|---|---|---|---|---|---|---|---|---|---|---|---|---|---|---|---|---|---|---|---|---|---|---|---|---|---|---|---|---|---|---|---|---|---|---|---|
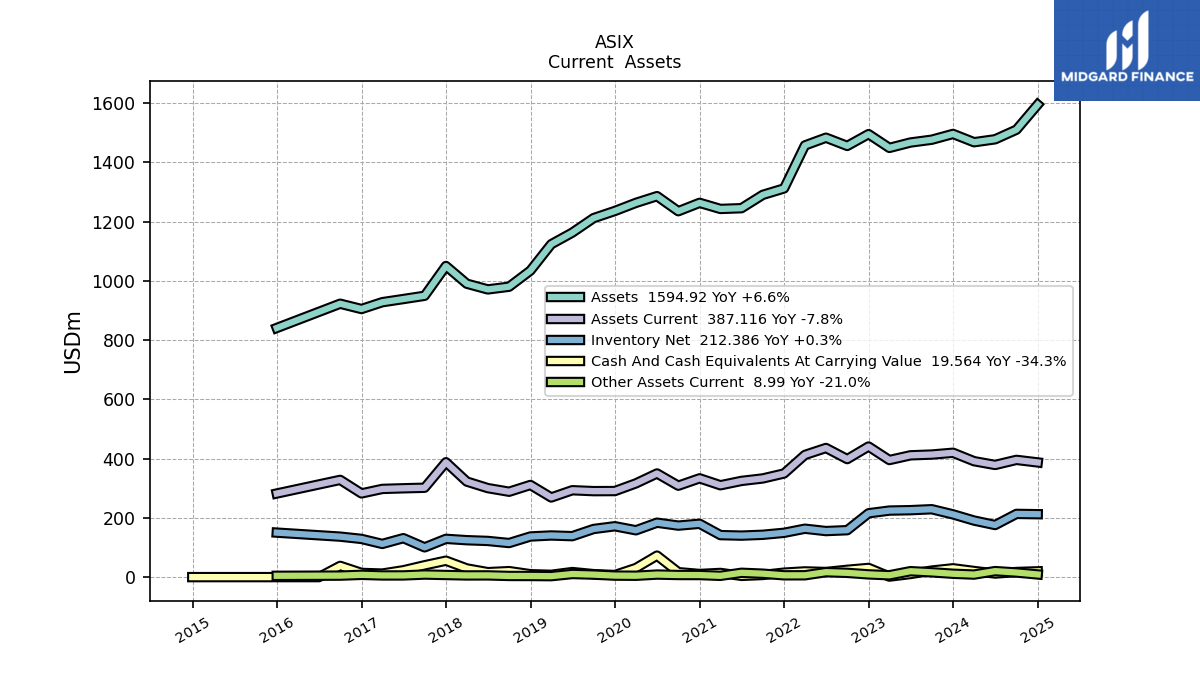
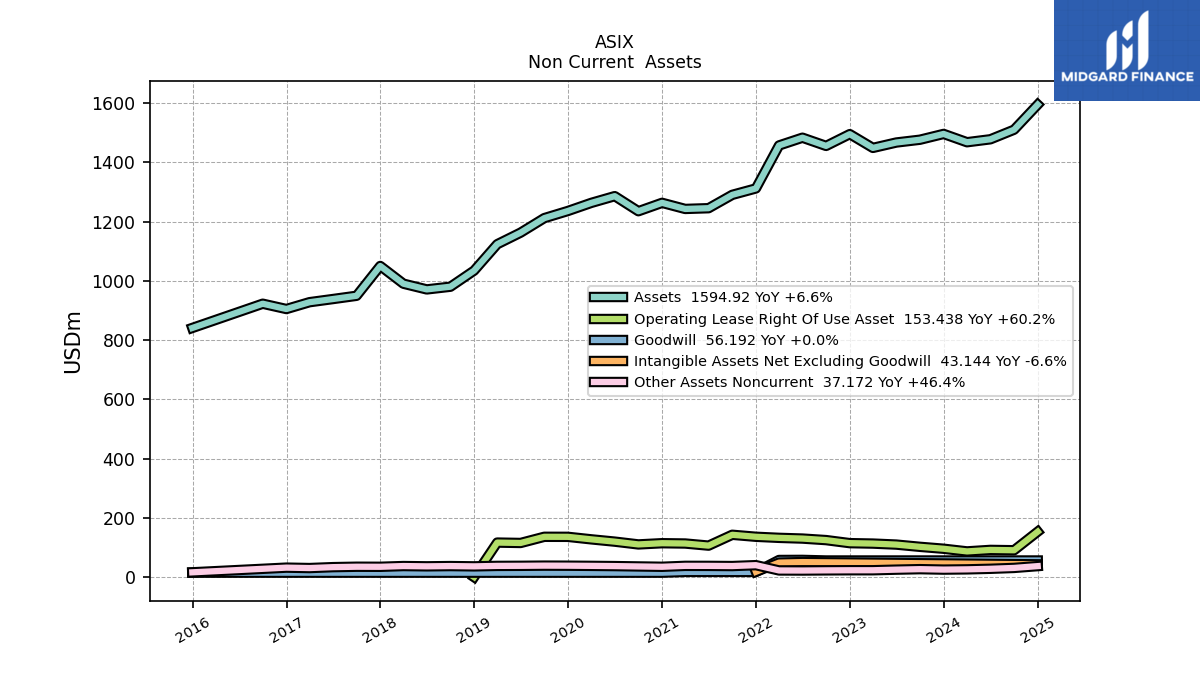
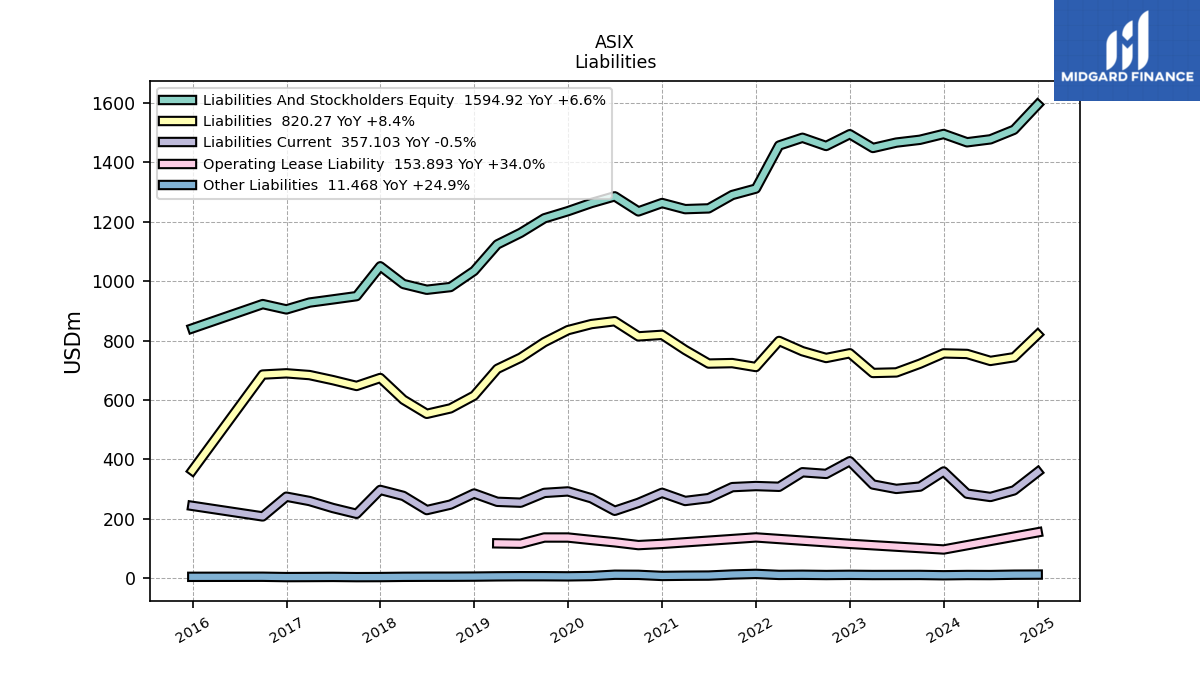
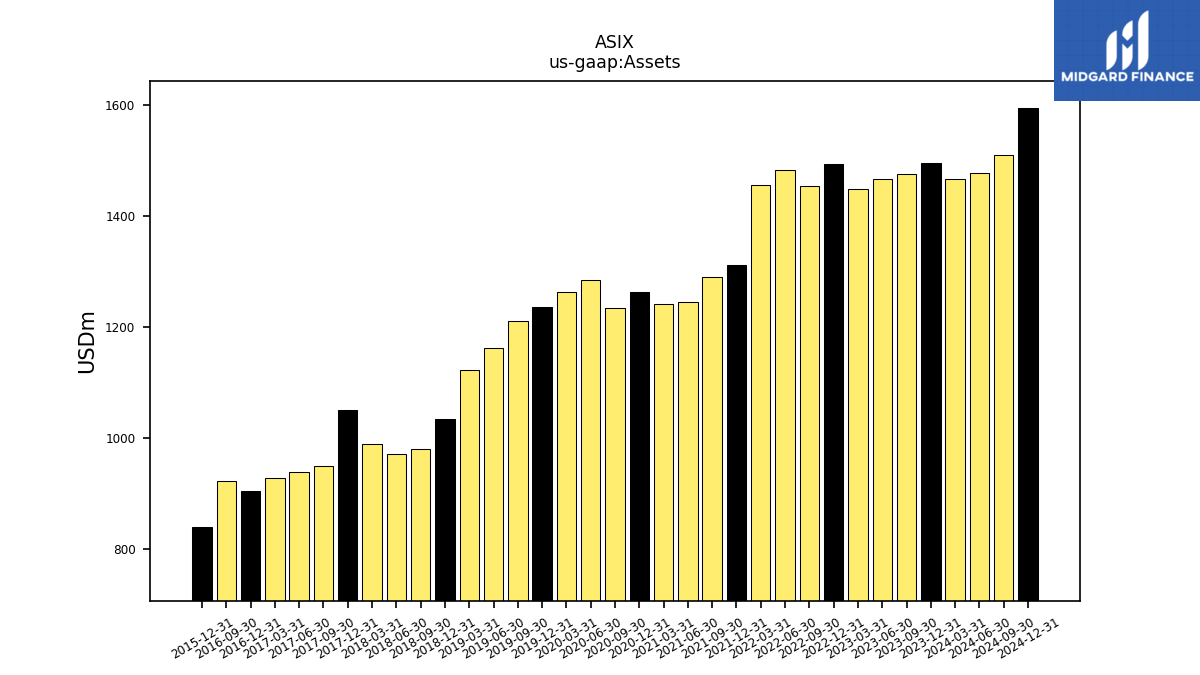
| Assets | 1467.98 | 1496.02 | 1476.45 | 1467.01 | 1448.82 | 1495.33 | 1455.53 | 1483.26 | 1457.12 | 1312.00 | 1290.36 | 1245.32 | 1242.78 | 1263.41 | 1235.13 | 1286.00 | 1263.31 | 1235.97 | 1211.82 | 1162.89 | 1123.77 | 1034.63 | 980.28 | 971.15 | 990.48 | 1050.27 | 949.64 | 938.67 | 928.03 | 904.96 | 922.87 | NA | NA | 840.99 | NA | NA | NA | |
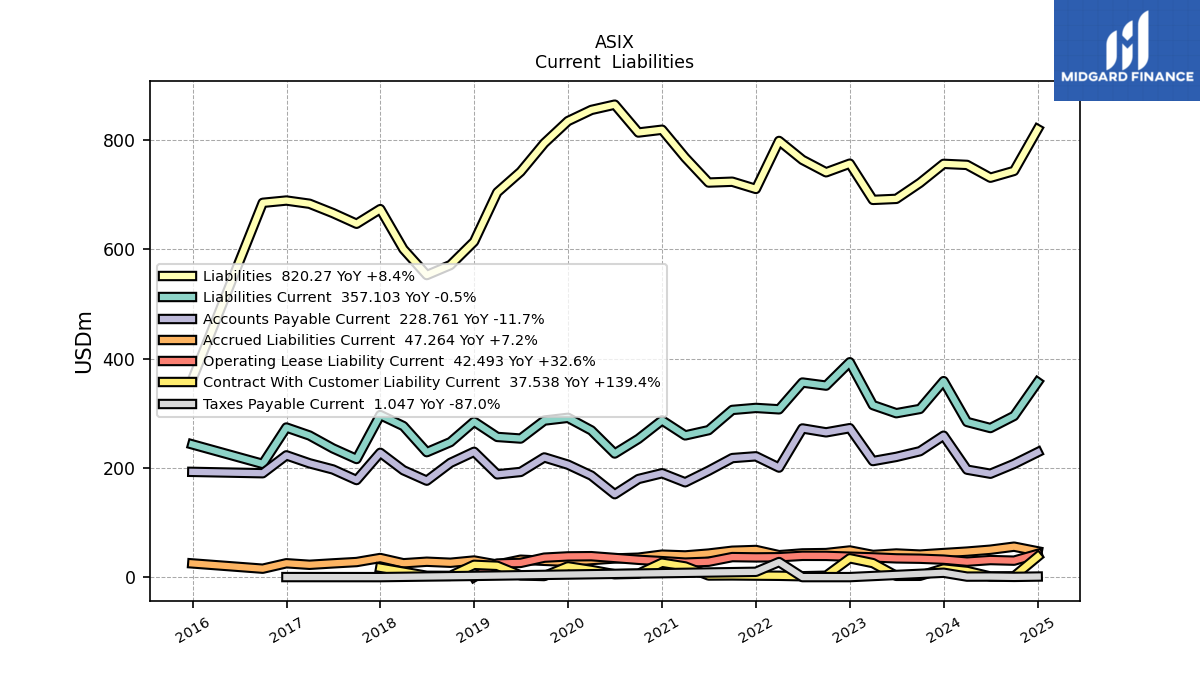
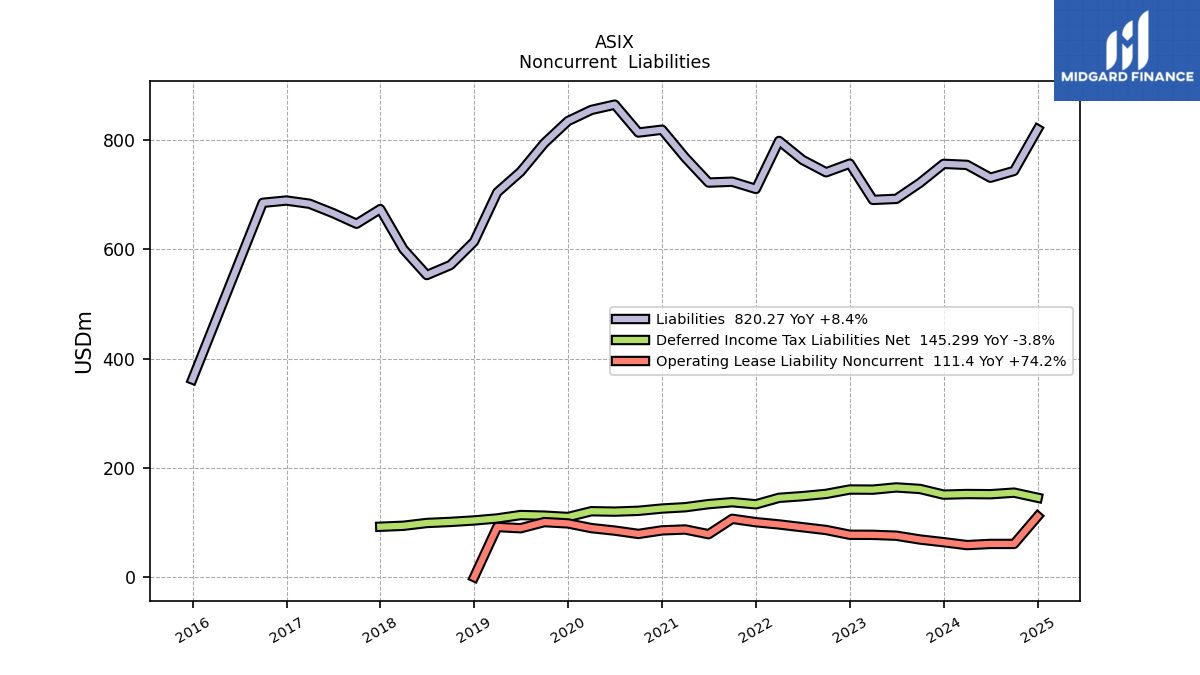
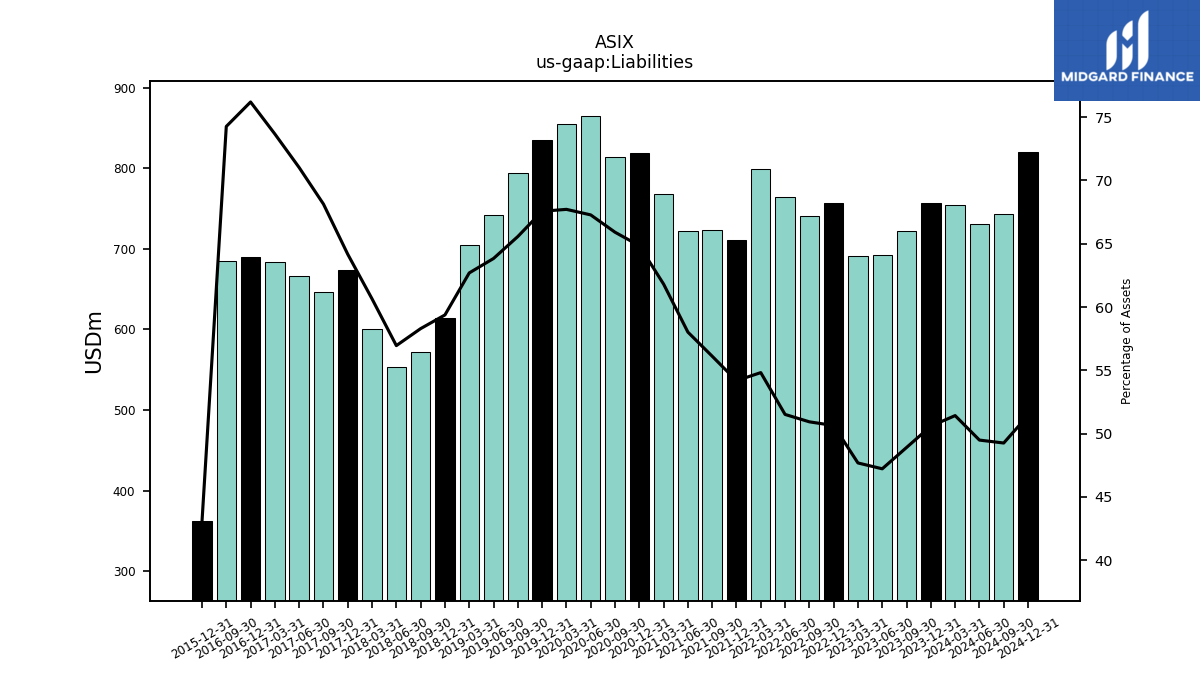
| Liabilities | 754.83 | 756.78 | 721.97 | 692.65 | 690.75 | 757.15 | 741.26 | 764.05 | 798.73 | 710.81 | 724.05 | 722.50 | 768.20 | 819.28 | 814.10 | 865.21 | 855.48 | 835.09 | 794.59 | 742.32 | 704.53 | 614.29 | 571.43 | 553.07 | 600.65 | 673.95 | 647.03 | 666.63 | 683.69 | 689.60 | 685.41 | NA | NA | 361.92 | NA | NA | NA | |
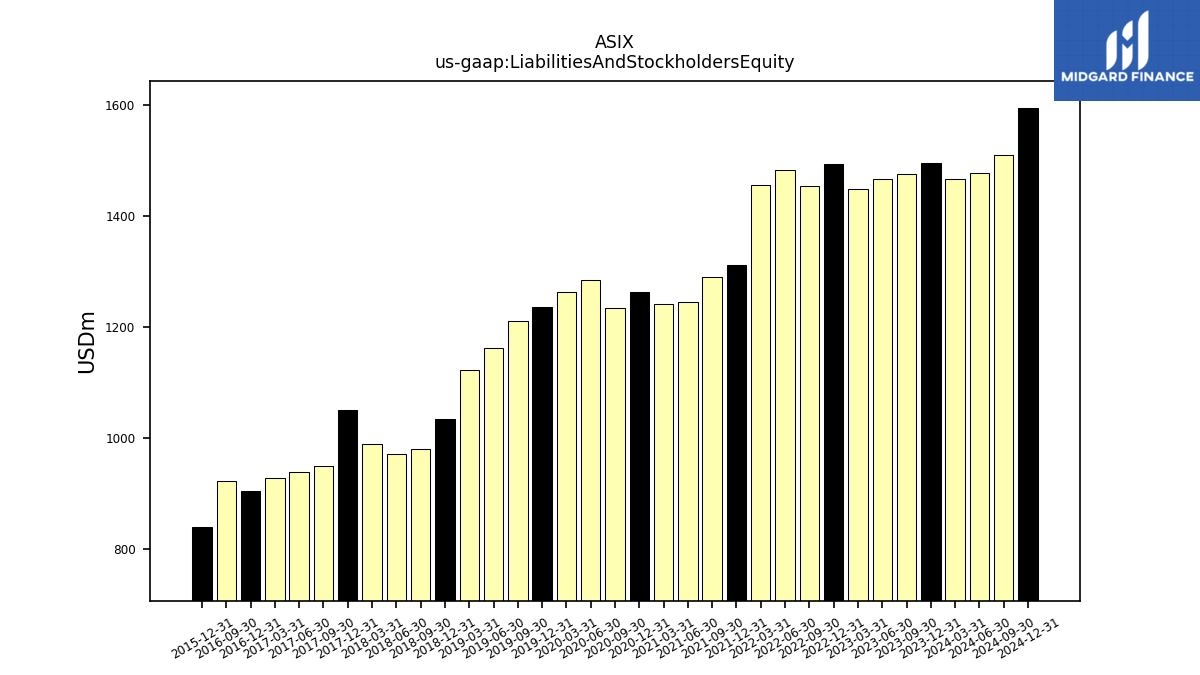
| Liabilities And Stockholders Equity | 1467.98 | 1496.02 | 1476.45 | 1467.01 | 1448.82 | 1495.33 | 1455.53 | 1483.26 | 1457.12 | 1312.00 | 1290.36 | 1245.32 | 1242.78 | 1263.41 | 1235.13 | 1286.00 | 1263.31 | 1235.97 | 1211.82 | 1162.89 | 1123.77 | 1034.63 | 980.28 | 971.15 | 990.48 | 1050.27 | 949.64 | 938.67 | 928.03 | 904.96 | 922.87 | NA | NA | 840.99 | NA | NA | NA | |
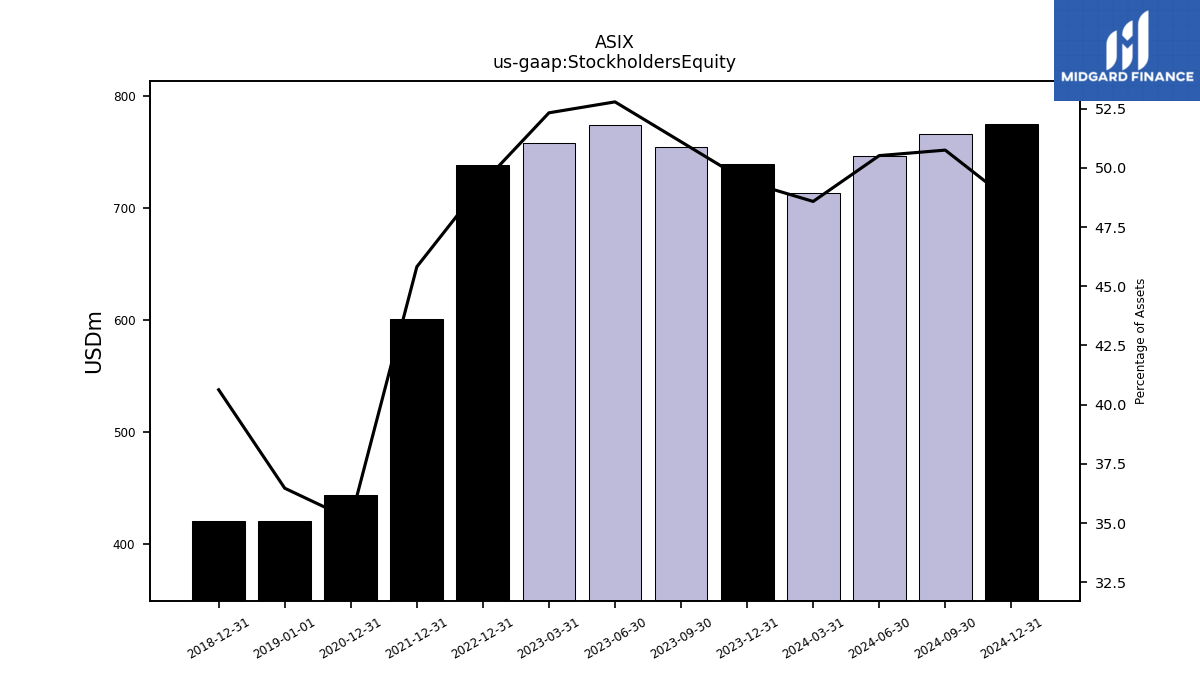
| Stockholders Equity | 713.16 | 739.24 | NA | NA | 758.07 | 738.18 | NA | NA | NA | 601.19 | NA | NA | NA | 444.12 | NA | NA | NA | NA | NA | NA | NA | 420.34 | NA | NA | NA | NA | NA | NA | NA | NA | NA | NA | NA | NA | NA | NA | NA |
| 2024-03-31 | 2023-12-31 | 2023-09-30 | 2023-06-30 | 2023-03-31 | 2022-12-31 | 2022-09-30 | 2022-06-30 | 2022-03-31 | 2021-12-31 | 2021-09-30 | 2021-06-30 | 2021-03-31 | 2020-12-31 | 2020-09-30 | 2020-06-30 | 2020-03-31 | 2019-12-31 | 2019-09-30 | 2019-06-30 | 2019-03-31 | 2018-12-31 | 2018-09-30 | 2018-06-30 | 2018-03-31 | 2017-12-31 | 2017-09-30 | 2017-06-30 | 2017-03-31 | 2016-12-31 | 2016-09-30 | 2016-06-30 | 2016-03-31 | 2015-12-31 | 2015-09-30 | 2015-06-30 | 2015-03-31 | ||
|---|---|---|---|---|---|---|---|---|---|---|---|---|---|---|---|---|---|---|---|---|---|---|---|---|---|---|---|---|---|---|---|---|---|---|---|---|---|---|
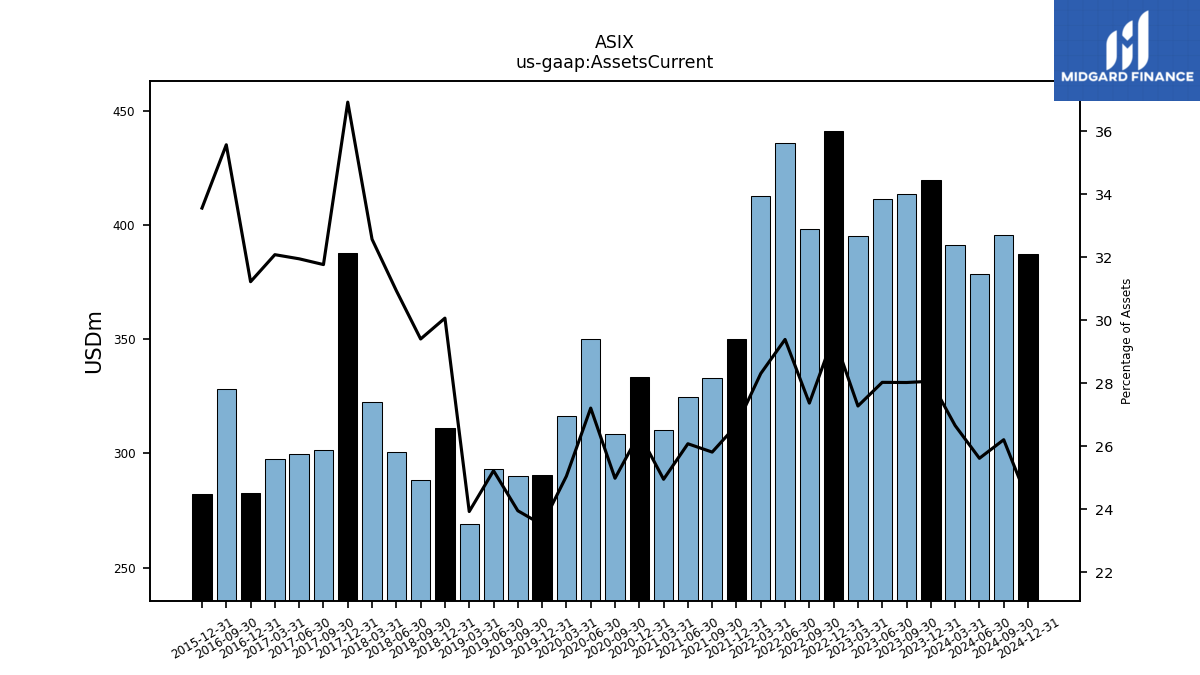
| Assets Current | 391.31 | 419.80 | 413.73 | 411.15 | 395.17 | 440.93 | 398.36 | 435.91 | 412.46 | 349.85 | 333.08 | 324.75 | 310.08 | 333.50 | 308.56 | 349.92 | 316.46 | 290.54 | 290.25 | 293.31 | 268.88 | 311.06 | 288.23 | 300.44 | 322.59 | 387.77 | 301.65 | 299.89 | 297.70 | 282.54 | 328.25 | NA | NA | 282.22 | NA | NA | NA | |
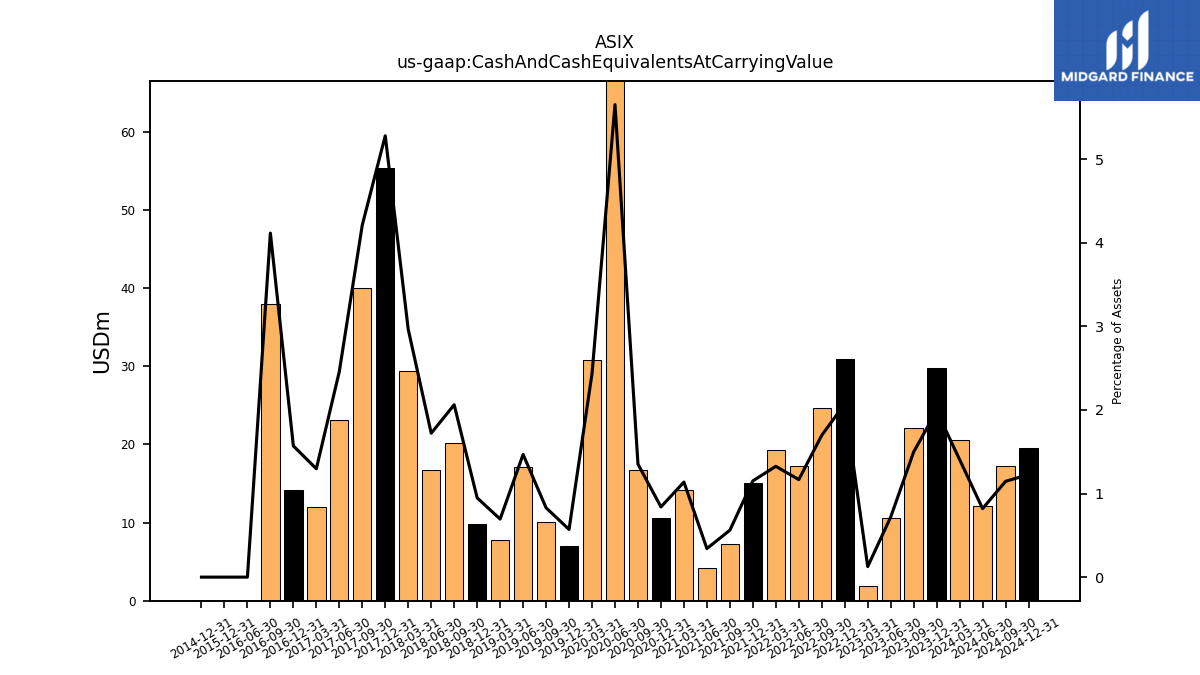
| Cash And Cash Equivalents At Carrying Value | 20.63 | 29.77 | 22.11 | 10.54 | 1.83 | 30.98 | 24.69 | 17.30 | 19.31 | 15.10 | 7.24 | 4.25 | 14.12 | 10.61 | 16.69 | 72.66 | 30.75 | 7.05 | 10.05 | 17.06 | 7.80 | 9.81 | 20.21 | 16.71 | 29.35 | 55.43 | 39.99 | 23.07 | 12.03 | 14.20 | 37.96 | 0.00 | NA | 0.00 | NA | NA | NA | |
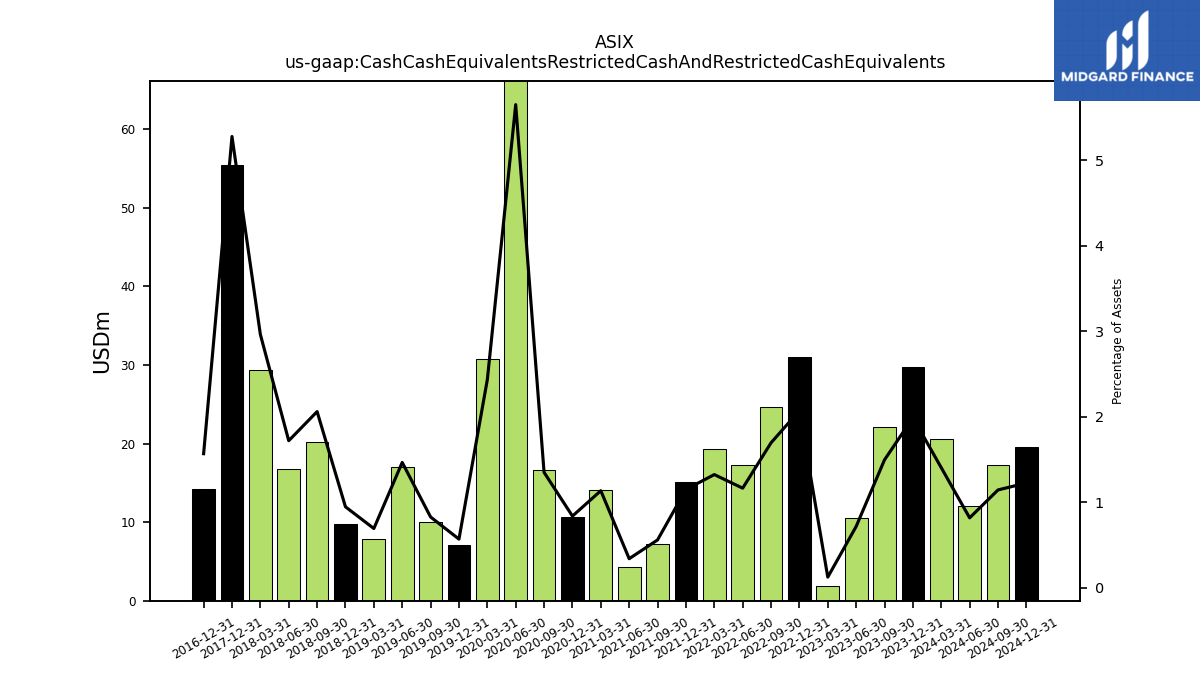
| Cash Cash Equivalents Restricted Cash And Restricted Cash Equivalents | 20.63 | 29.77 | 22.11 | 10.54 | 1.83 | 30.98 | 24.69 | 17.30 | 19.31 | 15.10 | 7.24 | 4.25 | 14.12 | 10.61 | 16.69 | 72.66 | 30.75 | 7.05 | 10.05 | 17.06 | 7.80 | 9.81 | 20.21 | 16.71 | 29.35 | 55.43 | NA | NA | NA | 14.20 | NA | NA | NA | NA | NA | NA | NA | |
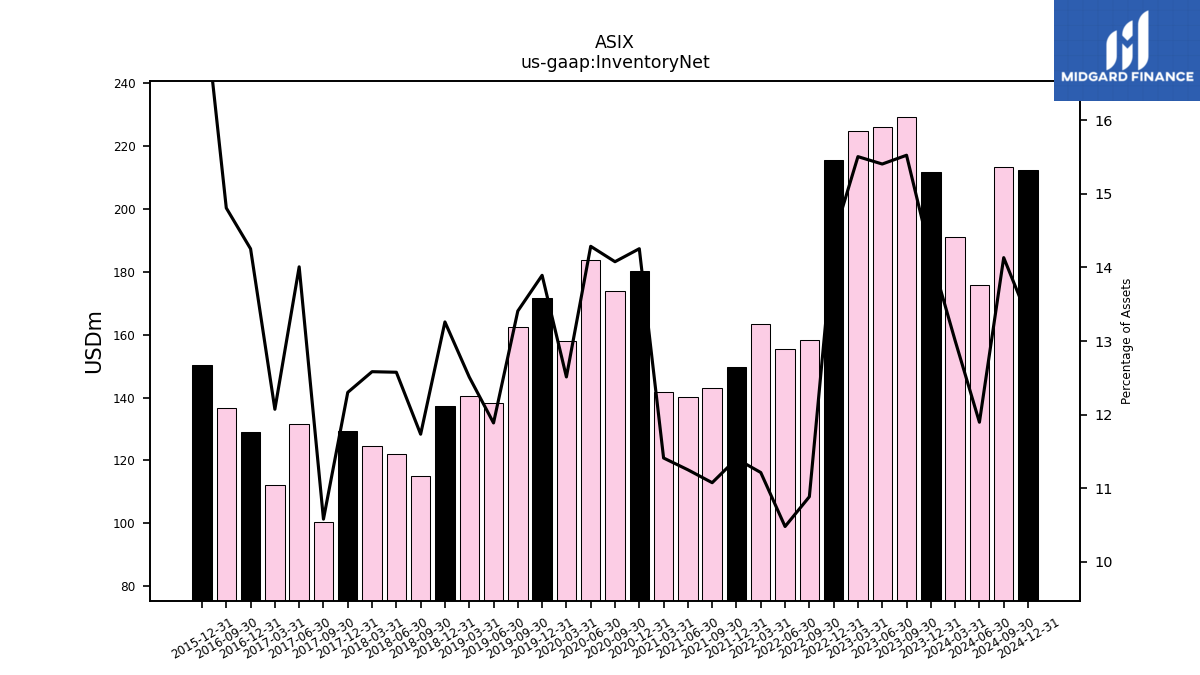
| Inventory Net | 190.92 | 211.83 | 229.20 | 225.99 | 224.63 | 215.50 | 158.43 | 155.45 | 163.40 | 149.57 | 142.91 | 140.10 | 141.81 | 180.09 | 173.87 | 183.72 | 158.07 | 171.71 | 162.48 | 138.23 | 140.60 | 137.18 | 115.03 | 122.13 | 124.64 | 129.21 | 100.47 | 131.49 | 112.04 | 128.98 | 136.65 | NA | NA | 150.23 | NA | NA | NA | |
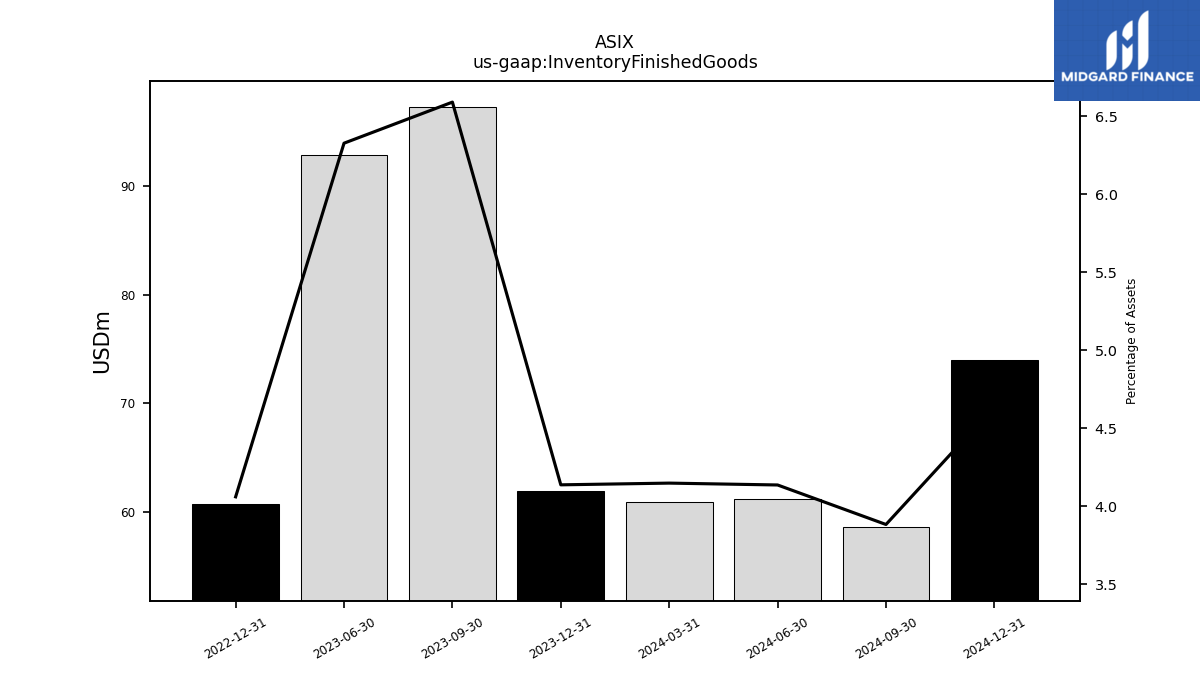
| Inventory Finished Goods | 60.89 | 61.89 | 97.31 | 92.82 | NA | 60.71 | NA | NA | NA | NA | NA | NA | NA | NA | NA | NA | NA | NA | NA | NA | NA | NA | NA | NA | NA | NA | NA | NA | NA | NA | NA | NA | NA | NA | NA | NA | NA | |
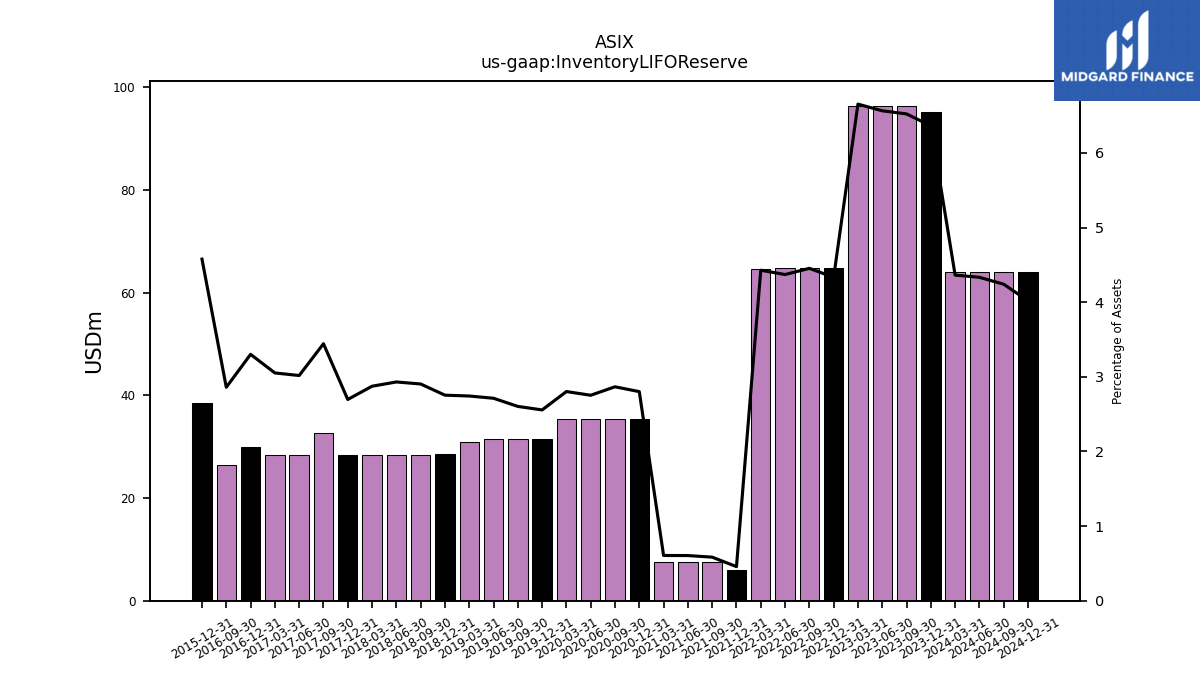
| Inventory L I F O Reserve | 64.05 | 95.20 | 96.31 | 96.31 | 96.41 | 64.80 | 64.83 | 64.83 | 64.53 | 6.00 | 7.54 | 7.54 | 7.54 | 35.40 | 35.41 | 35.41 | 35.41 | 31.60 | 31.56 | 31.55 | 30.83 | 28.50 | 28.47 | 28.47 | 28.47 | 28.33 | 32.70 | 28.33 | 28.33 | 29.88 | 26.40 | NA | NA | 38.50 | NA | NA | NA | |
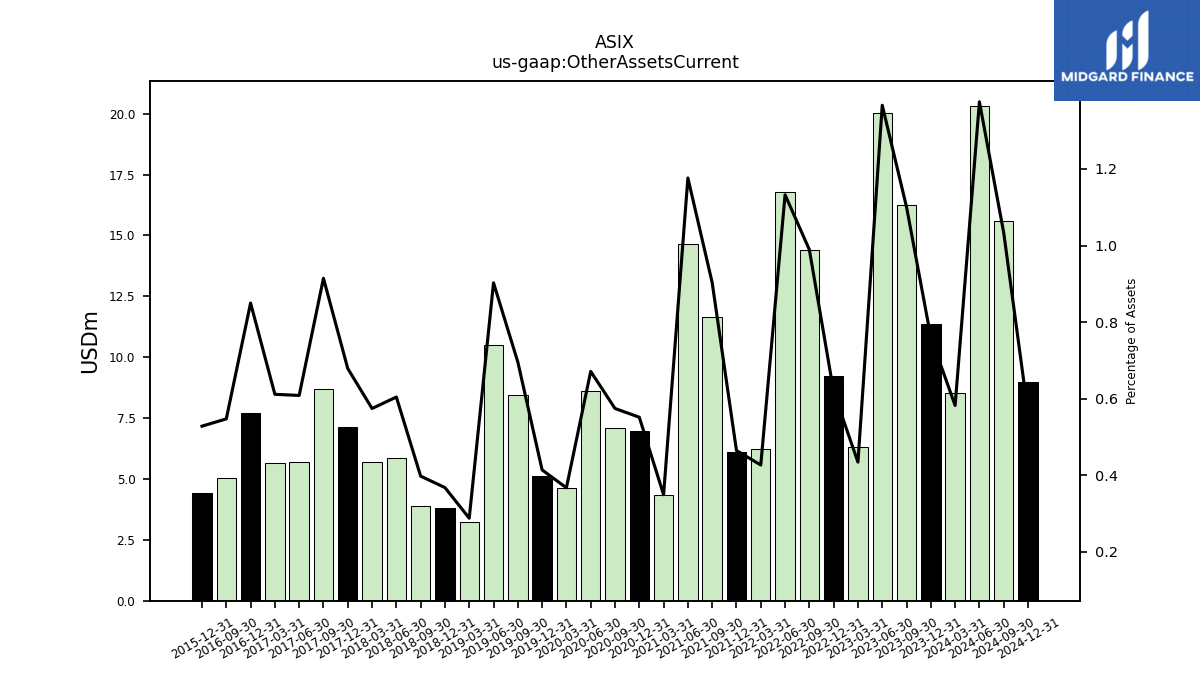
| Other Assets Current | 8.55 | 11.38 | 16.25 | 20.04 | 6.29 | 9.24 | 14.40 | 16.80 | 6.22 | 6.10 | 11.65 | 14.65 | 4.34 | 6.97 | 7.10 | 8.63 | 4.64 | 5.12 | 8.43 | 10.50 | 3.24 | 3.81 | 3.90 | 5.87 | 5.69 | 7.13 | 8.68 | 5.71 | 5.67 | 7.69 | 5.05 | NA | NA | 4.44 | NA | NA | NA |
| 2024-03-31 | 2023-12-31 | 2023-09-30 | 2023-06-30 | 2023-03-31 | 2022-12-31 | 2022-09-30 | 2022-06-30 | 2022-03-31 | 2021-12-31 | 2021-09-30 | 2021-06-30 | 2021-03-31 | 2020-12-31 | 2020-09-30 | 2020-06-30 | 2020-03-31 | 2019-12-31 | 2019-09-30 | 2019-06-30 | 2019-03-31 | 2018-12-31 | 2018-09-30 | 2018-06-30 | 2018-03-31 | 2017-12-31 | 2017-09-30 | 2017-06-30 | 2017-03-31 | 2016-12-31 | 2016-09-30 | 2016-06-30 | 2016-03-31 | 2015-12-31 | 2015-09-30 | 2015-06-30 | 2015-03-31 | ||
|---|---|---|---|---|---|---|---|---|---|---|---|---|---|---|---|---|---|---|---|---|---|---|---|---|---|---|---|---|---|---|---|---|---|---|---|---|---|---|
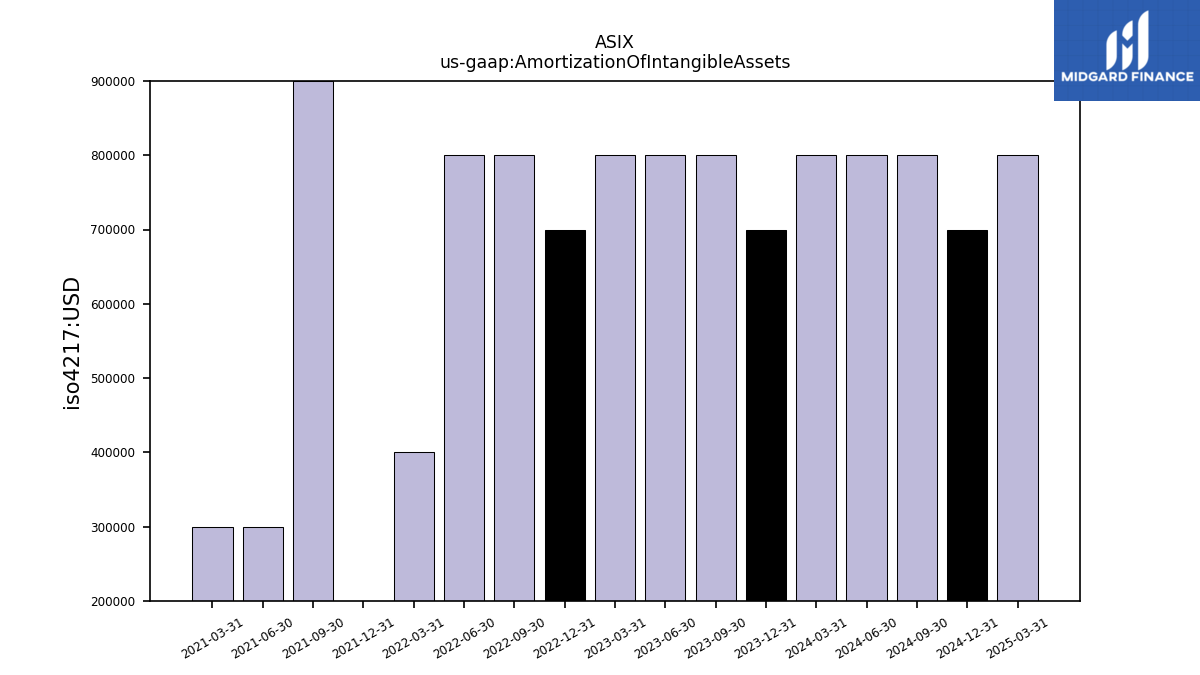
| Amortization Of Intangible Assets | 0.80 | 0.70 | 0.80 | 0.80 | 0.80 | 0.70 | 0.80 | 0.80 | 0.40 | -0.20 | 0.90 | 0.30 | 0.30 | NA | NA | NA | NA | NA | NA | NA | NA | NA | NA | NA | NA | NA | NA | NA | NA | NA | NA | NA | NA | NA | NA | NA | NA | |
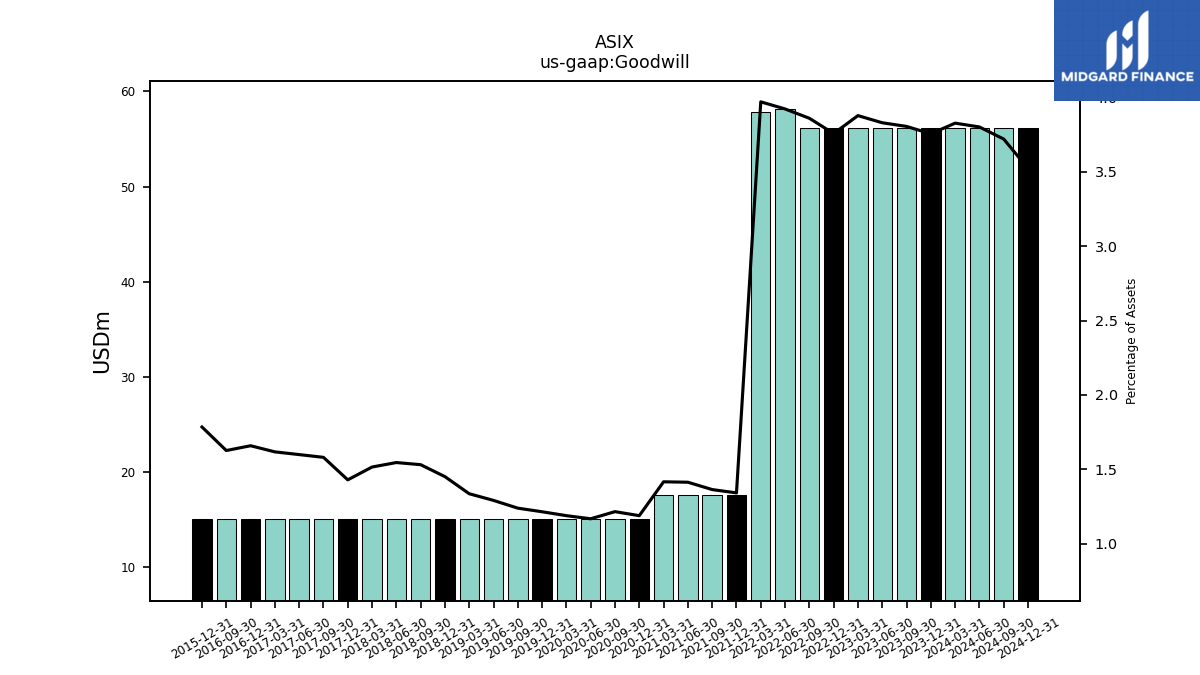
| Goodwill | 56.19 | 56.19 | 56.19 | 56.19 | 56.19 | 56.19 | 56.19 | 58.19 | 57.86 | 17.59 | 17.59 | 17.59 | 17.59 | 15.01 | 15.01 | 15.01 | 15.01 | 15.01 | 15.01 | 15.01 | 15.01 | 15.01 | 15.01 | 15.01 | 15.01 | 15.01 | 15.01 | 15.01 | 15.01 | 15.01 | 15.01 | NA | NA | 15.01 | NA | NA | NA | |
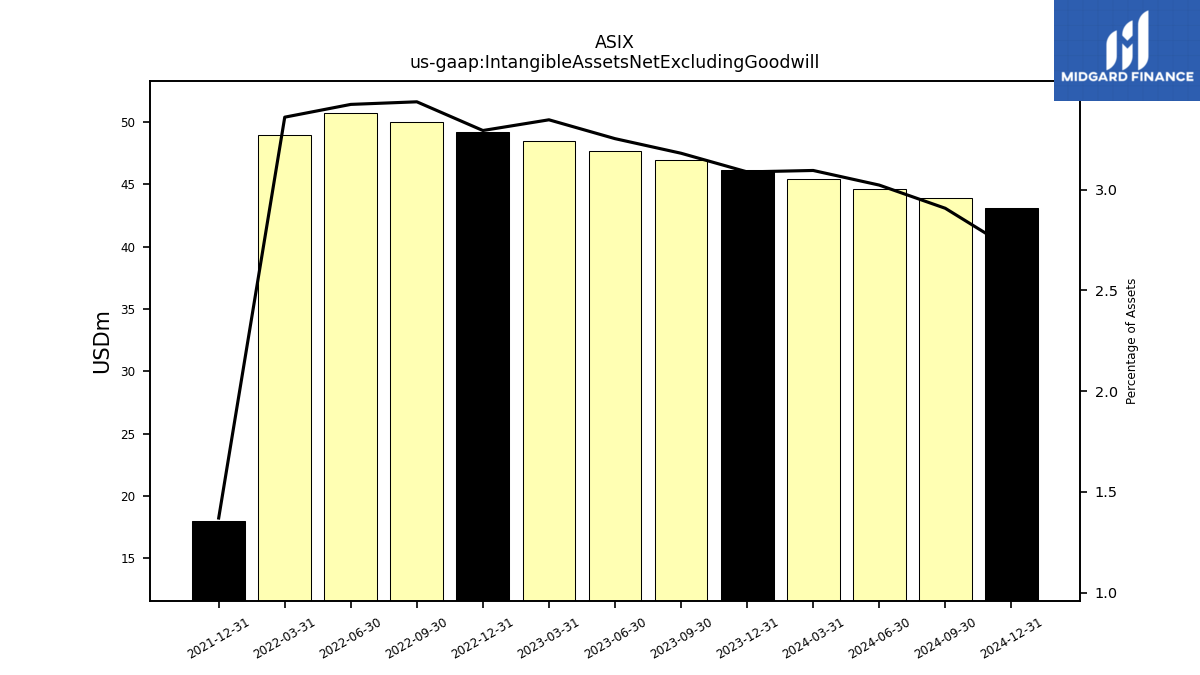
| Intangible Assets Net Excluding Goodwill | 45.43 | 46.19 | 46.95 | 47.72 | 48.48 | 49.24 | 50.00 | 50.77 | 48.95 | 17.98 | NA | NA | NA | NA | NA | NA | NA | NA | NA | NA | NA | NA | NA | NA | NA | NA | NA | NA | NA | NA | NA | NA | NA | NA | NA | NA | NA | |
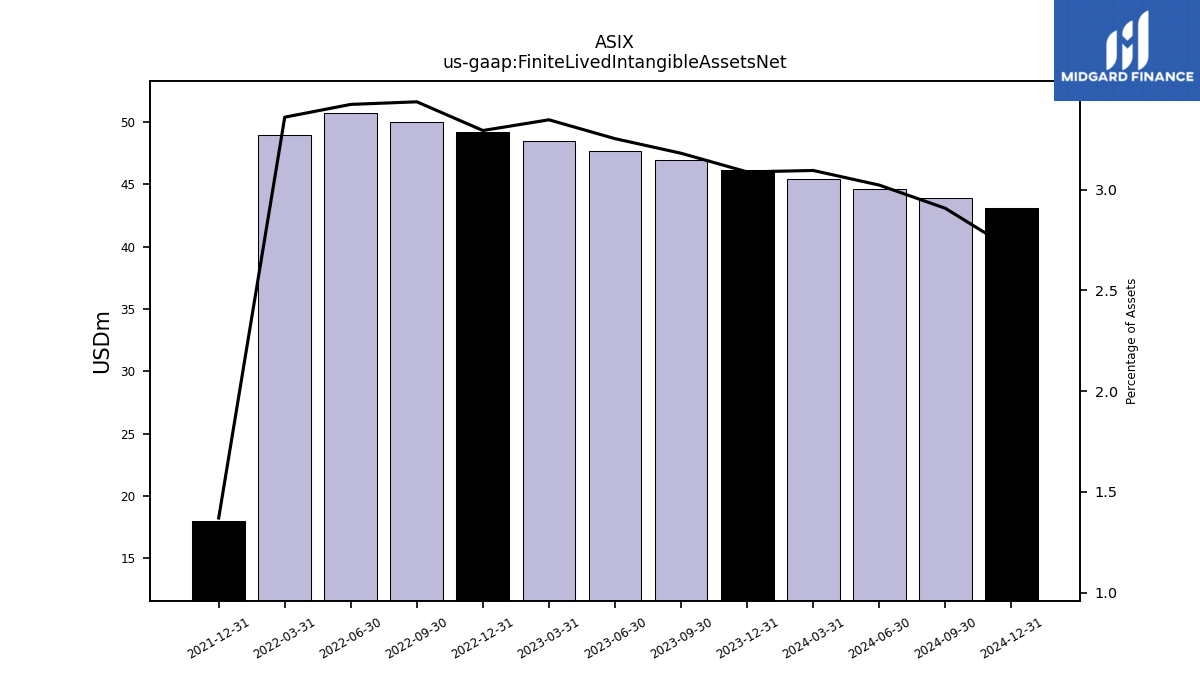
| Finite Lived Intangible Assets Net | 45.43 | 46.19 | 46.95 | 47.72 | 48.48 | 49.24 | 50.00 | 50.77 | 48.95 | 17.98 | NA | NA | NA | NA | NA | NA | NA | NA | NA | NA | NA | NA | NA | NA | NA | NA | NA | NA | NA | NA | NA | NA | NA | NA | NA | NA | NA | |
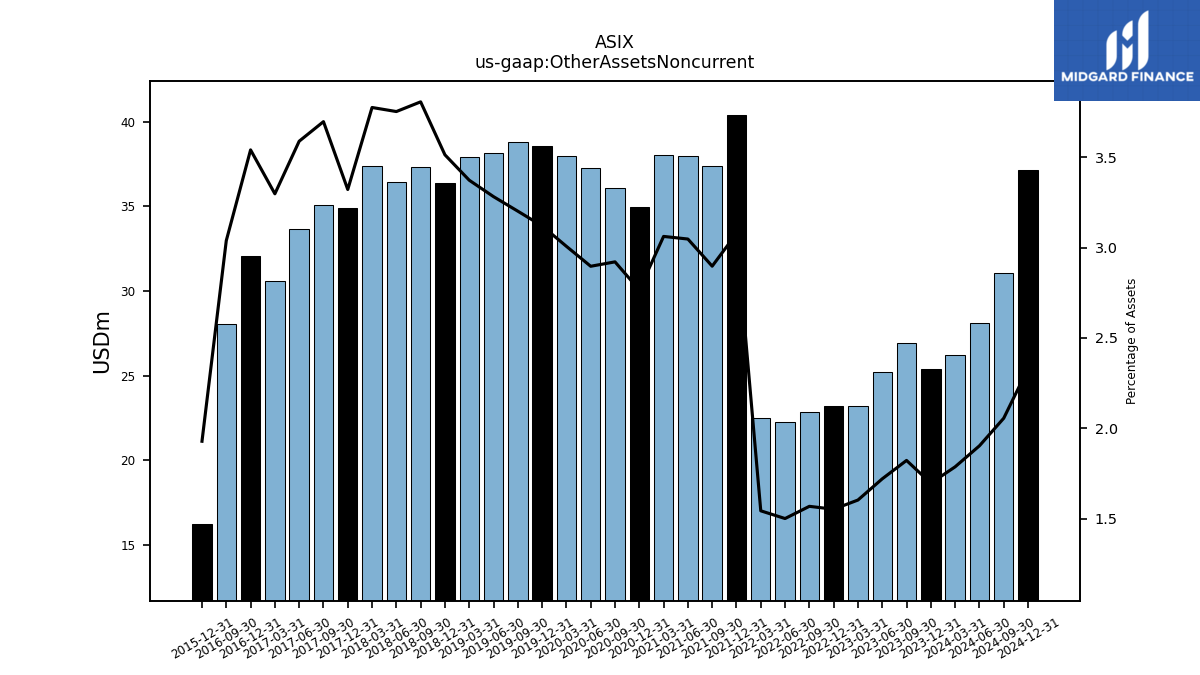
| Other Assets Noncurrent | 26.24 | 25.38 | 26.91 | 25.24 | 23.23 | 23.22 | 22.83 | 22.27 | 22.50 | 40.38 | 37.38 | 37.95 | 38.05 | 34.95 | 36.08 | 37.25 | 37.99 | 38.56 | 38.80 | 38.16 | 37.90 | 36.35 | 37.31 | 36.44 | 37.39 | 34.88 | 35.10 | 33.68 | 30.60 | 32.04 | 28.04 | NA | NA | 16.22 | NA | NA | NA |
| 2024-03-31 | 2023-12-31 | 2023-09-30 | 2023-06-30 | 2023-03-31 | 2022-12-31 | 2022-09-30 | 2022-06-30 | 2022-03-31 | 2021-12-31 | 2021-09-30 | 2021-06-30 | 2021-03-31 | 2020-12-31 | 2020-09-30 | 2020-06-30 | 2020-03-31 | 2019-12-31 | 2019-09-30 | 2019-06-30 | 2019-03-31 | 2018-12-31 | 2018-09-30 | 2018-06-30 | 2018-03-31 | 2017-12-31 | 2017-09-30 | 2017-06-30 | 2017-03-31 | 2016-12-31 | 2016-09-30 | 2016-06-30 | 2016-03-31 | 2015-12-31 | 2015-09-30 | 2015-06-30 | 2015-03-31 | ||
|---|---|---|---|---|---|---|---|---|---|---|---|---|---|---|---|---|---|---|---|---|---|---|---|---|---|---|---|---|---|---|---|---|---|---|---|---|---|---|
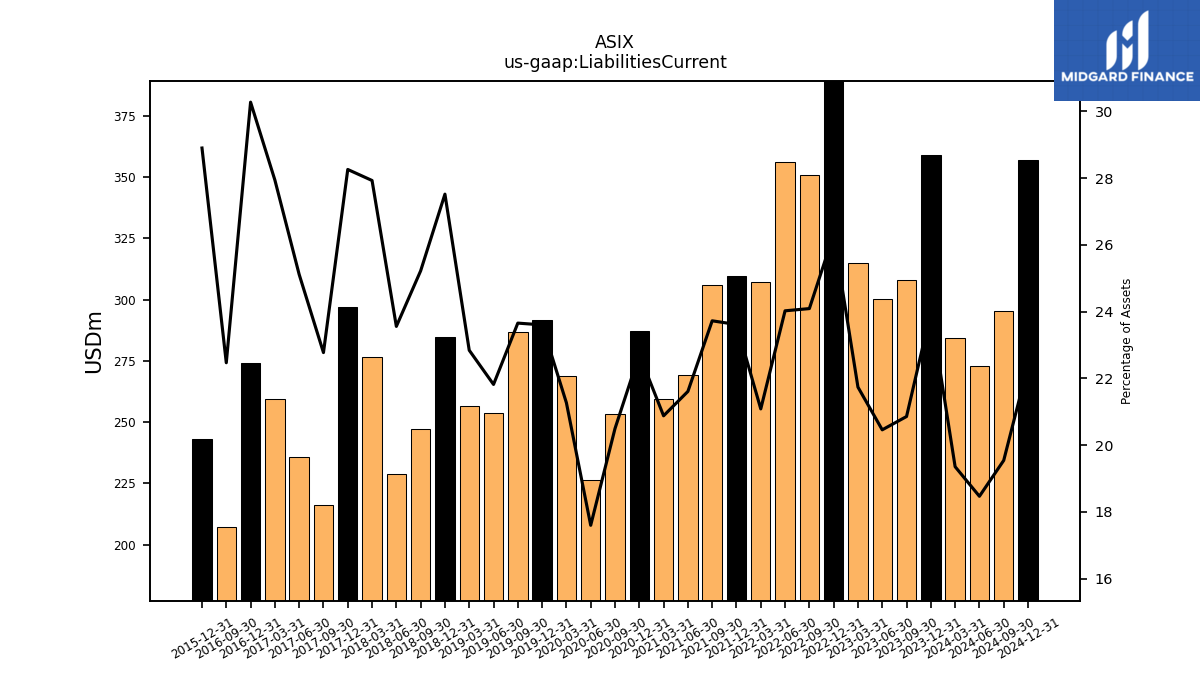
| Liabilities Current | 284.12 | 358.92 | 307.95 | 300.14 | 314.96 | 393.49 | 350.66 | 356.34 | 307.25 | 309.82 | 306.14 | 269.11 | 259.48 | 287.04 | 253.16 | 226.32 | 268.68 | 291.73 | 286.67 | 253.73 | 256.70 | 284.72 | 247.24 | 228.78 | 276.62 | 296.79 | 216.26 | 235.74 | 259.31 | 273.98 | 207.36 | NA | NA | 243.05 | NA | NA | NA | |
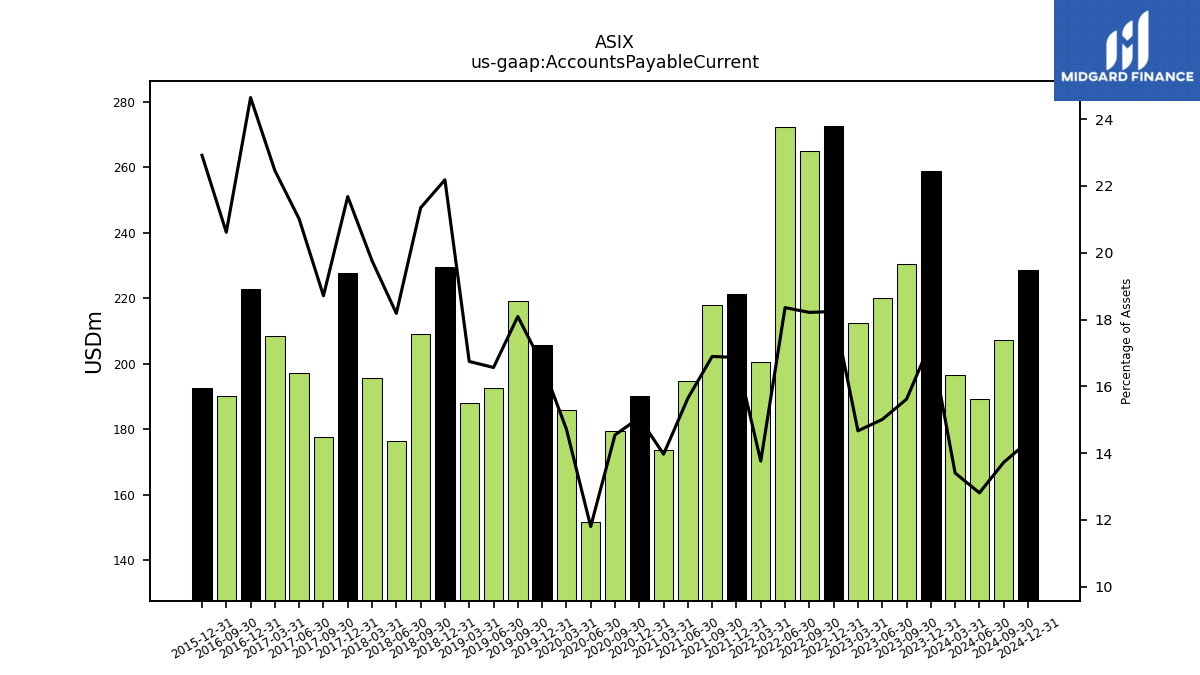
| Accounts Payable Current | 196.77 | 259.07 | 230.55 | 220.16 | 212.51 | 272.77 | 265.09 | 272.26 | 200.52 | 221.23 | 217.99 | 194.80 | 173.59 | 190.23 | 179.65 | 151.79 | 185.94 | 205.91 | 219.22 | 192.61 | 188.17 | 229.51 | 209.24 | 176.59 | 195.70 | 227.71 | 177.69 | 197.20 | 208.42 | 223.01 | 190.23 | NA | NA | 192.73 | NA | NA | NA | |
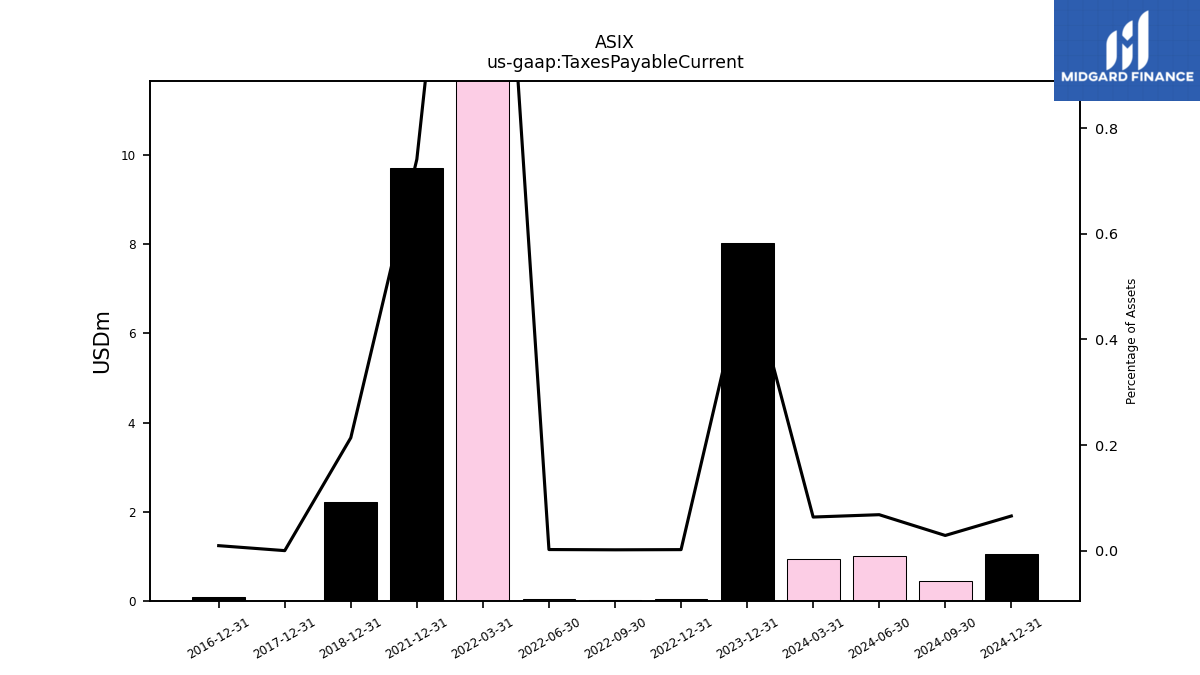
| Taxes Payable Current | 0.94 | 8.03 | NA | NA | NA | 0.03 | 0.02 | 0.03 | 27.66 | 9.72 | NA | NA | NA | NA | NA | NA | NA | NA | NA | NA | NA | 2.21 | NA | NA | NA | 0.00 | NA | NA | NA | 0.09 | NA | NA | NA | NA | NA | NA | NA | |
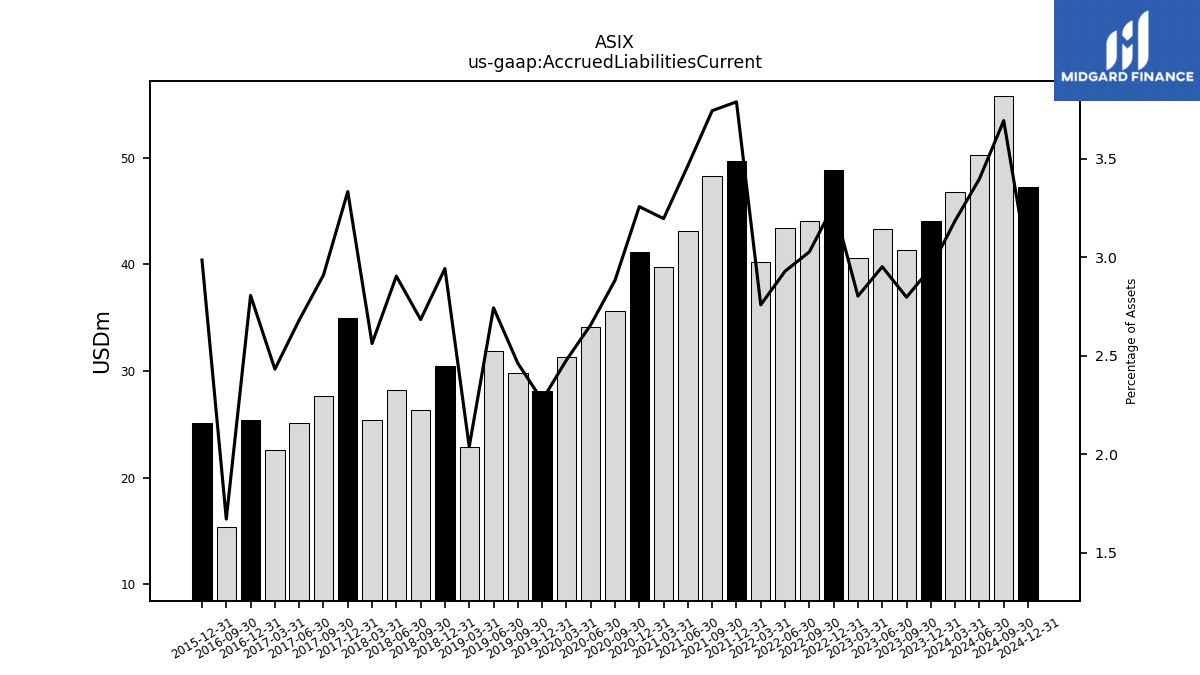
| Accrued Liabilities Current | 46.77 | 44.09 | 41.30 | 43.31 | 40.61 | 48.82 | 44.07 | 43.45 | 40.20 | 49.71 | 48.31 | 43.16 | 39.72 | 41.15 | 35.61 | 34.17 | 31.31 | 28.11 | 29.84 | 31.91 | 22.91 | 30.45 | 26.31 | 28.21 | 25.38 | 35.01 | 27.63 | 25.17 | 22.57 | 25.40 | 15.43 | NA | NA | 25.11 | NA | NA | NA | |
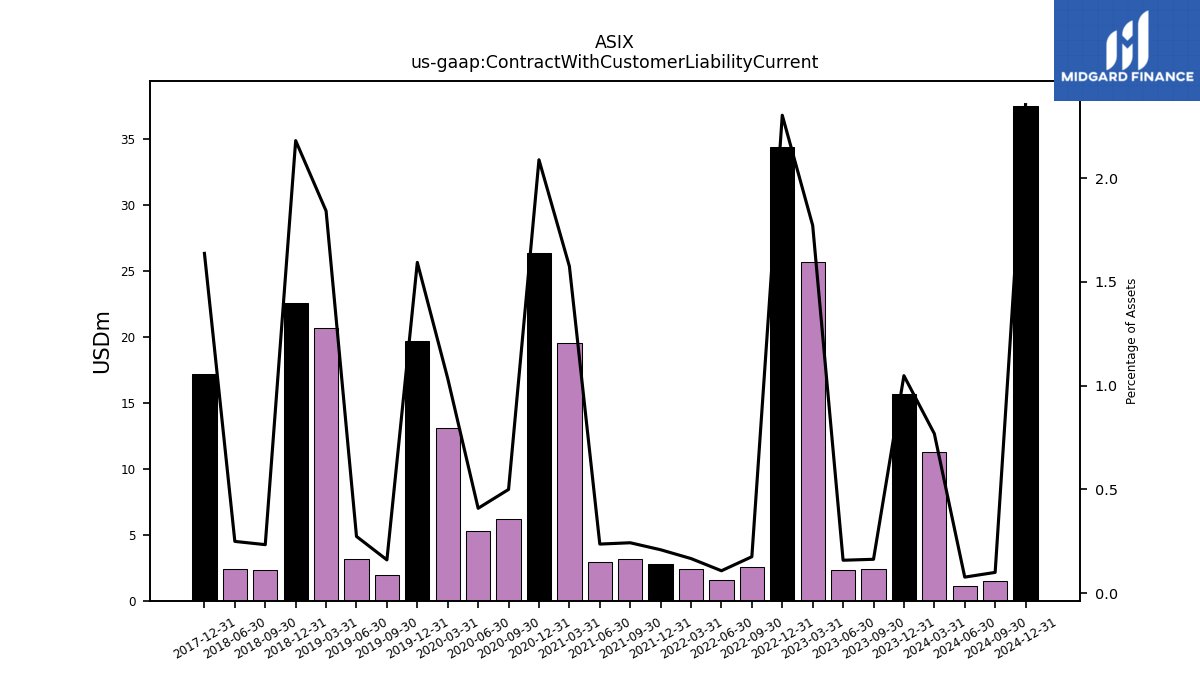
| Contract With Customer Liability Current | 11.29 | 15.68 | 2.42 | 2.33 | 25.67 | 34.43 | 2.56 | 1.61 | 2.43 | 2.75 | 3.14 | 2.95 | 19.58 | 26.38 | 6.18 | 5.26 | 13.07 | 19.70 | 1.95 | 3.18 | 20.69 | 22.56 | 2.29 | 2.42 | NA | 17.19 | NA | NA | NA | NA | NA | NA | NA | NA | NA | NA | NA | |
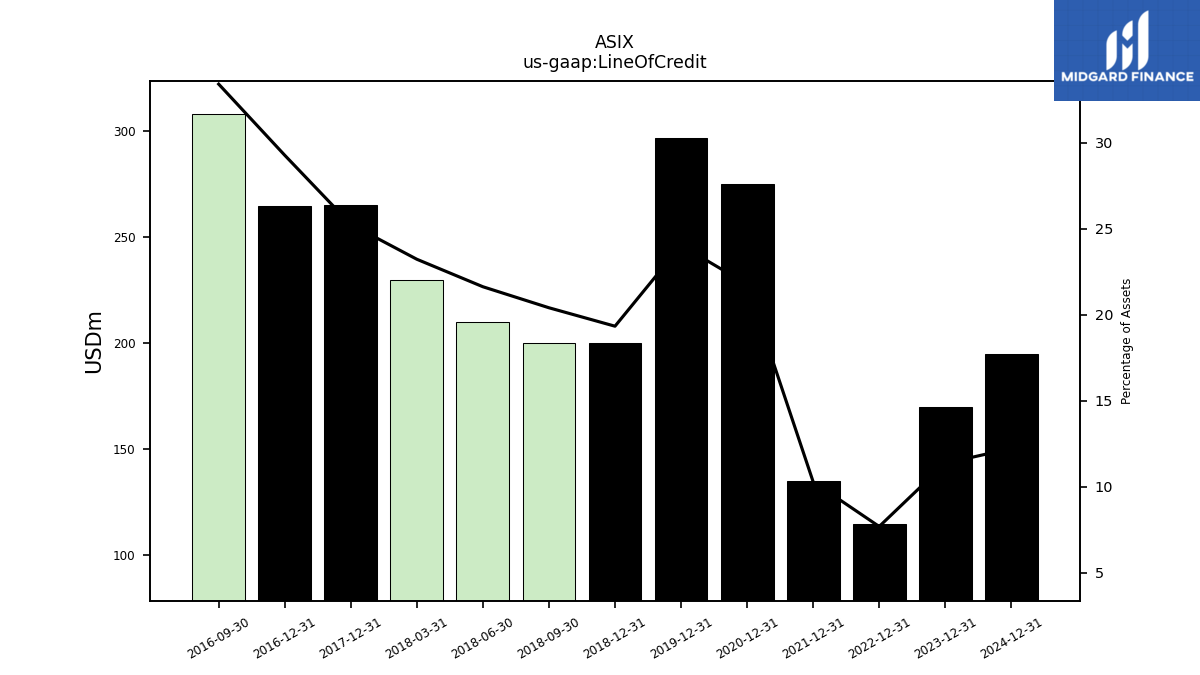
| Line Of Credit | NA | 170.00 | NA | NA | NA | 115.00 | NA | NA | NA | 135.00 | NA | NA | NA | 275.00 | NA | NA | NA | 297.00 | NA | NA | NA | 200.00 | 200.00 | 210.00 | 230.00 | 265.21 | NA | NA | NA | 264.84 | 308.23 | NA | NA | NA | NA | NA | NA |
| 2024-03-31 | 2023-12-31 | 2023-09-30 | 2023-06-30 | 2023-03-31 | 2022-12-31 | 2022-09-30 | 2022-06-30 | 2022-03-31 | 2021-12-31 | 2021-09-30 | 2021-06-30 | 2021-03-31 | 2020-12-31 | 2020-09-30 | 2020-06-30 | 2020-03-31 | 2019-12-31 | 2019-09-30 | 2019-06-30 | 2019-03-31 | 2018-12-31 | 2018-09-30 | 2018-06-30 | 2018-03-31 | 2017-12-31 | 2017-09-30 | 2017-06-30 | 2017-03-31 | 2016-12-31 | 2016-09-30 | 2016-06-30 | 2016-03-31 | 2015-12-31 | 2015-09-30 | 2015-06-30 | 2015-03-31 | ||
|---|---|---|---|---|---|---|---|---|---|---|---|---|---|---|---|---|---|---|---|---|---|---|---|---|---|---|---|---|---|---|---|---|---|---|---|---|---|---|
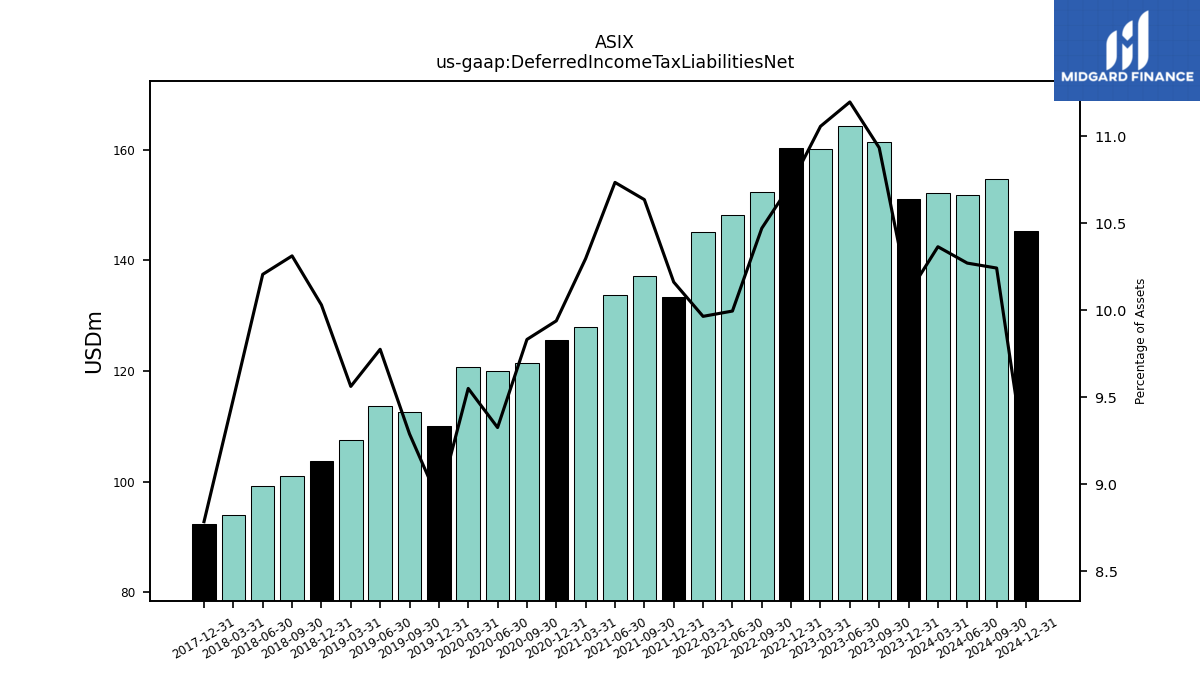
| Deferred Income Tax Liabilities Net | 152.16 | 151.06 | 161.43 | 164.26 | 160.19 | 160.41 | 152.41 | 148.26 | 145.21 | 133.33 | 137.24 | 133.68 | 127.97 | 125.58 | 121.44 | 119.94 | 120.66 | 110.07 | 112.58 | 113.69 | 107.47 | 103.78 | 101.09 | 99.12 | 94.02 | 92.28 | NA | NA | NA | NA | NA | NA | NA | NA | NA | NA | NA | |
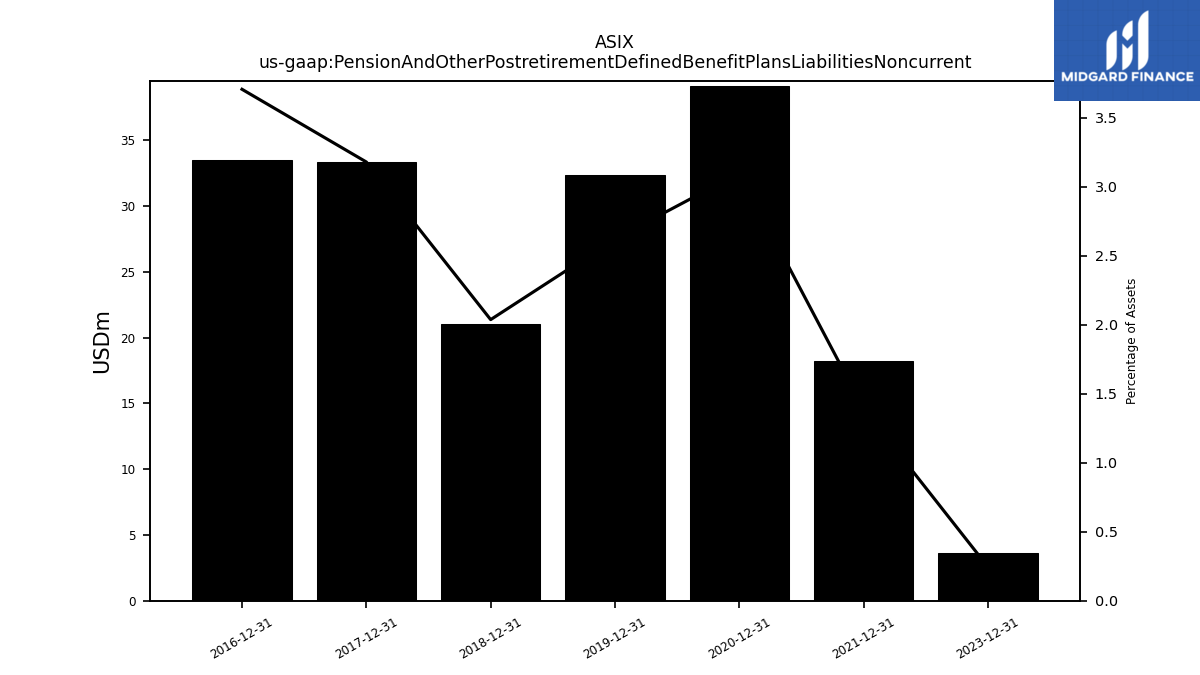
| Pension And Other Postretirement Defined Benefit Plans Liabilities Noncurrent | NA | 3.66 | NA | NA | NA | NA | NA | NA | NA | 18.24 | NA | NA | NA | 39.17 | NA | NA | NA | 32.41 | NA | NA | NA | 21.08 | NA | NA | NA | 33.40 | NA | NA | NA | 33.54 | NA | NA | NA | NA | NA | NA | NA | |
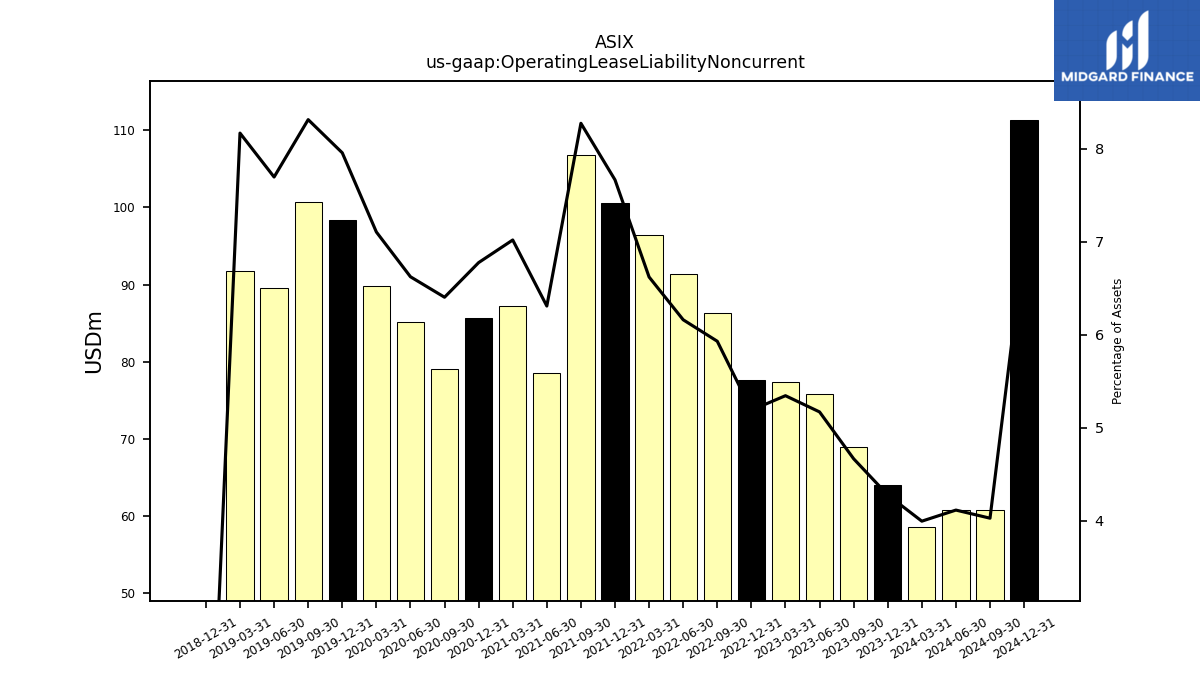
| Operating Lease Liability Noncurrent | 58.62 | 63.96 | 68.88 | 75.83 | 77.42 | 77.57 | 86.30 | 91.38 | 96.47 | 100.58 | 106.77 | 78.56 | 87.23 | 85.61 | 79.08 | 85.18 | 89.76 | 98.35 | 100.75 | 89.50 | 91.80 | 0.00 | NA | NA | NA | NA | NA | NA | NA | NA | NA | NA | NA | NA | NA | NA | NA |
| 2024-03-31 | 2023-12-31 | 2023-09-30 | 2023-06-30 | 2023-03-31 | 2022-12-31 | 2022-09-30 | 2022-06-30 | 2022-03-31 | 2021-12-31 | 2021-09-30 | 2021-06-30 | 2021-03-31 | 2020-12-31 | 2020-09-30 | 2020-06-30 | 2020-03-31 | 2019-12-31 | 2019-09-30 | 2019-06-30 | 2019-03-31 | 2018-12-31 | 2018-09-30 | 2018-06-30 | 2018-03-31 | 2017-12-31 | 2017-09-30 | 2017-06-30 | 2017-03-31 | 2016-12-31 | 2016-09-30 | 2016-06-30 | 2016-03-31 | 2015-12-31 | 2015-09-30 | 2015-06-30 | 2015-03-31 | ||
|---|---|---|---|---|---|---|---|---|---|---|---|---|---|---|---|---|---|---|---|---|---|---|---|---|---|---|---|---|---|---|---|---|---|---|---|---|---|---|
| Stockholders Equity | 713.16 | 739.24 | NA | NA | 758.07 | 738.18 | NA | NA | NA | 601.19 | NA | NA | NA | 444.12 | NA | NA | NA | NA | NA | NA | NA | 420.34 | NA | NA | NA | NA | NA | NA | NA | NA | NA | NA | NA | NA | NA | NA | NA | |
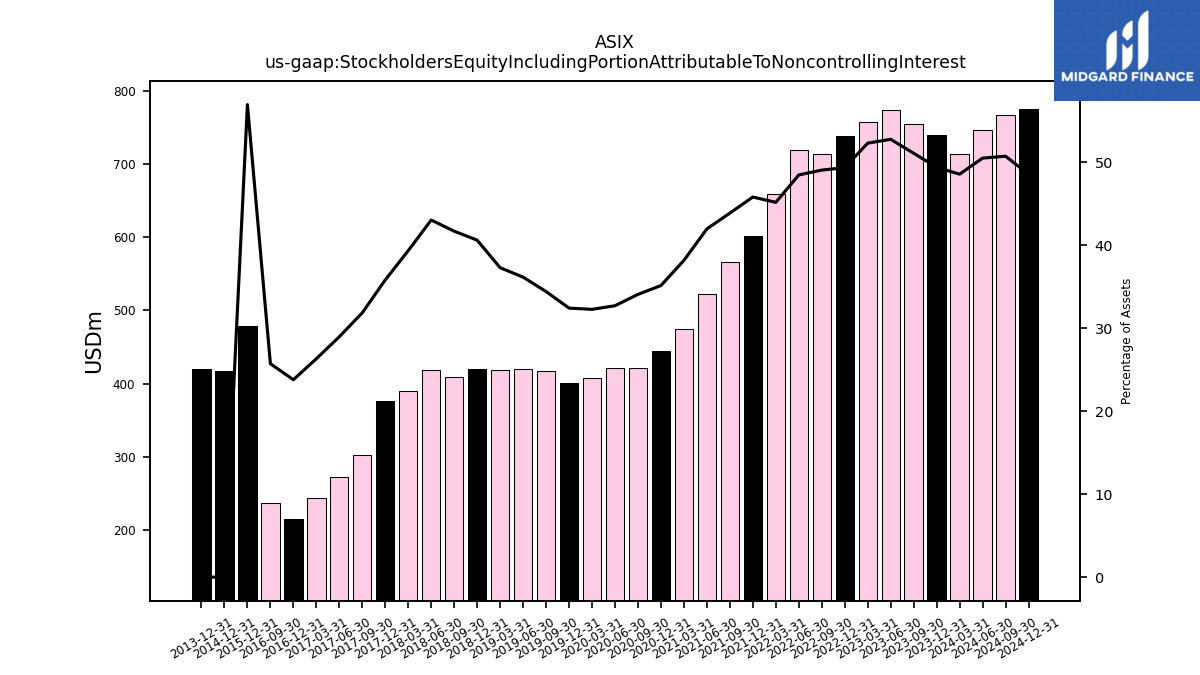
| Stockholders Equity Including Portion Attributable To Noncontrolling Interest | 713.16 | 739.24 | 754.49 | 774.36 | 758.07 | 738.18 | 714.28 | 719.21 | 658.39 | 601.19 | 566.31 | 522.83 | 474.59 | 444.12 | 421.03 | 420.79 | 407.84 | 400.88 | 417.23 | 420.56 | 419.24 | 420.34 | 408.85 | 418.08 | 389.83 | 376.32 | 302.61 | 272.04 | 244.34 | 215.36 | 237.47 | NA | NA | 479.07 | NA | NA | NA | |
| Common Stock Value | 0.33 | 0.33 | 0.33 | 0.33 | 0.33 | 0.32 | 0.32 | 0.32 | 0.32 | 0.32 | 0.32 | 0.32 | 0.32 | 0.32 | 0.32 | 0.32 | 0.32 | 0.31 | 0.31 | 0.31 | 0.31 | 0.31 | 0.31 | 0.30 | 0.30 | 0.30 | 0.30 | 0.30 | 0.30 | 0.30 | 0.30 | NA | NA | NA | NA | NA | NA | |
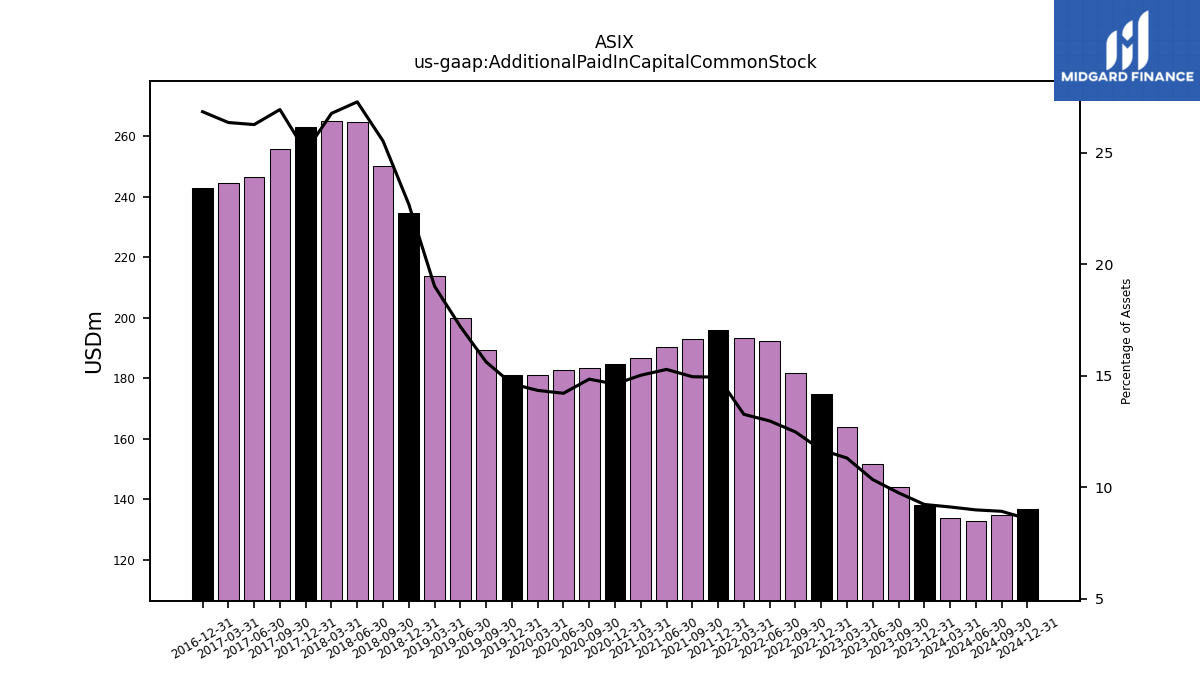
| Additional Paid In Capital Common Stock | 133.82 | 138.05 | 143.97 | 151.71 | 163.83 | 174.59 | 181.63 | 192.39 | 193.32 | 195.93 | 192.95 | 190.29 | 186.65 | 184.73 | 183.36 | 182.75 | 181.16 | 180.88 | 189.24 | 200.04 | 213.63 | 234.70 | 250.15 | 264.85 | 264.99 | 263.08 | 255.71 | 246.43 | 244.49 | 242.81 | NA | NA | NA | NA | NA | NA | NA | |
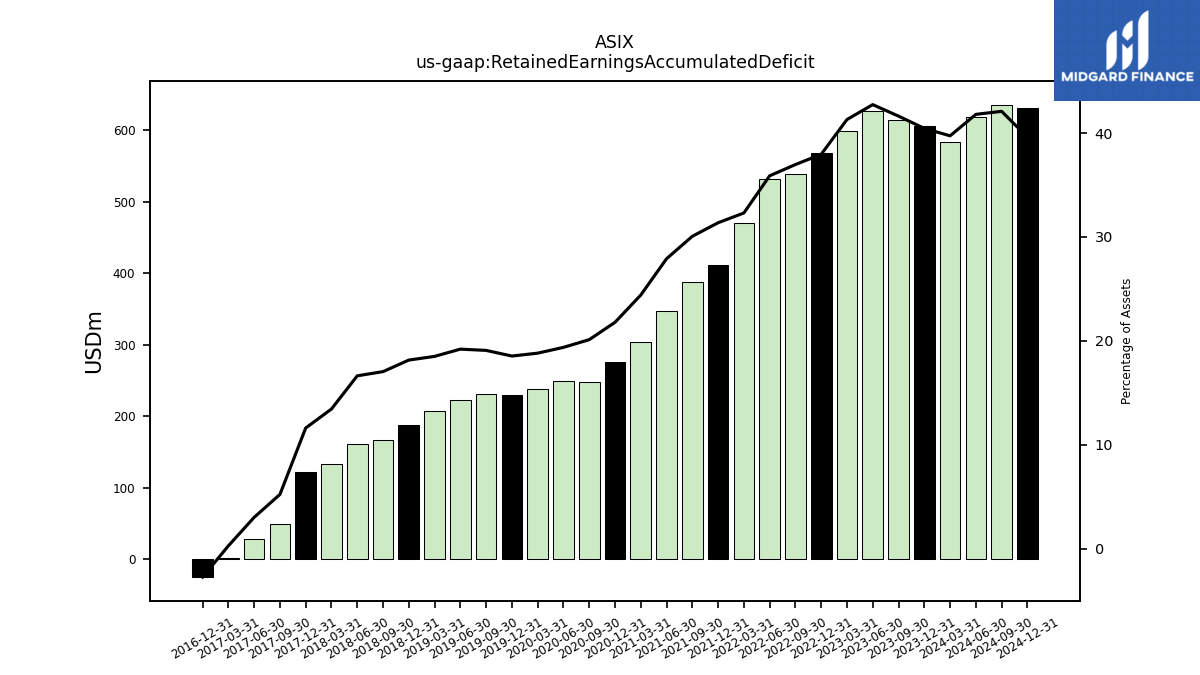
| Retained Earnings Accumulated Deficit | 583.22 | 605.07 | 614.56 | 626.88 | 598.34 | 567.52 | 538.06 | 532.25 | 470.76 | 411.52 | 387.93 | 347.50 | 303.37 | 275.24 | 248.48 | 249.17 | 237.74 | 229.17 | 231.26 | 223.34 | 207.99 | 187.82 | 167.06 | 161.58 | 133.17 | 121.98 | 49.62 | 28.34 | 2.58 | -24.71 | NA | NA | NA | NA | NA | NA | NA | |
| Accumulated Other Comprehensive Income Loss Net Of Tax | -4.15 | -4.14 | -4.31 | -4.50 | -4.38 | -4.20 | -5.68 | -5.71 | -5.97 | -6.54 | -14.85 | -15.25 | -15.72 | -16.13 | -11.08 | -11.42 | -11.34 | -9.45 | -3.55 | -3.09 | -2.67 | -2.47 | -8.66 | -8.65 | -8.64 | -9.05 | -3.02 | -3.04 | -3.04 | -3.04 | -5.09 | NA | NA | -3.74 | NA | NA | NA | |
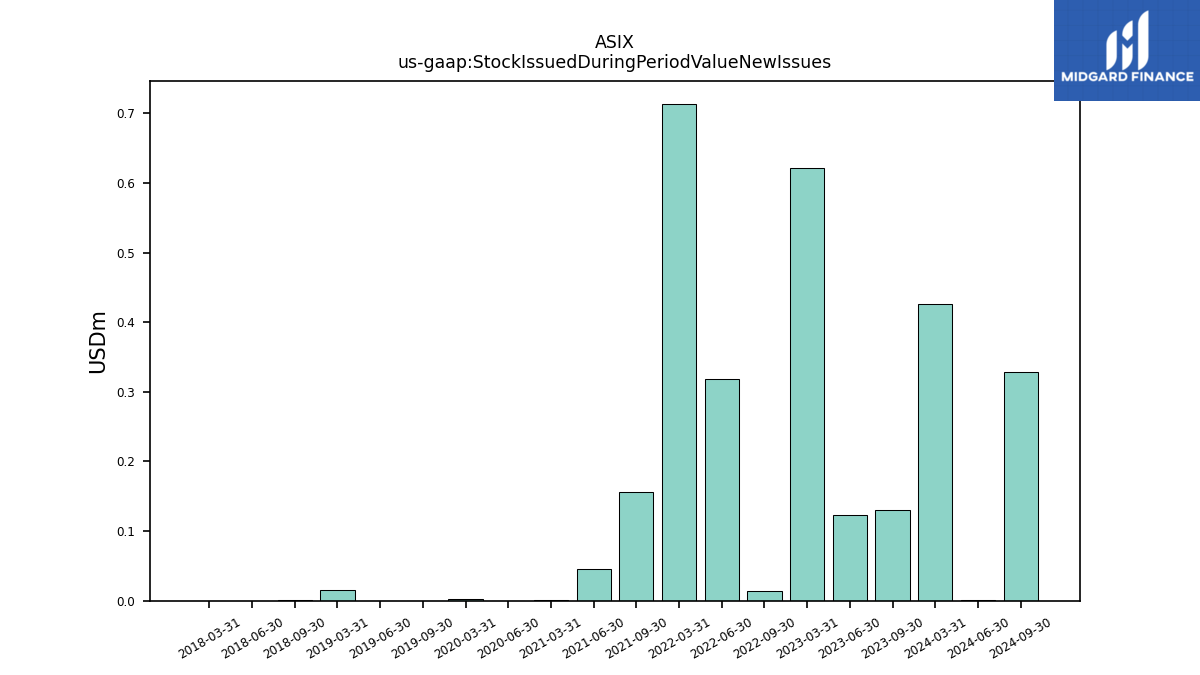
| Stock Issued During Period Value New Issues | 0.43 | NA | 0.13 | 0.12 | 0.62 | NA | 0.01 | 0.32 | 0.71 | NA | 0.16 | 0.04 | 0.00 | NA | NA | 0.00 | 0.00 | NA | 0.00 | 0.00 | 0.02 | NA | 0.00 | 0.00 | 0.00 | NA | NA | NA | NA | NA | NA | NA | NA | NA | NA | NA | NA | |
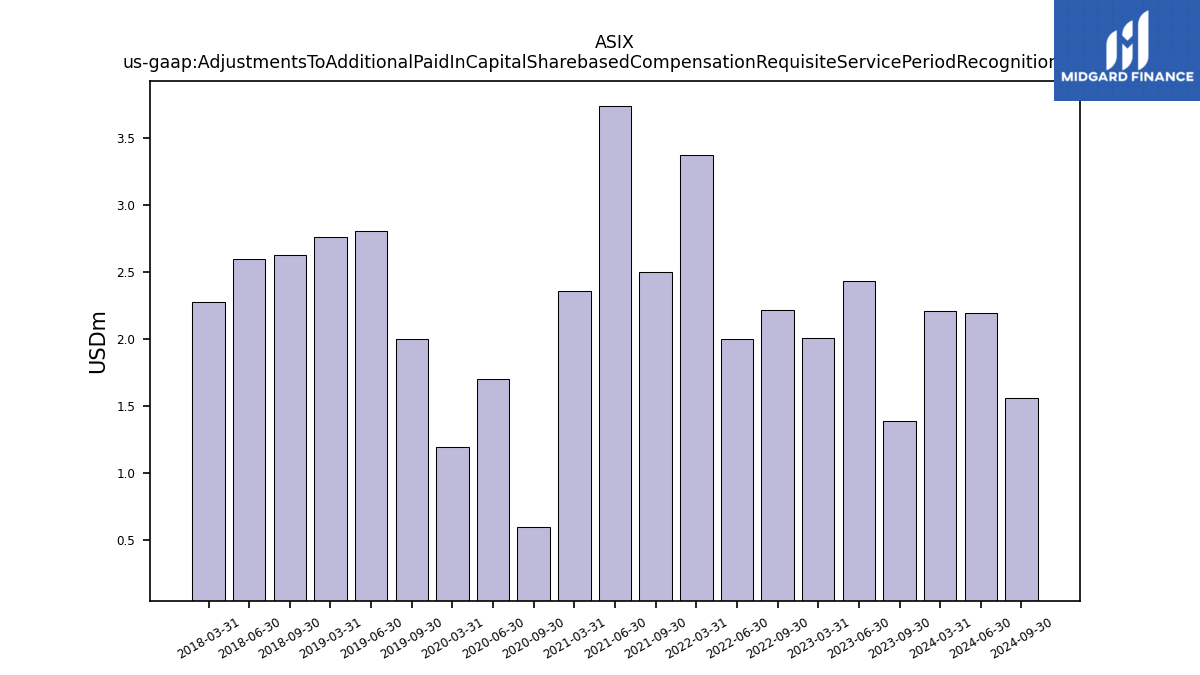
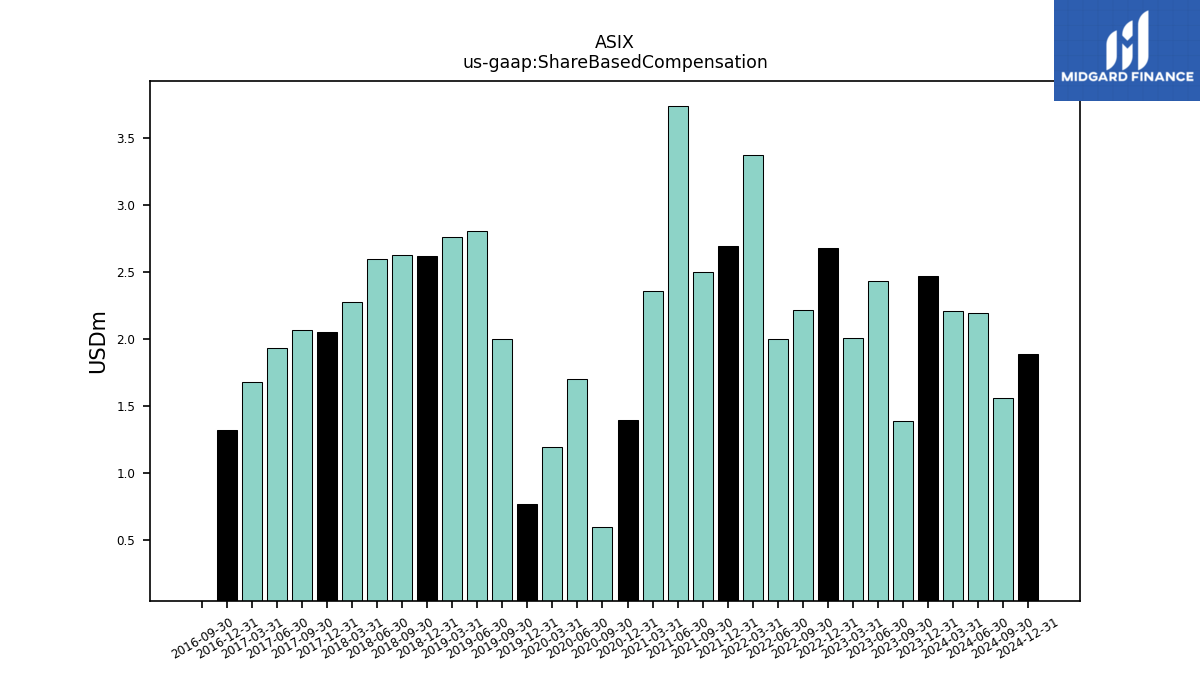
| Adjustments To Additional Paid In Capital Sharebased Compensation Requisite Service Period Recognition Value | 2.21 | NA | 1.39 | 2.44 | 2.01 | NA | 2.22 | 2.00 | 3.37 | NA | 2.50 | 3.74 | 2.36 | NA | 0.60 | 1.70 | 1.20 | NA | 2.00 | 2.81 | 2.76 | NA | 2.63 | 2.60 | 2.28 | NA | NA | NA | NA | NA | NA | NA | NA | NA | NA | NA | NA |
| 2024-03-31 | 2023-12-31 | 2023-09-30 | 2023-06-30 | 2023-03-31 | 2022-12-31 | 2022-09-30 | 2022-06-30 | 2022-03-31 | 2021-12-31 | 2021-09-30 | 2021-06-30 | 2021-03-31 | 2020-12-31 | 2020-09-30 | 2020-06-30 | 2020-03-31 | 2019-12-31 | 2019-09-30 | 2019-06-30 | 2019-03-31 | 2018-12-31 | 2018-09-30 | 2018-06-30 | 2018-03-31 | 2017-12-31 | 2017-09-30 | 2017-06-30 | 2017-03-31 | 2016-12-31 | 2016-09-30 | 2016-06-30 | 2016-03-31 | 2015-12-31 | 2015-09-30 | 2015-06-30 | 2015-03-31 | ||
|---|---|---|---|---|---|---|---|---|---|---|---|---|---|---|---|---|---|---|---|---|---|---|---|---|---|---|---|---|---|---|---|---|---|---|---|---|---|---|
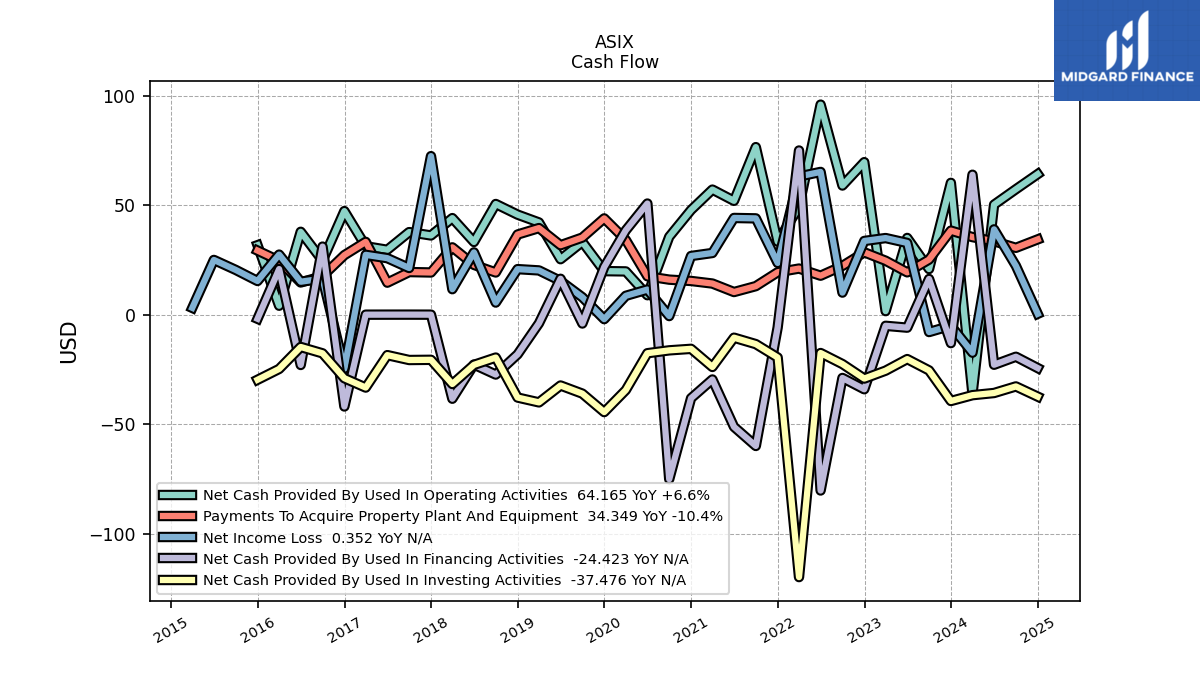
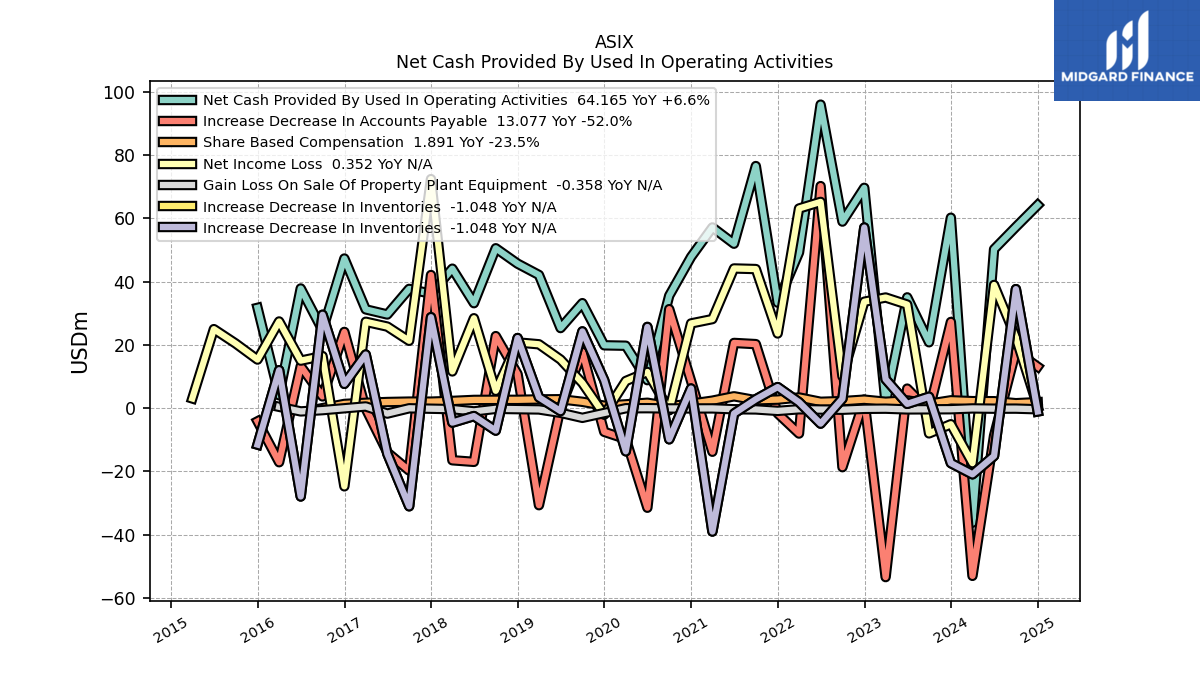
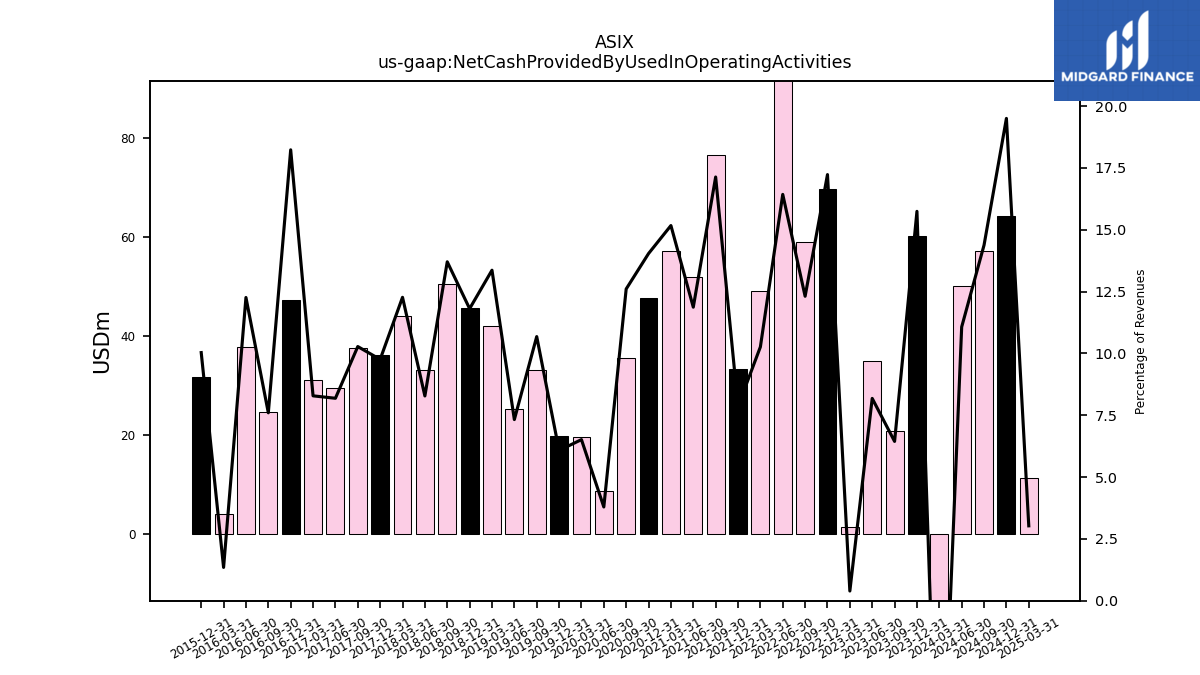
| Net Cash Provided By Used In Operating Activities | -36.20 | 60.17 | 20.80 | 35.00 | 1.57 | 69.61 | 58.93 | 95.89 | 49.16 | 33.33 | 76.49 | 51.95 | 57.09 | 47.76 | 35.53 | 8.83 | 19.72 | 19.85 | 33.17 | 25.29 | 42.08 | 45.65 | 50.51 | 33.15 | 44.07 | 36.14 | 37.68 | 29.59 | 31.21 | 47.27 | 24.61 | 37.81 | 4.04 | 31.69 | NA | NA | NA | |
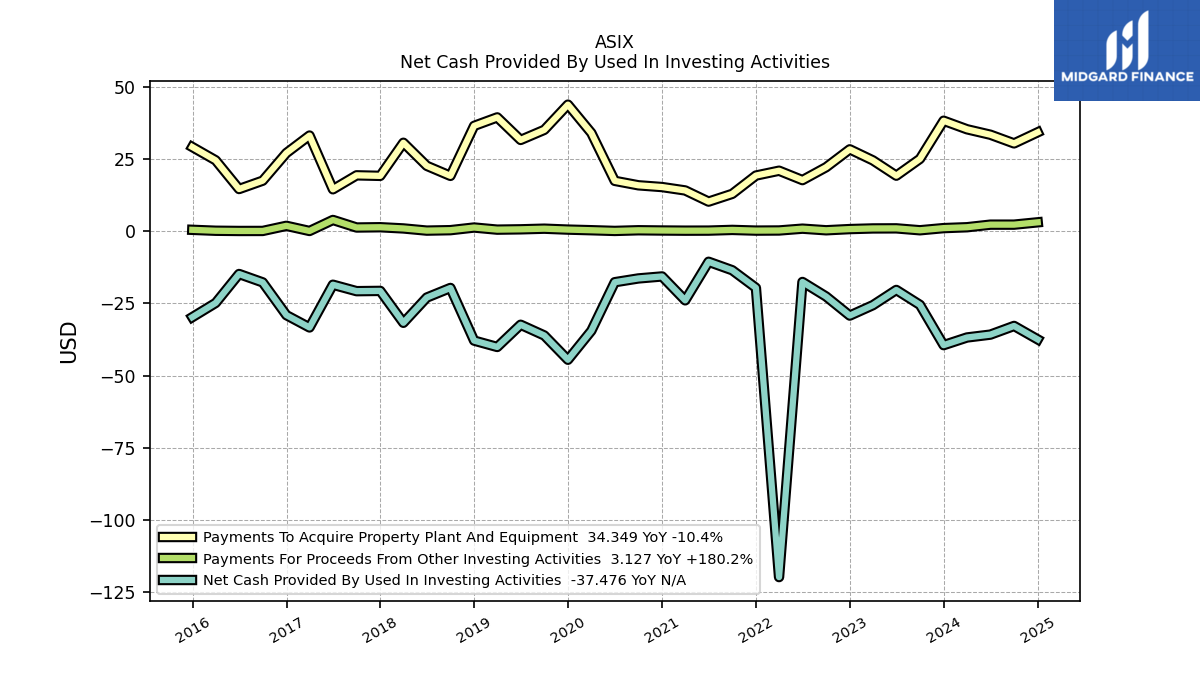
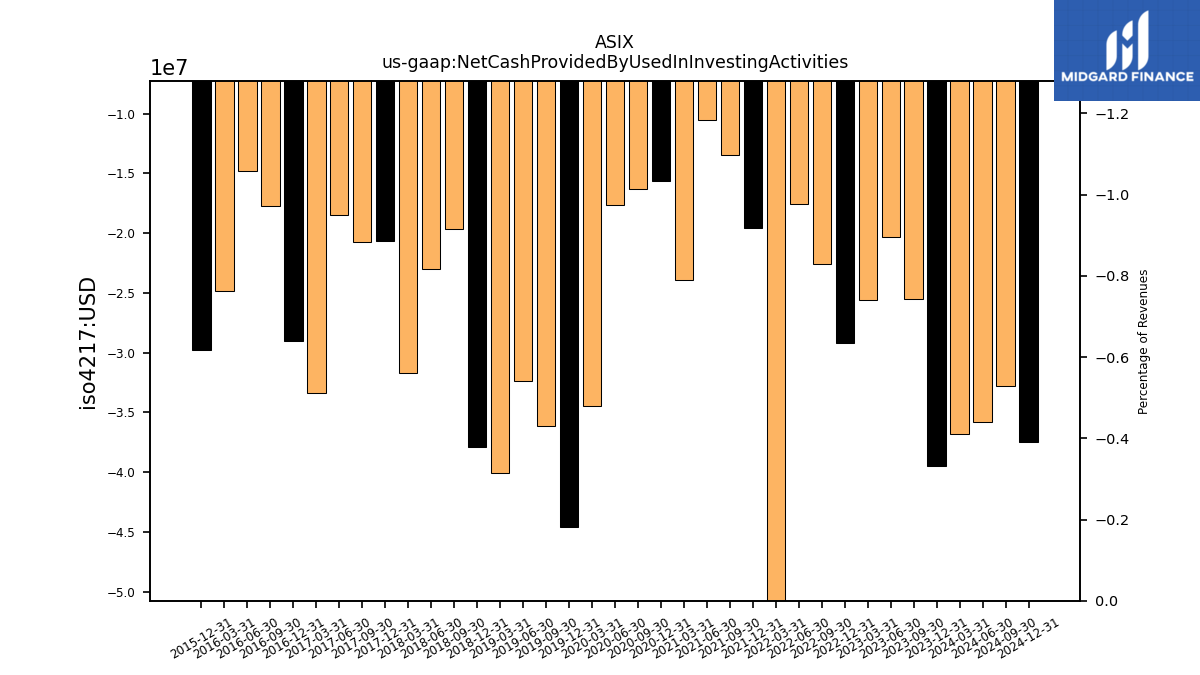
| Net Cash Provided By Used In Investing Activities | -36.81 | -39.47 | -25.50 | -20.32 | -25.61 | -29.22 | -22.60 | -17.55 | -119.90 | -19.59 | -13.49 | -10.55 | -23.93 | -15.64 | -16.33 | -17.64 | -34.48 | -44.54 | -36.10 | -32.39 | -40.10 | -37.88 | -19.63 | -22.96 | -31.71 | -20.65 | -20.75 | -18.51 | -33.34 | -29.06 | -17.70 | -14.79 | -24.83 | -29.77 | NA | NA | NA | |
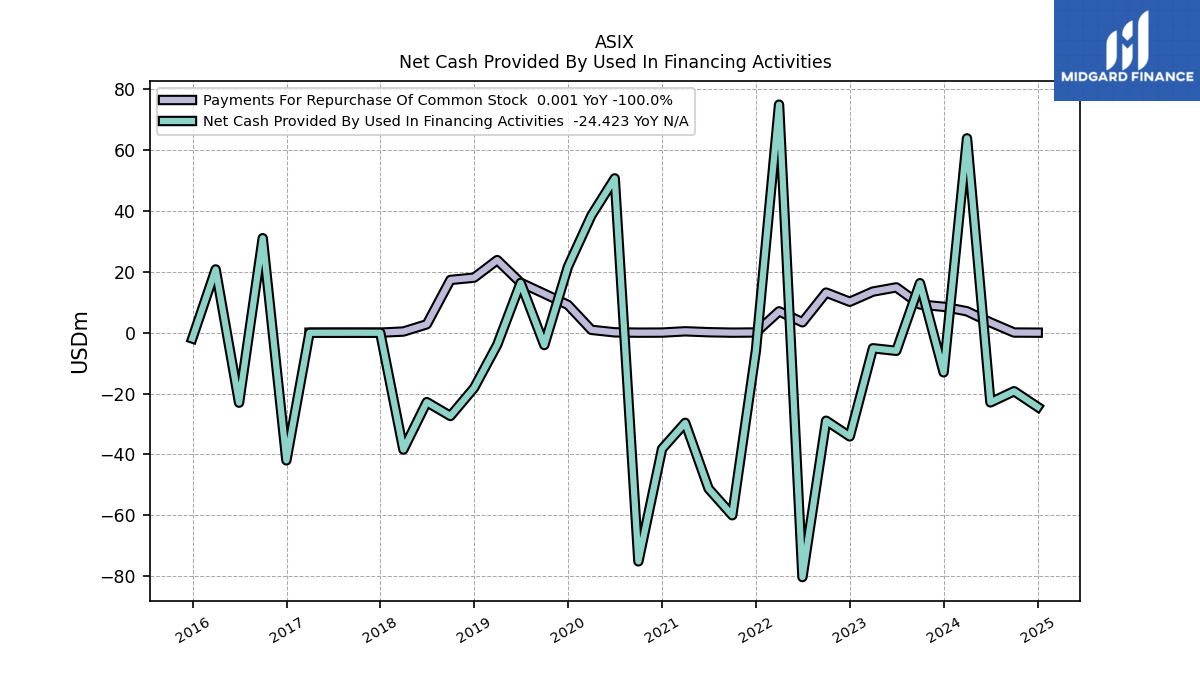
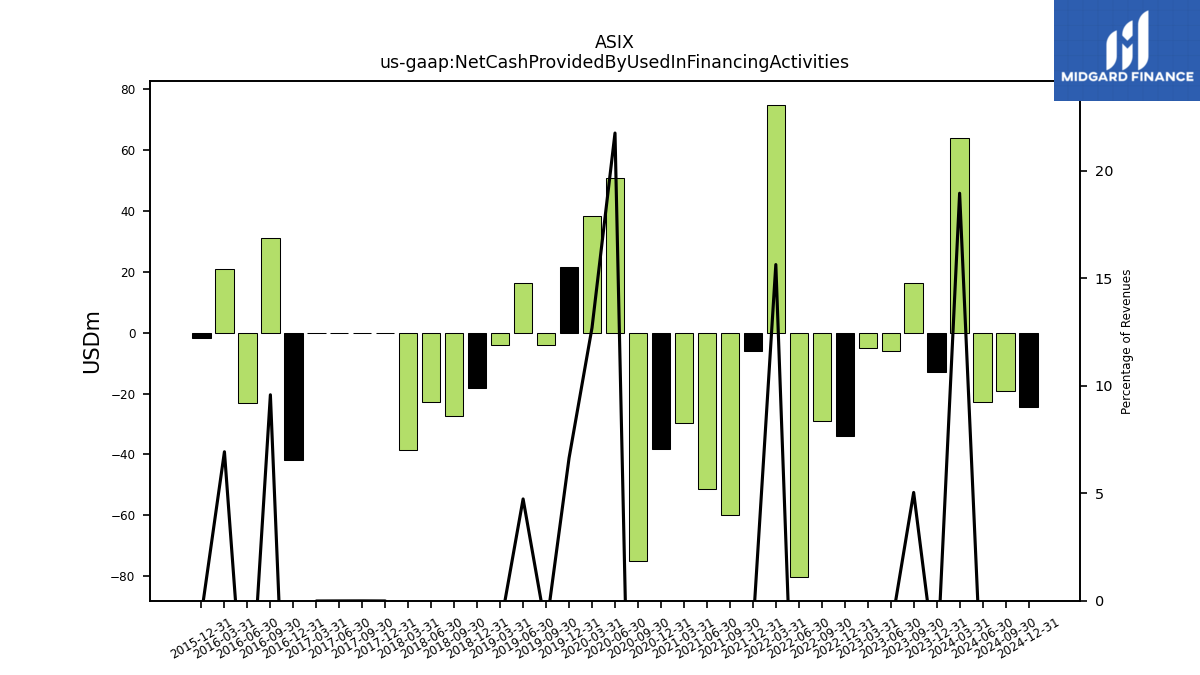
| Net Cash Provided By Used In Financing Activities | 63.87 | -13.04 | 16.27 | -5.97 | -5.13 | -34.10 | -28.94 | -80.35 | 74.95 | -5.87 | -60.01 | -51.27 | -29.64 | -38.20 | -75.18 | 50.72 | 38.47 | 21.69 | -4.08 | 16.35 | -3.98 | -18.16 | -27.39 | -22.83 | -38.43 | -0.04 | -0.02 | -0.03 | -0.04 | -41.98 | 31.05 | -23.02 | 20.79 | -1.92 | NA | NA | NA |
| 2024-03-31 | 2023-12-31 | 2023-09-30 | 2023-06-30 | 2023-03-31 | 2022-12-31 | 2022-09-30 | 2022-06-30 | 2022-03-31 | 2021-12-31 | 2021-09-30 | 2021-06-30 | 2021-03-31 | 2020-12-31 | 2020-09-30 | 2020-06-30 | 2020-03-31 | 2019-12-31 | 2019-09-30 | 2019-06-30 | 2019-03-31 | 2018-12-31 | 2018-09-30 | 2018-06-30 | 2018-03-31 | 2017-12-31 | 2017-09-30 | 2017-06-30 | 2017-03-31 | 2016-12-31 | 2016-09-30 | 2016-06-30 | 2016-03-31 | 2015-12-31 | 2015-09-30 | 2015-06-30 | 2015-03-31 | ||
|---|---|---|---|---|---|---|---|---|---|---|---|---|---|---|---|---|---|---|---|---|---|---|---|---|---|---|---|---|---|---|---|---|---|---|---|---|---|---|
| Net Cash Provided By Used In Operating Activities | -36.20 | 60.17 | 20.80 | 35.00 | 1.57 | 69.61 | 58.93 | 95.89 | 49.16 | 33.33 | 76.49 | 51.95 | 57.09 | 47.76 | 35.53 | 8.83 | 19.72 | 19.85 | 33.17 | 25.29 | 42.08 | 45.65 | 50.51 | 33.15 | 44.07 | 36.14 | 37.68 | 29.59 | 31.21 | 47.27 | 24.61 | 37.81 | 4.04 | 31.69 | NA | NA | NA | |
| Net Income Loss | -17.40 | -5.08 | -7.98 | 32.73 | 34.95 | 33.62 | 10.03 | 65.16 | 63.07 | 23.59 | 43.94 | 44.13 | 28.13 | 26.76 | -0.69 | 11.43 | 8.58 | -2.09 | 7.92 | 15.35 | 20.17 | 20.76 | 5.48 | 28.41 | 11.59 | 72.37 | 21.27 | 25.77 | 27.29 | -24.71 | 16.46 | 15.01 | 27.39 | 15.34 | 20.41 | 24.96 | 3.06 | |
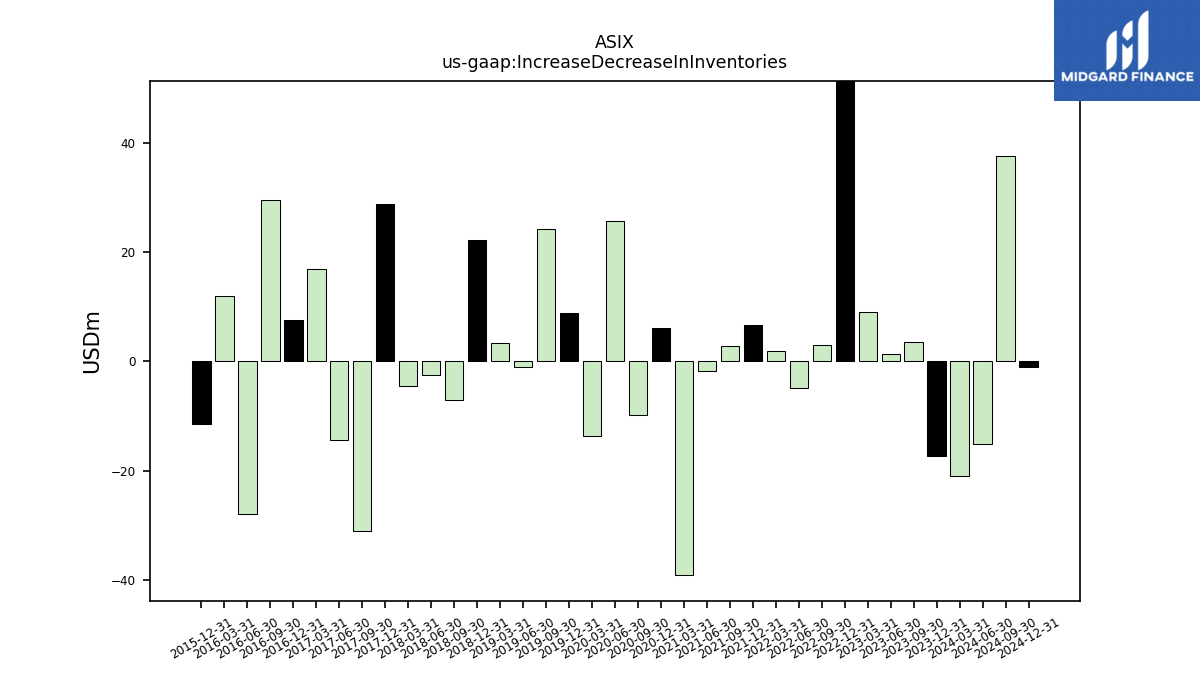
| Increase Decrease In Inventories | -20.91 | -17.37 | 3.60 | 1.35 | 9.13 | 57.07 | 2.98 | -4.90 | 1.89 | 6.66 | 2.81 | -1.71 | -38.99 | 6.21 | -9.85 | 25.66 | -13.64 | 8.83 | 24.25 | -0.92 | 3.42 | 22.16 | -7.10 | -2.51 | -4.57 | 28.73 | -31.01 | -14.43 | 16.94 | 7.67 | 29.51 | -27.91 | 11.99 | -11.52 | NA | NA | NA | |
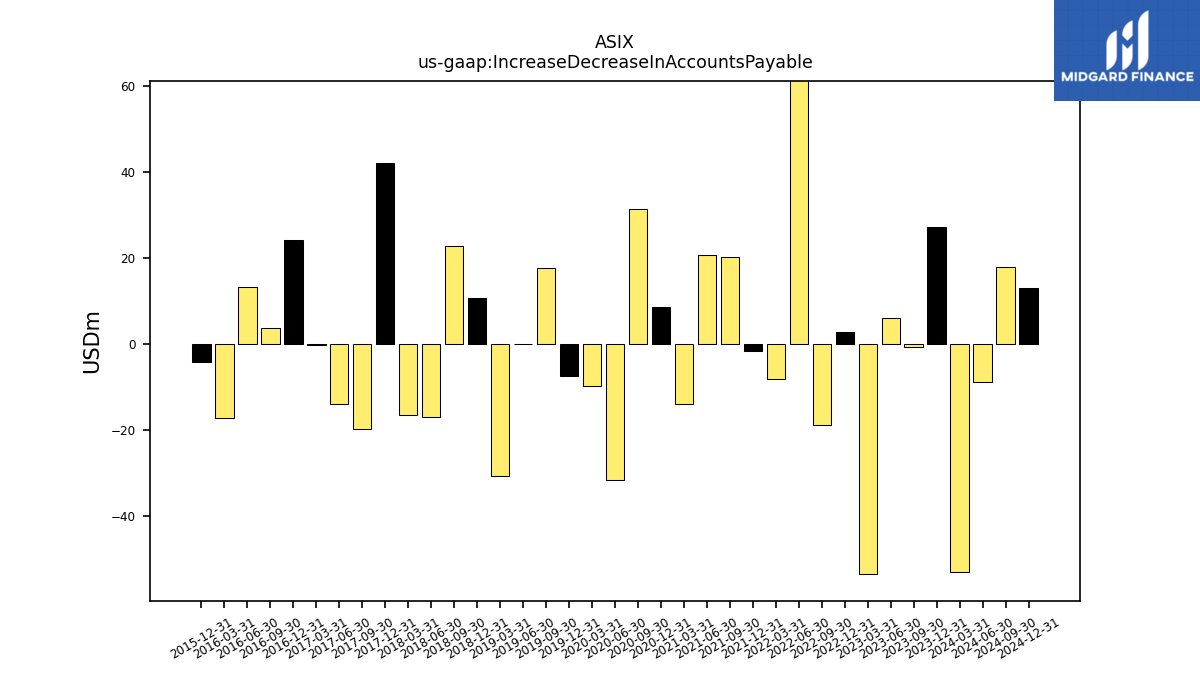
| Increase Decrease In Accounts Payable | -52.99 | 27.23 | -0.77 | 6.17 | -53.39 | 2.70 | -18.66 | 70.16 | -8.03 | -1.65 | 20.23 | 20.60 | -13.78 | 8.60 | 31.29 | -31.47 | -9.75 | -7.49 | 17.74 | 0.09 | -30.67 | 10.74 | 22.77 | -16.97 | -16.47 | 42.06 | -19.74 | -13.98 | -0.18 | 24.09 | 3.70 | 13.24 | -17.10 | -4.18 | NA | NA | NA | |
| Share Based Compensation | 2.21 | 2.47 | 1.39 | 2.44 | 2.01 | 2.68 | 2.22 | 2.00 | 3.37 | 2.69 | 2.50 | 3.74 | 2.36 | 1.40 | 0.60 | 1.70 | 1.20 | 0.77 | 2.00 | 2.81 | 2.76 | 2.62 | 2.63 | 2.60 | 2.28 | 2.06 | 2.07 | 1.94 | 1.68 | 1.33 | 0.00 | NA | NA | NA | NA | NA | NA | |
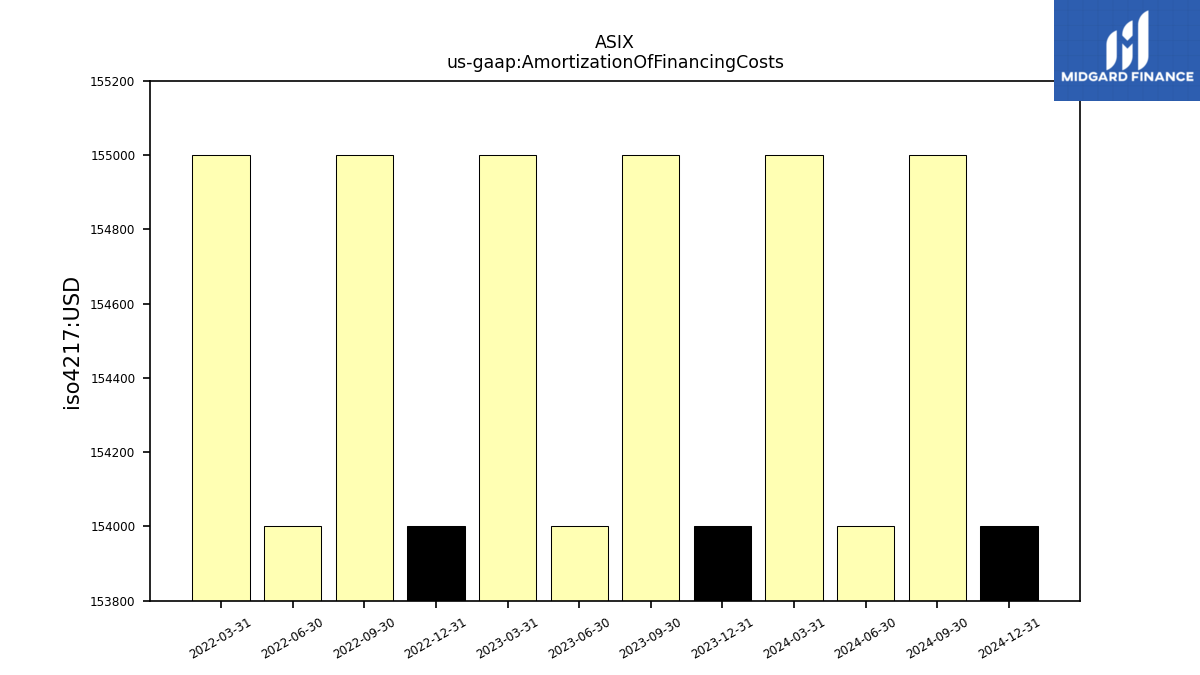
| Amortization Of Financing Costs | 0.15 | 0.15 | 0.15 | 0.15 | 0.15 | 0.15 | 0.15 | 0.15 | 0.15 | NA | NA | NA | NA | NA | NA | NA | NA | NA | NA | NA | NA | NA | NA | NA | NA | NA | NA | NA | NA | NA | NA | NA | NA | NA | NA | NA | NA |
| 2024-03-31 | 2023-12-31 | 2023-09-30 | 2023-06-30 | 2023-03-31 | 2022-12-31 | 2022-09-30 | 2022-06-30 | 2022-03-31 | 2021-12-31 | 2021-09-30 | 2021-06-30 | 2021-03-31 | 2020-12-31 | 2020-09-30 | 2020-06-30 | 2020-03-31 | 2019-12-31 | 2019-09-30 | 2019-06-30 | 2019-03-31 | 2018-12-31 | 2018-09-30 | 2018-06-30 | 2018-03-31 | 2017-12-31 | 2017-09-30 | 2017-06-30 | 2017-03-31 | 2016-12-31 | 2016-09-30 | 2016-06-30 | 2016-03-31 | 2015-12-31 | 2015-09-30 | 2015-06-30 | 2015-03-31 | ||
|---|---|---|---|---|---|---|---|---|---|---|---|---|---|---|---|---|---|---|---|---|---|---|---|---|---|---|---|---|---|---|---|---|---|---|---|---|---|---|
| Net Cash Provided By Used In Investing Activities | -36.81 | -39.47 | -25.50 | -20.32 | -25.61 | -29.22 | -22.60 | -17.55 | -119.90 | -19.59 | -13.49 | -10.55 | -23.93 | -15.64 | -16.33 | -17.64 | -34.48 | -44.54 | -36.10 | -32.39 | -40.10 | -37.88 | -19.63 | -22.96 | -31.71 | -20.65 | -20.75 | -18.51 | -33.34 | -29.06 | -17.70 | -14.79 | -24.83 | -29.77 | NA | NA | NA | |
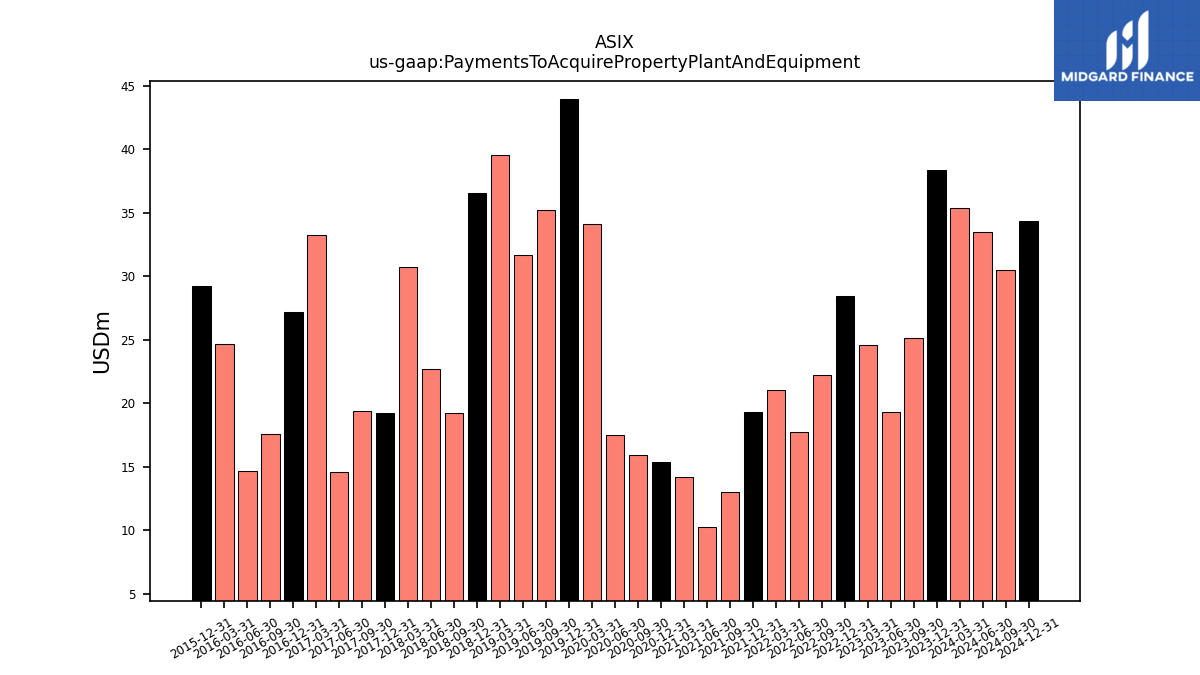
| Payments To Acquire Property Plant And Equipment | 35.39 | 38.35 | 25.13 | 19.29 | 24.60 | 28.44 | 22.23 | 17.76 | 21.02 | 19.34 | 12.99 | 10.30 | 14.18 | 15.36 | 15.96 | 17.50 | 34.10 | 43.94 | 35.19 | 31.69 | 39.51 | 36.56 | 19.23 | 22.71 | 30.71 | 19.23 | 19.42 | 14.57 | 33.21 | 27.15 | 17.57 | 14.67 | 24.63 | 29.25 | NA | NA | NA |
| 2024-03-31 | 2023-12-31 | 2023-09-30 | 2023-06-30 | 2023-03-31 | 2022-12-31 | 2022-09-30 | 2022-06-30 | 2022-03-31 | 2021-12-31 | 2021-09-30 | 2021-06-30 | 2021-03-31 | 2020-12-31 | 2020-09-30 | 2020-06-30 | 2020-03-31 | 2019-12-31 | 2019-09-30 | 2019-06-30 | 2019-03-31 | 2018-12-31 | 2018-09-30 | 2018-06-30 | 2018-03-31 | 2017-12-31 | 2017-09-30 | 2017-06-30 | 2017-03-31 | 2016-12-31 | 2016-09-30 | 2016-06-30 | 2016-03-31 | 2015-12-31 | 2015-09-30 | 2015-06-30 | 2015-03-31 | ||
|---|---|---|---|---|---|---|---|---|---|---|---|---|---|---|---|---|---|---|---|---|---|---|---|---|---|---|---|---|---|---|---|---|---|---|---|---|---|---|
| Net Cash Provided By Used In Financing Activities | 63.87 | -13.04 | 16.27 | -5.97 | -5.13 | -34.10 | -28.94 | -80.35 | 74.95 | -5.87 | -60.01 | -51.27 | -29.64 | -38.20 | -75.18 | 50.72 | 38.47 | 21.69 | -4.08 | 16.35 | -3.98 | -18.16 | -27.39 | -22.83 | -38.43 | -0.04 | -0.02 | -0.03 | -0.04 | -41.98 | 31.05 | -23.02 | 20.79 | -1.92 | NA | NA | NA | |
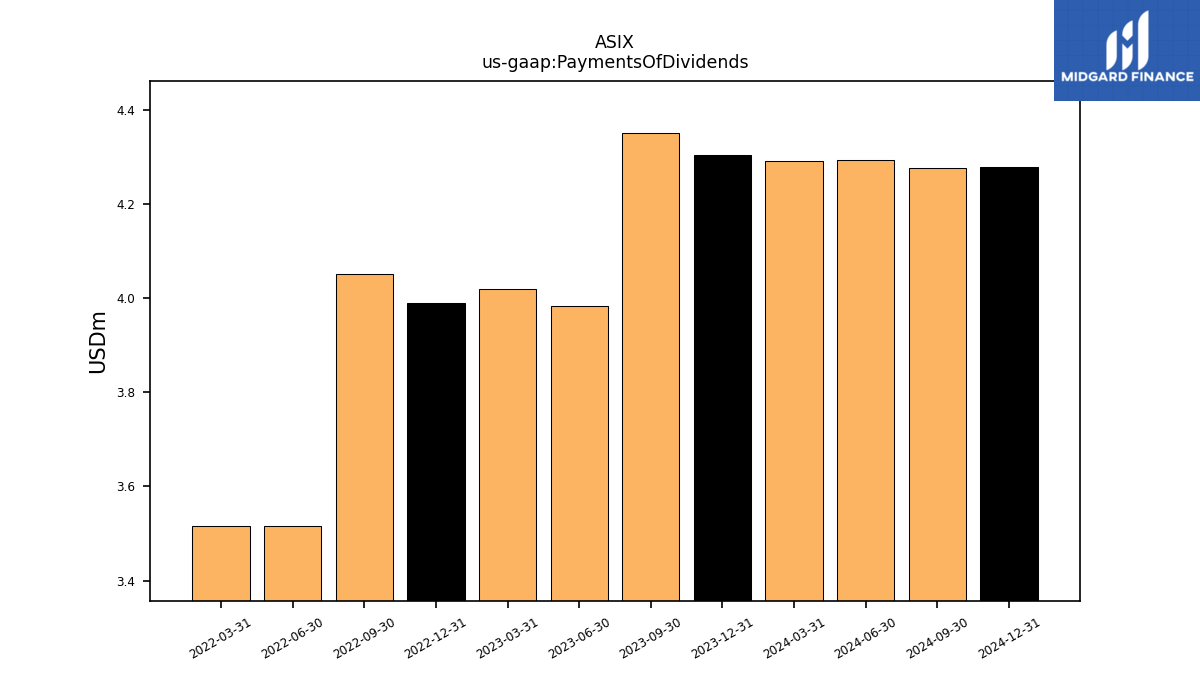
| Payments Of Dividends | 4.29 | 4.30 | 4.35 | 3.98 | 4.02 | 3.99 | 4.05 | 3.52 | 3.52 | NA | NA | NA | NA | NA | NA | NA | NA | NA | NA | NA | NA | NA | NA | NA | NA | NA | NA | NA | NA | NA | NA | NA | NA | NA | NA | NA | NA | |
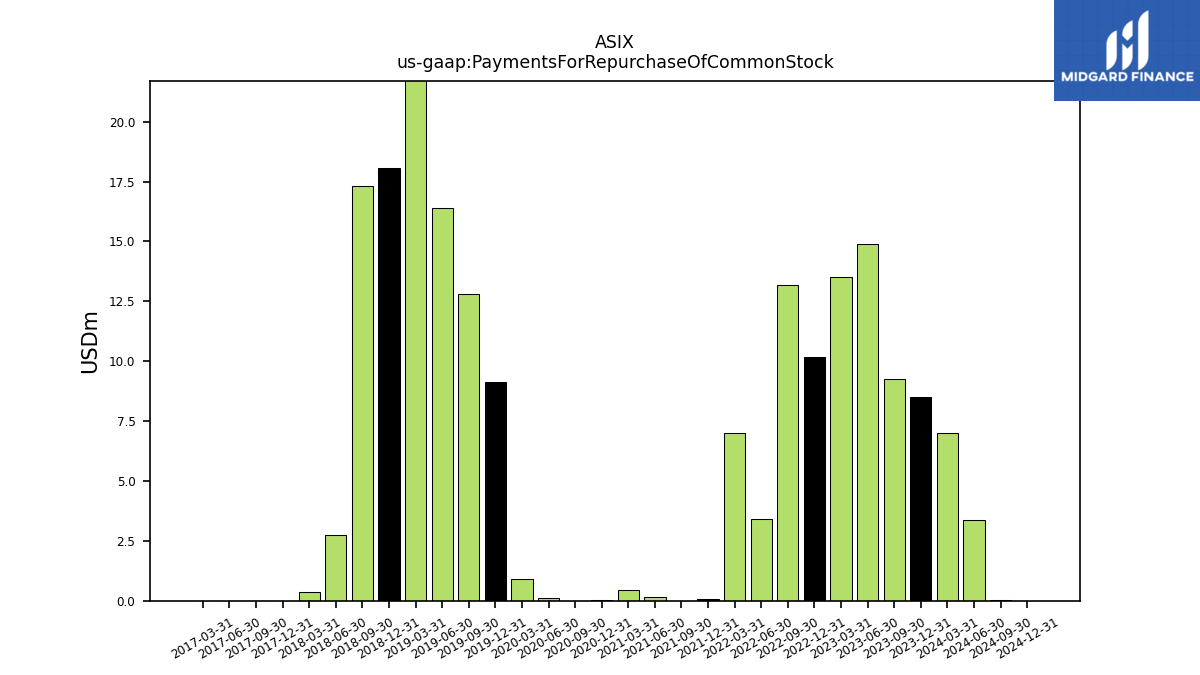
| Payments For Repurchase Of Common Stock | 7.02 | 8.50 | 9.27 | 14.89 | 13.50 | 10.16 | 13.17 | 3.41 | 7.01 | 0.06 | 0.00 | 0.15 | 0.44 | 0.02 | 0.00 | 0.11 | 0.93 | 9.13 | 12.80 | 16.41 | 23.85 | 18.08 | 17.33 | 2.74 | 0.37 | 0.00 | 0.00 | 0.00 | 0.00 | NA | NA | NA | NA | NA | NA | NA | NA |
| 2024-03-31 | 2023-12-31 | 2023-09-30 | 2023-06-30 | 2023-03-31 | 2022-12-31 | 2022-09-30 | 2022-06-30 | 2022-03-31 | 2021-12-31 | 2021-09-30 | 2021-06-30 | 2021-03-31 | 2020-12-31 | 2020-09-30 | 2020-06-30 | 2020-03-31 | 2019-12-31 | 2019-09-30 | 2019-06-30 | 2019-03-31 | 2018-12-31 | 2018-09-30 | 2018-06-30 | 2018-03-31 | 2017-12-31 | 2017-09-30 | 2017-06-30 | 2017-03-31 | 2016-12-31 | 2016-09-30 | 2016-06-30 | 2016-03-31 | 2015-12-31 | 2015-09-30 | 2015-06-30 | 2015-03-31 | ||
|---|---|---|---|---|---|---|---|---|---|---|---|---|---|---|---|---|---|---|---|---|---|---|---|---|---|---|---|---|---|---|---|---|---|---|---|---|---|---|
| Revenues | 336.83 | 382.21 | 322.91 | 427.94 | 400.54 | 404.06 | 478.77 | 583.74 | 479.07 | 424.06 | 446.50 | 437.68 | 376.38 | 340.27 | 281.91 | 233.02 | 302.71 | 326.65 | 310.63 | 345.21 | 314.89 | 386.63 | 368.65 | 400.46 | 359.24 | 370.39 | 366.66 | 361.44 | 376.70 | 259.32 | 323.95 | 308.42 | 299.83 | 315.87 | 335.87 | 367.44 | 310.23 | |
| Revenue From Contract With Customer Excluding Assessed Tax | 336.83 | 382.21 | 322.91 | 427.94 | 400.54 | 404.06 | 478.77 | 583.74 | 479.07 | 424.06 | 446.50 | 437.68 | 376.38 | 340.27 | 281.91 | 233.02 | 302.71 | 326.65 | 310.63 | 345.21 | 314.89 | 386.63 | 368.65 | 400.46 | 359.24 | 370.39 | 366.66 | 361.44 | 376.70 | 259.32 | 323.95 | 308.42 | 299.83 | 315.87 | 335.87 | 367.44 | 310.23 | |
| Revenue From Contract With Customer Including Assessed Tax | 336.83 | 382.21 | 322.91 | 427.94 | 400.54 | 404.06 | 478.77 | 583.74 | 479.07 | 424.06 | 446.50 | 437.68 | 376.38 | 340.27 | 281.91 | 233.02 | 302.71 | 326.65 | 310.63 | 345.21 | 314.89 | 386.63 | 368.65 | 400.46 | 359.24 | 370.39 | 366.66 | 361.44 | 376.70 | 259.32 | 323.95 | 308.42 | 299.83 | 315.87 | 335.87 | 367.44 | 310.23 | |
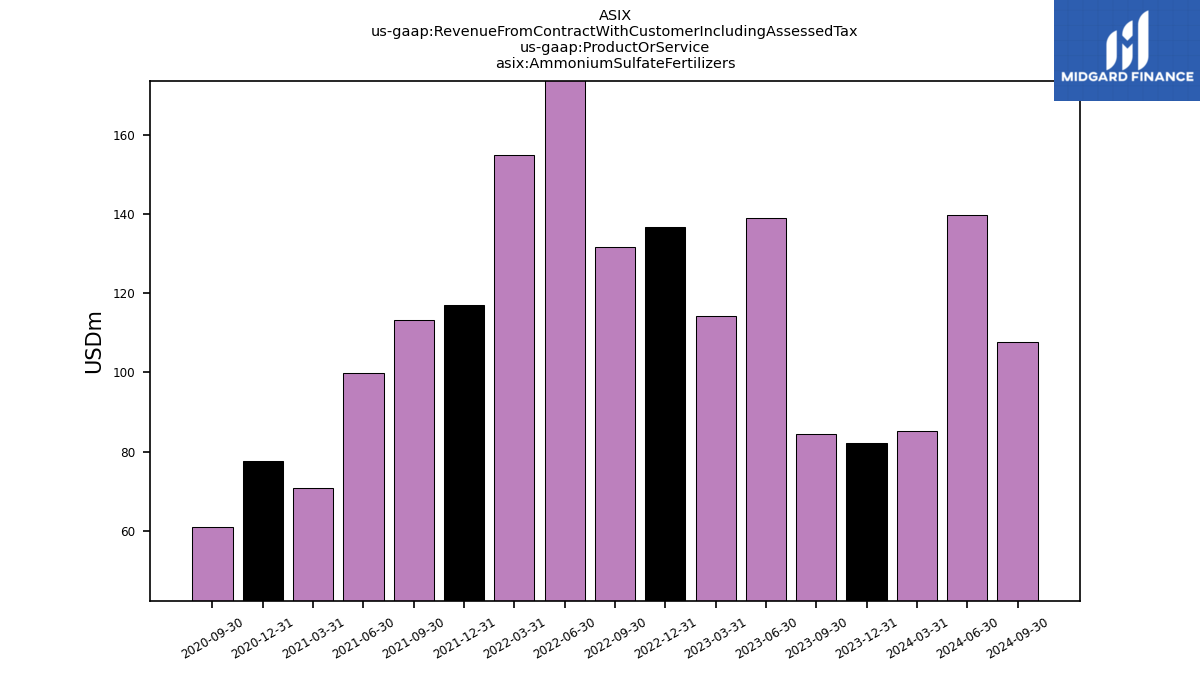
| Ammonium Sulfate Fertilizers | 85.26 | 82.11 | 84.60 | 138.94 | 114.22 | 136.73 | 131.67 | 205.85 | 154.77 | 117.08 | 113.20 | 99.98 | 70.83 | 77.81 | 61.18 | NA | NA | NA | NA | NA | NA | NA | NA | NA | NA | NA | NA | NA | NA | NA | NA | NA | NA | NA | NA | NA | NA | |
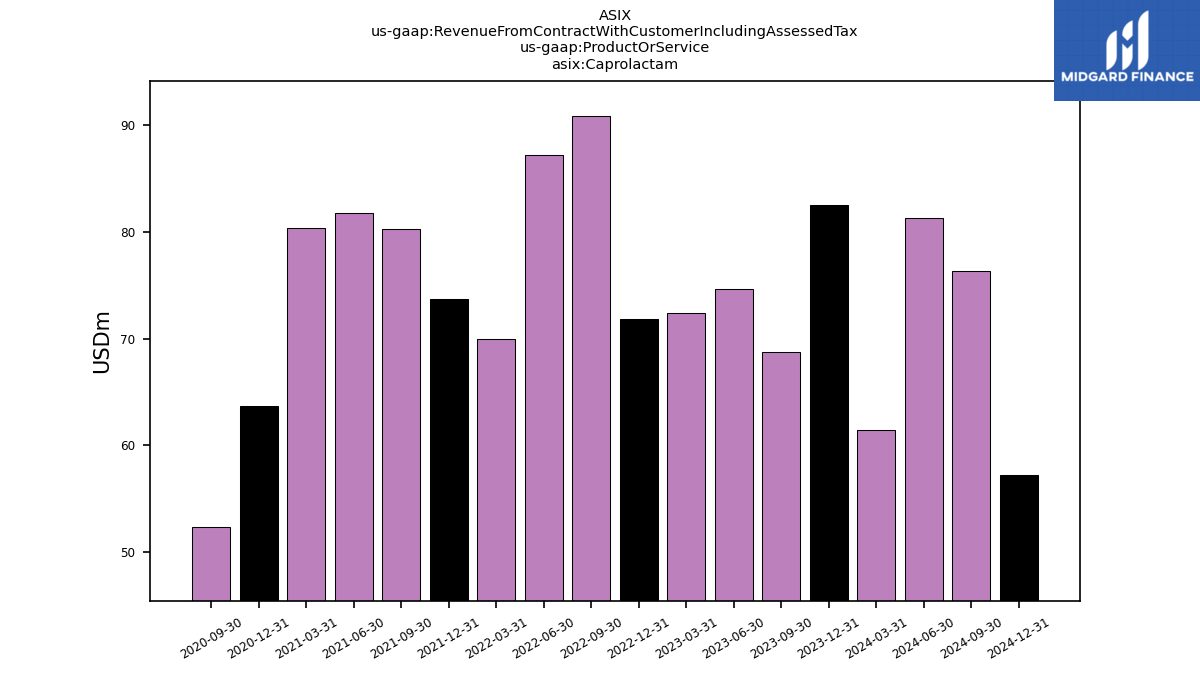
| Caprolactam | 61.48 | 82.51 | 68.79 | 74.68 | 72.39 | 71.87 | 90.82 | 87.17 | 70.00 | 73.67 | 80.27 | 81.79 | 80.40 | 63.67 | 52.41 | NA | NA | NA | NA | NA | NA | NA | NA | NA | NA | NA | NA | NA | NA | NA | NA | NA | NA | NA | NA | NA | NA | |
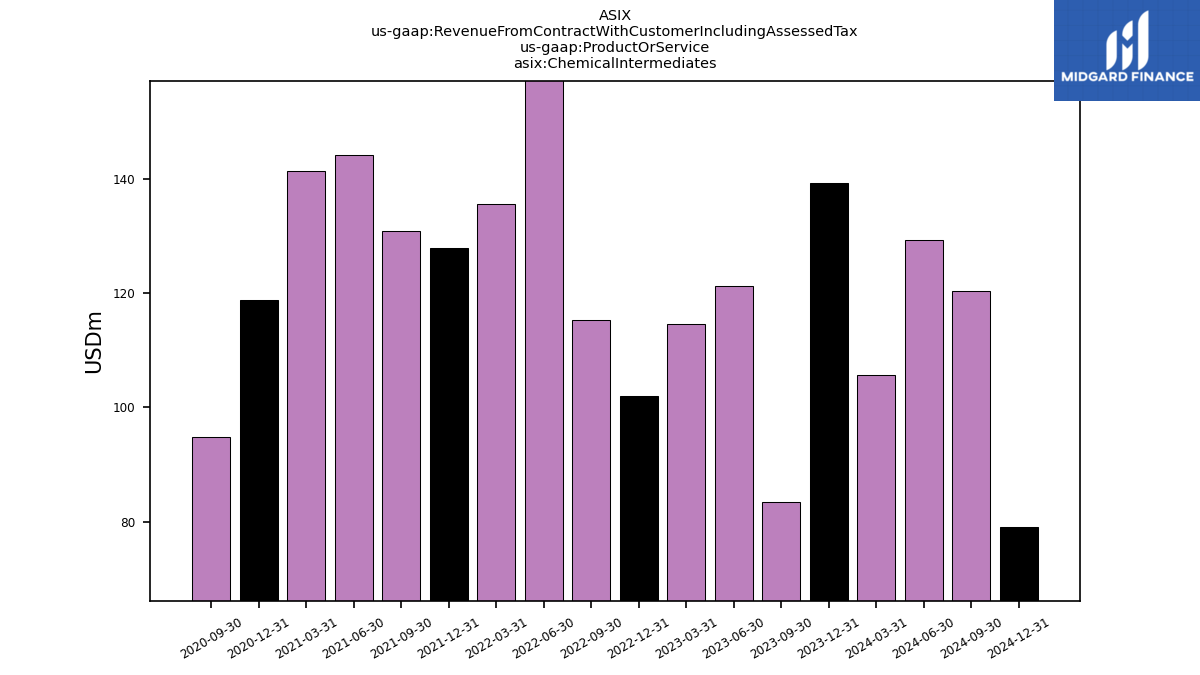
| Chemical Intermediates | 105.70 | 139.34 | 83.46 | 121.36 | 114.56 | 101.95 | 115.27 | 158.61 | 135.69 | 128.02 | 130.92 | 144.20 | 141.36 | 118.83 | 94.77 | NA | NA | NA | NA | NA | NA | NA | NA | NA | NA | NA | NA | NA | NA | NA | NA | NA | NA | NA | NA | NA | NA | |
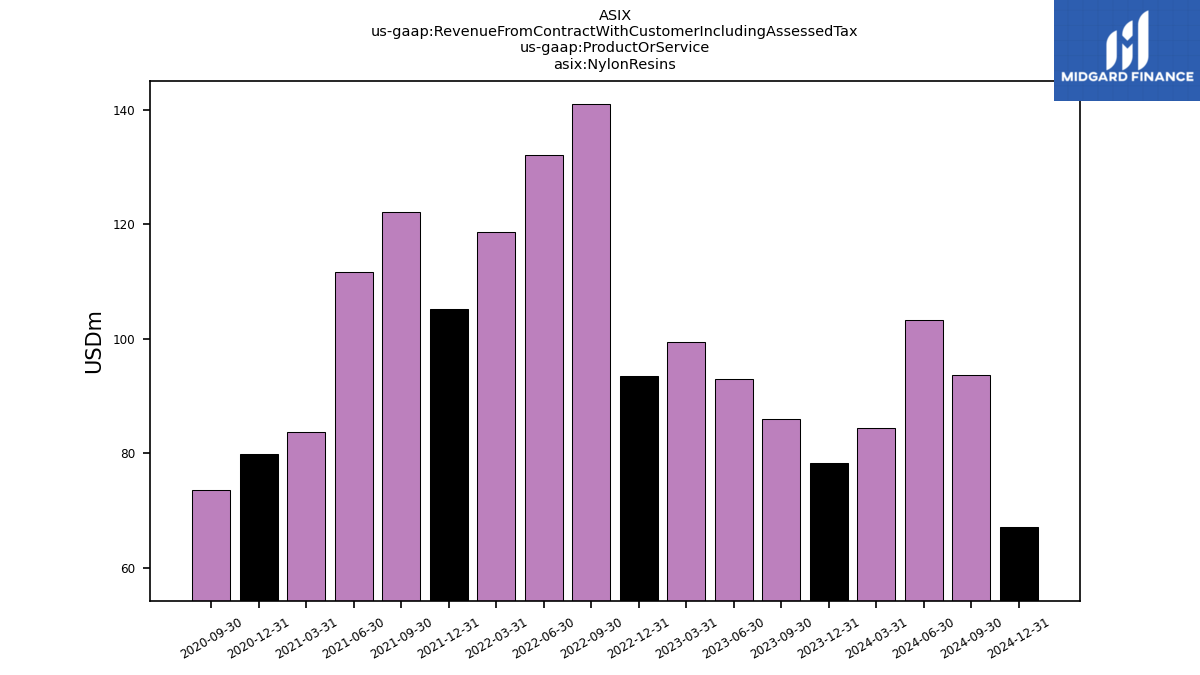
| Nylon Resins | 84.39 | 78.25 | 86.06 | 92.95 | 99.37 | 93.51 | 141.02 | 132.10 | 118.61 | 105.29 | 122.11 | 111.71 | 83.79 | 79.96 | 73.56 | NA | NA | NA | NA | NA | NA | NA | NA | NA | NA | NA | NA | NA | NA | NA | NA | NA | NA | NA | NA | NA | NA | |
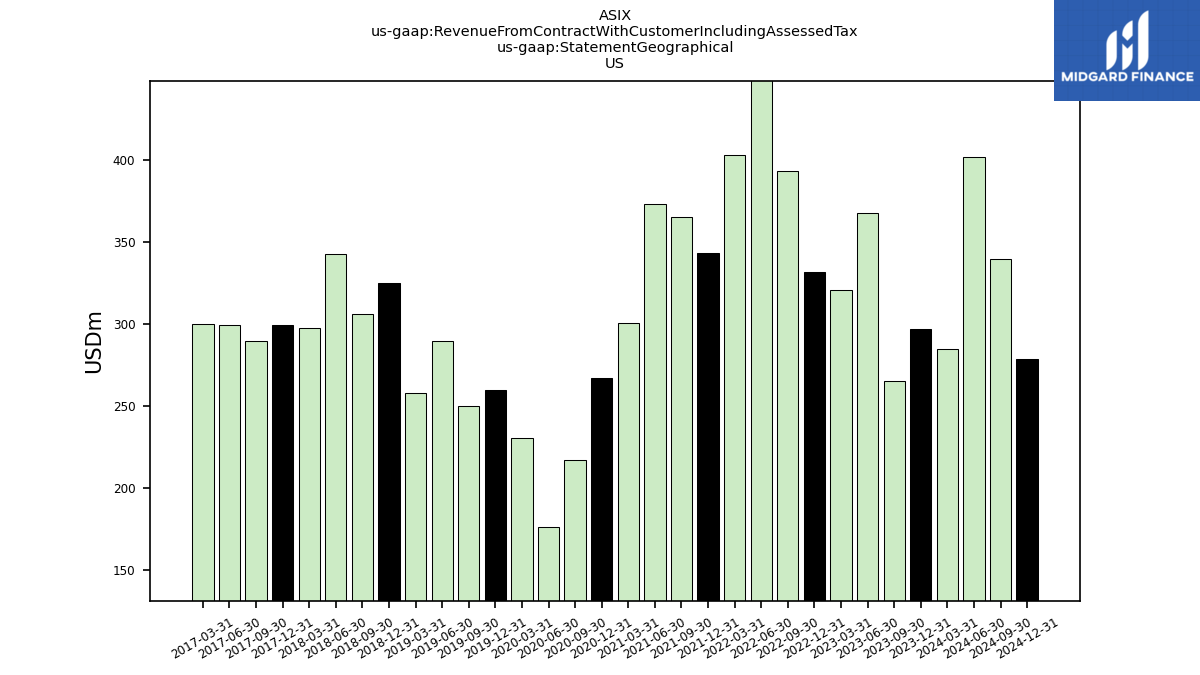
| US | 284.59 | 296.70 | 264.86 | 367.61 | 320.93 | 331.92 | 393.45 | 494.15 | 403.02 | 343.17 | 365.21 | 373.41 | 300.67 | 266.96 | 217.06 | 176.31 | 230.44 | 259.75 | 250.06 | 289.55 | 257.64 | 324.81 | 306.05 | 342.50 | 297.65 | 299.49 | 289.48 | 299.54 | 300.05 | NA | NA | NA | NA | NA | NA | NA | NA | |
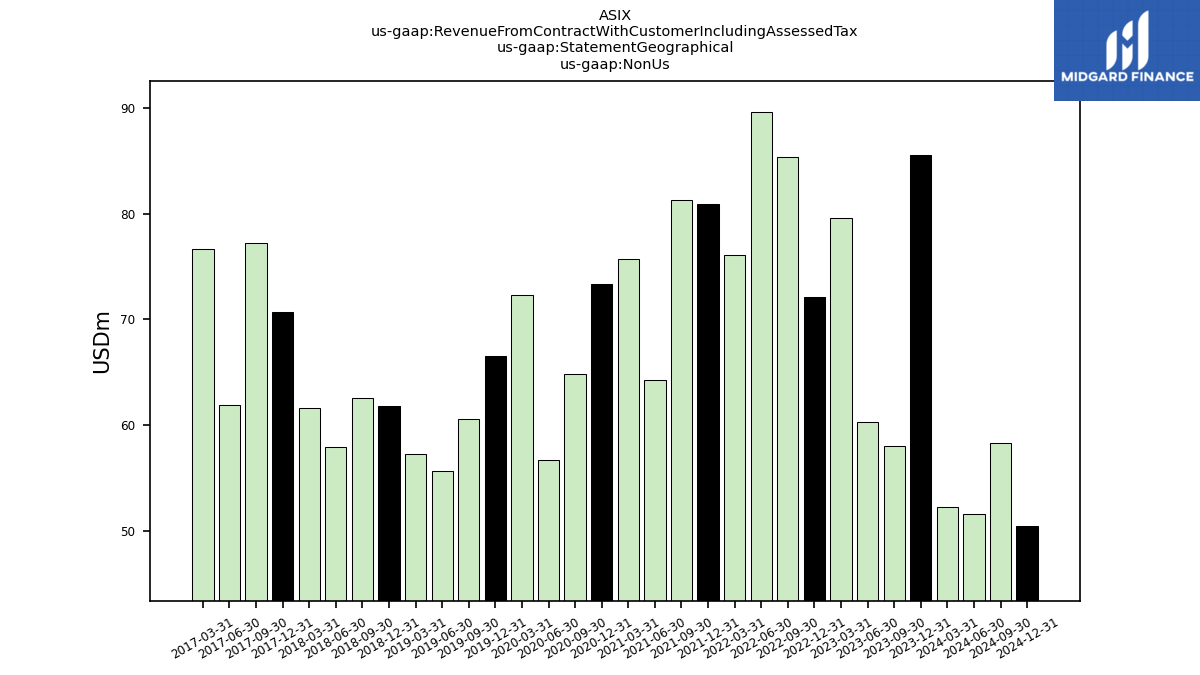
| Non Us | 52.24 | 85.51 | 58.05 | 60.33 | 79.62 | 72.15 | 85.32 | 89.58 | 76.06 | 80.89 | 81.28 | 64.27 | 75.71 | 73.31 | 64.85 | 56.71 | 72.27 | 66.51 | 60.58 | 55.66 | 57.25 | 61.84 | 62.60 | 57.96 | 61.59 | 70.71 | 77.18 | 61.90 | 76.66 | NA | NA | NA | NA | NA | NA | NA | NA |
