
| 2023-09-30 | 2023-06-30 | 2023-03-31 | 2022-12-31 | 2022-09-30 | 2022-06-30 | 2022-03-31 | 2021-12-31 | 2021-09-30 | 2021-06-30 | 2021-03-31 | 2020-12-31 | 2020-09-30 | 2020-06-30 | 2020-03-31 | 2019-12-31 | 2019-09-30 | 2019-06-30 | 2019-03-31 | 2018-12-31 | 2018-09-30 | 2018-06-30 | 2018-03-31 | 2017-12-31 | 2017-09-30 | 2017-06-30 | 2017-03-31 | 2016-12-31 | 2016-09-30 | 2016-06-30 | 2016-03-31 | 2015-12-31 | 2015-09-30 | 2015-06-30 | 2015-03-31 | 2014-12-31 | 2014-09-30 | 2014-06-30 | 2014-03-31 | 2013-12-31 | 2013-09-30 | 2013-06-30 | 2013-03-31 | ||
|---|---|---|---|---|---|---|---|---|---|---|---|---|---|---|---|---|---|---|---|---|---|---|---|---|---|---|---|---|---|---|---|---|---|---|---|---|---|---|---|---|---|---|---|---|
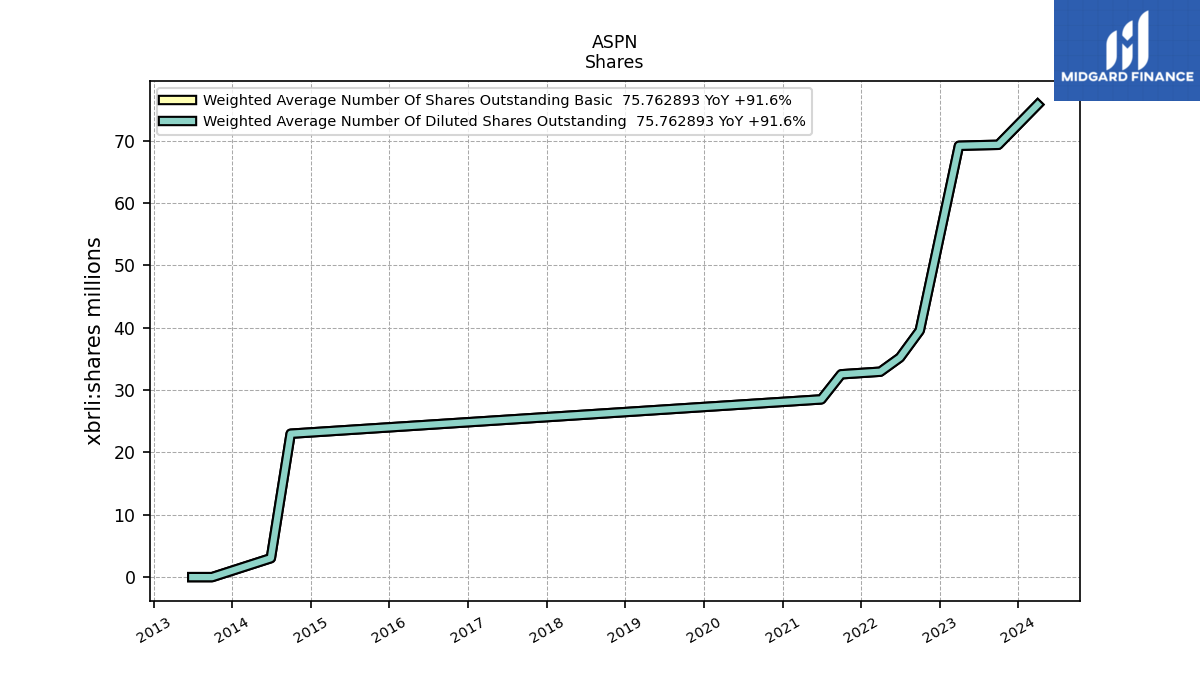
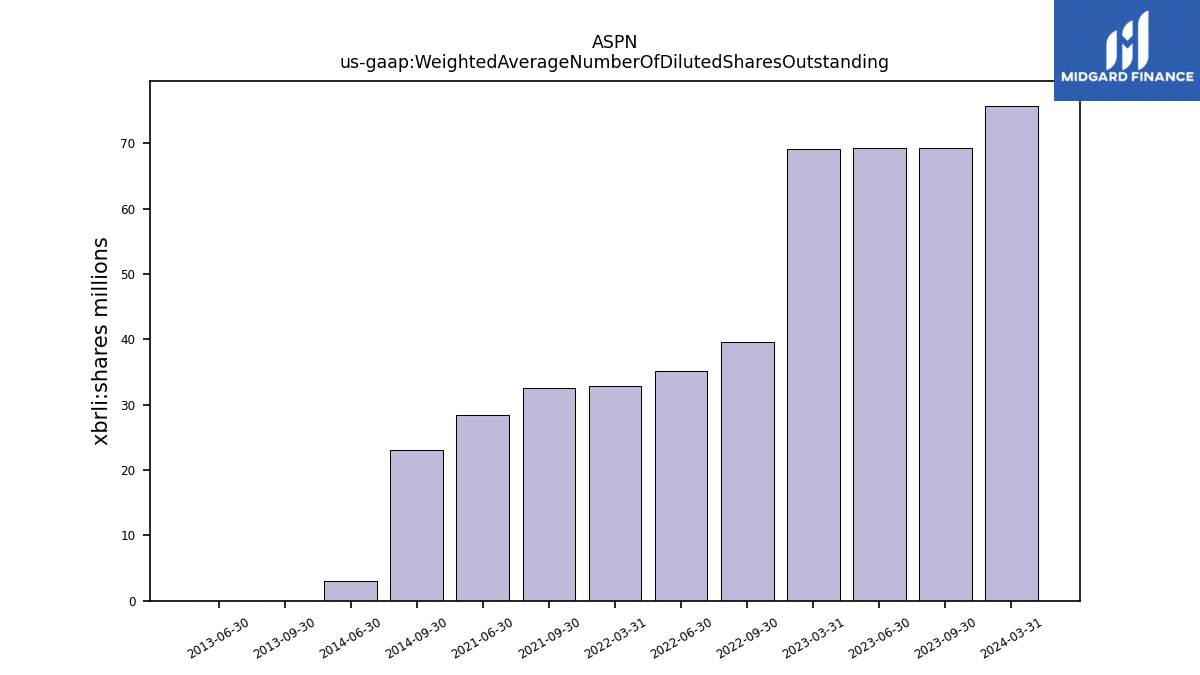
| Weighted Average Number Of Diluted Shares Outstanding | 69.32 | 69.25 | 69.16 | NA | 39.53 | 35.21 | 32.94 | NA | 32.52 | 28.50 | NA | NA | NA | NA | NA | NA | NA | NA | NA | NA | NA | NA | NA | NA | NA | NA | NA | NA | NA | NA | NA | NA | NA | NA | NA | NA | 23.00 | 3.04 | NA | NA | 0.00 | 0.00 | NA | |
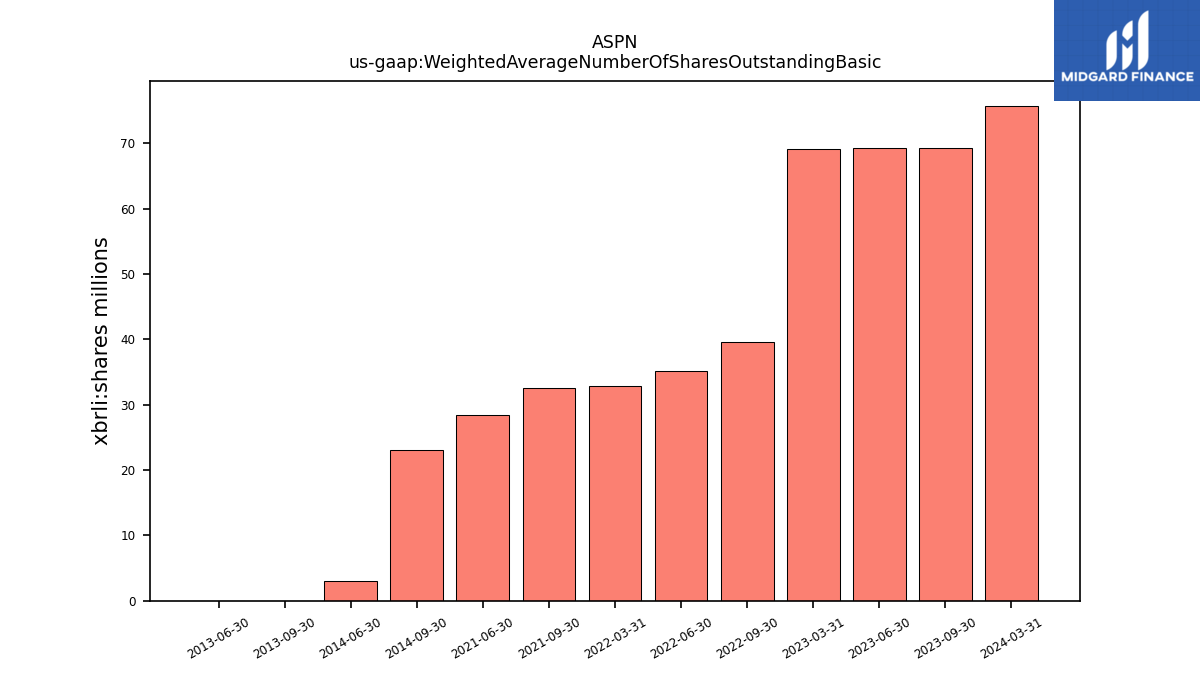
| Weighted Average Number Of Shares Outstanding Basic | 69.32 | 69.25 | 69.16 | NA | 39.53 | 35.21 | 32.94 | NA | 32.52 | 28.50 | NA | NA | NA | NA | NA | NA | NA | NA | NA | NA | NA | NA | NA | NA | NA | NA | NA | NA | NA | NA | NA | NA | NA | NA | NA | NA | 23.00 | 3.04 | NA | NA | 0.00 | 0.00 | NA | |
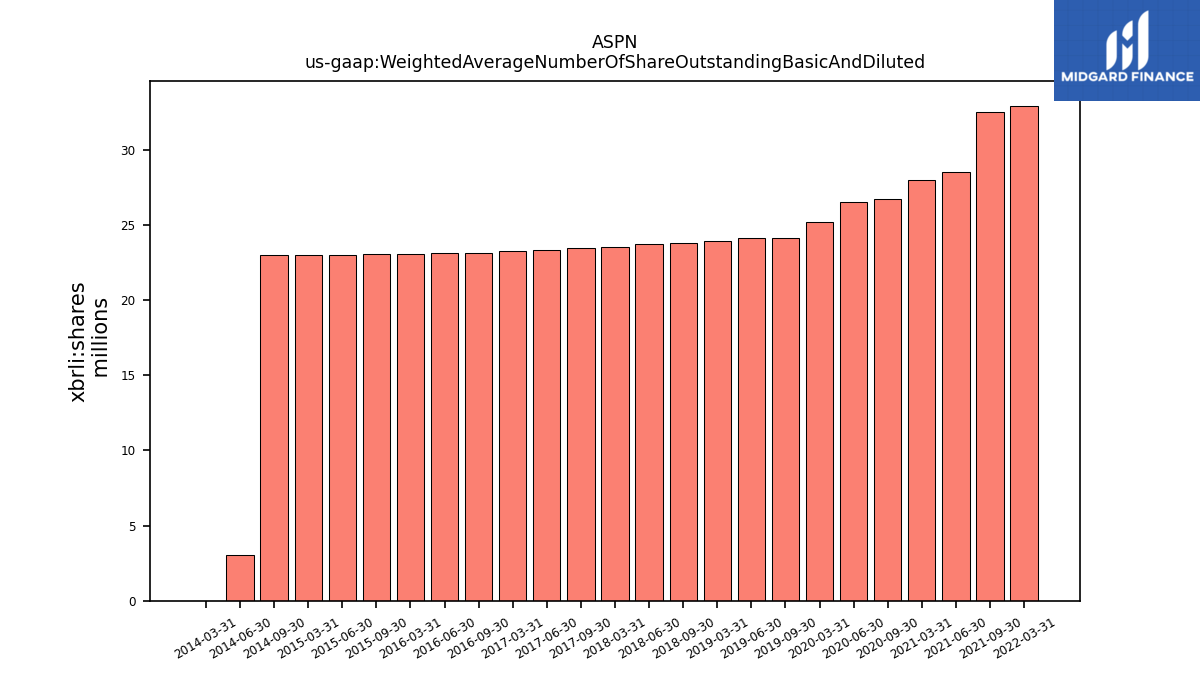
| Weighted Average Number Of Share Outstanding Basic And Diluted | NA | NA | NA | NA | NA | NA | 32.94 | NA | 32.52 | 28.50 | 27.98 | NA | 26.73 | 26.52 | 25.19 | NA | 24.17 | 24.12 | 23.93 | NA | 23.81 | 23.74 | 23.57 | NA | 23.44 | 23.37 | 23.26 | NA | 23.17 | 23.11 | 23.06 | NA | 23.06 | 23.00 | 22.99 | NA | 23.00 | 3.04 | 0.00 | NA | NA | NA | NA | |
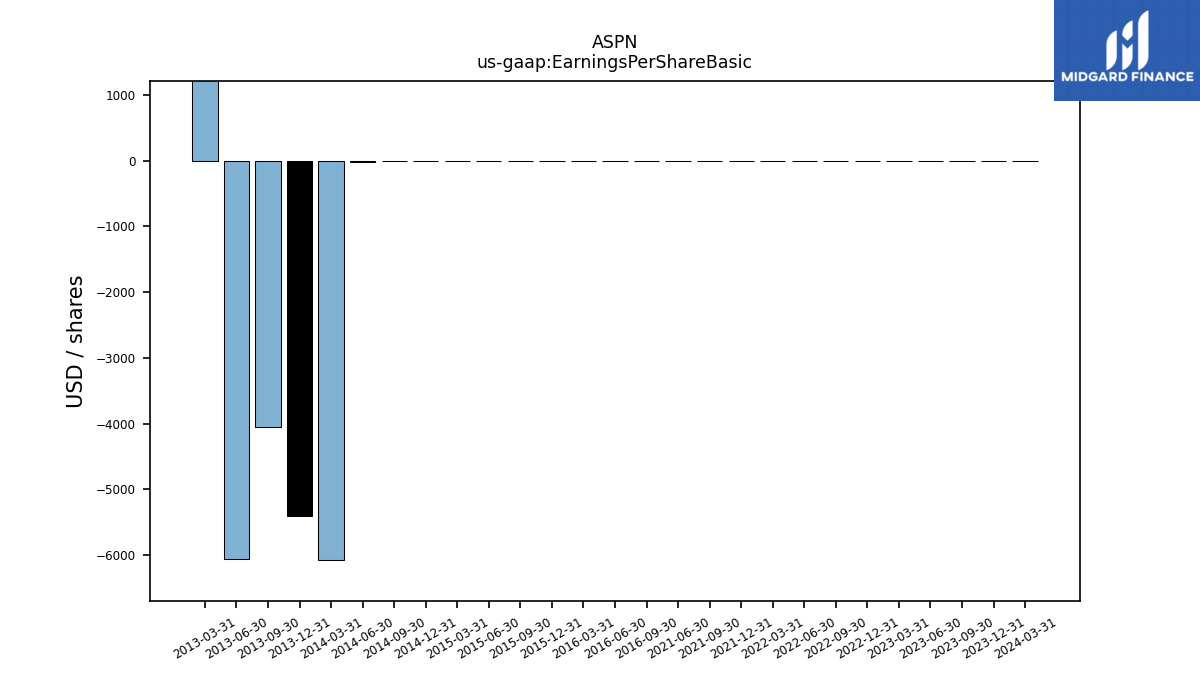
| Earnings Per Share Basic | -0.19 | -0.22 | -0.24 | -0.07 | -0.75 | -0.68 | -0.59 | -0.52 | -0.24 | -0.23 | NA | NA | NA | NA | NA | NA | NA | NA | NA | NA | NA | NA | NA | NA | NA | NA | NA | NA | -0.13 | -0.06 | -0.08 | 0.07 | -0.11 | -0.12 | -0.12 | -0.12 | -0.10 | -13.88 | -6065.89 | -5403.25 | -4049.41 | -6051.64 | 6455.53 | |
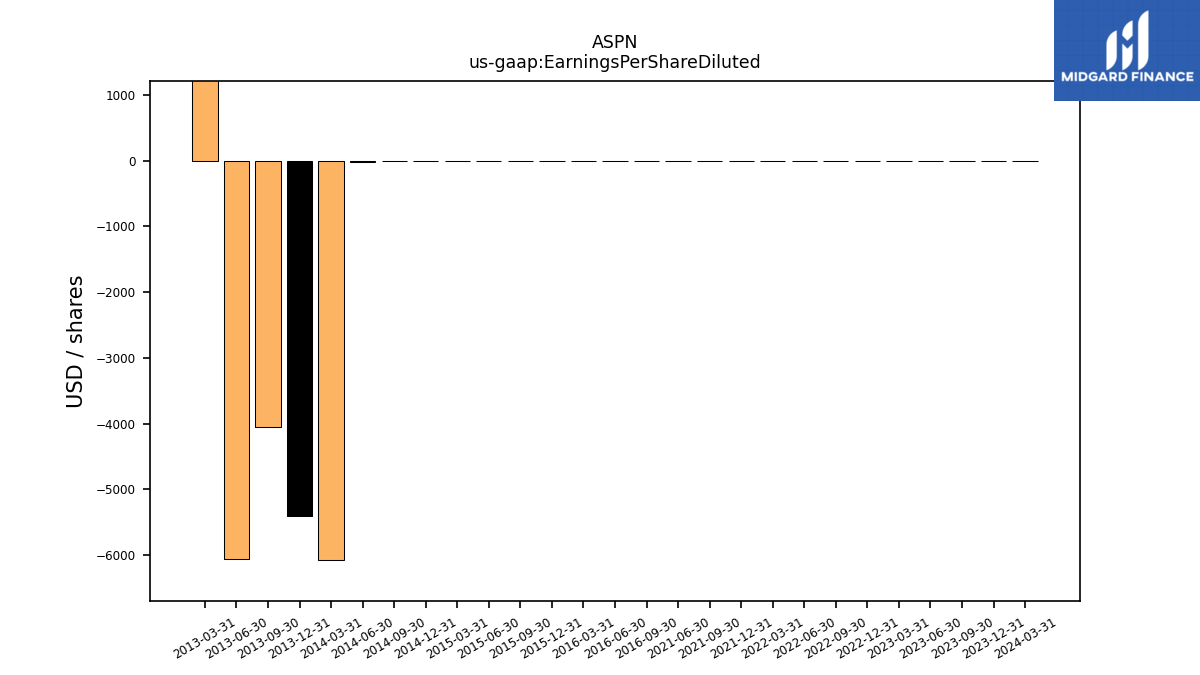
| Earnings Per Share Diluted | -0.19 | -0.22 | -0.24 | -0.07 | -0.75 | -0.68 | -0.59 | -0.52 | -0.24 | -0.23 | NA | NA | NA | NA | NA | NA | NA | NA | NA | NA | NA | NA | NA | NA | NA | NA | NA | NA | -0.13 | -0.06 | -0.08 | 0.07 | -0.11 | -0.12 | -0.12 | -0.12 | -0.10 | -13.88 | -6065.89 | -5403.25 | -4049.41 | -6051.64 | 6455.21 | |
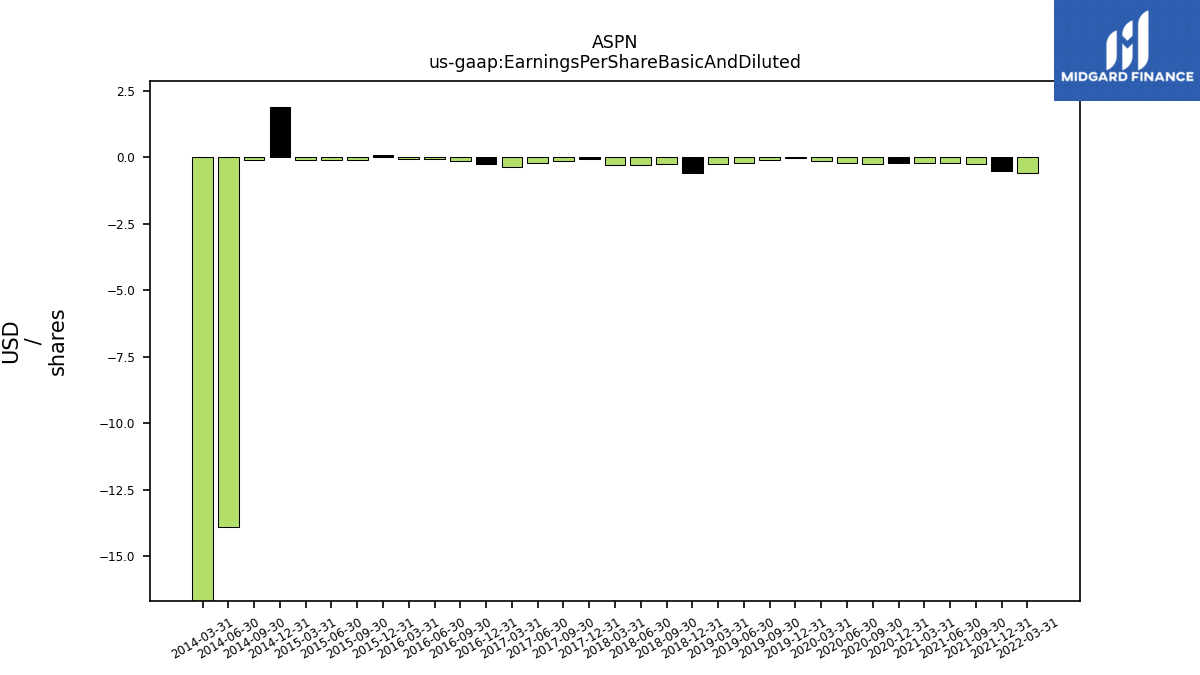
| Earnings Per Share Basic And Diluted | NA | NA | NA | NA | NA | NA | -0.59 | -0.52 | -0.24 | -0.23 | -0.22 | -0.23 | -0.25 | -0.21 | -0.13 | -0.04 | -0.09 | -0.22 | -0.25 | -0.59 | -0.27 | -0.29 | -0.29 | -0.07 | -0.13 | -0.23 | -0.39 | -0.25 | -0.13 | -0.06 | -0.08 | 0.07 | -0.11 | -0.12 | -0.12 | 1.89 | -0.10 | -13.88 | -6066.56 | NA | NA | NA | NA |
| 2023-09-30 | 2023-06-30 | 2023-03-31 | 2022-12-31 | 2022-09-30 | 2022-06-30 | 2022-03-31 | 2021-12-31 | 2021-09-30 | 2021-06-30 | 2021-03-31 | 2020-12-31 | 2020-09-30 | 2020-06-30 | 2020-03-31 | 2019-12-31 | 2019-09-30 | 2019-06-30 | 2019-03-31 | 2018-12-31 | 2018-09-30 | 2018-06-30 | 2018-03-31 | 2017-12-31 | 2017-09-30 | 2017-06-30 | 2017-03-31 | 2016-12-31 | 2016-09-30 | 2016-06-30 | 2016-03-31 | 2015-12-31 | 2015-09-30 | 2015-06-30 | 2015-03-31 | 2014-12-31 | 2014-09-30 | 2014-06-30 | 2014-03-31 | 2013-12-31 | 2013-09-30 | 2013-06-30 | 2013-03-31 | ||
|---|---|---|---|---|---|---|---|---|---|---|---|---|---|---|---|---|---|---|---|---|---|---|---|---|---|---|---|---|---|---|---|---|---|---|---|---|---|---|---|---|---|---|---|---|
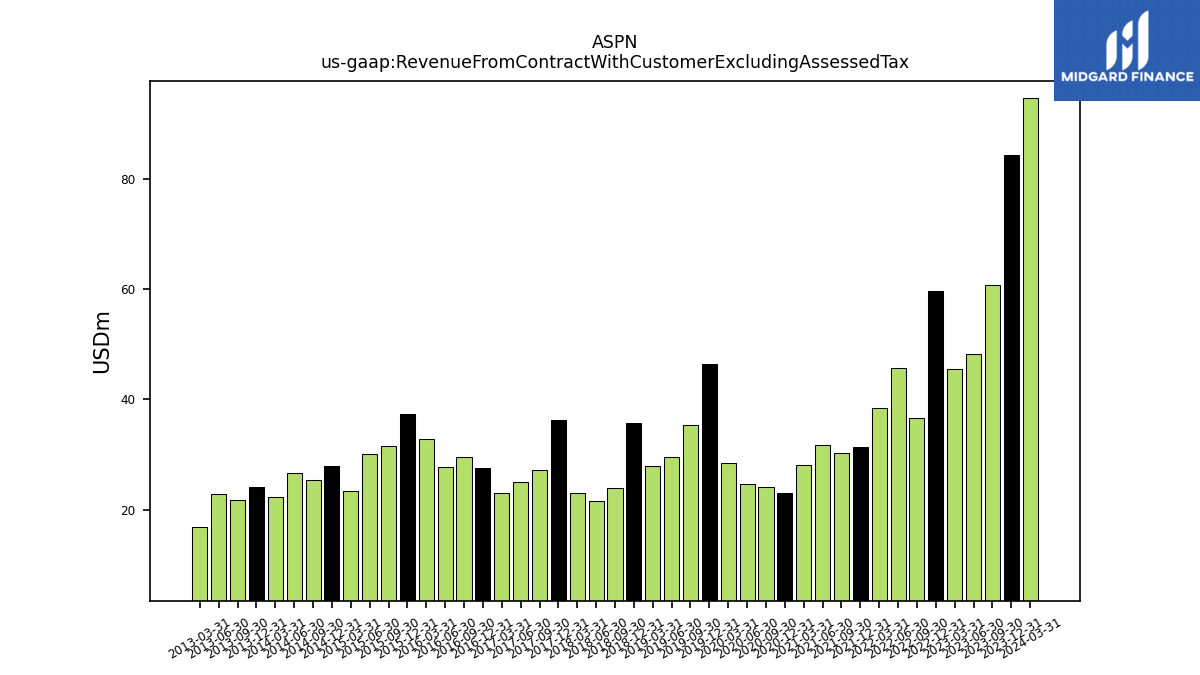
| Revenue From Contract With Customer Excluding Assessed Tax | 60.76 | 48.16 | 45.59 | 59.61 | 36.71 | 45.64 | 38.41 | 31.48 | 30.38 | 31.67 | 28.10 | 23.02 | 24.20 | 24.64 | 28.42 | 46.51 | 35.42 | 29.53 | 27.91 | 35.68 | 23.94 | 21.67 | 23.07 | 36.36 | 27.20 | 25.07 | 23.00 | 27.64 | 29.56 | 27.72 | 32.82 | 37.38 | 31.54 | 30.10 | 23.50 | 27.98 | 25.44 | 26.61 | 22.36 | 24.23 | 21.88 | 22.98 | 17.00 | |
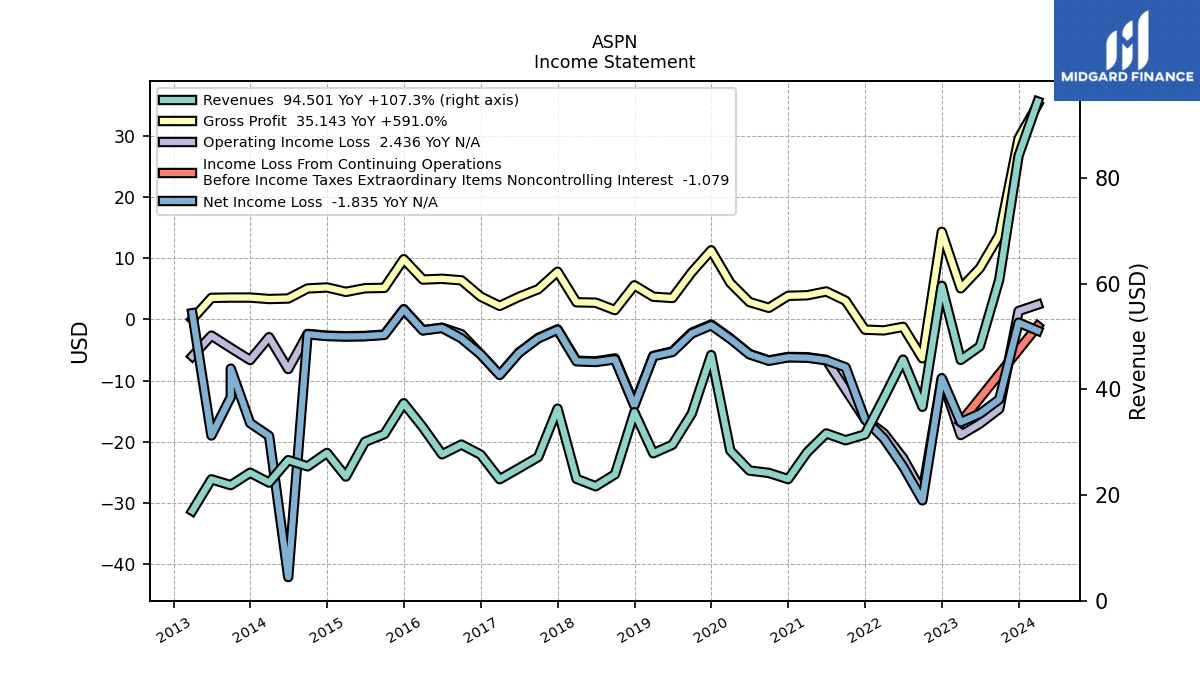
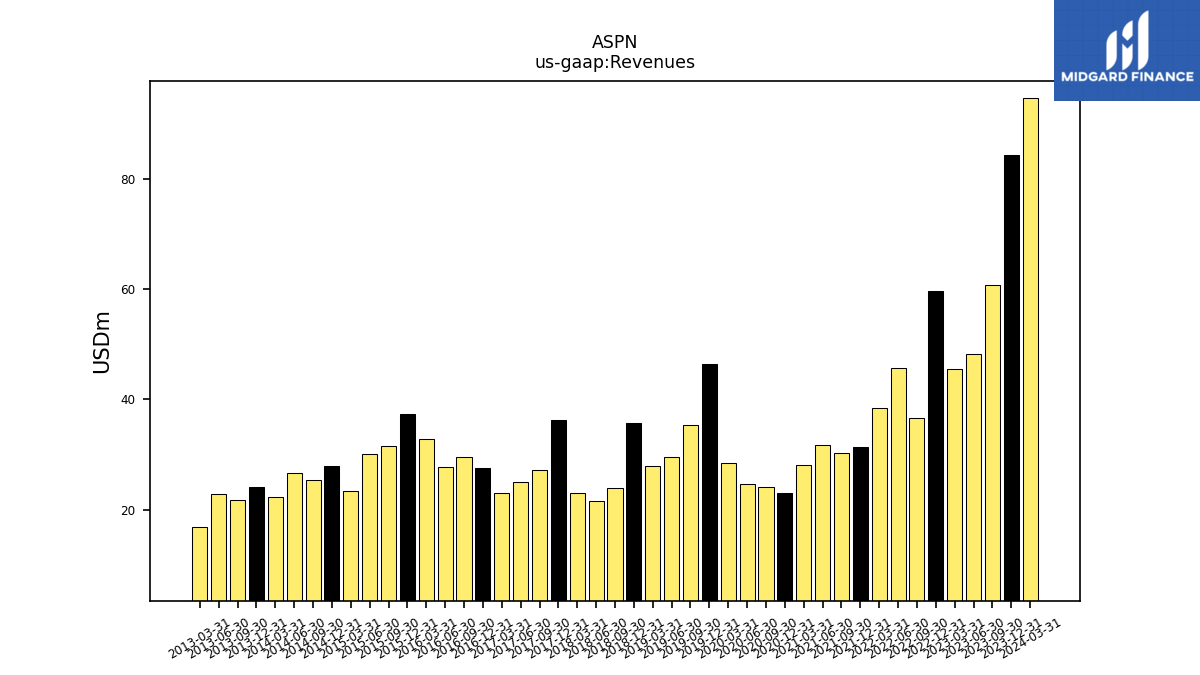
| Revenues | 60.76 | 48.16 | 45.59 | 59.61 | 36.71 | 45.64 | 38.41 | 31.48 | 30.38 | 31.67 | 28.10 | 23.02 | 24.20 | 24.64 | 28.42 | 46.51 | 35.42 | 29.53 | 27.91 | 35.68 | 23.94 | 21.67 | 23.07 | 36.36 | 27.20 | 25.07 | 23.00 | 27.64 | 29.56 | 27.72 | 32.82 | 37.38 | 31.54 | 30.10 | 23.50 | 27.98 | 25.44 | 26.61 | 22.36 | 24.23 | 21.88 | 22.98 | 17.00 | |
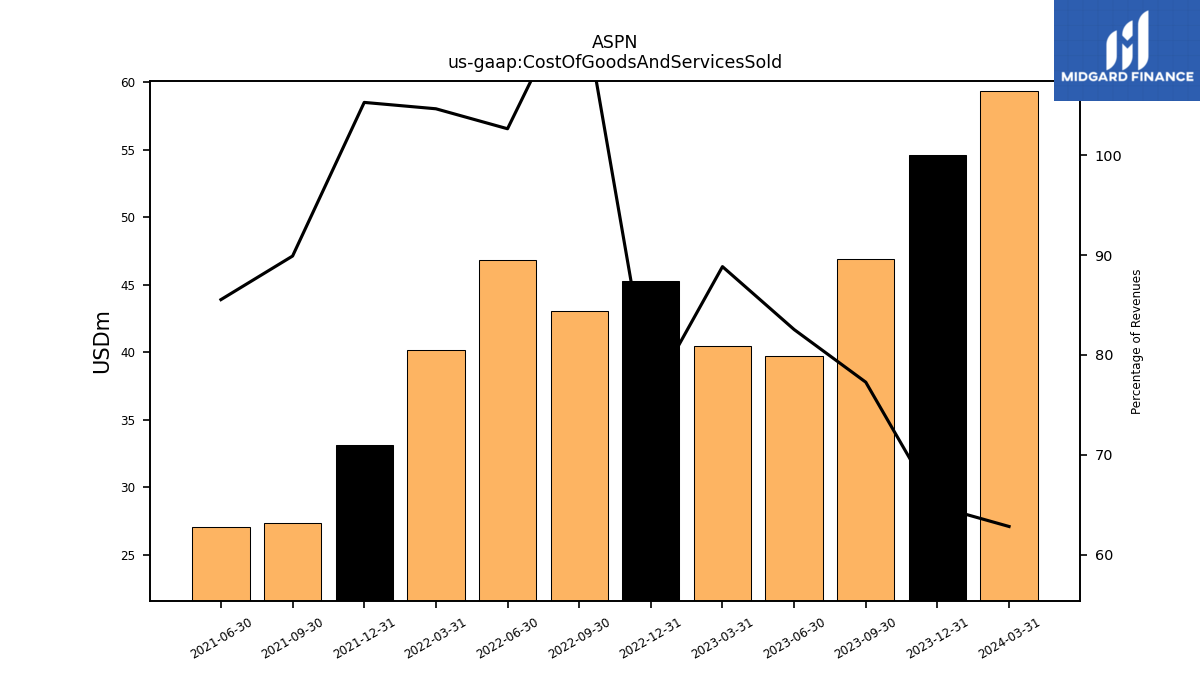
| Cost Of Goods And Services Sold | 46.95 | 39.75 | 40.50 | 45.28 | 43.06 | 46.85 | 40.20 | 33.14 | 27.31 | 27.09 | NA | NA | NA | NA | NA | NA | NA | NA | NA | NA | NA | NA | NA | NA | NA | NA | NA | NA | NA | NA | NA | NA | NA | NA | NA | NA | NA | NA | NA | NA | NA | NA | NA | |
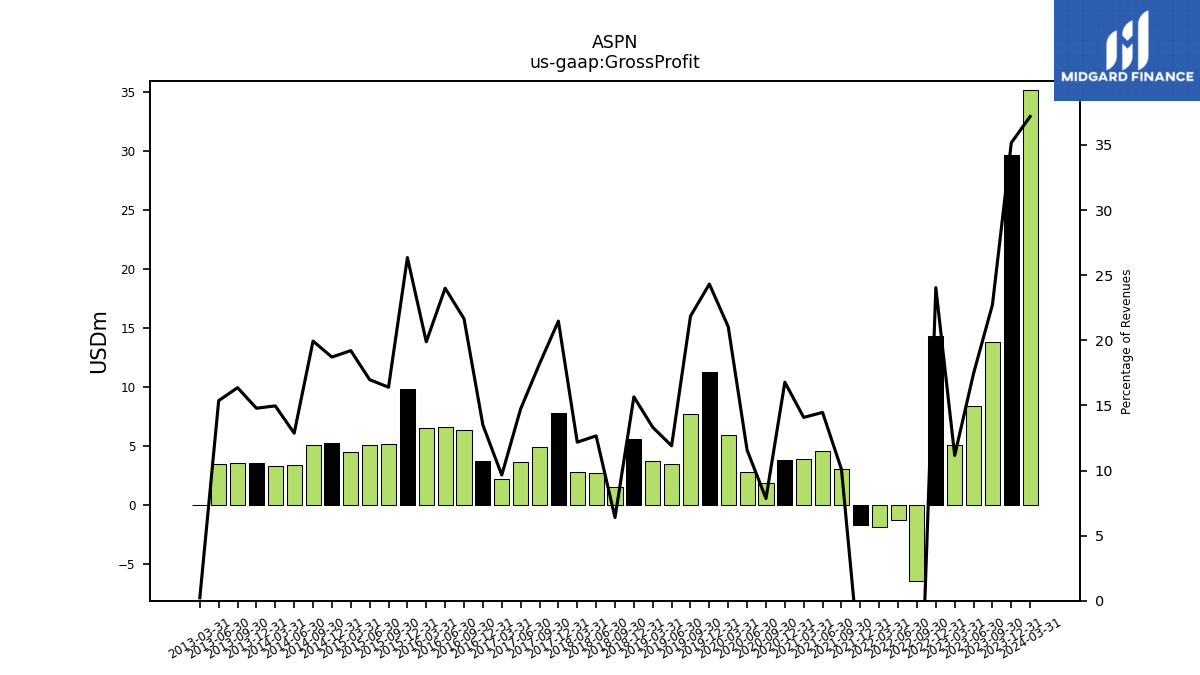
| Gross Profit | 13.81 | 8.41 | 5.09 | 14.33 | -6.36 | -1.21 | -1.79 | -1.67 | 3.07 | 4.58 | 3.96 | 3.86 | 1.90 | 2.85 | 5.98 | 11.31 | 7.74 | 3.51 | 3.72 | 5.59 | 1.53 | 2.74 | 2.81 | 7.81 | 4.95 | 3.69 | 2.22 | 3.73 | 6.40 | 6.65 | 6.53 | 9.85 | 5.17 | 5.11 | 4.51 | 5.24 | 5.07 | 3.42 | 3.35 | 3.58 | 3.58 | 3.53 | 0.04 | |
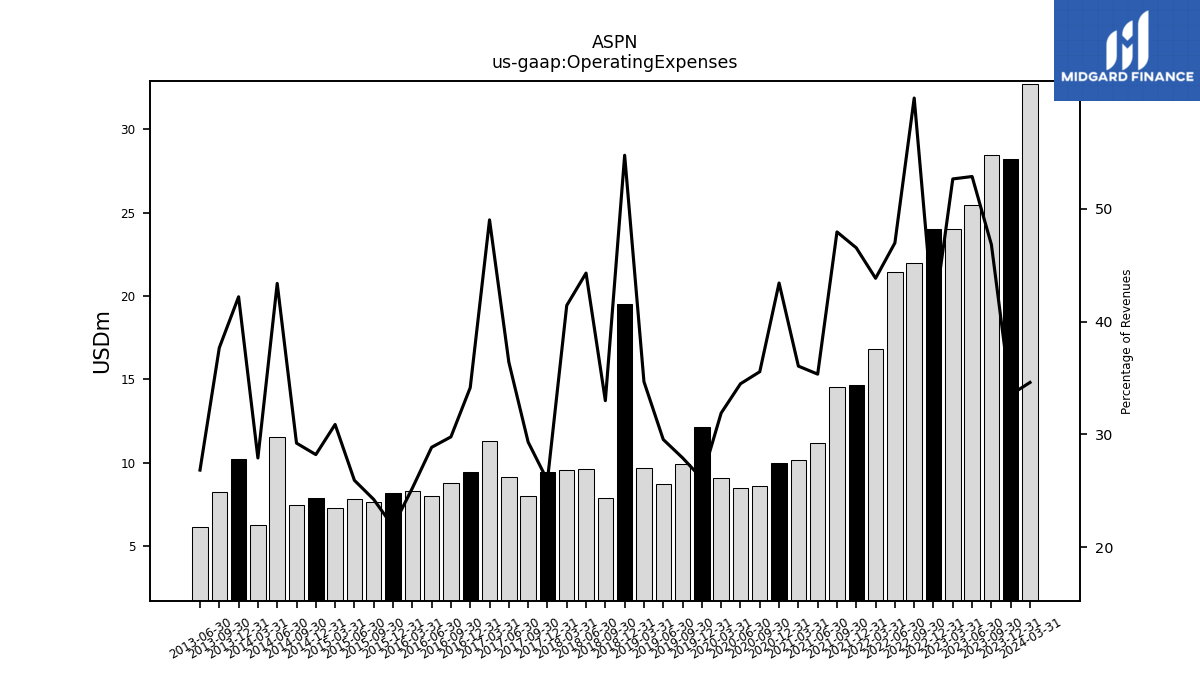
| Operating Expenses | 28.44 | 25.45 | 23.99 | 24.00 | 21.95 | 21.43 | 16.84 | 14.65 | 14.56 | 11.19 | 10.13 | 9.99 | 8.60 | 8.50 | 9.07 | 12.14 | 9.89 | 8.73 | 9.68 | 19.53 | 7.90 | 9.60 | 9.56 | 9.43 | 7.98 | 9.13 | 11.27 | 9.44 | 8.81 | 8.00 | 8.29 | 8.17 | 7.65 | 7.81 | 7.26 | 7.90 | 7.44 | 11.55 | 6.24 | 10.22 | 8.24 | 6.17 | NA | |
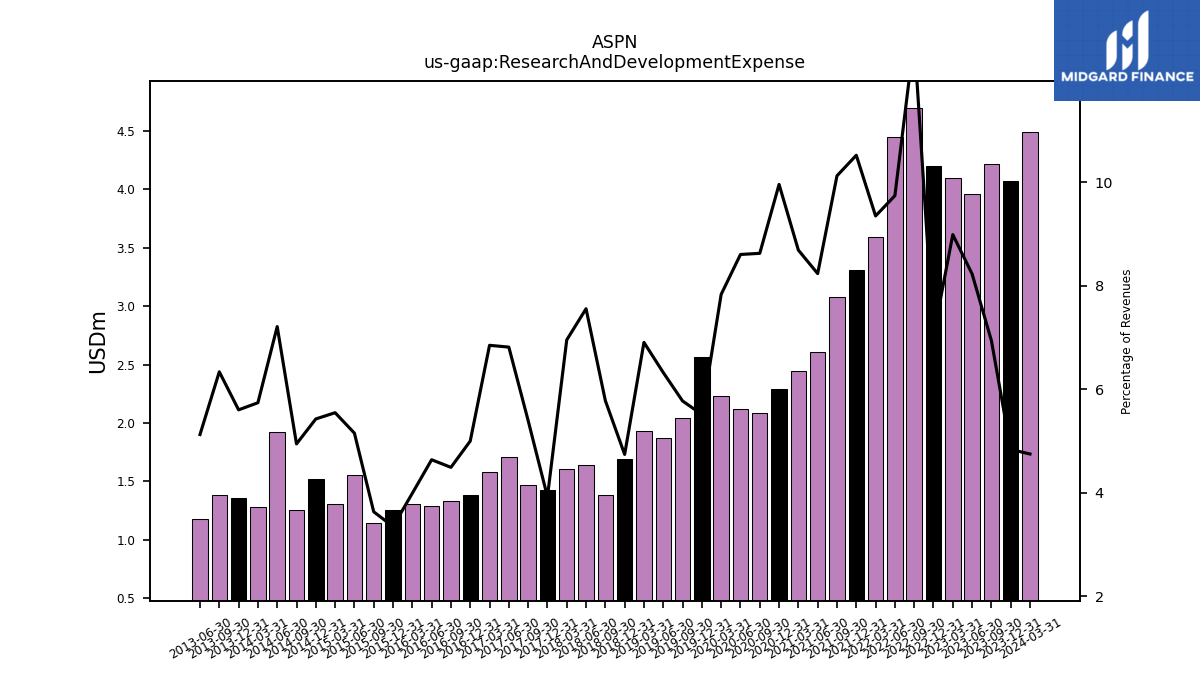
| Research And Development Expense | 4.22 | 3.96 | 4.10 | 4.20 | 4.69 | 4.45 | 3.59 | 3.31 | 3.08 | 2.61 | 2.44 | 2.29 | 2.09 | 2.12 | 2.23 | 2.56 | 2.05 | 1.87 | 1.93 | 1.69 | 1.38 | 1.64 | 1.60 | 1.43 | 1.47 | 1.71 | 1.58 | 1.38 | 1.33 | 1.29 | 1.31 | 1.25 | 1.15 | 1.55 | 1.30 | 1.52 | 1.26 | 1.92 | 1.28 | 1.36 | 1.39 | 1.18 | NA | |
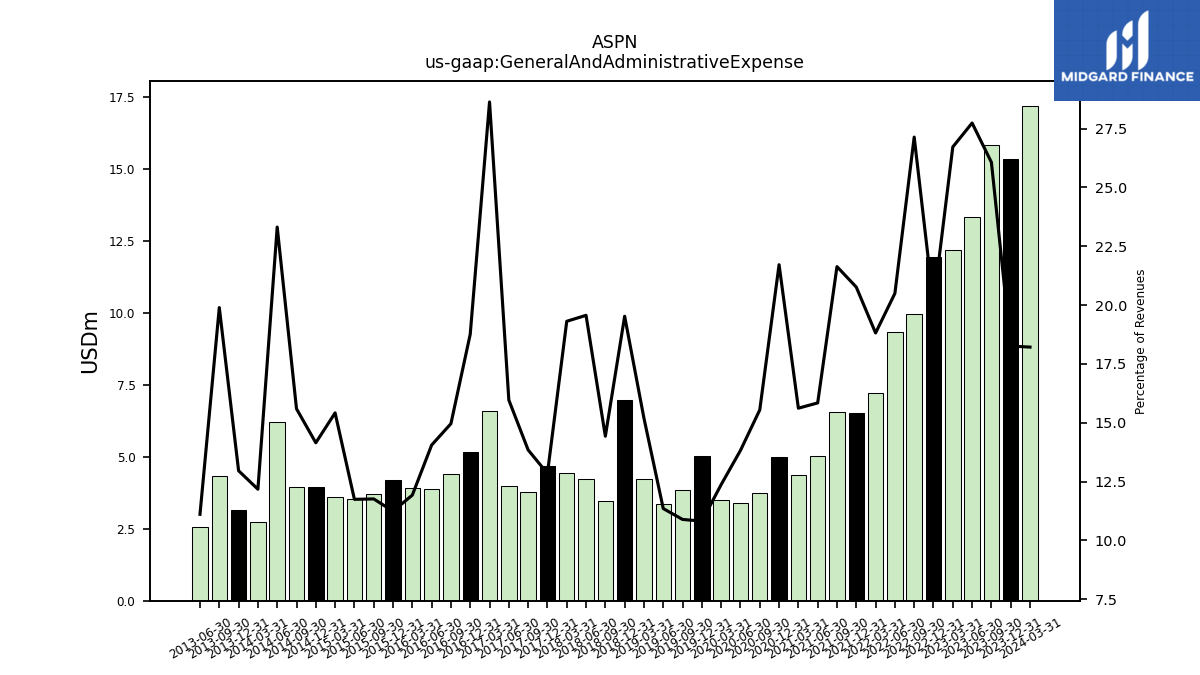
| General And Administrative Expense | 15.84 | 13.36 | 12.18 | 11.96 | 9.96 | 9.36 | 7.23 | 6.54 | 6.57 | 5.02 | 4.39 | 5.00 | 3.76 | 3.41 | 3.52 | 5.03 | 3.86 | 3.35 | 4.24 | 6.97 | 3.45 | 4.24 | 4.46 | 4.67 | 3.77 | 4.00 | 6.59 | 5.19 | 4.42 | 3.89 | 3.91 | 4.20 | 3.71 | 3.53 | 3.62 | 3.96 | 3.97 | 6.21 | 2.72 | 3.14 | 4.35 | 2.55 | NA | |
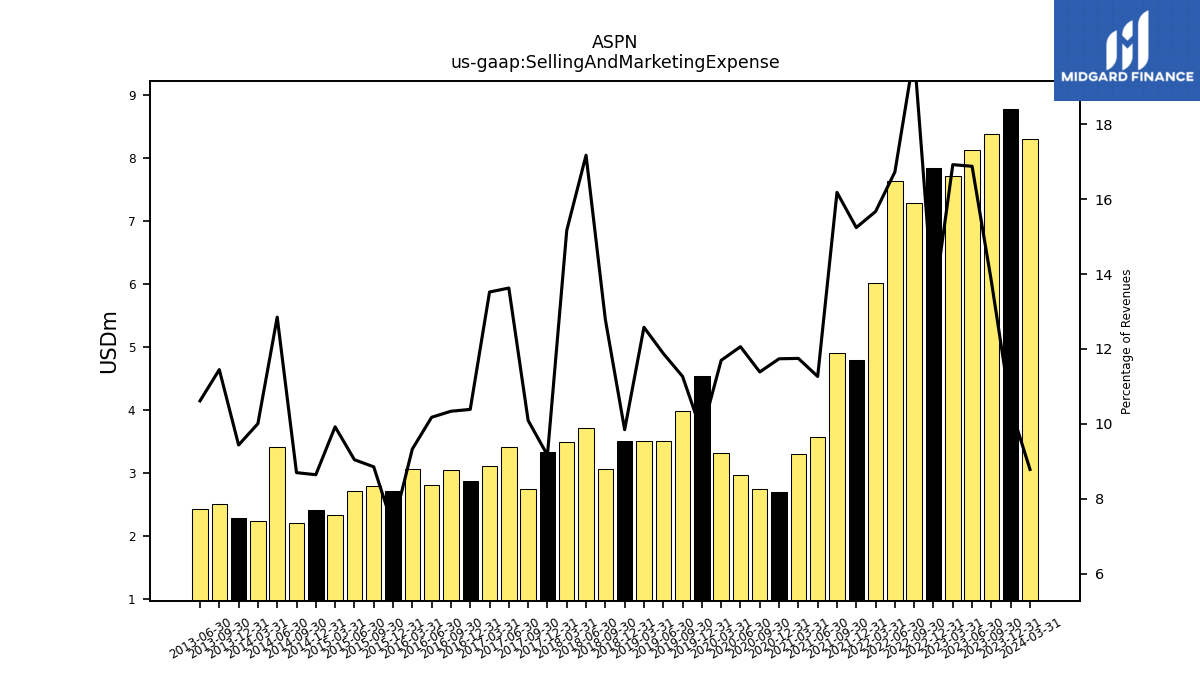
| Selling And Marketing Expense | 8.39 | 8.13 | 7.71 | 7.85 | 7.29 | 7.63 | 6.02 | 4.80 | 4.92 | 3.57 | 3.30 | 2.70 | 2.75 | 2.97 | 3.32 | 4.54 | 3.99 | 3.51 | 3.51 | 3.51 | 3.06 | 3.72 | 3.50 | 3.33 | 2.75 | 3.42 | 3.11 | 2.87 | 3.06 | 2.82 | 3.06 | 2.71 | 2.79 | 2.72 | 2.33 | 2.42 | 2.21 | 3.42 | 2.24 | 2.29 | 2.50 | 2.44 | NA | |
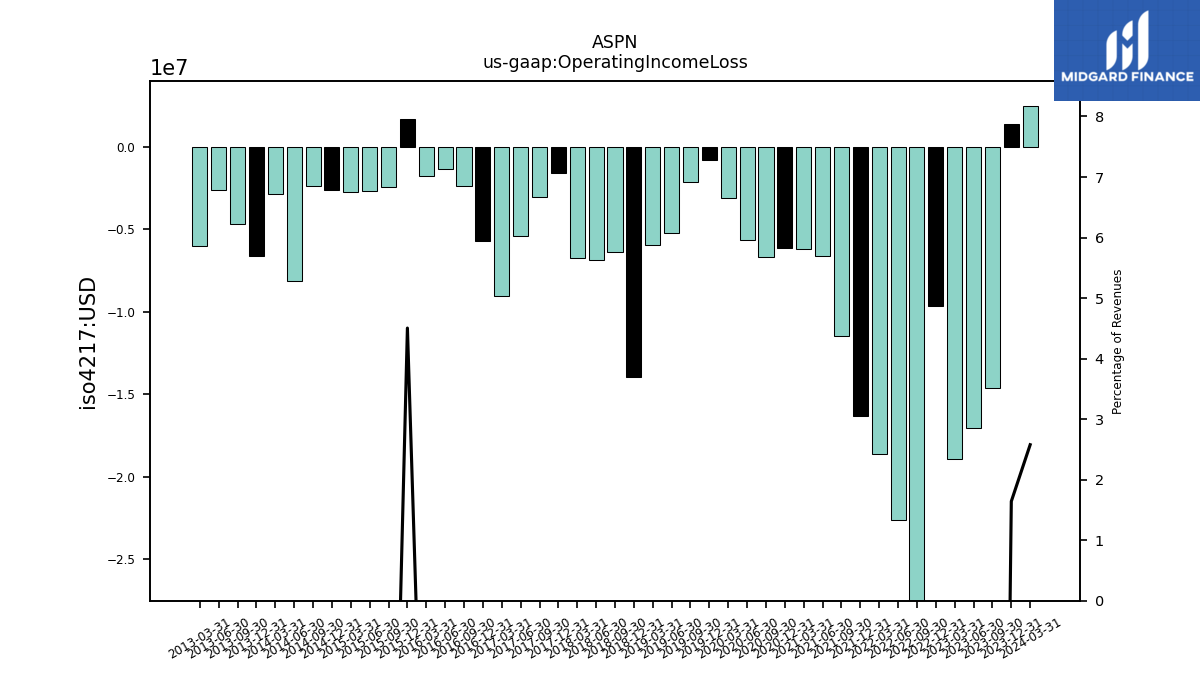
| Operating Income Loss | -14.63 | -17.04 | -18.91 | -9.67 | -28.31 | -22.65 | -18.62 | -16.31 | -11.50 | -6.61 | -6.17 | -6.13 | -6.70 | -5.65 | -3.09 | -0.83 | -2.15 | -5.21 | -5.96 | -13.94 | -6.37 | -6.86 | -6.75 | -1.62 | -3.03 | -5.43 | -9.05 | -5.71 | -2.40 | -1.35 | -1.76 | 1.68 | -2.48 | -2.70 | -2.75 | -2.66 | -2.37 | -8.12 | -2.90 | -6.64 | -4.67 | -2.64 | -6.03 | |
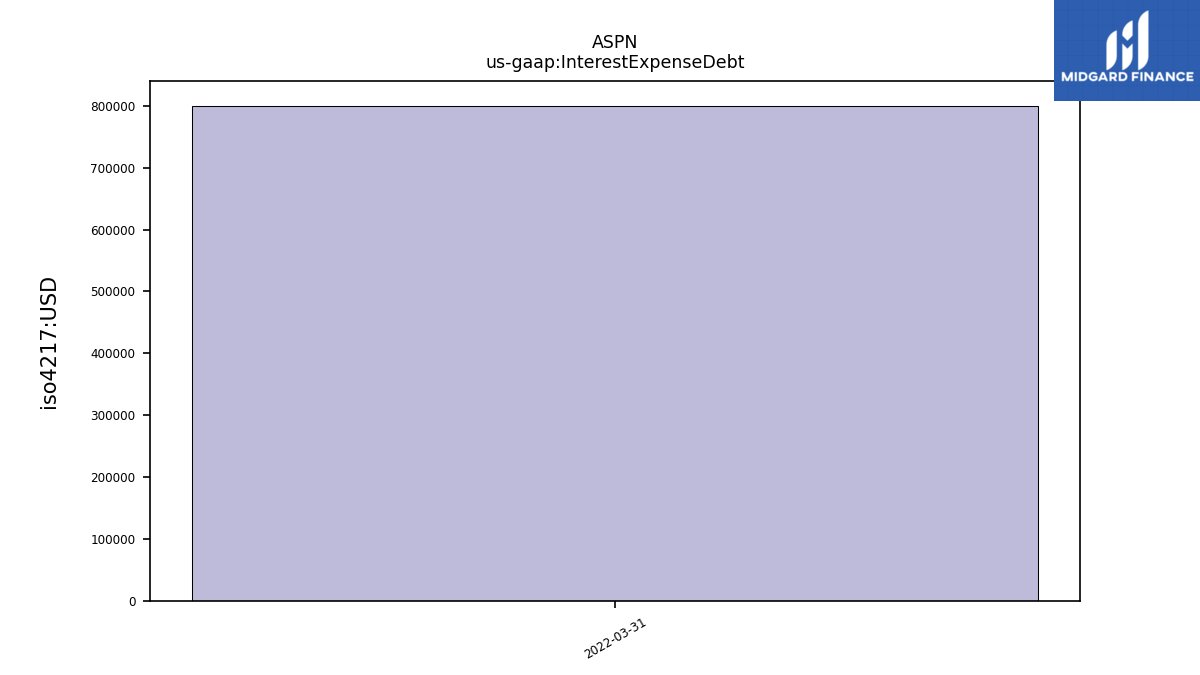
| Interest Expense Debt | NA | NA | NA | NA | NA | NA | 0.80 | NA | NA | NA | NA | NA | NA | NA | NA | NA | NA | NA | NA | NA | NA | NA | NA | NA | NA | NA | NA | NA | NA | NA | NA | NA | NA | NA | NA | NA | NA | NA | NA | NA | NA | NA | NA | |
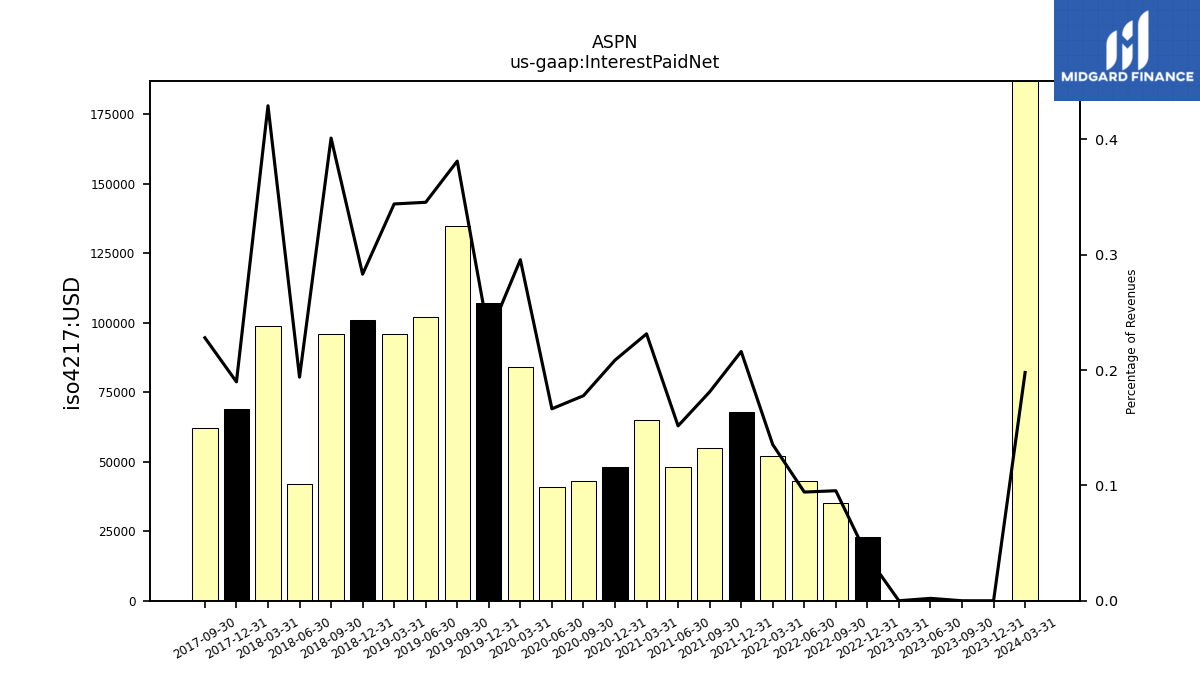
| Interest Paid Net | 0.00 | NA | NA | 0.02 | 0.04 | 0.04 | 0.05 | 0.07 | 0.06 | 0.05 | 0.07 | 0.05 | 0.04 | 0.04 | 0.08 | 0.11 | 0.14 | 0.10 | 0.10 | 0.10 | 0.10 | 0.04 | 0.10 | 0.07 | 0.06 | NA | NA | NA | NA | NA | NA | NA | NA | NA | NA | NA | NA | NA | NA | NA | NA | NA | NA | |
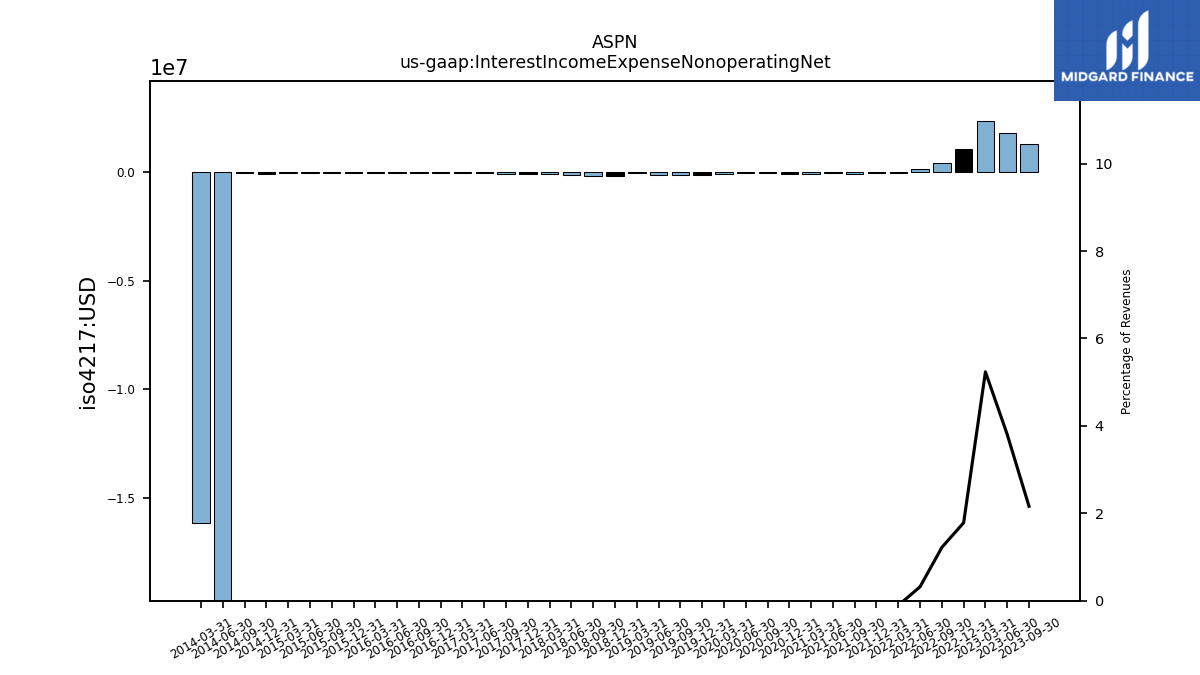
| Interest Income Expense Nonoperating Net | 1.31 | 1.83 | 2.39 | 1.06 | 0.45 | 0.15 | -0.04 | -0.04 | -0.06 | -0.06 | -0.07 | -0.06 | -0.05 | -0.05 | -0.08 | -0.13 | -0.14 | -0.10 | -0.04 | -0.17 | -0.16 | -0.10 | -0.09 | -0.06 | -0.06 | -0.04 | -0.03 | -0.03 | -0.04 | -0.04 | -0.04 | -0.05 | -0.05 | -0.04 | -0.04 | -0.10 | -0.05 | -34.03 | -16.15 | NA | NA | NA | NA | |
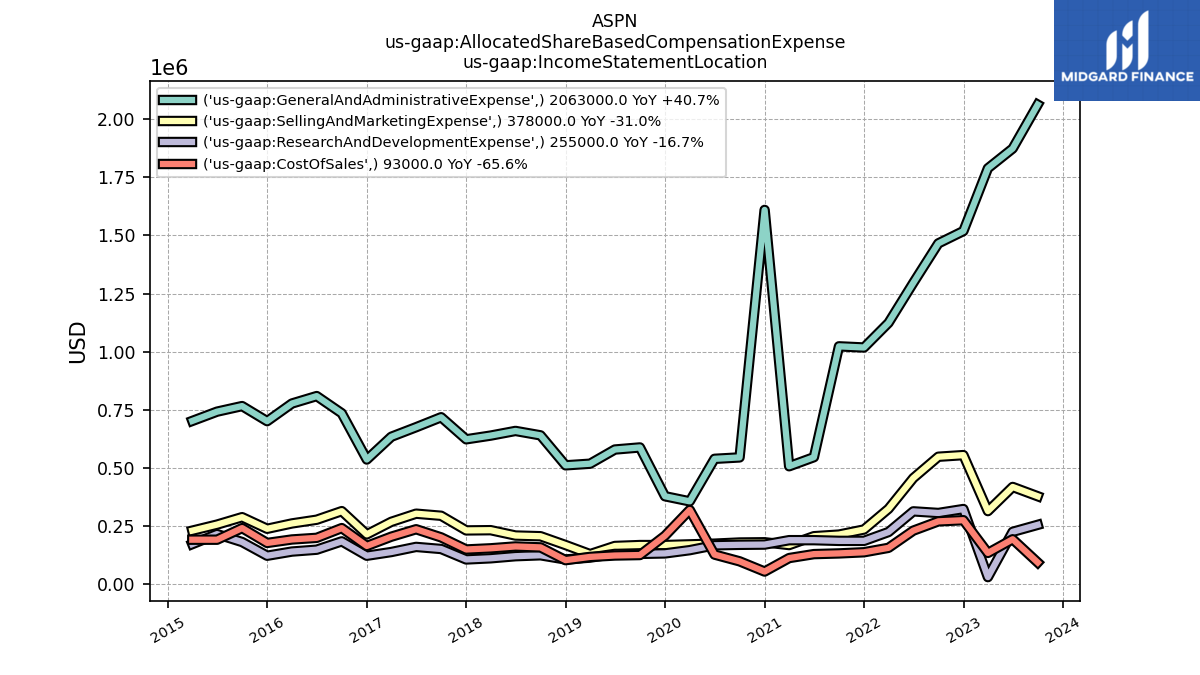
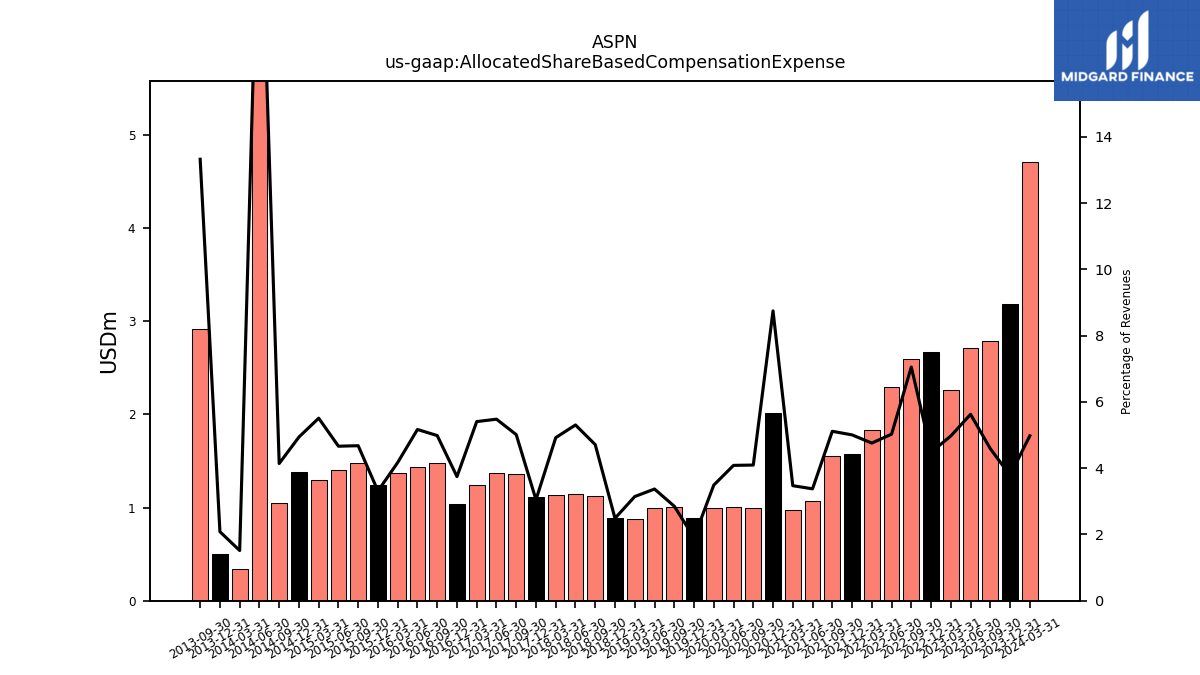
| Allocated Share Based Compensation Expense | 2.79 | 2.71 | 2.27 | 2.67 | 2.59 | 2.29 | 1.83 | 1.58 | 1.55 | 1.07 | 0.98 | 2.01 | 0.99 | 1.01 | 0.99 | 0.89 | 1.01 | 1.00 | 0.88 | 0.89 | 1.13 | 1.15 | 1.14 | 1.11 | 1.36 | 1.37 | 1.24 | 1.04 | 1.47 | 1.43 | 1.37 | 1.24 | 1.48 | 1.40 | 1.29 | 1.38 | 1.05 | 6.00 | 0.34 | 0.51 | 2.92 | NA | NA | |
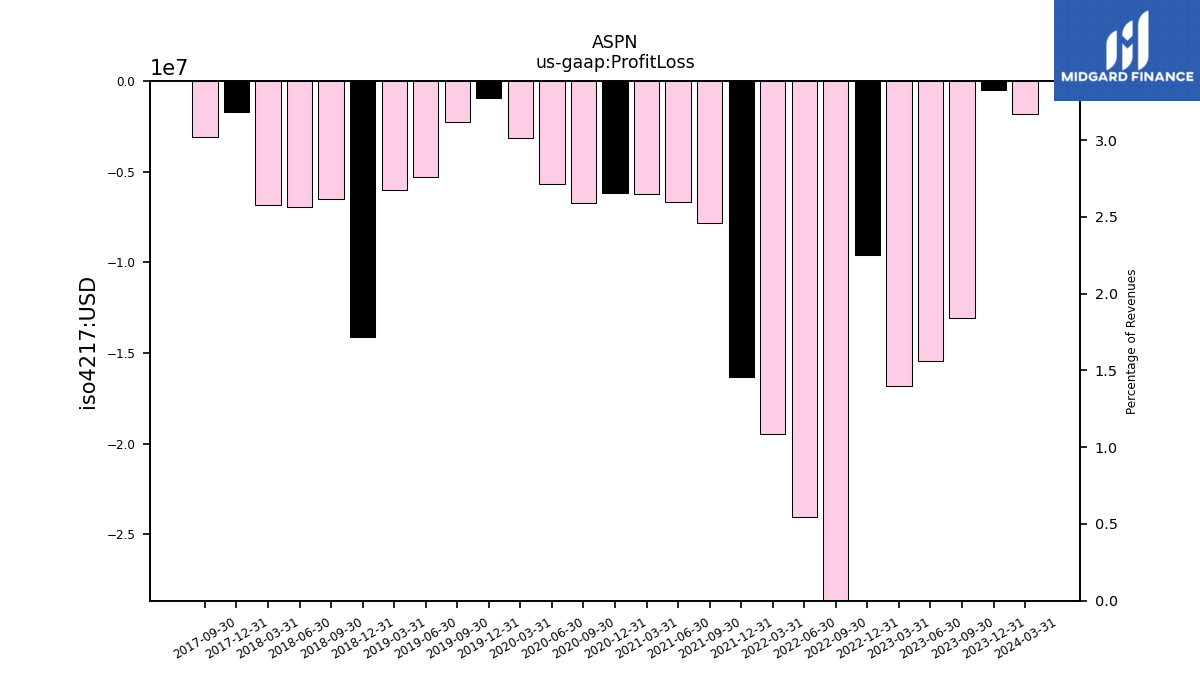
| Profit Loss | -13.07 | -15.42 | -16.80 | -9.61 | -29.59 | -24.05 | -19.48 | -16.35 | -7.82 | -6.67 | -6.25 | -6.19 | -6.75 | -5.70 | -3.17 | -0.96 | -2.29 | -5.32 | -6.00 | -14.11 | -6.53 | -6.96 | -6.84 | -1.68 | -3.09 | NA | NA | NA | NA | NA | NA | NA | NA | NA | NA | NA | NA | NA | NA | NA | NA | NA | NA | |
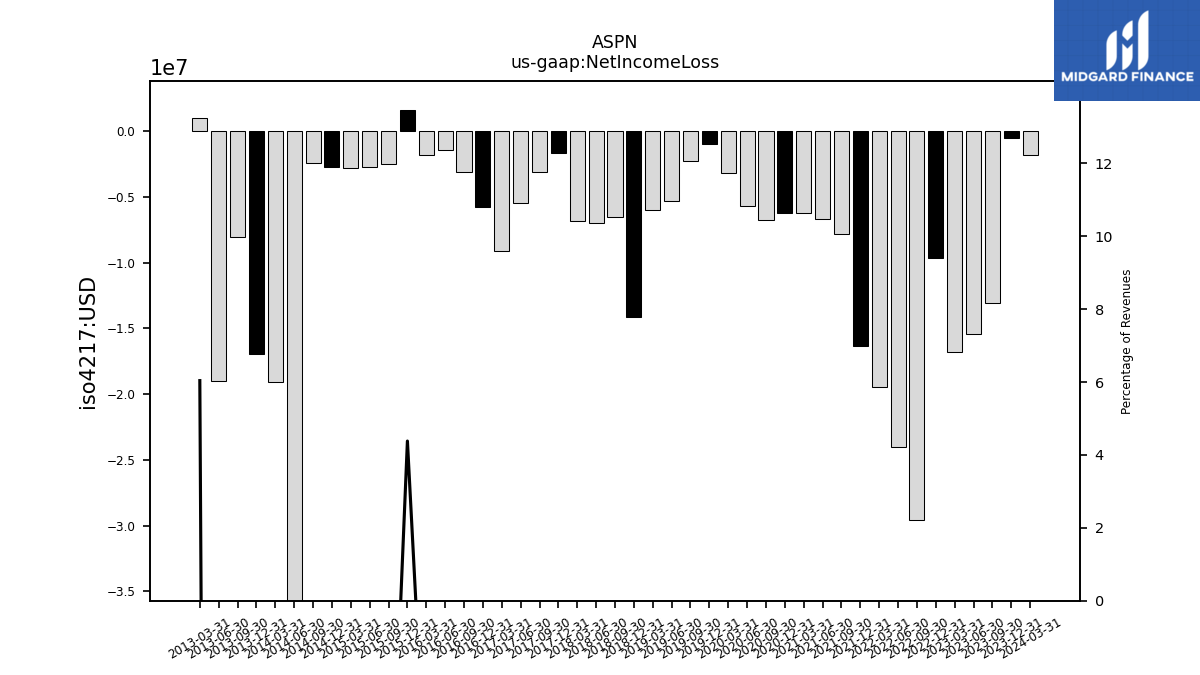
| Net Income Loss | -13.07 | -15.42 | -16.80 | -9.61 | -29.59 | -24.05 | -19.48 | -16.35 | -7.82 | -6.67 | -6.25 | -6.19 | -6.75 | -5.70 | -3.17 | -0.96 | -2.29 | -5.32 | -6.00 | -14.11 | -6.53 | -6.96 | -6.84 | -1.68 | -3.09 | -5.47 | -9.08 | -5.74 | -3.10 | -1.39 | -1.80 | 1.64 | -2.52 | -2.74 | -2.79 | -2.71 | -2.41 | -42.15 | -19.05 | -16.95 | -8.04 | -18.98 | 1.03 |
| 2023-09-30 | 2023-06-30 | 2023-03-31 | 2022-12-31 | 2022-09-30 | 2022-06-30 | 2022-03-31 | 2021-12-31 | 2021-09-30 | 2021-06-30 | 2021-03-31 | 2020-12-31 | 2020-09-30 | 2020-06-30 | 2020-03-31 | 2019-12-31 | 2019-09-30 | 2019-06-30 | 2019-03-31 | 2018-12-31 | 2018-09-30 | 2018-06-30 | 2018-03-31 | 2017-12-31 | 2017-09-30 | 2017-06-30 | 2017-03-31 | 2016-12-31 | 2016-09-30 | 2016-06-30 | 2016-03-31 | 2015-12-31 | 2015-09-30 | 2015-06-30 | 2015-03-31 | 2014-12-31 | 2014-09-30 | 2014-06-30 | 2014-03-31 | 2013-12-31 | 2013-09-30 | 2013-06-30 | 2013-03-31 | ||
|---|---|---|---|---|---|---|---|---|---|---|---|---|---|---|---|---|---|---|---|---|---|---|---|---|---|---|---|---|---|---|---|---|---|---|---|---|---|---|---|---|---|---|---|---|
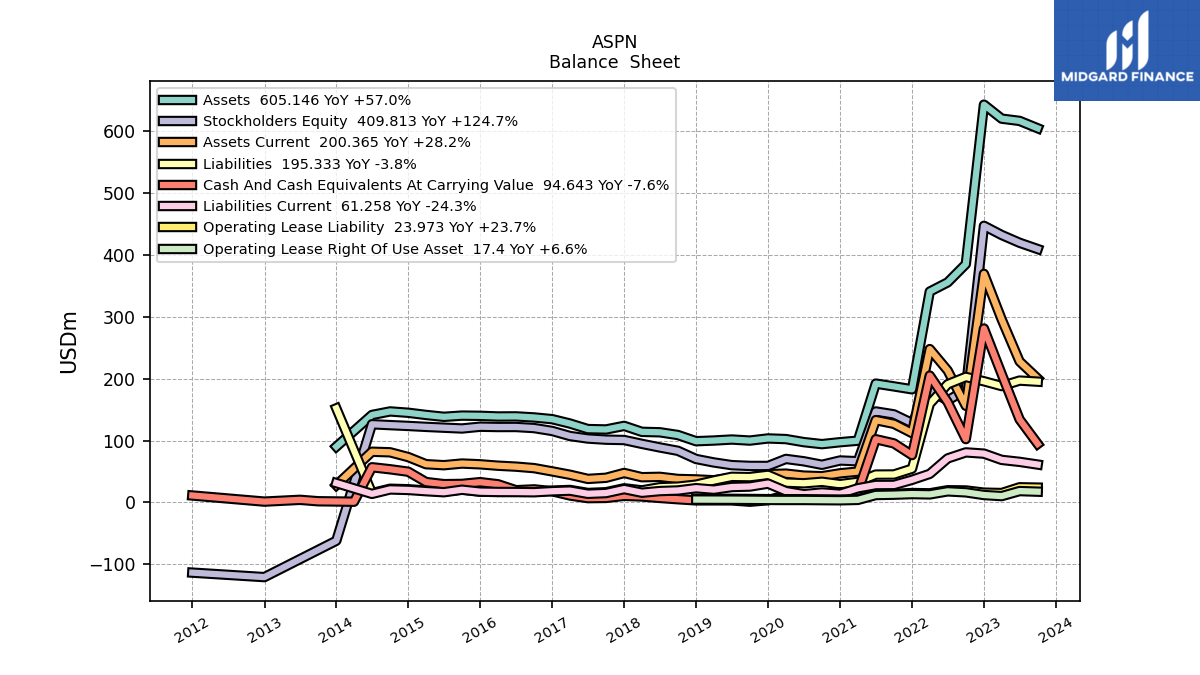
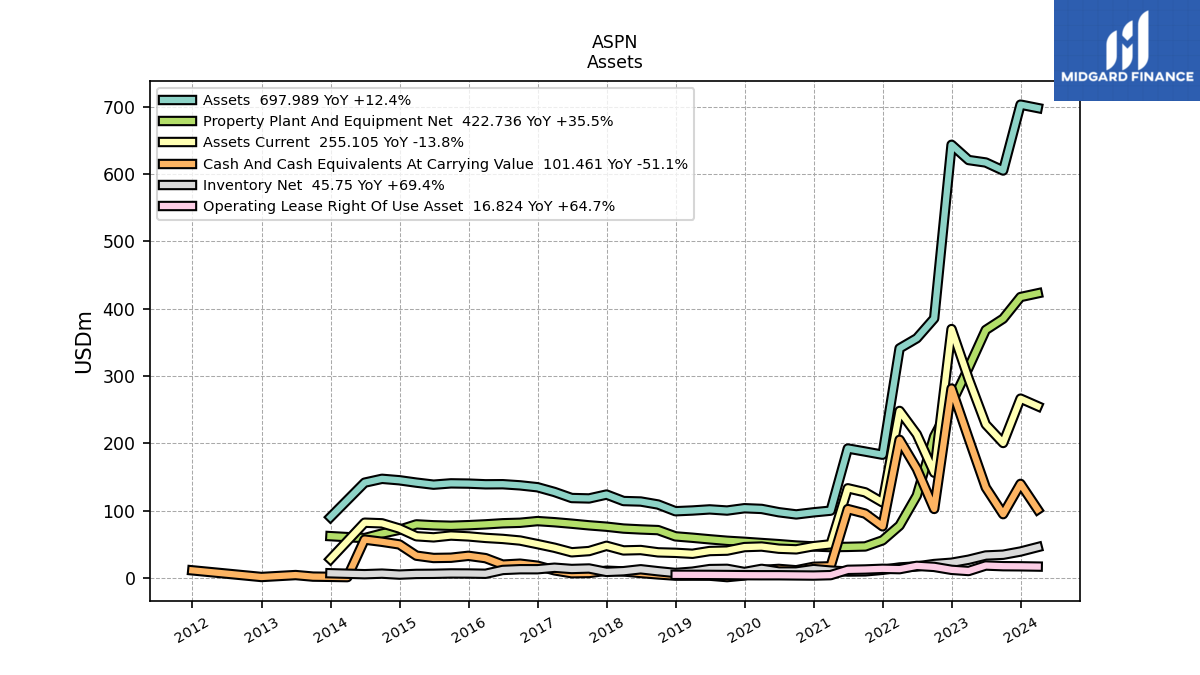
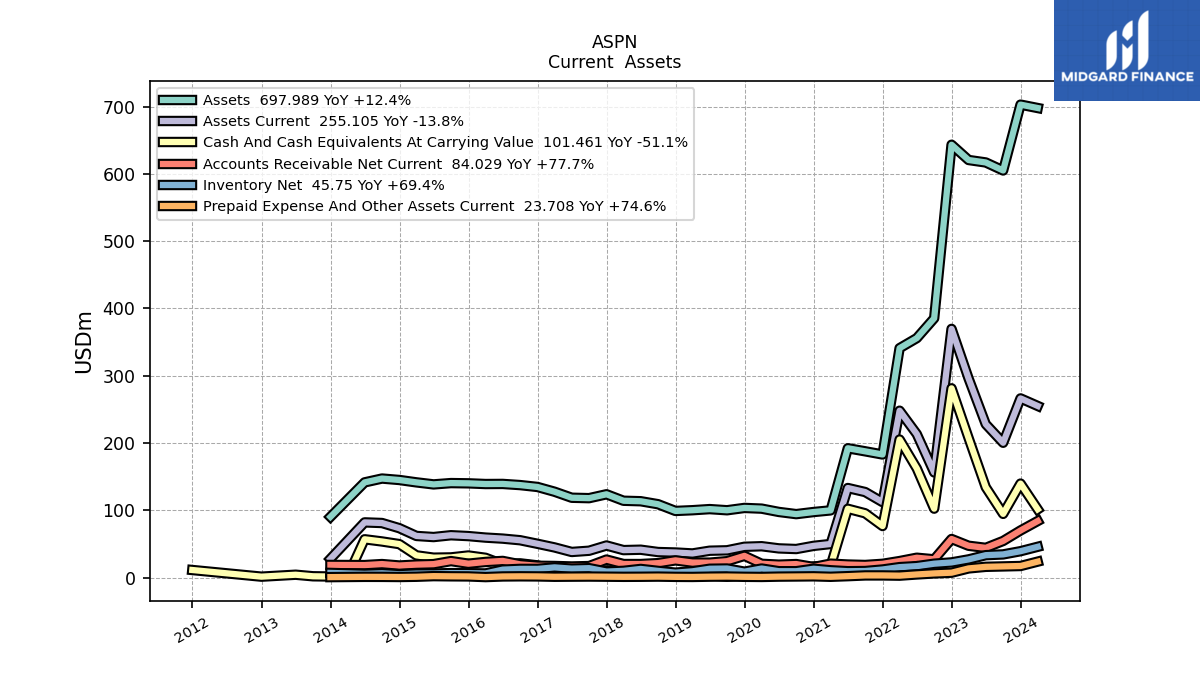
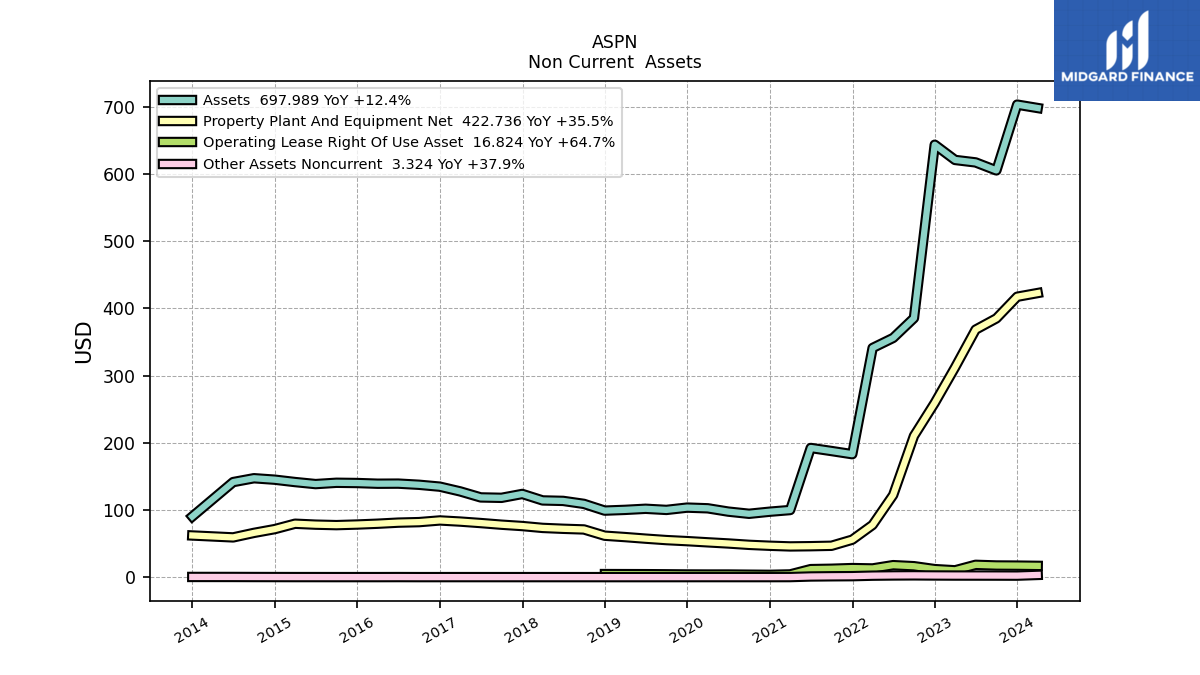
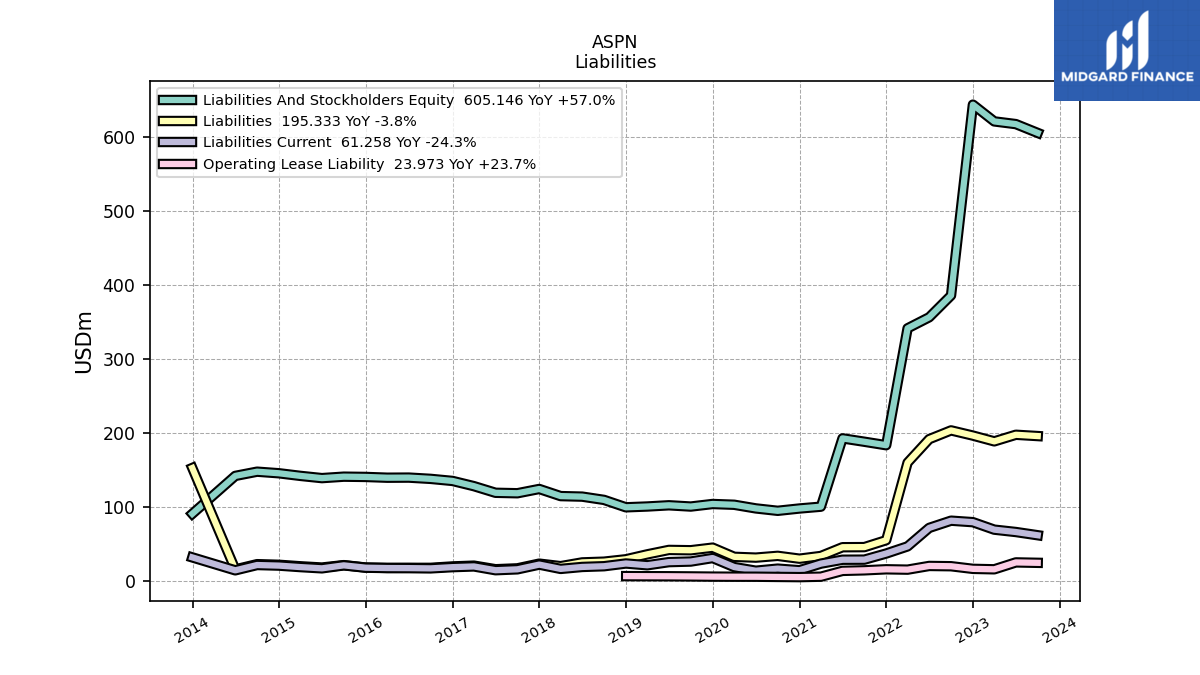
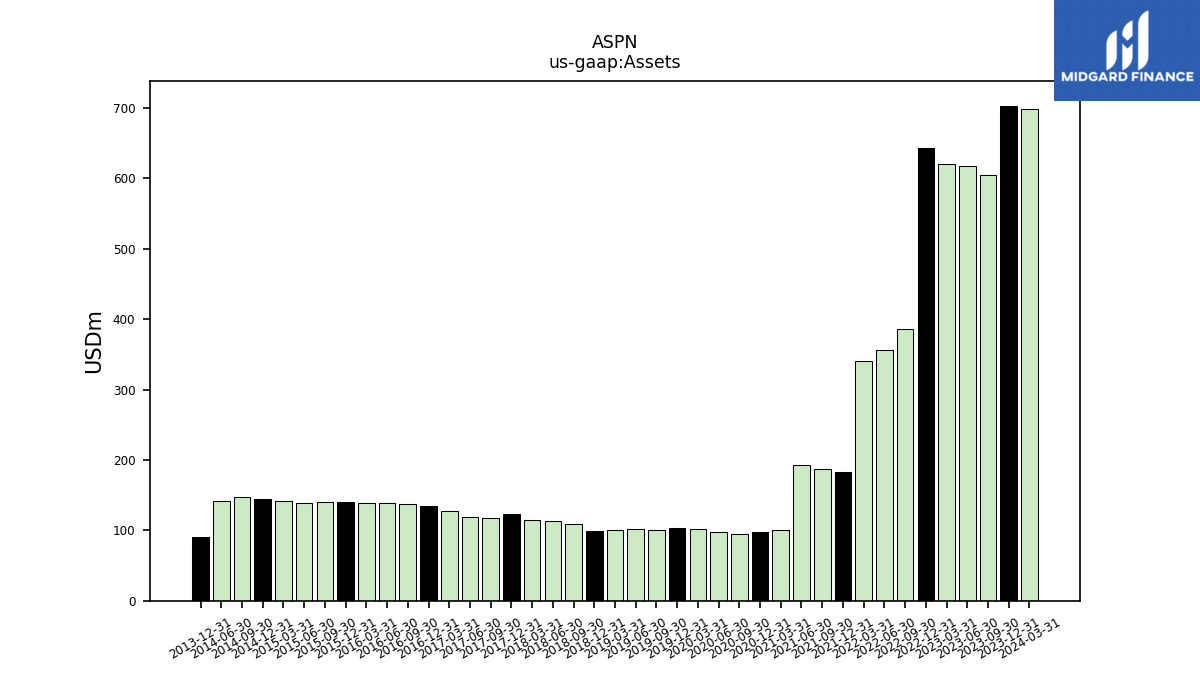
| Assets | 605.15 | 617.07 | 620.73 | 643.42 | 385.41 | 355.93 | 341.01 | 182.95 | 187.67 | 192.22 | 99.87 | 97.42 | 94.30 | 97.55 | 102.47 | 103.50 | 100.05 | 101.76 | 100.12 | 99.02 | 109.03 | 113.47 | 114.19 | 123.81 | 118.04 | 118.66 | 127.62 | 134.67 | 137.47 | 139.19 | 139.04 | 140.07 | 140.44 | 138.49 | 141.52 | 145.04 | 147.20 | 141.49 | NA | 90.23 | NA | NA | NA | |
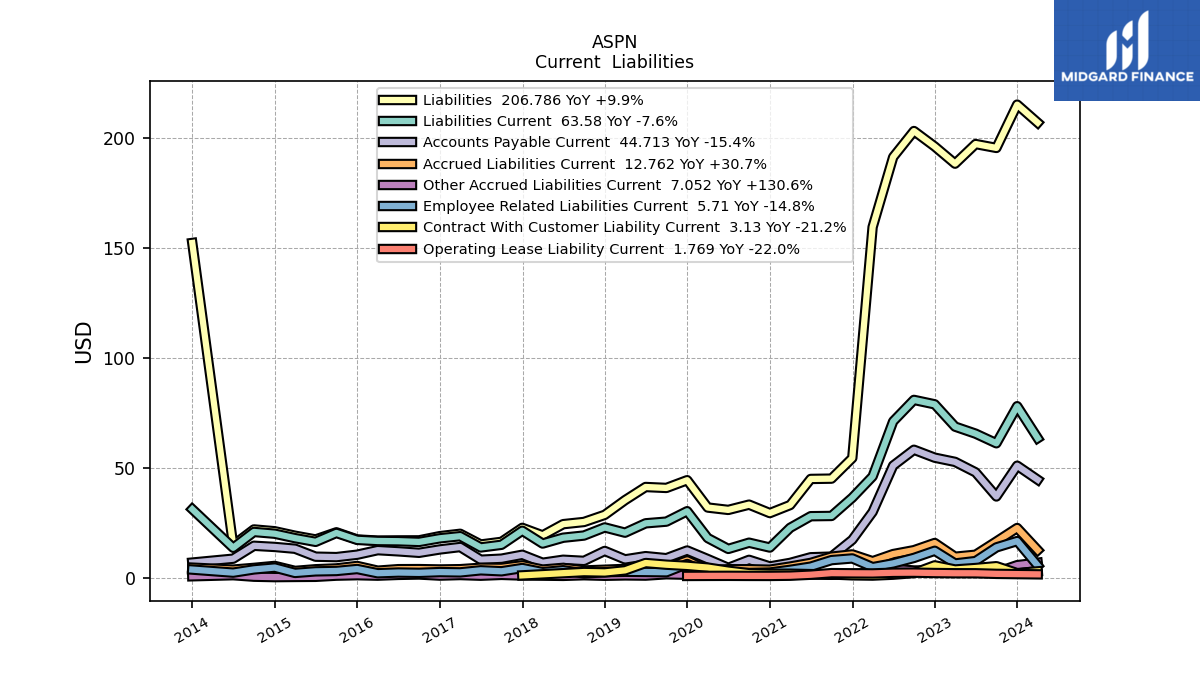
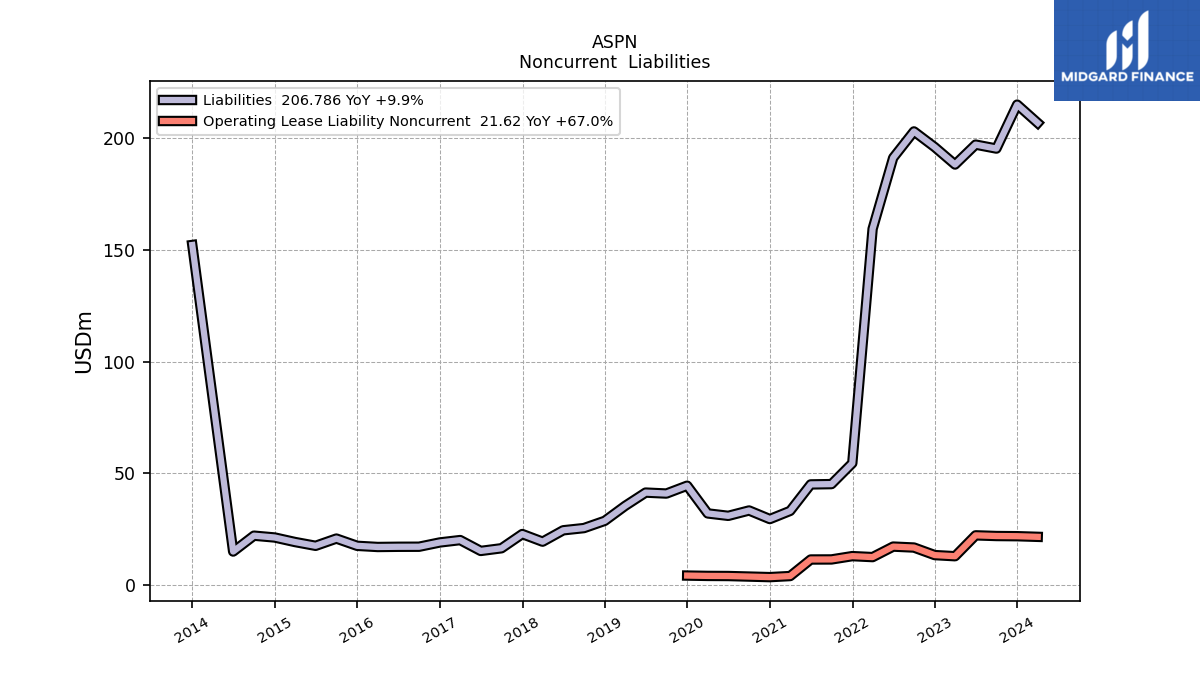
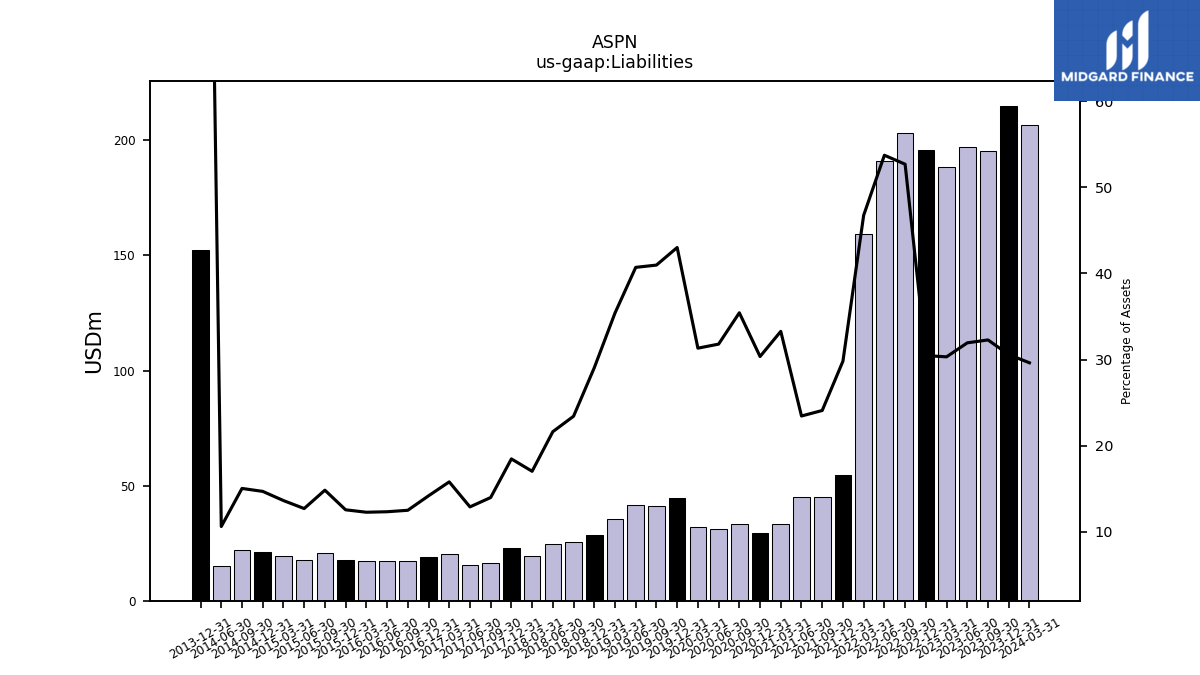
| Liabilities | 195.33 | 197.10 | 188.19 | 195.98 | 203.01 | 191.18 | 159.40 | 54.55 | 45.21 | 45.08 | 33.23 | 29.57 | 33.41 | 31.01 | 32.10 | 44.51 | 40.99 | 41.42 | 35.45 | 28.77 | 25.54 | 24.55 | 19.45 | 22.87 | 16.52 | 15.31 | 20.17 | 19.11 | 17.20 | 17.18 | 17.08 | 17.60 | 20.85 | 17.61 | 19.30 | 21.33 | 22.15 | 15.04 | NA | 152.20 | NA | NA | NA | |
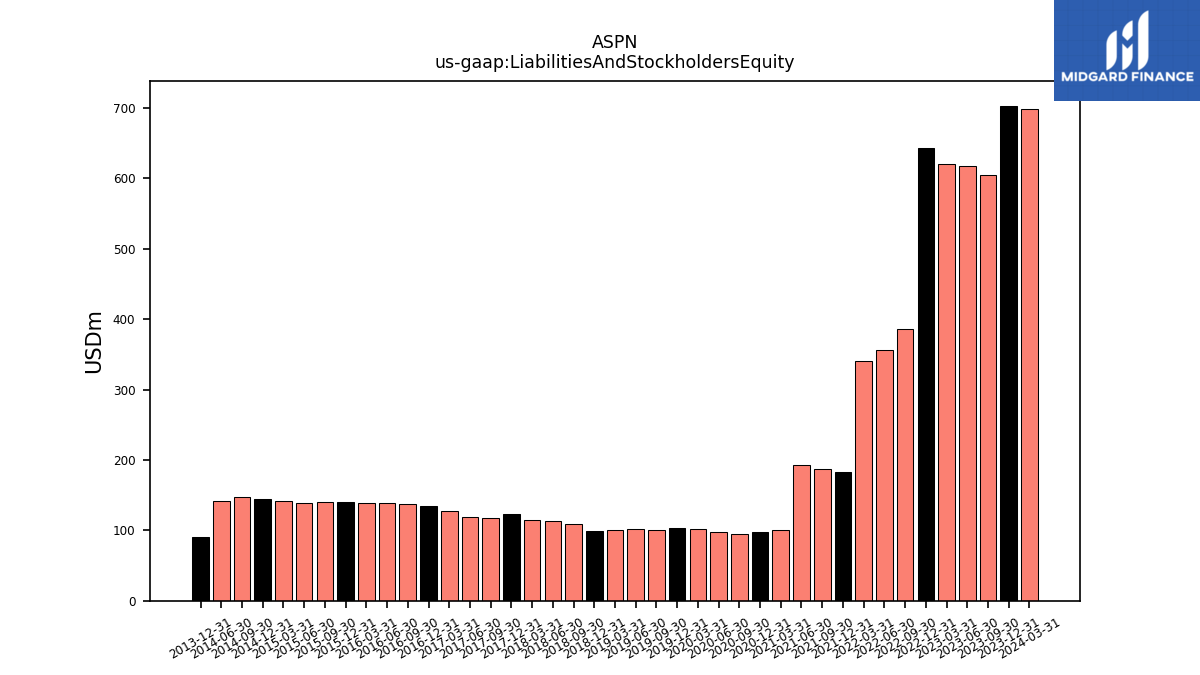
| Liabilities And Stockholders Equity | 605.15 | 617.07 | 620.73 | 643.42 | 385.41 | 355.93 | 341.01 | 182.95 | 187.67 | 192.22 | 99.87 | 97.42 | 94.30 | 97.55 | 102.47 | 103.50 | 100.05 | 101.76 | 100.12 | 99.02 | 109.03 | 113.47 | 114.19 | 123.81 | 118.04 | 118.66 | 127.62 | 134.67 | 137.47 | 139.19 | 139.04 | 140.07 | 140.44 | 138.49 | 141.52 | 145.04 | 147.20 | 141.49 | NA | 90.23 | NA | NA | NA | |
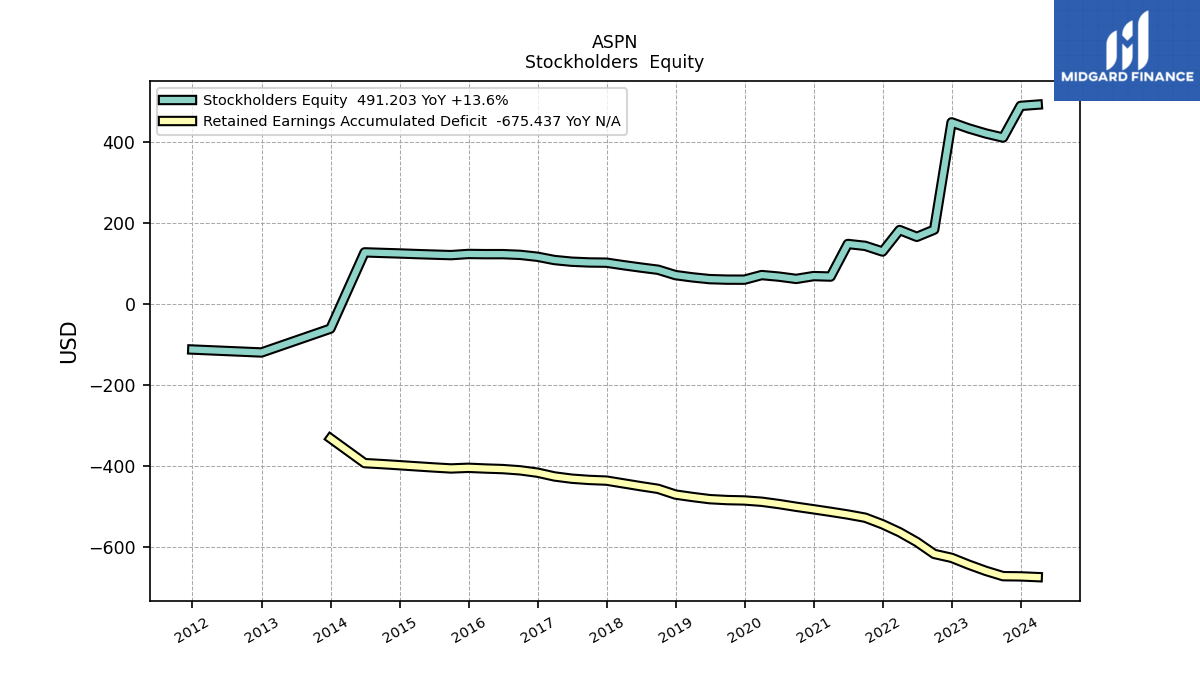
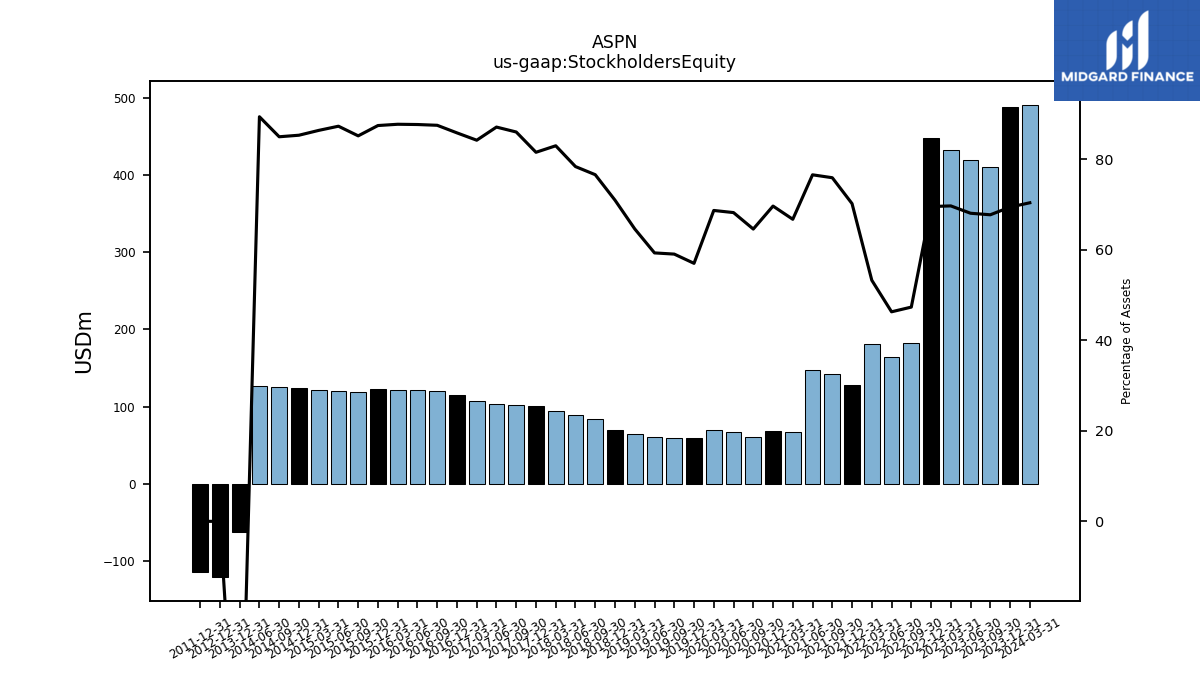
| Stockholders Equity | 409.81 | 419.97 | 432.54 | 447.44 | 182.41 | 164.75 | 181.61 | 128.41 | 142.46 | 147.15 | 66.64 | 67.85 | 60.89 | 66.53 | 70.37 | 58.99 | 59.07 | 60.34 | 64.68 | 70.25 | 83.49 | 88.92 | 94.73 | 100.94 | 101.52 | 103.35 | 107.44 | 115.56 | 120.27 | 122.01 | 121.97 | 122.47 | 119.60 | 120.88 | 122.22 | 123.72 | 125.05 | 126.45 | NA | -61.97 | NA | NA | NA |
| 2023-09-30 | 2023-06-30 | 2023-03-31 | 2022-12-31 | 2022-09-30 | 2022-06-30 | 2022-03-31 | 2021-12-31 | 2021-09-30 | 2021-06-30 | 2021-03-31 | 2020-12-31 | 2020-09-30 | 2020-06-30 | 2020-03-31 | 2019-12-31 | 2019-09-30 | 2019-06-30 | 2019-03-31 | 2018-12-31 | 2018-09-30 | 2018-06-30 | 2018-03-31 | 2017-12-31 | 2017-09-30 | 2017-06-30 | 2017-03-31 | 2016-12-31 | 2016-09-30 | 2016-06-30 | 2016-03-31 | 2015-12-31 | 2015-09-30 | 2015-06-30 | 2015-03-31 | 2014-12-31 | 2014-09-30 | 2014-06-30 | 2014-03-31 | 2013-12-31 | 2013-09-30 | 2013-06-30 | 2013-03-31 | ||
|---|---|---|---|---|---|---|---|---|---|---|---|---|---|---|---|---|---|---|---|---|---|---|---|---|---|---|---|---|---|---|---|---|---|---|---|---|---|---|---|---|---|---|---|---|
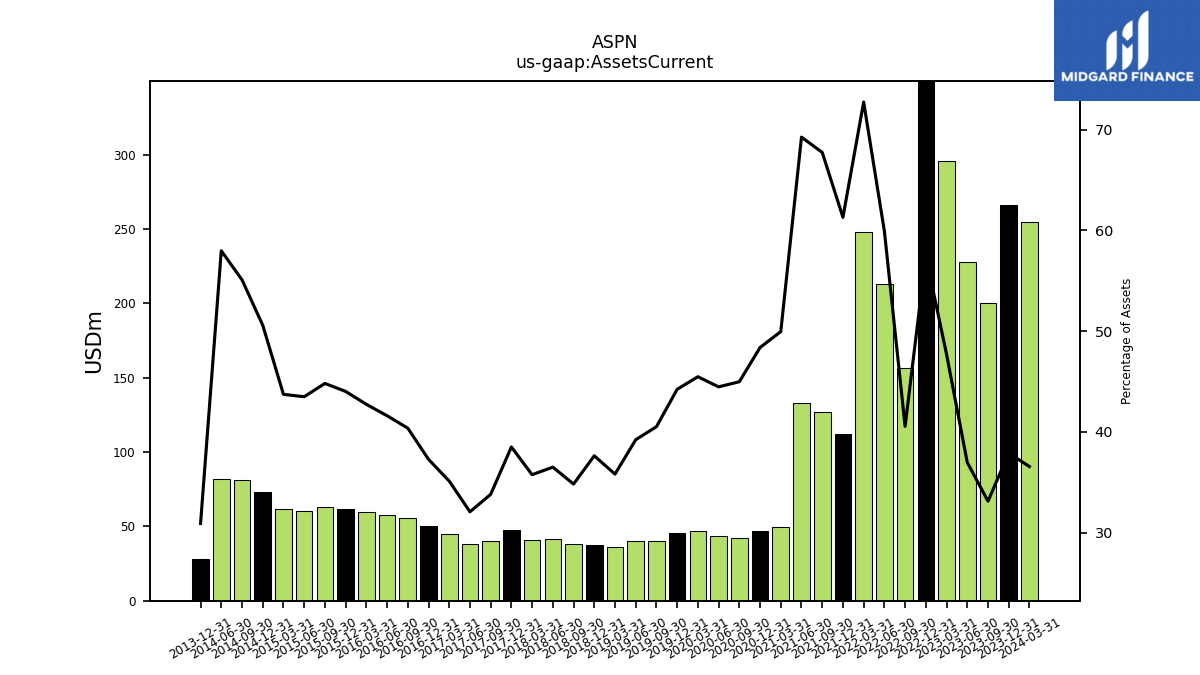
| Assets Current | 200.37 | 228.04 | 296.04 | 369.69 | 156.27 | 213.28 | 248.05 | 112.15 | 127.13 | 133.13 | 49.89 | 47.12 | 42.41 | 43.37 | 46.59 | 45.77 | 40.53 | 39.91 | 35.84 | 37.25 | 37.96 | 41.40 | 40.81 | 47.66 | 39.88 | 38.04 | 44.80 | 50.19 | 55.49 | 57.89 | 59.41 | 61.65 | 62.92 | 60.22 | 61.87 | 73.38 | 81.09 | 82.02 | NA | 27.88 | NA | NA | NA | |
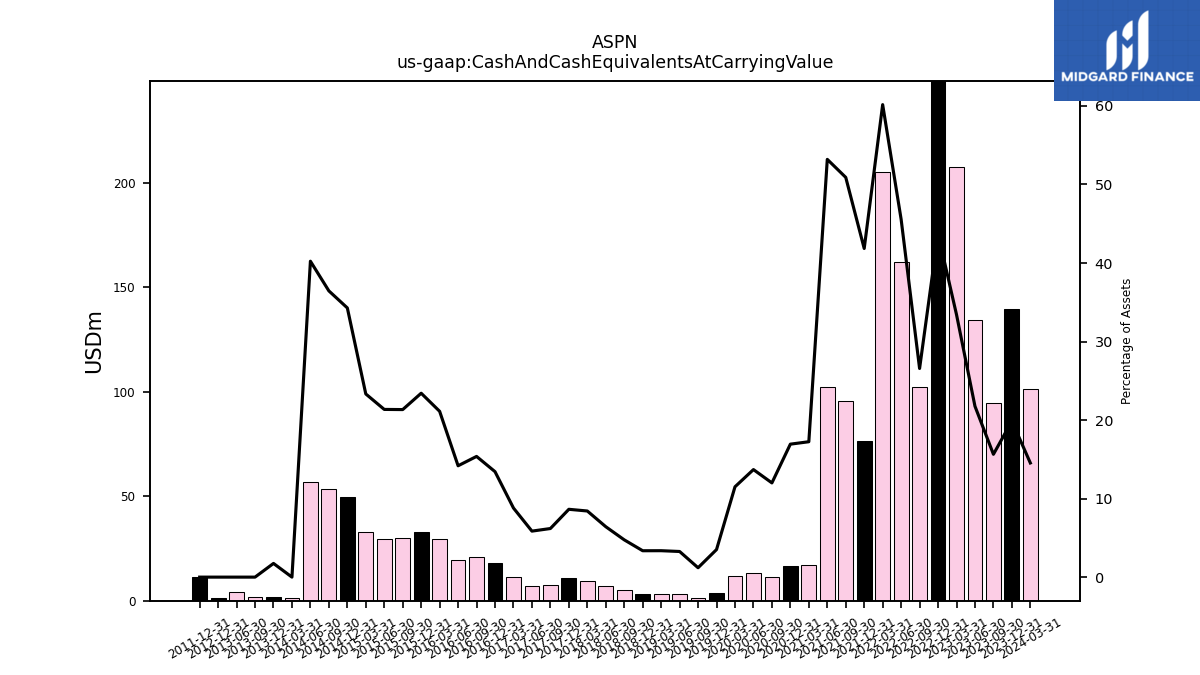
| Cash And Cash Equivalents At Carrying Value | 94.64 | 134.30 | 207.54 | 281.33 | 102.40 | 162.19 | 205.18 | 76.56 | 95.53 | 102.26 | 17.22 | 16.50 | 11.31 | 13.36 | 11.79 | 3.63 | 1.20 | 3.32 | 3.37 | 3.33 | 5.18 | 7.29 | 9.62 | 10.69 | 7.30 | 6.95 | 11.23 | 18.09 | 21.13 | 19.74 | 29.36 | 32.80 | 29.96 | 29.57 | 33.01 | 49.72 | 53.65 | 56.92 | 1.16 | 1.57 | 1.91 | 4.22 | NA | |
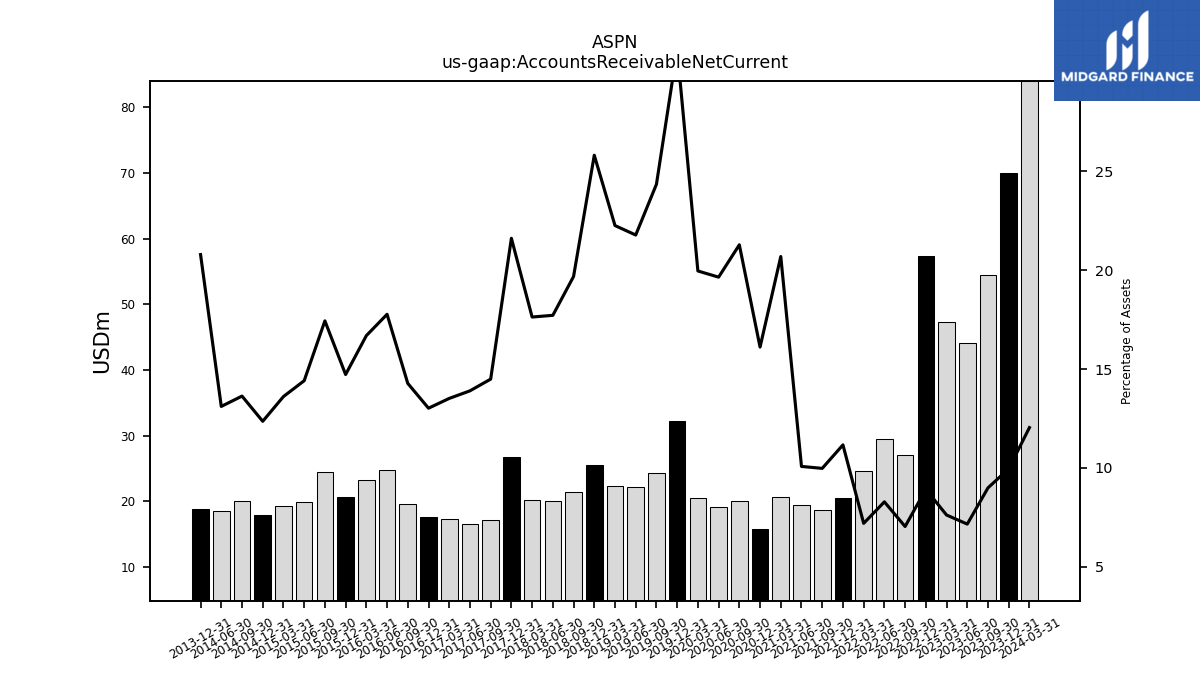
| Accounts Receivable Net Current | 54.41 | 44.17 | 47.28 | 57.35 | 27.12 | 29.48 | 24.53 | 20.43 | 18.72 | 19.37 | 20.67 | 15.70 | 20.07 | 19.17 | 20.45 | 32.25 | 24.36 | 22.17 | 22.29 | 25.57 | 21.46 | 20.11 | 20.13 | 26.76 | 17.11 | 16.49 | 17.25 | 17.54 | 19.62 | 24.73 | 23.21 | 20.62 | 24.49 | 19.96 | 19.26 | 17.92 | 20.07 | 18.55 | NA | 18.76 | NA | NA | NA | |
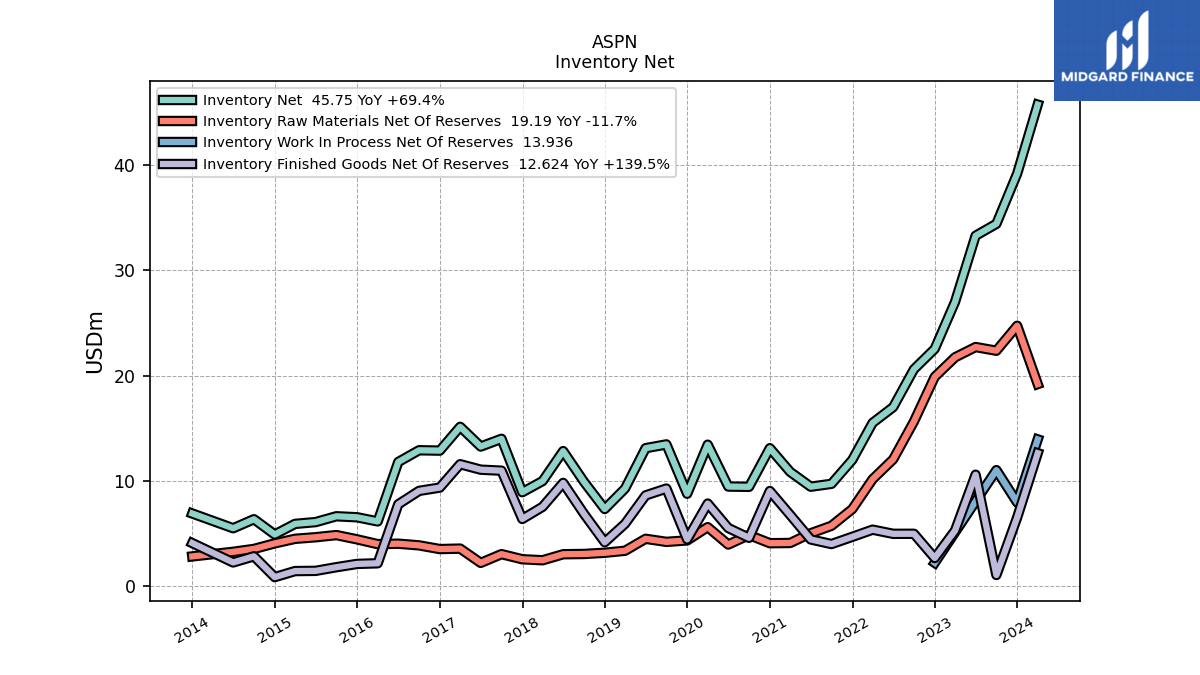
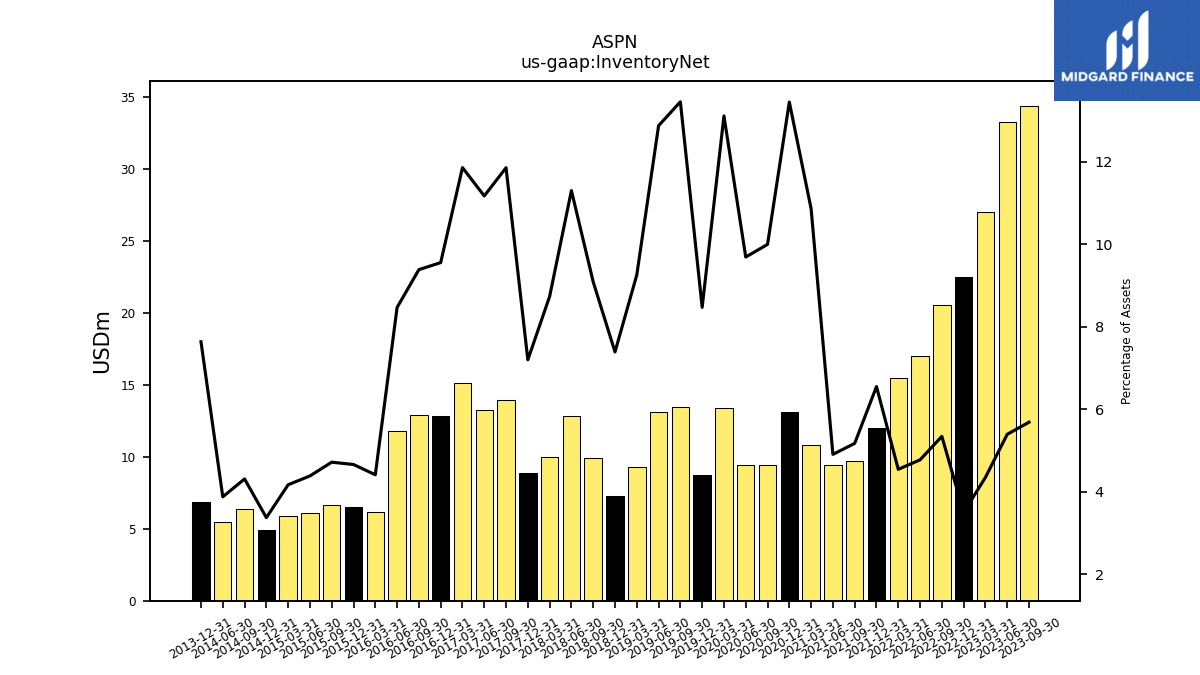
| Inventory Net | 34.42 | 33.29 | 27.01 | 22.54 | 20.60 | 17.00 | 15.51 | 11.99 | 9.71 | 9.44 | 10.85 | 13.10 | 9.43 | 9.45 | 13.43 | 8.77 | 13.46 | 13.10 | 9.27 | 7.32 | 9.91 | 12.82 | 9.97 | 8.91 | 13.99 | 13.26 | 15.13 | 12.87 | 12.90 | 11.79 | 6.14 | 6.53 | 6.63 | 6.08 | 5.91 | 4.90 | 6.35 | 5.49 | NA | 6.89 | NA | NA | NA | |
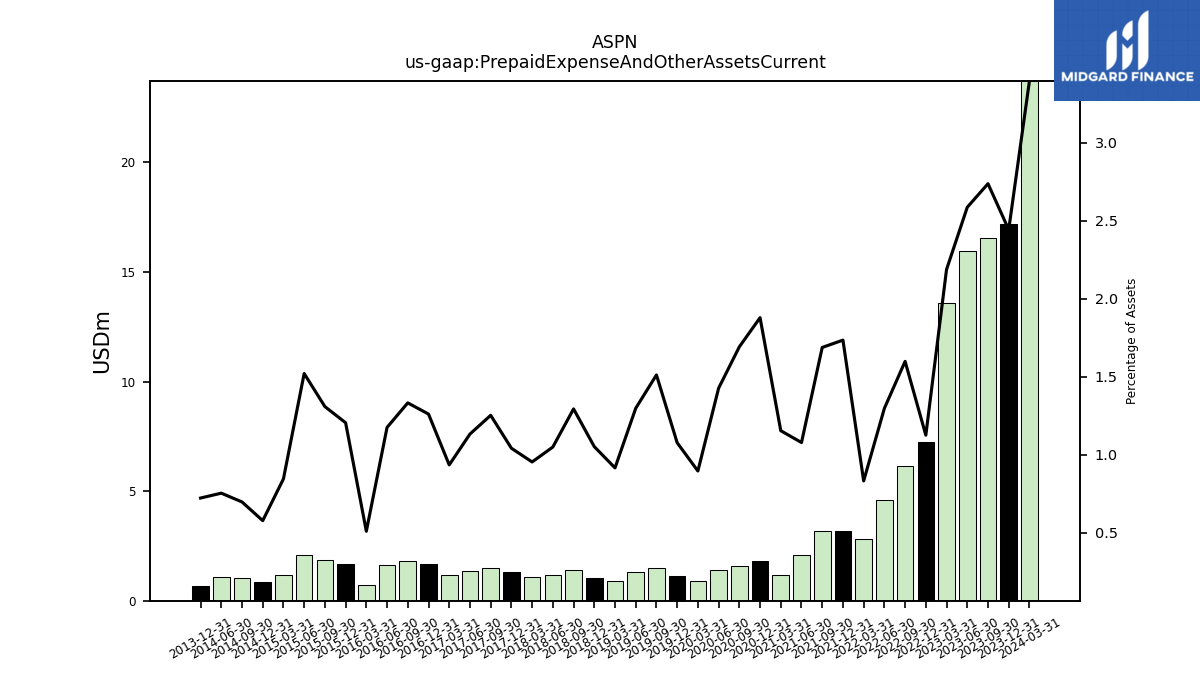
| Prepaid Expense And Other Assets Current | 16.57 | 15.96 | 13.58 | 7.24 | 6.16 | 4.62 | 2.83 | 3.17 | 3.17 | 2.07 | 1.15 | 1.83 | 1.59 | 1.39 | 0.92 | 1.11 | 1.51 | 1.32 | 0.92 | 1.04 | 1.41 | 1.19 | 1.09 | 1.29 | 1.48 | 1.34 | 1.19 | 1.70 | 1.83 | 1.64 | 0.71 | 1.69 | 1.84 | 2.10 | 1.20 | 0.84 | 1.02 | 1.06 | NA | 0.65 | NA | NA | NA |
| 2023-09-30 | 2023-06-30 | 2023-03-31 | 2022-12-31 | 2022-09-30 | 2022-06-30 | 2022-03-31 | 2021-12-31 | 2021-09-30 | 2021-06-30 | 2021-03-31 | 2020-12-31 | 2020-09-30 | 2020-06-30 | 2020-03-31 | 2019-12-31 | 2019-09-30 | 2019-06-30 | 2019-03-31 | 2018-12-31 | 2018-09-30 | 2018-06-30 | 2018-03-31 | 2017-12-31 | 2017-09-30 | 2017-06-30 | 2017-03-31 | 2016-12-31 | 2016-09-30 | 2016-06-30 | 2016-03-31 | 2015-12-31 | 2015-09-30 | 2015-06-30 | 2015-03-31 | 2014-12-31 | 2014-09-30 | 2014-06-30 | 2014-03-31 | 2013-12-31 | 2013-09-30 | 2013-06-30 | 2013-03-31 | ||
|---|---|---|---|---|---|---|---|---|---|---|---|---|---|---|---|---|---|---|---|---|---|---|---|---|---|---|---|---|---|---|---|---|---|---|---|---|---|---|---|---|---|---|---|---|
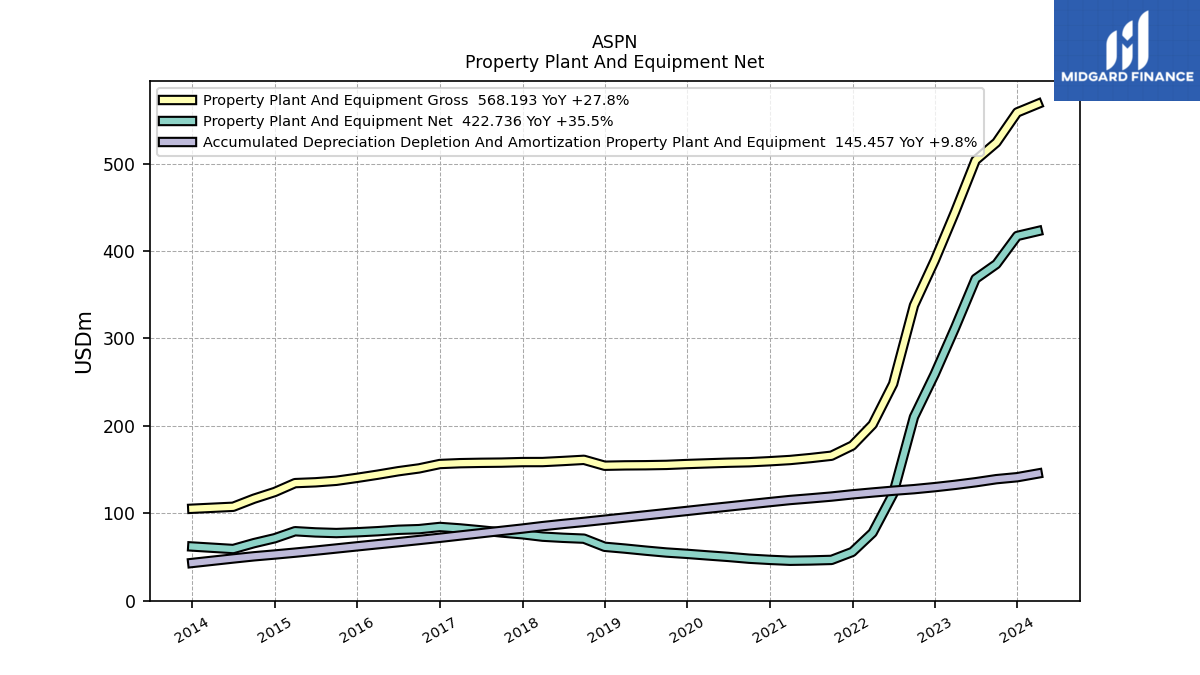
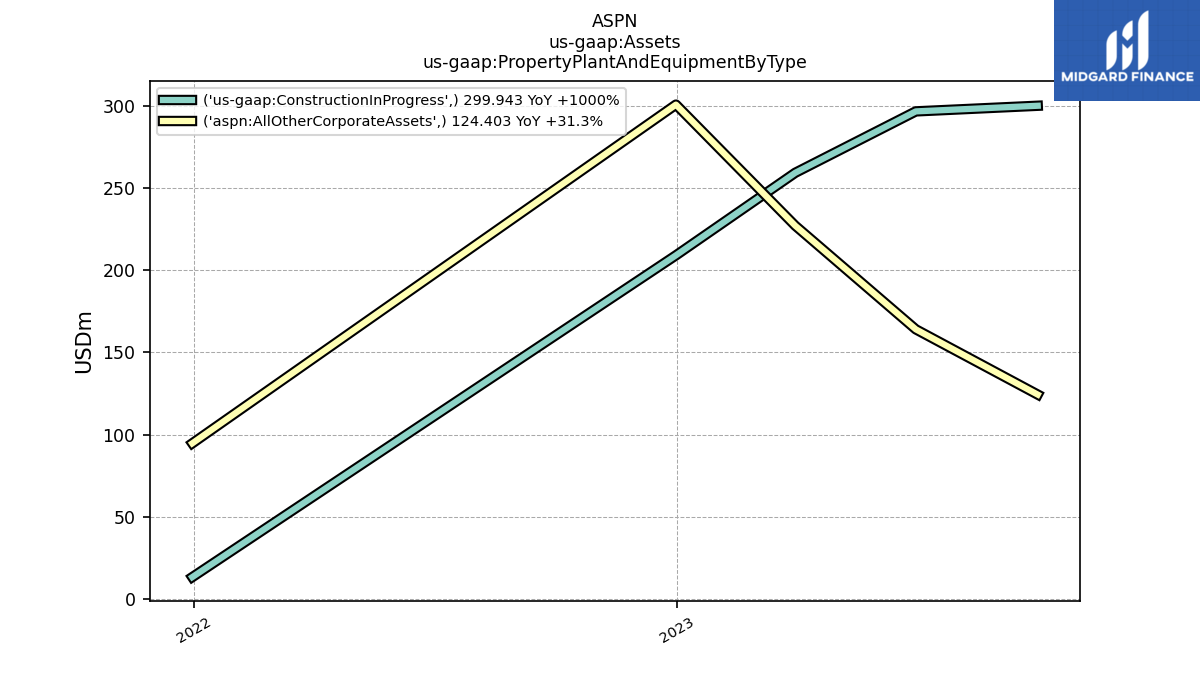
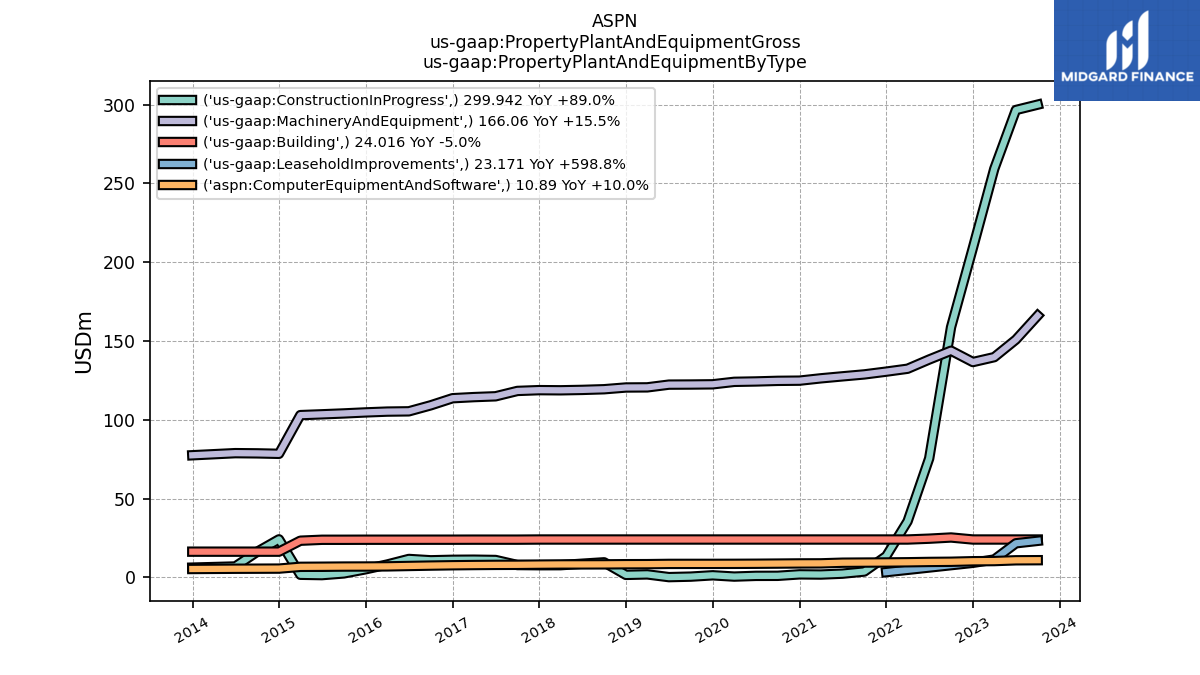
| Property Plant And Equipment Gross | 524.08 | 503.81 | 444.59 | 389.14 | 337.72 | 248.05 | 201.53 | 177.46 | 165.87 | 163.21 | 160.97 | 159.58 | 158.41 | 157.90 | 157.15 | 156.37 | 155.39 | 154.99 | 154.83 | 154.40 | 161.17 | 159.83 | 158.63 | 158.60 | 157.99 | 157.75 | 157.33 | 156.38 | 151.36 | 148.13 | 144.18 | 140.57 | 137.21 | 135.47 | 134.53 | 124.36 | 116.69 | 107.49 | NA | 105.24 | NA | NA | NA | |
| Leasehold Improvements Gross | NA | NA | NA | 1.20 | NA | NA | NA | 1.20 | NA | NA | NA | 1.20 | NA | NA | NA | 1.20 | NA | NA | NA | 1.20 | NA | NA | NA | 1.20 | NA | NA | NA | 0.70 | NA | NA | NA | NA | NA | NA | NA | NA | NA | NA | NA | NA | NA | NA | NA | |
| Accumulated Depreciation Depletion And Amortization Property Plant And Equipment | 139.05 | 135.53 | 132.52 | 129.92 | 127.61 | 125.84 | 123.81 | 121.68 | 119.17 | 117.12 | 115.22 | 112.84 | 110.31 | 107.77 | 105.31 | 102.75 | 100.22 | 97.67 | 95.18 | 92.70 | 90.17 | 87.84 | 85.34 | 82.53 | 79.91 | 77.22 | 74.61 | 71.98 | 69.45 | 66.98 | 64.64 | 62.25 | 59.78 | 57.33 | 55.01 | 52.87 | 50.81 | 48.32 | NA | 43.22 | NA | NA | NA | |
| Property Plant And Equipment Net | 385.03 | 368.27 | 312.07 | 259.22 | 210.11 | 122.21 | 77.72 | 55.78 | 46.71 | 46.09 | 45.75 | 46.74 | 48.10 | 50.13 | 51.83 | 53.62 | 55.16 | 57.32 | 59.65 | 61.70 | 71.00 | 71.99 | 73.29 | 76.07 | 78.07 | 80.52 | 82.72 | 84.39 | 81.91 | 81.15 | 79.54 | 78.32 | 77.42 | 78.15 | 79.52 | 71.49 | 65.88 | 59.16 | NA | 62.02 | NA | NA | NA | |
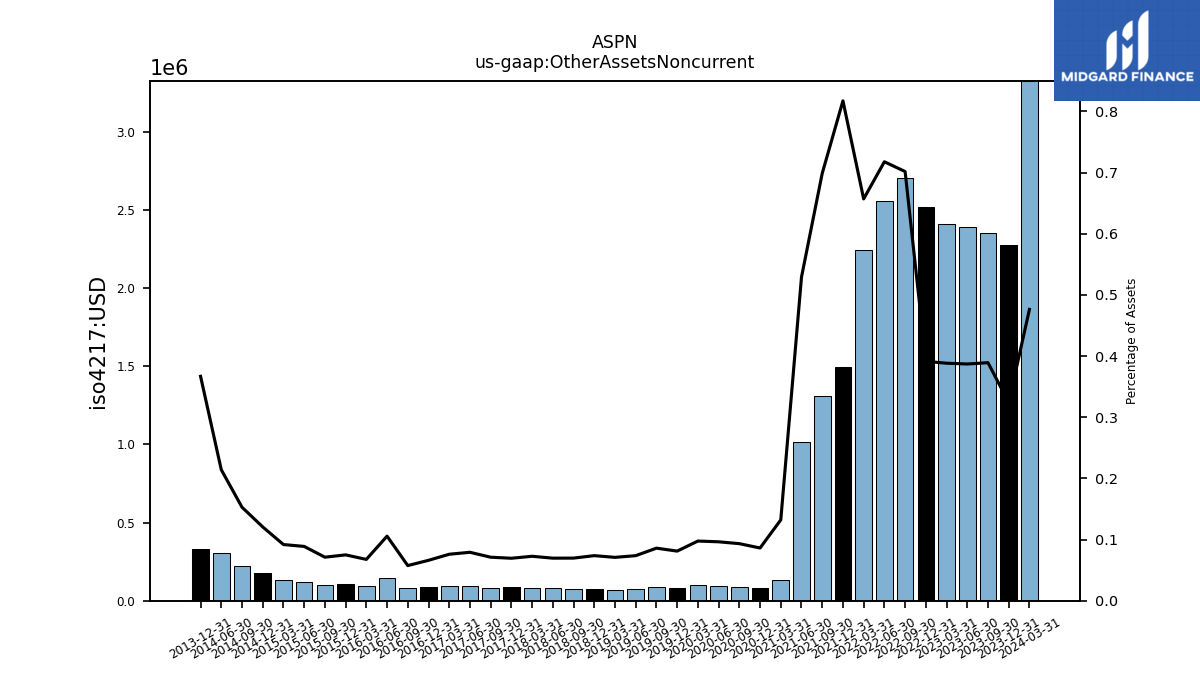
| Other Assets Noncurrent | 2.35 | 2.39 | 2.41 | 2.52 | 2.70 | 2.55 | 2.24 | 1.50 | 1.31 | 1.02 | 0.13 | 0.08 | 0.09 | 0.09 | 0.10 | 0.08 | 0.09 | 0.07 | 0.07 | 0.07 | 0.08 | 0.08 | 0.08 | 0.09 | 0.08 | 0.09 | 0.10 | 0.09 | 0.08 | 0.15 | 0.09 | 0.10 | 0.10 | 0.12 | 0.13 | 0.17 | 0.23 | 0.30 | NA | 0.33 | NA | NA | NA |
| 2023-09-30 | 2023-06-30 | 2023-03-31 | 2022-12-31 | 2022-09-30 | 2022-06-30 | 2022-03-31 | 2021-12-31 | 2021-09-30 | 2021-06-30 | 2021-03-31 | 2020-12-31 | 2020-09-30 | 2020-06-30 | 2020-03-31 | 2019-12-31 | 2019-09-30 | 2019-06-30 | 2019-03-31 | 2018-12-31 | 2018-09-30 | 2018-06-30 | 2018-03-31 | 2017-12-31 | 2017-09-30 | 2017-06-30 | 2017-03-31 | 2016-12-31 | 2016-09-30 | 2016-06-30 | 2016-03-31 | 2015-12-31 | 2015-09-30 | 2015-06-30 | 2015-03-31 | 2014-12-31 | 2014-09-30 | 2014-06-30 | 2014-03-31 | 2013-12-31 | 2013-09-30 | 2013-06-30 | 2013-03-31 | ||
|---|---|---|---|---|---|---|---|---|---|---|---|---|---|---|---|---|---|---|---|---|---|---|---|---|---|---|---|---|---|---|---|---|---|---|---|---|---|---|---|---|---|---|---|---|
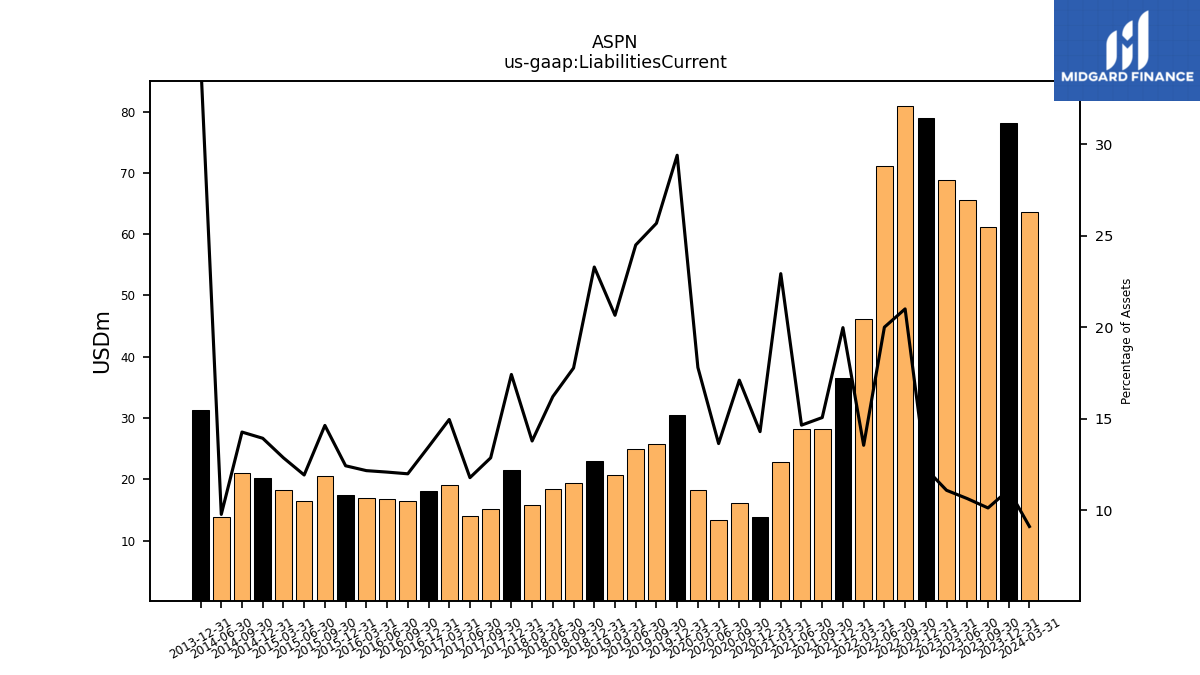
| Liabilities Current | 61.26 | 65.62 | 68.83 | 78.94 | 80.96 | 71.20 | 46.20 | 36.55 | 28.27 | 28.16 | 22.90 | 13.93 | 16.13 | 13.31 | 18.24 | 30.43 | 25.70 | 24.93 | 20.68 | 23.07 | 19.38 | 18.39 | 15.74 | 21.57 | 15.18 | 13.98 | 19.09 | 18.13 | 16.48 | 16.82 | 16.91 | 17.41 | 20.55 | 16.52 | 18.20 | 20.21 | 21.01 | 13.82 | NA | 31.34 | NA | NA | NA | |
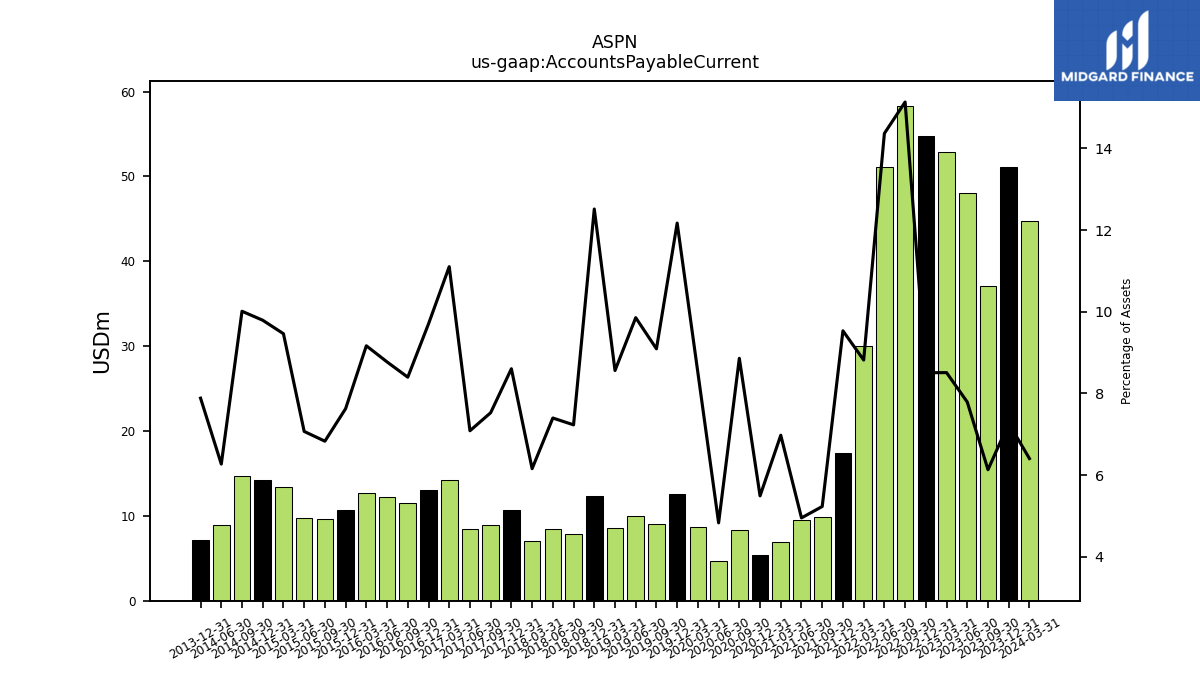
| Accounts Payable Current | 37.12 | 48.06 | 52.82 | 54.73 | 58.32 | 51.13 | 30.07 | 17.44 | 9.82 | 9.52 | 6.97 | 5.35 | 8.35 | 4.71 | 8.72 | 12.60 | 9.10 | 10.03 | 8.57 | 12.39 | 7.88 | 8.39 | 7.03 | 10.65 | 8.89 | 8.41 | 14.17 | 13.06 | 11.54 | 12.21 | 12.74 | 10.68 | 9.59 | 9.79 | 13.39 | 14.20 | 14.74 | 8.87 | NA | 7.11 | NA | NA | NA | |
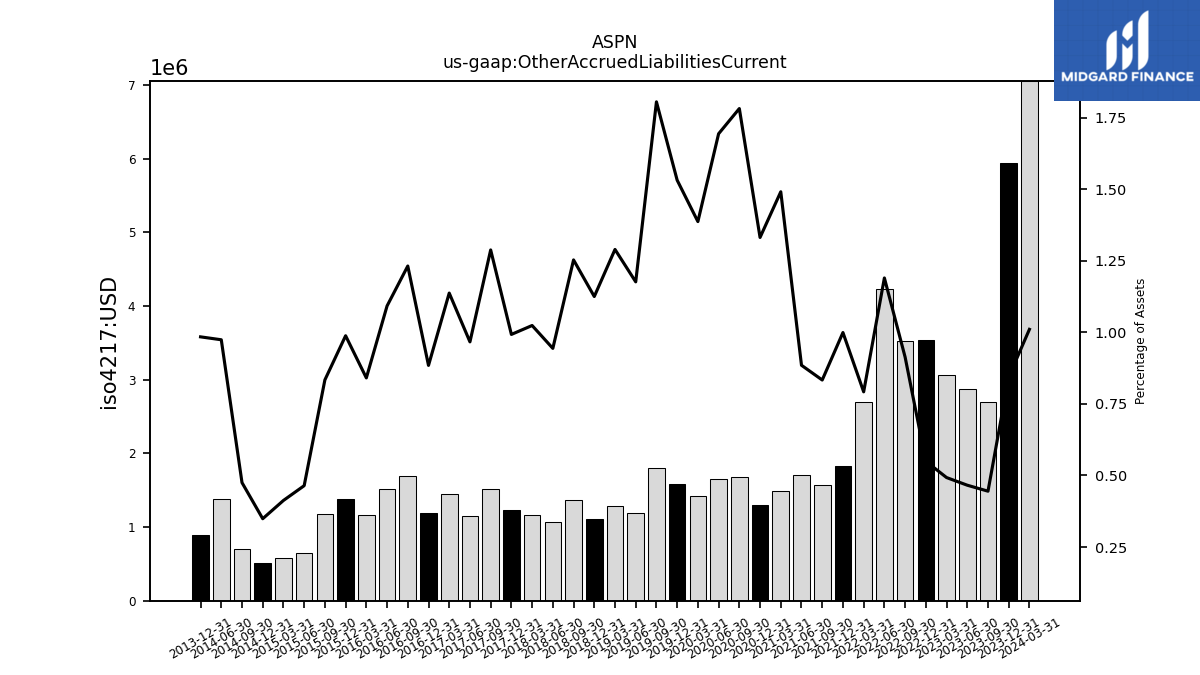
| Other Accrued Liabilities Current | 2.69 | 2.88 | 3.06 | 3.54 | 3.52 | 4.24 | 2.70 | 1.83 | 1.56 | 1.70 | 1.49 | 1.30 | 1.68 | 1.65 | 1.42 | 1.58 | 1.81 | 1.20 | 1.29 | 1.11 | 1.37 | 1.07 | 1.17 | 1.23 | 1.52 | 1.15 | 1.45 | 1.19 | 1.69 | 1.52 | 1.17 | 1.38 | 1.17 | 0.64 | 0.58 | 0.51 | 0.70 | 1.38 | NA | 0.89 | NA | NA | NA | |
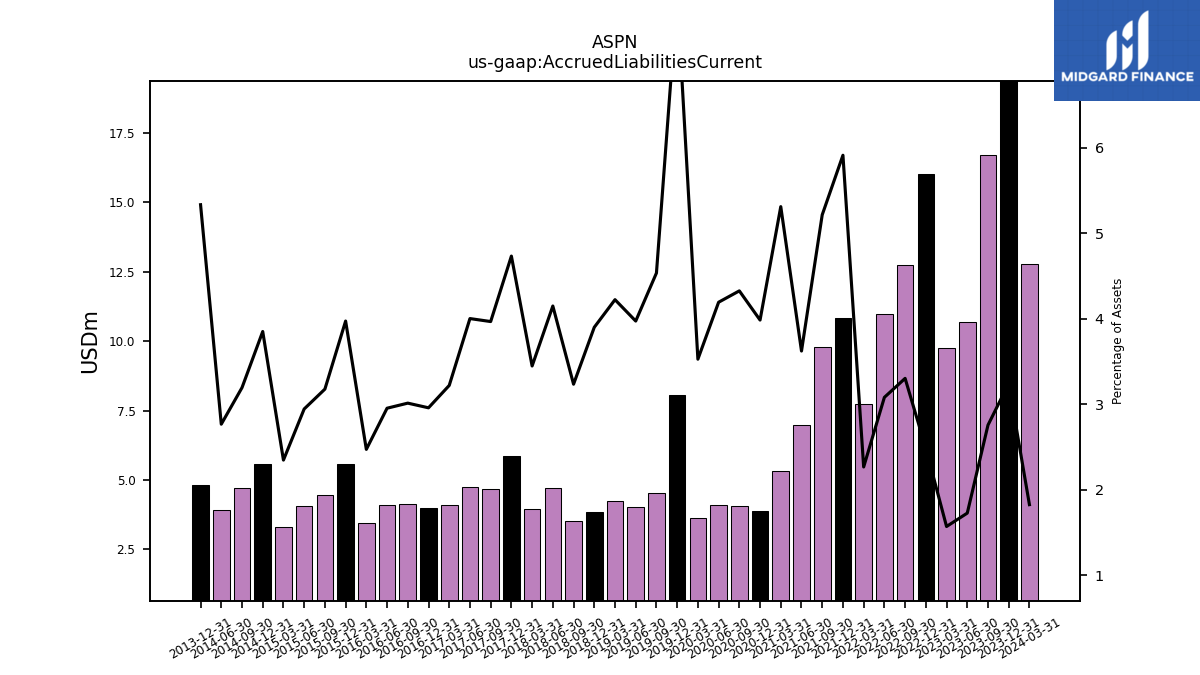
| Accrued Liabilities Current | 16.69 | 10.67 | 9.76 | 16.00 | 12.74 | 10.97 | 7.74 | 10.82 | 9.79 | 6.97 | 5.31 | 3.88 | 4.08 | 4.09 | 3.62 | 8.06 | 4.54 | 4.04 | 4.23 | 3.86 | 3.53 | 4.71 | 3.94 | 5.86 | 4.68 | 4.75 | 4.11 | 3.99 | 4.14 | 4.11 | 3.44 | 5.57 | 4.46 | 4.08 | 3.33 | 5.59 | 4.71 | 3.92 | NA | 4.81 | NA | NA | NA | |
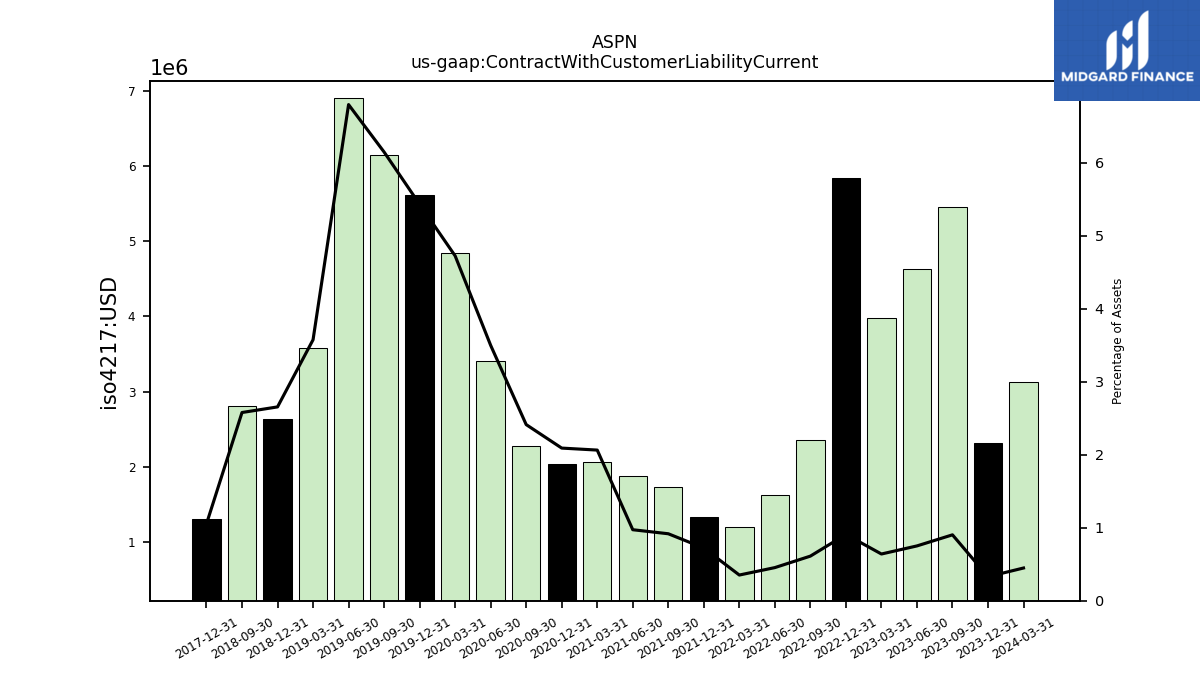
| Contract With Customer Liability Current | 5.46 | 4.63 | 3.97 | 5.85 | 2.36 | 1.62 | 1.20 | 1.32 | 1.72 | 1.87 | 2.06 | 2.04 | 2.27 | 3.41 | 4.84 | 5.62 | 6.15 | 6.92 | 3.58 | 2.63 | 2.81 | NA | NA | 1.30 | NA | NA | NA | NA | NA | NA | NA | NA | NA | NA | NA | NA | NA | NA | NA | NA | NA | NA | NA |
| 2023-09-30 | 2023-06-30 | 2023-03-31 | 2022-12-31 | 2022-09-30 | 2022-06-30 | 2022-03-31 | 2021-12-31 | 2021-09-30 | 2021-06-30 | 2021-03-31 | 2020-12-31 | 2020-09-30 | 2020-06-30 | 2020-03-31 | 2019-12-31 | 2019-09-30 | 2019-06-30 | 2019-03-31 | 2018-12-31 | 2018-09-30 | 2018-06-30 | 2018-03-31 | 2017-12-31 | 2017-09-30 | 2017-06-30 | 2017-03-31 | 2016-12-31 | 2016-09-30 | 2016-06-30 | 2016-03-31 | 2015-12-31 | 2015-09-30 | 2015-06-30 | 2015-03-31 | 2014-12-31 | 2014-09-30 | 2014-06-30 | 2014-03-31 | 2013-12-31 | 2013-09-30 | 2013-06-30 | 2013-03-31 | ||
|---|---|---|---|---|---|---|---|---|---|---|---|---|---|---|---|---|---|---|---|---|---|---|---|---|---|---|---|---|---|---|---|---|---|---|---|---|---|---|---|---|---|---|---|---|
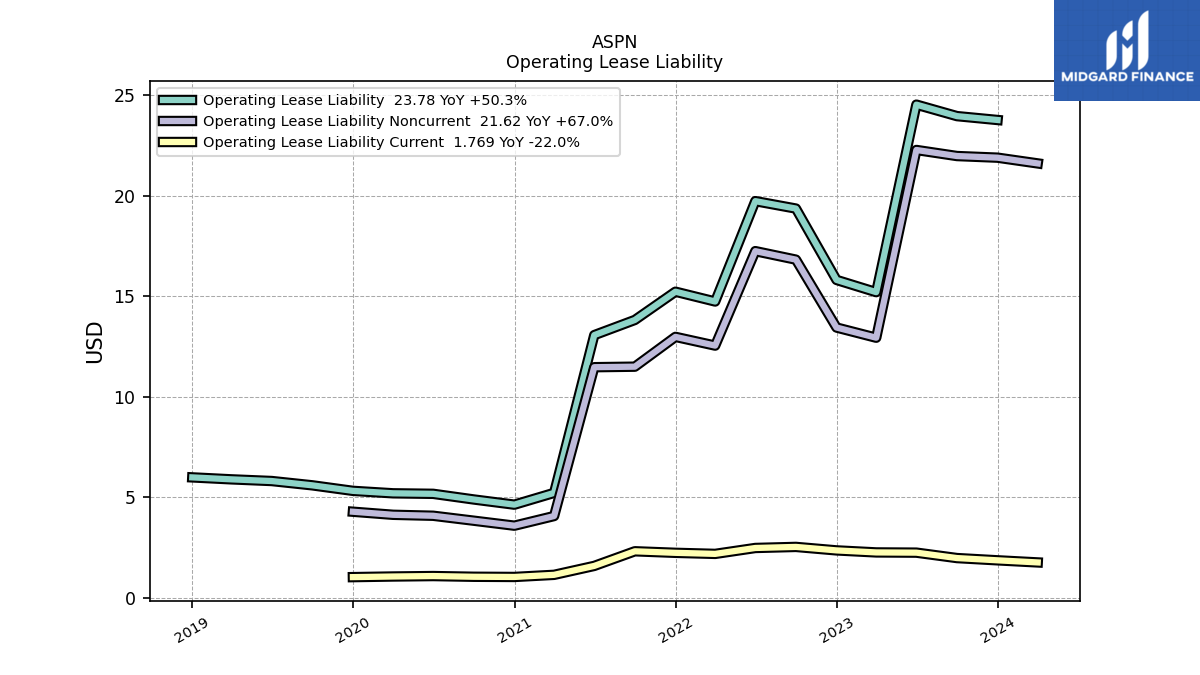
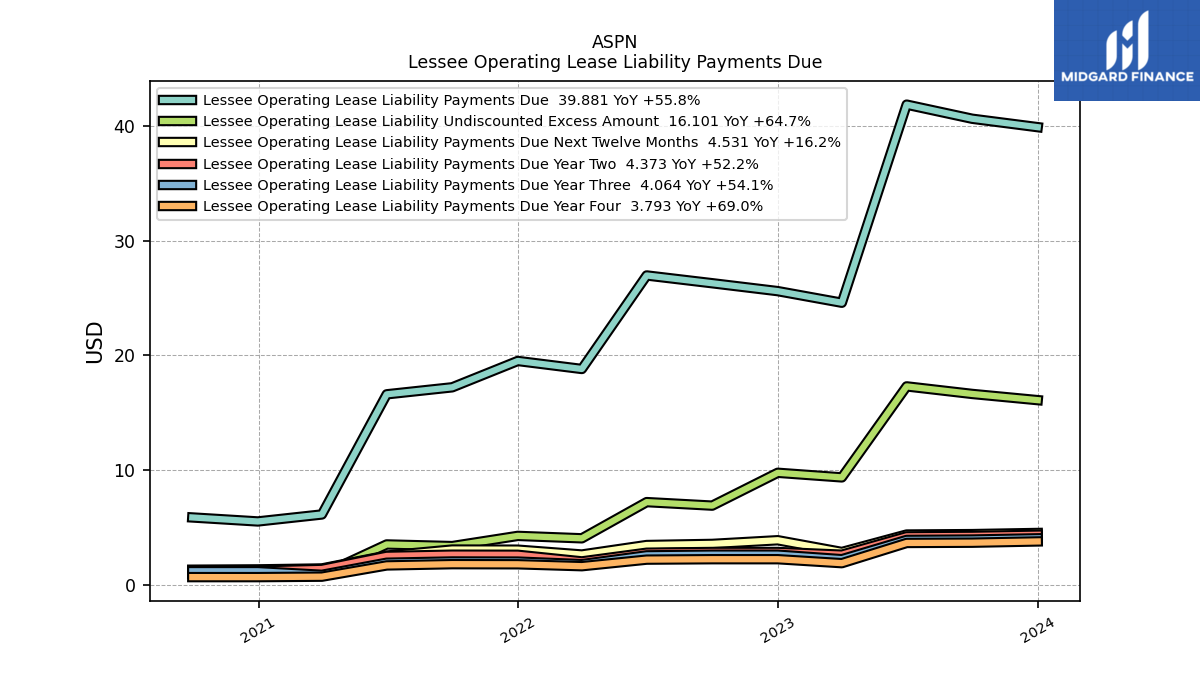
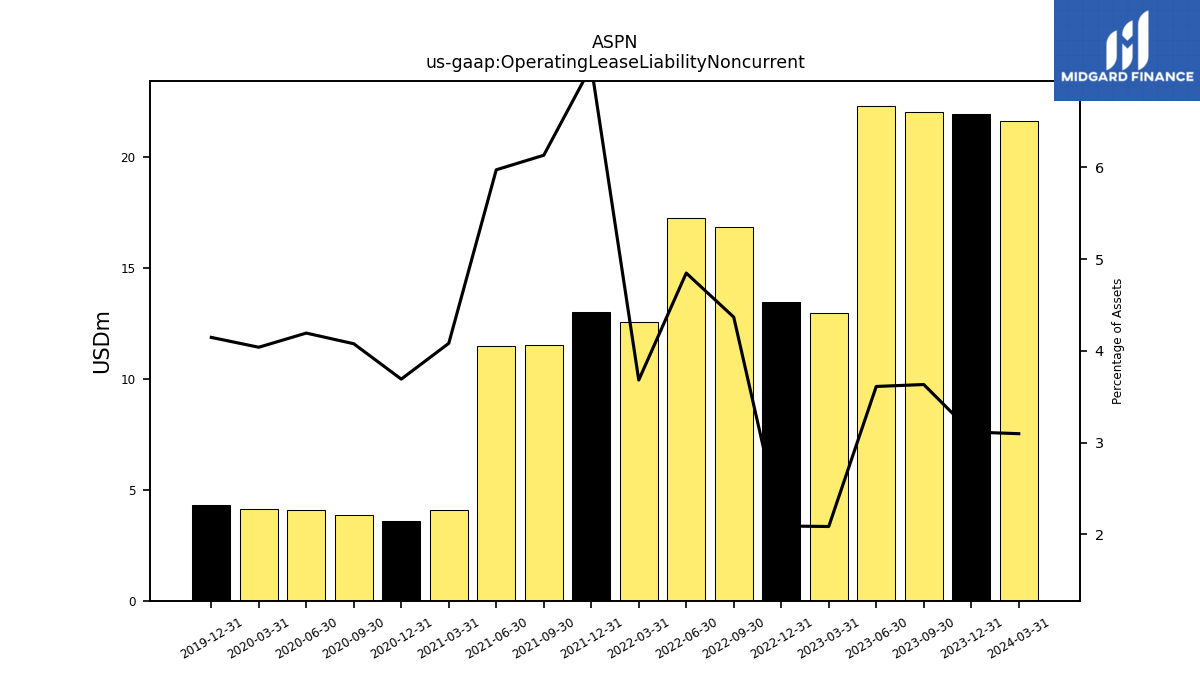
| Operating Lease Liability Noncurrent | 21.99 | 22.29 | 12.95 | 13.46 | 16.83 | 17.26 | 12.56 | 12.99 | 11.51 | 11.48 | 4.08 | 3.60 | 3.85 | 4.09 | 4.14 | 4.29 | NA | NA | NA | NA | NA | NA | NA | NA | NA | NA | NA | NA | NA | NA | NA | NA | NA | NA | NA | NA | NA | NA | NA | NA | NA | NA | NA |
| 2023-09-30 | 2023-06-30 | 2023-03-31 | 2022-12-31 | 2022-09-30 | 2022-06-30 | 2022-03-31 | 2021-12-31 | 2021-09-30 | 2021-06-30 | 2021-03-31 | 2020-12-31 | 2020-09-30 | 2020-06-30 | 2020-03-31 | 2019-12-31 | 2019-09-30 | 2019-06-30 | 2019-03-31 | 2018-12-31 | 2018-09-30 | 2018-06-30 | 2018-03-31 | 2017-12-31 | 2017-09-30 | 2017-06-30 | 2017-03-31 | 2016-12-31 | 2016-09-30 | 2016-06-30 | 2016-03-31 | 2015-12-31 | 2015-09-30 | 2015-06-30 | 2015-03-31 | 2014-12-31 | 2014-09-30 | 2014-06-30 | 2014-03-31 | 2013-12-31 | 2013-09-30 | 2013-06-30 | 2013-03-31 | ||
|---|---|---|---|---|---|---|---|---|---|---|---|---|---|---|---|---|---|---|---|---|---|---|---|---|---|---|---|---|---|---|---|---|---|---|---|---|---|---|---|---|---|---|---|---|
| Stockholders Equity | 409.81 | 419.97 | 432.54 | 447.44 | 182.41 | 164.75 | 181.61 | 128.41 | 142.46 | 147.15 | 66.64 | 67.85 | 60.89 | 66.53 | 70.37 | 58.99 | 59.07 | 60.34 | 64.68 | 70.25 | 83.49 | 88.92 | 94.73 | 100.94 | 101.52 | 103.35 | 107.44 | 115.56 | 120.27 | 122.01 | 121.97 | 122.47 | 119.60 | 120.88 | 122.22 | 123.72 | 125.05 | 126.45 | NA | -61.97 | NA | NA | NA | |
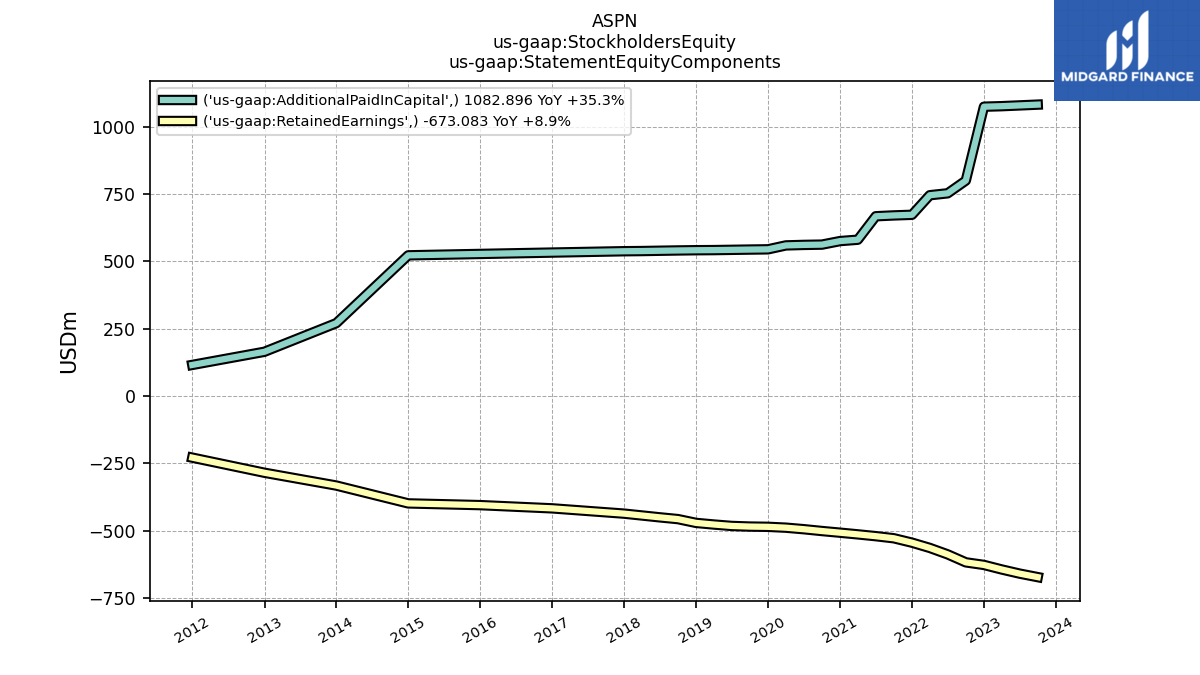
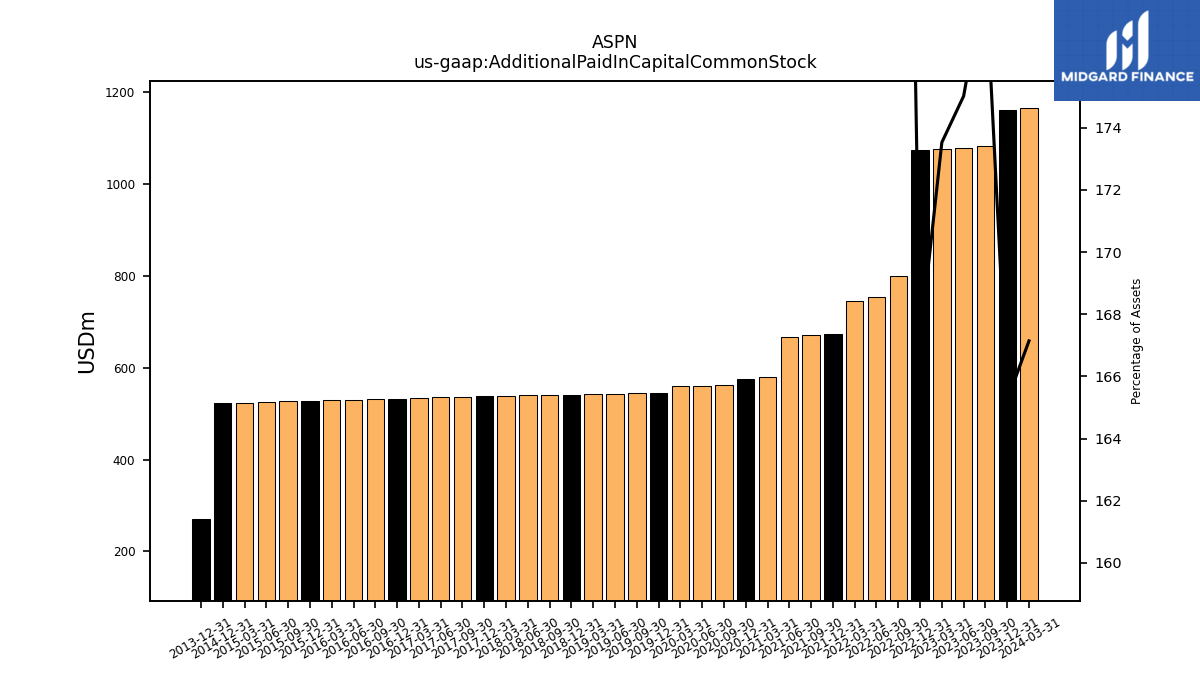
| Additional Paid In Capital Common Stock | 1082.90 | 1079.98 | 1077.13 | 1075.23 | 800.59 | 753.34 | 746.15 | 673.46 | 671.16 | 668.03 | 580.85 | 575.81 | 562.66 | 561.55 | 559.69 | 545.14 | 544.26 | 543.25 | 542.26 | 541.84 | 540.97 | 539.87 | 538.72 | 538.09 | 536.99 | 535.72 | 534.35 | 533.09 | 532.06 | 530.70 | 529.26 | 527.98 | 526.74 | 525.50 | 524.10 | 522.80 | NA | NA | NA | 270.79 | NA | NA | NA | |
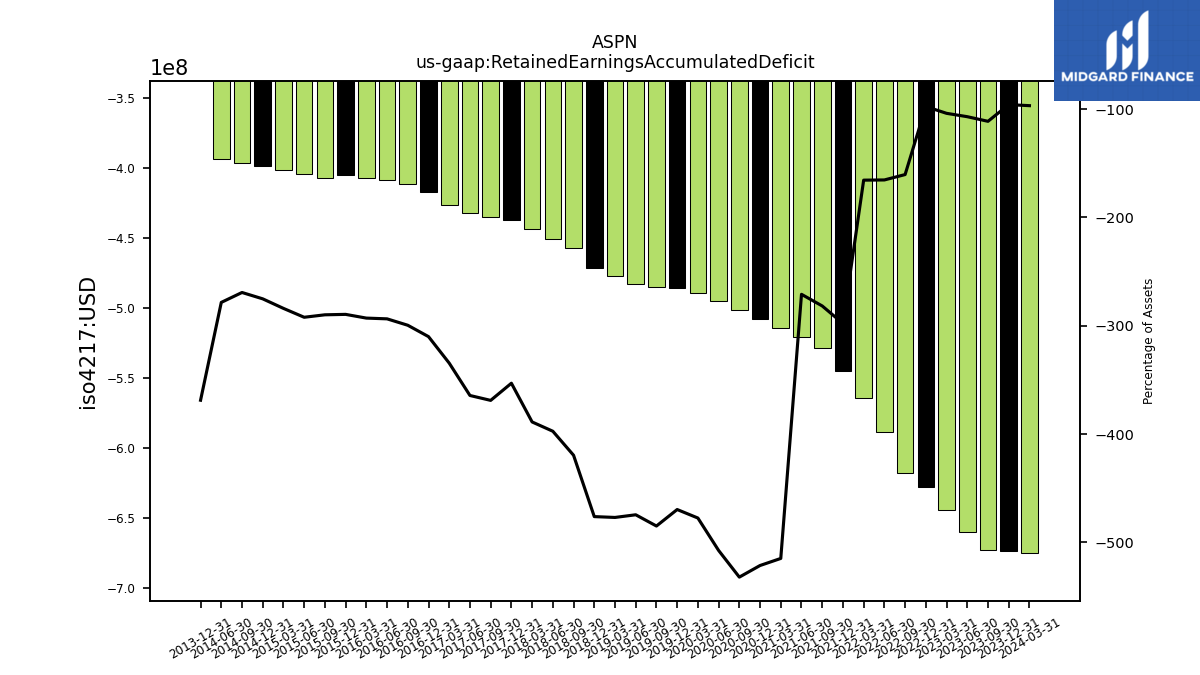
| Retained Earnings Accumulated Deficit | -673.08 | -660.01 | -644.59 | -627.79 | -618.18 | -588.59 | -564.54 | -545.05 | -528.70 | -520.88 | -514.21 | -507.96 | -501.77 | -495.02 | -489.32 | -486.15 | -485.19 | -482.90 | -477.59 | -471.58 | -457.48 | -450.94 | -443.99 | -437.14 | -435.46 | -432.37 | -426.90 | -417.52 | -411.78 | -408.69 | -407.30 | -405.50 | -407.14 | -404.62 | -401.87 | -399.08 | -396.37 | -393.96 | NA | -332.76 | NA | NA | NA | |
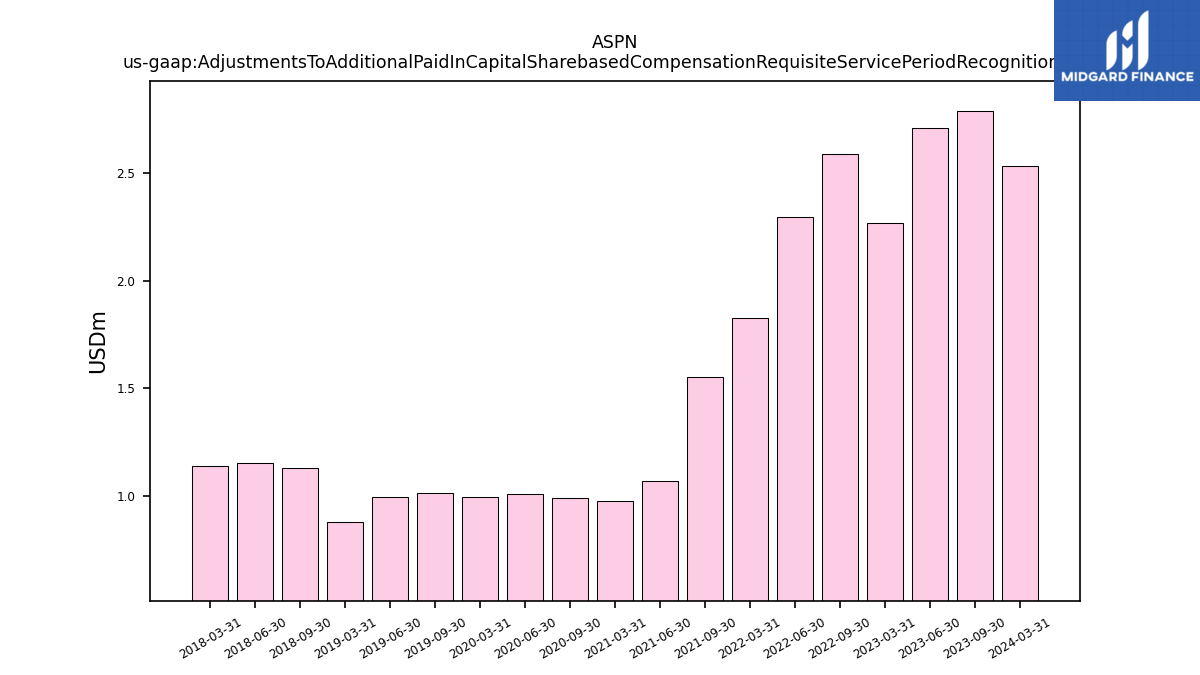
| Adjustments To Additional Paid In Capital Sharebased Compensation Requisite Service Period Recognition Value | 2.79 | 2.71 | 2.27 | NA | 2.59 | 2.29 | 1.83 | NA | 1.55 | 1.07 | 0.98 | NA | 0.99 | 1.01 | 0.99 | NA | 1.01 | 1.00 | 0.88 | NA | 1.13 | 1.15 | 1.14 | NA | NA | NA | NA | NA | NA | NA | NA | NA | NA | NA | NA | NA | NA | NA | NA | NA | NA | NA | NA |
| 2023-09-30 | 2023-06-30 | 2023-03-31 | 2022-12-31 | 2022-09-30 | 2022-06-30 | 2022-03-31 | 2021-12-31 | 2021-09-30 | 2021-06-30 | 2021-03-31 | 2020-12-31 | 2020-09-30 | 2020-06-30 | 2020-03-31 | 2019-12-31 | 2019-09-30 | 2019-06-30 | 2019-03-31 | 2018-12-31 | 2018-09-30 | 2018-06-30 | 2018-03-31 | 2017-12-31 | 2017-09-30 | 2017-06-30 | 2017-03-31 | 2016-12-31 | 2016-09-30 | 2016-06-30 | 2016-03-31 | 2015-12-31 | 2015-09-30 | 2015-06-30 | 2015-03-31 | 2014-12-31 | 2014-09-30 | 2014-06-30 | 2014-03-31 | 2013-12-31 | 2013-09-30 | 2013-06-30 | 2013-03-31 | ||
|---|---|---|---|---|---|---|---|---|---|---|---|---|---|---|---|---|---|---|---|---|---|---|---|---|---|---|---|---|---|---|---|---|---|---|---|---|---|---|---|---|---|---|---|---|
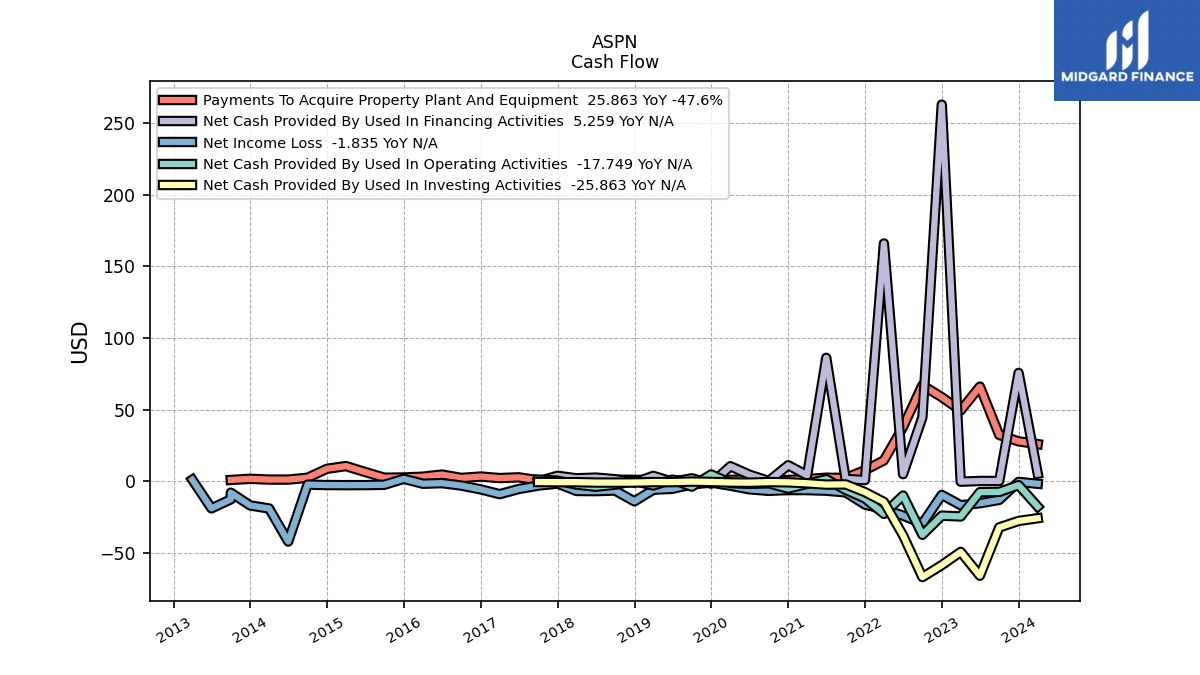
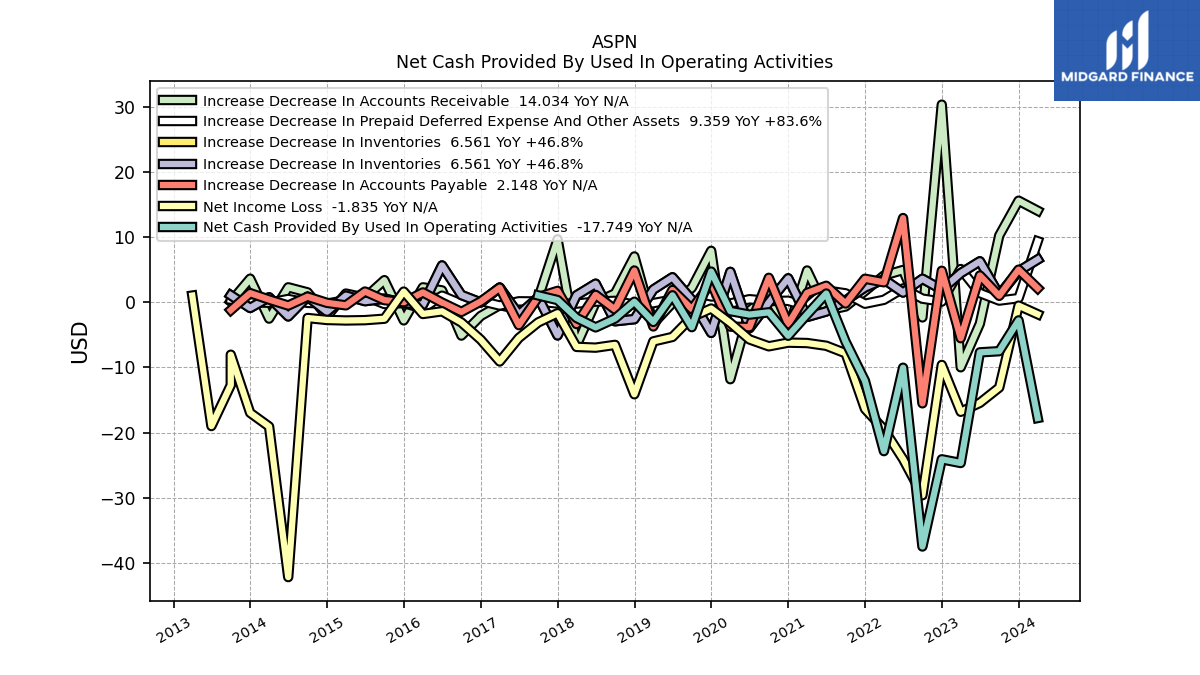
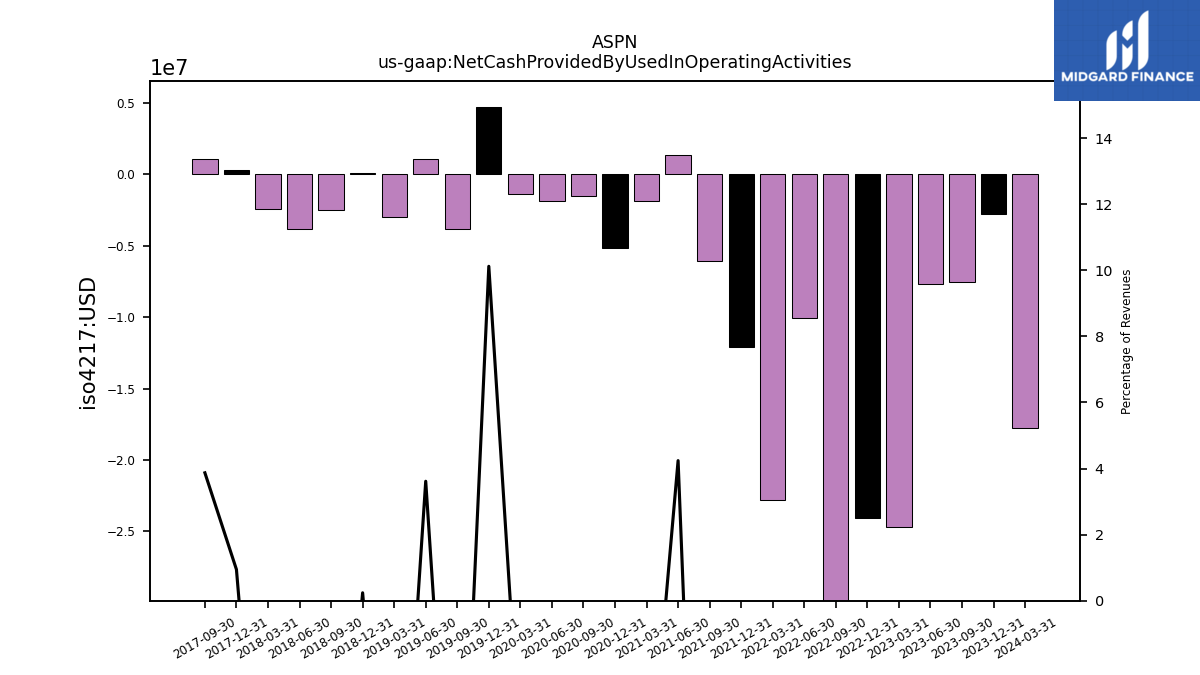
| Net Cash Provided By Used In Operating Activities | -7.50 | -7.68 | -24.65 | -24.08 | -37.45 | -10.04 | -22.83 | -12.05 | -6.05 | 1.34 | -1.87 | -5.14 | -1.54 | -1.89 | -1.35 | 4.71 | -3.82 | 1.07 | -3.01 | 0.09 | -2.49 | -3.85 | -2.40 | 0.34 | 1.05 | NA | NA | NA | NA | NA | NA | NA | NA | NA | NA | NA | NA | NA | NA | NA | NA | NA | NA | |
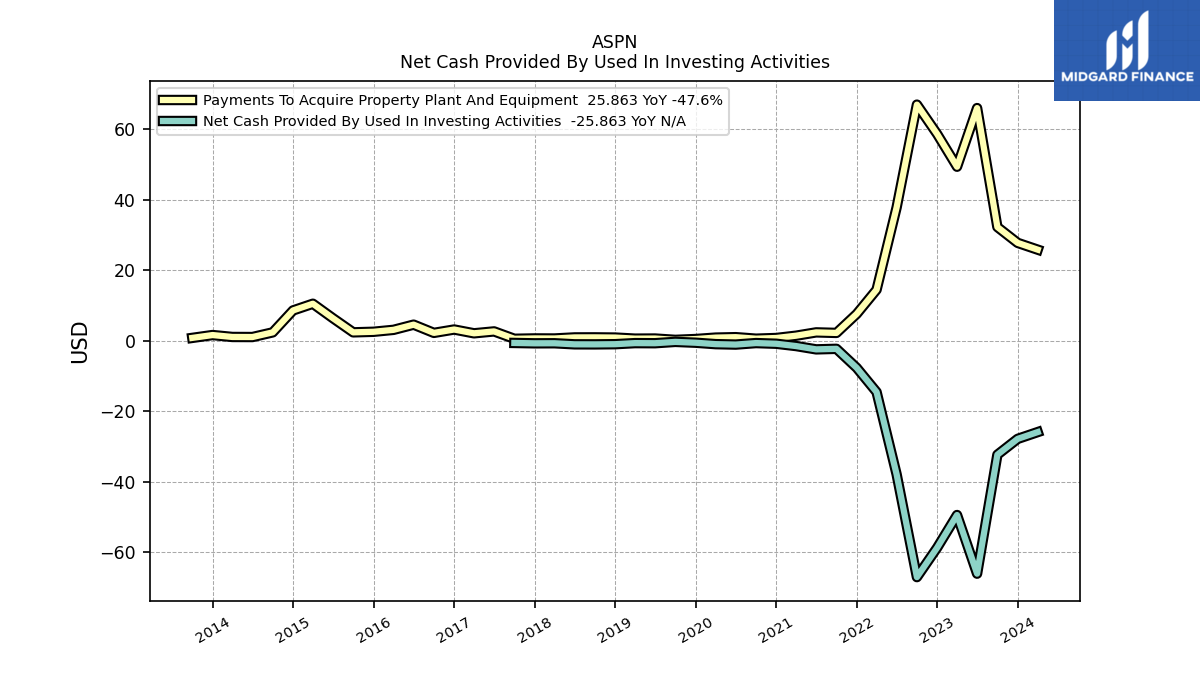
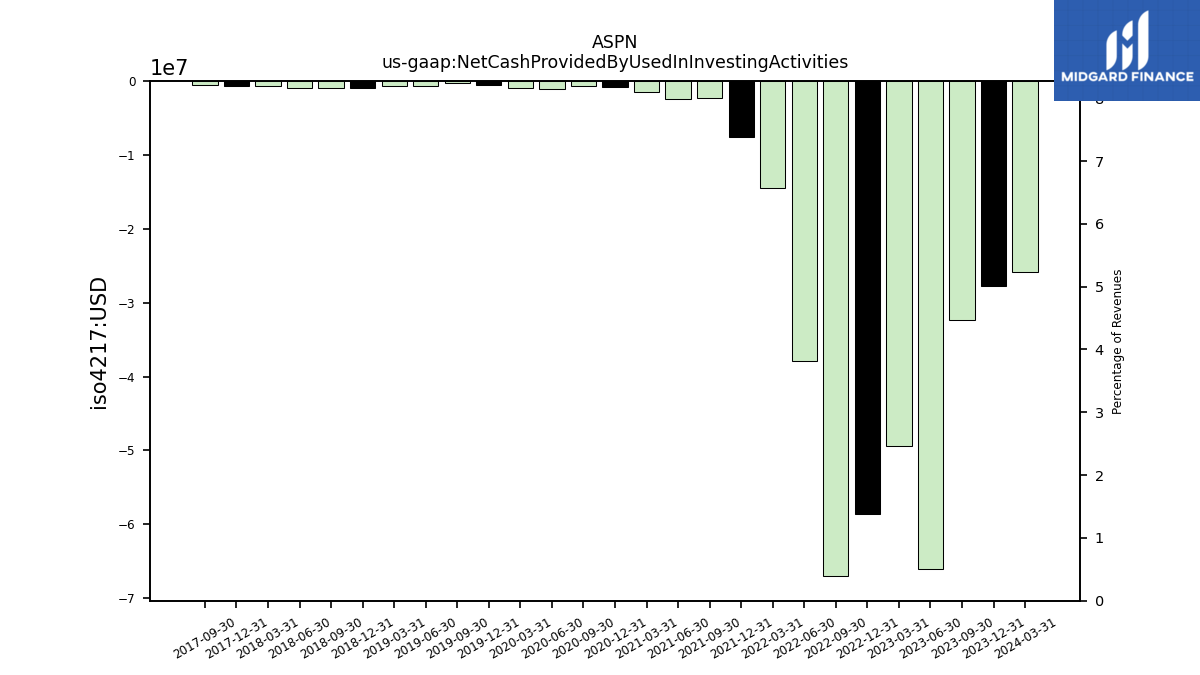
| Net Cash Provided By Used In Investing Activities | -32.28 | -66.01 | -49.38 | -58.63 | -66.99 | -37.85 | -14.50 | -7.64 | -2.25 | -2.41 | -1.47 | -0.82 | -0.62 | -1.05 | -0.93 | -0.52 | -0.29 | -0.67 | -0.64 | -0.94 | -0.99 | -0.98 | -0.68 | -0.69 | -0.59 | NA | NA | NA | NA | NA | NA | NA | NA | NA | NA | NA | NA | NA | NA | NA | NA | NA | NA | |
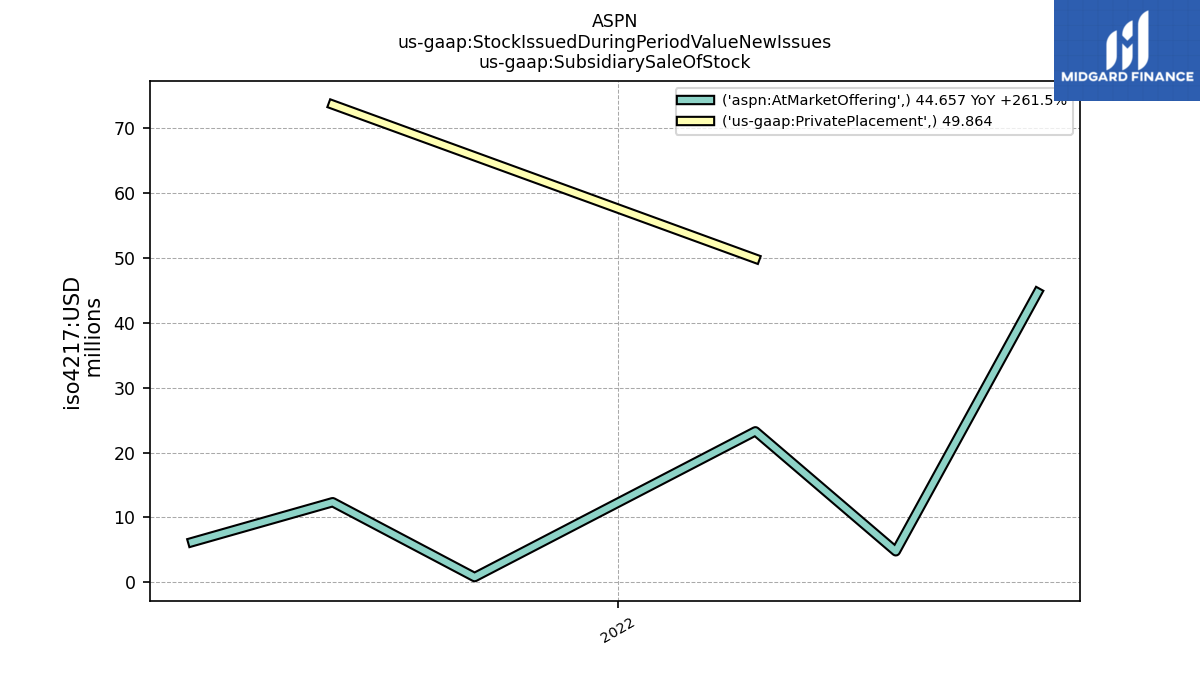
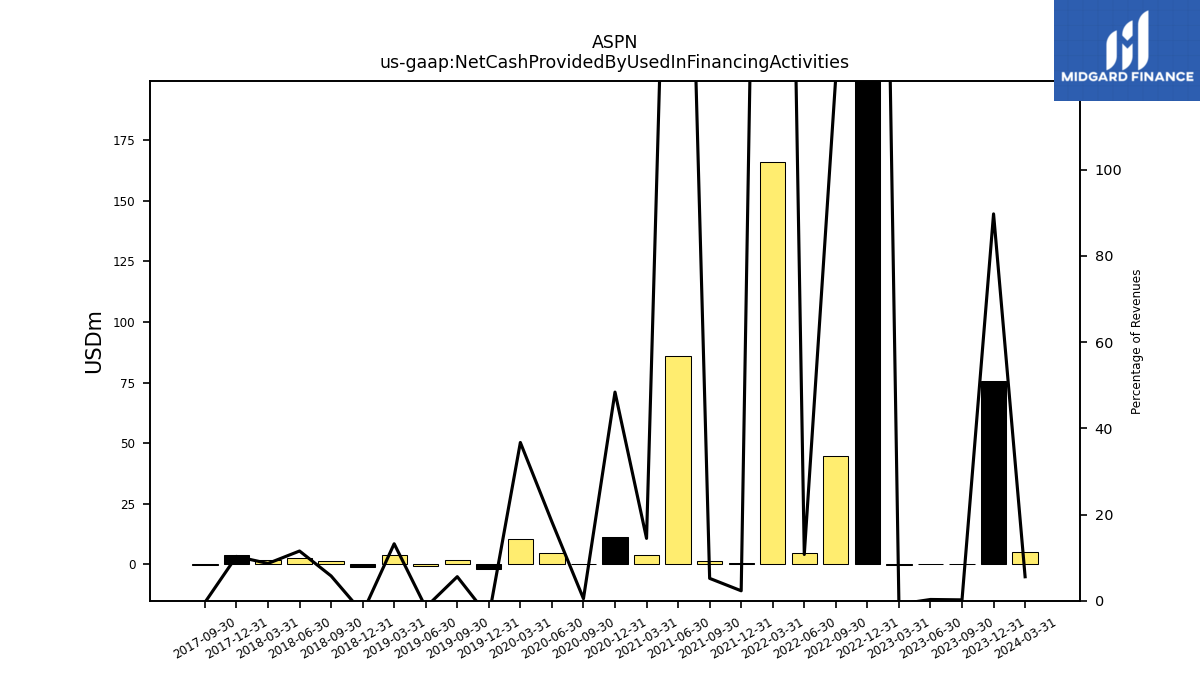
| Net Cash Provided By Used In Financing Activities | 0.13 | 0.14 | -0.36 | 262.87 | 44.66 | 4.90 | 165.95 | 0.73 | 1.58 | 86.10 | 4.07 | 11.14 | 0.12 | 4.51 | 10.43 | -1.75 | 1.98 | -0.45 | 3.69 | -0.99 | 1.38 | 2.50 | 2.00 | 3.74 | -0.11 | NA | NA | NA | NA | NA | NA | NA | NA | NA | NA | NA | NA | NA | NA | NA | NA | NA | NA |
| 2023-09-30 | 2023-06-30 | 2023-03-31 | 2022-12-31 | 2022-09-30 | 2022-06-30 | 2022-03-31 | 2021-12-31 | 2021-09-30 | 2021-06-30 | 2021-03-31 | 2020-12-31 | 2020-09-30 | 2020-06-30 | 2020-03-31 | 2019-12-31 | 2019-09-30 | 2019-06-30 | 2019-03-31 | 2018-12-31 | 2018-09-30 | 2018-06-30 | 2018-03-31 | 2017-12-31 | 2017-09-30 | 2017-06-30 | 2017-03-31 | 2016-12-31 | 2016-09-30 | 2016-06-30 | 2016-03-31 | 2015-12-31 | 2015-09-30 | 2015-06-30 | 2015-03-31 | 2014-12-31 | 2014-09-30 | 2014-06-30 | 2014-03-31 | 2013-12-31 | 2013-09-30 | 2013-06-30 | 2013-03-31 | ||
|---|---|---|---|---|---|---|---|---|---|---|---|---|---|---|---|---|---|---|---|---|---|---|---|---|---|---|---|---|---|---|---|---|---|---|---|---|---|---|---|---|---|---|---|---|
| Net Cash Provided By Used In Operating Activities | -7.50 | -7.68 | -24.65 | -24.08 | -37.45 | -10.04 | -22.83 | -12.05 | -6.05 | 1.34 | -1.87 | -5.14 | -1.54 | -1.89 | -1.35 | 4.71 | -3.82 | 1.07 | -3.01 | 0.09 | -2.49 | -3.85 | -2.40 | 0.34 | 1.05 | NA | NA | NA | NA | NA | NA | NA | NA | NA | NA | NA | NA | NA | NA | NA | NA | NA | NA | |
| Net Income Loss | -13.07 | -15.42 | -16.80 | -9.61 | -29.59 | -24.05 | -19.48 | -16.35 | -7.82 | -6.67 | -6.25 | -6.19 | -6.75 | -5.70 | -3.17 | -0.96 | -2.29 | -5.32 | -6.00 | -14.11 | -6.53 | -6.96 | -6.84 | -1.68 | -3.09 | -5.47 | -9.08 | -5.74 | -3.10 | -1.39 | -1.80 | 1.64 | -2.52 | -2.74 | -2.79 | -2.71 | -2.41 | -42.15 | -19.05 | -16.95 | -8.04 | -18.98 | 1.03 | |
| Profit Loss | -13.07 | -15.42 | -16.80 | -9.61 | -29.59 | -24.05 | -19.48 | -16.35 | -7.82 | -6.67 | -6.25 | -6.19 | -6.75 | -5.70 | -3.17 | -0.96 | -2.29 | -5.32 | -6.00 | -14.11 | -6.53 | -6.96 | -6.84 | -1.68 | -3.09 | NA | NA | NA | NA | NA | NA | NA | NA | NA | NA | NA | NA | NA | NA | NA | NA | NA | NA | |
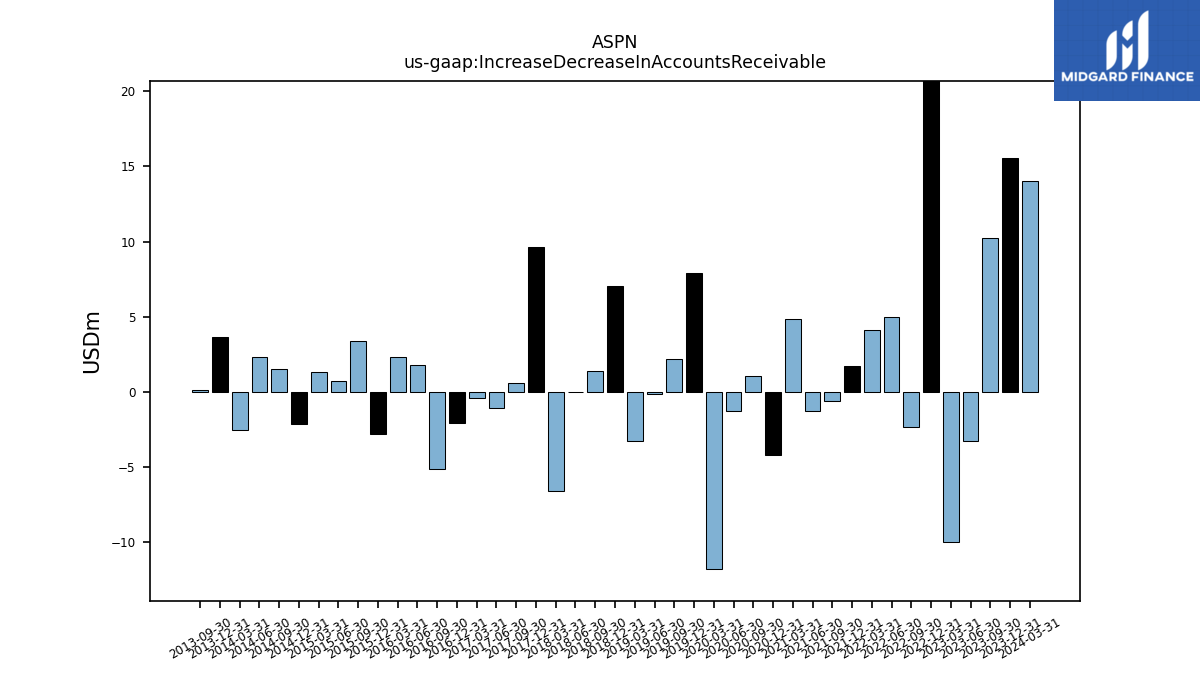
| Increase Decrease In Accounts Receivable | 10.23 | -3.28 | -9.97 | 30.31 | -2.32 | 4.95 | 4.10 | 1.72 | -0.64 | -1.30 | 4.88 | -4.22 | 1.07 | -1.29 | -11.80 | 7.89 | 2.20 | -0.12 | -3.28 | 7.03 | 1.35 | -0.03 | -6.63 | 9.65 | 0.57 | -1.08 | -0.44 | -2.09 | -5.11 | 1.82 | 2.29 | -2.78 | 3.39 | 0.70 | 1.34 | -2.14 | 1.52 | 2.30 | -2.51 | 3.62 | 0.10 | NA | NA | |
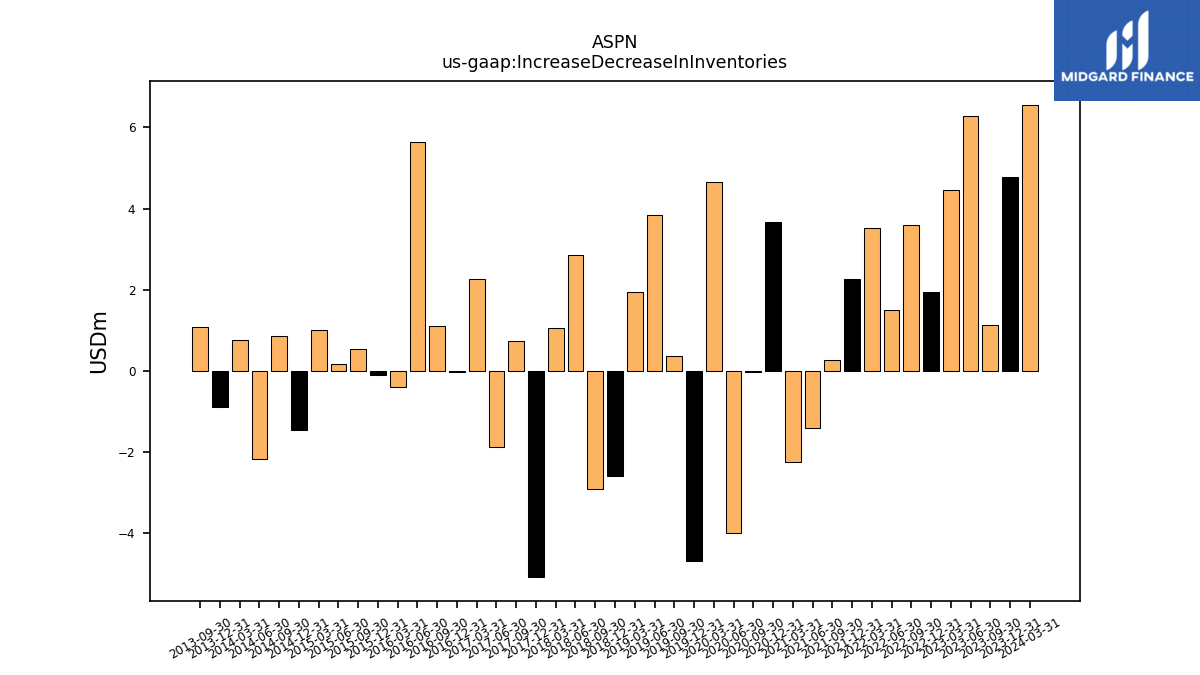
| Increase Decrease In Inventories | 1.13 | 6.28 | 4.47 | 1.94 | 3.60 | 1.50 | 3.52 | 2.27 | 0.27 | -1.41 | -2.25 | 3.67 | -0.03 | -3.98 | 4.66 | -4.69 | 0.36 | 3.83 | 1.95 | -2.59 | -2.91 | 2.85 | 1.06 | -5.08 | 0.74 | -1.88 | 2.26 | -0.03 | 1.11 | 5.65 | -0.39 | -0.10 | 0.55 | 0.17 | 1.01 | -1.45 | 0.86 | -2.17 | 0.77 | -0.88 | 1.07 | NA | NA | |
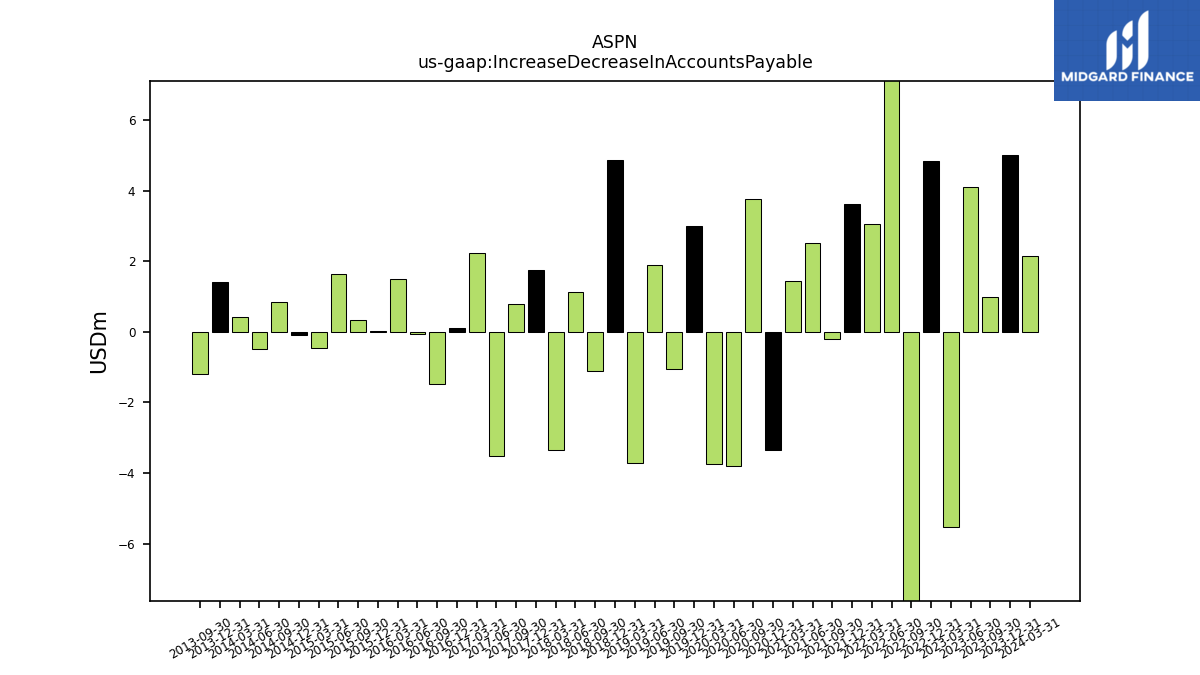
| Increase Decrease In Accounts Payable | 0.99 | 4.11 | -5.52 | 4.84 | -15.50 | 12.92 | 3.06 | 3.61 | -0.19 | 2.53 | 1.43 | -3.35 | 3.75 | -3.81 | -3.73 | 3.01 | -1.04 | 1.89 | -3.71 | 4.87 | -1.10 | 1.13 | -3.34 | 1.75 | 0.79 | -3.51 | 2.24 | 0.12 | -1.48 | -0.05 | 1.51 | 0.01 | 0.33 | 1.65 | -0.47 | -0.09 | 0.86 | -0.50 | 0.41 | 1.41 | -1.21 | NA | NA | |
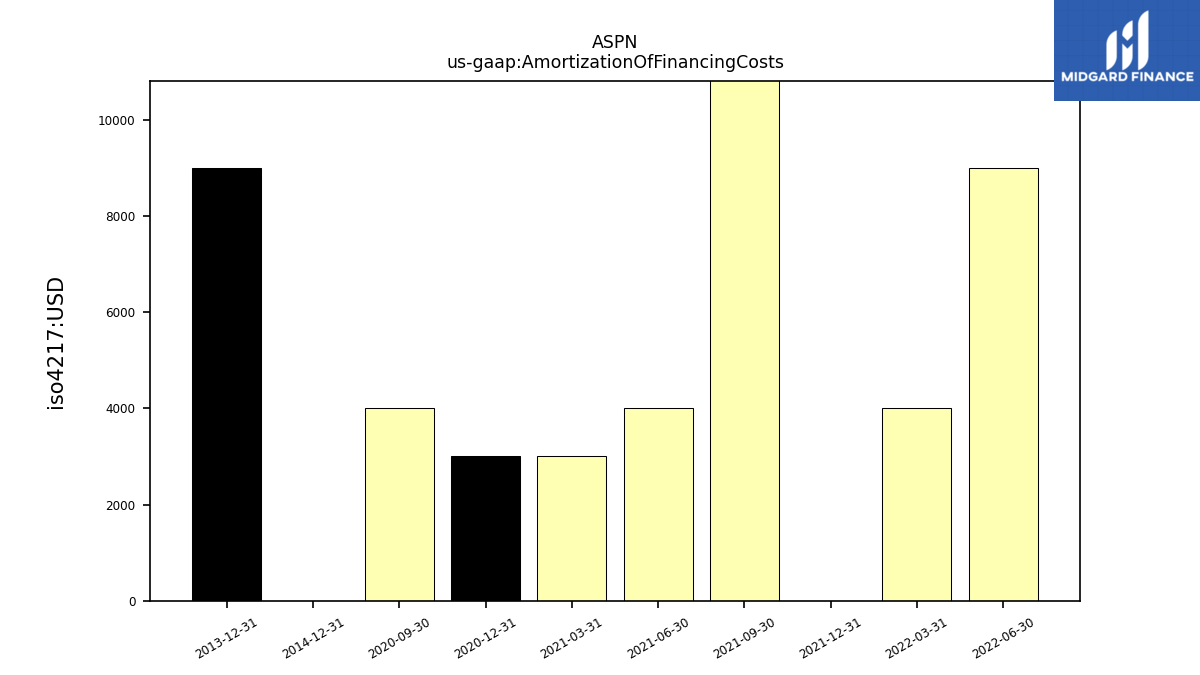
| Amortization Of Financing Costs | NA | NA | NA | NA | NA | 0.01 | 0.00 | 0.00 | 0.01 | 0.00 | 0.00 | 0.00 | 0.00 | NA | NA | NA | NA | NA | NA | NA | NA | NA | NA | NA | NA | NA | NA | NA | NA | NA | NA | NA | NA | NA | NA | 0.00 | NA | NA | NA | 0.01 | NA | NA | NA |
| 2023-09-30 | 2023-06-30 | 2023-03-31 | 2022-12-31 | 2022-09-30 | 2022-06-30 | 2022-03-31 | 2021-12-31 | 2021-09-30 | 2021-06-30 | 2021-03-31 | 2020-12-31 | 2020-09-30 | 2020-06-30 | 2020-03-31 | 2019-12-31 | 2019-09-30 | 2019-06-30 | 2019-03-31 | 2018-12-31 | 2018-09-30 | 2018-06-30 | 2018-03-31 | 2017-12-31 | 2017-09-30 | 2017-06-30 | 2017-03-31 | 2016-12-31 | 2016-09-30 | 2016-06-30 | 2016-03-31 | 2015-12-31 | 2015-09-30 | 2015-06-30 | 2015-03-31 | 2014-12-31 | 2014-09-30 | 2014-06-30 | 2014-03-31 | 2013-12-31 | 2013-09-30 | 2013-06-30 | 2013-03-31 | ||
|---|---|---|---|---|---|---|---|---|---|---|---|---|---|---|---|---|---|---|---|---|---|---|---|---|---|---|---|---|---|---|---|---|---|---|---|---|---|---|---|---|---|---|---|---|
| Net Cash Provided By Used In Investing Activities | -32.28 | -66.01 | -49.38 | -58.63 | -66.99 | -37.85 | -14.50 | -7.64 | -2.25 | -2.41 | -1.47 | -0.82 | -0.62 | -1.05 | -0.93 | -0.52 | -0.29 | -0.67 | -0.64 | -0.94 | -0.99 | -0.98 | -0.68 | -0.69 | -0.59 | NA | NA | NA | NA | NA | NA | NA | NA | NA | NA | NA | NA | NA | NA | NA | NA | NA | NA | |
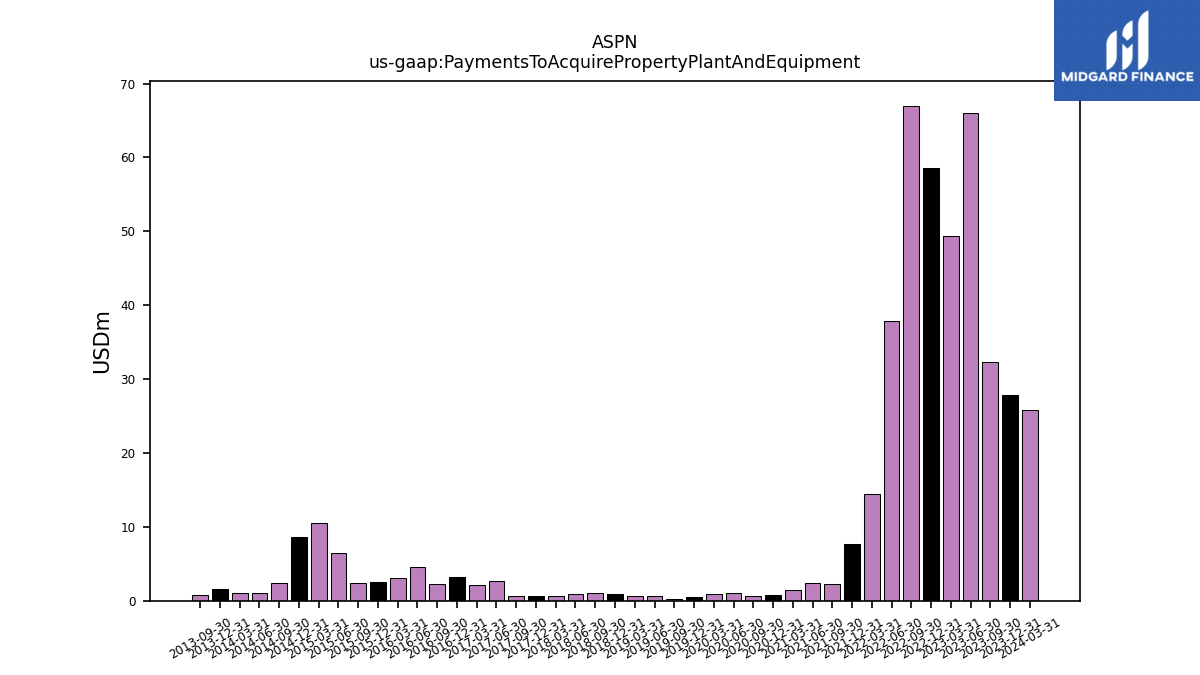
| Payments To Acquire Property Plant And Equipment | 32.28 | 66.01 | 49.38 | 58.63 | 66.99 | 37.85 | 14.50 | 7.64 | 2.25 | 2.41 | 1.47 | 0.82 | 0.62 | 1.05 | 0.93 | 0.52 | 0.29 | 0.67 | 0.64 | 0.94 | 0.99 | 0.98 | 0.68 | 0.69 | 0.59 | 2.69 | 2.15 | 3.22 | 2.27 | 4.60 | 3.13 | 2.58 | 2.42 | 6.43 | 10.53 | 8.63 | 2.41 | 1.09 | 1.11 | 1.65 | 0.84 | NA | NA | |
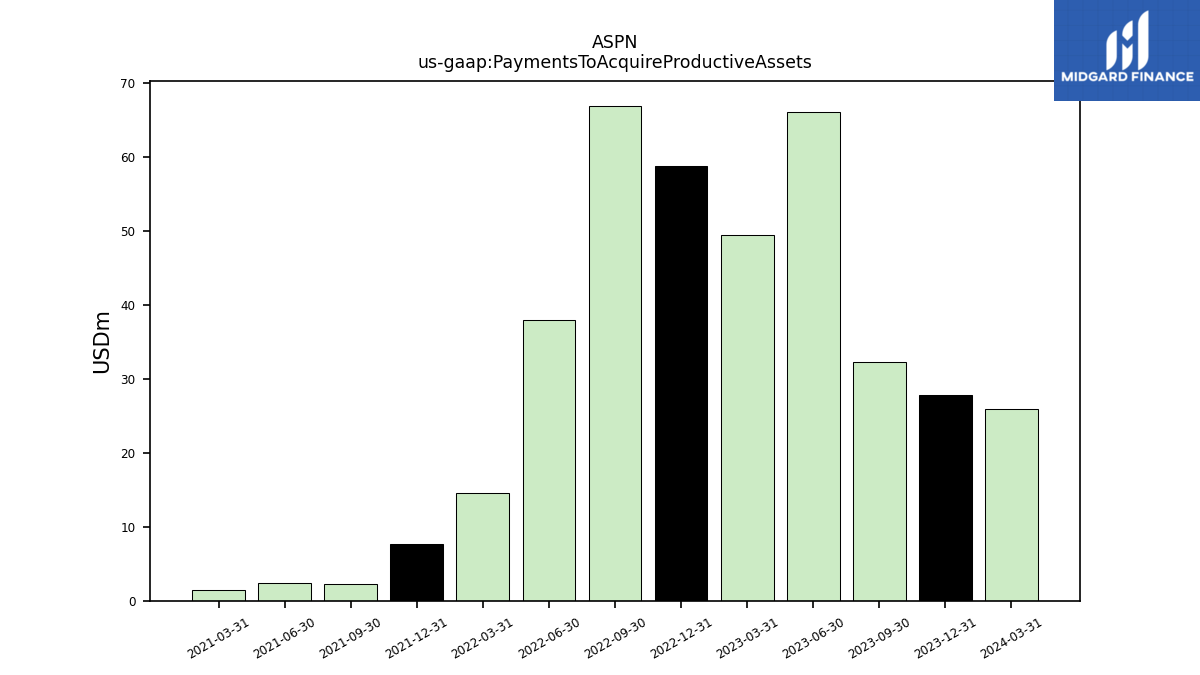
| Payments To Acquire Productive Assets | 32.30 | 66.00 | 49.40 | 58.70 | 66.90 | 37.90 | 14.50 | 7.70 | 2.20 | 2.40 | 1.50 | NA | NA | NA | NA | NA | NA | NA | NA | NA | NA | NA | NA | NA | NA | NA | NA | NA | NA | NA | NA | NA | NA | NA | NA | NA | NA | NA | NA | NA | NA | NA | NA |
| 2023-09-30 | 2023-06-30 | 2023-03-31 | 2022-12-31 | 2022-09-30 | 2022-06-30 | 2022-03-31 | 2021-12-31 | 2021-09-30 | 2021-06-30 | 2021-03-31 | 2020-12-31 | 2020-09-30 | 2020-06-30 | 2020-03-31 | 2019-12-31 | 2019-09-30 | 2019-06-30 | 2019-03-31 | 2018-12-31 | 2018-09-30 | 2018-06-30 | 2018-03-31 | 2017-12-31 | 2017-09-30 | 2017-06-30 | 2017-03-31 | 2016-12-31 | 2016-09-30 | 2016-06-30 | 2016-03-31 | 2015-12-31 | 2015-09-30 | 2015-06-30 | 2015-03-31 | 2014-12-31 | 2014-09-30 | 2014-06-30 | 2014-03-31 | 2013-12-31 | 2013-09-30 | 2013-06-30 | 2013-03-31 | ||
|---|---|---|---|---|---|---|---|---|---|---|---|---|---|---|---|---|---|---|---|---|---|---|---|---|---|---|---|---|---|---|---|---|---|---|---|---|---|---|---|---|---|---|---|---|
| Net Cash Provided By Used In Financing Activities | 0.13 | 0.14 | -0.36 | 262.87 | 44.66 | 4.90 | 165.95 | 0.73 | 1.58 | 86.10 | 4.07 | 11.14 | 0.12 | 4.51 | 10.43 | -1.75 | 1.98 | -0.45 | 3.69 | -0.99 | 1.38 | 2.50 | 2.00 | 3.74 | -0.11 | NA | NA | NA | NA | NA | NA | NA | NA | NA | NA | NA | NA | NA | NA | NA | NA | NA | NA |
| 2023-09-30 | 2023-06-30 | 2023-03-31 | 2022-12-31 | 2022-09-30 | 2022-06-30 | 2022-03-31 | 2021-12-31 | 2021-09-30 | 2021-06-30 | 2021-03-31 | 2020-12-31 | 2020-09-30 | 2020-06-30 | 2020-03-31 | 2019-12-31 | 2019-09-30 | 2019-06-30 | 2019-03-31 | 2018-12-31 | 2018-09-30 | 2018-06-30 | 2018-03-31 | 2017-12-31 | 2017-09-30 | 2017-06-30 | 2017-03-31 | 2016-12-31 | 2016-09-30 | 2016-06-30 | 2016-03-31 | 2015-12-31 | 2015-09-30 | 2015-06-30 | 2015-03-31 | 2014-12-31 | 2014-09-30 | 2014-06-30 | 2014-03-31 | 2013-12-31 | 2013-09-30 | 2013-06-30 | 2013-03-31 | ||
|---|---|---|---|---|---|---|---|---|---|---|---|---|---|---|---|---|---|---|---|---|---|---|---|---|---|---|---|---|---|---|---|---|---|---|---|---|---|---|---|---|---|---|---|---|
| Revenues | 60.76 | 48.16 | 45.59 | 59.61 | 36.71 | 45.64 | 38.41 | 31.48 | 30.38 | 31.67 | 28.10 | 23.02 | 24.20 | 24.64 | 28.42 | 46.51 | 35.42 | 29.53 | 27.91 | 35.68 | 23.94 | 21.67 | 23.07 | 36.36 | 27.20 | 25.07 | 23.00 | 27.64 | 29.56 | 27.72 | 32.82 | 37.38 | 31.54 | 30.10 | 23.50 | 27.98 | 25.44 | 26.61 | 22.36 | 24.23 | 21.88 | 22.98 | 17.00 | |
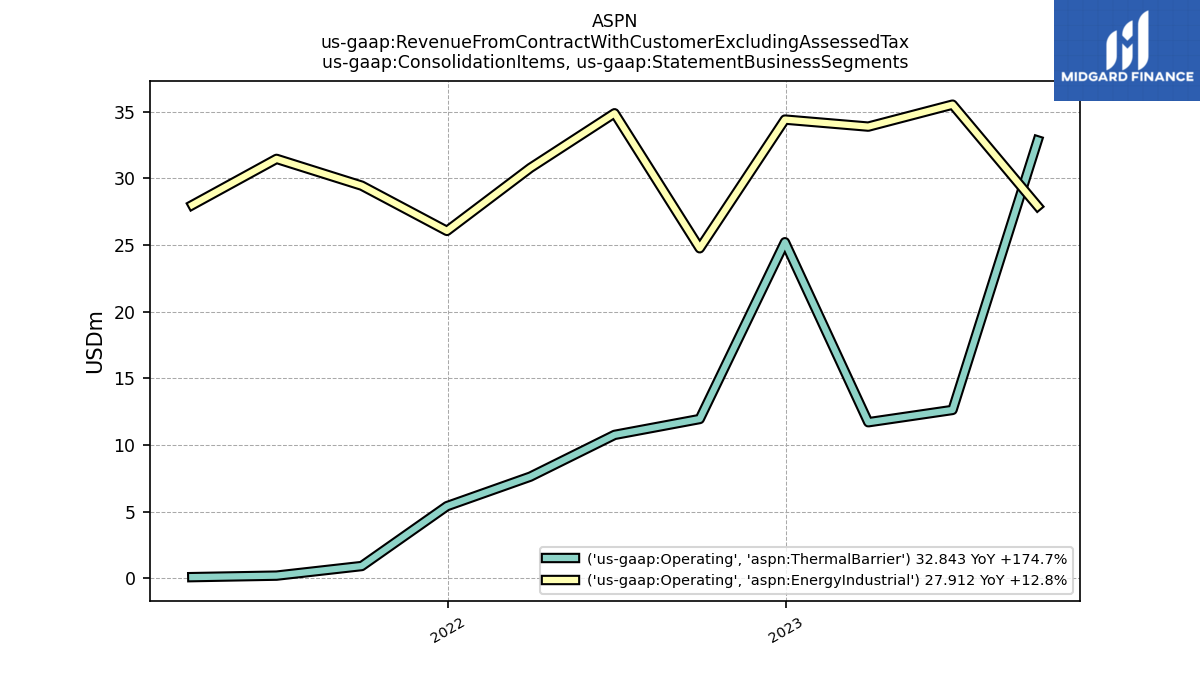
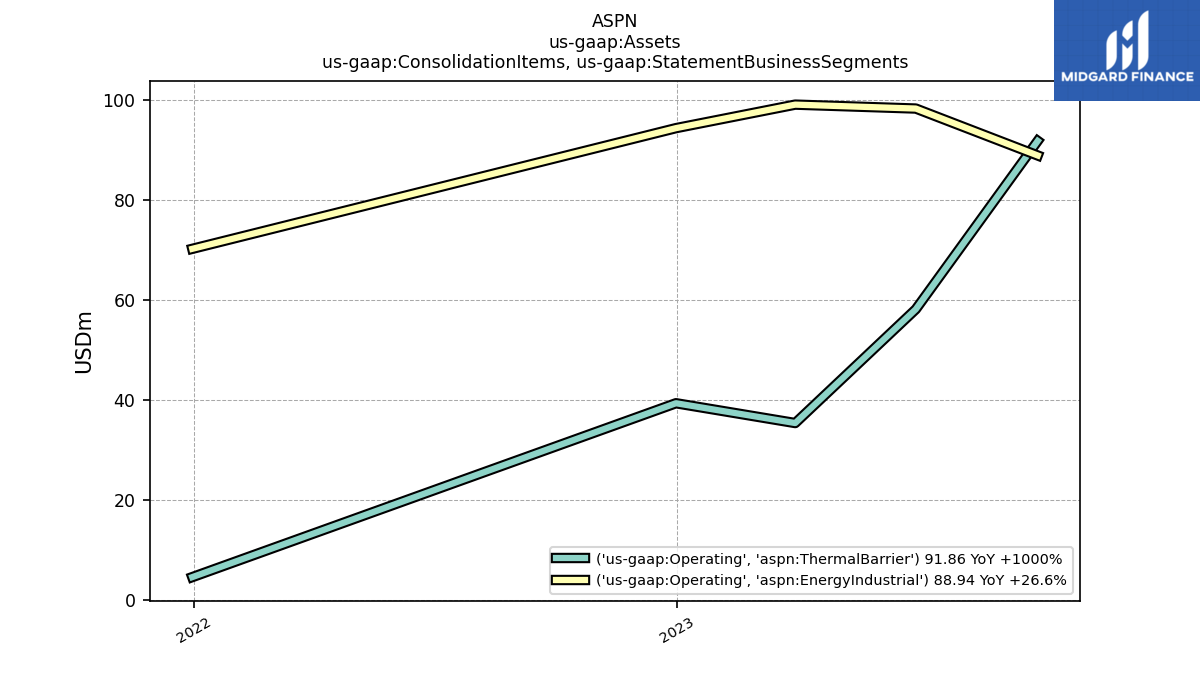
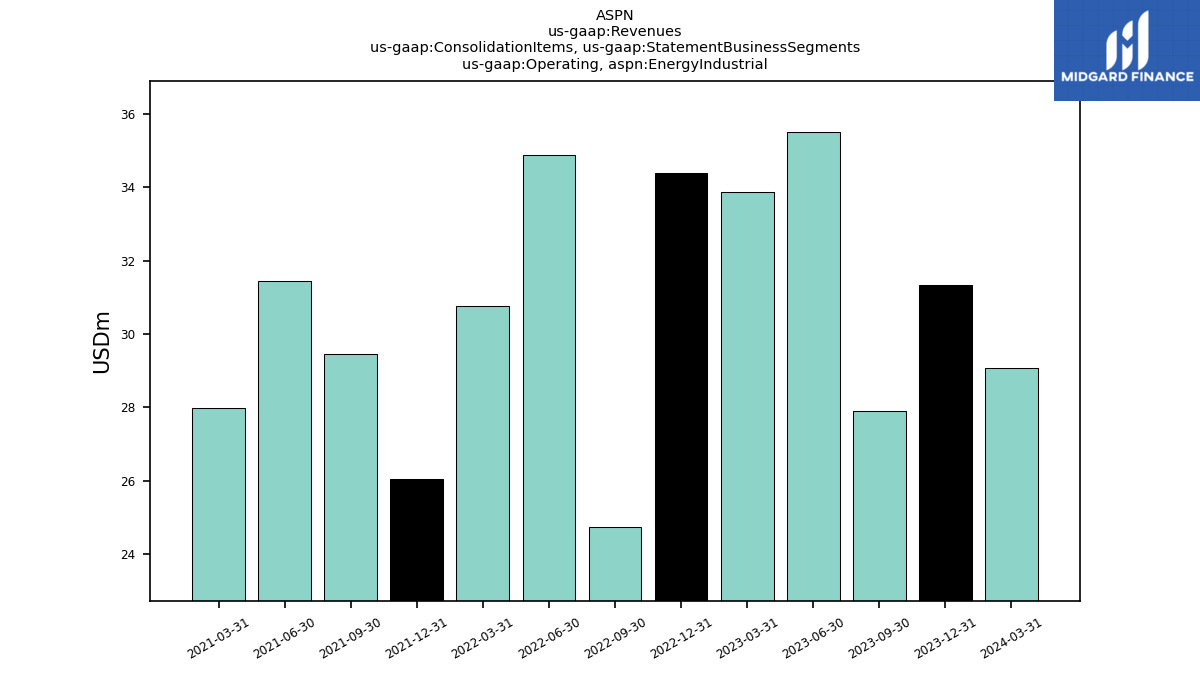
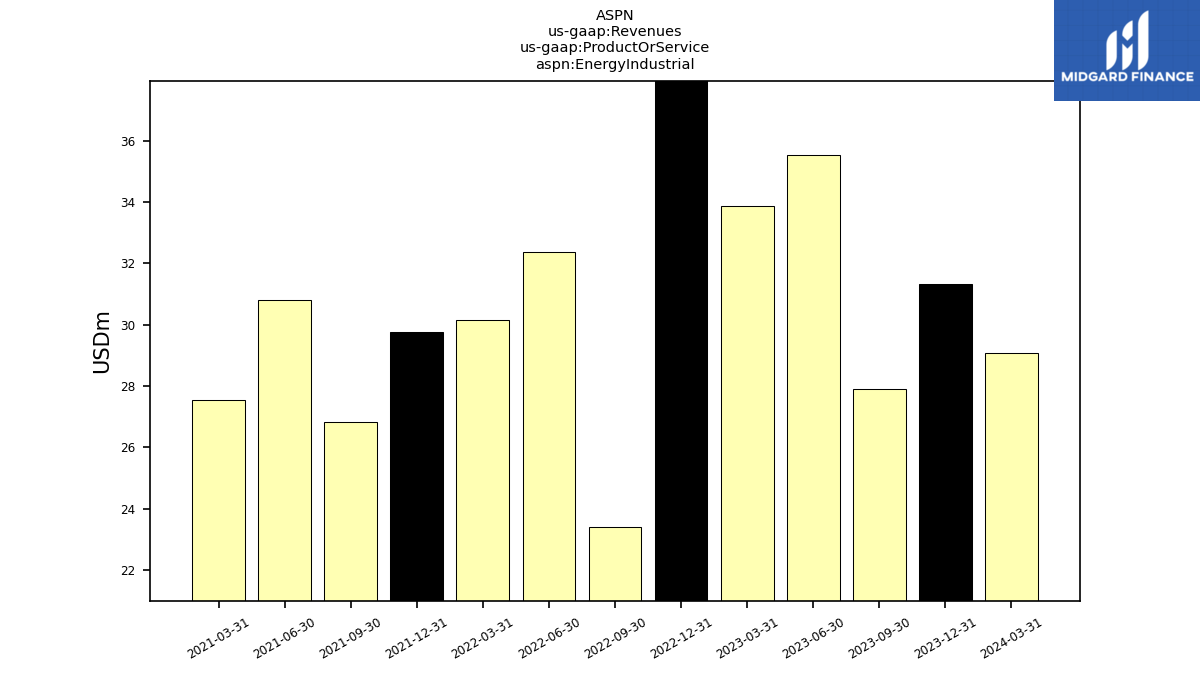
| Operating, Energy Industrial | 27.91 | 35.52 | 33.88 | 34.40 | 24.75 | 34.88 | 30.77 | 26.05 | 29.45 | 31.46 | 28.00 | NA | NA | NA | NA | NA | NA | NA | NA | NA | NA | NA | NA | NA | NA | NA | NA | NA | NA | NA | NA | NA | NA | NA | NA | NA | NA | NA | NA | NA | NA | NA | NA | |
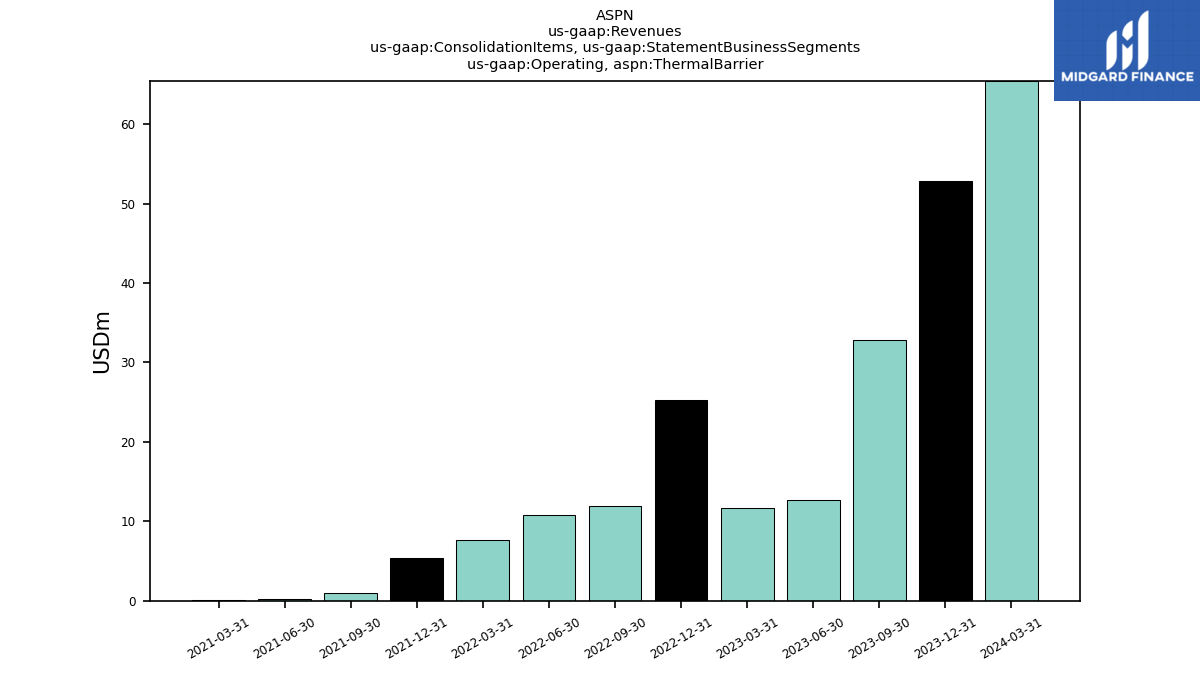
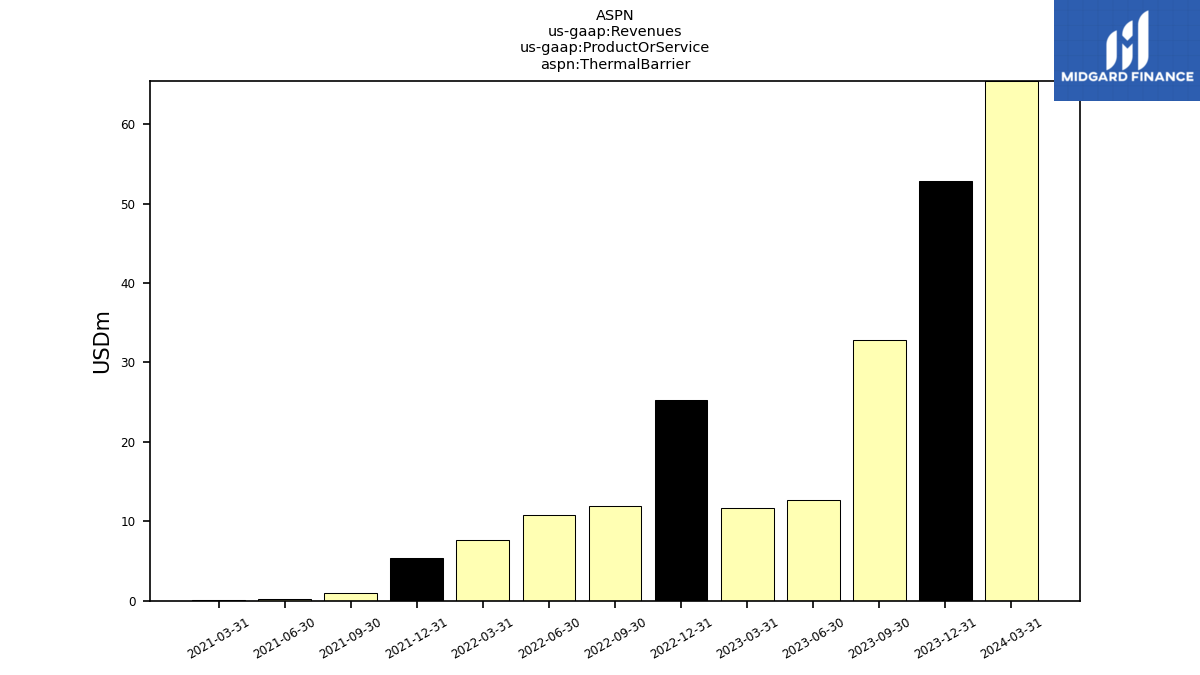
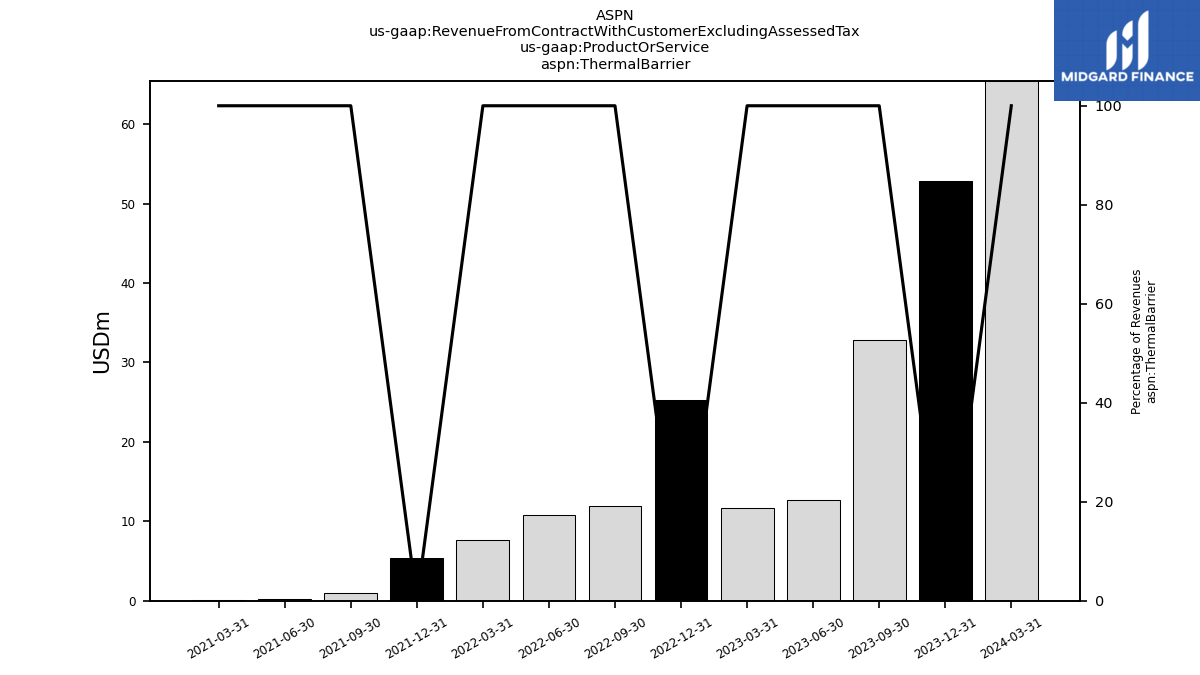
| Operating, Thermal Barrier | 32.84 | 12.63 | 11.71 | 25.21 | 11.95 | 10.76 | 7.63 | 5.42 | 0.93 | 0.21 | 0.10 | NA | NA | NA | NA | NA | NA | NA | NA | NA | NA | NA | NA | NA | NA | NA | NA | NA | NA | NA | NA | NA | NA | NA | NA | NA | NA | NA | NA | NA | NA | NA | NA | |
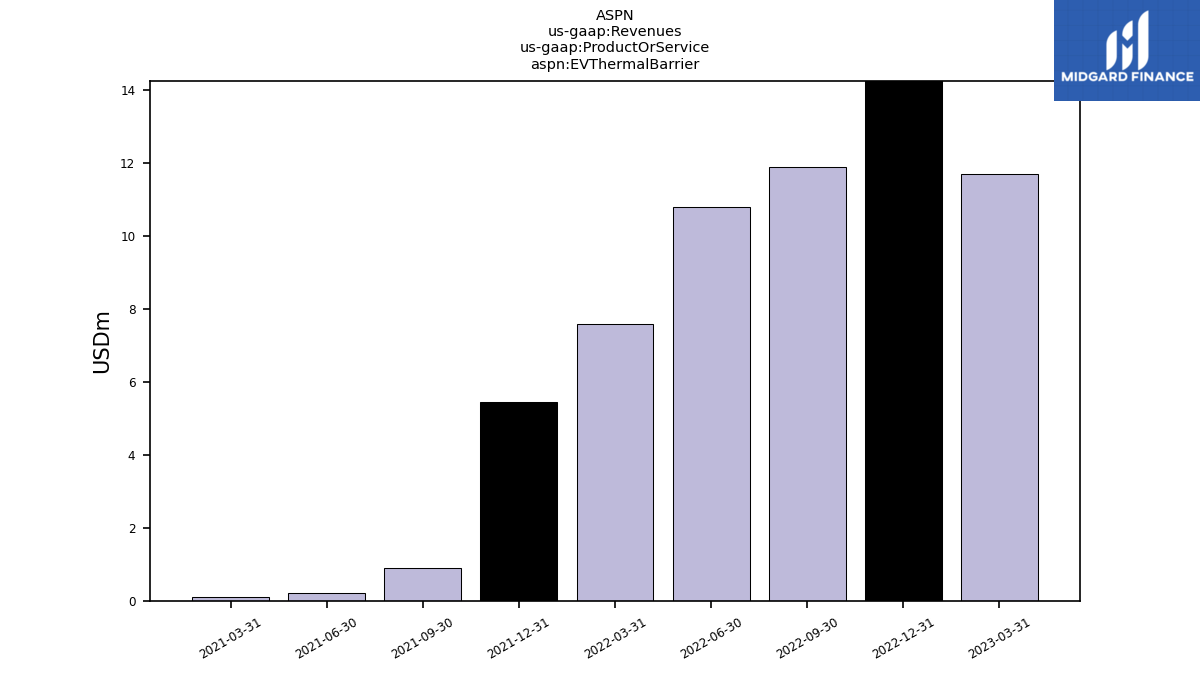
| E V Thermal Barrier | NA | NA | 11.70 | 25.30 | 11.90 | 10.80 | 7.60 | 5.46 | 0.90 | 0.20 | 0.10 | NA | NA | NA | NA | NA | NA | NA | NA | NA | NA | NA | NA | NA | NA | NA | NA | NA | NA | NA | NA | NA | NA | NA | NA | NA | NA | NA | NA | NA | NA | NA | NA | |
| Energy Industrial | 27.91 | 35.52 | 33.88 | 38.81 | 23.41 | 32.36 | 30.14 | 29.74 | 26.84 | 30.79 | 27.55 | NA | NA | NA | NA | NA | NA | NA | NA | NA | NA | NA | NA | NA | NA | NA | NA | NA | NA | NA | NA | NA | NA | NA | NA | NA | NA | NA | NA | NA | NA | NA | NA | |
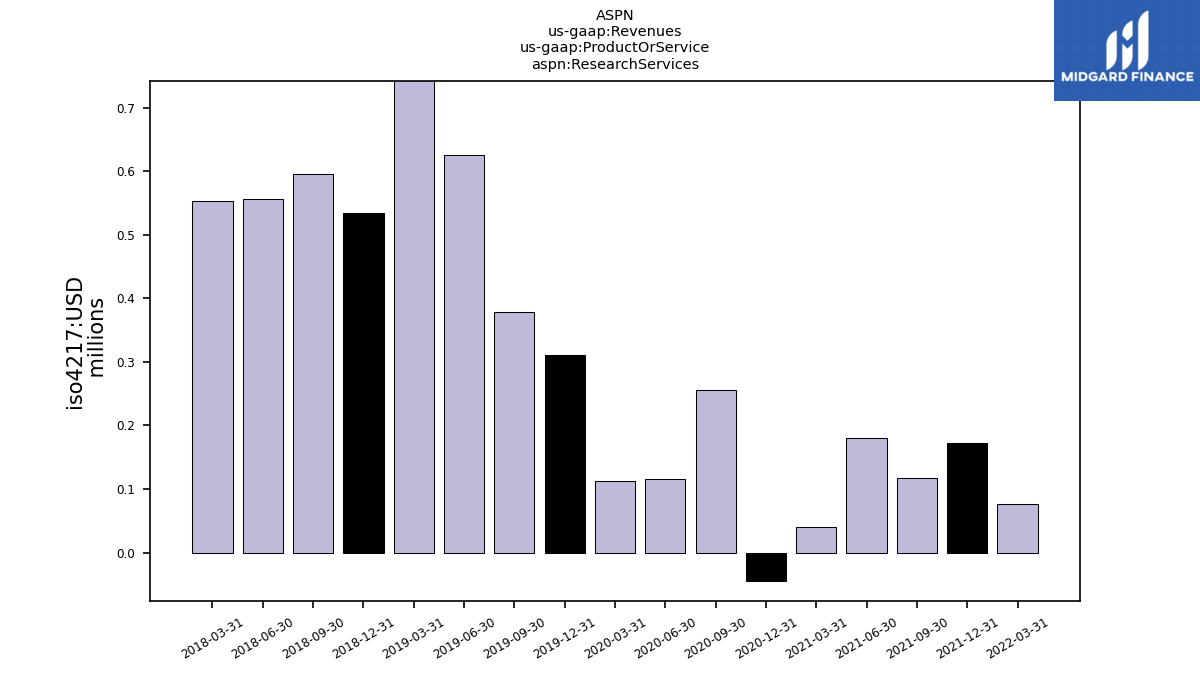
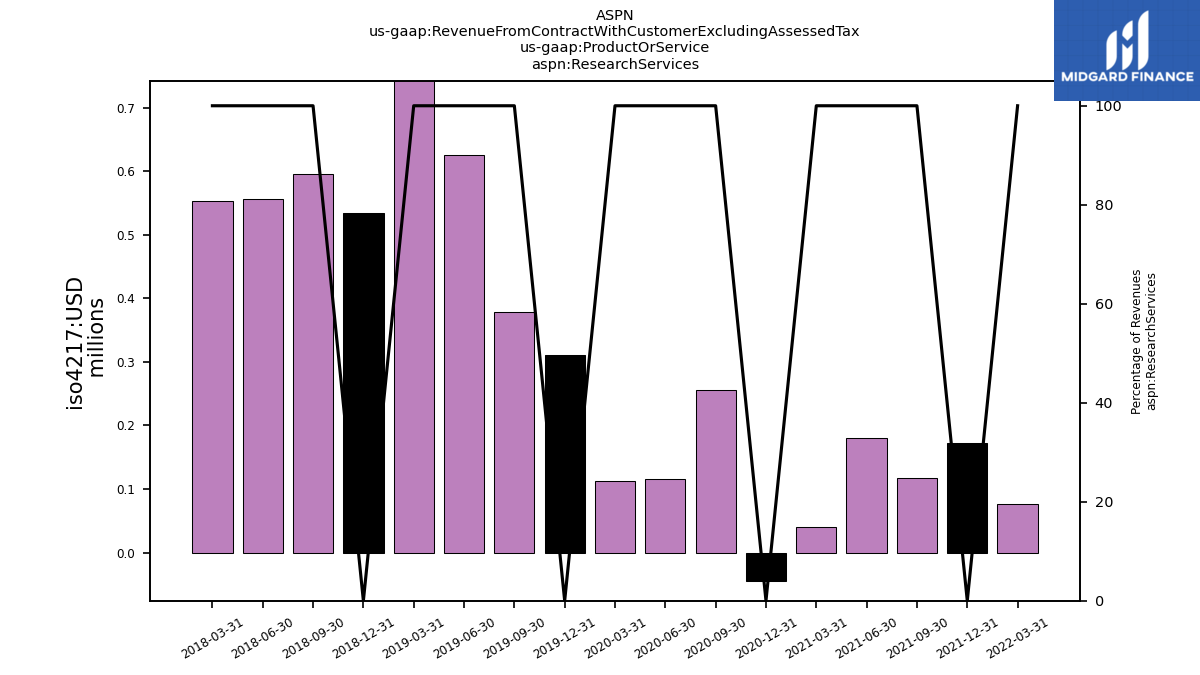
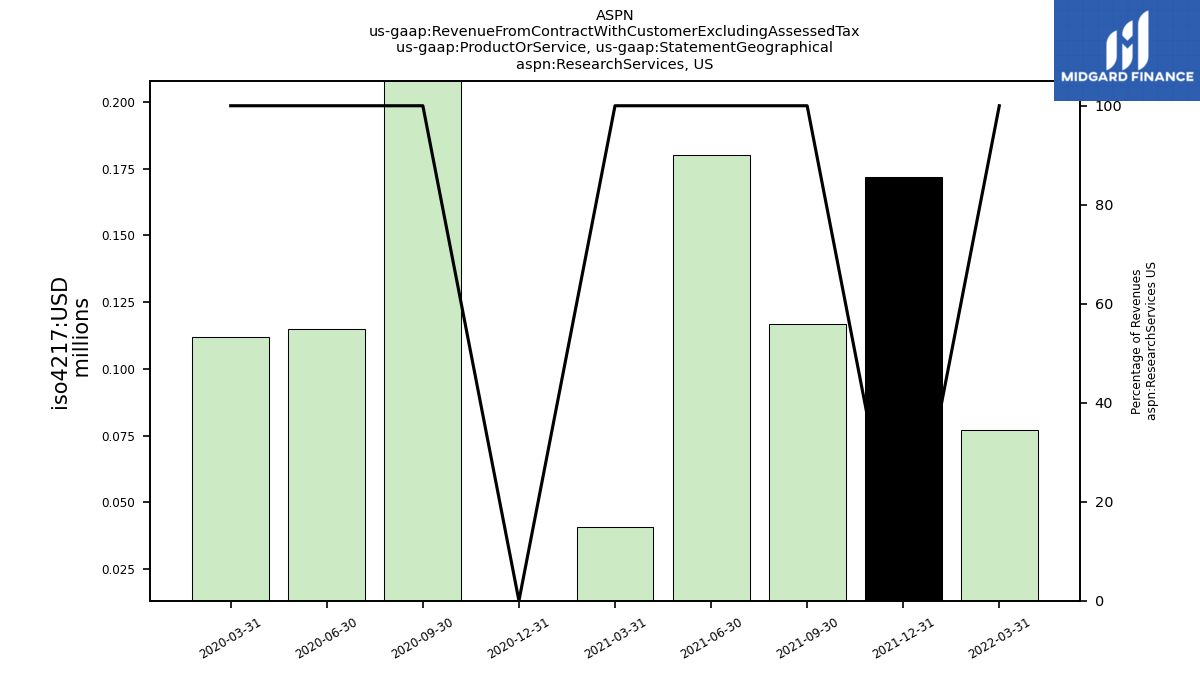
| Research Services | NA | NA | NA | NA | NA | NA | 0.08 | 0.17 | 0.12 | 0.18 | 0.04 | -0.04 | 0.26 | 0.12 | 0.11 | 0.31 | 0.38 | 0.62 | 1.13 | 0.53 | 0.59 | 0.56 | 0.55 | NA | NA | NA | NA | NA | NA | NA | NA | NA | NA | NA | NA | NA | NA | NA | NA | NA | NA | NA | NA | |
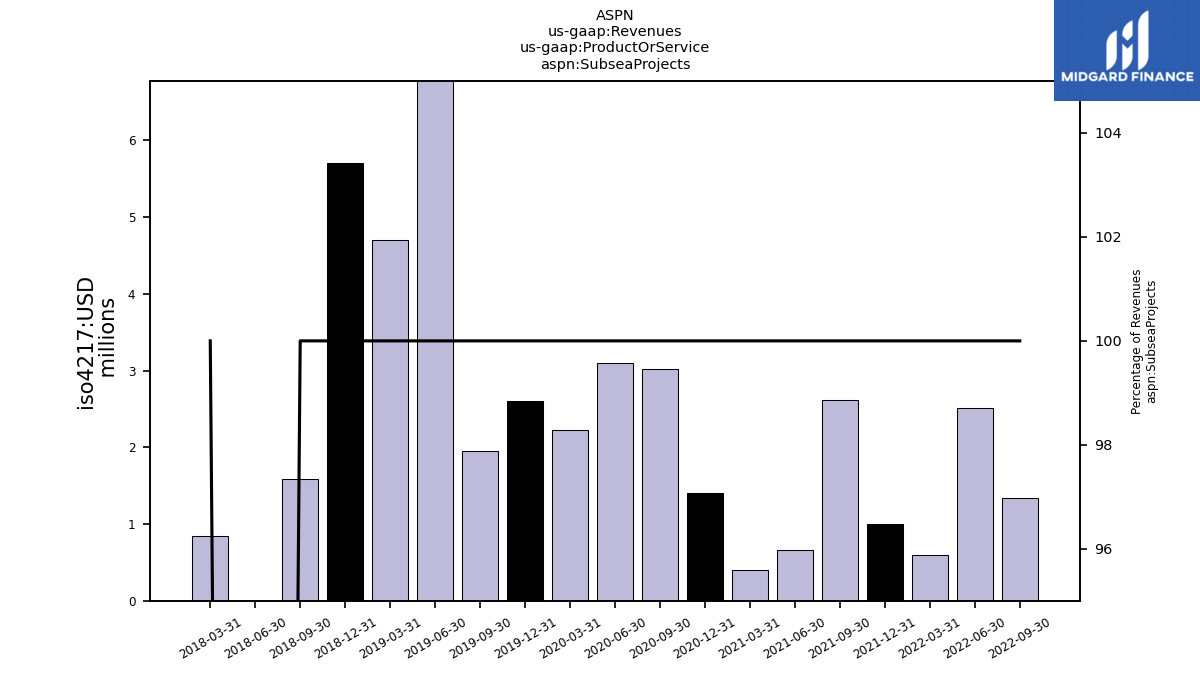
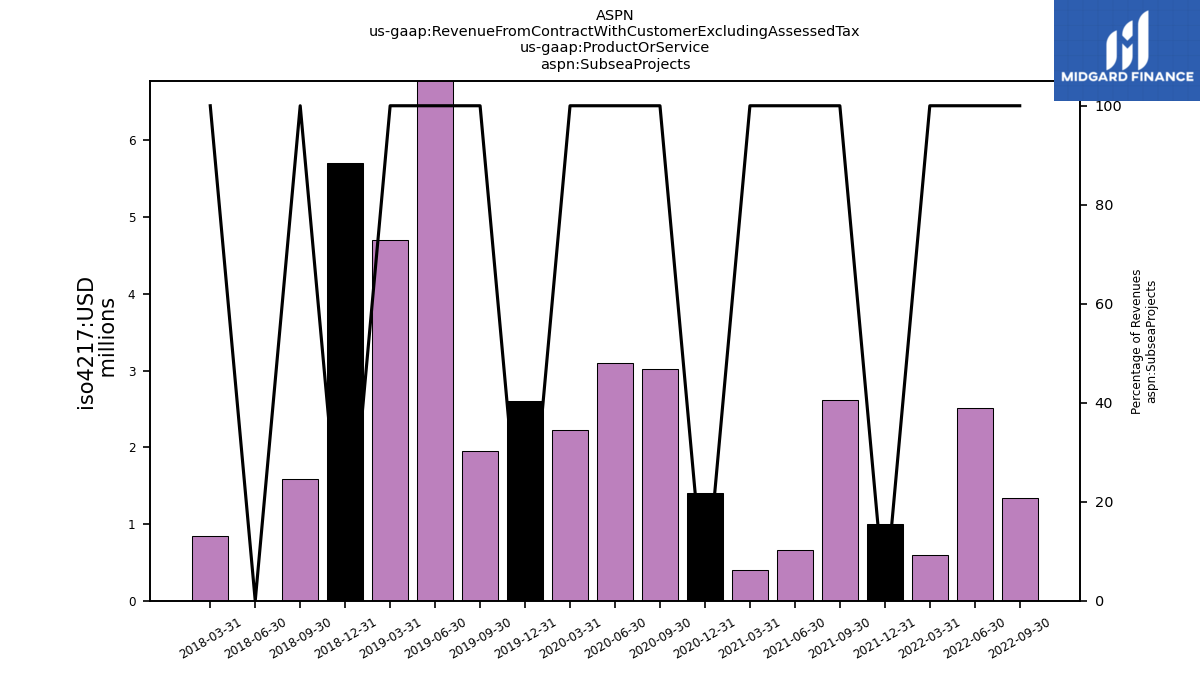
| Subsea Projects | NA | NA | NA | NA | 1.34 | 2.51 | 0.60 | 1.00 | 2.61 | 0.67 | 0.40 | 1.40 | 3.02 | 3.10 | 2.22 | 2.60 | 1.95 | 7.78 | 4.70 | 5.71 | 1.59 | 0.00 | 0.84 | NA | NA | NA | NA | NA | NA | NA | NA | NA | NA | NA | NA | NA | NA | NA | NA | NA | NA | NA | NA | |
| Thermal Barrier | 32.84 | 12.63 | 11.71 | 25.21 | 11.95 | 10.76 | 7.63 | 5.42 | 0.93 | 0.21 | 0.10 | NA | NA | NA | NA | NA | NA | NA | NA | NA | NA | NA | NA | NA | NA | NA | NA | NA | NA | NA | NA | NA | NA | NA | NA | NA | NA | NA | NA | NA | NA | NA | NA | |
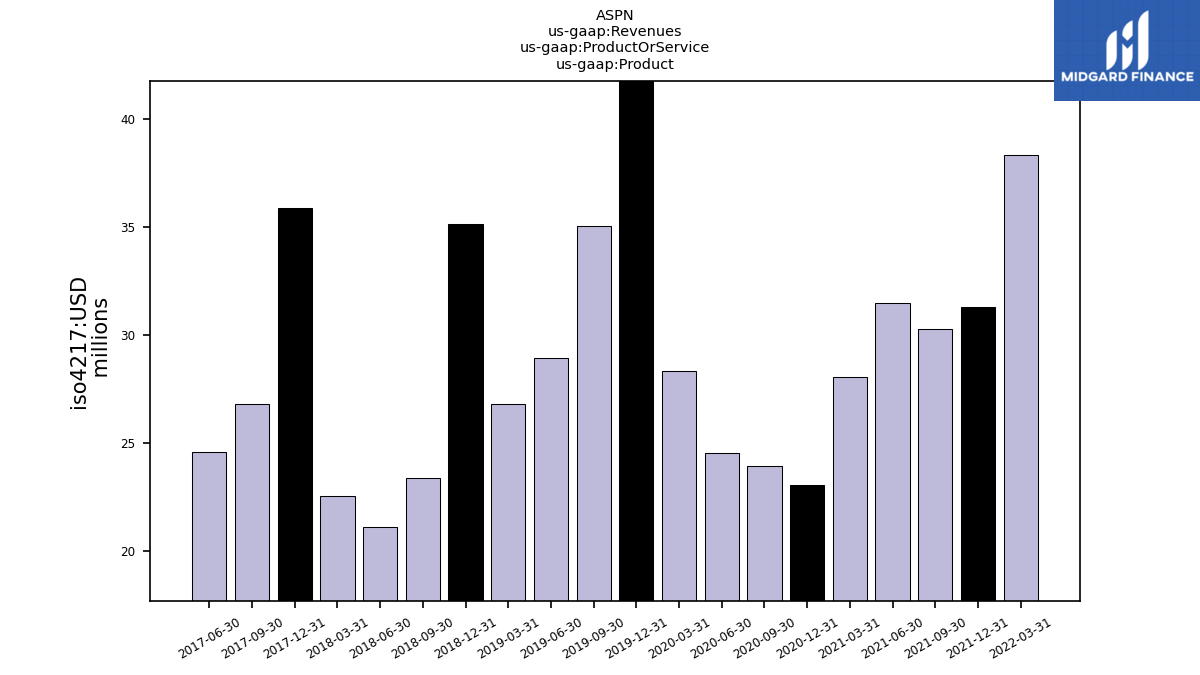
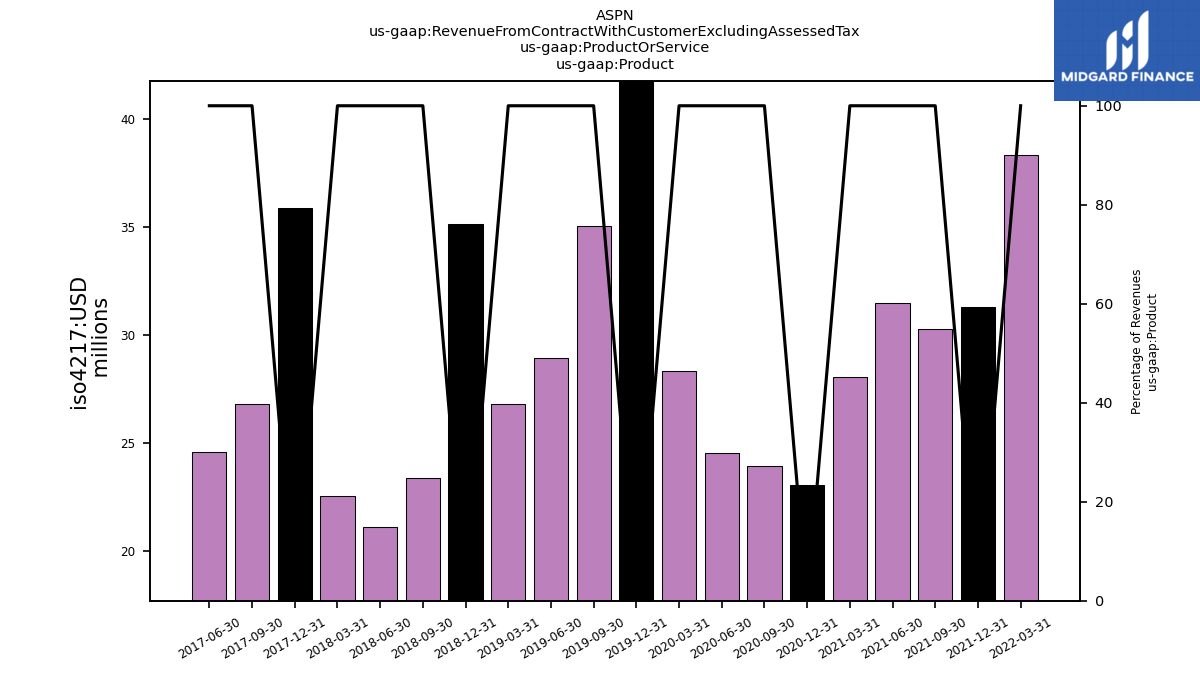
| Product | NA | NA | NA | NA | NA | NA | 38.33 | 31.30 | 30.26 | 31.49 | 28.06 | 23.06 | 23.94 | 24.53 | 28.31 | 46.20 | 35.05 | 28.91 | 26.79 | 35.15 | 23.34 | 21.11 | 22.52 | 35.89 | 26.81 | 24.56 | NA | NA | NA | NA | NA | NA | NA | NA | NA | NA | NA | NA | NA | NA | NA | NA | NA | |
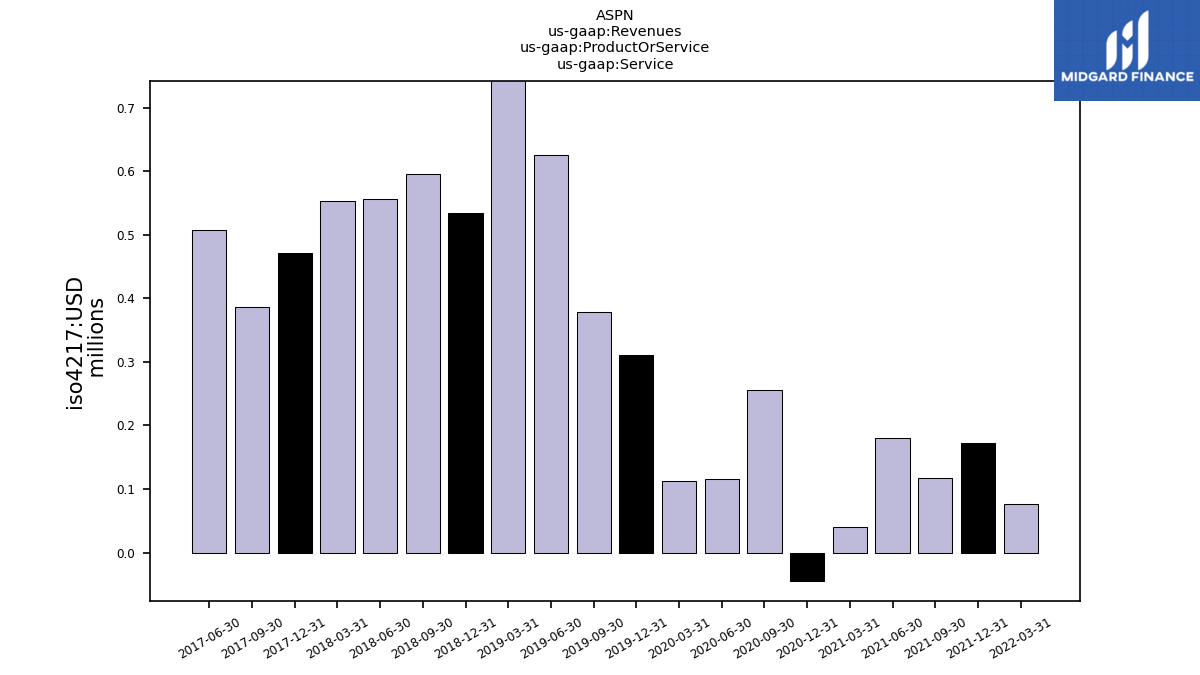
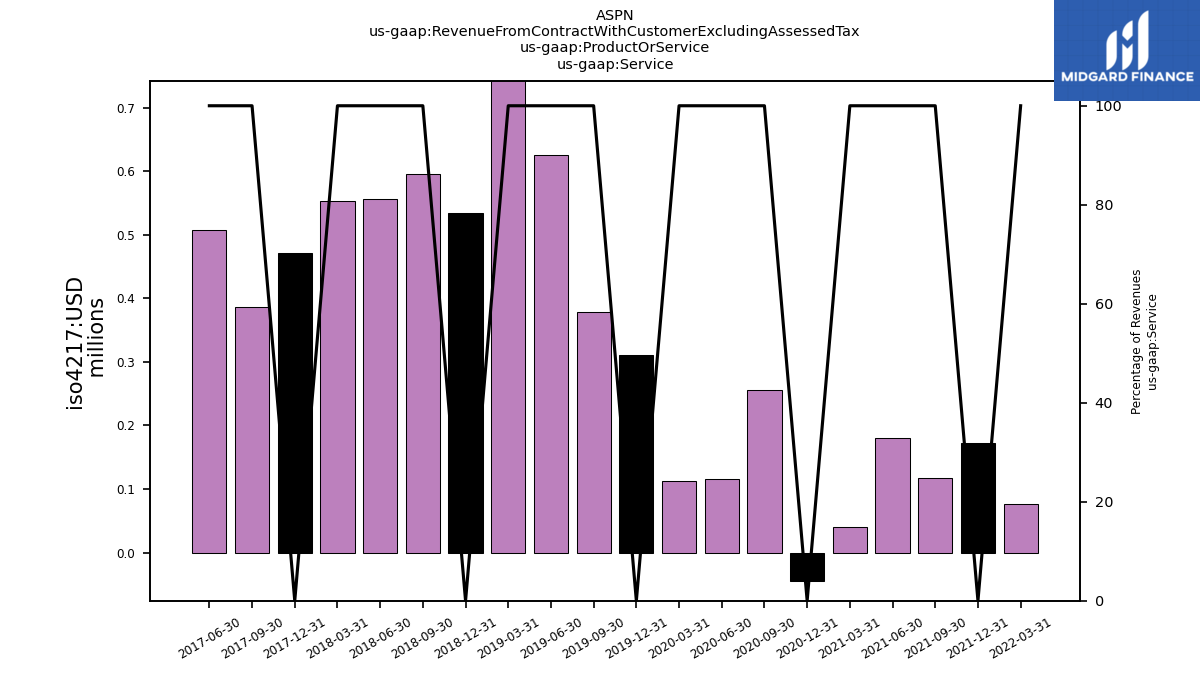
| Service | NA | NA | NA | NA | NA | NA | 0.08 | 0.17 | 0.12 | 0.18 | 0.04 | -0.04 | 0.26 | 0.12 | 0.11 | 0.31 | 0.38 | 0.62 | 1.13 | 0.53 | 0.59 | 0.56 | 0.55 | 0.47 | 0.39 | 0.51 | NA | NA | NA | NA | NA | NA | NA | NA | NA | NA | NA | NA | NA | NA | NA | NA | NA | |
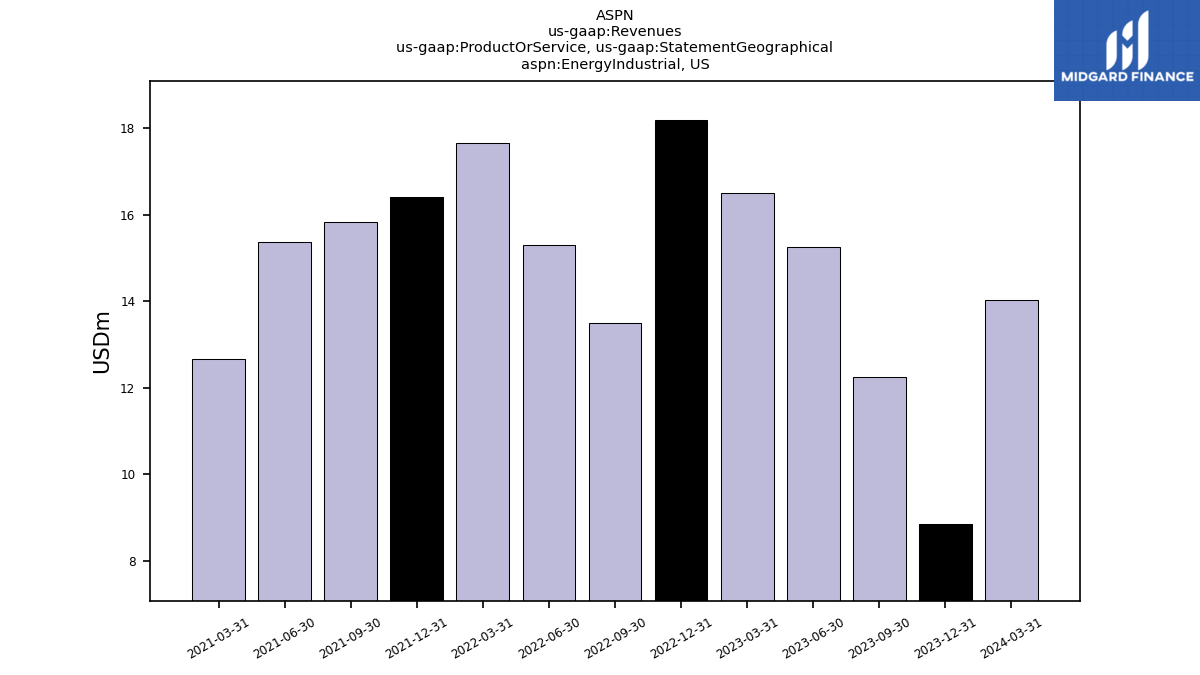
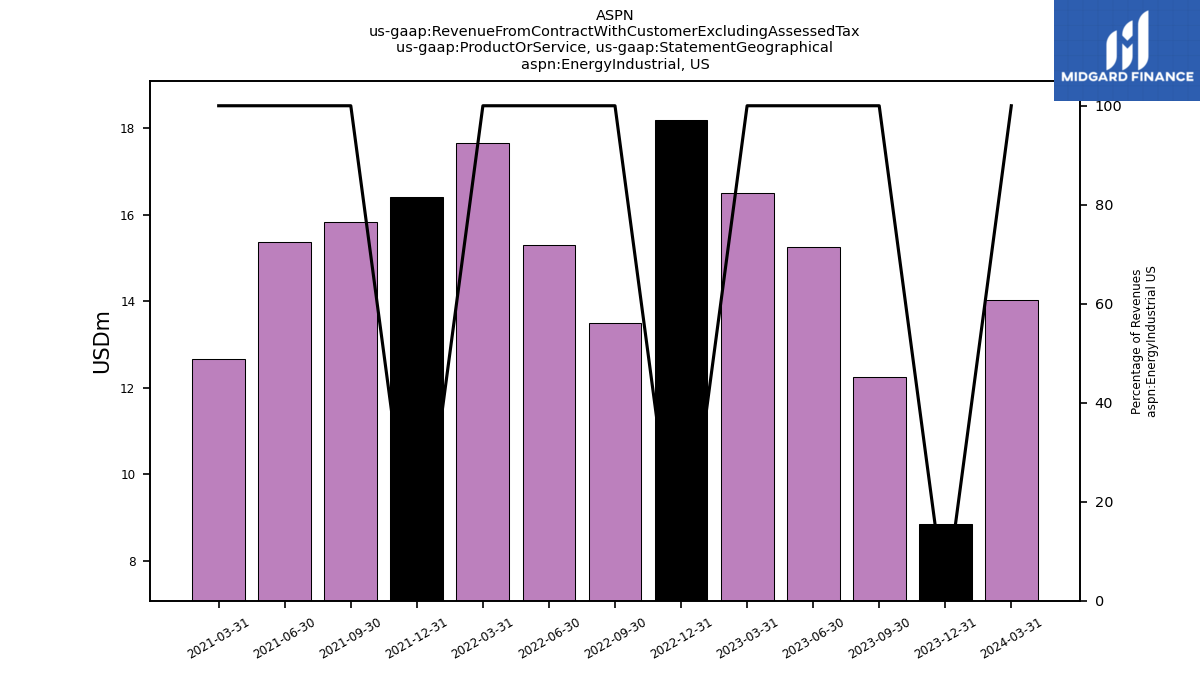
| Energy Industrial,US | 12.25 | 15.24 | 16.50 | 18.18 | 13.50 | 15.29 | 17.65 | 16.39 | 15.84 | 15.37 | 12.66 | NA | NA | NA | NA | NA | NA | NA | NA | NA | NA | NA | NA | NA | NA | NA | NA | NA | NA | NA | NA | NA | NA | NA | NA | NA | NA | NA | NA | NA | NA | NA | NA | |
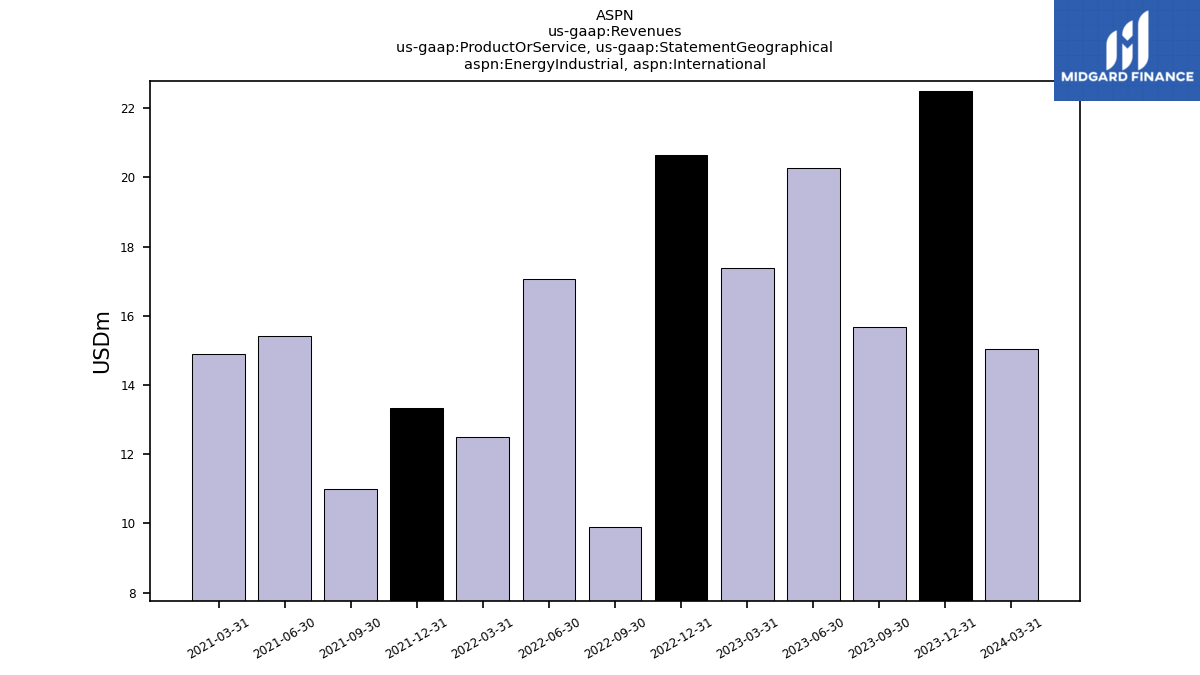
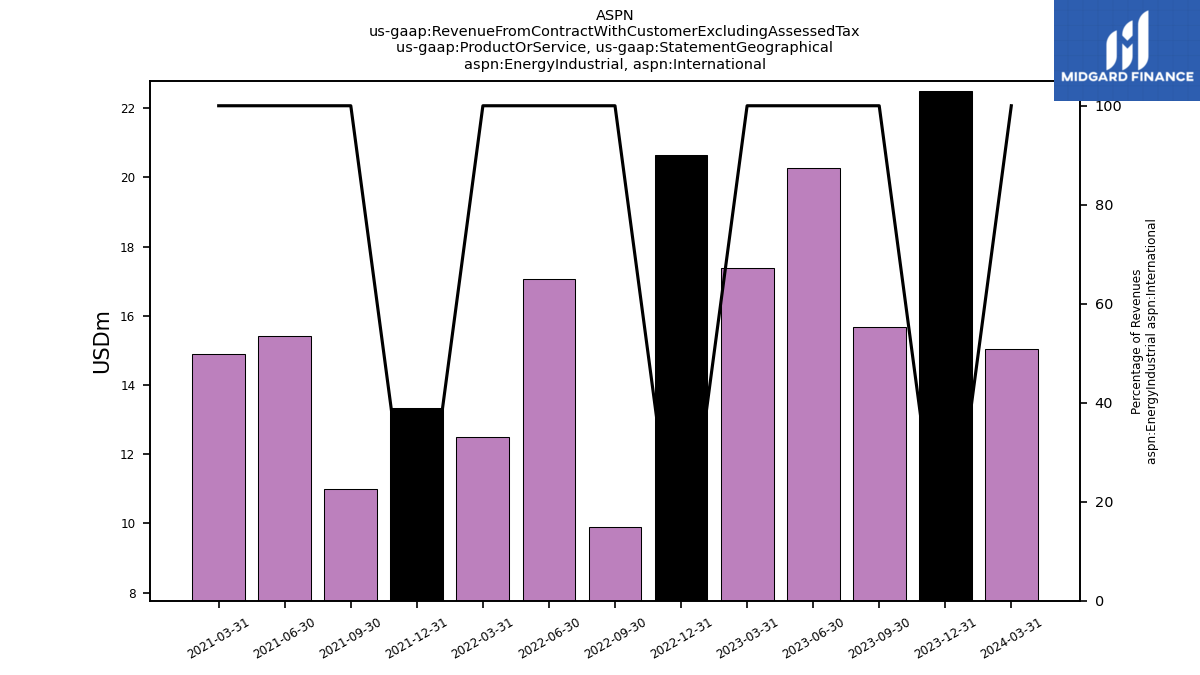
| Energy Industrial, International | 15.66 | 20.28 | 17.37 | 20.64 | 9.91 | 17.07 | 12.49 | 13.35 | 11.00 | 15.42 | 14.89 | NA | NA | NA | NA | NA | NA | NA | NA | NA | NA | NA | NA | NA | NA | NA | NA | NA | NA | NA | NA | NA | NA | NA | NA | NA | NA | NA | NA | NA | NA | NA | NA | |
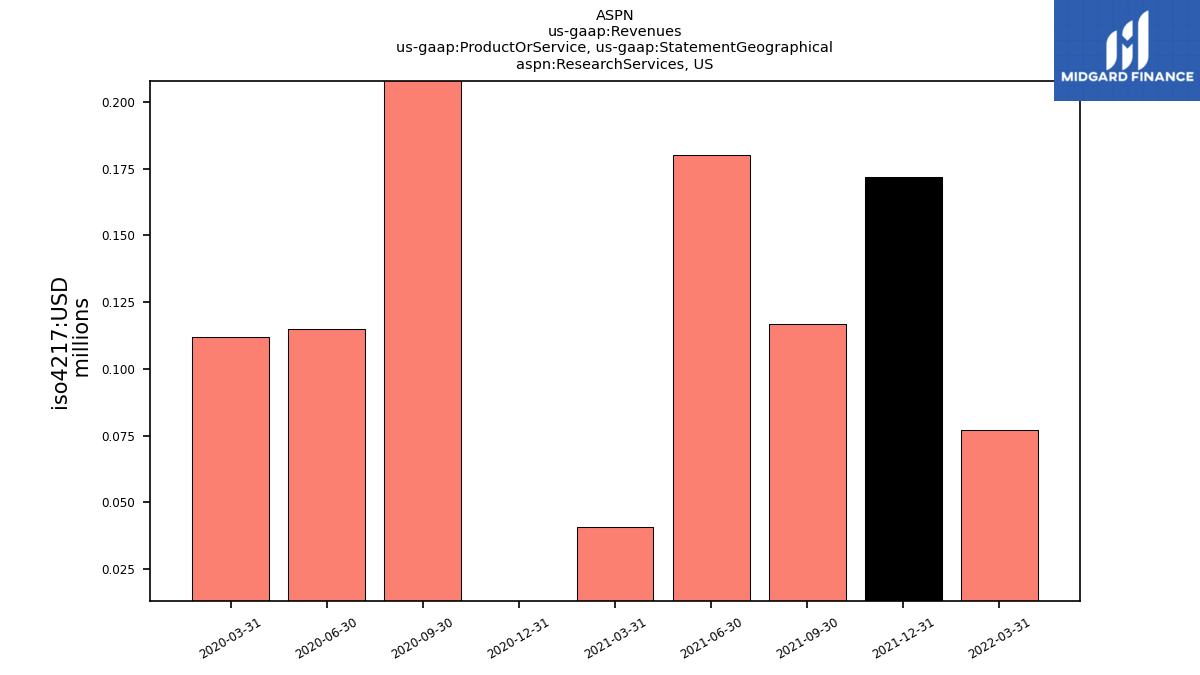
| Research Services,US | NA | NA | NA | NA | NA | NA | 0.08 | 0.17 | 0.12 | 0.18 | 0.04 | -0.04 | 0.26 | 0.12 | 0.11 | NA | NA | NA | NA | NA | NA | NA | NA | NA | NA | NA | NA | NA | NA | NA | NA | NA | NA | NA | NA | NA | NA | NA | NA | NA | NA | NA | NA | |
| Subsea Projects,US | NA | NA | NA | NA | 0.01 | 0.91 | 0.55 | NA | NA | NA | NA | 0.01 | 0.87 | 0.00 | 1.11 | NA | NA | NA | NA | NA | NA | NA | NA | NA | NA | NA | NA | NA | NA | NA | NA | NA | NA | NA | NA | NA | NA | NA | NA | NA | NA | NA | NA | |
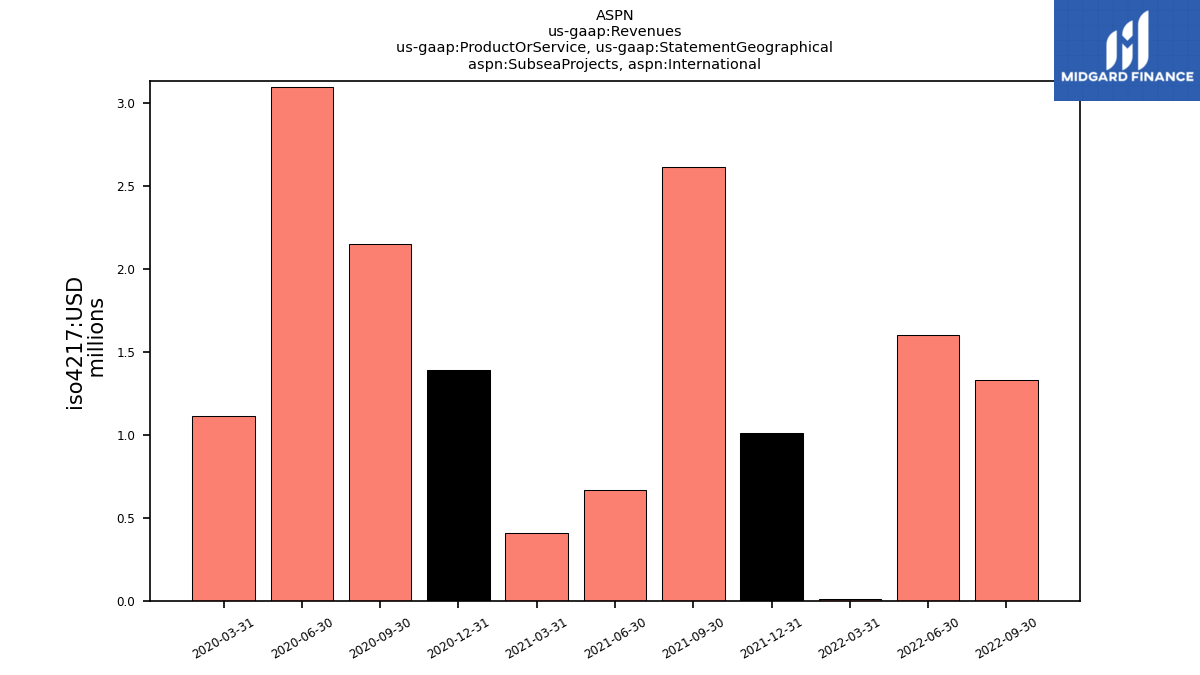
| Subsea Projects, International | NA | NA | NA | NA | 1.33 | 1.60 | 0.01 | 1.01 | 2.61 | 0.67 | 0.41 | 1.39 | 2.15 | 3.10 | 1.11 | NA | NA | NA | NA | NA | NA | NA | NA | NA | NA | NA | NA | NA | NA | NA | NA | NA | NA | NA | NA | NA | NA | NA | NA | NA | NA | NA | NA | |
| Thermal Barrier,US | 29.54 | 10.19 | 9.94 | 23.35 | 10.61 | 8.88 | 6.43 | 5.41 | 0.90 | 0.18 | 0.05 | NA | NA | NA | NA | NA | NA | NA | NA | NA | NA | NA | NA | NA | NA | NA | NA | NA | NA | NA | NA | NA | NA | NA | NA | NA | NA | NA | NA | NA | NA | NA | NA | |
| Thermal Barrier, International | 3.31 | 2.44 | 1.77 | 1.85 | 1.35 | 1.89 | 1.20 | 0.01 | 0.03 | 0.04 | 0.05 | NA | NA | NA | NA | NA | NA | NA | NA | NA | NA | NA | NA | NA | NA | NA | NA | NA | NA | NA | NA | NA | NA | NA | NA | NA | NA | NA | NA | NA | NA | NA | NA | |
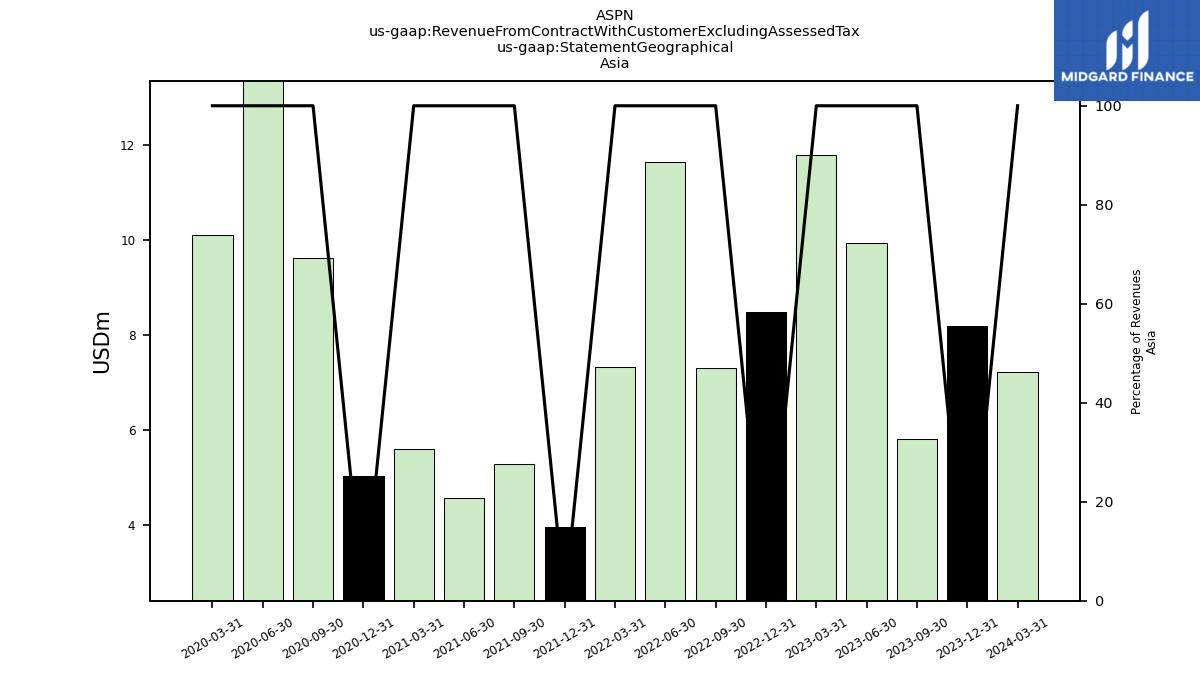
| 5.80 | 9.94 | 11.78 | 8.47 | 7.30 | 11.65 | 7.32 | 3.96 | 5.28 | 4.55 | 5.59 | 5.03 | 9.62 | 13.65 | 10.10 | NA | NA | NA | NA | NA | NA | NA | NA | NA | NA | NA | NA | NA | NA | NA | NA | NA | NA | NA | NA | NA | NA | NA | NA | NA | NA | NA | NA | ||
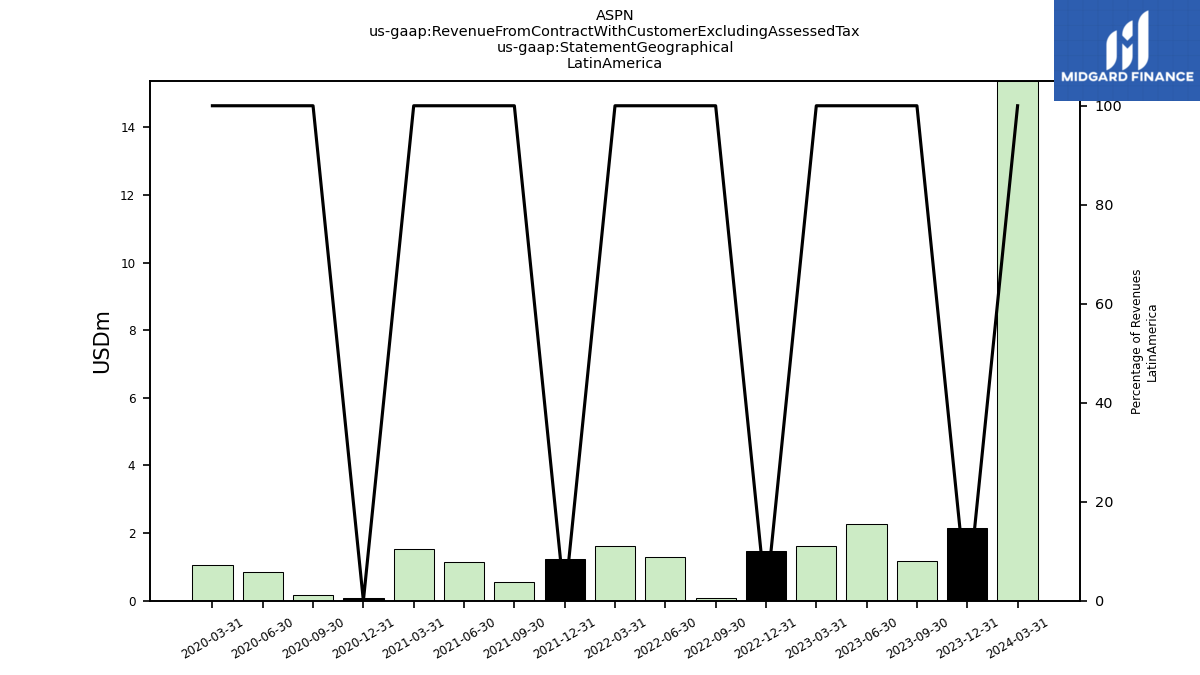
| 0.63 | 0.56 | 0.32 | 1.71 | 0.93 | 1.45 | 0.86 | 0.77 | 0.26 | 0.99 | 0.96 | 0.27 | 0.03 | 0.23 | 0.46 | NA | NA | NA | NA | NA | NA | NA | NA | NA | NA | NA | NA | NA | NA | NA | NA | NA | NA | NA | NA | NA | NA | NA | NA | NA | NA | NA | NA | ||
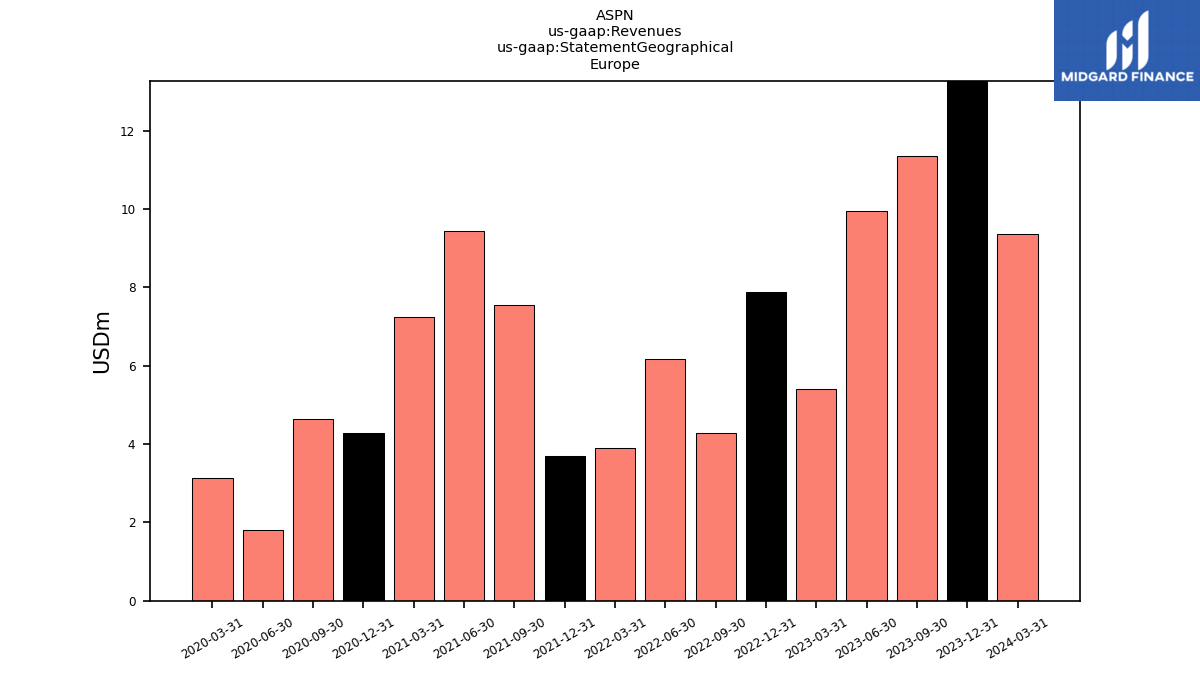
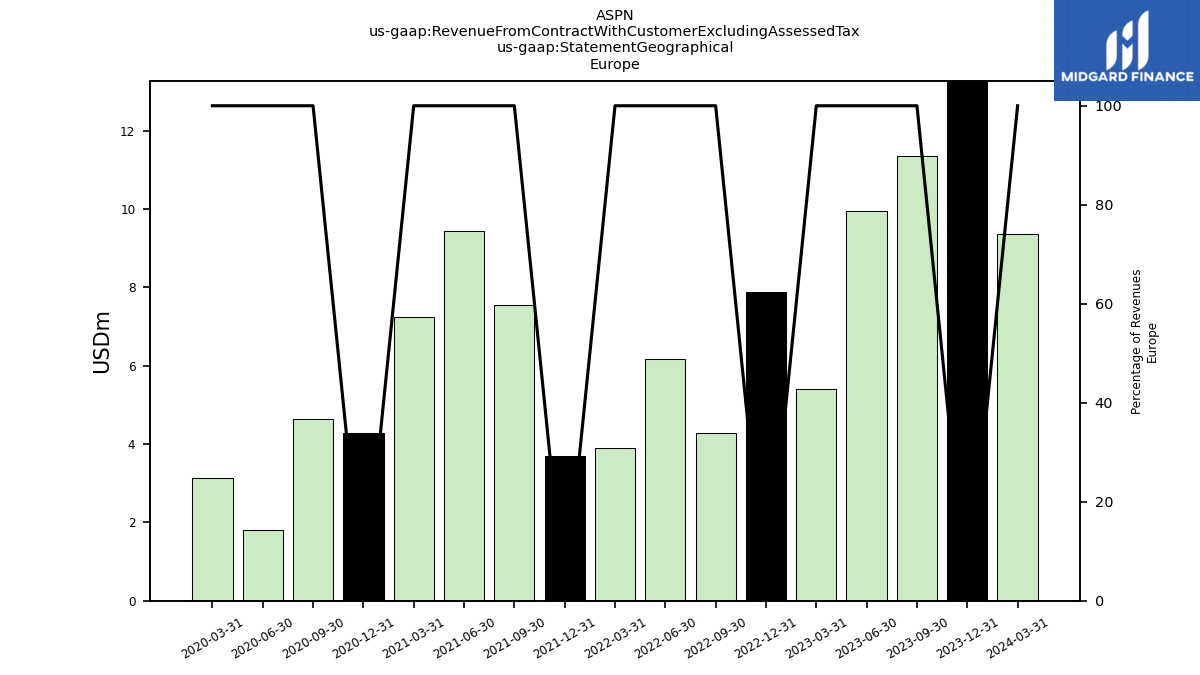
| 11.36 | 9.96 | 5.41 | 7.89 | 4.28 | 6.16 | 3.91 | 3.69 | 7.55 | 9.44 | 7.25 | 4.29 | 4.63 | 1.82 | 3.14 | NA | NA | NA | NA | NA | NA | NA | NA | NA | NA | NA | NA | NA | NA | NA | NA | NA | NA | NA | NA | NA | NA | NA | NA | NA | NA | NA | NA | ||
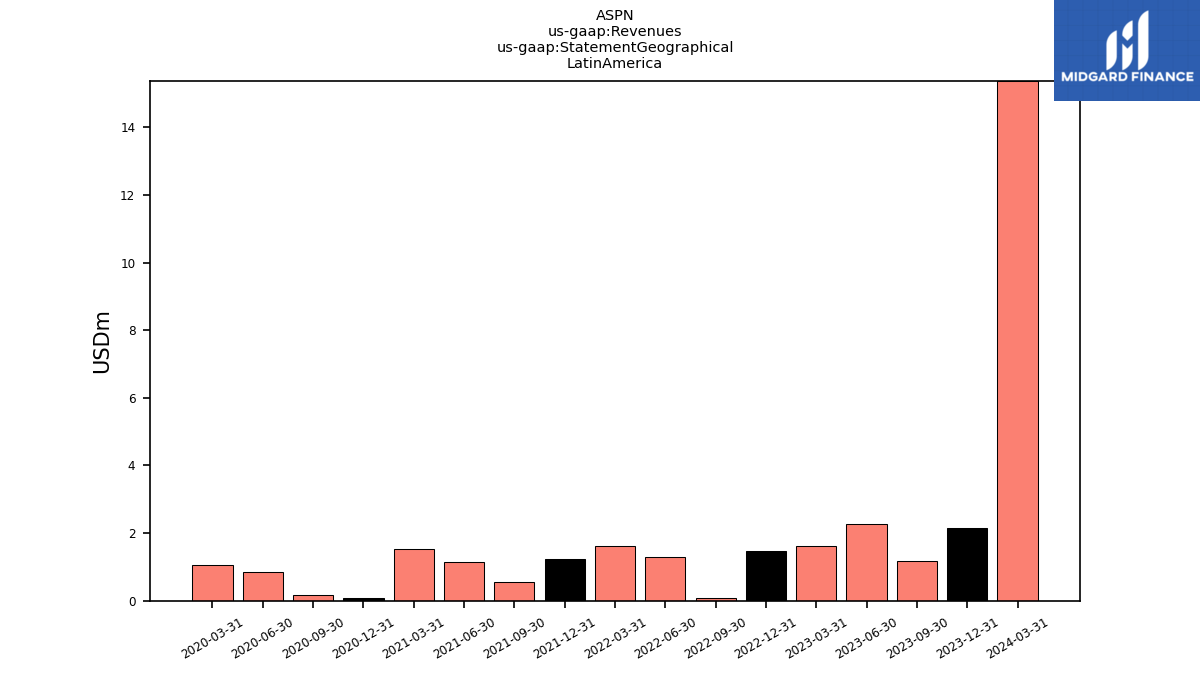
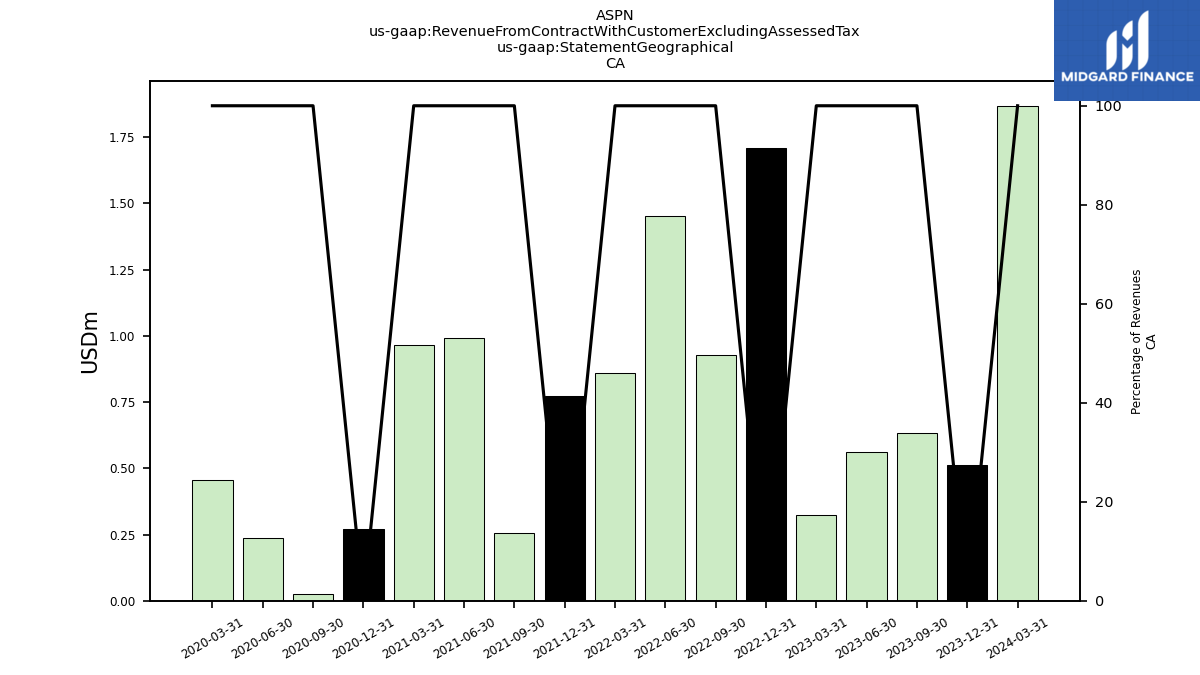
| 1.18 | 2.27 | 1.62 | 1.48 | 0.08 | 1.29 | 1.61 | 1.25 | 0.55 | 1.15 | 1.54 | 0.09 | 0.18 | 0.84 | 1.05 | NA | NA | NA | NA | NA | NA | NA | NA | NA | NA | NA | NA | NA | NA | NA | NA | NA | NA | NA | NA | NA | NA | NA | NA | NA | NA | NA | NA | ||
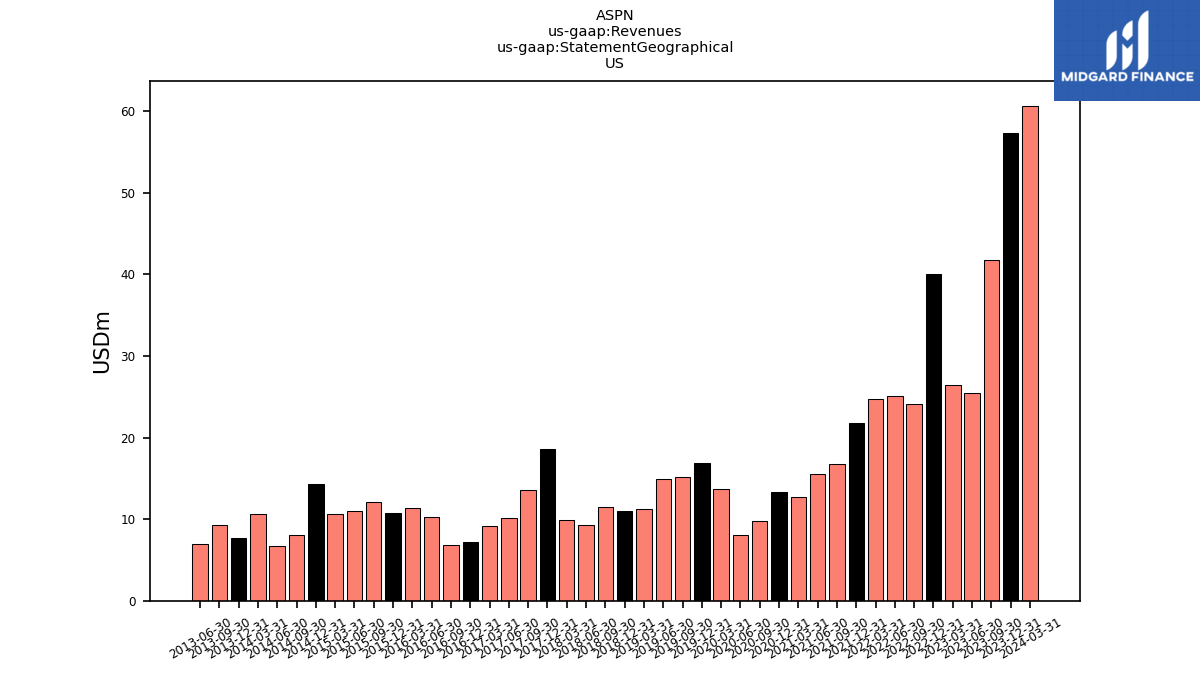
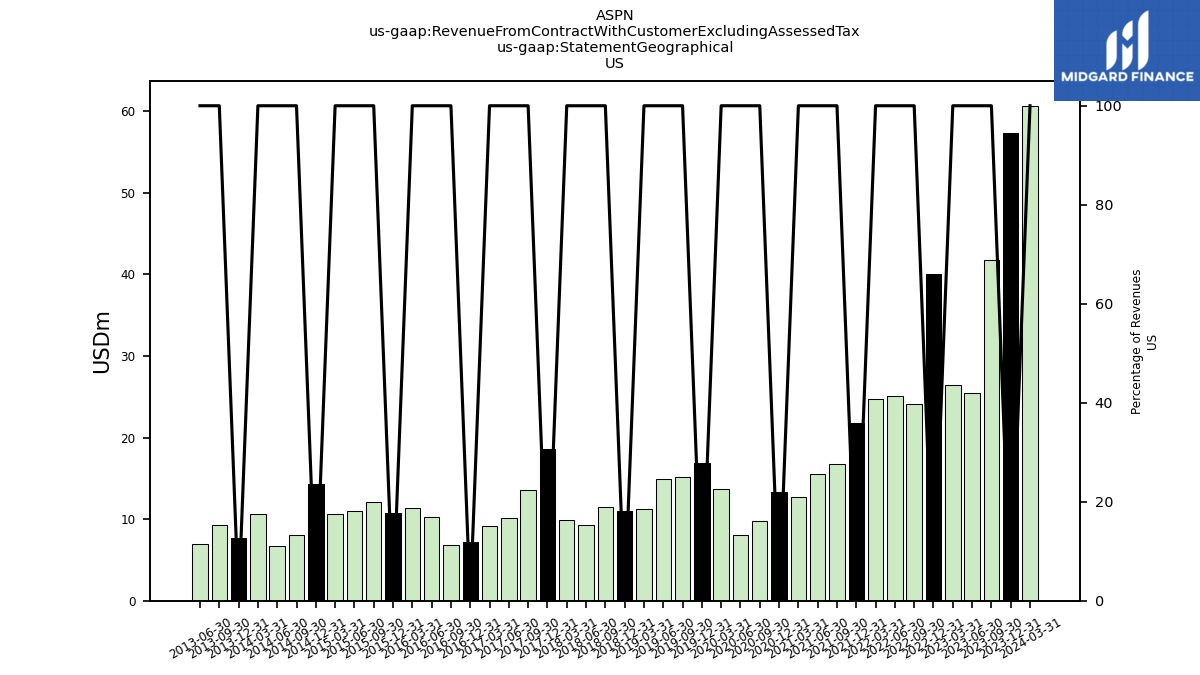
| US | 41.78 | 25.43 | 26.44 | 40.06 | 24.12 | 25.08 | 24.71 | 21.80 | 16.73 | 15.54 | 12.76 | 13.34 | 9.74 | 8.09 | 13.67 | 16.91 | 15.19 | 14.97 | 11.25 | 11.06 | 11.48 | 9.31 | 9.88 | 18.62 | 13.55 | 10.13 | 9.13 | 7.25 | 6.85 | 10.21 | 11.41 | 10.74 | 12.09 | 11.04 | 10.68 | 14.31 | 8.07 | 6.77 | 10.65 | 7.73 | 9.23 | 6.93 | NA | |
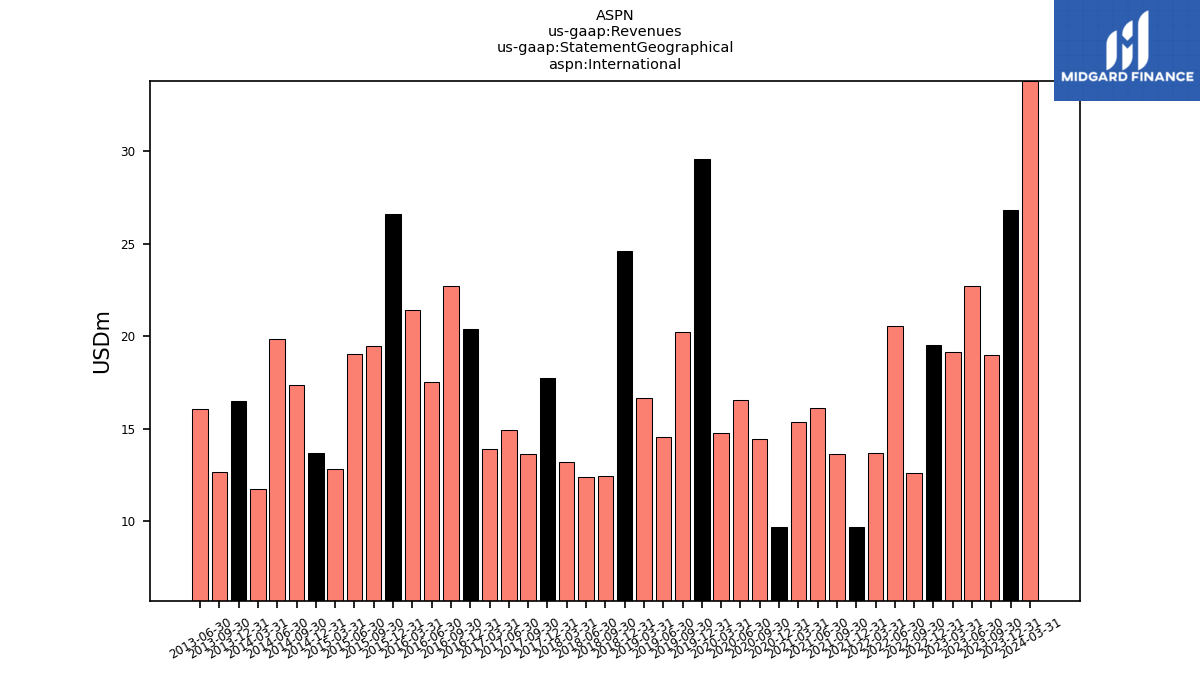
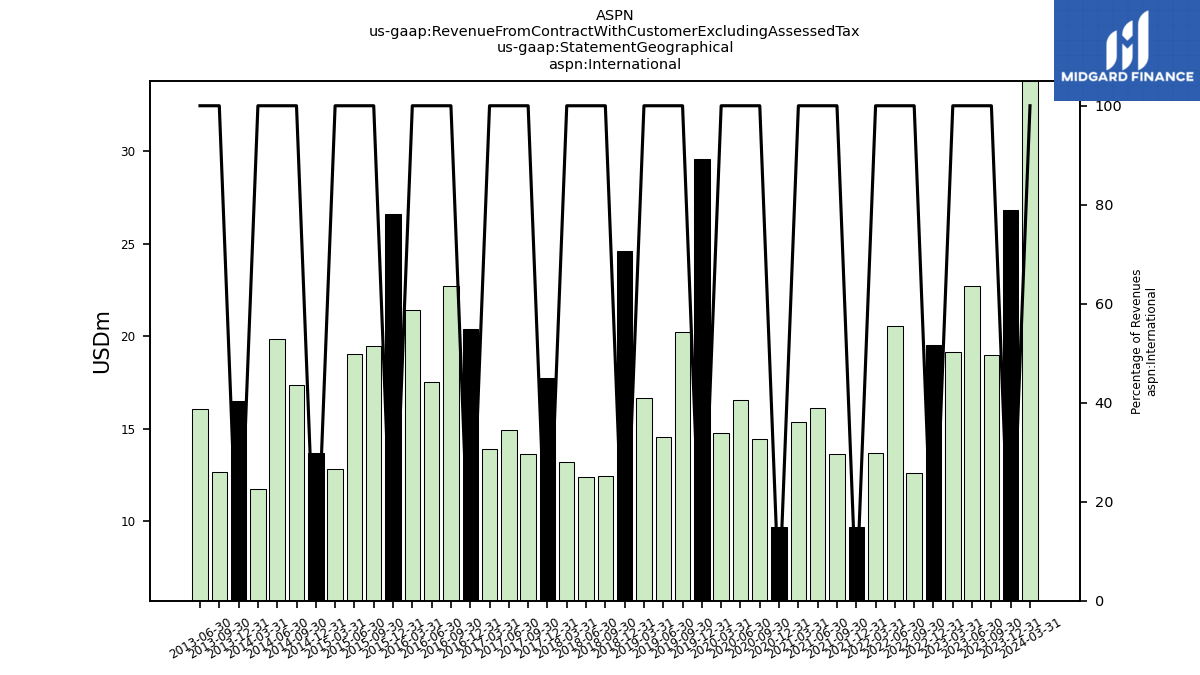
| International | 18.97 | 22.73 | 19.14 | 19.55 | 12.59 | 20.56 | 13.70 | 9.67 | 13.65 | 16.13 | 15.34 | 9.68 | 14.46 | 16.55 | 14.75 | 29.59 | 20.23 | 14.56 | 16.66 | 24.62 | 12.45 | 12.36 | 13.19 | 17.74 | 13.64 | 14.94 | 13.87 | 20.38 | 22.71 | 17.51 | 21.41 | 26.64 | 19.45 | 19.06 | 12.82 | 13.68 | 17.37 | 19.84 | 11.71 | 16.50 | 12.65 | 16.04 | NA | |
| Revenue From Contract With Customer Excluding Assessed Tax | 60.76 | 48.16 | 45.59 | 59.61 | 36.71 | 45.64 | 38.41 | 31.48 | 30.38 | 31.67 | 28.10 | 23.02 | 24.20 | 24.64 | 28.42 | 46.51 | 35.42 | 29.53 | 27.91 | 35.68 | 23.94 | 21.67 | 23.07 | 36.36 | 27.20 | 25.07 | 23.00 | 27.64 | 29.56 | 27.72 | 32.82 | 37.38 | 31.54 | 30.10 | 23.50 | 27.98 | 25.44 | 26.61 | 22.36 | 24.23 | 21.88 | 22.98 | 17.00 | |
| Operating, Energy Industrial | 27.91 | 35.52 | 33.88 | 34.40 | 24.75 | 34.88 | 30.77 | 26.05 | 29.45 | 31.46 | 28.00 | NA | NA | NA | NA | NA | NA | NA | NA | NA | NA | NA | NA | NA | NA | NA | NA | NA | NA | NA | NA | NA | NA | NA | NA | NA | NA | NA | NA | NA | NA | NA | NA | |
| Operating, Thermal Barrier | 32.84 | 12.63 | 11.71 | 25.21 | 11.95 | 10.76 | 7.63 | 5.42 | 0.93 | 0.21 | 0.10 | NA | NA | NA | NA | NA | NA | NA | NA | NA | NA | NA | NA | NA | NA | NA | NA | NA | NA | NA | NA | NA | NA | NA | NA | NA | NA | NA | NA | NA | NA | NA | NA | |
| E V Thermal Barrier | NA | NA | 11.70 | 25.30 | 11.90 | 10.80 | 7.60 | 5.46 | 0.90 | 0.20 | 0.10 | NA | NA | NA | NA | NA | NA | NA | NA | NA | NA | NA | NA | NA | NA | NA | NA | NA | NA | NA | NA | NA | NA | NA | NA | NA | NA | NA | NA | NA | NA | NA | NA | |
| Energy Industrial | 27.91 | 35.52 | 33.88 | 38.81 | 23.41 | 32.36 | 30.14 | 29.74 | 26.84 | 30.79 | 27.55 | NA | NA | NA | NA | NA | NA | NA | NA | NA | NA | NA | NA | NA | NA | NA | NA | NA | NA | NA | NA | NA | NA | NA | NA | NA | NA | NA | NA | NA | NA | NA | NA | |
| Research Services | NA | NA | NA | NA | NA | NA | 0.08 | 0.17 | 0.12 | 0.18 | 0.04 | -0.04 | 0.26 | 0.12 | 0.11 | 0.31 | 0.38 | 0.62 | 1.13 | 0.53 | 0.59 | 0.56 | 0.55 | NA | NA | NA | NA | NA | NA | NA | NA | NA | NA | NA | NA | NA | NA | NA | NA | NA | NA | NA | NA | |
| Subsea Projects | NA | NA | NA | NA | 1.34 | 2.51 | 0.60 | 1.00 | 2.61 | 0.67 | 0.40 | 1.40 | 3.02 | 3.10 | 2.22 | 2.60 | 1.95 | 7.78 | 4.70 | 5.71 | 1.59 | 0.00 | 0.84 | NA | NA | NA | NA | NA | NA | NA | NA | NA | NA | NA | NA | NA | NA | NA | NA | NA | NA | NA | NA | |
| Thermal Barrier | 32.84 | 12.63 | 11.71 | 25.21 | 11.95 | 10.76 | 7.63 | 5.42 | 0.93 | 0.21 | 0.10 | NA | NA | NA | NA | NA | NA | NA | NA | NA | NA | NA | NA | NA | NA | NA | NA | NA | NA | NA | NA | NA | NA | NA | NA | NA | NA | NA | NA | NA | NA | NA | NA | |
| Product | NA | NA | NA | NA | NA | NA | 38.33 | 31.30 | 30.26 | 31.49 | 28.06 | 23.06 | 23.94 | 24.53 | 28.31 | 46.20 | 35.05 | 28.91 | 26.79 | 35.15 | 23.34 | 21.11 | 22.52 | 35.89 | 26.81 | 24.56 | NA | NA | NA | NA | NA | NA | NA | NA | NA | NA | NA | NA | NA | NA | NA | NA | NA | |
| Service | NA | NA | NA | NA | NA | NA | 0.08 | 0.17 | 0.12 | 0.18 | 0.04 | -0.04 | 0.26 | 0.12 | 0.11 | 0.31 | 0.38 | 0.62 | 1.13 | 0.53 | 0.59 | 0.56 | 0.55 | 0.47 | 0.39 | 0.51 | NA | NA | NA | NA | NA | NA | NA | NA | NA | NA | NA | NA | NA | NA | NA | NA | NA | |
| Energy Industrial,US | 12.25 | 15.24 | 16.50 | 18.18 | 13.50 | 15.29 | 17.65 | 16.39 | 15.84 | 15.37 | 12.66 | NA | NA | NA | NA | NA | NA | NA | NA | NA | NA | NA | NA | NA | NA | NA | NA | NA | NA | NA | NA | NA | NA | NA | NA | NA | NA | NA | NA | NA | NA | NA | NA | |
| Energy Industrial, International | 15.66 | 20.28 | 17.37 | 20.64 | 9.91 | 17.07 | 12.49 | 13.35 | 11.00 | 15.42 | 14.89 | NA | NA | NA | NA | NA | NA | NA | NA | NA | NA | NA | NA | NA | NA | NA | NA | NA | NA | NA | NA | NA | NA | NA | NA | NA | NA | NA | NA | NA | NA | NA | NA | |
| Research Services,US | NA | NA | NA | NA | NA | NA | 0.08 | 0.17 | 0.12 | 0.18 | 0.04 | -0.04 | 0.26 | 0.12 | 0.11 | NA | NA | NA | NA | NA | NA | NA | NA | NA | NA | NA | NA | NA | NA | NA | NA | NA | NA | NA | NA | NA | NA | NA | NA | NA | NA | NA | NA | |
| Subsea Projects,US | NA | NA | NA | NA | 0.01 | 0.91 | 0.55 | NA | NA | NA | NA | 0.01 | 0.87 | 0.00 | 1.11 | NA | NA | NA | NA | NA | NA | NA | NA | NA | NA | NA | NA | NA | NA | NA | NA | NA | NA | NA | NA | NA | NA | NA | NA | NA | NA | NA | NA | |
| Subsea Projects, International | NA | NA | NA | NA | 1.33 | 1.60 | 0.01 | 1.01 | 2.61 | 0.67 | 0.41 | 1.39 | 2.15 | 3.10 | 1.11 | NA | NA | NA | NA | NA | NA | NA | NA | NA | NA | NA | NA | NA | NA | NA | NA | NA | NA | NA | NA | NA | NA | NA | NA | NA | NA | NA | NA | |
| Thermal Barrier,US | 29.54 | 10.19 | 9.94 | 23.35 | 10.61 | 8.88 | 6.43 | 5.41 | 0.90 | 0.18 | 0.05 | NA | NA | NA | NA | NA | NA | NA | NA | NA | NA | NA | NA | NA | NA | NA | NA | NA | NA | NA | NA | NA | NA | NA | NA | NA | NA | NA | NA | NA | NA | NA | NA | |
| Thermal Barrier, International | 3.31 | 2.44 | 1.77 | 1.85 | 1.35 | 1.89 | 1.20 | 0.01 | 0.03 | 0.04 | 0.05 | NA | NA | NA | NA | NA | NA | NA | NA | NA | NA | NA | NA | NA | NA | NA | NA | NA | NA | NA | NA | NA | NA | NA | NA | NA | NA | NA | NA | NA | NA | NA | NA | |
| 5.80 | 9.94 | 11.78 | 8.47 | 7.30 | 11.65 | 7.32 | 3.96 | 5.28 | 4.55 | 5.59 | 5.03 | 9.62 | 13.65 | 10.10 | NA | NA | NA | NA | NA | NA | NA | NA | NA | NA | NA | NA | NA | NA | NA | NA | NA | NA | NA | NA | NA | NA | NA | NA | NA | NA | NA | NA | ||
| 0.63 | 0.56 | 0.32 | 1.71 | 0.93 | 1.45 | 0.86 | 0.77 | 0.26 | 0.99 | 0.96 | 0.27 | 0.03 | 0.23 | 0.46 | NA | NA | NA | NA | NA | NA | NA | NA | NA | NA | NA | NA | NA | NA | NA | NA | NA | NA | NA | NA | NA | NA | NA | NA | NA | NA | NA | NA | ||
| 11.36 | 9.96 | 5.41 | 7.89 | 4.28 | 6.16 | 3.91 | 3.69 | 7.55 | 9.44 | 7.25 | 4.29 | 4.63 | 1.82 | 3.14 | NA | NA | NA | NA | NA | NA | NA | NA | NA | NA | NA | NA | NA | NA | NA | NA | NA | NA | NA | NA | NA | NA | NA | NA | NA | NA | NA | NA | ||
| 1.18 | 2.27 | 1.62 | 1.48 | 0.08 | 1.29 | 1.61 | 1.25 | 0.55 | 1.15 | 1.54 | 0.09 | 0.18 | 0.84 | 1.05 | NA | NA | NA | NA | NA | NA | NA | NA | NA | NA | NA | NA | NA | NA | NA | NA | NA | NA | NA | NA | NA | NA | NA | NA | NA | NA | NA | NA | ||
| US | 41.78 | 25.43 | 26.44 | 40.06 | 24.12 | 25.08 | 24.71 | 21.80 | 16.73 | 15.54 | 12.76 | 13.34 | 9.74 | 8.09 | 13.67 | 16.91 | 15.19 | 14.97 | 11.25 | 11.06 | 11.48 | 9.31 | 9.88 | 18.62 | 13.55 | 10.13 | 9.13 | 7.25 | 6.85 | 10.21 | 11.41 | 10.74 | 12.09 | 11.04 | 10.68 | 14.31 | 8.07 | 6.77 | 10.65 | 7.73 | 9.23 | 6.93 | NA | |
| International | 18.97 | 22.73 | 19.14 | 19.55 | 12.59 | 20.56 | 13.70 | 9.67 | 13.65 | 16.13 | 15.34 | 9.68 | 14.46 | 16.55 | 14.75 | 29.59 | 20.23 | 14.56 | 16.66 | 24.62 | 12.45 | 12.36 | 13.19 | 17.74 | 13.64 | 14.94 | 13.87 | 20.38 | 22.71 | 17.51 | 21.41 | 26.64 | 19.45 | 19.06 | 12.82 | 13.68 | 17.37 | 19.84 | 11.71 | 16.50 | 12.65 | 16.04 | NA |


