
| 2024-01-31 | 2023-10-31 | 2023-07-31 | 2023-04-30 | 2023-01-31 | 2022-10-31 | 2022-07-31 | 2022-04-30 | 2022-01-31 | 2021-10-31 | 2021-07-31 | 2021-04-30 | 2021-01-31 | 2020-10-31 | 2020-07-31 | ||
|---|---|---|---|---|---|---|---|---|---|---|---|---|---|---|---|---|
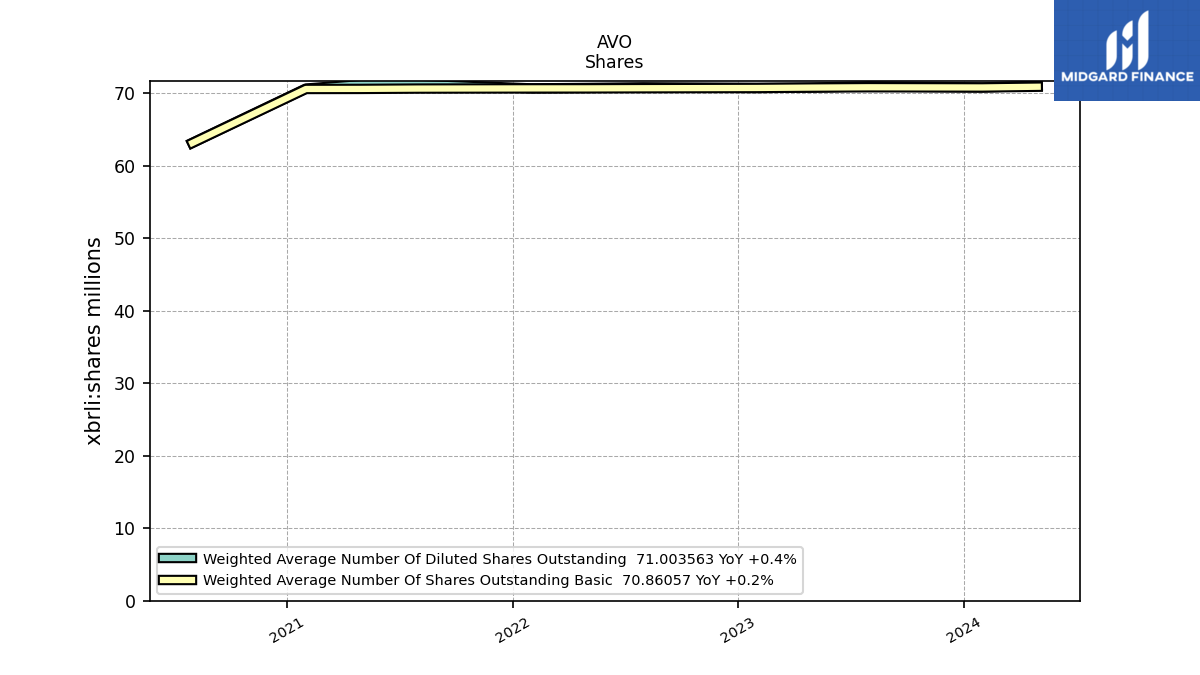
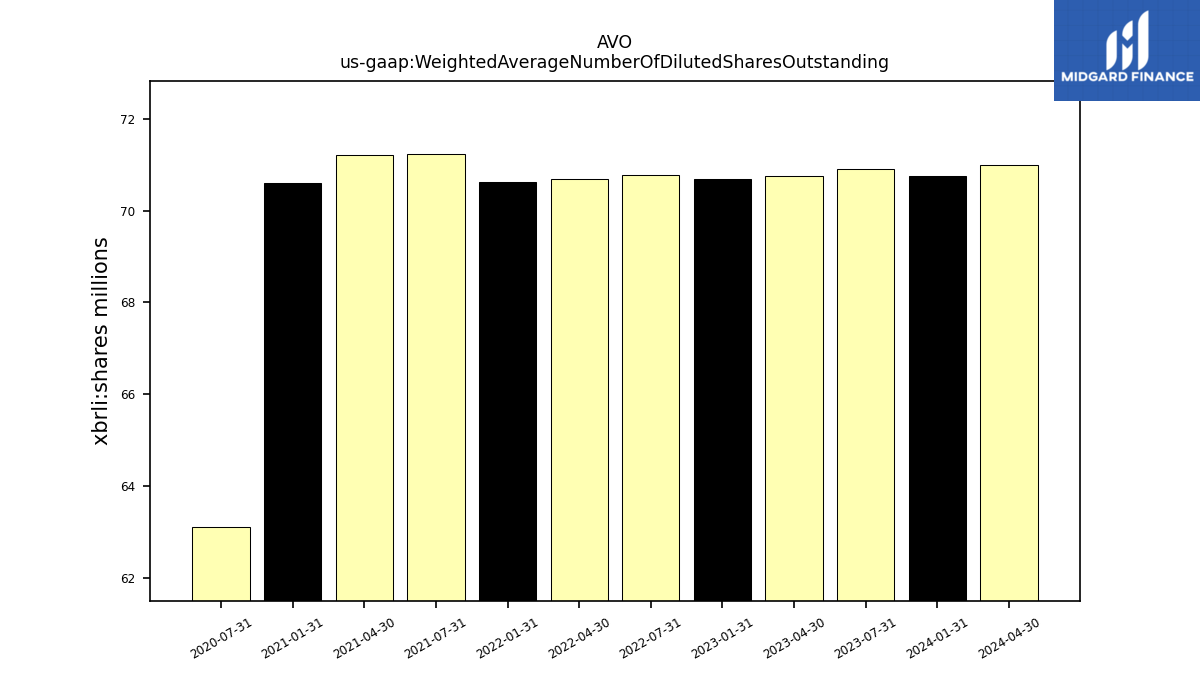
| Weighted Average Number Of Diluted Shares Outstanding | 70.76 | NA | 70.92 | 70.74 | 70.69 | NA | 70.78 | 70.69 | 70.63 | NA | 71.24 | 71.21 | 70.61 | NA | 63.12 | |
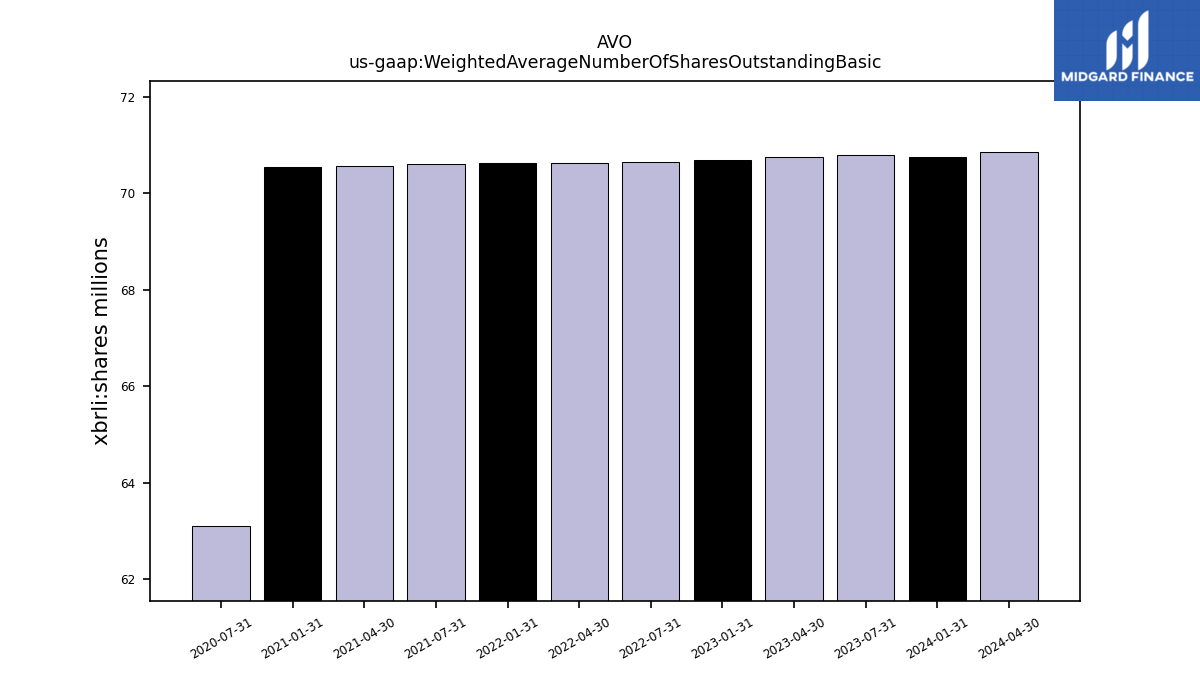
| Weighted Average Number Of Shares Outstanding Basic | 70.76 | NA | 70.79 | 70.74 | 70.69 | NA | 70.66 | 70.64 | 70.63 | NA | 70.61 | 70.56 | 70.55 | NA | 63.10 | |
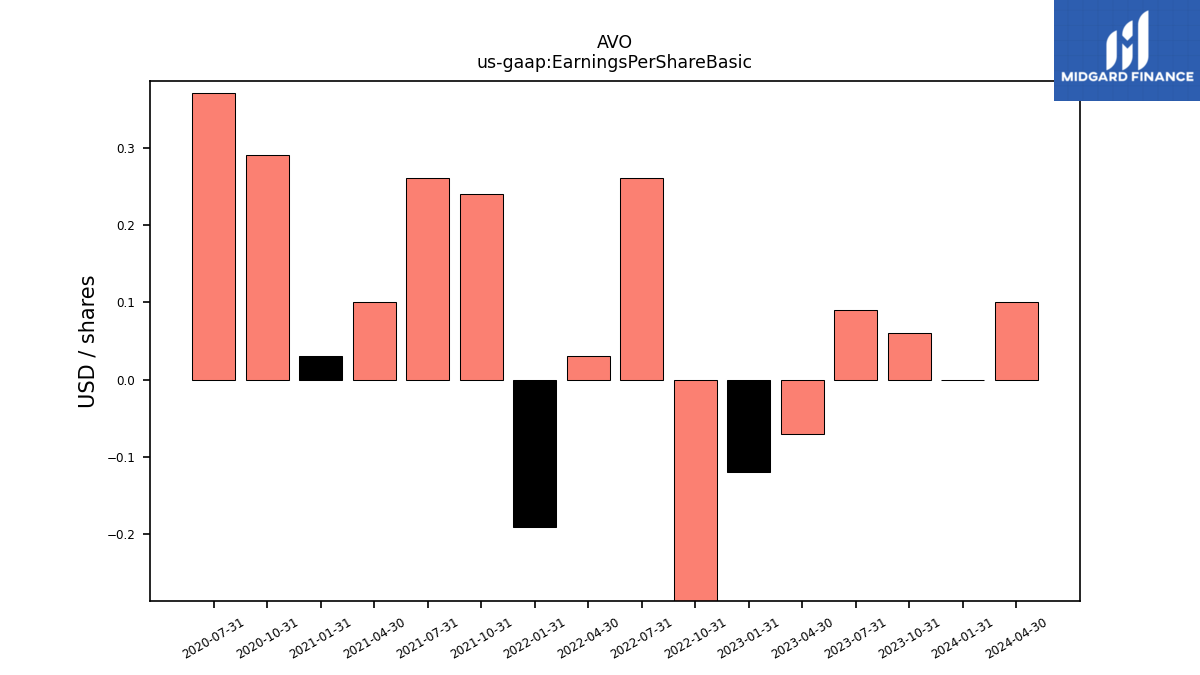
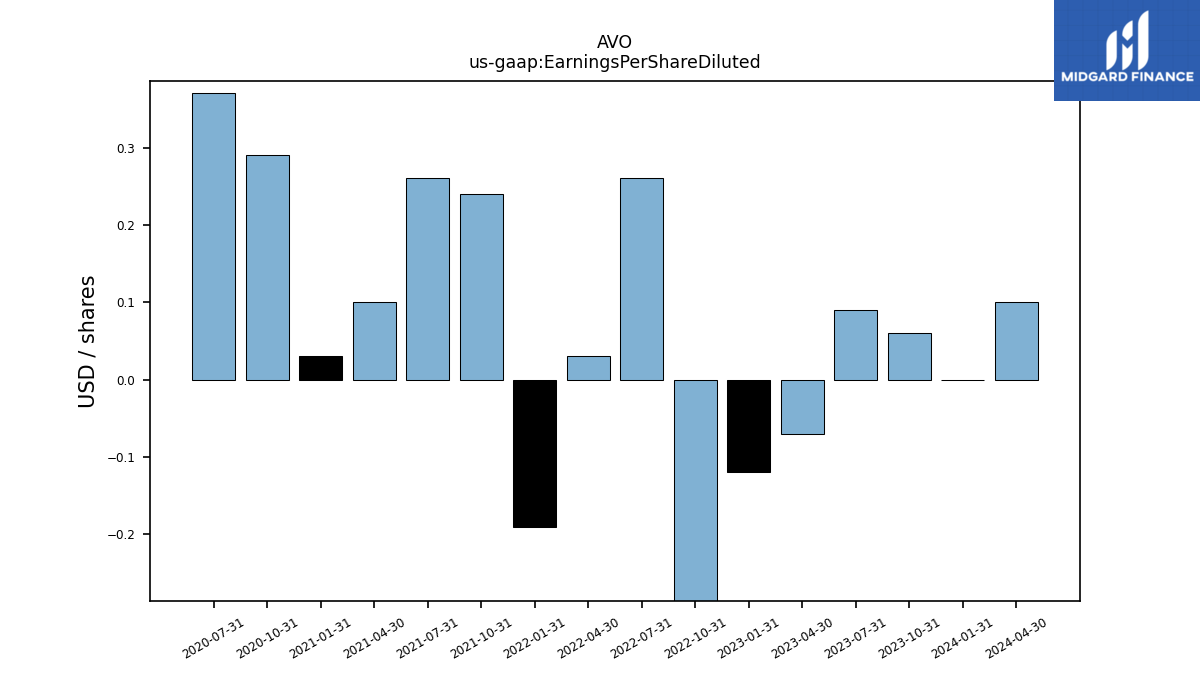
| Earnings Per Share Basic | -0.00 | 0.06 | 0.09 | -0.07 | -0.12 | -0.59 | 0.26 | 0.03 | -0.19 | 0.24 | 0.26 | 0.10 | 0.03 | 0.29 | 0.37 | |
| Earnings Per Share Diluted | -0.00 | 0.06 | 0.09 | -0.07 | -0.12 | -0.59 | 0.26 | 0.03 | -0.19 | 0.24 | 0.26 | 0.10 | 0.03 | 0.29 | 0.37 |
| 2024-01-31 | 2023-10-31 | 2023-07-31 | 2023-04-30 | 2023-01-31 | 2022-10-31 | 2022-07-31 | 2022-04-30 | 2022-01-31 | 2021-10-31 | 2021-07-31 | 2021-04-30 | 2021-01-31 | 2020-10-31 | 2020-07-31 | ||
|---|---|---|---|---|---|---|---|---|---|---|---|---|---|---|---|---|
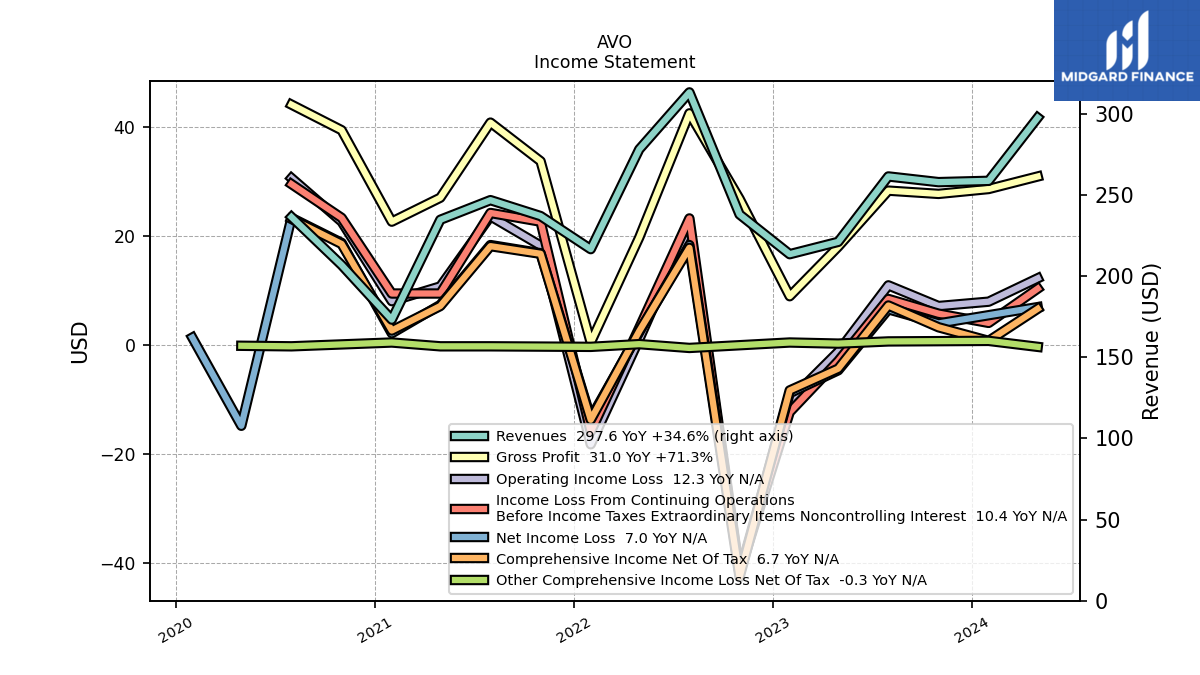
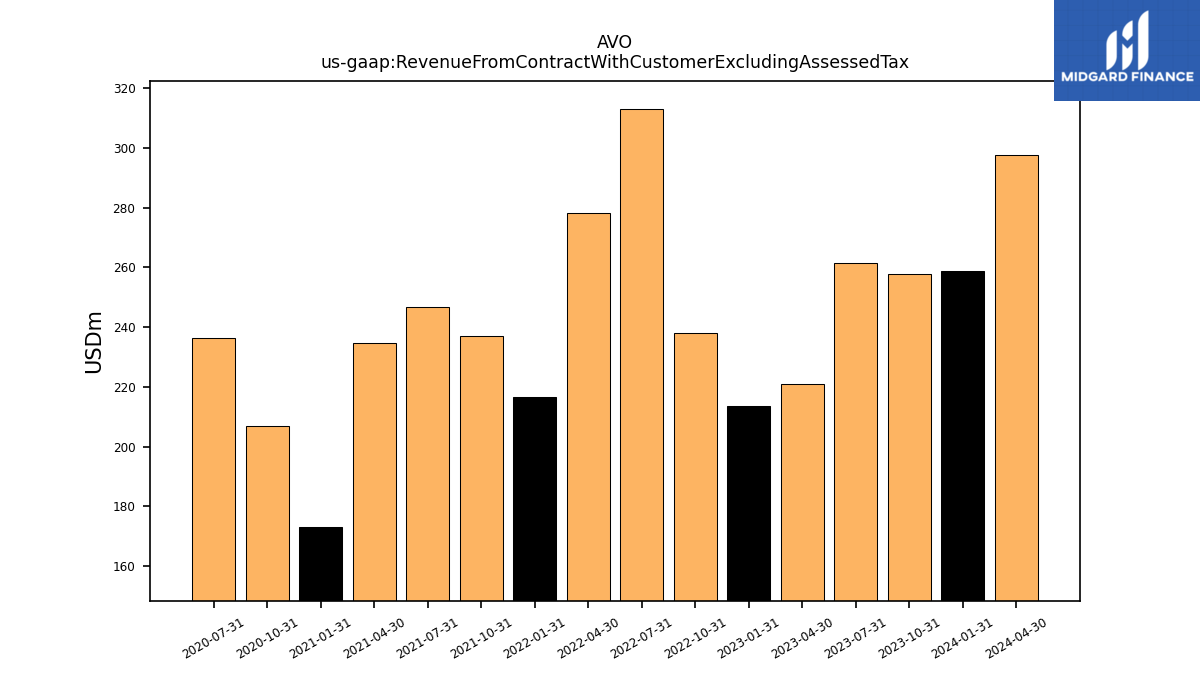
| Revenue From Contract With Customer Excluding Assessed Tax | 258.70 | 257.90 | 261.40 | 221.10 | 213.50 | 238.00 | 313.20 | 278.10 | 216.60 | 237.00 | 246.80 | 234.70 | 173.20 | 206.80 | 236.40 | |
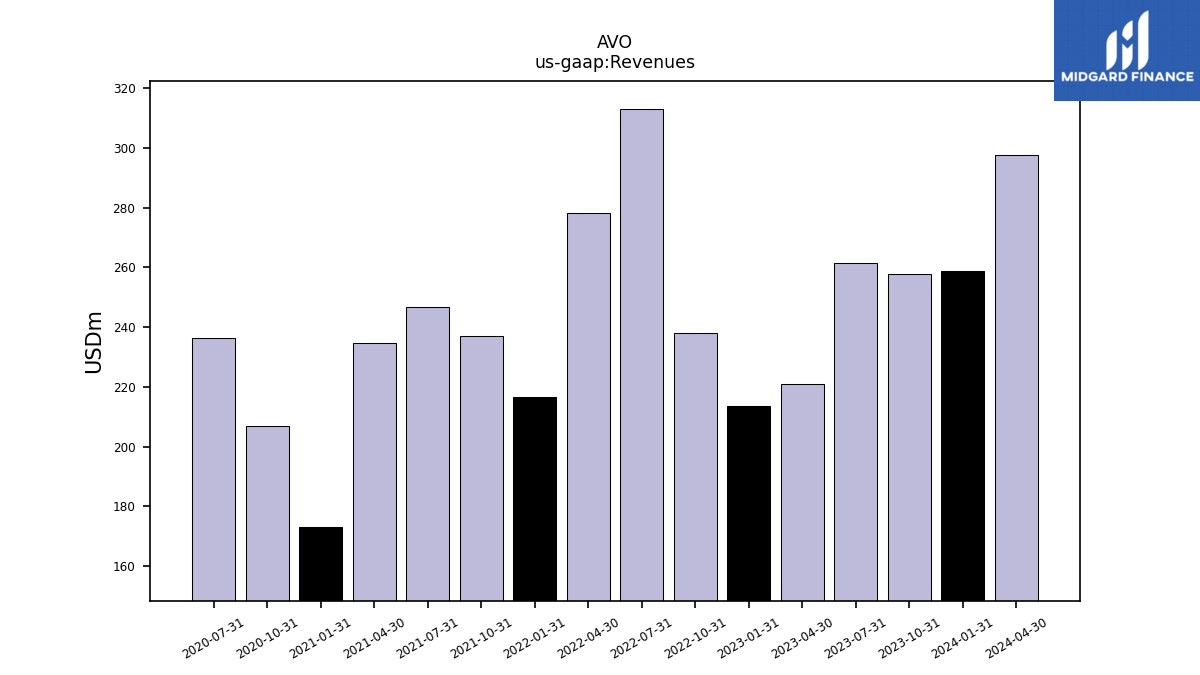
| Revenues | 258.70 | 257.90 | 261.40 | 221.10 | 213.50 | 238.00 | 313.20 | 278.10 | 216.60 | 237.00 | 246.80 | 234.70 | 173.20 | 206.80 | 236.40 | |
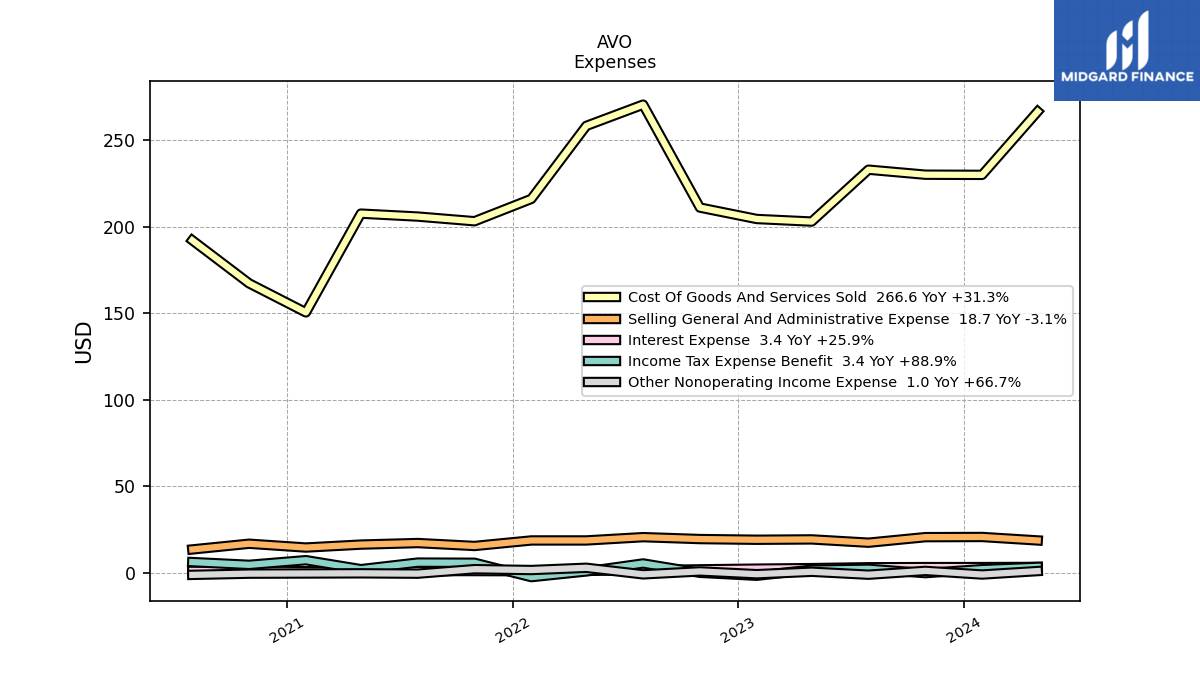
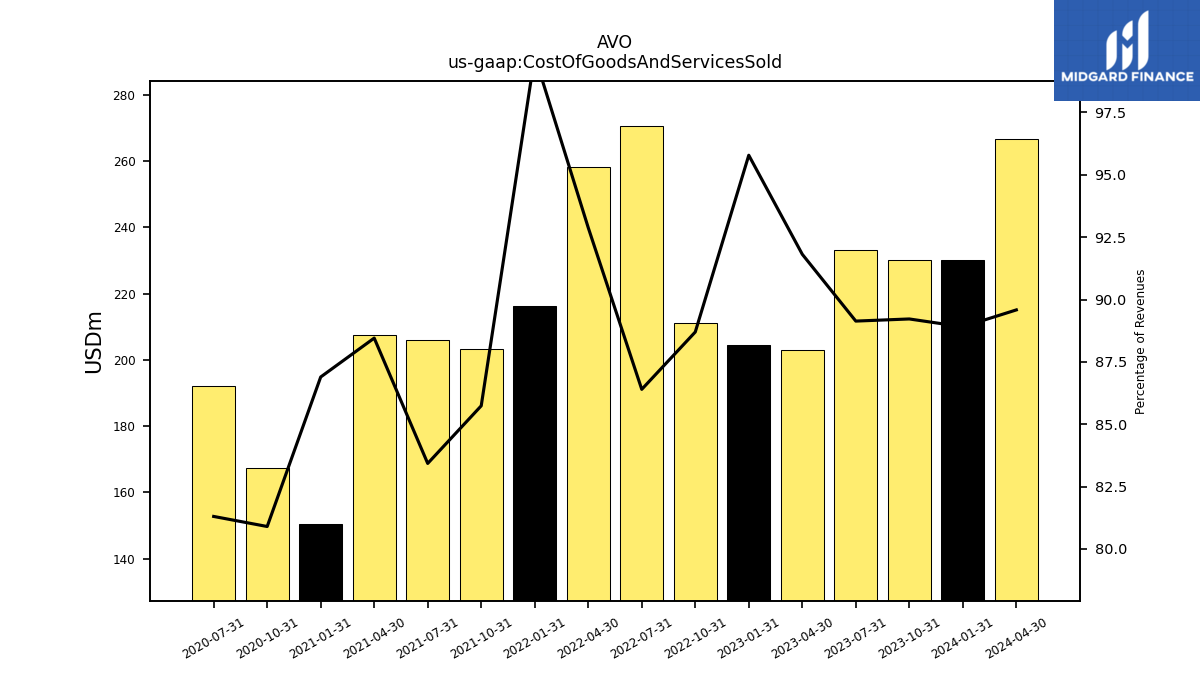
| Cost Of Goods And Services Sold | 230.00 | 230.10 | 233.00 | 203.00 | 204.50 | 211.10 | 270.60 | 258.30 | 216.10 | 203.20 | 205.90 | 207.60 | 150.50 | 167.30 | 192.20 | |
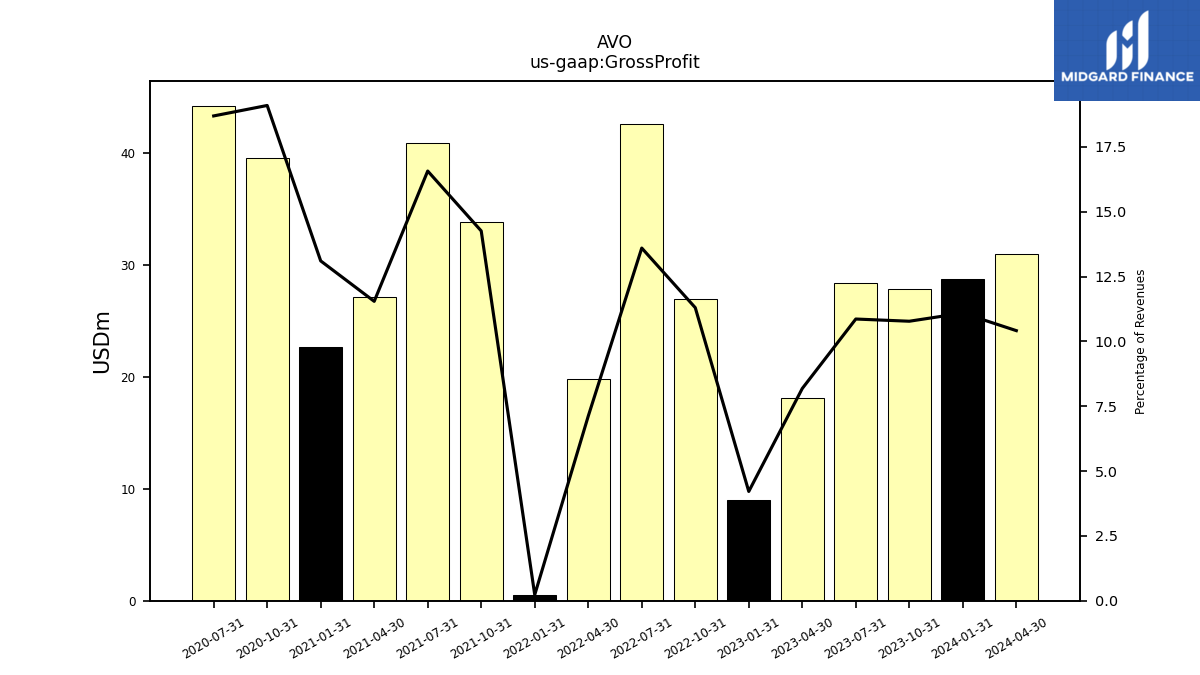
| Gross Profit | 28.70 | 27.80 | 28.40 | 18.10 | 9.00 | 26.90 | 42.60 | 19.80 | 0.50 | 33.80 | 40.90 | 27.10 | 22.70 | 39.50 | 44.20 | |
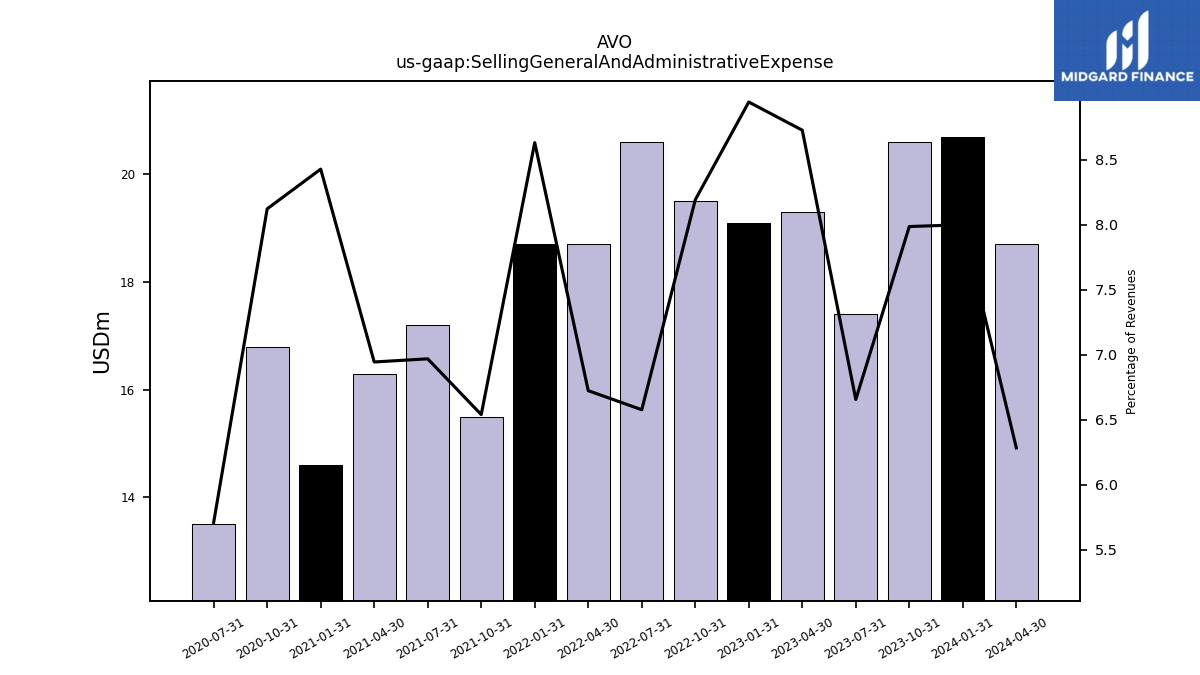
| Selling General And Administrative Expense | 20.70 | 20.60 | 17.40 | 19.30 | 19.10 | 19.50 | 20.60 | 18.70 | 18.70 | 15.50 | 17.20 | 16.30 | 14.60 | 16.80 | 13.50 | |
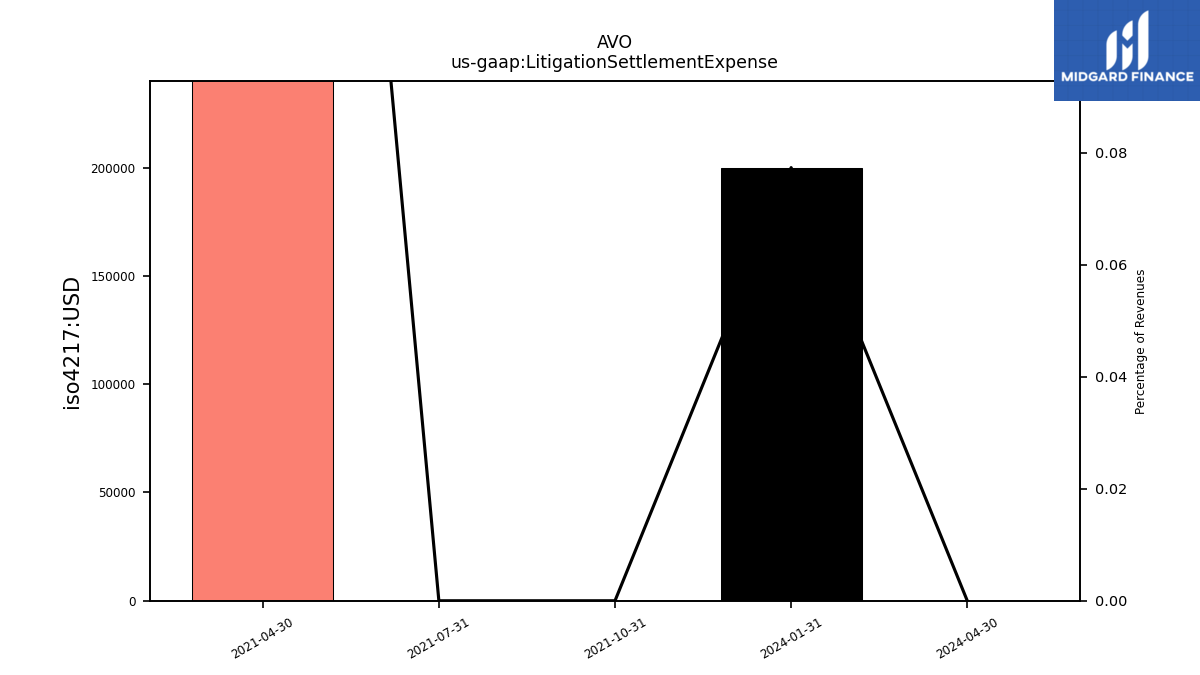
| Litigation Settlement Expense | 0.20 | NA | NA | NA | NA | NA | NA | NA | NA | 0.00 | 0.00 | 0.80 | NA | NA | NA | |
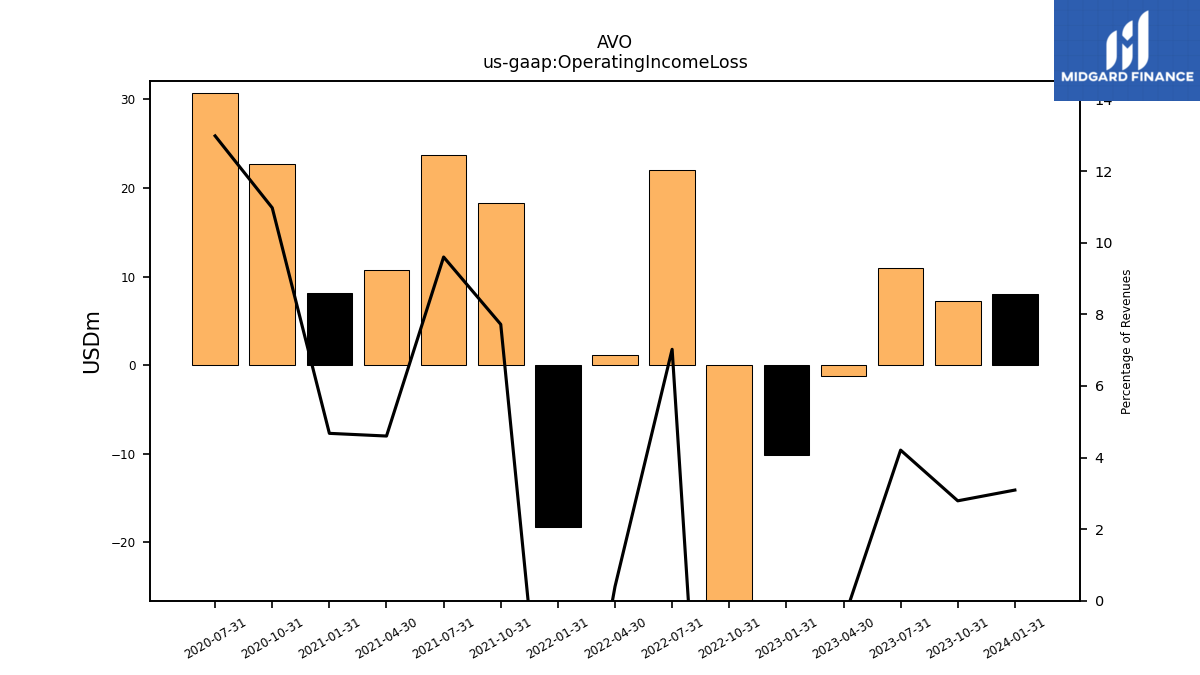
| Operating Income Loss | 8.00 | 7.20 | 11.00 | -1.20 | -10.10 | -42.10 | 22.00 | 1.10 | -18.20 | 18.30 | 23.70 | 10.80 | 8.10 | 22.70 | 30.70 | |
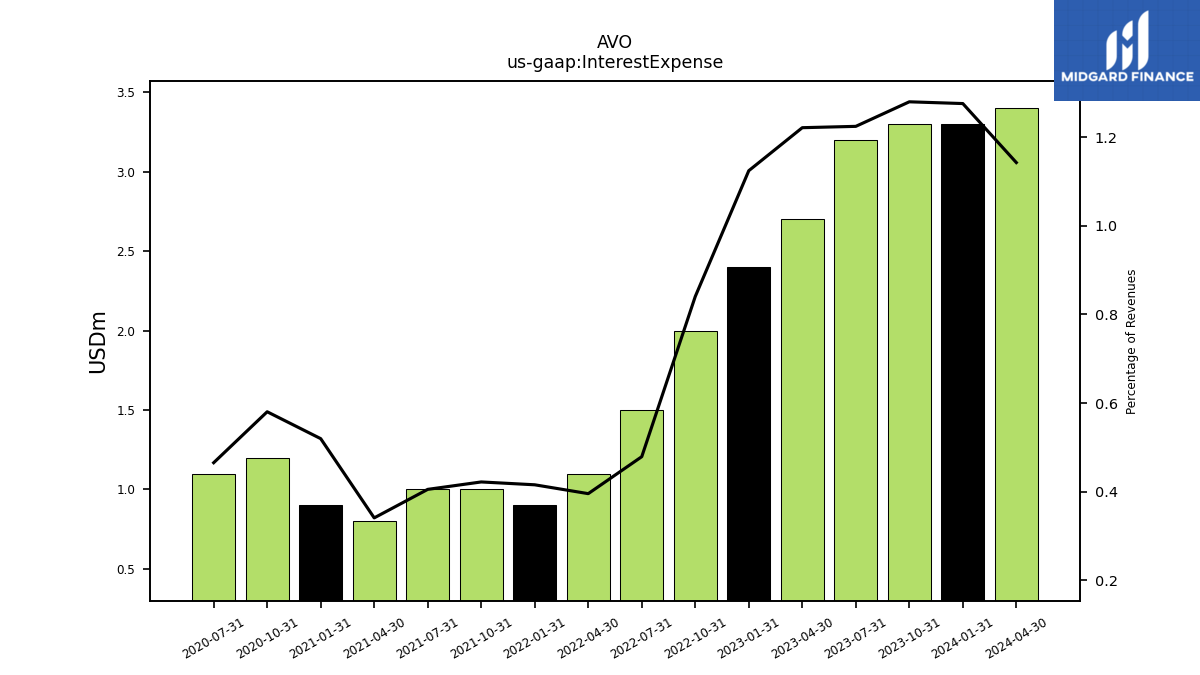
| Interest Expense | 3.30 | 3.30 | 3.20 | 2.70 | 2.40 | 2.00 | 1.50 | 1.10 | 0.90 | 1.00 | 1.00 | 0.80 | 0.90 | 1.20 | 1.10 | |
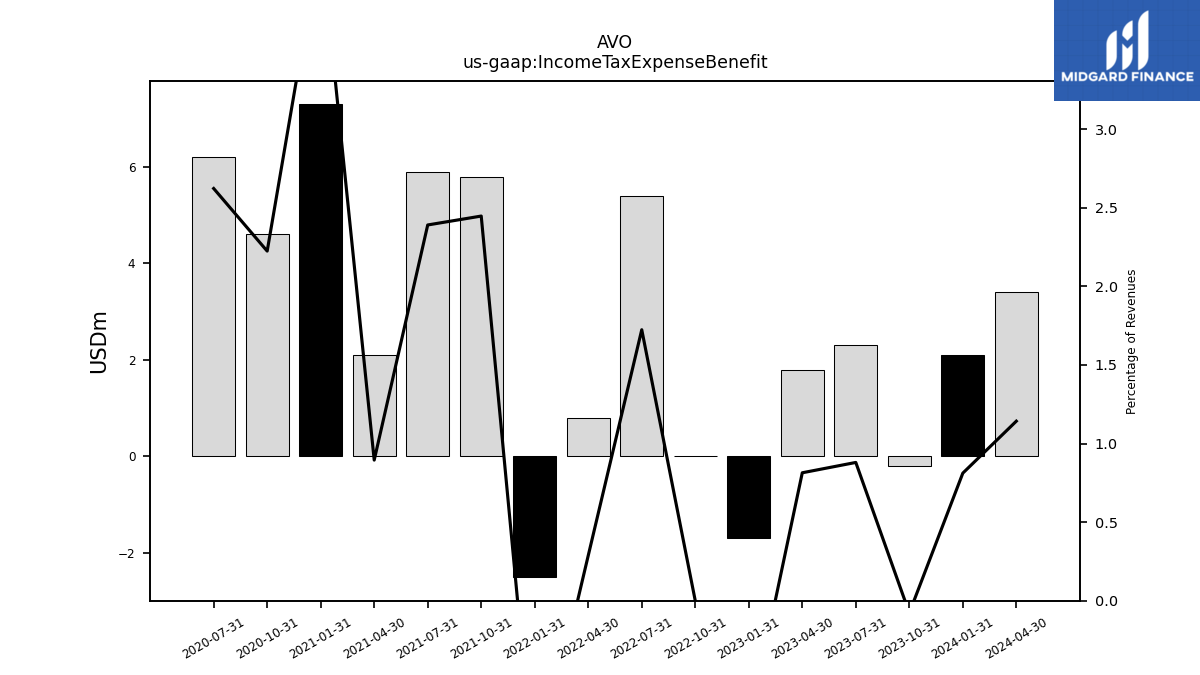
| Income Tax Expense Benefit | 2.10 | -0.20 | 2.30 | 1.80 | -1.70 | 0.00 | 5.40 | 0.80 | -2.50 | 5.80 | 5.90 | 2.10 | 7.30 | 4.60 | 6.20 | |
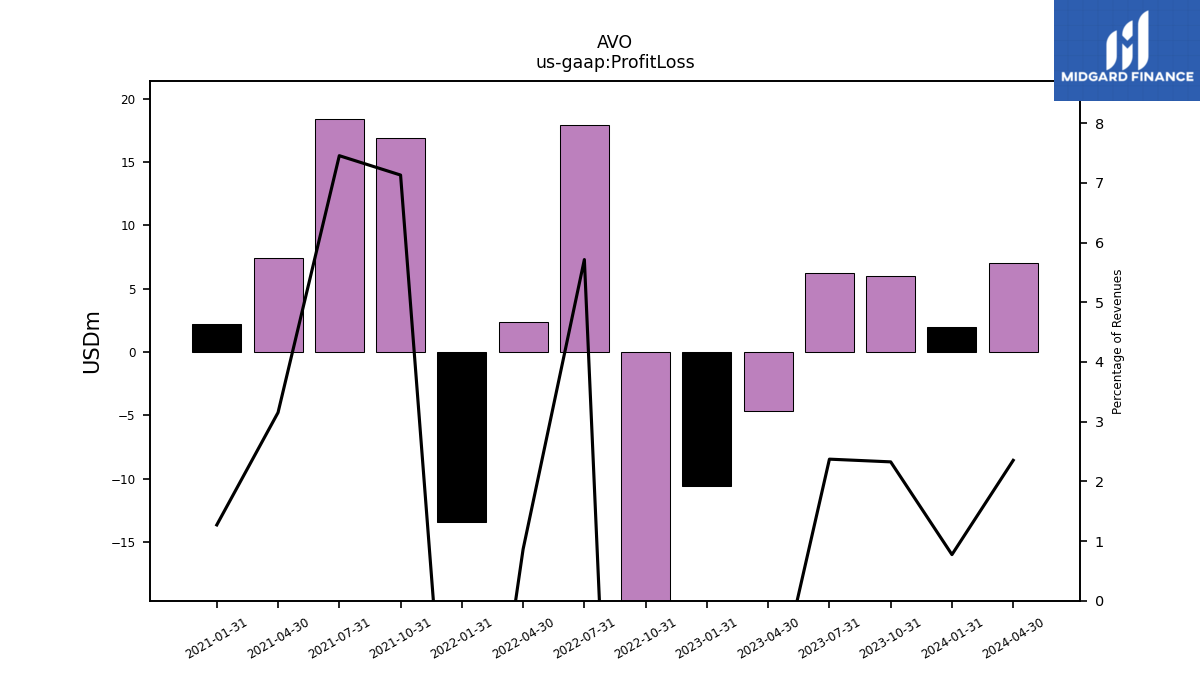
| Profit Loss | 2.00 | 6.00 | 6.20 | -4.70 | -10.60 | -41.80 | 17.90 | 2.40 | -13.40 | 16.90 | 18.40 | 7.40 | 2.20 | NA | NA | |
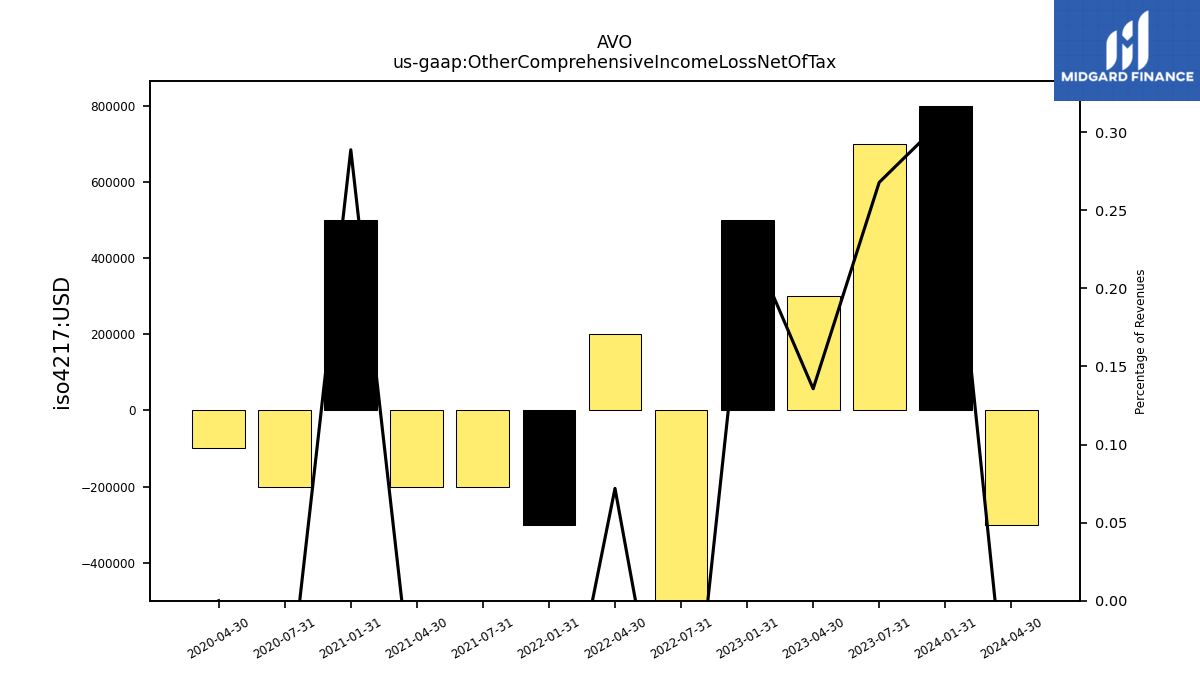
| Other Comprehensive Income Loss Net Of Tax | 0.80 | NA | 0.70 | 0.30 | 0.50 | NA | -0.50 | 0.20 | -0.30 | NA | -0.20 | -0.20 | 0.50 | NA | -0.20 | |
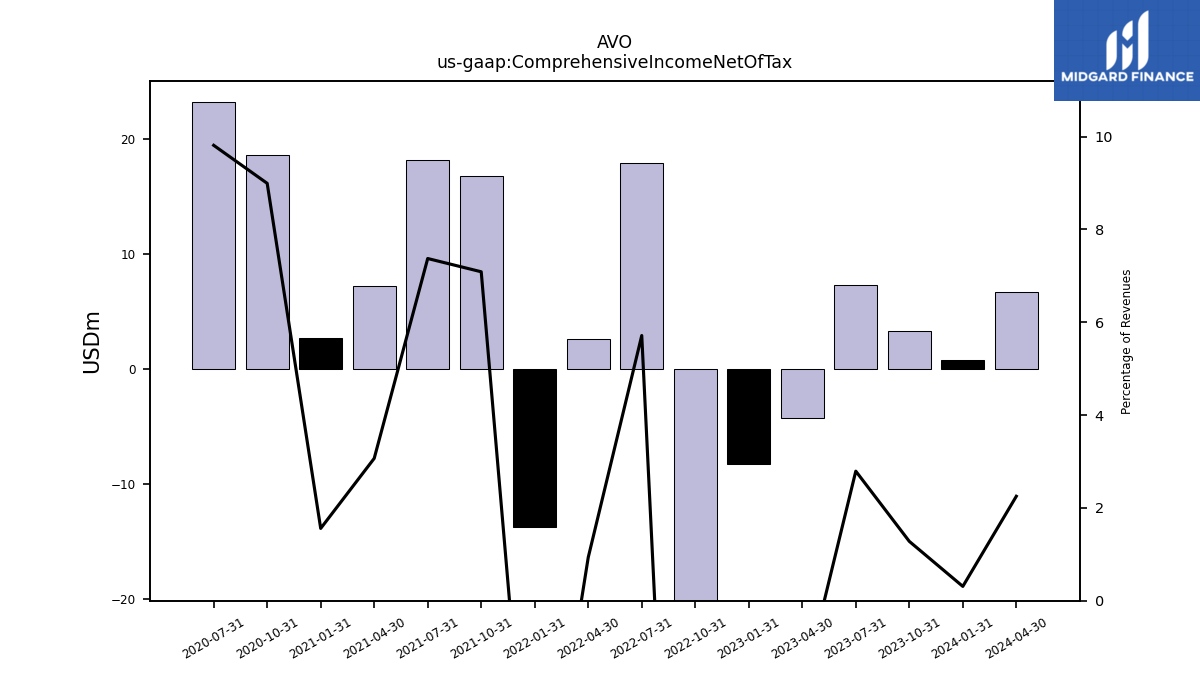
| Comprehensive Income Net Of Tax | 0.80 | 3.30 | 7.30 | -4.30 | -8.30 | -42.60 | 17.90 | 2.60 | -13.70 | 16.80 | 18.20 | 7.20 | 2.70 | 18.60 | 23.20 |
| 2024-01-31 | 2023-10-31 | 2023-07-31 | 2023-04-30 | 2023-01-31 | 2022-10-31 | 2022-07-31 | 2022-04-30 | 2022-01-31 | 2021-10-31 | 2021-07-31 | 2021-04-30 | 2021-01-31 | 2020-10-31 | 2020-07-31 | ||
|---|---|---|---|---|---|---|---|---|---|---|---|---|---|---|---|---|
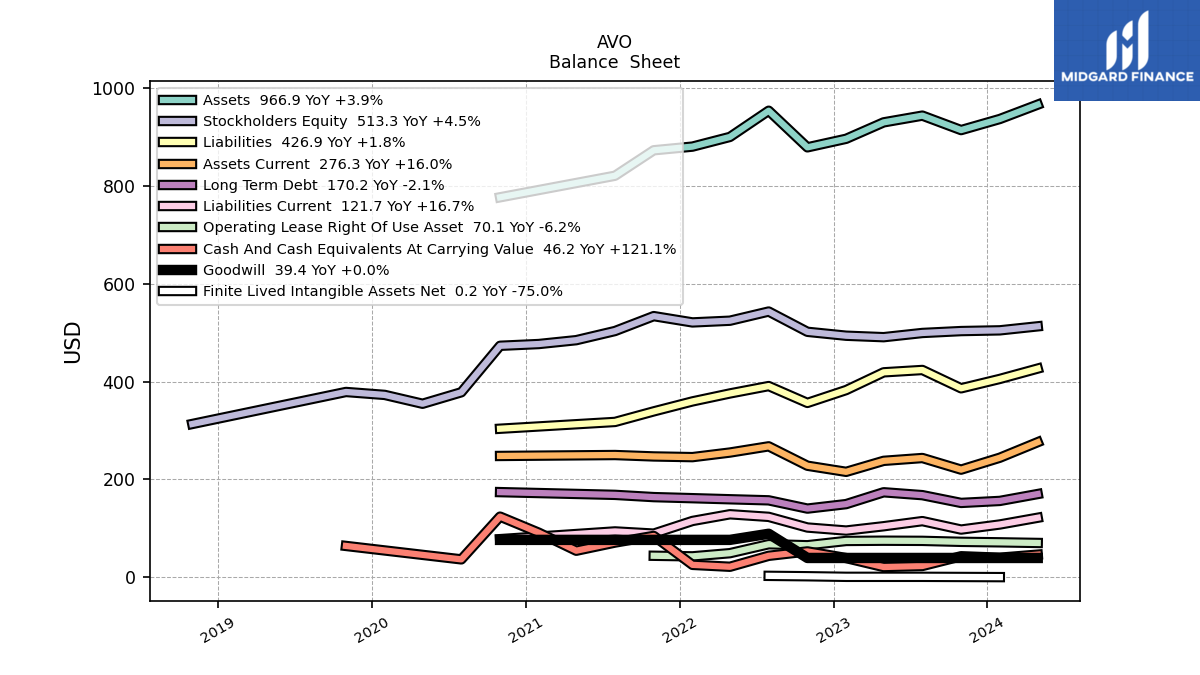
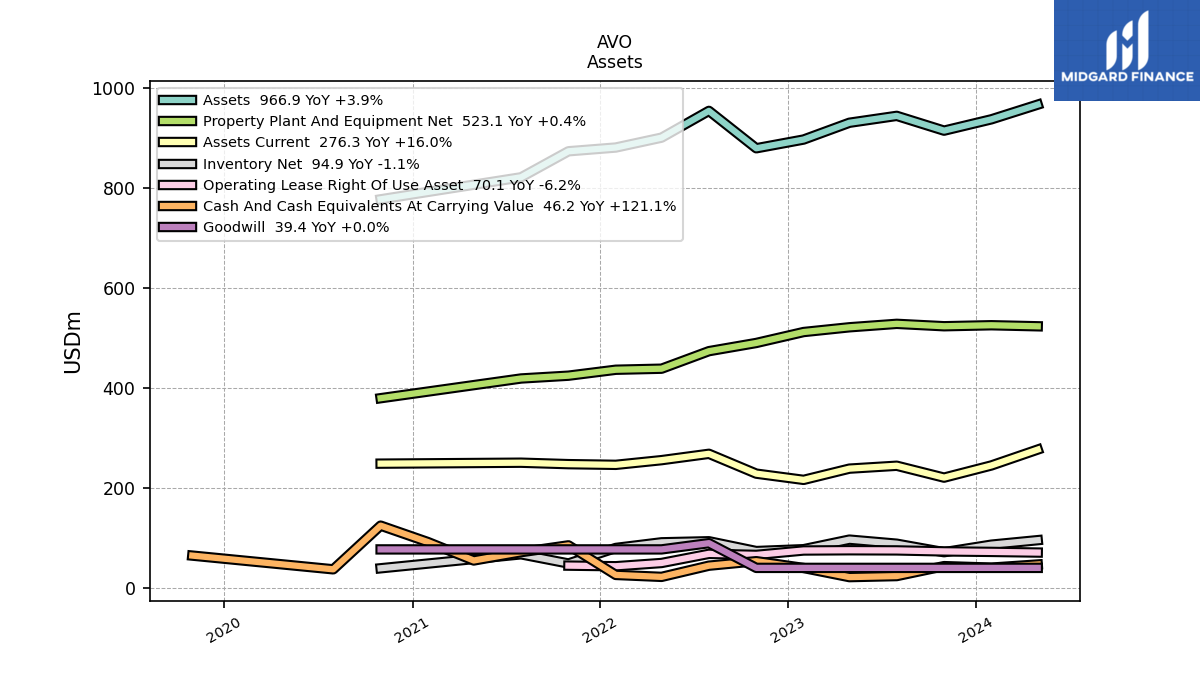
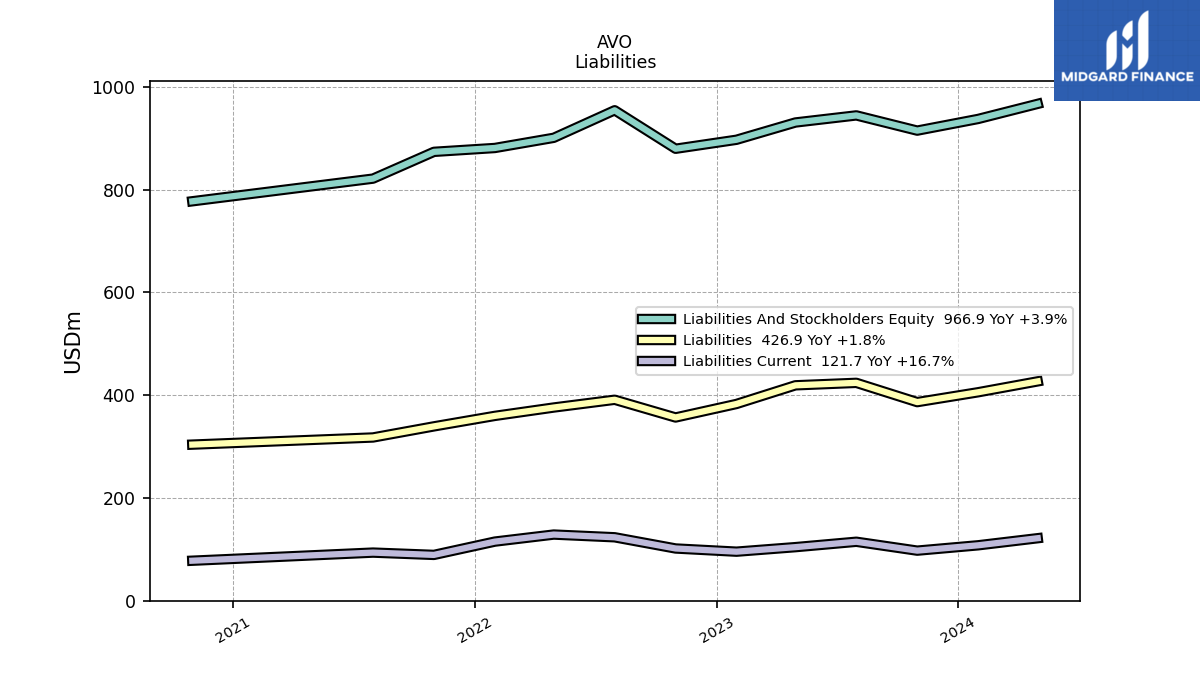
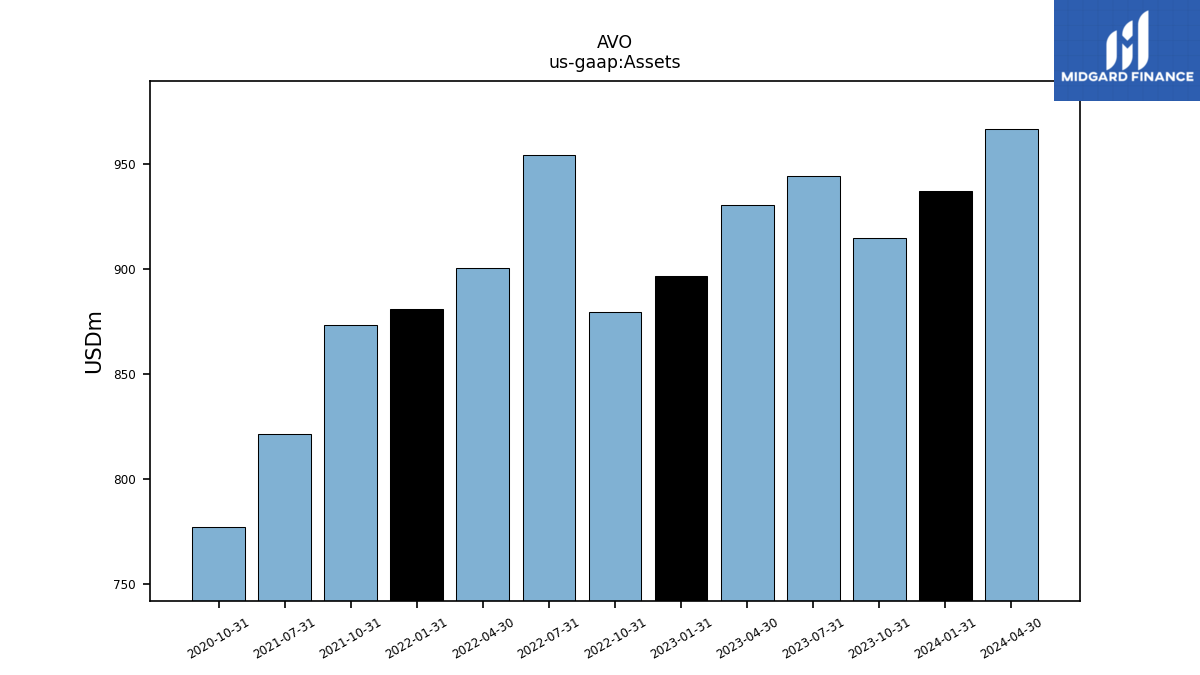
| Assets | 937.50 | 914.80 | 944.40 | 930.60 | 897.00 | 879.50 | 954.40 | 900.80 | 881.00 | 873.50 | 821.40 | NA | NA | 777.30 | NA | |
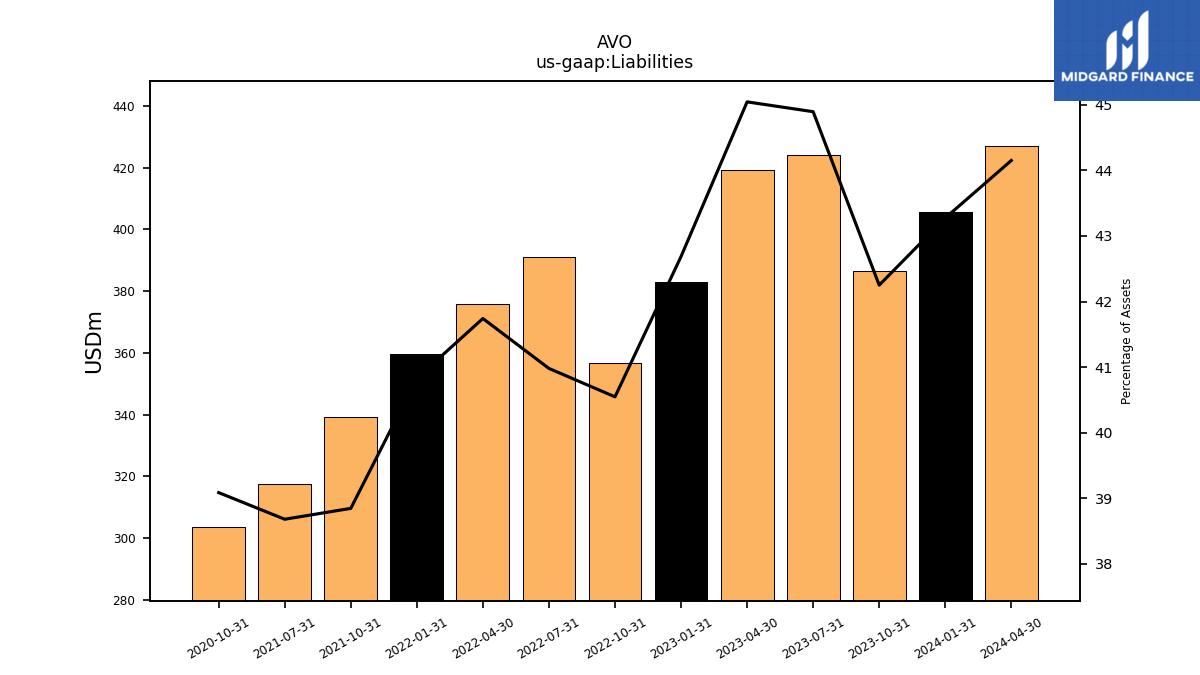
| Liabilities | 405.70 | 386.50 | 424.00 | 419.20 | 382.90 | 356.60 | 391.10 | 376.00 | 359.70 | 339.30 | 317.70 | NA | NA | 303.80 | NA | |
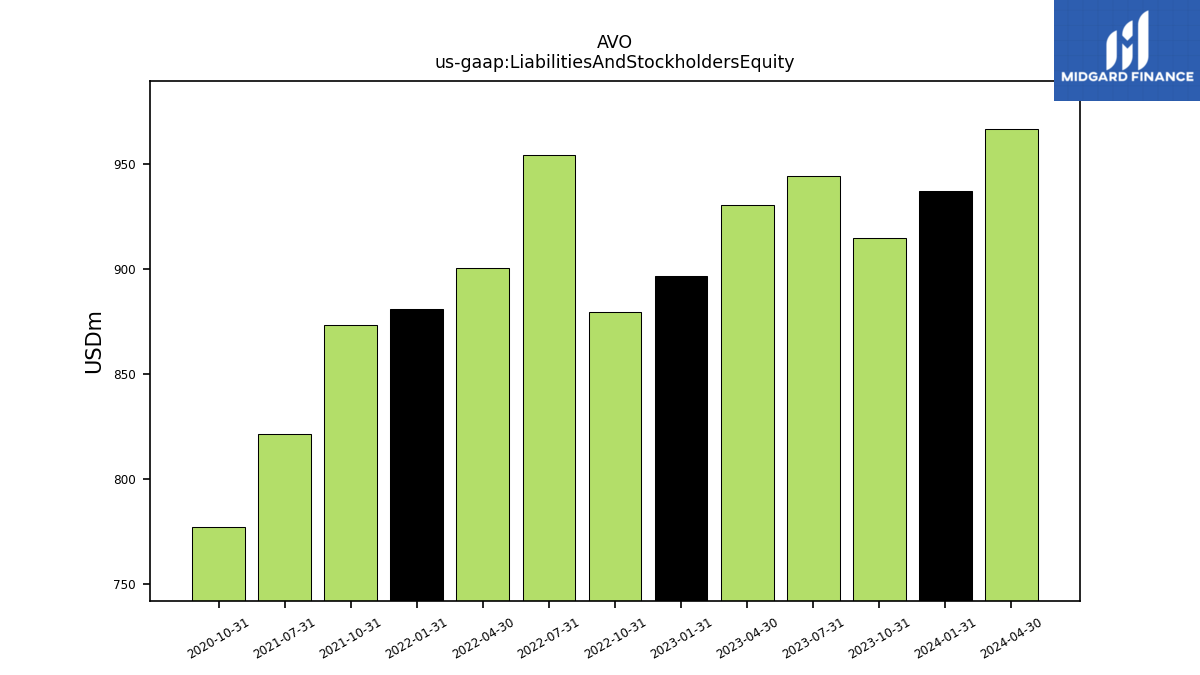
| Liabilities And Stockholders Equity | 937.50 | 914.80 | 944.40 | 930.60 | 897.00 | 879.50 | 954.40 | 900.80 | 881.00 | 873.50 | 821.40 | NA | NA | 777.30 | NA | |
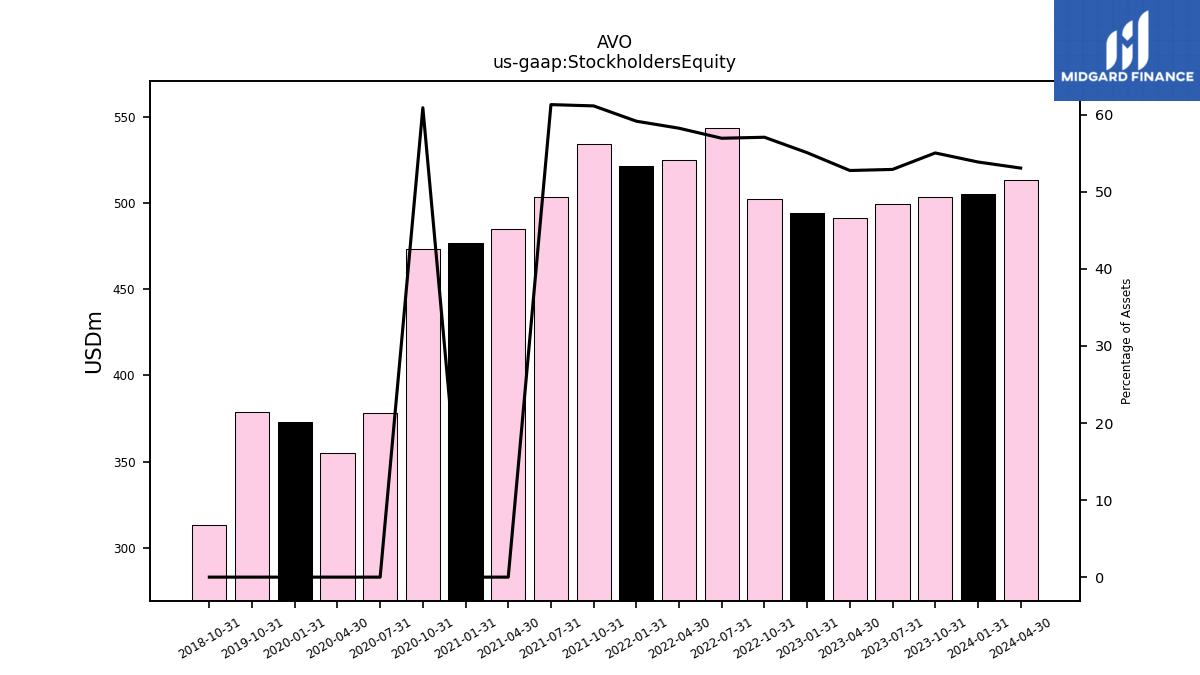
| Stockholders Equity | 505.10 | 503.60 | 499.70 | 491.10 | 494.10 | 502.10 | 543.60 | 524.80 | 521.30 | 534.20 | 503.70 | 485.00 | 477.10 | 473.50 | 378.40 |
| 2024-01-31 | 2023-10-31 | 2023-07-31 | 2023-04-30 | 2023-01-31 | 2022-10-31 | 2022-07-31 | 2022-04-30 | 2022-01-31 | 2021-10-31 | 2021-07-31 | 2021-04-30 | 2021-01-31 | 2020-10-31 | 2020-07-31 | ||
|---|---|---|---|---|---|---|---|---|---|---|---|---|---|---|---|---|
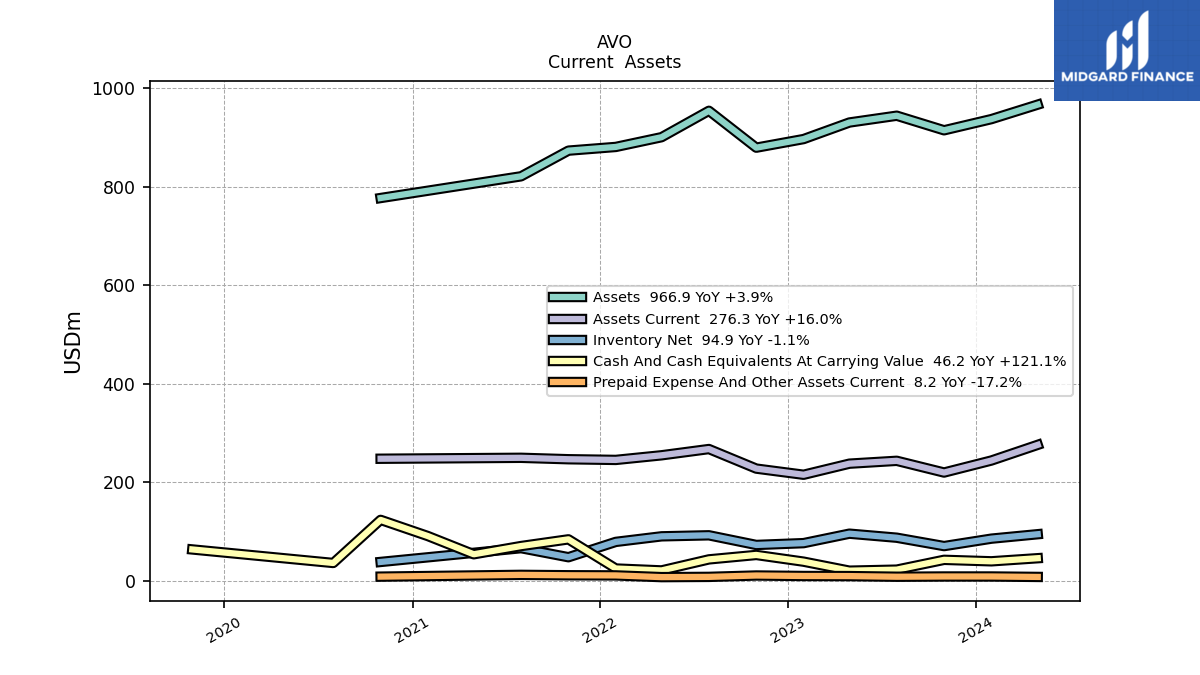
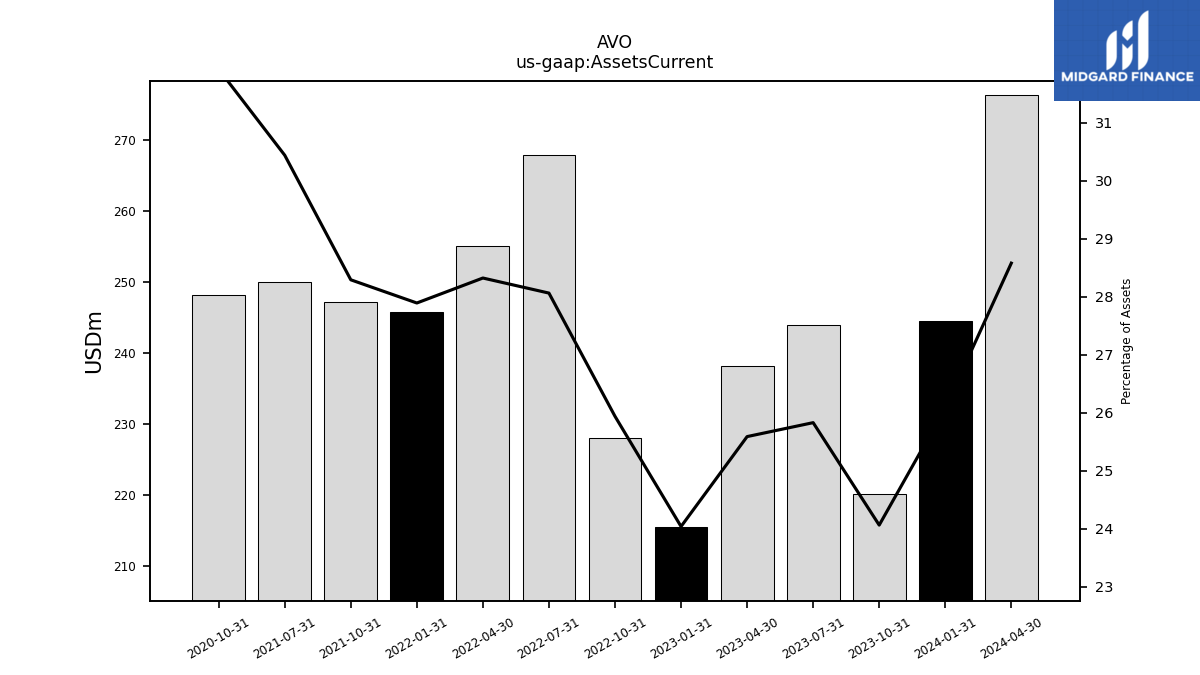
| Assets Current | 244.50 | 220.10 | 243.90 | 238.10 | 215.60 | 228.10 | 267.80 | 255.10 | 245.70 | 247.10 | 250.00 | NA | NA | 248.10 | NA | |
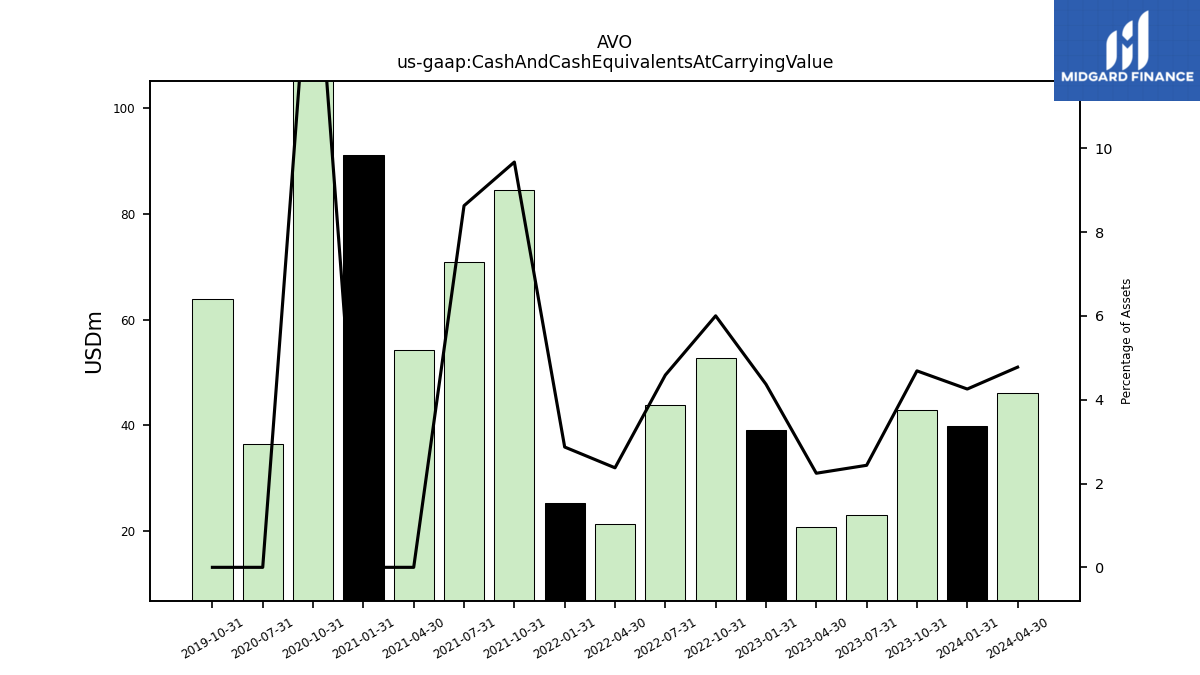
| Cash And Cash Equivalents At Carrying Value | 39.90 | 42.90 | 23.00 | 20.90 | 39.20 | 52.80 | 43.80 | 21.40 | 25.30 | 84.50 | 70.90 | 54.20 | 91.10 | 124.00 | 36.50 | |
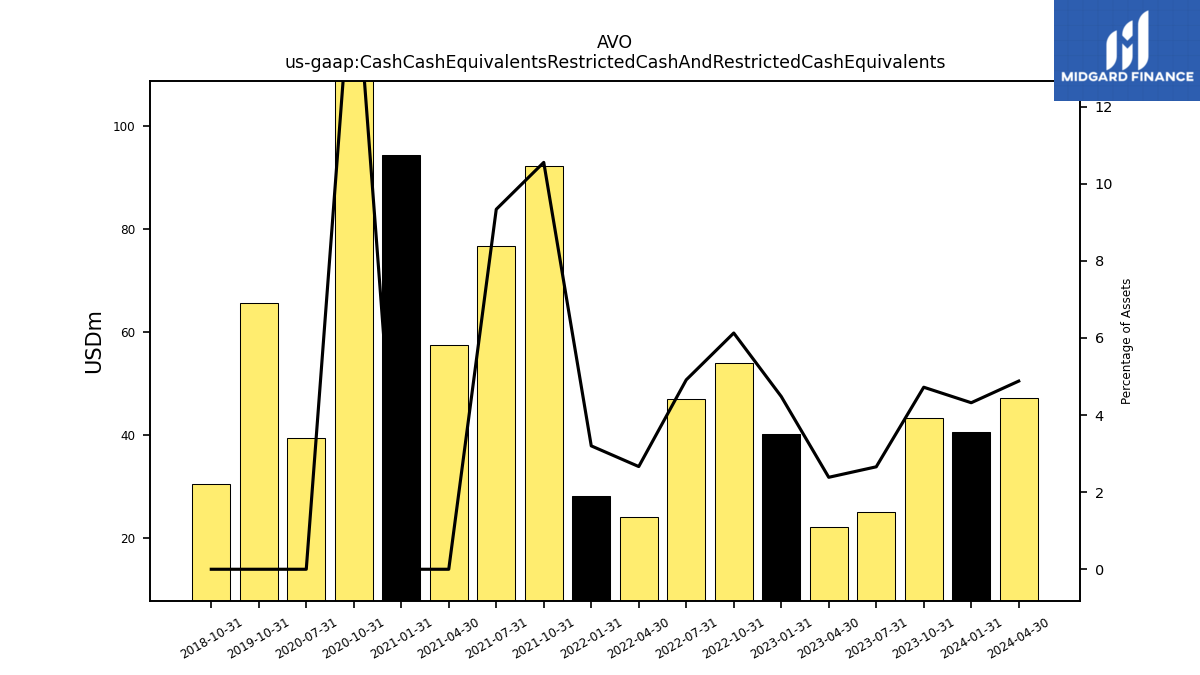
| Cash Cash Equivalents Restricted Cash And Restricted Cash Equivalents | 40.50 | 43.20 | 25.10 | 22.20 | 40.20 | 53.90 | 46.90 | 24.00 | 28.20 | 92.20 | 76.70 | 57.50 | 94.30 | 127.00 | 39.40 | |
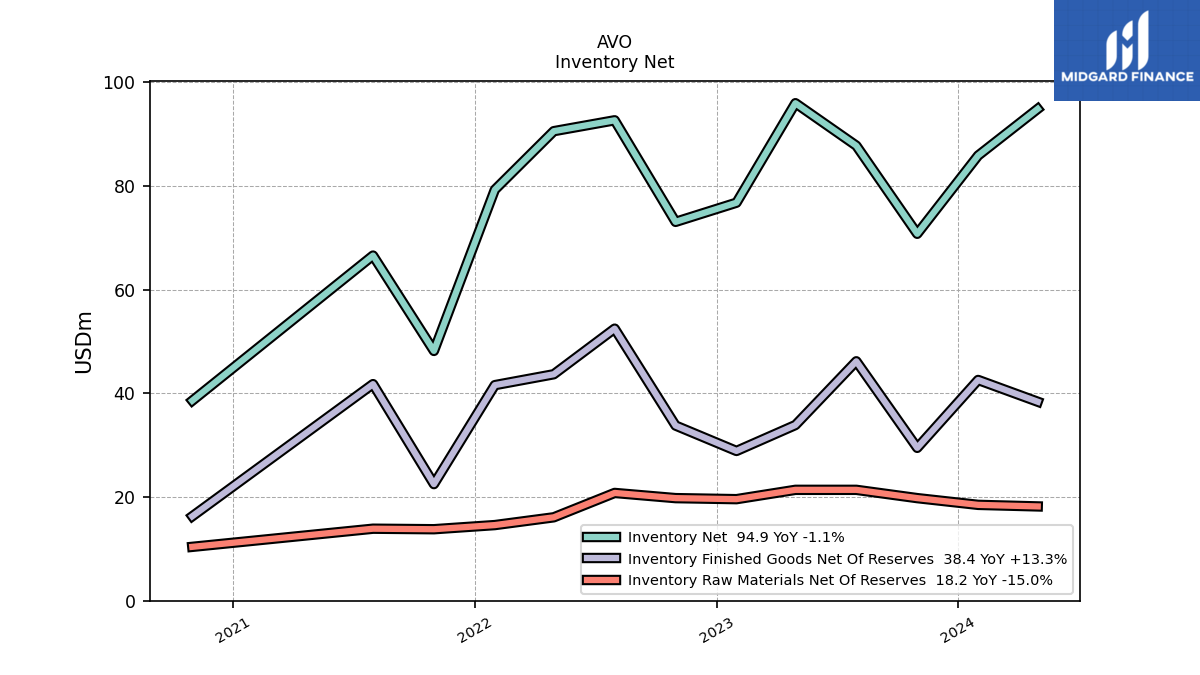
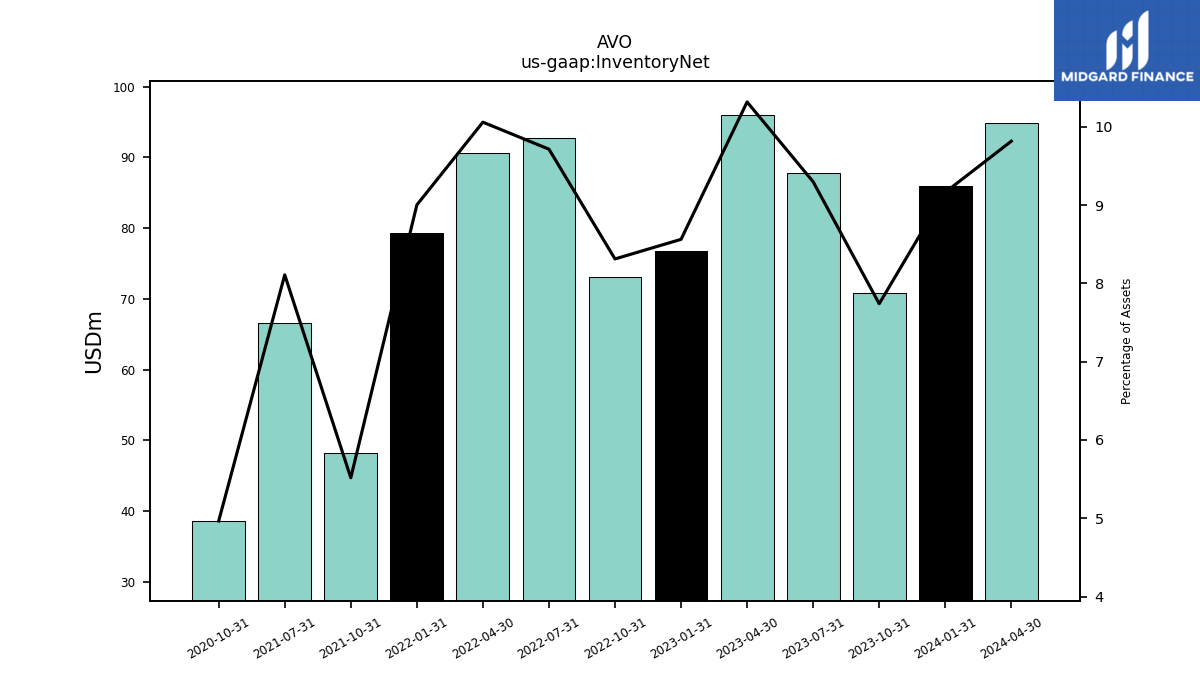
| Inventory Net | 85.90 | 70.80 | 87.80 | 96.00 | 76.80 | 73.10 | 92.70 | 90.60 | 79.30 | 48.20 | 66.60 | NA | NA | 38.60 | NA | |
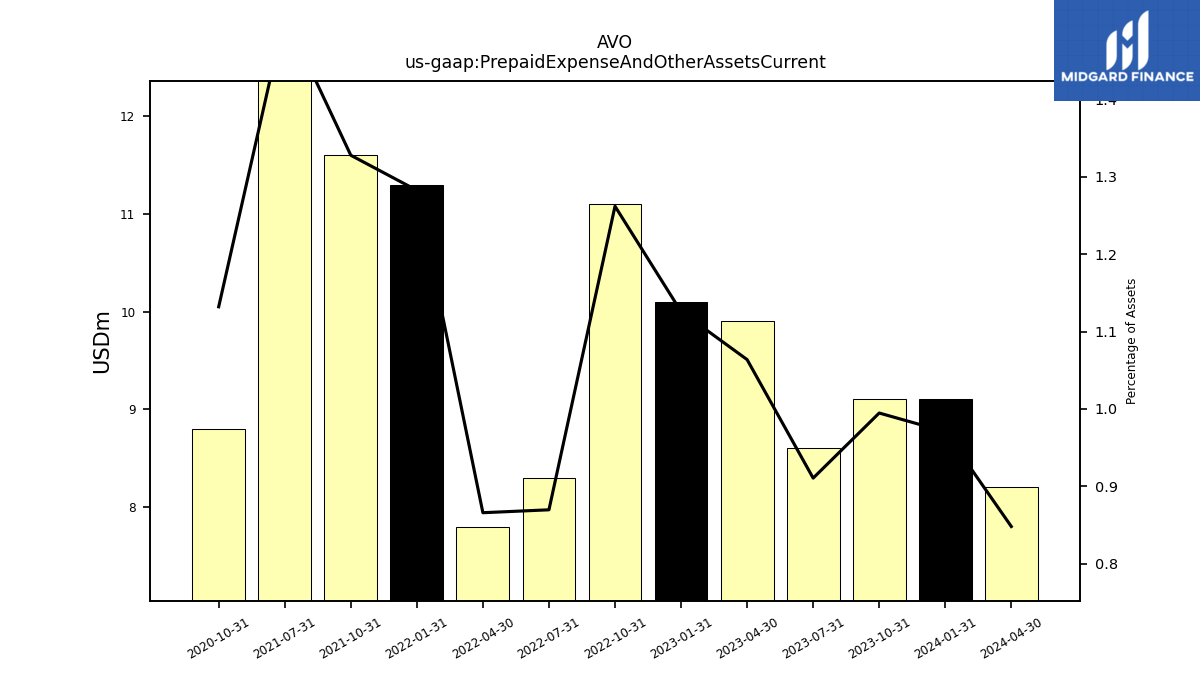
| Prepaid Expense And Other Assets Current | 9.10 | 9.10 | 8.60 | 9.90 | 10.10 | 11.10 | 8.30 | 7.80 | 11.30 | 11.60 | 12.40 | NA | NA | 8.80 | NA |
| 2024-01-31 | 2023-10-31 | 2023-07-31 | 2023-04-30 | 2023-01-31 | 2022-10-31 | 2022-07-31 | 2022-04-30 | 2022-01-31 | 2021-10-31 | 2021-07-31 | 2021-04-30 | 2021-01-31 | 2020-10-31 | 2020-07-31 | ||
|---|---|---|---|---|---|---|---|---|---|---|---|---|---|---|---|---|
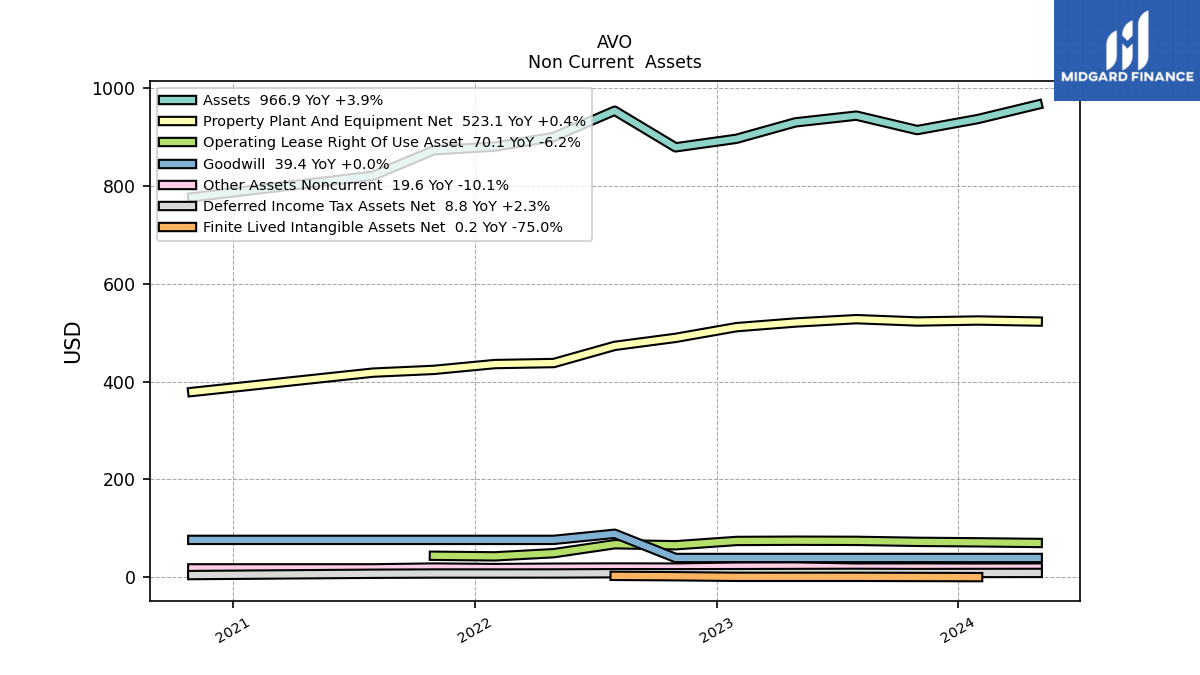
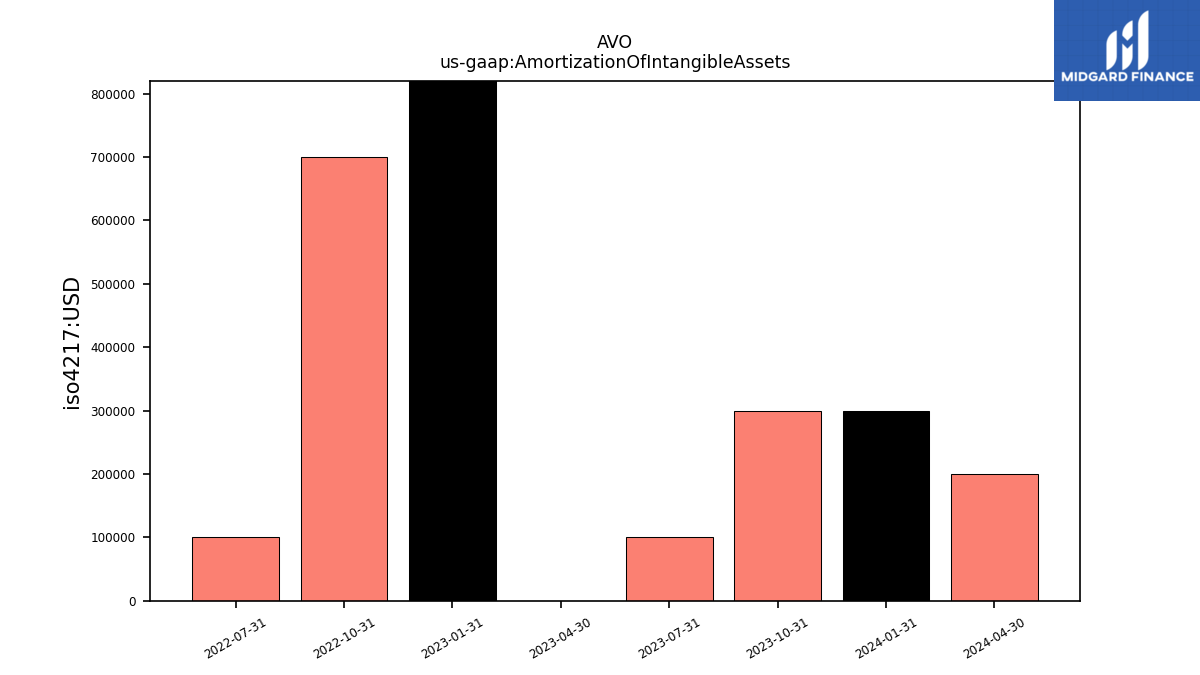
| Amortization Of Intangible Assets | 0.30 | 0.30 | 0.10 | 0.00 | 1.20 | 0.70 | 0.10 | NA | NA | NA | NA | NA | NA | NA | NA | |
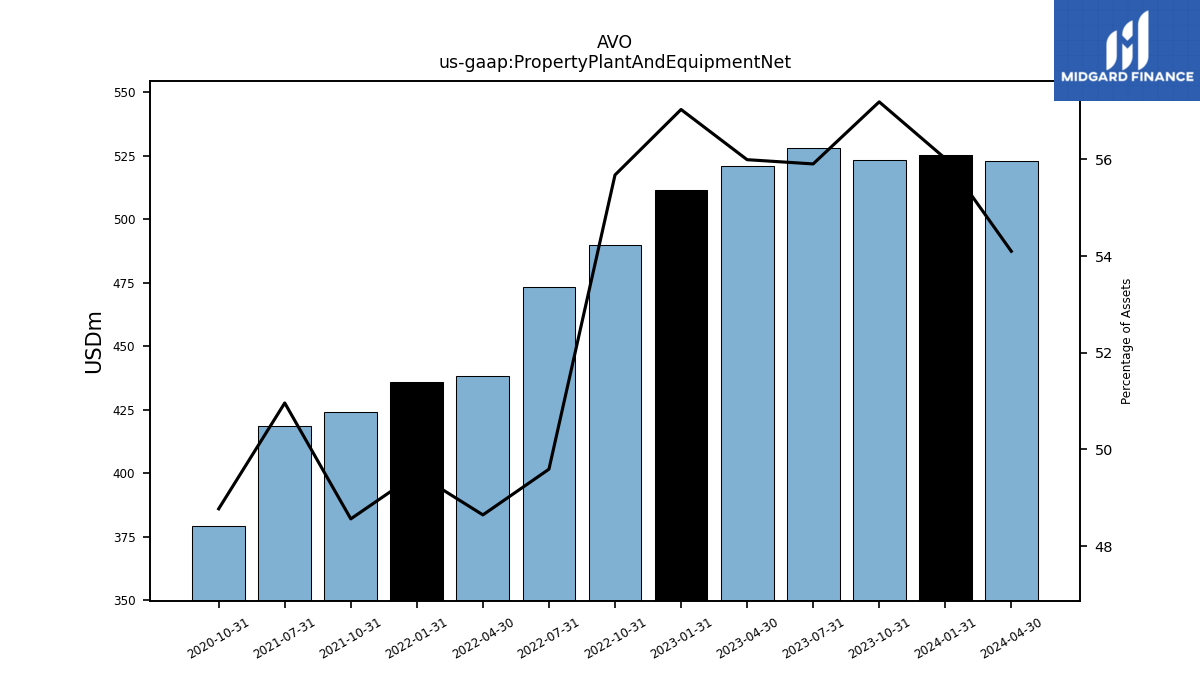
| Property Plant And Equipment Net | 525.20 | 523.20 | 528.00 | 521.10 | 511.60 | 489.70 | 473.30 | 438.20 | 436.10 | 424.20 | 418.60 | NA | NA | 379.10 | NA | |
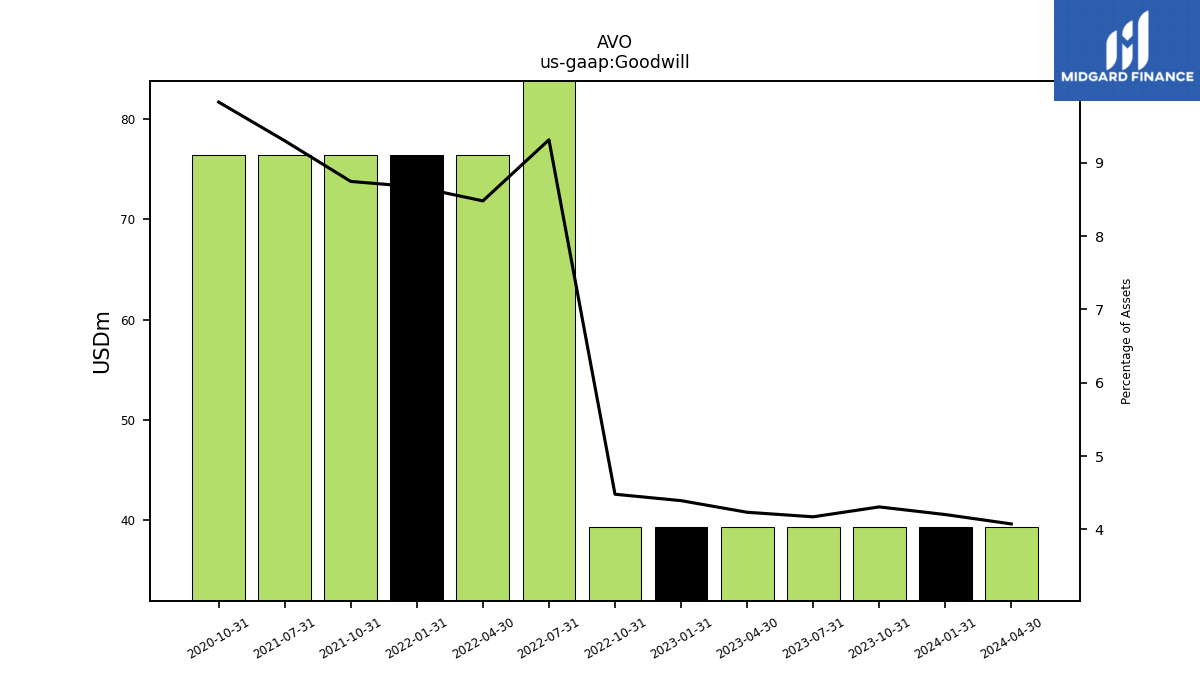
| Goodwill | 39.40 | 39.40 | 39.40 | 39.40 | 39.40 | 39.40 | 88.90 | 76.40 | 76.40 | 76.40 | 76.40 | NA | NA | 76.40 | NA | |
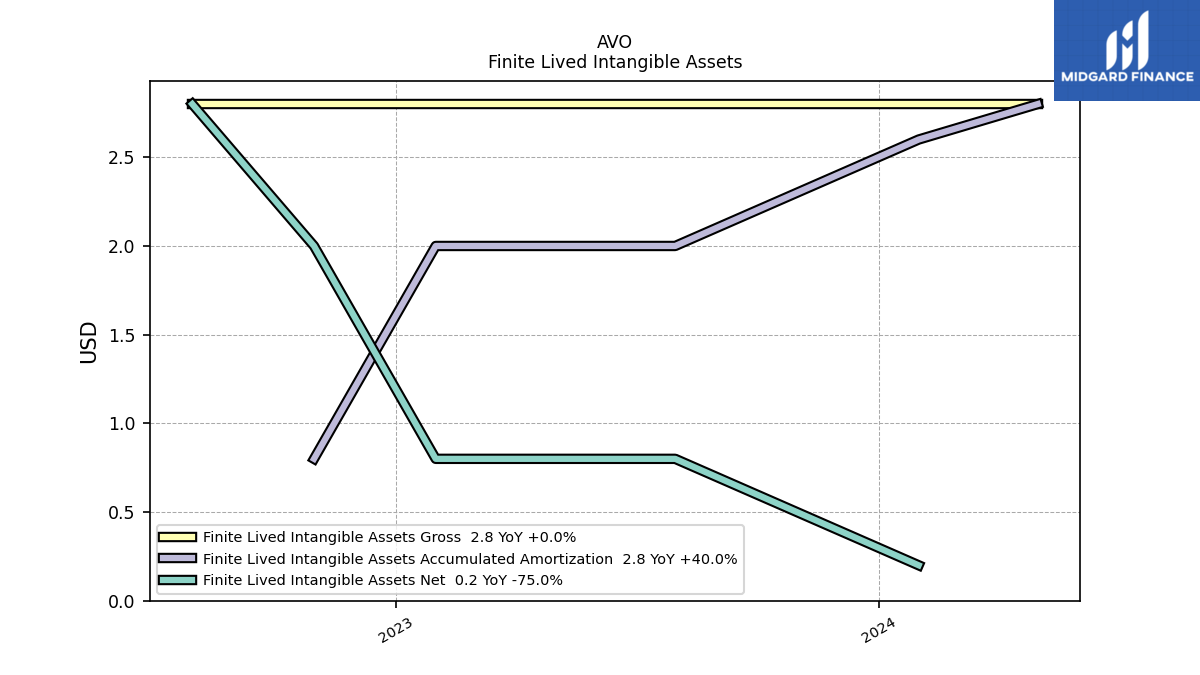
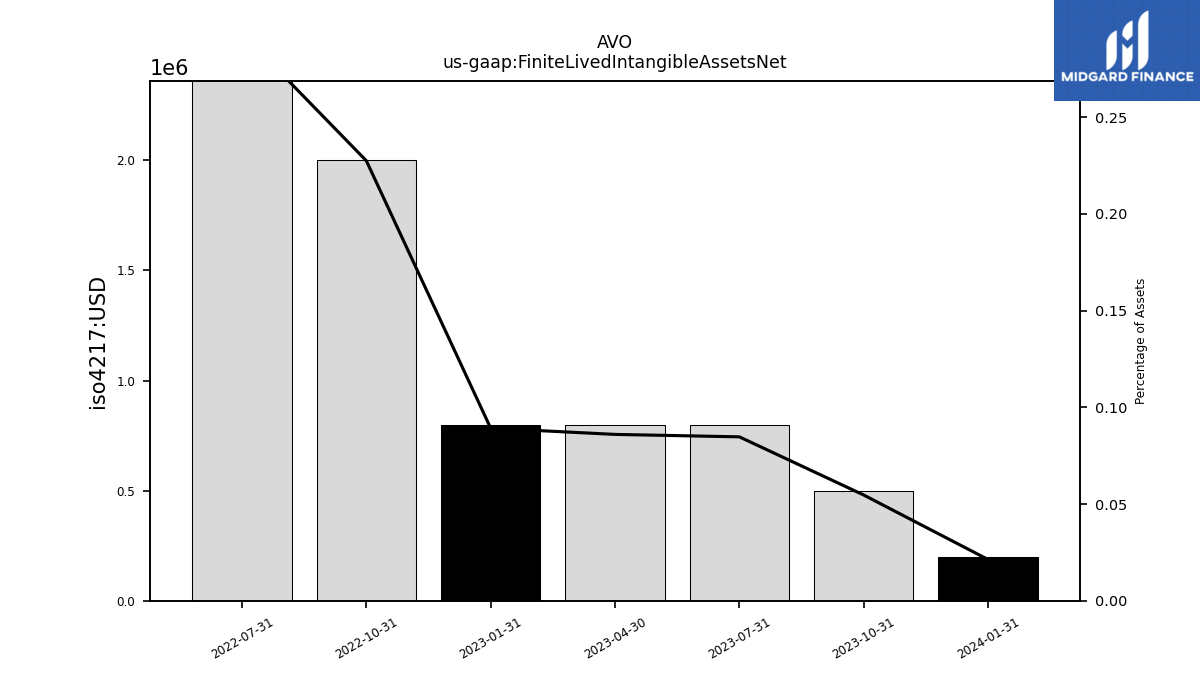
| Finite Lived Intangible Assets Net | 0.20 | 0.50 | 0.80 | 0.80 | 0.80 | 2.00 | 2.80 | NA | NA | NA | NA | NA | NA | NA | NA | |
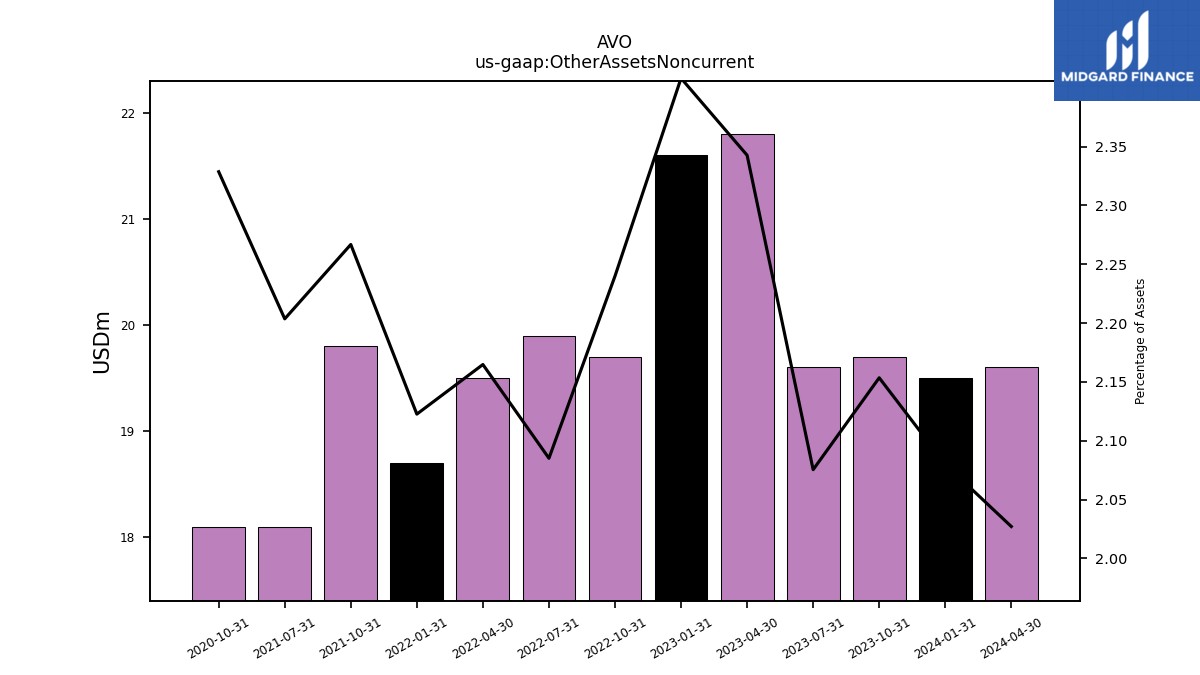
| Other Assets Noncurrent | 19.50 | 19.70 | 19.60 | 21.80 | 21.60 | 19.70 | 19.90 | 19.50 | 18.70 | 19.80 | 18.10 | NA | NA | 18.10 | NA |
| 2024-01-31 | 2023-10-31 | 2023-07-31 | 2023-04-30 | 2023-01-31 | 2022-10-31 | 2022-07-31 | 2022-04-30 | 2022-01-31 | 2021-10-31 | 2021-07-31 | 2021-04-30 | 2021-01-31 | 2020-10-31 | 2020-07-31 | ||
|---|---|---|---|---|---|---|---|---|---|---|---|---|---|---|---|---|
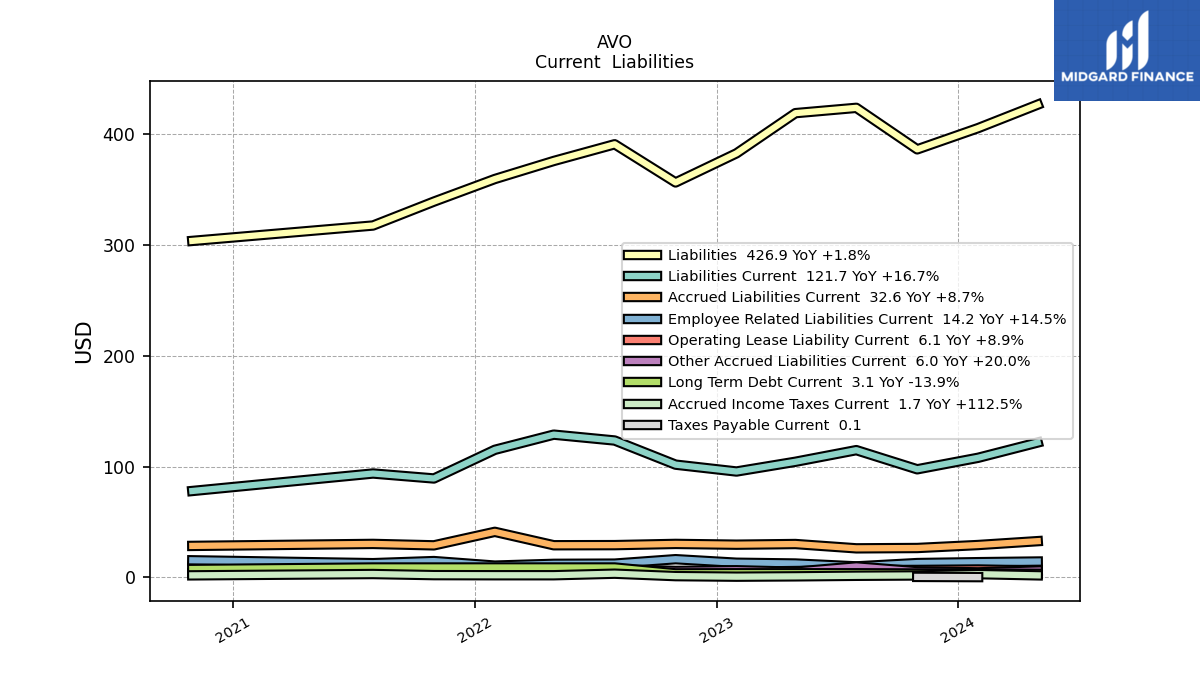
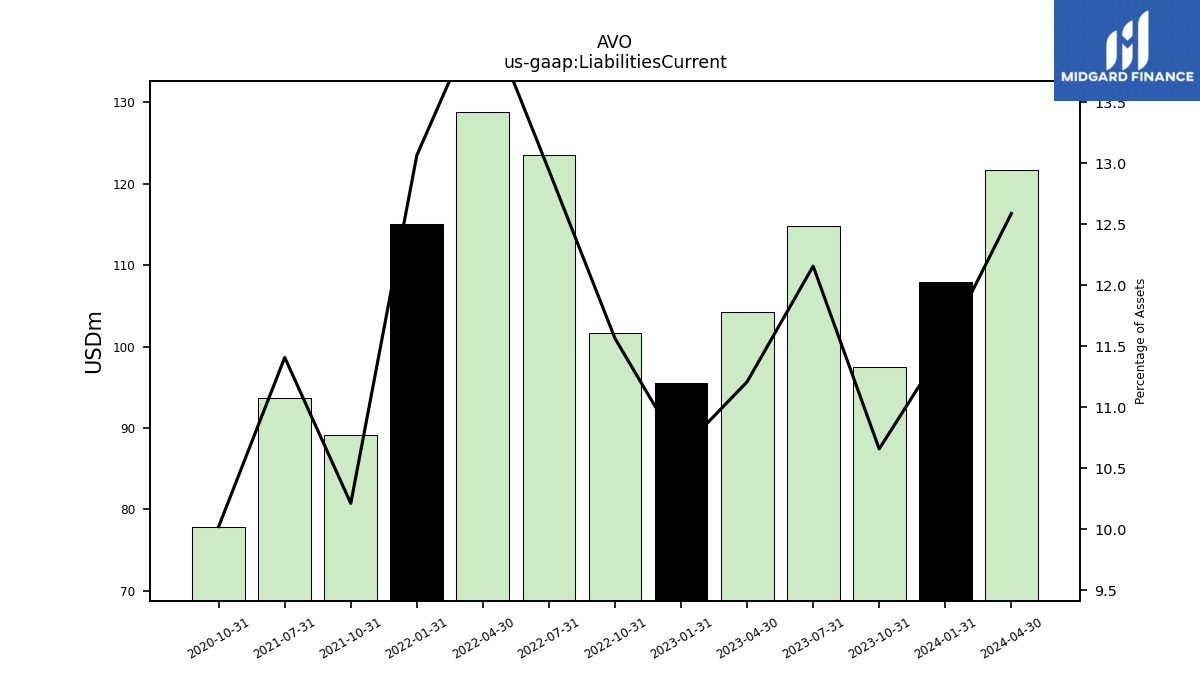
| Liabilities Current | 107.90 | 97.50 | 114.80 | 104.30 | 95.50 | 101.70 | 123.50 | 128.80 | 115.10 | 89.20 | 93.70 | NA | NA | 77.90 | NA | |
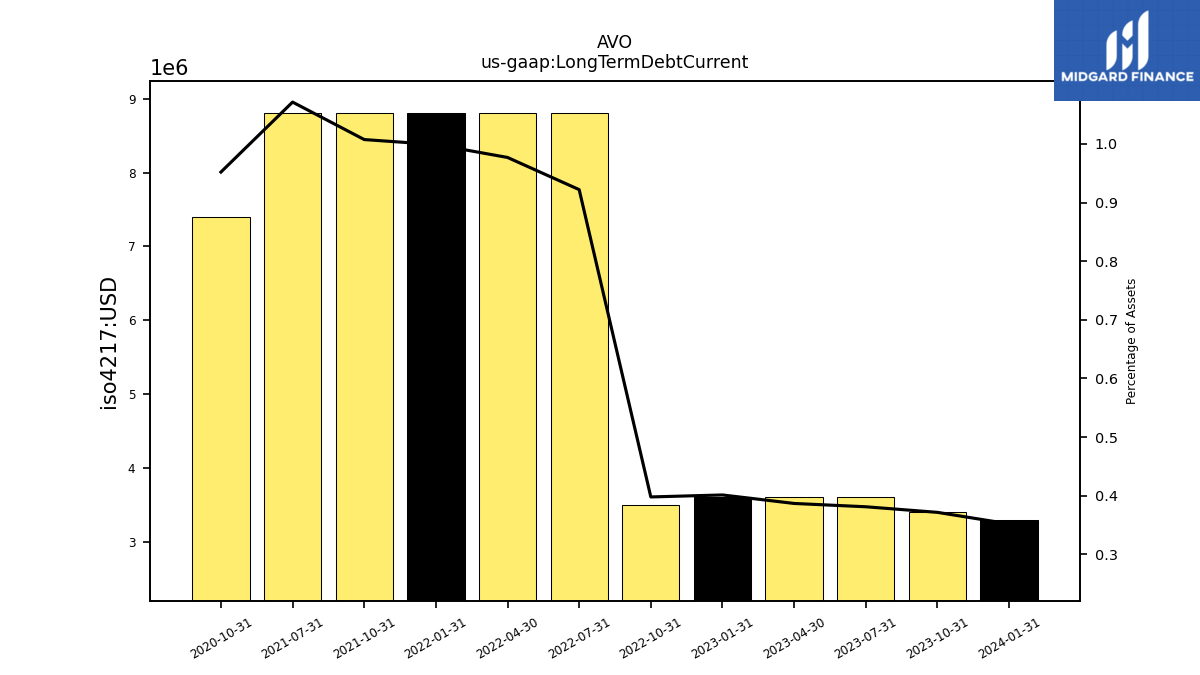
| Long Term Debt Current | 3.30 | 3.40 | 3.60 | 3.60 | 3.60 | 3.50 | 8.80 | 8.80 | 8.80 | 8.80 | 8.80 | NA | NA | 7.40 | NA | |
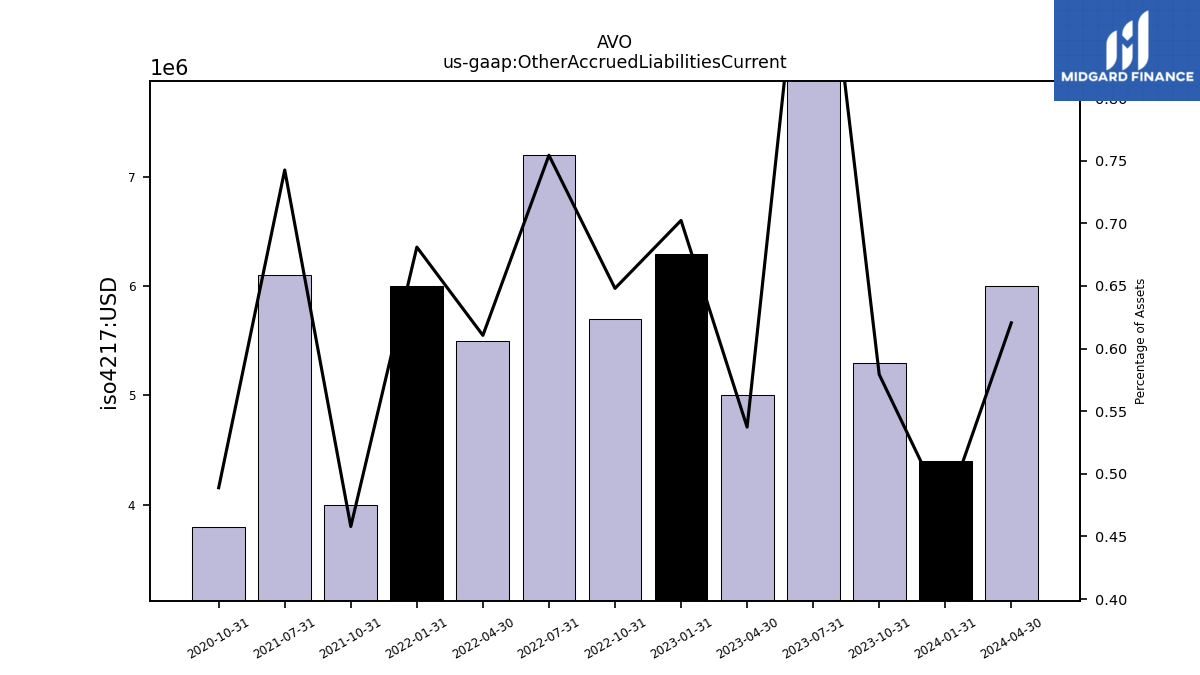
| Other Accrued Liabilities Current | 4.40 | 5.30 | 9.70 | 5.00 | 6.30 | 5.70 | 7.20 | 5.50 | 6.00 | 4.00 | 6.10 | NA | NA | 3.80 | NA | |
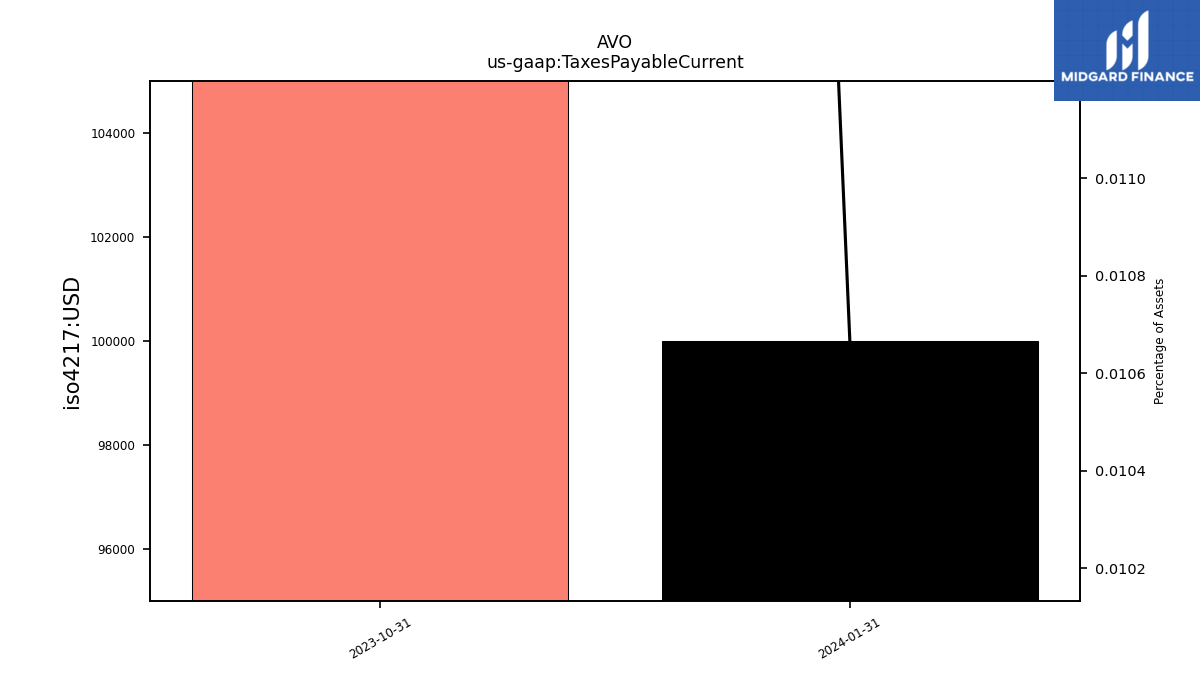
| Taxes Payable Current | 0.10 | 0.30 | NA | NA | NA | NA | NA | NA | NA | NA | NA | NA | NA | NA | NA | |
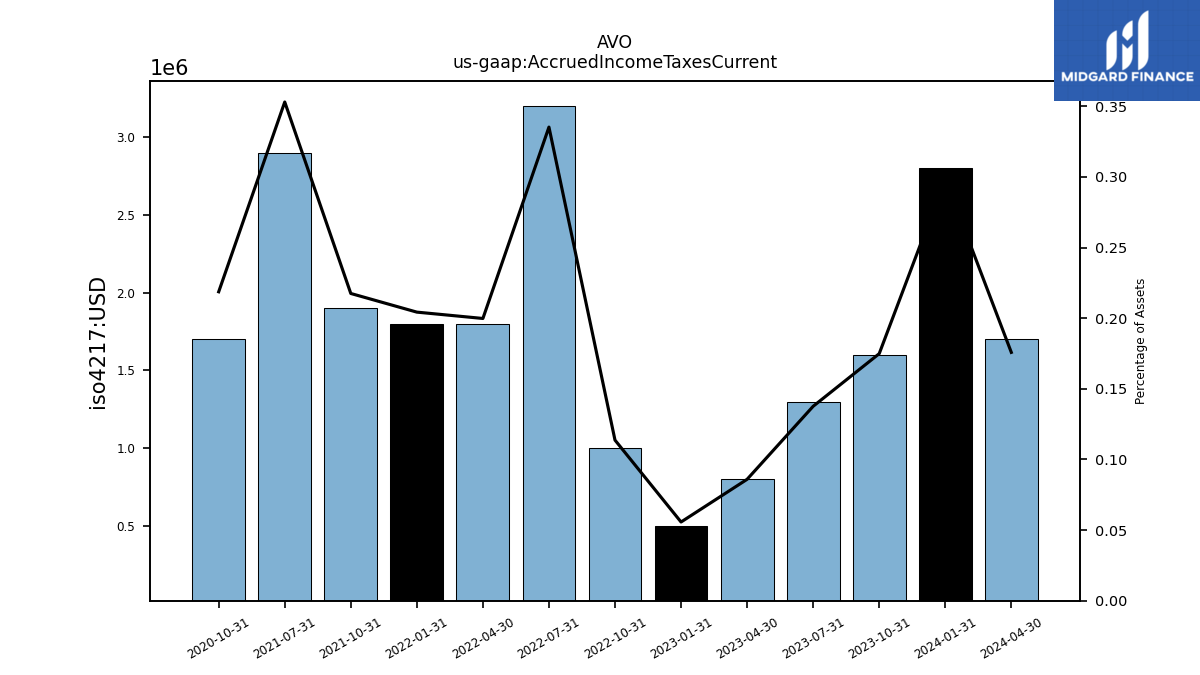
| Accrued Income Taxes Current | 2.80 | 1.60 | 1.30 | 0.80 | 0.50 | 1.00 | 3.20 | 1.80 | 1.80 | 1.90 | 2.90 | NA | NA | 1.70 | NA | |
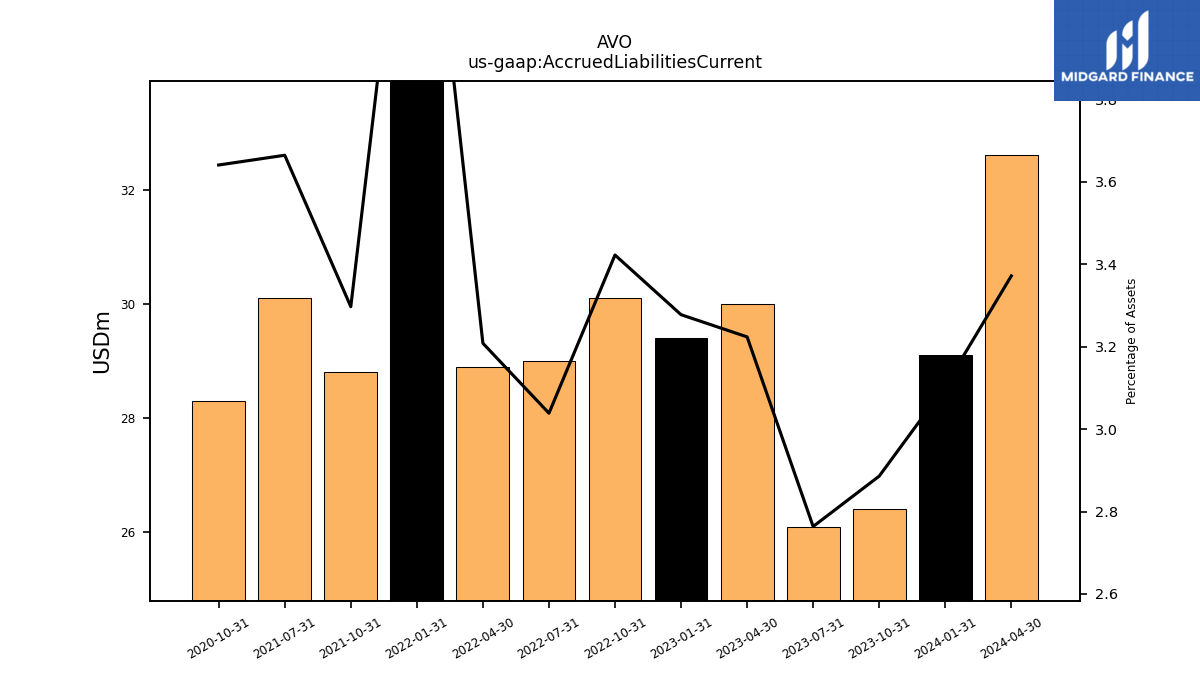
| Accrued Liabilities Current | 29.10 | 26.40 | 26.10 | 30.00 | 29.40 | 30.10 | 29.00 | 28.90 | 41.00 | 28.80 | 30.10 | NA | NA | 28.30 | NA |
| 2024-01-31 | 2023-10-31 | 2023-07-31 | 2023-04-30 | 2023-01-31 | 2022-10-31 | 2022-07-31 | 2022-04-30 | 2022-01-31 | 2021-10-31 | 2021-07-31 | 2021-04-30 | 2021-01-31 | 2020-10-31 | 2020-07-31 | ||
|---|---|---|---|---|---|---|---|---|---|---|---|---|---|---|---|---|
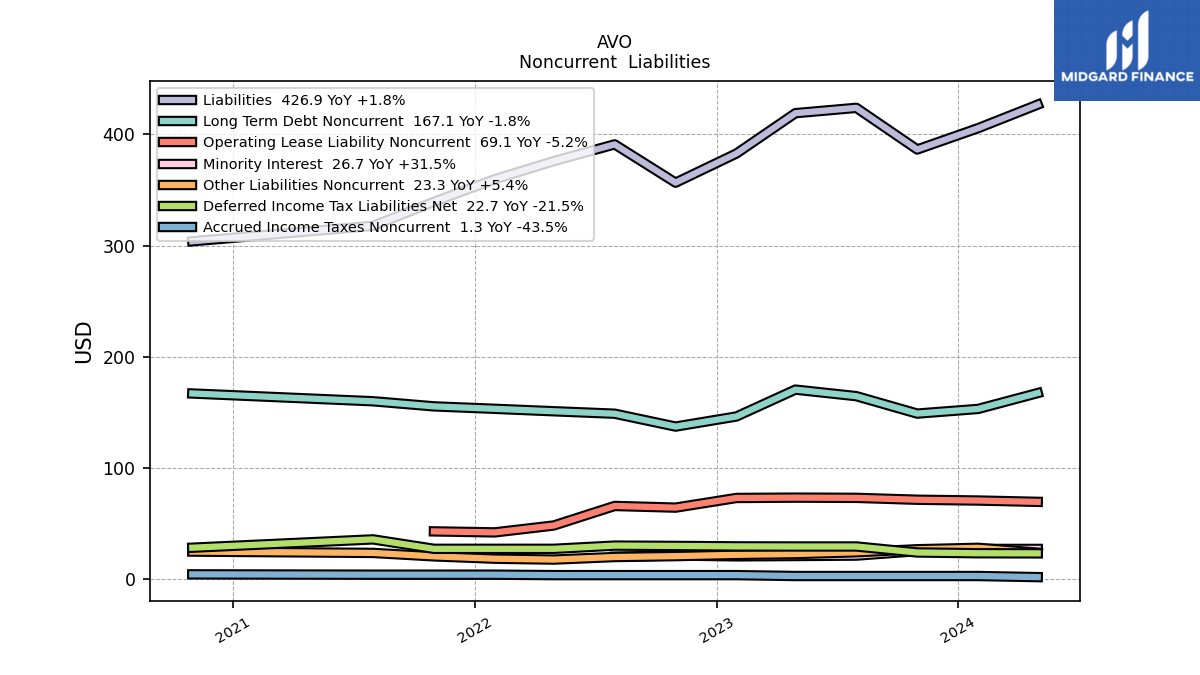
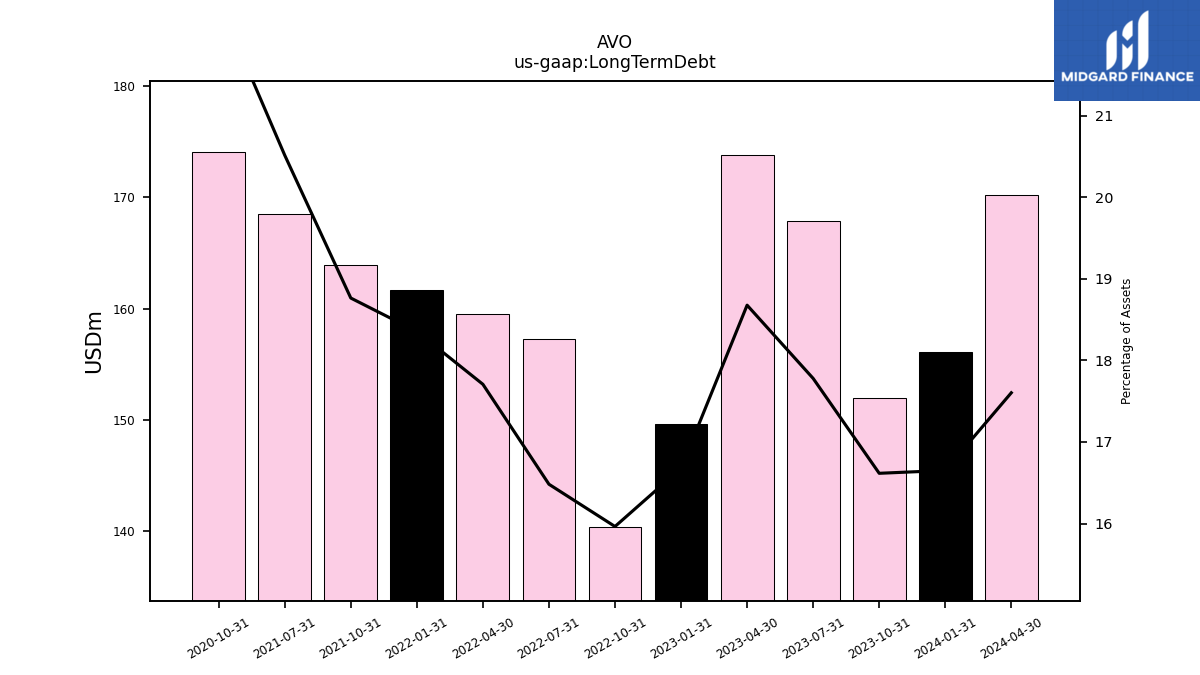
| Long Term Debt | 156.10 | 152.00 | 167.90 | 173.80 | 149.60 | 140.40 | 157.30 | 159.50 | 161.70 | 163.90 | 168.50 | NA | NA | 174.10 | NA | |
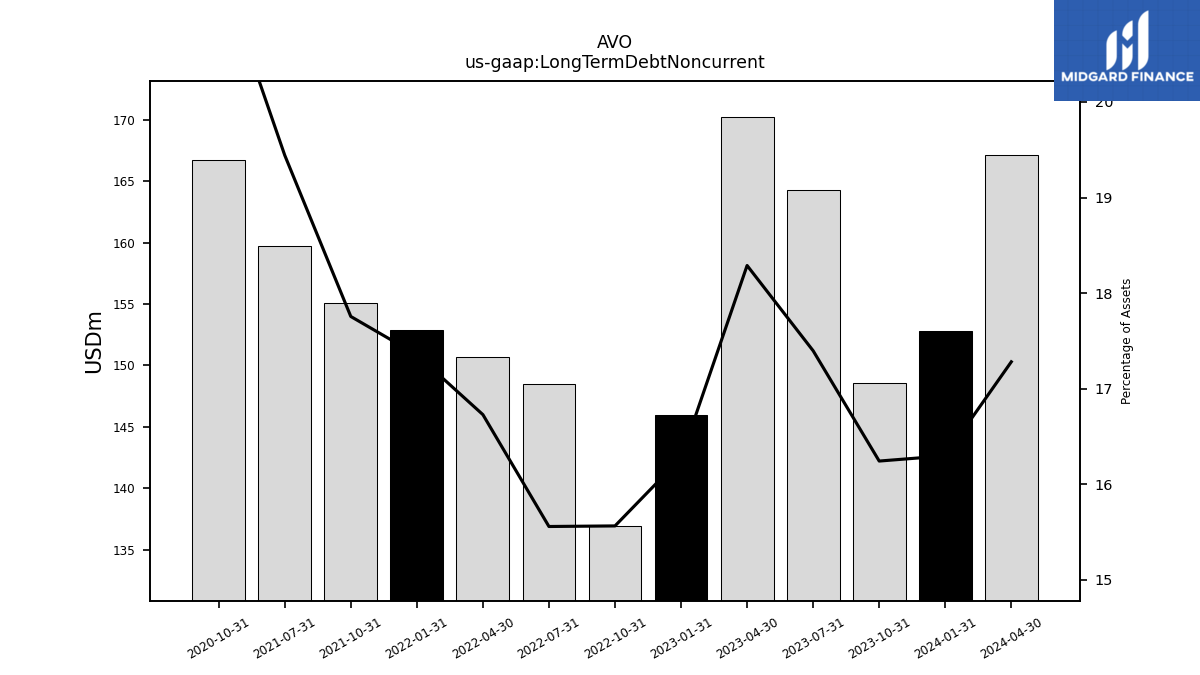
| Long Term Debt Noncurrent | 152.80 | 148.60 | 164.30 | 170.20 | 146.00 | 136.90 | 148.50 | 150.70 | 152.90 | 155.10 | 159.70 | NA | NA | 166.70 | NA | |
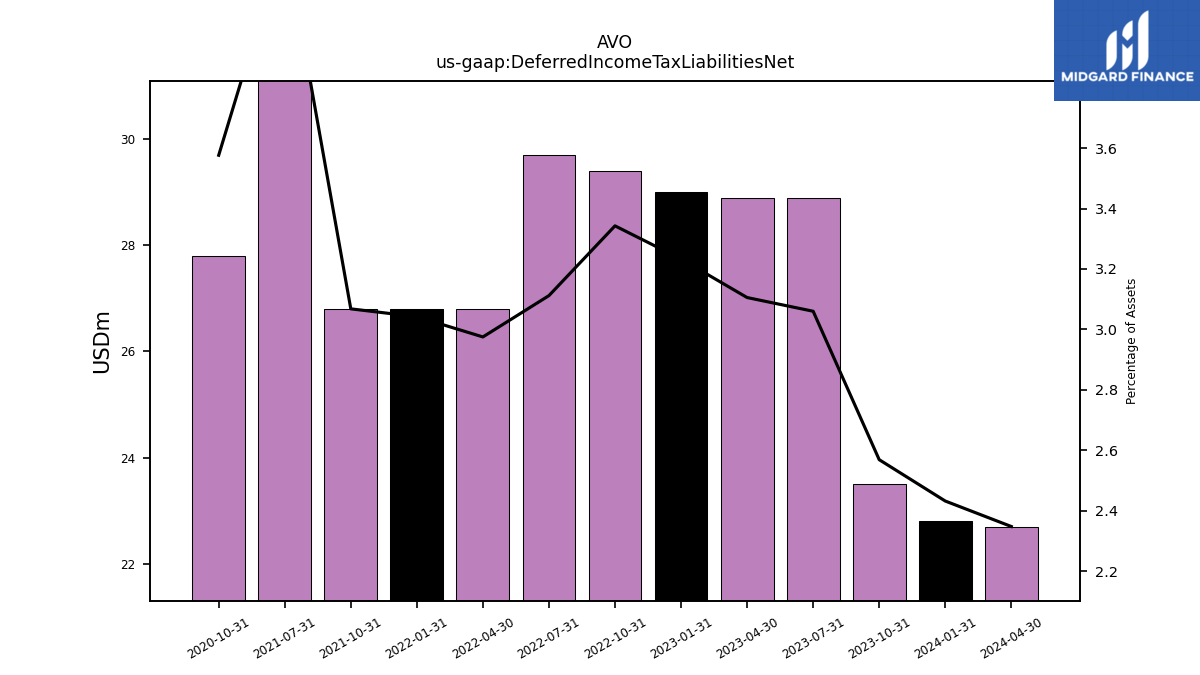
| Deferred Income Tax Liabilities Net | 22.80 | 23.50 | 28.90 | 28.90 | 29.00 | 29.40 | 29.70 | 26.80 | 26.80 | 26.80 | 35.30 | NA | NA | 27.80 | NA | |
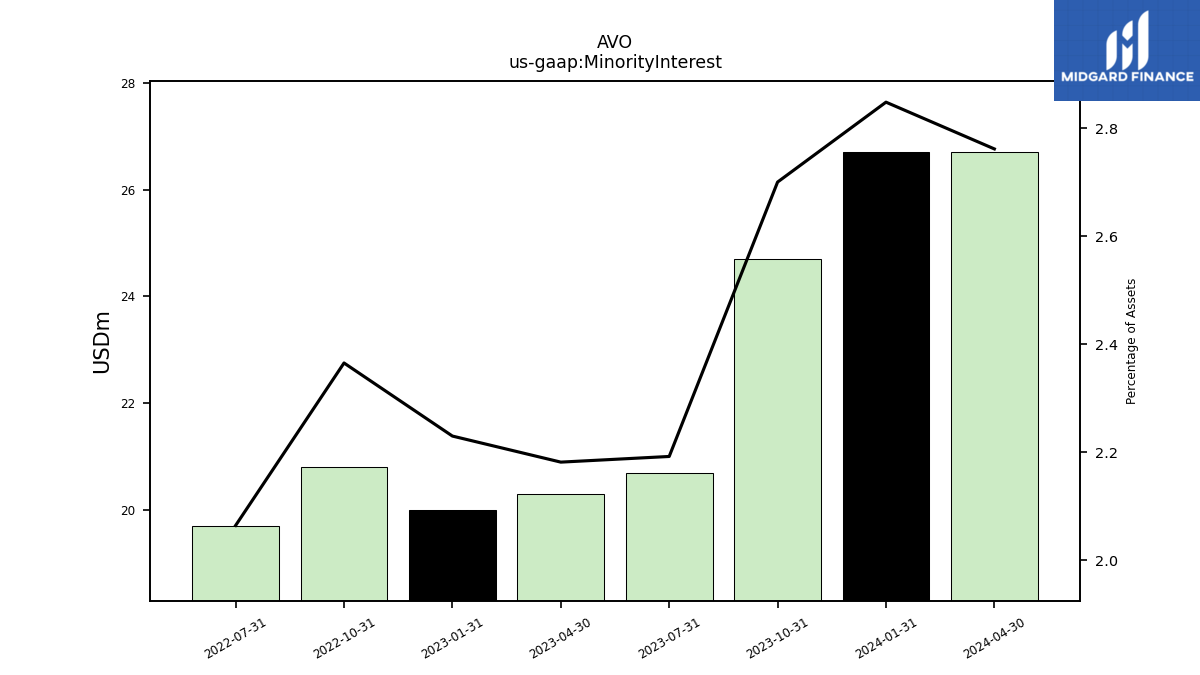
| Minority Interest | 26.70 | 24.70 | 20.70 | 20.30 | 20.00 | 20.80 | 19.70 | NA | NA | NA | NA | NA | NA | NA | NA | |
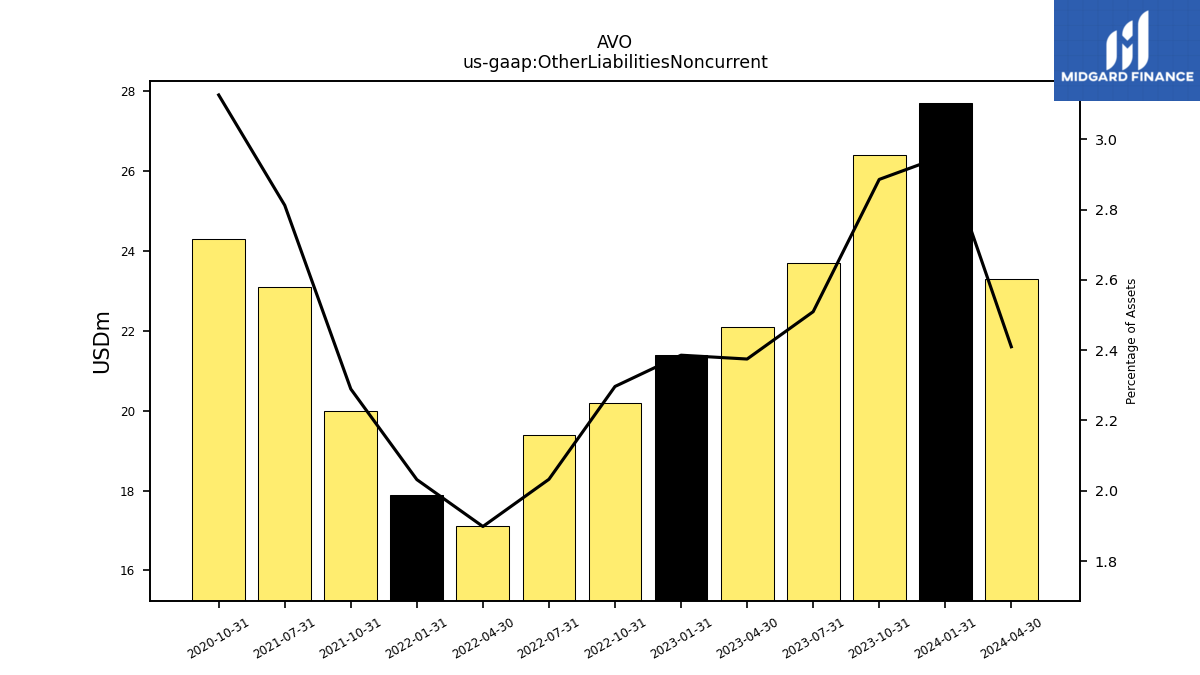
| Other Liabilities Noncurrent | 27.70 | 26.40 | 23.70 | 22.10 | 21.40 | 20.20 | 19.40 | 17.10 | 17.90 | 20.00 | 23.10 | NA | NA | 24.30 | NA | |
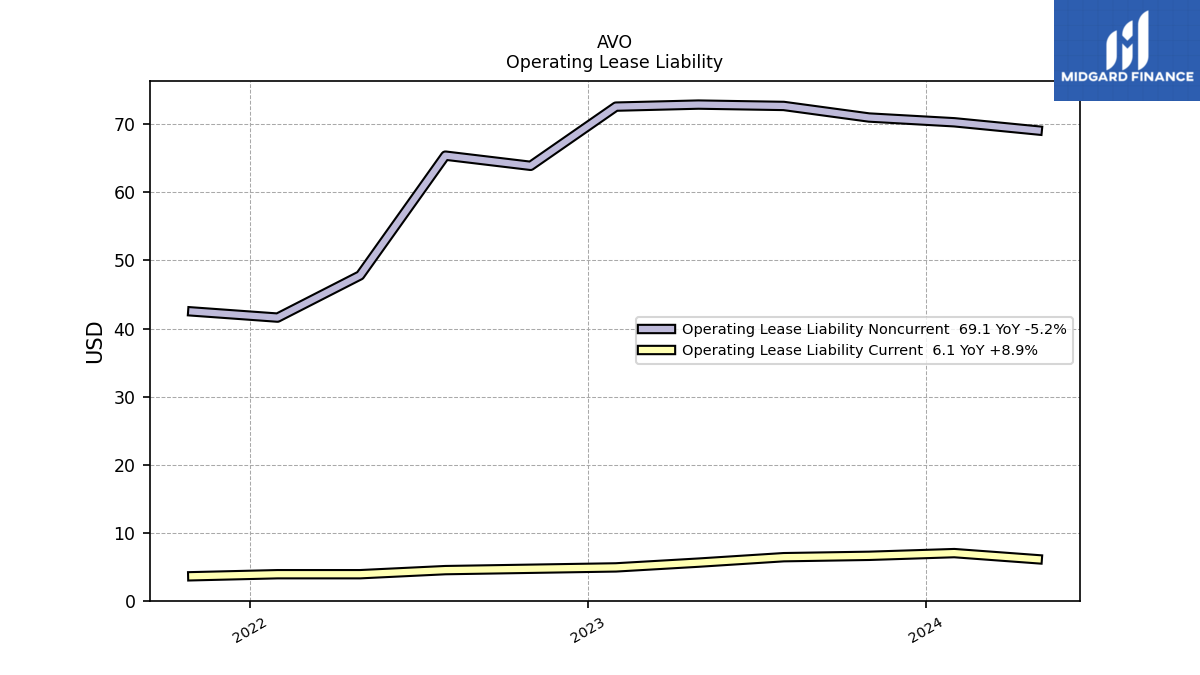
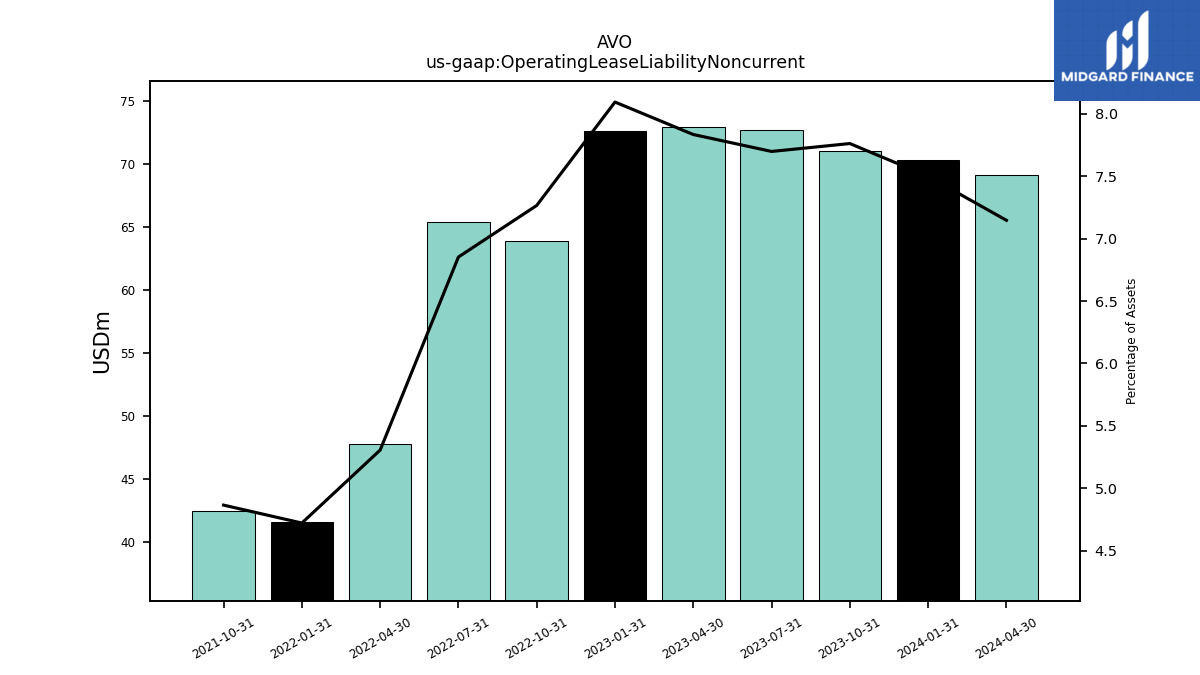
| Operating Lease Liability Noncurrent | 70.30 | 71.00 | 72.70 | 72.90 | 72.60 | 63.90 | 65.40 | 47.80 | 41.60 | 42.50 | NA | NA | NA | NA | NA |
| 2024-01-31 | 2023-10-31 | 2023-07-31 | 2023-04-30 | 2023-01-31 | 2022-10-31 | 2022-07-31 | 2022-04-30 | 2022-01-31 | 2021-10-31 | 2021-07-31 | 2021-04-30 | 2021-01-31 | 2020-10-31 | 2020-07-31 | ||
|---|---|---|---|---|---|---|---|---|---|---|---|---|---|---|---|---|
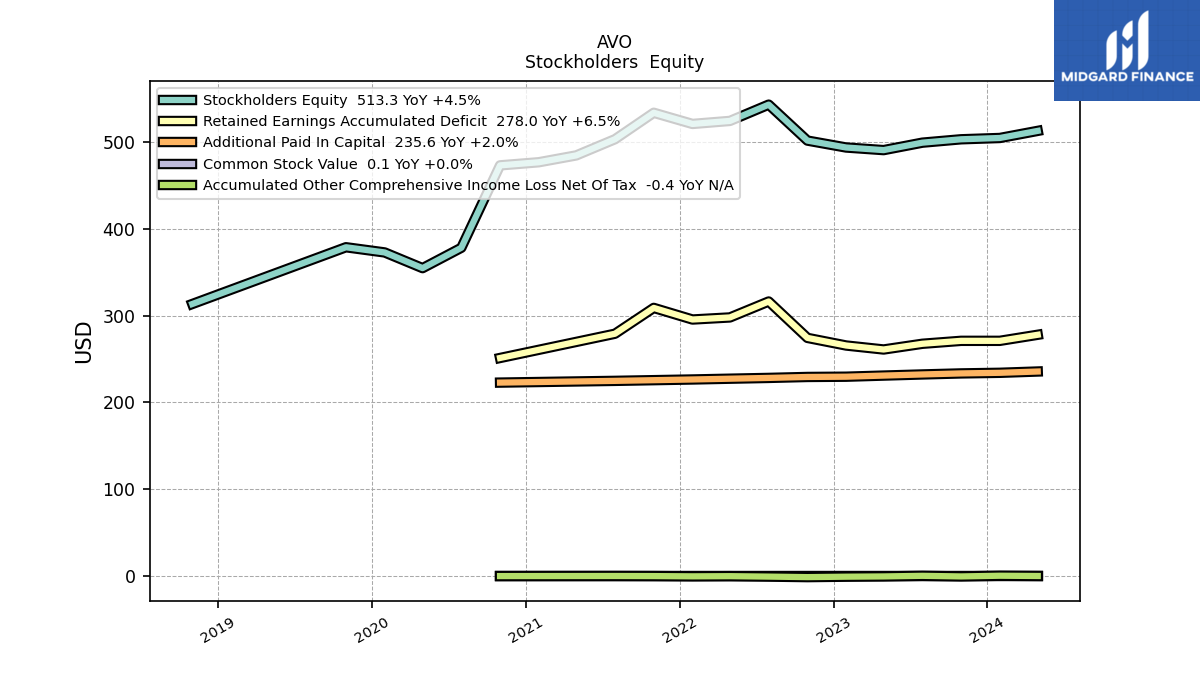
| Stockholders Equity | 505.10 | 503.60 | 499.70 | 491.10 | 494.10 | 502.10 | 543.60 | 524.80 | 521.30 | 534.20 | 503.70 | 485.00 | 477.10 | 473.50 | 378.40 | |
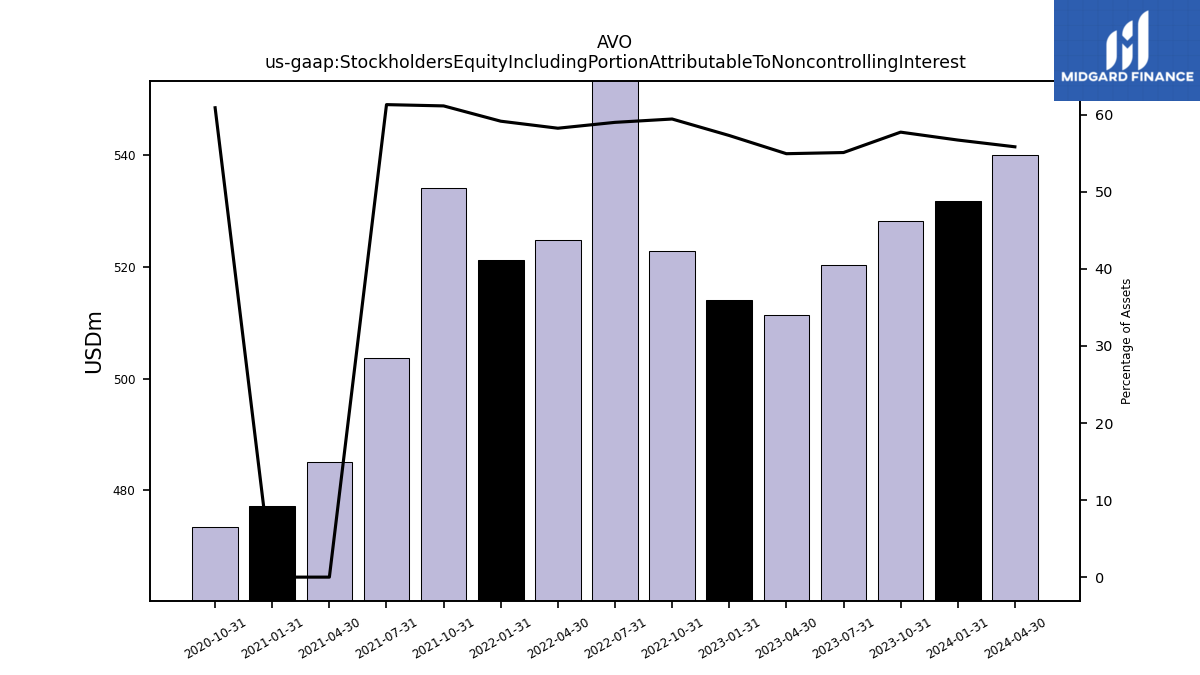
| Stockholders Equity Including Portion Attributable To Noncontrolling Interest | 531.80 | 528.30 | 520.40 | 511.40 | 514.10 | 522.90 | 563.30 | 524.80 | 521.30 | 534.20 | 503.70 | 485.00 | 477.10 | 473.50 | NA | |
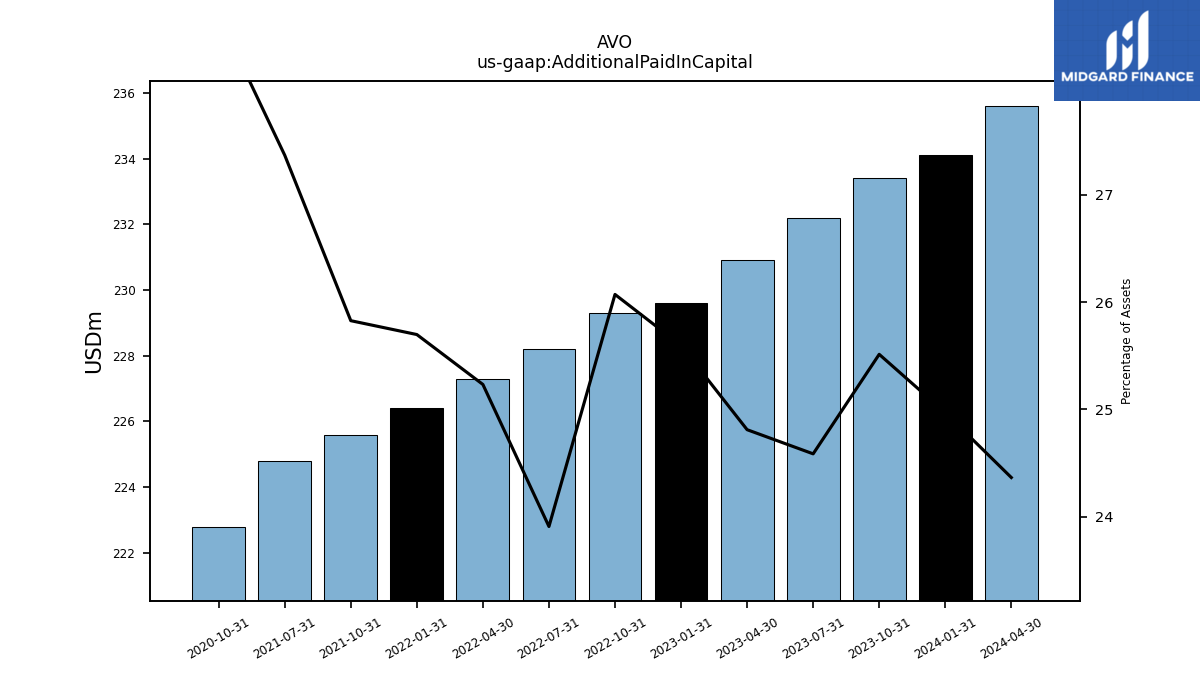
| Additional Paid In Capital | 234.10 | 233.40 | 232.20 | 230.90 | 229.60 | 229.30 | 228.20 | 227.30 | 226.40 | 225.60 | 224.80 | NA | NA | 222.80 | NA | |
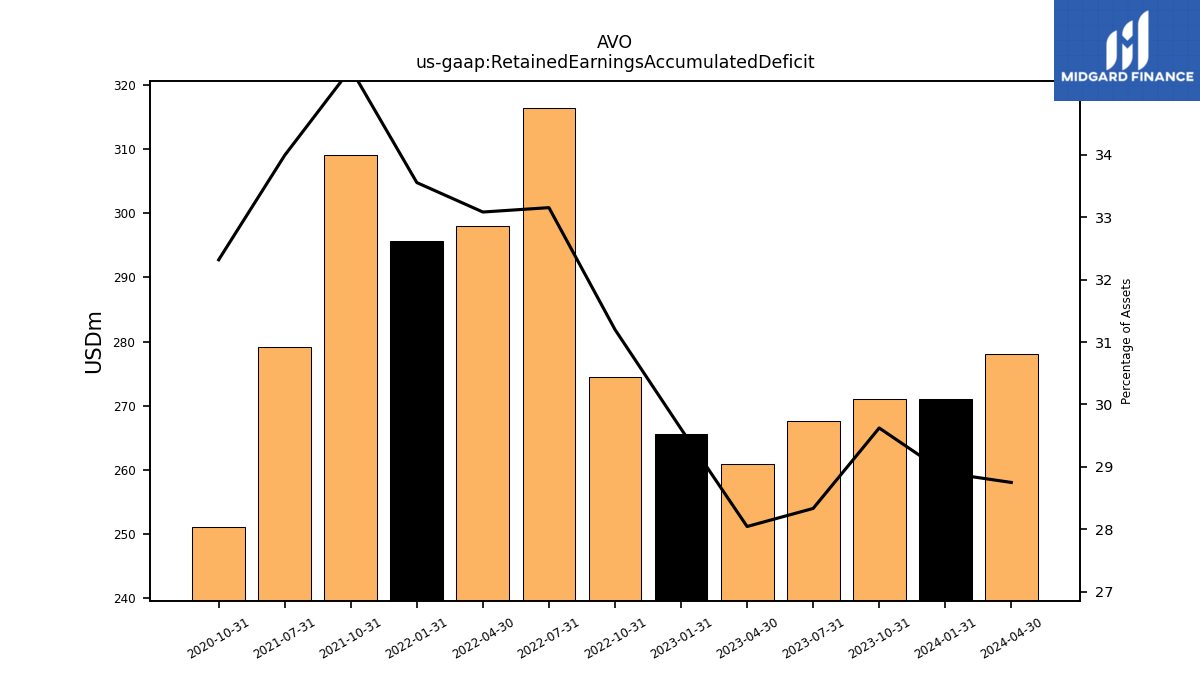
| Retained Earnings Accumulated Deficit | 271.00 | 271.00 | 267.60 | 261.00 | 265.60 | 274.40 | 316.40 | 298.00 | 295.60 | 309.00 | 279.20 | NA | NA | 251.20 | NA | |
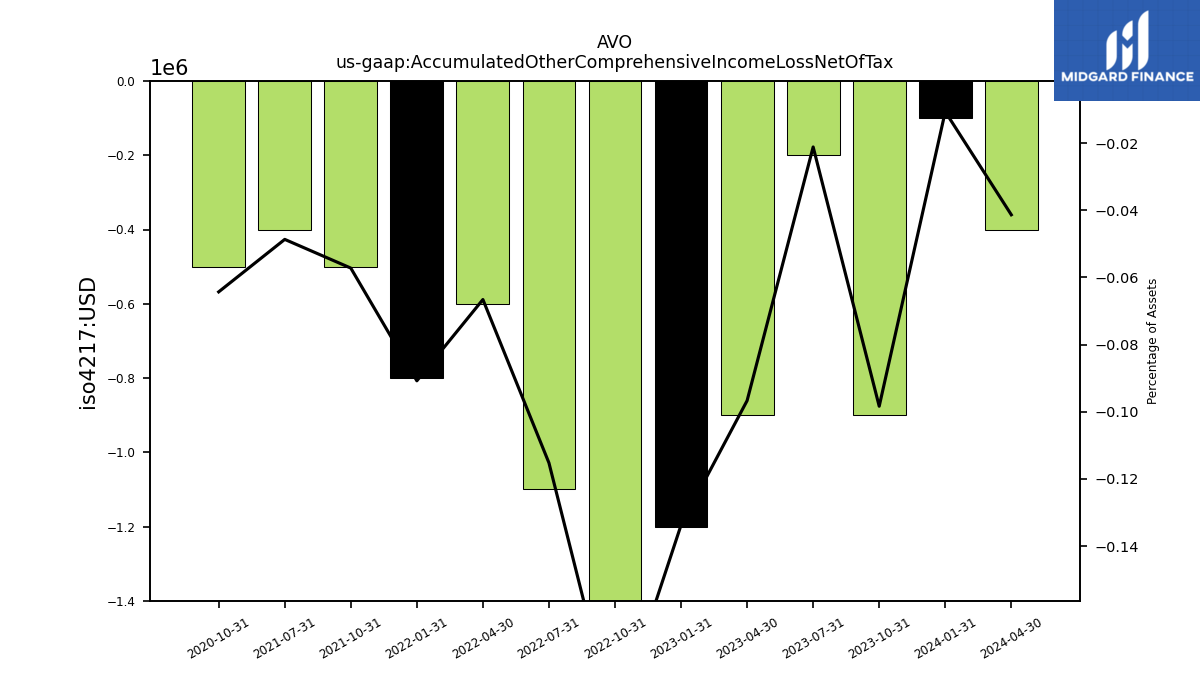
| Accumulated Other Comprehensive Income Loss Net Of Tax | -0.10 | -0.90 | -0.20 | -0.90 | -1.20 | -1.70 | -1.10 | -0.60 | -0.80 | -0.50 | -0.40 | NA | NA | -0.50 | NA | |
| Minority Interest | 26.70 | 24.70 | 20.70 | 20.30 | 20.00 | 20.80 | 19.70 | NA | NA | NA | NA | NA | NA | NA | NA | |
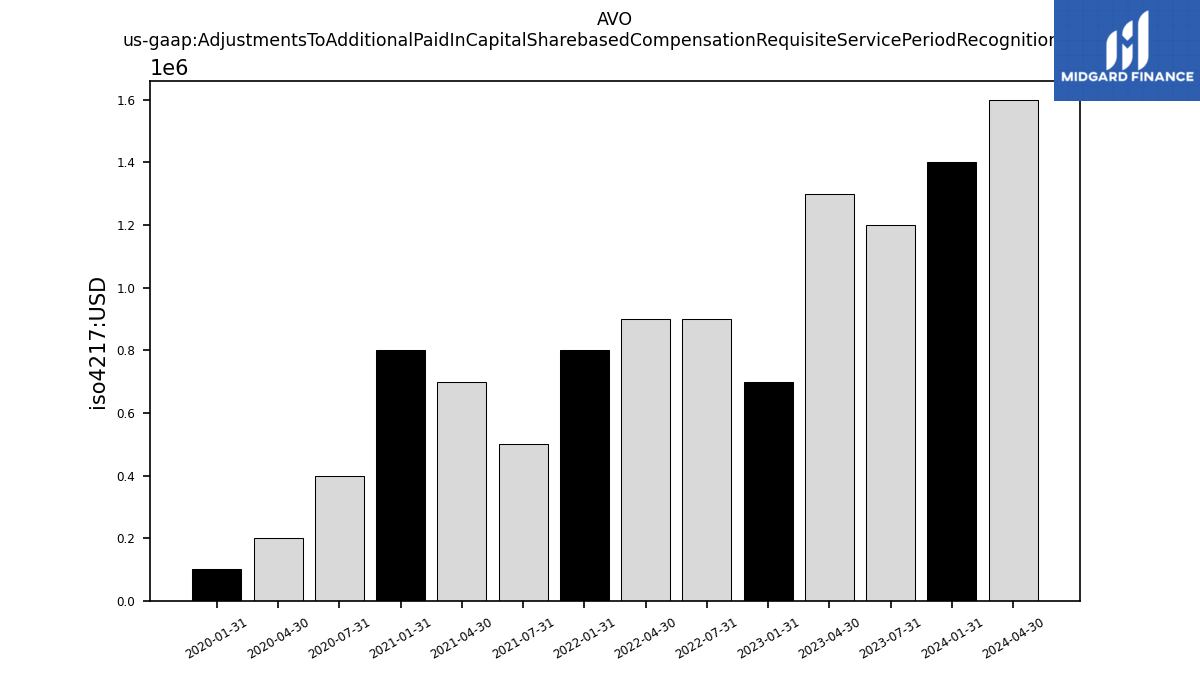
| Adjustments To Additional Paid In Capital Sharebased Compensation Requisite Service Period Recognition Value | 1.40 | NA | 1.20 | 1.30 | 0.70 | NA | 0.90 | 0.90 | 0.80 | NA | 0.50 | 0.70 | 0.80 | NA | 0.40 |
| 2024-01-31 | 2023-10-31 | 2023-07-31 | 2023-04-30 | 2023-01-31 | 2022-10-31 | 2022-07-31 | 2022-04-30 | 2022-01-31 | 2021-10-31 | 2021-07-31 | 2021-04-30 | 2021-01-31 | 2020-10-31 | 2020-07-31 | ||
|---|---|---|---|---|---|---|---|---|---|---|---|---|---|---|---|---|
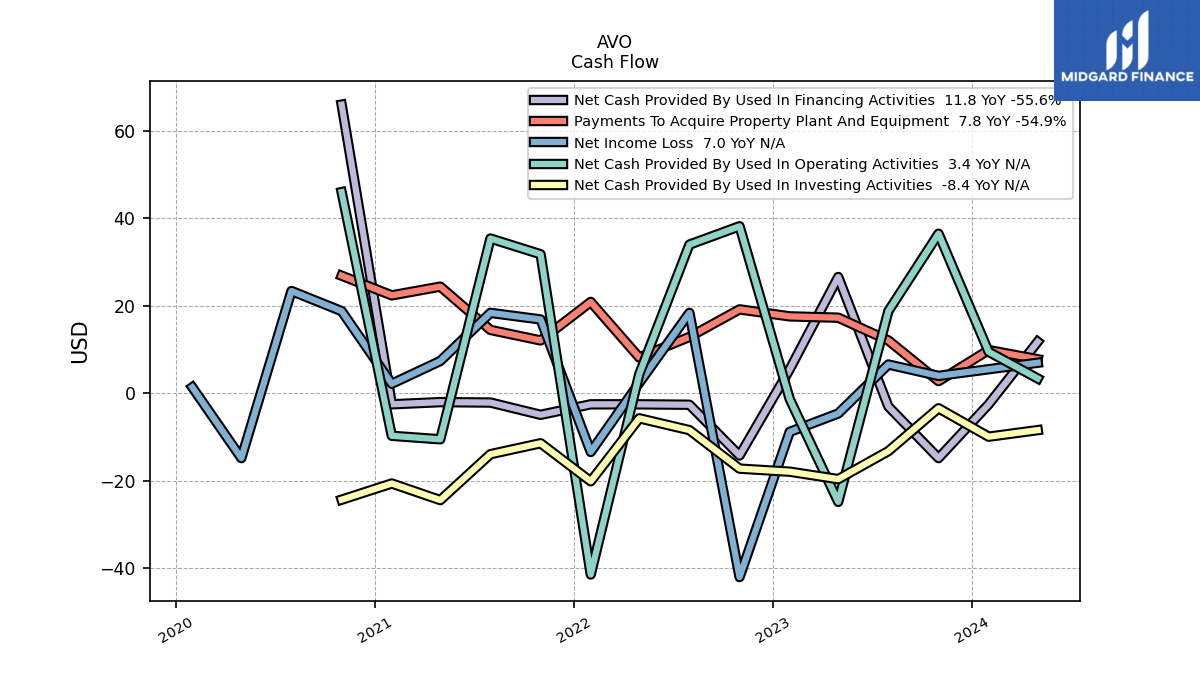
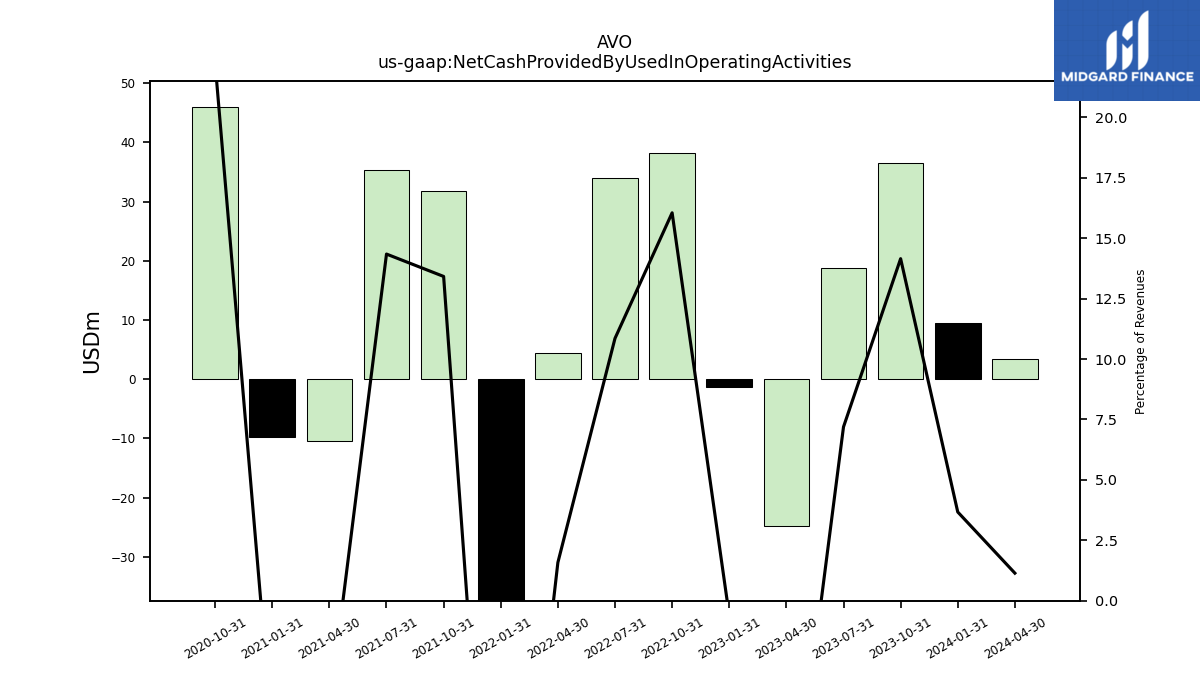
| Net Cash Provided By Used In Operating Activities | 9.50 | 36.50 | 18.80 | -24.80 | -1.30 | 38.20 | 34.00 | 4.40 | -41.40 | 31.80 | 35.40 | -10.50 | -9.70 | 46.00 | NA | |
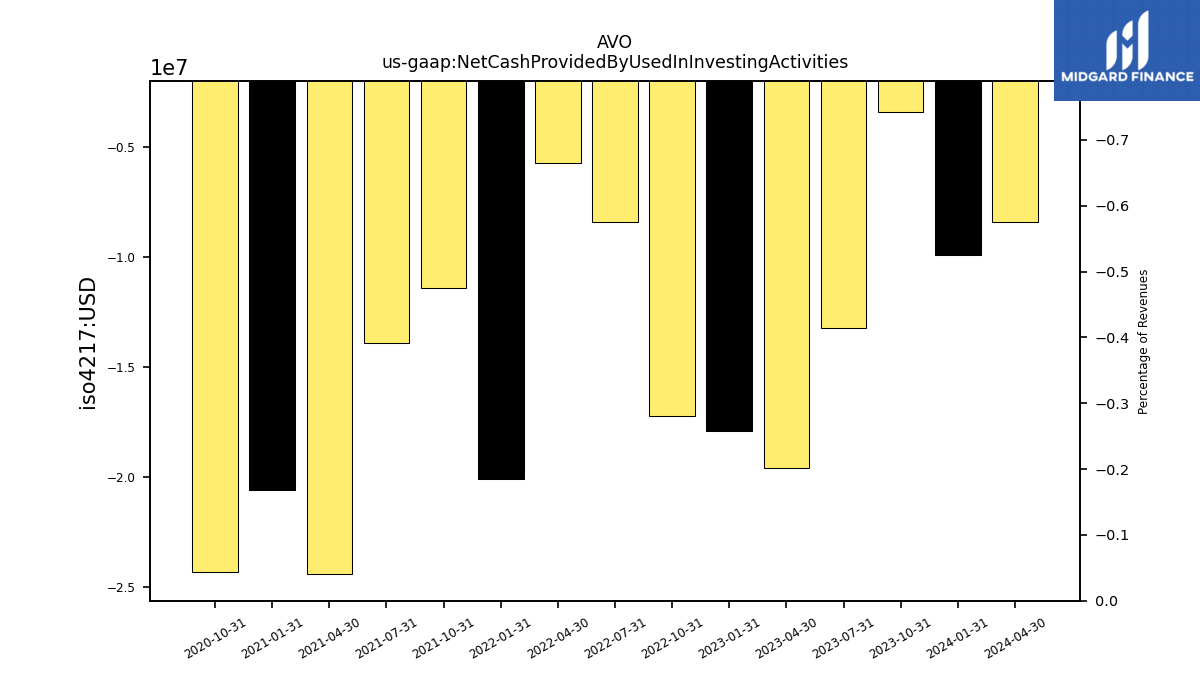
| Net Cash Provided By Used In Investing Activities | -9.90 | -3.40 | -13.20 | -19.60 | -17.90 | -17.20 | -8.40 | -5.70 | -20.10 | -11.40 | -13.90 | -24.40 | -20.60 | -24.30 | NA | |
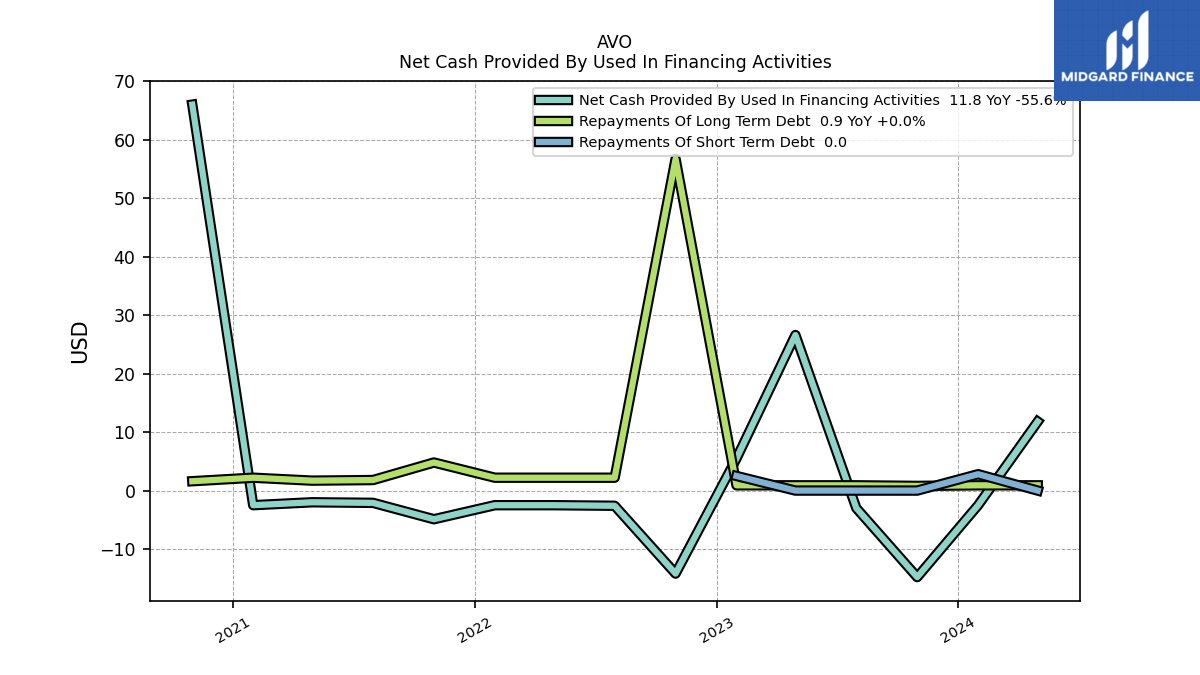
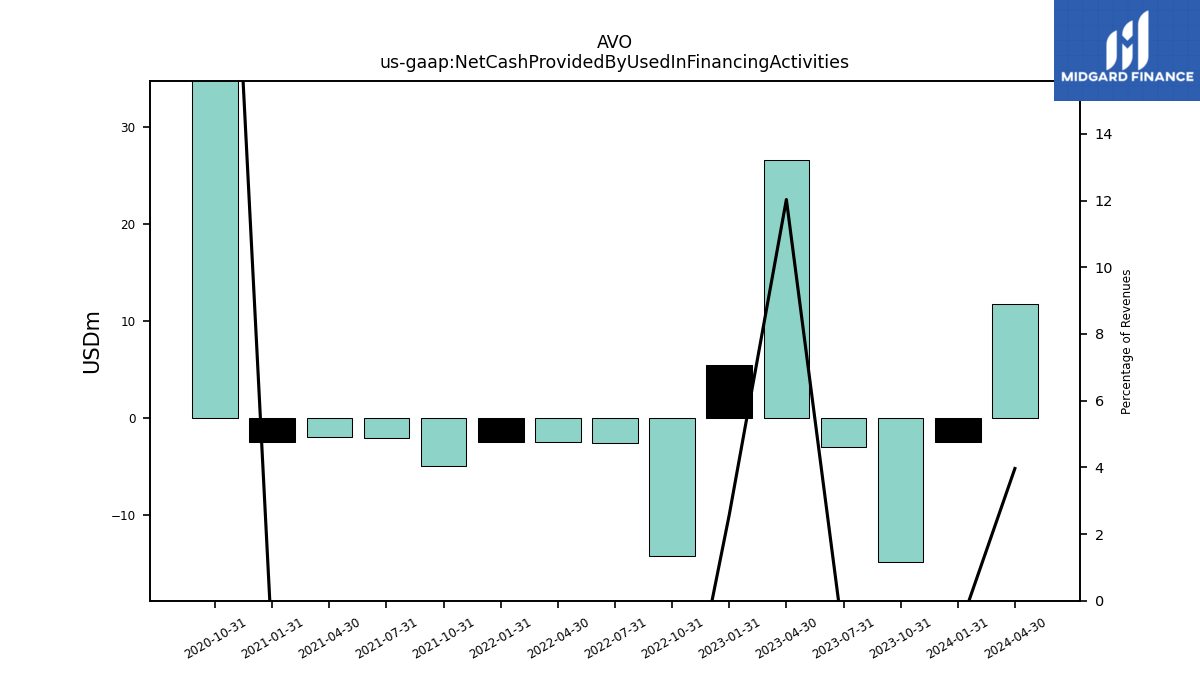
| Net Cash Provided By Used In Financing Activities | -2.50 | -14.80 | -3.00 | 26.60 | 5.50 | -14.20 | -2.60 | -2.50 | -2.50 | -4.90 | -2.10 | -2.00 | -2.50 | 66.00 | NA |
| 2024-01-31 | 2023-10-31 | 2023-07-31 | 2023-04-30 | 2023-01-31 | 2022-10-31 | 2022-07-31 | 2022-04-30 | 2022-01-31 | 2021-10-31 | 2021-07-31 | 2021-04-30 | 2021-01-31 | 2020-10-31 | 2020-07-31 | ||
|---|---|---|---|---|---|---|---|---|---|---|---|---|---|---|---|---|
| Net Cash Provided By Used In Operating Activities | 9.50 | 36.50 | 18.80 | -24.80 | -1.30 | 38.20 | 34.00 | 4.40 | -41.40 | 31.80 | 35.40 | -10.50 | -9.70 | 46.00 | NA | |
| Profit Loss | 2.00 | 6.00 | 6.20 | -4.70 | -10.60 | -41.80 | 17.90 | 2.40 | -13.40 | 16.90 | 18.40 | 7.40 | 2.20 | NA | NA | |
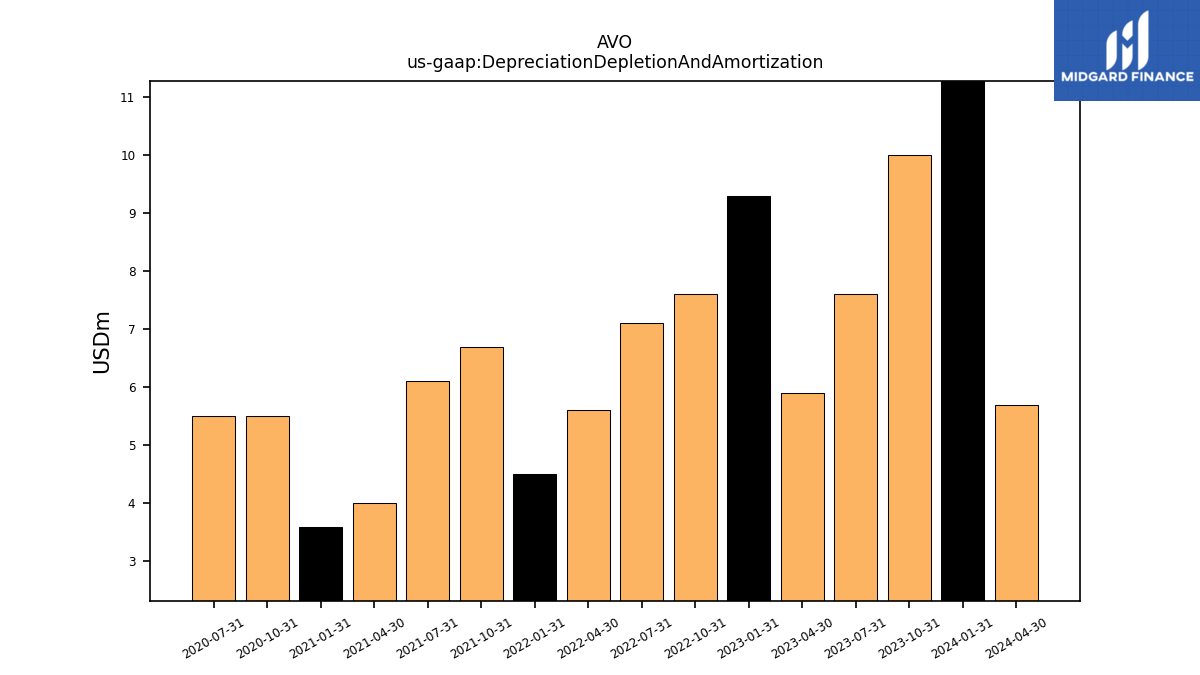
| Depreciation Depletion And Amortization | 12.90 | 10.00 | 7.60 | 5.90 | 9.30 | 7.60 | 7.10 | 5.60 | 4.50 | 6.70 | 6.10 | 4.00 | 3.60 | 5.50 | 5.50 | |
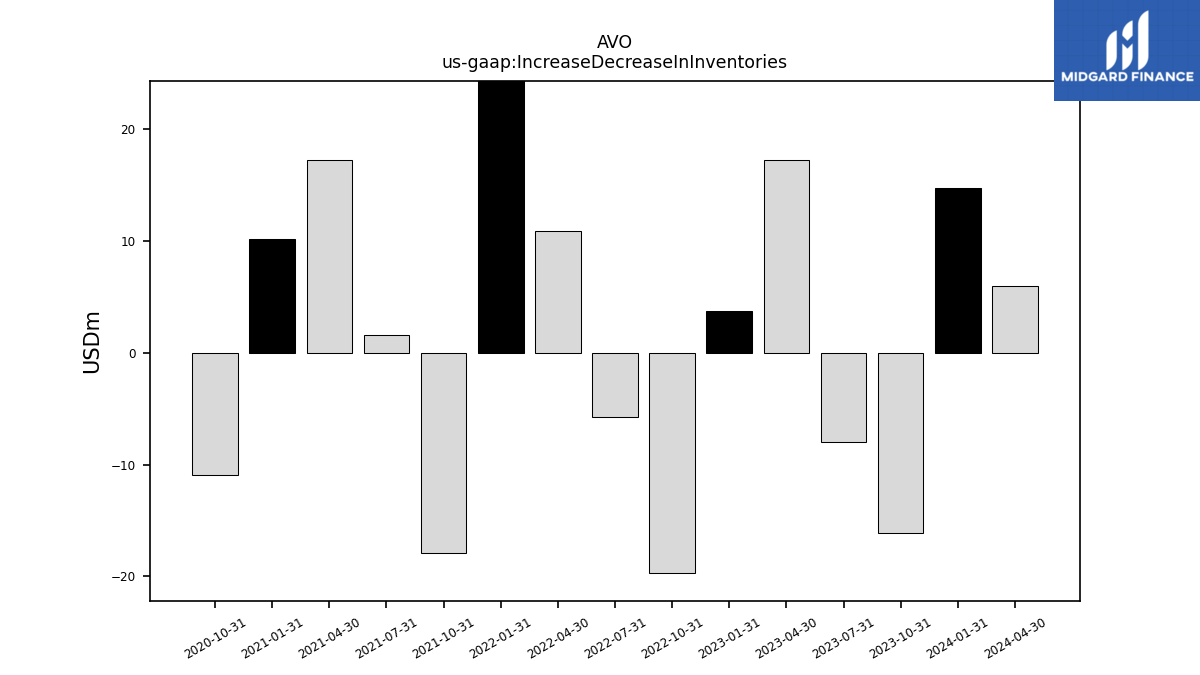
| Increase Decrease In Inventories | 14.80 | -16.10 | -8.00 | 17.30 | 3.80 | -19.70 | -5.70 | 10.90 | 29.80 | -17.90 | 1.60 | 17.30 | 10.20 | -10.90 | NA | |
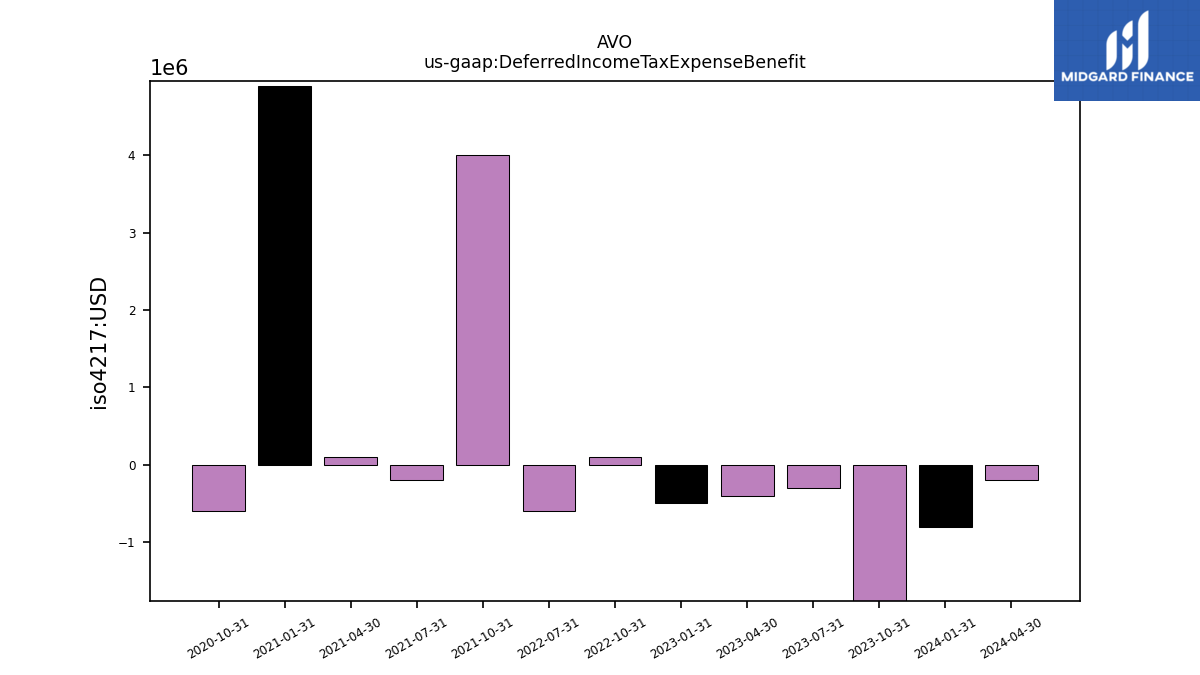
| Deferred Income Tax Expense Benefit | -0.80 | -5.20 | -0.30 | -0.40 | -0.50 | 0.10 | -0.60 | NA | NA | 4.00 | -0.20 | 0.10 | 4.90 | -0.60 | NA | |
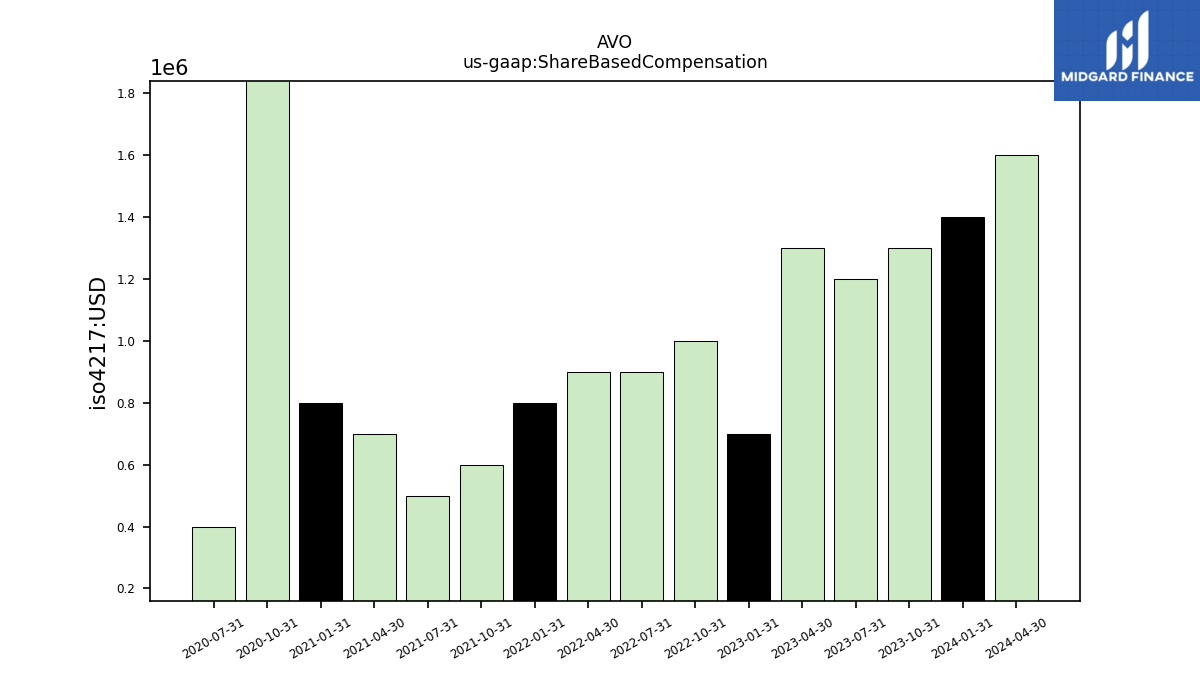
| Share Based Compensation | 1.40 | 1.30 | 1.20 | 1.30 | 0.70 | 1.00 | 0.90 | 0.90 | 0.80 | 0.60 | 0.50 | 0.70 | 0.80 | 3.90 | 0.40 | |
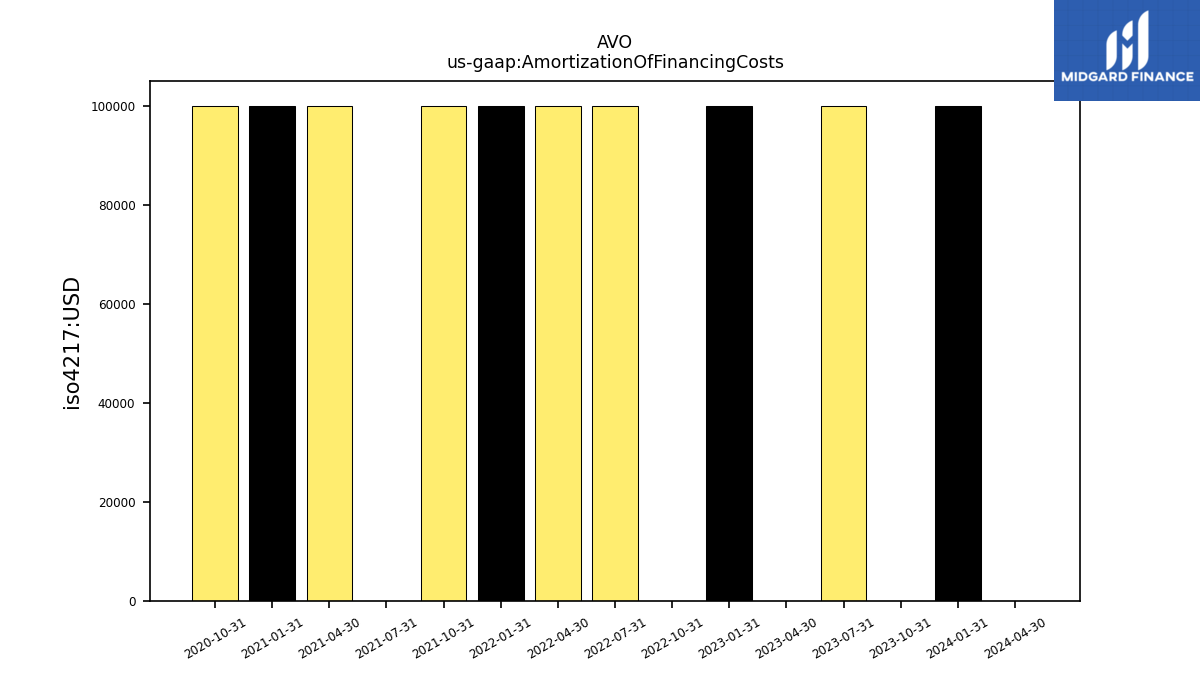
| Amortization Of Financing Costs | 0.10 | 0.00 | 0.10 | 0.00 | 0.10 | 0.00 | 0.10 | 0.10 | 0.10 | 0.10 | 0.00 | 0.10 | 0.10 | 0.10 | NA |
| 2024-01-31 | 2023-10-31 | 2023-07-31 | 2023-04-30 | 2023-01-31 | 2022-10-31 | 2022-07-31 | 2022-04-30 | 2022-01-31 | 2021-10-31 | 2021-07-31 | 2021-04-30 | 2021-01-31 | 2020-10-31 | 2020-07-31 | ||
|---|---|---|---|---|---|---|---|---|---|---|---|---|---|---|---|---|
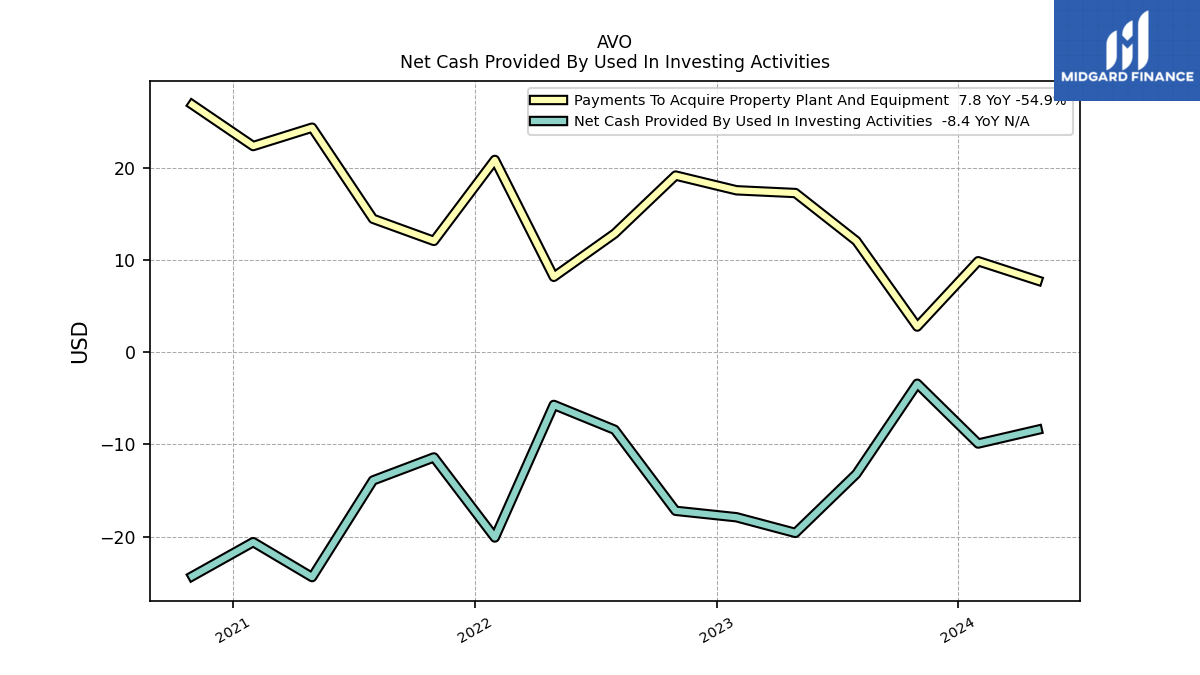
| Net Cash Provided By Used In Investing Activities | -9.90 | -3.40 | -13.20 | -19.60 | -17.90 | -17.20 | -8.40 | -5.70 | -20.10 | -11.40 | -13.90 | -24.40 | -20.60 | -24.30 | NA | |
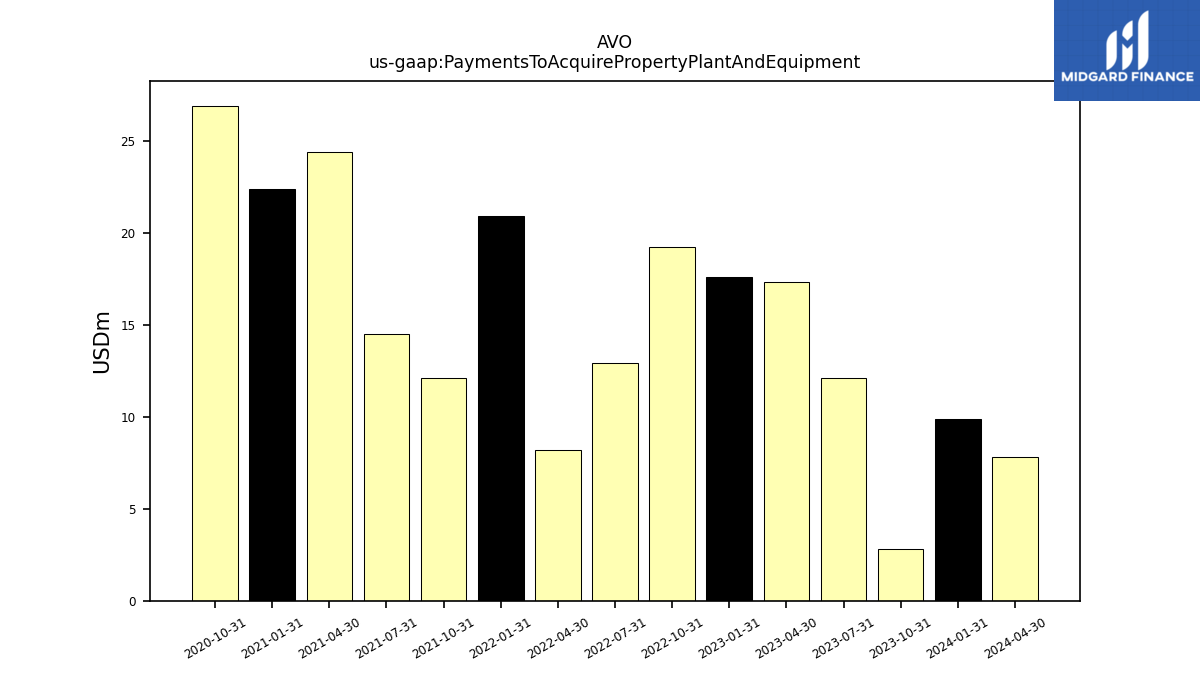
| Payments To Acquire Property Plant And Equipment | 9.90 | 2.80 | 12.10 | 17.30 | 17.60 | 19.20 | 12.90 | 8.20 | 20.90 | 12.10 | 14.50 | 24.40 | 22.40 | 26.90 | NA |
| 2024-01-31 | 2023-10-31 | 2023-07-31 | 2023-04-30 | 2023-01-31 | 2022-10-31 | 2022-07-31 | 2022-04-30 | 2022-01-31 | 2021-10-31 | 2021-07-31 | 2021-04-30 | 2021-01-31 | 2020-10-31 | 2020-07-31 | ||
|---|---|---|---|---|---|---|---|---|---|---|---|---|---|---|---|---|
| Net Cash Provided By Used In Financing Activities | -2.50 | -14.80 | -3.00 | 26.60 | 5.50 | -14.20 | -2.60 | -2.50 | -2.50 | -4.90 | -2.10 | -2.00 | -2.50 | 66.00 | NA |
| 2024-01-31 | 2023-10-31 | 2023-07-31 | 2023-04-30 | 2023-01-31 | 2022-10-31 | 2022-07-31 | 2022-04-30 | 2022-01-31 | 2021-10-31 | 2021-07-31 | 2021-04-30 | 2021-01-31 | 2020-10-31 | 2020-07-31 | ||
|---|---|---|---|---|---|---|---|---|---|---|---|---|---|---|---|---|
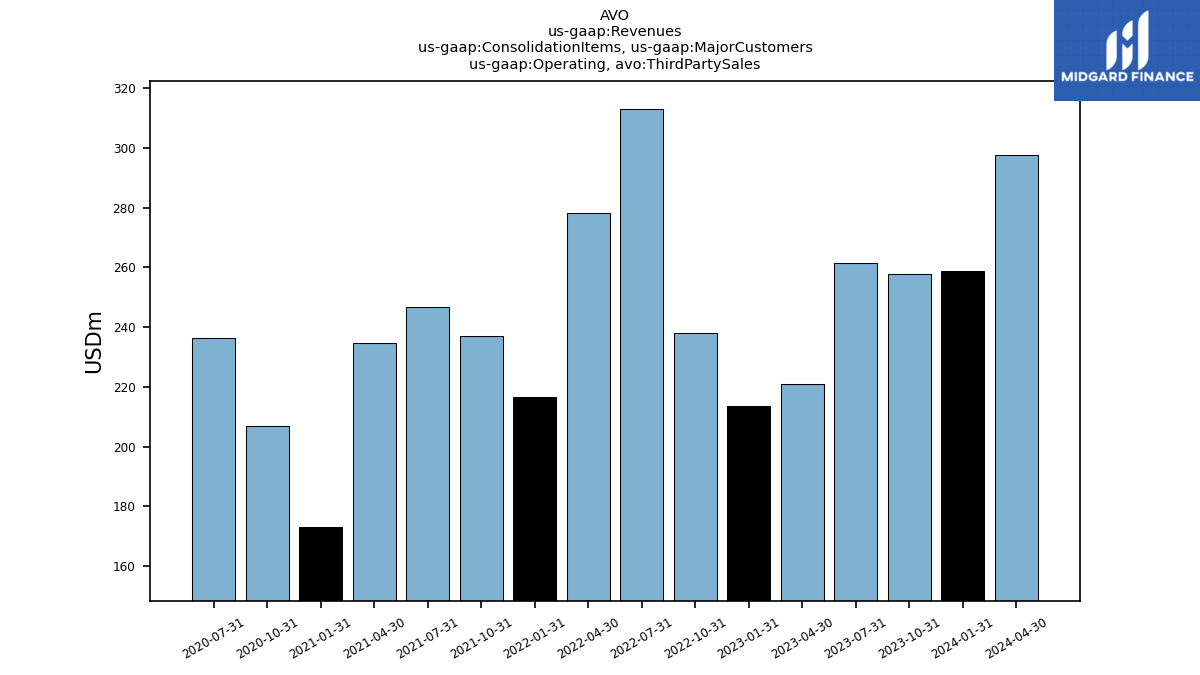
| Revenues | 258.70 | 257.90 | 261.40 | 221.10 | 213.50 | 238.00 | 313.20 | 278.10 | 216.60 | 237.00 | 246.80 | 234.70 | 173.20 | 206.80 | 236.40 | |
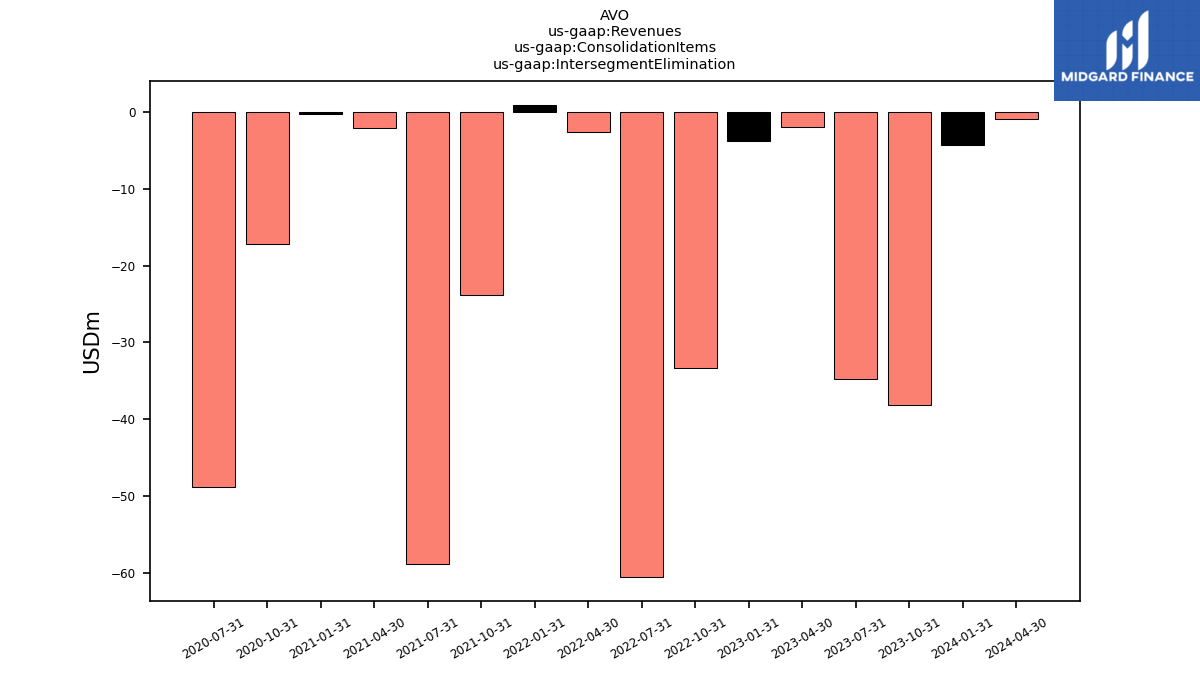
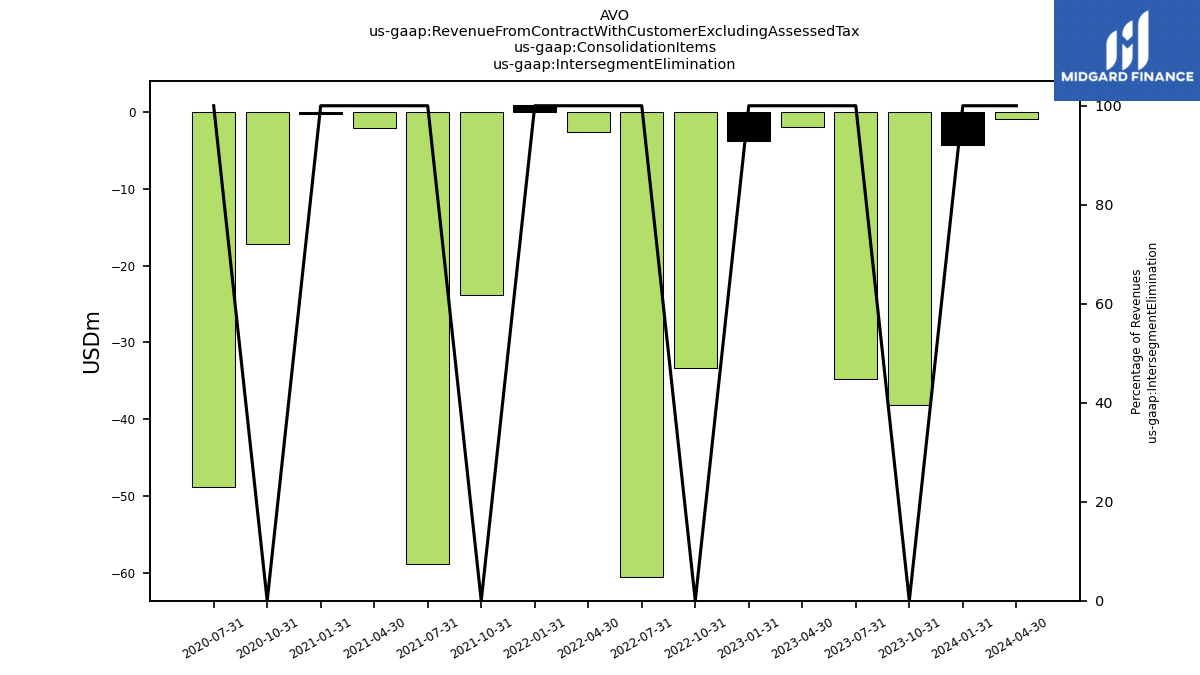
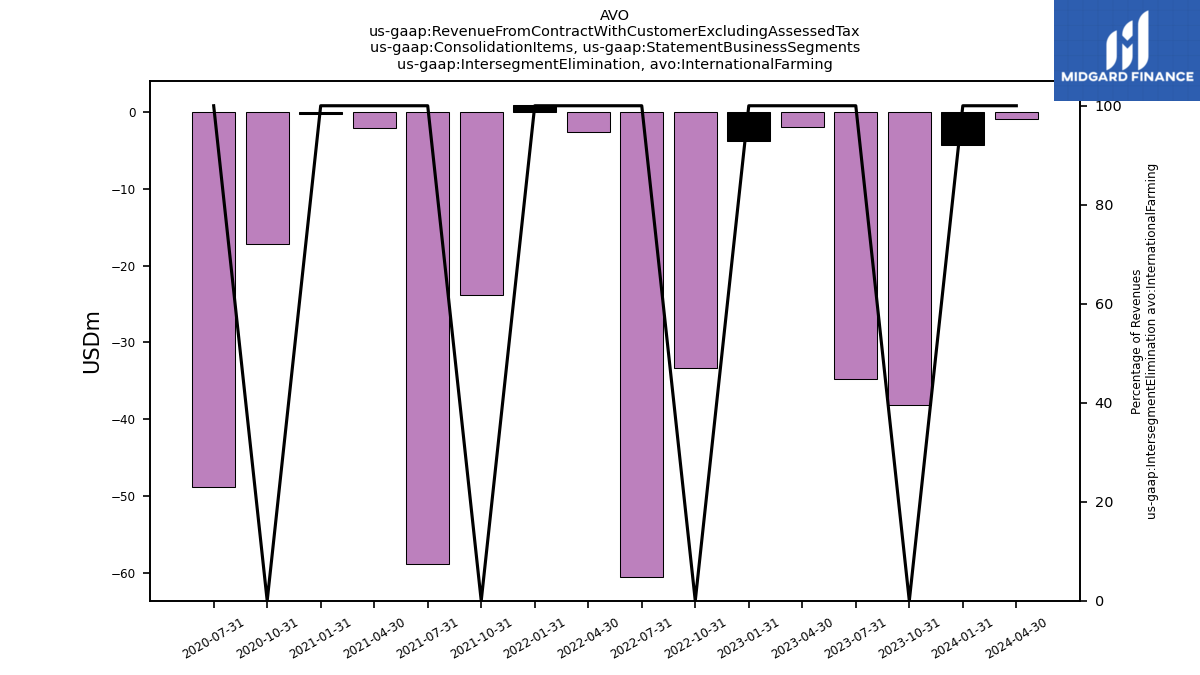
| Intersegment Elimination | -4.20 | -38.10 | -34.80 | -1.90 | -3.80 | -33.40 | -60.60 | -2.60 | 1.00 | -23.80 | -58.90 | -2.00 | -0.20 | -17.20 | -48.90 | |
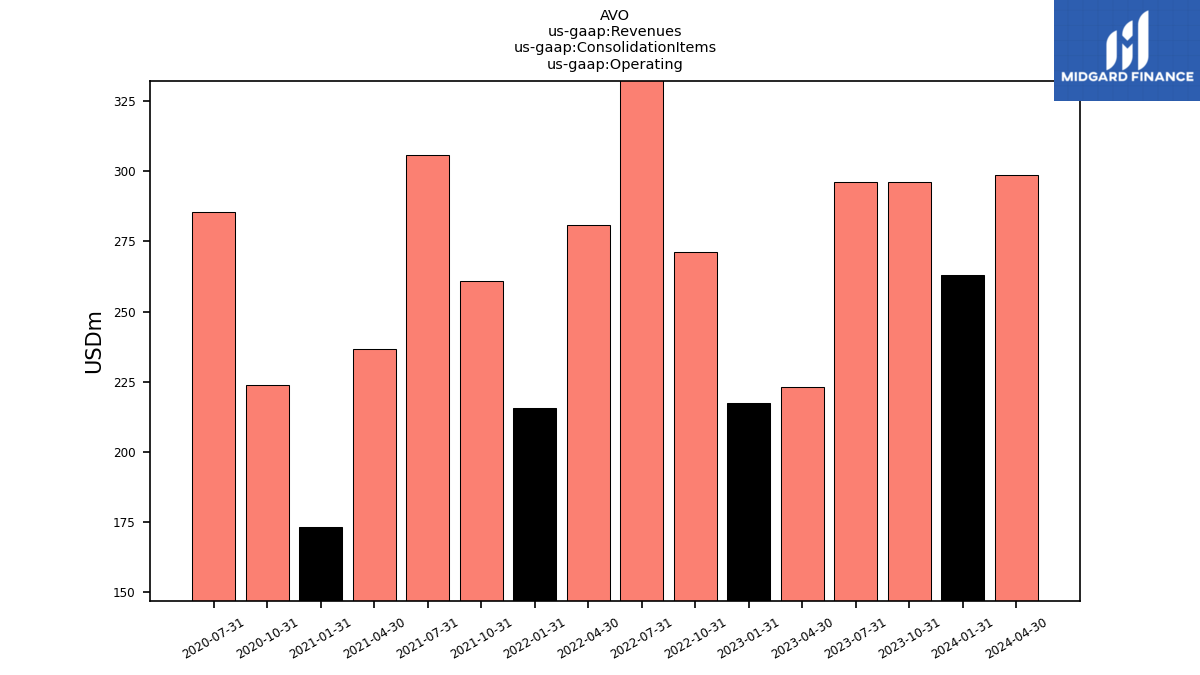
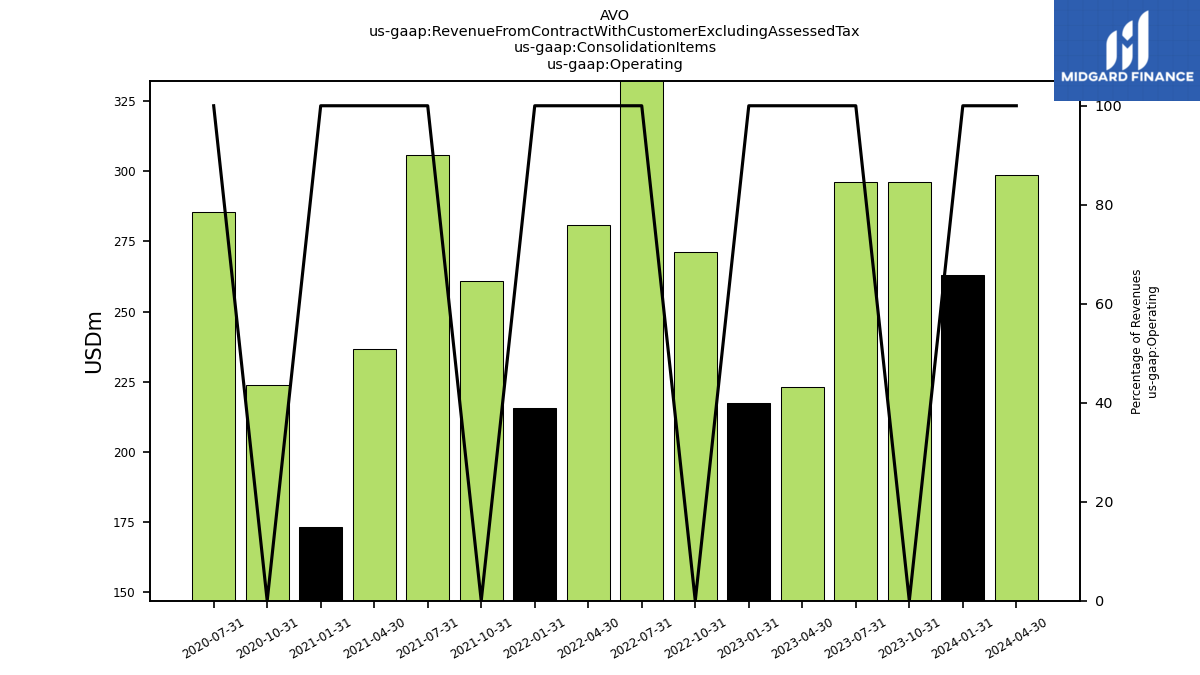
| Operating | 262.90 | 296.00 | 296.20 | 223.00 | 217.30 | 271.40 | 373.80 | 280.70 | 215.60 | 260.80 | 305.70 | 236.70 | 173.40 | 224.00 | 285.30 | |
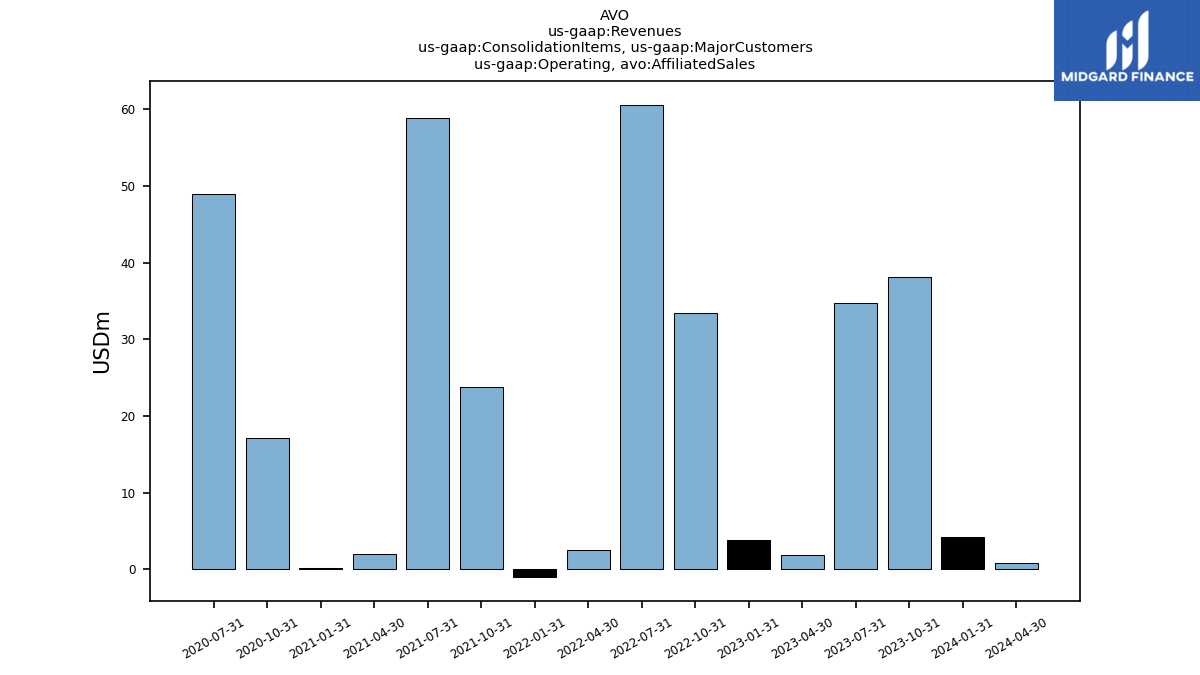
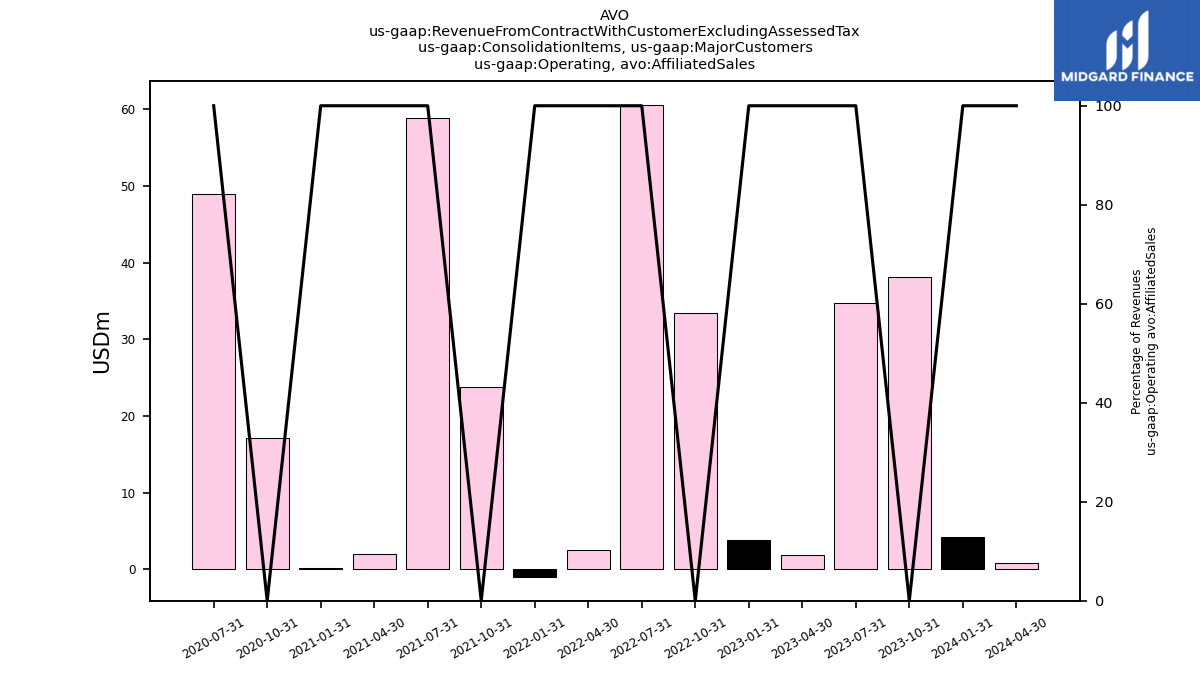
| Operating, Affiliated Sales | 4.20 | 38.10 | 34.80 | 1.90 | 3.80 | 33.40 | 60.60 | 2.60 | -1.00 | 23.80 | 58.90 | 2.00 | 0.20 | 17.20 | 48.90 | |
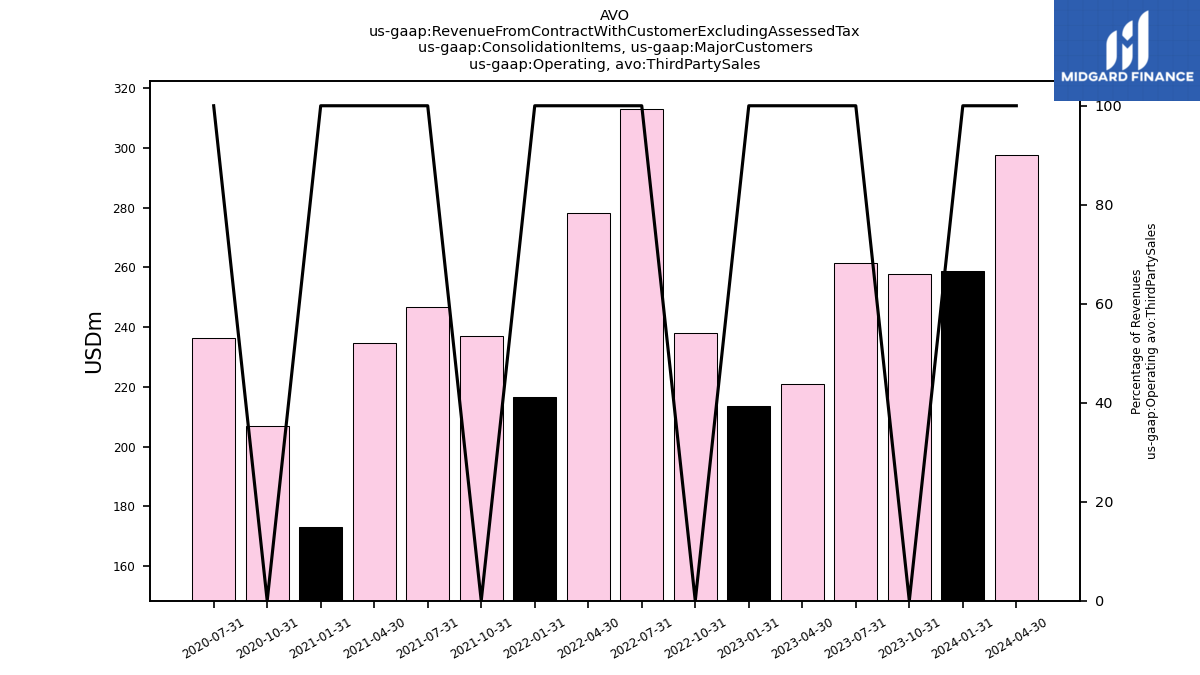
| Operating, Third Party Sales | 258.70 | 257.90 | 261.40 | 221.10 | 213.50 | 238.00 | 313.20 | 278.10 | 216.60 | 237.00 | 246.80 | 234.70 | 173.20 | 206.80 | 236.40 | |
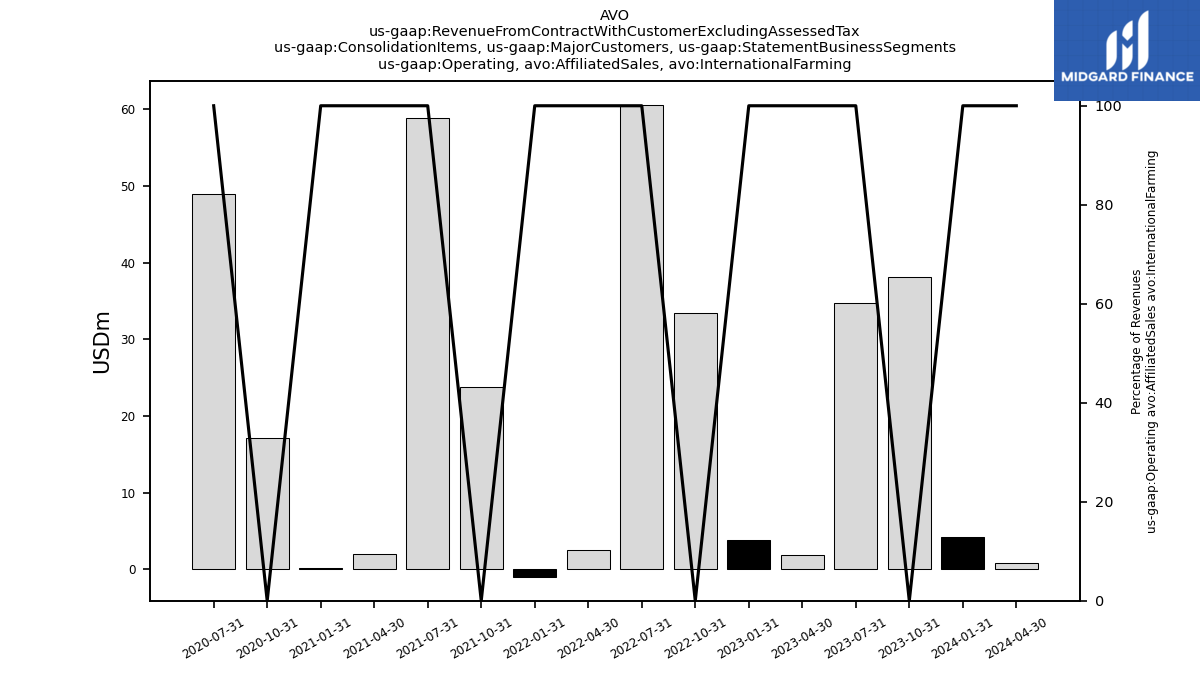
| Operating, Affiliated Sales, International Farming | 4.20 | 38.10 | 34.80 | 1.90 | 3.80 | 33.40 | 60.60 | 2.60 | -1.00 | 23.80 | 58.90 | 2.00 | 0.20 | 17.20 | 48.90 | |
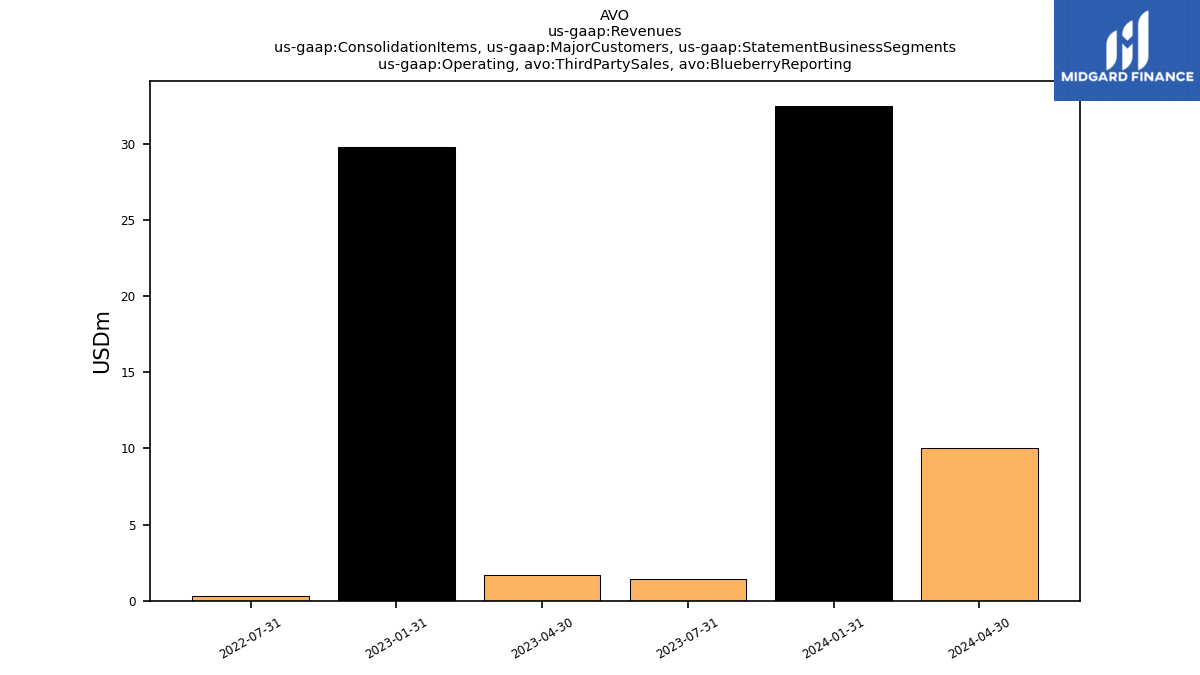
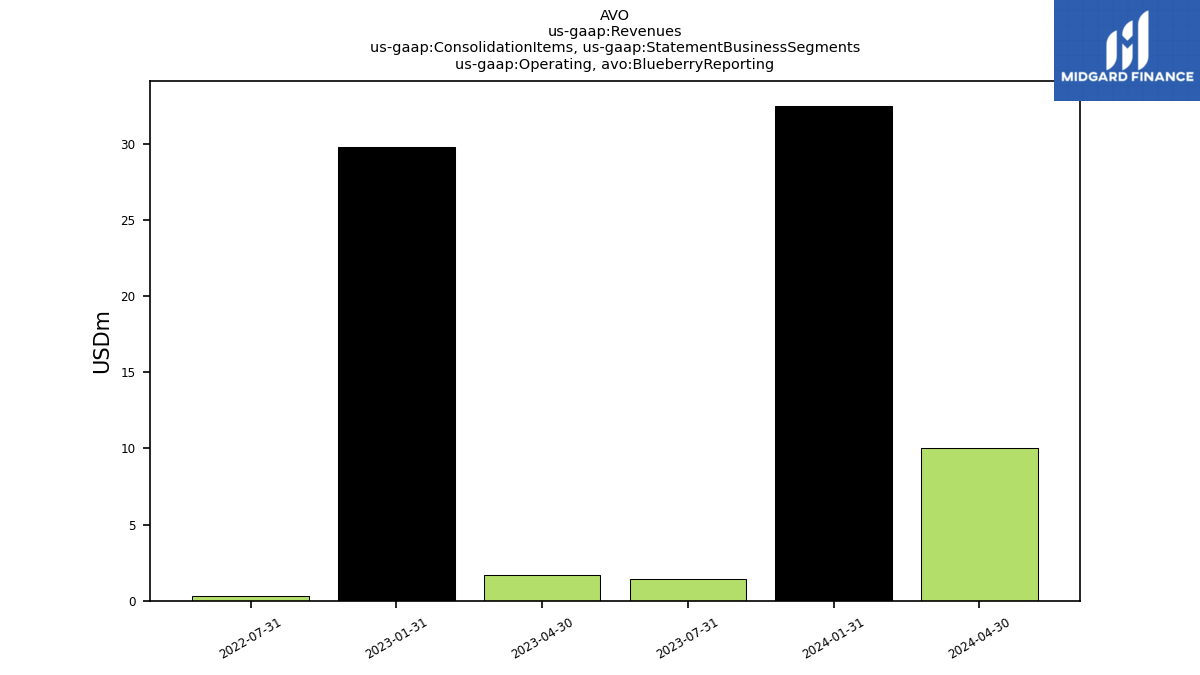
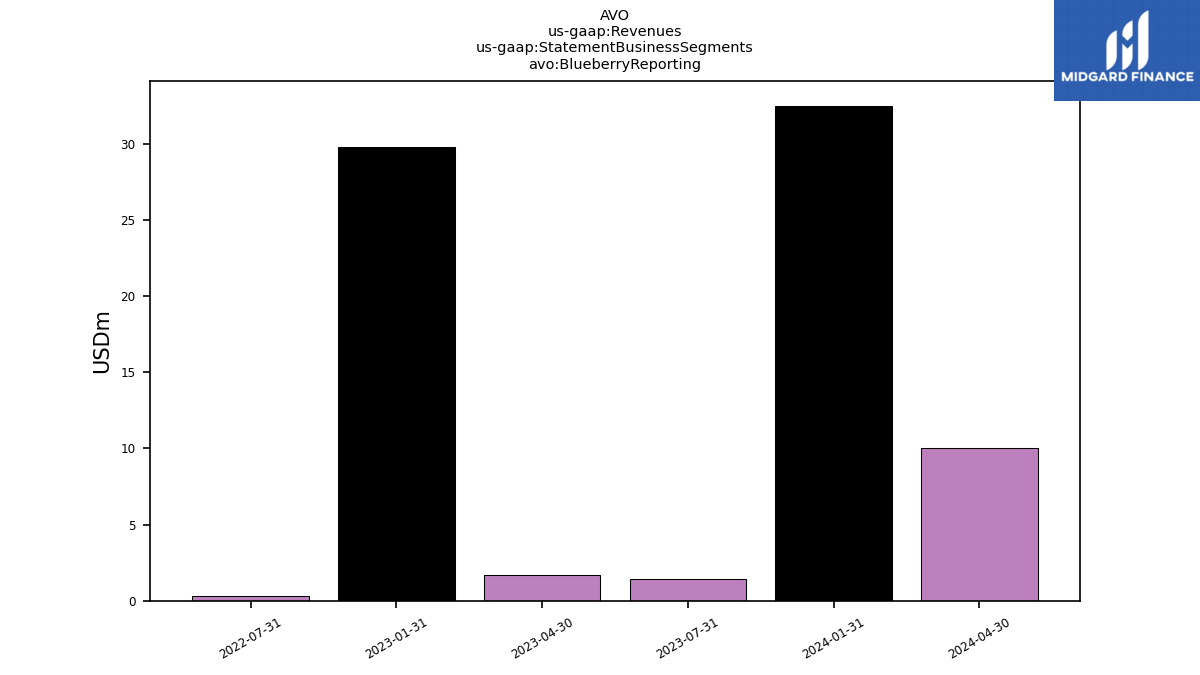
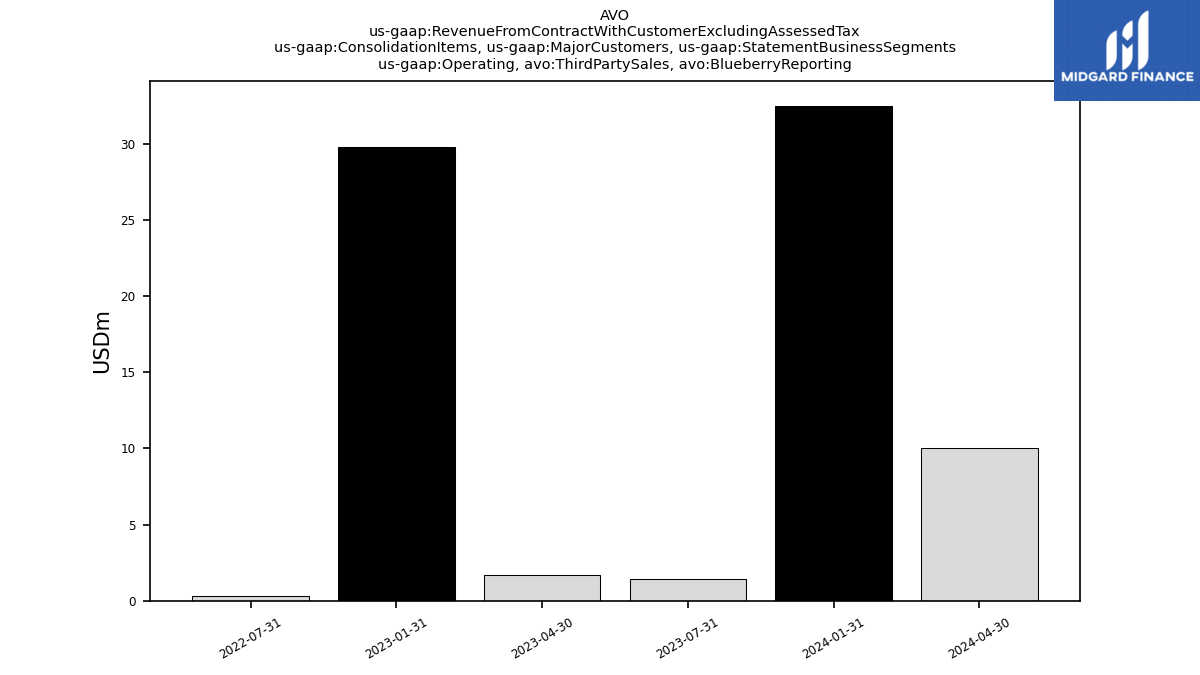
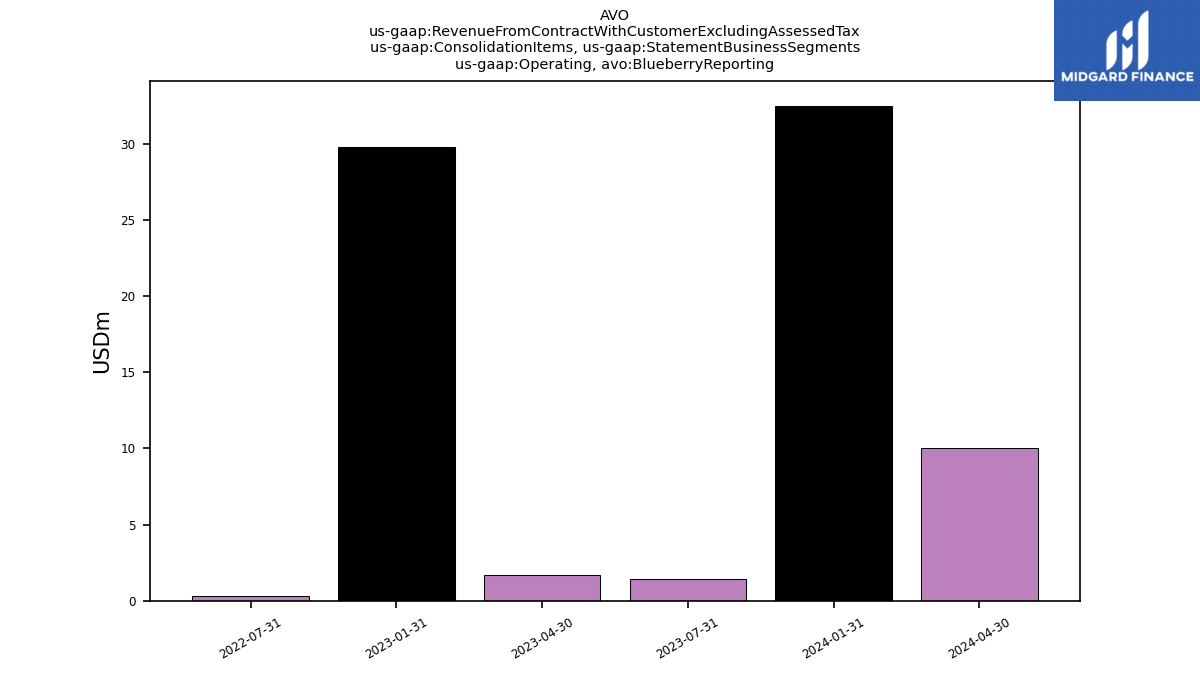
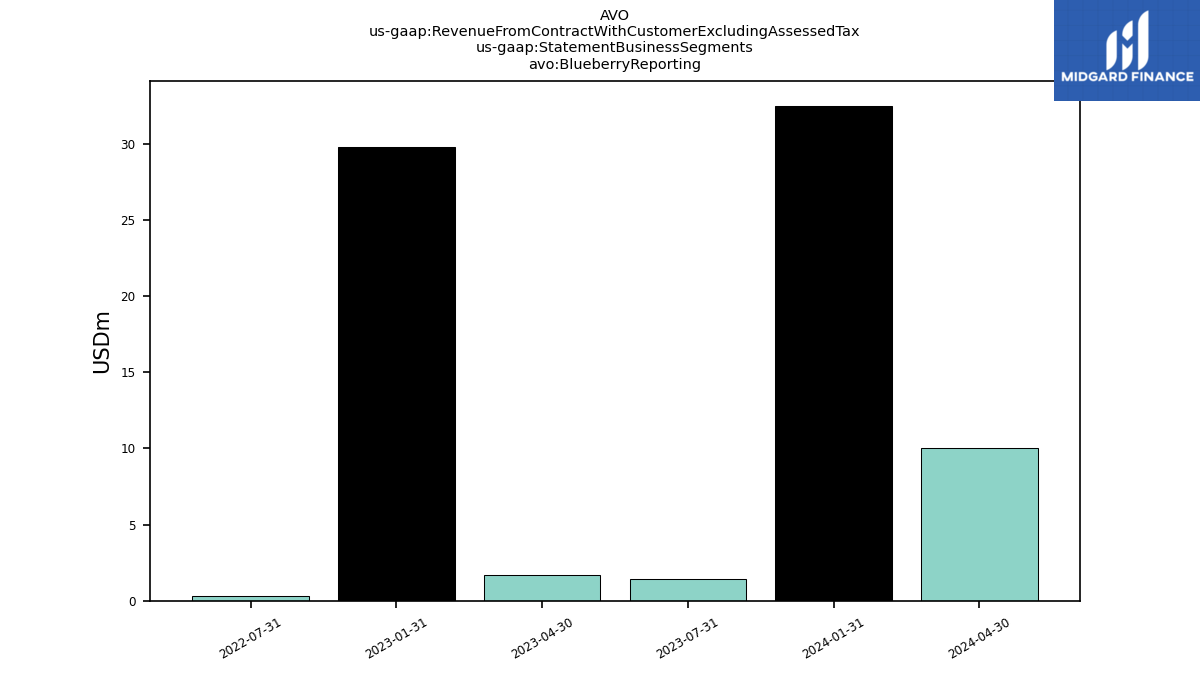
| Operating, Third Party Sales, Blueberry Reporting | 32.50 | NA | 1.40 | 1.70 | 29.80 | NA | 0.30 | NA | NA | NA | NA | NA | NA | NA | NA | |
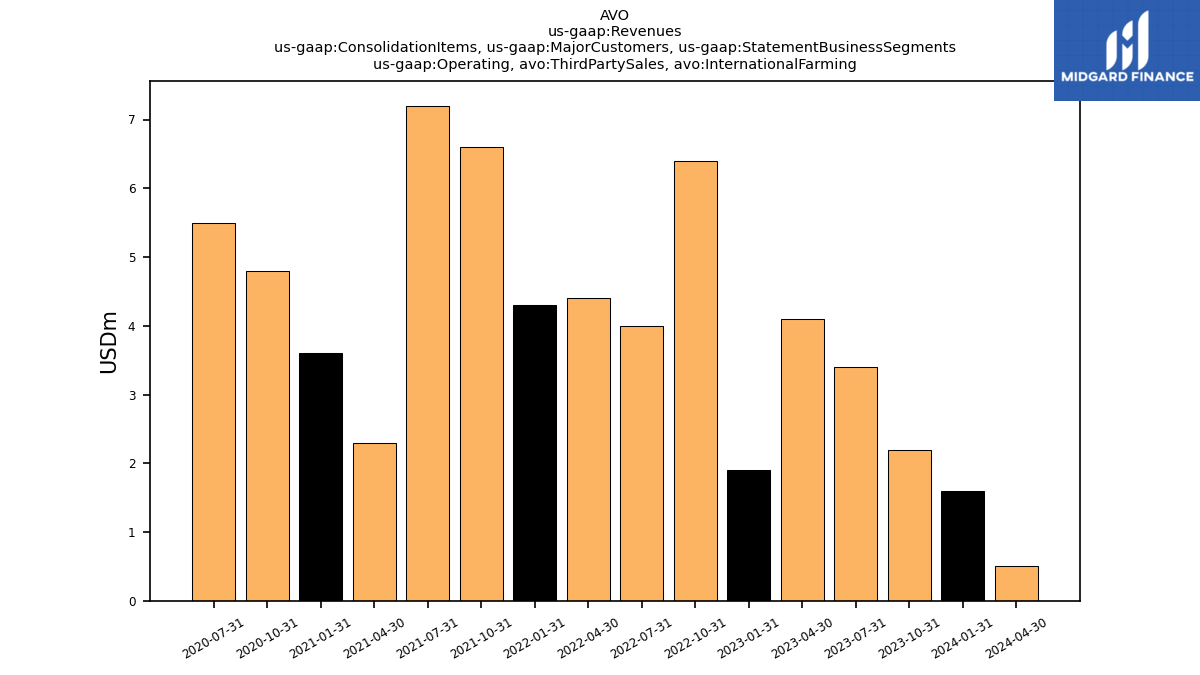
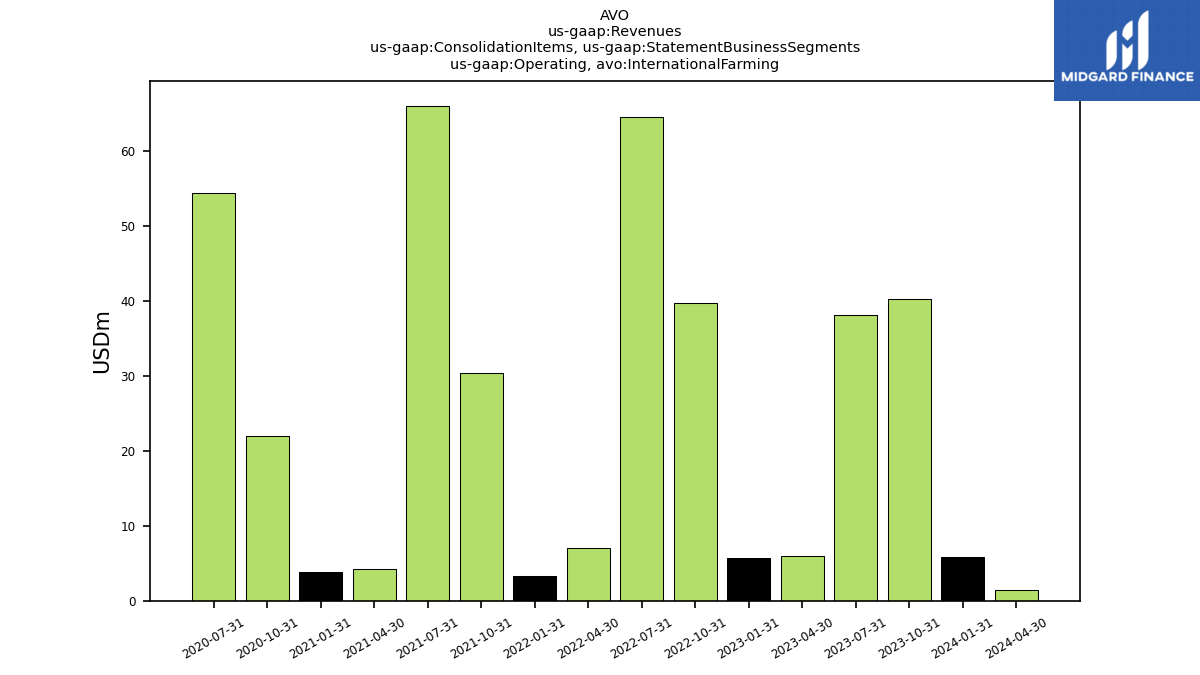
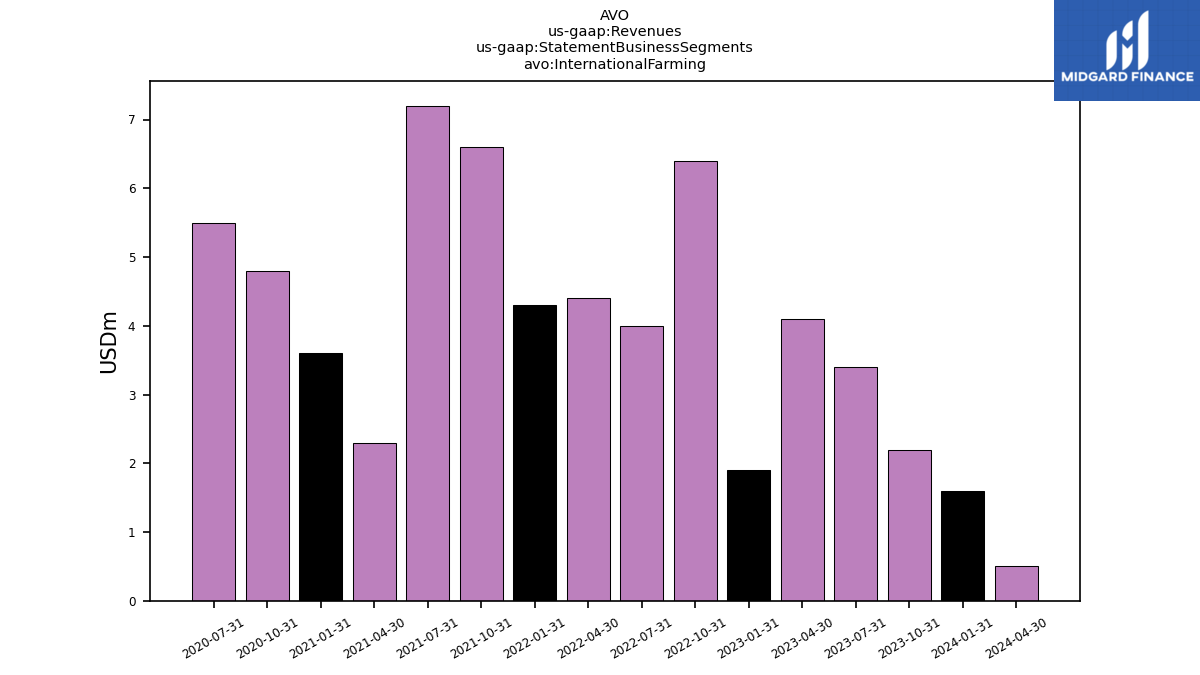
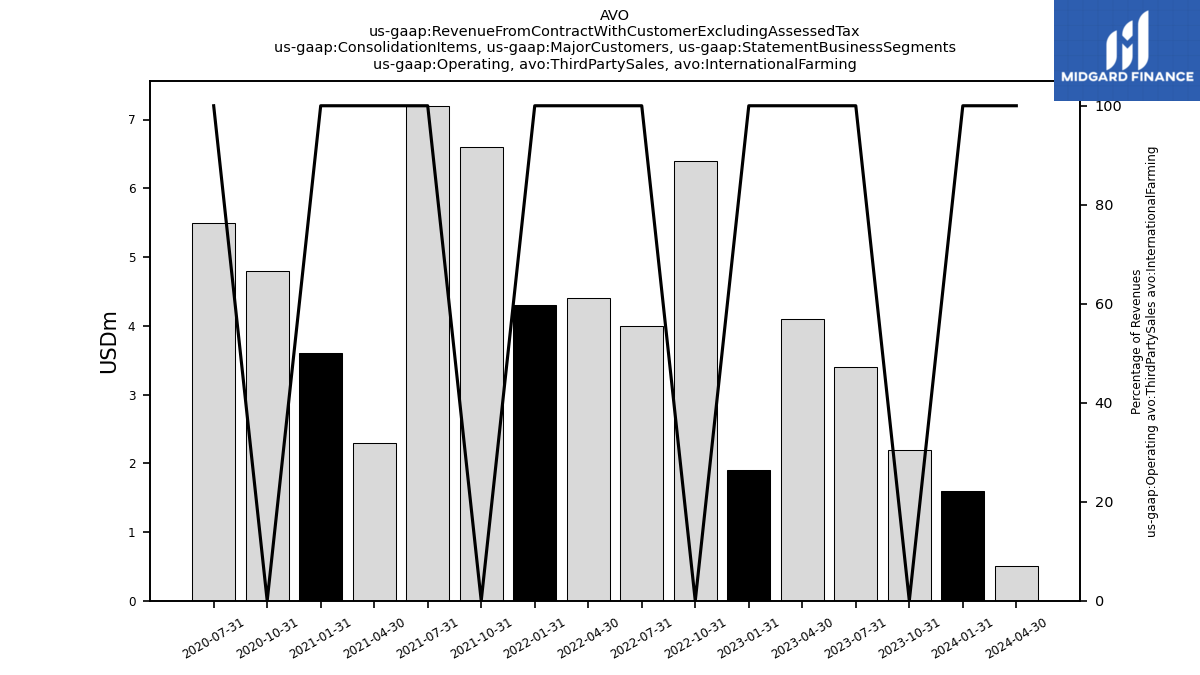
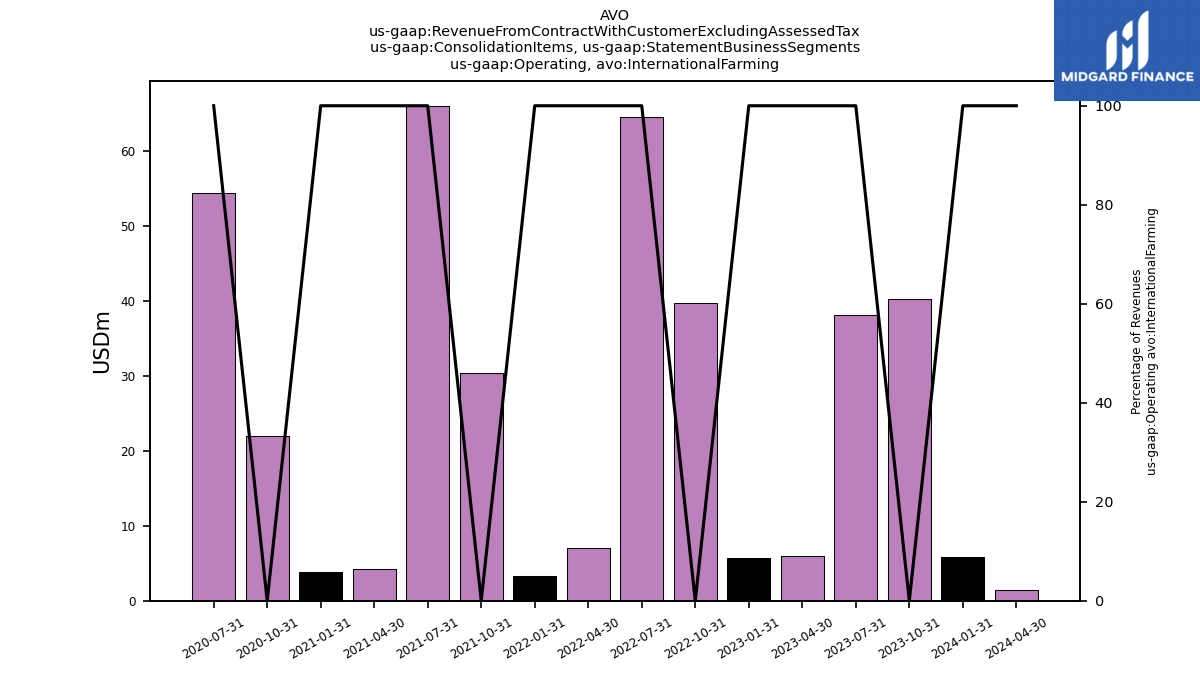
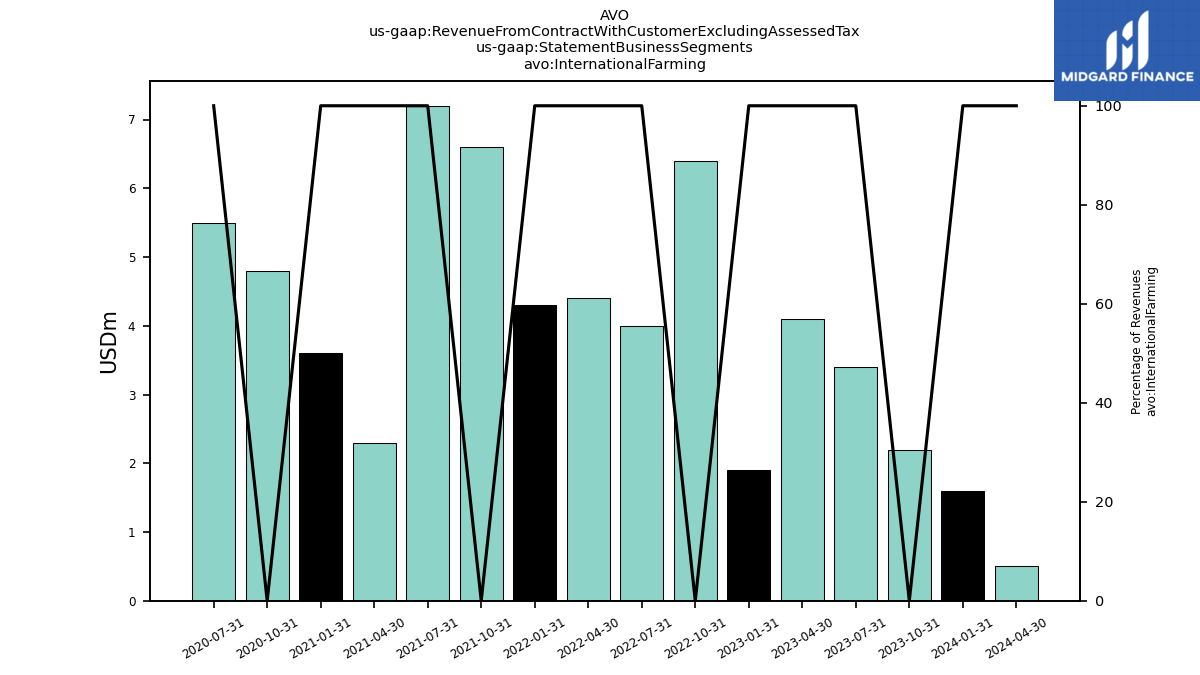
| Operating, Third Party Sales, International Farming | 1.60 | 2.20 | 3.40 | 4.10 | 1.90 | 6.40 | 4.00 | 4.40 | 4.30 | 6.60 | 7.20 | 2.30 | 3.60 | 4.80 | 5.50 | |
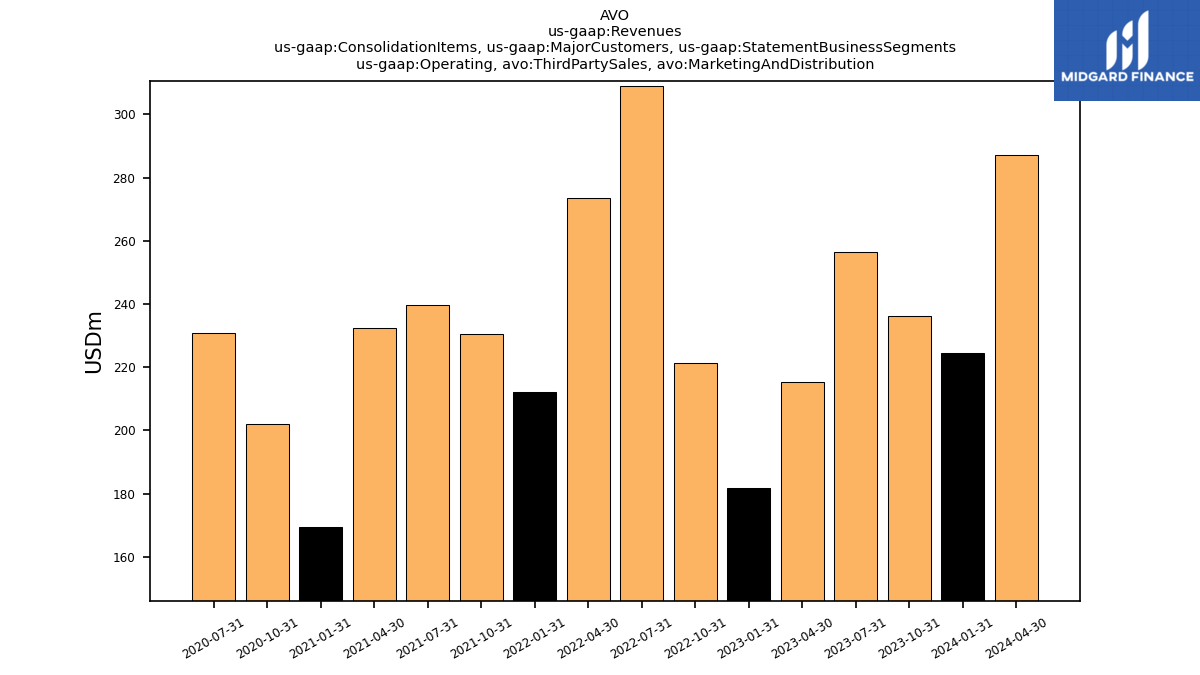
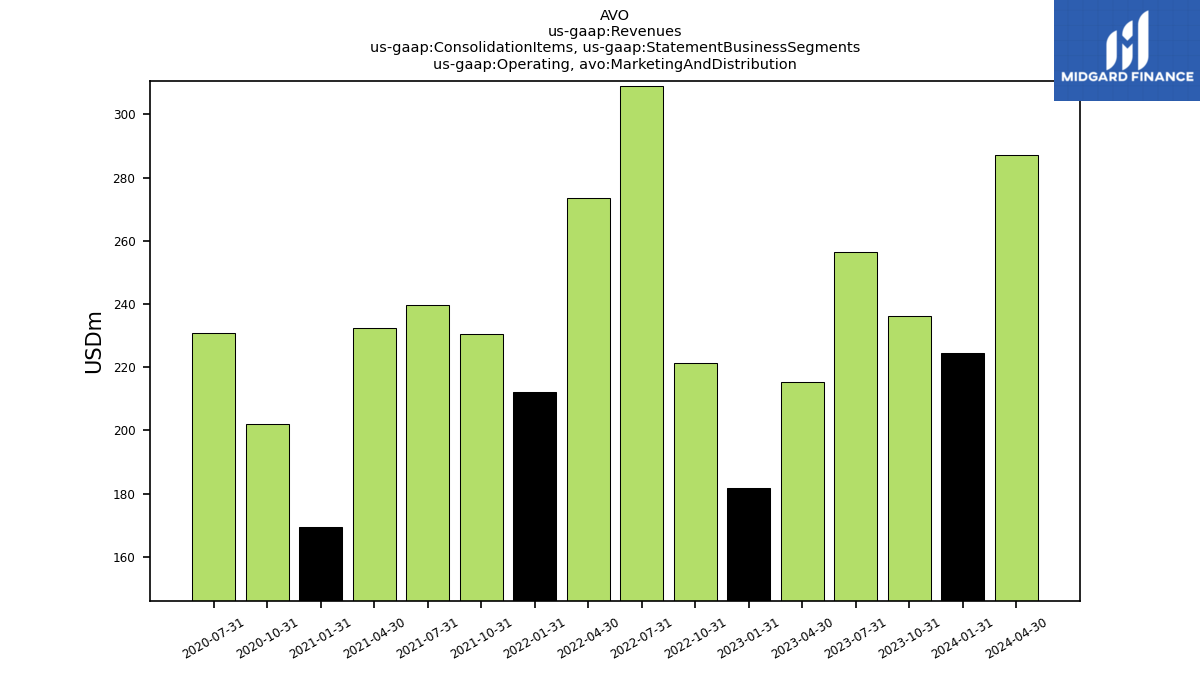
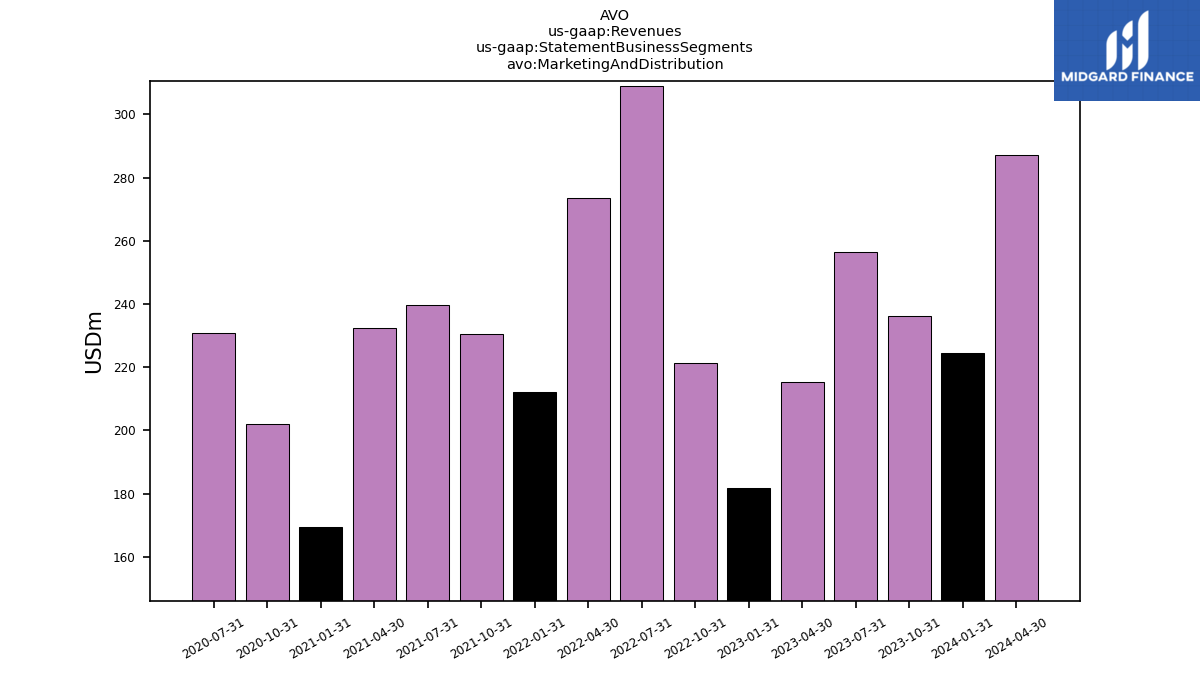
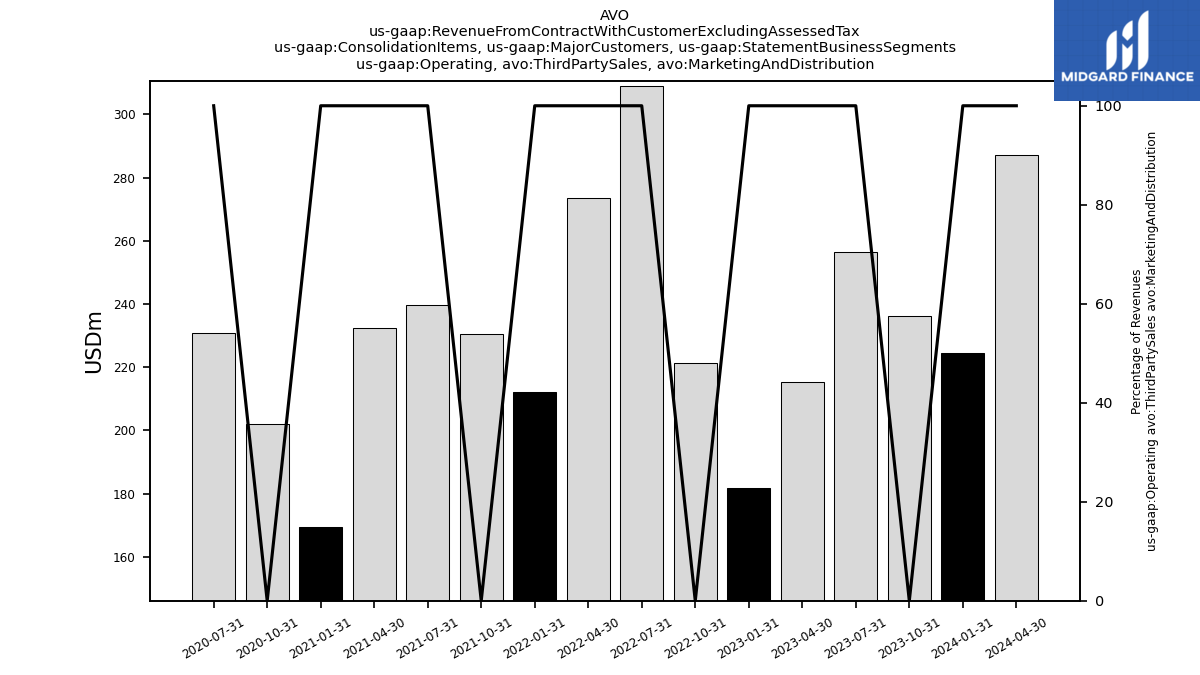
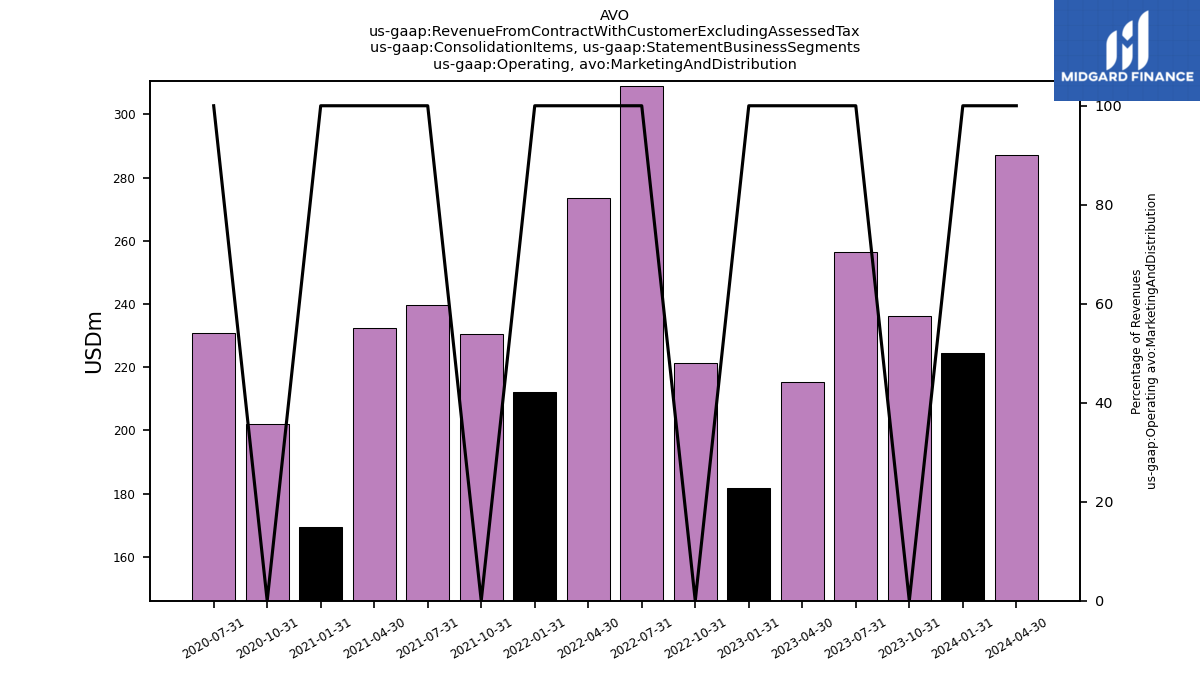
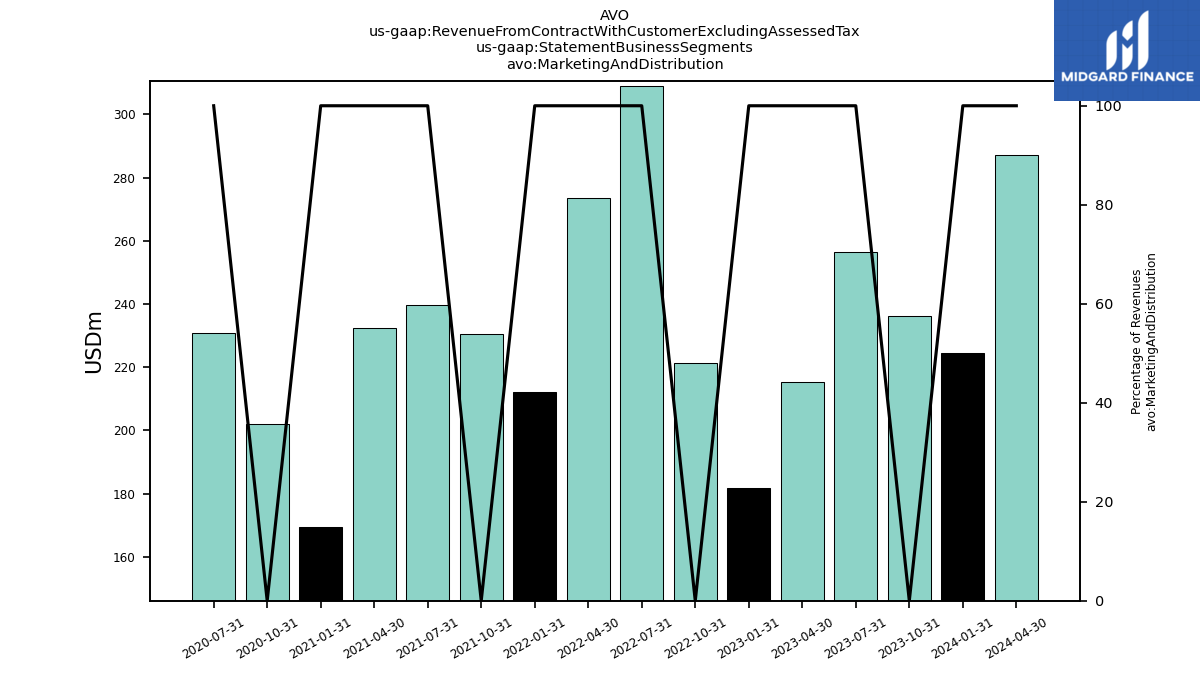
| Operating, Third Party Sales, Marketing And Distribution | 224.60 | 236.20 | 256.60 | 215.30 | 181.80 | 221.20 | 308.90 | 273.70 | 212.30 | 230.40 | 239.60 | 232.40 | 169.60 | 202.00 | 230.90 | |
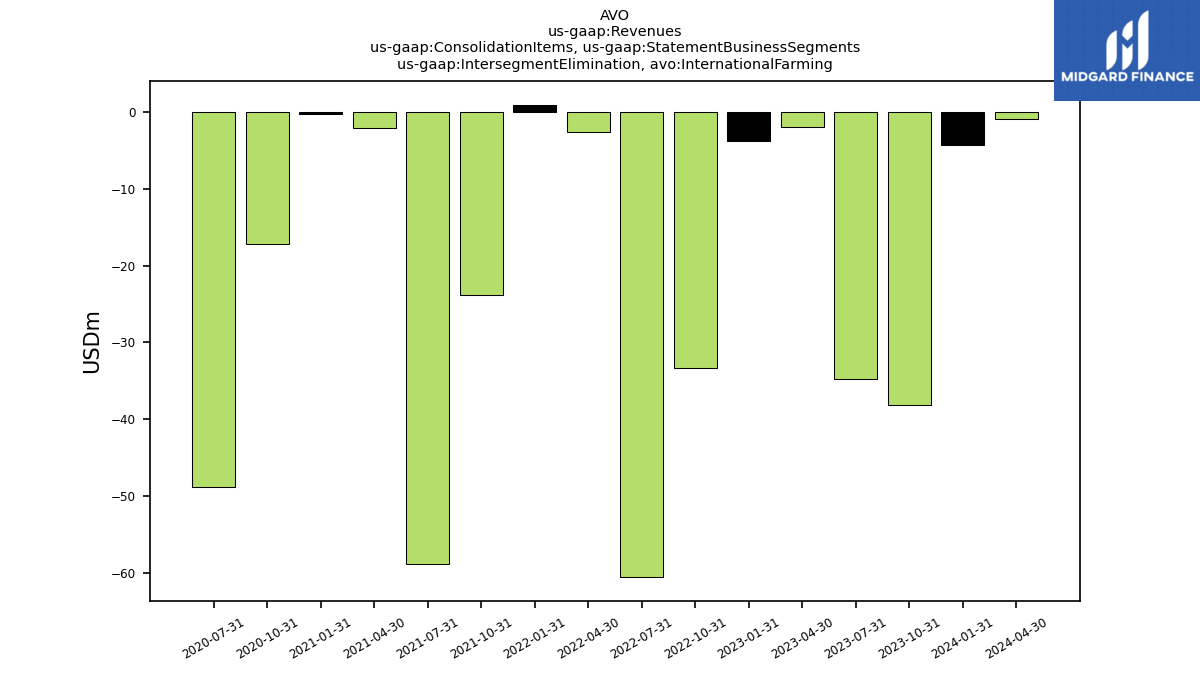
| Intersegment Elimination, International Farming | -4.20 | -38.10 | -34.80 | -1.90 | -3.80 | -33.40 | -60.60 | -2.60 | 1.00 | -23.80 | -58.90 | -2.00 | -0.20 | -17.20 | -48.90 | |
| Operating, Blueberry Reporting | 32.50 | NA | 1.40 | 1.70 | 29.80 | NA | 0.30 | NA | NA | NA | NA | NA | NA | NA | NA | |
| Operating, International Farming | 5.80 | 40.30 | 38.20 | 6.00 | 5.70 | 39.80 | 64.60 | 7.00 | 3.30 | 30.40 | 66.10 | 4.30 | 3.80 | 22.00 | 54.40 | |
| Operating, Marketing And Distribution | 224.60 | 236.20 | 256.60 | 215.30 | 181.80 | 221.20 | 308.90 | 273.70 | 212.30 | 230.40 | 239.60 | 232.40 | 169.60 | 202.00 | 230.90 | |
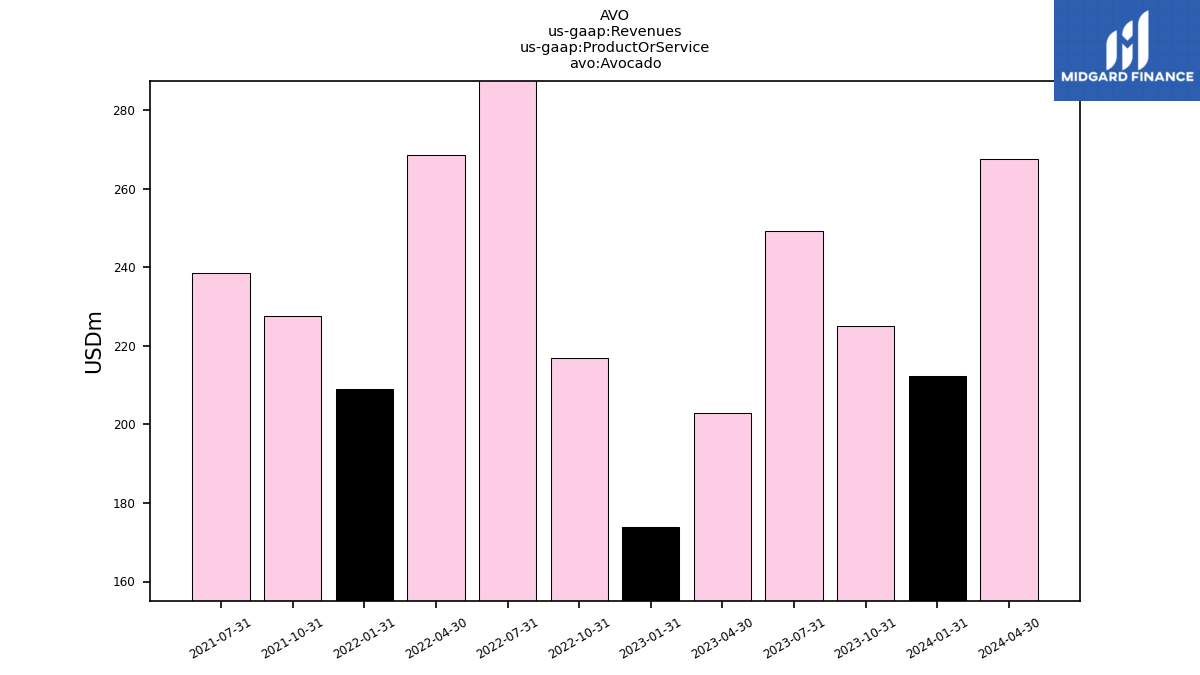
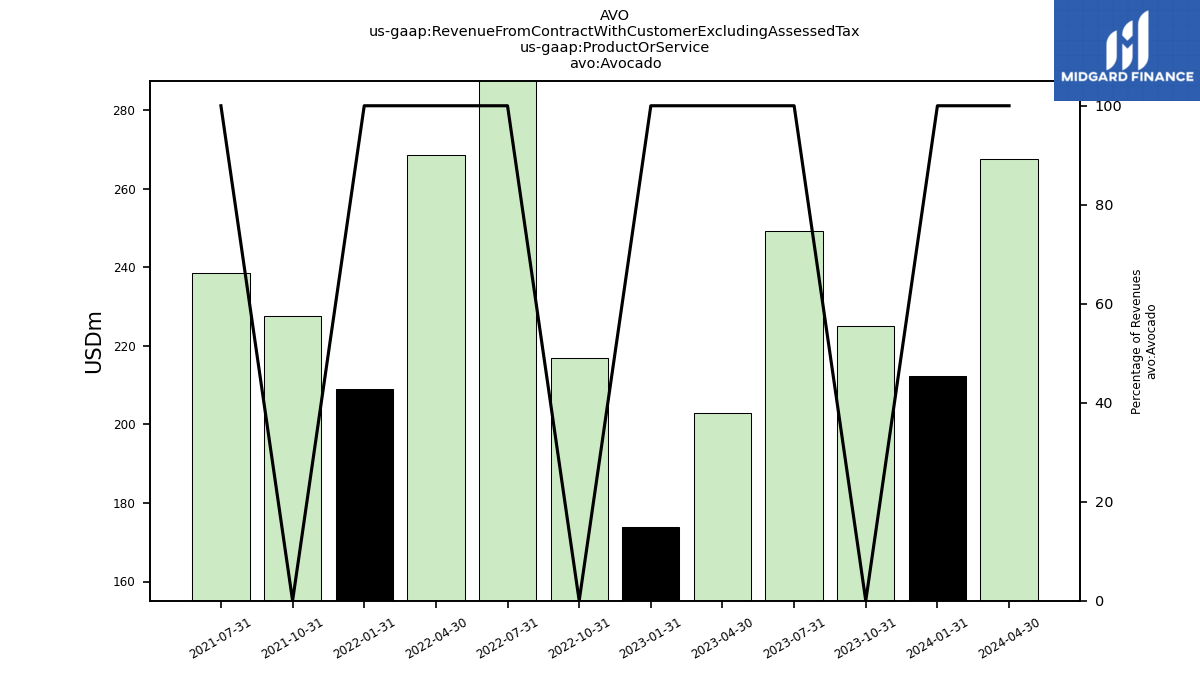
| Avocado | 212.30 | 225.00 | 249.20 | 202.90 | 174.00 | 216.90 | 303.90 | 268.50 | 209.10 | 227.50 | 238.40 | NA | NA | NA | NA | |
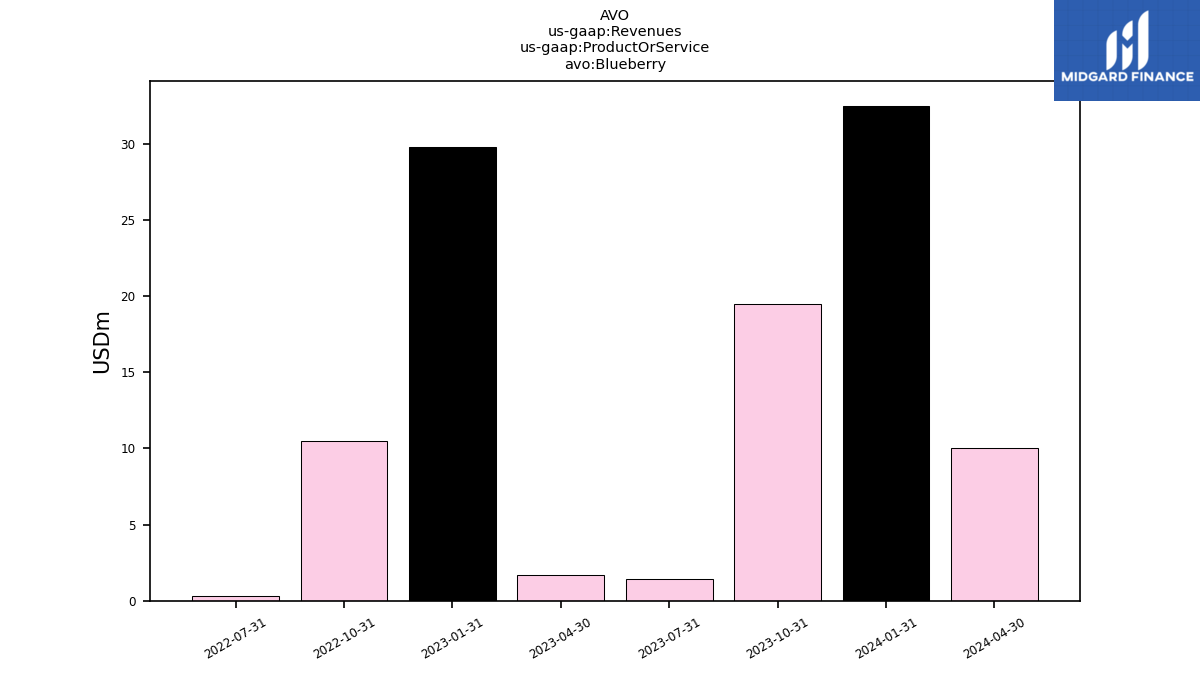
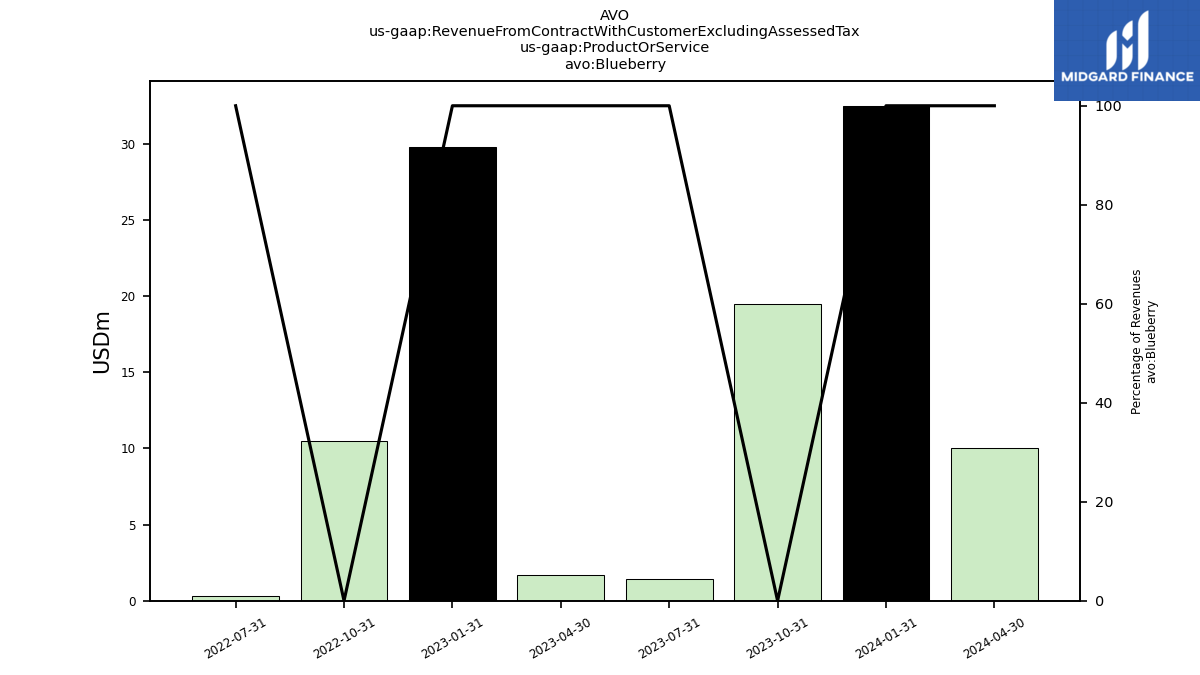
| Blueberry | 32.50 | 19.50 | 1.40 | 1.70 | 29.80 | 10.50 | 0.30 | NA | NA | NA | NA | NA | NA | NA | NA | |
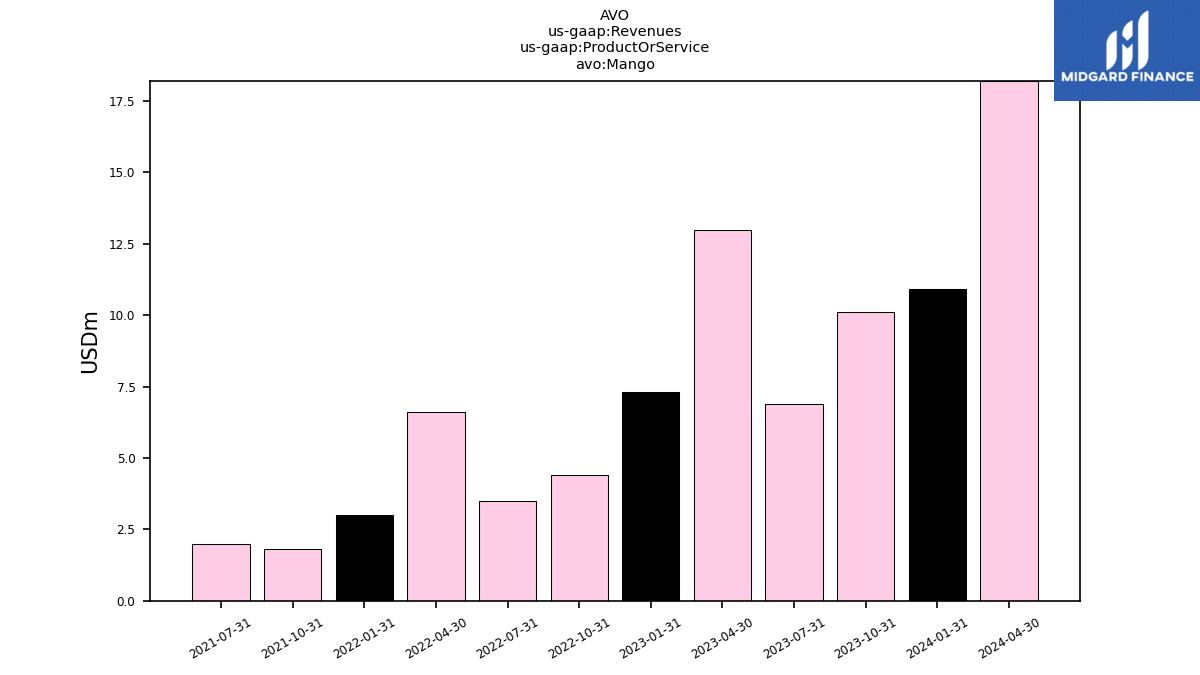
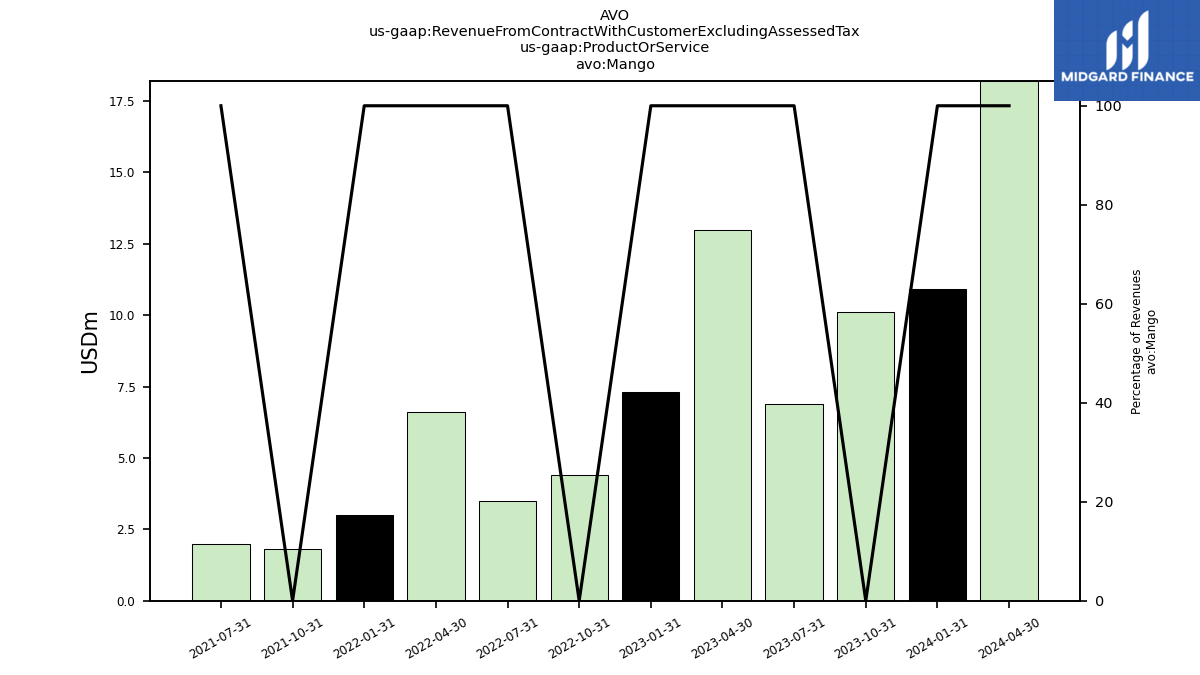
| Mango | 10.90 | 10.10 | 6.90 | 13.00 | 7.30 | 4.40 | 3.50 | 6.60 | 3.00 | 1.80 | 2.00 | NA | NA | NA | NA | |
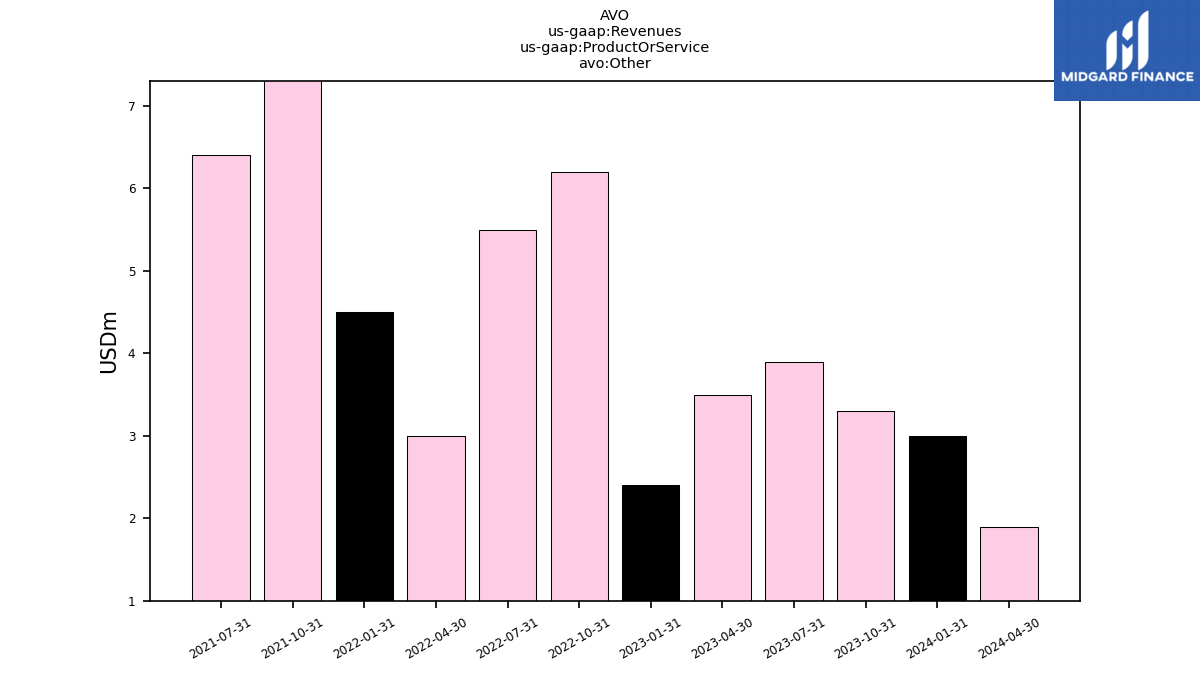
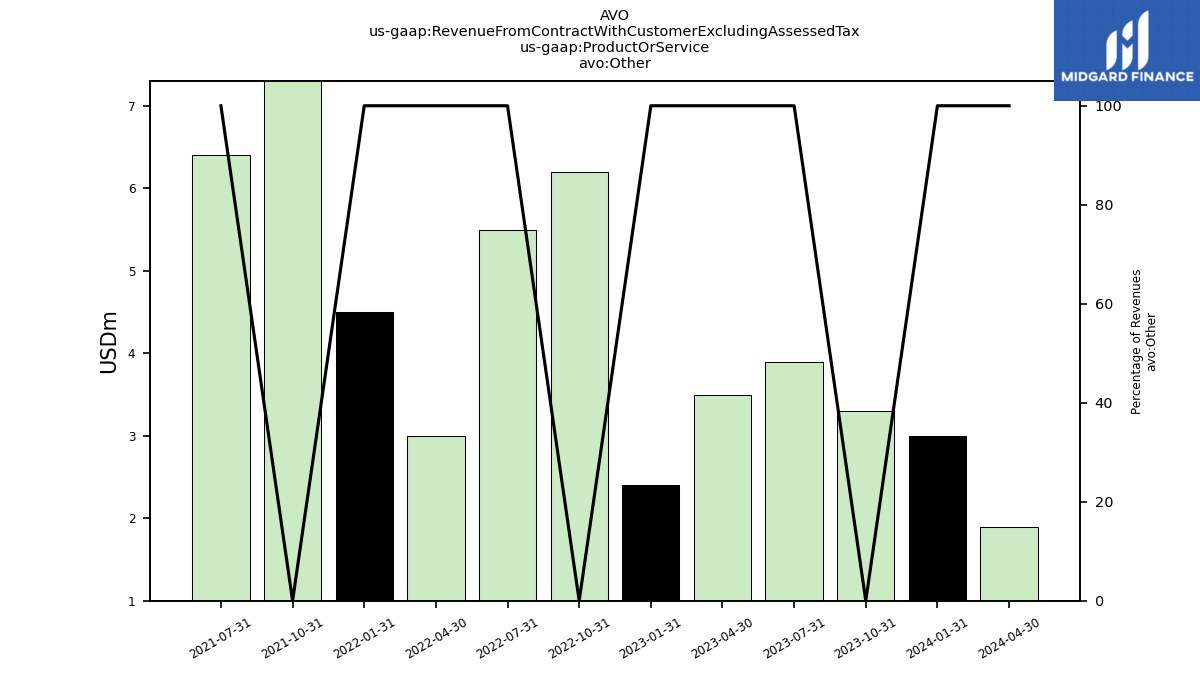
| Other | 3.00 | 3.30 | 3.90 | 3.50 | 2.40 | 6.20 | 5.50 | 3.00 | 4.50 | 7.70 | 6.40 | NA | NA | NA | NA | |
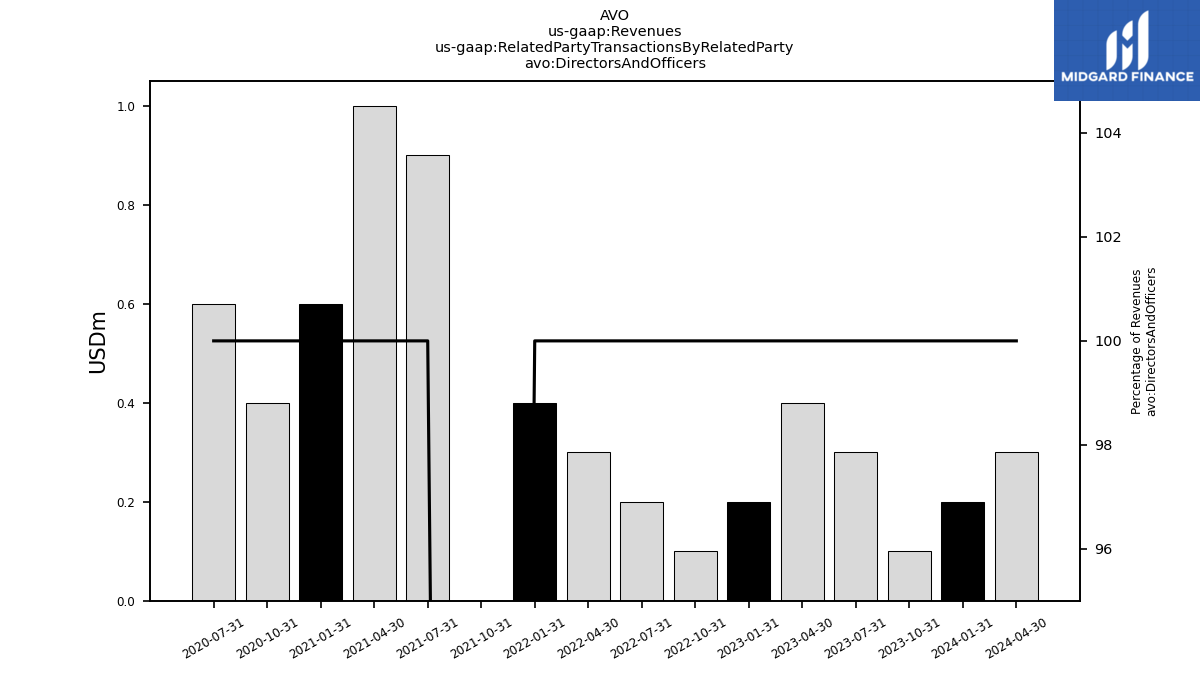
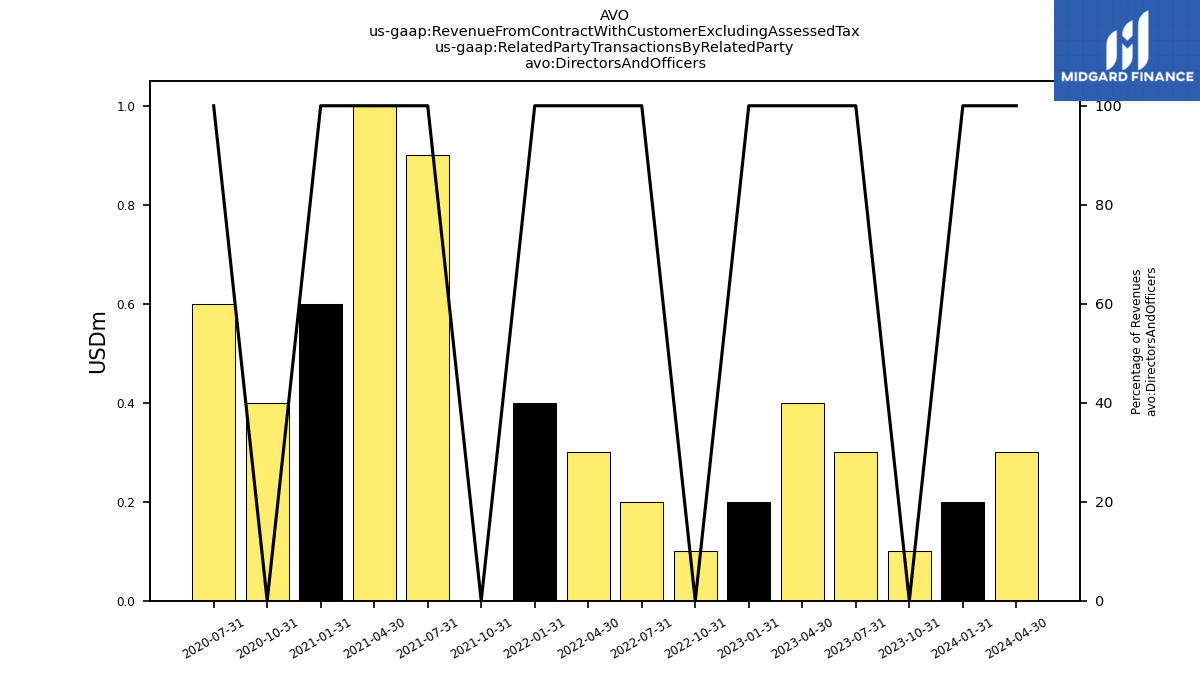
| Directors And Officers | 0.20 | 0.10 | 0.30 | 0.40 | 0.20 | 0.10 | 0.20 | 0.30 | 0.40 | 0.00 | 0.90 | 1.00 | 0.60 | 0.40 | 0.60 | |
| Blueberry Reporting | 32.50 | NA | 1.40 | 1.70 | 29.80 | NA | 0.30 | NA | NA | NA | NA | NA | NA | NA | NA | |
| International Farming | 1.60 | 2.20 | 3.40 | 4.10 | 1.90 | 6.40 | 4.00 | 4.40 | 4.30 | 6.60 | 7.20 | 2.30 | 3.60 | 4.80 | 5.50 | |
| Marketing And Distribution | 224.60 | 236.20 | 256.60 | 215.30 | 181.80 | 221.20 | 308.90 | 273.70 | 212.30 | 230.40 | 239.60 | 232.40 | 169.60 | 202.00 | 230.90 | |
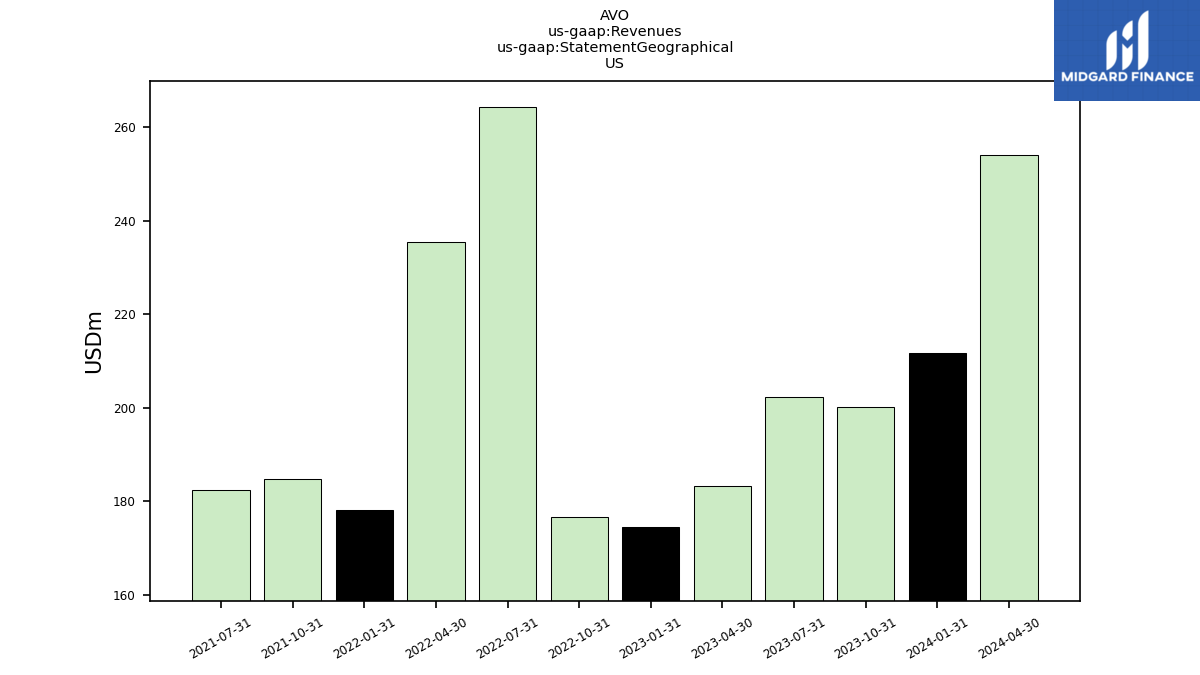
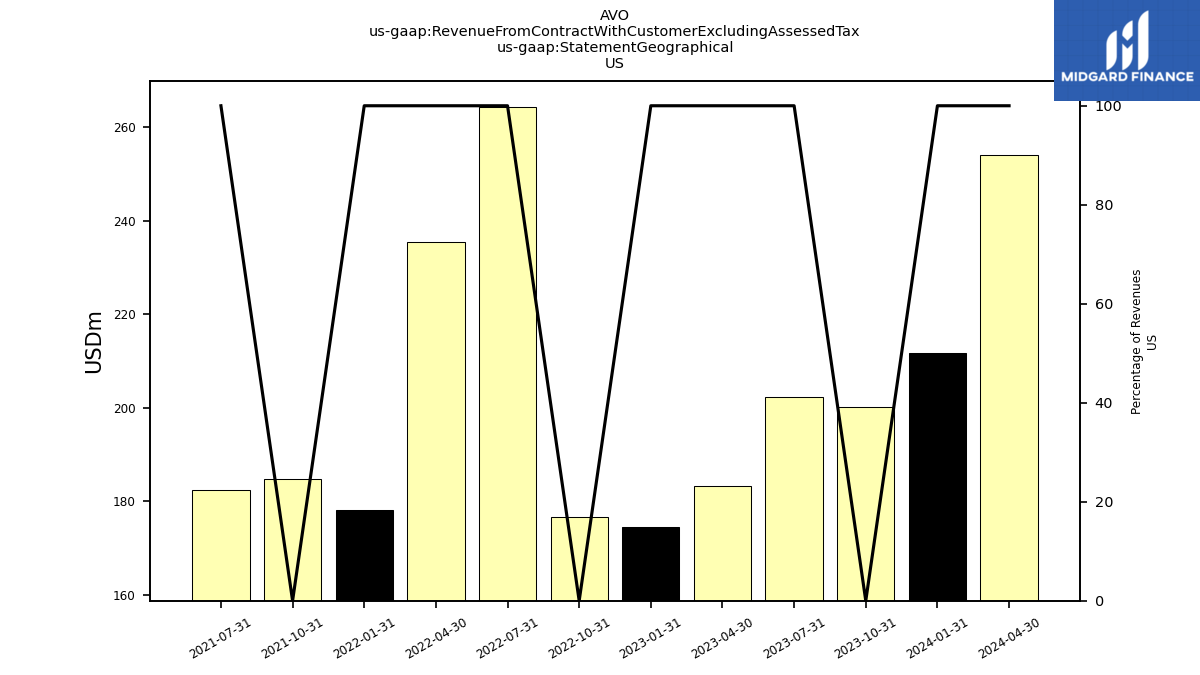
| US | 211.80 | 200.20 | 202.40 | 183.30 | 174.60 | 176.70 | 264.40 | 235.50 | 178.10 | 184.70 | 182.50 | NA | NA | NA | NA | |
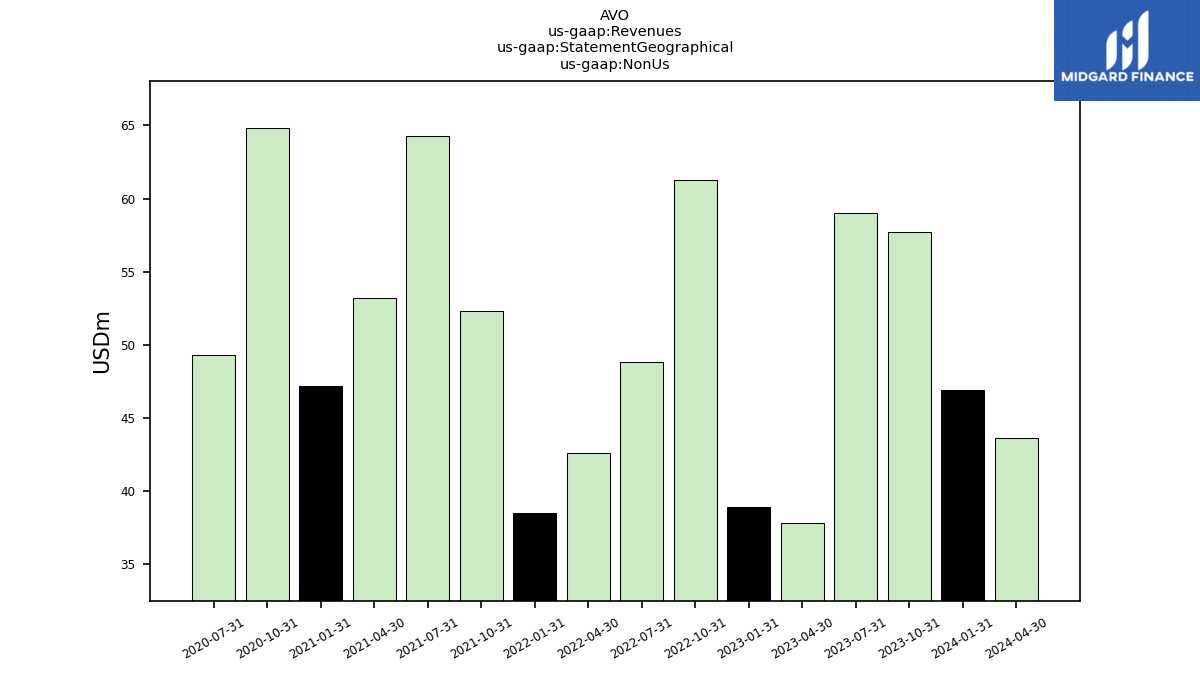
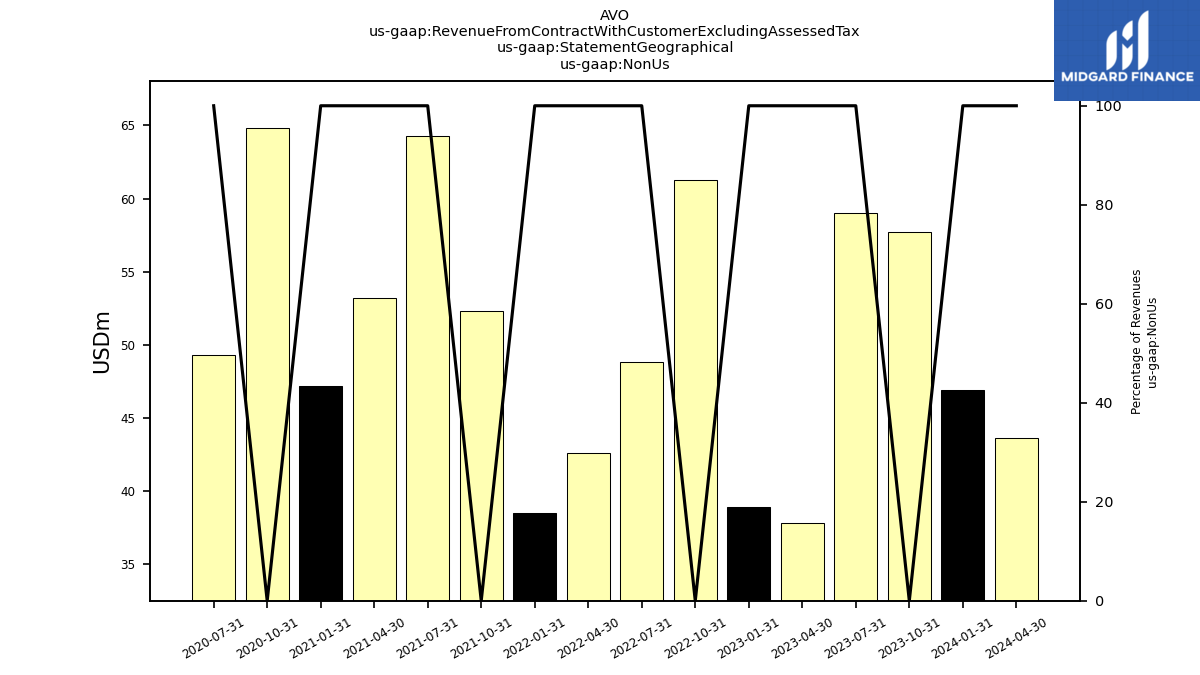
| Non Us | 46.90 | 57.70 | 59.00 | 37.80 | 38.90 | 61.30 | 48.80 | 42.60 | 38.50 | 52.30 | 64.30 | 53.20 | 47.20 | 64.80 | 49.30 | |
| Revenue From Contract With Customer Excluding Assessed Tax | 258.70 | 257.90 | 261.40 | 221.10 | 213.50 | 238.00 | 313.20 | 278.10 | 216.60 | 237.00 | 246.80 | 234.70 | 173.20 | 206.80 | 236.40 | |
| Intersegment Elimination | -4.20 | -38.10 | -34.80 | -1.90 | -3.80 | -33.40 | -60.60 | -2.60 | 1.00 | -23.80 | -58.90 | -2.00 | -0.20 | -17.20 | -48.90 | |
| Operating | 262.90 | 296.00 | 296.20 | 223.00 | 217.30 | 271.40 | 373.80 | 280.70 | 215.60 | 260.80 | 305.70 | 236.70 | 173.40 | 224.00 | 285.30 | |
| Operating, Affiliated Sales | 4.20 | 38.10 | 34.80 | 1.90 | 3.80 | 33.40 | 60.60 | 2.60 | -1.00 | 23.80 | 58.90 | 2.00 | 0.20 | 17.20 | 48.90 | |
| Operating, Third Party Sales | 258.70 | 257.90 | 261.40 | 221.10 | 213.50 | 238.00 | 313.20 | 278.10 | 216.60 | 237.00 | 246.80 | 234.70 | 173.20 | 206.80 | 236.40 | |
| Operating, Affiliated Sales, International Farming | 4.20 | 38.10 | 34.80 | 1.90 | 3.80 | 33.40 | 60.60 | 2.60 | -1.00 | 23.80 | 58.90 | 2.00 | 0.20 | 17.20 | 48.90 | |
| Operating, Third Party Sales, Blueberry Reporting | 32.50 | NA | 1.40 | 1.70 | 29.80 | NA | 0.30 | NA | NA | NA | NA | NA | NA | NA | NA | |
| Operating, Third Party Sales, International Farming | 1.60 | 2.20 | 3.40 | 4.10 | 1.90 | 6.40 | 4.00 | 4.40 | 4.30 | 6.60 | 7.20 | 2.30 | 3.60 | 4.80 | 5.50 | |
| Operating, Third Party Sales, Marketing And Distribution | 224.60 | 236.20 | 256.60 | 215.30 | 181.80 | 221.20 | 308.90 | 273.70 | 212.30 | 230.40 | 239.60 | 232.40 | 169.60 | 202.00 | 230.90 | |
| Intersegment Elimination, International Farming | -4.20 | -38.10 | -34.80 | -1.90 | -3.80 | -33.40 | -60.60 | -2.60 | 1.00 | -23.80 | -58.90 | -2.00 | -0.20 | -17.20 | -48.90 | |
| Operating, Blueberry Reporting | 32.50 | NA | 1.40 | 1.70 | 29.80 | NA | 0.30 | NA | NA | NA | NA | NA | NA | NA | NA | |
| Operating, International Farming | 5.80 | 40.30 | 38.20 | 6.00 | 5.70 | 39.80 | 64.60 | 7.00 | 3.30 | 30.40 | 66.10 | 4.30 | 3.80 | 22.00 | 54.40 | |
| Operating, Marketing And Distribution | 224.60 | 236.20 | 256.60 | 215.30 | 181.80 | 221.20 | 308.90 | 273.70 | 212.30 | 230.40 | 239.60 | 232.40 | 169.60 | 202.00 | 230.90 | |
| Avocado | 212.30 | 225.00 | 249.20 | 202.90 | 174.00 | 216.90 | 303.90 | 268.50 | 209.10 | 227.50 | 238.40 | NA | NA | NA | NA | |
| Blueberry | 32.50 | 19.50 | 1.40 | 1.70 | 29.80 | 10.50 | 0.30 | NA | NA | NA | NA | NA | NA | NA | NA | |
| Mango | 10.90 | 10.10 | 6.90 | 13.00 | 7.30 | 4.40 | 3.50 | 6.60 | 3.00 | 1.80 | 2.00 | NA | NA | NA | NA | |
| Other | 3.00 | 3.30 | 3.90 | 3.50 | 2.40 | 6.20 | 5.50 | 3.00 | 4.50 | 7.70 | 6.40 | NA | NA | NA | NA | |
| Directors And Officers | 0.20 | 0.10 | 0.30 | 0.40 | 0.20 | 0.10 | 0.20 | 0.30 | 0.40 | 0.00 | 0.90 | 1.00 | 0.60 | 0.40 | 0.60 | |
| Blueberry Reporting | 32.50 | NA | 1.40 | 1.70 | 29.80 | NA | 0.30 | NA | NA | NA | NA | NA | NA | NA | NA | |
| International Farming | 1.60 | 2.20 | 3.40 | 4.10 | 1.90 | 6.40 | 4.00 | 4.40 | 4.30 | 6.60 | 7.20 | 2.30 | 3.60 | 4.80 | 5.50 | |
| Marketing And Distribution | 224.60 | 236.20 | 256.60 | 215.30 | 181.80 | 221.20 | 308.90 | 273.70 | 212.30 | 230.40 | 239.60 | 232.40 | 169.60 | 202.00 | 230.90 | |
| US | 211.80 | 200.20 | 202.40 | 183.30 | 174.60 | 176.70 | 264.40 | 235.50 | 178.10 | 184.70 | 182.50 | NA | NA | NA | NA | |
| Non Us | 46.90 | 57.70 | 59.00 | 37.80 | 38.90 | 61.30 | 48.80 | 42.60 | 38.50 | 52.30 | 64.30 | 53.20 | 47.20 | 64.80 | 49.30 |
