
| 2024-03-31 | 2023-12-31 | 2023-09-30 | 2023-06-30 | 2023-03-31 | 2022-12-31 | 2022-09-30 | 2022-06-30 | 2022-03-31 | 2021-12-31 | 2021-09-30 | 2021-06-30 | 2021-03-31 | 2020-12-31 | 2020-09-30 | 2020-06-30 | 2020-03-31 | 2019-12-31 | 2019-09-30 | 2019-06-30 | 2019-03-31 | 2018-12-31 | 2018-09-30 | 2018-06-30 | 2018-03-31 | 2017-12-31 | 2017-09-30 | ||
|---|---|---|---|---|---|---|---|---|---|---|---|---|---|---|---|---|---|---|---|---|---|---|---|---|---|---|---|---|
| Common Stock Value | 0.01 | 0.01 | 0.01 | 0.01 | 0.01 | 0.01 | 0.01 | 0.01 | 0.01 | 0.01 | 0.01 | 0.01 | 0.00 | 0.00 | 0.00 | 0.00 | 0.00 | 0.00 | 0.00 | 0.00 | 0.00 | 0.00 | 0.00 | NA | NA | 0.00 | NA | |
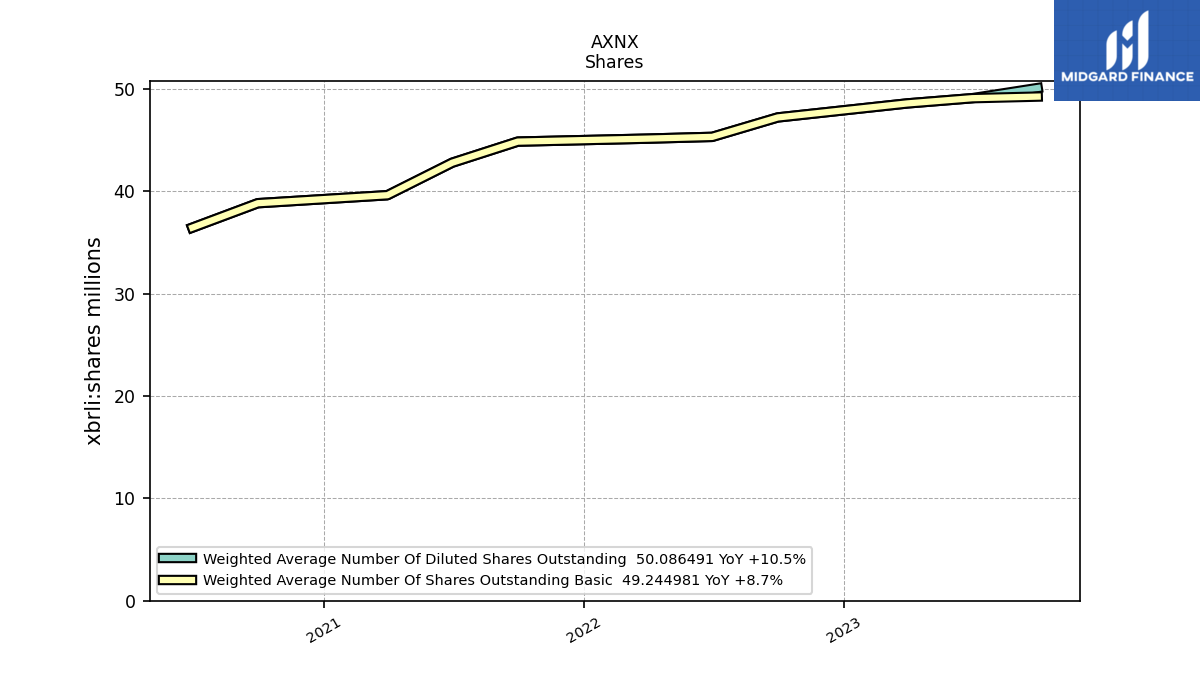
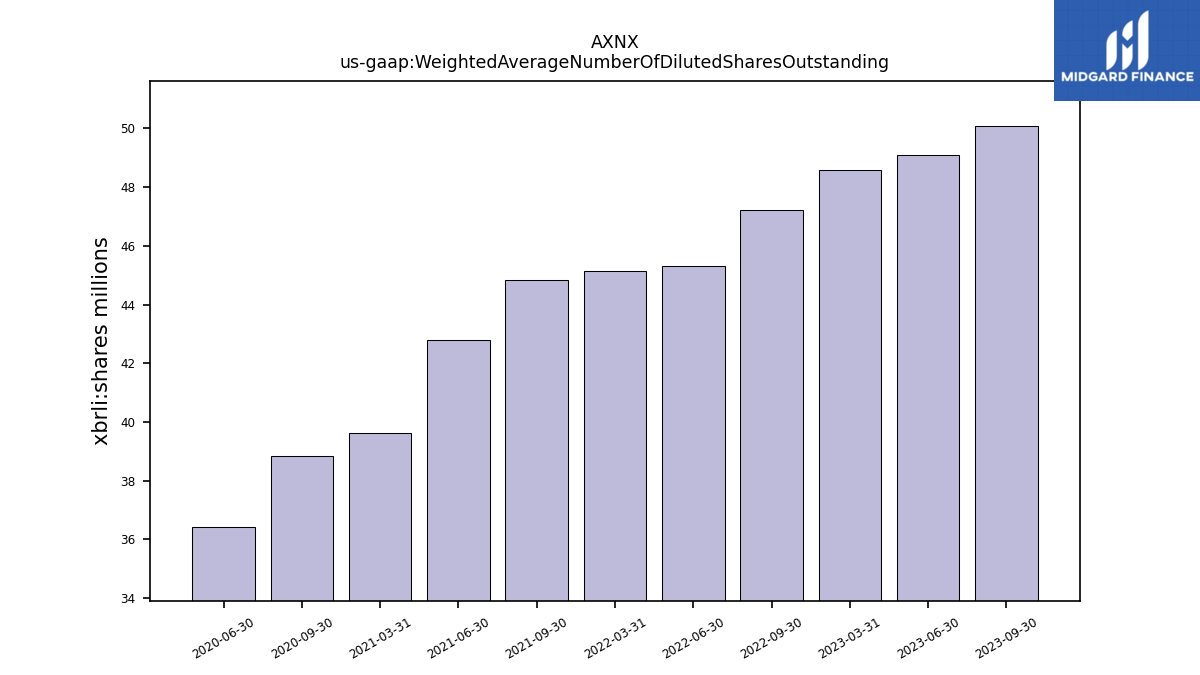
| Weighted Average Number Of Diluted Shares Outstanding | 50.93 | NA | 50.09 | 49.09 | 48.58 | NA | 47.21 | 45.31 | 45.14 | NA | 44.85 | 42.79 | 39.61 | NA | 38.83 | 36.44 | NA | NA | NA | NA | NA | NA | NA | NA | NA | NA | NA | |
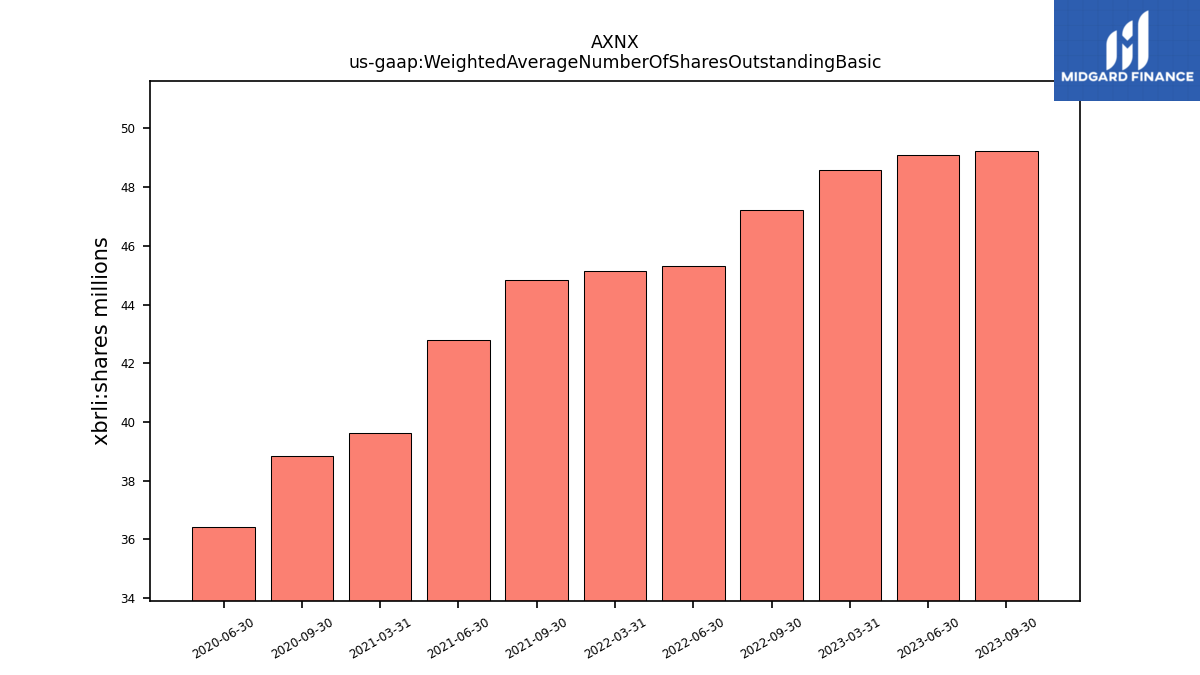
| Weighted Average Number Of Shares Outstanding Basic | 50.93 | NA | 49.24 | 49.09 | 48.58 | NA | 47.21 | 45.31 | 45.14 | NA | 44.85 | 42.79 | 39.61 | NA | 38.83 | 36.44 | NA | NA | NA | NA | NA | NA | NA | NA | NA | NA | NA | |
| Earnings Per Share Basic | -0.38 | 0.14 | 0.08 | -0.15 | -0.19 | 0.03 | -0.34 | -0.47 | -0.50 | -0.33 | -0.38 | -0.59 | -0.57 | -0.28 | -0.24 | -0.54 | NA | NA | NA | NA | NA | NA | NA | NA | NA | NA | NA | |
| Earnings Per Share Diluted | -0.38 | 0.14 | 0.08 | -0.15 | -0.19 | 0.03 | -0.34 | -0.47 | -0.50 | -0.33 | -0.38 | -0.59 | -0.57 | -0.28 | -0.24 | -0.54 | NA | NA | NA | NA | NA | NA | NA | NA | NA | NA | NA |
| 2024-03-31 | 2023-12-31 | 2023-09-30 | 2023-06-30 | 2023-03-31 | 2022-12-31 | 2022-09-30 | 2022-06-30 | 2022-03-31 | 2021-12-31 | 2021-09-30 | 2021-06-30 | 2021-03-31 | 2020-12-31 | 2020-09-30 | 2020-06-30 | 2020-03-31 | 2019-12-31 | 2019-09-30 | 2019-06-30 | 2019-03-31 | 2018-12-31 | 2018-09-30 | 2018-06-30 | 2018-03-31 | 2017-12-31 | 2017-09-30 | ||
|---|---|---|---|---|---|---|---|---|---|---|---|---|---|---|---|---|---|---|---|---|---|---|---|---|---|---|---|---|
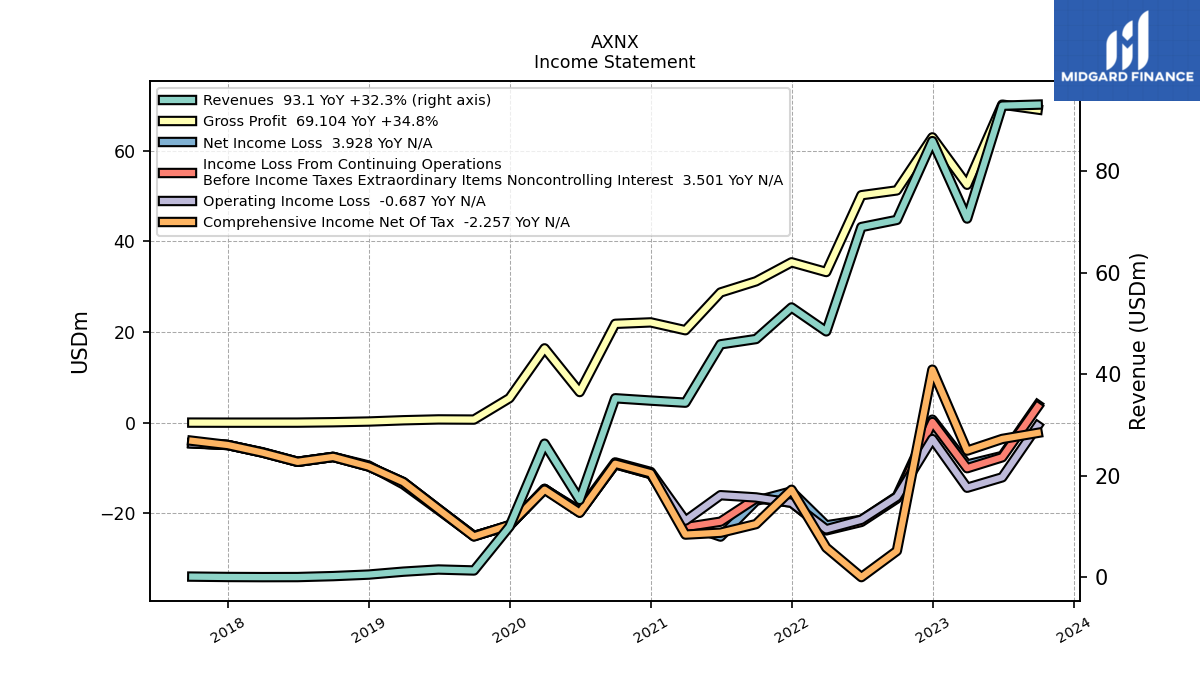
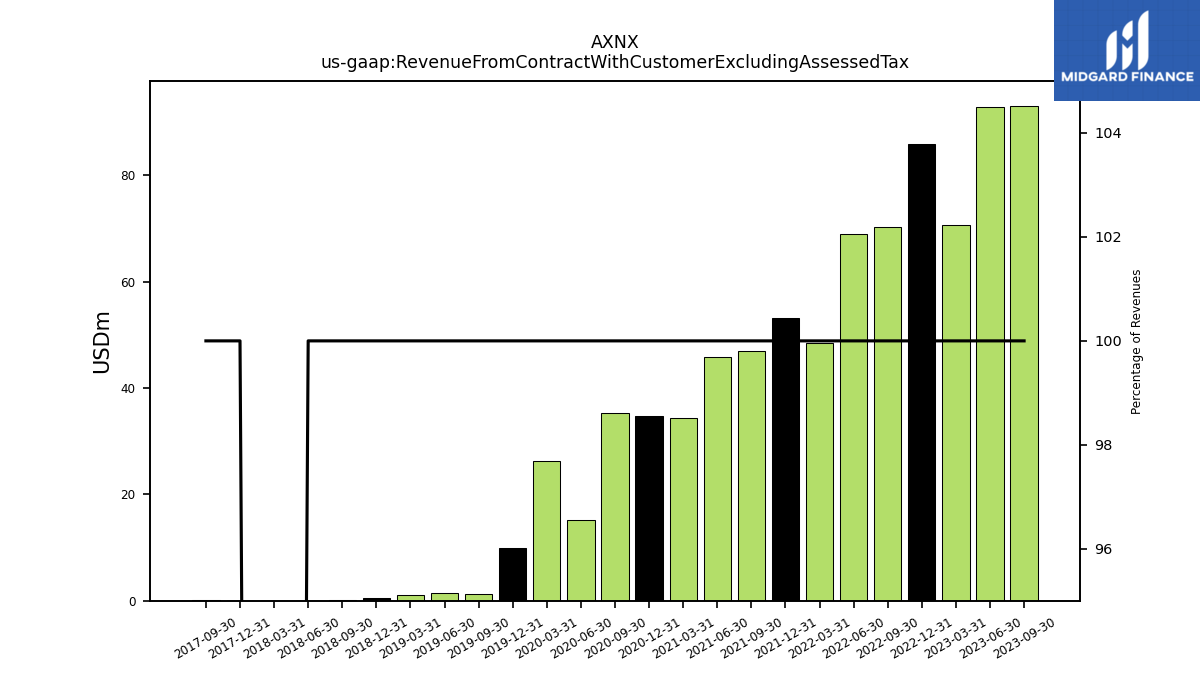
| Revenue From Contract With Customer Excluding Assessed Tax | 91.41 | 109.73 | 93.10 | 92.89 | 70.65 | 85.92 | 70.38 | 68.98 | 48.42 | 53.13 | 46.91 | 45.87 | 34.37 | 34.78 | 35.24 | 15.21 | 26.30 | 9.95 | 1.31 | 1.50 | 1.08 | 0.50 | 0.20 | 0.01 | 0.00 | 0.03 | 0.10 | |
| Revenues | 91.41 | 109.73 | 93.10 | 92.89 | 70.65 | 85.92 | 70.38 | 68.98 | 48.42 | 53.13 | 46.91 | 45.87 | 34.37 | 34.78 | 35.24 | 15.21 | 26.30 | 9.95 | 1.31 | 1.50 | 1.08 | 0.50 | 0.20 | 0.01 | 0.00 | 0.03 | 0.10 | |
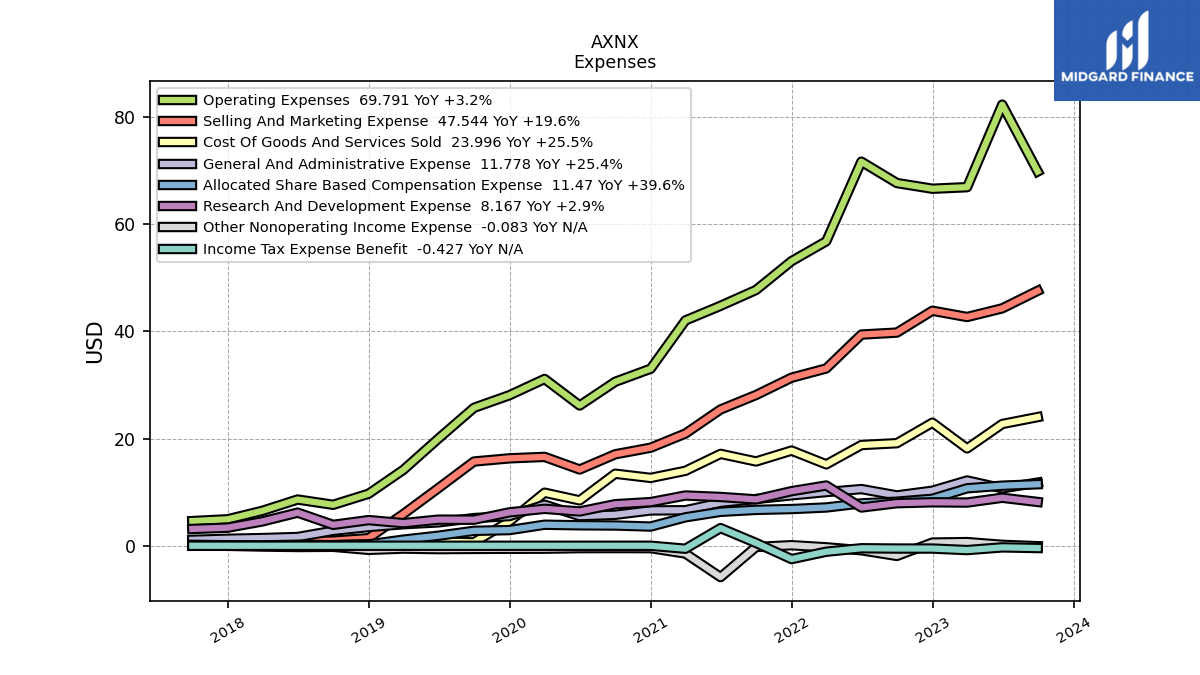
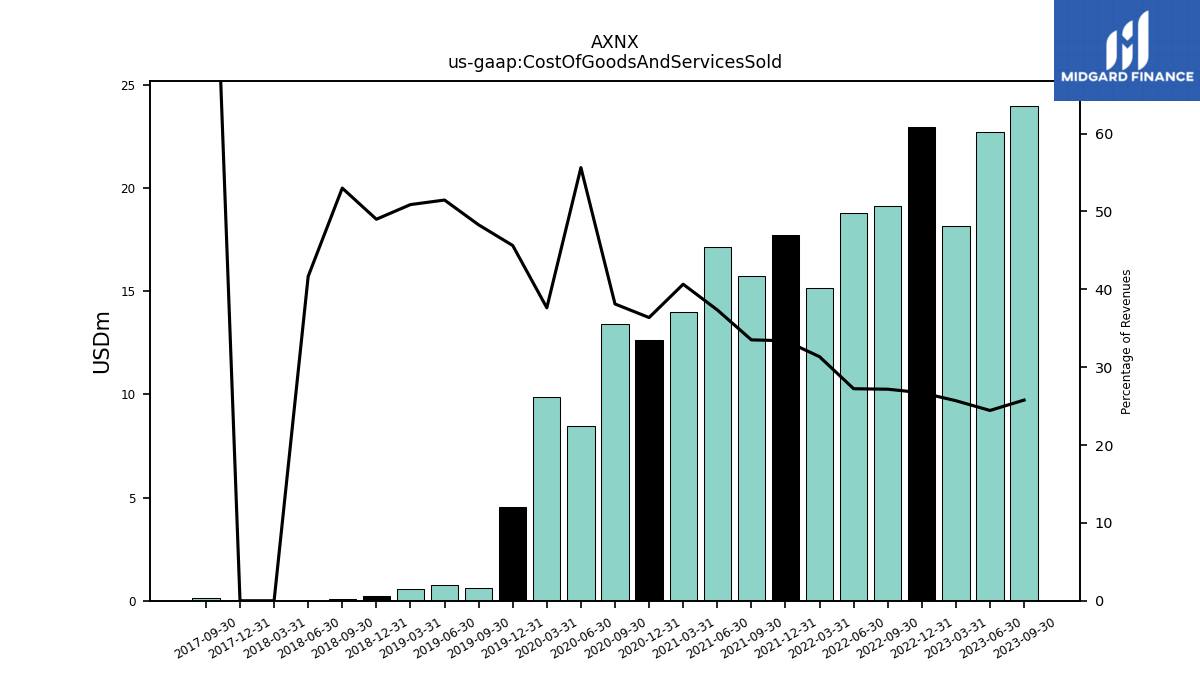
| Cost Of Goods And Services Sold | 22.16 | 26.98 | 24.00 | 22.70 | 18.15 | 22.95 | 19.12 | 18.78 | 15.18 | 17.74 | 15.72 | 17.14 | 13.97 | 12.65 | 13.43 | 8.46 | 9.89 | 4.54 | 0.63 | 0.77 | 0.55 | 0.24 | 0.11 | 0.01 | 0.00 | 0.00 | 0.12 | |
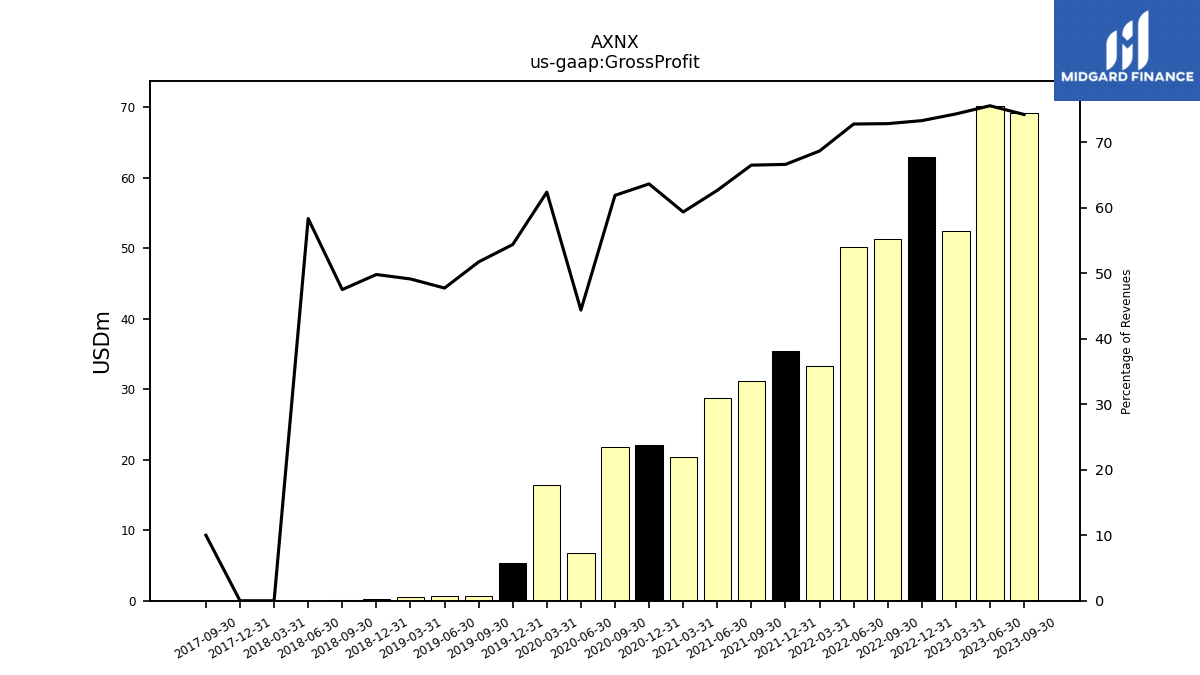
| Gross Profit | 69.25 | 82.76 | 69.10 | 70.19 | 52.50 | 62.97 | 51.26 | 50.20 | 33.24 | 35.39 | 31.19 | 28.73 | 20.40 | 22.13 | 21.81 | 6.75 | 16.40 | 5.41 | 0.68 | 0.72 | 0.53 | 0.25 | 0.10 | 0.01 | 0.00 | 0.00 | 0.01 | |
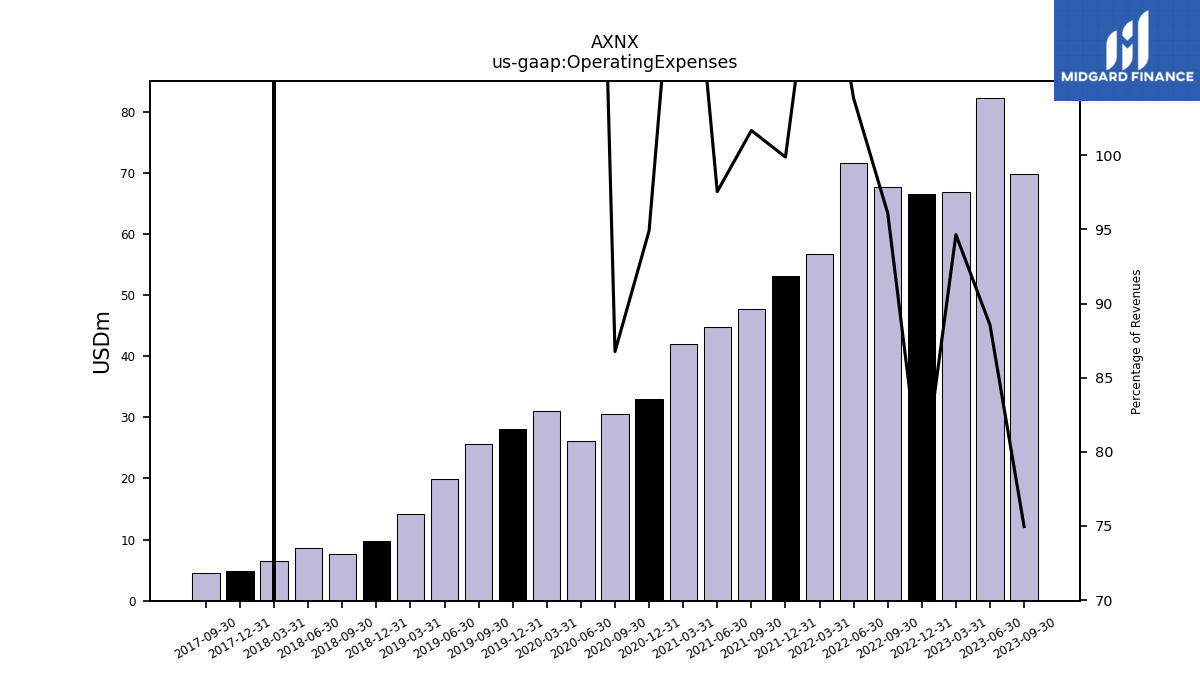
| Operating Expenses | 88.43 | 81.69 | 69.79 | 82.26 | 66.87 | 66.58 | 67.64 | 71.62 | 56.77 | 53.07 | 47.70 | 44.74 | 42.02 | 33.01 | 30.58 | 26.16 | 31.11 | 28.07 | 25.72 | 19.99 | 14.15 | 9.70 | 7.64 | 8.62 | 6.53 | 4.94 | 4.60 | |
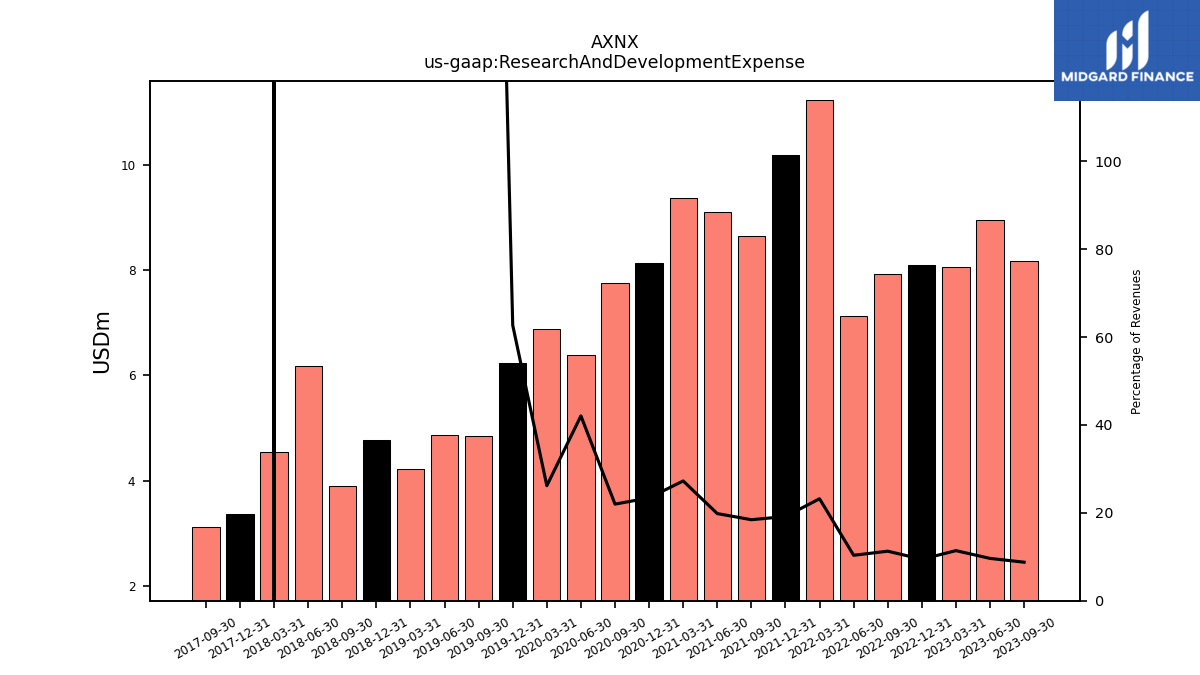
| Research And Development Expense | 11.06 | 9.71 | 8.17 | 8.95 | 8.06 | 8.10 | 7.94 | 7.13 | 11.24 | 10.18 | 8.65 | 9.10 | 9.37 | 8.14 | 7.75 | 6.40 | 6.88 | 6.23 | 4.86 | 4.87 | 4.22 | 4.78 | 3.90 | 6.18 | 4.54 | 3.37 | 3.13 | |
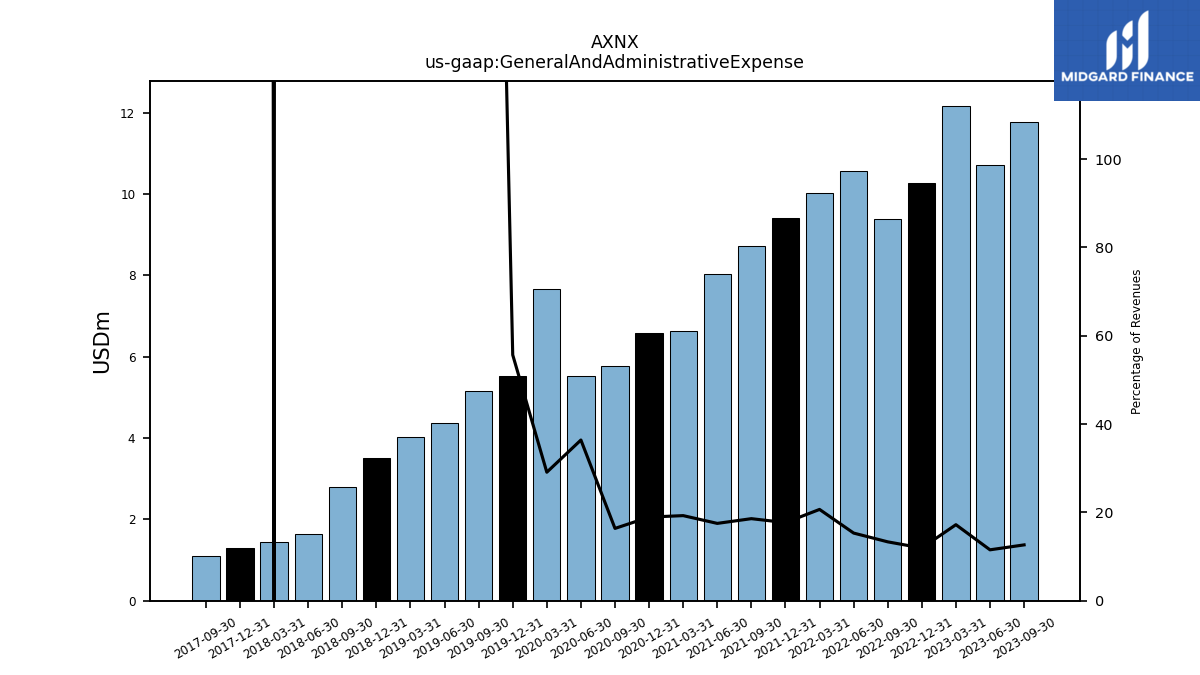
| General And Administrative Expense | 15.10 | 11.10 | 11.78 | 10.71 | 12.17 | 10.26 | 9.39 | 10.57 | 10.01 | 9.40 | 8.72 | 8.04 | 6.63 | 6.59 | 5.77 | 5.54 | 7.65 | 5.54 | 5.16 | 4.36 | 4.01 | 3.50 | 2.79 | 1.64 | 1.44 | 1.30 | 1.10 | |
| Selling And Marketing Expense | 56.19 | 55.09 | 47.54 | 44.27 | 42.65 | 43.82 | 39.75 | 39.38 | 33.06 | 31.34 | 28.11 | 25.41 | 20.93 | 18.28 | 17.06 | 14.22 | 16.57 | 16.30 | 15.71 | 10.75 | 5.91 | 1.42 | 0.95 | 0.81 | 0.55 | 0.26 | 0.37 | |
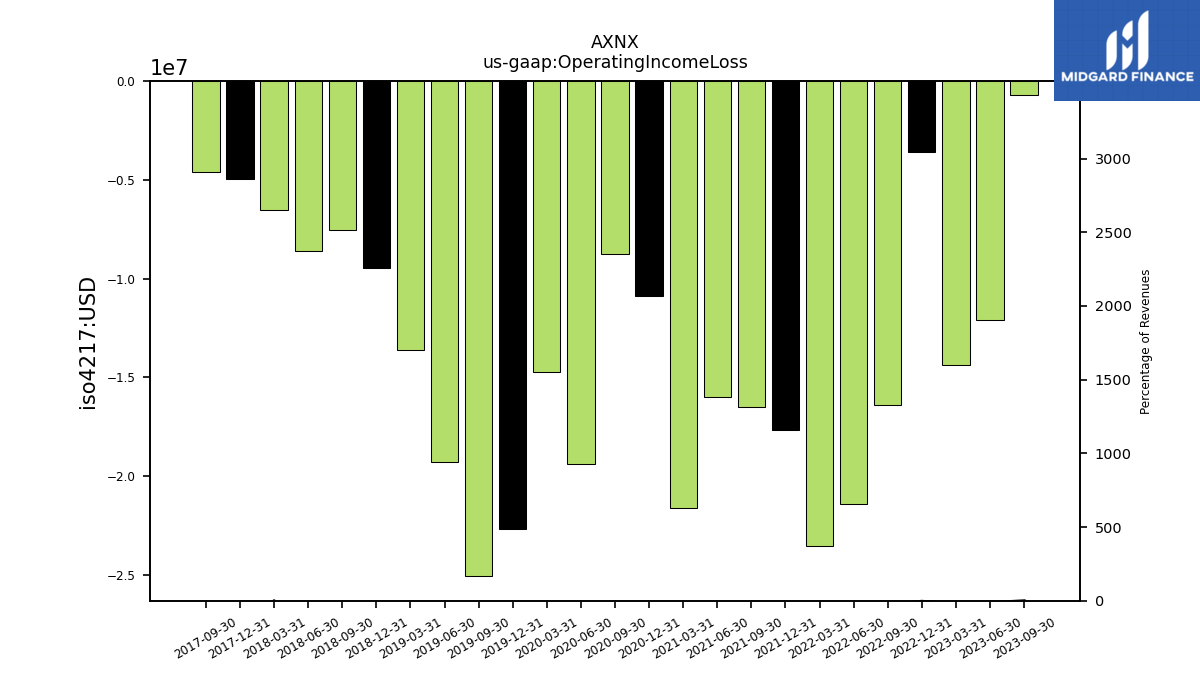
| Operating Income Loss | -19.18 | 1.07 | -0.69 | -12.07 | -14.37 | -3.61 | -16.38 | -21.43 | -23.53 | -17.68 | -16.50 | -16.01 | -21.62 | -10.88 | -8.77 | -19.41 | -14.71 | -22.66 | -25.05 | -19.27 | -13.62 | -9.45 | -7.54 | -8.62 | -6.53 | -4.94 | -4.59 | |
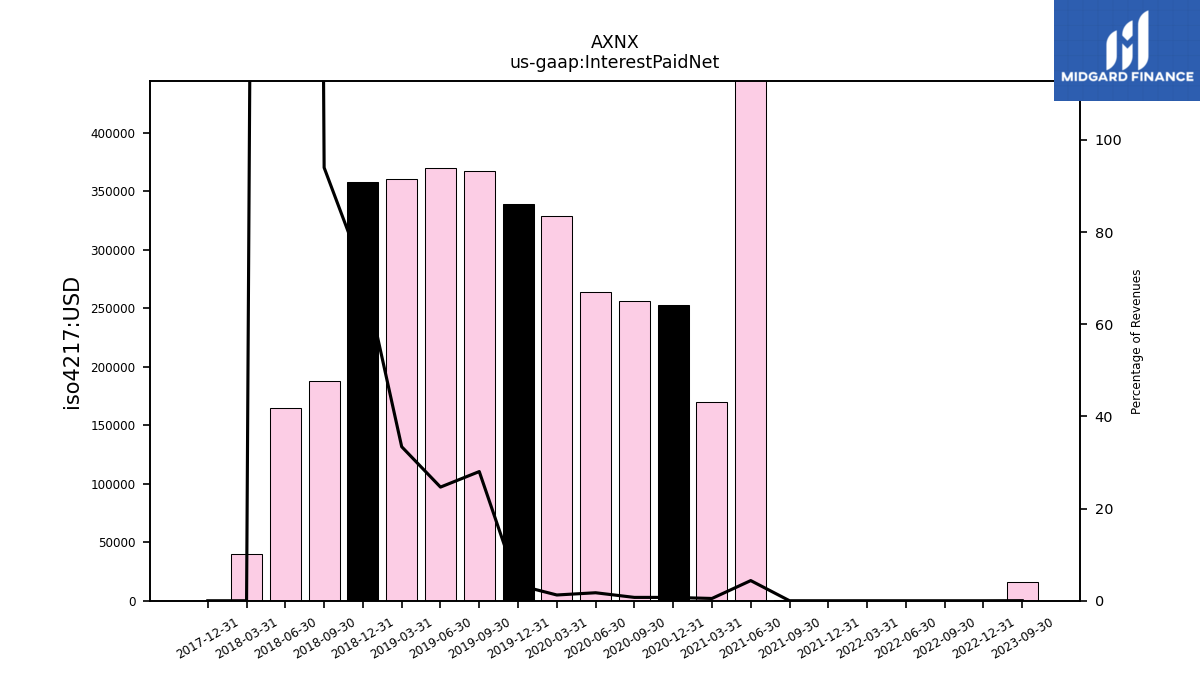
| Interest Paid Net | NA | 0.01 | 0.02 | NA | NA | 0.00 | 0.00 | 0.00 | 0.00 | 0.00 | 0.00 | 2.01 | 0.17 | 0.25 | 0.26 | 0.26 | 0.33 | 0.34 | 0.37 | 0.37 | 0.36 | 0.36 | 0.19 | 0.17 | 0.04 | 0.00 | NA | |
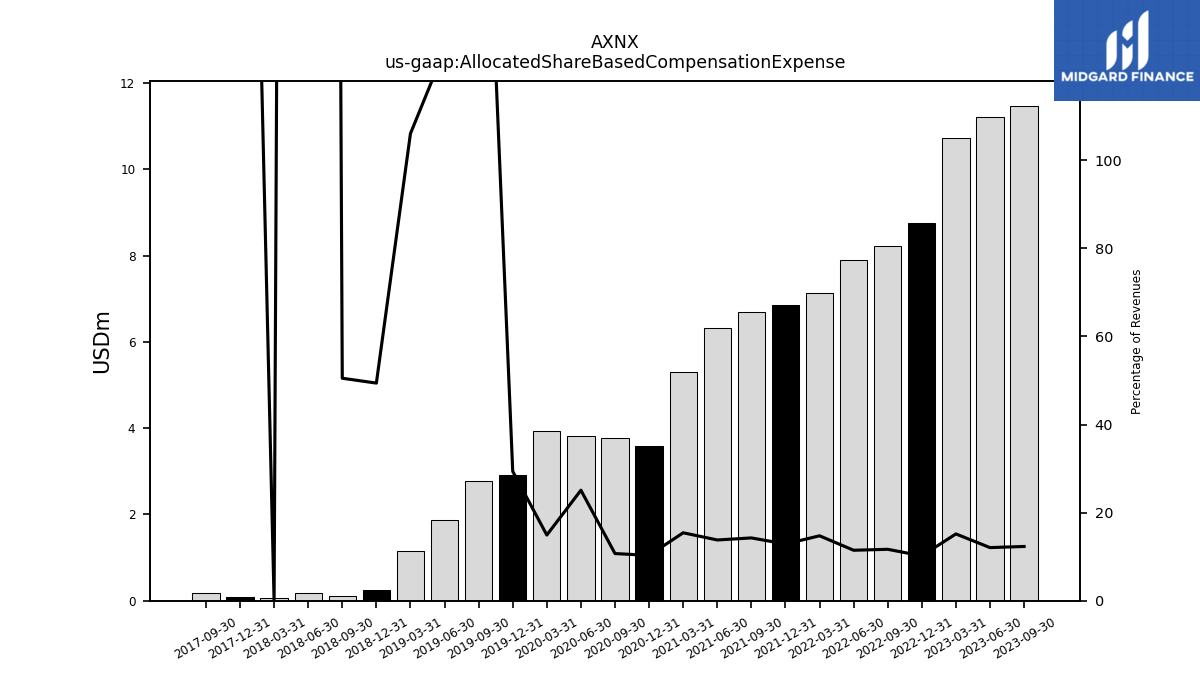
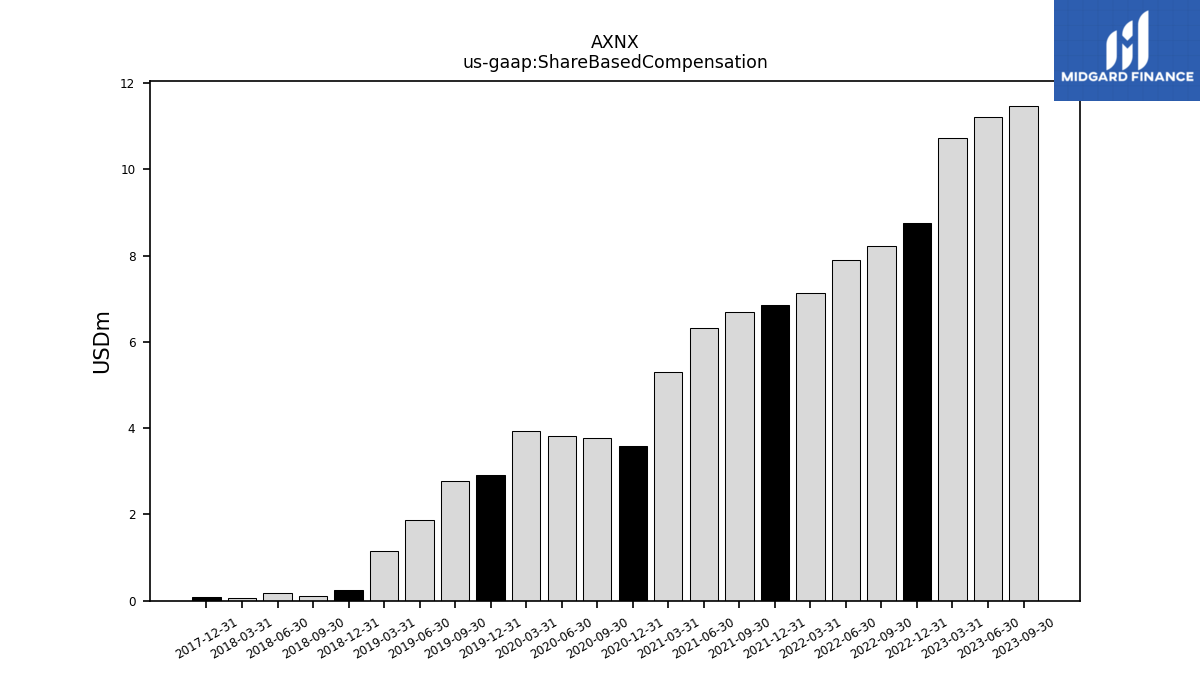
| Allocated Share Based Compensation Expense | 9.55 | 11.15 | 11.47 | 11.20 | 10.71 | 8.76 | 8.22 | 7.91 | 7.14 | 6.84 | 6.69 | 6.33 | 5.30 | 3.58 | 3.77 | 3.82 | 3.92 | 2.92 | 2.78 | 1.88 | 1.14 | 0.25 | 0.10 | 0.19 | 0.07 | 0.09 | 0.17 | |
| Income Tax Expense Benefit | 3.85 | -1.12 | -0.43 | -0.30 | -0.81 | -0.52 | -0.52 | -0.47 | -1.11 | -2.49 | 0.53 | 3.30 | -0.56 | 0.00 | 0.00 | 0.00 | 0.00 | 0.00 | 0.00 | 0.00 | 0.00 | 0.00 | 0.00 | 0.00 | 0.00 | 0.00 | 0.00 | |
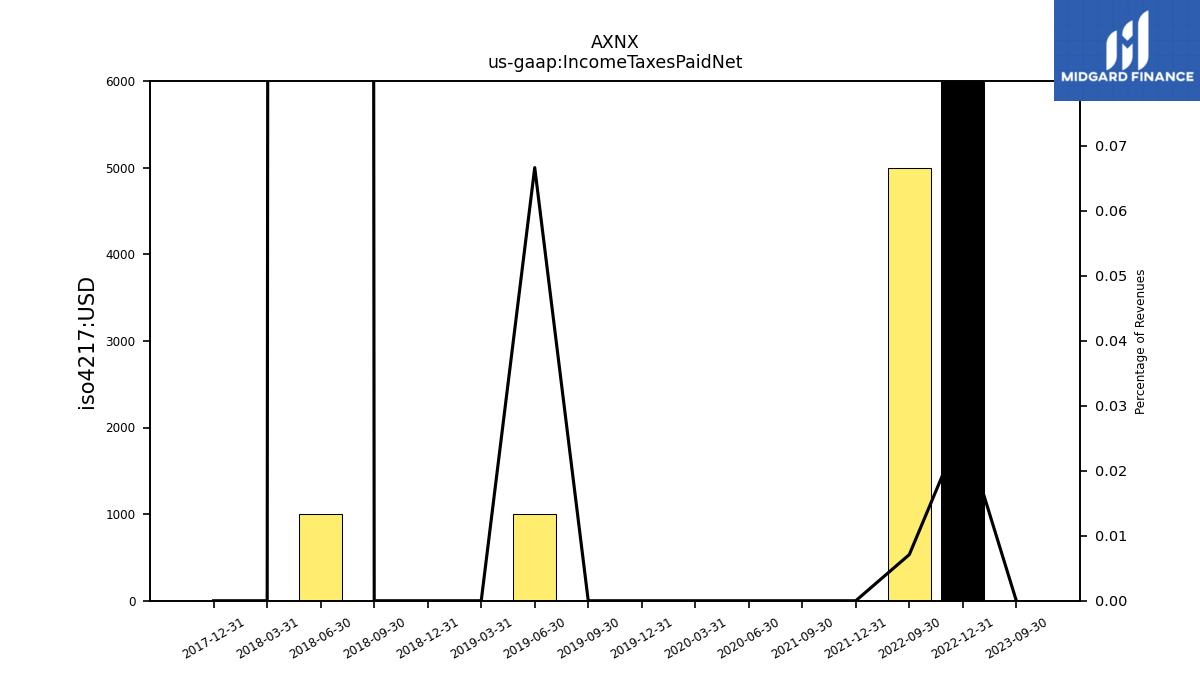
| Income Taxes Paid Net | 0.40 | 0.16 | 0.00 | NA | NA | 0.02 | 0.01 | NA | NA | 0.00 | 0.00 | NA | NA | NA | NA | 0.00 | 0.00 | 0.00 | 0.00 | 0.00 | 0.00 | 0.00 | 0.00 | 0.00 | 0.00 | 0.00 | NA | |
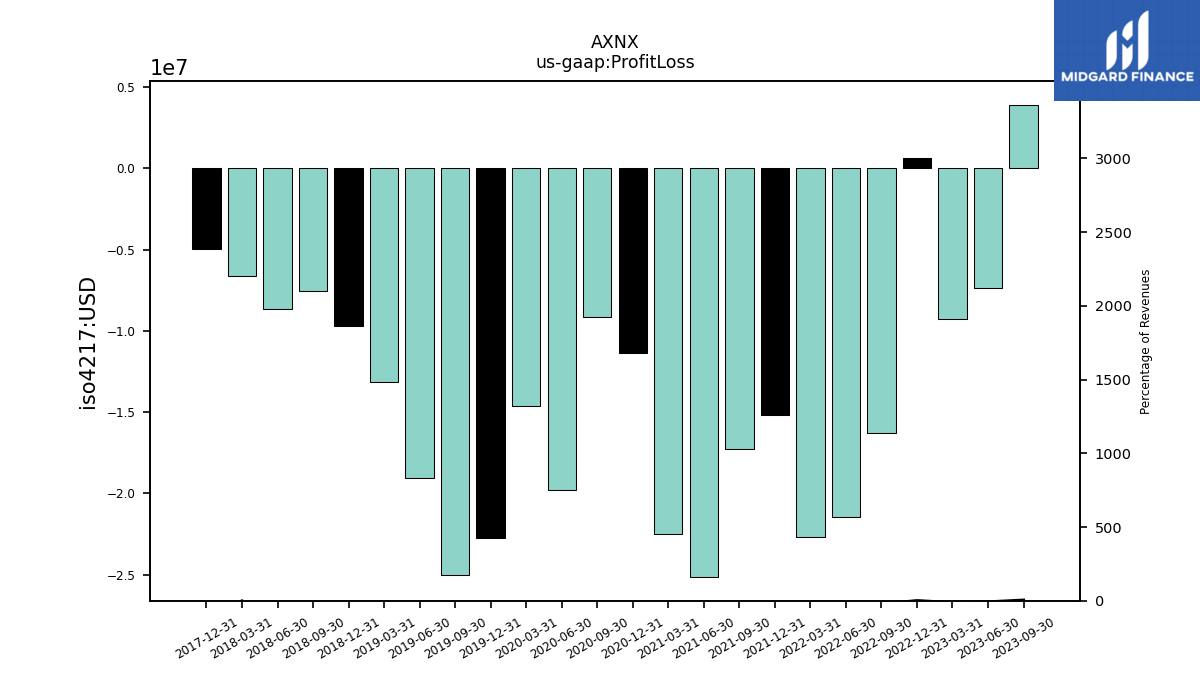
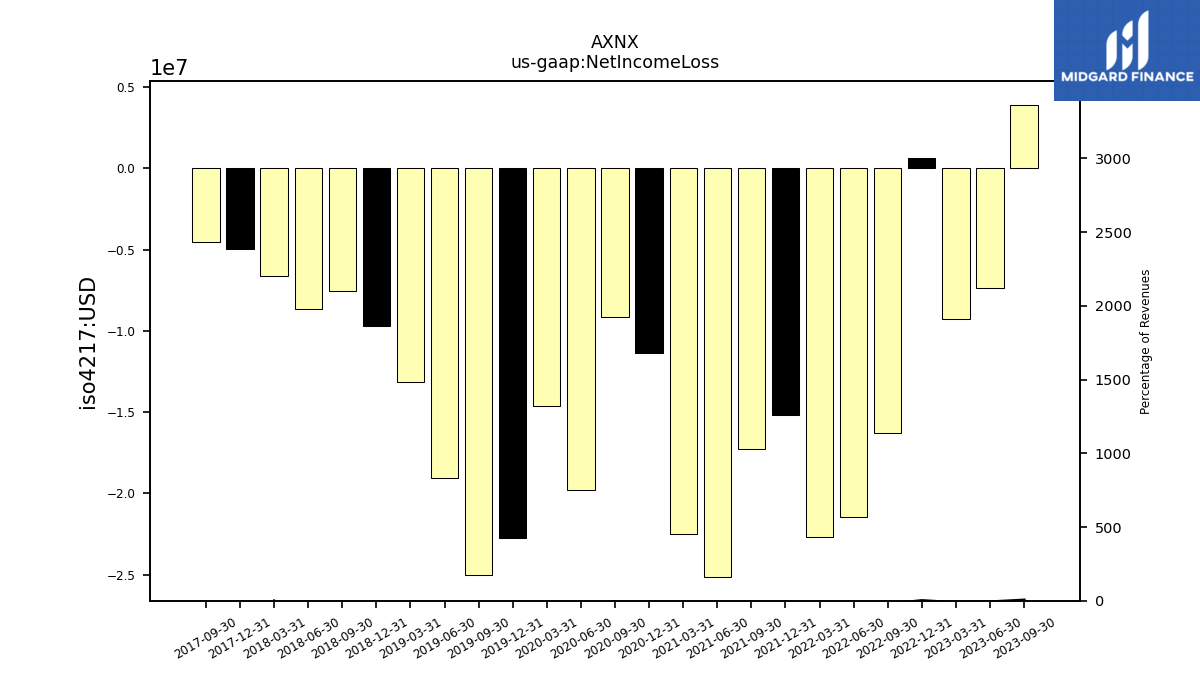
| Profit Loss | -19.11 | 6.57 | 3.93 | -7.34 | -9.25 | 0.67 | -16.25 | -21.44 | -22.67 | -15.17 | -17.25 | -25.15 | -22.50 | -11.35 | -9.17 | -19.78 | -14.62 | -22.75 | -25.01 | -19.06 | -13.12 | -9.66 | -7.57 | -8.65 | -6.60 | -4.93 | NA | |
| Net Income Loss | -19.11 | 6.57 | 3.93 | -7.34 | -9.25 | 0.67 | -16.25 | -21.44 | -22.67 | -15.17 | -17.25 | -25.15 | -22.50 | -11.35 | -9.17 | -19.78 | -14.62 | -22.75 | -25.01 | -19.06 | -13.12 | -9.66 | -7.57 | -8.65 | -6.60 | -4.93 | -4.52 | |
| Comprehensive Income Net Of Tax | -20.26 | 15.22 | -2.26 | -3.59 | -6.18 | 11.70 | -28.31 | -34.09 | -27.59 | -14.81 | -22.39 | -24.29 | -24.70 | -11.16 | -9.07 | -19.89 | -14.79 | -22.60 | -25.12 | -19.10 | -13.13 | -9.68 | -7.57 | -8.65 | -6.61 | -4.93 | -4.00 |
| 2024-03-31 | 2023-12-31 | 2023-09-30 | 2023-06-30 | 2023-03-31 | 2022-12-31 | 2022-09-30 | 2022-06-30 | 2022-03-31 | 2021-12-31 | 2021-09-30 | 2021-06-30 | 2021-03-31 | 2020-12-31 | 2020-09-30 | 2020-06-30 | 2020-03-31 | 2019-12-31 | 2019-09-30 | 2019-06-30 | 2019-03-31 | 2018-12-31 | 2018-09-30 | 2018-06-30 | 2018-03-31 | 2017-12-31 | 2017-09-30 | ||
|---|---|---|---|---|---|---|---|---|---|---|---|---|---|---|---|---|---|---|---|---|---|---|---|---|---|---|---|---|
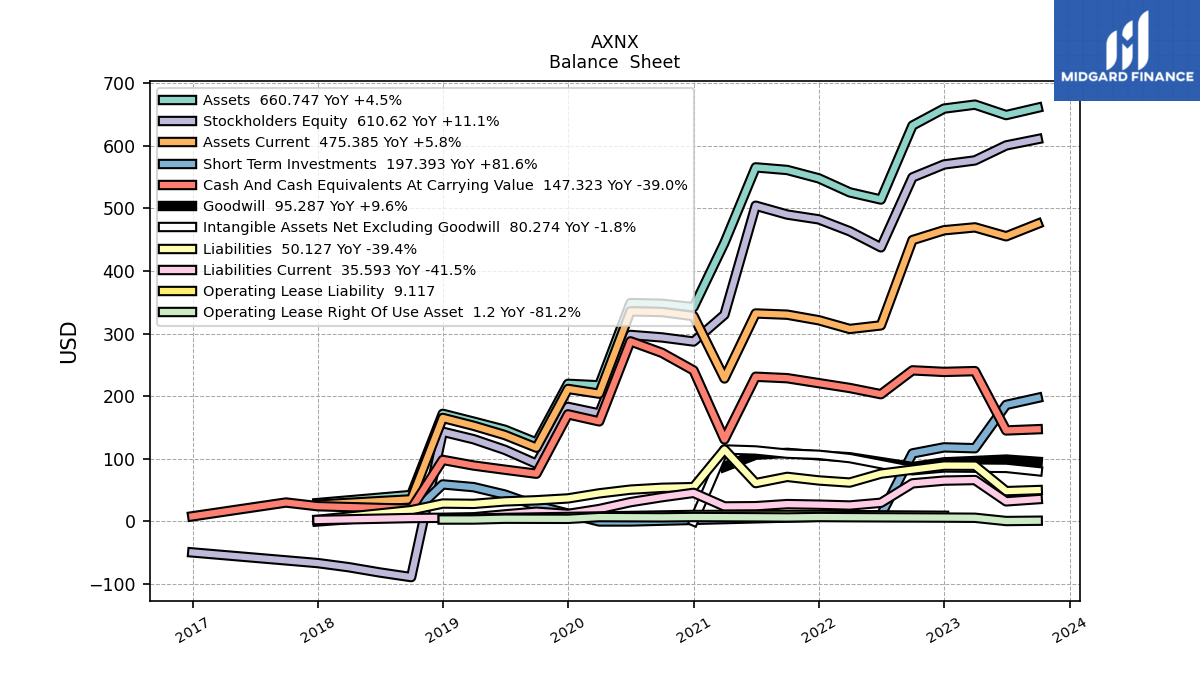
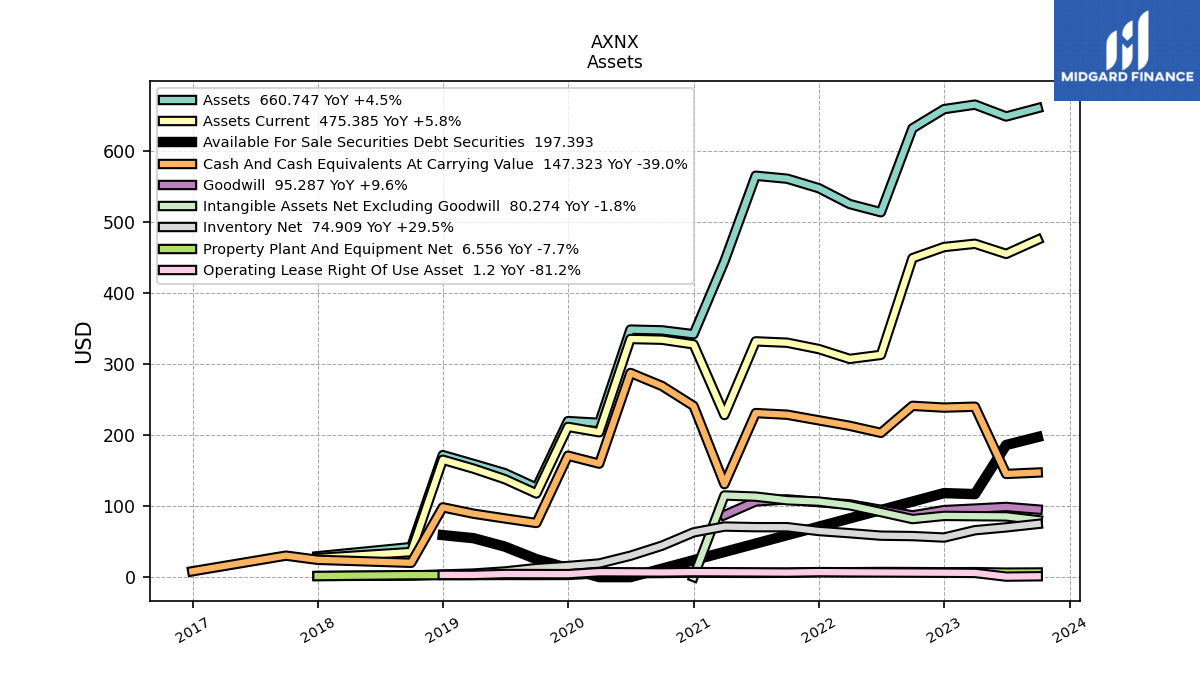
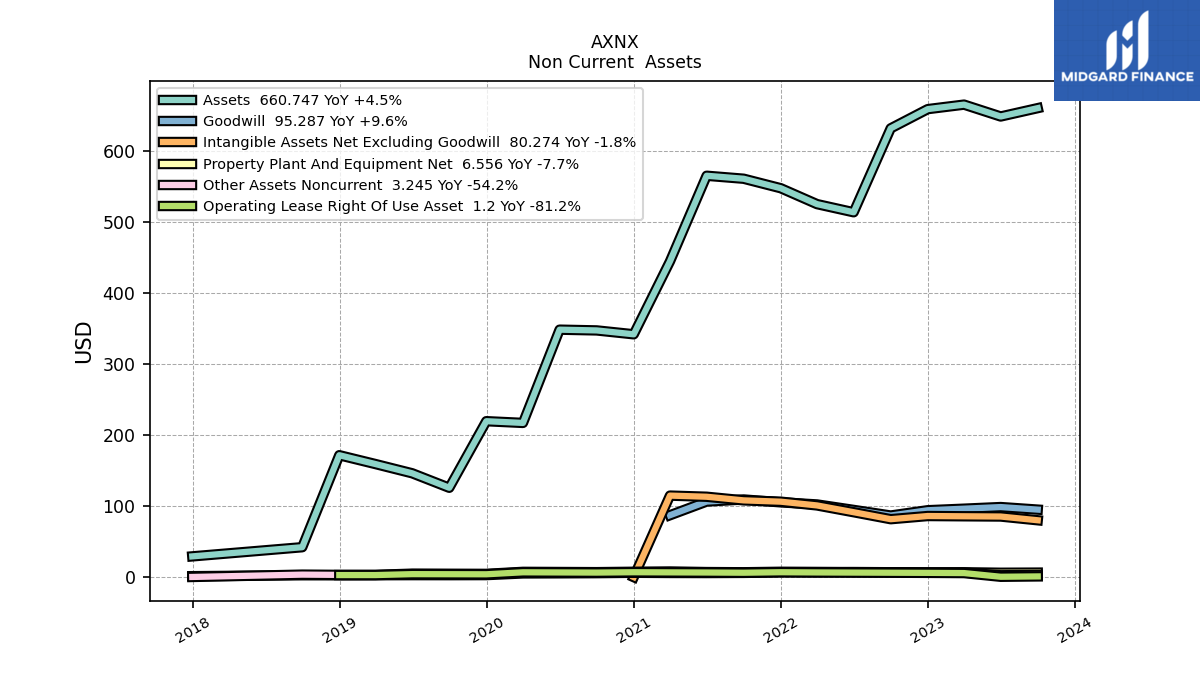
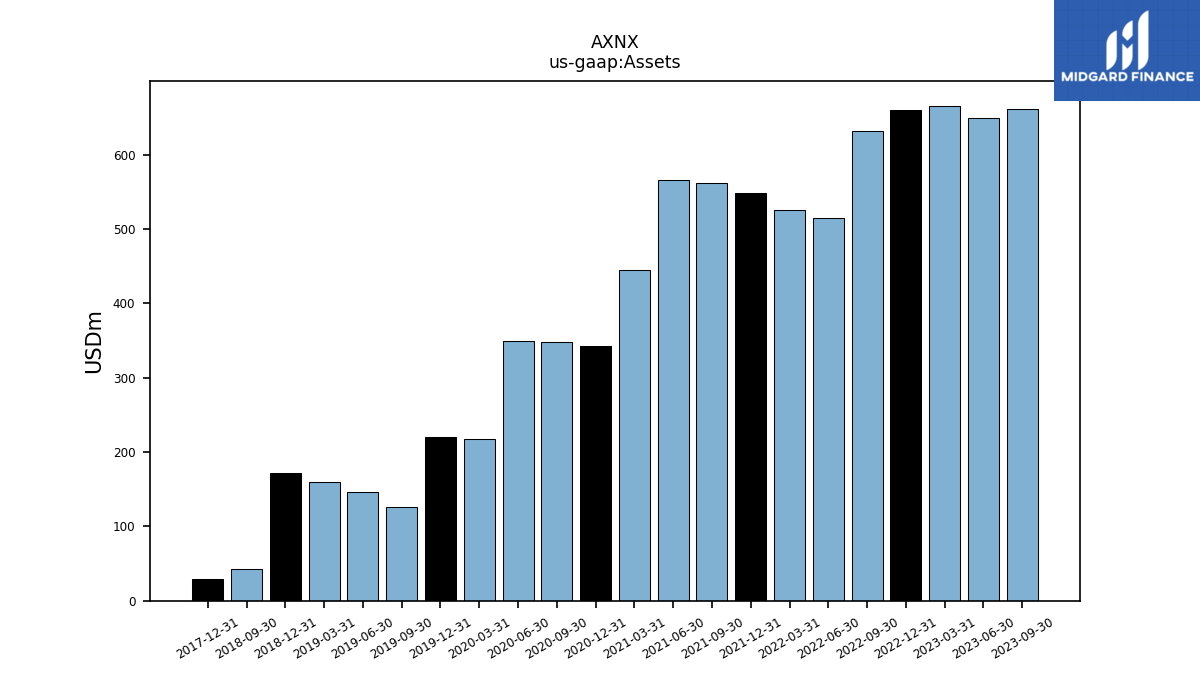
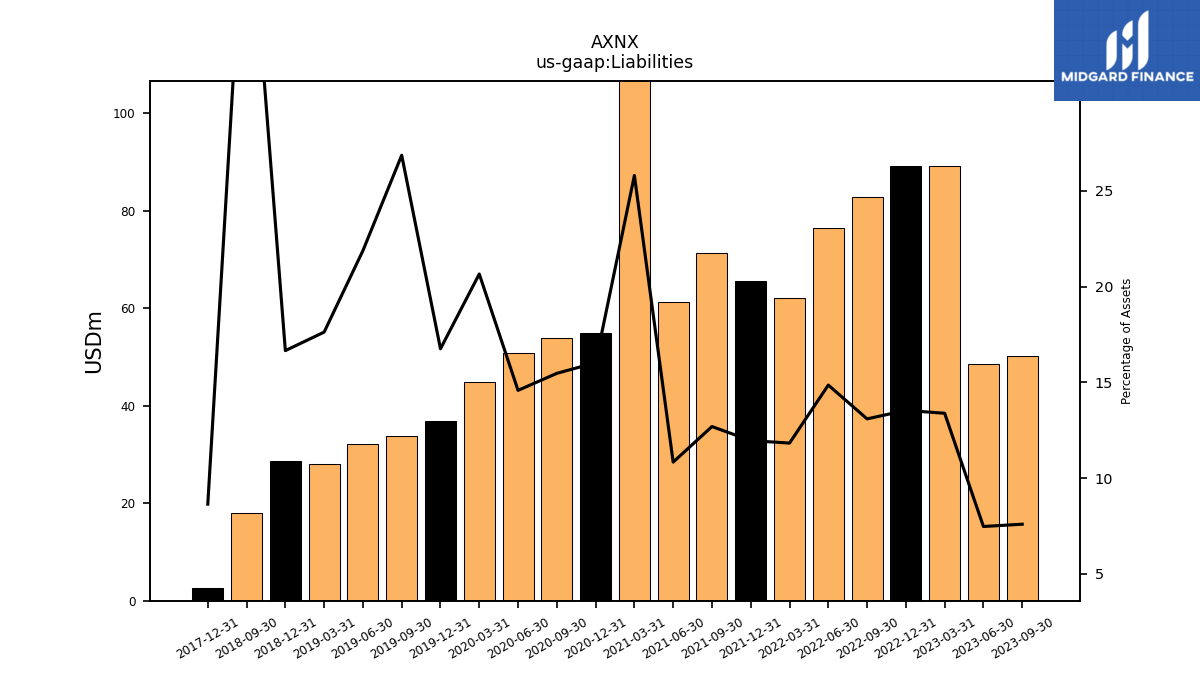
| Assets | 715.56 | 719.92 | 660.75 | 648.99 | 665.69 | 659.35 | 632.28 | 514.09 | 525.57 | 547.95 | 561.30 | 565.51 | 444.97 | 342.21 | 347.67 | 348.74 | 217.38 | 219.82 | 126.04 | 146.45 | 159.43 | 171.91 | 42.32 | NA | NA | 29.41 | NA | |
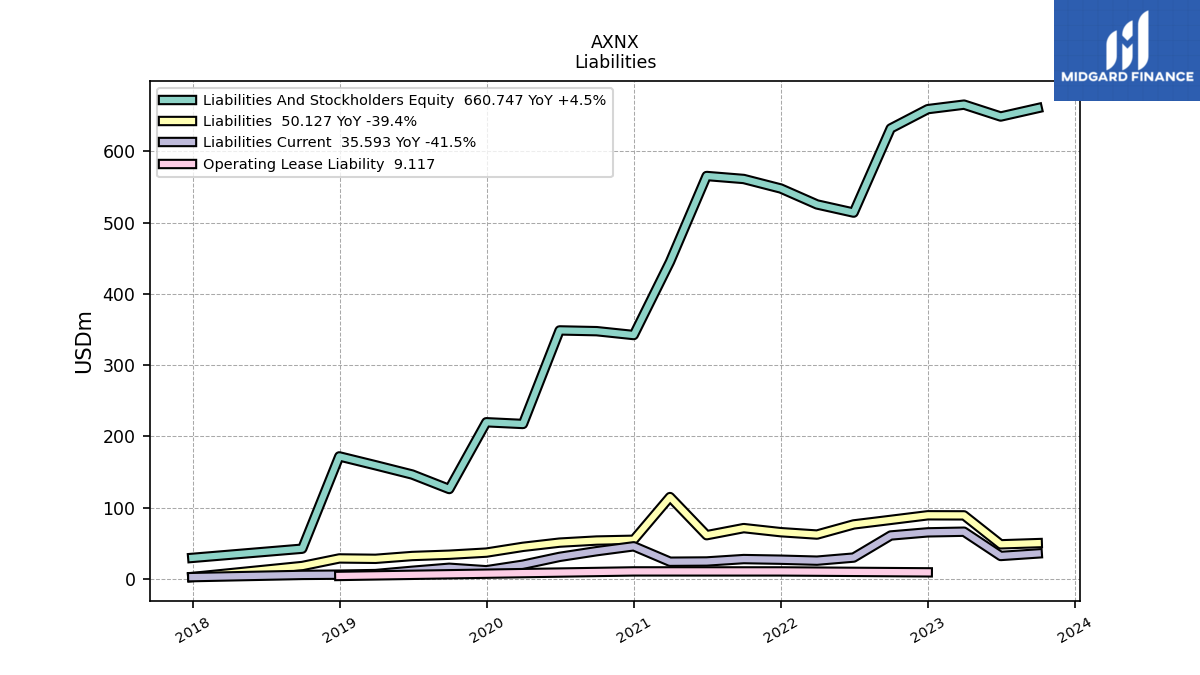
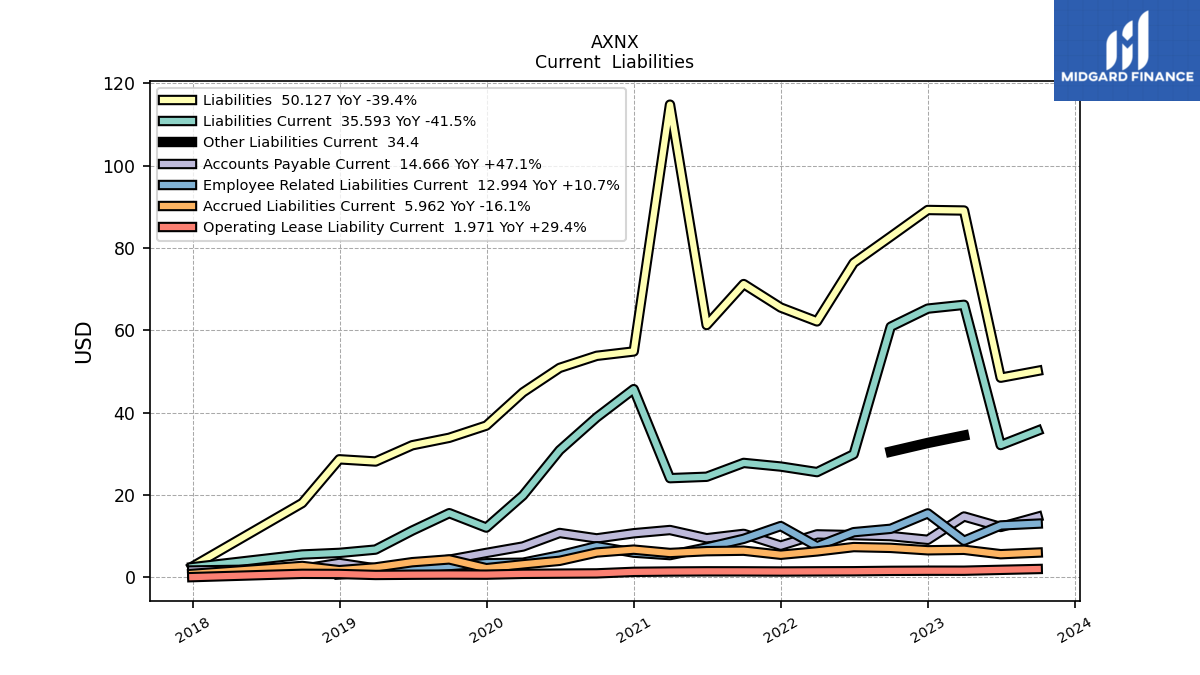
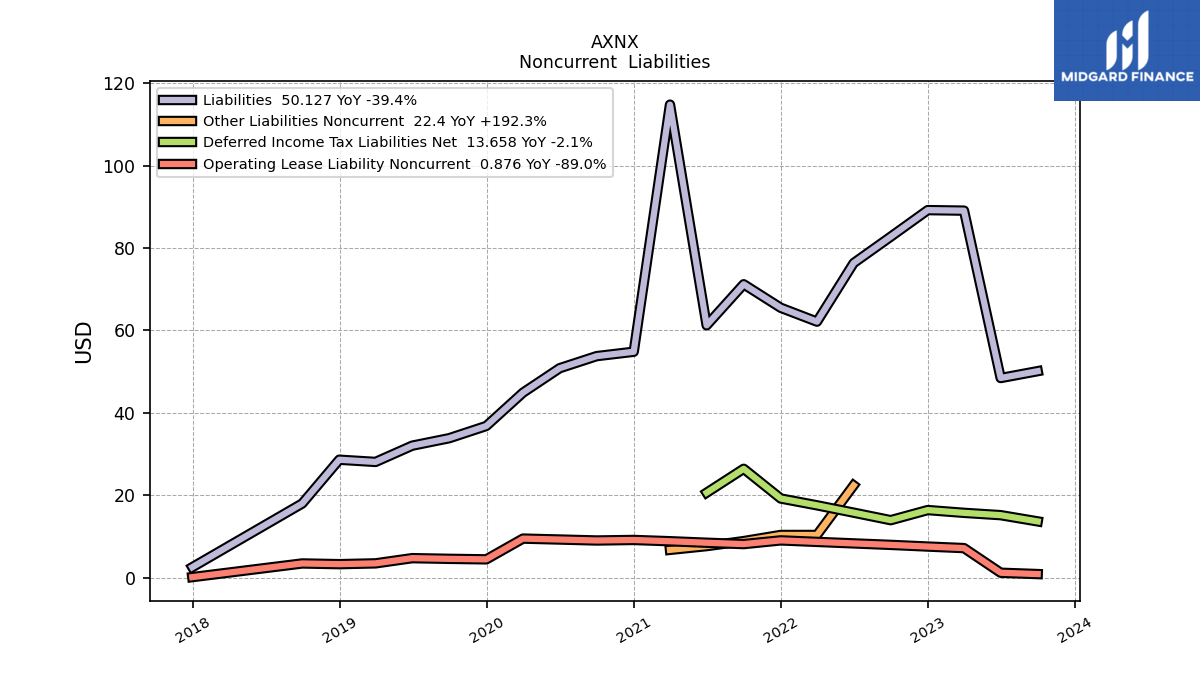
| Liabilities | 88.46 | 82.36 | 50.13 | 48.46 | 89.08 | 89.21 | 82.76 | 76.36 | 62.14 | 65.51 | 71.22 | 61.25 | 114.82 | 54.84 | 53.77 | 50.84 | 44.90 | 36.82 | 33.86 | 32.04 | 28.09 | 28.63 | 18.00 | NA | NA | 2.54 | NA | |
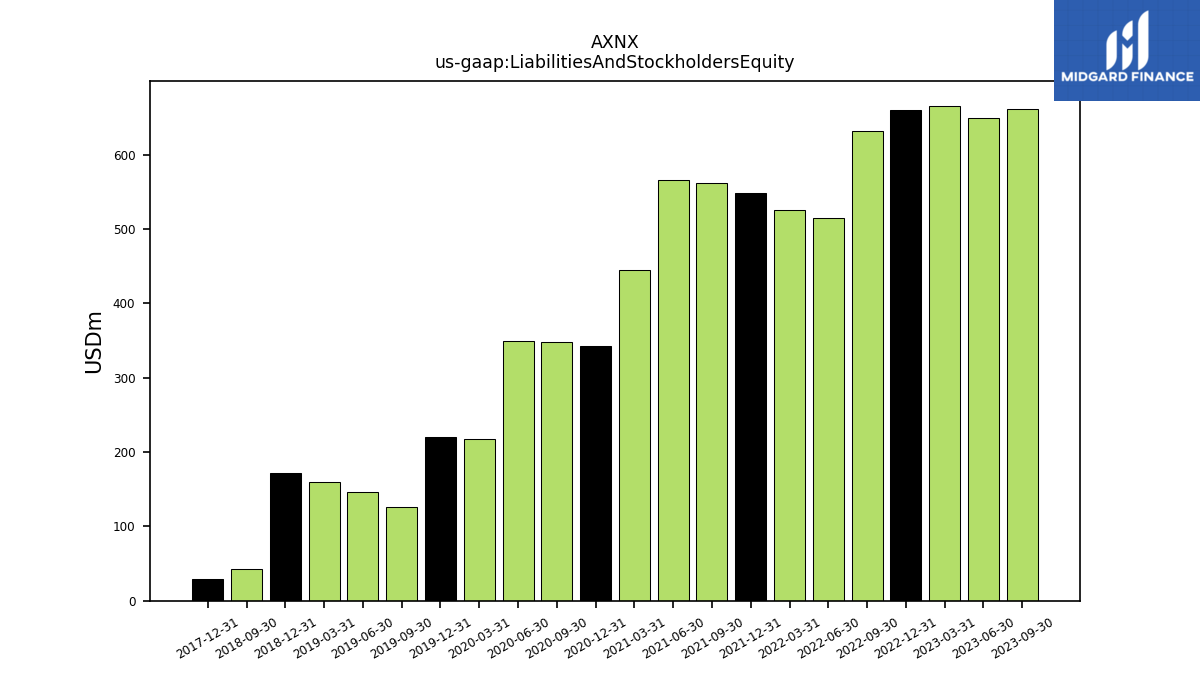
| Liabilities And Stockholders Equity | 715.56 | 719.92 | 660.75 | 648.99 | 665.69 | 659.35 | 632.28 | 514.09 | 525.57 | 547.95 | 561.30 | 565.51 | 444.97 | 342.21 | 347.67 | 348.74 | 217.38 | 219.82 | 126.04 | 146.45 | 159.43 | 171.91 | 42.32 | NA | NA | 29.41 | NA | |
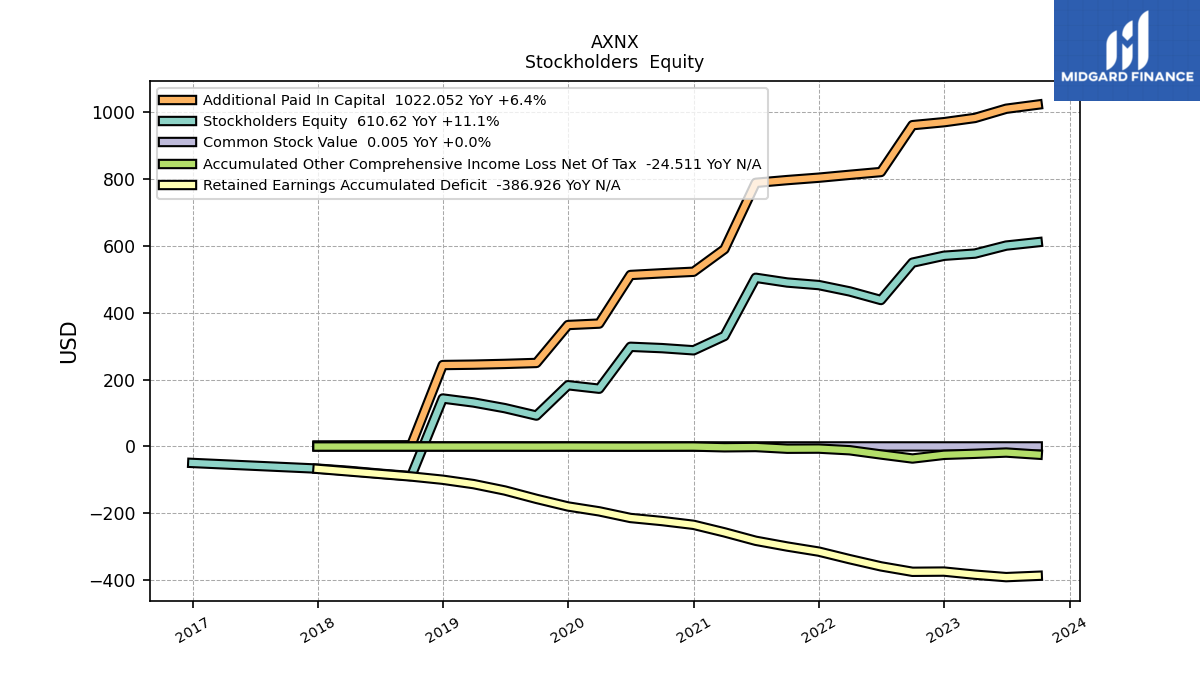
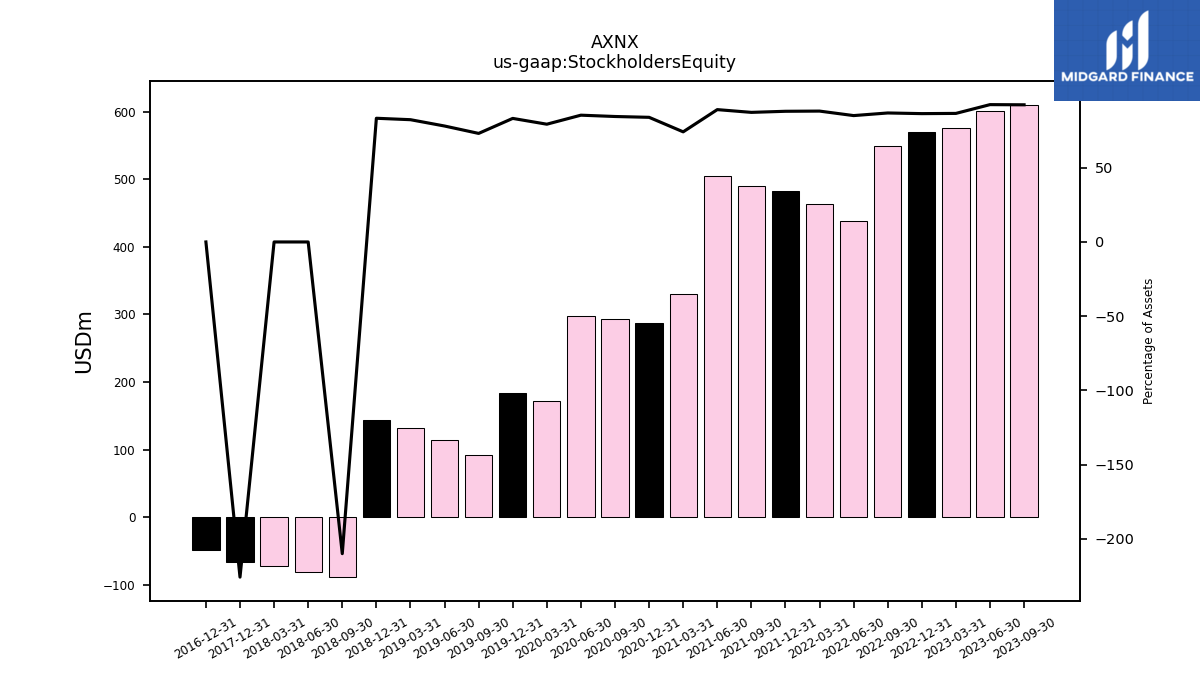
| Stockholders Equity | 627.10 | 637.56 | 610.62 | 600.53 | 576.61 | 570.14 | 549.52 | 437.73 | 463.43 | 482.44 | 490.09 | 504.26 | 330.15 | 287.37 | 293.90 | 297.90 | 172.48 | 183.00 | 92.19 | 114.41 | 131.33 | 143.28 | -88.88 | -81.42 | -72.96 | -66.42 | NA |
| 2024-03-31 | 2023-12-31 | 2023-09-30 | 2023-06-30 | 2023-03-31 | 2022-12-31 | 2022-09-30 | 2022-06-30 | 2022-03-31 | 2021-12-31 | 2021-09-30 | 2021-06-30 | 2021-03-31 | 2020-12-31 | 2020-09-30 | 2020-06-30 | 2020-03-31 | 2019-12-31 | 2019-09-30 | 2019-06-30 | 2019-03-31 | 2018-12-31 | 2018-09-30 | 2018-06-30 | 2018-03-31 | 2017-12-31 | 2017-09-30 | ||
|---|---|---|---|---|---|---|---|---|---|---|---|---|---|---|---|---|---|---|---|---|---|---|---|---|---|---|---|---|
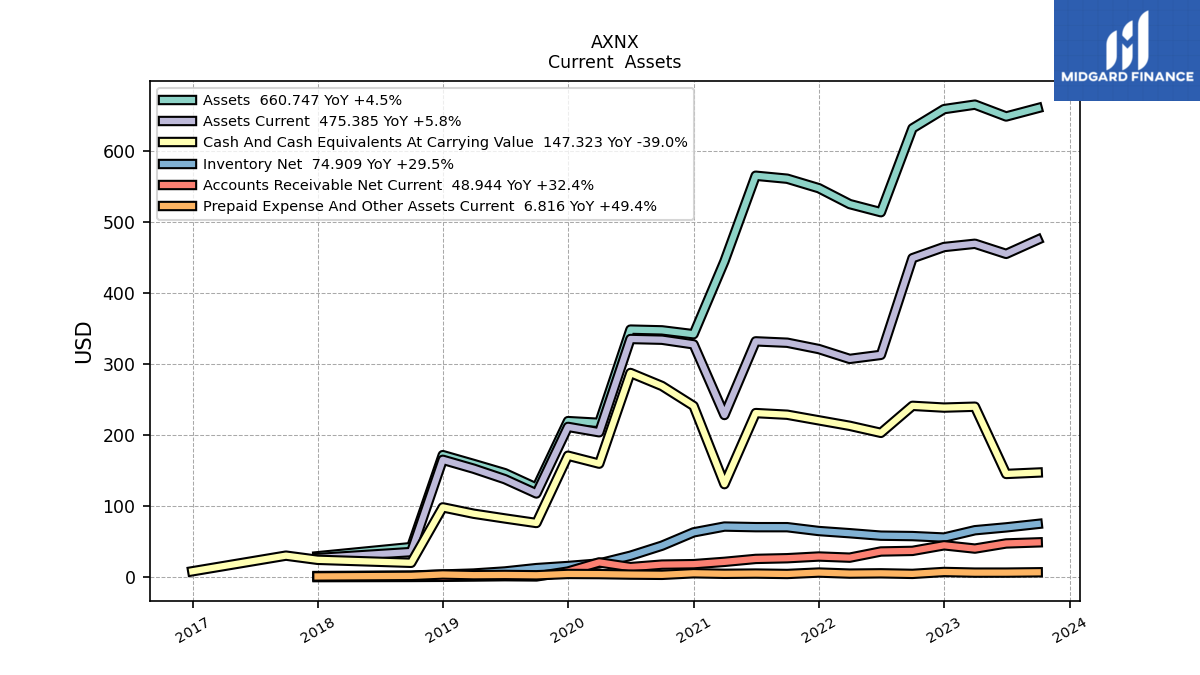
| Assets Current | 482.03 | 491.42 | 475.38 | 455.40 | 469.67 | 465.07 | 449.36 | 313.13 | 307.43 | 321.32 | 330.23 | 332.18 | 228.37 | 327.95 | 334.46 | 335.50 | 204.06 | 211.68 | 117.82 | 138.02 | 152.80 | 165.34 | 35.34 | NA | NA | 26.92 | NA | |
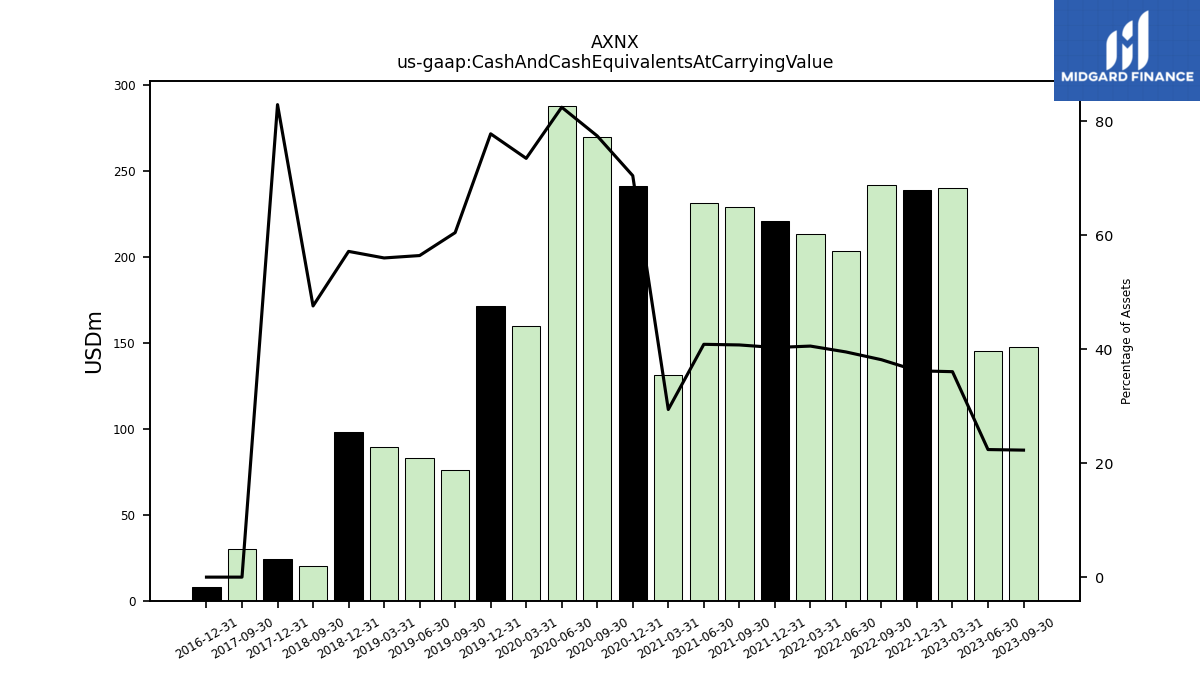
| Cash And Cash Equivalents At Carrying Value | 232.65 | 104.81 | 147.32 | 145.34 | 240.10 | 238.85 | 241.33 | 203.24 | 213.18 | 220.88 | 228.80 | 231.14 | 130.96 | 241.18 | 269.28 | 287.68 | 159.82 | 171.08 | 76.23 | 82.68 | 89.33 | 98.31 | 20.15 | NA | NA | 24.40 | 30.27 | |
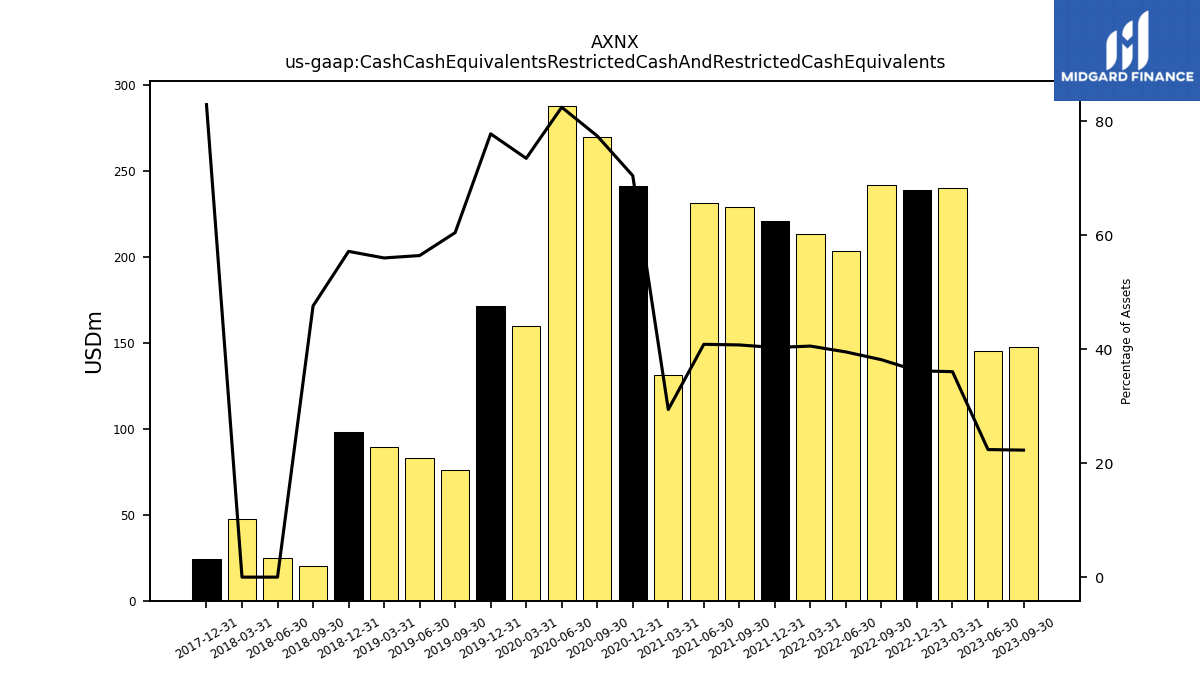
| Cash Cash Equivalents Restricted Cash And Restricted Cash Equivalents | 248.47 | 117.53 | 147.32 | 145.34 | 240.10 | 238.85 | 241.33 | 203.24 | 213.18 | 220.88 | 228.80 | 231.14 | 130.96 | 241.18 | 269.28 | 287.68 | 159.82 | 171.08 | 76.23 | 82.68 | 89.33 | 98.31 | 20.15 | 24.73 | 47.38 | 24.40 | NA | |
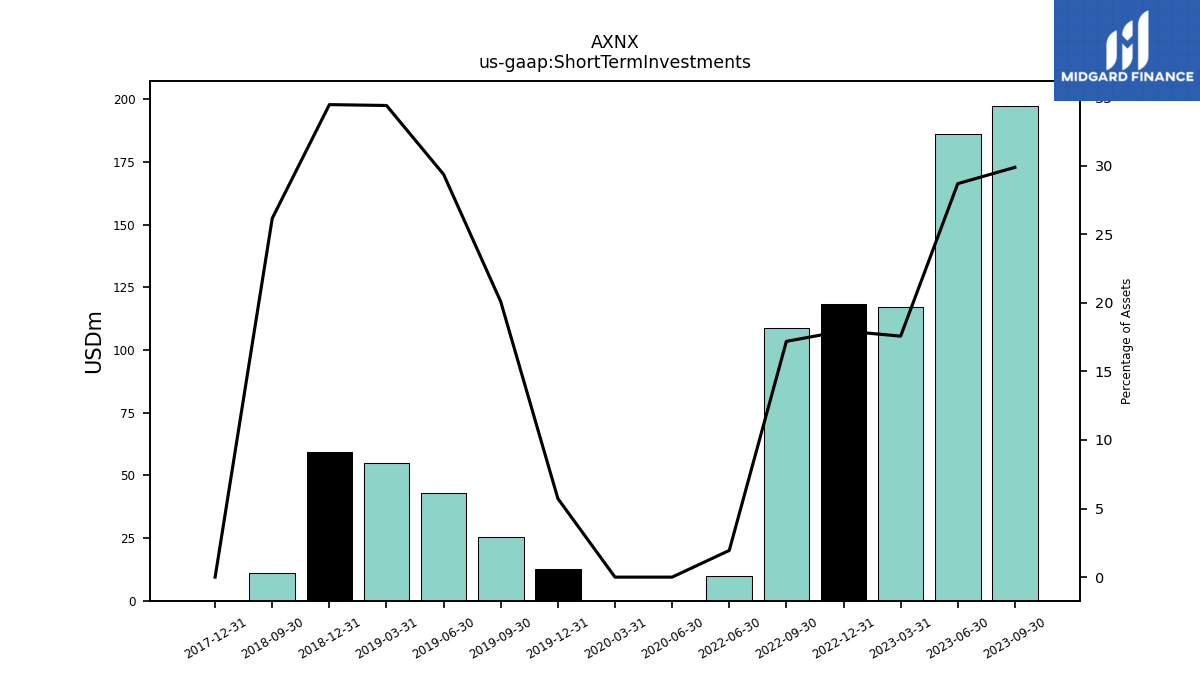
| Short Term Investments | 100.16 | 240.15 | 197.39 | 186.17 | 116.96 | 118.36 | 108.68 | 10.00 | NA | NA | NA | NA | NA | NA | NA | 0.00 | 0.00 | 12.59 | 25.31 | 43.00 | 54.82 | 59.22 | 11.07 | NA | NA | 0.00 | NA | |
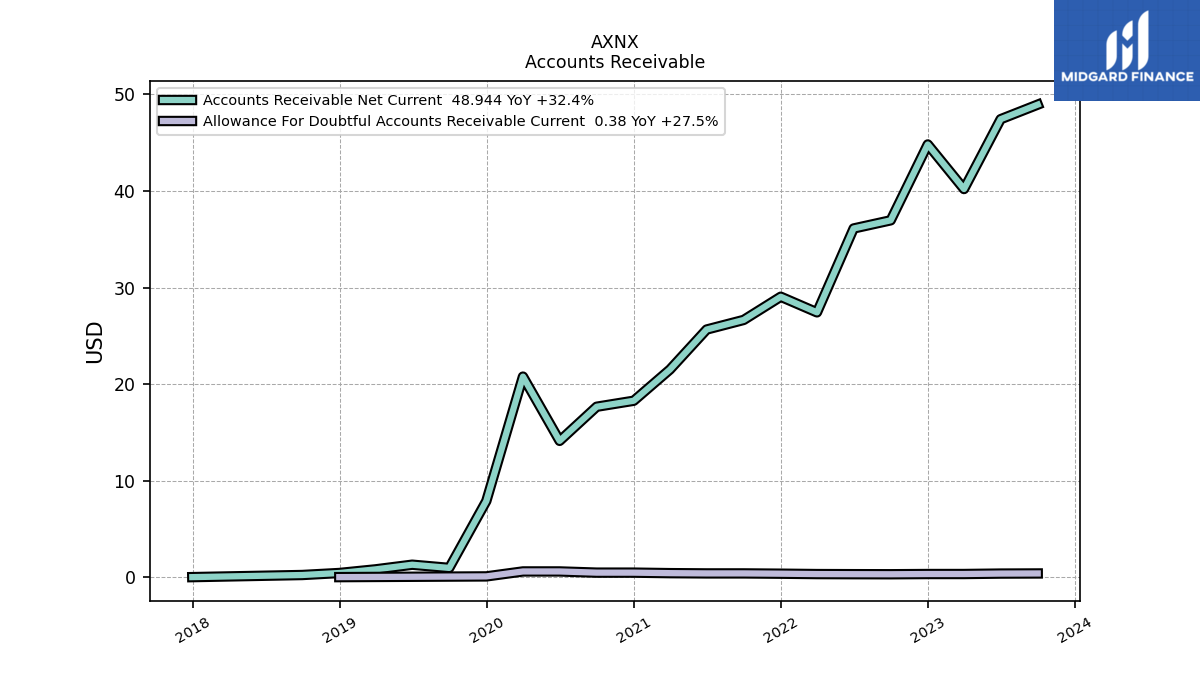
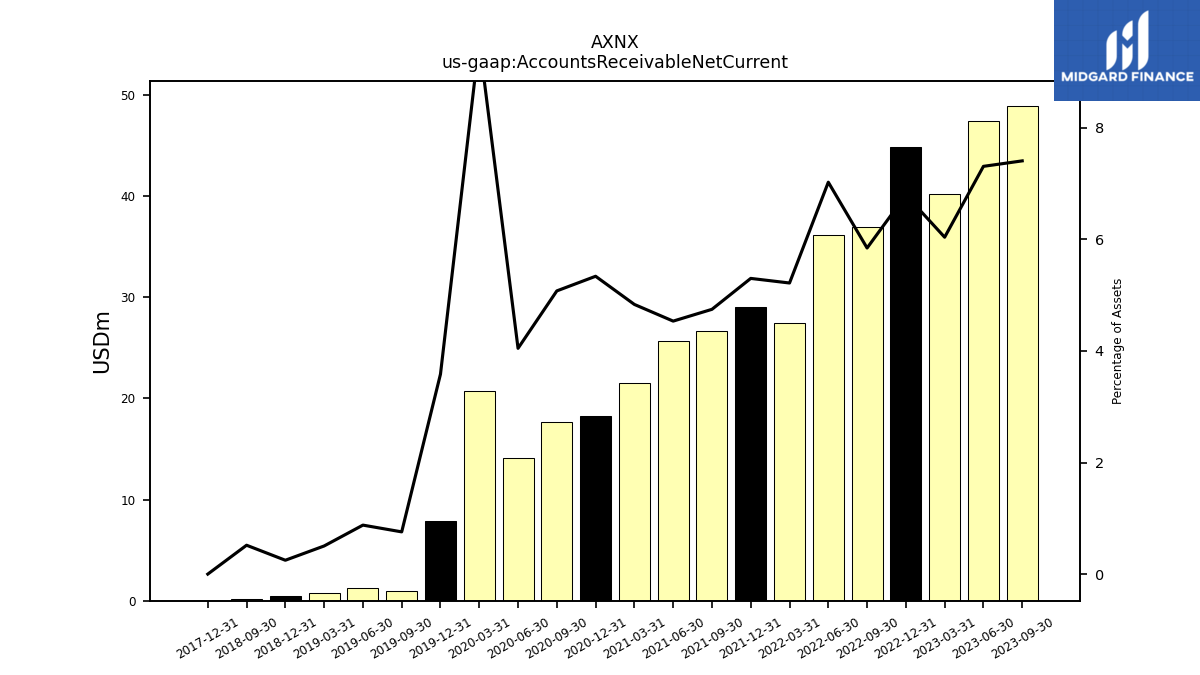
| Accounts Receivable Net Current | 50.53 | 57.24 | 48.94 | 47.44 | 40.20 | 44.82 | 36.96 | 36.12 | 27.43 | 29.04 | 26.64 | 25.65 | 21.51 | 18.27 | 17.65 | 14.12 | 20.77 | 7.88 | 0.95 | 1.29 | 0.80 | 0.43 | 0.22 | NA | NA | 0.00 | NA | |
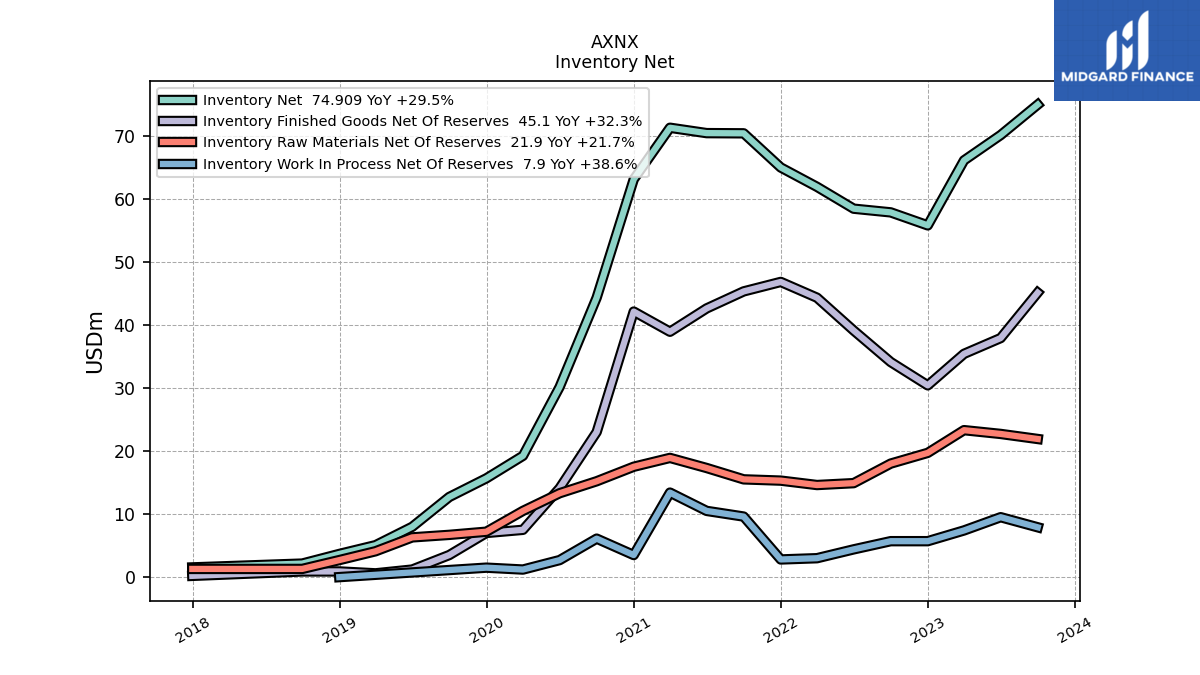
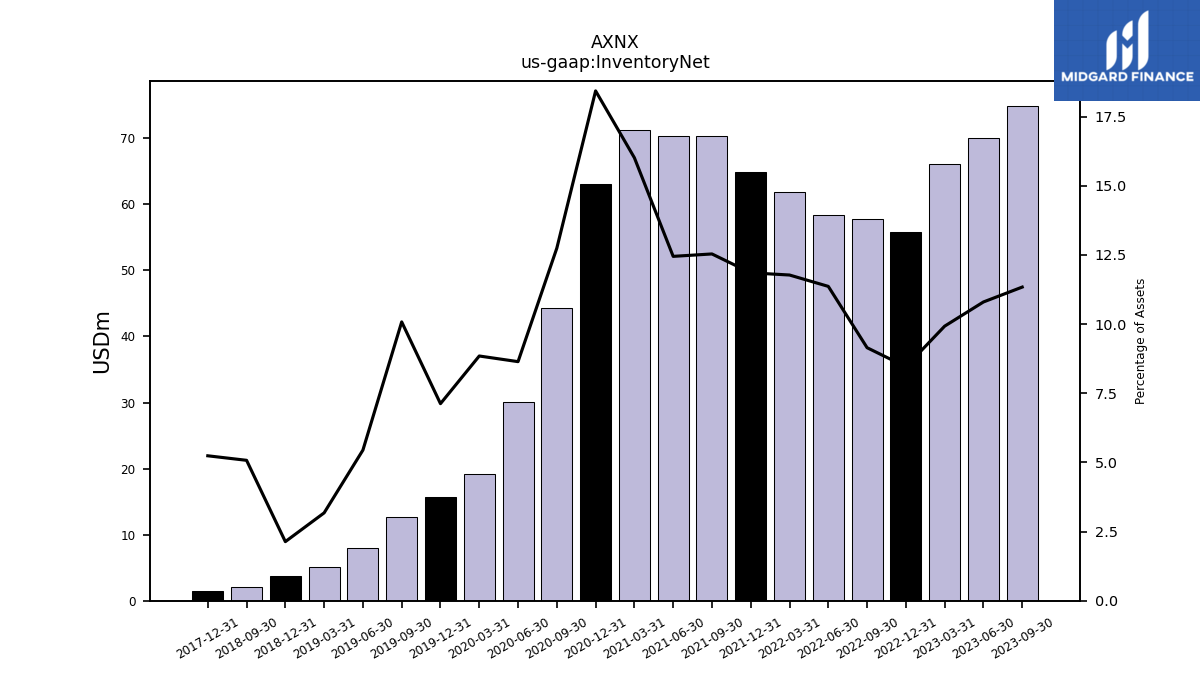
| Inventory Net | 93.19 | 79.94 | 74.91 | 70.08 | 66.07 | 55.77 | 57.83 | 58.41 | 61.88 | 64.95 | 70.36 | 70.39 | 71.24 | 63.06 | 44.31 | 30.14 | 19.23 | 15.66 | 12.70 | 7.97 | 5.06 | 3.67 | 2.15 | NA | NA | 1.54 | NA | |
| Prepaid Expense And Other Assets Current | 5.51 | 9.28 | 6.82 | 6.36 | 6.34 | 7.28 | 4.56 | 5.37 | 4.95 | 6.45 | 4.43 | 5.01 | 4.66 | 5.43 | 3.22 | 3.57 | 4.25 | 4.47 | 2.62 | 3.07 | 2.78 | 3.72 | 1.75 | NA | NA | 0.98 | NA | |
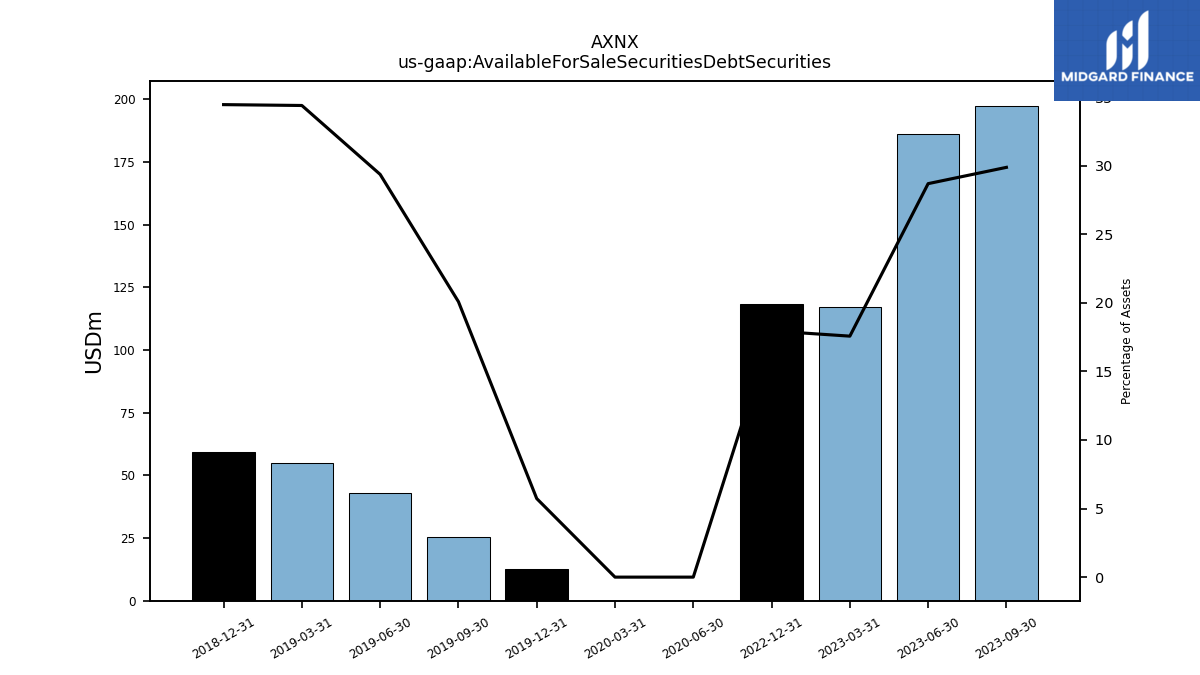
| Available For Sale Securities Debt Securities | 100.16 | 240.15 | 197.39 | 186.17 | 116.96 | 118.36 | NA | NA | NA | NA | NA | NA | NA | NA | NA | 0.00 | 0.00 | 12.59 | 25.31 | 43.00 | 54.82 | 59.22 | NA | NA | NA | NA | NA |
| 2024-03-31 | 2023-12-31 | 2023-09-30 | 2023-06-30 | 2023-03-31 | 2022-12-31 | 2022-09-30 | 2022-06-30 | 2022-03-31 | 2021-12-31 | 2021-09-30 | 2021-06-30 | 2021-03-31 | 2020-12-31 | 2020-09-30 | 2020-06-30 | 2020-03-31 | 2019-12-31 | 2019-09-30 | 2019-06-30 | 2019-03-31 | 2018-12-31 | 2018-09-30 | 2018-06-30 | 2018-03-31 | 2017-12-31 | 2017-09-30 | ||
|---|---|---|---|---|---|---|---|---|---|---|---|---|---|---|---|---|---|---|---|---|---|---|---|---|---|---|---|---|
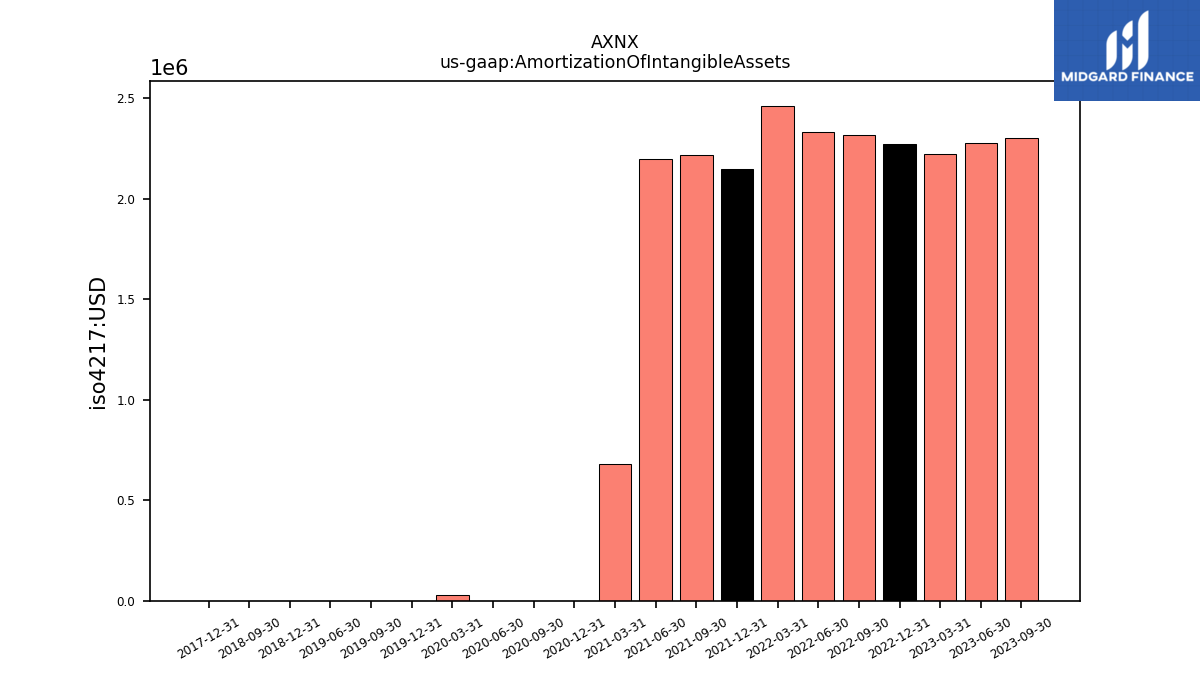
| Amortization Of Intangible Assets | 2.25 | 2.26 | 2.30 | 2.28 | 2.22 | 2.27 | 2.32 | 2.33 | 2.46 | 2.15 | 2.22 | 2.20 | 0.68 | 0.00 | 0.00 | 0.00 | 0.03 | 0.00 | 0.00 | 0.00 | NA | 0.00 | 0.00 | NA | NA | 0.00 | NA | |
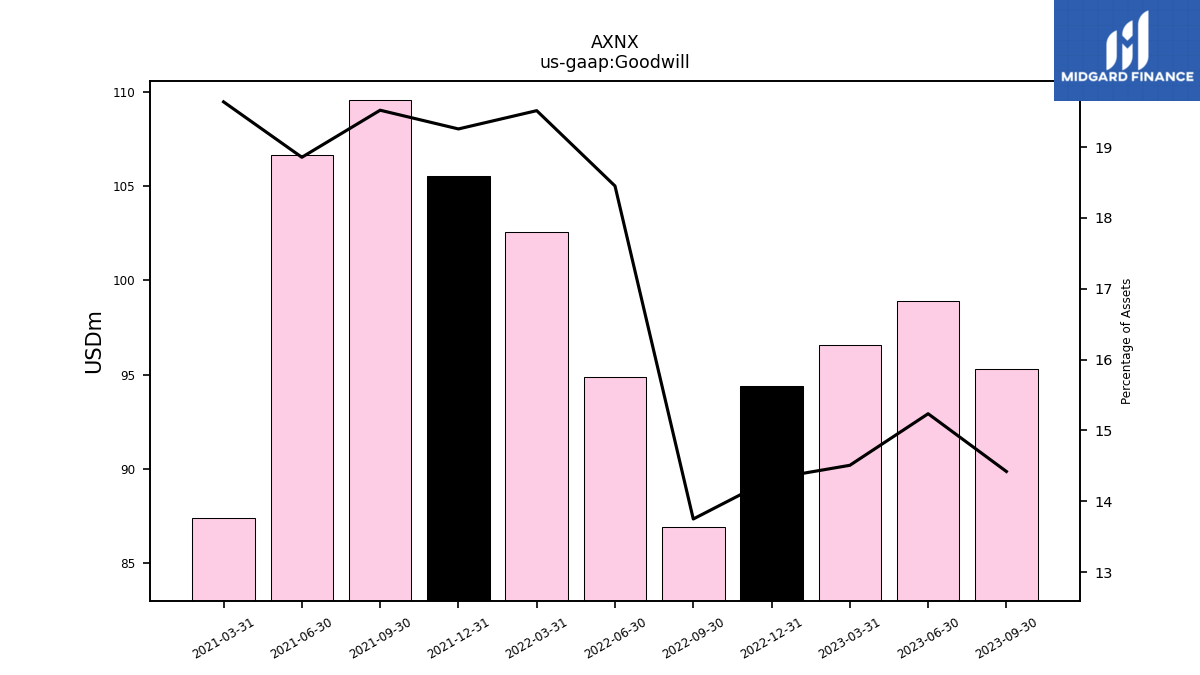
| Goodwill | 98.54 | 99.42 | 95.29 | 98.88 | 96.58 | 94.41 | 86.94 | 94.85 | 102.56 | 105.51 | 109.56 | 106.63 | 87.38 | NA | NA | NA | NA | NA | NA | NA | NA | NA | NA | NA | NA | NA | NA | |
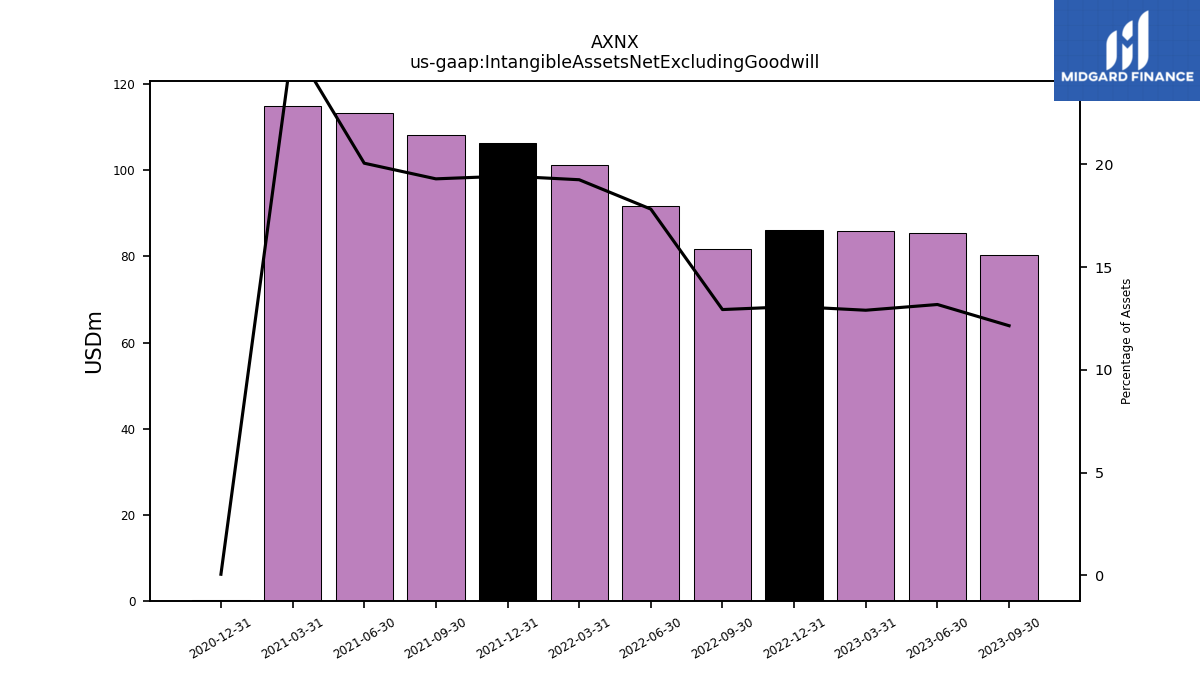
| Intangible Assets Net Excluding Goodwill | 78.42 | 81.38 | 80.27 | 85.54 | 85.89 | 86.25 | 81.79 | 91.63 | 101.18 | 106.47 | 108.30 | 113.42 | 115.02 | 0.20 | NA | NA | NA | NA | NA | NA | NA | NA | NA | NA | NA | NA | NA | |
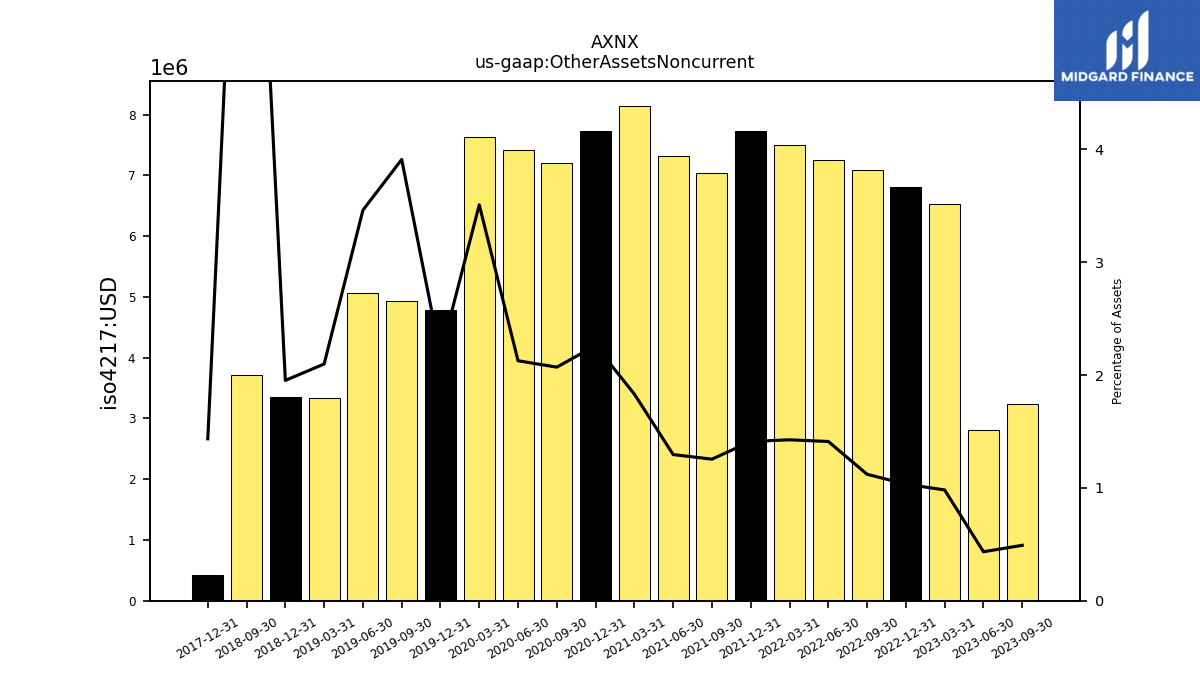
| Other Assets Noncurrent | 23.70 | 24.23 | 3.25 | 2.82 | 6.53 | 6.81 | 7.08 | 7.25 | 7.49 | 7.73 | 7.04 | 7.32 | 8.14 | 7.74 | 7.20 | 7.42 | 7.63 | 4.78 | 4.93 | 5.07 | 3.34 | 3.36 | 3.71 | NA | NA | 0.42 | NA | |
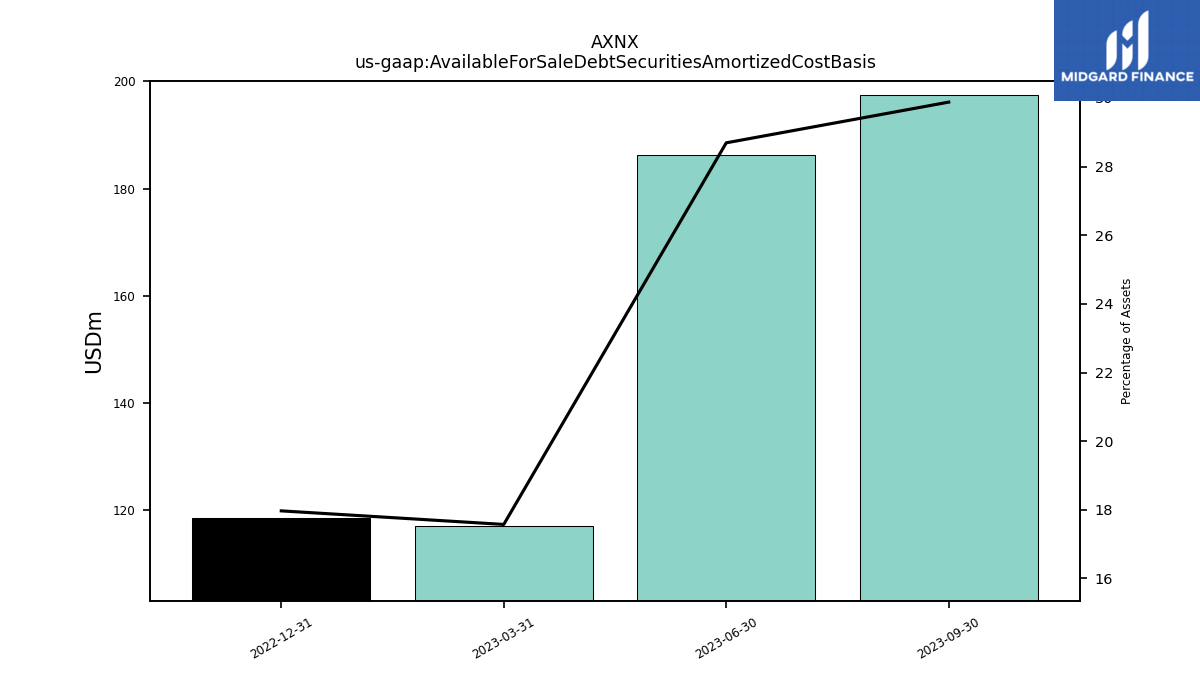
| Available For Sale Debt Securities Amortized Cost Basis | 100.17 | 240.10 | 197.43 | 186.21 | 116.99 | 118.48 | NA | NA | NA | NA | NA | NA | NA | NA | NA | NA | NA | NA | NA | NA | NA | NA | NA | NA | NA | NA | NA |
| 2024-03-31 | 2023-12-31 | 2023-09-30 | 2023-06-30 | 2023-03-31 | 2022-12-31 | 2022-09-30 | 2022-06-30 | 2022-03-31 | 2021-12-31 | 2021-09-30 | 2021-06-30 | 2021-03-31 | 2020-12-31 | 2020-09-30 | 2020-06-30 | 2020-03-31 | 2019-12-31 | 2019-09-30 | 2019-06-30 | 2019-03-31 | 2018-12-31 | 2018-09-30 | 2018-06-30 | 2018-03-31 | 2017-12-31 | 2017-09-30 | ||
|---|---|---|---|---|---|---|---|---|---|---|---|---|---|---|---|---|---|---|---|---|---|---|---|---|---|---|---|---|
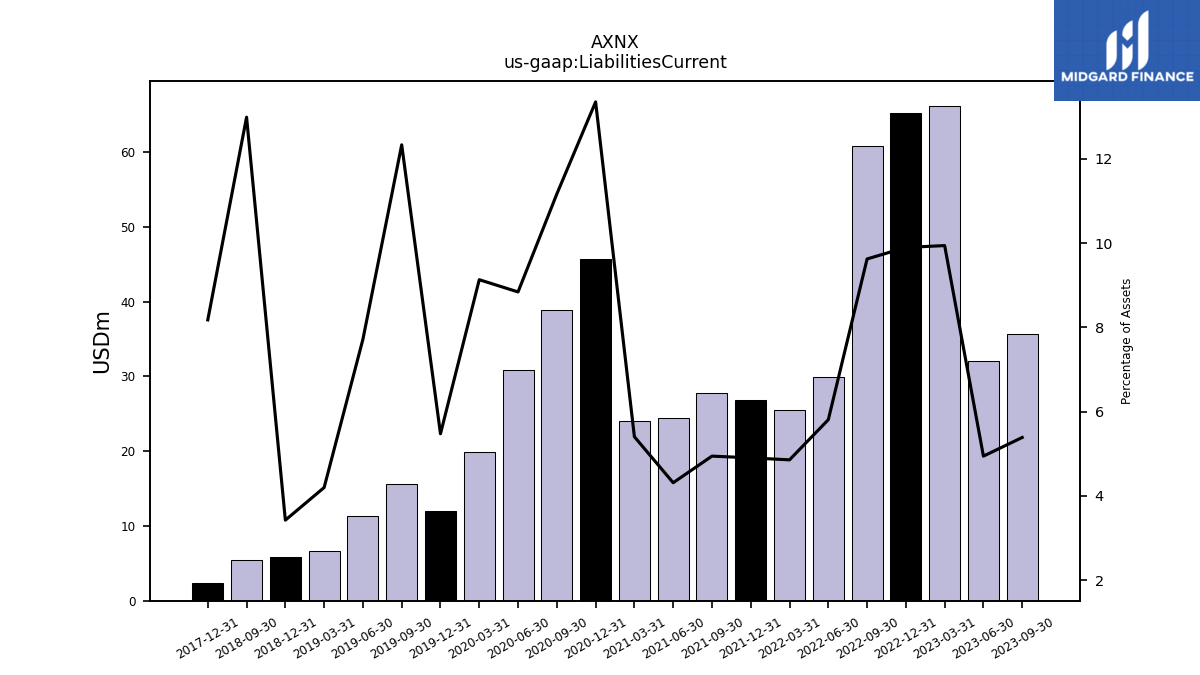
| Liabilities Current | 48.39 | 45.82 | 35.59 | 32.08 | 66.17 | 65.25 | 60.84 | 29.86 | 25.52 | 26.87 | 27.75 | 24.39 | 24.05 | 45.68 | 38.82 | 30.83 | 19.85 | 12.03 | 15.54 | 11.30 | 6.69 | 5.89 | 5.50 | NA | NA | 2.40 | NA | |
| Accounts Payable Current | 15.77 | 18.45 | 14.67 | 12.19 | 14.74 | 9.07 | 9.97 | 10.21 | 10.39 | 7.65 | 10.51 | 9.45 | 11.45 | 10.66 | 9.41 | 10.73 | 7.44 | 5.88 | 4.23 | 3.19 | 2.10 | 3.44 | 1.98 | NA | NA | 1.62 | NA | |
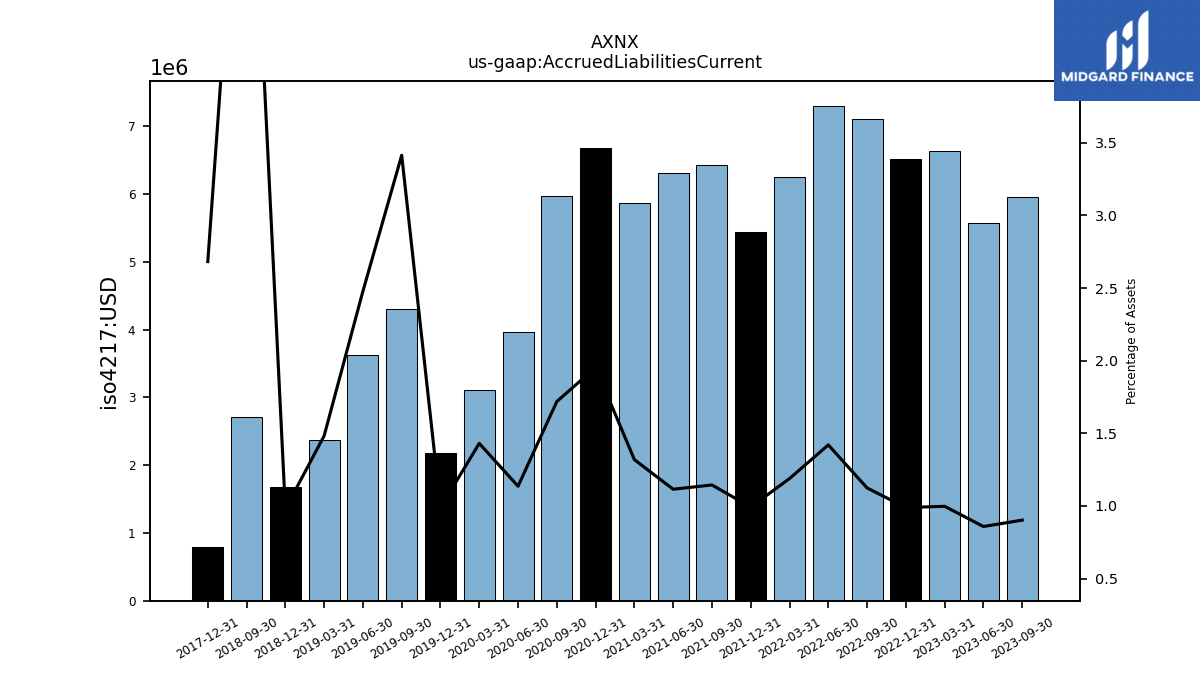
| Accrued Liabilities Current | 14.75 | 10.53 | 5.96 | 5.57 | 6.64 | 6.52 | 7.11 | 7.30 | 6.25 | 5.43 | 6.42 | 6.30 | 5.87 | 6.68 | 5.98 | 3.96 | 3.11 | 2.17 | 4.30 | 3.63 | 2.36 | 1.68 | 2.71 | NA | NA | 0.79 | NA |
| 2024-03-31 | 2023-12-31 | 2023-09-30 | 2023-06-30 | 2023-03-31 | 2022-12-31 | 2022-09-30 | 2022-06-30 | 2022-03-31 | 2021-12-31 | 2021-09-30 | 2021-06-30 | 2021-03-31 | 2020-12-31 | 2020-09-30 | 2020-06-30 | 2020-03-31 | 2019-12-31 | 2019-09-30 | 2019-06-30 | 2019-03-31 | 2018-12-31 | 2018-09-30 | 2018-06-30 | 2018-03-31 | 2017-12-31 | 2017-09-30 | ||
|---|---|---|---|---|---|---|---|---|---|---|---|---|---|---|---|---|---|---|---|---|---|---|---|---|---|---|---|---|
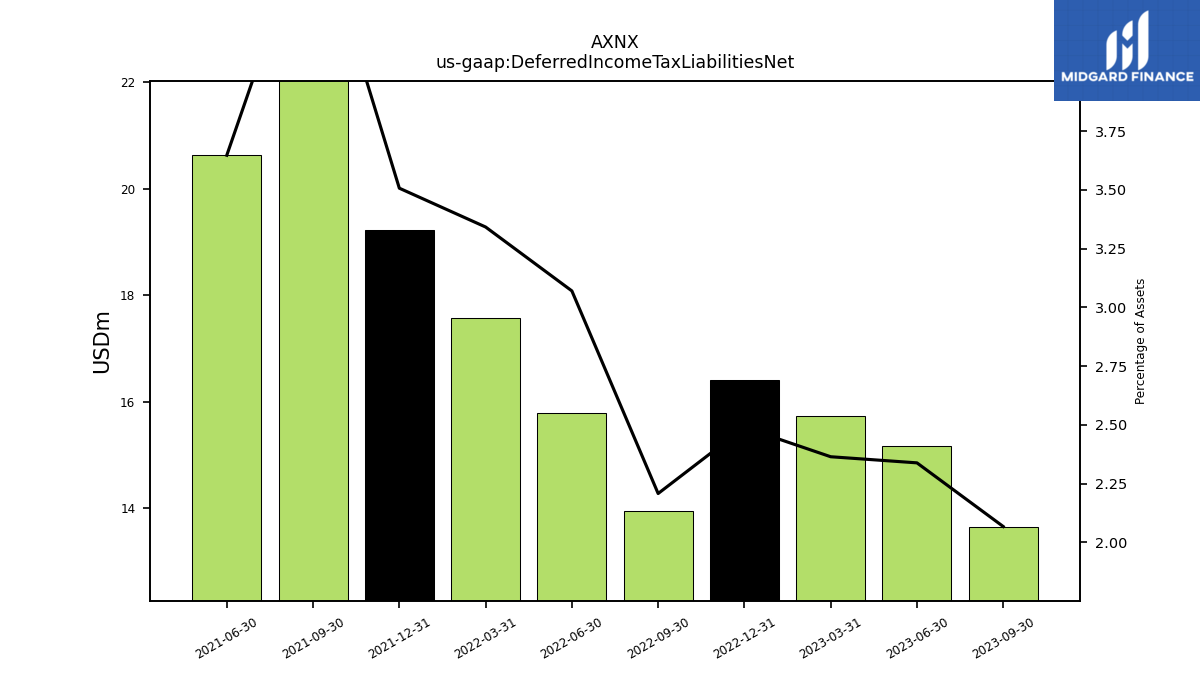
| Deferred Income Tax Liabilities Net | 9.92 | 10.70 | 13.66 | 15.17 | 15.74 | 16.41 | 13.96 | 15.78 | 17.56 | 19.22 | 26.43 | 20.63 | NA | NA | NA | NA | NA | NA | NA | NA | NA | NA | NA | NA | NA | NA | NA | |
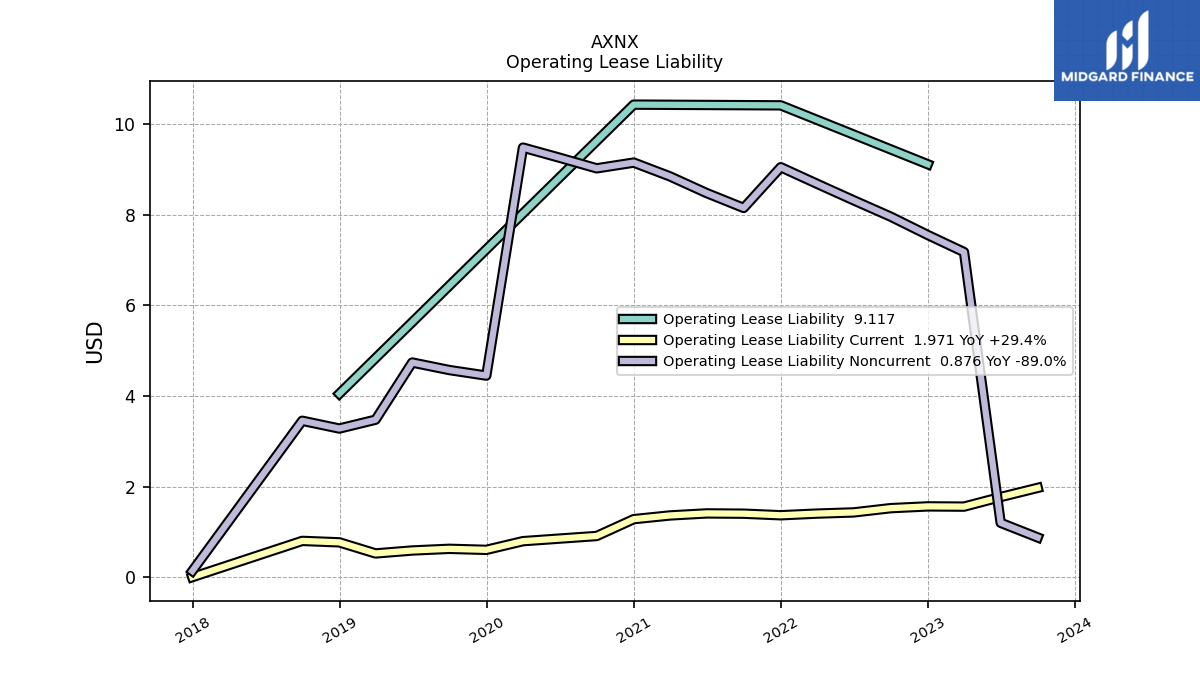
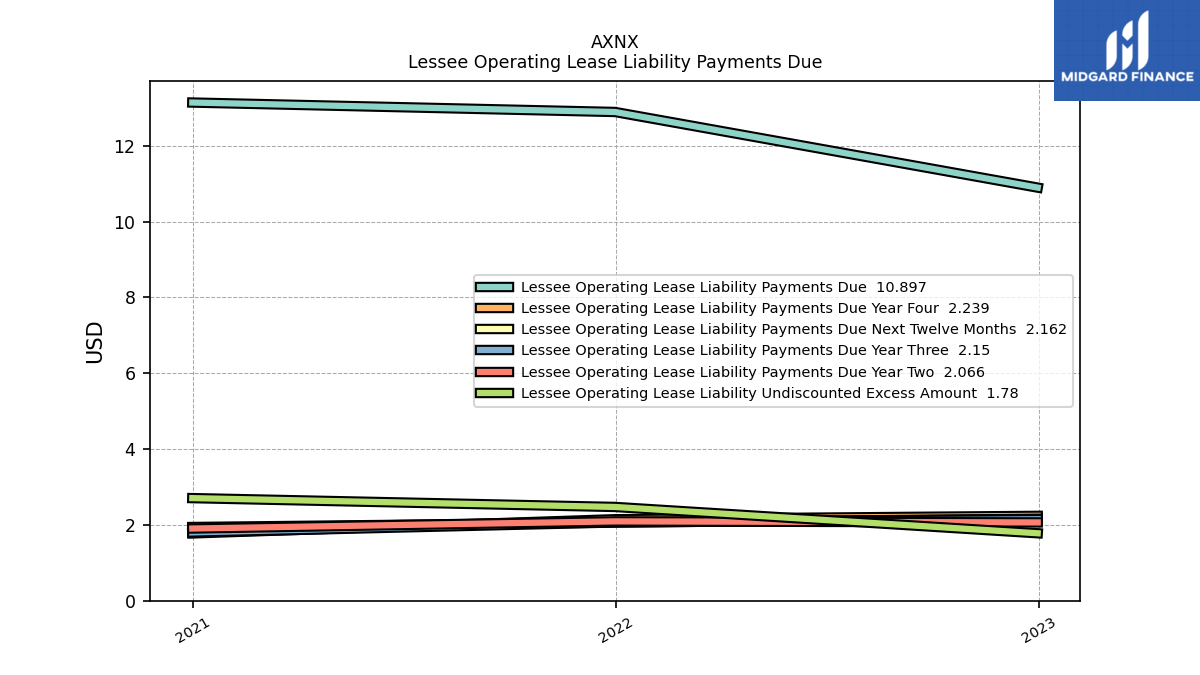
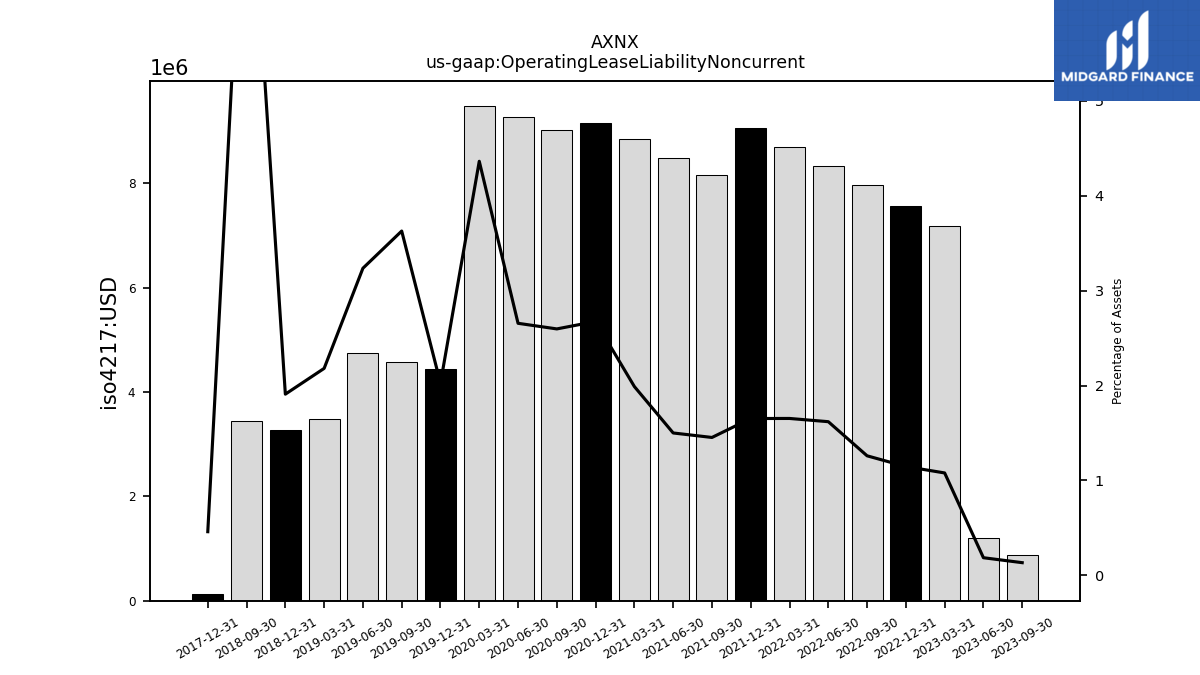
| Operating Lease Liability Noncurrent | 30.15 | 25.84 | 0.88 | 1.20 | 7.18 | 7.55 | 7.96 | 8.32 | 8.69 | 9.05 | 8.15 | 8.48 | 8.85 | 9.15 | 9.03 | 9.26 | 9.48 | 4.45 | 4.57 | 4.74 | 3.48 | 3.28 | 3.45 | NA | NA | 0.14 | NA |
| 2024-03-31 | 2023-12-31 | 2023-09-30 | 2023-06-30 | 2023-03-31 | 2022-12-31 | 2022-09-30 | 2022-06-30 | 2022-03-31 | 2021-12-31 | 2021-09-30 | 2021-06-30 | 2021-03-31 | 2020-12-31 | 2020-09-30 | 2020-06-30 | 2020-03-31 | 2019-12-31 | 2019-09-30 | 2019-06-30 | 2019-03-31 | 2018-12-31 | 2018-09-30 | 2018-06-30 | 2018-03-31 | 2017-12-31 | 2017-09-30 | ||
|---|---|---|---|---|---|---|---|---|---|---|---|---|---|---|---|---|---|---|---|---|---|---|---|---|---|---|---|---|
| Stockholders Equity | 627.10 | 637.56 | 610.62 | 600.53 | 576.61 | 570.14 | 549.52 | 437.73 | 463.43 | 482.44 | 490.09 | 504.26 | 330.15 | 287.37 | 293.90 | 297.90 | 172.48 | 183.00 | 92.19 | 114.41 | 131.33 | 143.28 | -88.88 | -81.42 | -72.96 | -66.42 | NA | |
| Common Stock Value | 0.01 | 0.01 | 0.01 | 0.01 | 0.01 | 0.01 | 0.01 | 0.01 | 0.01 | 0.01 | 0.01 | 0.01 | 0.00 | 0.00 | 0.00 | 0.00 | 0.00 | 0.00 | 0.00 | 0.00 | 0.00 | 0.00 | 0.00 | NA | NA | 0.00 | NA | |
| Additional Paid In Capital | 1043.58 | 1033.78 | 1022.05 | 1009.70 | 982.19 | 969.54 | 960.63 | 820.53 | 812.14 | 803.56 | 796.40 | 788.18 | 589.78 | 522.30 | 517.66 | 512.59 | 367.28 | 363.01 | 249.60 | 246.71 | 244.52 | 243.34 | 3.34 | NA | NA | 2.90 | NA | |
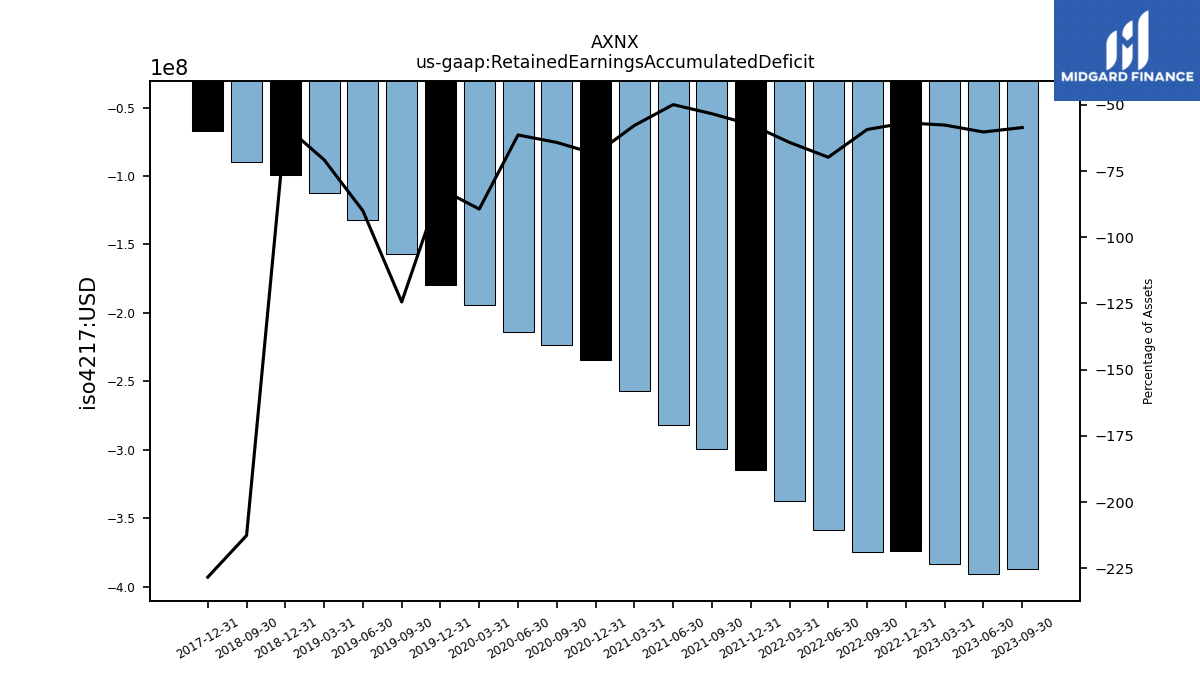
| Retained Earnings Accumulated Deficit | -399.46 | -380.35 | -386.93 | -390.85 | -383.51 | -374.26 | -374.93 | -358.68 | -337.23 | -314.57 | -299.40 | -282.15 | -257.00 | -234.50 | -223.15 | -213.98 | -194.20 | -179.58 | -156.83 | -131.83 | -112.77 | -99.65 | -89.98 | NA | NA | -67.17 | NA | |
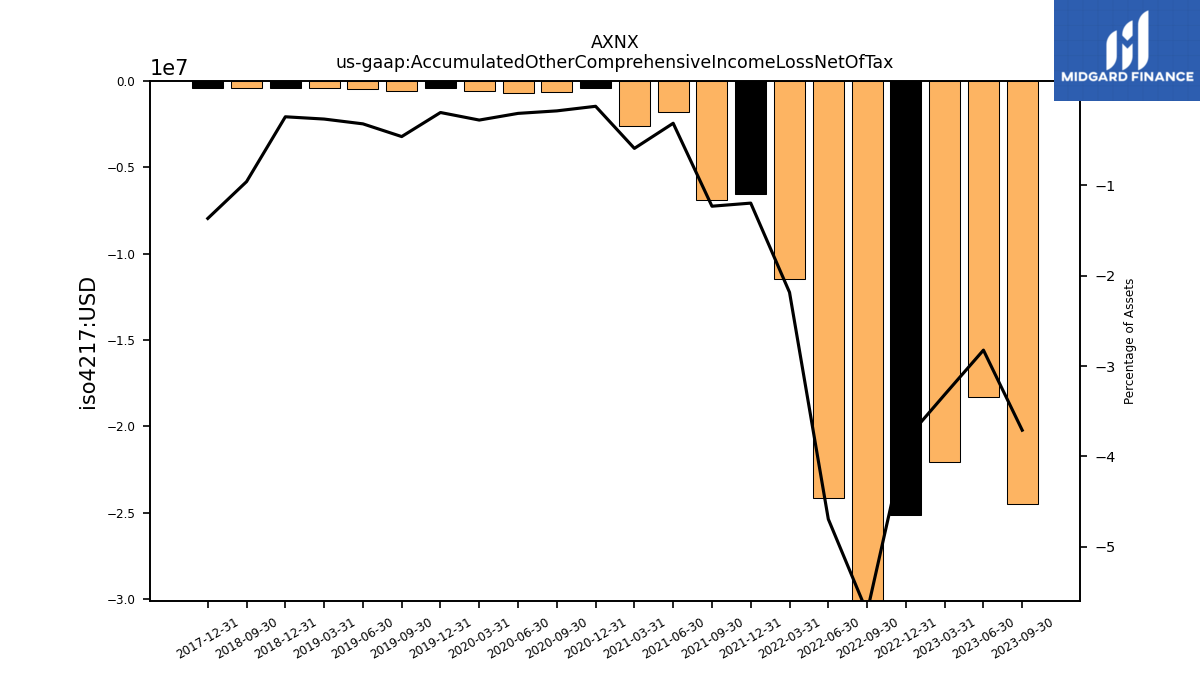
| Accumulated Other Comprehensive Income Loss Net Of Tax | -17.02 | -15.87 | -24.51 | -18.33 | -22.08 | -25.15 | -36.19 | -24.13 | -11.48 | -6.56 | -6.91 | -1.77 | -2.63 | -0.43 | -0.61 | -0.71 | -0.60 | -0.43 | -0.58 | -0.47 | -0.43 | -0.42 | -0.41 | NA | NA | -0.40 | NA |
| 2024-03-31 | 2023-12-31 | 2023-09-30 | 2023-06-30 | 2023-03-31 | 2022-12-31 | 2022-09-30 | 2022-06-30 | 2022-03-31 | 2021-12-31 | 2021-09-30 | 2021-06-30 | 2021-03-31 | 2020-12-31 | 2020-09-30 | 2020-06-30 | 2020-03-31 | 2019-12-31 | 2019-09-30 | 2019-06-30 | 2019-03-31 | 2018-12-31 | 2018-09-30 | 2018-06-30 | 2018-03-31 | 2017-12-31 | 2017-09-30 | ||
|---|---|---|---|---|---|---|---|---|---|---|---|---|---|---|---|---|---|---|---|---|---|---|---|---|---|---|---|---|
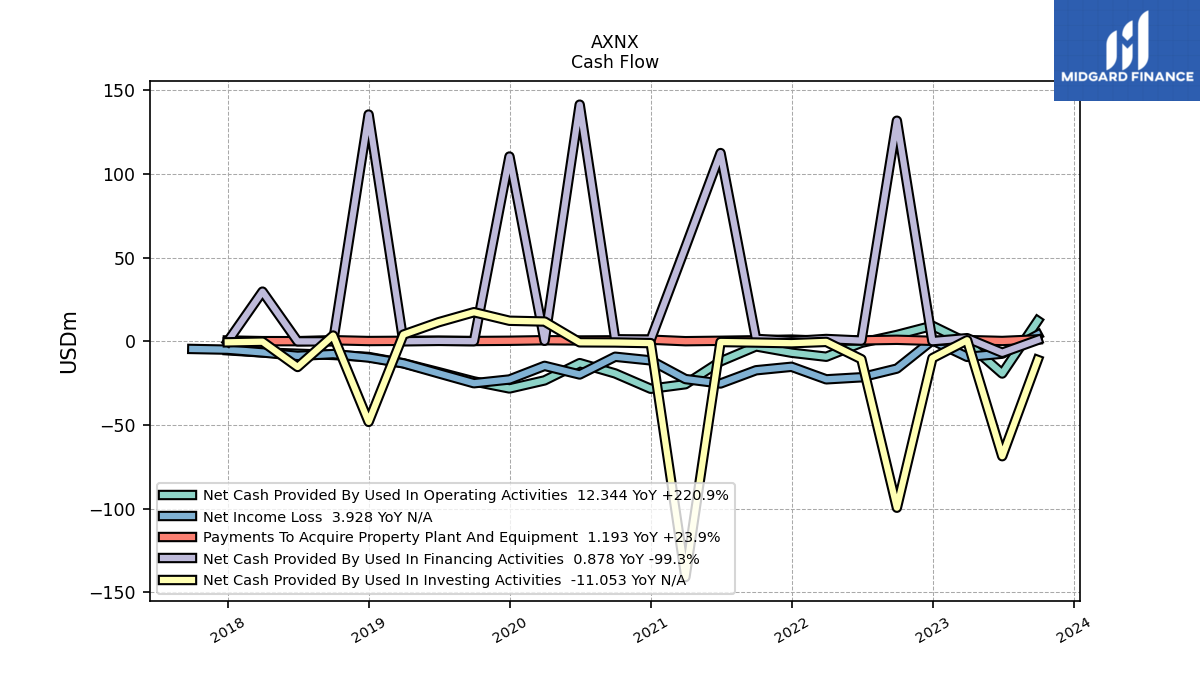
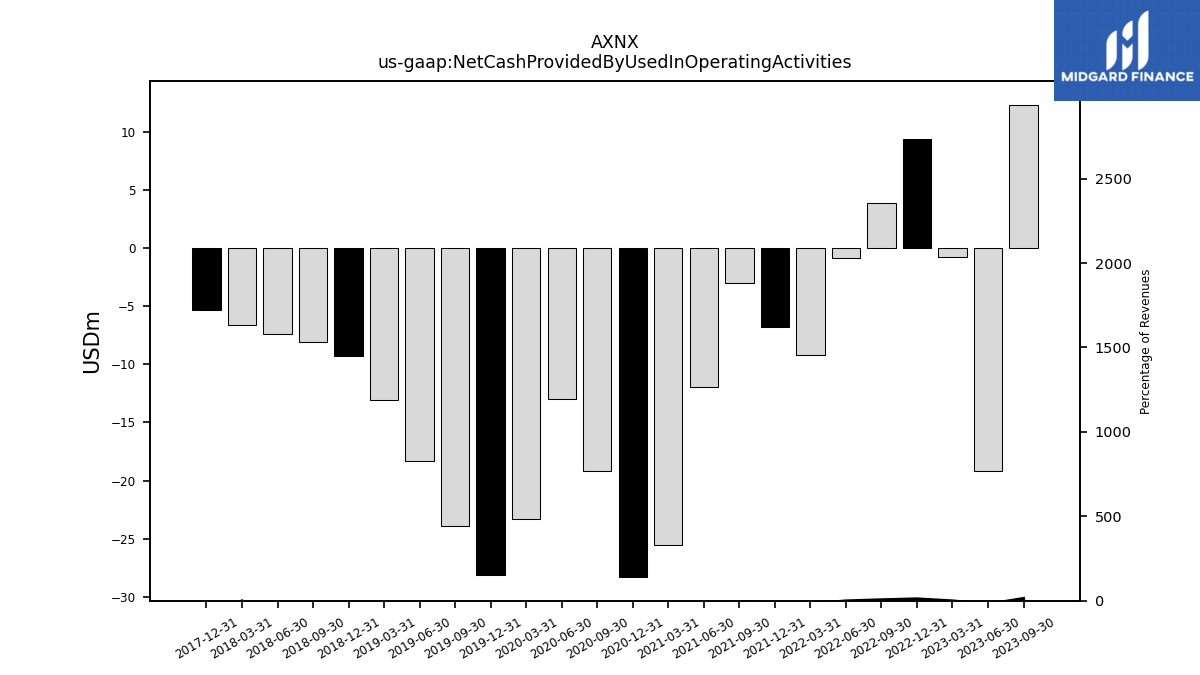
| Net Cash Provided By Used In Operating Activities | -9.24 | 5.63 | 12.34 | -19.21 | -0.78 | 9.35 | 3.85 | -0.84 | -9.17 | -6.78 | -2.99 | -11.95 | -25.58 | -28.31 | -19.15 | -12.97 | -23.31 | -28.14 | -23.90 | -18.36 | -13.05 | -9.30 | -8.10 | -7.35 | -6.62 | -5.33 | NA | |
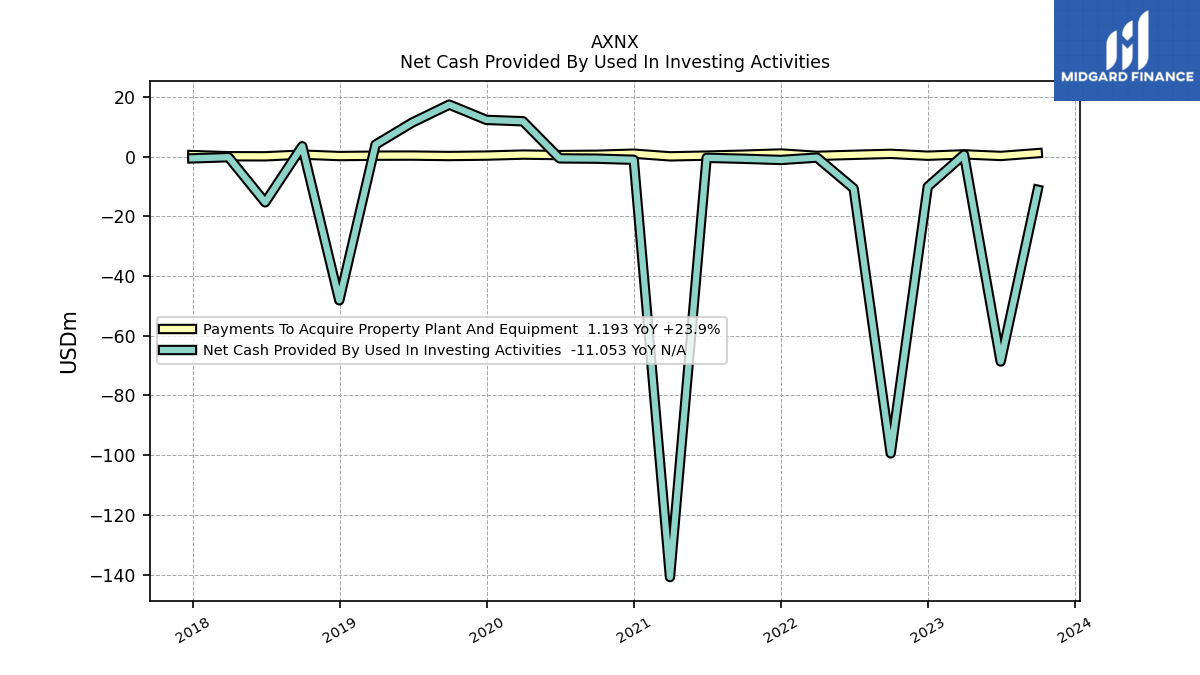
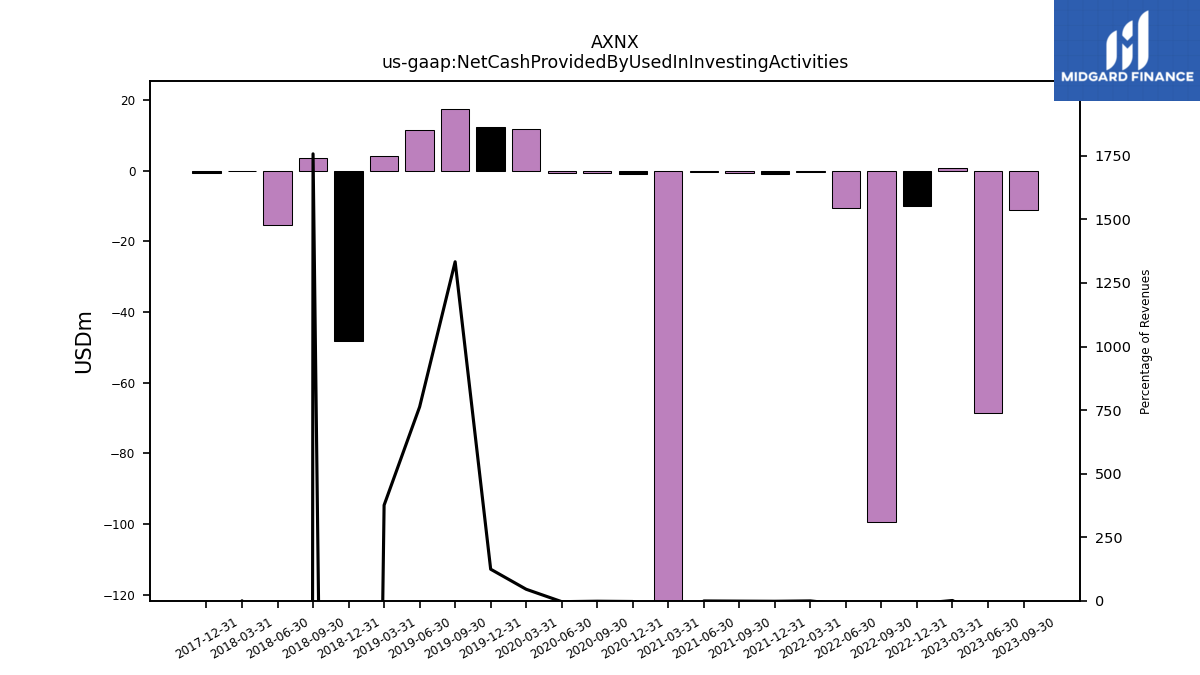
| Net Cash Provided By Used In Investing Activities | 138.23 | -37.92 | -11.05 | -68.62 | 0.69 | -10.03 | -99.40 | -10.63 | -0.29 | -1.08 | -0.68 | -0.37 | -140.86 | -1.02 | -0.65 | -0.55 | 11.88 | 12.34 | 17.46 | 11.44 | 4.05 | -48.12 | 3.52 | -15.29 | -0.16 | -0.55 | NA | |
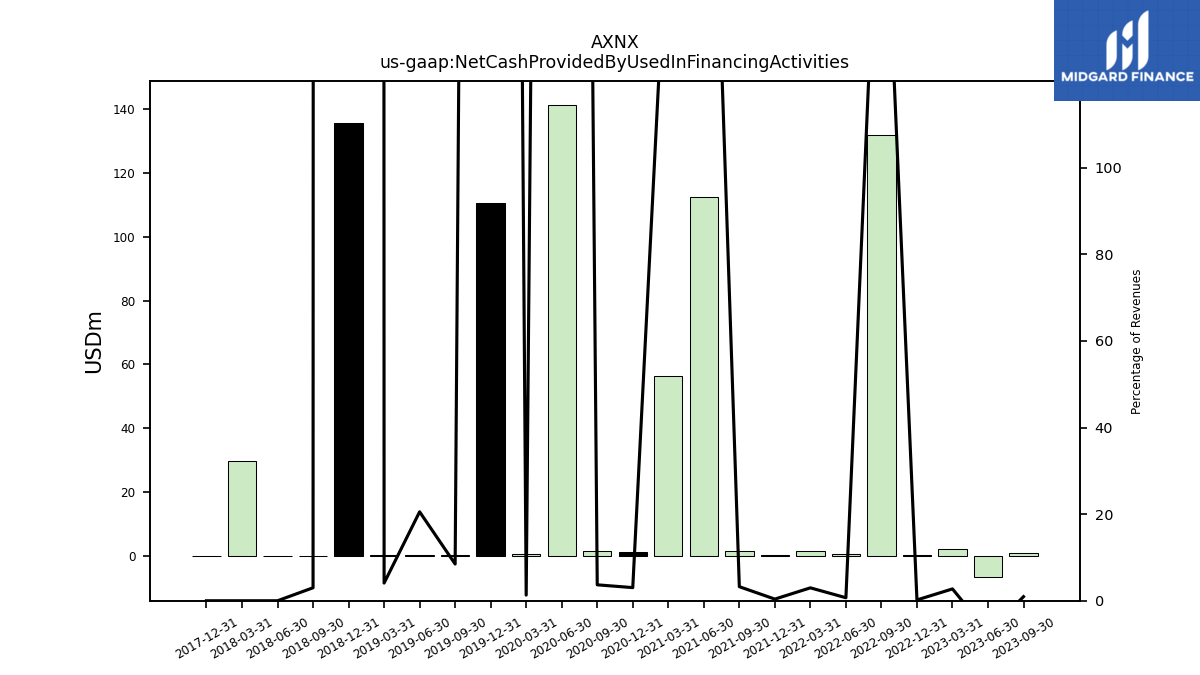
| Net Cash Provided By Used In Financing Activities | 0.25 | 0.58 | 0.88 | -6.77 | 1.93 | 0.16 | 131.88 | 0.48 | 1.44 | 0.20 | 1.52 | 112.57 | 56.22 | 1.05 | 1.30 | 141.50 | 0.34 | 110.49 | 0.11 | 0.31 | 0.04 | 135.58 | 0.01 | 0.00 | 29.76 | 0.00 | NA |
| 2024-03-31 | 2023-12-31 | 2023-09-30 | 2023-06-30 | 2023-03-31 | 2022-12-31 | 2022-09-30 | 2022-06-30 | 2022-03-31 | 2021-12-31 | 2021-09-30 | 2021-06-30 | 2021-03-31 | 2020-12-31 | 2020-09-30 | 2020-06-30 | 2020-03-31 | 2019-12-31 | 2019-09-30 | 2019-06-30 | 2019-03-31 | 2018-12-31 | 2018-09-30 | 2018-06-30 | 2018-03-31 | 2017-12-31 | 2017-09-30 | ||
|---|---|---|---|---|---|---|---|---|---|---|---|---|---|---|---|---|---|---|---|---|---|---|---|---|---|---|---|---|
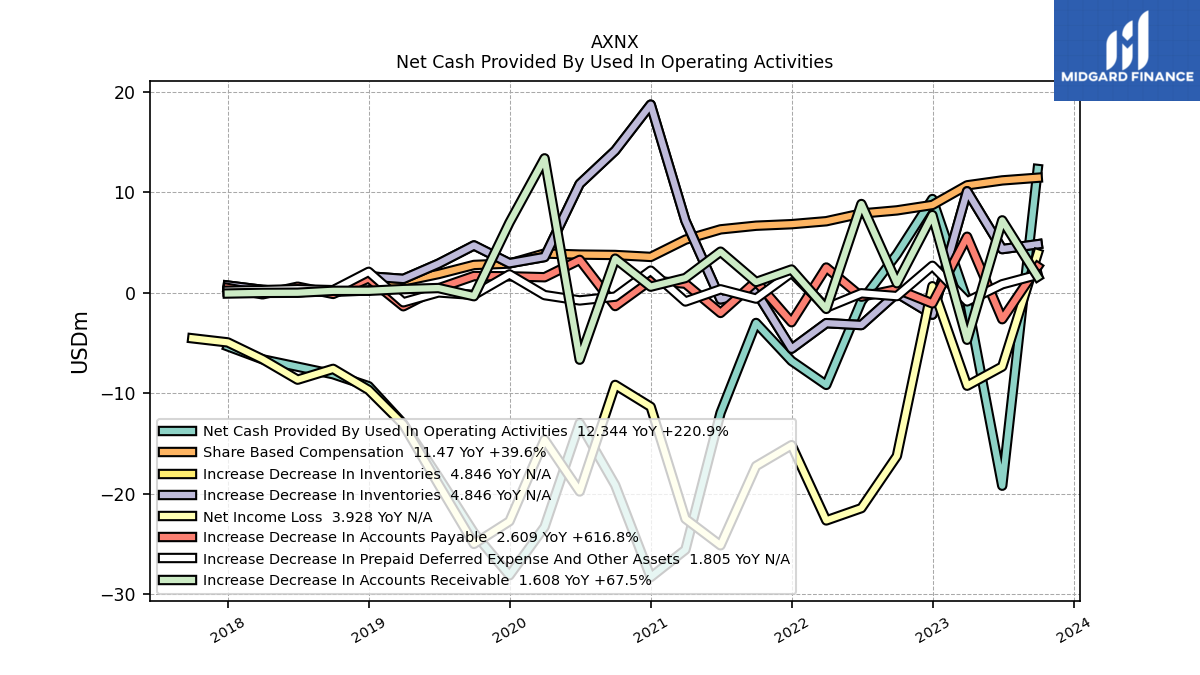
| Net Cash Provided By Used In Operating Activities | -9.24 | 5.63 | 12.34 | -19.21 | -0.78 | 9.35 | 3.85 | -0.84 | -9.17 | -6.78 | -2.99 | -11.95 | -25.58 | -28.31 | -19.15 | -12.97 | -23.31 | -28.14 | -23.90 | -18.36 | -13.05 | -9.30 | -8.10 | -7.35 | -6.62 | -5.33 | NA | |
| Net Income Loss | -19.11 | 6.57 | 3.93 | -7.34 | -9.25 | 0.67 | -16.25 | -21.44 | -22.67 | -15.17 | -17.25 | -25.15 | -22.50 | -11.35 | -9.17 | -19.78 | -14.62 | -22.75 | -25.01 | -19.06 | -13.12 | -9.66 | -7.57 | -8.65 | -6.60 | -4.93 | -4.52 | |
| Profit Loss | -19.11 | 6.57 | 3.93 | -7.34 | -9.25 | 0.67 | -16.25 | -21.44 | -22.67 | -15.17 | -17.25 | -25.15 | -22.50 | -11.35 | -9.17 | -19.78 | -14.62 | -22.75 | -25.01 | -19.06 | -13.12 | -9.66 | -7.57 | -8.65 | -6.60 | -4.93 | NA | |
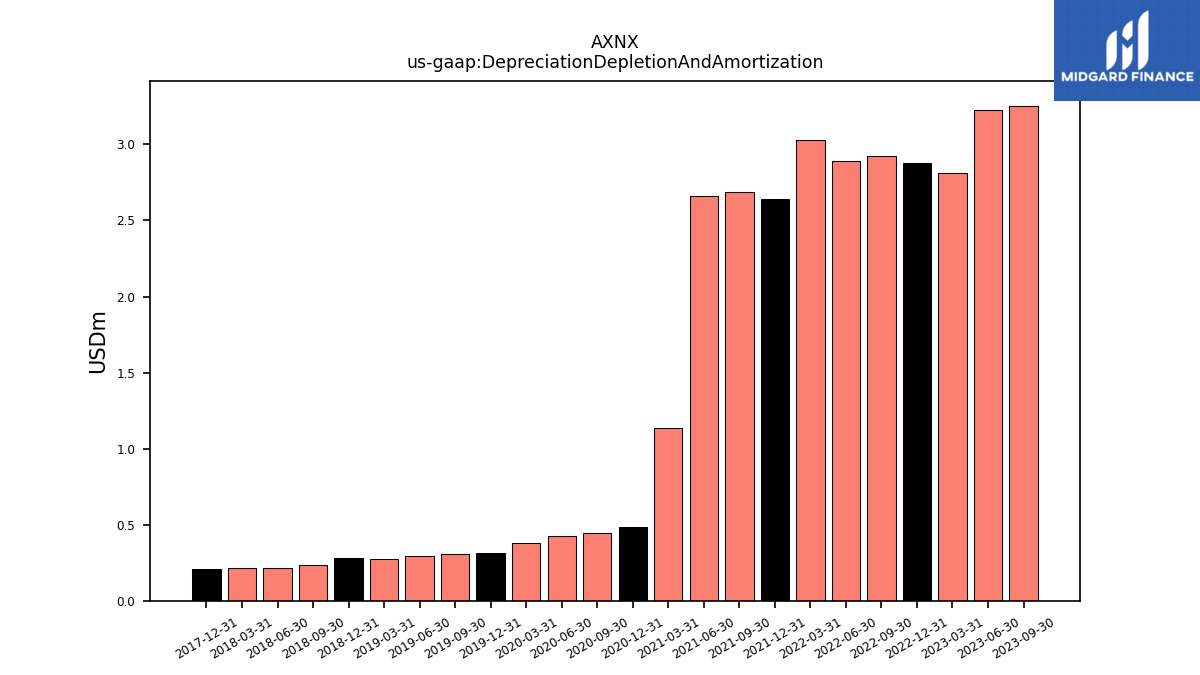
| Depreciation Depletion And Amortization | 3.18 | 3.19 | 3.25 | 3.23 | 2.81 | 2.88 | 2.92 | 2.89 | 3.03 | 2.64 | 2.69 | 2.66 | 1.13 | 0.49 | 0.45 | 0.43 | 0.38 | 0.31 | 0.31 | 0.29 | 0.28 | 0.28 | 0.23 | 0.21 | 0.21 | 0.21 | NA | |
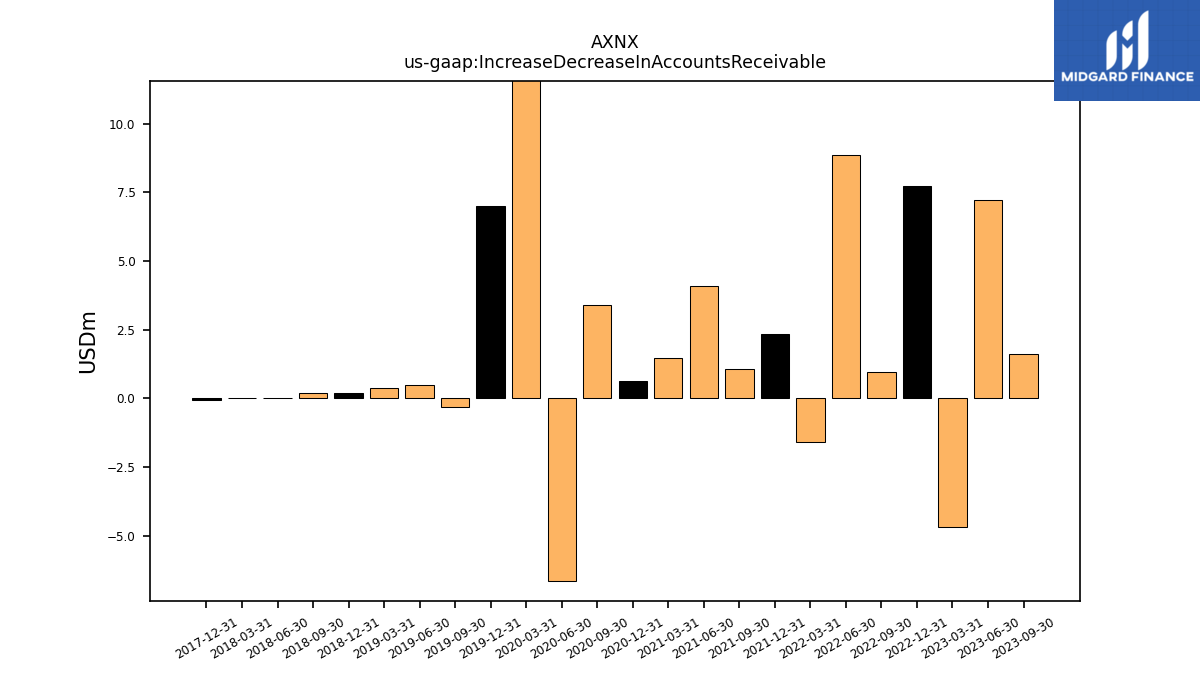
| Increase Decrease In Accounts Receivable | -6.06 | 8.27 | 1.61 | 7.23 | -4.67 | 7.75 | 0.96 | 8.86 | -1.59 | 2.33 | 1.08 | 4.11 | 1.48 | 0.62 | 3.41 | -6.66 | 13.40 | 7.00 | -0.33 | 0.48 | 0.38 | 0.21 | 0.20 | 0.01 | 0.00 | -0.06 | NA | |
| Increase Decrease In Inventories | 14.42 | 6.43 | 4.85 | 4.36 | 10.12 | -2.17 | -0.04 | -3.21 | -3.02 | -5.56 | 0.12 | -0.65 | 7.19 | 18.75 | 14.17 | 10.86 | 3.57 | 2.96 | 4.73 | 2.91 | 1.39 | 1.65 | 0.23 | 0.07 | 0.30 | 0.73 | NA | |
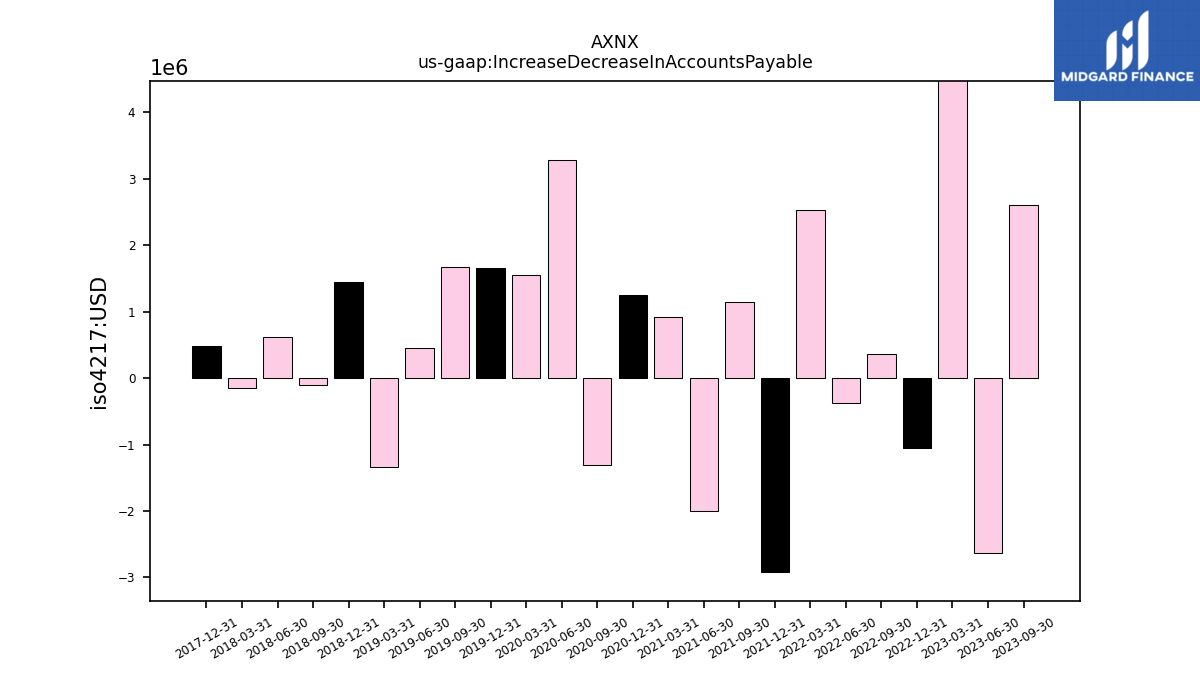
| Increase Decrease In Accounts Payable | -2.69 | 3.44 | 2.61 | -2.62 | 5.59 | -1.05 | 0.36 | -0.38 | 2.53 | -2.92 | 1.15 | -2.00 | 0.91 | 1.25 | -1.31 | 3.29 | 1.56 | 1.65 | 1.68 | 0.45 | -1.33 | 1.45 | -0.10 | 0.62 | -0.15 | 0.49 | NA | |
| Share Based Compensation | 9.55 | 11.15 | 11.47 | 11.20 | 10.71 | 8.76 | 8.22 | 7.91 | 7.14 | 6.84 | 6.69 | 6.33 | 5.30 | 3.58 | 3.77 | 3.82 | 3.92 | 2.92 | 2.78 | 1.88 | 1.14 | 0.25 | 0.10 | 0.19 | 0.07 | 0.09 | NA |
| 2024-03-31 | 2023-12-31 | 2023-09-30 | 2023-06-30 | 2023-03-31 | 2022-12-31 | 2022-09-30 | 2022-06-30 | 2022-03-31 | 2021-12-31 | 2021-09-30 | 2021-06-30 | 2021-03-31 | 2020-12-31 | 2020-09-30 | 2020-06-30 | 2020-03-31 | 2019-12-31 | 2019-09-30 | 2019-06-30 | 2019-03-31 | 2018-12-31 | 2018-09-30 | 2018-06-30 | 2018-03-31 | 2017-12-31 | 2017-09-30 | ||
|---|---|---|---|---|---|---|---|---|---|---|---|---|---|---|---|---|---|---|---|---|---|---|---|---|---|---|---|---|
| Net Cash Provided By Used In Investing Activities | 138.23 | -37.92 | -11.05 | -68.62 | 0.69 | -10.03 | -99.40 | -10.63 | -0.29 | -1.08 | -0.68 | -0.37 | -140.86 | -1.02 | -0.65 | -0.55 | 11.88 | 12.34 | 17.46 | 11.44 | 4.05 | -48.12 | 3.52 | -15.29 | -0.16 | -0.55 | NA | |
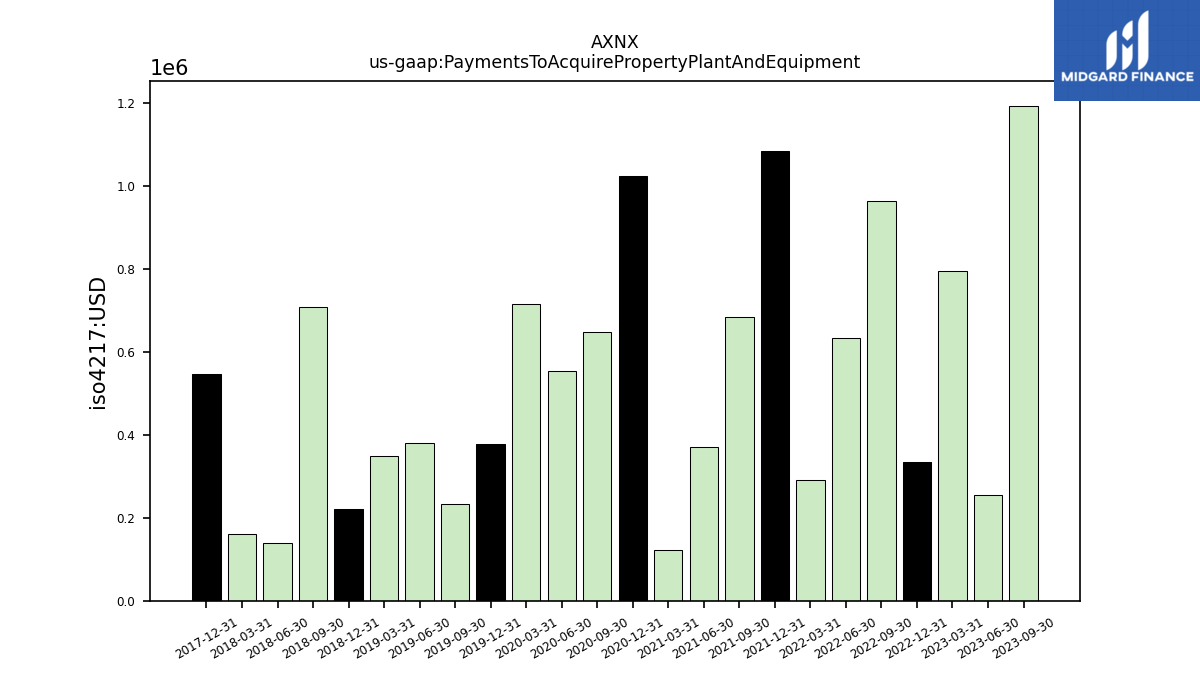
| Payments To Acquire Property Plant And Equipment | 3.06 | 1.31 | 1.19 | 0.26 | 0.79 | 0.34 | 0.96 | 0.63 | 0.29 | 1.08 | 0.68 | 0.37 | 0.12 | 1.02 | 0.65 | 0.55 | 0.71 | 0.38 | 0.23 | 0.38 | 0.35 | 0.22 | 0.71 | 0.14 | 0.16 | 0.55 | NA |
| 2024-03-31 | 2023-12-31 | 2023-09-30 | 2023-06-30 | 2023-03-31 | 2022-12-31 | 2022-09-30 | 2022-06-30 | 2022-03-31 | 2021-12-31 | 2021-09-30 | 2021-06-30 | 2021-03-31 | 2020-12-31 | 2020-09-30 | 2020-06-30 | 2020-03-31 | 2019-12-31 | 2019-09-30 | 2019-06-30 | 2019-03-31 | 2018-12-31 | 2018-09-30 | 2018-06-30 | 2018-03-31 | 2017-12-31 | 2017-09-30 | ||
|---|---|---|---|---|---|---|---|---|---|---|---|---|---|---|---|---|---|---|---|---|---|---|---|---|---|---|---|---|
| Net Cash Provided By Used In Financing Activities | 0.25 | 0.58 | 0.88 | -6.77 | 1.93 | 0.16 | 131.88 | 0.48 | 1.44 | 0.20 | 1.52 | 112.57 | 56.22 | 1.05 | 1.30 | 141.50 | 0.34 | 110.49 | 0.11 | 0.31 | 0.04 | 135.58 | 0.01 | 0.00 | 29.76 | 0.00 | NA |
| 2024-03-31 | 2023-12-31 | 2023-09-30 | 2023-06-30 | 2023-03-31 | 2022-12-31 | 2022-09-30 | 2022-06-30 | 2022-03-31 | 2021-12-31 | 2021-09-30 | 2021-06-30 | 2021-03-31 | 2020-12-31 | 2020-09-30 | 2020-06-30 | 2020-03-31 | 2019-12-31 | 2019-09-30 | 2019-06-30 | 2019-03-31 | 2018-12-31 | 2018-09-30 | 2018-06-30 | 2018-03-31 | 2017-12-31 | 2017-09-30 | ||
|---|---|---|---|---|---|---|---|---|---|---|---|---|---|---|---|---|---|---|---|---|---|---|---|---|---|---|---|---|
| Revenues | 91.41 | 109.73 | 93.10 | 92.89 | 70.65 | 85.92 | 70.38 | 68.98 | 48.42 | 53.13 | 46.91 | 45.87 | 34.37 | 34.78 | 35.24 | 15.21 | 26.30 | 9.95 | 1.31 | 1.50 | 1.08 | 0.50 | 0.20 | 0.01 | 0.00 | 0.03 | 0.10 | |
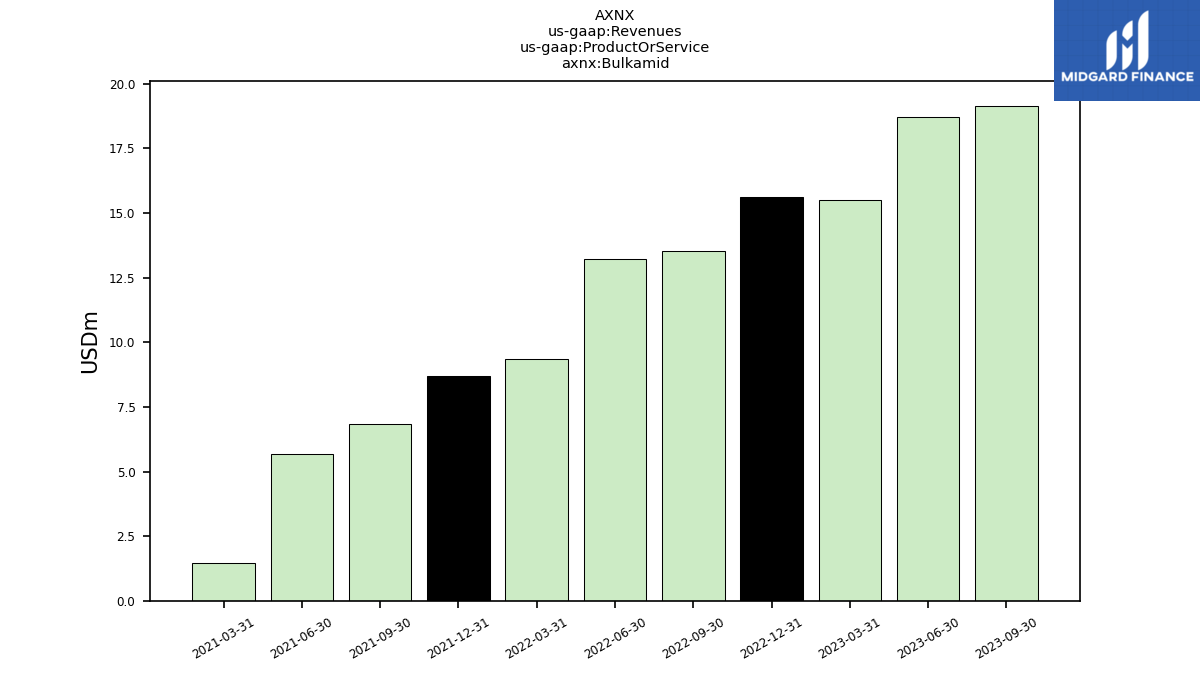
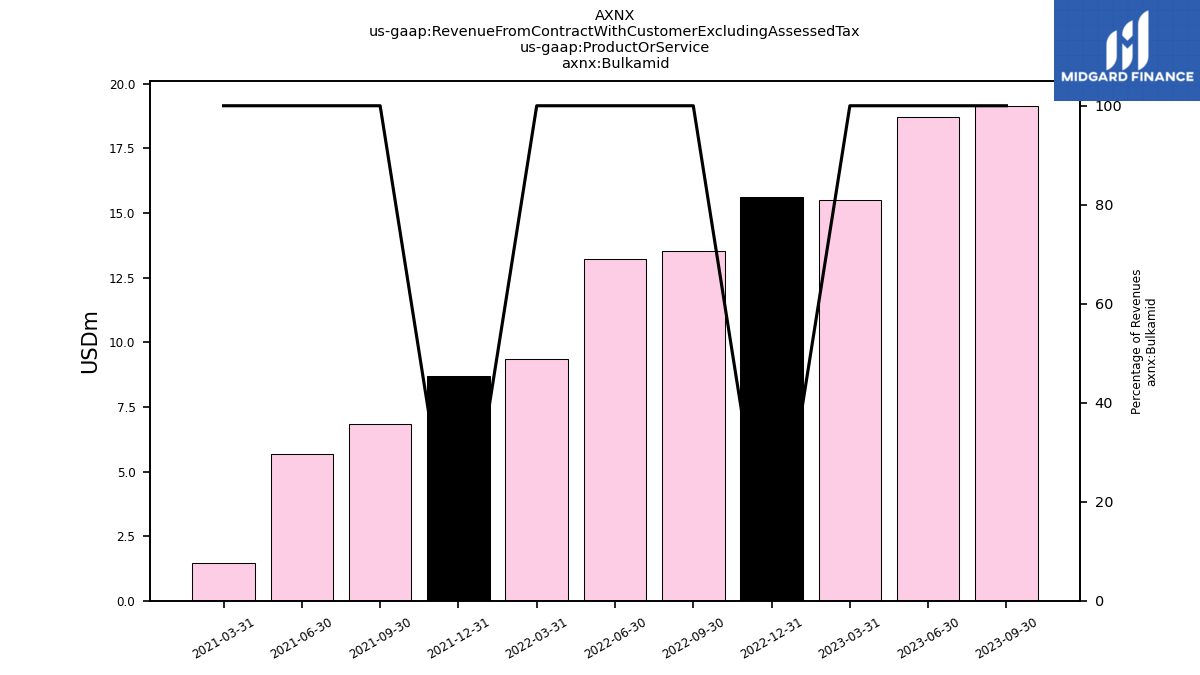
| Bulkamid | 19.73 | 21.23 | 19.15 | 18.71 | 15.49 | 15.61 | 13.53 | 13.22 | 9.35 | 8.71 | 6.84 | 5.67 | 1.47 | NA | NA | NA | NA | NA | NA | NA | NA | NA | NA | NA | NA | NA | NA | |
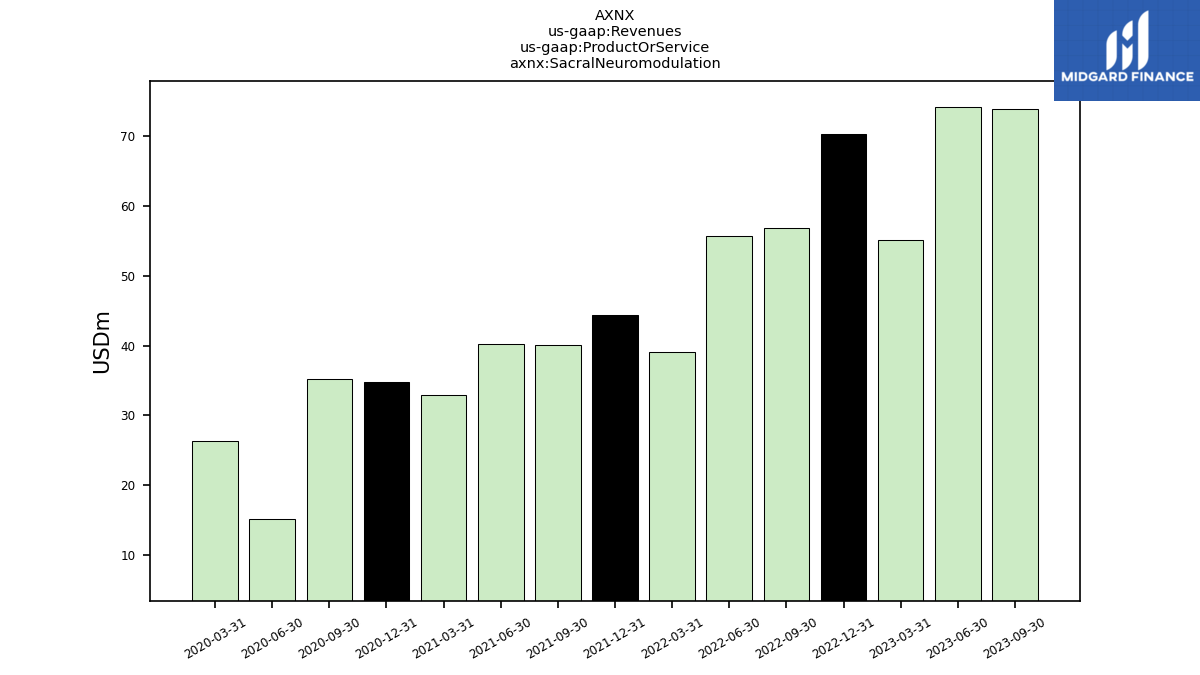
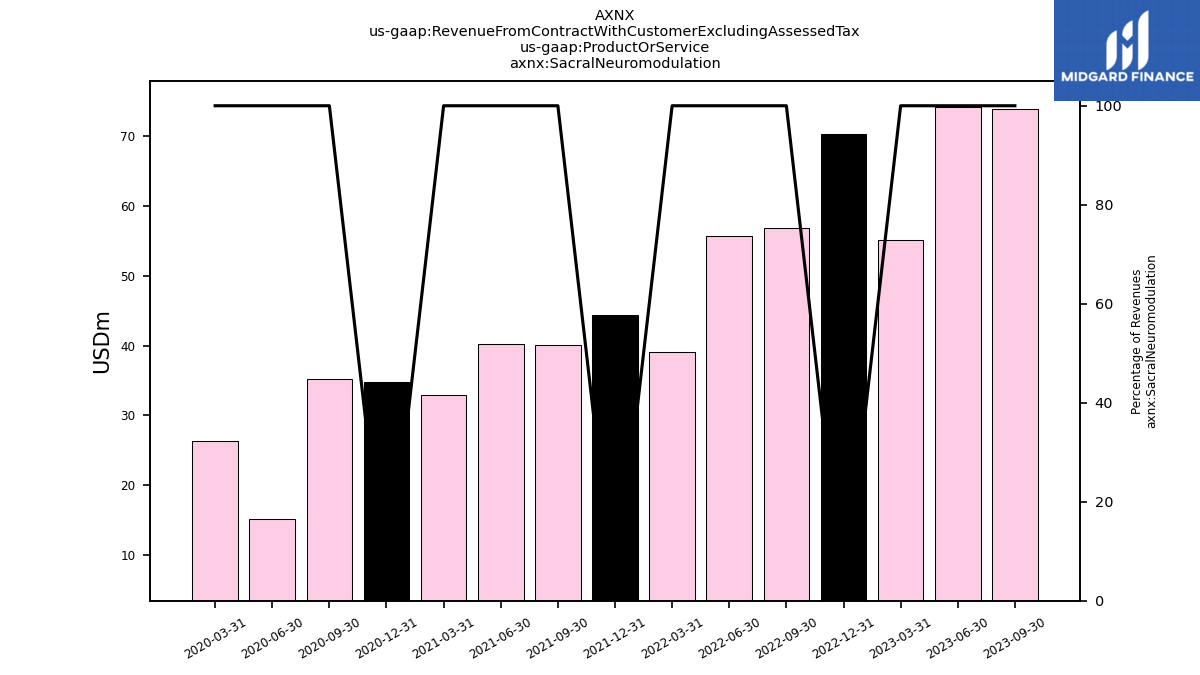
| Sacral Neuromodulation | 71.68 | 88.51 | 73.95 | 74.19 | 55.16 | 70.30 | 56.86 | 55.76 | 39.07 | 44.42 | 40.07 | 40.19 | 32.90 | 34.78 | 35.24 | 15.21 | 26.30 | NA | NA | NA | NA | NA | NA | NA | NA | NA | NA | |
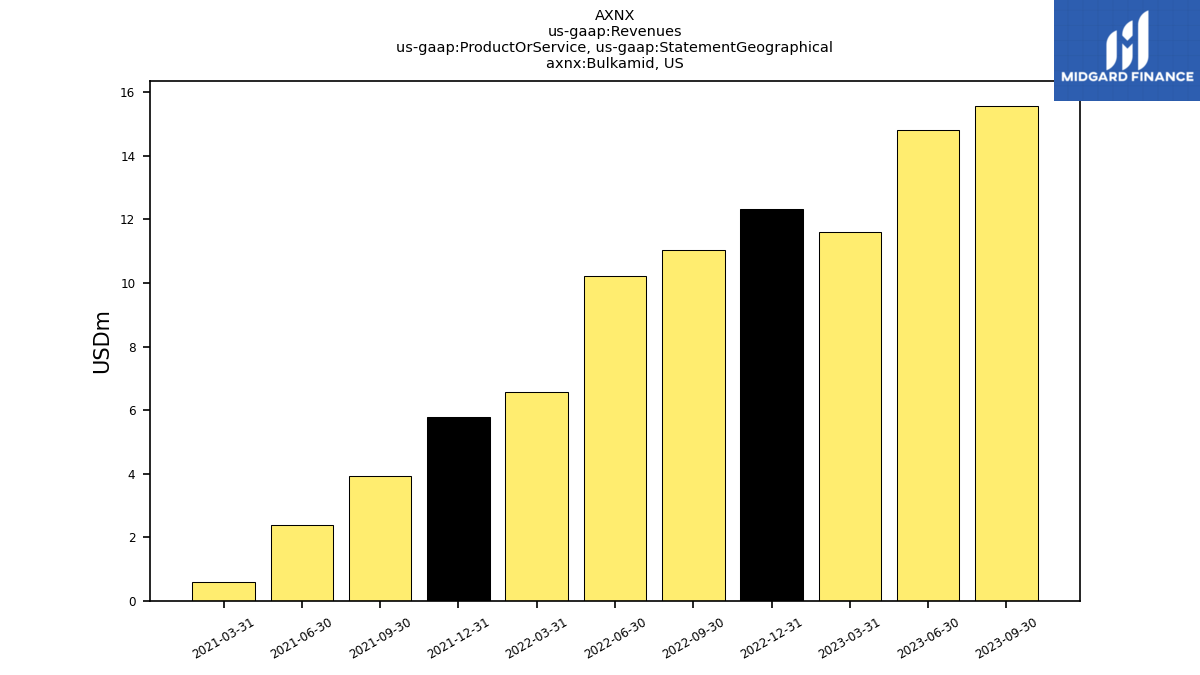
| Bulkamid,US | 15.22 | 17.04 | 15.58 | 14.81 | 11.61 | 12.34 | 11.04 | 10.22 | 6.57 | 5.79 | 3.92 | 2.37 | 0.58 | NA | NA | NA | NA | NA | NA | NA | NA | NA | NA | NA | NA | NA | NA | |
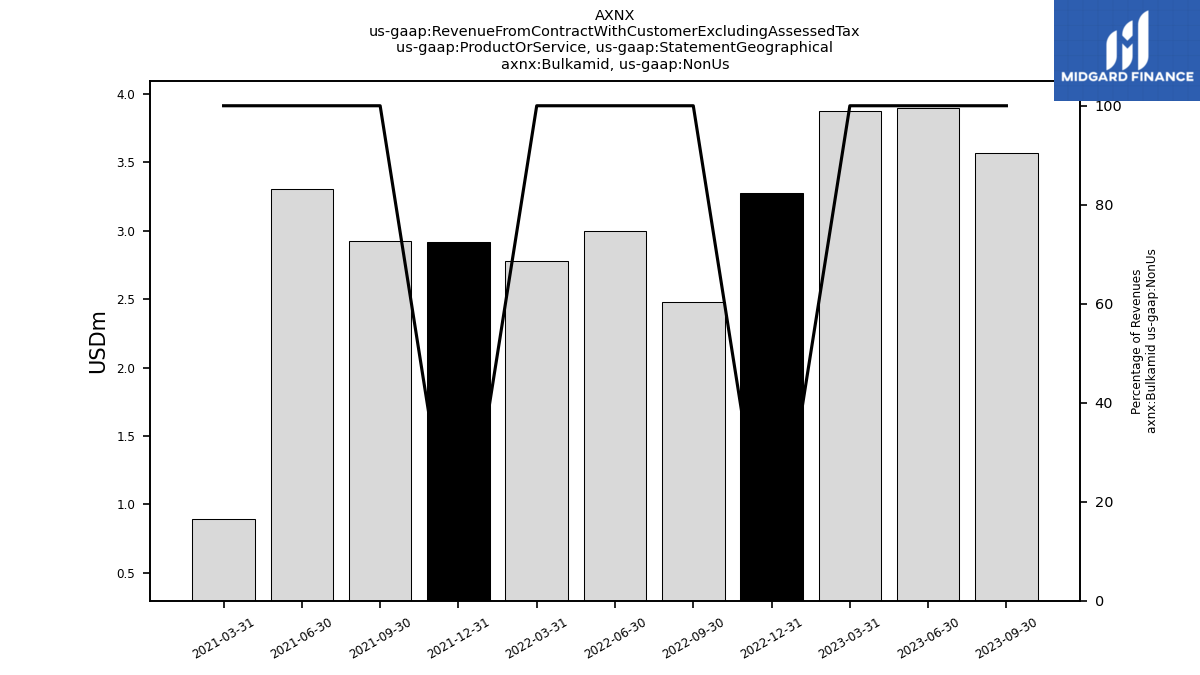
| Bulkamid, Non Us | 4.51 | 4.19 | 3.57 | 3.90 | 3.88 | 3.27 | 2.48 | 3.00 | 2.78 | 2.92 | 2.92 | 3.30 | 0.89 | NA | NA | NA | NA | NA | NA | NA | NA | NA | NA | NA | NA | NA | NA | |
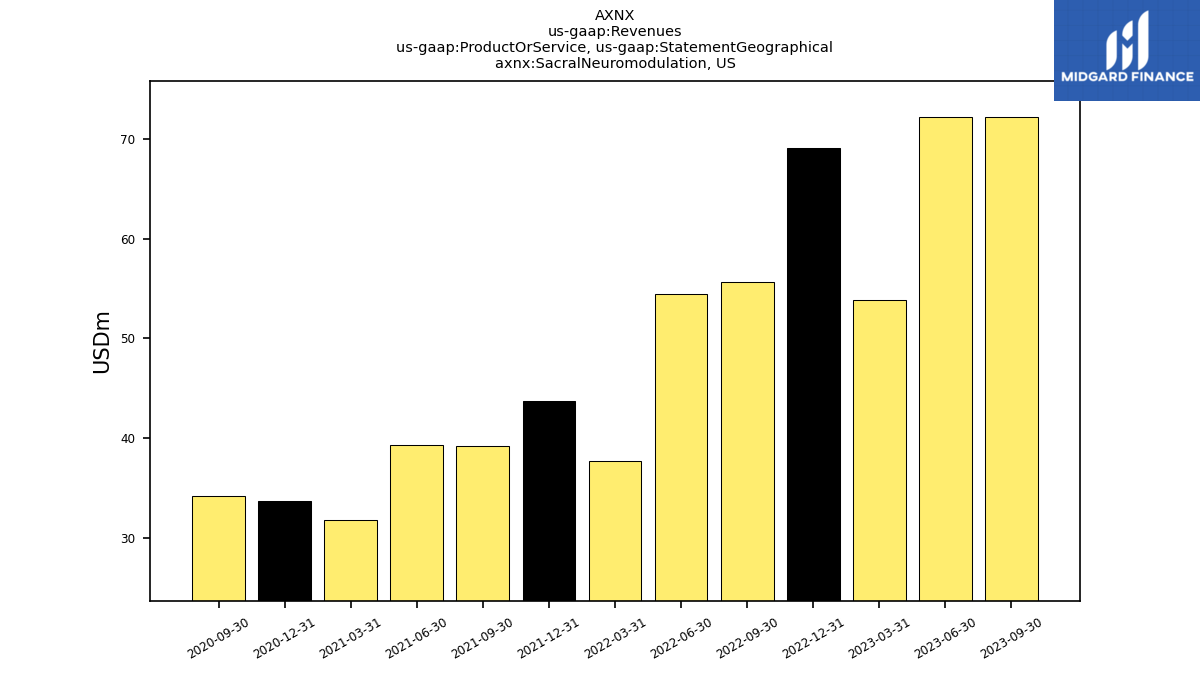
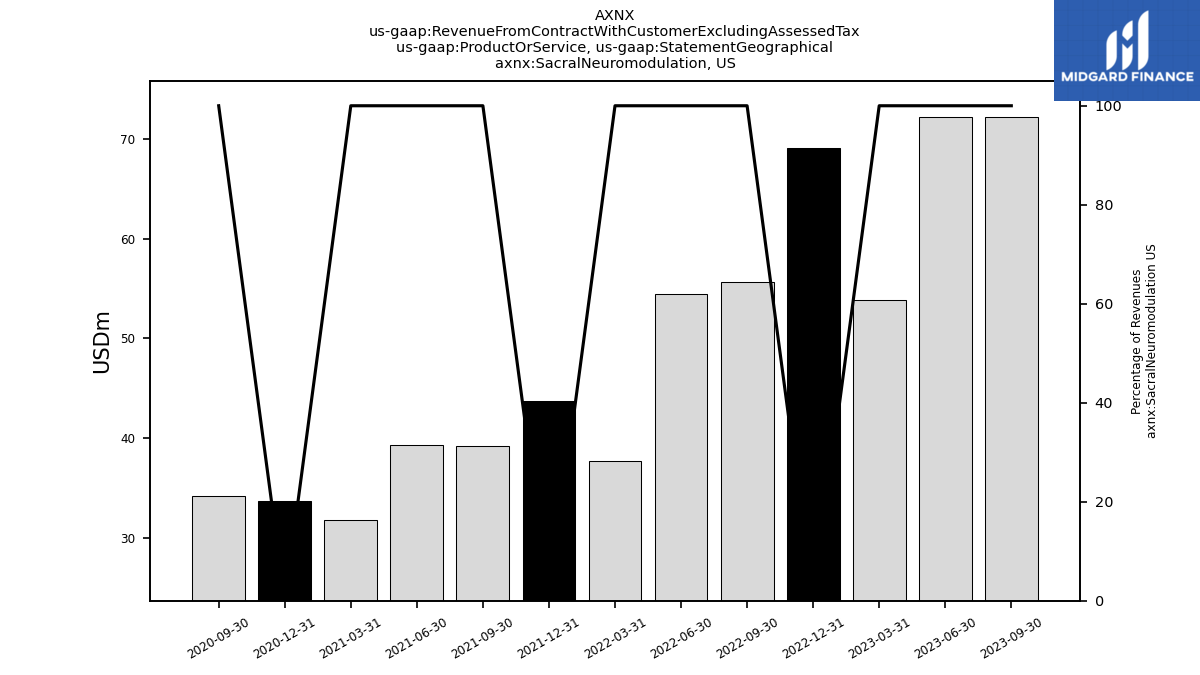
| Sacral Neuromodulation,US | 69.84 | 86.58 | 72.21 | 72.20 | 53.85 | 69.07 | 55.61 | 54.47 | 37.72 | 43.70 | 39.15 | 39.24 | 31.75 | 33.71 | 34.14 | NA | NA | NA | NA | NA | NA | NA | NA | NA | NA | NA | NA | |
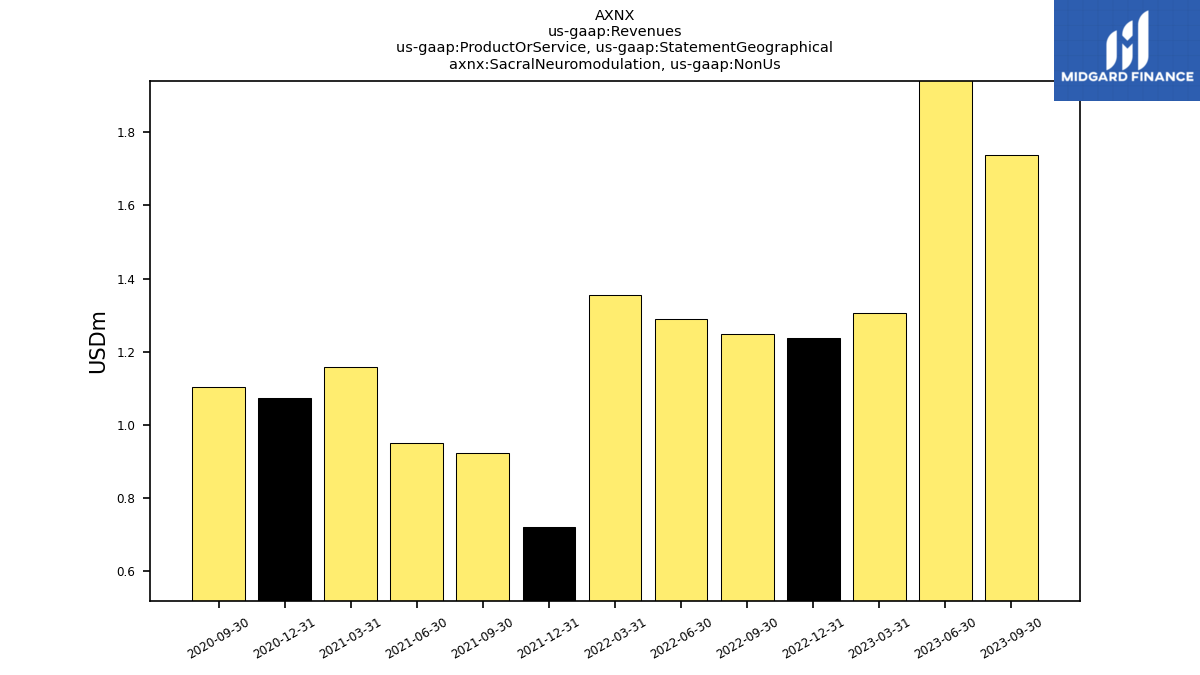
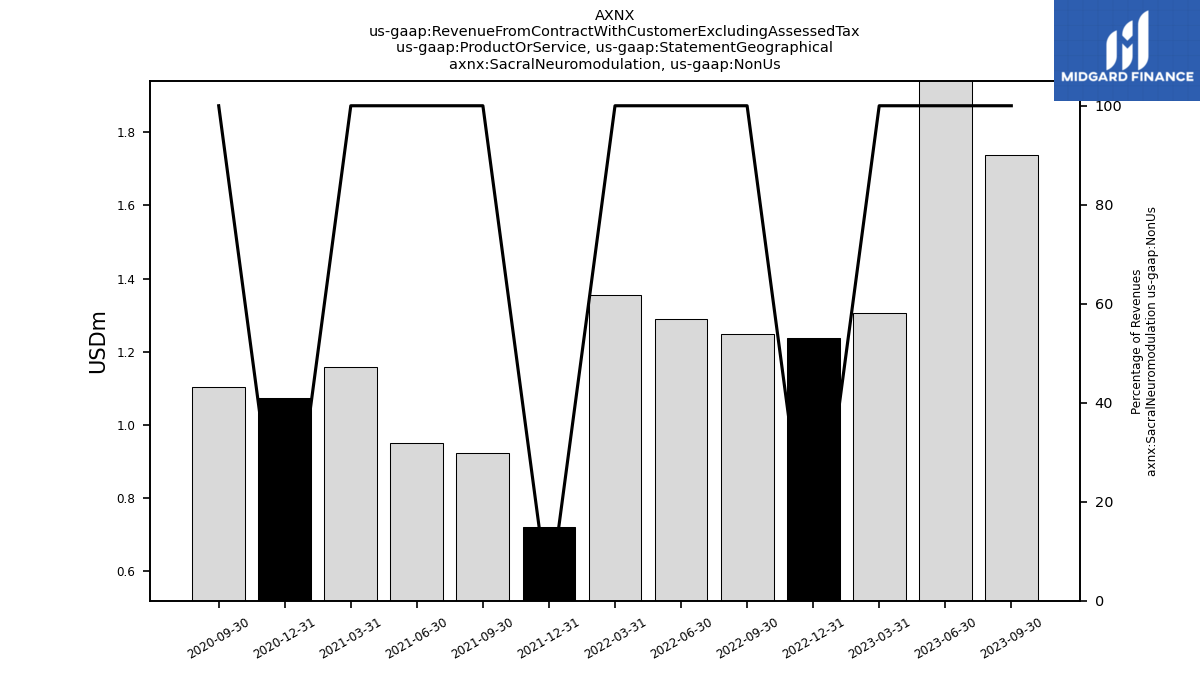
| Sacral Neuromodulation, Non Us | 1.84 | 1.93 | 1.74 | 1.98 | 1.30 | 1.24 | 1.25 | 1.29 | 1.35 | 0.72 | 0.92 | 0.95 | 1.16 | 1.07 | 1.10 | NA | NA | NA | NA | NA | NA | NA | NA | NA | NA | NA | NA | |
| Revenue From Contract With Customer Excluding Assessed Tax | 91.41 | 109.73 | 93.10 | 92.89 | 70.65 | 85.92 | 70.38 | 68.98 | 48.42 | 53.13 | 46.91 | 45.87 | 34.37 | 34.78 | 35.24 | 15.21 | 26.30 | 9.95 | 1.31 | 1.50 | 1.08 | 0.50 | 0.20 | 0.01 | 0.00 | 0.03 | 0.10 | |
| Bulkamid | 19.73 | 21.23 | 19.15 | 18.71 | 15.49 | 15.61 | 13.53 | 13.22 | 9.35 | 8.71 | 6.84 | 5.67 | 1.47 | NA | NA | NA | NA | NA | NA | NA | NA | NA | NA | NA | NA | NA | NA | |
| Sacral Neuromodulation | 71.68 | 88.51 | 73.95 | 74.19 | 55.16 | 70.30 | 56.86 | 55.76 | 39.07 | 44.42 | 40.07 | 40.19 | 32.90 | 34.78 | 35.24 | 15.21 | 26.30 | NA | NA | NA | NA | NA | NA | NA | NA | NA | NA | |
| Bulkamid,US | 15.22 | 17.04 | 15.58 | 14.81 | 11.61 | 12.34 | 11.04 | 10.22 | 6.57 | 5.79 | 3.92 | 2.37 | 0.58 | NA | NA | NA | NA | NA | NA | NA | NA | NA | NA | NA | NA | NA | NA | |
| Bulkamid, Non Us | 4.51 | 4.19 | 3.57 | 3.90 | 3.88 | 3.27 | 2.48 | 3.00 | 2.78 | 2.92 | 2.92 | 3.30 | 0.89 | NA | NA | NA | NA | NA | NA | NA | NA | NA | NA | NA | NA | NA | NA | |
| Sacral Neuromodulation,US | 69.84 | 86.58 | 72.21 | 72.20 | 53.85 | 69.07 | 55.61 | 54.47 | 37.72 | 43.70 | 39.15 | 39.24 | 31.75 | 33.71 | 34.14 | NA | NA | NA | NA | NA | NA | NA | NA | NA | NA | NA | NA | |
| Sacral Neuromodulation, Non Us | 1.84 | 1.93 | 1.74 | 1.98 | 1.30 | 1.24 | 1.25 | 1.29 | 1.35 | 0.72 | 0.92 | 0.95 | 1.16 | 1.07 | 1.10 | NA | NA | NA | NA | NA | NA | NA | NA | NA | NA | NA | NA |