
| 2024-03-31 | 2023-12-31 | 2023-09-30 | 2023-06-30 | 2023-03-31 | 2022-12-31 | 2022-09-30 | 2022-06-30 | 2022-03-31 | 2021-12-31 | 2021-09-30 | 2021-06-30 | 2021-03-31 | 2020-12-31 | 2020-09-30 | 2020-06-30 | 2020-03-31 | 2019-12-31 | 2019-09-30 | 2019-06-30 | 2019-03-31 | 2018-12-31 | 2018-09-30 | 2018-06-30 | 2018-03-31 | 2017-12-31 | 2017-09-30 | 2017-06-30 | 2017-03-31 | 2016-12-31 | 2016-09-30 | 2016-06-30 | 2016-03-31 | 2015-12-31 | 2015-09-30 | 2015-06-30 | 2015-03-31 | 2014-12-31 | 2014-09-30 | 2014-06-30 | 2014-03-31 | 2013-12-31 | 2013-09-30 | 2013-06-30 | 2013-03-31 | 2012-12-31 | 2012-09-30 | 2012-06-30 | 2012-03-31 | 2011-12-31 | 2011-09-30 | 2011-06-30 | 2011-03-31 | 2010-12-31 | 2010-09-30 | 2010-06-30 | 2010-03-31 | ||
|---|---|---|---|---|---|---|---|---|---|---|---|---|---|---|---|---|---|---|---|---|---|---|---|---|---|---|---|---|---|---|---|---|---|---|---|---|---|---|---|---|---|---|---|---|---|---|---|---|---|---|---|---|---|---|---|---|---|---|
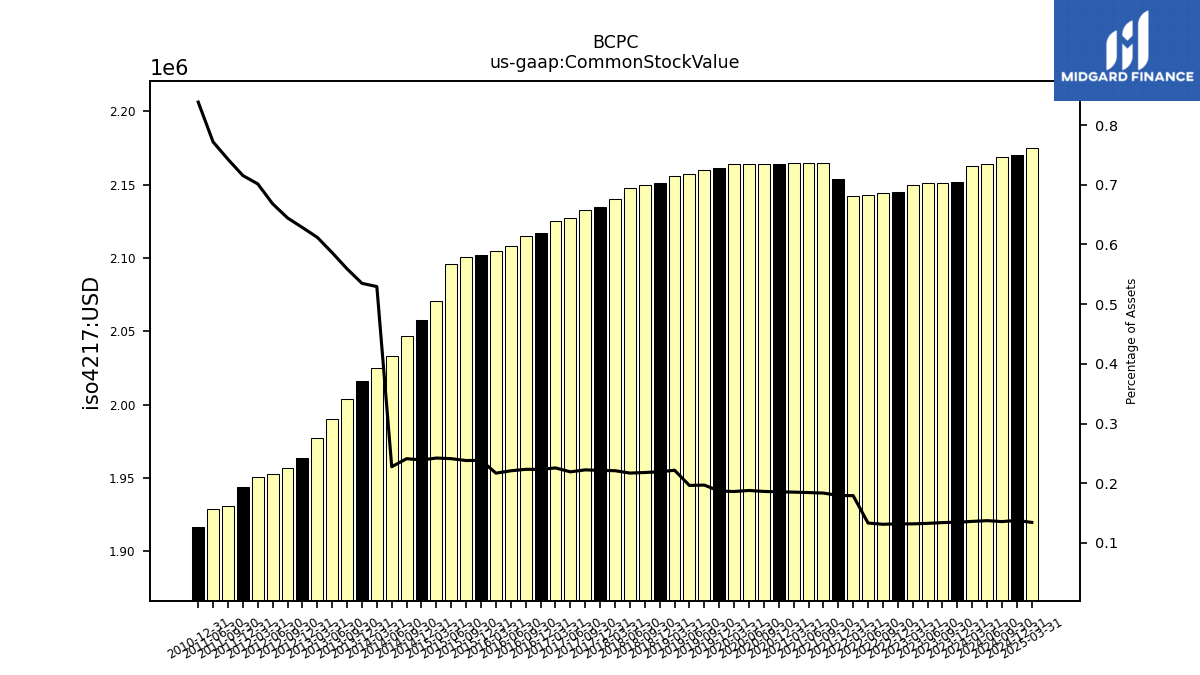
| Common Stock Value | 2.16 | 2.15 | 2.15 | 2.15 | 2.15 | 2.15 | 2.14 | 2.14 | 2.14 | 2.15 | 2.17 | 2.17 | 2.17 | 2.16 | 2.16 | 2.16 | 2.16 | 2.16 | 2.16 | 2.16 | 2.16 | 2.15 | 2.15 | 2.15 | 2.14 | 2.13 | 2.13 | 2.13 | 2.12 | 2.12 | 2.12 | 2.11 | 2.10 | 2.10 | 2.10 | 2.10 | 2.07 | 2.06 | 2.05 | 2.03 | 2.02 | 2.02 | 2.00 | 1.99 | 1.98 | 1.96 | 1.96 | 1.95 | 1.95 | 1.94 | 1.93 | 1.93 | NA | 1.92 | NA | NA | NA | |
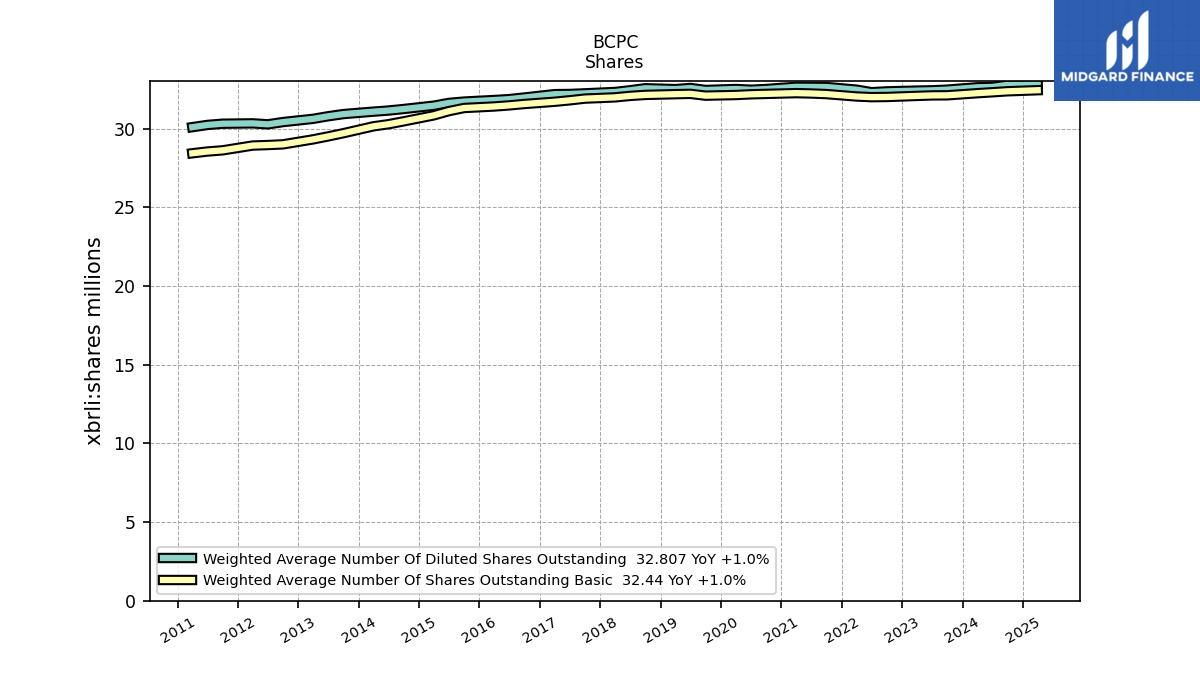
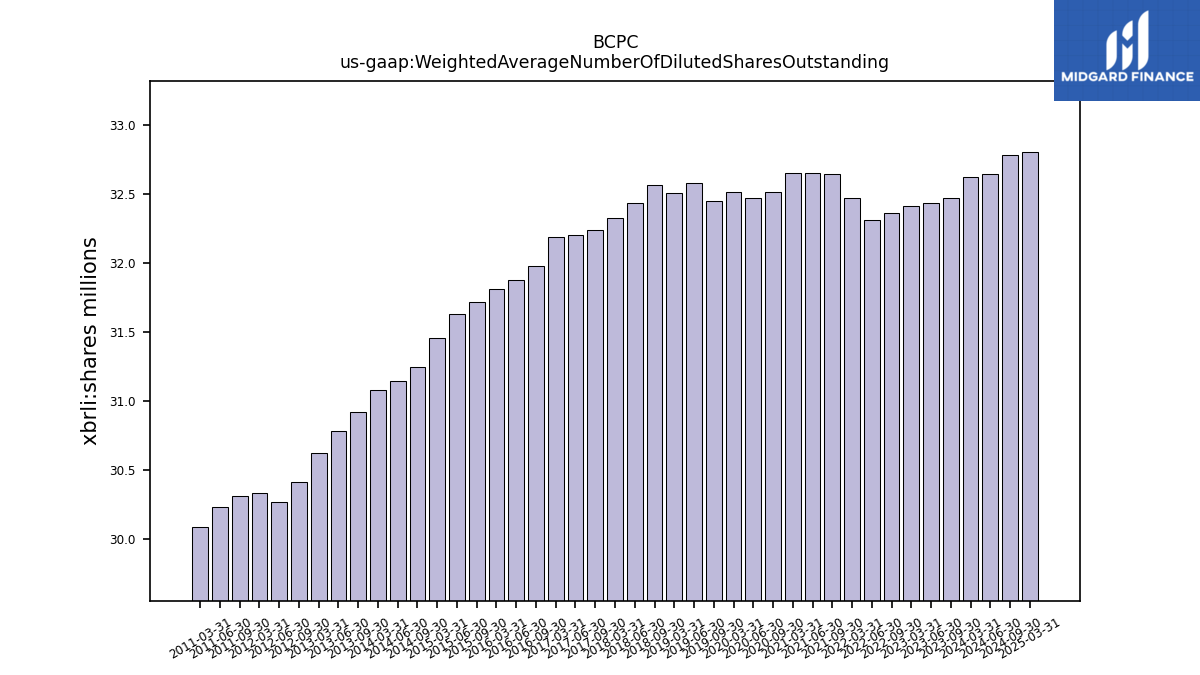
| Weighted Average Number Of Diluted Shares Outstanding | 32.63 | NA | 32.48 | 32.43 | 32.41 | NA | 32.37 | 32.31 | 32.48 | NA | 32.64 | 32.65 | 32.66 | NA | 32.52 | 32.47 | 32.52 | NA | 32.45 | 32.58 | 32.51 | NA | 32.57 | 32.44 | 32.33 | NA | 32.24 | 32.20 | 32.19 | NA | 31.98 | 31.88 | 31.82 | NA | 31.72 | 31.63 | 31.46 | NA | 31.25 | 31.15 | 31.08 | NA | 30.92 | 30.79 | 30.62 | NA | 30.42 | 30.27 | 30.33 | NA | 30.31 | 30.23 | 30.09 | NA | NA | NA | NA | |
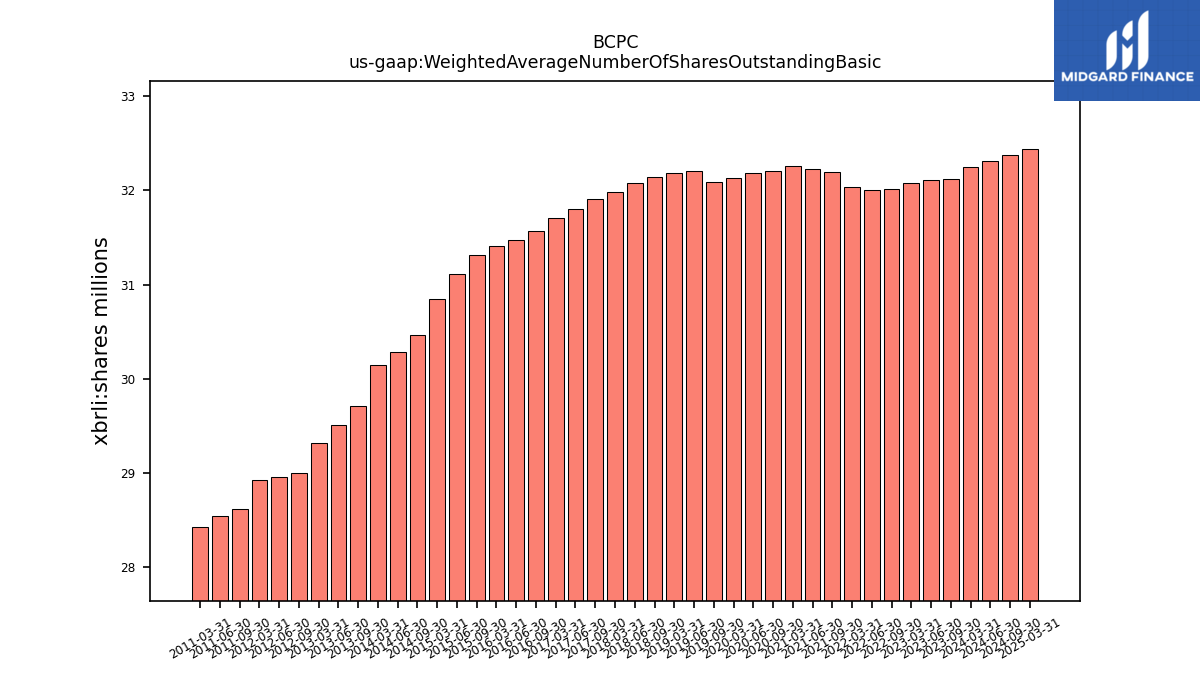
| Weighted Average Number Of Shares Outstanding Basic | 32.25 | NA | 32.12 | 32.11 | 32.08 | NA | 32.01 | 32.00 | 32.04 | NA | 32.19 | 32.23 | 32.26 | NA | 32.21 | 32.18 | 32.13 | NA | 32.09 | 32.21 | 32.19 | NA | 32.14 | 32.08 | 31.99 | NA | 31.91 | 31.80 | 31.71 | NA | 31.57 | 31.48 | 31.41 | NA | 31.31 | 31.11 | 30.84 | NA | 30.46 | 30.28 | 30.15 | NA | 29.71 | 29.51 | 29.32 | NA | 29.00 | 28.96 | 28.93 | NA | 28.62 | 28.54 | 28.43 | NA | NA | NA | NA | |
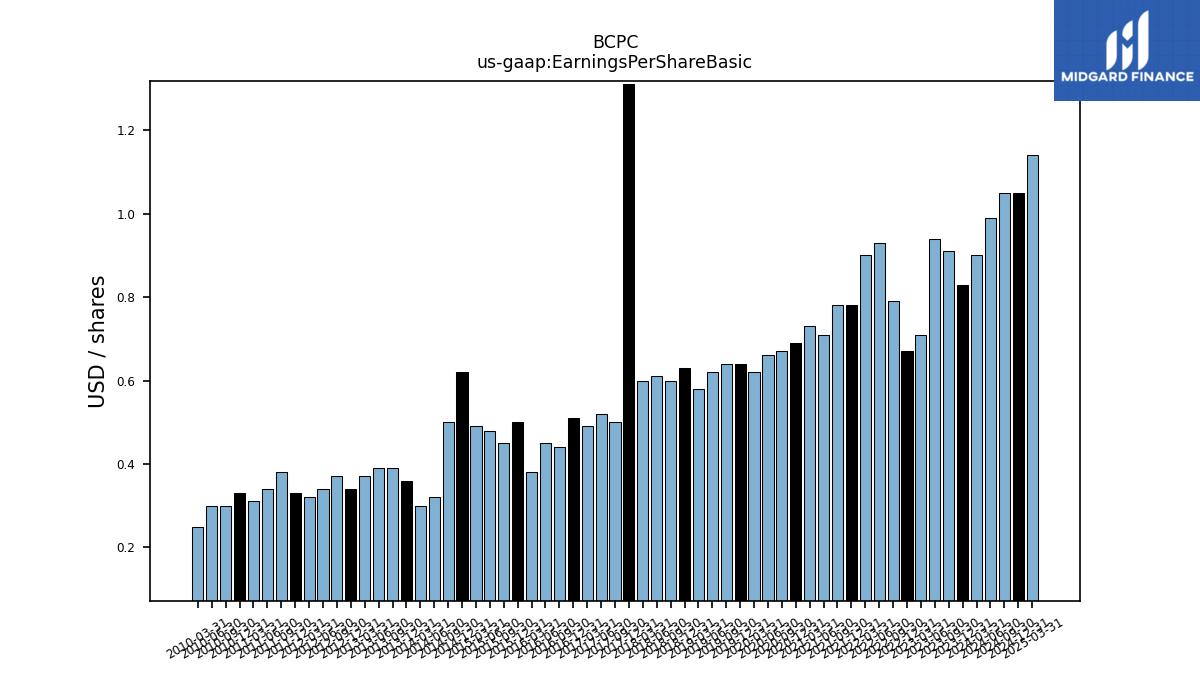
| Earnings Per Share Basic | 0.90 | 0.83 | 0.91 | 0.94 | 0.71 | 0.67 | 0.79 | 0.93 | 0.90 | 0.78 | 0.78 | 0.71 | 0.73 | 0.69 | 0.67 | 0.66 | 0.62 | 0.64 | 0.64 | 0.62 | 0.58 | 0.63 | 0.60 | 0.61 | 0.60 | 1.31 | 0.50 | 0.52 | 0.49 | 0.51 | 0.44 | 0.45 | 0.38 | 0.50 | 0.45 | 0.48 | 0.49 | 0.62 | 0.50 | 0.32 | 0.30 | 0.36 | 0.39 | 0.39 | 0.37 | 0.34 | 0.37 | 0.34 | 0.32 | 0.33 | 0.38 | 0.34 | 0.31 | 0.33 | 0.30 | 0.30 | 0.25 | |
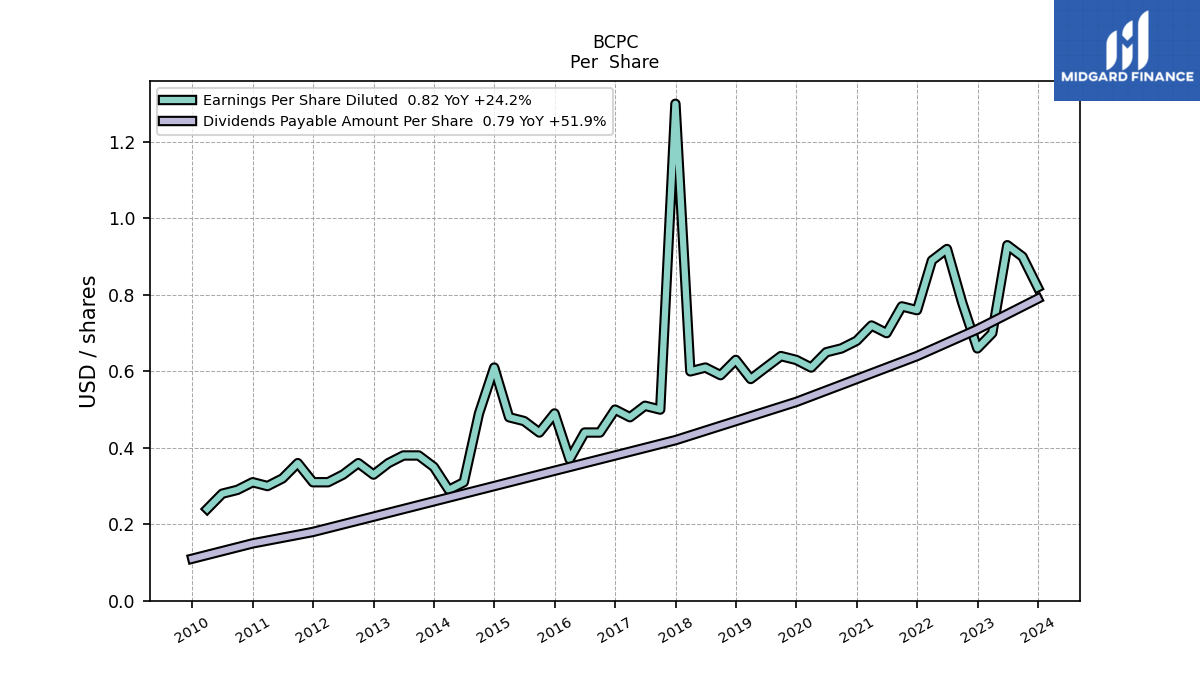
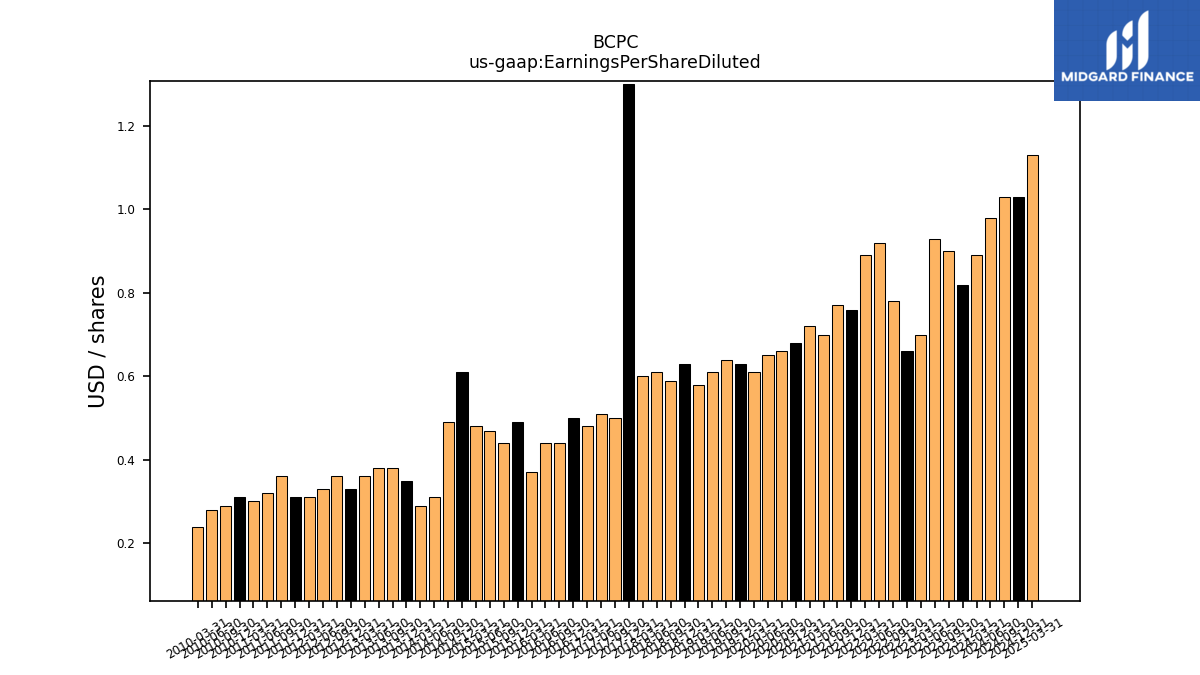
| Earnings Per Share Diluted | 0.89 | 0.82 | 0.90 | 0.93 | 0.70 | 0.66 | 0.78 | 0.92 | 0.89 | 0.76 | 0.77 | 0.70 | 0.72 | 0.68 | 0.66 | 0.65 | 0.61 | 0.63 | 0.64 | 0.61 | 0.58 | 0.63 | 0.59 | 0.61 | 0.60 | 1.30 | 0.50 | 0.51 | 0.48 | 0.50 | 0.44 | 0.44 | 0.37 | 0.49 | 0.44 | 0.47 | 0.48 | 0.61 | 0.49 | 0.31 | 0.29 | 0.35 | 0.38 | 0.38 | 0.36 | 0.33 | 0.36 | 0.33 | 0.31 | 0.31 | 0.36 | 0.32 | 0.30 | 0.31 | 0.29 | 0.28 | 0.24 |
| 2024-03-31 | 2023-12-31 | 2023-09-30 | 2023-06-30 | 2023-03-31 | 2022-12-31 | 2022-09-30 | 2022-06-30 | 2022-03-31 | 2021-12-31 | 2021-09-30 | 2021-06-30 | 2021-03-31 | 2020-12-31 | 2020-09-30 | 2020-06-30 | 2020-03-31 | 2019-12-31 | 2019-09-30 | 2019-06-30 | 2019-03-31 | 2018-12-31 | 2018-09-30 | 2018-06-30 | 2018-03-31 | 2017-12-31 | 2017-09-30 | 2017-06-30 | 2017-03-31 | 2016-12-31 | 2016-09-30 | 2016-06-30 | 2016-03-31 | 2015-12-31 | 2015-09-30 | 2015-06-30 | 2015-03-31 | 2014-12-31 | 2014-09-30 | 2014-06-30 | 2014-03-31 | 2013-12-31 | 2013-09-30 | 2013-06-30 | 2013-03-31 | 2012-12-31 | 2012-09-30 | 2012-06-30 | 2012-03-31 | 2011-12-31 | 2011-09-30 | 2011-06-30 | 2011-03-31 | 2010-12-31 | 2010-09-30 | 2010-06-30 | 2010-03-31 | ||
|---|---|---|---|---|---|---|---|---|---|---|---|---|---|---|---|---|---|---|---|---|---|---|---|---|---|---|---|---|---|---|---|---|---|---|---|---|---|---|---|---|---|---|---|---|---|---|---|---|---|---|---|---|---|---|---|---|---|---|
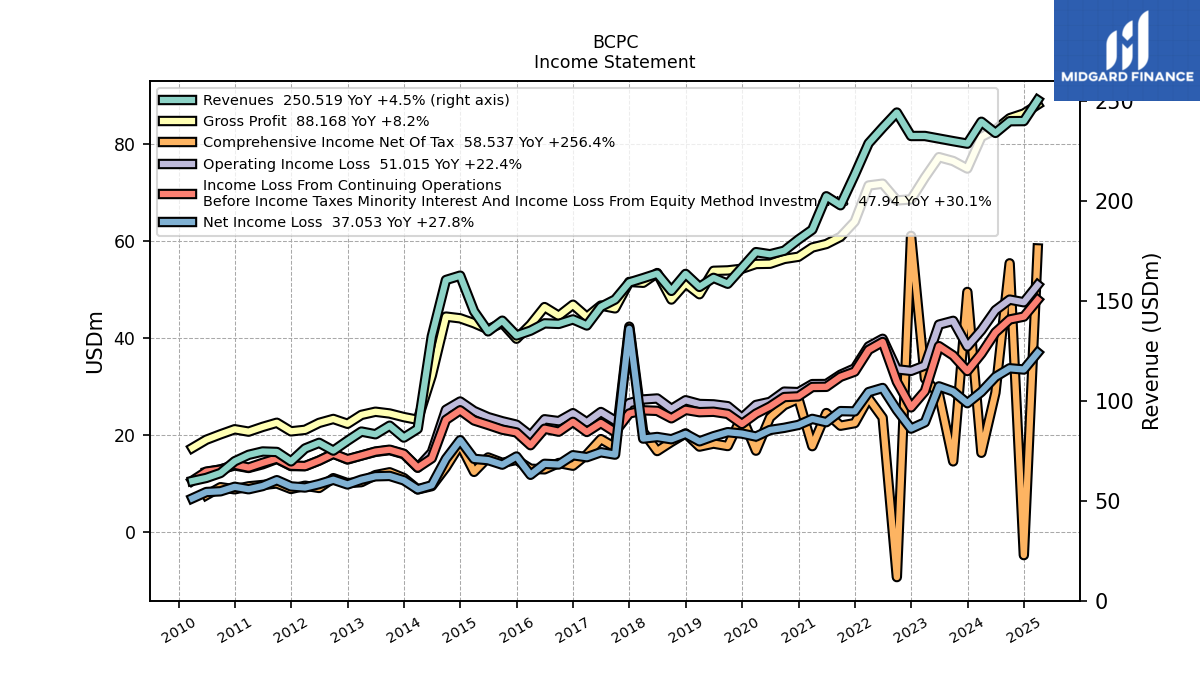
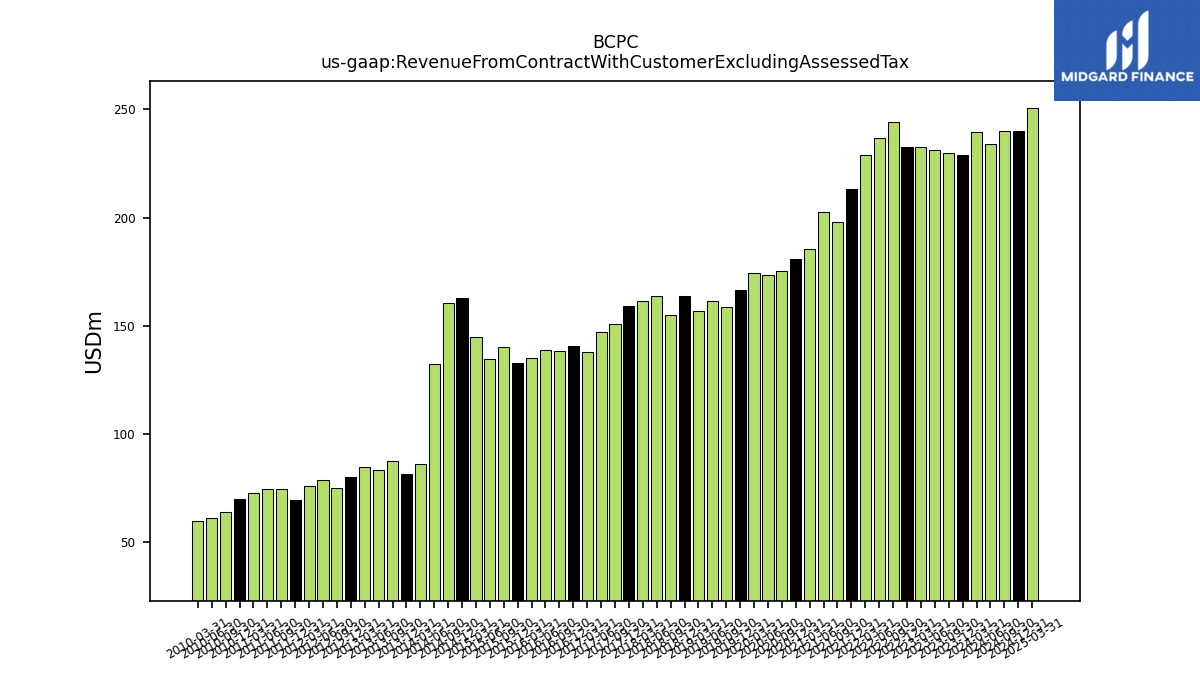
| Revenue From Contract With Customer Excluding Assessed Tax | 239.66 | 228.70 | 229.95 | 231.25 | 232.54 | 232.53 | 244.27 | 236.69 | 228.87 | 213.13 | 197.87 | 202.37 | 185.66 | 180.71 | 175.14 | 173.35 | 174.44 | 166.53 | 158.59 | 161.55 | 157.03 | 163.54 | 155.04 | 163.69 | 161.41 | 159.26 | 150.72 | 147.08 | 137.73 | 140.76 | 138.51 | 138.79 | 135.14 | 132.73 | 140.13 | 134.77 | 144.86 | 162.67 | 160.49 | 132.23 | 86.00 | 81.63 | 87.59 | 83.30 | 84.65 | 80.06 | 75.12 | 79.01 | 76.20 | 69.73 | 74.44 | 74.69 | 73.01 | 69.80 | 63.91 | 61.46 | 59.90 | |
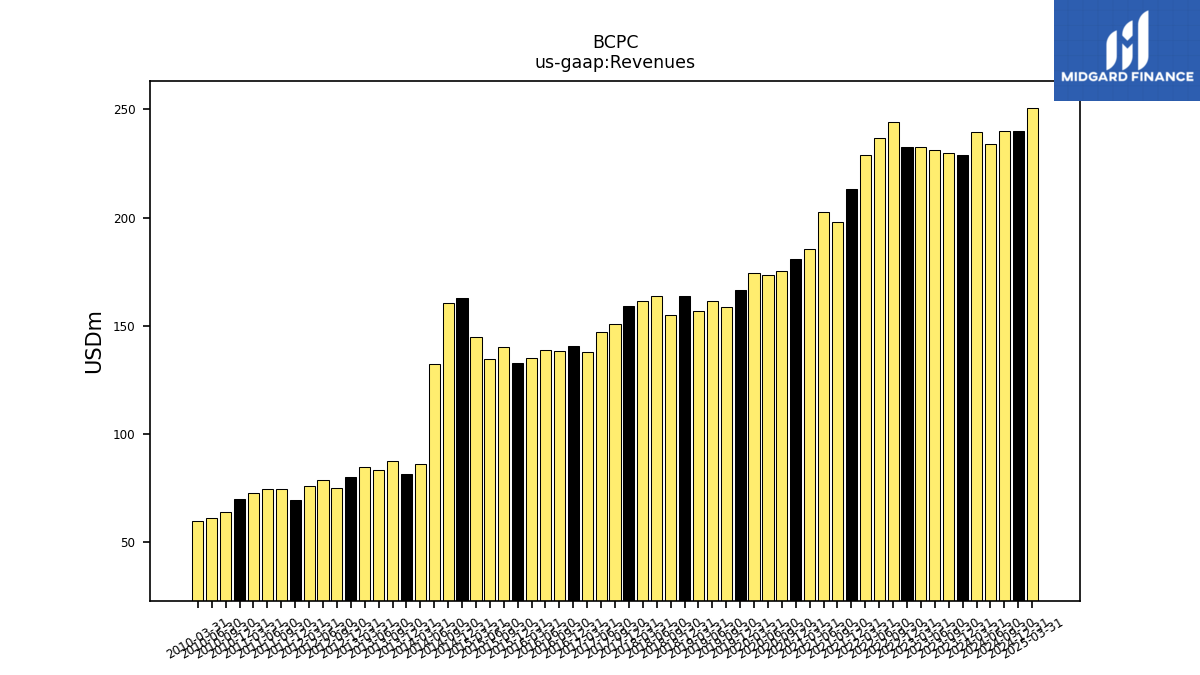
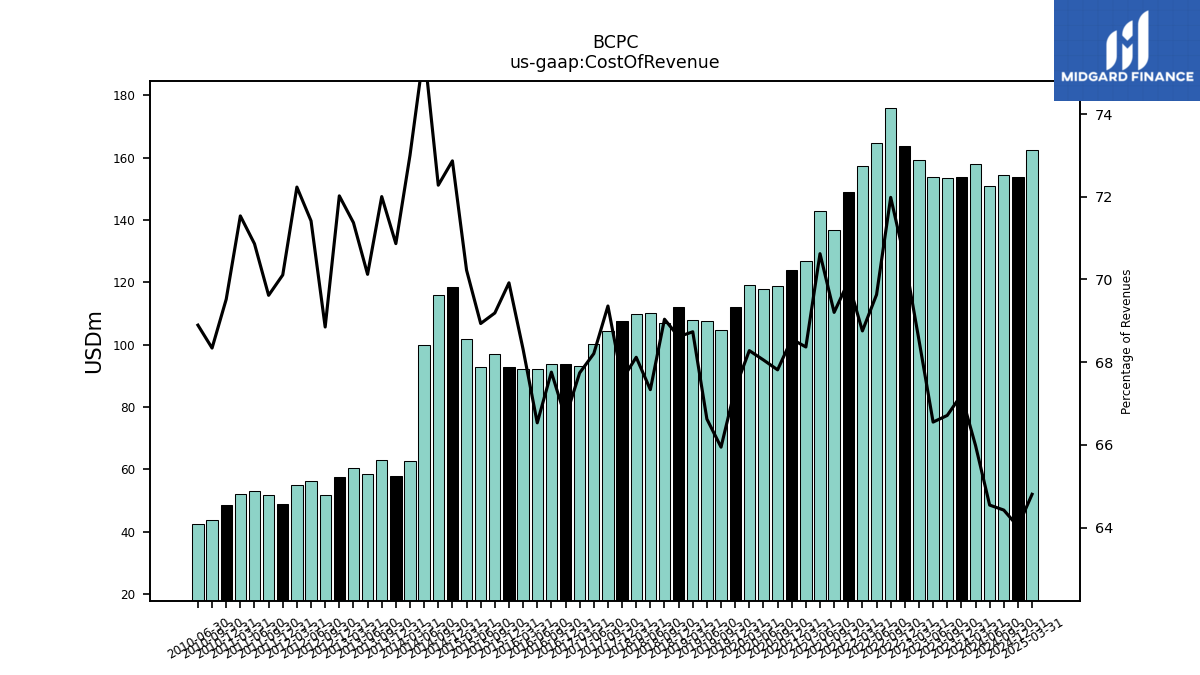
| Revenues | 239.66 | 228.70 | 229.95 | 231.25 | 232.54 | 232.53 | 244.27 | 236.69 | 228.87 | 213.13 | 197.87 | 202.37 | 185.66 | 180.71 | 175.14 | 173.35 | 174.44 | 166.53 | 158.59 | 161.55 | 157.03 | 163.54 | 155.04 | 163.69 | 161.41 | 159.26 | 150.72 | 147.08 | 137.73 | 140.76 | 138.51 | 138.79 | 135.14 | 132.73 | 140.13 | 134.77 | 144.86 | 162.67 | 160.49 | 132.23 | 86.00 | 81.63 | 87.59 | 83.30 | 84.65 | 80.06 | 75.12 | 79.01 | 76.20 | 69.73 | 74.44 | 74.69 | 73.01 | 69.80 | 63.91 | 61.46 | 59.90 | |
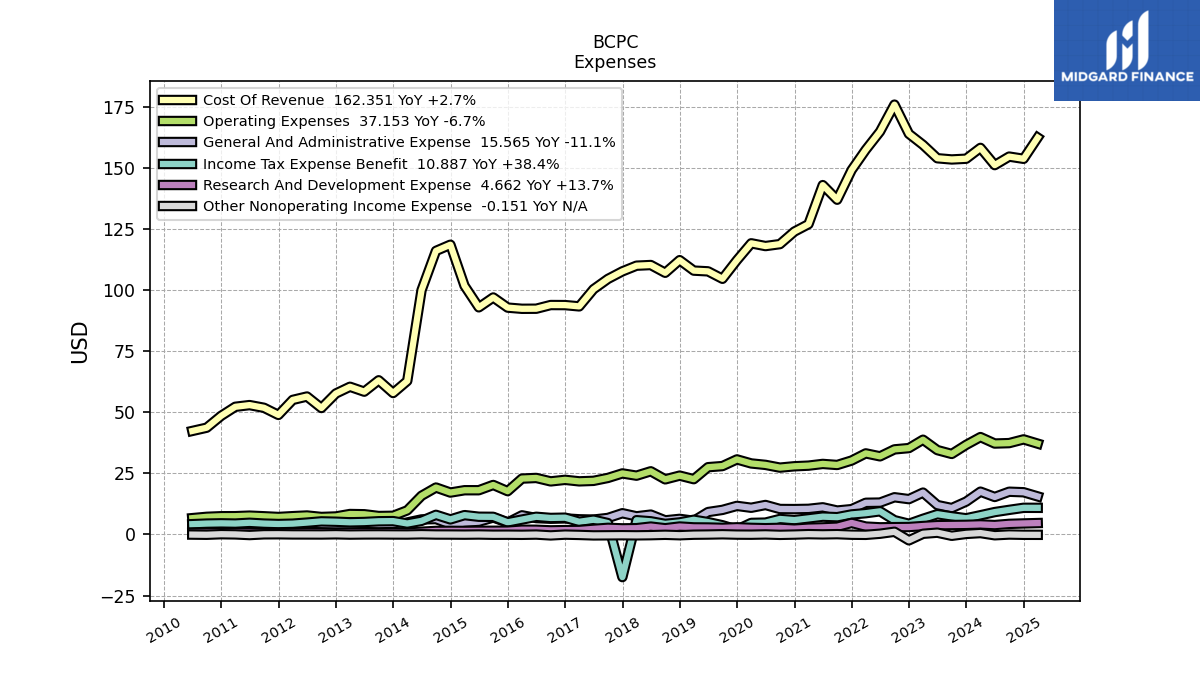
| Cost Of Revenue | 158.15 | 153.71 | 153.40 | 153.90 | 159.37 | 163.89 | 175.84 | 164.82 | 157.36 | 149.07 | 136.94 | 142.92 | 126.93 | 123.89 | 118.77 | 117.97 | 119.11 | 112.18 | 104.59 | 107.64 | 107.93 | 112.21 | 107.04 | 110.22 | 109.95 | 107.63 | 104.53 | 100.32 | 93.30 | 93.83 | 93.85 | 92.34 | 92.32 | 92.80 | 96.95 | 92.91 | 101.73 | 118.53 | 116.00 | 99.89 | 62.78 | 57.85 | 63.07 | 58.41 | 60.42 | 57.66 | 51.72 | 56.43 | 55.05 | 48.89 | 51.82 | 52.93 | 52.23 | 48.53 | 43.68 | 42.34 | NA | |
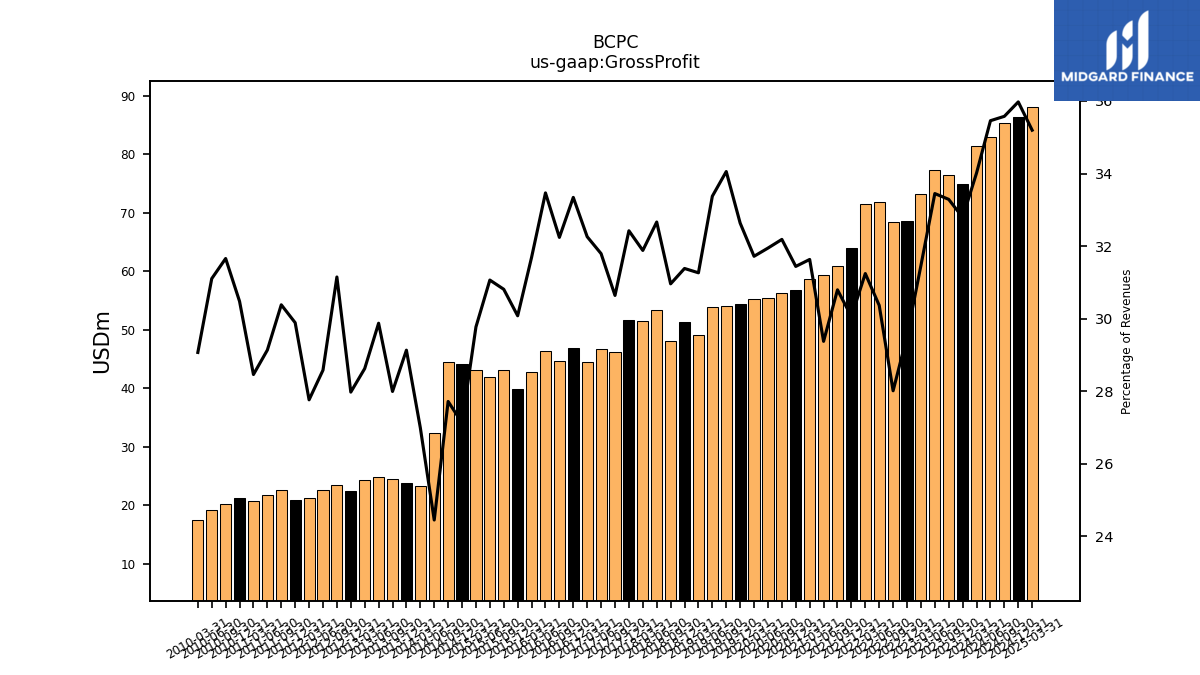
| Gross Profit | 81.51 | 74.99 | 76.54 | 77.35 | 73.17 | 68.64 | 68.43 | 71.88 | 71.51 | 64.07 | 60.93 | 59.45 | 58.73 | 56.82 | 56.37 | 55.38 | 55.33 | 54.35 | 54.01 | 53.92 | 49.09 | 51.33 | 48.00 | 53.47 | 51.46 | 51.64 | 46.18 | 46.76 | 44.43 | 46.93 | 44.66 | 46.45 | 42.82 | 39.93 | 43.17 | 41.87 | 43.13 | 44.13 | 44.49 | 32.34 | 23.21 | 23.78 | 24.52 | 24.89 | 24.23 | 22.40 | 23.40 | 22.58 | 21.16 | 20.84 | 22.62 | 21.76 | 20.78 | 21.27 | 20.23 | 19.12 | 17.41 | |
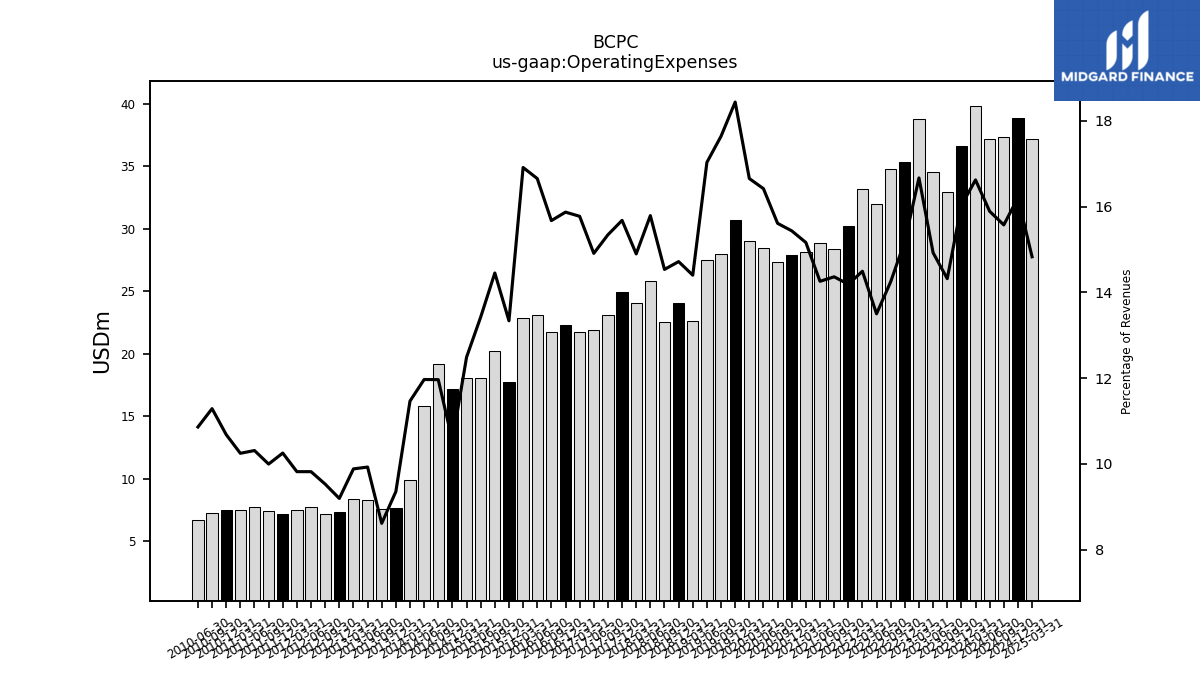
| Operating Expenses | 39.84 | 36.66 | 32.93 | 34.51 | 38.76 | 35.33 | 34.80 | 31.96 | 33.17 | 30.25 | 28.42 | 28.85 | 28.15 | 27.89 | 27.34 | 28.46 | 29.05 | 30.70 | 27.98 | 27.52 | 22.61 | 24.07 | 22.54 | 25.85 | 24.05 | 24.97 | 23.13 | 21.93 | 21.73 | 22.34 | 21.71 | 23.12 | 22.86 | 17.70 | 20.25 | 18.09 | 18.09 | 17.14 | 19.20 | 15.83 | 9.86 | 7.64 | 7.55 | 8.27 | 8.37 | 7.36 | 7.16 | 7.76 | 7.48 | 7.15 | 7.44 | 7.70 | 7.48 | 7.46 | 7.21 | 6.67 | NA | |
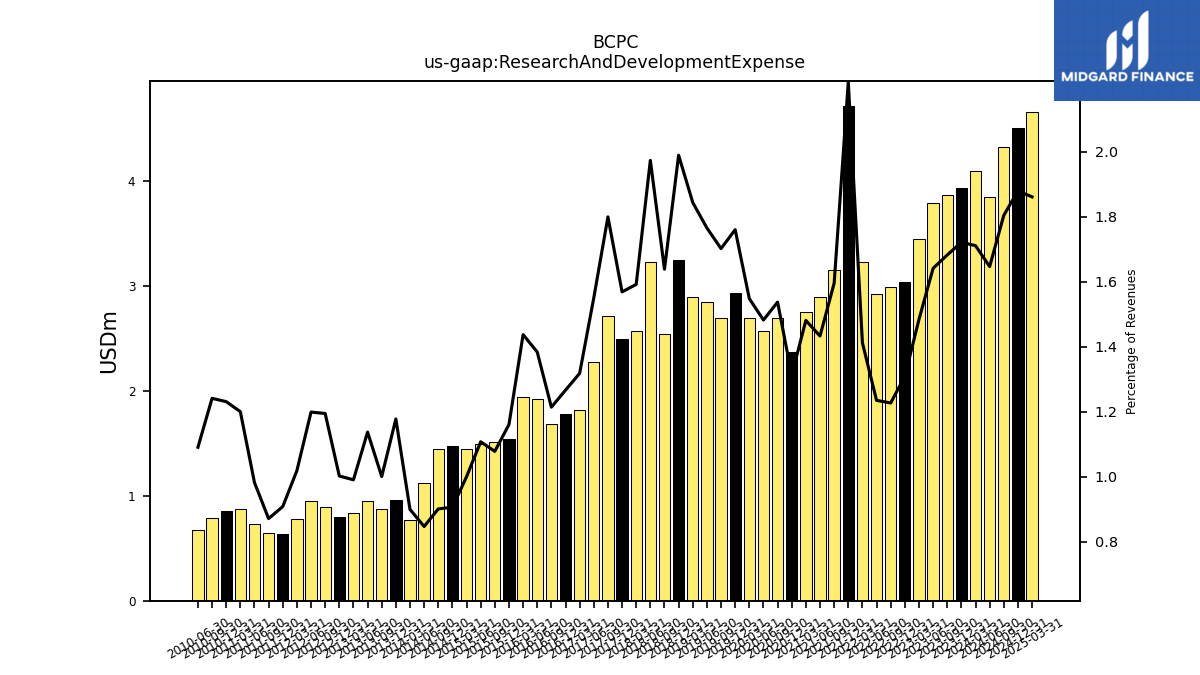
| Research And Development Expense | 4.10 | 3.94 | 3.87 | 3.79 | 3.45 | 3.04 | 3.00 | 2.92 | 3.23 | 4.72 | 3.16 | 2.90 | 2.75 | 2.37 | 2.69 | 2.57 | 2.70 | 2.93 | 2.70 | 2.85 | 2.90 | 3.25 | 2.54 | 3.23 | 2.57 | 2.50 | 2.71 | 2.28 | 1.81 | 1.78 | 1.68 | 1.92 | 1.94 | 1.54 | 1.51 | 1.49 | 1.45 | 1.47 | 1.45 | 1.12 | 0.77 | 0.96 | 0.88 | 0.95 | 0.84 | 0.80 | 0.90 | 0.95 | 0.78 | 0.63 | 0.65 | 0.73 | 0.88 | 0.86 | 0.79 | 0.67 | NA | |
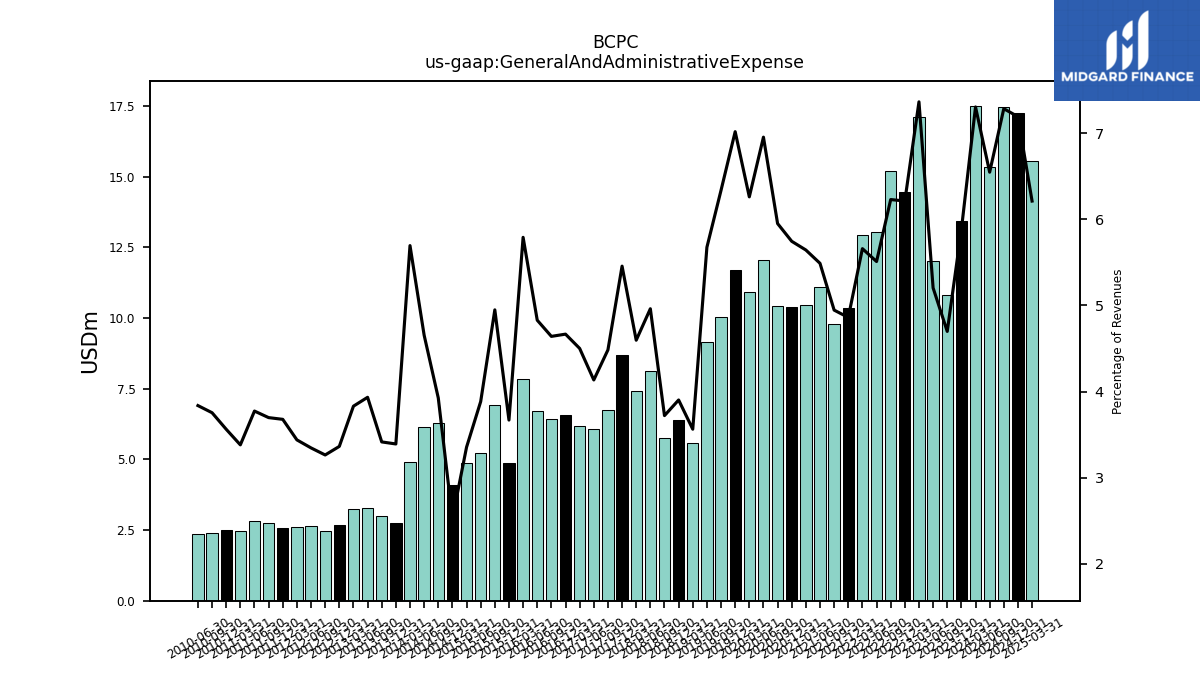
| General And Administrative Expense | 17.51 | 13.45 | 10.80 | 12.03 | 17.13 | 14.45 | 15.22 | 13.04 | 12.95 | 10.36 | 9.79 | 11.11 | 10.48 | 10.38 | 10.42 | 12.06 | 10.92 | 11.69 | 10.05 | 9.17 | 5.59 | 6.38 | 5.77 | 8.12 | 7.42 | 8.69 | 6.76 | 6.08 | 6.20 | 6.57 | 6.43 | 6.70 | 7.83 | 4.87 | 6.93 | 5.23 | 4.86 | 4.11 | 6.30 | 6.16 | 4.90 | 2.77 | 2.99 | 3.28 | 3.24 | 2.69 | 2.45 | 2.64 | 2.62 | 2.56 | 2.75 | 2.82 | 2.47 | 2.49 | 2.40 | 2.36 | NA | |
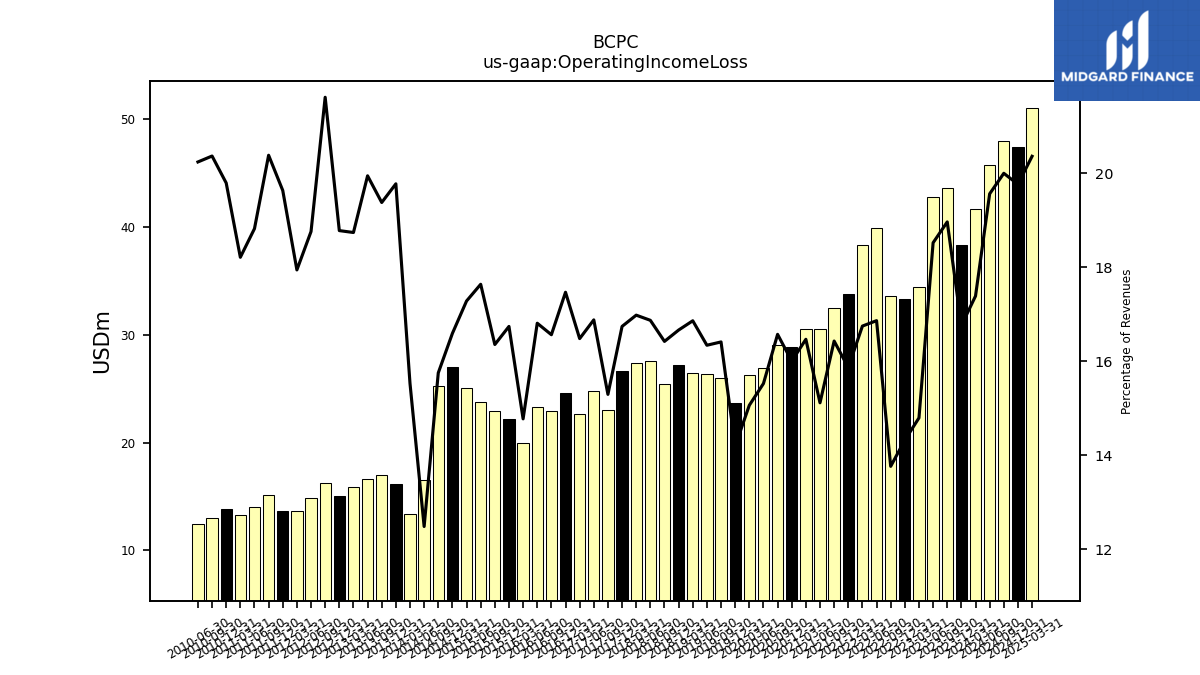
| Operating Income Loss | 41.68 | 38.34 | 43.61 | 42.84 | 34.41 | 33.30 | 33.62 | 39.92 | 38.34 | 33.82 | 32.51 | 30.59 | 30.57 | 28.92 | 29.03 | 26.92 | 26.28 | 23.64 | 26.03 | 26.40 | 26.48 | 27.25 | 25.46 | 27.62 | 27.41 | 26.67 | 23.05 | 24.83 | 22.70 | 24.59 | 22.95 | 23.33 | 19.97 | 22.22 | 22.92 | 23.77 | 25.04 | 27.00 | 25.28 | 16.51 | 13.36 | 16.14 | 16.98 | 16.62 | 15.87 | 15.04 | 16.24 | 14.82 | 13.68 | 13.69 | 15.18 | 14.06 | 13.30 | 13.82 | 13.02 | 12.44 | NA | |
| Interest Income Expense Net | -5.40 | -5.29 | -6.59 | -5.16 | -5.57 | -5.12 | -3.64 | -0.96 | -0.55 | -0.57 | -0.56 | -0.61 | -0.72 | -0.83 | -0.95 | -0.96 | -1.70 | -1.21 | -1.67 | -1.49 | -1.59 | -1.68 | -1.80 | -2.27 | -1.87 | NA | NA | NA | NA | NA | NA | NA | NA | NA | NA | NA | NA | NA | NA | NA | NA | NA | NA | NA | NA | NA | NA | NA | NA | NA | NA | NA | NA | NA | NA | NA | NA | |
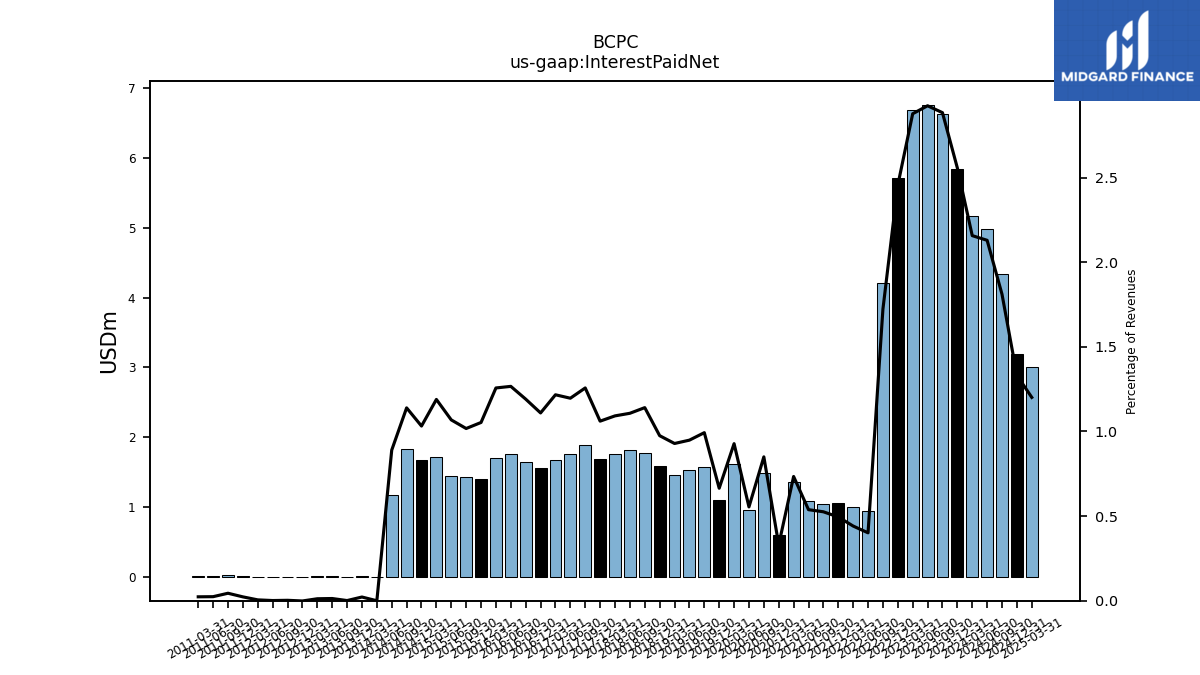
| Interest Paid Net | 5.17 | 5.85 | 6.63 | 6.76 | 6.69 | 5.71 | 4.21 | 0.95 | 1.01 | 1.05 | 1.04 | 1.09 | 1.36 | 0.60 | 1.49 | 0.96 | 1.62 | 1.11 | 1.57 | 1.53 | 1.46 | 1.59 | 1.77 | 1.81 | 1.76 | 1.69 | 1.90 | 1.76 | 1.68 | 1.56 | 1.65 | 1.76 | 1.70 | 1.40 | 1.43 | 1.44 | 1.72 | 1.68 | 1.83 | 1.18 | 0.00 | 0.02 | 0.00 | 0.01 | 0.01 | -0.00 | 0.00 | 0.00 | 0.00 | 0.02 | 0.03 | 0.02 | 0.02 | NA | NA | NA | NA | |
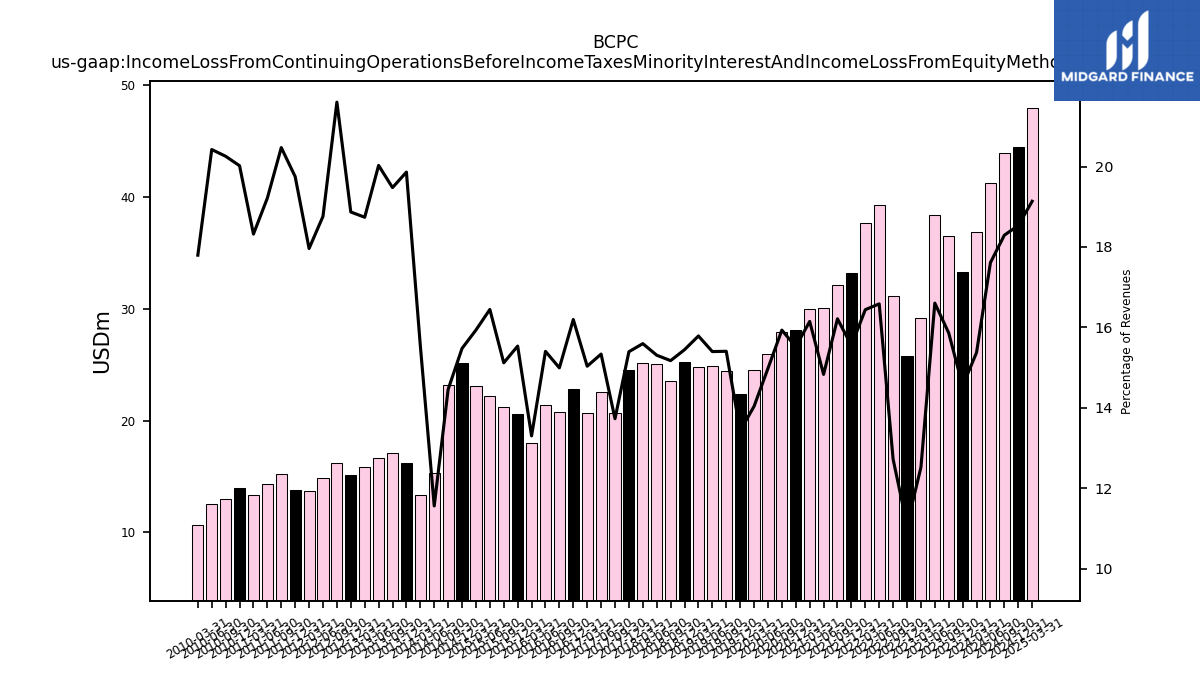
| Income Loss From Continuing Operations Before Income Taxes Minority Interest And Income Loss From Equity Method Investments | 36.85 | 33.27 | 36.48 | 38.40 | 29.12 | 25.78 | 31.09 | 39.26 | 37.63 | 33.15 | 32.09 | 30.02 | 29.98 | 28.05 | 27.91 | 25.97 | 24.49 | 22.37 | 24.44 | 24.88 | 24.79 | 25.26 | 23.53 | 25.06 | 25.18 | 24.52 | 20.70 | 22.56 | 20.71 | 22.80 | 20.77 | 21.38 | 17.98 | 20.62 | 21.19 | 22.17 | 23.09 | 25.18 | 23.21 | 15.29 | 13.37 | 16.21 | 17.06 | 16.68 | 15.86 | 15.11 | 16.23 | 14.82 | 13.69 | 13.77 | 15.24 | 14.35 | 13.38 | 13.97 | 12.95 | 12.55 | 10.66 | |
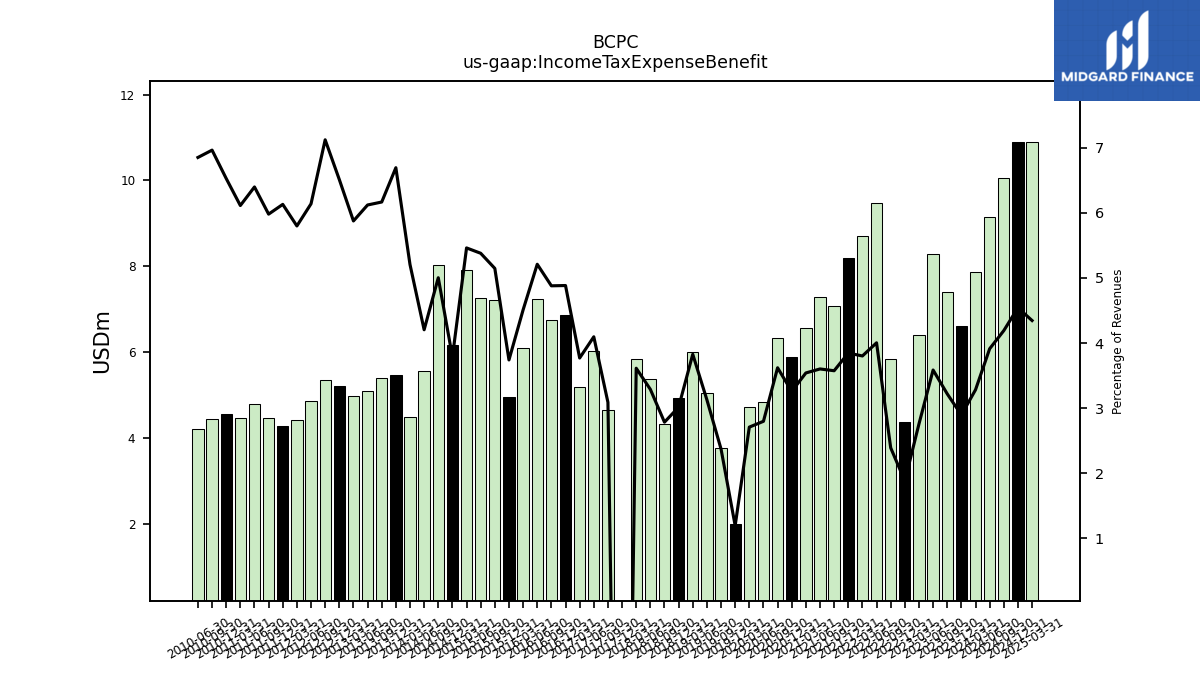
| Income Tax Expense Benefit | 7.86 | 6.62 | 7.40 | 8.29 | 6.41 | 4.37 | 5.84 | 9.48 | 8.70 | 8.20 | 7.07 | 7.29 | 6.57 | 5.88 | 6.34 | 4.85 | 4.72 | 1.99 | 3.76 | 5.05 | 6.01 | 4.93 | 4.32 | 5.38 | 5.83 | -17.45 | 4.65 | 6.02 | 5.19 | 6.88 | 6.76 | 7.23 | 6.09 | 4.96 | 7.21 | 7.25 | 7.91 | 6.16 | 8.03 | 5.56 | 4.48 | 5.47 | 5.40 | 5.10 | 4.97 | 5.21 | 5.35 | 4.85 | 4.42 | 4.28 | 4.45 | 4.78 | 4.46 | 4.56 | 4.45 | 4.21 | NA | |
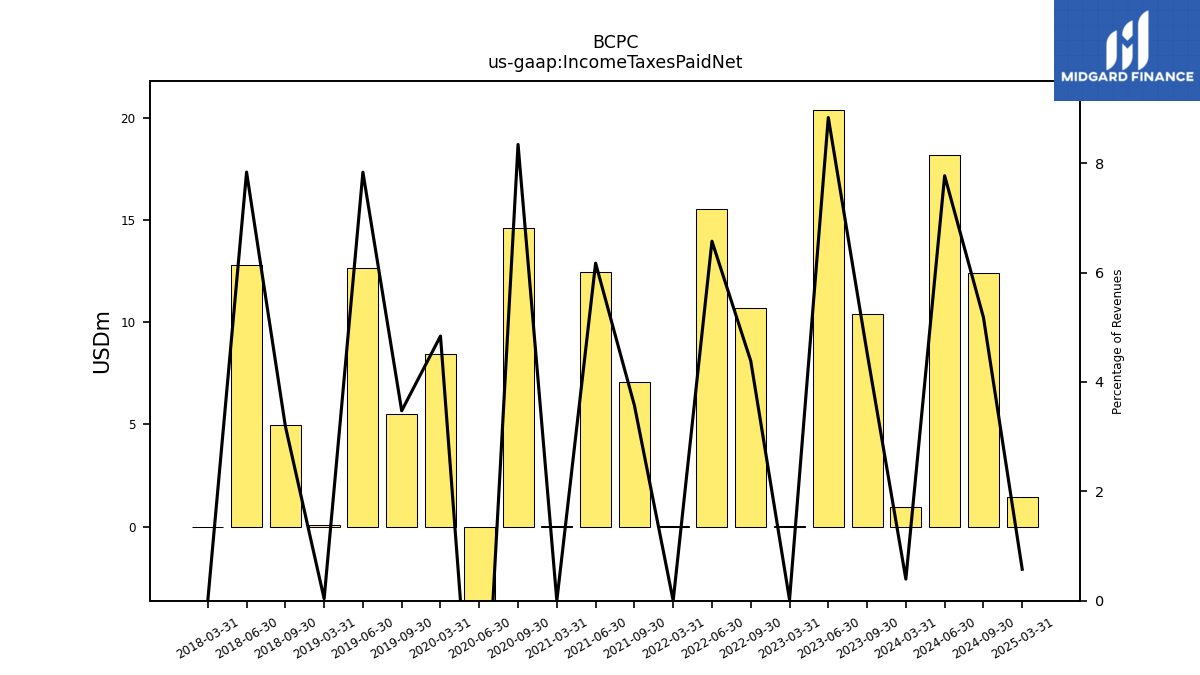
| Income Taxes Paid Net | 0.95 | NA | 10.43 | 20.43 | 0.04 | NA | 10.71 | 15.56 | 0.00 | NA | 7.07 | 12.49 | 0.00 | NA | 14.61 | -7.89 | 8.44 | NA | 5.51 | 12.66 | 0.06 | NA | 4.95 | 12.83 | 0.00 | NA | NA | NA | NA | NA | NA | NA | NA | NA | NA | NA | NA | NA | NA | NA | NA | NA | NA | NA | NA | NA | NA | NA | NA | NA | NA | NA | NA | NA | NA | NA | NA | |
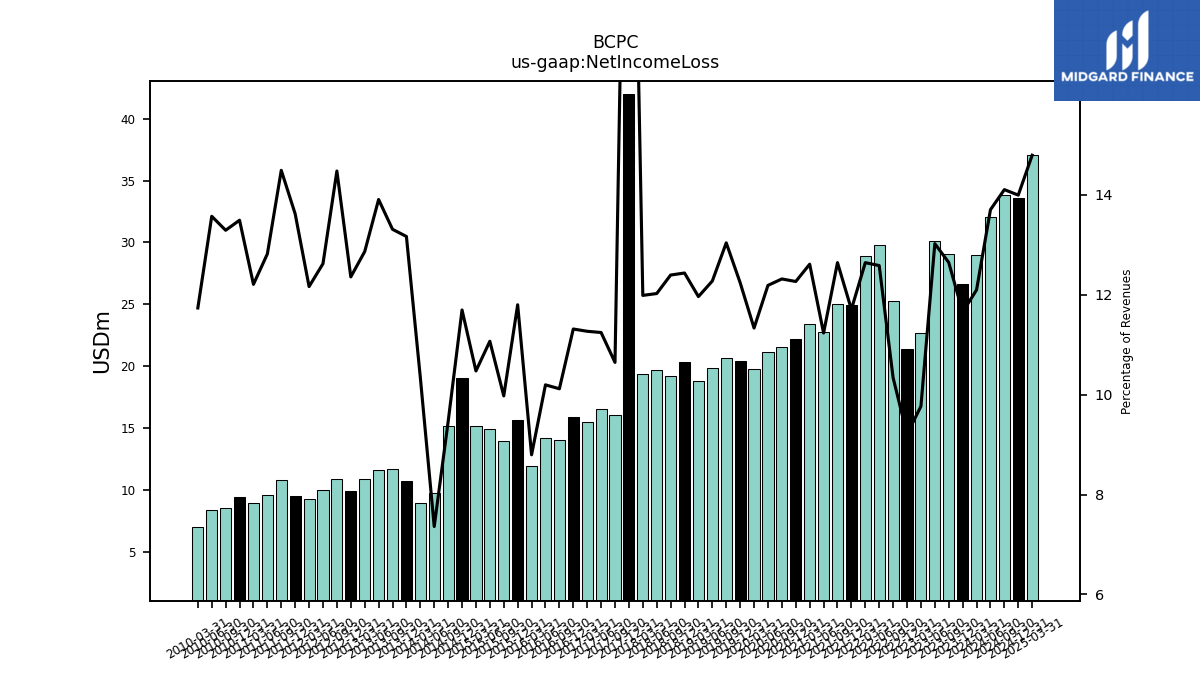
| Net Income Loss | 28.99 | 26.65 | 29.07 | 30.11 | 22.71 | 21.41 | 25.25 | 29.78 | 28.93 | 24.95 | 25.01 | 22.73 | 23.41 | 22.16 | 21.57 | 21.12 | 19.77 | 20.38 | 20.68 | 19.83 | 18.78 | 20.33 | 19.21 | 19.68 | 19.35 | 41.98 | 16.04 | 16.54 | 15.52 | 15.92 | 14.01 | 14.15 | 11.89 | 15.66 | 13.98 | 14.92 | 15.17 | 19.02 | 15.18 | 9.73 | 8.89 | 10.75 | 11.66 | 11.58 | 10.89 | 9.89 | 10.87 | 9.97 | 9.27 | 9.50 | 10.79 | 9.57 | 8.91 | 9.42 | 8.49 | 8.34 | 7.03 | |
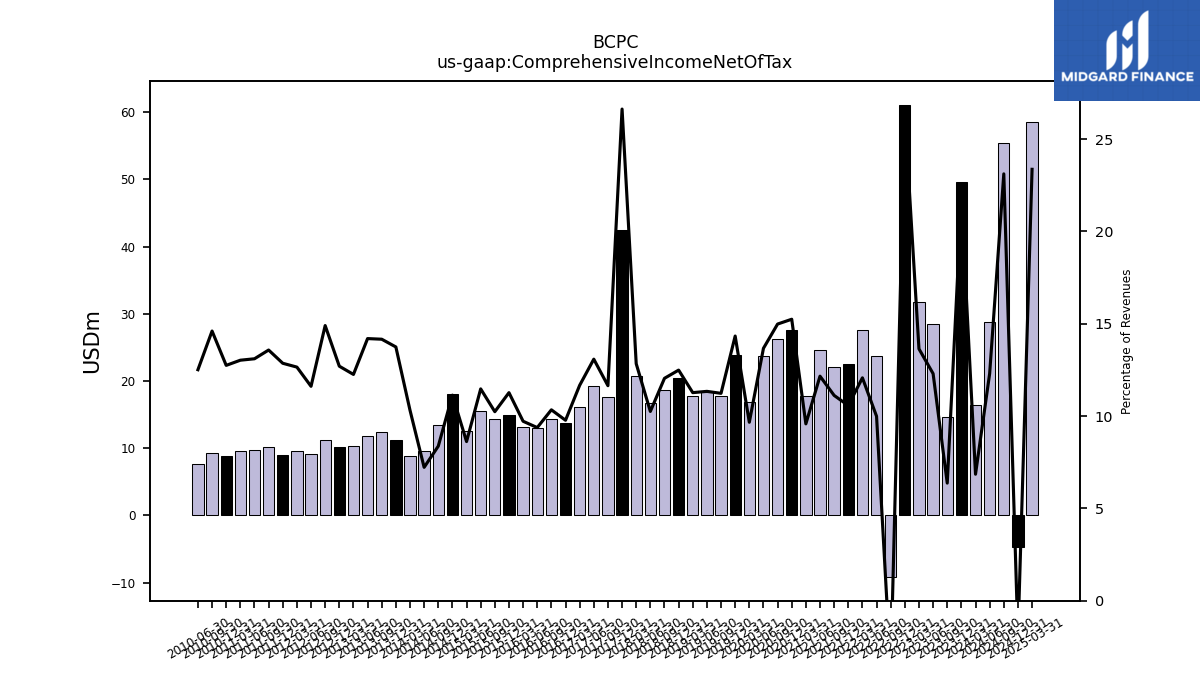
| Comprehensive Income Net Of Tax | 16.42 | 49.57 | 14.65 | 28.44 | 31.72 | 61.12 | -9.20 | 23.65 | 27.63 | 22.53 | 22.00 | 24.61 | 17.79 | 27.55 | 26.25 | 23.70 | 16.86 | 23.87 | 17.82 | 18.32 | 17.70 | 20.43 | 18.68 | 16.78 | 20.72 | 42.41 | 17.55 | 19.24 | 16.07 | 13.76 | 14.32 | 13.02 | 13.14 | 14.96 | 14.35 | 15.46 | 12.49 | 18.11 | 13.44 | 9.55 | 8.87 | 11.22 | 12.41 | 11.83 | 10.38 | 10.17 | 11.20 | 9.18 | 9.64 | 8.97 | 10.11 | 9.79 | 9.51 | 8.90 | 9.34 | 7.69 | NA |
| 2024-03-31 | 2023-12-31 | 2023-09-30 | 2023-06-30 | 2023-03-31 | 2022-12-31 | 2022-09-30 | 2022-06-30 | 2022-03-31 | 2021-12-31 | 2021-09-30 | 2021-06-30 | 2021-03-31 | 2020-12-31 | 2020-09-30 | 2020-06-30 | 2020-03-31 | 2019-12-31 | 2019-09-30 | 2019-06-30 | 2019-03-31 | 2018-12-31 | 2018-09-30 | 2018-06-30 | 2018-03-31 | 2017-12-31 | 2017-09-30 | 2017-06-30 | 2017-03-31 | 2016-12-31 | 2016-09-30 | 2016-06-30 | 2016-03-31 | 2015-12-31 | 2015-09-30 | 2015-06-30 | 2015-03-31 | 2014-12-31 | 2014-09-30 | 2014-06-30 | 2014-03-31 | 2013-12-31 | 2013-09-30 | 2013-06-30 | 2013-03-31 | 2012-12-31 | 2012-09-30 | 2012-06-30 | 2012-03-31 | 2011-12-31 | 2011-09-30 | 2011-06-30 | 2011-03-31 | 2010-12-31 | 2010-09-30 | 2010-06-30 | 2010-03-31 | ||
|---|---|---|---|---|---|---|---|---|---|---|---|---|---|---|---|---|---|---|---|---|---|---|---|---|---|---|---|---|---|---|---|---|---|---|---|---|---|---|---|---|---|---|---|---|---|---|---|---|---|---|---|---|---|---|---|---|---|---|
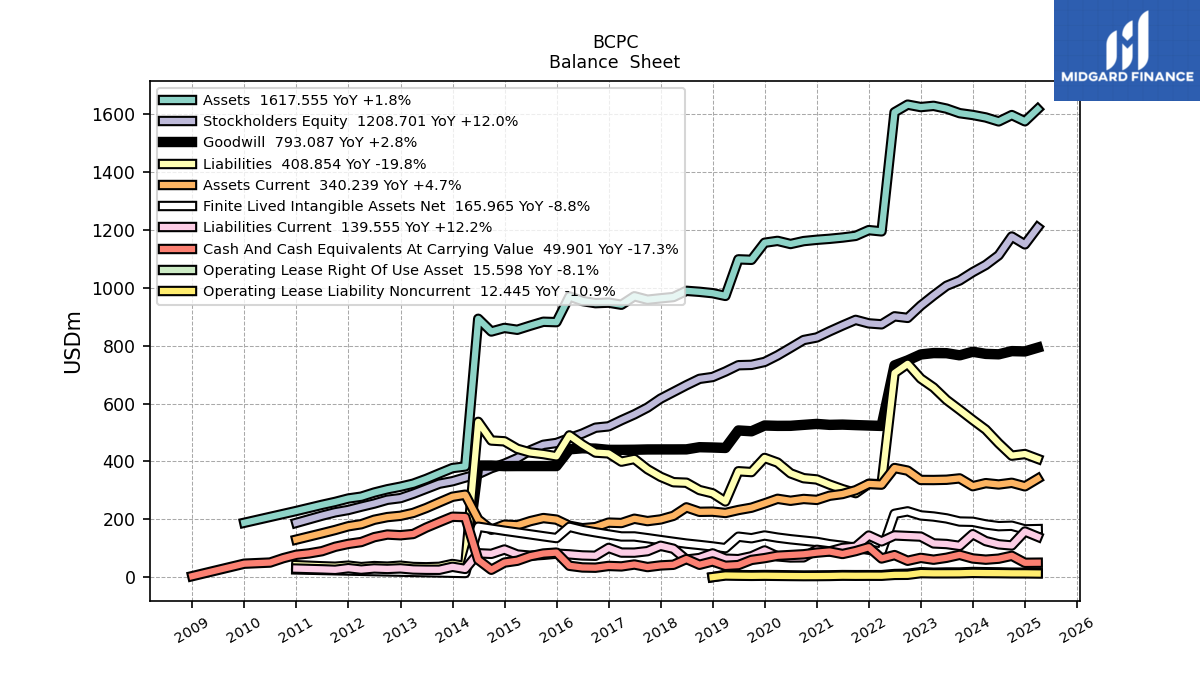
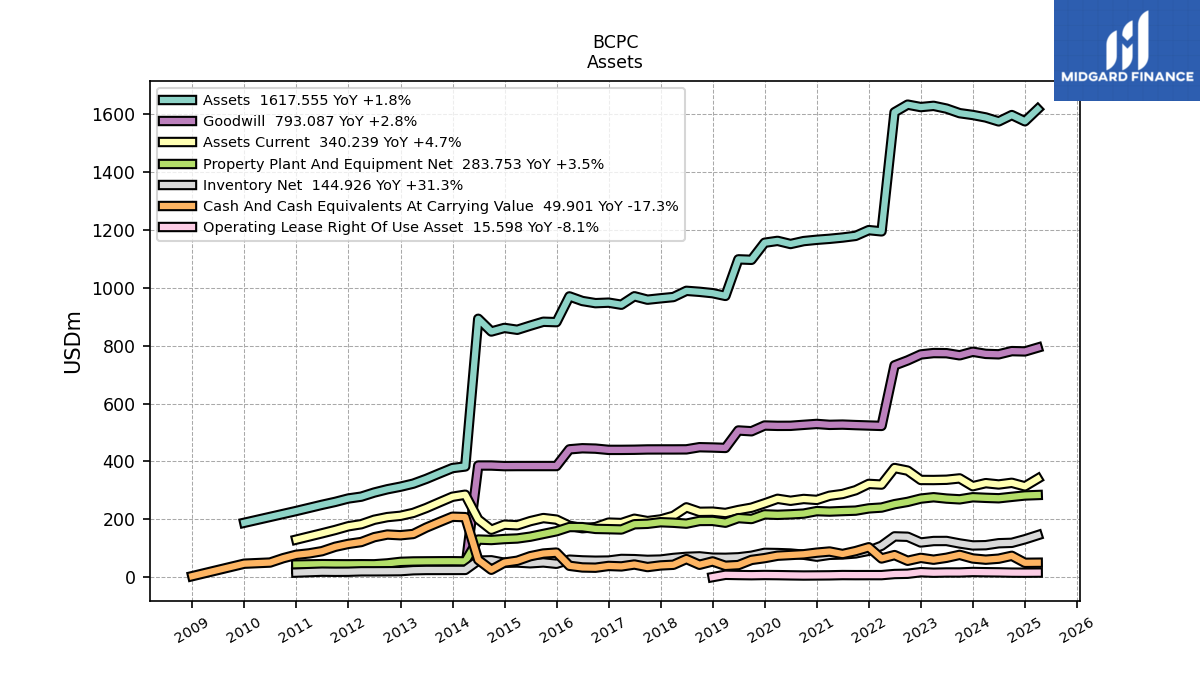
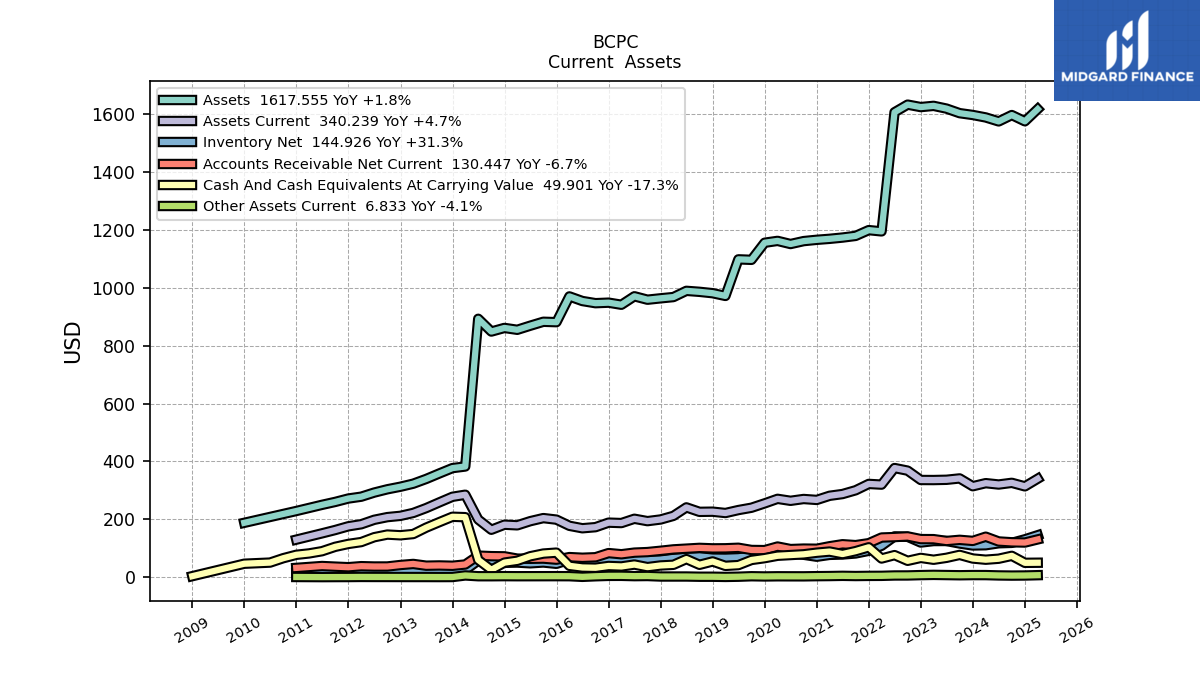
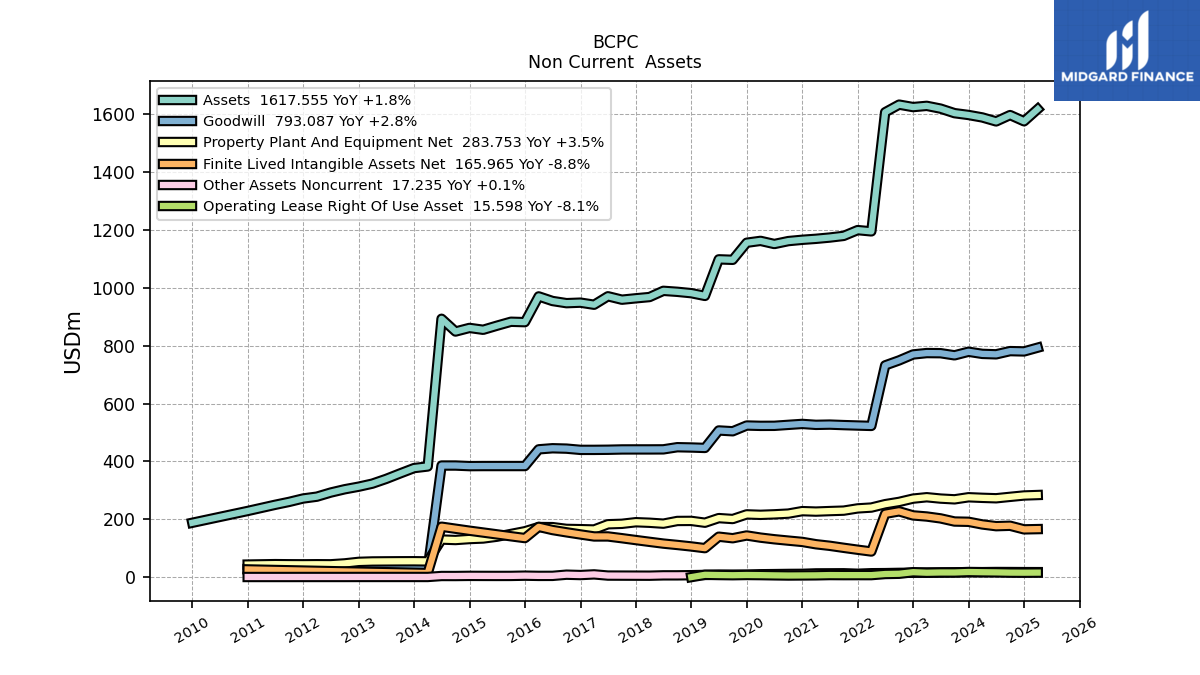
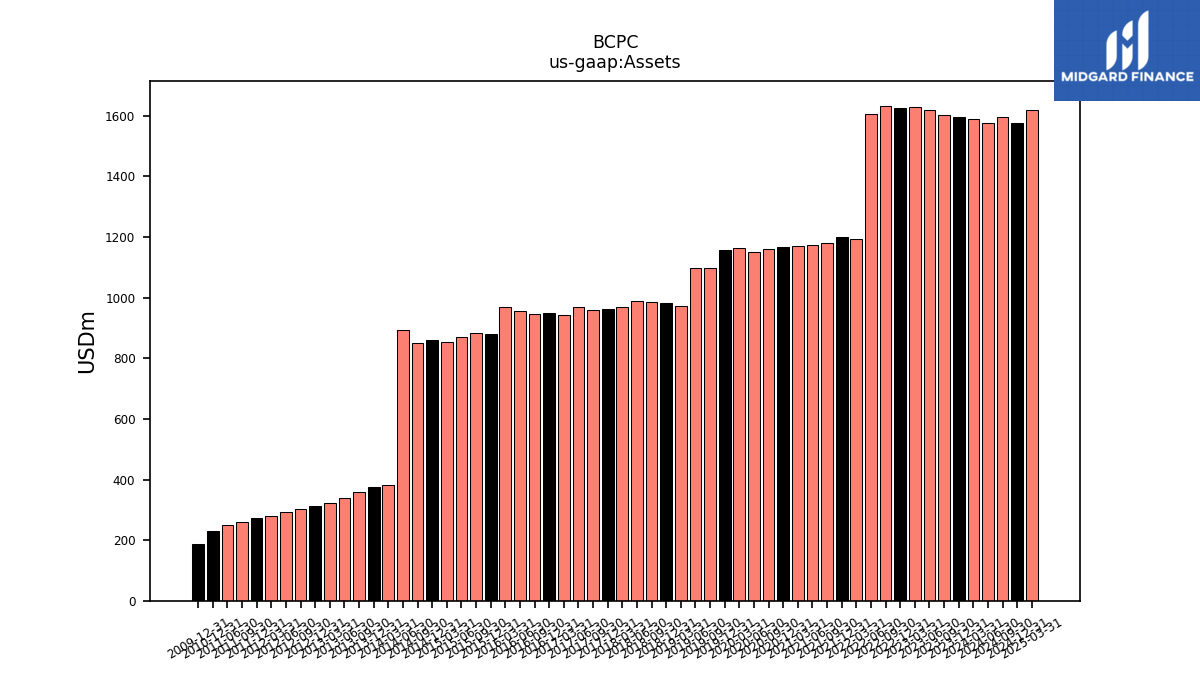
| Assets | 1588.70 | 1597.21 | 1603.48 | 1619.23 | 1628.77 | 1624.51 | 1633.01 | 1606.67 | 1194.91 | 1199.33 | 1179.35 | 1173.61 | 1169.21 | 1165.84 | 1161.34 | 1151.26 | 1162.11 | 1155.68 | 1096.63 | 1098.32 | 971.89 | 981.36 | 986.08 | 989.47 | 967.99 | 963.64 | 958.84 | 970.68 | 941.38 | 948.63 | 946.83 | 954.29 | 970.23 | 881.22 | 882.59 | 868.98 | 854.84 | 861.27 | 848.80 | 892.92 | 382.45 | 376.87 | 358.40 | 339.45 | 323.06 | 312.55 | 303.66 | 292.31 | 278.12 | 271.72 | 260.00 | 249.96 | NA | 228.62 | NA | NA | NA | |
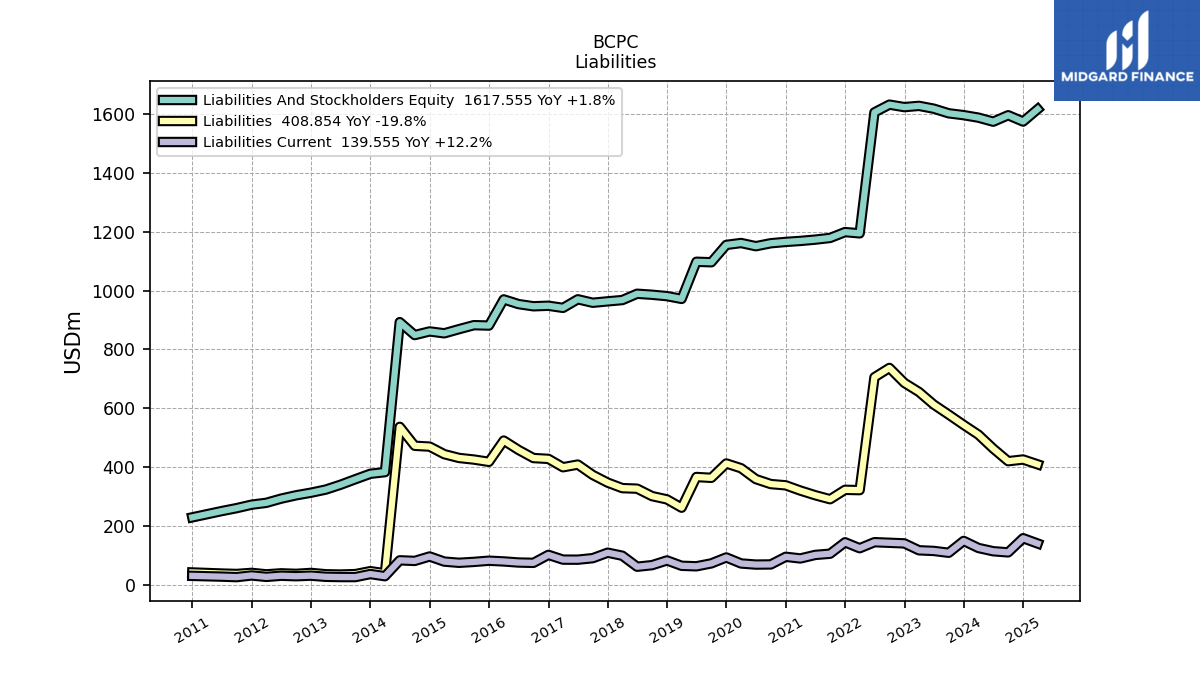
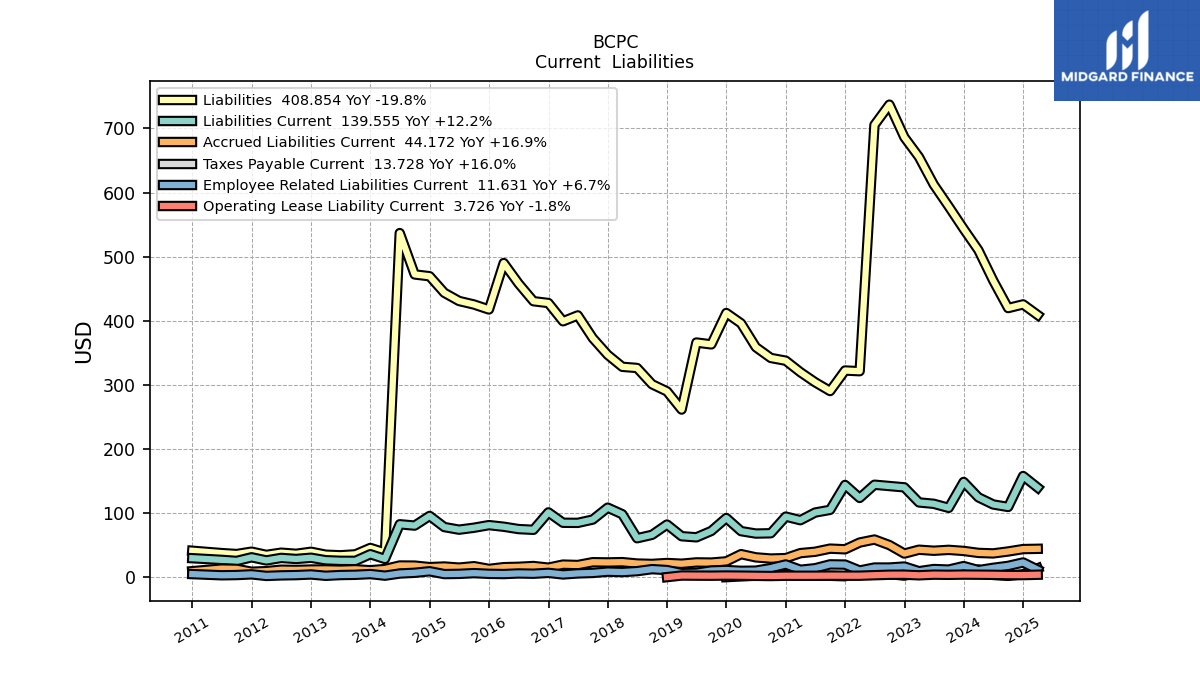
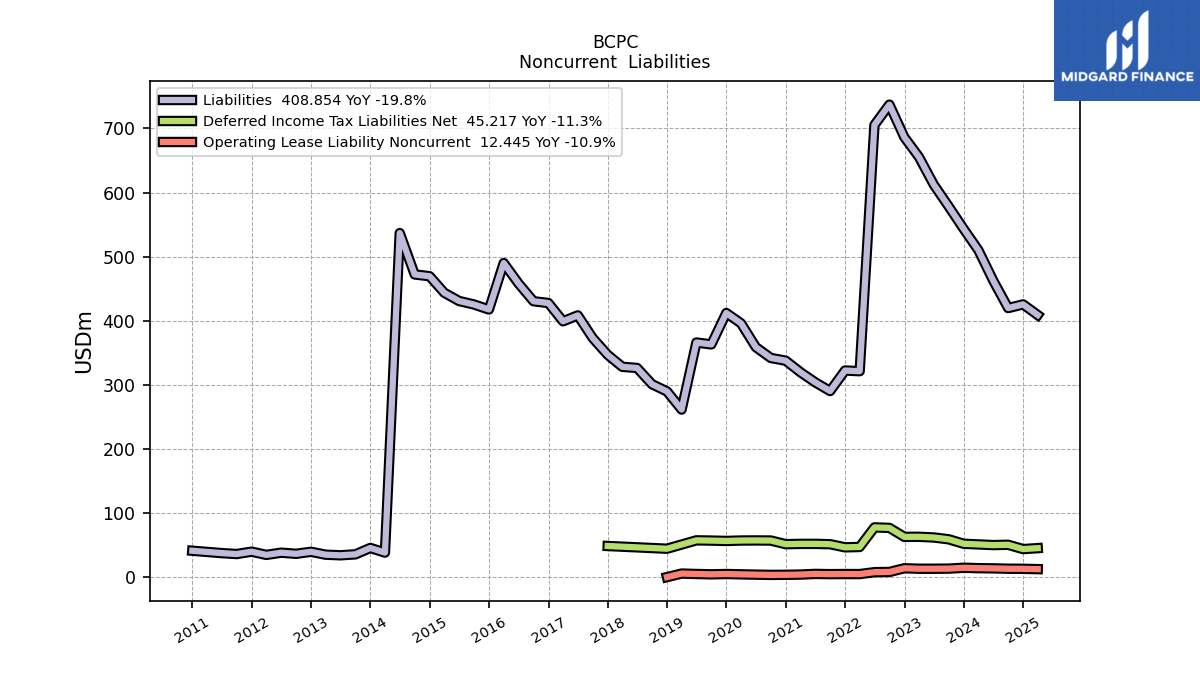
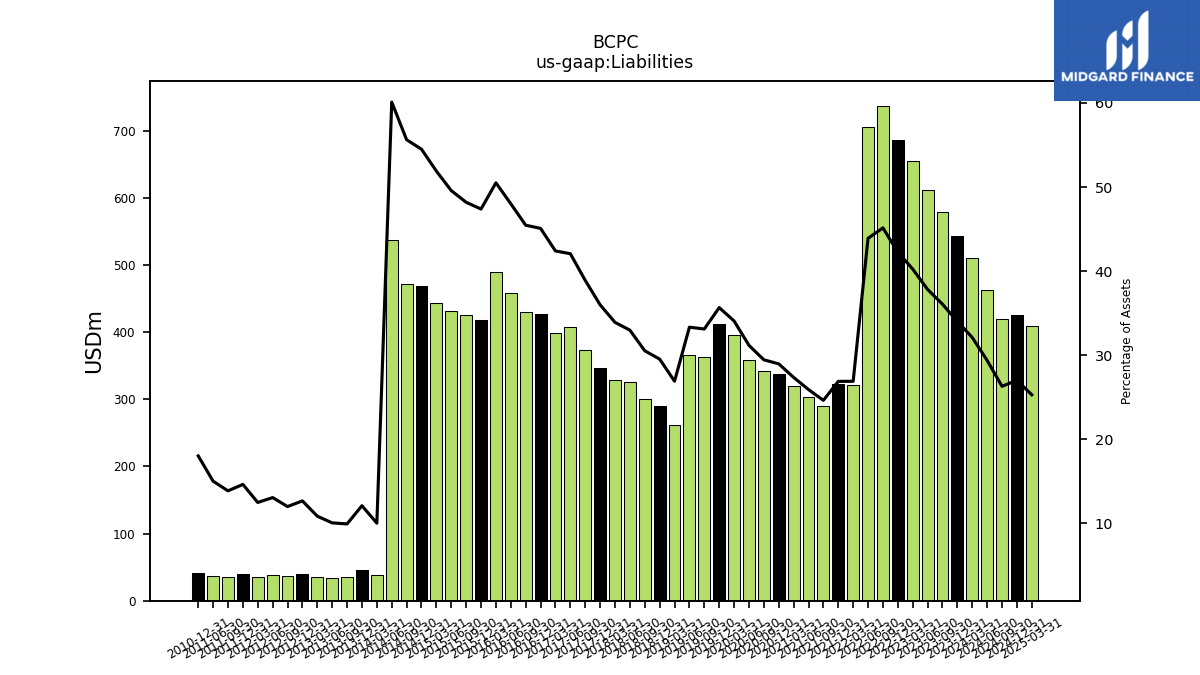
| Liabilities | 509.91 | 543.23 | 578.22 | 612.33 | 655.35 | 686.23 | 737.09 | 705.30 | 321.23 | 322.31 | 290.27 | 303.96 | 319.72 | 337.61 | 341.90 | 358.73 | 395.84 | 412.01 | 363.04 | 365.98 | 261.38 | 289.74 | 300.87 | 326.25 | 328.10 | 346.75 | 372.90 | 408.30 | 399.08 | 427.59 | 430.41 | 458.14 | 489.98 | 417.52 | 425.28 | 430.76 | 443.62 | 469.37 | 472.16 | 536.70 | 38.25 | 45.51 | 35.52 | 34.06 | 34.99 | 39.53 | 36.37 | 38.13 | 34.67 | 39.71 | 36.01 | 37.48 | NA | 41.16 | NA | NA | NA | |
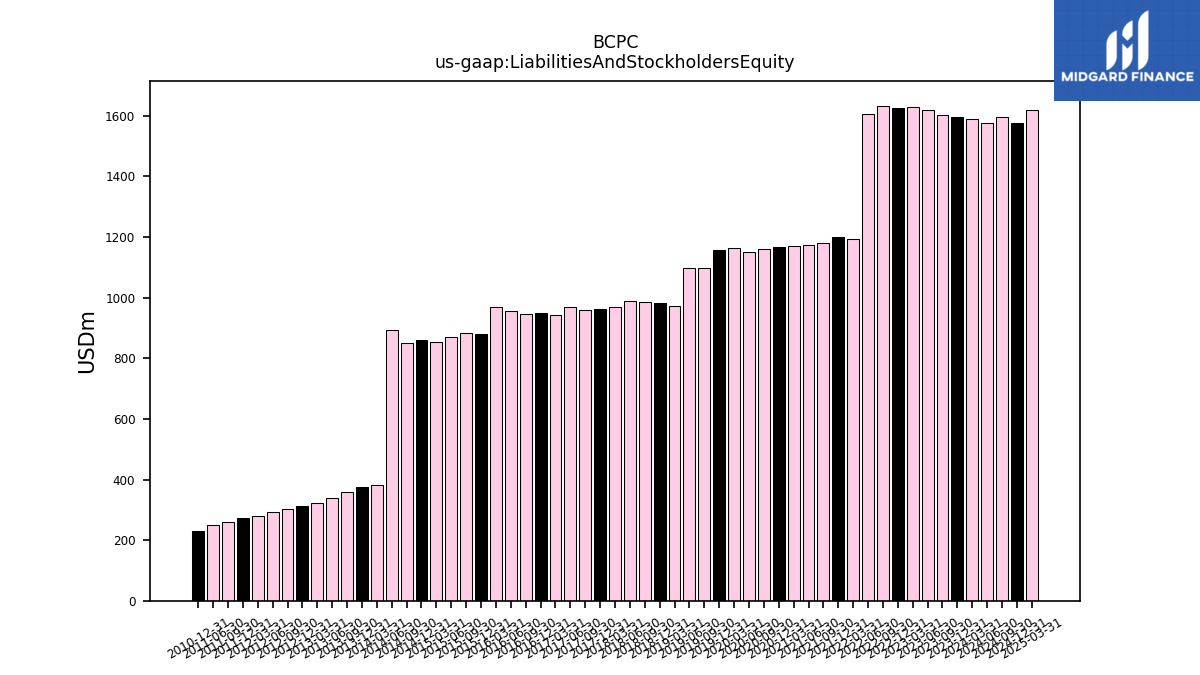
| Liabilities And Stockholders Equity | 1588.70 | 1597.21 | 1603.48 | 1619.23 | 1628.77 | 1624.51 | 1633.01 | 1606.67 | 1194.91 | 1199.33 | 1179.35 | 1173.61 | 1169.21 | 1165.84 | 1161.34 | 1151.26 | 1162.11 | 1155.68 | 1096.63 | 1098.32 | 971.89 | 981.36 | 986.08 | 989.47 | 967.99 | 963.64 | 958.84 | 970.68 | 941.38 | 948.63 | 946.83 | 954.29 | 970.23 | 881.22 | 882.59 | 868.98 | 854.84 | 861.27 | 848.80 | 892.92 | 382.45 | 376.87 | 358.40 | 339.45 | 323.06 | 312.55 | 303.66 | 292.31 | 278.12 | 271.72 | 260.00 | 249.96 | NA | 228.62 | NA | NA | NA | |
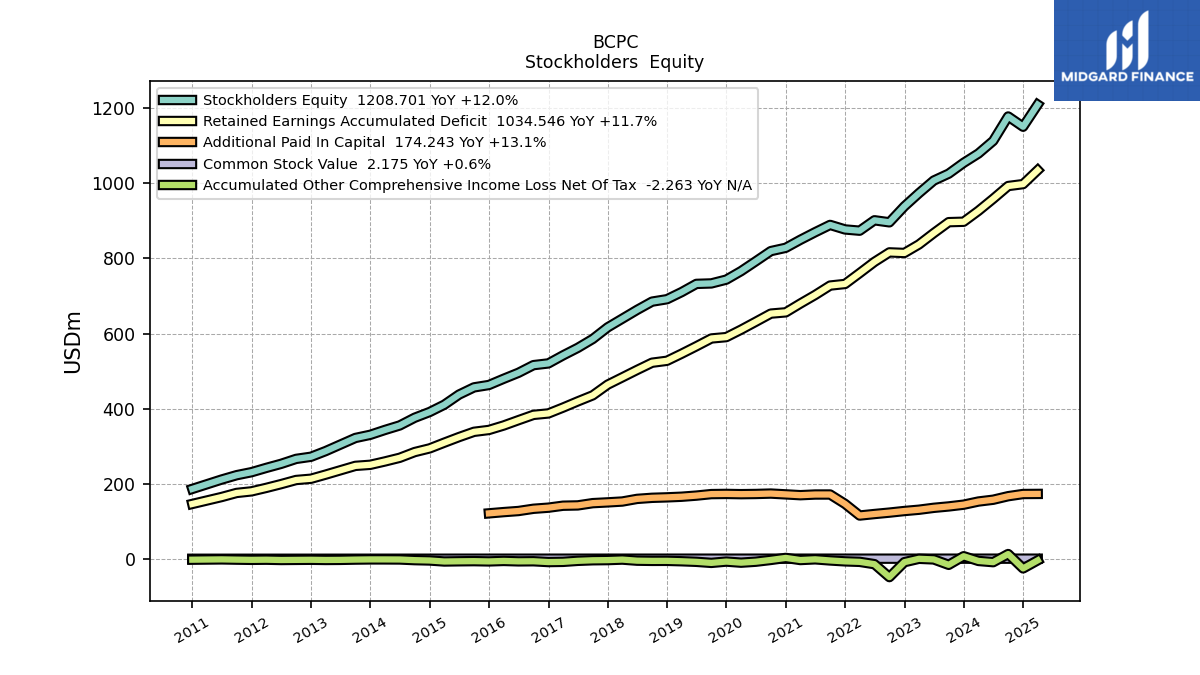
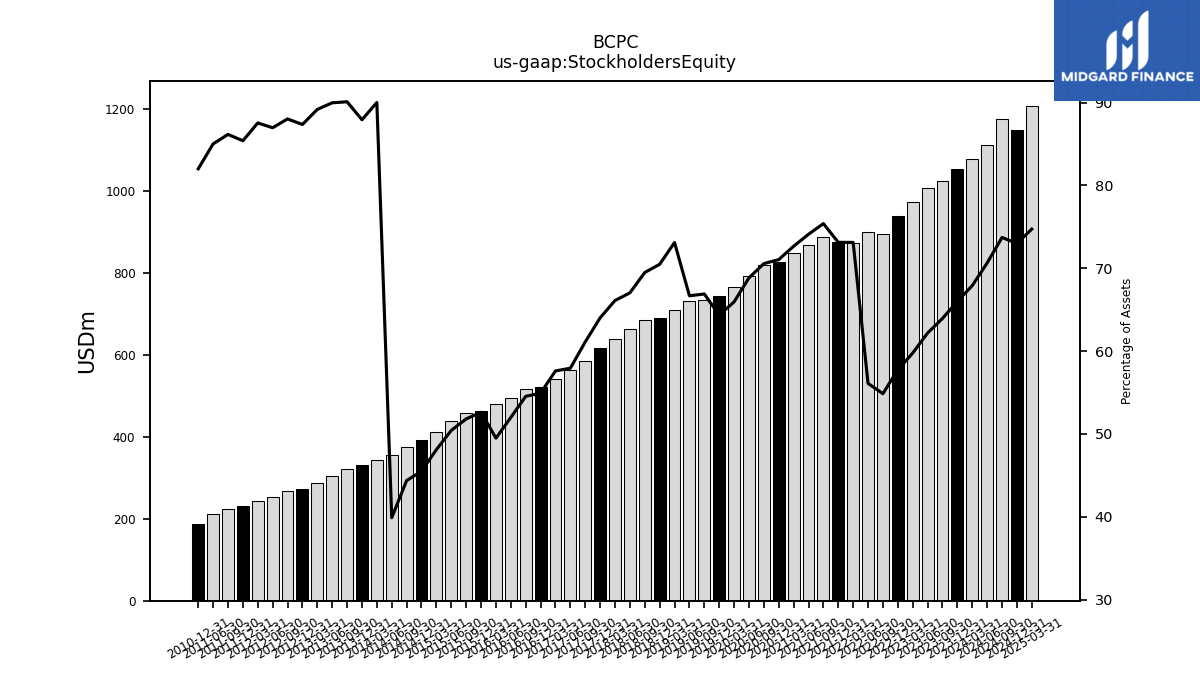
| Stockholders Equity | 1078.79 | 1053.98 | 1025.27 | 1006.90 | 973.42 | 938.28 | 895.92 | 901.37 | 873.68 | 877.01 | 889.08 | 869.64 | 849.49 | 828.23 | 819.44 | 792.52 | 766.27 | 743.67 | 733.59 | 732.35 | 710.51 | 691.62 | 685.20 | 663.22 | 639.89 | 616.88 | 585.94 | 562.38 | 542.30 | 521.03 | 516.42 | 496.15 | 480.25 | 463.70 | 457.32 | 438.22 | 411.22 | 391.90 | 376.64 | 356.22 | 344.20 | 331.36 | 322.88 | 305.39 | 288.07 | 273.01 | 267.28 | 254.18 | 243.45 | 232.01 | 224.00 | 212.48 | NA | 187.47 | NA | NA | NA |
| 2024-03-31 | 2023-12-31 | 2023-09-30 | 2023-06-30 | 2023-03-31 | 2022-12-31 | 2022-09-30 | 2022-06-30 | 2022-03-31 | 2021-12-31 | 2021-09-30 | 2021-06-30 | 2021-03-31 | 2020-12-31 | 2020-09-30 | 2020-06-30 | 2020-03-31 | 2019-12-31 | 2019-09-30 | 2019-06-30 | 2019-03-31 | 2018-12-31 | 2018-09-30 | 2018-06-30 | 2018-03-31 | 2017-12-31 | 2017-09-30 | 2017-06-30 | 2017-03-31 | 2016-12-31 | 2016-09-30 | 2016-06-30 | 2016-03-31 | 2015-12-31 | 2015-09-30 | 2015-06-30 | 2015-03-31 | 2014-12-31 | 2014-09-30 | 2014-06-30 | 2014-03-31 | 2013-12-31 | 2013-09-30 | 2013-06-30 | 2013-03-31 | 2012-12-31 | 2012-09-30 | 2012-06-30 | 2012-03-31 | 2011-12-31 | 2011-09-30 | 2011-06-30 | 2011-03-31 | 2010-12-31 | 2010-09-30 | 2010-06-30 | 2010-03-31 | ||
|---|---|---|---|---|---|---|---|---|---|---|---|---|---|---|---|---|---|---|---|---|---|---|---|---|---|---|---|---|---|---|---|---|---|---|---|---|---|---|---|---|---|---|---|---|---|---|---|---|---|---|---|---|---|---|---|---|---|---|
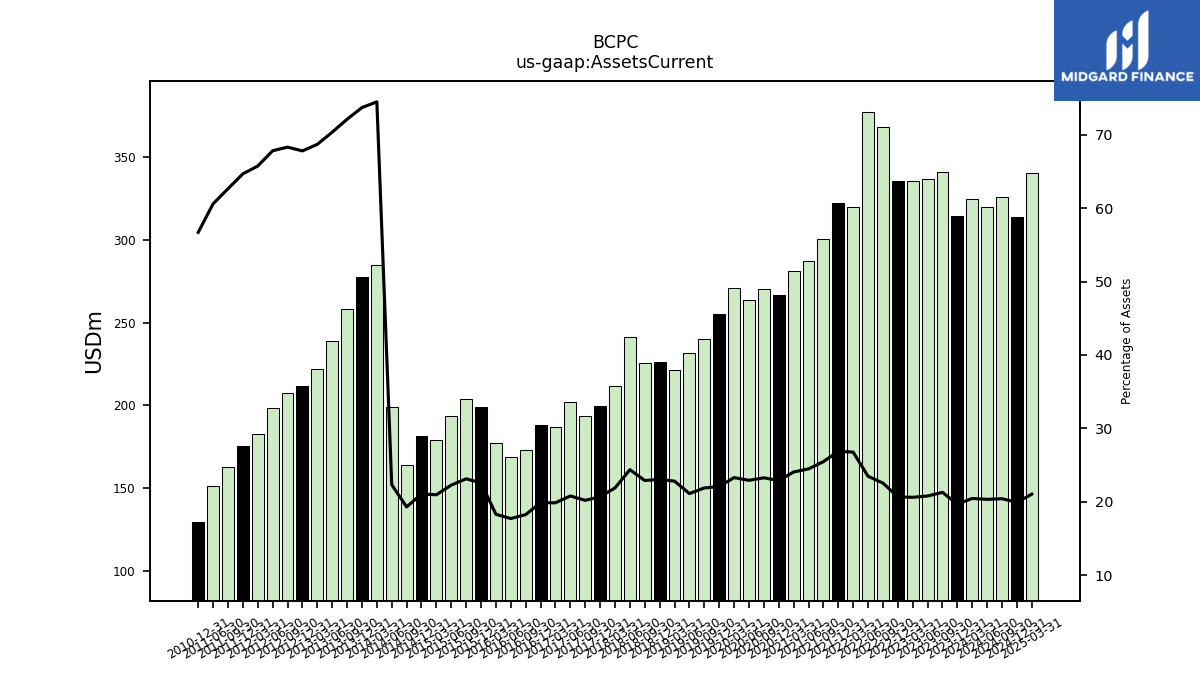
| Assets Current | 324.86 | 314.24 | 341.22 | 336.53 | 335.60 | 335.80 | 368.11 | 377.14 | 319.80 | 322.23 | 300.27 | 287.26 | 281.20 | 266.89 | 270.12 | 263.86 | 270.68 | 254.95 | 239.95 | 231.88 | 221.67 | 226.31 | 225.71 | 241.14 | 211.81 | 199.34 | 193.61 | 201.79 | 186.96 | 188.44 | 172.78 | 169.00 | 177.46 | 198.83 | 204.13 | 193.48 | 179.13 | 181.30 | 163.79 | 199.27 | 284.88 | 277.77 | 258.46 | 238.80 | 221.94 | 211.91 | 207.45 | 198.26 | 182.85 | 175.74 | 162.89 | 151.46 | NA | 129.65 | NA | NA | NA | |
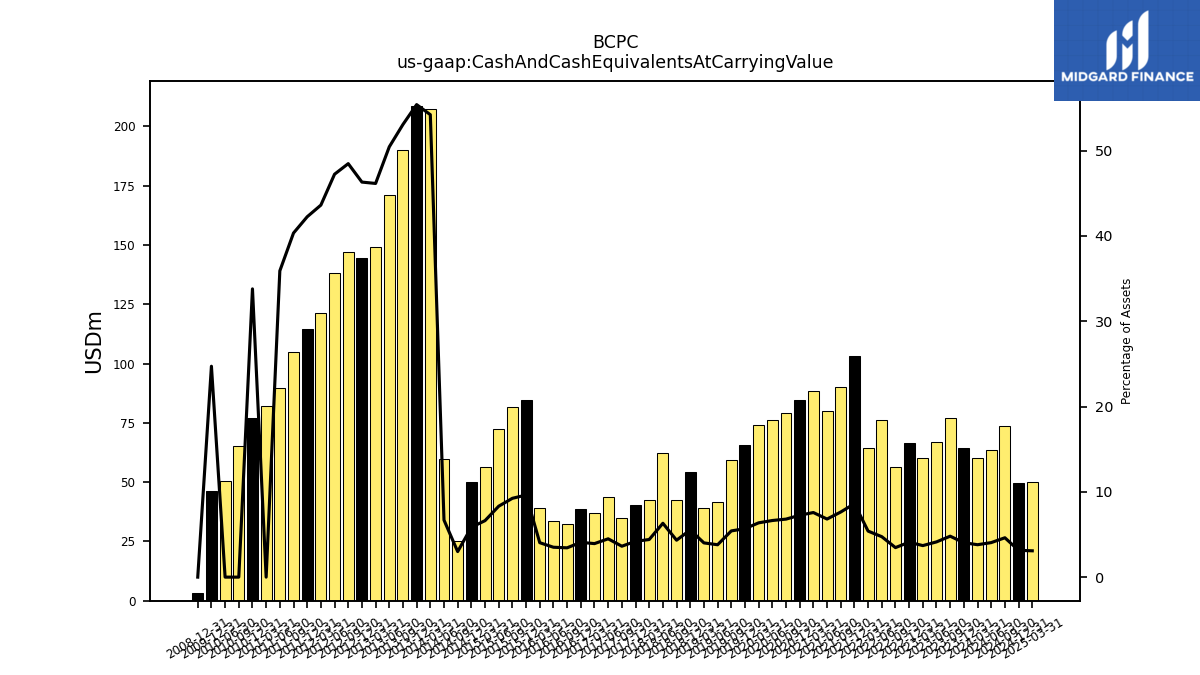
| Cash And Cash Equivalents At Carrying Value | 60.35 | 64.45 | 76.95 | 66.86 | 60.20 | 66.56 | 56.49 | 76.18 | 64.47 | 103.24 | 90.01 | 79.90 | 88.53 | 84.57 | 78.97 | 76.41 | 73.96 | 65.67 | 59.40 | 41.67 | 39.00 | 54.27 | 42.67 | 62.48 | 42.68 | 40.42 | 34.74 | 43.60 | 37.00 | 38.64 | 32.53 | 33.42 | 39.17 | 84.80 | 81.56 | 72.24 | 56.61 | 50.29 | 25.40 | 59.71 | 207.33 | 208.75 | 190.18 | 171.22 | 149.09 | 144.74 | 147.18 | 138.06 | 121.29 | 114.78 | 104.87 | 89.74 | 82.05 | 77.25 | 65.45 | 50.37 | NA | |
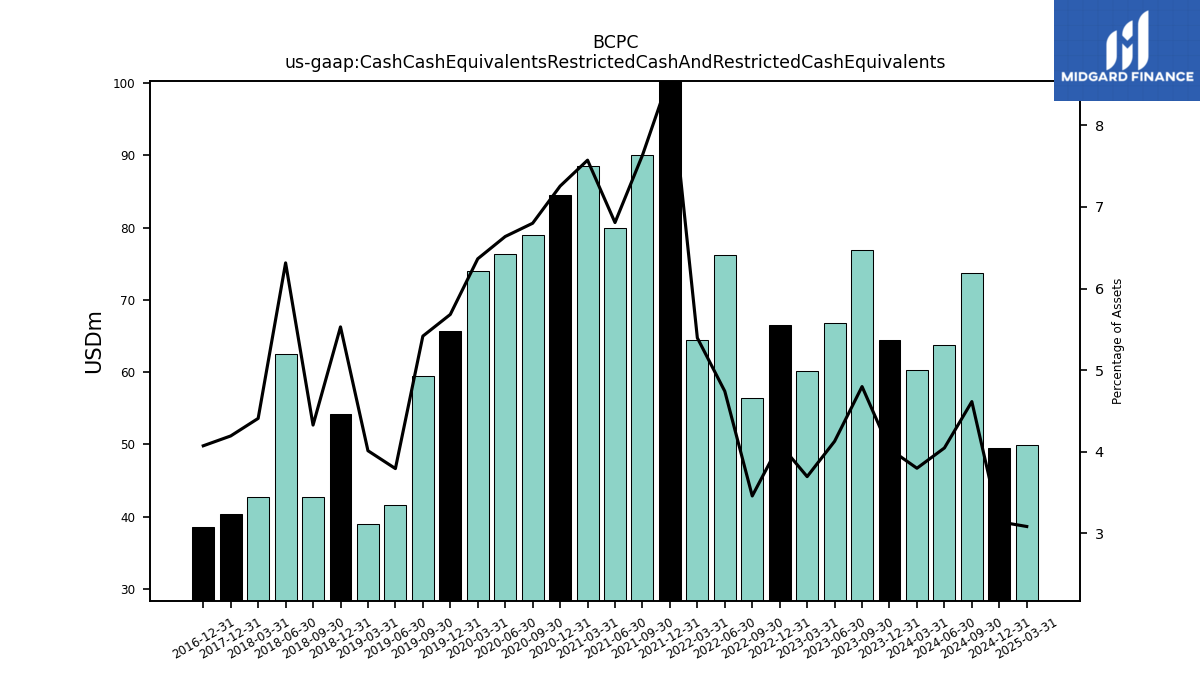
| Cash Cash Equivalents Restricted Cash And Restricted Cash Equivalents | 60.35 | 64.45 | 76.95 | 66.86 | 60.20 | 66.56 | 56.49 | 76.18 | 64.47 | 103.24 | 90.01 | 79.90 | 88.53 | 84.57 | 78.97 | 76.41 | 73.96 | 65.67 | 59.40 | 41.67 | 39.00 | 54.27 | 42.67 | 62.48 | 42.68 | 40.42 | NA | NA | NA | 38.64 | NA | NA | NA | NA | NA | NA | NA | NA | NA | NA | NA | NA | NA | NA | NA | NA | NA | NA | NA | NA | NA | NA | NA | NA | NA | NA | NA | |
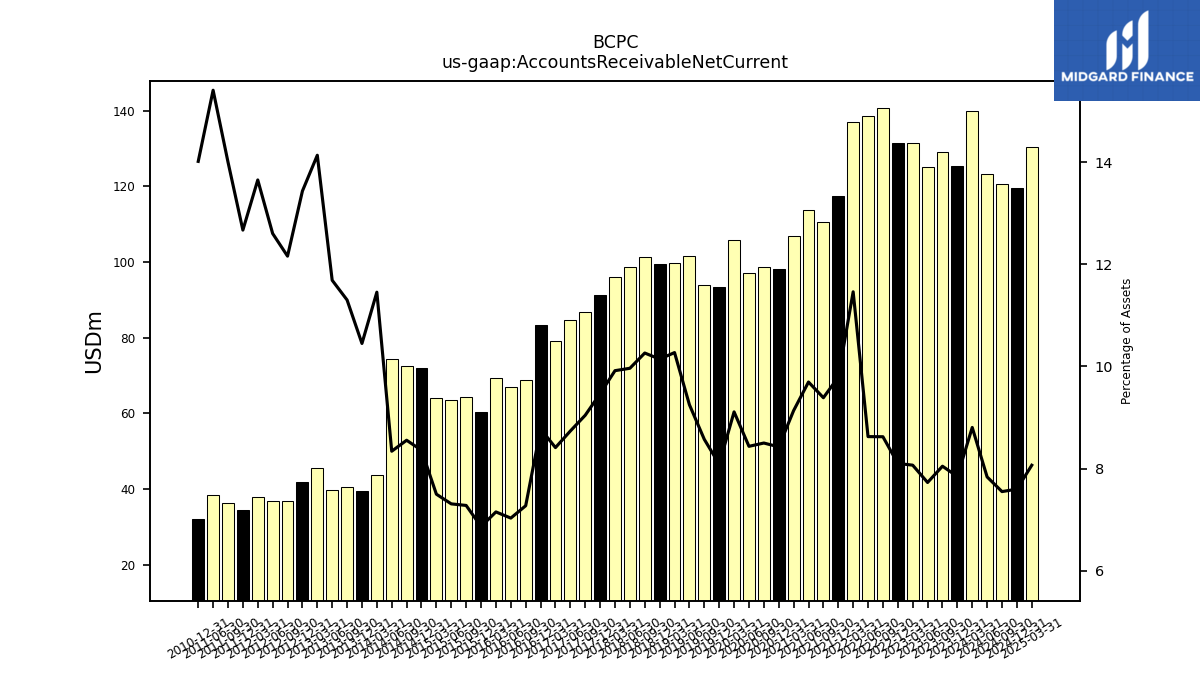
| Accounts Receivable Net Current | 139.88 | 125.28 | 129.01 | 125.11 | 131.37 | 131.58 | 140.81 | 138.58 | 136.97 | 117.41 | 110.71 | 113.78 | 106.81 | 98.21 | 98.71 | 97.11 | 105.87 | 93.44 | 94.00 | 101.59 | 99.83 | 99.55 | 101.20 | 98.59 | 96.00 | 91.23 | 86.72 | 84.79 | 79.17 | 83.25 | 68.84 | 67.07 | 69.36 | 60.48 | 64.22 | 63.50 | 64.09 | 71.98 | 72.61 | 74.46 | 43.81 | 39.39 | 40.51 | 39.68 | 45.68 | 42.00 | 36.93 | 36.85 | 37.98 | 34.43 | 36.41 | 38.53 | NA | 32.05 | NA | NA | NA | |
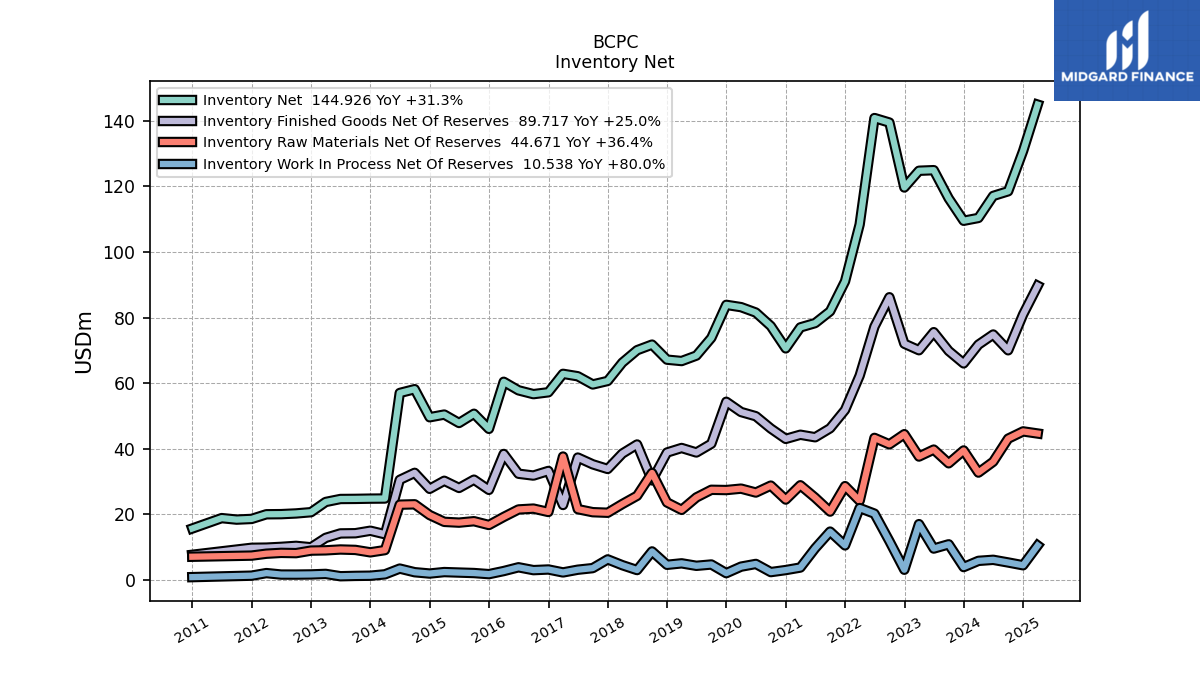
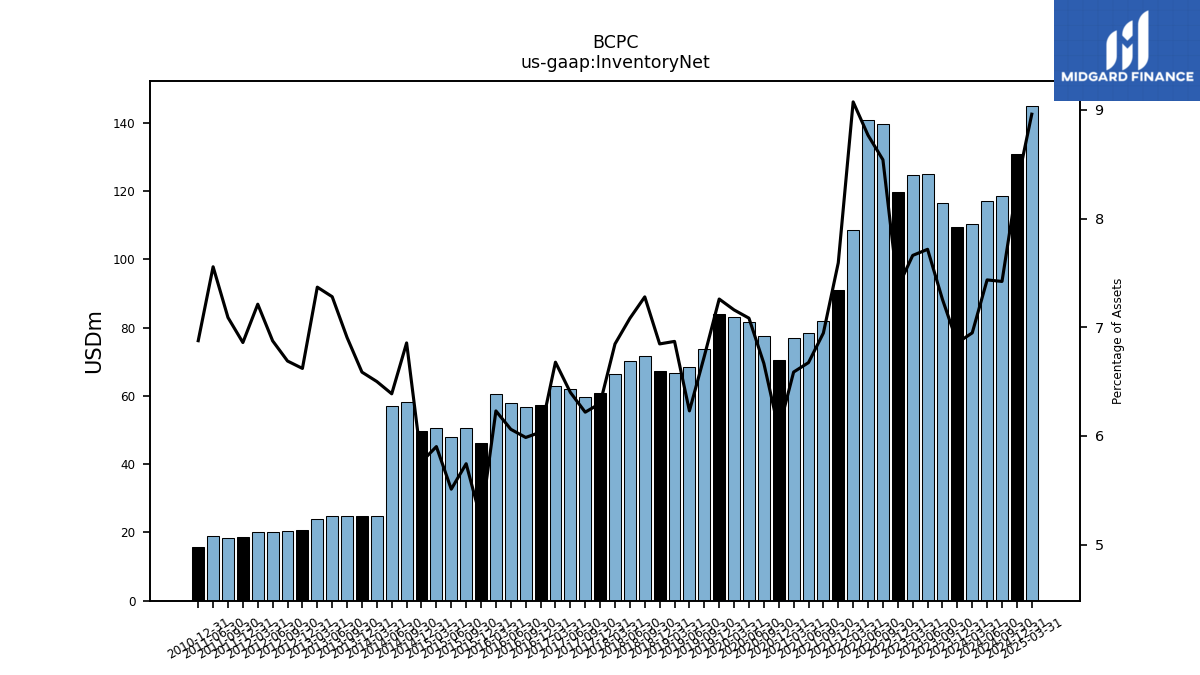
| Inventory Net | 110.38 | 109.52 | 116.35 | 124.95 | 124.77 | 119.67 | 139.46 | 140.84 | 108.41 | 91.06 | 81.92 | 78.33 | 77.02 | 70.62 | 77.43 | 81.55 | 83.20 | 83.89 | 73.83 | 68.43 | 66.76 | 67.19 | 71.78 | 70.07 | 66.27 | 60.70 | 59.62 | 62.13 | 62.87 | 57.24 | 56.67 | 57.84 | 60.44 | 46.09 | 50.70 | 47.88 | 50.45 | 49.62 | 58.19 | 57.03 | 24.86 | 24.82 | 24.75 | 24.71 | 23.80 | 20.69 | 20.31 | 20.09 | 20.06 | 18.64 | 18.43 | 18.89 | NA | 15.72 | NA | NA | NA | |
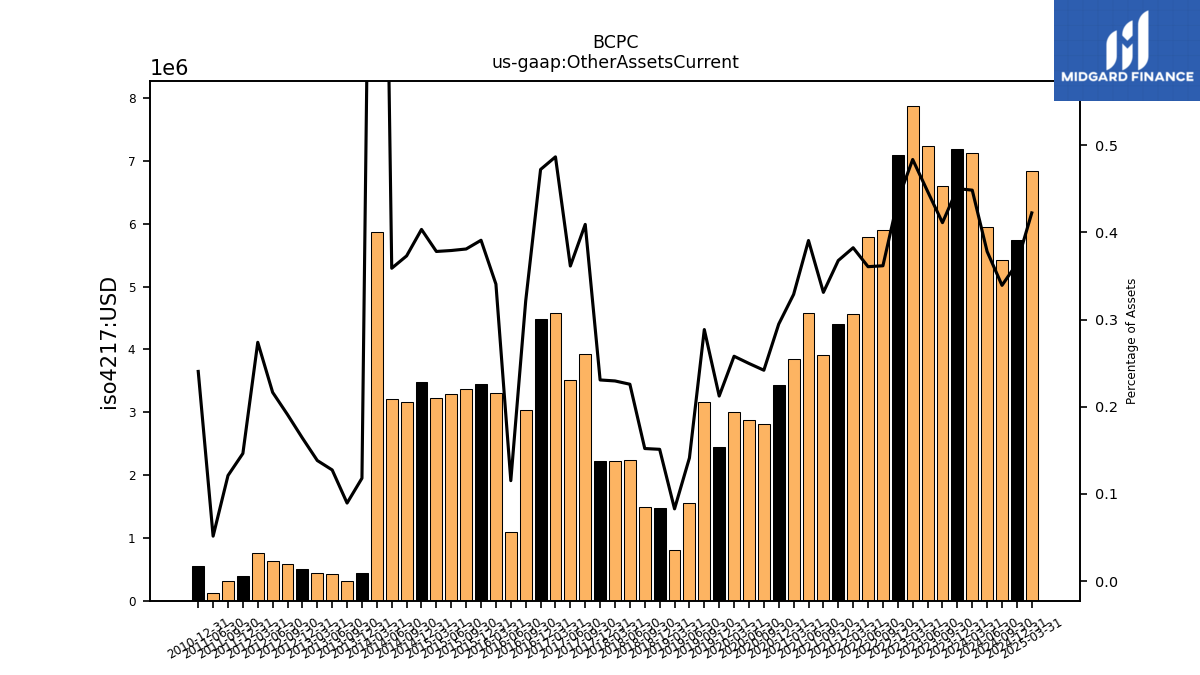
| Other Assets Current | 7.13 | 7.19 | 6.59 | 7.24 | 7.88 | 7.10 | 5.91 | 5.80 | 4.57 | 4.41 | 3.91 | 4.59 | 3.85 | 3.44 | 2.81 | 2.88 | 3.00 | 2.45 | 3.17 | 1.55 | 0.81 | 1.48 | 1.50 | 2.23 | 2.22 | 2.22 | 3.92 | 3.51 | 4.58 | 4.48 | 3.04 | 1.10 | 3.31 | 3.45 | 3.36 | 3.30 | 3.23 | 3.48 | 3.17 | 3.21 | 5.87 | 0.45 | 0.32 | 0.43 | 0.45 | 0.51 | 0.58 | 0.63 | 0.76 | 0.40 | 0.32 | 0.13 | NA | 0.55 | NA | NA | NA |
| 2024-03-31 | 2023-12-31 | 2023-09-30 | 2023-06-30 | 2023-03-31 | 2022-12-31 | 2022-09-30 | 2022-06-30 | 2022-03-31 | 2021-12-31 | 2021-09-30 | 2021-06-30 | 2021-03-31 | 2020-12-31 | 2020-09-30 | 2020-06-30 | 2020-03-31 | 2019-12-31 | 2019-09-30 | 2019-06-30 | 2019-03-31 | 2018-12-31 | 2018-09-30 | 2018-06-30 | 2018-03-31 | 2017-12-31 | 2017-09-30 | 2017-06-30 | 2017-03-31 | 2016-12-31 | 2016-09-30 | 2016-06-30 | 2016-03-31 | 2015-12-31 | 2015-09-30 | 2015-06-30 | 2015-03-31 | 2014-12-31 | 2014-09-30 | 2014-06-30 | 2014-03-31 | 2013-12-31 | 2013-09-30 | 2013-06-30 | 2013-03-31 | 2012-12-31 | 2012-09-30 | 2012-06-30 | 2012-03-31 | 2011-12-31 | 2011-09-30 | 2011-06-30 | 2011-03-31 | 2010-12-31 | 2010-09-30 | 2010-06-30 | 2010-03-31 | ||
|---|---|---|---|---|---|---|---|---|---|---|---|---|---|---|---|---|---|---|---|---|---|---|---|---|---|---|---|---|---|---|---|---|---|---|---|---|---|---|---|---|---|---|---|---|---|---|---|---|---|---|---|---|---|---|---|---|---|---|
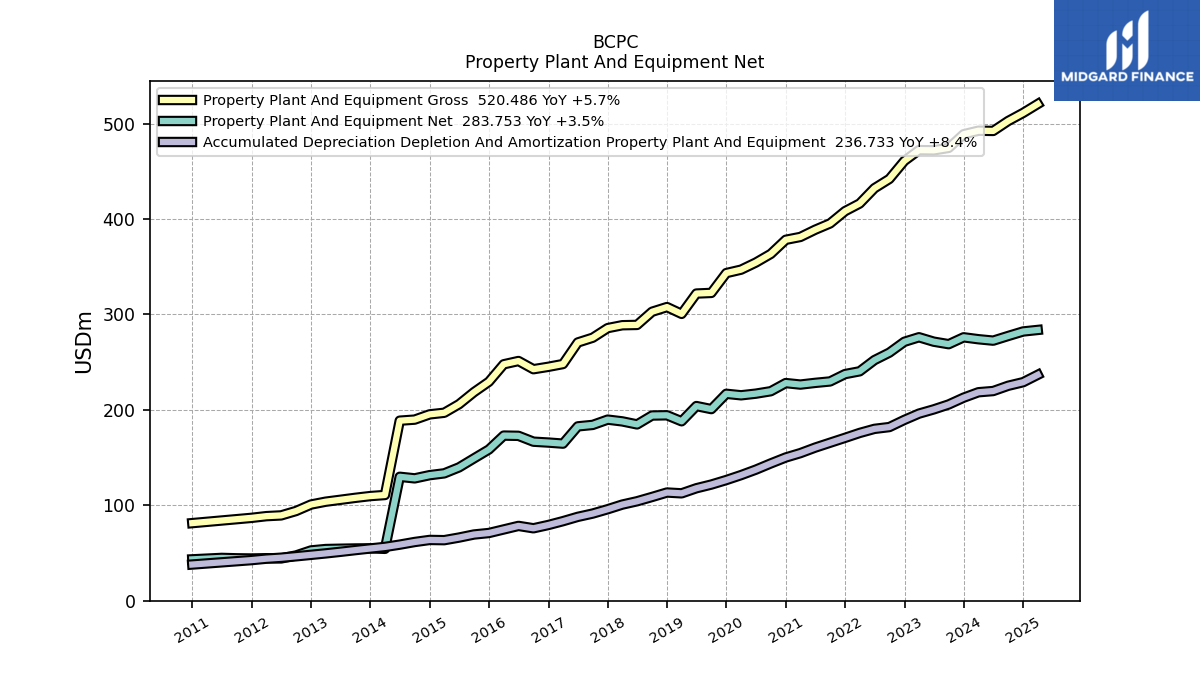
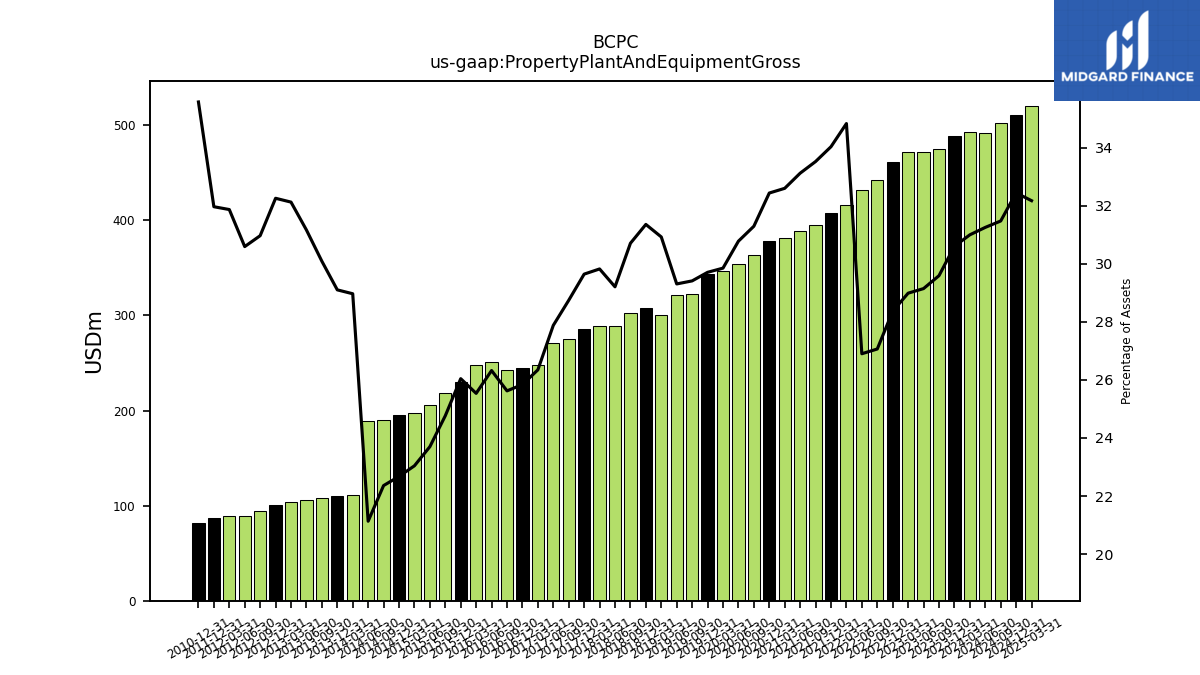
| Property Plant And Equipment Gross | 492.51 | 488.83 | 474.52 | 471.99 | 472.19 | 460.84 | 442.01 | 432.25 | 416.24 | 408.22 | 395.39 | 388.75 | 381.20 | 378.21 | 363.46 | 354.38 | 346.93 | 343.34 | 322.56 | 321.90 | 300.58 | 307.75 | 302.82 | 289.02 | 288.70 | 285.69 | 275.62 | 270.63 | 248.03 | 245.14 | 242.62 | 251.22 | 247.78 | 229.50 | 218.58 | 205.95 | 196.97 | 195.30 | 189.79 | 188.69 | 110.80 | 109.69 | 107.85 | 105.80 | 103.80 | 100.83 | 94.05 | 89.43 | 88.64 | 86.87 | NA | NA | NA | 81.34 | NA | NA | NA | |
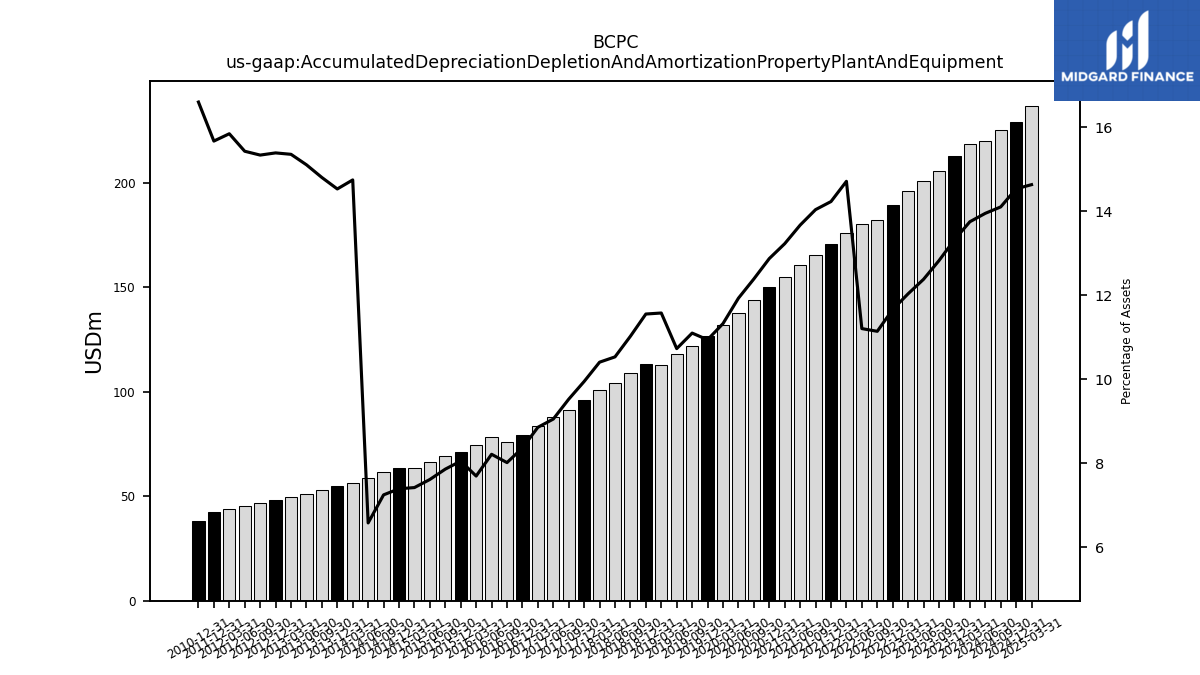
| Accumulated Depreciation Depletion And Amortization Property Plant And Equipment | 218.48 | 212.80 | 205.69 | 200.51 | 196.08 | 189.48 | 182.00 | 180.10 | 175.82 | 170.70 | 165.59 | 160.46 | 154.69 | 150.12 | 143.91 | 137.38 | 131.66 | 126.48 | 121.75 | 117.88 | 112.55 | 113.41 | 108.74 | 104.25 | 100.77 | 95.89 | 91.37 | 87.91 | 83.41 | 79.39 | 75.94 | 78.42 | 74.71 | 70.99 | 69.41 | 66.20 | 63.48 | 63.71 | 61.56 | 58.80 | 56.40 | 54.77 | 53.06 | 51.28 | 49.61 | 48.10 | 46.58 | 45.10 | 44.07 | 42.59 | NA | NA | NA | 37.95 | NA | NA | NA | |
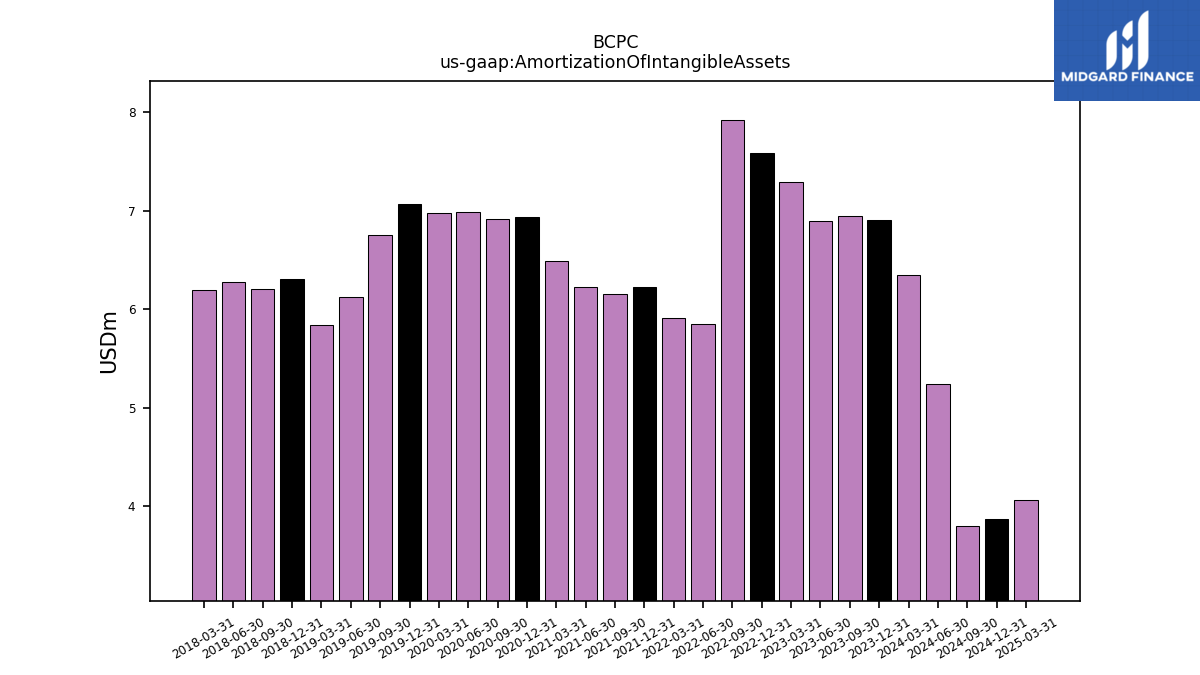
| Amortization Of Intangible Assets | 6.34 | 6.90 | 6.95 | 6.89 | 7.29 | 7.59 | 7.92 | 5.85 | 5.91 | 6.22 | 6.16 | 6.23 | 6.48 | 6.94 | 6.91 | 6.99 | 6.98 | 7.07 | 6.75 | 6.13 | 5.84 | 6.31 | 6.21 | 6.28 | 6.19 | NA | NA | NA | NA | NA | NA | NA | NA | NA | NA | NA | NA | NA | NA | NA | NA | NA | NA | NA | NA | NA | NA | NA | NA | NA | NA | NA | NA | NA | NA | NA | NA | |
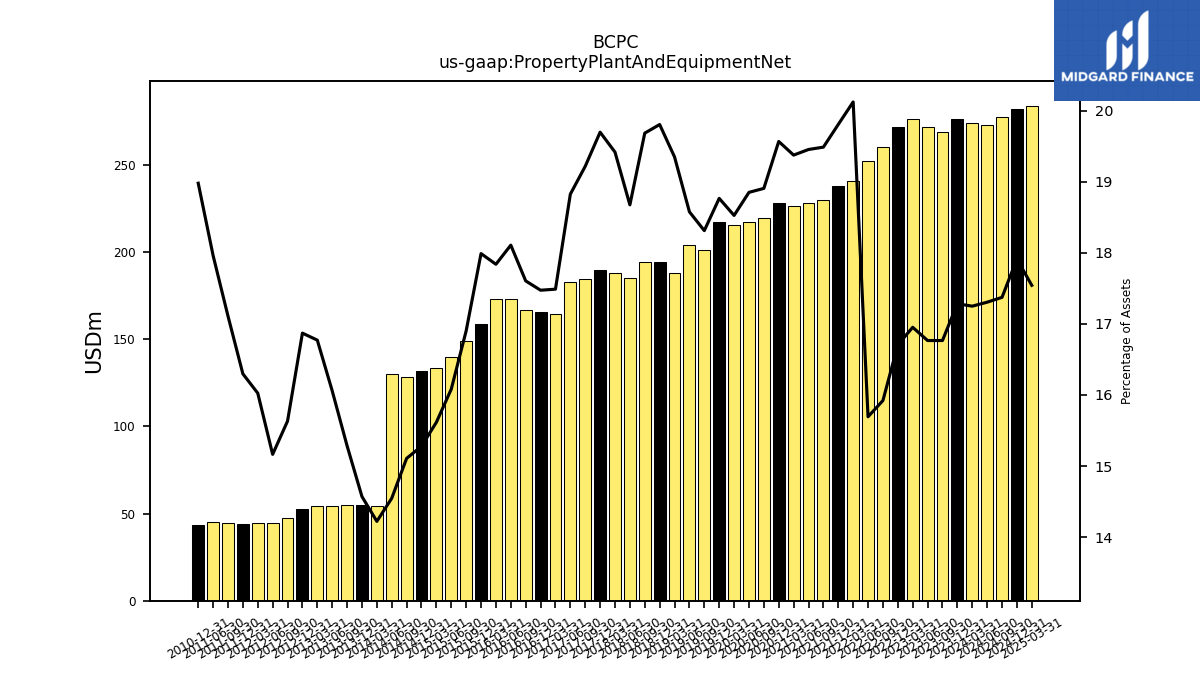
| Property Plant And Equipment Net | 274.03 | 276.04 | 268.83 | 271.47 | 276.10 | 271.36 | 260.01 | 252.15 | 240.42 | 237.52 | 229.80 | 228.29 | 226.51 | 228.10 | 219.55 | 217.00 | 215.28 | 216.86 | 200.81 | 204.02 | 188.04 | 194.34 | 194.08 | 184.77 | 187.94 | 189.79 | 184.25 | 182.72 | 164.63 | 165.75 | 166.68 | 172.79 | 173.07 | 158.51 | 149.17 | 139.75 | 133.49 | 131.59 | 128.24 | 129.90 | 54.39 | 54.92 | 54.78 | 54.51 | 54.18 | 52.73 | 47.47 | 44.33 | 44.57 | 44.28 | 44.48 | 44.89 | NA | 43.39 | NA | NA | NA | |
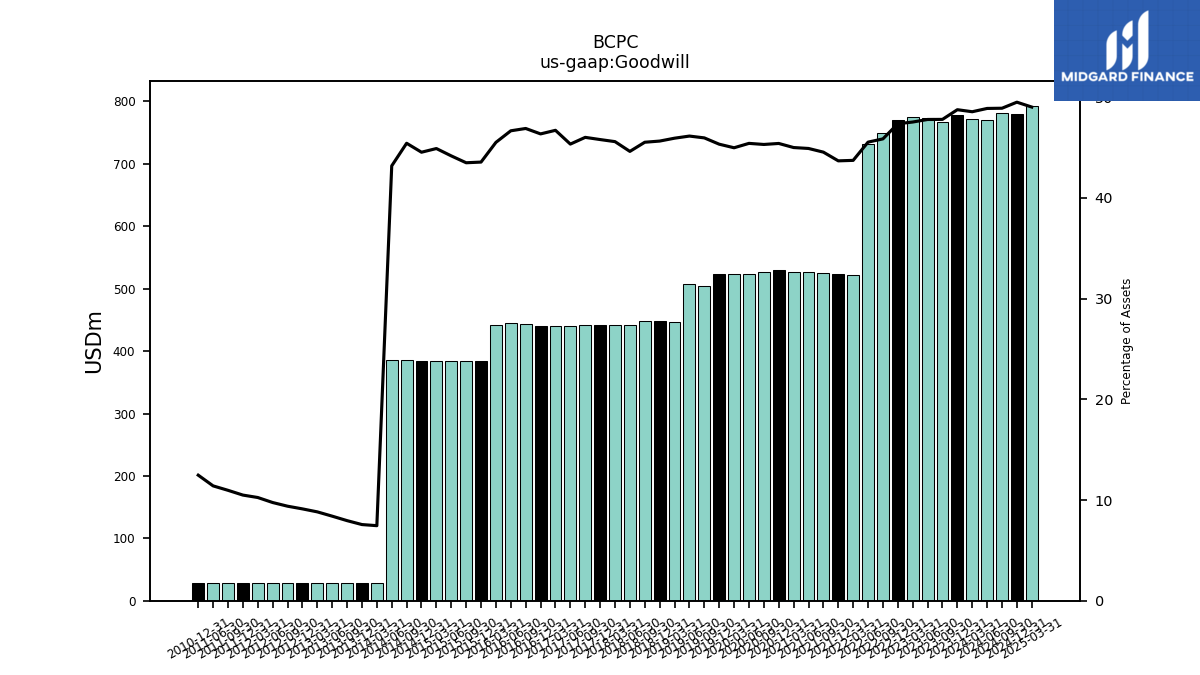
| Goodwill | 771.54 | 778.91 | 766.54 | 773.91 | 774.36 | 769.51 | 749.03 | 731.77 | 522.59 | 523.95 | 525.42 | 527.15 | 526.25 | 529.46 | 526.26 | 522.93 | 522.78 | 524.00 | 504.09 | 506.85 | 446.45 | 448.00 | 449.01 | 441.55 | 441.36 | 441.36 | 441.26 | 440.21 | 439.81 | 439.81 | 444.08 | 445.39 | 441.67 | 383.91 | 383.91 | 383.91 | 383.91 | 383.65 | 385.65 | 385.65 | 28.52 | 28.52 | 28.52 | 28.52 | 28.52 | 28.52 | 28.52 | 28.52 | 28.52 | 28.52 | 28.52 | 28.52 | NA | 28.52 | NA | NA | NA | |
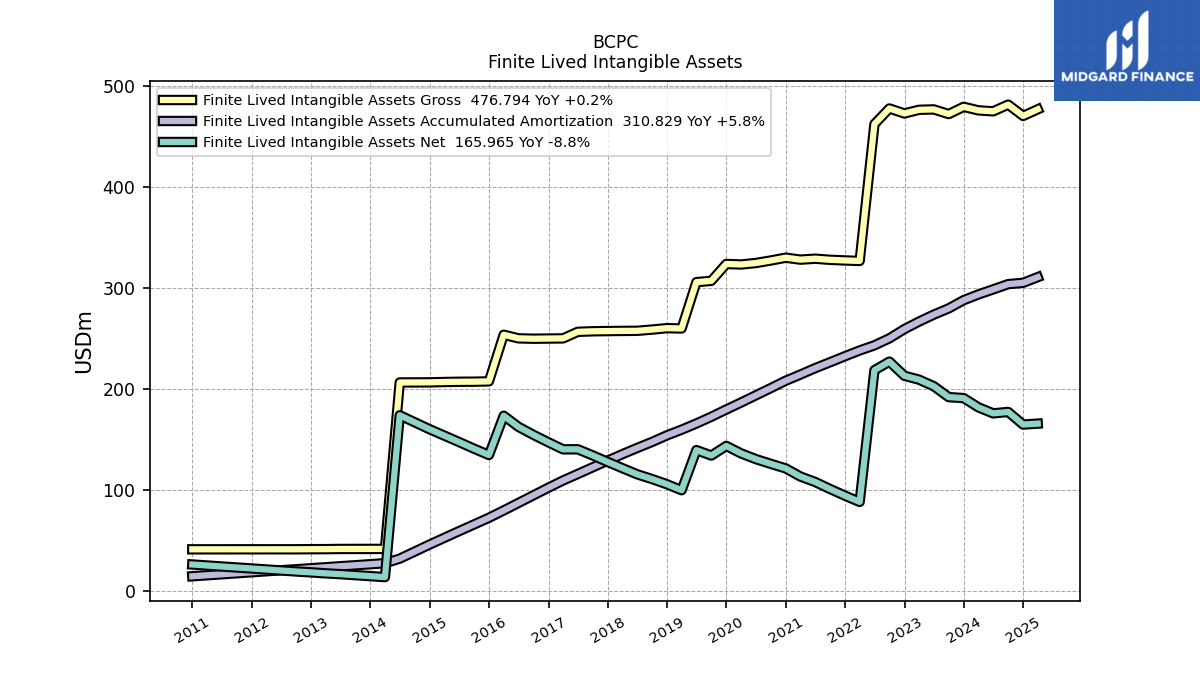
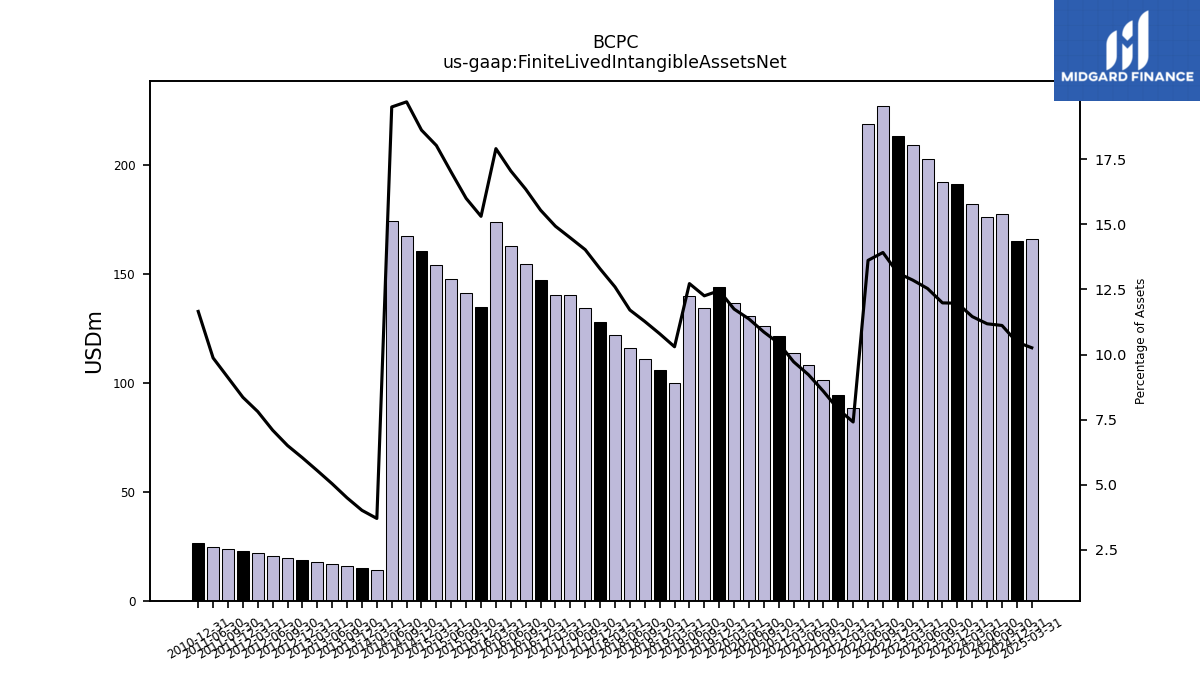
| Finite Lived Intangible Assets Net | 182.04 | 191.21 | 192.17 | 202.98 | 209.47 | 213.29 | 227.32 | 218.80 | 88.53 | 94.67 | 101.28 | 108.25 | 113.66 | 121.66 | 126.18 | 130.87 | 136.51 | 143.92 | 134.40 | 139.77 | 100.09 | 105.98 | 111.14 | 115.87 | 121.94 | 128.07 | 134.51 | 140.58 | 140.54 | 147.48 | 154.84 | 162.75 | 173.77 | 134.91 | 141.22 | 147.75 | 154.13 | 160.39 | 167.29 | 174.22 | 14.16 | 15.13 | 16.10 | 17.08 | 17.89 | 18.86 | 19.75 | 20.73 | 21.71 | 22.71 | 23.70 | 24.67 | NA | 26.65 | NA | NA | NA | |
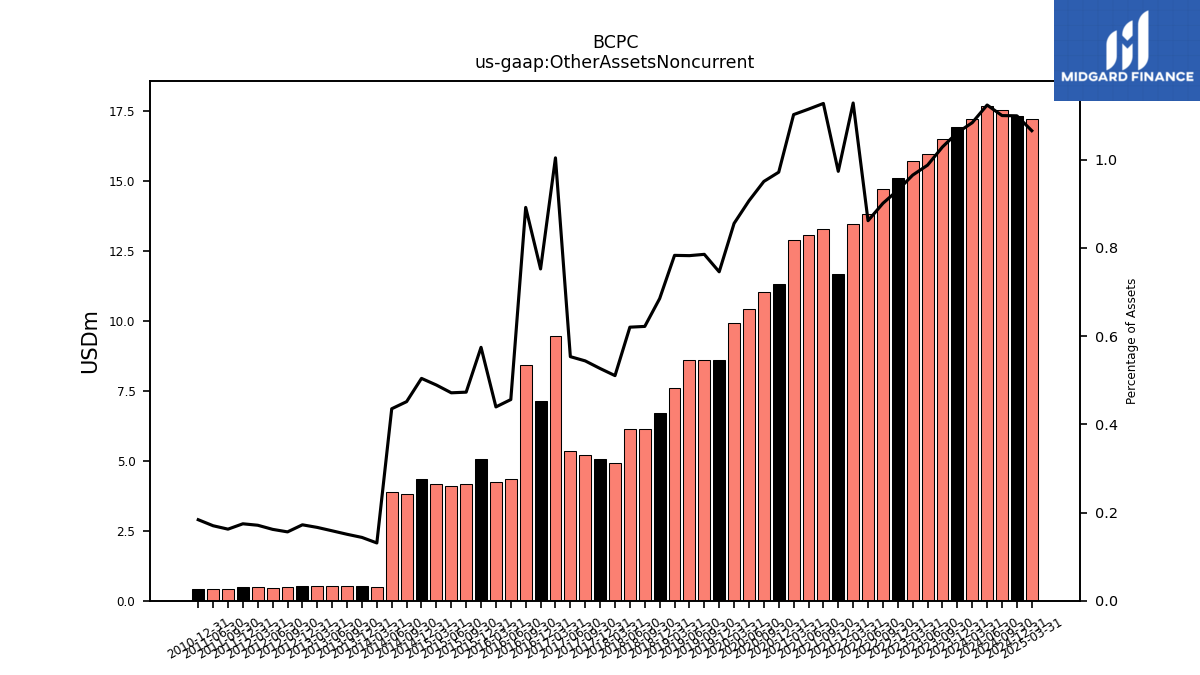
| Other Assets Noncurrent | 17.22 | 16.95 | 16.49 | 15.99 | 15.71 | 15.12 | 14.71 | 13.84 | 13.48 | 11.67 | 13.29 | 13.08 | 12.88 | 11.33 | 11.04 | 10.44 | 9.94 | 8.62 | 8.61 | 8.59 | 7.61 | 6.72 | 6.13 | 6.14 | 4.94 | 5.07 | 5.21 | 5.37 | 9.45 | 7.13 | 8.44 | 4.35 | 4.26 | 5.06 | 4.17 | 4.10 | 4.18 | 4.34 | 3.83 | 3.89 | 0.50 | 0.54 | 0.54 | 0.54 | 0.54 | 0.54 | 0.47 | 0.47 | 0.48 | 0.47 | 0.42 | 0.42 | NA | 0.42 | NA | NA | NA |
| 2024-03-31 | 2023-12-31 | 2023-09-30 | 2023-06-30 | 2023-03-31 | 2022-12-31 | 2022-09-30 | 2022-06-30 | 2022-03-31 | 2021-12-31 | 2021-09-30 | 2021-06-30 | 2021-03-31 | 2020-12-31 | 2020-09-30 | 2020-06-30 | 2020-03-31 | 2019-12-31 | 2019-09-30 | 2019-06-30 | 2019-03-31 | 2018-12-31 | 2018-09-30 | 2018-06-30 | 2018-03-31 | 2017-12-31 | 2017-09-30 | 2017-06-30 | 2017-03-31 | 2016-12-31 | 2016-09-30 | 2016-06-30 | 2016-03-31 | 2015-12-31 | 2015-09-30 | 2015-06-30 | 2015-03-31 | 2014-12-31 | 2014-09-30 | 2014-06-30 | 2014-03-31 | 2013-12-31 | 2013-09-30 | 2013-06-30 | 2013-03-31 | 2012-12-31 | 2012-09-30 | 2012-06-30 | 2012-03-31 | 2011-12-31 | 2011-09-30 | 2011-06-30 | 2011-03-31 | 2010-12-31 | 2010-09-30 | 2010-06-30 | 2010-03-31 | ||
|---|---|---|---|---|---|---|---|---|---|---|---|---|---|---|---|---|---|---|---|---|---|---|---|---|---|---|---|---|---|---|---|---|---|---|---|---|---|---|---|---|---|---|---|---|---|---|---|---|---|---|---|---|---|---|---|---|---|---|
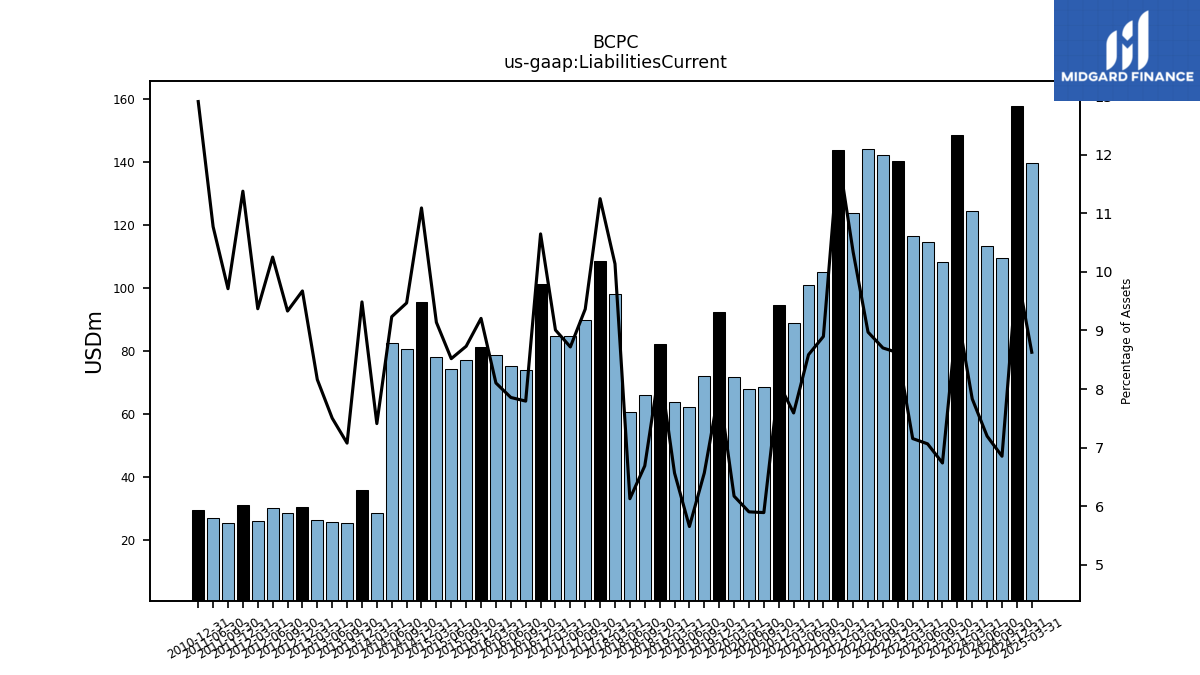
| Liabilities Current | 124.42 | 148.49 | 108.04 | 114.39 | 116.52 | 140.04 | 142.09 | 144.14 | 123.53 | 143.80 | 104.93 | 100.76 | 88.76 | 94.43 | 68.41 | 67.96 | 71.72 | 92.26 | 72.02 | 62.09 | 63.81 | 82.06 | 65.95 | 60.63 | 98.11 | 108.40 | 89.79 | 84.63 | 84.79 | 101.01 | 73.79 | 74.97 | 78.62 | 81.12 | 77.05 | 74.02 | 78.12 | 95.52 | 80.37 | 82.45 | 28.34 | 35.75 | 25.36 | 25.47 | 26.37 | 30.23 | 28.33 | 29.97 | 26.06 | 30.91 | 25.25 | 26.92 | NA | 29.51 | NA | NA | NA | |
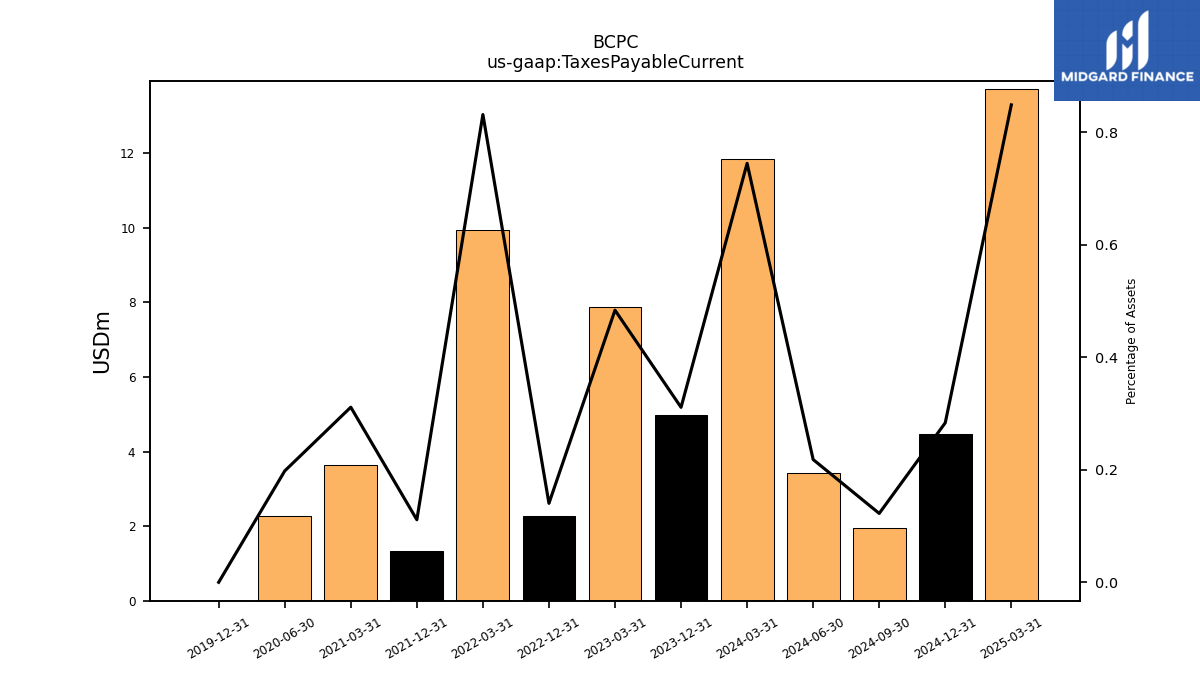
| Taxes Payable Current | 11.83 | 4.97 | NA | NA | 7.88 | 2.28 | NA | NA | 9.94 | 1.33 | NA | NA | 3.64 | NA | NA | 2.28 | NA | 0.00 | NA | NA | NA | NA | NA | NA | NA | NA | NA | NA | NA | NA | NA | NA | NA | NA | NA | NA | NA | NA | NA | NA | NA | NA | NA | NA | NA | NA | NA | NA | NA | NA | NA | NA | NA | NA | NA | NA | NA | |
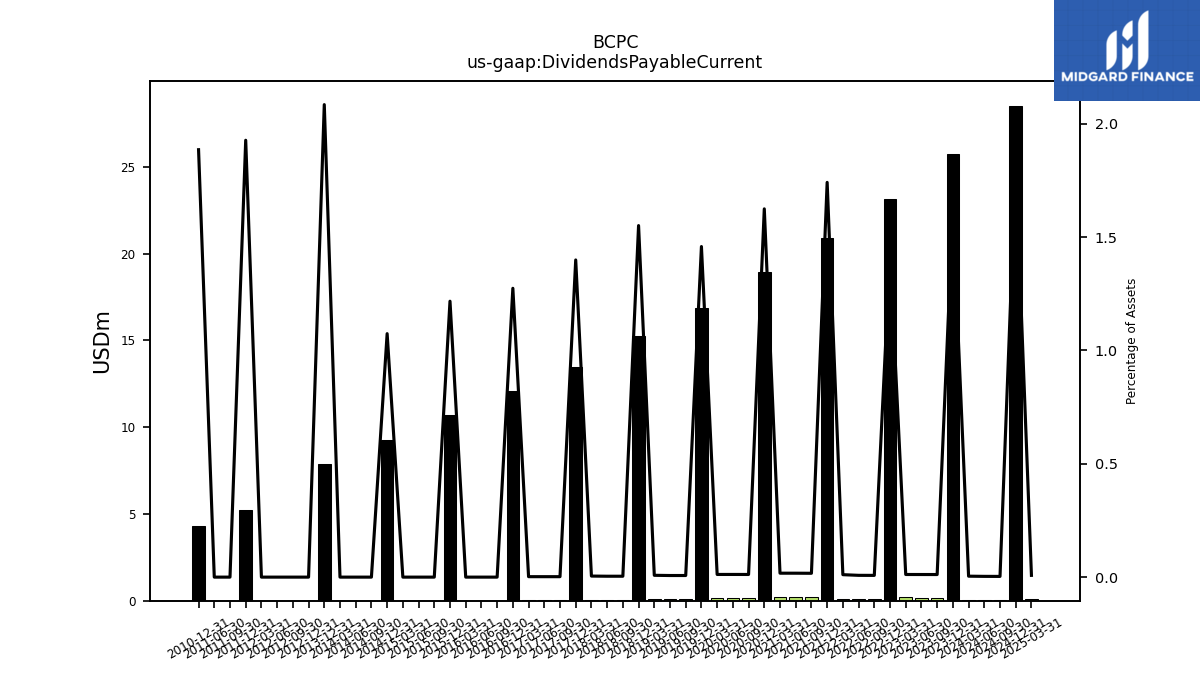
| Dividends Payable Current | 0.07 | 25.72 | 0.18 | 0.19 | 0.19 | 23.13 | 0.12 | 0.13 | 0.13 | 20.89 | 0.20 | 0.20 | 0.20 | 18.94 | 0.14 | 0.14 | 0.14 | 16.86 | 0.08 | 0.08 | 0.08 | 15.22 | 0.04 | 0.04 | 0.04 | 13.48 | 0.02 | 0.02 | 0.02 | 12.09 | 0.00 | 0.00 | 0.00 | 10.73 | 0.00 | 0.00 | 0.00 | 9.25 | 0.00 | 0.00 | 0.00 | 7.86 | NA | NA | NA | 0.00 | 0.00 | 0.00 | 0.00 | 5.24 | 0.00 | 0.00 | NA | 4.31 | NA | NA | NA | |
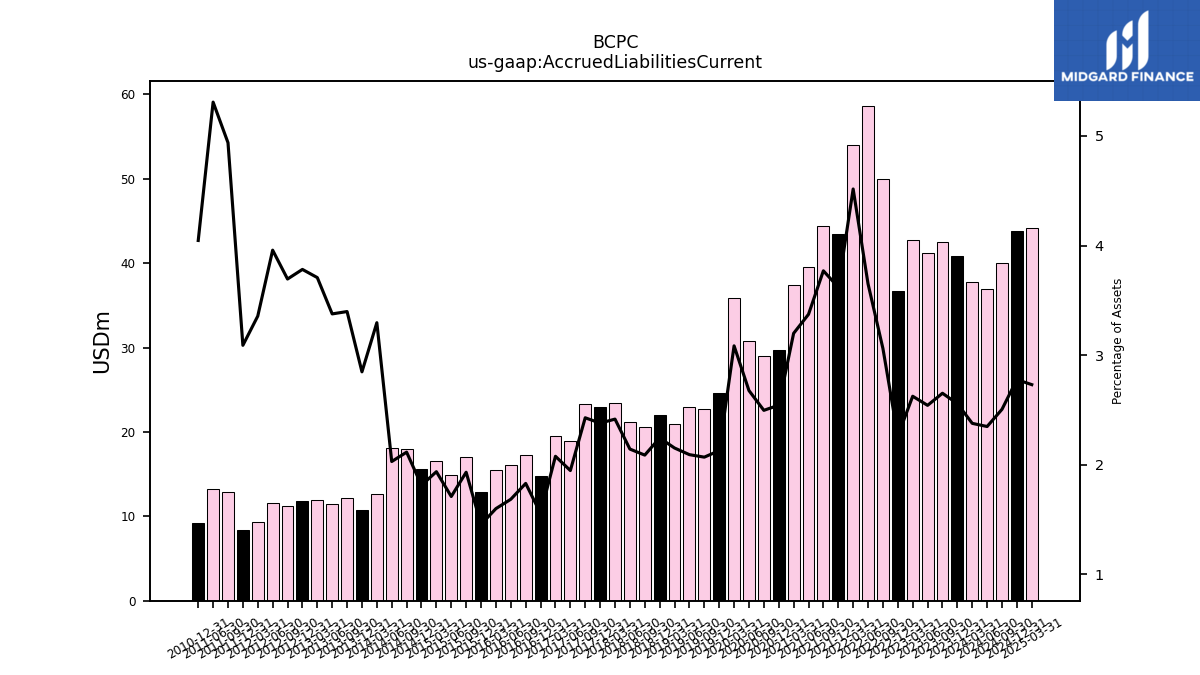
| Accrued Liabilities Current | 37.77 | 40.85 | 42.53 | 41.16 | 42.75 | 36.74 | 49.98 | 58.65 | 53.96 | 43.41 | 44.45 | 39.58 | 37.40 | 29.66 | 28.99 | 30.82 | 35.85 | 24.60 | 22.69 | 22.98 | 20.92 | 22.02 | 20.59 | 21.21 | 23.39 | 22.93 | 23.29 | 18.90 | 19.55 | 14.76 | 17.32 | 16.08 | 15.52 | 12.83 | 17.05 | 14.86 | 16.55 | 15.61 | 17.95 | 18.12 | 12.61 | 10.73 | 12.18 | 11.46 | 11.98 | 11.82 | 11.22 | 11.57 | 9.33 | 8.39 | 12.84 | 13.27 | NA | 9.25 | NA | NA | NA |
| 2024-03-31 | 2023-12-31 | 2023-09-30 | 2023-06-30 | 2023-03-31 | 2022-12-31 | 2022-09-30 | 2022-06-30 | 2022-03-31 | 2021-12-31 | 2021-09-30 | 2021-06-30 | 2021-03-31 | 2020-12-31 | 2020-09-30 | 2020-06-30 | 2020-03-31 | 2019-12-31 | 2019-09-30 | 2019-06-30 | 2019-03-31 | 2018-12-31 | 2018-09-30 | 2018-06-30 | 2018-03-31 | 2017-12-31 | 2017-09-30 | 2017-06-30 | 2017-03-31 | 2016-12-31 | 2016-09-30 | 2016-06-30 | 2016-03-31 | 2015-12-31 | 2015-09-30 | 2015-06-30 | 2015-03-31 | 2014-12-31 | 2014-09-30 | 2014-06-30 | 2014-03-31 | 2013-12-31 | 2013-09-30 | 2013-06-30 | 2013-03-31 | 2012-12-31 | 2012-09-30 | 2012-06-30 | 2012-03-31 | 2011-12-31 | 2011-09-30 | 2011-06-30 | 2011-03-31 | 2010-12-31 | 2010-09-30 | 2010-06-30 | 2010-03-31 | ||
|---|---|---|---|---|---|---|---|---|---|---|---|---|---|---|---|---|---|---|---|---|---|---|---|---|---|---|---|---|---|---|---|---|---|---|---|---|---|---|---|---|---|---|---|---|---|---|---|---|---|---|---|---|---|---|---|---|---|---|
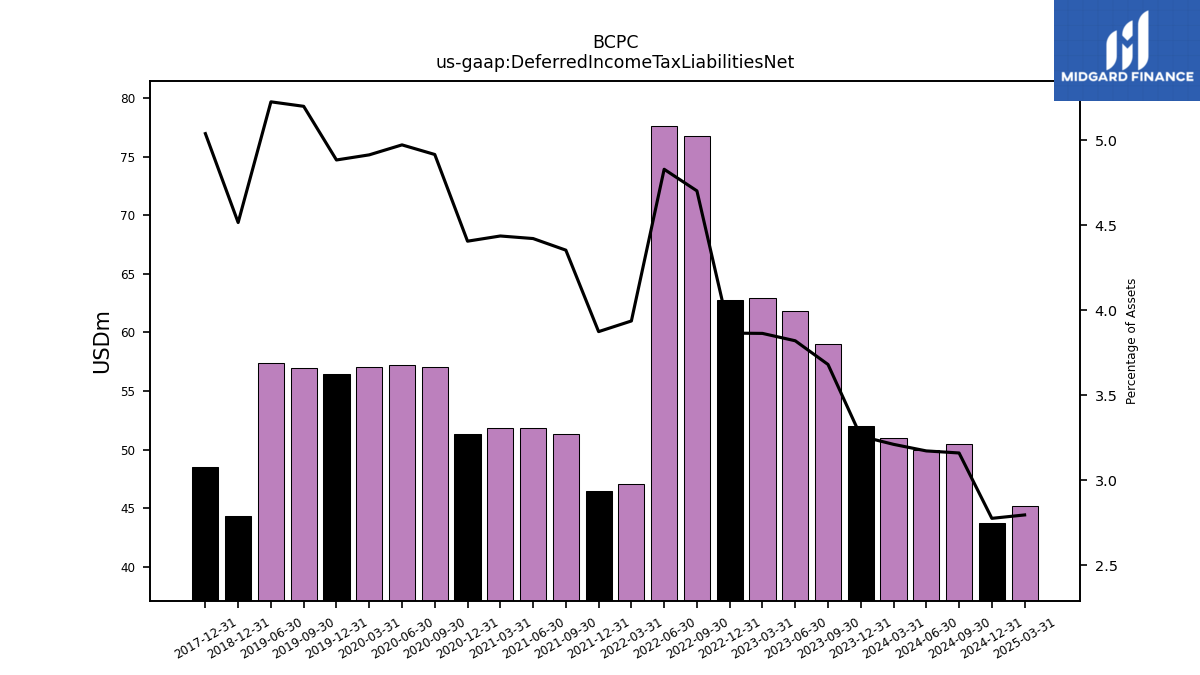
| Deferred Income Tax Liabilities Net | 51.01 | 52.05 | 59.01 | 61.85 | 62.92 | 62.78 | 76.77 | 77.57 | 47.03 | 46.45 | 51.33 | 51.88 | 51.87 | 51.36 | 57.08 | 57.24 | 57.09 | 56.43 | 57.01 | 57.39 | NA | 44.31 | NA | NA | NA | 48.55 | NA | NA | NA | NA | NA | NA | NA | NA | NA | NA | NA | NA | NA | NA | NA | NA | NA | NA | NA | NA | NA | NA | NA | NA | NA | NA | NA | NA | NA | NA | NA | |
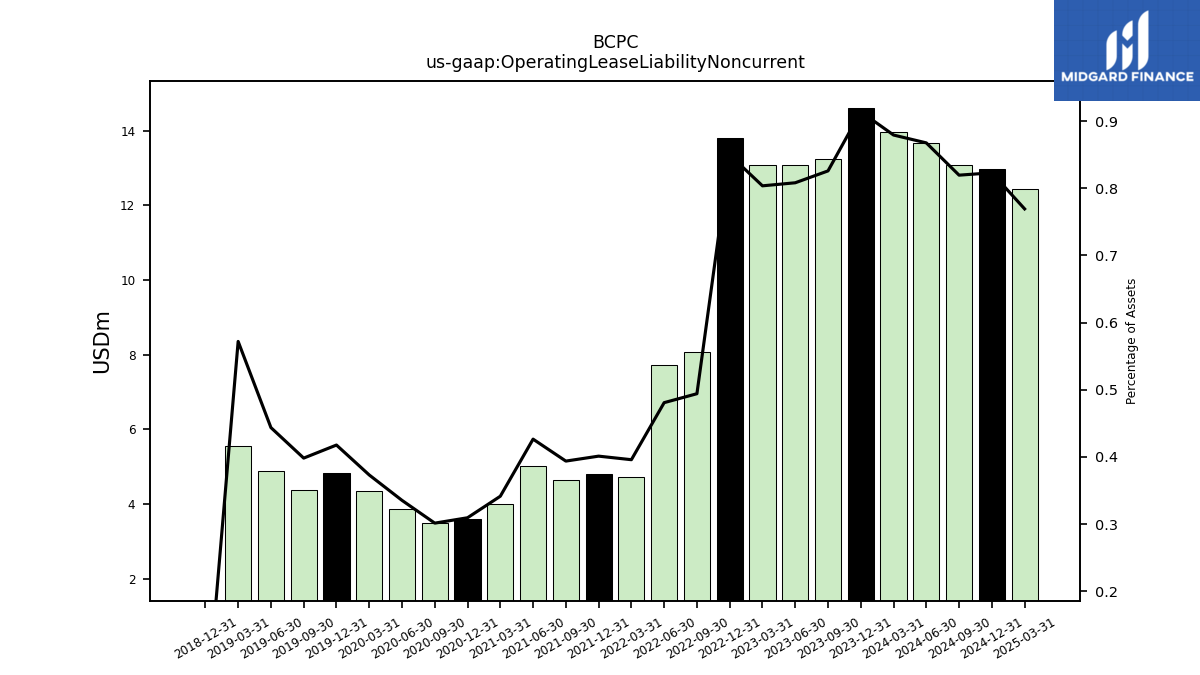
| Operating Lease Liability Noncurrent | 13.97 | 14.60 | 13.24 | 13.09 | 13.09 | 13.81 | 8.07 | 7.72 | 4.73 | 4.81 | 4.64 | 5.00 | 3.99 | 3.61 | 3.50 | 3.86 | 4.34 | 4.83 | 4.37 | 4.87 | 5.56 | 0.00 | NA | NA | NA | NA | NA | NA | NA | NA | NA | NA | NA | NA | NA | NA | NA | NA | NA | NA | NA | NA | NA | NA | NA | NA | NA | NA | NA | NA | NA | NA | NA | NA | NA | NA | NA |
| 2024-03-31 | 2023-12-31 | 2023-09-30 | 2023-06-30 | 2023-03-31 | 2022-12-31 | 2022-09-30 | 2022-06-30 | 2022-03-31 | 2021-12-31 | 2021-09-30 | 2021-06-30 | 2021-03-31 | 2020-12-31 | 2020-09-30 | 2020-06-30 | 2020-03-31 | 2019-12-31 | 2019-09-30 | 2019-06-30 | 2019-03-31 | 2018-12-31 | 2018-09-30 | 2018-06-30 | 2018-03-31 | 2017-12-31 | 2017-09-30 | 2017-06-30 | 2017-03-31 | 2016-12-31 | 2016-09-30 | 2016-06-30 | 2016-03-31 | 2015-12-31 | 2015-09-30 | 2015-06-30 | 2015-03-31 | 2014-12-31 | 2014-09-30 | 2014-06-30 | 2014-03-31 | 2013-12-31 | 2013-09-30 | 2013-06-30 | 2013-03-31 | 2012-12-31 | 2012-09-30 | 2012-06-30 | 2012-03-31 | 2011-12-31 | 2011-09-30 | 2011-06-30 | 2011-03-31 | 2010-12-31 | 2010-09-30 | 2010-06-30 | 2010-03-31 | ||
|---|---|---|---|---|---|---|---|---|---|---|---|---|---|---|---|---|---|---|---|---|---|---|---|---|---|---|---|---|---|---|---|---|---|---|---|---|---|---|---|---|---|---|---|---|---|---|---|---|---|---|---|---|---|---|---|---|---|---|
| Stockholders Equity | 1078.79 | 1053.98 | 1025.27 | 1006.90 | 973.42 | 938.28 | 895.92 | 901.37 | 873.68 | 877.01 | 889.08 | 869.64 | 849.49 | 828.23 | 819.44 | 792.52 | 766.27 | 743.67 | 733.59 | 732.35 | 710.51 | 691.62 | 685.20 | 663.22 | 639.89 | 616.88 | 585.94 | 562.38 | 542.30 | 521.03 | 516.42 | 496.15 | 480.25 | 463.70 | 457.32 | 438.22 | 411.22 | 391.90 | 376.64 | 356.22 | 344.20 | 331.36 | 322.88 | 305.39 | 288.07 | 273.01 | 267.28 | 254.18 | 243.45 | 232.01 | 224.00 | 212.48 | NA | 187.47 | NA | NA | NA | |
| Common Stock Value | 2.16 | 2.15 | 2.15 | 2.15 | 2.15 | 2.15 | 2.14 | 2.14 | 2.14 | 2.15 | 2.17 | 2.17 | 2.17 | 2.16 | 2.16 | 2.16 | 2.16 | 2.16 | 2.16 | 2.16 | 2.16 | 2.15 | 2.15 | 2.15 | 2.14 | 2.13 | 2.13 | 2.13 | 2.12 | 2.12 | 2.12 | 2.11 | 2.10 | 2.10 | 2.10 | 2.10 | 2.07 | 2.06 | 2.05 | 2.03 | 2.02 | 2.02 | 2.00 | 1.99 | 1.98 | 1.96 | 1.96 | 1.95 | 1.95 | 1.94 | 1.93 | 1.93 | NA | 1.92 | NA | NA | NA | |
| Additional Paid In Capital | 154.03 | 145.65 | 140.97 | 137.25 | 132.21 | 128.81 | 124.56 | 120.81 | 116.77 | 147.72 | 172.68 | 172.63 | 170.84 | 173.03 | 175.16 | 174.07 | 173.58 | 174.22 | 173.76 | 169.74 | 166.76 | 165.10 | 163.87 | 161.00 | 154.03 | 151.75 | 149.70 | 143.70 | 142.87 | 137.68 | 134.75 | 128.81 | 125.93 | 122.59 | NA | NA | NA | NA | NA | NA | NA | NA | NA | NA | NA | NA | NA | NA | NA | NA | NA | NA | NA | NA | NA | NA | NA | |
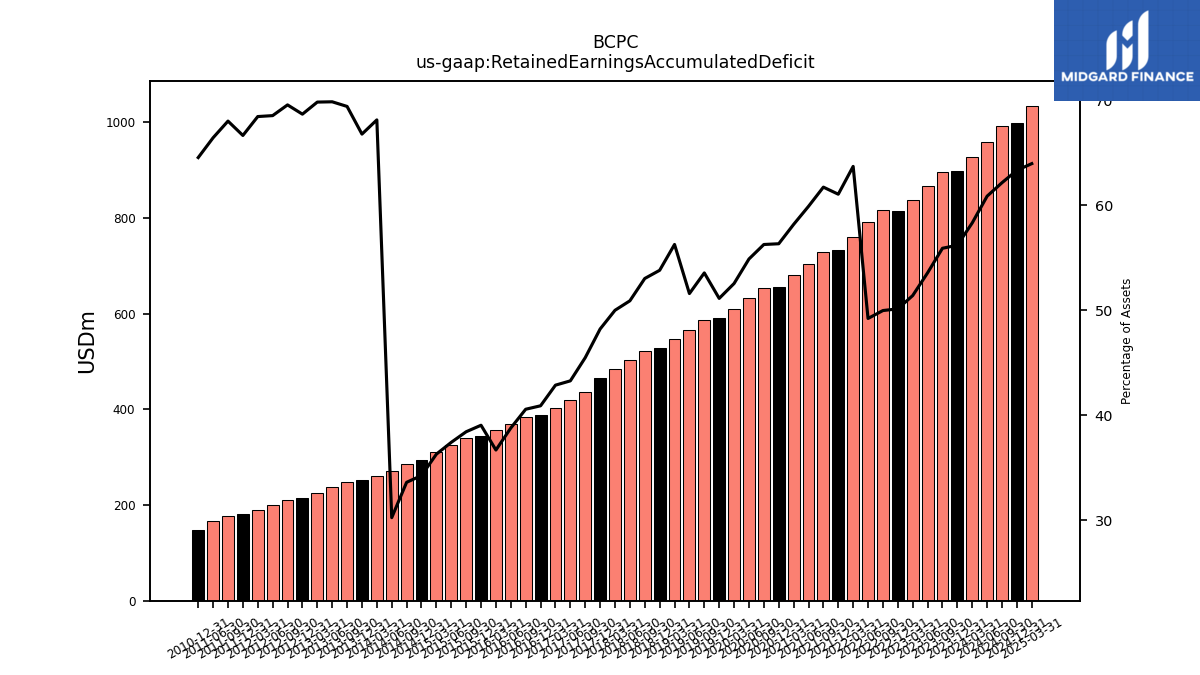
| Retained Earnings Accumulated Deficit | 926.47 | 897.49 | 896.38 | 867.31 | 837.20 | 814.49 | 816.09 | 790.84 | 761.06 | 732.14 | 727.89 | 702.88 | 680.15 | 656.74 | 653.38 | 631.81 | 610.69 | 590.92 | 587.32 | 566.64 | 546.81 | 528.03 | 522.88 | 503.67 | 483.99 | 464.64 | 436.19 | 420.14 | 403.61 | 388.09 | 384.25 | 370.23 | 356.08 | 344.20 | 339.27 | 325.29 | 310.37 | 295.20 | 285.43 | 270.25 | 260.52 | 251.63 | 248.74 | 237.08 | 225.54 | 214.61 | 211.18 | 200.31 | 190.34 | 181.07 | 176.81 | 166.03 | NA | 147.54 | NA | NA | NA | |
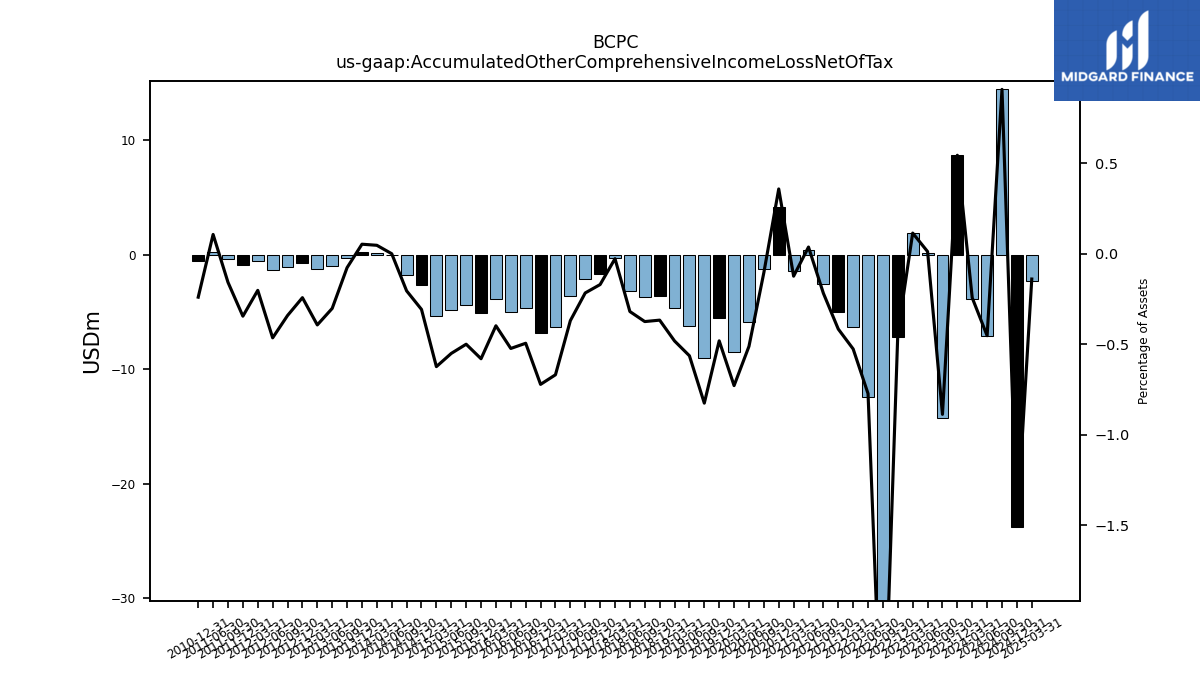
| Accumulated Other Comprehensive Income Loss Net Of Tax | -3.87 | 8.69 | -14.23 | 0.19 | 1.86 | -7.15 | -46.87 | -12.42 | -6.29 | -4.99 | -2.58 | 0.43 | -1.45 | 4.17 | -1.22 | -5.89 | -8.47 | -5.56 | -9.05 | -6.19 | -4.69 | -3.60 | -3.70 | -3.16 | -0.27 | -1.64 | -2.08 | -3.59 | -6.30 | -6.85 | -4.68 | -5.00 | -3.86 | -5.11 | -4.41 | -4.79 | -5.33 | -2.65 | -1.74 | 0.00 | 0.18 | 0.20 | -0.28 | -1.03 | -1.27 | -0.76 | -1.04 | -1.36 | -0.56 | -0.94 | -0.41 | 0.27 | NA | -0.55 | NA | NA | NA |
| 2024-03-31 | 2023-12-31 | 2023-09-30 | 2023-06-30 | 2023-03-31 | 2022-12-31 | 2022-09-30 | 2022-06-30 | 2022-03-31 | 2021-12-31 | 2021-09-30 | 2021-06-30 | 2021-03-31 | 2020-12-31 | 2020-09-30 | 2020-06-30 | 2020-03-31 | 2019-12-31 | 2019-09-30 | 2019-06-30 | 2019-03-31 | 2018-12-31 | 2018-09-30 | 2018-06-30 | 2018-03-31 | 2017-12-31 | 2017-09-30 | 2017-06-30 | 2017-03-31 | 2016-12-31 | 2016-09-30 | 2016-06-30 | 2016-03-31 | 2015-12-31 | 2015-09-30 | 2015-06-30 | 2015-03-31 | 2014-12-31 | 2014-09-30 | 2014-06-30 | 2014-03-31 | 2013-12-31 | 2013-09-30 | 2013-06-30 | 2013-03-31 | 2012-12-31 | 2012-09-30 | 2012-06-30 | 2012-03-31 | 2011-12-31 | 2011-09-30 | 2011-06-30 | 2011-03-31 | 2010-12-31 | 2010-09-30 | 2010-06-30 | 2010-03-31 | ||
|---|---|---|---|---|---|---|---|---|---|---|---|---|---|---|---|---|---|---|---|---|---|---|---|---|---|---|---|---|---|---|---|---|---|---|---|---|---|---|---|---|---|---|---|---|---|---|---|---|---|---|---|---|---|---|---|---|---|---|
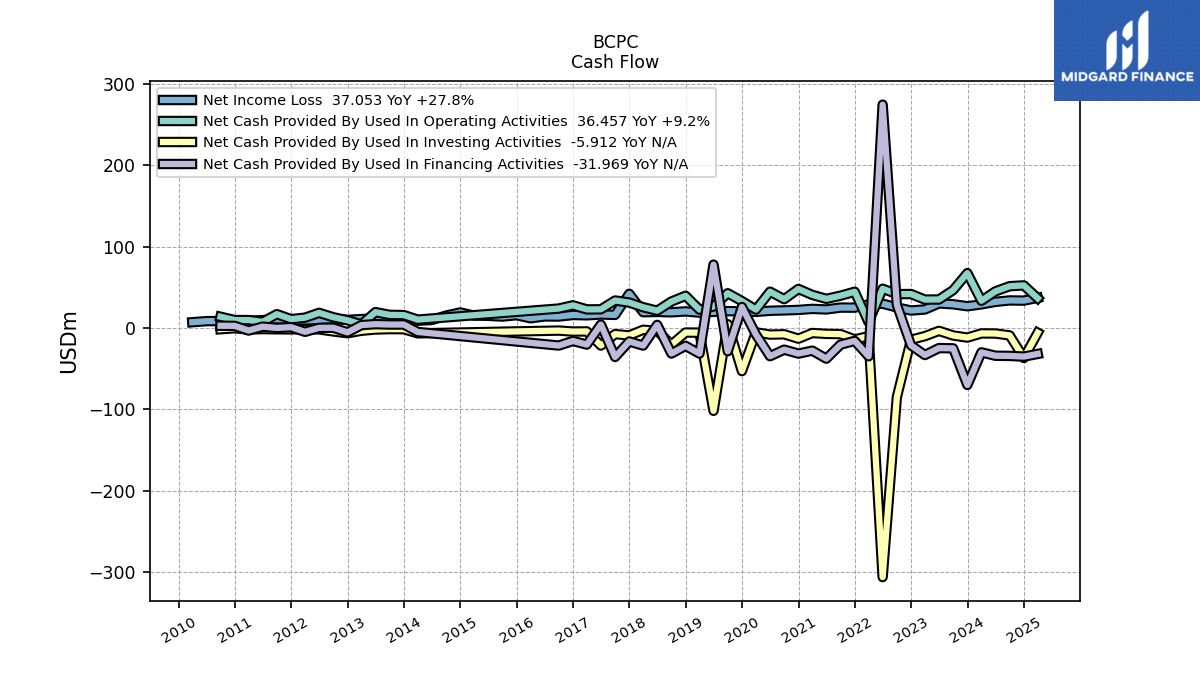
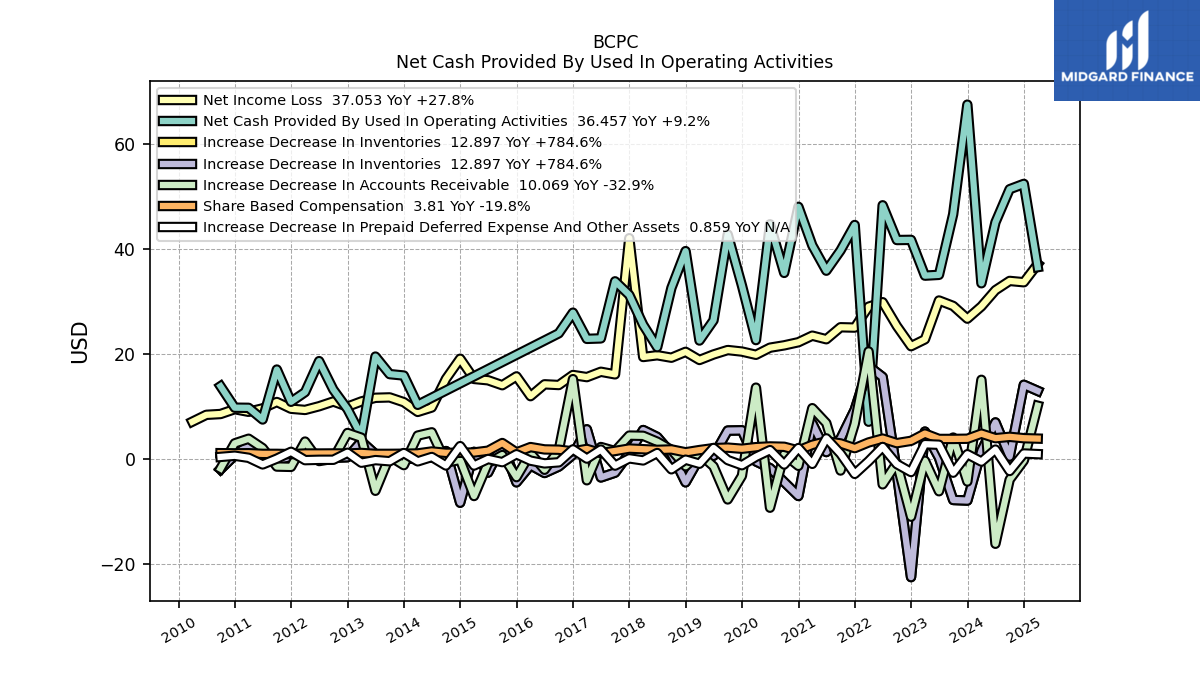
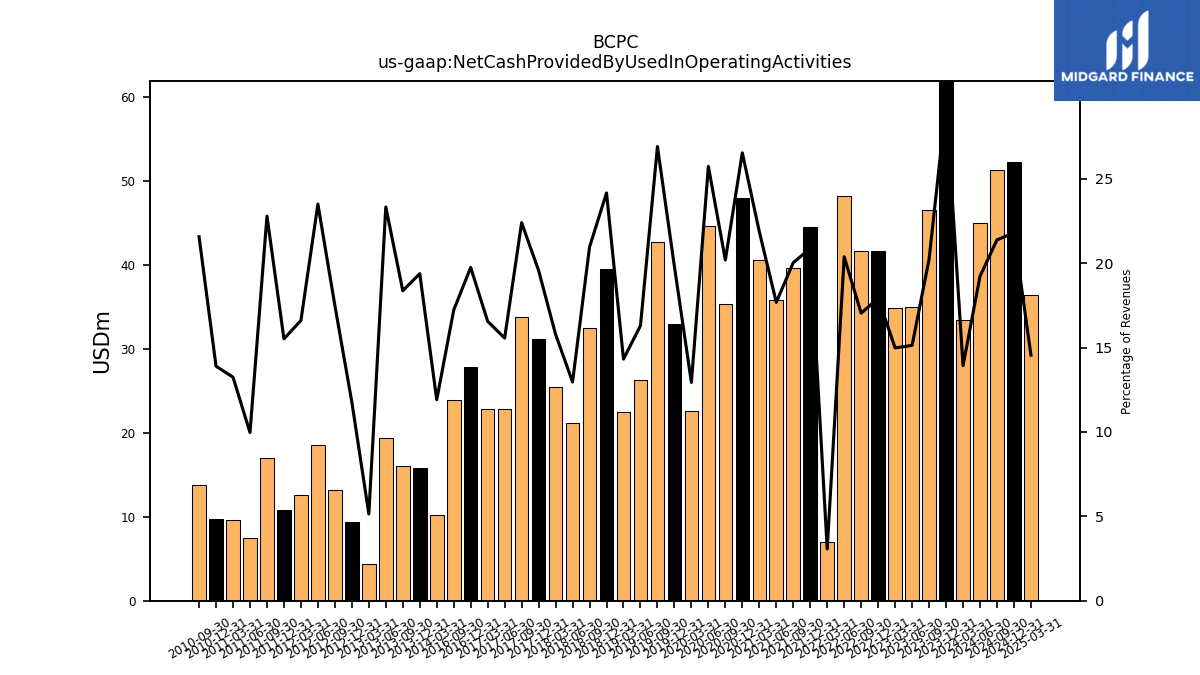
| Net Cash Provided By Used In Operating Activities | 33.39 | 67.41 | 46.53 | 34.99 | 34.84 | 41.66 | 41.62 | 48.24 | 7.02 | 44.49 | 39.63 | 35.78 | 40.61 | 47.95 | 35.36 | 44.62 | 22.57 | 32.97 | 42.68 | 26.33 | 22.48 | 39.51 | 32.49 | 21.22 | 25.48 | 31.16 | 33.76 | 22.89 | 22.80 | 27.80 | 23.86 | NA | NA | NA | NA | NA | NA | NA | NA | NA | 10.24 | 15.82 | 16.09 | 19.43 | 4.35 | 9.42 | 13.14 | 18.57 | 12.65 | 10.82 | 16.96 | 7.45 | 9.67 | 9.70 | 13.78 | NA | NA | |
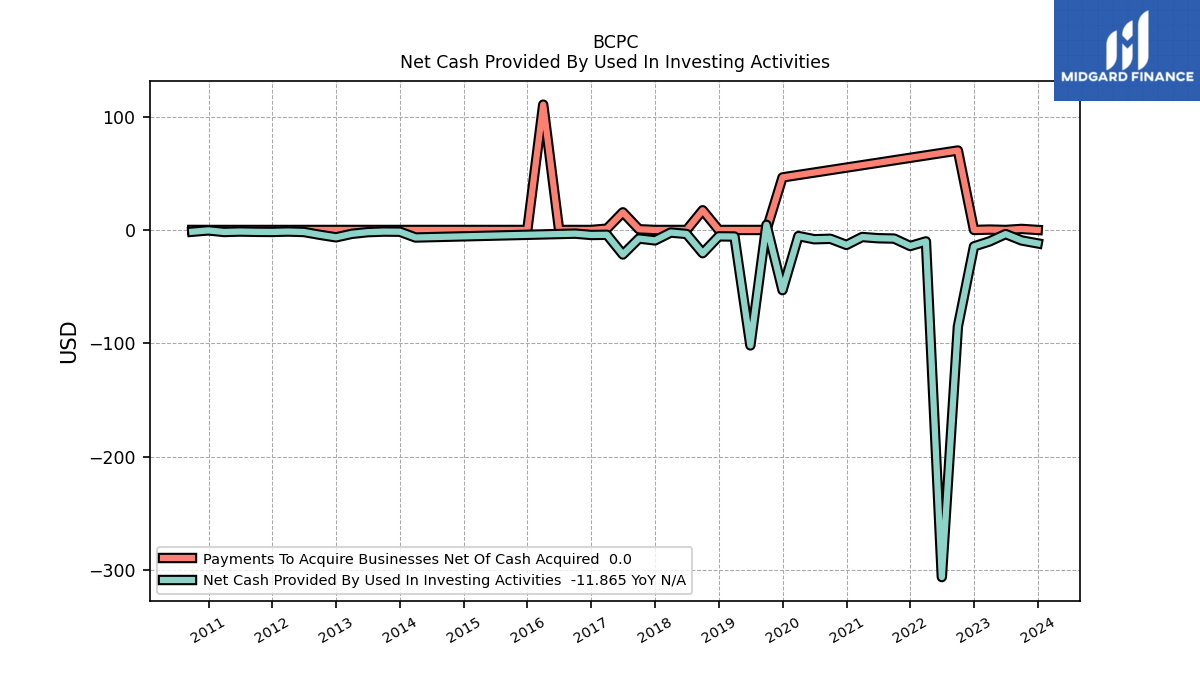
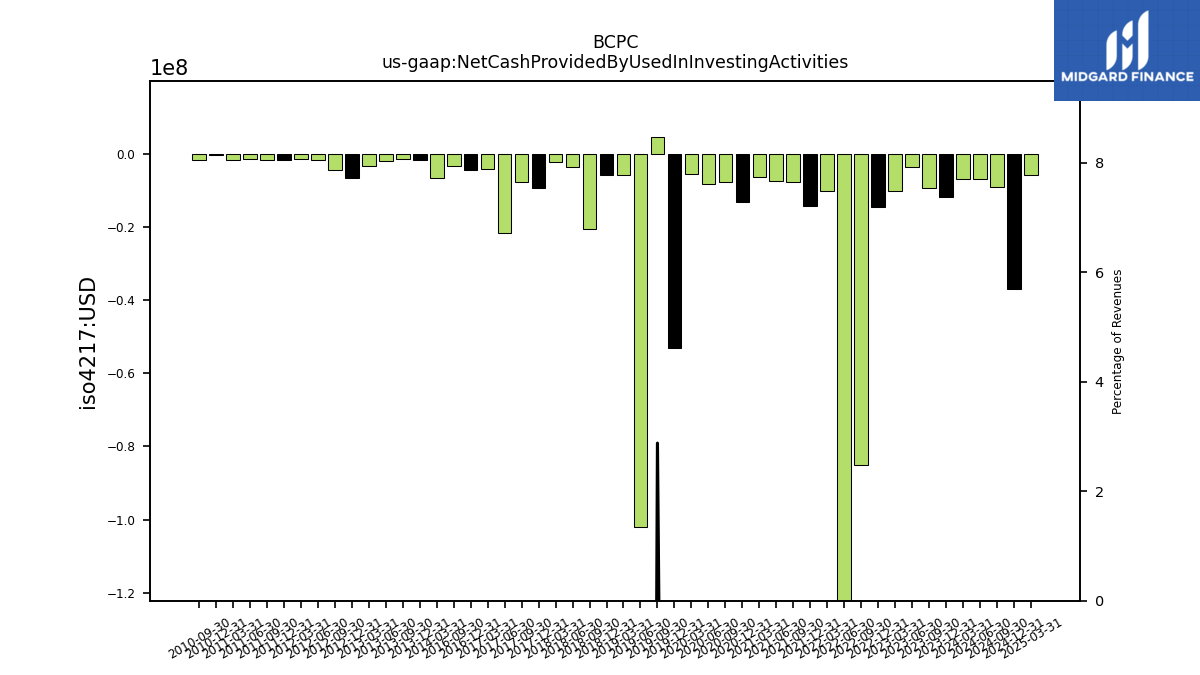
| Net Cash Provided By Used In Investing Activities | -6.74 | -11.87 | -9.28 | -3.61 | -10.06 | -14.49 | -85.11 | -306.34 | -10.07 | -14.18 | -7.60 | -7.29 | -6.23 | -13.21 | -7.79 | -8.20 | -5.39 | -53.12 | 4.57 | -101.89 | -5.78 | -5.64 | -20.52 | -3.57 | -2.26 | -9.22 | -7.57 | -21.66 | -4.25 | -4.43 | -3.24 | NA | NA | NA | NA | NA | NA | NA | NA | NA | -6.67 | -1.55 | -1.44 | -1.95 | -3.43 | -6.50 | -4.30 | -1.81 | -1.40 | -1.76 | -1.66 | -1.40 | -1.79 | -0.38 | -1.57 | NA | NA | |
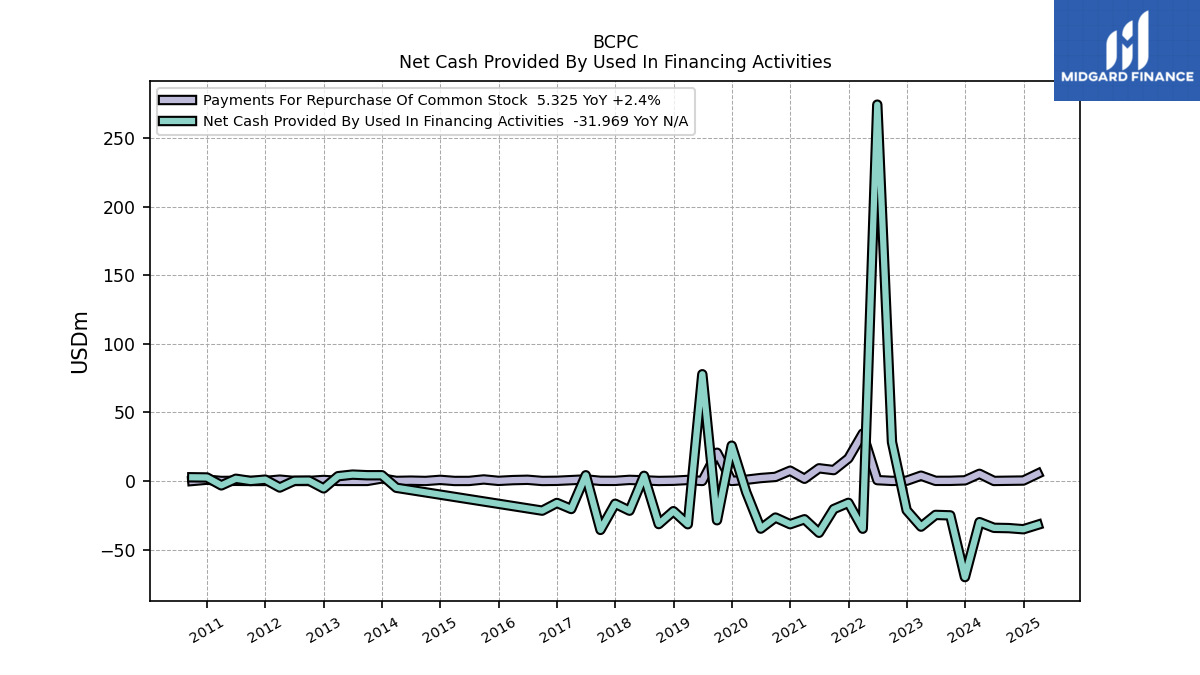
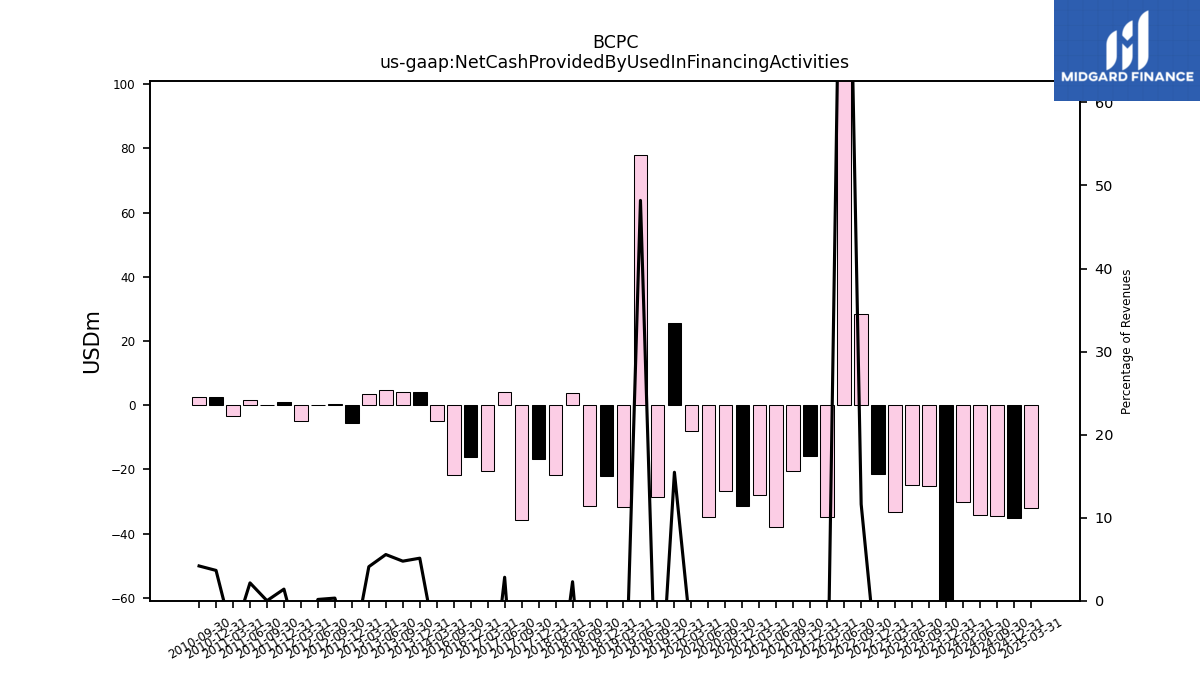
| Net Cash Provided By Used In Financing Activities | -30.02 | -70.15 | -25.10 | -24.76 | -33.32 | -21.40 | 28.39 | 274.54 | -34.84 | -15.95 | -20.51 | -37.79 | -27.93 | -31.55 | -26.69 | -34.77 | -8.16 | 25.76 | -28.67 | 77.87 | -31.57 | -22.04 | -31.46 | 3.75 | -21.70 | -16.61 | -35.71 | 4.16 | -20.46 | -16.04 | -21.65 | NA | NA | NA | NA | NA | NA | NA | NA | NA | -4.96 | 4.18 | 4.17 | 4.63 | 3.47 | -5.42 | 0.24 | 0.12 | -4.78 | 0.98 | 0.00 | 1.61 | -3.22 | 2.55 | 2.68 | NA | NA |
| 2024-03-31 | 2023-12-31 | 2023-09-30 | 2023-06-30 | 2023-03-31 | 2022-12-31 | 2022-09-30 | 2022-06-30 | 2022-03-31 | 2021-12-31 | 2021-09-30 | 2021-06-30 | 2021-03-31 | 2020-12-31 | 2020-09-30 | 2020-06-30 | 2020-03-31 | 2019-12-31 | 2019-09-30 | 2019-06-30 | 2019-03-31 | 2018-12-31 | 2018-09-30 | 2018-06-30 | 2018-03-31 | 2017-12-31 | 2017-09-30 | 2017-06-30 | 2017-03-31 | 2016-12-31 | 2016-09-30 | 2016-06-30 | 2016-03-31 | 2015-12-31 | 2015-09-30 | 2015-06-30 | 2015-03-31 | 2014-12-31 | 2014-09-30 | 2014-06-30 | 2014-03-31 | 2013-12-31 | 2013-09-30 | 2013-06-30 | 2013-03-31 | 2012-12-31 | 2012-09-30 | 2012-06-30 | 2012-03-31 | 2011-12-31 | 2011-09-30 | 2011-06-30 | 2011-03-31 | 2010-12-31 | 2010-09-30 | 2010-06-30 | 2010-03-31 | ||
|---|---|---|---|---|---|---|---|---|---|---|---|---|---|---|---|---|---|---|---|---|---|---|---|---|---|---|---|---|---|---|---|---|---|---|---|---|---|---|---|---|---|---|---|---|---|---|---|---|---|---|---|---|---|---|---|---|---|---|
| Net Cash Provided By Used In Operating Activities | 33.39 | 67.41 | 46.53 | 34.99 | 34.84 | 41.66 | 41.62 | 48.24 | 7.02 | 44.49 | 39.63 | 35.78 | 40.61 | 47.95 | 35.36 | 44.62 | 22.57 | 32.97 | 42.68 | 26.33 | 22.48 | 39.51 | 32.49 | 21.22 | 25.48 | 31.16 | 33.76 | 22.89 | 22.80 | 27.80 | 23.86 | NA | NA | NA | NA | NA | NA | NA | NA | NA | 10.24 | 15.82 | 16.09 | 19.43 | 4.35 | 9.42 | 13.14 | 18.57 | 12.65 | 10.82 | 16.96 | 7.45 | 9.67 | 9.70 | 13.78 | NA | NA | |
| Net Income Loss | 28.99 | 26.65 | 29.07 | 30.11 | 22.71 | 21.41 | 25.25 | 29.78 | 28.93 | 24.95 | 25.01 | 22.73 | 23.41 | 22.16 | 21.57 | 21.12 | 19.77 | 20.38 | 20.68 | 19.83 | 18.78 | 20.33 | 19.21 | 19.68 | 19.35 | 41.98 | 16.04 | 16.54 | 15.52 | 15.92 | 14.01 | 14.15 | 11.89 | 15.66 | 13.98 | 14.92 | 15.17 | 19.02 | 15.18 | 9.73 | 8.89 | 10.75 | 11.66 | 11.58 | 10.89 | 9.89 | 10.87 | 9.97 | 9.27 | 9.50 | 10.79 | 9.57 | 8.91 | 9.42 | 8.49 | 8.34 | 7.03 | |
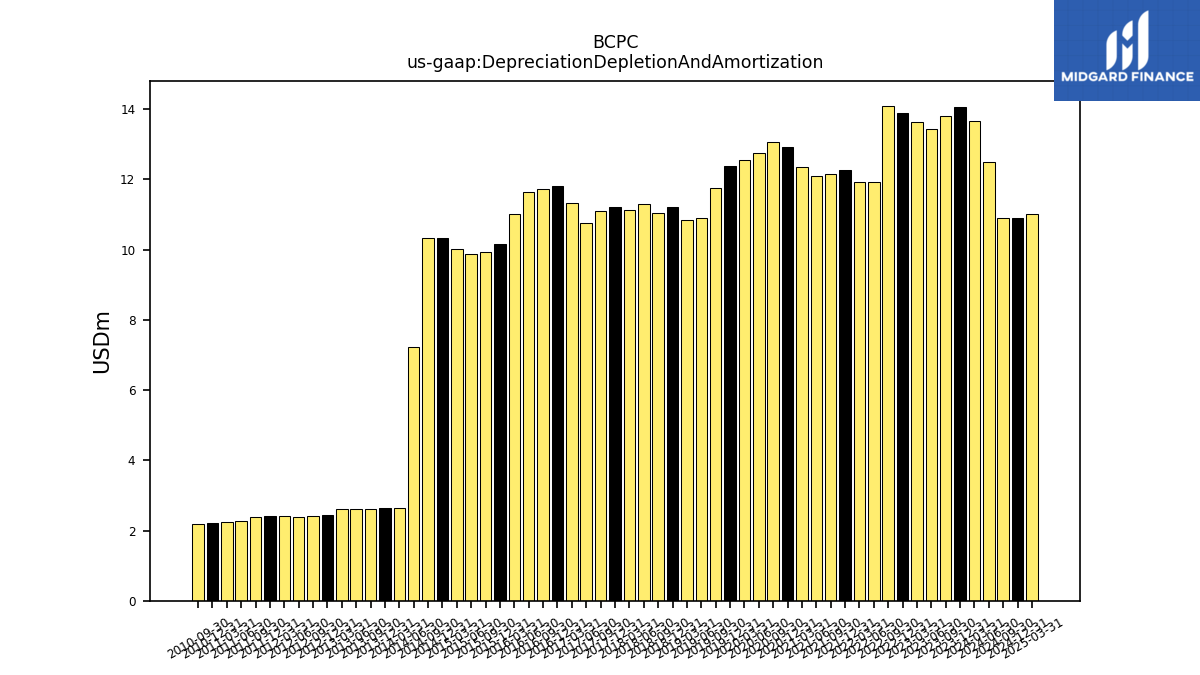
| Depreciation Depletion And Amortization | 13.67 | 14.06 | 13.80 | 13.43 | 13.65 | 13.89 | 14.10 | 11.93 | 11.93 | 12.26 | 12.16 | 12.10 | 12.36 | 12.93 | 13.05 | 12.74 | 12.55 | 12.38 | 11.75 | 10.90 | 10.84 | 11.21 | 11.03 | 11.30 | 11.13 | 11.21 | 11.09 | 10.75 | 11.34 | 11.82 | 11.72 | 11.65 | 11.02 | 10.15 | 9.93 | 9.87 | 10.03 | 10.33 | 10.33 | 7.23 | 2.63 | 2.64 | 2.61 | 2.61 | 2.62 | 2.43 | 2.41 | 2.39 | 2.42 | 2.42 | 2.38 | 2.26 | 2.23 | 2.23 | 2.19 | NA | NA | |
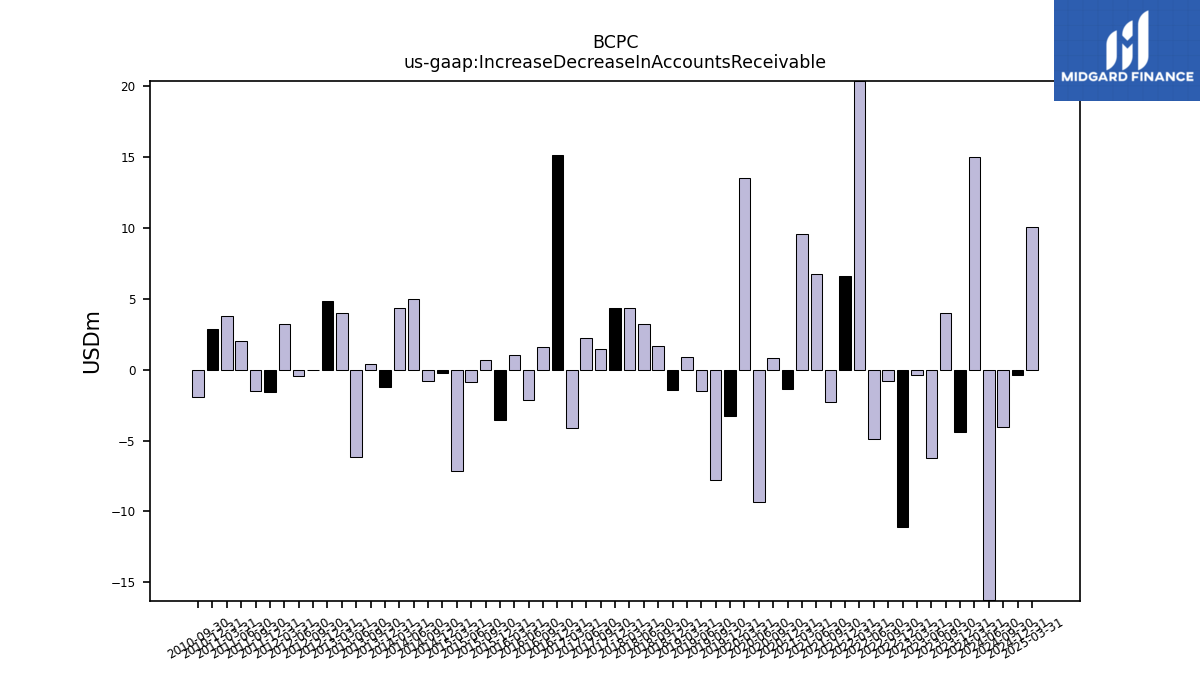
| Increase Decrease In Accounts Receivable | 15.01 | -4.36 | 4.01 | -6.22 | -0.40 | -11.06 | -0.83 | -4.90 | 20.41 | 6.61 | -2.27 | 6.75 | 9.61 | -1.38 | 0.81 | -9.35 | 13.52 | -3.28 | -7.78 | -1.48 | 0.91 | -1.45 | 1.67 | 3.22 | 4.34 | 4.39 | 1.43 | 2.21 | -4.13 | 15.14 | 1.59 | -2.12 | 1.05 | -3.53 | 0.69 | -0.84 | -7.12 | -0.24 | -0.76 | 5.01 | 4.39 | -1.25 | 0.43 | -6.13 | 3.98 | 4.88 | -0.03 | -0.47 | 3.25 | -1.57 | -1.51 | 2.00 | 3.79 | 2.91 | -1.89 | NA | NA | |
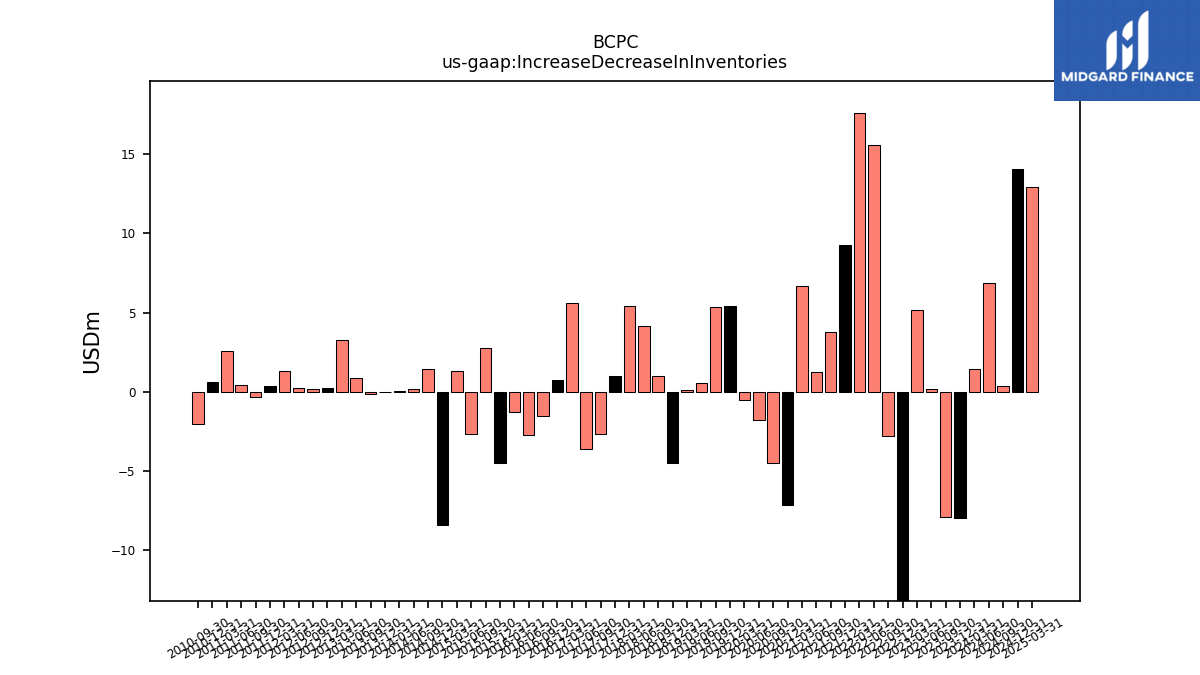
| Increase Decrease In Inventories | 1.46 | -7.99 | -7.88 | 0.19 | 5.14 | -22.57 | -2.77 | 15.54 | 17.60 | 9.29 | 3.79 | 1.25 | 6.70 | -7.12 | -4.46 | -1.81 | -0.53 | 5.38 | 5.34 | 0.54 | 0.14 | -4.52 | 0.97 | 4.12 | 5.44 | 1.00 | -2.67 | -3.58 | 5.57 | 0.76 | -1.51 | -2.73 | -1.26 | -4.52 | 2.77 | -2.66 | 1.29 | -8.40 | 1.44 | 0.21 | 0.05 | -0.02 | -0.14 | 0.84 | 3.26 | 0.27 | 0.17 | 0.22 | 1.31 | 0.36 | -0.32 | 0.40 | 2.58 | 0.63 | -2.03 | NA | NA | |
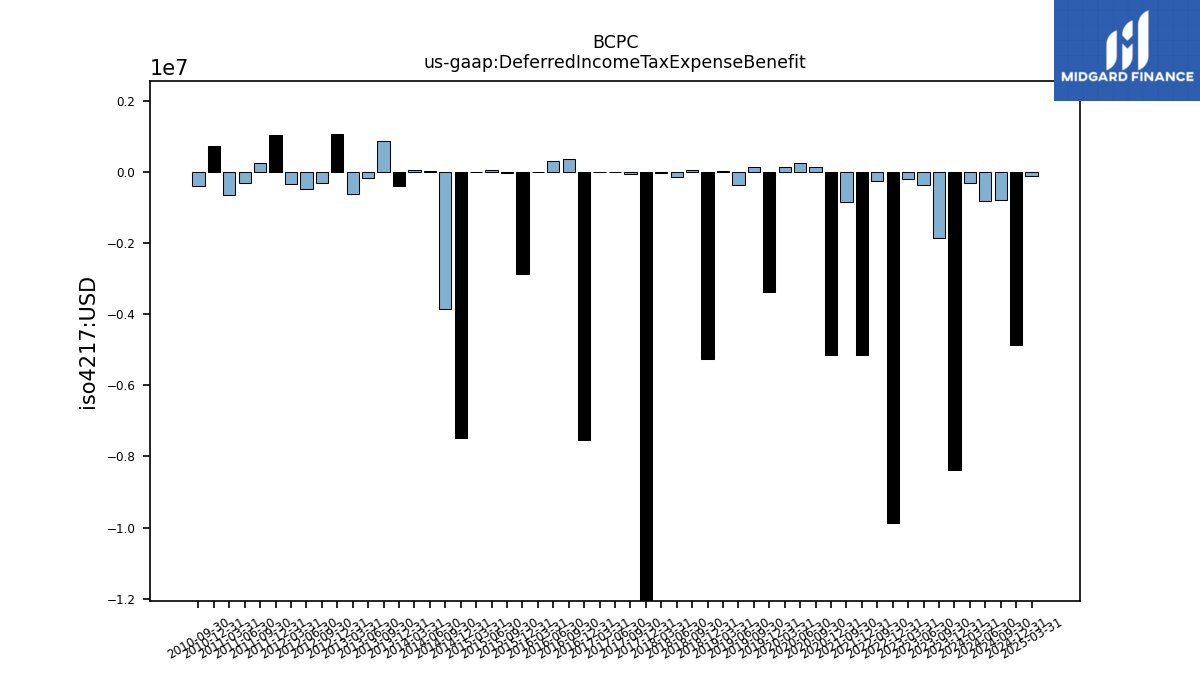
| Deferred Income Tax Expense Benefit | -0.30 | -8.39 | -1.85 | -0.37 | -0.20 | -9.88 | -0.27 | NA | NA | -5.14 | -0.86 | NA | NA | -5.16 | 0.15 | 0.25 | 0.14 | -3.37 | 0.13 | -0.36 | 0.04 | -5.26 | 0.04 | -0.14 | -0.04 | -28.72 | -0.05 | -0.01 | -0.00 | -7.54 | 0.36 | 0.29 | 0.00 | -2.88 | -0.03 | 0.05 | 0.00 | -7.47 | -3.86 | 0.02 | 0.06 | -0.39 | 0.86 | -0.16 | -0.62 | 1.06 | -0.33 | -0.47 | -0.35 | 1.02 | 0.26 | -0.32 | -0.66 | 0.73 | -0.39 | NA | NA | |
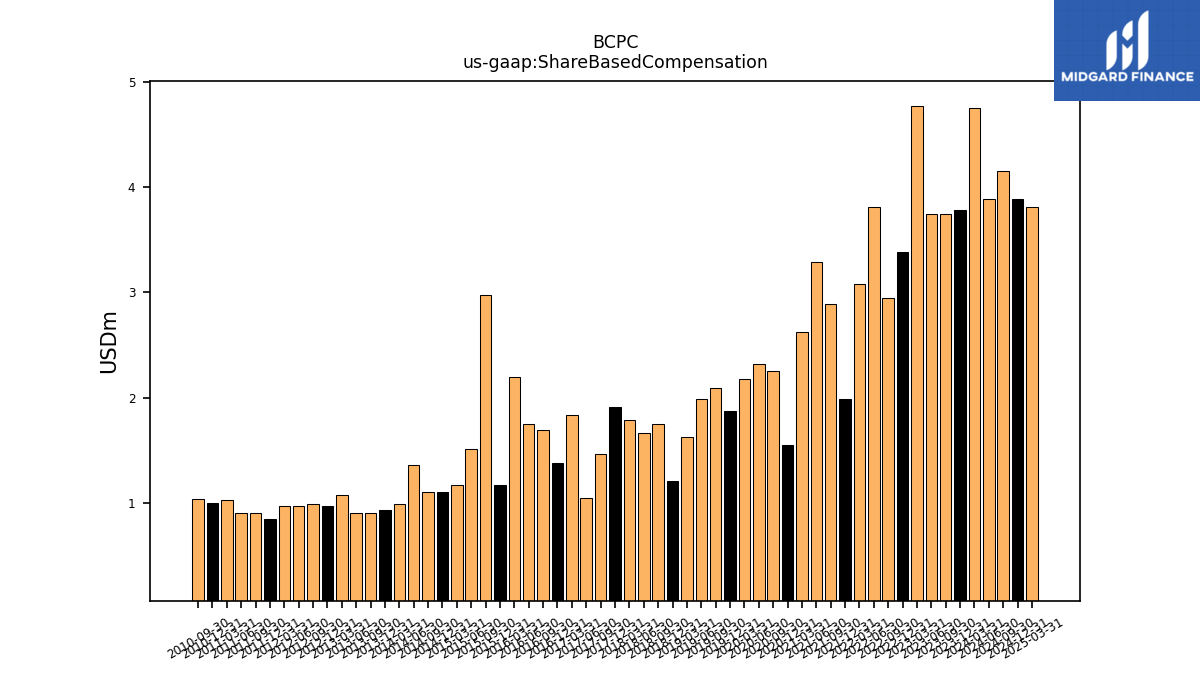
| Share Based Compensation | 4.75 | 3.79 | 3.75 | 3.75 | 4.77 | 3.39 | 2.95 | 3.81 | 3.08 | 1.99 | 2.90 | 3.29 | 2.62 | 1.55 | 2.25 | 2.32 | 2.18 | 1.88 | 2.10 | 1.99 | 1.63 | 1.21 | 1.75 | 1.67 | 1.79 | 1.92 | 1.46 | 1.04 | 1.84 | 1.38 | 1.70 | 1.75 | 2.20 | 1.17 | 2.97 | 1.51 | 1.17 | 1.11 | 1.10 | 1.36 | 0.99 | 0.93 | 0.91 | 0.91 | 1.08 | 0.97 | 0.99 | 0.97 | 0.97 | 0.85 | 0.91 | 0.91 | 1.03 | 1.00 | 1.03 | NA | NA | |
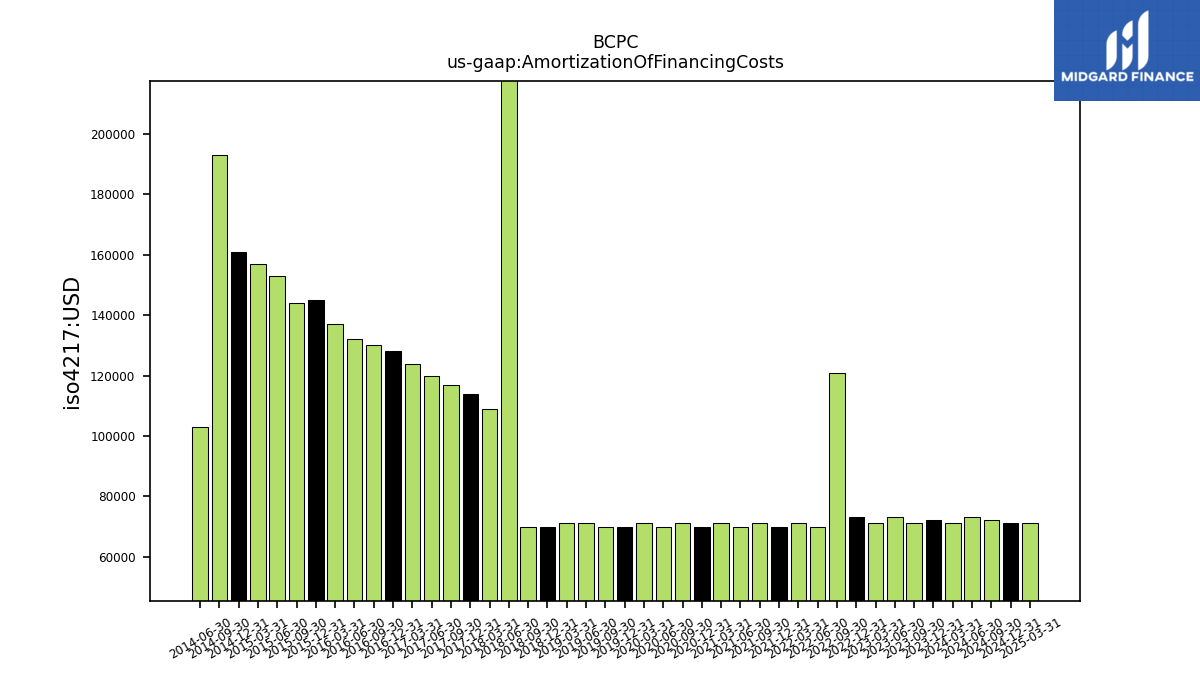
| Amortization Of Financing Costs | 0.07 | 0.07 | 0.07 | 0.07 | 0.07 | 0.07 | 0.12 | 0.07 | 0.07 | 0.07 | 0.07 | 0.07 | 0.07 | 0.07 | 0.07 | 0.07 | 0.07 | 0.07 | 0.07 | 0.07 | 0.07 | 0.07 | 0.07 | 0.43 | 0.11 | 0.11 | 0.12 | 0.12 | 0.12 | 0.13 | 0.13 | 0.13 | 0.14 | 0.14 | 0.14 | 0.15 | 0.16 | 0.16 | 0.19 | 0.10 | NA | NA | NA | NA | NA | NA | NA | NA | NA | NA | NA | NA | NA | NA | NA | NA | NA |
| 2024-03-31 | 2023-12-31 | 2023-09-30 | 2023-06-30 | 2023-03-31 | 2022-12-31 | 2022-09-30 | 2022-06-30 | 2022-03-31 | 2021-12-31 | 2021-09-30 | 2021-06-30 | 2021-03-31 | 2020-12-31 | 2020-09-30 | 2020-06-30 | 2020-03-31 | 2019-12-31 | 2019-09-30 | 2019-06-30 | 2019-03-31 | 2018-12-31 | 2018-09-30 | 2018-06-30 | 2018-03-31 | 2017-12-31 | 2017-09-30 | 2017-06-30 | 2017-03-31 | 2016-12-31 | 2016-09-30 | 2016-06-30 | 2016-03-31 | 2015-12-31 | 2015-09-30 | 2015-06-30 | 2015-03-31 | 2014-12-31 | 2014-09-30 | 2014-06-30 | 2014-03-31 | 2013-12-31 | 2013-09-30 | 2013-06-30 | 2013-03-31 | 2012-12-31 | 2012-09-30 | 2012-06-30 | 2012-03-31 | 2011-12-31 | 2011-09-30 | 2011-06-30 | 2011-03-31 | 2010-12-31 | 2010-09-30 | 2010-06-30 | 2010-03-31 | ||
|---|---|---|---|---|---|---|---|---|---|---|---|---|---|---|---|---|---|---|---|---|---|---|---|---|---|---|---|---|---|---|---|---|---|---|---|---|---|---|---|---|---|---|---|---|---|---|---|---|---|---|---|---|---|---|---|---|---|---|
| Net Cash Provided By Used In Investing Activities | -6.74 | -11.87 | -9.28 | -3.61 | -10.06 | -14.49 | -85.11 | -306.34 | -10.07 | -14.18 | -7.60 | -7.29 | -6.23 | -13.21 | -7.79 | -8.20 | -5.39 | -53.12 | 4.57 | -101.89 | -5.78 | -5.64 | -20.52 | -3.57 | -2.26 | -9.22 | -7.57 | -21.66 | -4.25 | -4.43 | -3.24 | NA | NA | NA | NA | NA | NA | NA | NA | NA | -6.67 | -1.55 | -1.44 | -1.95 | -3.43 | -6.50 | -4.30 | -1.81 | -1.40 | -1.76 | -1.66 | -1.40 | -1.79 | -0.38 | -1.57 | NA | NA |
| 2024-03-31 | 2023-12-31 | 2023-09-30 | 2023-06-30 | 2023-03-31 | 2022-12-31 | 2022-09-30 | 2022-06-30 | 2022-03-31 | 2021-12-31 | 2021-09-30 | 2021-06-30 | 2021-03-31 | 2020-12-31 | 2020-09-30 | 2020-06-30 | 2020-03-31 | 2019-12-31 | 2019-09-30 | 2019-06-30 | 2019-03-31 | 2018-12-31 | 2018-09-30 | 2018-06-30 | 2018-03-31 | 2017-12-31 | 2017-09-30 | 2017-06-30 | 2017-03-31 | 2016-12-31 | 2016-09-30 | 2016-06-30 | 2016-03-31 | 2015-12-31 | 2015-09-30 | 2015-06-30 | 2015-03-31 | 2014-12-31 | 2014-09-30 | 2014-06-30 | 2014-03-31 | 2013-12-31 | 2013-09-30 | 2013-06-30 | 2013-03-31 | 2012-12-31 | 2012-09-30 | 2012-06-30 | 2012-03-31 | 2011-12-31 | 2011-09-30 | 2011-06-30 | 2011-03-31 | 2010-12-31 | 2010-09-30 | 2010-06-30 | 2010-03-31 | ||
|---|---|---|---|---|---|---|---|---|---|---|---|---|---|---|---|---|---|---|---|---|---|---|---|---|---|---|---|---|---|---|---|---|---|---|---|---|---|---|---|---|---|---|---|---|---|---|---|---|---|---|---|---|---|---|---|---|---|---|
| Net Cash Provided By Used In Financing Activities | -30.02 | -70.15 | -25.10 | -24.76 | -33.32 | -21.40 | 28.39 | 274.54 | -34.84 | -15.95 | -20.51 | -37.79 | -27.93 | -31.55 | -26.69 | -34.77 | -8.16 | 25.76 | -28.67 | 77.87 | -31.57 | -22.04 | -31.46 | 3.75 | -21.70 | -16.61 | -35.71 | 4.16 | -20.46 | -16.04 | -21.65 | NA | NA | NA | NA | NA | NA | NA | NA | NA | -4.96 | 4.18 | 4.17 | 4.63 | 3.47 | -5.42 | 0.24 | 0.12 | -4.78 | 0.98 | 0.00 | 1.61 | -3.22 | 2.55 | 2.68 | NA | NA | |
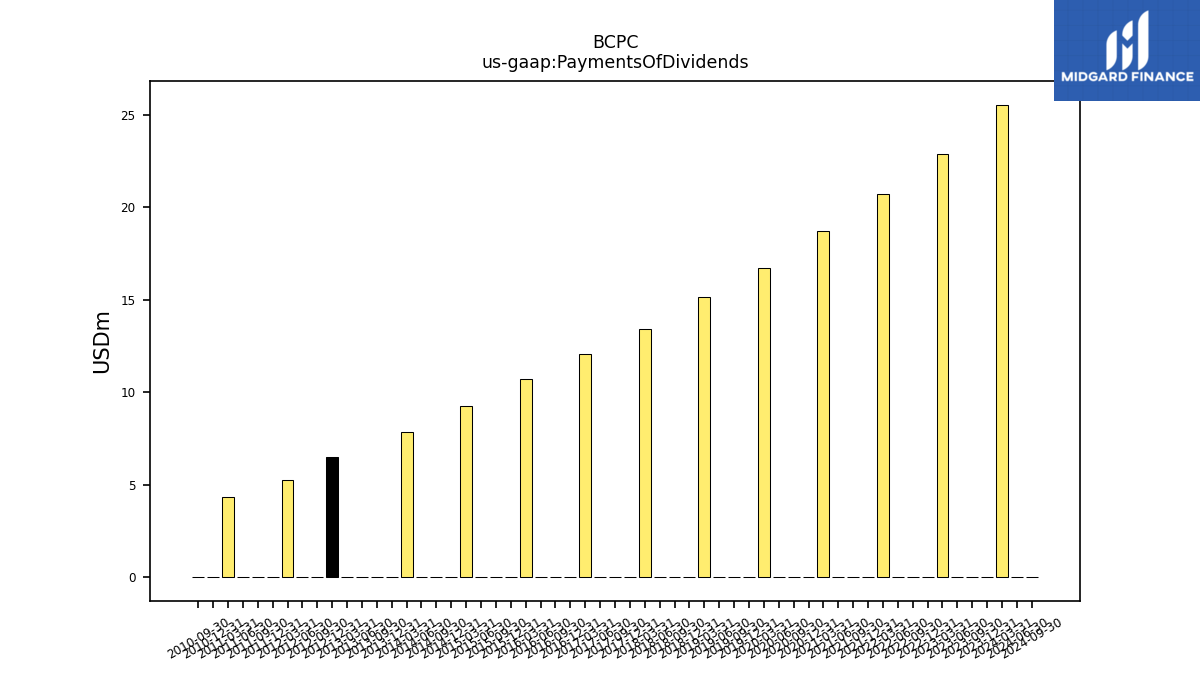
| Payments Of Dividends | 25.55 | 0.00 | 0.00 | 0.00 | 22.87 | 0.01 | 0.00 | 0.00 | 20.70 | 0.02 | 0.00 | 0.00 | 18.70 | 0.00 | 0.00 | 0.00 | 16.70 | 0.00 | 0.00 | 0.00 | 15.13 | 0.00 | 0.00 | 0.01 | 13.42 | 0.00 | 0.00 | 0.00 | 12.07 | -0.01 | 0.00 | 0.00 | 10.73 | 0.00 | 0.00 | 0.00 | 9.25 | 0.00 | 0.00 | 0.00 | 7.86 | 0.00 | 0.00 | 0.00 | 0.00 | 6.47 | 0.00 | 0.00 | 5.24 | 0.00 | 0.00 | -0.00 | 4.31 | 0.00 | 0.00 | NA | NA | |
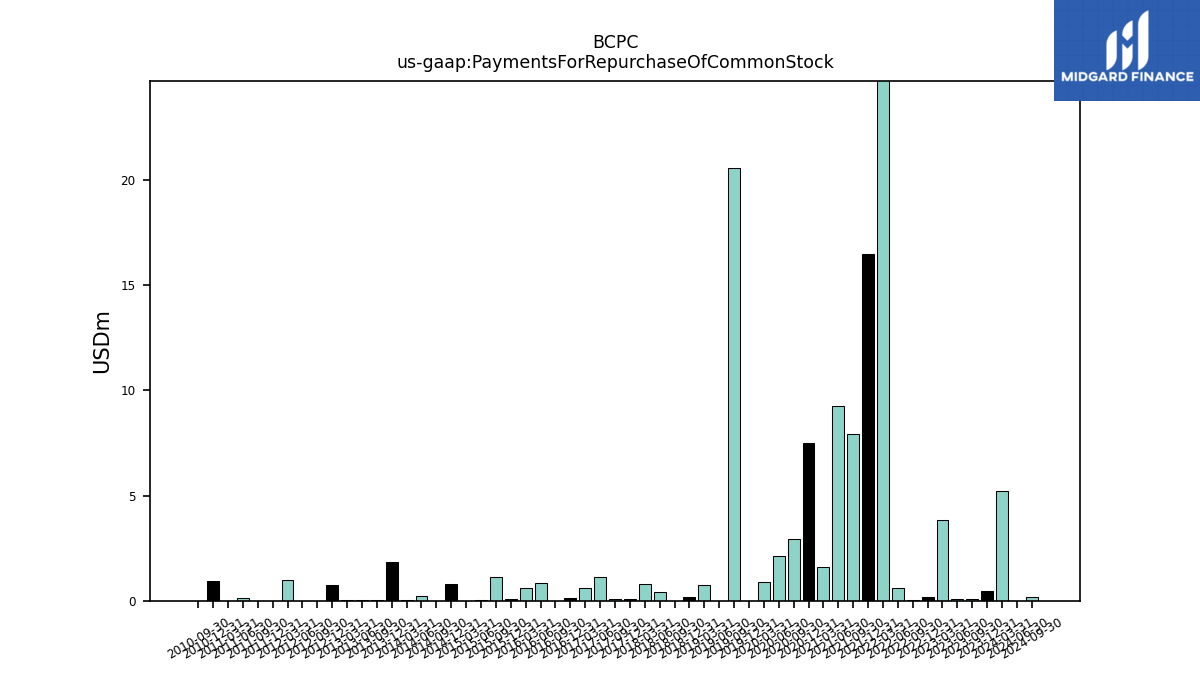
| Payments For Repurchase Of Common Stock | 5.20 | 0.44 | 0.10 | 0.07 | 3.85 | 0.18 | 0.05 | 0.60 | 34.60 | 16.48 | 7.93 | 9.24 | 1.60 | 7.48 | 2.96 | 2.13 | 0.89 | 0.00 | 20.59 | 0.00 | 0.73 | 0.17 | 0.00 | 0.44 | 0.79 | 0.07 | 0.09 | 1.13 | 0.61 | 0.11 | 0.00 | 0.86 | 0.61 | 0.07 | 1.11 | 0.02 | 0.00 | 0.80 | 0.00 | 0.23 | 0.03 | 1.84 | 0.03 | 0.03 | 0.03 | 0.73 | 0.00 | 0.00 | 0.96 | 0.00 | 0.00 | 0.11 | 0.00 | 0.94 | 0.00 | NA | NA |
| 2024-03-31 | 2023-12-31 | 2023-09-30 | 2023-06-30 | 2023-03-31 | 2022-12-31 | 2022-09-30 | 2022-06-30 | 2022-03-31 | 2021-12-31 | 2021-09-30 | 2021-06-30 | 2021-03-31 | 2020-12-31 | 2020-09-30 | 2020-06-30 | 2020-03-31 | 2019-12-31 | 2019-09-30 | 2019-06-30 | 2019-03-31 | 2018-12-31 | 2018-09-30 | 2018-06-30 | 2018-03-31 | 2017-12-31 | 2017-09-30 | 2017-06-30 | 2017-03-31 | 2016-12-31 | 2016-09-30 | 2016-06-30 | 2016-03-31 | 2015-12-31 | 2015-09-30 | 2015-06-30 | 2015-03-31 | 2014-12-31 | 2014-09-30 | 2014-06-30 | 2014-03-31 | 2013-12-31 | 2013-09-30 | 2013-06-30 | 2013-03-31 | 2012-12-31 | 2012-09-30 | 2012-06-30 | 2012-03-31 | 2011-12-31 | 2011-09-30 | 2011-06-30 | 2011-03-31 | 2010-12-31 | 2010-09-30 | 2010-06-30 | 2010-03-31 | ||
|---|---|---|---|---|---|---|---|---|---|---|---|---|---|---|---|---|---|---|---|---|---|---|---|---|---|---|---|---|---|---|---|---|---|---|---|---|---|---|---|---|---|---|---|---|---|---|---|---|---|---|---|---|---|---|---|---|---|---|
| Revenues | 239.66 | 228.70 | 229.95 | 231.25 | 232.54 | 232.53 | 244.27 | 236.69 | 228.87 | 213.13 | 197.87 | 202.37 | 185.66 | 180.71 | 175.14 | 173.35 | 174.44 | 166.53 | 158.59 | 161.55 | 157.03 | 163.54 | 155.04 | 163.69 | 161.41 | 159.26 | 150.72 | 147.08 | 137.73 | 140.76 | 138.51 | 138.79 | 135.14 | 132.73 | 140.13 | 134.77 | 144.86 | 162.67 | 160.49 | 132.23 | 86.00 | 81.63 | 87.59 | 83.30 | 84.65 | 80.06 | 75.12 | 79.01 | 76.20 | 69.73 | 74.44 | 74.69 | 73.01 | 69.80 | 63.91 | 61.46 | 59.90 | |
| Revenue From Contract With Customer Excluding Assessed Tax | 239.66 | 228.70 | 229.95 | 231.25 | 232.54 | 232.53 | 244.27 | 236.69 | 228.87 | 213.13 | 197.87 | 202.37 | 185.66 | 180.71 | 175.14 | 173.35 | 174.44 | 166.53 | 158.59 | 161.55 | 157.03 | 163.54 | 155.04 | 163.69 | 161.41 | 159.26 | 150.72 | 147.08 | 137.73 | 140.76 | 138.51 | 138.79 | 135.14 | 132.73 | 140.13 | 134.77 | 144.86 | 162.67 | 160.49 | 132.23 | 86.00 | 81.63 | 87.59 | 83.30 | 84.65 | 80.06 | 75.12 | 79.01 | 76.20 | 69.73 | 74.44 | 74.69 | 73.01 | 69.80 | 63.91 | 61.46 | 59.90 | |
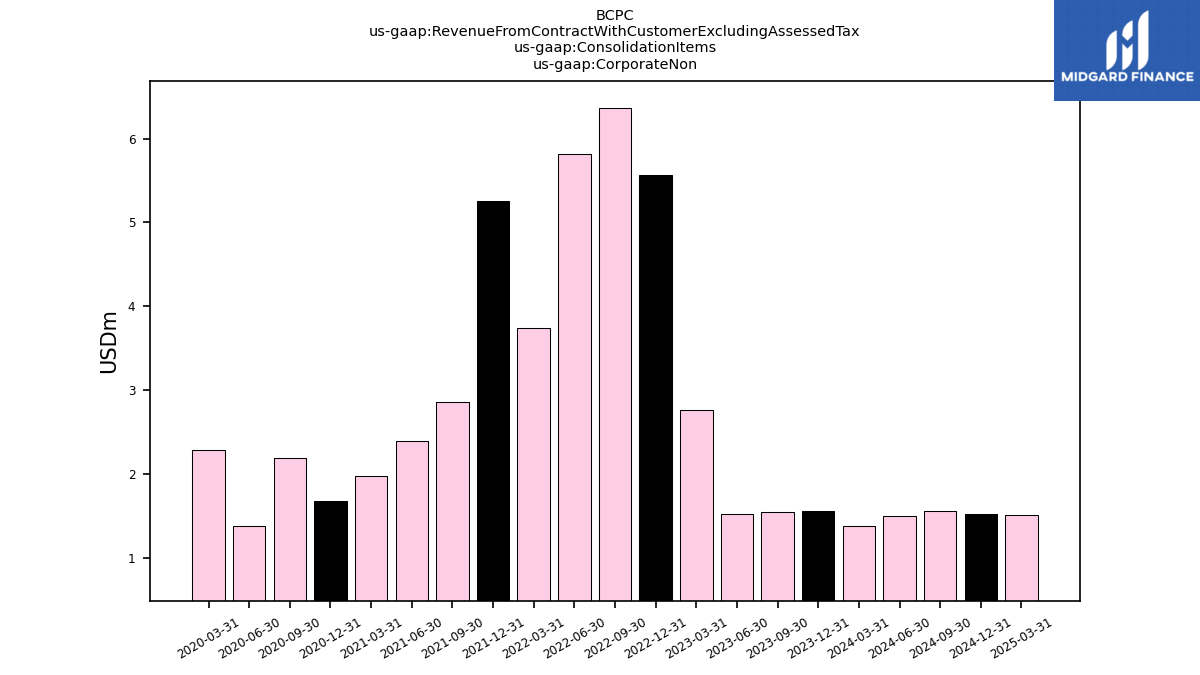
| Corporate Non | 1.38 | 1.56 | 1.54 | 1.53 | 2.77 | 5.56 | 6.37 | 5.82 | 3.75 | 5.26 | 2.86 | 2.39 | 1.98 | 1.68 | 2.19 | 1.39 | 2.29 | NA | NA | NA | NA | NA | NA | NA | NA | NA | NA | NA | NA | NA | NA | NA | NA | NA | NA | NA | NA | NA | NA | NA | NA | NA | NA | NA | NA | NA | NA | NA | NA | NA | NA | NA | NA | NA | NA | NA | NA | |
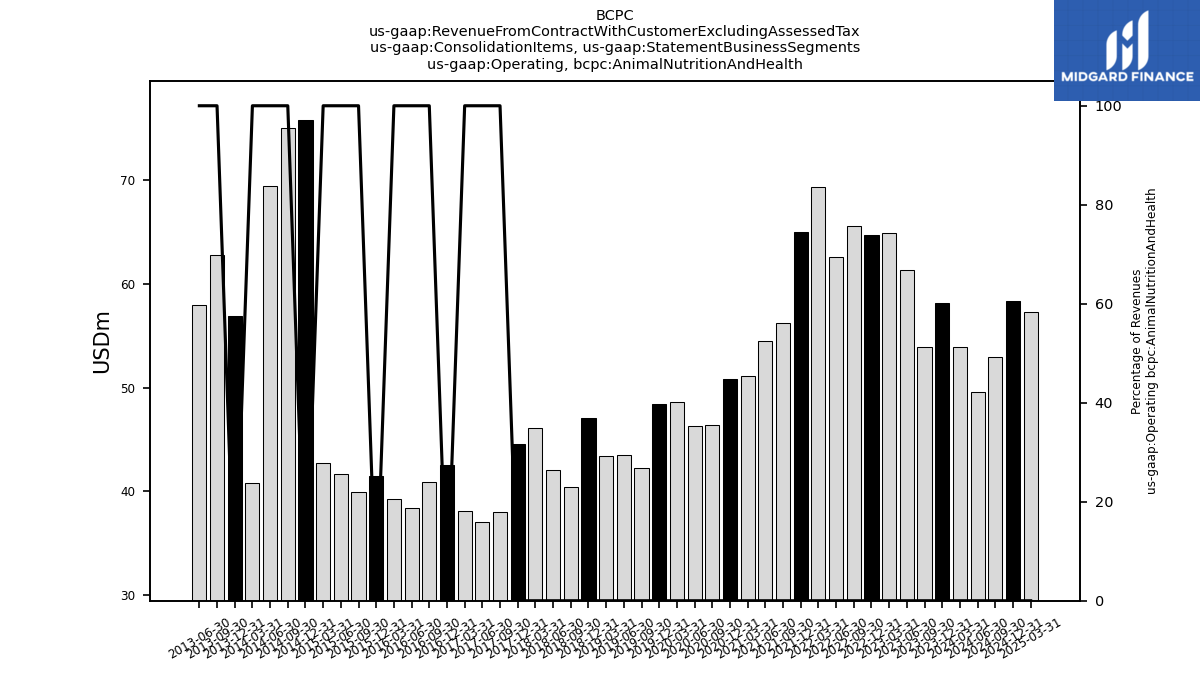
| Operating, Animal Nutrition And Health | 53.92 | 58.16 | 53.94 | 61.33 | 64.89 | 64.75 | 65.60 | 62.60 | 69.34 | 64.95 | 56.19 | 54.48 | 51.15 | 50.85 | 46.35 | 46.34 | 48.64 | 48.43 | 42.29 | 43.48 | 43.36 | 47.11 | 40.41 | 42.04 | 46.14 | 44.55 | 38.01 | 37.05 | 38.08 | 42.54 | 40.94 | 38.41 | 39.23 | 41.47 | 39.95 | 41.64 | 42.71 | 75.77 | 75.02 | 69.39 | 40.85 | 56.90 | 62.83 | 57.93 | NA | NA | NA | NA | NA | NA | NA | NA | NA | NA | NA | NA | NA | |
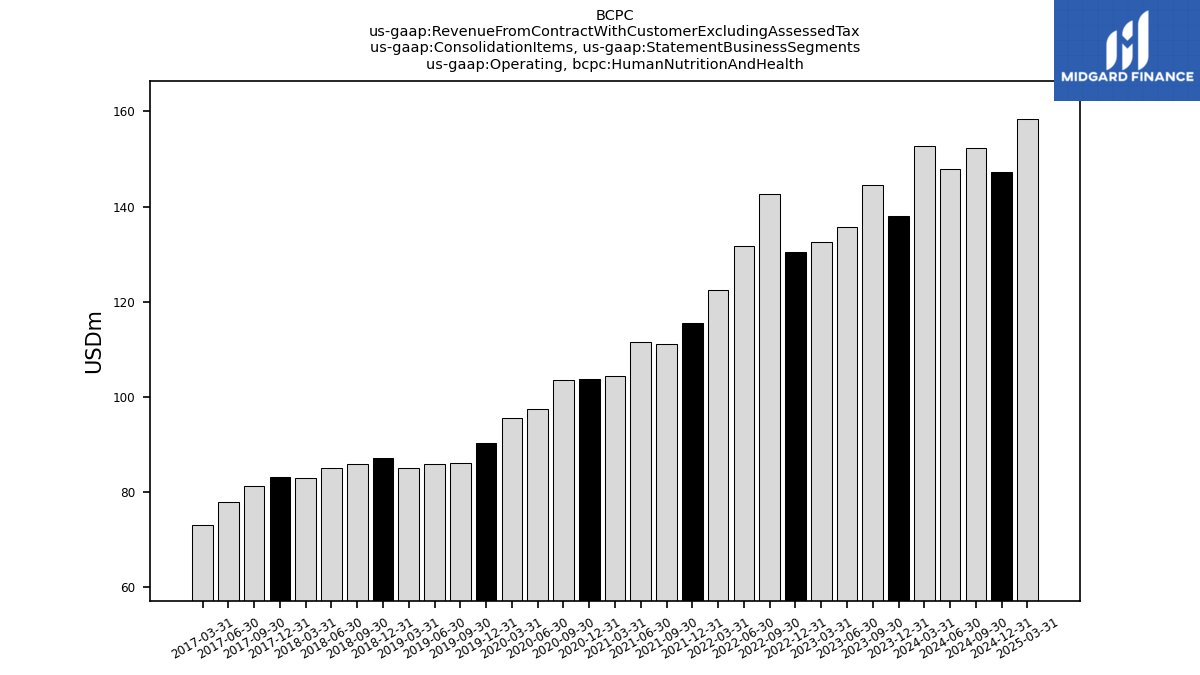
| Operating, Human Nutrition And Health | 152.74 | 137.97 | 144.46 | 135.67 | 132.65 | 130.40 | 142.66 | 131.63 | 122.44 | 115.55 | 111.20 | 111.47 | 104.52 | 103.81 | 103.59 | 97.43 | 95.51 | 90.27 | 86.14 | 85.87 | 85.15 | 87.27 | 85.89 | 85.01 | 83.06 | 83.27 | 81.36 | 78.03 | 73.13 | NA | NA | NA | NA | NA | NA | NA | NA | NA | NA | NA | NA | NA | NA | NA | NA | NA | NA | NA | NA | NA | NA | NA | NA | NA | NA | NA | NA | |
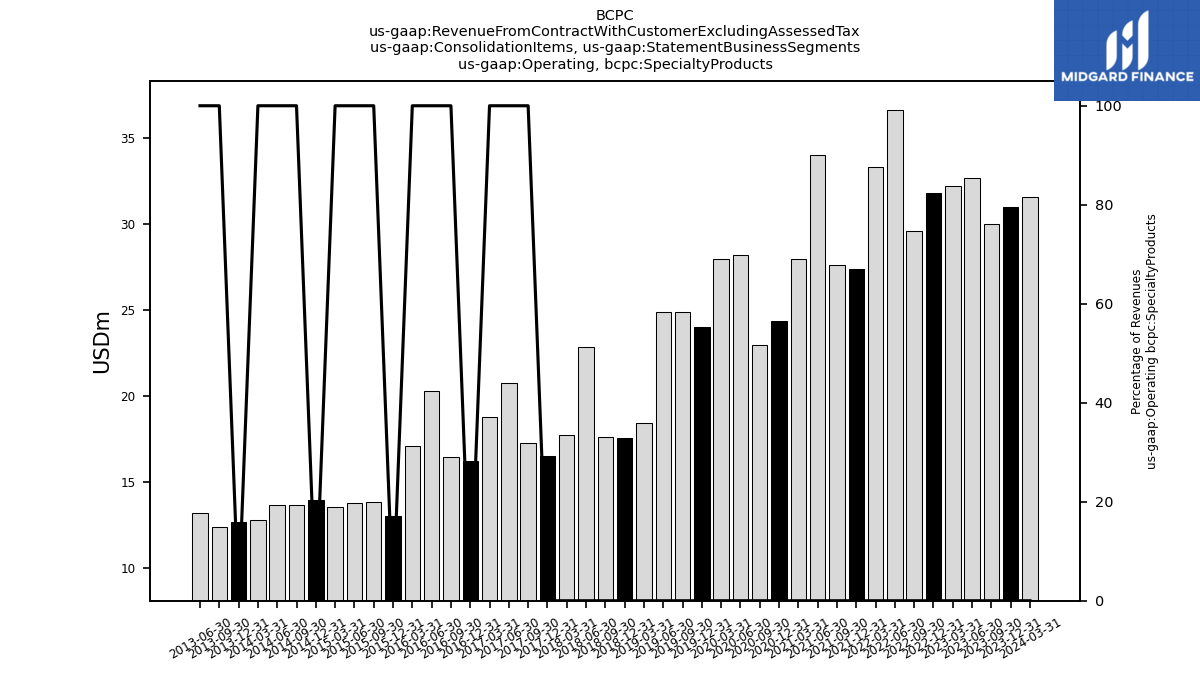
| Operating, Specialty Products | 31.61 | 31.00 | 30.00 | 32.73 | 32.23 | 31.82 | 29.64 | 36.65 | 33.33 | 27.38 | 27.61 | 34.02 | 28.01 | 24.37 | 23.00 | 28.19 | 28.00 | 24.04 | 24.89 | 24.91 | 18.42 | 17.57 | 17.63 | 22.86 | 17.74 | 16.54 | 17.26 | 20.76 | 18.79 | 16.21 | 16.48 | 20.32 | 17.12 | 13.03 | 13.82 | 13.80 | 13.58 | 13.97 | 13.65 | 13.64 | 12.79 | 12.67 | 12.42 | 13.22 | NA | NA | NA | NA | NA | NA | NA | NA | NA | NA | NA | NA | NA | |
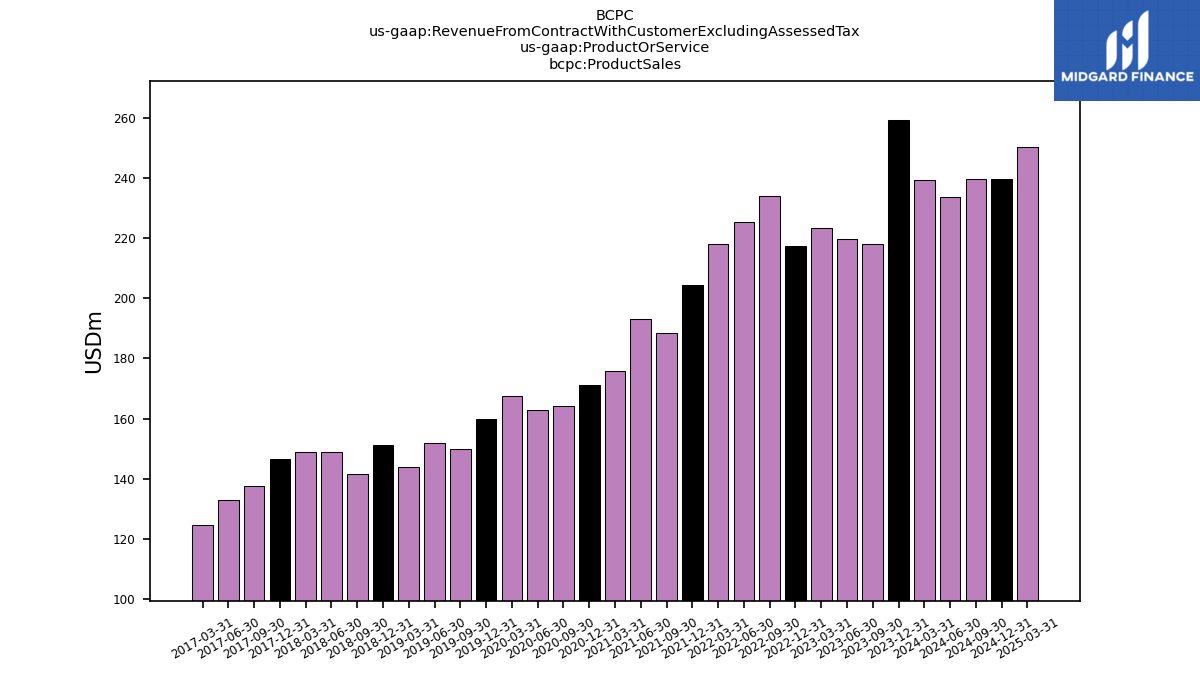
| Product Sales | 239.13 | 259.18 | 218.03 | 219.57 | 223.17 | 217.18 | 233.82 | 225.26 | 218.05 | 204.40 | 188.57 | 193.12 | 175.99 | 171.34 | 164.25 | 163.04 | 167.56 | 159.86 | 149.86 | 152.07 | 143.87 | 151.24 | 141.72 | 149.05 | 148.78 | 146.68 | 137.61 | 133.15 | 124.62 | NA | NA | NA | NA | NA | NA | NA | NA | NA | NA | NA | NA | NA | NA | NA | NA | NA | NA | NA | NA | NA | NA | NA | NA | NA | NA | NA | NA | |
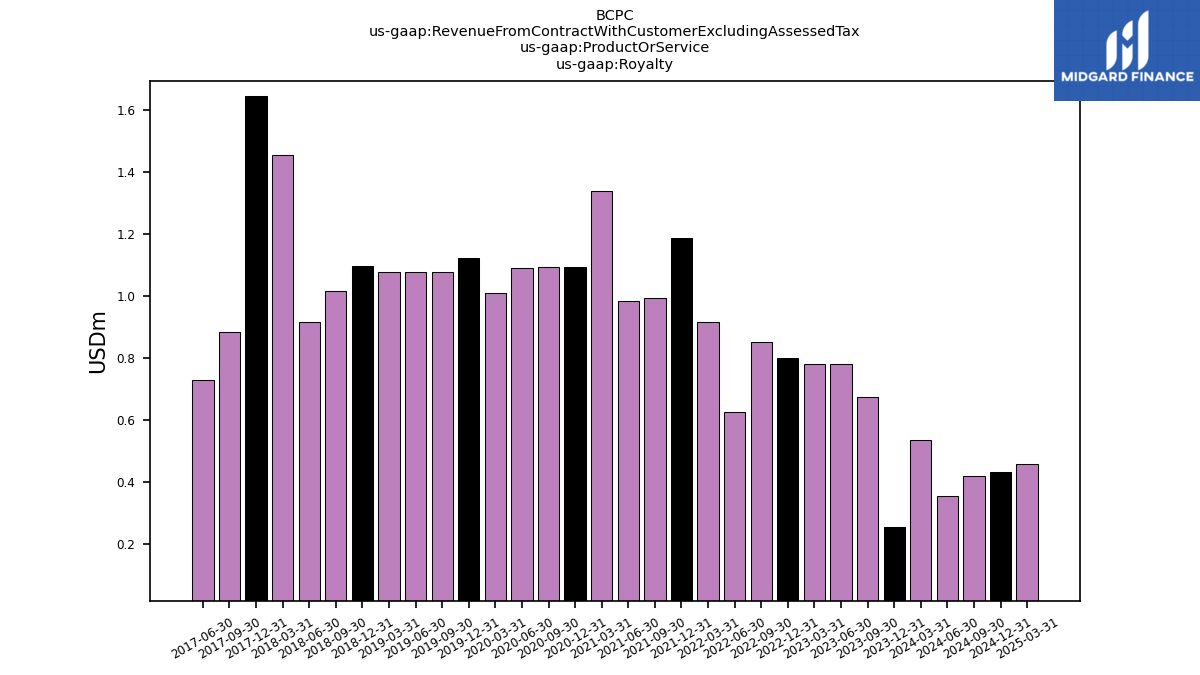
| Royalty | 0.53 | 0.26 | 0.67 | 0.78 | 0.78 | 0.80 | 0.85 | 0.62 | 0.92 | 1.19 | 0.99 | 0.98 | 1.34 | 1.09 | 1.09 | 1.09 | 1.01 | 1.12 | 1.08 | 1.08 | 1.08 | 1.10 | 1.02 | 0.92 | 1.46 | 1.65 | 0.89 | 0.73 | NA | NA | NA | NA | NA | NA | NA | NA | NA | NA | NA | NA | NA | NA | NA | NA | NA | NA | NA | NA | NA | NA | NA | NA | NA | NA | NA | NA | NA | |
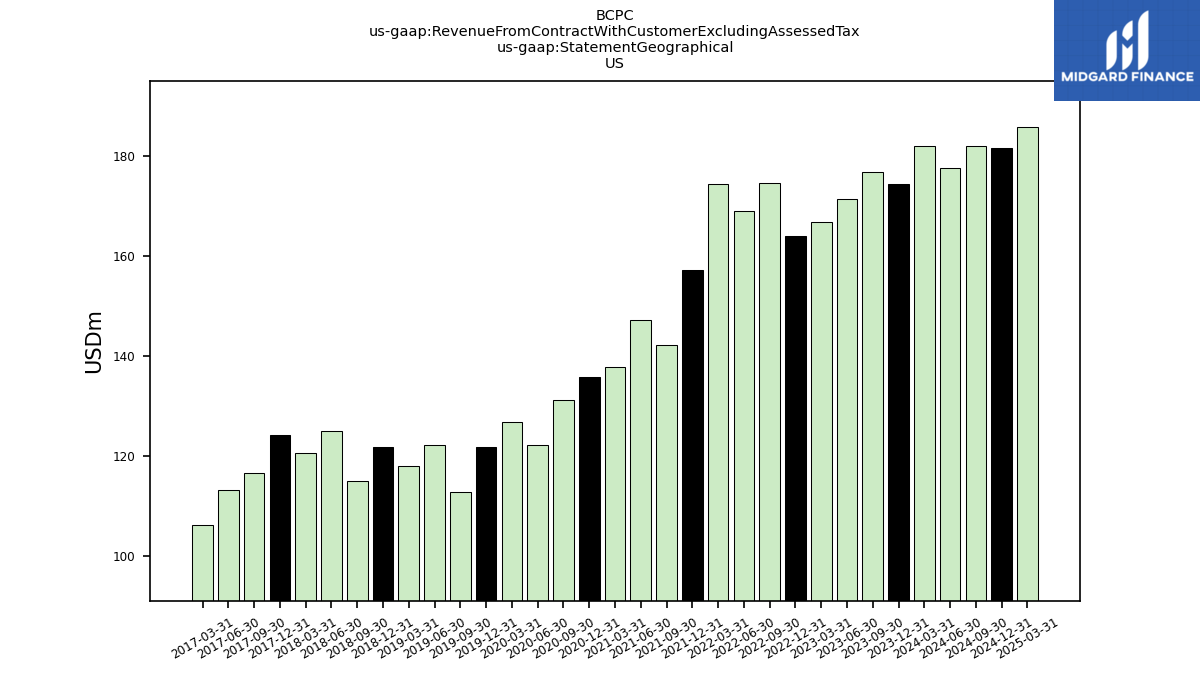
| US | 182.09 | 174.50 | 176.76 | 171.45 | 166.88 | 164.11 | 174.56 | 169.08 | 174.49 | 157.31 | 142.31 | 147.19 | 137.85 | 135.90 | 131.31 | 122.24 | 126.91 | 121.92 | 112.81 | 122.19 | 118.11 | 121.85 | 115.16 | 125.02 | 120.67 | 124.30 | 116.77 | 113.23 | 106.30 | NA | NA | NA | NA | NA | NA | NA | NA | NA | NA | NA | NA | NA | NA | NA | NA | NA | NA | NA | NA | NA | NA | NA | NA | NA | NA | NA | NA | |
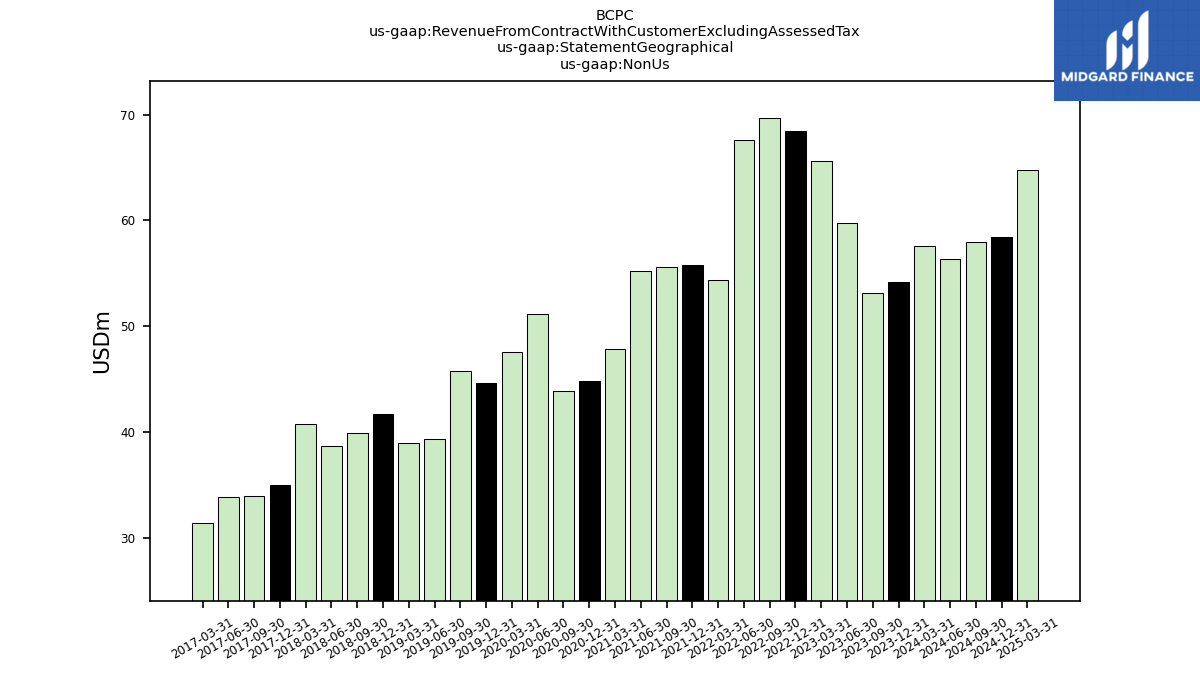
| Non Us | 57.57 | 54.20 | 53.18 | 59.80 | 65.66 | 68.42 | 69.70 | 67.62 | 54.38 | 55.82 | 55.56 | 55.18 | 47.80 | 44.82 | 43.84 | 51.12 | 47.53 | 44.60 | 45.78 | 39.37 | 38.92 | 41.69 | 39.89 | 38.67 | 40.74 | 34.96 | 33.95 | 33.85 | 31.43 | NA | NA | NA | NA | NA | NA | NA | NA | NA | NA | NA | NA | NA | NA | NA | NA | NA | NA | NA | NA | NA | NA | NA | NA | NA | NA | NA | NA |
