
| 2023-09-30 | 2023-06-30 | 2023-03-31 | 2022-12-31 | 2022-09-30 | 2022-06-30 | 2022-03-31 | 2021-12-31 | 2021-09-30 | 2021-06-30 | 2021-03-31 | 2020-12-31 | 2020-09-30 | 2020-06-30 | 2020-03-31 | 2019-12-31 | 2019-09-30 | 2019-06-30 | 2019-03-31 | ||
|---|---|---|---|---|---|---|---|---|---|---|---|---|---|---|---|---|---|---|---|---|
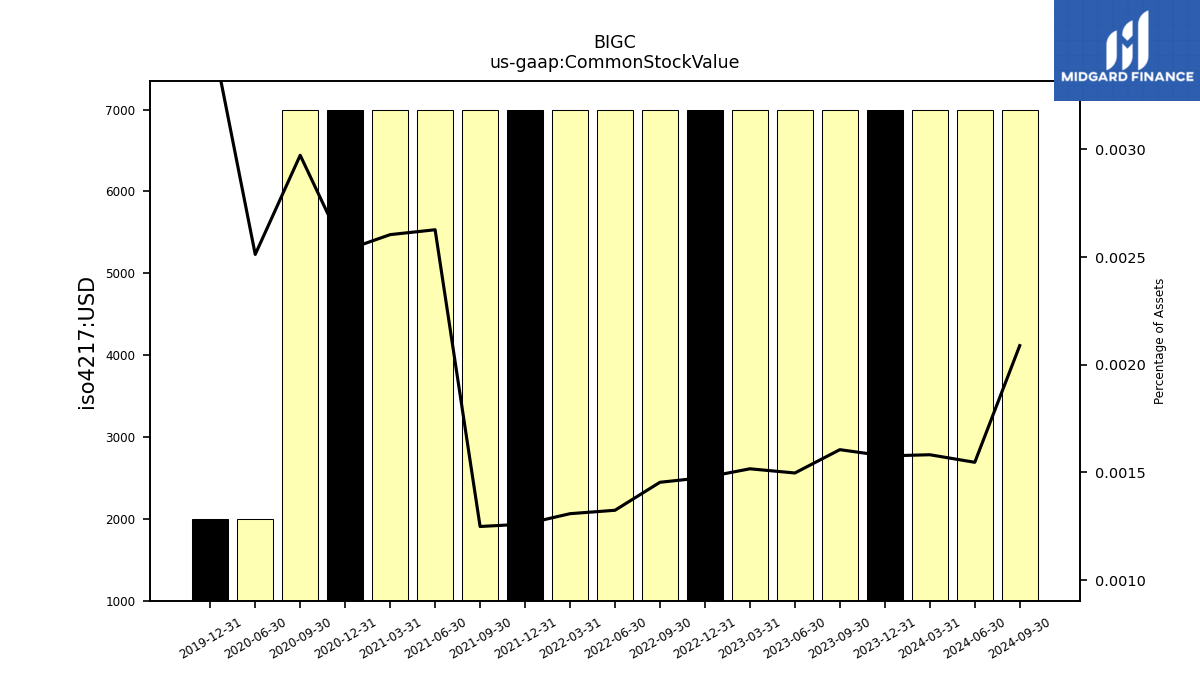
| Common Stock Value | 0.01 | 0.01 | 0.01 | 0.01 | 0.01 | 0.01 | 0.01 | 0.01 | 0.01 | 0.01 | 0.01 | 0.01 | 0.01 | 0.00 | NA | 0.00 | NA | NA | NA | |
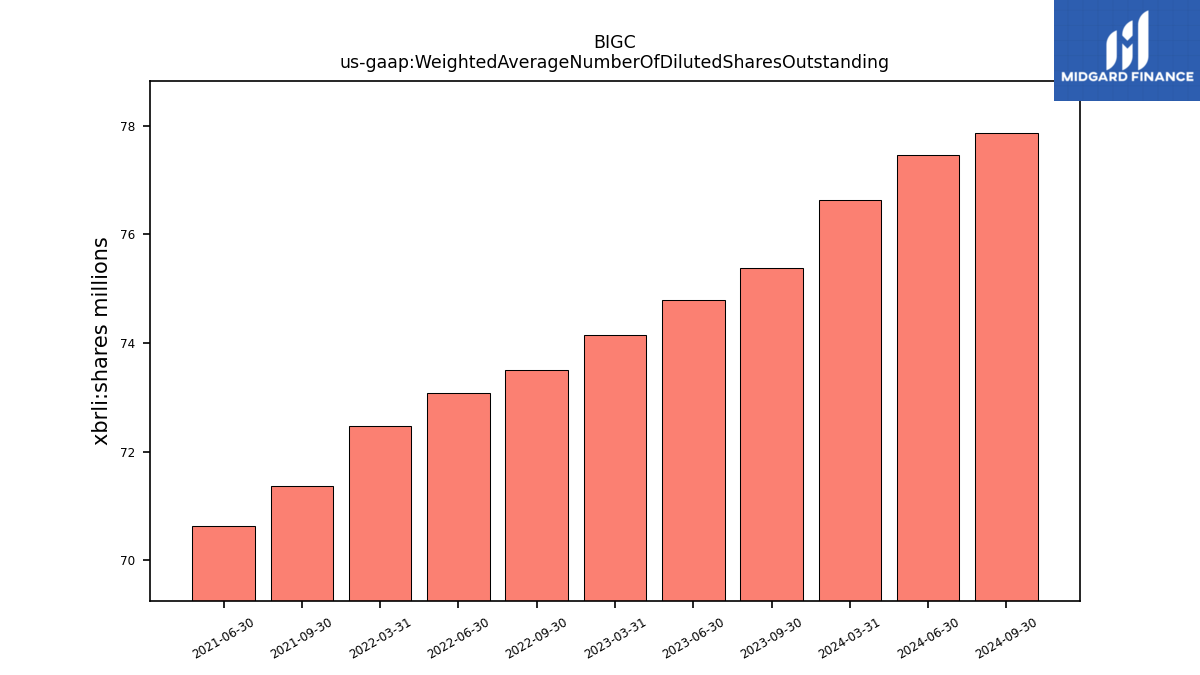
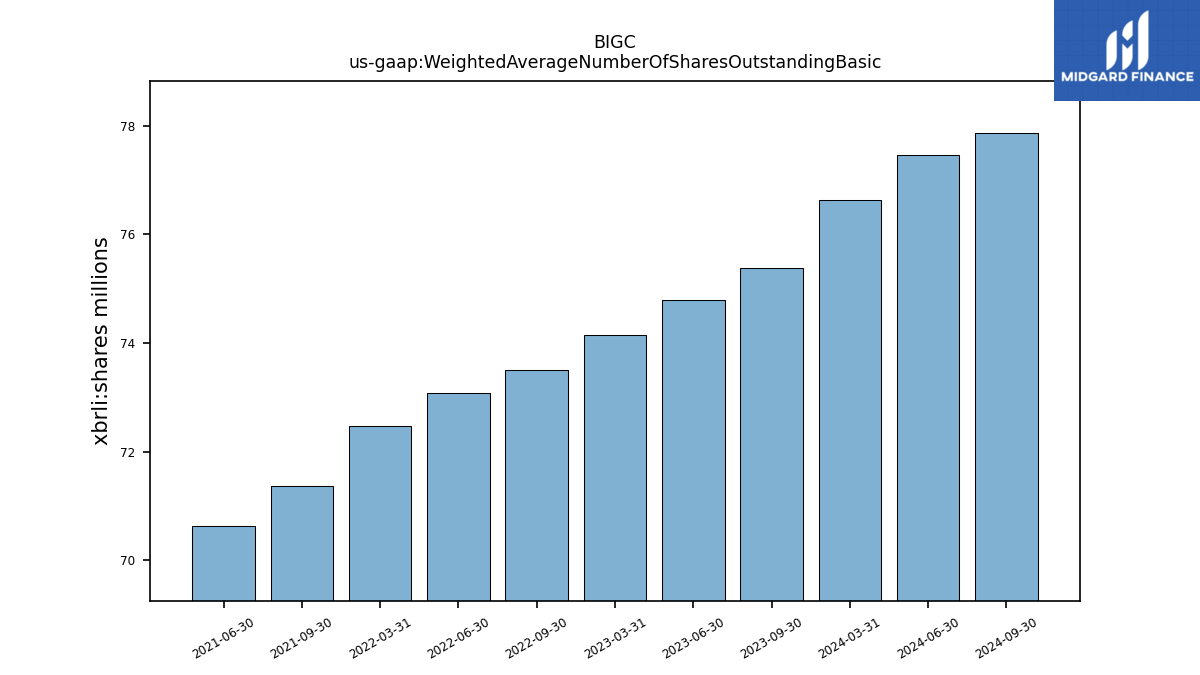
| Weighted Average Number Of Diluted Shares Outstanding | 75.39 | 74.79 | 74.14 | NA | 73.51 | 73.08 | 72.48 | NA | 71.37 | 70.62 | NA | NA | NA | NA | NA | NA | NA | NA | NA | |
| Weighted Average Number Of Shares Outstanding Basic | 75.39 | 74.79 | 74.14 | NA | 73.51 | 73.08 | 72.48 | NA | 71.37 | 70.62 | NA | NA | NA | NA | NA | NA | NA | NA | NA | |
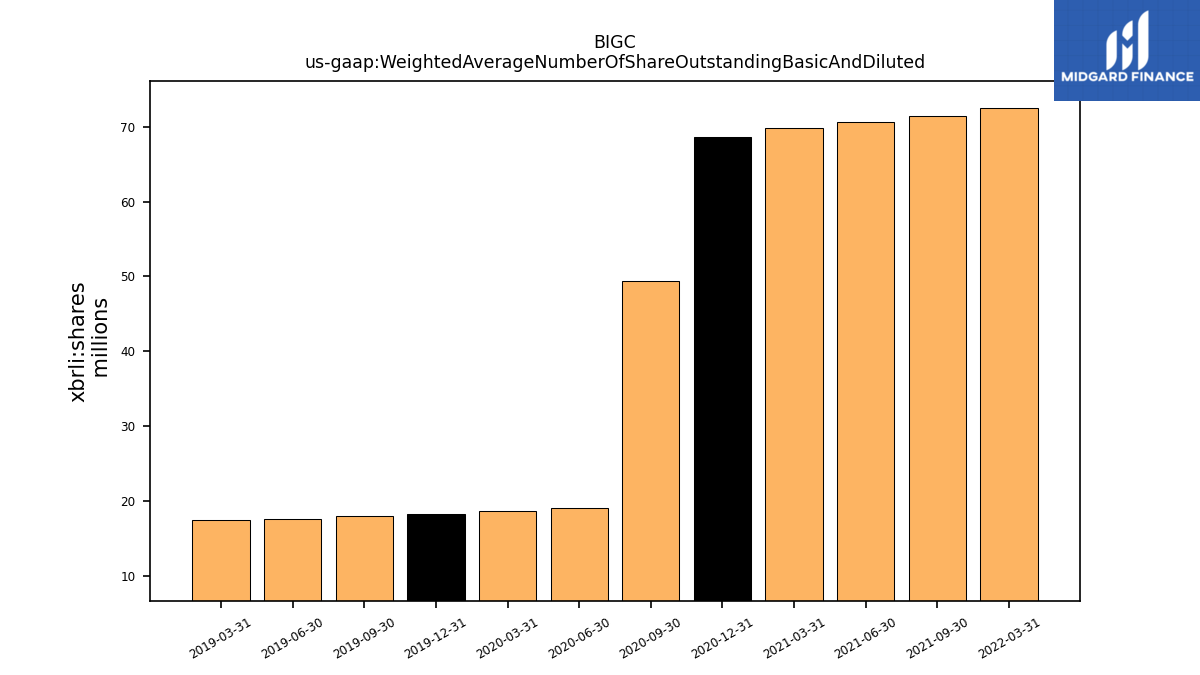
| Weighted Average Number Of Share Outstanding Basic And Diluted | NA | NA | NA | NA | NA | NA | 72.48 | NA | 71.37 | 70.62 | 69.79 | 68.64 | 49.35 | 19.15 | 18.64 | 18.29 | 17.96 | 17.59 | 17.49 | |
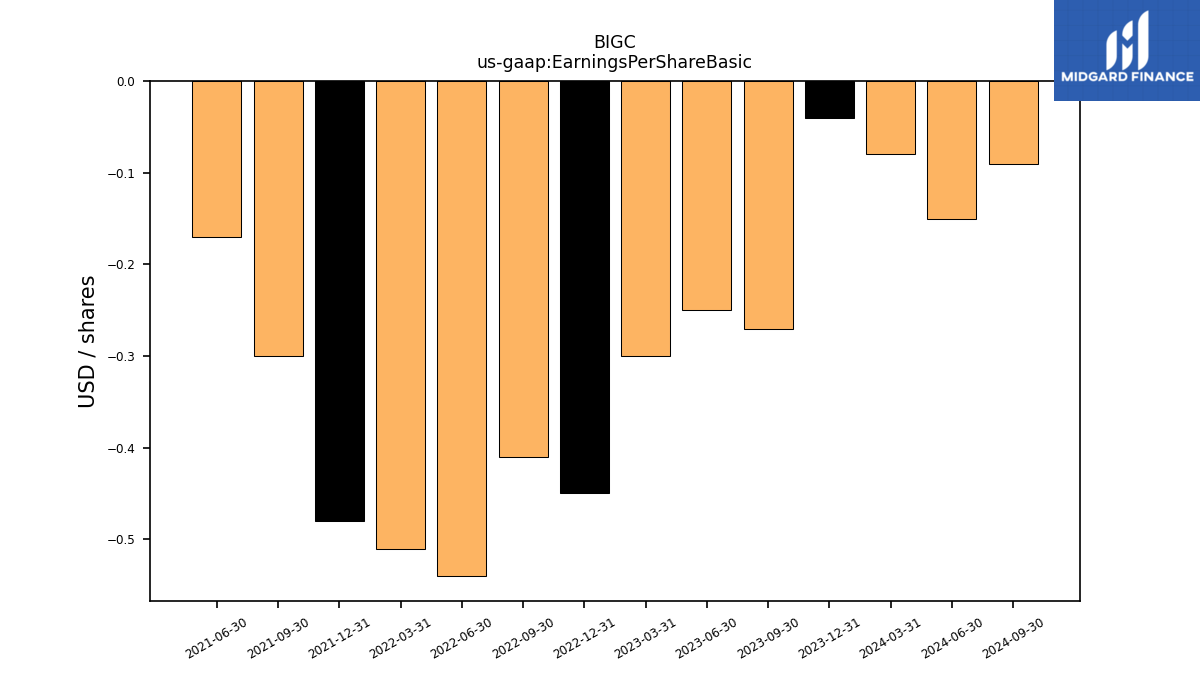
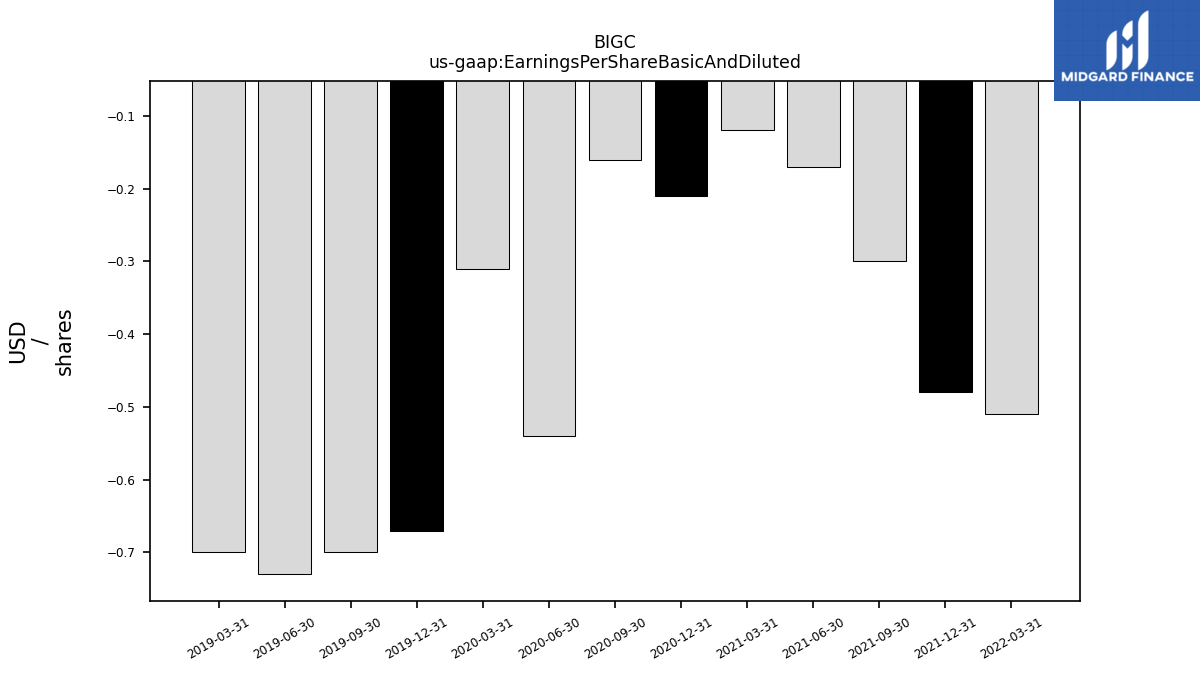
| Earnings Per Share Basic | -0.27 | -0.25 | -0.30 | -0.45 | -0.41 | -0.54 | -0.51 | -0.48 | -0.30 | -0.17 | NA | NA | NA | NA | NA | NA | NA | NA | NA | |
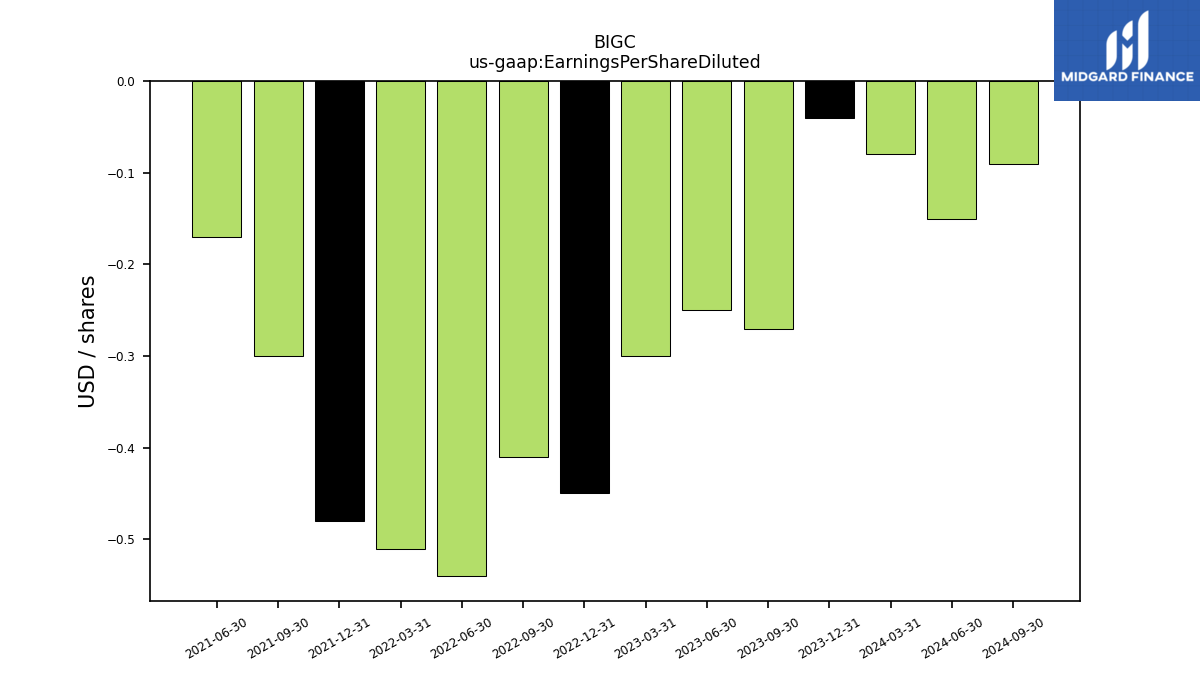
| Earnings Per Share Diluted | -0.27 | -0.25 | -0.30 | -0.45 | -0.41 | -0.54 | -0.51 | -0.48 | -0.30 | -0.17 | NA | NA | NA | NA | NA | NA | NA | NA | NA | |
| Earnings Per Share Basic And Diluted | NA | NA | NA | NA | NA | NA | -0.51 | -0.48 | -0.30 | -0.17 | -0.12 | -0.21 | -0.16 | -0.54 | -0.31 | -0.67 | -0.70 | -0.73 | -0.70 |
| 2023-09-30 | 2023-06-30 | 2023-03-31 | 2022-12-31 | 2022-09-30 | 2022-06-30 | 2022-03-31 | 2021-12-31 | 2021-09-30 | 2021-06-30 | 2021-03-31 | 2020-12-31 | 2020-09-30 | 2020-06-30 | 2020-03-31 | 2019-12-31 | 2019-09-30 | 2019-06-30 | 2019-03-31 | ||
|---|---|---|---|---|---|---|---|---|---|---|---|---|---|---|---|---|---|---|---|---|
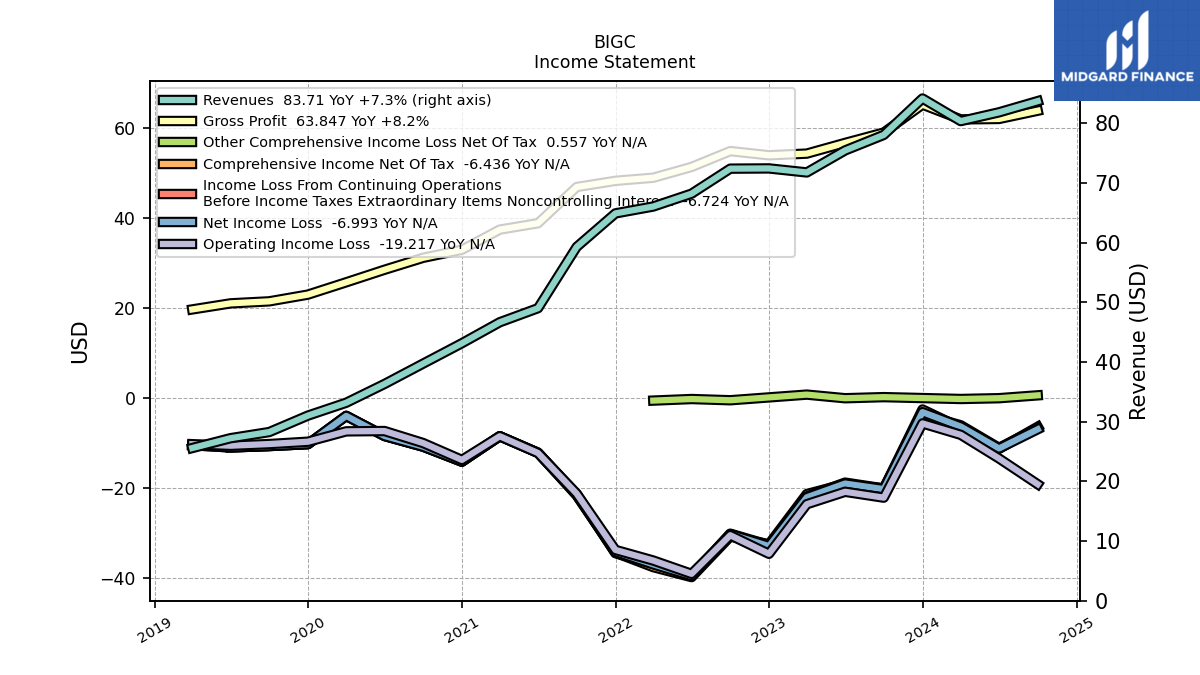
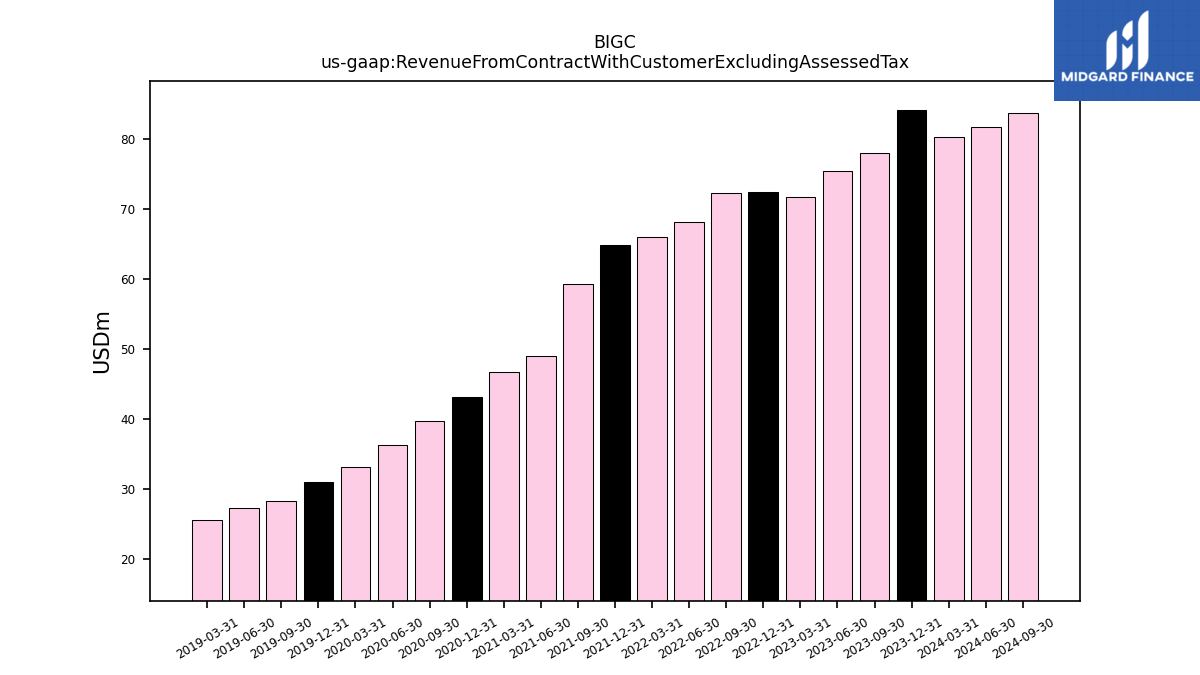
| Revenue From Contract With Customer Excluding Assessed Tax | 78.05 | 75.44 | 71.76 | 72.43 | 72.39 | 68.20 | 66.05 | 64.90 | 59.28 | 49.01 | 46.66 | 43.14 | 39.73 | 36.32 | 33.17 | 31.02 | 28.26 | 27.23 | 25.58 | |
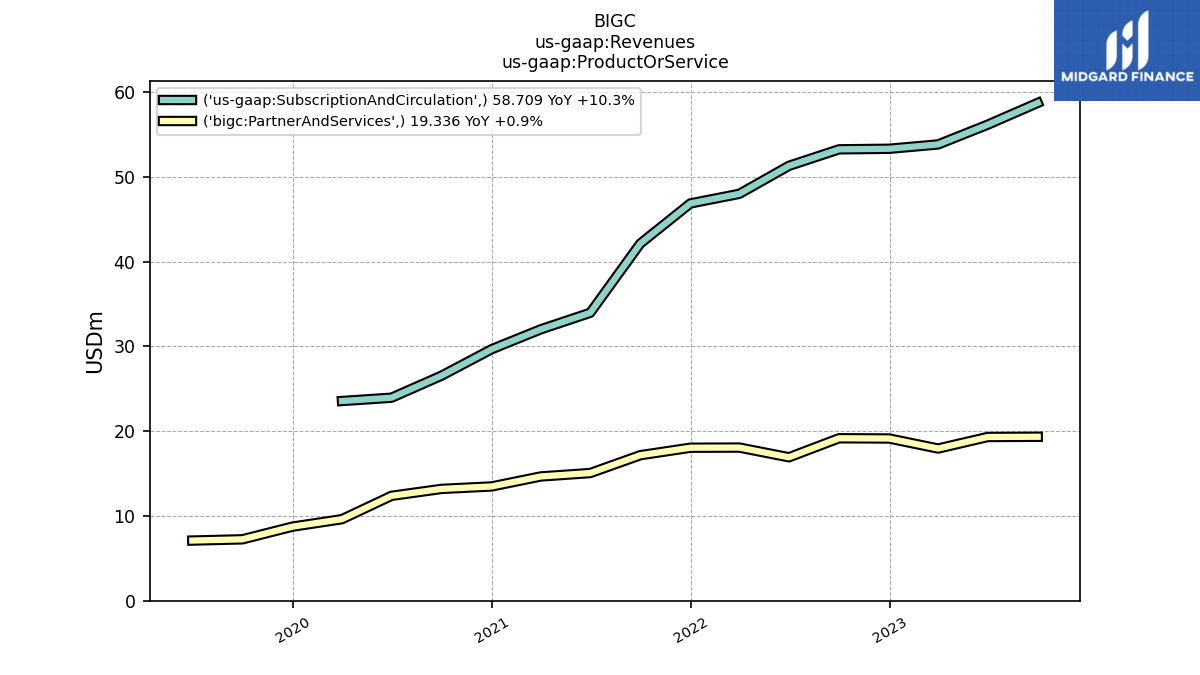
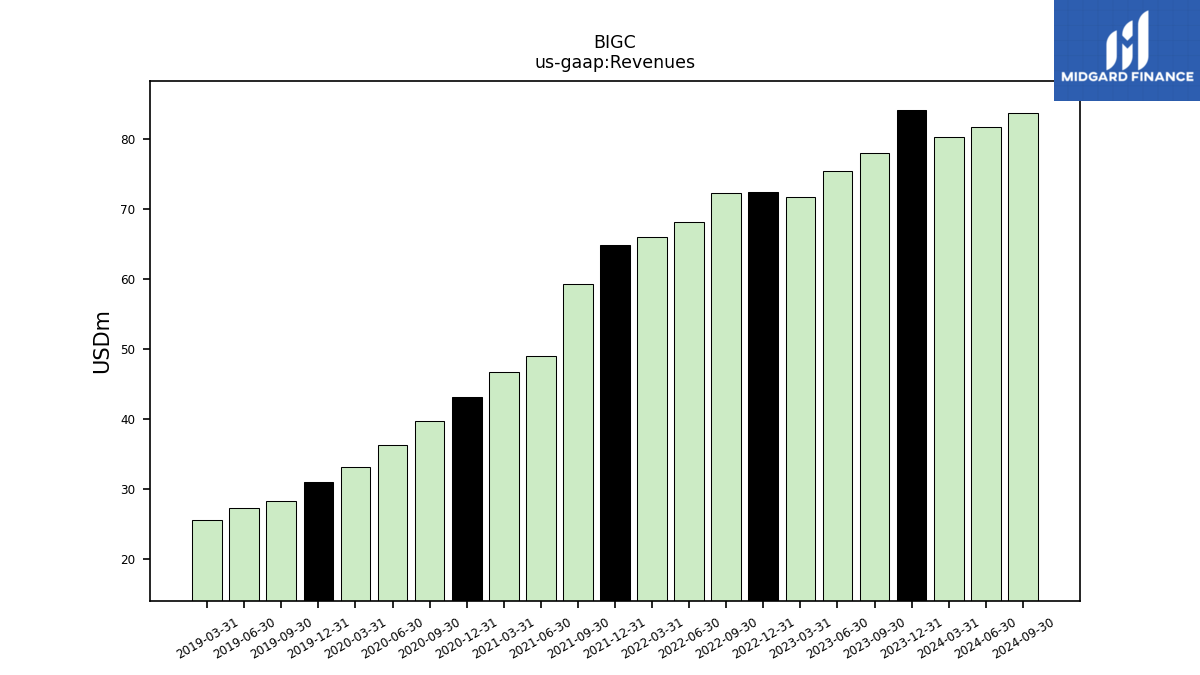
| Revenues | 78.05 | 75.44 | 71.76 | 72.43 | 72.39 | 68.20 | 66.05 | 64.90 | 59.28 | 49.01 | 46.66 | 43.14 | 39.73 | 36.32 | 33.17 | 31.02 | 28.26 | 27.23 | 25.58 | |
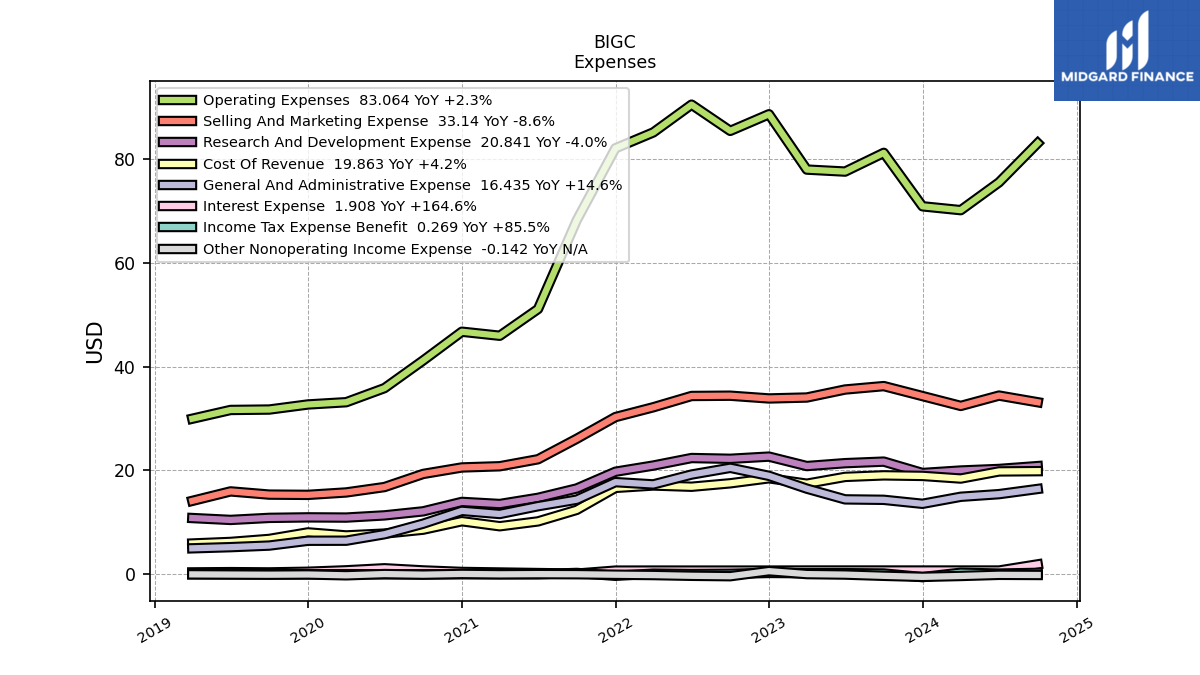
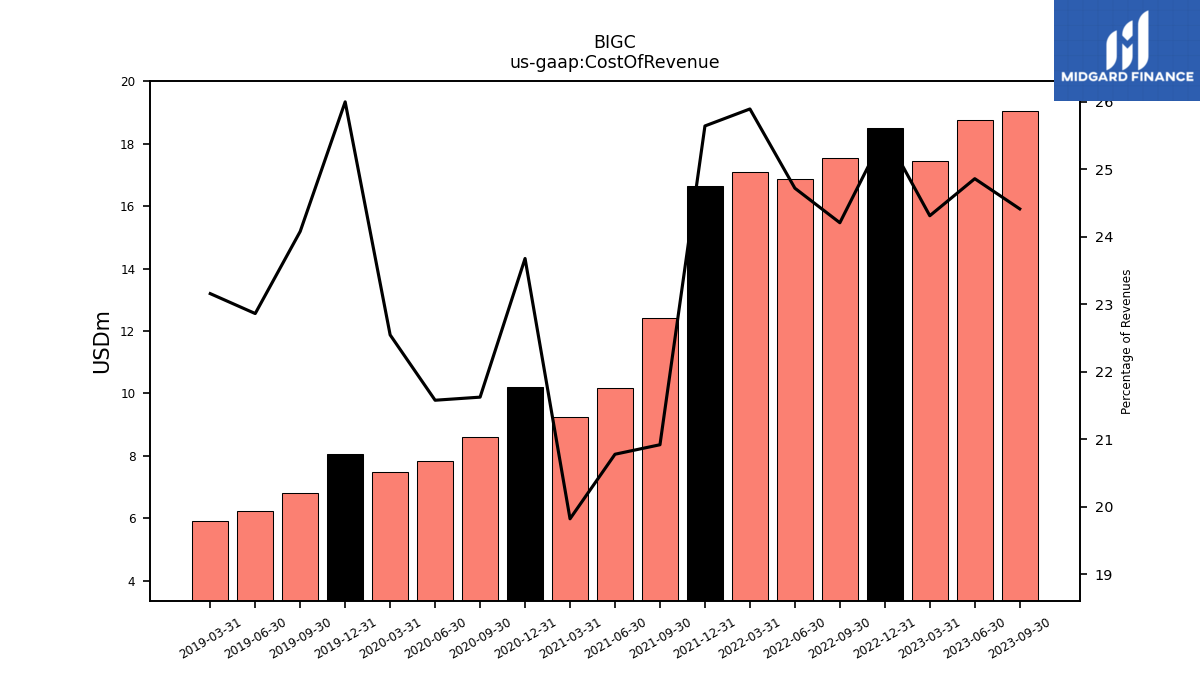
| Cost Of Revenue | 19.05 | 18.76 | 17.45 | 18.49 | 17.52 | 16.86 | 17.10 | 16.64 | 12.40 | 10.19 | 9.25 | 10.22 | 8.59 | 7.84 | 7.48 | 8.06 | 6.81 | 6.23 | 5.92 | |
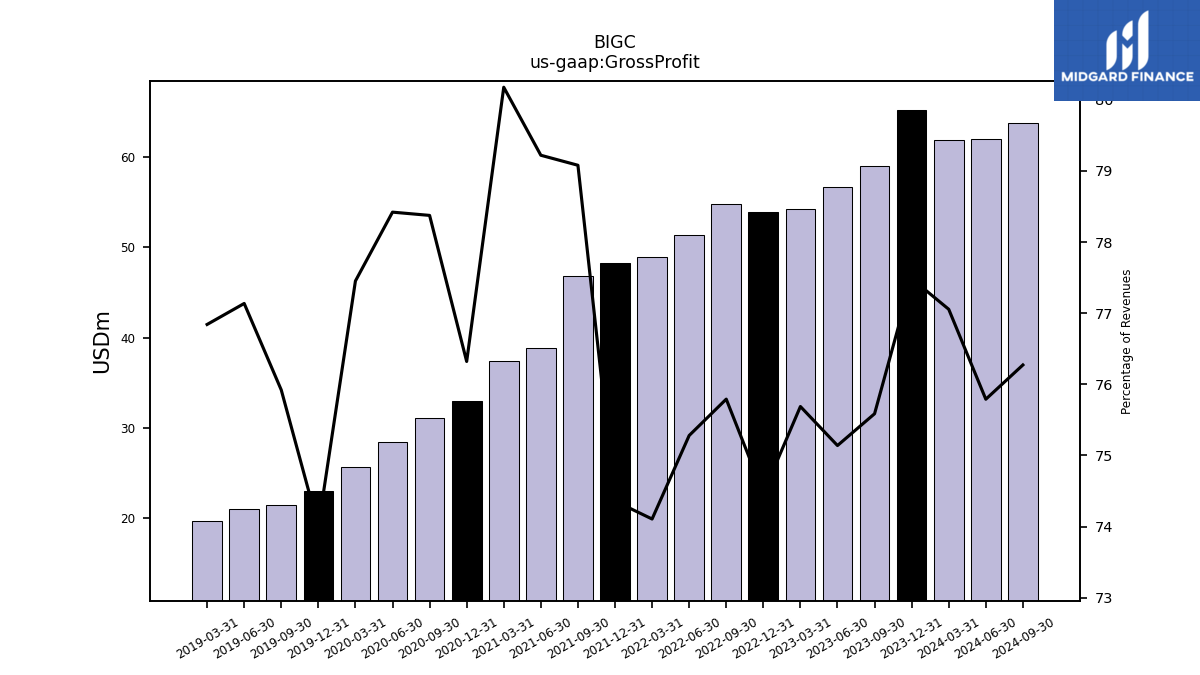
| Gross Profit | 58.99 | 56.69 | 54.31 | 53.94 | 54.87 | 51.34 | 48.95 | 48.26 | 46.88 | 38.83 | 37.41 | 32.93 | 31.14 | 28.48 | 25.69 | 22.95 | 21.46 | 21.01 | 19.66 | |
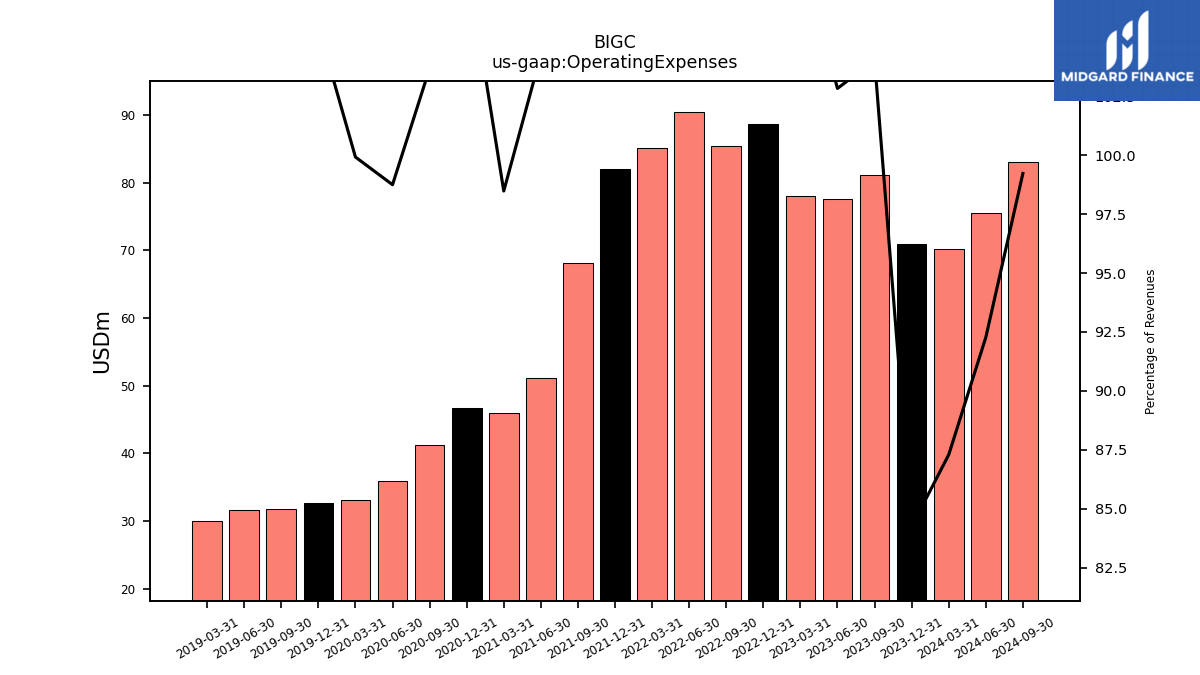
| Operating Expenses | 81.19 | 77.58 | 77.97 | 88.63 | 85.43 | 90.48 | 85.13 | 82.07 | 68.20 | 51.10 | 45.95 | 46.73 | 41.20 | 35.86 | 33.15 | 32.71 | 31.73 | 31.65 | 29.97 | |
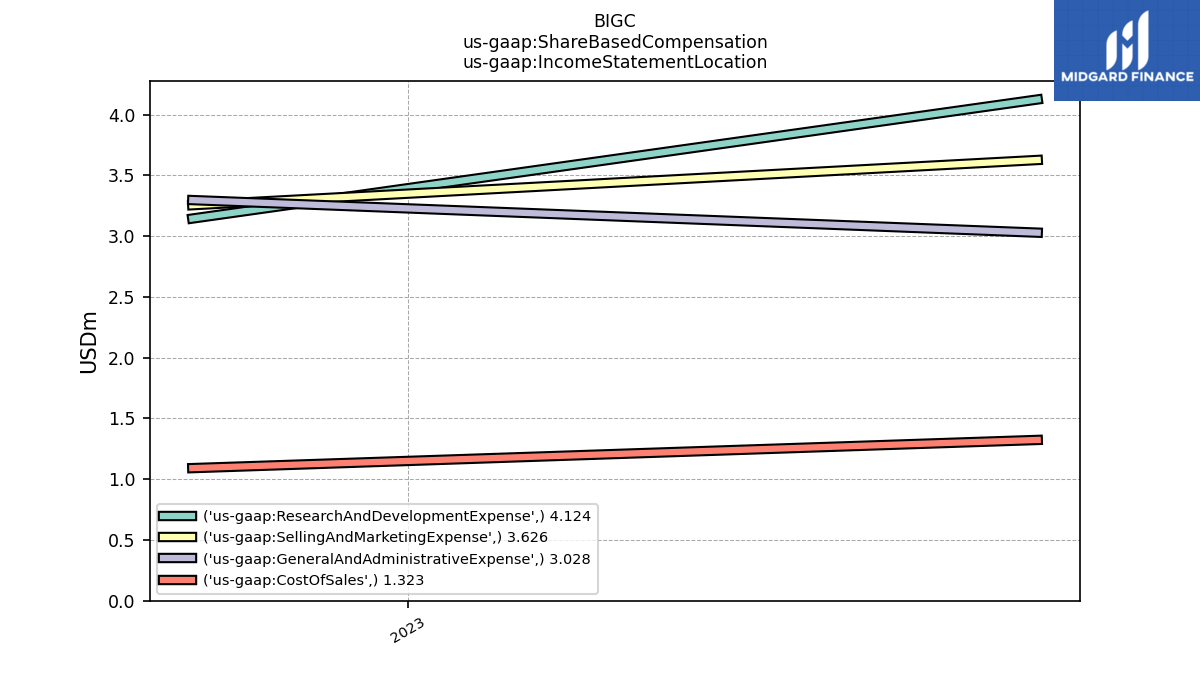
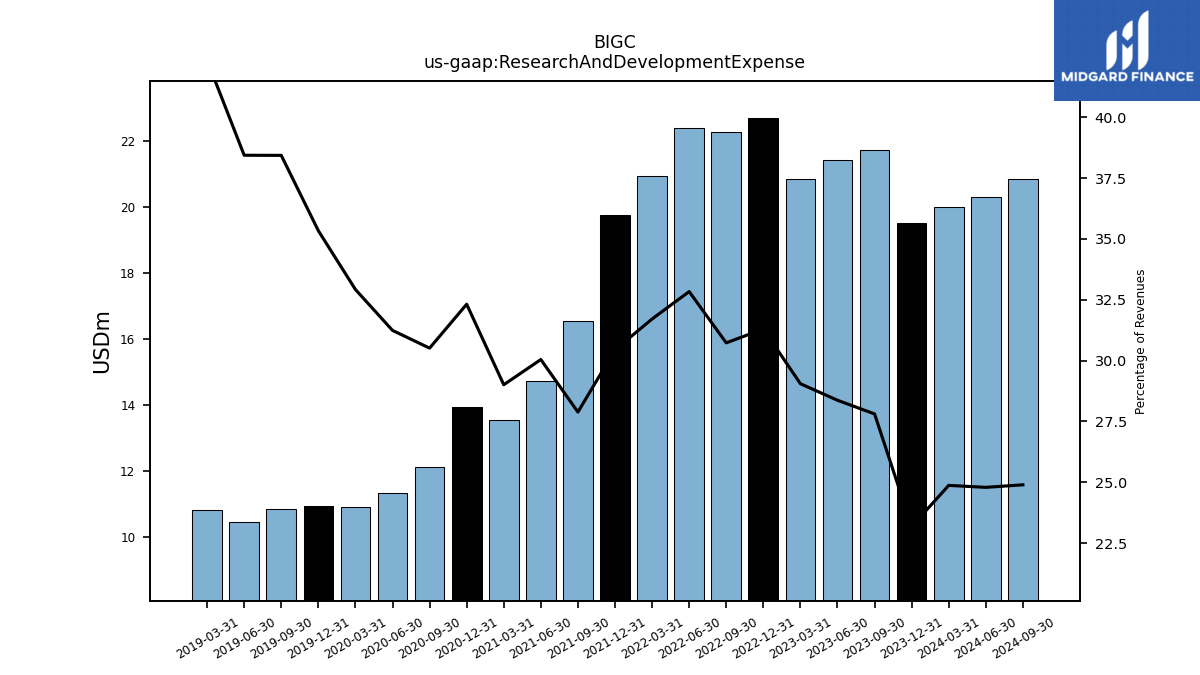
| Research And Development Expense | 21.70 | 21.40 | 20.84 | 22.67 | 22.25 | 22.39 | 20.94 | 19.75 | 16.53 | 14.72 | 13.54 | 13.94 | 12.12 | 11.35 | 10.92 | 10.96 | 10.86 | 10.47 | 10.83 | |
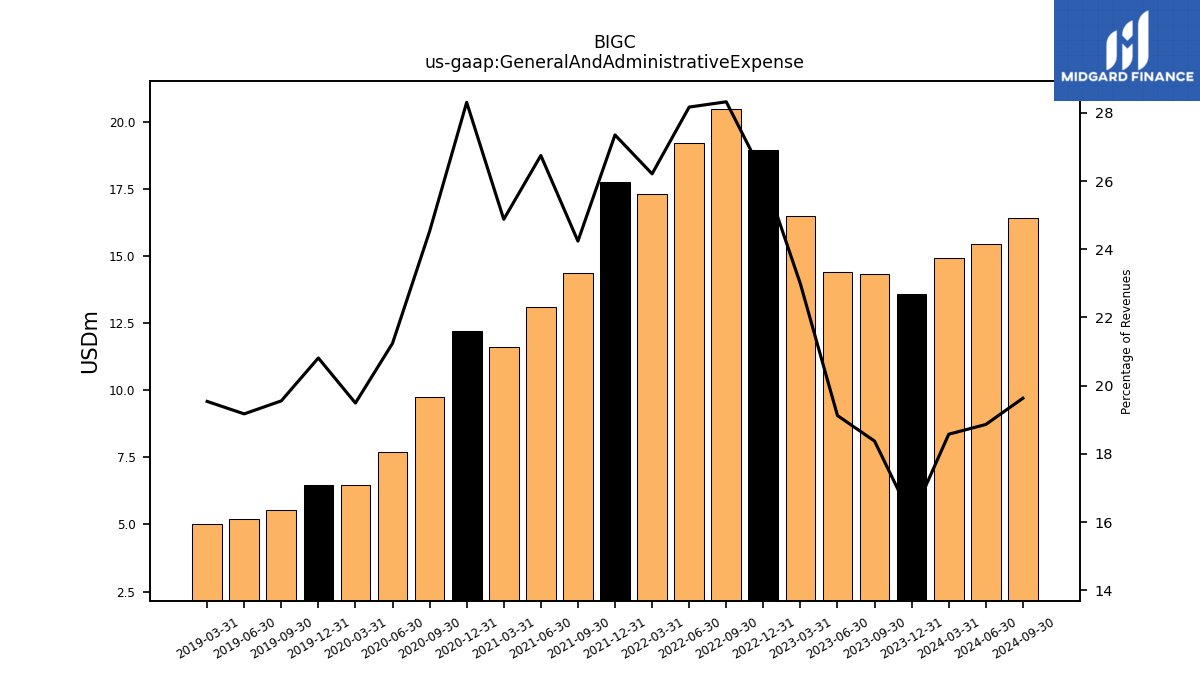
| General And Administrative Expense | 14.34 | 14.43 | 16.49 | 18.96 | 20.50 | 19.21 | 17.31 | 17.75 | 14.37 | 13.11 | 11.61 | 12.21 | 9.74 | 7.71 | 6.47 | 6.46 | 5.53 | 5.22 | 5.00 | |
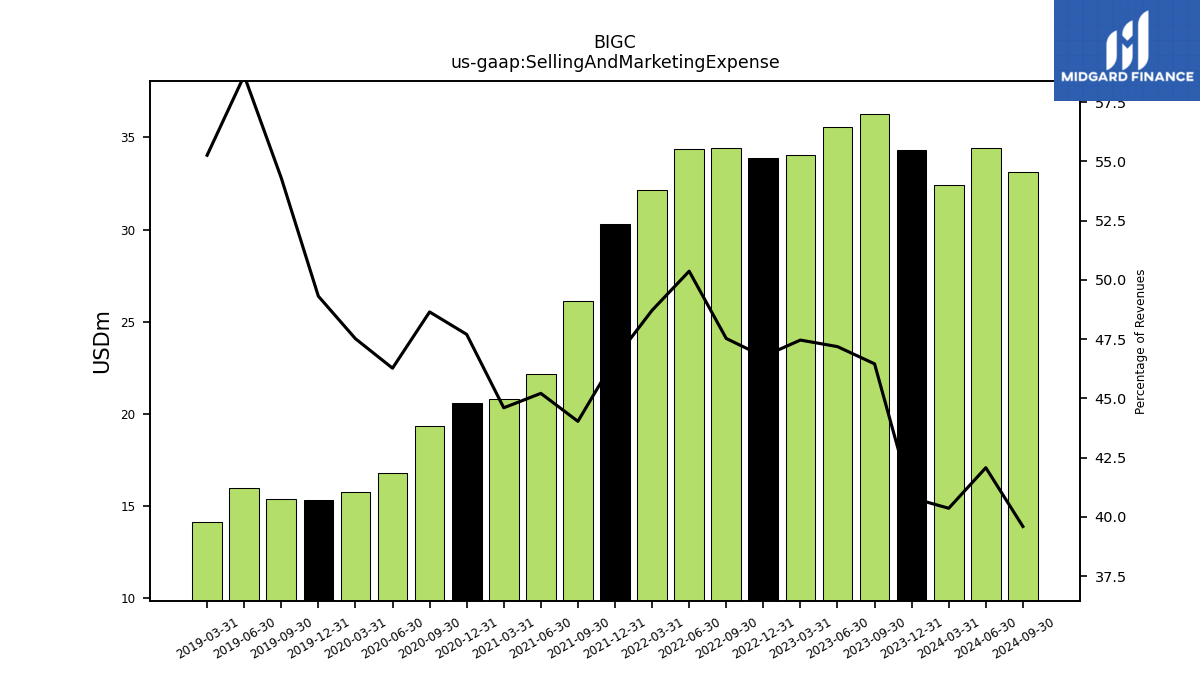
| Selling And Marketing Expense | 36.25 | 35.59 | 34.05 | 33.87 | 34.40 | 34.35 | 32.17 | 30.28 | 26.10 | 22.16 | 20.81 | 20.58 | 19.33 | 16.80 | 15.76 | 15.29 | 15.35 | 15.96 | 14.14 | |
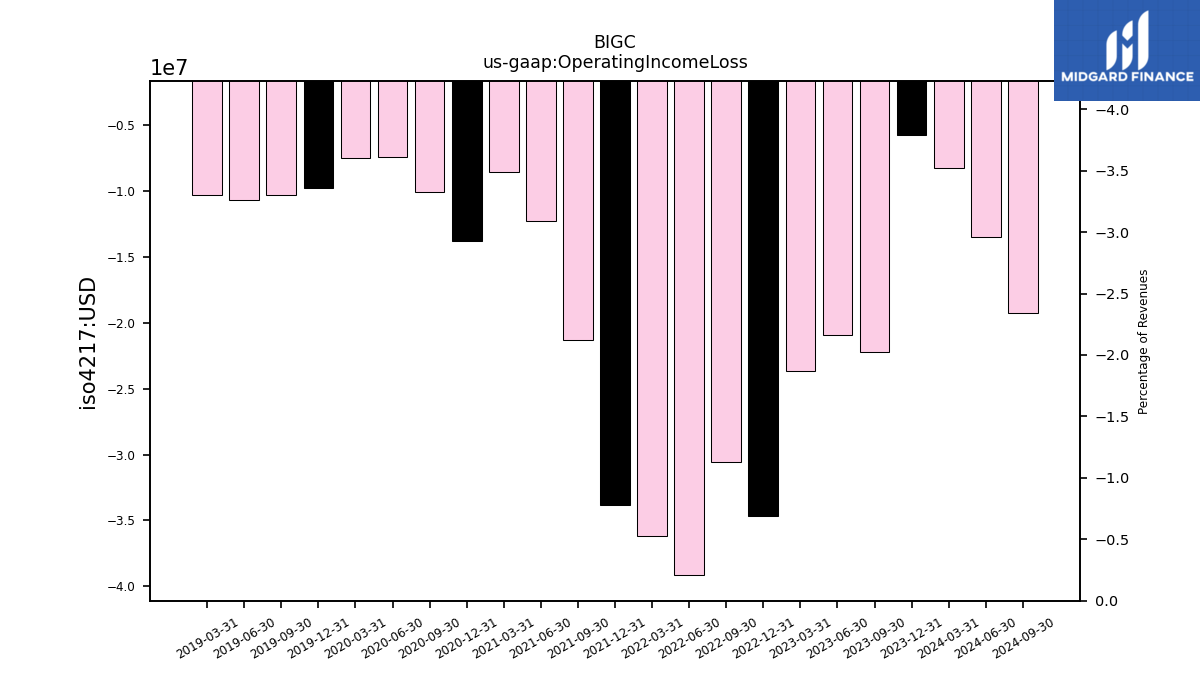
| Operating Income Loss | -22.20 | -20.89 | -23.66 | -34.69 | -30.56 | -39.14 | -36.18 | -33.81 | -21.32 | -12.27 | -8.54 | -13.80 | -10.05 | -7.38 | -7.46 | -9.76 | -10.28 | -10.64 | -10.31 | |
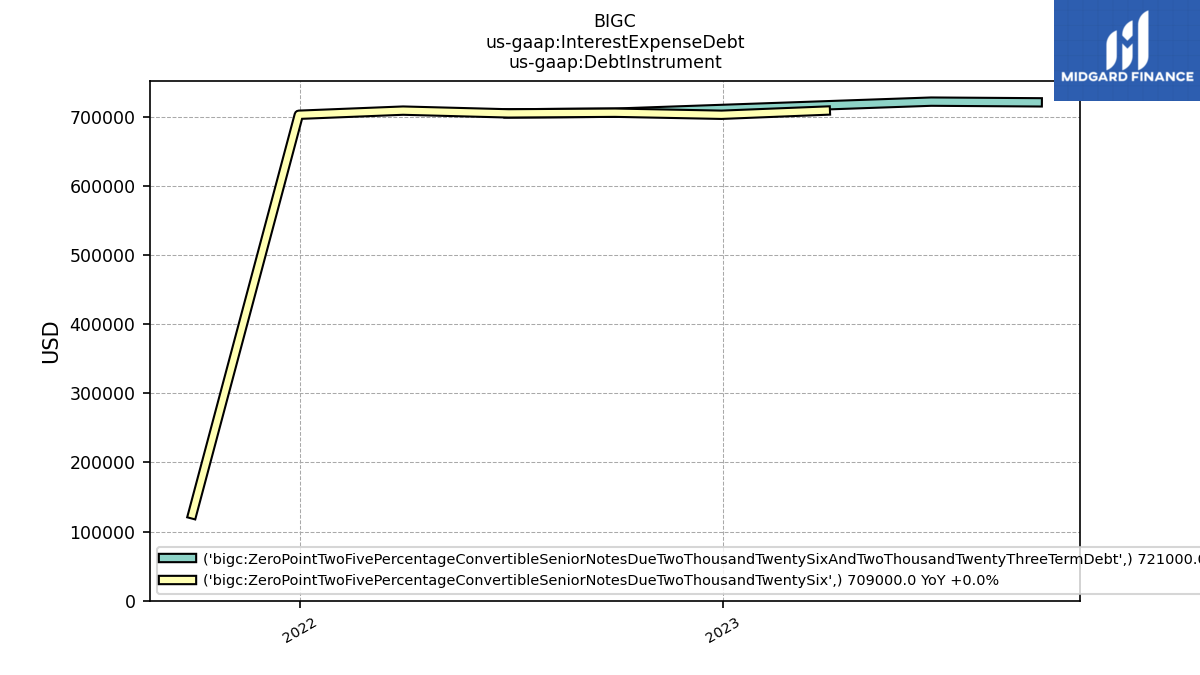
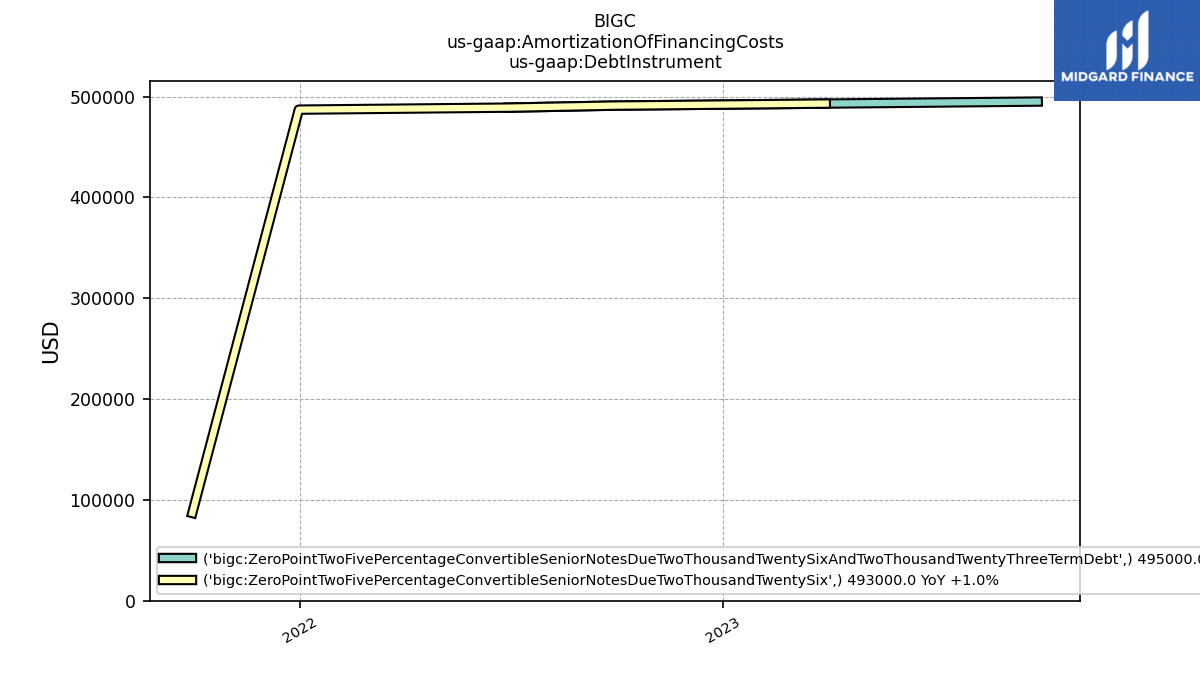
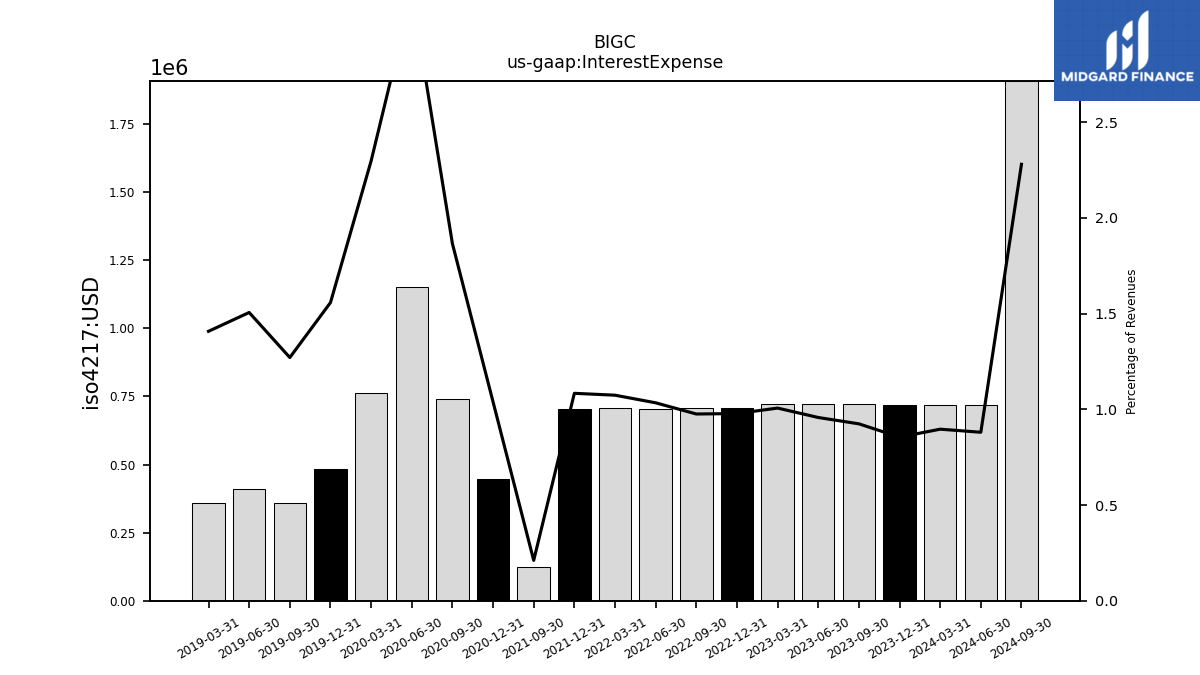
| Interest Expense | 0.72 | 0.72 | 0.72 | 0.71 | 0.71 | 0.70 | 0.71 | 0.70 | 0.12 | NA | NA | 0.45 | 0.74 | 1.15 | 0.76 | 0.48 | 0.36 | 0.41 | 0.36 | |
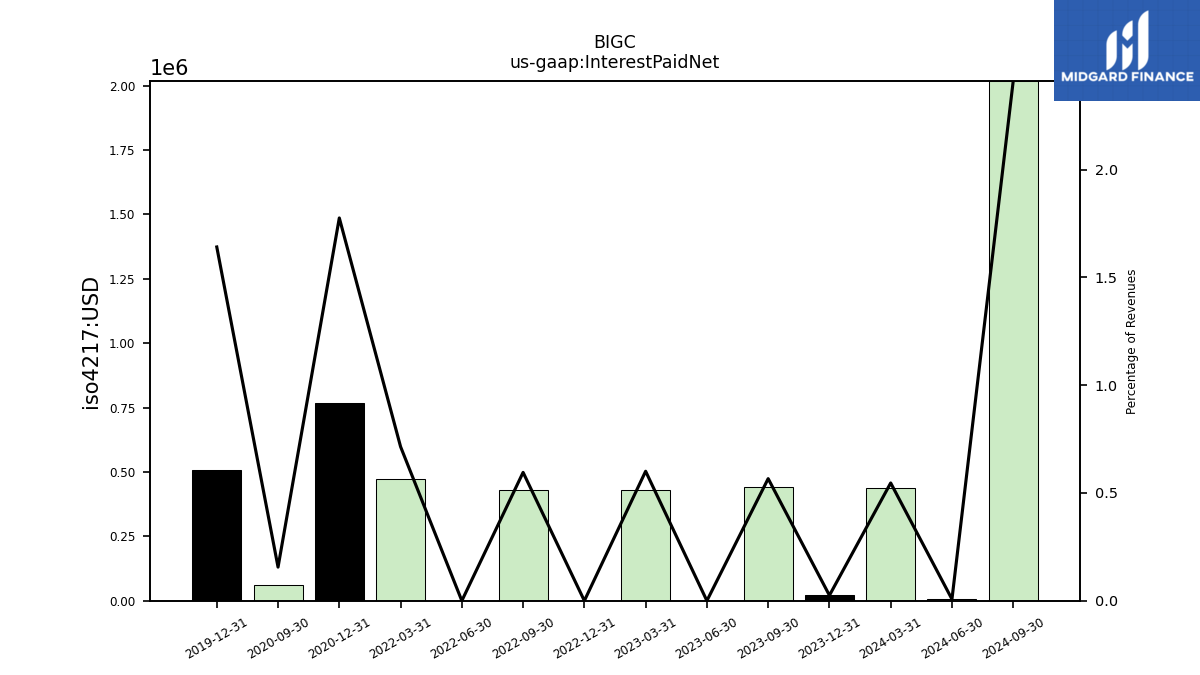
| Interest Paid Net | 0.44 | 0.00 | 0.43 | 0.00 | 0.43 | 0.00 | 0.47 | NA | NA | NA | NA | 0.77 | 0.06 | NA | NA | 0.51 | NA | NA | NA | |
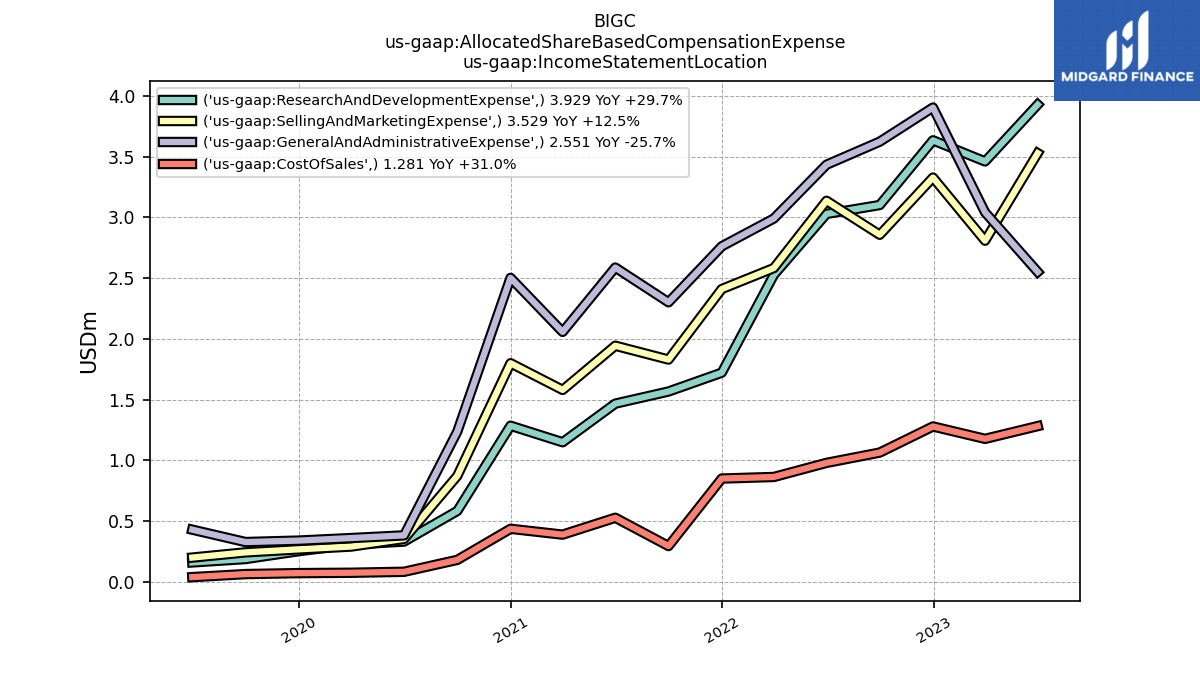
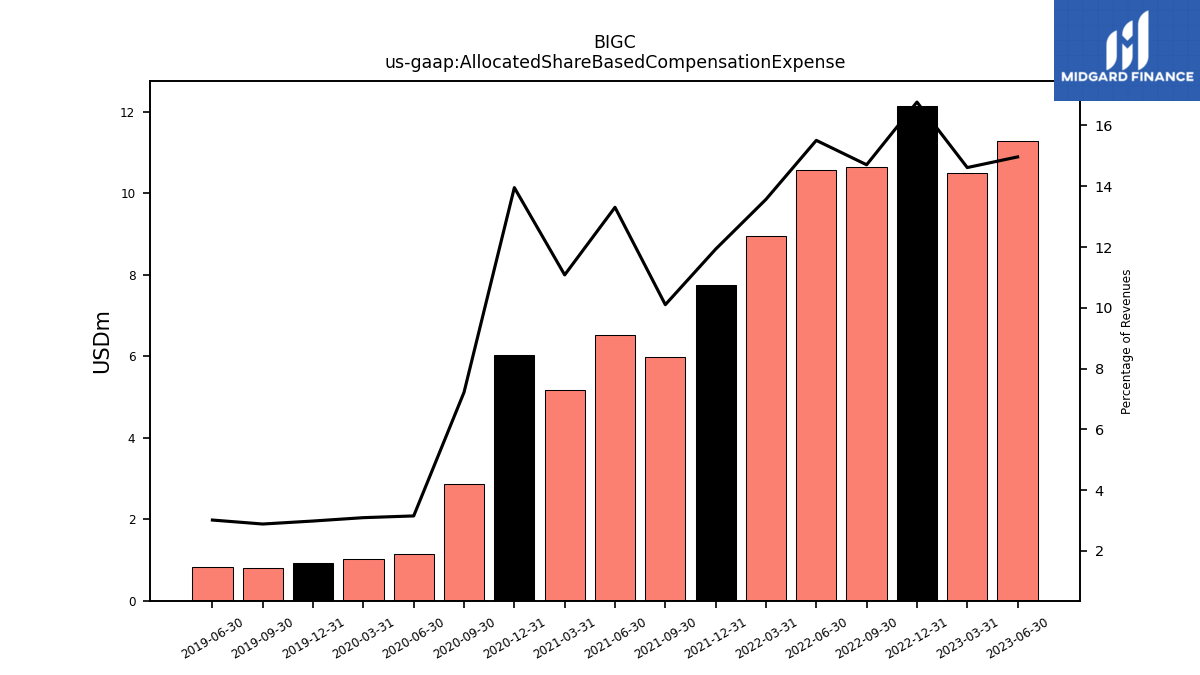
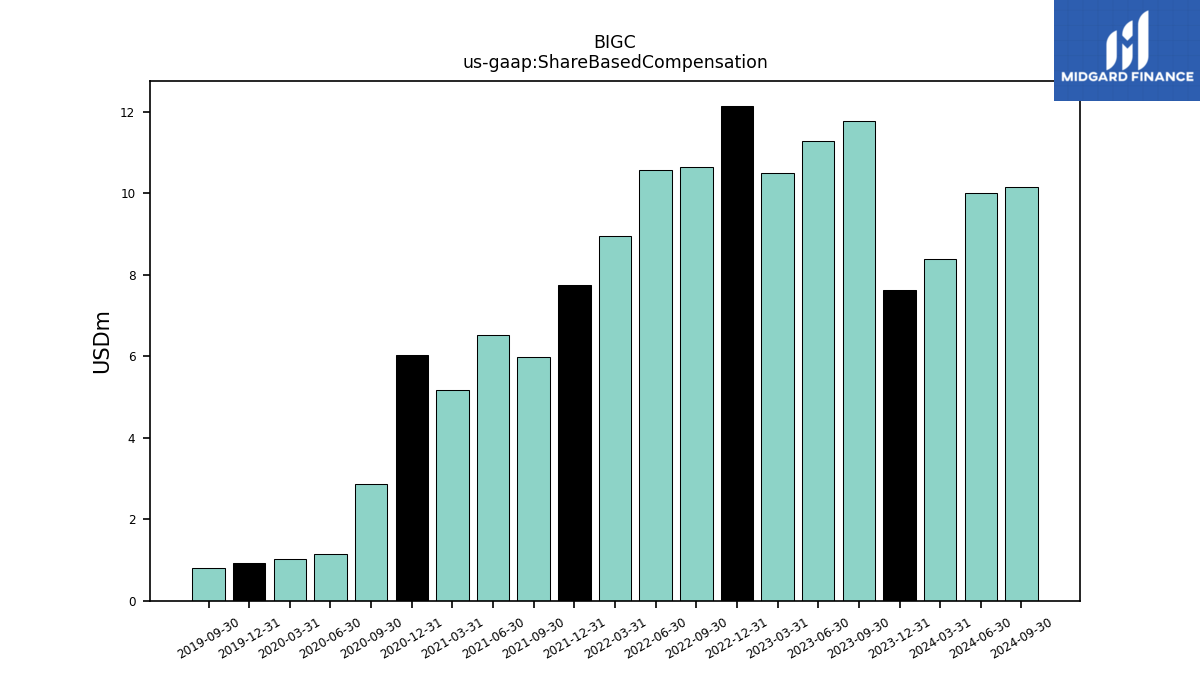
| Allocated Share Based Compensation Expense | NA | 11.29 | 10.49 | 12.15 | 10.65 | 10.58 | 8.96 | 7.74 | 5.99 | 6.52 | 5.17 | 6.02 | 2.87 | 1.14 | 1.03 | 0.93 | 0.81 | 0.82 | NA | |
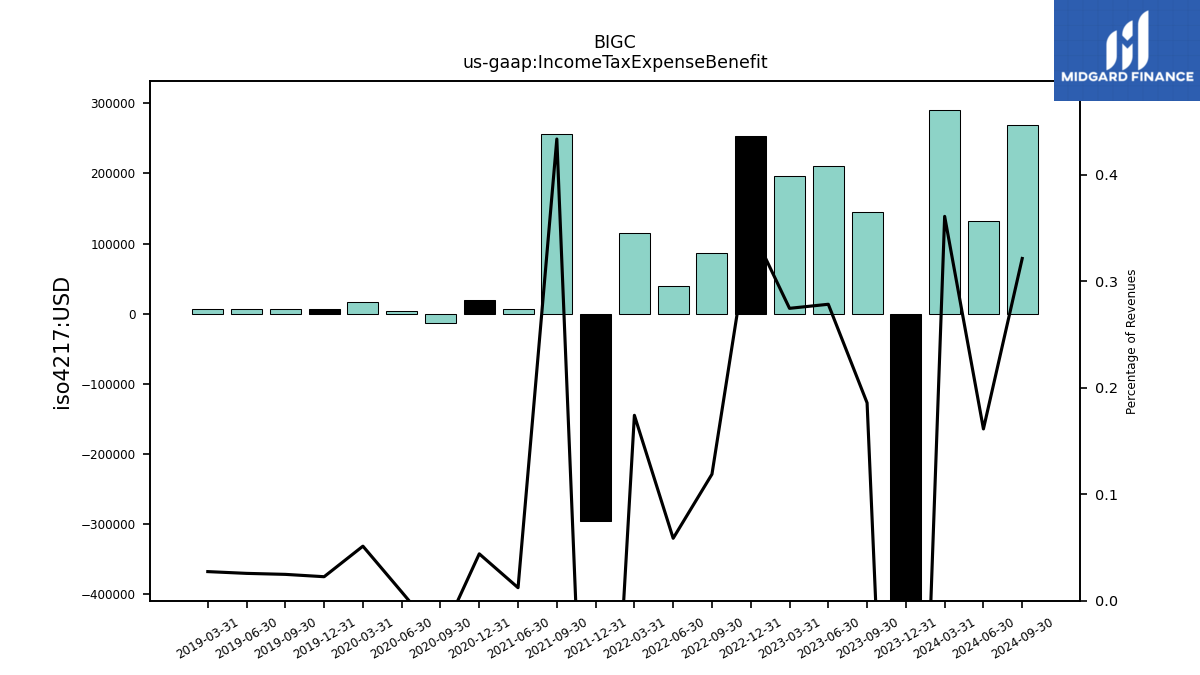
| Income Tax Expense Benefit | 0.14 | 0.21 | 0.20 | 0.25 | 0.09 | 0.04 | 0.12 | -0.30 | 0.26 | 0.01 | NA | 0.02 | -0.01 | 0.00 | 0.02 | 0.01 | 0.01 | 0.01 | 0.01 | |
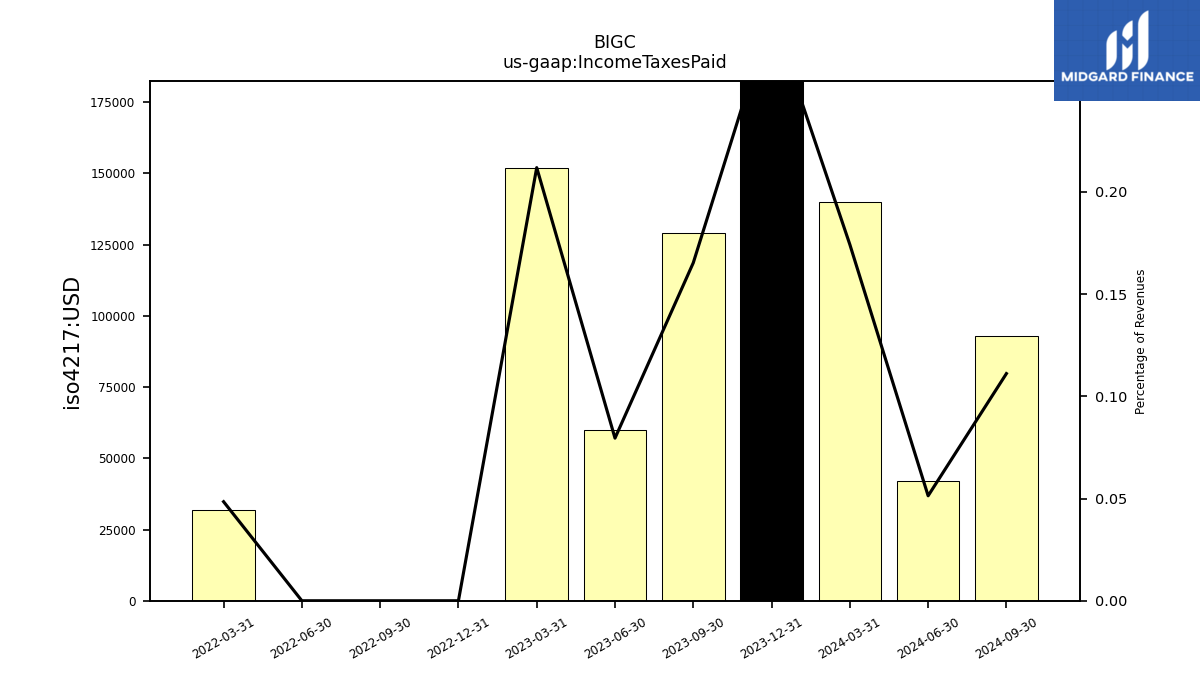
| Income Taxes Paid | 0.13 | 0.06 | 0.15 | 0.00 | 0.00 | 0.00 | 0.03 | NA | NA | NA | NA | NA | NA | NA | NA | NA | NA | NA | NA | |
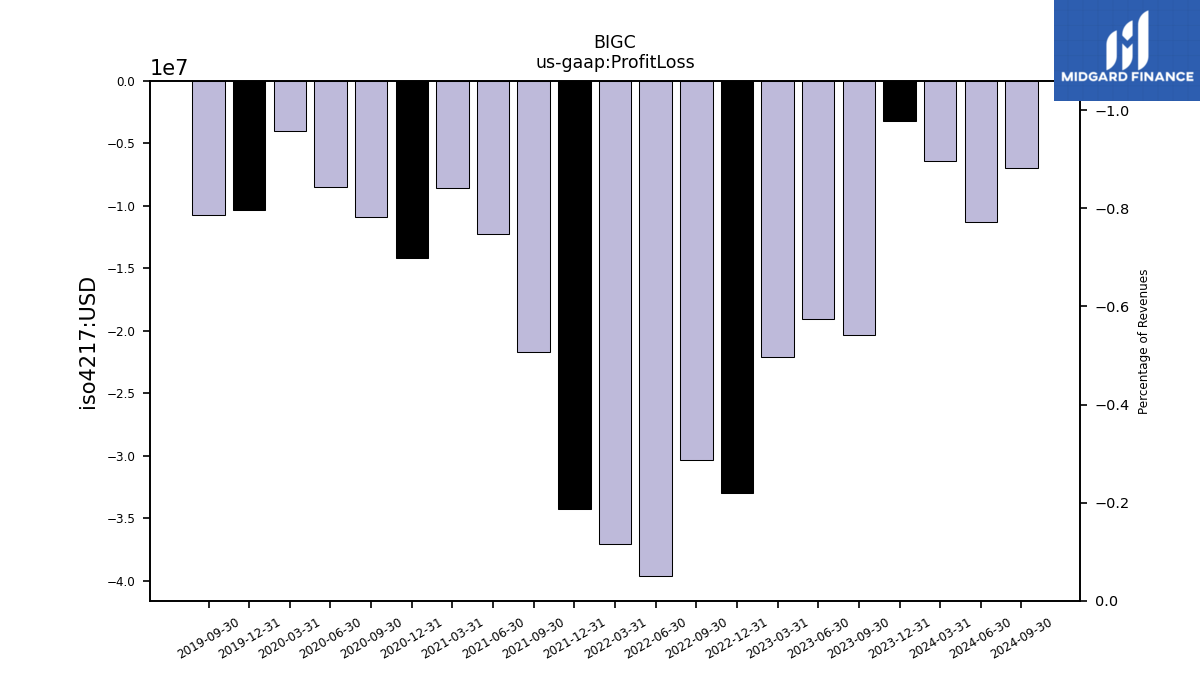
| Profit Loss | -20.31 | -19.07 | -22.12 | -32.98 | -30.30 | -39.60 | -37.04 | -34.24 | -21.67 | -12.22 | -8.54 | -14.20 | -10.86 | -8.48 | -4.02 | -10.29 | -10.72 | NA | NA | |
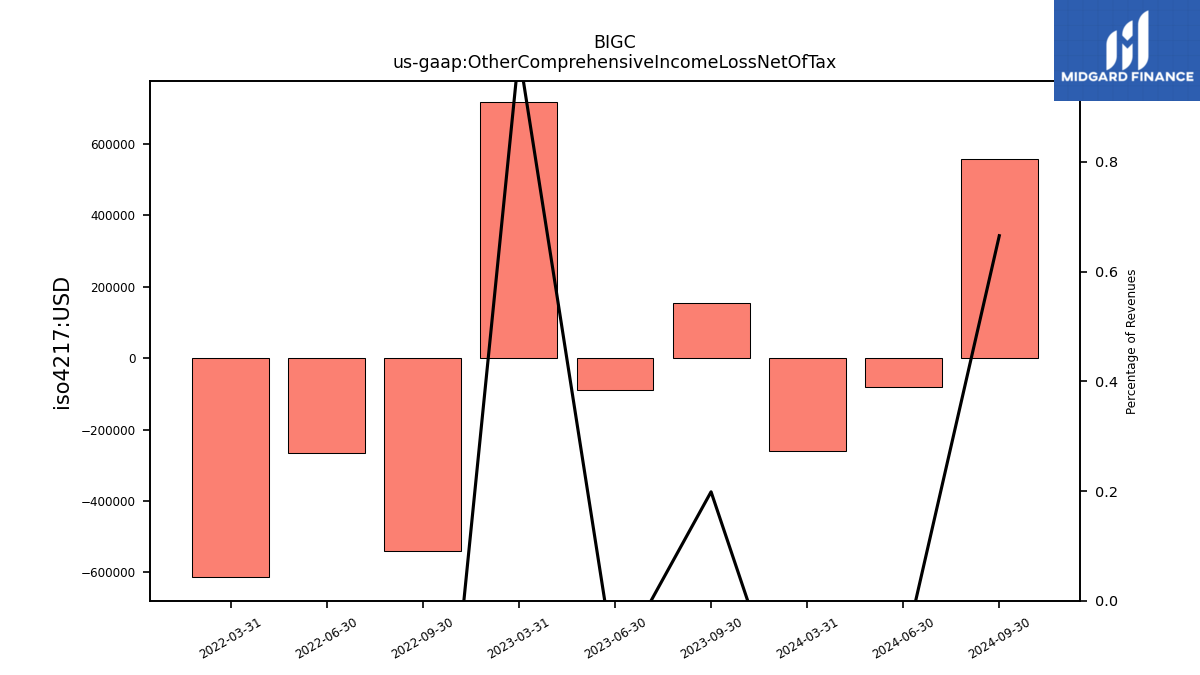
| Other Comprehensive Income Loss Net Of Tax | 0.15 | -0.09 | 0.72 | NA | -0.54 | -0.27 | -0.61 | NA | NA | NA | NA | NA | NA | NA | NA | NA | NA | NA | NA | |
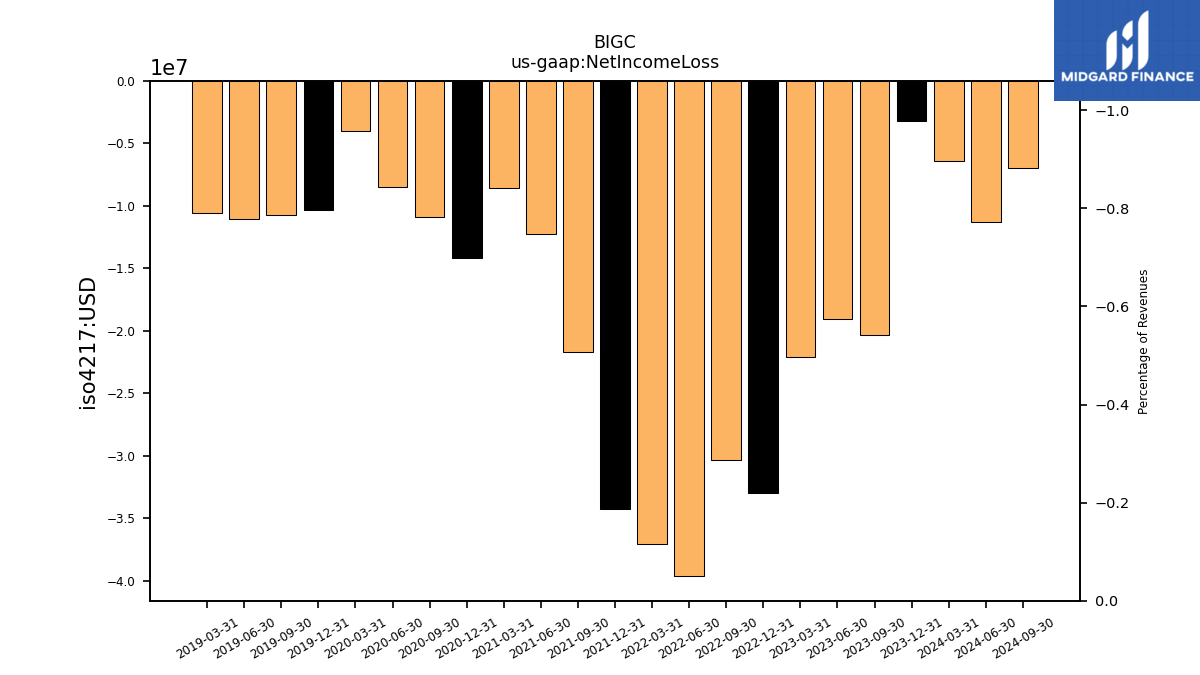
| Net Income Loss | -20.31 | -19.07 | -22.12 | -32.98 | -30.30 | -39.60 | -37.04 | -34.24 | -21.67 | -12.22 | -8.54 | -14.20 | -10.86 | -8.48 | -4.02 | -10.29 | -10.72 | -11.03 | -10.54 | |
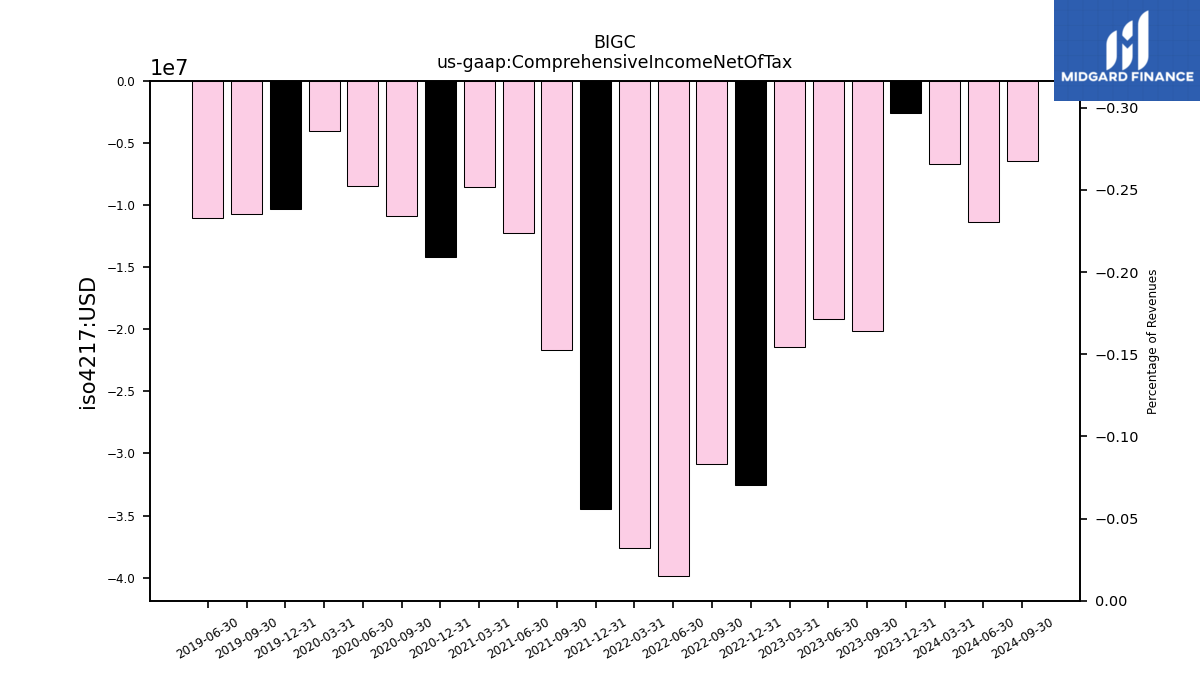
| Comprehensive Income Net Of Tax | -20.16 | -19.16 | -21.40 | -32.57 | -30.84 | -39.87 | -37.65 | -34.44 | -21.67 | -12.22 | -8.54 | -14.20 | -10.86 | -8.48 | -4.02 | -10.29 | -10.71 | -11.02 | NA |
| 2023-09-30 | 2023-06-30 | 2023-03-31 | 2022-12-31 | 2022-09-30 | 2022-06-30 | 2022-03-31 | 2021-12-31 | 2021-09-30 | 2021-06-30 | 2021-03-31 | 2020-12-31 | 2020-09-30 | 2020-06-30 | 2020-03-31 | 2019-12-31 | 2019-09-30 | 2019-06-30 | 2019-03-31 | ||
|---|---|---|---|---|---|---|---|---|---|---|---|---|---|---|---|---|---|---|---|---|
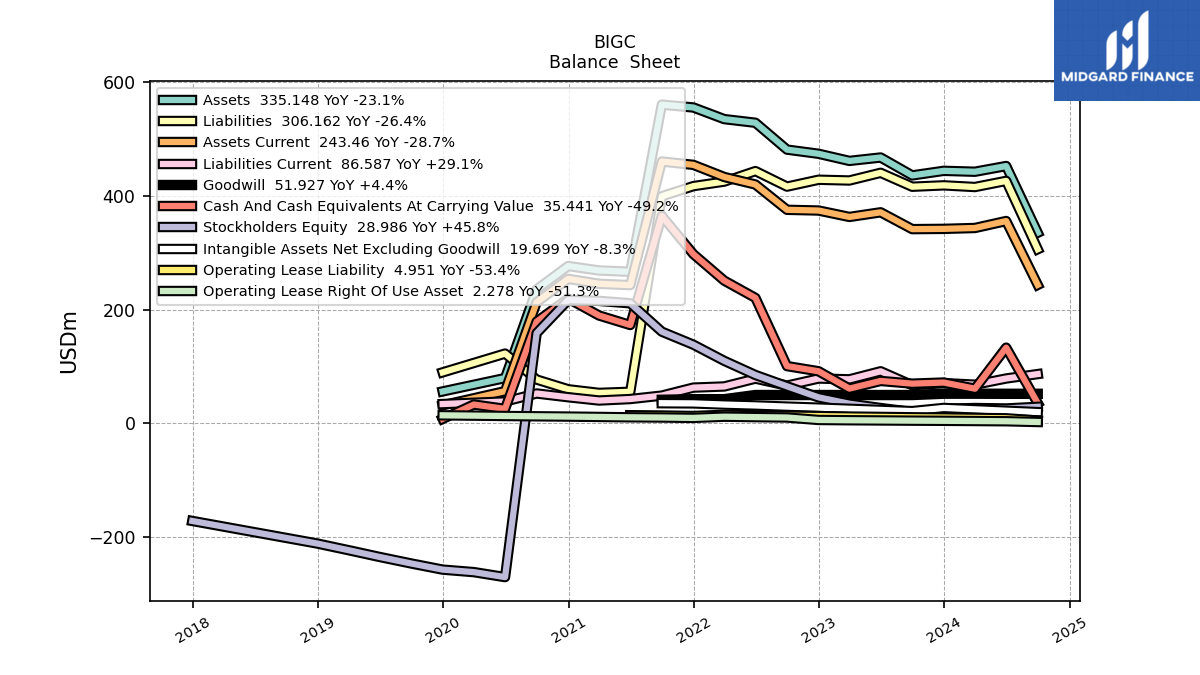
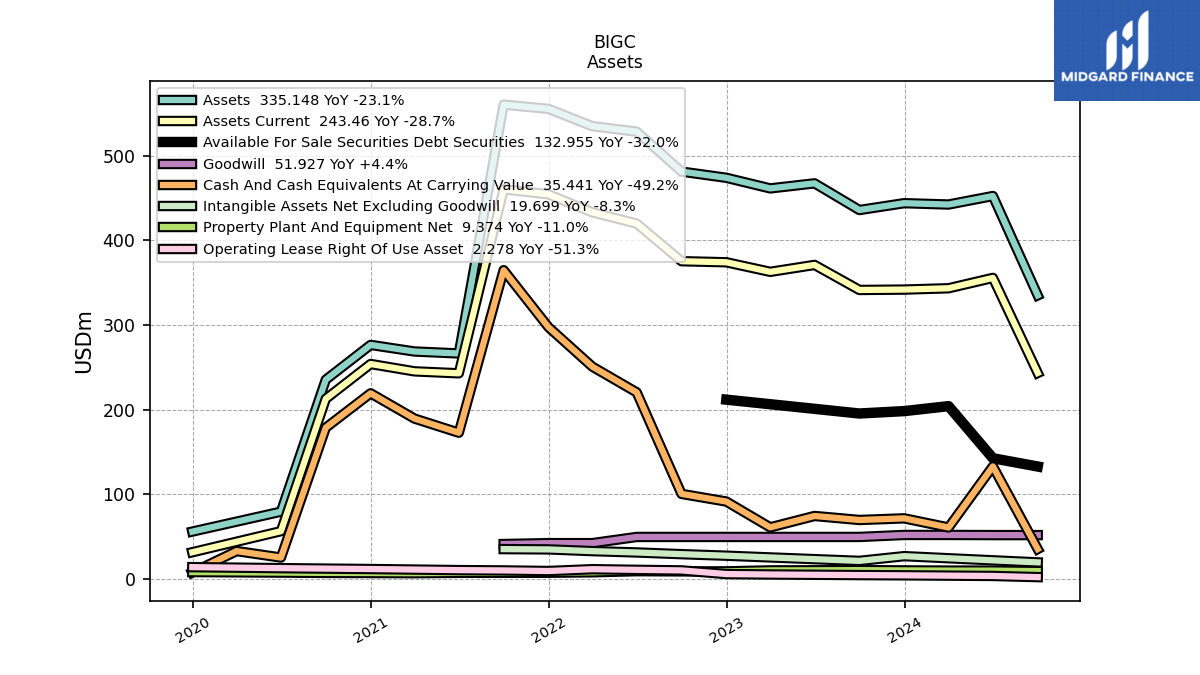
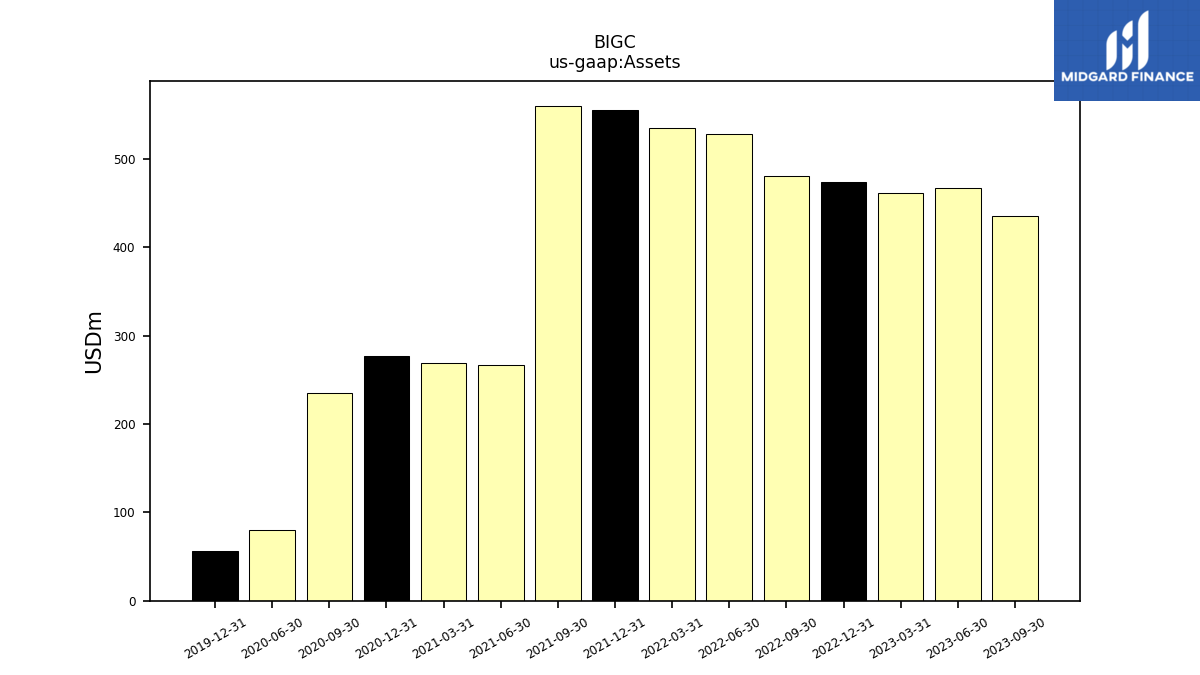
| Assets | 435.98 | 467.50 | 461.51 | 474.06 | 481.37 | 528.59 | 535.01 | 555.46 | 560.49 | 266.51 | 268.83 | 276.63 | 235.50 | 79.62 | NA | 56.06 | NA | NA | NA | |
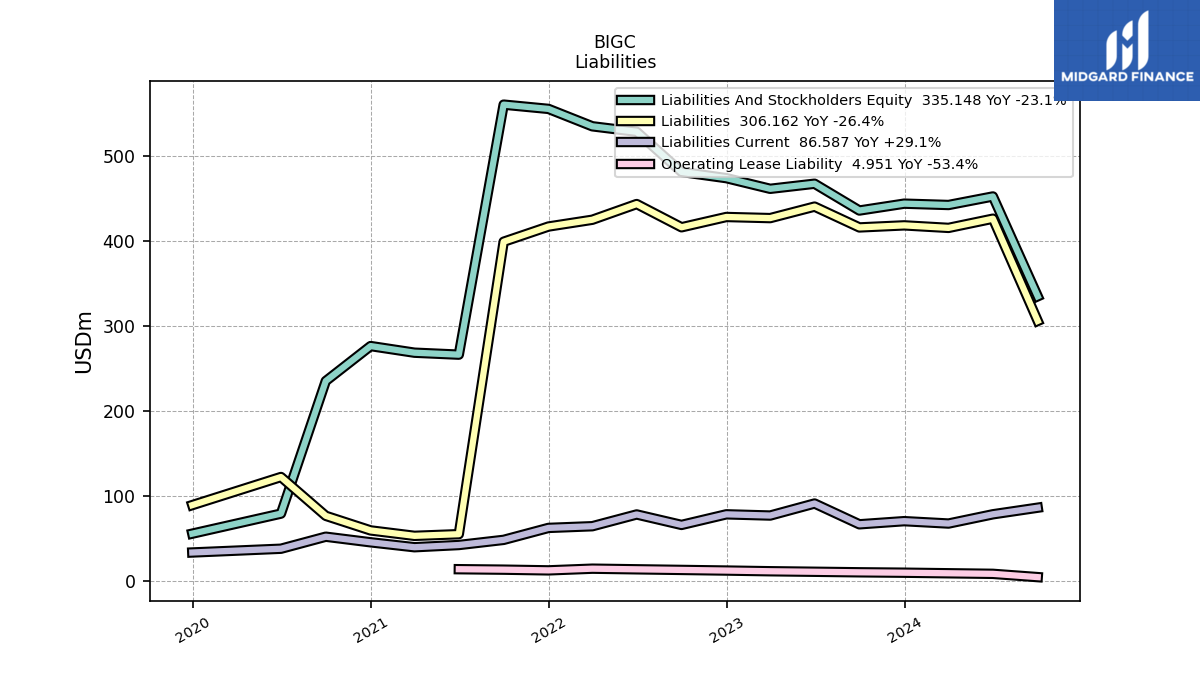
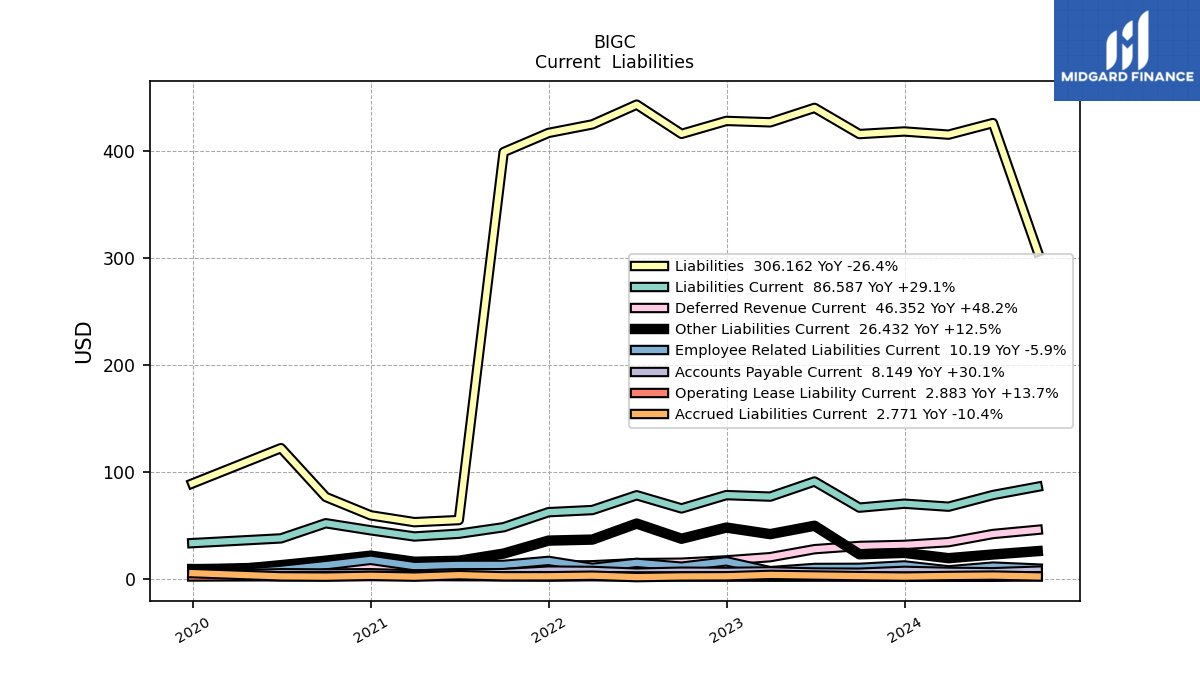
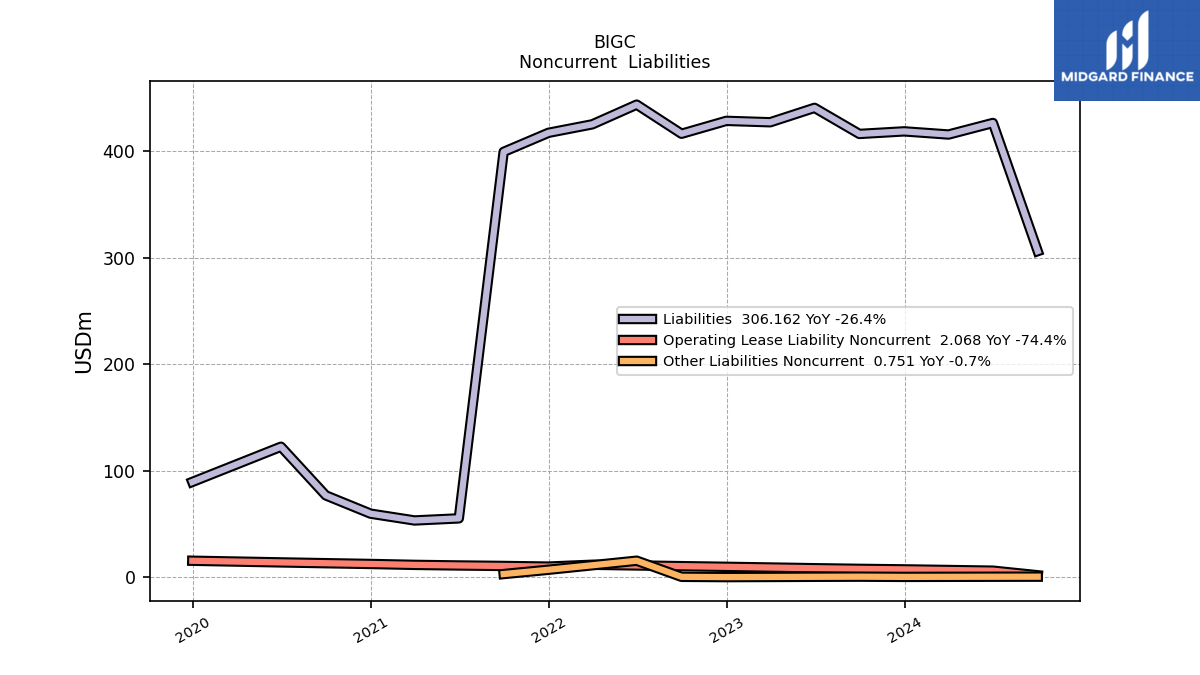
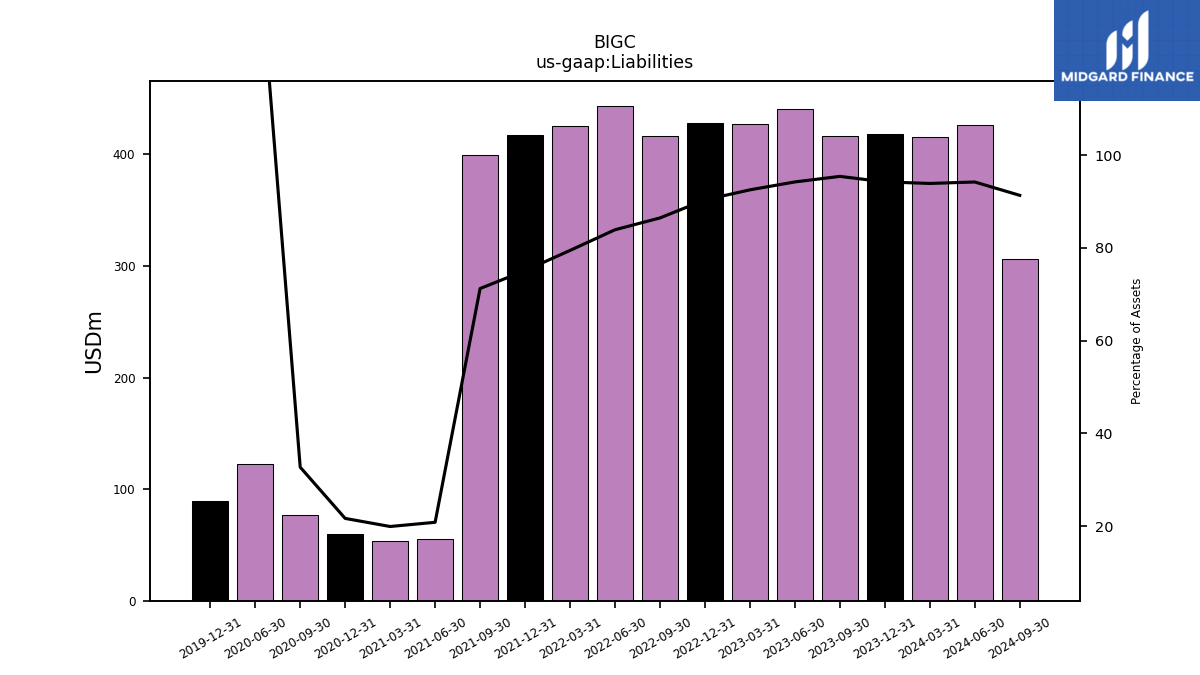
| Liabilities | 416.10 | 440.58 | 427.07 | 428.38 | 416.28 | 443.61 | 425.13 | 417.17 | 399.30 | 55.45 | 53.49 | 59.87 | 77.00 | 122.67 | NA | 89.61 | NA | NA | NA | |
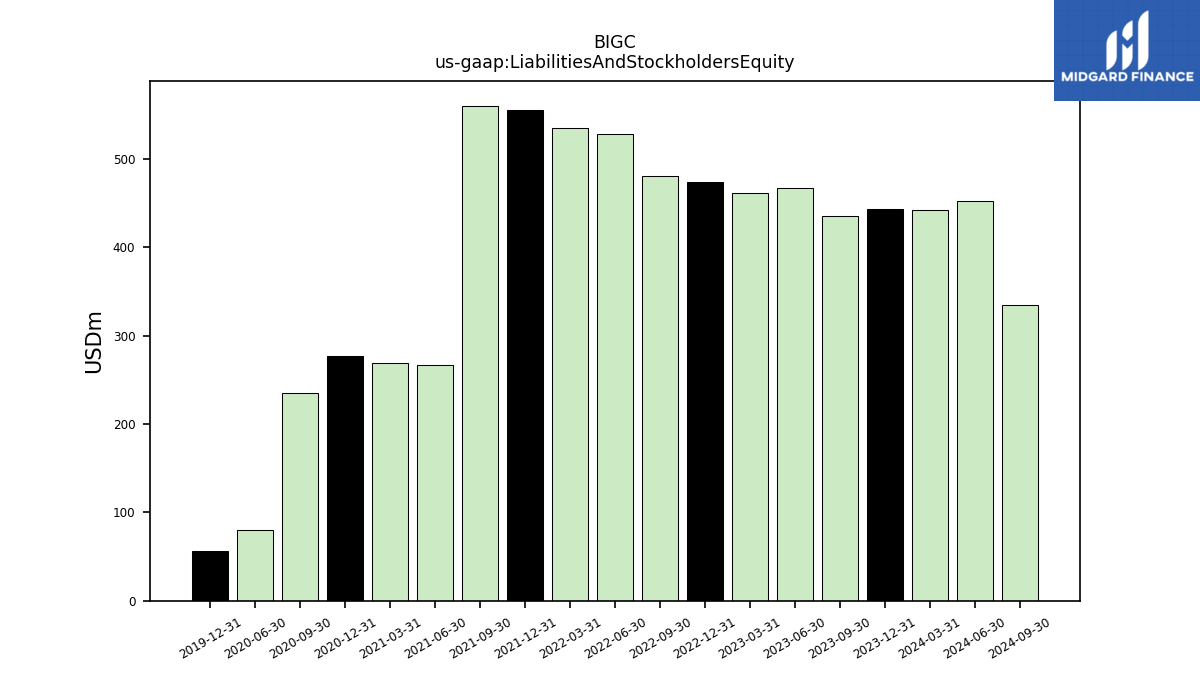
| Liabilities And Stockholders Equity | 435.98 | 467.50 | 461.51 | 474.06 | 481.37 | 528.59 | 535.01 | 555.46 | 560.49 | 266.51 | 268.83 | 276.63 | 235.50 | 79.62 | NA | 56.06 | NA | NA | NA | |
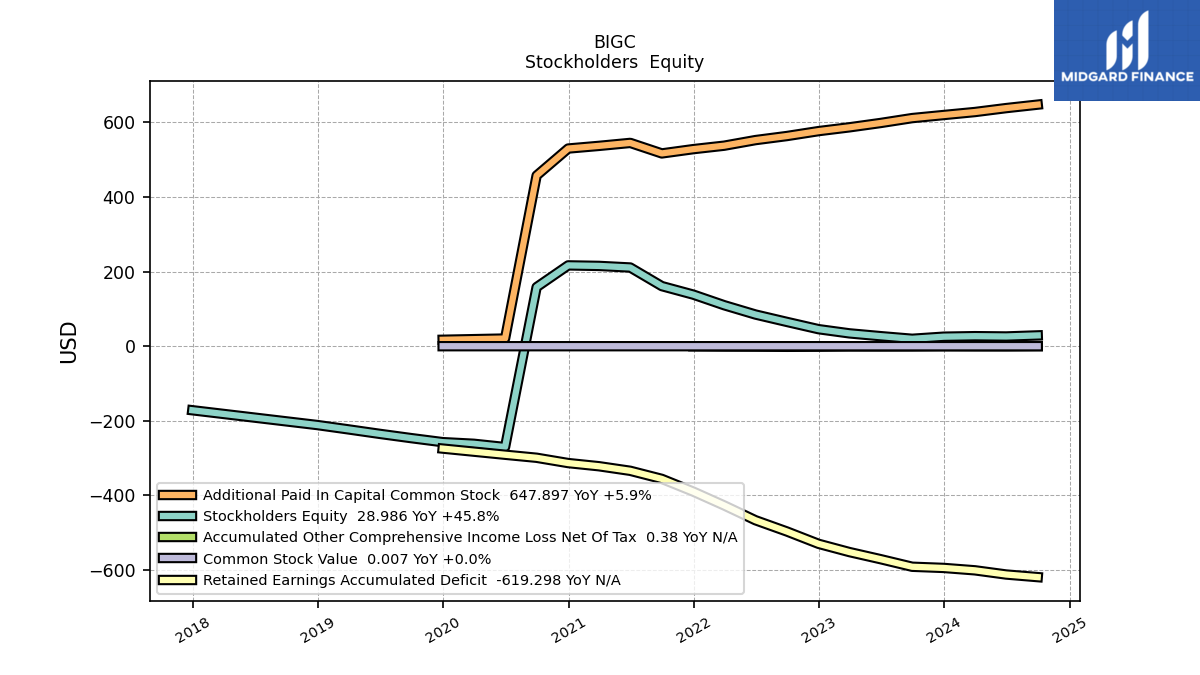
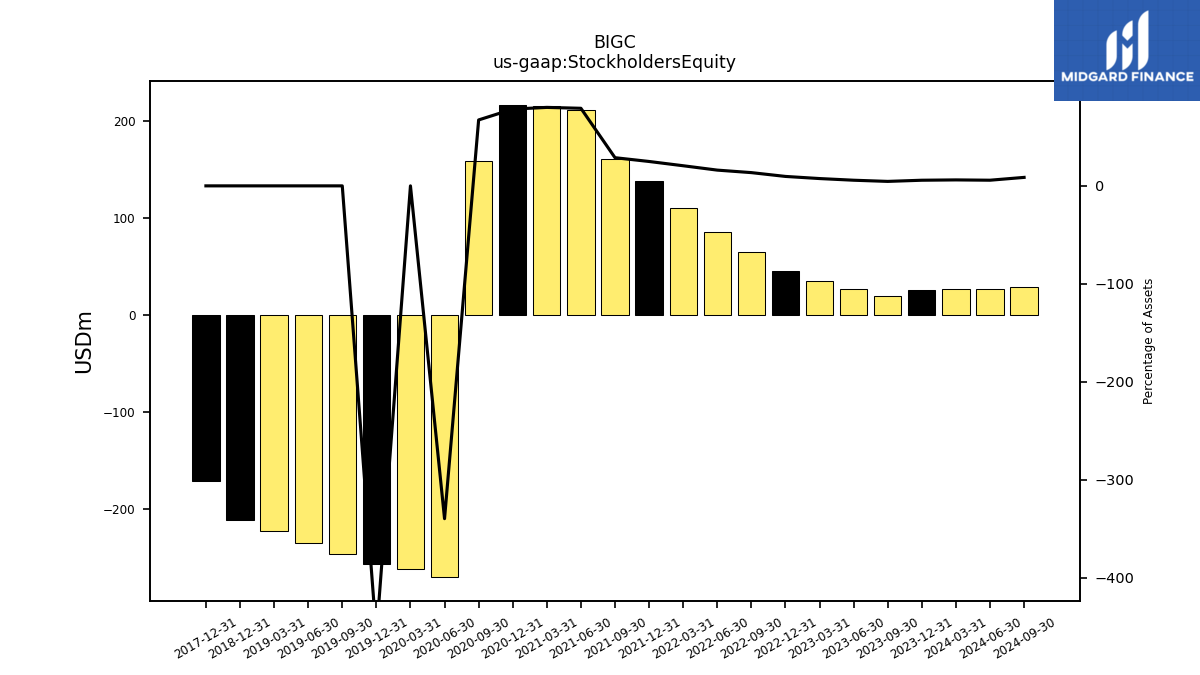
| Stockholders Equity | 19.88 | 26.92 | 34.44 | 45.67 | 65.09 | 84.98 | 109.88 | 138.29 | 161.19 | 211.07 | 215.34 | 216.76 | 158.50 | -270.51 | -261.71 | -257.30 | -246.47 | -235.01 | -223.04 |
| 2023-09-30 | 2023-06-30 | 2023-03-31 | 2022-12-31 | 2022-09-30 | 2022-06-30 | 2022-03-31 | 2021-12-31 | 2021-09-30 | 2021-06-30 | 2021-03-31 | 2020-12-31 | 2020-09-30 | 2020-06-30 | 2020-03-31 | 2019-12-31 | 2019-09-30 | 2019-06-30 | 2019-03-31 | ||
|---|---|---|---|---|---|---|---|---|---|---|---|---|---|---|---|---|---|---|---|---|
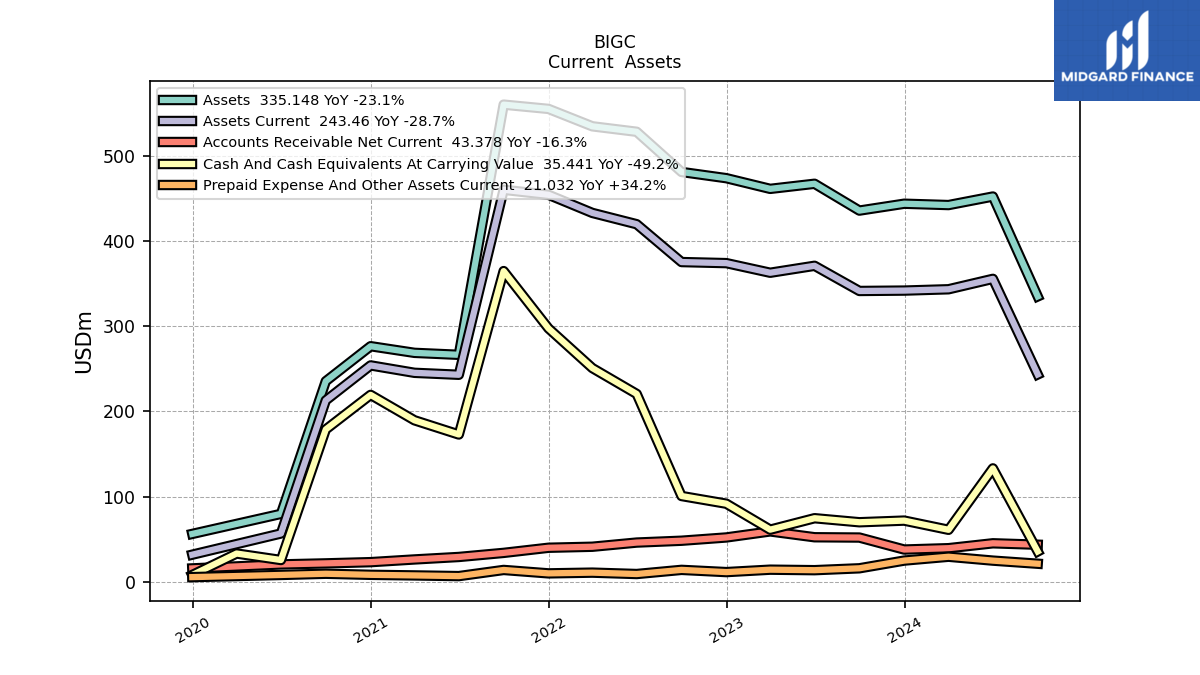
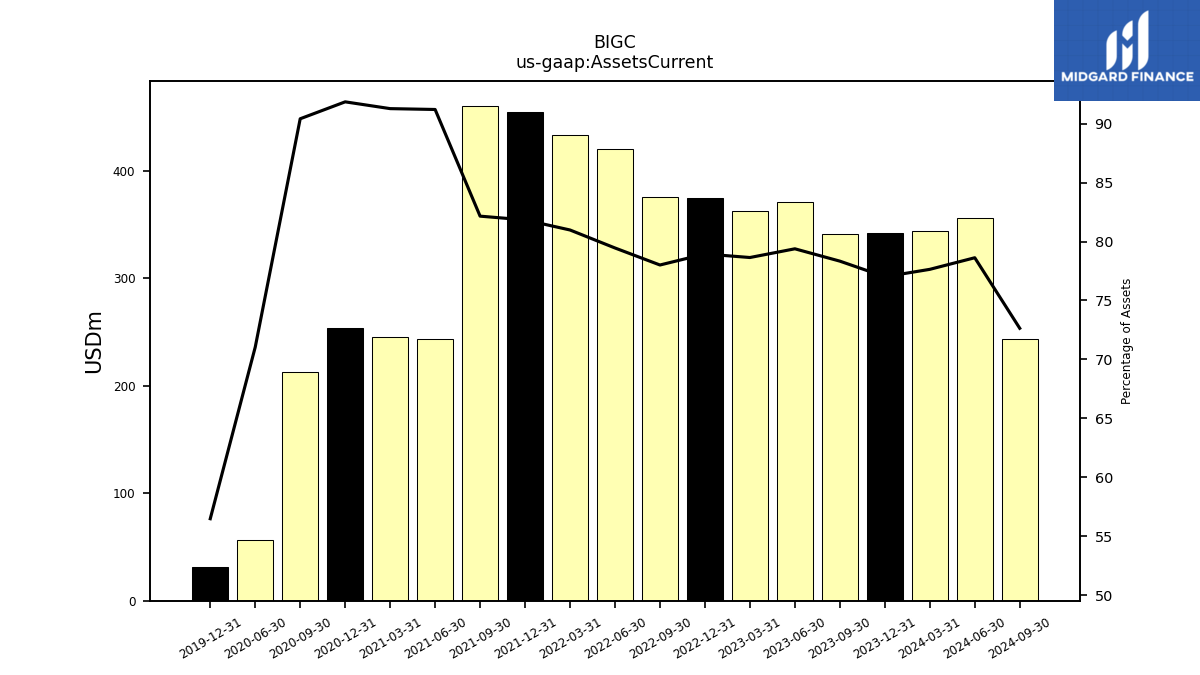
| Assets Current | 341.53 | 371.12 | 362.95 | 374.25 | 375.51 | 419.98 | 433.24 | 454.55 | 460.46 | 243.06 | 245.36 | 254.07 | 212.92 | 56.56 | NA | 31.67 | NA | NA | NA | |
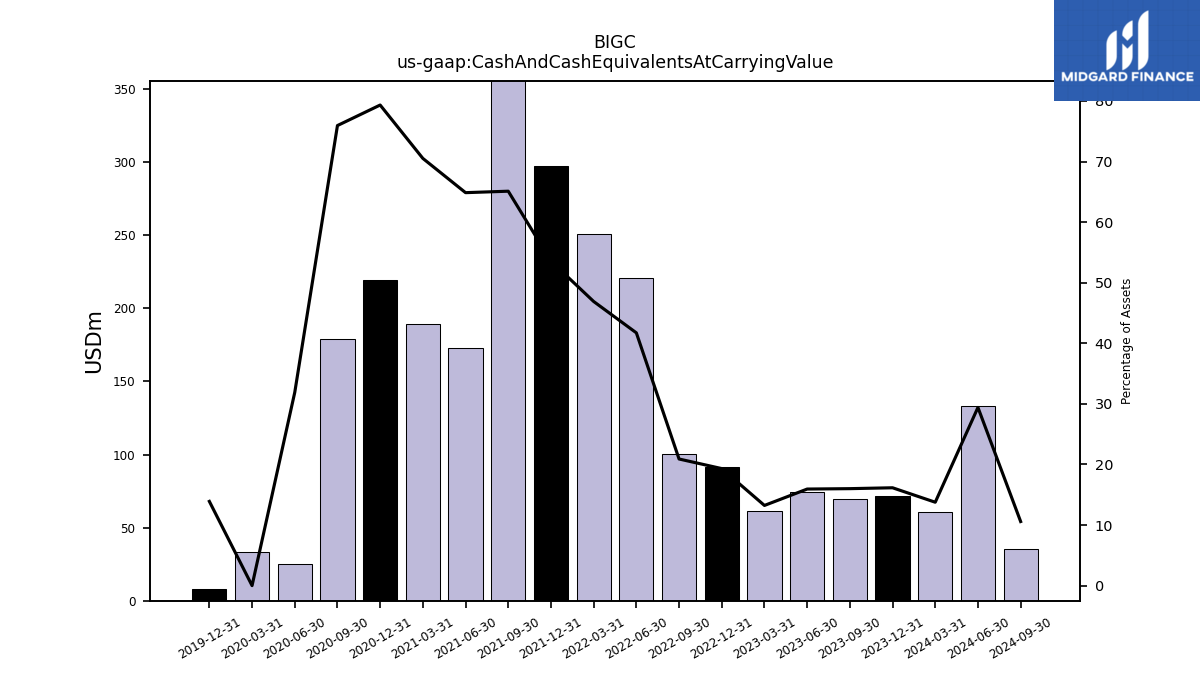
| Cash And Cash Equivalents At Carrying Value | 69.78 | 74.52 | 61.07 | 91.57 | 100.61 | 220.55 | 250.93 | 297.56 | 364.91 | 172.87 | 189.58 | 219.45 | 178.85 | 25.39 | 33.03 | 7.79 | NA | NA | NA | |
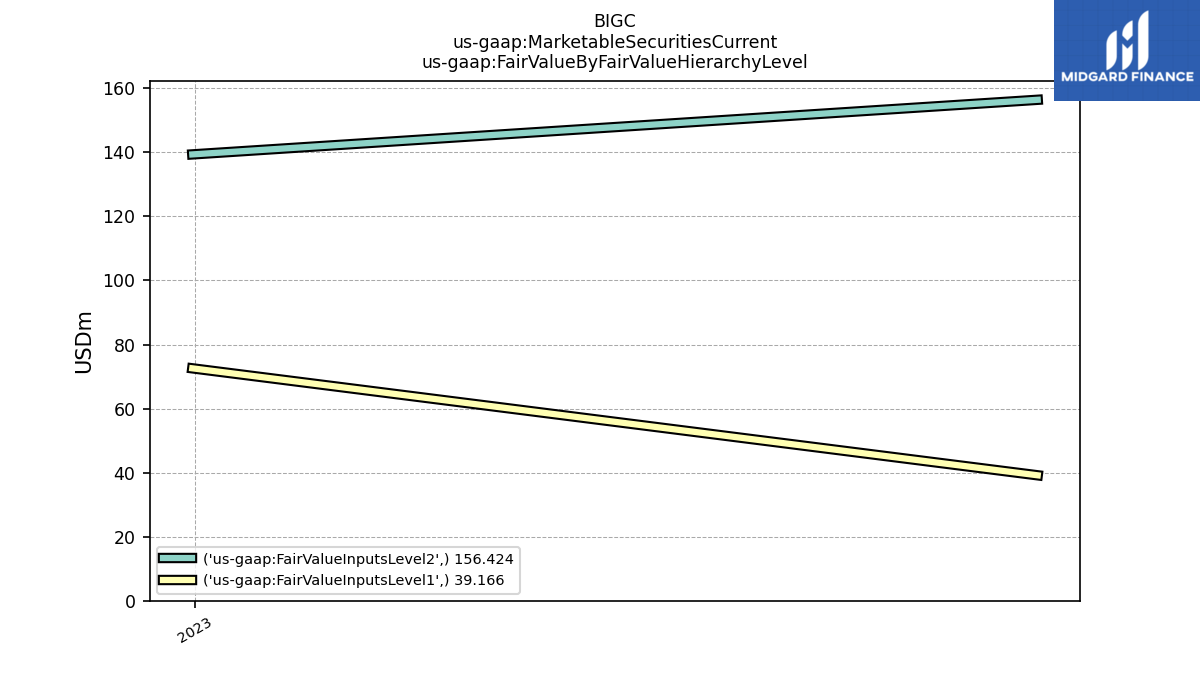
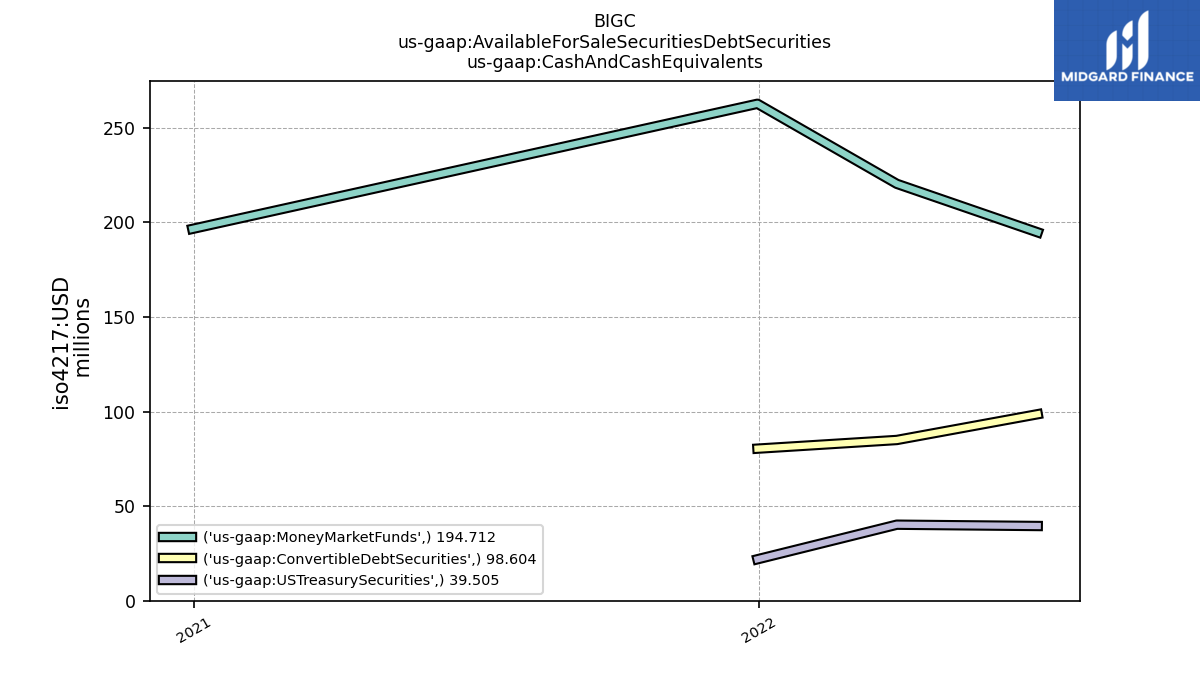
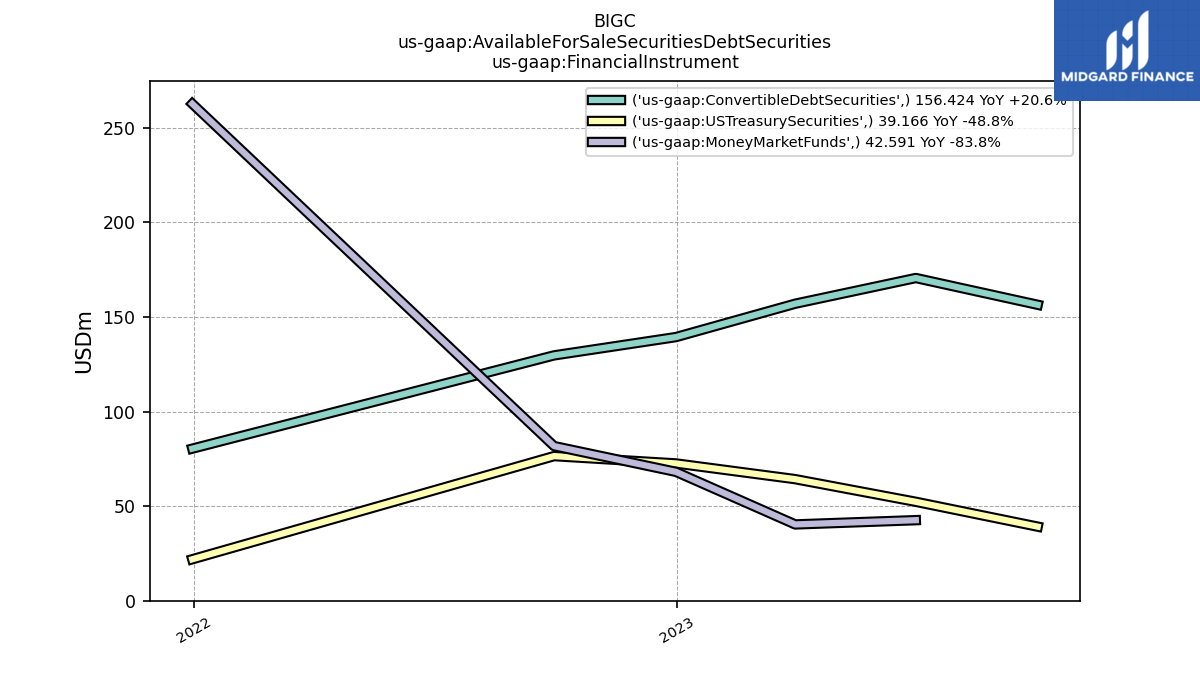
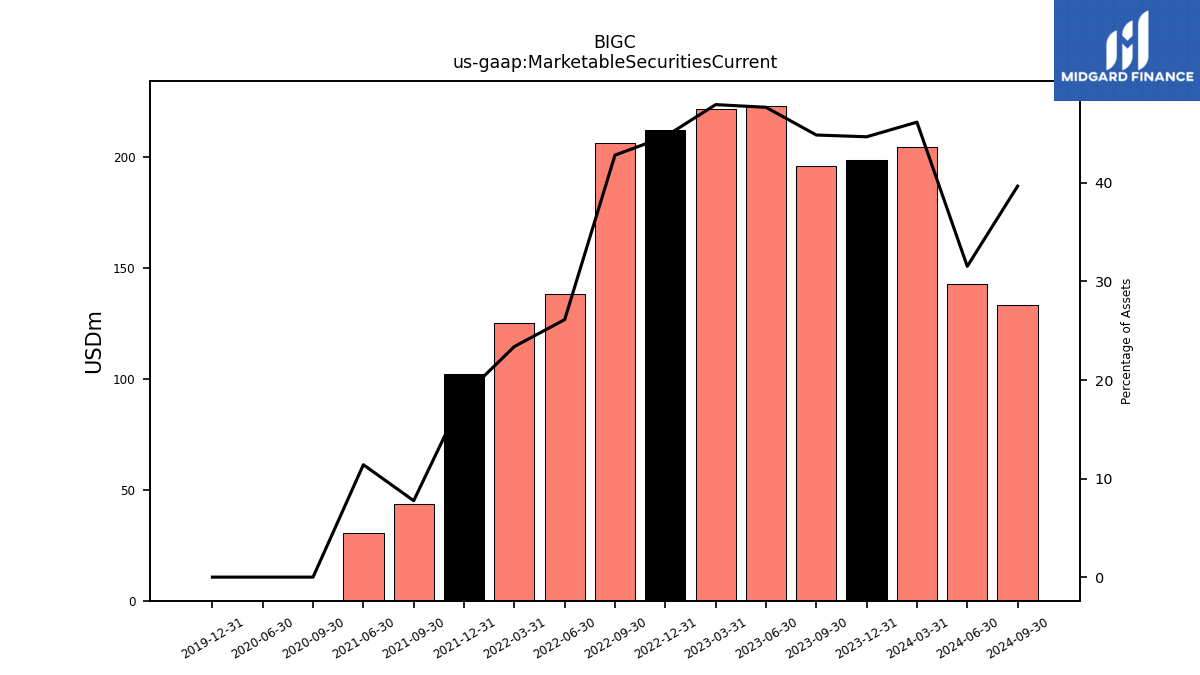
| Marketable Securities Current | 195.59 | 222.89 | 221.27 | 211.94 | 206.13 | 138.11 | 125.17 | 102.31 | 43.47 | 30.40 | NA | NA | 0.00 | 0.00 | NA | 0.00 | NA | NA | NA | |
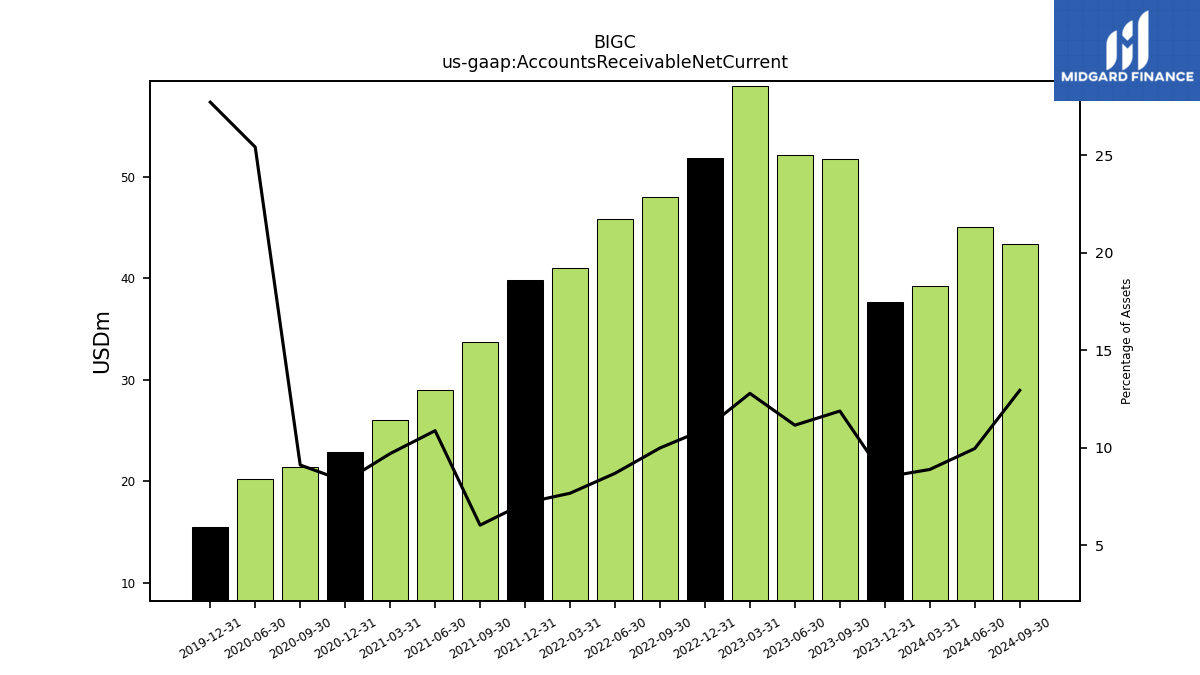
| Accounts Receivable Net Current | 51.80 | 52.15 | 59.01 | 51.90 | 48.06 | 45.91 | 40.99 | 39.81 | 33.77 | 28.98 | 26.07 | 22.89 | 21.46 | 20.24 | NA | 15.55 | NA | NA | NA | |
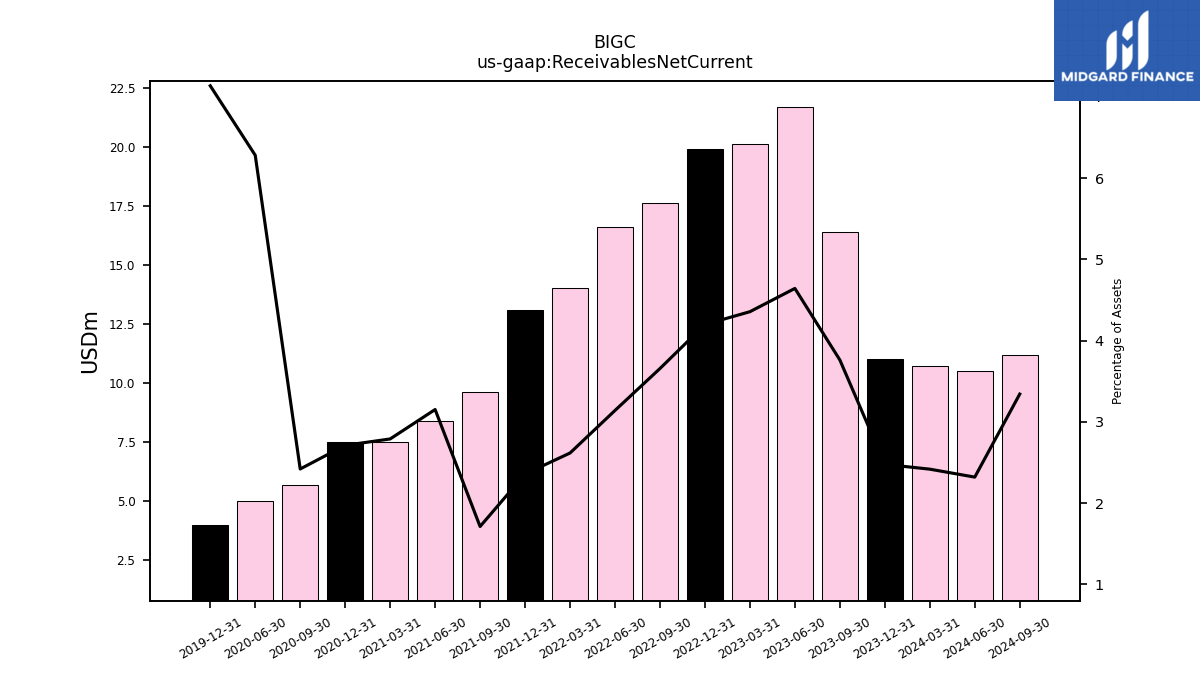
| Receivables Net Current | 16.40 | 21.70 | 20.10 | 19.90 | 17.60 | 16.60 | 14.00 | 13.10 | 9.60 | 8.40 | 7.50 | 7.50 | 5.70 | 5.00 | NA | 4.00 | NA | NA | NA | |
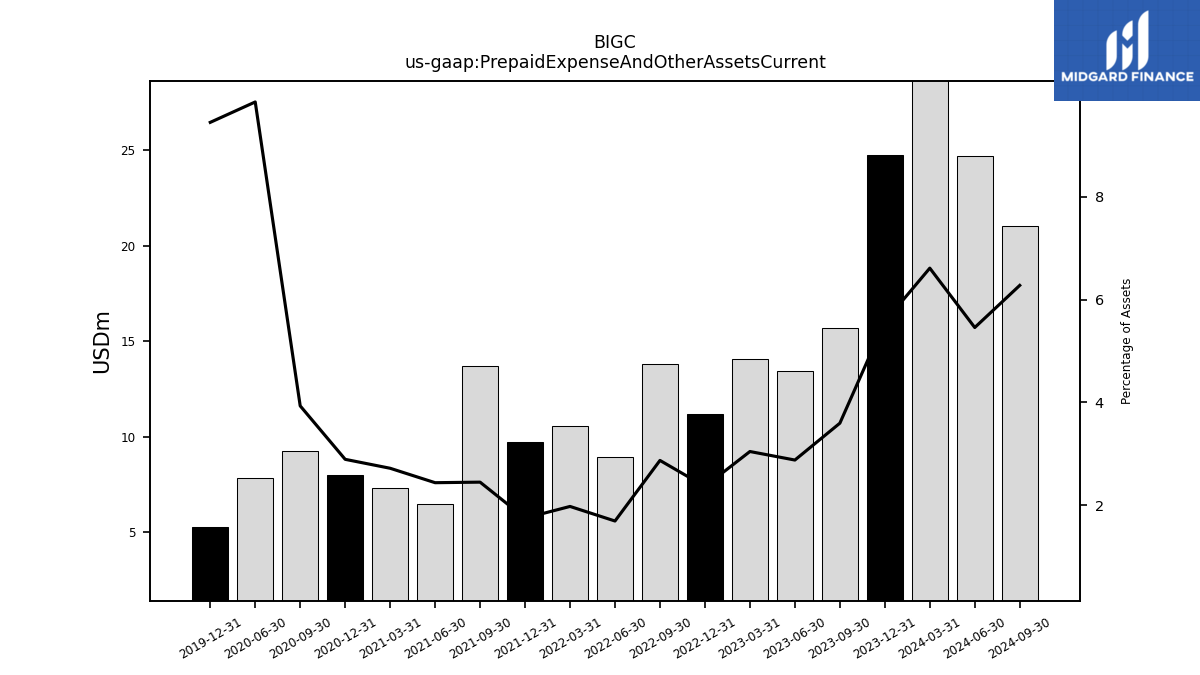
| Prepaid Expense And Other Assets Current | 15.67 | 13.46 | 14.05 | 11.21 | 13.82 | 8.94 | 10.57 | 9.71 | 13.72 | 6.50 | 7.31 | 8.00 | 9.26 | 7.84 | NA | 5.30 | NA | NA | NA | |
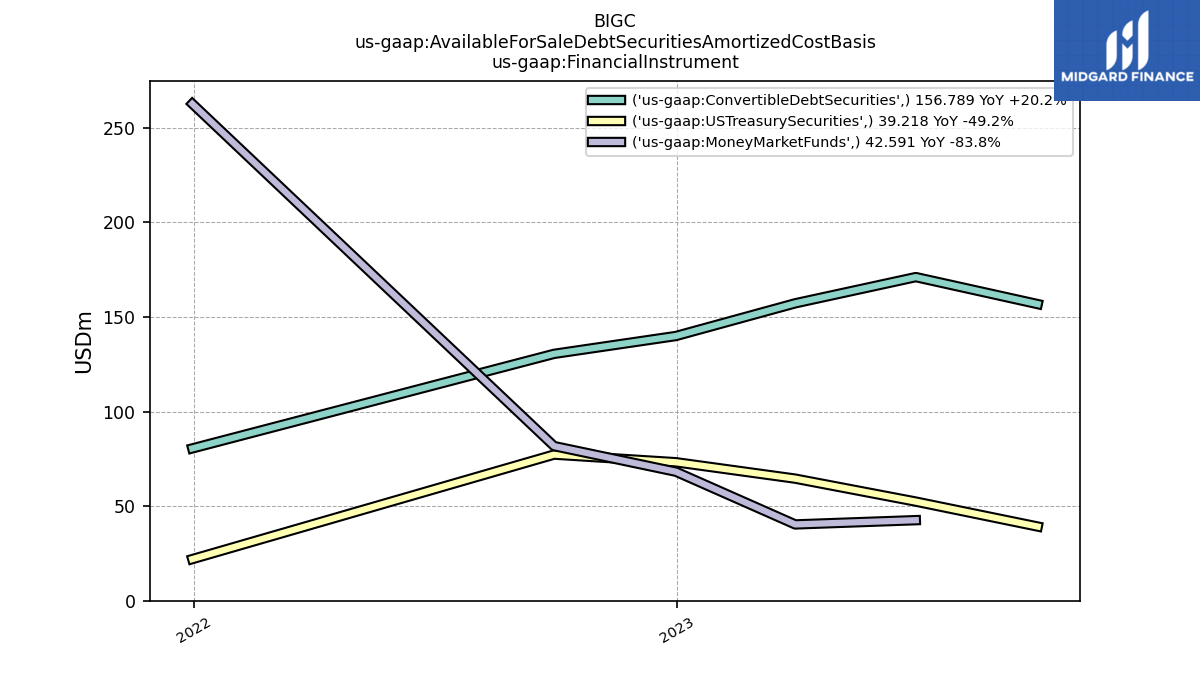
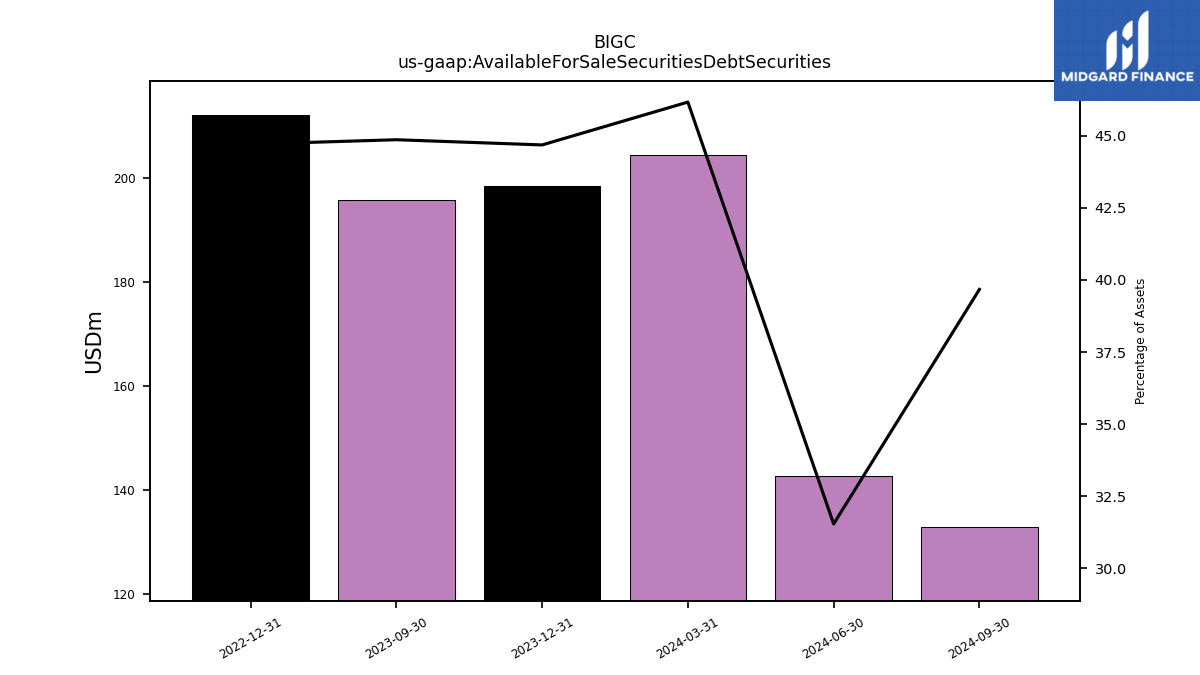
| Available For Sale Securities Debt Securities | 195.59 | NA | NA | 211.94 | NA | NA | NA | NA | NA | NA | NA | NA | NA | NA | NA | NA | NA | NA | NA |
| 2023-09-30 | 2023-06-30 | 2023-03-31 | 2022-12-31 | 2022-09-30 | 2022-06-30 | 2022-03-31 | 2021-12-31 | 2021-09-30 | 2021-06-30 | 2021-03-31 | 2020-12-31 | 2020-09-30 | 2020-06-30 | 2020-03-31 | 2019-12-31 | 2019-09-30 | 2019-06-30 | 2019-03-31 | ||
|---|---|---|---|---|---|---|---|---|---|---|---|---|---|---|---|---|---|---|---|---|
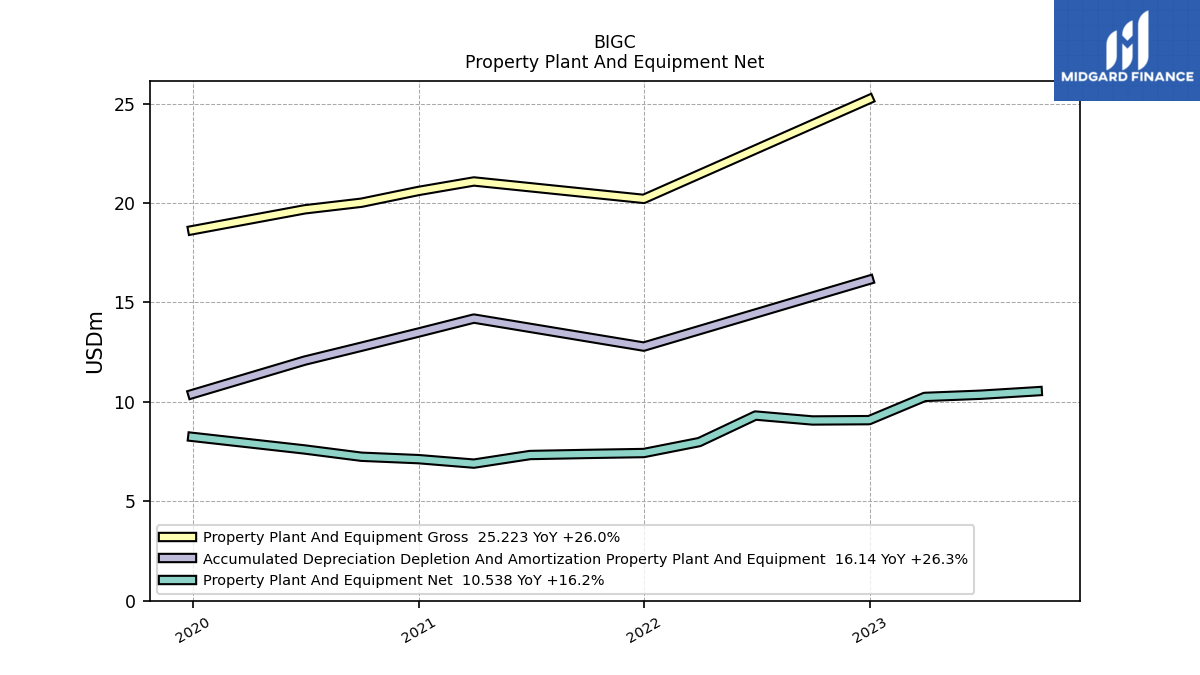
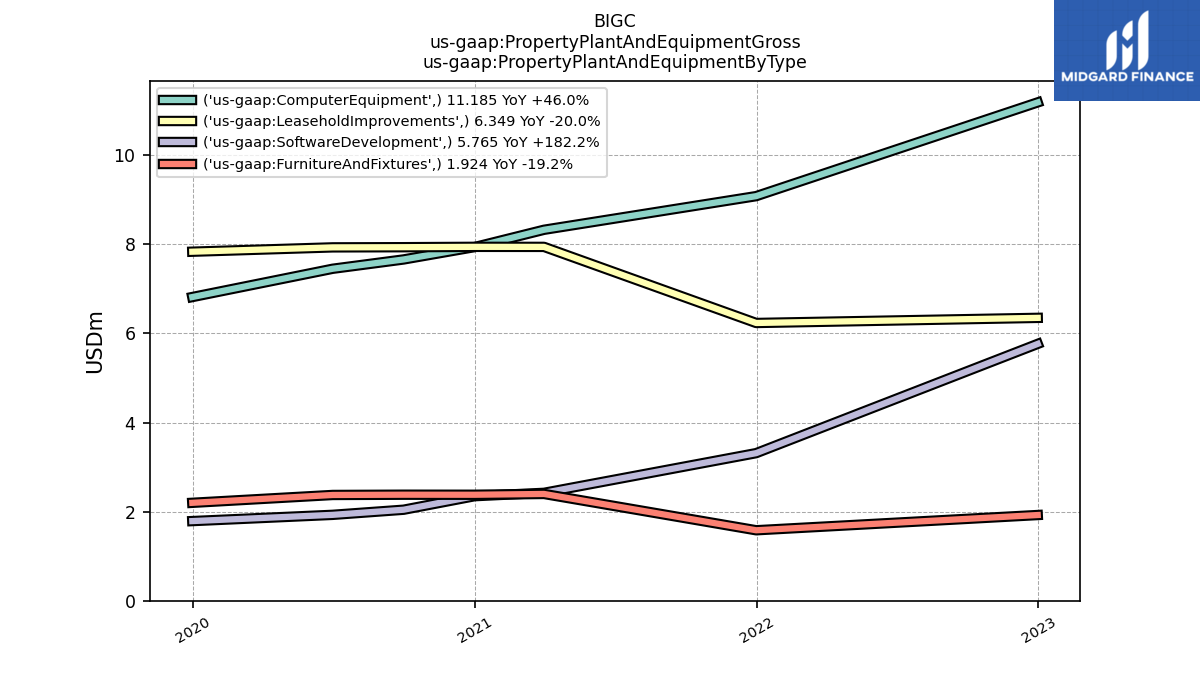
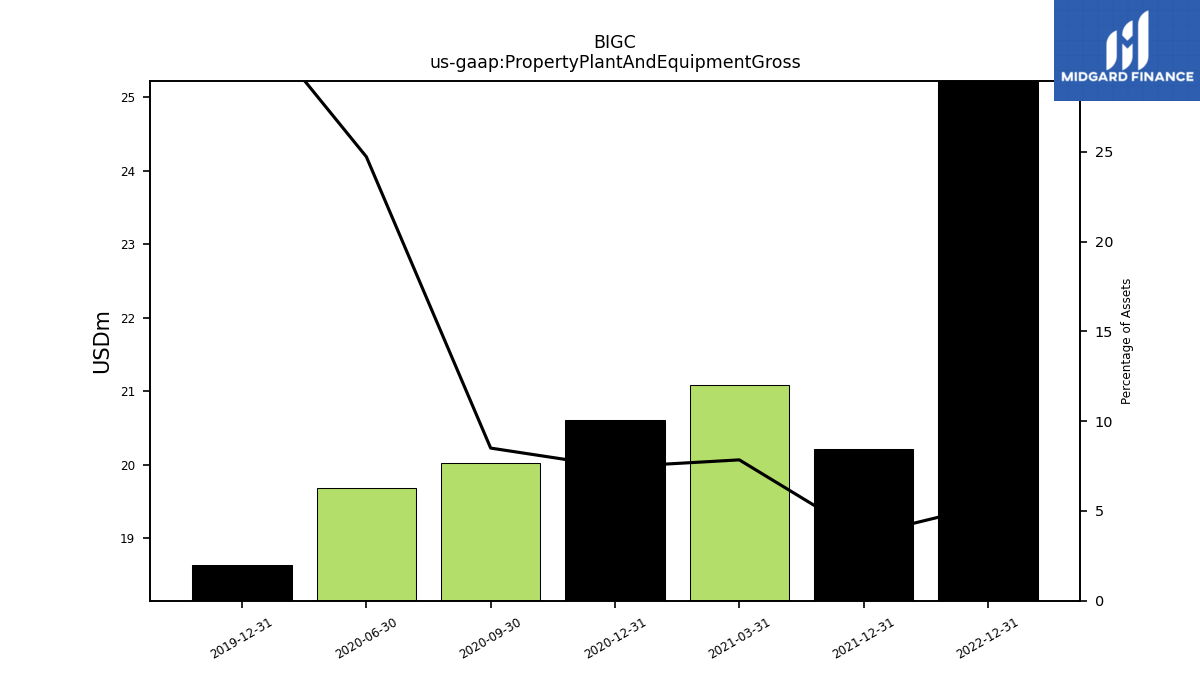
| Property Plant And Equipment Gross | NA | NA | NA | 25.22 | NA | NA | NA | 20.21 | NA | NA | 21.09 | 20.61 | 20.02 | 19.68 | NA | 18.64 | NA | NA | NA | |
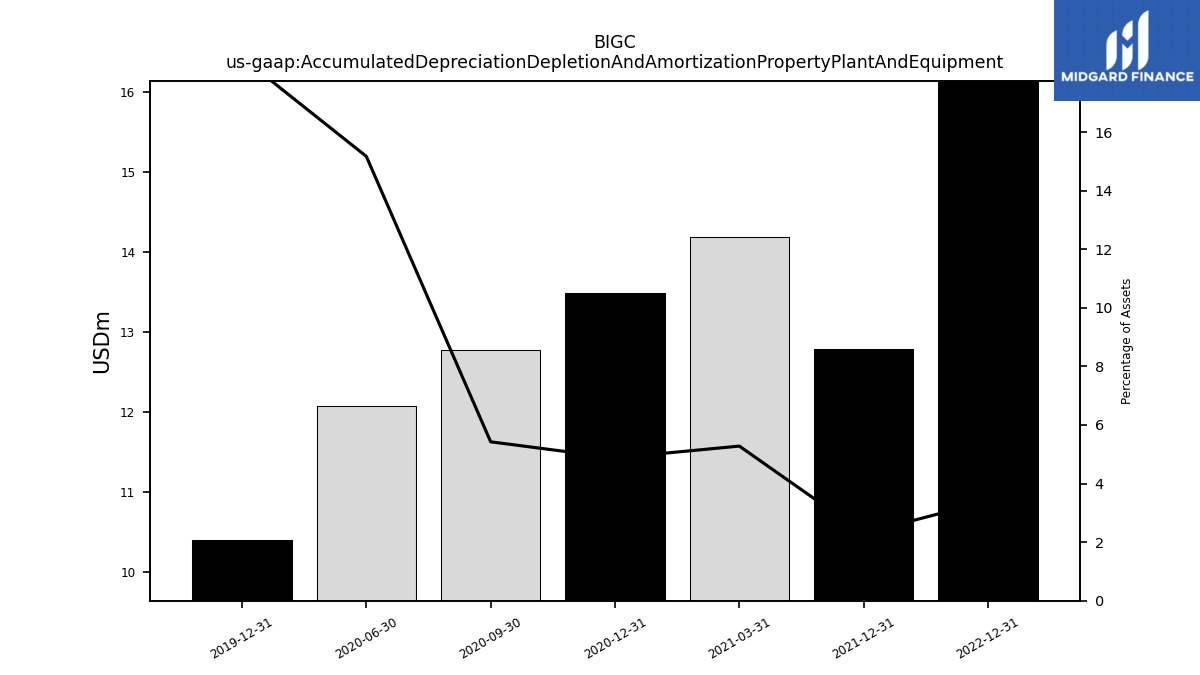
| Accumulated Depreciation Depletion And Amortization Property Plant And Equipment | NA | NA | NA | 16.14 | NA | NA | NA | 12.78 | NA | NA | 14.19 | 13.48 | 12.78 | 12.08 | NA | 10.39 | NA | NA | NA | |
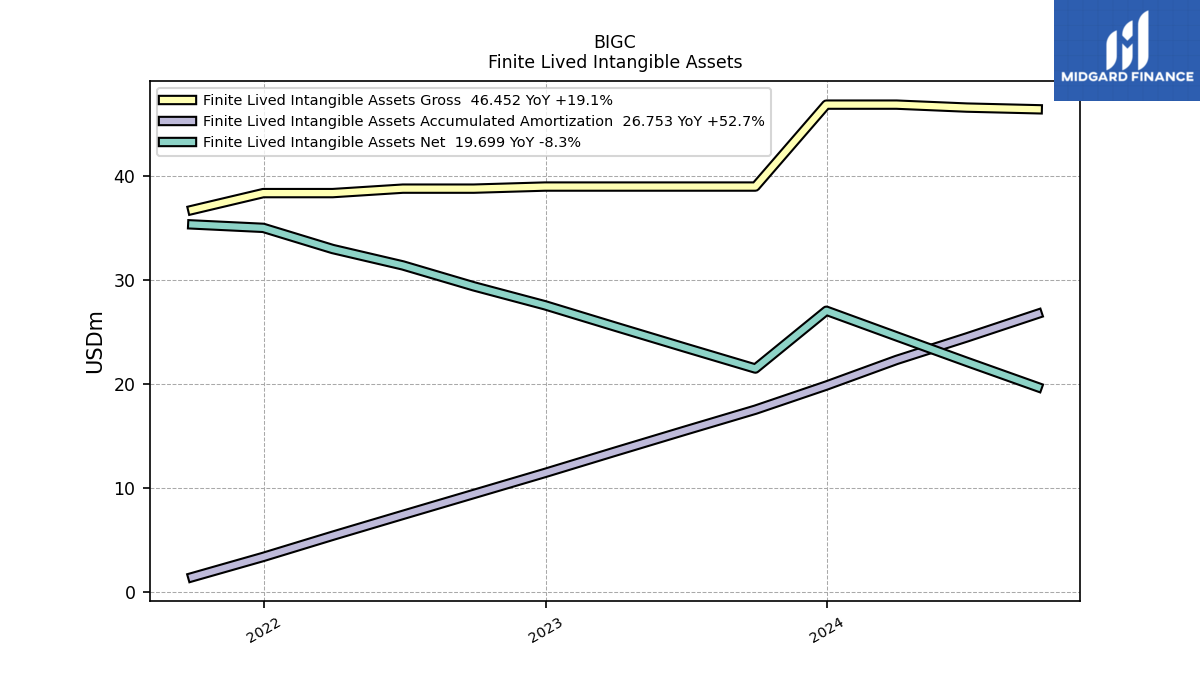
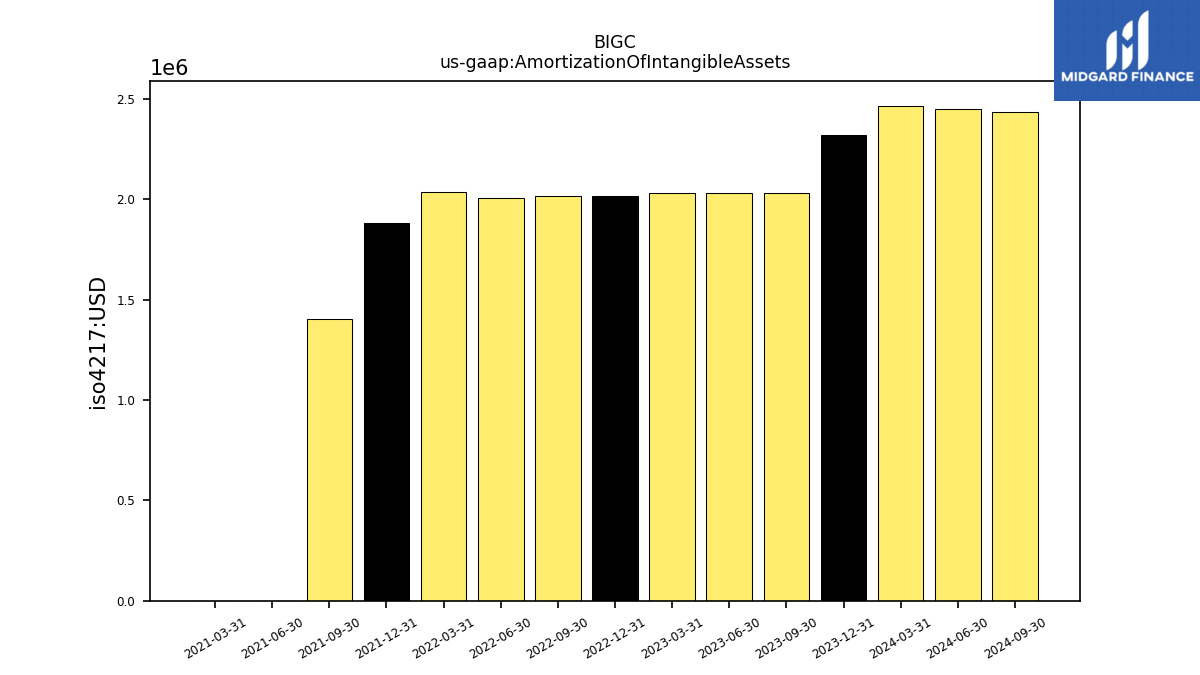
| Amortization Of Intangible Assets | 2.03 | 2.03 | 2.03 | 2.02 | 2.02 | 2.01 | 2.04 | 1.88 | 1.40 | 0.00 | 0.00 | NA | NA | NA | NA | NA | NA | NA | NA | |
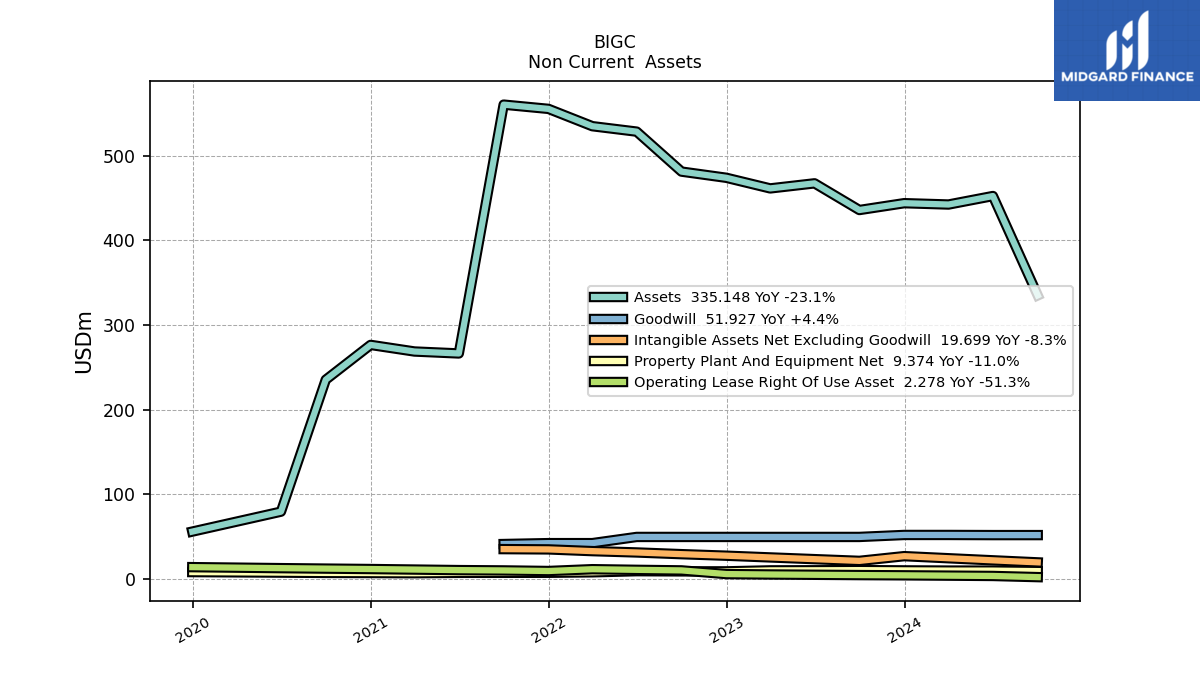
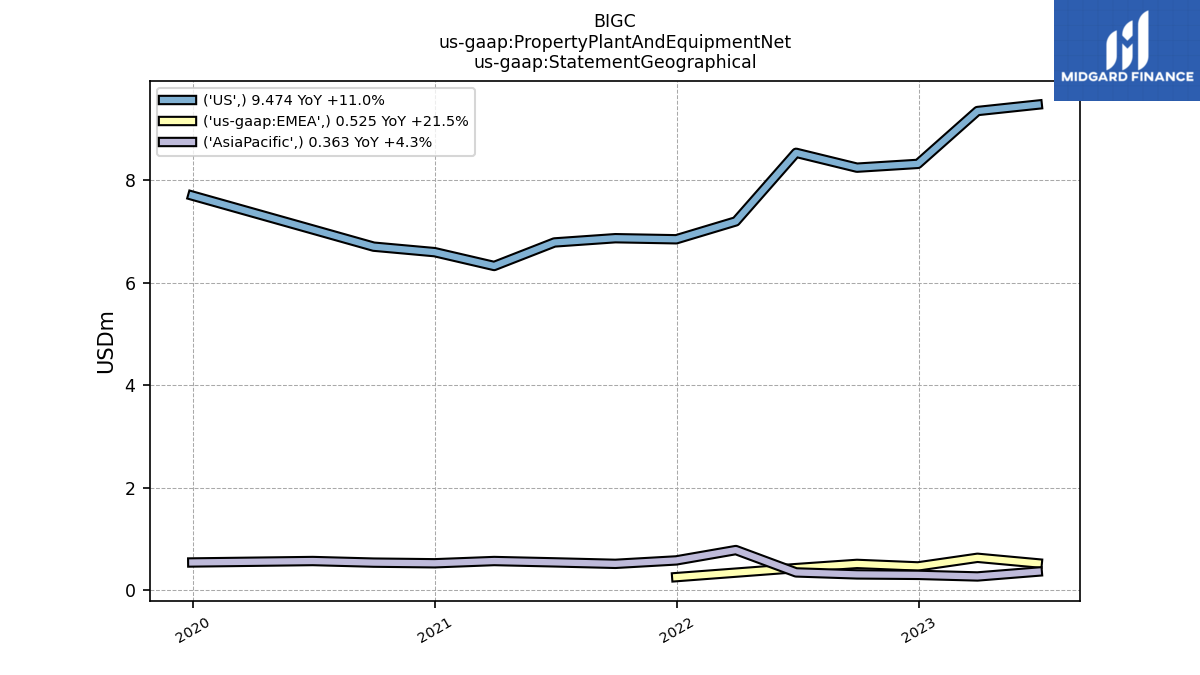
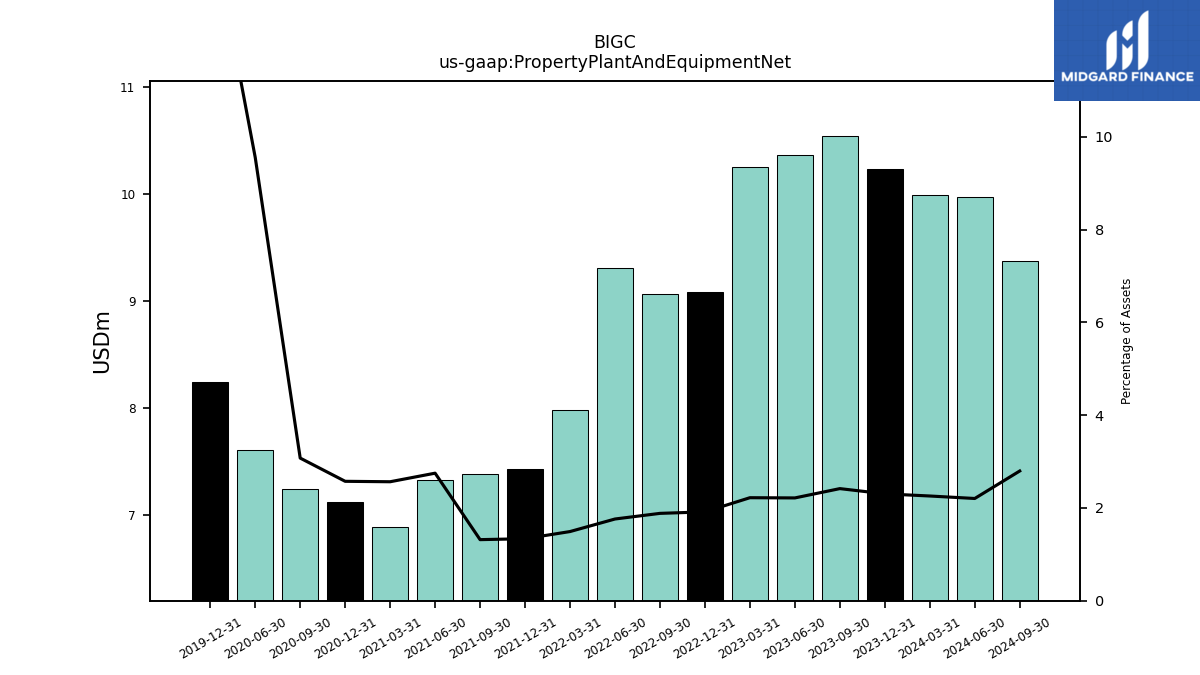
| Property Plant And Equipment Net | 10.54 | 10.36 | 10.25 | 9.08 | 9.07 | 9.31 | 7.98 | 7.43 | 7.38 | 7.33 | 6.90 | 7.12 | 7.24 | 7.61 | NA | 8.24 | NA | NA | NA | |
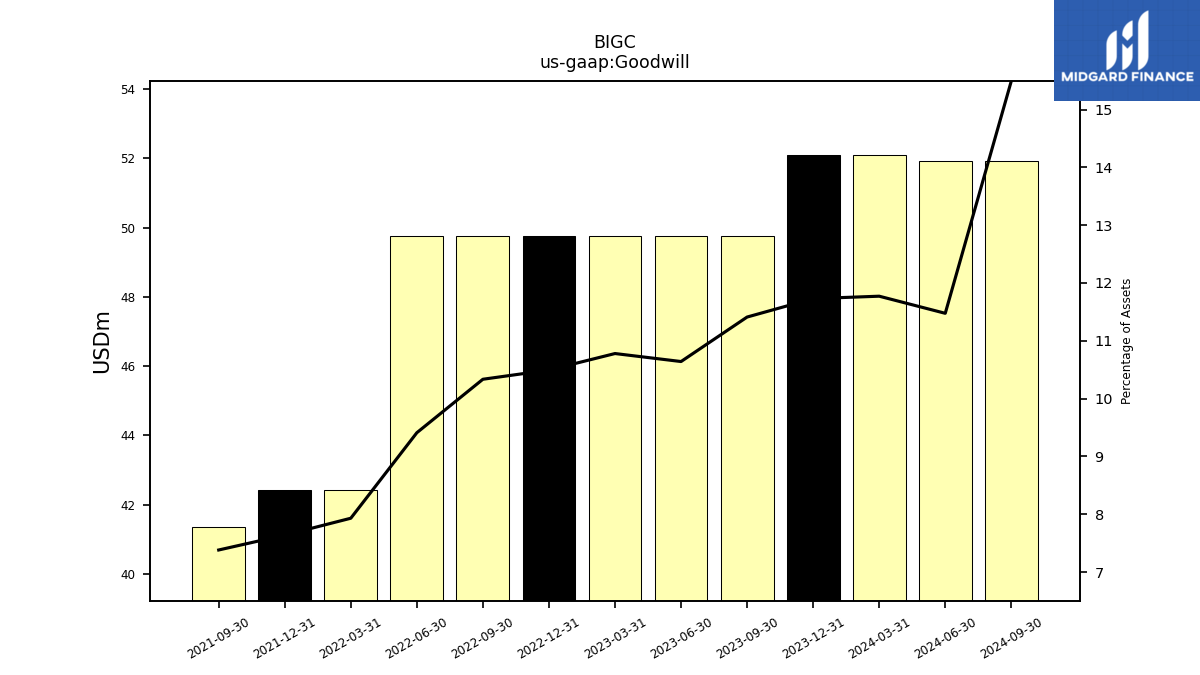
| Goodwill | 49.75 | 49.75 | 49.75 | 49.75 | 49.75 | 49.74 | 42.43 | 42.43 | 41.37 | NA | NA | NA | NA | NA | NA | NA | NA | NA | NA | |
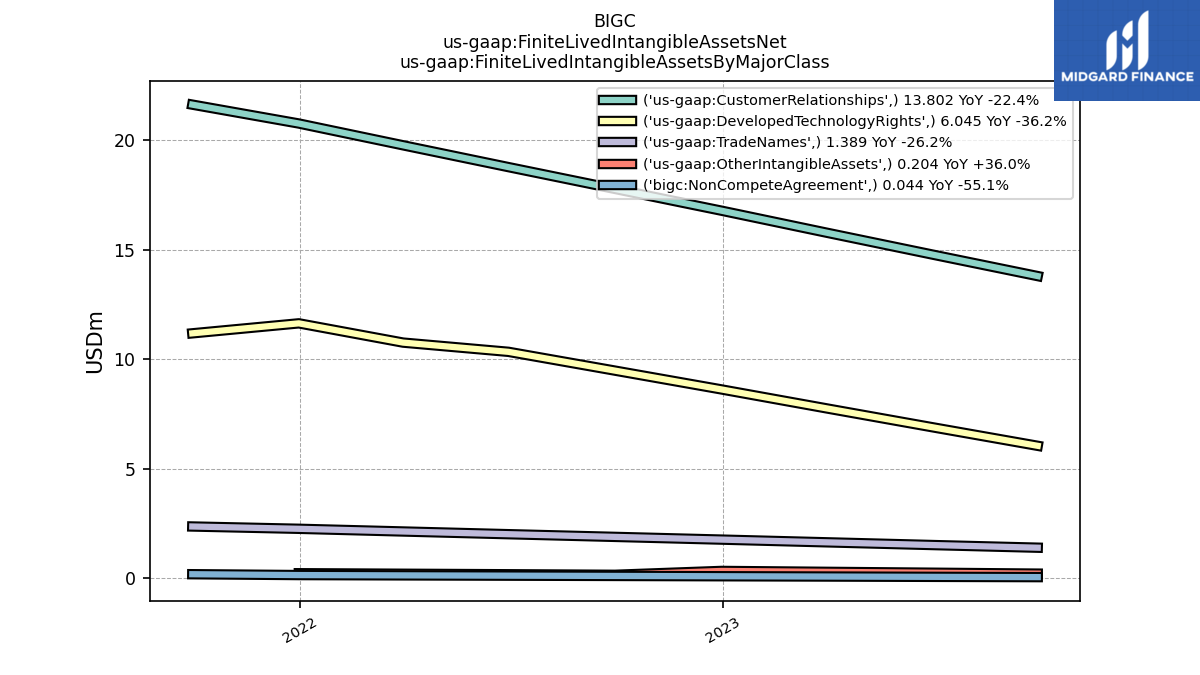
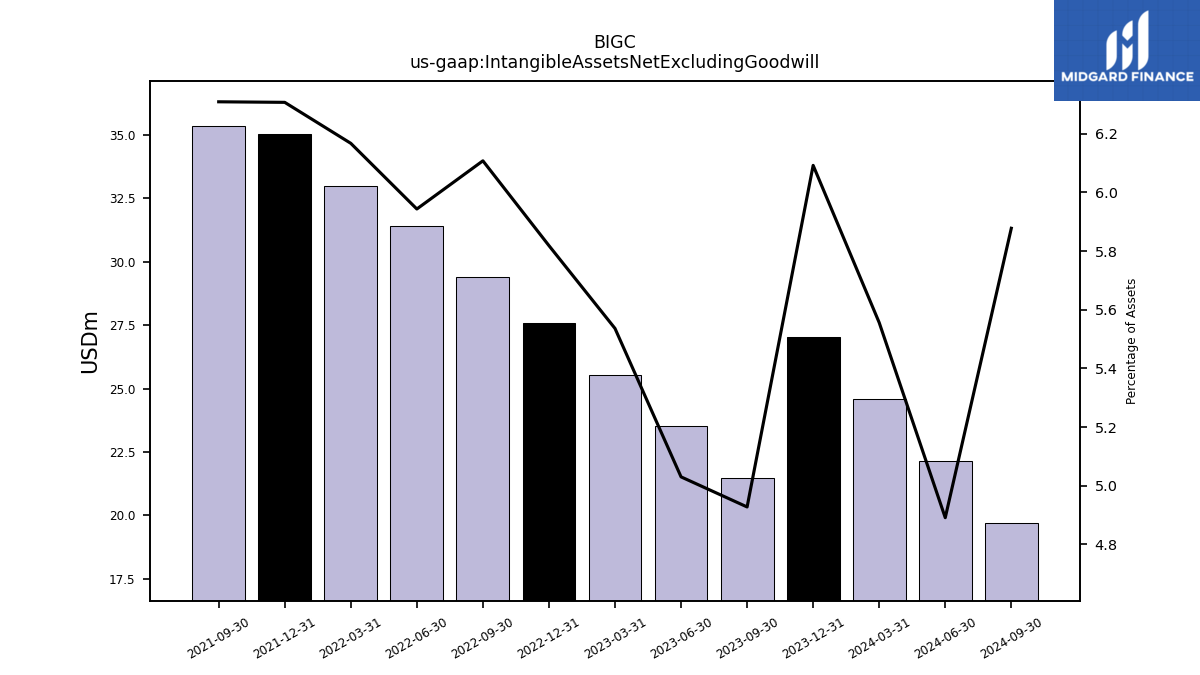
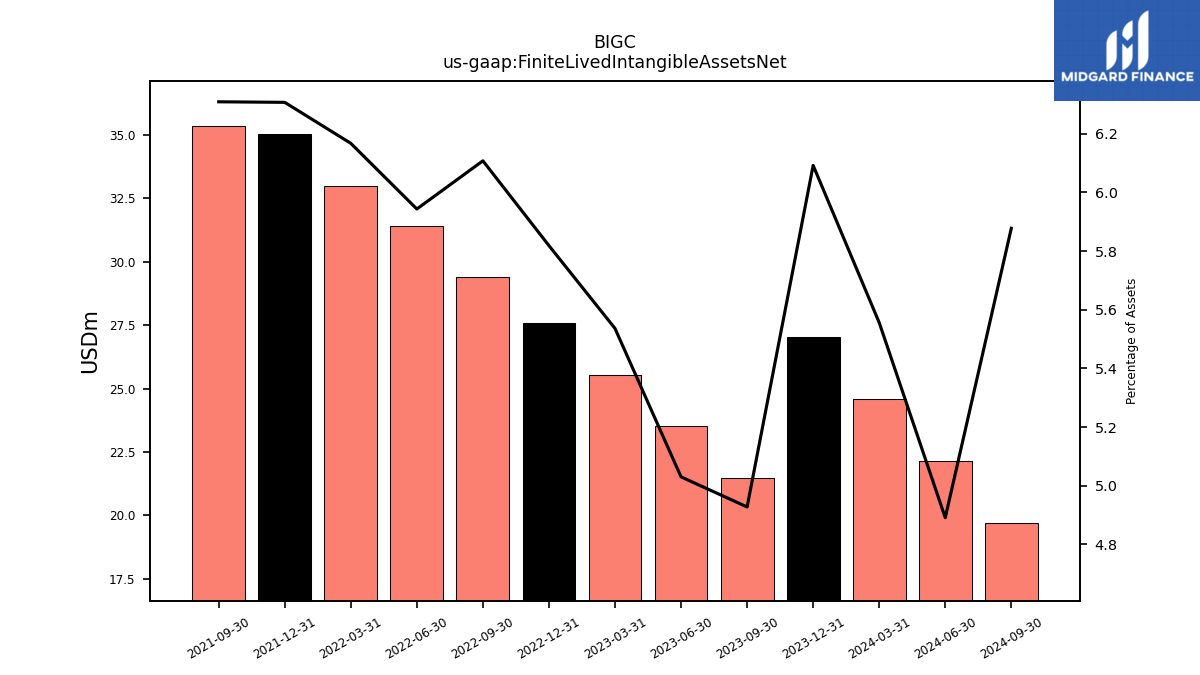
| Intangible Assets Net Excluding Goodwill | 21.48 | 23.52 | 25.55 | 27.58 | 29.40 | 31.42 | 32.99 | 35.03 | 35.36 | NA | NA | NA | NA | NA | NA | NA | NA | NA | NA | |
| Finite Lived Intangible Assets Net | 21.48 | 23.52 | 25.55 | 27.58 | 29.40 | 31.42 | 32.99 | 35.03 | 35.36 | NA | NA | NA | NA | NA | NA | NA | NA | NA | NA | |
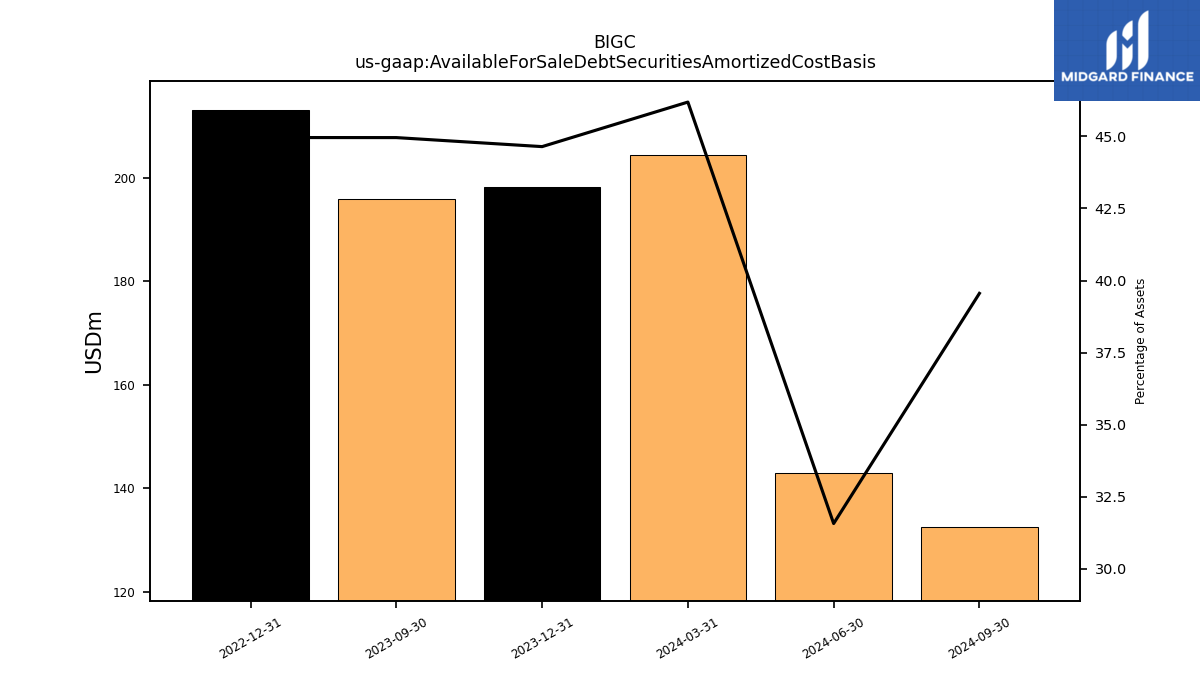
| Available For Sale Debt Securities Amortized Cost Basis | 196.01 | NA | NA | 213.14 | NA | NA | NA | NA | NA | NA | NA | NA | NA | NA | NA | NA | NA | NA | NA |
| 2023-09-30 | 2023-06-30 | 2023-03-31 | 2022-12-31 | 2022-09-30 | 2022-06-30 | 2022-03-31 | 2021-12-31 | 2021-09-30 | 2021-06-30 | 2021-03-31 | 2020-12-31 | 2020-09-30 | 2020-06-30 | 2020-03-31 | 2019-12-31 | 2019-09-30 | 2019-06-30 | 2019-03-31 | ||
|---|---|---|---|---|---|---|---|---|---|---|---|---|---|---|---|---|---|---|---|---|
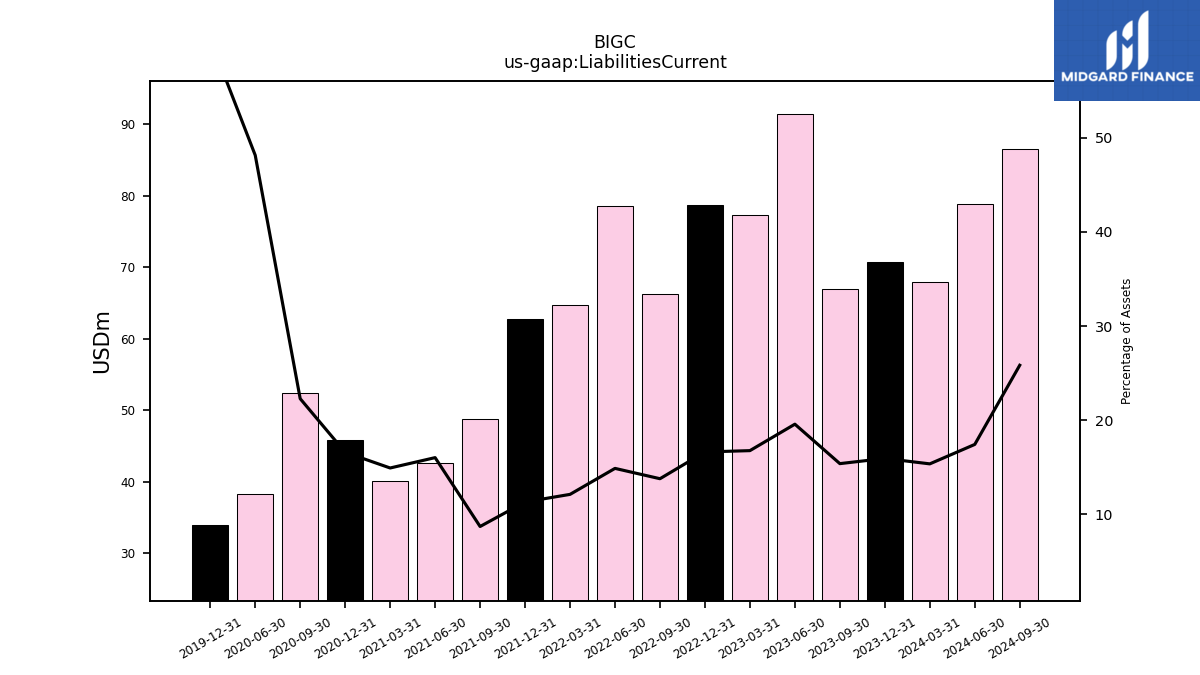
| Liabilities Current | 67.05 | 91.50 | 77.36 | 78.79 | 66.32 | 78.63 | 64.81 | 62.81 | 48.76 | 42.69 | 40.10 | 45.89 | 52.48 | 38.34 | NA | 33.91 | NA | NA | NA | |
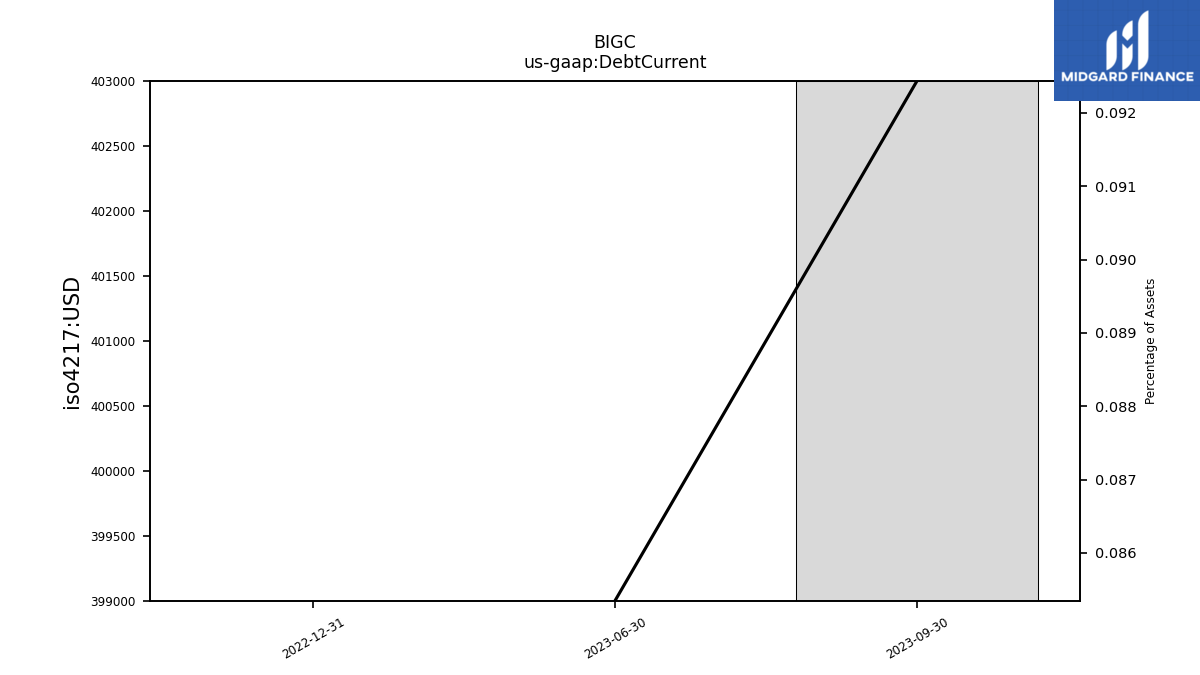
| Debt Current | 0.40 | 0.40 | NA | 0.00 | NA | NA | NA | NA | NA | NA | NA | NA | NA | NA | NA | NA | NA | NA | NA | |
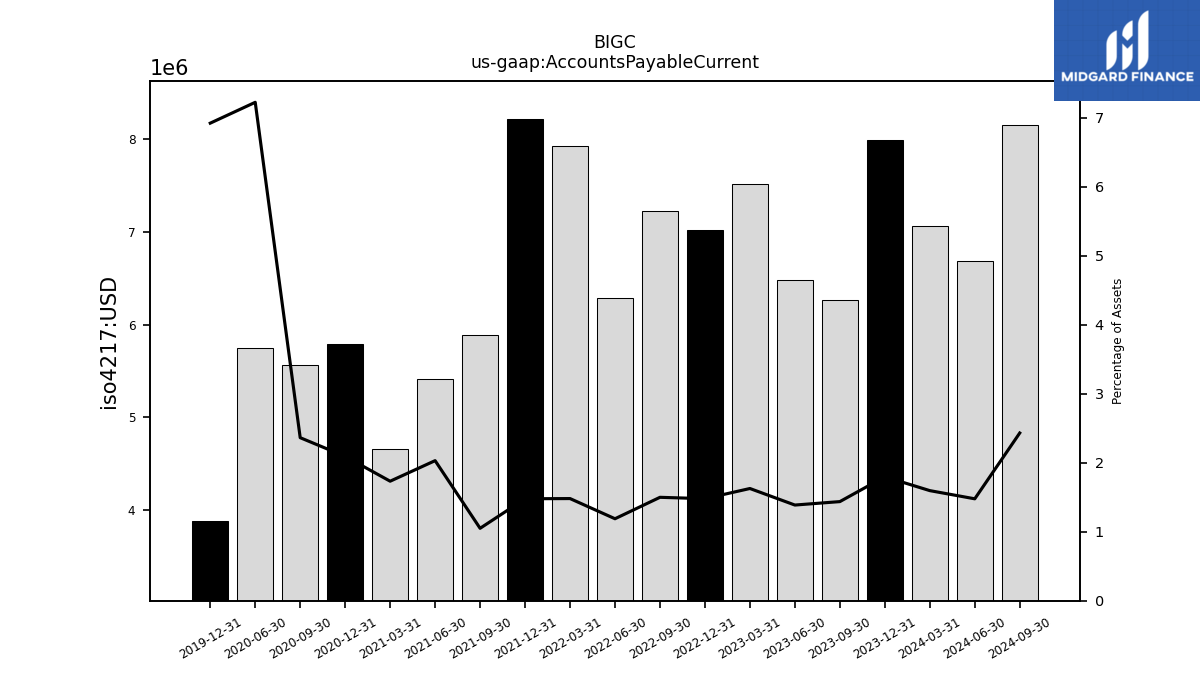
| Accounts Payable Current | 6.26 | 6.49 | 7.51 | 7.01 | 7.22 | 6.28 | 7.92 | 8.21 | 5.88 | 5.41 | 4.66 | 5.79 | 5.57 | 5.75 | NA | 3.88 | NA | NA | NA | |
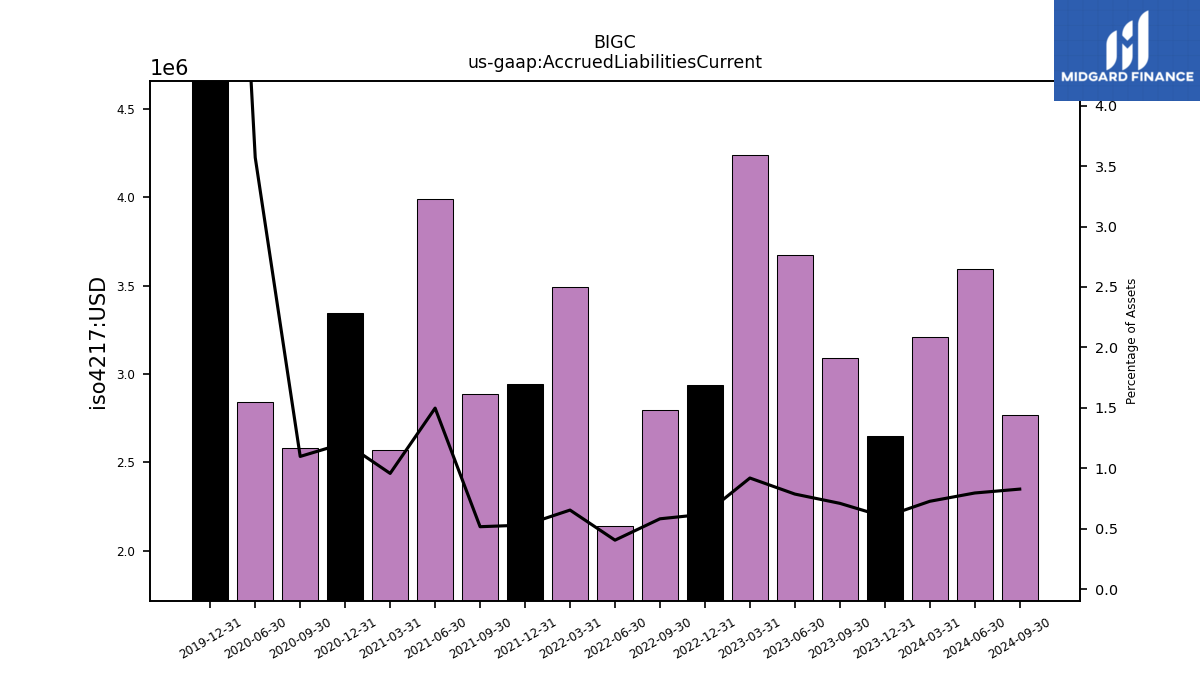
| Accrued Liabilities Current | 3.09 | 3.67 | 4.24 | 2.94 | 2.80 | 2.14 | 3.50 | 2.94 | 2.89 | 3.99 | 2.57 | 3.34 | 2.58 | 2.84 | NA | 5.85 | NA | NA | NA | |
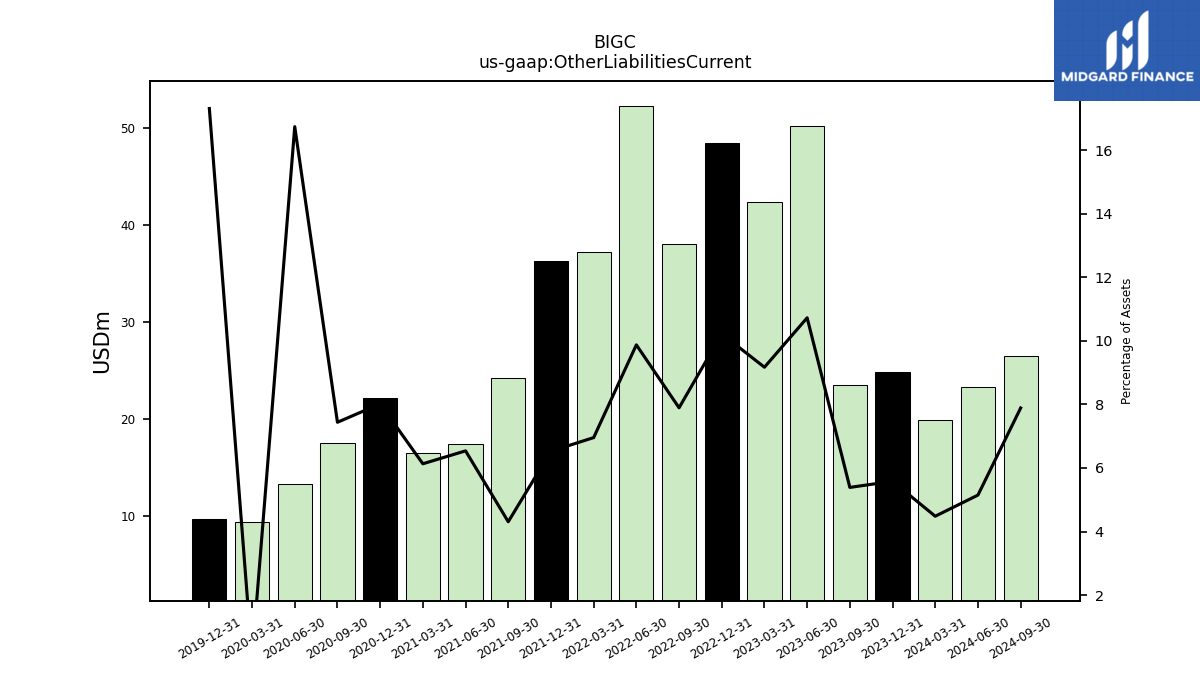
| Other Liabilities Current | 23.49 | 50.14 | 42.32 | 48.44 | 38.00 | 52.19 | 37.21 | 36.25 | 24.15 | 17.43 | 16.48 | 22.18 | 17.52 | 13.33 | 9.40 | 9.70 | NA | NA | NA |
| 2023-09-30 | 2023-06-30 | 2023-03-31 | 2022-12-31 | 2022-09-30 | 2022-06-30 | 2022-03-31 | 2021-12-31 | 2021-09-30 | 2021-06-30 | 2021-03-31 | 2020-12-31 | 2020-09-30 | 2020-06-30 | 2020-03-31 | 2019-12-31 | 2019-09-30 | 2019-06-30 | 2019-03-31 | ||
|---|---|---|---|---|---|---|---|---|---|---|---|---|---|---|---|---|---|---|---|---|
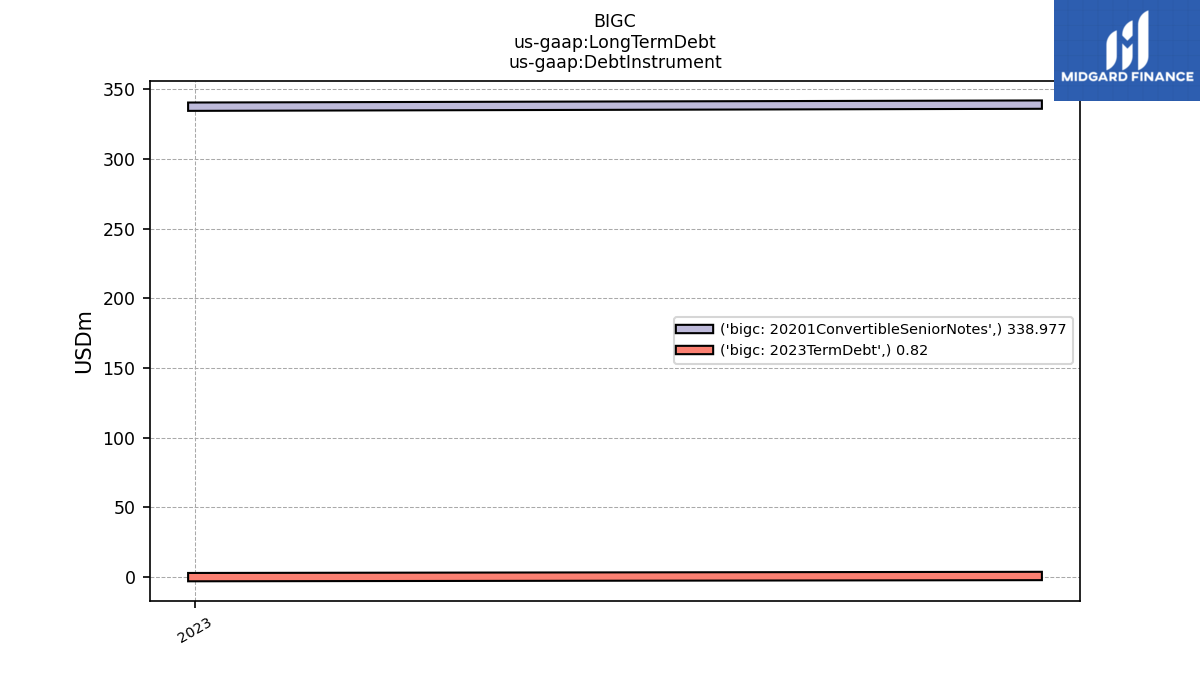
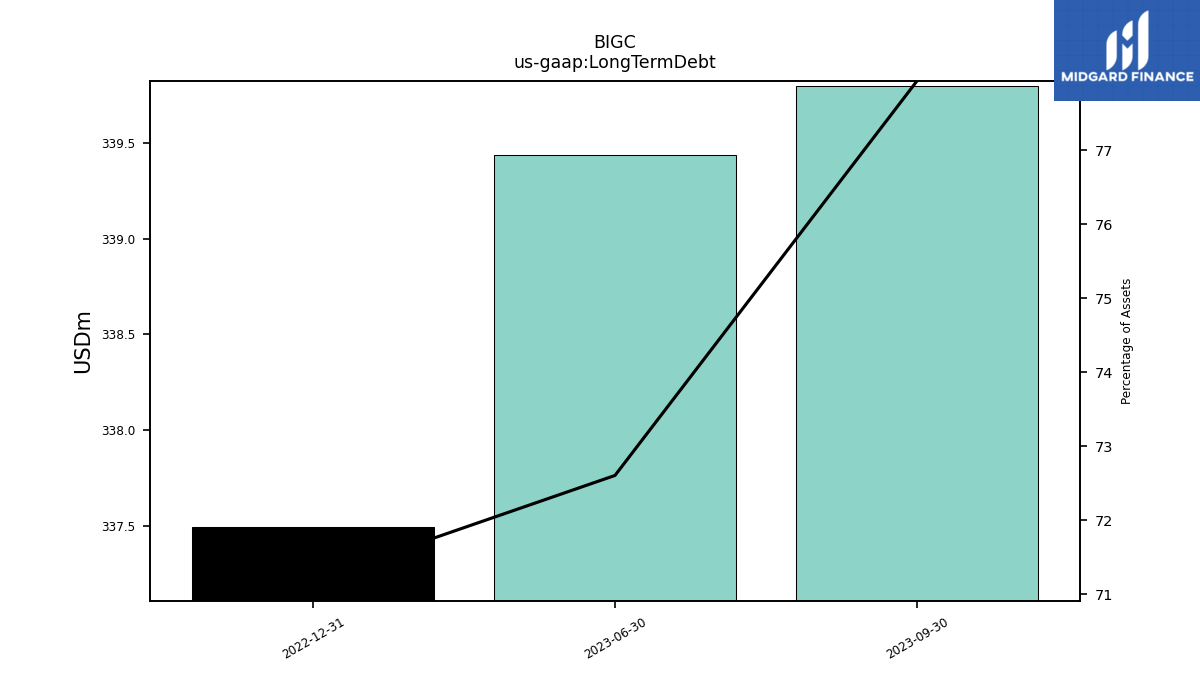
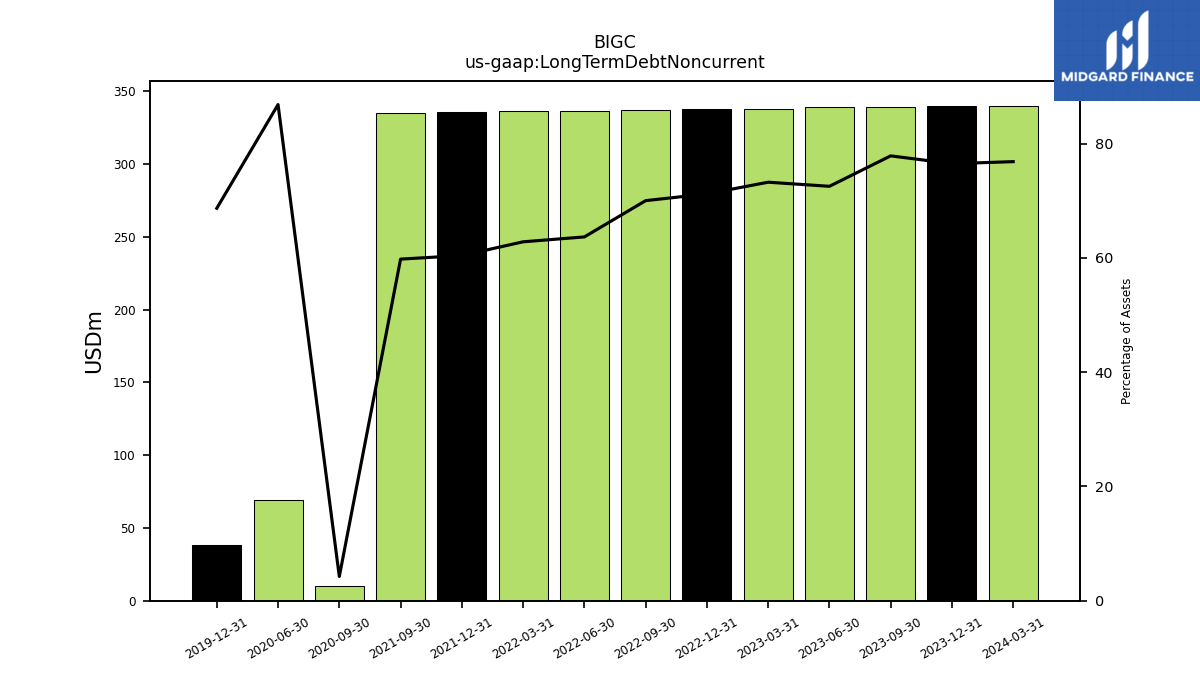
| Long Term Debt | 339.80 | 339.44 | NA | 337.50 | NA | NA | NA | NA | NA | NA | NA | NA | NA | NA | NA | NA | NA | NA | NA | |
| Long Term Debt Noncurrent | 339.39 | 339.04 | 337.99 | 337.50 | 337.00 | 336.51 | 336.02 | 335.54 | 335.05 | NA | NA | NA | 10.00 | 69.12 | NA | 38.50 | NA | NA | NA | |
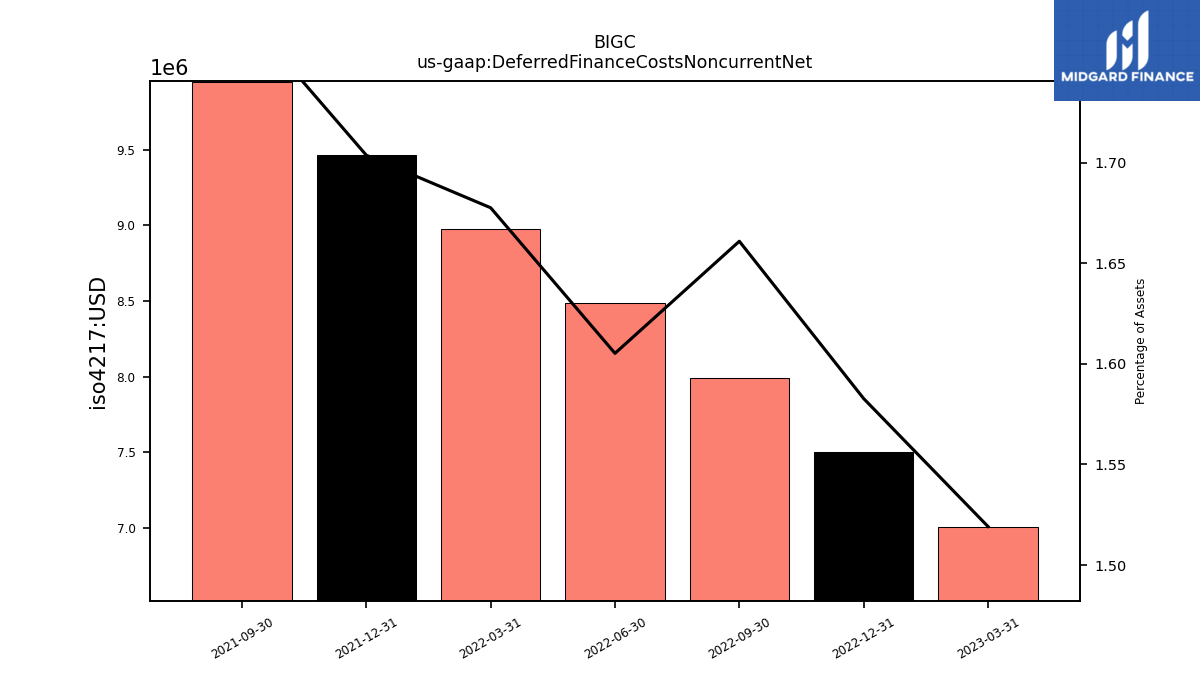
| Deferred Finance Costs Noncurrent Net | NA | NA | 7.01 | 7.50 | 8.00 | 8.48 | 8.97 | 9.46 | 9.95 | NA | NA | NA | NA | NA | NA | NA | NA | NA | NA | |
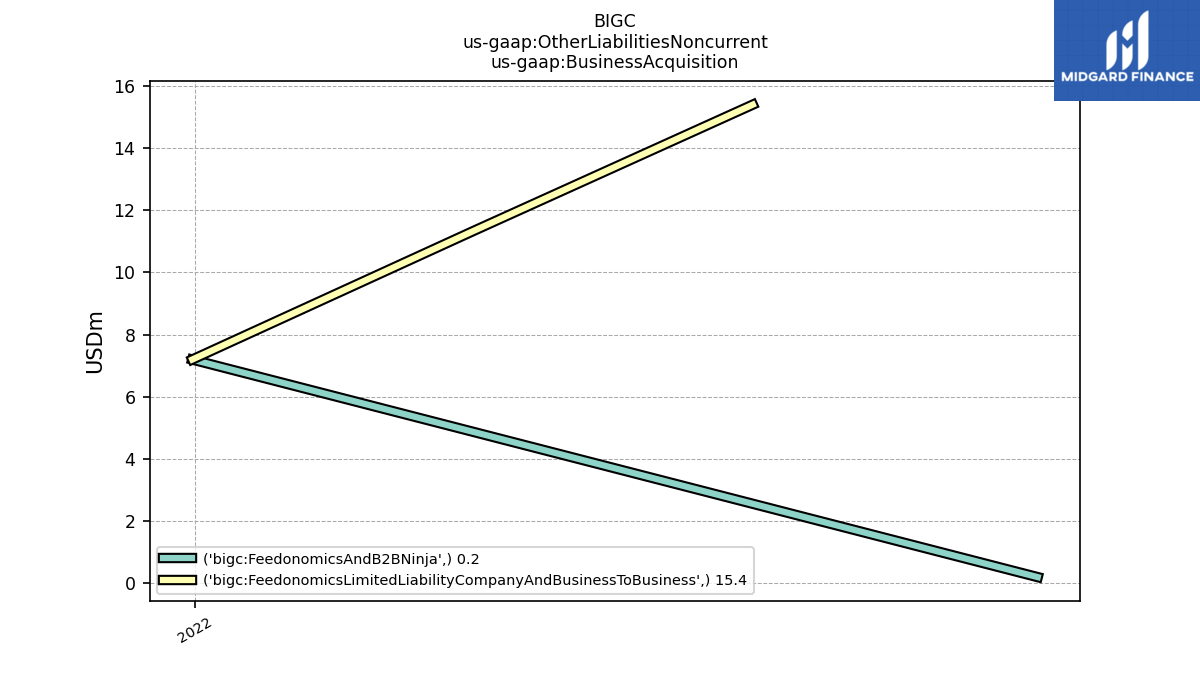
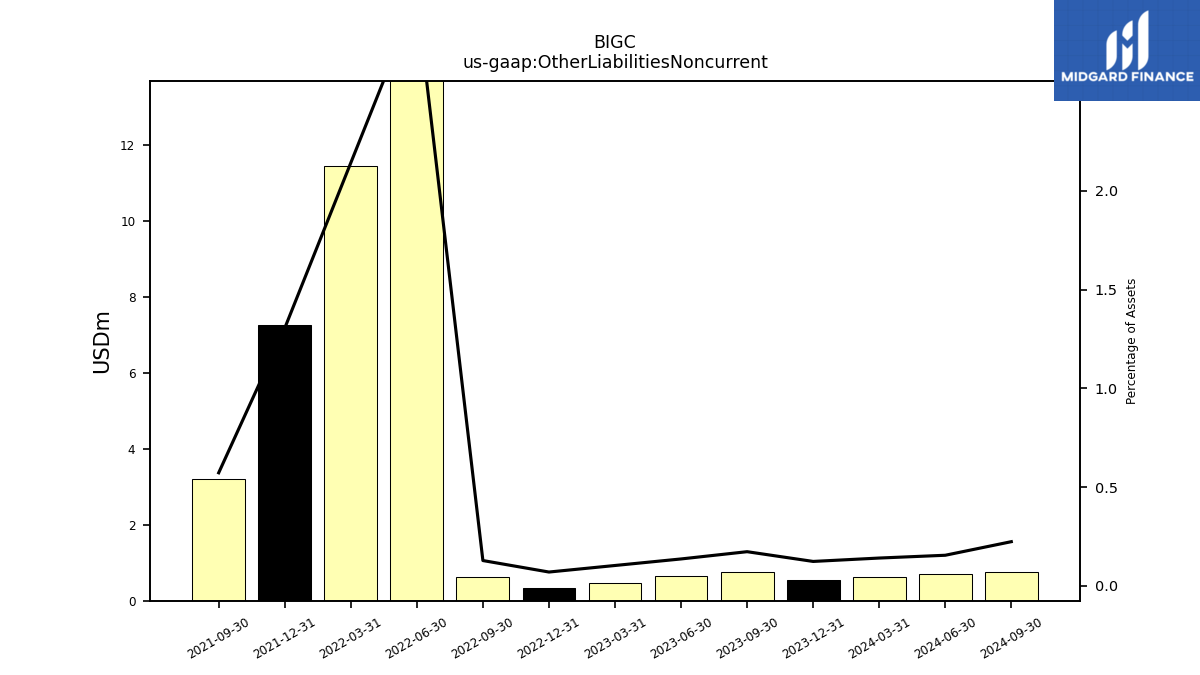
| Other Liabilities Noncurrent | 0.76 | 0.64 | 0.48 | 0.33 | 0.62 | 15.74 | 11.46 | 7.25 | 3.21 | NA | NA | NA | NA | NA | NA | NA | NA | NA | NA | |
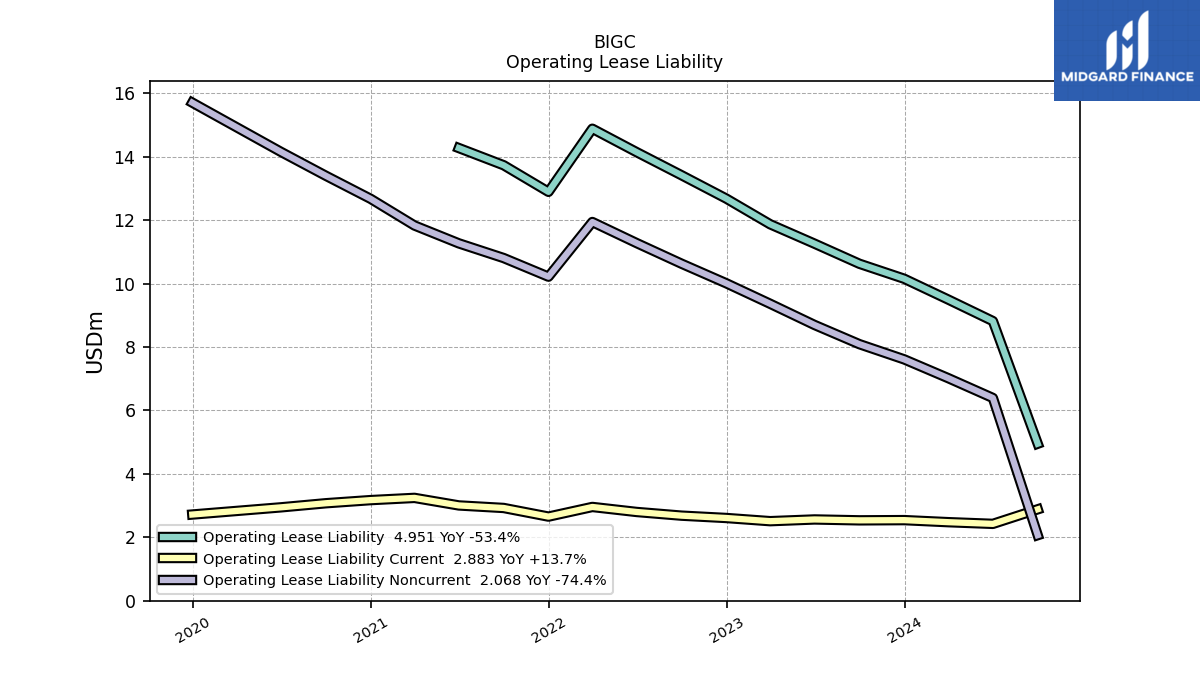
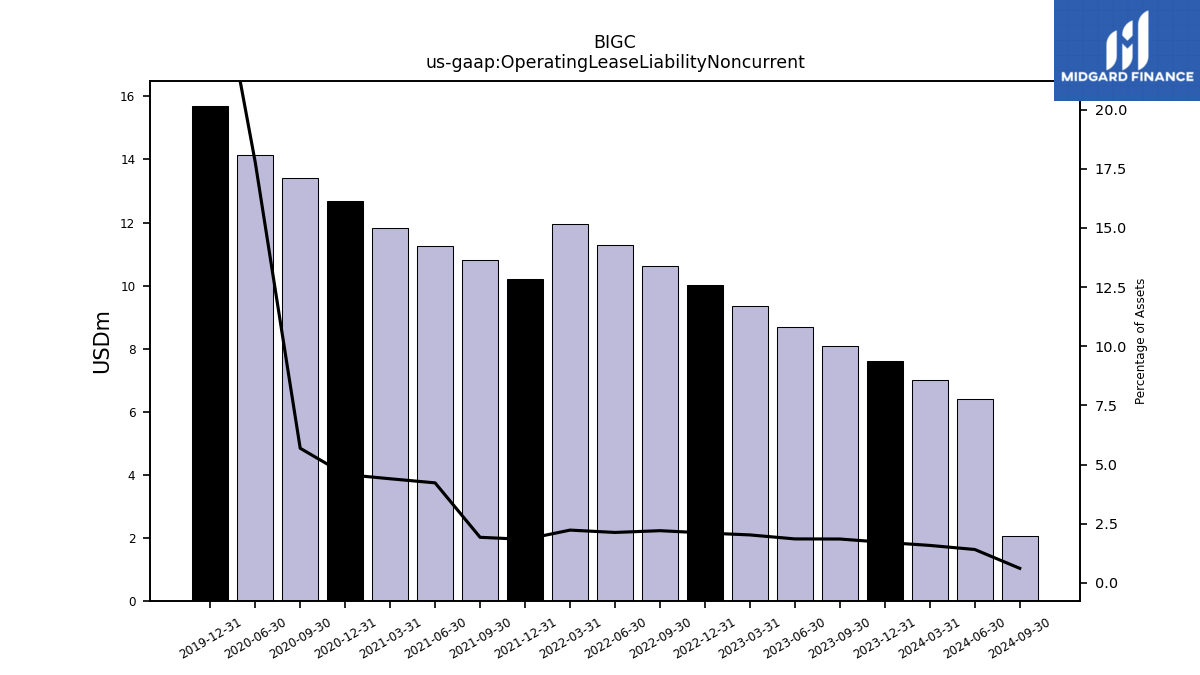
| Operating Lease Liability Noncurrent | 8.09 | 8.70 | 9.36 | 10.01 | 10.63 | 11.28 | 11.94 | 10.22 | 10.80 | 11.27 | 11.83 | 12.67 | 13.40 | 14.15 | NA | 15.71 | NA | NA | NA |
| 2023-09-30 | 2023-06-30 | 2023-03-31 | 2022-12-31 | 2022-09-30 | 2022-06-30 | 2022-03-31 | 2021-12-31 | 2021-09-30 | 2021-06-30 | 2021-03-31 | 2020-12-31 | 2020-09-30 | 2020-06-30 | 2020-03-31 | 2019-12-31 | 2019-09-30 | 2019-06-30 | 2019-03-31 | ||
|---|---|---|---|---|---|---|---|---|---|---|---|---|---|---|---|---|---|---|---|---|
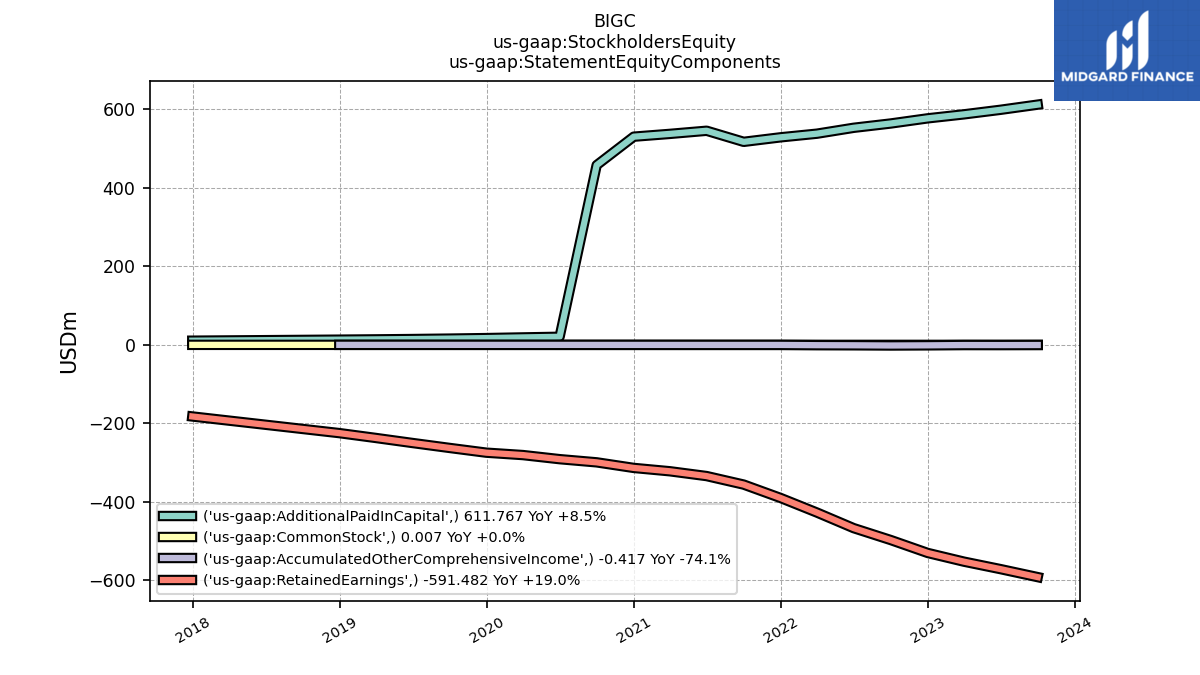
| Stockholders Equity | 19.88 | 26.92 | 34.44 | 45.67 | 65.09 | 84.98 | 109.88 | 138.29 | 161.19 | 211.07 | 215.34 | 216.76 | 158.50 | -270.51 | -261.71 | -257.30 | -246.47 | -235.01 | -223.04 | |
| Common Stock Value | 0.01 | 0.01 | 0.01 | 0.01 | 0.01 | 0.01 | 0.01 | 0.01 | 0.01 | 0.01 | 0.01 | 0.01 | 0.01 | 0.00 | NA | 0.00 | NA | NA | NA | |
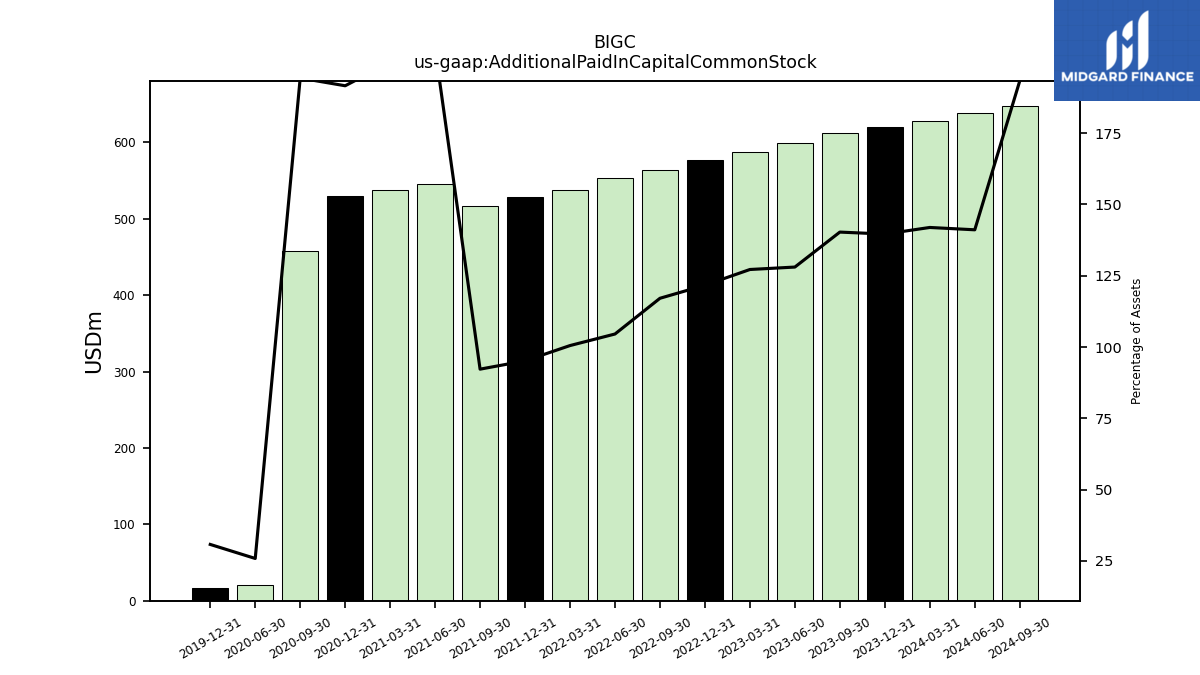
| Additional Paid In Capital Common Stock | 611.77 | 598.66 | 587.02 | 576.85 | 563.70 | 552.75 | 537.78 | 528.54 | 517.01 | 545.22 | 537.27 | 530.14 | 457.68 | 20.57 | NA | 17.24 | NA | NA | NA | |
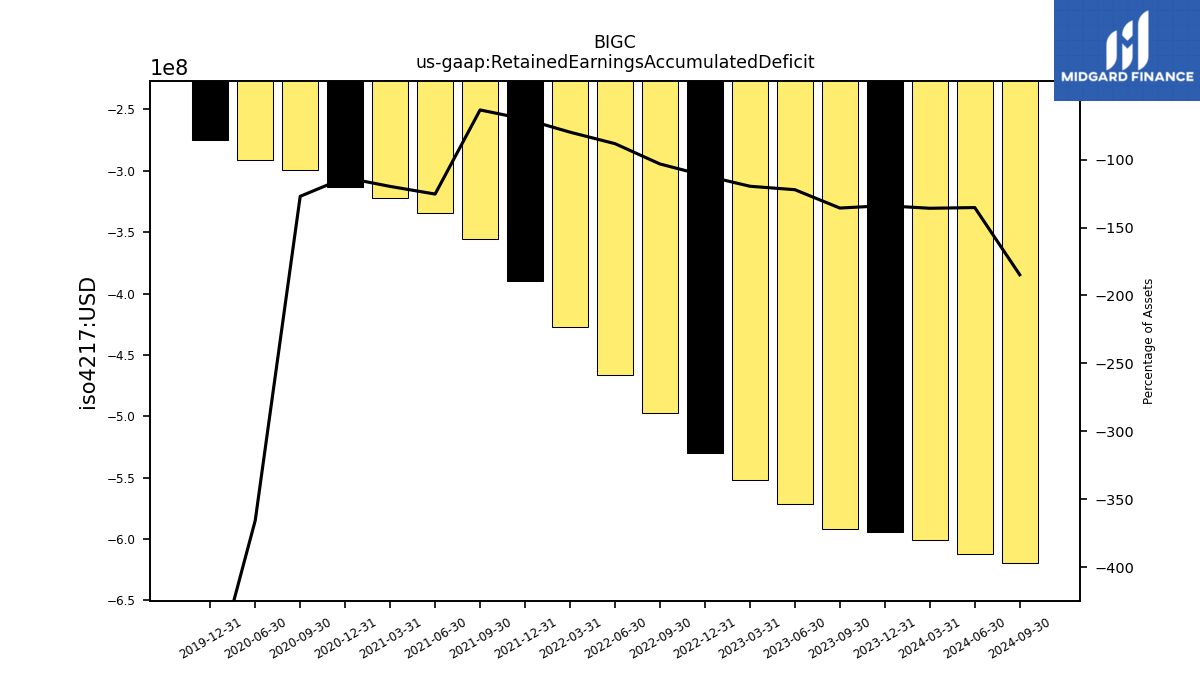
| Retained Earnings Accumulated Deficit | -591.48 | -571.17 | -552.11 | -529.99 | -497.01 | -466.71 | -427.11 | -390.07 | -355.82 | -334.16 | -321.94 | -313.39 | -299.19 | -291.08 | NA | -274.55 | NA | NA | NA | |
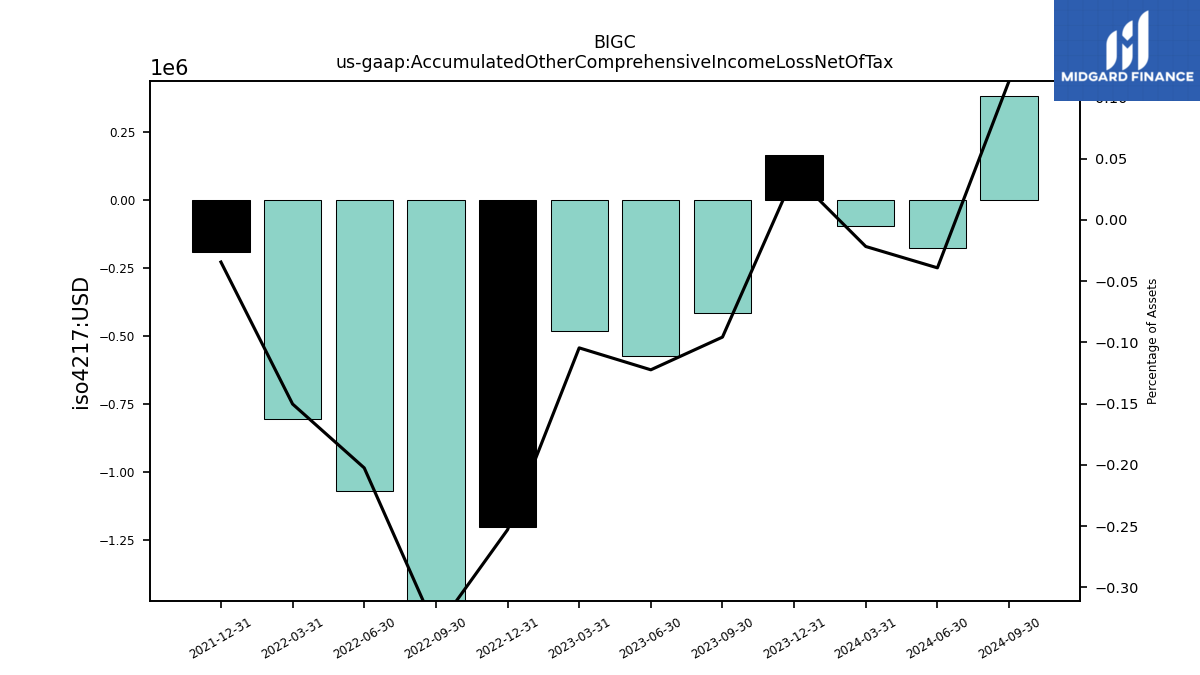
| Accumulated Other Comprehensive Income Loss Net Of Tax | -0.42 | -0.57 | -0.48 | -1.20 | -1.61 | -1.07 | -0.80 | -0.19 | NA | NA | NA | NA | NA | NA | NA | NA | NA | NA | NA | |
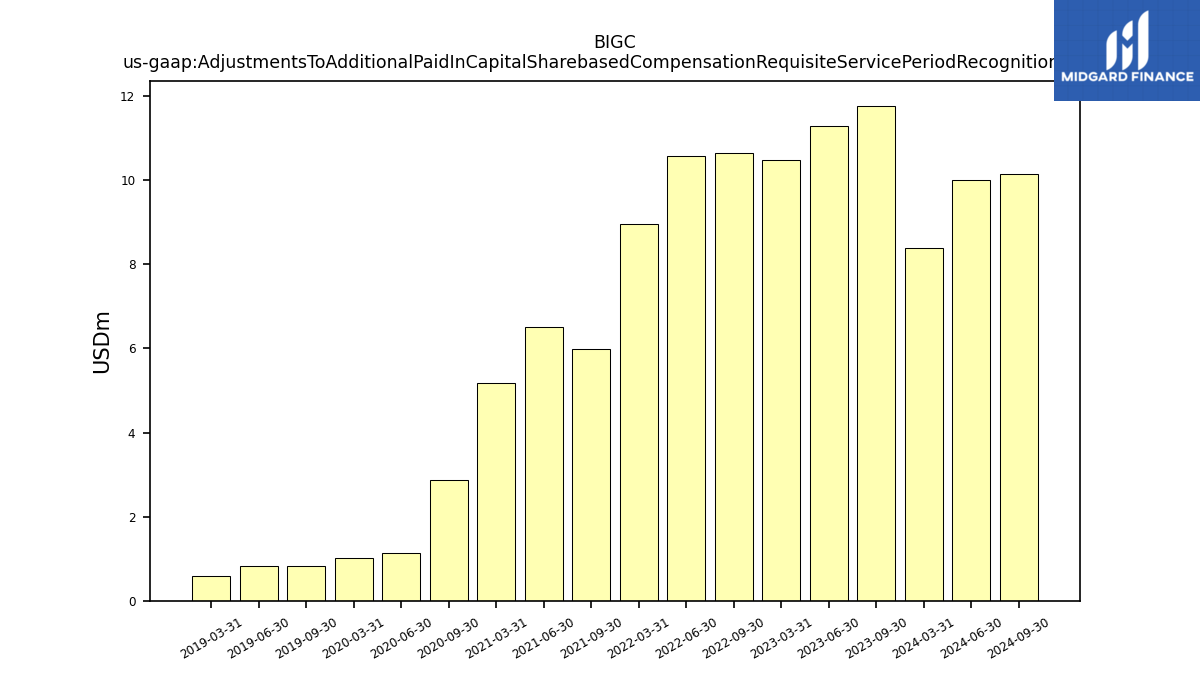
| Adjustments To Additional Paid In Capital Sharebased Compensation Requisite Service Period Recognition Value | 11.77 | 11.29 | 10.49 | NA | 10.65 | 10.58 | 8.96 | NA | 5.99 | 6.52 | 5.17 | NA | 2.87 | 1.14 | 1.03 | NA | 0.81 | 0.82 | 0.59 |
| 2023-09-30 | 2023-06-30 | 2023-03-31 | 2022-12-31 | 2022-09-30 | 2022-06-30 | 2022-03-31 | 2021-12-31 | 2021-09-30 | 2021-06-30 | 2021-03-31 | 2020-12-31 | 2020-09-30 | 2020-06-30 | 2020-03-31 | 2019-12-31 | 2019-09-30 | 2019-06-30 | 2019-03-31 | ||
|---|---|---|---|---|---|---|---|---|---|---|---|---|---|---|---|---|---|---|---|---|
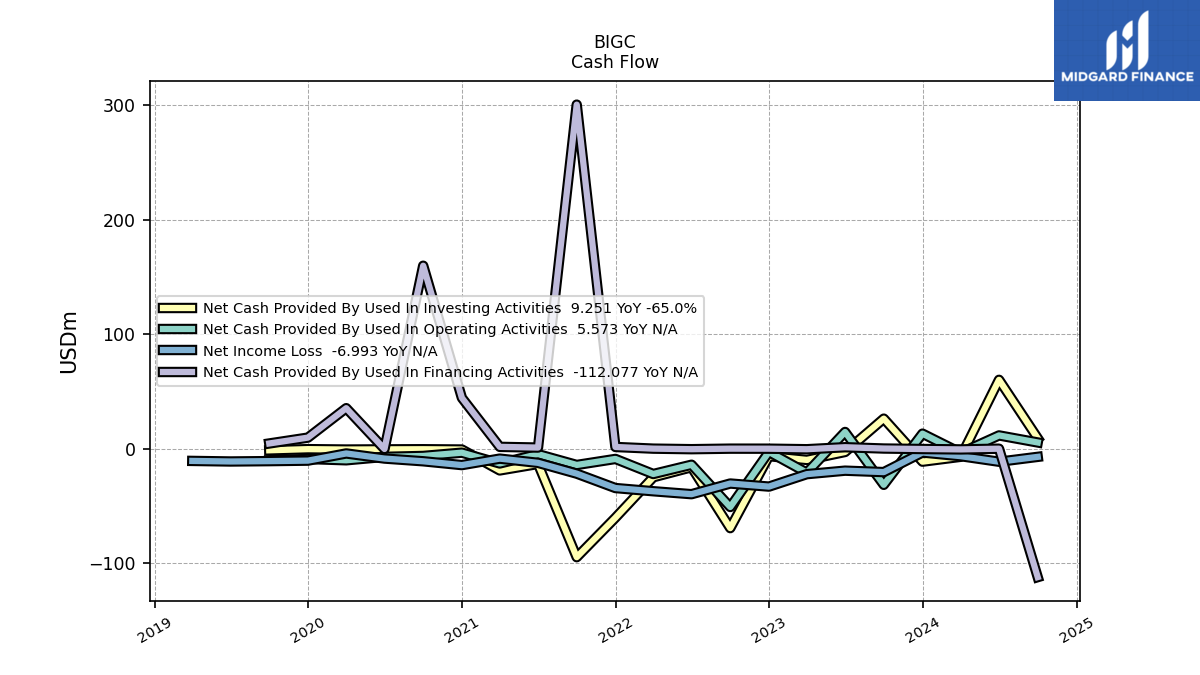
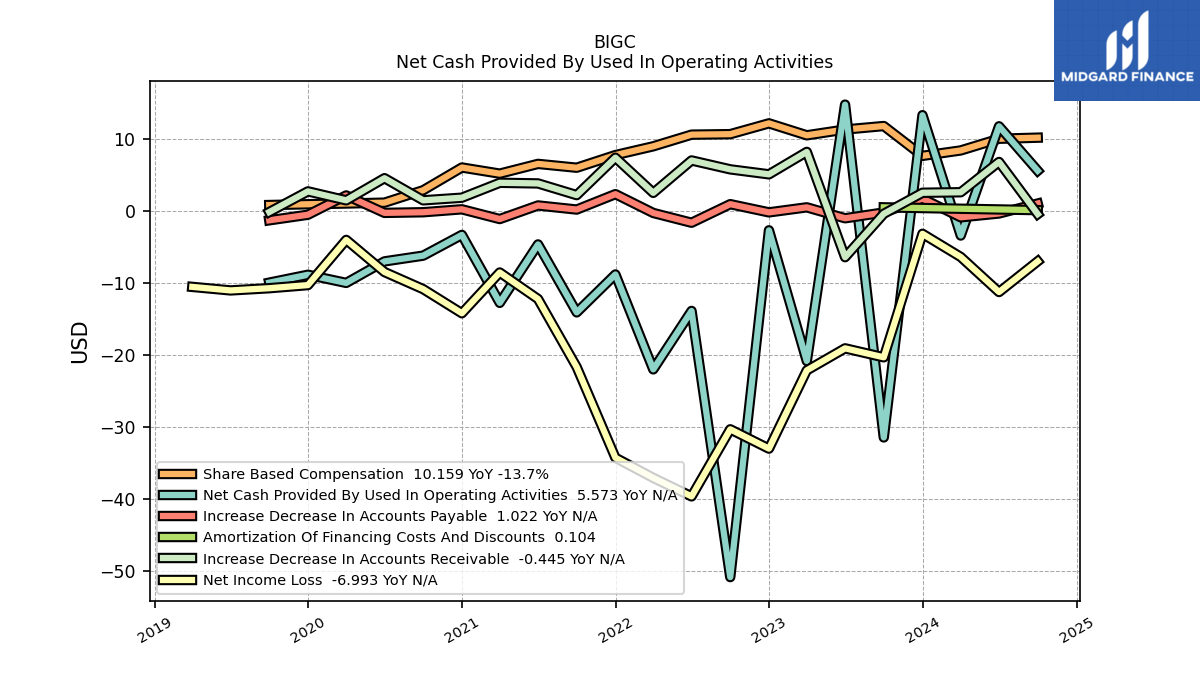
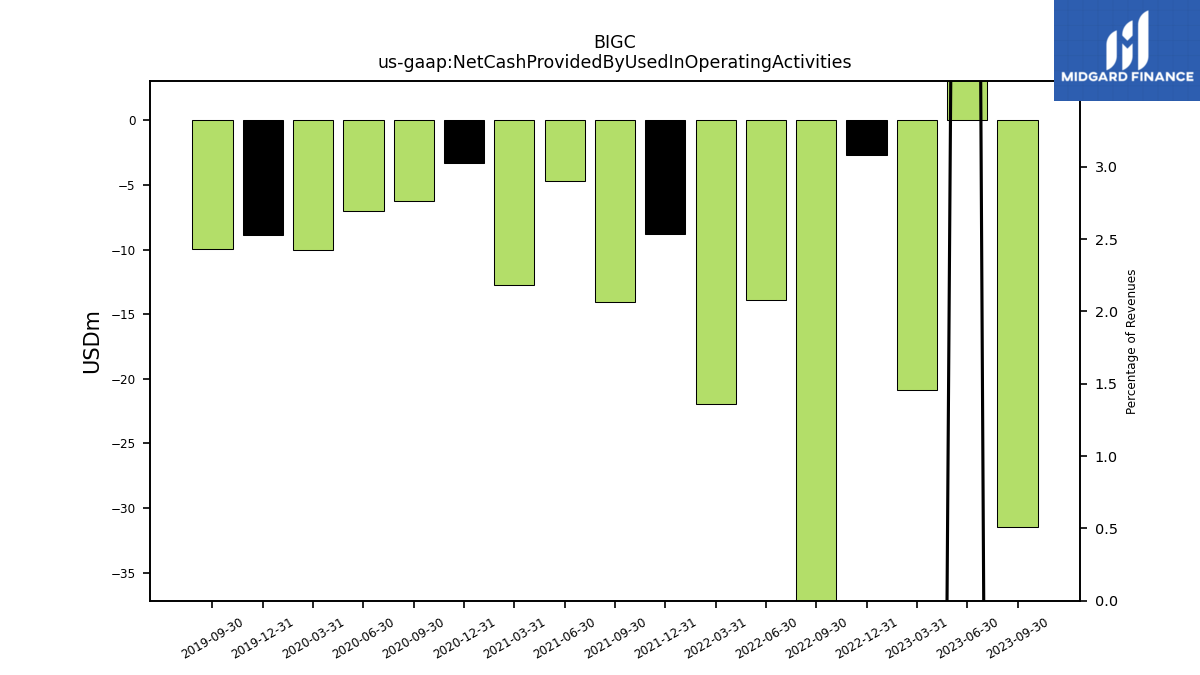
| Net Cash Provided By Used In Operating Activities | -31.43 | 14.74 | -20.84 | -2.69 | -50.80 | -13.88 | -21.98 | -8.82 | -14.08 | -4.65 | -12.76 | -3.33 | -6.21 | -7.00 | -9.99 | -8.86 | -9.95 | NA | NA | |
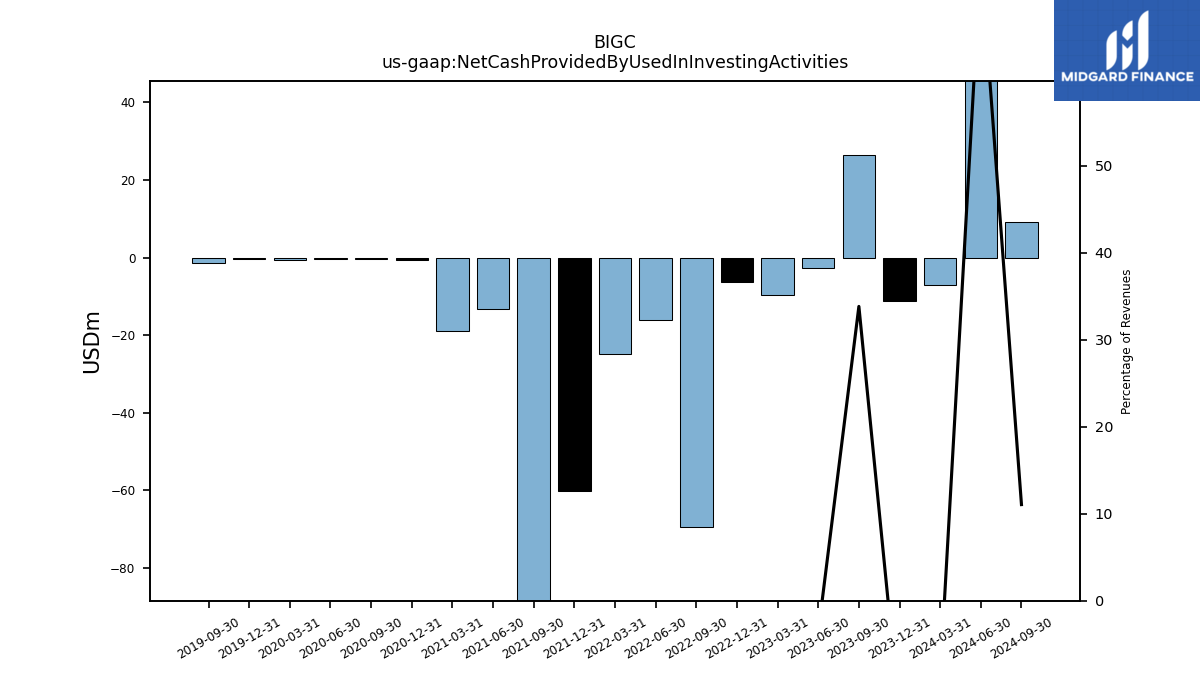
| Net Cash Provided By Used In Investing Activities | 26.40 | -2.73 | -9.68 | -6.39 | -69.28 | -16.04 | -24.81 | -60.17 | -94.67 | -13.19 | -18.85 | -0.59 | -0.33 | -0.45 | -0.60 | -0.25 | -1.26 | NA | NA | |
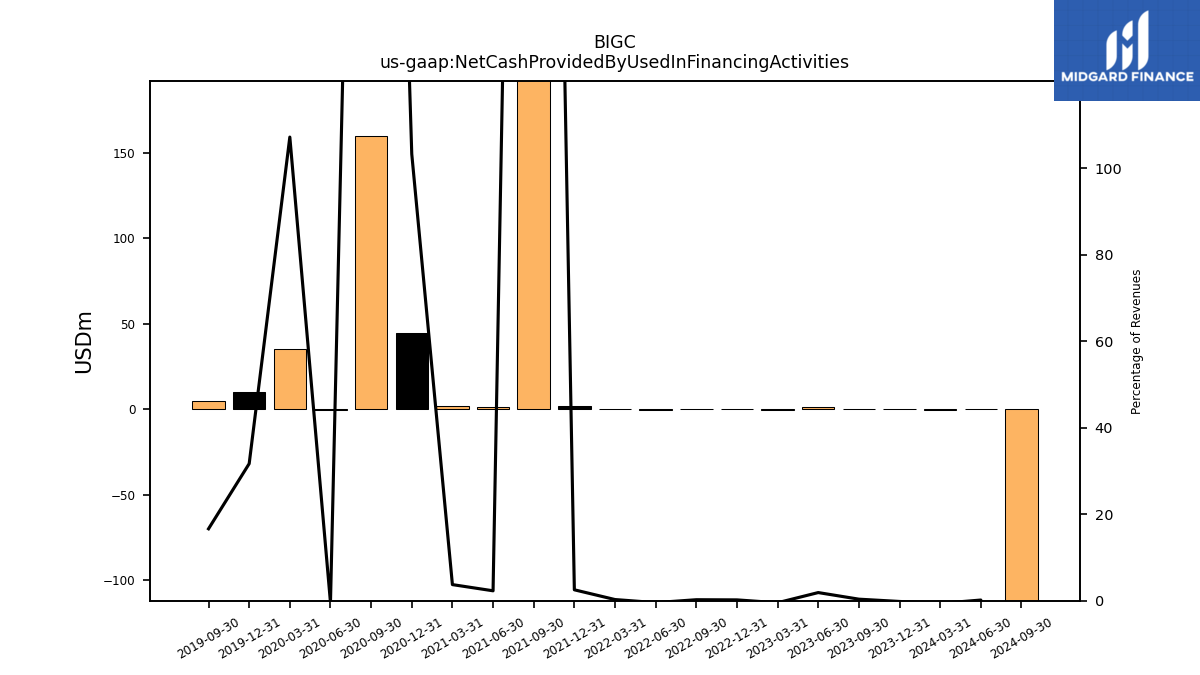
| Net Cash Provided By Used In Financing Activities | 0.28 | 1.43 | -0.33 | 0.14 | 0.17 | -0.29 | 0.18 | 1.64 | 300.76 | 1.13 | 1.74 | 44.54 | 160.01 | -0.15 | 35.55 | 9.83 | 4.70 | NA | NA |
| 2023-09-30 | 2023-06-30 | 2023-03-31 | 2022-12-31 | 2022-09-30 | 2022-06-30 | 2022-03-31 | 2021-12-31 | 2021-09-30 | 2021-06-30 | 2021-03-31 | 2020-12-31 | 2020-09-30 | 2020-06-30 | 2020-03-31 | 2019-12-31 | 2019-09-30 | 2019-06-30 | 2019-03-31 | ||
|---|---|---|---|---|---|---|---|---|---|---|---|---|---|---|---|---|---|---|---|---|
| Net Cash Provided By Used In Operating Activities | -31.43 | 14.74 | -20.84 | -2.69 | -50.80 | -13.88 | -21.98 | -8.82 | -14.08 | -4.65 | -12.76 | -3.33 | -6.21 | -7.00 | -9.99 | -8.86 | -9.95 | NA | NA | |
| Net Income Loss | -20.31 | -19.07 | -22.12 | -32.98 | -30.30 | -39.60 | -37.04 | -34.24 | -21.67 | -12.22 | -8.54 | -14.20 | -10.86 | -8.48 | -4.02 | -10.29 | -10.72 | -11.03 | -10.54 | |
| Profit Loss | -20.31 | -19.07 | -22.12 | -32.98 | -30.30 | -39.60 | -37.04 | -34.24 | -21.67 | -12.22 | -8.54 | -14.20 | -10.86 | -8.48 | -4.02 | -10.29 | -10.72 | NA | NA | |
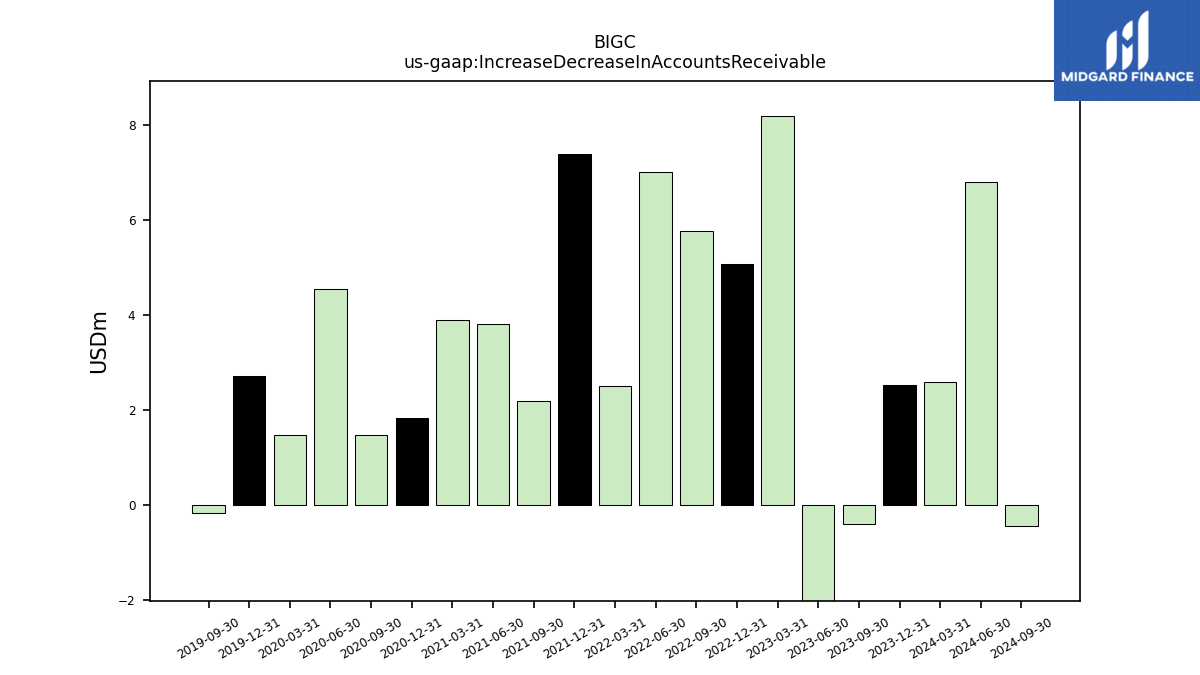
| Increase Decrease In Accounts Receivable | -0.40 | -6.42 | 8.19 | 5.07 | 5.76 | 7.00 | 2.50 | 7.38 | 2.19 | 3.81 | 3.90 | 1.83 | 1.47 | 4.54 | 1.47 | 2.71 | -0.16 | NA | NA | |
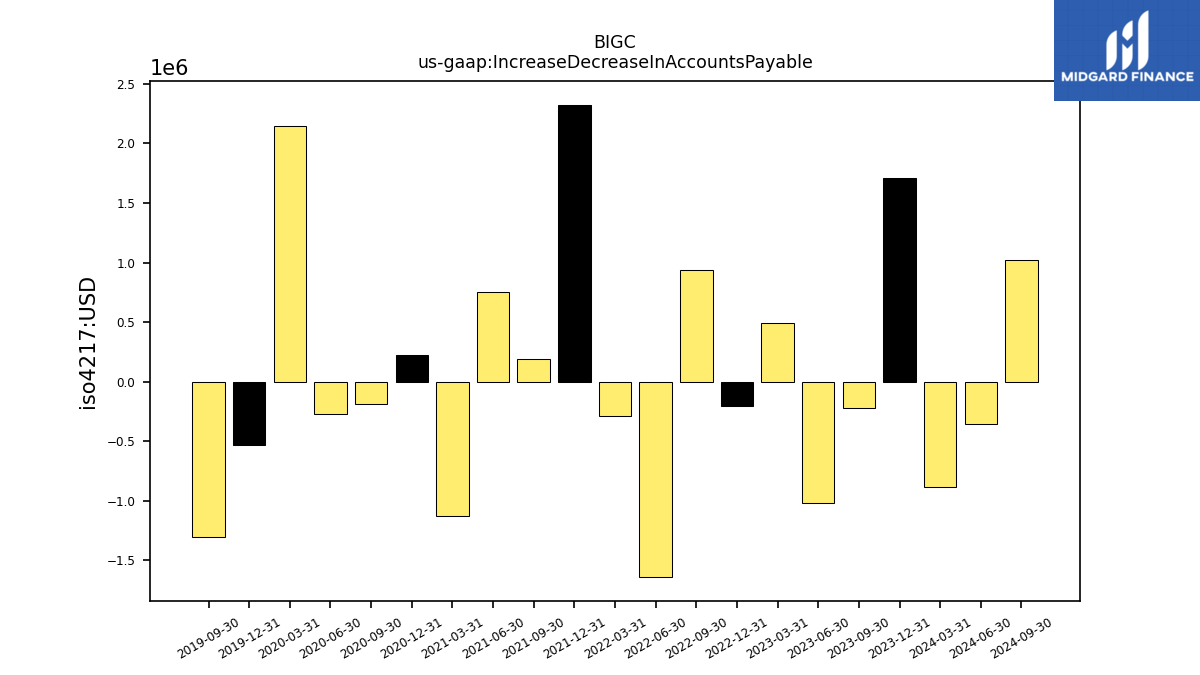
| Increase Decrease In Accounts Payable | -0.22 | -1.02 | 0.49 | -0.20 | 0.94 | -1.64 | -0.29 | 2.33 | 0.19 | 0.75 | -1.13 | 0.22 | -0.19 | -0.28 | 2.15 | -0.53 | -1.31 | NA | NA | |
| Share Based Compensation | 11.77 | 11.29 | 10.49 | 12.15 | 10.65 | 10.58 | 8.96 | 7.74 | 5.99 | 6.52 | 5.17 | 6.02 | 2.87 | 1.14 | 1.03 | 0.93 | 0.81 | NA | NA |
| 2023-09-30 | 2023-06-30 | 2023-03-31 | 2022-12-31 | 2022-09-30 | 2022-06-30 | 2022-03-31 | 2021-12-31 | 2021-09-30 | 2021-06-30 | 2021-03-31 | 2020-12-31 | 2020-09-30 | 2020-06-30 | 2020-03-31 | 2019-12-31 | 2019-09-30 | 2019-06-30 | 2019-03-31 | ||
|---|---|---|---|---|---|---|---|---|---|---|---|---|---|---|---|---|---|---|---|---|
| Net Cash Provided By Used In Investing Activities | 26.40 | -2.73 | -9.68 | -6.39 | -69.28 | -16.04 | -24.81 | -60.17 | -94.67 | -13.19 | -18.85 | -0.59 | -0.33 | -0.45 | -0.60 | -0.25 | -1.26 | NA | NA |
| 2023-09-30 | 2023-06-30 | 2023-03-31 | 2022-12-31 | 2022-09-30 | 2022-06-30 | 2022-03-31 | 2021-12-31 | 2021-09-30 | 2021-06-30 | 2021-03-31 | 2020-12-31 | 2020-09-30 | 2020-06-30 | 2020-03-31 | 2019-12-31 | 2019-09-30 | 2019-06-30 | 2019-03-31 | ||
|---|---|---|---|---|---|---|---|---|---|---|---|---|---|---|---|---|---|---|---|---|
| Net Cash Provided By Used In Financing Activities | 0.28 | 1.43 | -0.33 | 0.14 | 0.17 | -0.29 | 0.18 | 1.64 | 300.76 | 1.13 | 1.74 | 44.54 | 160.01 | -0.15 | 35.55 | 9.83 | 4.70 | NA | NA |
| 2023-09-30 | 2023-06-30 | 2023-03-31 | 2022-12-31 | 2022-09-30 | 2022-06-30 | 2022-03-31 | 2021-12-31 | 2021-09-30 | 2021-06-30 | 2021-03-31 | 2020-12-31 | 2020-09-30 | 2020-06-30 | 2020-03-31 | 2019-12-31 | 2019-09-30 | 2019-06-30 | 2019-03-31 | ||
|---|---|---|---|---|---|---|---|---|---|---|---|---|---|---|---|---|---|---|---|---|
| Revenues | 78.05 | 75.44 | 71.76 | 72.43 | 72.39 | 68.20 | 66.05 | 64.90 | 59.28 | 49.01 | 46.66 | 43.14 | 39.73 | 36.32 | 33.17 | 31.02 | 28.26 | 27.23 | 25.58 | |
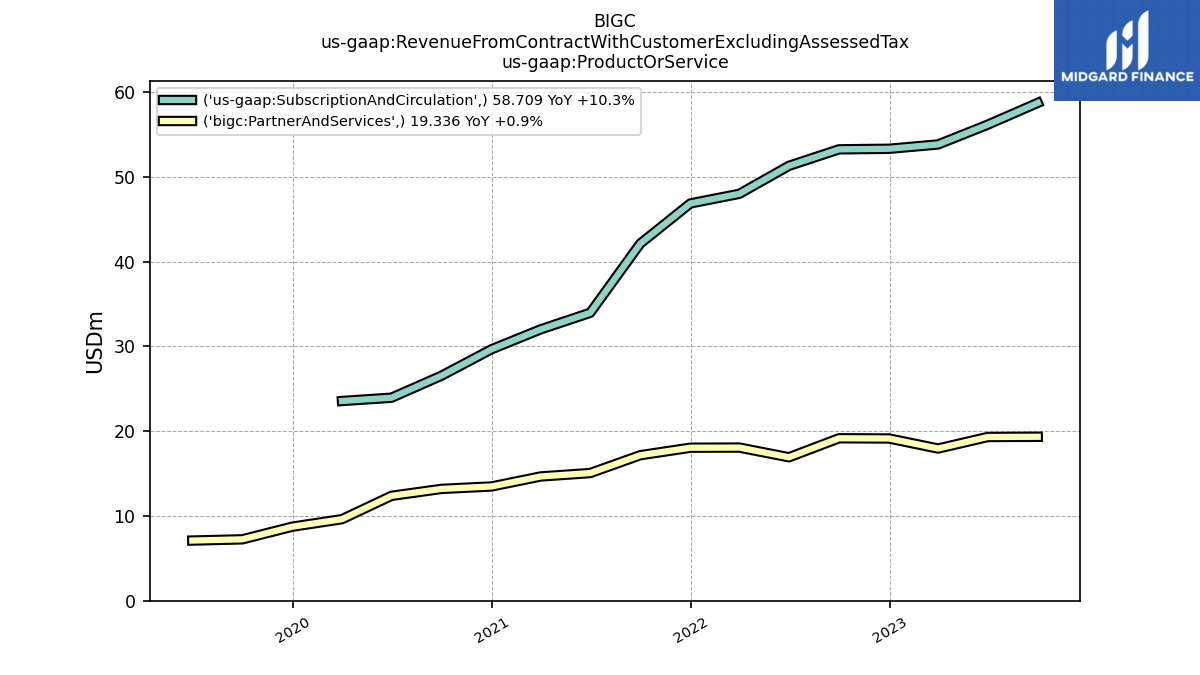
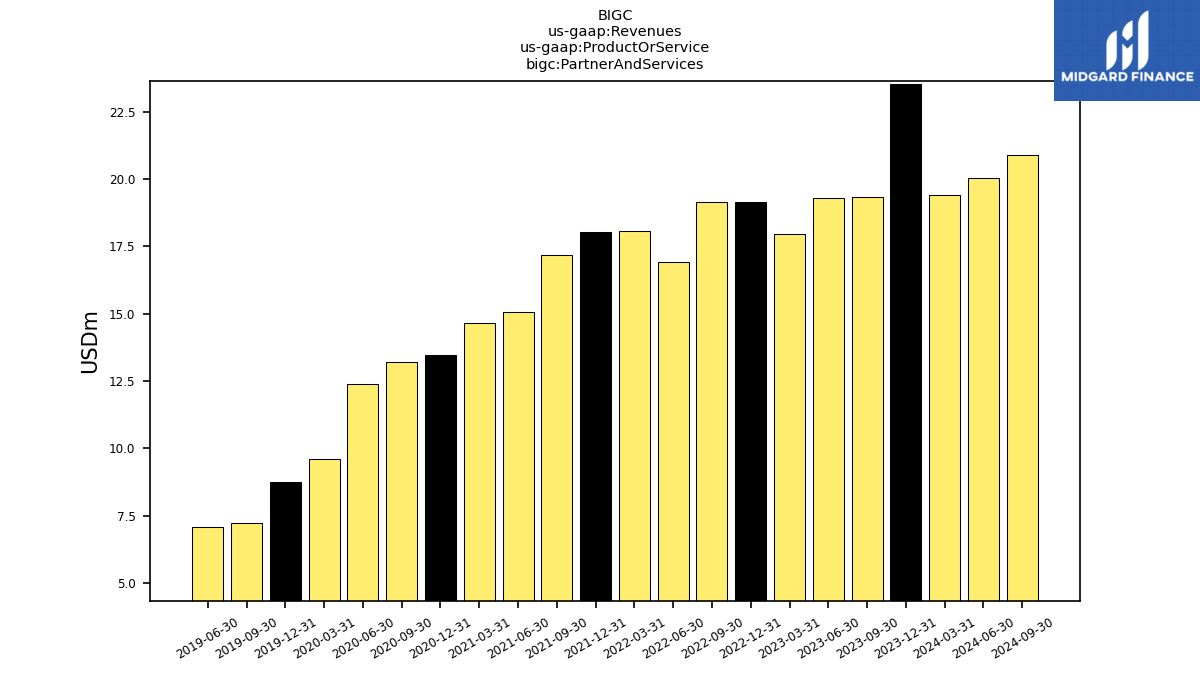
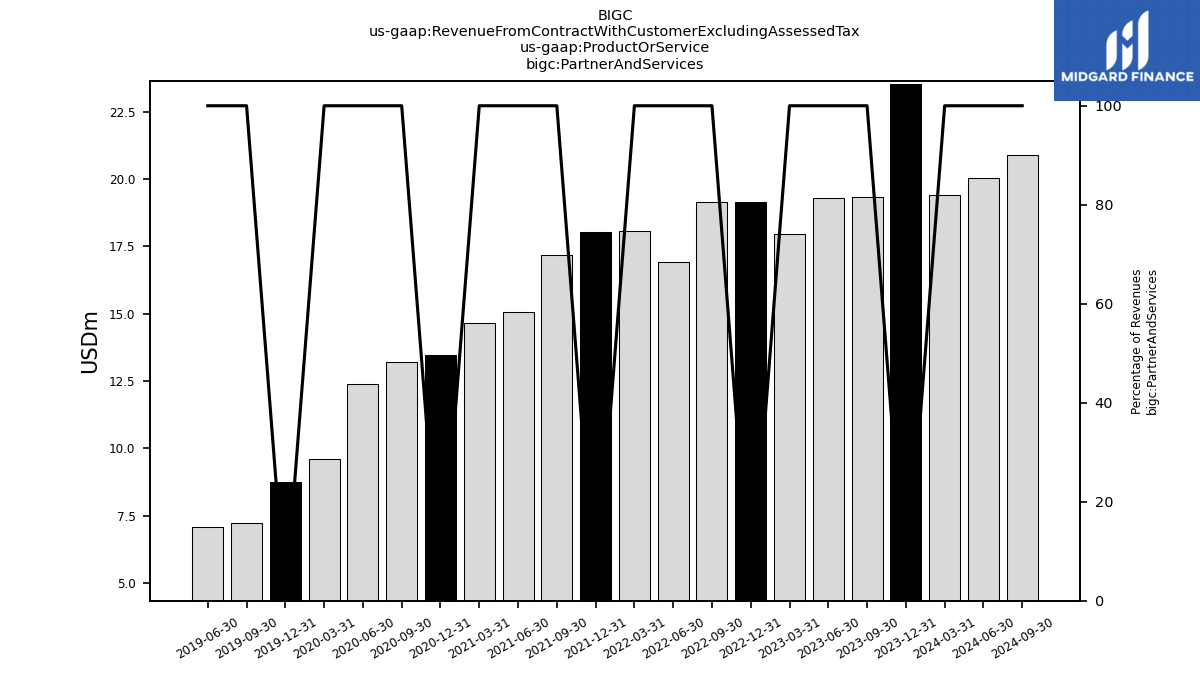
| Partner And Services | 19.34 | 19.31 | 17.95 | 19.13 | 19.16 | 16.92 | 18.06 | 18.05 | 17.16 | 15.06 | 14.66 | 13.48 | 13.19 | 12.37 | 9.62 | 8.74 | 7.24 | 7.10 | NA | |
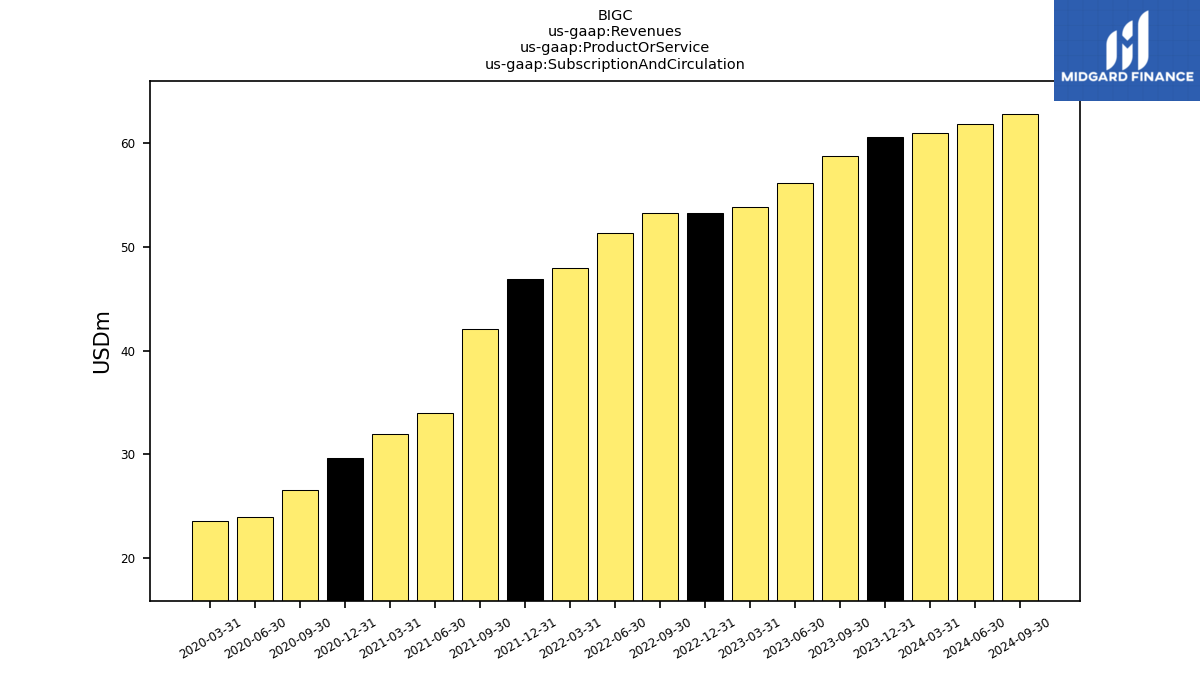
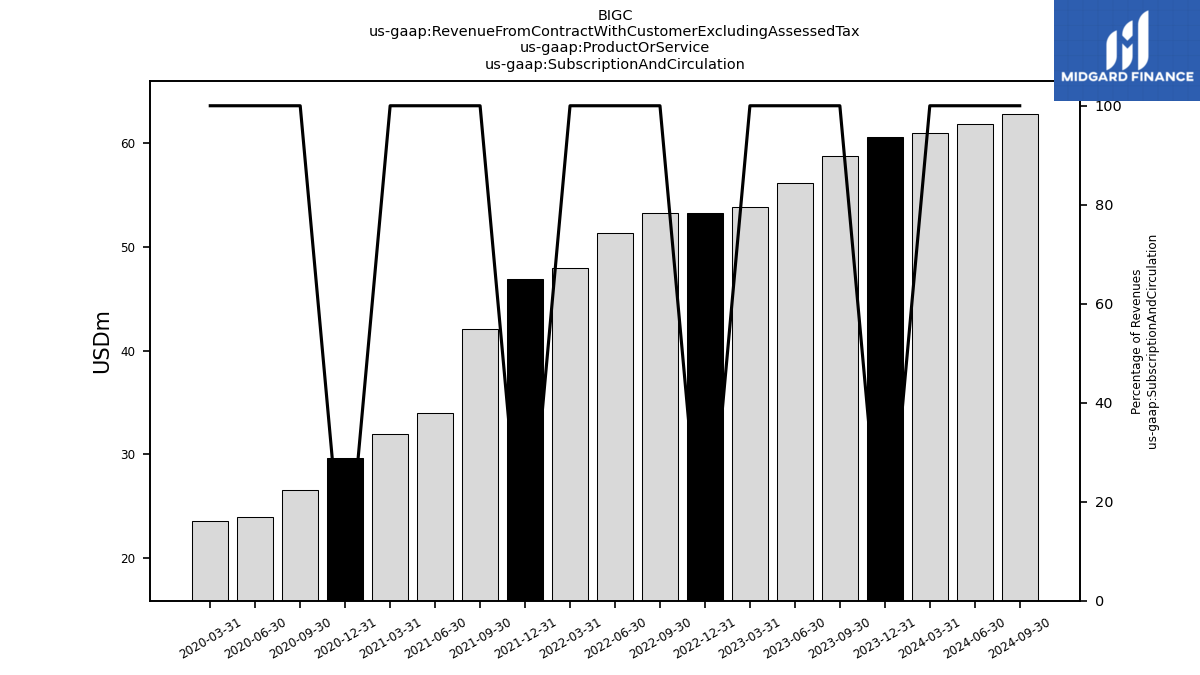
| Subscription And Circulation | 58.71 | 56.13 | 53.81 | 53.30 | 53.23 | 51.28 | 47.99 | 46.85 | 42.12 | 33.95 | 32.00 | 29.66 | 26.55 | 23.94 | 23.55 | NA | NA | NA | NA | |
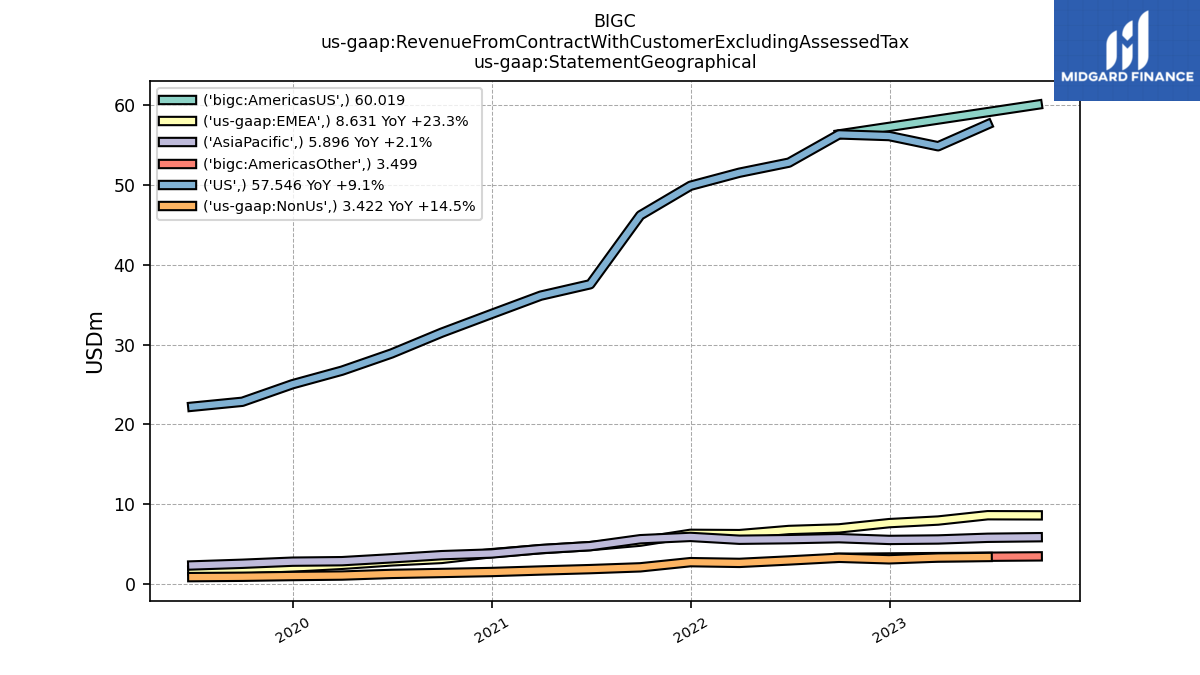
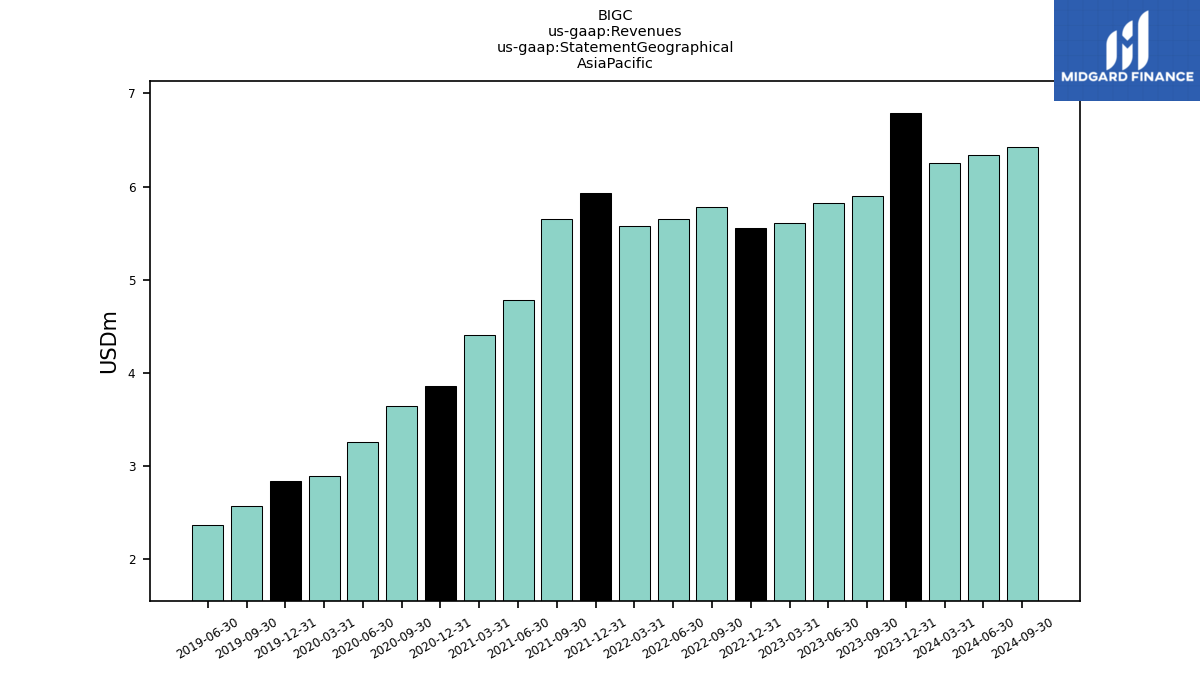
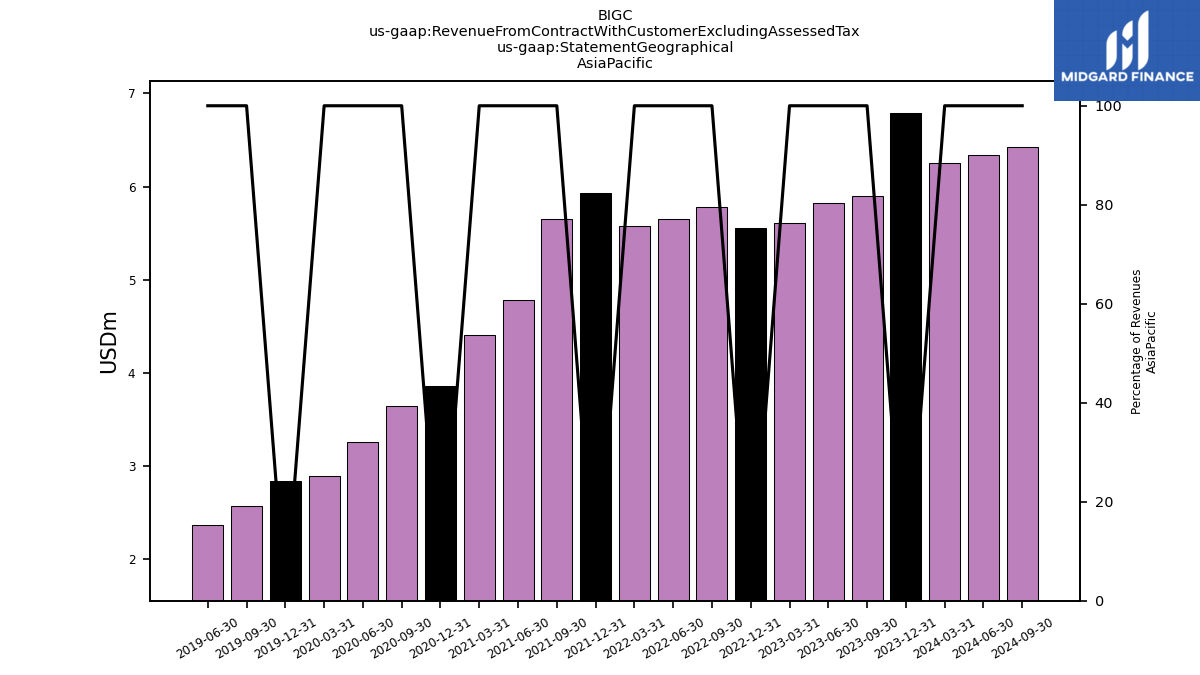
| 5.90 | 5.83 | 5.61 | 5.56 | 5.78 | 5.65 | 5.58 | 5.93 | 5.65 | 4.78 | 4.41 | 3.86 | 3.65 | 3.26 | 2.90 | 2.84 | 2.57 | 2.37 | NA | ||
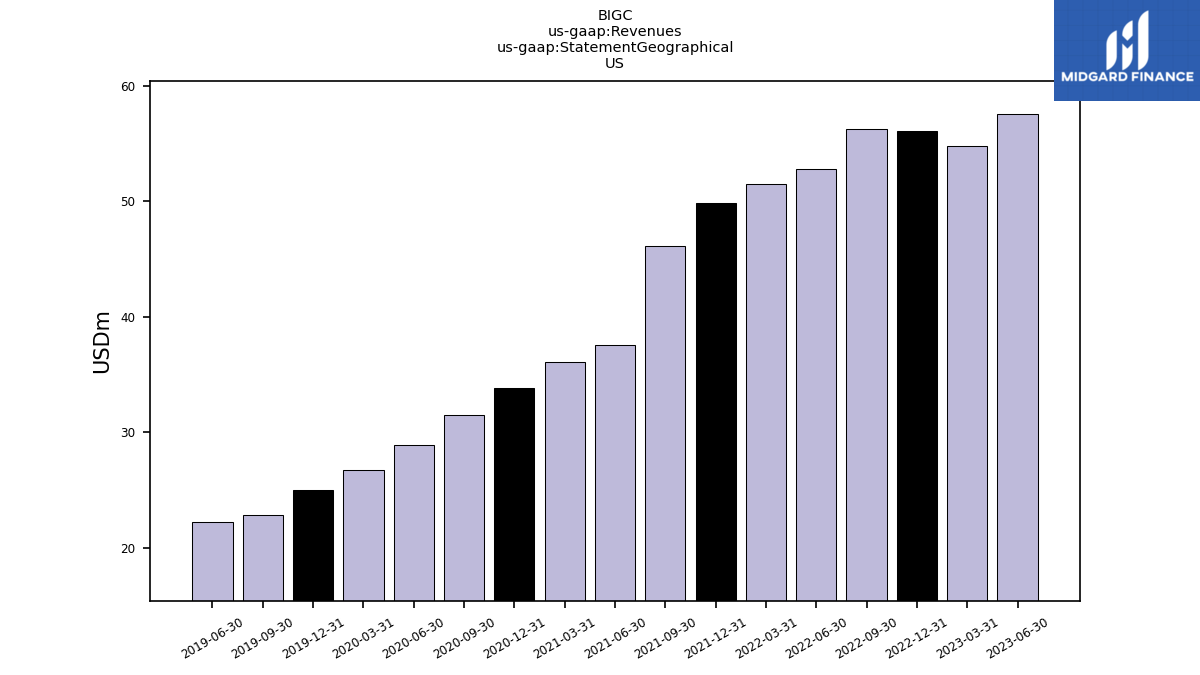
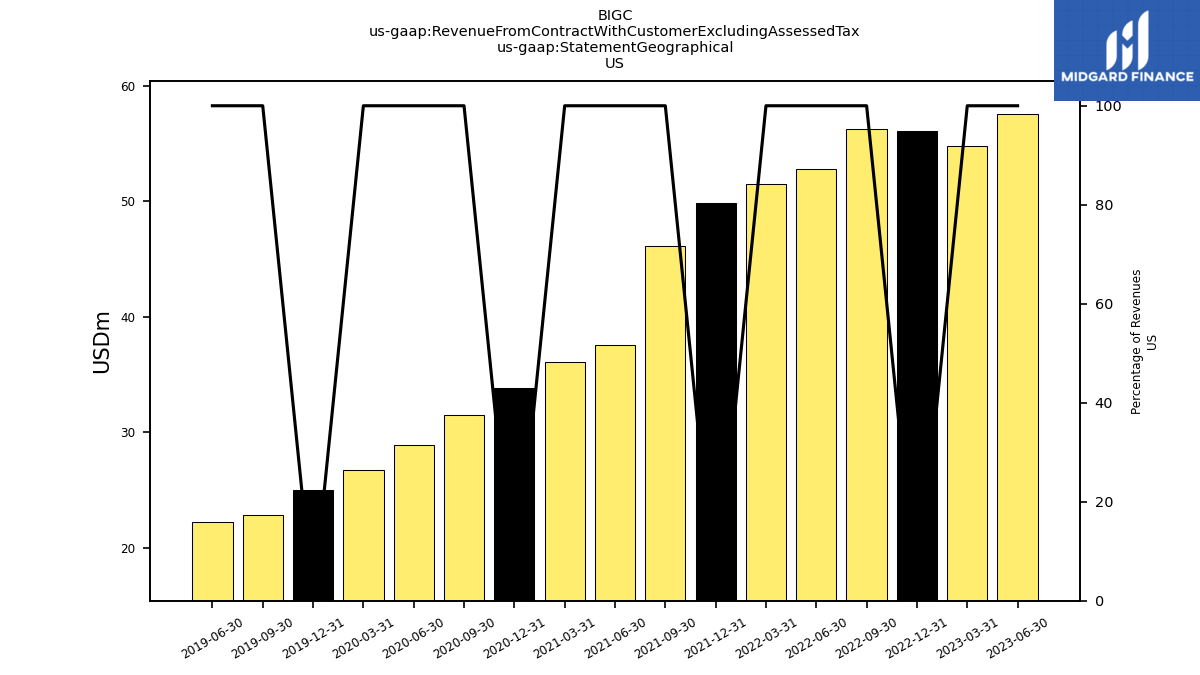
| US | NA | 57.55 | 54.81 | 56.09 | 56.29 | 52.76 | 51.50 | 49.87 | 46.17 | 37.54 | 36.12 | 33.84 | 31.48 | 28.88 | 26.73 | 25.04 | 22.84 | 22.23 | NA | |
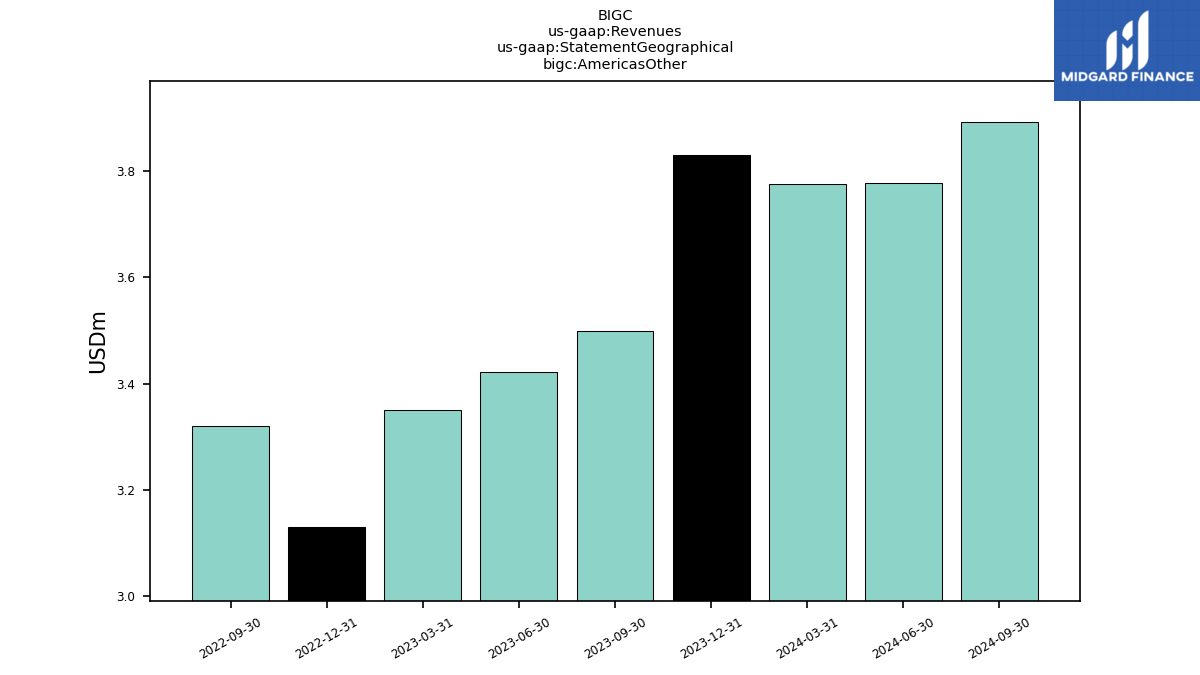
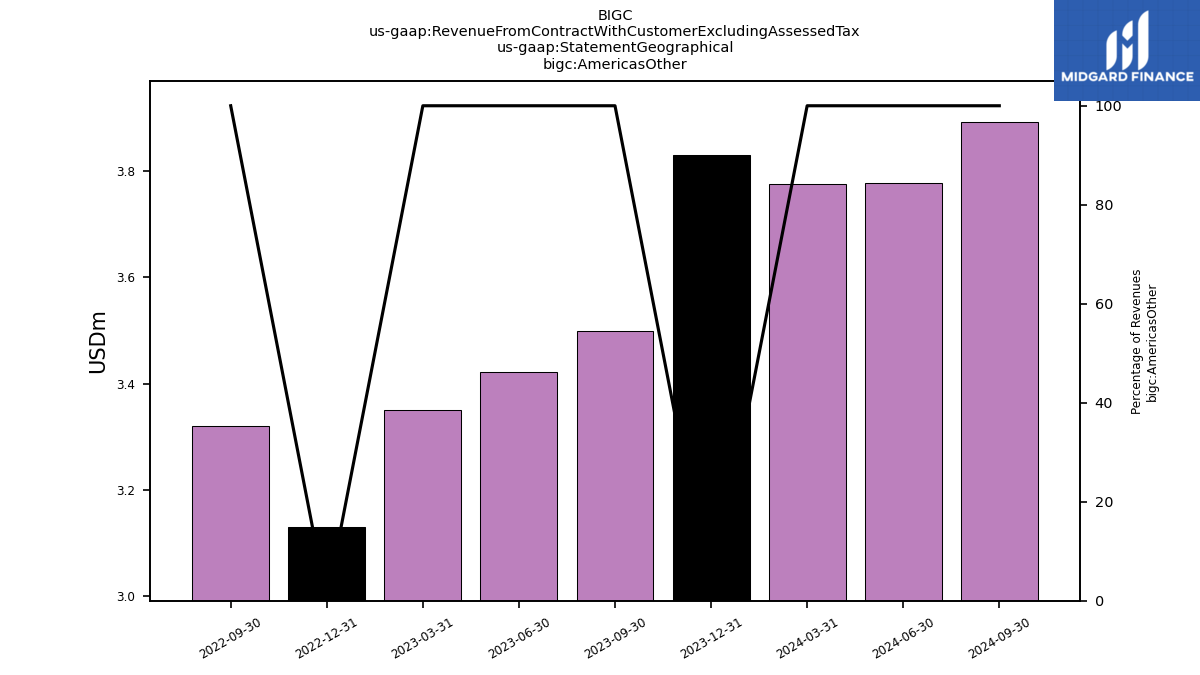
| Americas Other | 3.50 | NA | NA | NA | 3.32 | NA | NA | NA | NA | NA | NA | NA | NA | NA | NA | NA | NA | NA | NA | |
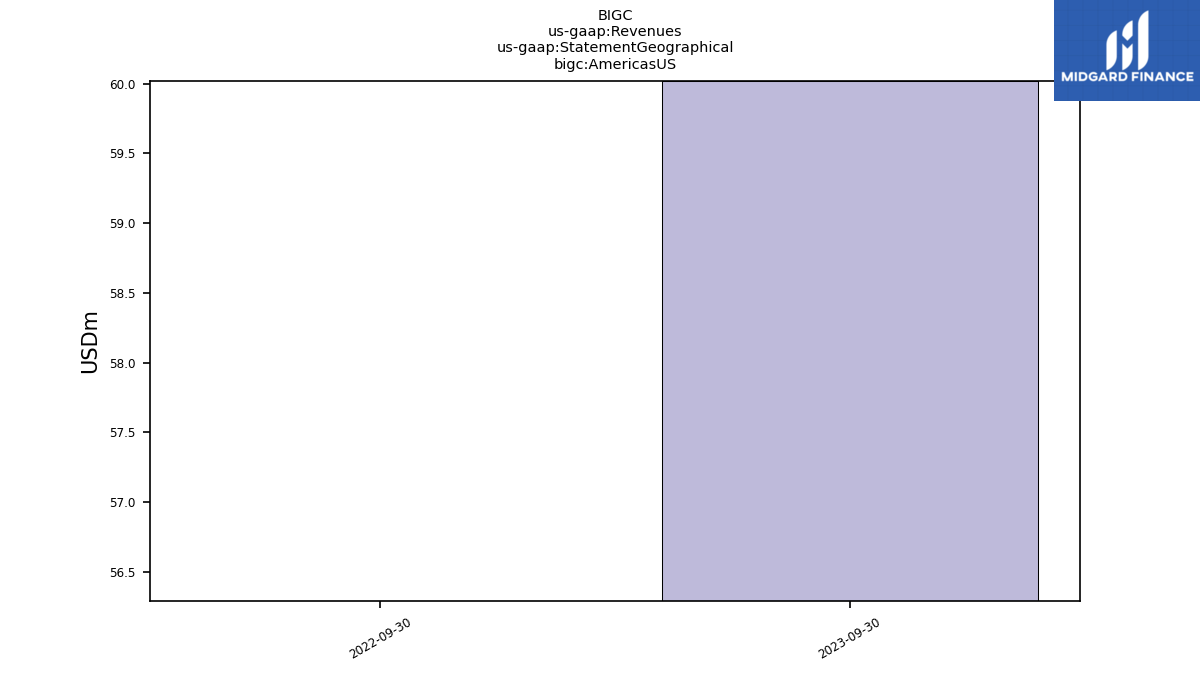
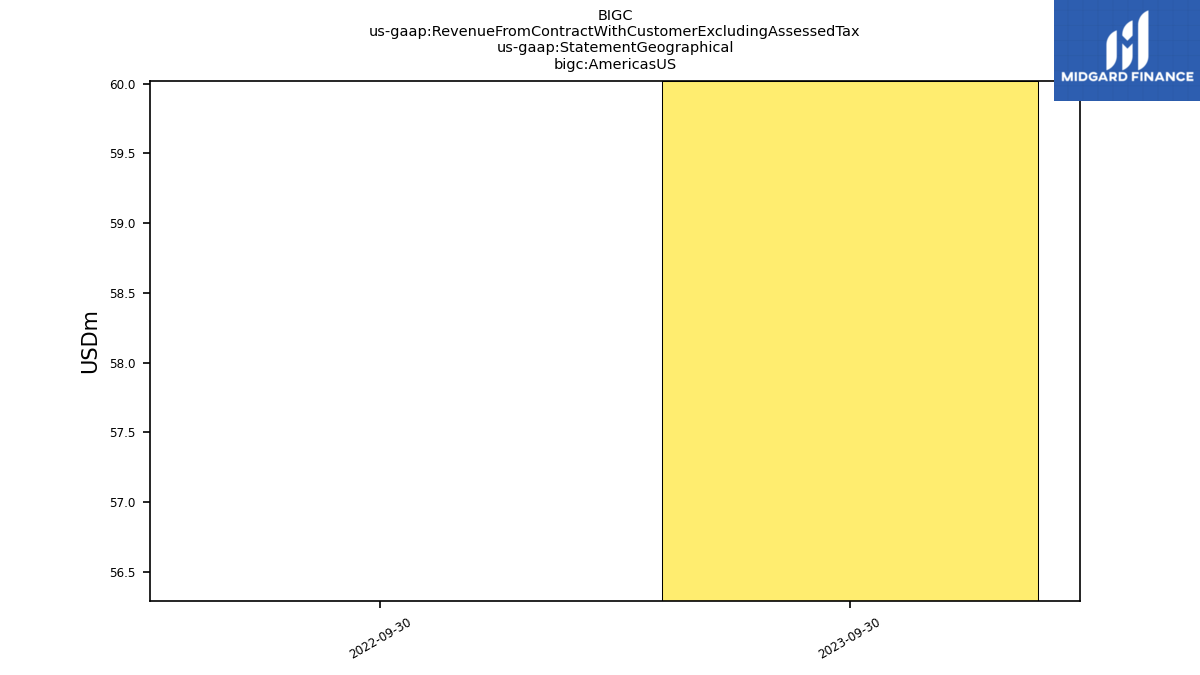
| Americas U S | 60.02 | NA | NA | NA | 56.29 | NA | NA | NA | NA | NA | NA | NA | NA | NA | NA | NA | NA | NA | NA | |
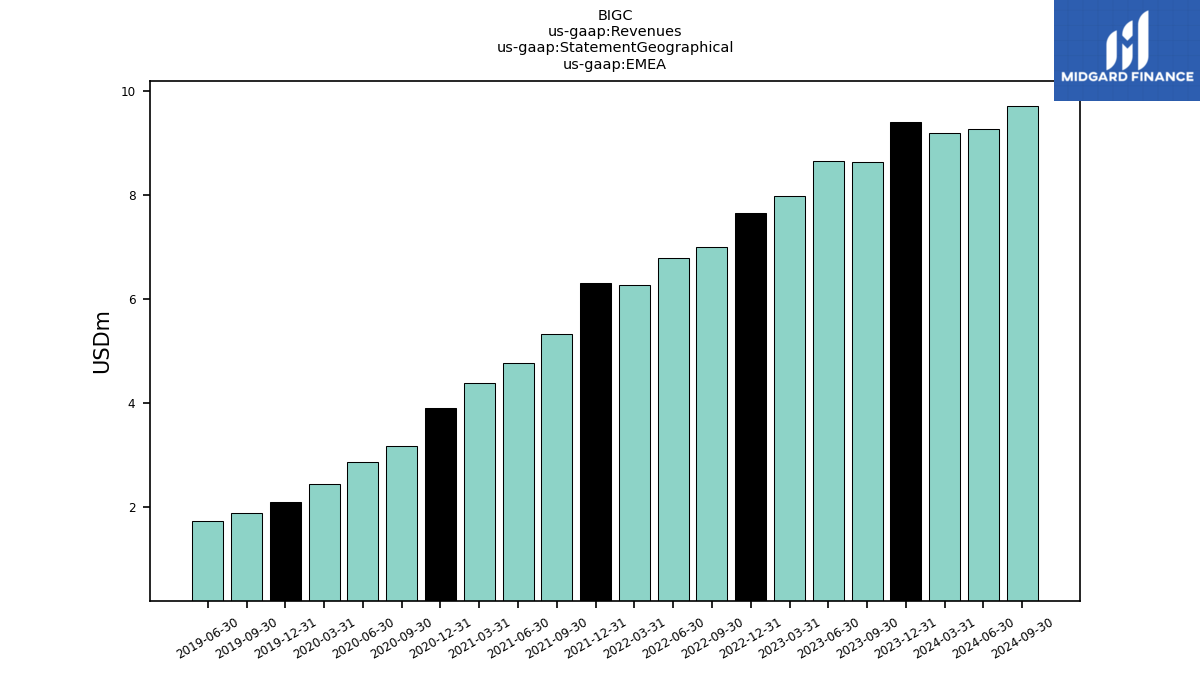
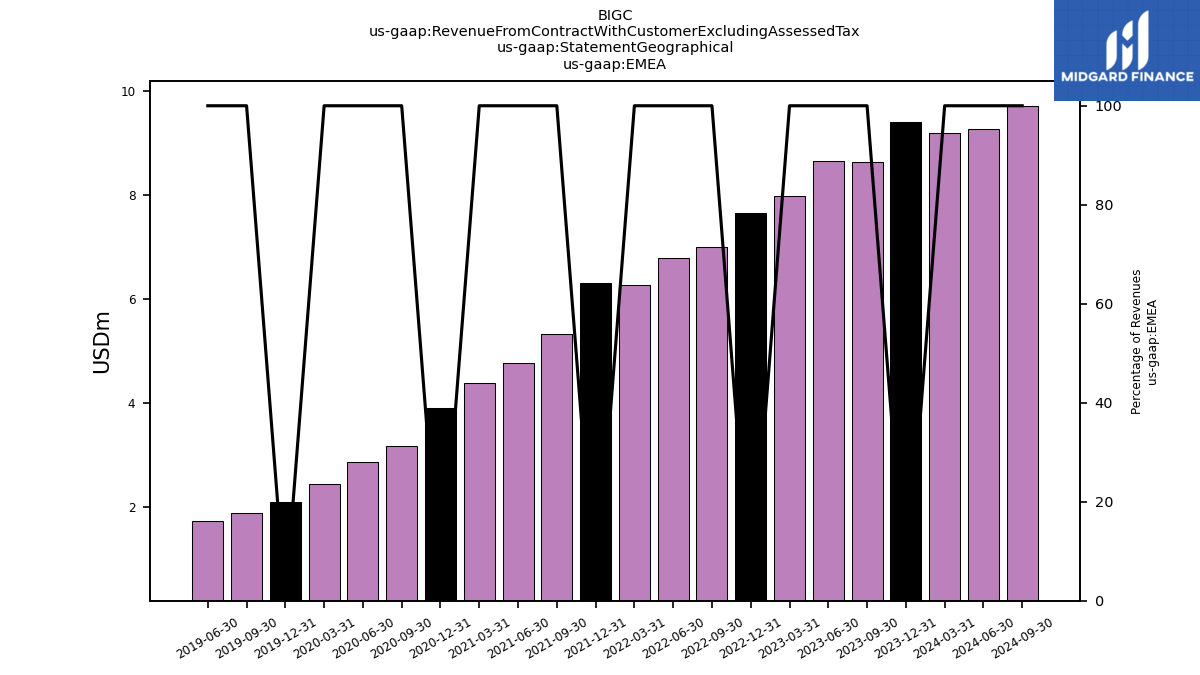
| EMEA | 8.63 | 8.65 | 7.98 | 7.66 | 7.00 | 6.80 | 6.28 | 6.32 | 5.34 | 4.78 | 4.40 | 3.90 | 3.18 | 2.87 | 2.44 | 2.11 | 1.90 | 1.74 | NA | |
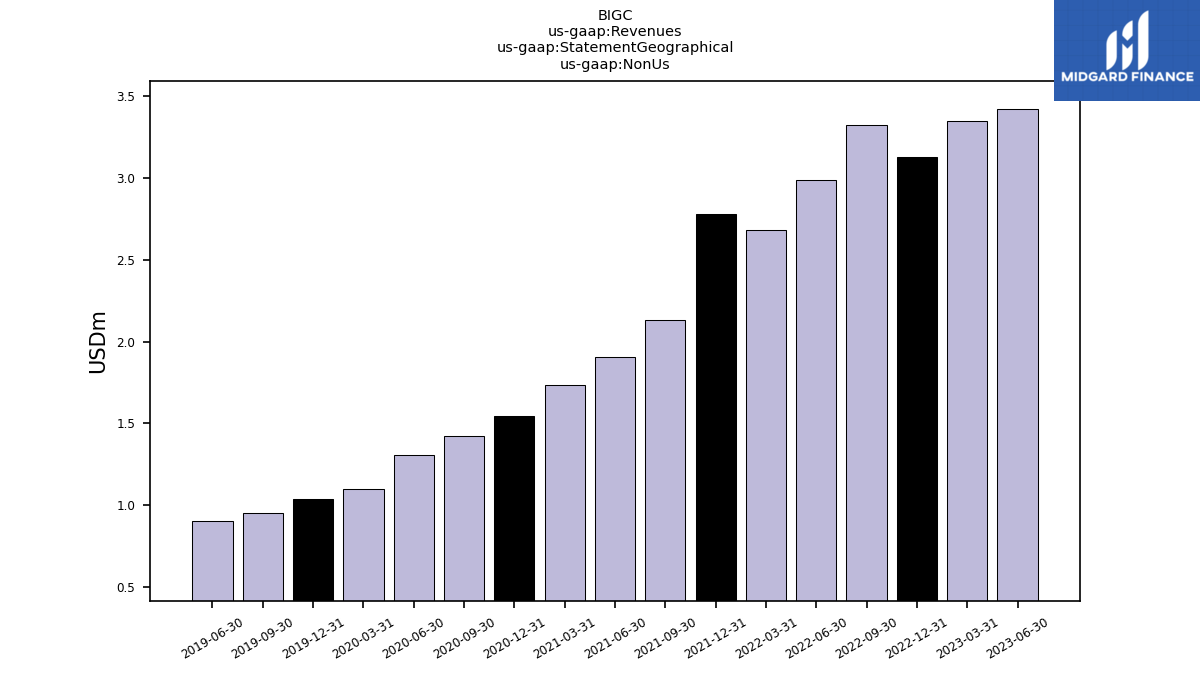
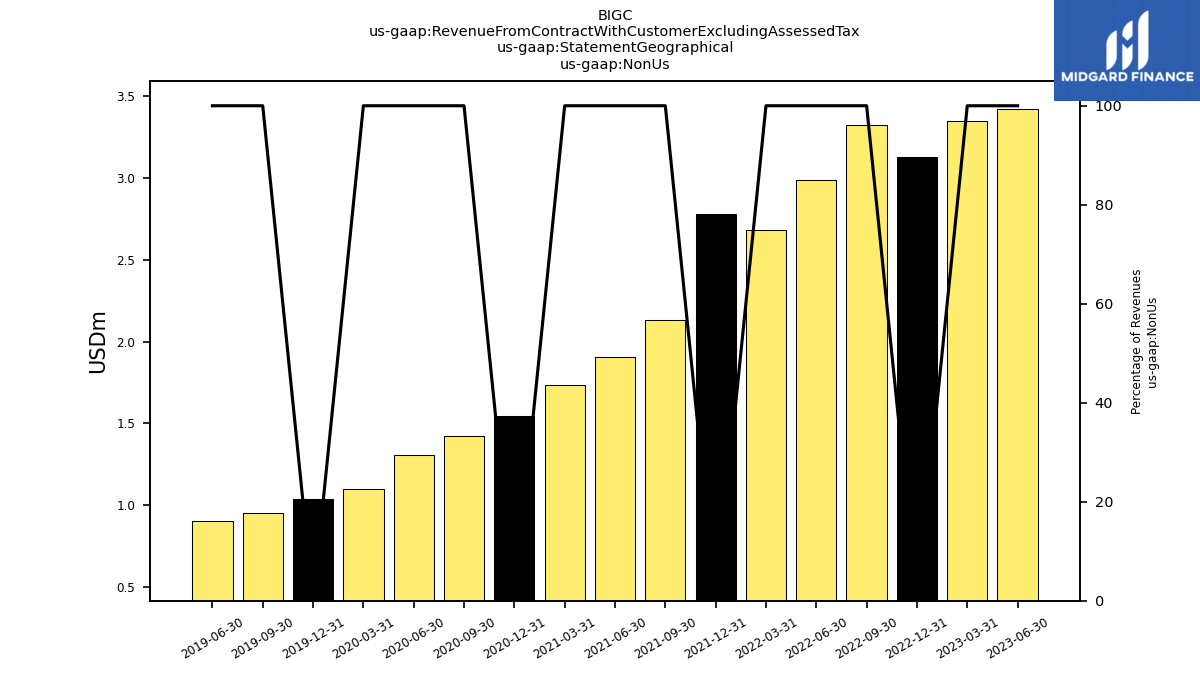
| Non Us | NA | 3.42 | 3.35 | 3.13 | 3.32 | 2.99 | 2.68 | 2.78 | 2.13 | 1.91 | 1.73 | 1.54 | 1.42 | 1.30 | 1.10 | 1.04 | 0.95 | 0.90 | NA | |
| Revenue From Contract With Customer Excluding Assessed Tax | 78.05 | 75.44 | 71.76 | 72.43 | 72.39 | 68.20 | 66.05 | 64.90 | 59.28 | 49.01 | 46.66 | 43.14 | 39.73 | 36.32 | 33.17 | 31.02 | 28.26 | 27.23 | 25.58 | |
| Partner And Services | 19.34 | 19.31 | 17.95 | 19.13 | 19.16 | 16.92 | 18.06 | 18.05 | 17.16 | 15.06 | 14.66 | 13.48 | 13.19 | 12.37 | 9.62 | 8.74 | 7.24 | 7.10 | NA | |
| Subscription And Circulation | 58.71 | 56.13 | 53.81 | 53.30 | 53.23 | 51.28 | 47.99 | 46.85 | 42.12 | 33.95 | 32.00 | 29.66 | 26.55 | 23.94 | 23.55 | NA | NA | NA | NA | |
| 5.90 | 5.83 | 5.61 | 5.56 | 5.78 | 5.65 | 5.58 | 5.93 | 5.65 | 4.78 | 4.41 | 3.86 | 3.65 | 3.26 | 2.90 | 2.84 | 2.57 | 2.37 | NA | ||
| US | NA | 57.55 | 54.81 | 56.09 | 56.29 | 52.76 | 51.50 | 49.87 | 46.17 | 37.54 | 36.12 | 33.84 | 31.48 | 28.88 | 26.73 | 25.04 | 22.84 | 22.23 | NA | |
| Americas Other | 3.50 | NA | NA | NA | 3.32 | NA | NA | NA | NA | NA | NA | NA | NA | NA | NA | NA | NA | NA | NA | |
| Americas U S | 60.02 | NA | NA | NA | 56.29 | NA | NA | NA | NA | NA | NA | NA | NA | NA | NA | NA | NA | NA | NA | |
| EMEA | 8.63 | 8.65 | 7.98 | 7.66 | 7.00 | 6.80 | 6.28 | 6.32 | 5.34 | 4.78 | 4.40 | 3.90 | 3.18 | 2.87 | 2.44 | 2.11 | 1.90 | 1.74 | NA | |
| Non Us | NA | 3.42 | 3.35 | 3.13 | 3.32 | 2.99 | 2.68 | 2.78 | 2.13 | 1.91 | 1.73 | 1.54 | 1.42 | 1.30 | 1.10 | 1.04 | 0.95 | 0.90 | NA |


