
| 2024-03-31 | 2023-12-31 | 2023-09-30 | 2023-06-30 | 2023-03-31 | 2022-12-31 | 2022-09-30 | 2022-06-30 | 2022-03-31 | 2021-12-31 | 2021-09-30 | 2021-06-30 | 2021-03-31 | 2020-12-31 | 2020-09-30 | 2020-06-30 | 2020-03-31 | 2019-12-31 | 2019-09-30 | 2019-06-30 | 2019-03-31 | 2018-12-31 | 2018-09-30 | 2018-06-30 | 2018-03-31 | 2017-12-31 | 2017-09-30 | 2017-06-30 | 2017-03-31 | 2016-12-31 | 2016-09-30 | 2016-06-30 | 2016-03-31 | 2015-12-31 | 2015-09-30 | 2015-06-30 | 2015-03-31 | 2014-12-31 | 2014-09-30 | 2014-06-30 | 2014-03-31 | 2013-12-31 | 2013-09-30 | 2013-06-30 | 2013-03-31 | ||
|---|---|---|---|---|---|---|---|---|---|---|---|---|---|---|---|---|---|---|---|---|---|---|---|---|---|---|---|---|---|---|---|---|---|---|---|---|---|---|---|---|---|---|---|---|---|---|
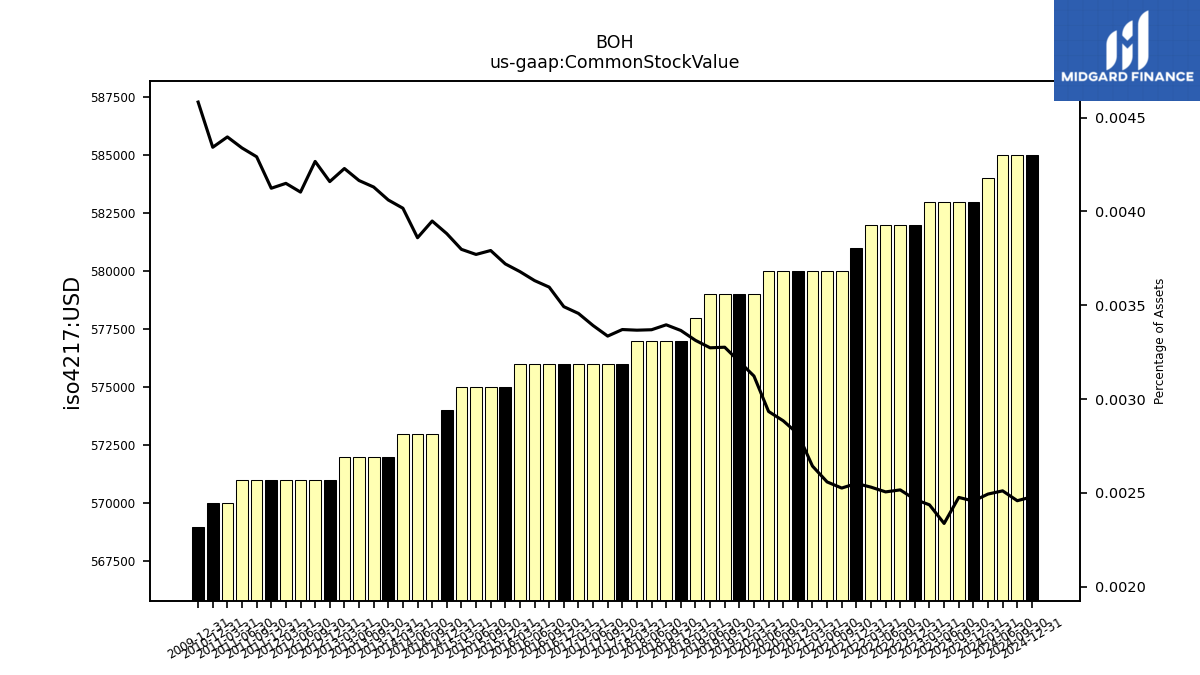
| Common Stock Value | 0.58 | 0.58 | 0.58 | 0.58 | 0.58 | 0.58 | 0.58 | 0.58 | 0.58 | 0.58 | 0.58 | 0.58 | 0.58 | 0.58 | 0.58 | 0.58 | 0.58 | 0.58 | 0.58 | 0.58 | 0.58 | 0.58 | 0.58 | 0.58 | 0.58 | 0.58 | 0.58 | 0.58 | 0.58 | 0.58 | 0.58 | 0.58 | 0.58 | 0.57 | 0.57 | 0.57 | 0.57 | 0.57 | 0.57 | 0.57 | 0.57 | 0.57 | 0.57 | 0.57 | 0.57 | |
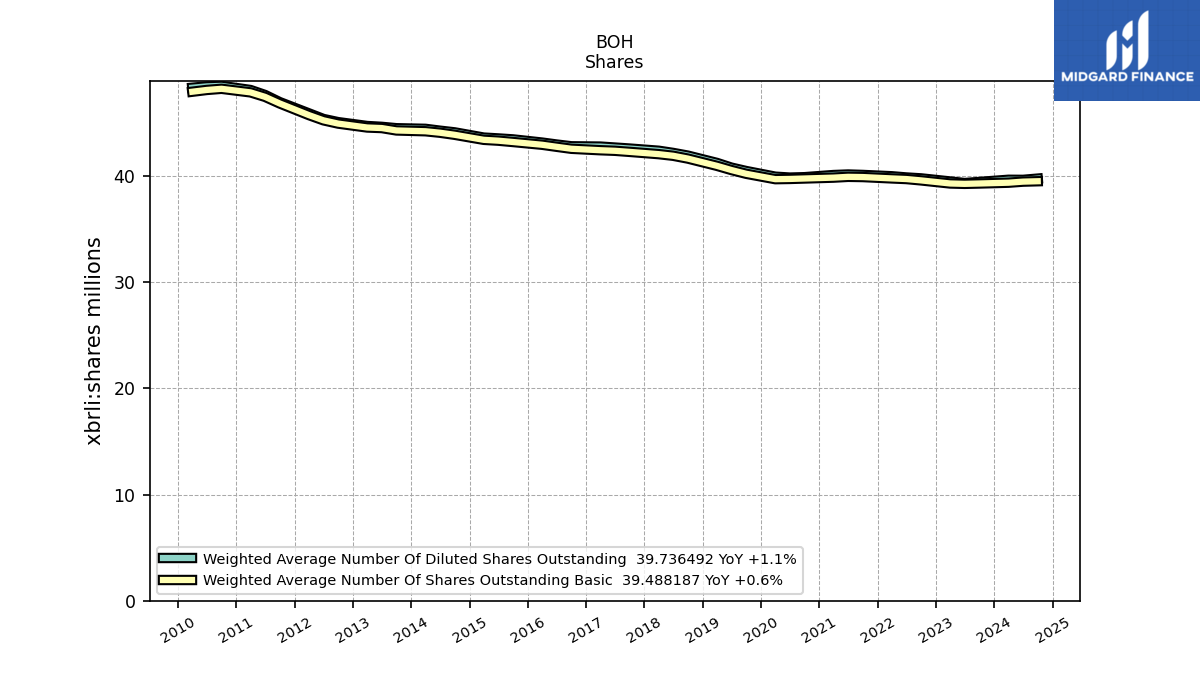
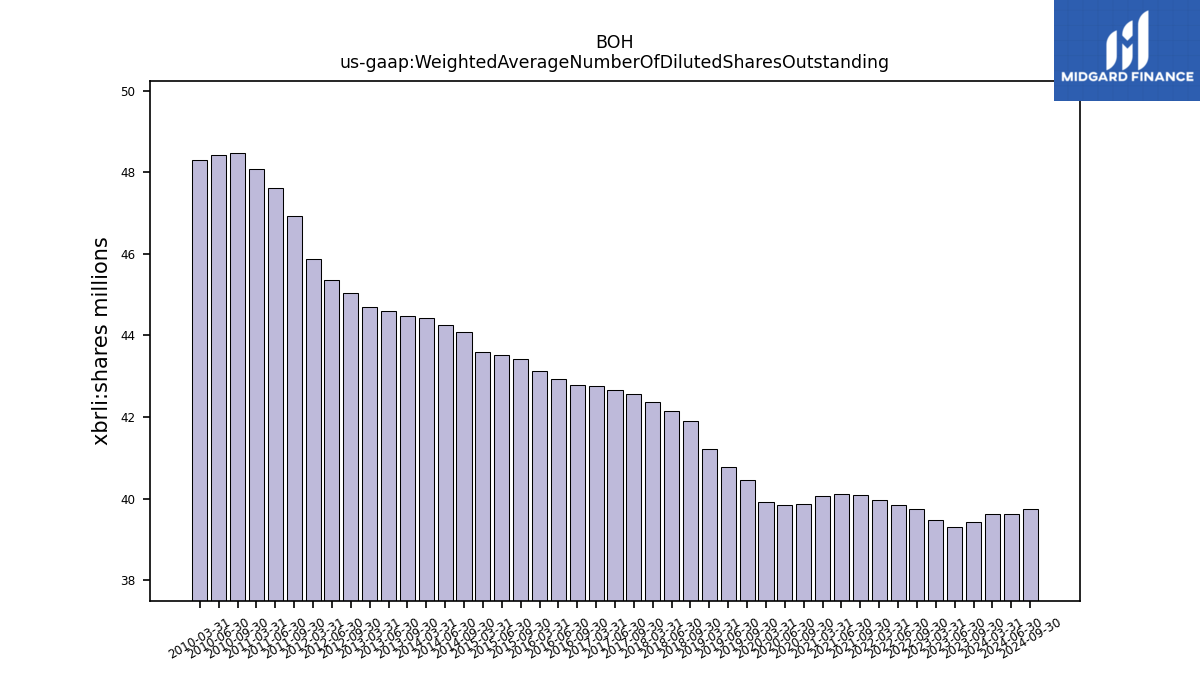
| Weighted Average Number Of Diluted Shares Outstanding | 39.63 | NA | 39.42 | 39.32 | 39.47 | NA | 39.76 | 39.84 | 39.96 | NA | 40.08 | 40.12 | 40.07 | NA | 39.87 | 39.83 | 39.92 | NA | 40.45 | 40.77 | 41.21 | NA | 41.90 | 42.15 | 42.36 | NA | 42.57 | 42.66 | 42.75 | NA | 42.78 | 42.94 | 43.13 | NA | 43.43 | 43.52 | 43.60 | NA | 44.09 | 44.25 | 44.42 | NA | 44.48 | 44.61 | 44.69 | |
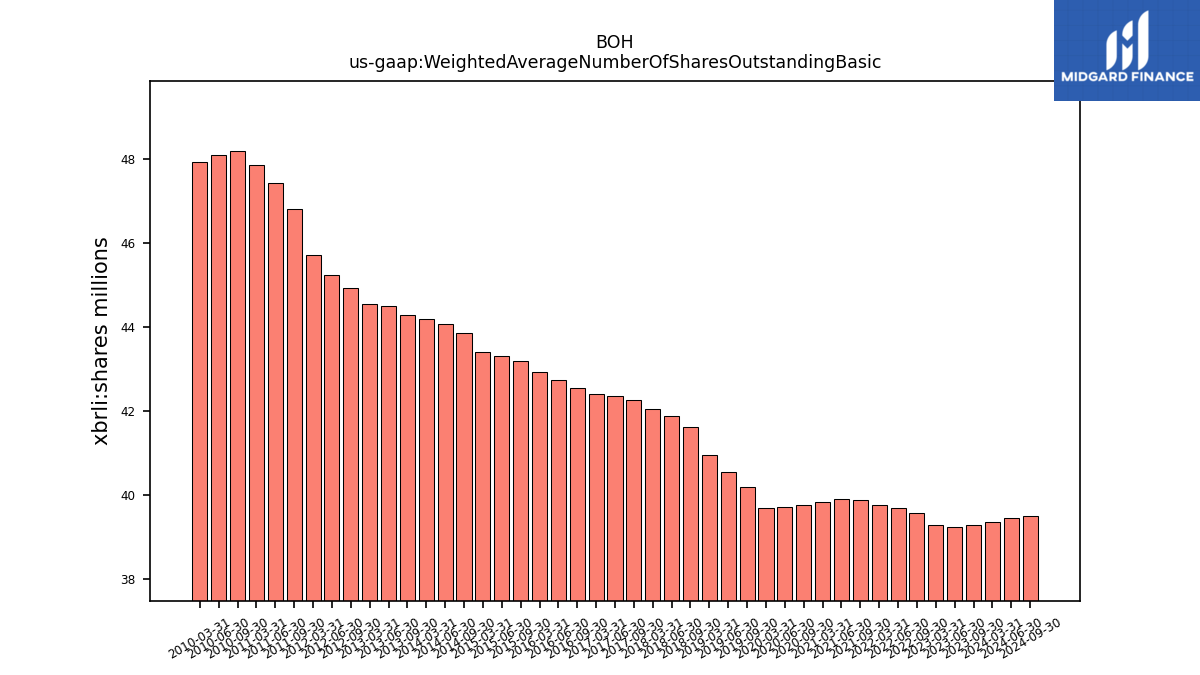
| Weighted Average Number Of Shares Outstanding Basic | 39.35 | NA | 39.27 | 39.24 | 39.28 | NA | 39.57 | 39.69 | 39.75 | NA | 39.88 | 39.90 | 39.83 | NA | 39.75 | 39.70 | 39.68 | NA | 40.19 | 40.54 | 40.94 | NA | 41.62 | 41.88 | 42.04 | NA | 42.25 | 42.35 | 42.41 | NA | 42.54 | 42.73 | 42.92 | NA | 43.18 | 43.31 | 43.39 | NA | 43.86 | 44.05 | 44.19 | NA | 44.27 | 44.49 | 44.55 | |
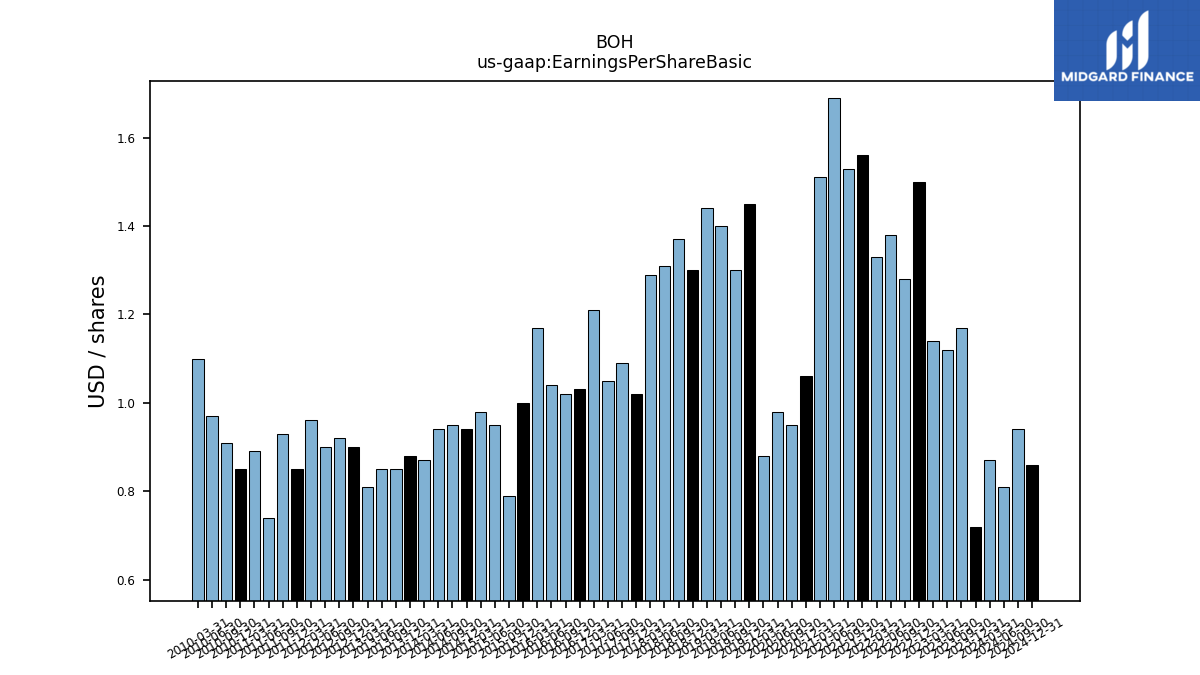
| Earnings Per Share Basic | 0.87 | 0.72 | 1.17 | 1.12 | 1.14 | 1.50 | 1.28 | 1.38 | 1.33 | 1.56 | 1.53 | 1.69 | 1.51 | 1.06 | 0.95 | 0.98 | 0.88 | 1.45 | 1.30 | 1.40 | 1.44 | 1.30 | 1.37 | 1.31 | 1.29 | 1.02 | 1.09 | 1.05 | 1.21 | 1.03 | 1.02 | 1.04 | 1.17 | 1.00 | 0.79 | 0.95 | 0.98 | 0.94 | 0.95 | 0.94 | 0.87 | 0.88 | 0.85 | 0.85 | 0.81 | |
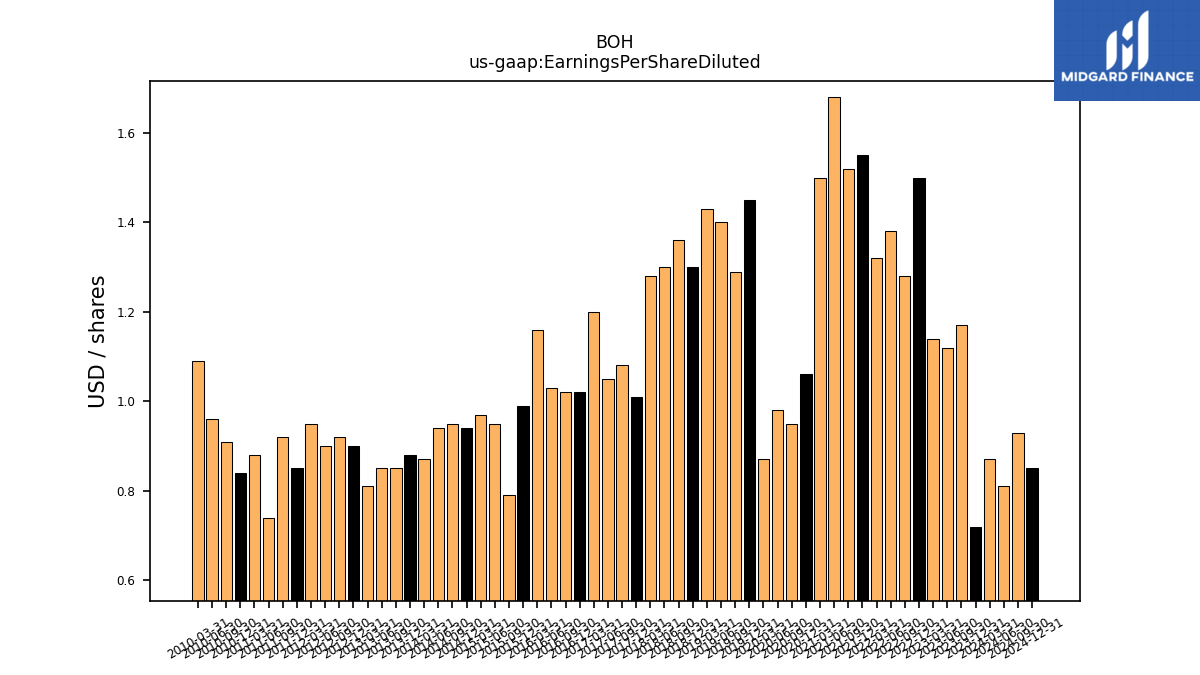
| Earnings Per Share Diluted | 0.87 | 0.72 | 1.17 | 1.12 | 1.14 | 1.50 | 1.28 | 1.38 | 1.32 | 1.55 | 1.52 | 1.68 | 1.50 | 1.06 | 0.95 | 0.98 | 0.87 | 1.45 | 1.29 | 1.40 | 1.43 | 1.30 | 1.36 | 1.30 | 1.28 | 1.01 | 1.08 | 1.05 | 1.20 | 1.02 | 1.02 | 1.03 | 1.16 | 0.99 | 0.79 | 0.95 | 0.97 | 0.94 | 0.95 | 0.94 | 0.87 | 0.88 | 0.85 | 0.85 | 0.81 |
| 2024-03-31 | 2023-12-31 | 2023-09-30 | 2023-06-30 | 2023-03-31 | 2022-12-31 | 2022-09-30 | 2022-06-30 | 2022-03-31 | 2021-12-31 | 2021-09-30 | 2021-06-30 | 2021-03-31 | 2020-12-31 | 2020-09-30 | 2020-06-30 | 2020-03-31 | 2019-12-31 | 2019-09-30 | 2019-06-30 | 2019-03-31 | 2018-12-31 | 2018-09-30 | 2018-06-30 | 2018-03-31 | 2017-12-31 | 2017-09-30 | 2017-06-30 | 2017-03-31 | 2016-12-31 | 2016-09-30 | 2016-06-30 | 2016-03-31 | 2015-12-31 | 2015-09-30 | 2015-06-30 | 2015-03-31 | 2014-12-31 | 2014-09-30 | 2014-06-30 | 2014-03-31 | 2013-12-31 | 2013-09-30 | 2013-06-30 | 2013-03-31 | ||
|---|---|---|---|---|---|---|---|---|---|---|---|---|---|---|---|---|---|---|---|---|---|---|---|---|---|---|---|---|---|---|---|---|---|---|---|---|---|---|---|---|---|---|---|---|---|---|
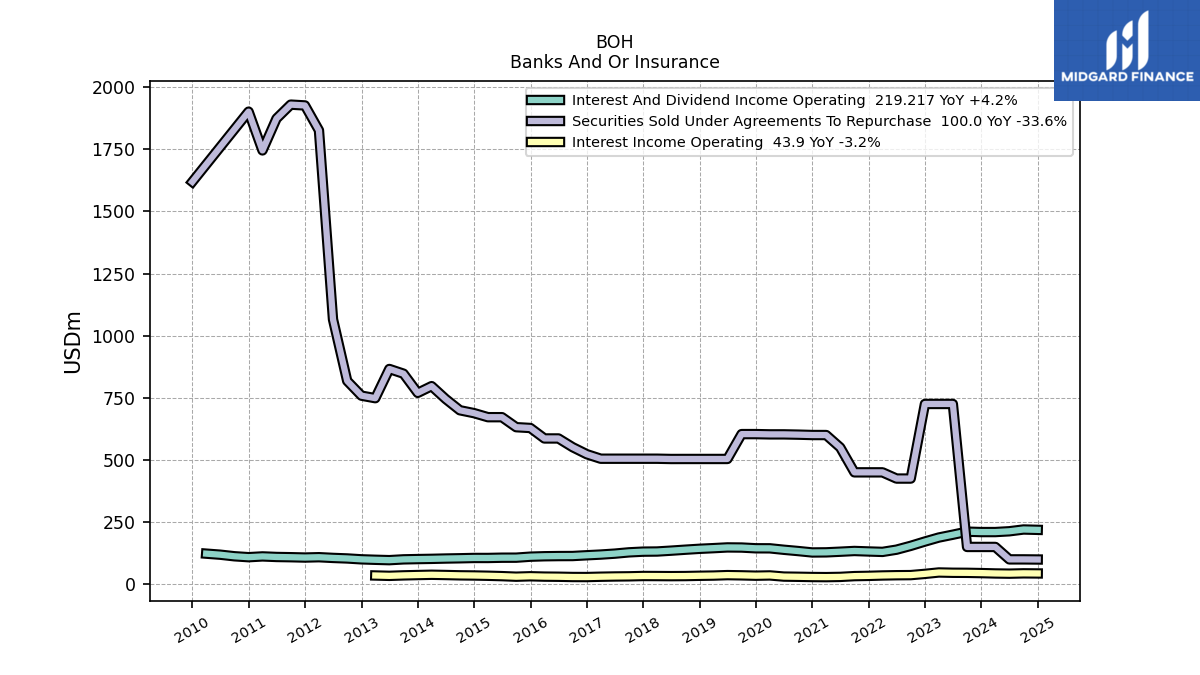
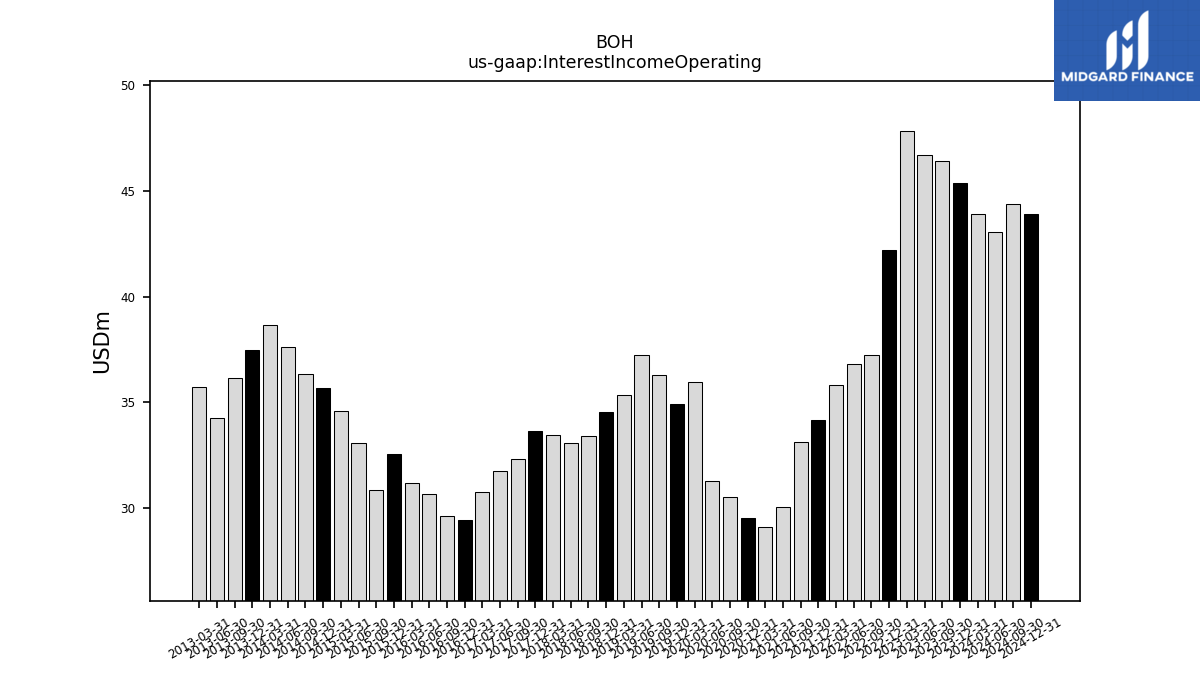
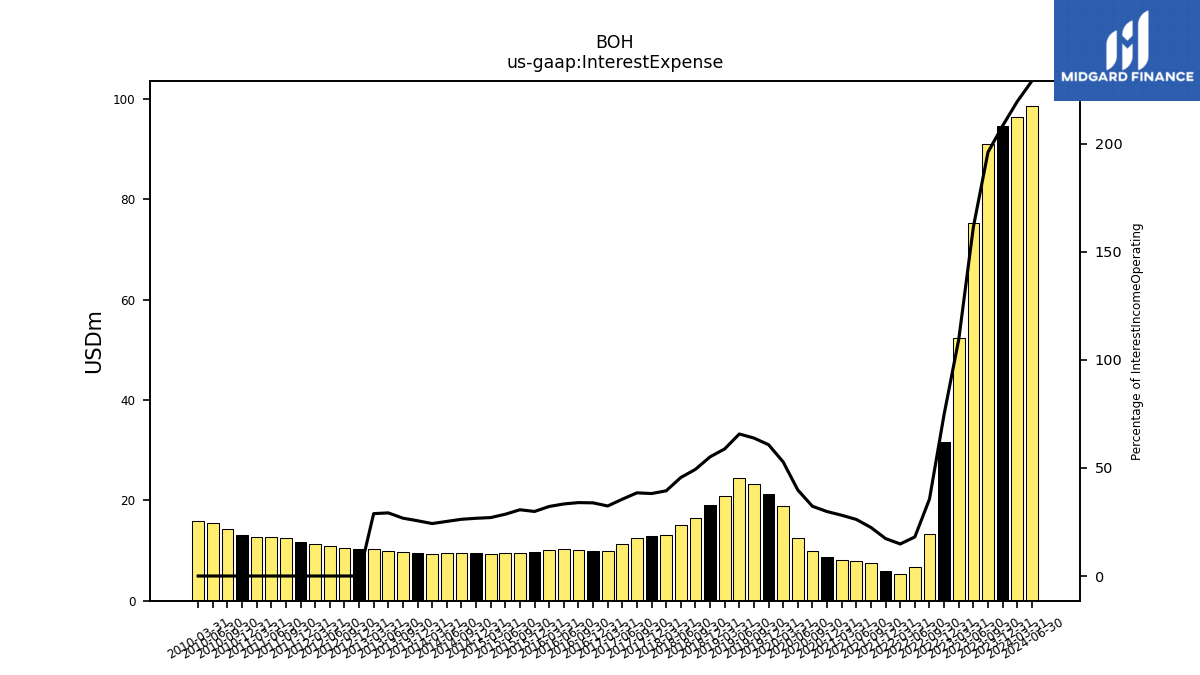
| Interest Income Operating | 43.89 | 45.37 | 46.39 | 46.68 | 47.84 | 42.18 | 37.24 | 36.82 | 35.80 | 34.17 | 33.15 | 30.04 | 29.14 | 29.56 | 30.52 | 31.30 | 35.96 | 34.91 | 36.31 | 37.22 | 35.35 | 34.52 | 33.41 | 33.09 | 33.44 | 33.65 | 32.32 | 31.75 | 30.79 | 29.46 | 29.63 | 30.69 | 31.20 | 32.55 | 30.88 | 33.10 | 34.60 | 35.70 | 36.35 | 37.63 | 38.65 | 37.49 | 36.17 | 34.26 | 35.70 | |
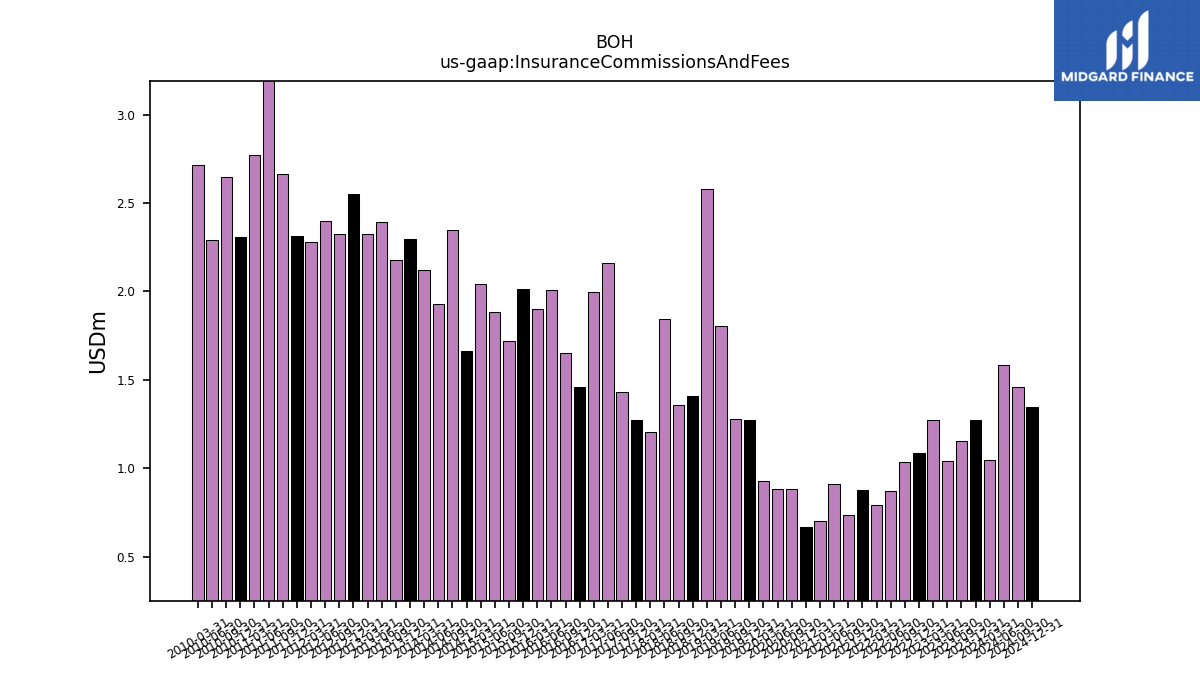
| Insurance Commissions And Fees | 1.05 | 1.27 | 1.16 | 1.04 | 1.27 | 1.09 | 1.03 | 0.87 | 0.79 | 0.88 | 0.73 | 0.91 | 0.70 | 0.67 | 0.88 | 0.88 | 0.93 | 1.27 | 1.28 | 1.81 | 2.58 | 1.41 | 1.36 | 1.85 | 1.21 | 1.27 | 1.43 | 2.16 | 2.00 | 1.46 | 1.65 | 2.01 | 1.90 | 2.01 | 1.72 | 1.89 | 2.04 | 1.66 | 2.35 | 1.93 | 2.12 | 2.29 | 2.18 | 2.39 | 2.33 | |
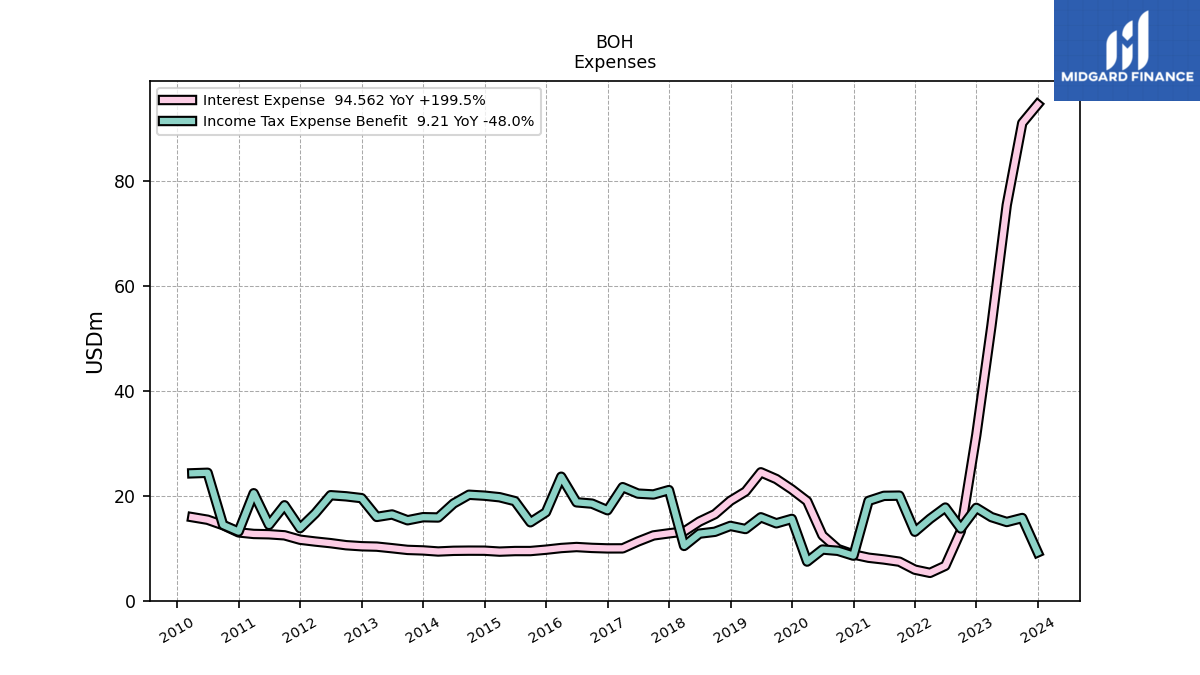
| Interest Expense | 96.42 | 94.56 | 91.01 | 75.40 | 52.38 | 31.57 | 13.26 | 6.66 | 5.31 | 5.92 | 7.44 | 7.87 | 8.20 | 8.82 | 9.85 | 12.45 | 18.98 | 21.22 | 23.19 | 24.47 | 20.80 | 19.05 | 16.50 | 15.09 | 13.19 | 12.84 | 12.44 | 11.29 | 9.98 | 9.97 | 10.07 | 10.23 | 10.04 | 9.73 | 9.47 | 9.47 | 9.36 | 9.54 | 9.54 | 9.51 | 9.38 | 9.59 | 9.69 | 10.01 | 10.31 | |
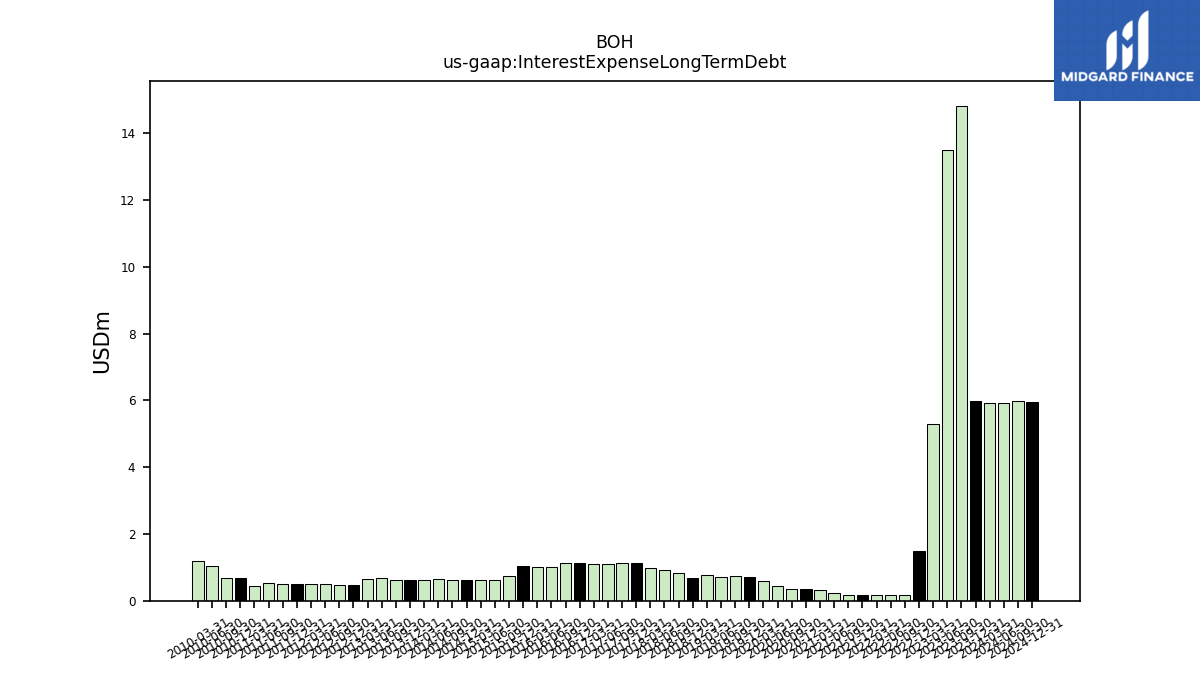
| Interest Expense Long Term Debt | 5.92 | 5.98 | 14.82 | 13.49 | 5.30 | 1.50 | 0.18 | 0.18 | 0.18 | 0.18 | 0.18 | 0.24 | 0.33 | 0.34 | 0.34 | 0.44 | 0.58 | 0.71 | 0.73 | 0.71 | 0.76 | 0.67 | 0.84 | 0.92 | 0.98 | 1.12 | 1.12 | 1.11 | 1.10 | 1.12 | 1.12 | 1.02 | 1.00 | 1.03 | 0.75 | 0.62 | 0.62 | 0.62 | 0.63 | 0.65 | 0.63 | 0.63 | 0.63 | 0.67 | 0.64 | |
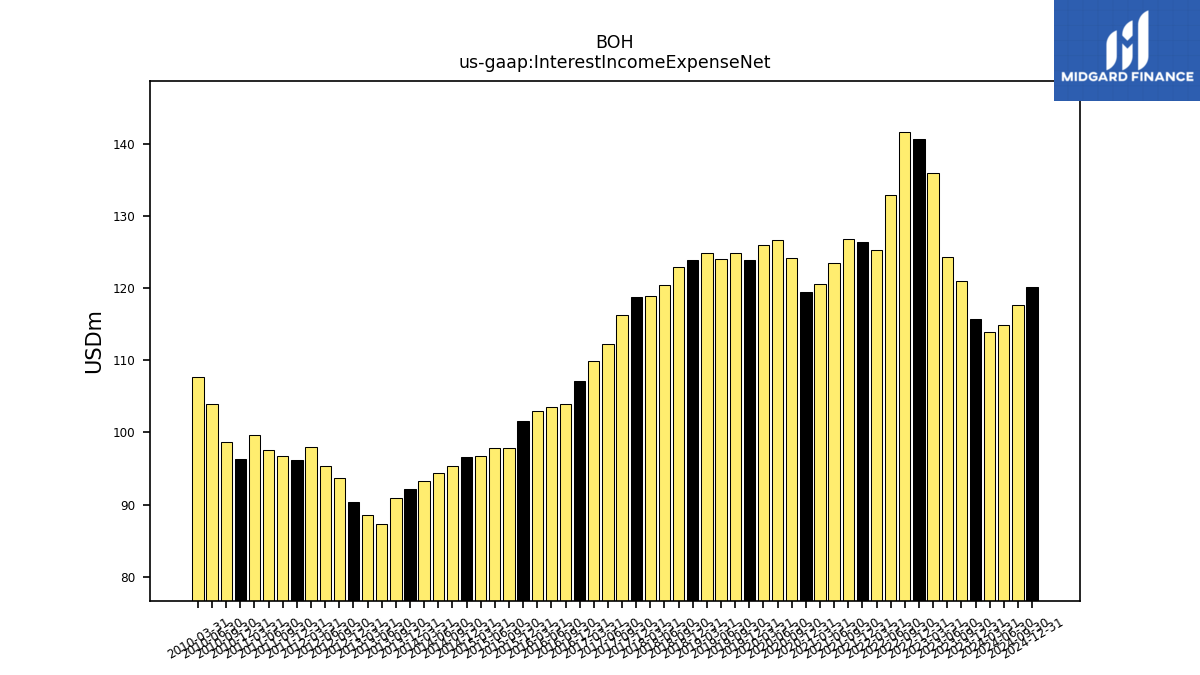
| Interest Income Expense Net | 113.94 | 115.78 | 120.94 | 124.35 | 135.96 | 140.74 | 141.66 | 132.90 | 125.26 | 126.39 | 126.82 | 123.51 | 120.57 | 119.50 | 124.17 | 126.69 | 125.97 | 123.89 | 124.90 | 124.10 | 124.84 | 123.97 | 122.93 | 120.50 | 118.96 | 118.77 | 116.32 | 112.28 | 109.87 | 107.09 | 103.91 | 103.55 | 103.02 | 101.64 | 97.89 | 97.78 | 96.77 | 96.63 | 95.38 | 94.41 | 93.23 | 92.12 | 90.89 | 87.34 | 88.56 | |
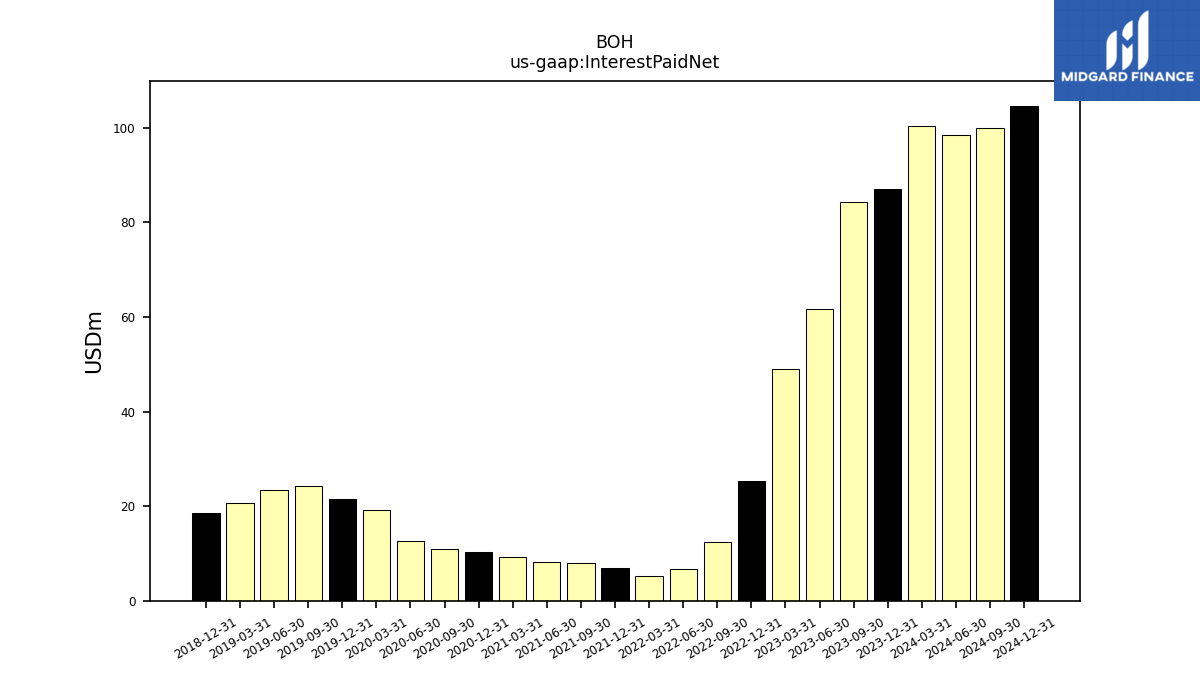
| Interest Paid Net | 100.36 | 86.97 | 84.31 | 61.73 | 49.01 | 25.28 | 12.40 | 6.66 | 5.26 | 6.84 | 7.91 | 8.10 | 9.20 | 10.31 | 11.01 | 12.61 | 19.09 | 21.61 | 24.21 | 23.49 | 20.58 | 18.48 | NA | NA | NA | NA | NA | NA | NA | NA | NA | NA | NA | NA | NA | NA | NA | NA | NA | NA | NA | NA | NA | NA | NA | |
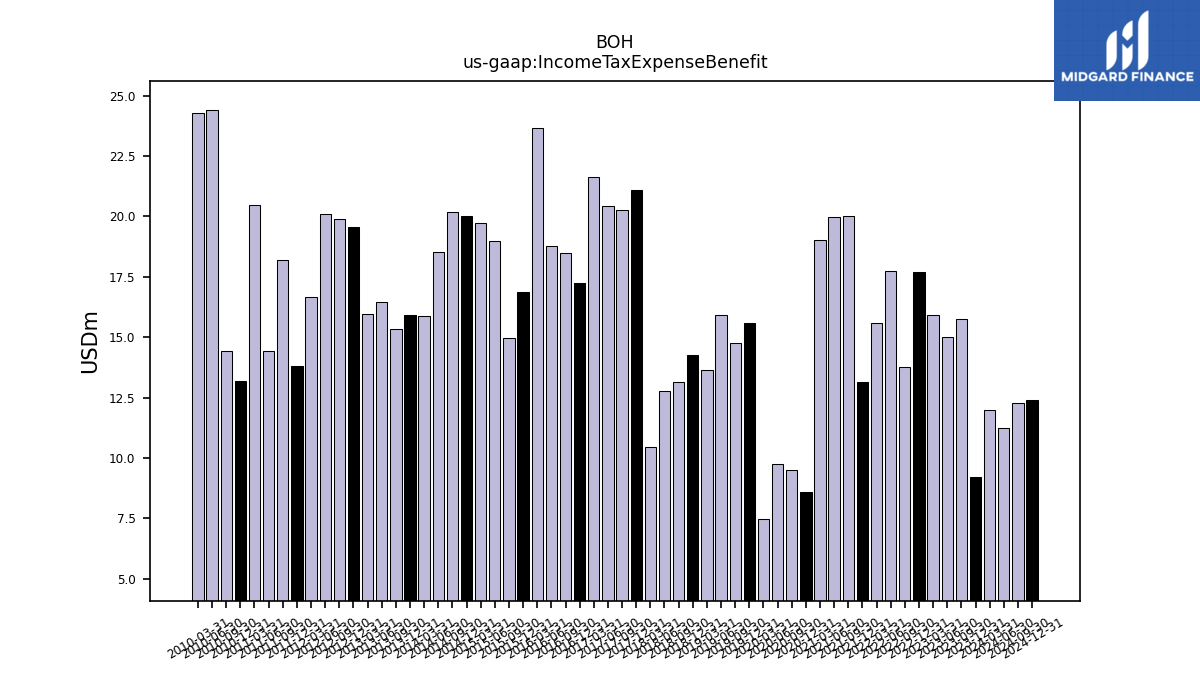
| Income Tax Expense Benefit | 11.97 | 9.21 | 15.77 | 15.01 | 15.93 | 17.70 | 13.77 | 17.76 | 15.61 | 13.15 | 20.02 | 19.98 | 19.02 | 8.59 | 9.51 | 9.76 | 7.46 | 15.60 | 14.75 | 15.90 | 13.66 | 14.26 | 13.14 | 12.79 | 10.44 | 21.09 | 20.25 | 20.41 | 21.64 | 17.24 | 18.50 | 18.75 | 23.64 | 16.85 | 14.95 | 18.98 | 19.72 | 20.02 | 20.20 | 18.52 | 15.86 | 15.92 | 15.33 | 16.44 | 15.97 | |
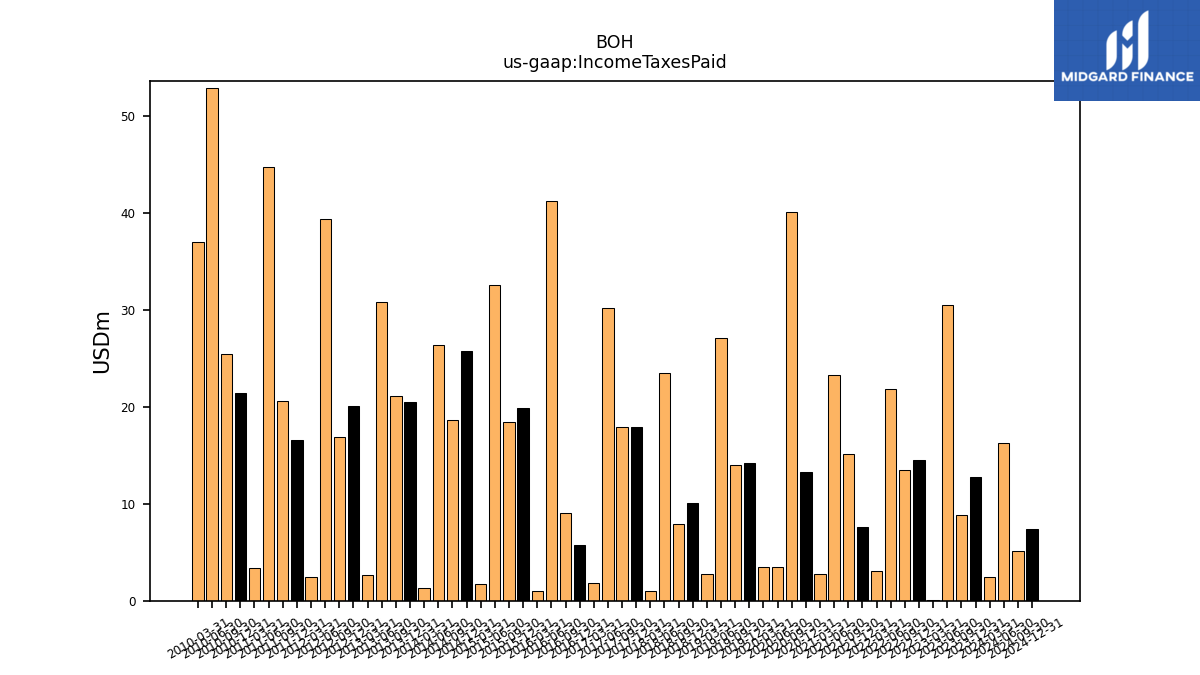
| Income Taxes Paid | 2.49 | 12.78 | 8.85 | 30.53 | 0.09 | 14.56 | 13.52 | 21.88 | 3.07 | 7.57 | 15.12 | 23.30 | 2.77 | 13.23 | 40.05 | 3.44 | 3.46 | 14.25 | 14.04 | 27.10 | 2.76 | 10.07 | 7.92 | 23.53 | 0.96 | 17.93 | 17.90 | 30.24 | 1.82 | 5.75 | 9.03 | 41.23 | 1.00 | 19.93 | 18.47 | 32.56 | 1.78 | 25.76 | 18.67 | 26.34 | 1.35 | 20.52 | 21.09 | 30.86 | 2.69 | |
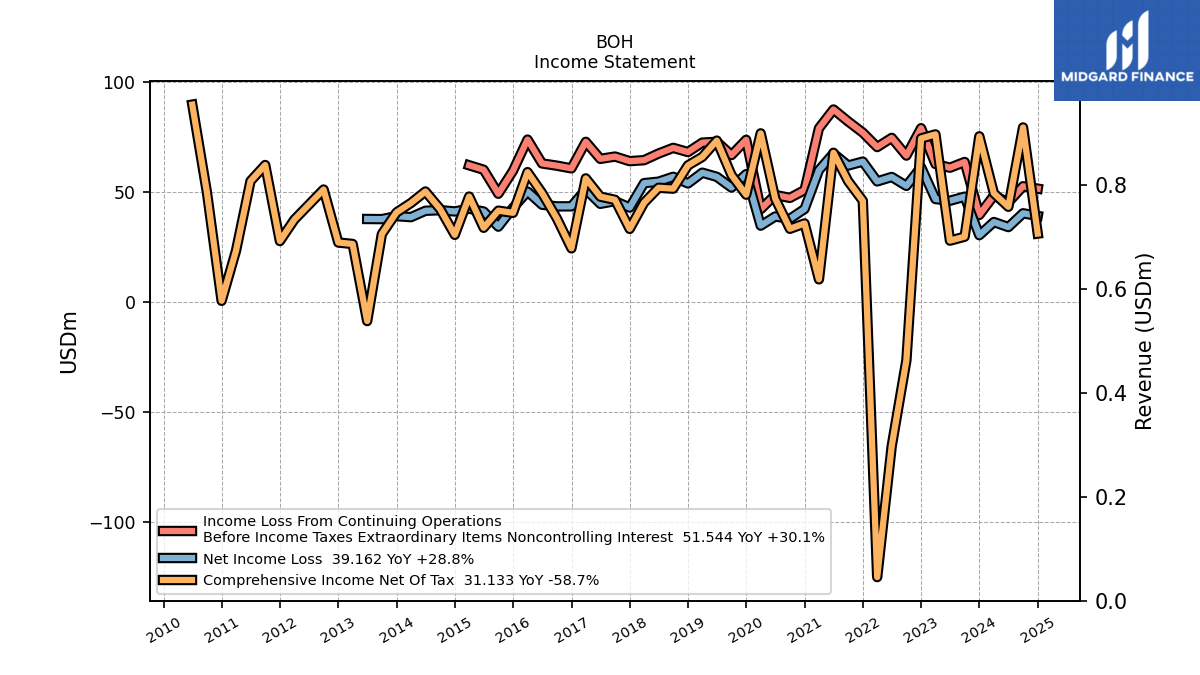
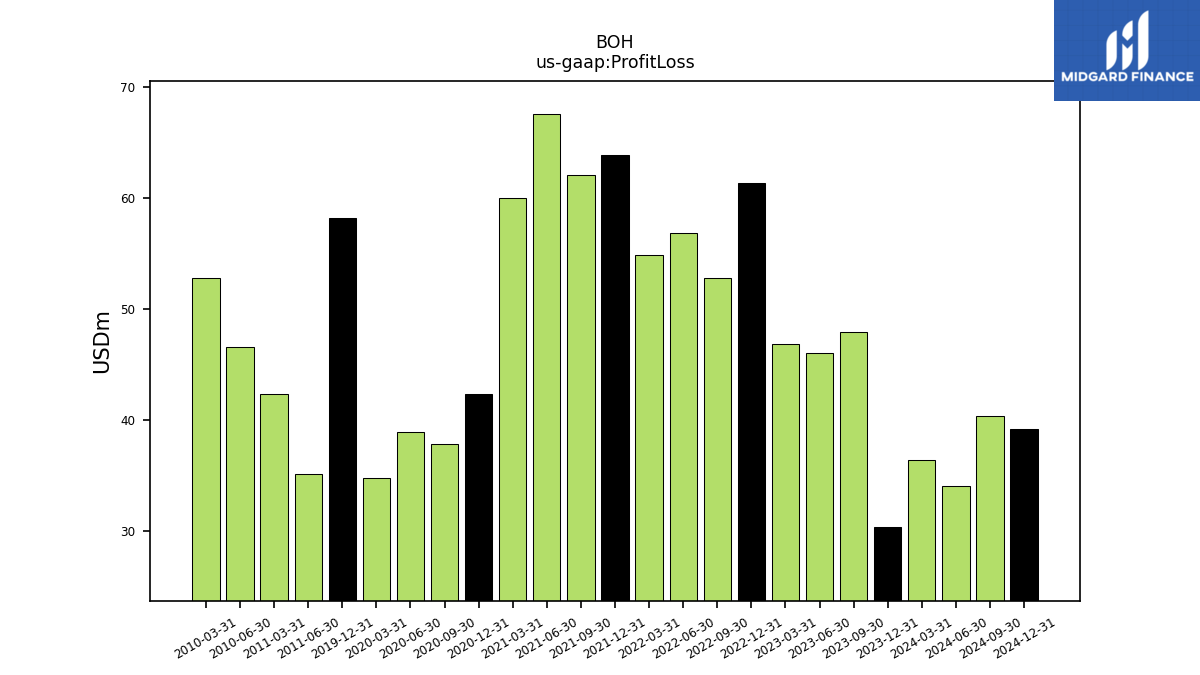
| Profit Loss | 36.39 | 30.40 | 47.90 | 46.06 | 46.84 | 61.31 | 52.80 | 56.86 | 54.83 | 63.84 | 62.05 | 67.53 | 59.95 | 42.31 | 37.84 | 38.91 | 34.74 | 58.14 | NA | NA | NA | NA | NA | NA | NA | NA | NA | NA | NA | NA | NA | NA | NA | NA | NA | NA | NA | NA | NA | NA | NA | NA | NA | NA | NA | |
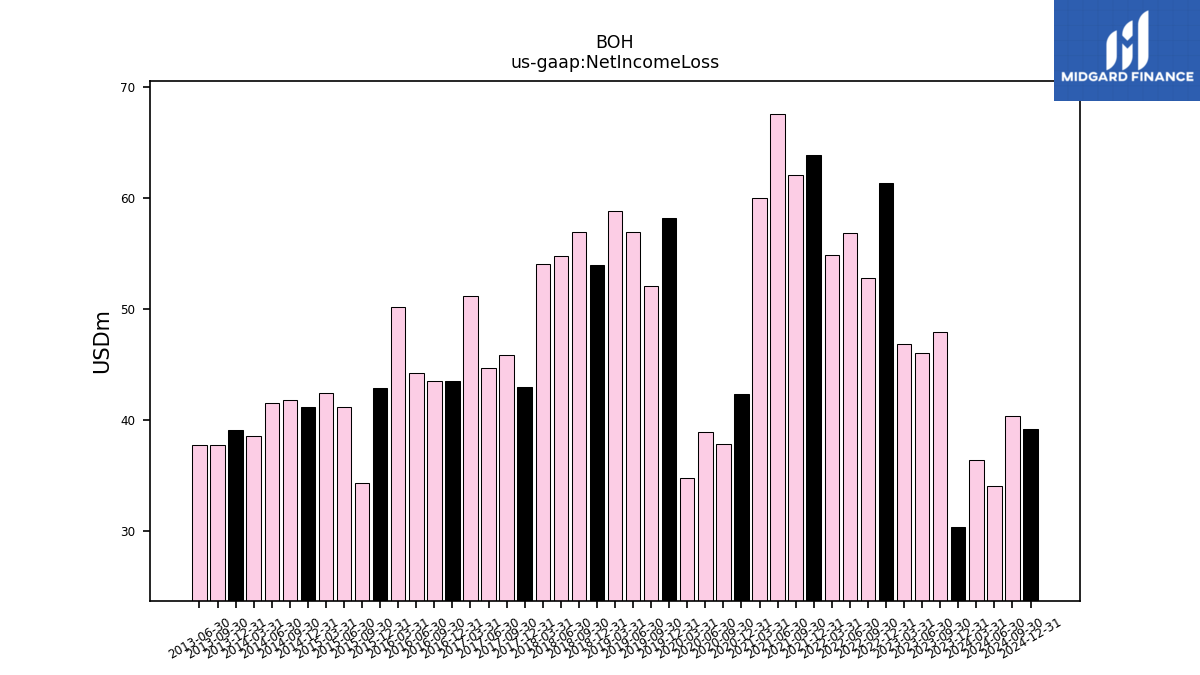
| Net Income Loss | 36.39 | 30.40 | 47.90 | 46.06 | 46.84 | 61.31 | 52.80 | 56.86 | 54.83 | 63.84 | 62.05 | 67.53 | 59.95 | 42.31 | 37.84 | 38.91 | 34.74 | 58.14 | 52.05 | 56.92 | 58.80 | 53.91 | 56.93 | 54.72 | 54.04 | 42.95 | 45.88 | 44.66 | 51.18 | 43.51 | 43.49 | 44.24 | 50.21 | 42.83 | 34.28 | 41.15 | 42.44 | 41.19 | 41.77 | 41.49 | 38.59 | 39.05 | 37.70 | 37.76 | NA | |
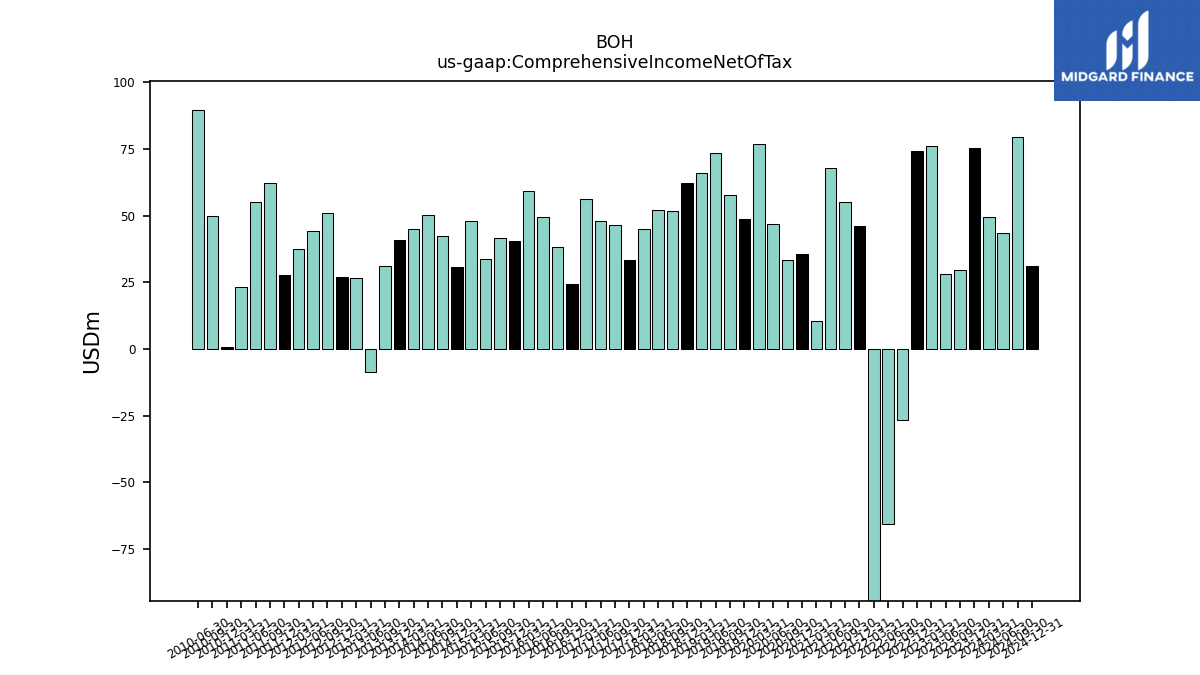
| Comprehensive Income Net Of Tax | 49.50 | 75.32 | 29.72 | 27.93 | 76.20 | 74.34 | -26.45 | -65.43 | -124.94 | 46.02 | 54.95 | 67.85 | 10.34 | 35.74 | 33.31 | 47.01 | 76.67 | 48.80 | 57.70 | 73.37 | 65.96 | 62.11 | 51.55 | 51.96 | 45.13 | 33.26 | 46.47 | 47.91 | 56.22 | 24.42 | 38.10 | 49.54 | 59.05 | 40.57 | 41.55 | 33.76 | 47.96 | 30.57 | 42.33 | 50.26 | 45.02 | 40.74 | 30.92 | -8.61 | 26.42 | |
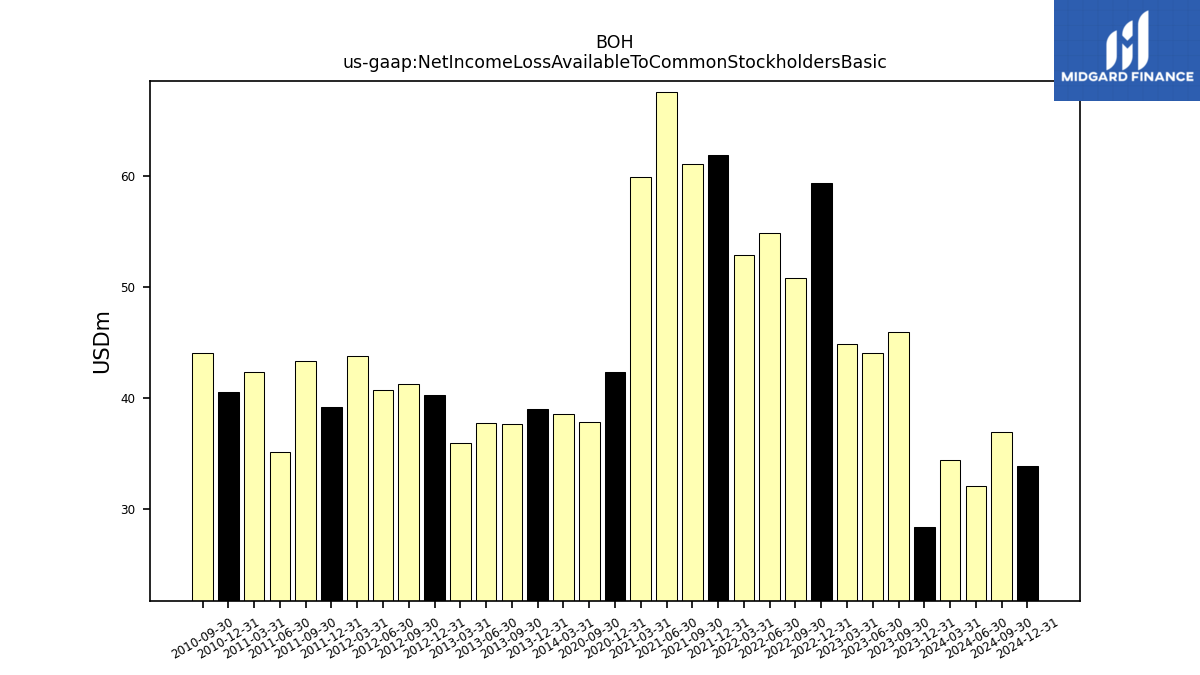
| Net Income Loss Available To Common Stockholders Basic | 34.42 | 28.43 | 45.93 | 44.09 | 44.87 | 59.34 | 50.83 | 54.89 | 52.87 | 61.87 | 61.05 | 67.53 | 59.95 | 42.31 | 37.84 | NA | NA | NA | NA | NA | NA | NA | NA | NA | NA | NA | NA | NA | NA | NA | NA | NA | NA | NA | NA | NA | NA | NA | NA | NA | 38.59 | 39.05 | 37.70 | 37.76 | 35.98 | |
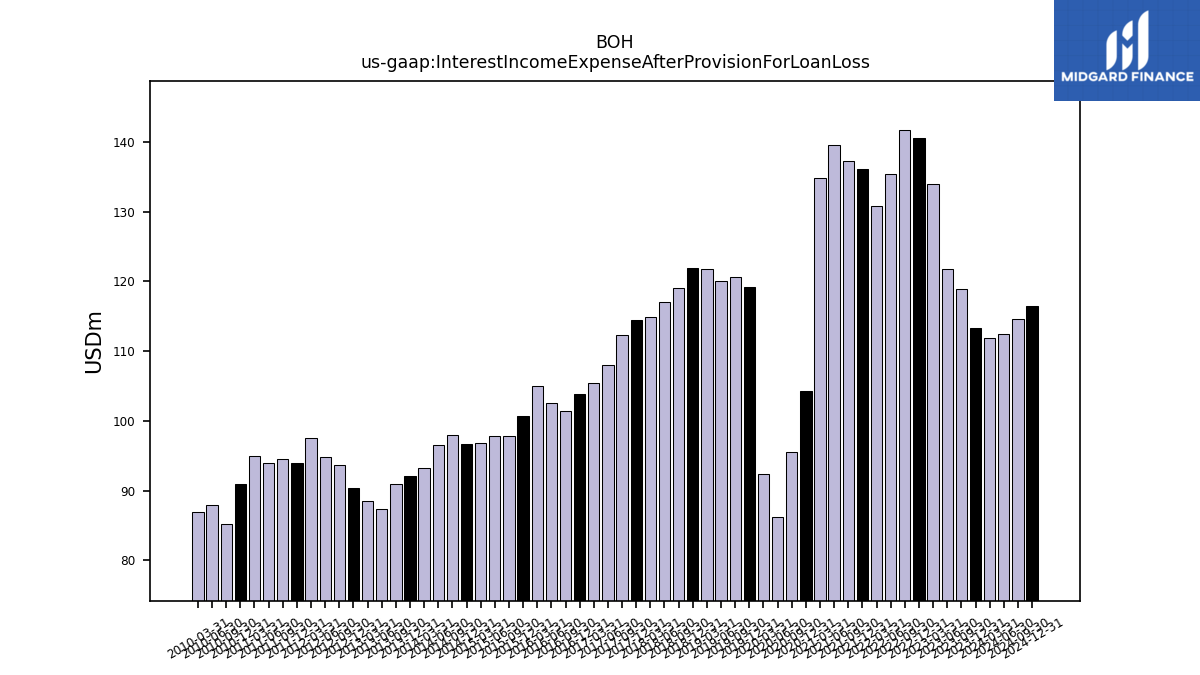
| Interest Income Expense After Provision For Loan Loss | 111.94 | 113.28 | 118.94 | 121.85 | 133.96 | 140.54 | 141.66 | 135.40 | 130.76 | 136.09 | 137.22 | 139.61 | 134.87 | 104.30 | 95.57 | 86.29 | 92.37 | 119.14 | 120.65 | 120.10 | 121.84 | 121.97 | 119.13 | 117.00 | 114.83 | 114.52 | 112.32 | 108.03 | 105.47 | 103.84 | 101.41 | 102.55 | 105.02 | 100.64 | 97.89 | 97.78 | 96.77 | 96.63 | 98.04 | 96.61 | 93.23 | 92.12 | 90.89 | 87.34 | 88.56 | |
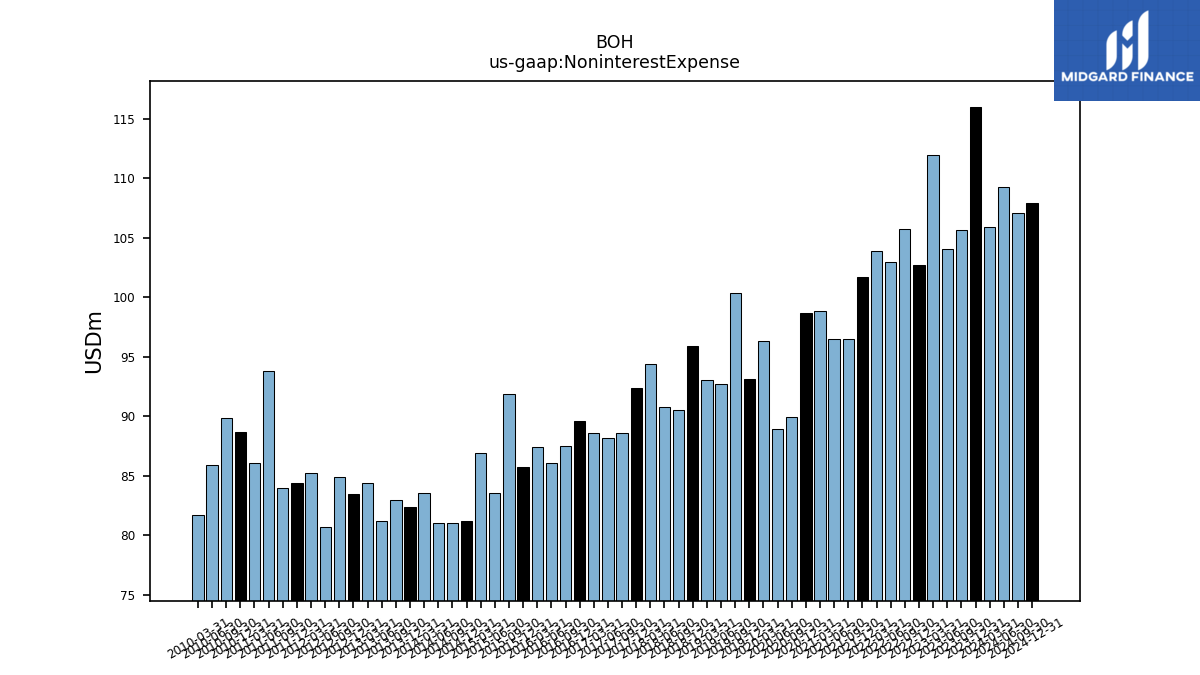
| Noninterest Expense | 105.86 | 115.96 | 105.60 | 104.04 | 111.92 | 102.70 | 105.75 | 102.94 | 103.87 | 101.68 | 96.52 | 96.53 | 98.86 | 98.65 | 89.95 | 88.89 | 96.31 | 93.10 | 100.35 | 92.72 | 93.06 | 95.91 | 90.54 | 90.79 | 94.38 | 92.34 | 88.60 | 88.19 | 88.57 | 89.59 | 87.53 | 86.07 | 87.39 | 85.73 | 91.89 | 83.57 | 86.92 | 81.24 | 81.03 | 81.08 | 83.55 | 82.42 | 82.98 | 81.18 | 84.39 | |
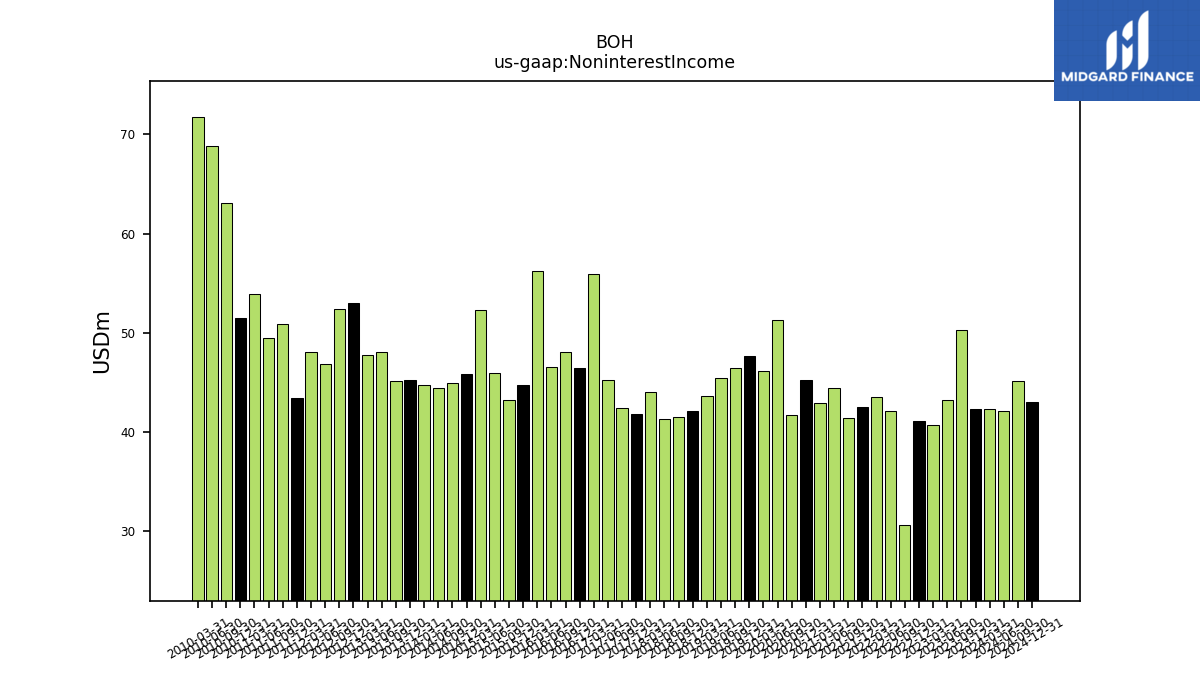
| Noninterest Income | 42.28 | 42.28 | 50.33 | 43.26 | 40.74 | 41.17 | 30.66 | 42.16 | 43.55 | 42.57 | 41.38 | 44.43 | 42.97 | 45.26 | 41.73 | 51.27 | 46.15 | 47.70 | 46.51 | 45.45 | 43.68 | 42.11 | 41.48 | 41.30 | 44.03 | 41.85 | 42.41 | 45.24 | 55.92 | 46.50 | 48.11 | 46.52 | 56.21 | 44.77 | 43.22 | 45.92 | 52.31 | 45.82 | 44.95 | 44.48 | 44.77 | 45.28 | 45.13 | 48.04 | 47.78 |
| 2024-03-31 | 2023-12-31 | 2023-09-30 | 2023-06-30 | 2023-03-31 | 2022-12-31 | 2022-09-30 | 2022-06-30 | 2022-03-31 | 2021-12-31 | 2021-09-30 | 2021-06-30 | 2021-03-31 | 2020-12-31 | 2020-09-30 | 2020-06-30 | 2020-03-31 | 2019-12-31 | 2019-09-30 | 2019-06-30 | 2019-03-31 | 2018-12-31 | 2018-09-30 | 2018-06-30 | 2018-03-31 | 2017-12-31 | 2017-09-30 | 2017-06-30 | 2017-03-31 | 2016-12-31 | 2016-09-30 | 2016-06-30 | 2016-03-31 | 2015-12-31 | 2015-09-30 | 2015-06-30 | 2015-03-31 | 2014-12-31 | 2014-09-30 | 2014-06-30 | 2014-03-31 | 2013-12-31 | 2013-09-30 | 2013-06-30 | 2013-03-31 | ||
|---|---|---|---|---|---|---|---|---|---|---|---|---|---|---|---|---|---|---|---|---|---|---|---|---|---|---|---|---|---|---|---|---|---|---|---|---|---|---|---|---|---|---|---|---|---|---|
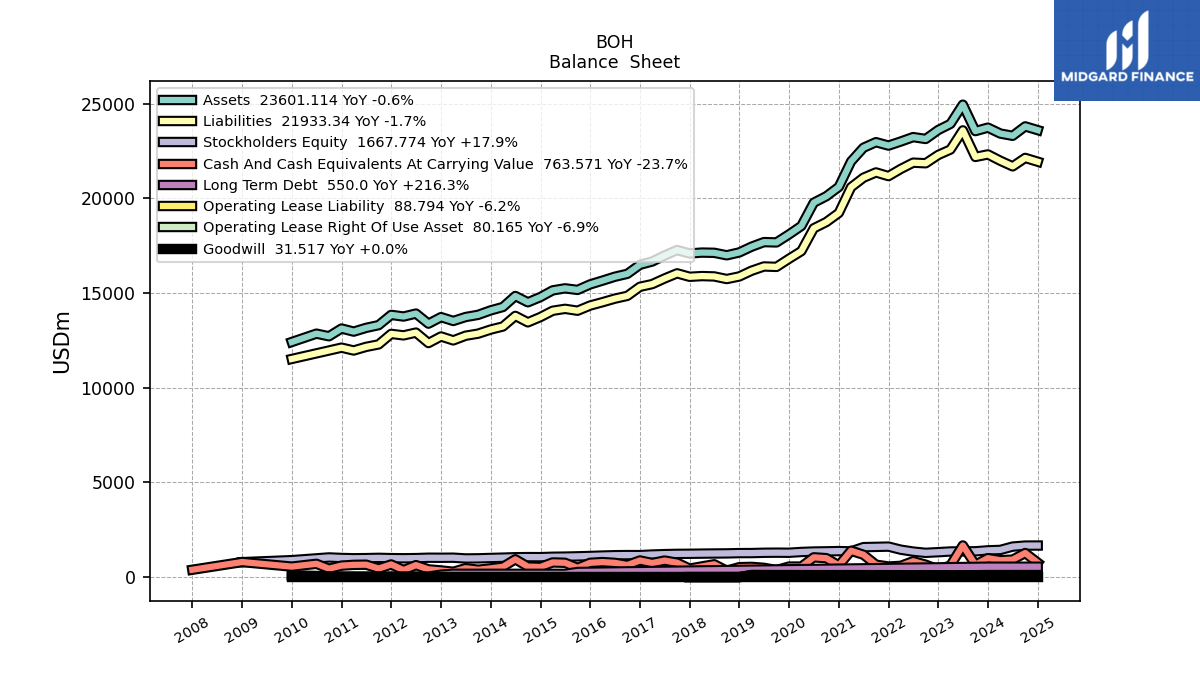
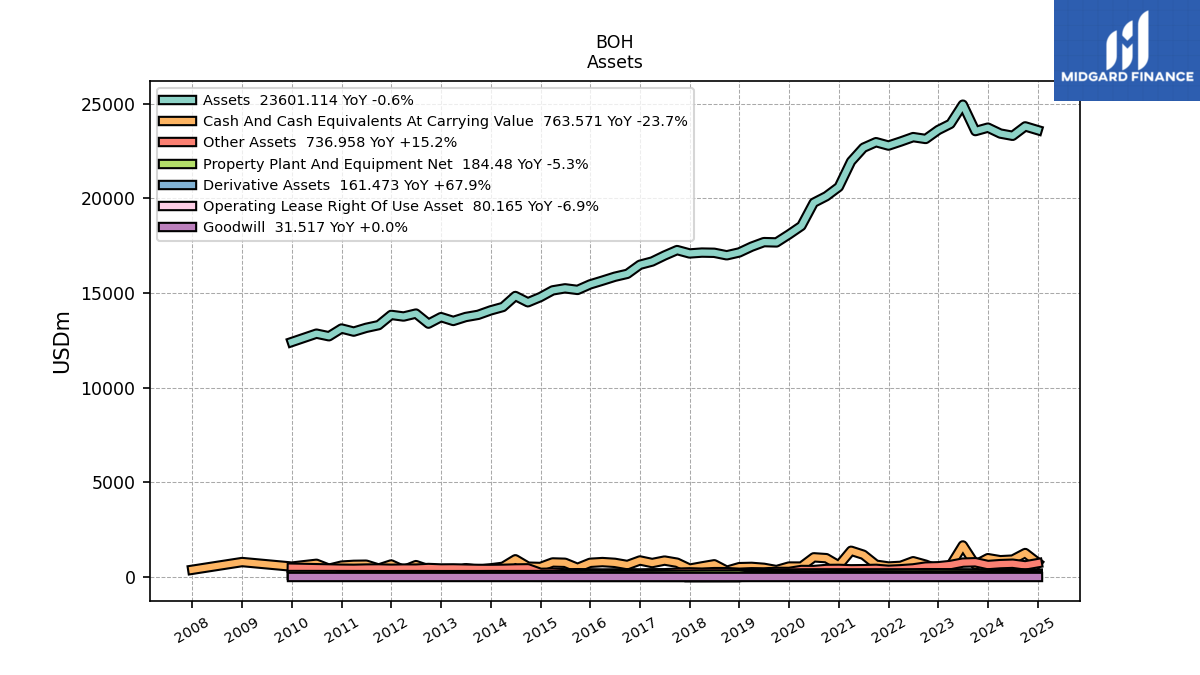
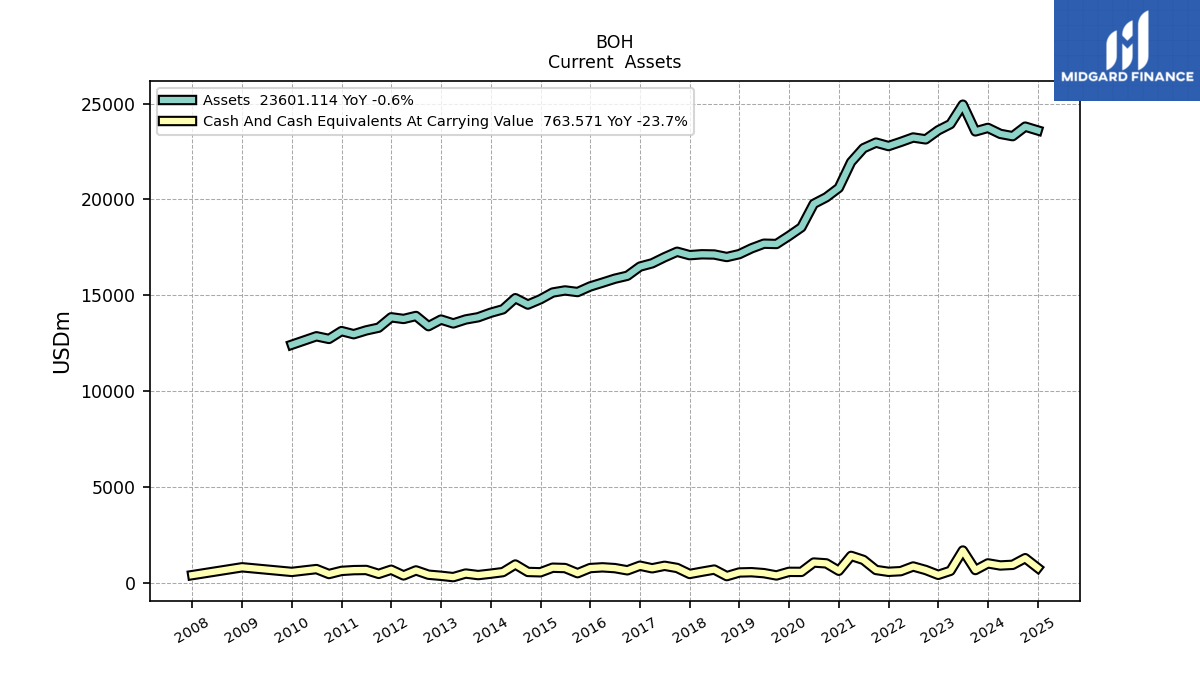
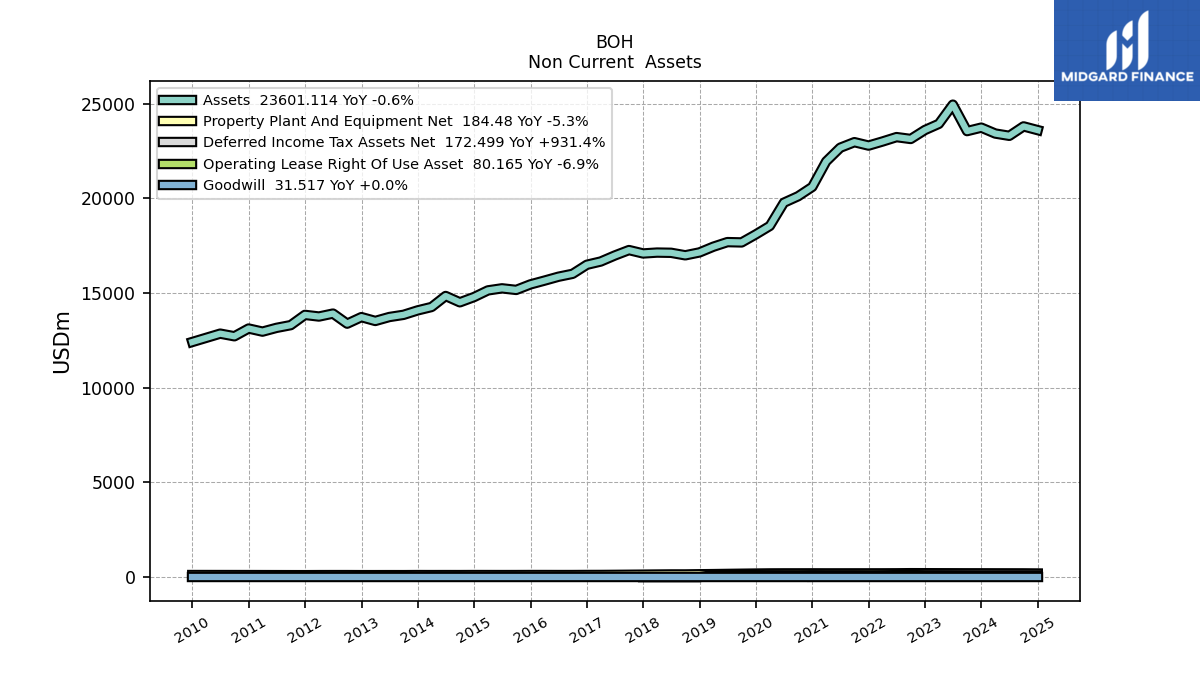
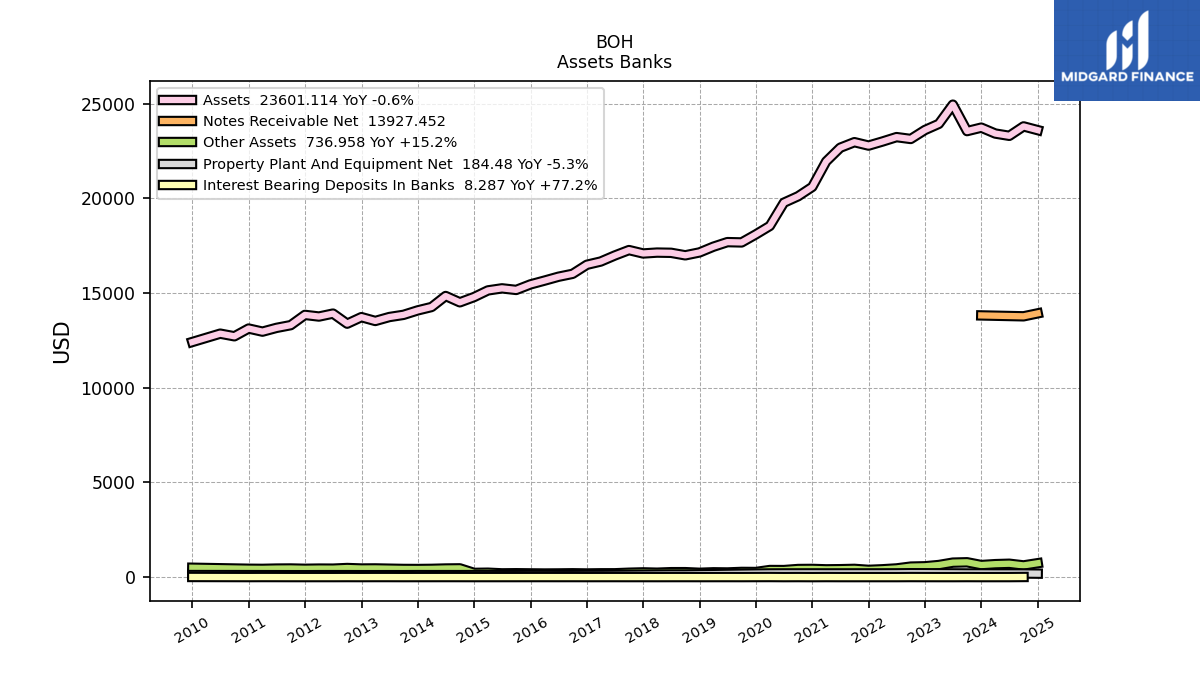
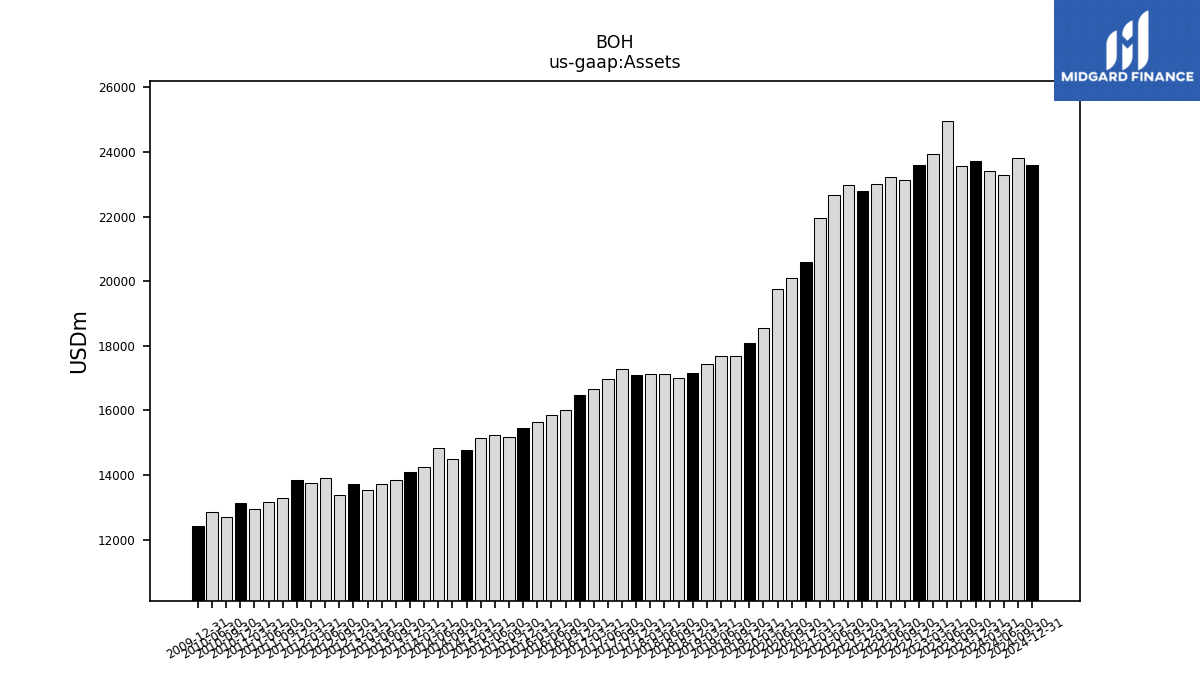
| Assets | 23420.86 | 23733.30 | 23549.78 | 24947.94 | 23931.98 | 23606.88 | 23134.04 | 23232.70 | 23000.32 | 22784.94 | 22965.38 | 22672.18 | 21947.27 | 20603.65 | 20109.49 | 19769.94 | 18542.23 | 18095.50 | 17672.14 | 17688.85 | 17446.41 | 17143.97 | 16991.73 | 17124.16 | 17136.03 | 17089.05 | 17268.30 | 16981.29 | 16664.22 | 16492.37 | 16014.64 | 15860.90 | 15654.69 | 15455.02 | 15164.12 | 15248.04 | 15139.18 | 14787.21 | 14510.17 | 14844.50 | 14263.12 | 14084.28 | 13848.87 | 13733.42 | 13525.67 | |
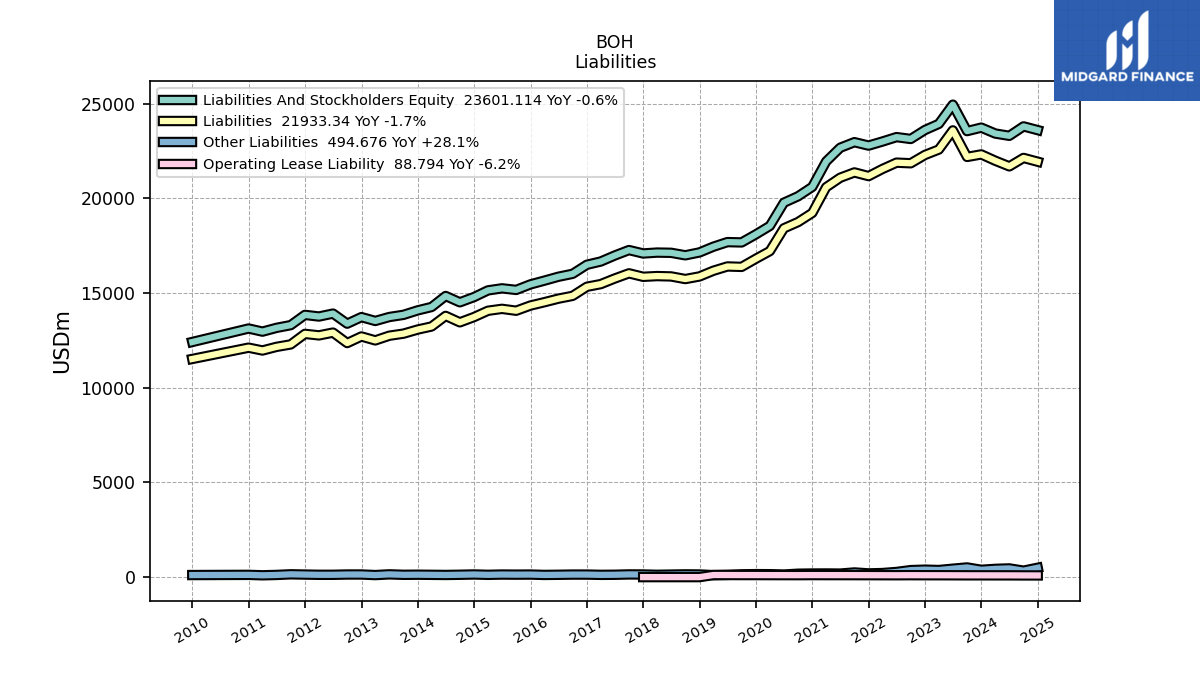
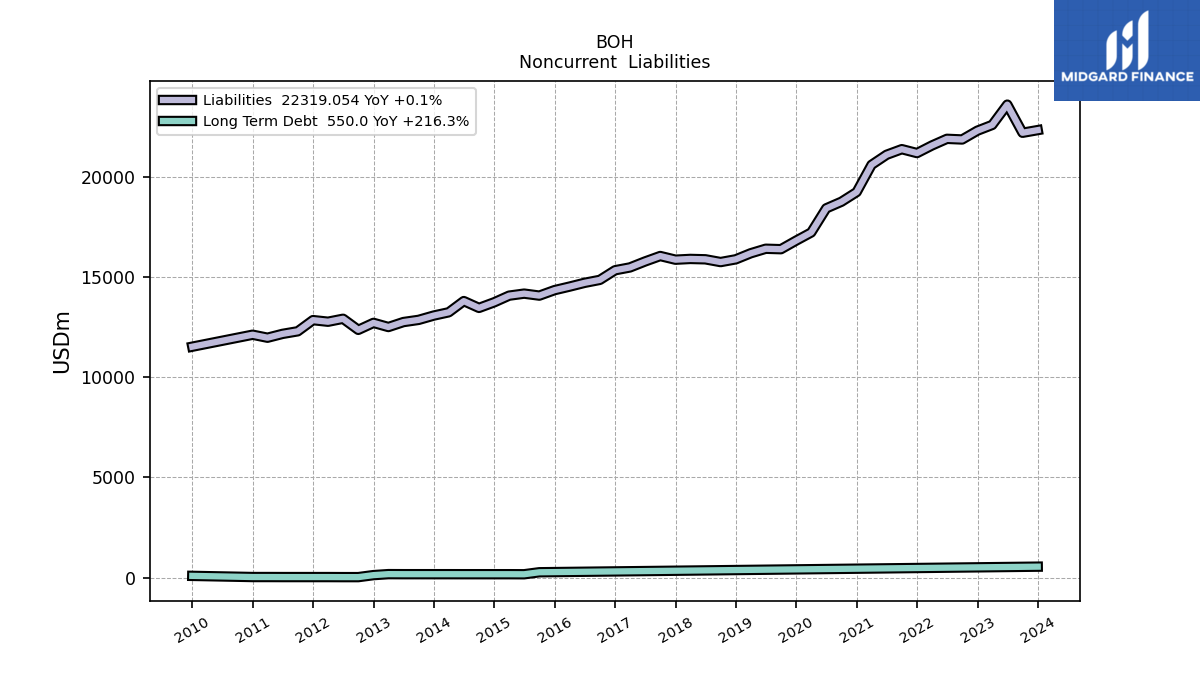
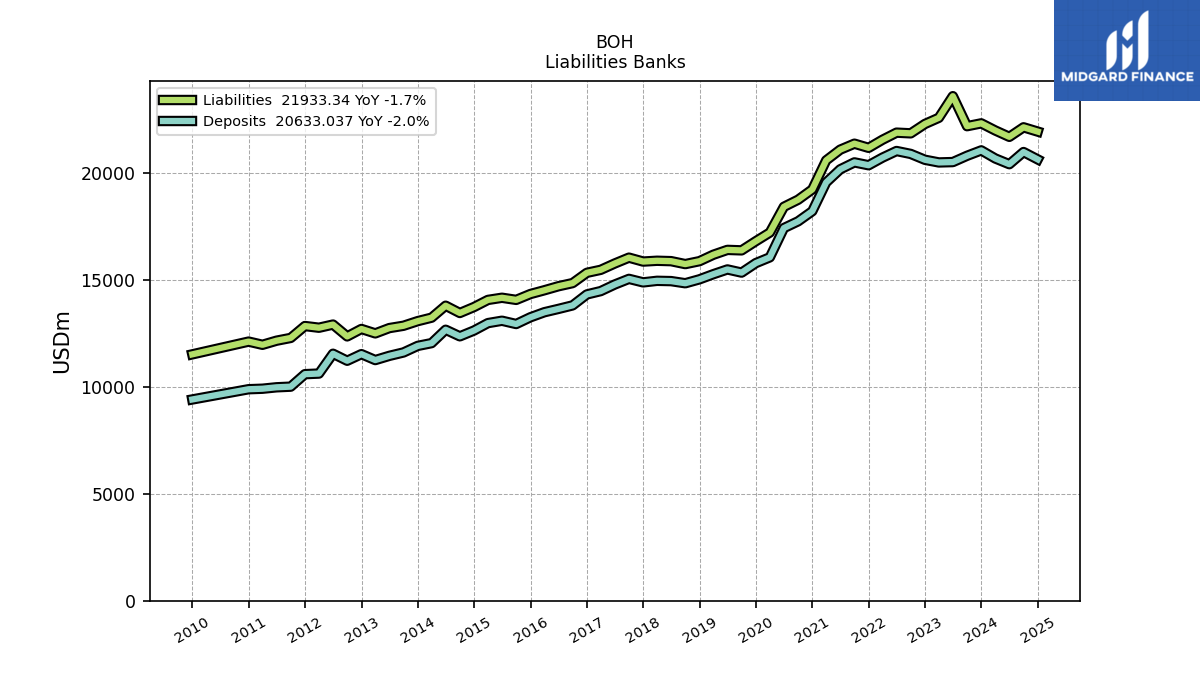
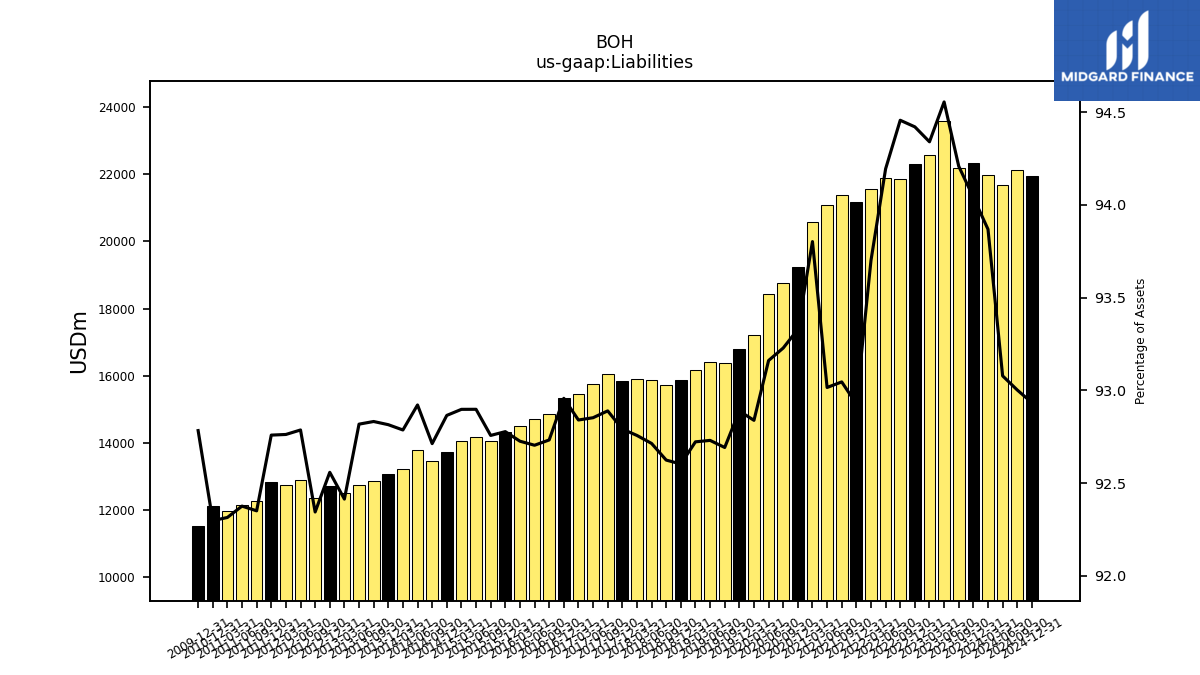
| Liabilities | 21984.88 | 22319.05 | 22185.94 | 23589.66 | 22577.55 | 22289.88 | 21851.66 | 21883.95 | 21551.43 | 21173.33 | 21368.27 | 21088.65 | 20587.05 | 19229.14 | 18747.75 | 18417.86 | 17214.30 | 16808.66 | 16380.65 | 16402.90 | 16176.72 | 15875.77 | 15738.41 | 15876.44 | 15894.84 | 15857.18 | 16040.41 | 15767.53 | 15471.08 | 15330.83 | 14850.78 | 14703.68 | 14515.94 | 14338.76 | 14065.77 | 14165.10 | 14063.93 | 13732.12 | 13452.75 | 13793.70 | 13234.21 | 13072.30 | 12856.18 | 12747.05 | 12499.56 | |
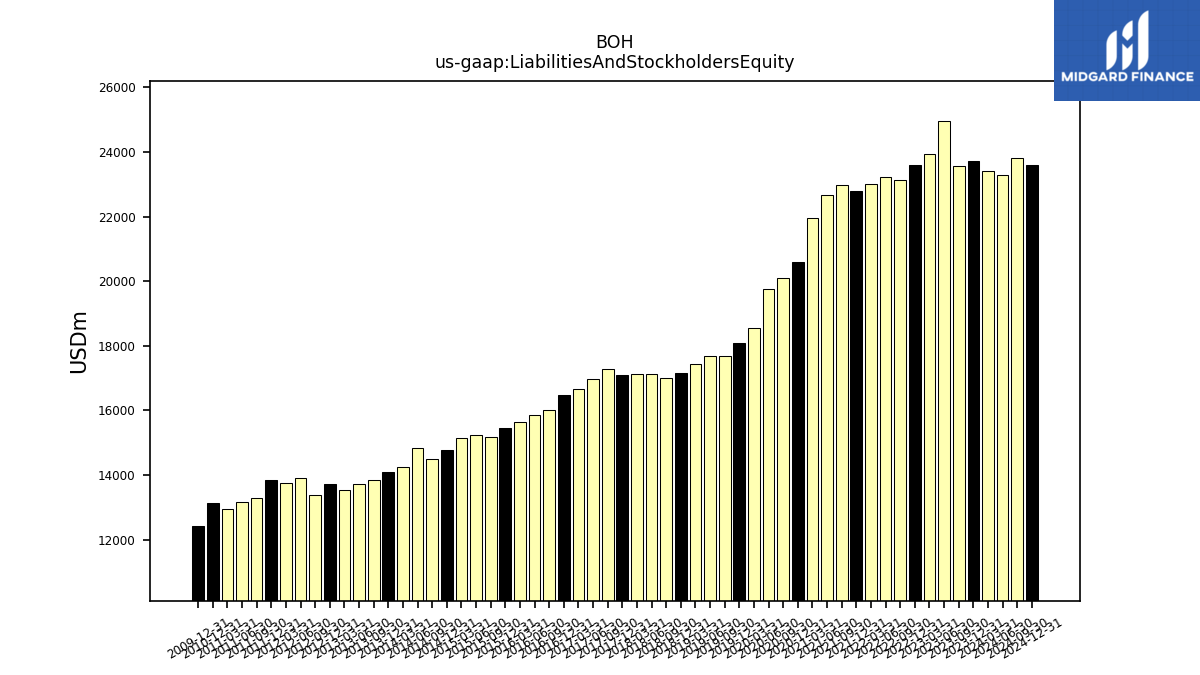
| Liabilities And Stockholders Equity | 23420.86 | 23733.30 | 23549.78 | 24947.94 | 23931.98 | 23606.88 | 23134.04 | 23232.70 | 23000.32 | 22784.94 | 22965.38 | 22672.18 | 21947.27 | 20603.65 | 20109.49 | 19769.94 | 18542.23 | 18095.50 | 17672.14 | 17688.85 | 17446.41 | 17143.97 | 16991.73 | 17124.16 | 17136.03 | 17089.05 | 17268.30 | 16981.29 | 16664.22 | 16492.37 | 16014.64 | 15860.90 | 15654.69 | 15455.02 | 15164.12 | 15248.04 | 15139.18 | 14787.21 | 14510.17 | 14844.50 | 14263.12 | 14084.28 | 13848.87 | 13733.42 | 13525.67 | |
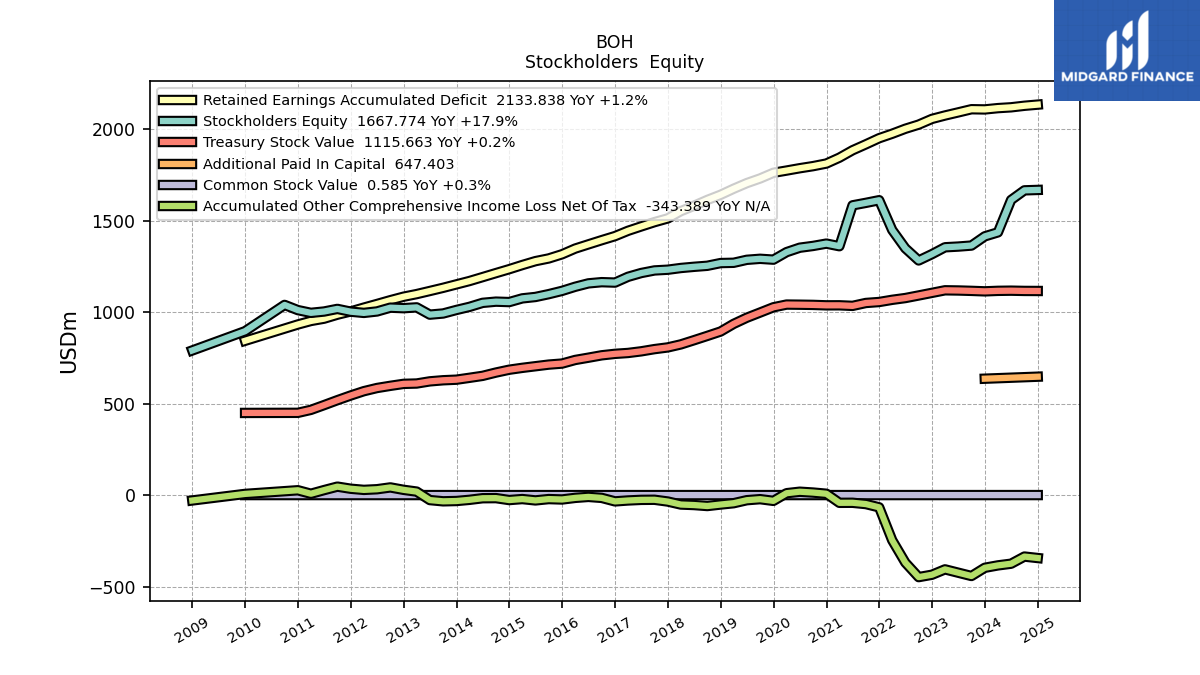
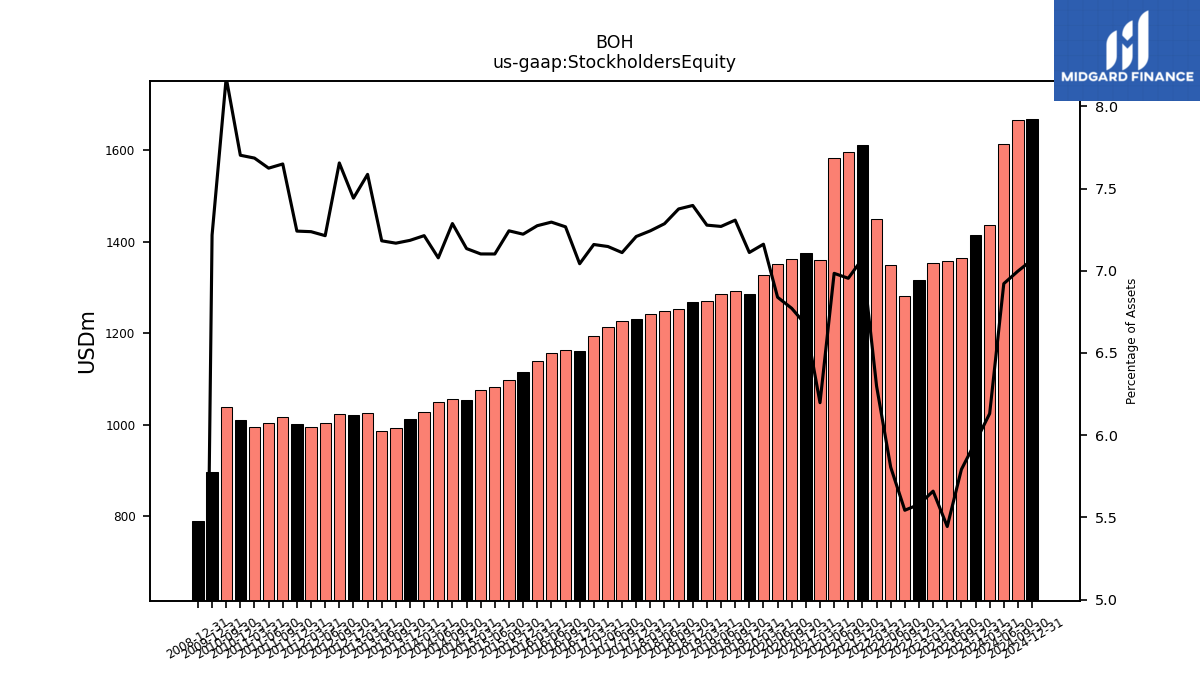
| Stockholders Equity | 1435.98 | 1414.24 | 1363.84 | 1358.28 | 1354.43 | 1316.99 | 1282.38 | 1348.75 | 1448.88 | 1611.61 | 1597.11 | 1583.53 | 1360.22 | 1374.51 | 1361.74 | 1352.08 | 1327.93 | 1286.83 | 1291.49 | 1285.95 | 1269.69 | 1268.20 | 1253.33 | 1247.72 | 1241.19 | 1231.87 | 1227.89 | 1213.76 | 1193.14 | 1161.54 | 1163.86 | 1157.22 | 1138.75 | 1116.26 | 1098.35 | 1082.94 | 1075.25 | 1055.09 | 1057.41 | 1050.80 | 1028.90 | 1011.98 | 992.69 | 986.37 | 1026.10 |
| 2024-03-31 | 2023-12-31 | 2023-09-30 | 2023-06-30 | 2023-03-31 | 2022-12-31 | 2022-09-30 | 2022-06-30 | 2022-03-31 | 2021-12-31 | 2021-09-30 | 2021-06-30 | 2021-03-31 | 2020-12-31 | 2020-09-30 | 2020-06-30 | 2020-03-31 | 2019-12-31 | 2019-09-30 | 2019-06-30 | 2019-03-31 | 2018-12-31 | 2018-09-30 | 2018-06-30 | 2018-03-31 | 2017-12-31 | 2017-09-30 | 2017-06-30 | 2017-03-31 | 2016-12-31 | 2016-09-30 | 2016-06-30 | 2016-03-31 | 2015-12-31 | 2015-09-30 | 2015-06-30 | 2015-03-31 | 2014-12-31 | 2014-09-30 | 2014-06-30 | 2014-03-31 | 2013-12-31 | 2013-09-30 | 2013-06-30 | 2013-03-31 | ||
|---|---|---|---|---|---|---|---|---|---|---|---|---|---|---|---|---|---|---|---|---|---|---|---|---|---|---|---|---|---|---|---|---|---|---|---|---|---|---|---|---|---|---|---|---|---|---|
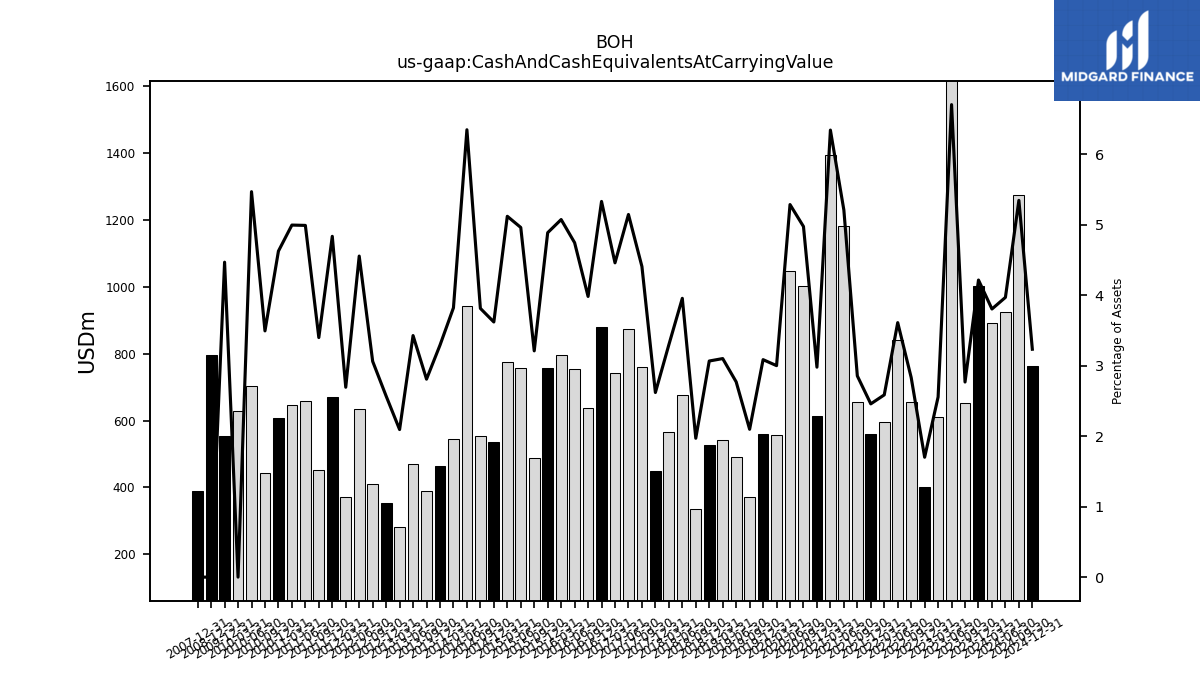
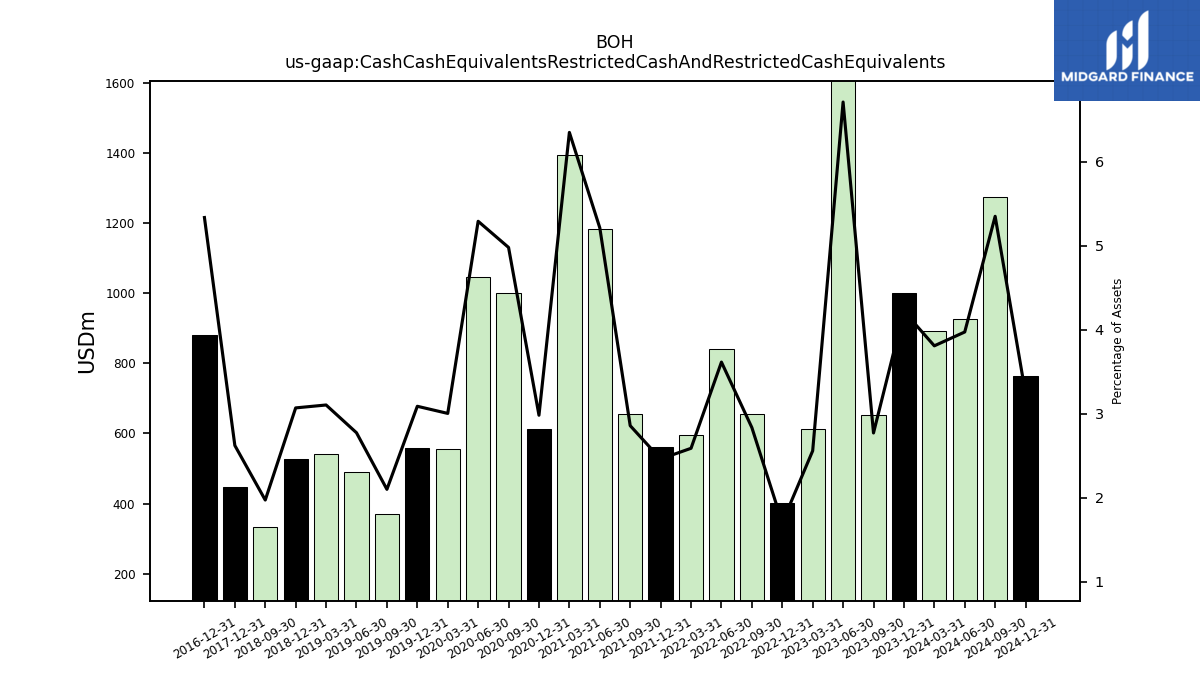
| Cash And Cash Equivalents At Carrying Value | 891.52 | 1000.94 | 652.23 | 1673.44 | 611.99 | 401.77 | 655.65 | 839.37 | 595.05 | 560.43 | 655.96 | 1181.47 | 1392.85 | 614.09 | 1000.92 | 1045.59 | 556.71 | 558.66 | 370.88 | 490.36 | 541.29 | 525.97 | 334.97 | 677.76 | 565.23 | 447.85 | 761.52 | 874.23 | 743.52 | 879.61 | 638.11 | 753.05 | 794.67 | 755.72 | 487.08 | 756.89 | 775.51 | 535.58 | 553.57 | 942.78 | 545.32 | 463.75 | 389.22 | 470.94 | 283.37 | |
| Cash Cash Equivalents Restricted Cash And Restricted Cash Equivalents | 891.52 | 1000.94 | 652.23 | 1673.44 | 611.99 | 401.77 | 655.65 | 839.37 | 595.05 | 560.43 | 655.96 | 1181.47 | 1392.85 | 614.09 | 1000.92 | 1045.59 | 556.71 | 558.66 | 370.88 | 490.36 | 541.29 | 525.97 | 334.96 | NA | NA | 447.85 | NA | NA | NA | 879.61 | NA | NA | NA | NA | NA | NA | NA | NA | NA | NA | NA | NA | NA | NA | NA | |
| Available For Sale Securities Debt Securities | 2352.05 | 2408.93 | 2387.32 | 2666.72 | 2815.08 | 2844.82 | 2424.61 | 3955.48 | 4258.53 | 4276.06 | 4353.52 | 4522.94 | 4024.76 | 3791.69 | 3190.31 | NA | NA | 2619.00 | NA | NA | NA | 2007.94 | NA | NA | NA | 2232.98 | NA | NA | NA | NA | NA | NA | NA | NA | NA | NA | NA | NA | NA | NA | NA | NA | NA | NA | NA |
| 2024-03-31 | 2023-12-31 | 2023-09-30 | 2023-06-30 | 2023-03-31 | 2022-12-31 | 2022-09-30 | 2022-06-30 | 2022-03-31 | 2021-12-31 | 2021-09-30 | 2021-06-30 | 2021-03-31 | 2020-12-31 | 2020-09-30 | 2020-06-30 | 2020-03-31 | 2019-12-31 | 2019-09-30 | 2019-06-30 | 2019-03-31 | 2018-12-31 | 2018-09-30 | 2018-06-30 | 2018-03-31 | 2017-12-31 | 2017-09-30 | 2017-06-30 | 2017-03-31 | 2016-12-31 | 2016-09-30 | 2016-06-30 | 2016-03-31 | 2015-12-31 | 2015-09-30 | 2015-06-30 | 2015-03-31 | 2014-12-31 | 2014-09-30 | 2014-06-30 | 2014-03-31 | 2013-12-31 | 2013-09-30 | 2013-06-30 | 2013-03-31 | ||
|---|---|---|---|---|---|---|---|---|---|---|---|---|---|---|---|---|---|---|---|---|---|---|---|---|---|---|---|---|---|---|---|---|---|---|---|---|---|---|---|---|---|---|---|---|---|---|
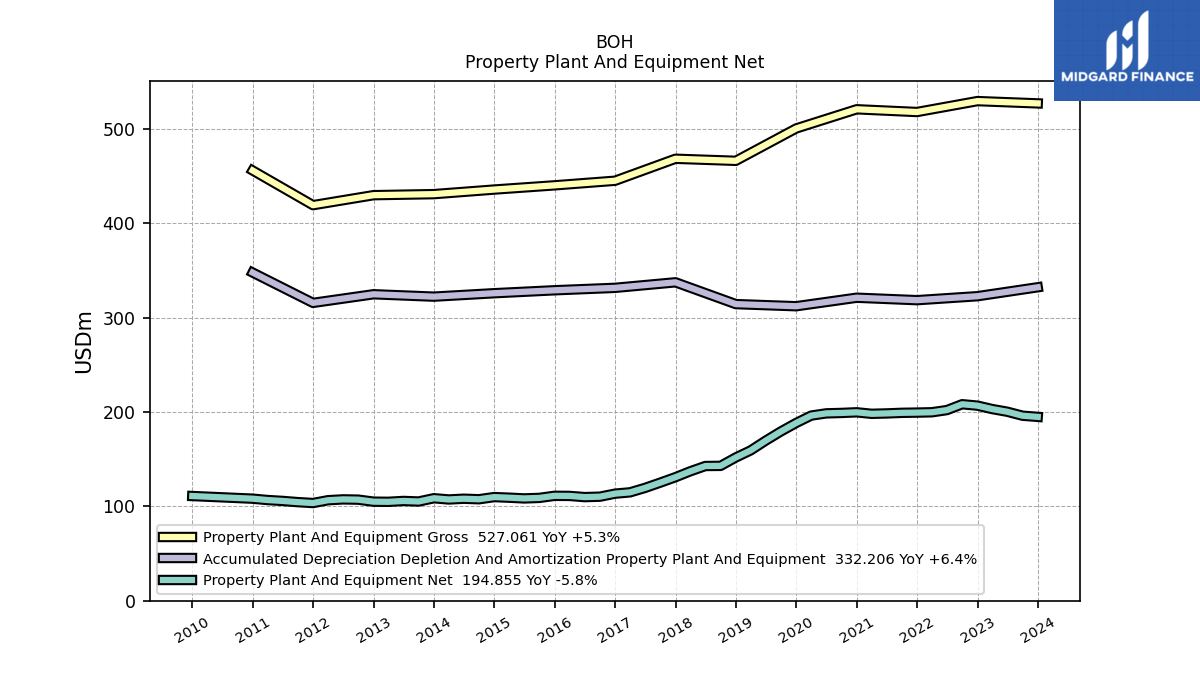
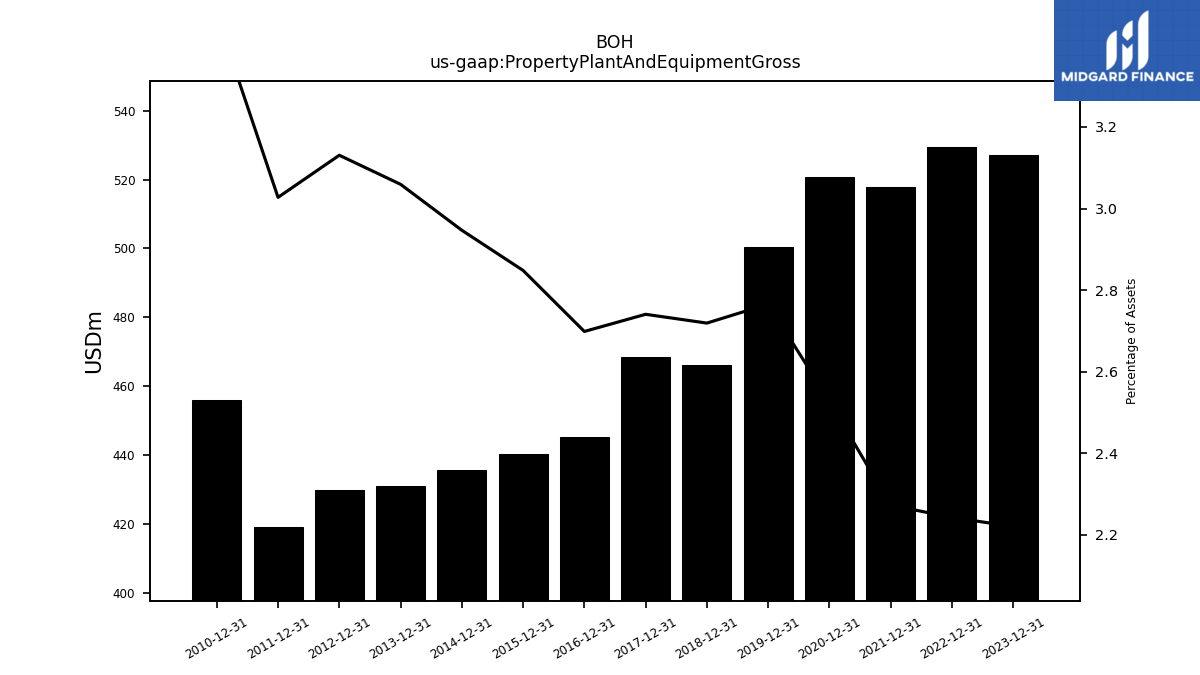
| Property Plant And Equipment Gross | NA | 527.06 | NA | NA | NA | 529.49 | NA | NA | NA | 517.92 | NA | NA | NA | 520.83 | NA | NA | NA | 500.49 | NA | NA | NA | 466.20 | NA | NA | NA | 468.39 | NA | NA | NA | 445.09 | NA | NA | NA | 440.22 | NA | NA | NA | 435.75 | NA | NA | NA | 430.90 | NA | NA | NA | |
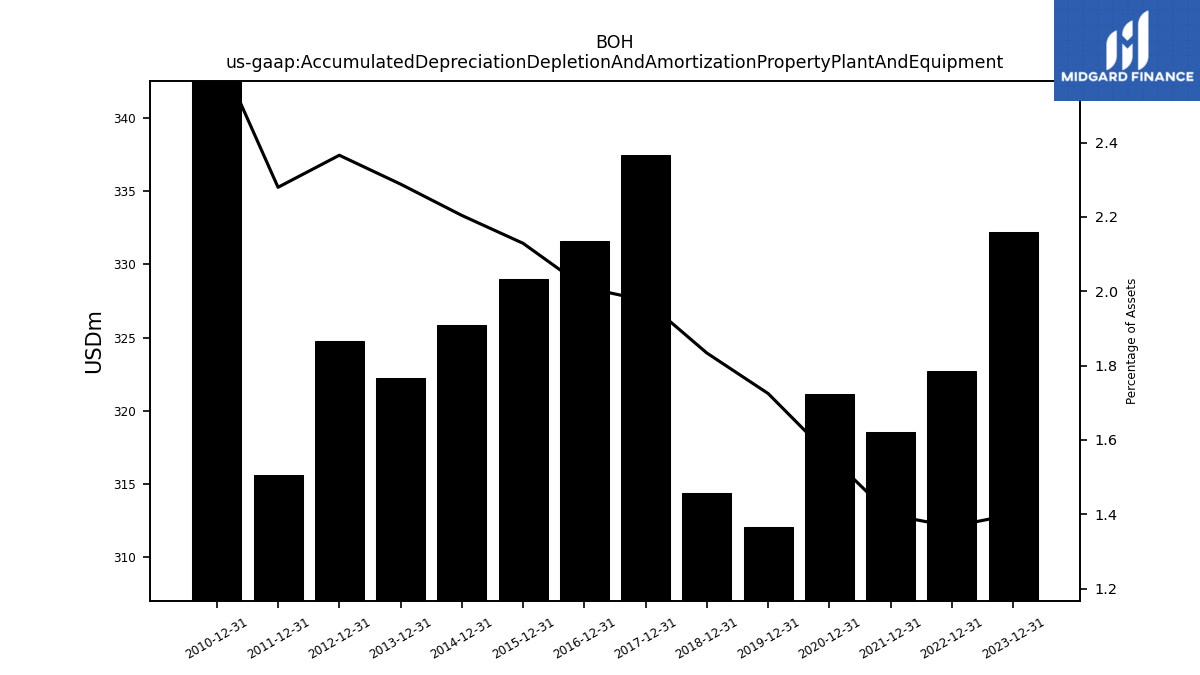
| Accumulated Depreciation Depletion And Amortization Property Plant And Equipment | NA | 332.21 | NA | NA | NA | 322.72 | NA | NA | NA | 318.52 | NA | NA | NA | 321.13 | NA | NA | NA | 312.10 | NA | NA | NA | 314.36 | NA | NA | NA | 337.46 | NA | NA | NA | 331.59 | NA | NA | NA | 329.02 | NA | NA | NA | 325.90 | NA | NA | NA | 322.26 | NA | NA | NA | |
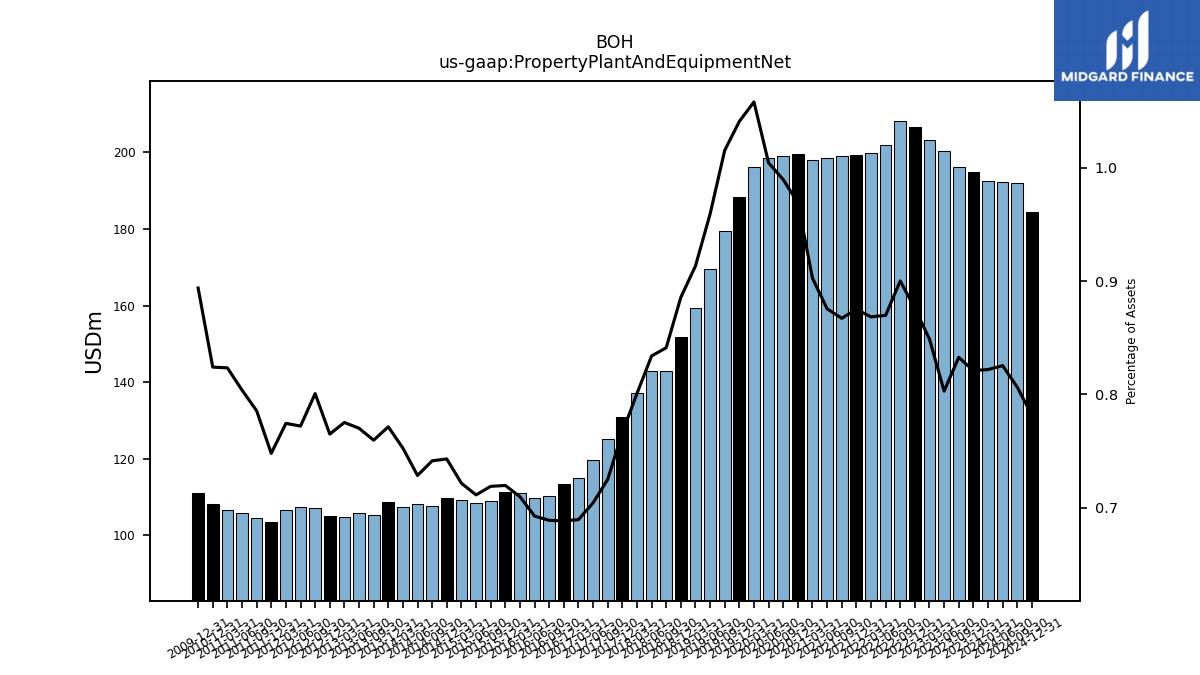
| Property Plant And Equipment Net | 192.49 | 194.85 | 196.09 | 200.30 | 203.13 | 206.78 | 208.25 | 202.06 | 199.74 | 199.39 | 199.14 | 198.51 | 198.11 | 199.69 | 199.02 | 198.58 | 196.23 | 188.39 | 179.45 | 169.67 | 159.34 | 151.84 | 142.93 | 142.79 | 137.20 | 130.93 | 125.16 | 119.57 | 114.86 | 113.50 | 110.29 | 109.83 | 111.09 | 111.20 | 108.99 | 108.44 | 109.22 | 109.85 | 107.56 | 108.12 | 107.32 | 108.64 | 105.18 | 105.75 | 104.84 | |
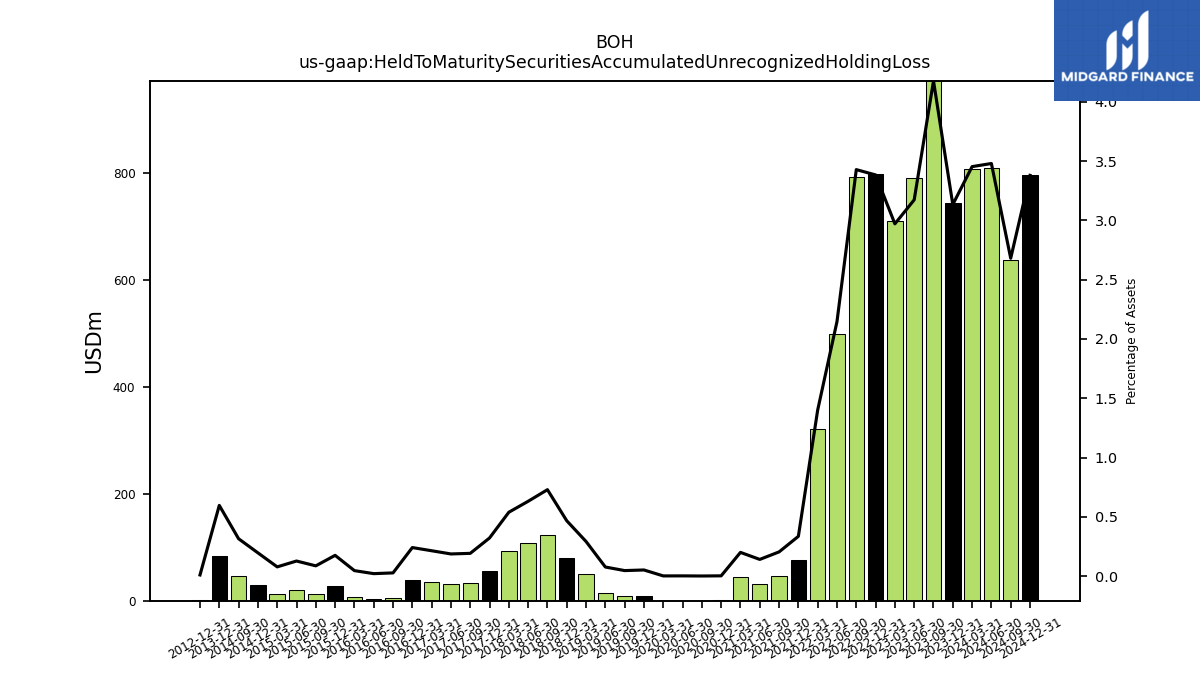
| Held To Maturity Securities Accumulated Unrecognized Holding Loss | 808.86 | 743.73 | 983.55 | 791.71 | 711.04 | 798.79 | 793.12 | 498.70 | 322.16 | 76.50 | 46.92 | 31.97 | 43.95 | 0.53 | 0.23 | 0.43 | 0.35 | 9.40 | 8.27 | 13.59 | 50.97 | 80.06 | 123.89 | 108.09 | 92.33 | 55.00 | 33.17 | 31.77 | 35.69 | 39.74 | 4.37 | 3.33 | 7.27 | 27.09 | 13.15 | 19.43 | 11.82 | 29.04 | 45.74 | NA | NA | 84.00 | NA | NA | NA | |
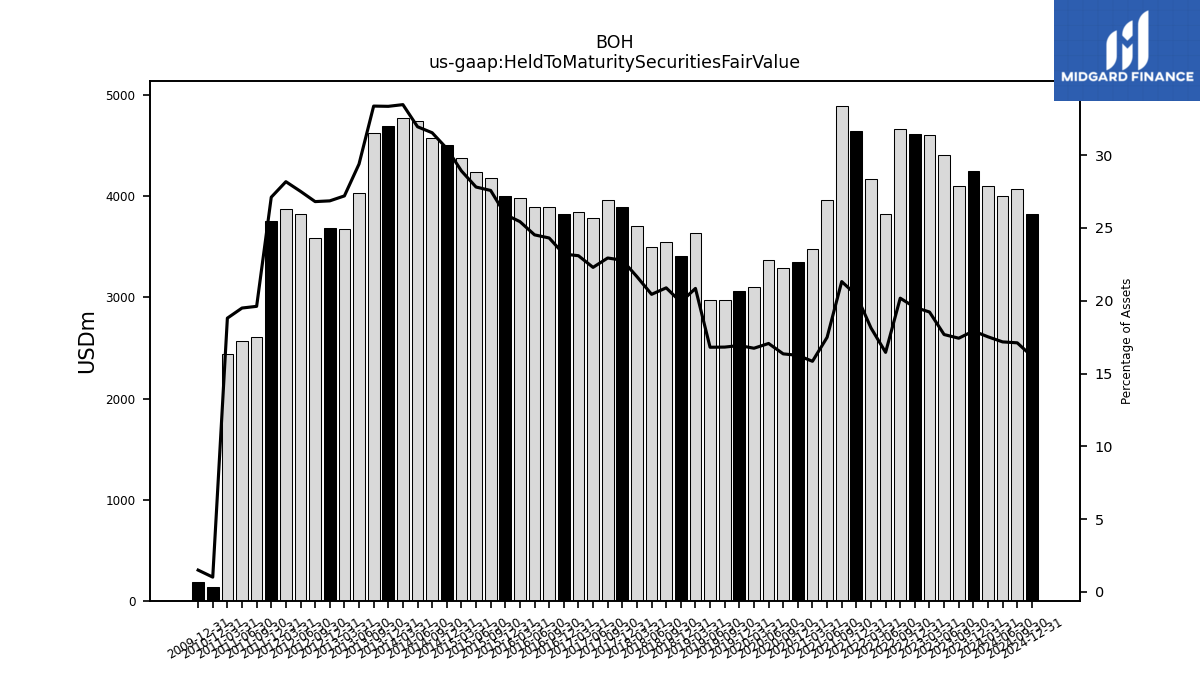
| Held To Maturity Securities Fair Value | 4104.62 | 4253.64 | 4104.47 | 4411.00 | 4601.88 | 4615.39 | 4668.07 | 3823.74 | 4171.26 | 4646.62 | 4895.76 | 3965.12 | 3477.35 | 3348.69 | 3288.67 | 3374.29 | 3104.02 | 3062.88 | 2972.27 | 2973.23 | 3637.50 | 3413.99 | 3549.24 | 3500.50 | 3711.15 | 3894.12 | 3960.96 | 3785.64 | 3848.61 | 3827.53 | 3893.54 | 3890.22 | 3981.83 | 4006.41 | 4181.61 | 4240.73 | 4378.01 | 4504.49 | 4576.40 | 4743.01 | 4774.03 | 4697.59 | 4621.49 | 4036.20 | 3679.21 | |
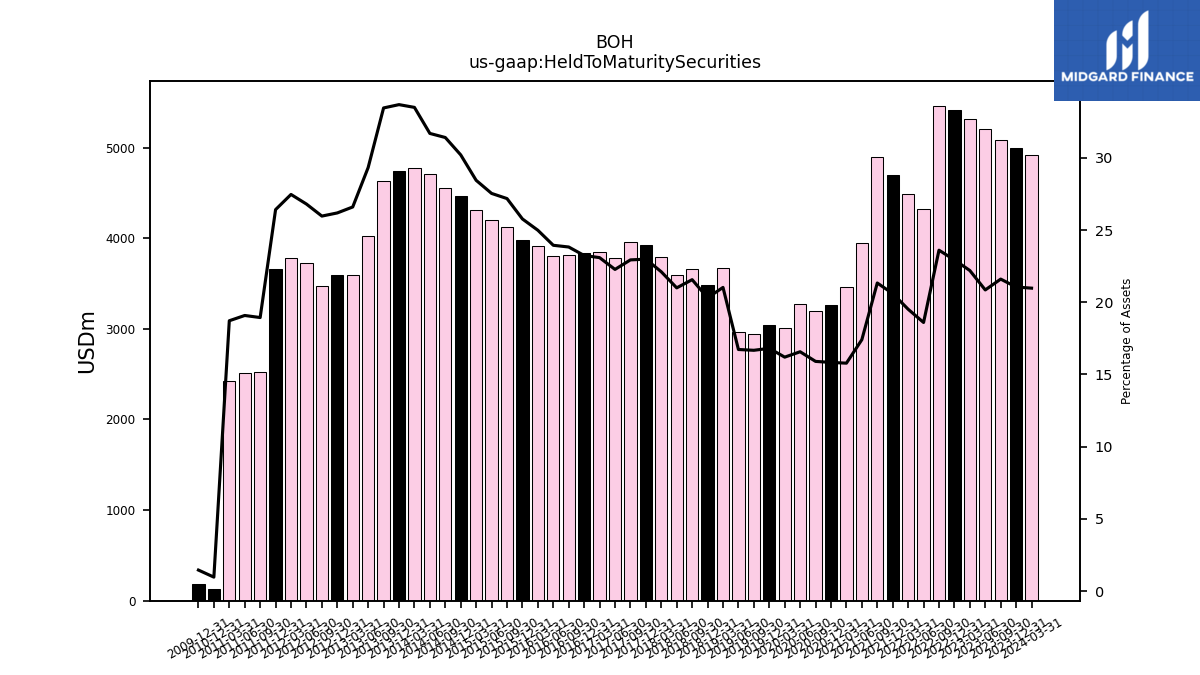
| Held To Maturity Securities | 4913.46 | 4997.34 | 5088.01 | 5202.70 | 5312.81 | 5414.14 | 5461.16 | 4321.69 | 4489.61 | 4694.78 | 4899.88 | 3947.61 | 3464.36 | 3262.73 | 3198.83 | 3276.83 | 3004.14 | 3042.29 | 2946.91 | 2959.61 | 3668.81 | 3482.09 | 3664.49 | 3595.89 | 3789.09 | 3928.17 | 3960.60 | 3782.70 | 3848.09 | 3833.00 | 3815.91 | 3798.20 | 3911.70 | 3982.74 | 4121.77 | 4199.12 | 4306.35 | 4466.68 | 4557.61 | 4704.55 | 4777.49 | 4744.52 | 4633.40 | 4027.83 | 3597.81 | |
| Available For Sale Debt Securities Amortized Cost Basis | 2642.73 | 2694.01 | 2752.09 | 2993.00 | 3109.78 | 3172.44 | 2752.36 | 4412.33 | 4548.51 | 4320.88 | 4362.59 | 4521.66 | 4022.93 | 3721.64 | 3118.85 | NA | NA | 2607.64 | NA | NA | NA | 2022.16 | NA | NA | NA | 2236.14 | NA | NA | NA | NA | NA | NA | NA | NA | NA | NA | NA | 2262.81 | NA | 2186.67 | 2179.53 | 2245.86 | 2269.88 | 2817.55 | 3227.55 | |
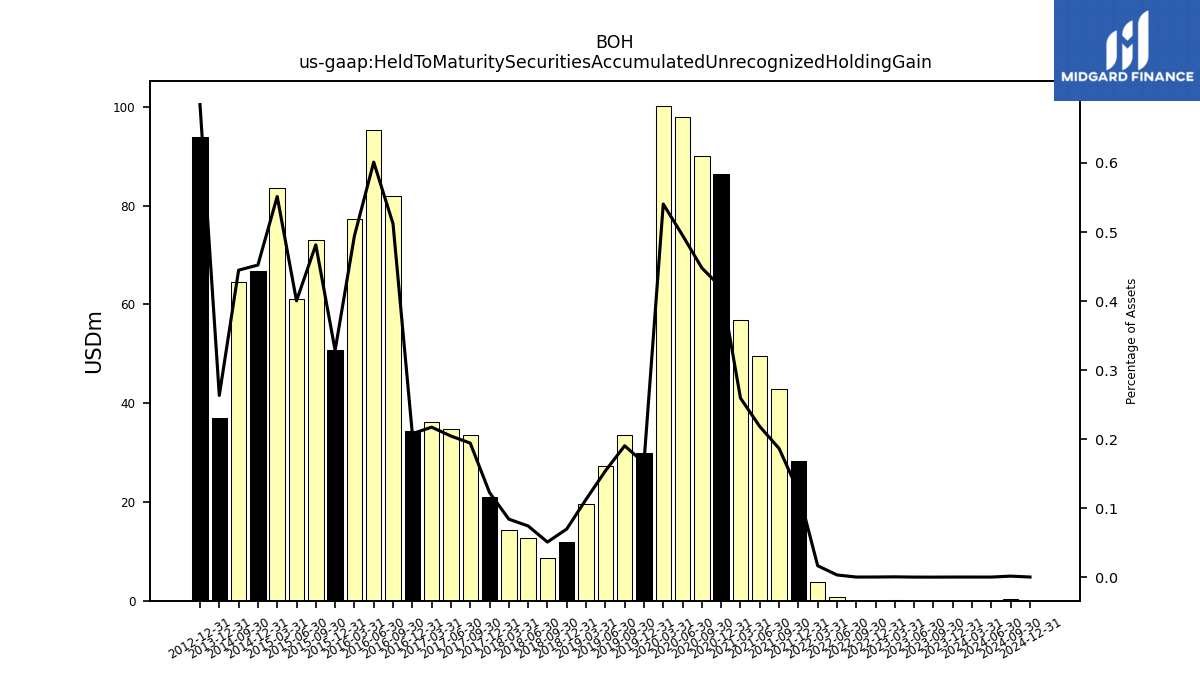
| Held To Maturity Securities Accumulated Unrecognized Holding Gain | 0.03 | 0.03 | 0.01 | 0.02 | 0.10 | 0.04 | 0.03 | 0.74 | 3.81 | 28.33 | 42.81 | 49.47 | 56.93 | 86.49 | 90.07 | 97.89 | 100.23 | 29.99 | 33.63 | 27.21 | 19.66 | 11.96 | 8.64 | 12.70 | 14.39 | 20.95 | 33.53 | 34.71 | 36.21 | 34.27 | 81.99 | 95.36 | 77.39 | 50.77 | 73.00 | 61.04 | 83.48 | 66.86 | 64.53 | NA | NA | 37.07 | NA | NA | NA | |
| Held To Maturity Securities Accumulated Unrecognized Holding Loss | 808.86 | 743.73 | 983.55 | 791.71 | 711.04 | 798.79 | 793.12 | 498.70 | 322.16 | 76.50 | 46.92 | 31.97 | 43.95 | 0.53 | 0.23 | 0.43 | 0.35 | 9.40 | 8.27 | 13.59 | 50.97 | 80.06 | 123.89 | 108.09 | 92.33 | 55.00 | 33.17 | 31.77 | 35.69 | 39.74 | 4.37 | 3.33 | 7.27 | 27.09 | 13.15 | 19.43 | 11.82 | 29.04 | 45.74 | NA | NA | 84.00 | NA | NA | NA | |
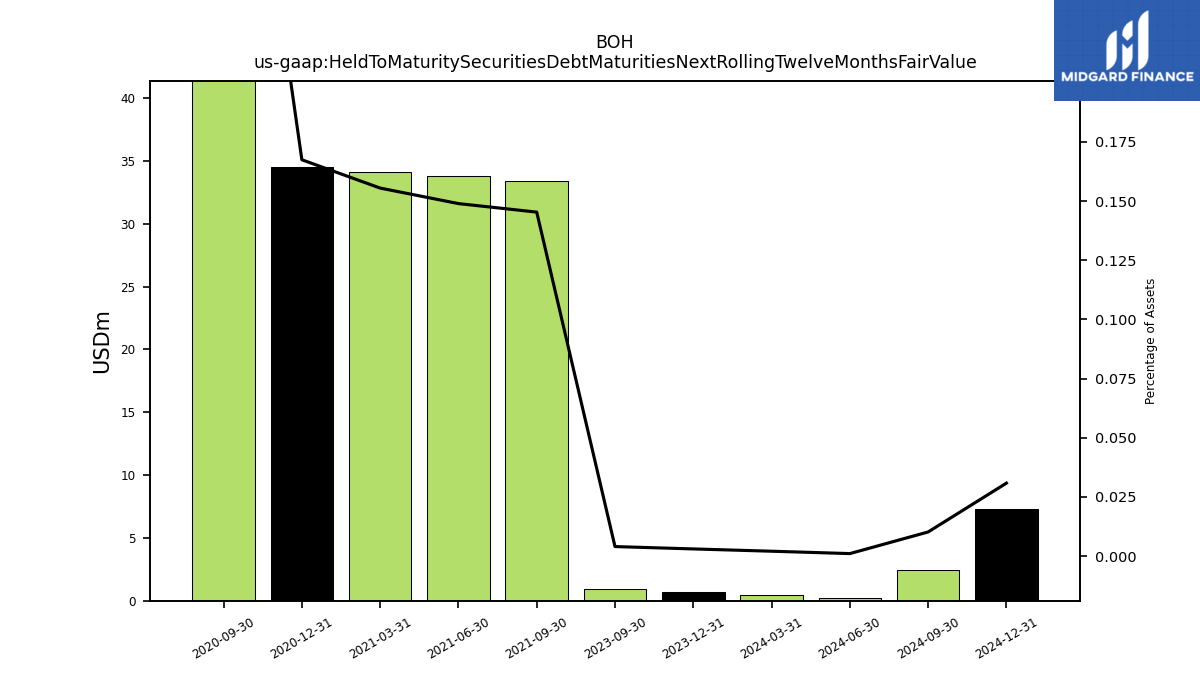
| Held To Maturity Securities Debt Maturities Next Rolling Twelve Months Fair Value | 0.48 | 0.71 | 0.94 | NA | NA | NA | NA | NA | NA | NA | 33.38 | 33.77 | 34.13 | 34.50 | 80.36 | NA | NA | NA | NA | NA | NA | NA | NA | NA | NA | NA | NA | NA | NA | NA | NA | NA | NA | NA | NA | NA | NA | NA | NA | NA | NA | NA | NA | NA | NA | |
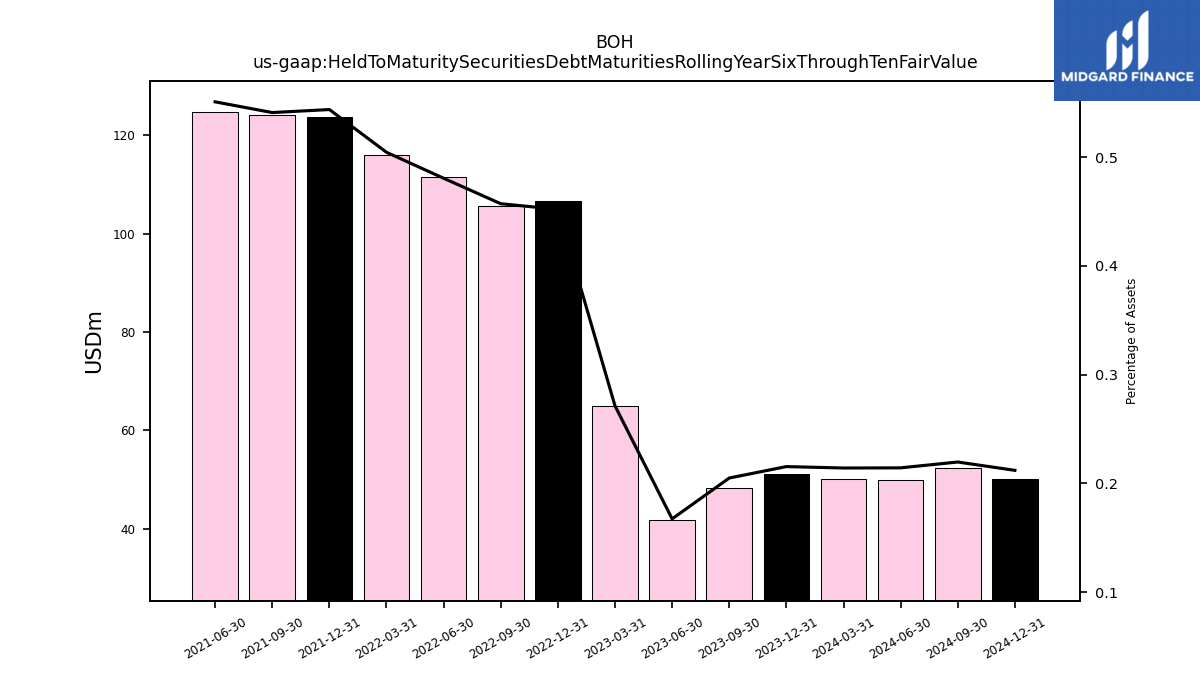
| Held To Maturity Securities Debt Maturities Rolling Year Six Through Ten Fair Value | 50.17 | 51.15 | 48.28 | 41.78 | 64.94 | 106.68 | 105.74 | 111.63 | 115.99 | 123.86 | 124.20 | 124.85 | NA | NA | NA | NA | NA | NA | NA | NA | NA | NA | NA | NA | NA | NA | NA | NA | NA | NA | NA | NA | NA | NA | NA | NA | NA | NA | NA | NA | NA | NA | NA | NA | NA | |
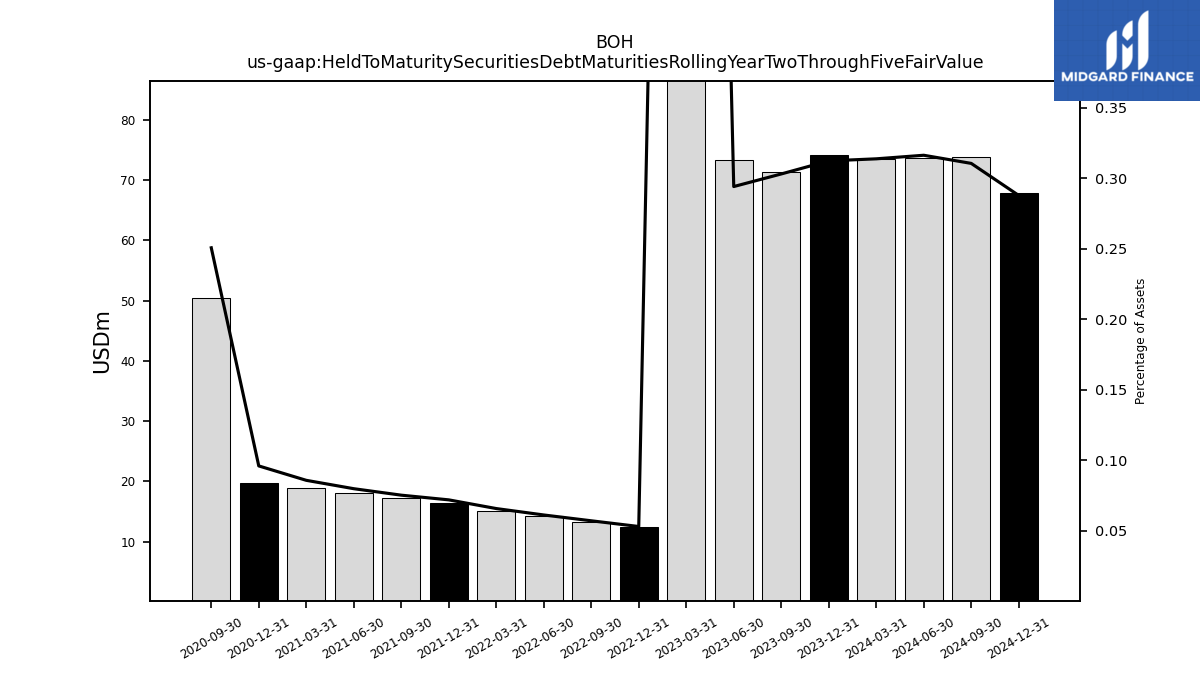
| Held To Maturity Securities Debt Maturities Rolling Year Two Through Five Fair Value | 73.52 | 74.15 | 71.39 | 73.40 | 400.68 | 12.52 | 13.21 | 14.22 | 15.13 | 16.39 | 17.29 | 18.11 | 18.83 | 19.78 | 50.43 | NA | NA | NA | NA | NA | NA | NA | NA | NA | NA | NA | NA | NA | NA | NA | NA | NA | NA | NA | NA | NA | NA | NA | NA | NA | NA | NA | NA | NA | NA |
| 2024-03-31 | 2023-12-31 | 2023-09-30 | 2023-06-30 | 2023-03-31 | 2022-12-31 | 2022-09-30 | 2022-06-30 | 2022-03-31 | 2021-12-31 | 2021-09-30 | 2021-06-30 | 2021-03-31 | 2020-12-31 | 2020-09-30 | 2020-06-30 | 2020-03-31 | 2019-12-31 | 2019-09-30 | 2019-06-30 | 2019-03-31 | 2018-12-31 | 2018-09-30 | 2018-06-30 | 2018-03-31 | 2017-12-31 | 2017-09-30 | 2017-06-30 | 2017-03-31 | 2016-12-31 | 2016-09-30 | 2016-06-30 | 2016-03-31 | 2015-12-31 | 2015-09-30 | 2015-06-30 | 2015-03-31 | 2014-12-31 | 2014-09-30 | 2014-06-30 | 2014-03-31 | 2013-12-31 | 2013-09-30 | 2013-06-30 | 2013-03-31 | ||
|---|---|---|---|---|---|---|---|---|---|---|---|---|---|---|---|---|---|---|---|---|---|---|---|---|---|---|---|---|---|---|---|---|---|---|---|---|---|---|---|---|---|---|---|---|---|---|
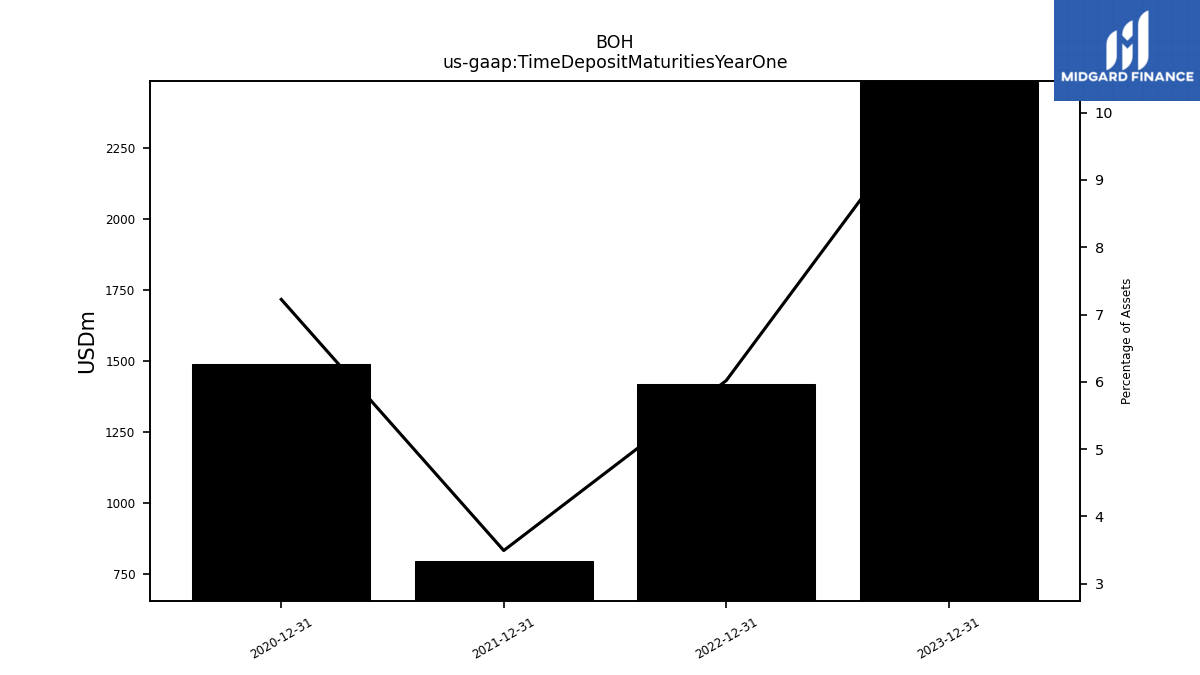
| Time Deposit Maturities Year One | NA | 2484.68 | NA | NA | NA | 1420.85 | NA | NA | NA | 796.09 | NA | NA | NA | 1488.52 | NA | NA | NA | NA | NA | NA | NA | NA | NA | NA | NA | NA | NA | NA | NA | NA | NA | NA | NA | NA | NA | NA | NA | NA | NA | NA | NA | NA | NA | NA | NA | |
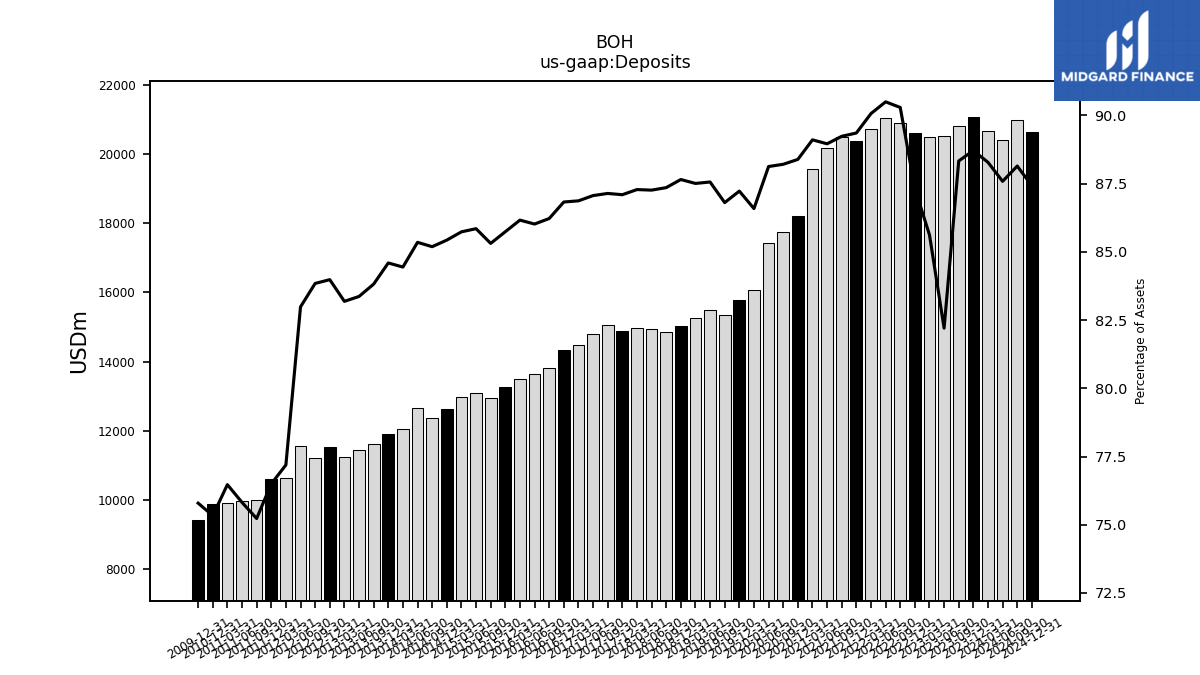
| Deposits | 20676.59 | 21055.04 | 20802.31 | 20508.62 | 20491.30 | 20615.70 | 20888.77 | 21025.68 | 20716.29 | 20360.11 | 20493.68 | 20169.71 | 19556.65 | 18211.62 | 17738.88 | 17423.15 | 16055.36 | 15784.48 | 15340.75 | 15488.82 | 15267.31 | 15027.24 | 14843.33 | 14943.36 | 14957.13 | 14883.97 | 15048.16 | 14784.65 | 14476.53 | 14320.24 | 13808.36 | 13643.81 | 13488.89 | 13251.10 | 12936.96 | 13090.69 | 12979.62 | 12633.09 | 12361.44 | 12670.03 | 12044.47 | 11914.66 | 11608.13 | 11449.20 | 11251.86 |
| 2024-03-31 | 2023-12-31 | 2023-09-30 | 2023-06-30 | 2023-03-31 | 2022-12-31 | 2022-09-30 | 2022-06-30 | 2022-03-31 | 2021-12-31 | 2021-09-30 | 2021-06-30 | 2021-03-31 | 2020-12-31 | 2020-09-30 | 2020-06-30 | 2020-03-31 | 2019-12-31 | 2019-09-30 | 2019-06-30 | 2019-03-31 | 2018-12-31 | 2018-09-30 | 2018-06-30 | 2018-03-31 | 2017-12-31 | 2017-09-30 | 2017-06-30 | 2017-03-31 | 2016-12-31 | 2016-09-30 | 2016-06-30 | 2016-03-31 | 2015-12-31 | 2015-09-30 | 2015-06-30 | 2015-03-31 | 2014-12-31 | 2014-09-30 | 2014-06-30 | 2014-03-31 | 2013-12-31 | 2013-09-30 | 2013-06-30 | 2013-03-31 | ||
|---|---|---|---|---|---|---|---|---|---|---|---|---|---|---|---|---|---|---|---|---|---|---|---|---|---|---|---|---|---|---|---|---|---|---|---|---|---|---|---|---|---|---|---|---|---|---|
| Long Term Debt | NA | 550.00 | NA | NA | NA | NA | NA | NA | NA | NA | NA | NA | NA | NA | NA | NA | NA | NA | NA | NA | NA | NA | NA | NA | NA | NA | NA | NA | NA | NA | NA | NA | NA | NA | 270.80 | 170.82 | 173.90 | 173.91 | 173.93 | 173.67 | 174.69 | 174.71 | 174.72 | 174.73 | 177.43 | |
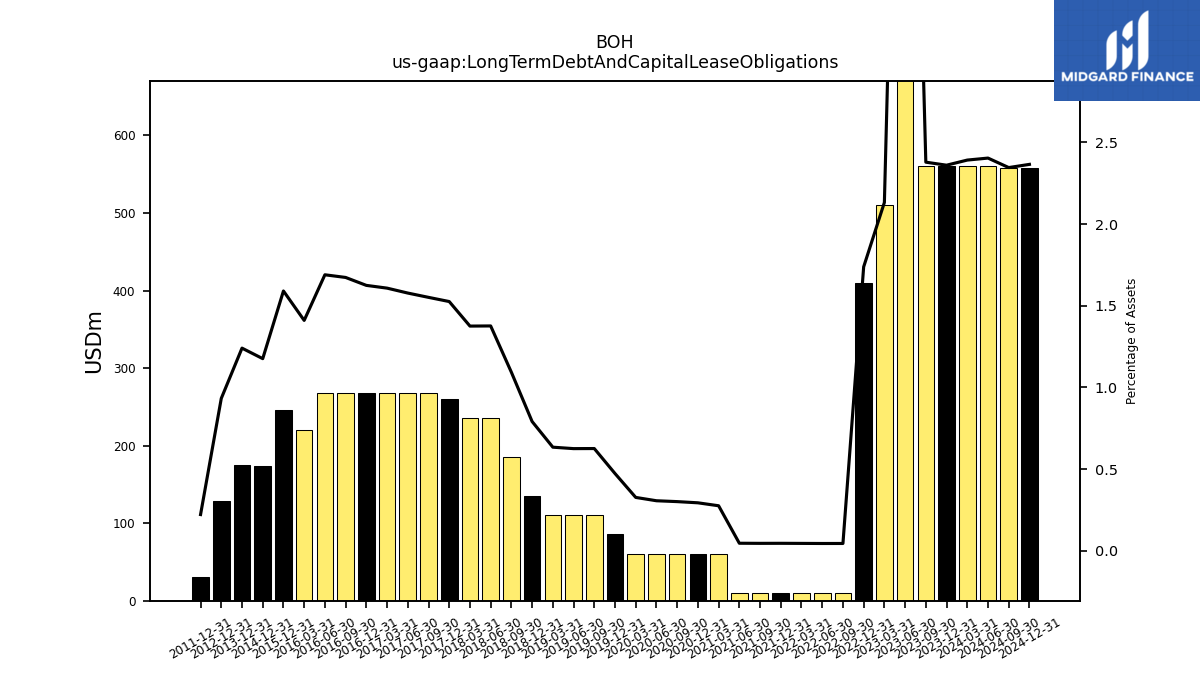
| Long Term Debt And Capital Lease Obligations | 560.16 | 560.19 | 560.22 | 1760.24 | 510.27 | 410.29 | 10.32 | 10.34 | 10.37 | 10.39 | 10.41 | 10.44 | 60.46 | 60.48 | 60.50 | 60.52 | 60.55 | 85.56 | 110.58 | 110.61 | 110.62 | 135.64 | 185.66 | 235.68 | 235.70 | 260.72 | 267.89 | 267.90 | 267.92 | 267.94 | 267.95 | 267.97 | 220.77 | 245.79 | NA | NA | NA | 173.91 | NA | NA | NA | 174.71 | NA | NA | NA |
| 2024-03-31 | 2023-12-31 | 2023-09-30 | 2023-06-30 | 2023-03-31 | 2022-12-31 | 2022-09-30 | 2022-06-30 | 2022-03-31 | 2021-12-31 | 2021-09-30 | 2021-06-30 | 2021-03-31 | 2020-12-31 | 2020-09-30 | 2020-06-30 | 2020-03-31 | 2019-12-31 | 2019-09-30 | 2019-06-30 | 2019-03-31 | 2018-12-31 | 2018-09-30 | 2018-06-30 | 2018-03-31 | 2017-12-31 | 2017-09-30 | 2017-06-30 | 2017-03-31 | 2016-12-31 | 2016-09-30 | 2016-06-30 | 2016-03-31 | 2015-12-31 | 2015-09-30 | 2015-06-30 | 2015-03-31 | 2014-12-31 | 2014-09-30 | 2014-06-30 | 2014-03-31 | 2013-12-31 | 2013-09-30 | 2013-06-30 | 2013-03-31 | ||
|---|---|---|---|---|---|---|---|---|---|---|---|---|---|---|---|---|---|---|---|---|---|---|---|---|---|---|---|---|---|---|---|---|---|---|---|---|---|---|---|---|---|---|---|---|---|---|
| Stockholders Equity | 1435.98 | 1414.24 | 1363.84 | 1358.28 | 1354.43 | 1316.99 | 1282.38 | 1348.75 | 1448.88 | 1611.61 | 1597.11 | 1583.53 | 1360.22 | 1374.51 | 1361.74 | 1352.08 | 1327.93 | 1286.83 | 1291.49 | 1285.95 | 1269.69 | 1268.20 | 1253.33 | 1247.72 | 1241.19 | 1231.87 | 1227.89 | 1213.76 | 1193.14 | 1161.54 | 1163.86 | 1157.22 | 1138.75 | 1116.26 | 1098.35 | 1082.94 | 1075.25 | 1055.09 | 1057.41 | 1050.80 | 1028.90 | 1011.98 | 992.69 | 986.37 | 1026.10 | |
| Common Stock Value | 0.58 | 0.58 | 0.58 | 0.58 | 0.58 | 0.58 | 0.58 | 0.58 | 0.58 | 0.58 | 0.58 | 0.58 | 0.58 | 0.58 | 0.58 | 0.58 | 0.58 | 0.58 | 0.58 | 0.58 | 0.58 | 0.58 | 0.58 | 0.58 | 0.58 | 0.58 | 0.58 | 0.58 | 0.58 | 0.58 | 0.58 | 0.58 | 0.58 | 0.57 | 0.57 | 0.57 | 0.57 | 0.57 | 0.57 | 0.57 | 0.57 | 0.57 | 0.57 | 0.57 | 0.57 | |
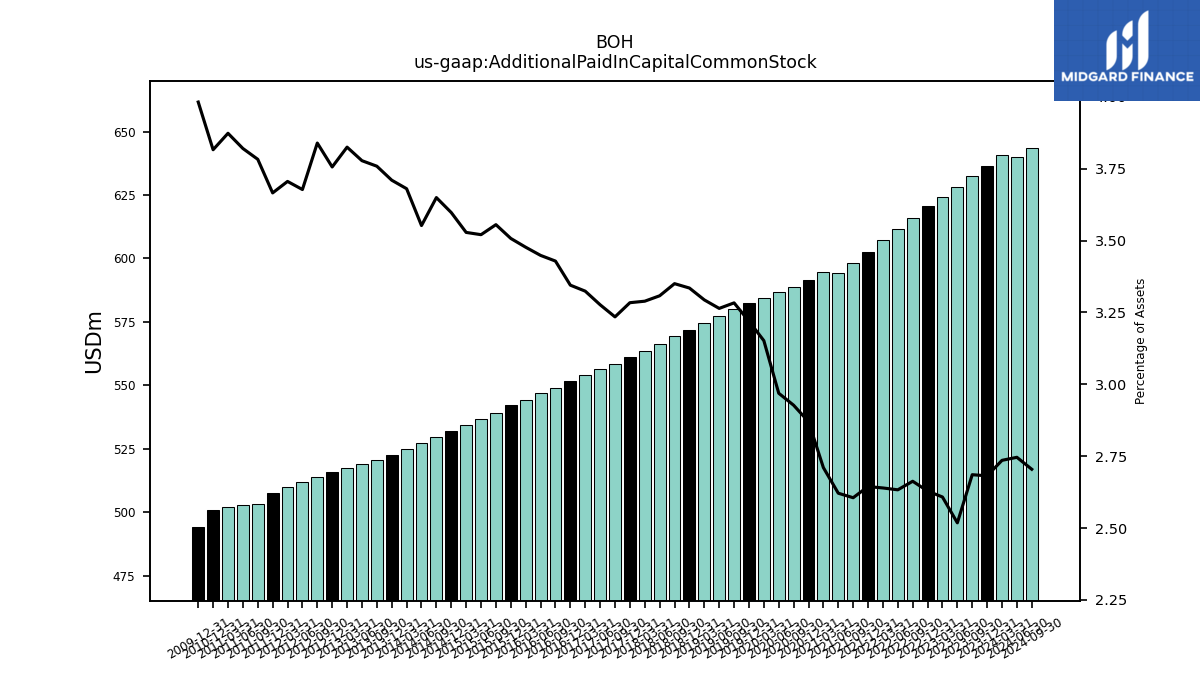
| Additional Paid In Capital Common Stock | 640.66 | 636.42 | 632.42 | 628.20 | 624.13 | 620.58 | 615.99 | 611.69 | 607.06 | 602.51 | 598.34 | 594.26 | 594.80 | 591.36 | 588.63 | 586.95 | 584.39 | 582.57 | 580.20 | 577.35 | 574.59 | 571.70 | 569.22 | 566.44 | 563.60 | 561.16 | 558.53 | 556.41 | 553.90 | 551.63 | 549.06 | 546.93 | 544.27 | 542.04 | 539.11 | 536.78 | 534.14 | 531.93 | 529.53 | 527.28 | 524.91 | 522.50 | 520.51 | 518.80 | 517.33 | |
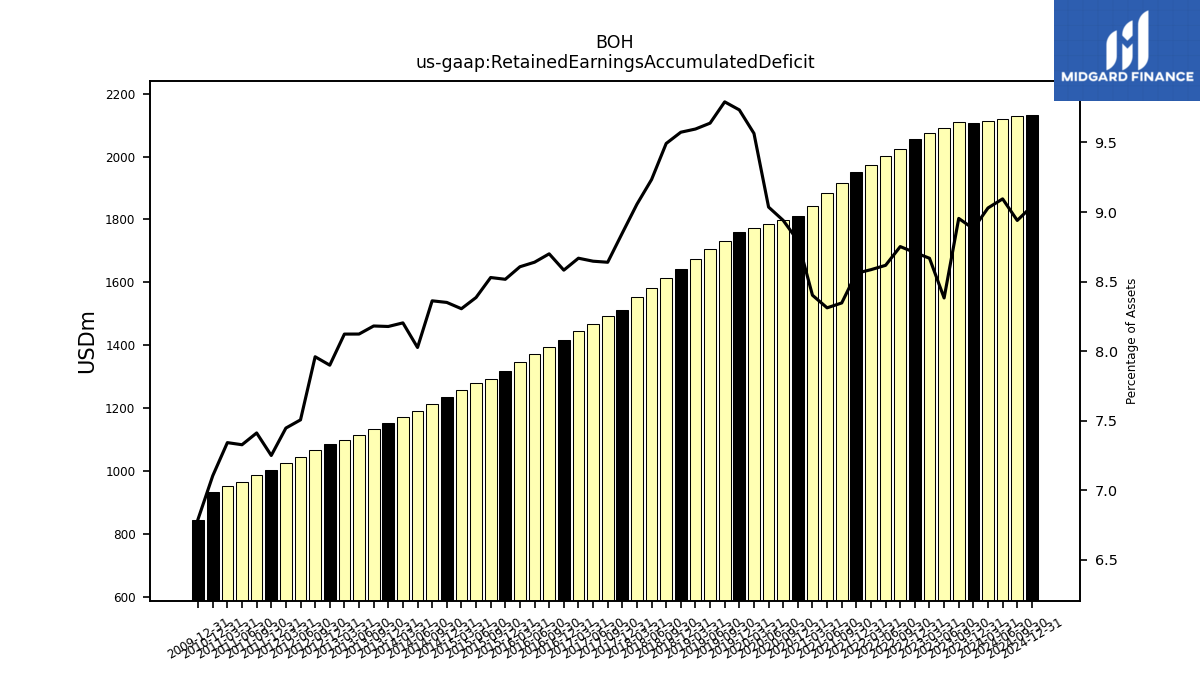
| Retained Earnings Accumulated Deficit | 2114.73 | 2107.57 | 2108.70 | 2091.29 | 2074.43 | 2055.91 | 2024.64 | 2002.01 | 1974.79 | 1950.38 | 1916.86 | 1884.43 | 1844.06 | 1811.98 | 1797.76 | 1786.35 | 1773.61 | 1761.41 | 1730.44 | 1704.99 | 1674.26 | 1641.31 | 1613.00 | 1581.17 | 1551.90 | 1512.22 | 1491.83 | 1468.33 | 1444.49 | 1415.44 | 1393.23 | 1370.31 | 1347.37 | 1316.26 | 1293.42 | 1278.67 | 1257.34 | 1234.80 | 1213.34 | 1191.51 | 1170.07 | 1151.75 | 1133.00 | 1115.59 | 1098.67 | |
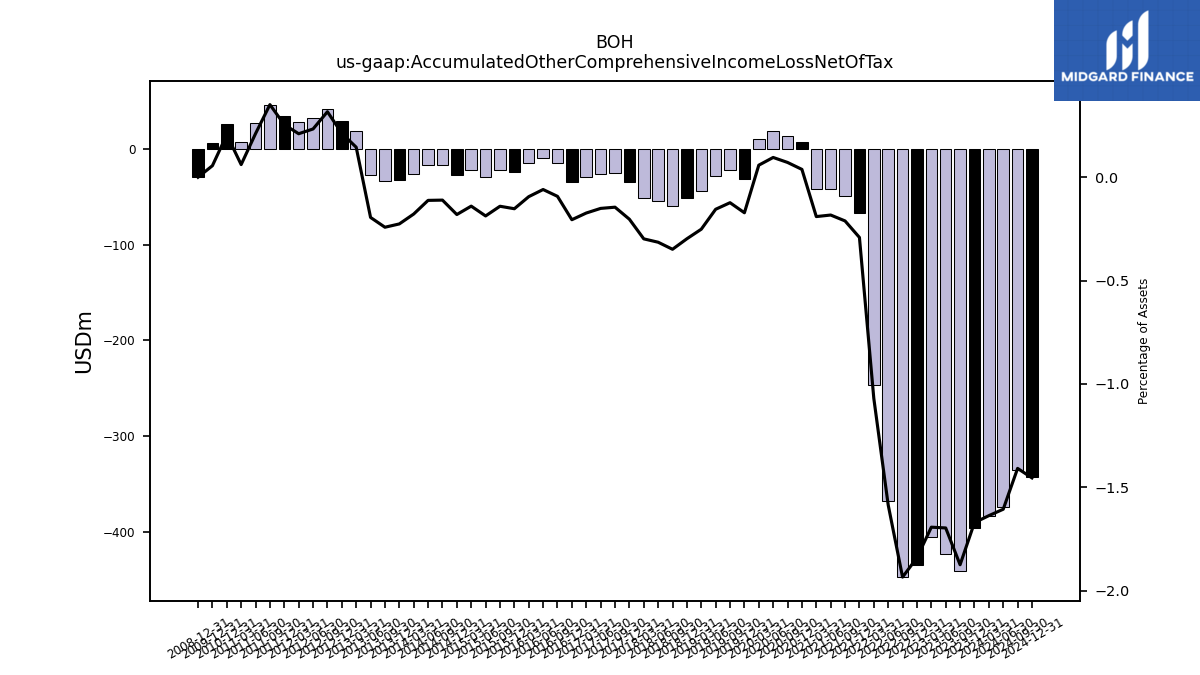
| Accumulated Other Comprehensive Income Loss Net Of Tax | -383.58 | -396.69 | -441.61 | -423.43 | -405.30 | -434.66 | -447.69 | -368.45 | -246.15 | -66.38 | -48.57 | -41.47 | -41.79 | 7.82 | 14.40 | 18.93 | 10.82 | -31.11 | -21.77 | -27.42 | -43.88 | -51.04 | -59.24 | -53.85 | -51.10 | -34.72 | -25.02 | -25.61 | -28.87 | -33.91 | -14.81 | -9.42 | -14.72 | -23.56 | -21.29 | -28.56 | -21.17 | -26.69 | -16.06 | -16.62 | -25.40 | -31.82 | -33.51 | -26.73 | 19.64 | |
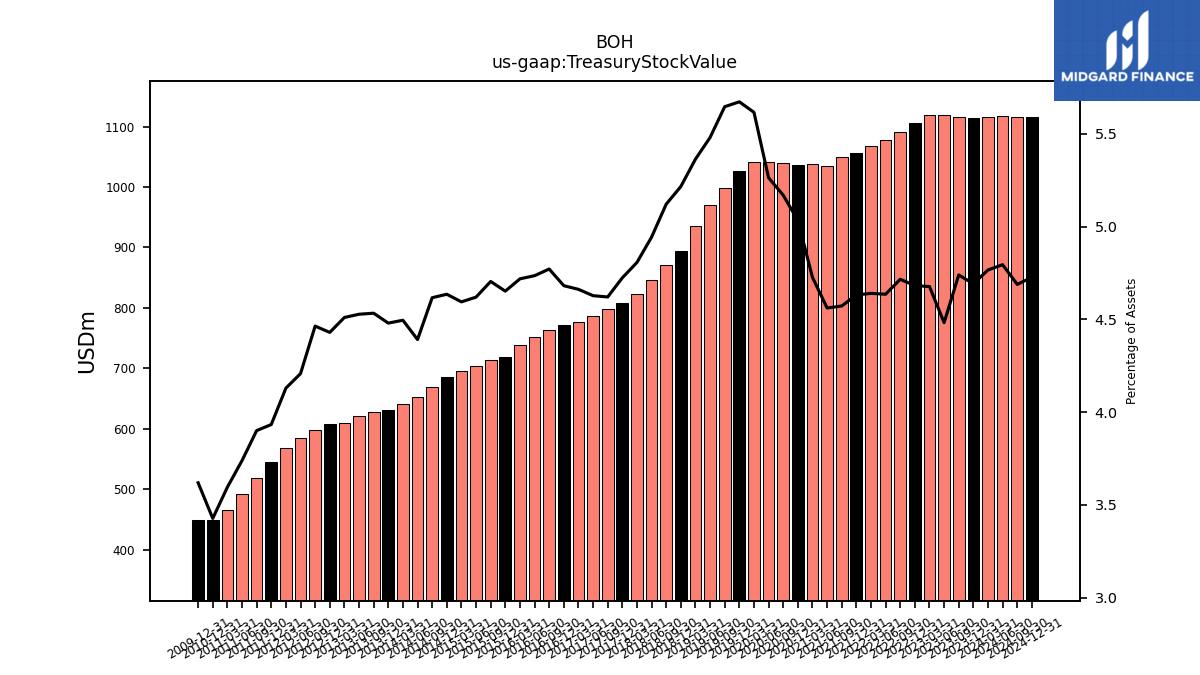
| Treasury Stock Value | 1116.42 | 1113.64 | 1116.26 | 1118.36 | 1119.41 | 1105.42 | 1091.13 | 1077.09 | 1067.39 | 1055.47 | 1050.11 | 1034.27 | 1037.43 | 1037.23 | 1039.63 | 1040.72 | 1041.47 | 1026.62 | 997.95 | 969.55 | 935.87 | 894.35 | 870.23 | 846.61 | 823.78 | 807.37 | 798.02 | 785.94 | 776.97 | 772.20 | 764.20 | 751.17 | 738.74 | 719.06 | 713.46 | 704.53 | 695.63 | 685.53 | 669.97 | 651.95 | 641.25 | 631.03 | 627.88 | 621.88 | 610.11 | |
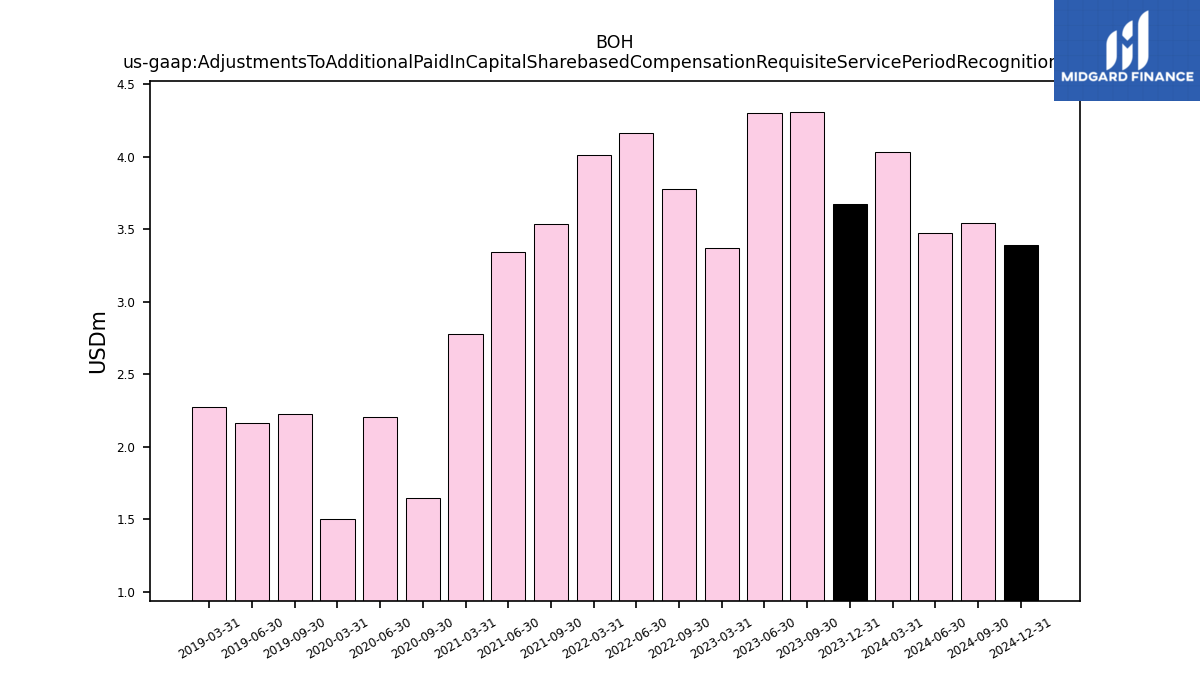
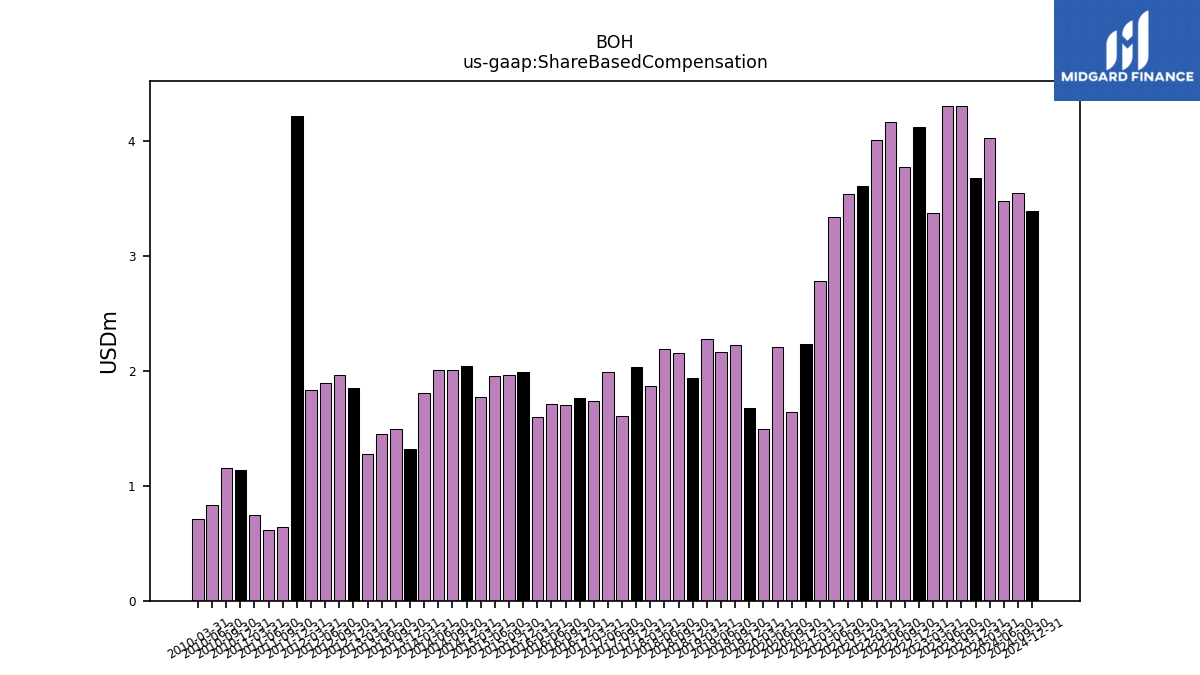
| Adjustments To Additional Paid In Capital Sharebased Compensation Requisite Service Period Recognition Value | 4.03 | NA | 4.31 | 4.30 | 3.37 | NA | 3.77 | 4.16 | 4.01 | NA | 3.54 | 3.34 | 2.78 | NA | 1.64 | 2.21 | 1.50 | NA | 2.22 | 2.16 | 2.27 | NA | NA | NA | NA | NA | NA | NA | NA | NA | NA | NA | NA | NA | NA | NA | NA | NA | NA | NA | NA | NA | NA | NA | NA |
| 2024-03-31 | 2023-12-31 | 2023-09-30 | 2023-06-30 | 2023-03-31 | 2022-12-31 | 2022-09-30 | 2022-06-30 | 2022-03-31 | 2021-12-31 | 2021-09-30 | 2021-06-30 | 2021-03-31 | 2020-12-31 | 2020-09-30 | 2020-06-30 | 2020-03-31 | 2019-12-31 | 2019-09-30 | 2019-06-30 | 2019-03-31 | 2018-12-31 | 2018-09-30 | 2018-06-30 | 2018-03-31 | 2017-12-31 | 2017-09-30 | 2017-06-30 | 2017-03-31 | 2016-12-31 | 2016-09-30 | 2016-06-30 | 2016-03-31 | 2015-12-31 | 2015-09-30 | 2015-06-30 | 2015-03-31 | 2014-12-31 | 2014-09-30 | 2014-06-30 | 2014-03-31 | 2013-12-31 | 2013-09-30 | 2013-06-30 | 2013-03-31 | ||
|---|---|---|---|---|---|---|---|---|---|---|---|---|---|---|---|---|---|---|---|---|---|---|---|---|---|---|---|---|---|---|---|---|---|---|---|---|---|---|---|---|---|---|---|---|---|---|
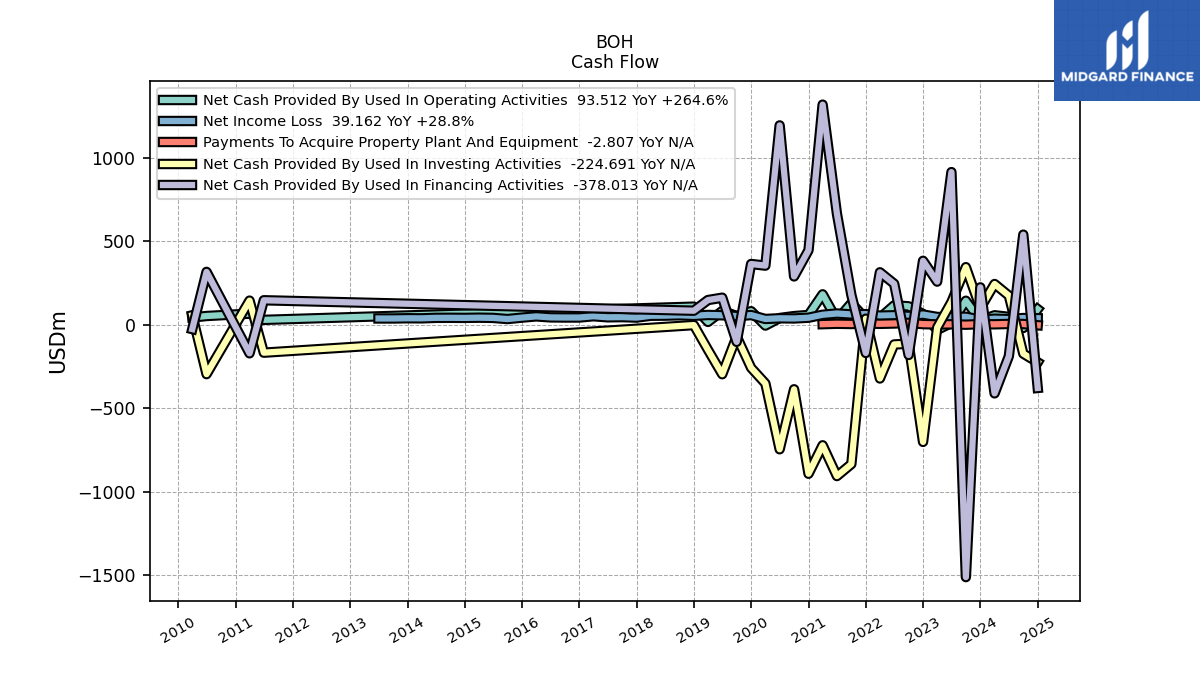
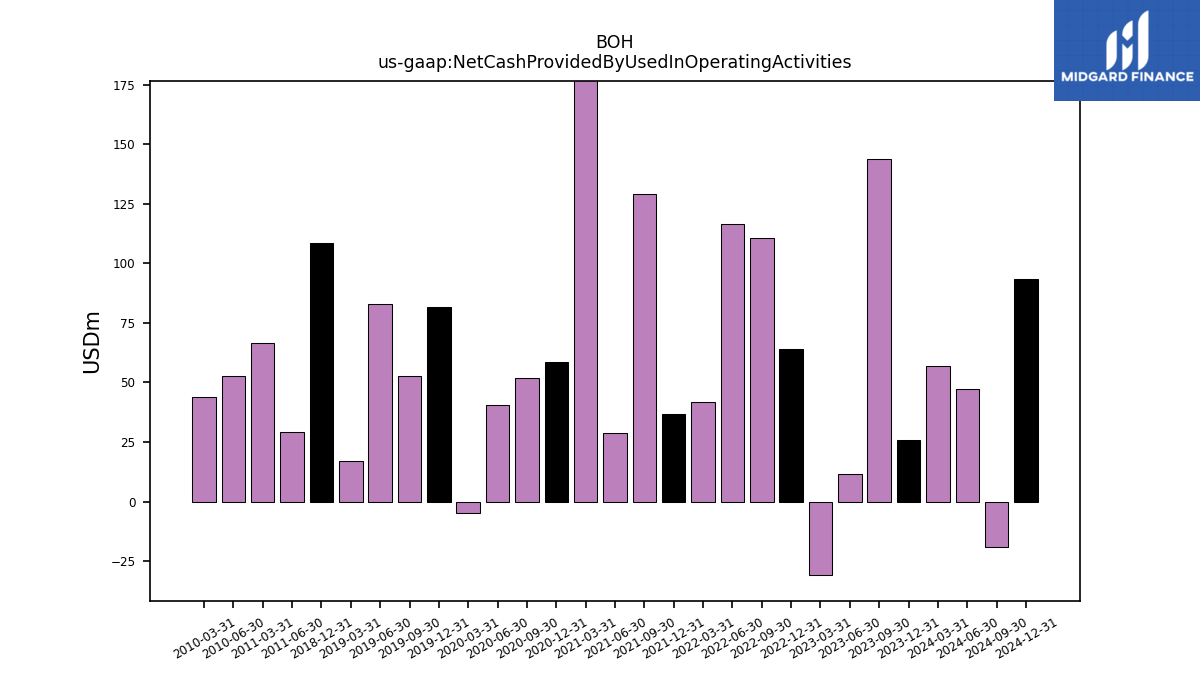
| Net Cash Provided By Used In Operating Activities | 56.84 | 25.65 | 143.94 | 11.59 | -30.96 | 64.09 | 110.52 | 116.55 | 41.80 | 36.88 | 129.01 | 28.86 | 182.41 | 58.72 | 51.93 | 40.62 | -4.86 | 81.50 | 52.78 | 82.84 | 17.12 | 108.55 | NA | NA | NA | NA | NA | NA | NA | NA | NA | NA | NA | NA | NA | NA | NA | NA | NA | NA | NA | NA | NA | NA | NA | |
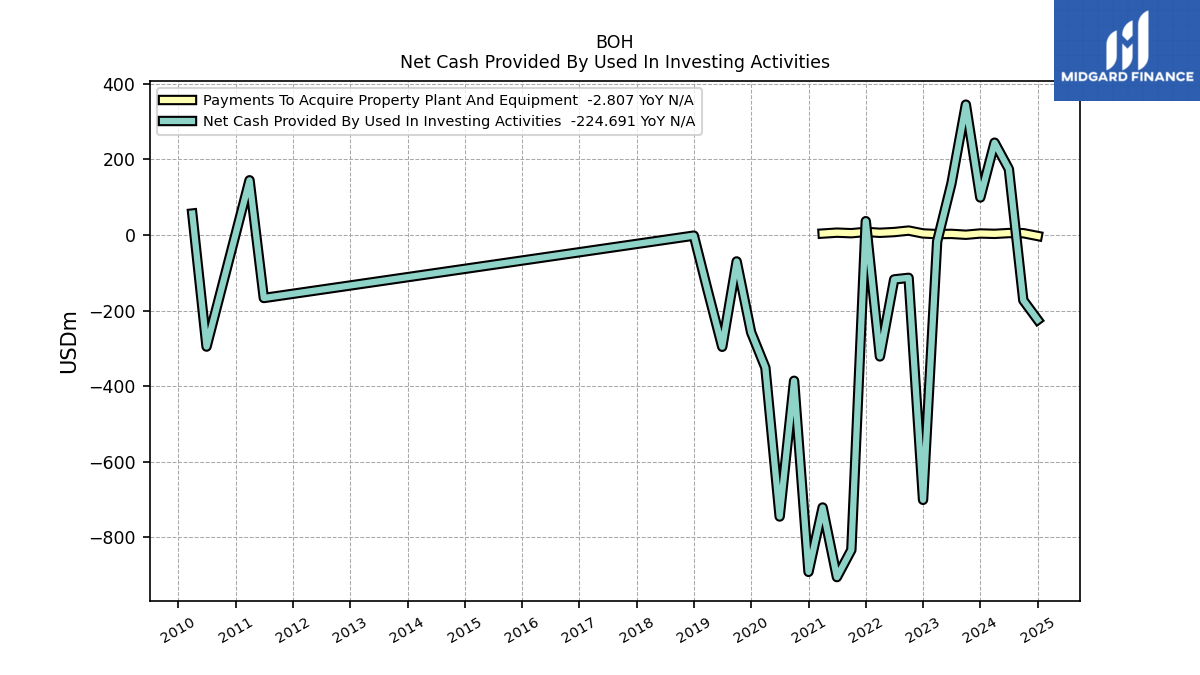
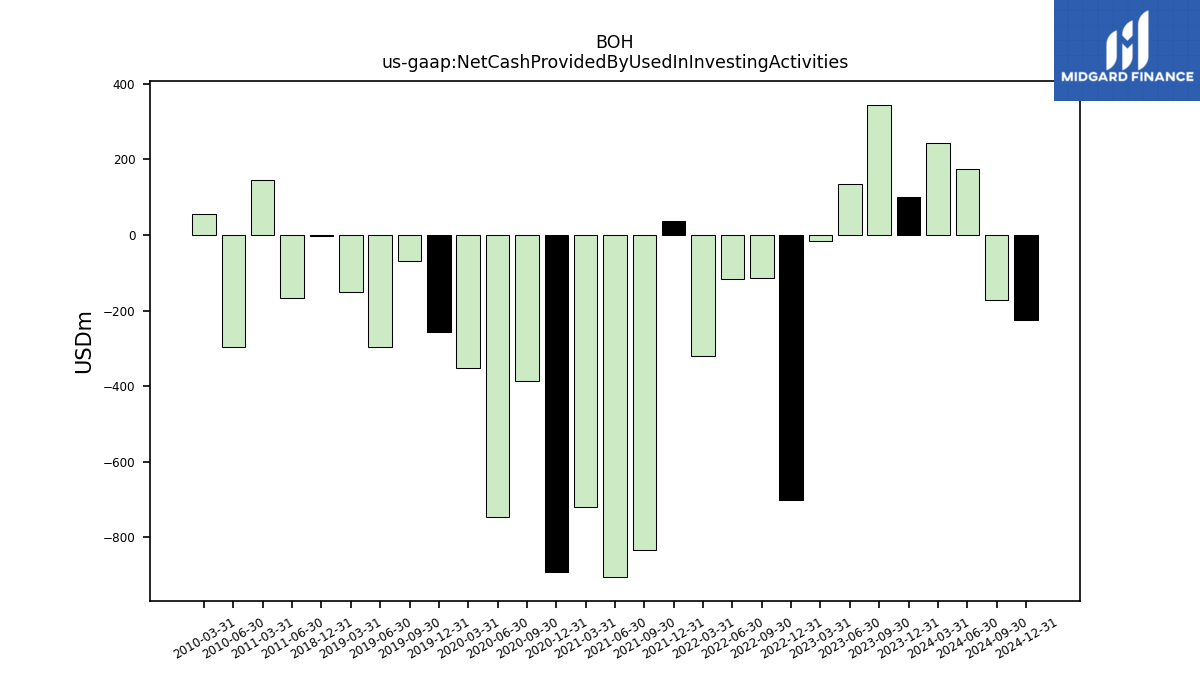
| Net Cash Provided By Used In Investing Activities | 244.15 | 99.08 | 344.77 | 136.08 | -17.13 | -700.89 | -113.48 | -117.62 | -321.42 | 36.43 | -833.44 | -905.29 | -721.04 | -891.47 | -385.80 | -744.98 | -351.04 | -257.49 | -70.03 | -295.94 | -149.81 | -1.82 | NA | NA | NA | NA | NA | NA | NA | NA | NA | NA | NA | NA | NA | NA | NA | NA | NA | NA | NA | NA | NA | NA | NA | |
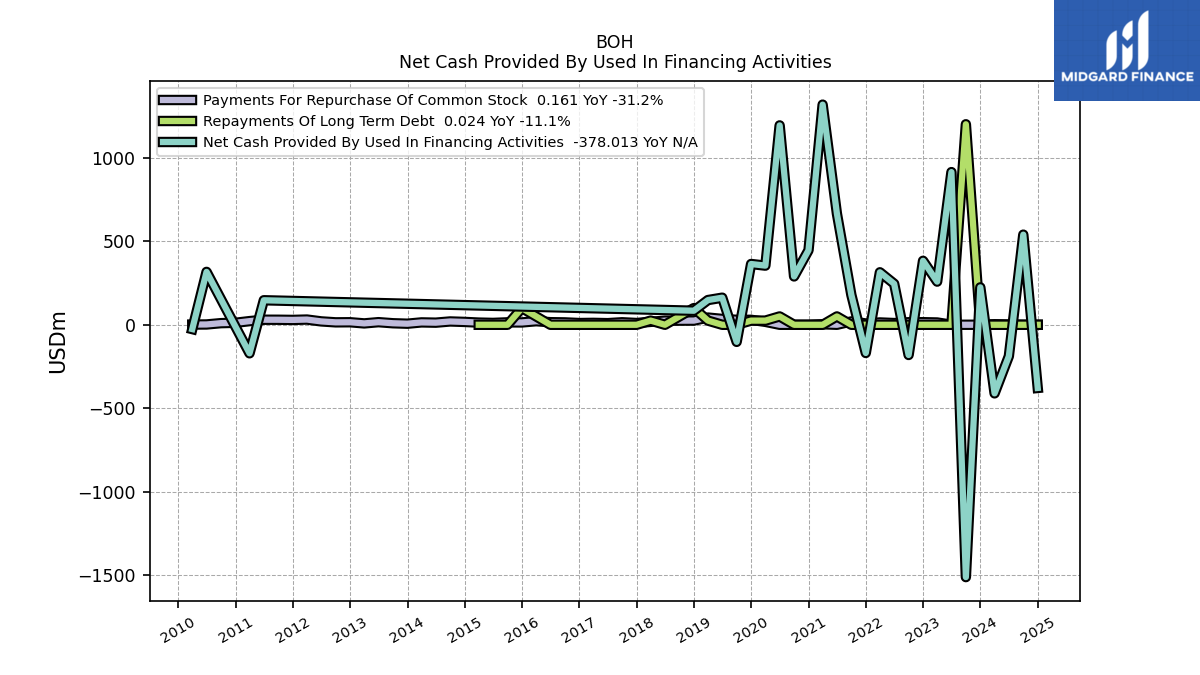
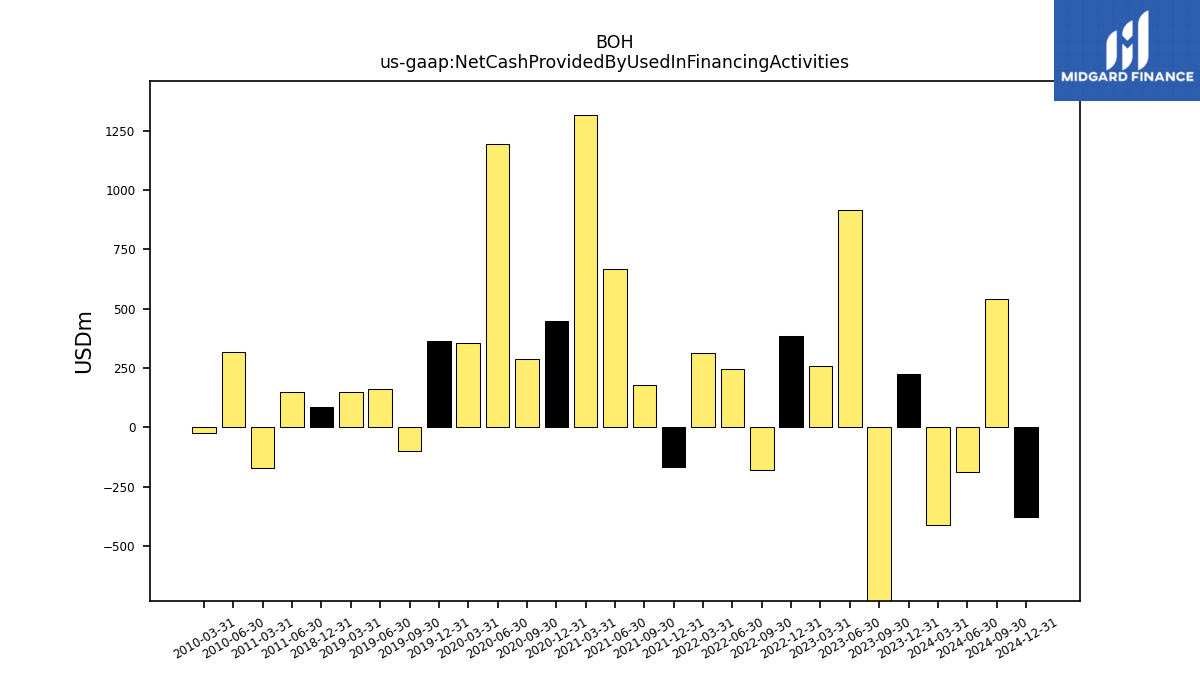
| Net Cash Provided By Used In Financing Activities | -410.41 | 223.99 | -1509.93 | 913.79 | 258.31 | 382.92 | -180.75 | 245.38 | 314.25 | -168.84 | 178.93 | 665.04 | 1317.40 | 445.91 | 289.20 | 1193.24 | 353.95 | 363.77 | -102.24 | 162.17 | 148.01 | 84.27 | NA | NA | NA | NA | NA | NA | NA | NA | NA | NA | NA | NA | NA | NA | NA | NA | NA | NA | NA | NA | NA | NA | NA |
| 2024-03-31 | 2023-12-31 | 2023-09-30 | 2023-06-30 | 2023-03-31 | 2022-12-31 | 2022-09-30 | 2022-06-30 | 2022-03-31 | 2021-12-31 | 2021-09-30 | 2021-06-30 | 2021-03-31 | 2020-12-31 | 2020-09-30 | 2020-06-30 | 2020-03-31 | 2019-12-31 | 2019-09-30 | 2019-06-30 | 2019-03-31 | 2018-12-31 | 2018-09-30 | 2018-06-30 | 2018-03-31 | 2017-12-31 | 2017-09-30 | 2017-06-30 | 2017-03-31 | 2016-12-31 | 2016-09-30 | 2016-06-30 | 2016-03-31 | 2015-12-31 | 2015-09-30 | 2015-06-30 | 2015-03-31 | 2014-12-31 | 2014-09-30 | 2014-06-30 | 2014-03-31 | 2013-12-31 | 2013-09-30 | 2013-06-30 | 2013-03-31 | ||
|---|---|---|---|---|---|---|---|---|---|---|---|---|---|---|---|---|---|---|---|---|---|---|---|---|---|---|---|---|---|---|---|---|---|---|---|---|---|---|---|---|---|---|---|---|---|---|
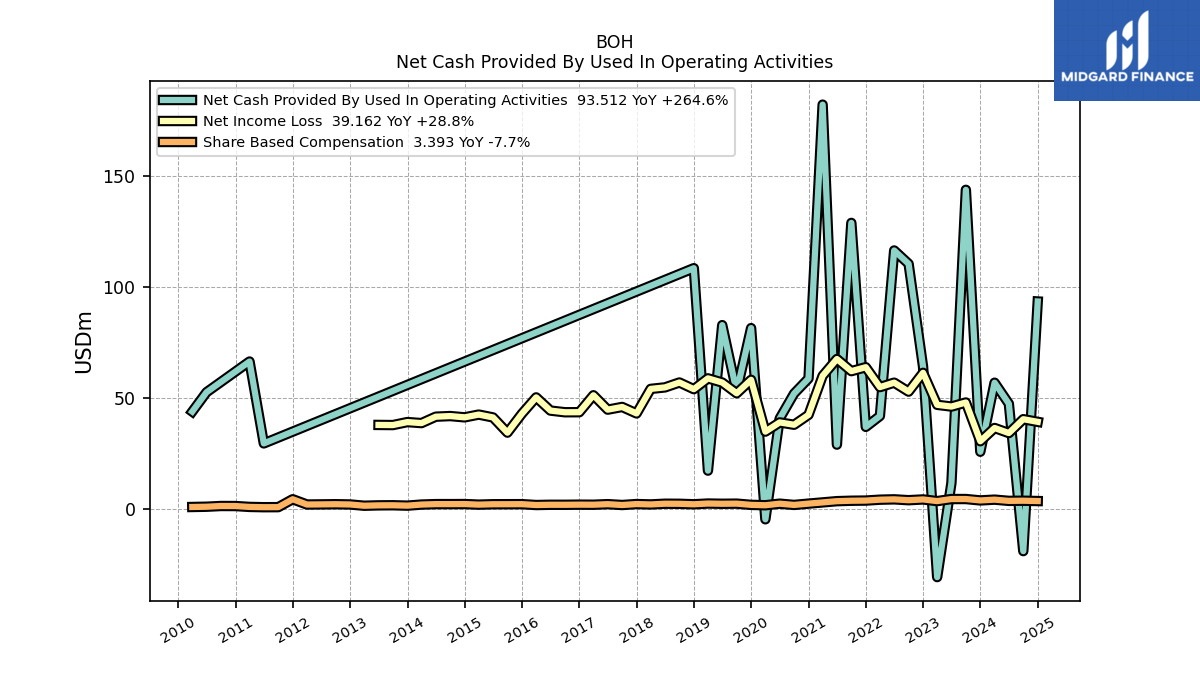
| Net Cash Provided By Used In Operating Activities | 56.84 | 25.65 | 143.94 | 11.59 | -30.96 | 64.09 | 110.52 | 116.55 | 41.80 | 36.88 | 129.01 | 28.86 | 182.41 | 58.72 | 51.93 | 40.62 | -4.86 | 81.50 | 52.78 | 82.84 | 17.12 | 108.55 | NA | NA | NA | NA | NA | NA | NA | NA | NA | NA | NA | NA | NA | NA | NA | NA | NA | NA | NA | NA | NA | NA | NA | |
| Net Income Loss | 36.39 | 30.40 | 47.90 | 46.06 | 46.84 | 61.31 | 52.80 | 56.86 | 54.83 | 63.84 | 62.05 | 67.53 | 59.95 | 42.31 | 37.84 | 38.91 | 34.74 | 58.14 | 52.05 | 56.92 | 58.80 | 53.91 | 56.93 | 54.72 | 54.04 | 42.95 | 45.88 | 44.66 | 51.18 | 43.51 | 43.49 | 44.24 | 50.21 | 42.83 | 34.28 | 41.15 | 42.44 | 41.19 | 41.77 | 41.49 | 38.59 | 39.05 | 37.70 | 37.76 | NA | |
| Profit Loss | 36.39 | 30.40 | 47.90 | 46.06 | 46.84 | 61.31 | 52.80 | 56.86 | 54.83 | 63.84 | 62.05 | 67.53 | 59.95 | 42.31 | 37.84 | 38.91 | 34.74 | 58.14 | NA | NA | NA | NA | NA | NA | NA | NA | NA | NA | NA | NA | NA | NA | NA | NA | NA | NA | NA | NA | NA | NA | NA | NA | NA | NA | NA | |
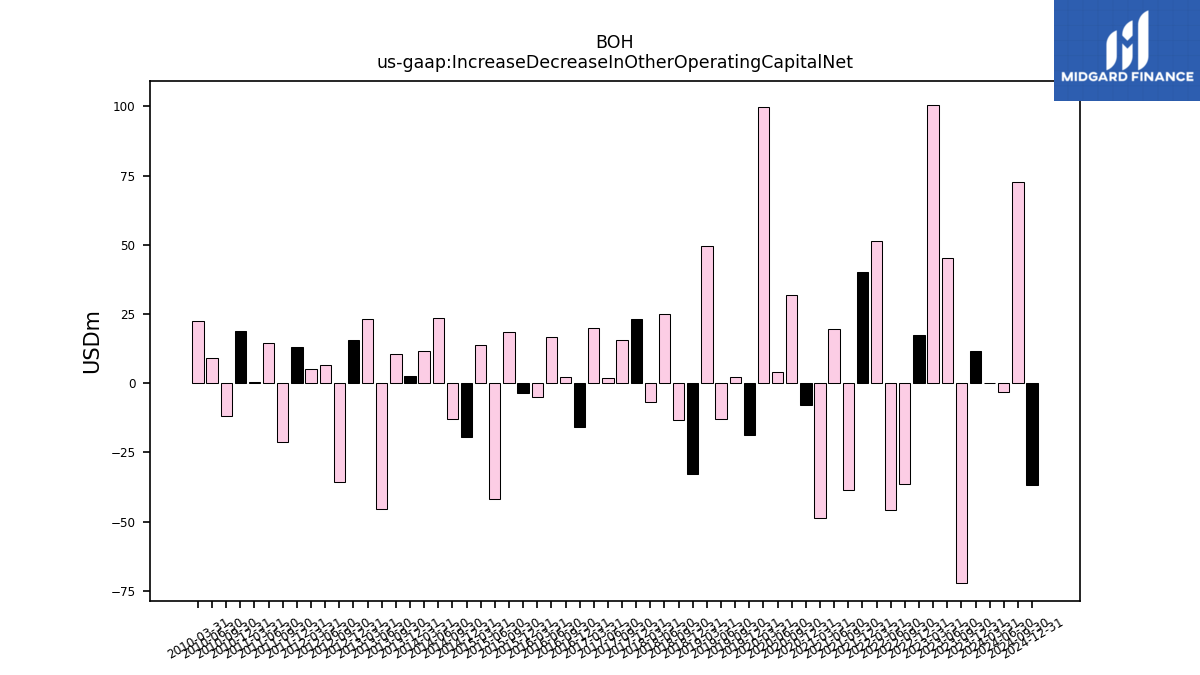
| Increase Decrease In Other Operating Capital Net | 0.00 | 11.73 | -72.11 | 45.29 | 100.58 | 17.46 | -36.58 | -45.85 | 51.37 | 40.09 | -38.75 | 19.53 | -48.86 | -7.82 | 31.96 | 3.90 | 99.89 | -18.67 | 2.22 | -13.01 | 49.49 | -32.96 | -13.38 | 25.16 | -6.63 | 23.22 | 15.60 | 1.86 | 19.94 | -15.99 | 2.39 | 16.80 | -4.96 | -3.61 | 18.41 | -41.78 | 13.65 | -19.30 | -12.82 | 23.47 | 11.56 | 2.54 | 10.59 | -45.32 | 23.04 | |
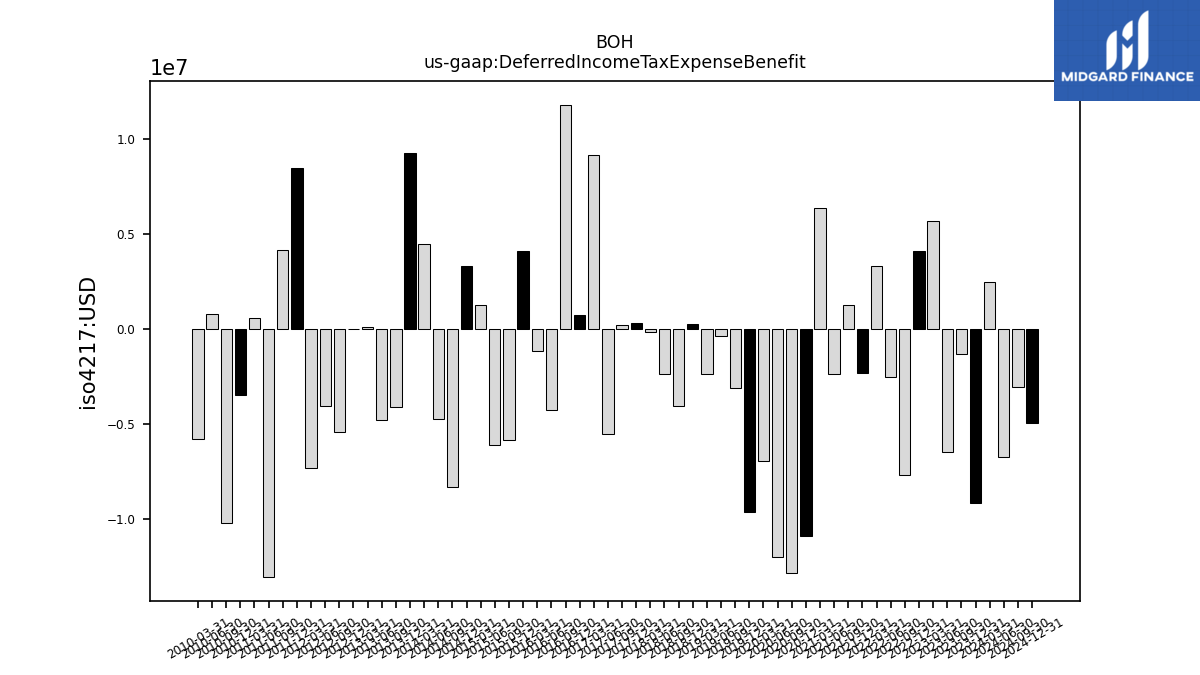
| Deferred Income Tax Expense Benefit | 2.47 | -9.16 | -1.31 | -6.44 | 5.71 | 4.13 | -7.68 | -2.49 | 3.33 | -2.29 | 1.28 | -2.37 | 6.40 | -10.86 | -12.80 | -11.98 | -6.94 | -9.61 | -3.09 | -0.35 | -2.36 | 0.28 | -4.06 | -2.36 | -0.14 | 0.31 | 0.24 | -5.53 | 9.16 | 0.72 | 11.82 | -4.22 | -1.13 | 4.10 | -5.82 | -6.09 | 1.29 | 3.31 | -8.30 | -4.70 | 4.48 | 9.27 | -4.11 | -4.78 | 0.13 | |
| Share Based Compensation | 4.03 | 3.68 | 4.31 | 4.30 | 3.37 | 4.12 | 3.77 | 4.16 | 4.01 | 3.61 | 3.54 | 3.34 | 2.78 | 2.23 | 1.64 | 2.21 | 1.50 | 1.68 | 2.22 | 2.16 | 2.27 | 1.94 | 2.15 | 2.19 | 1.87 | 2.04 | 1.61 | 1.99 | 1.74 | 1.77 | 1.71 | 1.72 | 1.60 | 1.99 | 1.97 | 1.96 | 1.78 | 2.04 | 2.01 | 2.01 | 1.81 | 1.32 | 1.49 | 1.45 | 1.28 |
| 2024-03-31 | 2023-12-31 | 2023-09-30 | 2023-06-30 | 2023-03-31 | 2022-12-31 | 2022-09-30 | 2022-06-30 | 2022-03-31 | 2021-12-31 | 2021-09-30 | 2021-06-30 | 2021-03-31 | 2020-12-31 | 2020-09-30 | 2020-06-30 | 2020-03-31 | 2019-12-31 | 2019-09-30 | 2019-06-30 | 2019-03-31 | 2018-12-31 | 2018-09-30 | 2018-06-30 | 2018-03-31 | 2017-12-31 | 2017-09-30 | 2017-06-30 | 2017-03-31 | 2016-12-31 | 2016-09-30 | 2016-06-30 | 2016-03-31 | 2015-12-31 | 2015-09-30 | 2015-06-30 | 2015-03-31 | 2014-12-31 | 2014-09-30 | 2014-06-30 | 2014-03-31 | 2013-12-31 | 2013-09-30 | 2013-06-30 | 2013-03-31 | ||
|---|---|---|---|---|---|---|---|---|---|---|---|---|---|---|---|---|---|---|---|---|---|---|---|---|---|---|---|---|---|---|---|---|---|---|---|---|---|---|---|---|---|---|---|---|---|---|
| Net Cash Provided By Used In Investing Activities | 244.15 | 99.08 | 344.77 | 136.08 | -17.13 | -700.89 | -113.48 | -117.62 | -321.42 | 36.43 | -833.44 | -905.29 | -721.04 | -891.47 | -385.80 | -744.98 | -351.04 | -257.49 | -70.03 | -295.94 | -149.81 | -1.82 | NA | NA | NA | NA | NA | NA | NA | NA | NA | NA | NA | NA | NA | NA | NA | NA | NA | NA | NA | NA | NA | NA | NA | |
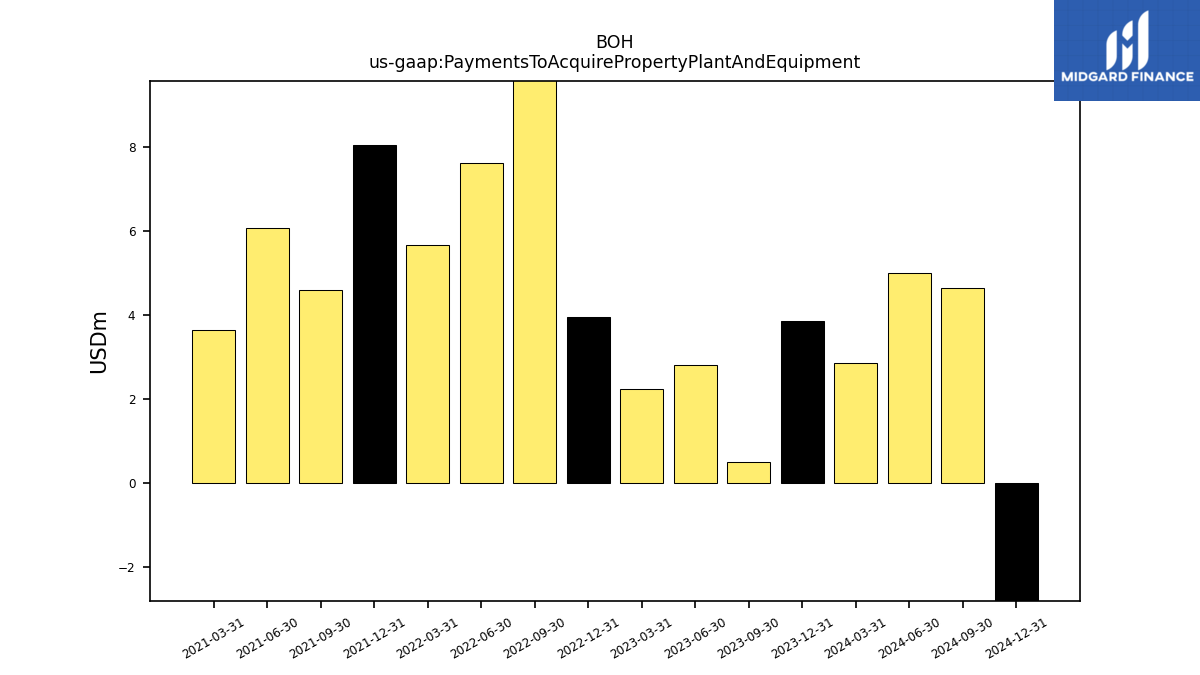
| Payments To Acquire Property Plant And Equipment | 2.86 | 3.87 | 0.49 | 2.81 | 2.24 | 3.96 | 11.53 | 7.62 | 5.66 | 8.06 | 4.58 | 6.08 | 3.65 | NA | NA | NA | NA | NA | NA | NA | NA | NA | NA | NA | NA | NA | NA | NA | NA | NA | NA | NA | NA | NA | NA | NA | NA | NA | NA | NA | NA | NA | NA | NA | NA |
| 2024-03-31 | 2023-12-31 | 2023-09-30 | 2023-06-30 | 2023-03-31 | 2022-12-31 | 2022-09-30 | 2022-06-30 | 2022-03-31 | 2021-12-31 | 2021-09-30 | 2021-06-30 | 2021-03-31 | 2020-12-31 | 2020-09-30 | 2020-06-30 | 2020-03-31 | 2019-12-31 | 2019-09-30 | 2019-06-30 | 2019-03-31 | 2018-12-31 | 2018-09-30 | 2018-06-30 | 2018-03-31 | 2017-12-31 | 2017-09-30 | 2017-06-30 | 2017-03-31 | 2016-12-31 | 2016-09-30 | 2016-06-30 | 2016-03-31 | 2015-12-31 | 2015-09-30 | 2015-06-30 | 2015-03-31 | 2014-12-31 | 2014-09-30 | 2014-06-30 | 2014-03-31 | 2013-12-31 | 2013-09-30 | 2013-06-30 | 2013-03-31 | ||
|---|---|---|---|---|---|---|---|---|---|---|---|---|---|---|---|---|---|---|---|---|---|---|---|---|---|---|---|---|---|---|---|---|---|---|---|---|---|---|---|---|---|---|---|---|---|---|
| Net Cash Provided By Used In Financing Activities | -410.41 | 223.99 | -1509.93 | 913.79 | 258.31 | 382.92 | -180.75 | 245.38 | 314.25 | -168.84 | 178.93 | 665.04 | 1317.40 | 445.91 | 289.20 | 1193.24 | 353.95 | 363.77 | -102.24 | 162.17 | 148.01 | 84.27 | NA | NA | NA | NA | NA | NA | NA | NA | NA | NA | NA | NA | NA | NA | NA | NA | NA | NA | NA | NA | NA | NA | NA | |
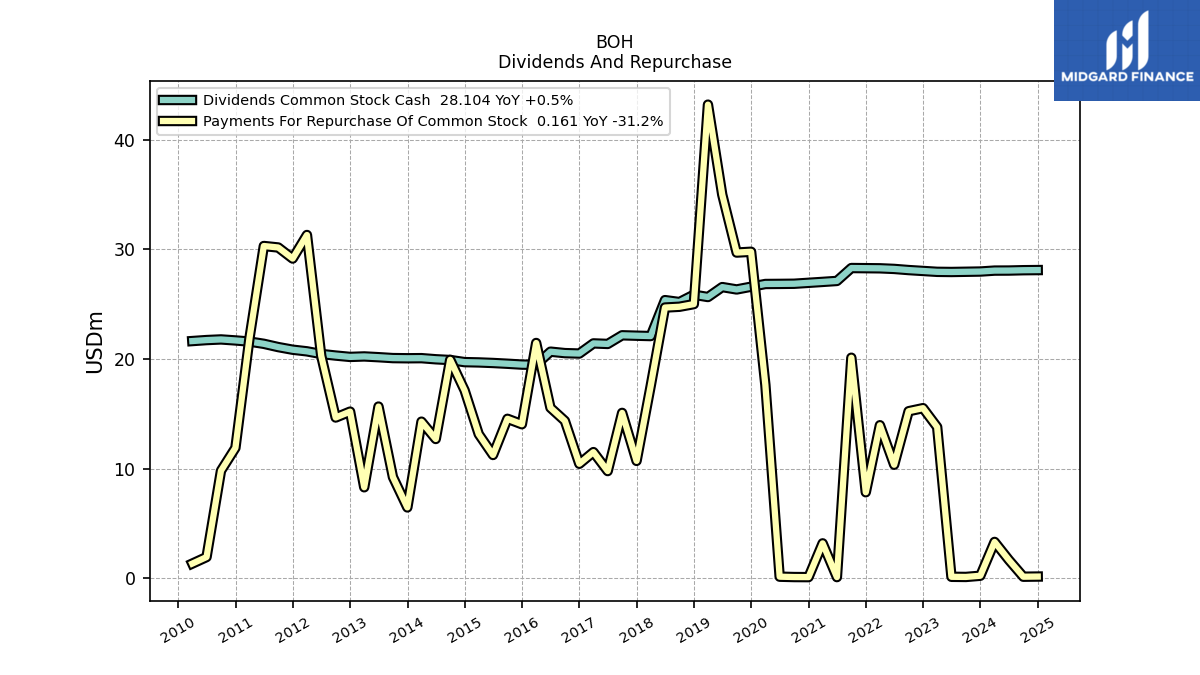
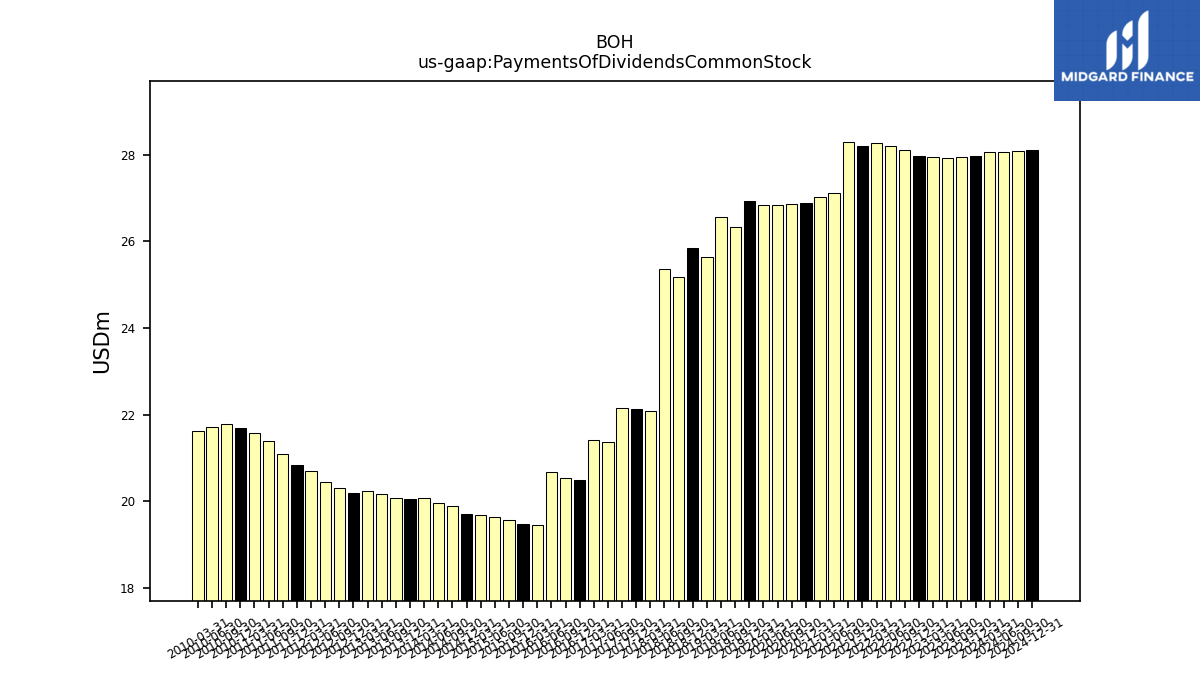
| Payments Of Dividends Common Stock | 28.06 | 27.97 | 27.95 | 27.93 | 27.94 | 27.98 | 28.11 | 28.21 | 28.27 | 28.20 | 28.29 | 27.11 | 27.03 | 26.90 | 26.86 | 26.84 | 26.84 | 26.94 | 26.34 | 26.55 | 25.65 | 25.86 | 25.19 | 25.36 | 22.09 | 22.12 | 22.16 | 21.37 | 21.42 | 20.49 | 20.53 | 20.67 | 19.46 | 19.49 | 19.56 | 19.63 | 19.68 | 19.71 | 19.90 | 19.97 | 20.07 | 20.06 | 20.08 | 20.16 | 20.23 | |
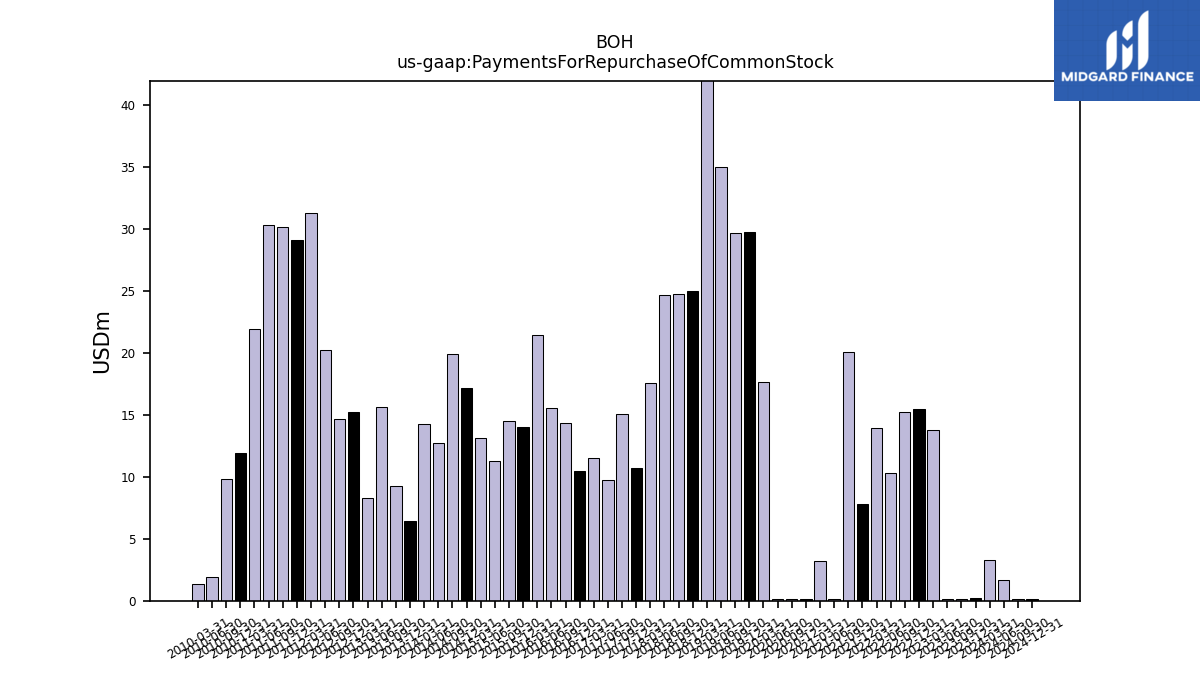
| Payments For Repurchase Of Common Stock | 3.32 | 0.23 | 0.12 | 0.14 | 13.79 | 15.52 | 15.23 | 10.35 | 13.96 | 7.85 | 20.11 | 0.11 | 3.19 | 0.11 | 0.12 | 0.15 | 17.63 | 29.77 | 29.70 | 34.99 | 43.19 | 25.00 | 24.76 | 24.69 | 17.54 | 10.71 | 15.08 | 9.78 | 11.51 | 10.44 | 14.36 | 15.55 | 21.46 | 14.05 | 14.55 | 11.24 | 13.14 | 17.14 | 19.92 | 12.70 | 14.28 | 6.46 | 9.23 | 15.66 | 8.30 |
| 2024-03-31 | 2023-12-31 | 2023-09-30 | 2023-06-30 | 2023-03-31 | 2022-12-31 | 2022-09-30 | 2022-06-30 | 2022-03-31 | 2021-12-31 | 2021-09-30 | 2021-06-30 | 2021-03-31 | 2020-12-31 | 2020-09-30 | 2020-06-30 | 2020-03-31 | 2019-12-31 | 2019-09-30 | 2019-06-30 | 2019-03-31 | 2018-12-31 | 2018-09-30 | 2018-06-30 | 2018-03-31 | 2017-12-31 | 2017-09-30 | 2017-06-30 | 2017-03-31 | 2016-12-31 | 2016-09-30 | 2016-06-30 | 2016-03-31 | 2015-12-31 | 2015-09-30 | 2015-06-30 | 2015-03-31 | 2014-12-31 | 2014-09-30 | 2014-06-30 | 2014-03-31 | 2013-12-31 | 2013-09-30 | 2013-06-30 | 2013-03-31 | ||
|---|---|---|---|---|---|---|---|---|---|---|---|---|---|---|---|---|---|---|---|---|---|---|---|---|---|---|---|---|---|---|---|---|---|---|---|---|---|---|---|---|---|---|---|---|---|---|
| Interest Income Operating | 43.89 | 45.37 | 46.39 | 46.68 | 47.84 | 42.18 | 37.24 | 36.82 | 35.80 | 34.17 | 33.15 | 30.04 | 29.14 | 29.56 | 30.52 | 31.30 | 35.96 | 34.91 | 36.31 | 37.22 | 35.35 | 34.52 | 33.41 | 33.09 | 33.44 | 33.65 | 32.32 | 31.75 | 30.79 | 29.46 | 29.63 | 30.69 | 31.20 | 32.55 | 30.88 | 33.10 | 34.60 | 35.70 | 36.35 | 37.63 | 38.65 | 37.49 | 36.17 | 34.26 | 35.70 |
