
| 2023-03-31 | 2022-12-31 | 2022-09-30 | 2022-06-30 | 2022-03-31 | 2021-12-31 | 2021-09-30 | 2021-06-30 | 2021-03-31 | 2020-12-31 | 2020-09-30 | 2020-06-30 | 2020-03-31 | 2019-12-31 | 2019-11-14 | 2019-09-30 | 2019-06-30 | 2019-03-31 | ||
|---|---|---|---|---|---|---|---|---|---|---|---|---|---|---|---|---|---|---|---|
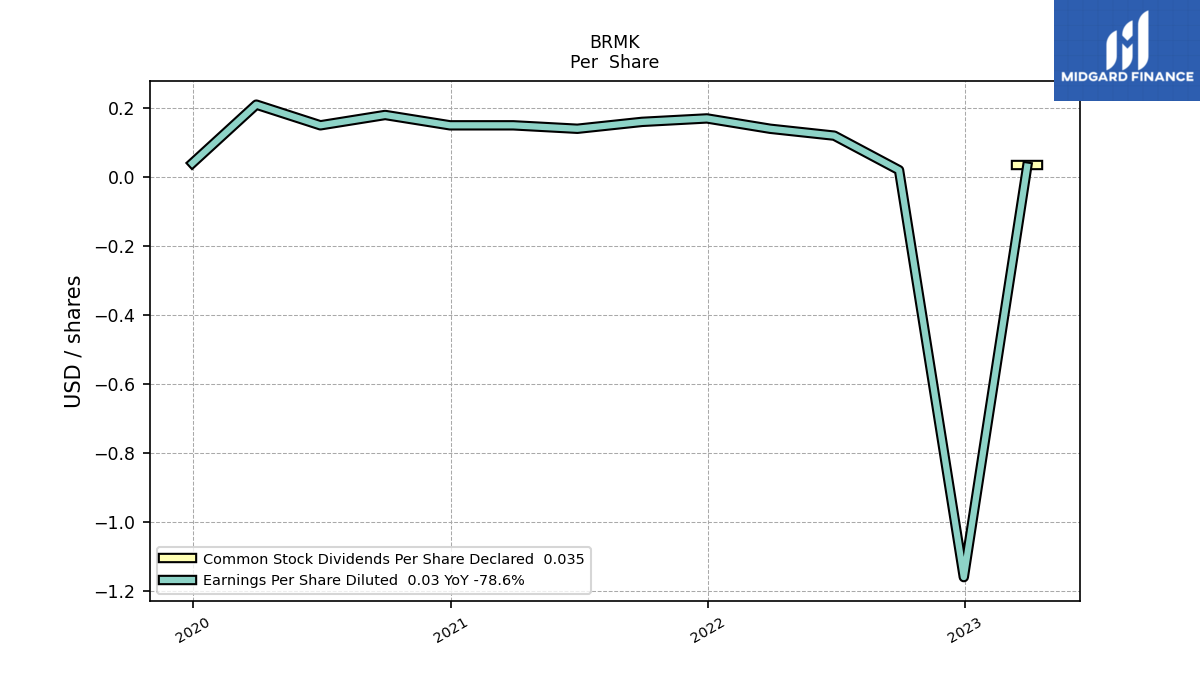
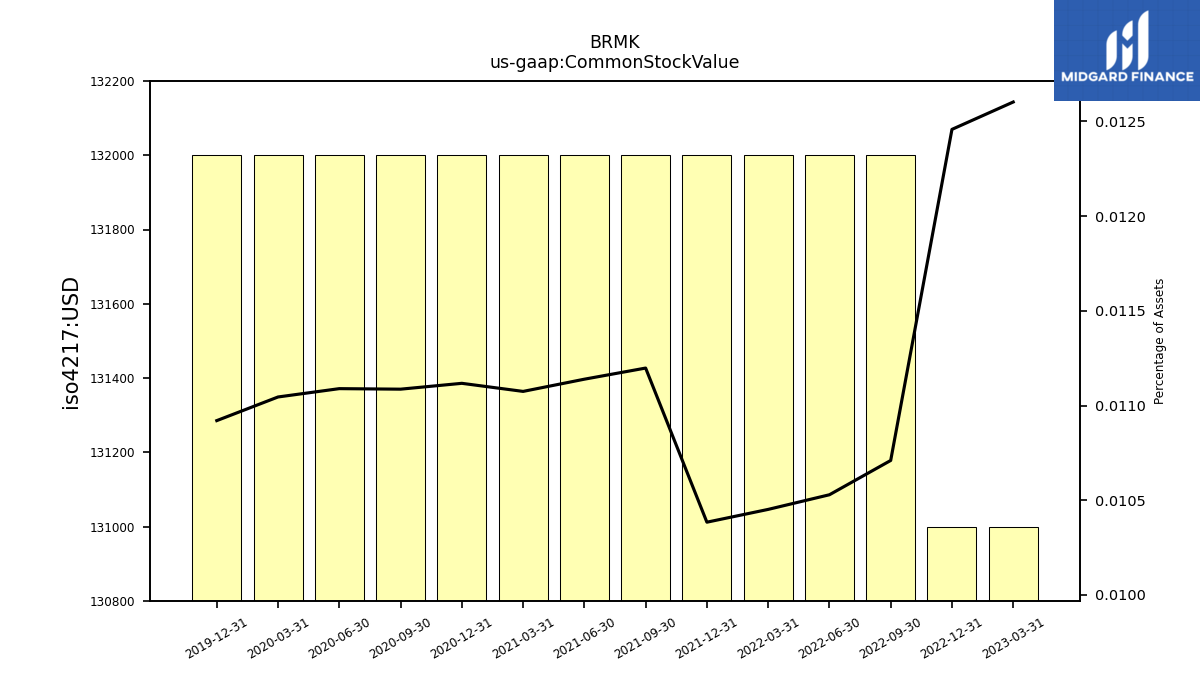
| Common Stock Value | 0.13 | 0.13 | 0.13 | 0.13 | 0.13 | 0.13 | 0.13 | 0.13 | 0.13 | 0.13 | 0.13 | 0.13 | 0.13 | 0.13 | NA | NA | NA | NA | |
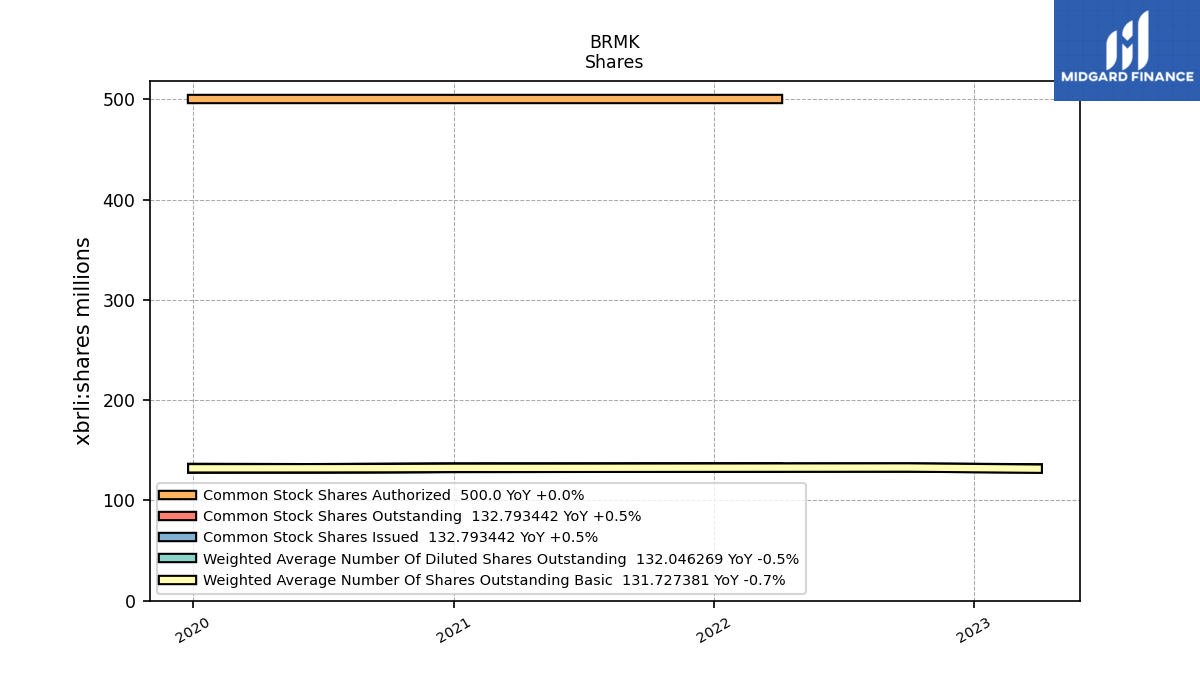
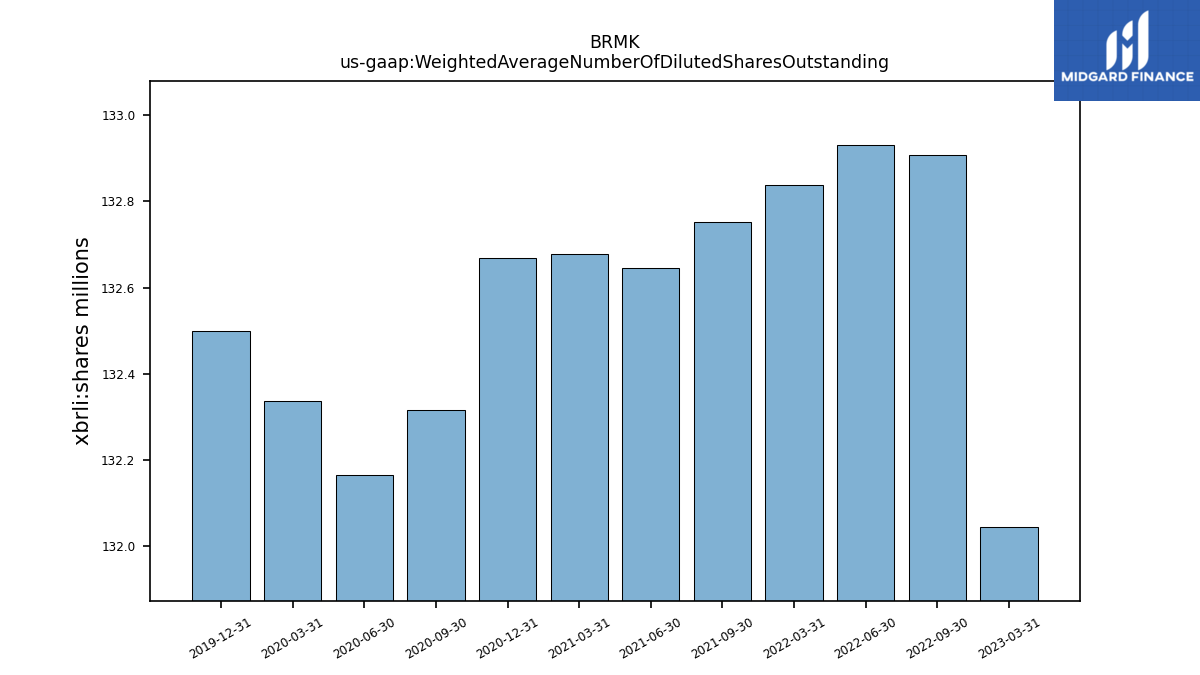
| Weighted Average Number Of Diluted Shares Outstanding | 132.05 | NA | 132.91 | 132.93 | 132.84 | NA | 132.75 | 132.65 | 132.68 | 132.67 | 132.32 | 132.17 | 132.34 | 132.50 | NA | NA | NA | NA | |
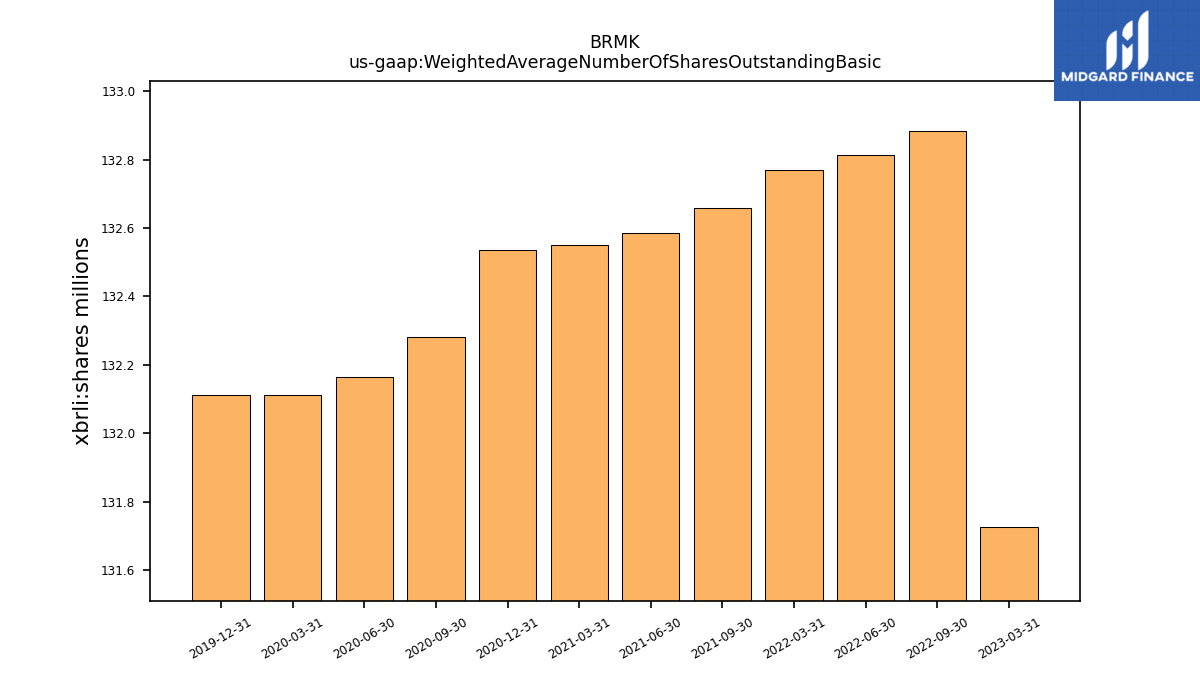
| Weighted Average Number Of Shares Outstanding Basic | 131.73 | NA | 132.88 | 132.81 | 132.77 | NA | 132.66 | 132.59 | 132.55 | 132.54 | 132.28 | 132.17 | 132.11 | 132.11 | NA | NA | NA | NA | |
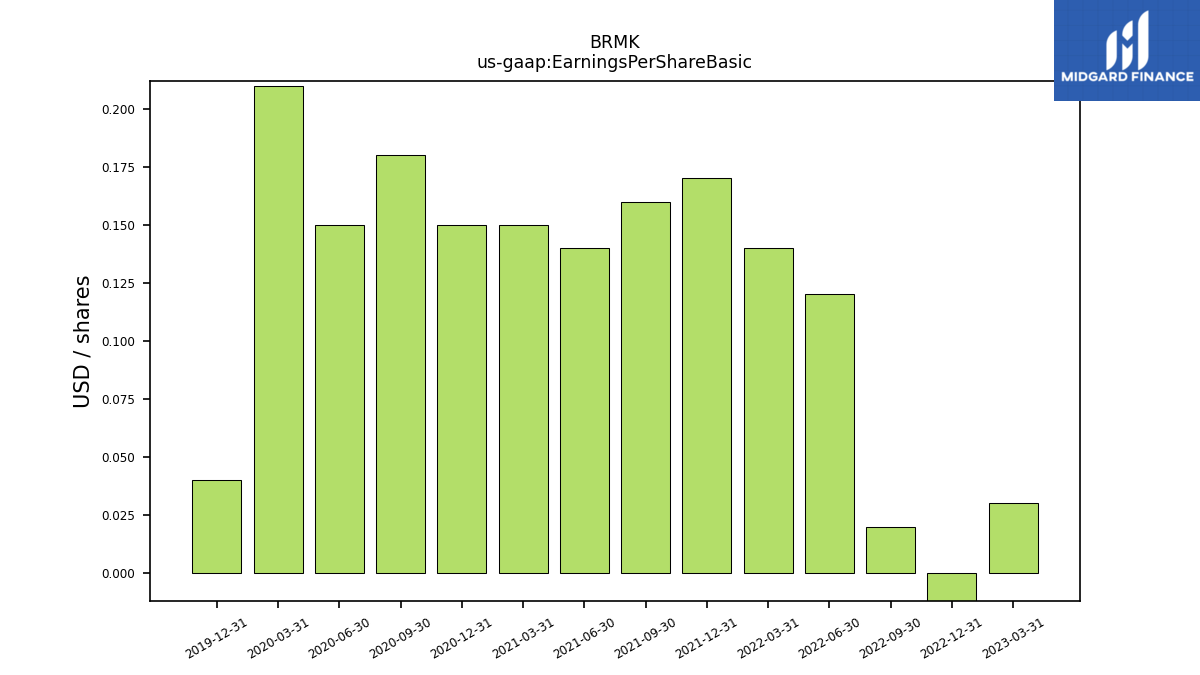
| Earnings Per Share Basic | 0.03 | -1.16 | 0.02 | 0.12 | 0.14 | 0.17 | 0.16 | 0.14 | 0.15 | 0.15 | 0.18 | 0.15 | 0.21 | 0.04 | NA | NA | NA | NA | |
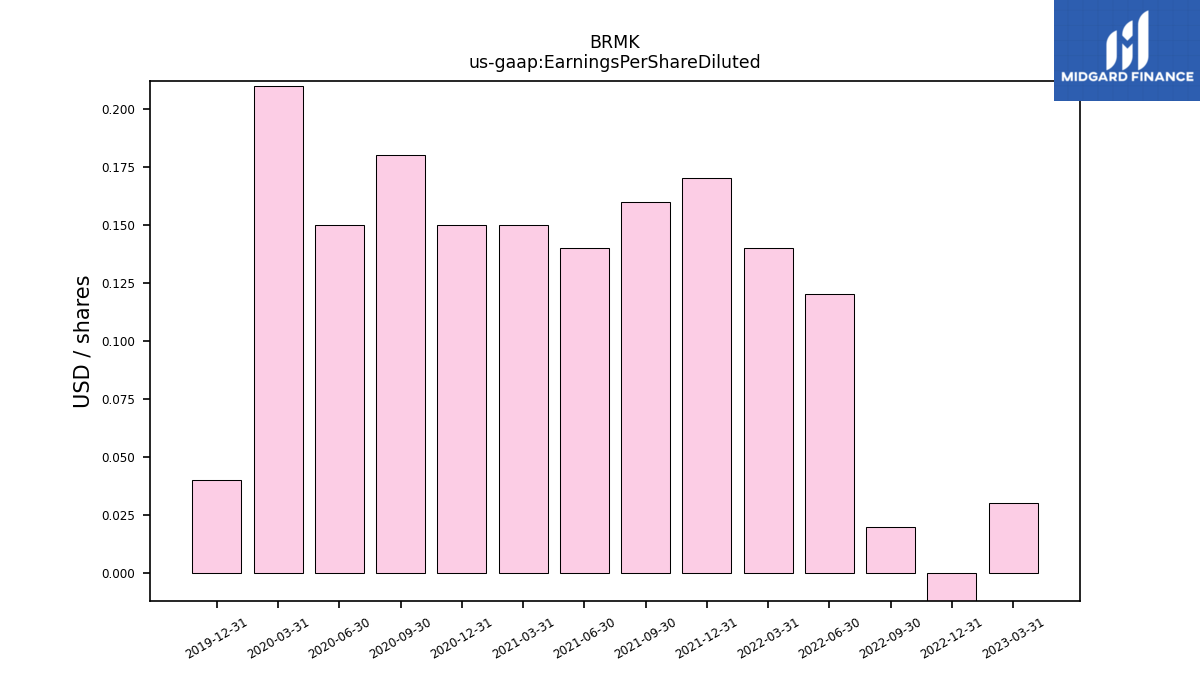
| Earnings Per Share Diluted | 0.03 | -1.16 | 0.02 | 0.12 | 0.14 | 0.17 | 0.16 | 0.14 | 0.15 | 0.15 | 0.18 | 0.15 | 0.21 | 0.04 | NA | NA | NA | NA |
| 2023-03-31 | 2022-12-31 | 2022-09-30 | 2022-06-30 | 2022-03-31 | 2021-12-31 | 2021-09-30 | 2021-06-30 | 2021-03-31 | 2020-12-31 | 2020-09-30 | 2020-06-30 | 2020-03-31 | 2019-12-31 | 2019-11-14 | 2019-09-30 | 2019-06-30 | 2019-03-31 | ||
|---|---|---|---|---|---|---|---|---|---|---|---|---|---|---|---|---|---|---|---|
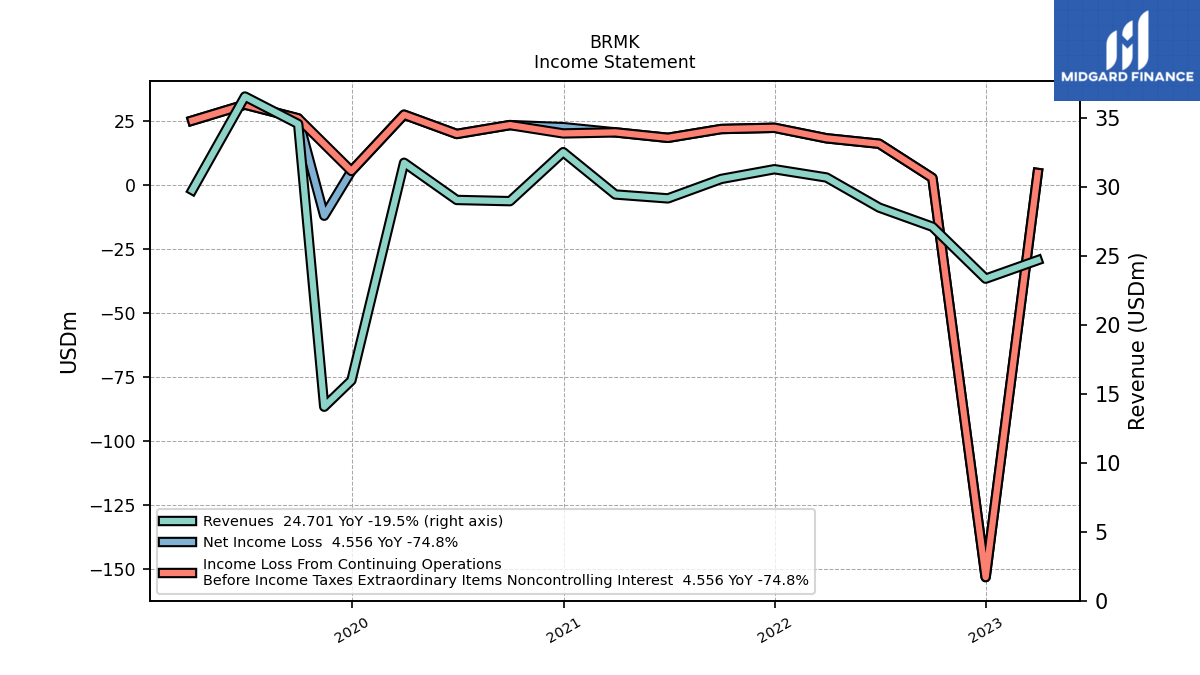
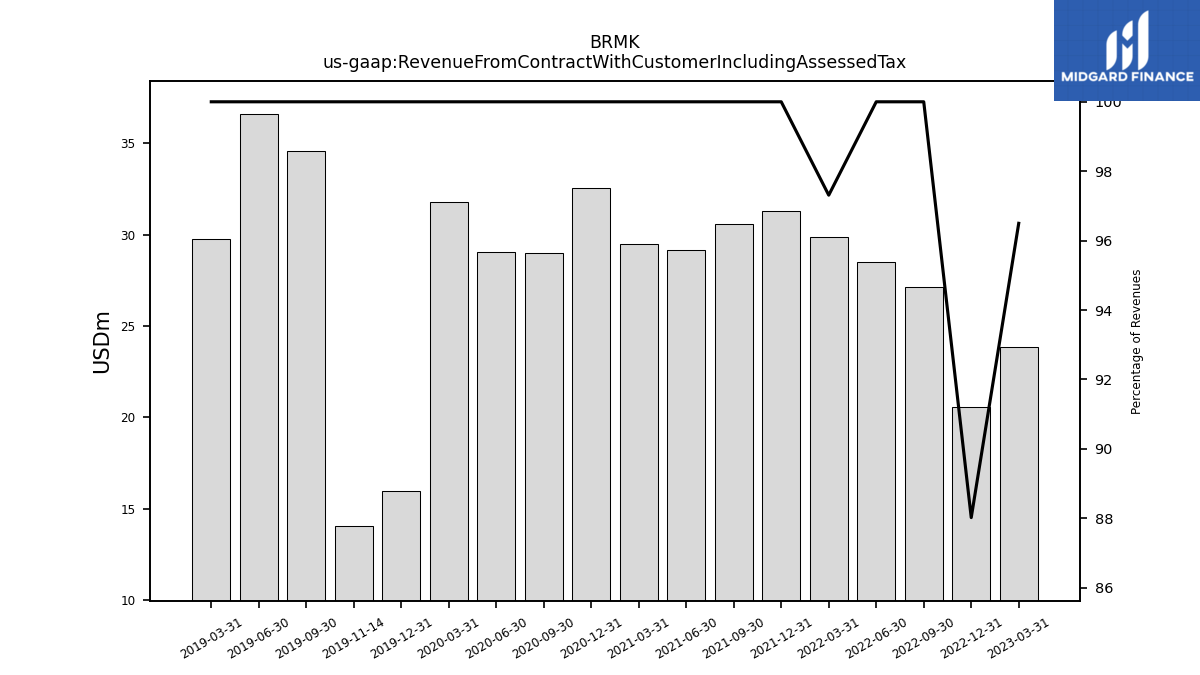
| Revenue From Contract With Customer Including Assessed Tax | 23.84 | 20.56 | 27.13 | 28.52 | 29.87 | 31.30 | 30.59 | 29.18 | 29.47 | 32.54 | 28.98 | 29.07 | 31.77 | 15.97 | 14.07 | 34.58 | 36.57 | 29.78 | |
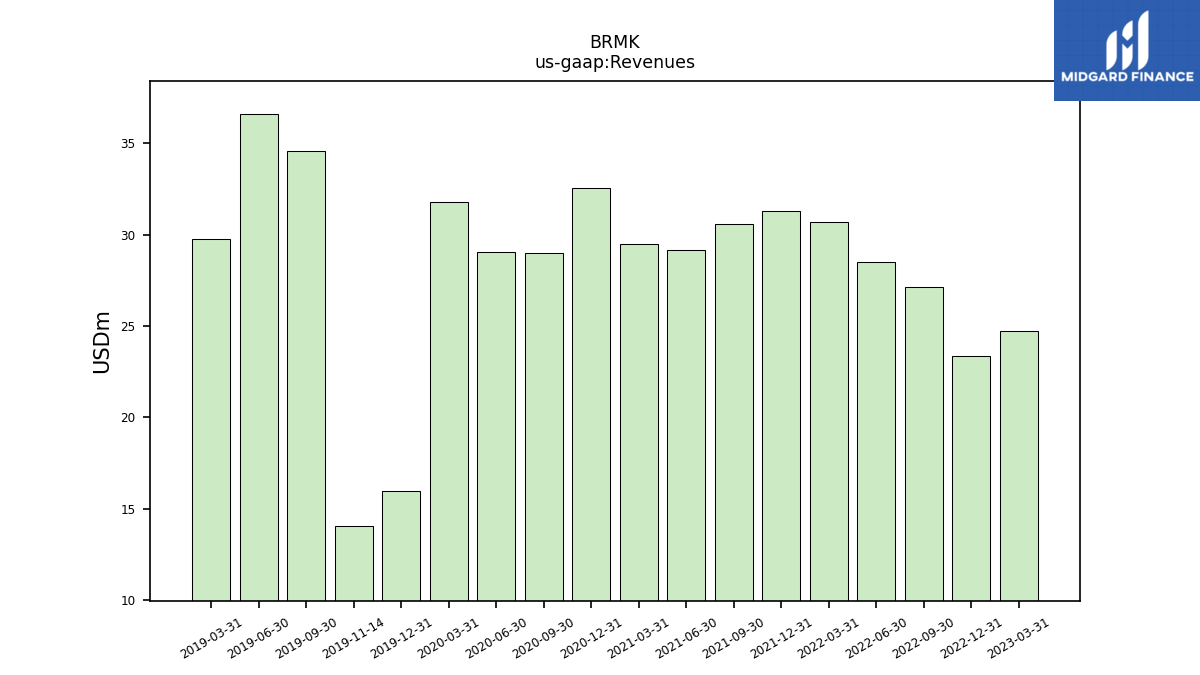
| Revenues | 24.70 | 23.36 | 27.13 | 28.52 | 30.70 | 31.30 | 30.59 | 29.18 | 29.47 | 32.54 | 28.98 | 29.07 | 31.77 | 15.97 | 14.07 | 34.58 | 36.57 | 29.78 | |
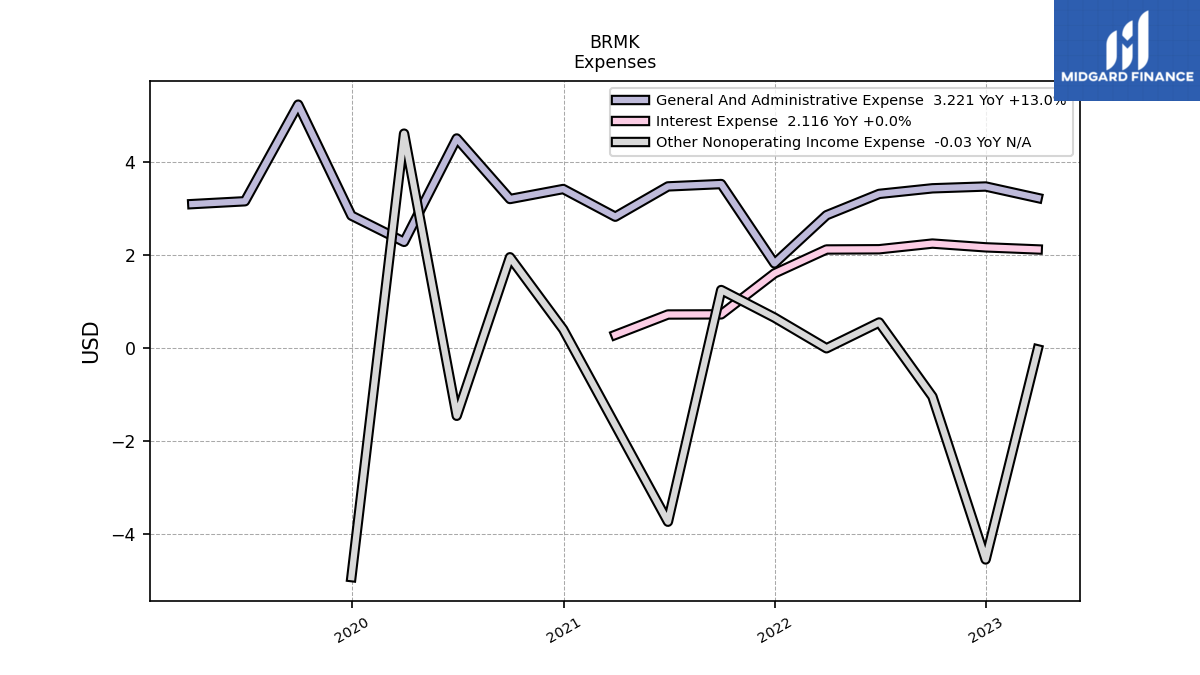
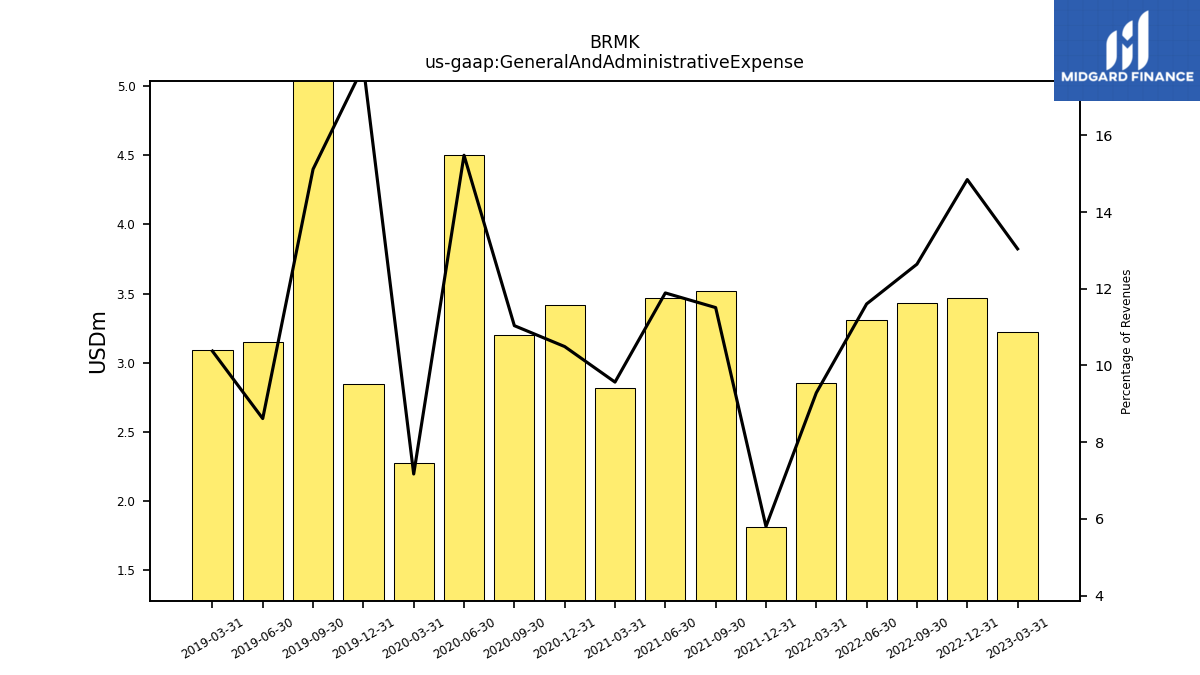
| General And Administrative Expense | 3.22 | 3.47 | 3.43 | 3.31 | 2.85 | 1.82 | 3.52 | 3.47 | 2.82 | 3.41 | 3.20 | 4.50 | 2.28 | 2.84 | NA | 5.23 | 3.15 | 3.09 | |
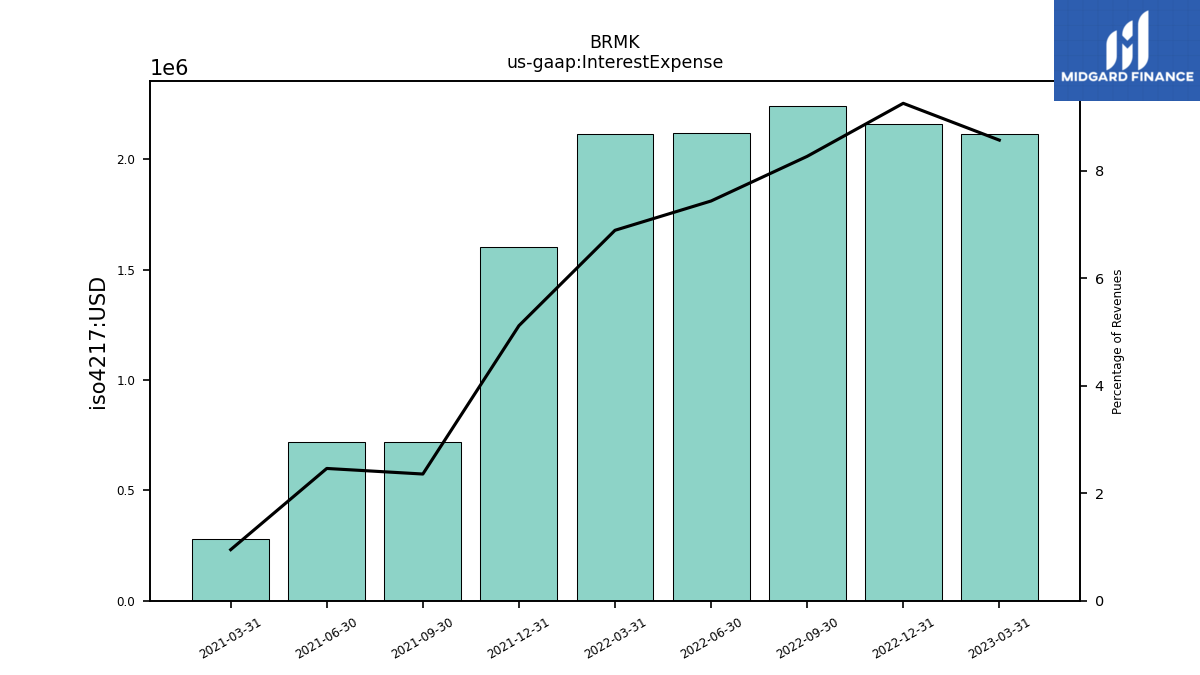
| Interest Expense | 2.12 | 2.16 | 2.24 | 2.12 | 2.12 | 1.60 | 0.72 | 0.72 | 0.28 | NA | NA | NA | NA | NA | NA | NA | NA | NA | |
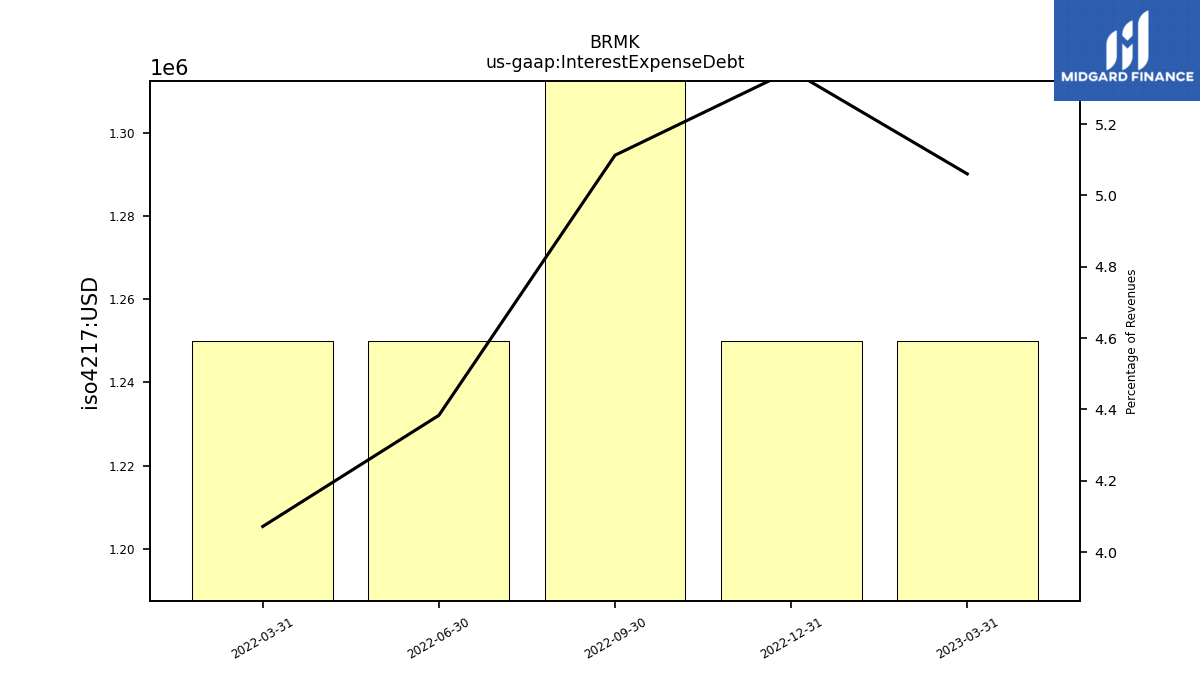
| Interest Expense Debt | 1.25 | 1.25 | 1.39 | 1.25 | 1.25 | NA | NA | NA | NA | NA | NA | NA | NA | NA | NA | NA | NA | NA | |
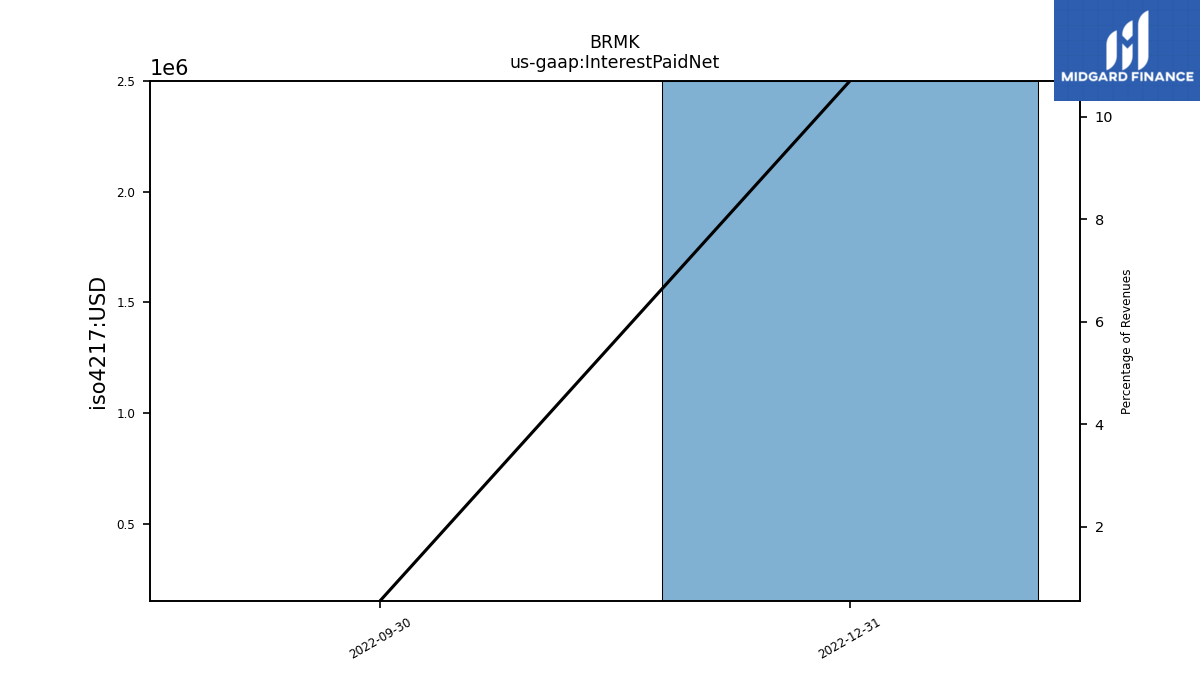
| Interest Paid Net | NA | 2.50 | 0.15 | NA | NA | NA | NA | NA | NA | NA | NA | NA | NA | NA | NA | NA | NA | NA | |
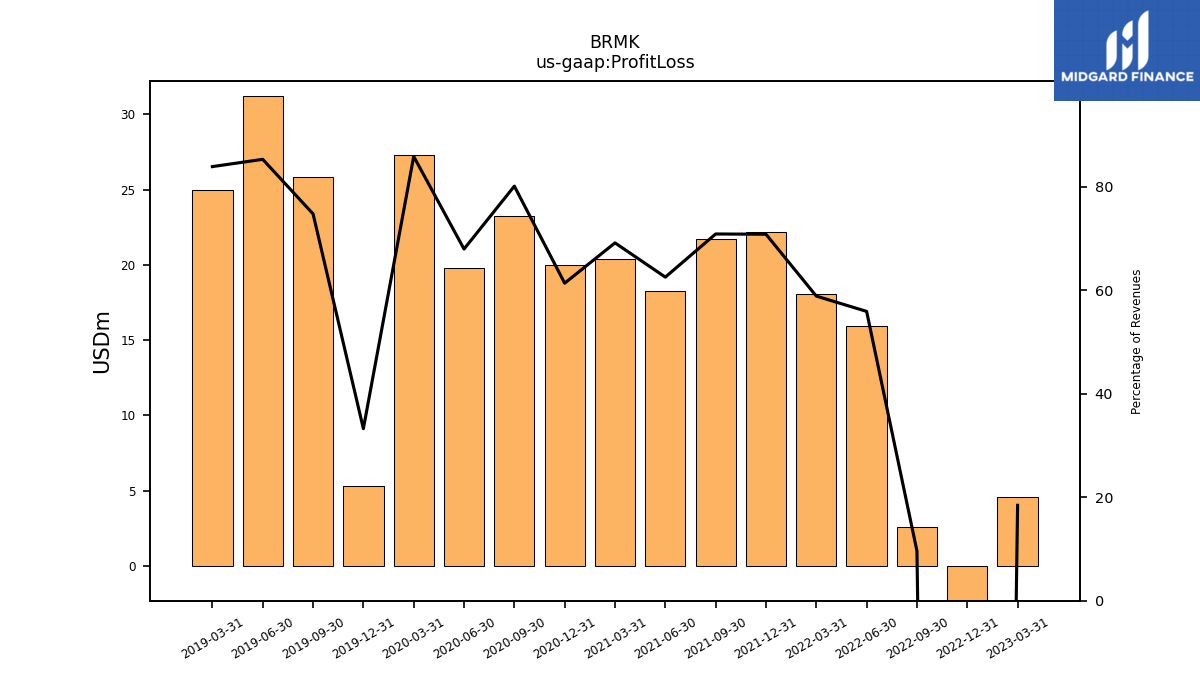
| Profit Loss | 4.56 | -153.02 | 2.61 | 15.95 | 18.07 | 22.17 | 21.68 | 18.25 | 20.38 | 19.97 | 23.22 | 19.76 | 27.28 | 5.31 | NA | 25.86 | 31.20 | 24.99 | |
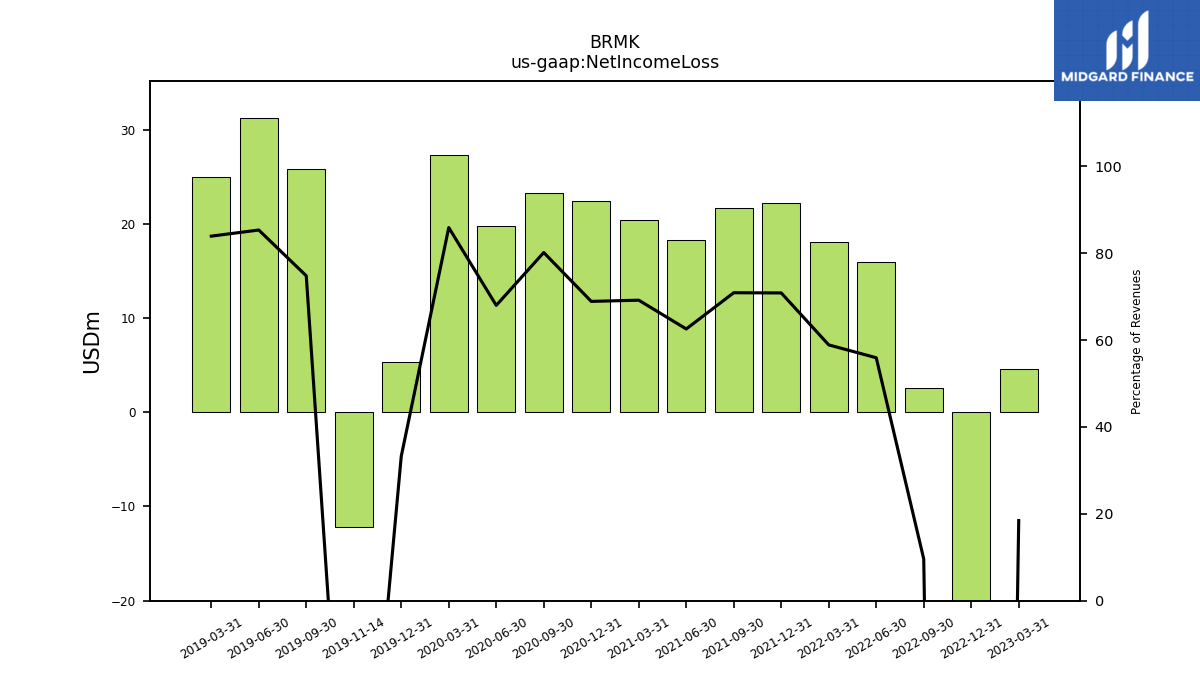
| Net Income Loss | 4.56 | -153.02 | 2.61 | 15.95 | 18.07 | 22.17 | 21.68 | 18.25 | 20.38 | 22.41 | 23.22 | 19.76 | 27.28 | 5.31 | -12.12 | 25.86 | 31.20 | 24.99 | |
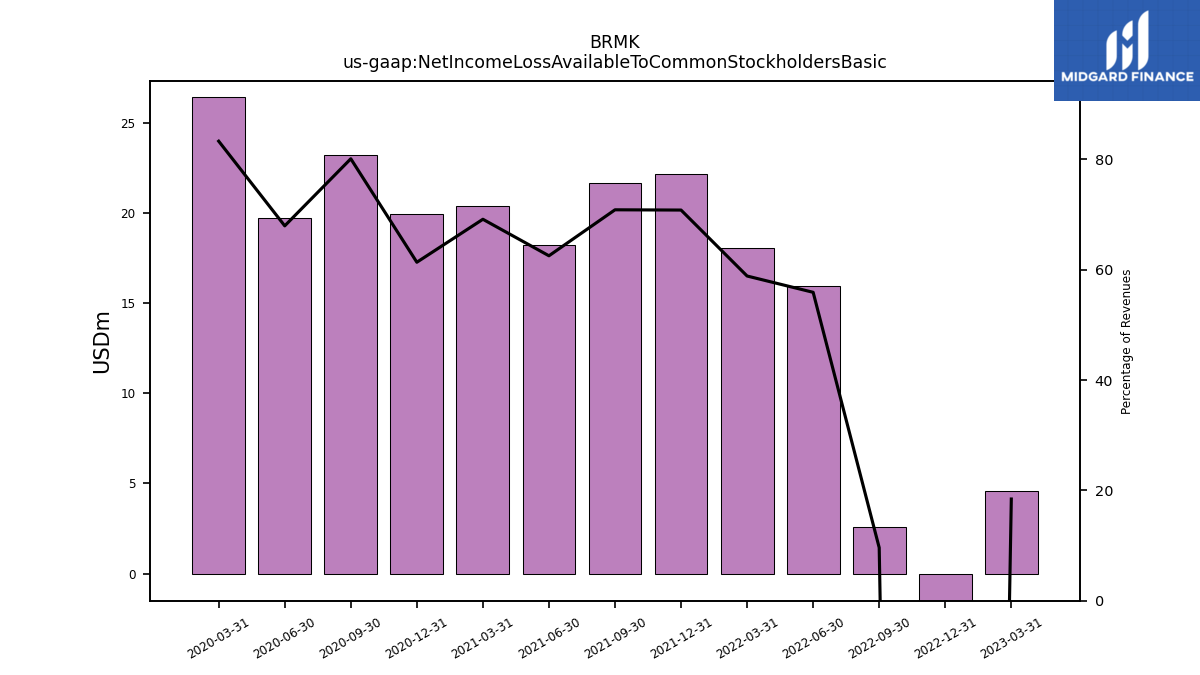
| Net Income Loss Available To Common Stockholders Basic | 4.56 | -153.02 | 2.61 | 15.95 | 18.07 | 22.17 | 21.68 | 18.25 | 20.38 | 19.97 | 23.22 | 19.76 | 26.47 | NA | NA | NA | NA | NA |
| 2023-03-31 | 2022-12-31 | 2022-09-30 | 2022-06-30 | 2022-03-31 | 2021-12-31 | 2021-09-30 | 2021-06-30 | 2021-03-31 | 2020-12-31 | 2020-09-30 | 2020-06-30 | 2020-03-31 | 2019-12-31 | 2019-11-14 | 2019-09-30 | 2019-06-30 | 2019-03-31 | ||
|---|---|---|---|---|---|---|---|---|---|---|---|---|---|---|---|---|---|---|---|
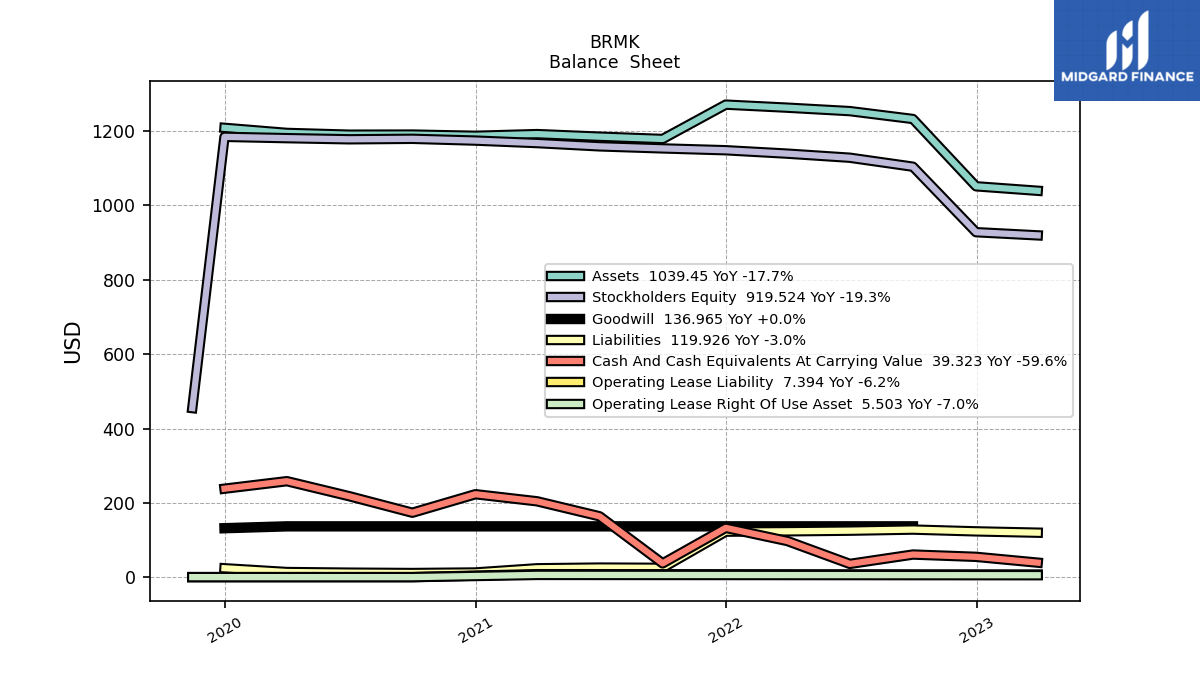
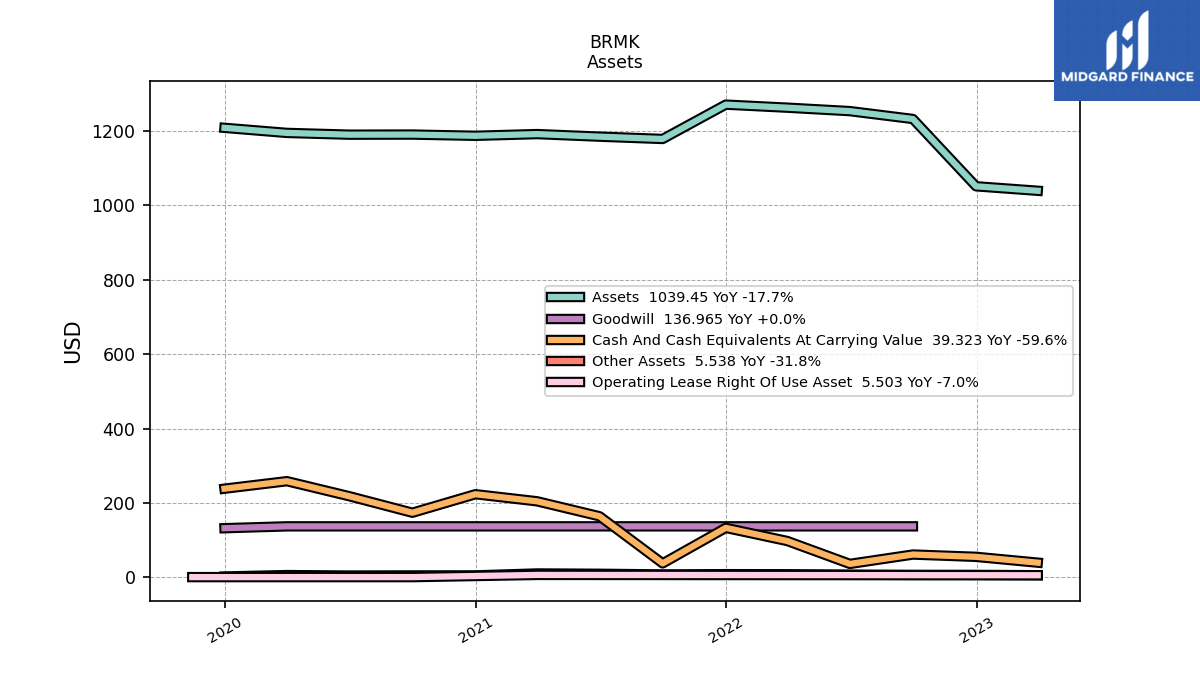
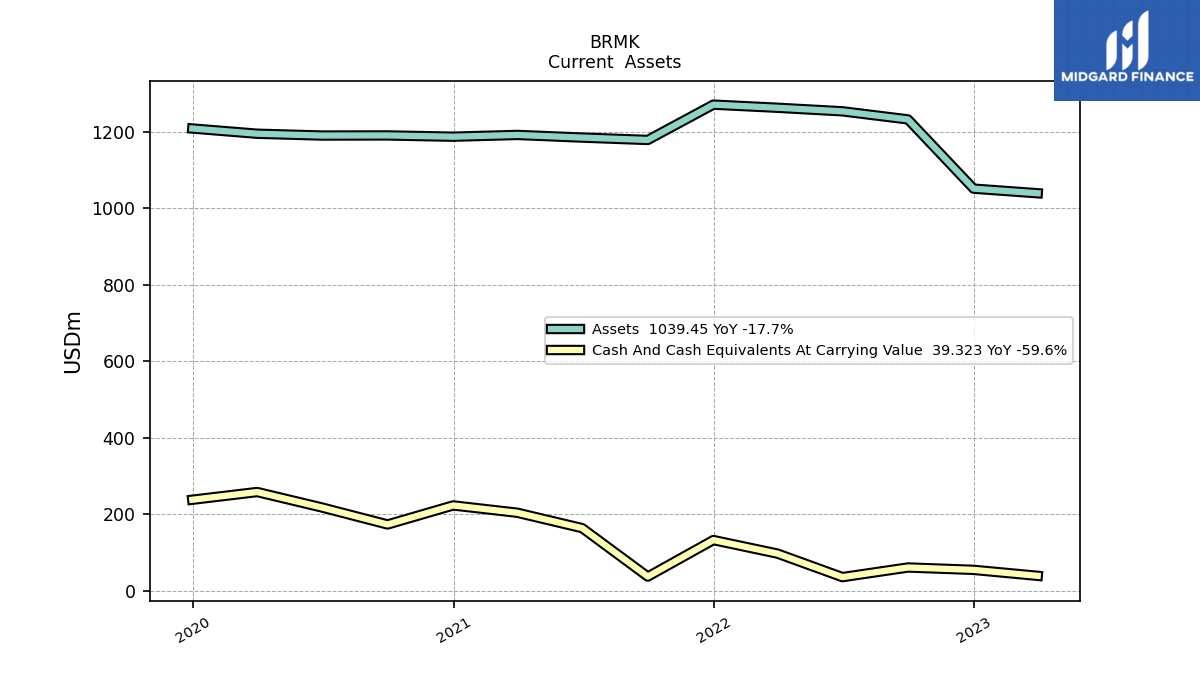
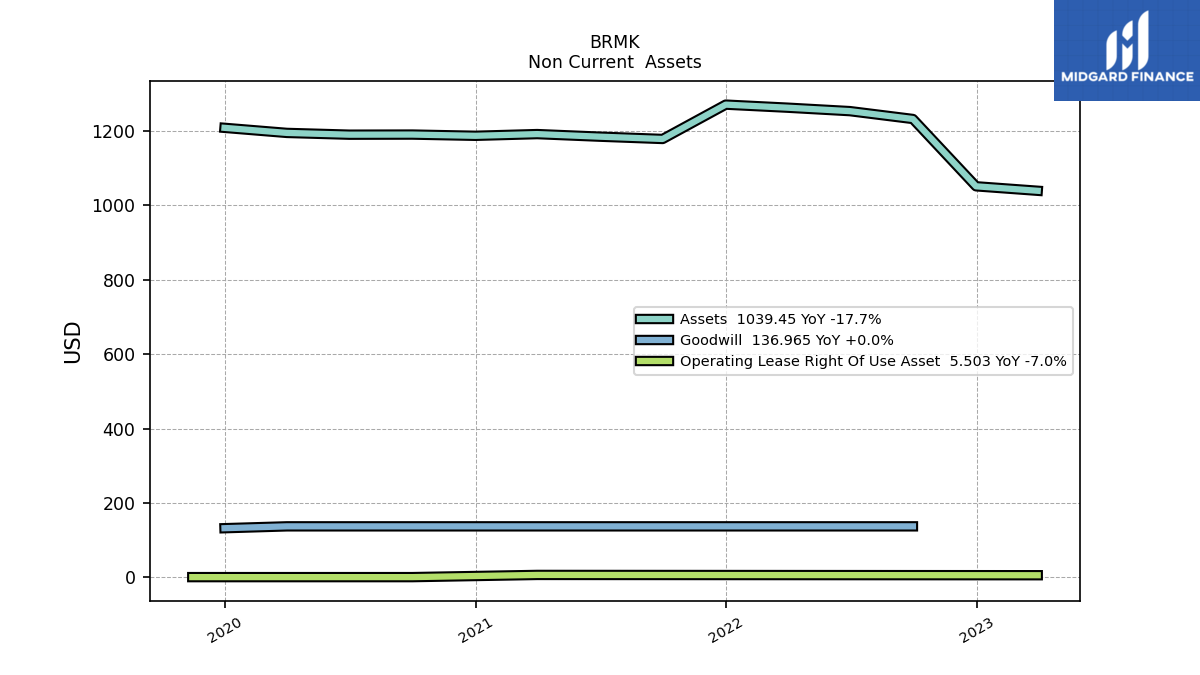
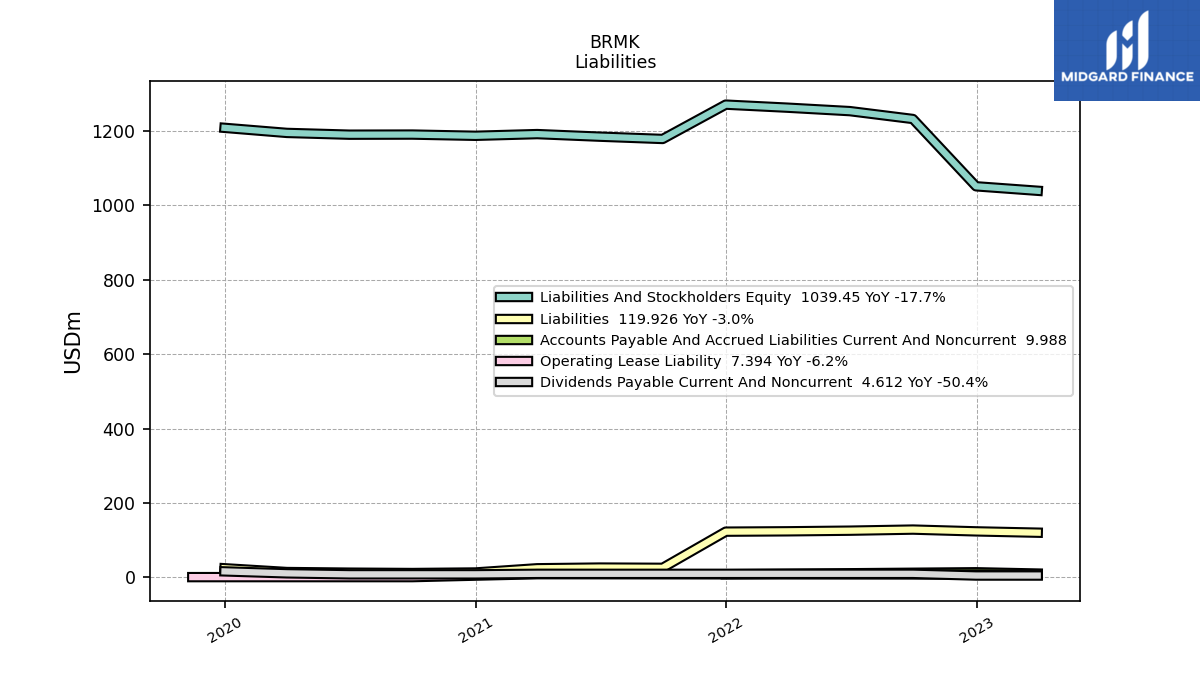
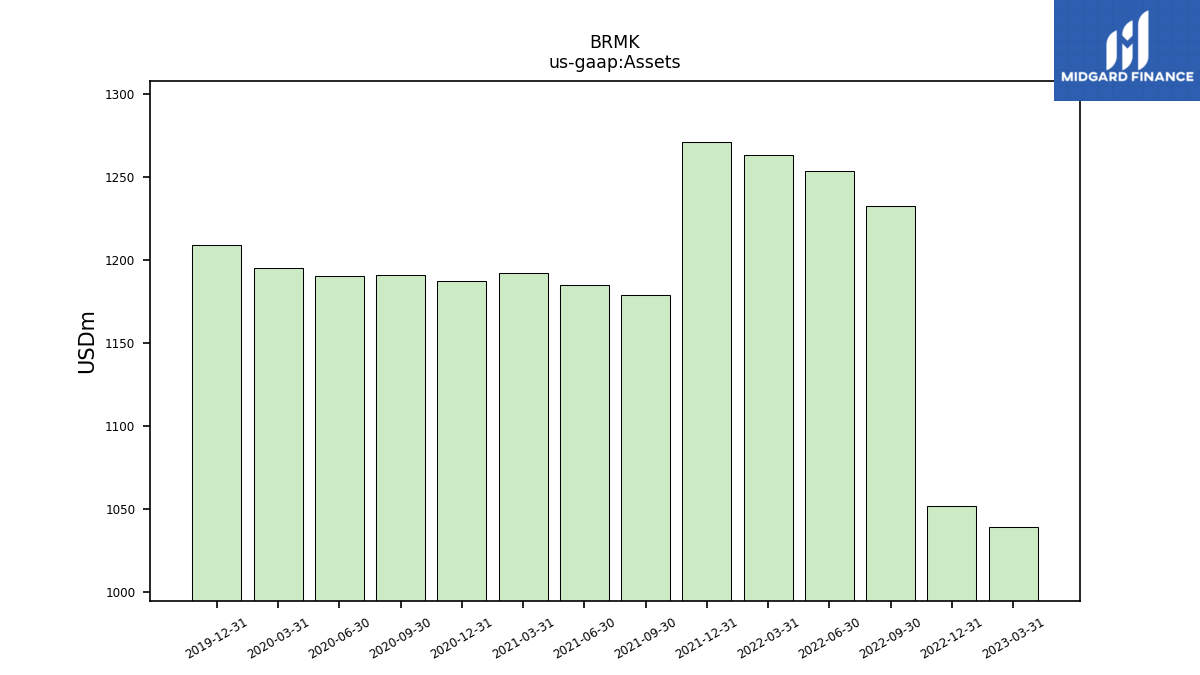
| Assets | 1039.45 | 1051.51 | 1232.47 | 1253.67 | 1262.94 | 1271.15 | 1178.78 | 1185.00 | 1191.90 | 1187.32 | 1190.63 | 1190.33 | 1195.07 | 1208.73 | NA | NA | NA | NA | |
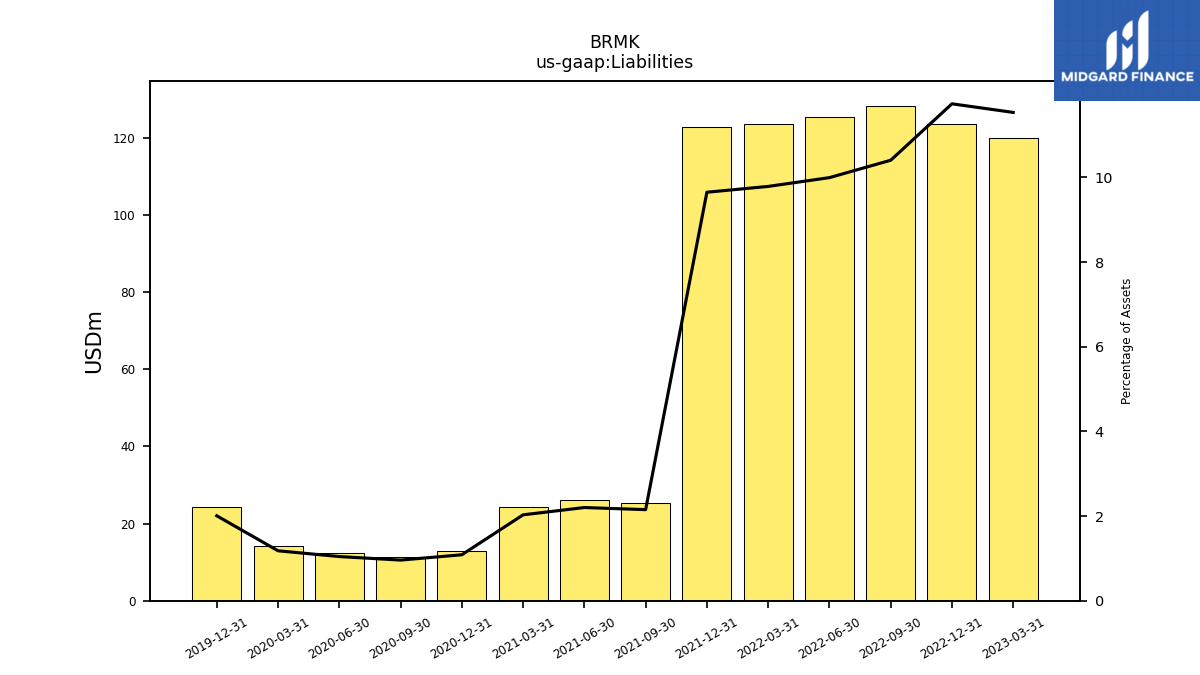
| Liabilities | 119.93 | 123.45 | 128.26 | 125.33 | 123.63 | 122.69 | 25.38 | 26.10 | 24.20 | 12.90 | 11.44 | 12.43 | 14.10 | 24.26 | NA | NA | NA | NA | |
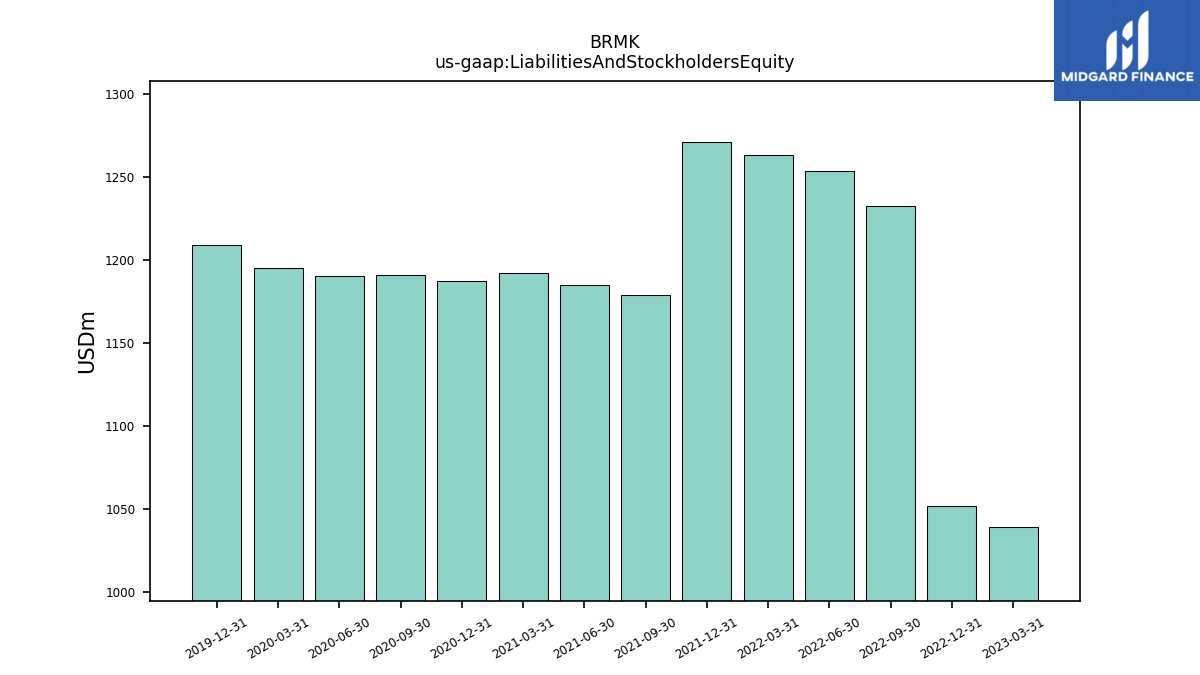
| Liabilities And Stockholders Equity | 1039.45 | 1051.51 | 1232.47 | 1253.67 | 1262.94 | 1271.15 | 1178.78 | 1185.00 | 1191.90 | 1187.32 | 1190.63 | 1190.33 | 1195.07 | 1208.73 | NA | NA | NA | NA | |
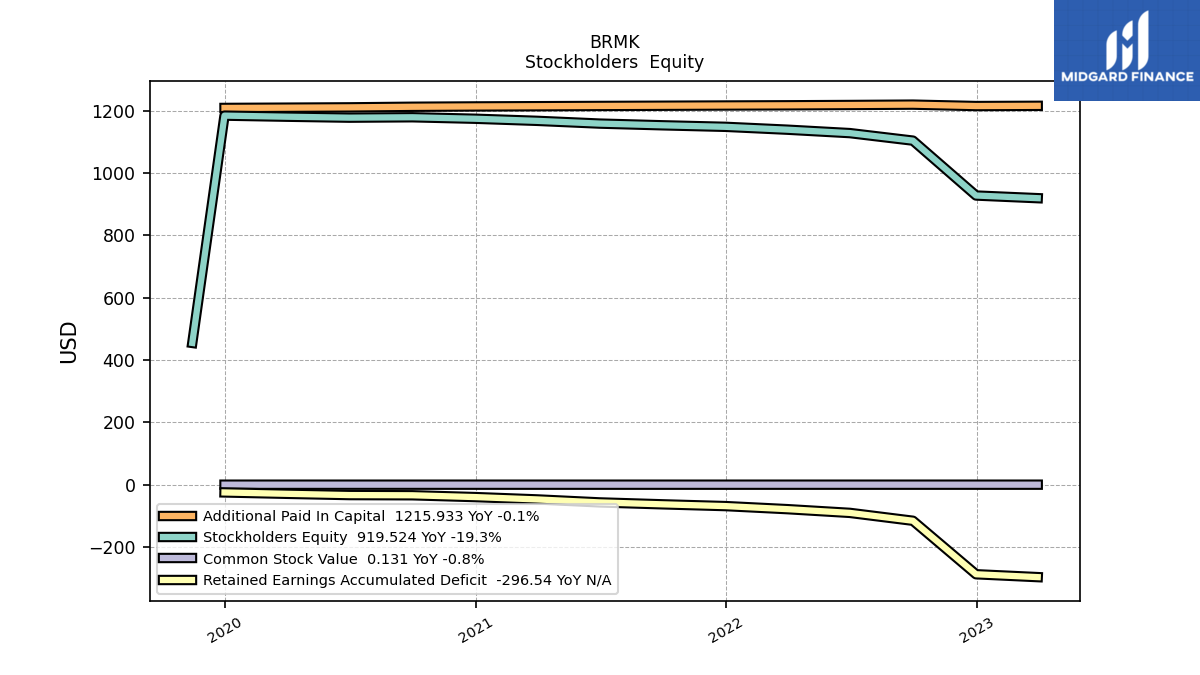
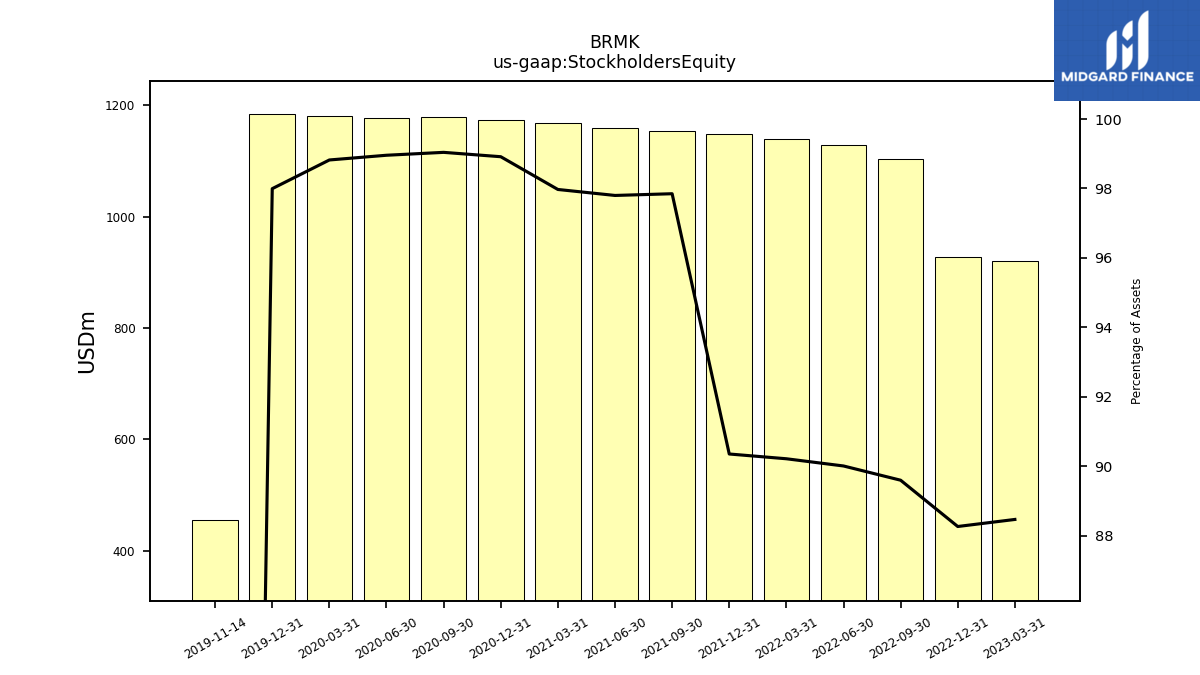
| Stockholders Equity | 919.52 | 928.05 | 1104.21 | 1128.34 | 1139.31 | 1148.47 | 1153.40 | 1158.90 | 1167.70 | 1174.42 | 1179.19 | 1177.90 | 1180.96 | 1184.47 | 454.98 | NA | NA | NA |
| 2023-03-31 | 2022-12-31 | 2022-09-30 | 2022-06-30 | 2022-03-31 | 2021-12-31 | 2021-09-30 | 2021-06-30 | 2021-03-31 | 2020-12-31 | 2020-09-30 | 2020-06-30 | 2020-03-31 | 2019-12-31 | 2019-11-14 | 2019-09-30 | 2019-06-30 | 2019-03-31 | ||
|---|---|---|---|---|---|---|---|---|---|---|---|---|---|---|---|---|---|---|---|
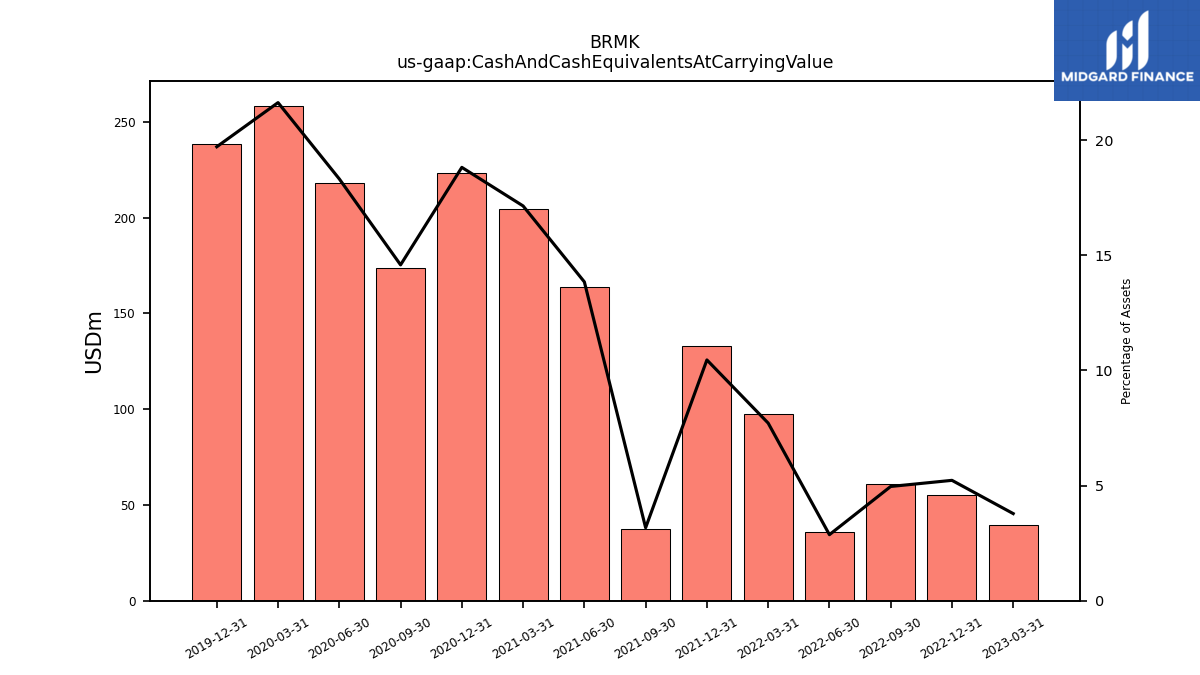
| Cash And Cash Equivalents At Carrying Value | 39.32 | 54.96 | 61.14 | 35.96 | 97.41 | 132.89 | 37.38 | 164.02 | 204.28 | 223.38 | 173.60 | 217.97 | 258.44 | 238.21 | NA | NA | NA | NA | |
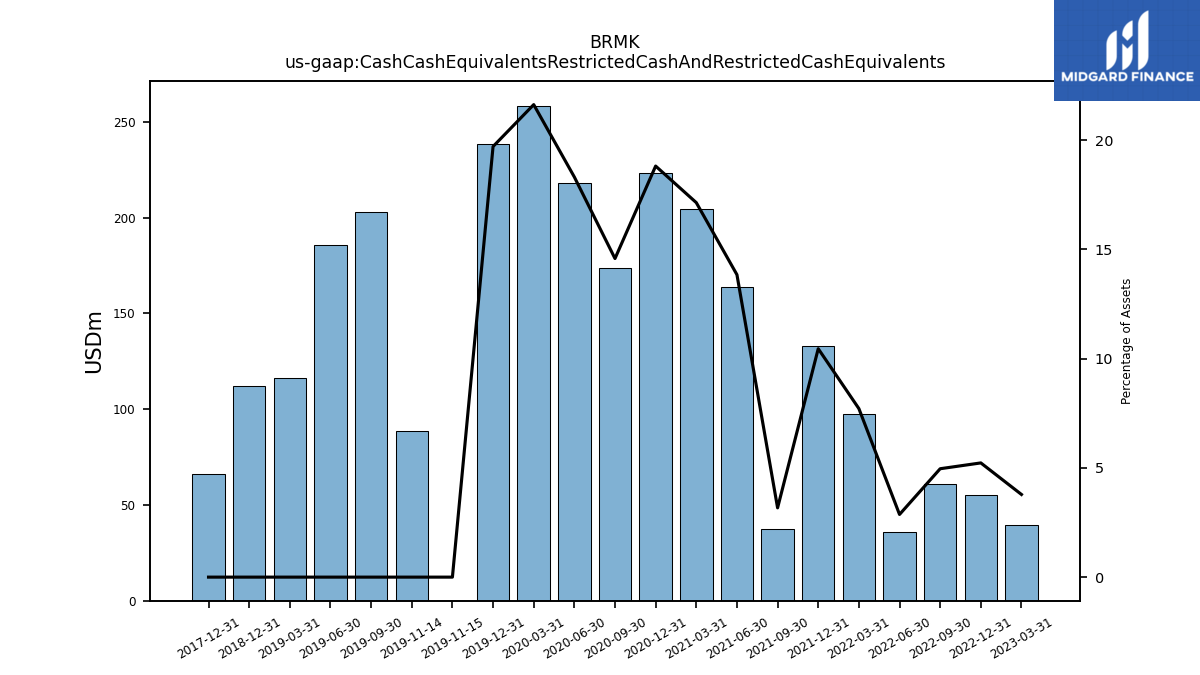
| Cash Cash Equivalents Restricted Cash And Restricted Cash Equivalents | 39.32 | 54.96 | 61.14 | 35.96 | 97.41 | 132.89 | 37.38 | 164.02 | 204.28 | 223.38 | 173.60 | 217.97 | 258.44 | 238.21 | 88.58 | 203.11 | 185.59 | 116.11 |
| 2023-03-31 | 2022-12-31 | 2022-09-30 | 2022-06-30 | 2022-03-31 | 2021-12-31 | 2021-09-30 | 2021-06-30 | 2021-03-31 | 2020-12-31 | 2020-09-30 | 2020-06-30 | 2020-03-31 | 2019-12-31 | 2019-11-14 | 2019-09-30 | 2019-06-30 | 2019-03-31 | ||
|---|---|---|---|---|---|---|---|---|---|---|---|---|---|---|---|---|---|---|---|
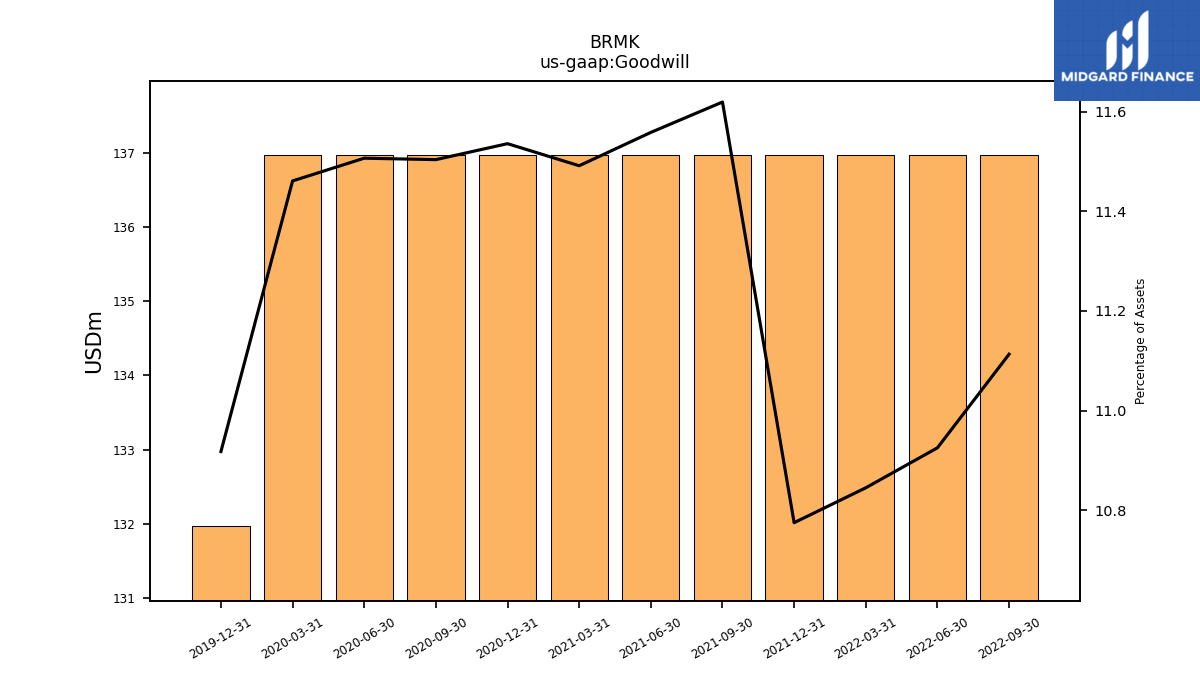
| Goodwill | NA | NA | 136.97 | 136.97 | 136.97 | 136.97 | 136.97 | 136.97 | 136.97 | 136.97 | 136.97 | 136.97 | 136.97 | 131.97 | NA | NA | NA | NA |
| 2023-03-31 | 2022-12-31 | 2022-09-30 | 2022-06-30 | 2022-03-31 | 2021-12-31 | 2021-09-30 | 2021-06-30 | 2021-03-31 | 2020-12-31 | 2020-09-30 | 2020-06-30 | 2020-03-31 | 2019-12-31 | 2019-11-14 | 2019-09-30 | 2019-06-30 | 2019-03-31 | ||
|---|---|---|---|---|---|---|---|---|---|---|---|---|---|---|---|---|---|---|---|
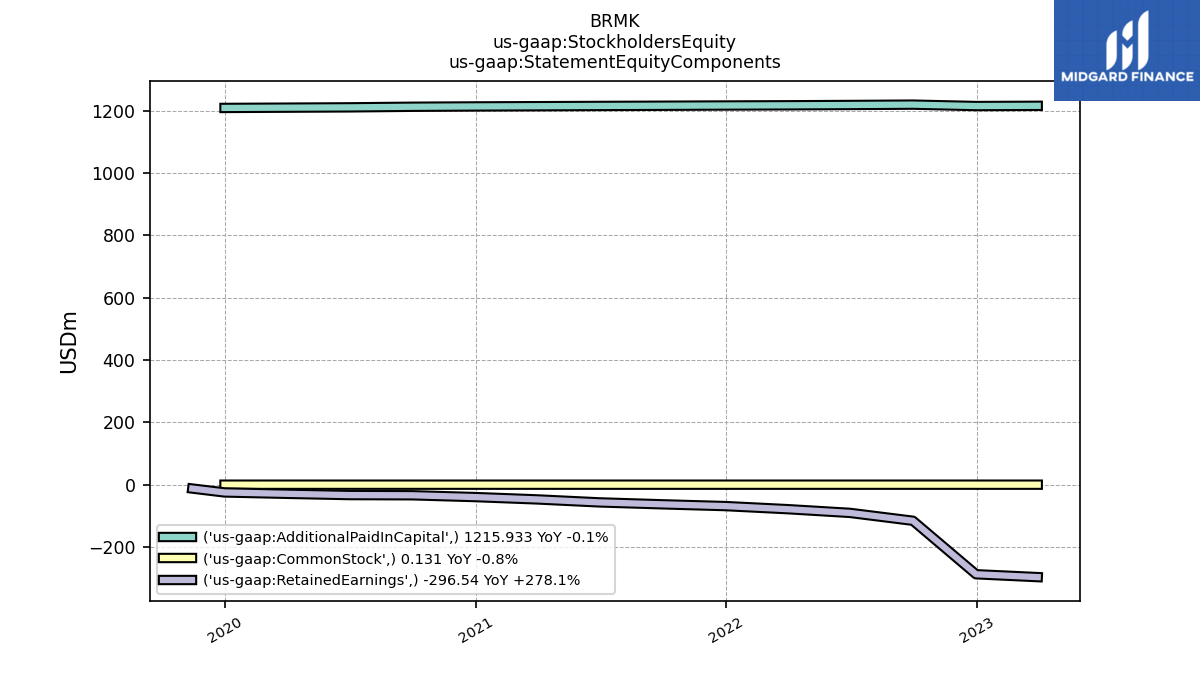
| Stockholders Equity | 919.52 | 928.05 | 1104.21 | 1128.34 | 1139.31 | 1148.47 | 1153.40 | 1158.90 | 1167.70 | 1174.42 | 1179.19 | 1177.90 | 1180.96 | 1184.47 | 454.98 | NA | NA | NA | |
| Common Stock Value | 0.13 | 0.13 | 0.13 | 0.13 | 0.13 | 0.13 | 0.13 | 0.13 | 0.13 | 0.13 | 0.13 | 0.13 | 0.13 | 0.13 | NA | NA | NA | NA | |
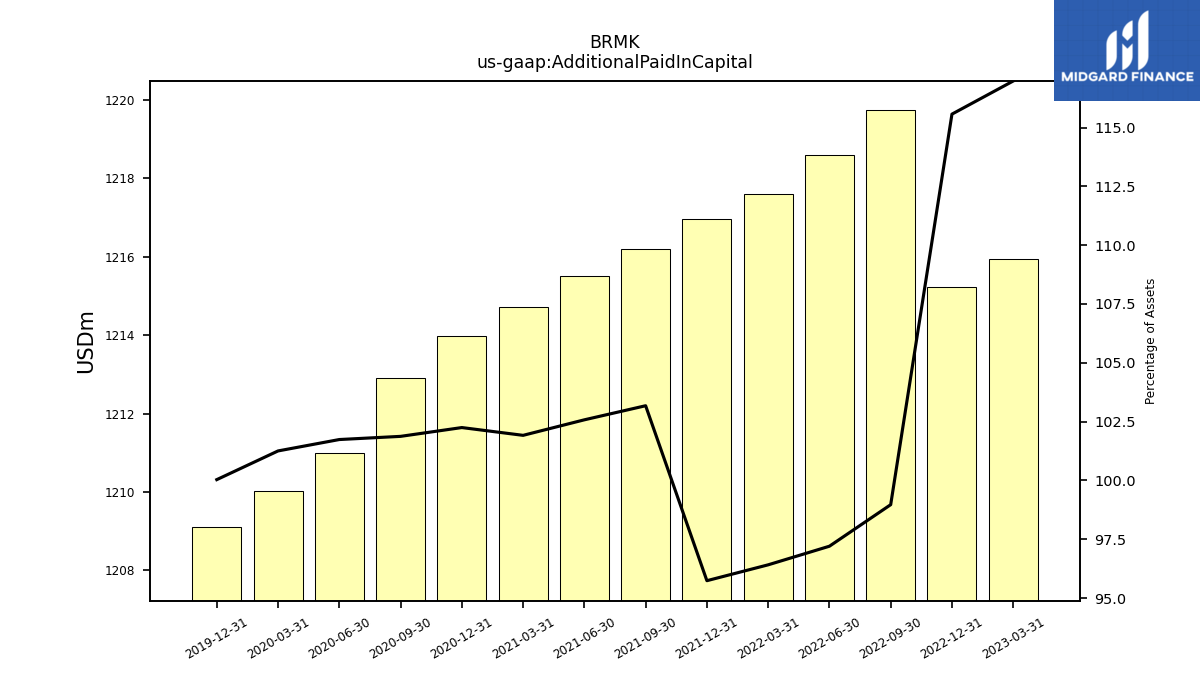
| Additional Paid In Capital | 1215.93 | 1215.23 | 1219.75 | 1218.59 | 1217.61 | 1216.96 | 1216.19 | 1215.51 | 1214.72 | 1213.99 | 1212.91 | 1211.00 | 1210.03 | 1209.12 | NA | NA | NA | NA | |
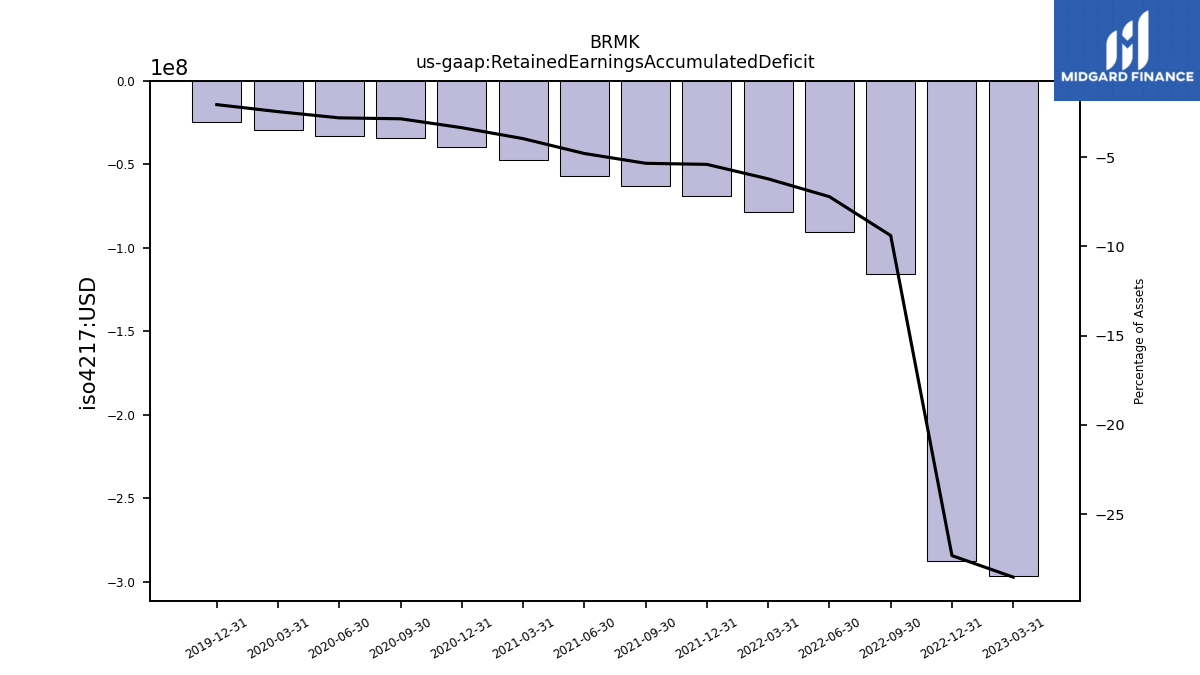
| Retained Earnings Accumulated Deficit | -296.54 | -287.31 | -115.68 | -90.38 | -78.43 | -68.62 | -62.92 | -56.75 | -47.16 | -39.70 | -33.86 | -33.23 | -29.20 | -24.78 | NA | NA | NA | NA | |
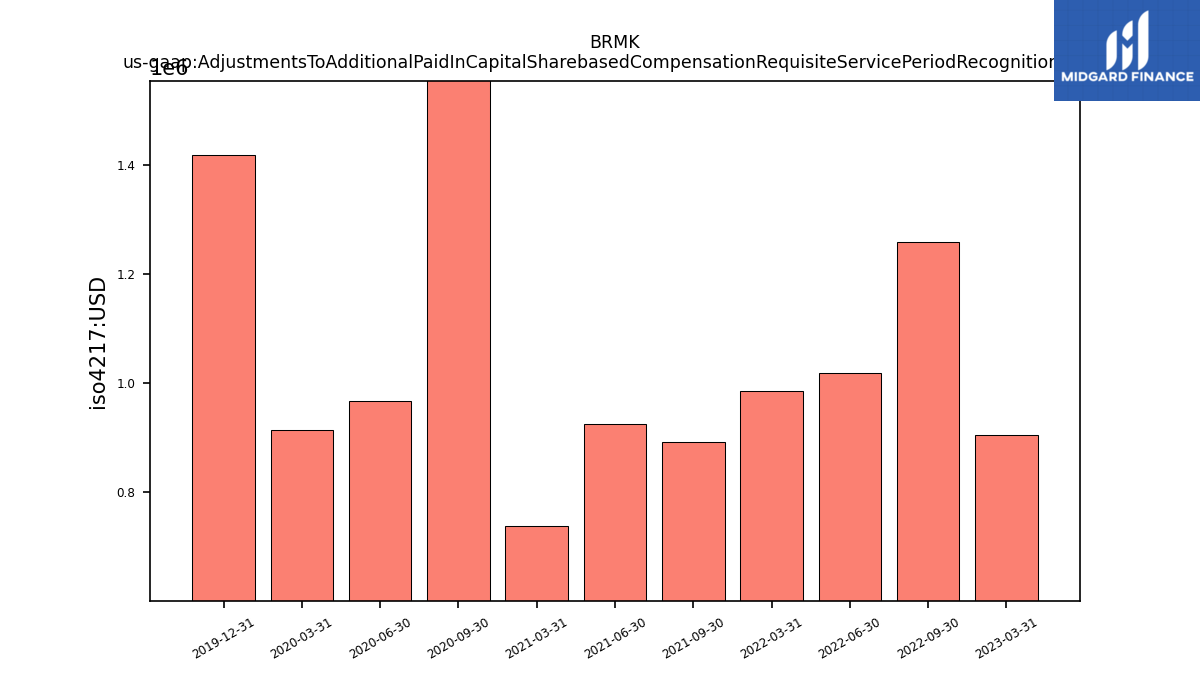
| Adjustments To Additional Paid In Capital Sharebased Compensation Requisite Service Period Recognition Value | 0.91 | NA | 1.26 | 1.02 | 0.98 | NA | 0.89 | 0.92 | 0.74 | NA | 1.91 | 0.97 | 0.91 | 1.42 | NA | NA | NA | NA |
| 2023-03-31 | 2022-12-31 | 2022-09-30 | 2022-06-30 | 2022-03-31 | 2021-12-31 | 2021-09-30 | 2021-06-30 | 2021-03-31 | 2020-12-31 | 2020-09-30 | 2020-06-30 | 2020-03-31 | 2019-12-31 | 2019-11-14 | 2019-09-30 | 2019-06-30 | 2019-03-31 | ||
|---|---|---|---|---|---|---|---|---|---|---|---|---|---|---|---|---|---|---|---|
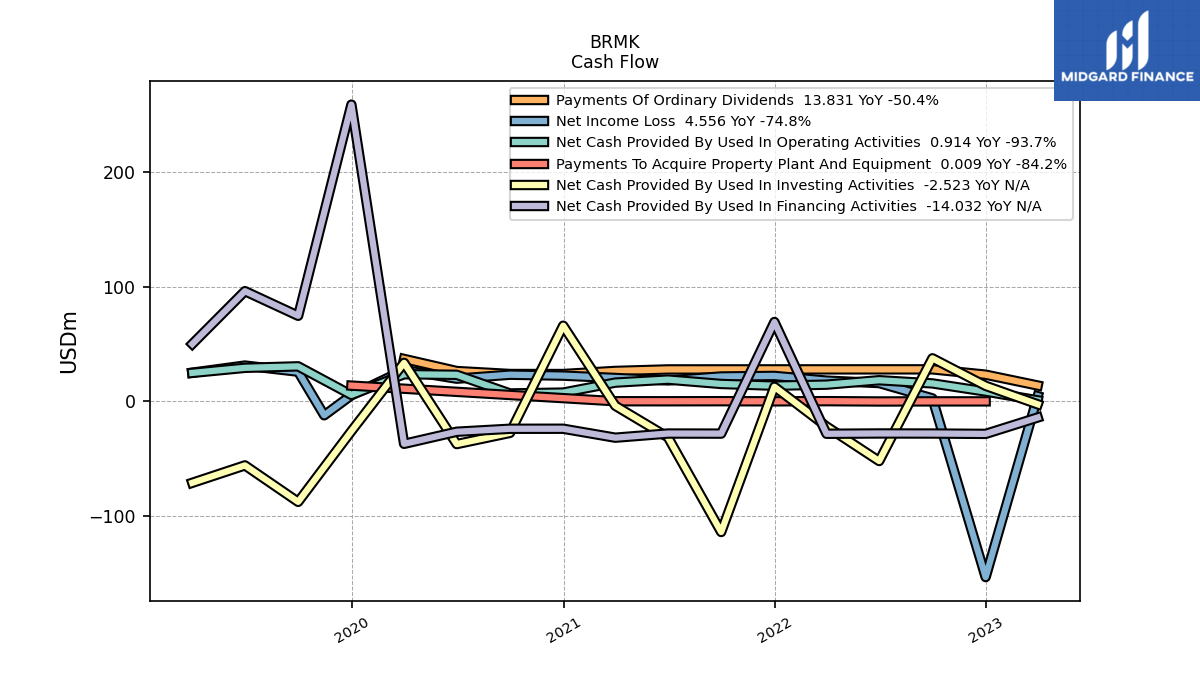
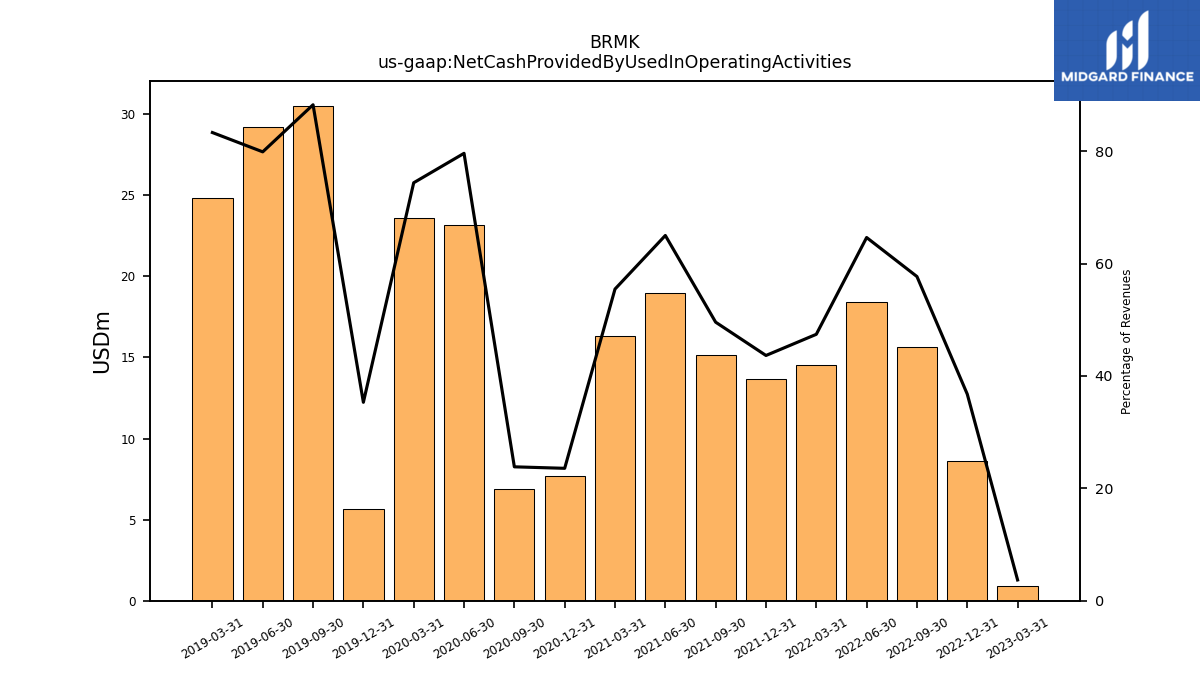
| Net Cash Provided By Used In Operating Activities | 0.91 | 8.59 | 15.65 | 18.43 | 14.55 | 13.66 | 15.16 | 18.97 | 16.34 | 7.67 | 6.91 | 23.14 | 23.63 | 5.64 | NA | 30.52 | 29.21 | 24.81 | |
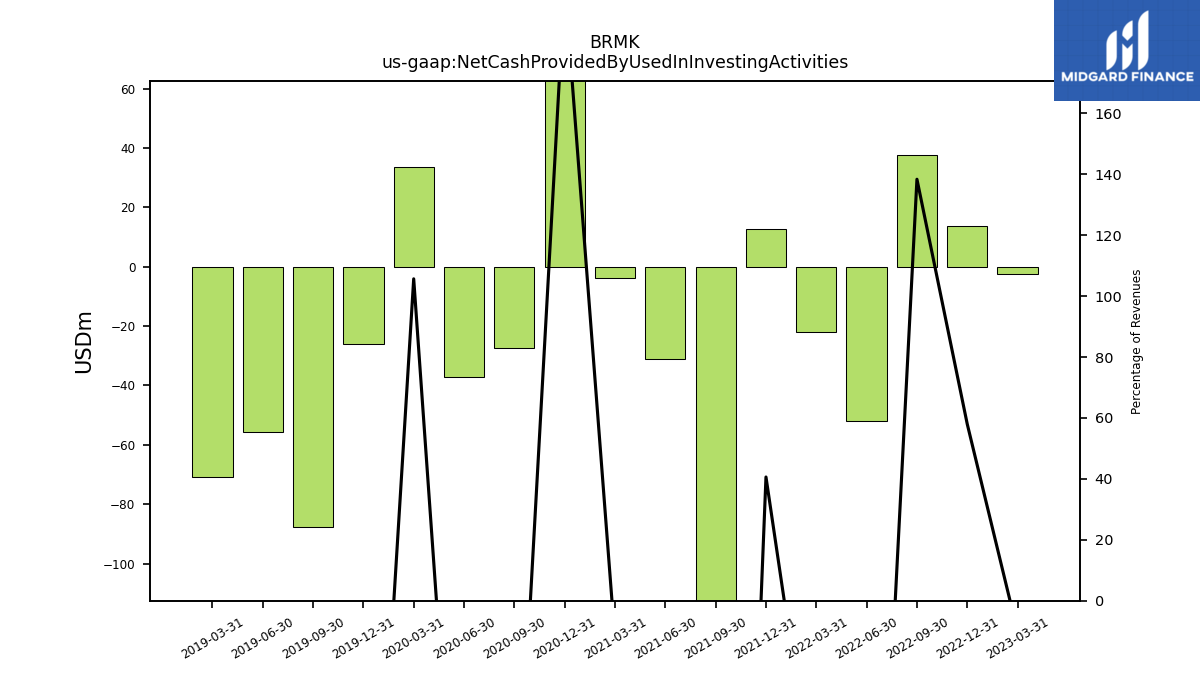
| Net Cash Provided By Used In Investing Activities | -2.52 | 13.54 | 37.53 | -51.95 | -21.83 | 12.71 | -113.74 | -31.23 | -3.83 | 65.92 | -27.43 | -37.18 | 33.57 | -25.89 | NA | -87.49 | -55.73 | -70.91 | |
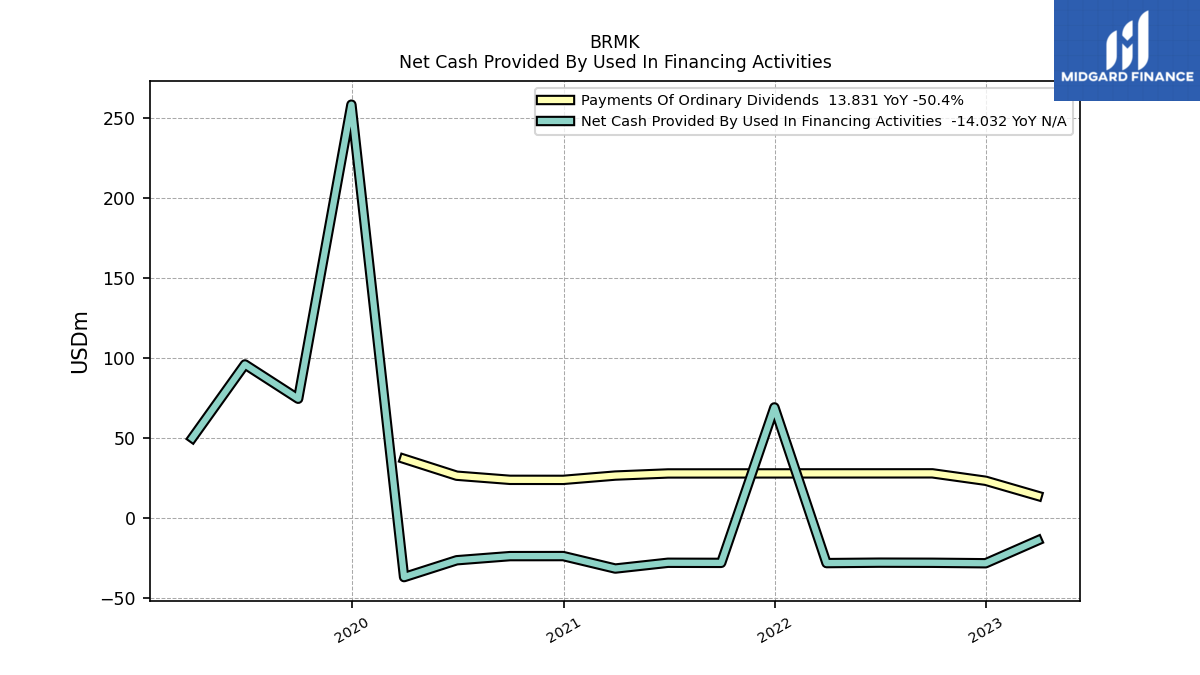
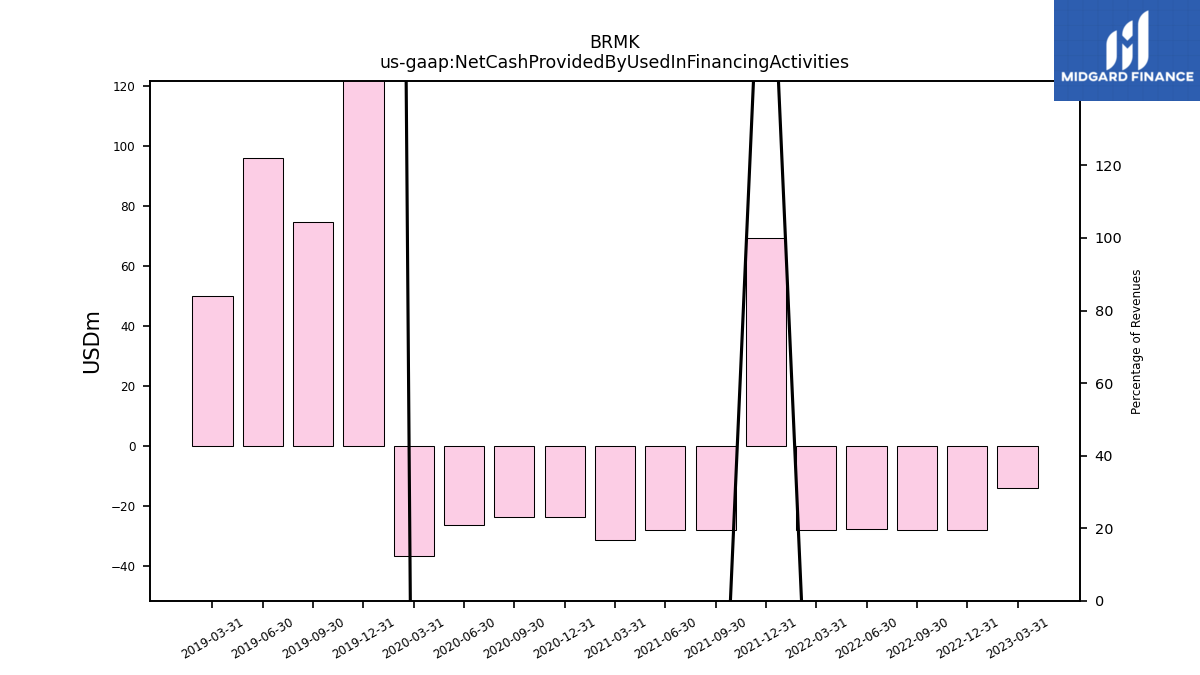
| Net Cash Provided By Used In Financing Activities | -14.03 | -28.30 | -28.00 | -27.93 | -28.21 | 69.14 | -28.07 | -28.00 | -31.61 | -23.82 | -23.85 | -26.43 | -36.97 | 258.40 | NA | 74.52 | 96.00 | 49.97 |
| 2023-03-31 | 2022-12-31 | 2022-09-30 | 2022-06-30 | 2022-03-31 | 2021-12-31 | 2021-09-30 | 2021-06-30 | 2021-03-31 | 2020-12-31 | 2020-09-30 | 2020-06-30 | 2020-03-31 | 2019-12-31 | 2019-11-14 | 2019-09-30 | 2019-06-30 | 2019-03-31 | ||
|---|---|---|---|---|---|---|---|---|---|---|---|---|---|---|---|---|---|---|---|
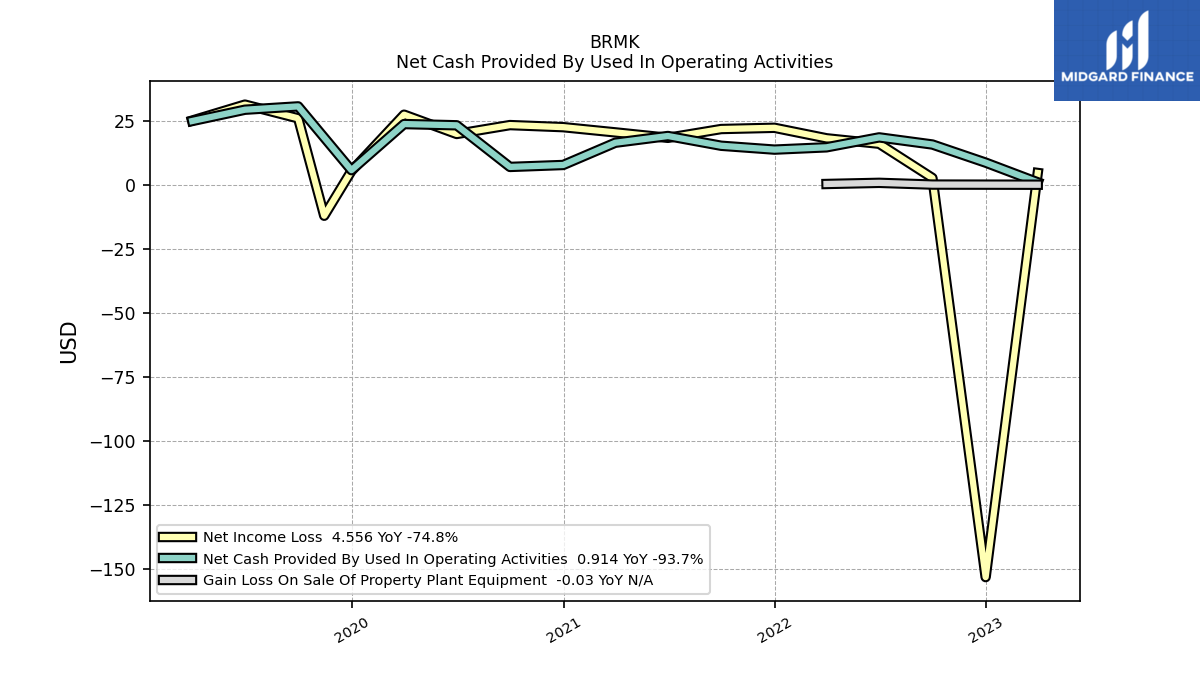
| Net Cash Provided By Used In Operating Activities | 0.91 | 8.59 | 15.65 | 18.43 | 14.55 | 13.66 | 15.16 | 18.97 | 16.34 | 7.67 | 6.91 | 23.14 | 23.63 | 5.64 | NA | 30.52 | 29.21 | 24.81 | |
| Net Income Loss | 4.56 | -153.02 | 2.61 | 15.95 | 18.07 | 22.17 | 21.68 | 18.25 | 20.38 | 22.41 | 23.22 | 19.76 | 27.28 | 5.31 | -12.12 | 25.86 | 31.20 | 24.99 | |
| Profit Loss | 4.56 | -153.02 | 2.61 | 15.95 | 18.07 | 22.17 | 21.68 | 18.25 | 20.38 | 19.97 | 23.22 | 19.76 | 27.28 | 5.31 | NA | 25.86 | 31.20 | 24.99 | |
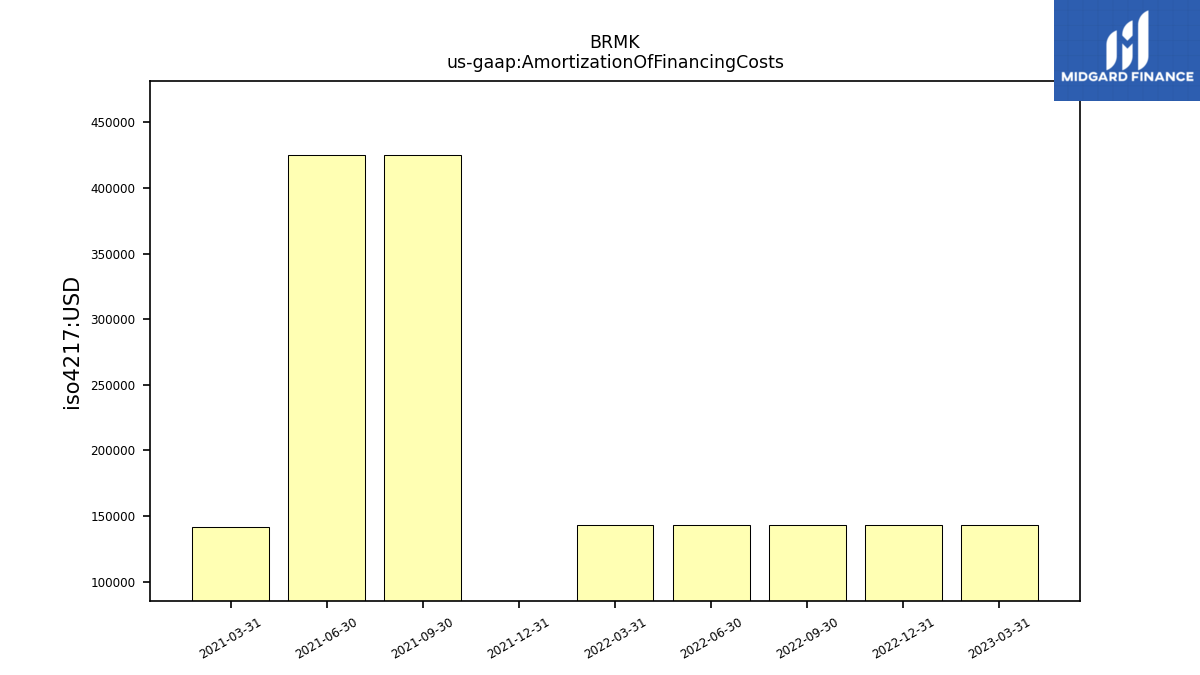
| Amortization Of Financing Costs | 0.14 | 0.14 | 0.14 | 0.14 | 0.14 | -0.91 | 0.42 | 0.42 | 0.14 | NA | NA | NA | NA | NA | NA | NA | NA | NA |
| 2023-03-31 | 2022-12-31 | 2022-09-30 | 2022-06-30 | 2022-03-31 | 2021-12-31 | 2021-09-30 | 2021-06-30 | 2021-03-31 | 2020-12-31 | 2020-09-30 | 2020-06-30 | 2020-03-31 | 2019-12-31 | 2019-11-14 | 2019-09-30 | 2019-06-30 | 2019-03-31 | ||
|---|---|---|---|---|---|---|---|---|---|---|---|---|---|---|---|---|---|---|---|
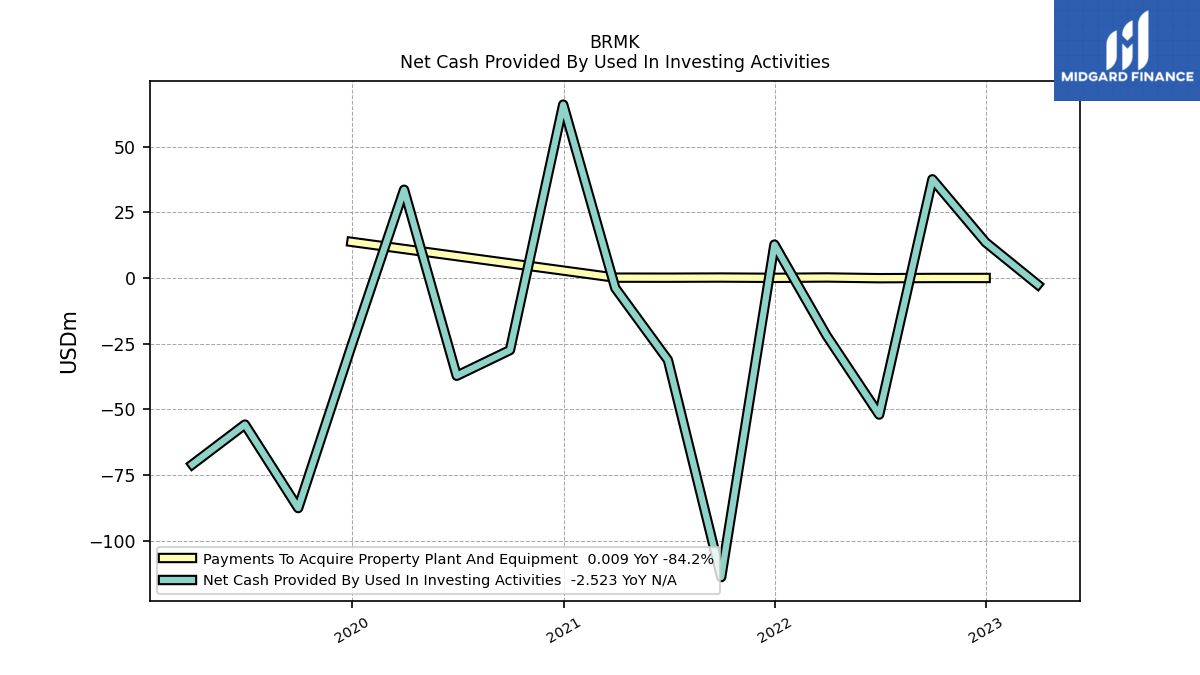
| Net Cash Provided By Used In Investing Activities | -2.52 | 13.54 | 37.53 | -51.95 | -21.83 | 12.71 | -113.74 | -31.23 | -3.83 | 65.92 | -27.43 | -37.18 | 33.57 | -25.89 | NA | -87.49 | -55.73 | -70.91 | |
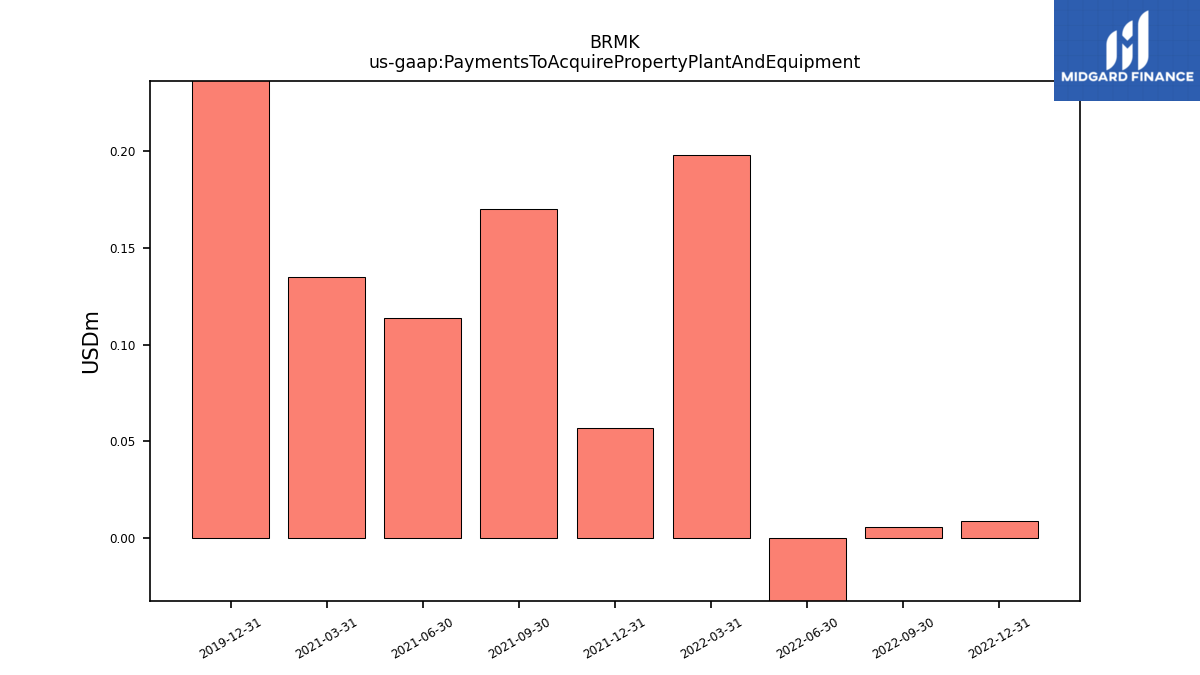
| Payments To Acquire Property Plant And Equipment | NA | 0.01 | 0.01 | -0.08 | 0.20 | 0.06 | 0.17 | 0.11 | 0.14 | NA | NA | NA | NA | 13.74 | NA | NA | NA | NA |
| 2023-03-31 | 2022-12-31 | 2022-09-30 | 2022-06-30 | 2022-03-31 | 2021-12-31 | 2021-09-30 | 2021-06-30 | 2021-03-31 | 2020-12-31 | 2020-09-30 | 2020-06-30 | 2020-03-31 | 2019-12-31 | 2019-11-14 | 2019-09-30 | 2019-06-30 | 2019-03-31 | ||
|---|---|---|---|---|---|---|---|---|---|---|---|---|---|---|---|---|---|---|---|
| Net Cash Provided By Used In Financing Activities | -14.03 | -28.30 | -28.00 | -27.93 | -28.21 | 69.14 | -28.07 | -28.00 | -31.61 | -23.82 | -23.85 | -26.43 | -36.97 | 258.40 | NA | 74.52 | 96.00 | 49.97 | |
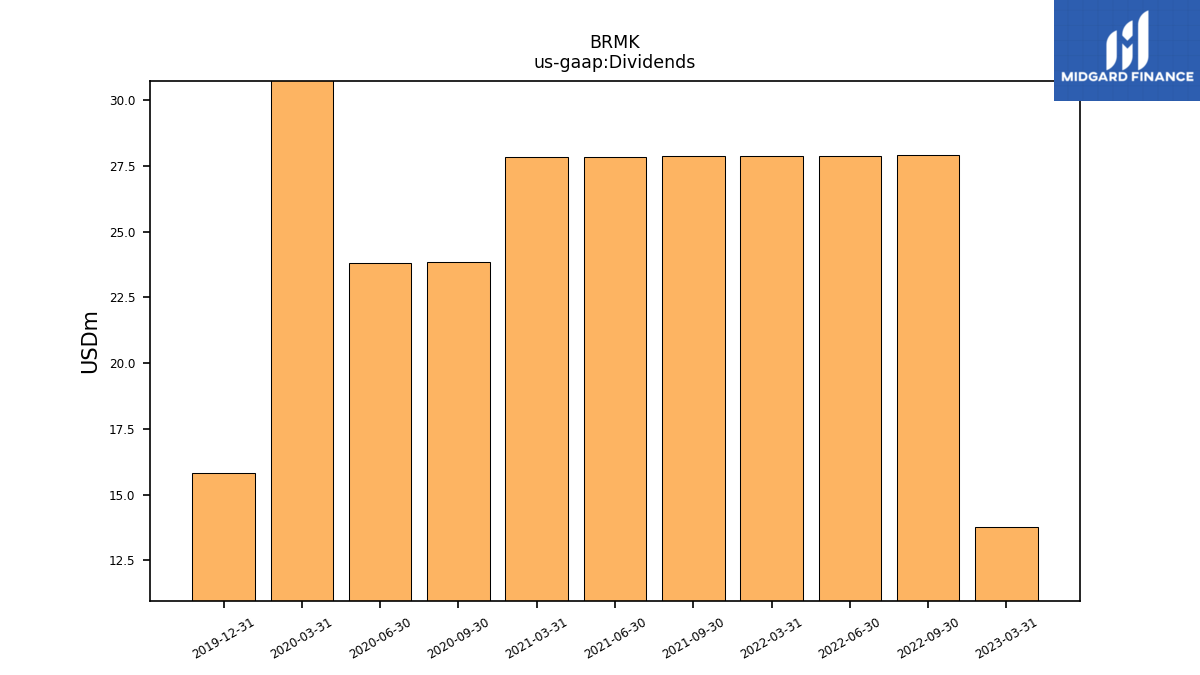
| Dividends | 13.79 | NA | 27.91 | 27.89 | 27.89 | NA | 27.86 | 27.84 | 27.84 | NA | 23.85 | 23.79 | 31.70 | 15.84 | NA | NA | NA | NA |
| 2023-03-31 | 2022-12-31 | 2022-09-30 | 2022-06-30 | 2022-03-31 | 2021-12-31 | 2021-09-30 | 2021-06-30 | 2021-03-31 | 2020-12-31 | 2020-09-30 | 2020-06-30 | 2020-03-31 | 2019-12-31 | 2019-11-14 | 2019-09-30 | 2019-06-30 | 2019-03-31 | ||
|---|---|---|---|---|---|---|---|---|---|---|---|---|---|---|---|---|---|---|---|
| Revenues | 24.70 | 23.36 | 27.13 | 28.52 | 30.70 | 31.30 | 30.59 | 29.18 | 29.47 | 32.54 | 28.98 | 29.07 | 31.77 | 15.97 | 14.07 | 34.58 | 36.57 | 29.78 | |
| Revenue From Contract With Customer Including Assessed Tax | 23.84 | 20.56 | 27.13 | 28.52 | 29.87 | 31.30 | 30.59 | 29.18 | 29.47 | 32.54 | 28.98 | 29.07 | 31.77 | 15.97 | 14.07 | 34.58 | 36.57 | 29.78 | |
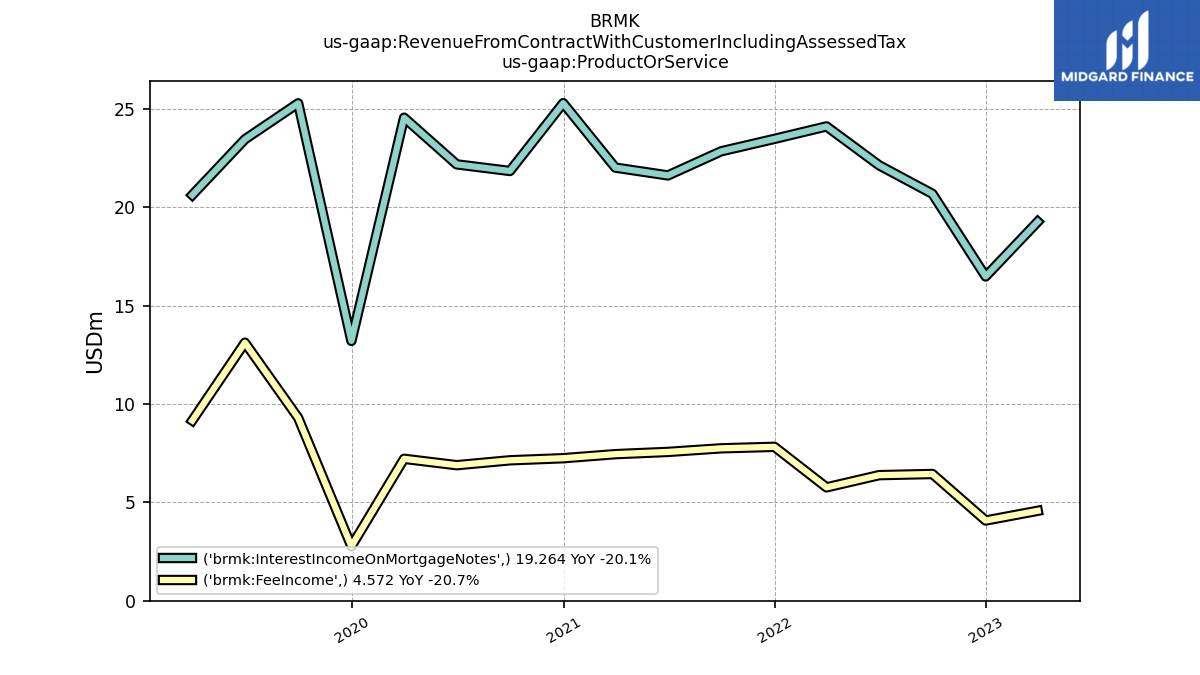
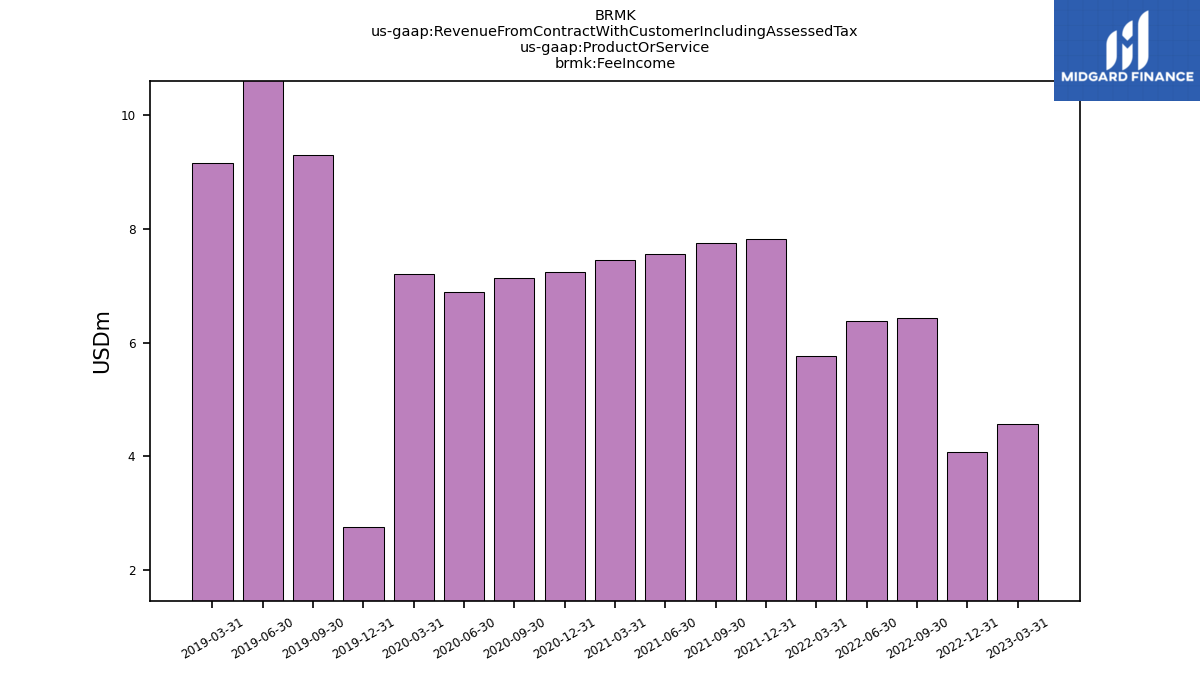
| Fee Income | 4.57 | 4.08 | 6.44 | 6.38 | 5.76 | 7.82 | 7.75 | 7.57 | 7.45 | 7.25 | 7.14 | 6.89 | 7.21 | 2.77 | NA | 9.30 | 13.12 | 9.16 | |
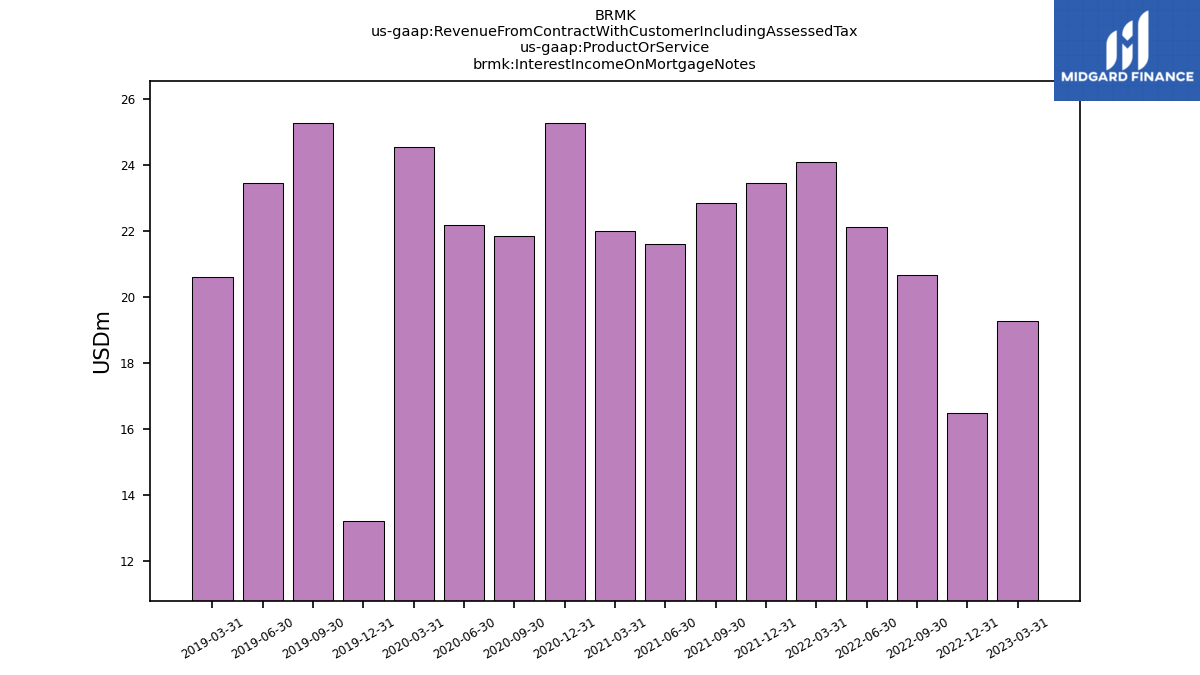
| Interest Income On Mortgage Notes | 19.26 | 16.48 | 20.68 | 22.13 | 24.11 | 23.48 | 22.85 | 21.62 | 22.02 | 25.29 | 21.84 | 22.18 | 24.55 | 13.21 | NA | 25.28 | 23.46 | 20.62 |