
| 2024-03-31 | 2023-03-31 | ||
|---|---|---|---|
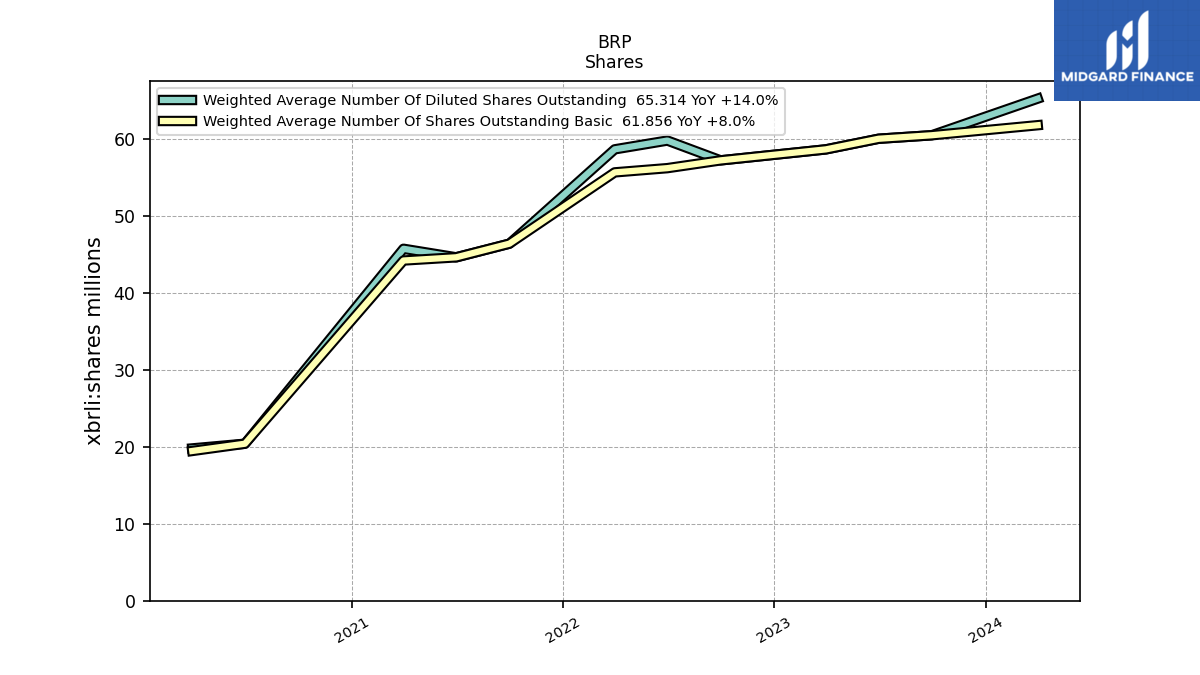
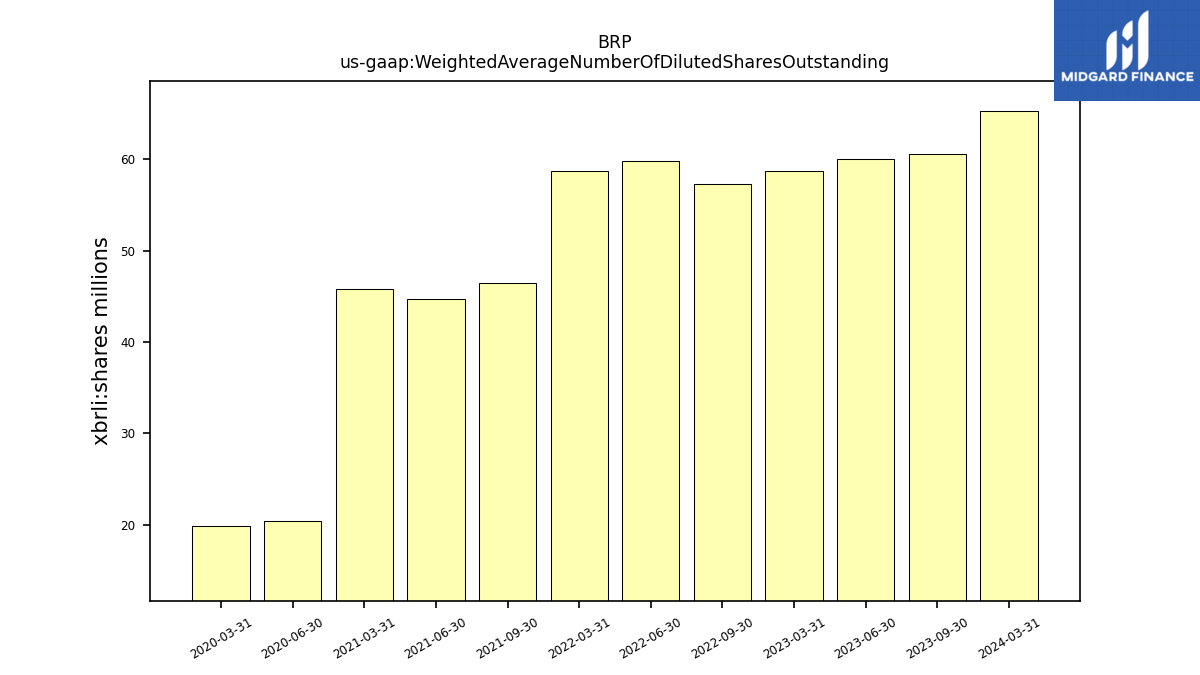
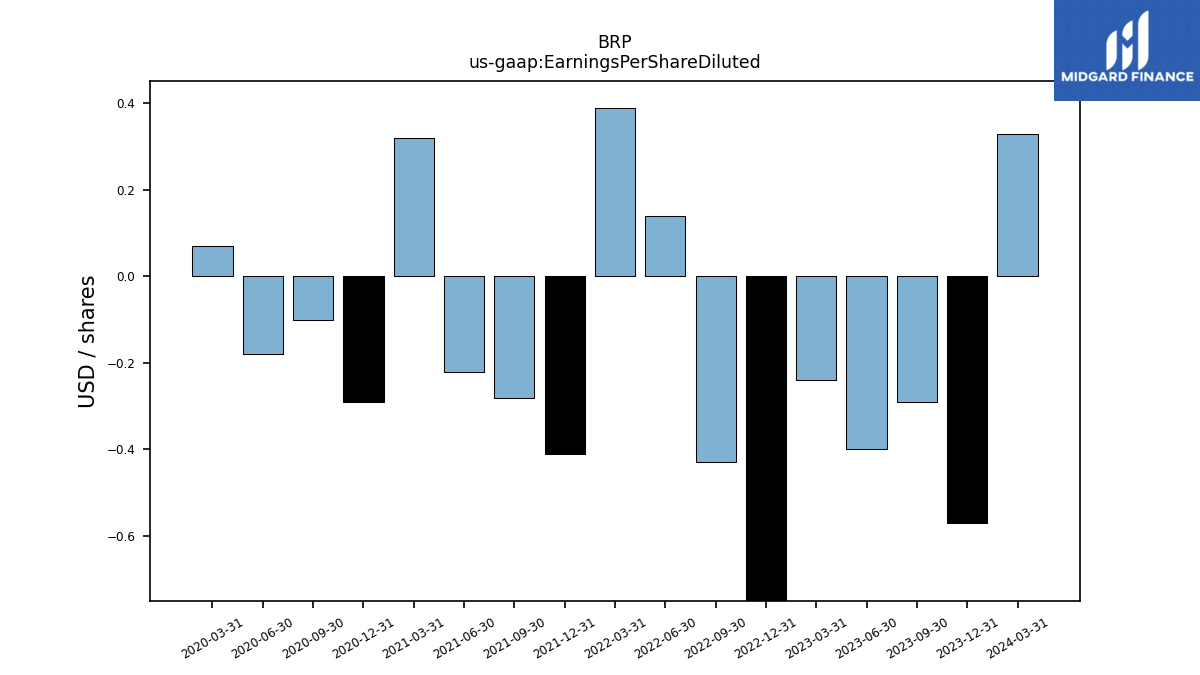
| Weighted Average Number Of Diluted Shares Outstanding | 65.31 | 58.71 | |
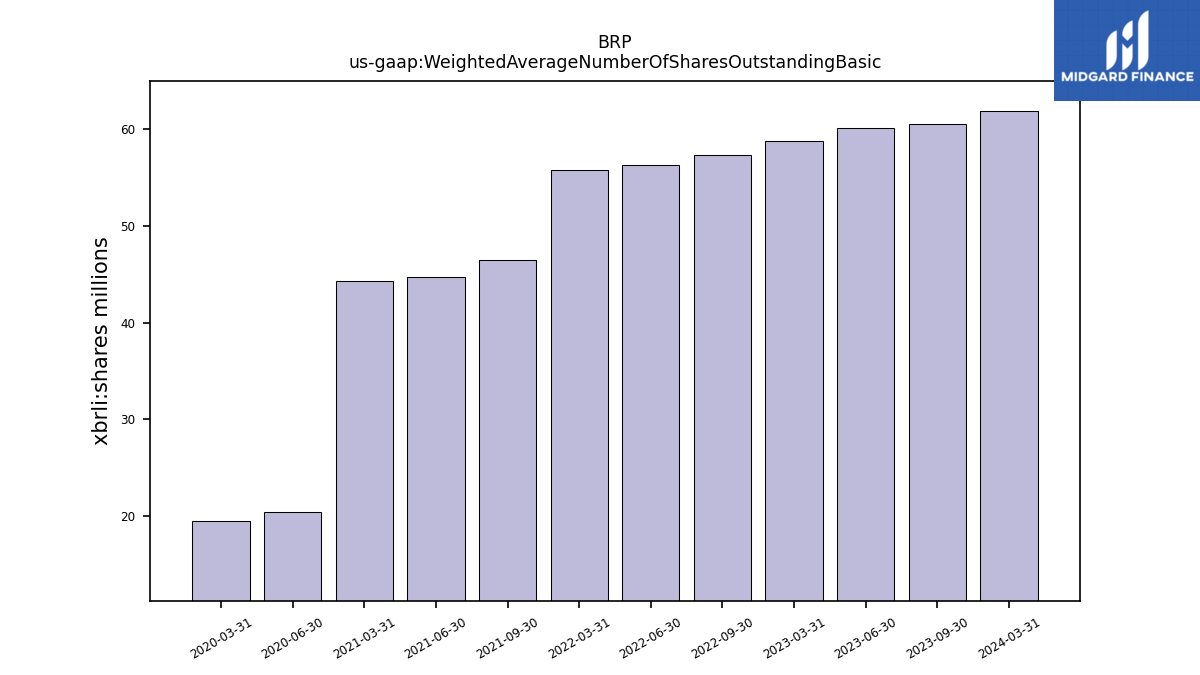
| Weighted Average Number Of Shares Outstanding Basic | 61.86 | 58.71 | |
| Earnings Per Share Basic | 0.35 | -0.24 | |
| Earnings Per Share Diluted | 0.33 | -0.24 |
| 2024-03-31 | 2023-03-31 | ||
|---|---|---|---|
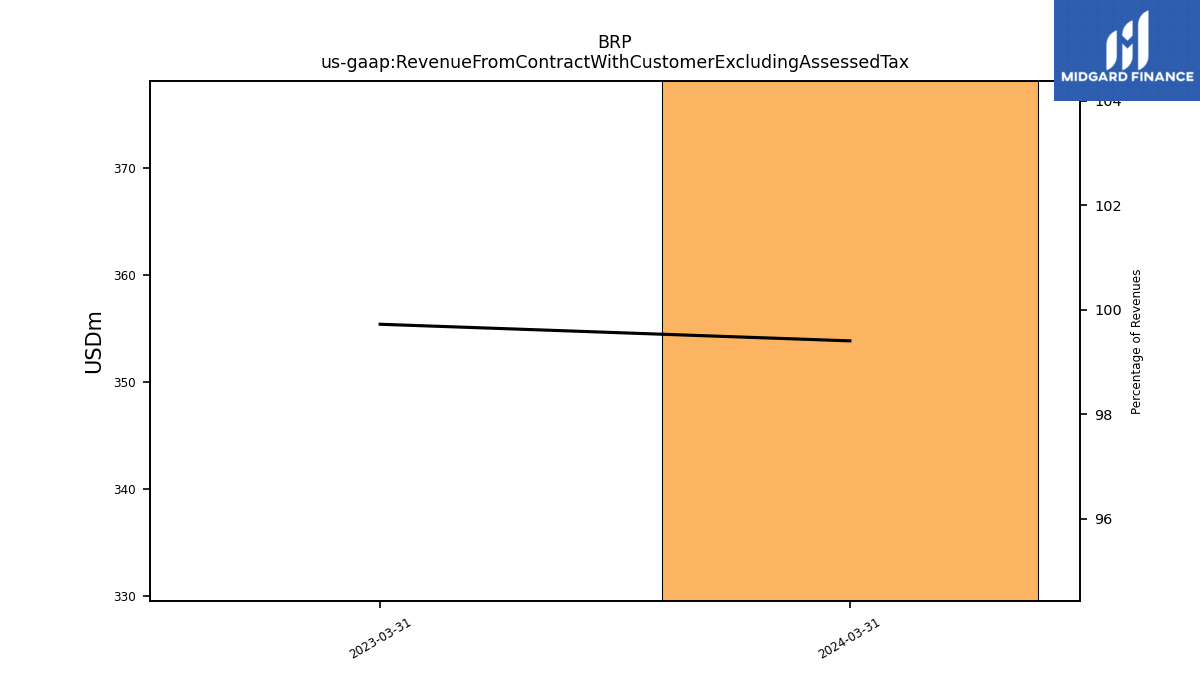
| Revenue From Contract With Customer Excluding Assessed Tax | 378.10 | 329.52 | |
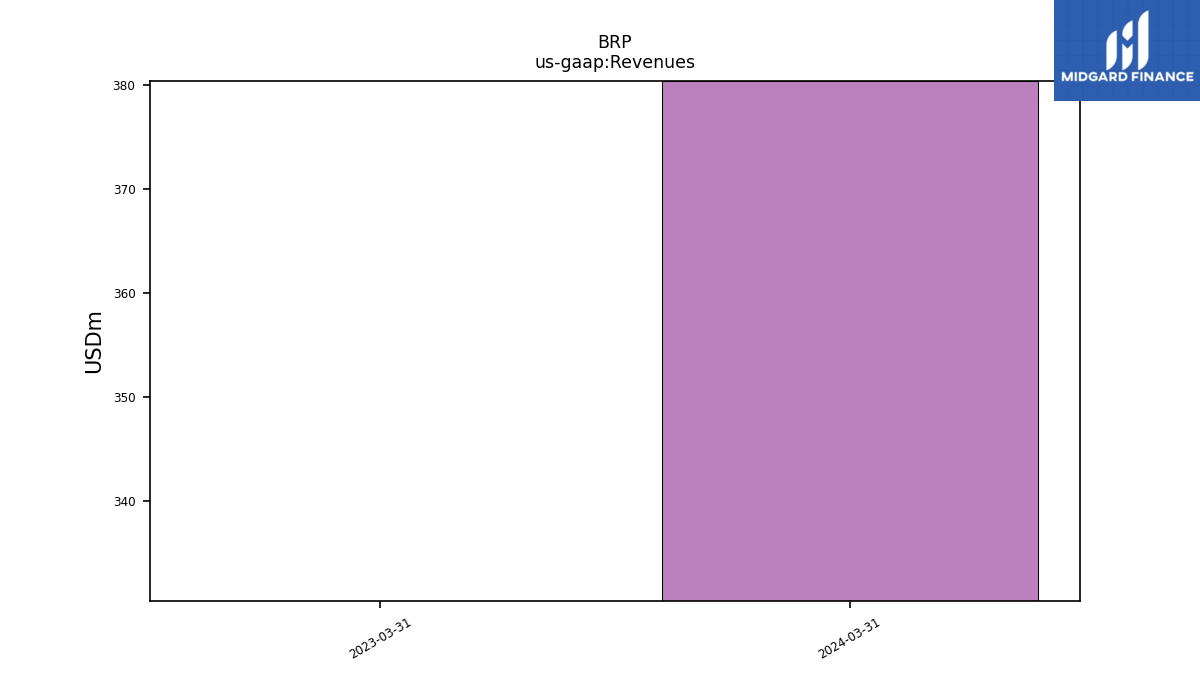
| Revenues | 380.37 | 330.45 | |
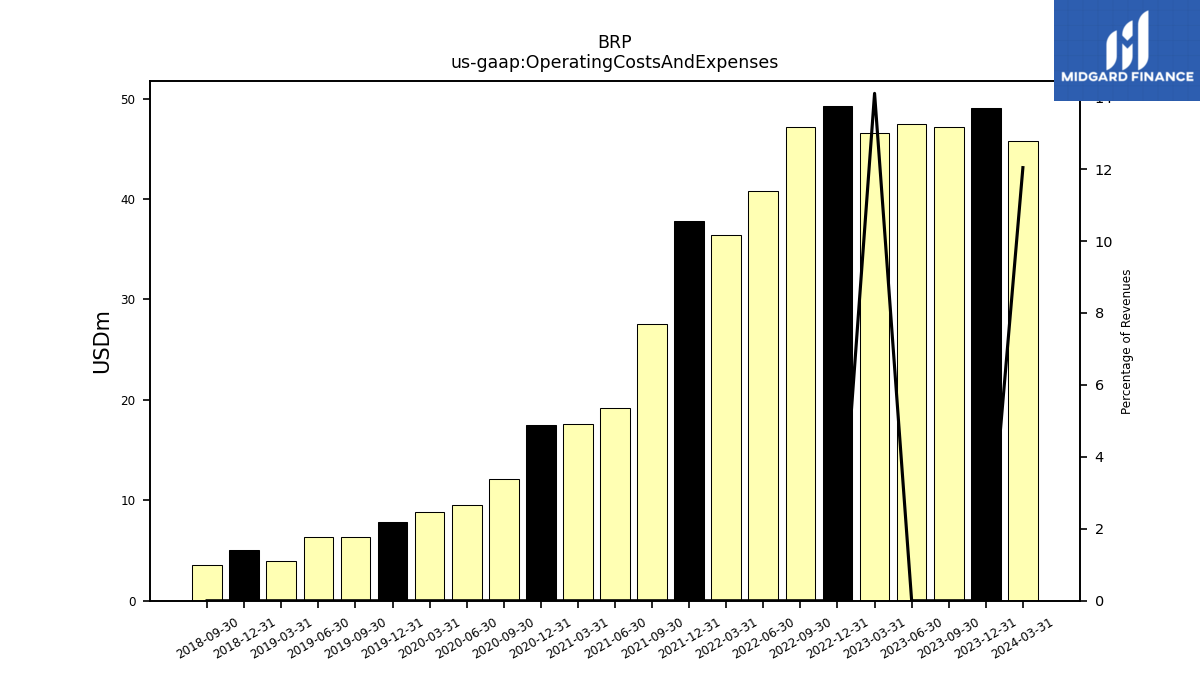
| Operating Costs And Expenses | 45.80 | 46.60 | |
| Costs And Expenses | 346.11 | 326.83 | |
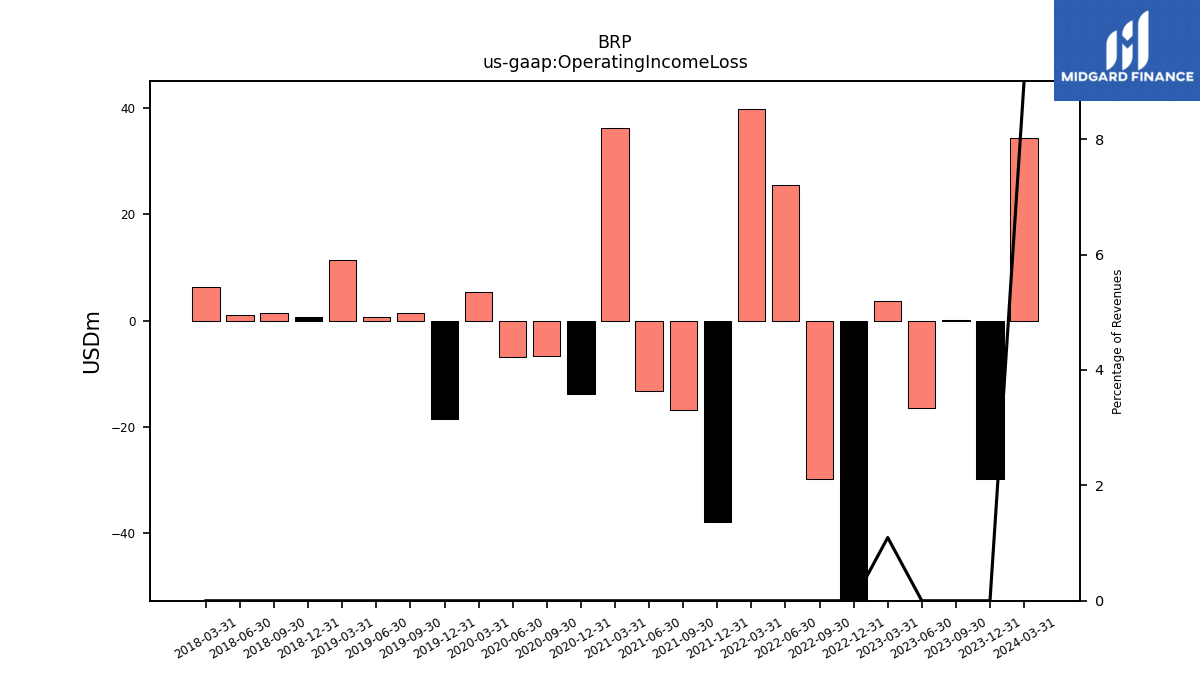
| Operating Income Loss | 34.26 | 3.62 | |
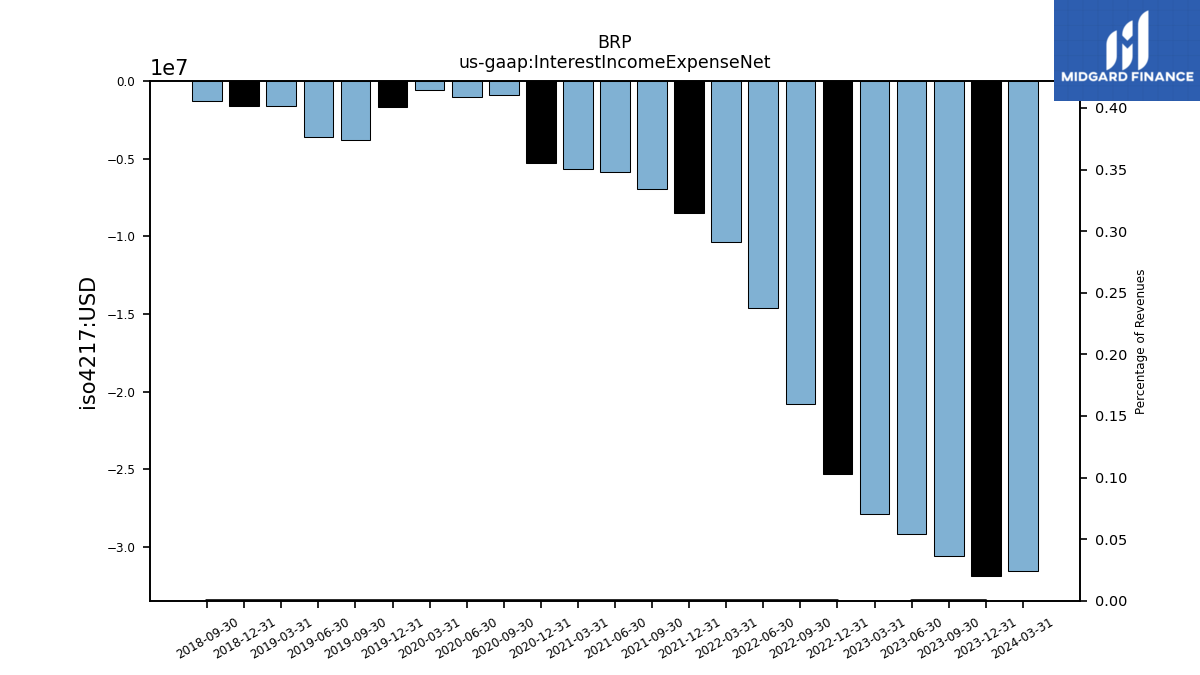
| Interest Income Expense Net | -31.55 | -27.88 | |
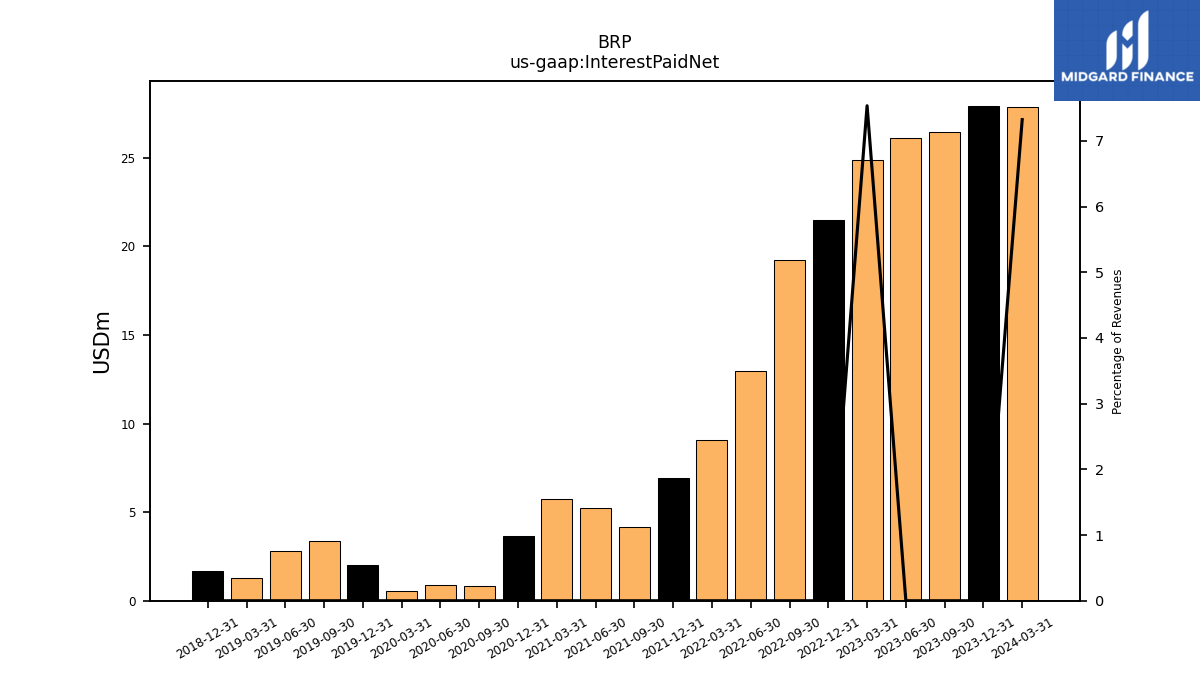
| Interest Paid Net | 27.86 | 24.90 | |
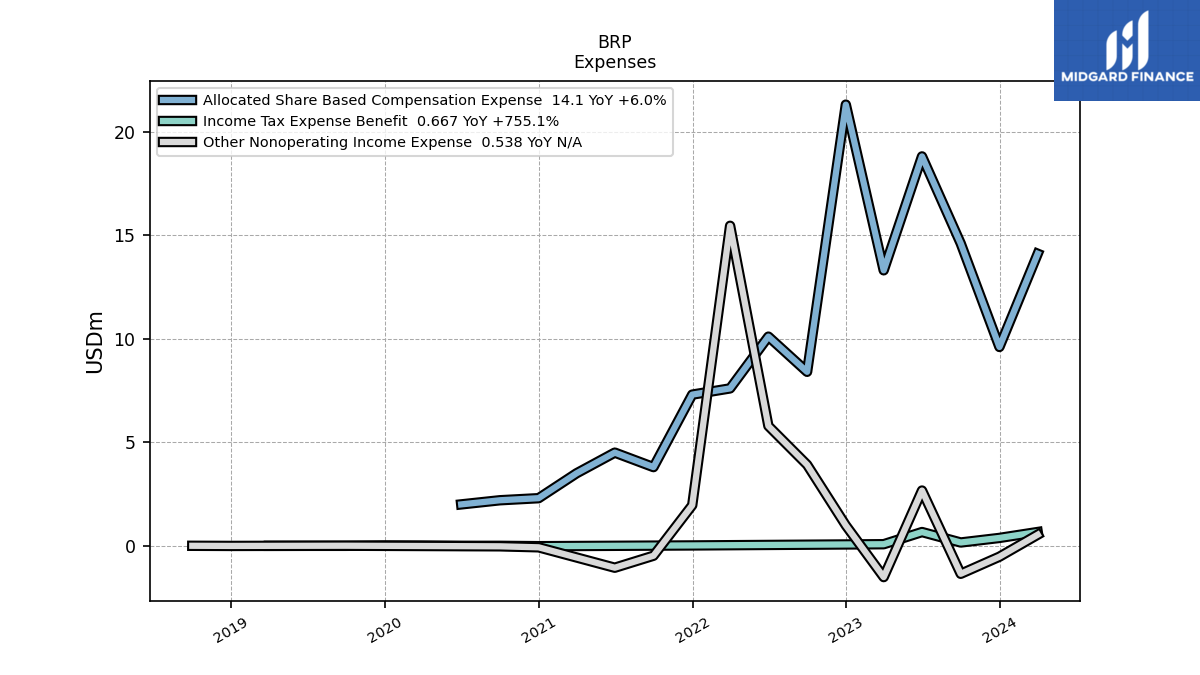
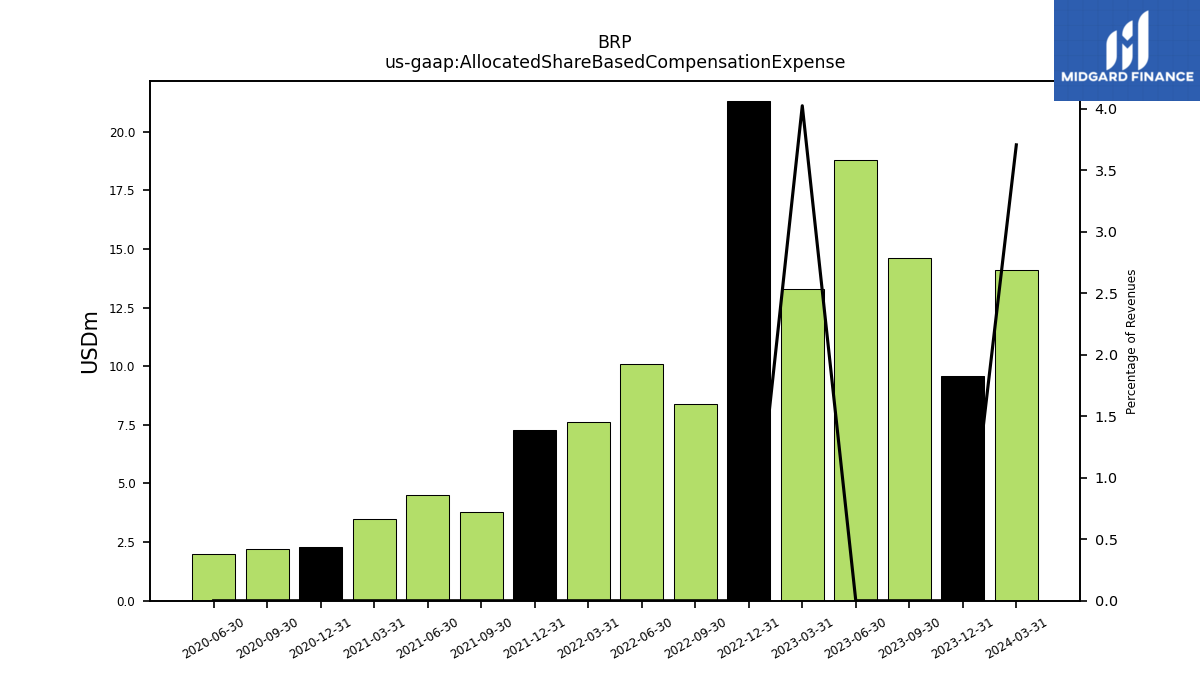
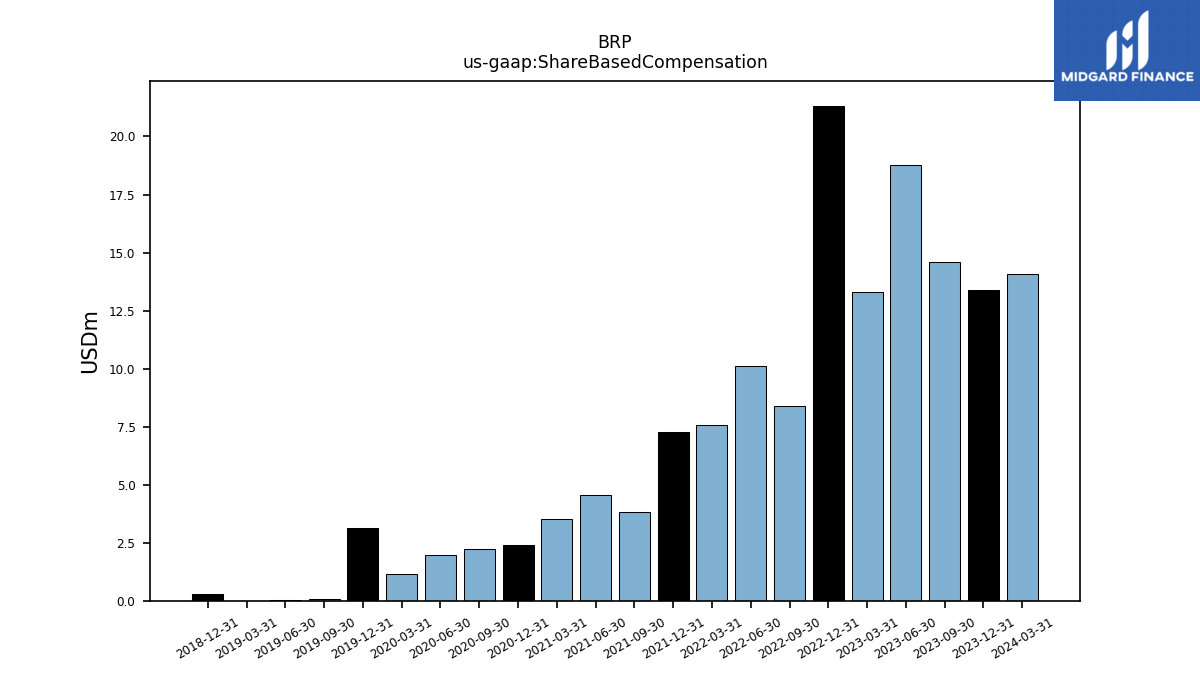
| Allocated Share Based Compensation Expense | 14.10 | 13.30 | |
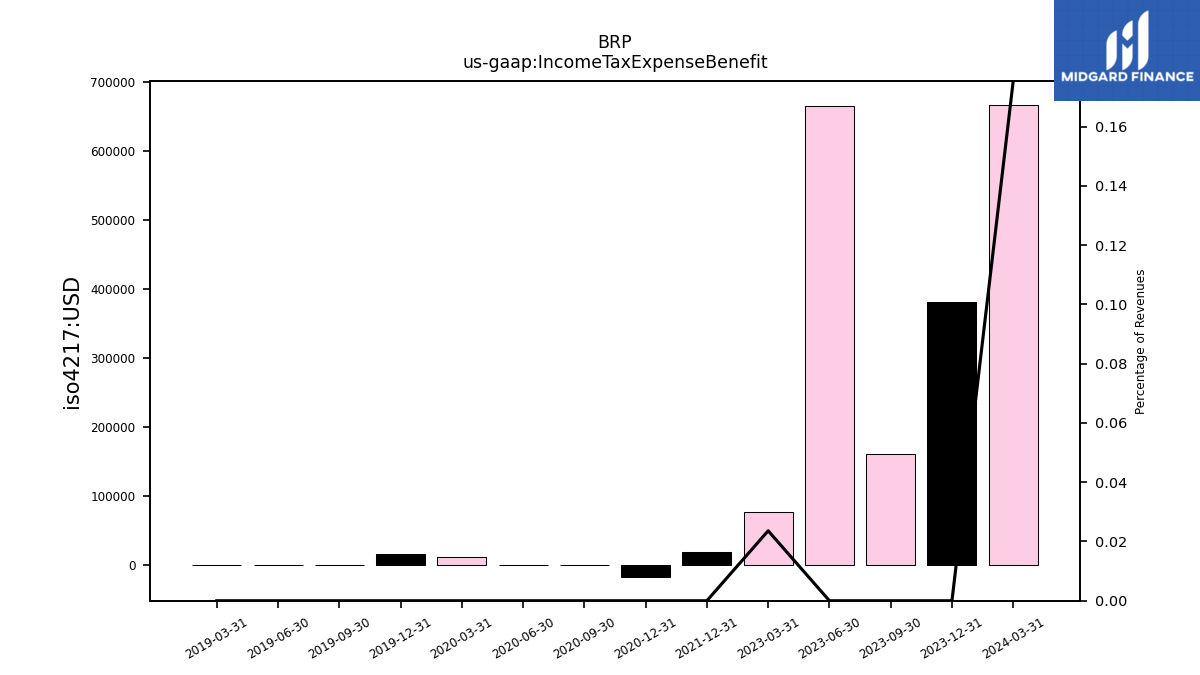
| Income Tax Expense Benefit | 0.67 | 0.08 | |
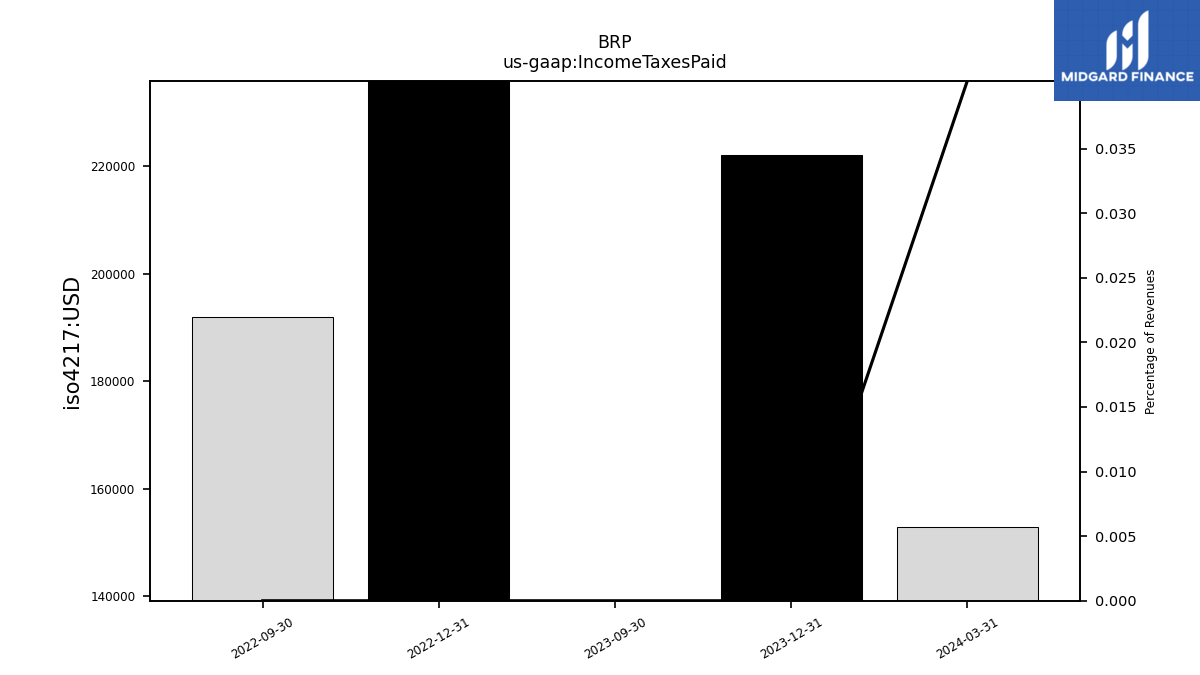
| Income Taxes Paid | 0.15 | NA | |
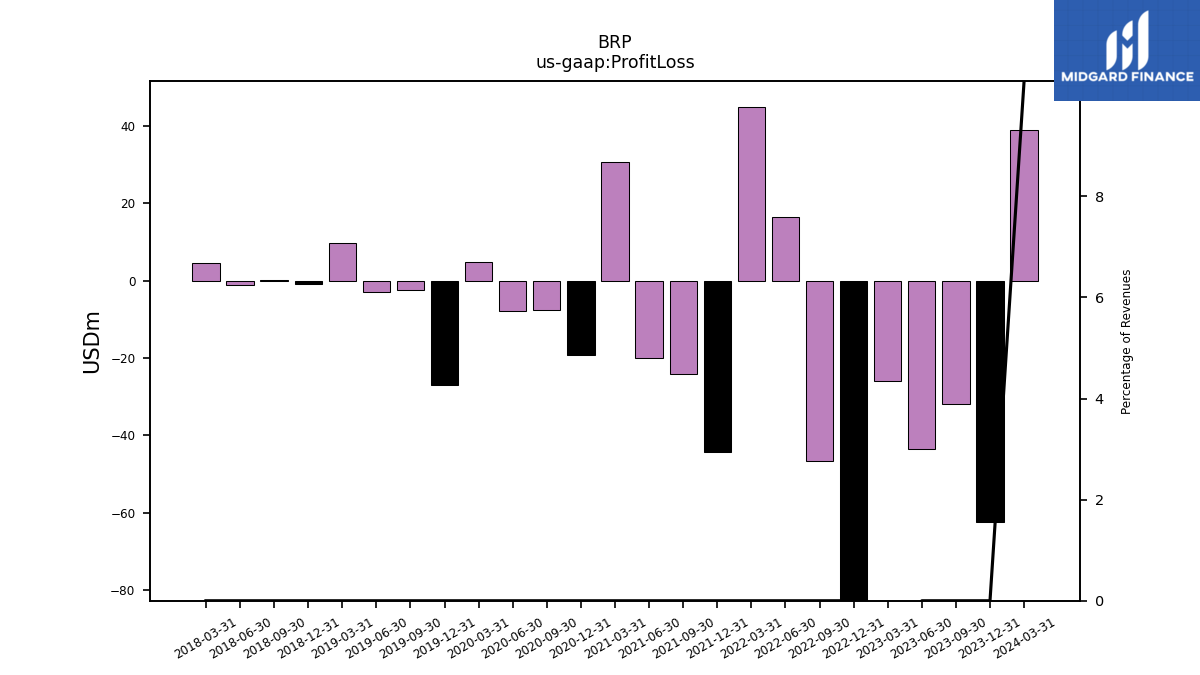
| Profit Loss | 39.10 | -25.85 | |
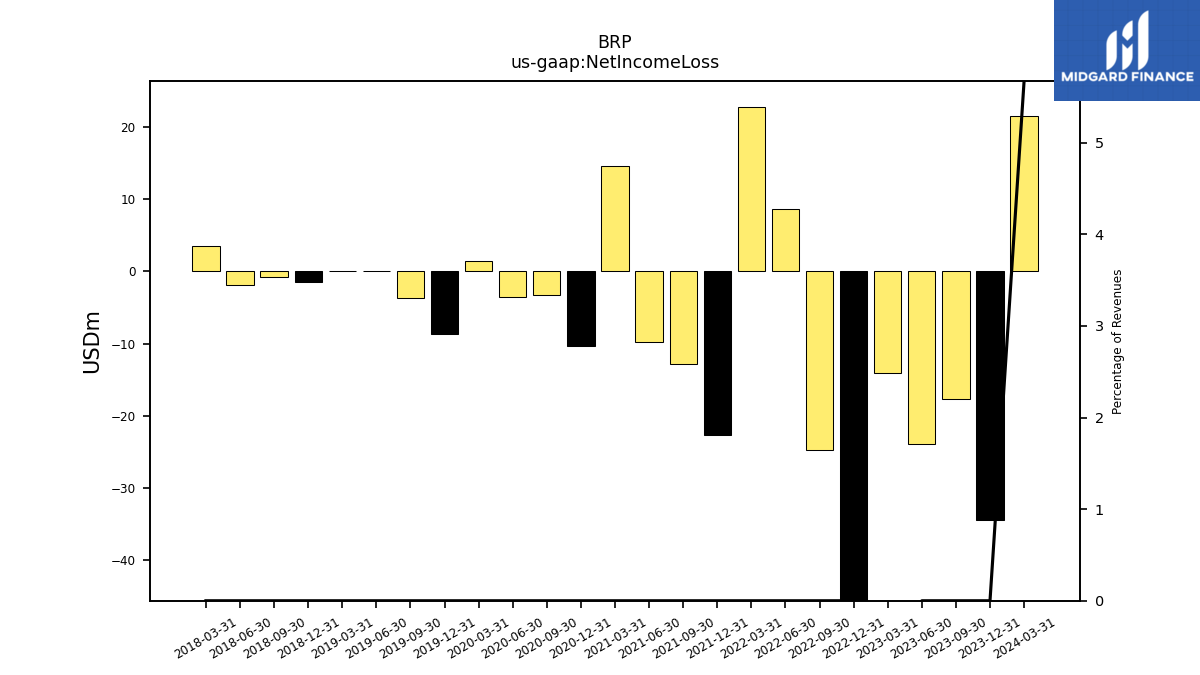
| Net Income Loss | 21.58 | -14.13 | |
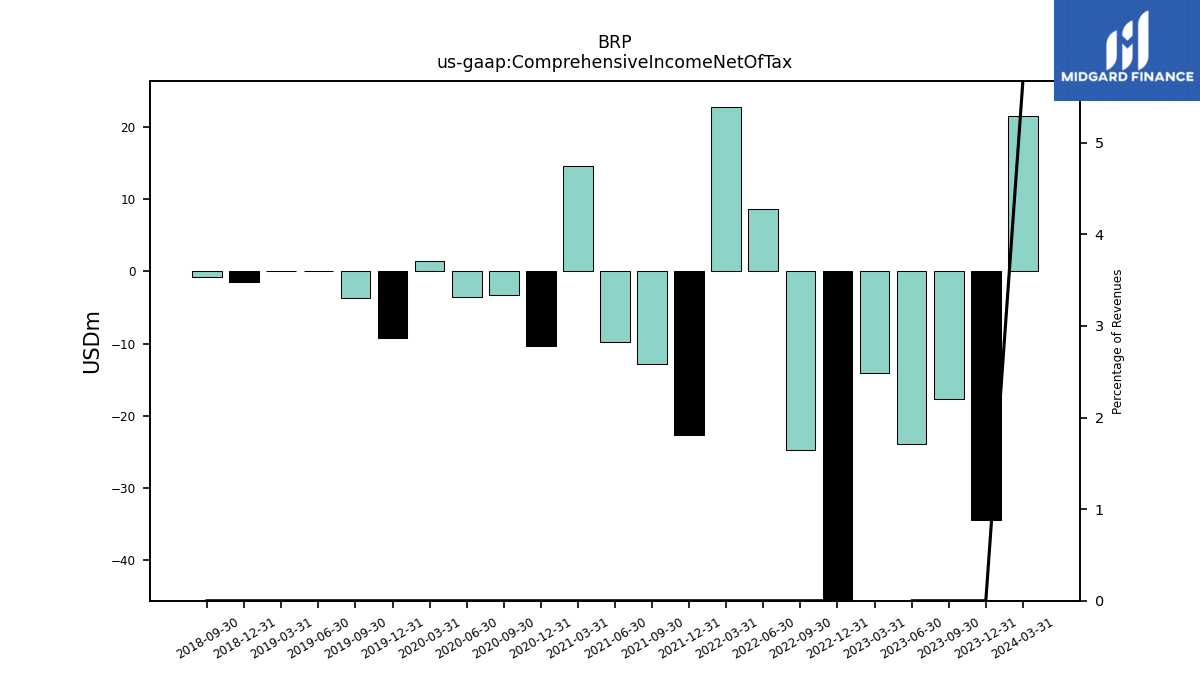
| Comprehensive Income Net Of Tax | 21.58 | -14.13 | |
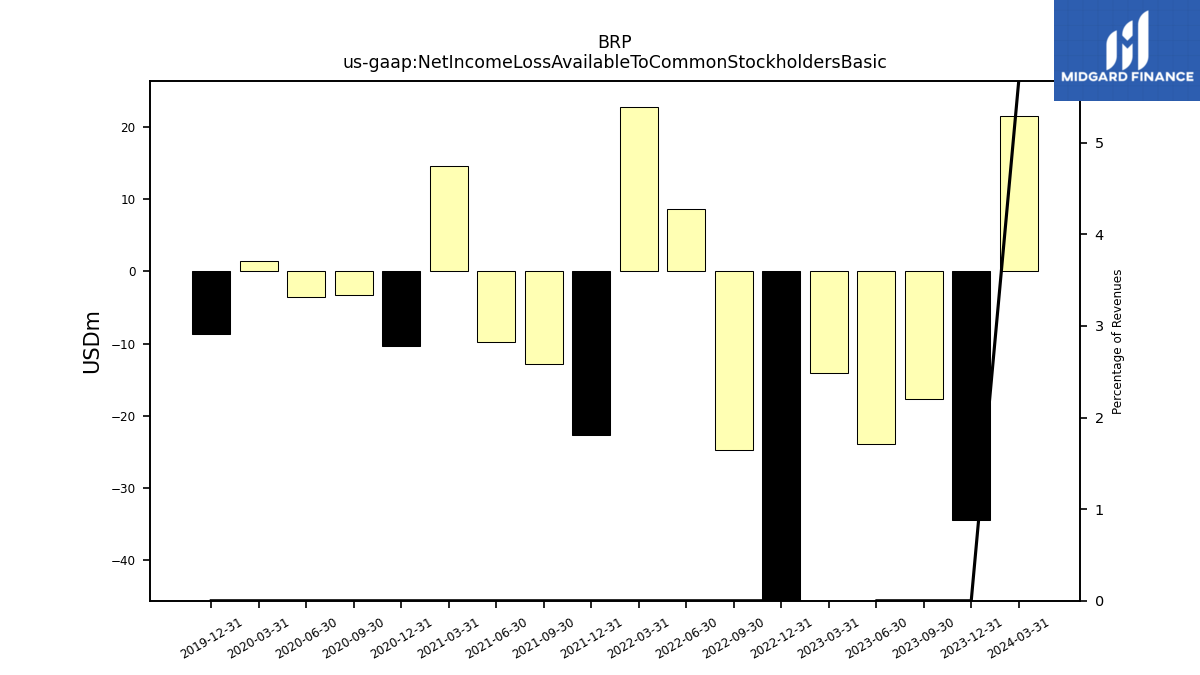
| Net Income Loss Available To Common Stockholders Basic | 21.58 | -14.13 | |
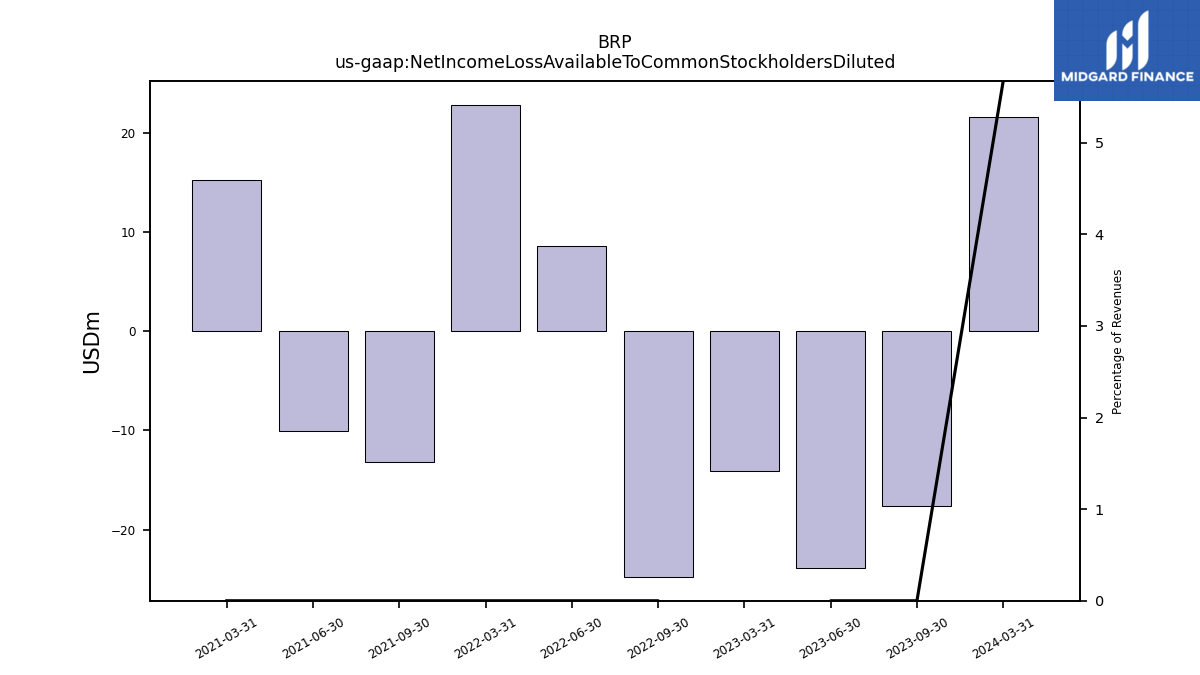
| Net Income Loss Available To Common Stockholders Diluted | 21.58 | -14.13 |
| 2024-03-31 | 2023-03-31 | ||
|---|---|---|---|
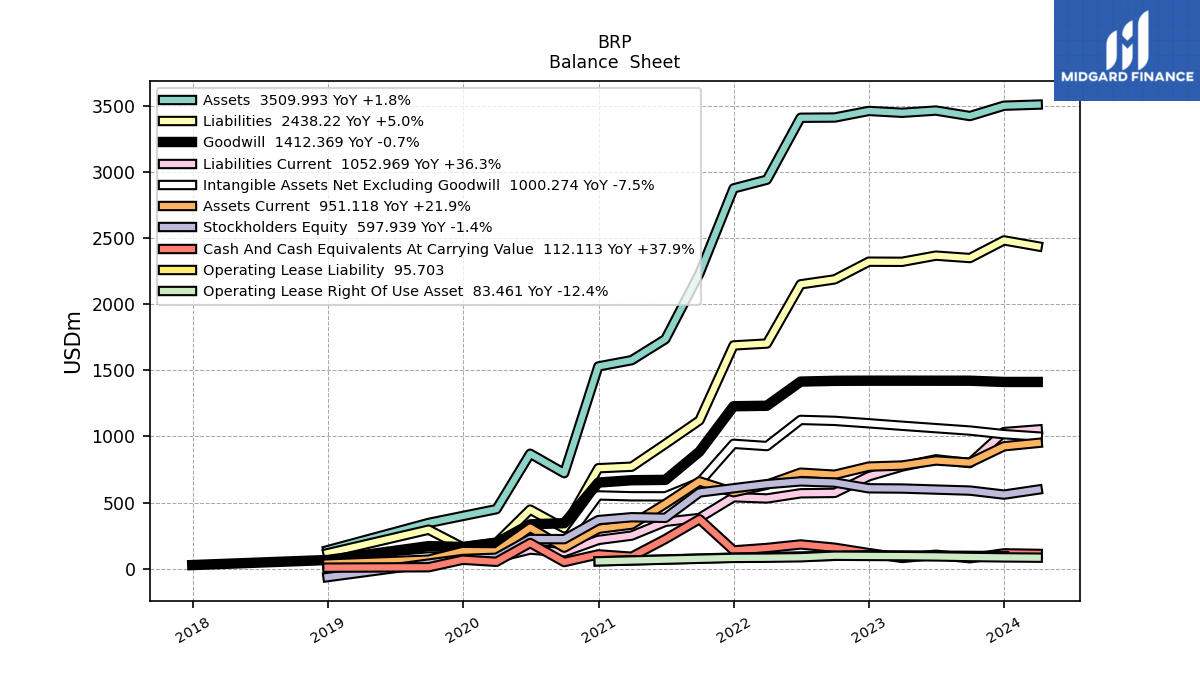
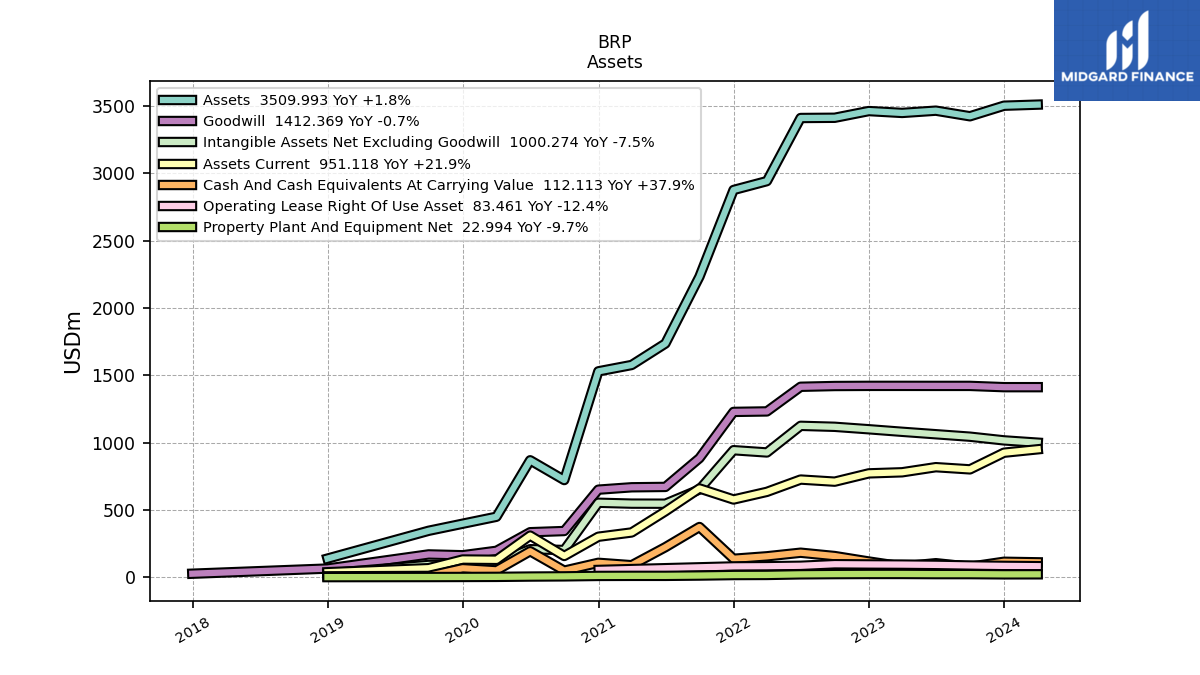
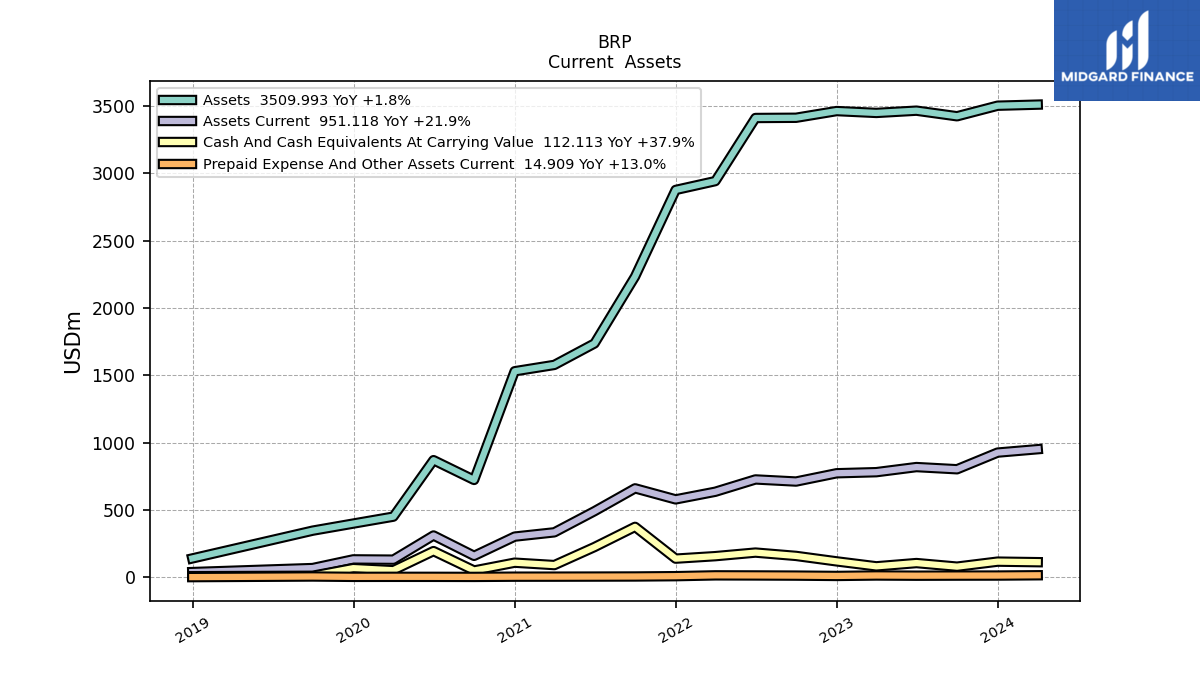
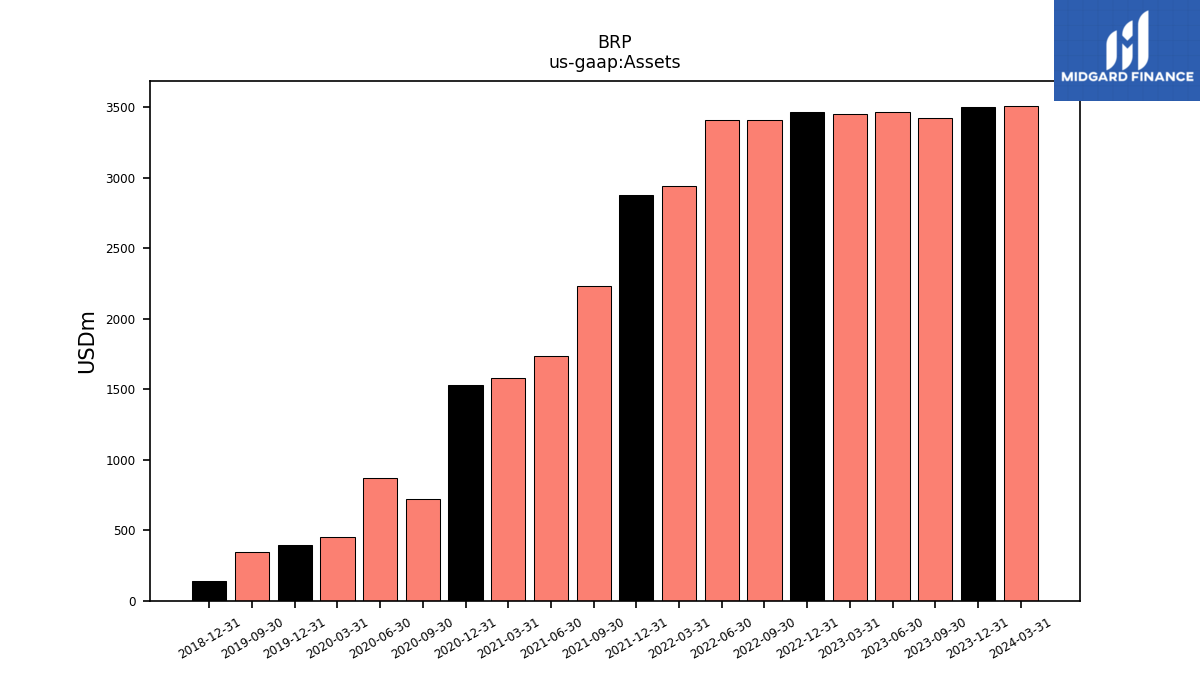
| Assets | 3509.99 | 3448.27 | |
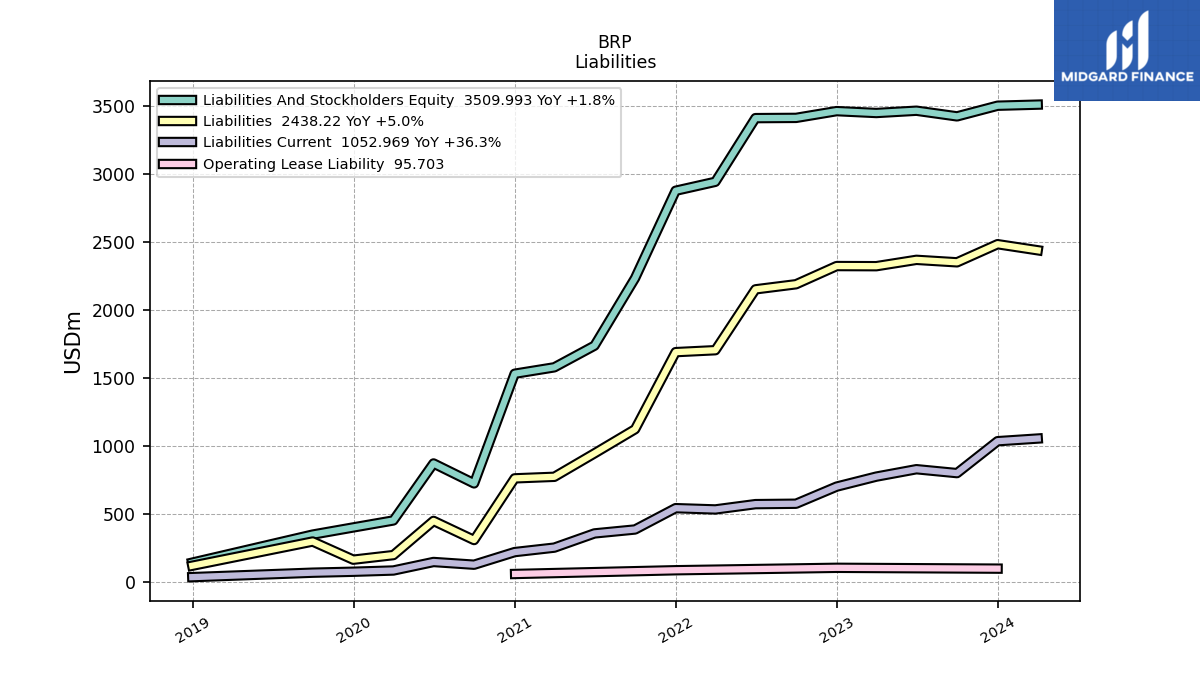
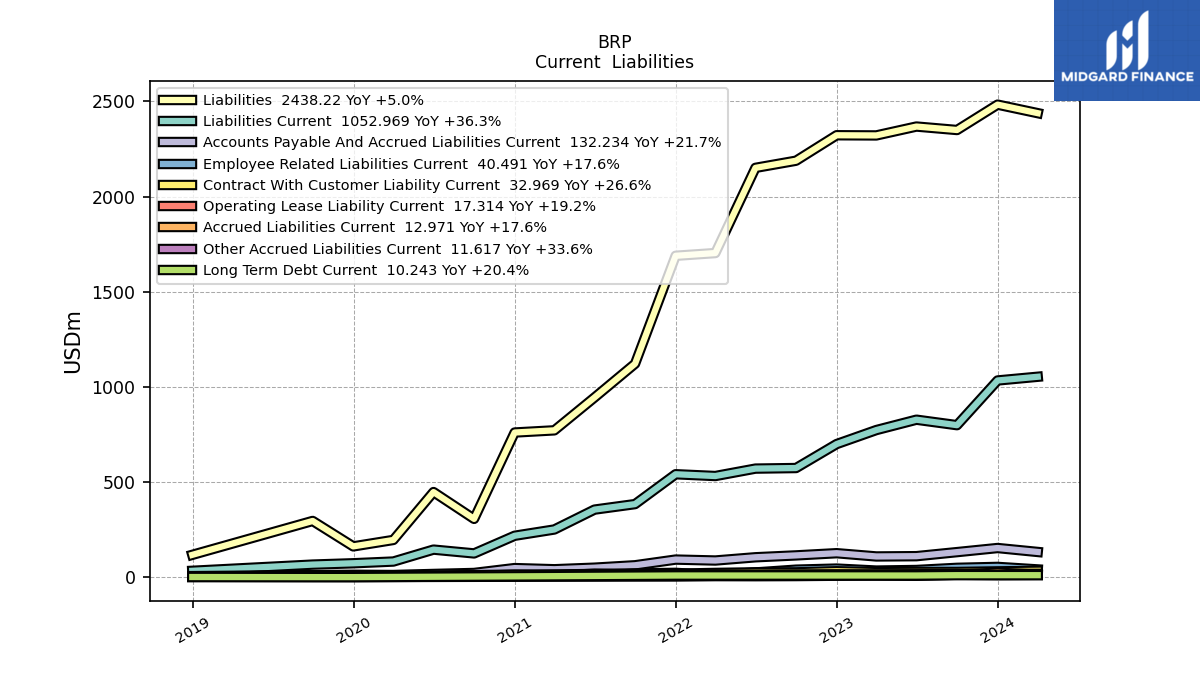
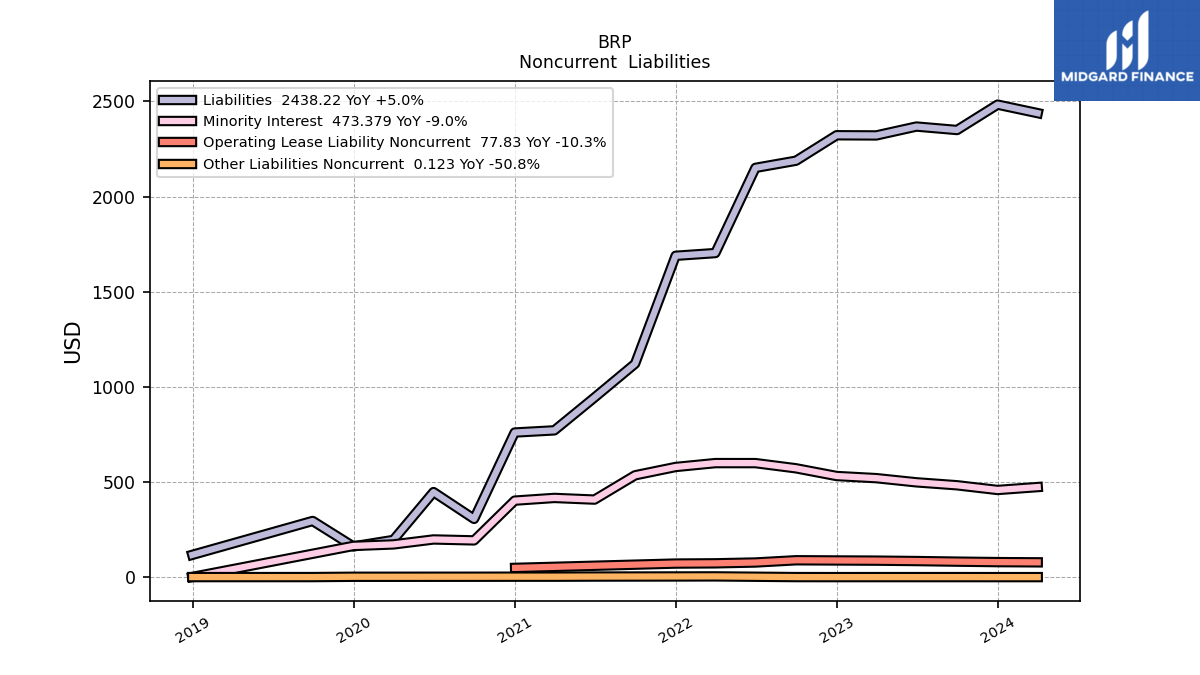
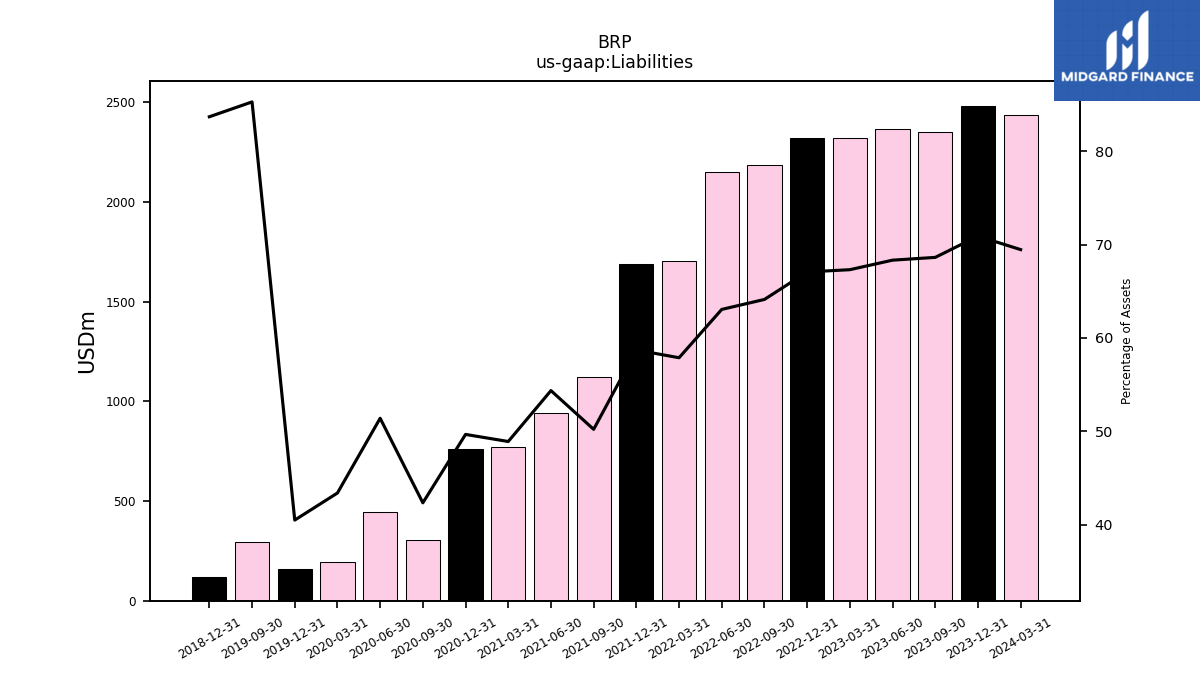
| Liabilities | 2438.22 | 2321.16 | |
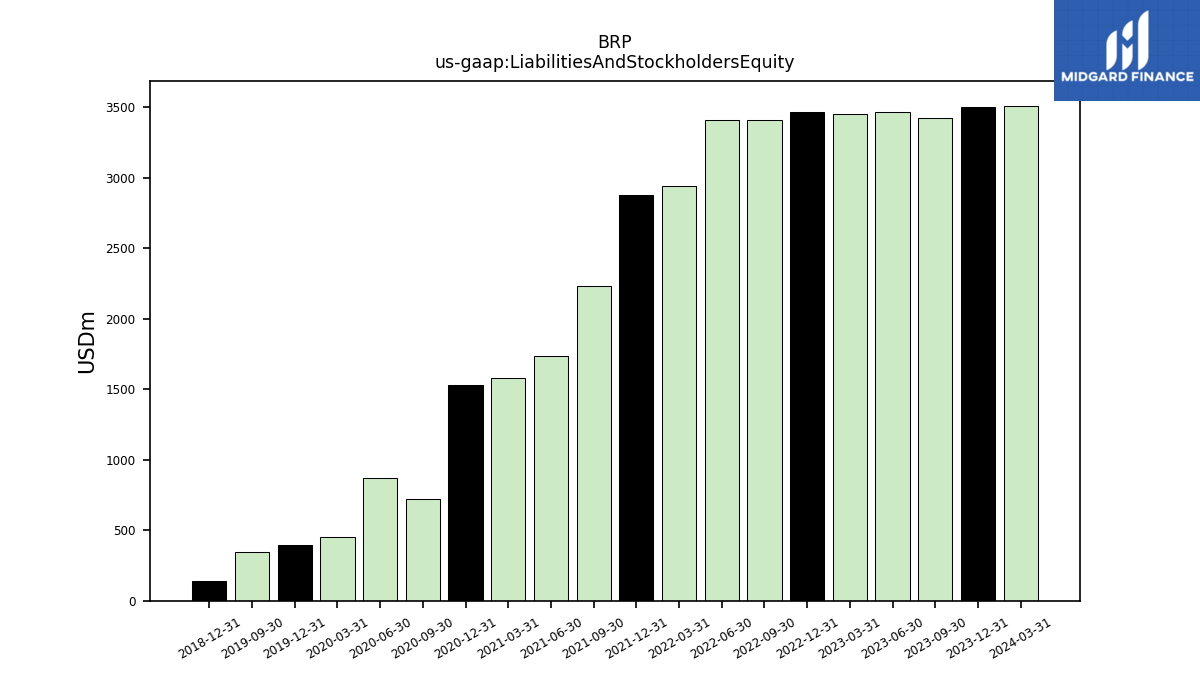
| Liabilities And Stockholders Equity | 3509.99 | 3448.27 | |
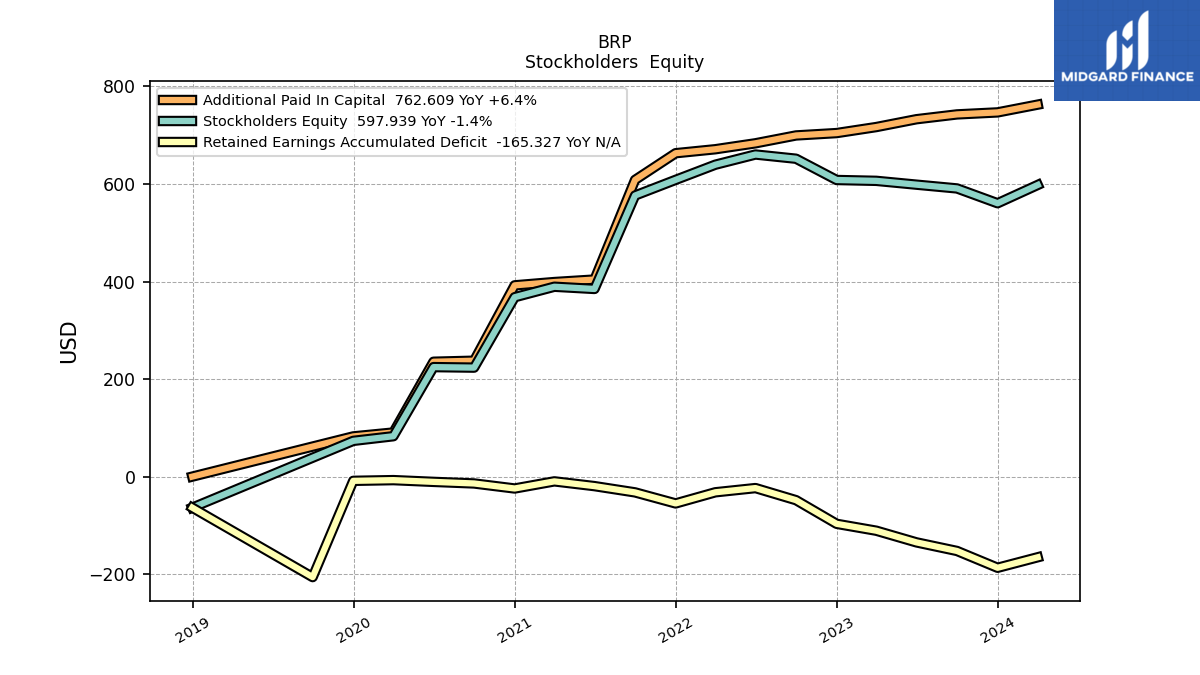
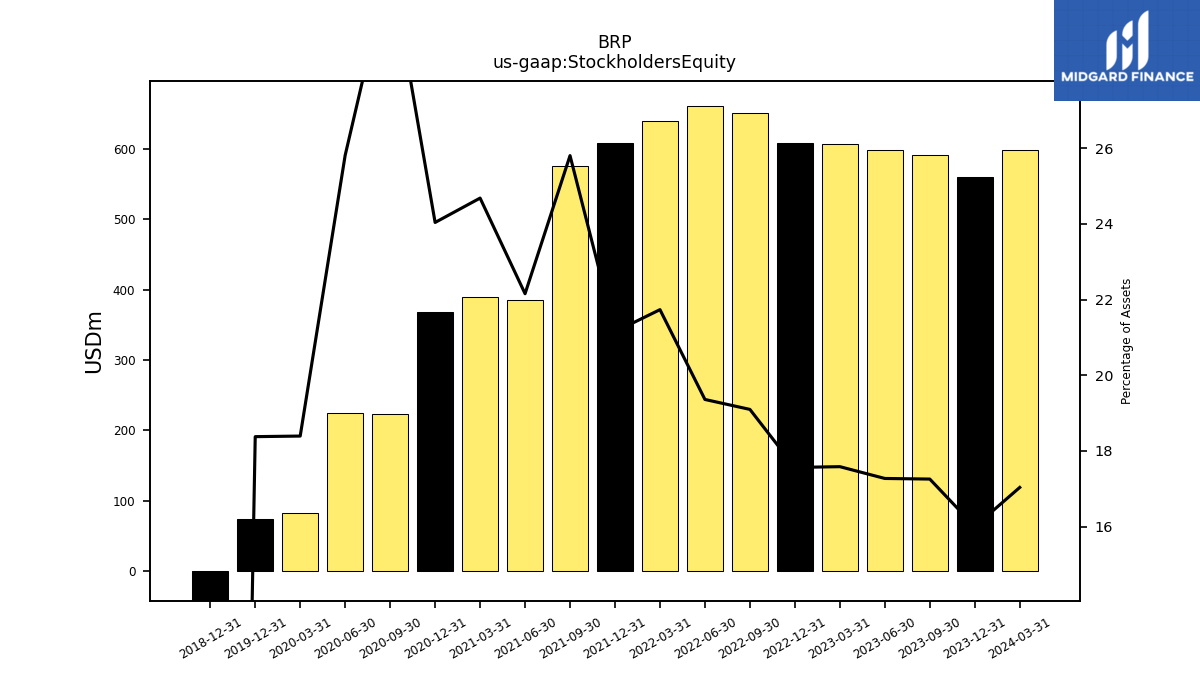
| Stockholders Equity | 597.94 | 606.36 |
| 2024-03-31 | 2023-03-31 | ||
|---|---|---|---|
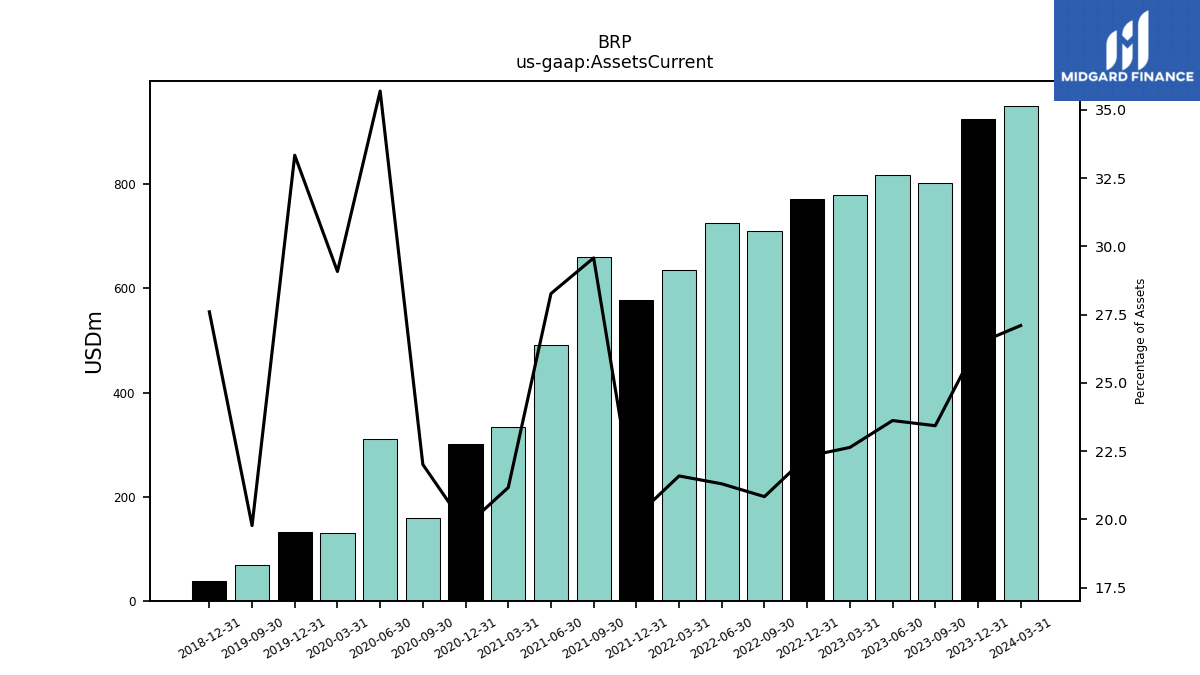
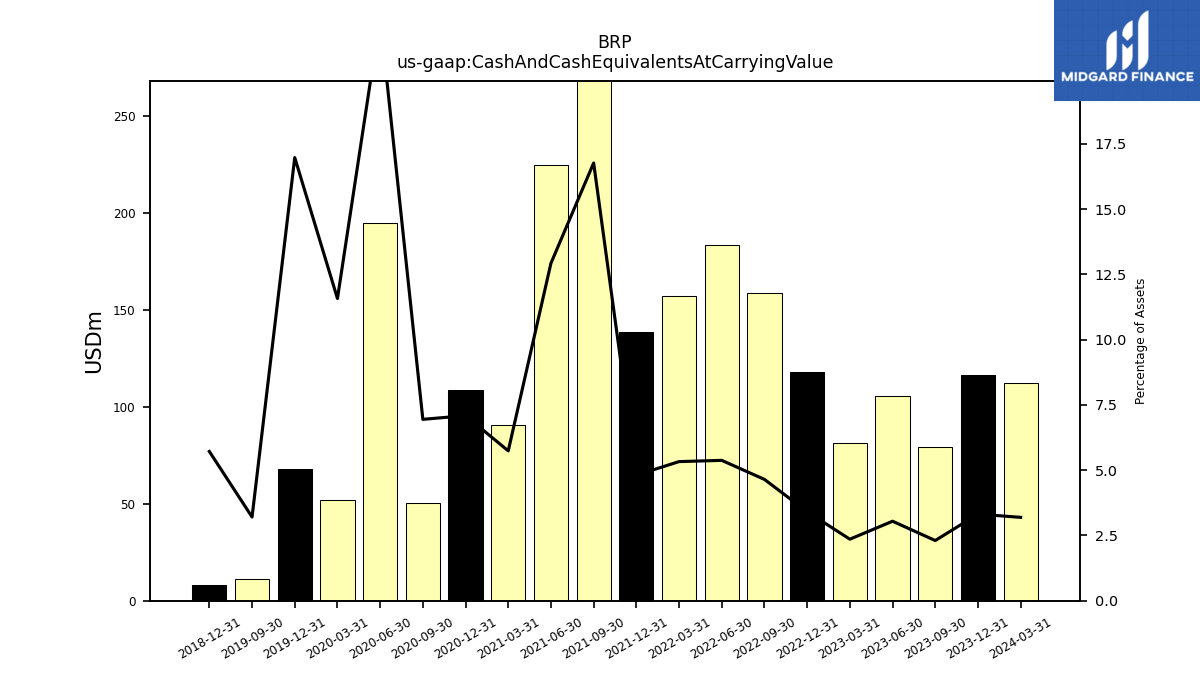
| Assets Current | 951.12 | 780.48 | |
| Cash And Cash Equivalents At Carrying Value | 112.11 | 81.30 | |
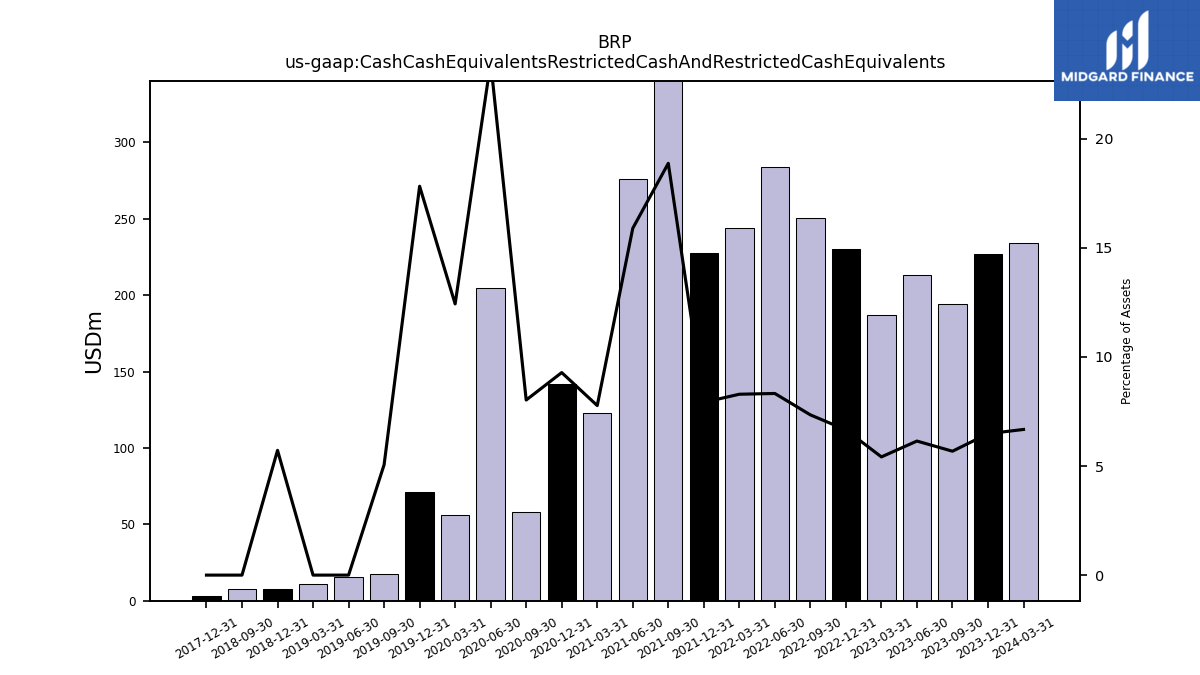
| Cash Cash Equivalents Restricted Cash And Restricted Cash Equivalents | 234.32 | 186.82 | |
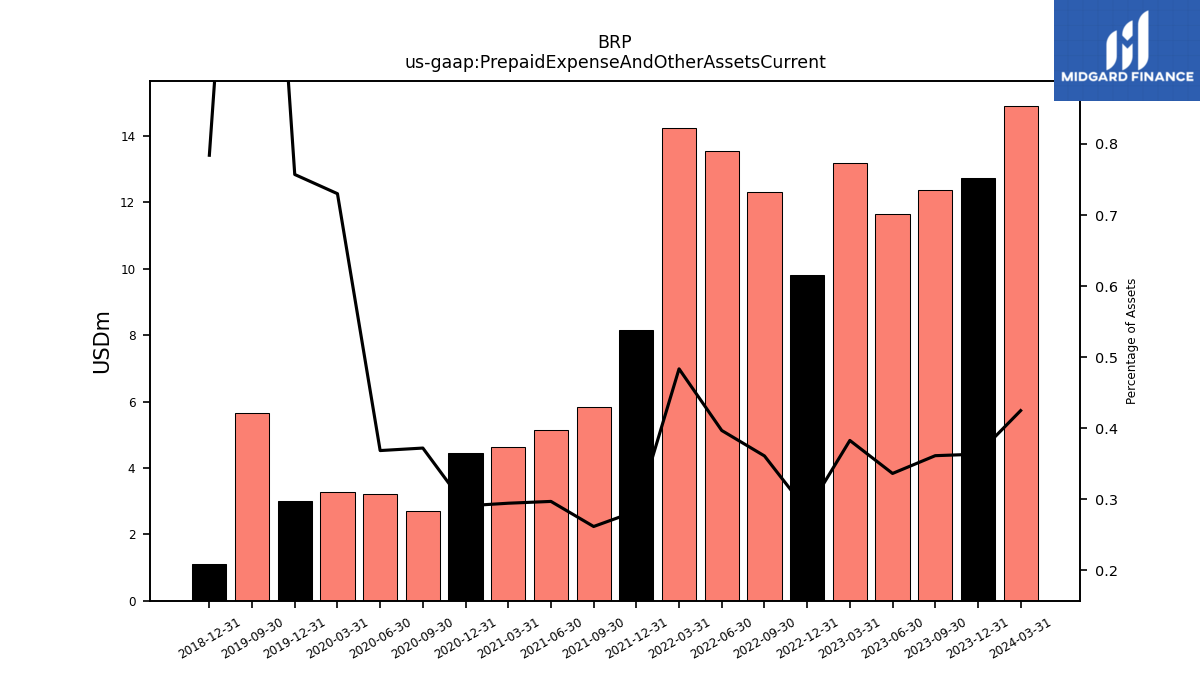
| Prepaid Expense And Other Assets Current | 14.91 | 13.20 |
| 2024-03-31 | 2023-03-31 | ||
|---|---|---|---|
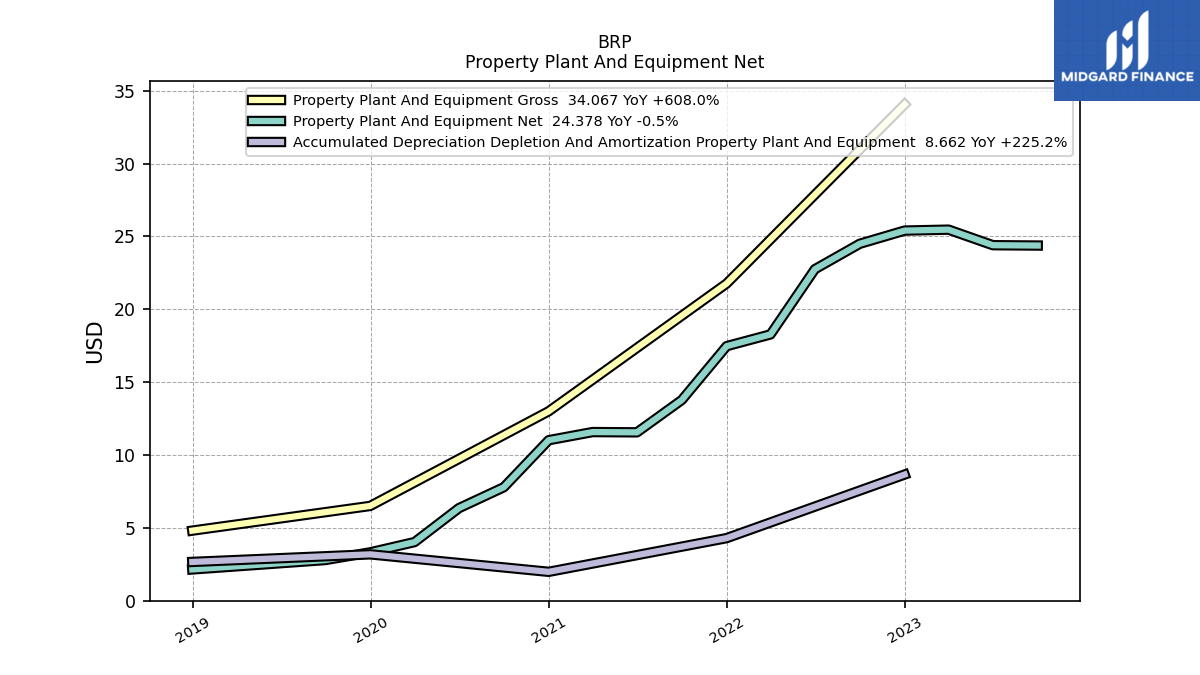
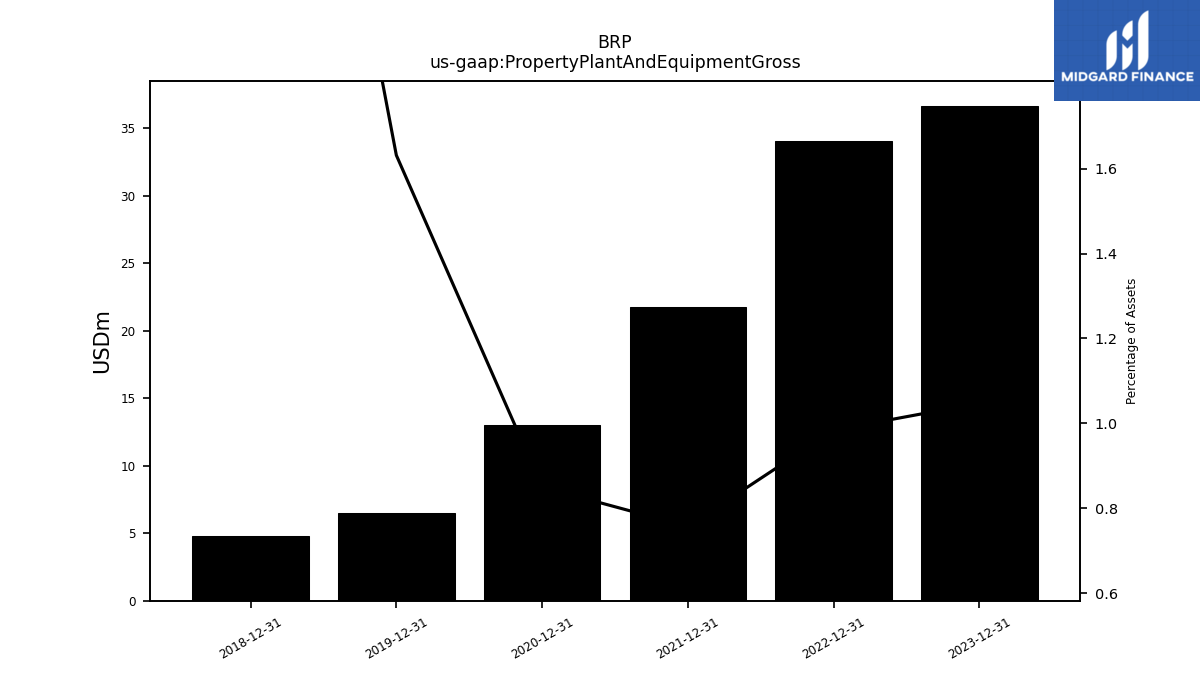
| Property Plant And Equipment Gross | NA | NA | |
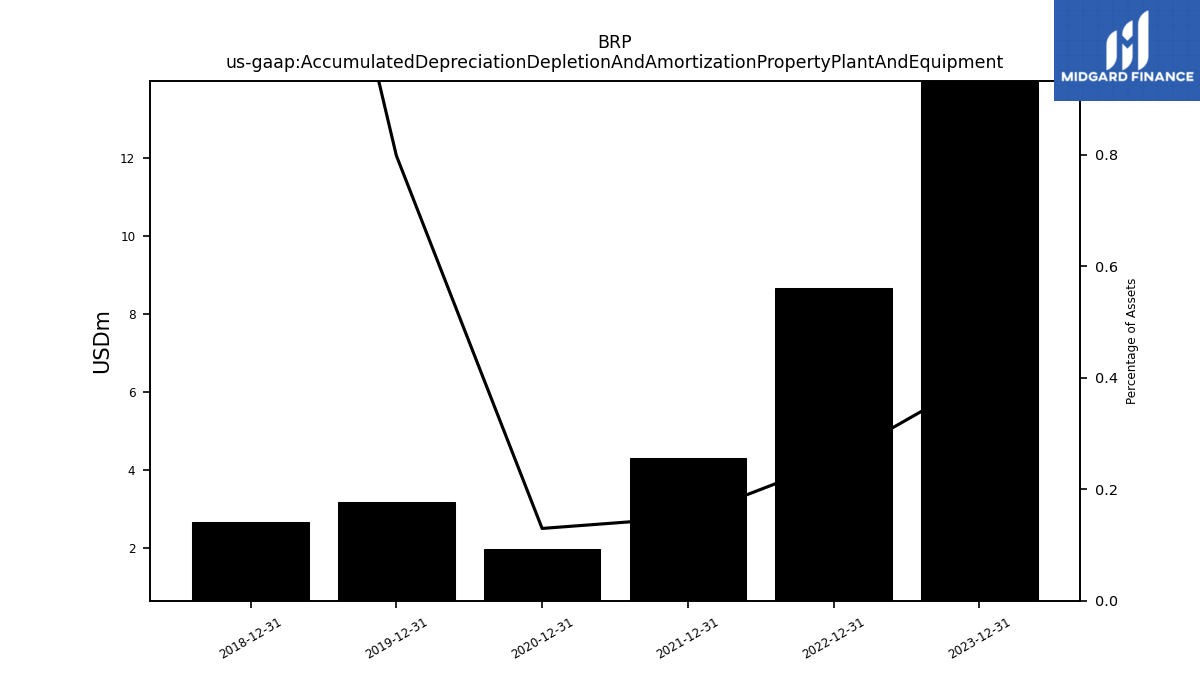
| Accumulated Depreciation Depletion And Amortization Property Plant And Equipment | NA | NA | |
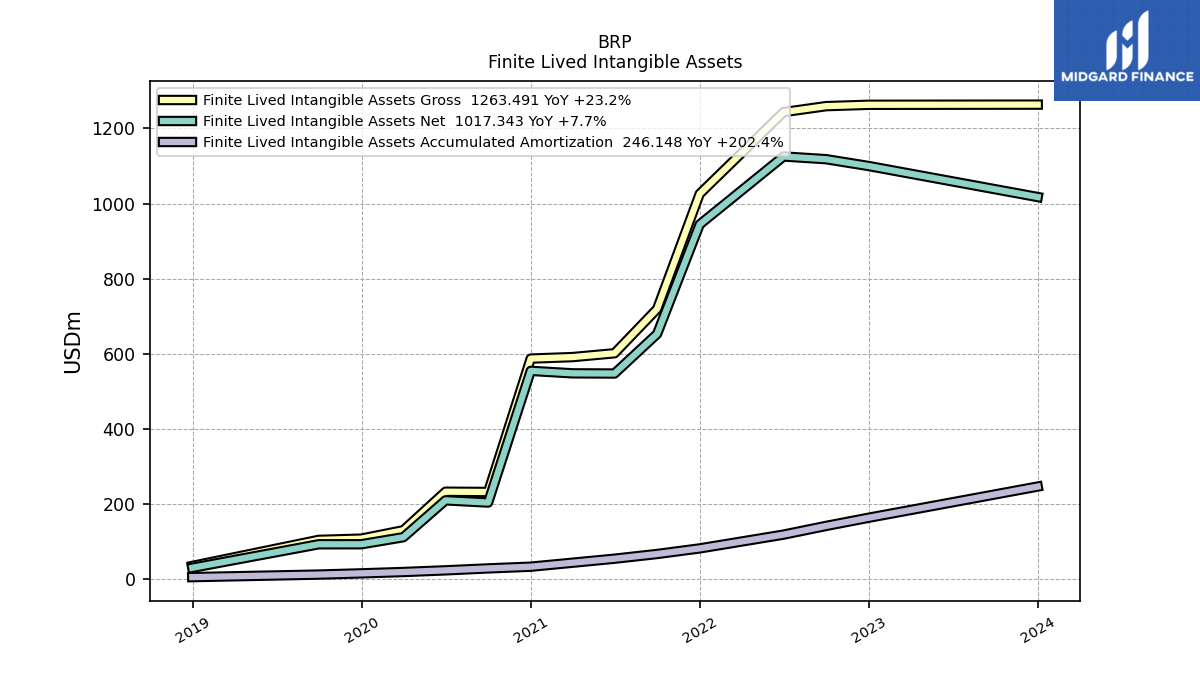
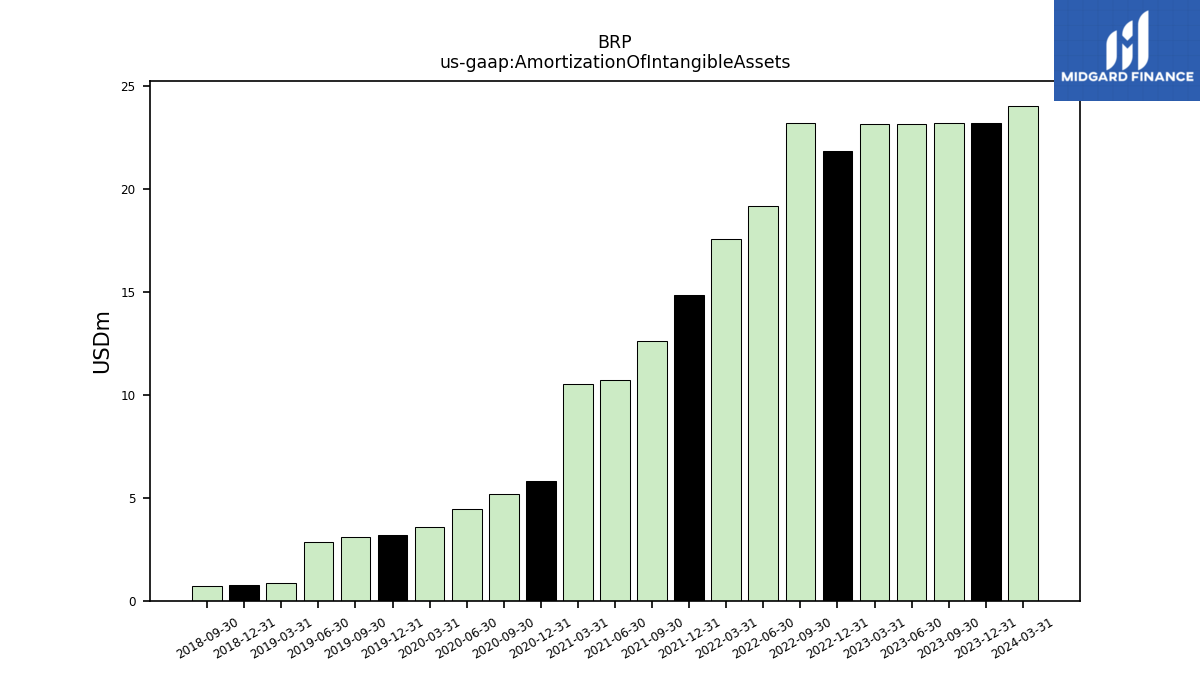
| Amortization Of Intangible Assets | 24.04 | 23.16 | |
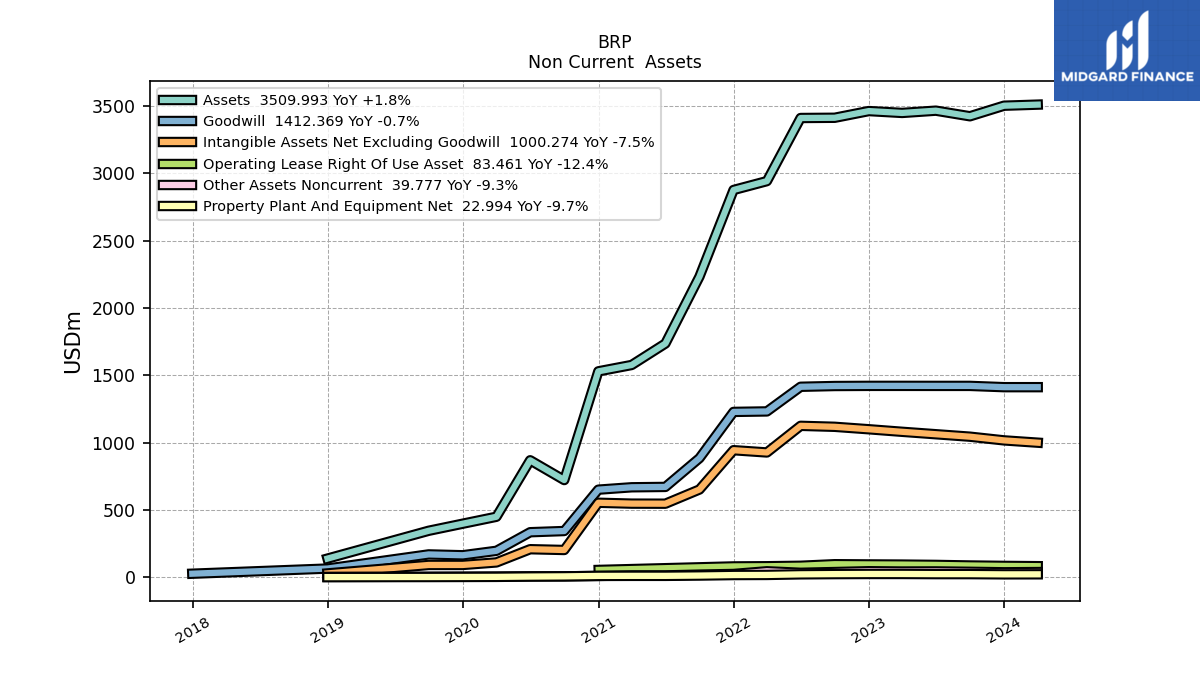
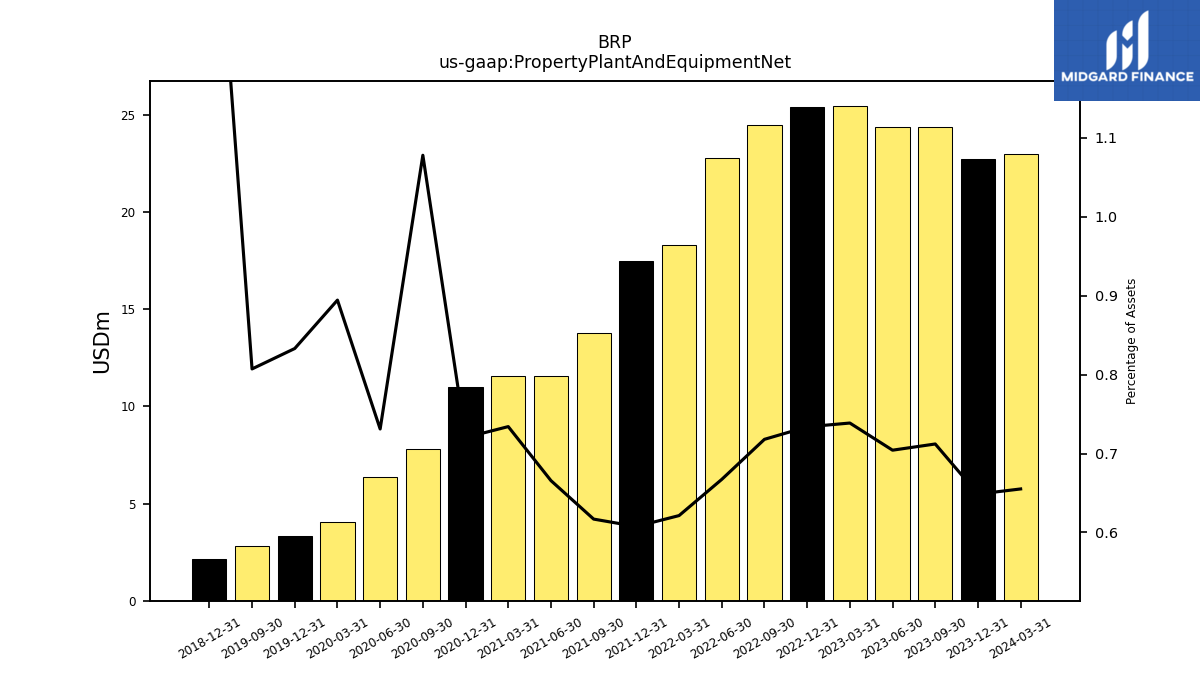
| Property Plant And Equipment Net | 22.99 | 25.47 | |
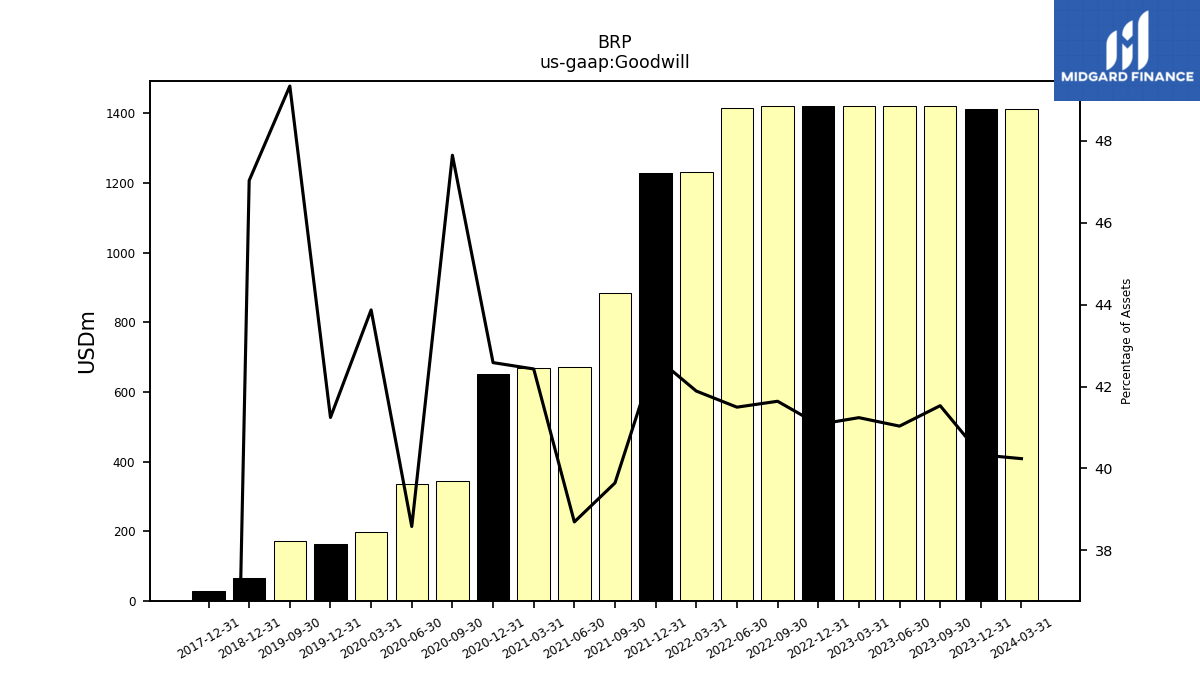
| Goodwill | 1412.37 | 1422.06 | |
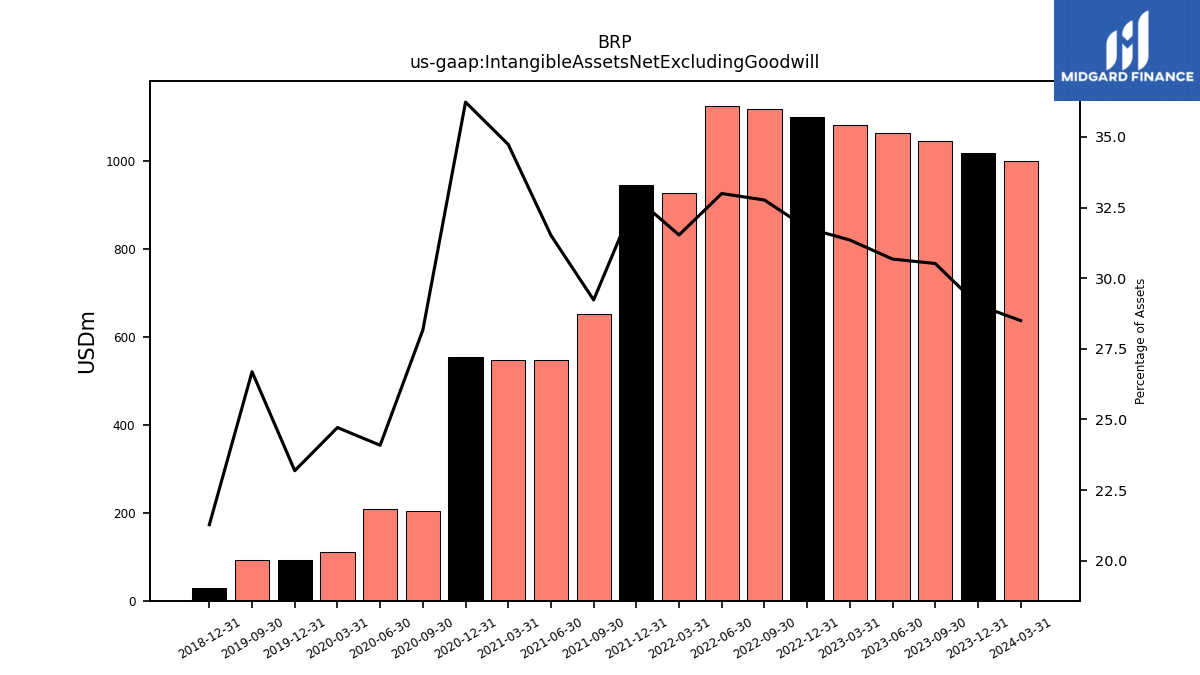
| Intangible Assets Net Excluding Goodwill | 1000.27 | 1081.07 | |
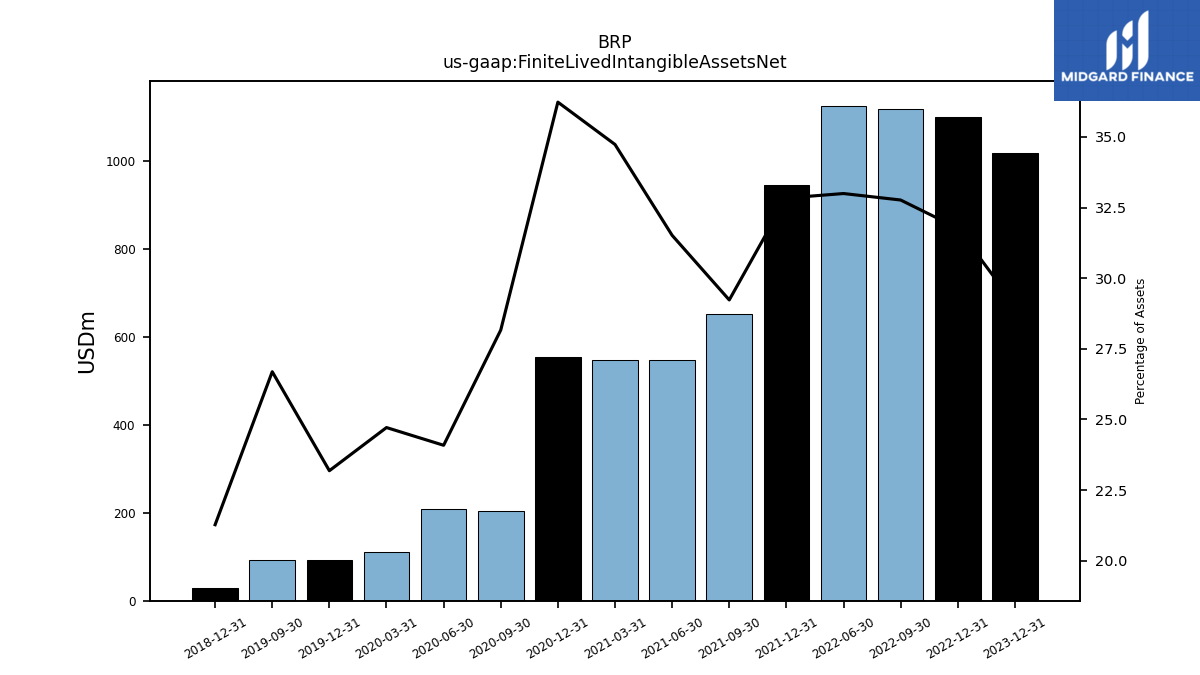
| Finite Lived Intangible Assets Net | NA | NA | |
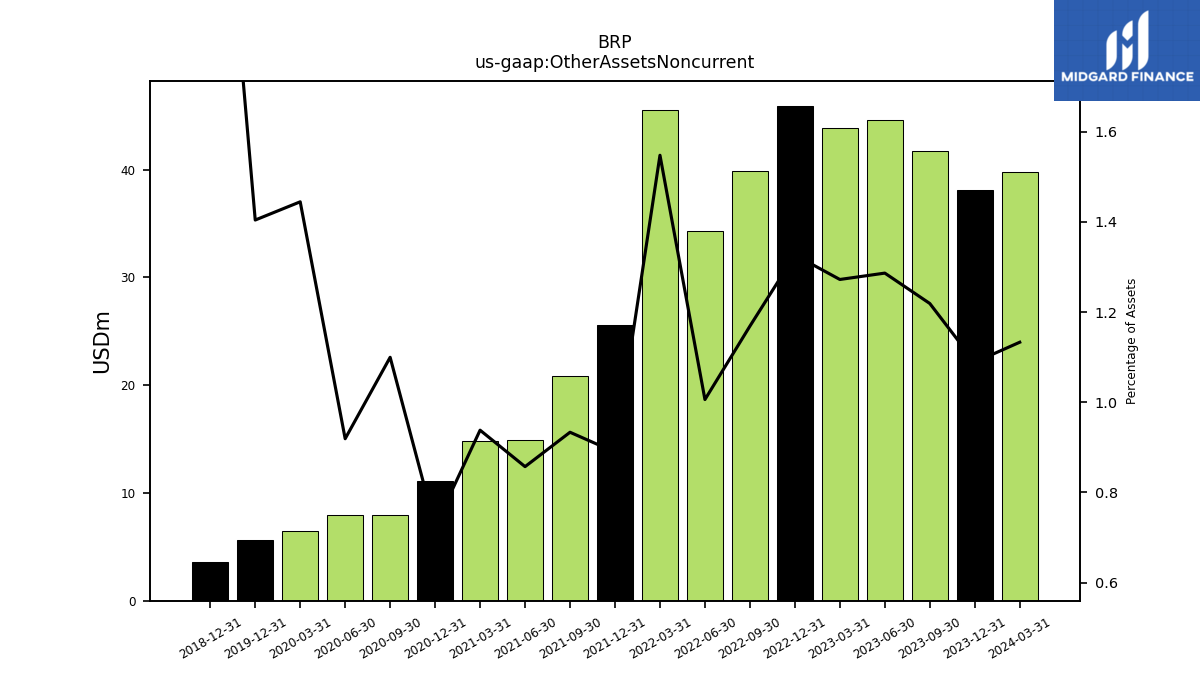
| Other Assets Noncurrent | 39.78 | 43.88 |
| 2024-03-31 | 2023-03-31 | ||
|---|---|---|---|
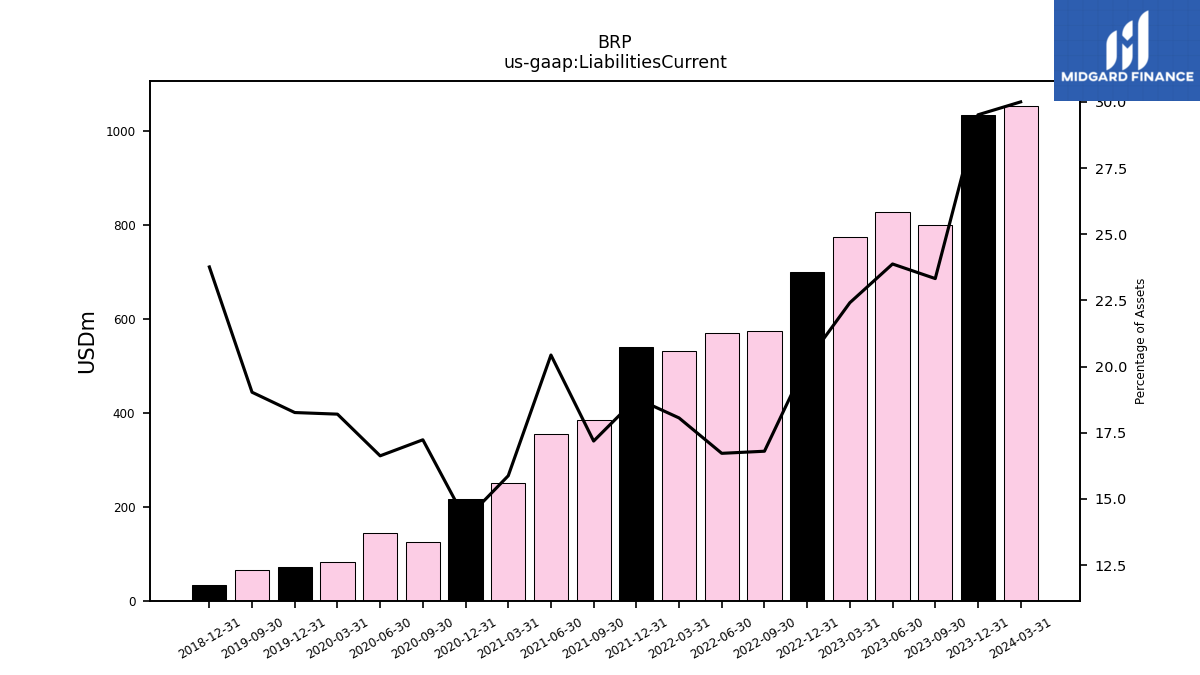
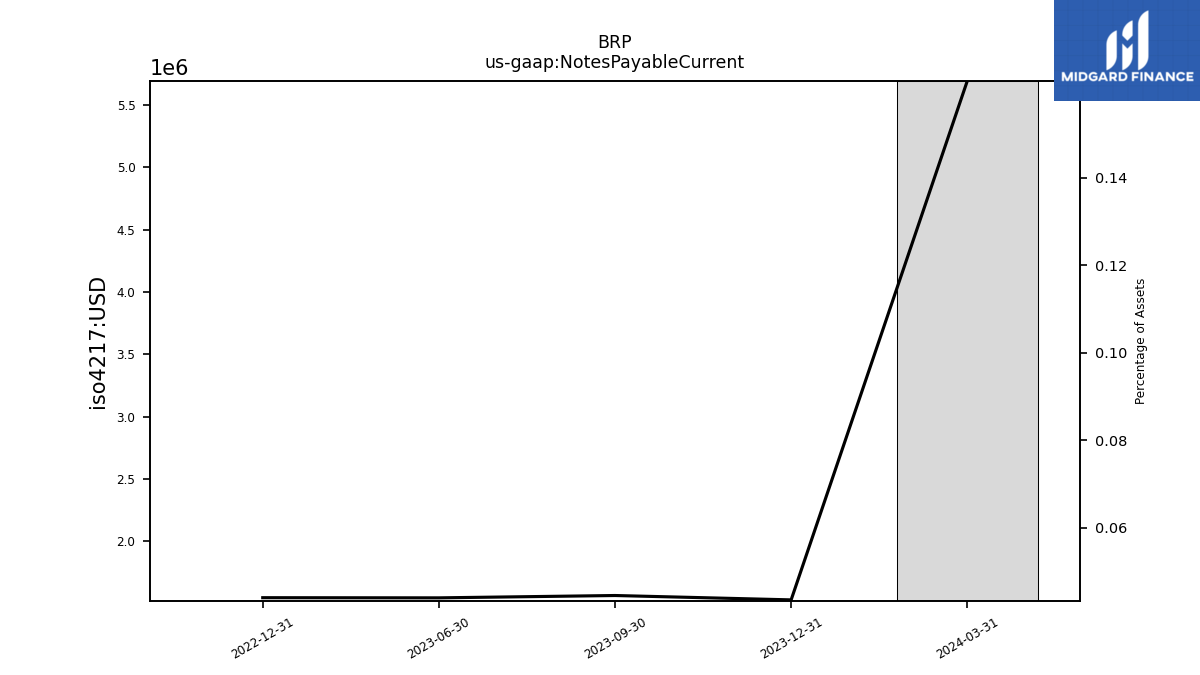
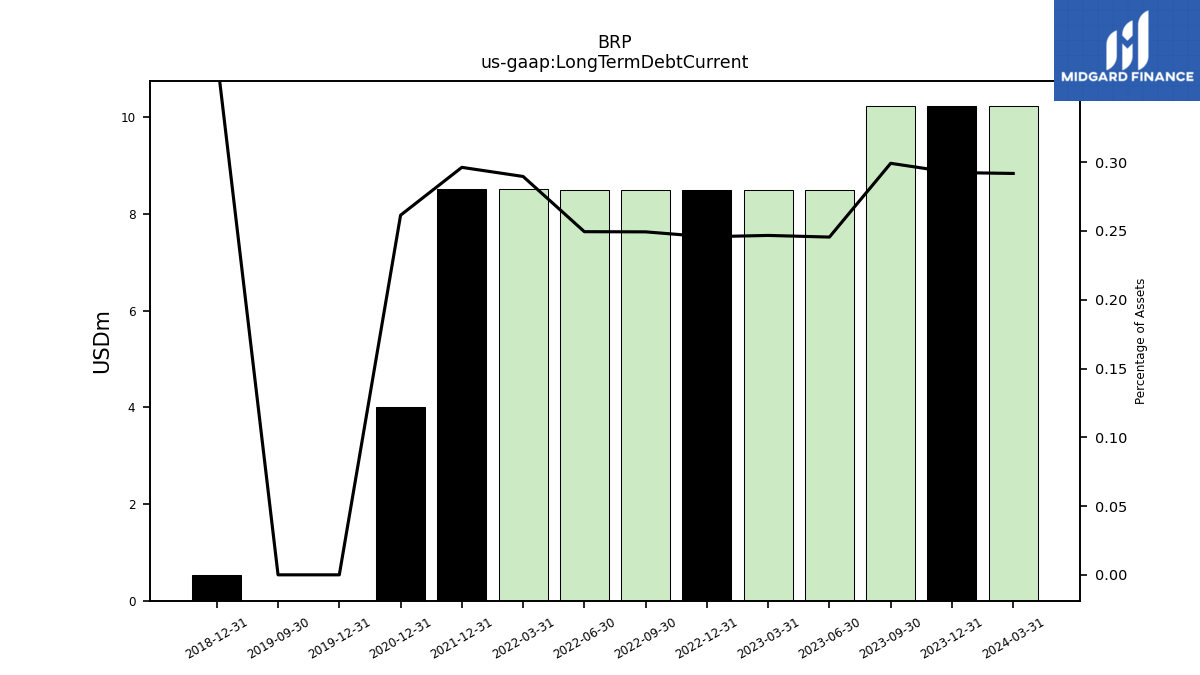
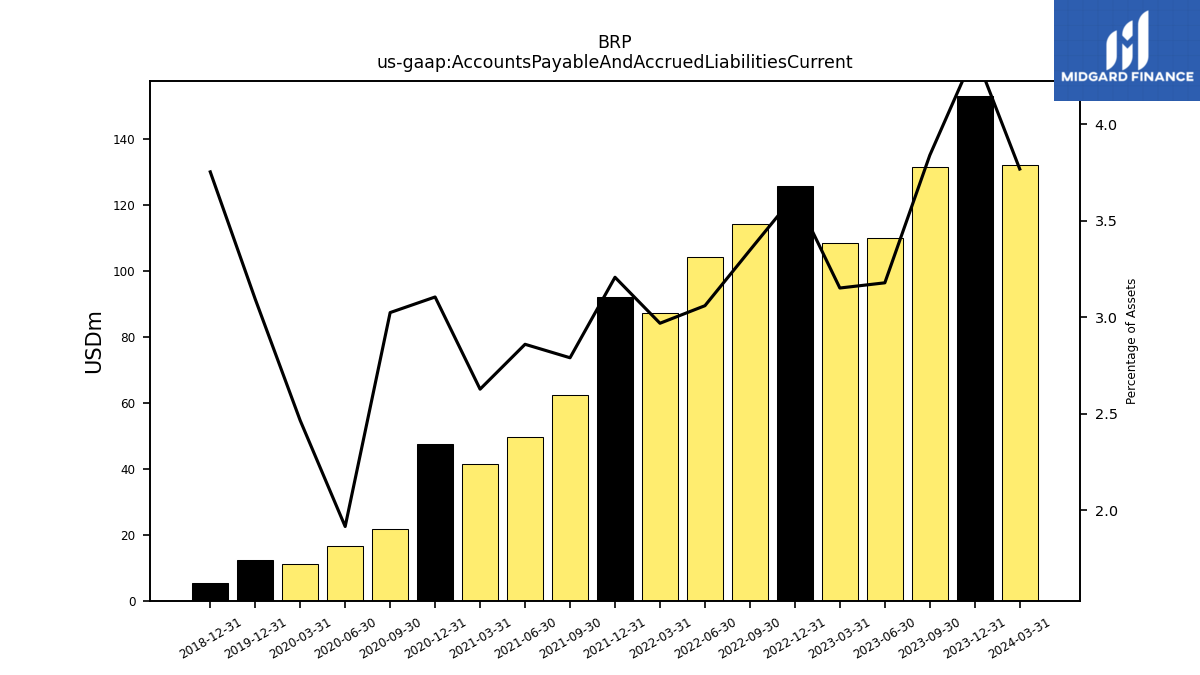
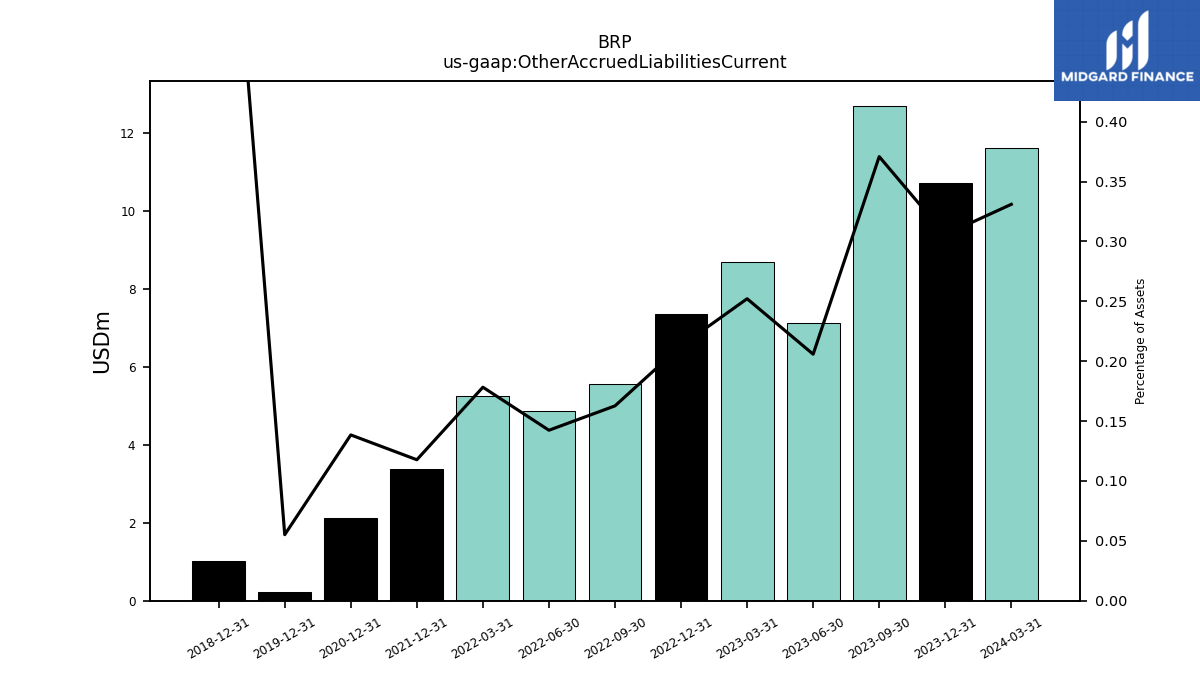
| Liabilities Current | 1052.97 | 772.82 | |
| Notes Payable Current | 5.69 | NA | |
| Long Term Debt Current | 10.24 | 8.51 | |
| Accounts Payable And Accrued Liabilities Current | 132.23 | 108.64 | |
| Other Accrued Liabilities Current | 11.62 | 8.69 | |
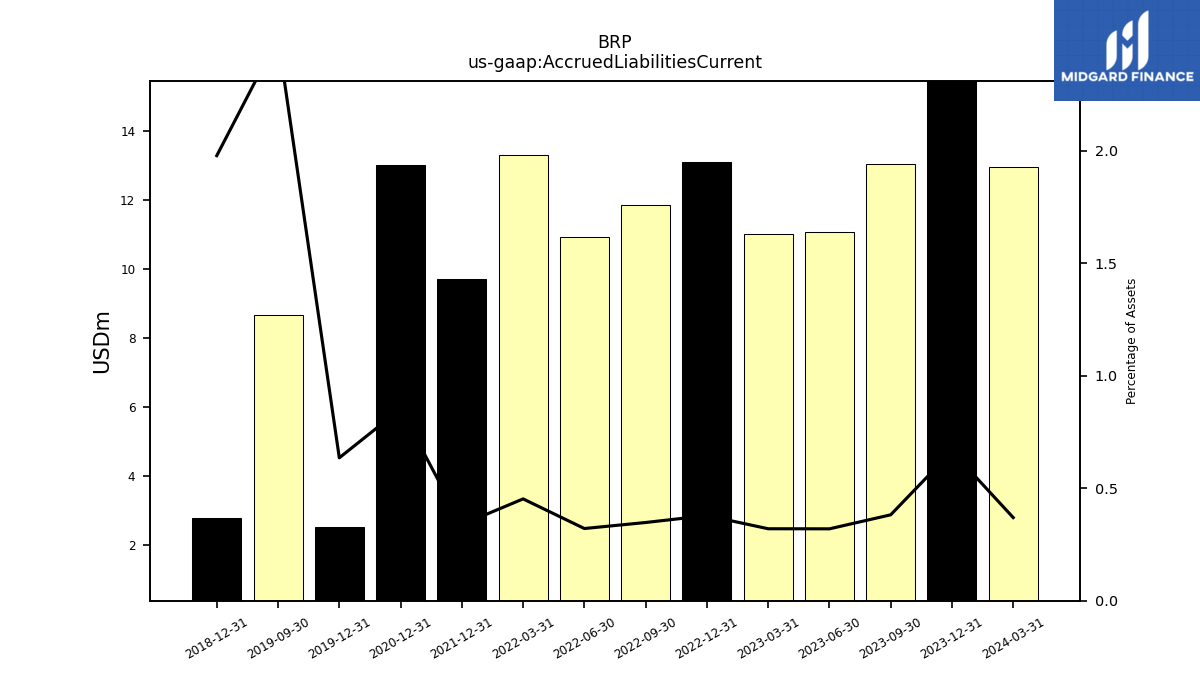
| Accrued Liabilities Current | 12.97 | 11.03 | |
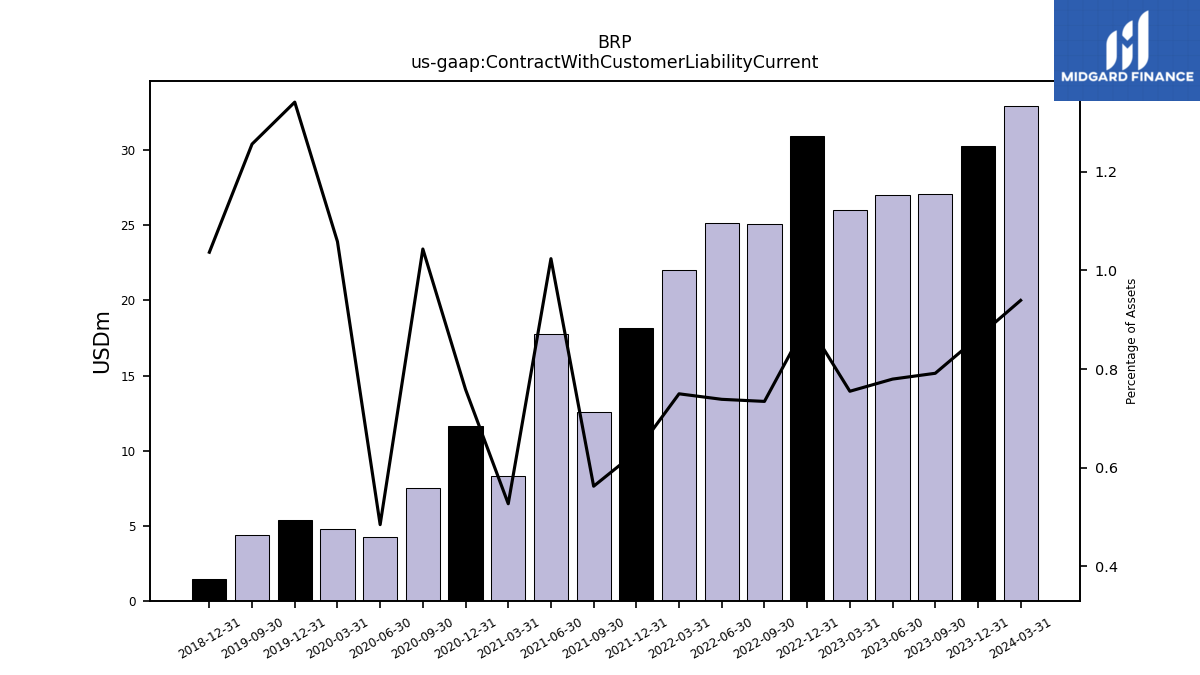
| Contract With Customer Liability Current | 32.97 | 26.03 |
| 2024-03-31 | 2023-03-31 | ||
|---|---|---|---|
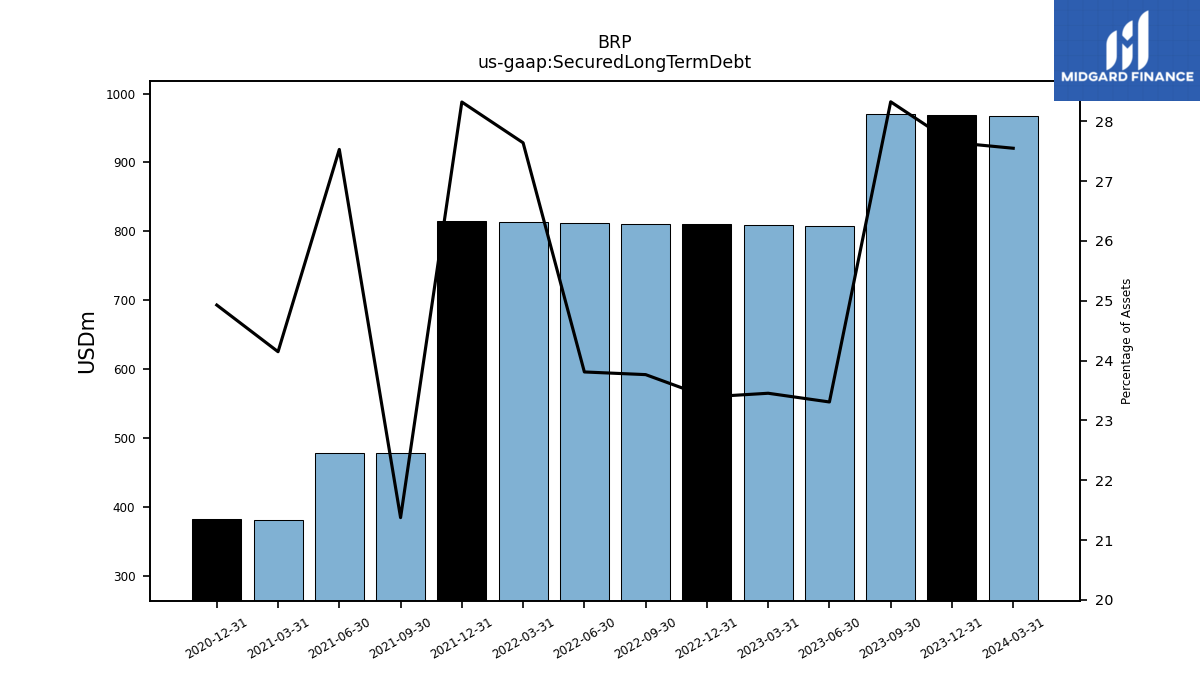
| Secured Long Term Debt | 966.96 | 808.76 | |
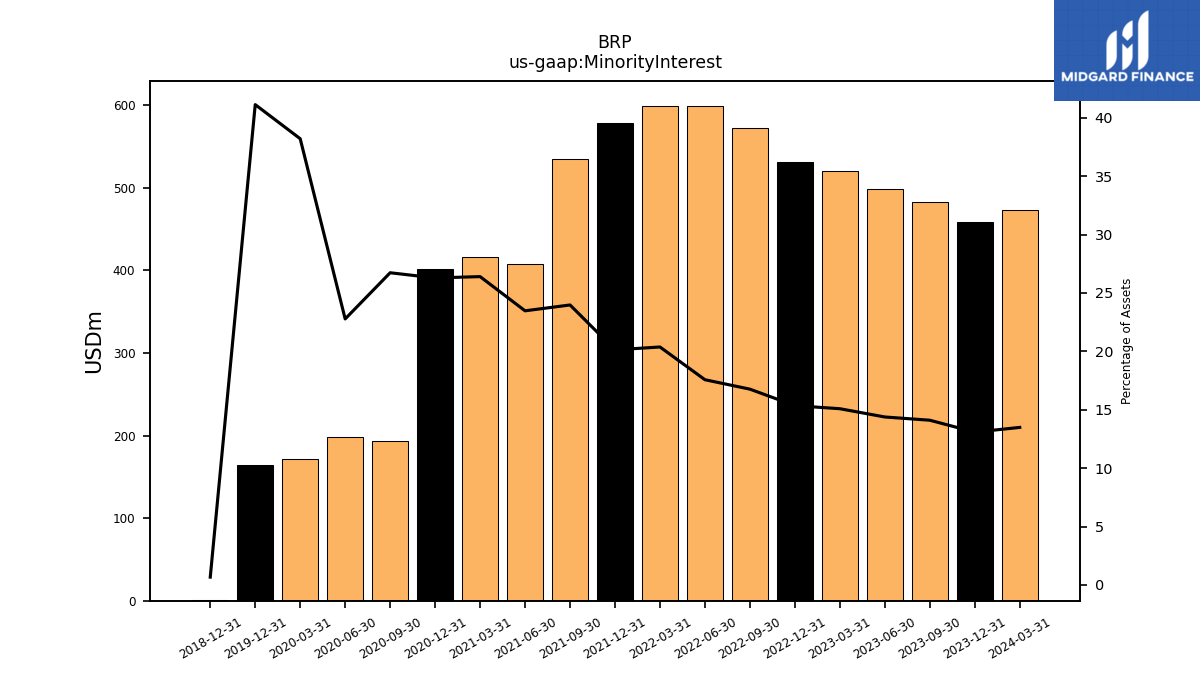
| Minority Interest | 473.38 | 520.21 | |
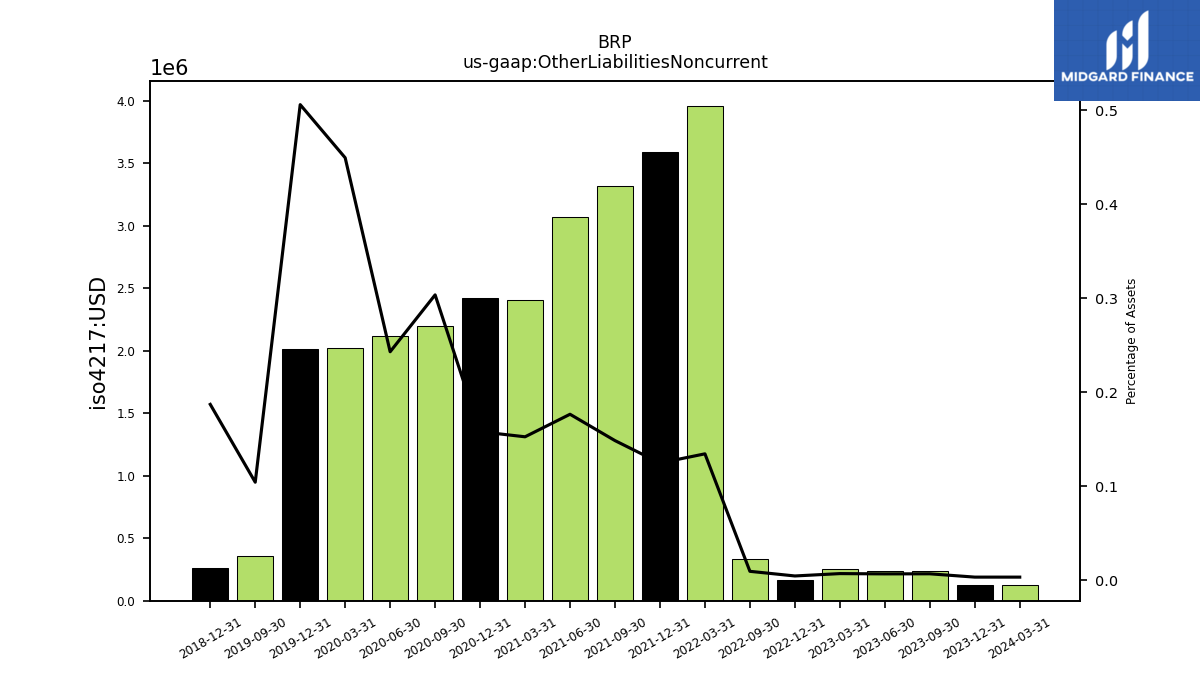
| Other Liabilities Noncurrent | 0.12 | 0.25 | |
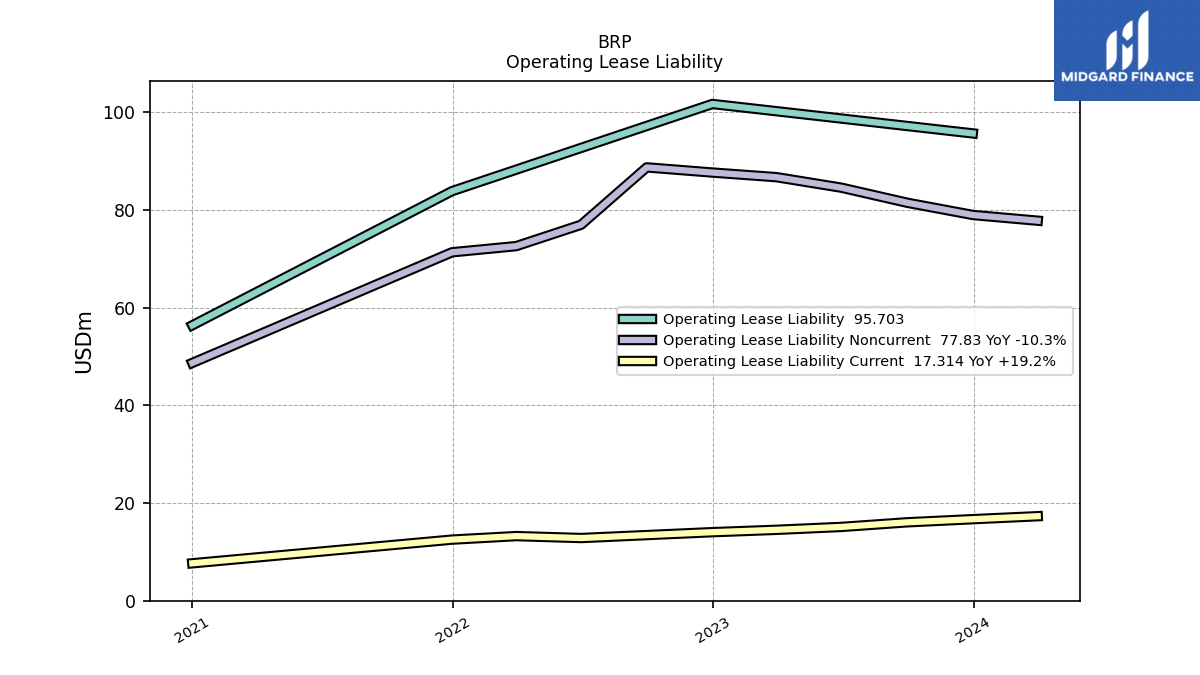
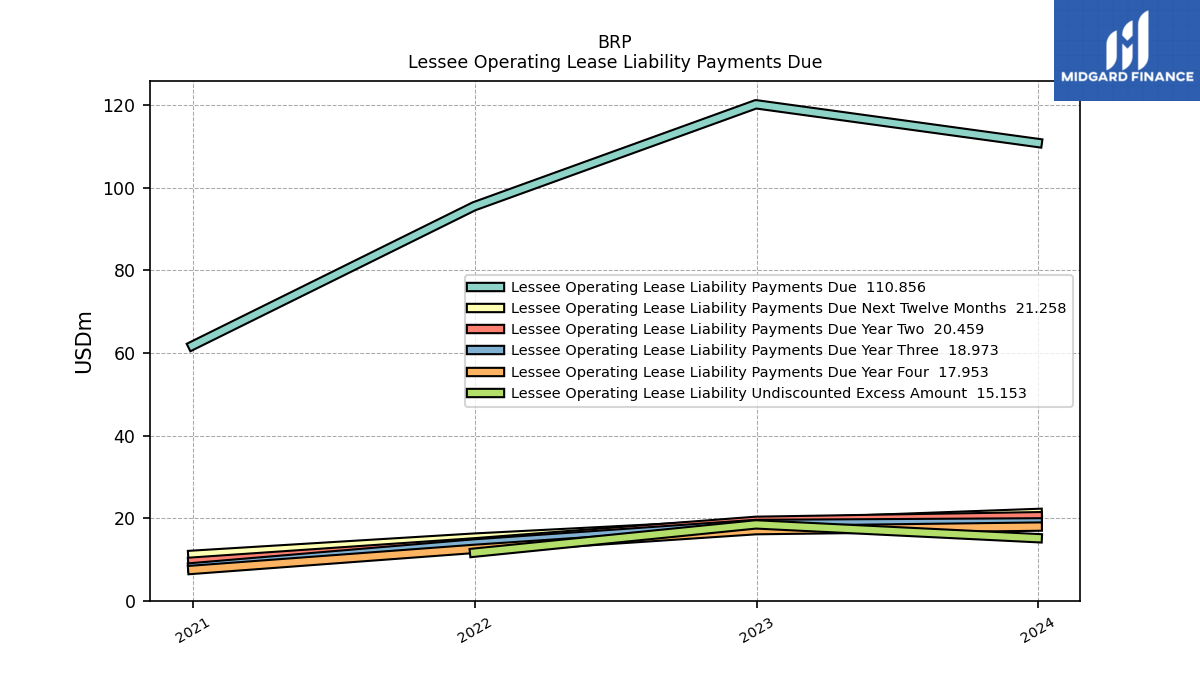
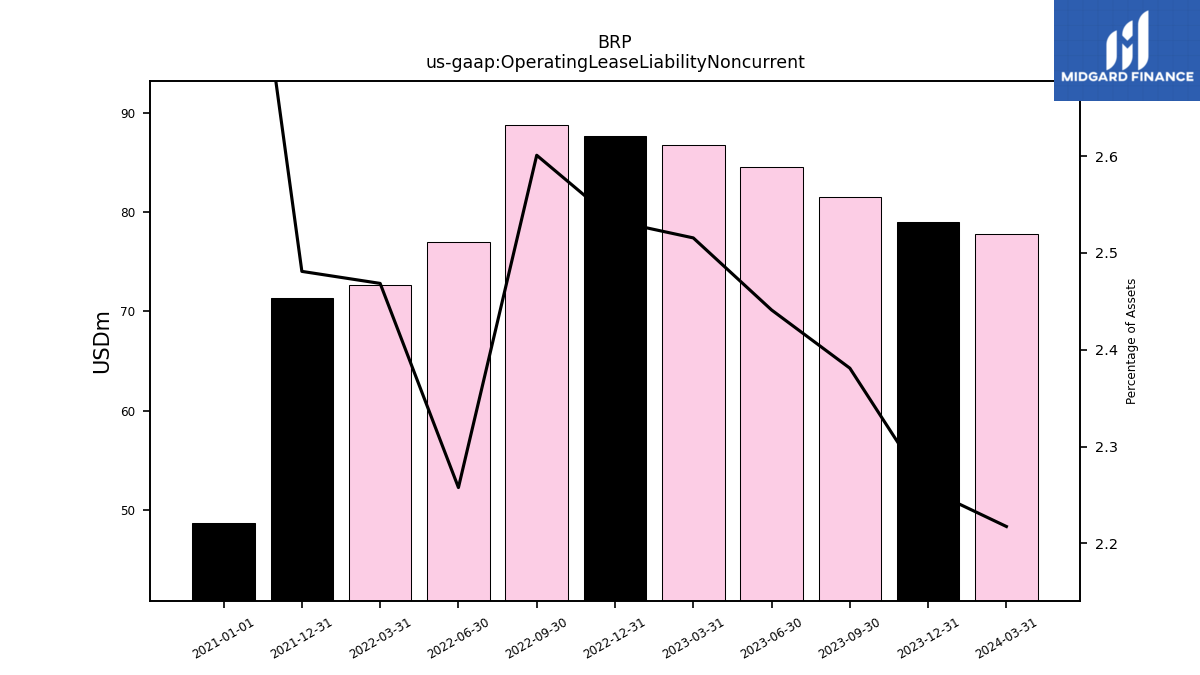
| Operating Lease Liability Noncurrent | 77.83 | 86.74 |
| 2024-03-31 | 2023-03-31 | ||
|---|---|---|---|
| Stockholders Equity | 597.94 | 606.36 | |
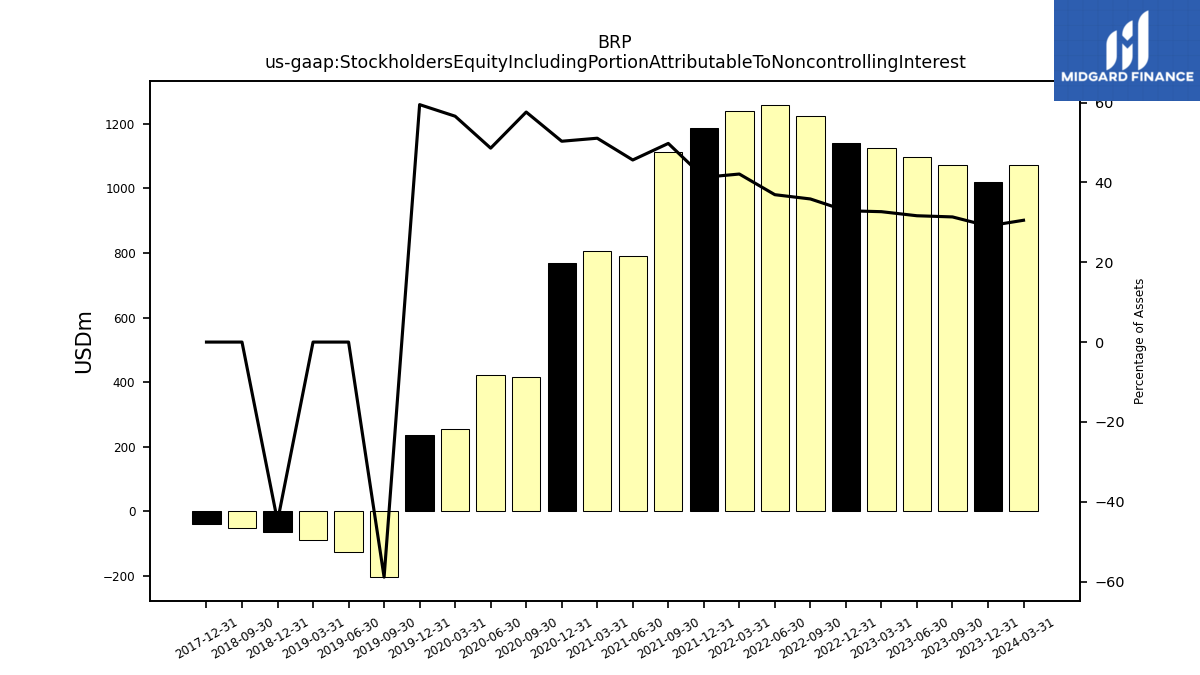
| Stockholders Equity Including Portion Attributable To Noncontrolling Interest | 1071.32 | 1126.57 | |
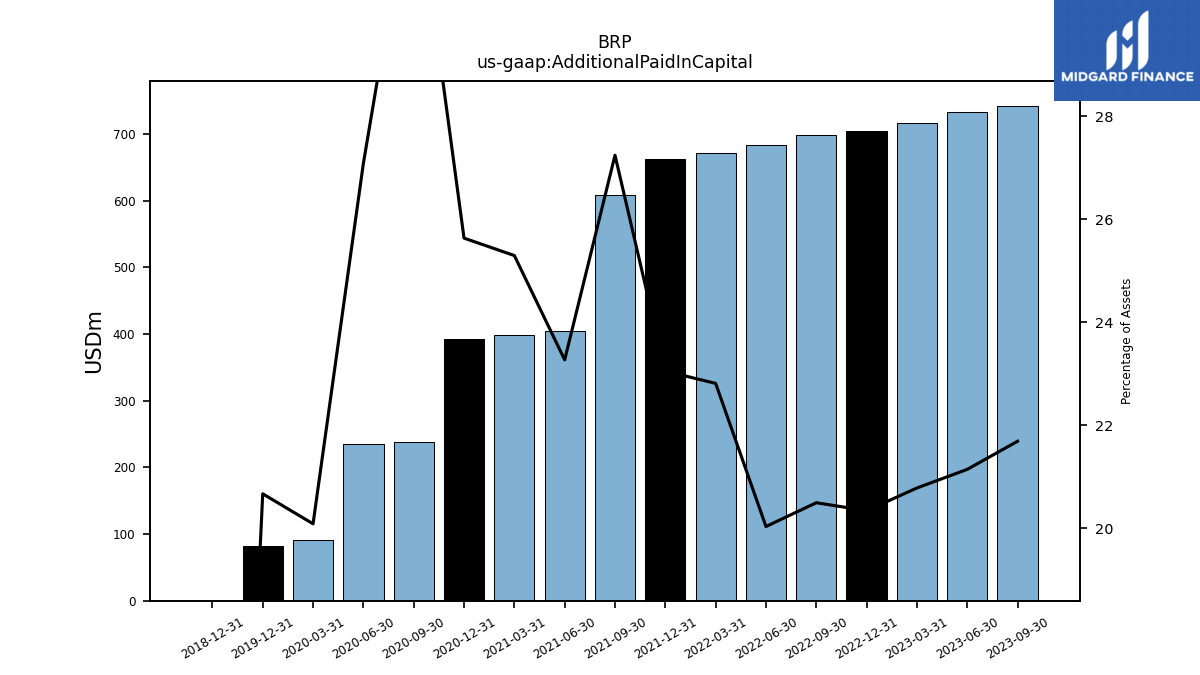
| Additional Paid In Capital | 762.61 | 716.64 | |
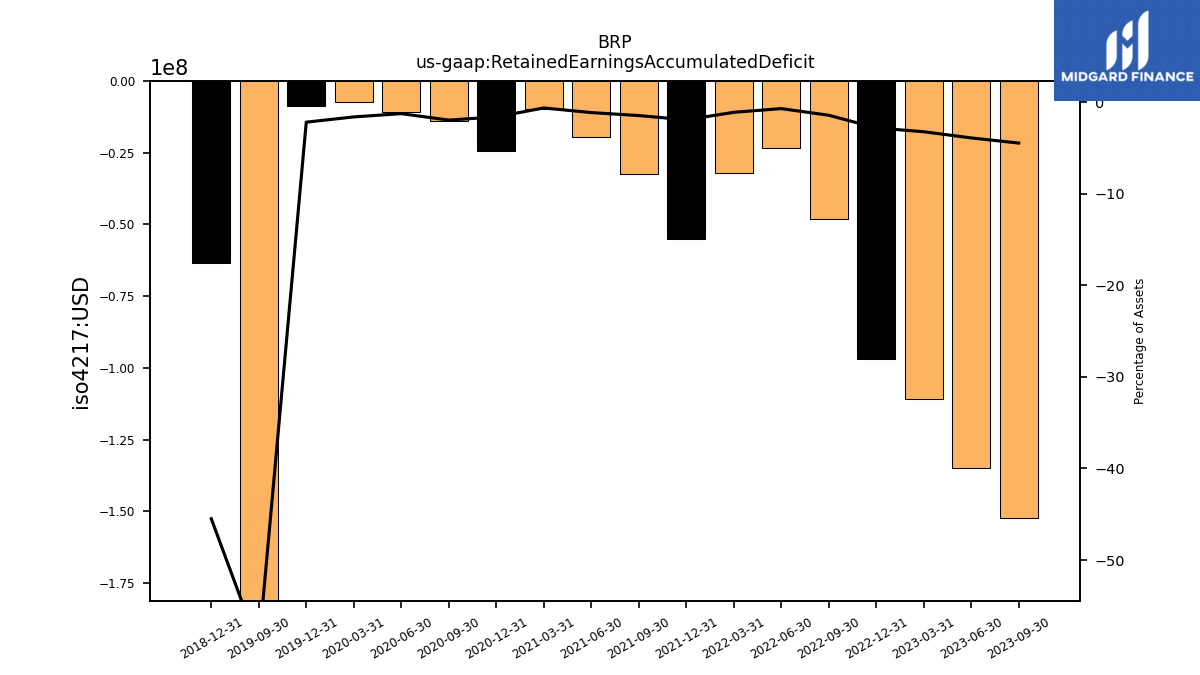
| Retained Earnings Accumulated Deficit | -165.33 | -110.90 | |
| Minority Interest | 473.38 | 520.21 | |
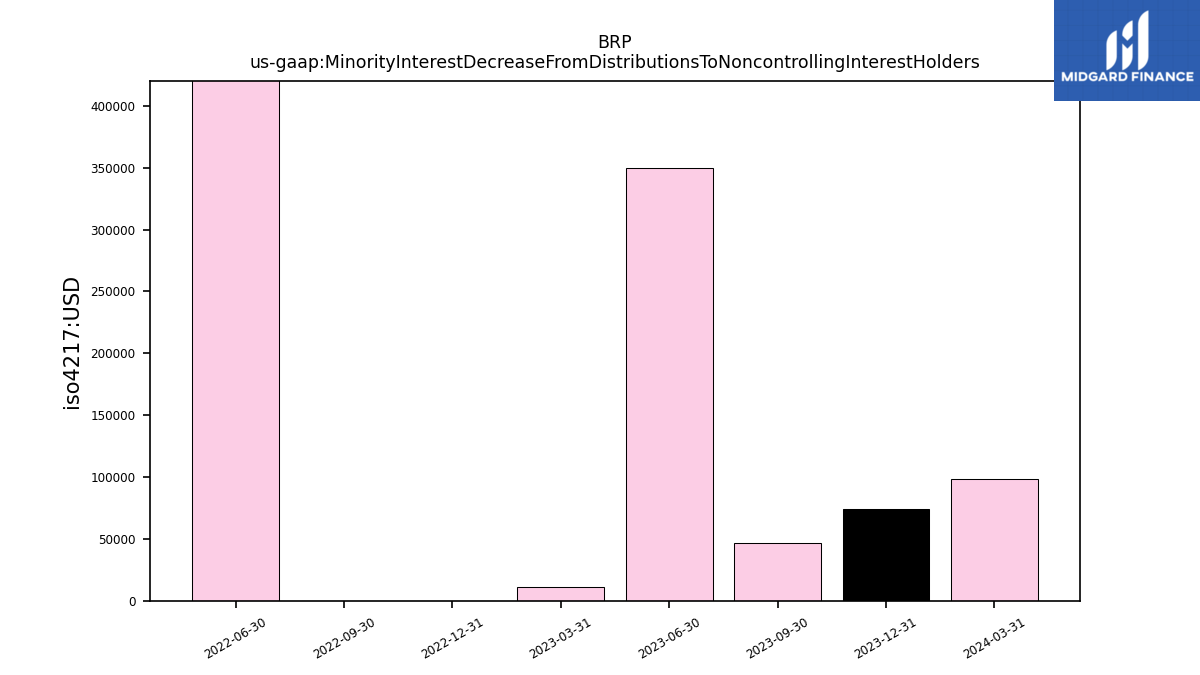
| Minority Interest Decrease From Distributions To Noncontrolling Interest Holders | 0.10 | 0.01 |
| 2024-03-31 | 2023-03-31 | ||
|---|---|---|---|
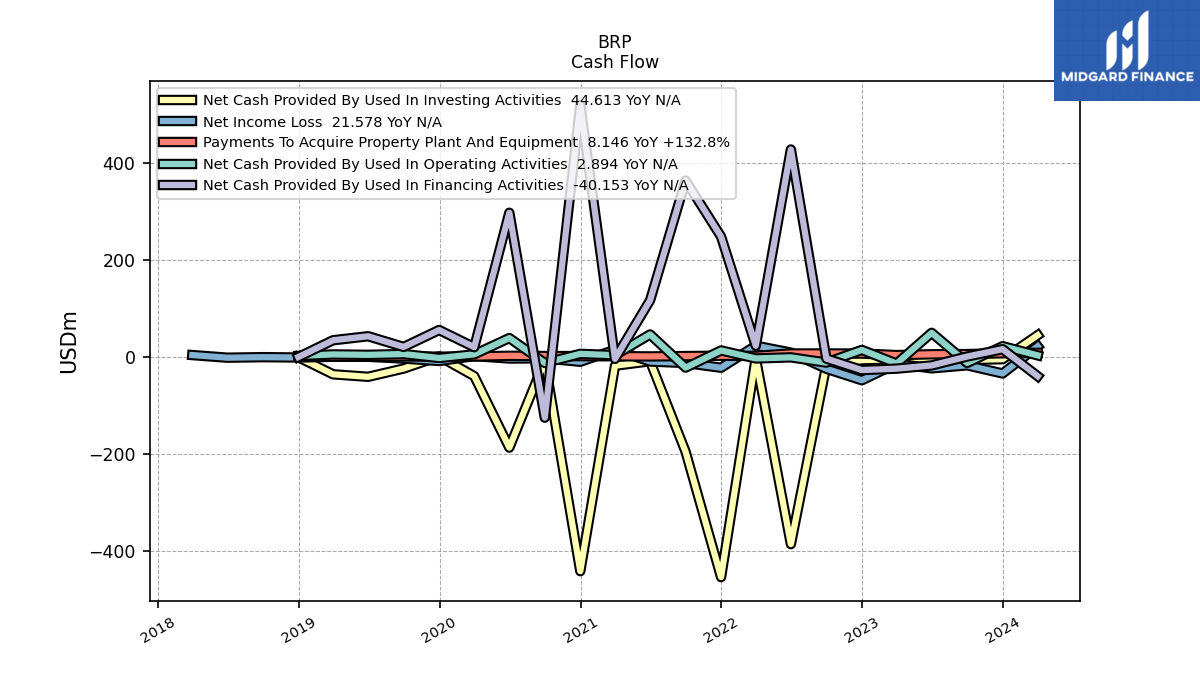
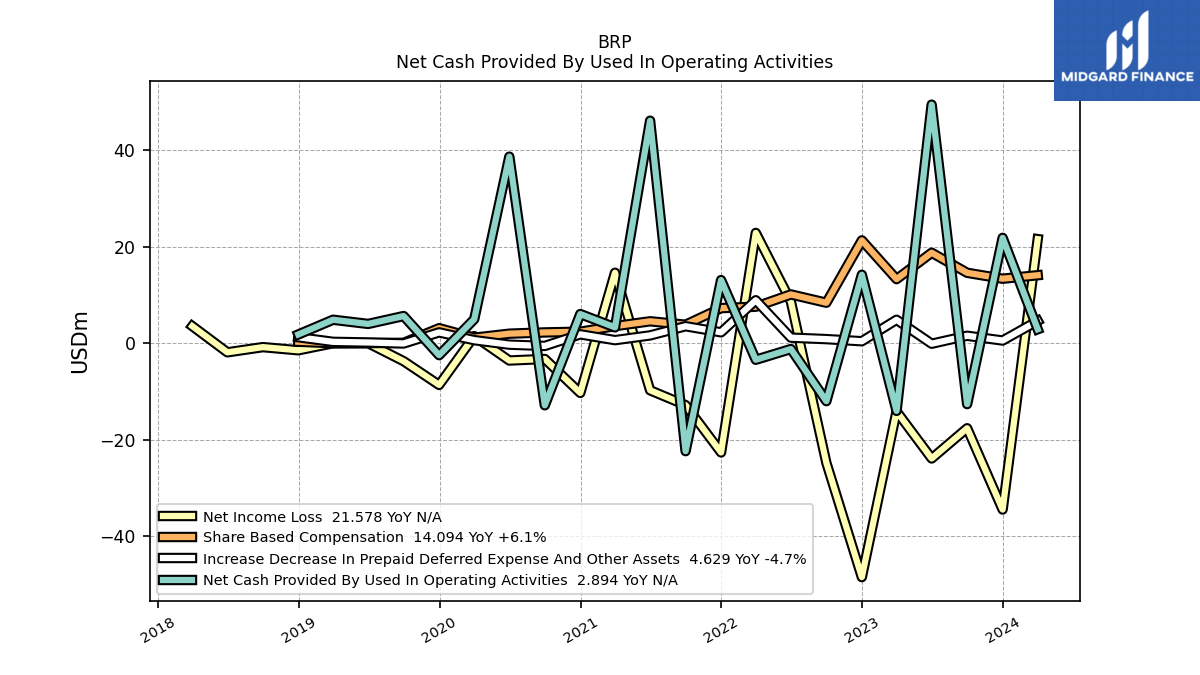
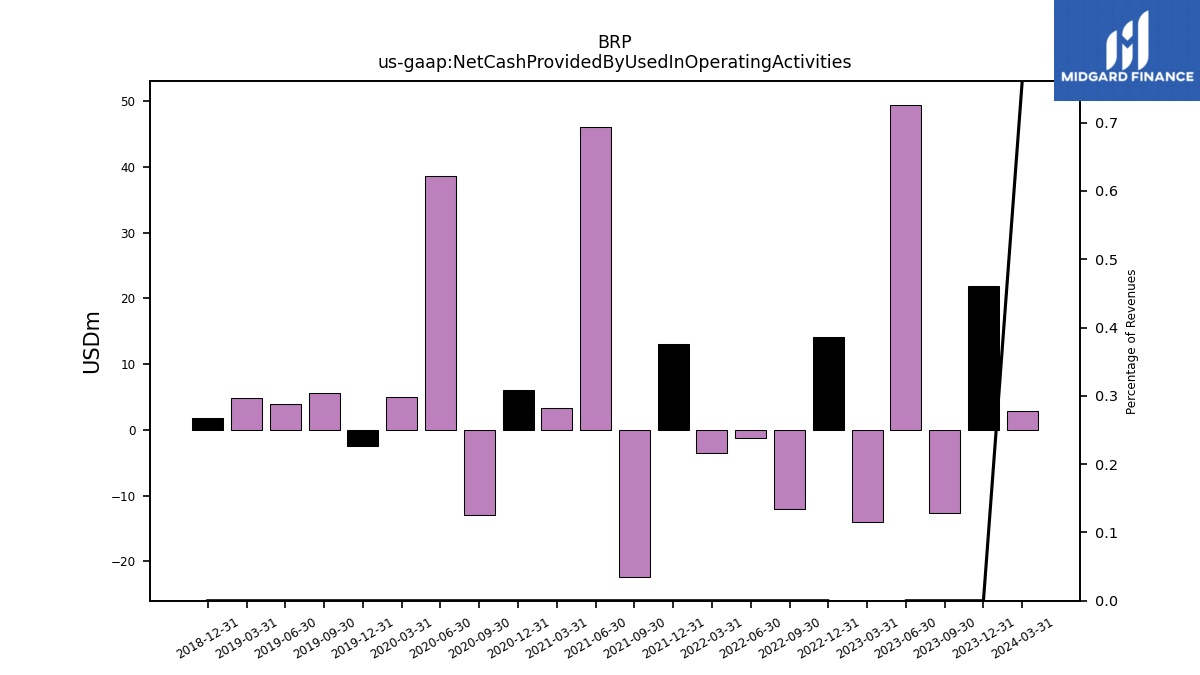
| Net Cash Provided By Used In Operating Activities | 2.89 | -14.03 | |
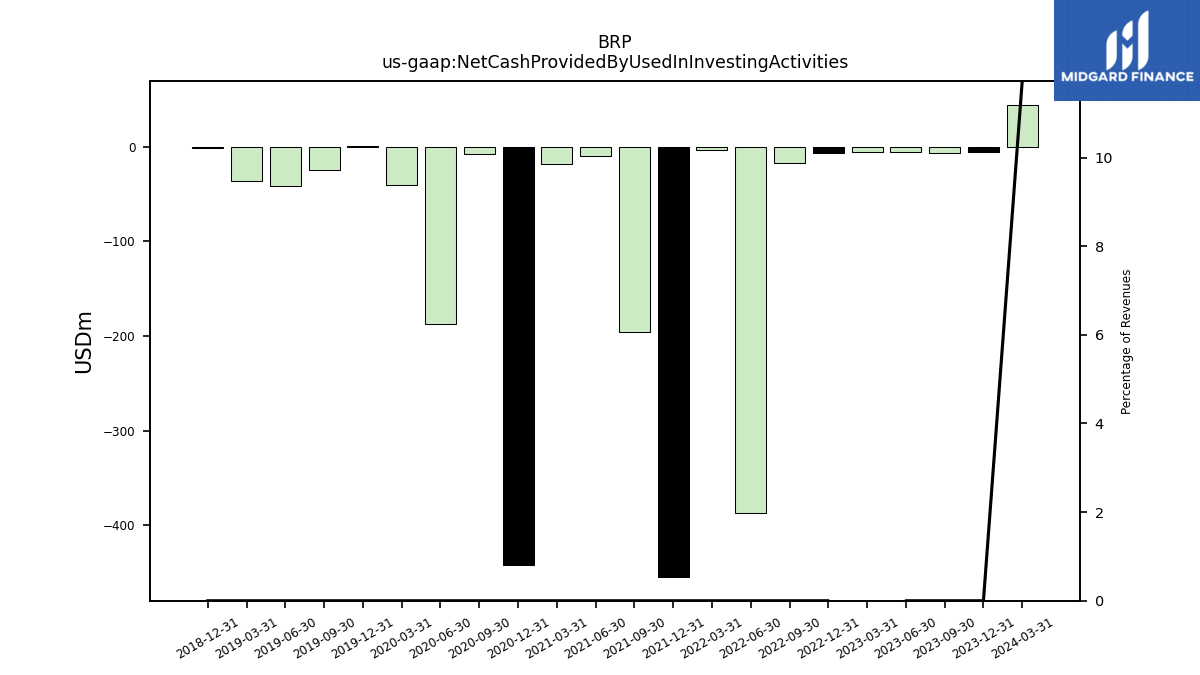
| Net Cash Provided By Used In Investing Activities | 44.61 | -5.10 | |
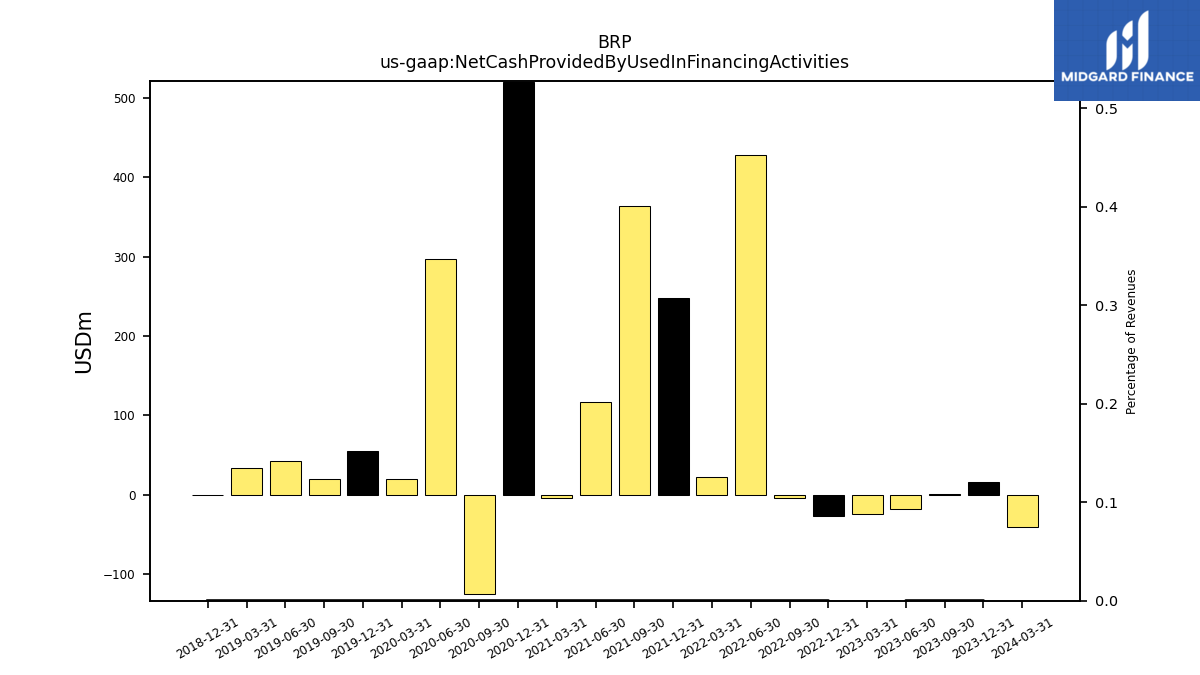
| Net Cash Provided By Used In Financing Activities | -40.15 | -24.52 |
| 2024-03-31 | 2023-03-31 | ||
|---|---|---|---|
| Net Cash Provided By Used In Operating Activities | 2.89 | -14.03 | |
| Net Income Loss | 21.58 | -14.13 | |
| Profit Loss | 39.10 | -25.85 | |
| Share Based Compensation | 14.09 | 13.28 | |
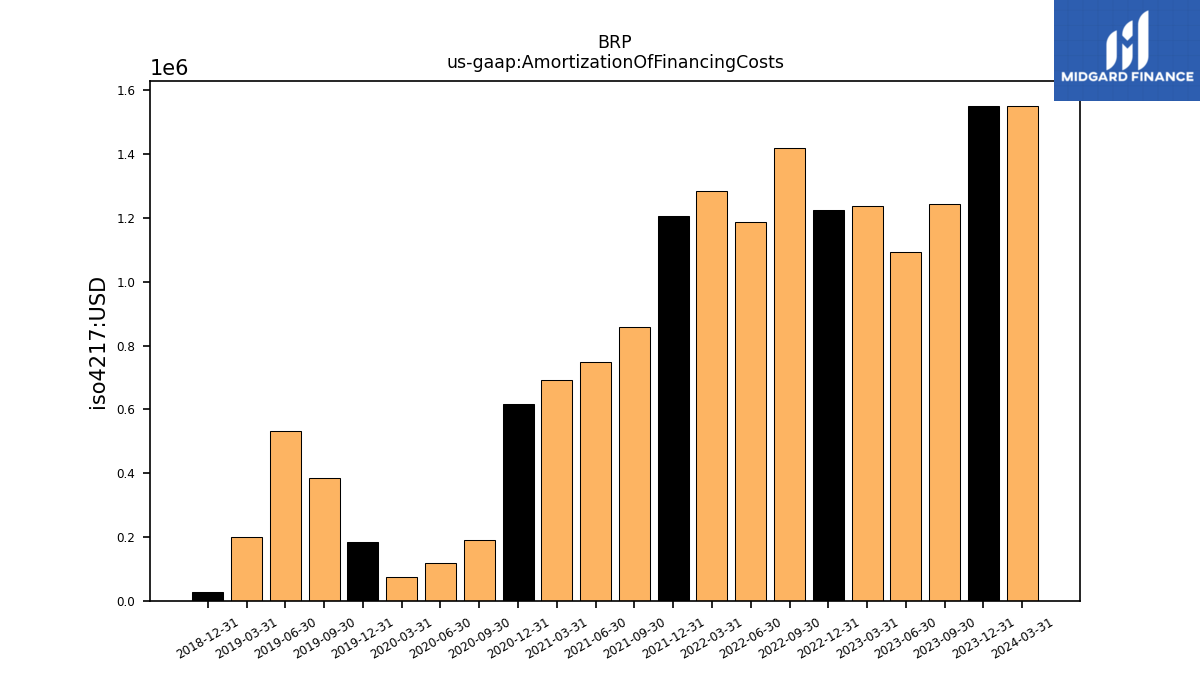
| Amortization Of Financing Costs | 1.55 | 1.24 |
| 2024-03-31 | 2023-03-31 | ||
|---|---|---|---|
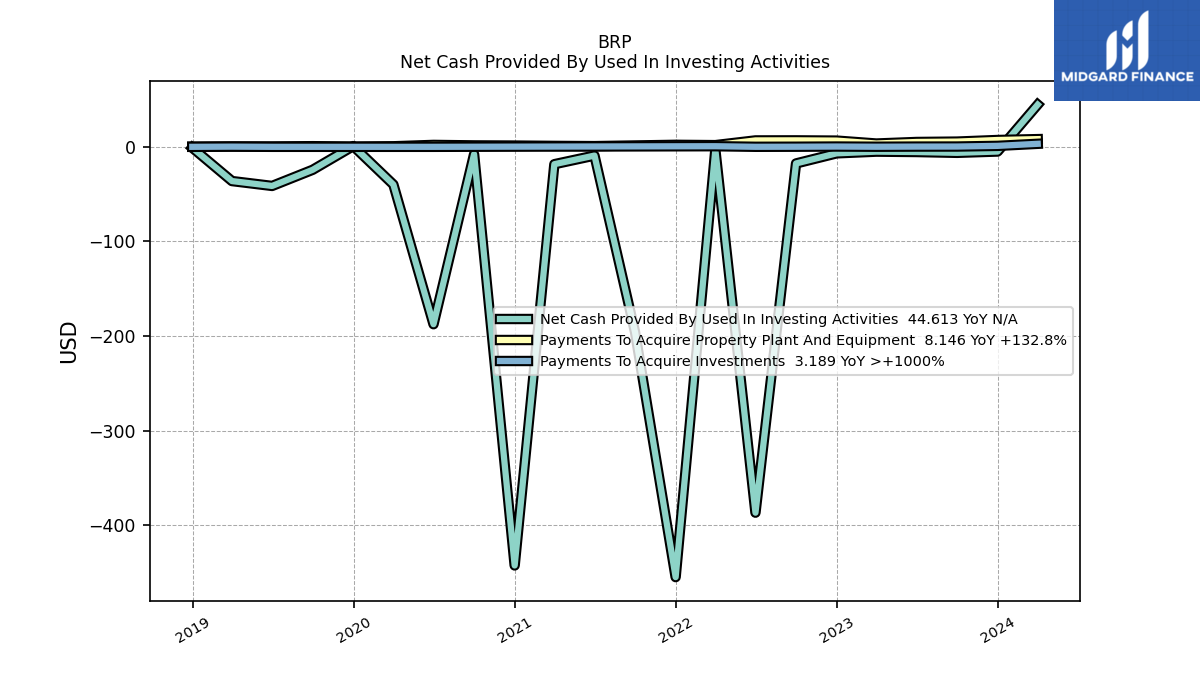
| Net Cash Provided By Used In Investing Activities | 44.61 | -5.10 | |
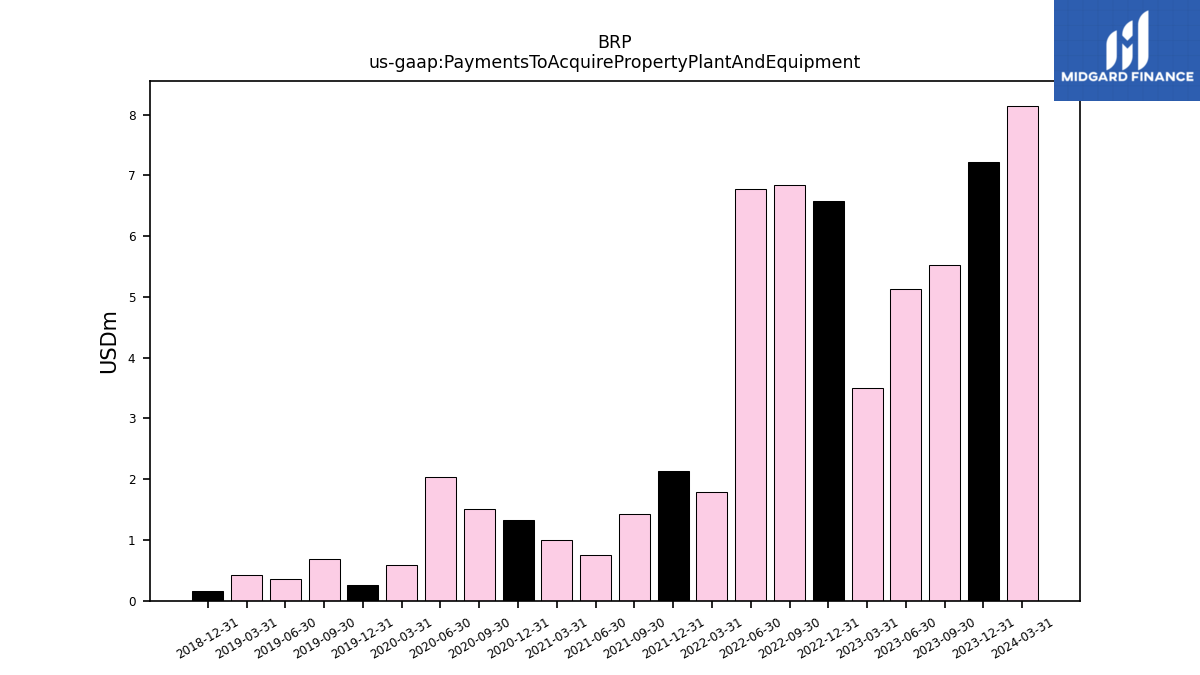
| Payments To Acquire Property Plant And Equipment | 8.15 | 3.50 | |
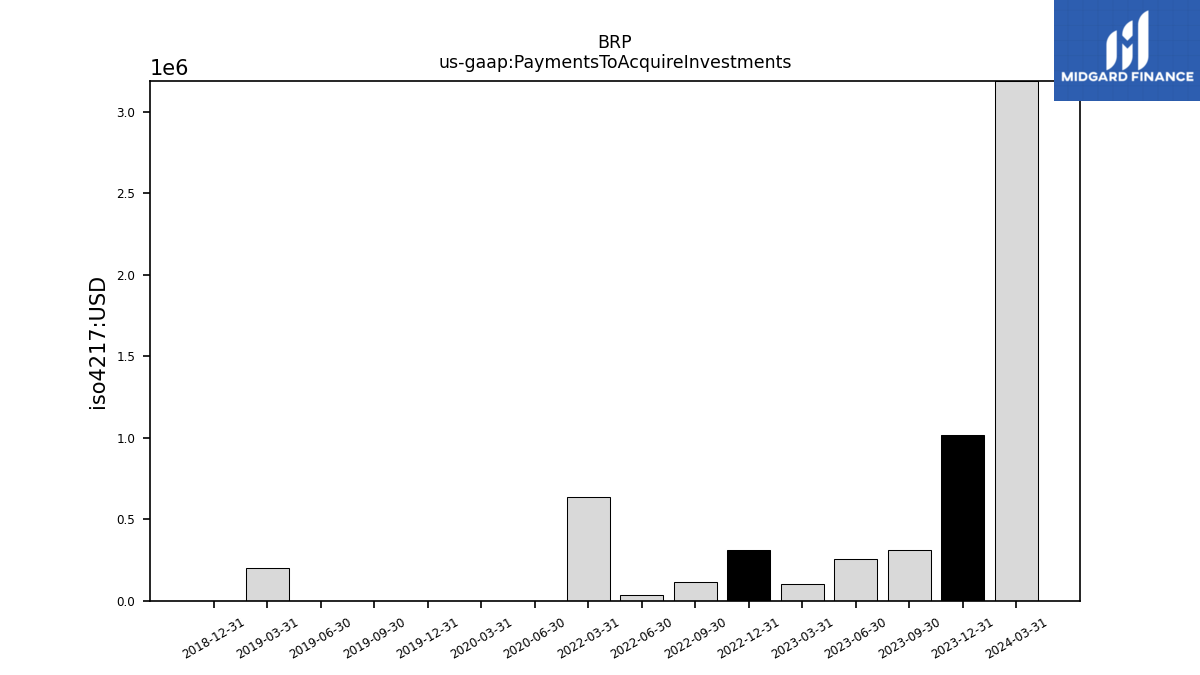
| Payments To Acquire Investments | 3.19 | 0.10 |
| 2024-03-31 | 2023-03-31 | ||
|---|---|---|---|
| Net Cash Provided By Used In Financing Activities | -40.15 | -24.52 |
| 2024-03-31 | 2023-03-31 | ||
|---|---|---|---|
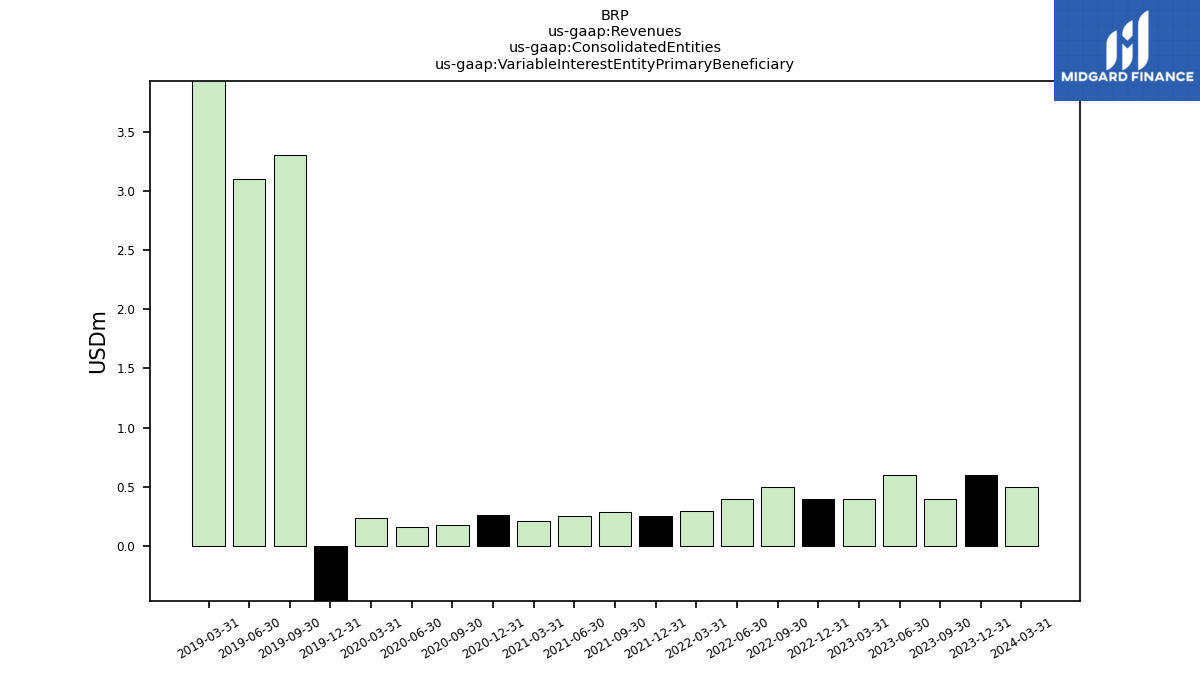
| Revenues | 380.37 | 330.45 | |
| Variable Interest Entity Primary Beneficiary | 0.50 | 0.40 | |
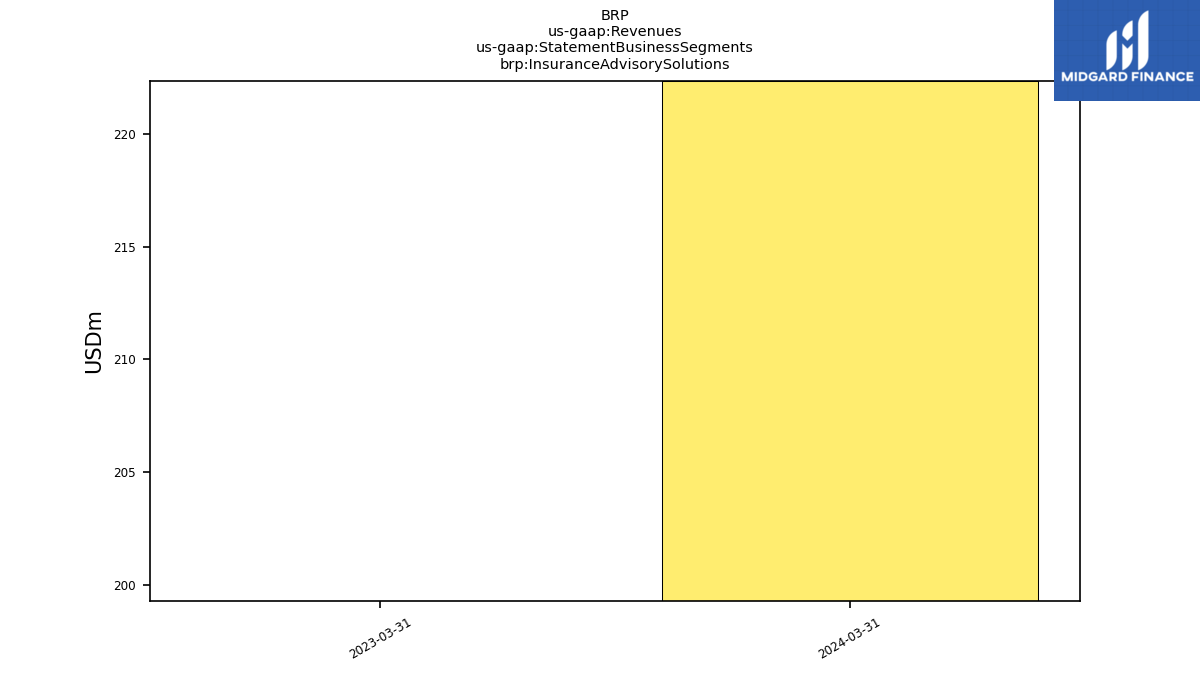
| Insurance Advisory Solutions | 222.34 | 199.29 | |
| Mainstreet Insurance Solutions | 71.70 | 58.14 | |
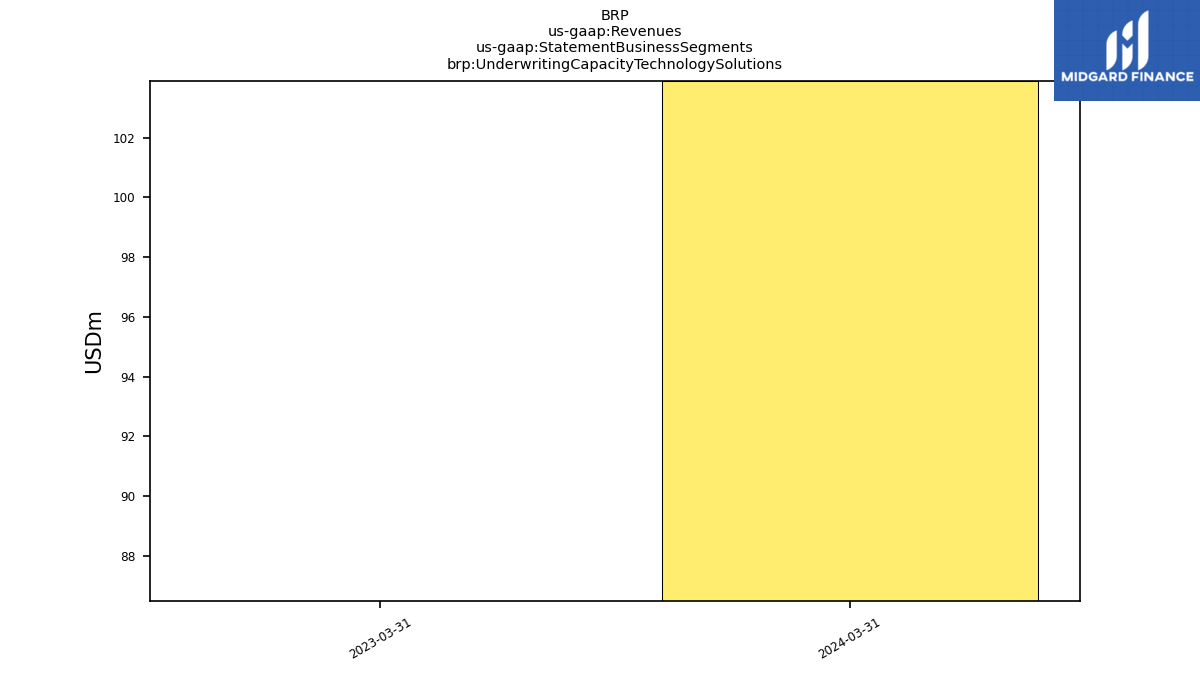
| Underwriting Capacity Technology Solutions | 103.90 | 86.49 | |
| Corporate And Other | -17.57 | -13.48 | |
| Revenue From Contract With Customer Excluding Assessed Tax | 378.10 | 329.52 | |
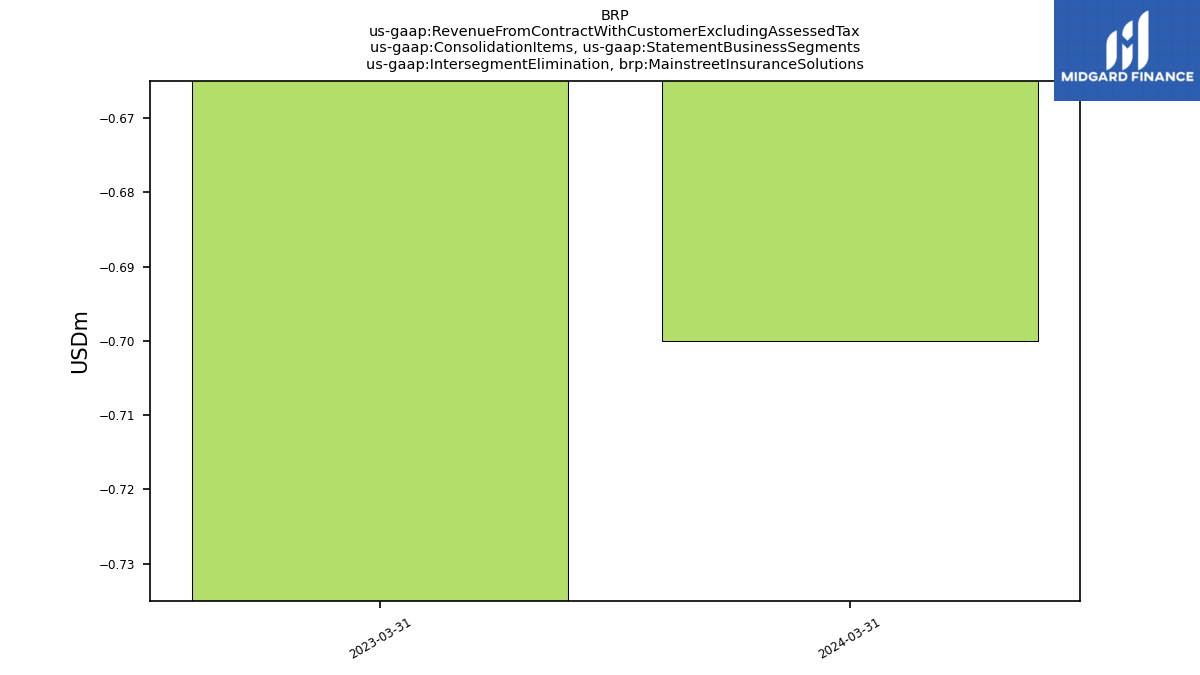
| Intersegment Elimination, Mainstreet Insurance Solutions | -0.70 | -0.90 | |
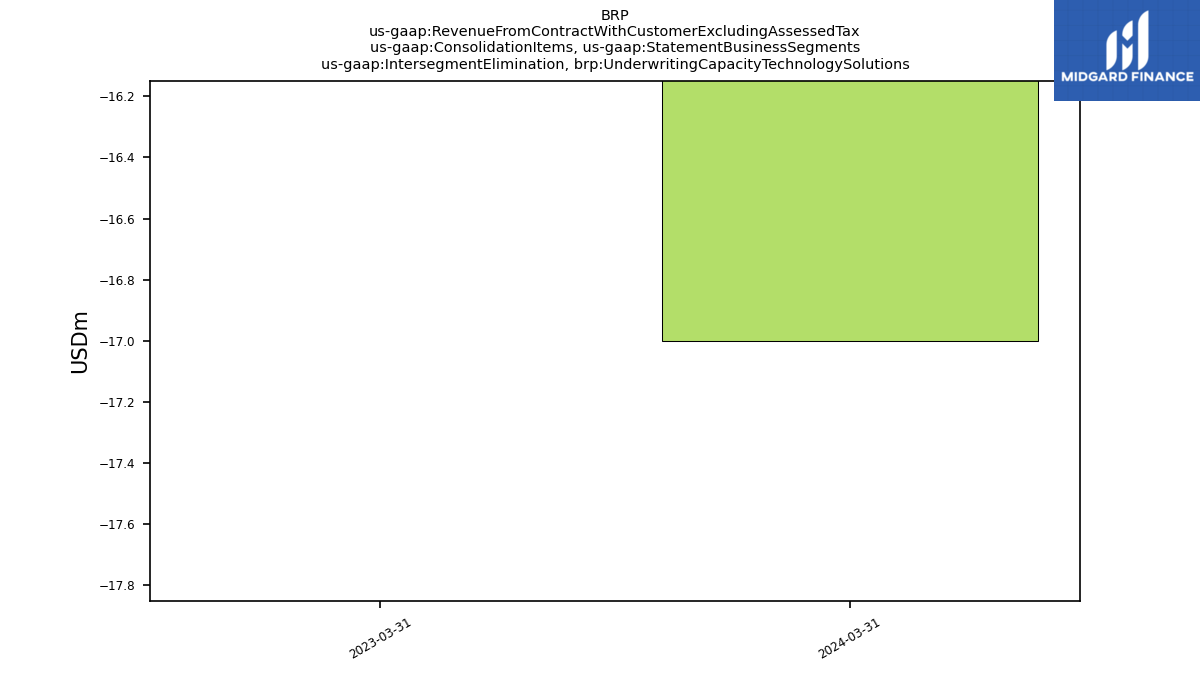
| Intersegment Elimination, Underwriting Capacity Technology Solutions | -17.00 | -12.60 | |
| Holding Company Of The Villages Inc And Affiliated Entities, Broker Services, Related Party | 1.80 | 1.50 | |
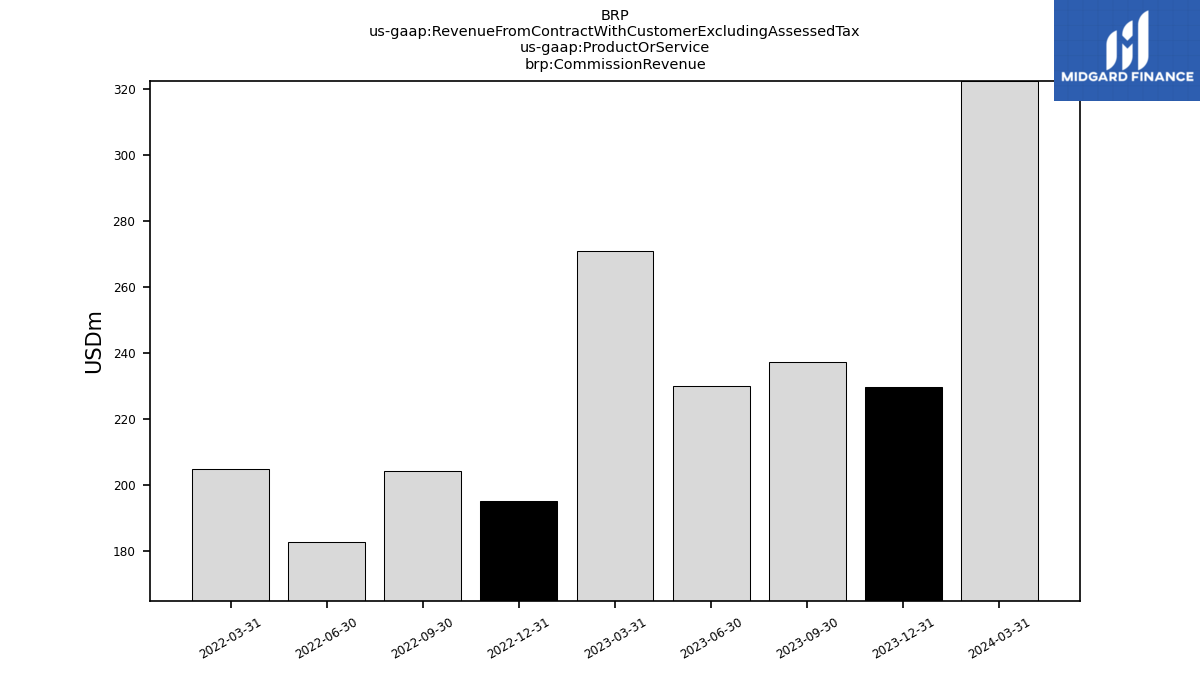
| Commission Revenue | 322.38 | 270.86 | |
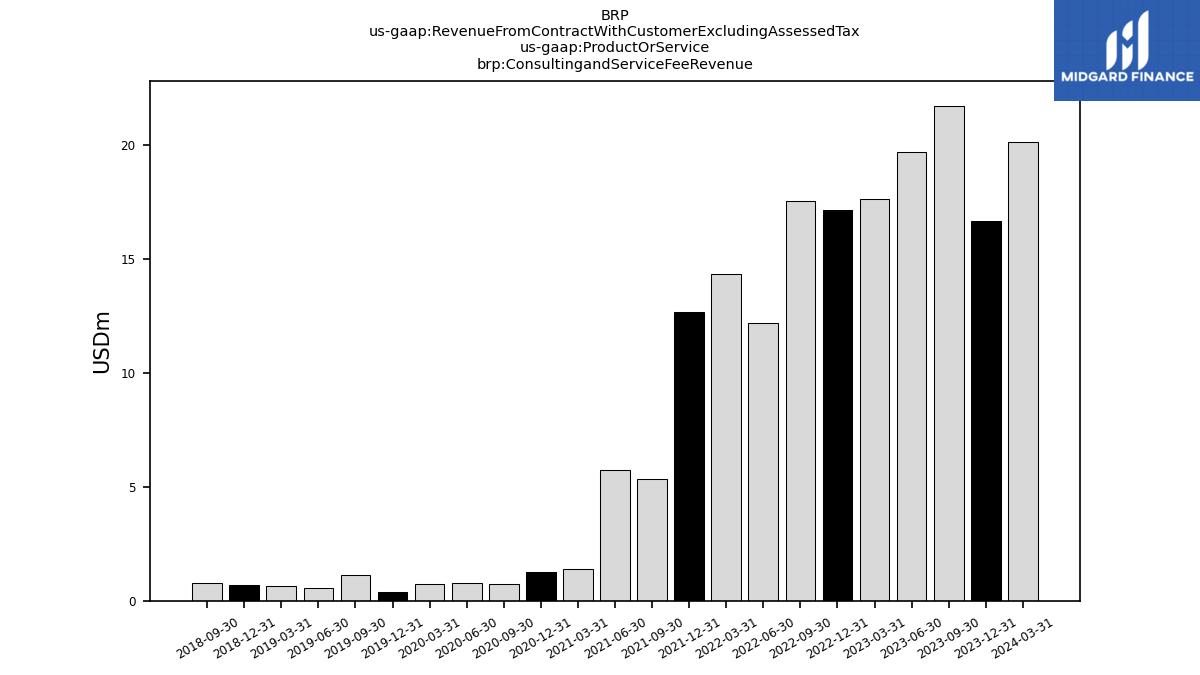
| Consultingand Service Fee Revenue | 20.13 | 17.64 | |
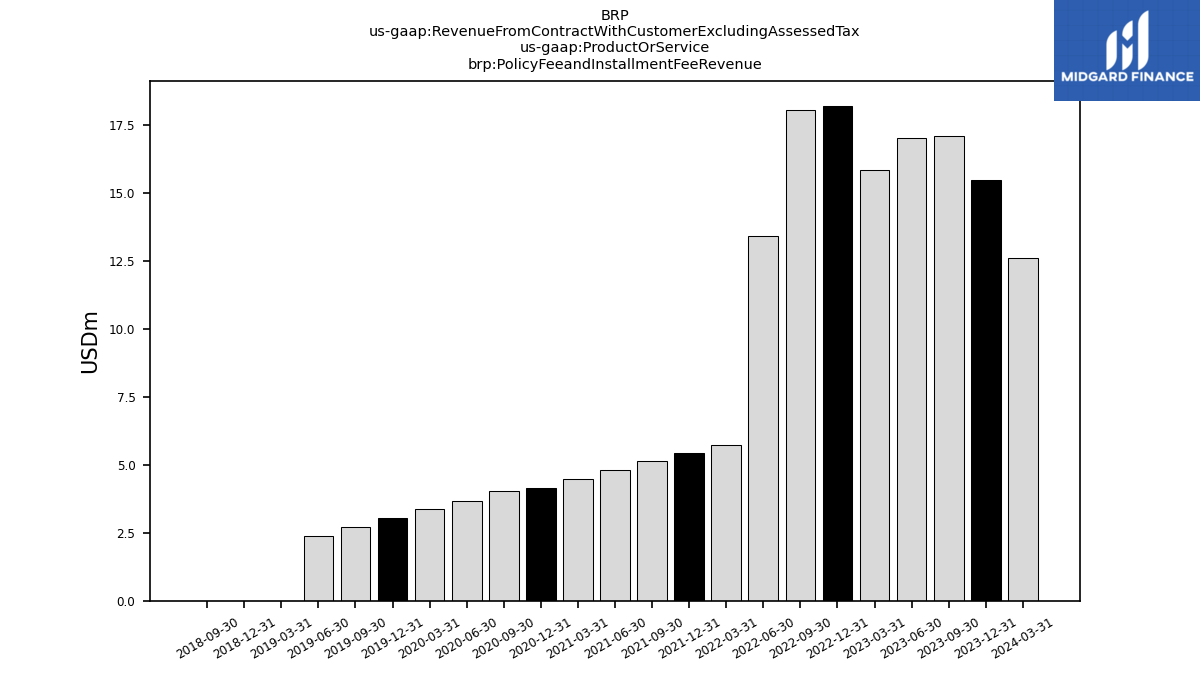
| Policy Feeand Installment Fee Revenue | 12.61 | 15.83 | |
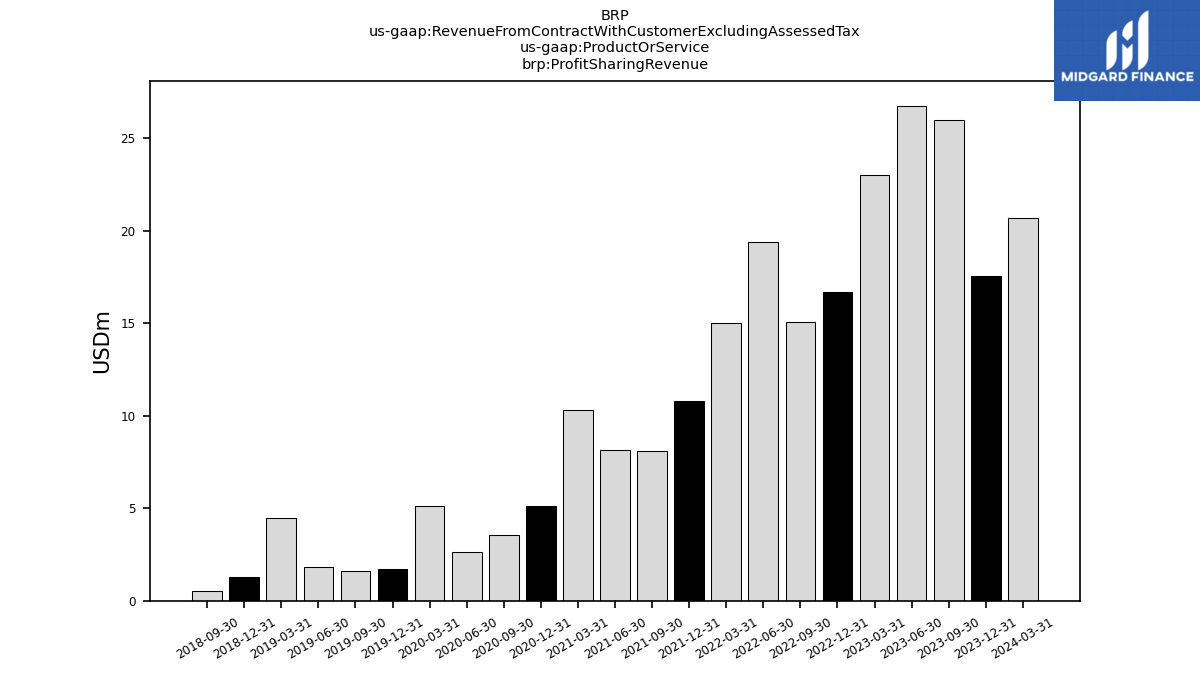
| Profit Sharing Revenue | 20.69 | 23.02 | |
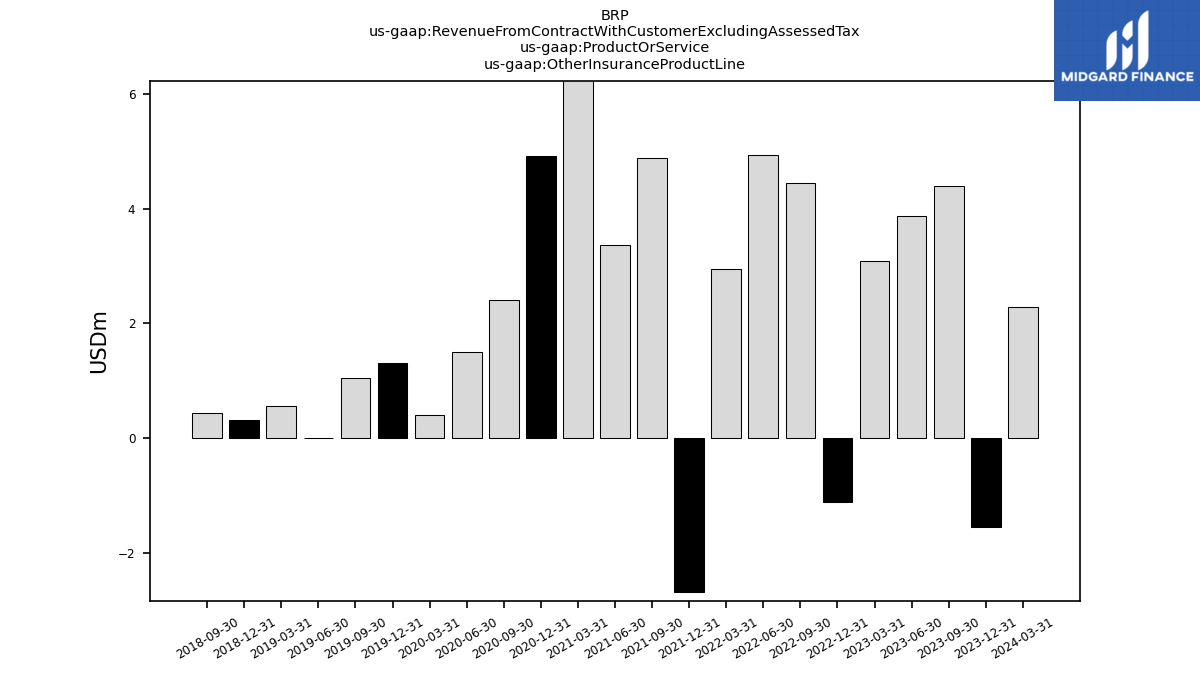
| Other Insurance Product Line | 2.29 | 3.09 |
