
| 2023-09-30 | 2023-06-30 | 2023-03-31 | 2022-12-31 | 2022-09-30 | 2022-06-30 | 2022-03-31 | 2021-12-31 | 2021-09-30 | 2021-06-30 | 2021-03-31 | 2020-12-31 | 2020-09-30 | 2020-06-30 | ||
|---|---|---|---|---|---|---|---|---|---|---|---|---|---|---|---|
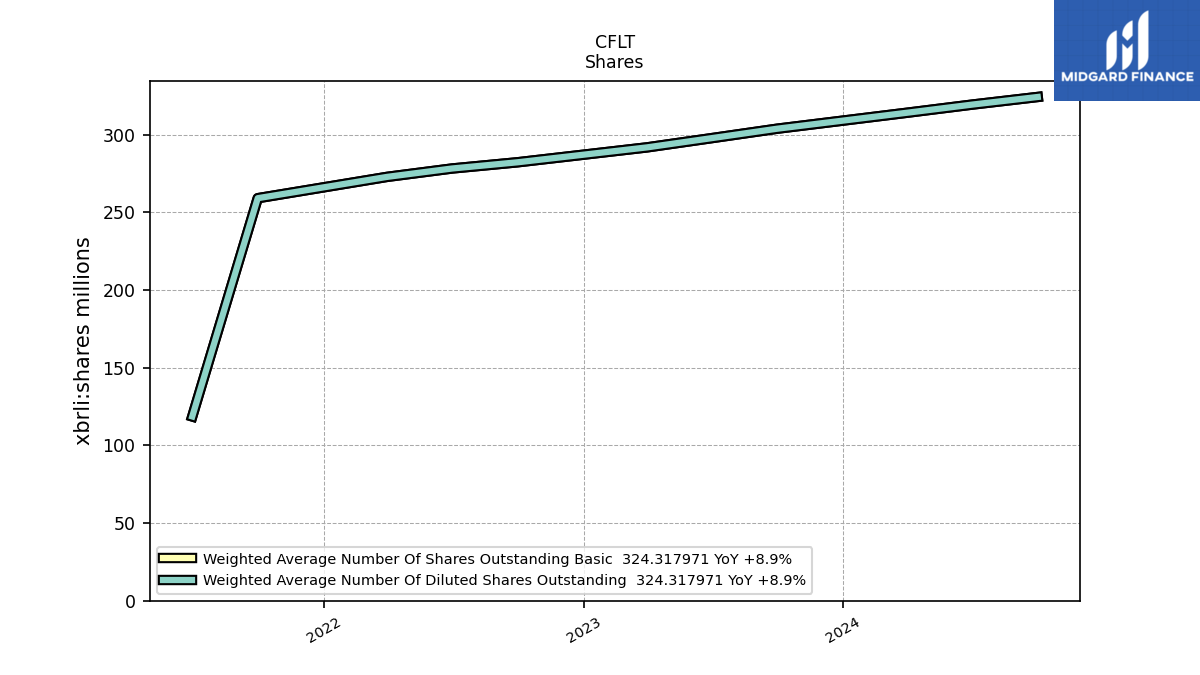
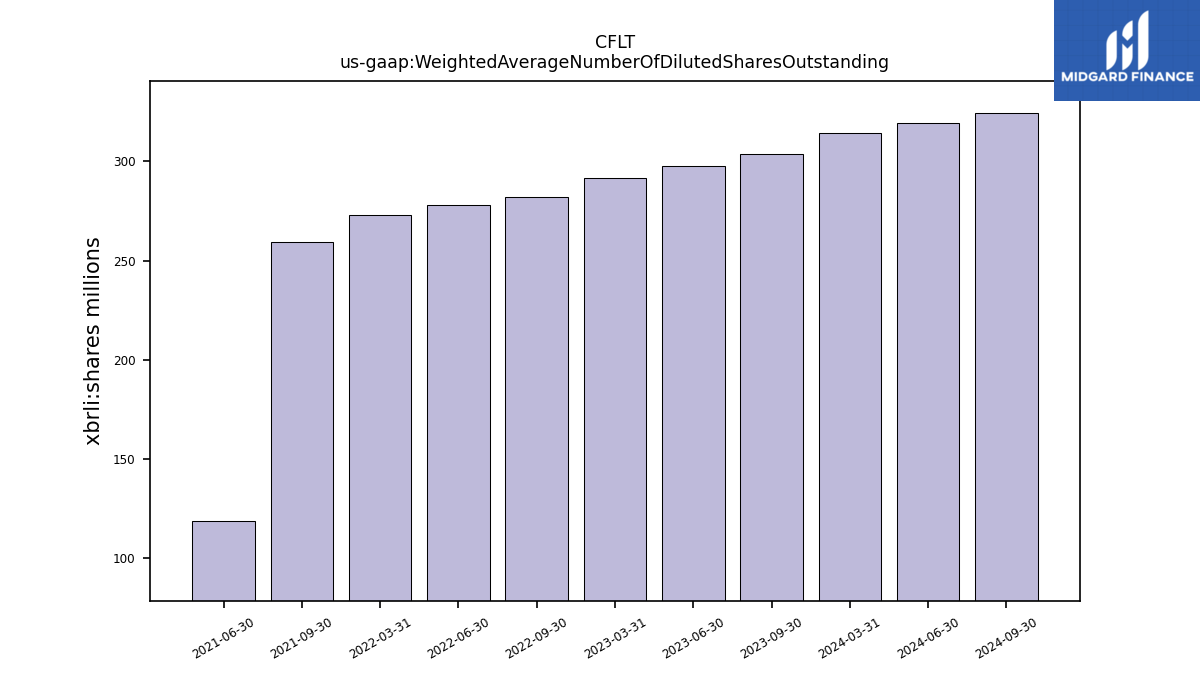
| Weighted Average Number Of Diluted Shares Outstanding | 303.90 | 297.83 | 291.86 | NA | 282.27 | 278.27 | 272.89 | NA | 259.15 | 118.65 | NA | NA | NA | NA | |
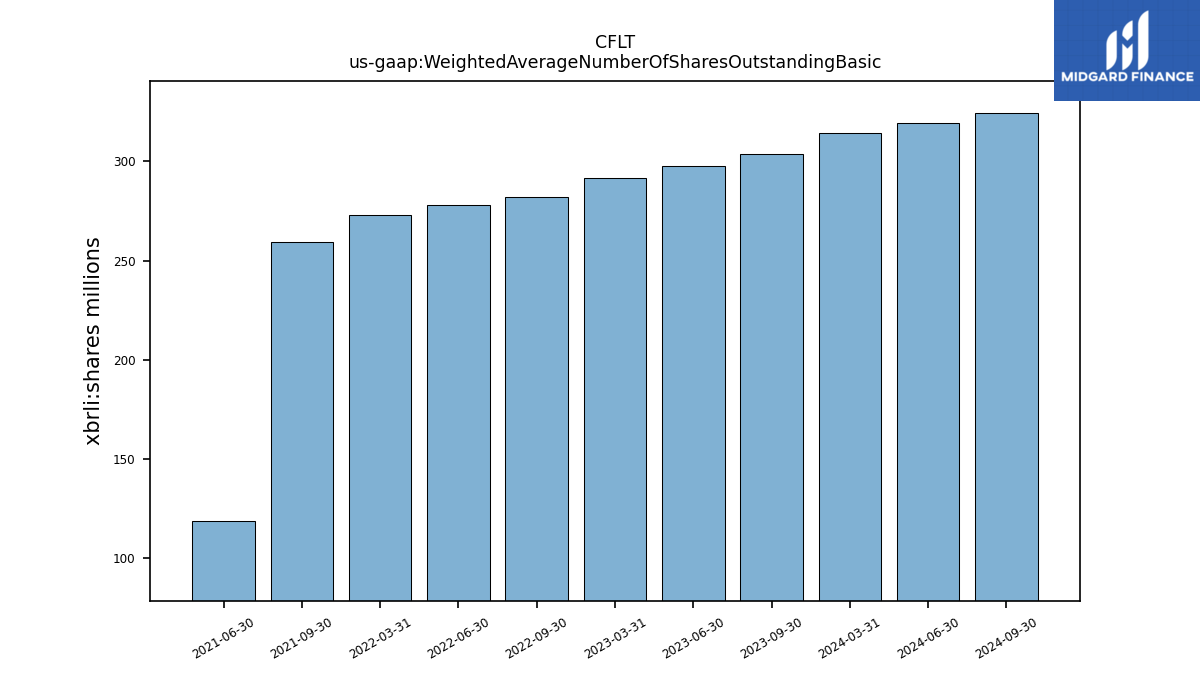
| Weighted Average Number Of Shares Outstanding Basic | 303.90 | 297.83 | 291.86 | NA | 282.27 | 278.27 | 272.89 | NA | 259.15 | 118.65 | NA | NA | NA | NA | |
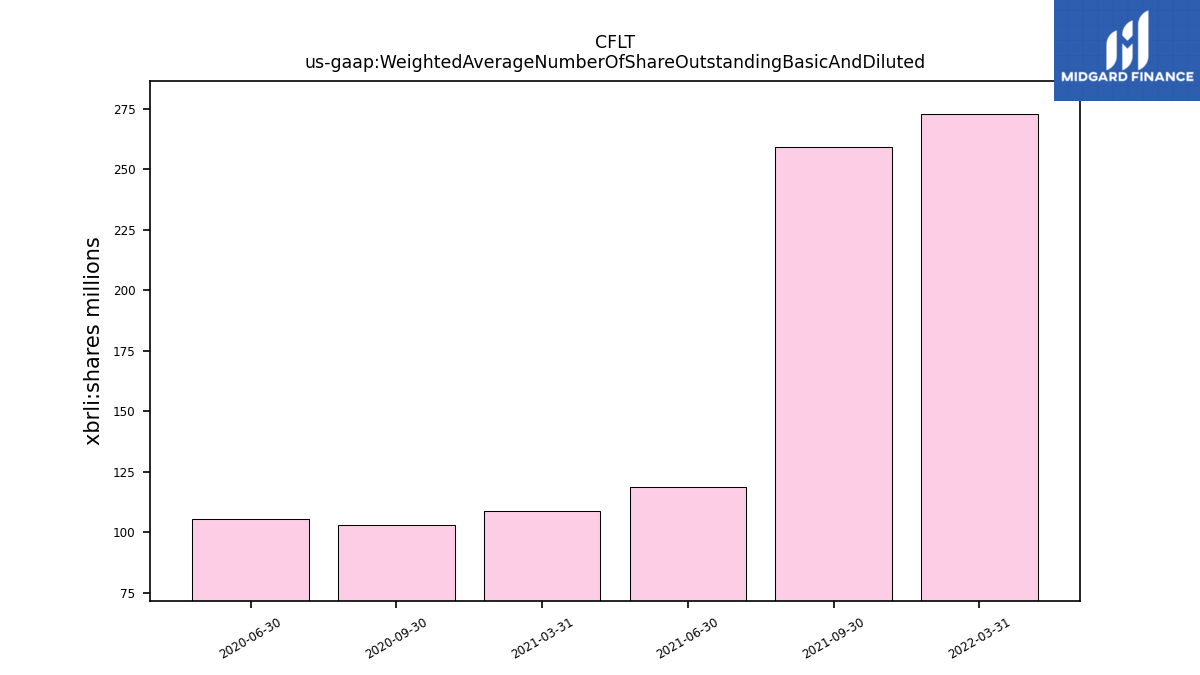
| Weighted Average Number Of Share Outstanding Basic And Diluted | NA | NA | NA | NA | NA | NA | 272.89 | NA | 259.15 | 118.65 | 108.73 | NA | 102.85 | 105.53 | |
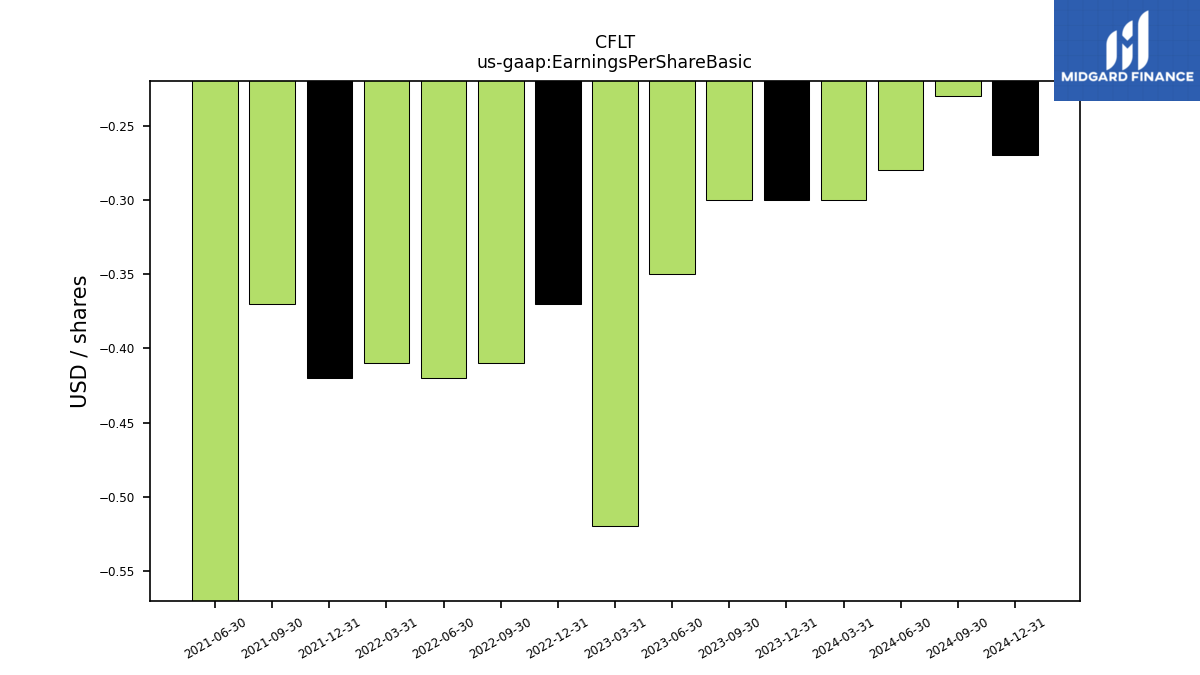
| Earnings Per Share Basic | -0.30 | -0.35 | -0.52 | -0.37 | -0.41 | -0.42 | -0.41 | -0.42 | -0.37 | -0.74 | NA | NA | NA | NA | |
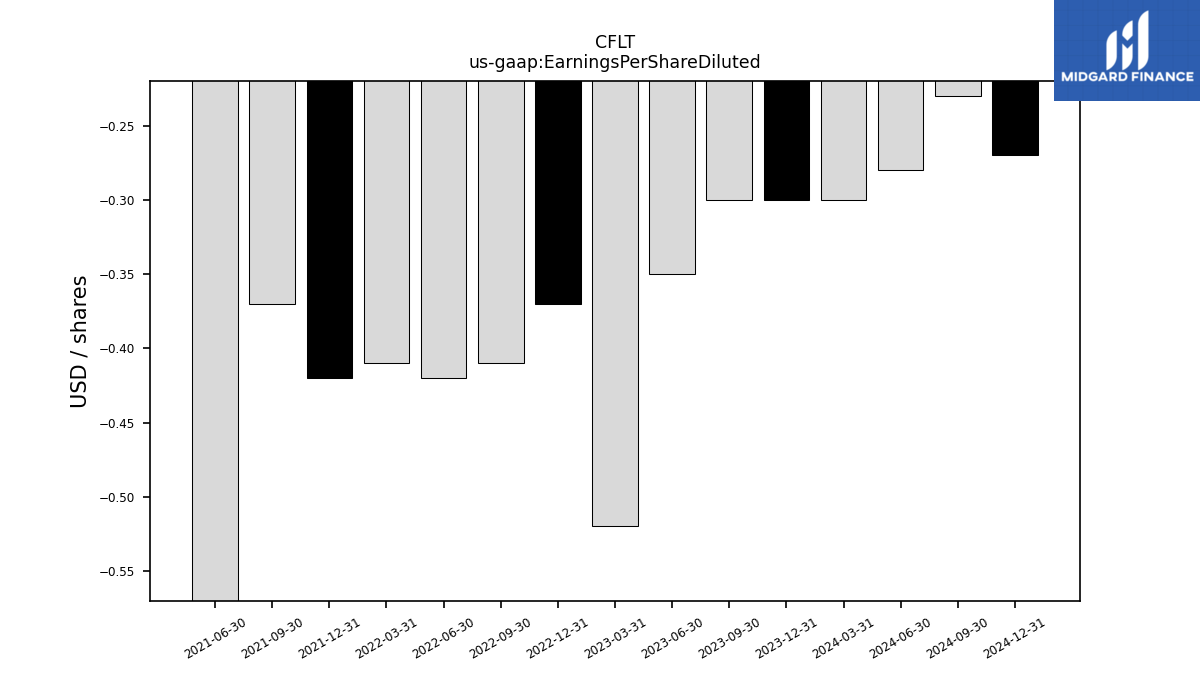
| Earnings Per Share Diluted | -0.30 | -0.35 | -0.52 | -0.37 | -0.41 | -0.42 | -0.41 | -0.42 | -0.37 | -0.74 | NA | NA | NA | NA | |
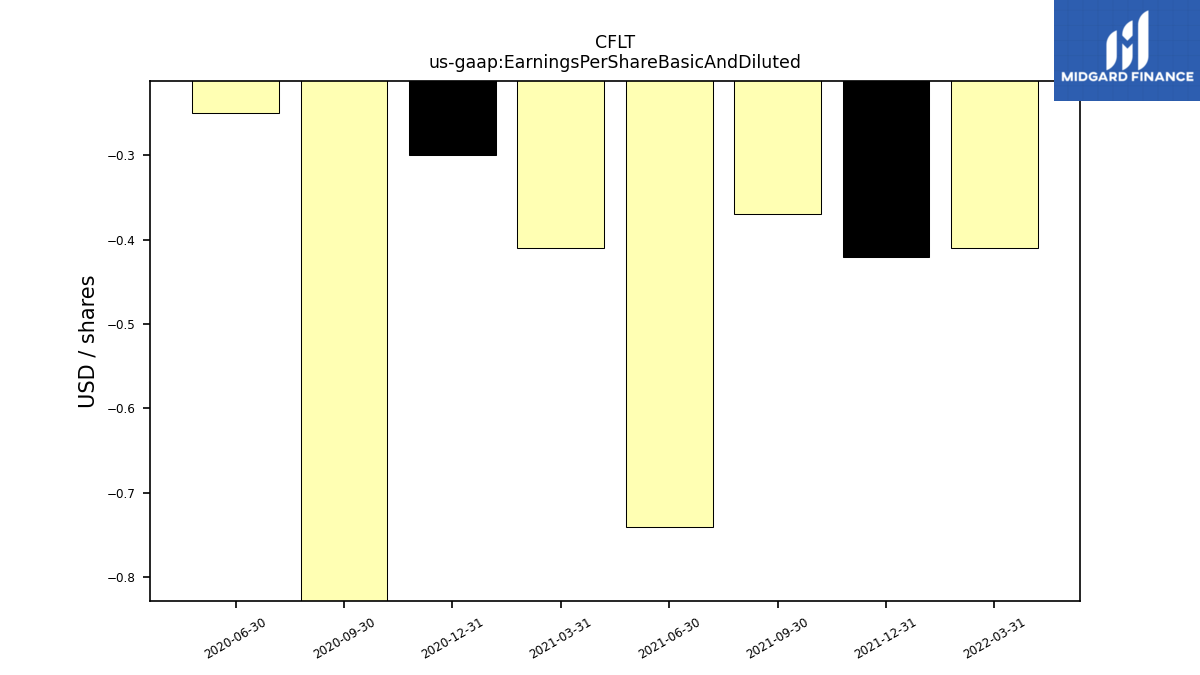
| Earnings Per Share Basic And Diluted | NA | NA | NA | NA | NA | NA | -0.41 | -0.42 | -0.37 | -0.74 | -0.41 | -0.30 | -1.34 | -0.25 |
| 2023-09-30 | 2023-06-30 | 2023-03-31 | 2022-12-31 | 2022-09-30 | 2022-06-30 | 2022-03-31 | 2021-12-31 | 2021-09-30 | 2021-06-30 | 2021-03-31 | 2020-12-31 | 2020-09-30 | 2020-06-30 | ||
|---|---|---|---|---|---|---|---|---|---|---|---|---|---|---|---|
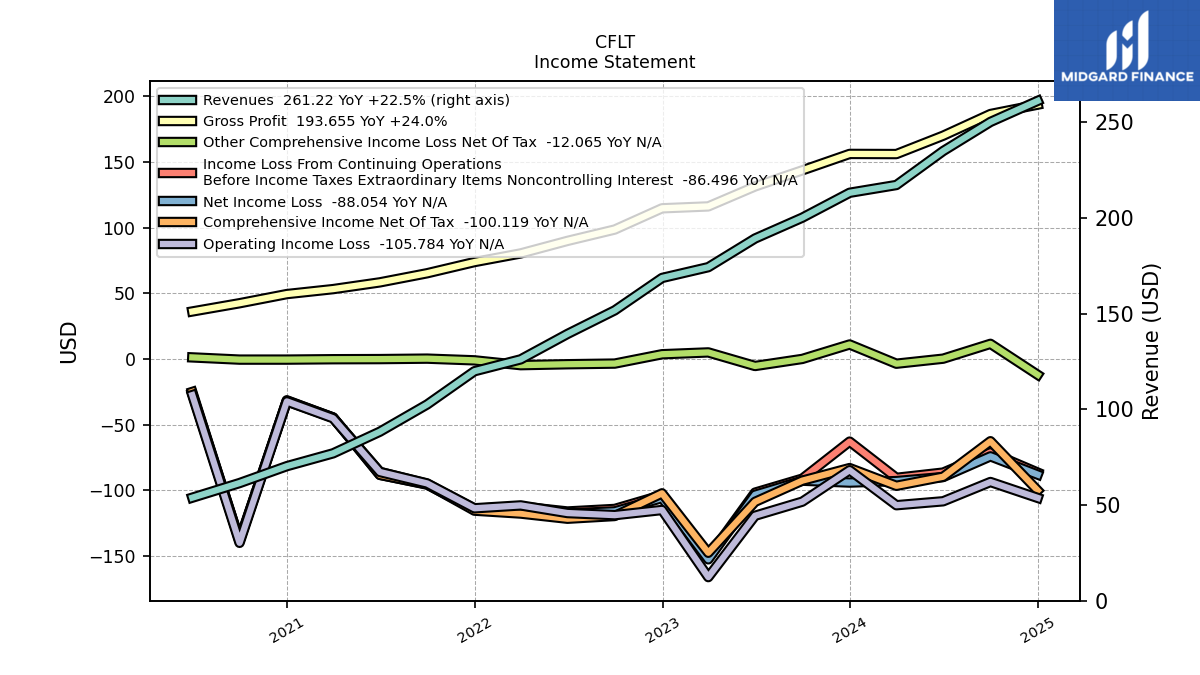
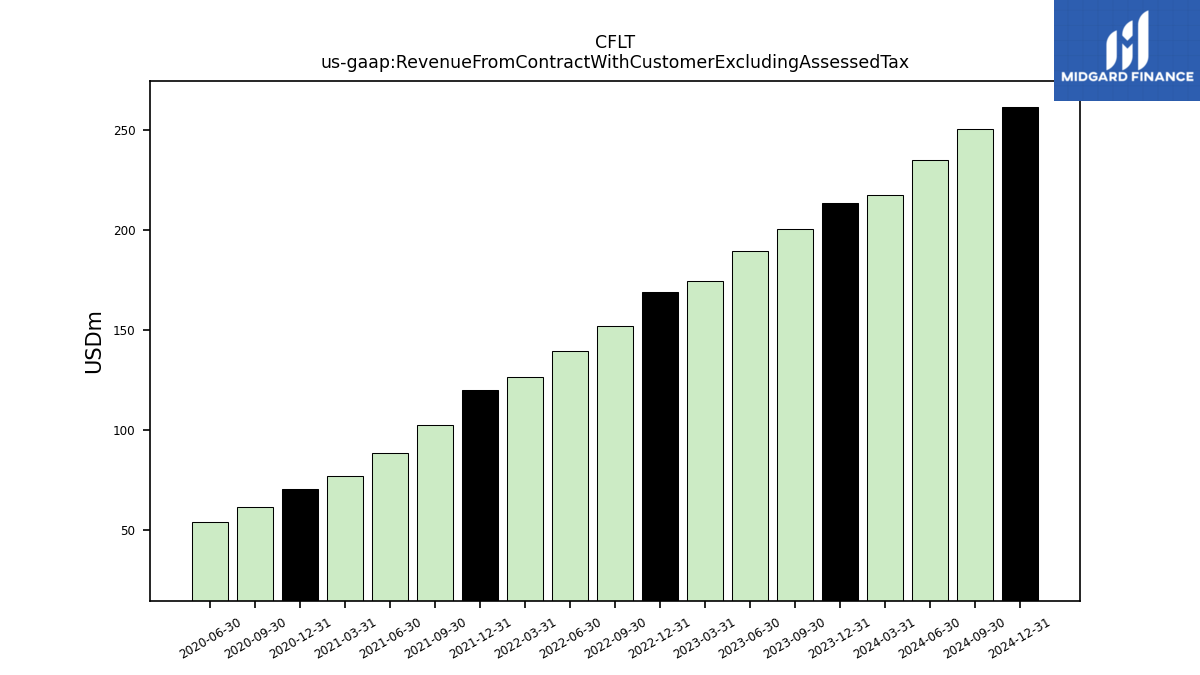
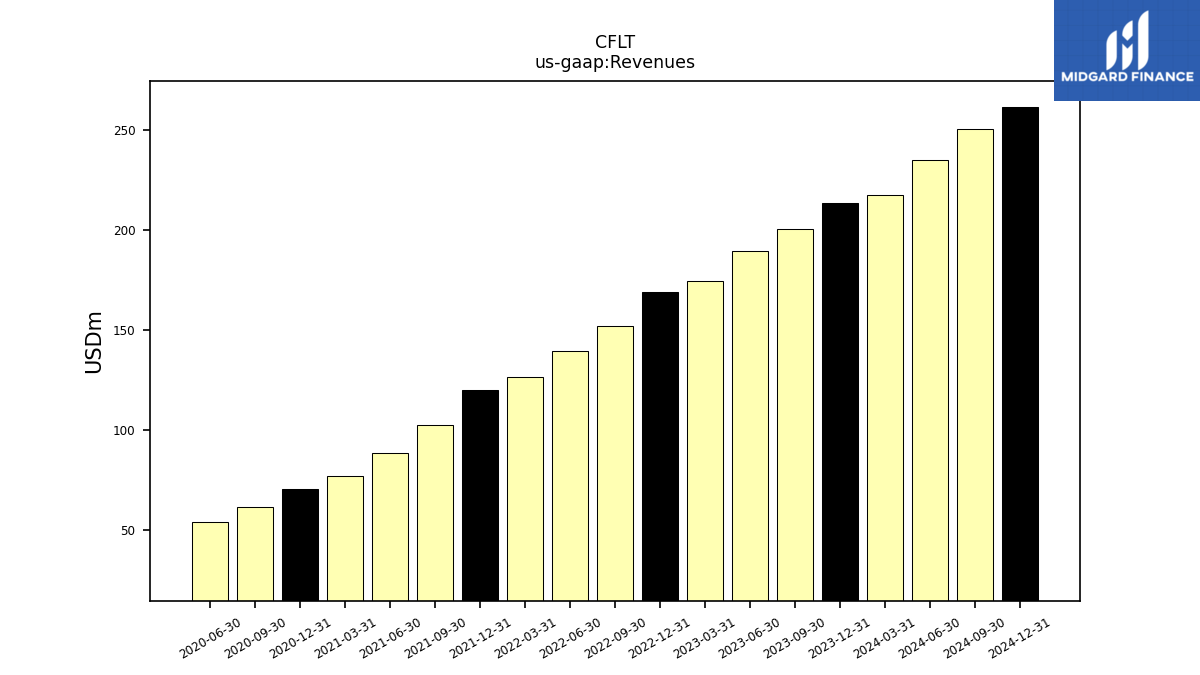
| Revenue From Contract With Customer Excluding Assessed Tax | 200.18 | 189.28 | 174.30 | 168.67 | 151.73 | 139.41 | 126.14 | 119.93 | 102.57 | 88.34 | 77.03 | 70.32 | 61.50 | 53.85 | |
| Revenues | 200.18 | 189.28 | 174.30 | 168.67 | 151.73 | 139.41 | 126.14 | 119.93 | 102.57 | 88.34 | 77.03 | 70.32 | 61.50 | 53.85 | |
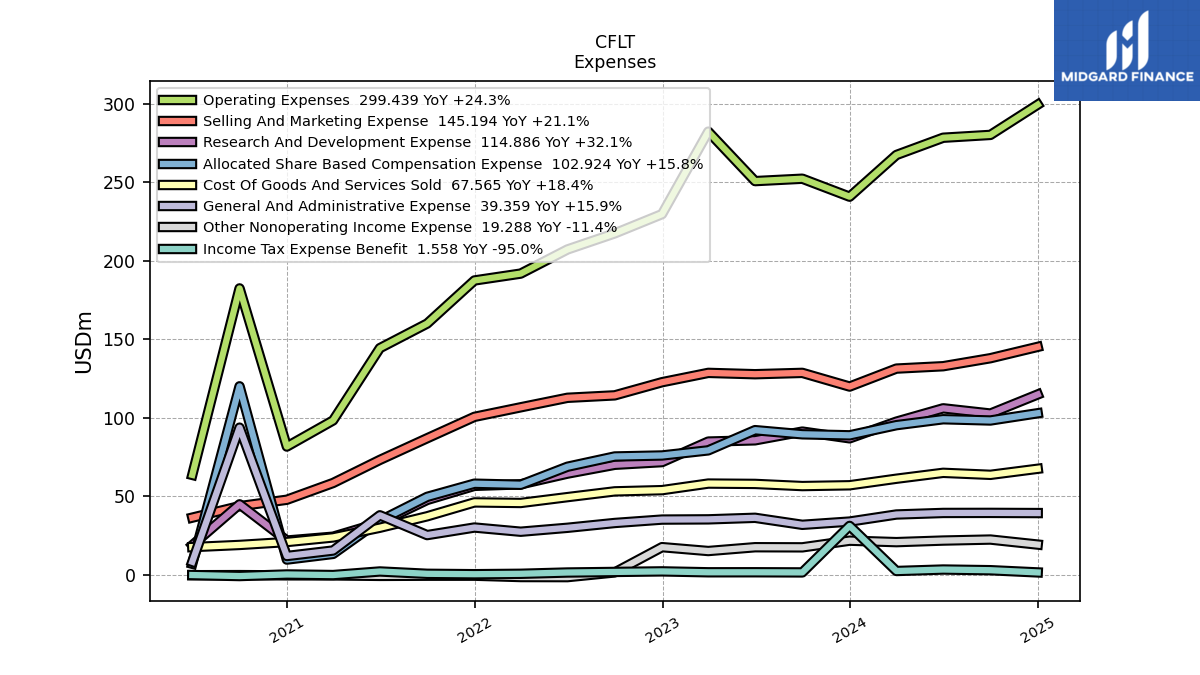
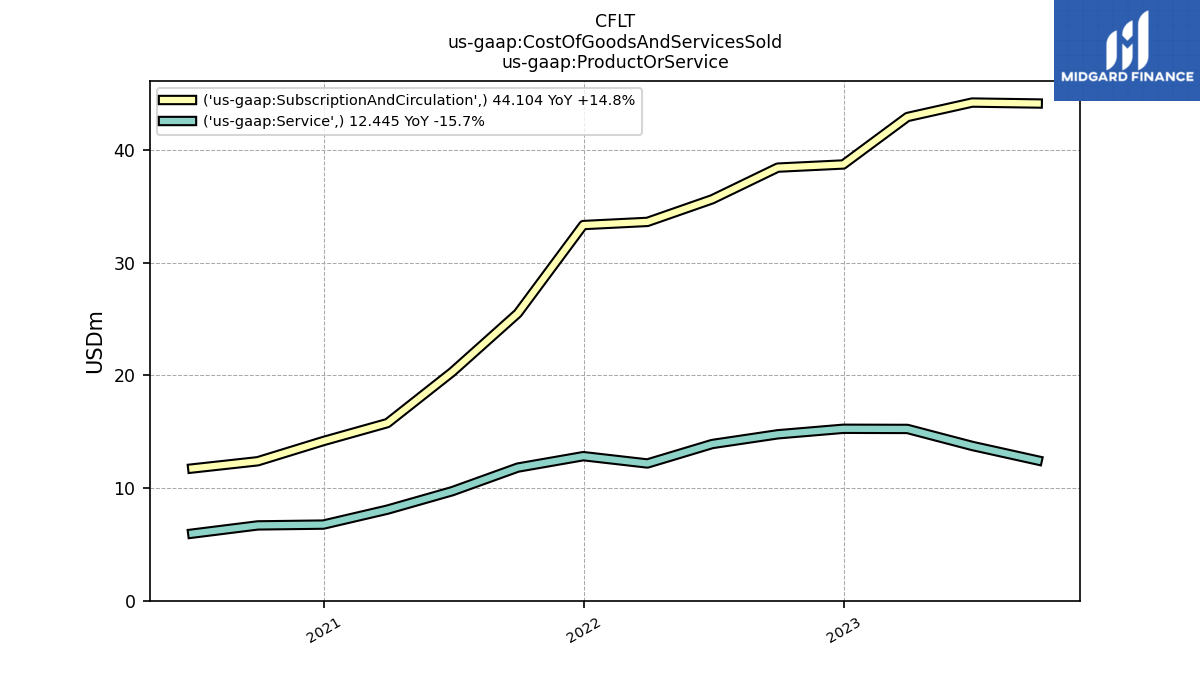
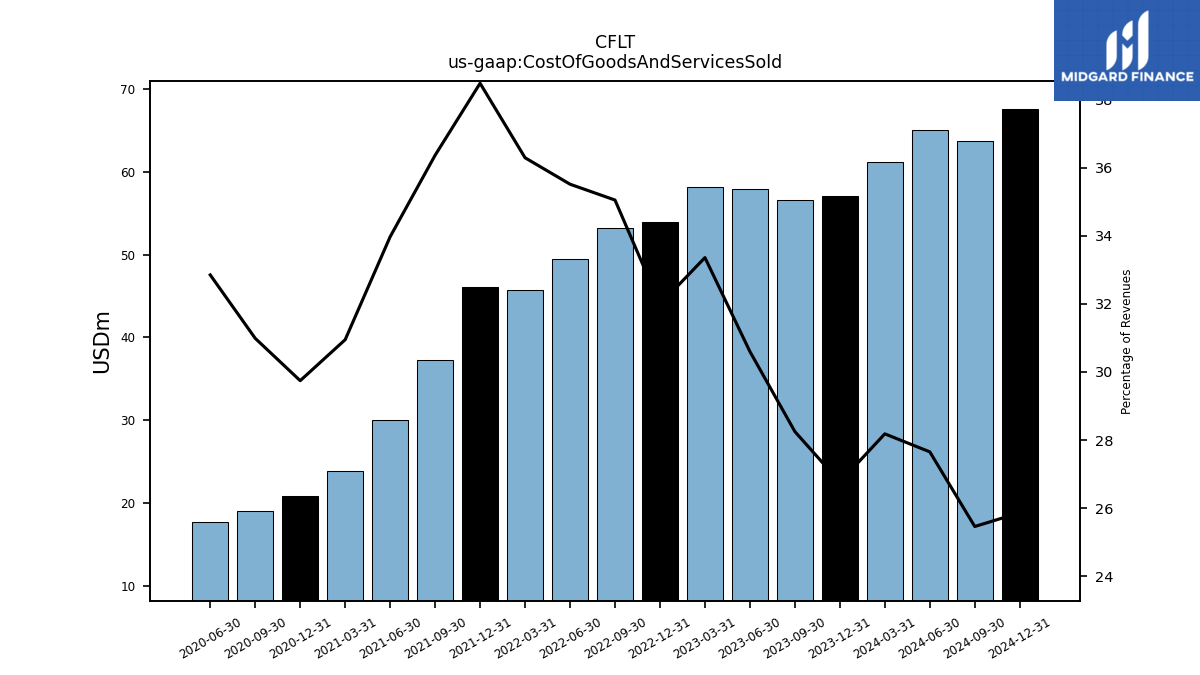
| Cost Of Goods And Services Sold | 56.55 | 57.92 | 58.14 | 53.95 | 53.18 | 49.51 | 45.78 | 46.15 | 37.30 | 30.01 | 23.84 | 20.92 | 19.06 | 17.69 | |
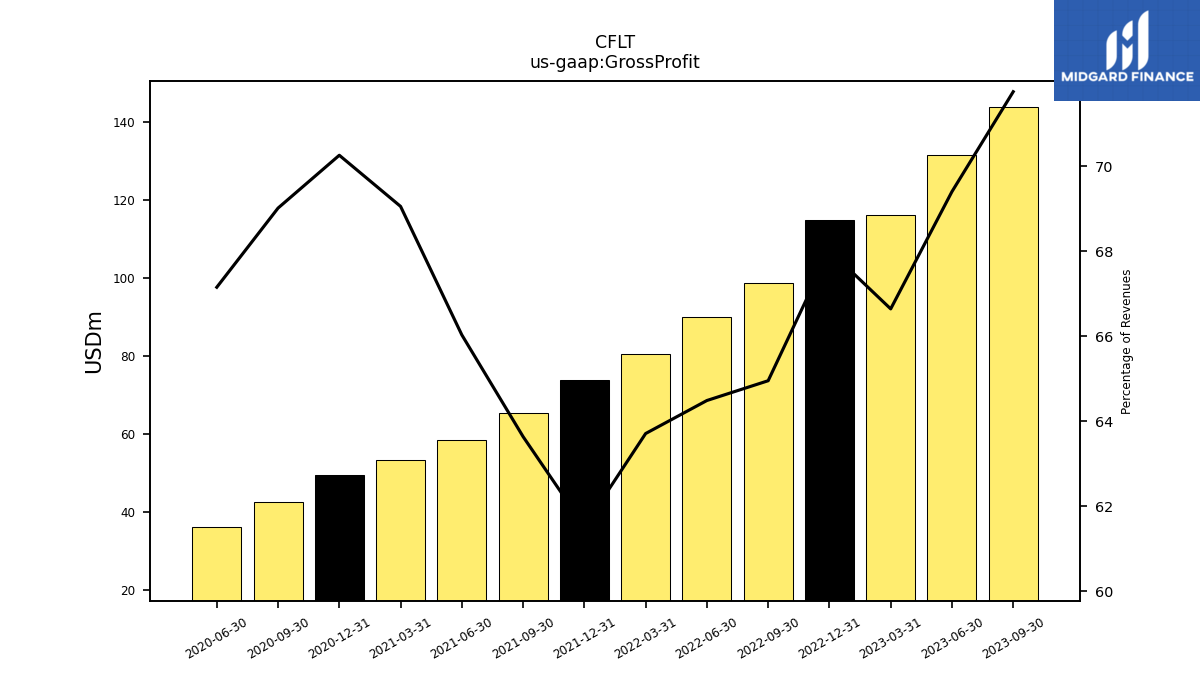
| Gross Profit | 143.63 | 131.37 | 116.16 | 114.72 | 98.55 | 89.90 | 80.36 | 73.78 | 65.27 | 58.33 | 53.19 | 49.41 | 42.44 | 36.16 | |
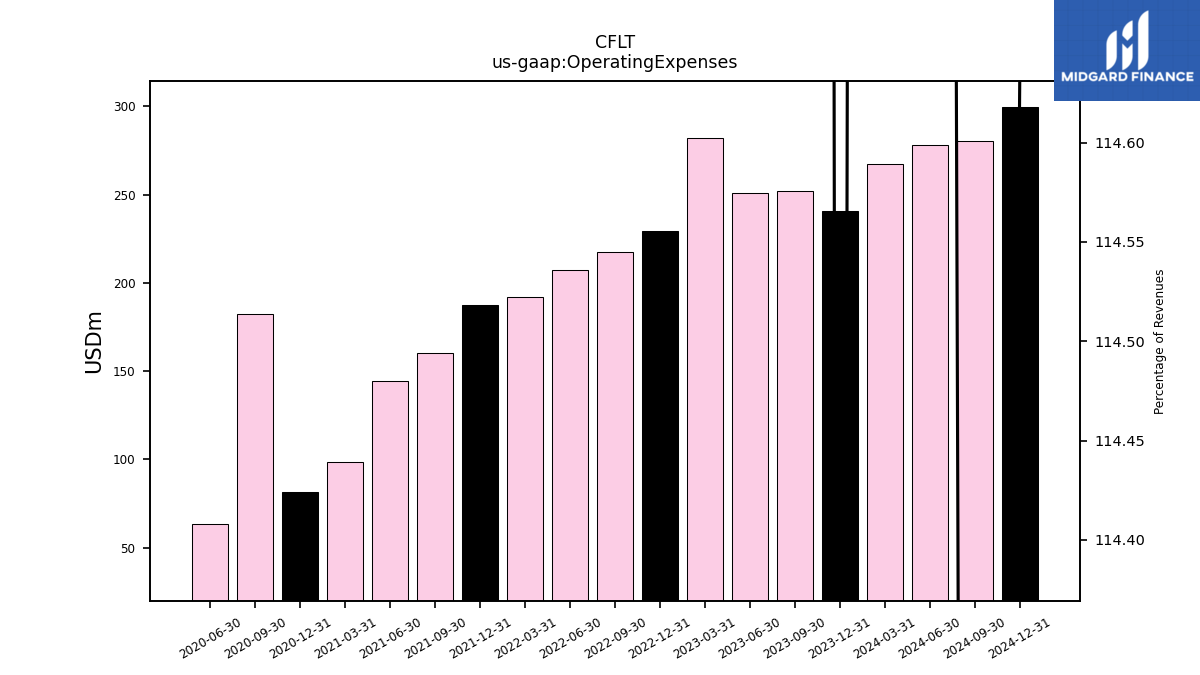
| Operating Expenses | 252.26 | 250.73 | 282.25 | 229.70 | 217.45 | 207.21 | 191.84 | 187.46 | 160.02 | 144.37 | 98.33 | 81.71 | 182.44 | 63.66 | |
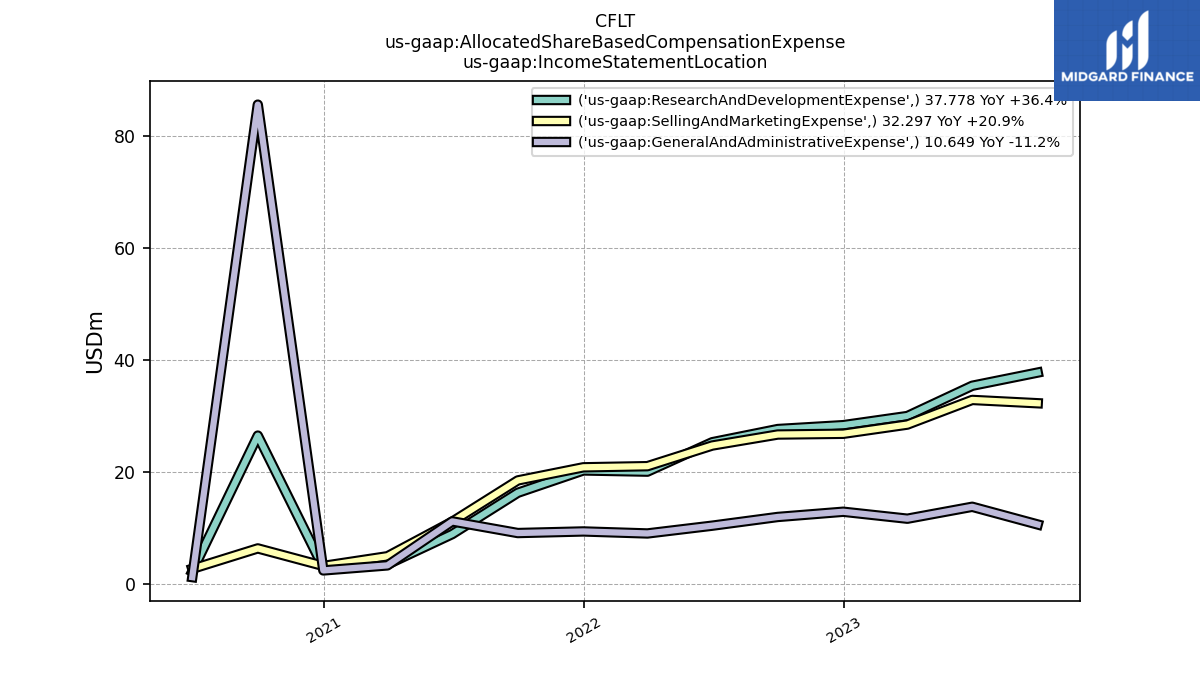
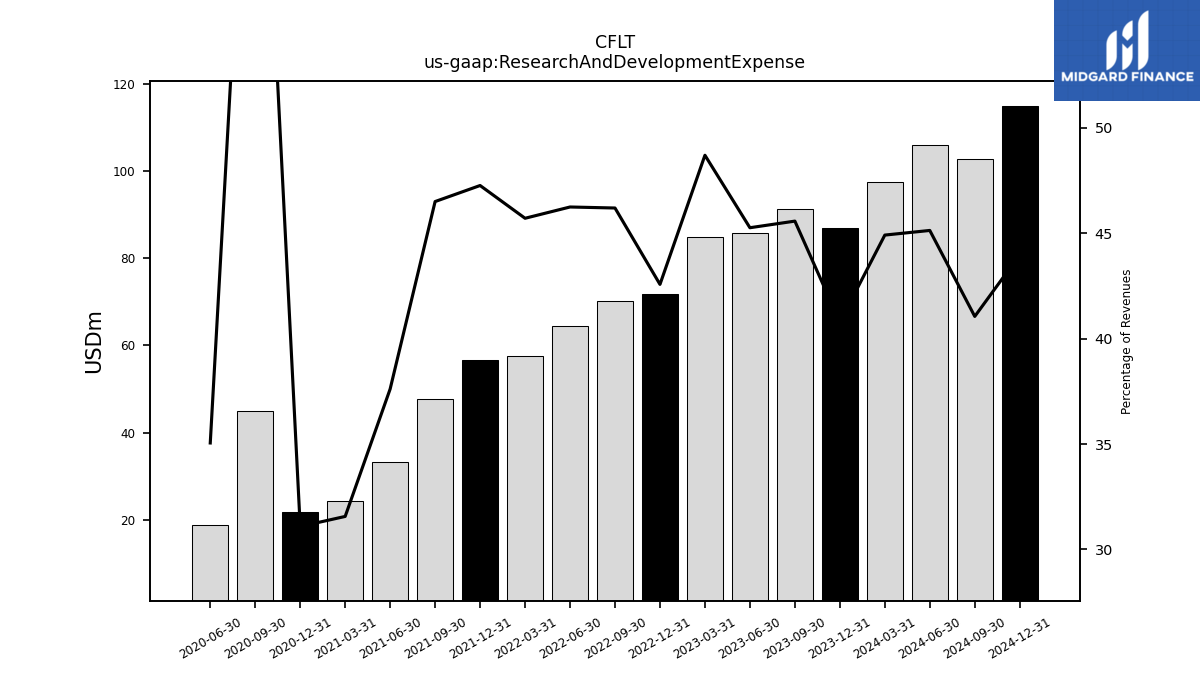
| Research And Development Expense | 91.24 | 85.68 | 84.89 | 71.81 | 70.10 | 64.47 | 57.66 | 56.69 | 47.70 | 33.23 | 24.31 | 21.86 | 44.92 | 18.88 | |
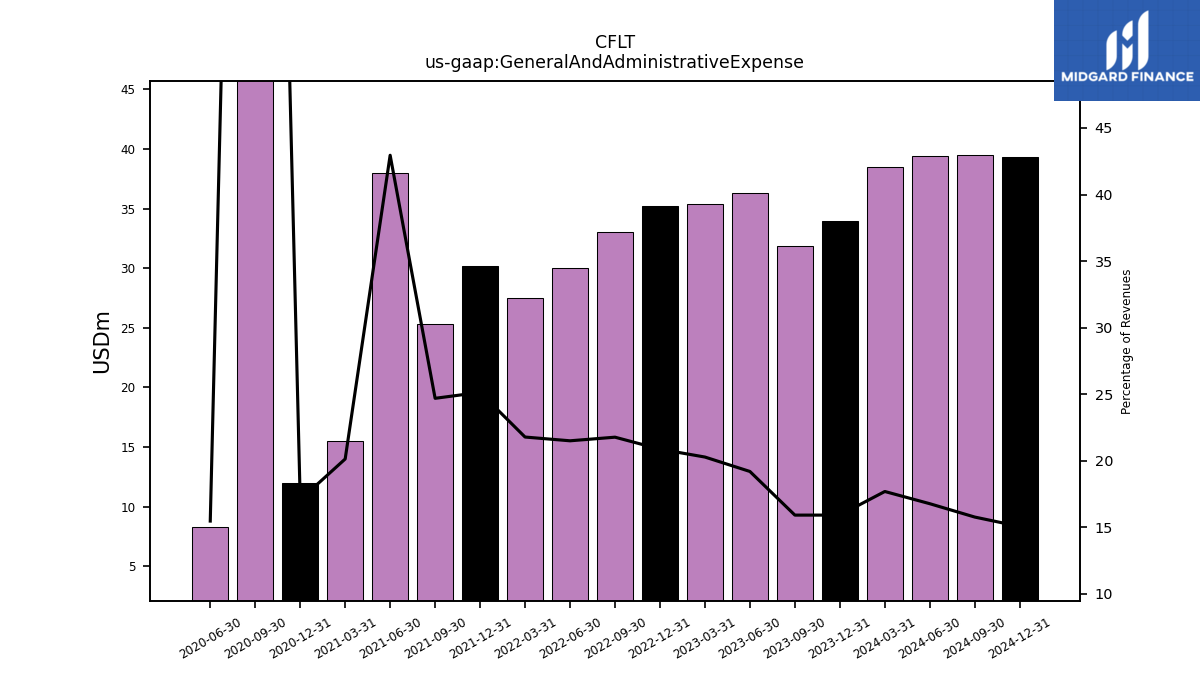
| General And Administrative Expense | 31.87 | 36.34 | 35.35 | 35.21 | 33.04 | 29.98 | 27.48 | 30.15 | 25.33 | 37.94 | 15.51 | 12.01 | 93.76 | 8.33 | |
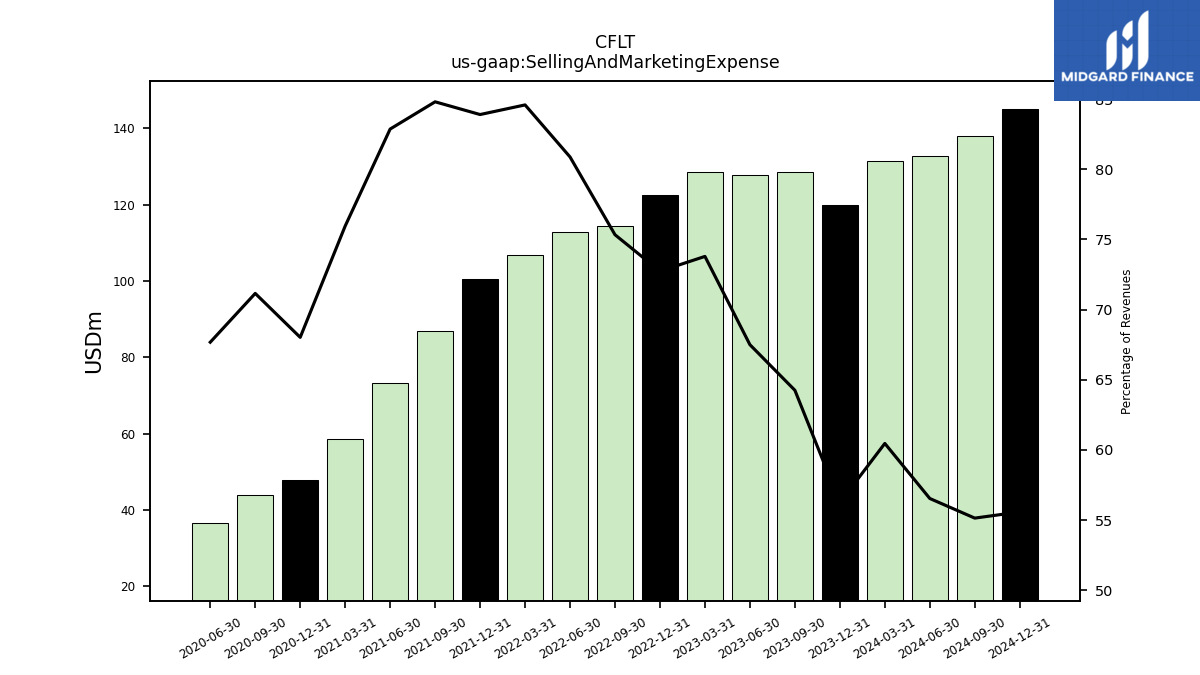
| Selling And Marketing Expense | 128.62 | 127.77 | 128.62 | 122.68 | 114.31 | 112.75 | 106.70 | 100.62 | 86.99 | 73.21 | 58.51 | 47.84 | 43.76 | 36.45 | |
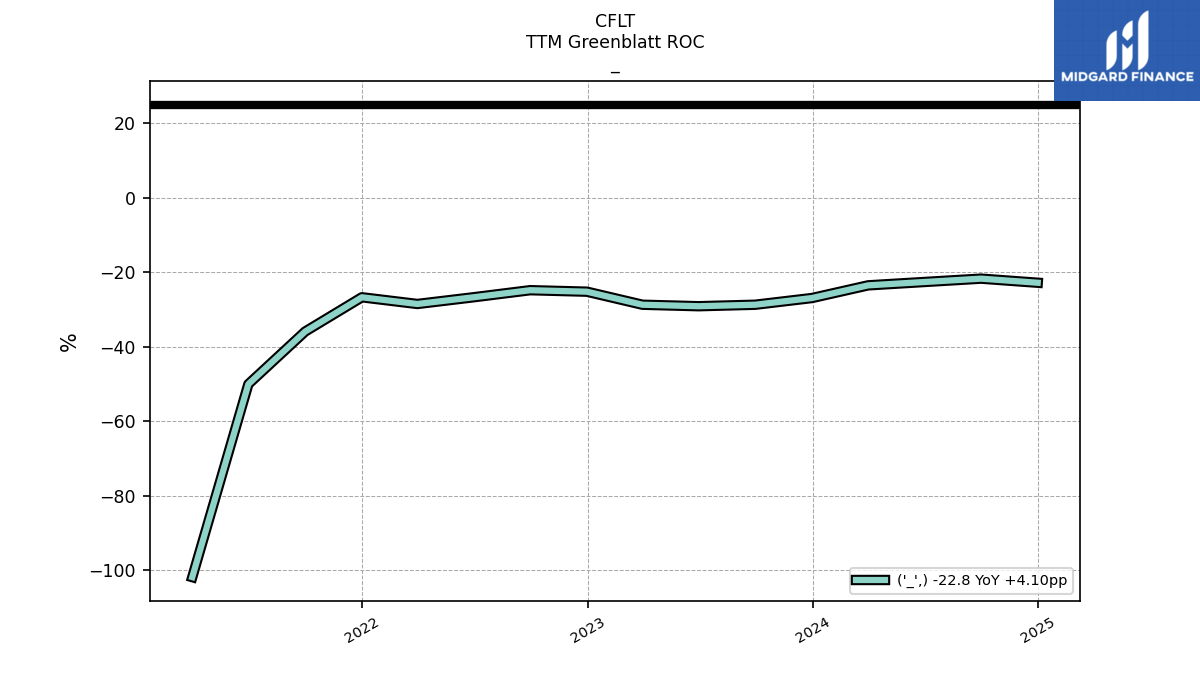
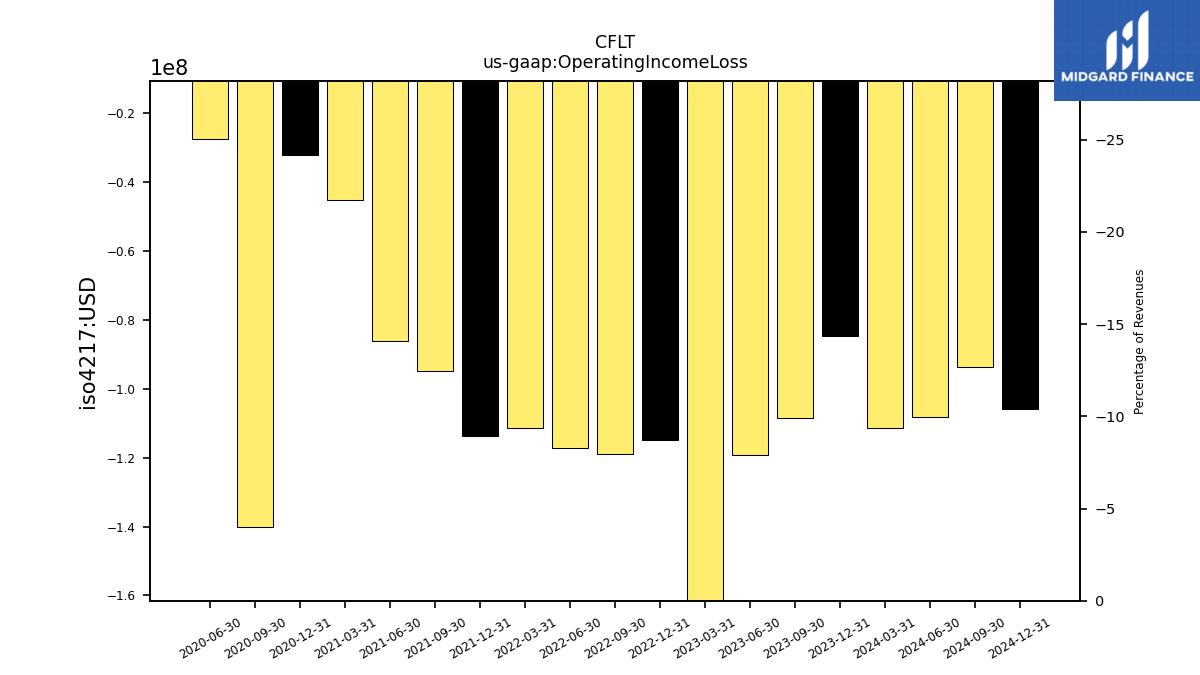
| Operating Income Loss | -108.63 | -119.37 | -166.09 | -114.98 | -118.90 | -117.31 | -111.48 | -113.68 | -94.75 | -86.05 | -45.14 | -32.30 | -140.00 | -27.49 | |
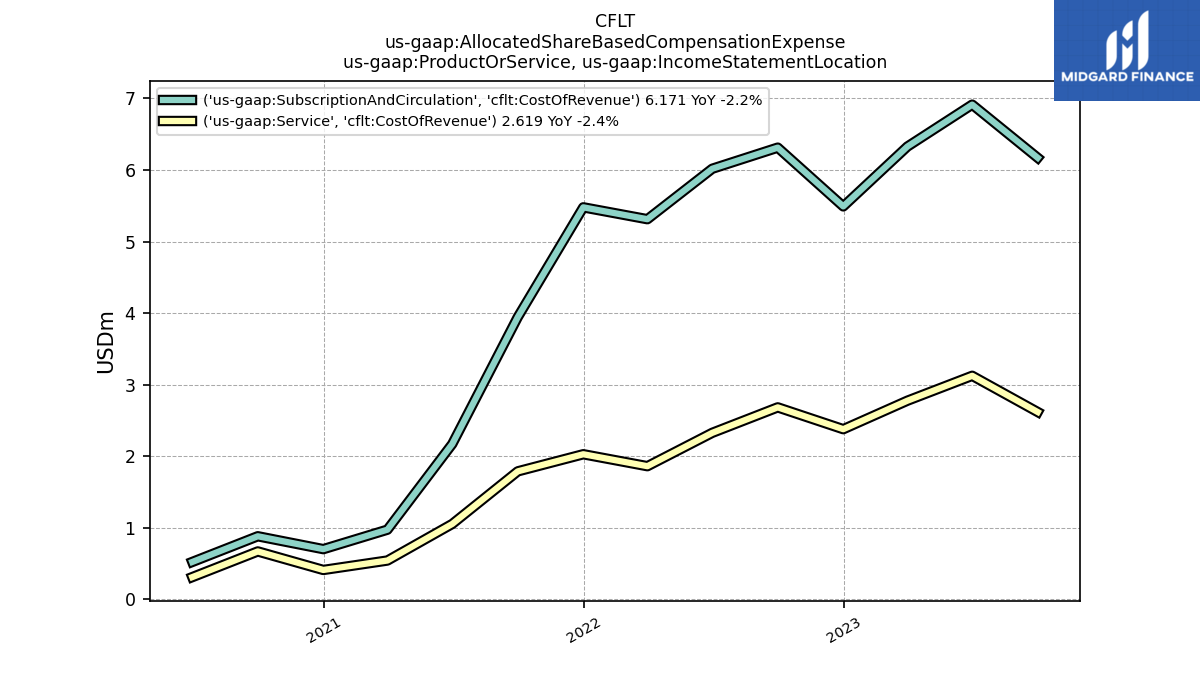
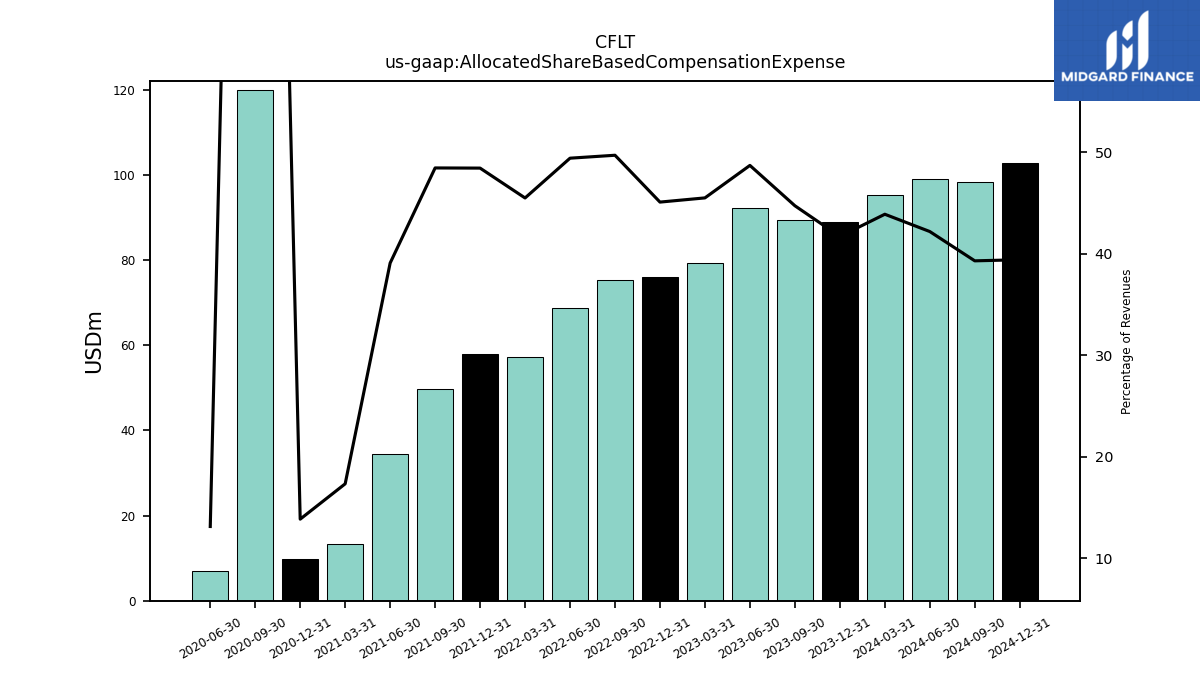
| Allocated Share Based Compensation Expense | 89.51 | 92.16 | 79.29 | 76.03 | 75.39 | 68.87 | 57.37 | 58.07 | 49.68 | 34.52 | 13.35 | 9.74 | 120.07 | 7.07 | |
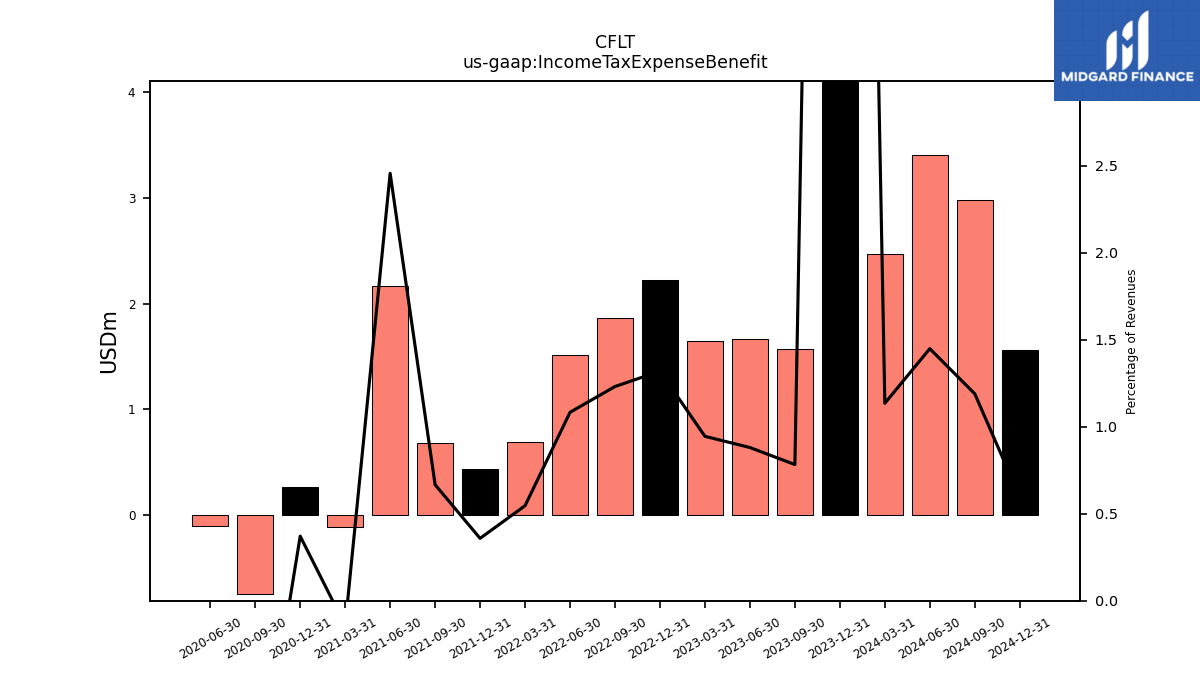
| Income Tax Expense Benefit | 1.57 | 1.67 | 1.65 | 2.23 | 1.87 | 1.51 | 0.69 | 0.43 | 0.68 | 2.17 | -0.11 | 0.26 | -0.75 | -0.11 | |
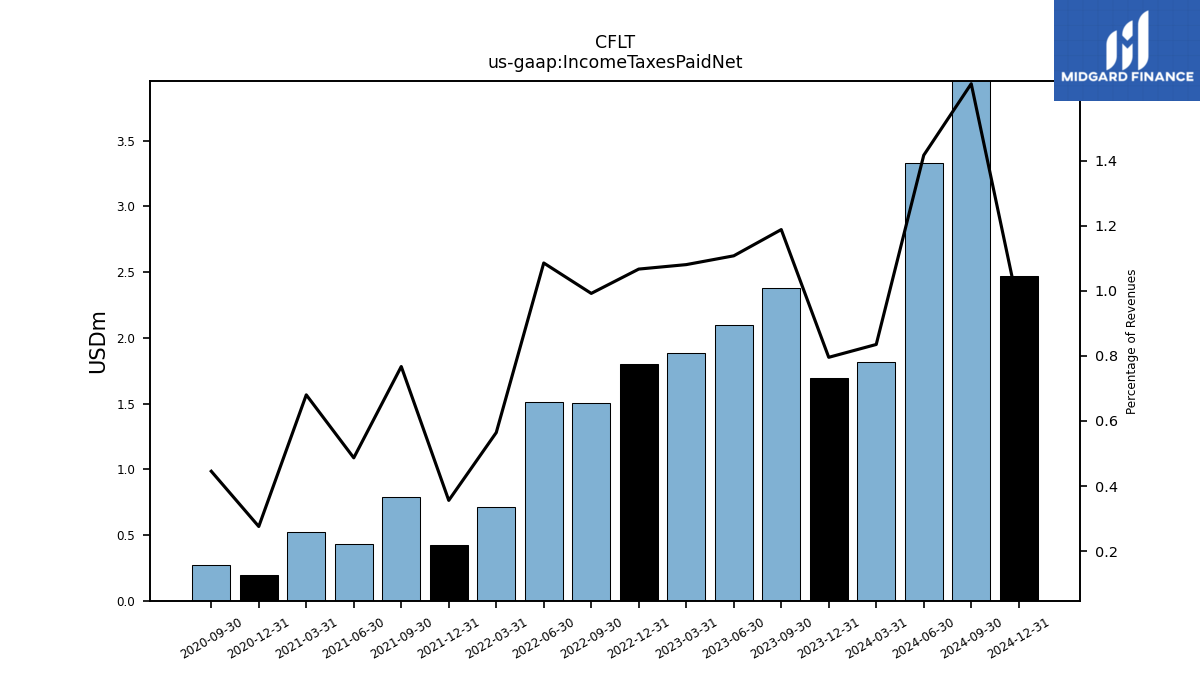
| Income Taxes Paid Net | 2.38 | 2.10 | 1.88 | 1.80 | 1.50 | 1.51 | 0.71 | 0.43 | 0.79 | 0.43 | 0.52 | 0.19 | 0.27 | NA | |
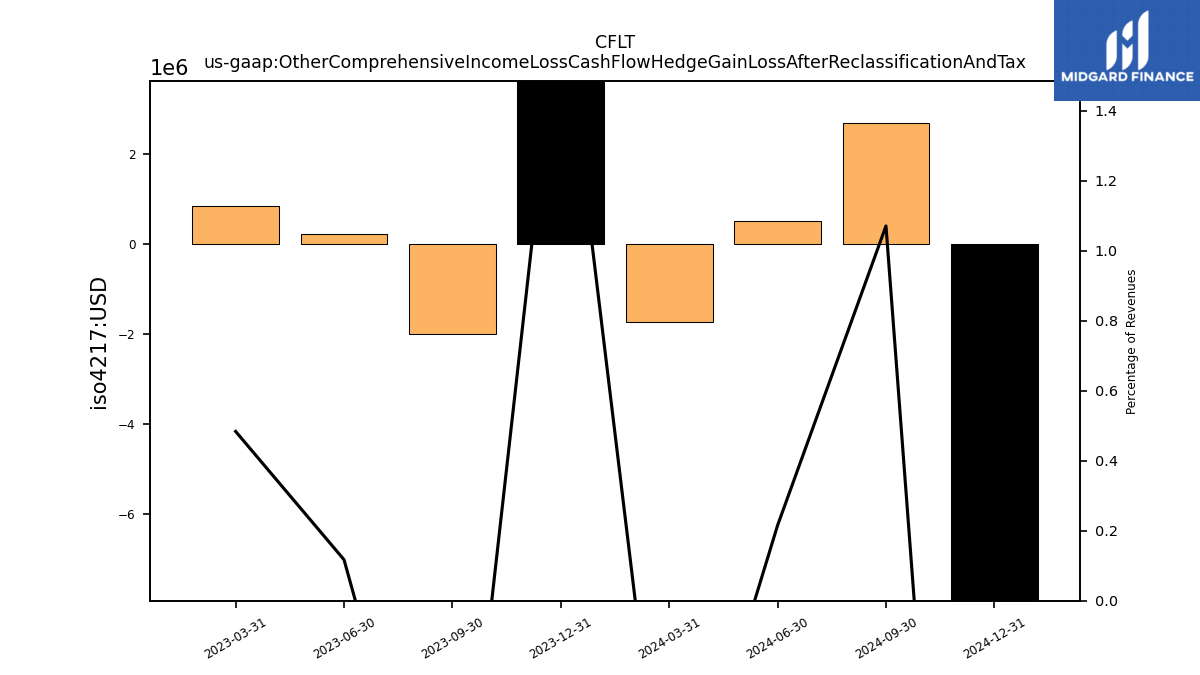
| Other Comprehensive Income Loss Cash Flow Hedge Gain Loss After Reclassification And Tax | -2.00 | 0.22 | 0.84 | NA | NA | NA | NA | NA | NA | NA | NA | NA | NA | NA | |
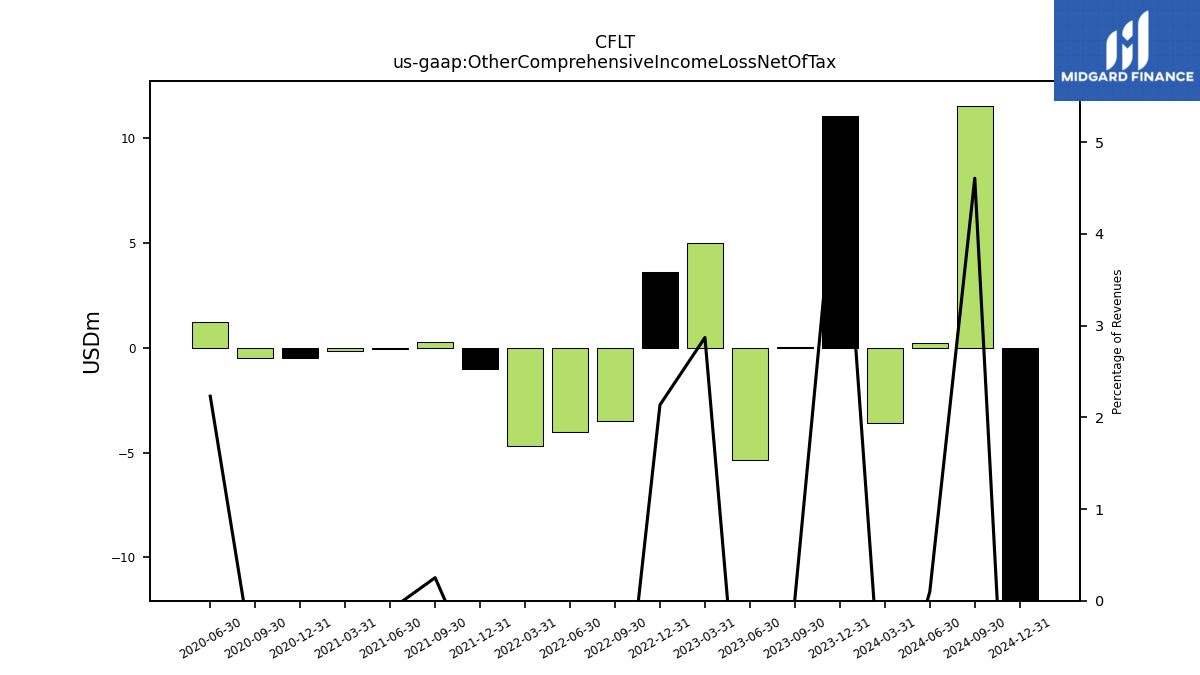
| Other Comprehensive Income Loss Net Of Tax | 0.04 | -5.35 | 5.00 | 3.60 | -3.51 | -4.00 | -4.71 | -1.04 | 0.26 | -0.09 | -0.18 | -0.48 | -0.49 | 1.20 | |
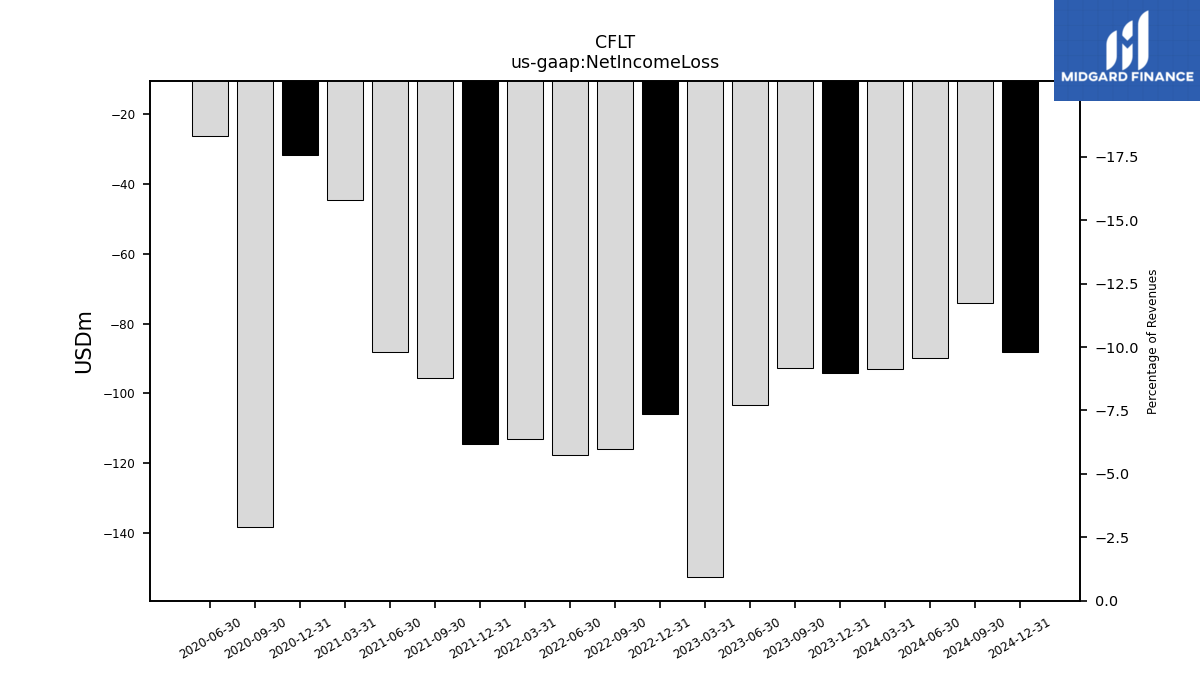
| Net Income Loss | -92.67 | -103.42 | -152.56 | -105.88 | -116.05 | -117.63 | -112.99 | -114.44 | -95.67 | -88.17 | -44.53 | -31.76 | -138.14 | -26.30 | |
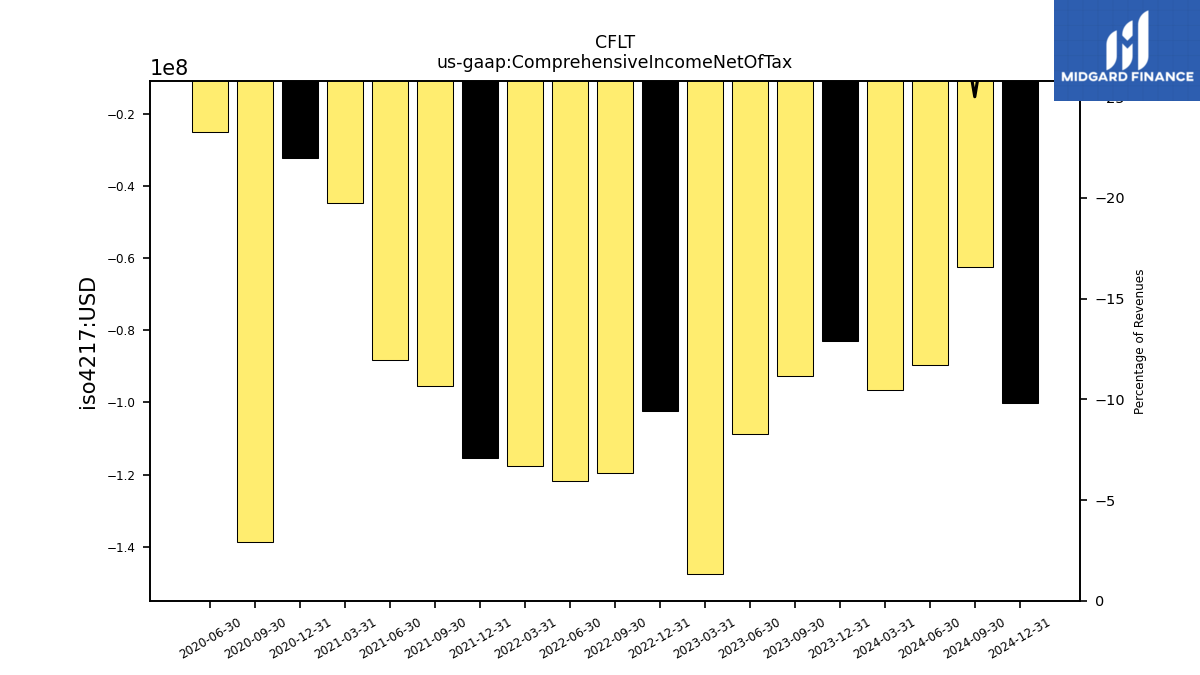
| Comprehensive Income Net Of Tax | -92.63 | -108.78 | -147.55 | -102.28 | -119.56 | -121.64 | -117.70 | -115.48 | -95.41 | -88.26 | -44.71 | -32.24 | -138.63 | -25.09 |
| 2023-09-30 | 2023-06-30 | 2023-03-31 | 2022-12-31 | 2022-09-30 | 2022-06-30 | 2022-03-31 | 2021-12-31 | 2021-09-30 | 2021-06-30 | 2021-03-31 | 2020-12-31 | 2020-09-30 | 2020-06-30 | ||
|---|---|---|---|---|---|---|---|---|---|---|---|---|---|---|---|
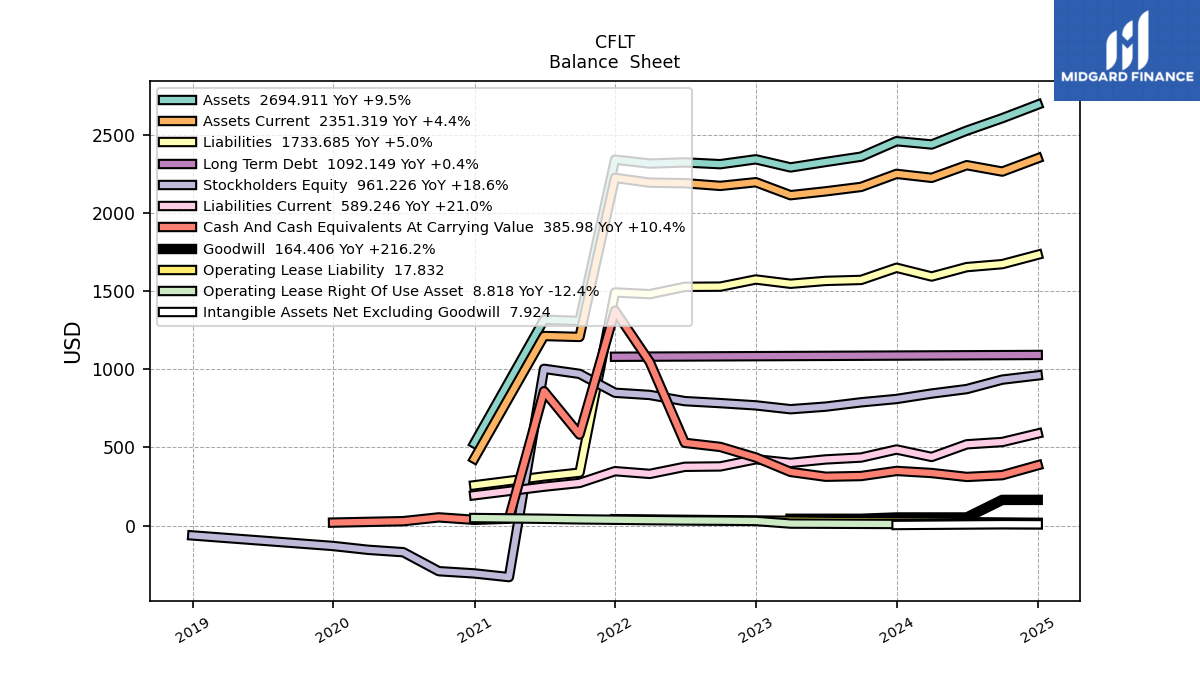
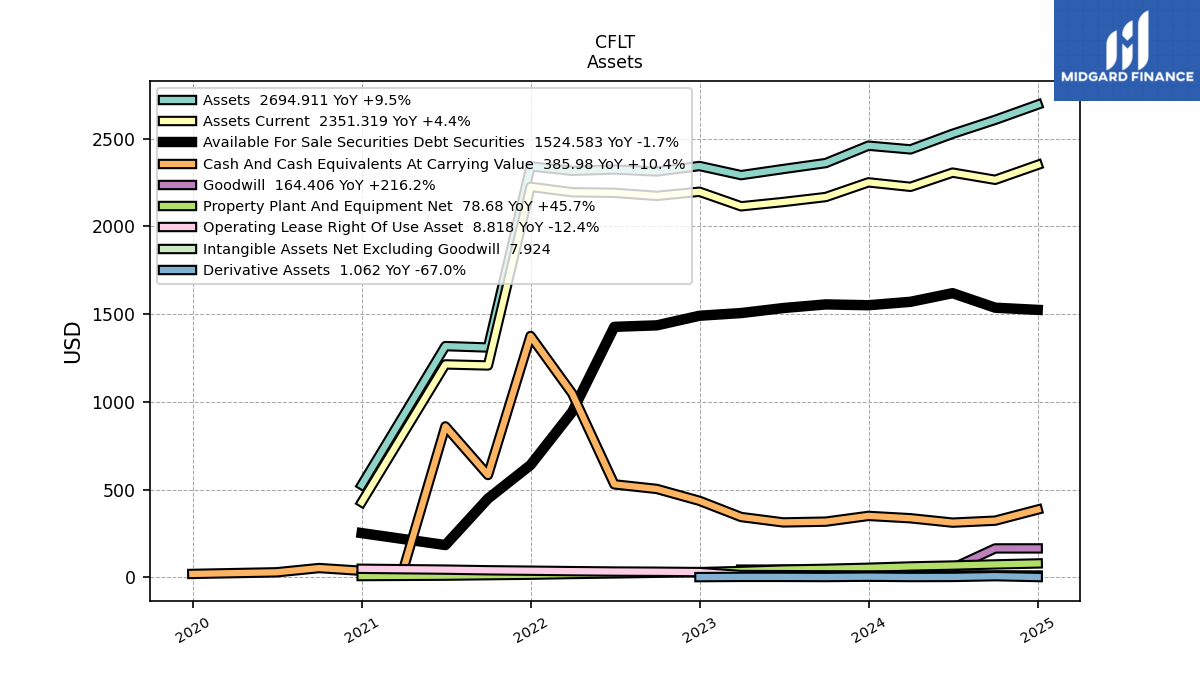
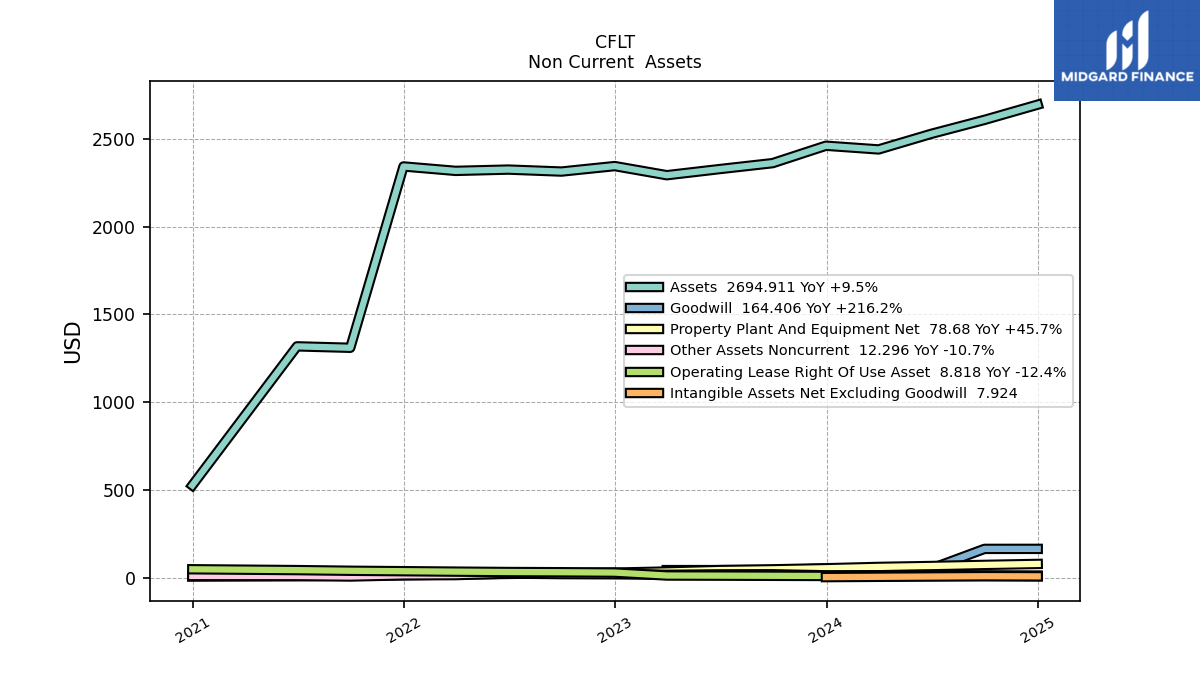
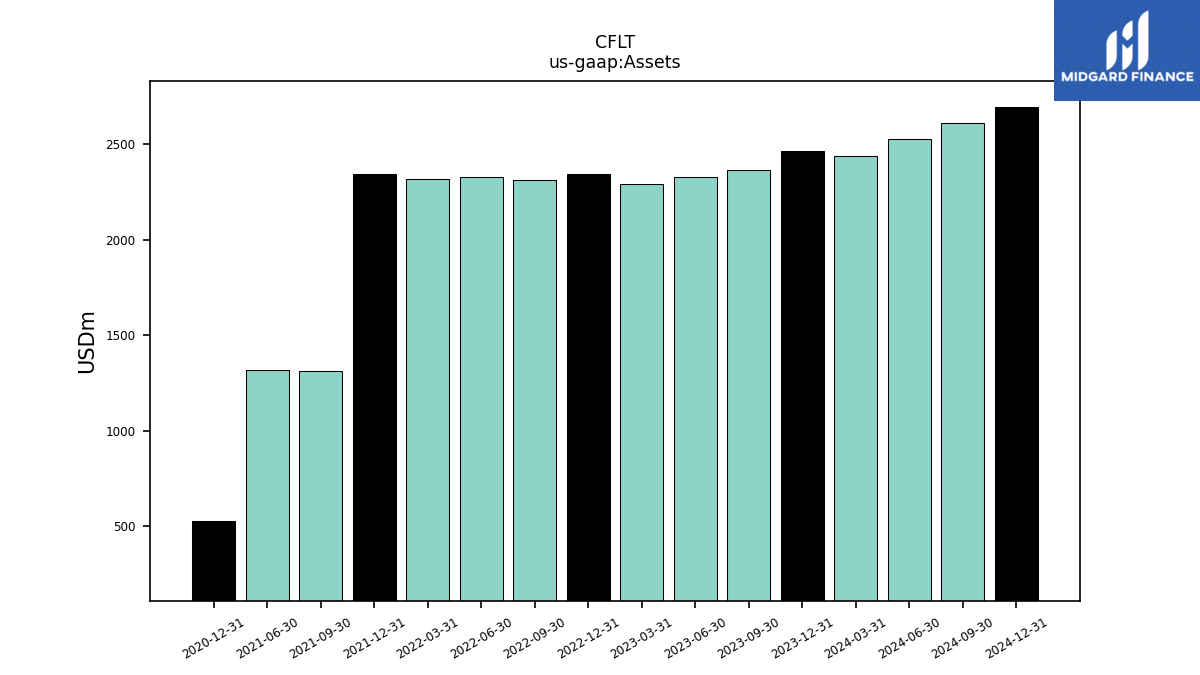
| Assets | 2361.67 | 2327.64 | 2292.82 | 2344.85 | 2313.63 | 2324.92 | 2317.50 | 2342.73 | 1309.82 | 1317.98 | NA | 526.12 | NA | NA | |
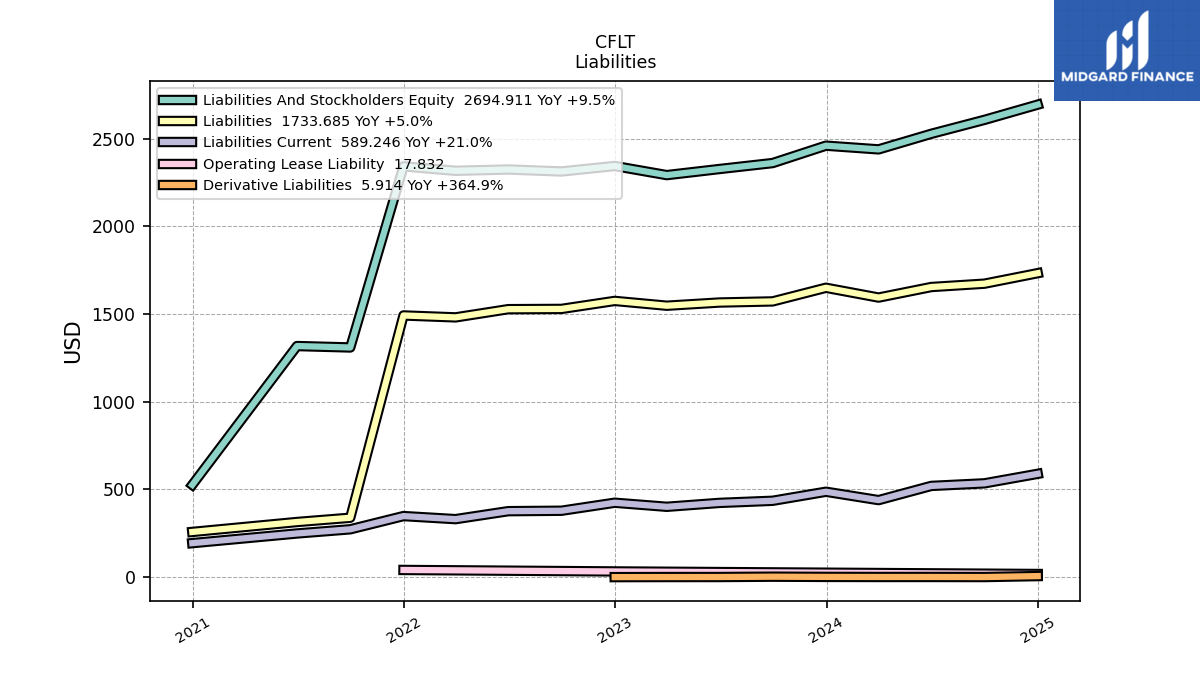
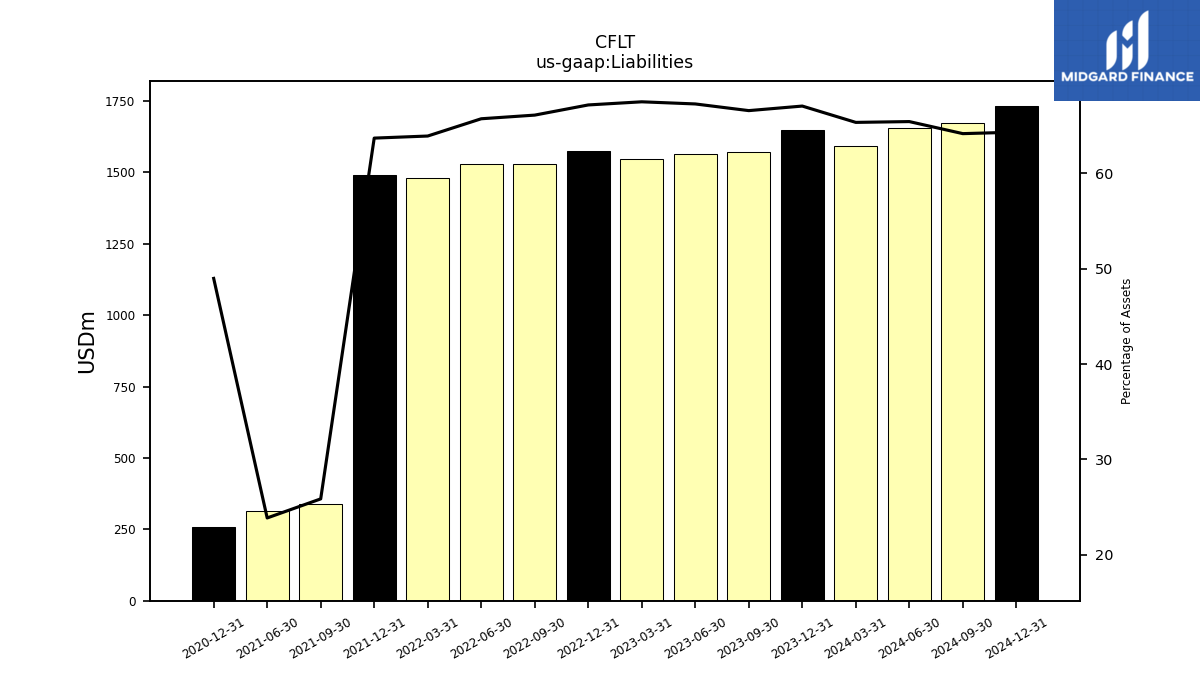
| Liabilities | 1572.61 | 1566.25 | 1547.97 | 1575.37 | 1529.73 | 1528.29 | 1481.43 | 1492.45 | 338.68 | 314.43 | NA | 257.73 | NA | NA | |
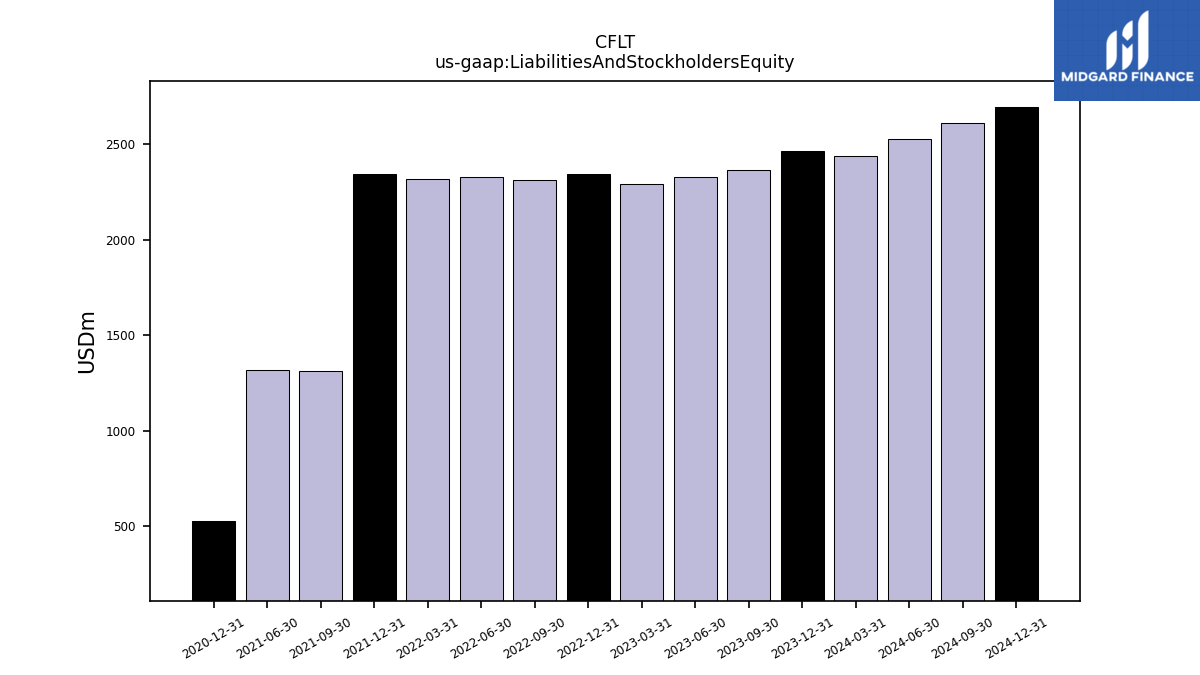
| Liabilities And Stockholders Equity | 2361.67 | 2327.64 | 2292.82 | 2344.85 | 2313.63 | 2324.92 | 2317.50 | 2342.73 | 1309.82 | 1317.98 | NA | 526.12 | NA | NA | |
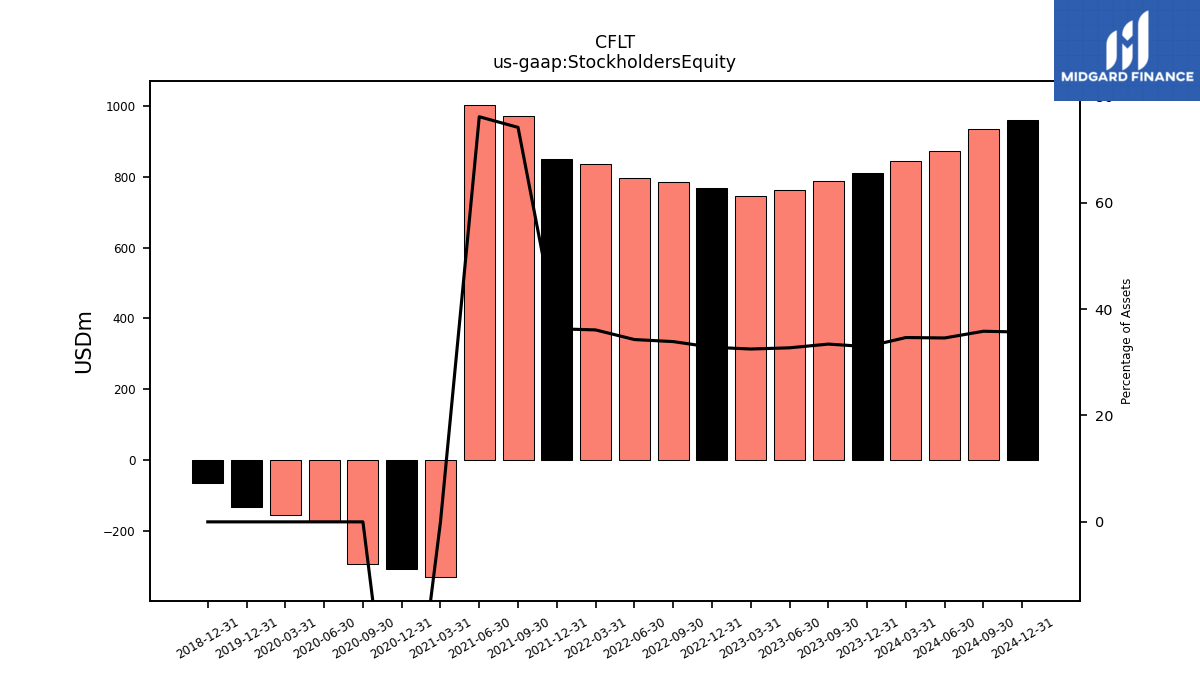
| Stockholders Equity | 789.06 | 761.39 | 744.85 | 769.48 | 783.90 | 796.62 | 836.07 | 850.28 | 971.14 | 1003.54 | -330.09 | -306.25 | -292.00 | -170.53 |
| 2023-09-30 | 2023-06-30 | 2023-03-31 | 2022-12-31 | 2022-09-30 | 2022-06-30 | 2022-03-31 | 2021-12-31 | 2021-09-30 | 2021-06-30 | 2021-03-31 | 2020-12-31 | 2020-09-30 | 2020-06-30 | ||
|---|---|---|---|---|---|---|---|---|---|---|---|---|---|---|---|
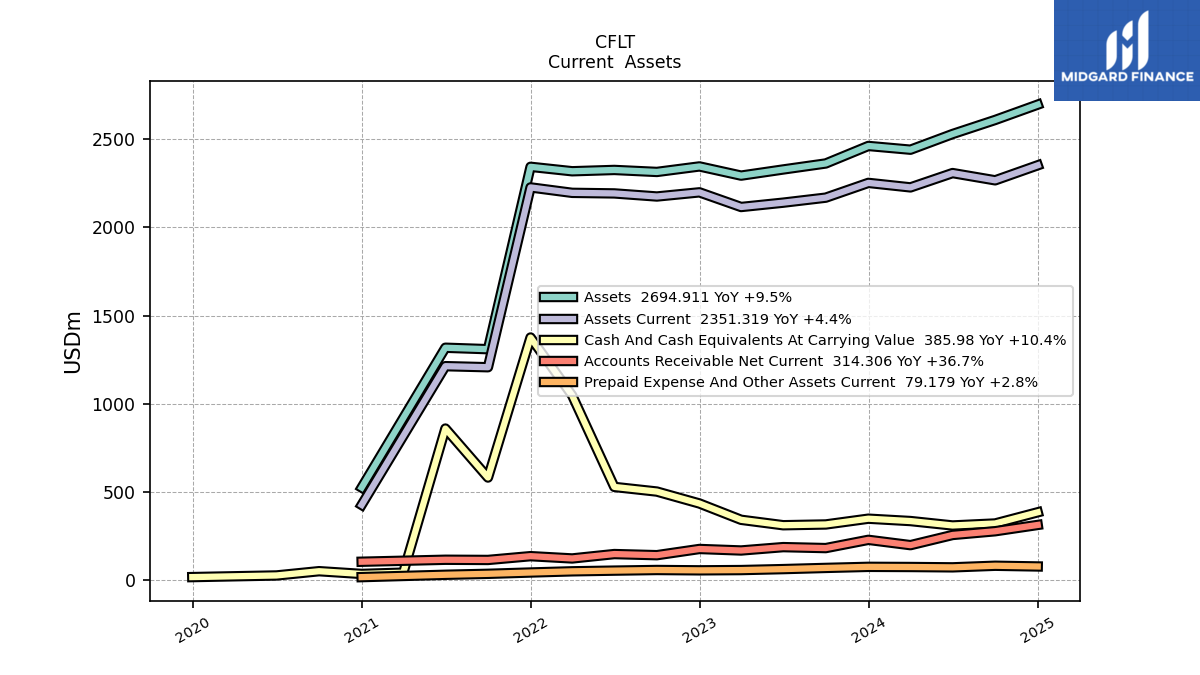
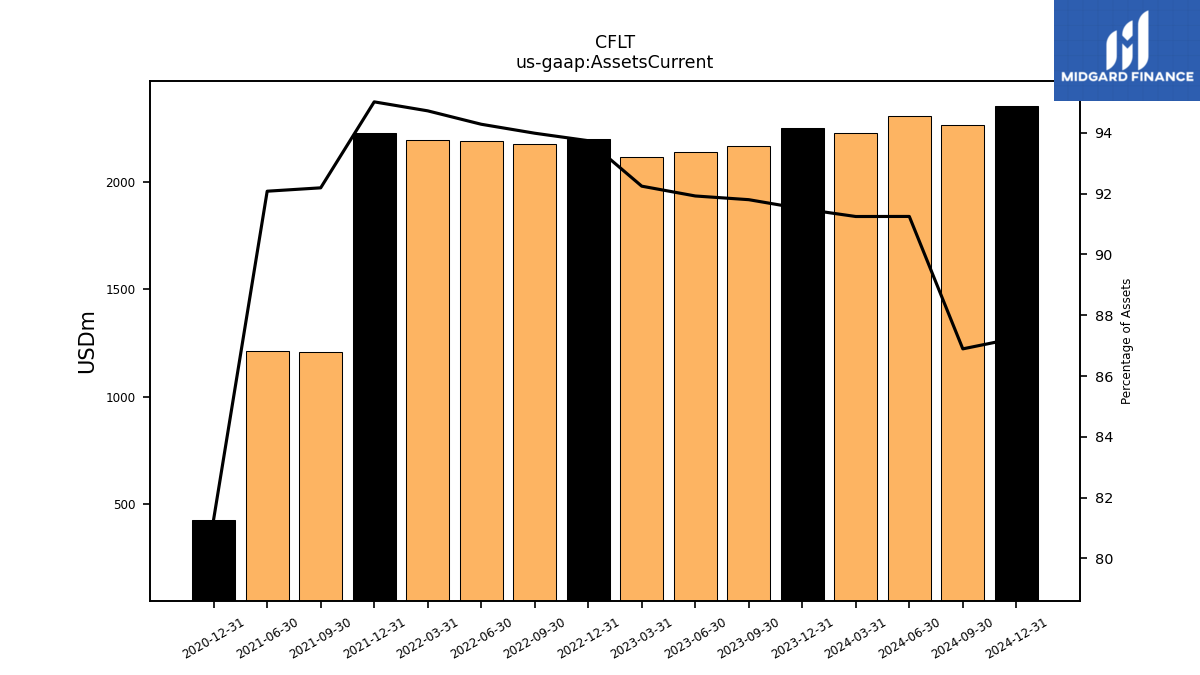
| Assets Current | 2168.06 | 2139.66 | 2115.05 | 2198.12 | 2174.55 | 2192.02 | 2195.25 | 2226.07 | 1207.55 | 1213.61 | NA | 427.69 | NA | NA | |
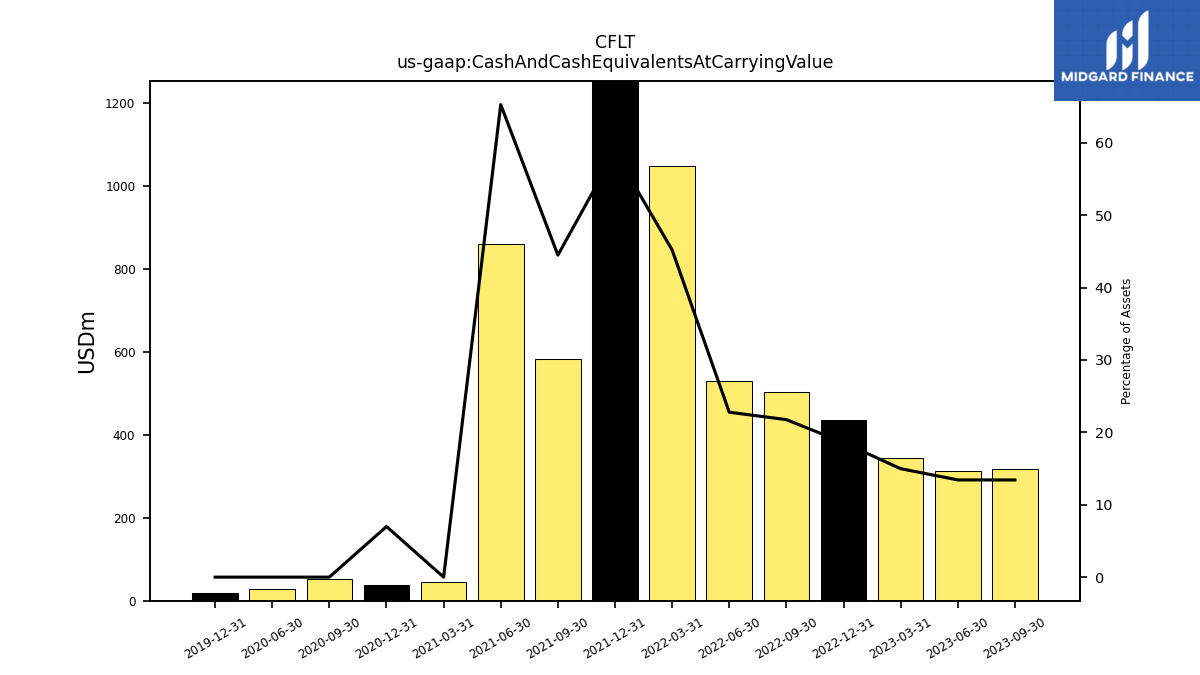
| Cash And Cash Equivalents At Carrying Value | 317.04 | 312.64 | 343.46 | 435.78 | 503.41 | 529.67 | 1047.59 | 1375.93 | 582.70 | 860.35 | 44.10 | 36.79 | 52.40 | 28.20 | |
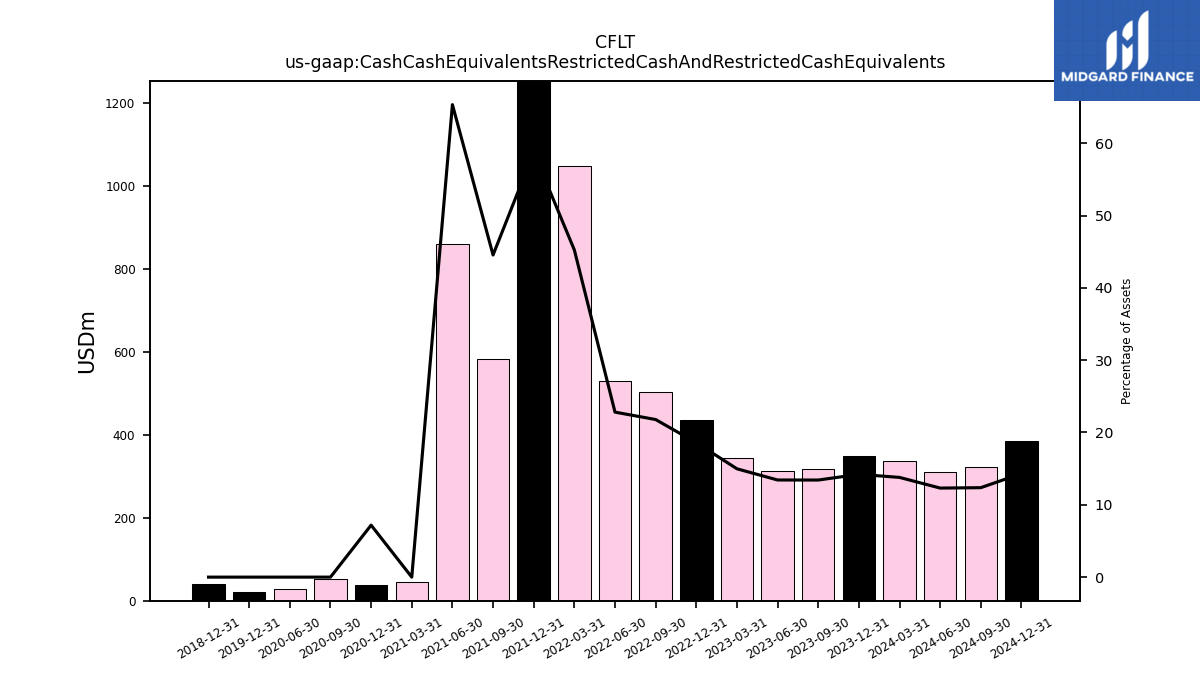
| Cash Cash Equivalents Restricted Cash And Restricted Cash Equivalents | 317.04 | 312.64 | 343.46 | 435.78 | 504.16 | 530.42 | 1048.34 | 1376.68 | 583.45 | 861.10 | 45.11 | 37.81 | 53.42 | 29.22 | |
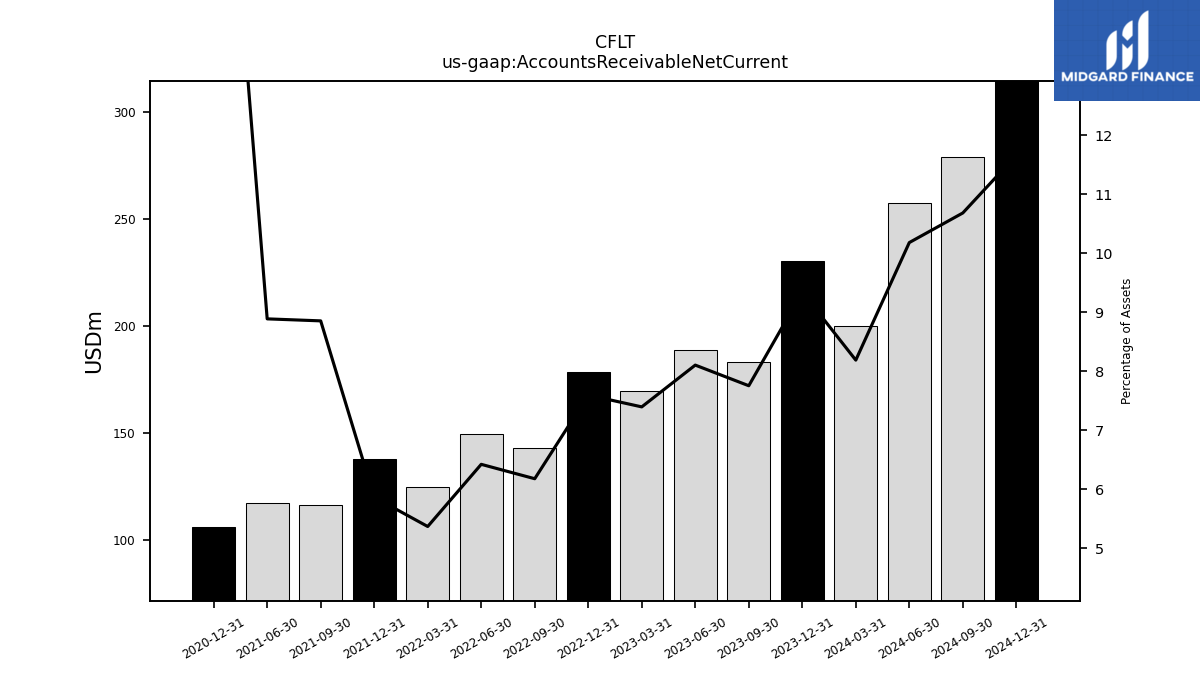
| Accounts Receivable Net Current | 183.21 | 188.71 | 169.65 | 178.19 | 143.03 | 149.39 | 124.50 | 137.49 | 116.01 | 117.18 | NA | 105.97 | NA | NA | |
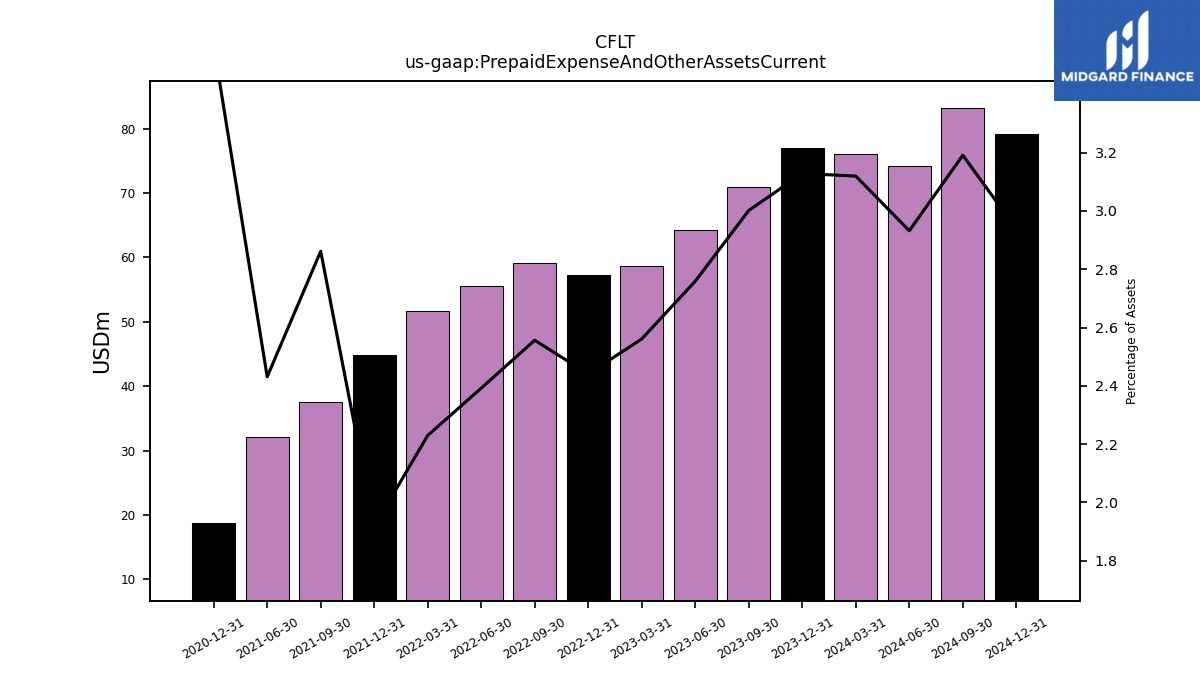
| Prepaid Expense And Other Assets Current | 70.89 | 64.22 | 58.72 | 57.23 | 59.14 | 55.61 | 51.67 | 44.92 | 37.48 | 32.04 | NA | 18.77 | NA | NA | |
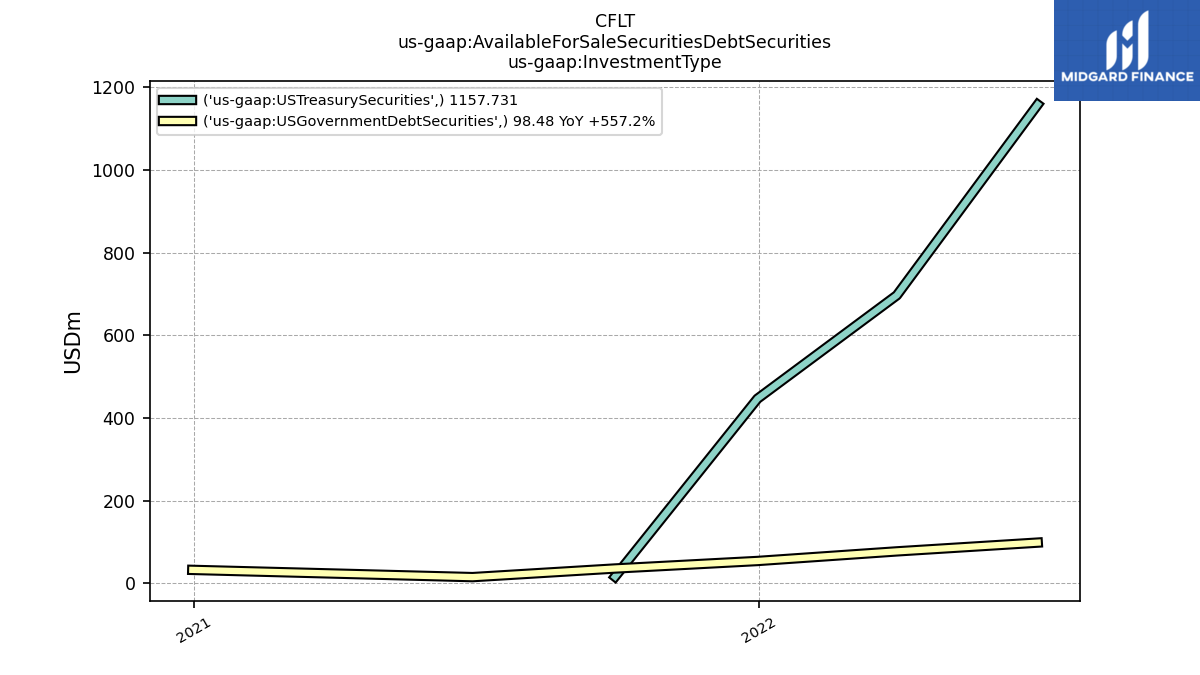
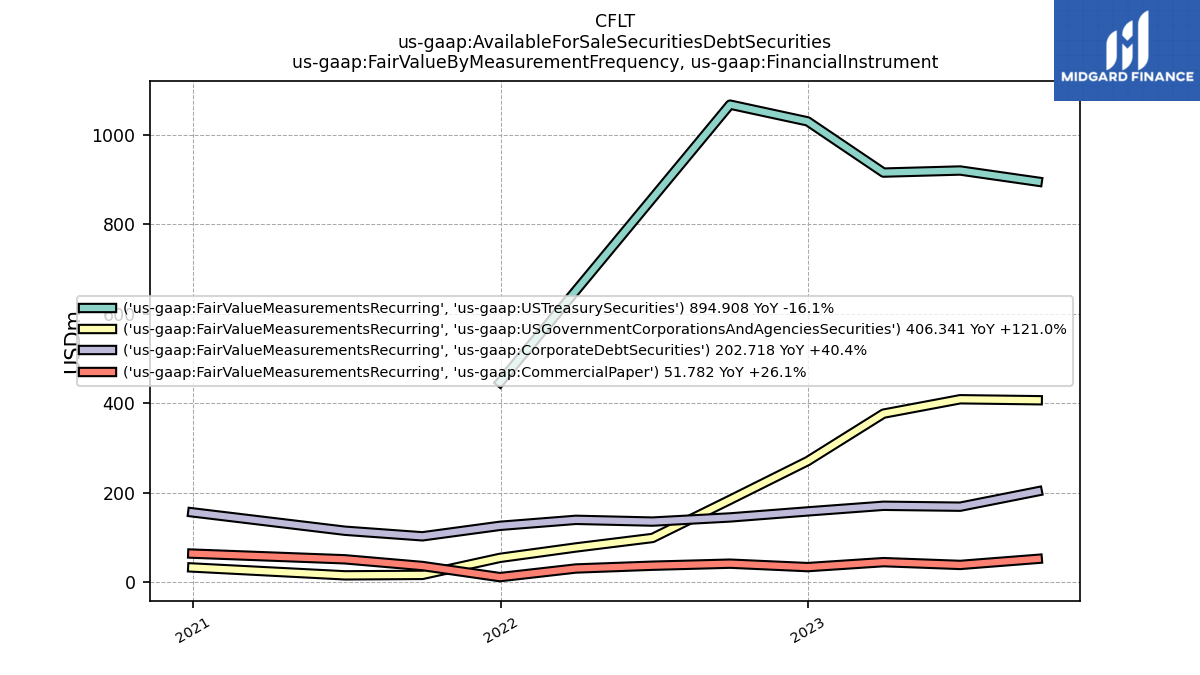
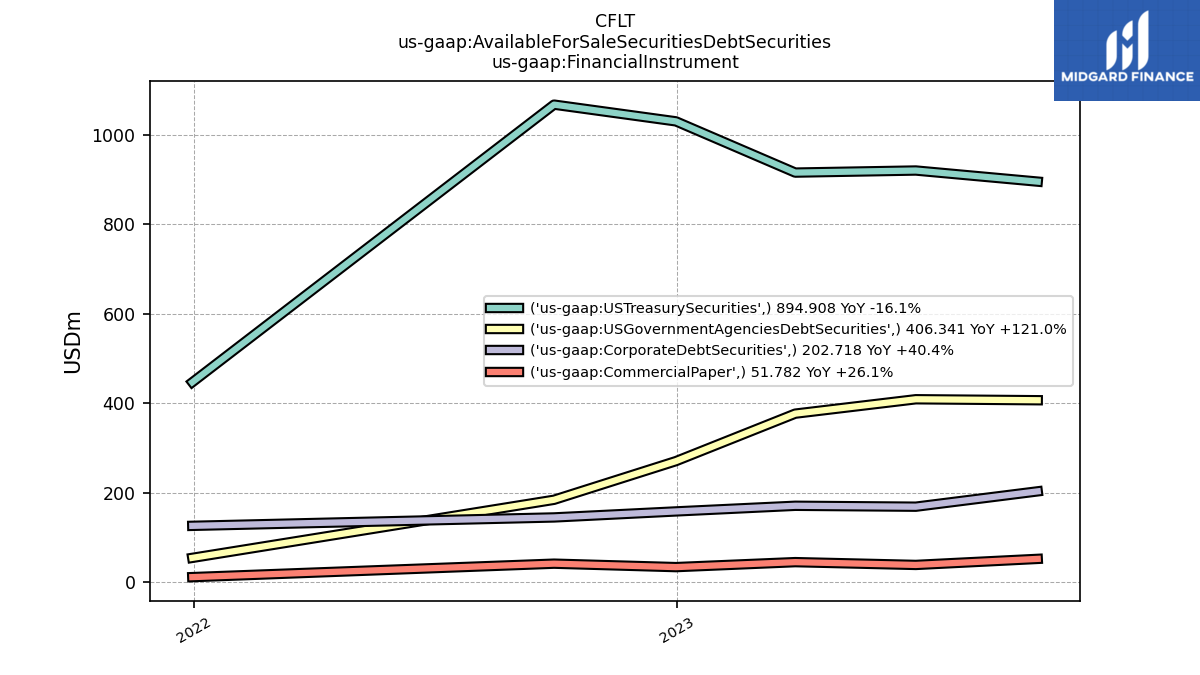
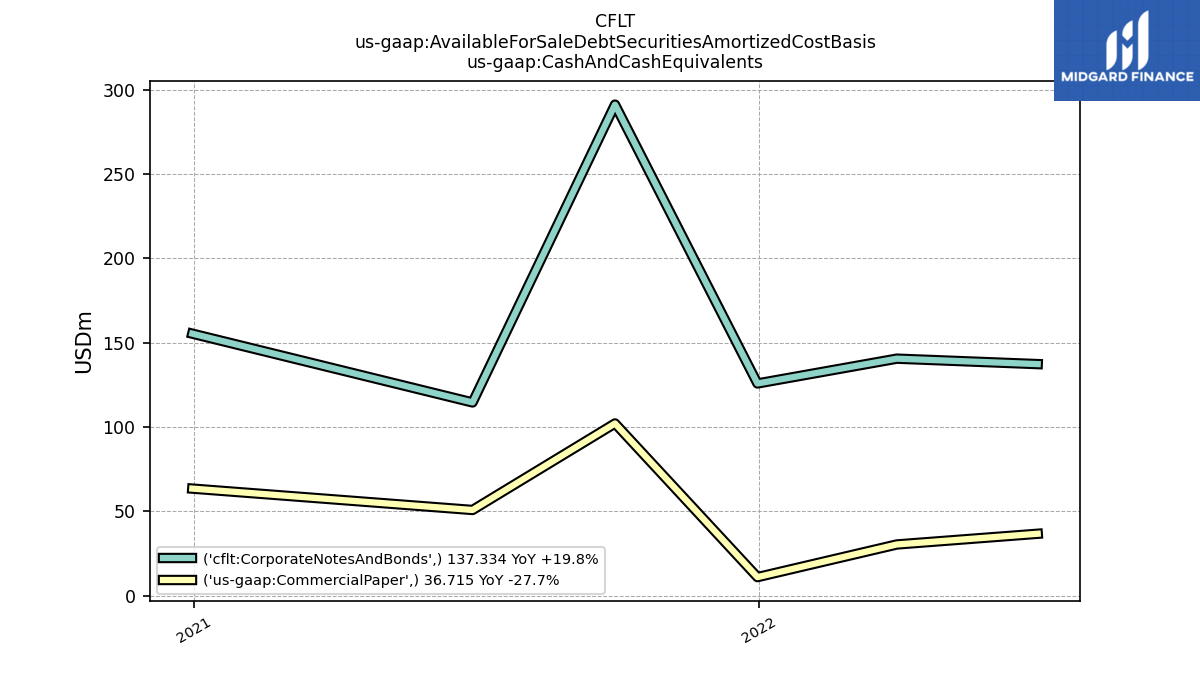
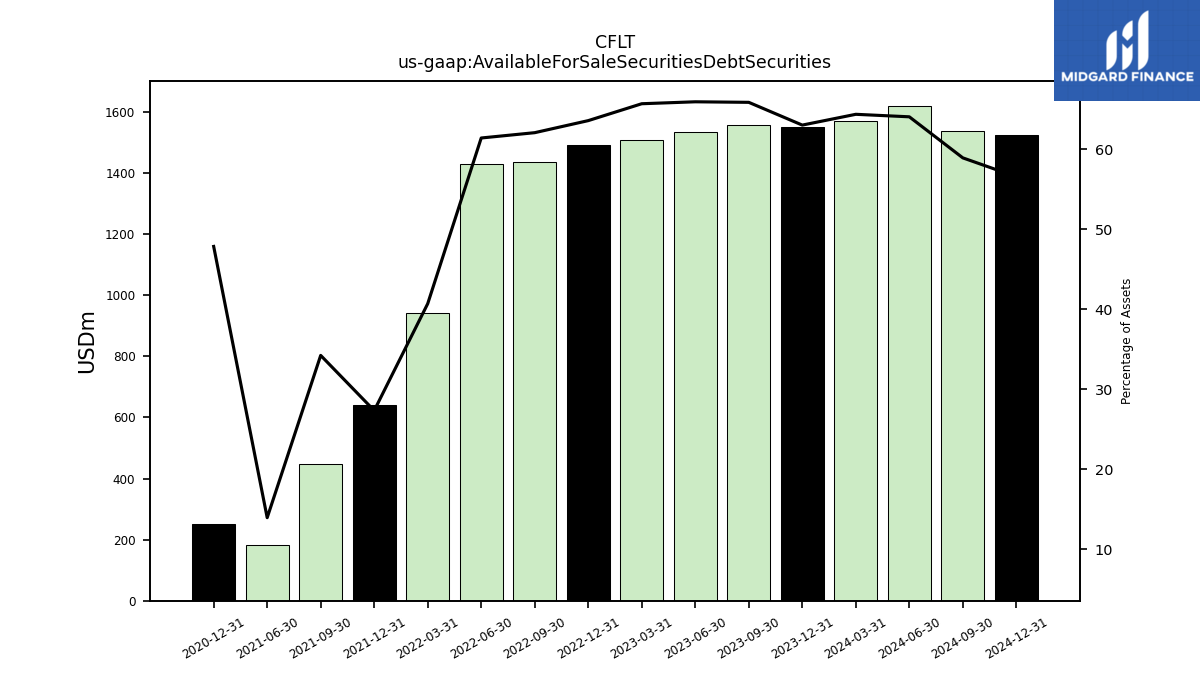
| Available For Sale Securities Debt Securities | 1555.75 | 1534.91 | 1506.39 | 1491.04 | 1436.31 | 1427.86 | 943.05 | 640.09 | 448.25 | 183.53 | NA | 251.76 | NA | NA |
| 2023-09-30 | 2023-06-30 | 2023-03-31 | 2022-12-31 | 2022-09-30 | 2022-06-30 | 2022-03-31 | 2021-12-31 | 2021-09-30 | 2021-06-30 | 2021-03-31 | 2020-12-31 | 2020-09-30 | 2020-06-30 | ||
|---|---|---|---|---|---|---|---|---|---|---|---|---|---|---|---|
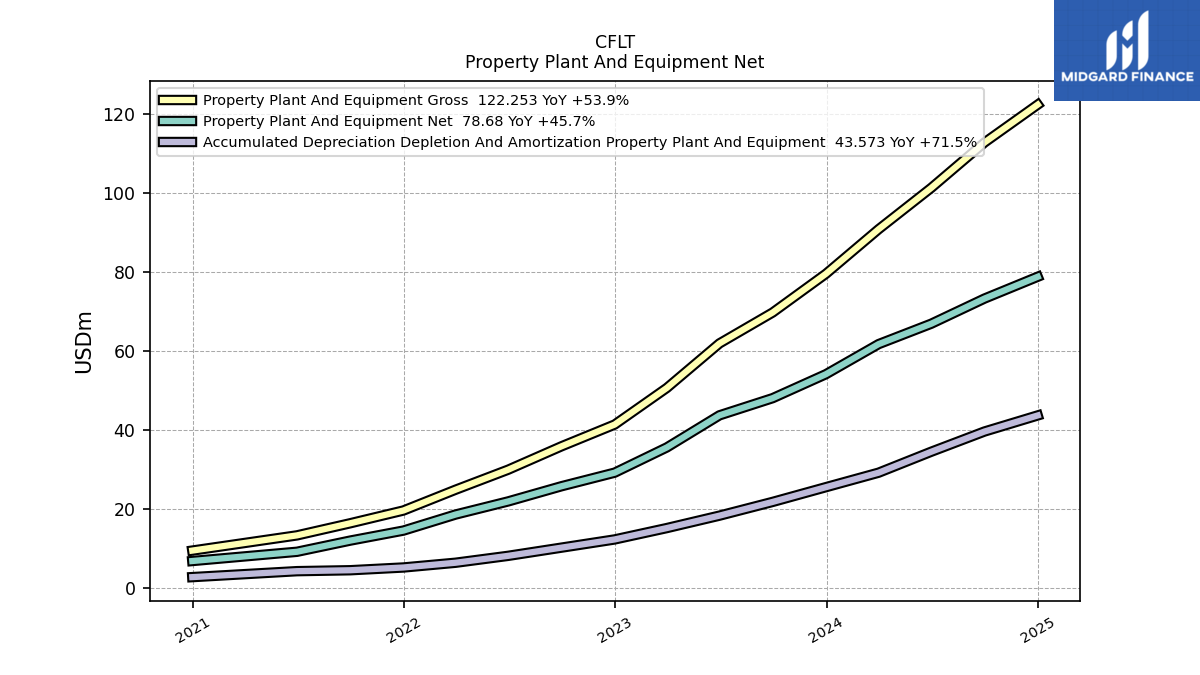
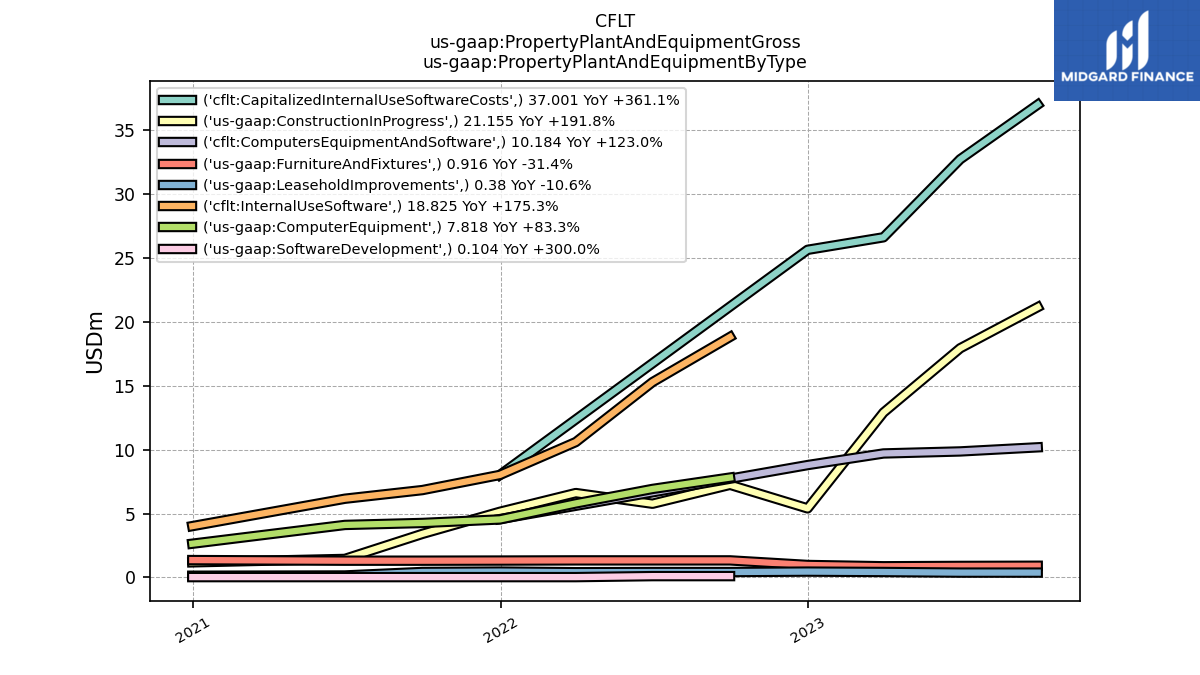
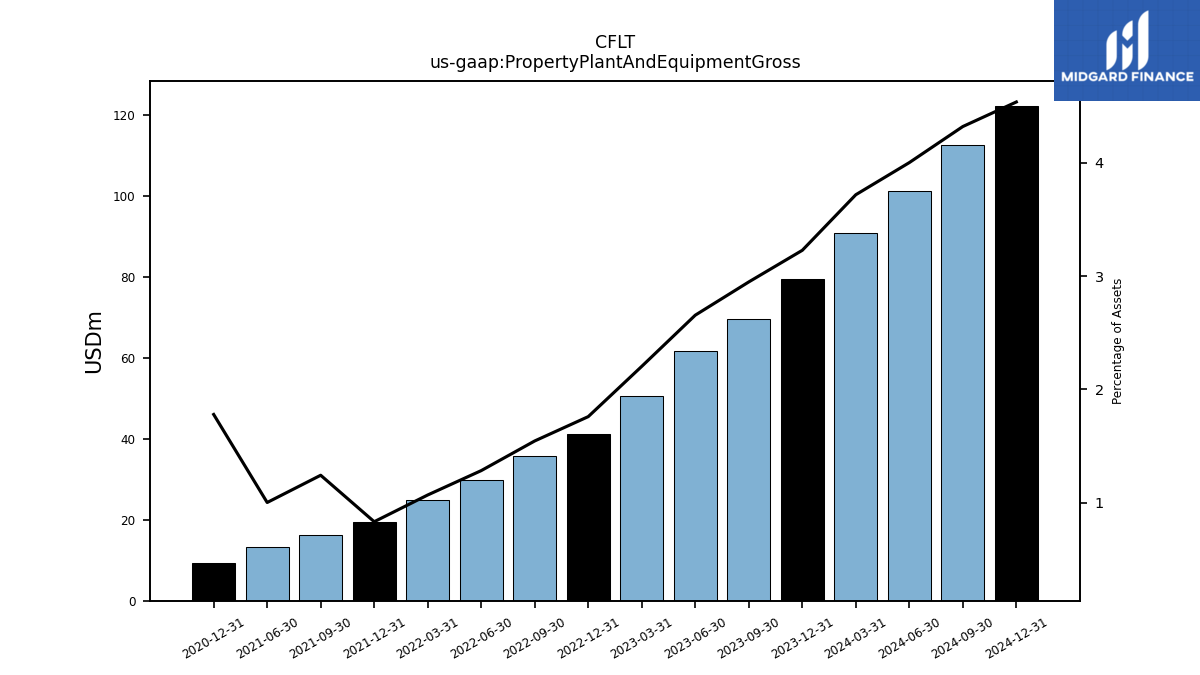
| Property Plant And Equipment Gross | 69.64 | 61.80 | 50.53 | 41.27 | 35.76 | 29.85 | 24.77 | 19.51 | 16.28 | 13.21 | NA | 9.36 | NA | NA | |
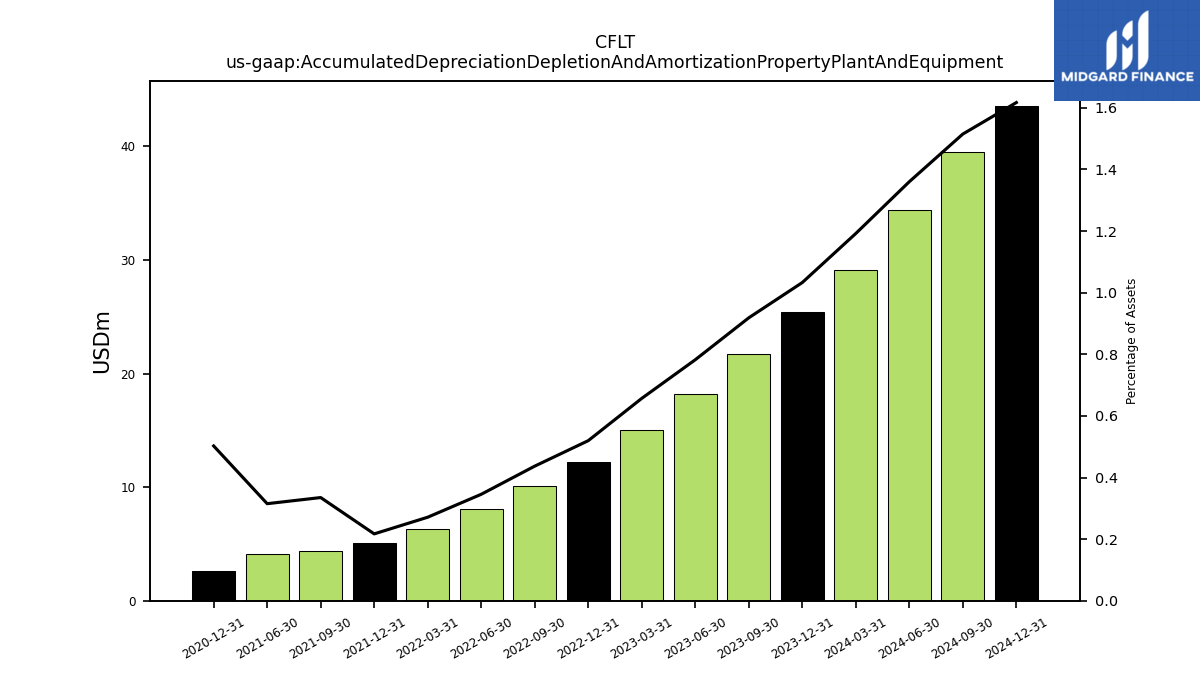
| Accumulated Depreciation Depletion And Amortization Property Plant And Equipment | 21.69 | 18.21 | 15.06 | 12.18 | 10.11 | 8.03 | 6.28 | 5.08 | 4.39 | 4.15 | NA | 2.64 | NA | NA | |
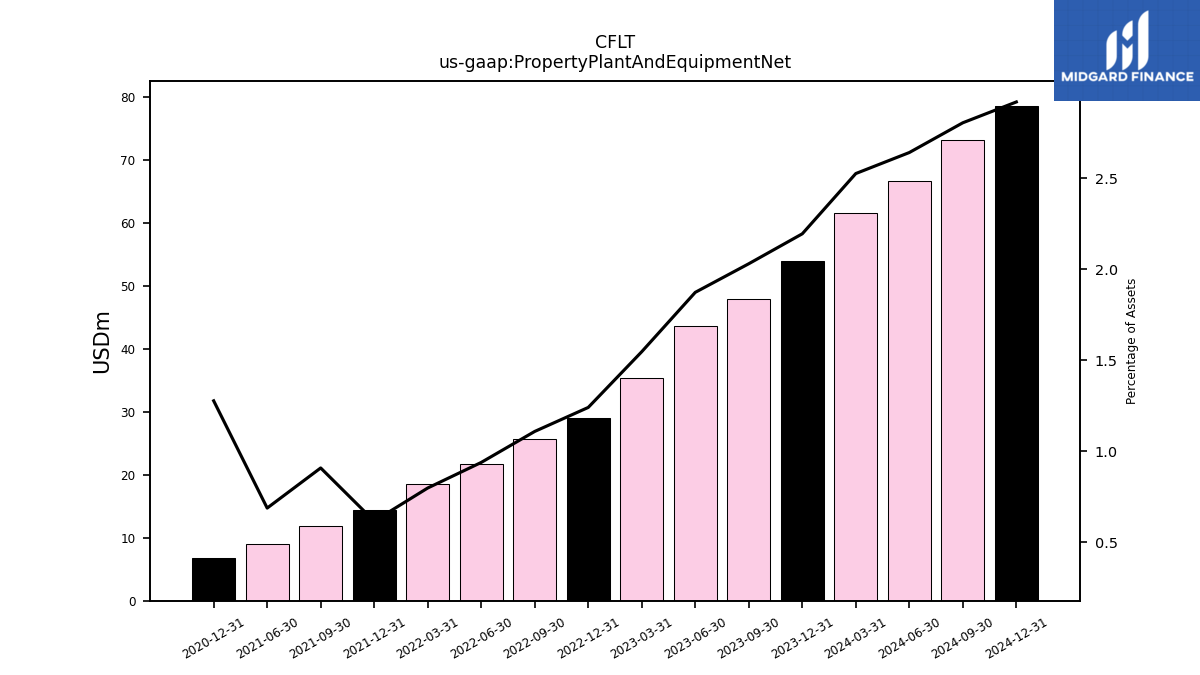
| Property Plant And Equipment Net | 47.95 | 43.60 | 35.47 | 29.09 | 25.65 | 21.81 | 18.49 | 14.43 | 11.89 | 9.06 | NA | 6.72 | NA | NA | |
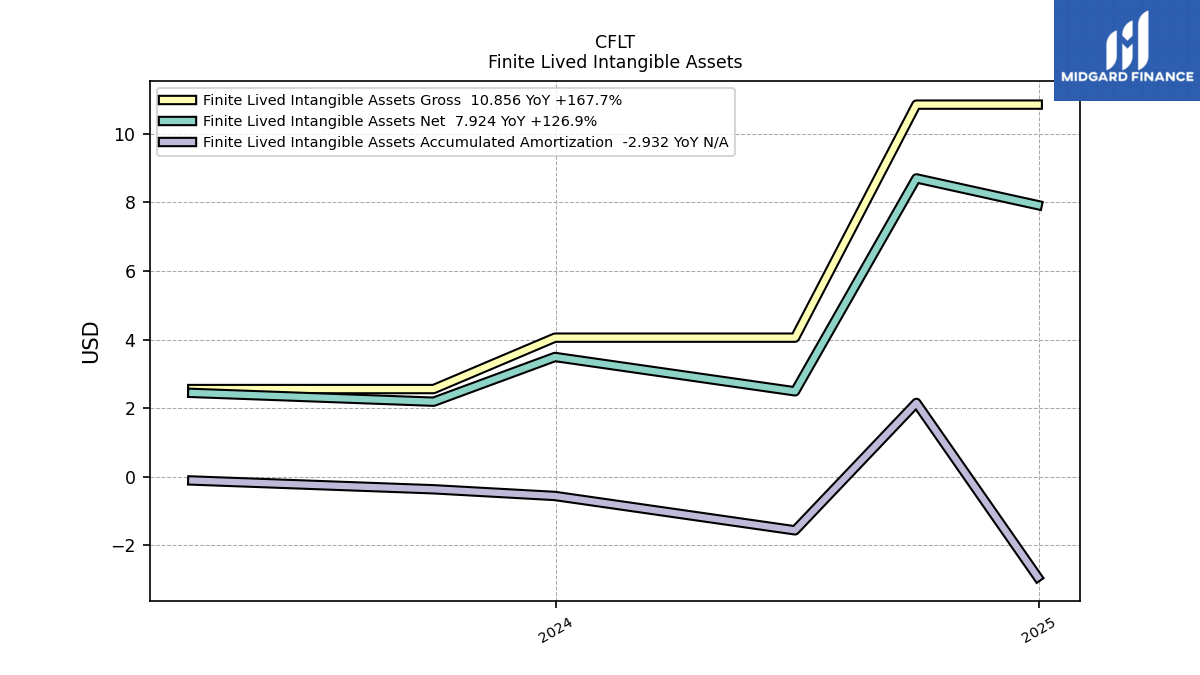
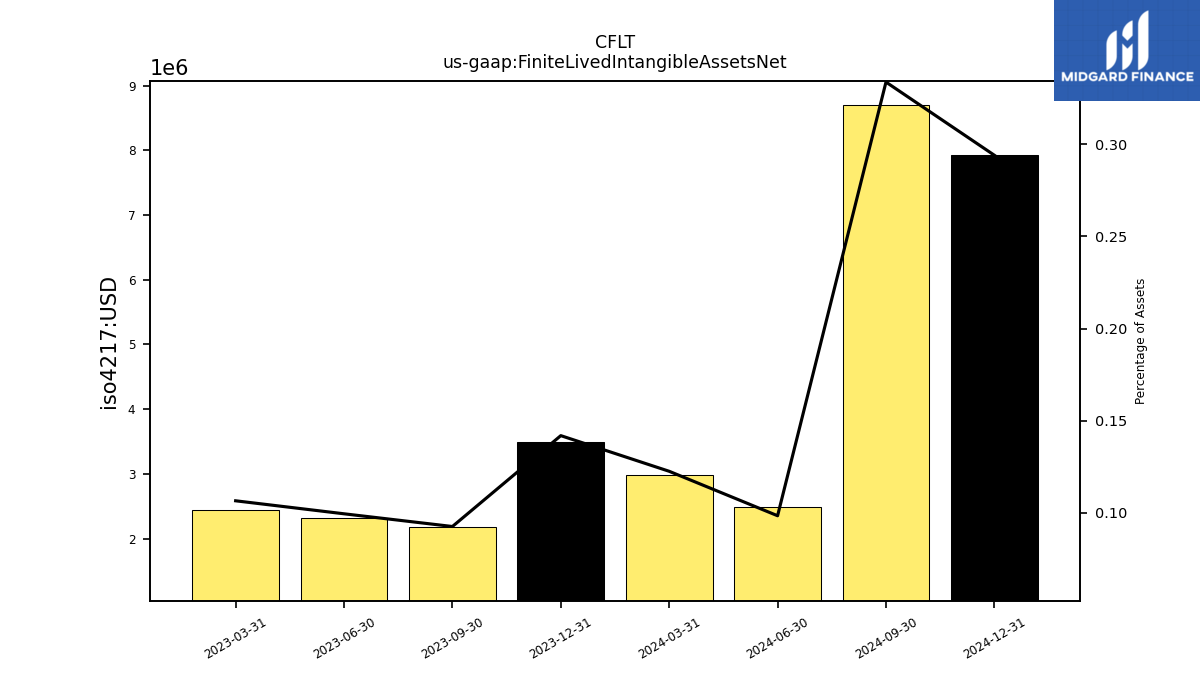
| Finite Lived Intangible Assets Net | 2.19 | 2.32 | 2.44 | NA | NA | NA | NA | NA | NA | NA | NA | NA | NA | NA | |
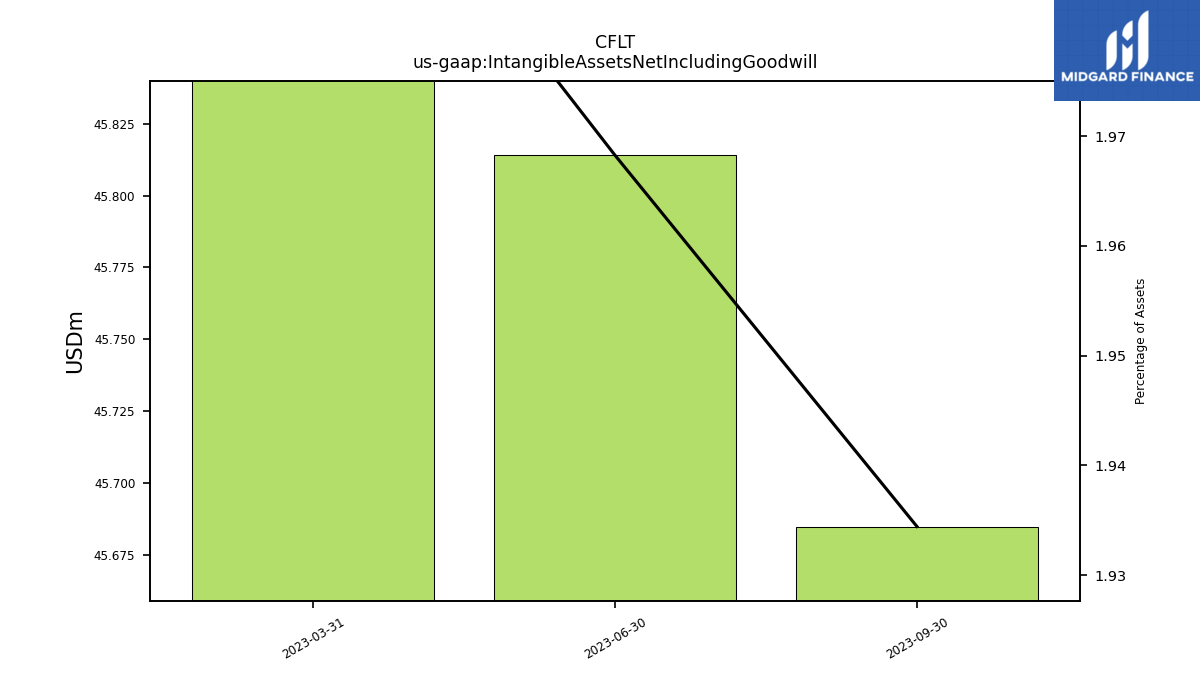
| Intangible Assets Net Including Goodwill | 45.69 | 45.81 | 45.94 | NA | NA | NA | NA | NA | NA | NA | NA | NA | NA | NA | |
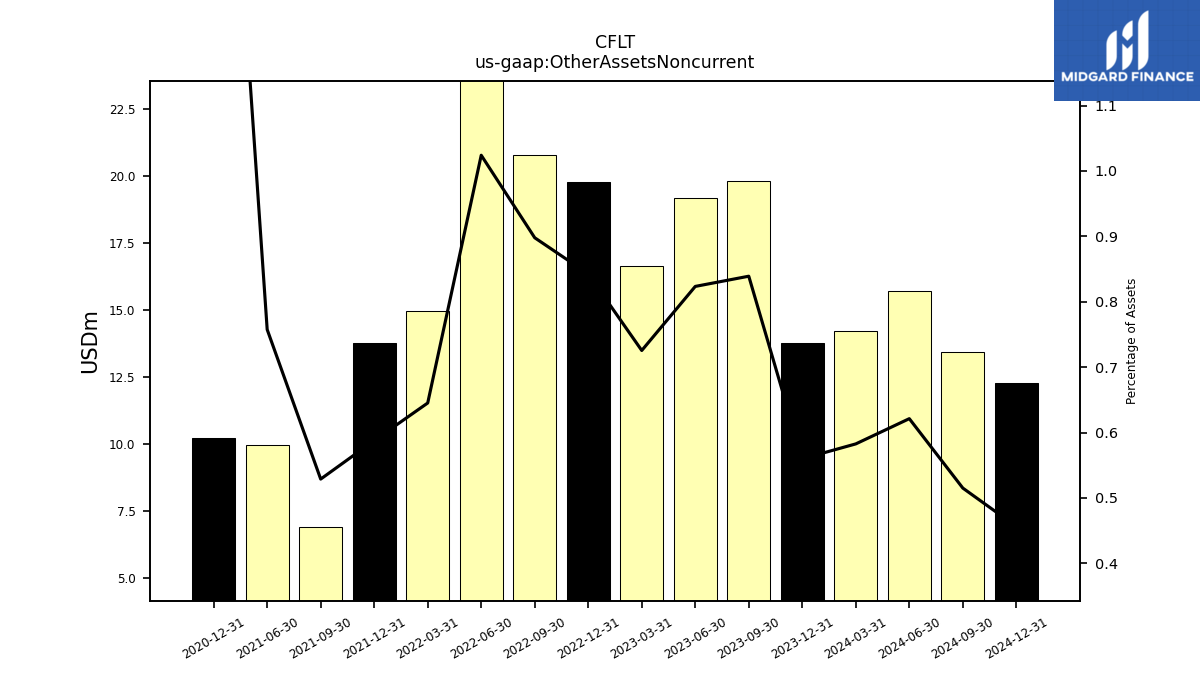
| Other Assets Noncurrent | 19.82 | 19.17 | 16.63 | 19.76 | 20.77 | 23.81 | 14.95 | 13.77 | 6.93 | 9.98 | NA | 10.24 | NA | NA | |
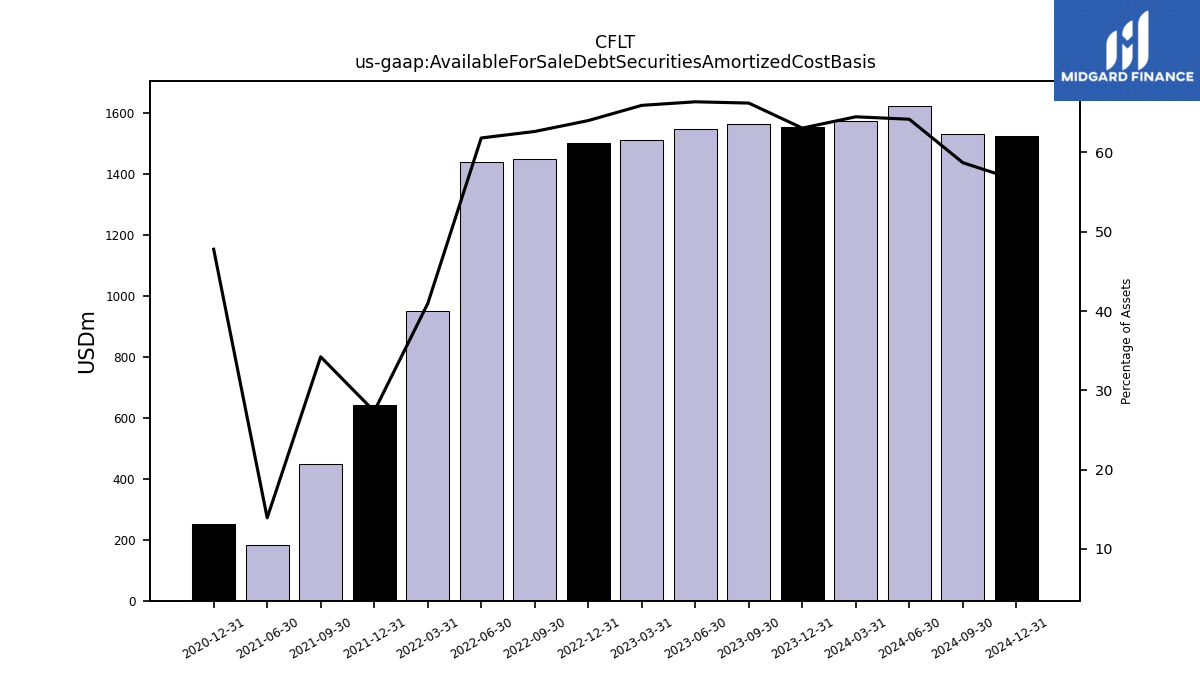
| Available For Sale Debt Securities Amortized Cost Basis | 1564.02 | 1545.23 | 1511.84 | 1501.12 | 1449.34 | 1437.35 | 948.52 | 640.88 | 448.25 | 183.46 | NA | 251.42 | NA | NA |
| 2023-09-30 | 2023-06-30 | 2023-03-31 | 2022-12-31 | 2022-09-30 | 2022-06-30 | 2022-03-31 | 2021-12-31 | 2021-09-30 | 2021-06-30 | 2021-03-31 | 2020-12-31 | 2020-09-30 | 2020-06-30 | ||
|---|---|---|---|---|---|---|---|---|---|---|---|---|---|---|---|
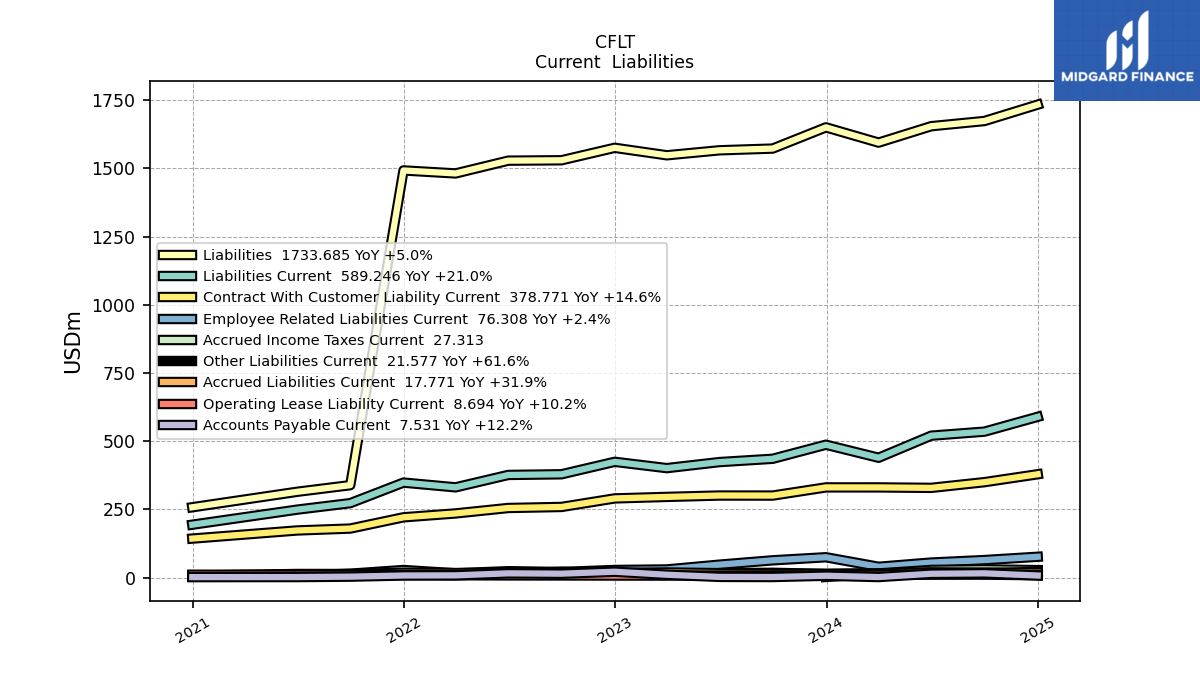
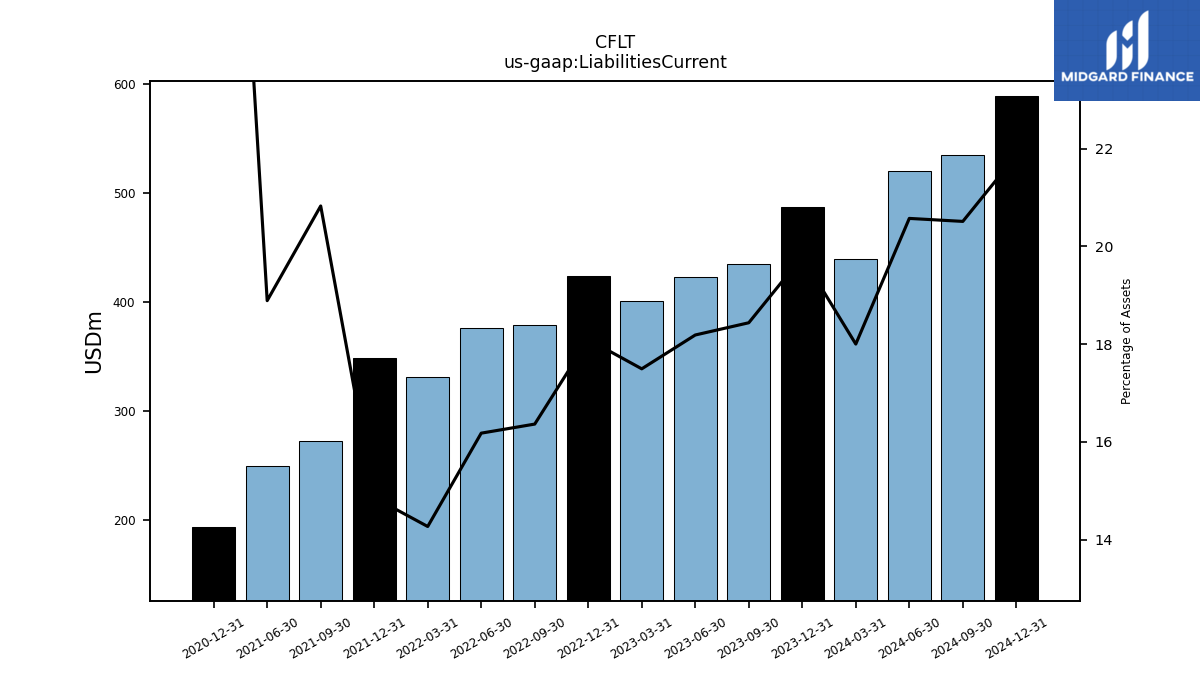
| Liabilities Current | 435.46 | 423.36 | 401.16 | 424.33 | 378.65 | 376.18 | 330.73 | 348.19 | 272.80 | 248.98 | NA | 193.80 | NA | NA | |
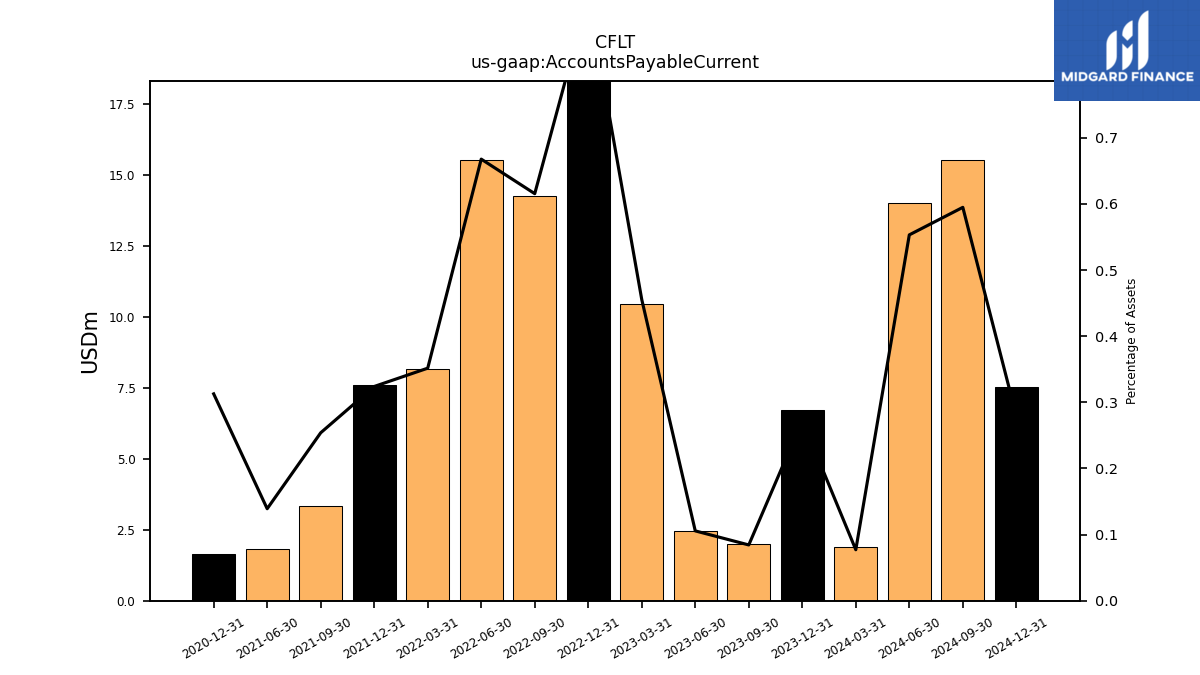
| Accounts Payable Current | 1.99 | 2.46 | 10.45 | 21.44 | 14.24 | 15.53 | 8.15 | 7.59 | 3.33 | 1.83 | NA | 1.65 | NA | NA | |
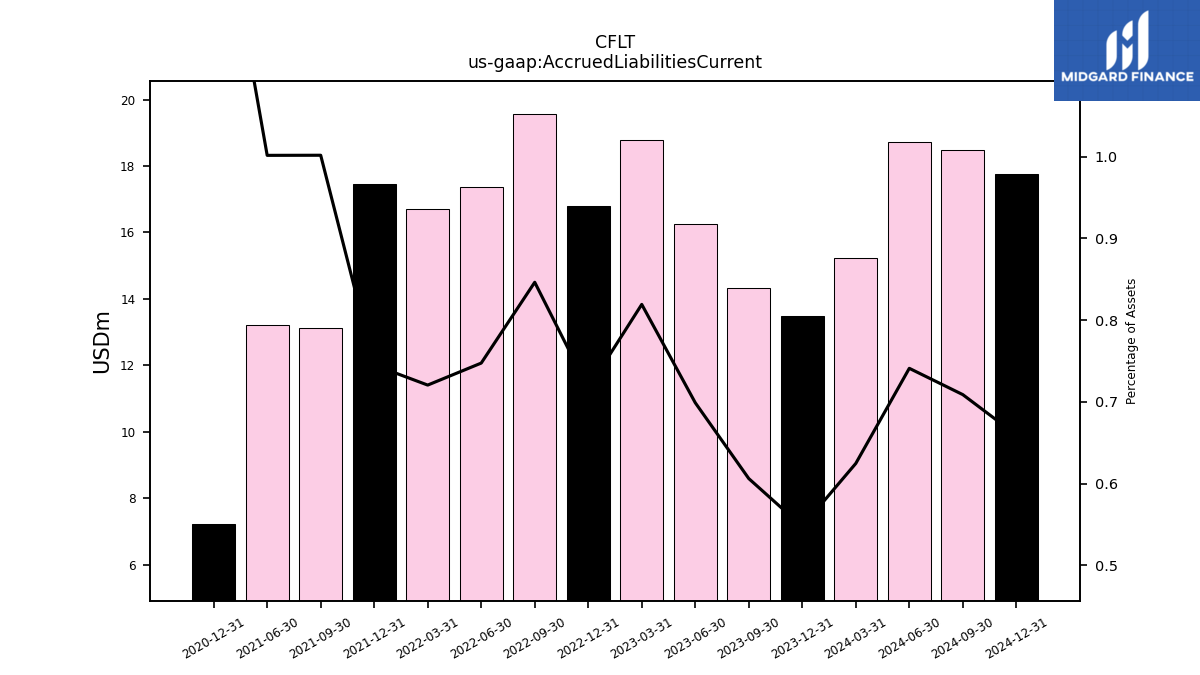
| Accrued Liabilities Current | 14.31 | 16.27 | 18.78 | 16.80 | 19.58 | 17.38 | 16.70 | 17.45 | 13.12 | 13.20 | NA | 7.22 | NA | NA | |
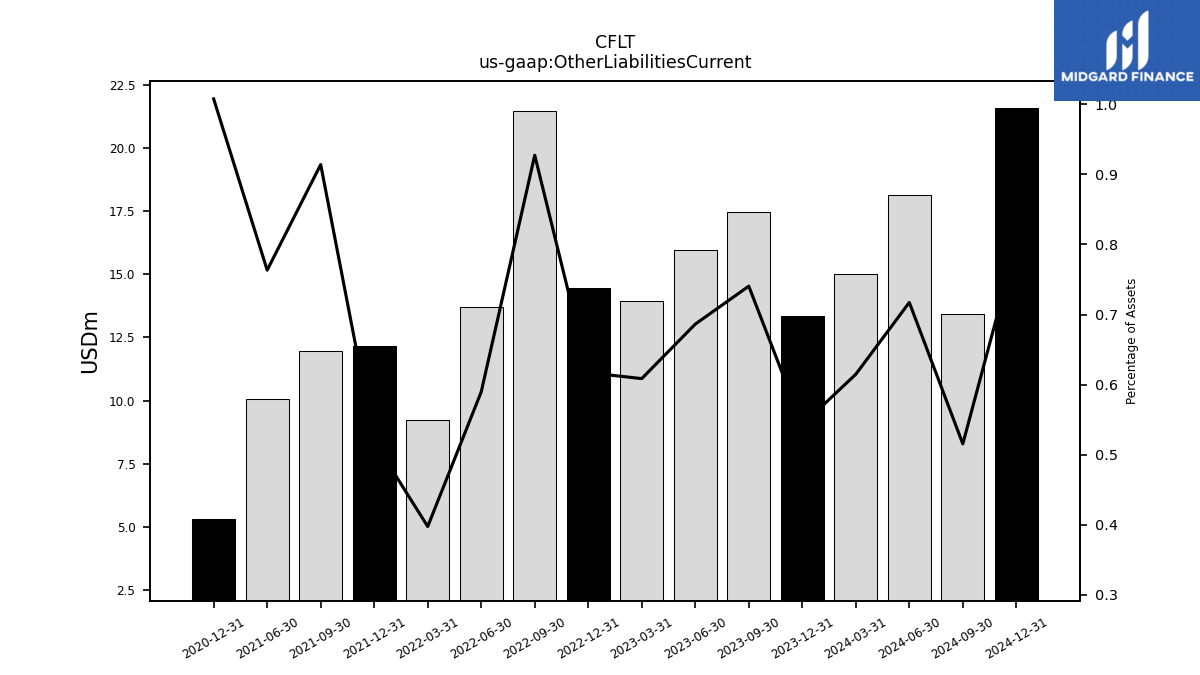
| Other Liabilities Current | 17.49 | 15.97 | 13.95 | 14.47 | 21.45 | 13.71 | 9.21 | 12.16 | 11.97 | 10.06 | NA | 5.30 | NA | NA | |
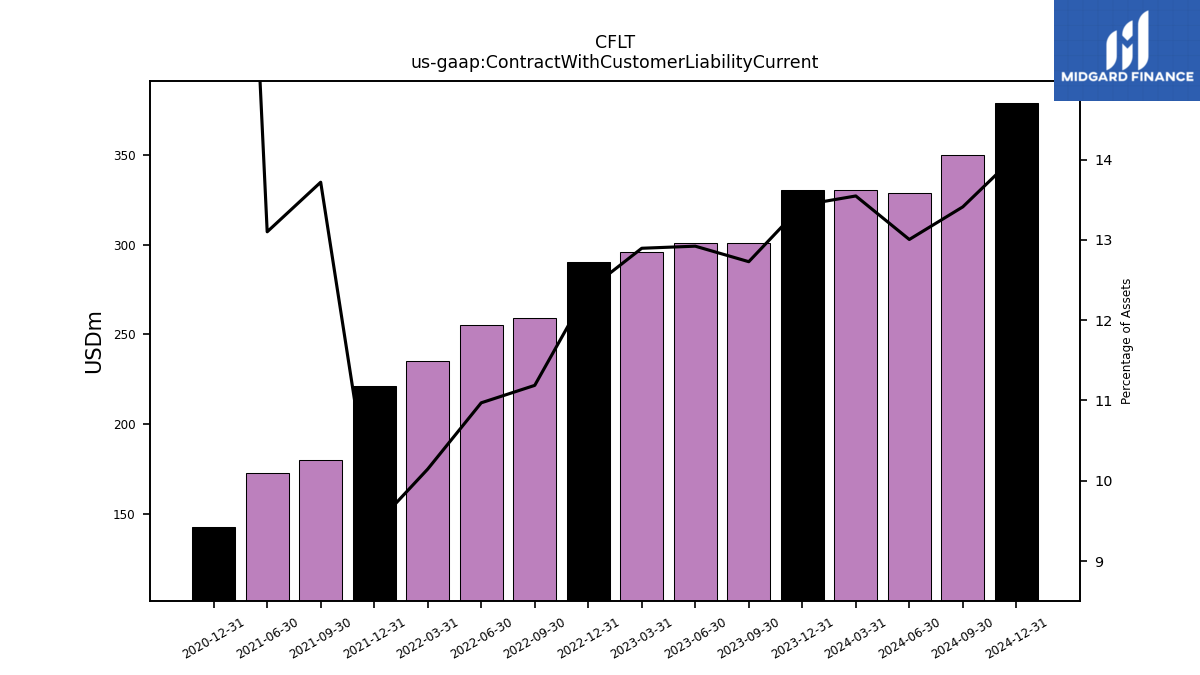
| Contract With Customer Liability Current | 300.62 | 300.79 | 295.69 | 290.19 | 258.85 | 255.06 | 235.12 | 220.92 | 179.70 | 172.67 | NA | 142.90 | NA | NA |
| 2023-09-30 | 2023-06-30 | 2023-03-31 | 2022-12-31 | 2022-09-30 | 2022-06-30 | 2022-03-31 | 2021-12-31 | 2021-09-30 | 2021-06-30 | 2021-03-31 | 2020-12-31 | 2020-09-30 | 2020-06-30 | ||
|---|---|---|---|---|---|---|---|---|---|---|---|---|---|---|---|
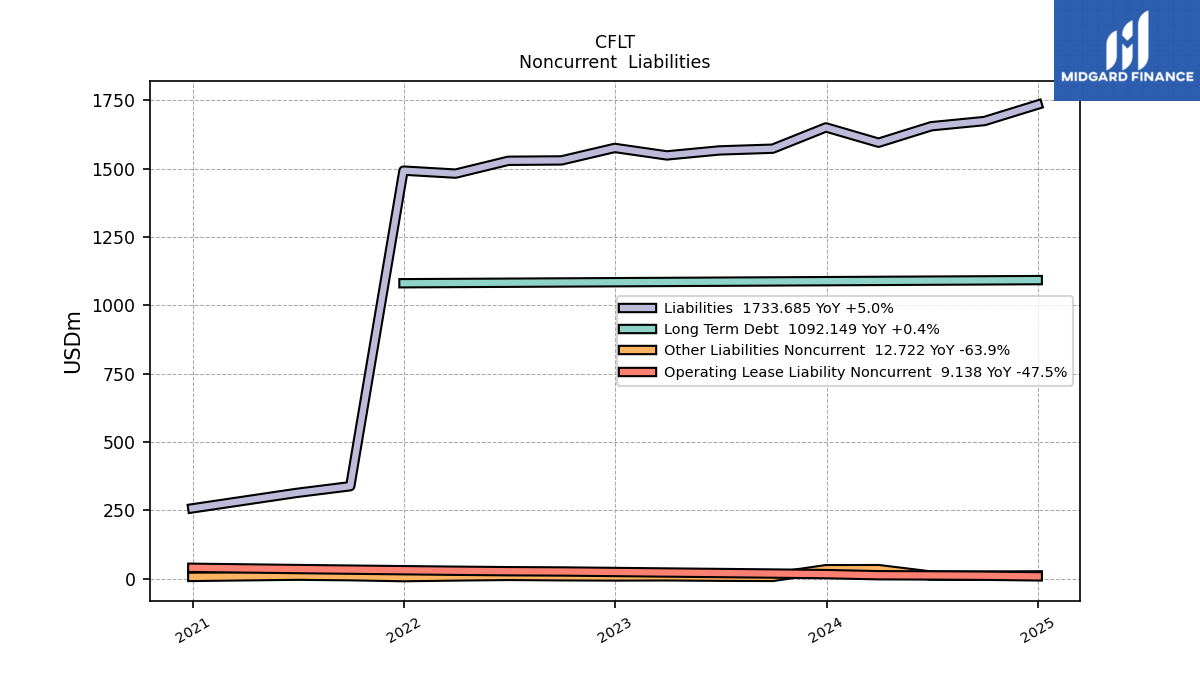
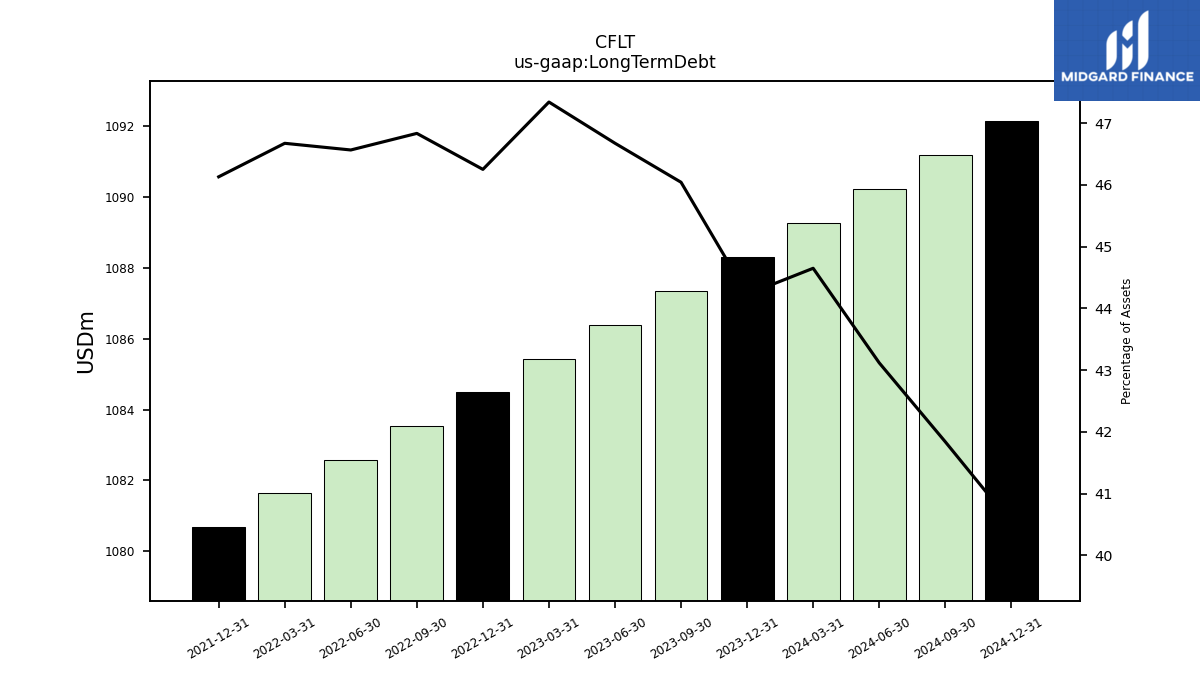
| Long Term Debt | 1087.35 | 1086.39 | 1085.44 | 1084.50 | 1083.54 | 1082.58 | 1081.64 | 1080.70 | NA | NA | NA | NA | NA | NA | |
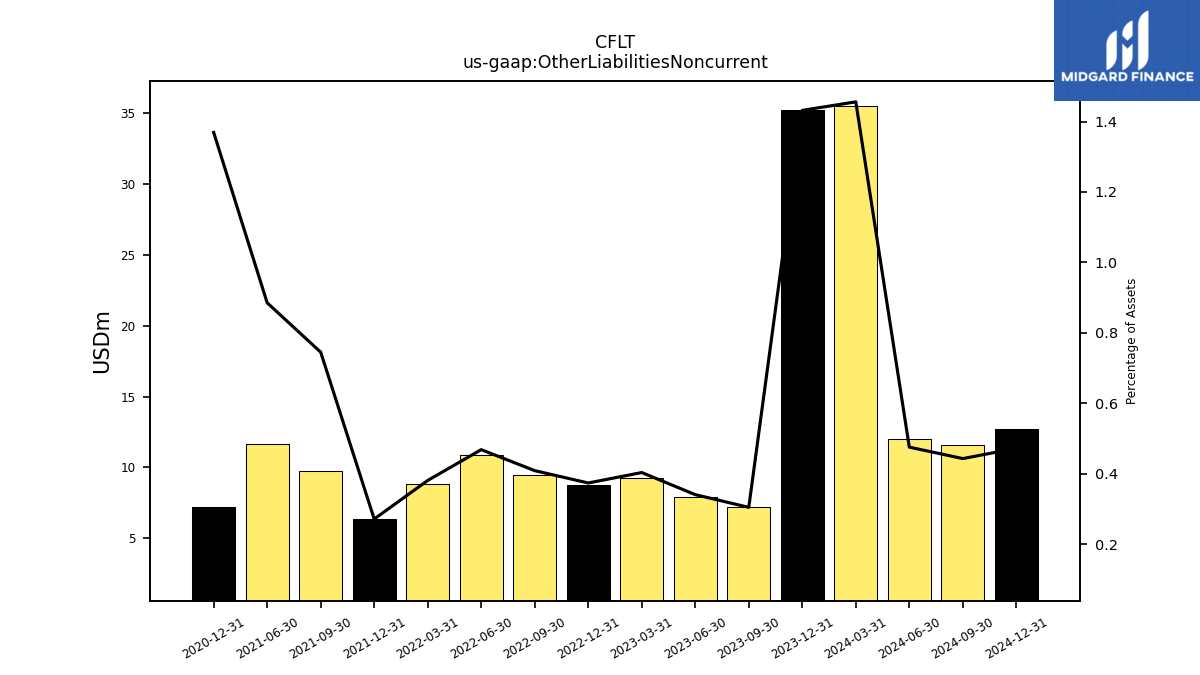
| Other Liabilities Noncurrent | 7.19 | 7.93 | 9.25 | 8.76 | 9.46 | 10.89 | 8.83 | 6.36 | 9.76 | 11.67 | NA | 7.20 | NA | NA | |
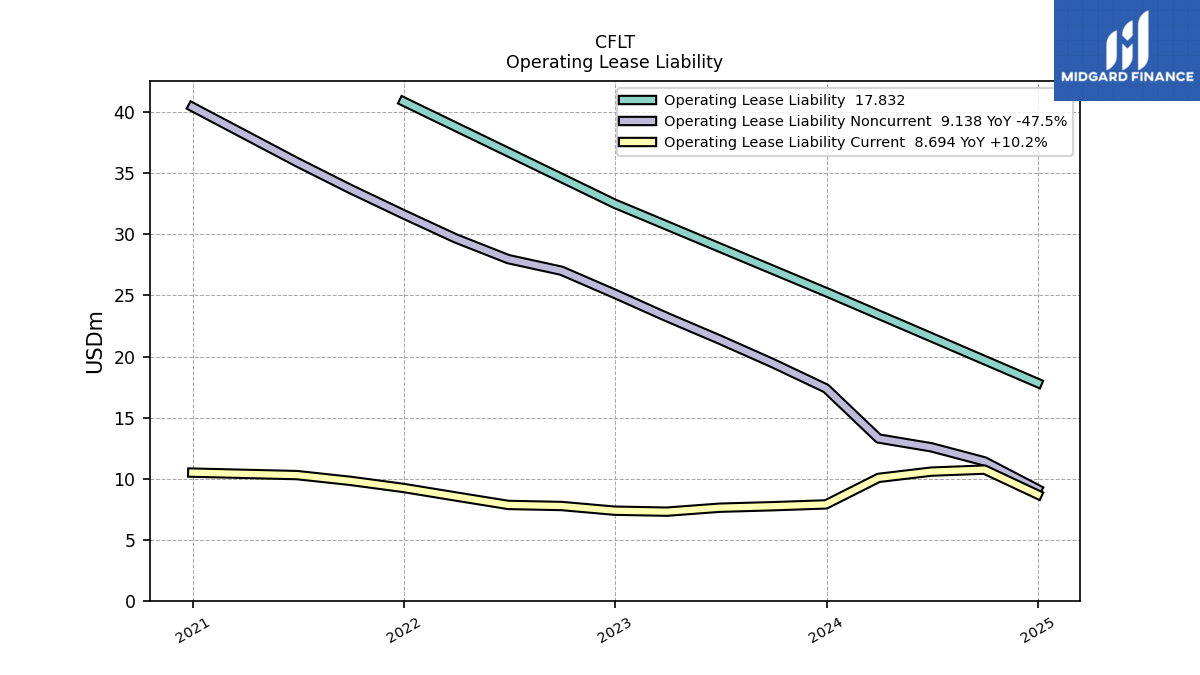
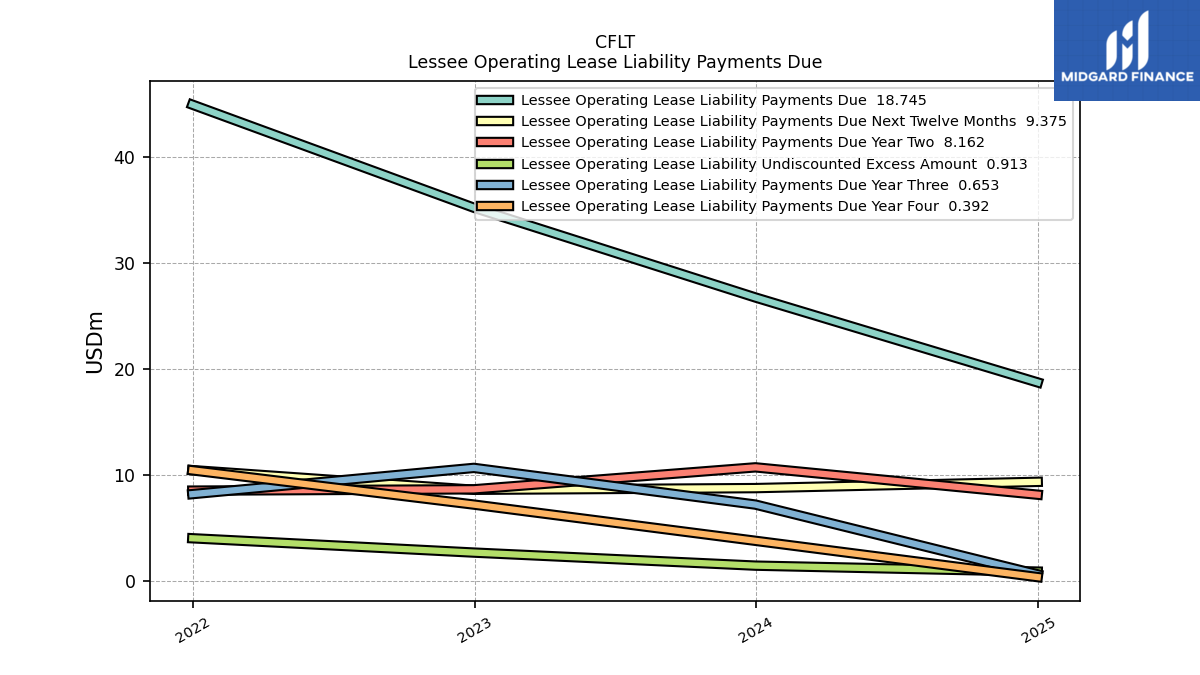
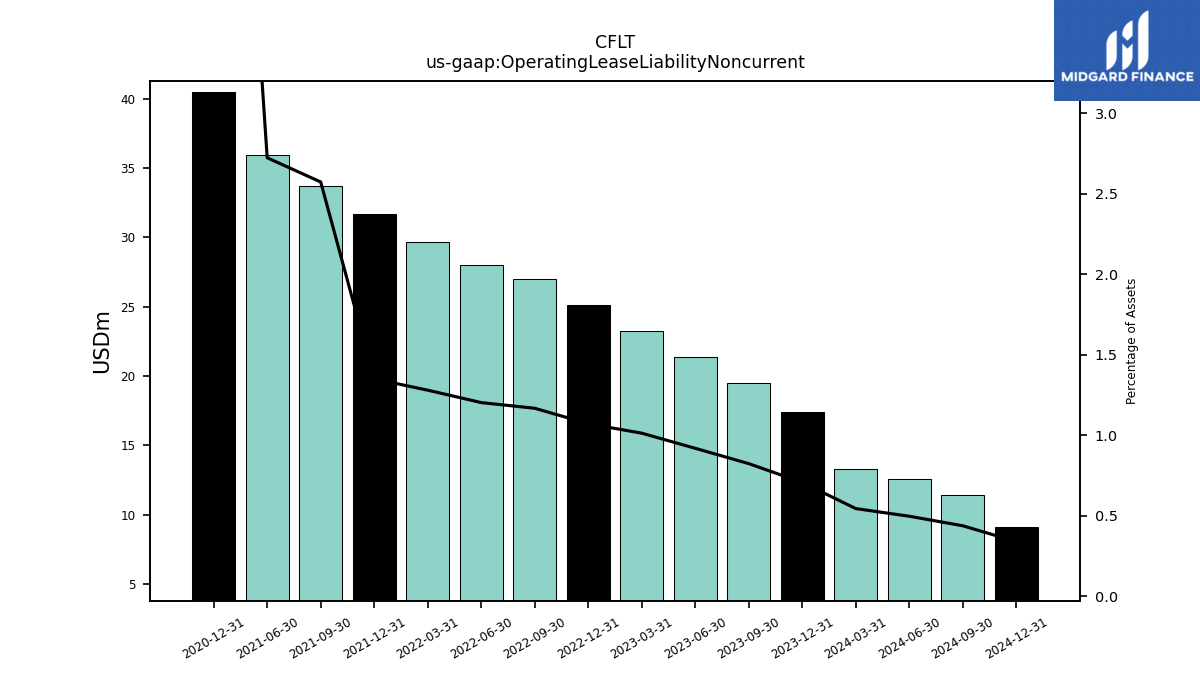
| Operating Lease Liability Noncurrent | 19.46 | 21.39 | 23.23 | 25.14 | 27.02 | 27.98 | 29.67 | 31.64 | 33.72 | 35.91 | NA | 40.44 | NA | NA |
| 2023-09-30 | 2023-06-30 | 2023-03-31 | 2022-12-31 | 2022-09-30 | 2022-06-30 | 2022-03-31 | 2021-12-31 | 2021-09-30 | 2021-06-30 | 2021-03-31 | 2020-12-31 | 2020-09-30 | 2020-06-30 | ||
|---|---|---|---|---|---|---|---|---|---|---|---|---|---|---|---|
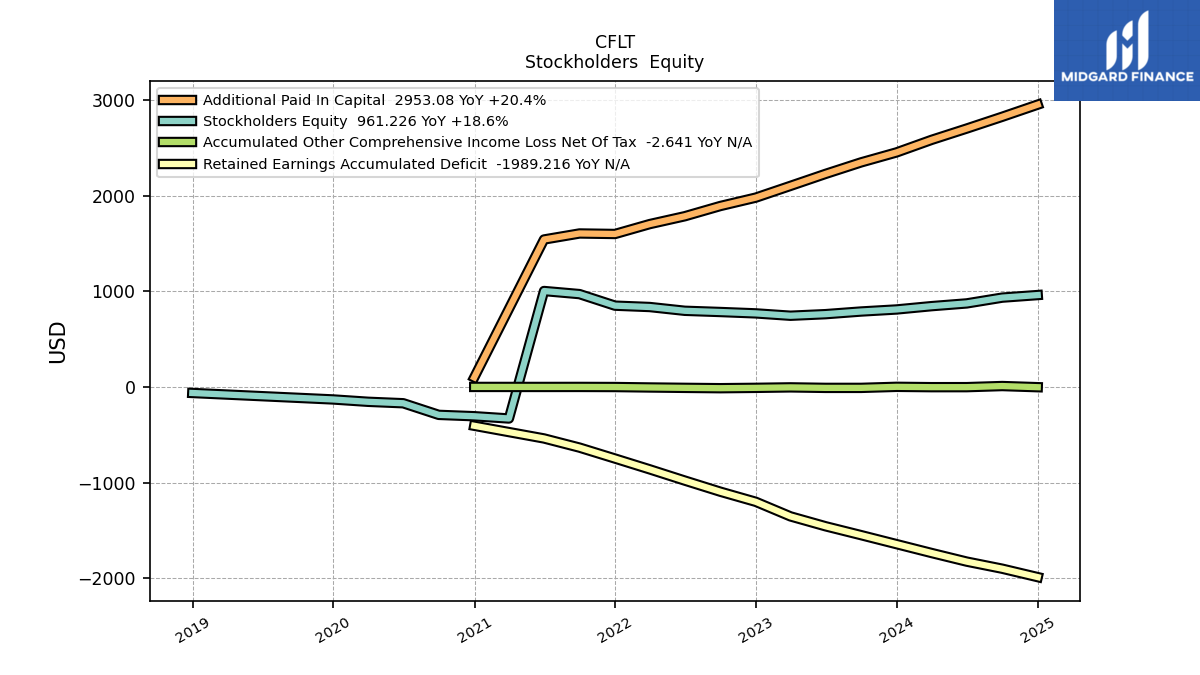
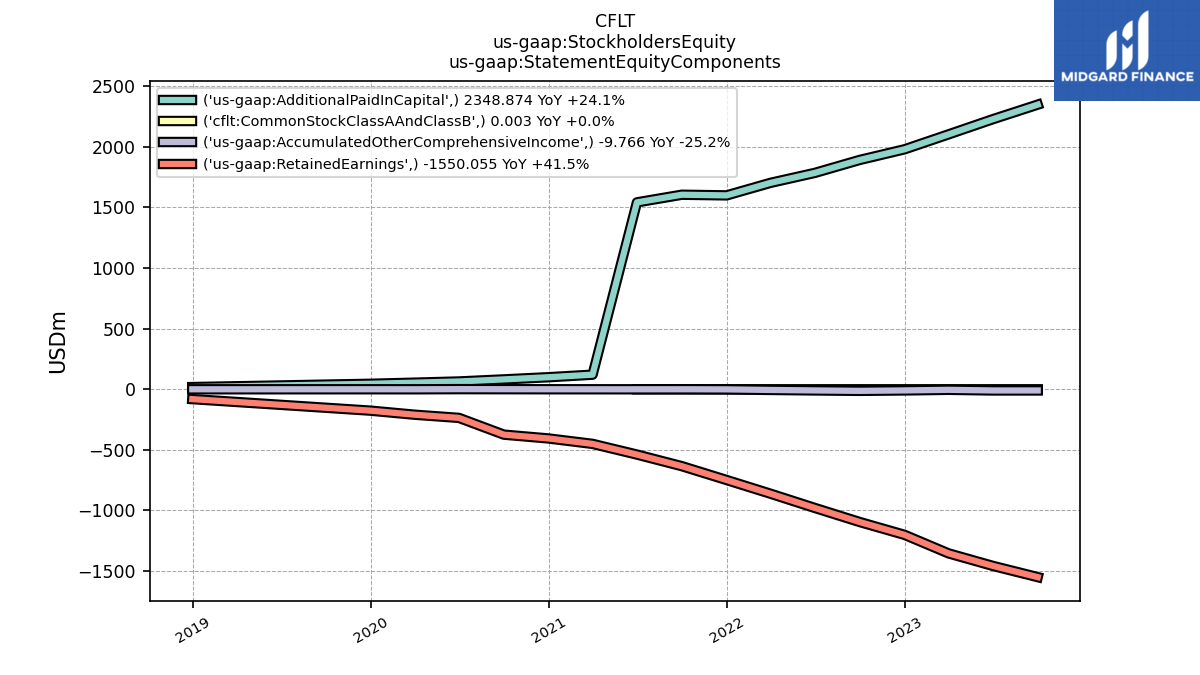
| Stockholders Equity | 789.06 | 761.39 | 744.85 | 769.48 | 783.90 | 796.62 | 836.07 | 850.28 | 971.14 | 1003.54 | -330.09 | -306.25 | -292.00 | -170.53 | |
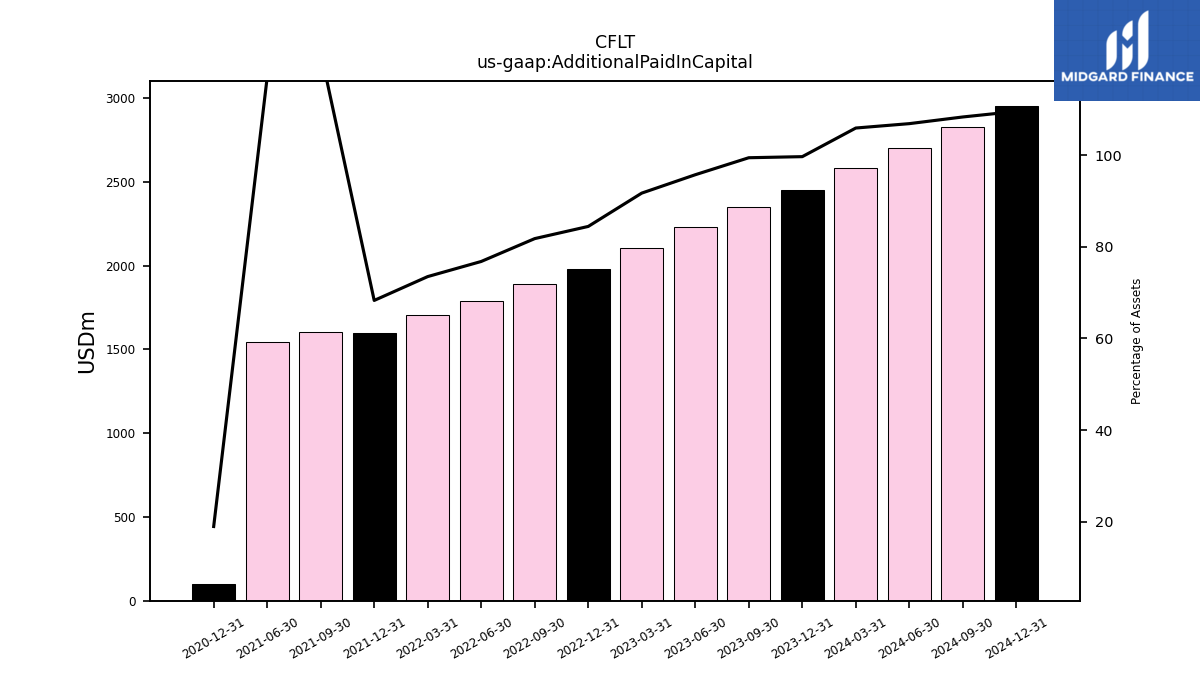
| Additional Paid In Capital | 2348.87 | 2228.57 | 2103.26 | 1980.34 | 1892.47 | 1785.64 | 1703.45 | 1599.96 | 1605.34 | 1542.34 | NA | 99.58 | NA | NA | |
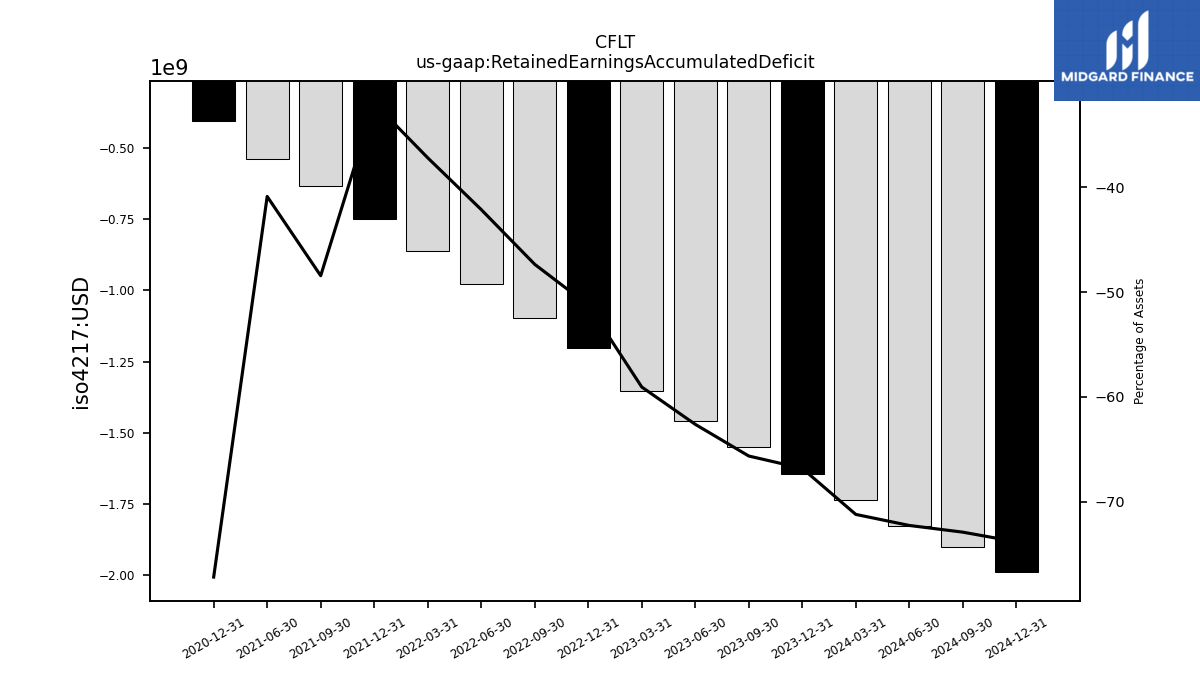
| Retained Earnings Accumulated Deficit | -1550.06 | -1457.38 | -1353.96 | -1201.40 | -1095.52 | -979.47 | -861.84 | -748.85 | -634.41 | -538.75 | NA | -406.05 | NA | NA | |
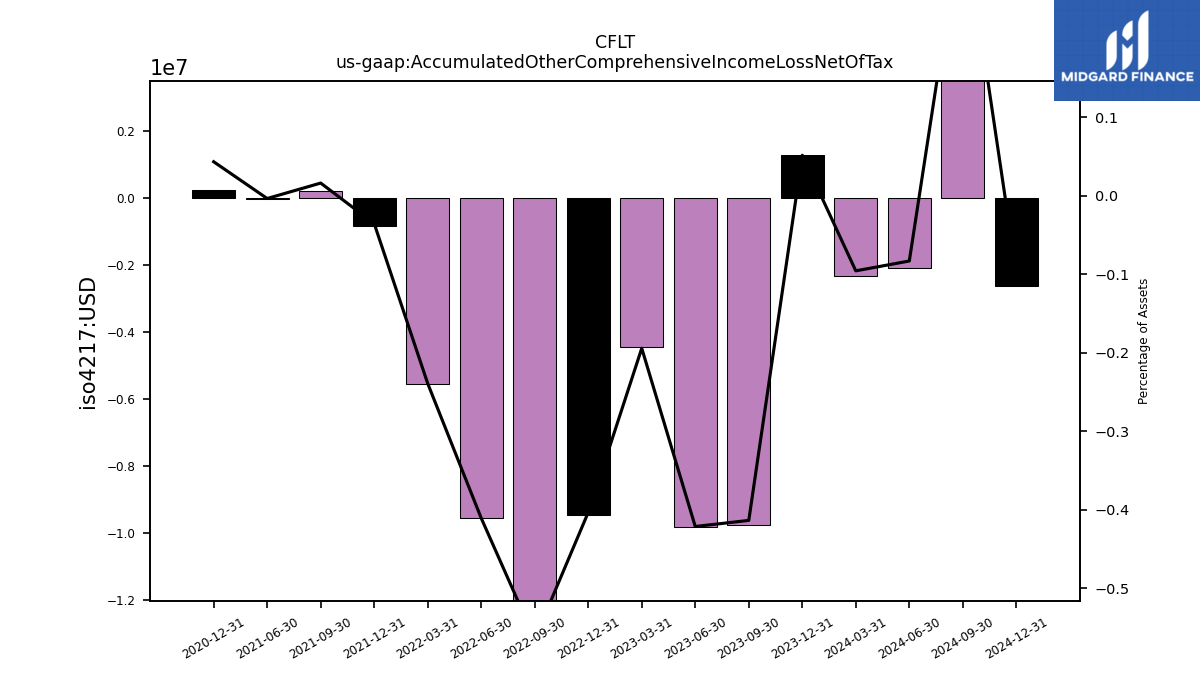
| Accumulated Other Comprehensive Income Loss Net Of Tax | -9.77 | -9.81 | -4.45 | -9.46 | -13.06 | -9.55 | -5.54 | -0.83 | 0.21 | -0.05 | NA | 0.23 | NA | NA | |
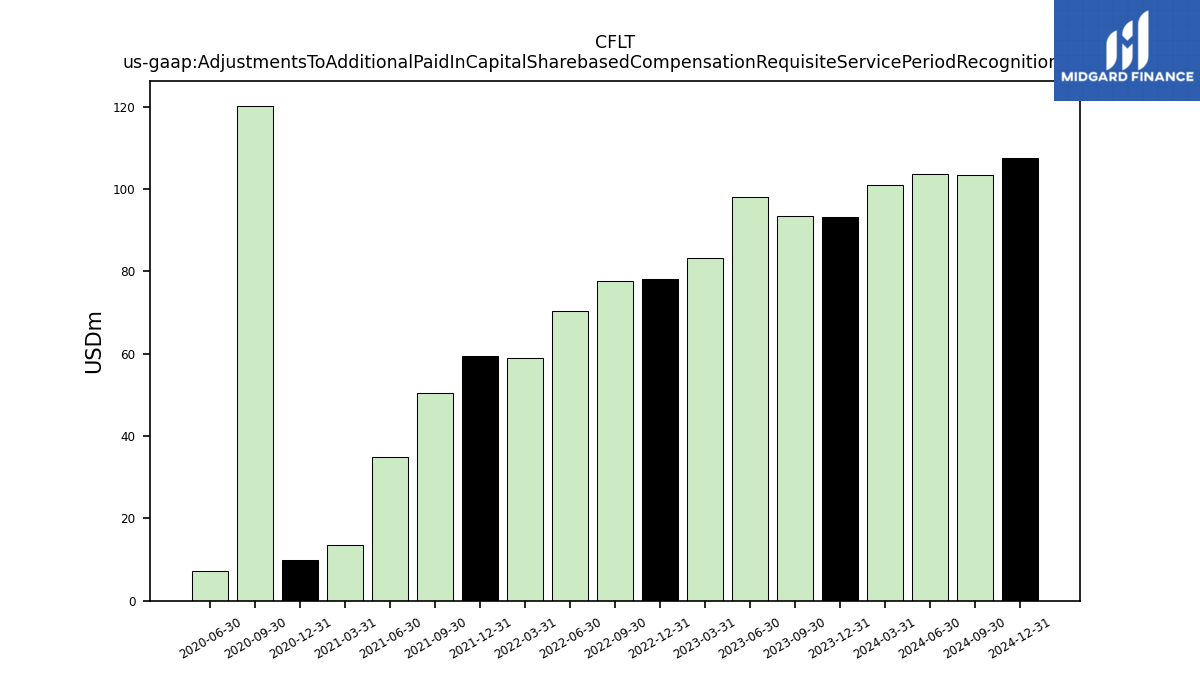
| Adjustments To Additional Paid In Capital Sharebased Compensation Requisite Service Period Recognition Value | 93.35 | 97.97 | 83.21 | 78.22 | 77.62 | 70.46 | 58.90 | 59.51 | 50.38 | 34.91 | 13.45 | 9.84 | 120.22 | 7.25 |
| 2023-09-30 | 2023-06-30 | 2023-03-31 | 2022-12-31 | 2022-09-30 | 2022-06-30 | 2022-03-31 | 2021-12-31 | 2021-09-30 | 2021-06-30 | 2021-03-31 | 2020-12-31 | 2020-09-30 | 2020-06-30 | ||
|---|---|---|---|---|---|---|---|---|---|---|---|---|---|---|---|
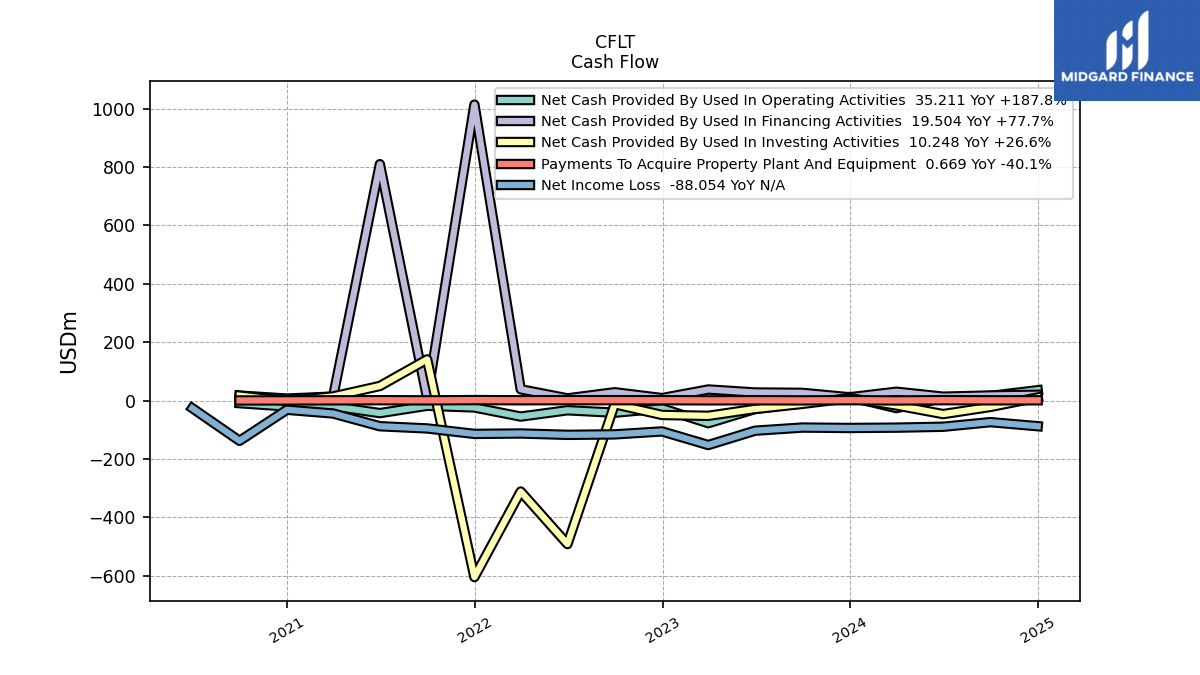
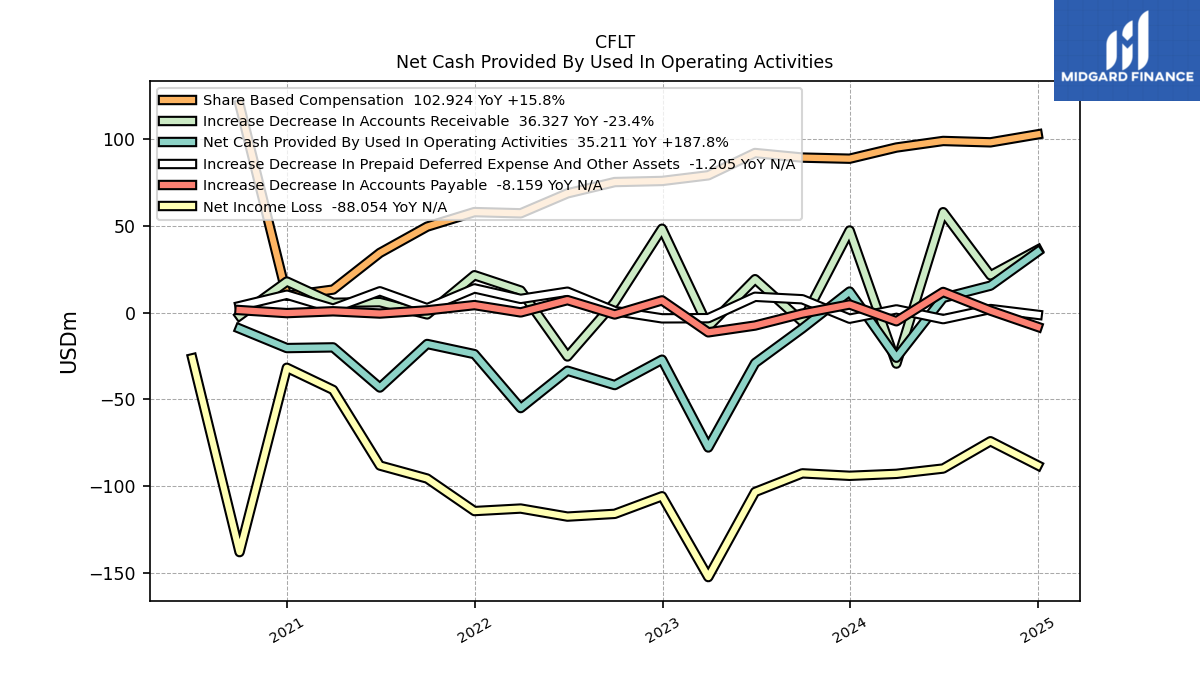
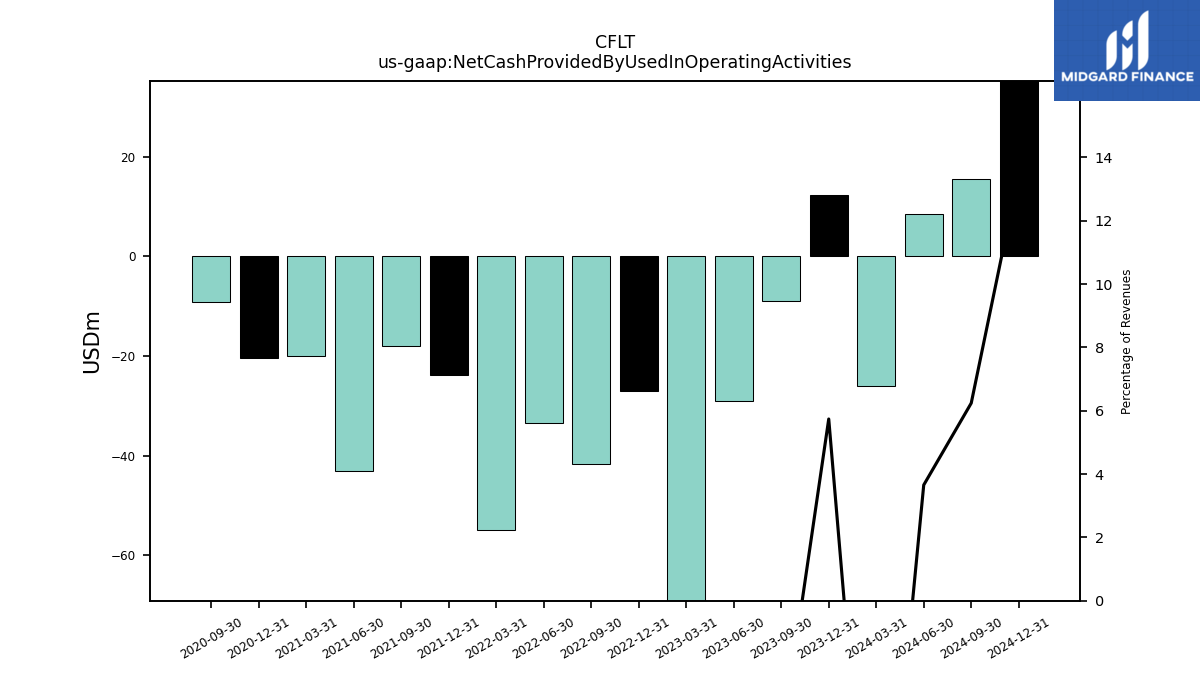
| Net Cash Provided By Used In Operating Activities | -9.06 | -29.06 | -77.77 | -27.08 | -41.75 | -33.47 | -55.03 | -23.88 | -18.03 | -43.17 | -19.99 | -20.39 | -9.18 | NA | |
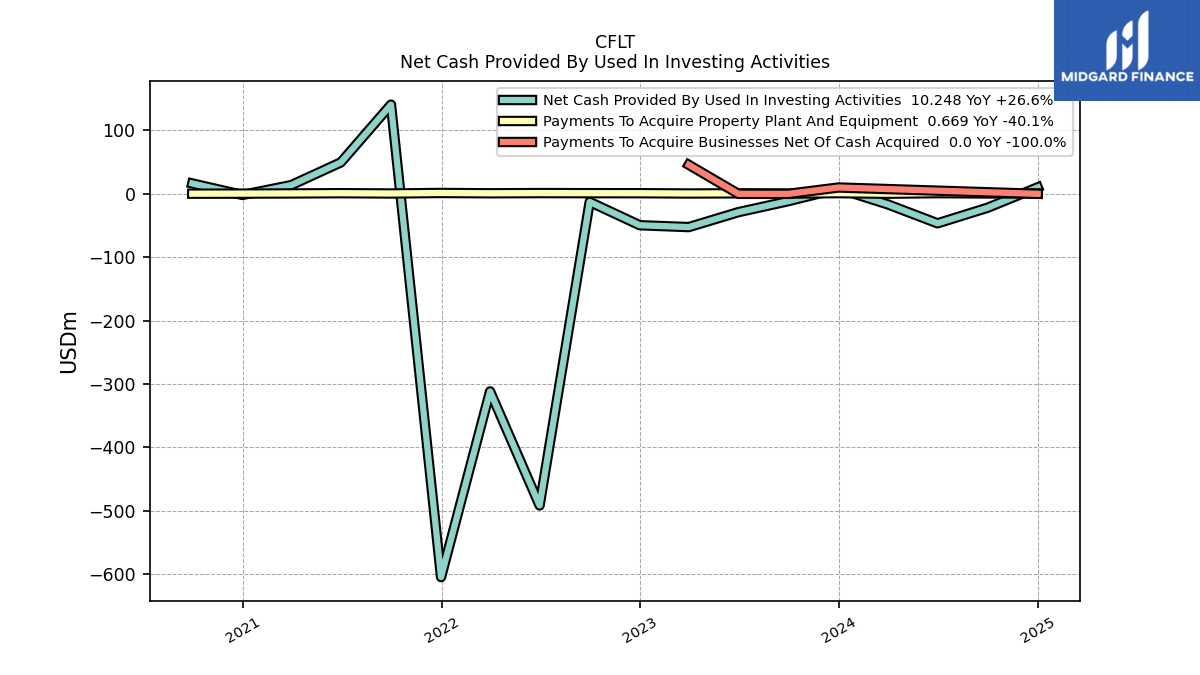
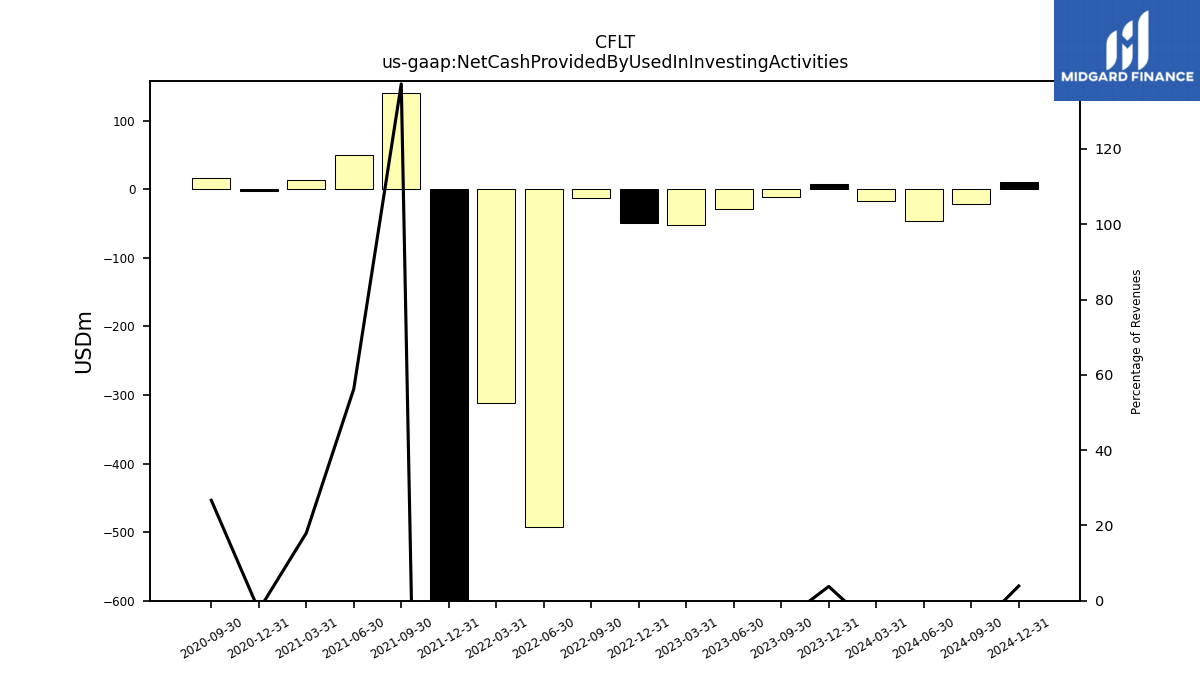
| Net Cash Provided By Used In Investing Activities | -11.52 | -28.94 | -52.48 | -49.55 | -12.72 | -491.81 | -311.73 | -604.91 | 140.80 | 49.68 | 13.85 | -1.75 | 16.42 | NA | |
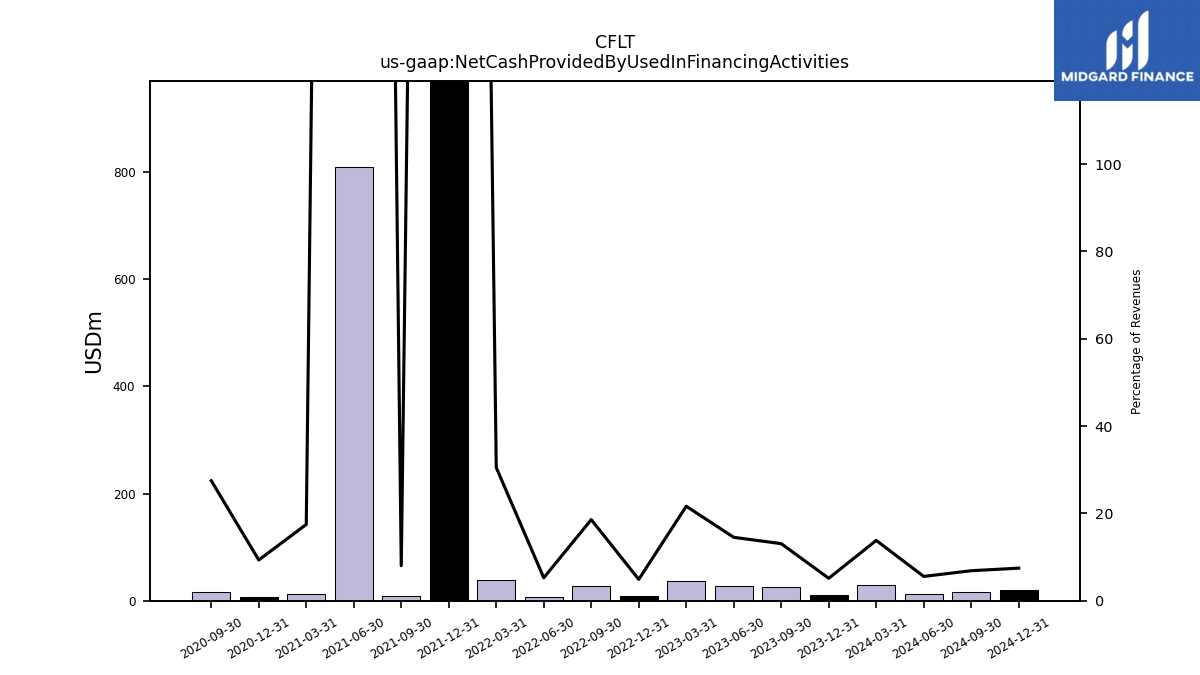
| Net Cash Provided By Used In Financing Activities | 26.18 | 27.49 | 37.73 | 8.25 | 28.19 | 7.33 | 38.47 | 1013.35 | 8.24 | 809.47 | 13.46 | 6.56 | 16.91 | NA |
| 2023-09-30 | 2023-06-30 | 2023-03-31 | 2022-12-31 | 2022-09-30 | 2022-06-30 | 2022-03-31 | 2021-12-31 | 2021-09-30 | 2021-06-30 | 2021-03-31 | 2020-12-31 | 2020-09-30 | 2020-06-30 | ||
|---|---|---|---|---|---|---|---|---|---|---|---|---|---|---|---|
| Net Cash Provided By Used In Operating Activities | -9.06 | -29.06 | -77.77 | -27.08 | -41.75 | -33.47 | -55.03 | -23.88 | -18.03 | -43.17 | -19.99 | -20.39 | -9.18 | NA | |
| Net Income Loss | -92.67 | -103.42 | -152.56 | -105.88 | -116.05 | -117.63 | -112.99 | -114.44 | -95.67 | -88.17 | -44.53 | -31.76 | -138.14 | -26.30 | |
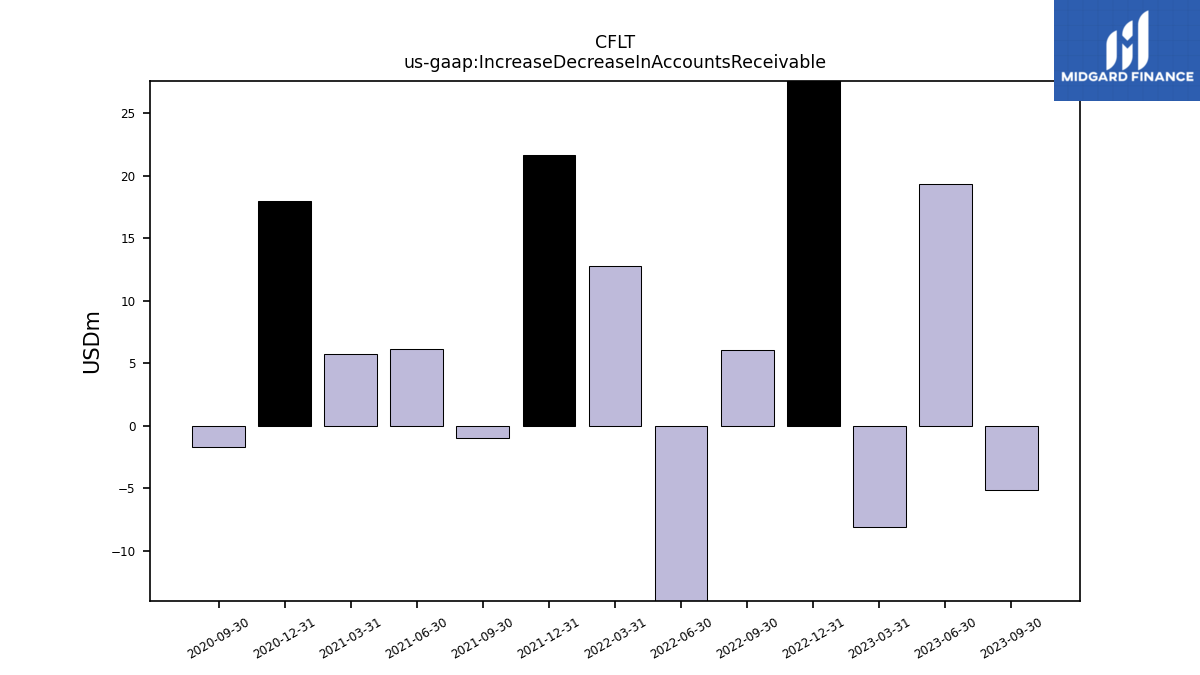
| Increase Decrease In Accounts Receivable | -5.15 | 19.36 | -8.07 | 48.49 | 6.05 | -25.24 | 12.78 | 21.64 | -0.98 | 6.12 | 5.73 | 18.01 | -1.74 | NA | |
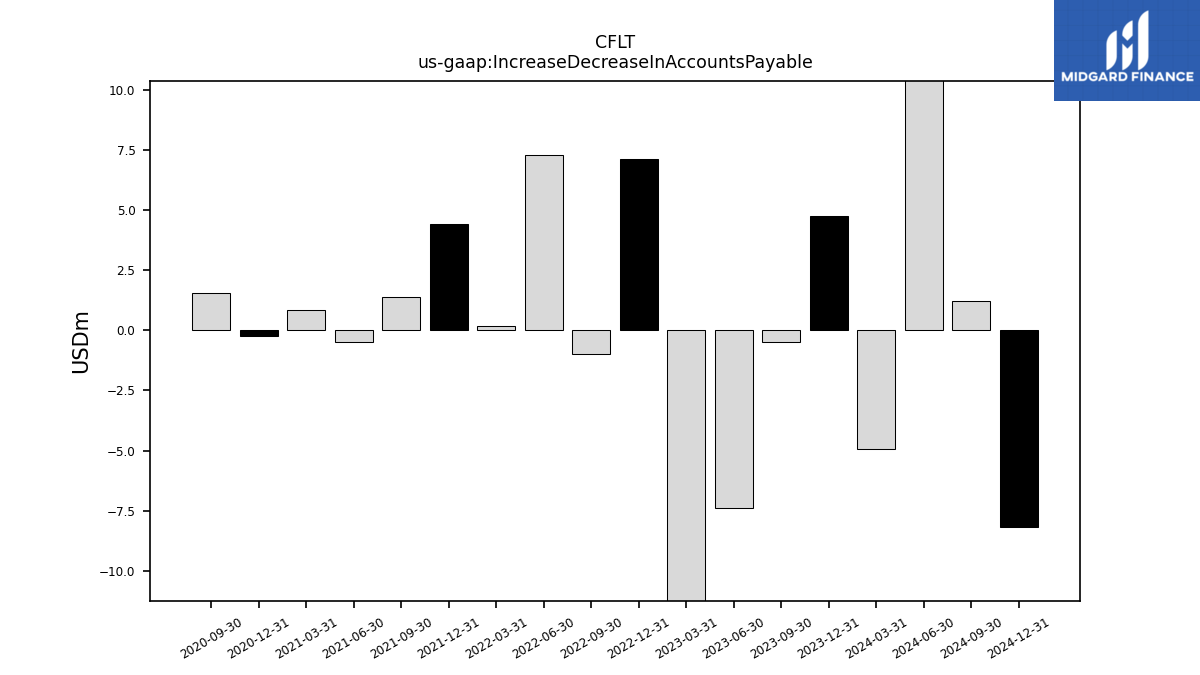
| Increase Decrease In Accounts Payable | -0.49 | -7.39 | -11.32 | 7.13 | -1.00 | 7.28 | 0.18 | 4.41 | 1.37 | -0.47 | 0.84 | -0.22 | 1.53 | NA | |
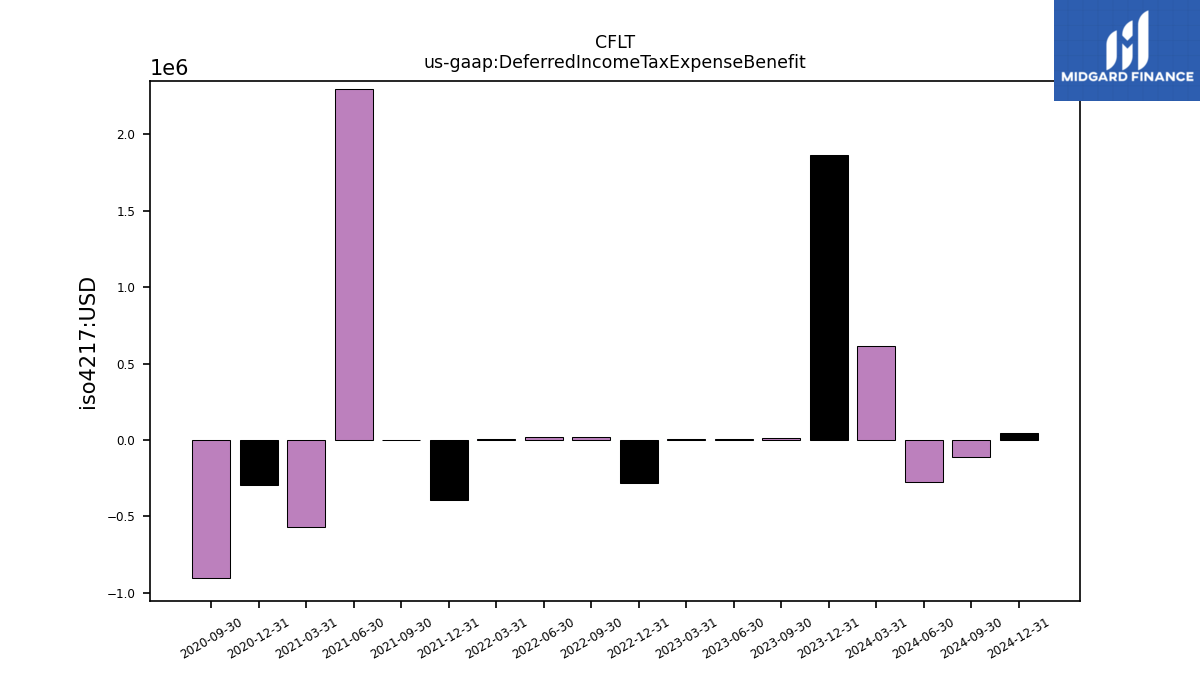
| Deferred Income Tax Expense Benefit | 0.01 | 0.01 | 0.01 | -0.28 | 0.02 | 0.02 | 0.00 | -0.39 | -0.00 | 2.30 | -0.57 | -0.30 | -0.91 | NA | |
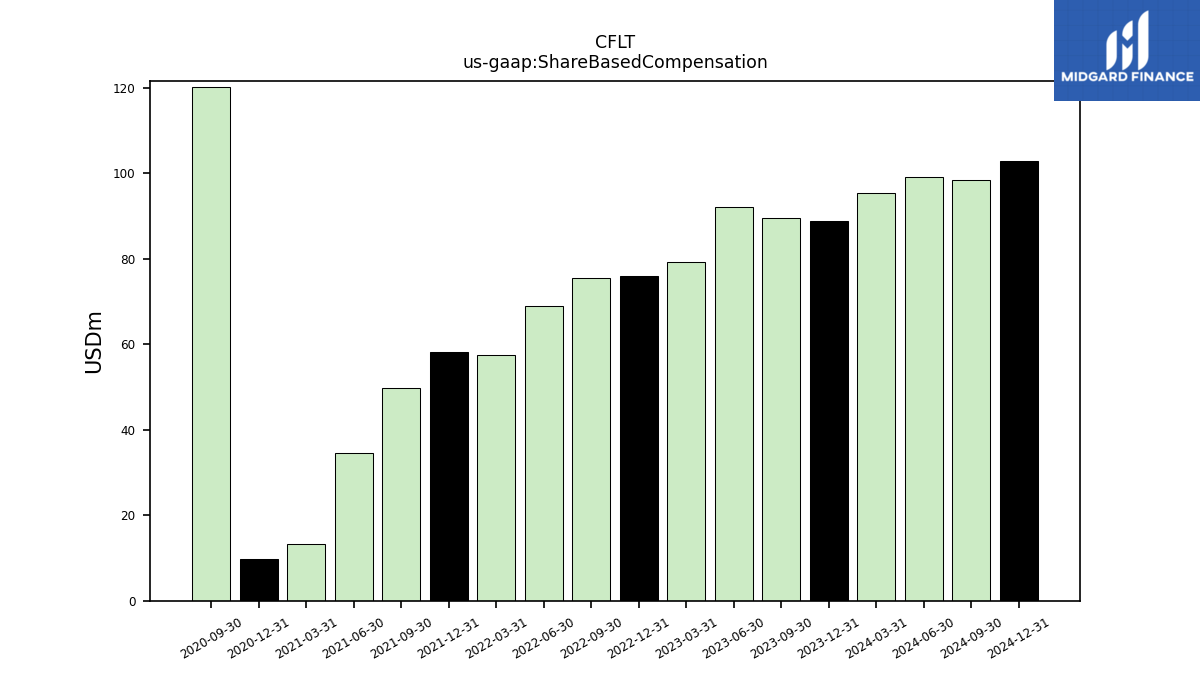
| Share Based Compensation | 89.51 | 92.16 | 79.29 | 76.03 | 75.39 | 68.87 | 57.37 | 58.07 | 49.68 | 34.52 | 13.35 | 9.74 | 120.07 | NA | |
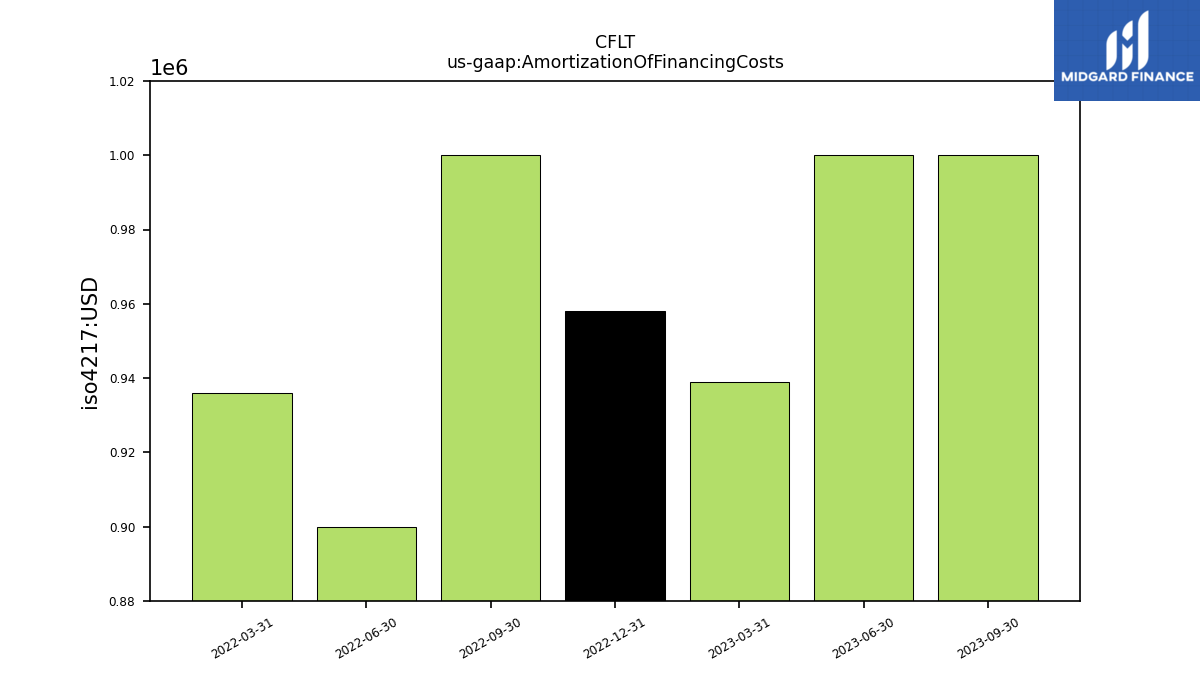
| Amortization Of Financing Costs | 1.00 | 1.00 | 0.94 | 0.96 | 1.00 | 0.90 | 0.94 | NA | NA | NA | NA | NA | NA | NA |
| 2023-09-30 | 2023-06-30 | 2023-03-31 | 2022-12-31 | 2022-09-30 | 2022-06-30 | 2022-03-31 | 2021-12-31 | 2021-09-30 | 2021-06-30 | 2021-03-31 | 2020-12-31 | 2020-09-30 | 2020-06-30 | ||
|---|---|---|---|---|---|---|---|---|---|---|---|---|---|---|---|
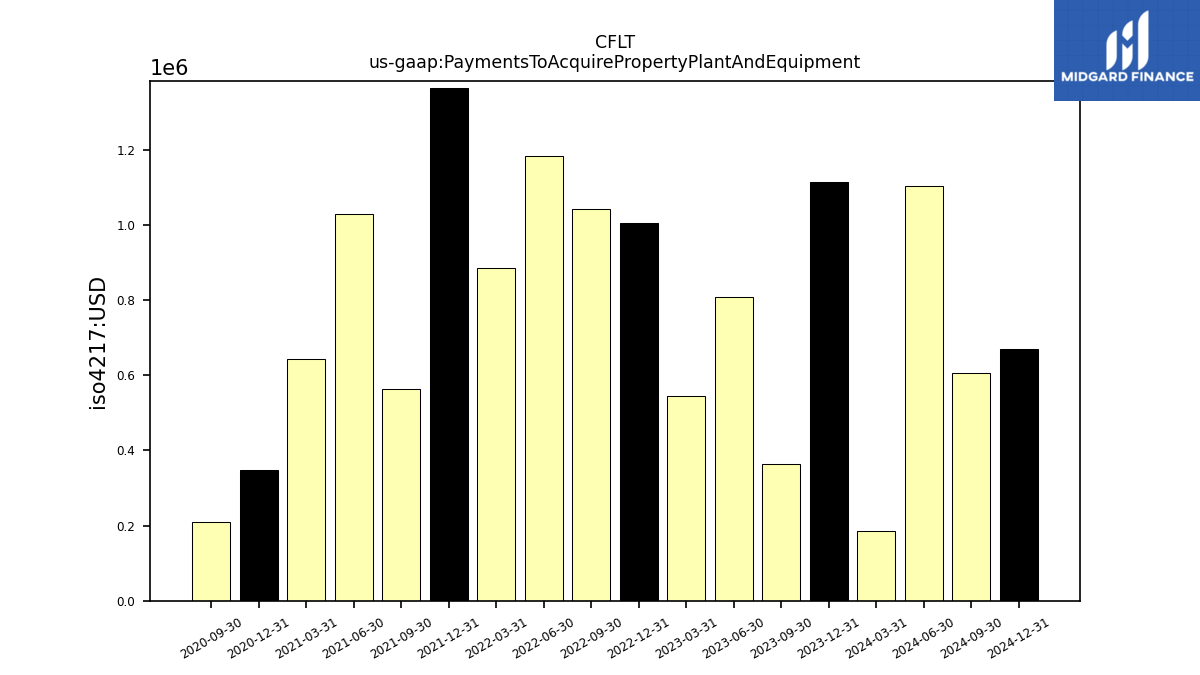
| Net Cash Provided By Used In Investing Activities | -11.52 | -28.94 | -52.48 | -49.55 | -12.72 | -491.81 | -311.73 | -604.91 | 140.80 | 49.68 | 13.85 | -1.75 | 16.42 | NA | |
| Payments To Acquire Property Plant And Equipment | 0.36 | 0.81 | 0.55 | 1.01 | 1.04 | 1.18 | 0.89 | 1.36 | 0.56 | 1.03 | 0.64 | 0.35 | 0.21 | NA |
| 2023-09-30 | 2023-06-30 | 2023-03-31 | 2022-12-31 | 2022-09-30 | 2022-06-30 | 2022-03-31 | 2021-12-31 | 2021-09-30 | 2021-06-30 | 2021-03-31 | 2020-12-31 | 2020-09-30 | 2020-06-30 | ||
|---|---|---|---|---|---|---|---|---|---|---|---|---|---|---|---|
| Net Cash Provided By Used In Financing Activities | 26.18 | 27.49 | 37.73 | 8.25 | 28.19 | 7.33 | 38.47 | 1013.35 | 8.24 | 809.47 | 13.46 | 6.56 | 16.91 | NA |
| 2023-09-30 | 2023-06-30 | 2023-03-31 | 2022-12-31 | 2022-09-30 | 2022-06-30 | 2022-03-31 | 2021-12-31 | 2021-09-30 | 2021-06-30 | 2021-03-31 | 2020-12-31 | 2020-09-30 | 2020-06-30 | ||
|---|---|---|---|---|---|---|---|---|---|---|---|---|---|---|---|
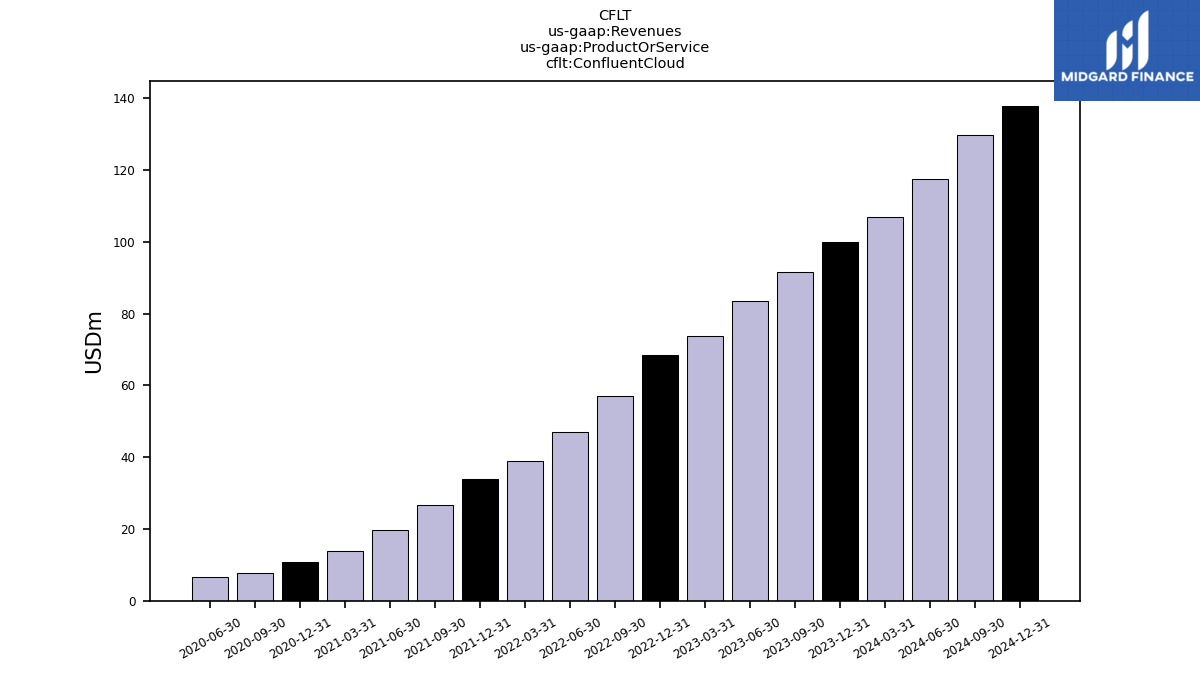
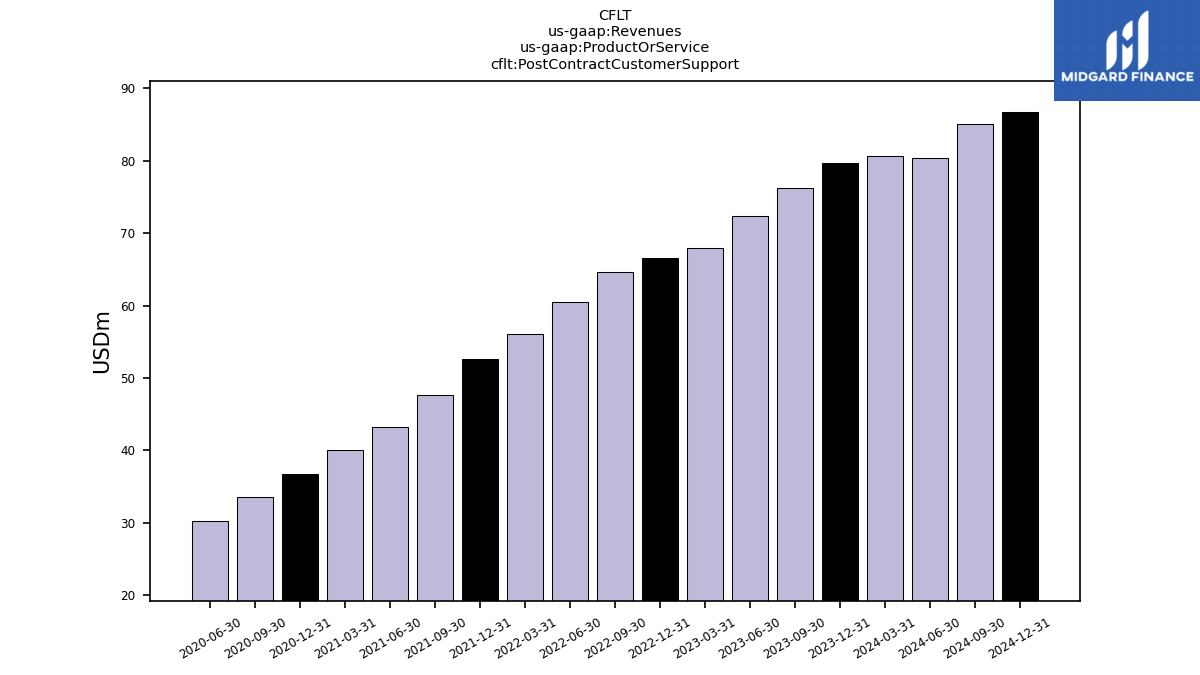
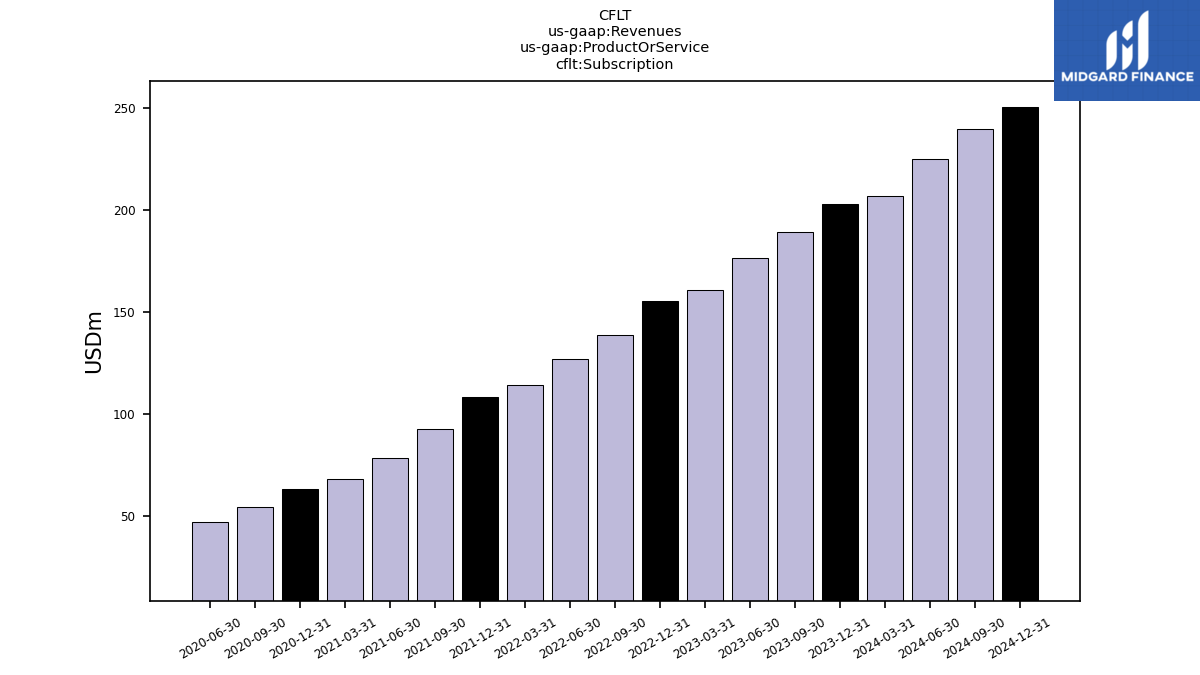
| Revenues | 200.18 | 189.28 | 174.30 | 168.67 | 151.73 | 139.41 | 126.14 | 119.93 | 102.57 | 88.34 | 77.03 | 70.32 | 61.50 | 53.85 | |
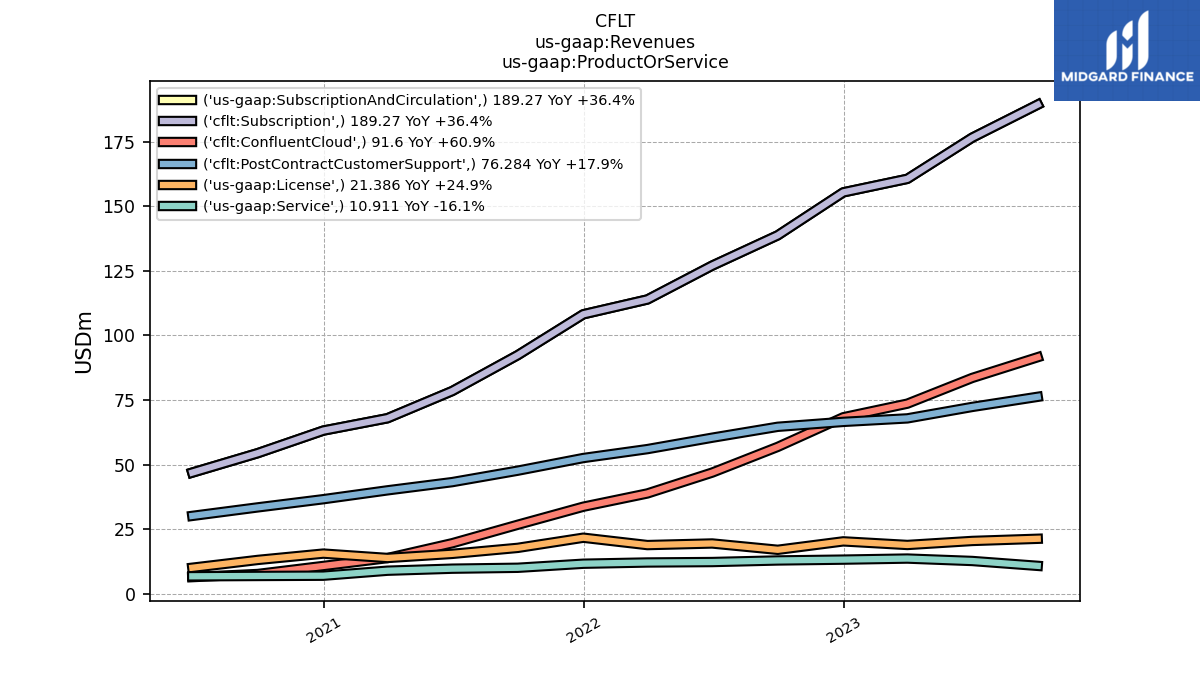
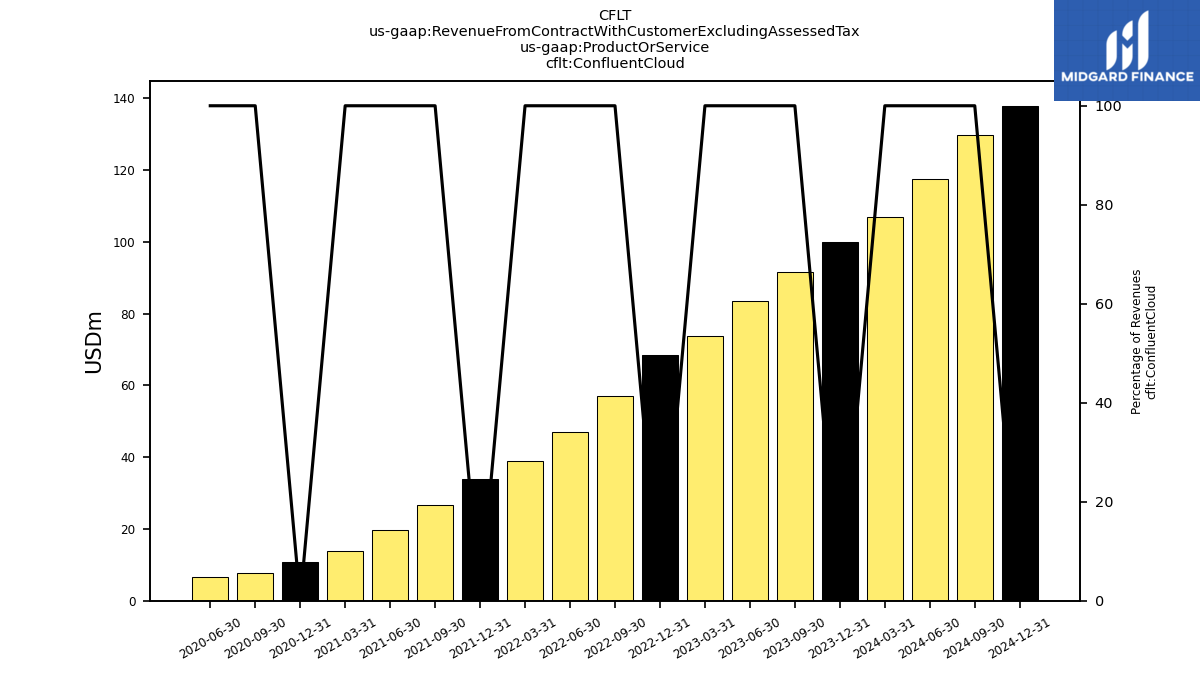
| Confluent Cloud | 91.60 | 83.58 | 73.64 | 68.37 | 56.92 | 46.98 | 38.91 | 33.78 | 26.81 | 19.67 | 13.92 | 10.87 | 7.77 | 6.56 | |
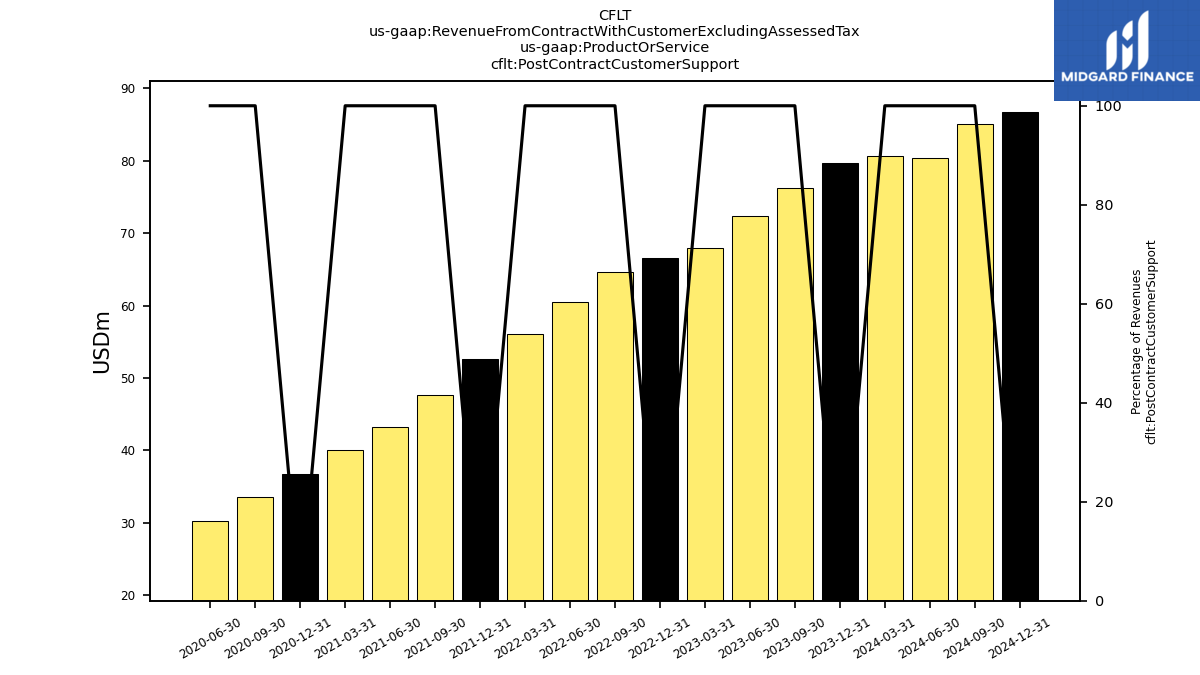
| Post Contract Customer Support | 76.28 | 72.37 | 67.94 | 66.58 | 64.69 | 60.47 | 56.06 | 52.61 | 47.72 | 43.30 | 40.11 | 36.69 | 33.53 | 30.23 | |
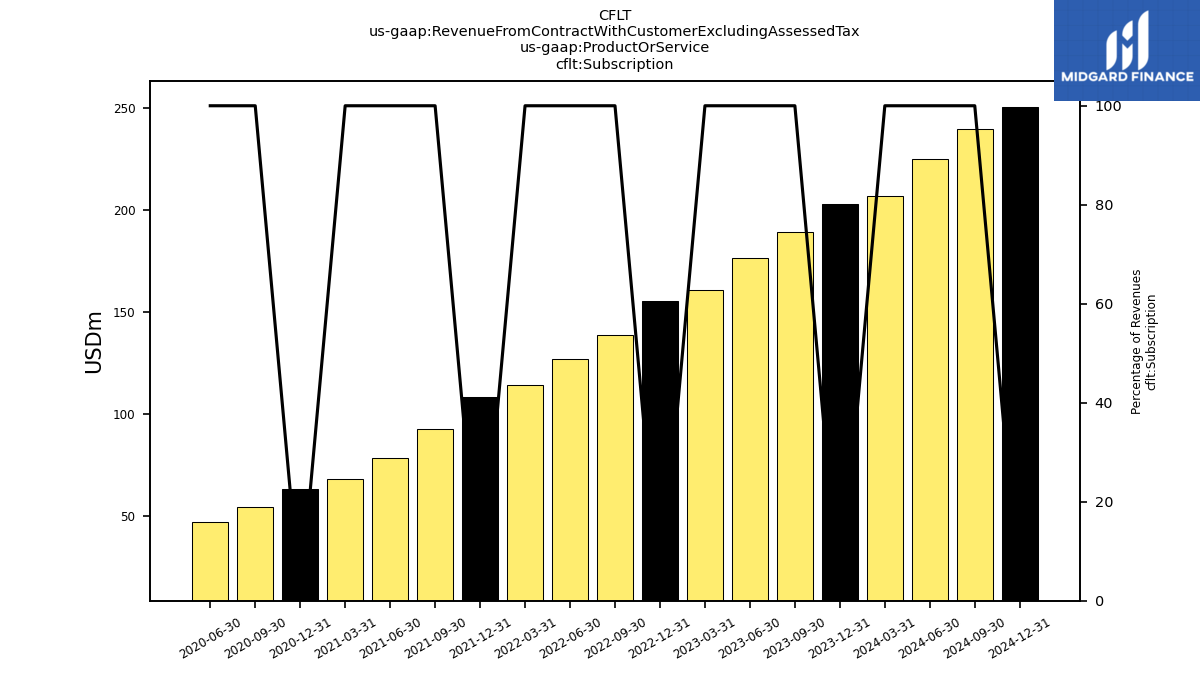
| Subscription | 189.27 | 176.49 | 160.57 | 155.34 | 138.73 | 127.02 | 113.92 | 108.19 | 92.40 | 78.52 | 67.99 | 63.22 | 54.50 | 46.97 | |
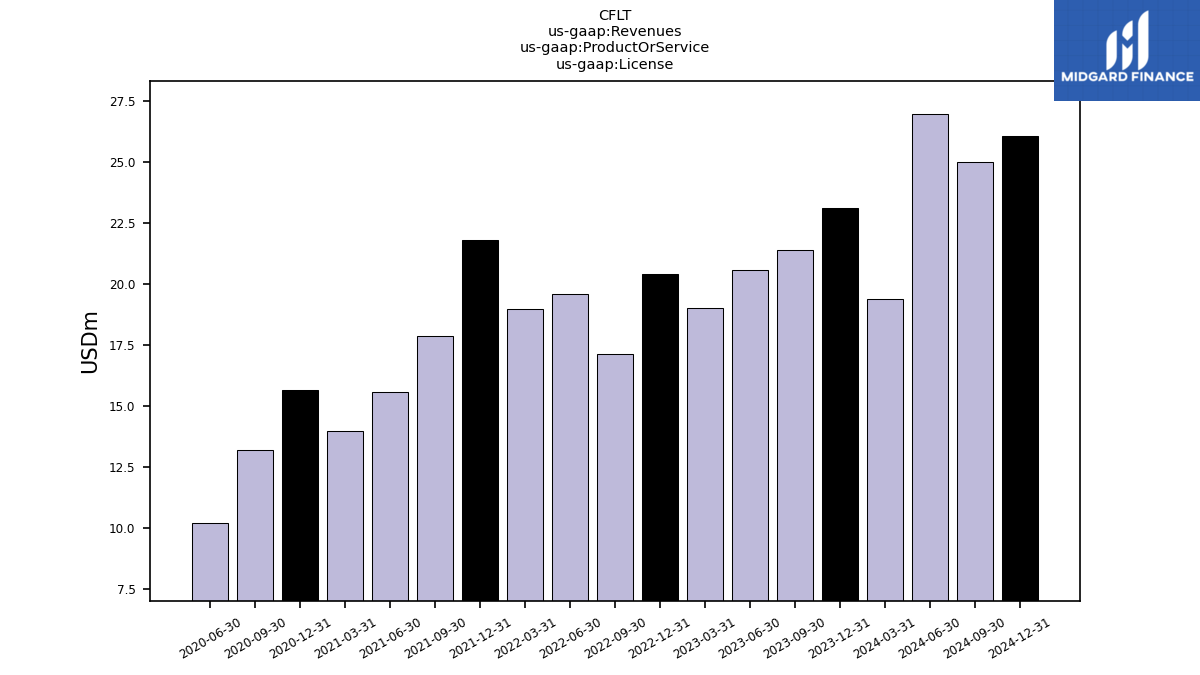
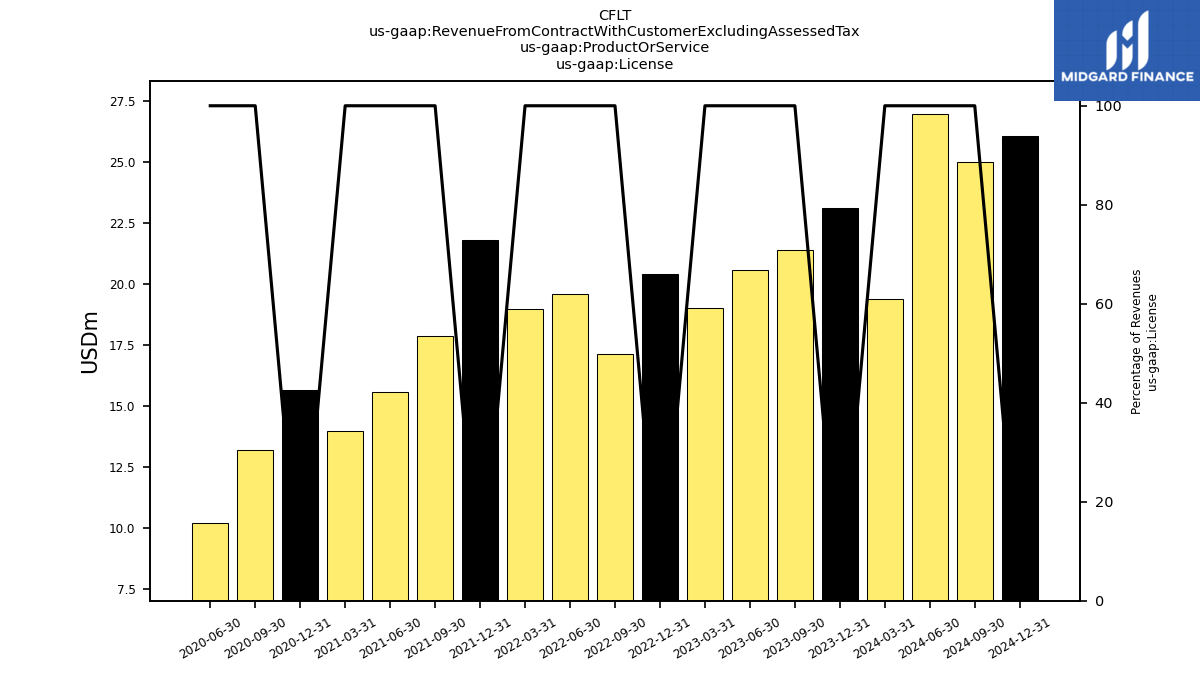
| License | 21.39 | 20.54 | 18.99 | 20.38 | 17.12 | 19.57 | 18.95 | 21.80 | 17.87 | 15.55 | 13.96 | 15.66 | 13.21 | 10.19 | |
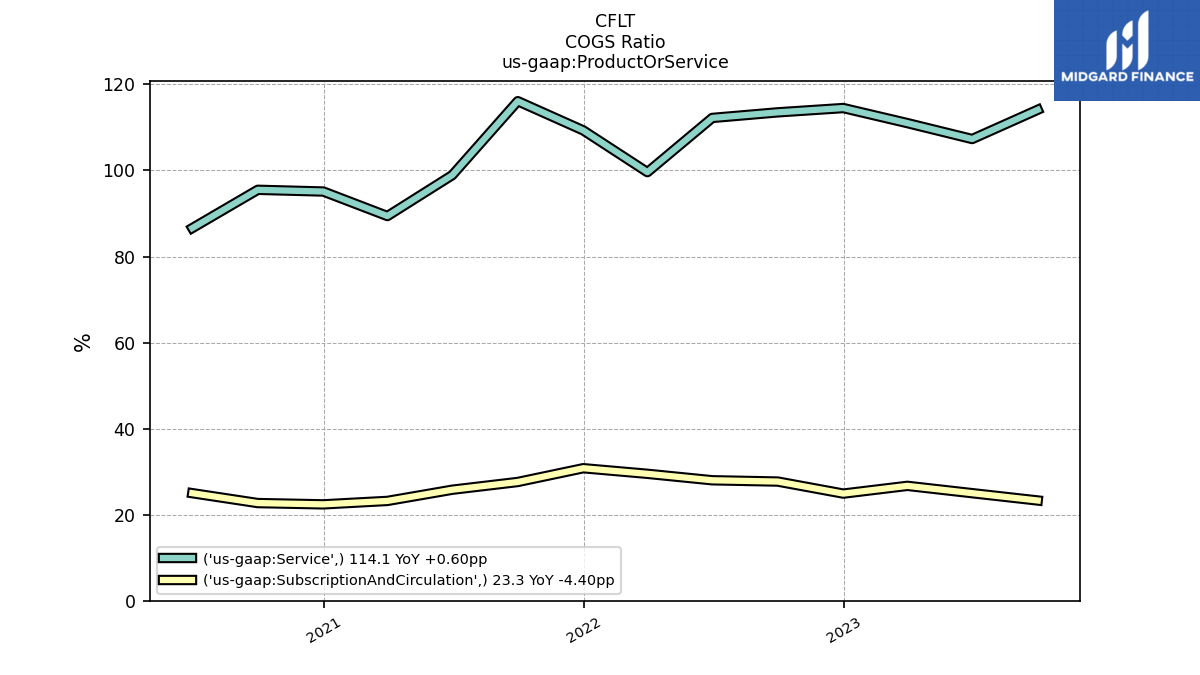
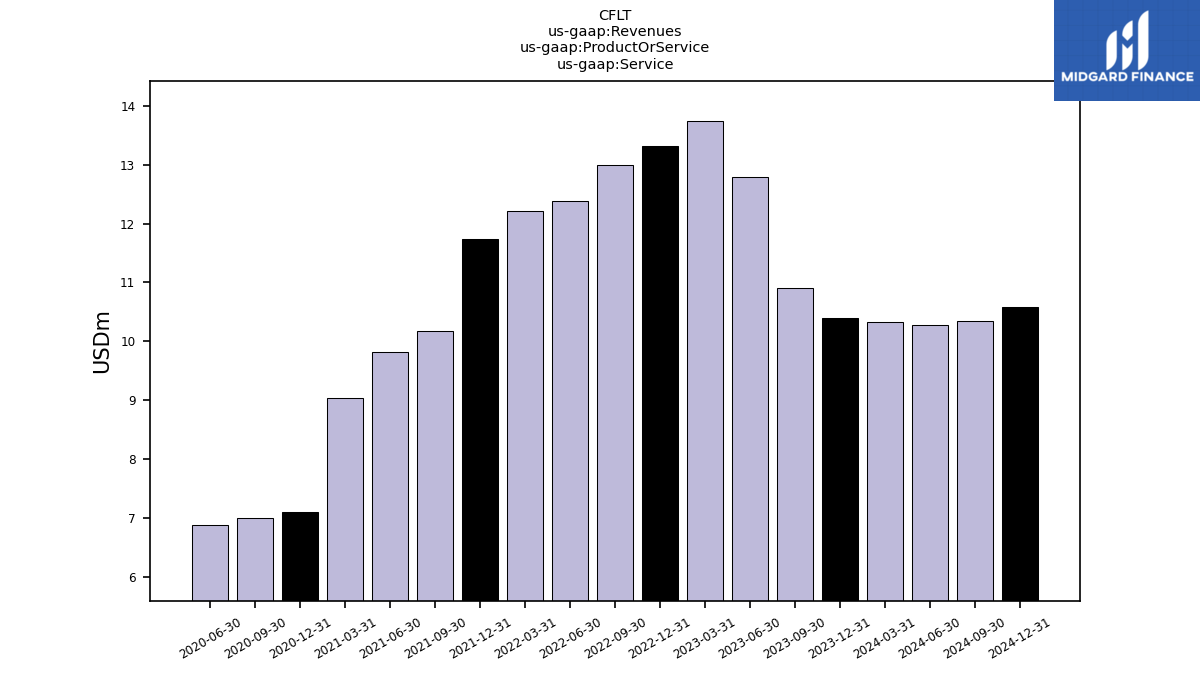
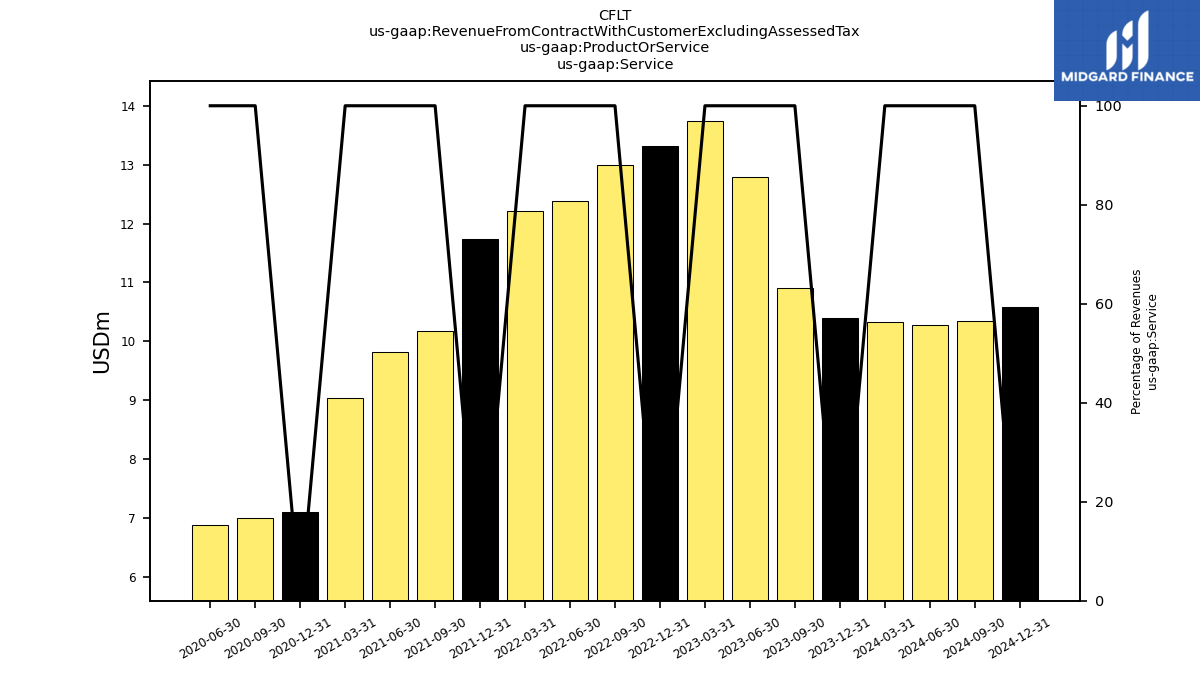
| Service | 10.91 | 12.80 | 13.73 | 13.32 | 13.00 | 12.39 | 12.22 | 11.74 | 10.17 | 9.82 | 9.04 | 7.11 | 7.00 | 6.88 | |
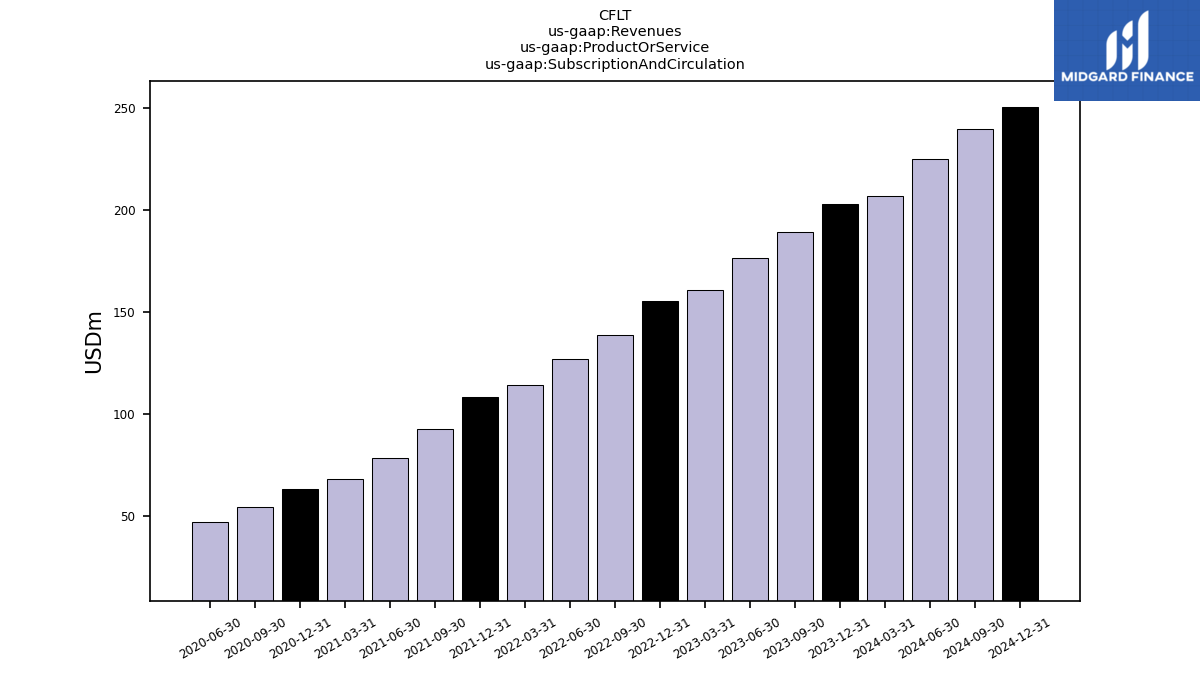
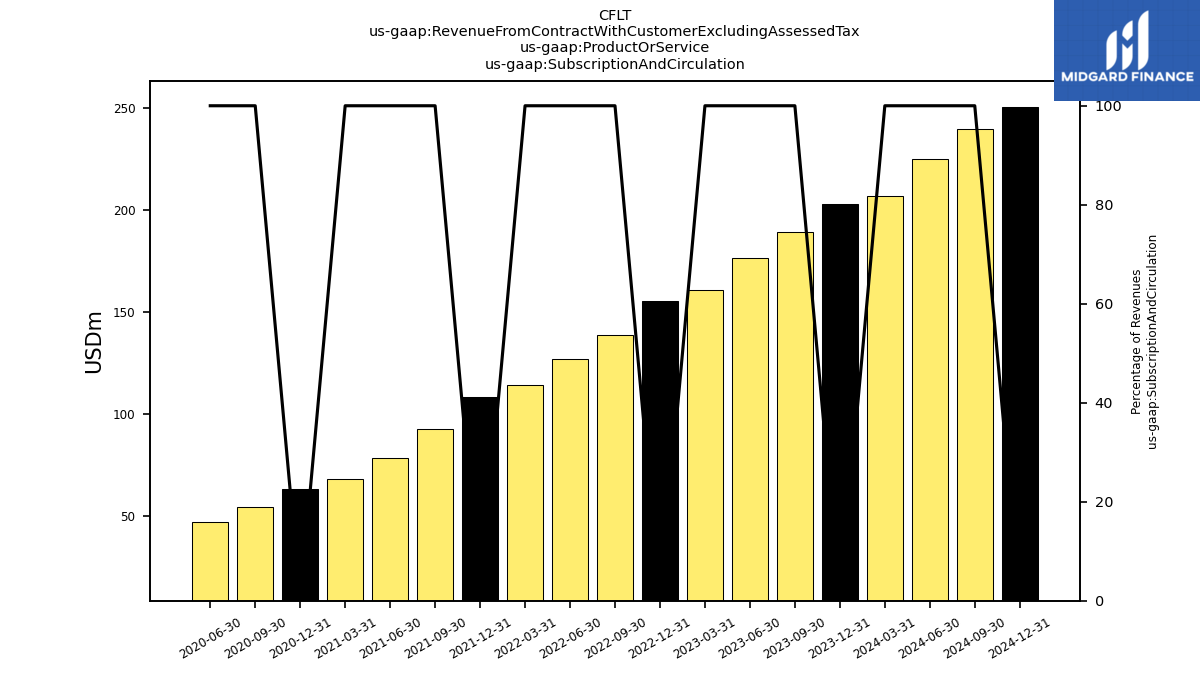
| Subscription And Circulation | 189.27 | 176.49 | 160.57 | 155.34 | 138.73 | 127.02 | 113.92 | 108.19 | 92.40 | 78.52 | 67.99 | 63.22 | 54.50 | 46.97 | |
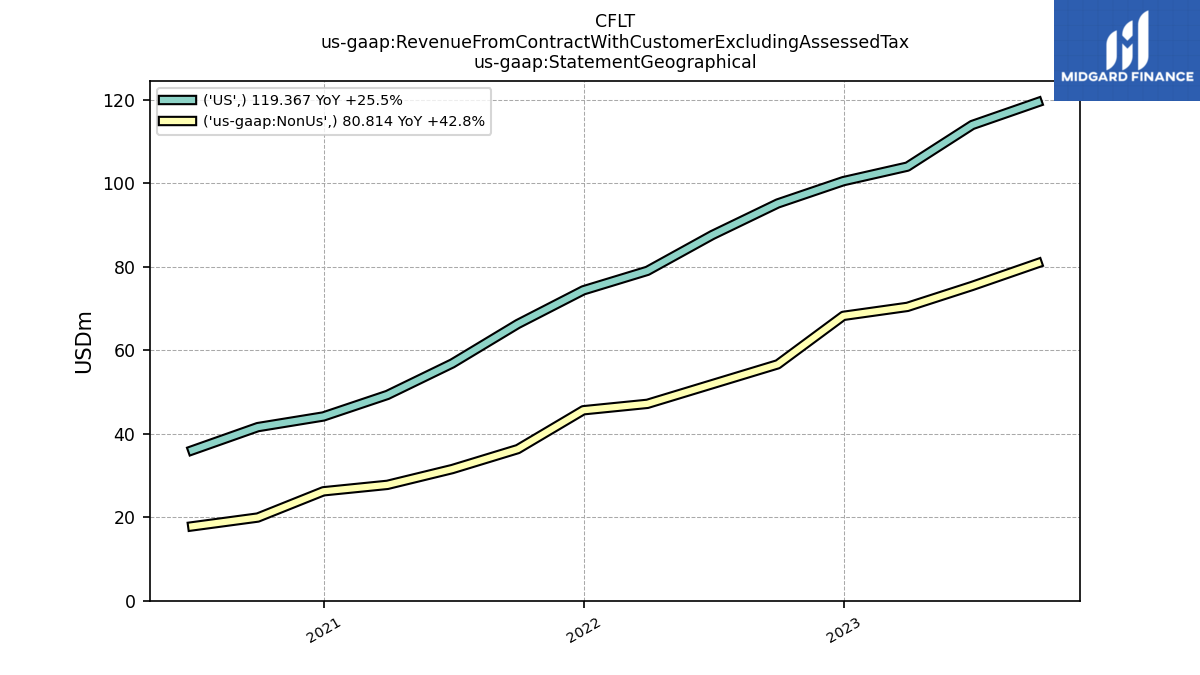
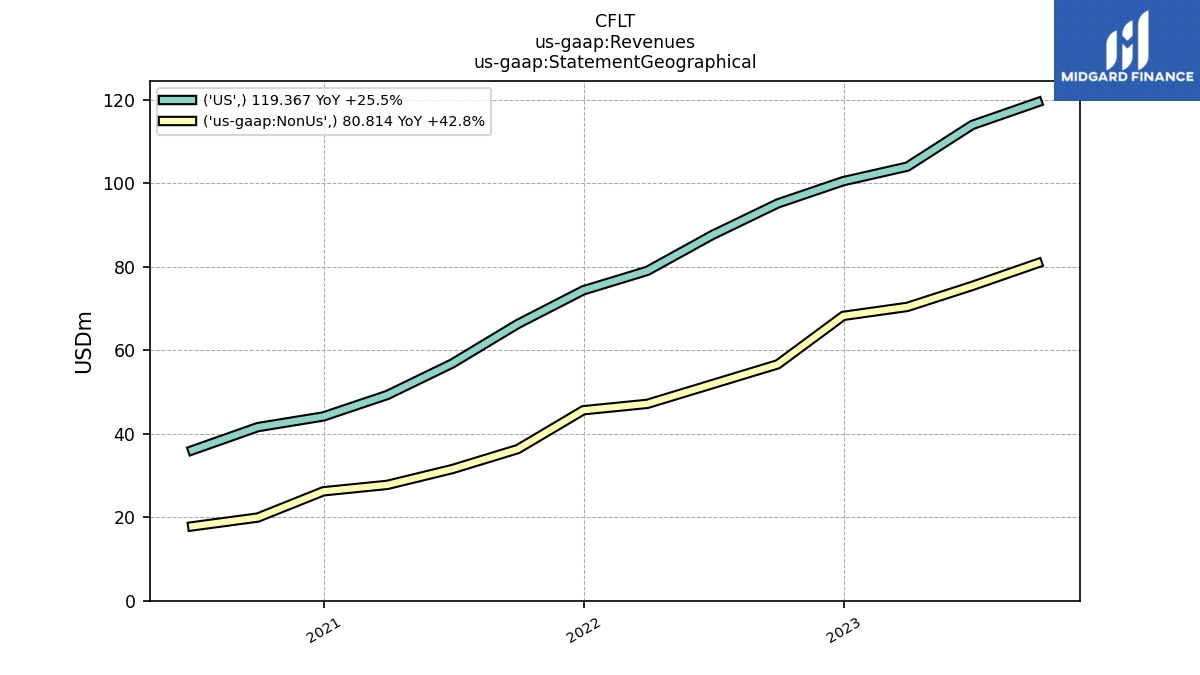
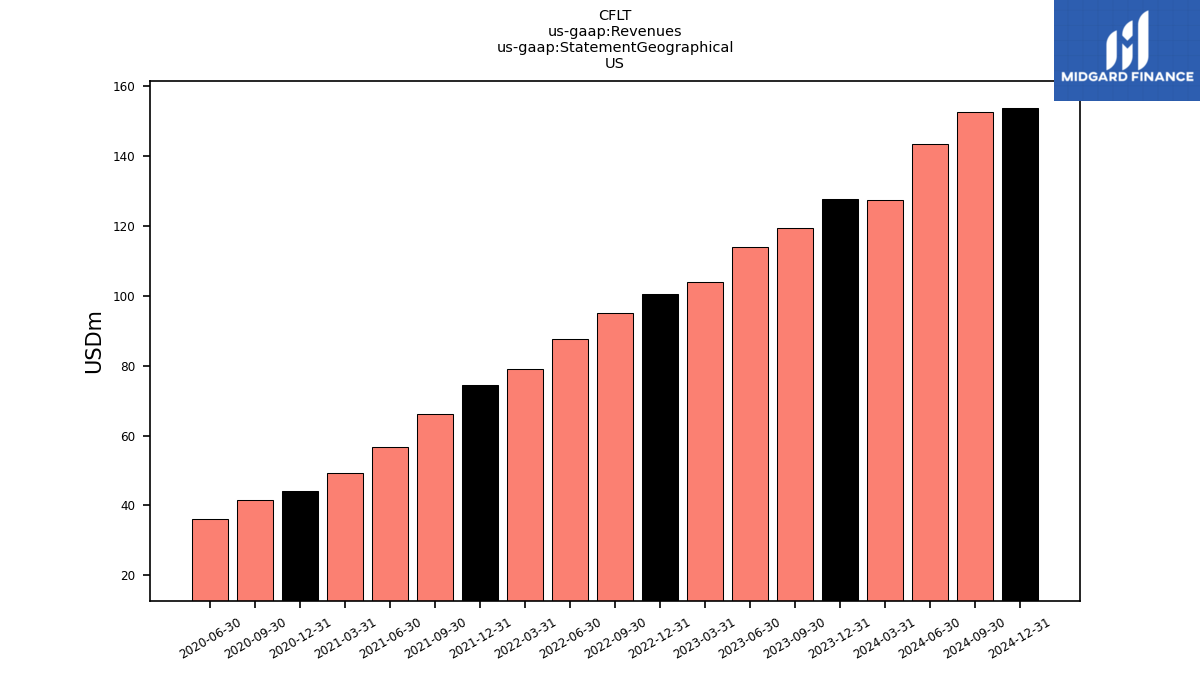
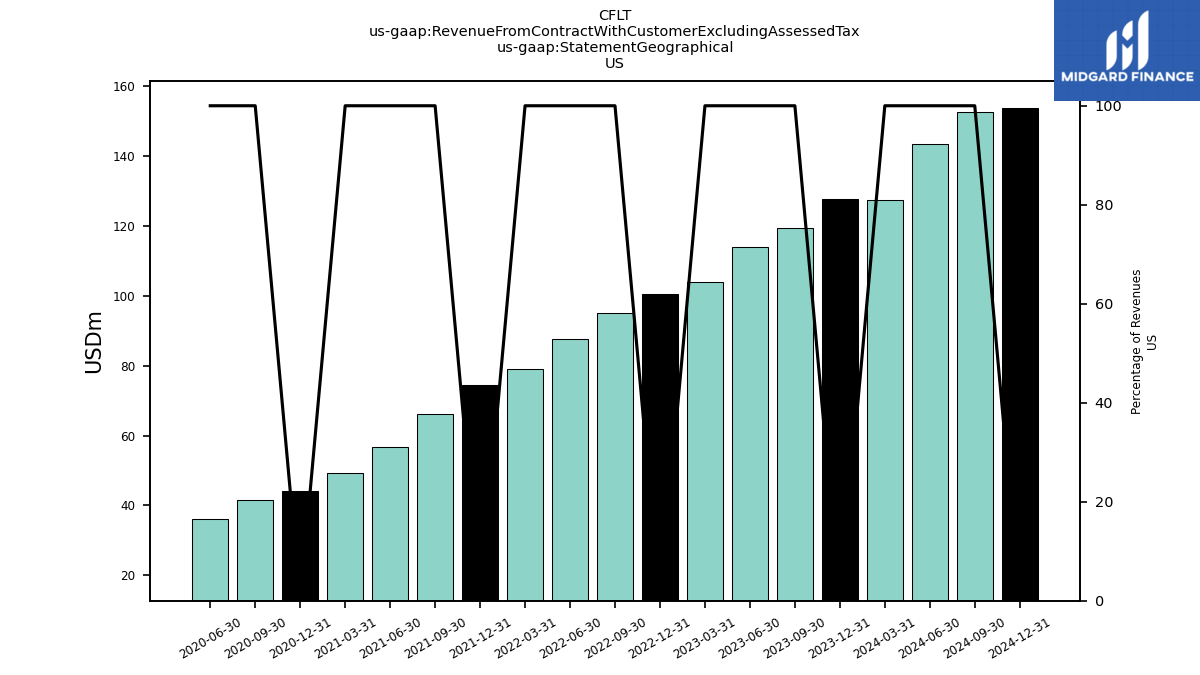
| US | 119.37 | 113.91 | 103.94 | 100.46 | 95.13 | 87.56 | 78.99 | 74.32 | 66.26 | 56.81 | 49.28 | 44.12 | 41.57 | 36.03 | |
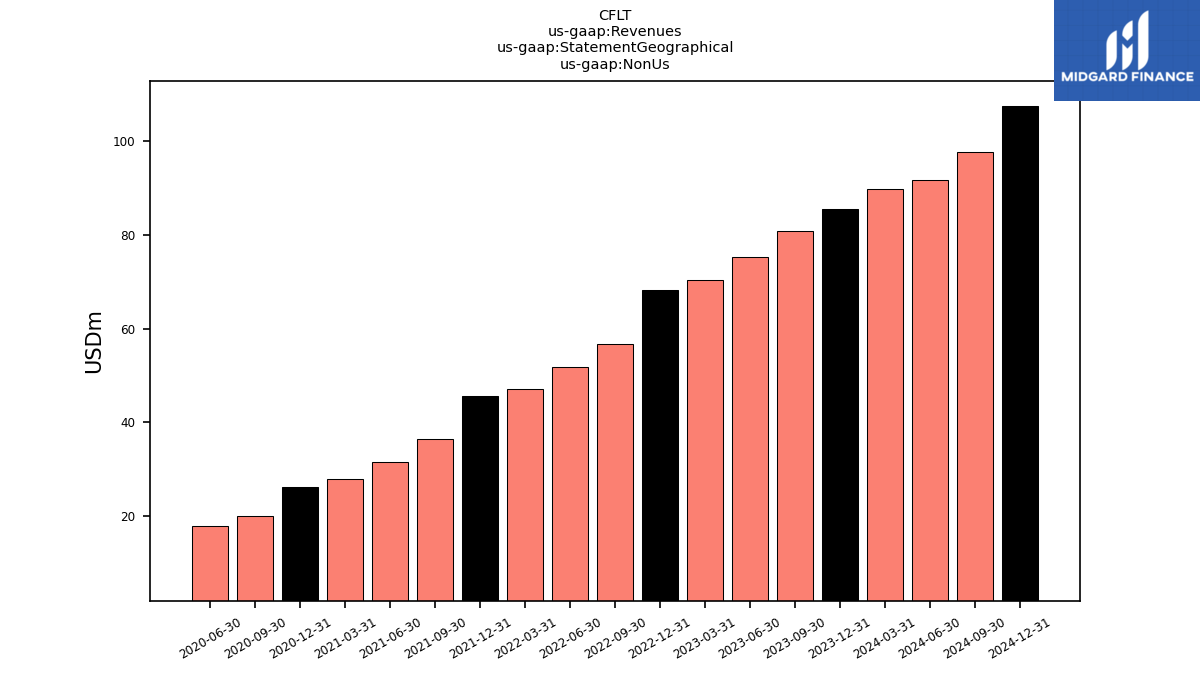
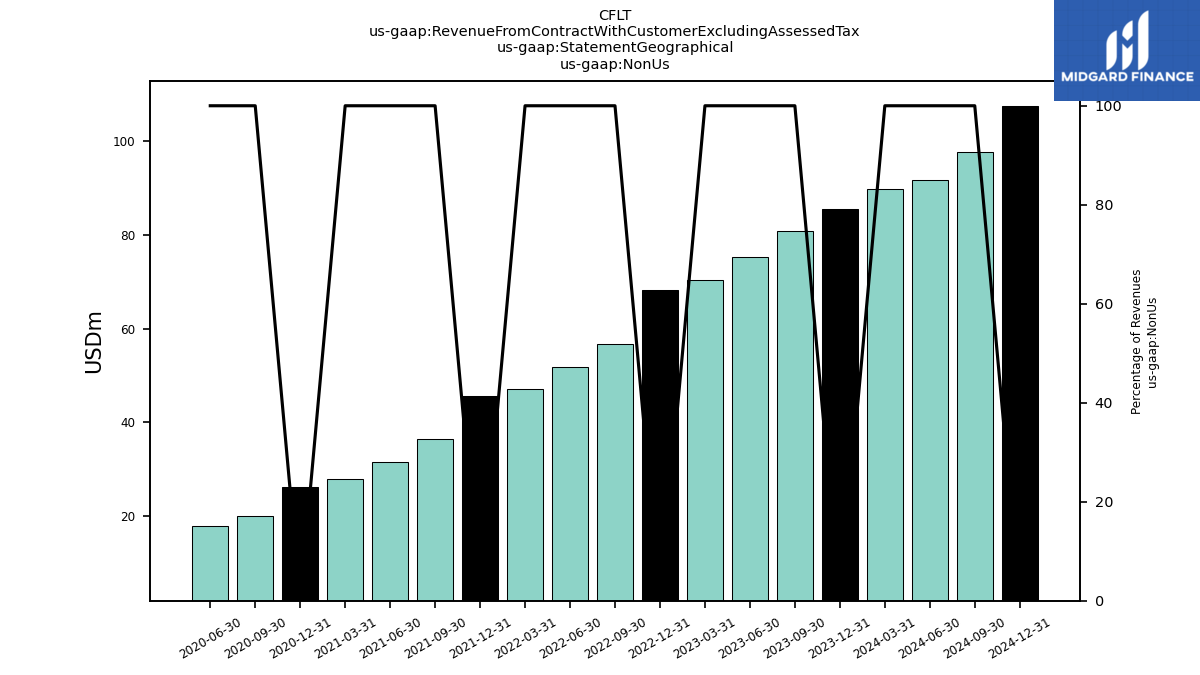
| Non Us | 80.81 | 75.38 | 70.36 | 68.21 | 56.61 | 51.85 | 47.15 | 45.61 | 36.31 | 31.53 | 27.75 | 26.20 | 19.93 | 17.82 | |
| Revenue From Contract With Customer Excluding Assessed Tax | 200.18 | 189.28 | 174.30 | 168.67 | 151.73 | 139.41 | 126.14 | 119.93 | 102.57 | 88.34 | 77.03 | 70.32 | 61.50 | 53.85 | |
| Confluent Cloud | 91.60 | 83.58 | 73.64 | 68.37 | 56.92 | 46.98 | 38.91 | 33.78 | 26.81 | 19.67 | 13.92 | 10.87 | 7.77 | 6.56 | |
| Post Contract Customer Support | 76.28 | 72.37 | 67.94 | 66.58 | 64.69 | 60.47 | 56.06 | 52.61 | 47.72 | 43.30 | 40.11 | 36.69 | 33.53 | 30.23 | |
| Subscription | 189.27 | 176.49 | 160.57 | 155.34 | 138.73 | 127.02 | 113.92 | 108.19 | 92.40 | 78.52 | 67.99 | 63.22 | 54.50 | 46.97 | |
| License | 21.39 | 20.54 | 18.99 | 20.38 | 17.12 | 19.57 | 18.95 | 21.80 | 17.87 | 15.55 | 13.96 | 15.66 | 13.21 | 10.19 | |
| Service | 10.91 | 12.80 | 13.73 | 13.32 | 13.00 | 12.39 | 12.22 | 11.74 | 10.17 | 9.82 | 9.04 | 7.11 | 7.00 | 6.88 | |
| Subscription And Circulation | 189.27 | 176.49 | 160.57 | 155.34 | 138.73 | 127.02 | 113.92 | 108.19 | 92.40 | 78.52 | 67.99 | 63.22 | 54.50 | 46.97 | |
| US | 119.37 | 113.91 | 103.94 | 100.46 | 95.13 | 87.56 | 78.99 | 74.32 | 66.26 | 56.81 | 49.28 | 44.12 | 41.57 | 36.03 | |
| Non Us | 80.81 | 75.38 | 70.36 | 68.21 | 56.61 | 51.85 | 47.15 | 45.61 | 36.31 | 31.53 | 27.75 | 26.20 | 19.93 | 17.82 |


