
| 2023-09-30 | 2023-06-30 | 2023-03-31 | 2022-12-31 | 2022-09-30 | 2022-06-30 | 2022-03-31 | 2021-12-31 | 2021-09-30 | 2021-06-30 | 2021-03-31 | 2020-12-31 | 2020-09-30 | 2020-06-30 | 2020-03-31 | 2019-12-31 | 2019-09-30 | 2019-06-30 | 2019-03-31 | 2018-12-31 | 2018-09-30 | 2018-06-30 | 2018-03-31 | 2017-12-31 | 2017-09-30 | 2017-06-30 | 2017-03-31 | 2016-12-31 | 2016-09-30 | 2016-06-30 | 2016-03-31 | 2015-12-31 | 2015-09-30 | 2015-06-30 | 2015-03-31 | 2014-12-31 | 2014-09-30 | 2014-06-30 | 2014-03-31 | ||
|---|---|---|---|---|---|---|---|---|---|---|---|---|---|---|---|---|---|---|---|---|---|---|---|---|---|---|---|---|---|---|---|---|---|---|---|---|---|---|---|---|
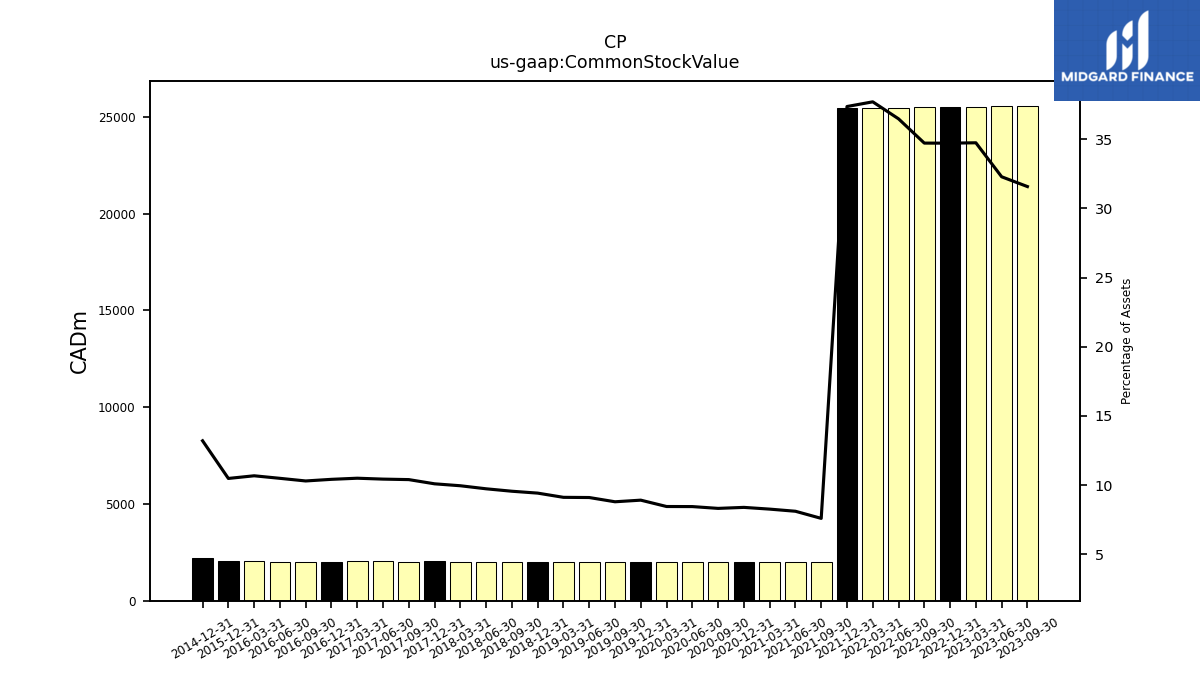
| Common Stock Value | 25579.00 | 25563.00 | 25538.00 | 25516.00 | 25498.00 | 25488.00 | 25486.00 | 25475.00 | 2008.00 | 2003.00 | 1993.00 | 1983.00 | 1978.00 | 1990.00 | 1985.00 | 1993.00 | 1982.00 | 1996.00 | 1997.00 | 2002.00 | 2017.00 | 2013.00 | 2022.00 | 2032.00 | 2025.00 | 2038.00 | 2036.00 | 2002.00 | 2000.00 | 2000.00 | 2065.00 | 2058.00 | NA | NA | NA | 2185.00 | NA | NA | NA | |
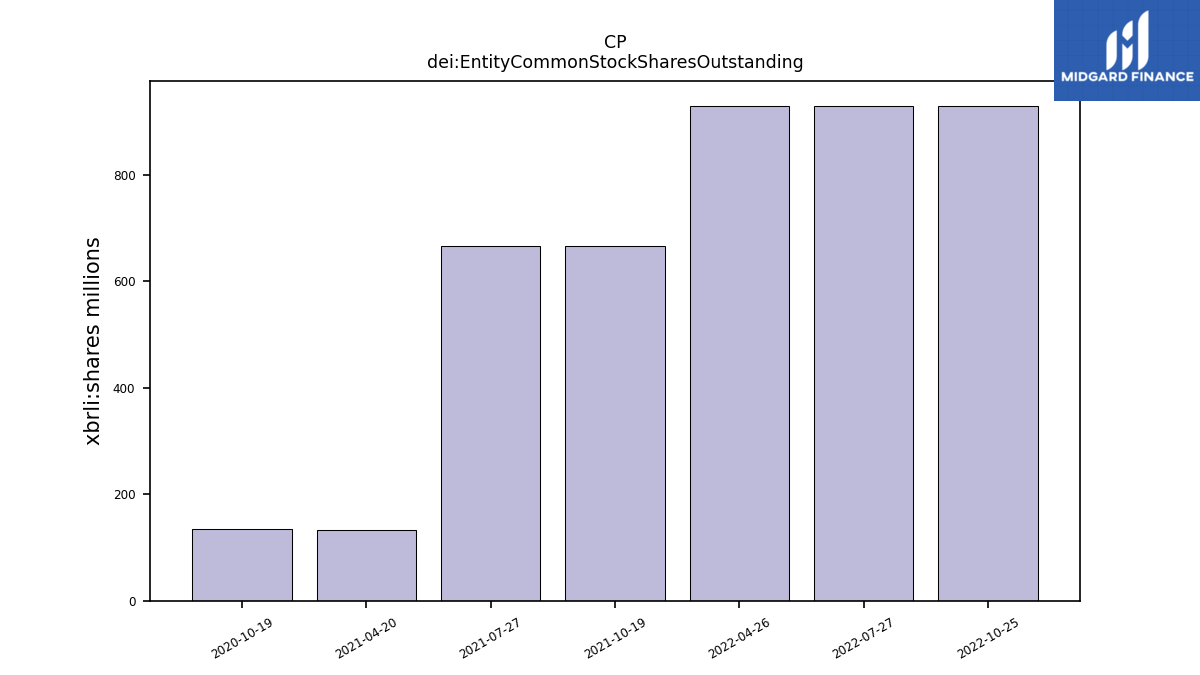
| dei: Entity Common Stock Shares Outstanding | NA | NA | NA | NA | NA | NA | NA | NA | NA | NA | NA | NA | NA | NA | NA | NA | NA | NA | NA | NA | NA | NA | NA | NA | NA | NA | NA | NA | NA | NA | NA | NA | NA | NA | NA | NA | NA | NA | NA | |
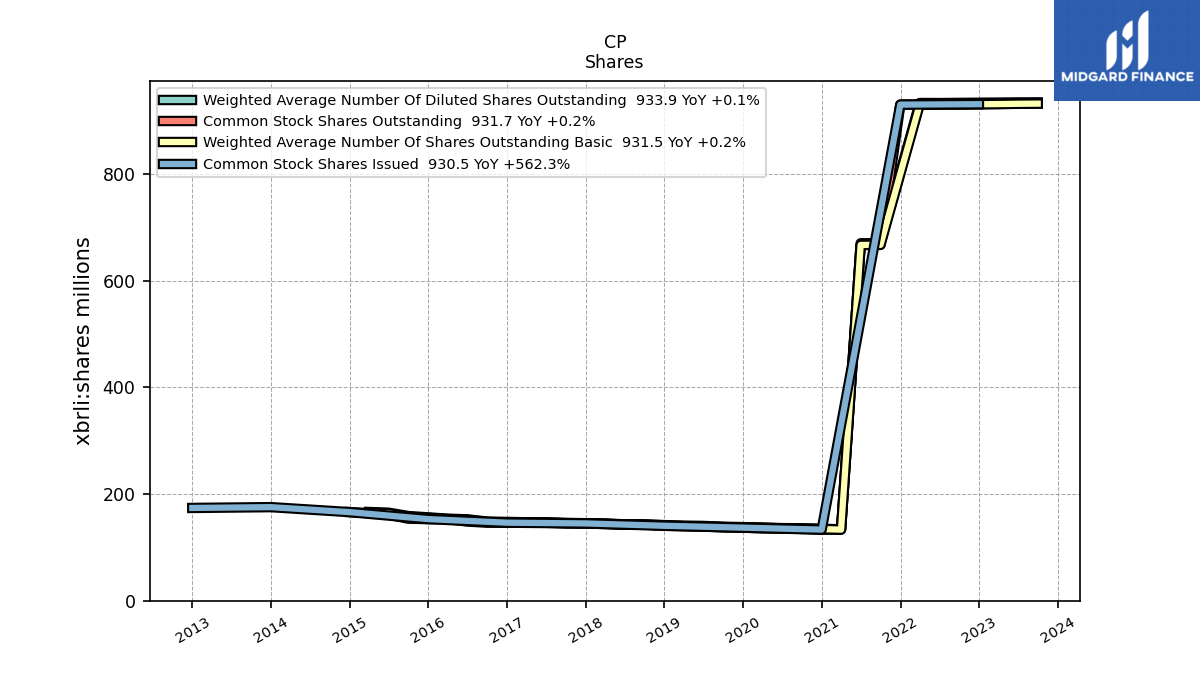
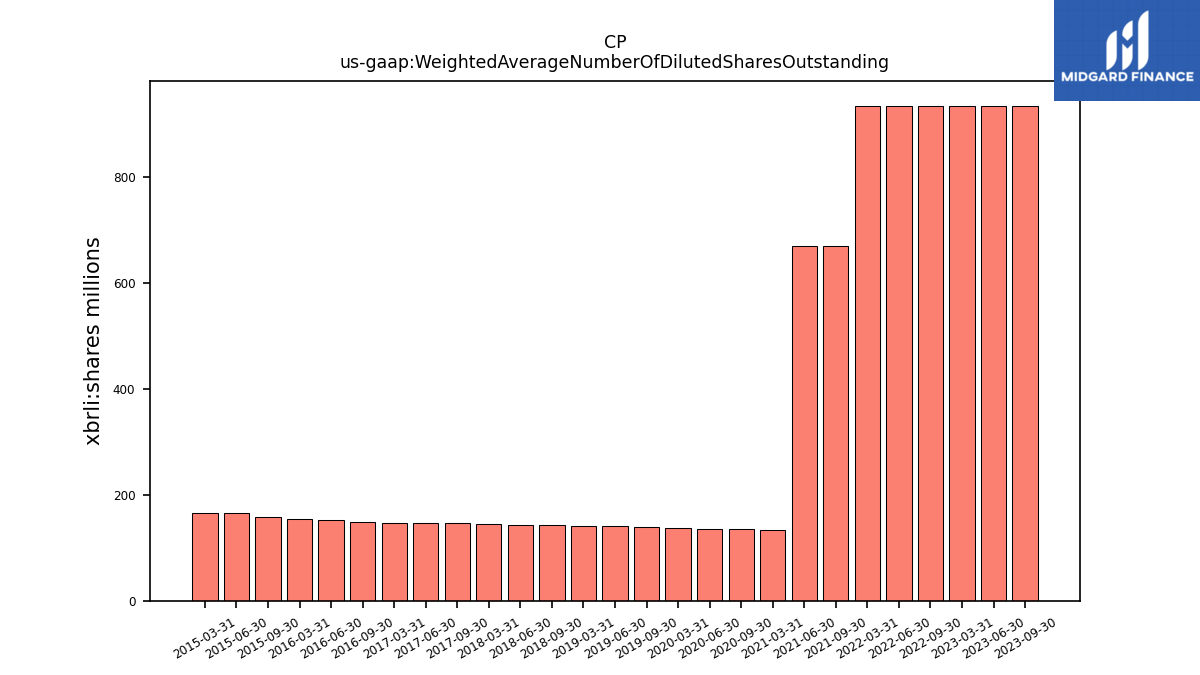
| Weighted Average Number Of Diluted Shares Outstanding | 933.90 | 933.80 | 933.50 | NA | 932.90 | 932.60 | 932.70 | NA | 669.80 | 669.90 | 133.90 | NA | 135.80 | 136.10 | 137.20 | NA | 138.70 | 140.20 | 140.50 | NA | 143.10 | 143.20 | 144.80 | NA | 145.80 | 146.90 | 147.10 | NA | 148.30 | 152.60 | 153.80 | NA | 158.70 | 165.00 | 166.30 | NA | NA | NA | NA | |
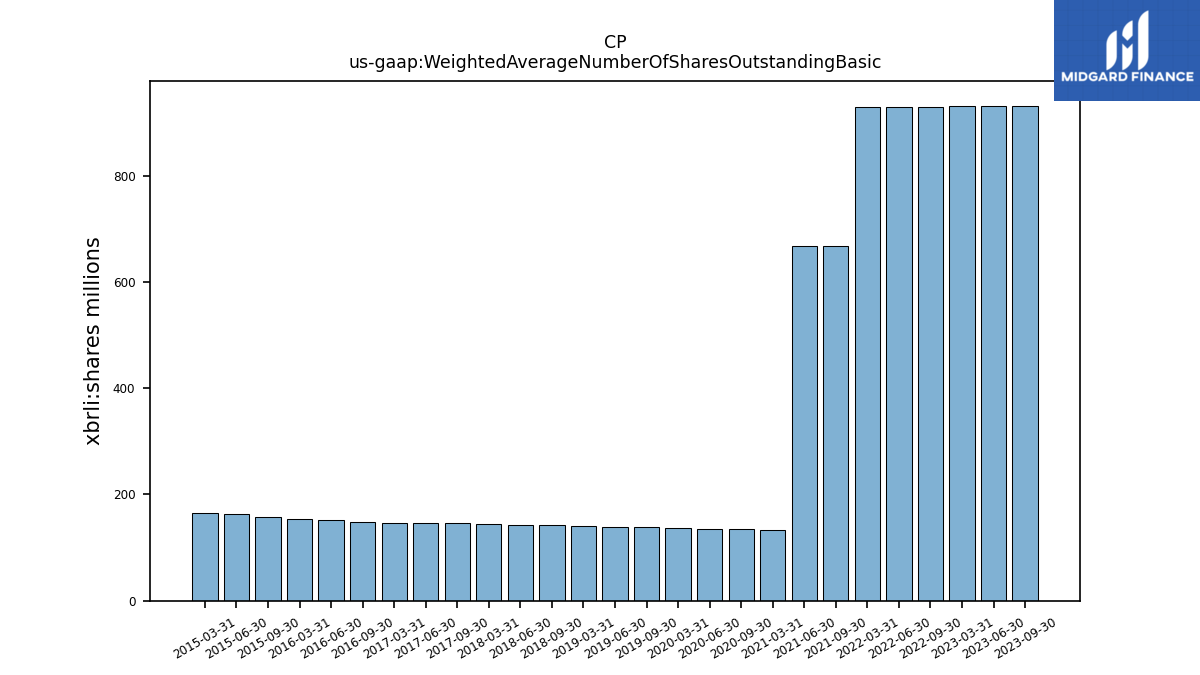
| Weighted Average Number Of Shares Outstanding Basic | 931.50 | 931.20 | 930.70 | NA | 930.00 | 929.90 | 929.70 | NA | 666.90 | 666.70 | 133.30 | NA | 135.20 | 135.60 | 136.70 | NA | 138.10 | 139.70 | 140.10 | NA | 142.60 | 142.80 | 144.40 | NA | 145.50 | 146.50 | 146.50 | NA | 147.30 | 151.70 | 153.00 | NA | 157.60 | 163.70 | 164.90 | NA | NA | NA | NA | |
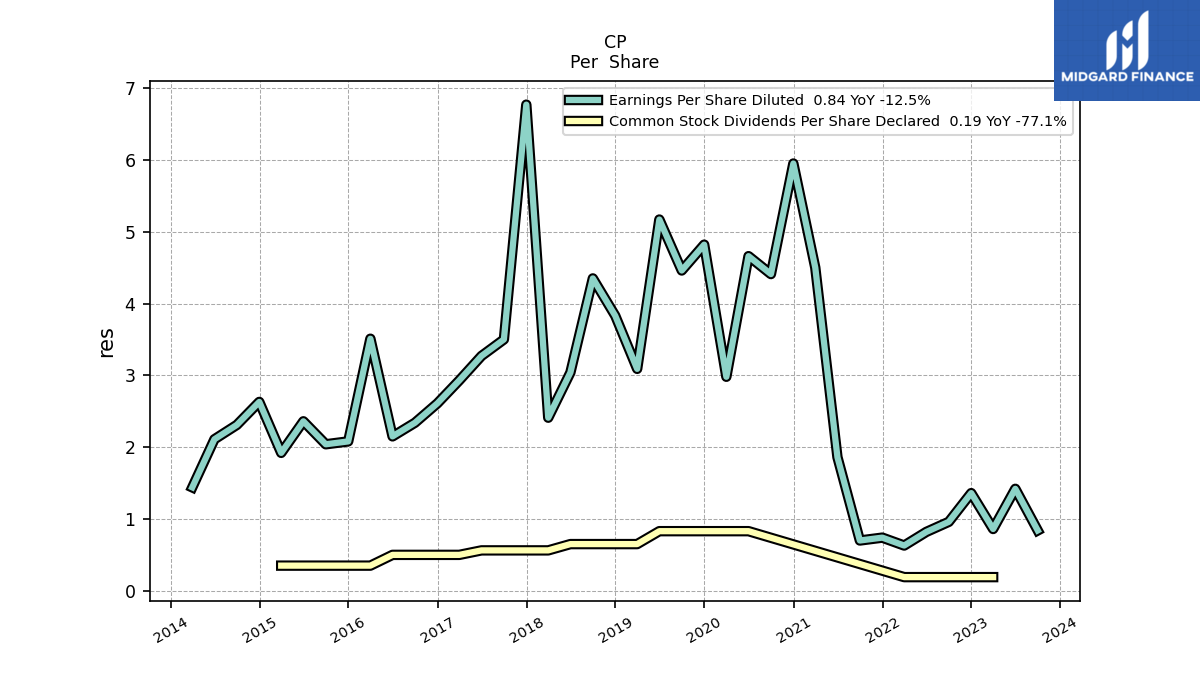
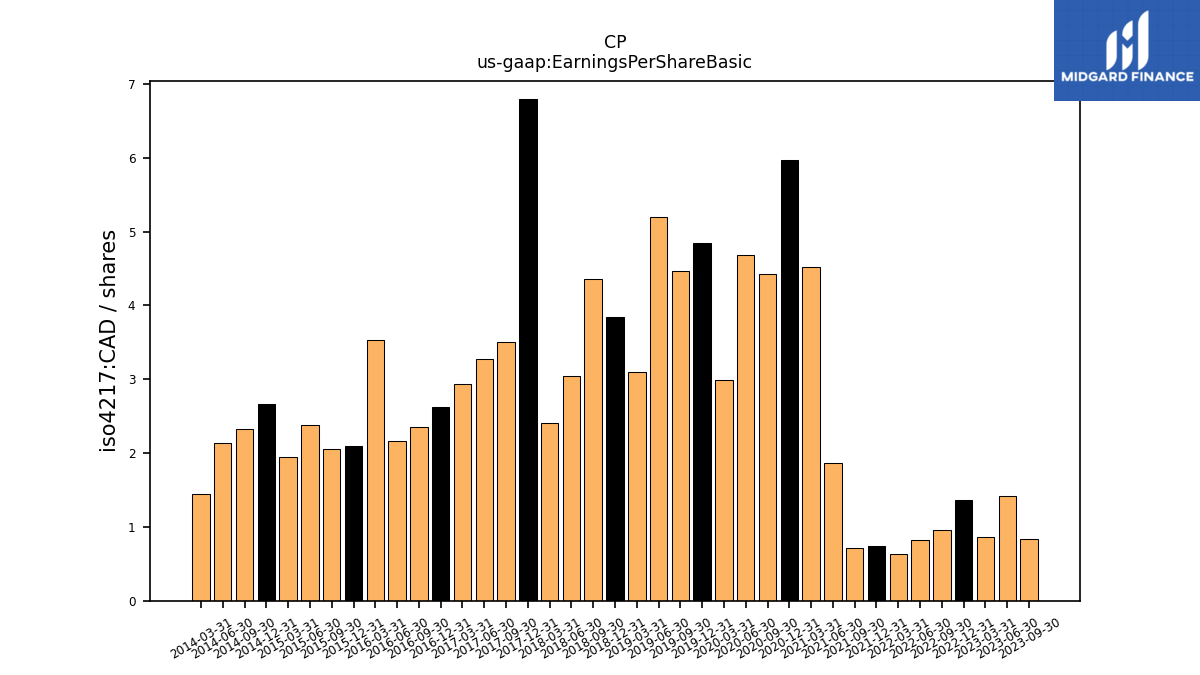
| Earnings Per Share Basic | 0.84 | 1.42 | 0.86 | 1.36 | 0.96 | 0.82 | 0.63 | 0.74 | 0.71 | 1.87 | 4.52 | 5.97 | 4.42 | 4.68 | 2.99 | 4.84 | 4.47 | 5.19 | 3.10 | 3.84 | 4.36 | 3.05 | 2.41 | 6.79 | 3.50 | 3.28 | 2.94 | 2.63 | 2.35 | 2.16 | 3.53 | 2.09 | 2.05 | 2.38 | 1.94 | 2.66 | 2.33 | 2.13 | 1.45 | |
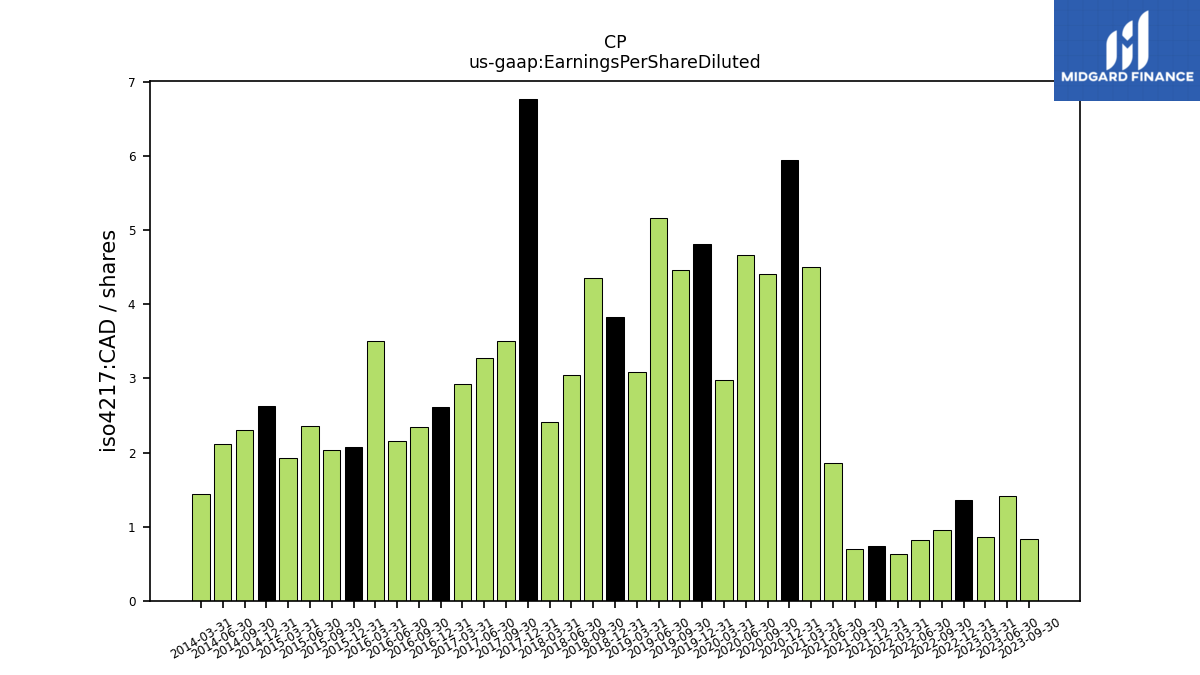
| Earnings Per Share Diluted | 0.84 | 1.42 | 0.86 | 1.36 | 0.96 | 0.82 | 0.63 | 0.74 | 0.70 | 1.86 | 4.50 | 5.95 | 4.41 | 4.66 | 2.98 | 4.82 | 4.46 | 5.17 | 3.09 | 3.83 | 4.35 | 3.04 | 2.41 | 6.77 | 3.50 | 3.27 | 2.93 | 2.61 | 2.34 | 2.15 | 3.51 | 2.08 | 2.04 | 2.36 | 1.92 | 2.63 | 2.31 | 2.11 | 1.44 |
| 2023-09-30 | 2023-06-30 | 2023-03-31 | 2022-12-31 | 2022-09-30 | 2022-06-30 | 2022-03-31 | 2021-12-31 | 2021-09-30 | 2021-06-30 | 2021-03-31 | 2020-12-31 | 2020-09-30 | 2020-06-30 | 2020-03-31 | 2019-12-31 | 2019-09-30 | 2019-06-30 | 2019-03-31 | 2018-12-31 | 2018-09-30 | 2018-06-30 | 2018-03-31 | 2017-12-31 | 2017-09-30 | 2017-06-30 | 2017-03-31 | 2016-12-31 | 2016-09-30 | 2016-06-30 | 2016-03-31 | 2015-12-31 | 2015-09-30 | 2015-06-30 | 2015-03-31 | 2014-12-31 | 2014-09-30 | 2014-06-30 | 2014-03-31 | ||
|---|---|---|---|---|---|---|---|---|---|---|---|---|---|---|---|---|---|---|---|---|---|---|---|---|---|---|---|---|---|---|---|---|---|---|---|---|---|---|---|---|
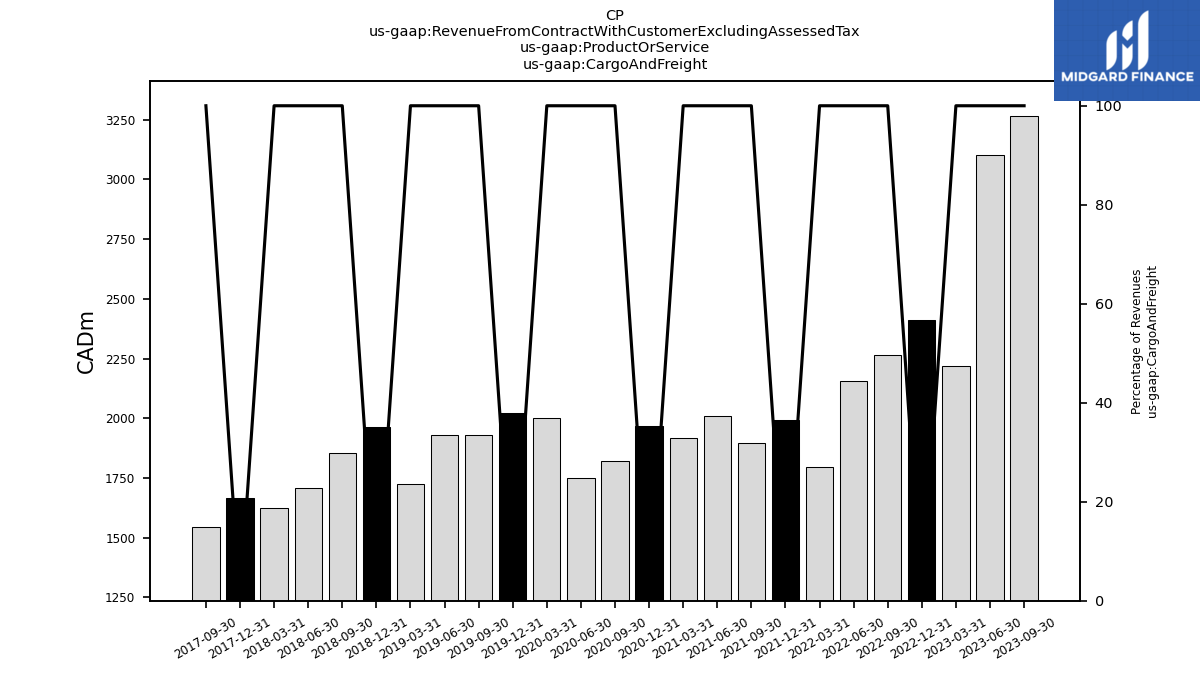
| Revenue From Contract With Customer Excluding Assessed Tax | 3305.00 | 3140.00 | 2244.00 | 2439.00 | 2292.00 | 2181.00 | 1818.00 | 2040.00 | 1921.00 | 2034.00 | 1942.00 | 2012.00 | 1848.00 | 1777.00 | 2029.00 | 2069.00 | 1964.00 | 1961.00 | 1752.00 | 2006.00 | 1882.00 | 1734.00 | 1648.00 | 1713.00 | 1581.00 | 1627.00 | 1591.00 | 1637.00 | 1554.00 | 1450.00 | 1591.00 | 1687.00 | 1709.00 | 1651.00 | 1665.00 | 1760.00 | 1670.00 | 1681.00 | 1509.00 | |
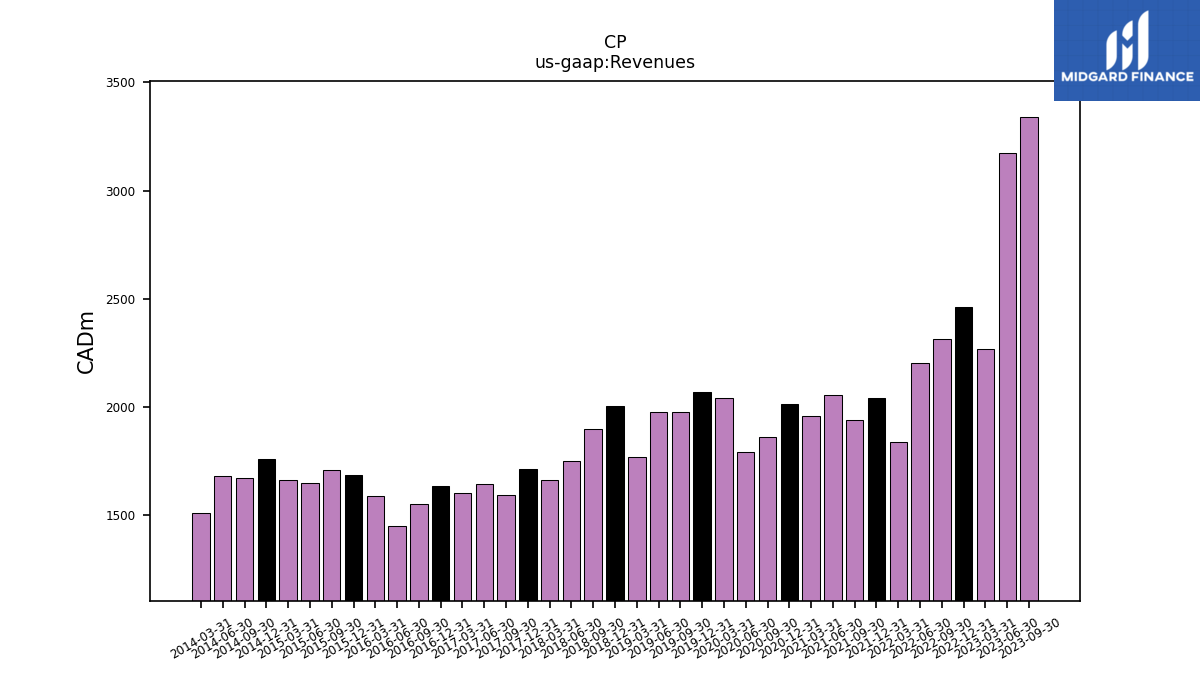
| Revenues | 3339.00 | 3174.00 | 2266.00 | 2462.00 | 2312.00 | 2202.00 | 1838.00 | 2040.00 | 1942.00 | 2054.00 | 1959.00 | 2012.00 | 1863.00 | 1792.00 | 2043.00 | 2069.00 | 1979.00 | 1977.00 | 1767.00 | 2006.00 | 1898.00 | 1750.00 | 1662.00 | 1713.00 | 1595.00 | 1643.00 | 1603.00 | 1637.00 | 1554.00 | 1450.00 | 1591.00 | 1687.00 | 1709.00 | 1651.00 | 1665.00 | 1760.00 | 1670.00 | 1681.00 | 1509.00 | |
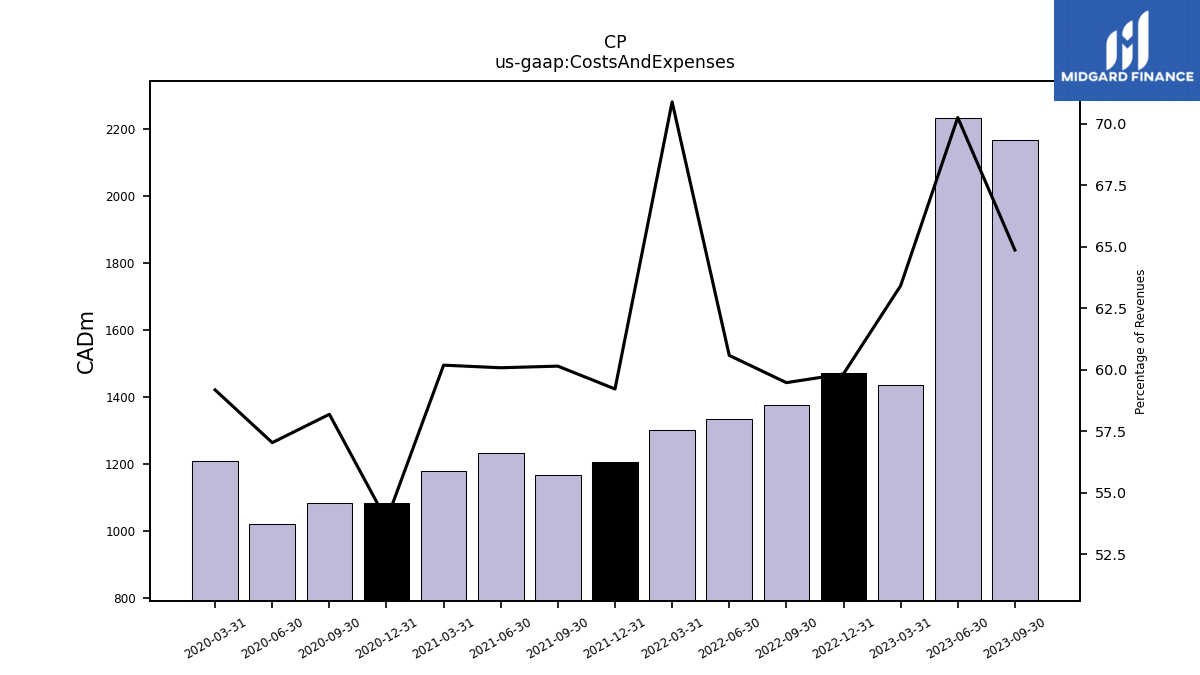
| Costs And Expenses | 2166.00 | 2230.00 | 1437.00 | 1473.00 | 1375.00 | 1334.00 | 1303.00 | 1208.00 | 1168.00 | 1234.00 | 1179.00 | 1084.00 | 1084.00 | 1022.00 | 1209.00 | NA | NA | NA | NA | NA | NA | NA | NA | NA | NA | NA | NA | NA | NA | NA | NA | NA | NA | NA | NA | NA | NA | NA | NA | |
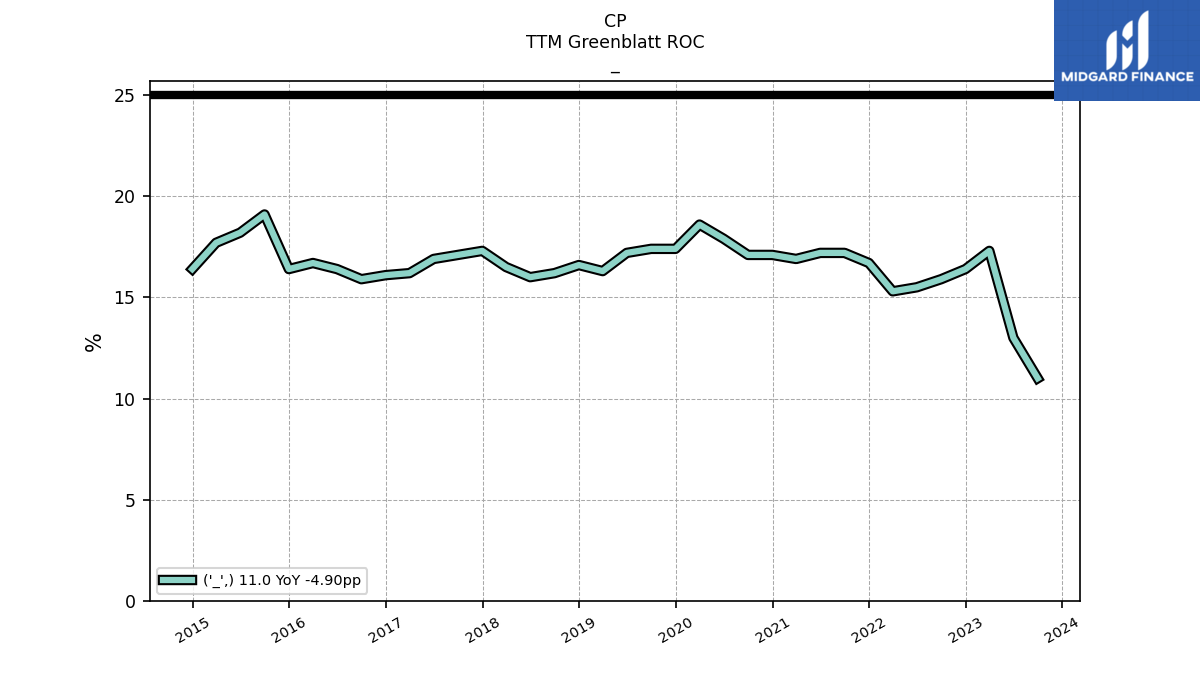
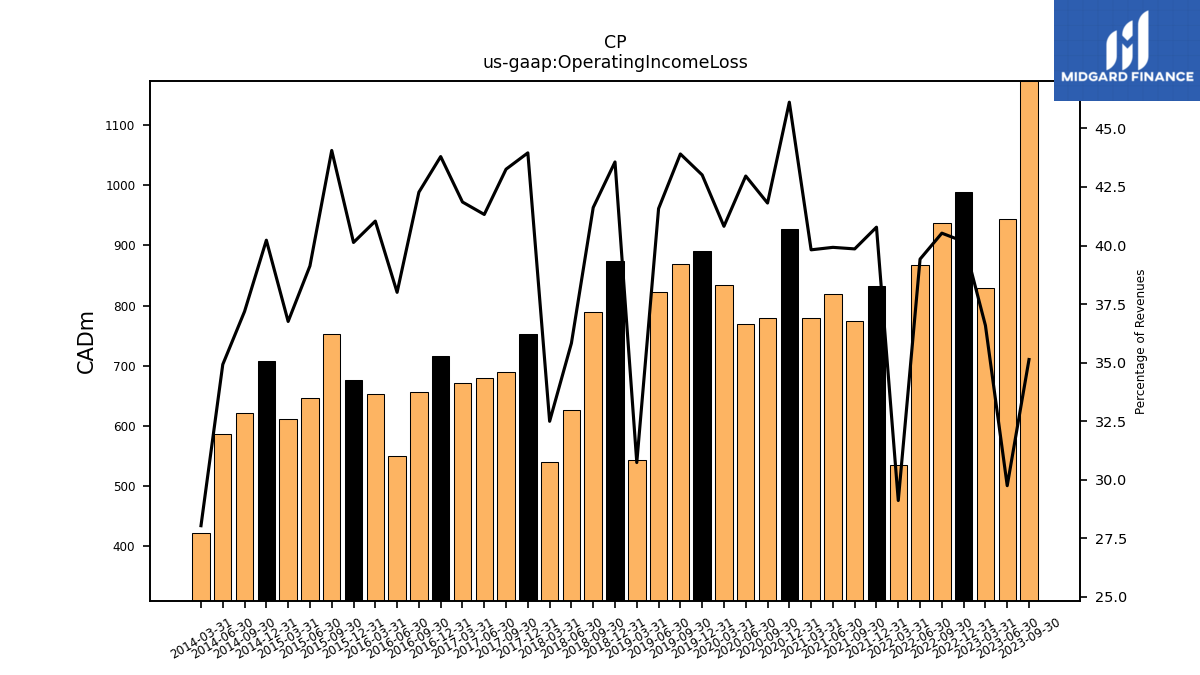
| Operating Income Loss | 1173.00 | 944.00 | 829.00 | 989.00 | 937.00 | 868.00 | 535.00 | 832.00 | 774.00 | 820.00 | 780.00 | 928.00 | 779.00 | 770.00 | 834.00 | 890.00 | 869.00 | 822.00 | 543.00 | 874.00 | 790.00 | 627.00 | 540.00 | 753.00 | 690.00 | 679.00 | 671.00 | 717.00 | 657.00 | 551.00 | 653.00 | 677.00 | 753.00 | 646.00 | 612.00 | 708.00 | 621.00 | 587.00 | 423.00 | |
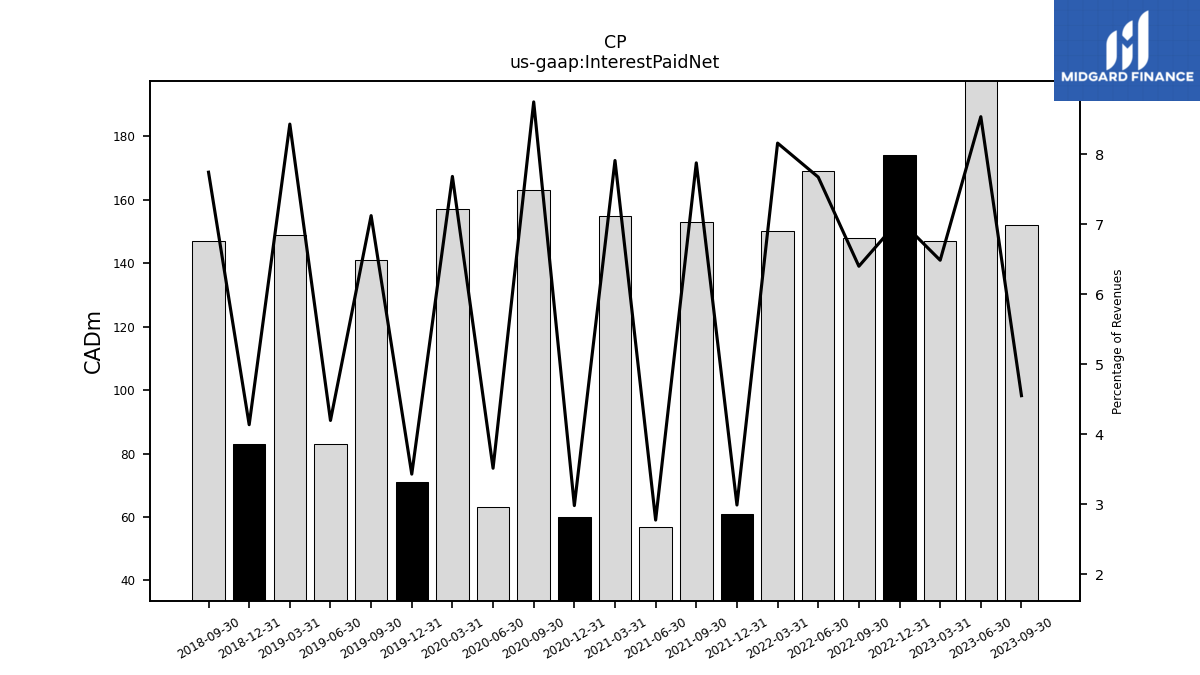
| Interest Paid Net | 152.00 | 271.00 | 147.00 | 174.00 | 148.00 | 169.00 | 150.00 | 61.00 | 153.00 | 57.00 | 155.00 | 60.00 | 163.00 | 63.00 | 157.00 | 71.00 | 141.00 | 83.00 | 149.00 | 83.00 | 147.00 | NA | NA | NA | NA | NA | NA | NA | NA | NA | NA | NA | NA | NA | NA | NA | NA | NA | NA | |
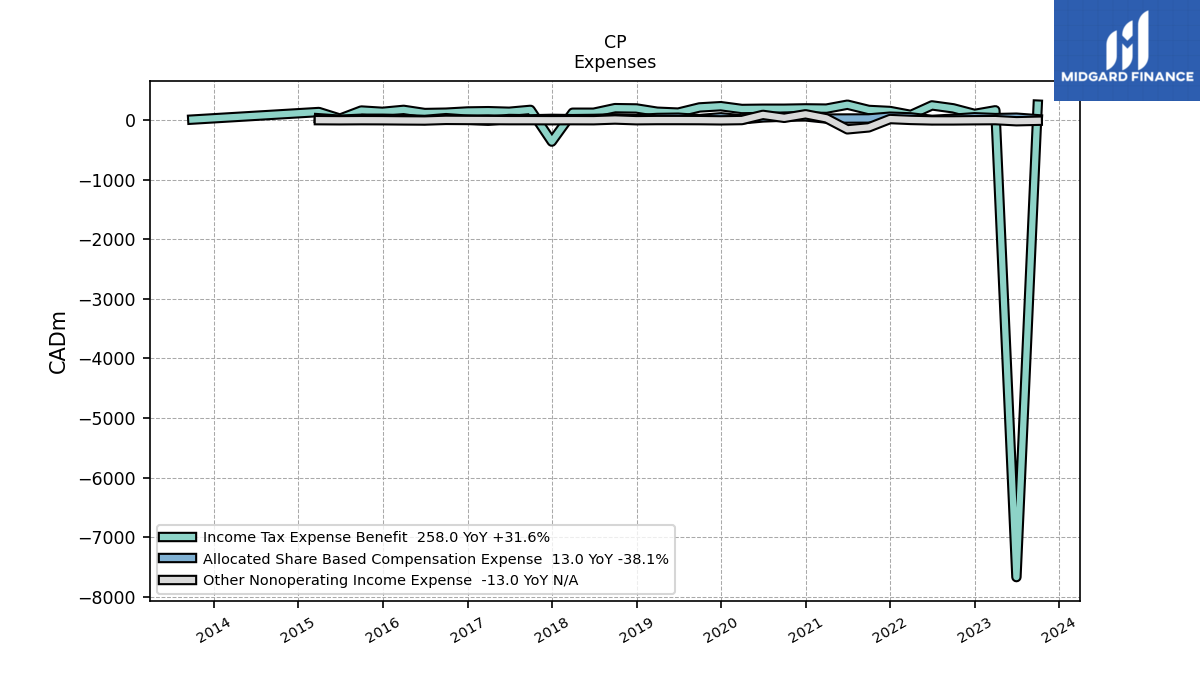
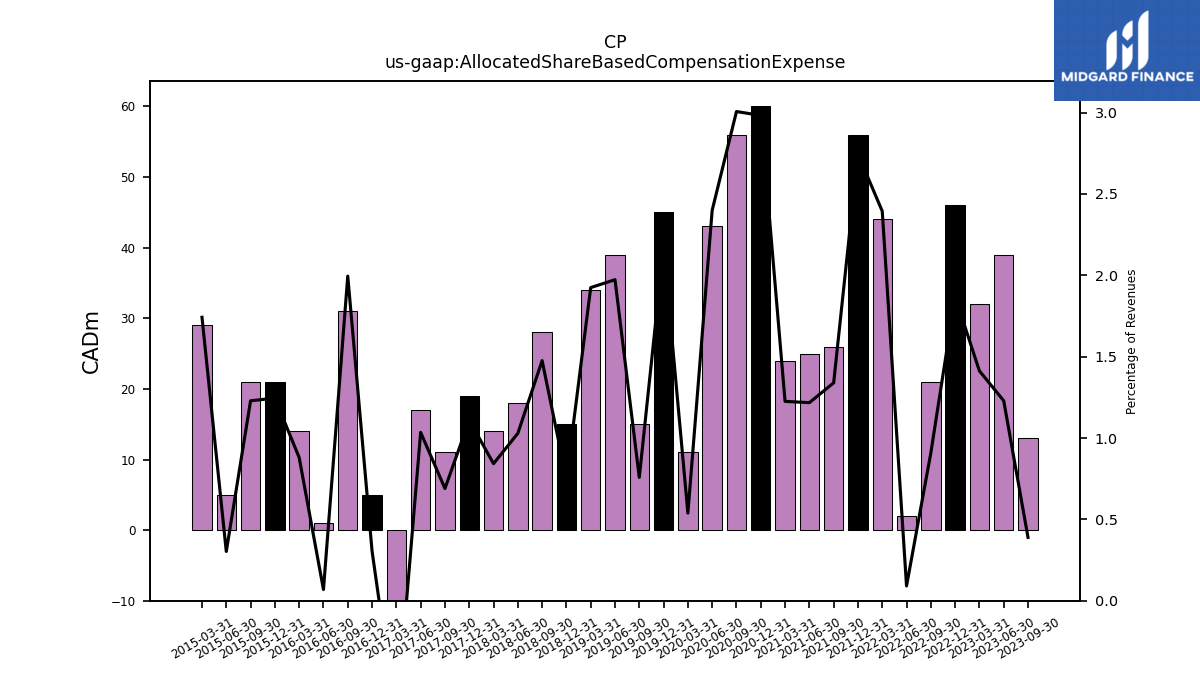
| Allocated Share Based Compensation Expense | 13.00 | 39.00 | 32.00 | 46.00 | 21.00 | 2.00 | 44.00 | 56.00 | 26.00 | 25.00 | 24.00 | 60.00 | 56.00 | 43.00 | 11.00 | 45.00 | 15.00 | 39.00 | 34.00 | 15.00 | 28.00 | 18.00 | 14.00 | 19.00 | 11.00 | 17.00 | -12.00 | 5.00 | 31.00 | 1.00 | 14.00 | 21.00 | 21.00 | 5.00 | 29.00 | NA | NA | NA | NA | |
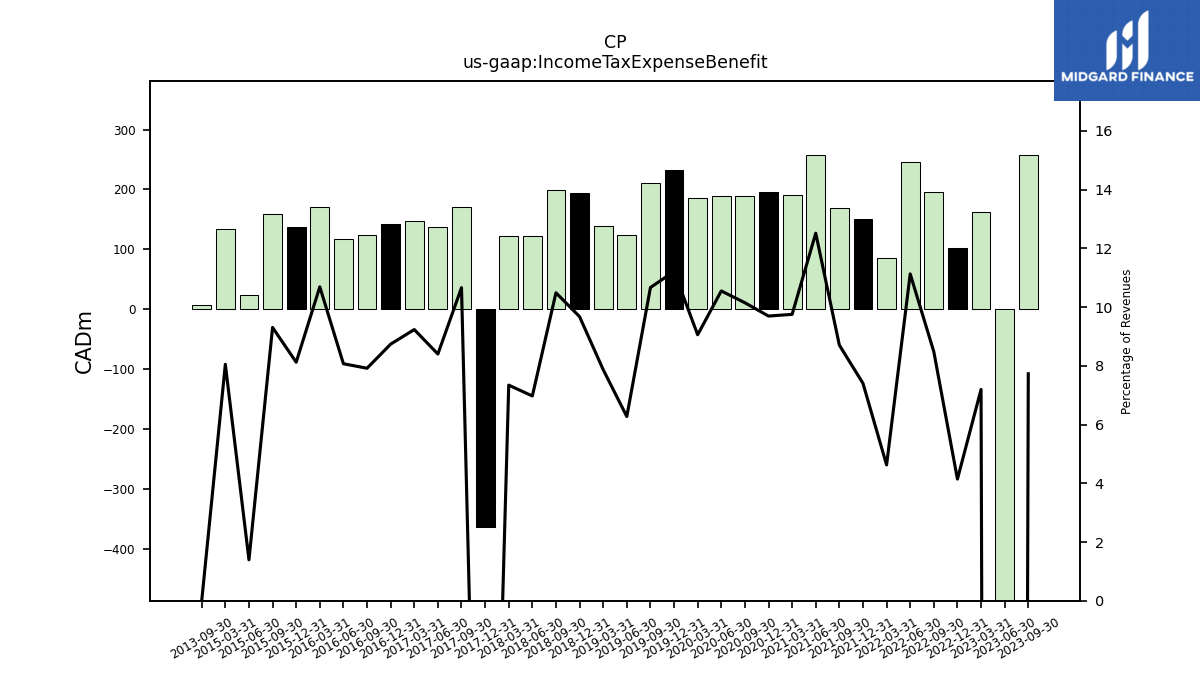
| Income Tax Expense Benefit | 258.00 | -7672.00 | 163.00 | 102.00 | 196.00 | 245.00 | 85.00 | 151.00 | 169.00 | 257.00 | 191.00 | 195.00 | 189.00 | 189.00 | 185.00 | 232.00 | 211.00 | 124.00 | 139.00 | 194.00 | 199.00 | 122.00 | 122.00 | -363.00 | 170.00 | 138.00 | 148.00 | 143.00 | 123.00 | 117.00 | 170.00 | 137.00 | 159.00 | 23.00 | 134.00 | NA | NA | NA | NA | |
| Income Taxes Paid Net | 205.00 | 259.00 | 184.00 | 89.00 | 67.00 | 93.00 | 159.00 | 151.00 | 129.00 | 139.00 | 133.00 | 127.00 | 311.00 | 5.00 | 139.00 | 127.00 | 122.00 | 108.00 | 149.00 | 88.00 | 74.00 | 52.00 | 104.00 | 61.00 | 78.00 | 116.00 | 170.00 | 48.00 | 17.00 | 65.00 | 192.00 | 69.00 | 48.00 | 62.00 | -3.00 | NA | NA | NA | NA | |
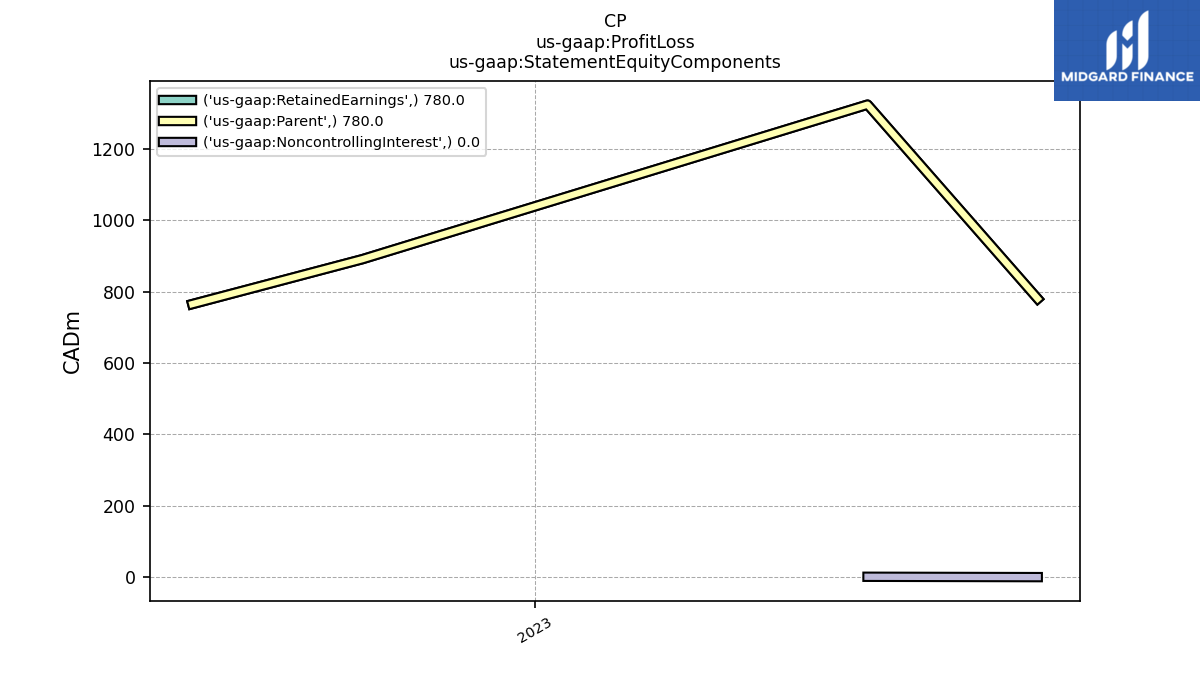
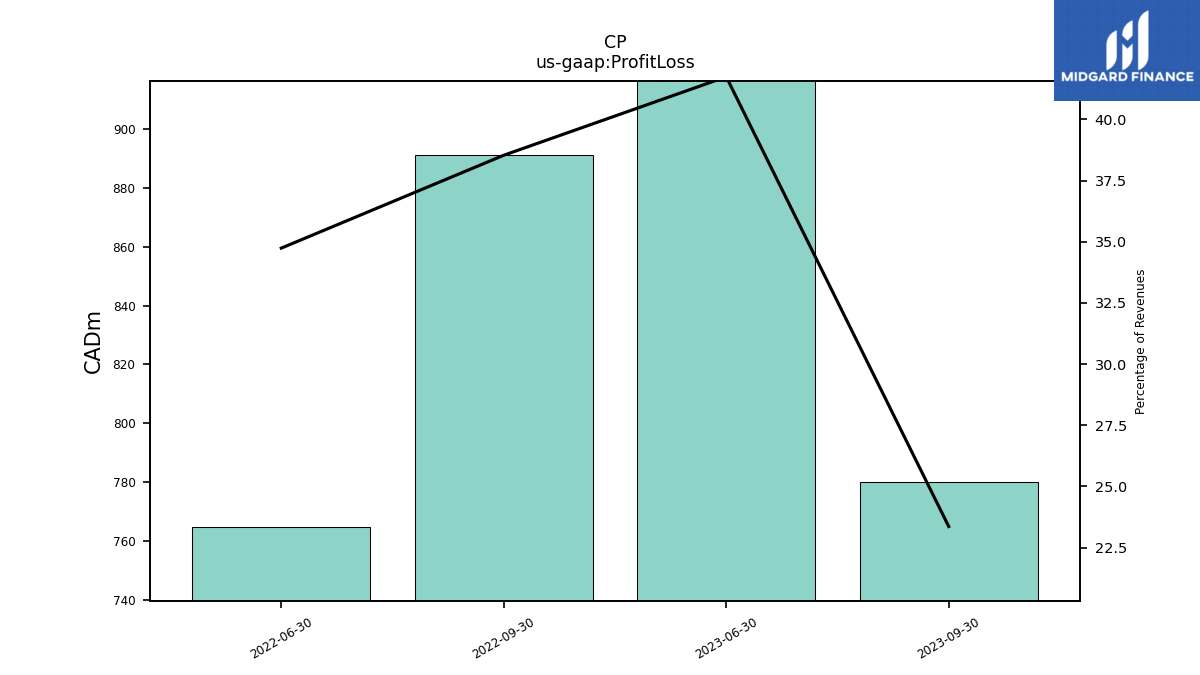
| Profit Loss | 780.00 | 1325.00 | NA | NA | 891.00 | 765.00 | NA | NA | NA | NA | NA | NA | NA | NA | NA | NA | NA | NA | NA | NA | NA | NA | NA | NA | NA | NA | NA | NA | NA | NA | NA | NA | NA | NA | NA | NA | NA | NA | NA | |
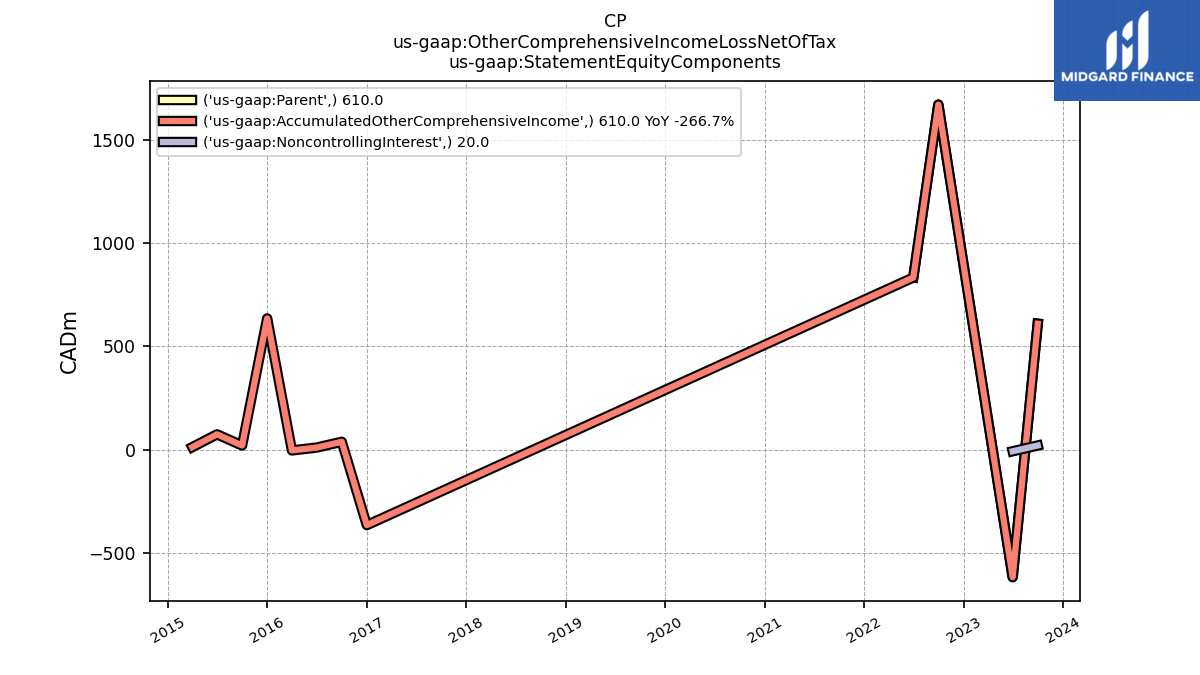
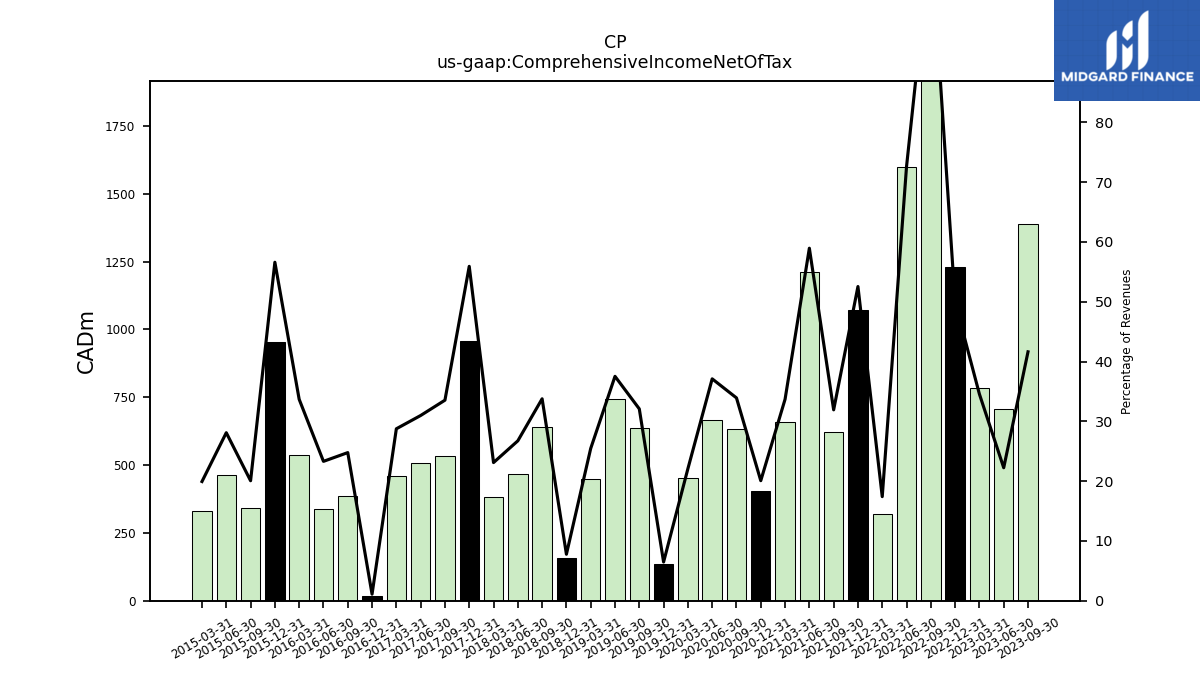
| Other Comprehensive Income Loss Net Of Tax | 630.00 | -626.00 | -17.00 | -42.00 | 1672.00 | 834.00 | -270.00 | 540.00 | 148.00 | -35.00 | 58.00 | -398.00 | 34.00 | 30.00 | 42.00 | -530.00 | 17.00 | 18.00 | 16.00 | -389.00 | 19.00 | 32.00 | 36.00 | -26.00 | 25.00 | 29.00 | 30.00 | -366.00 | 38.00 | 10.00 | -4.00 | NA | NA | NA | NA | NA | NA | NA | NA | |
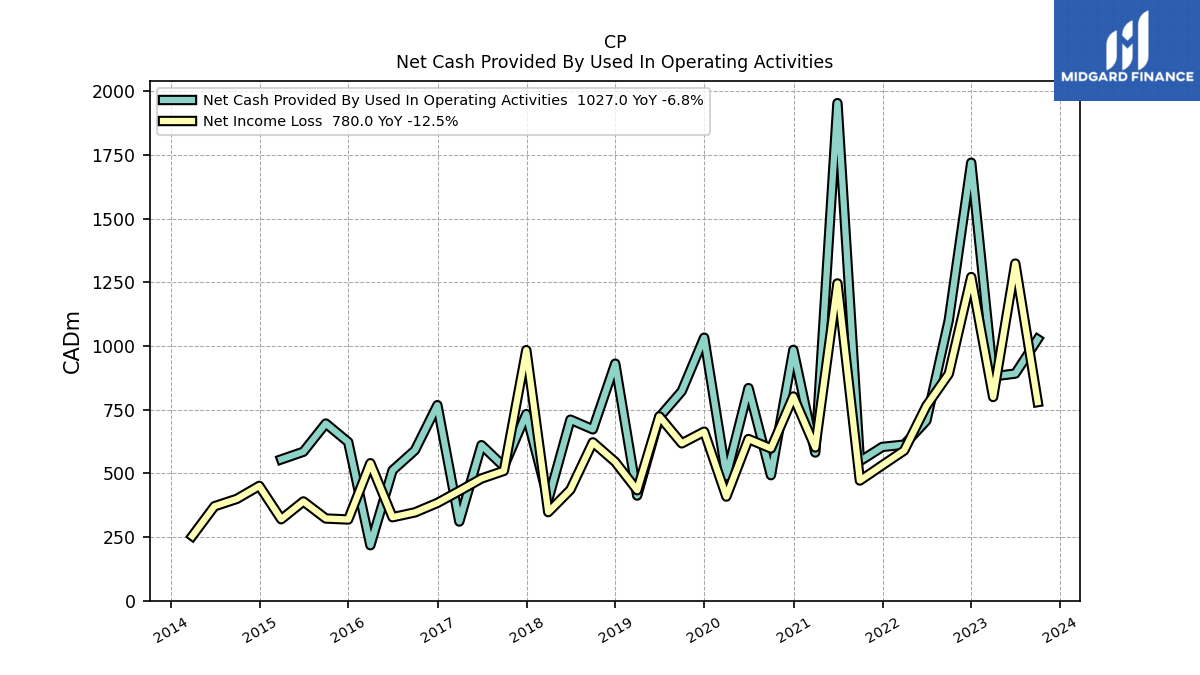
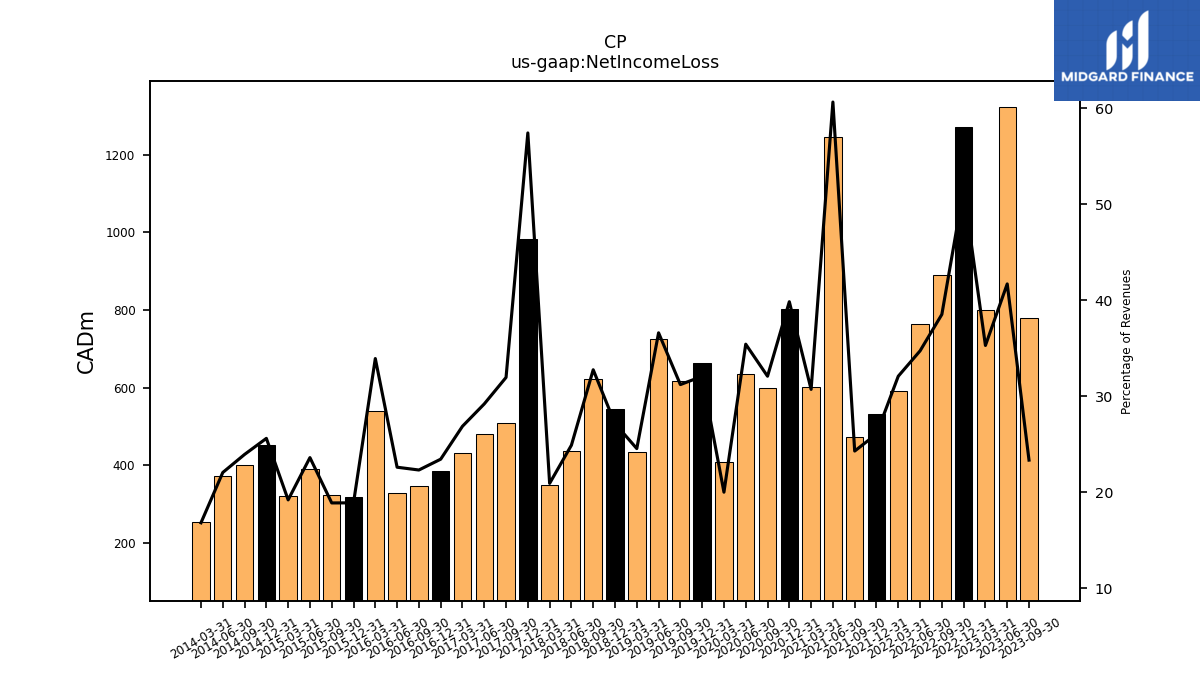
| Net Income Loss | 780.00 | 1324.00 | 800.00 | 1271.00 | 891.00 | 765.00 | 590.00 | 532.00 | 472.00 | 1246.00 | 602.00 | 802.00 | 598.00 | 635.00 | 409.00 | 664.00 | 618.00 | 724.00 | 434.00 | 545.00 | 622.00 | 436.00 | 348.00 | 984.00 | 510.00 | 480.00 | 431.00 | 384.00 | 347.00 | 328.00 | 540.00 | 319.00 | 323.00 | 390.00 | 320.00 | 451.00 | 400.00 | 371.00 | 254.00 | |
| Comprehensive Income Net Of Tax | 1390.00 | 706.00 | 783.00 | 1229.00 | 2563.00 | 1599.00 | 320.00 | 1072.00 | 620.00 | 1211.00 | 660.00 | 404.00 | 632.00 | 665.00 | 451.00 | 134.00 | 635.00 | 742.00 | 450.00 | 156.00 | 641.00 | 468.00 | 384.00 | 958.00 | 535.00 | 509.00 | 461.00 | 18.00 | 385.00 | 338.00 | 536.00 | 955.00 | 343.00 | 464.00 | 332.00 | NA | NA | NA | NA |
| 2023-09-30 | 2023-06-30 | 2023-03-31 | 2022-12-31 | 2022-09-30 | 2022-06-30 | 2022-03-31 | 2021-12-31 | 2021-09-30 | 2021-06-30 | 2021-03-31 | 2020-12-31 | 2020-09-30 | 2020-06-30 | 2020-03-31 | 2019-12-31 | 2019-09-30 | 2019-06-30 | 2019-03-31 | 2018-12-31 | 2018-09-30 | 2018-06-30 | 2018-03-31 | 2017-12-31 | 2017-09-30 | 2017-06-30 | 2017-03-31 | 2016-12-31 | 2016-09-30 | 2016-06-30 | 2016-03-31 | 2015-12-31 | 2015-09-30 | 2015-06-30 | 2015-03-31 | 2014-12-31 | 2014-09-30 | 2014-06-30 | 2014-03-31 | ||
|---|---|---|---|---|---|---|---|---|---|---|---|---|---|---|---|---|---|---|---|---|---|---|---|---|---|---|---|---|---|---|---|---|---|---|---|---|---|---|---|---|
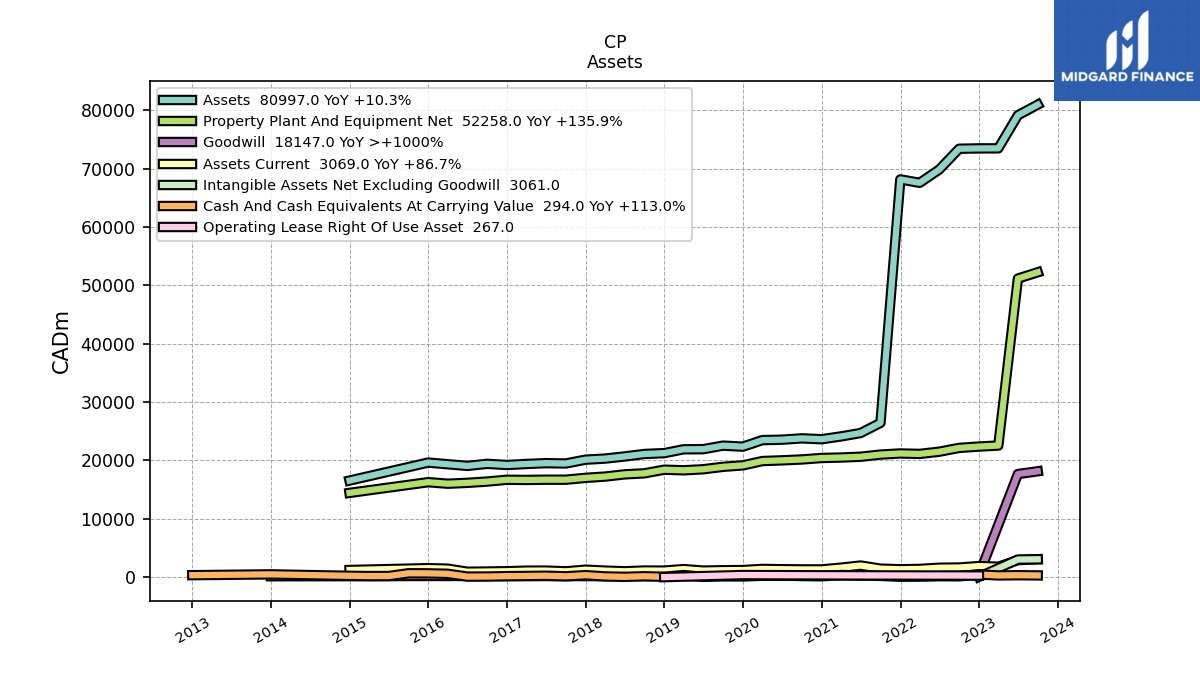
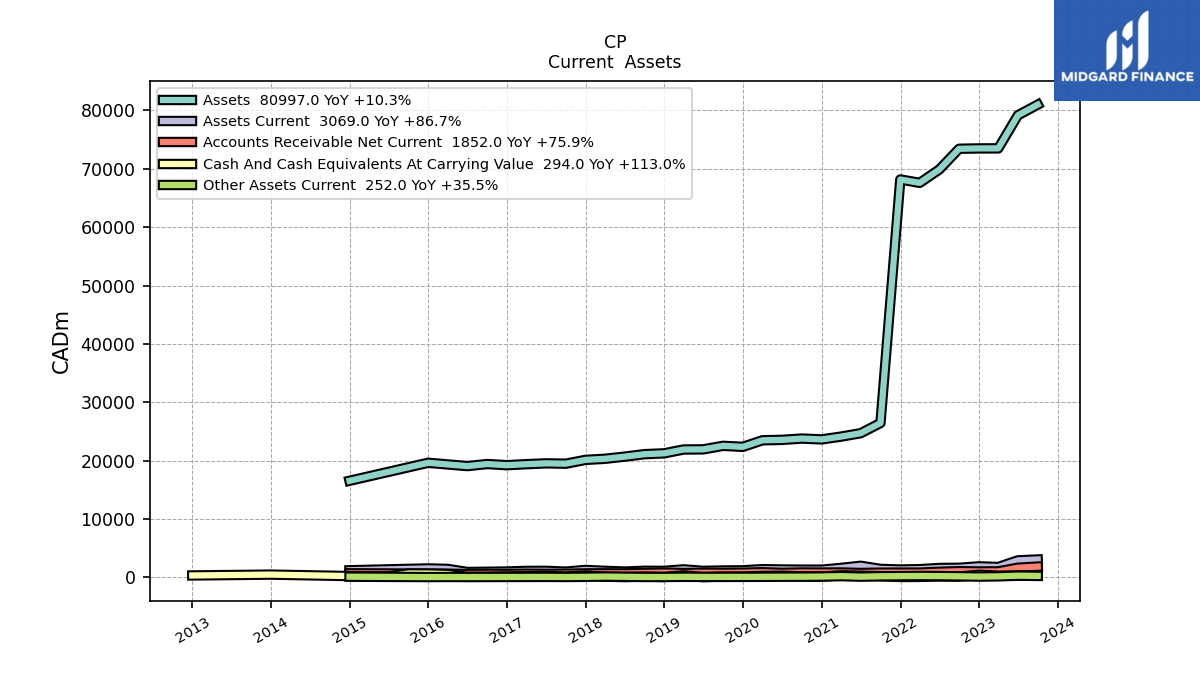
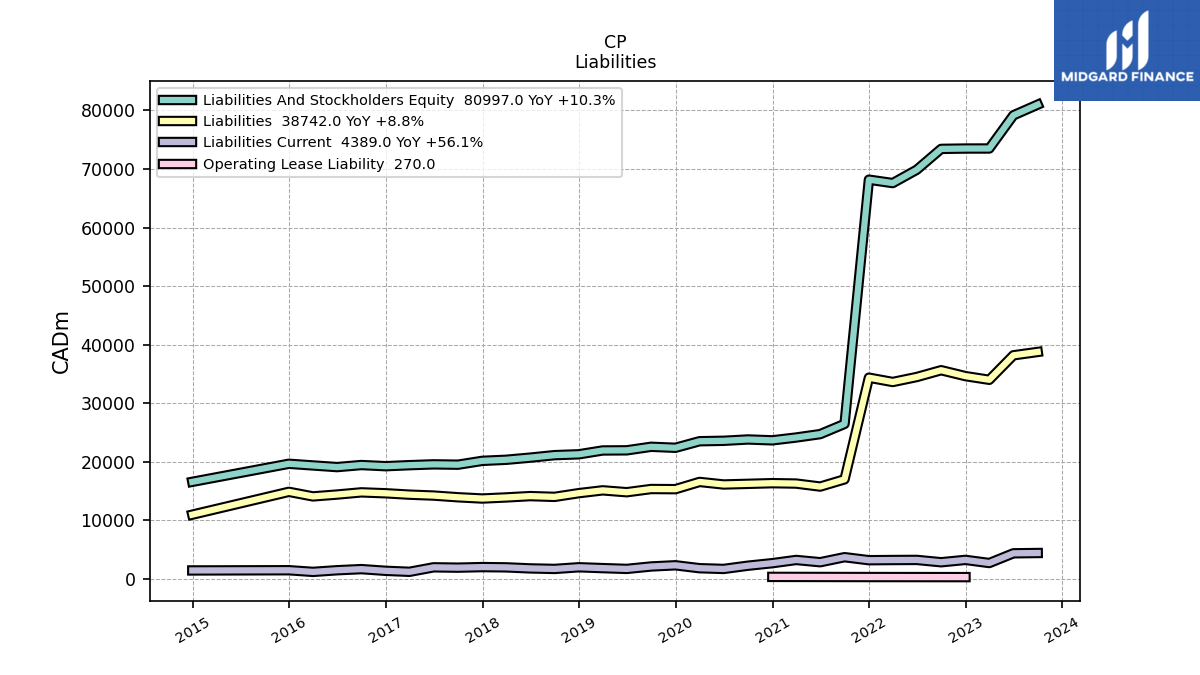
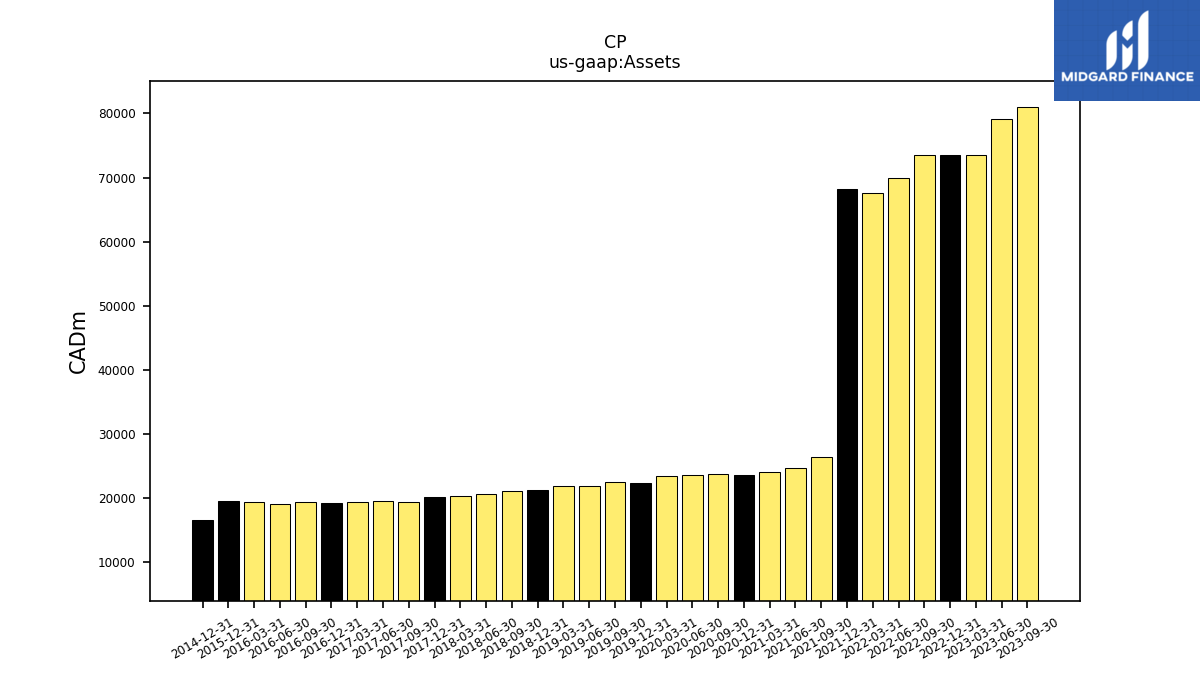
| Assets | 80997.00 | 79172.00 | 73502.00 | 73495.00 | 73435.00 | 69874.00 | 67592.00 | 68177.00 | 26445.00 | 24704.00 | 24121.00 | 23640.00 | 23787.00 | 23562.00 | 23488.00 | 22367.00 | 22539.00 | 21933.00 | 21910.00 | 21254.00 | 21109.00 | 20685.00 | 20318.00 | 20135.00 | 19479.00 | 19537.00 | 19397.00 | 19221.00 | 19421.00 | 19068.00 | 19349.00 | 19637.00 | NA | NA | NA | 16550.00 | NA | NA | NA | |
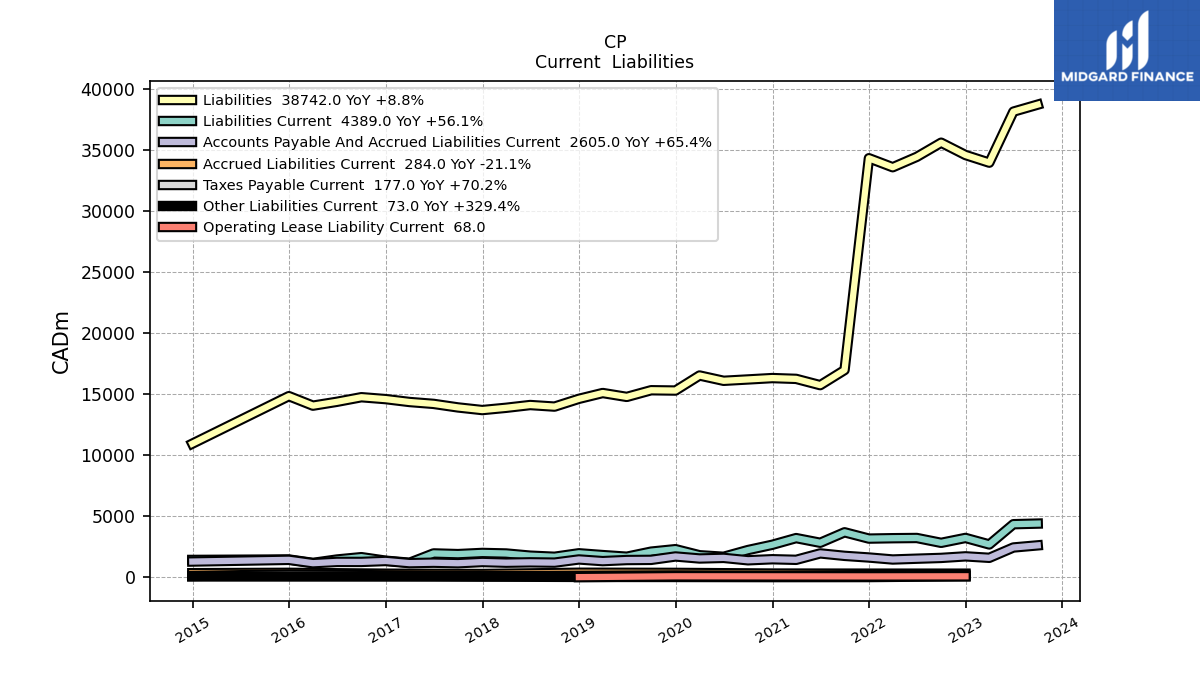
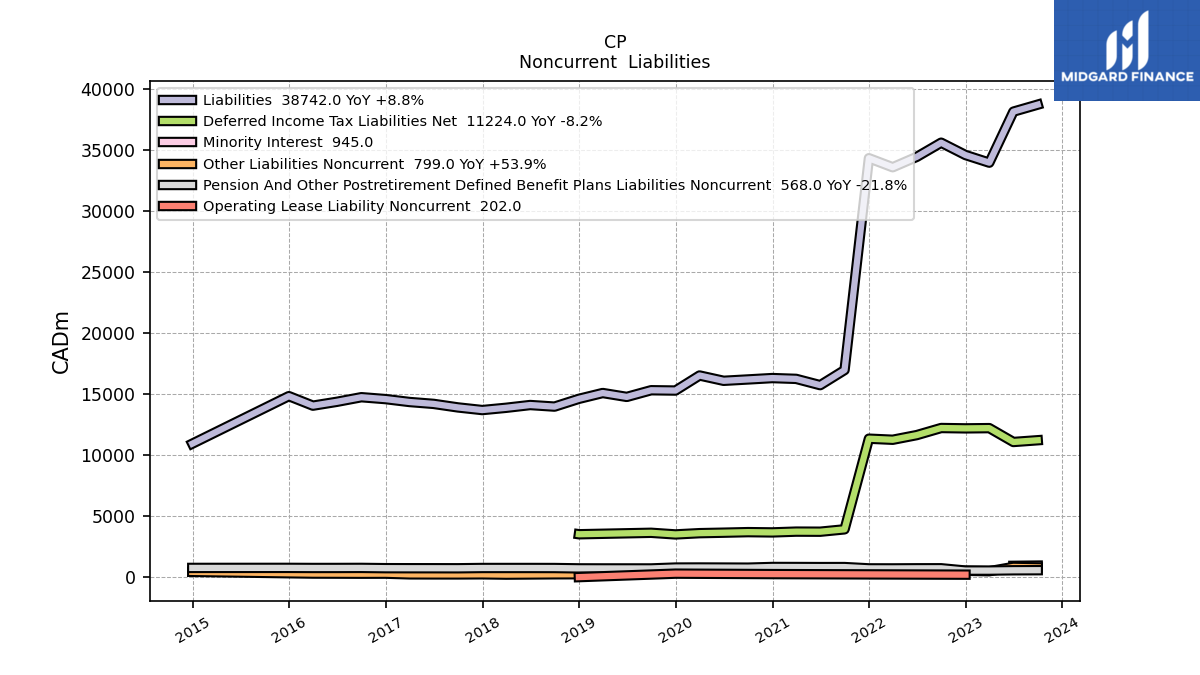
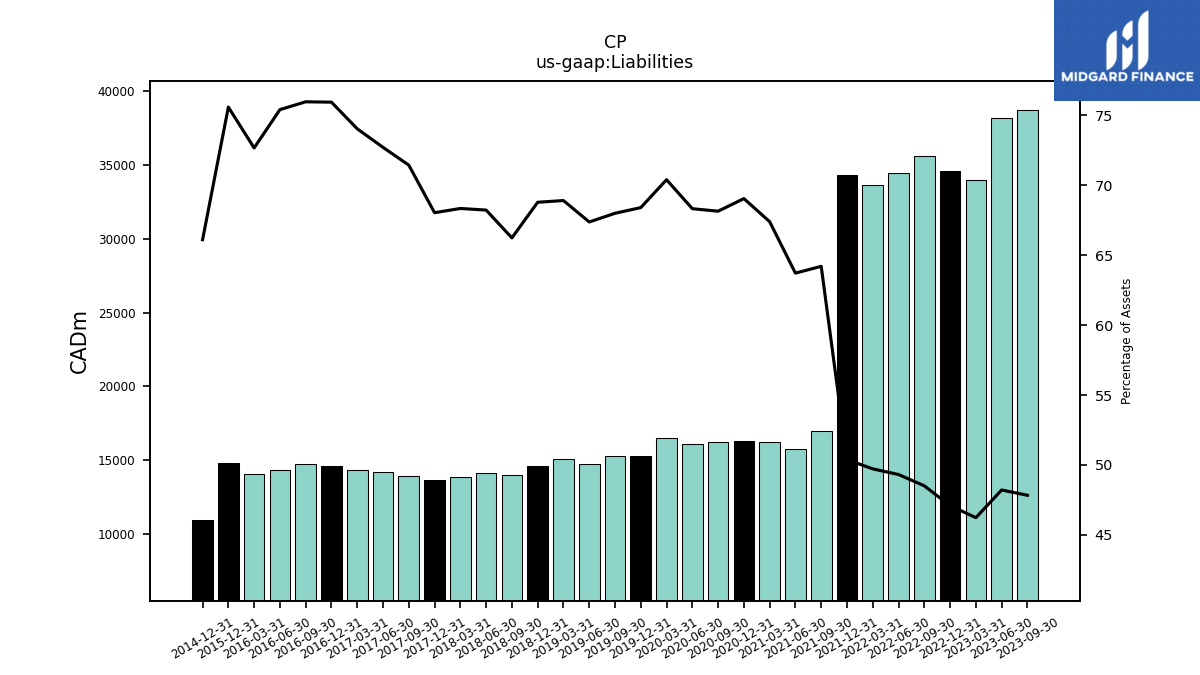
| Liabilities | 38742.00 | 38168.00 | 33982.00 | 34609.00 | 35621.00 | 34460.00 | 33607.00 | 34348.00 | 16977.00 | 15739.00 | 16255.00 | 16321.00 | 16208.00 | 16097.00 | 16533.00 | 15298.00 | 15324.00 | 14776.00 | 15096.00 | 14618.00 | 13981.00 | 14111.00 | 13884.00 | 13698.00 | 13914.00 | 14204.00 | 14359.00 | 14595.00 | 14752.00 | 14377.00 | 14059.00 | 14841.00 | NA | NA | NA | 10940.00 | NA | NA | NA | |
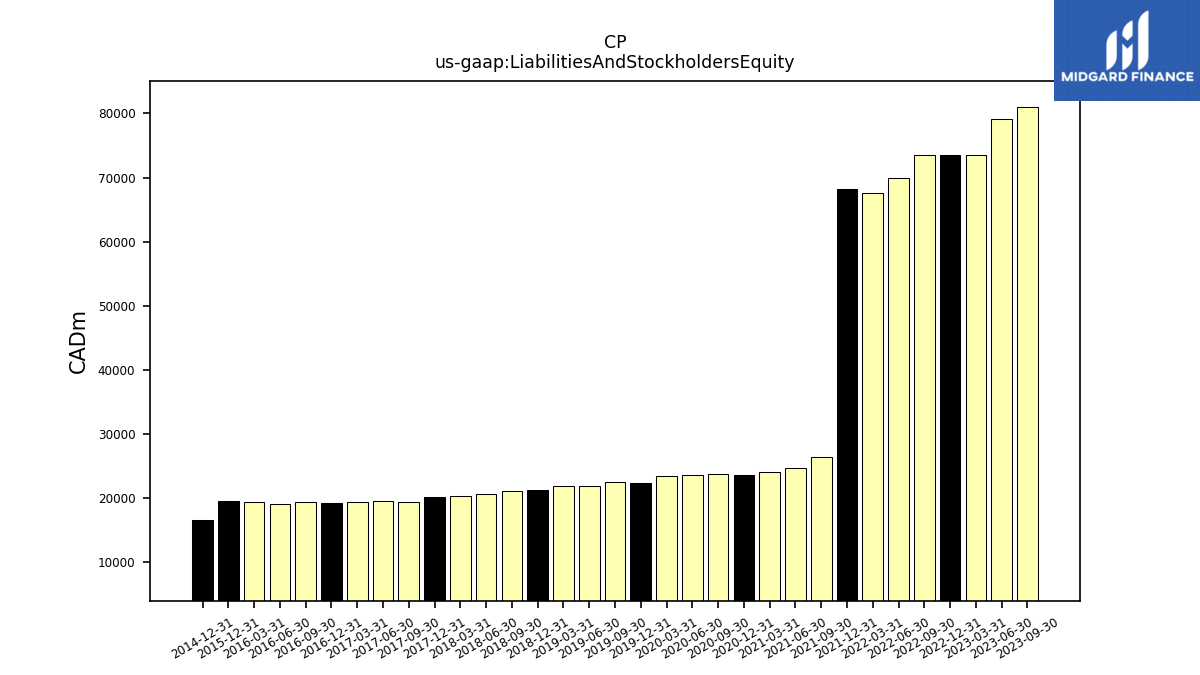
| Liabilities And Stockholders Equity | 80997.00 | 79172.00 | 73502.00 | 73495.00 | 73435.00 | 69874.00 | 67592.00 | 68177.00 | 26445.00 | 24704.00 | 24121.00 | 23640.00 | 23787.00 | 23562.00 | 23488.00 | 22367.00 | 22539.00 | 21933.00 | 21910.00 | 21254.00 | 21109.00 | 20685.00 | 20318.00 | 20135.00 | 19479.00 | 19537.00 | 19397.00 | 19221.00 | 19421.00 | 19068.00 | 19349.00 | 19637.00 | NA | NA | NA | 16550.00 | NA | NA | NA | |
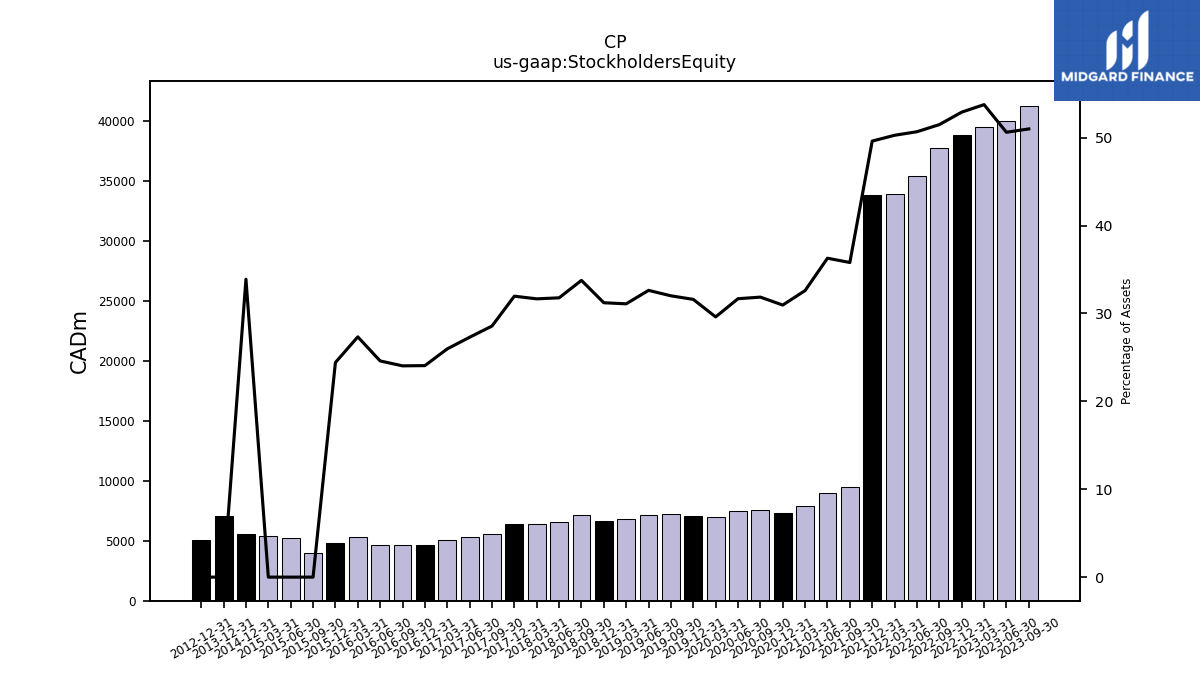
| Stockholders Equity | 41310.00 | 40079.00 | 39520.00 | 38886.00 | 37814.00 | 35414.00 | 33985.00 | 33829.00 | 9468.00 | 8965.00 | 7866.00 | 7319.00 | 7579.00 | 7465.00 | 6955.00 | 7069.00 | 7215.00 | 7157.00 | 6814.00 | 6636.00 | 7128.00 | 6574.00 | 6434.00 | 6437.00 | 5565.00 | 5333.00 | 5038.00 | 4626.00 | 4669.00 | 4691.00 | 5290.00 | 4796.00 | 3992.00 | 5251.00 | 5418.00 | 5610.00 | NA | NA | NA |
| 2023-09-30 | 2023-06-30 | 2023-03-31 | 2022-12-31 | 2022-09-30 | 2022-06-30 | 2022-03-31 | 2021-12-31 | 2021-09-30 | 2021-06-30 | 2021-03-31 | 2020-12-31 | 2020-09-30 | 2020-06-30 | 2020-03-31 | 2019-12-31 | 2019-09-30 | 2019-06-30 | 2019-03-31 | 2018-12-31 | 2018-09-30 | 2018-06-30 | 2018-03-31 | 2017-12-31 | 2017-09-30 | 2017-06-30 | 2017-03-31 | 2016-12-31 | 2016-09-30 | 2016-06-30 | 2016-03-31 | 2015-12-31 | 2015-09-30 | 2015-06-30 | 2015-03-31 | 2014-12-31 | 2014-09-30 | 2014-06-30 | 2014-03-31 | ||
|---|---|---|---|---|---|---|---|---|---|---|---|---|---|---|---|---|---|---|---|---|---|---|---|---|---|---|---|---|---|---|---|---|---|---|---|---|---|---|---|---|
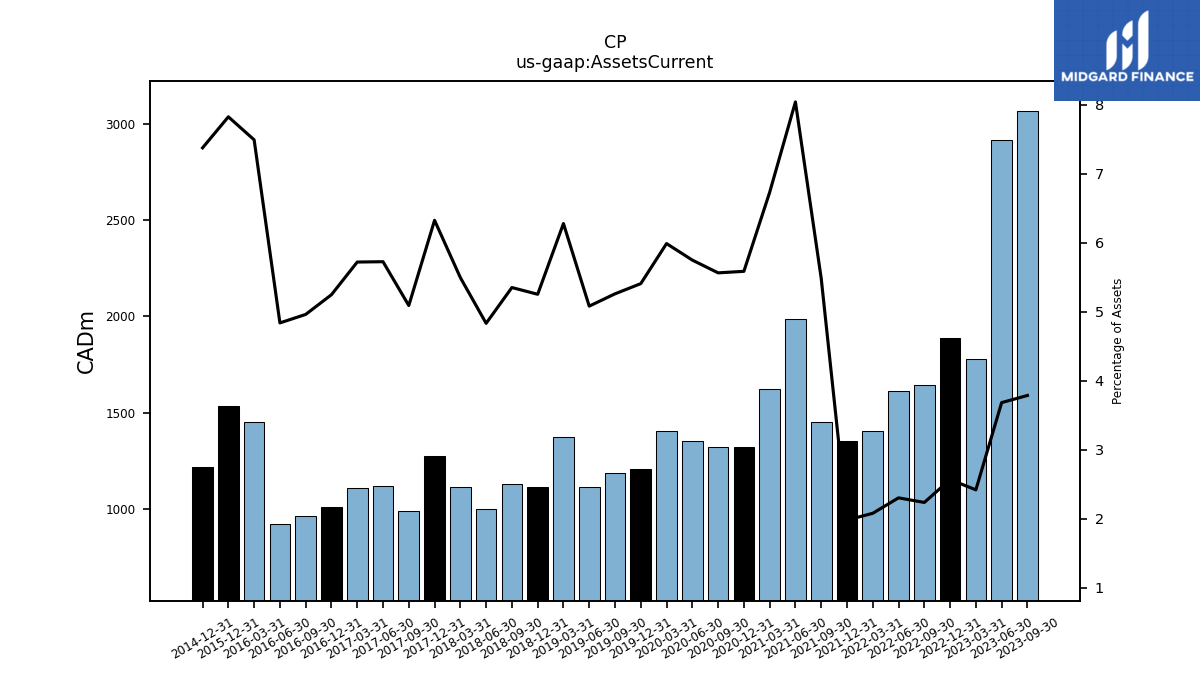
| Assets Current | 3069.00 | 2918.00 | 1780.00 | 1889.00 | 1644.00 | 1611.00 | 1407.00 | 1352.00 | 1451.00 | 1987.00 | 1624.00 | 1321.00 | 1324.00 | 1355.00 | 1407.00 | 1210.00 | 1186.00 | 1115.00 | 1376.00 | 1117.00 | 1130.00 | 1000.00 | 1117.00 | 1274.00 | 992.00 | 1119.00 | 1110.00 | 1009.00 | 964.00 | 923.00 | 1450.00 | 1537.00 | NA | NA | NA | 1221.00 | NA | NA | NA | |
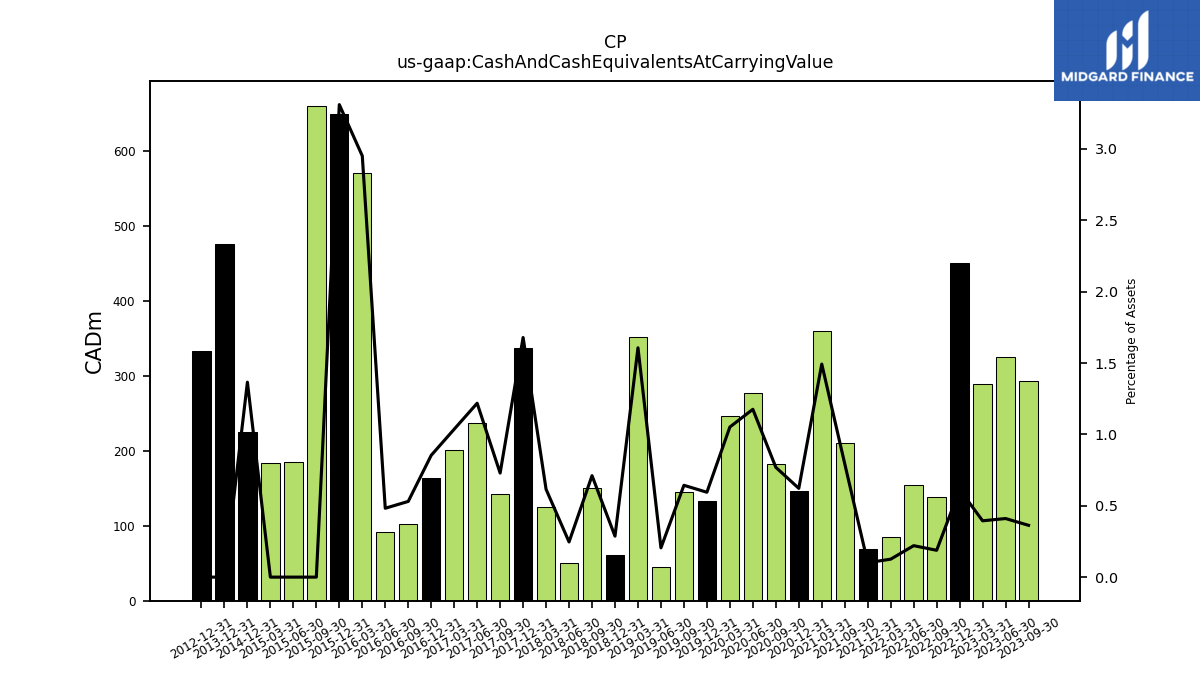
| Cash And Cash Equivalents At Carrying Value | 294.00 | 325.00 | 290.00 | 451.00 | 138.00 | 154.00 | 85.00 | 69.00 | 210.00 | NA | 360.00 | 147.00 | 183.00 | 277.00 | 247.00 | 133.00 | 145.00 | 45.00 | 352.00 | 61.00 | 150.00 | 51.00 | 125.00 | 338.00 | 142.00 | 238.00 | 201.00 | 164.00 | 103.00 | 92.00 | 571.00 | 650.00 | 661.00 | 185.00 | 184.00 | 226.00 | NA | NA | NA | |
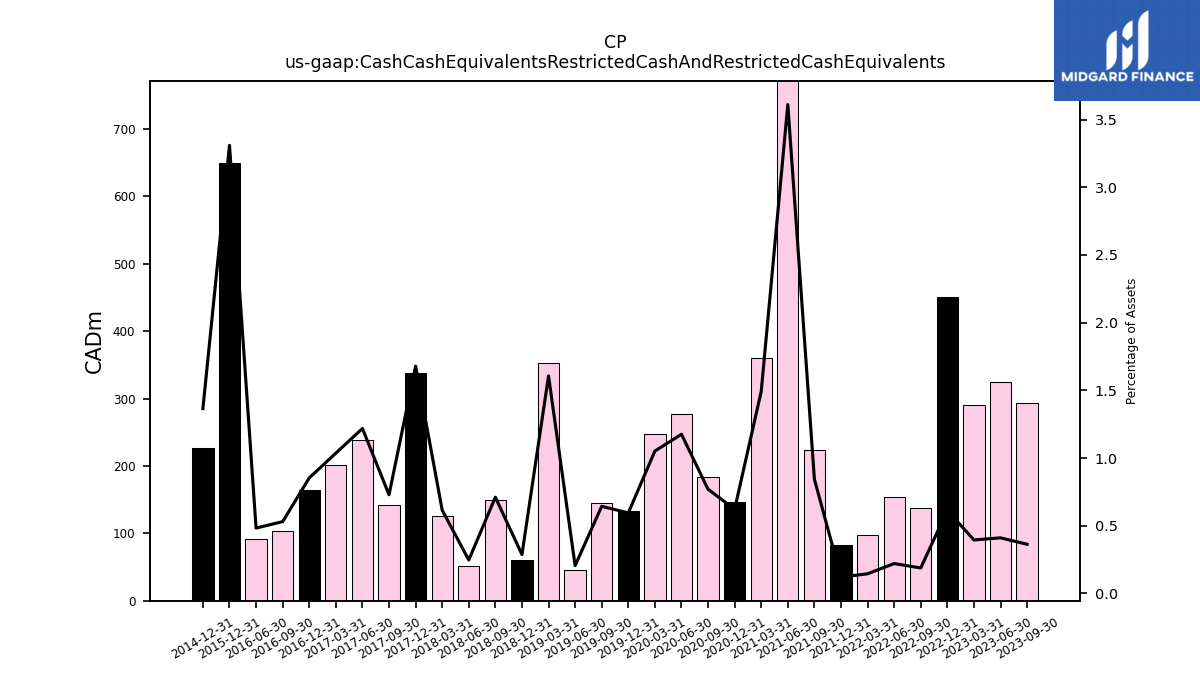
| Cash Cash Equivalents Restricted Cash And Restricted Cash Equivalents | 294.00 | 325.00 | 290.00 | 451.00 | 138.00 | 154.00 | 98.00 | 82.00 | 223.00 | 892.00 | 360.00 | 147.00 | 183.00 | 277.00 | 247.00 | 133.00 | 145.00 | 45.00 | 352.00 | 61.00 | 150.00 | 51.00 | 125.00 | 338.00 | 142.00 | 238.00 | 201.00 | 164.00 | 103.00 | 92.00 | NA | 650.00 | NA | NA | NA | 226.00 | NA | NA | NA | |
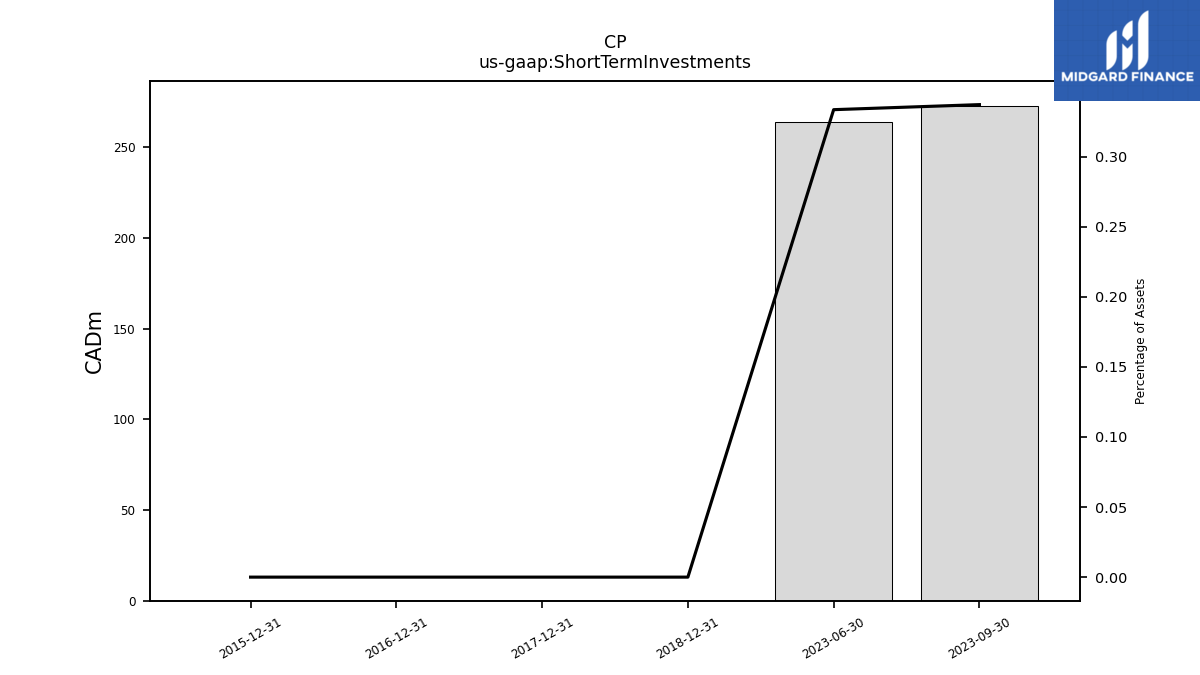
| Short Term Investments | 273.00 | 264.00 | NA | NA | NA | NA | NA | NA | NA | NA | NA | NA | NA | NA | NA | NA | NA | NA | NA | 0.00 | NA | NA | NA | 0.00 | NA | NA | NA | 0.00 | NA | NA | NA | 0.00 | NA | NA | NA | NA | NA | NA | NA | |
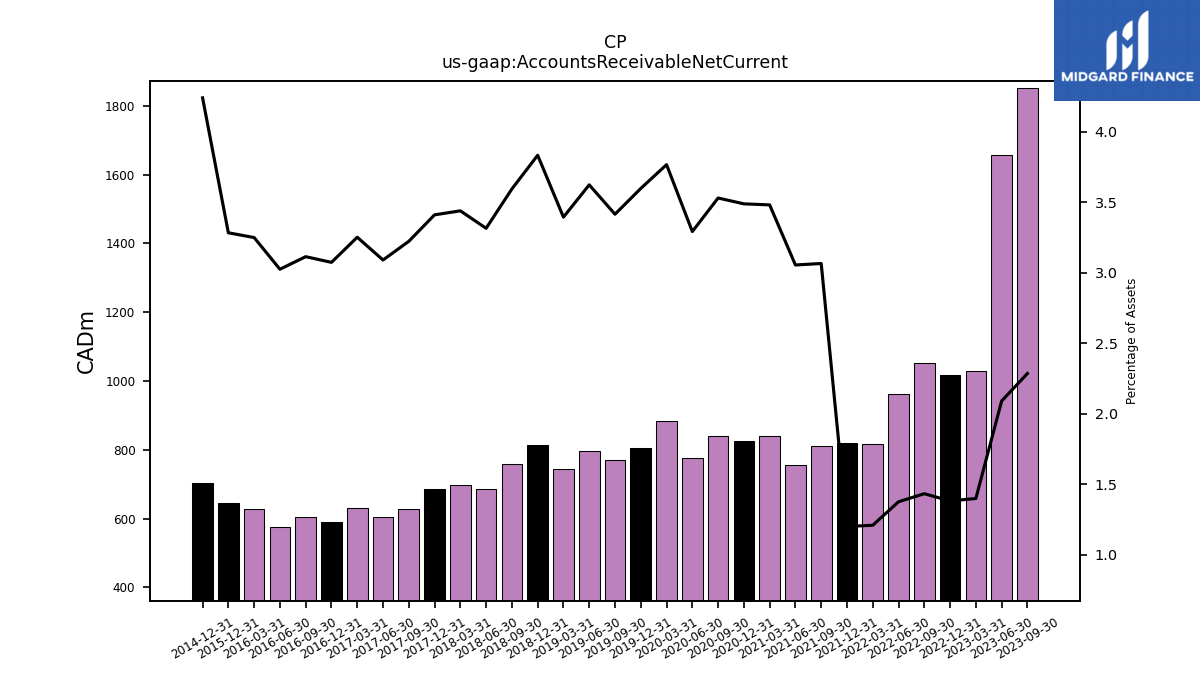
| Accounts Receivable Net Current | 1852.00 | 1656.00 | 1029.00 | 1016.00 | 1053.00 | 962.00 | 818.00 | 819.00 | 811.00 | 755.00 | 840.00 | 825.00 | 840.00 | 776.00 | 885.00 | 805.00 | 770.00 | 795.00 | 744.00 | 815.00 | 759.00 | 686.00 | 699.00 | 687.00 | 628.00 | 604.00 | 631.00 | 591.00 | 605.00 | 577.00 | 629.00 | 645.00 | NA | NA | NA | 702.00 | NA | NA | NA | |
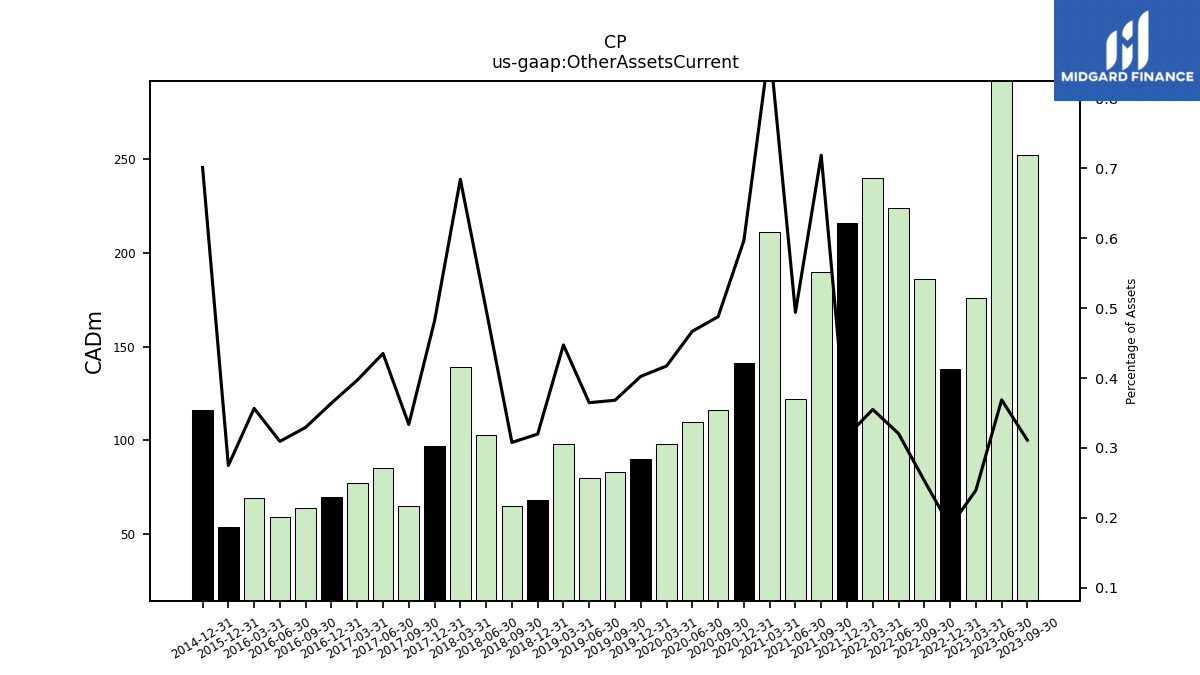
| Other Assets Current | 252.00 | 292.00 | 176.00 | 138.00 | 186.00 | 224.00 | 240.00 | 216.00 | 190.00 | 122.00 | 211.00 | 141.00 | 116.00 | 110.00 | 98.00 | 90.00 | 83.00 | 80.00 | 98.00 | 68.00 | 65.00 | 103.00 | 139.00 | 97.00 | 65.00 | 85.00 | 77.00 | 70.00 | 64.00 | 59.00 | 69.00 | 54.00 | NA | NA | NA | 116.00 | NA | NA | NA |
| 2023-09-30 | 2023-06-30 | 2023-03-31 | 2022-12-31 | 2022-09-30 | 2022-06-30 | 2022-03-31 | 2021-12-31 | 2021-09-30 | 2021-06-30 | 2021-03-31 | 2020-12-31 | 2020-09-30 | 2020-06-30 | 2020-03-31 | 2019-12-31 | 2019-09-30 | 2019-06-30 | 2019-03-31 | 2018-12-31 | 2018-09-30 | 2018-06-30 | 2018-03-31 | 2017-12-31 | 2017-09-30 | 2017-06-30 | 2017-03-31 | 2016-12-31 | 2016-09-30 | 2016-06-30 | 2016-03-31 | 2015-12-31 | 2015-09-30 | 2015-06-30 | 2015-03-31 | 2014-12-31 | 2014-09-30 | 2014-06-30 | 2014-03-31 | ||
|---|---|---|---|---|---|---|---|---|---|---|---|---|---|---|---|---|---|---|---|---|---|---|---|---|---|---|---|---|---|---|---|---|---|---|---|---|---|---|---|---|
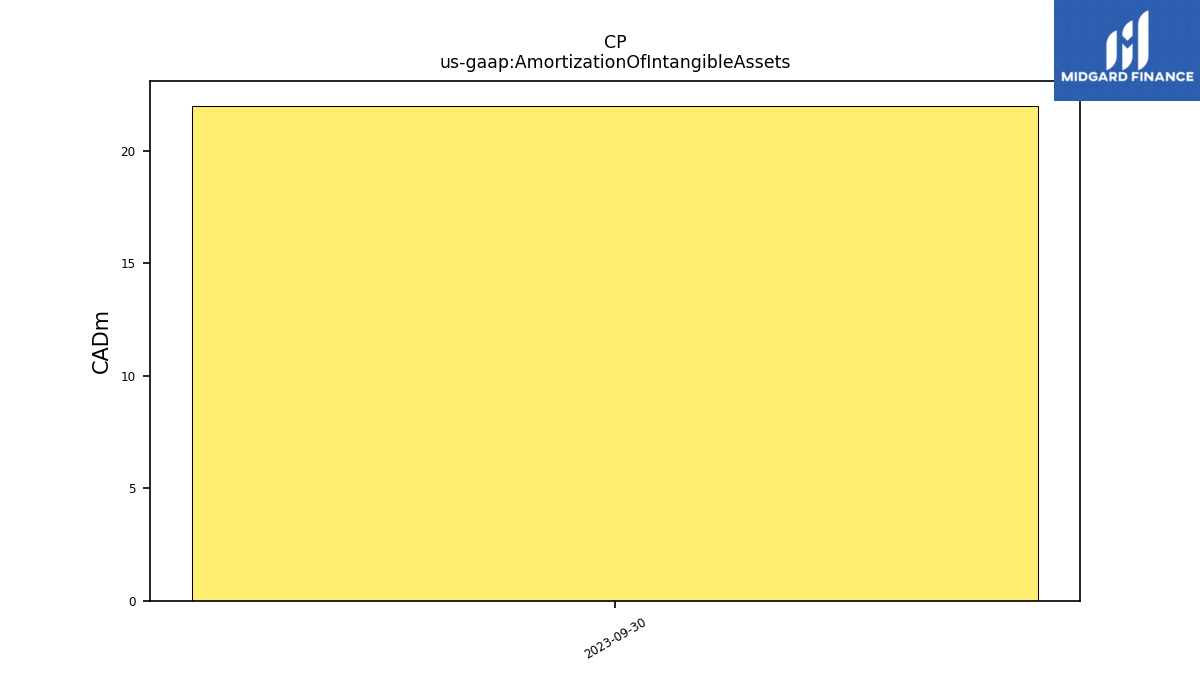
| Amortization Of Intangible Assets | 22.00 | NA | NA | NA | NA | NA | NA | NA | NA | NA | NA | NA | NA | NA | NA | NA | NA | NA | NA | NA | NA | NA | NA | NA | NA | NA | NA | NA | NA | NA | NA | NA | NA | NA | NA | NA | NA | NA | NA | |
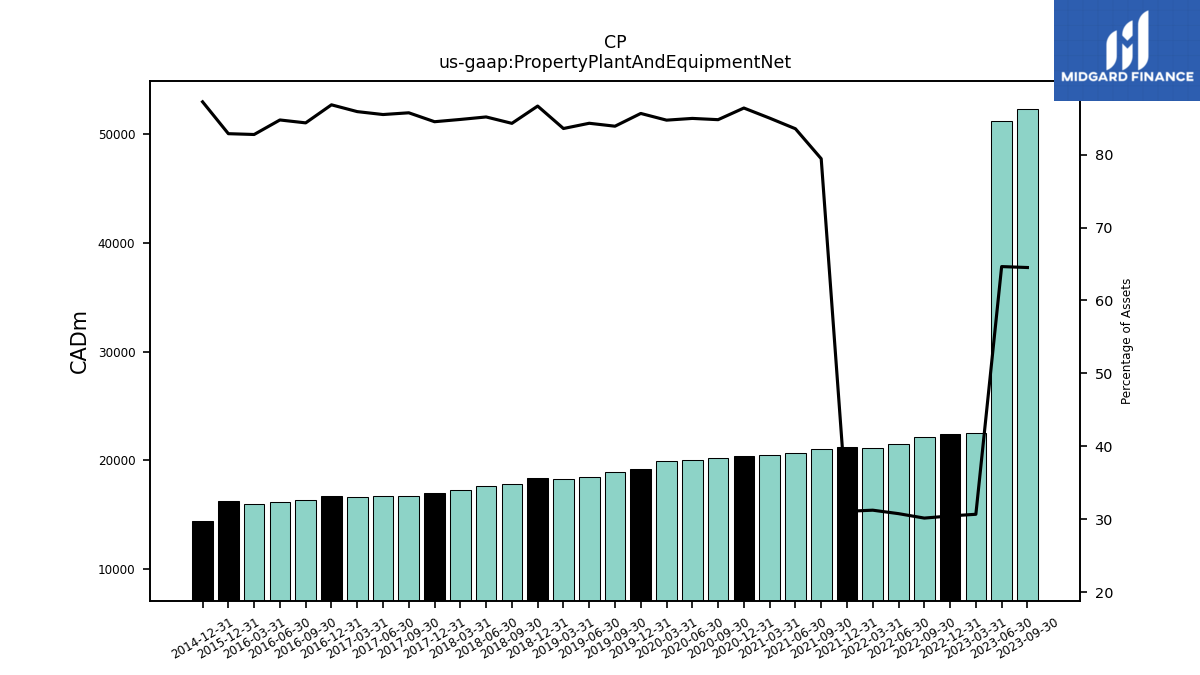
| Property Plant And Equipment Net | 52258.00 | 51183.00 | 22555.00 | 22385.00 | 22150.00 | 21502.00 | 21120.00 | 21200.00 | 21007.00 | 20639.00 | 20503.00 | 20422.00 | 20169.00 | 20019.00 | 19900.00 | 19156.00 | 18909.00 | 18489.00 | 18312.00 | 18418.00 | 17792.00 | 17616.00 | 17234.00 | 17016.00 | 16700.00 | 16703.00 | 16661.00 | 16689.00 | 16382.00 | 16160.00 | 16013.00 | 16273.00 | NA | NA | NA | 14438.00 | NA | NA | NA | |
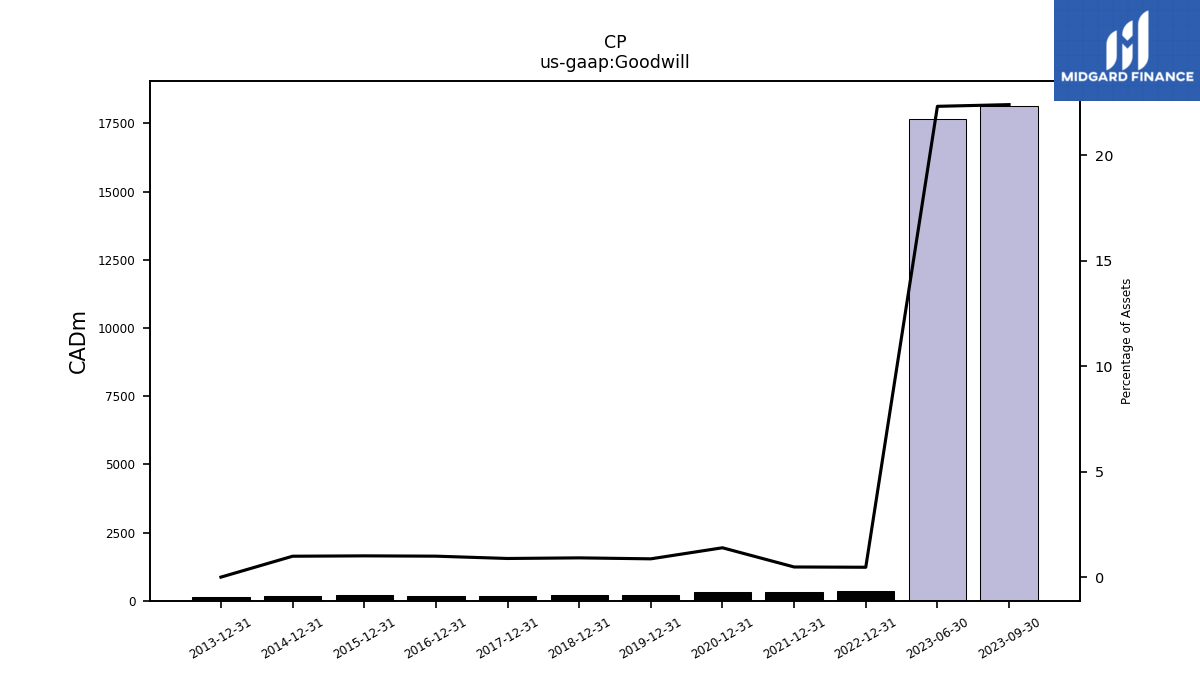
| Goodwill | 18147.00 | 17674.00 | NA | 344.00 | NA | NA | NA | 328.00 | NA | NA | NA | 329.00 | NA | NA | NA | 194.00 | NA | NA | NA | 194.00 | NA | NA | NA | 178.00 | NA | NA | NA | 191.00 | NA | NA | NA | 198.00 | NA | NA | NA | 164.00 | NA | NA | NA | |
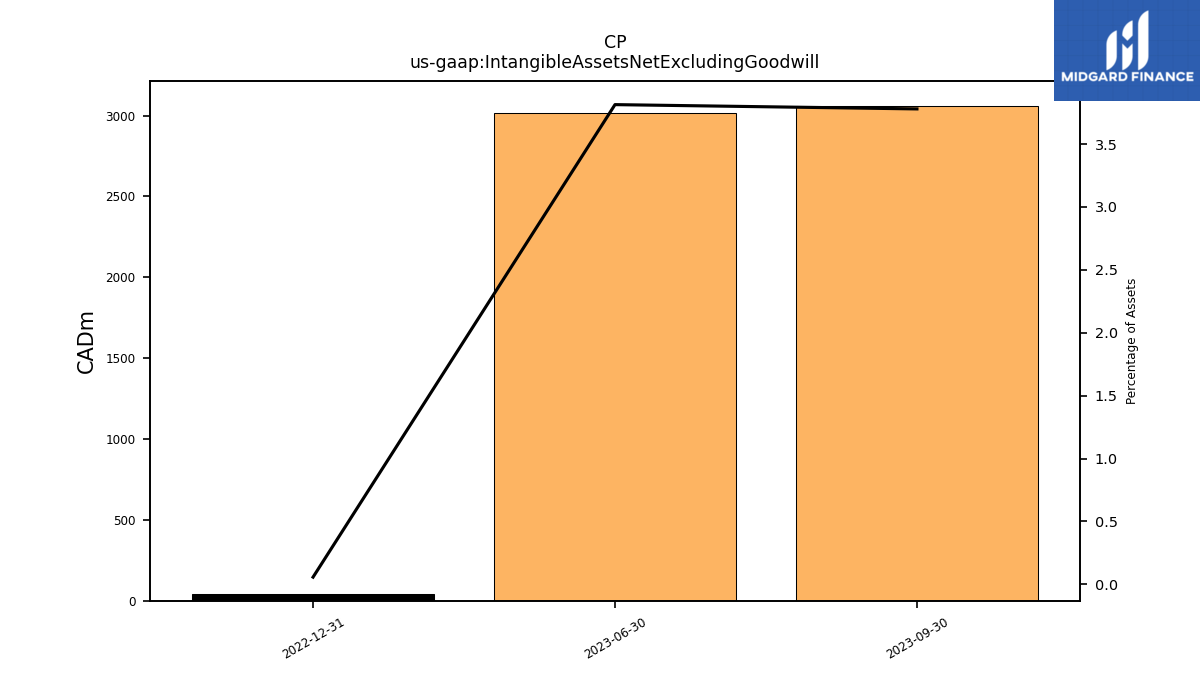
| Intangible Assets Net Excluding Goodwill | 3061.00 | 3019.00 | NA | 42.00 | NA | NA | NA | NA | NA | NA | NA | NA | NA | NA | NA | NA | NA | NA | NA | NA | NA | NA | NA | NA | NA | NA | NA | NA | NA | NA | NA | NA | NA | NA | NA | NA | NA | NA | NA | |
| Finite Lived Intangible Assets Net | 3061.00 | 3019.00 | NA | 42.00 | NA | NA | NA | 43.00 | NA | NA | NA | 37.00 | NA | NA | NA | 12.00 | NA | NA | NA | 8.00 | NA | NA | NA | 9.00 | NA | NA | NA | 11.00 | NA | NA | NA | 13.00 | NA | NA | NA | 12.00 | NA | NA | NA | |
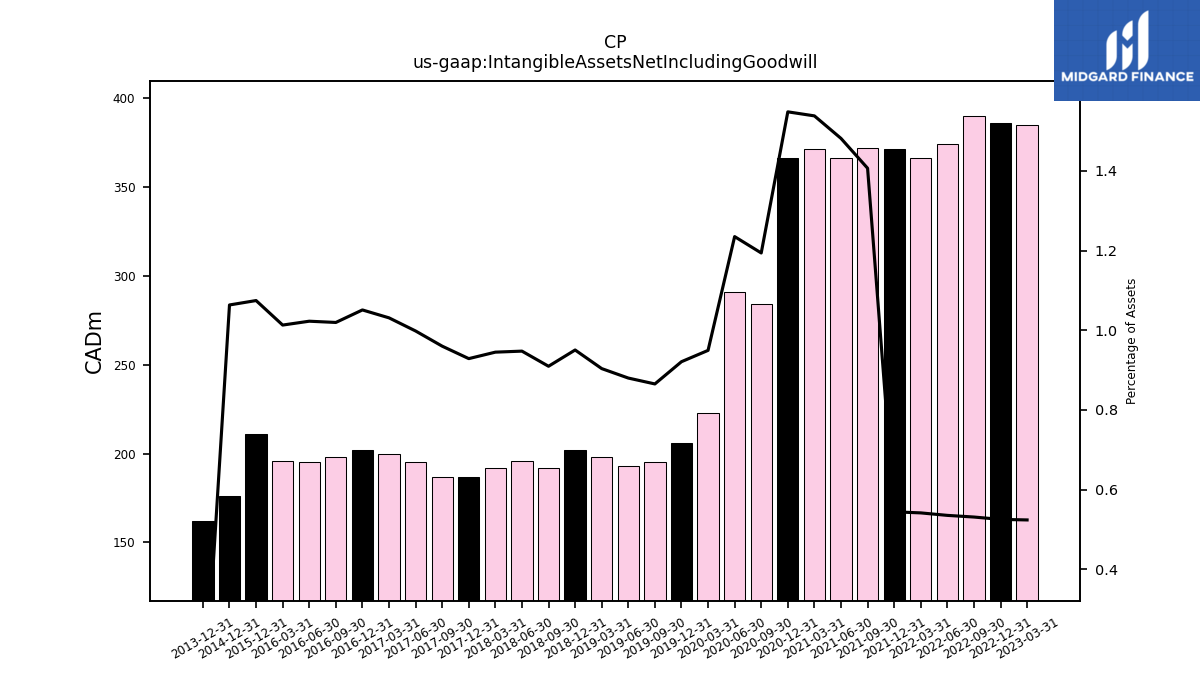
| Intangible Assets Net Including Goodwill | NA | NA | 385.00 | 386.00 | 390.00 | 374.00 | 366.00 | 371.00 | 372.00 | 366.00 | 371.00 | 366.00 | 284.00 | 291.00 | 223.00 | 206.00 | 195.00 | 193.00 | 198.00 | 202.00 | 192.00 | 196.00 | 192.00 | 187.00 | 187.00 | 195.00 | 200.00 | 202.00 | 198.00 | 195.00 | 196.00 | 211.00 | NA | NA | NA | 176.00 | NA | NA | NA | |
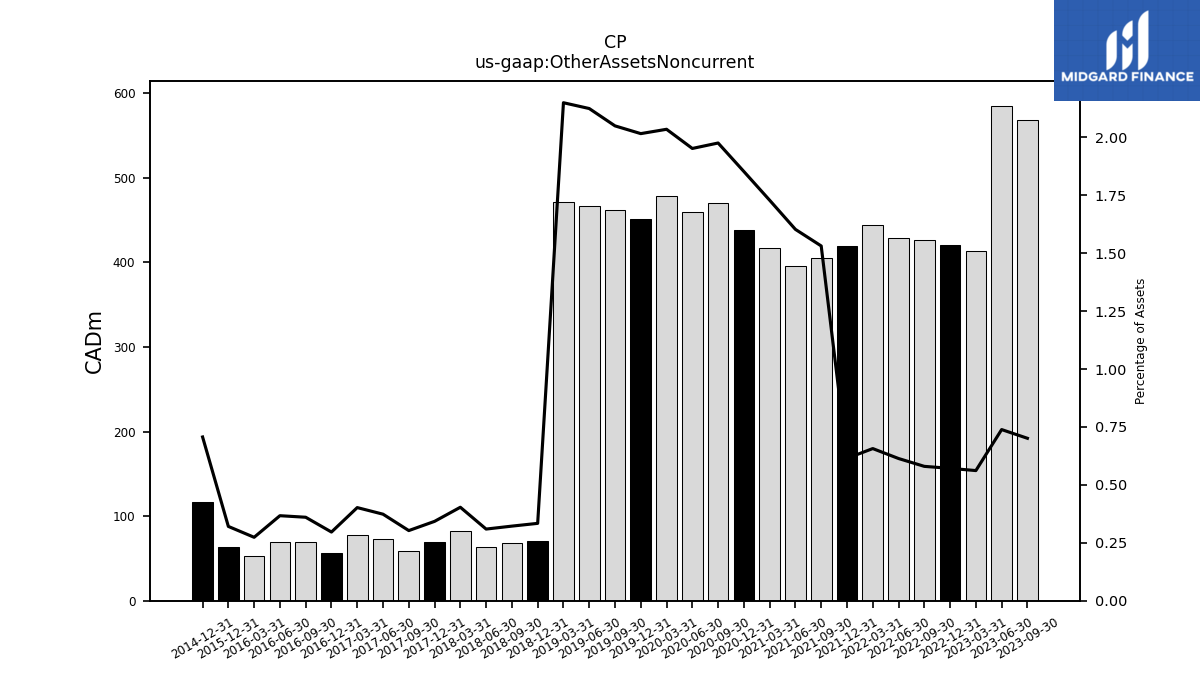
| Other Assets Noncurrent | 568.00 | 585.00 | 413.00 | 420.00 | 426.00 | 429.00 | 444.00 | 419.00 | 405.00 | 396.00 | 417.00 | 438.00 | 470.00 | 460.00 | 478.00 | 451.00 | 462.00 | 466.00 | 471.00 | 71.00 | 68.00 | 64.00 | 82.00 | 69.00 | 59.00 | 73.00 | 78.00 | 57.00 | 70.00 | 70.00 | 53.00 | 63.00 | NA | NA | NA | 117.00 | NA | NA | NA |
| 2023-09-30 | 2023-06-30 | 2023-03-31 | 2022-12-31 | 2022-09-30 | 2022-06-30 | 2022-03-31 | 2021-12-31 | 2021-09-30 | 2021-06-30 | 2021-03-31 | 2020-12-31 | 2020-09-30 | 2020-06-30 | 2020-03-31 | 2019-12-31 | 2019-09-30 | 2019-06-30 | 2019-03-31 | 2018-12-31 | 2018-09-30 | 2018-06-30 | 2018-03-31 | 2017-12-31 | 2017-09-30 | 2017-06-30 | 2017-03-31 | 2016-12-31 | 2016-09-30 | 2016-06-30 | 2016-03-31 | 2015-12-31 | 2015-09-30 | 2015-06-30 | 2015-03-31 | 2014-12-31 | 2014-09-30 | 2014-06-30 | 2014-03-31 | ||
|---|---|---|---|---|---|---|---|---|---|---|---|---|---|---|---|---|---|---|---|---|---|---|---|---|---|---|---|---|---|---|---|---|---|---|---|---|---|---|---|---|
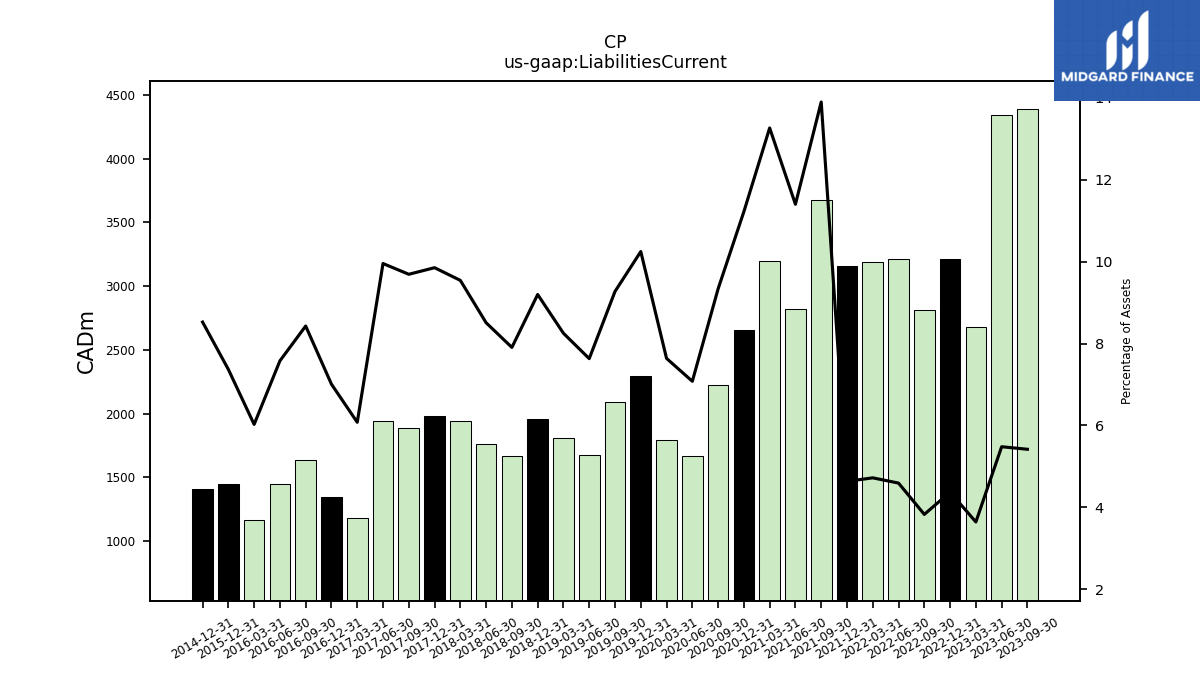
| Liabilities Current | 4389.00 | 4339.00 | 2678.00 | 3213.00 | 2811.00 | 3209.00 | 3191.00 | 3159.00 | 3676.00 | 2817.00 | 3200.00 | 2653.00 | 2221.00 | 1668.00 | 1794.00 | 2292.00 | 2090.00 | 1674.00 | 1808.00 | 1955.00 | 1669.00 | 1760.00 | 1939.00 | 1984.00 | 1888.00 | 1945.00 | 1179.00 | 1347.00 | 1637.00 | 1445.00 | 1166.00 | 1447.00 | NA | NA | NA | 1411.00 | NA | NA | NA | |
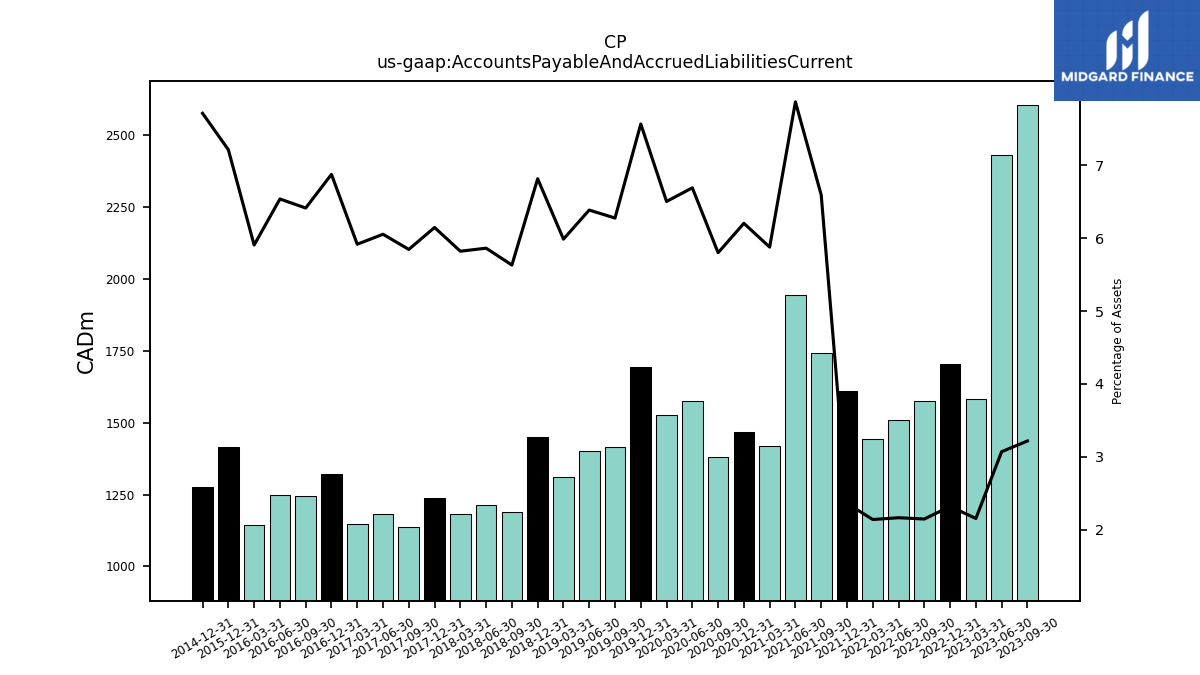
| Accounts Payable And Accrued Liabilities Current | 2605.00 | 2430.00 | 1582.00 | 1703.00 | 1575.00 | 1511.00 | 1445.00 | 1609.00 | 1744.00 | 1945.00 | 1418.00 | 1467.00 | 1380.00 | 1577.00 | 1528.00 | 1693.00 | 1415.00 | 1401.00 | 1312.00 | 1449.00 | 1189.00 | 1213.00 | 1183.00 | 1238.00 | 1139.00 | 1183.00 | 1148.00 | 1322.00 | 1246.00 | 1247.00 | 1143.00 | 1417.00 | NA | NA | NA | 1277.00 | NA | NA | NA | |
| Taxes Payable Current | NA | NA | NA | 177.00 | NA | NA | NA | 164.00 | NA | NA | NA | 115.00 | NA | NA | NA | 139.00 | NA | NA | NA | 104.00 | NA | NA | NA | 72.00 | NA | NA | NA | 146.00 | NA | NA | NA | 218.00 | NA | NA | NA | 95.00 | NA | NA | NA | |
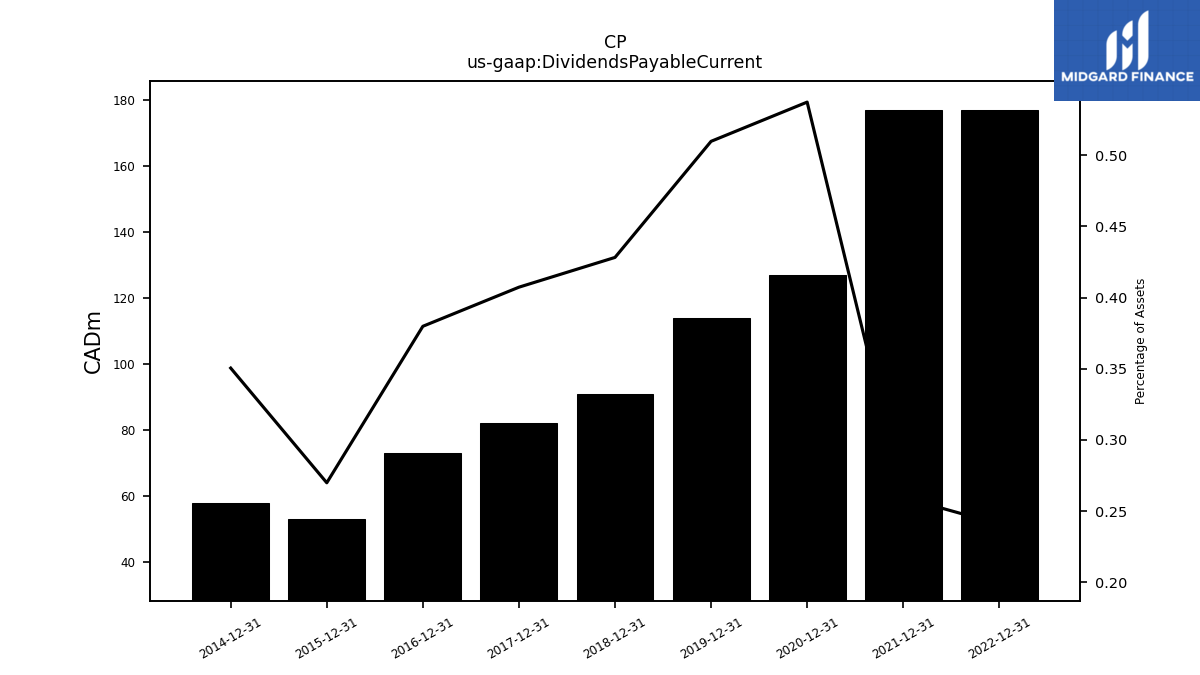
| Dividends Payable Current | NA | NA | NA | 177.00 | NA | NA | NA | 177.00 | NA | NA | NA | 127.00 | NA | NA | NA | 114.00 | NA | NA | NA | 91.00 | NA | NA | NA | 82.00 | NA | NA | NA | 73.00 | NA | NA | NA | 53.00 | NA | NA | NA | 58.00 | NA | NA | NA | |
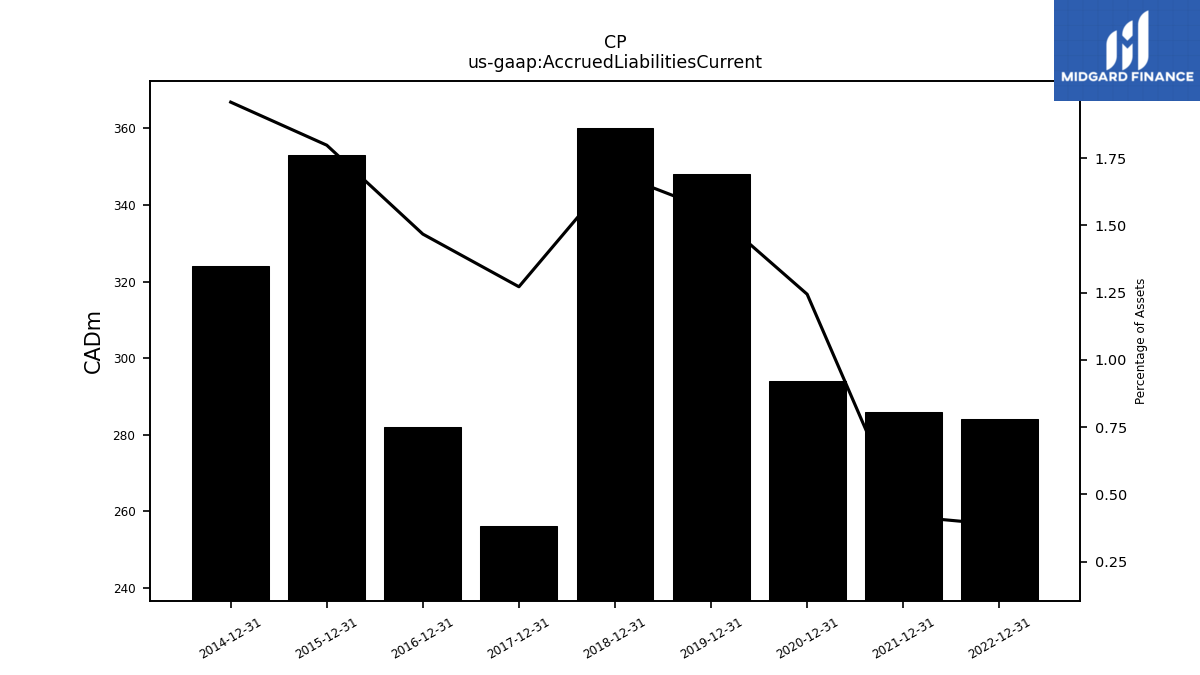
| Accrued Liabilities Current | NA | NA | NA | 284.00 | NA | NA | NA | 286.00 | NA | NA | NA | 294.00 | NA | NA | NA | 348.00 | NA | NA | NA | 360.00 | NA | NA | NA | 256.00 | NA | NA | NA | 282.00 | NA | NA | NA | 353.00 | NA | NA | NA | 324.00 | NA | NA | NA | |
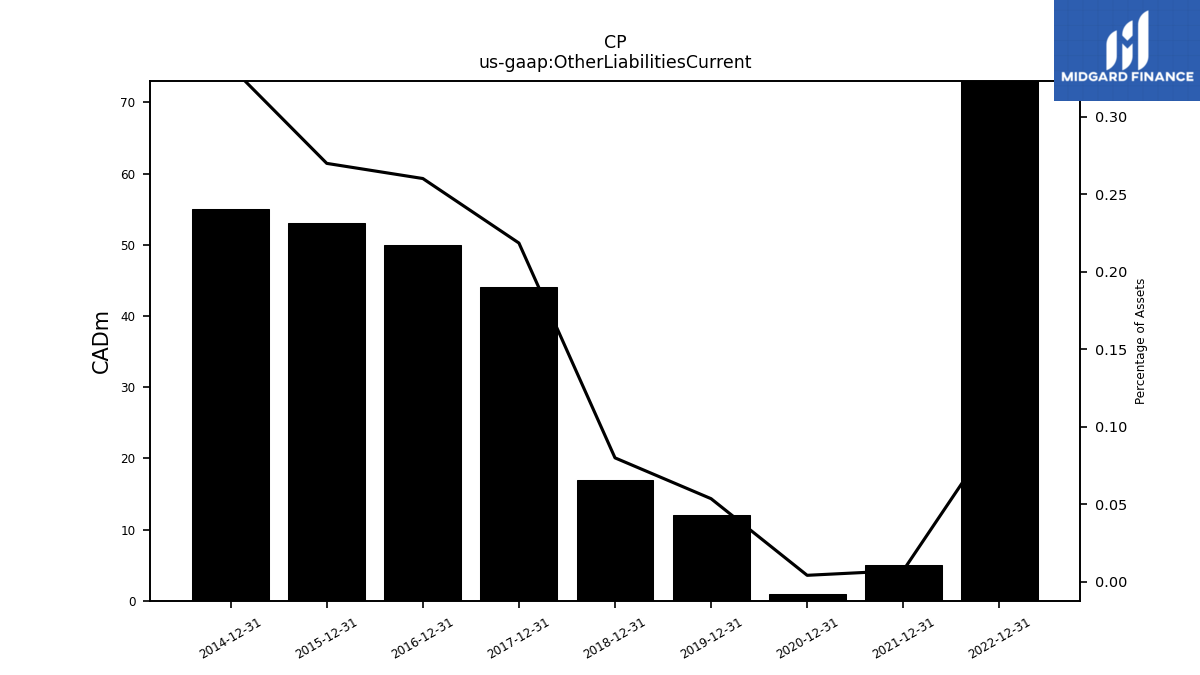
| Other Liabilities Current | NA | NA | NA | 73.00 | NA | NA | NA | 5.00 | NA | NA | NA | 1.00 | NA | NA | NA | 12.00 | NA | NA | NA | 17.00 | NA | NA | NA | 44.00 | NA | NA | NA | 50.00 | NA | NA | NA | 53.00 | NA | NA | NA | 55.00 | NA | NA | NA |
| 2023-09-30 | 2023-06-30 | 2023-03-31 | 2022-12-31 | 2022-09-30 | 2022-06-30 | 2022-03-31 | 2021-12-31 | 2021-09-30 | 2021-06-30 | 2021-03-31 | 2020-12-31 | 2020-09-30 | 2020-06-30 | 2020-03-31 | 2019-12-31 | 2019-09-30 | 2019-06-30 | 2019-03-31 | 2018-12-31 | 2018-09-30 | 2018-06-30 | 2018-03-31 | 2017-12-31 | 2017-09-30 | 2017-06-30 | 2017-03-31 | 2016-12-31 | 2016-09-30 | 2016-06-30 | 2016-03-31 | 2015-12-31 | 2015-09-30 | 2015-06-30 | 2015-03-31 | 2014-12-31 | 2014-09-30 | 2014-06-30 | 2014-03-31 | ||
|---|---|---|---|---|---|---|---|---|---|---|---|---|---|---|---|---|---|---|---|---|---|---|---|---|---|---|---|---|---|---|---|---|---|---|---|---|---|---|---|---|
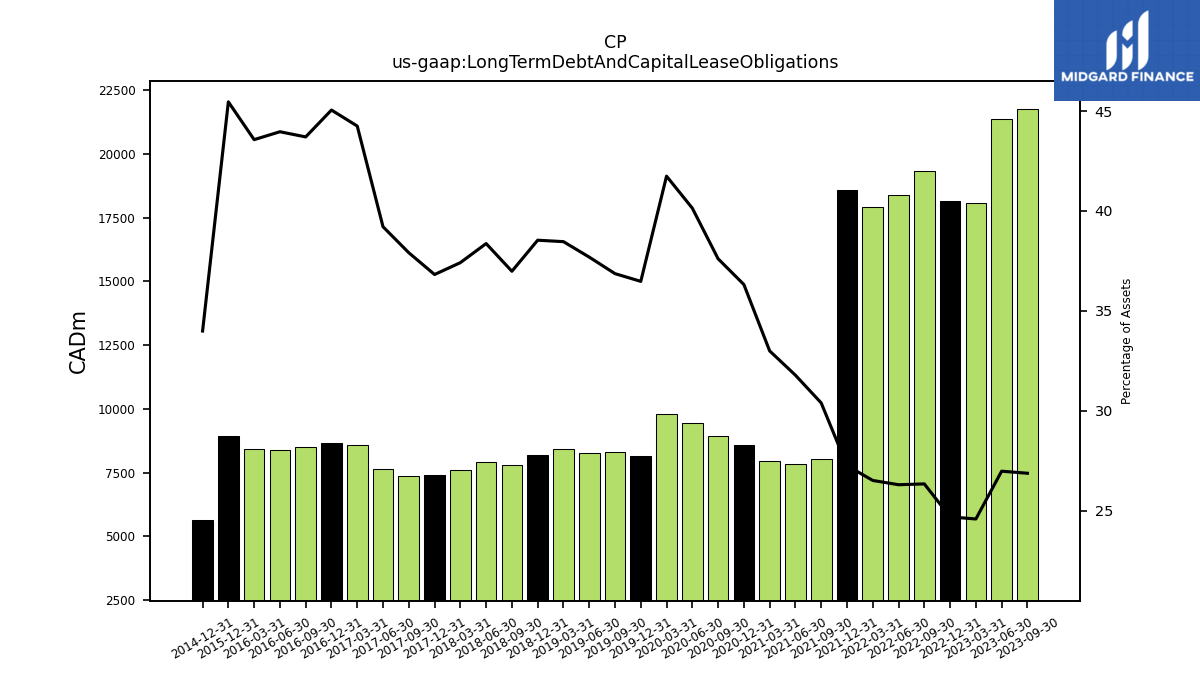
| Long Term Debt And Capital Lease Obligations | 21762.00 | 21353.00 | 18066.00 | 18141.00 | 19339.00 | 18372.00 | 17917.00 | 18577.00 | 8036.00 | 7850.00 | 7958.00 | 8585.00 | 8945.00 | 9457.00 | 9804.00 | 8158.00 | 8308.00 | 8266.00 | 8427.00 | 8190.00 | 7806.00 | 7936.00 | 7601.00 | 7413.00 | 7384.00 | 7660.00 | 8583.00 | 8659.00 | 8488.00 | 8383.00 | 8430.00 | 8927.00 | NA | NA | NA | 5625.00 | NA | NA | NA | |
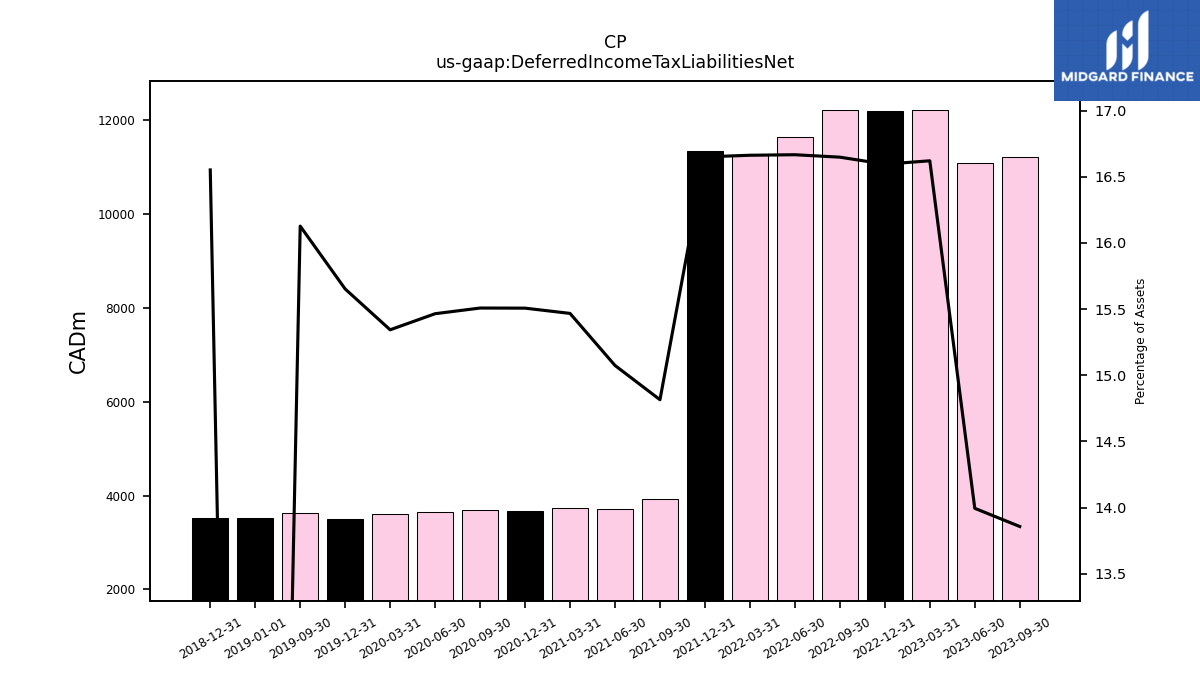
| Deferred Income Tax Liabilities Net | 11224.00 | 11080.00 | 12217.00 | 12197.00 | 12226.00 | 11646.00 | 11263.00 | 11352.00 | 3918.00 | 3724.00 | 3731.00 | 3666.00 | 3689.00 | 3644.00 | 3604.00 | 3501.00 | 3635.00 | NA | NA | 3518.00 | NA | NA | NA | NA | NA | NA | NA | NA | NA | NA | NA | NA | NA | NA | NA | NA | NA | NA | NA | |
| Pension And Other Postretirement Defined Benefit Plans Liabilities Noncurrent | 568.00 | 562.00 | 537.00 | 538.00 | 726.00 | 724.00 | 715.00 | 718.00 | 825.00 | 823.00 | 829.00 | 832.00 | 777.00 | 784.00 | 790.00 | 785.00 | 712.00 | 713.00 | 714.00 | 718.00 | 746.00 | 749.00 | 749.00 | 749.00 | 726.00 | 729.00 | 730.00 | 734.00 | 756.00 | 751.00 | 750.00 | 758.00 | NA | NA | NA | 755.00 | NA | NA | NA | |
| Minority Interest | 945.00 | 925.00 | NA | NA | NA | NA | NA | NA | NA | NA | NA | NA | NA | NA | NA | NA | NA | NA | NA | NA | NA | NA | NA | NA | NA | NA | NA | NA | NA | NA | NA | NA | NA | NA | NA | NA | NA | NA | NA | |
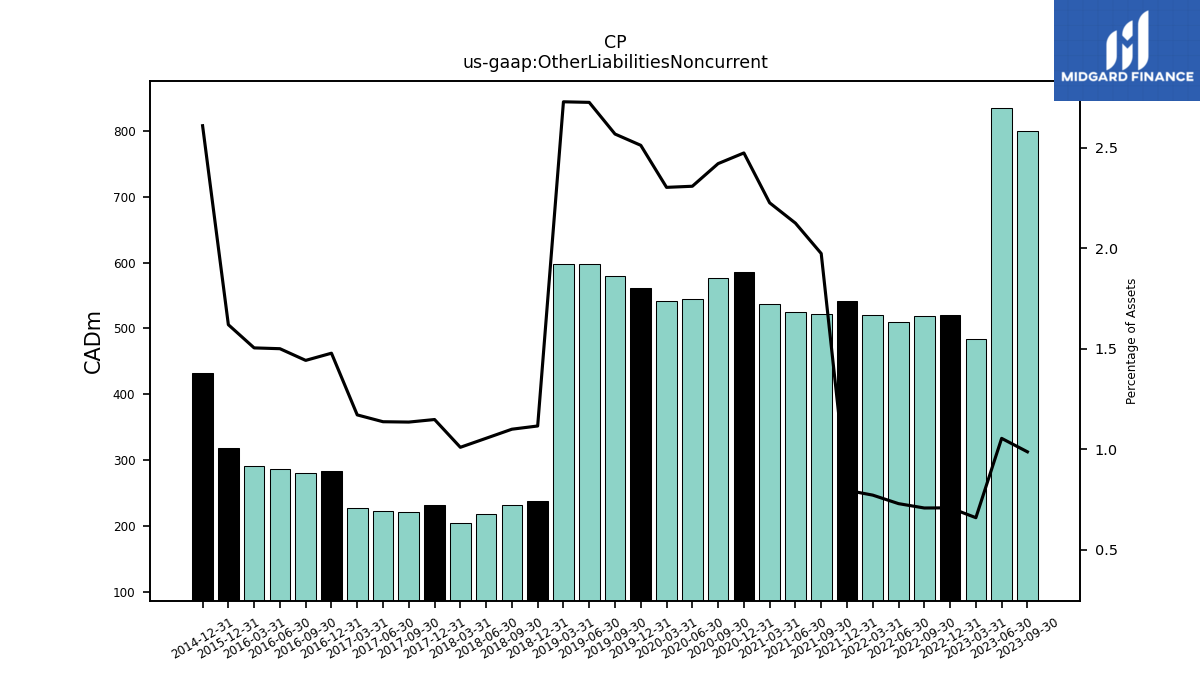
| Other Liabilities Noncurrent | 799.00 | 834.00 | 484.00 | 520.00 | 519.00 | 509.00 | 521.00 | 542.00 | 522.00 | 525.00 | 537.00 | 585.00 | 576.00 | 544.00 | 541.00 | 562.00 | 579.00 | 598.00 | 598.00 | 237.00 | 232.00 | 218.00 | 205.00 | 231.00 | 221.00 | 222.00 | 227.00 | 284.00 | 280.00 | 286.00 | 291.00 | 318.00 | NA | NA | NA | 432.00 | NA | NA | NA | |
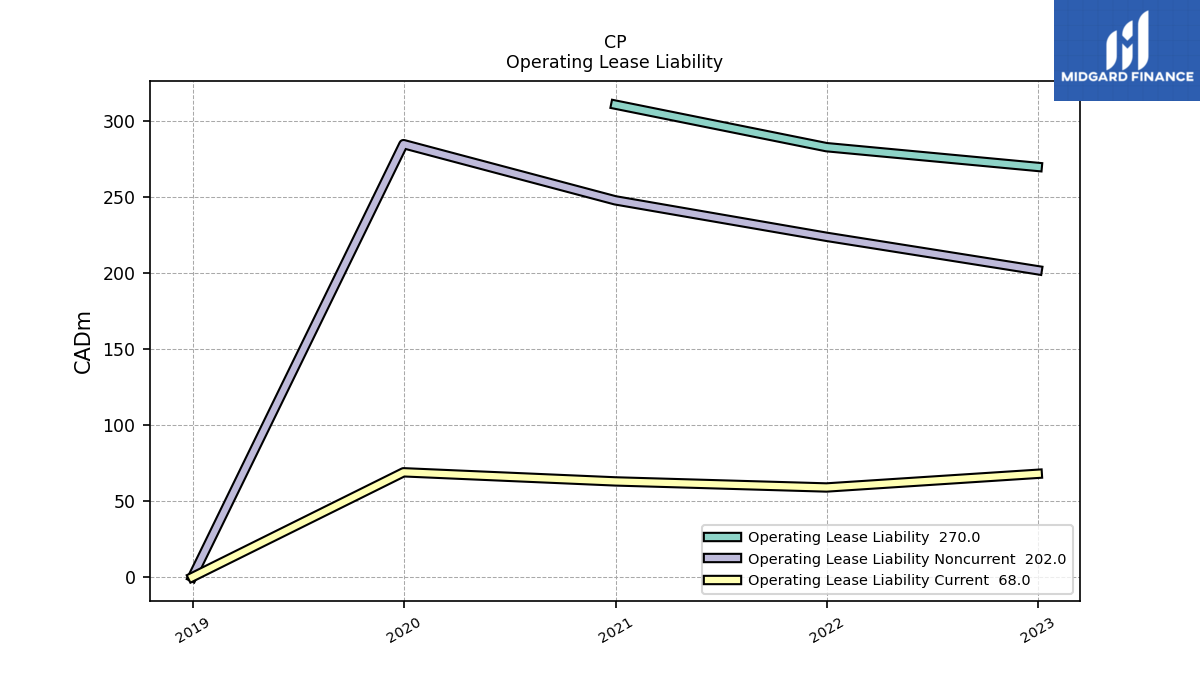
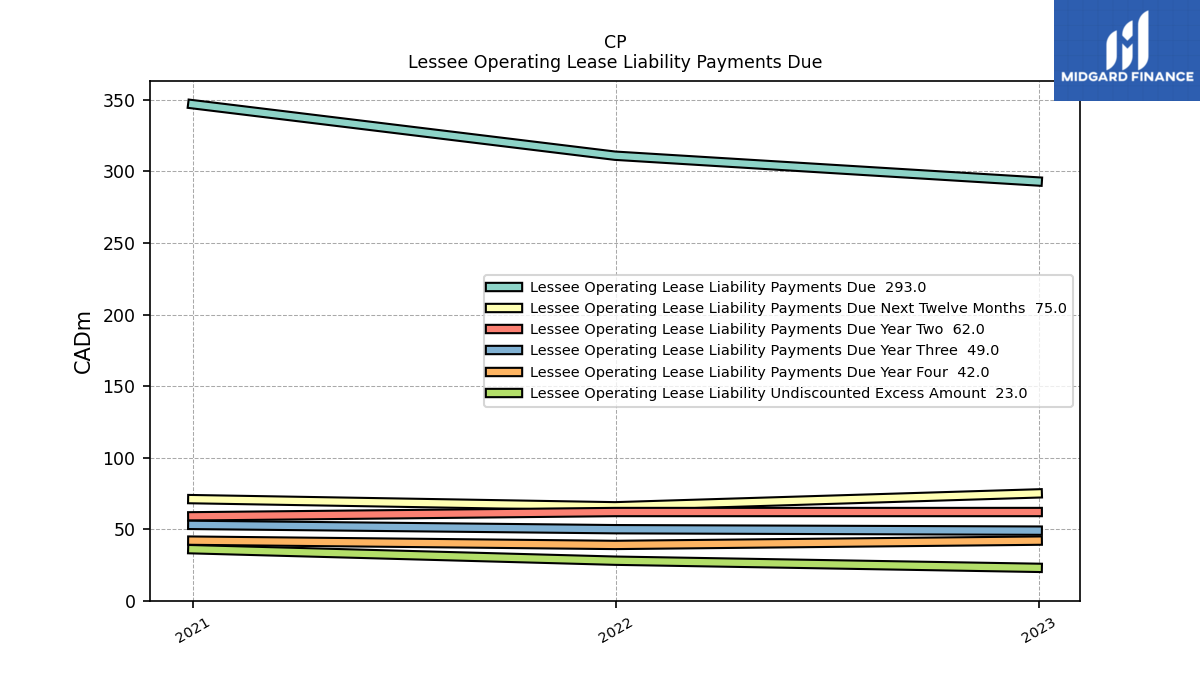
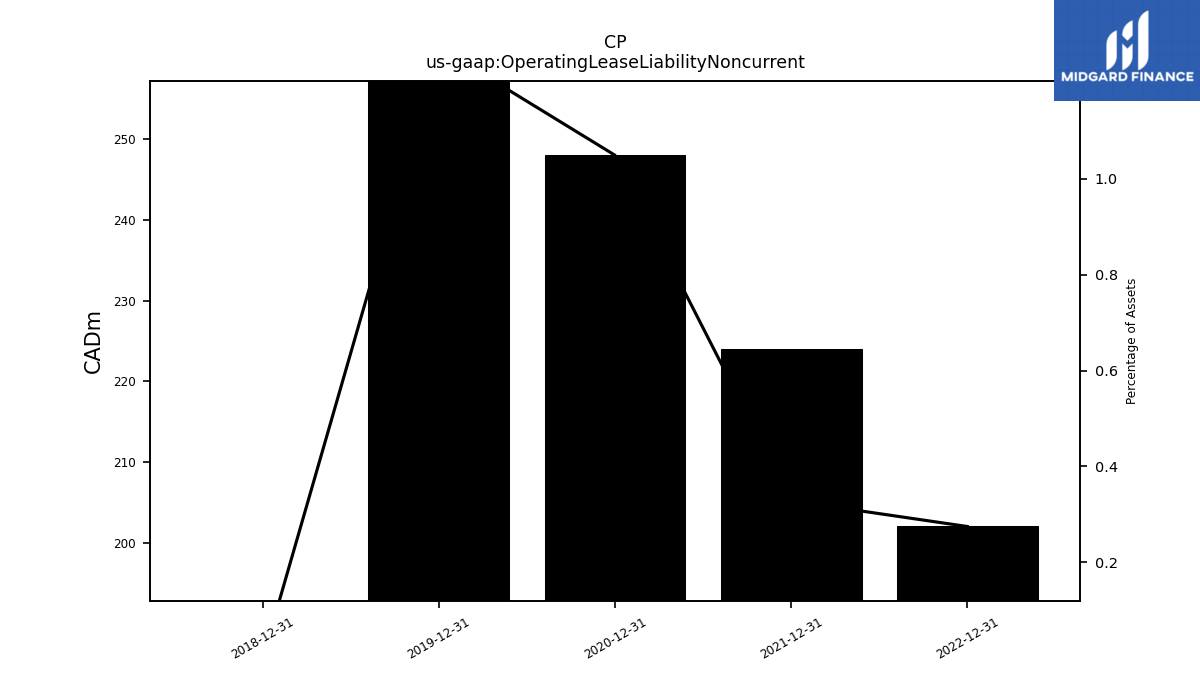
| Operating Lease Liability Noncurrent | NA | NA | NA | 202.00 | NA | NA | NA | 224.00 | NA | NA | NA | 248.00 | NA | NA | NA | 285.00 | NA | NA | NA | 0.00 | NA | NA | NA | NA | NA | NA | NA | NA | NA | NA | NA | NA | NA | NA | NA | NA | NA | NA | NA |
| 2023-09-30 | 2023-06-30 | 2023-03-31 | 2022-12-31 | 2022-09-30 | 2022-06-30 | 2022-03-31 | 2021-12-31 | 2021-09-30 | 2021-06-30 | 2021-03-31 | 2020-12-31 | 2020-09-30 | 2020-06-30 | 2020-03-31 | 2019-12-31 | 2019-09-30 | 2019-06-30 | 2019-03-31 | 2018-12-31 | 2018-09-30 | 2018-06-30 | 2018-03-31 | 2017-12-31 | 2017-09-30 | 2017-06-30 | 2017-03-31 | 2016-12-31 | 2016-09-30 | 2016-06-30 | 2016-03-31 | 2015-12-31 | 2015-09-30 | 2015-06-30 | 2015-03-31 | 2014-12-31 | 2014-09-30 | 2014-06-30 | 2014-03-31 | ||
|---|---|---|---|---|---|---|---|---|---|---|---|---|---|---|---|---|---|---|---|---|---|---|---|---|---|---|---|---|---|---|---|---|---|---|---|---|---|---|---|---|
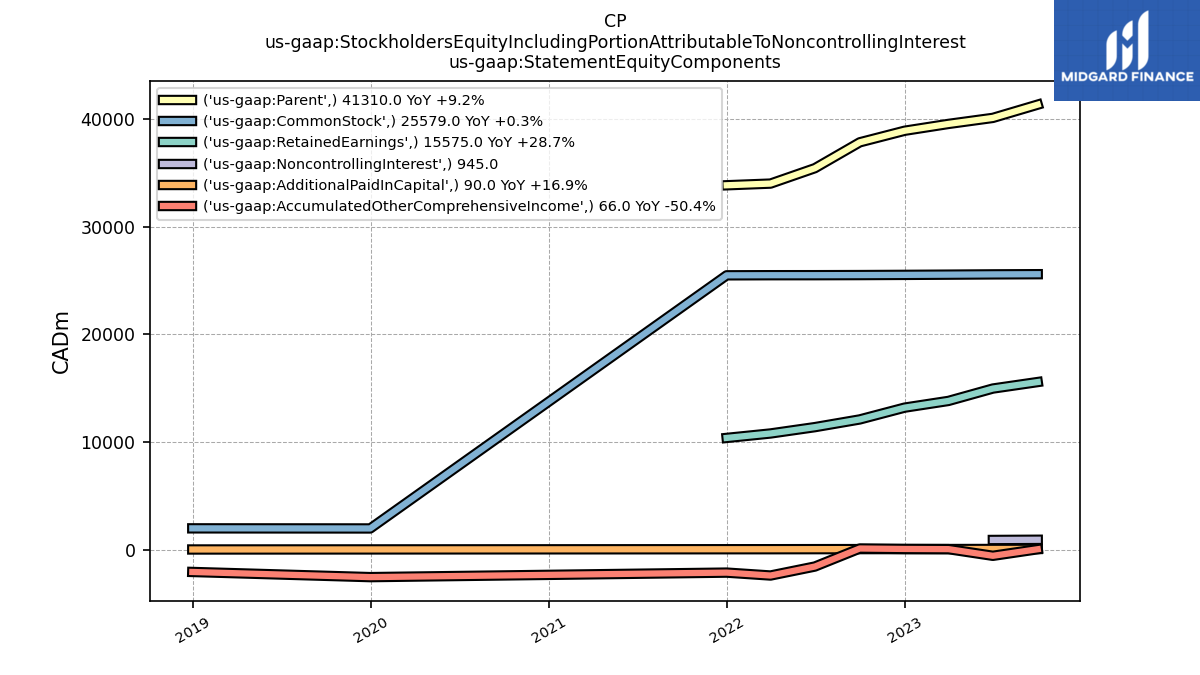
| Stockholders Equity | 41310.00 | 40079.00 | 39520.00 | 38886.00 | 37814.00 | 35414.00 | 33985.00 | 33829.00 | 9468.00 | 8965.00 | 7866.00 | 7319.00 | 7579.00 | 7465.00 | 6955.00 | 7069.00 | 7215.00 | 7157.00 | 6814.00 | 6636.00 | 7128.00 | 6574.00 | 6434.00 | 6437.00 | 5565.00 | 5333.00 | 5038.00 | 4626.00 | 4669.00 | 4691.00 | 5290.00 | 4796.00 | 3992.00 | 5251.00 | 5418.00 | 5610.00 | NA | NA | NA | |
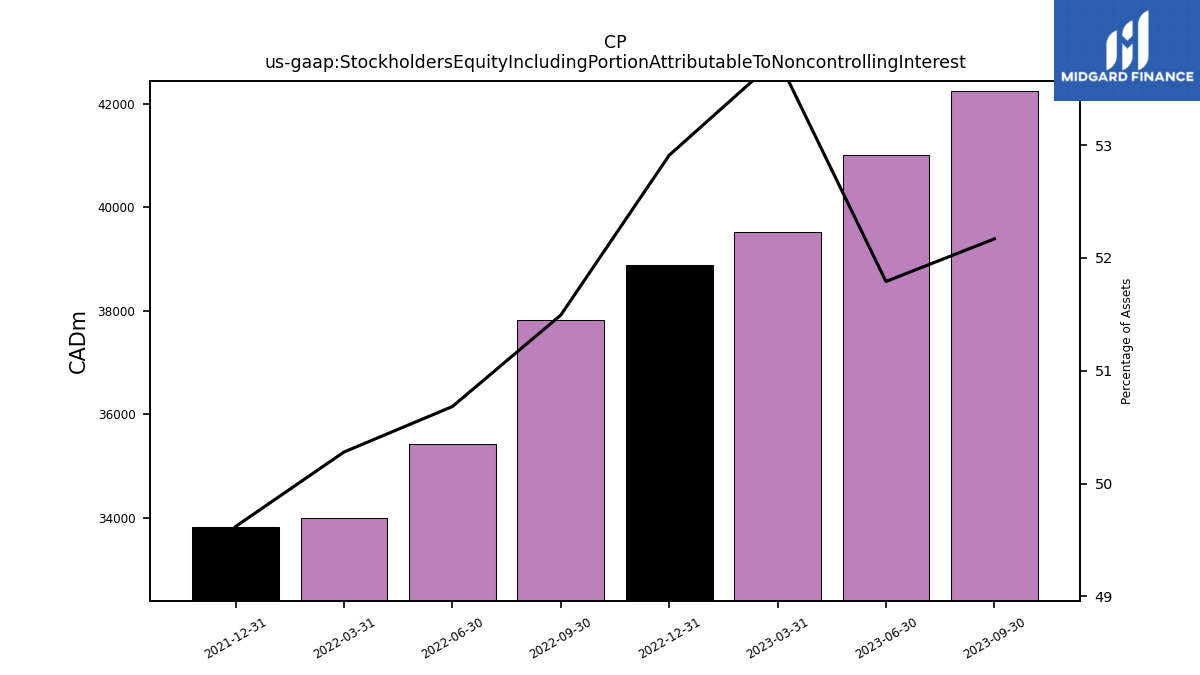
| Stockholders Equity Including Portion Attributable To Noncontrolling Interest | 42255.00 | 41004.00 | 39520.00 | 38886.00 | 37814.00 | 35414.00 | 33985.00 | 33829.00 | NA | NA | NA | NA | NA | NA | NA | NA | NA | NA | NA | NA | NA | NA | NA | NA | NA | NA | NA | NA | NA | NA | NA | NA | NA | NA | NA | NA | NA | NA | NA | |
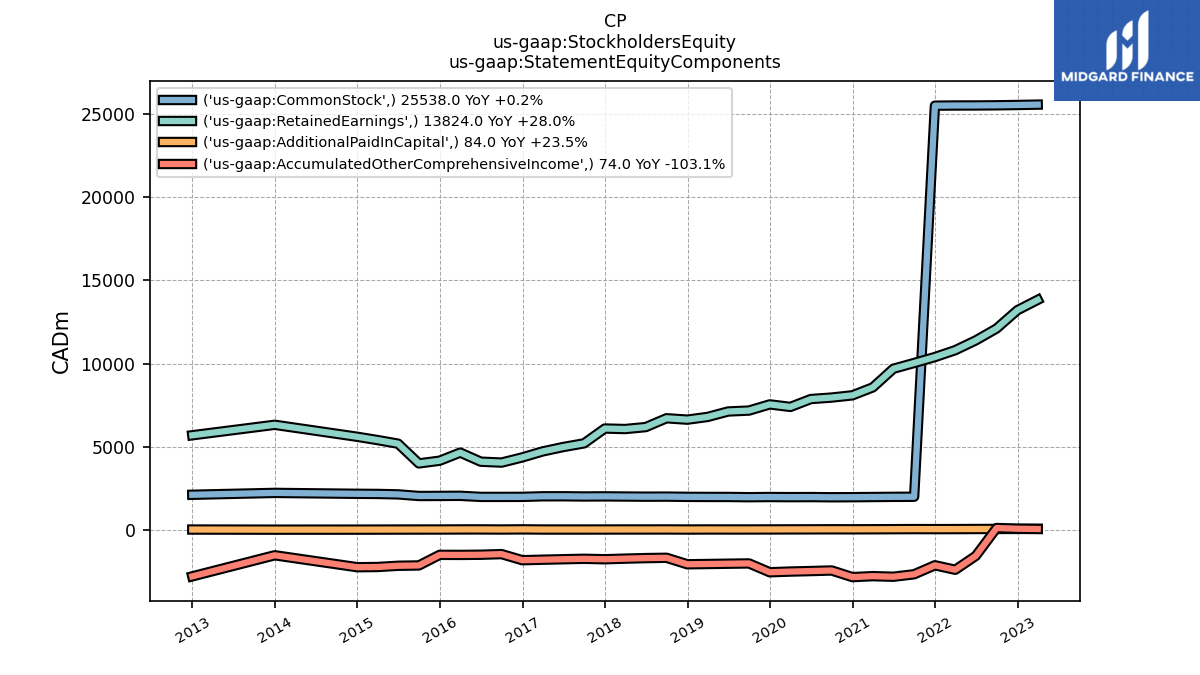
| Common Stock Value | 25579.00 | 25563.00 | 25538.00 | 25516.00 | 25498.00 | 25488.00 | 25486.00 | 25475.00 | 2008.00 | 2003.00 | 1993.00 | 1983.00 | 1978.00 | 1990.00 | 1985.00 | 1993.00 | 1982.00 | 1996.00 | 1997.00 | 2002.00 | 2017.00 | 2013.00 | 2022.00 | 2032.00 | 2025.00 | 2038.00 | 2036.00 | 2002.00 | 2000.00 | 2000.00 | 2065.00 | 2058.00 | NA | NA | NA | 2185.00 | NA | NA | NA | |
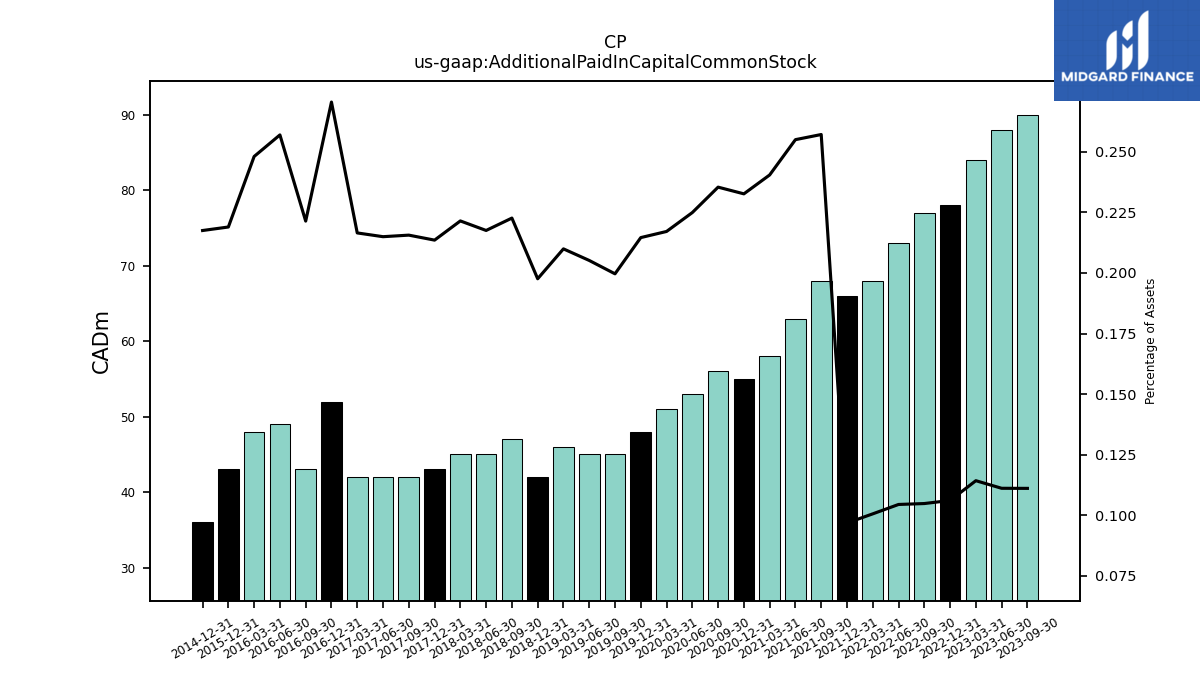
| Additional Paid In Capital Common Stock | 90.00 | 88.00 | 84.00 | 78.00 | 77.00 | 73.00 | 68.00 | 66.00 | 68.00 | 63.00 | 58.00 | 55.00 | 56.00 | 53.00 | 51.00 | 48.00 | 45.00 | 45.00 | 46.00 | 42.00 | 47.00 | 45.00 | 45.00 | 43.00 | 42.00 | 42.00 | 42.00 | 52.00 | 43.00 | 49.00 | 48.00 | 43.00 | NA | NA | NA | 36.00 | NA | NA | NA | |
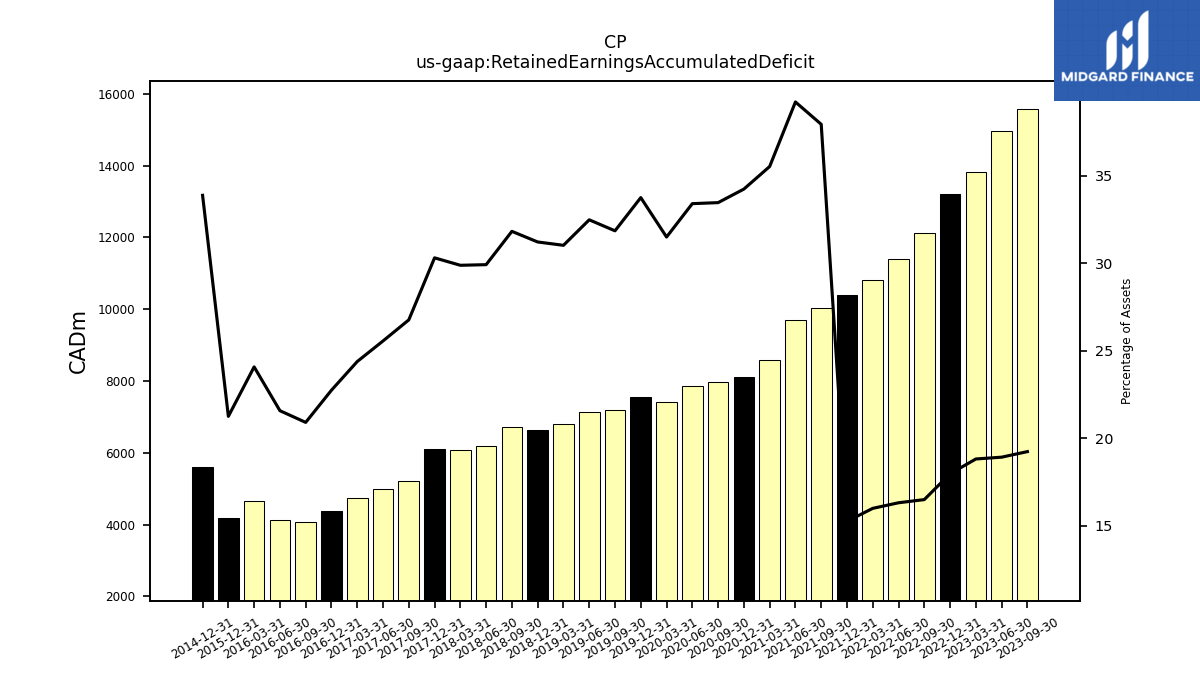
| Retained Earnings Accumulated Deficit | 15575.00 | 14972.00 | 13824.00 | 13201.00 | 12106.00 | 11392.00 | 10804.00 | 10391.00 | 10035.00 | 9690.00 | 8571.00 | 8095.00 | 7961.00 | 7872.00 | 7399.00 | 7550.00 | 7180.00 | 7125.00 | 6798.00 | 6635.00 | 6718.00 | 6189.00 | 6072.00 | 6103.00 | 5213.00 | 4993.00 | 4729.00 | 4371.00 | 4059.00 | 4113.00 | 4658.00 | 4172.00 | NA | NA | NA | 5608.00 | NA | NA | NA | |
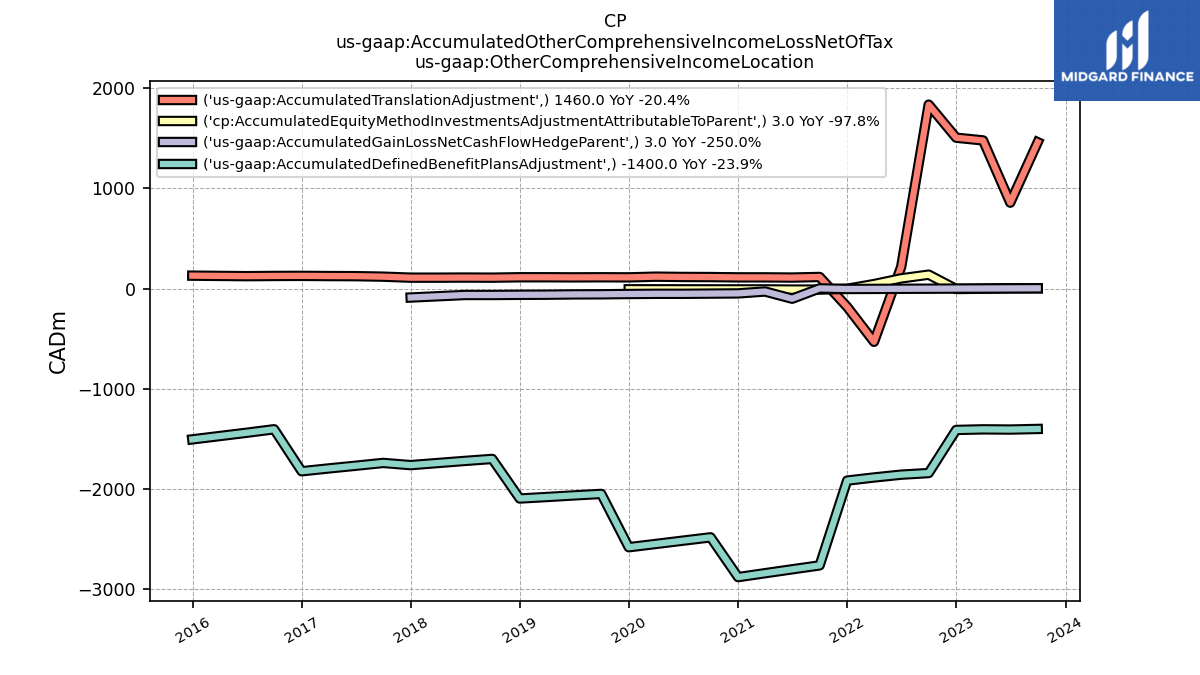
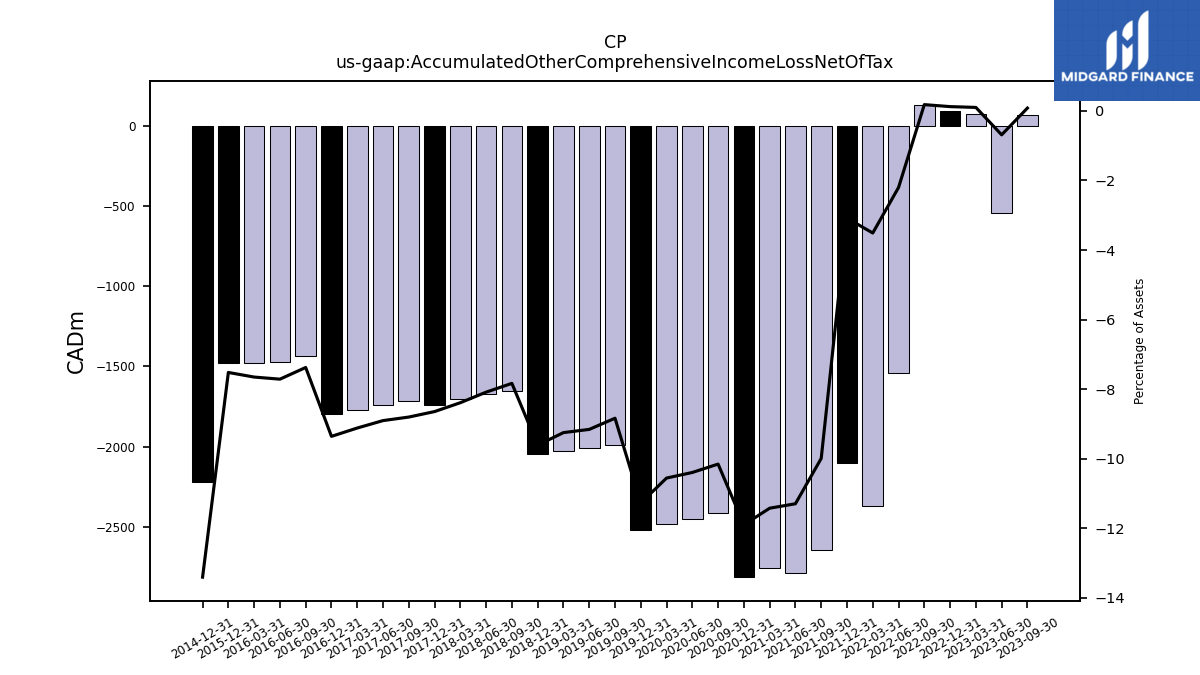
| Accumulated Other Comprehensive Income Loss Net Of Tax | 66.00 | -544.00 | 74.00 | 91.00 | 133.00 | -1539.00 | -2373.00 | -2103.00 | -2643.00 | -2791.00 | -2756.00 | -2814.00 | -2416.00 | -2450.00 | -2480.00 | -2522.00 | -1992.00 | -2009.00 | -2027.00 | -2043.00 | -1654.00 | -1673.00 | -1705.00 | -1741.00 | -1715.00 | -1740.00 | -1769.00 | -1799.00 | -1433.00 | -1471.00 | -1481.00 | -1477.00 | NA | NA | NA | -2219.00 | NA | NA | NA | |
| Minority Interest | 945.00 | 925.00 | NA | NA | NA | NA | NA | NA | NA | NA | NA | NA | NA | NA | NA | NA | NA | NA | NA | NA | NA | NA | NA | NA | NA | NA | NA | NA | NA | NA | NA | NA | NA | NA | NA | NA | NA | NA | NA | |
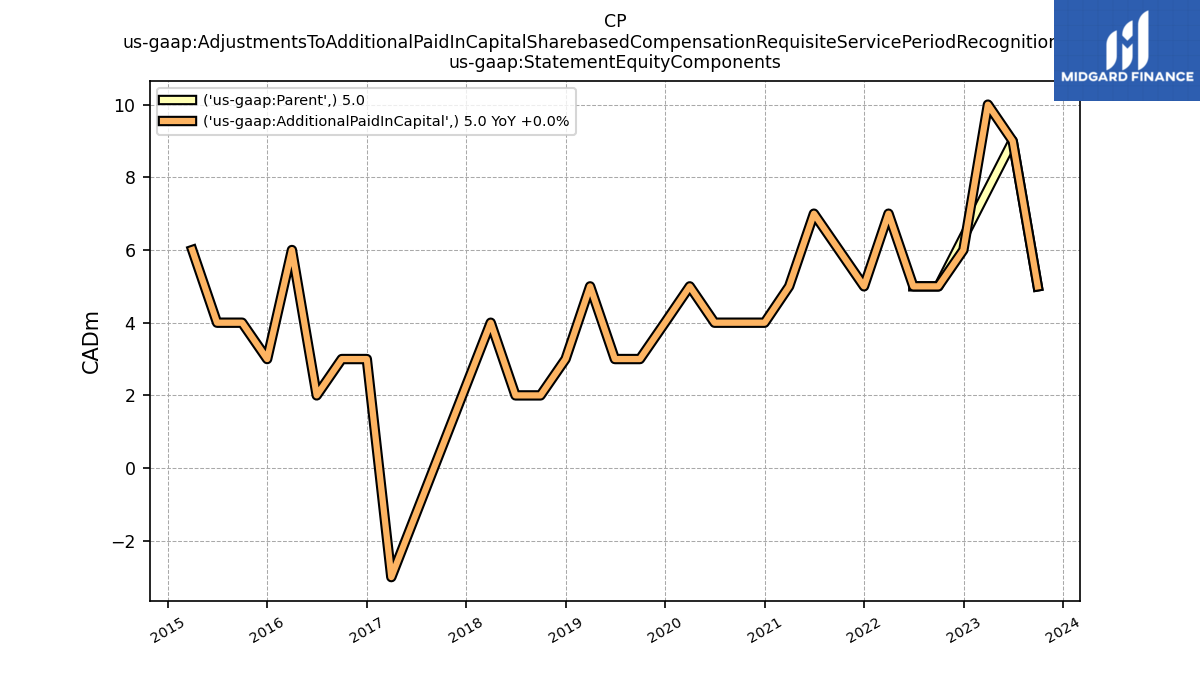
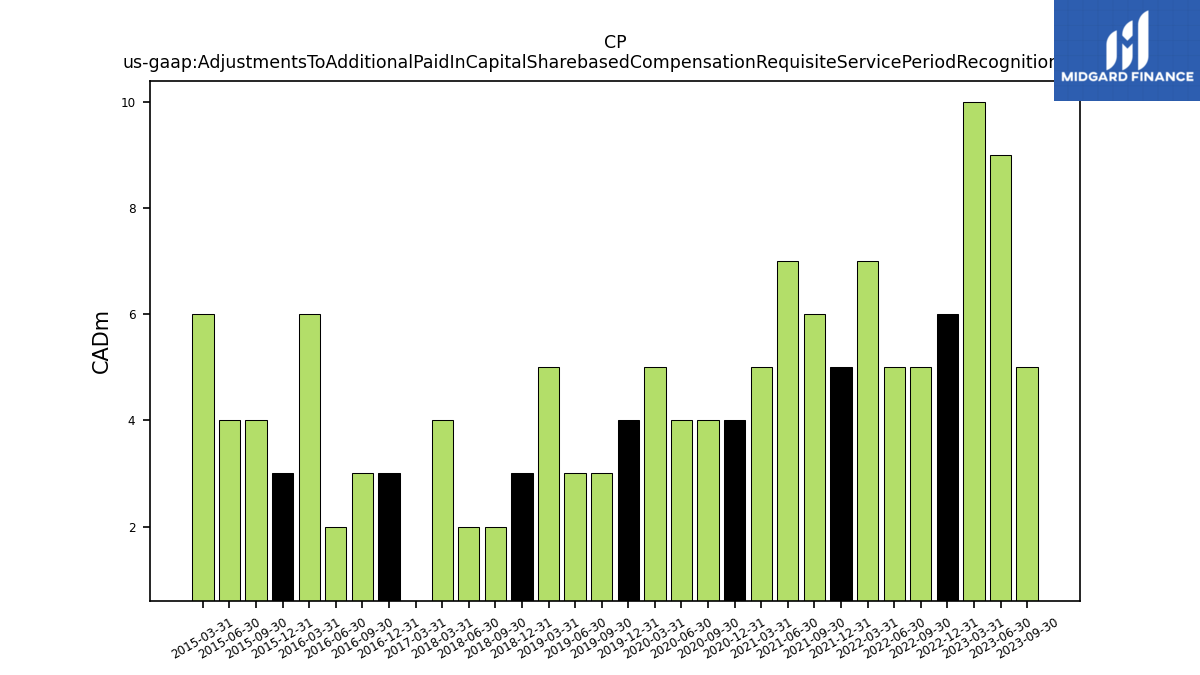
| Adjustments To Additional Paid In Capital Sharebased Compensation Requisite Service Period Recognition Value | 5.00 | 9.00 | 10.00 | 6.00 | 5.00 | 5.00 | 7.00 | 5.00 | 6.00 | 7.00 | 5.00 | 4.00 | 4.00 | 4.00 | 5.00 | 4.00 | 3.00 | 3.00 | 5.00 | 3.00 | 2.00 | 2.00 | 4.00 | NA | NA | NA | -3.00 | 3.00 | 3.00 | 2.00 | 6.00 | 3.00 | 4.00 | 4.00 | 6.00 | NA | NA | NA | NA |
| 2023-09-30 | 2023-06-30 | 2023-03-31 | 2022-12-31 | 2022-09-30 | 2022-06-30 | 2022-03-31 | 2021-12-31 | 2021-09-30 | 2021-06-30 | 2021-03-31 | 2020-12-31 | 2020-09-30 | 2020-06-30 | 2020-03-31 | 2019-12-31 | 2019-09-30 | 2019-06-30 | 2019-03-31 | 2018-12-31 | 2018-09-30 | 2018-06-30 | 2018-03-31 | 2017-12-31 | 2017-09-30 | 2017-06-30 | 2017-03-31 | 2016-12-31 | 2016-09-30 | 2016-06-30 | 2016-03-31 | 2015-12-31 | 2015-09-30 | 2015-06-30 | 2015-03-31 | 2014-12-31 | 2014-09-30 | 2014-06-30 | 2014-03-31 | ||
|---|---|---|---|---|---|---|---|---|---|---|---|---|---|---|---|---|---|---|---|---|---|---|---|---|---|---|---|---|---|---|---|---|---|---|---|---|---|---|---|---|
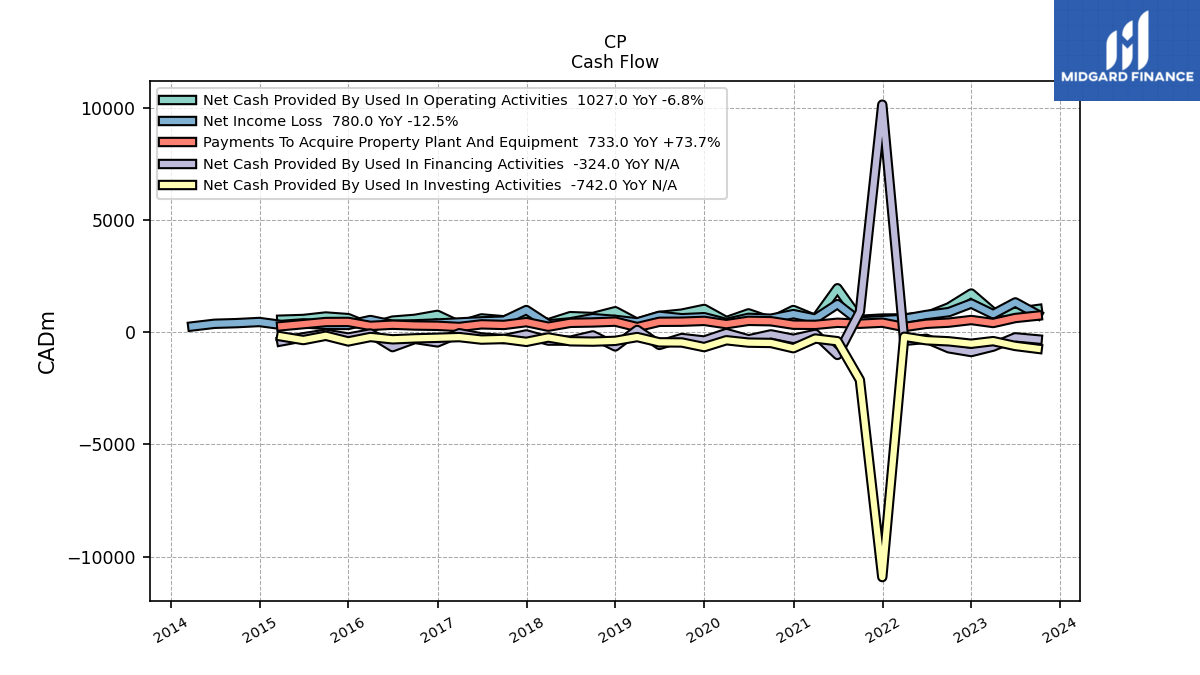
| Net Cash Provided By Used In Operating Activities | 1027.00 | 892.00 | 881.00 | 1720.00 | 1102.00 | 707.00 | 613.00 | 604.00 | 548.00 | 1954.00 | 582.00 | 985.00 | 493.00 | 835.00 | 489.00 | 1033.00 | 823.00 | 721.00 | 413.00 | 931.00 | 673.00 | 711.00 | 397.00 | 733.00 | 527.00 | 611.00 | 311.00 | 768.00 | 591.00 | 512.00 | 218.00 | 623.00 | 696.00 | 585.00 | 555.00 | NA | NA | NA | NA | |
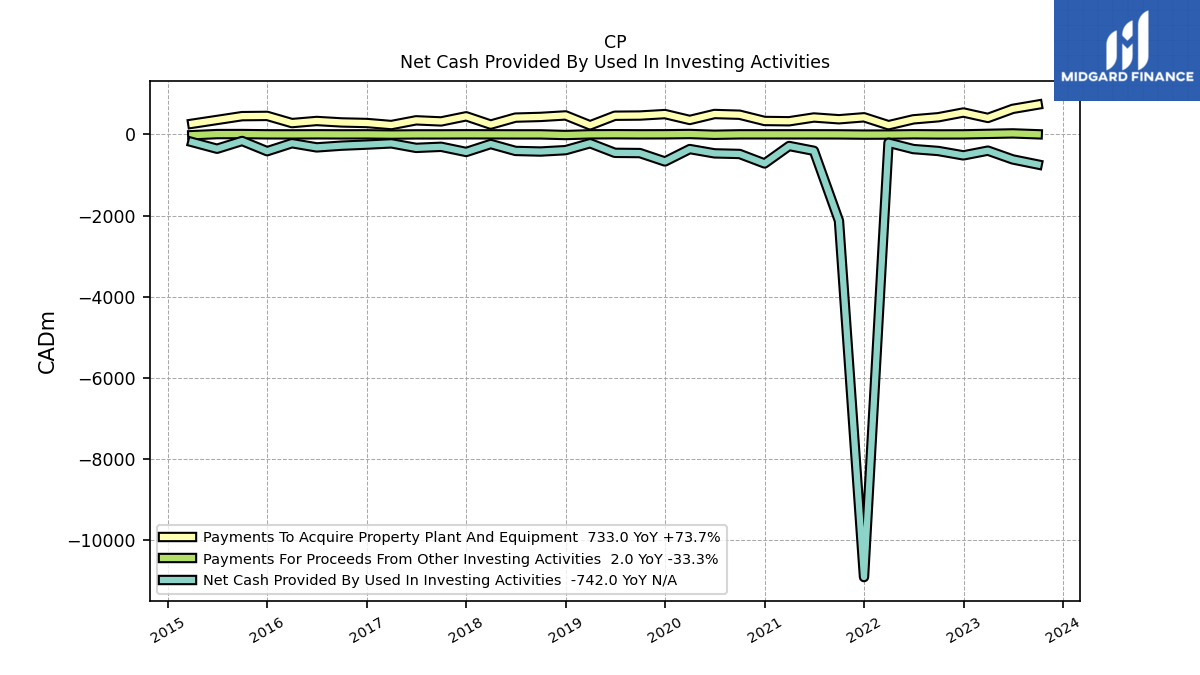
| Net Cash Provided By Used In Investing Activities | -742.00 | -617.00 | -401.00 | -518.00 | -410.00 | -362.00 | -206.00 | -10910.00 | -2129.00 | -405.00 | -286.00 | -717.00 | -483.00 | -468.00 | -362.00 | -668.00 | -461.00 | -455.00 | -219.00 | -389.00 | -423.00 | -408.00 | -238.00 | -434.00 | -306.00 | -333.00 | -222.00 | -252.00 | -278.00 | -321.00 | -218.00 | -415.00 | -163.00 | -354.00 | -191.00 | NA | NA | NA | NA | |
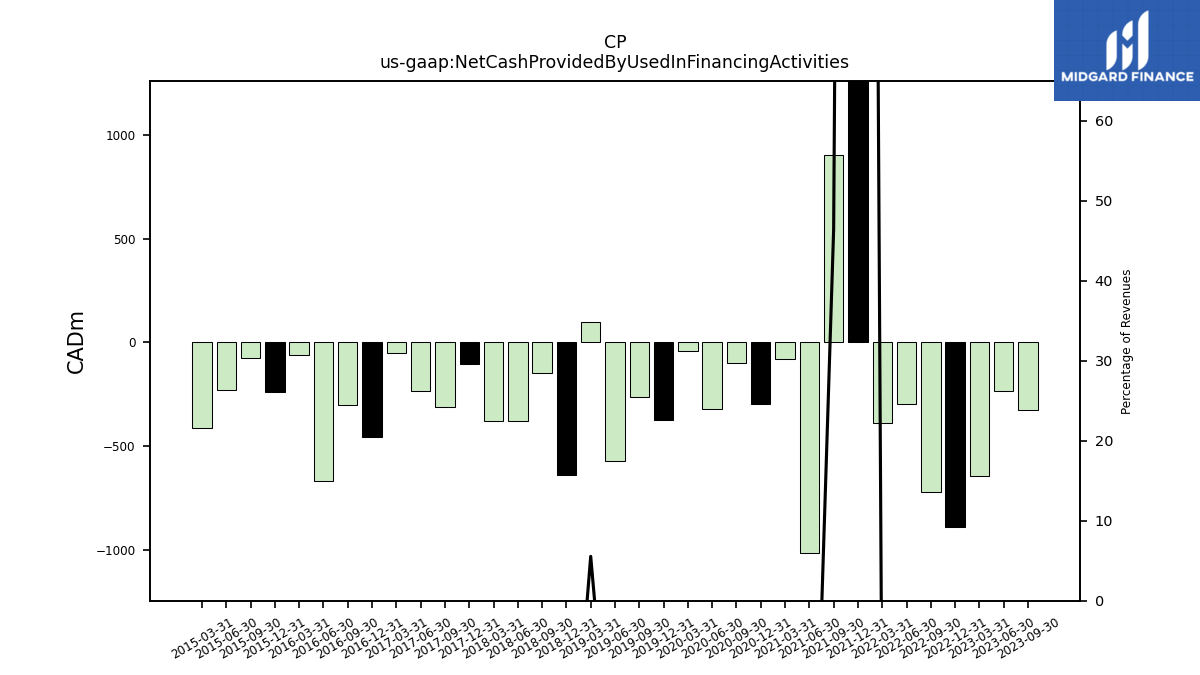
| Net Cash Provided By Used In Financing Activities | -324.00 | -233.00 | -645.00 | -888.00 | -721.00 | -297.00 | -391.00 | 10130.00 | 902.00 | -1016.00 | -80.00 | -298.00 | -100.00 | -322.00 | -44.00 | -374.00 | -263.00 | -572.00 | 98.00 | -638.00 | -146.00 | -381.00 | -377.00 | -103.00 | -310.00 | -237.00 | -50.00 | -458.00 | -304.00 | -669.00 | -62.00 | -241.00 | -75.00 | -229.00 | -412.00 | NA | NA | NA | NA |
| 2023-09-30 | 2023-06-30 | 2023-03-31 | 2022-12-31 | 2022-09-30 | 2022-06-30 | 2022-03-31 | 2021-12-31 | 2021-09-30 | 2021-06-30 | 2021-03-31 | 2020-12-31 | 2020-09-30 | 2020-06-30 | 2020-03-31 | 2019-12-31 | 2019-09-30 | 2019-06-30 | 2019-03-31 | 2018-12-31 | 2018-09-30 | 2018-06-30 | 2018-03-31 | 2017-12-31 | 2017-09-30 | 2017-06-30 | 2017-03-31 | 2016-12-31 | 2016-09-30 | 2016-06-30 | 2016-03-31 | 2015-12-31 | 2015-09-30 | 2015-06-30 | 2015-03-31 | 2014-12-31 | 2014-09-30 | 2014-06-30 | 2014-03-31 | ||
|---|---|---|---|---|---|---|---|---|---|---|---|---|---|---|---|---|---|---|---|---|---|---|---|---|---|---|---|---|---|---|---|---|---|---|---|---|---|---|---|---|
| Net Cash Provided By Used In Operating Activities | 1027.00 | 892.00 | 881.00 | 1720.00 | 1102.00 | 707.00 | 613.00 | 604.00 | 548.00 | 1954.00 | 582.00 | 985.00 | 493.00 | 835.00 | 489.00 | 1033.00 | 823.00 | 721.00 | 413.00 | 931.00 | 673.00 | 711.00 | 397.00 | 733.00 | 527.00 | 611.00 | 311.00 | 768.00 | 591.00 | 512.00 | 218.00 | 623.00 | 696.00 | 585.00 | 555.00 | NA | NA | NA | NA | |
| Net Income Loss | 780.00 | 1324.00 | 800.00 | 1271.00 | 891.00 | 765.00 | 590.00 | 532.00 | 472.00 | 1246.00 | 602.00 | 802.00 | 598.00 | 635.00 | 409.00 | 664.00 | 618.00 | 724.00 | 434.00 | 545.00 | 622.00 | 436.00 | 348.00 | 984.00 | 510.00 | 480.00 | 431.00 | 384.00 | 347.00 | 328.00 | 540.00 | 319.00 | 323.00 | 390.00 | 320.00 | 451.00 | 400.00 | 371.00 | 254.00 | |
| Profit Loss | 780.00 | 1325.00 | NA | NA | 891.00 | 765.00 | NA | NA | NA | NA | NA | NA | NA | NA | NA | NA | NA | NA | NA | NA | NA | NA | NA | NA | NA | NA | NA | NA | NA | NA | NA | NA | NA | NA | NA | NA | NA | NA | NA | |
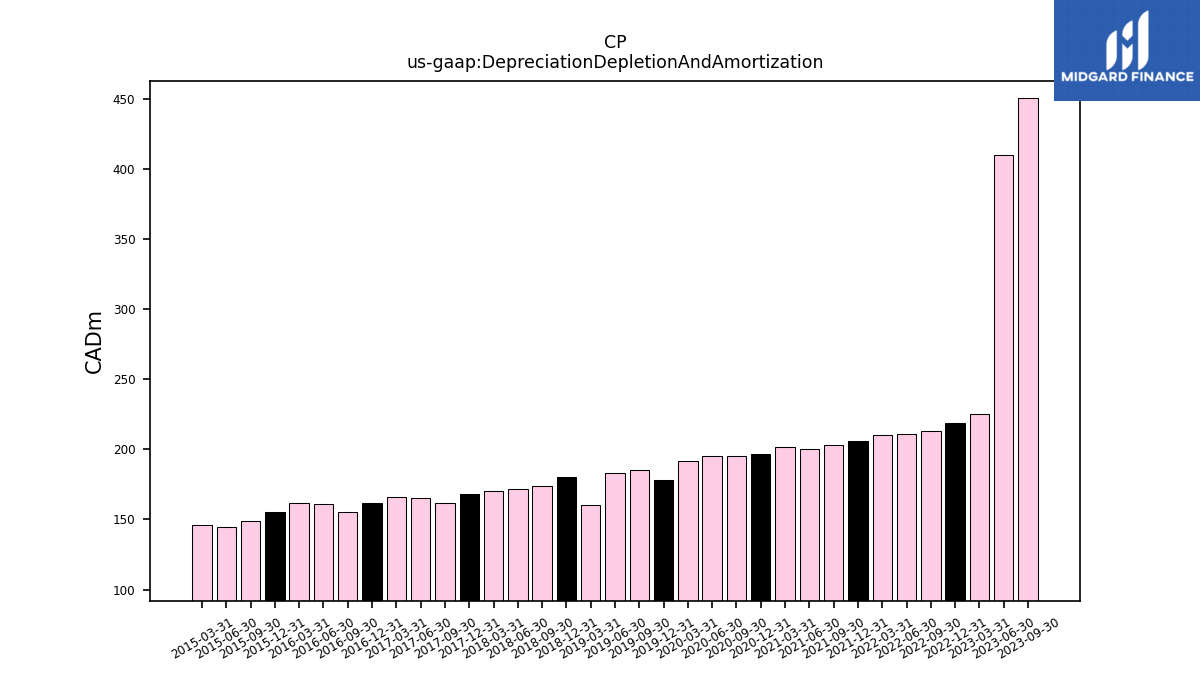
| Depreciation Depletion And Amortization | 451.00 | 410.00 | 225.00 | 219.00 | 213.00 | 211.00 | 210.00 | 206.00 | 203.00 | 200.00 | 202.00 | 197.00 | 195.00 | 195.00 | 192.00 | 178.00 | 185.00 | 183.00 | 160.00 | 180.00 | 174.00 | 172.00 | 170.00 | 168.00 | 162.00 | 165.00 | 166.00 | 162.00 | 155.00 | 161.00 | 162.00 | 155.00 | 149.00 | 145.00 | 146.00 | NA | NA | NA | NA | |
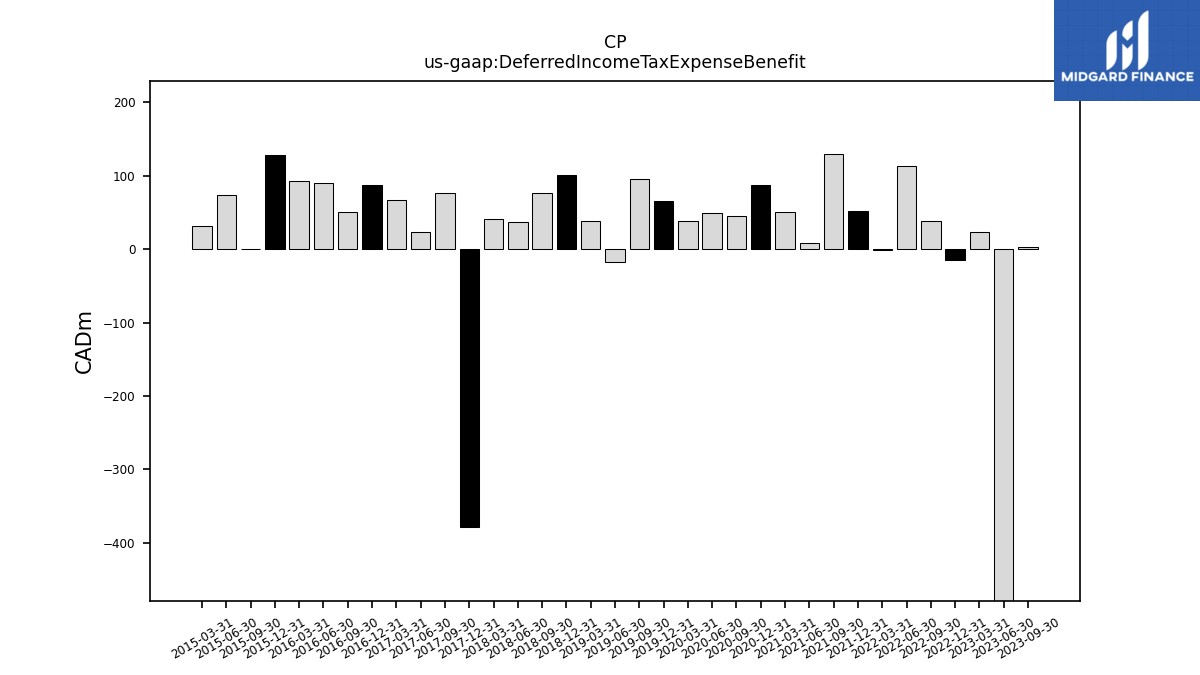
| Deferred Income Tax Expense Benefit | 3.00 | -7953.00 | 24.00 | -15.00 | 38.00 | 114.00 | -1.00 | 52.00 | 130.00 | 9.00 | 51.00 | 88.00 | 45.00 | 49.00 | 39.00 | 65.00 | 96.00 | -18.00 | 38.00 | 101.00 | 77.00 | 37.00 | 41.00 | -378.00 | 77.00 | 24.00 | 67.00 | 87.00 | 50.00 | 90.00 | 93.00 | 128.00 | 0.00 | 74.00 | 32.00 | NA | NA | NA | NA |
| 2023-09-30 | 2023-06-30 | 2023-03-31 | 2022-12-31 | 2022-09-30 | 2022-06-30 | 2022-03-31 | 2021-12-31 | 2021-09-30 | 2021-06-30 | 2021-03-31 | 2020-12-31 | 2020-09-30 | 2020-06-30 | 2020-03-31 | 2019-12-31 | 2019-09-30 | 2019-06-30 | 2019-03-31 | 2018-12-31 | 2018-09-30 | 2018-06-30 | 2018-03-31 | 2017-12-31 | 2017-09-30 | 2017-06-30 | 2017-03-31 | 2016-12-31 | 2016-09-30 | 2016-06-30 | 2016-03-31 | 2015-12-31 | 2015-09-30 | 2015-06-30 | 2015-03-31 | 2014-12-31 | 2014-09-30 | 2014-06-30 | 2014-03-31 | ||
|---|---|---|---|---|---|---|---|---|---|---|---|---|---|---|---|---|---|---|---|---|---|---|---|---|---|---|---|---|---|---|---|---|---|---|---|---|---|---|---|---|
| Net Cash Provided By Used In Investing Activities | -742.00 | -617.00 | -401.00 | -518.00 | -410.00 | -362.00 | -206.00 | -10910.00 | -2129.00 | -405.00 | -286.00 | -717.00 | -483.00 | -468.00 | -362.00 | -668.00 | -461.00 | -455.00 | -219.00 | -389.00 | -423.00 | -408.00 | -238.00 | -434.00 | -306.00 | -333.00 | -222.00 | -252.00 | -278.00 | -321.00 | -218.00 | -415.00 | -163.00 | -354.00 | -191.00 | NA | NA | NA | NA | |
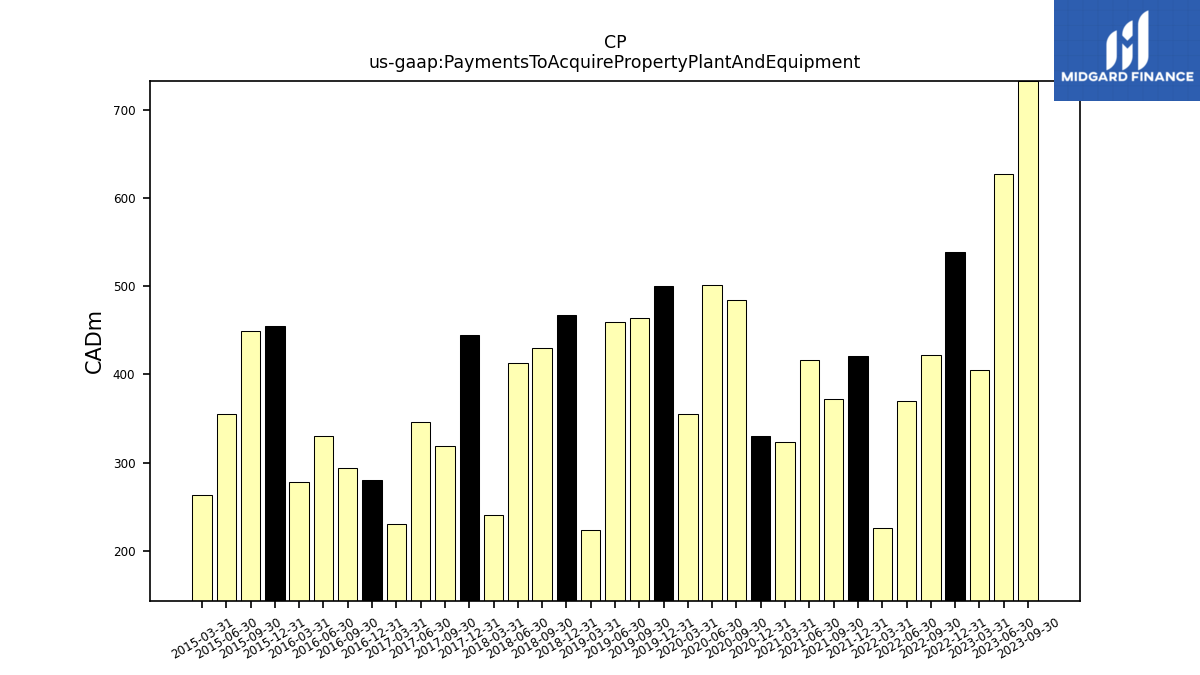
| Payments To Acquire Property Plant And Equipment | 733.00 | 628.00 | 405.00 | 539.00 | 422.00 | 370.00 | 226.00 | 421.00 | 372.00 | 416.00 | 323.00 | 330.00 | 484.00 | 502.00 | 355.00 | 500.00 | 464.00 | 459.00 | 224.00 | 467.00 | 430.00 | 413.00 | 241.00 | 445.00 | 319.00 | 346.00 | 230.00 | 280.00 | 294.00 | 330.00 | 278.00 | 455.00 | 449.00 | 355.00 | 263.00 | NA | NA | NA | NA |
| 2023-09-30 | 2023-06-30 | 2023-03-31 | 2022-12-31 | 2022-09-30 | 2022-06-30 | 2022-03-31 | 2021-12-31 | 2021-09-30 | 2021-06-30 | 2021-03-31 | 2020-12-31 | 2020-09-30 | 2020-06-30 | 2020-03-31 | 2019-12-31 | 2019-09-30 | 2019-06-30 | 2019-03-31 | 2018-12-31 | 2018-09-30 | 2018-06-30 | 2018-03-31 | 2017-12-31 | 2017-09-30 | 2017-06-30 | 2017-03-31 | 2016-12-31 | 2016-09-30 | 2016-06-30 | 2016-03-31 | 2015-12-31 | 2015-09-30 | 2015-06-30 | 2015-03-31 | 2014-12-31 | 2014-09-30 | 2014-06-30 | 2014-03-31 | ||
|---|---|---|---|---|---|---|---|---|---|---|---|---|---|---|---|---|---|---|---|---|---|---|---|---|---|---|---|---|---|---|---|---|---|---|---|---|---|---|---|---|
| Net Cash Provided By Used In Financing Activities | -324.00 | -233.00 | -645.00 | -888.00 | -721.00 | -297.00 | -391.00 | 10130.00 | 902.00 | -1016.00 | -80.00 | -298.00 | -100.00 | -322.00 | -44.00 | -374.00 | -263.00 | -572.00 | 98.00 | -638.00 | -146.00 | -381.00 | -377.00 | -103.00 | -310.00 | -237.00 | -50.00 | -458.00 | -304.00 | -669.00 | -62.00 | -241.00 | -75.00 | -229.00 | -412.00 | NA | NA | NA | NA | |
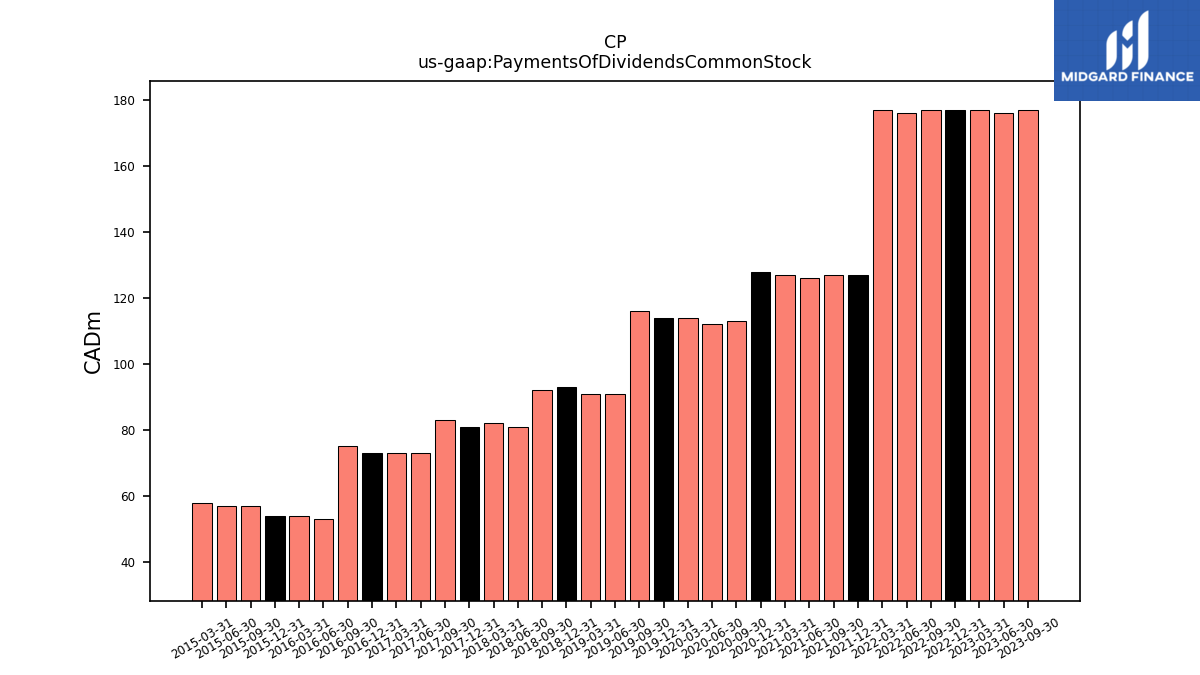
| Payments Of Dividends Common Stock | 177.00 | 176.00 | 177.00 | 177.00 | 177.00 | 176.00 | 177.00 | 127.00 | 127.00 | 126.00 | 127.00 | 128.00 | 113.00 | 112.00 | 114.00 | 114.00 | 116.00 | 91.00 | 91.00 | 93.00 | 92.00 | 81.00 | 82.00 | 81.00 | 83.00 | 73.00 | 73.00 | 73.00 | 75.00 | 53.00 | 54.00 | 54.00 | 57.00 | 57.00 | 58.00 | NA | NA | NA | NA |
| 2023-09-30 | 2023-06-30 | 2023-03-31 | 2022-12-31 | 2022-09-30 | 2022-06-30 | 2022-03-31 | 2021-12-31 | 2021-09-30 | 2021-06-30 | 2021-03-31 | 2020-12-31 | 2020-09-30 | 2020-06-30 | 2020-03-31 | 2019-12-31 | 2019-09-30 | 2019-06-30 | 2019-03-31 | 2018-12-31 | 2018-09-30 | 2018-06-30 | 2018-03-31 | 2017-12-31 | 2017-09-30 | 2017-06-30 | 2017-03-31 | 2016-12-31 | 2016-09-30 | 2016-06-30 | 2016-03-31 | 2015-12-31 | 2015-09-30 | 2015-06-30 | 2015-03-31 | 2014-12-31 | 2014-09-30 | 2014-06-30 | 2014-03-31 | ||
|---|---|---|---|---|---|---|---|---|---|---|---|---|---|---|---|---|---|---|---|---|---|---|---|---|---|---|---|---|---|---|---|---|---|---|---|---|---|---|---|---|
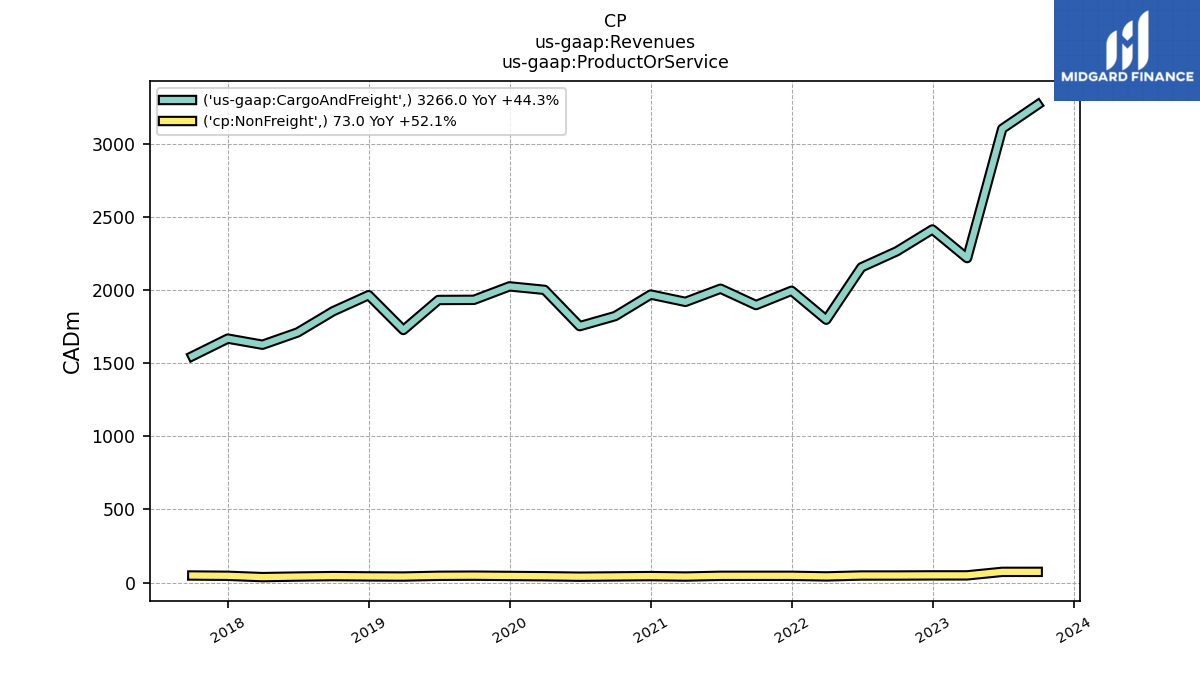
| Revenues | 3339.00 | 3174.00 | 2266.00 | 2462.00 | 2312.00 | 2202.00 | 1838.00 | 2040.00 | 1942.00 | 2054.00 | 1959.00 | 2012.00 | 1863.00 | 1792.00 | 2043.00 | 2069.00 | 1979.00 | 1977.00 | 1767.00 | 2006.00 | 1898.00 | 1750.00 | 1662.00 | 1713.00 | 1595.00 | 1643.00 | 1603.00 | 1637.00 | 1554.00 | 1450.00 | 1591.00 | 1687.00 | 1709.00 | 1651.00 | 1665.00 | 1760.00 | 1670.00 | 1681.00 | 1509.00 | |
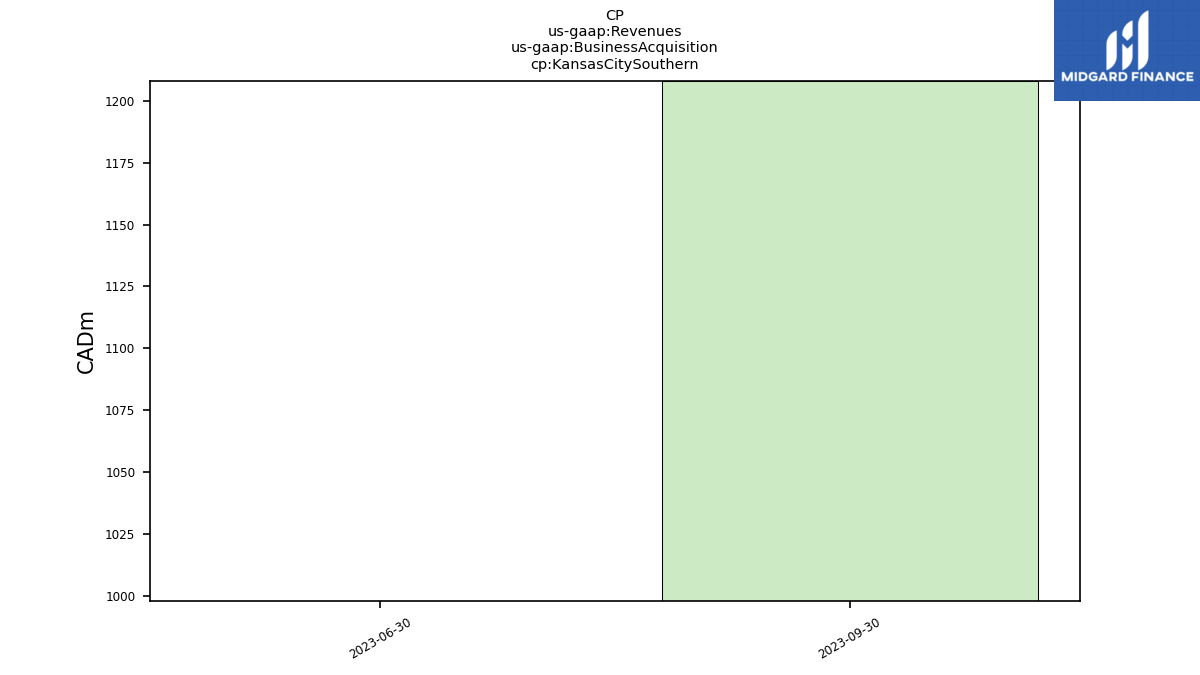
| Kansas City Southern | 1208.00 | 998.00 | NA | NA | NA | NA | NA | NA | NA | NA | NA | NA | NA | NA | NA | NA | NA | NA | NA | NA | NA | NA | NA | NA | NA | NA | NA | NA | NA | NA | NA | NA | NA | NA | NA | NA | NA | NA | NA | |
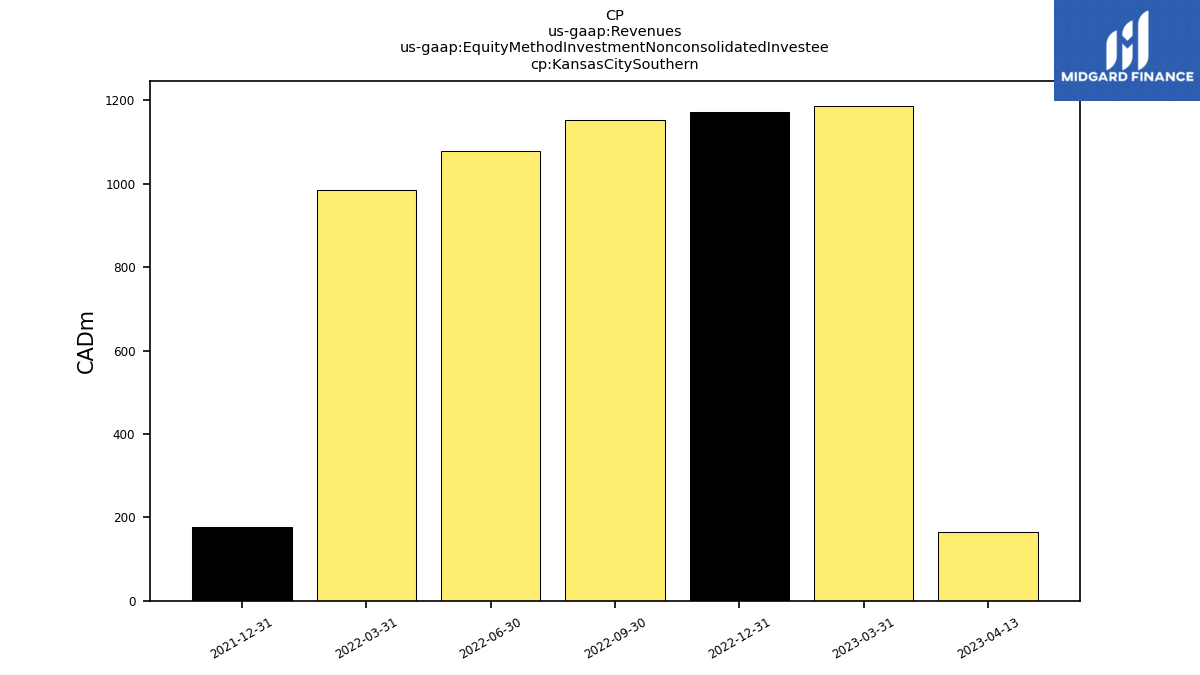
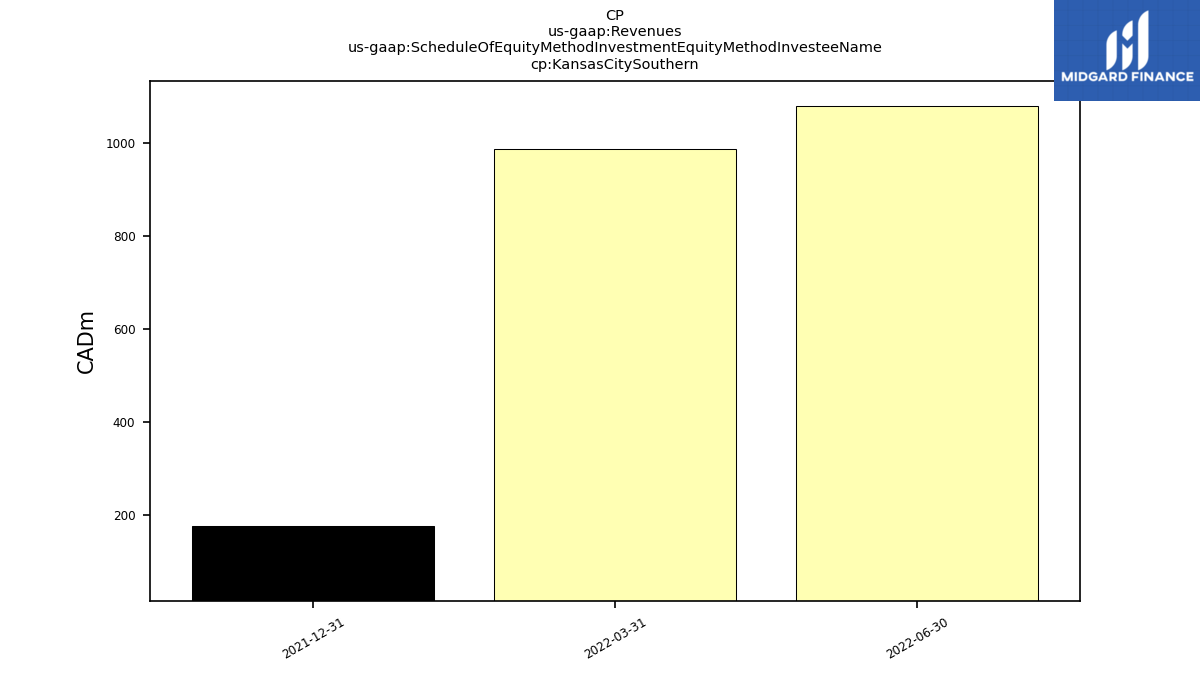
| Kansas City Southern | NA | NA | 1187.00 | 1171.00 | 1152.00 | 1079.00 | 986.00 | 178.00 | NA | NA | NA | NA | NA | NA | NA | NA | NA | NA | NA | NA | NA | NA | NA | NA | NA | NA | NA | NA | NA | NA | NA | NA | NA | NA | NA | NA | NA | NA | NA | |
| Non Freight | 73.00 | 73.00 | 49.00 | 49.00 | 48.00 | 48.00 | 42.00 | 46.00 | 46.00 | 46.00 | 41.00 | 44.00 | 42.00 | 40.00 | 43.00 | 45.00 | 47.00 | 46.00 | 41.00 | 42.00 | 44.00 | 41.00 | 37.00 | 46.00 | 48.00 | NA | NA | NA | NA | NA | NA | NA | NA | NA | NA | NA | NA | NA | NA | |
| Cargo And Freight | 3266.00 | 3101.00 | 2217.00 | 2413.00 | 2264.00 | 2154.00 | 1796.00 | 1994.00 | 1896.00 | 2008.00 | 1918.00 | 1968.00 | 1821.00 | 1752.00 | 2000.00 | 2024.00 | 1932.00 | 1931.00 | 1726.00 | 1964.00 | 1854.00 | 1709.00 | 1625.00 | 1667.00 | 1547.00 | NA | NA | NA | NA | NA | NA | NA | NA | NA | NA | NA | NA | NA | NA | |
| Kansas City Southern | NA | NA | NA | NA | NA | 1079.00 | 986.00 | 178.00 | NA | NA | NA | NA | NA | NA | NA | NA | NA | NA | NA | NA | NA | NA | NA | NA | NA | NA | NA | NA | NA | NA | NA | NA | NA | NA | NA | NA | NA | NA | NA | |
| Revenue From Contract With Customer Excluding Assessed Tax | 3305.00 | 3140.00 | 2244.00 | 2439.00 | 2292.00 | 2181.00 | 1818.00 | 2040.00 | 1921.00 | 2034.00 | 1942.00 | 2012.00 | 1848.00 | 1777.00 | 2029.00 | 2069.00 | 1964.00 | 1961.00 | 1752.00 | 2006.00 | 1882.00 | 1734.00 | 1648.00 | 1713.00 | 1581.00 | 1627.00 | 1591.00 | 1637.00 | 1554.00 | 1450.00 | 1591.00 | 1687.00 | 1709.00 | 1651.00 | 1665.00 | 1760.00 | 1670.00 | 1681.00 | 1509.00 | |
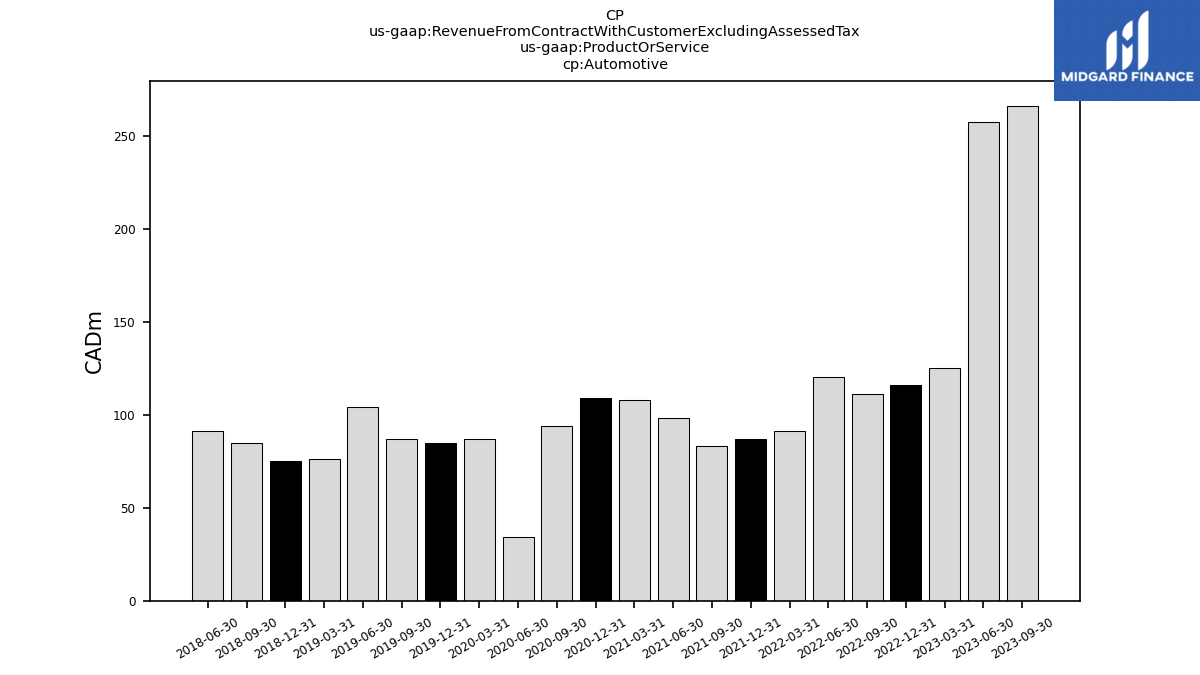
| Automotive | 266.00 | 257.00 | 125.00 | 116.00 | 111.00 | 120.00 | 91.00 | 87.00 | 83.00 | 98.00 | 108.00 | 109.00 | 94.00 | 34.00 | 87.00 | 85.00 | 87.00 | 104.00 | 76.00 | 75.00 | 85.00 | 91.00 | NA | NA | NA | NA | NA | NA | NA | NA | NA | NA | NA | NA | NA | NA | NA | NA | NA | |
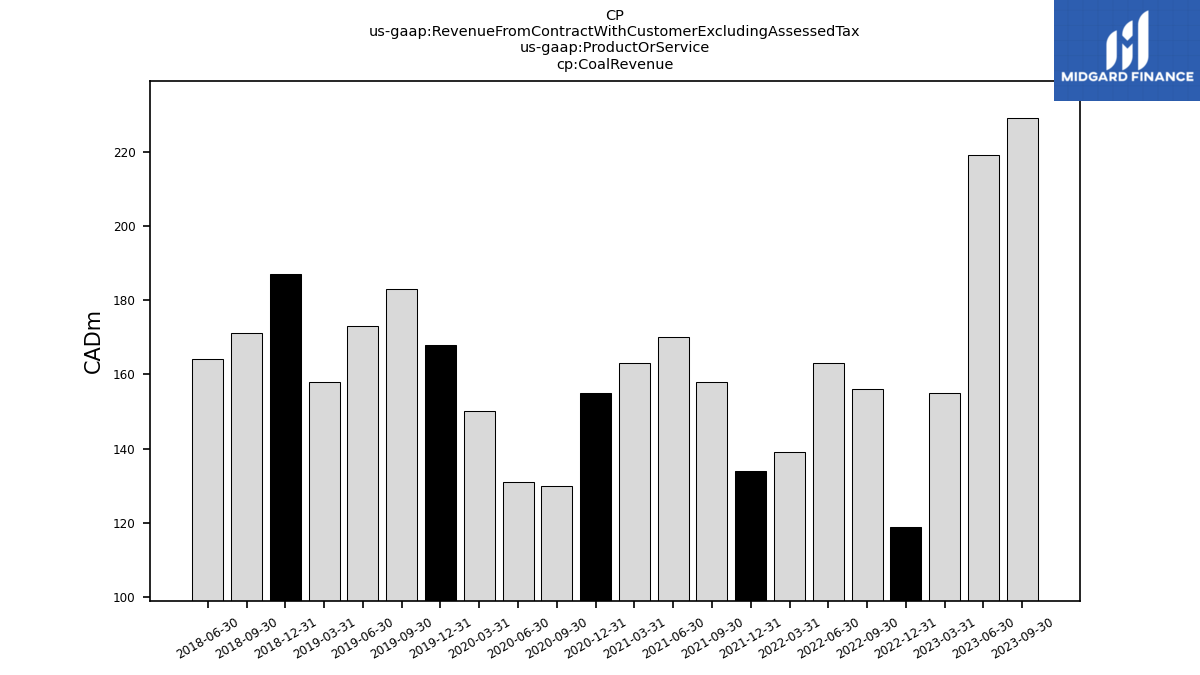
| Coal Revenue | 229.00 | 219.00 | 155.00 | 119.00 | 156.00 | 163.00 | 139.00 | 134.00 | 158.00 | 170.00 | 163.00 | 155.00 | 130.00 | 131.00 | 150.00 | 168.00 | 183.00 | 173.00 | 158.00 | 187.00 | 171.00 | 164.00 | NA | NA | NA | NA | NA | NA | NA | NA | NA | NA | NA | NA | NA | NA | NA | NA | NA | |
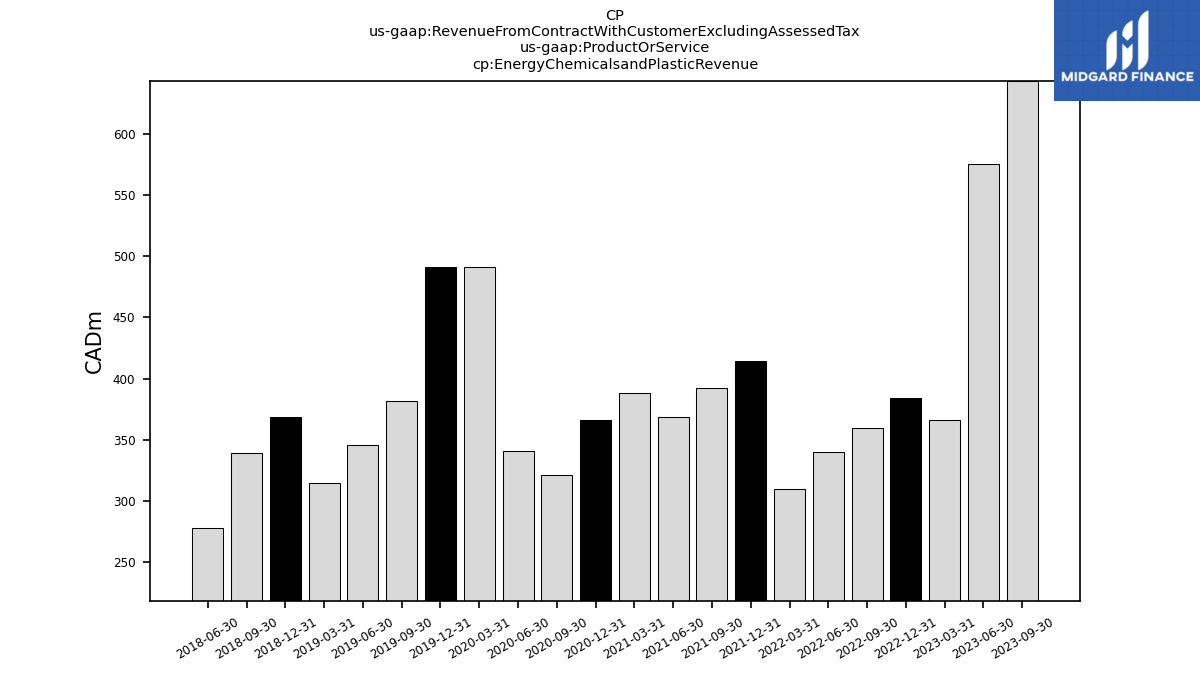
| Energy Chemicalsand Plastic Revenue | 643.00 | 575.00 | 366.00 | 384.00 | 360.00 | 340.00 | 310.00 | 414.00 | 392.00 | 369.00 | 388.00 | 366.00 | 321.00 | 341.00 | 491.00 | 491.00 | 382.00 | 346.00 | 315.00 | 369.00 | 339.00 | 278.00 | NA | NA | NA | NA | NA | NA | NA | NA | NA | NA | NA | NA | NA | NA | NA | NA | NA | |
| Fertilizerand Sulphur Revenue | 91.00 | 89.00 | 96.00 | 88.00 | 81.00 | 85.00 | 78.00 | 78.00 | 72.00 | 78.00 | 77.00 | 78.00 | 65.00 | 77.00 | 70.00 | 64.00 | 66.00 | 63.00 | 57.00 | 72.00 | 55.00 | 55.00 | NA | NA | NA | NA | NA | NA | NA | NA | NA | NA | NA | NA | NA | NA | NA | NA | NA | |
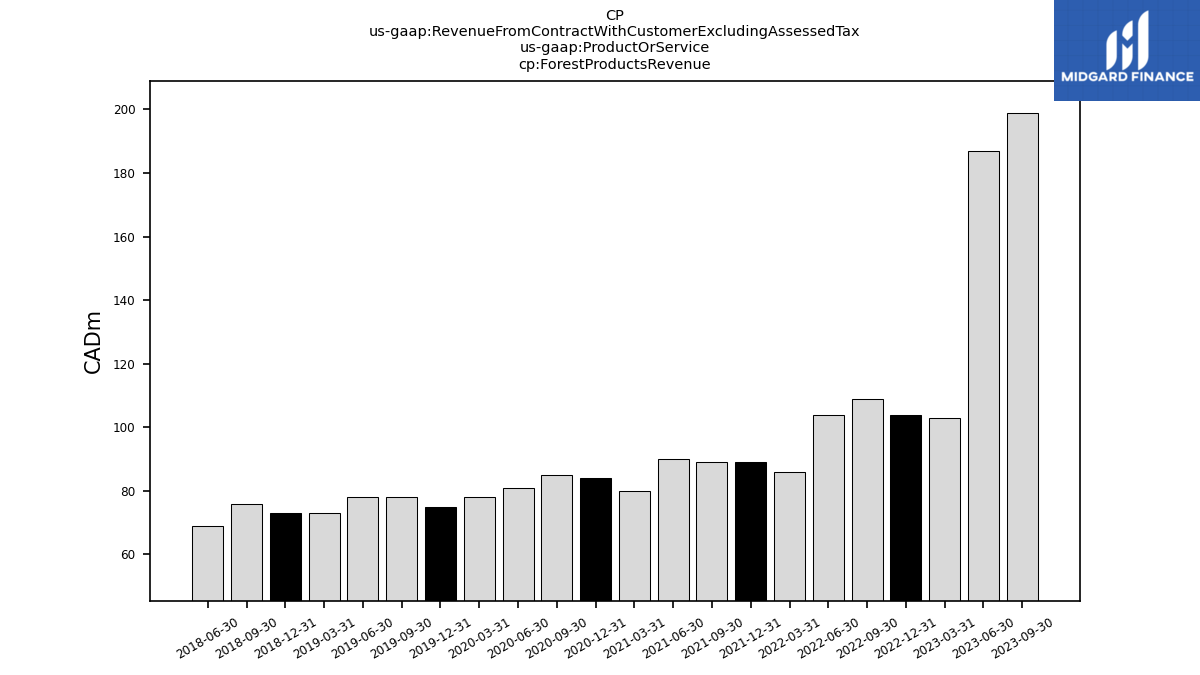
| Forest Products Revenue | 199.00 | 187.00 | 103.00 | 104.00 | 109.00 | 104.00 | 86.00 | 89.00 | 89.00 | 90.00 | 80.00 | 84.00 | 85.00 | 81.00 | 78.00 | 75.00 | 78.00 | 78.00 | 73.00 | 73.00 | 76.00 | 69.00 | NA | NA | NA | NA | NA | NA | NA | NA | NA | NA | NA | NA | NA | NA | NA | NA | NA | |
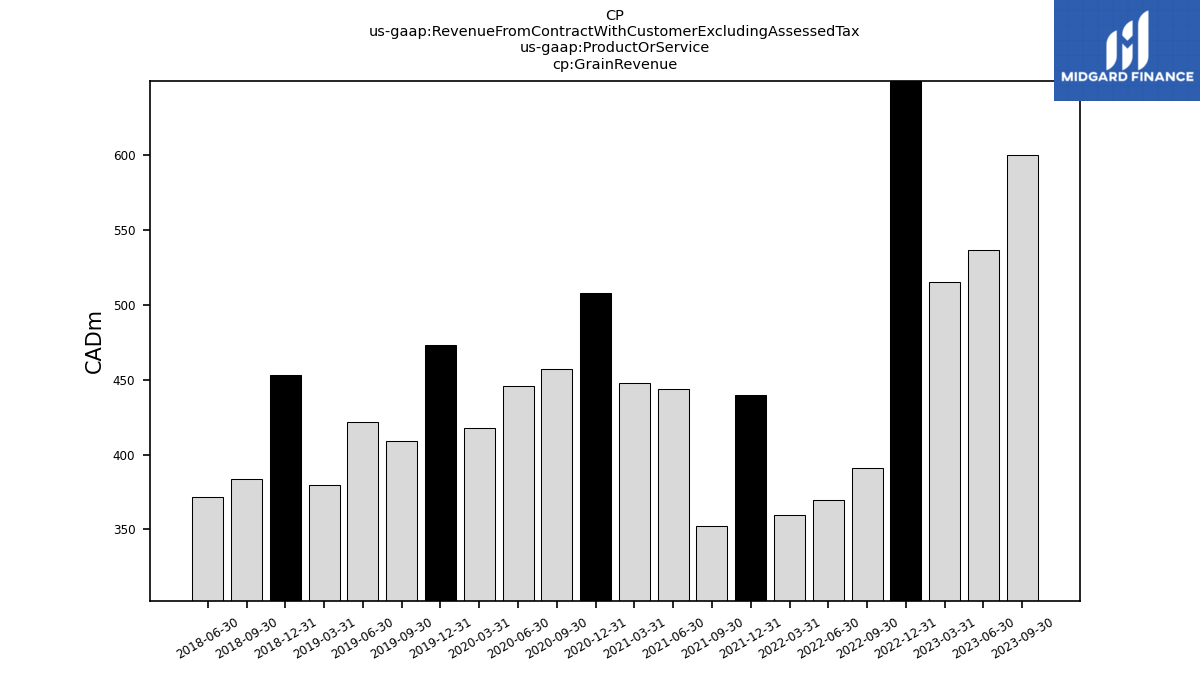
| Grain Revenue | 600.00 | 537.00 | 515.00 | 655.00 | 391.00 | 370.00 | 360.00 | 440.00 | 352.00 | 444.00 | 448.00 | 508.00 | 457.00 | 446.00 | 418.00 | 473.00 | 409.00 | 422.00 | 380.00 | 453.00 | 384.00 | 372.00 | NA | NA | NA | NA | NA | NA | NA | NA | NA | NA | NA | NA | NA | NA | NA | NA | NA | |
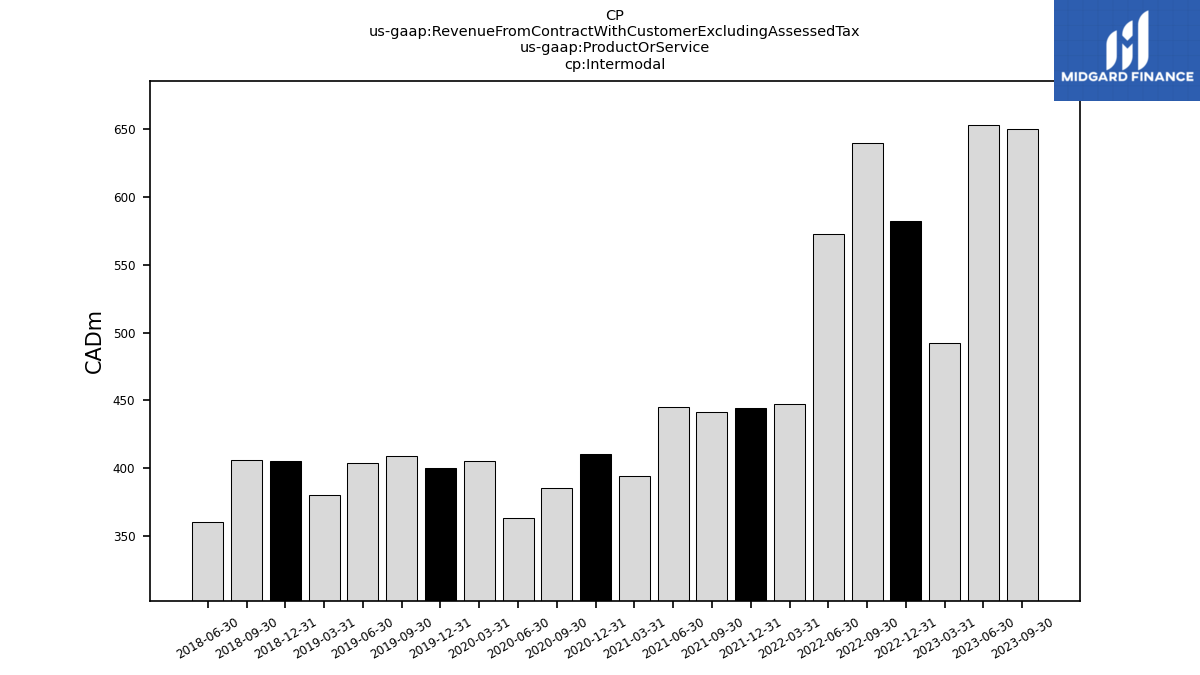
| Intermodal | 650.00 | 653.00 | 492.00 | 582.00 | 640.00 | 573.00 | 447.00 | 444.00 | 441.00 | 445.00 | 394.00 | 410.00 | 385.00 | 363.00 | 405.00 | 400.00 | 409.00 | 404.00 | 380.00 | 405.00 | 406.00 | 360.00 | NA | NA | NA | NA | NA | NA | NA | NA | NA | NA | NA | NA | NA | NA | NA | NA | NA | |
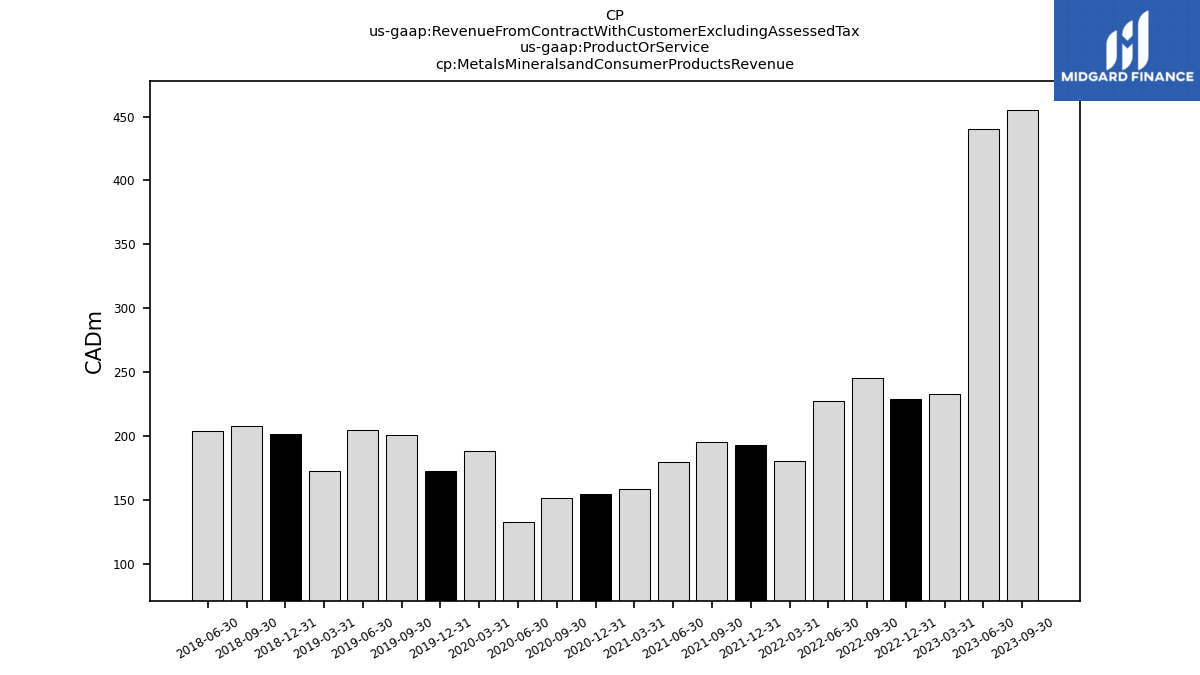
| Metals Mineralsand Consumer Products Revenue | 455.00 | 440.00 | 233.00 | 229.00 | 246.00 | 228.00 | 181.00 | 193.00 | 196.00 | 180.00 | 159.00 | 155.00 | 152.00 | 133.00 | 189.00 | 173.00 | 201.00 | 205.00 | 173.00 | 202.00 | 208.00 | 204.00 | NA | NA | NA | NA | NA | NA | NA | NA | NA | NA | NA | NA | NA | NA | NA | NA | NA | |
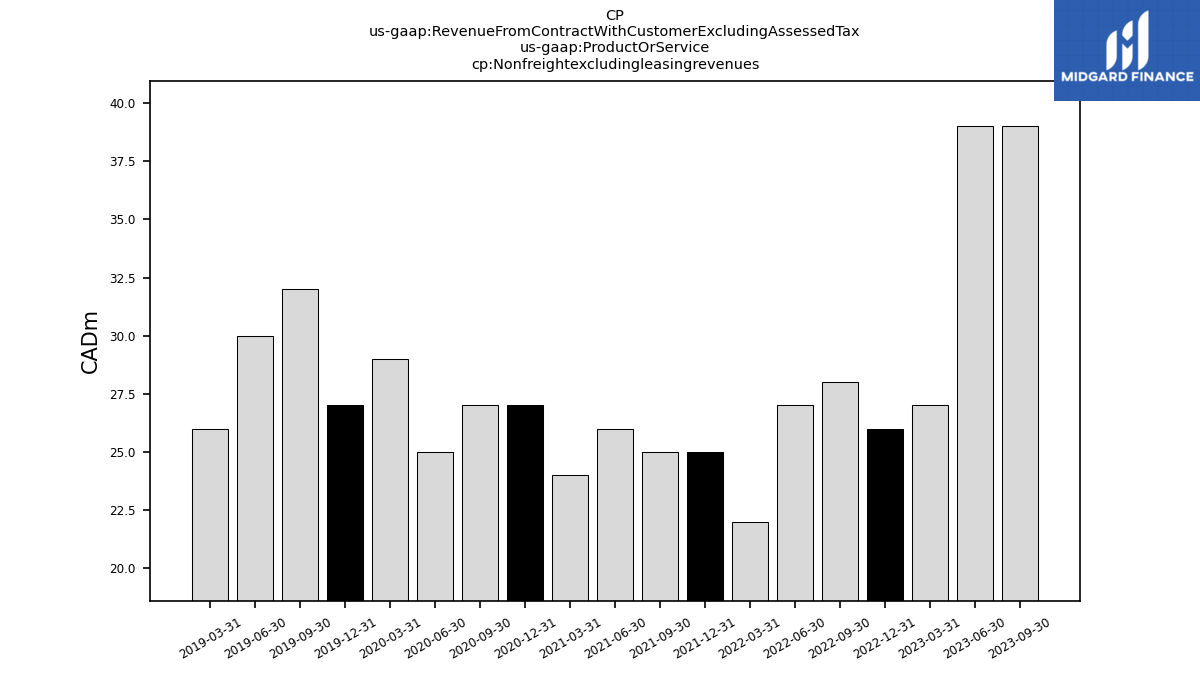
| Nonfreightexcludingleasingrevenues | 39.00 | 39.00 | 27.00 | 26.00 | 28.00 | 27.00 | 22.00 | 25.00 | 25.00 | 26.00 | 24.00 | 27.00 | 27.00 | 25.00 | 29.00 | 27.00 | 32.00 | 30.00 | 26.00 | NA | NA | NA | NA | NA | NA | NA | NA | NA | NA | NA | NA | NA | NA | NA | NA | NA | NA | NA | NA | |
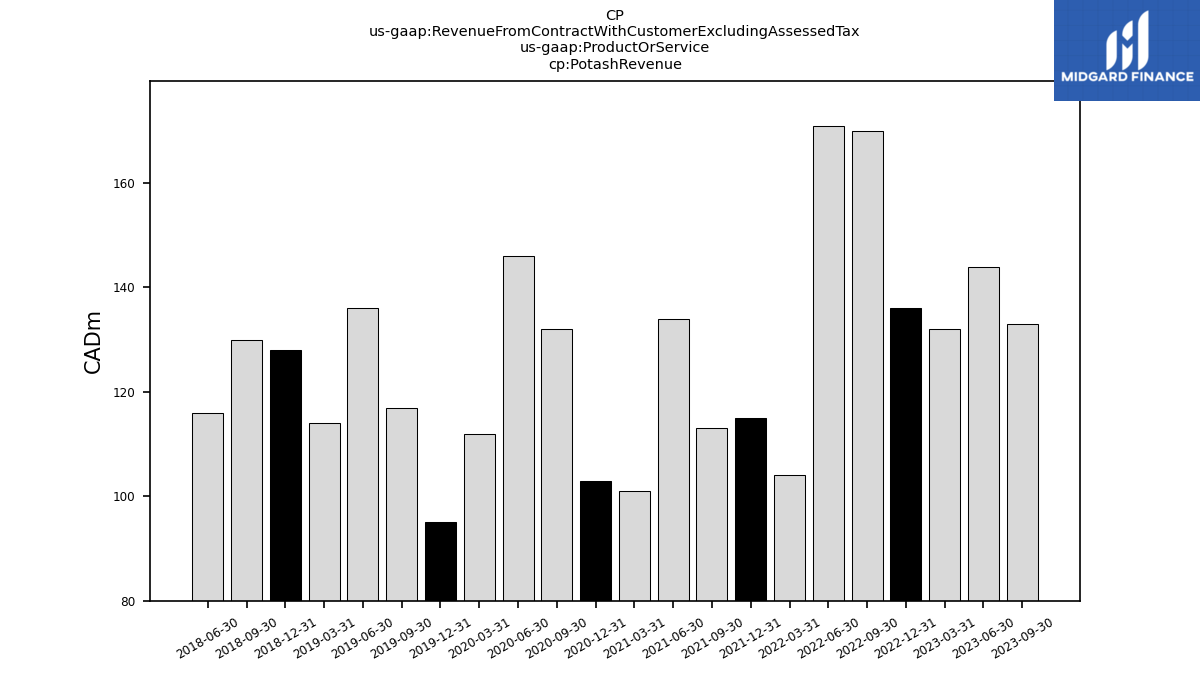
| Potash Revenue | 133.00 | 144.00 | 132.00 | 136.00 | 170.00 | 171.00 | 104.00 | 115.00 | 113.00 | 134.00 | 101.00 | 103.00 | 132.00 | 146.00 | 112.00 | 95.00 | 117.00 | 136.00 | 114.00 | 128.00 | 130.00 | 116.00 | NA | NA | NA | NA | NA | NA | NA | NA | NA | NA | NA | NA | NA | NA | NA | NA | NA | |
| Cargo And Freight | 3266.00 | 3101.00 | 2217.00 | 2413.00 | 2264.00 | 2154.00 | 1796.00 | 1994.00 | 1896.00 | 2008.00 | 1918.00 | 1968.00 | 1821.00 | 1752.00 | 2000.00 | 2024.00 | 1932.00 | 1931.00 | 1726.00 | 1964.00 | 1854.00 | 1709.00 | 1625.00 | 1667.00 | 1547.00 | NA | NA | NA | NA | NA | NA | NA | NA | NA | NA | NA | NA | NA | NA |


