
| 2024-03-31 | 2023-12-31 | 2023-09-30 | 2023-06-30 | 2023-03-31 | 2022-12-31 | 2022-09-30 | 2022-06-30 | 2022-03-31 | 2021-12-31 | 2021-09-30 | 2021-06-30 | 2021-03-31 | 2020-12-31 | 2020-09-30 | 2020-06-30 | 2020-03-31 | 2019-12-31 | 2019-09-30 | 2019-06-30 | 2019-03-31 | 2018-12-31 | 2018-10-31 | 2018-09-30 | 2018-07-31 | 2018-06-30 | 2018-04-30 | 2018-03-31 | 2018-01-31 | 2017-10-31 | 2017-07-31 | 2017-04-30 | 2017-01-31 | 2016-10-31 | 2016-07-31 | 2016-04-30 | 2016-01-31 | 2015-10-31 | 2015-07-31 | 2015-04-30 | 2015-01-31 | 2014-10-31 | 2014-07-31 | 2014-04-30 | 2014-01-31 | 2013-10-31 | 2013-07-31 | 2013-04-30 | 2013-01-31 | 2012-10-31 | 2012-07-31 | 2012-04-30 | ||
|---|---|---|---|---|---|---|---|---|---|---|---|---|---|---|---|---|---|---|---|---|---|---|---|---|---|---|---|---|---|---|---|---|---|---|---|---|---|---|---|---|---|---|---|---|---|---|---|---|---|---|---|---|---|
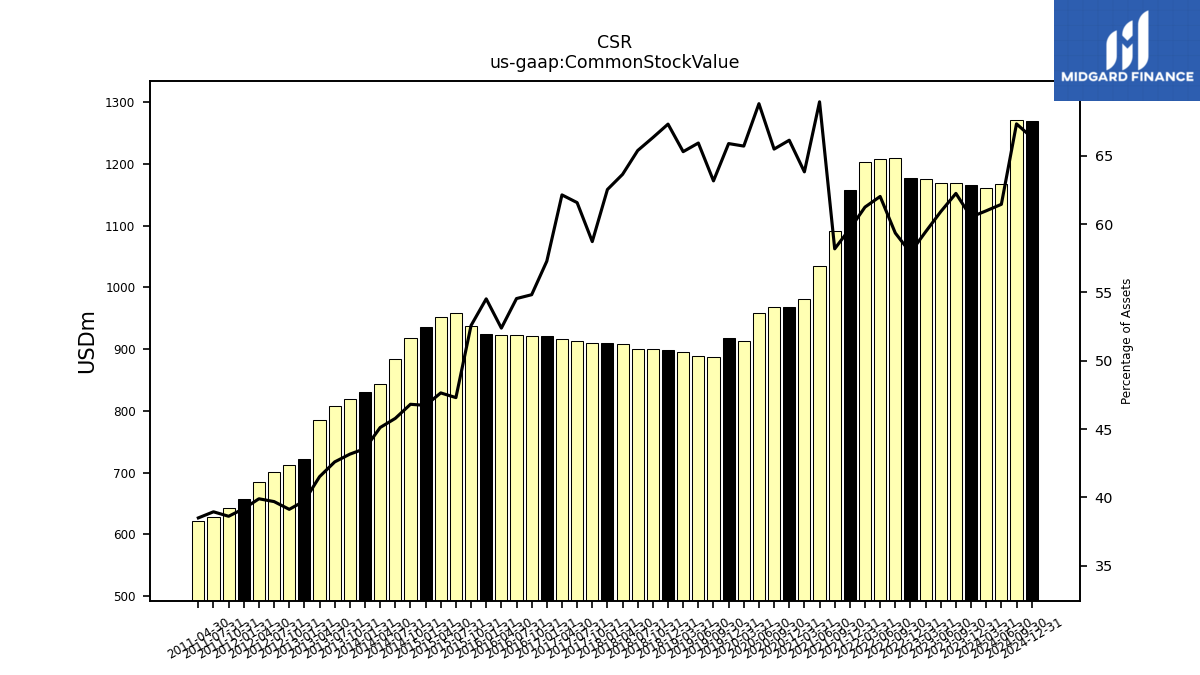
| Common Stock Value | 1160.49 | 1165.69 | 1169.03 | 1169.50 | 1176.06 | 1177.48 | 1209.73 | 1207.85 | 1203.68 | 1157.26 | 1092.13 | 1033.94 | 980.45 | 968.26 | 968.44 | 958.29 | 912.65 | 917.40 | 886.60 | 888.54 | 895.38 | 899.23 | 900.53 | NA | 899.71 | NA | 907.84 | NA | 910.17 | 910.68 | 912.62 | 916.12 | 921.74 | 920.76 | 922.70 | 922.08 | 924.66 | 936.89 | 957.71 | 951.87 | 935.29 | 918.22 | 884.41 | 843.27 | 829.82 | 818.52 | 807.93 | 784.45 | 721.74 | 711.88 | 701.43 | 684.05 | |
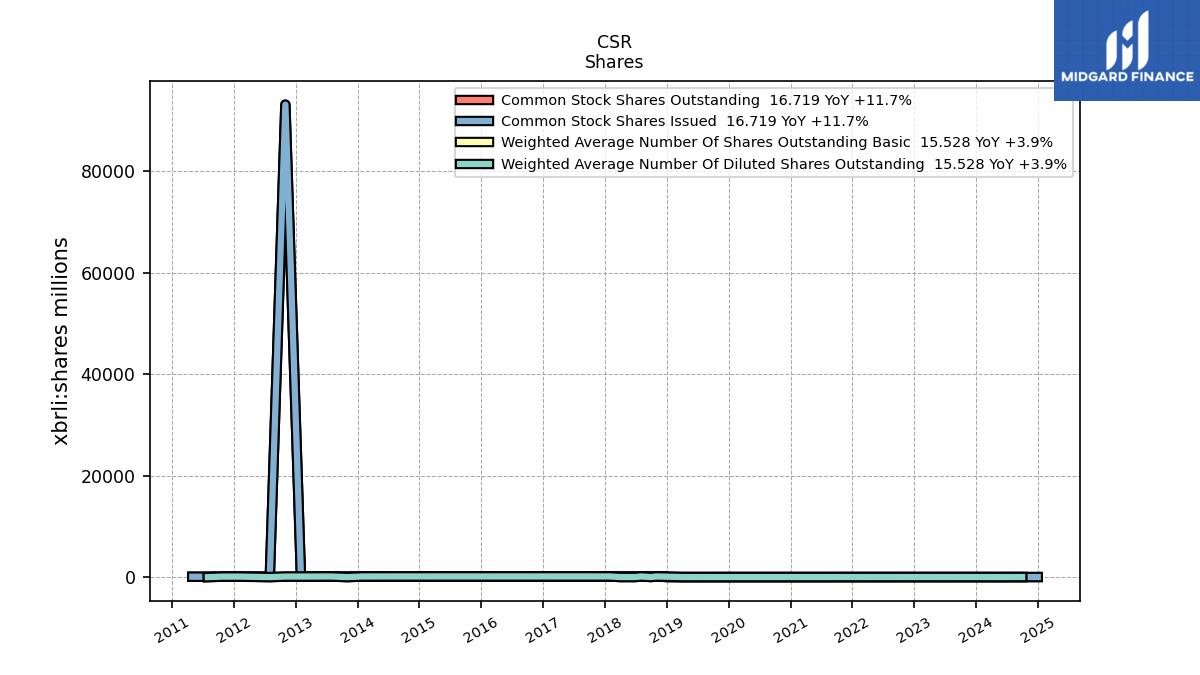
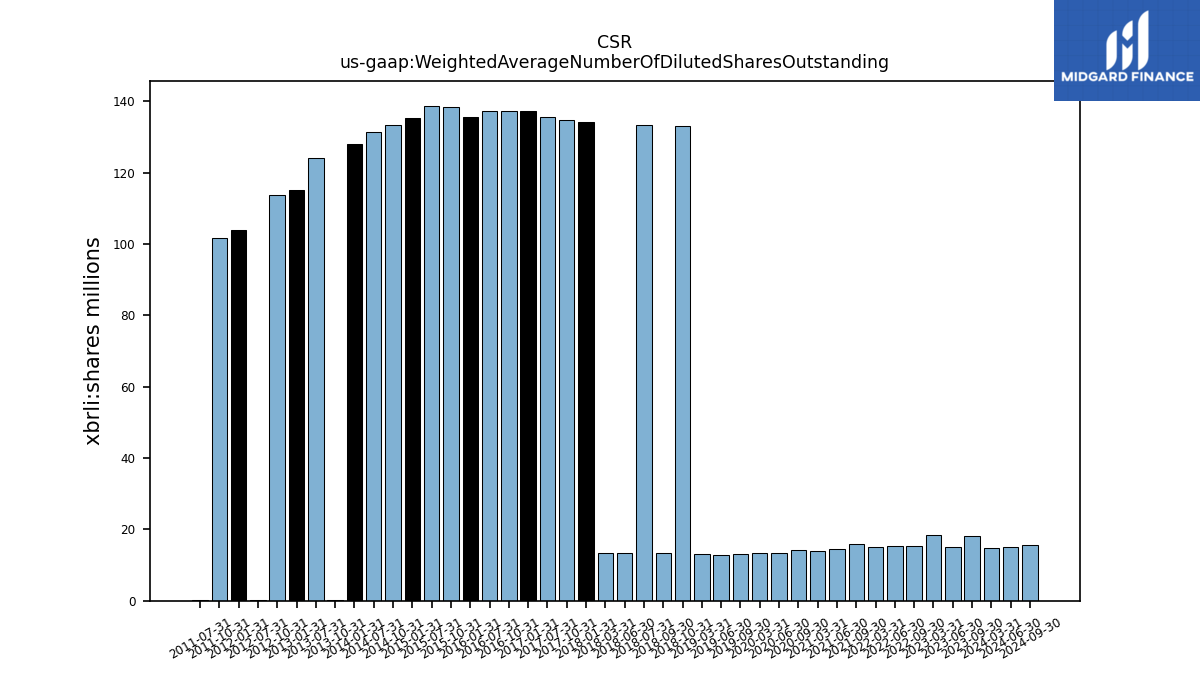
| Weighted Average Number Of Diluted Shares Outstanding | 14.92 | NA | 18.02 | 14.95 | 18.36 | NA | 15.37 | 15.37 | 15.10 | NA | 15.92 | 14.51 | 14.04 | NA | 14.14 | 13.32 | 13.40 | NA | 13.09 | 12.96 | 13.13 | NA | 133.19 | 13.32 | 133.27 | 13.34 | NA | 13.40 | 134.18 | 134.77 | 135.55 | NA | 137.38 | 137.42 | 137.40 | NA | 135.74 | 138.56 | 138.81 | NA | 135.32 | 133.29 | 131.33 | NA | 128.03 | 0.13 | 124.18 | NA | 115.21 | 113.69 | 0.11 | NA | |
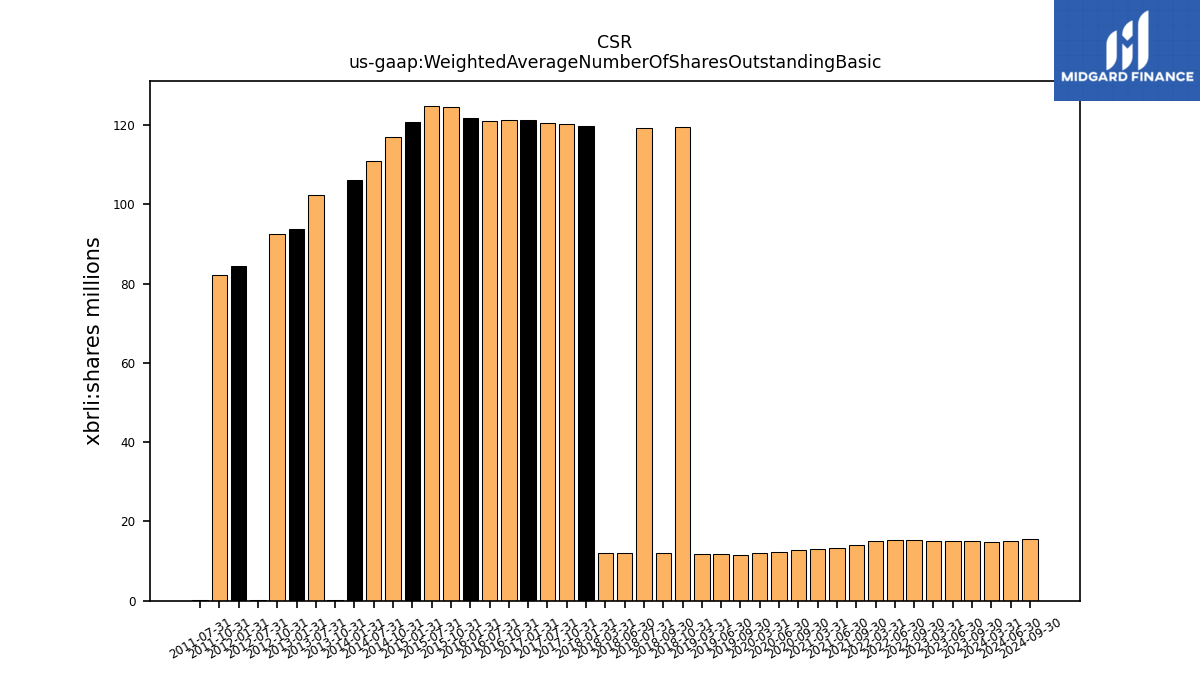
| Weighted Average Number Of Shares Outstanding Basic | 14.92 | NA | 14.99 | 14.95 | 15.03 | NA | 15.37 | 15.37 | 15.10 | NA | 14.06 | 13.35 | 13.08 | NA | 12.88 | 12.28 | 12.10 | NA | 11.62 | 11.73 | 11.76 | NA | 119.40 | 11.93 | 119.25 | 11.93 | NA | 11.97 | 119.74 | 120.14 | 120.42 | NA | 121.25 | 121.15 | 121.12 | NA | 121.86 | 124.67 | 124.86 | NA | 120.86 | 117.03 | 111.04 | NA | 106.21 | 0.10 | 102.36 | NA | 93.79 | 92.47 | 0.09 | NA | |
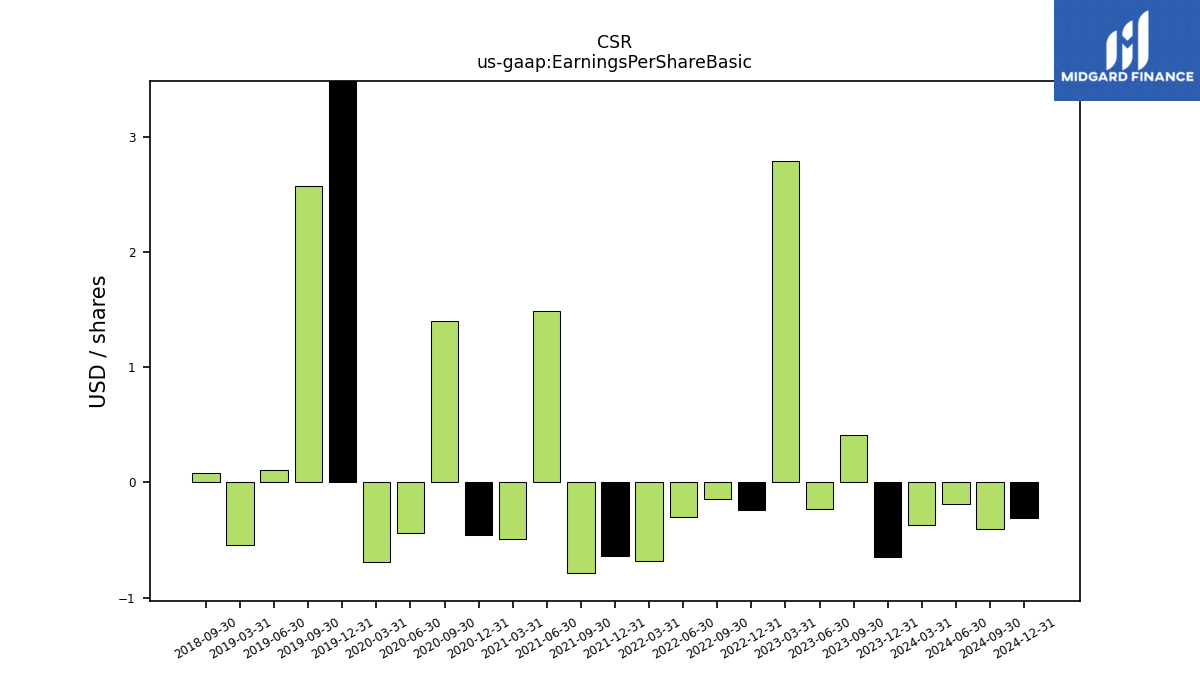
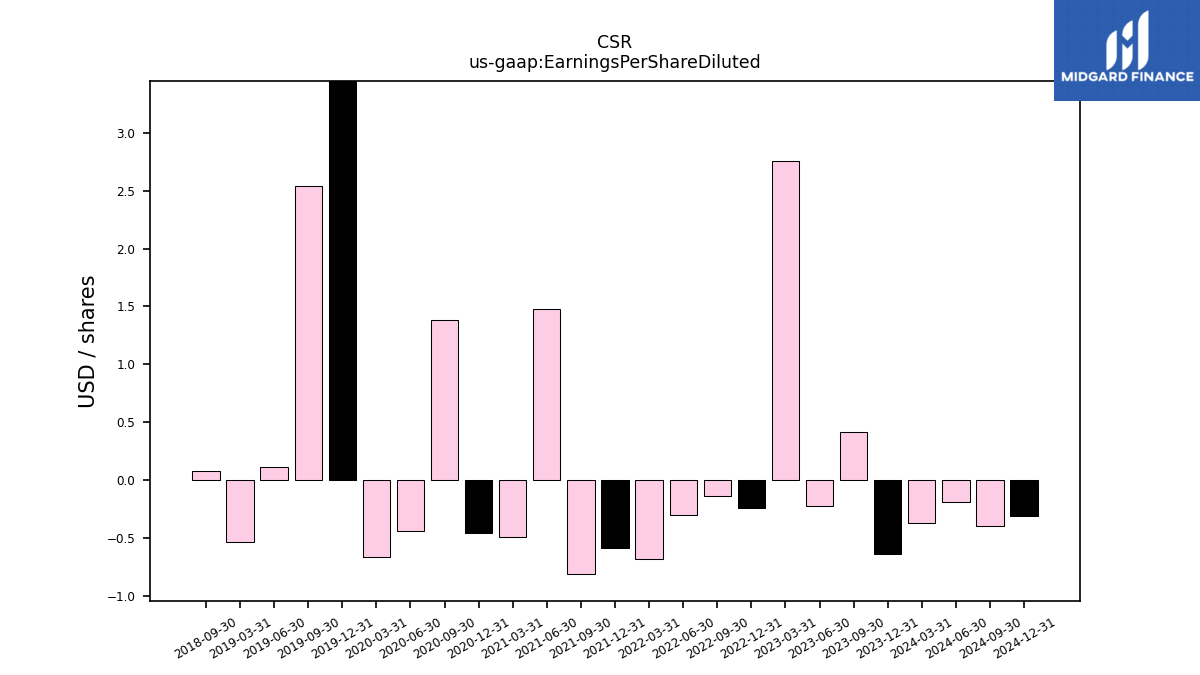
| Earnings Per Share Basic | -0.37 | -0.65 | 0.41 | -0.23 | 2.79 | -0.24 | -0.14 | -0.30 | -0.68 | -0.64 | -0.79 | 1.49 | -0.49 | -0.46 | 1.40 | -0.44 | -0.69 | 3.95 | 2.57 | 0.11 | -0.54 | NA | NA | 0.08 | NA | NA | NA | NA | NA | NA | NA | NA | NA | NA | NA | NA | NA | NA | NA | NA | NA | NA | NA | NA | NA | NA | NA | NA | NA | NA | NA | NA | |
| Earnings Per Share Diluted | -0.37 | -0.64 | 0.41 | -0.23 | 2.76 | -0.24 | -0.14 | -0.30 | -0.68 | -0.59 | -0.81 | 1.48 | -0.49 | -0.46 | 1.38 | -0.44 | -0.67 | 3.89 | 2.54 | 0.11 | -0.54 | NA | NA | 0.08 | NA | NA | NA | NA | NA | NA | NA | NA | NA | NA | NA | NA | NA | NA | NA | NA | NA | NA | NA | NA | NA | NA | NA | NA | NA | NA | NA | NA |
| 2024-03-31 | 2023-12-31 | 2023-09-30 | 2023-06-30 | 2023-03-31 | 2022-12-31 | 2022-09-30 | 2022-06-30 | 2022-03-31 | 2021-12-31 | 2021-09-30 | 2021-06-30 | 2021-03-31 | 2020-12-31 | 2020-09-30 | 2020-06-30 | 2020-03-31 | 2019-12-31 | 2019-09-30 | 2019-06-30 | 2019-03-31 | 2018-12-31 | 2018-10-31 | 2018-09-30 | 2018-07-31 | 2018-06-30 | 2018-04-30 | 2018-03-31 | 2018-01-31 | 2017-10-31 | 2017-07-31 | 2017-04-30 | 2017-01-31 | 2016-10-31 | 2016-07-31 | 2016-04-30 | 2016-01-31 | 2015-10-31 | 2015-07-31 | 2015-04-30 | 2015-01-31 | 2014-10-31 | 2014-07-31 | 2014-04-30 | 2014-01-31 | 2013-10-31 | 2013-07-31 | 2013-04-30 | 2013-01-31 | 2012-10-31 | 2012-07-31 | 2012-04-30 | ||
|---|---|---|---|---|---|---|---|---|---|---|---|---|---|---|---|---|---|---|---|---|---|---|---|---|---|---|---|---|---|---|---|---|---|---|---|---|---|---|---|---|---|---|---|---|---|---|---|---|---|---|---|---|---|
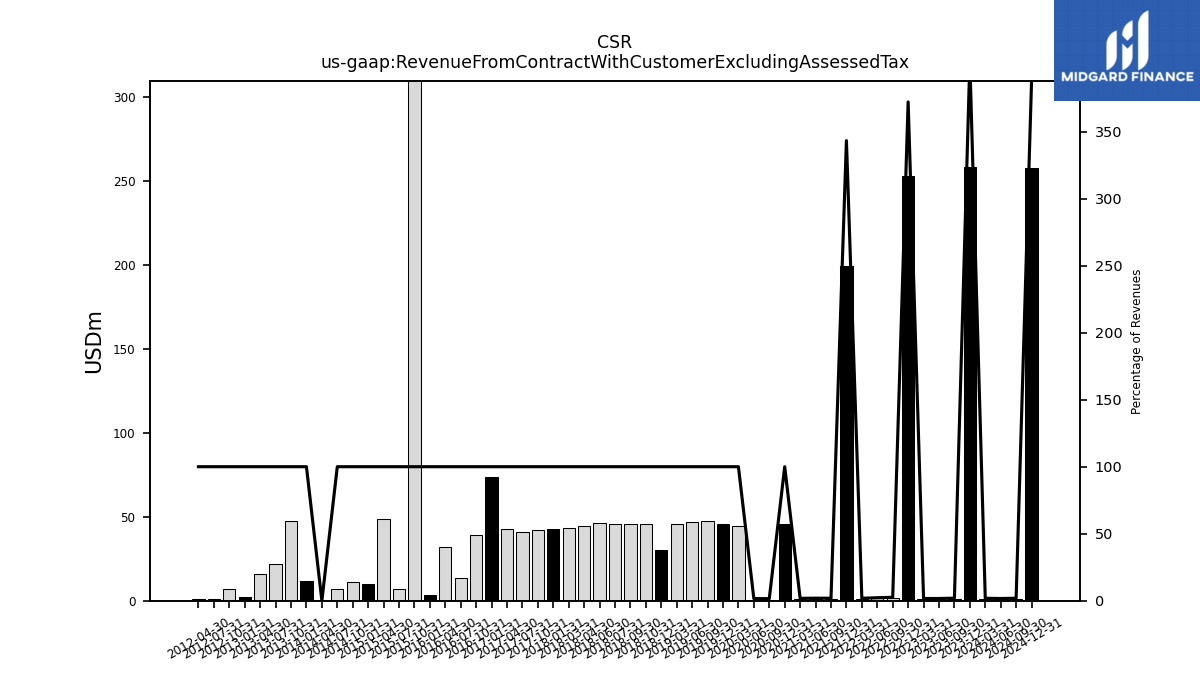
| Revenue From Contract With Customer Excluding Assessed Tax | 1.19 | 257.85 | 1.24 | 1.09 | 1.13 | 252.49 | 1.68 | 1.43 | 1.12 | 199.05 | 0.95 | 0.89 | 0.84 | 45.54 | 0.70 | 0.70 | 44.41 | 45.78 | 47.44 | 46.93 | 45.61 | 30.29 | 45.64 | 45.41 | 45.95 | 46.20 | 44.19 | 43.03 | 42.72 | 41.87 | 40.98 | 42.81 | 73.90 | 39.20 | 13.65 | 31.81 | 3.50 | 371.90 | 7.00 | 48.43 | 10.00 | 10.90 | 6.70 | 0.00 | 11.74 | 47.35 | 21.79 | 16.10 | 1.95 | 7.27 | 0.95 | 1.06 | |
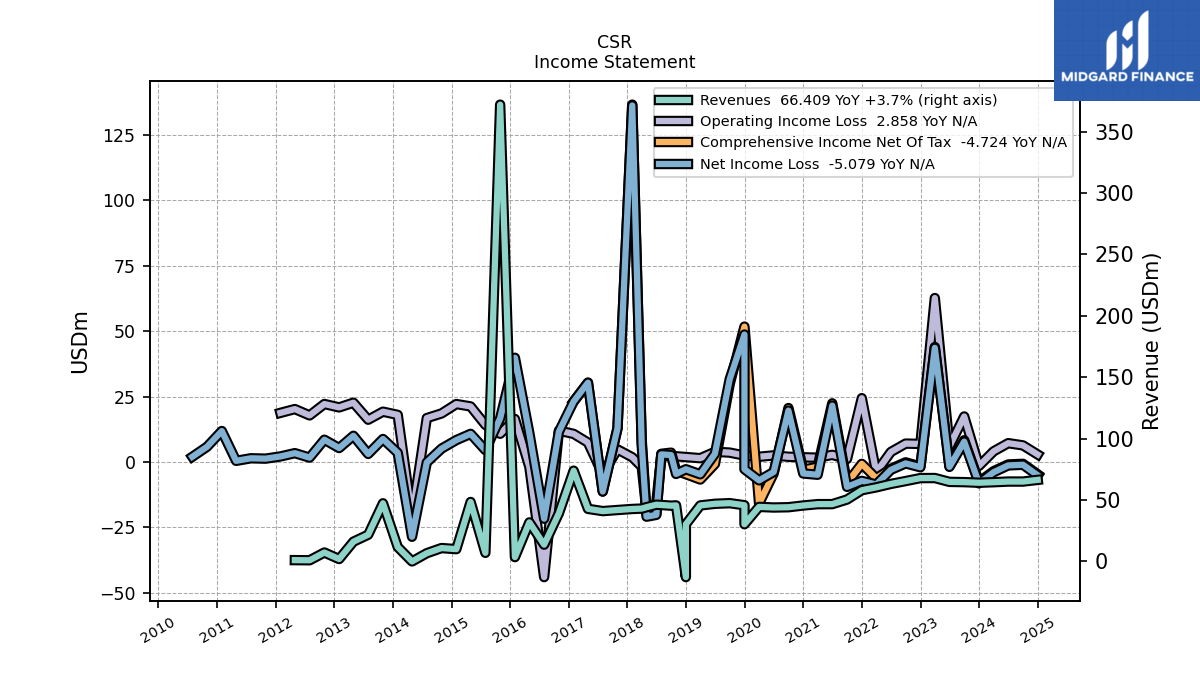
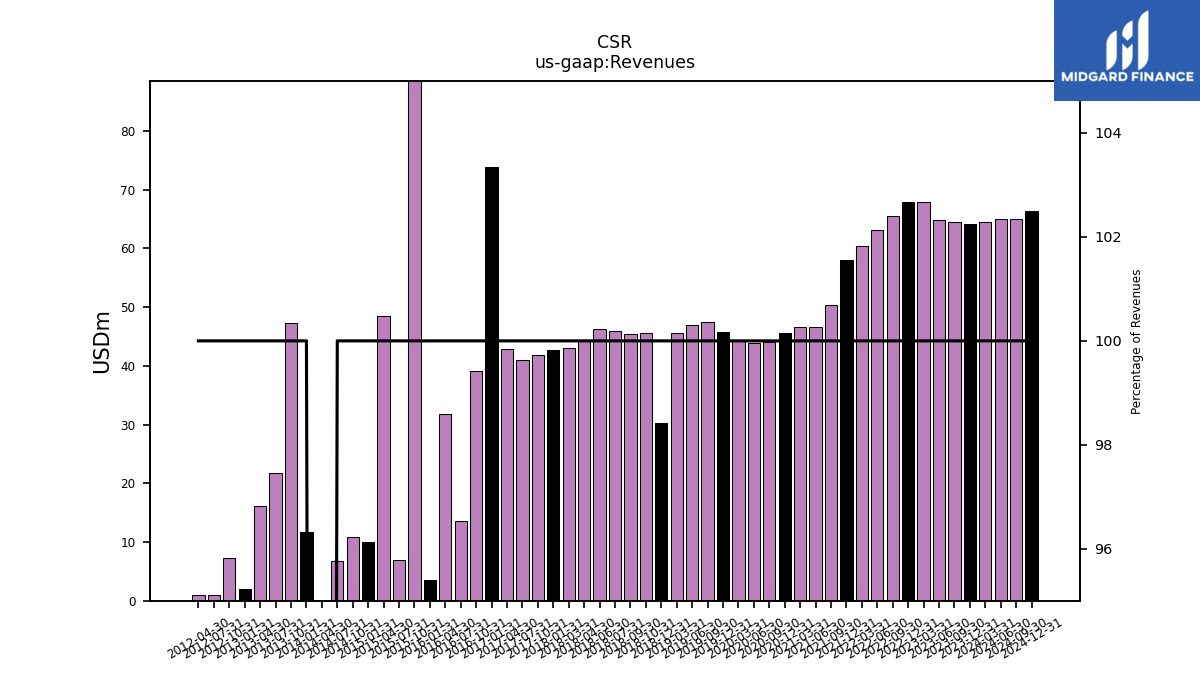
| Revenues | 64.51 | 64.07 | 64.57 | 64.78 | 67.90 | 67.85 | 65.44 | 63.12 | 60.31 | 57.99 | 50.41 | 46.66 | 46.65 | 45.54 | 44.14 | 43.91 | 44.41 | 45.78 | 47.44 | 46.93 | 45.61 | 30.29 | 45.64 | 45.41 | 45.95 | 46.20 | 44.19 | 43.03 | 42.72 | 41.87 | 40.98 | 42.81 | 73.90 | 39.20 | 13.65 | 31.81 | 3.50 | 371.90 | 7.00 | 48.43 | 10.00 | 10.90 | 6.70 | 0.00 | 11.74 | 47.35 | 21.79 | 16.10 | 1.95 | 7.27 | 0.95 | 1.06 | |
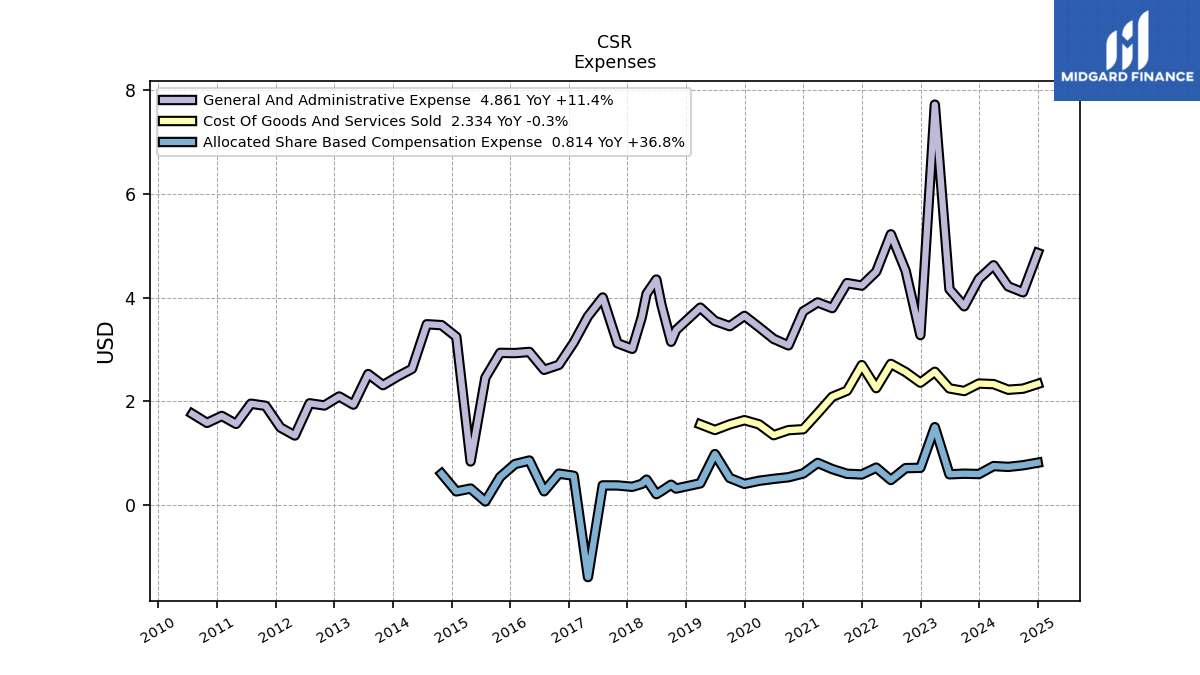
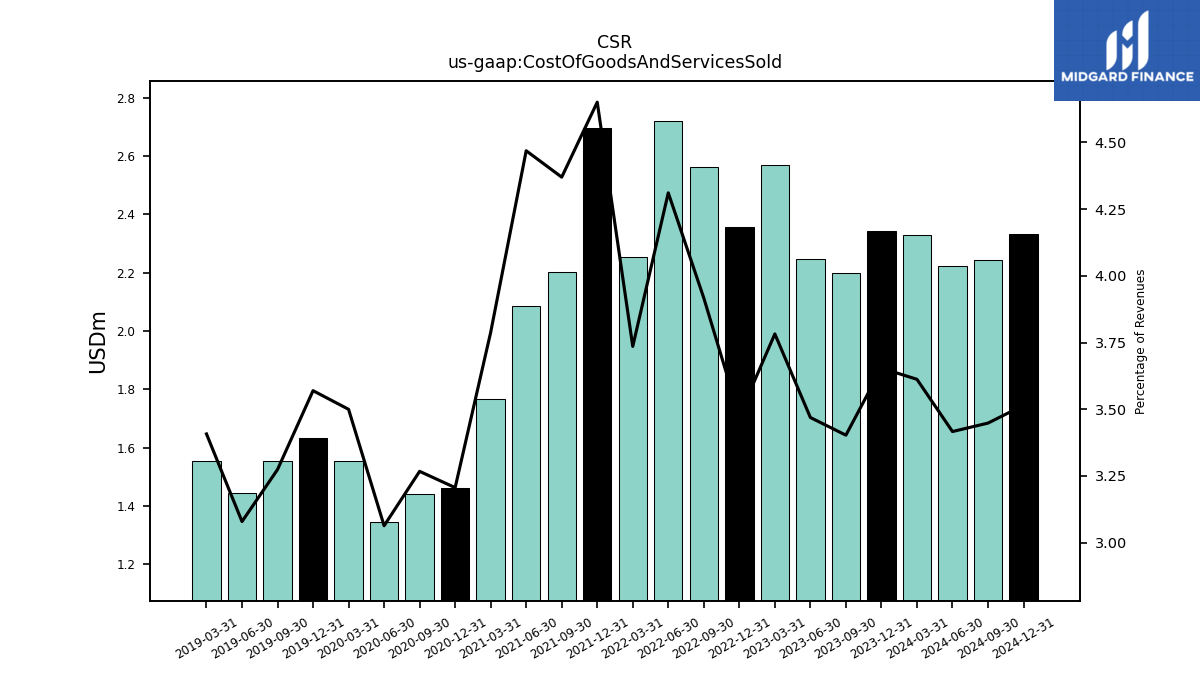
| Cost Of Goods And Services Sold | 2.33 | 2.34 | 2.20 | 2.25 | 2.57 | 2.36 | 2.56 | 2.72 | 2.25 | 2.70 | 2.20 | 2.08 | 1.77 | 1.46 | 1.44 | 1.34 | 1.55 | 1.63 | 1.55 | 1.45 | 1.55 | NA | NA | NA | NA | NA | NA | NA | NA | NA | NA | NA | NA | NA | NA | NA | NA | NA | NA | NA | NA | NA | NA | NA | NA | NA | NA | NA | NA | NA | NA | NA | |
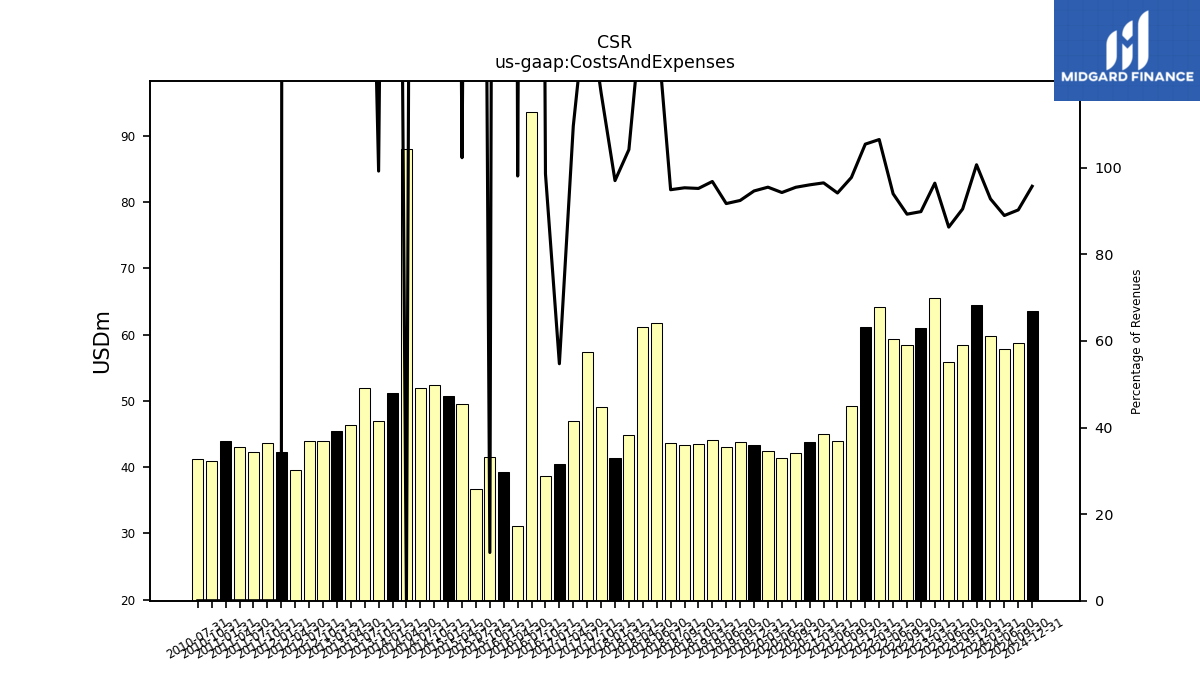
| Costs And Expenses | 59.85 | 64.49 | 58.41 | 55.88 | 65.46 | 60.96 | 58.41 | 59.31 | 64.22 | 61.13 | 49.27 | 43.92 | 45.01 | 43.73 | 42.14 | 41.39 | 42.40 | 43.31 | 43.84 | 43.04 | 44.15 | NA | 43.45 | 43.29 | 43.60 | 61.67 | 61.17 | 44.83 | 41.44 | 49.11 | 57.44 | 46.92 | 40.44 | 38.63 | 93.56 | 31.20 | 39.34 | 41.48 | 36.77 | 49.54 | 50.79 | 52.34 | 51.86 | 87.92 | 51.15 | 46.98 | 52.00 | 46.43 | 45.38 | 43.88 | 43.97 | 39.60 | |
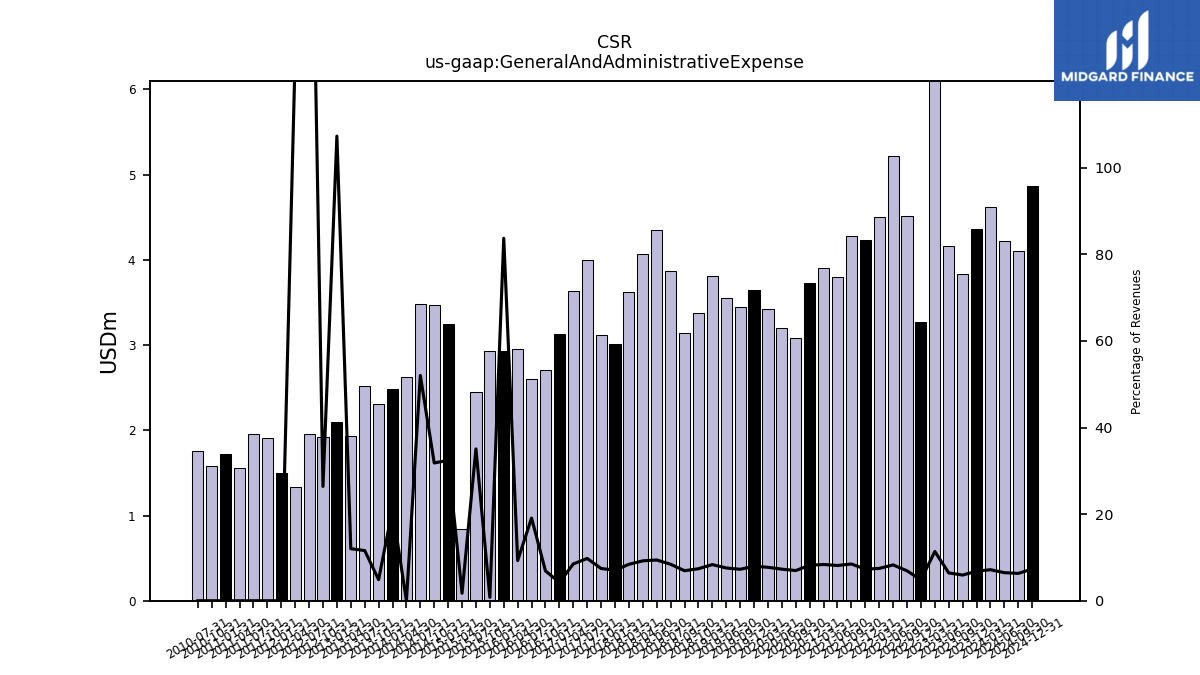
| General And Administrative Expense | 4.62 | 4.36 | 3.83 | 4.16 | 7.72 | 3.28 | 4.52 | 5.22 | 4.50 | 4.23 | 4.28 | 3.80 | 3.91 | 3.73 | 3.08 | 3.20 | 3.43 | 3.65 | 3.45 | 3.55 | 3.81 | NA | 3.37 | 3.15 | 3.87 | 4.35 | 4.07 | 3.62 | 3.01 | 3.12 | 4.00 | 3.64 | 3.13 | 2.70 | 2.61 | 2.95 | 2.93 | 2.93 | 2.45 | 0.84 | 3.24 | 3.47 | 3.48 | 2.62 | 2.48 | 2.31 | 2.52 | 1.93 | 2.09 | 1.92 | 1.96 | 1.34 | |
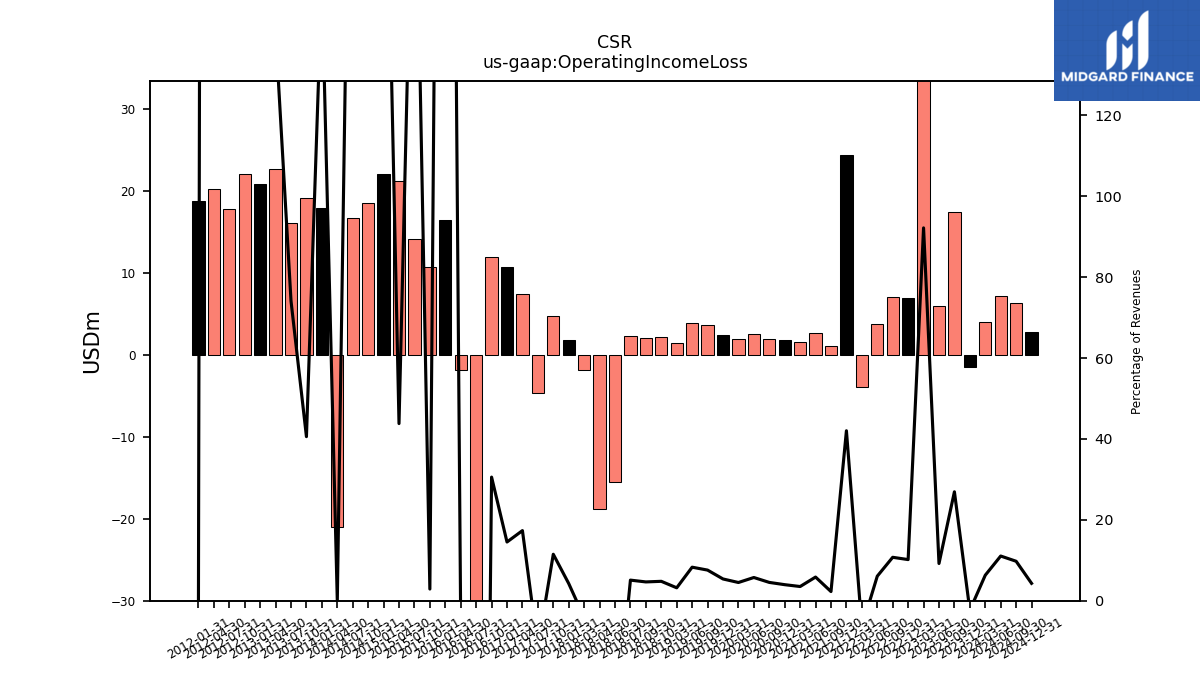
| Operating Income Loss | 4.08 | -1.50 | 17.39 | 5.97 | 62.60 | 6.91 | 7.03 | 3.83 | -3.91 | 24.37 | 1.14 | 2.73 | 1.64 | 1.81 | 2.00 | 2.52 | 2.00 | 2.47 | 3.60 | 3.90 | 1.46 | NA | 2.19 | 2.11 | 2.34 | -15.47 | -18.81 | -1.79 | 1.82 | 4.81 | -4.70 | 7.43 | 10.73 | 11.98 | -43.94 | -1.88 | 16.43 | 10.79 | 14.18 | 21.22 | 22.12 | 18.54 | 16.77 | -20.94 | 17.99 | 19.21 | 16.15 | 22.64 | 20.85 | 22.14 | 17.79 | 20.21 | |
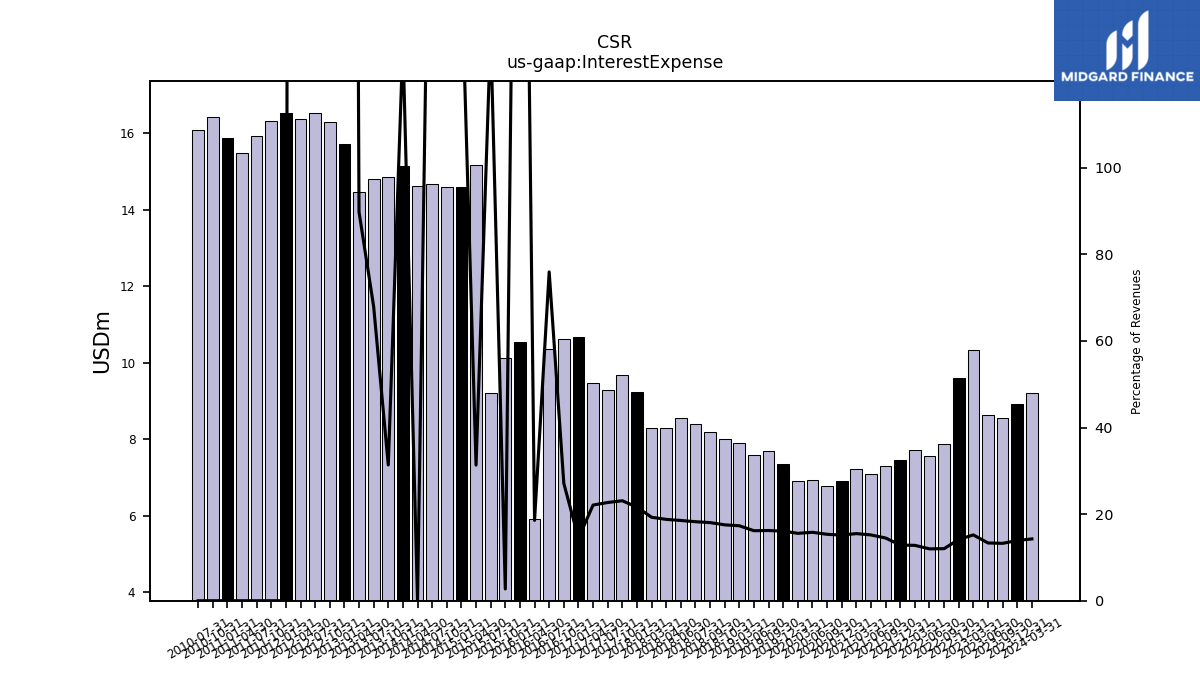
| Interest Expense | 9.21 | 8.91 | 8.56 | 8.64 | 10.32 | 9.60 | 7.87 | 7.56 | 7.71 | 7.46 | 7.30 | 7.09 | 7.23 | 6.90 | 6.77 | 6.94 | 6.91 | 7.36 | 7.69 | 7.59 | 7.90 | NA | 8.00 | 8.19 | 8.38 | 8.56 | 8.30 | 8.30 | 9.24 | 9.67 | 9.29 | 9.46 | 10.68 | 10.63 | 10.36 | 5.90 | 10.54 | 10.13 | 9.20 | 15.16 | 14.60 | 14.60 | 14.66 | 14.62 | 15.13 | 14.85 | 14.80 | 14.45 | 15.72 | 16.30 | 16.52 | 16.36 | |
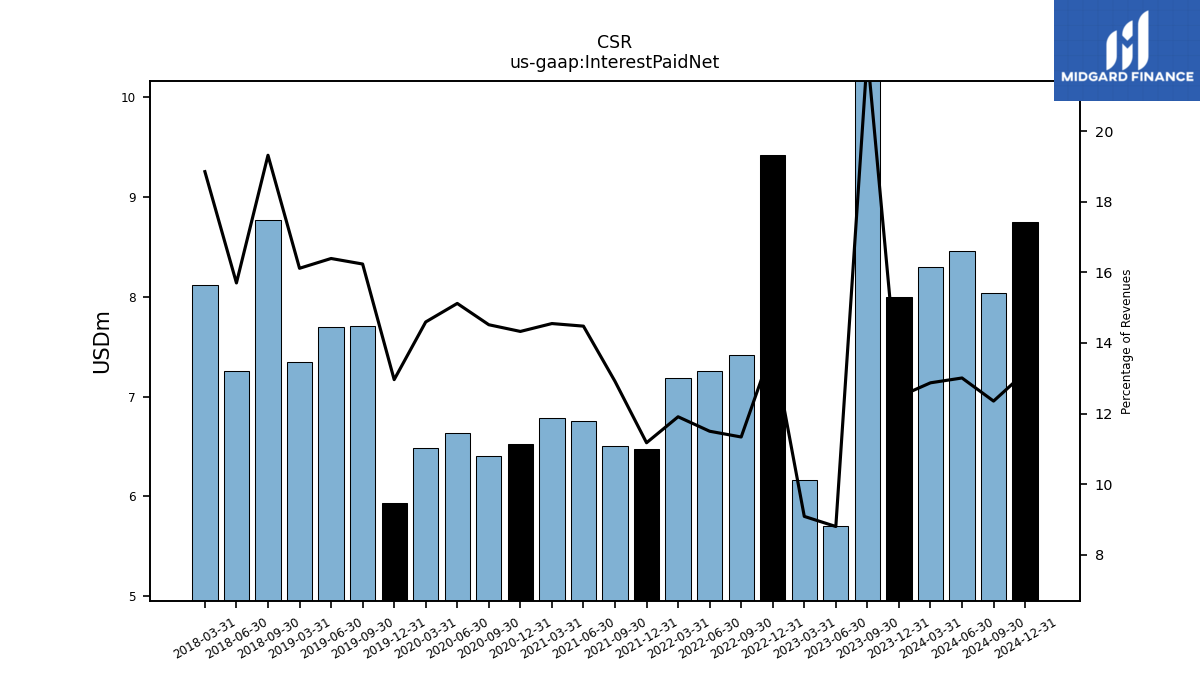
| Interest Paid Net | 8.30 | 7.99 | 14.32 | 5.70 | 6.17 | 9.42 | 7.42 | 7.26 | 7.18 | 6.48 | 6.51 | 6.75 | 6.79 | 6.52 | 6.41 | 6.64 | 6.48 | 5.93 | 7.70 | 7.69 | 7.35 | NA | NA | 8.77 | NA | 7.25 | NA | 8.11 | NA | NA | NA | NA | NA | NA | NA | NA | NA | NA | NA | NA | NA | NA | NA | NA | NA | NA | NA | NA | NA | NA | NA | NA | |
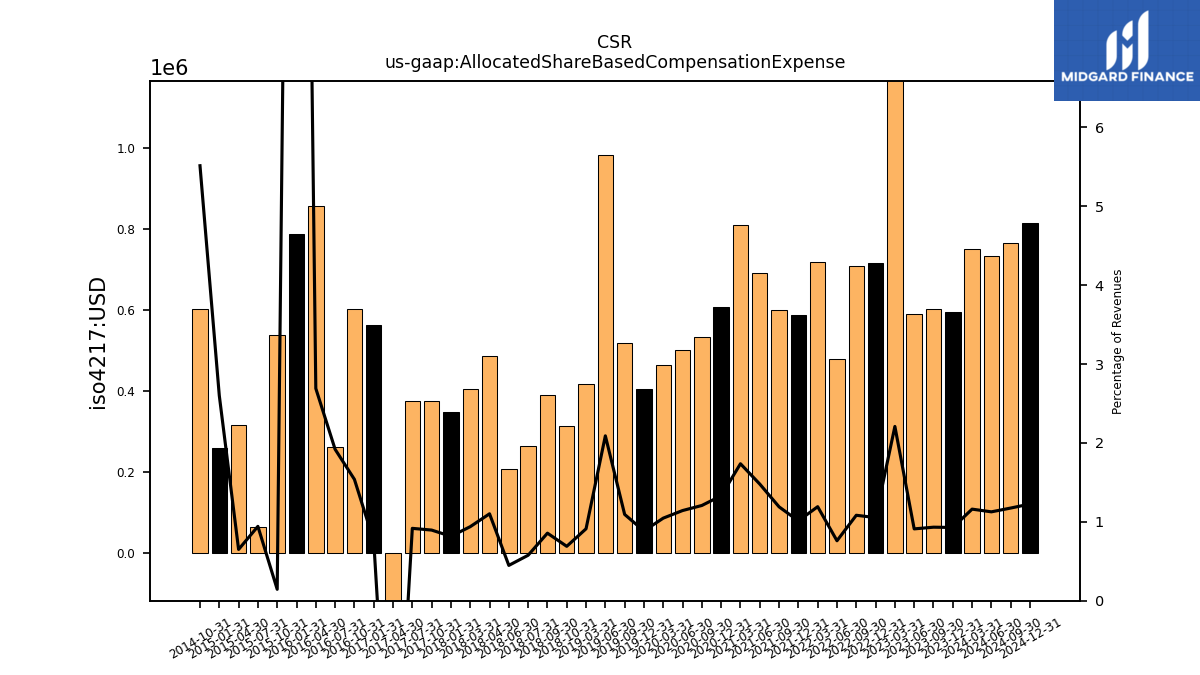
| Allocated Share Based Compensation Expense | 0.75 | 0.59 | 0.60 | 0.59 | 1.50 | 0.71 | 0.71 | 0.48 | 0.72 | 0.59 | 0.60 | 0.69 | 0.81 | 0.61 | 0.53 | 0.50 | 0.47 | 0.41 | 0.52 | 0.98 | 0.42 | NA | 0.31 | 0.39 | 0.27 | 0.21 | 0.49 | 0.40 | 0.35 | 0.38 | 0.38 | -1.39 | 0.56 | 0.60 | 0.26 | 0.86 | 0.79 | 0.54 | 0.07 | 0.32 | 0.26 | 0.60 | NA | NA | NA | NA | NA | NA | NA | NA | NA | NA | |
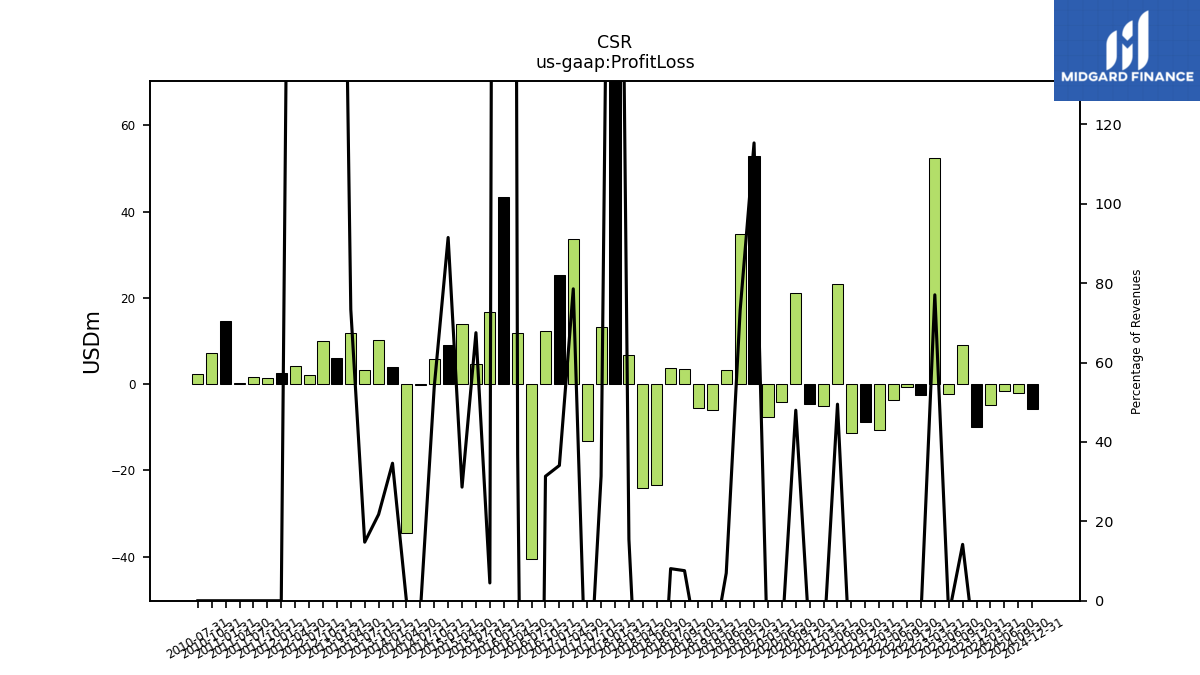
| Profit Loss | -4.79 | -9.88 | 9.17 | -2.38 | 52.33 | -2.56 | -0.77 | -3.74 | -10.56 | -8.80 | -11.24 | 23.10 | -5.16 | -4.67 | 21.18 | -4.08 | -7.68 | 52.80 | 34.72 | 3.27 | -5.96 | NA | -5.61 | 3.44 | 3.72 | -23.35 | -24.16 | 6.66 | 151.93 | 13.14 | -13.28 | 33.64 | 25.19 | 12.29 | -40.59 | 11.76 | 43.44 | 16.68 | 4.73 | 13.86 | 9.15 | 5.87 | -0.20 | -34.52 | 4.07 | 10.30 | 3.22 | 11.81 | 6.15 | 10.01 | 2.00 | 4.12 | |
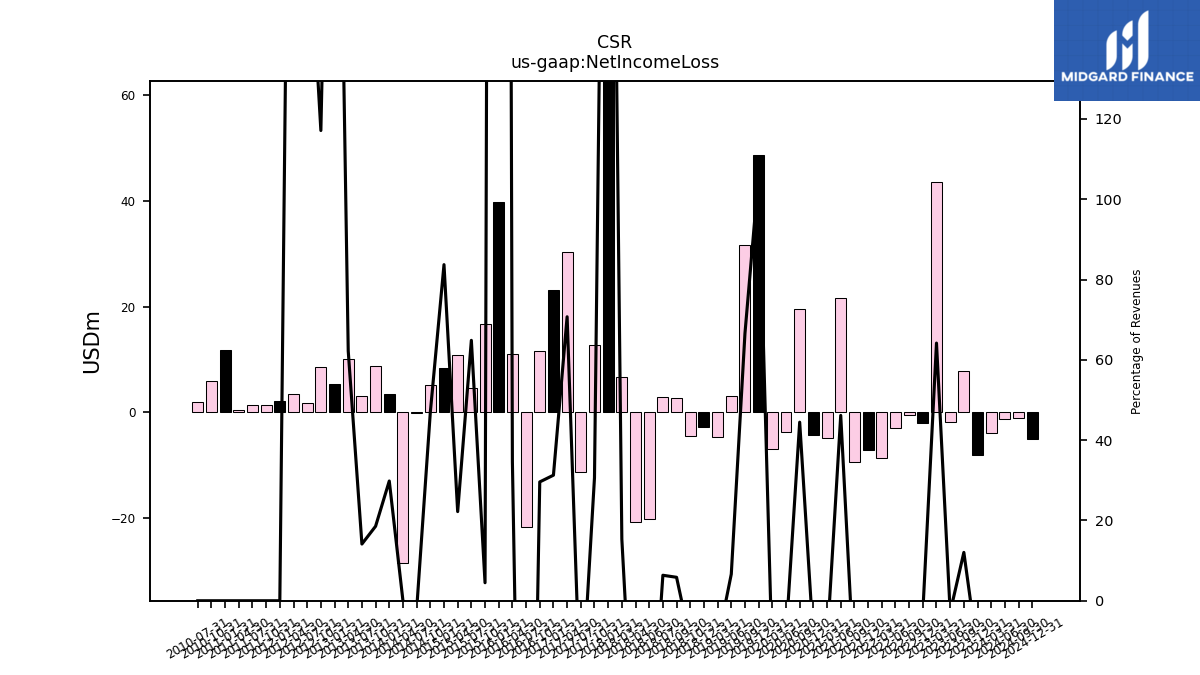
| Net Income Loss | -3.90 | -8.16 | 7.77 | -1.86 | 43.57 | -2.01 | -0.52 | -2.99 | -8.59 | -7.21 | -9.49 | 21.54 | -4.87 | -4.38 | 19.63 | -3.80 | -7.01 | 48.66 | 31.60 | 3.11 | -4.70 | -2.76 | -4.56 | 2.65 | 2.92 | -20.17 | -20.87 | 6.60 | 136.10 | 12.82 | -11.26 | 30.28 | 23.11 | 11.60 | -21.64 | 11.00 | 39.80 | 16.67 | 4.54 | 10.75 | 8.37 | 5.11 | -0.15 | -28.54 | 3.50 | 8.79 | 3.08 | 10.02 | 5.32 | 8.51 | 1.68 | 3.38 | |
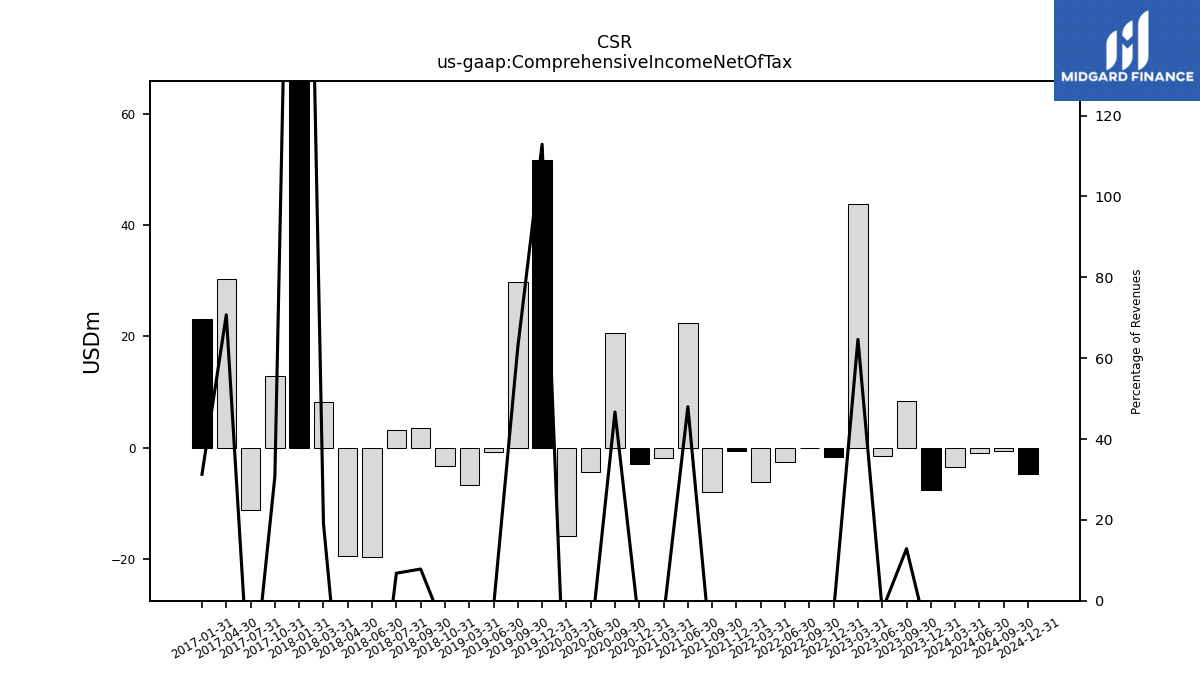
| Comprehensive Income Net Of Tax | -3.52 | -7.63 | 8.31 | -1.52 | 43.89 | -1.73 | -0.12 | -2.61 | -6.22 | -0.70 | -8.04 | 22.39 | -1.81 | -2.96 | 20.61 | -4.37 | -15.83 | 51.68 | 29.77 | -0.76 | -6.69 | NA | -3.27 | 3.56 | 3.13 | -19.76 | -19.60 | 8.23 | 136.43 | 12.86 | -11.26 | 30.28 | 23.11 | NA | NA | NA | NA | NA | NA | NA | NA | NA | NA | NA | NA | NA | NA | NA | NA | NA | NA | NA | |
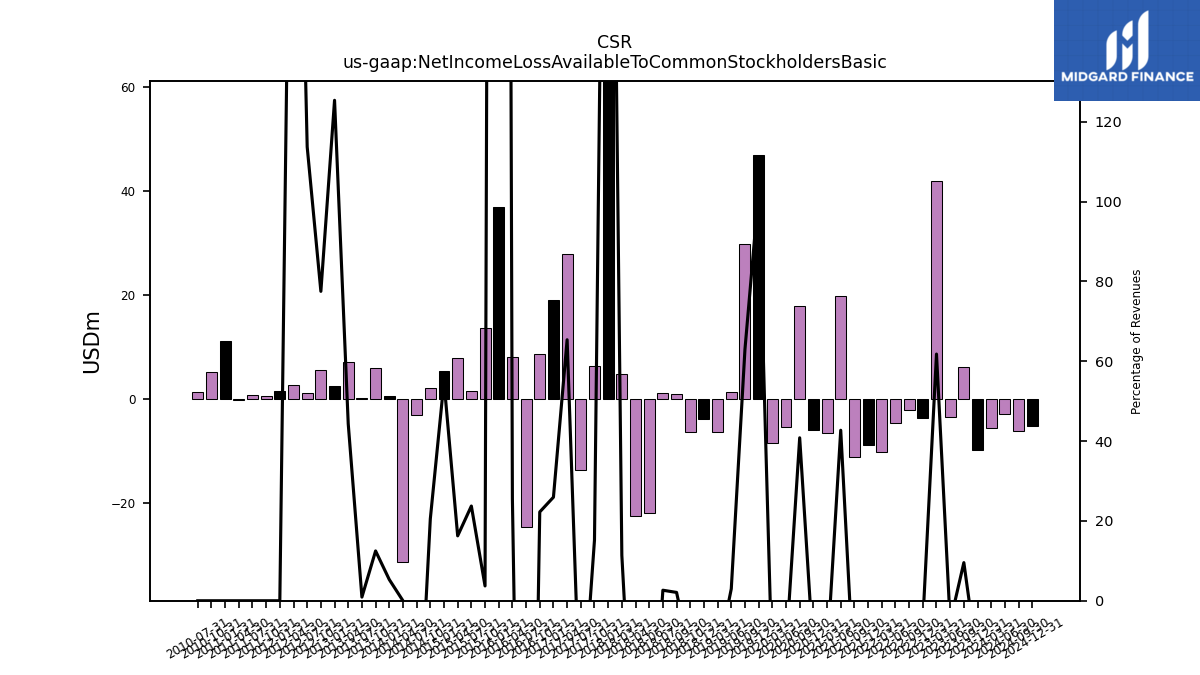
| Net Income Loss Available To Common Stockholders Basic | -5.51 | -9.76 | 6.17 | -3.47 | 41.96 | -3.61 | -2.13 | -4.60 | -10.20 | -8.81 | -11.10 | 19.93 | -6.47 | -5.99 | 18.02 | -5.39 | -8.44 | 46.95 | 29.89 | 1.41 | -6.40 | -3.89 | -6.26 | 0.95 | 1.21 | -21.88 | -22.58 | 4.90 | 134.33 | 6.36 | -13.55 | 27.99 | 19.17 | 8.72 | -24.52 | 8.12 | 36.92 | 13.79 | 1.66 | 7.88 | 5.49 | 2.24 | -3.03 | -31.42 | 0.62 | 5.91 | 0.20 | 7.14 | 2.44 | 5.63 | 1.09 | 2.79 | |
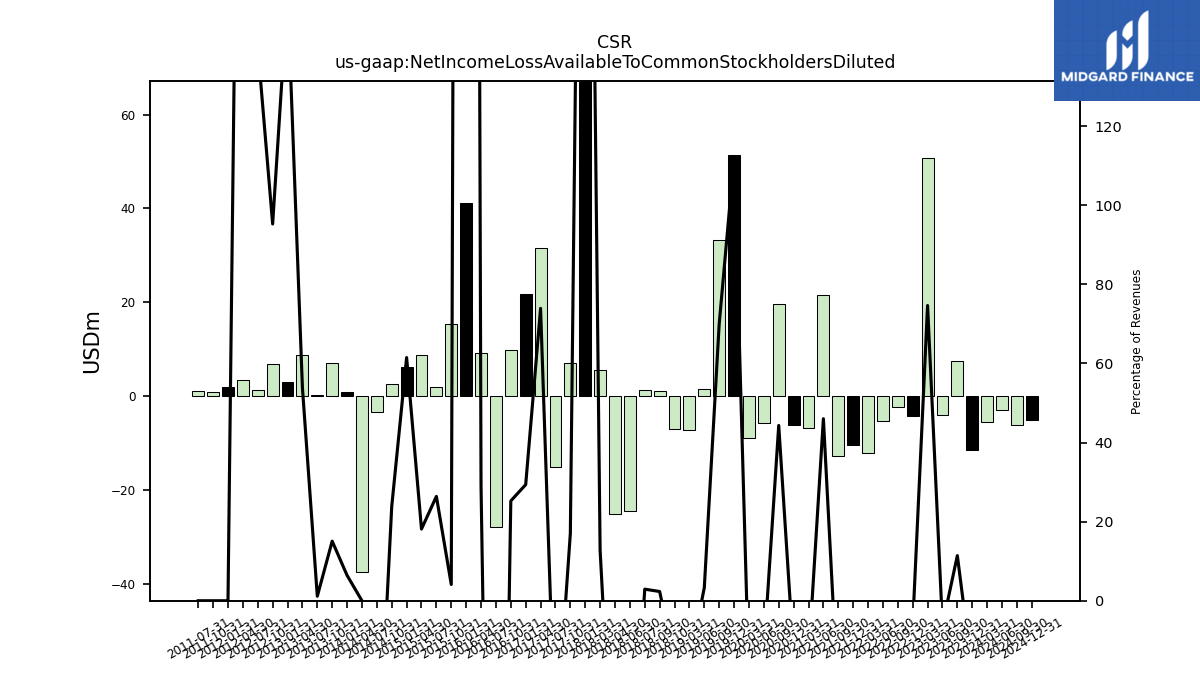
| Net Income Loss Available To Common Stockholders Diluted | -5.51 | -11.60 | 7.37 | -4.02 | 50.69 | -4.21 | -2.41 | -5.39 | -12.19 | -10.45 | -12.87 | 21.48 | -6.78 | -6.29 | 19.57 | -5.67 | -8.97 | 51.31 | 33.20 | 1.55 | -7.15 | NA | -6.99 | 1.06 | 1.35 | -24.46 | -25.24 | 5.48 | 150.57 | 7.13 | -15.19 | 31.65 | 21.70 | 9.90 | -27.82 | 9.22 | 41.15 | 15.31 | 1.85 | 8.78 | 6.15 | 2.60 | -3.43 | -37.50 | 0.75 | 7.13 | 0.25 | 8.67 | 3.00 | 6.92 | 1.34 | 3.42 |
| 2024-03-31 | 2023-12-31 | 2023-09-30 | 2023-06-30 | 2023-03-31 | 2022-12-31 | 2022-09-30 | 2022-06-30 | 2022-03-31 | 2021-12-31 | 2021-09-30 | 2021-06-30 | 2021-03-31 | 2020-12-31 | 2020-09-30 | 2020-06-30 | 2020-03-31 | 2019-12-31 | 2019-09-30 | 2019-06-30 | 2019-03-31 | 2018-12-31 | 2018-10-31 | 2018-09-30 | 2018-07-31 | 2018-06-30 | 2018-04-30 | 2018-03-31 | 2018-01-31 | 2017-10-31 | 2017-07-31 | 2017-04-30 | 2017-01-31 | 2016-10-31 | 2016-07-31 | 2016-04-30 | 2016-01-31 | 2015-10-31 | 2015-07-31 | 2015-04-30 | 2015-01-31 | 2014-10-31 | 2014-07-31 | 2014-04-30 | 2014-01-31 | 2013-10-31 | 2013-07-31 | 2013-04-30 | 2013-01-31 | 2012-10-31 | 2012-07-31 | 2012-04-30 | ||
|---|---|---|---|---|---|---|---|---|---|---|---|---|---|---|---|---|---|---|---|---|---|---|---|---|---|---|---|---|---|---|---|---|---|---|---|---|---|---|---|---|---|---|---|---|---|---|---|---|---|---|---|---|---|
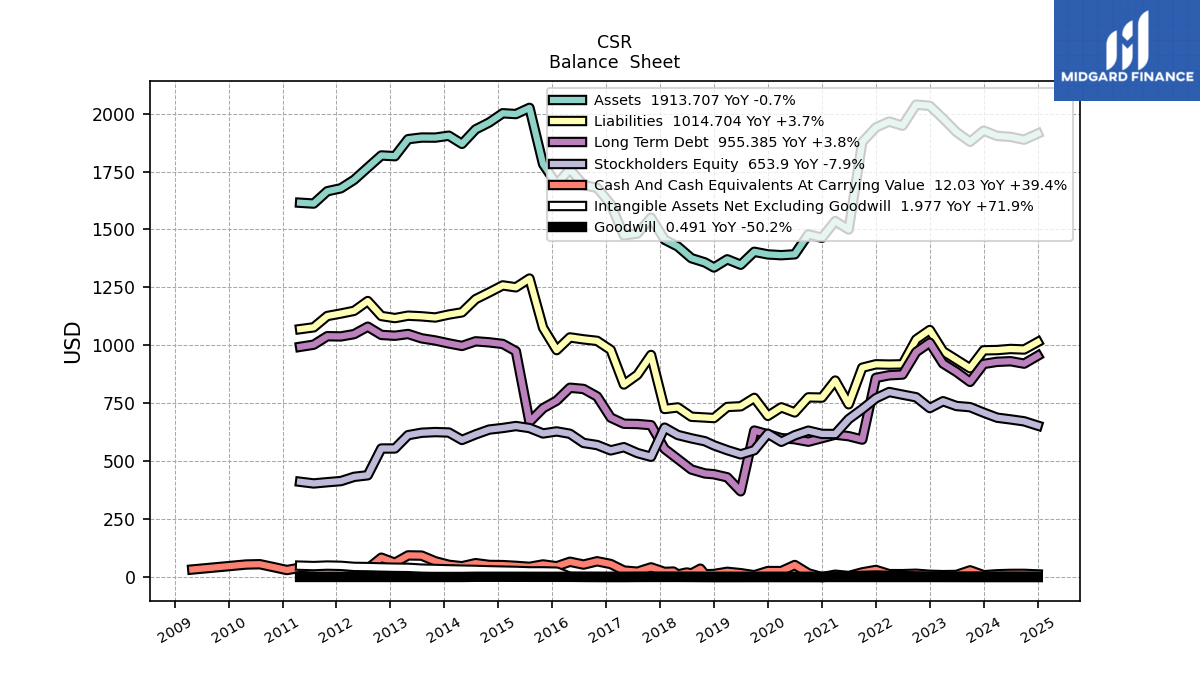
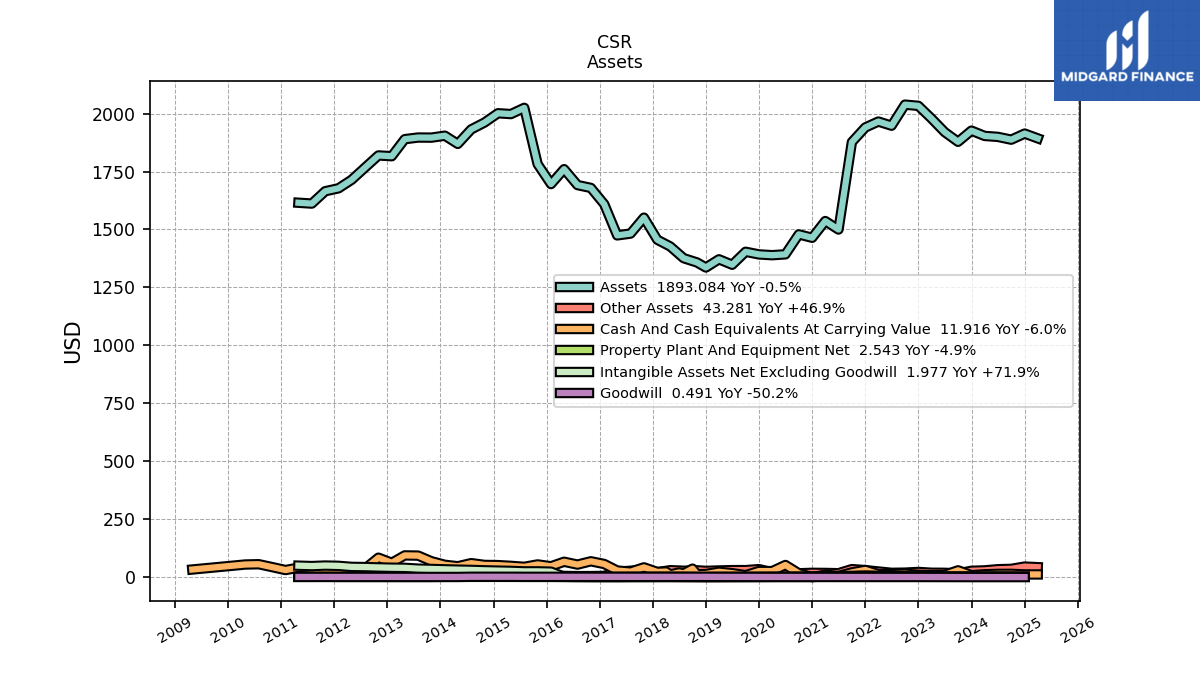
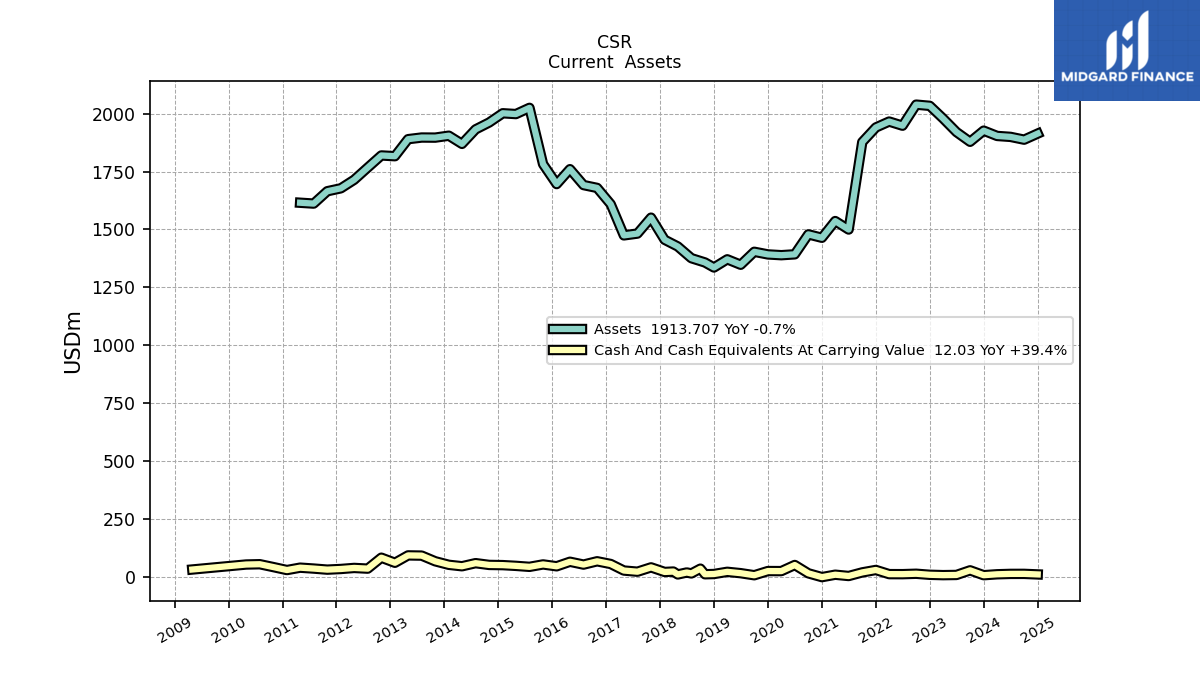
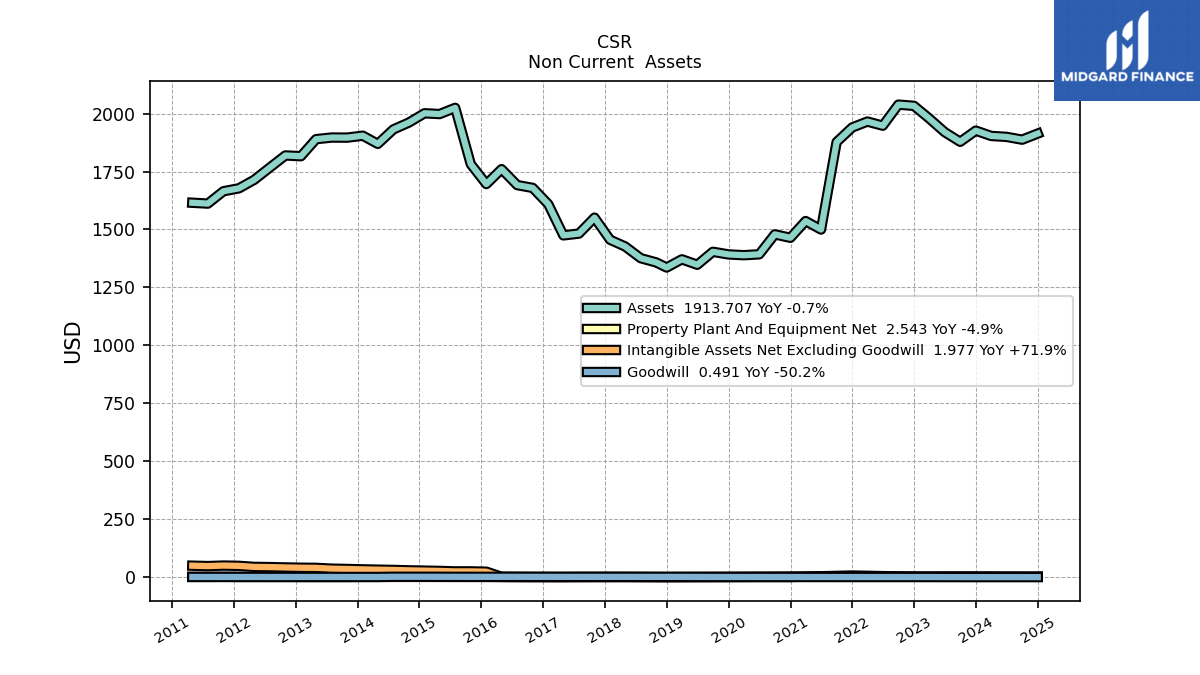
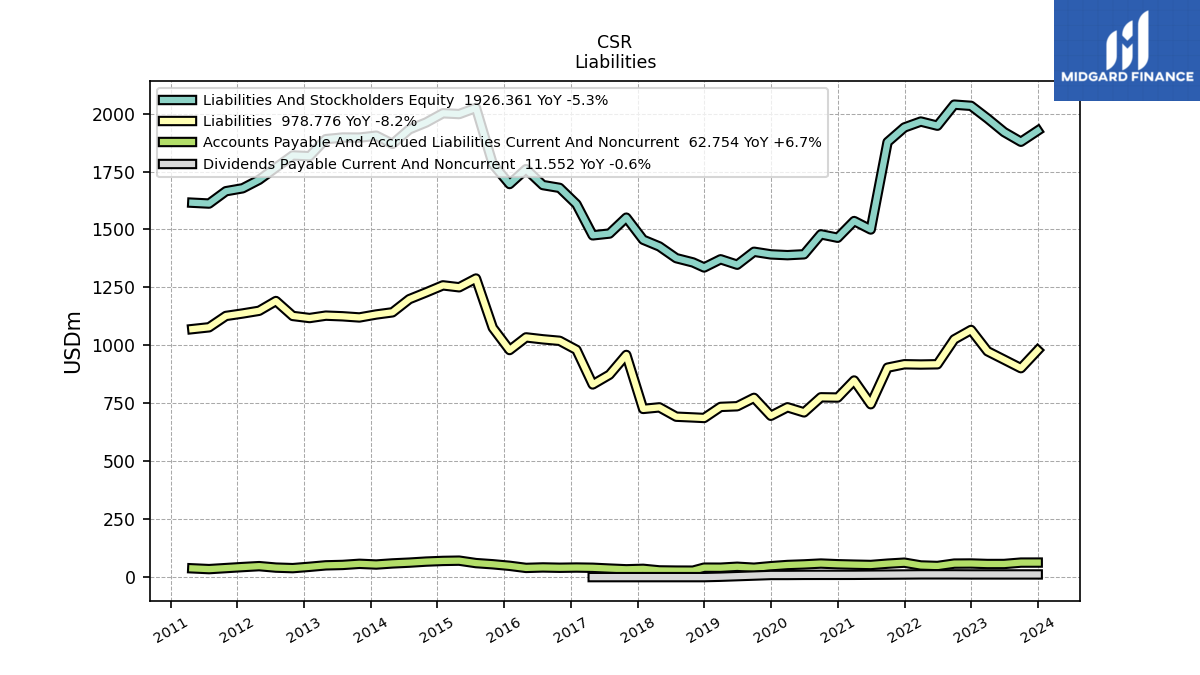
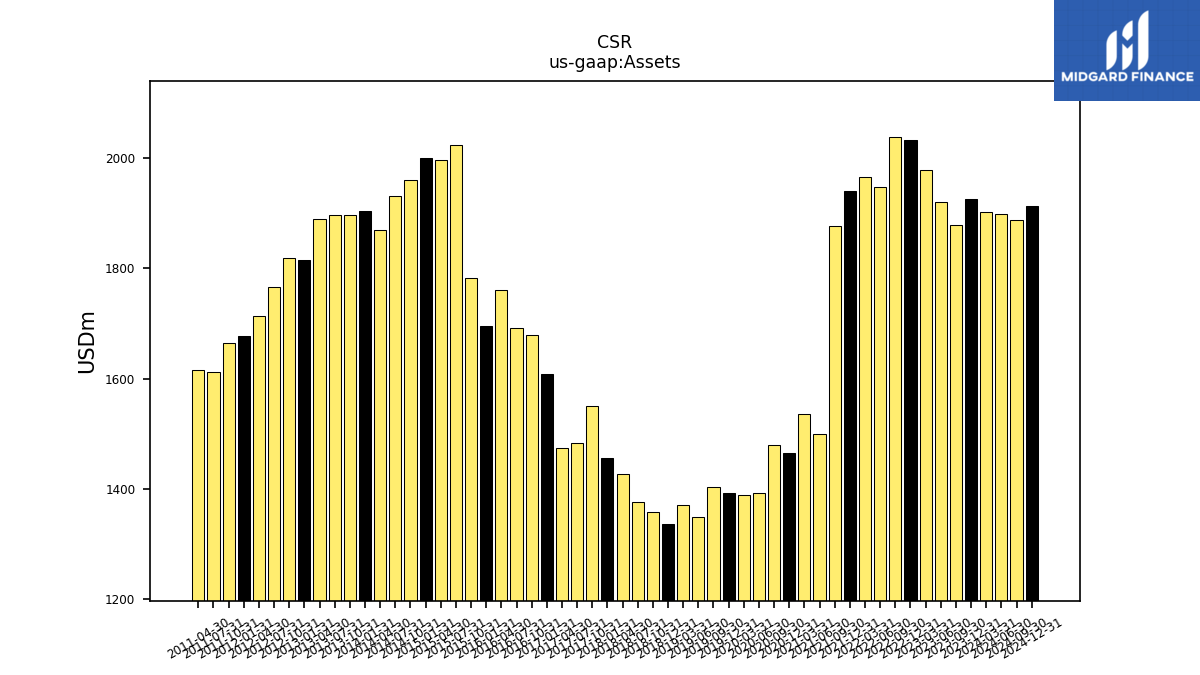
| Assets | 1903.47 | 1926.36 | 1878.28 | 1920.18 | 1978.88 | 2033.30 | 2038.59 | 1947.61 | 1965.57 | 1940.06 | 1876.95 | 1499.75 | 1536.35 | 1464.18 | 1478.93 | 1392.81 | 1389.09 | 1392.42 | 1403.80 | 1347.81 | 1371.31 | 1336.00 | 1357.74 | NA | 1376.17 | NA | 1426.66 | NA | 1455.69 | 1551.03 | 1482.35 | 1474.51 | 1609.09 | 1679.32 | 1691.54 | 1760.18 | 1695.81 | 1781.95 | 2024.67 | 1997.84 | 2001.34 | 1961.47 | 1931.77 | 1869.22 | 1904.56 | 1896.25 | 1896.64 | 1889.55 | 1816.07 | 1819.34 | 1767.06 | 1714.37 | |
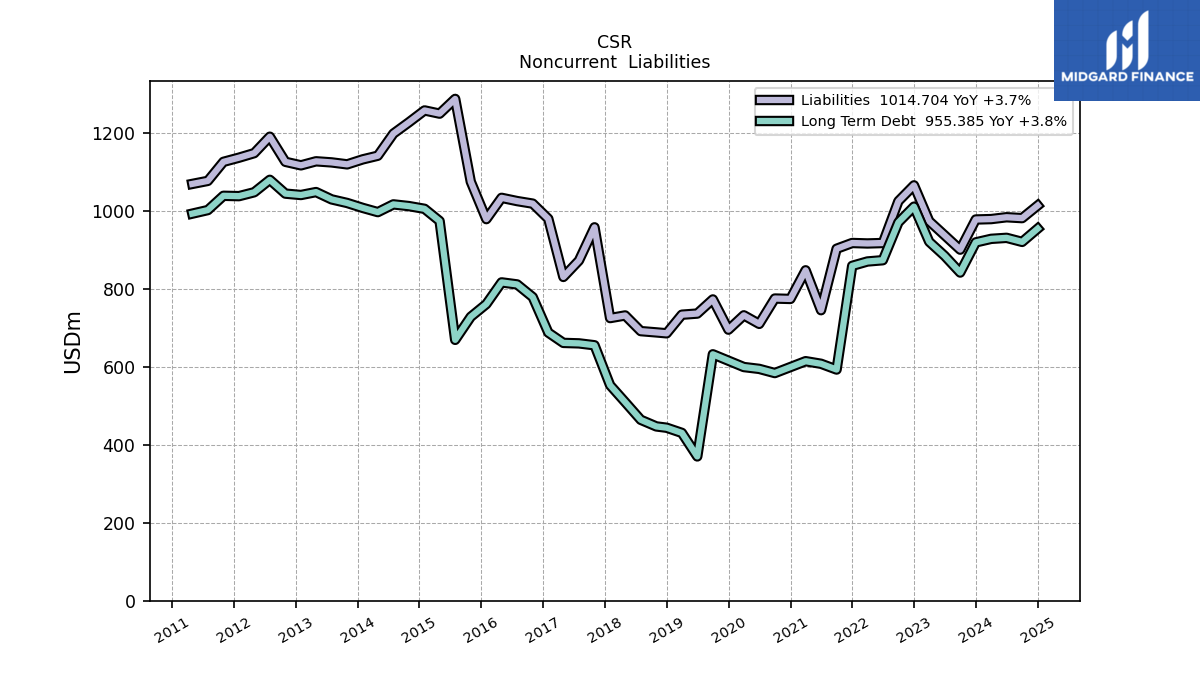
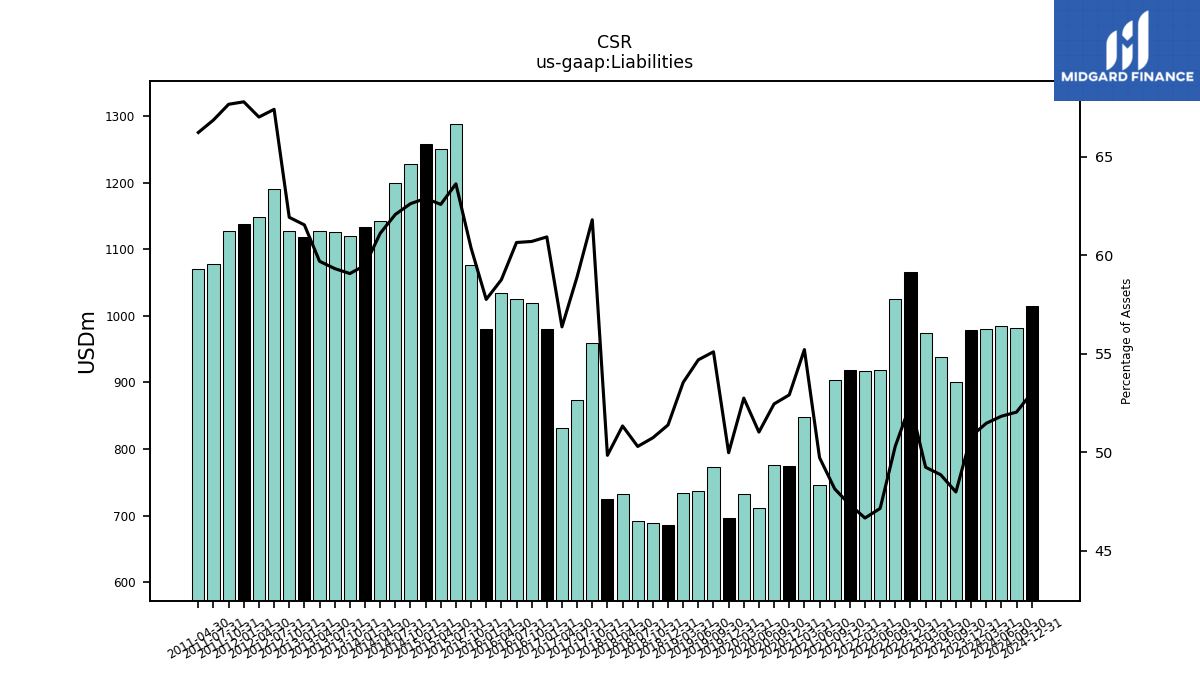
| Liabilities | 979.83 | 978.78 | 901.36 | 938.21 | 974.52 | 1066.44 | 1025.74 | 918.37 | 917.25 | 918.45 | 903.69 | 745.84 | 848.34 | 774.80 | 775.86 | 710.74 | 732.81 | 695.96 | 773.58 | 737.25 | 734.36 | 686.58 | 688.92 | NA | 692.21 | NA | 732.45 | NA | 725.66 | 958.72 | 873.40 | 831.24 | 980.59 | 1019.52 | 1026.06 | 1034.39 | 979.64 | 1075.97 | 1288.42 | 1250.52 | 1258.79 | 1228.43 | 1199.26 | 1142.47 | 1133.13 | 1120.31 | 1125.34 | 1128.17 | 1117.80 | 1126.85 | 1191.33 | 1149.10 | |
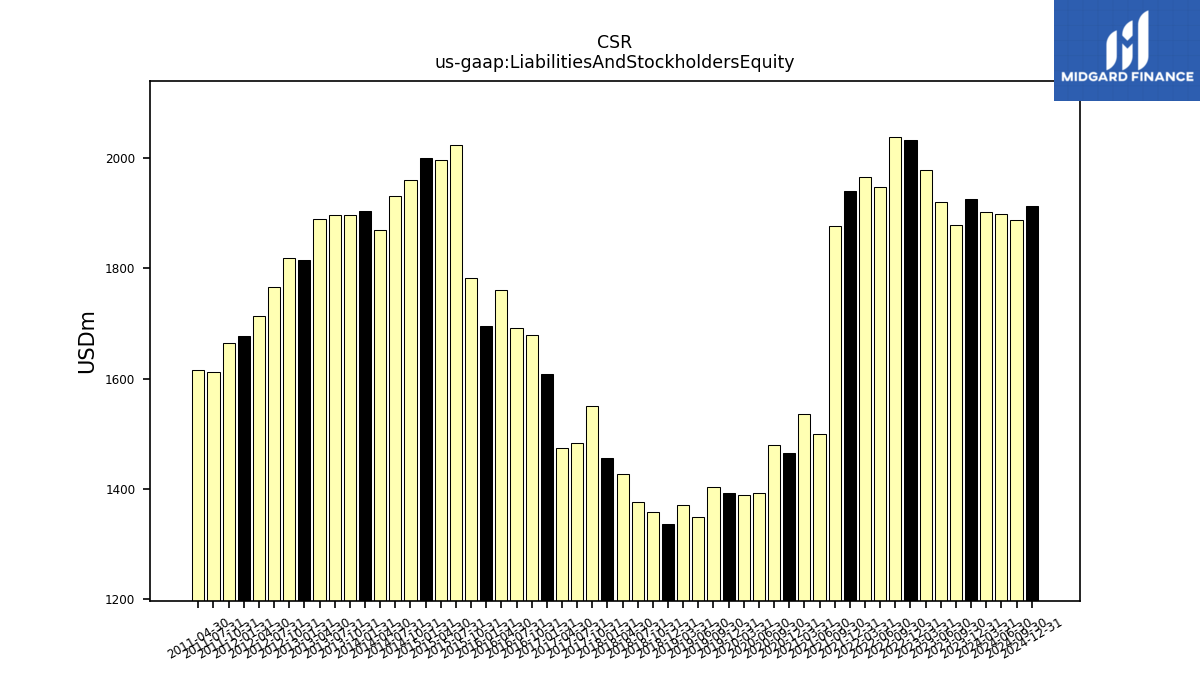
| Liabilities And Stockholders Equity | 1903.47 | 1926.36 | 1878.28 | 1920.18 | 1978.88 | 2033.30 | 2038.59 | 1947.61 | 1965.57 | 1940.06 | 1876.95 | 1499.75 | 1536.35 | 1464.18 | 1478.93 | 1392.81 | 1389.09 | 1392.42 | 1403.80 | 1347.81 | 1371.31 | 1336.00 | 1357.74 | NA | 1376.17 | NA | 1426.66 | NA | 1455.69 | 1551.03 | 1482.35 | 1474.51 | 1609.09 | 1679.32 | 1691.54 | 1760.18 | 1695.81 | 1781.95 | 2024.67 | 1997.84 | 2001.34 | 1961.47 | 1931.77 | 1869.22 | 1904.56 | 1896.25 | 1896.64 | 1889.55 | 1816.07 | 1819.34 | 1767.06 | 1714.37 | |
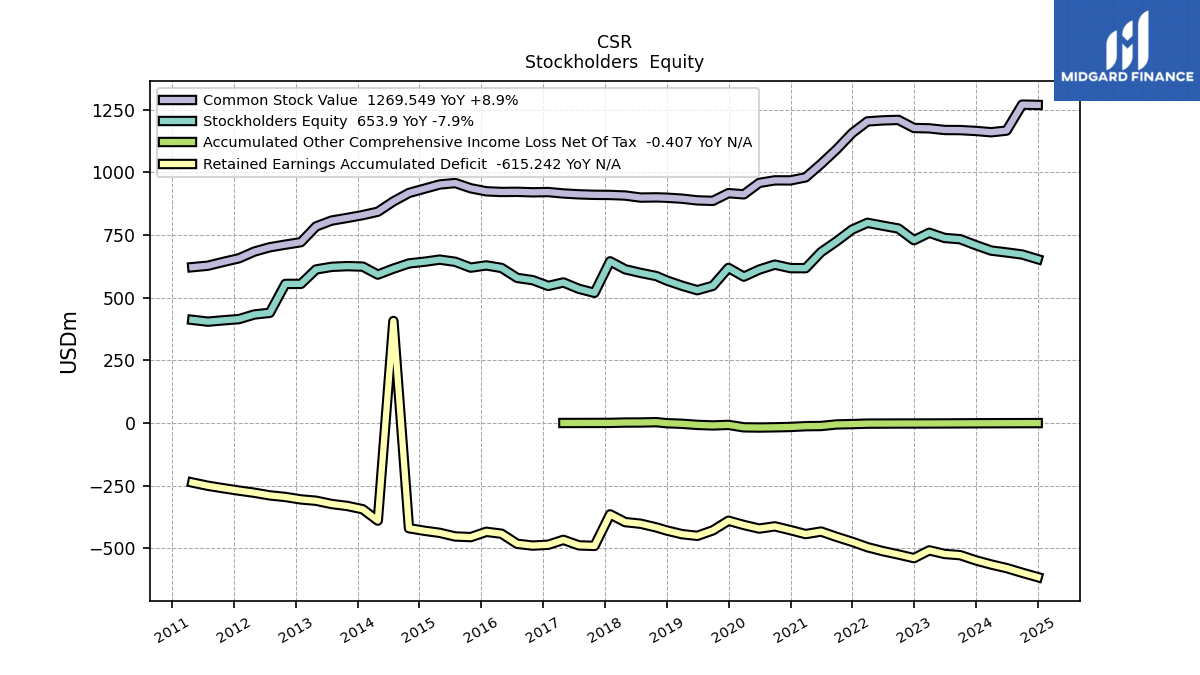
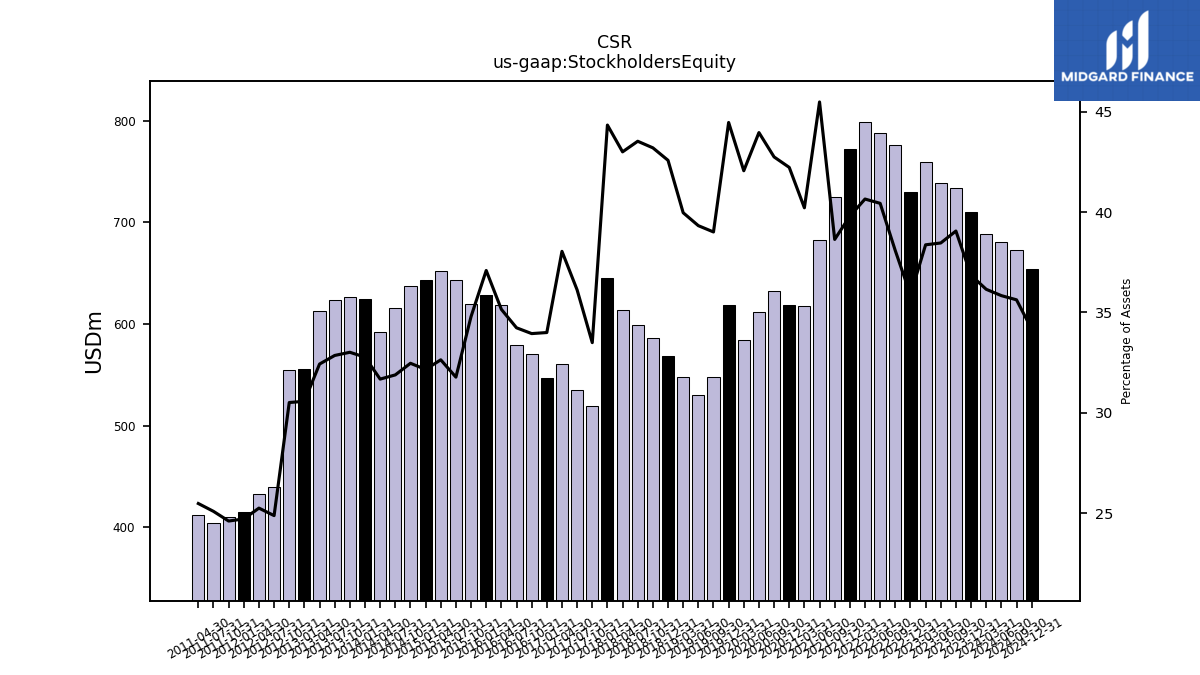
| Stockholders Equity | 688.15 | 709.83 | 733.53 | 738.48 | 759.25 | 729.54 | 776.20 | 787.47 | 798.93 | 772.03 | 725.18 | 682.10 | 617.78 | 618.21 | 632.13 | 612.22 | 584.19 | 619.05 | 547.58 | 529.97 | 548.04 | 568.79 | 586.48 | NA | 598.96 | NA | 613.41 | NA | 645.30 | 519.54 | 535.45 | 560.94 | 547.08 | 570.08 | 579.11 | 618.76 | 628.94 | 620.06 | 643.41 | 652.11 | 643.68 | 636.86 | 616.04 | 592.18 | 624.20 | 626.07 | 623.20 | 612.79 | 555.27 | 555.16 | 439.72 | 432.99 |
| 2024-03-31 | 2023-12-31 | 2023-09-30 | 2023-06-30 | 2023-03-31 | 2022-12-31 | 2022-09-30 | 2022-06-30 | 2022-03-31 | 2021-12-31 | 2021-09-30 | 2021-06-30 | 2021-03-31 | 2020-12-31 | 2020-09-30 | 2020-06-30 | 2020-03-31 | 2019-12-31 | 2019-09-30 | 2019-06-30 | 2019-03-31 | 2018-12-31 | 2018-10-31 | 2018-09-30 | 2018-07-31 | 2018-06-30 | 2018-04-30 | 2018-03-31 | 2018-01-31 | 2017-10-31 | 2017-07-31 | 2017-04-30 | 2017-01-31 | 2016-10-31 | 2016-07-31 | 2016-04-30 | 2016-01-31 | 2015-10-31 | 2015-07-31 | 2015-04-30 | 2015-01-31 | 2014-10-31 | 2014-07-31 | 2014-04-30 | 2014-01-31 | 2013-10-31 | 2013-07-31 | 2013-04-30 | 2013-01-31 | 2012-10-31 | 2012-07-31 | 2012-04-30 | ||
|---|---|---|---|---|---|---|---|---|---|---|---|---|---|---|---|---|---|---|---|---|---|---|---|---|---|---|---|---|---|---|---|---|---|---|---|---|---|---|---|---|---|---|---|---|---|---|---|---|---|---|---|---|---|
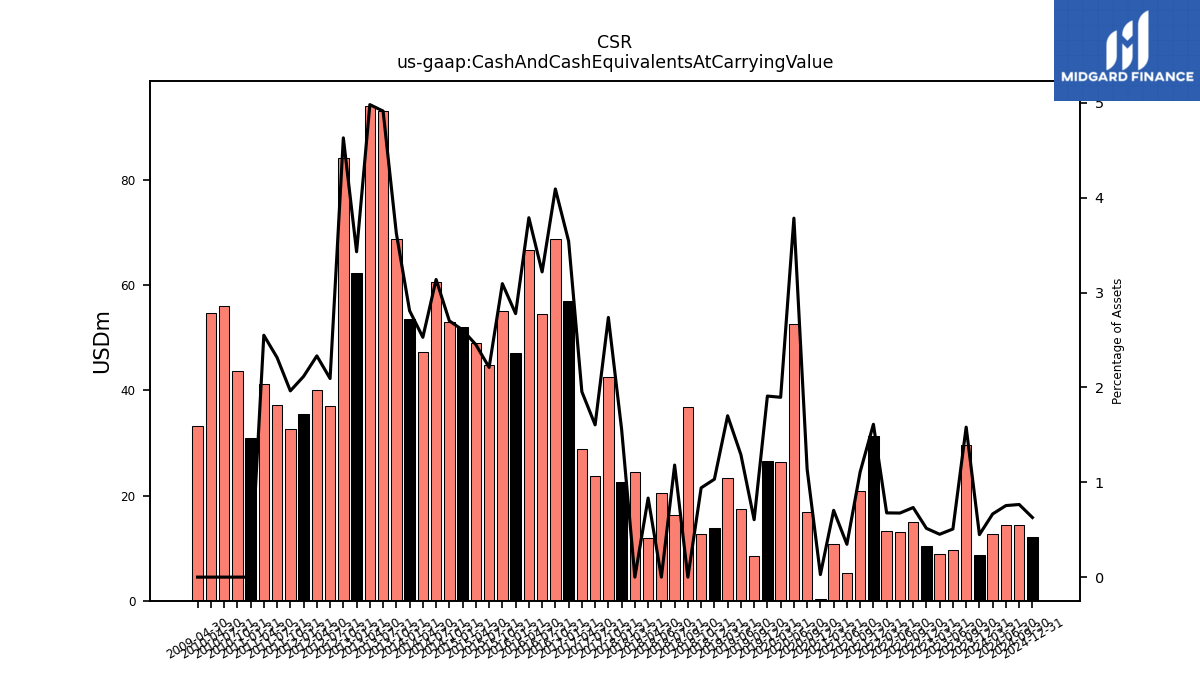
| Cash And Cash Equivalents At Carrying Value | 12.68 | 8.63 | 29.70 | 9.74 | 8.94 | 10.46 | 14.96 | 13.16 | 13.31 | 31.27 | 20.82 | 5.19 | 10.82 | 0.39 | 16.80 | 52.71 | 26.34 | 26.58 | 8.50 | 17.41 | 23.33 | 13.79 | 12.78 | 36.91 | 16.26 | 20.45 | 11.89 | 24.42 | 22.67 | 42.46 | 23.80 | 28.82 | 57.00 | 68.73 | 54.44 | 66.70 | 47.12 | 55.13 | 44.77 | 48.97 | 52.15 | 53.00 | 60.62 | 47.27 | 53.49 | 68.73 | 93.19 | 94.13 | 62.30 | 84.26 | 37.00 | 39.99 | |
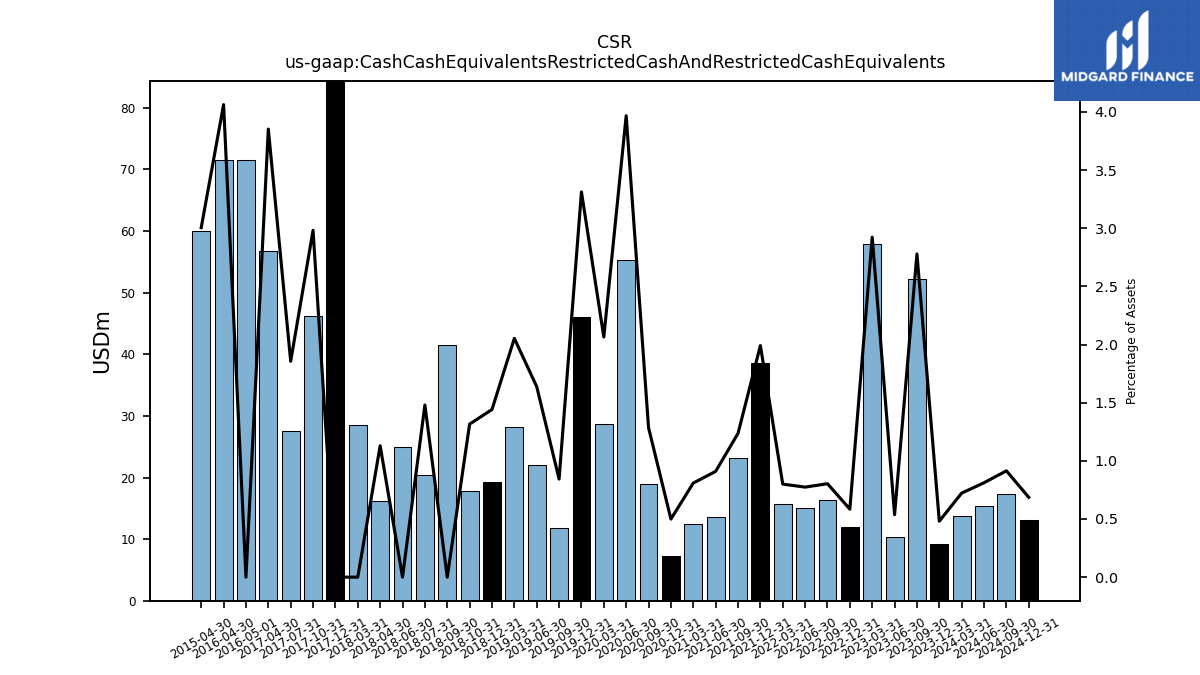
| Cash Cash Equivalents Restricted Cash And Restricted Cash Equivalents | 13.75 | 9.27 | 52.20 | 10.31 | 57.84 | 11.89 | 16.37 | 15.07 | 15.72 | 38.62 | 23.19 | 13.64 | 12.43 | 7.31 | 19.00 | 55.25 | 28.68 | 46.12 | 11.84 | 22.08 | 28.15 | 19.26 | 17.86 | 41.58 | 20.36 | 24.91 | 16.12 | 28.48 | NA | 46.25 | 27.51 | 56.80 | NA | NA | NA | 71.51 | NA | NA | NA | 60.03 | NA | NA | NA | NA | NA | NA | NA | NA | NA | NA | NA | NA |
| 2024-03-31 | 2023-12-31 | 2023-09-30 | 2023-06-30 | 2023-03-31 | 2022-12-31 | 2022-09-30 | 2022-06-30 | 2022-03-31 | 2021-12-31 | 2021-09-30 | 2021-06-30 | 2021-03-31 | 2020-12-31 | 2020-09-30 | 2020-06-30 | 2020-03-31 | 2019-12-31 | 2019-09-30 | 2019-06-30 | 2019-03-31 | 2018-12-31 | 2018-10-31 | 2018-09-30 | 2018-07-31 | 2018-06-30 | 2018-04-30 | 2018-03-31 | 2018-01-31 | 2017-10-31 | 2017-07-31 | 2017-04-30 | 2017-01-31 | 2016-10-31 | 2016-07-31 | 2016-04-30 | 2016-01-31 | 2015-10-31 | 2015-07-31 | 2015-04-30 | 2015-01-31 | 2014-10-31 | 2014-07-31 | 2014-04-30 | 2014-01-31 | 2013-10-31 | 2013-07-31 | 2013-04-30 | 2013-01-31 | 2012-10-31 | 2012-07-31 | 2012-04-30 | ||
|---|---|---|---|---|---|---|---|---|---|---|---|---|---|---|---|---|---|---|---|---|---|---|---|---|---|---|---|---|---|---|---|---|---|---|---|---|---|---|---|---|---|---|---|---|---|---|---|---|---|---|---|---|---|
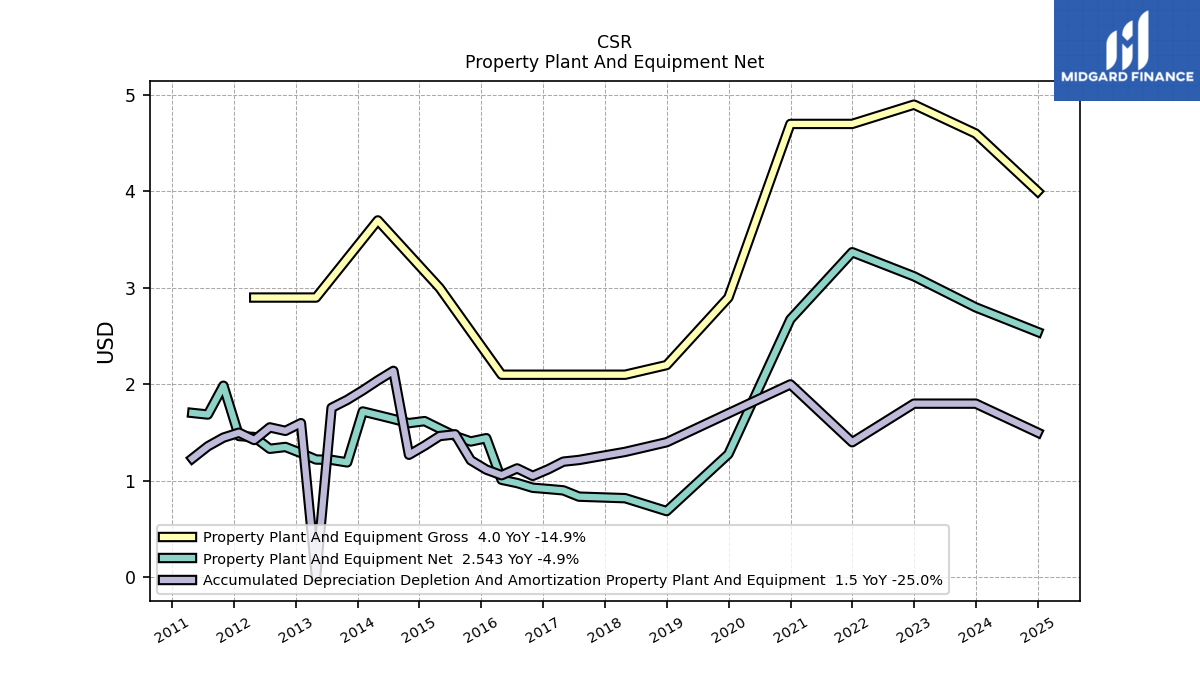
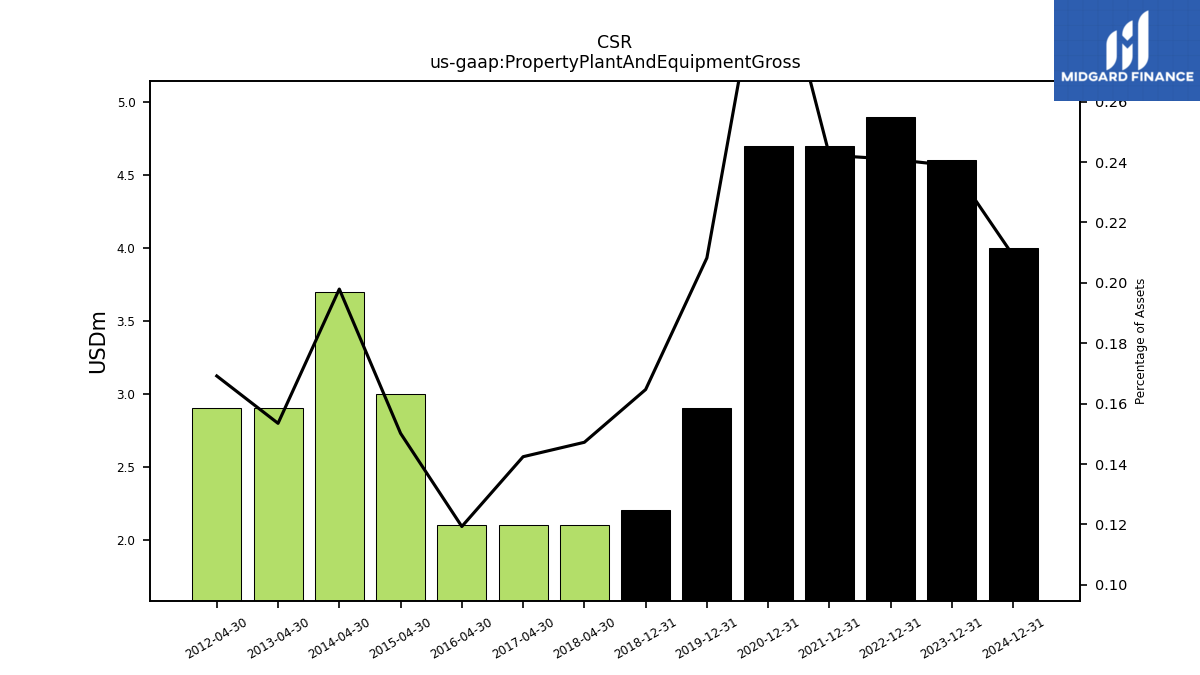
| Property Plant And Equipment Gross | NA | 4.60 | NA | NA | NA | 4.90 | NA | NA | NA | 4.70 | NA | NA | NA | 4.70 | NA | NA | NA | 2.90 | NA | NA | NA | 2.20 | NA | NA | NA | NA | 2.10 | NA | NA | NA | NA | 2.10 | NA | NA | NA | 2.10 | NA | NA | NA | 3.00 | NA | NA | NA | 3.70 | NA | NA | NA | 2.90 | NA | NA | NA | 2.90 | |
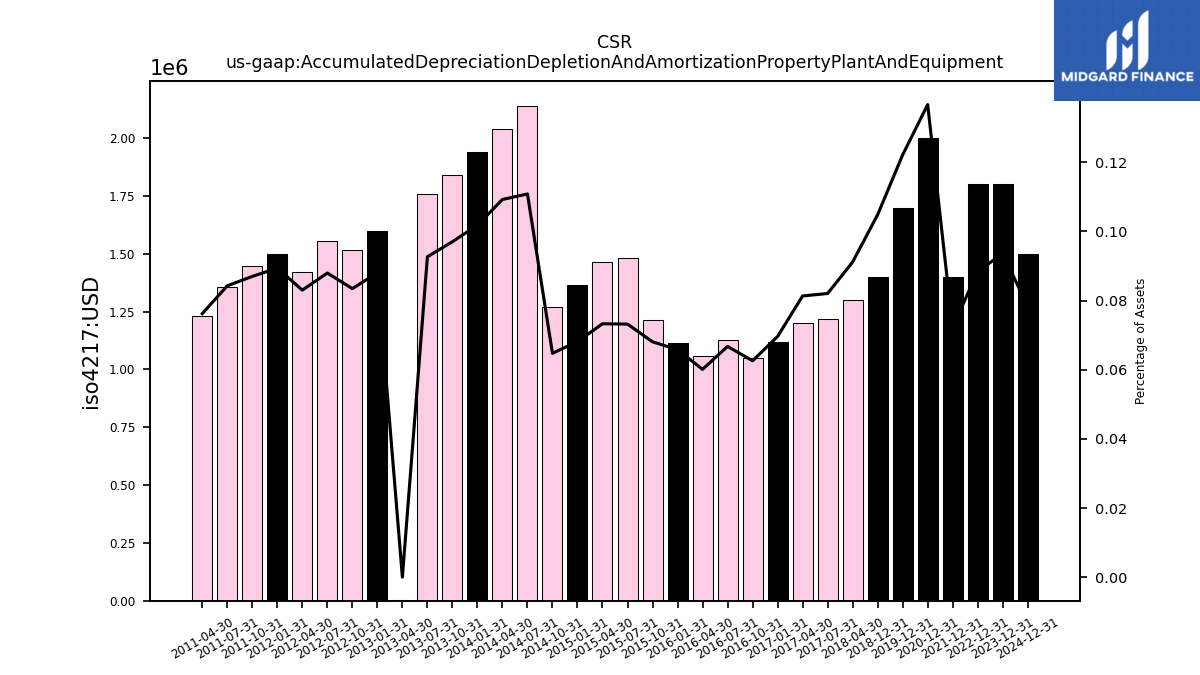
| Accumulated Depreciation Depletion And Amortization Property Plant And Equipment | NA | 1.80 | NA | NA | NA | 1.80 | NA | NA | NA | 1.40 | NA | NA | NA | 2.00 | NA | NA | NA | 1.70 | NA | NA | NA | 1.40 | NA | NA | NA | NA | 1.30 | NA | NA | NA | 1.22 | 1.20 | 1.12 | 1.05 | 1.13 | 1.06 | 1.12 | 1.21 | 1.48 | 1.46 | 1.36 | 1.27 | 2.14 | 2.04 | 1.94 | 1.84 | 1.76 | 0.00 | 1.60 | 1.52 | 1.55 | 1.42 | |
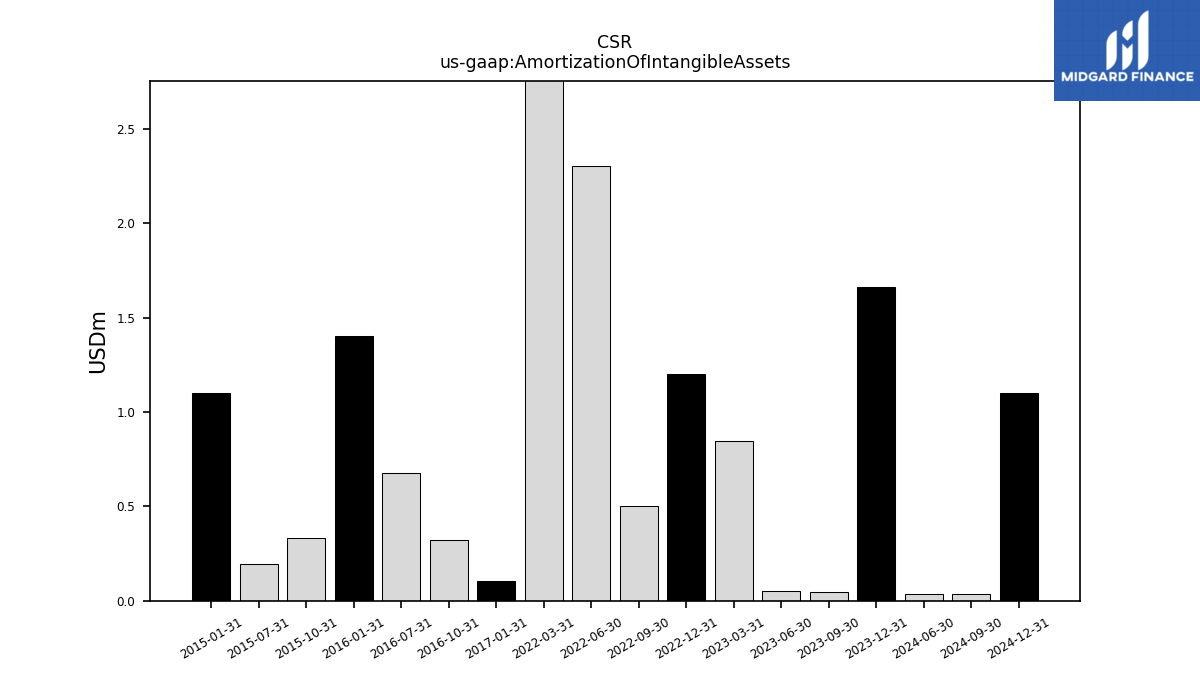
| Amortization Of Intangible Assets | NA | 1.66 | 0.05 | 0.05 | 0.84 | 1.20 | 0.50 | 2.30 | 8.30 | NA | NA | NA | NA | NA | NA | NA | NA | NA | NA | NA | NA | NA | NA | NA | NA | NA | NA | NA | NA | NA | NA | NA | 0.11 | 0.32 | 0.68 | NA | 1.40 | 0.33 | 0.19 | NA | 1.10 | NA | NA | NA | NA | NA | NA | NA | NA | NA | NA | NA | |
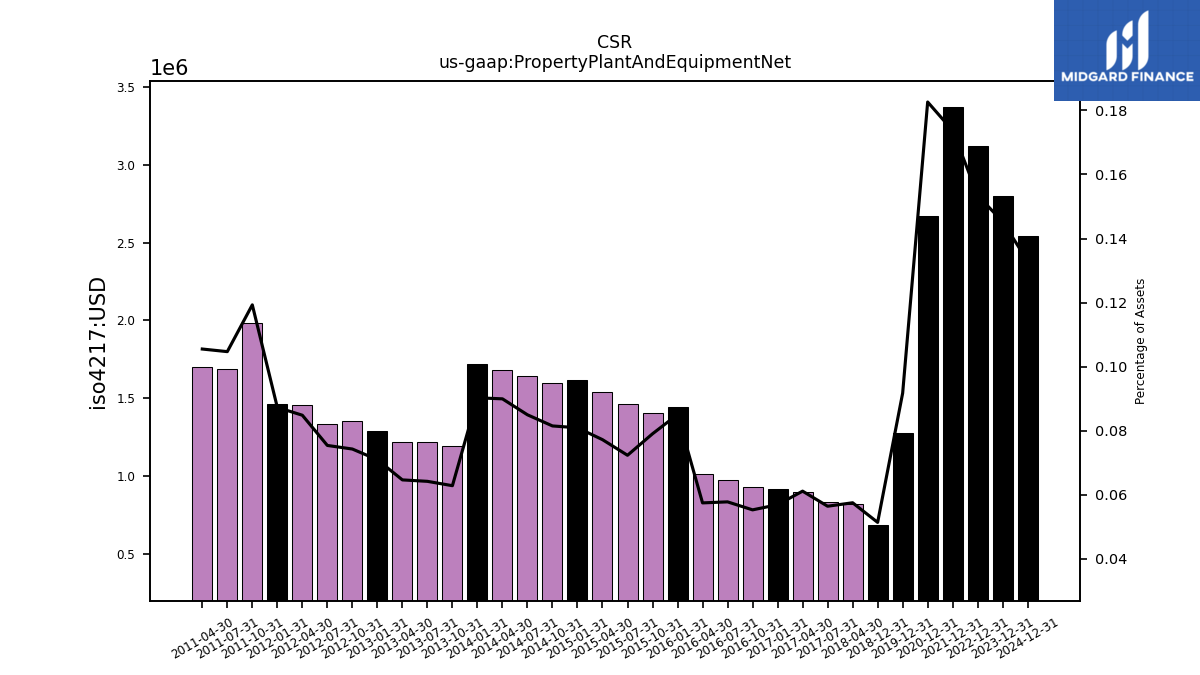
| Property Plant And Equipment Net | NA | 2.80 | NA | NA | NA | 3.12 | NA | NA | NA | 3.37 | NA | NA | NA | 2.67 | NA | NA | NA | 1.28 | NA | NA | NA | 0.69 | NA | NA | NA | NA | 0.82 | NA | NA | NA | 0.84 | 0.90 | 0.92 | 0.93 | 0.98 | 1.01 | 1.44 | 1.41 | 1.46 | 1.54 | 1.62 | 1.60 | 1.64 | 1.68 | 1.72 | 1.19 | 1.22 | 1.22 | 1.29 | 1.35 | 1.33 | 1.45 | |
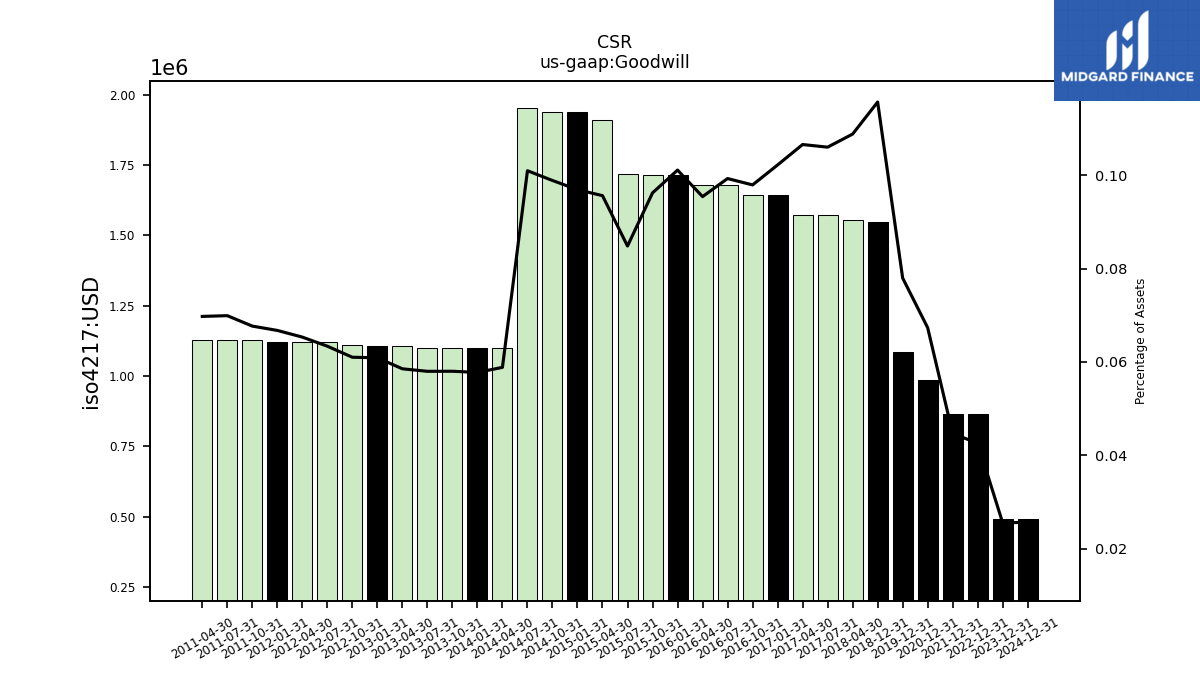
| Goodwill | NA | 0.49 | NA | NA | NA | 0.87 | NA | NA | NA | 0.87 | NA | NA | NA | 0.99 | NA | NA | NA | 1.09 | NA | NA | NA | 1.55 | NA | NA | NA | NA | 1.55 | NA | NA | NA | 1.57 | 1.57 | 1.65 | 1.65 | 1.68 | 1.68 | 1.72 | 1.72 | 1.72 | 1.91 | 1.94 | 1.94 | 1.95 | 1.10 | 1.10 | 1.10 | 1.10 | 1.11 | 1.11 | 1.11 | 1.12 | 1.12 | |
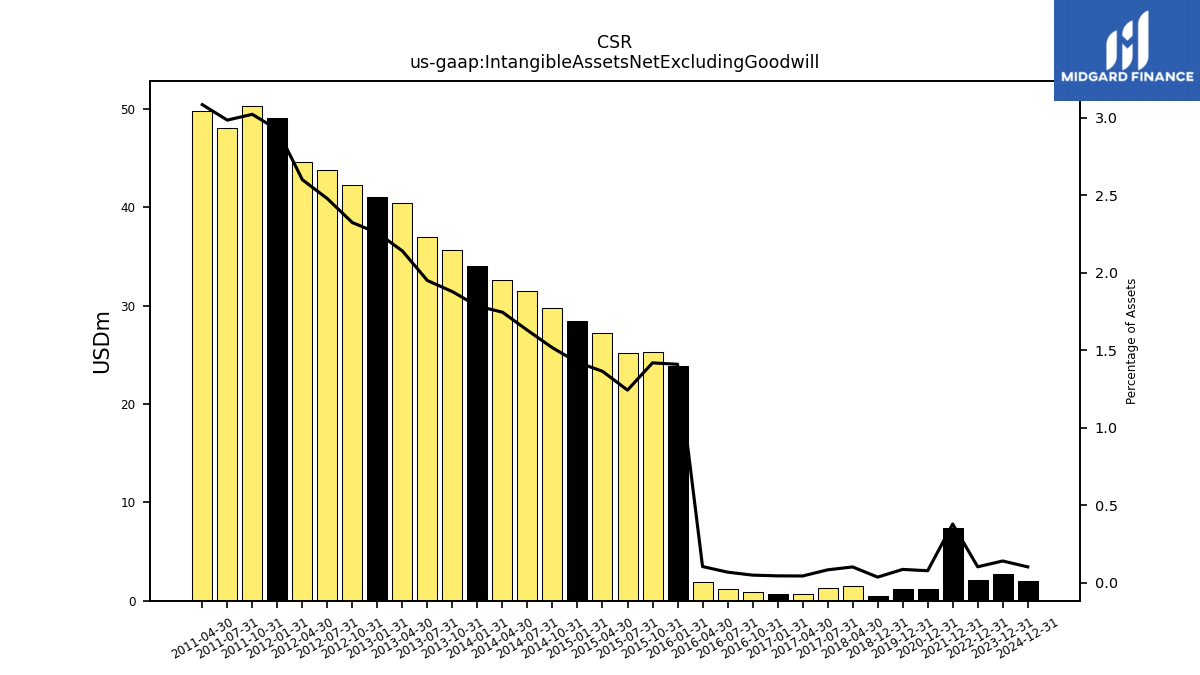
| Intangible Assets Net Excluding Goodwill | NA | 2.72 | NA | NA | NA | 2.11 | NA | NA | NA | 7.37 | NA | NA | NA | 1.15 | NA | NA | NA | 1.21 | NA | NA | NA | 0.50 | NA | NA | NA | NA | 1.47 | NA | NA | NA | 1.25 | 0.66 | 0.73 | 0.84 | 1.17 | 1.86 | 23.91 | 25.29 | 25.18 | 27.27 | 28.48 | 29.75 | 31.48 | 32.64 | 34.01 | 35.62 | 36.99 | 40.46 | 41.01 | 42.28 | 43.80 | 44.59 |
| 2024-03-31 | 2023-12-31 | 2023-09-30 | 2023-06-30 | 2023-03-31 | 2022-12-31 | 2022-09-30 | 2022-06-30 | 2022-03-31 | 2021-12-31 | 2021-09-30 | 2021-06-30 | 2021-03-31 | 2020-12-31 | 2020-09-30 | 2020-06-30 | 2020-03-31 | 2019-12-31 | 2019-09-30 | 2019-06-30 | 2019-03-31 | 2018-12-31 | 2018-10-31 | 2018-09-30 | 2018-07-31 | 2018-06-30 | 2018-04-30 | 2018-03-31 | 2018-01-31 | 2017-10-31 | 2017-07-31 | 2017-04-30 | 2017-01-31 | 2016-10-31 | 2016-07-31 | 2016-04-30 | 2016-01-31 | 2015-10-31 | 2015-07-31 | 2015-04-30 | 2015-01-31 | 2014-10-31 | 2014-07-31 | 2014-04-30 | 2014-01-31 | 2013-10-31 | 2013-07-31 | 2013-04-30 | 2013-01-31 | 2012-10-31 | 2012-07-31 | 2012-04-30 | ||
|---|---|---|---|---|---|---|---|---|---|---|---|---|---|---|---|---|---|---|---|---|---|---|---|---|---|---|---|---|---|---|---|---|---|---|---|---|---|---|---|---|---|---|---|---|---|---|---|---|---|---|---|---|---|
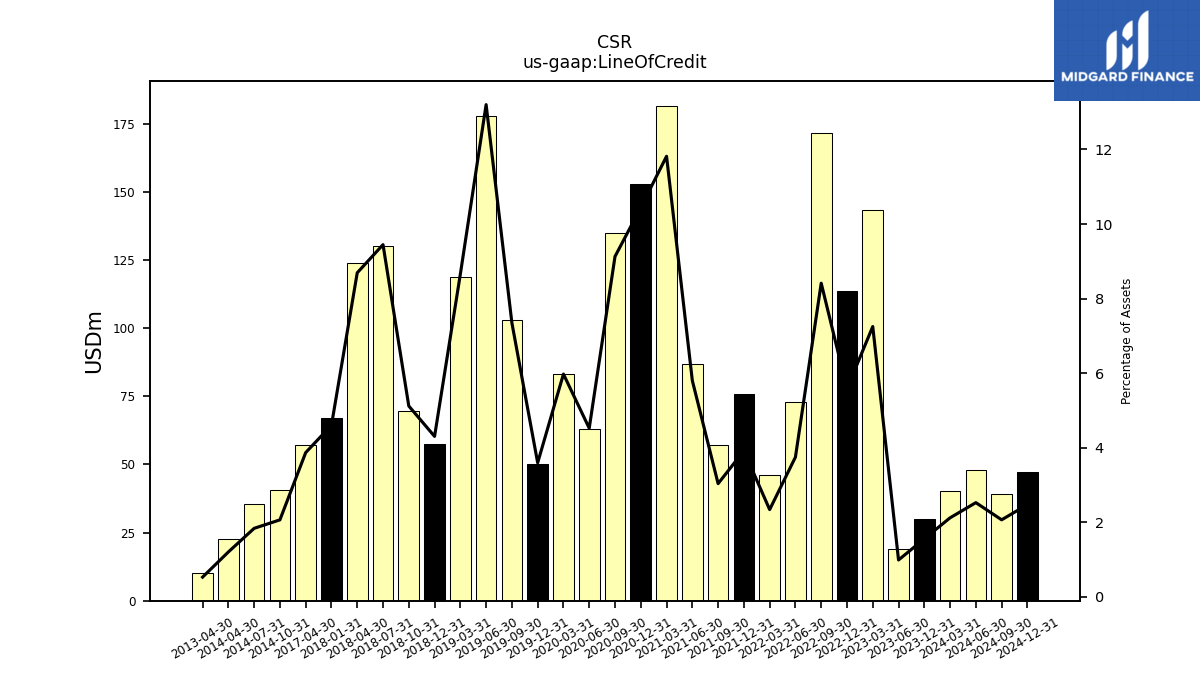
| Line Of Credit | 40.36 | 30.00 | NA | 18.99 | 143.47 | 113.50 | 171.50 | 73.00 | 46.00 | 76.00 | 57.00 | 87.00 | 181.54 | 152.87 | 135.00 | 63.00 | 83.00 | 50.08 | 103.14 | 177.94 | 118.68 | 57.50 | 69.50 | NA | 130.00 | NA | 124.00 | NA | 67.00 | NA | NA | 57.05 | NA | NA | NA | NA | NA | NA | NA | NA | NA | 40.50 | 35.50 | 22.50 | NA | NA | NA | 10.00 | NA | NA | NA | NA |
| 2024-03-31 | 2023-12-31 | 2023-09-30 | 2023-06-30 | 2023-03-31 | 2022-12-31 | 2022-09-30 | 2022-06-30 | 2022-03-31 | 2021-12-31 | 2021-09-30 | 2021-06-30 | 2021-03-31 | 2020-12-31 | 2020-09-30 | 2020-06-30 | 2020-03-31 | 2019-12-31 | 2019-09-30 | 2019-06-30 | 2019-03-31 | 2018-12-31 | 2018-10-31 | 2018-09-30 | 2018-07-31 | 2018-06-30 | 2018-04-30 | 2018-03-31 | 2018-01-31 | 2017-10-31 | 2017-07-31 | 2017-04-30 | 2017-01-31 | 2016-10-31 | 2016-07-31 | 2016-04-30 | 2016-01-31 | 2015-10-31 | 2015-07-31 | 2015-04-30 | 2015-01-31 | 2014-10-31 | 2014-07-31 | 2014-04-30 | 2014-01-31 | 2013-10-31 | 2013-07-31 | 2013-04-30 | 2013-01-31 | 2012-10-31 | 2012-07-31 | 2012-04-30 | ||
|---|---|---|---|---|---|---|---|---|---|---|---|---|---|---|---|---|---|---|---|---|---|---|---|---|---|---|---|---|---|---|---|---|---|---|---|---|---|---|---|---|---|---|---|---|---|---|---|---|---|---|---|---|---|
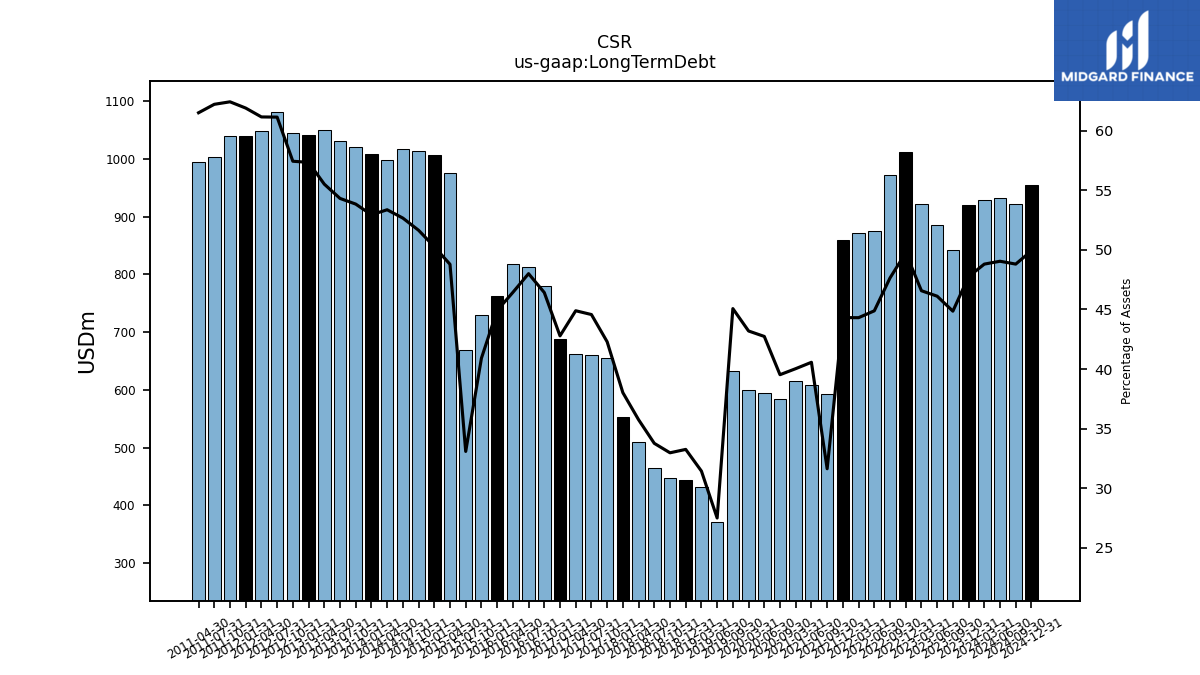
| Long Term Debt | 929.08 | 919.99 | 842.56 | 885.52 | 921.66 | 1011.78 | 971.31 | 874.21 | 870.96 | 859.78 | 593.55 | 608.36 | 615.00 | NA | 584.51 | 595.23 | 599.99 | NA | 632.73 | 370.46 | 430.95 | 444.20 | 447.55 | NA | 464.56 | NA | 509.92 | NA | 553.39 | 655.90 | 660.75 | 661.96 | 688.42 | 779.57 | 812.08 | 817.32 | 761.64 | 728.97 | 669.73 | 974.83 | 1006.18 | 1013.16 | 1017.57 | 997.69 | 1008.52 | 1021.17 | 1030.41 | 1049.21 | 1041.62 | 1045.20 | 1080.65 | 1048.69 |
| 2024-03-31 | 2023-12-31 | 2023-09-30 | 2023-06-30 | 2023-03-31 | 2022-12-31 | 2022-09-30 | 2022-06-30 | 2022-03-31 | 2021-12-31 | 2021-09-30 | 2021-06-30 | 2021-03-31 | 2020-12-31 | 2020-09-30 | 2020-06-30 | 2020-03-31 | 2019-12-31 | 2019-09-30 | 2019-06-30 | 2019-03-31 | 2018-12-31 | 2018-10-31 | 2018-09-30 | 2018-07-31 | 2018-06-30 | 2018-04-30 | 2018-03-31 | 2018-01-31 | 2017-10-31 | 2017-07-31 | 2017-04-30 | 2017-01-31 | 2016-10-31 | 2016-07-31 | 2016-04-30 | 2016-01-31 | 2015-10-31 | 2015-07-31 | 2015-04-30 | 2015-01-31 | 2014-10-31 | 2014-07-31 | 2014-04-30 | 2014-01-31 | 2013-10-31 | 2013-07-31 | 2013-04-30 | 2013-01-31 | 2012-10-31 | 2012-07-31 | 2012-04-30 | ||
|---|---|---|---|---|---|---|---|---|---|---|---|---|---|---|---|---|---|---|---|---|---|---|---|---|---|---|---|---|---|---|---|---|---|---|---|---|---|---|---|---|---|---|---|---|---|---|---|---|---|---|---|---|---|
| Stockholders Equity | 688.15 | 709.83 | 733.53 | 738.48 | 759.25 | 729.54 | 776.20 | 787.47 | 798.93 | 772.03 | 725.18 | 682.10 | 617.78 | 618.21 | 632.13 | 612.22 | 584.19 | 619.05 | 547.58 | 529.97 | 548.04 | 568.79 | 586.48 | NA | 598.96 | NA | 613.41 | NA | 645.30 | 519.54 | 535.45 | 560.94 | 547.08 | 570.08 | 579.11 | 618.76 | 628.94 | 620.06 | 643.41 | 652.11 | 643.68 | 636.86 | 616.04 | 592.18 | 624.20 | 626.07 | 623.20 | 612.79 | 555.27 | 555.16 | 439.72 | 432.99 | |
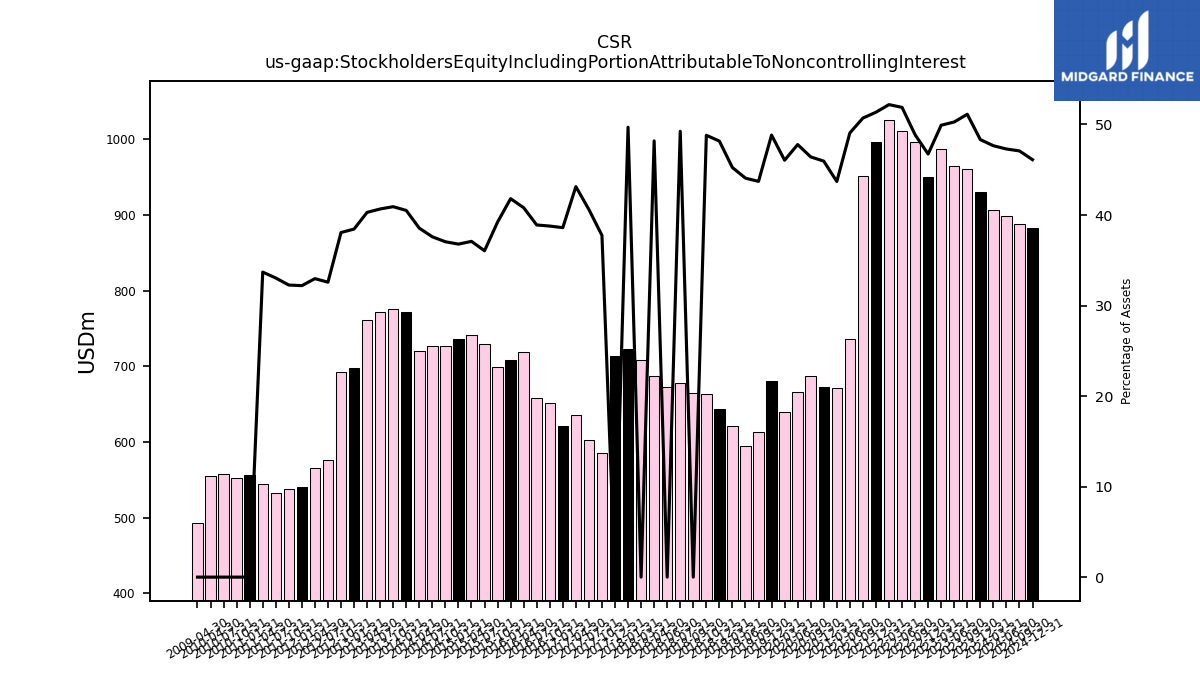
| Stockholders Equity Including Portion Attributable To Noncontrolling Interest | 907.09 | 931.02 | 960.36 | 965.41 | 987.80 | 950.30 | 996.29 | 1010.62 | 1025.91 | 996.28 | 951.68 | 735.89 | 671.45 | 672.82 | 686.51 | 665.51 | 639.72 | 679.90 | 613.66 | 594.00 | 620.39 | 643.45 | 662.74 | 664.17 | 677.73 | 672.38 | 687.50 | 708.47 | 723.39 | 585.49 | 601.94 | 636.09 | 621.20 | 651.22 | 658.02 | 718.26 | 708.93 | 698.87 | 729.89 | 740.95 | 736.21 | 726.67 | 726.20 | 720.55 | 771.43 | 775.93 | 771.31 | 761.38 | 698.28 | 692.49 | 575.73 | 565.26 | |
| Common Stock Value | 1160.49 | 1165.69 | 1169.03 | 1169.50 | 1176.06 | 1177.48 | 1209.73 | 1207.85 | 1203.68 | 1157.26 | 1092.13 | 1033.94 | 980.45 | 968.26 | 968.44 | 958.29 | 912.65 | 917.40 | 886.60 | 888.54 | 895.38 | 899.23 | 900.53 | NA | 899.71 | NA | 907.84 | NA | 910.17 | 910.68 | 912.62 | 916.12 | 921.74 | 920.76 | 922.70 | 922.08 | 924.66 | 936.89 | 957.71 | 951.87 | 935.29 | 918.22 | 884.41 | 843.27 | 829.82 | 818.52 | 807.93 | 784.45 | 721.74 | 711.88 | 701.43 | 684.05 | |
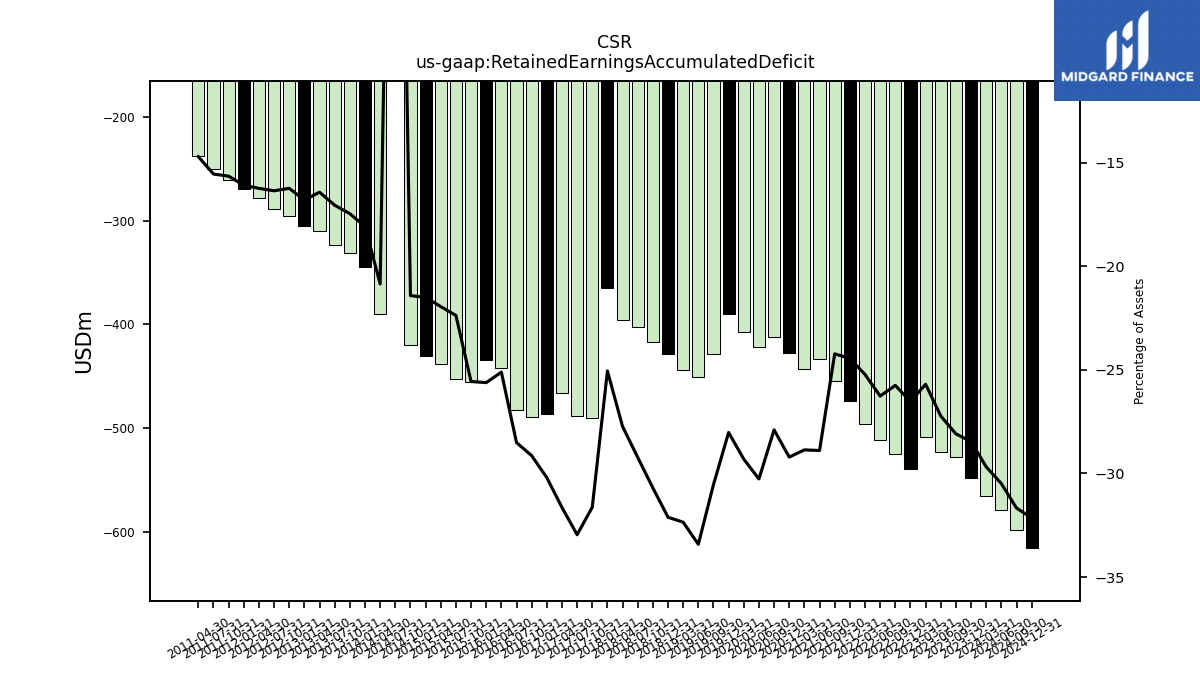
| Retained Earnings Accumulated Deficit | -564.95 | -548.27 | -527.59 | -522.80 | -508.42 | -539.42 | -524.90 | -511.55 | -495.73 | -474.32 | -454.69 | -433.31 | -443.41 | -427.68 | -412.58 | -421.51 | -407.15 | -390.20 | -428.68 | -450.43 | -443.66 | -429.05 | -416.82 | NA | -402.19 | NA | -395.67 | NA | -364.68 | -490.61 | -488.54 | -466.54 | -486.01 | -489.36 | -482.26 | -442.00 | -434.39 | -455.51 | -452.97 | -438.43 | -430.28 | -420.04 | 407.05 | -389.76 | -344.29 | -331.12 | -323.41 | -310.34 | -305.14 | -295.40 | -289.02 | -278.38 | |
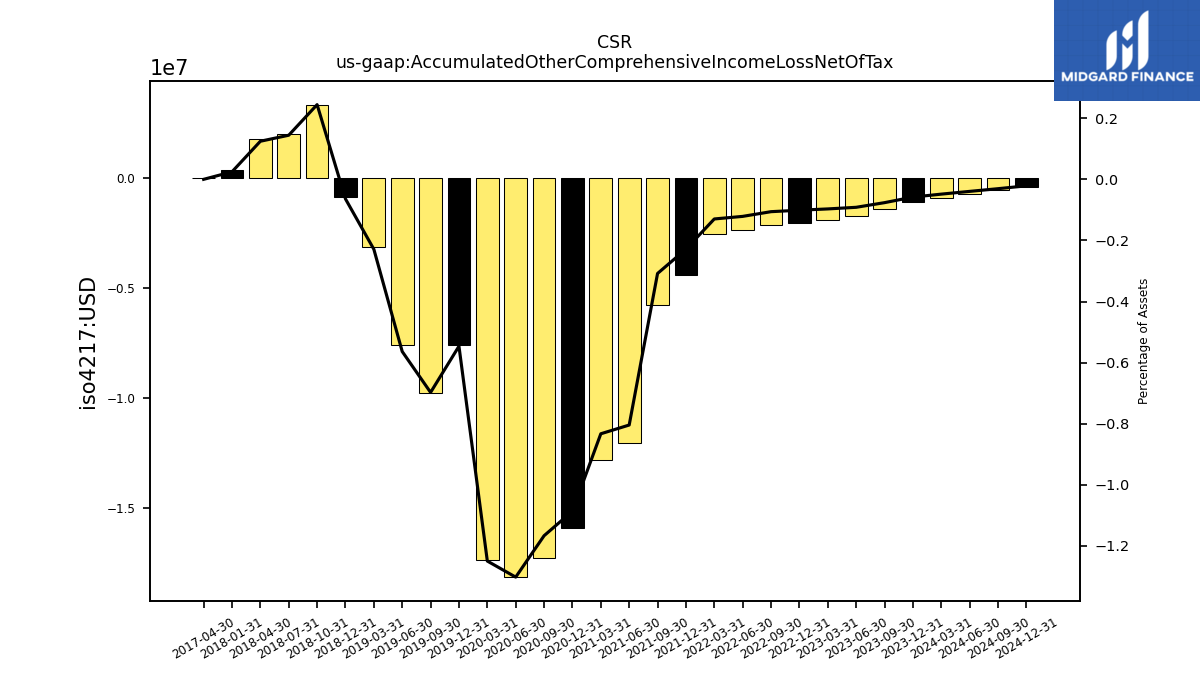
| Accumulated Other Comprehensive Income Loss Net Of Tax | -0.92 | -1.12 | -1.43 | -1.76 | -1.92 | -2.06 | -2.16 | -2.36 | -2.55 | -4.43 | -5.78 | -12.06 | -12.80 | -15.90 | -17.26 | -18.14 | -17.36 | -7.61 | -9.79 | -7.60 | -3.14 | -0.86 | 3.32 | NA | 1.99 | NA | 1.78 | NA | 0.36 | NA | NA | 0.00 | NA | NA | NA | NA | NA | NA | NA | NA | NA | NA | NA | NA | NA | NA | NA | NA | NA | NA | NA | NA |
| 2024-03-31 | 2023-12-31 | 2023-09-30 | 2023-06-30 | 2023-03-31 | 2022-12-31 | 2022-09-30 | 2022-06-30 | 2022-03-31 | 2021-12-31 | 2021-09-30 | 2021-06-30 | 2021-03-31 | 2020-12-31 | 2020-09-30 | 2020-06-30 | 2020-03-31 | 2019-12-31 | 2019-09-30 | 2019-06-30 | 2019-03-31 | 2018-12-31 | 2018-10-31 | 2018-09-30 | 2018-07-31 | 2018-06-30 | 2018-04-30 | 2018-03-31 | 2018-01-31 | 2017-10-31 | 2017-07-31 | 2017-04-30 | 2017-01-31 | 2016-10-31 | 2016-07-31 | 2016-04-30 | 2016-01-31 | 2015-10-31 | 2015-07-31 | 2015-04-30 | 2015-01-31 | 2014-10-31 | 2014-07-31 | 2014-04-30 | 2014-01-31 | 2013-10-31 | 2013-07-31 | 2013-04-30 | 2013-01-31 | 2012-10-31 | 2012-07-31 | 2012-04-30 | ||
|---|---|---|---|---|---|---|---|---|---|---|---|---|---|---|---|---|---|---|---|---|---|---|---|---|---|---|---|---|---|---|---|---|---|---|---|---|---|---|---|---|---|---|---|---|---|---|---|---|---|---|---|---|---|
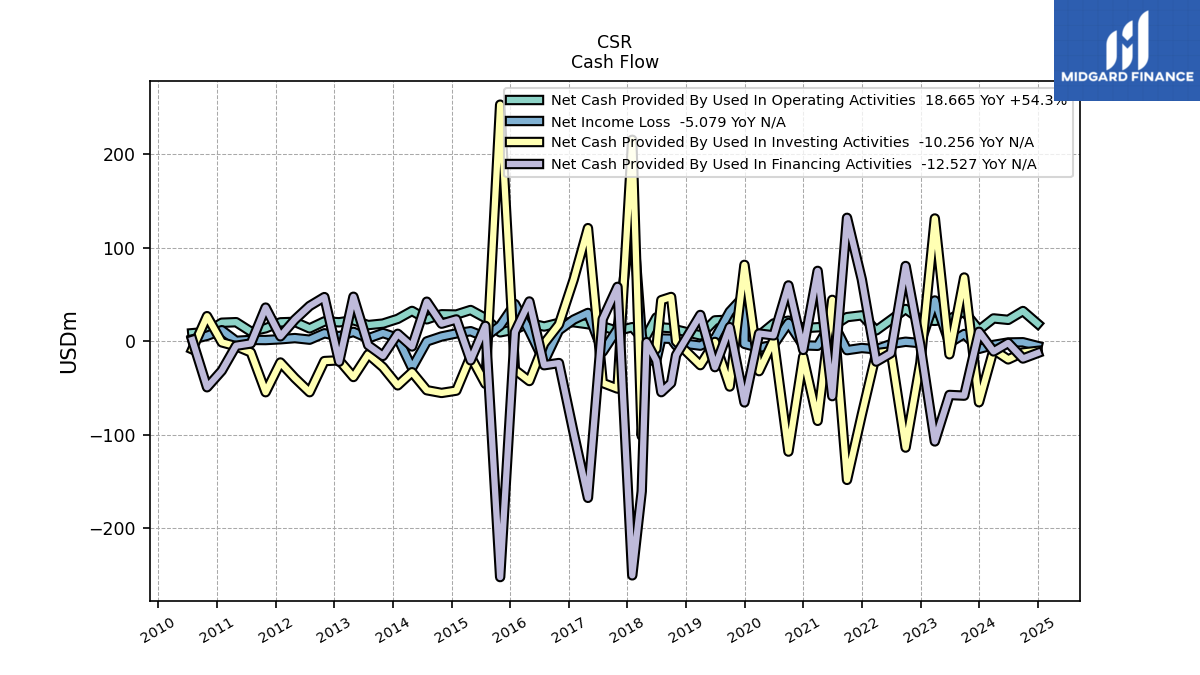
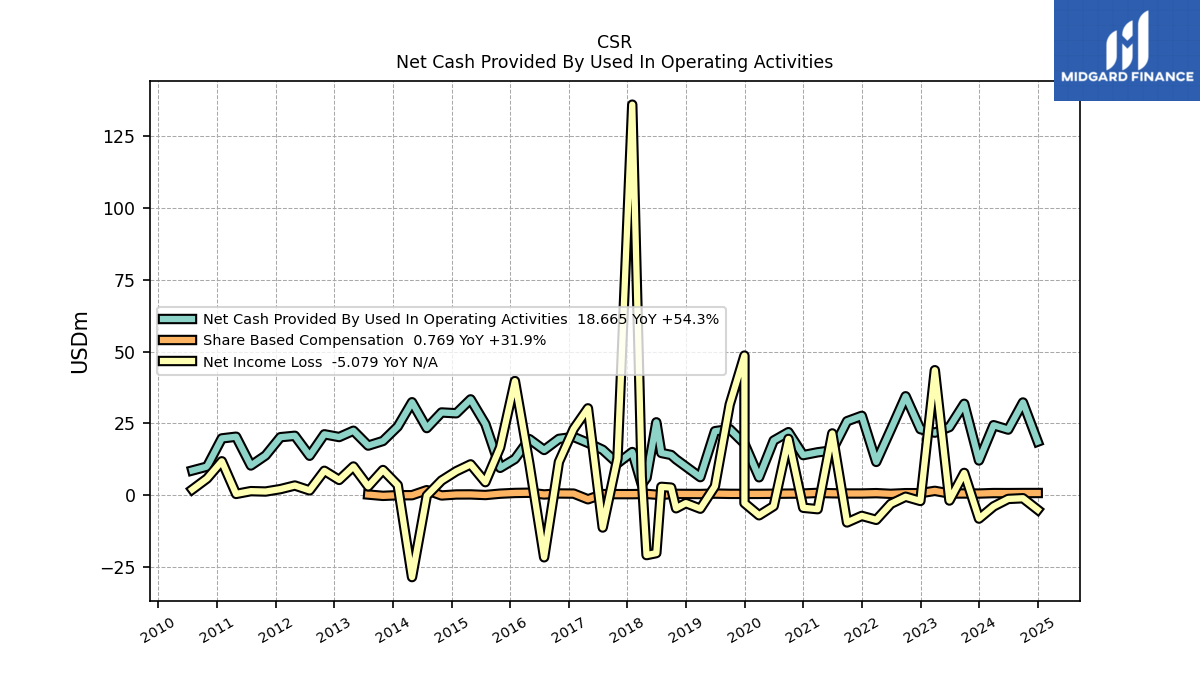
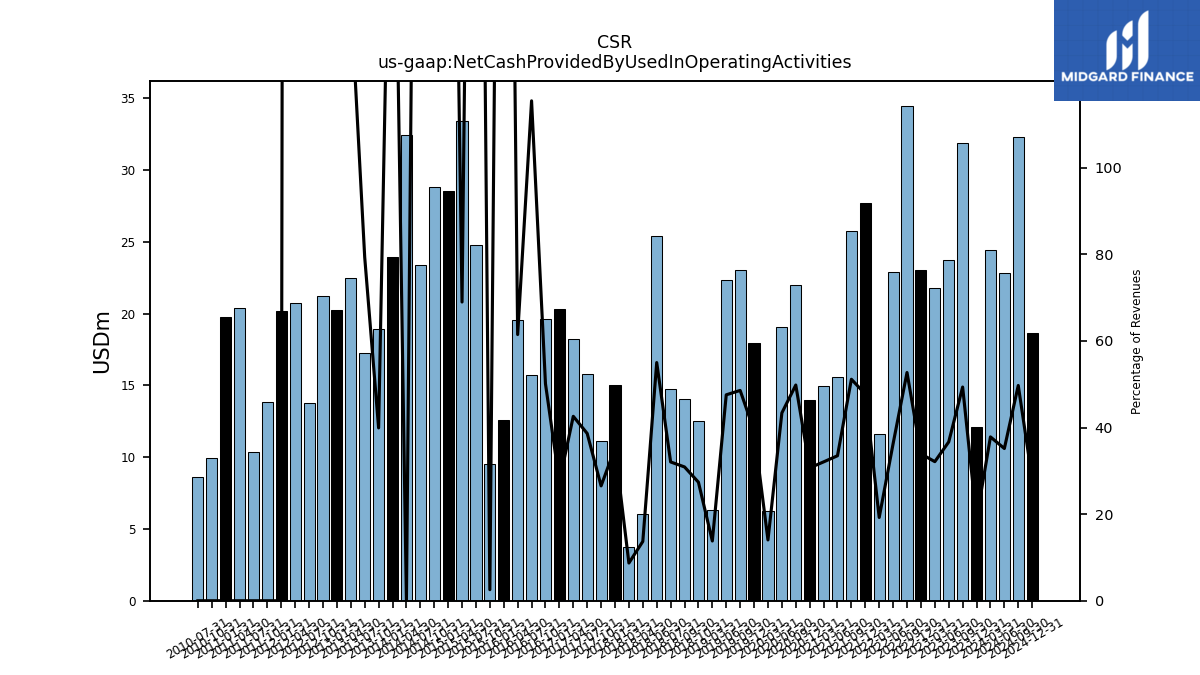
| Net Cash Provided By Used In Operating Activities | 24.40 | 12.10 | 31.86 | 23.76 | 21.80 | 23.02 | 34.48 | 22.89 | 11.60 | 27.67 | 25.78 | 15.62 | 14.96 | 13.97 | 21.98 | 19.04 | 6.24 | 17.98 | 23.04 | 22.31 | 6.29 | NA | 12.49 | 14.03 | 14.72 | 25.41 | 6.05 | 3.75 | 15.05 | 11.10 | 15.83 | 18.23 | 20.31 | 19.63 | 15.76 | 19.55 | 12.62 | 9.54 | 24.78 | 33.41 | 28.55 | 28.84 | 23.39 | 32.41 | 23.92 | 18.90 | 17.28 | 22.47 | 20.27 | 21.23 | 13.74 | 20.71 | |
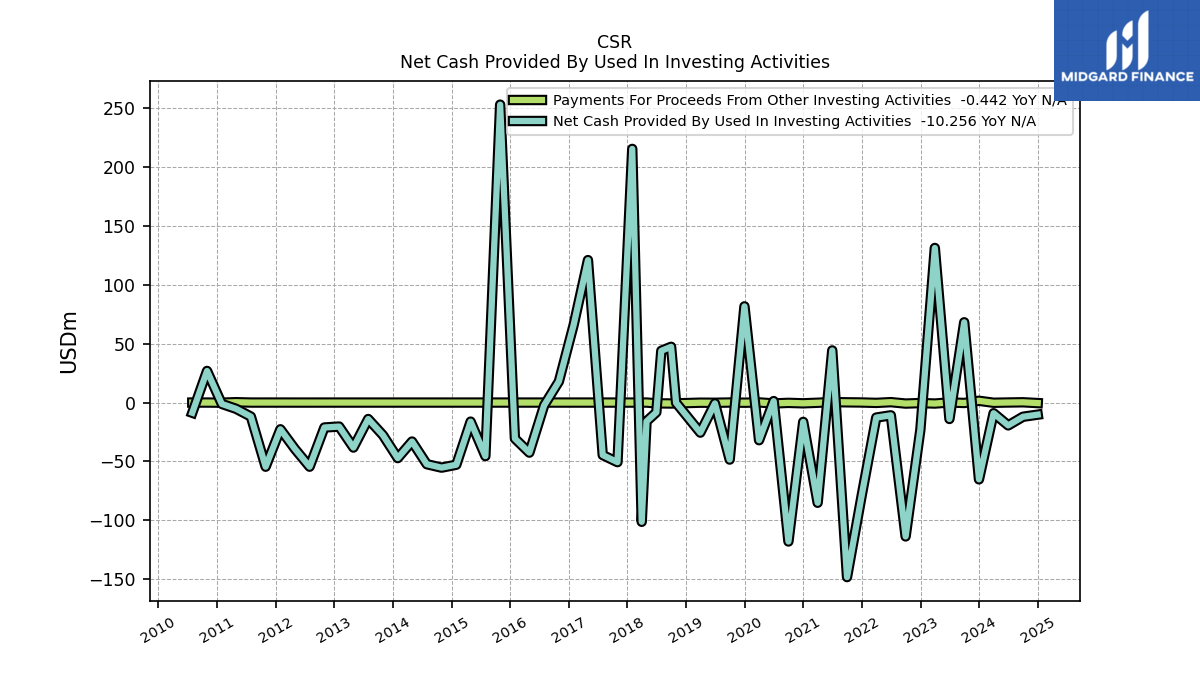
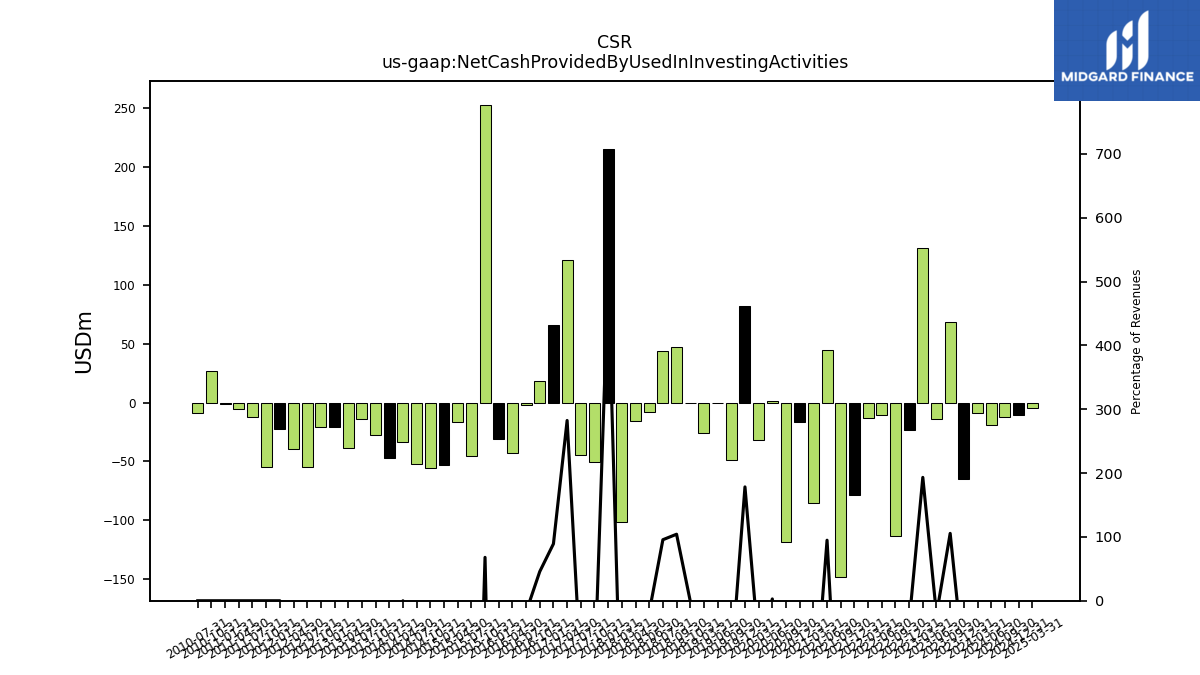
| Net Cash Provided By Used In Investing Activities | -9.03 | -65.16 | 68.12 | -13.94 | 131.18 | -22.95 | -113.59 | -10.82 | -12.73 | -78.33 | -148.10 | 44.24 | -85.03 | -16.39 | -117.88 | 1.26 | -31.95 | 81.62 | -48.39 | -0.71 | -25.52 | NA | -0.19 | 47.30 | 43.92 | -8.30 | -15.92 | -101.17 | 215.22 | -50.57 | -44.54 | 120.87 | 65.88 | 17.92 | -2.41 | -42.49 | -30.58 | 252.77 | -45.45 | -16.16 | -52.73 | -55.21 | -52.30 | -33.06 | -47.13 | -27.69 | -13.96 | -38.20 | -20.36 | -21.15 | -54.43 | -39.29 | |
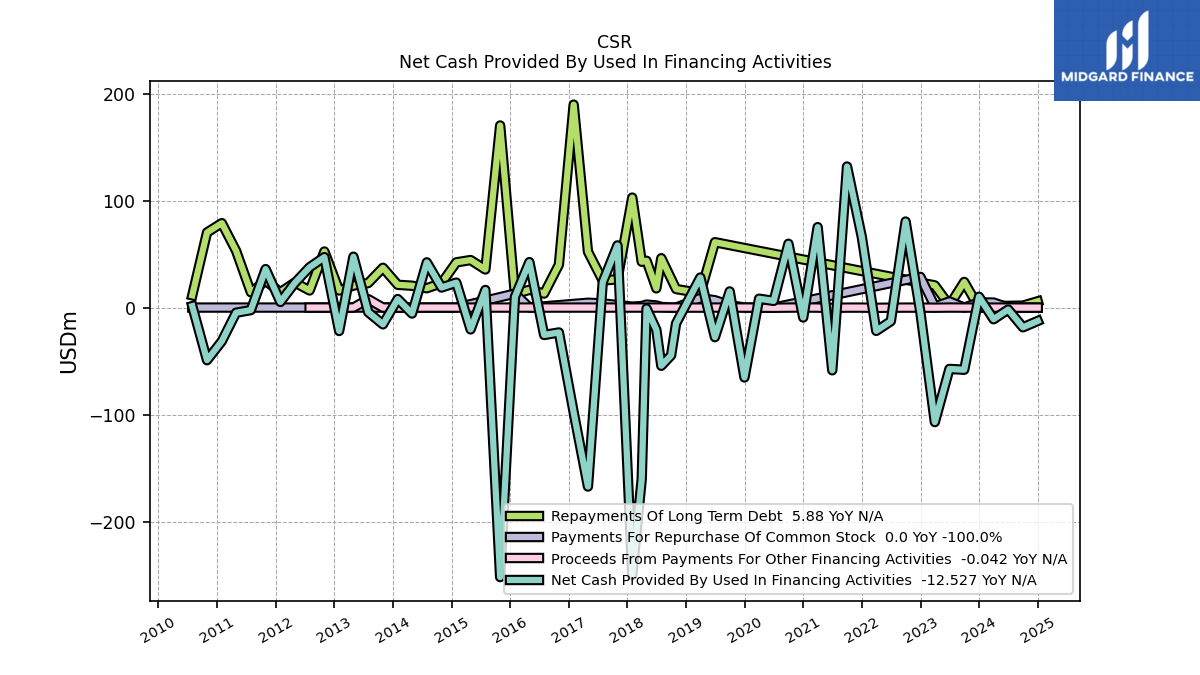
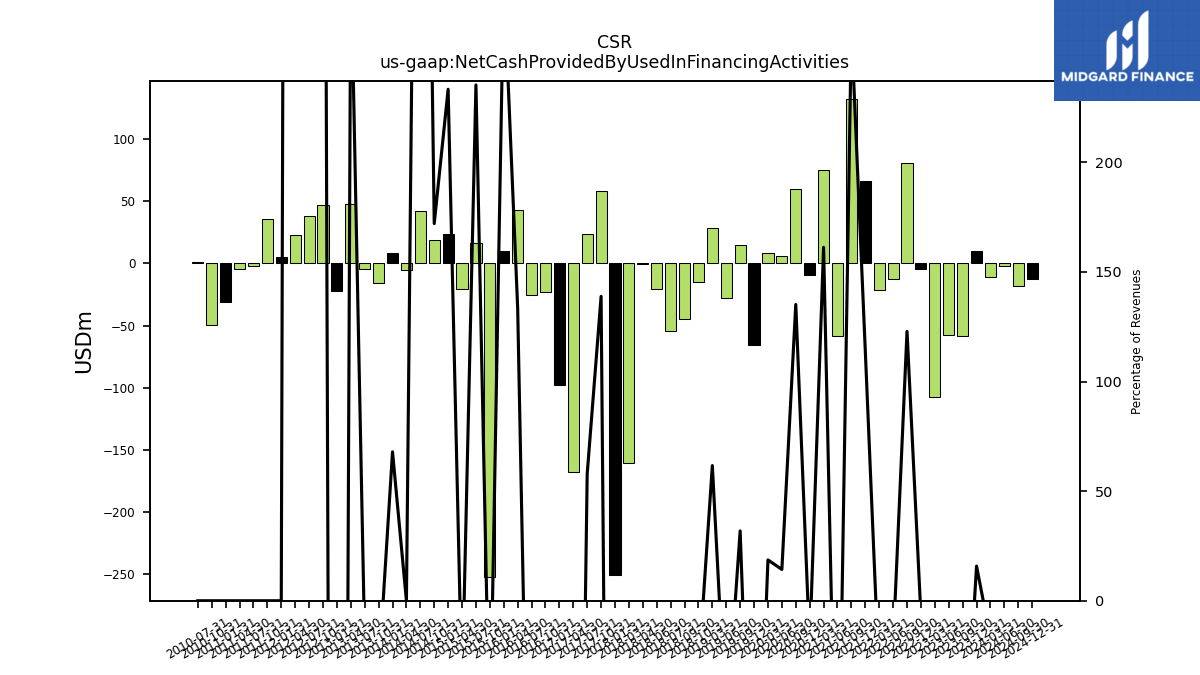
| Net Cash Provided By Used In Financing Activities | -10.89 | 10.13 | -58.10 | -57.35 | -107.04 | -4.55 | 80.42 | -12.73 | -21.77 | 66.09 | 131.87 | -58.65 | 75.20 | -9.27 | 59.66 | 6.27 | 8.28 | -65.33 | 15.11 | -27.68 | 28.12 | NA | -14.80 | -44.66 | -54.39 | -20.68 | -0.90 | -160.32 | -250.07 | 58.13 | 23.70 | -167.28 | -97.92 | -23.26 | -25.61 | 42.52 | 9.94 | -251.94 | 16.47 | -20.42 | 23.33 | 18.75 | 42.27 | -5.58 | 7.98 | -15.68 | -4.27 | 47.56 | -21.86 | 47.18 | 37.70 | 23.07 |
| 2024-03-31 | 2023-12-31 | 2023-09-30 | 2023-06-30 | 2023-03-31 | 2022-12-31 | 2022-09-30 | 2022-06-30 | 2022-03-31 | 2021-12-31 | 2021-09-30 | 2021-06-30 | 2021-03-31 | 2020-12-31 | 2020-09-30 | 2020-06-30 | 2020-03-31 | 2019-12-31 | 2019-09-30 | 2019-06-30 | 2019-03-31 | 2018-12-31 | 2018-10-31 | 2018-09-30 | 2018-07-31 | 2018-06-30 | 2018-04-30 | 2018-03-31 | 2018-01-31 | 2017-10-31 | 2017-07-31 | 2017-04-30 | 2017-01-31 | 2016-10-31 | 2016-07-31 | 2016-04-30 | 2016-01-31 | 2015-10-31 | 2015-07-31 | 2015-04-30 | 2015-01-31 | 2014-10-31 | 2014-07-31 | 2014-04-30 | 2014-01-31 | 2013-10-31 | 2013-07-31 | 2013-04-30 | 2013-01-31 | 2012-10-31 | 2012-07-31 | 2012-04-30 | ||
|---|---|---|---|---|---|---|---|---|---|---|---|---|---|---|---|---|---|---|---|---|---|---|---|---|---|---|---|---|---|---|---|---|---|---|---|---|---|---|---|---|---|---|---|---|---|---|---|---|---|---|---|---|---|
| Net Cash Provided By Used In Operating Activities | 24.40 | 12.10 | 31.86 | 23.76 | 21.80 | 23.02 | 34.48 | 22.89 | 11.60 | 27.67 | 25.78 | 15.62 | 14.96 | 13.97 | 21.98 | 19.04 | 6.24 | 17.98 | 23.04 | 22.31 | 6.29 | NA | 12.49 | 14.03 | 14.72 | 25.41 | 6.05 | 3.75 | 15.05 | 11.10 | 15.83 | 18.23 | 20.31 | 19.63 | 15.76 | 19.55 | 12.62 | 9.54 | 24.78 | 33.41 | 28.55 | 28.84 | 23.39 | 32.41 | 23.92 | 18.90 | 17.28 | 22.47 | 20.27 | 21.23 | 13.74 | 20.71 | |
| Net Income Loss | -3.90 | -8.16 | 7.77 | -1.86 | 43.57 | -2.01 | -0.52 | -2.99 | -8.59 | -7.21 | -9.49 | 21.54 | -4.87 | -4.38 | 19.63 | -3.80 | -7.01 | 48.66 | 31.60 | 3.11 | -4.70 | -2.76 | -4.56 | 2.65 | 2.92 | -20.17 | -20.87 | 6.60 | 136.10 | 12.82 | -11.26 | 30.28 | 23.11 | 11.60 | -21.64 | 11.00 | 39.80 | 16.67 | 4.54 | 10.75 | 8.37 | 5.11 | -0.15 | -28.54 | 3.50 | 8.79 | 3.08 | 10.02 | 5.32 | 8.51 | 1.68 | 3.38 | |
| Profit Loss | -4.79 | -9.88 | 9.17 | -2.38 | 52.33 | -2.56 | -0.77 | -3.74 | -10.56 | -8.80 | -11.24 | 23.10 | -5.16 | -4.67 | 21.18 | -4.08 | -7.68 | 52.80 | 34.72 | 3.27 | -5.96 | NA | -5.61 | 3.44 | 3.72 | -23.35 | -24.16 | 6.66 | 151.93 | 13.14 | -13.28 | 33.64 | 25.19 | 12.29 | -40.59 | 11.76 | 43.44 | 16.68 | 4.73 | 13.86 | 9.15 | 5.87 | -0.20 | -34.52 | 4.07 | 10.30 | 3.22 | 11.81 | 6.15 | 10.01 | 2.00 | 4.12 | |
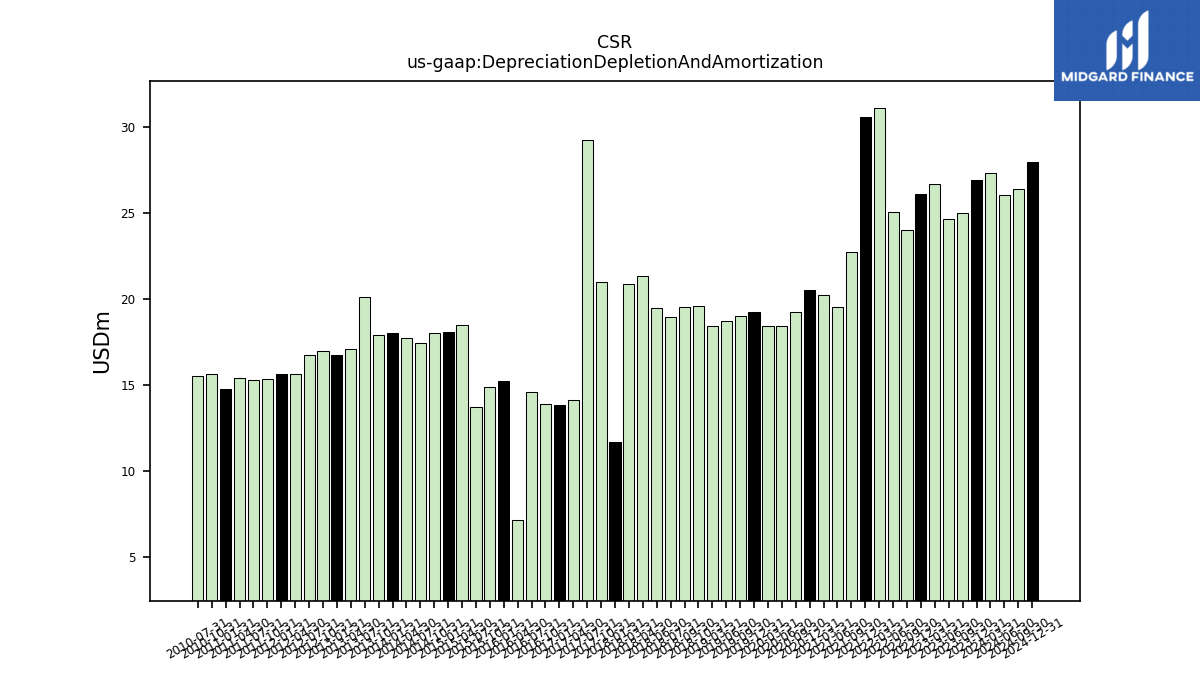
| Depreciation Depletion And Amortization | 27.30 | 26.91 | 24.97 | 24.64 | 26.65 | 26.10 | 23.98 | 25.03 | 31.10 | 30.58 | 22.73 | 19.55 | 20.25 | 20.53 | 19.24 | 18.41 | 18.42 | 19.24 | 19.03 | 18.72 | 18.41 | NA | 19.58 | 19.55 | 18.94 | 19.49 | 21.31 | 20.86 | 11.72 | 21.01 | 29.23 | 14.15 | 13.83 | 13.92 | 14.63 | 7.17 | 15.22 | 14.88 | 13.71 | 18.50 | 18.11 | 18.01 | 17.46 | 17.73 | 18.01 | 17.90 | 20.09 | 17.08 | 16.75 | 17.01 | 16.72 | 15.63 | |
| Share Based Compensation | 0.75 | 0.58 | 0.60 | 0.59 | 1.52 | 0.71 | 0.71 | 0.48 | 0.72 | 0.60 | 0.60 | 0.68 | 0.81 | 0.58 | 0.55 | 0.50 | 0.47 | 0.45 | 0.47 | 0.56 | 0.42 | NA | 0.47 | 0.42 | 0.11 | 0.19 | 0.46 | 0.42 | 0.37 | 0.38 | 0.38 | -1.42 | 0.56 | 0.60 | 0.26 | 0.86 | 0.79 | 0.54 | 0.07 | 0.28 | 0.26 | -0.09 | 1.76 | 0.00 | 0.00 | -0.23 | 0.23 | NA | NA | NA | NA | NA |
| 2024-03-31 | 2023-12-31 | 2023-09-30 | 2023-06-30 | 2023-03-31 | 2022-12-31 | 2022-09-30 | 2022-06-30 | 2022-03-31 | 2021-12-31 | 2021-09-30 | 2021-06-30 | 2021-03-31 | 2020-12-31 | 2020-09-30 | 2020-06-30 | 2020-03-31 | 2019-12-31 | 2019-09-30 | 2019-06-30 | 2019-03-31 | 2018-12-31 | 2018-10-31 | 2018-09-30 | 2018-07-31 | 2018-06-30 | 2018-04-30 | 2018-03-31 | 2018-01-31 | 2017-10-31 | 2017-07-31 | 2017-04-30 | 2017-01-31 | 2016-10-31 | 2016-07-31 | 2016-04-30 | 2016-01-31 | 2015-10-31 | 2015-07-31 | 2015-04-30 | 2015-01-31 | 2014-10-31 | 2014-07-31 | 2014-04-30 | 2014-01-31 | 2013-10-31 | 2013-07-31 | 2013-04-30 | 2013-01-31 | 2012-10-31 | 2012-07-31 | 2012-04-30 | ||
|---|---|---|---|---|---|---|---|---|---|---|---|---|---|---|---|---|---|---|---|---|---|---|---|---|---|---|---|---|---|---|---|---|---|---|---|---|---|---|---|---|---|---|---|---|---|---|---|---|---|---|---|---|---|
| Net Cash Provided By Used In Investing Activities | -9.03 | -65.16 | 68.12 | -13.94 | 131.18 | -22.95 | -113.59 | -10.82 | -12.73 | -78.33 | -148.10 | 44.24 | -85.03 | -16.39 | -117.88 | 1.26 | -31.95 | 81.62 | -48.39 | -0.71 | -25.52 | NA | -0.19 | 47.30 | 43.92 | -8.30 | -15.92 | -101.17 | 215.22 | -50.57 | -44.54 | 120.87 | 65.88 | 17.92 | -2.41 | -42.49 | -30.58 | 252.77 | -45.45 | -16.16 | -52.73 | -55.21 | -52.30 | -33.06 | -47.13 | -27.69 | -13.96 | -38.20 | -20.36 | -21.15 | -54.43 | -39.29 |
| 2024-03-31 | 2023-12-31 | 2023-09-30 | 2023-06-30 | 2023-03-31 | 2022-12-31 | 2022-09-30 | 2022-06-30 | 2022-03-31 | 2021-12-31 | 2021-09-30 | 2021-06-30 | 2021-03-31 | 2020-12-31 | 2020-09-30 | 2020-06-30 | 2020-03-31 | 2019-12-31 | 2019-09-30 | 2019-06-30 | 2019-03-31 | 2018-12-31 | 2018-10-31 | 2018-09-30 | 2018-07-31 | 2018-06-30 | 2018-04-30 | 2018-03-31 | 2018-01-31 | 2017-10-31 | 2017-07-31 | 2017-04-30 | 2017-01-31 | 2016-10-31 | 2016-07-31 | 2016-04-30 | 2016-01-31 | 2015-10-31 | 2015-07-31 | 2015-04-30 | 2015-01-31 | 2014-10-31 | 2014-07-31 | 2014-04-30 | 2014-01-31 | 2013-10-31 | 2013-07-31 | 2013-04-30 | 2013-01-31 | 2012-10-31 | 2012-07-31 | 2012-04-30 | ||
|---|---|---|---|---|---|---|---|---|---|---|---|---|---|---|---|---|---|---|---|---|---|---|---|---|---|---|---|---|---|---|---|---|---|---|---|---|---|---|---|---|---|---|---|---|---|---|---|---|---|---|---|---|---|
| Net Cash Provided By Used In Financing Activities | -10.89 | 10.13 | -58.10 | -57.35 | -107.04 | -4.55 | 80.42 | -12.73 | -21.77 | 66.09 | 131.87 | -58.65 | 75.20 | -9.27 | 59.66 | 6.27 | 8.28 | -65.33 | 15.11 | -27.68 | 28.12 | NA | -14.80 | -44.66 | -54.39 | -20.68 | -0.90 | -160.32 | -250.07 | 58.13 | 23.70 | -167.28 | -97.92 | -23.26 | -25.61 | 42.52 | 9.94 | -251.94 | 16.47 | -20.42 | 23.33 | 18.75 | 42.27 | -5.58 | 7.98 | -15.68 | -4.27 | 47.56 | -21.86 | 47.18 | 37.70 | 23.07 | |
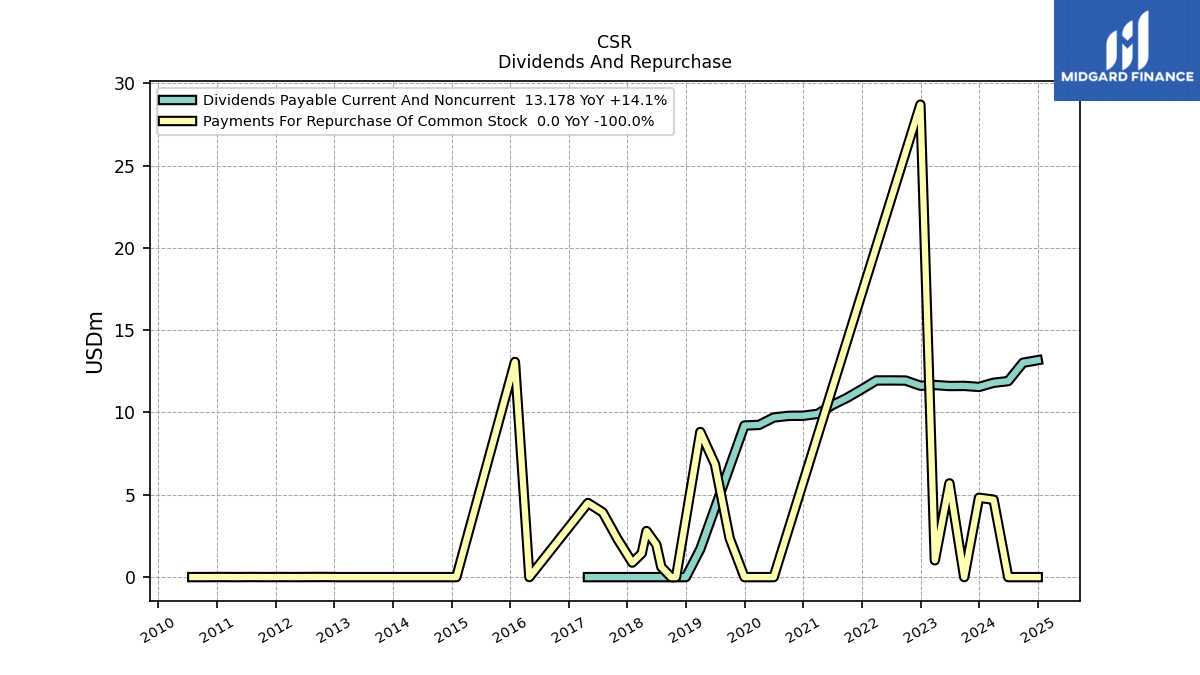
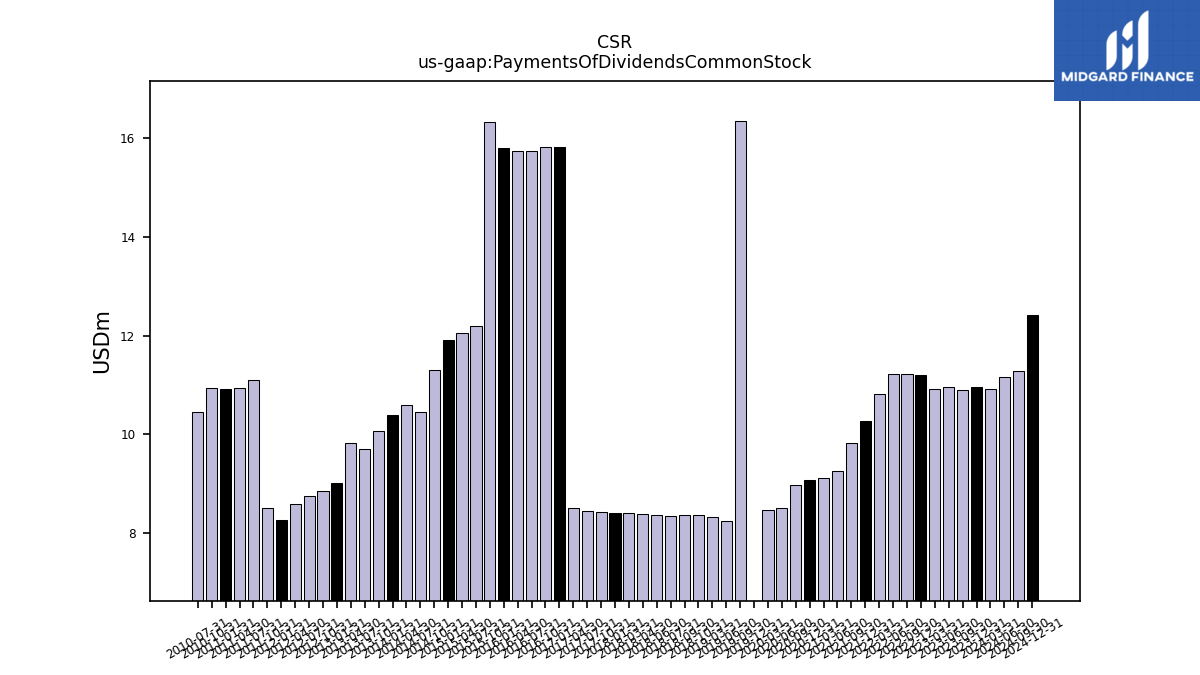
| Payments Of Dividends Common Stock | 10.92 | 10.96 | 10.91 | 10.96 | 10.92 | 11.21 | 11.22 | 11.22 | 10.81 | 10.28 | 9.83 | 9.25 | 9.12 | 9.08 | 8.98 | 8.52 | 8.47 | -0.03 | 16.34 | 8.25 | 8.34 | NA | 8.37 | 8.37 | 8.36 | 8.36 | 8.40 | 8.40 | 8.41 | 8.44 | 8.44 | 8.52 | 15.83 | 15.81 | 15.74 | 15.74 | 15.80 | 16.32 | 12.20 | 12.06 | 11.91 | 11.30 | 10.46 | 10.59 | 10.39 | 10.07 | 9.71 | 9.84 | 9.02 | 8.85 | 8.76 | 8.59 | |
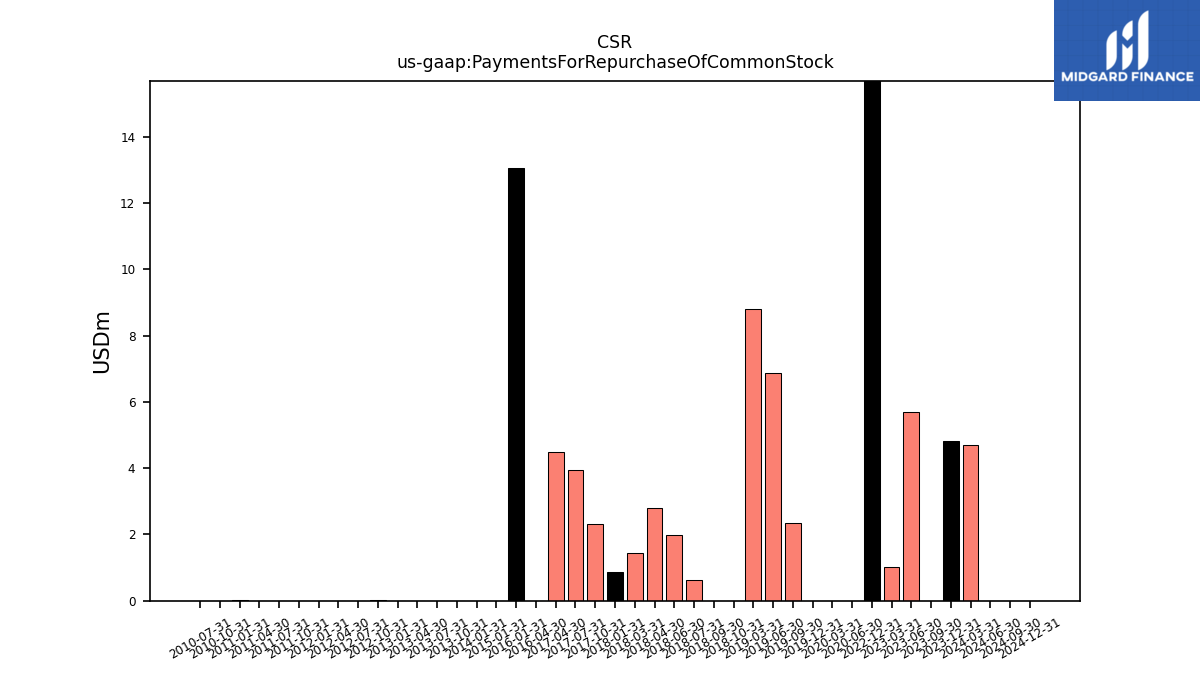
| Payments For Repurchase Of Common Stock | 4.70 | 4.82 | 0.00 | 5.70 | 1.02 | 28.70 | NA | NA | NA | NA | NA | NA | NA | NA | NA | 0.00 | 0.00 | 0.00 | 2.35 | 6.86 | 8.81 | NA | 0.00 | 0.00 | 0.61 | 1.97 | 2.80 | 1.44 | 0.88 | 2.32 | 3.94 | 4.50 | NA | NA | NA | 0.00 | 13.07 | NA | NA | NA | 0.00 | NA | NA | NA | 0.00 | 0.00 | 0.00 | 0.00 | 0.00 | 0.01 | 0.01 | 0.00 |
| 2024-03-31 | 2023-12-31 | 2023-09-30 | 2023-06-30 | 2023-03-31 | 2022-12-31 | 2022-09-30 | 2022-06-30 | 2022-03-31 | 2021-12-31 | 2021-09-30 | 2021-06-30 | 2021-03-31 | 2020-12-31 | 2020-09-30 | 2020-06-30 | 2020-03-31 | 2019-12-31 | 2019-09-30 | 2019-06-30 | 2019-03-31 | 2018-12-31 | 2018-10-31 | 2018-09-30 | 2018-07-31 | 2018-06-30 | 2018-04-30 | 2018-03-31 | 2018-01-31 | 2017-10-31 | 2017-07-31 | 2017-04-30 | 2017-01-31 | 2016-10-31 | 2016-07-31 | 2016-04-30 | 2016-01-31 | 2015-10-31 | 2015-07-31 | 2015-04-30 | 2015-01-31 | 2014-10-31 | 2014-07-31 | 2014-04-30 | 2014-01-31 | 2013-10-31 | 2013-07-31 | 2013-04-30 | 2013-01-31 | 2012-10-31 | 2012-07-31 | 2012-04-30 | ||
|---|---|---|---|---|---|---|---|---|---|---|---|---|---|---|---|---|---|---|---|---|---|---|---|---|---|---|---|---|---|---|---|---|---|---|---|---|---|---|---|---|---|---|---|---|---|---|---|---|---|---|---|---|---|
| Revenues | 64.51 | 64.07 | 64.57 | 64.78 | 67.90 | 67.85 | 65.44 | 63.12 | 60.31 | 57.99 | 50.41 | 46.66 | 46.65 | 45.54 | 44.14 | 43.91 | 44.41 | 45.78 | 47.44 | 46.93 | 45.61 | 30.29 | 45.64 | 45.41 | 45.95 | 46.20 | 44.19 | 43.03 | 42.72 | 41.87 | 40.98 | 42.81 | 73.90 | 39.20 | 13.65 | 31.81 | 3.50 | 371.90 | 7.00 | 48.43 | 10.00 | 10.90 | 6.70 | 0.00 | 11.74 | 47.35 | 21.79 | 16.10 | 1.95 | 7.27 | 0.95 | 1.06 | |
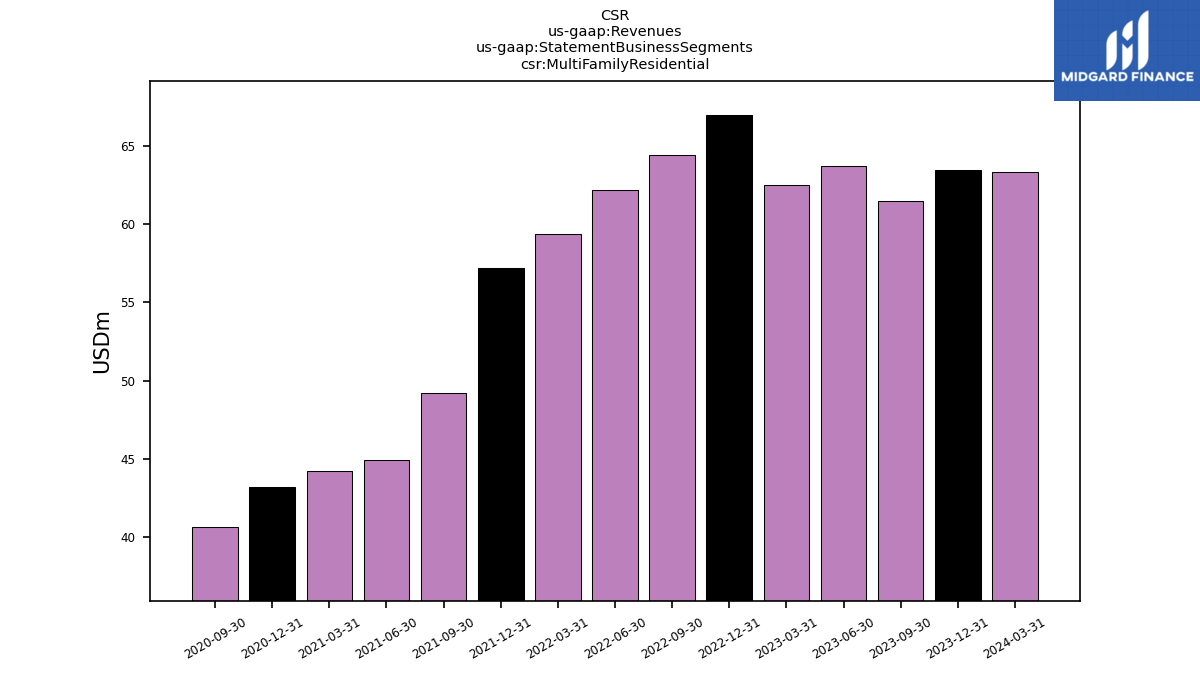
| Multi Family Residential | 63.34 | 63.47 | 61.51 | 63.73 | 62.50 | 66.95 | 64.40 | 62.20 | 59.40 | 57.18 | 49.25 | 44.96 | 44.24 | 43.18 | 40.69 | NA | NA | NA | NA | NA | NA | NA | NA | NA | NA | NA | NA | NA | NA | NA | NA | NA | NA | NA | NA | NA | NA | NA | NA | NA | NA | NA | NA | NA | NA | NA | NA | NA | NA | NA | NA | NA | |
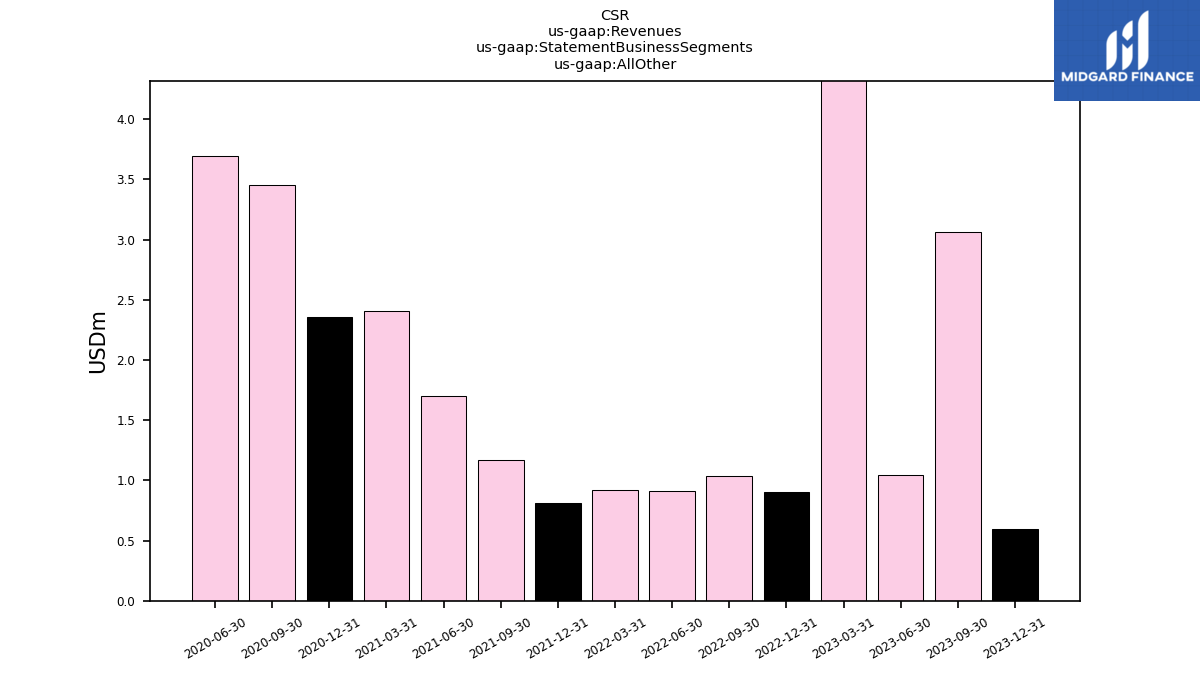
| All Other | 1.17 | 0.60 | 3.06 | 1.04 | 5.40 | 0.90 | 1.03 | 0.92 | 0.92 | 0.81 | 1.17 | 1.70 | 2.41 | 2.36 | 3.45 | 3.70 | NA | NA | NA | NA | NA | NA | NA | NA | NA | NA | NA | NA | NA | NA | NA | NA | NA | NA | NA | NA | NA | NA | NA | NA | NA | NA | NA | NA | NA | NA | NA | NA | NA | NA | NA | NA | |
| Revenue From Contract With Customer Excluding Assessed Tax | 1.19 | 257.85 | 1.24 | 1.09 | 1.13 | 252.49 | 1.68 | 1.43 | 1.12 | 199.05 | 0.95 | 0.89 | 0.84 | 45.54 | 0.70 | 0.70 | 44.41 | 45.78 | 47.44 | 46.93 | 45.61 | 30.29 | 45.64 | 45.41 | 45.95 | 46.20 | 44.19 | 43.03 | 42.72 | 41.87 | 40.98 | 42.81 | 73.90 | 39.20 | 13.65 | 31.81 | 3.50 | 371.90 | 7.00 | 48.43 | 10.00 | 10.90 | 6.70 | 0.00 | 11.74 | 47.35 | 21.79 | 16.10 | 1.95 | 7.27 | 0.95 | 1.06 |