
| 2024-03-31 | 2023-12-31 | 2023-09-30 | 2023-06-30 | 2023-03-31 | 2022-12-31 | 2022-09-30 | 2022-06-30 | 2022-03-31 | 2021-12-31 | 2021-09-30 | 2021-06-30 | 2021-03-31 | 2020-12-31 | 2020-09-30 | 2020-06-30 | 2020-03-31 | 2019-12-31 | 2019-09-30 | 2019-06-30 | 2019-03-31 | 2018-12-31 | 2018-09-30 | 2018-06-30 | 2018-03-31 | 2017-12-31 | 2017-09-30 | 2017-06-30 | 2017-03-31 | ||
|---|---|---|---|---|---|---|---|---|---|---|---|---|---|---|---|---|---|---|---|---|---|---|---|---|---|---|---|---|---|---|
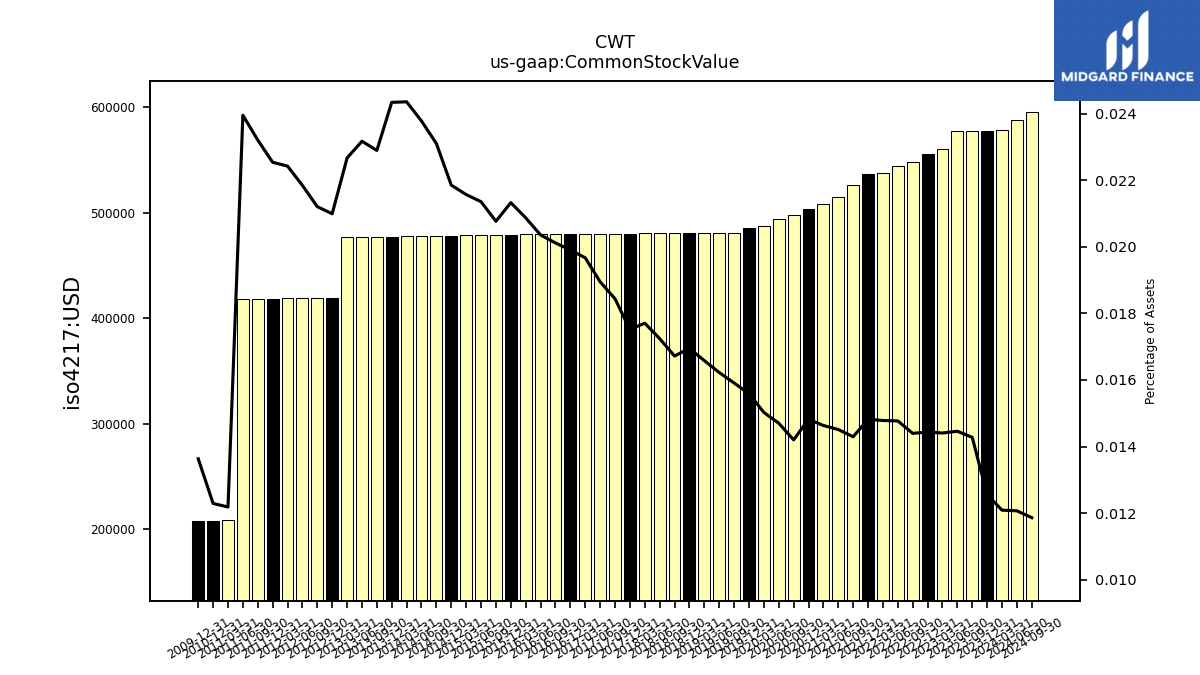
| Common Stock Value | 0.58 | 0.58 | 0.58 | 0.58 | 0.56 | 0.56 | 0.55 | 0.54 | 0.54 | 0.54 | 0.53 | 0.52 | 0.51 | 0.50 | 0.50 | 0.49 | 0.49 | 0.48 | 0.48 | 0.48 | 0.48 | 0.48 | 0.48 | 0.48 | 0.48 | 0.48 | 0.48 | 0.48 | 0.48 | |
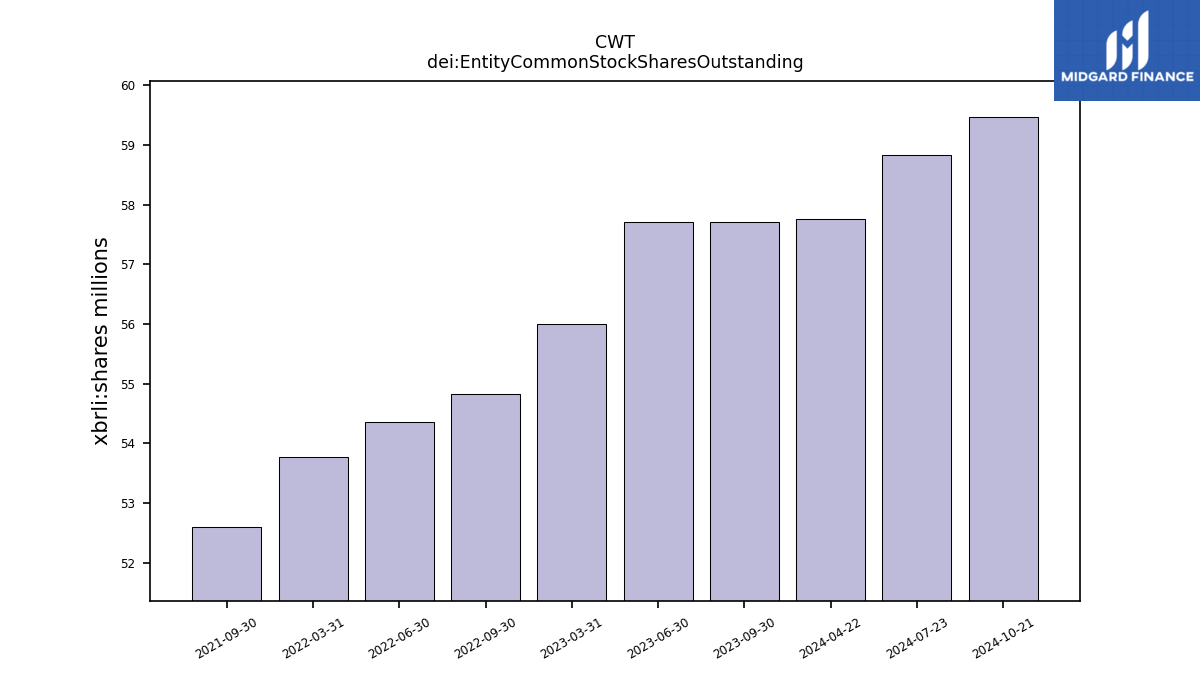
| dei: Entity Common Stock Shares Outstanding | NA | NA | 57.71 | 57.70 | 55.99 | NA | 54.82 | 54.36 | 53.77 | NA | 52.61 | NA | NA | NA | NA | NA | NA | NA | NA | NA | NA | NA | NA | NA | NA | NA | NA | NA | NA | |
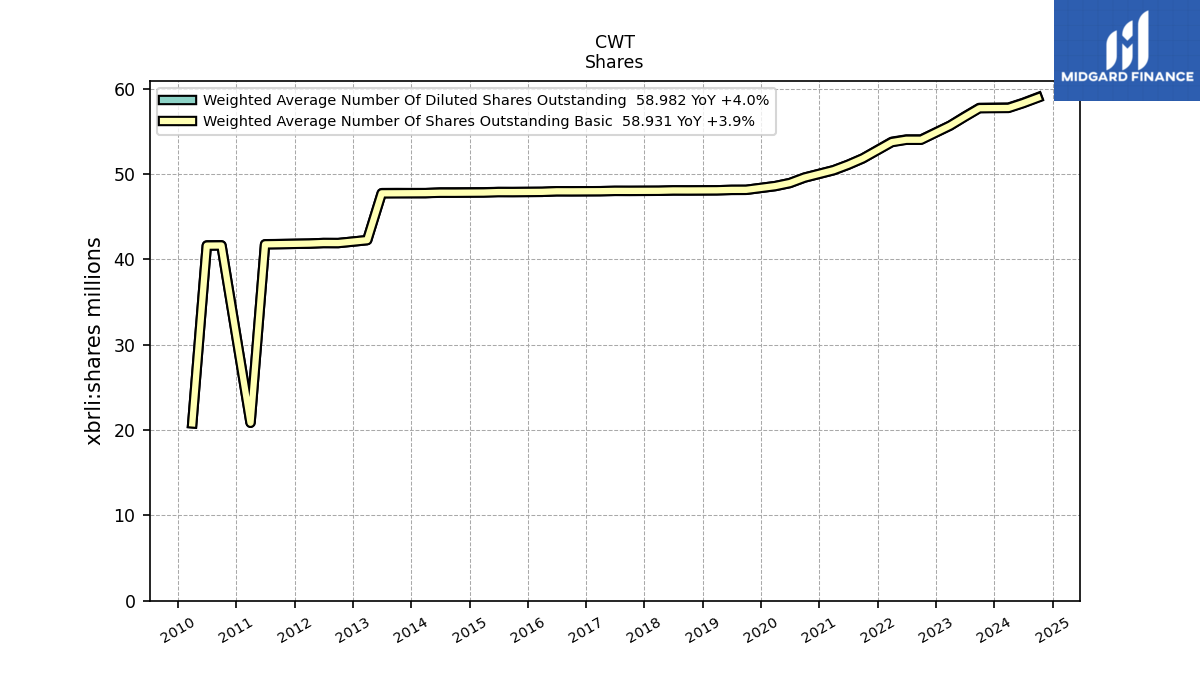
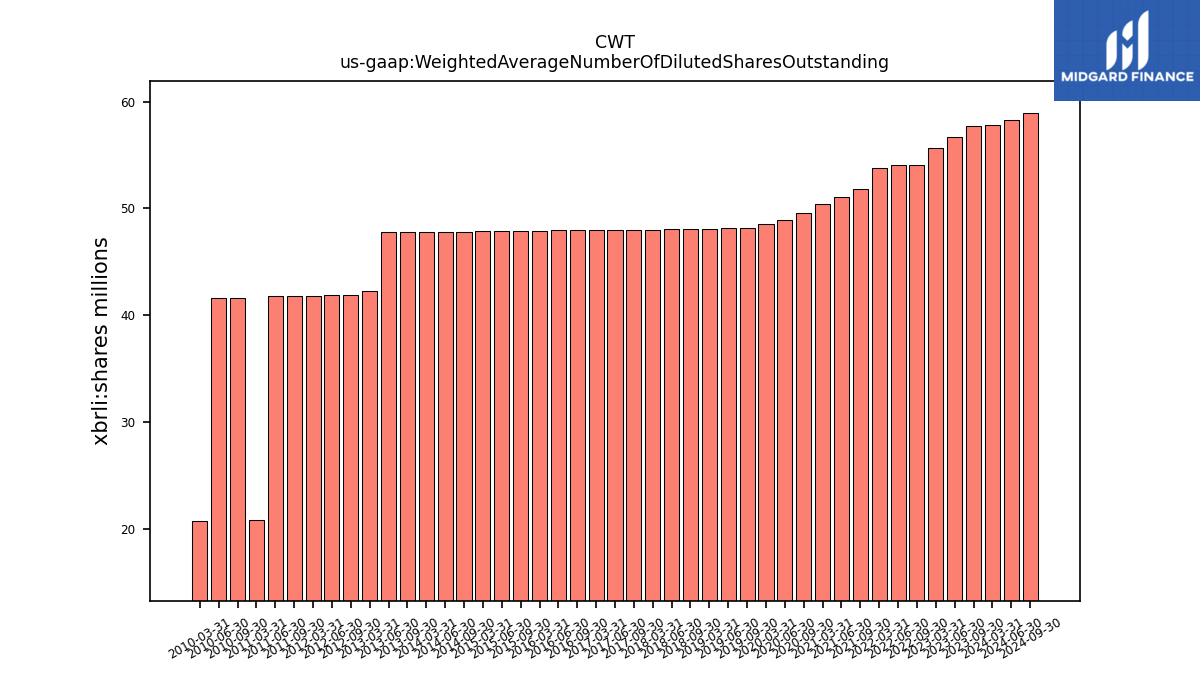
| Weighted Average Number Of Diluted Shares Outstanding | 57.77 | NA | 57.74 | 56.73 | 55.67 | NA | 54.04 | 54.04 | 53.77 | NA | 51.82 | 51.08 | 50.44 | NA | 49.58 | 48.94 | 48.58 | NA | 48.14 | 48.14 | 48.09 | NA | 48.07 | 48.07 | 48.03 | NA | 48.02 | 48.02 | 47.98 | |
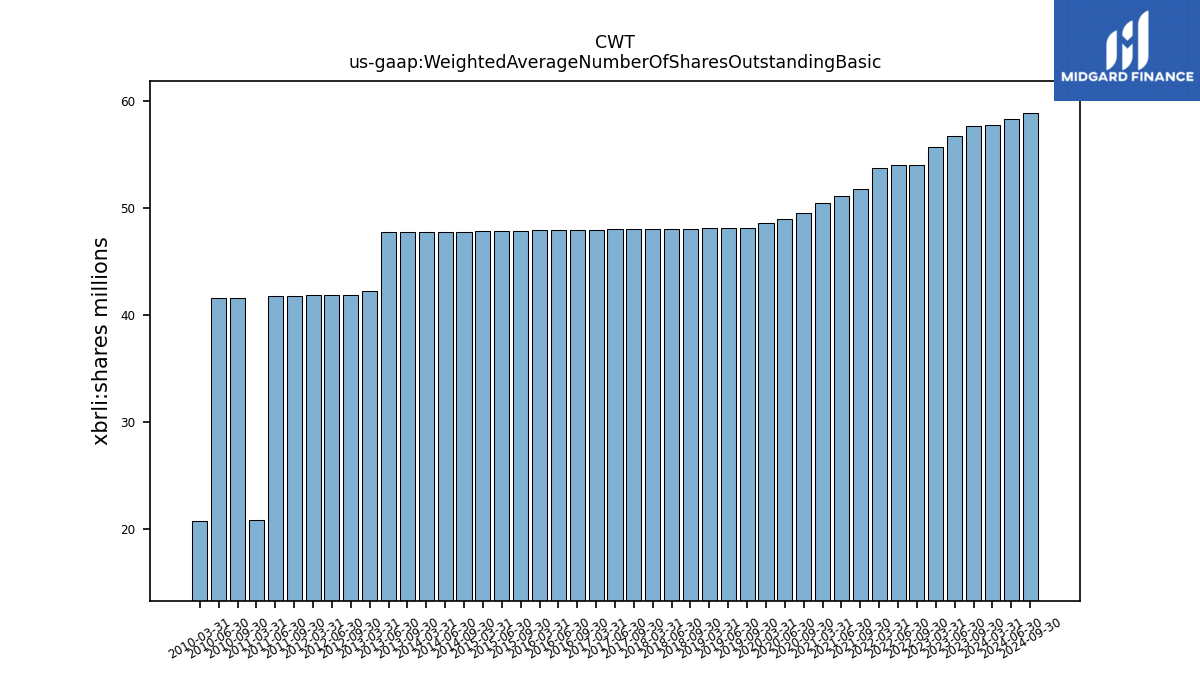
| Weighted Average Number Of Shares Outstanding Basic | 57.73 | NA | 57.70 | 56.69 | 55.67 | NA | 54.01 | 54.01 | 53.73 | NA | 51.82 | 51.08 | 50.44 | NA | 49.58 | 48.94 | 48.58 | NA | 48.14 | 48.14 | 48.09 | NA | 48.07 | 48.07 | 48.03 | NA | 48.02 | 48.02 | 47.98 | |
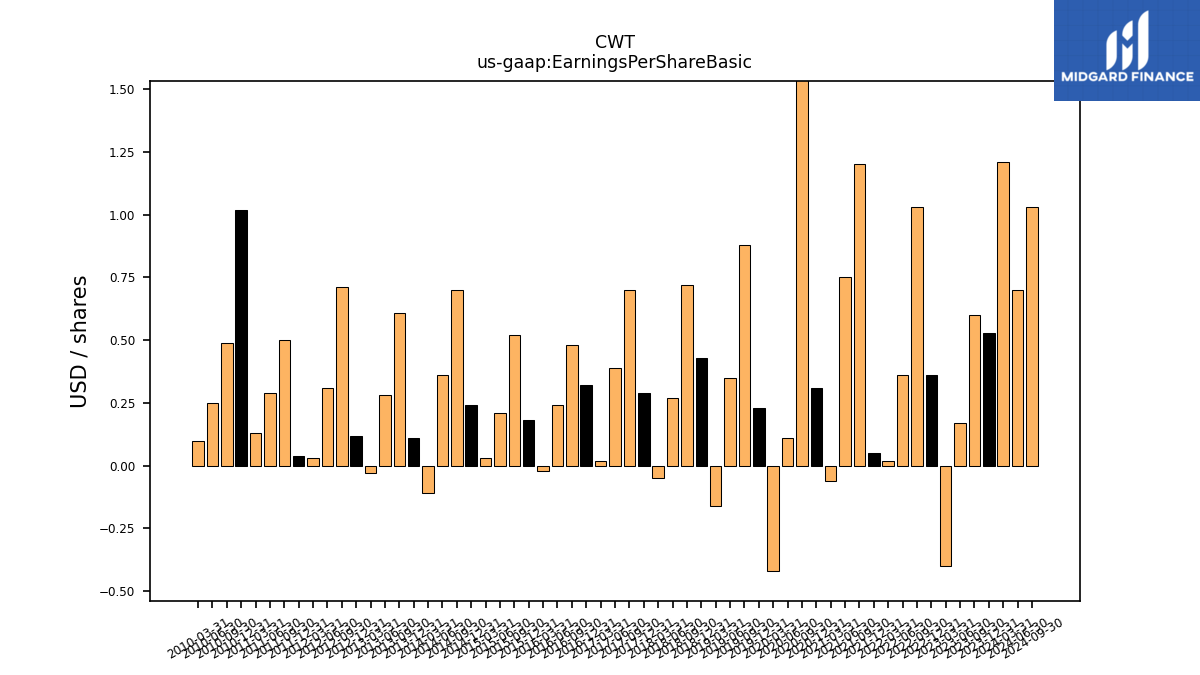
| Earnings Per Share Basic | 1.21 | 0.53 | 0.60 | 0.17 | -0.40 | 0.36 | 1.03 | 0.36 | 0.02 | 0.05 | 1.20 | 0.75 | -0.06 | 0.31 | 1.94 | 0.11 | -0.42 | 0.23 | 0.88 | 0.35 | -0.16 | 0.43 | 0.72 | 0.27 | -0.05 | 0.29 | 0.70 | 0.39 | 0.02 | |
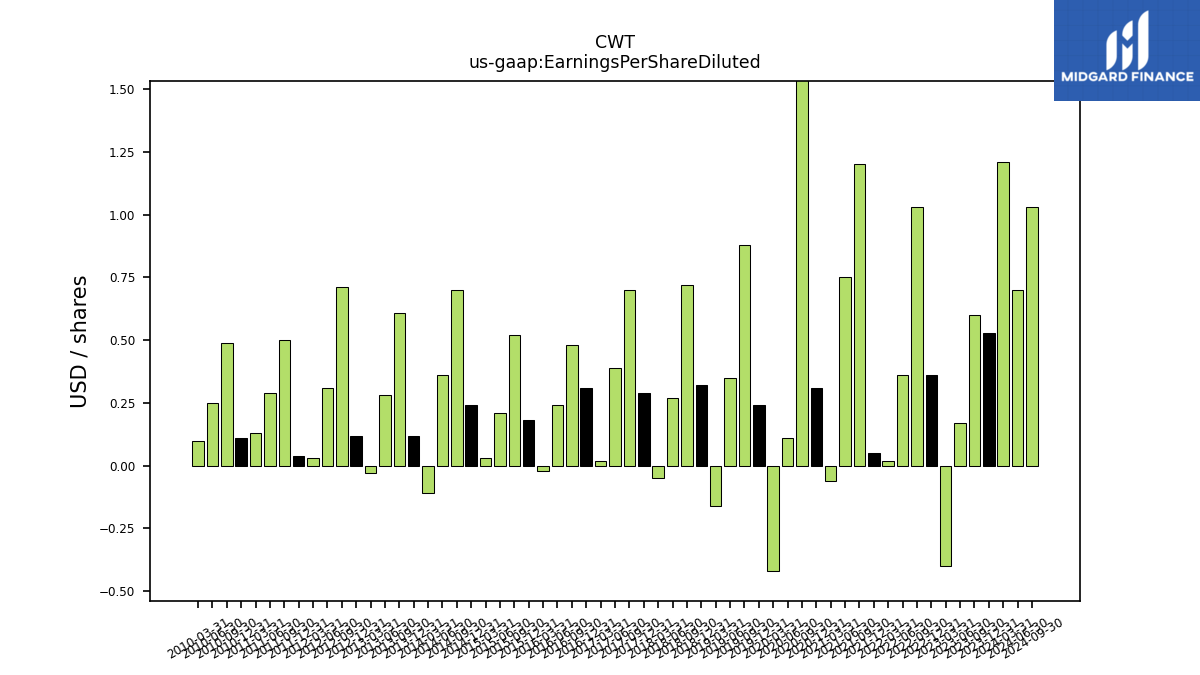
| Earnings Per Share Diluted | 1.21 | 0.53 | 0.60 | 0.17 | -0.40 | 0.36 | 1.03 | 0.36 | 0.02 | 0.05 | 1.20 | 0.75 | -0.06 | 0.31 | 1.94 | 0.11 | -0.42 | 0.24 | 0.88 | 0.35 | -0.16 | 0.32 | 0.72 | 0.27 | -0.05 | 0.29 | 0.70 | 0.39 | 0.02 |
| 2024-03-31 | 2023-12-31 | 2023-09-30 | 2023-06-30 | 2023-03-31 | 2022-12-31 | 2022-09-30 | 2022-06-30 | 2022-03-31 | 2021-12-31 | 2021-09-30 | 2021-06-30 | 2021-03-31 | 2020-12-31 | 2020-09-30 | 2020-06-30 | 2020-03-31 | 2019-12-31 | 2019-09-30 | 2019-06-30 | 2019-03-31 | 2018-12-31 | 2018-09-30 | 2018-06-30 | 2018-03-31 | 2017-12-31 | 2017-09-30 | 2017-06-30 | 2017-03-31 | ||
|---|---|---|---|---|---|---|---|---|---|---|---|---|---|---|---|---|---|---|---|---|---|---|---|---|---|---|---|---|---|---|
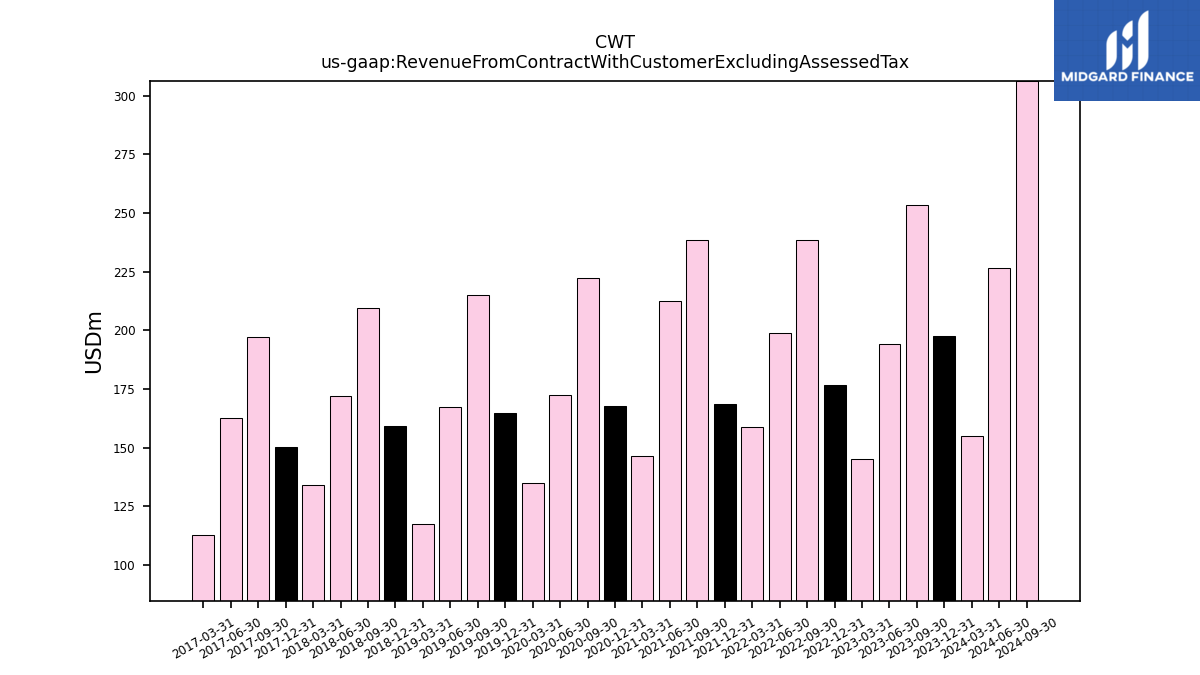
| Revenue From Contract With Customer Excluding Assessed Tax | 154.90 | 197.57 | 253.34 | 194.21 | 145.22 | 176.76 | 238.27 | 198.66 | 158.93 | 168.37 | 238.35 | 212.46 | 146.53 | 167.77 | 222.47 | 172.50 | 134.83 | 164.52 | 214.96 | 167.47 | 117.41 | 159.17 | 209.54 | 171.77 | 134.25 | 150.06 | 197.01 | 162.59 | 112.81 | |
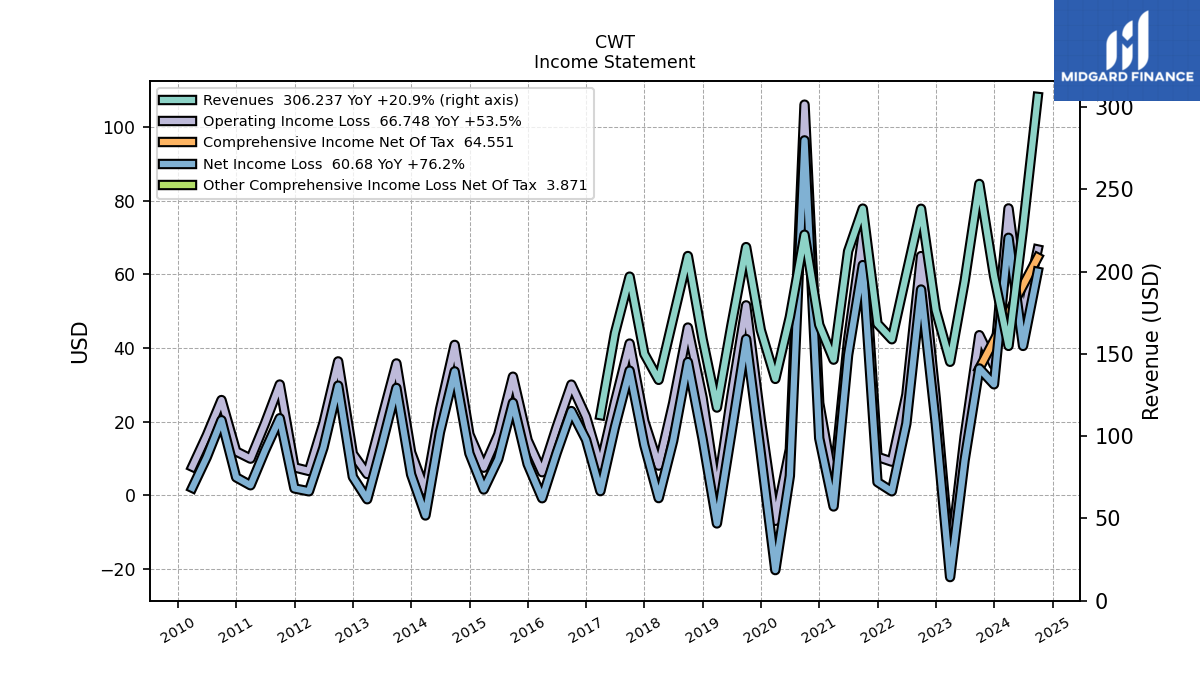
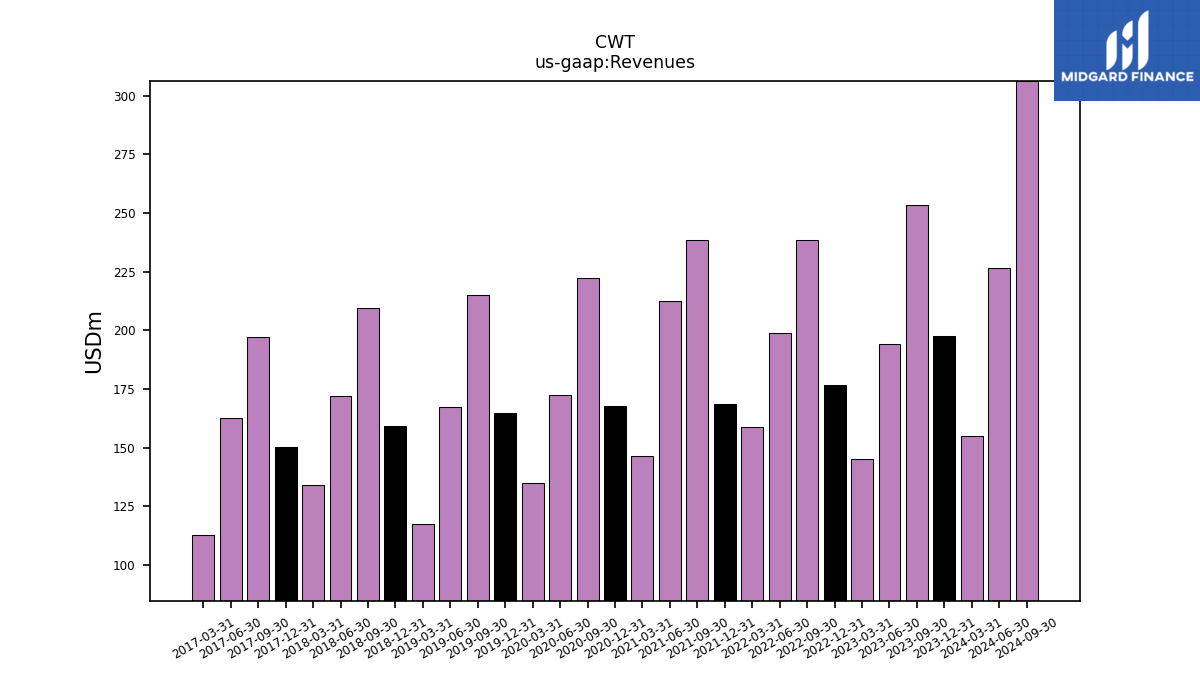
| Revenues | 154.90 | 197.57 | 253.34 | 194.21 | 145.22 | 176.76 | 238.27 | 198.66 | 158.93 | 168.37 | 238.35 | 212.46 | 146.53 | 167.77 | 222.47 | 172.50 | 134.83 | 164.52 | 214.96 | 167.47 | 117.41 | 159.17 | 209.54 | 171.77 | 134.25 | 150.06 | 197.01 | 162.59 | 112.81 | |
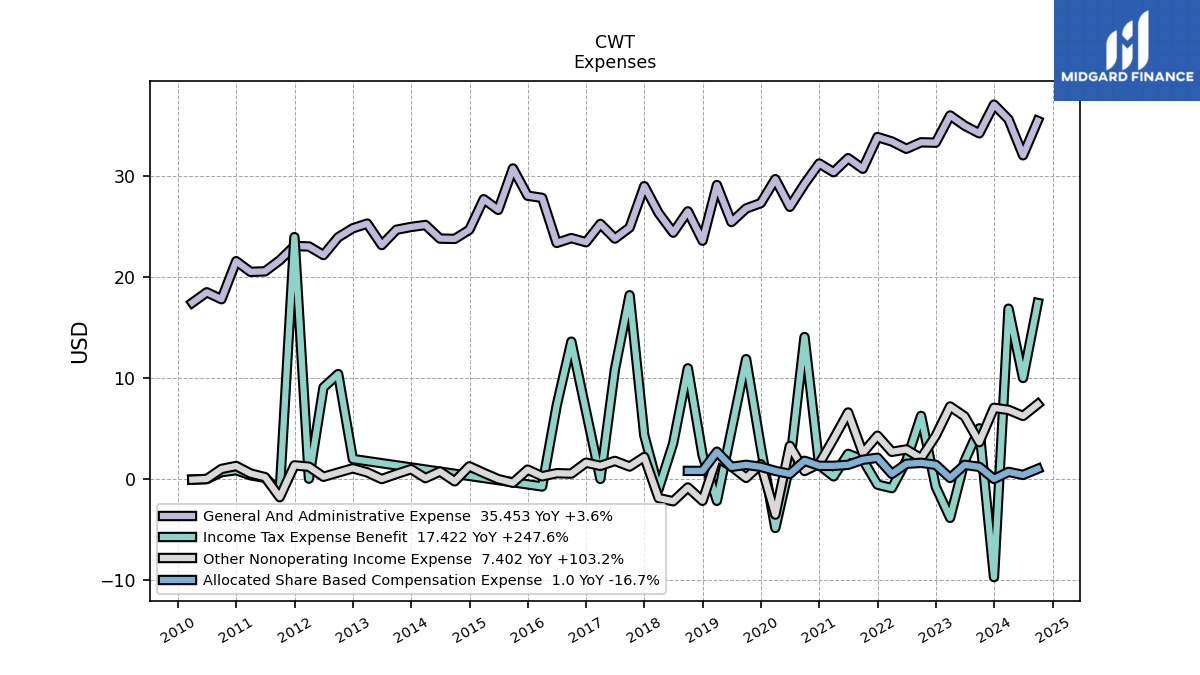
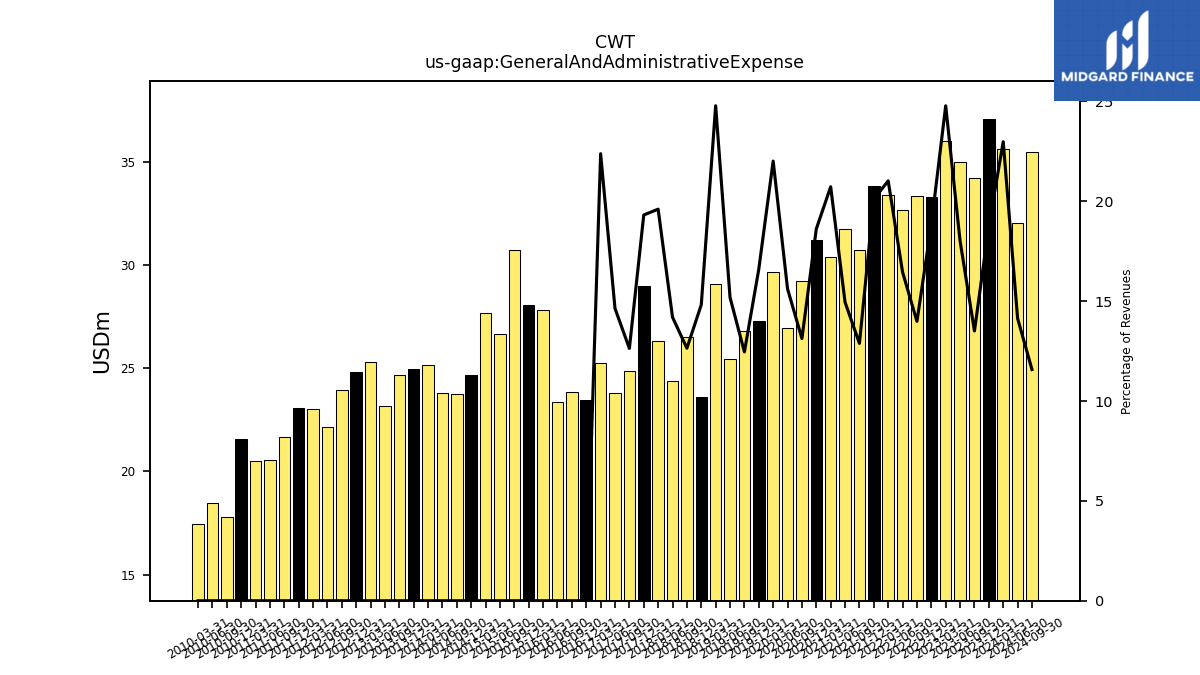
| General And Administrative Expense | 35.60 | 37.06 | 34.22 | 34.98 | 35.99 | 33.29 | 33.33 | 32.69 | 33.41 | 33.85 | 30.71 | 31.76 | 30.37 | 31.23 | 29.21 | 26.94 | 29.68 | 27.31 | 26.78 | 25.43 | 29.10 | 23.59 | 26.49 | 24.38 | 26.32 | 28.98 | 24.89 | 23.80 | 25.25 | |
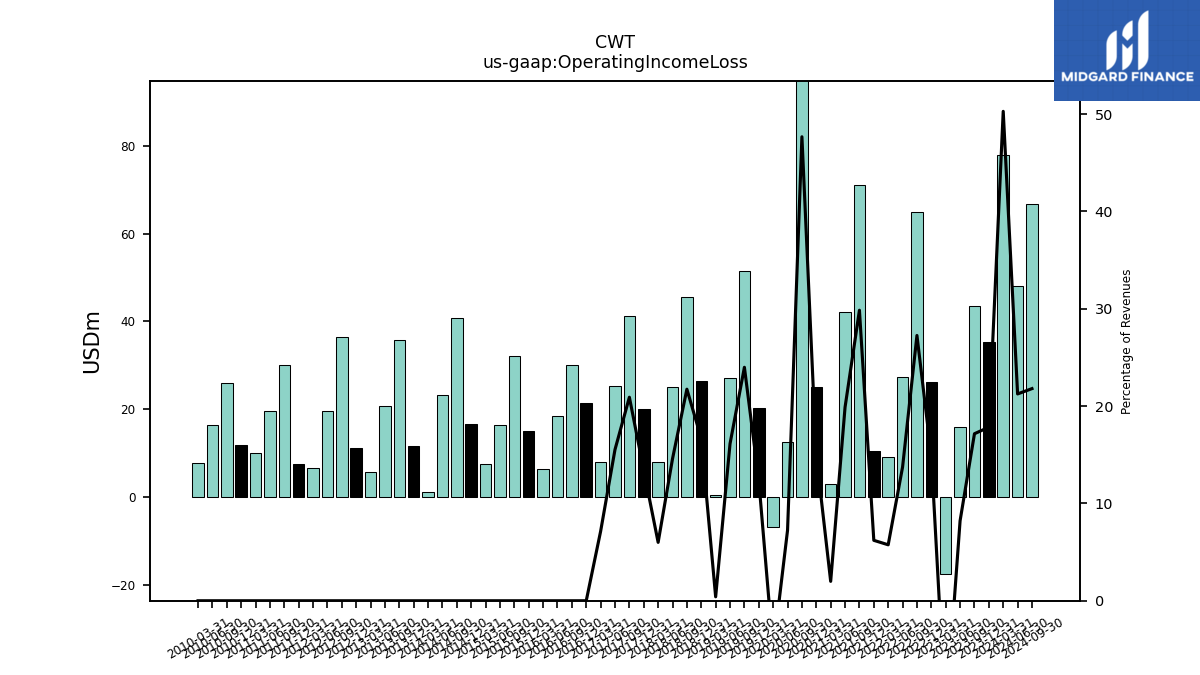
| Operating Income Loss | 77.89 | 35.24 | 43.47 | 15.95 | -17.52 | 26.29 | 64.95 | 27.29 | 9.14 | 10.45 | 71.15 | 42.25 | 2.92 | 25.03 | 106.06 | 12.49 | -6.92 | 20.36 | 51.57 | 27.01 | 0.48 | 26.54 | 45.55 | 25.06 | 8.05 | 20.12 | 41.20 | 25.26 | 8.05 | |
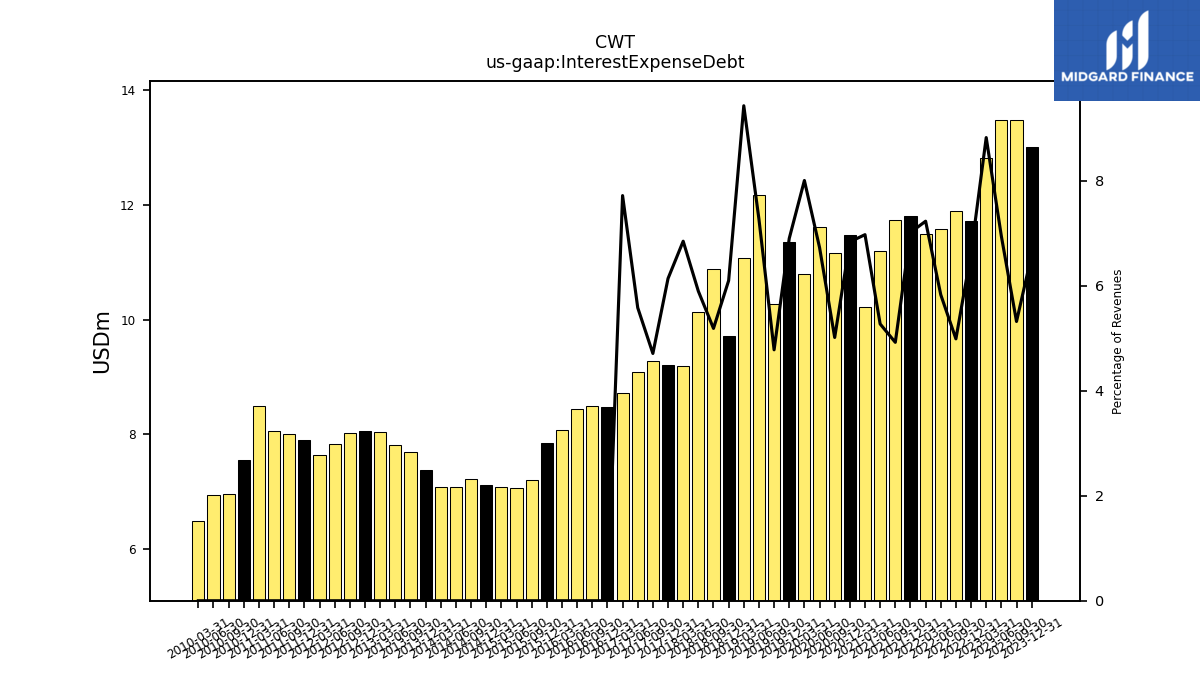
| Interest Expense Debt | 15.80 | 13.02 | 13.48 | 13.49 | 12.82 | 11.71 | 11.89 | 11.59 | 11.49 | 11.81 | 11.74 | 11.21 | 10.22 | 11.47 | 11.16 | 11.61 | 10.80 | 11.36 | 10.28 | 12.18 | 11.07 | 9.71 | 10.88 | 10.13 | 9.20 | 9.21 | 9.28 | 9.08 | 8.71 | |
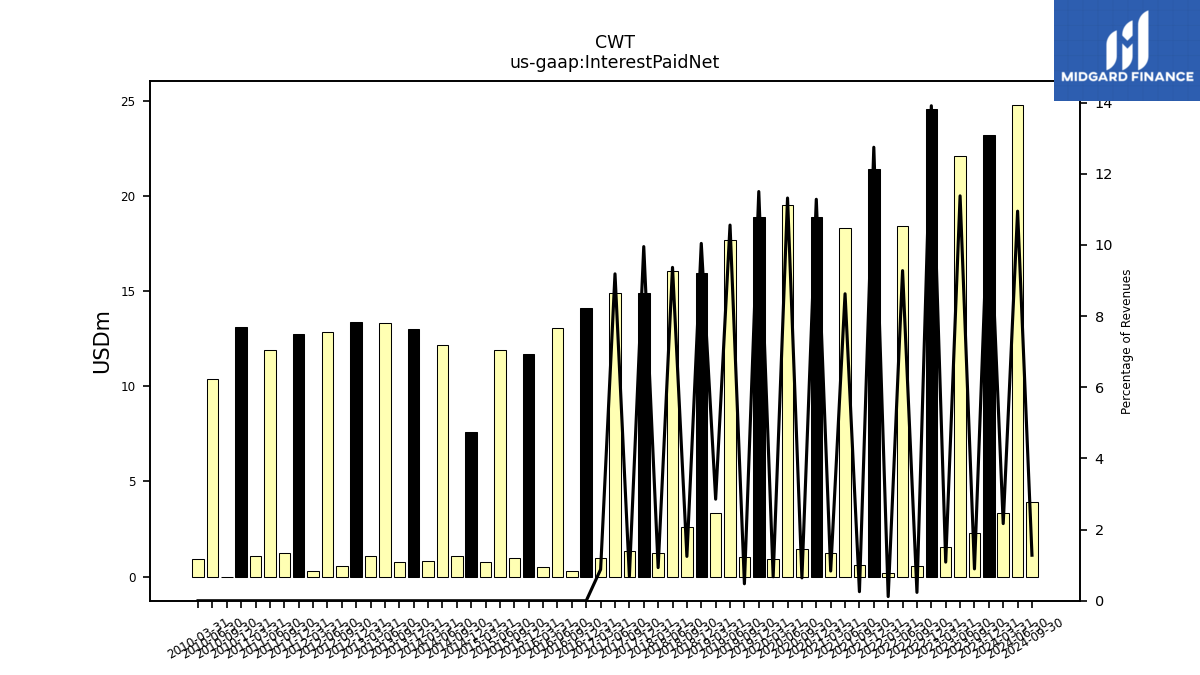
| Interest Paid Net | 3.36 | 23.20 | 2.27 | 22.10 | 1.58 | 24.59 | 0.56 | 18.43 | 0.19 | 21.46 | 0.61 | 18.33 | 1.23 | 18.93 | 1.43 | 19.52 | 0.91 | 18.92 | 1.03 | 17.68 | 3.35 | 15.98 | 2.61 | 16.09 | 1.25 | 14.94 | 1.35 | 14.94 | 0.99 | |
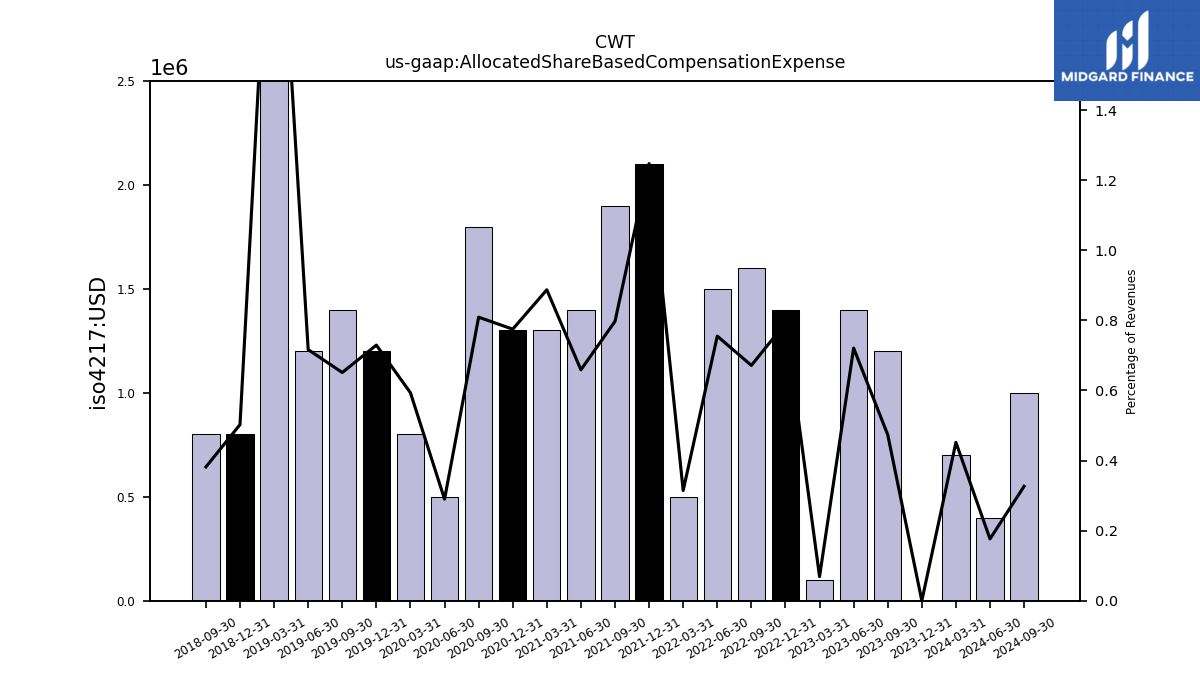
| Allocated Share Based Compensation Expense | 0.70 | 0.00 | 1.20 | 1.40 | 0.10 | 1.40 | 1.60 | 1.50 | 0.50 | 2.10 | 1.90 | 1.40 | 1.30 | 1.30 | 1.80 | 0.50 | 0.80 | 1.20 | 1.40 | 1.20 | 2.70 | 0.80 | 0.80 | NA | NA | NA | NA | NA | NA | |
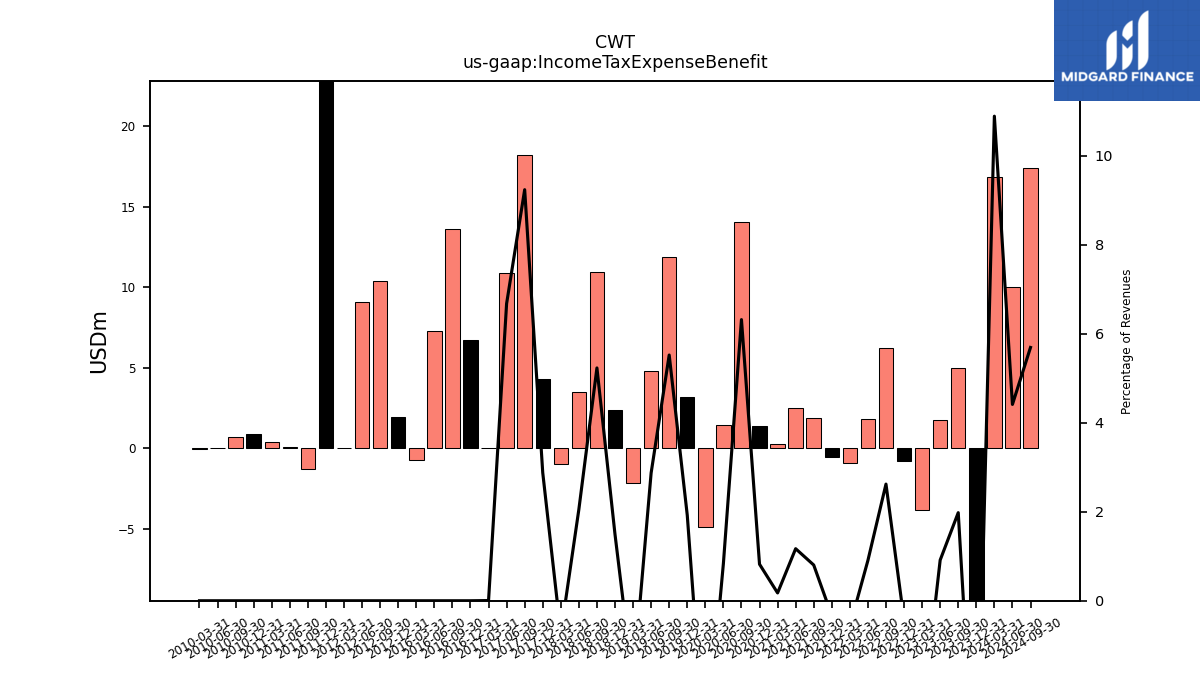
| Income Tax Expense Benefit | 16.86 | -9.72 | 5.01 | 1.77 | -3.85 | -0.76 | 6.24 | 1.80 | -0.91 | -0.56 | 1.91 | 2.48 | 0.26 | 1.38 | 14.05 | 1.44 | -4.85 | 3.16 | 11.86 | 4.81 | -2.16 | 2.37 | 10.96 | 3.53 | -0.99 | 4.32 | 18.19 | 10.85 | 0.01 | |
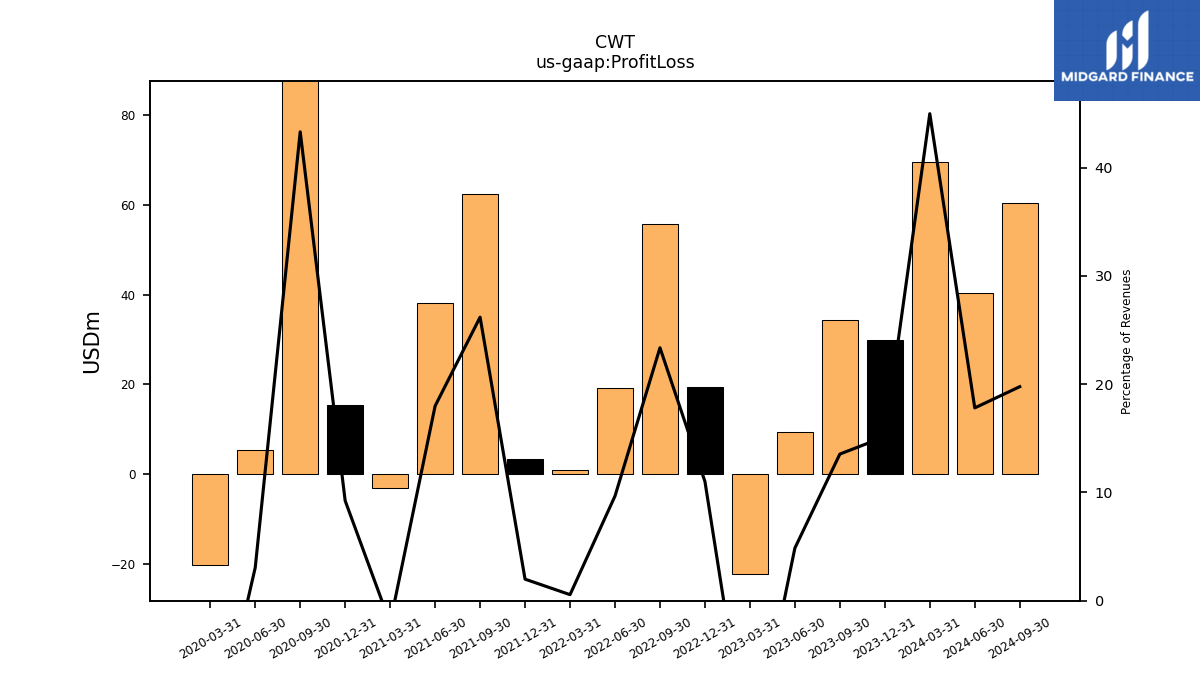
| Profit Loss | 69.69 | 29.94 | 34.33 | 9.45 | -22.33 | 19.47 | 55.68 | 19.21 | 0.89 | 3.36 | 62.43 | 38.23 | -3.03 | 15.50 | 96.36 | 5.28 | -20.31 | NA | NA | NA | NA | NA | NA | NA | NA | NA | NA | NA | NA | |
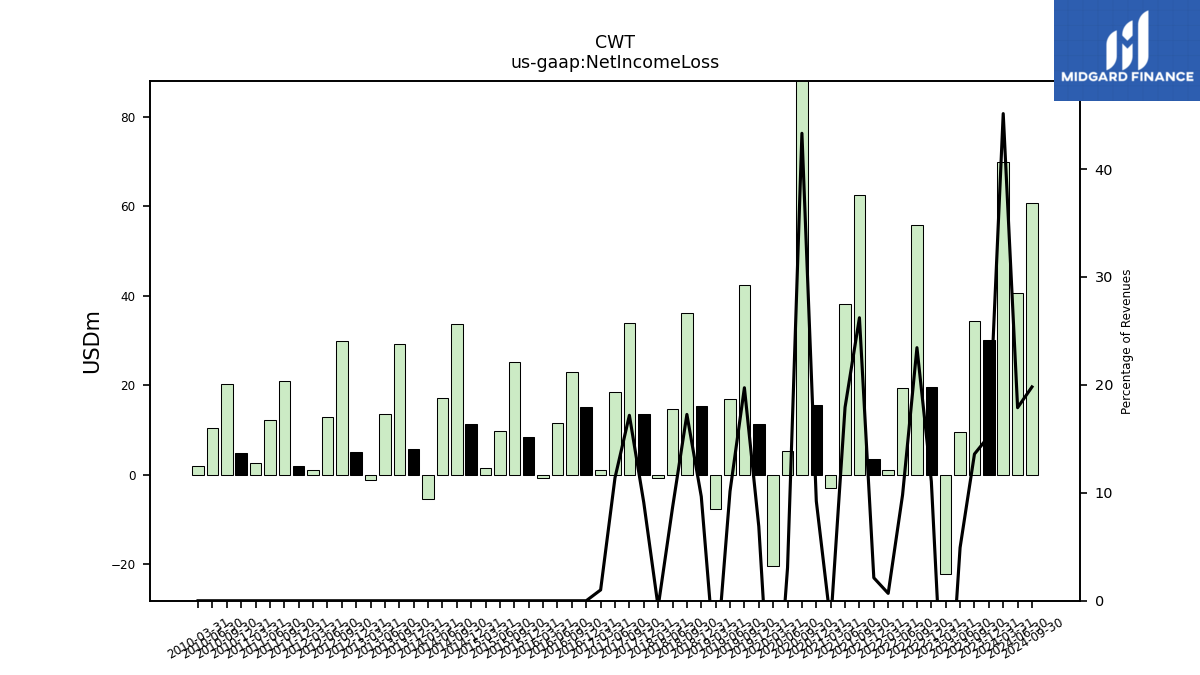
| Net Income Loss | 69.92 | 30.13 | 34.44 | 9.56 | -22.21 | 19.57 | 55.87 | 19.48 | 1.09 | 3.58 | 62.50 | 38.08 | -3.03 | 15.50 | 96.36 | 5.28 | -20.31 | 11.34 | 42.42 | 17.00 | -7.64 | 15.37 | 36.17 | 14.80 | -0.76 | 13.67 | 33.85 | 18.53 | 1.13 |
| 2024-03-31 | 2023-12-31 | 2023-09-30 | 2023-06-30 | 2023-03-31 | 2022-12-31 | 2022-09-30 | 2022-06-30 | 2022-03-31 | 2021-12-31 | 2021-09-30 | 2021-06-30 | 2021-03-31 | 2020-12-31 | 2020-09-30 | 2020-06-30 | 2020-03-31 | 2019-12-31 | 2019-09-30 | 2019-06-30 | 2019-03-31 | 2018-12-31 | 2018-09-30 | 2018-06-30 | 2018-03-31 | 2017-12-31 | 2017-09-30 | 2017-06-30 | 2017-03-31 | ||
|---|---|---|---|---|---|---|---|---|---|---|---|---|---|---|---|---|---|---|---|---|---|---|---|---|---|---|---|---|---|---|
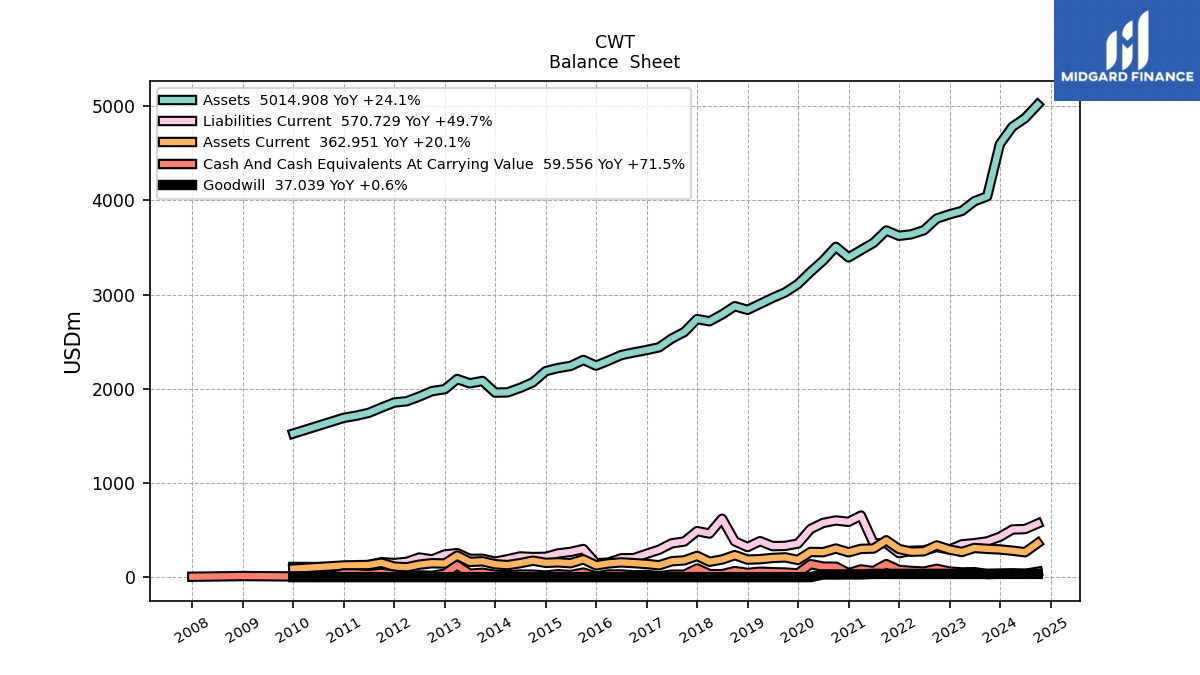
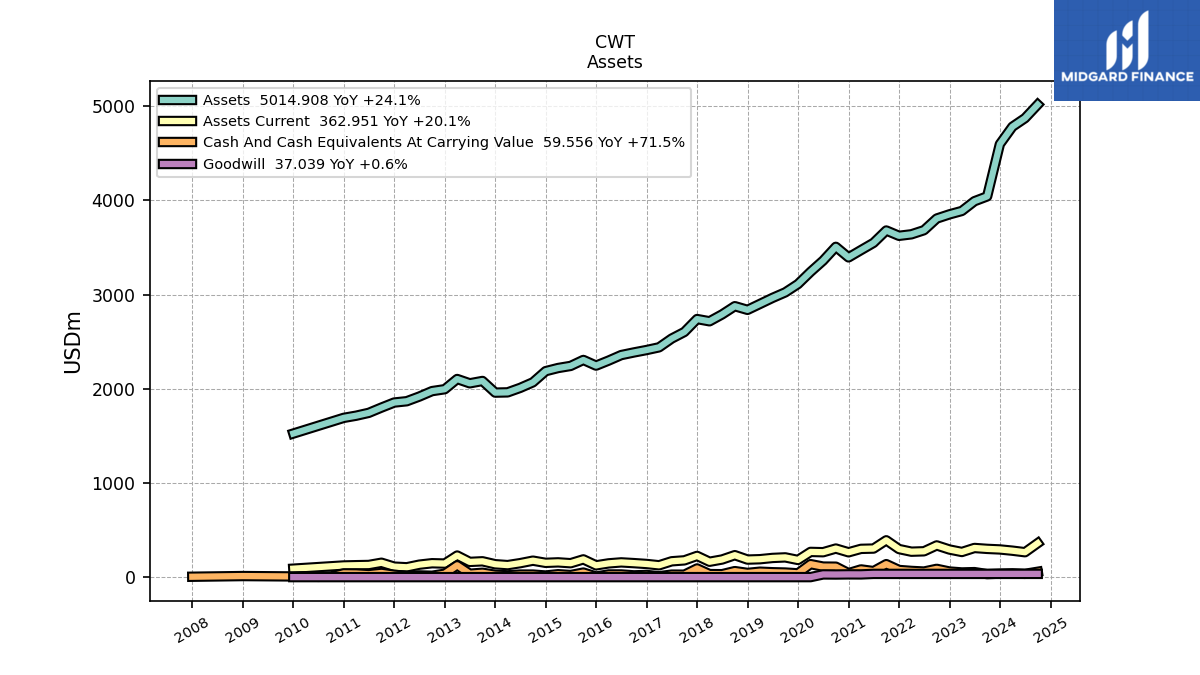
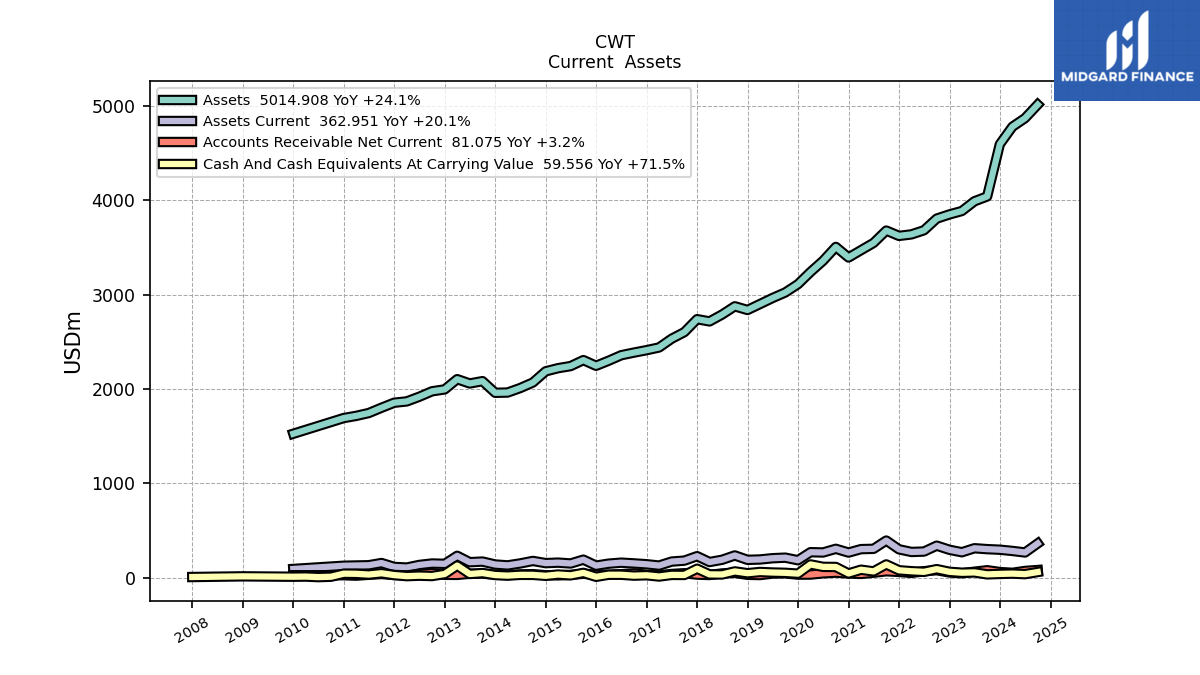
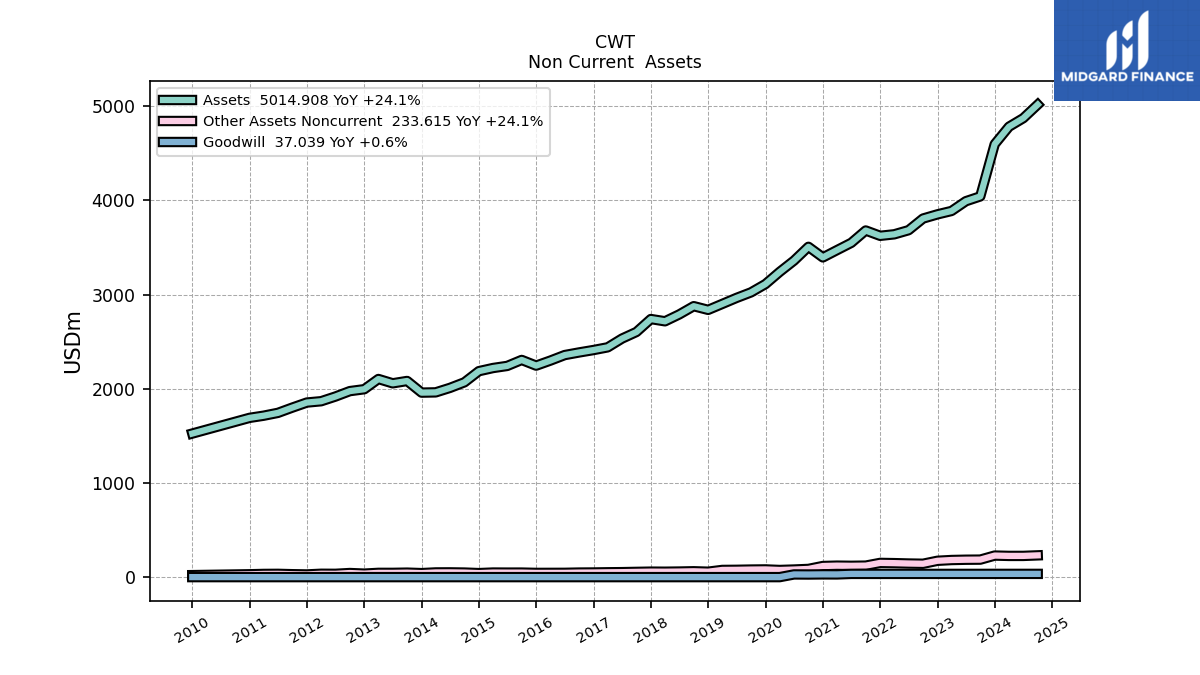
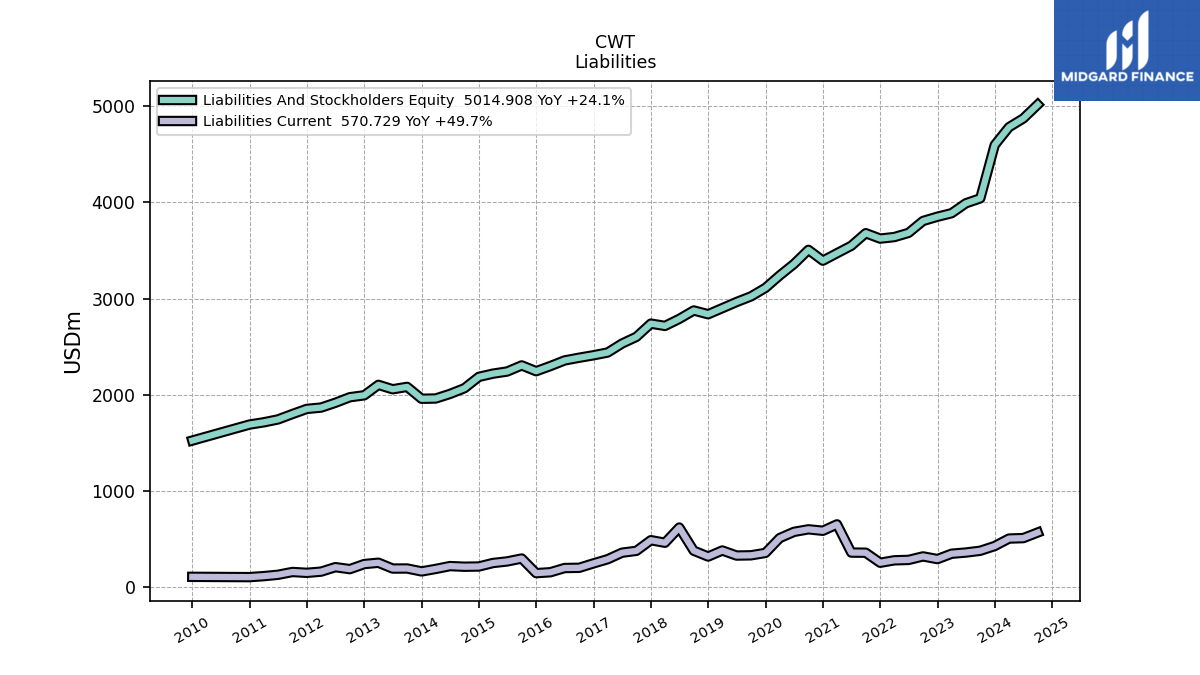
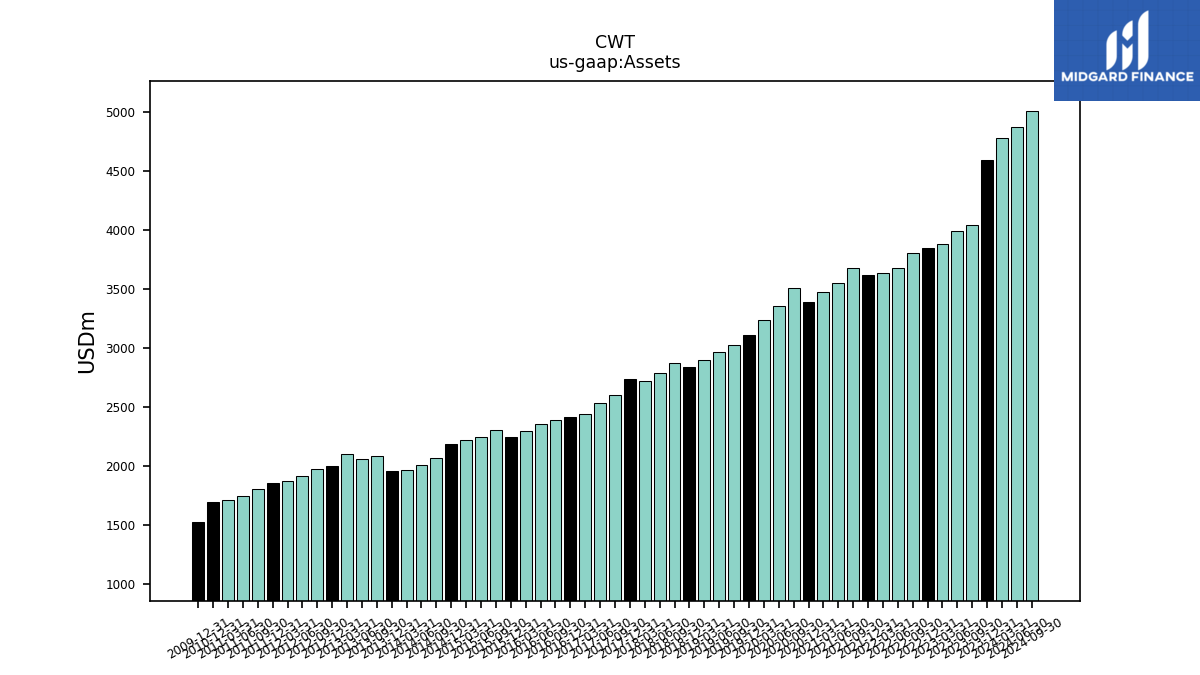
| Assets | 4780.83 | 4595.53 | 4041.36 | 3990.20 | 3886.86 | 3850.75 | 3806.40 | 3682.75 | 3639.24 | 3623.27 | 3679.69 | 3548.75 | 3471.47 | 3394.25 | 3506.43 | 3359.93 | 3240.84 | 3111.31 | 3023.25 | 2964.59 | 2900.66 | 2837.70 | 2876.86 | 2789.51 | 2716.51 | 2740.38 | 2603.10 | 2533.03 | 2440.30 | |
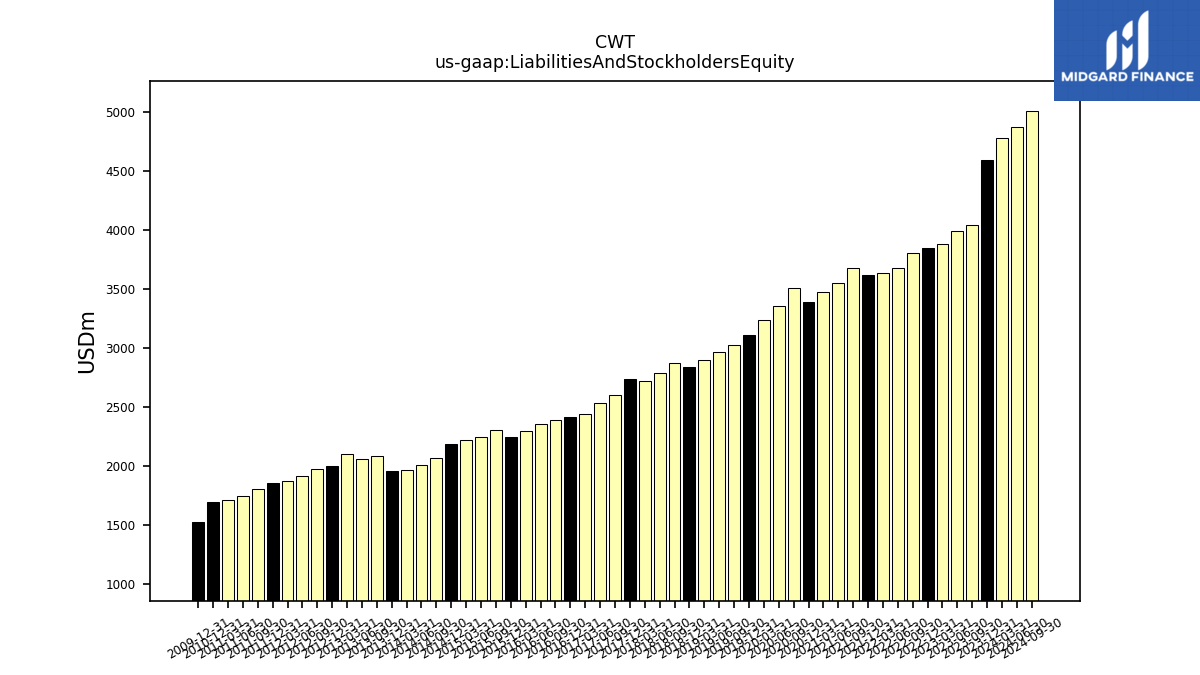
| Liabilities And Stockholders Equity | 4780.83 | 4595.53 | 4041.36 | 3990.20 | 3886.86 | 3850.75 | 3806.40 | 3682.75 | 3639.24 | 3623.27 | 3679.69 | 3548.75 | 3471.47 | 3394.25 | 3506.43 | 3359.93 | 3240.84 | 3111.31 | 3023.25 | 2964.59 | 2900.66 | 2837.70 | 2876.86 | 2789.51 | 2716.51 | 2740.38 | 2603.10 | 2533.03 | 2440.30 |
| 2024-03-31 | 2023-12-31 | 2023-09-30 | 2023-06-30 | 2023-03-31 | 2022-12-31 | 2022-09-30 | 2022-06-30 | 2022-03-31 | 2021-12-31 | 2021-09-30 | 2021-06-30 | 2021-03-31 | 2020-12-31 | 2020-09-30 | 2020-06-30 | 2020-03-31 | 2019-12-31 | 2019-09-30 | 2019-06-30 | 2019-03-31 | 2018-12-31 | 2018-09-30 | 2018-06-30 | 2018-03-31 | 2017-12-31 | 2017-09-30 | 2017-06-30 | 2017-03-31 | ||
|---|---|---|---|---|---|---|---|---|---|---|---|---|---|---|---|---|---|---|---|---|---|---|---|---|---|---|---|---|---|---|
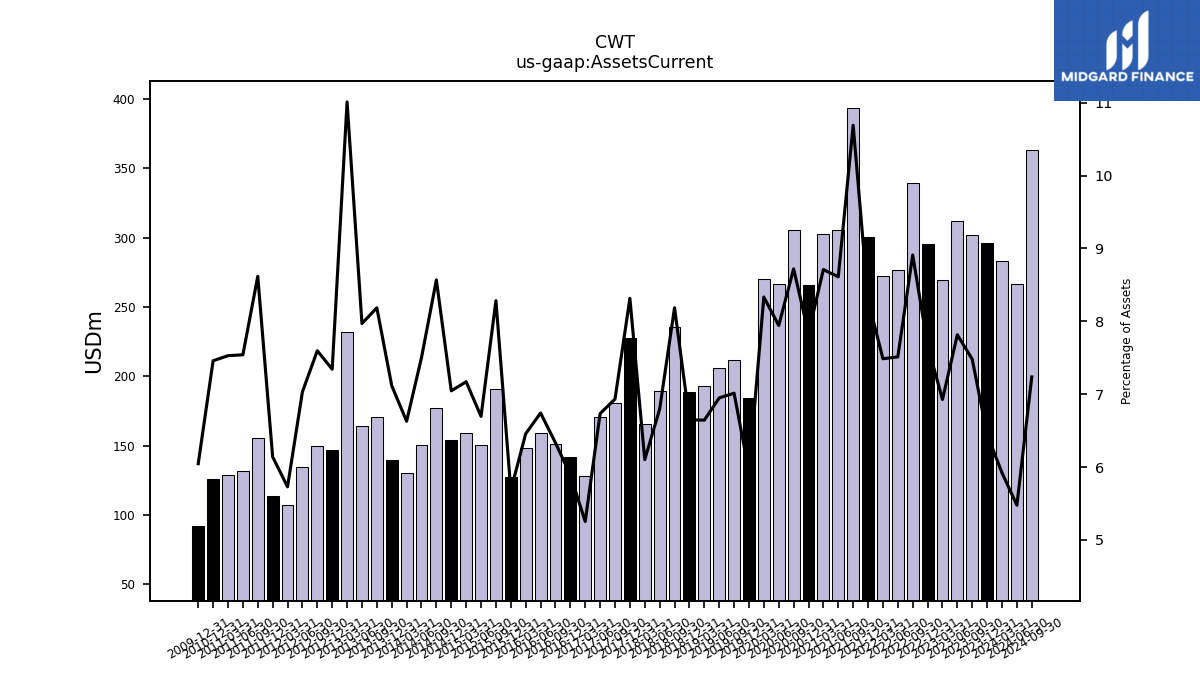
| Assets Current | 283.13 | 296.29 | 302.28 | 311.86 | 269.28 | 295.54 | 339.17 | 276.65 | 272.47 | 300.46 | 393.41 | 305.59 | 302.40 | 266.02 | 305.76 | 266.89 | 270.08 | 184.71 | 212.06 | 206.03 | 192.72 | 188.70 | 235.54 | 189.57 | 165.78 | 227.87 | 180.49 | 170.58 | 128.21 | |
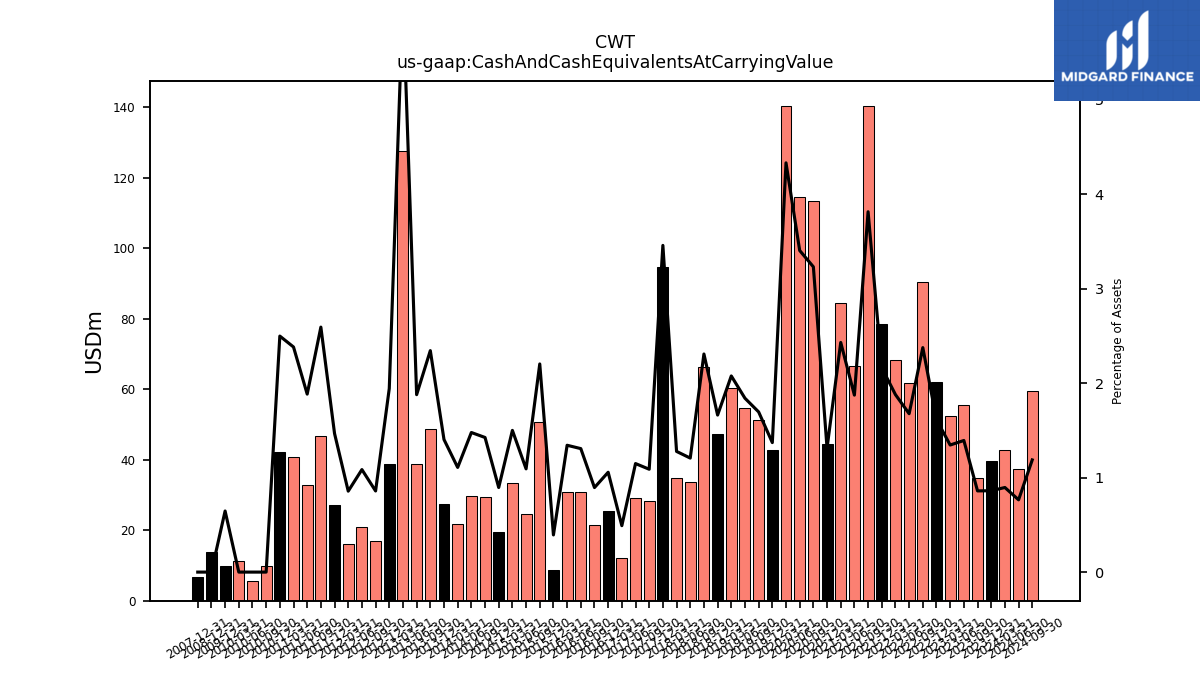
| Cash And Cash Equivalents At Carrying Value | 42.81 | 39.59 | 34.73 | 55.59 | 52.29 | 62.10 | 90.46 | 61.75 | 68.38 | 78.38 | 140.37 | 66.48 | 84.39 | 44.55 | 113.31 | 114.39 | 140.41 | 42.65 | 51.26 | 54.56 | 60.23 | 47.18 | 66.42 | 33.67 | 34.70 | 94.78 | 28.34 | 29.10 | 11.99 | |
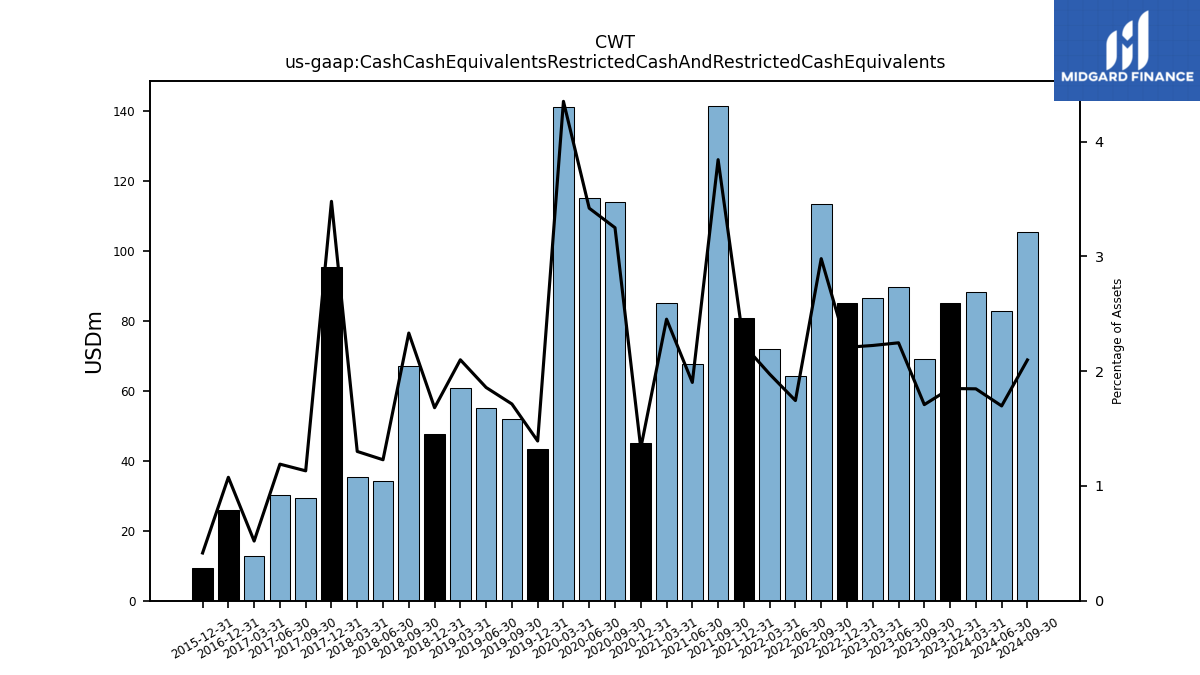
| Cash Cash Equivalents Restricted Cash And Restricted Cash Equivalents | 88.26 | 84.97 | 69.05 | 89.66 | 86.44 | 85.03 | 113.44 | 64.23 | 71.85 | 80.65 | 141.39 | 67.50 | 85.15 | 45.13 | 113.95 | 114.90 | 141.00 | 43.30 | 51.82 | 55.08 | 60.89 | 47.72 | 67.09 | 34.27 | 35.33 | 95.35 | 29.46 | 30.14 | 12.69 | |
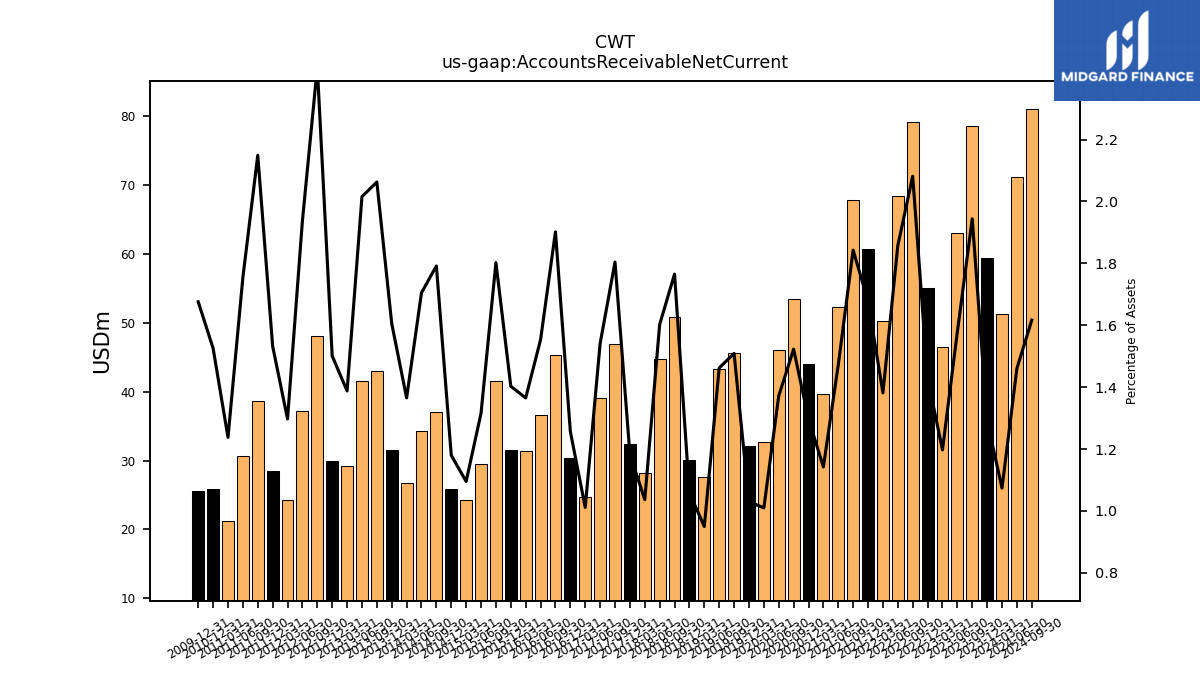
| Accounts Receivable Net Current | 51.35 | 59.35 | 78.56 | 62.98 | 46.54 | 55.08 | 79.24 | 68.40 | 50.28 | 60.78 | 67.81 | 52.24 | 39.65 | 44.02 | 53.40 | 46.09 | 32.73 | 32.06 | 45.62 | 43.34 | 27.55 | 30.04 | 50.78 | 44.70 | 28.16 | 32.45 | 46.96 | 39.03 | 24.68 |
| 2024-03-31 | 2023-12-31 | 2023-09-30 | 2023-06-30 | 2023-03-31 | 2022-12-31 | 2022-09-30 | 2022-06-30 | 2022-03-31 | 2021-12-31 | 2021-09-30 | 2021-06-30 | 2021-03-31 | 2020-12-31 | 2020-09-30 | 2020-06-30 | 2020-03-31 | 2019-12-31 | 2019-09-30 | 2019-06-30 | 2019-03-31 | 2018-12-31 | 2018-09-30 | 2018-06-30 | 2018-03-31 | 2017-12-31 | 2017-09-30 | 2017-06-30 | 2017-03-31 | ||
|---|---|---|---|---|---|---|---|---|---|---|---|---|---|---|---|---|---|---|---|---|---|---|---|---|---|---|---|---|---|---|
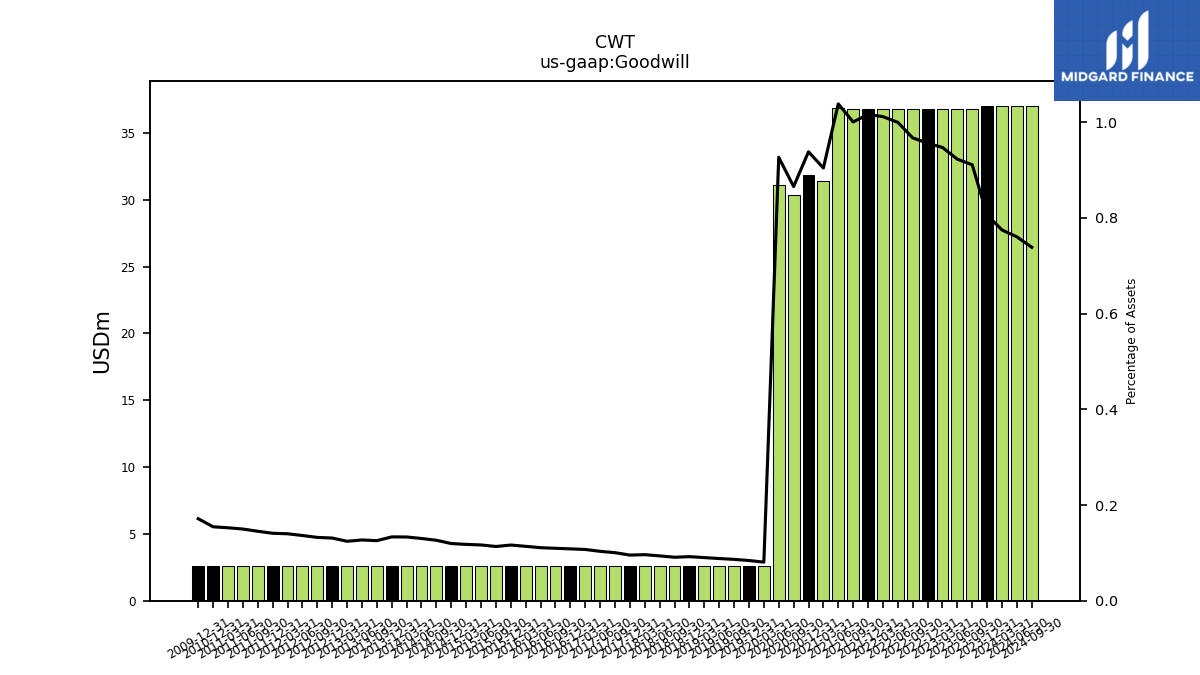
| Goodwill | 37.04 | 37.04 | 36.81 | 36.81 | 36.81 | 36.81 | 36.81 | 36.81 | 36.81 | 36.81 | 36.81 | 36.84 | 31.39 | 31.84 | 30.35 | 31.13 | 2.62 | 2.62 | 2.62 | 2.62 | 2.62 | 2.62 | 2.62 | 2.62 | 2.62 | 2.62 | 2.62 | 2.62 | 2.62 | |
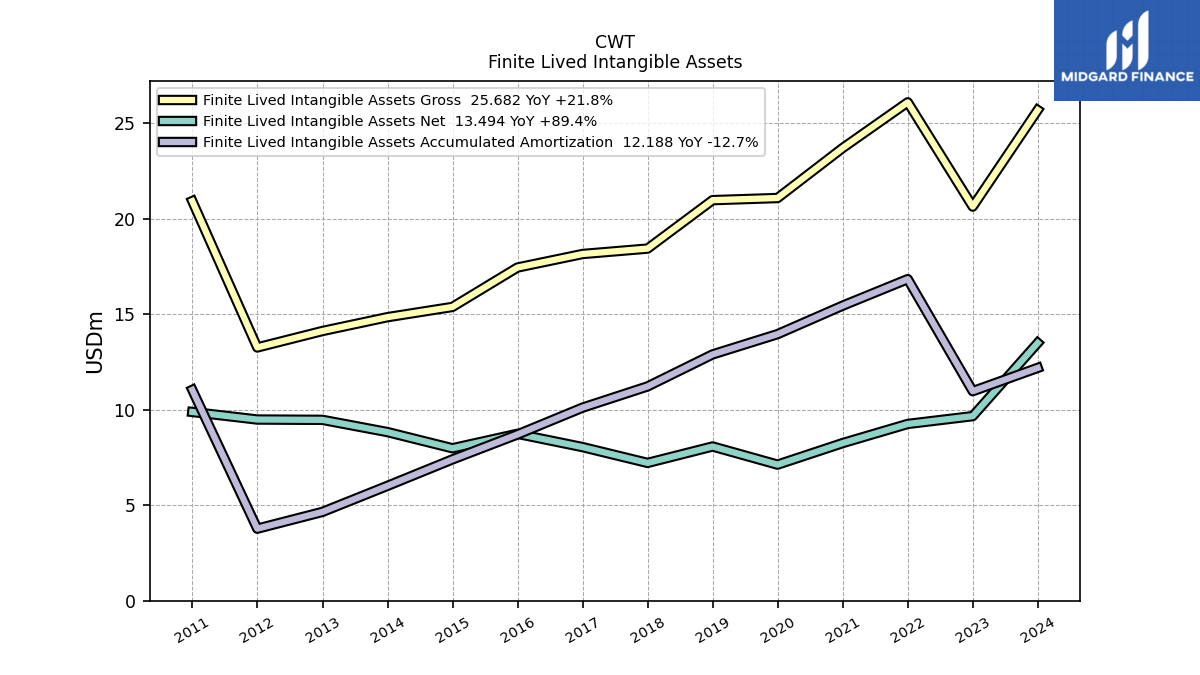
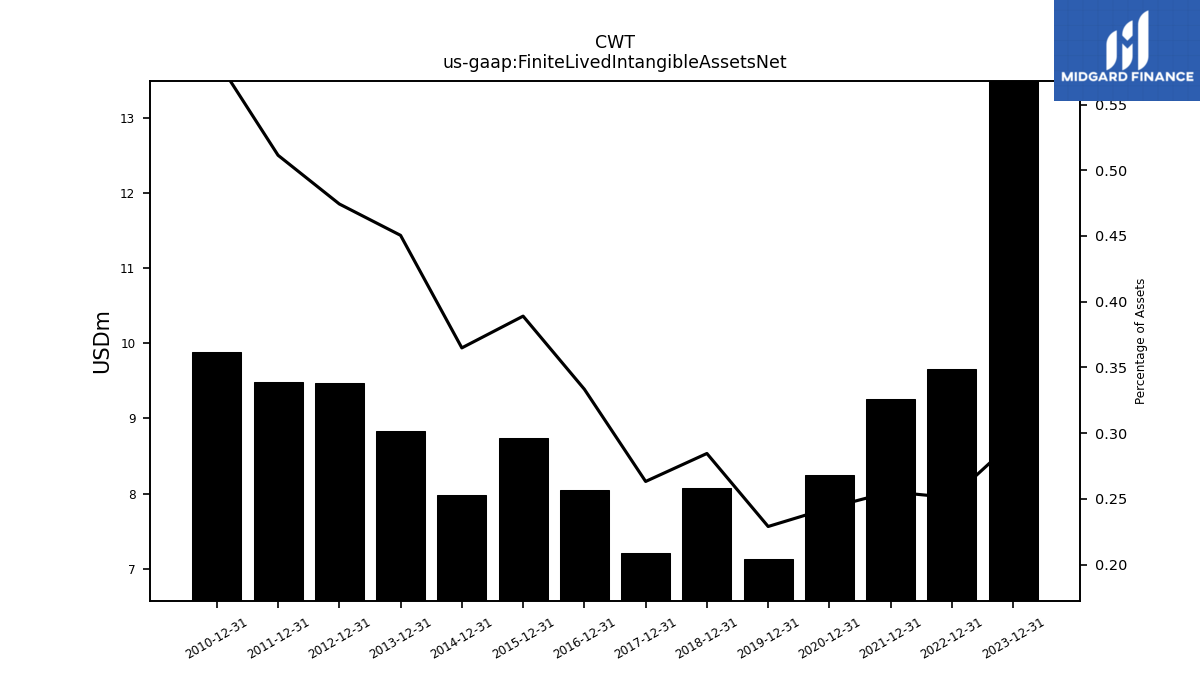
| Finite Lived Intangible Assets Net | NA | 13.49 | NA | NA | NA | 9.66 | NA | NA | NA | 9.25 | NA | NA | NA | 8.25 | NA | NA | NA | 7.12 | NA | NA | NA | 8.07 | NA | NA | NA | 7.21 | NA | NA | NA | |
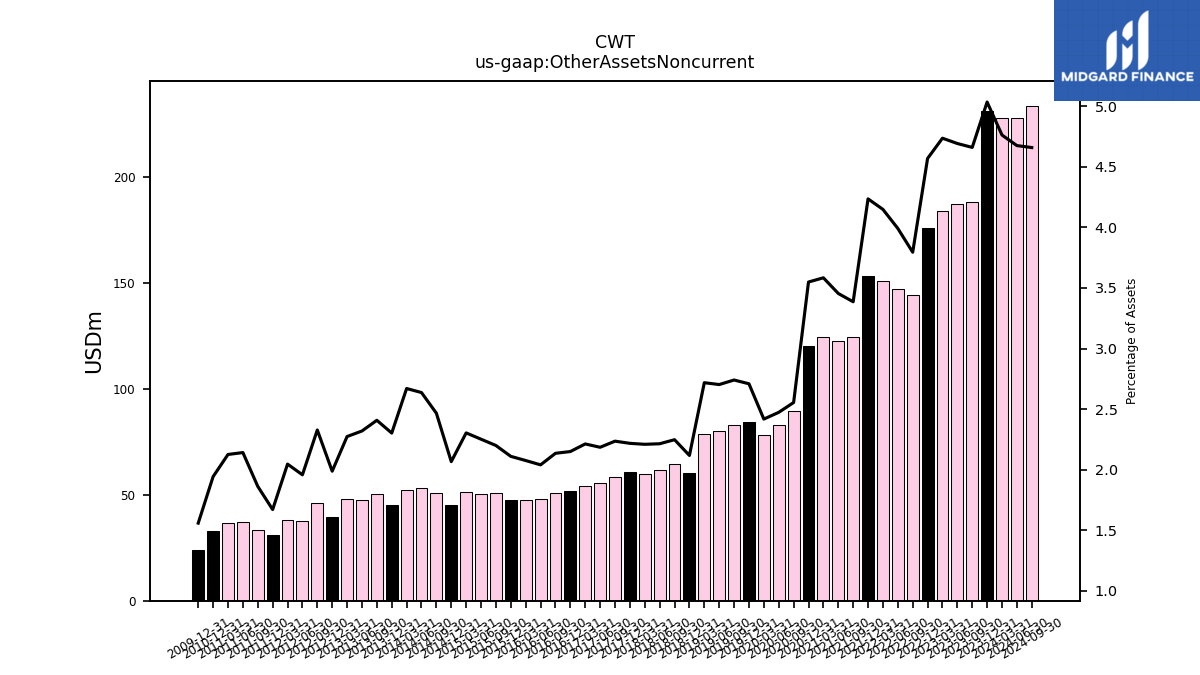
| Other Assets Noncurrent | 227.65 | 231.33 | 188.31 | 187.21 | 184.06 | 175.91 | 144.44 | 146.99 | 150.96 | 153.44 | 124.59 | 122.59 | 124.41 | 120.46 | 89.57 | 83.11 | 78.36 | 84.29 | 82.84 | 80.13 | 78.84 | 60.09 | 64.67 | 61.77 | 60.03 | 60.77 | 58.20 | 55.35 | 54.00 |
| 2024-03-31 | 2023-12-31 | 2023-09-30 | 2023-06-30 | 2023-03-31 | 2022-12-31 | 2022-09-30 | 2022-06-30 | 2022-03-31 | 2021-12-31 | 2021-09-30 | 2021-06-30 | 2021-03-31 | 2020-12-31 | 2020-09-30 | 2020-06-30 | 2020-03-31 | 2019-12-31 | 2019-09-30 | 2019-06-30 | 2019-03-31 | 2018-12-31 | 2018-09-30 | 2018-06-30 | 2018-03-31 | 2017-12-31 | 2017-09-30 | 2017-06-30 | 2017-03-31 | ||
|---|---|---|---|---|---|---|---|---|---|---|---|---|---|---|---|---|---|---|---|---|---|---|---|---|---|---|---|---|---|---|
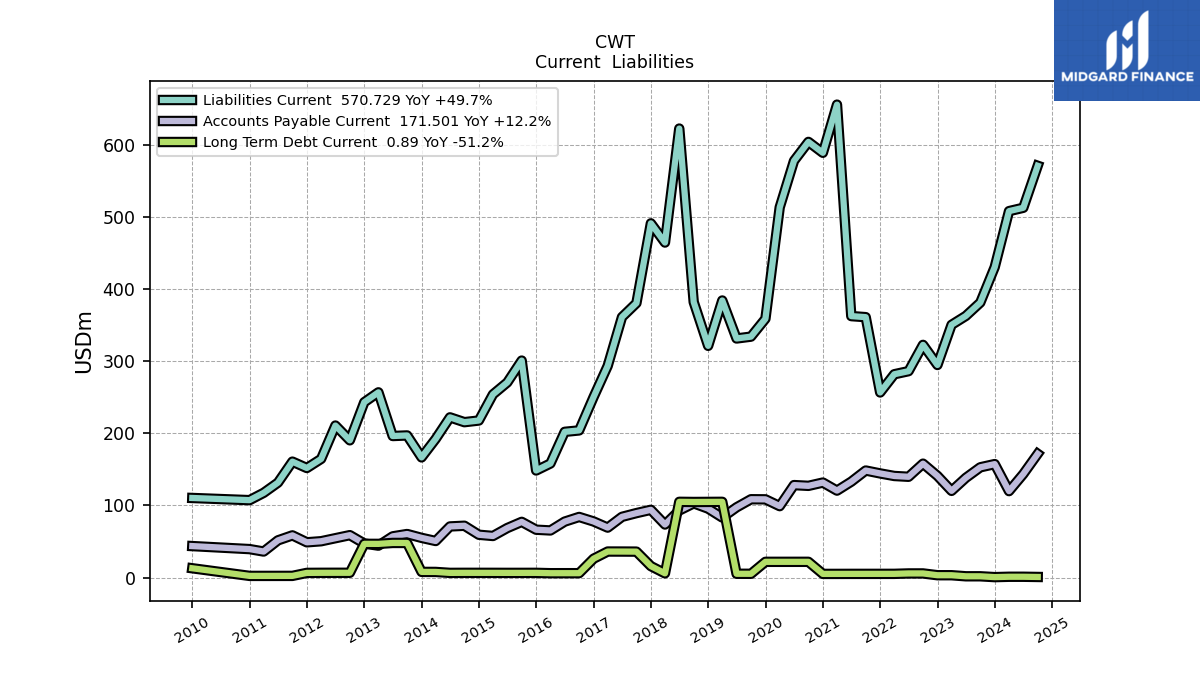
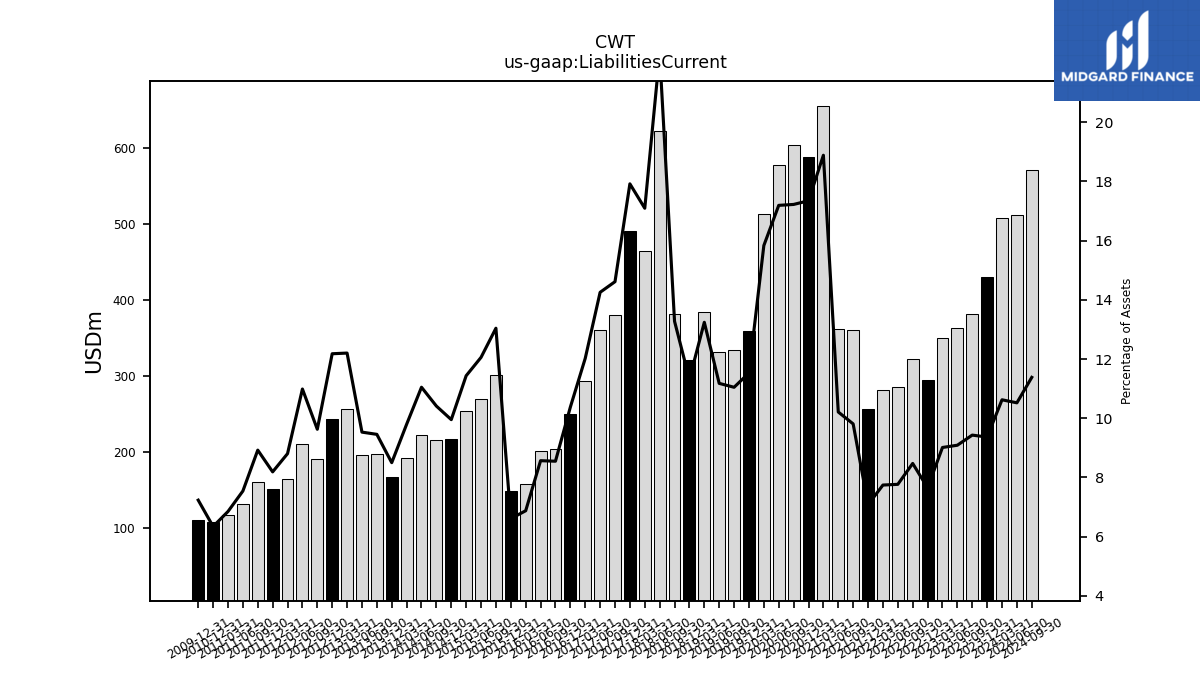
| Liabilities Current | 507.88 | 430.34 | 381.14 | 362.66 | 350.30 | 294.65 | 322.55 | 286.08 | 281.82 | 256.58 | 360.94 | 362.38 | 655.47 | 588.71 | 603.82 | 577.55 | 513.13 | 358.72 | 333.94 | 331.39 | 384.04 | 321.17 | 381.89 | 622.30 | 464.32 | 490.96 | 380.36 | 361.03 | 293.37 | |
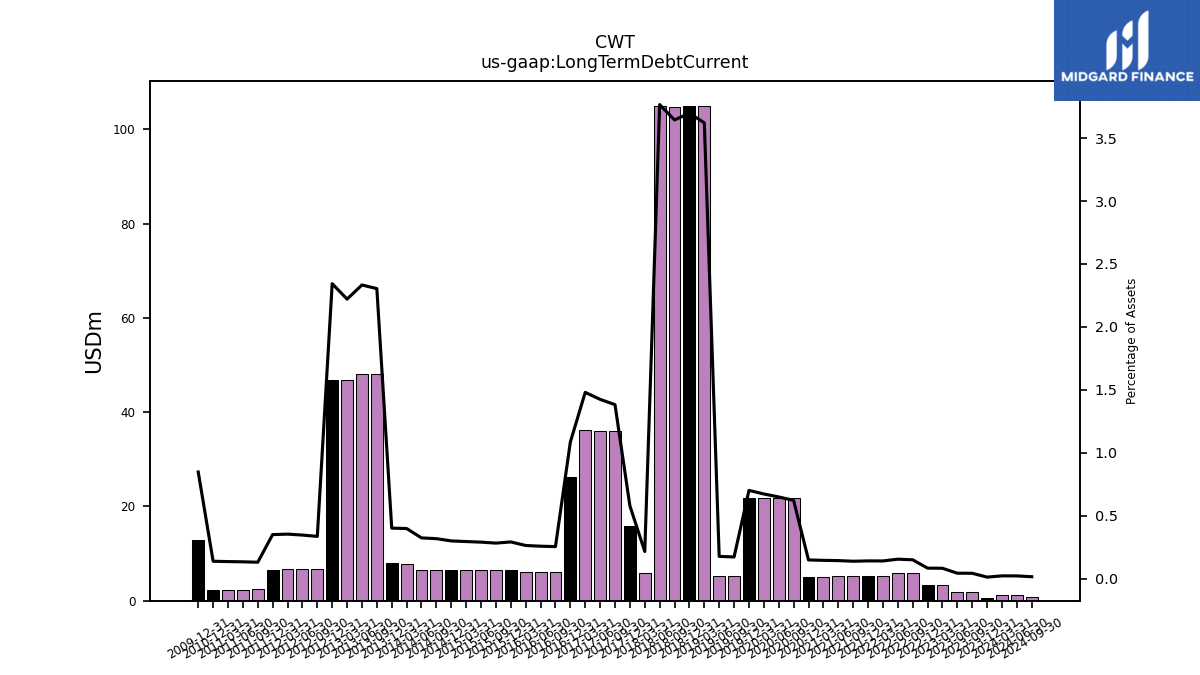
| Long Term Debt Current | 1.18 | 0.67 | 1.82 | 1.82 | 3.30 | 3.31 | 5.79 | 5.78 | 5.21 | 5.19 | 5.18 | 5.17 | 5.14 | 5.13 | 21.88 | 21.87 | 21.86 | 21.87 | 5.28 | 5.31 | 105.01 | 104.91 | 104.81 | 105.02 | 5.92 | 15.92 | 36.02 | 36.11 | 36.14 | |
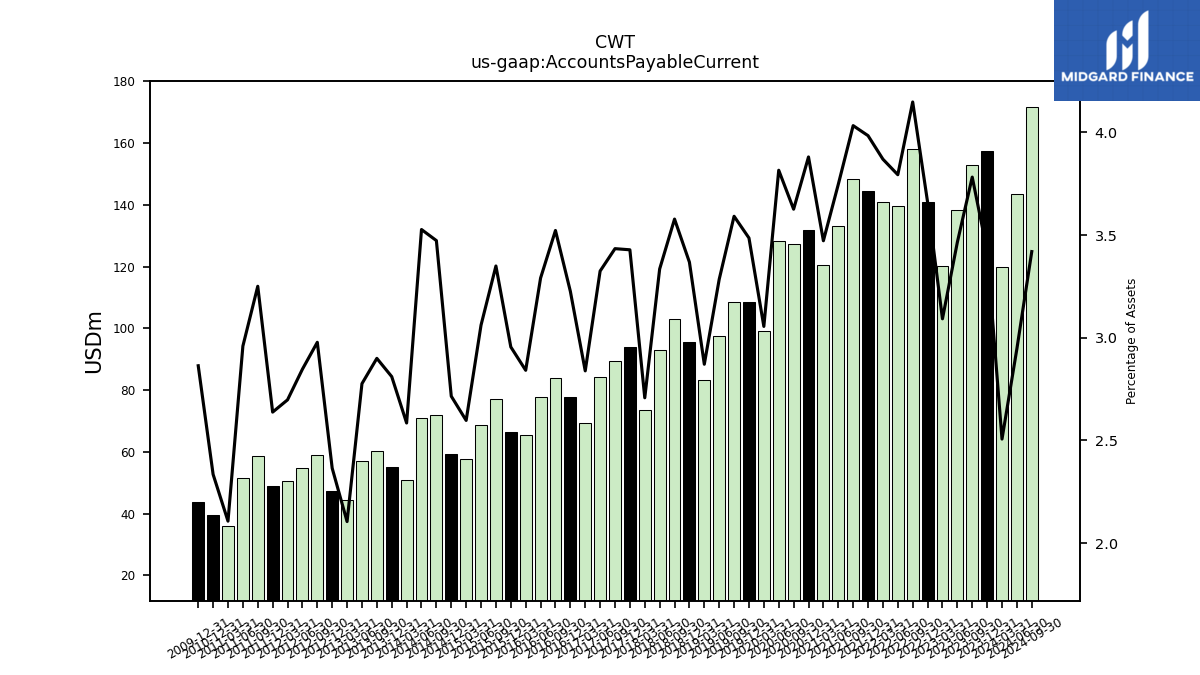
| Accounts Payable Current | 119.84 | 157.31 | 152.87 | 138.27 | 120.20 | 140.99 | 157.91 | 139.73 | 140.83 | 144.37 | 148.41 | 132.97 | 120.55 | 131.72 | 127.16 | 128.22 | 99.02 | 108.46 | 108.59 | 97.38 | 83.28 | 95.58 | 102.94 | 93.03 | 73.56 | 93.95 | 89.39 | 84.22 | 69.28 | |
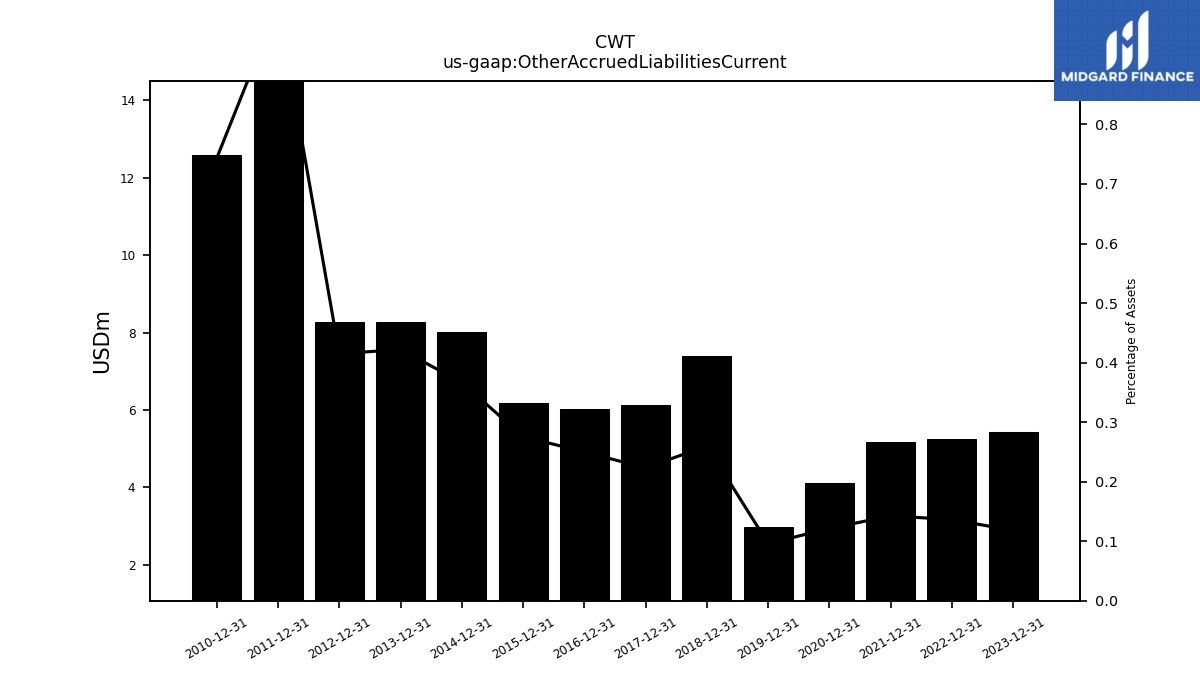
| Other Accrued Liabilities Current | NA | 5.42 | NA | NA | NA | 5.25 | NA | NA | NA | 5.16 | NA | NA | NA | 4.12 | NA | NA | NA | 2.99 | NA | NA | NA | 7.38 | NA | NA | NA | 6.12 | NA | NA | NA | |
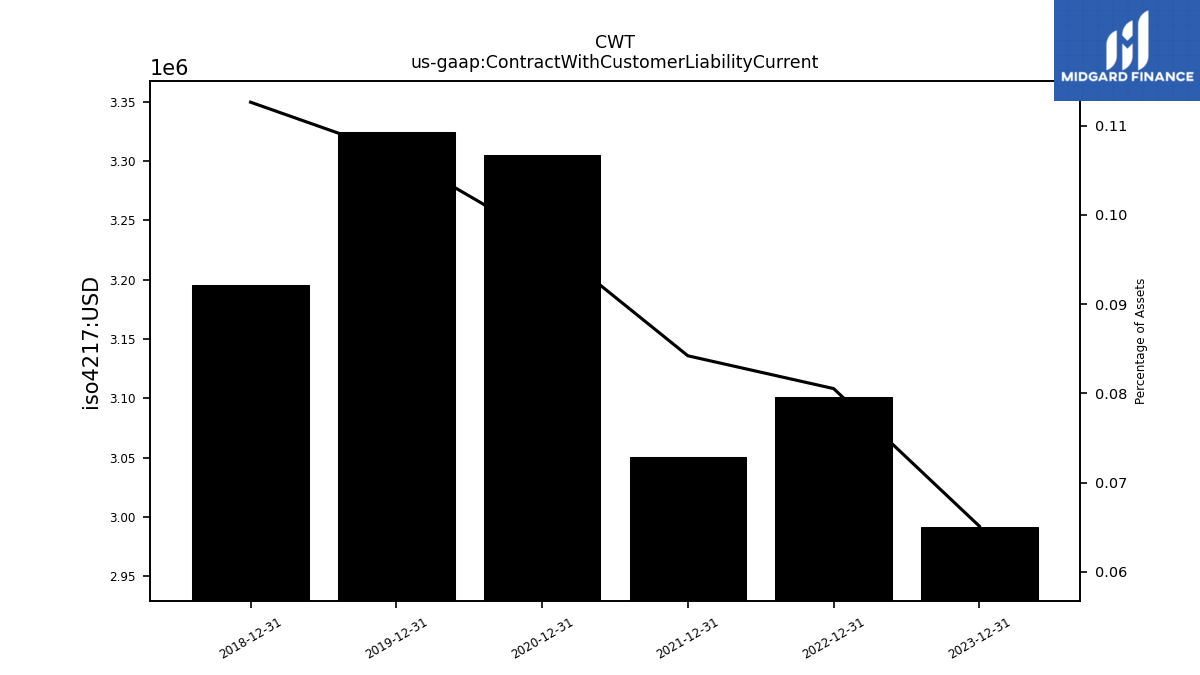
| Contract With Customer Liability Current | NA | 2.99 | NA | NA | NA | 3.10 | NA | NA | NA | 3.05 | NA | NA | NA | 3.31 | NA | NA | NA | 3.33 | NA | NA | NA | 3.20 | NA | NA | NA | NA | NA | NA | NA |
| 2024-03-31 | 2023-12-31 | 2023-09-30 | 2023-06-30 | 2023-03-31 | 2022-12-31 | 2022-09-30 | 2022-06-30 | 2022-03-31 | 2021-12-31 | 2021-09-30 | 2021-06-30 | 2021-03-31 | 2020-12-31 | 2020-09-30 | 2020-06-30 | 2020-03-31 | 2019-12-31 | 2019-09-30 | 2019-06-30 | 2019-03-31 | 2018-12-31 | 2018-09-30 | 2018-06-30 | 2018-03-31 | 2017-12-31 | 2017-09-30 | 2017-06-30 | 2017-03-31 | ||
|---|---|---|---|---|---|---|---|---|---|---|---|---|---|---|---|---|---|---|---|---|---|---|---|---|---|---|---|---|---|---|
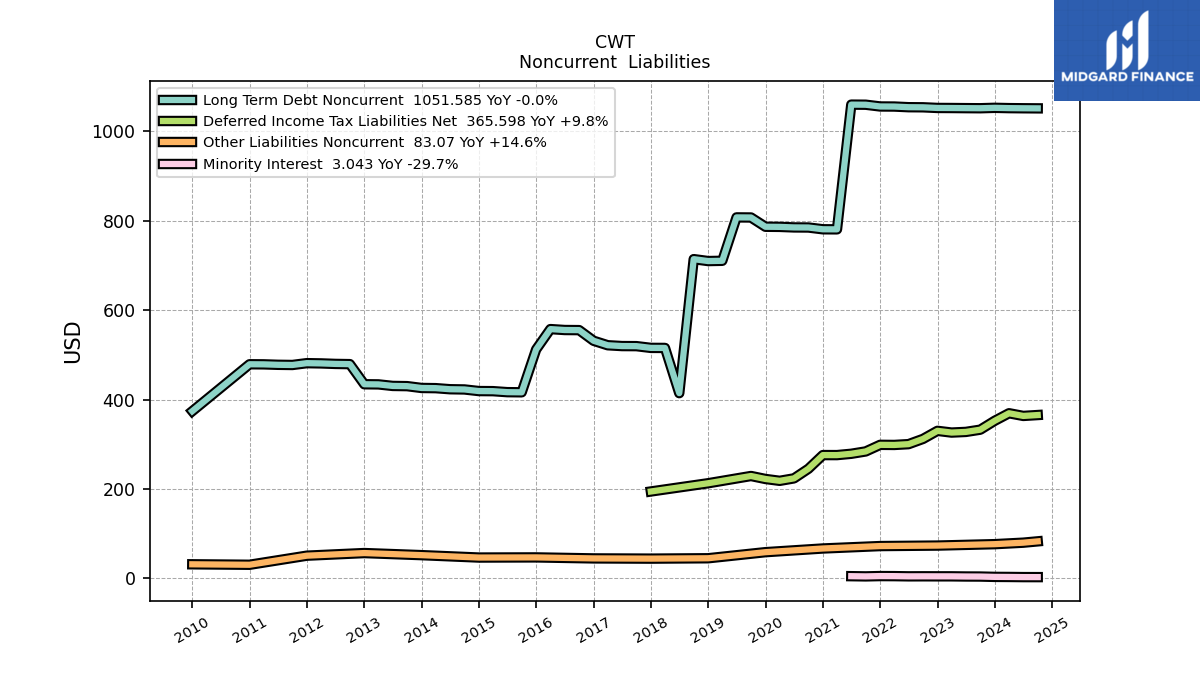
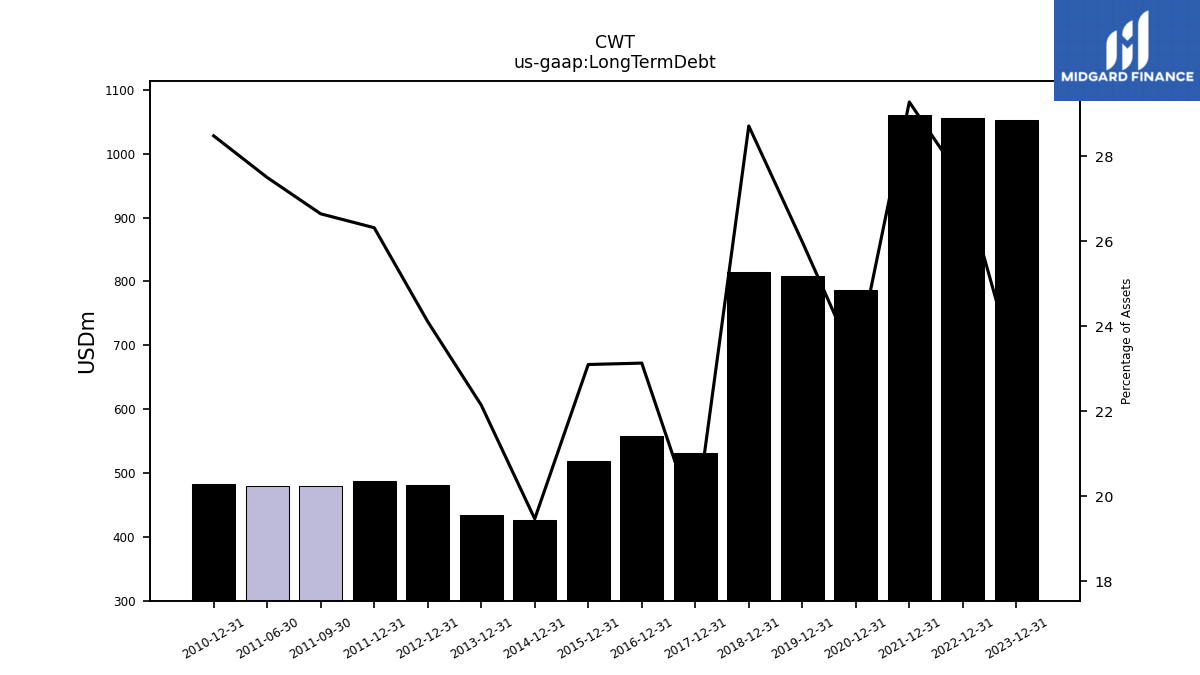
| Long Term Debt | NA | 1053.44 | NA | NA | NA | 1055.80 | NA | NA | NA | 1060.99 | NA | NA | NA | 786.23 | NA | NA | NA | 808.62 | NA | NA | NA | 814.94 | NA | NA | NA | 531.71 | NA | NA | NA | |
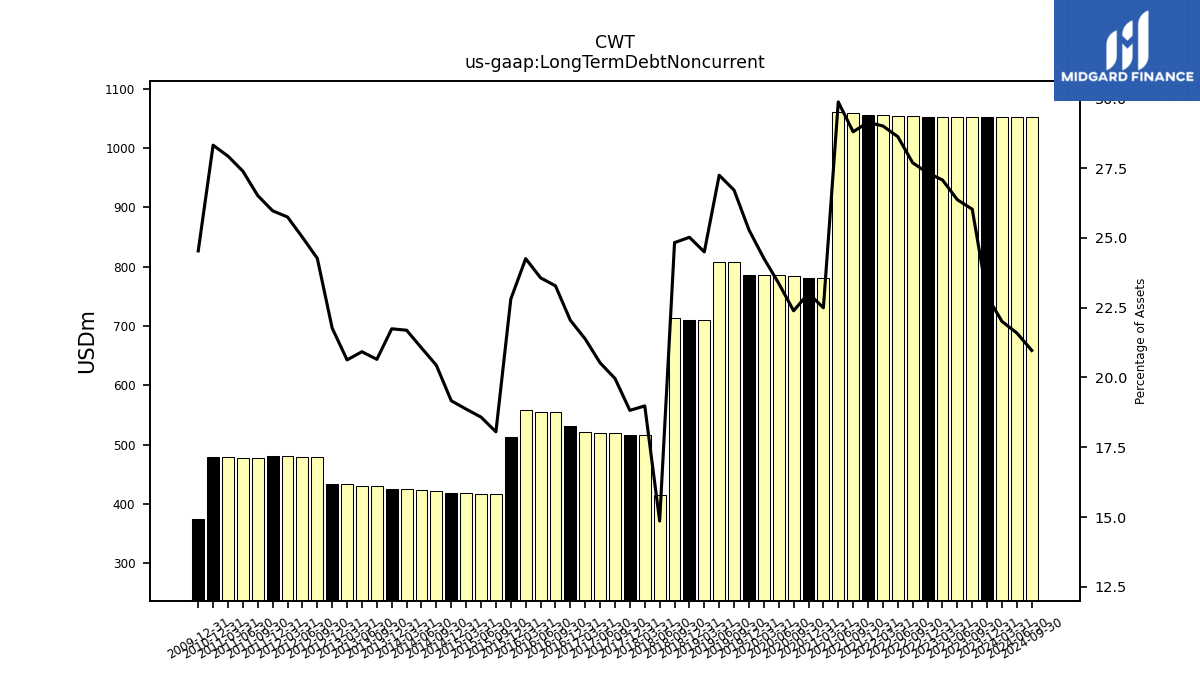
| Long Term Debt Noncurrent | 1052.10 | 1052.77 | 1051.85 | 1052.07 | 1052.34 | 1052.49 | 1053.94 | 1054.17 | 1055.64 | 1055.79 | 1059.72 | 1059.94 | 780.95 | 781.10 | 785.05 | 785.26 | 786.47 | 786.75 | 807.48 | 807.69 | 710.60 | 710.03 | 714.31 | 414.53 | 515.67 | 515.79 | 519.70 | 519.88 | 521.72 | |
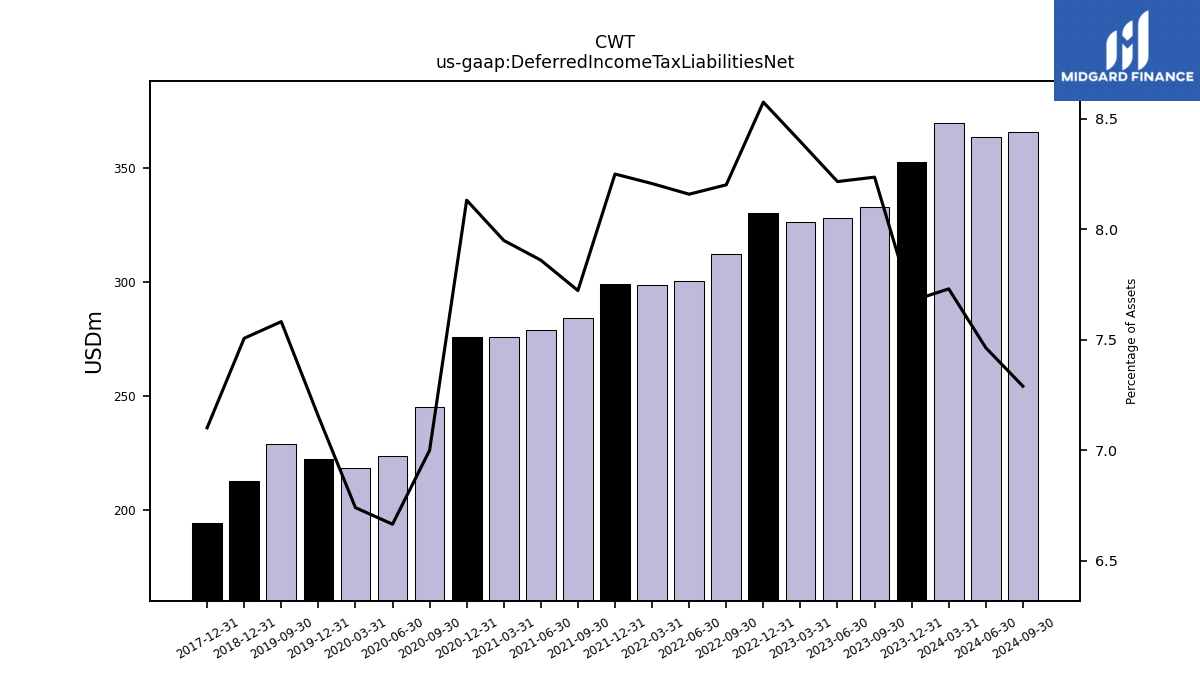
| Deferred Income Tax Liabilities Net | 369.60 | 352.76 | 332.87 | 327.86 | 326.40 | 330.25 | 312.19 | 300.49 | 298.69 | 298.94 | 284.19 | 278.96 | 275.99 | 276.03 | 245.46 | 223.96 | 218.45 | 222.59 | 229.24 | NA | NA | 213.03 | NA | NA | NA | 194.62 | NA | NA | NA | |
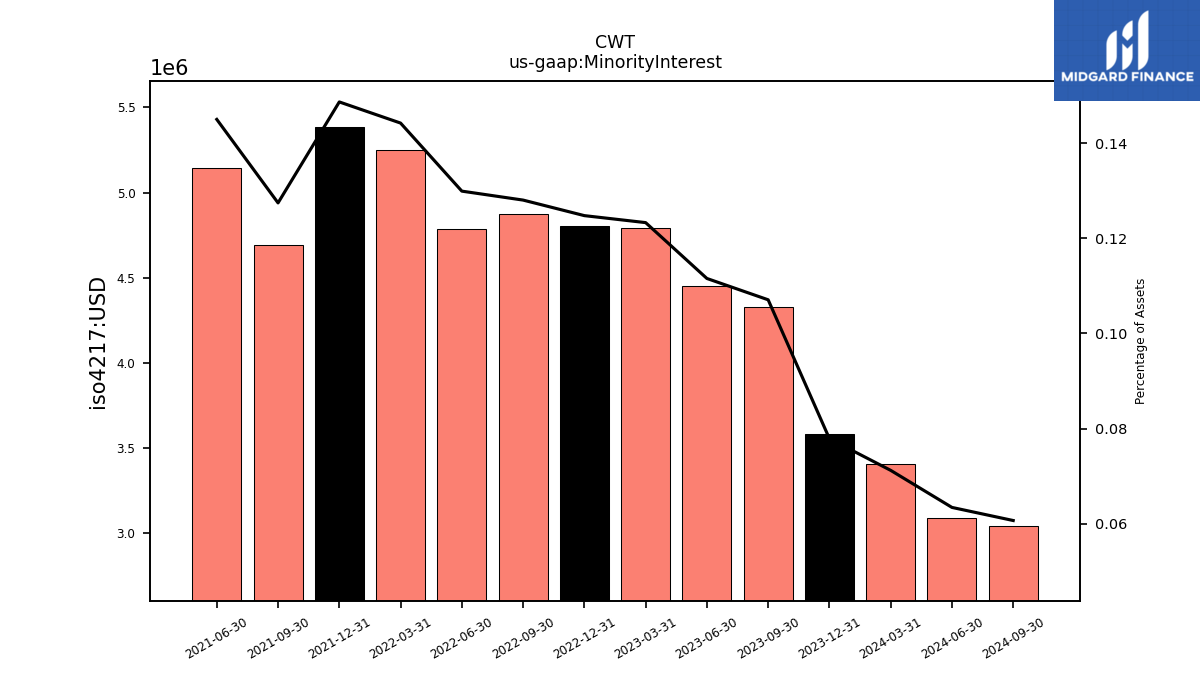
| Minority Interest | 3.40 | 3.58 | 4.33 | 4.45 | 4.79 | 4.80 | 4.87 | 4.78 | 5.25 | 5.39 | 4.69 | 5.14 | NA | NA | NA | NA | NA | NA | NA | NA | NA | NA | NA | NA | NA | NA | NA | NA | NA | |
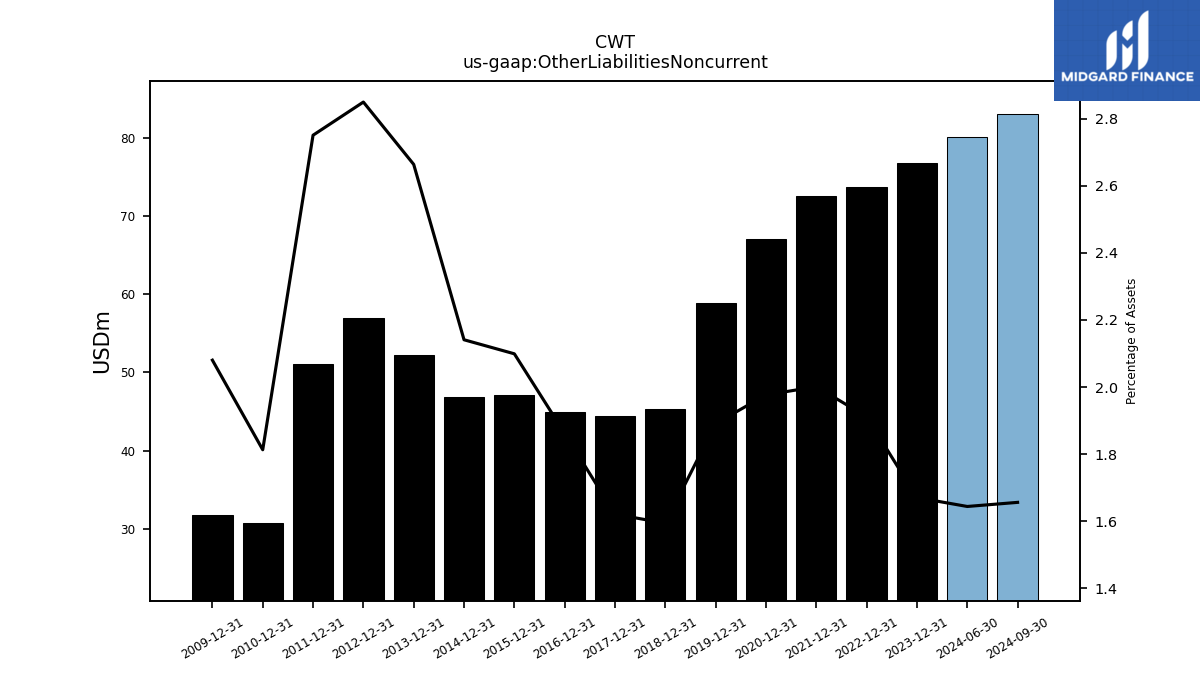
| Other Liabilities Noncurrent | NA | 76.78 | NA | NA | NA | 73.61 | NA | NA | NA | 72.51 | NA | NA | NA | 67.09 | NA | NA | NA | 58.84 | NA | NA | NA | 45.25 | NA | NA | NA | 44.42 | NA | NA | NA | |
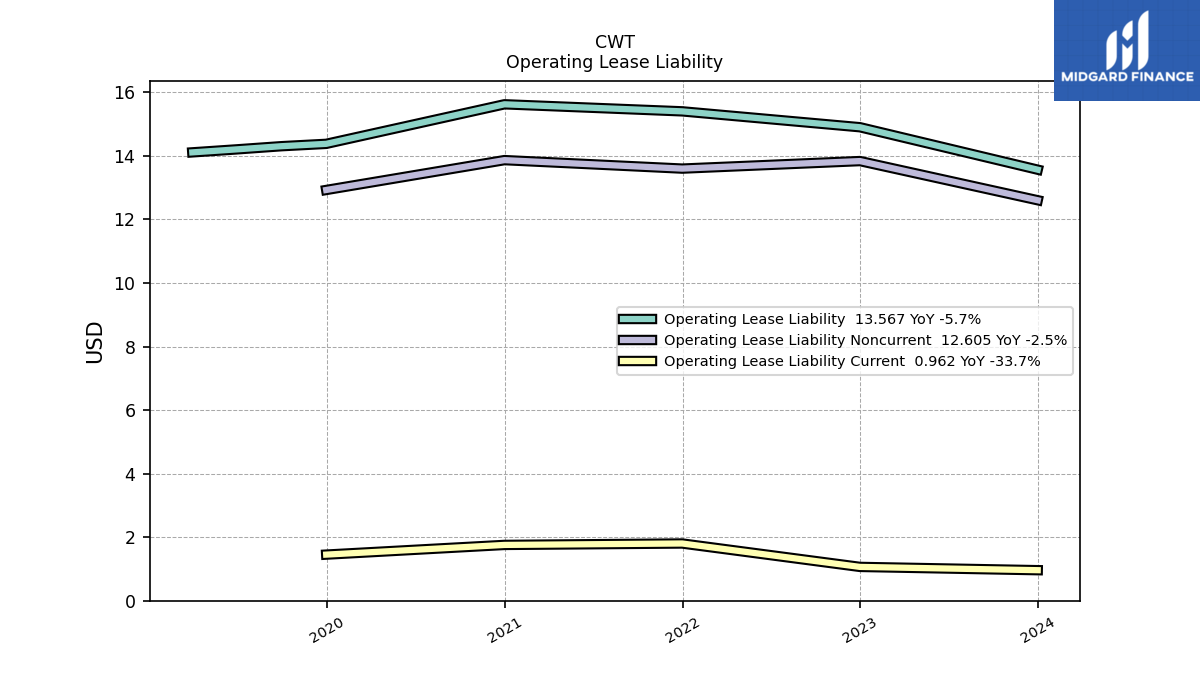
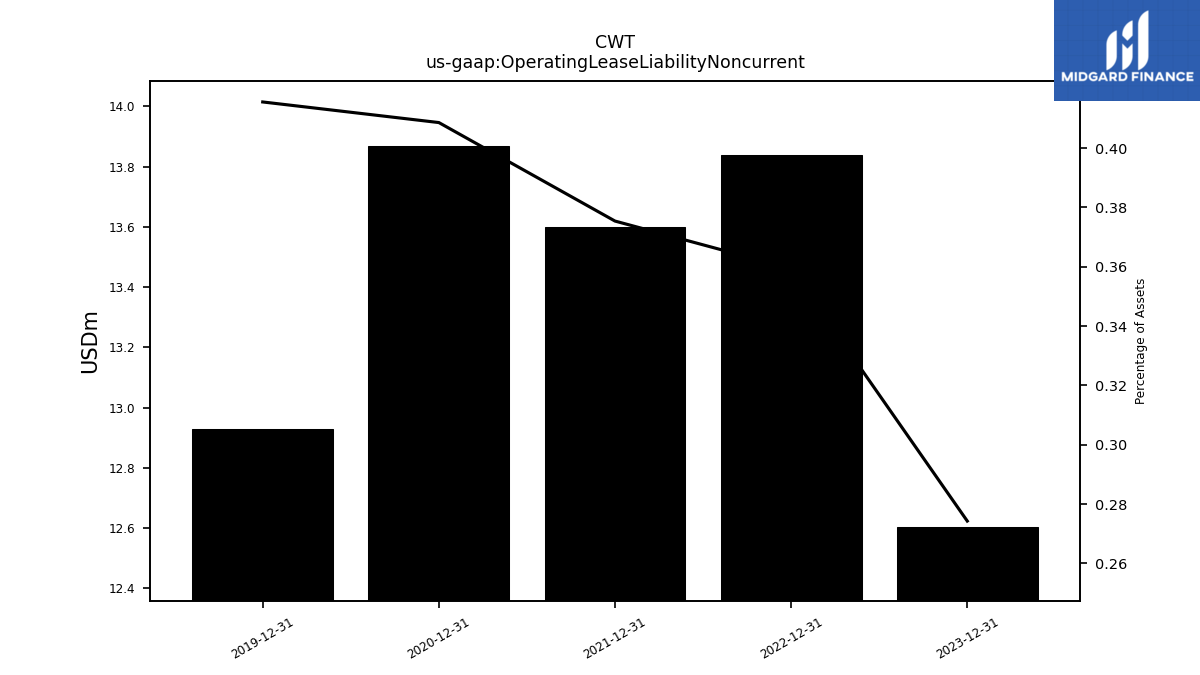
| Operating Lease Liability Noncurrent | NA | 12.61 | NA | NA | NA | 13.84 | NA | NA | NA | 13.60 | NA | NA | NA | 13.87 | NA | NA | NA | 12.93 | NA | NA | NA | NA | NA | NA | NA | NA | NA | NA | NA |
| 2024-03-31 | 2023-12-31 | 2023-09-30 | 2023-06-30 | 2023-03-31 | 2022-12-31 | 2022-09-30 | 2022-06-30 | 2022-03-31 | 2021-12-31 | 2021-09-30 | 2021-06-30 | 2021-03-31 | 2020-12-31 | 2020-09-30 | 2020-06-30 | 2020-03-31 | 2019-12-31 | 2019-09-30 | 2019-06-30 | 2019-03-31 | 2018-12-31 | 2018-09-30 | 2018-06-30 | 2018-03-31 | 2017-12-31 | 2017-09-30 | 2017-06-30 | 2017-03-31 | ||
|---|---|---|---|---|---|---|---|---|---|---|---|---|---|---|---|---|---|---|---|---|---|---|---|---|---|---|---|---|---|---|
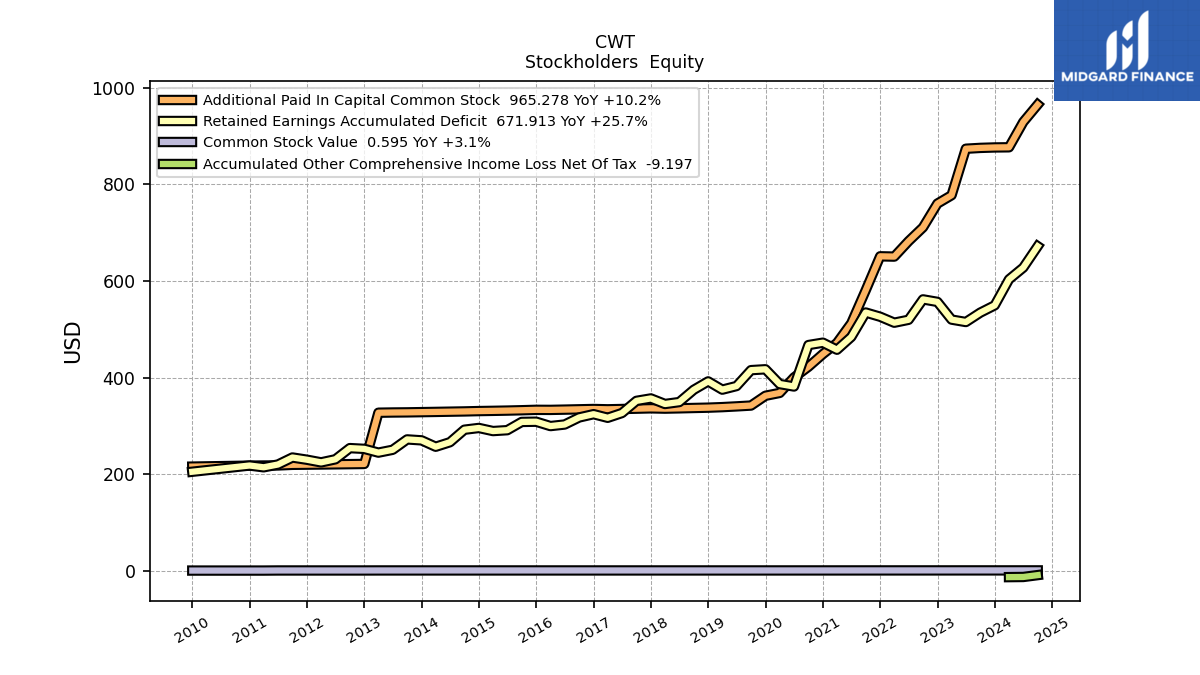
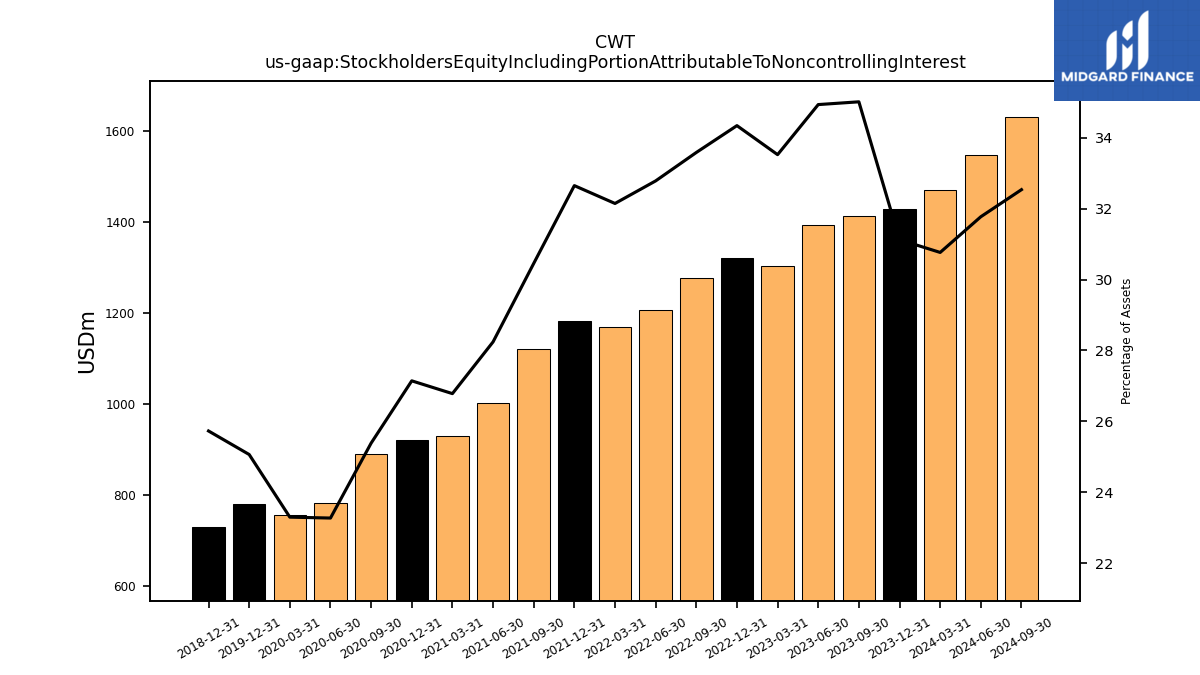
| Stockholders Equity Including Portion Attributable To Noncontrolling Interest | 1470.84 | 1430.31 | 1414.99 | 1393.97 | 1302.99 | 1322.39 | 1278.33 | 1207.31 | 1169.88 | 1182.98 | 1120.66 | 1002.26 | 929.80 | 921.34 | 890.19 | 782.02 | 755.14 | 779.91 | NA | NA | NA | 730.16 | NA | NA | NA | NA | NA | NA | NA | |
| Common Stock Value | 0.58 | 0.58 | 0.58 | 0.58 | 0.56 | 0.56 | 0.55 | 0.54 | 0.54 | 0.54 | 0.53 | 0.52 | 0.51 | 0.50 | 0.50 | 0.49 | 0.49 | 0.48 | 0.48 | 0.48 | 0.48 | 0.48 | 0.48 | 0.48 | 0.48 | 0.48 | 0.48 | 0.48 | 0.48 | |
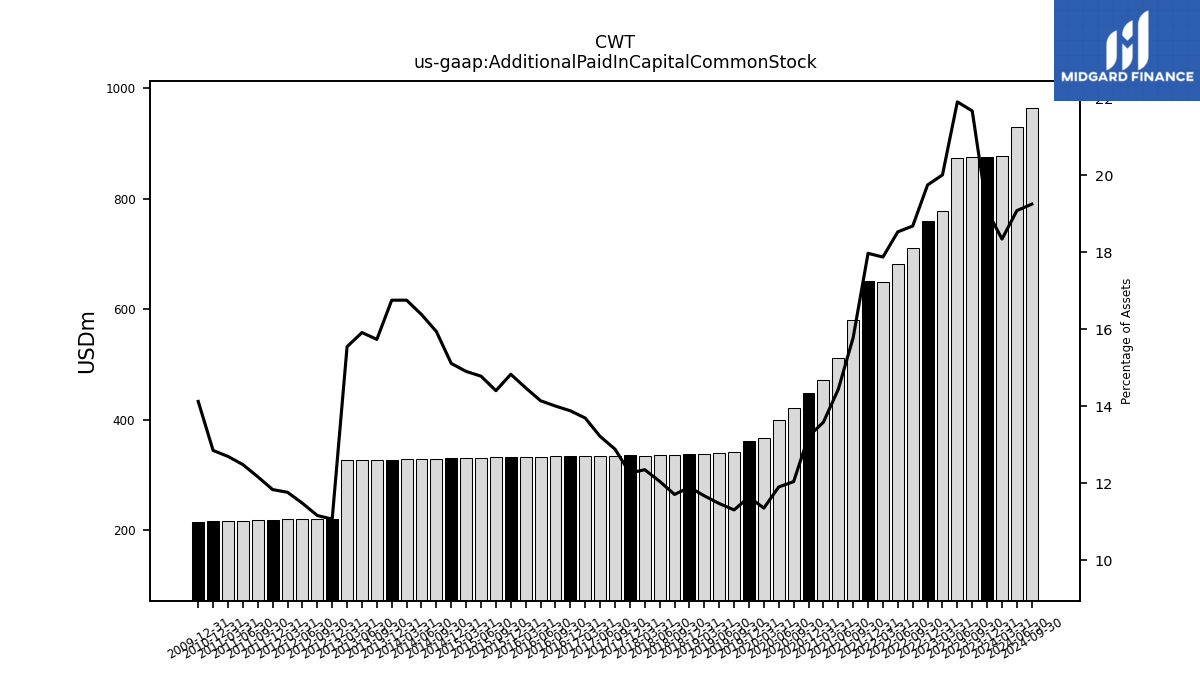
| Additional Paid In Capital Common Stock | 876.89 | 876.58 | 875.64 | 873.92 | 777.61 | 760.34 | 711.00 | 682.35 | 650.50 | 651.12 | 580.76 | 512.48 | 471.70 | 448.63 | 422.39 | 400.08 | 368.13 | 362.27 | 341.99 | 340.27 | 338.73 | 337.62 | 336.96 | 336.24 | 335.62 | 336.23 | 335.52 | 334.83 | 334.22 | |
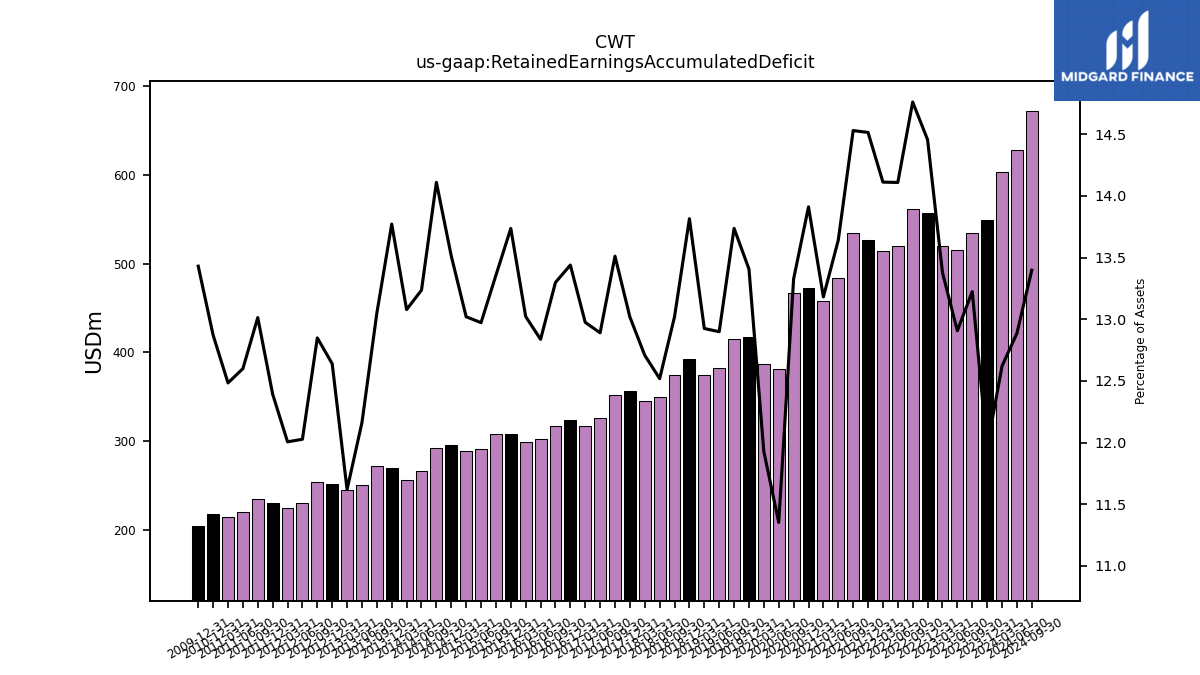
| Retained Earnings Accumulated Deficit | 603.33 | 549.57 | 534.45 | 515.02 | 520.03 | 556.70 | 561.91 | 519.62 | 513.59 | 525.94 | 534.68 | 484.12 | 457.60 | 472.21 | 467.30 | 381.45 | 386.52 | 417.15 | 415.33 | 382.41 | 374.92 | 392.05 | 374.59 | 349.21 | 345.20 | 356.75 | 351.73 | 326.52 | 316.63 | |
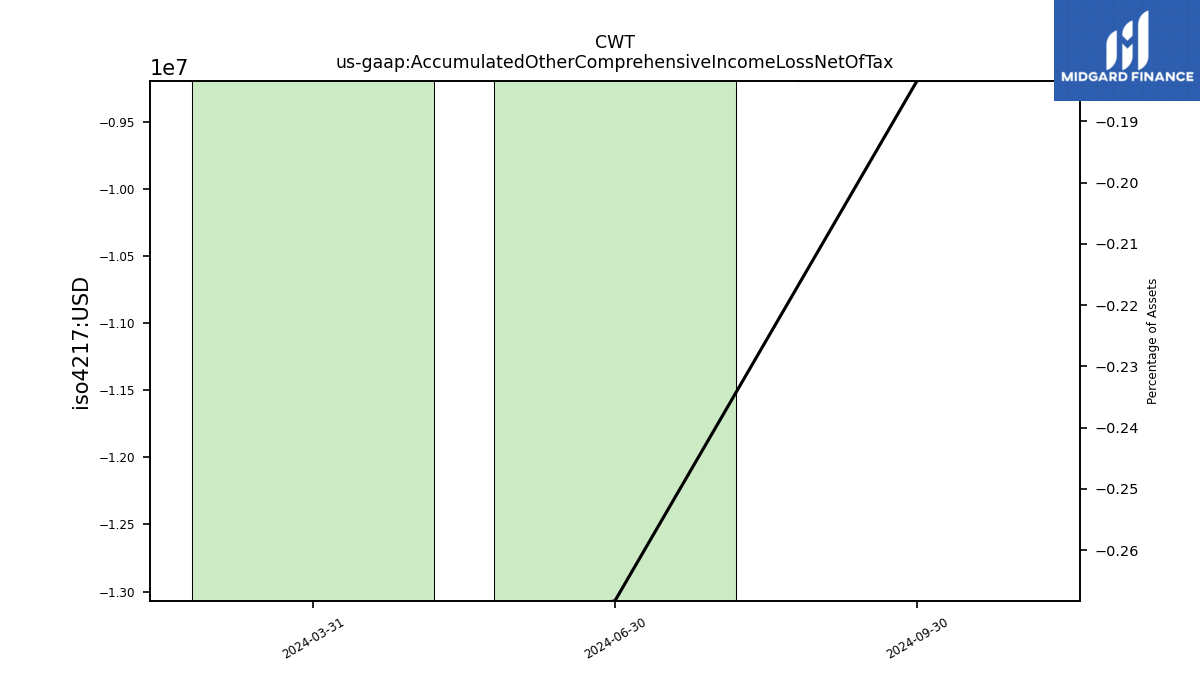
| Accumulated Other Comprehensive Income Loss Net Of Tax | -13.37 | NA | NA | NA | NA | NA | NA | NA | NA | NA | NA | NA | NA | NA | NA | NA | NA | NA | NA | NA | NA | NA | NA | NA | NA | NA | NA | NA | NA | |
| Minority Interest | 3.40 | 3.58 | 4.33 | 4.45 | 4.79 | 4.80 | 4.87 | 4.78 | 5.25 | 5.39 | 4.69 | 5.14 | NA | NA | NA | NA | NA | NA | NA | NA | NA | NA | NA | NA | NA | NA | NA | NA | NA | |
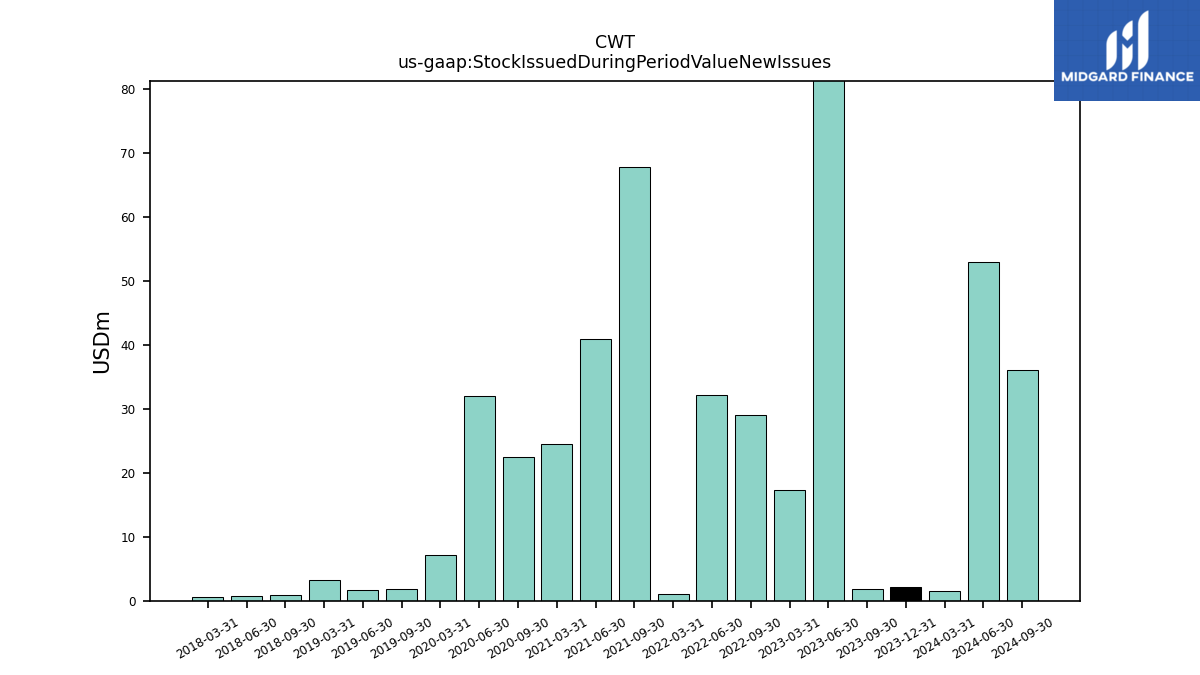
| Stock Issued During Period Value New Issues | 1.51 | NA | 1.80 | 96.50 | 17.38 | NA | 29.04 | 32.12 | 1.11 | NA | 67.83 | 40.90 | 24.49 | NA | 22.41 | 32.06 | 7.23 | NA | 1.87 | 1.68 | 3.18 | NA | 0.85 | 0.74 | 0.64 | NA | NA | NA | NA |
| 2024-03-31 | 2023-12-31 | 2023-09-30 | 2023-06-30 | 2023-03-31 | 2022-12-31 | 2022-09-30 | 2022-06-30 | 2022-03-31 | 2021-12-31 | 2021-09-30 | 2021-06-30 | 2021-03-31 | 2020-12-31 | 2020-09-30 | 2020-06-30 | 2020-03-31 | 2019-12-31 | 2019-09-30 | 2019-06-30 | 2019-03-31 | 2018-12-31 | 2018-09-30 | 2018-06-30 | 2018-03-31 | 2017-12-31 | 2017-09-30 | 2017-06-30 | 2017-03-31 | ||
|---|---|---|---|---|---|---|---|---|---|---|---|---|---|---|---|---|---|---|---|---|---|---|---|---|---|---|---|---|---|---|
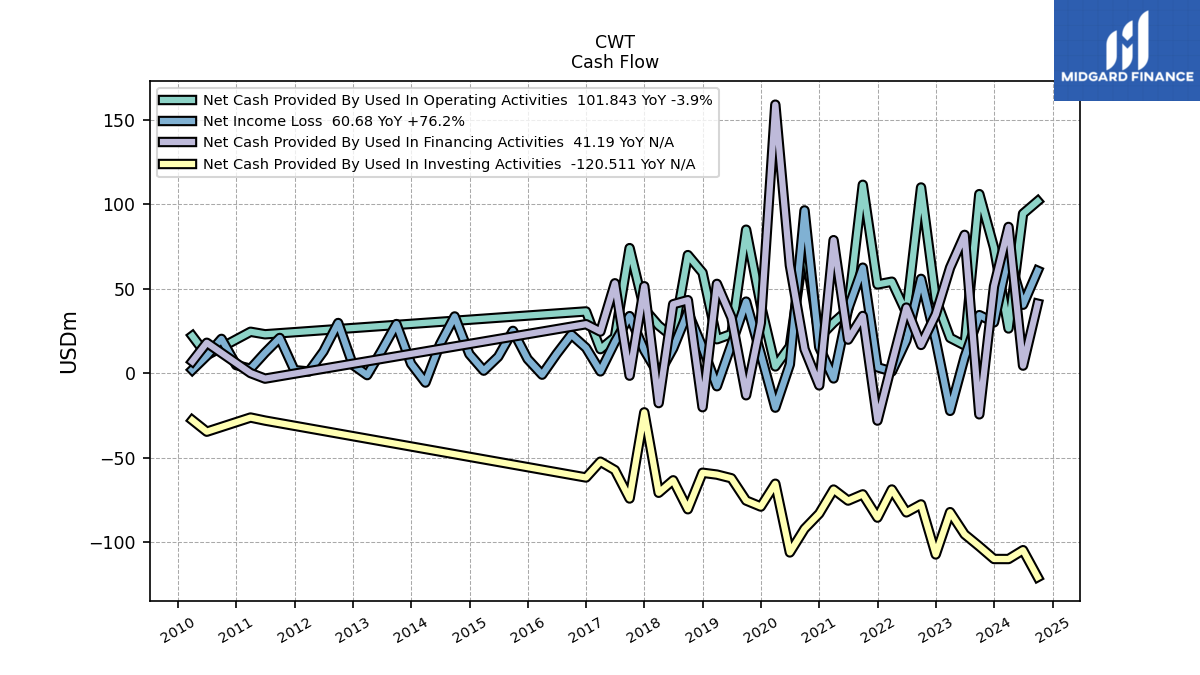
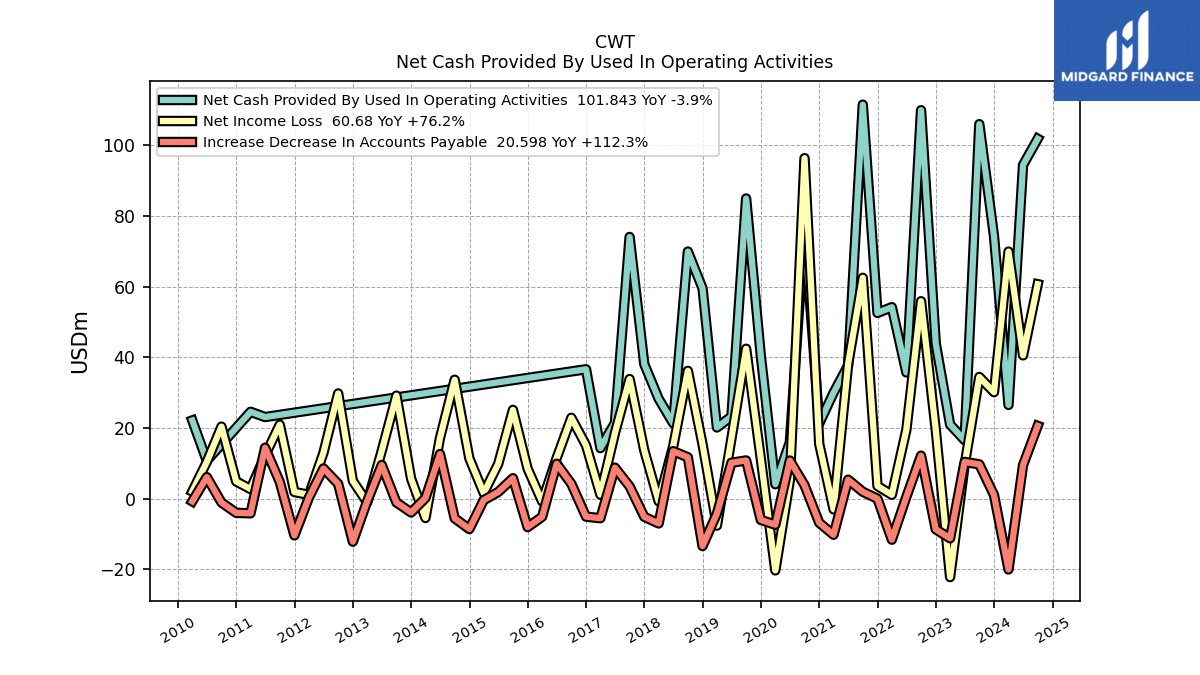
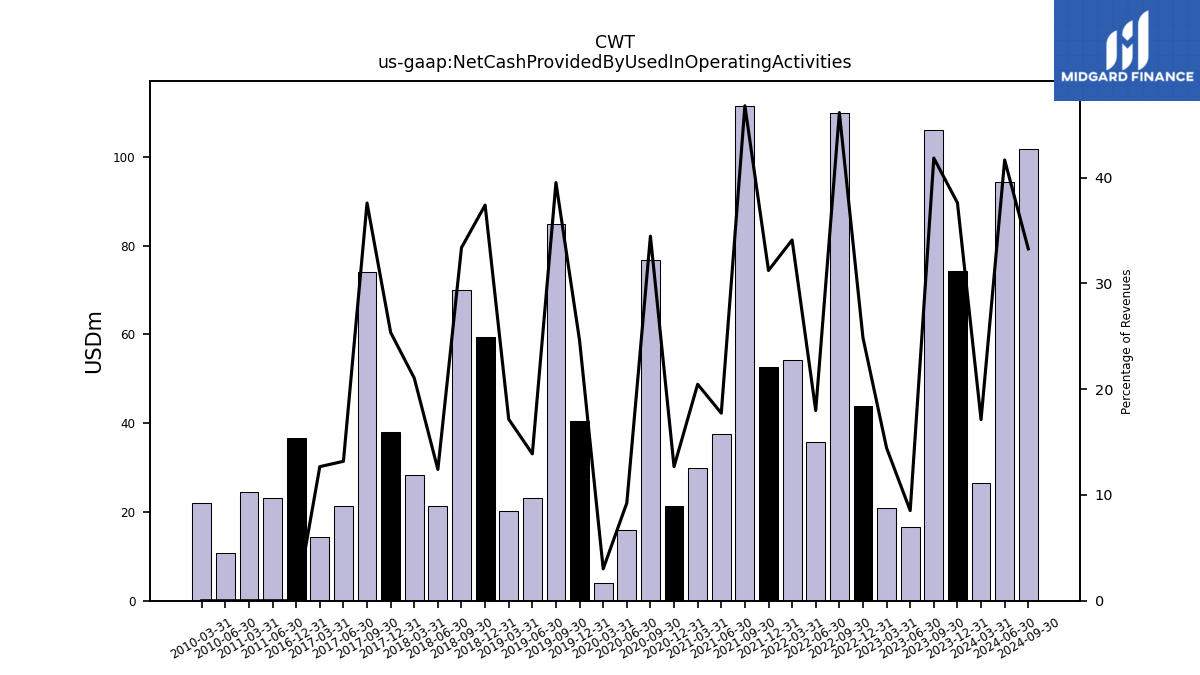
| Net Cash Provided By Used In Operating Activities | 26.52 | 74.31 | 105.99 | 16.55 | 20.97 | 43.93 | 109.93 | 35.72 | 54.19 | 52.56 | 111.51 | 37.67 | 29.98 | 21.26 | 76.66 | 15.94 | 4.07 | 40.45 | 84.95 | 23.25 | 20.14 | 59.52 | 69.93 | 21.32 | 28.25 | 38.05 | 74.06 | 21.43 | 14.30 | |
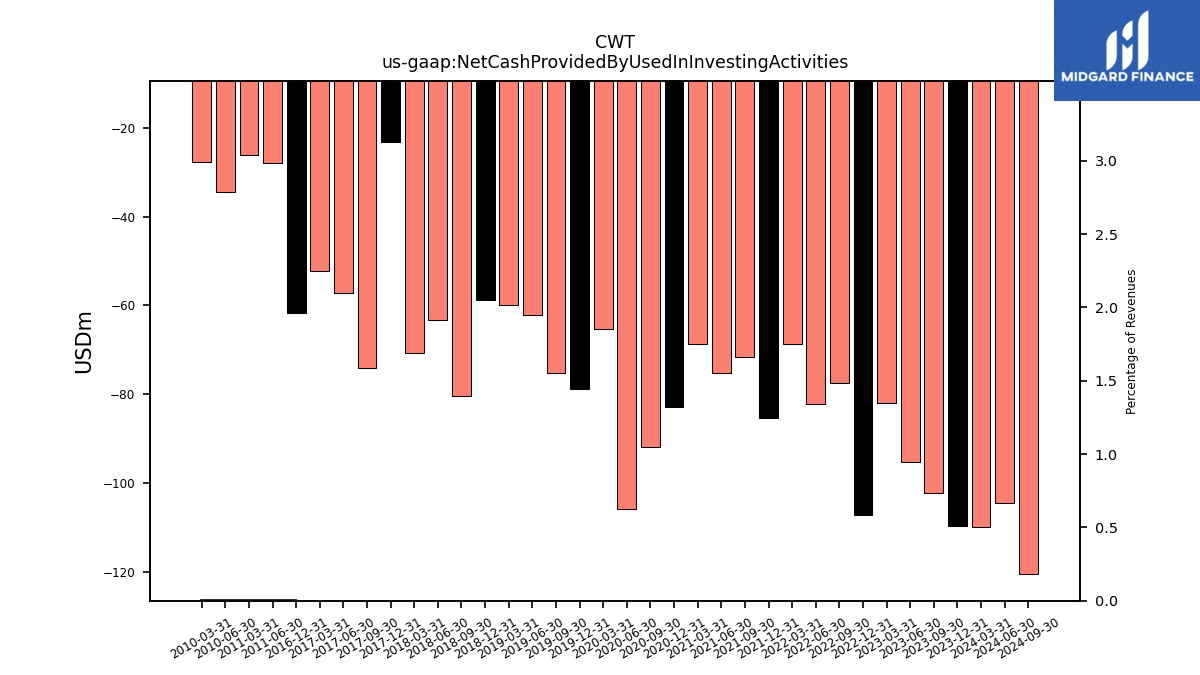
| Net Cash Provided By Used In Investing Activities | -109.81 | -109.79 | -102.33 | -95.21 | -82.08 | -107.12 | -77.50 | -82.23 | -68.68 | -85.34 | -71.56 | -75.26 | -68.72 | -82.93 | -91.95 | -105.92 | -65.27 | -78.80 | -75.22 | -62.05 | -59.88 | -58.79 | -80.39 | -63.25 | -70.65 | -23.06 | -74.03 | -57.24 | -52.24 | |
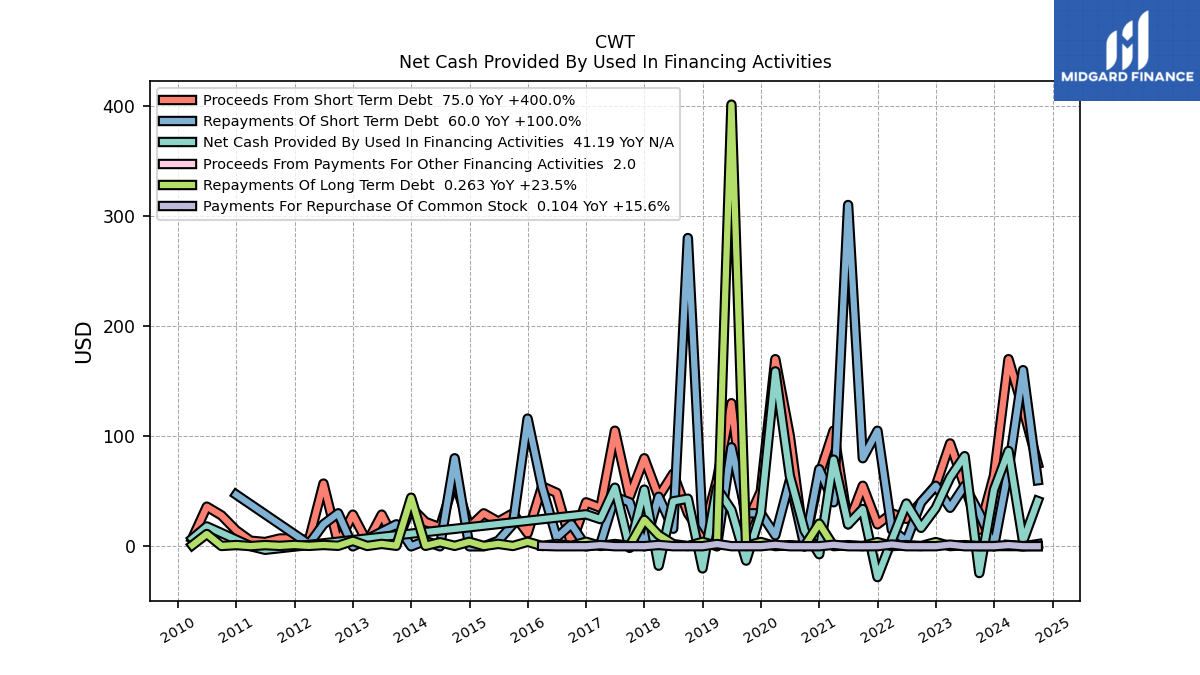
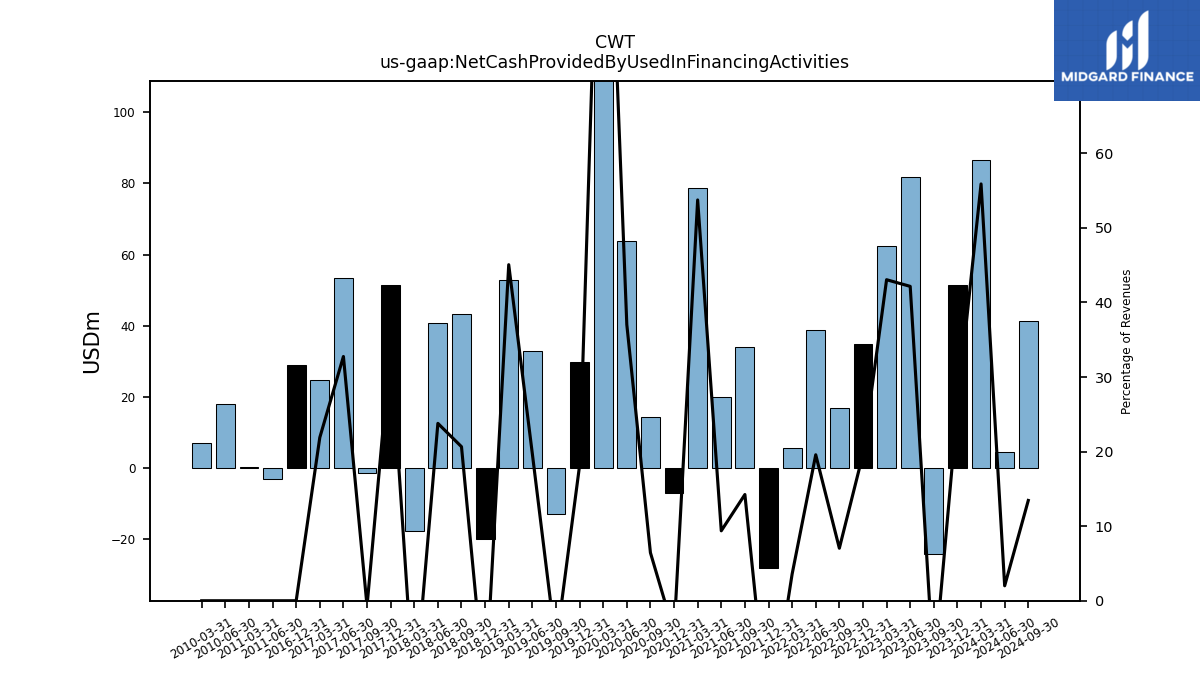
| Net Cash Provided By Used In Financing Activities | 86.59 | 51.40 | -24.27 | 81.88 | 62.53 | 34.77 | 16.78 | 38.89 | 5.68 | -27.96 | 33.95 | 19.93 | 78.76 | -7.15 | 14.34 | 63.89 | 158.90 | 29.82 | -12.99 | 32.99 | 52.91 | -20.05 | 43.28 | 40.86 | -17.62 | 51.52 | -1.39 | 53.26 | 24.70 |
| 2024-03-31 | 2023-12-31 | 2023-09-30 | 2023-06-30 | 2023-03-31 | 2022-12-31 | 2022-09-30 | 2022-06-30 | 2022-03-31 | 2021-12-31 | 2021-09-30 | 2021-06-30 | 2021-03-31 | 2020-12-31 | 2020-09-30 | 2020-06-30 | 2020-03-31 | 2019-12-31 | 2019-09-30 | 2019-06-30 | 2019-03-31 | 2018-12-31 | 2018-09-30 | 2018-06-30 | 2018-03-31 | 2017-12-31 | 2017-09-30 | 2017-06-30 | 2017-03-31 | ||
|---|---|---|---|---|---|---|---|---|---|---|---|---|---|---|---|---|---|---|---|---|---|---|---|---|---|---|---|---|---|---|
| Net Cash Provided By Used In Operating Activities | 26.52 | 74.31 | 105.99 | 16.55 | 20.97 | 43.93 | 109.93 | 35.72 | 54.19 | 52.56 | 111.51 | 37.67 | 29.98 | 21.26 | 76.66 | 15.94 | 4.07 | 40.45 | 84.95 | 23.25 | 20.14 | 59.52 | 69.93 | 21.32 | 28.25 | 38.05 | 74.06 | 21.43 | 14.30 | |
| Net Income Loss | 69.92 | 30.13 | 34.44 | 9.56 | -22.21 | 19.57 | 55.87 | 19.48 | 1.09 | 3.58 | 62.50 | 38.08 | -3.03 | 15.50 | 96.36 | 5.28 | -20.31 | 11.34 | 42.42 | 17.00 | -7.64 | 15.37 | 36.17 | 14.80 | -0.76 | 13.67 | 33.85 | 18.53 | 1.13 | |
| Profit Loss | 69.69 | 29.94 | 34.33 | 9.45 | -22.33 | 19.47 | 55.68 | 19.21 | 0.89 | 3.36 | 62.43 | 38.23 | -3.03 | 15.50 | 96.36 | 5.28 | -20.31 | NA | NA | NA | NA | NA | NA | NA | NA | NA | NA | NA | NA | |
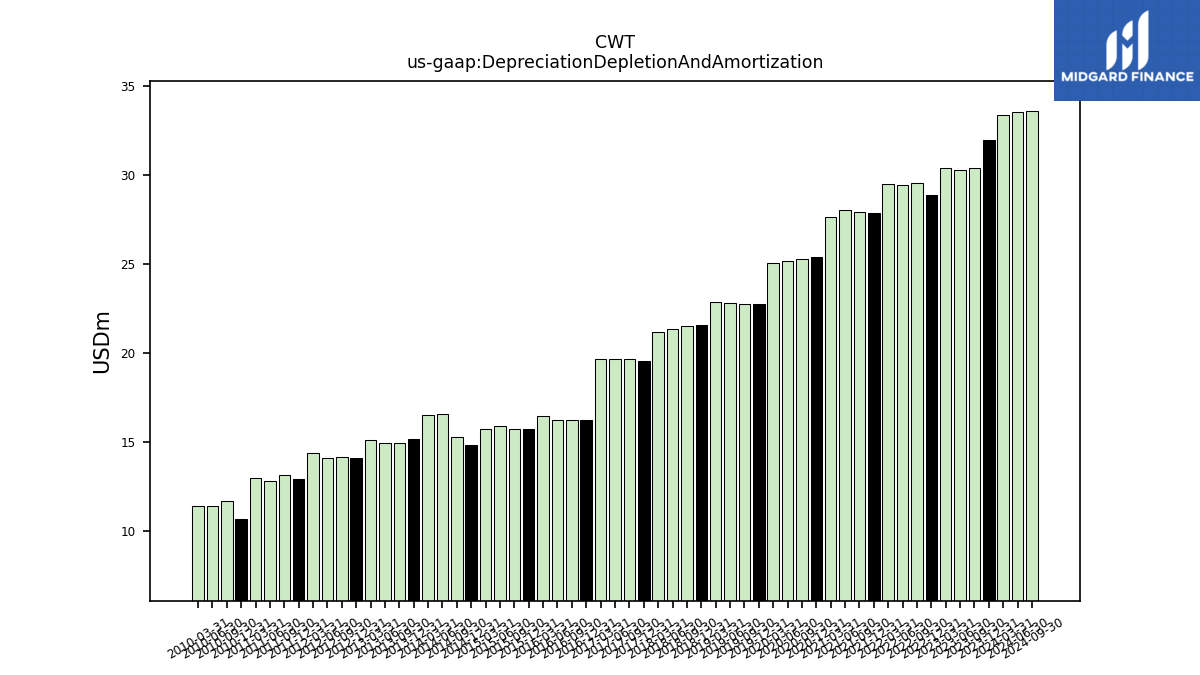
| Depreciation Depletion And Amortization | 33.40 | 31.99 | 30.39 | 30.31 | 30.43 | 28.88 | 29.56 | 29.45 | 29.48 | 27.91 | 27.94 | 28.06 | 27.67 | 25.39 | 25.30 | 25.16 | 25.09 | 22.77 | 22.78 | 22.85 | 22.89 | 21.58 | 21.55 | 21.38 | 21.21 | 19.58 | 19.69 | 19.67 | 19.66 | |
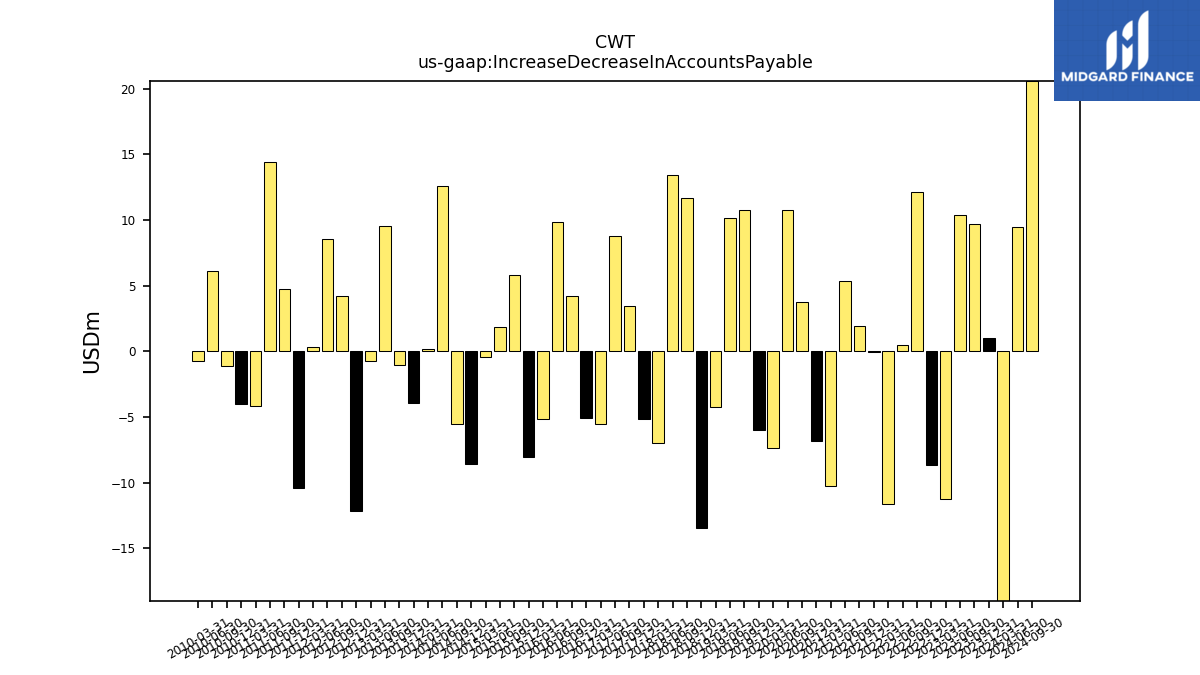
| Increase Decrease In Accounts Payable | -20.04 | 1.03 | 9.70 | 10.39 | -11.23 | -8.68 | 12.17 | 0.50 | -11.62 | -0.02 | 1.95 | 5.36 | -10.22 | -6.83 | 3.79 | 10.78 | -7.38 | -6.02 | 10.81 | 10.16 | -4.23 | -13.43 | 11.72 | 13.43 | -7.01 | -5.15 | 3.47 | 8.78 | -5.54 |
| 2024-03-31 | 2023-12-31 | 2023-09-30 | 2023-06-30 | 2023-03-31 | 2022-12-31 | 2022-09-30 | 2022-06-30 | 2022-03-31 | 2021-12-31 | 2021-09-30 | 2021-06-30 | 2021-03-31 | 2020-12-31 | 2020-09-30 | 2020-06-30 | 2020-03-31 | 2019-12-31 | 2019-09-30 | 2019-06-30 | 2019-03-31 | 2018-12-31 | 2018-09-30 | 2018-06-30 | 2018-03-31 | 2017-12-31 | 2017-09-30 | 2017-06-30 | 2017-03-31 | ||
|---|---|---|---|---|---|---|---|---|---|---|---|---|---|---|---|---|---|---|---|---|---|---|---|---|---|---|---|---|---|---|
| Net Cash Provided By Used In Investing Activities | -109.81 | -109.79 | -102.33 | -95.21 | -82.08 | -107.12 | -77.50 | -82.23 | -68.68 | -85.34 | -71.56 | -75.26 | -68.72 | -82.93 | -91.95 | -105.92 | -65.27 | -78.80 | -75.22 | -62.05 | -59.88 | -58.79 | -80.39 | -63.25 | -70.65 | -23.06 | -74.03 | -57.24 | -52.24 |
| 2024-03-31 | 2023-12-31 | 2023-09-30 | 2023-06-30 | 2023-03-31 | 2022-12-31 | 2022-09-30 | 2022-06-30 | 2022-03-31 | 2021-12-31 | 2021-09-30 | 2021-06-30 | 2021-03-31 | 2020-12-31 | 2020-09-30 | 2020-06-30 | 2020-03-31 | 2019-12-31 | 2019-09-30 | 2019-06-30 | 2019-03-31 | 2018-12-31 | 2018-09-30 | 2018-06-30 | 2018-03-31 | 2017-12-31 | 2017-09-30 | 2017-06-30 | 2017-03-31 | ||
|---|---|---|---|---|---|---|---|---|---|---|---|---|---|---|---|---|---|---|---|---|---|---|---|---|---|---|---|---|---|---|
| Net Cash Provided By Used In Financing Activities | 86.59 | 51.40 | -24.27 | 81.88 | 62.53 | 34.77 | 16.78 | 38.89 | 5.68 | -27.96 | 33.95 | 19.93 | 78.76 | -7.15 | 14.34 | 63.89 | 158.90 | 29.82 | -12.99 | 32.99 | 52.91 | -20.05 | 43.28 | 40.86 | -17.62 | 51.52 | -1.39 | 53.26 | 24.70 | |
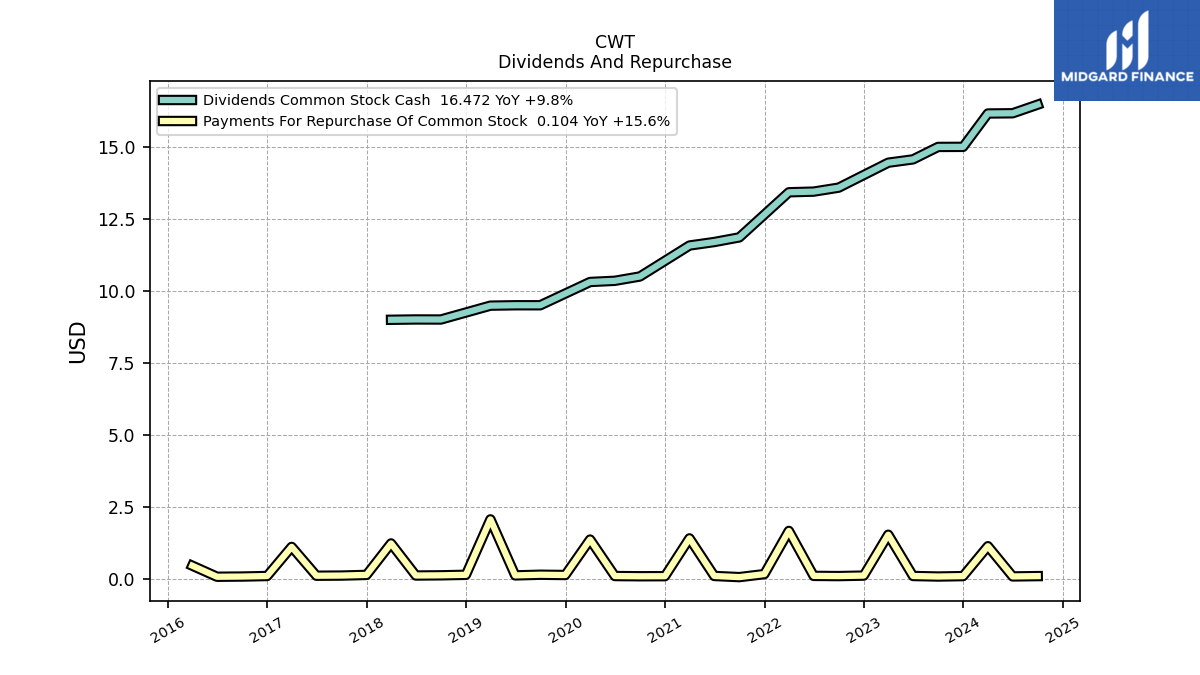
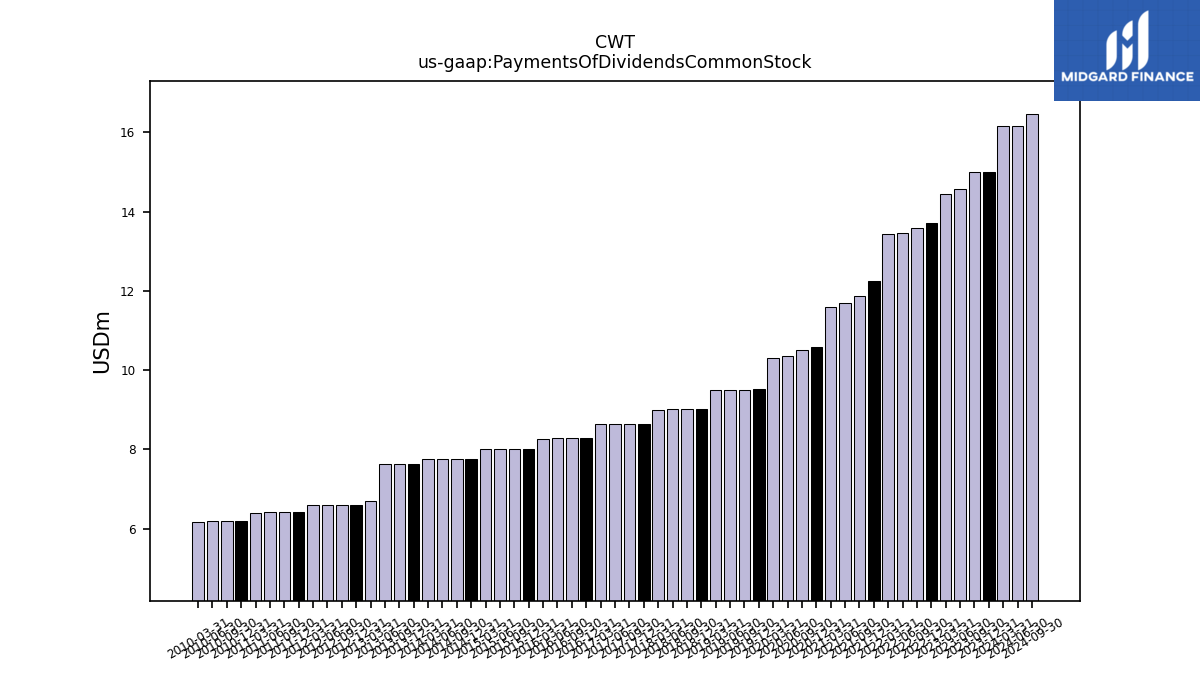
| Payments Of Dividends Common Stock | 16.16 | 15.01 | 15.00 | 14.57 | 14.46 | 13.71 | 13.59 | 13.45 | 13.43 | 12.25 | 11.86 | 11.70 | 11.58 | 10.59 | 10.51 | 10.36 | 10.31 | 9.52 | 9.51 | 9.51 | 9.49 | 9.01 | 9.01 | 9.01 | 9.00 | 8.64 | 8.64 | 8.64 | 8.63 | |
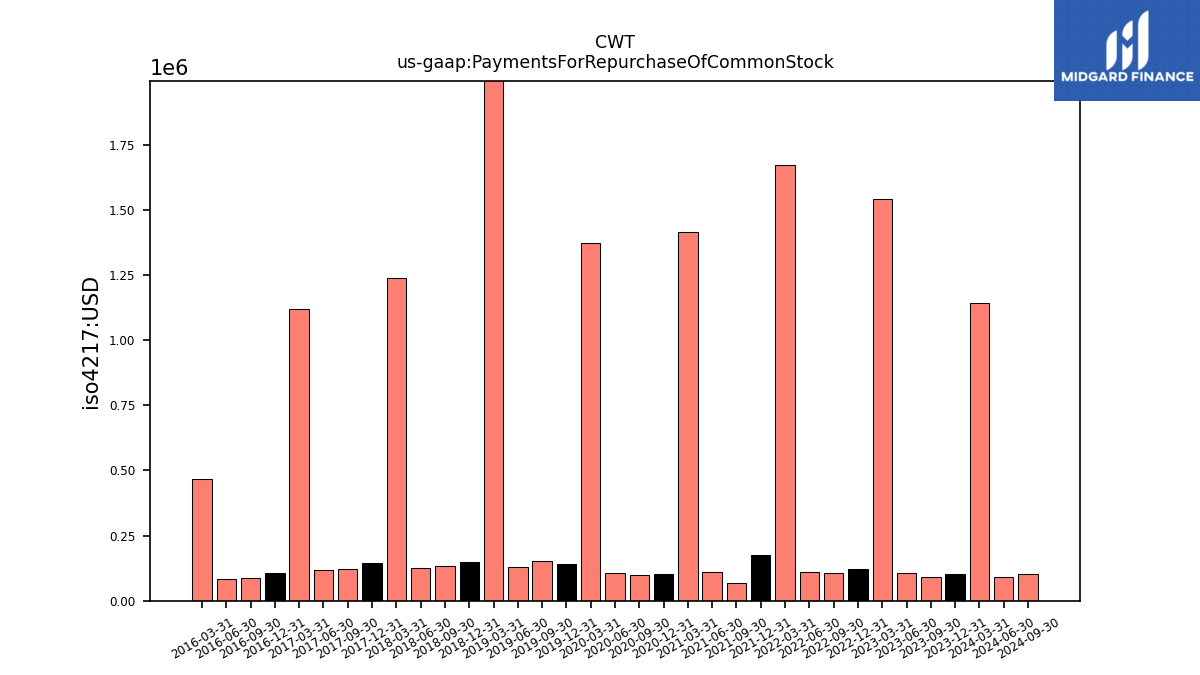
| Payments For Repurchase Of Common Stock | 1.14 | 0.10 | 0.09 | 0.11 | 1.54 | 0.12 | 0.10 | 0.11 | 1.67 | 0.17 | 0.07 | 0.11 | 1.42 | 0.10 | 0.10 | 0.11 | 1.37 | 0.14 | 0.15 | 0.13 | 2.07 | 0.15 | 0.13 | 0.12 | 1.24 | 0.15 | 0.12 | 0.12 | 1.12 |
| 2024-03-31 | 2023-12-31 | 2023-09-30 | 2023-06-30 | 2023-03-31 | 2022-12-31 | 2022-09-30 | 2022-06-30 | 2022-03-31 | 2021-12-31 | 2021-09-30 | 2021-06-30 | 2021-03-31 | 2020-12-31 | 2020-09-30 | 2020-06-30 | 2020-03-31 | 2019-12-31 | 2019-09-30 | 2019-06-30 | 2019-03-31 | 2018-12-31 | 2018-09-30 | 2018-06-30 | 2018-03-31 | 2017-12-31 | 2017-09-30 | 2017-06-30 | 2017-03-31 | ||
|---|---|---|---|---|---|---|---|---|---|---|---|---|---|---|---|---|---|---|---|---|---|---|---|---|---|---|---|---|---|---|
| Revenues | 154.90 | 197.57 | 253.34 | 194.21 | 145.22 | 176.76 | 238.27 | 198.66 | 158.93 | 168.37 | 238.35 | 212.46 | 146.53 | 167.77 | 222.47 | 172.50 | 134.83 | 164.52 | 214.96 | 167.47 | 117.41 | 159.17 | 209.54 | 171.77 | 134.25 | 150.06 | 197.01 | 162.59 | 112.81 | |
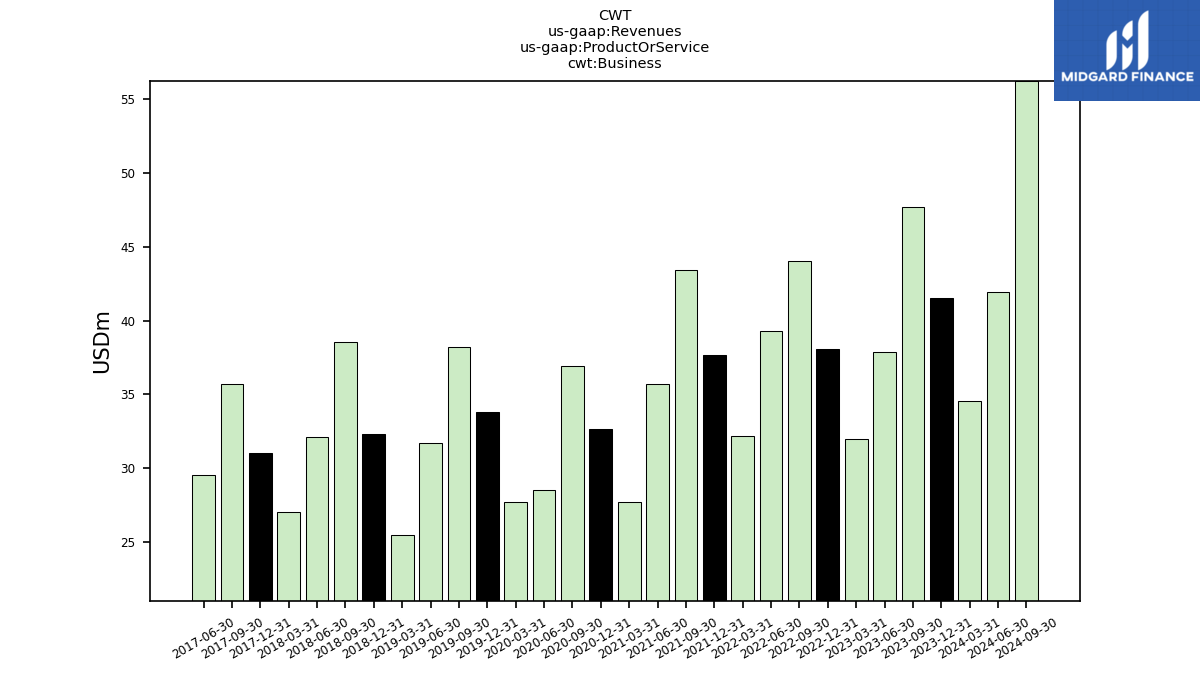
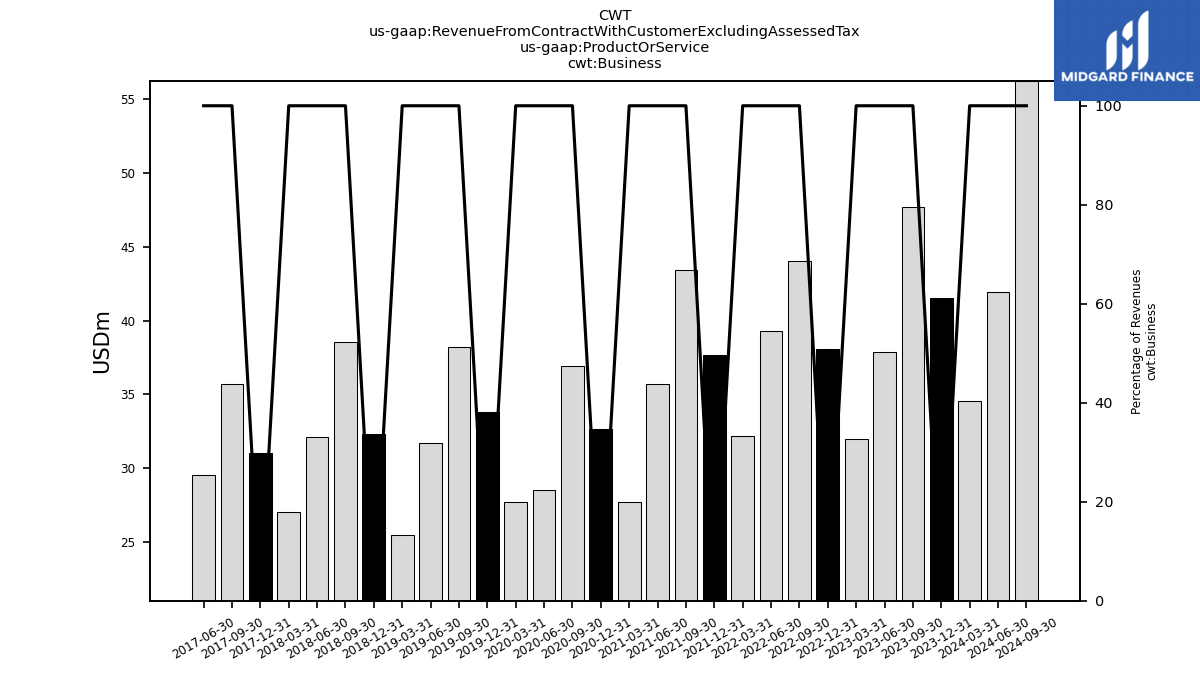
| Business | 34.55 | 41.52 | 47.71 | 37.85 | 31.97 | 38.10 | 44.03 | 39.28 | 32.16 | 37.66 | 43.45 | 35.73 | 27.72 | 32.64 | 36.95 | 28.53 | 27.69 | 33.79 | 38.25 | 31.71 | 25.48 | 32.32 | 38.54 | 32.12 | 27.06 | 31.03 | 35.68 | 29.54 | NA | |
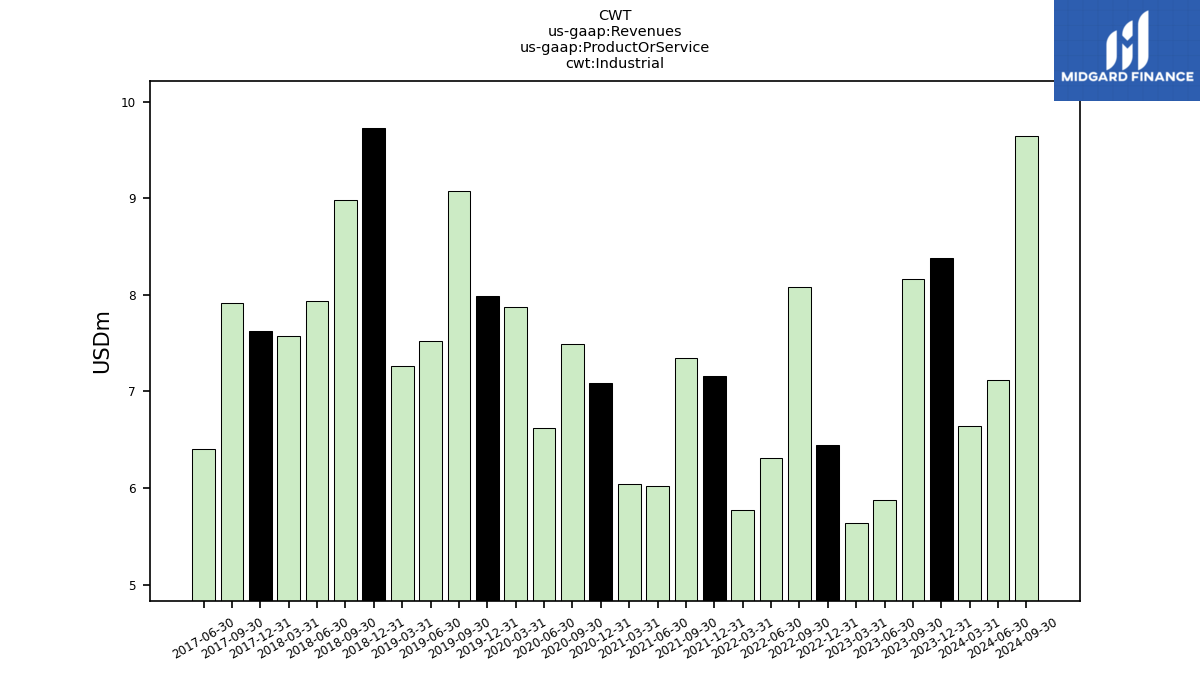
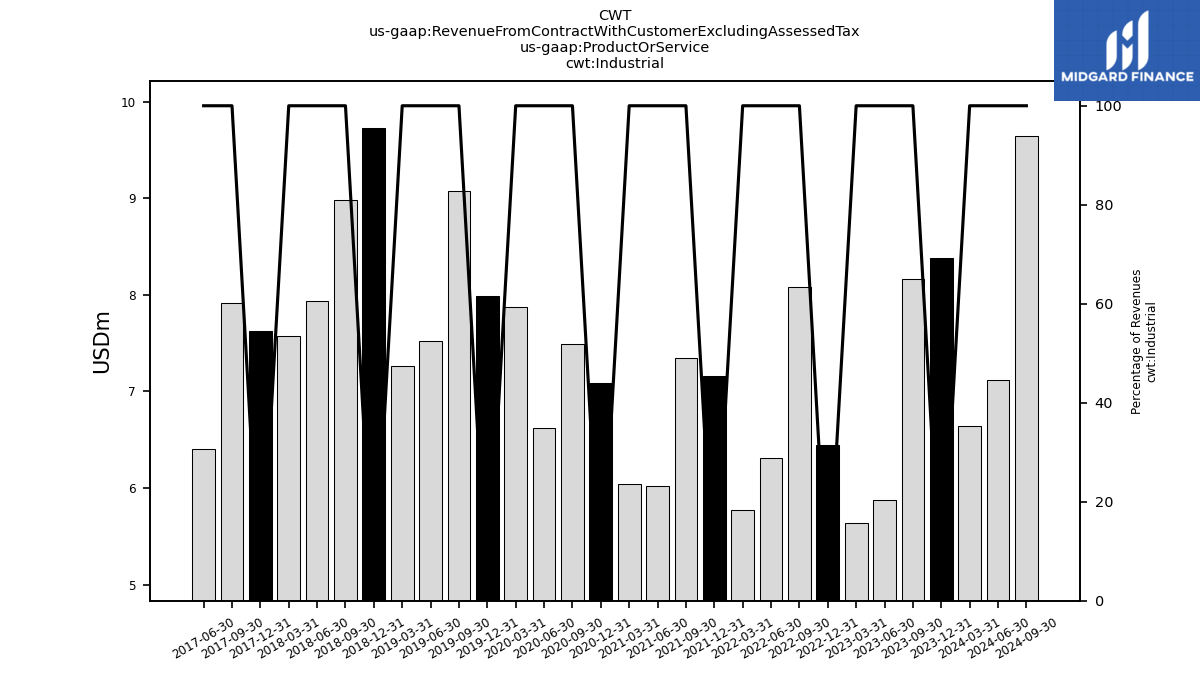
| Industrial | 6.64 | 8.38 | 8.16 | 5.87 | 5.63 | 6.45 | 8.09 | 6.31 | 5.77 | 7.16 | 7.35 | 6.02 | 6.04 | 7.09 | 7.50 | 6.62 | 7.88 | 7.99 | 9.08 | 7.52 | 7.26 | 9.73 | 8.99 | 7.94 | 7.58 | 7.62 | 7.92 | 6.41 | NA | |
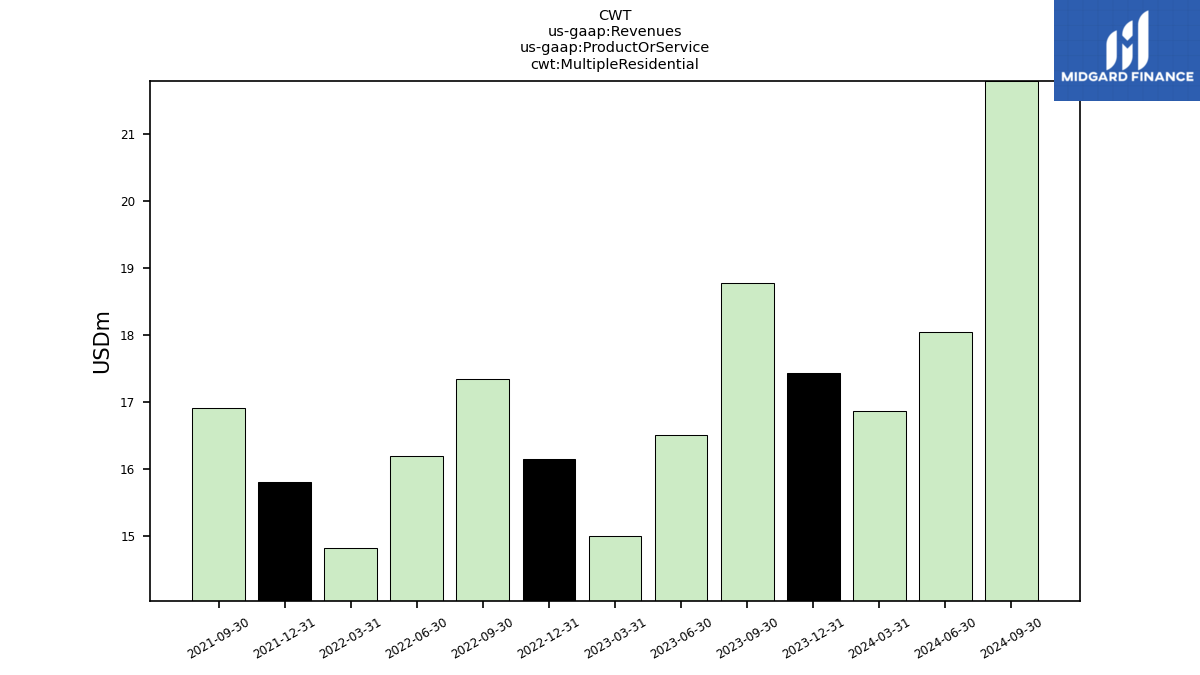
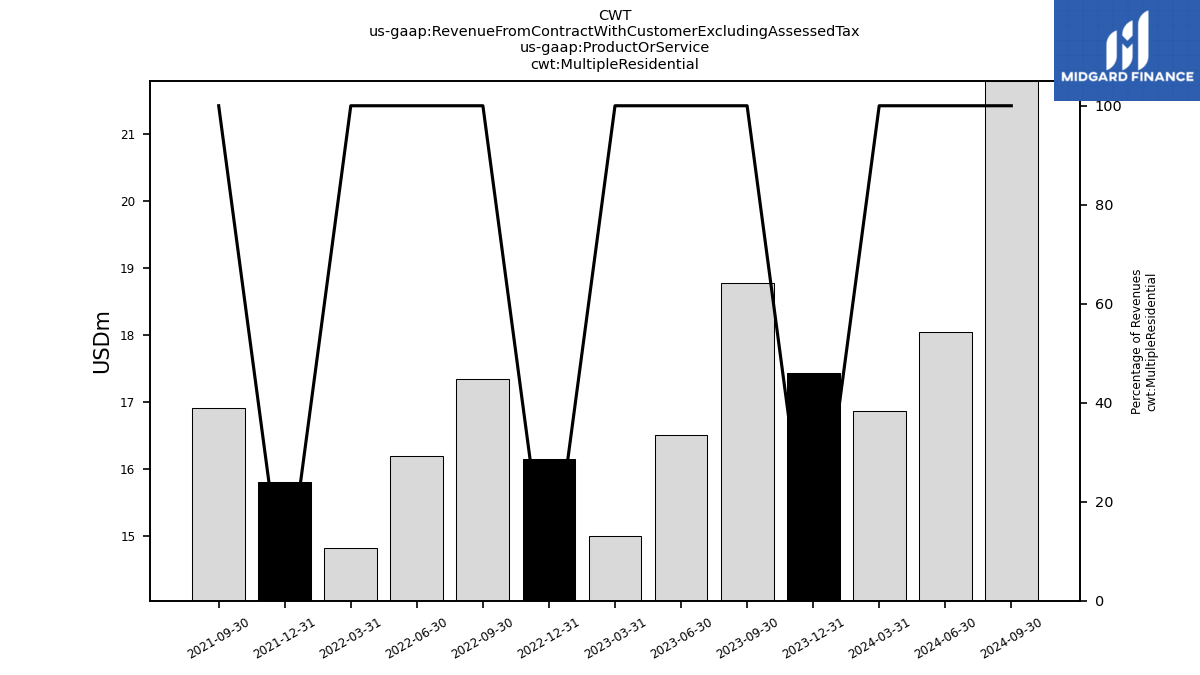
| Multiple Residential | 16.87 | 17.42 | 18.78 | 16.50 | 15.00 | 16.14 | 17.33 | 16.19 | 14.82 | 15.80 | 16.90 | NA | NA | NA | NA | NA | NA | NA | NA | NA | NA | NA | NA | NA | NA | NA | NA | NA | NA | |
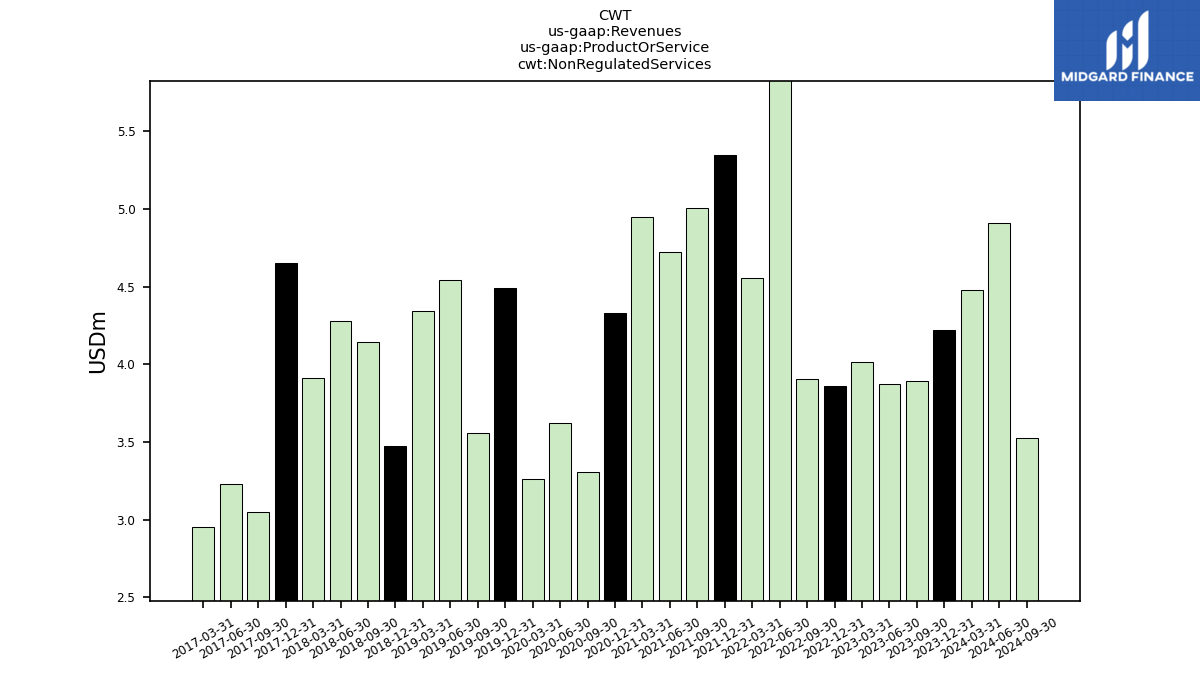
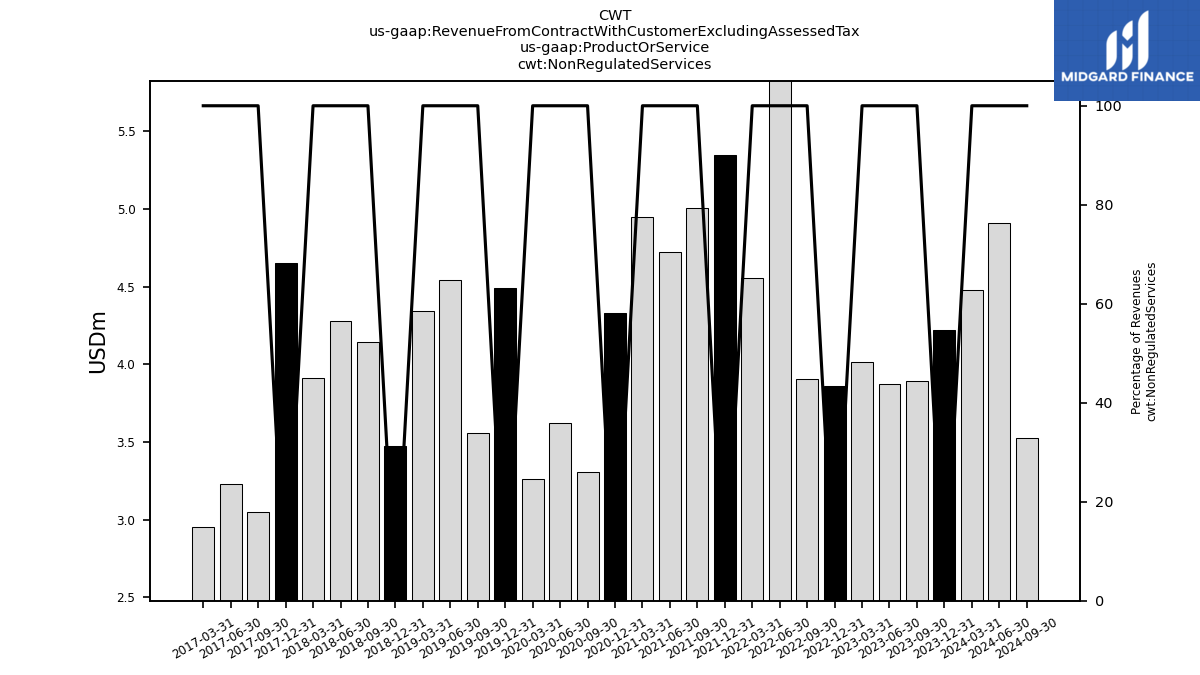
| Non Regulated Services | 4.48 | 4.22 | 3.89 | 3.88 | 4.02 | 3.86 | 3.90 | 6.31 | 4.55 | 5.34 | 5.00 | 4.72 | 4.95 | 4.33 | 3.31 | 3.62 | 3.26 | 4.49 | 3.56 | 4.54 | 4.34 | 3.47 | 4.14 | 4.28 | 3.91 | 4.65 | 3.05 | 3.23 | 2.96 | |
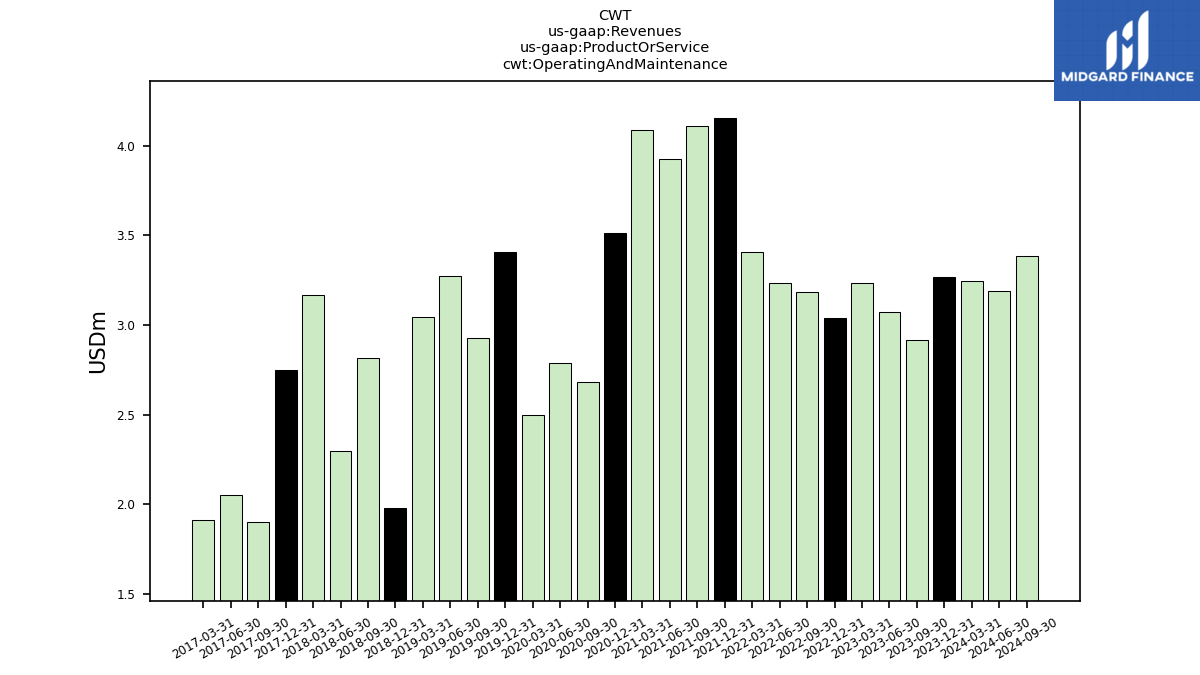
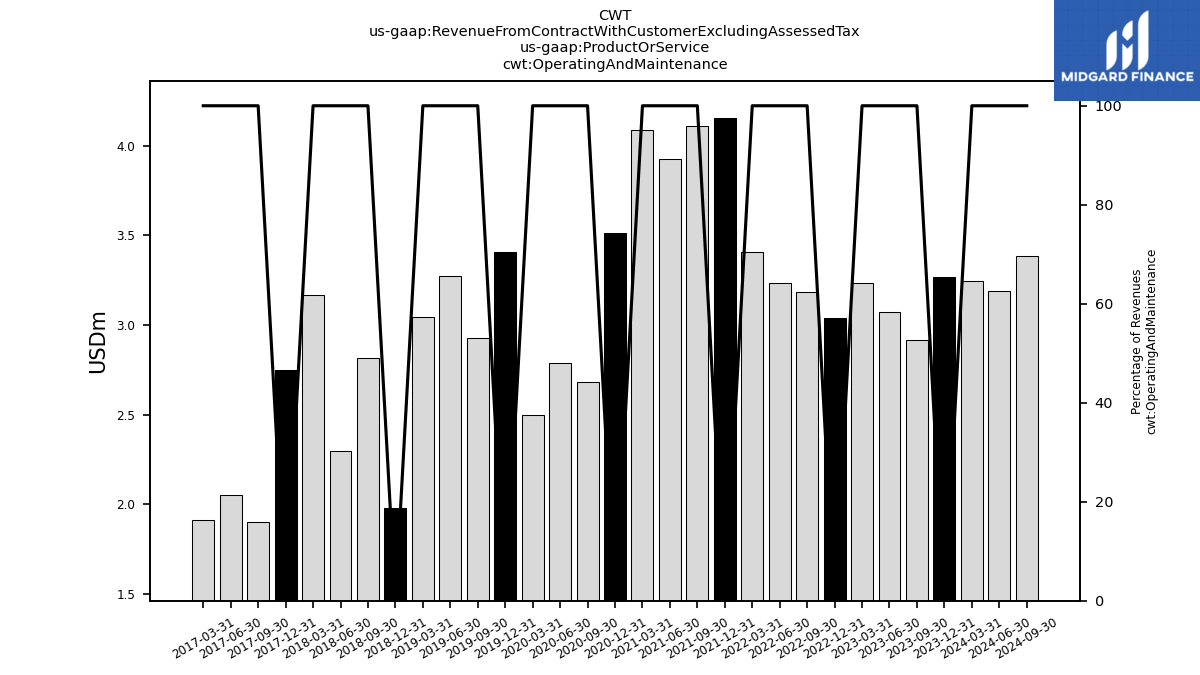
| Operating And Maintenance | 3.25 | 3.27 | 2.92 | 3.08 | 3.23 | 3.04 | 3.18 | 3.23 | 3.40 | 4.15 | 4.11 | 3.92 | 4.09 | 3.51 | 2.68 | 2.79 | 2.50 | 3.41 | 2.93 | 3.27 | 3.05 | 1.98 | 2.82 | 2.30 | 3.17 | 2.75 | 1.90 | 2.05 | 1.91 | |
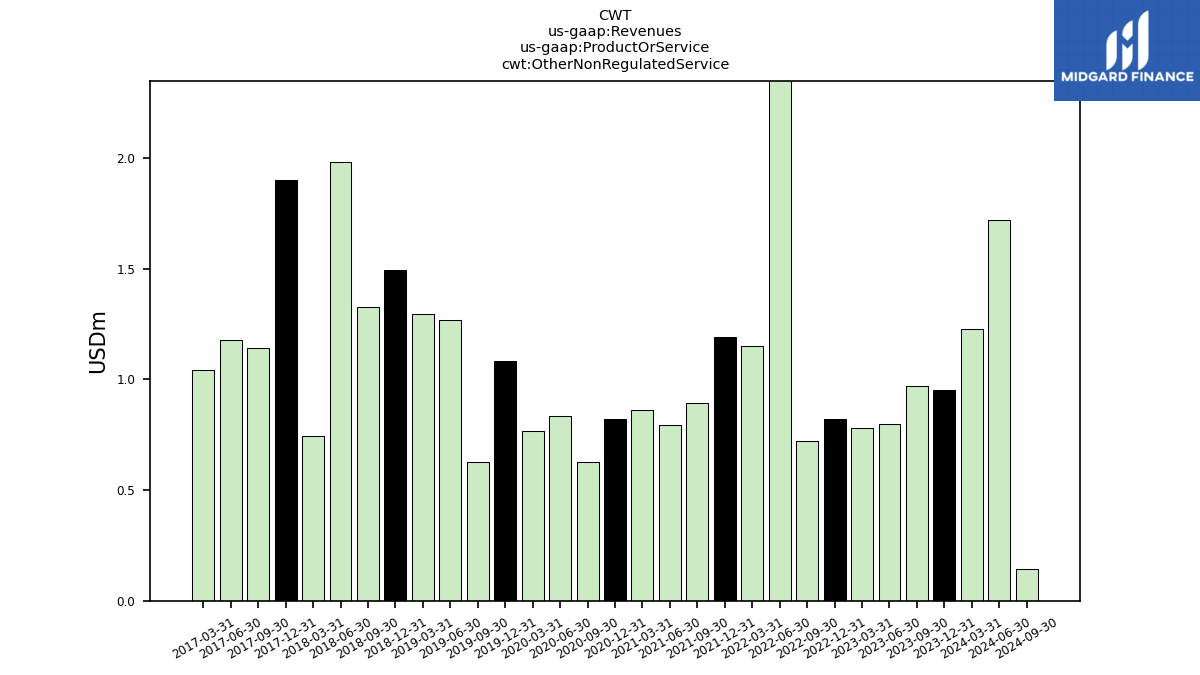
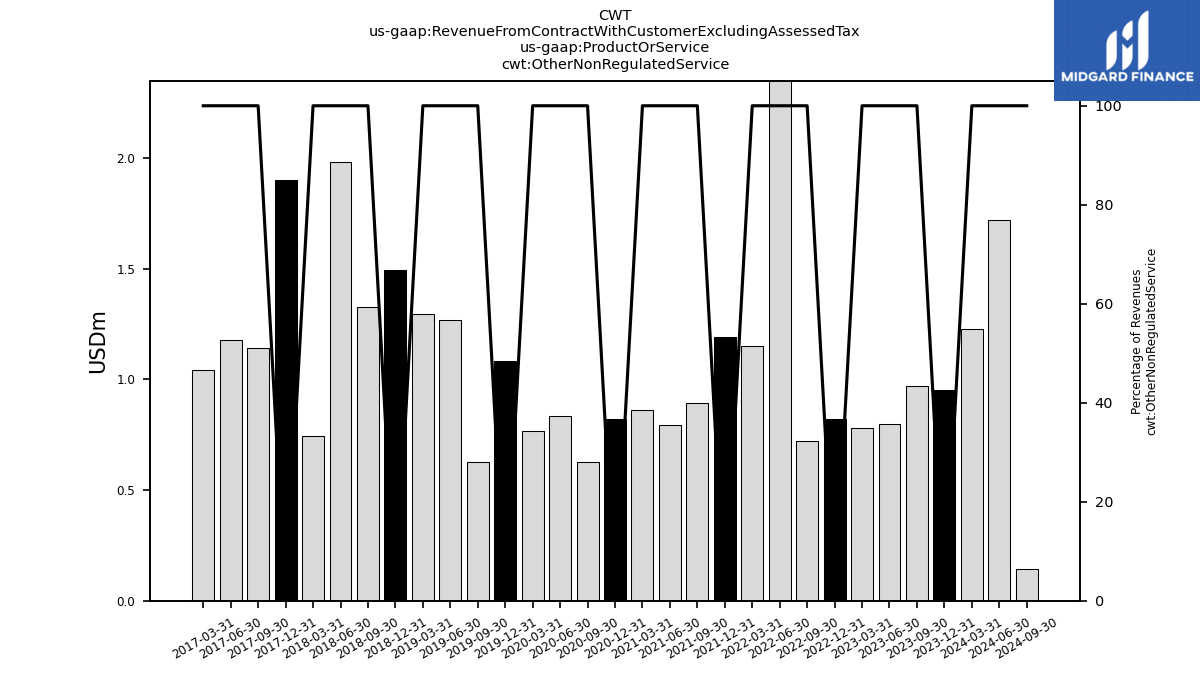
| Other Non Regulated Service | 1.23 | 0.95 | 0.97 | 0.80 | 0.78 | 0.82 | 0.72 | 3.08 | 1.15 | 1.19 | 0.89 | 0.80 | 0.86 | 0.82 | 0.62 | 0.83 | 0.77 | 1.08 | 0.63 | 1.27 | 1.30 | 1.49 | 1.33 | 1.98 | 0.74 | 1.90 | 1.14 | 1.18 | 1.04 | |
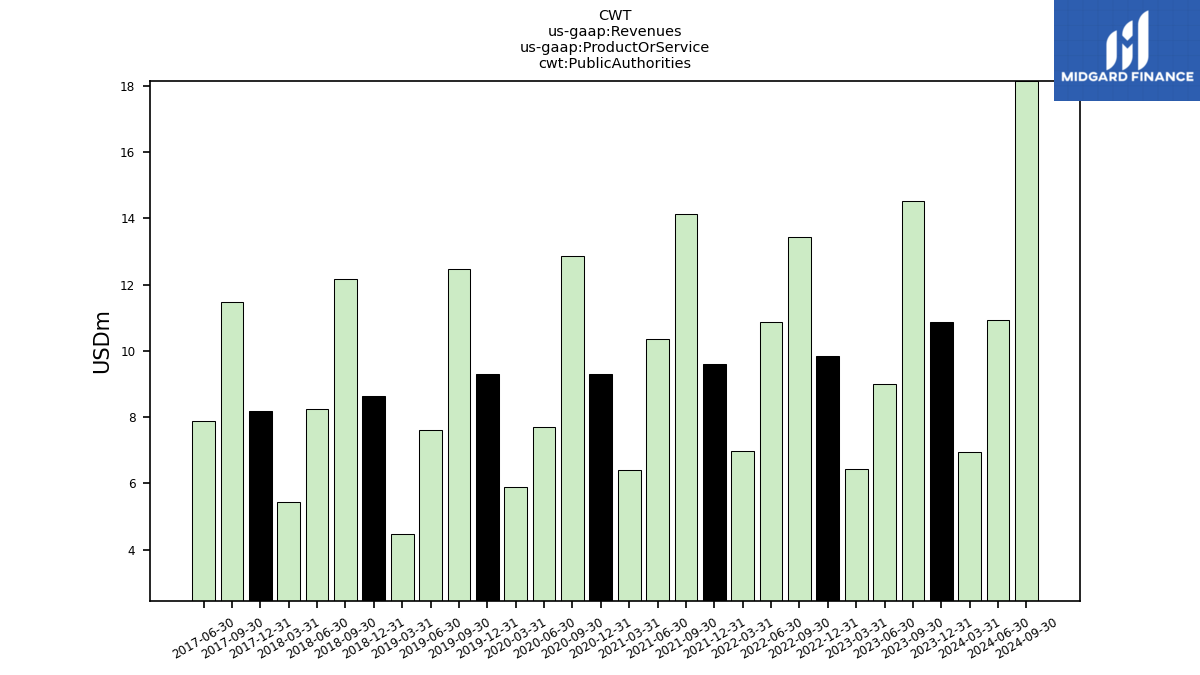
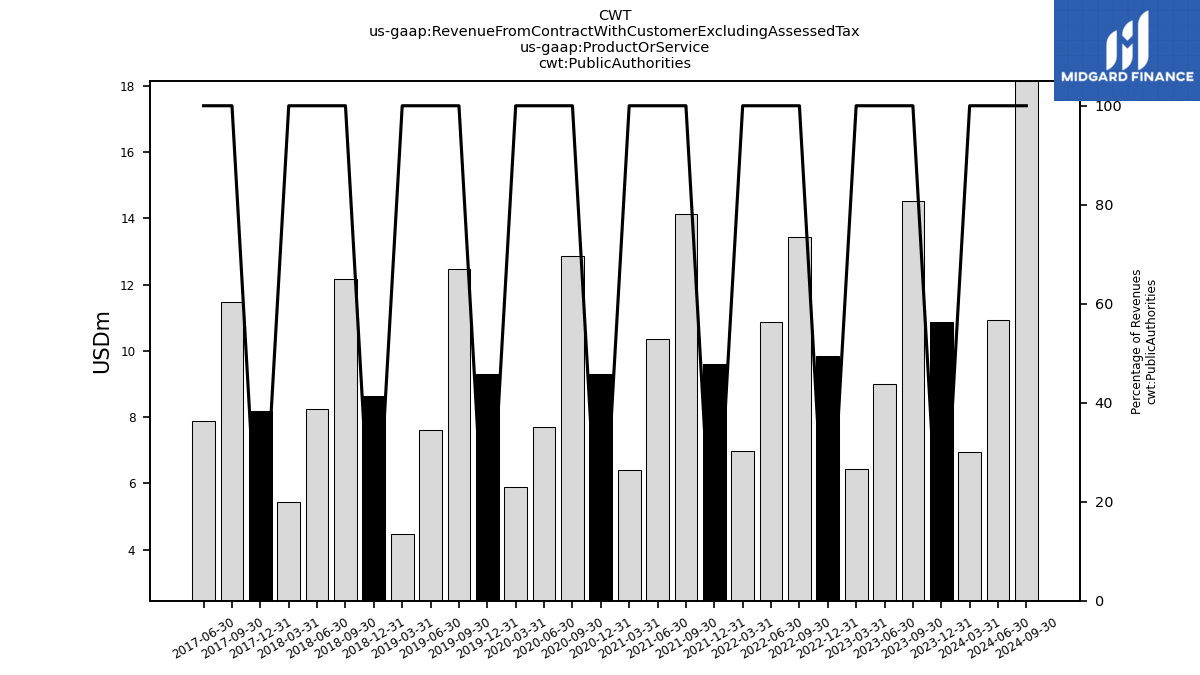
| Public Authorities | 6.96 | 10.87 | 14.52 | 8.99 | 6.42 | 9.84 | 13.44 | 10.88 | 6.99 | 9.62 | 14.13 | 10.36 | 6.40 | 9.31 | 12.86 | 7.71 | 5.90 | 9.30 | 12.48 | 7.61 | 4.47 | 8.64 | 12.18 | 8.25 | 5.44 | 8.17 | 11.48 | 7.87 | NA | |
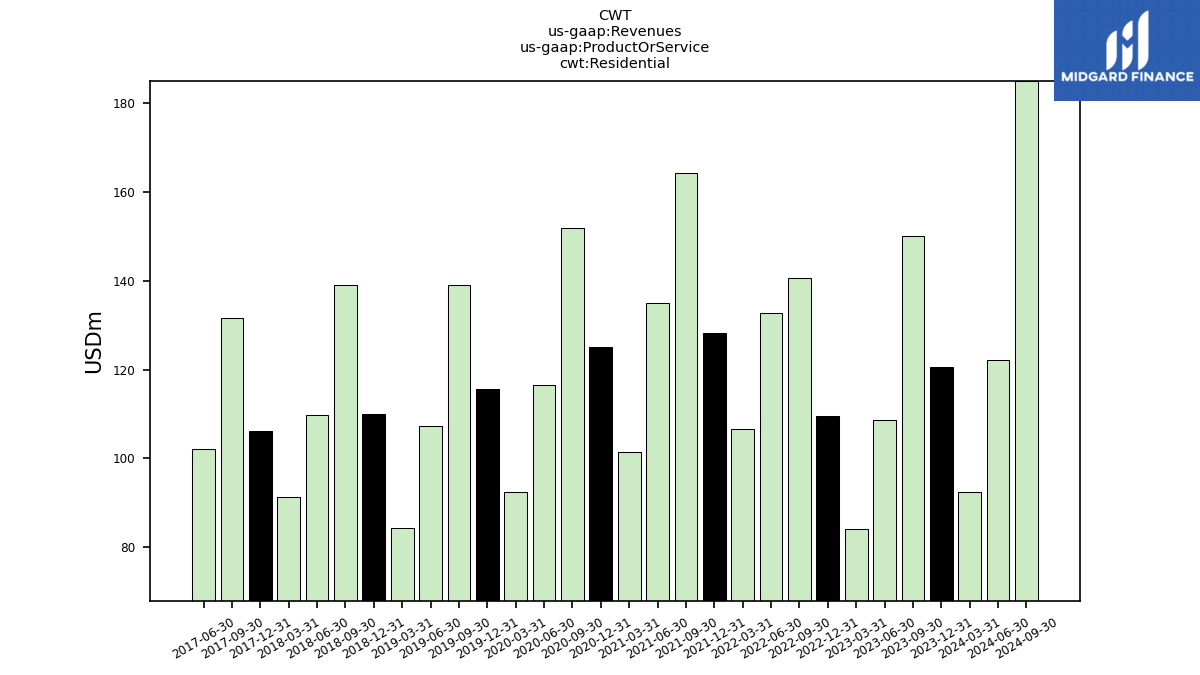
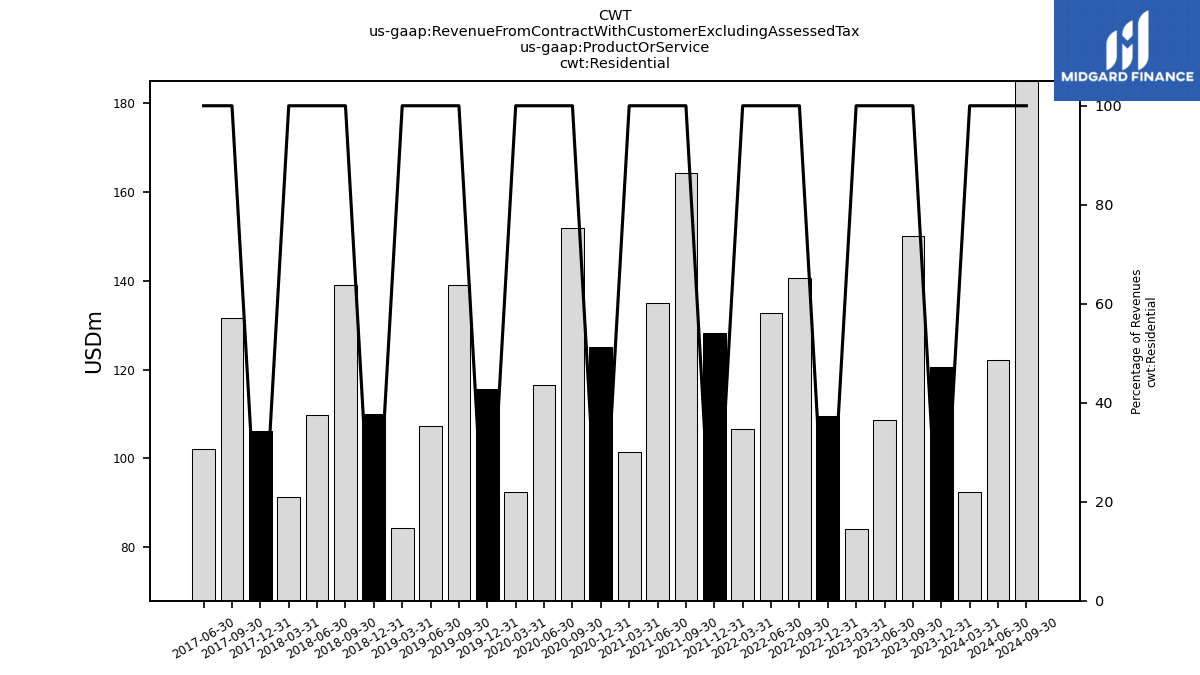
| Residential | 92.49 | 120.61 | 150.03 | 108.74 | 84.03 | 109.48 | 140.59 | 132.83 | 106.56 | 128.19 | 164.31 | 134.97 | 101.37 | 125.13 | 151.94 | 116.45 | 92.54 | 115.58 | 139.14 | 107.35 | 84.26 | 109.95 | 138.94 | 109.85 | 91.32 | 106.25 | 131.61 | 102.17 | NA | |
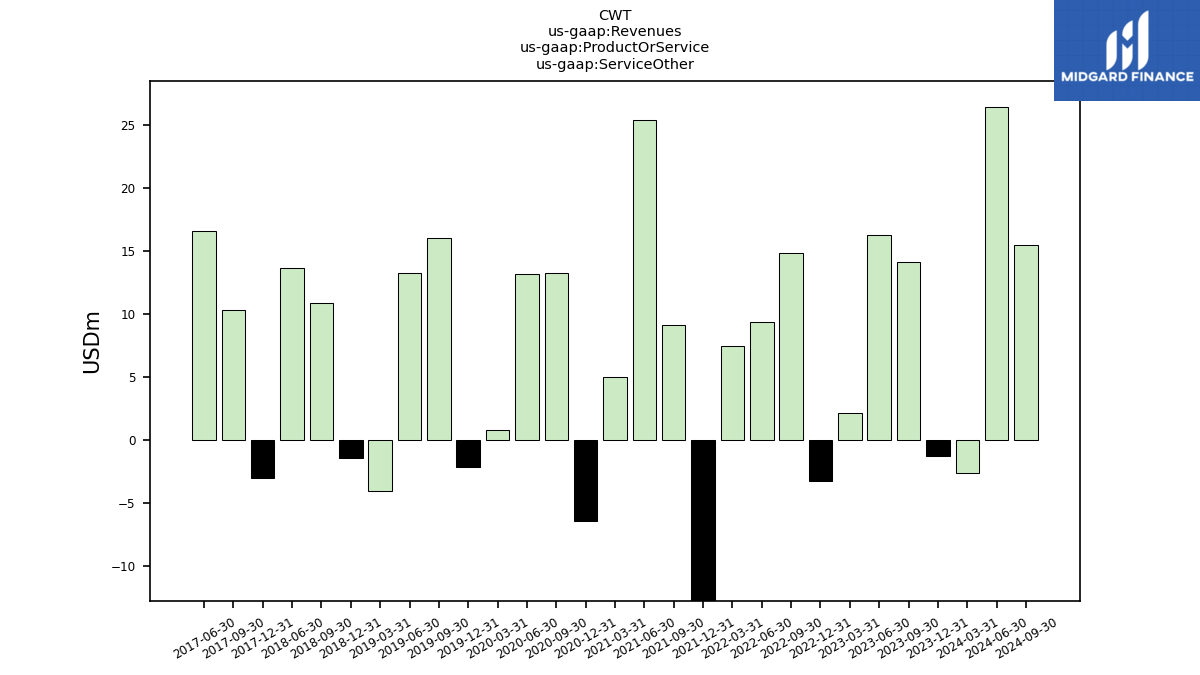
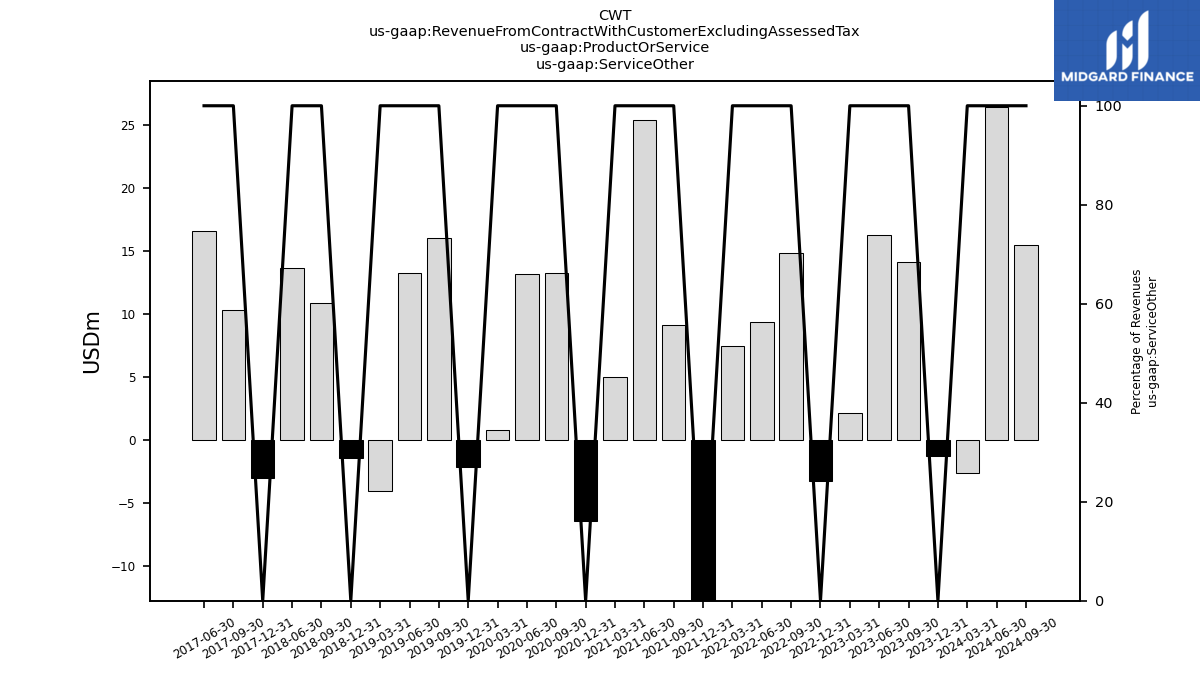
| Service Other | -2.61 | -1.25 | 14.13 | 16.25 | 2.16 | -3.25 | 14.79 | 9.35 | 7.45 | -14.26 | 9.12 | 25.38 | 4.99 | -6.40 | 13.23 | 13.18 | 0.82 | -2.14 | 16.02 | 13.28 | -4.07 | -1.47 | 10.90 | 13.61 | NA | -3.01 | 10.32 | 16.60 | NA | |
| Revenue From Contract With Customer Excluding Assessed Tax | 154.90 | 197.57 | 253.34 | 194.21 | 145.22 | 176.76 | 238.27 | 198.66 | 158.93 | 168.37 | 238.35 | 212.46 | 146.53 | 167.77 | 222.47 | 172.50 | 134.83 | 164.52 | 214.96 | 167.47 | 117.41 | 159.17 | 209.54 | 171.77 | 134.25 | 150.06 | 197.01 | 162.59 | 112.81 | |
| Business | 34.55 | 41.52 | 47.71 | 37.85 | 31.97 | 38.10 | 44.03 | 39.28 | 32.16 | 37.66 | 43.45 | 35.73 | 27.72 | 32.64 | 36.95 | 28.53 | 27.69 | 33.79 | 38.25 | 31.71 | 25.48 | 32.32 | 38.54 | 32.12 | 27.06 | 31.03 | 35.68 | 29.54 | NA | |
| Industrial | 6.64 | 8.38 | 8.16 | 5.87 | 5.63 | 6.45 | 8.09 | 6.31 | 5.77 | 7.16 | 7.35 | 6.02 | 6.04 | 7.09 | 7.50 | 6.62 | 7.88 | 7.99 | 9.08 | 7.52 | 7.26 | 9.73 | 8.99 | 7.94 | 7.58 | 7.62 | 7.92 | 6.41 | NA | |
| Multiple Residential | 16.87 | 17.42 | 18.78 | 16.50 | 15.00 | 16.14 | 17.33 | 16.19 | 14.82 | 15.80 | 16.90 | NA | NA | NA | NA | NA | NA | NA | NA | NA | NA | NA | NA | NA | NA | NA | NA | NA | NA | |
| Non Regulated Services | 4.48 | 4.22 | 3.89 | 3.88 | 4.02 | 3.86 | 3.90 | 6.31 | 4.55 | 5.34 | 5.00 | 4.72 | 4.95 | 4.33 | 3.31 | 3.62 | 3.26 | 4.49 | 3.56 | 4.54 | 4.34 | 3.47 | 4.14 | 4.28 | 3.91 | 4.65 | 3.05 | 3.23 | 2.96 | |
| Operating And Maintenance | 3.25 | 3.27 | 2.92 | 3.08 | 3.23 | 3.04 | 3.18 | 3.23 | 3.40 | 4.15 | 4.11 | 3.92 | 4.09 | 3.51 | 2.68 | 2.79 | 2.50 | 3.41 | 2.93 | 3.27 | 3.05 | 1.98 | 2.82 | 2.30 | 3.17 | 2.75 | 1.90 | 2.05 | 1.91 | |
| Other Non Regulated Service | 1.23 | 0.95 | 0.97 | 0.80 | 0.78 | 0.82 | 0.72 | 3.08 | 1.15 | 1.19 | 0.89 | 0.80 | 0.86 | 0.82 | 0.62 | 0.83 | 0.77 | 1.08 | 0.63 | 1.27 | 1.30 | 1.49 | 1.33 | 1.98 | 0.74 | 1.90 | 1.14 | 1.18 | 1.04 | |
| Public Authorities | 6.96 | 10.87 | 14.52 | 8.99 | 6.42 | 9.84 | 13.44 | 10.88 | 6.99 | 9.62 | 14.13 | 10.36 | 6.40 | 9.31 | 12.86 | 7.71 | 5.90 | 9.30 | 12.48 | 7.61 | 4.47 | 8.64 | 12.18 | 8.25 | 5.44 | 8.17 | 11.48 | 7.87 | NA | |
| Residential | 92.49 | 120.61 | 150.03 | 108.74 | 84.03 | 109.48 | 140.59 | 132.83 | 106.56 | 128.19 | 164.31 | 134.97 | 101.37 | 125.13 | 151.94 | 116.45 | 92.54 | 115.58 | 139.14 | 107.35 | 84.26 | 109.95 | 138.94 | 109.85 | 91.32 | 106.25 | 131.61 | 102.17 | NA | |
| Service Other | -2.61 | -1.25 | 14.13 | 16.25 | 2.16 | -3.25 | 14.79 | 9.35 | 7.45 | -14.26 | 9.12 | 25.38 | 4.99 | -6.40 | 13.23 | 13.18 | 0.82 | -2.14 | 16.02 | 13.28 | -4.07 | -1.47 | 10.90 | 13.61 | NA | -3.01 | 10.32 | 16.60 | NA |