
| 2023-12-31 | 2023-09-30 | 2023-06-30 | 2023-03-31 | 2022-12-31 | 2022-09-30 | 2022-06-30 | 2022-03-31 | 2021-12-31 | 2021-09-30 | 2021-06-30 | 2021-03-31 | 2020-12-31 | 2020-09-30 | 2020-06-30 | 2020-03-31 | 2019-12-31 | 2019-09-30 | 2019-06-30 | 2019-03-31 | 2018-12-31 | 2018-09-30 | 2018-06-30 | 2018-03-31 | 2017-12-31 | 2017-09-30 | 2017-06-30 | ||
|---|---|---|---|---|---|---|---|---|---|---|---|---|---|---|---|---|---|---|---|---|---|---|---|---|---|---|---|---|
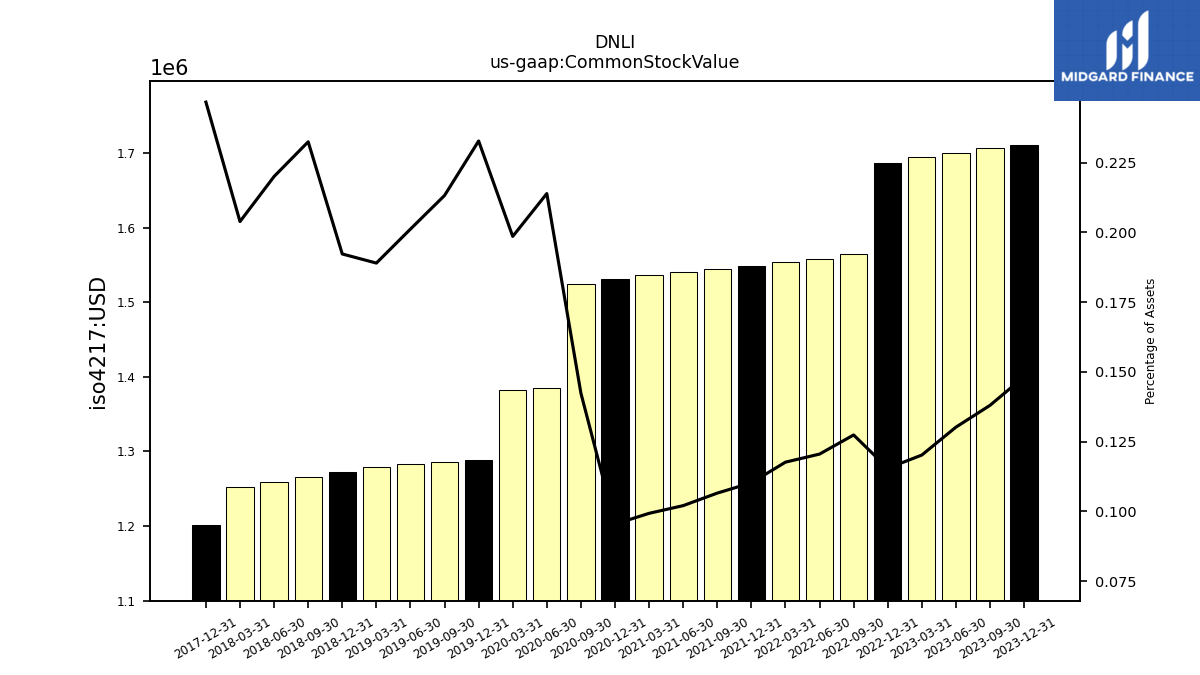
| Common Stock Value | 1.71 | 1.71 | 1.70 | 1.69 | 1.69 | 1.56 | 1.56 | 1.55 | 1.55 | 1.54 | 1.54 | 1.54 | 1.53 | 1.52 | 1.39 | 1.38 | 1.29 | 1.29 | 1.28 | 1.28 | 1.27 | 1.27 | 1.26 | 1.25 | 1.20 | NA | NA | |
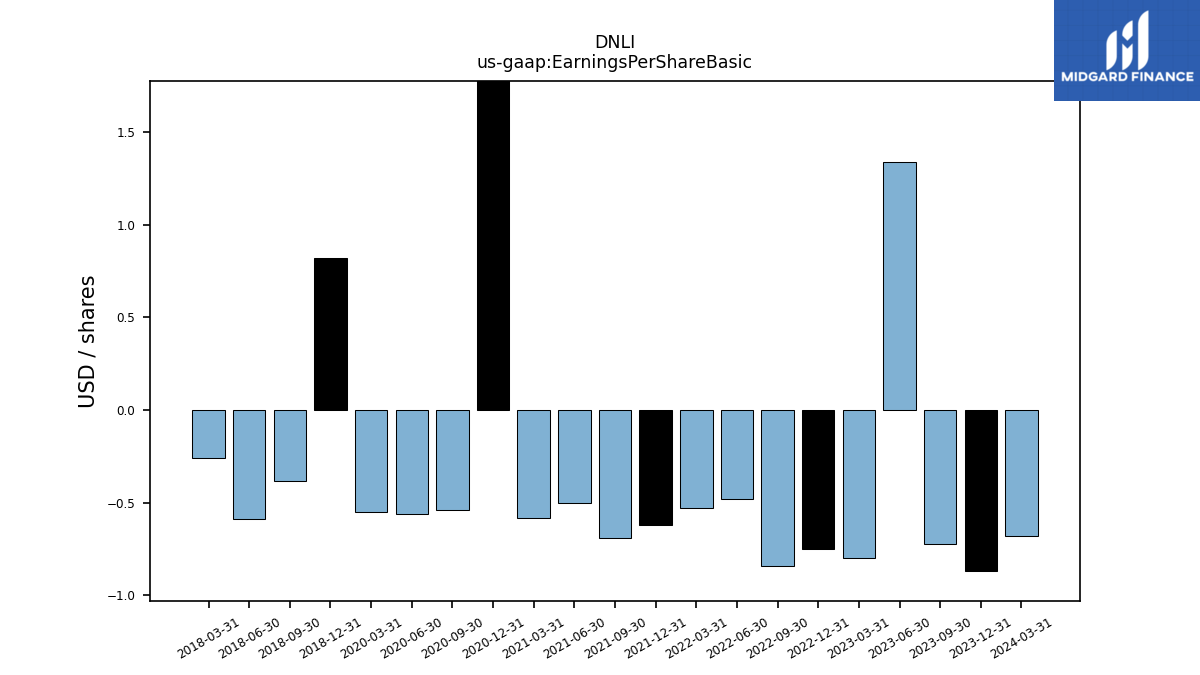
| Earnings Per Share Basic | -0.87 | -0.72 | 1.34 | -0.80 | -0.75 | -0.84 | -0.48 | -0.53 | -0.62 | -0.69 | -0.50 | -0.58 | 2.30 | -0.54 | -0.56 | -0.55 | NA | NA | NA | NA | 0.82 | -0.38 | -0.59 | -0.26 | NA | NA | NA | |
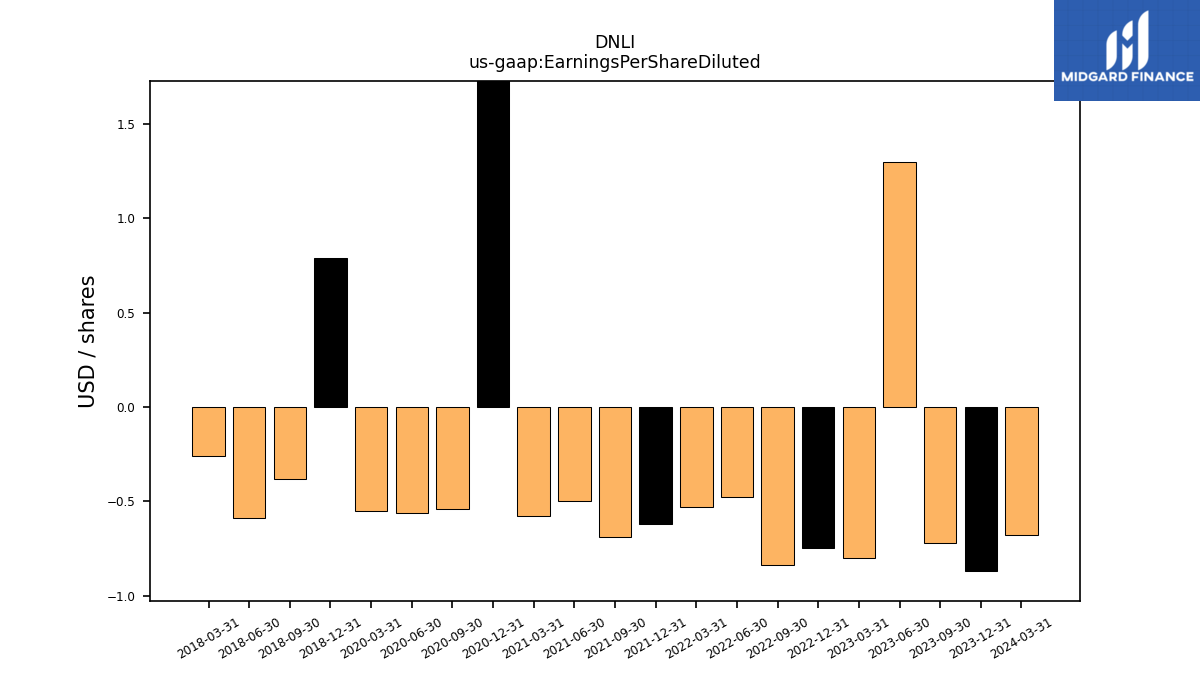
| Earnings Per Share Diluted | -0.87 | -0.72 | 1.30 | -0.80 | -0.75 | -0.84 | -0.48 | -0.53 | -0.62 | -0.69 | -0.50 | -0.58 | 2.28 | -0.54 | -0.56 | -0.55 | NA | NA | NA | NA | 0.79 | -0.38 | -0.59 | -0.26 | NA | NA | NA |
| 2023-12-31 | 2023-09-30 | 2023-06-30 | 2023-03-31 | 2022-12-31 | 2022-09-30 | 2022-06-30 | 2022-03-31 | 2021-12-31 | 2021-09-30 | 2021-06-30 | 2021-03-31 | 2020-12-31 | 2020-09-30 | 2020-06-30 | 2020-03-31 | 2019-12-31 | 2019-09-30 | 2019-06-30 | 2019-03-31 | 2018-12-31 | 2018-09-30 | 2018-06-30 | 2018-03-31 | 2017-12-31 | 2017-09-30 | 2017-06-30 | ||
|---|---|---|---|---|---|---|---|---|---|---|---|---|---|---|---|---|---|---|---|---|---|---|---|---|---|---|---|---|
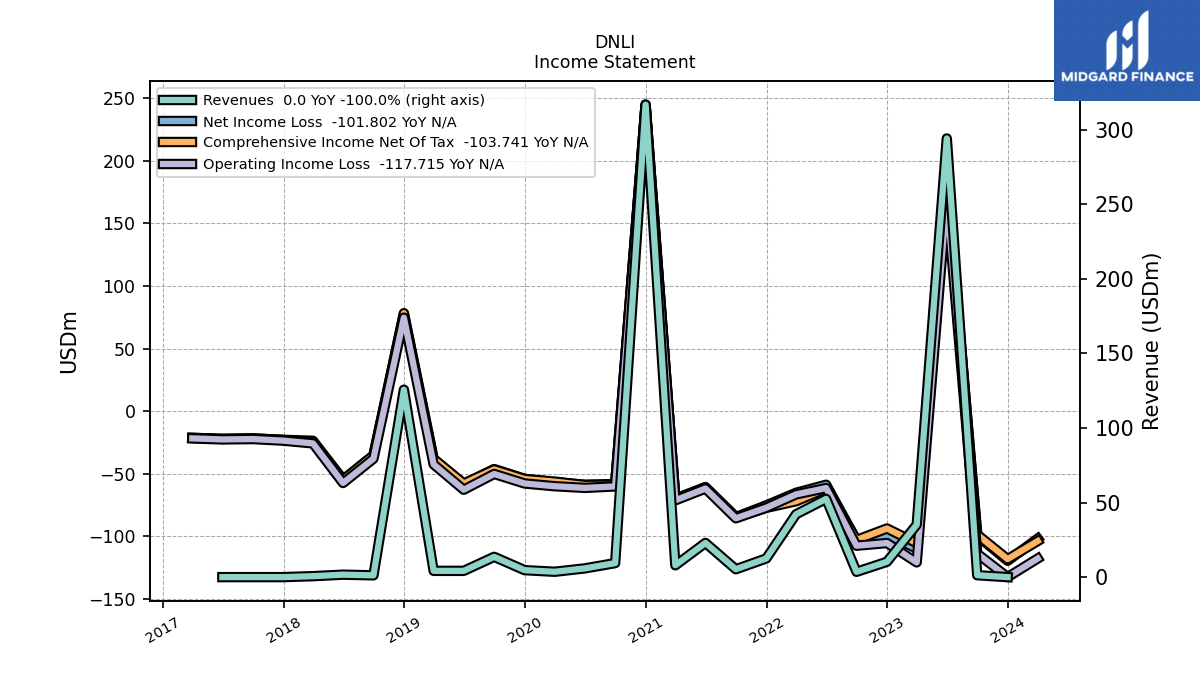
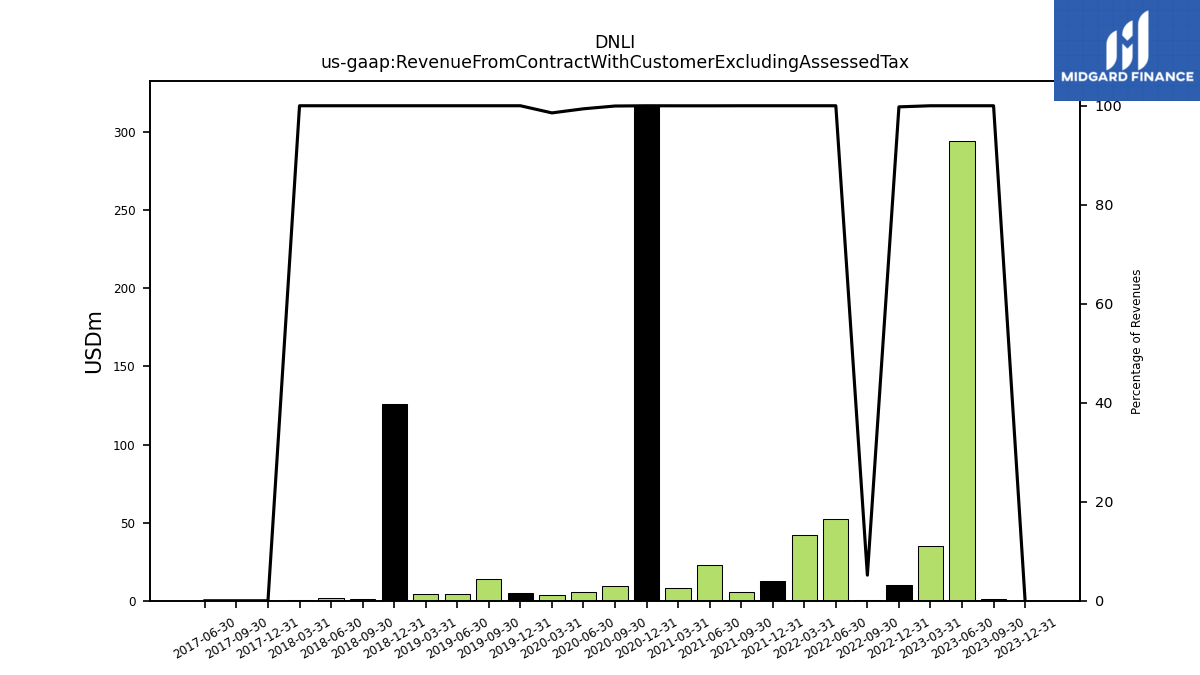
| Revenue From Contract With Customer Excluding Assessed Tax | 0.00 | 1.27 | 294.12 | 35.14 | 10.26 | 0.18 | 52.48 | 42.14 | 12.51 | 5.29 | 22.94 | 7.92 | 316.81 | 9.39 | 5.81 | 3.55 | 4.67 | 13.60 | 4.20 | 4.21 | 125.68 | 1.20 | 1.65 | 0.64 | 0.00 | 0.00 | 0.00 | |
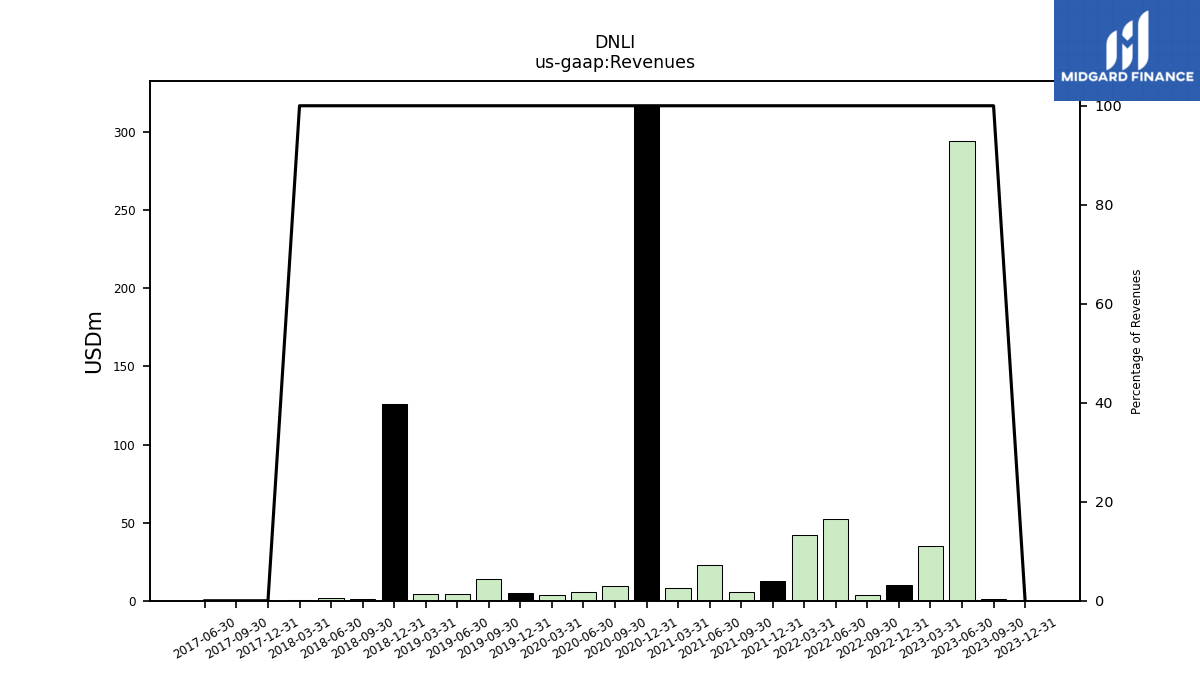
| Revenues | 0.00 | 1.27 | 294.12 | 35.14 | 10.28 | 3.56 | 52.48 | 42.14 | 12.51 | 5.29 | 22.94 | 7.92 | 316.81 | 9.39 | 5.85 | 3.60 | 4.67 | 13.60 | 4.20 | 4.21 | 125.68 | 1.20 | 1.65 | 0.64 | 0.00 | 0.00 | 0.00 | |
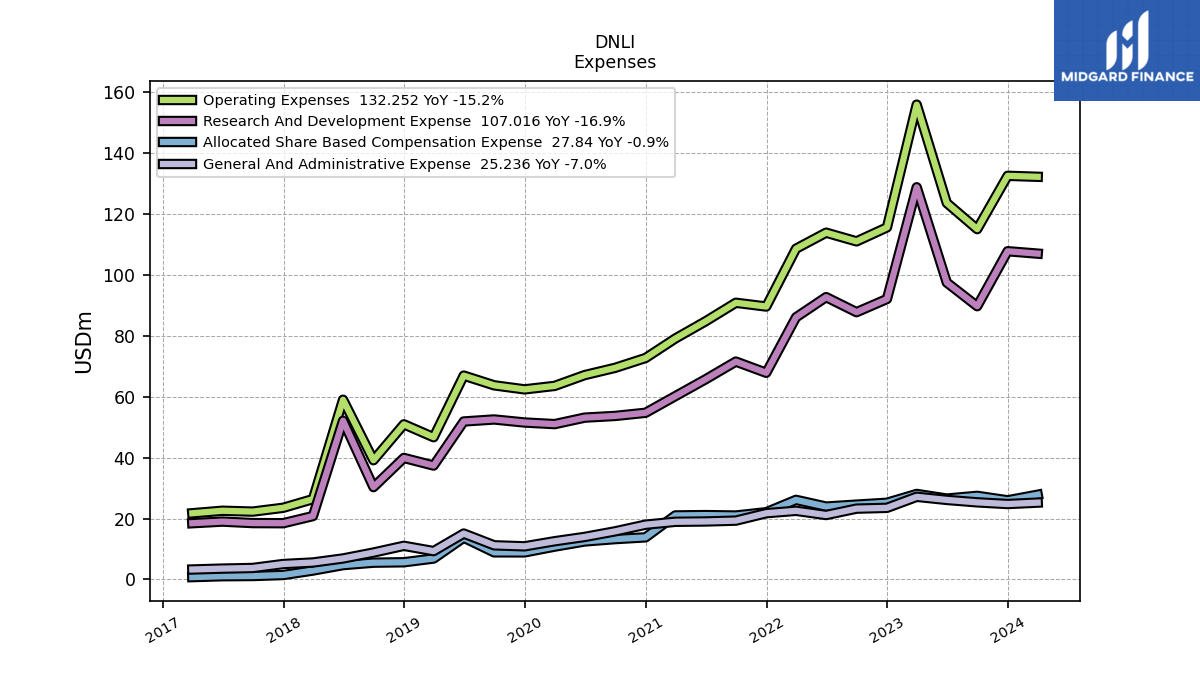
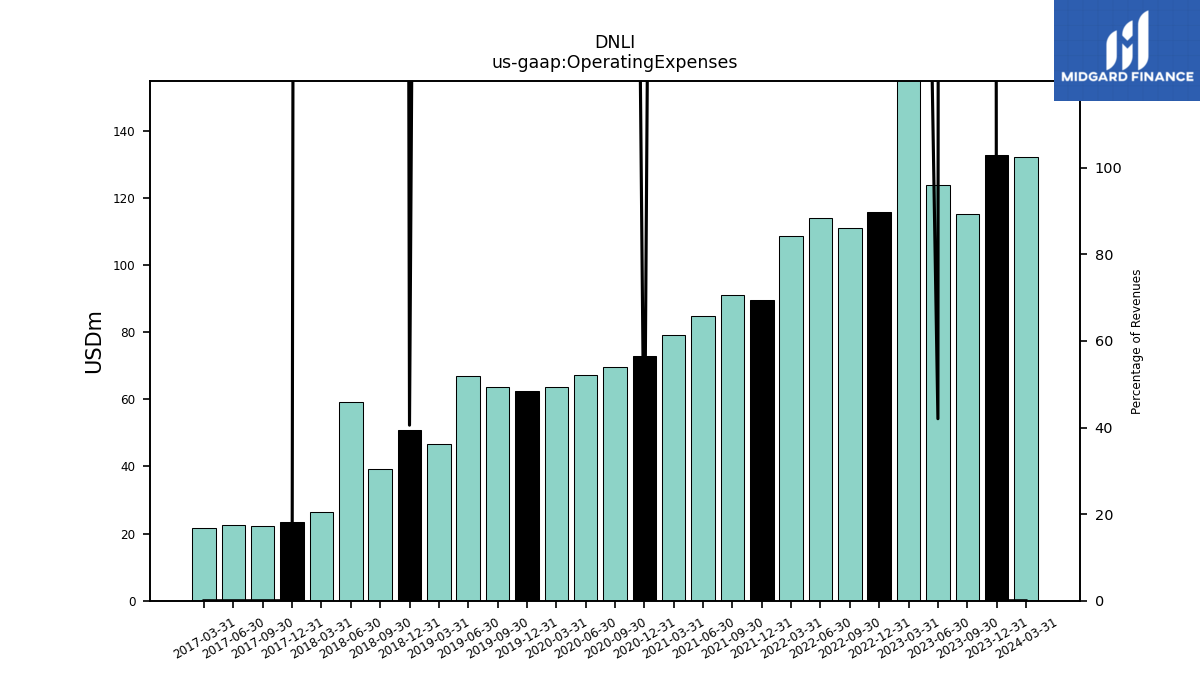
| Operating Expenses | 132.57 | 115.06 | 123.64 | 155.96 | 115.63 | 111.05 | 113.90 | 108.64 | 89.64 | 90.88 | 84.76 | 79.14 | 72.74 | 69.51 | 67.12 | 63.57 | 62.43 | 63.76 | 66.96 | 46.71 | 50.95 | 39.16 | 59.03 | 26.39 | 23.54 | 22.29 | 22.57 | |
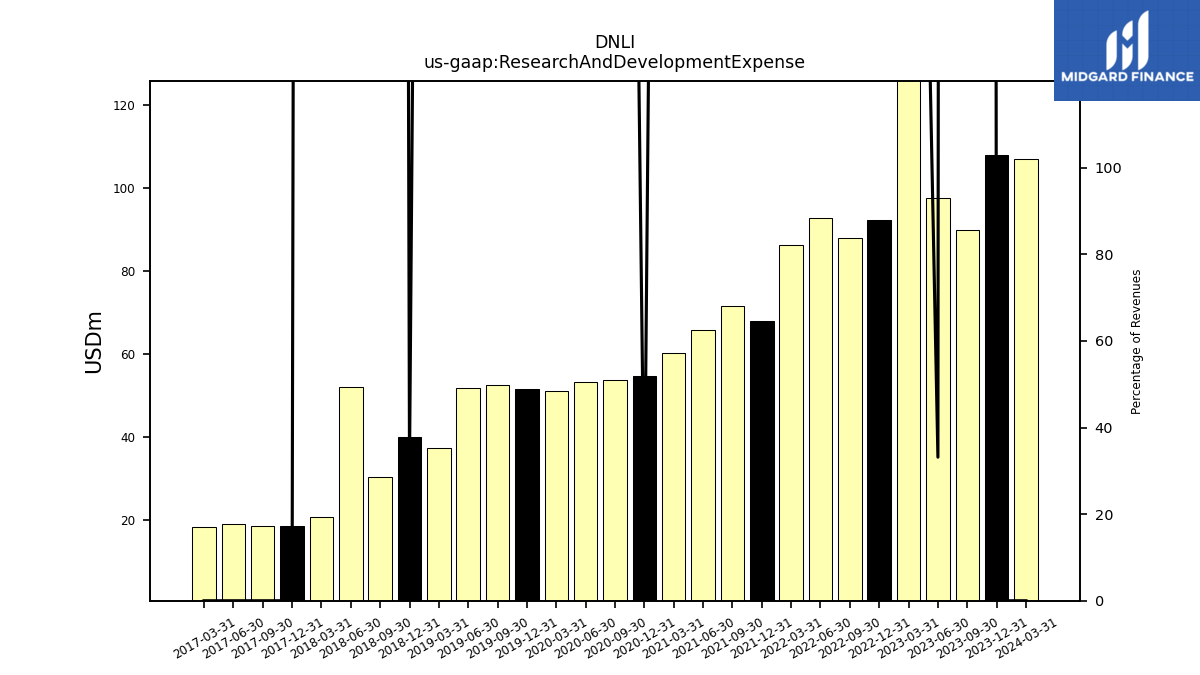
| Research And Development Expense | 107.80 | 89.74 | 97.52 | 128.82 | 92.11 | 87.79 | 92.74 | 86.10 | 67.88 | 71.56 | 65.71 | 60.21 | 54.74 | 53.70 | 53.15 | 51.02 | 51.55 | 52.54 | 51.88 | 37.40 | 39.91 | 30.32 | 52.13 | 20.82 | 18.47 | 18.52 | 19.00 | |
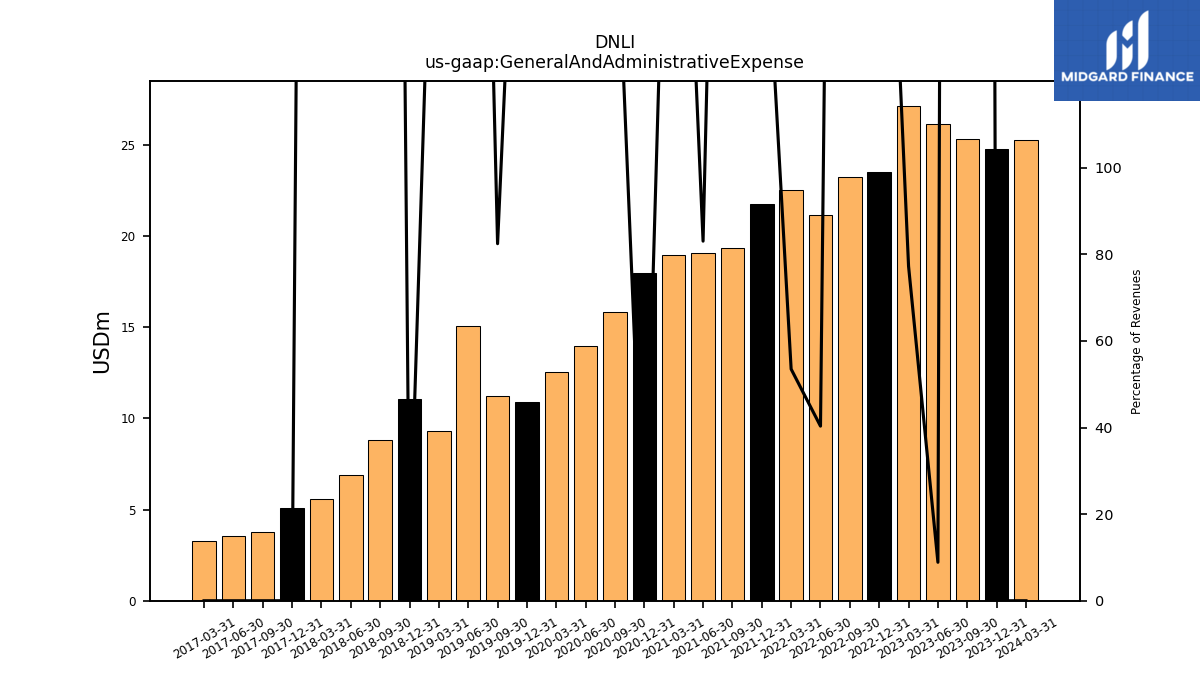
| General And Administrative Expense | 24.77 | 25.32 | 26.12 | 27.14 | 23.52 | 23.26 | 21.16 | 22.54 | 21.76 | 19.32 | 19.05 | 18.94 | 17.99 | 15.80 | 13.97 | 12.55 | 10.88 | 11.21 | 15.08 | 9.31 | 11.04 | 8.84 | 6.90 | 5.57 | 5.07 | 3.77 | 3.56 | |
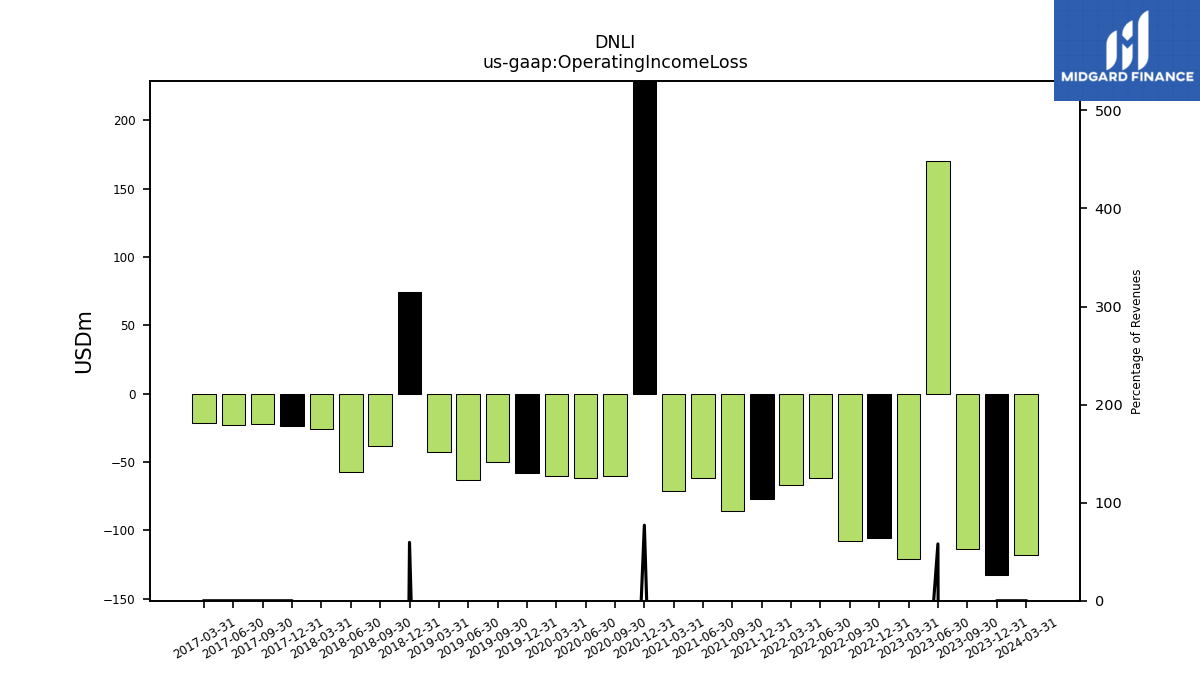
| Operating Income Loss | -132.57 | -113.80 | 170.48 | -120.81 | -105.34 | -107.49 | -61.42 | -66.50 | -77.12 | -85.59 | -61.82 | -71.22 | 244.08 | -60.12 | -61.28 | -59.97 | -57.76 | -50.16 | -62.76 | -42.51 | 74.72 | -37.96 | -57.38 | -25.75 | -23.54 | -22.29 | -22.57 | |
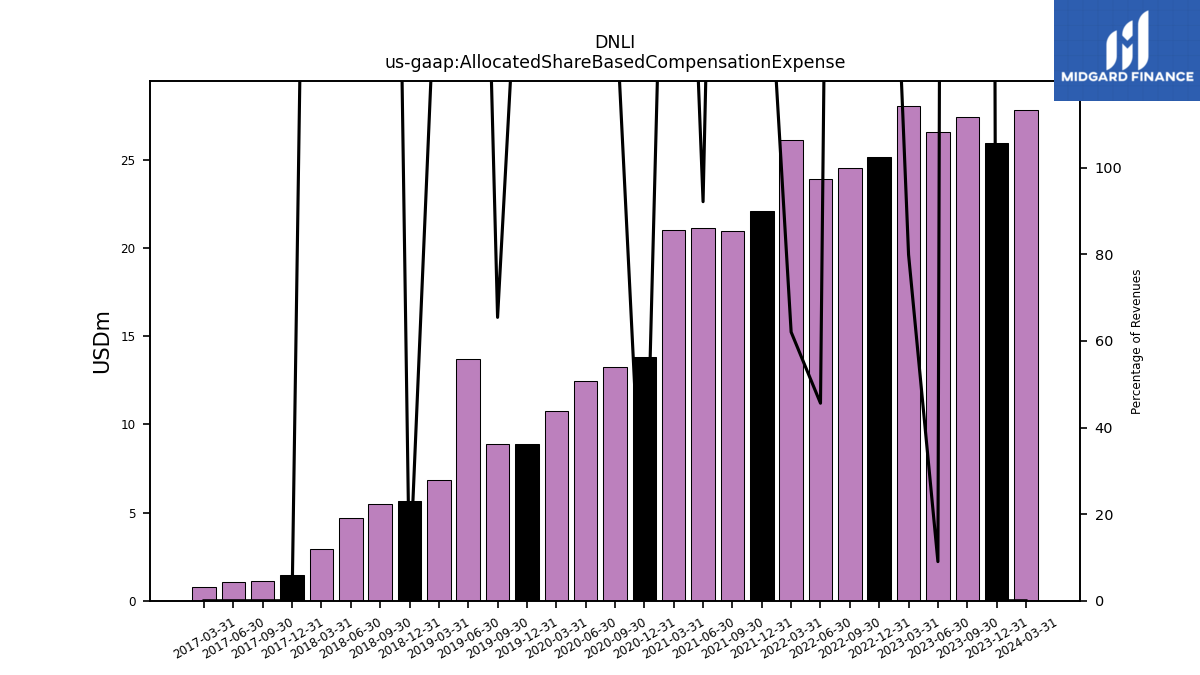
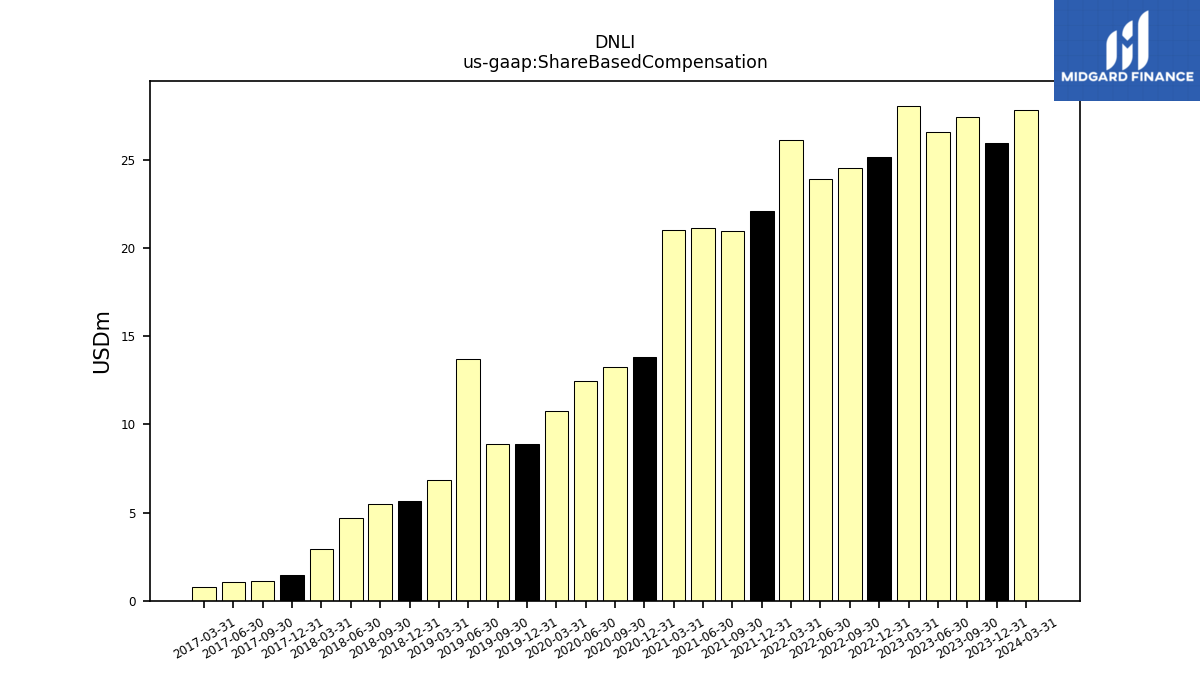
| Allocated Share Based Compensation Expense | 25.99 | 27.46 | 26.57 | 28.08 | 25.19 | 24.58 | 23.94 | 26.14 | 22.09 | 21.00 | 21.14 | 21.03 | 13.83 | 13.25 | 12.48 | 10.79 | 8.89 | 8.90 | 13.71 | 6.87 | 5.65 | 5.51 | 4.71 | 2.92 | 1.46 | 1.13 | 1.06 | |
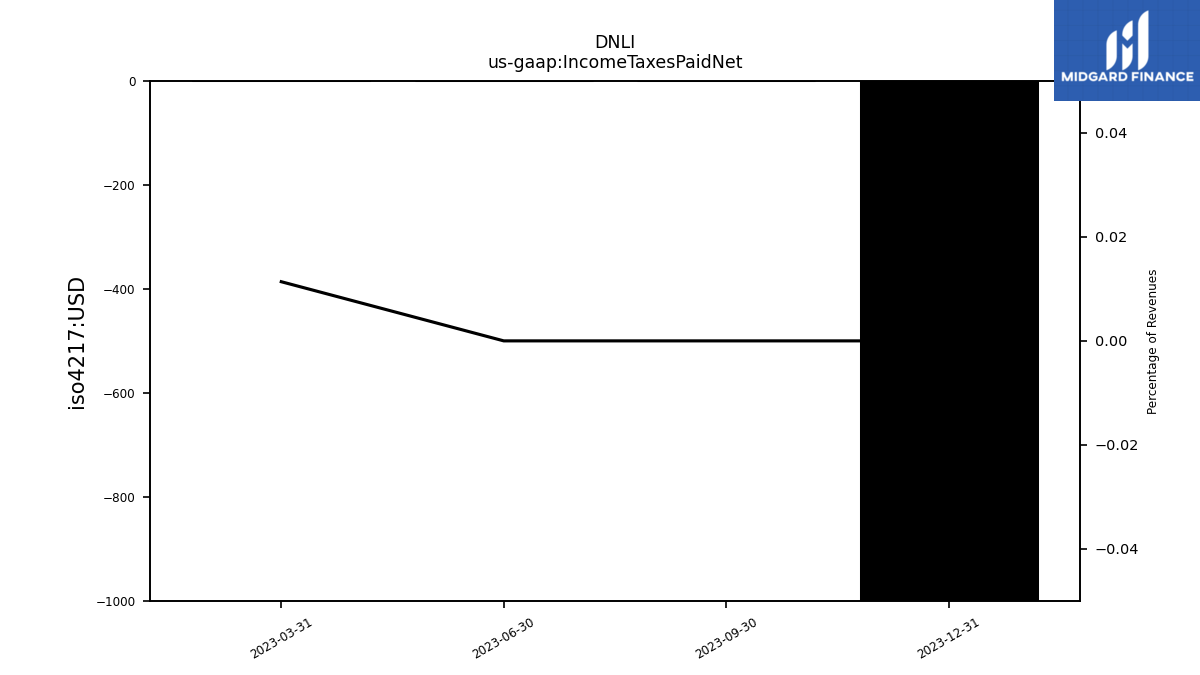
| Income Taxes Paid Net | -0.00 | 0.00 | 0.00 | 0.00 | NA | NA | NA | NA | NA | NA | NA | NA | NA | NA | NA | NA | NA | NA | NA | NA | NA | NA | NA | NA | NA | NA | NA | |
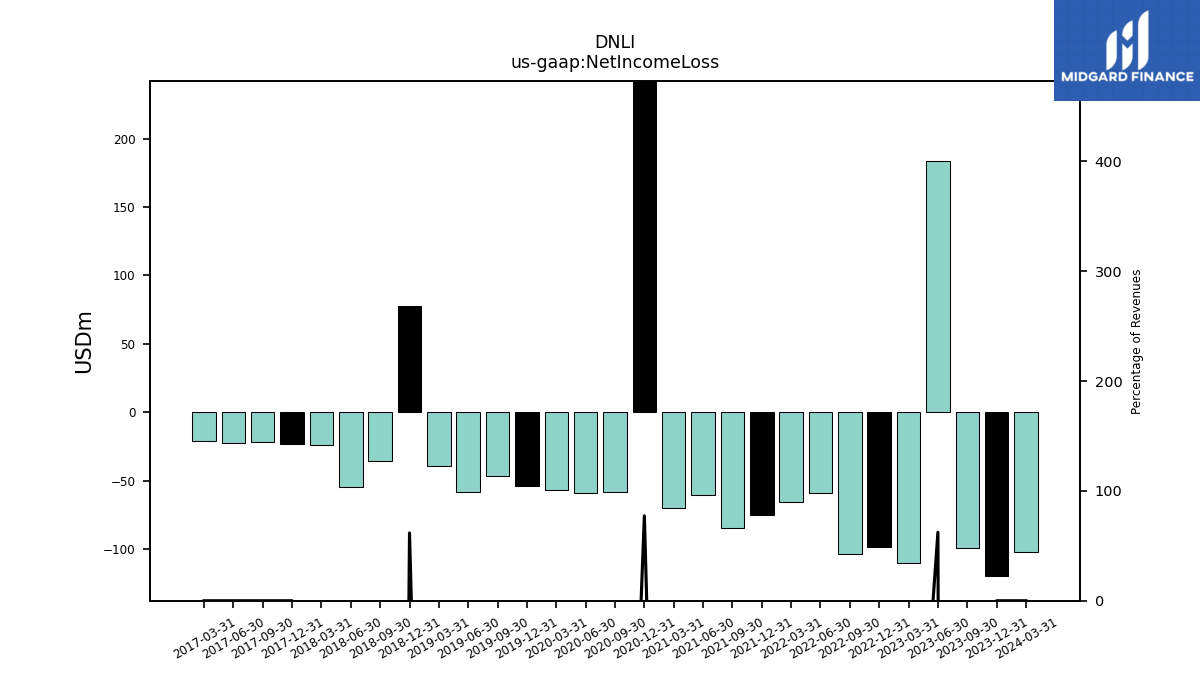
| Net Income Loss | -119.47 | -99.35 | 183.38 | -109.78 | -98.68 | -103.30 | -58.79 | -65.22 | -75.26 | -84.59 | -60.69 | -70.04 | 244.88 | -58.23 | -58.76 | -56.76 | -54.02 | -46.26 | -58.34 | -38.99 | 77.53 | -35.37 | -54.72 | -23.68 | -22.89 | -21.84 | -22.13 | |
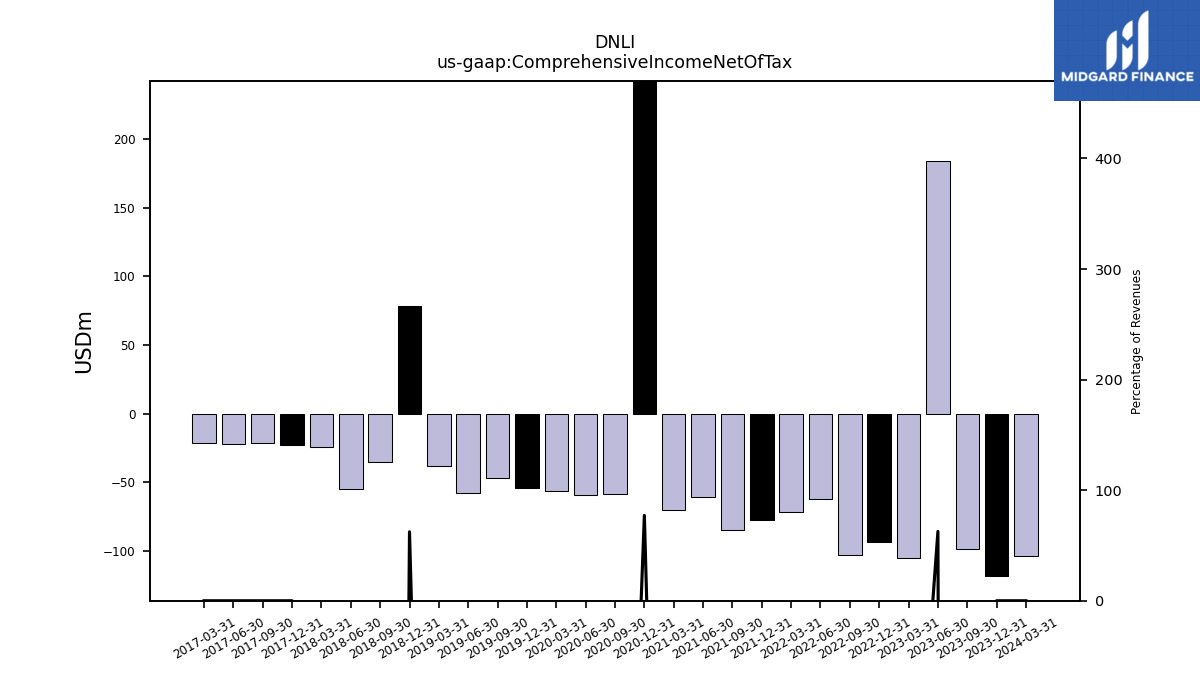
| Comprehensive Income Net Of Tax | -118.18 | -98.56 | 184.46 | -105.41 | -93.71 | -102.88 | -61.82 | -71.97 | -77.24 | -84.74 | -60.83 | -70.03 | 244.63 | -58.77 | -59.04 | -56.28 | -54.24 | -46.58 | -57.79 | -38.01 | 78.30 | -35.29 | -54.93 | -24.60 | -23.02 | -21.70 | -22.12 |
| 2023-12-31 | 2023-09-30 | 2023-06-30 | 2023-03-31 | 2022-12-31 | 2022-09-30 | 2022-06-30 | 2022-03-31 | 2021-12-31 | 2021-09-30 | 2021-06-30 | 2021-03-31 | 2020-12-31 | 2020-09-30 | 2020-06-30 | 2020-03-31 | 2019-12-31 | 2019-09-30 | 2019-06-30 | 2019-03-31 | 2018-12-31 | 2018-09-30 | 2018-06-30 | 2018-03-31 | 2017-12-31 | 2017-09-30 | 2017-06-30 | ||
|---|---|---|---|---|---|---|---|---|---|---|---|---|---|---|---|---|---|---|---|---|---|---|---|---|---|---|---|---|
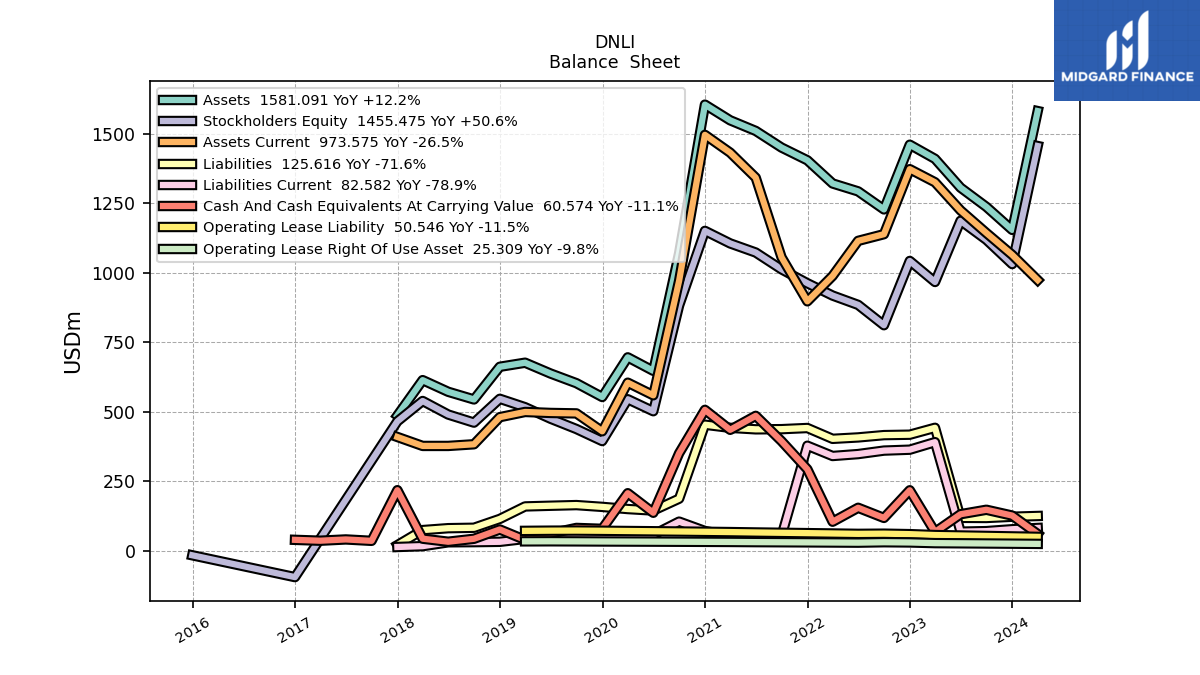
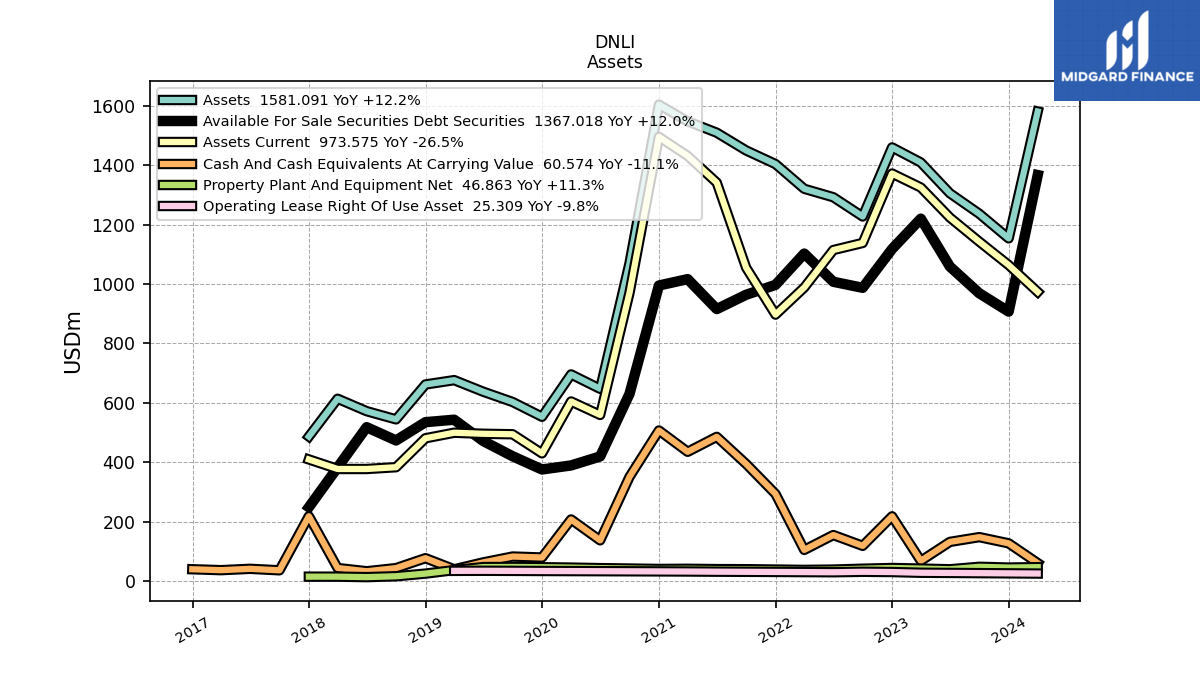
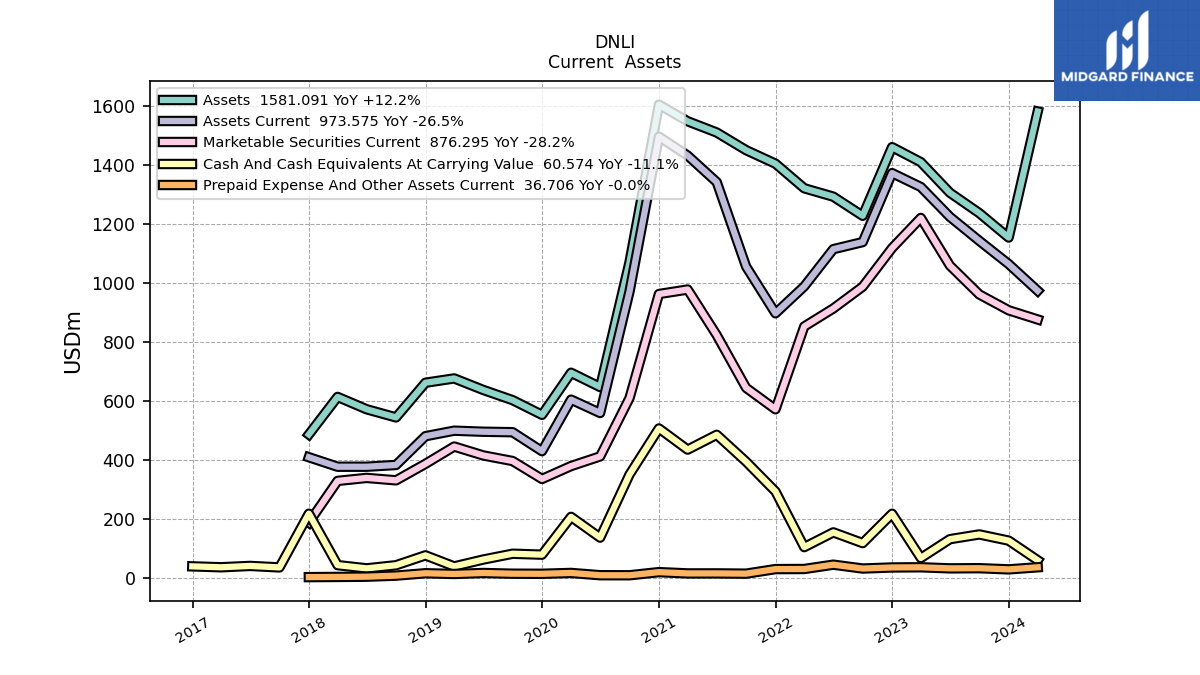
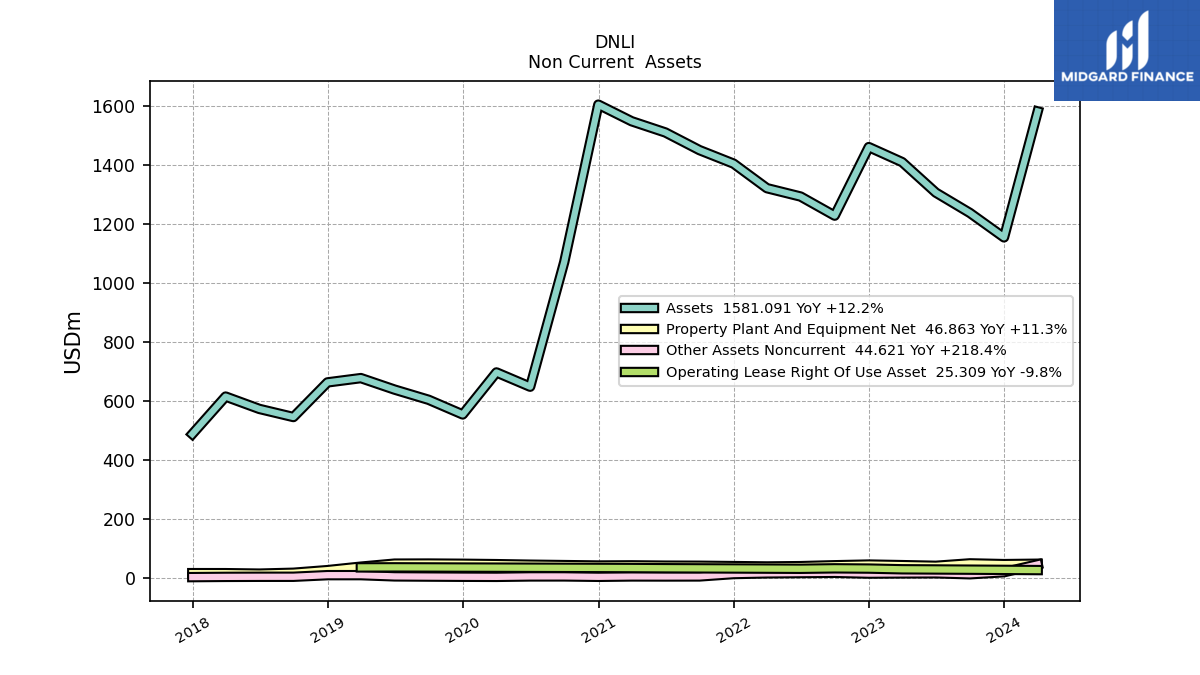
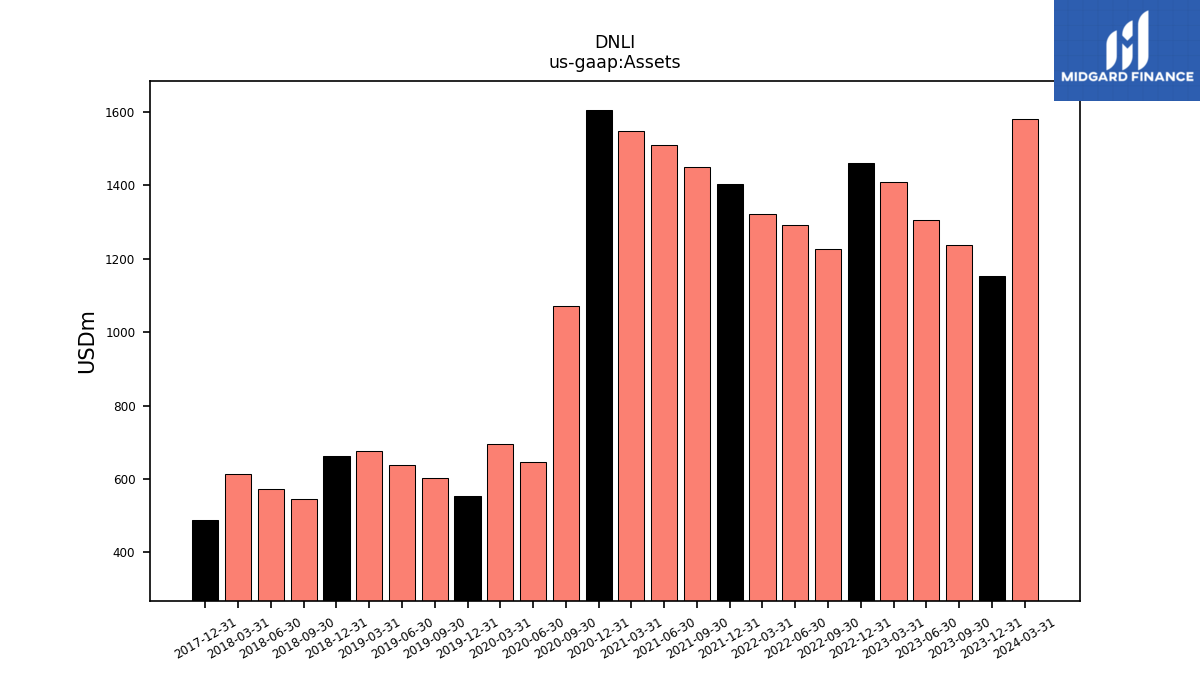
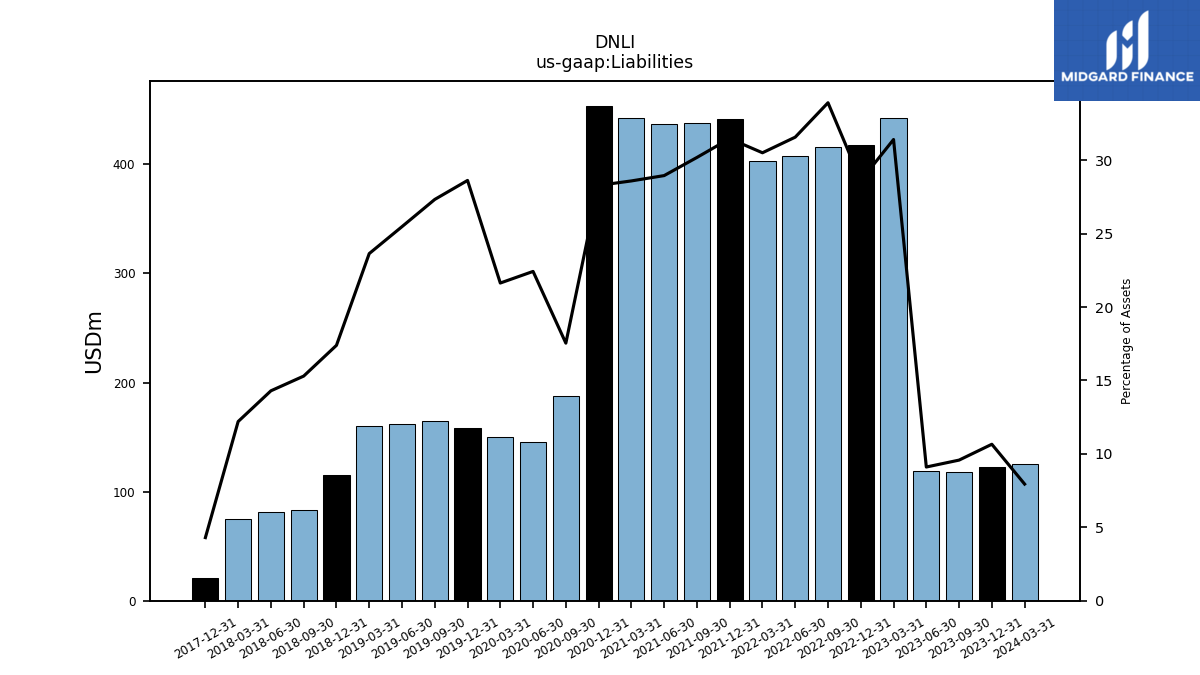
| Assets | 1153.92 | 1236.78 | 1305.73 | 1409.34 | 1460.24 | 1227.61 | 1292.46 | 1320.86 | 1404.16 | 1449.97 | 1509.82 | 1547.86 | 1604.28 | 1070.31 | 647.34 | 695.87 | 553.23 | 602.98 | 637.60 | 676.60 | 661.98 | 544.48 | 572.05 | 613.95 | 486.72 | NA | NA | |
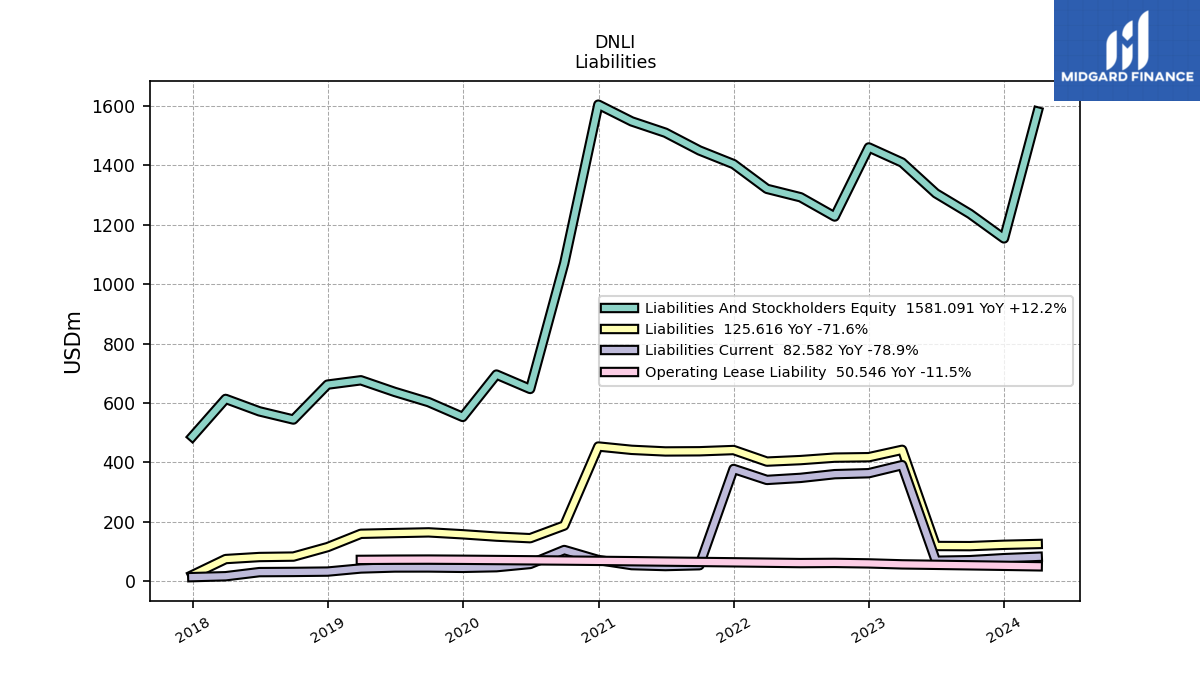
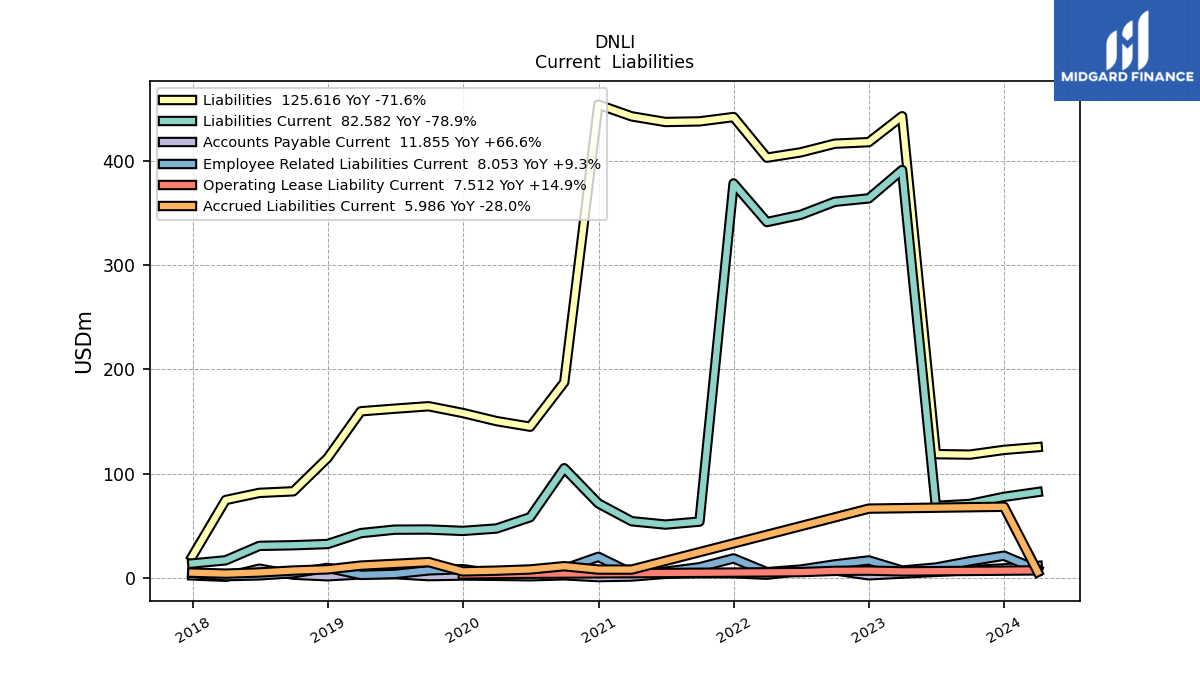
| Liabilities | 122.96 | 118.45 | 118.91 | 442.64 | 417.81 | 416.30 | 408.01 | 402.93 | 441.87 | 437.69 | 437.11 | 442.50 | 453.75 | 187.76 | 145.17 | 150.55 | 158.34 | 164.78 | 162.43 | 159.95 | 115.14 | 83.30 | 81.78 | 74.92 | 20.93 | NA | NA | |
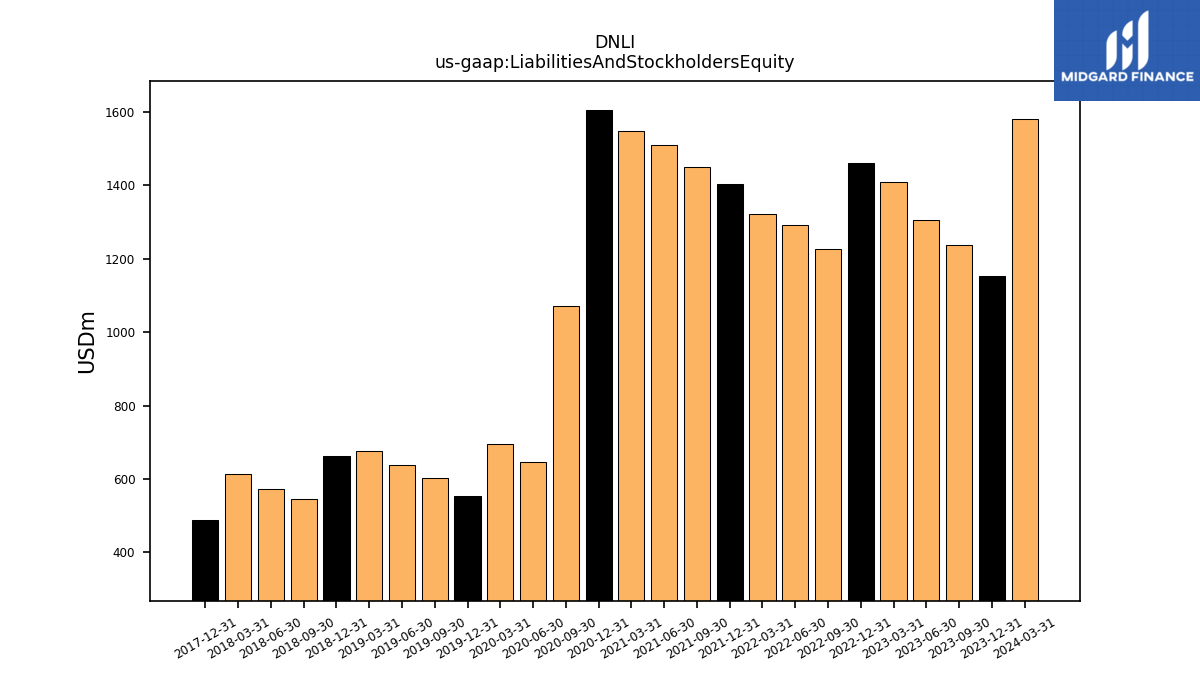
| Liabilities And Stockholders Equity | 1153.92 | 1236.78 | 1305.73 | 1409.34 | 1460.24 | 1227.61 | 1292.46 | 1320.86 | 1404.16 | 1449.97 | 1509.82 | 1547.86 | 1604.28 | 1070.31 | 647.34 | 695.87 | 553.23 | 602.98 | 637.60 | 676.60 | 661.98 | 544.48 | 572.05 | 613.95 | 486.72 | NA | NA | |
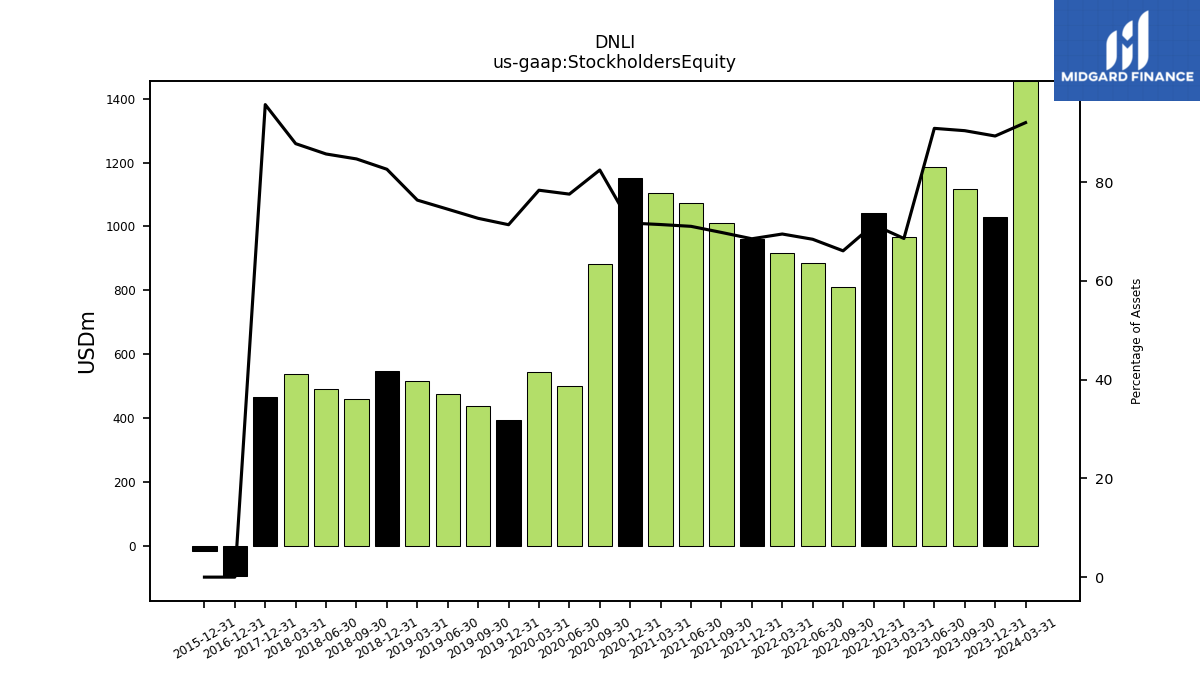
| Stockholders Equity | 1030.95 | 1118.33 | 1186.83 | 966.71 | 1042.43 | 811.30 | 884.45 | 917.93 | 962.29 | 1012.28 | 1072.70 | 1105.35 | 1150.53 | 882.55 | 502.17 | 545.31 | 394.89 | 438.20 | 475.17 | 516.65 | 546.85 | 461.18 | 490.27 | 539.03 | 465.80 | NA | NA |
| 2023-12-31 | 2023-09-30 | 2023-06-30 | 2023-03-31 | 2022-12-31 | 2022-09-30 | 2022-06-30 | 2022-03-31 | 2021-12-31 | 2021-09-30 | 2021-06-30 | 2021-03-31 | 2020-12-31 | 2020-09-30 | 2020-06-30 | 2020-03-31 | 2019-12-31 | 2019-09-30 | 2019-06-30 | 2019-03-31 | 2018-12-31 | 2018-09-30 | 2018-06-30 | 2018-03-31 | 2017-12-31 | 2017-09-30 | 2017-06-30 | ||
|---|---|---|---|---|---|---|---|---|---|---|---|---|---|---|---|---|---|---|---|---|---|---|---|---|---|---|---|---|
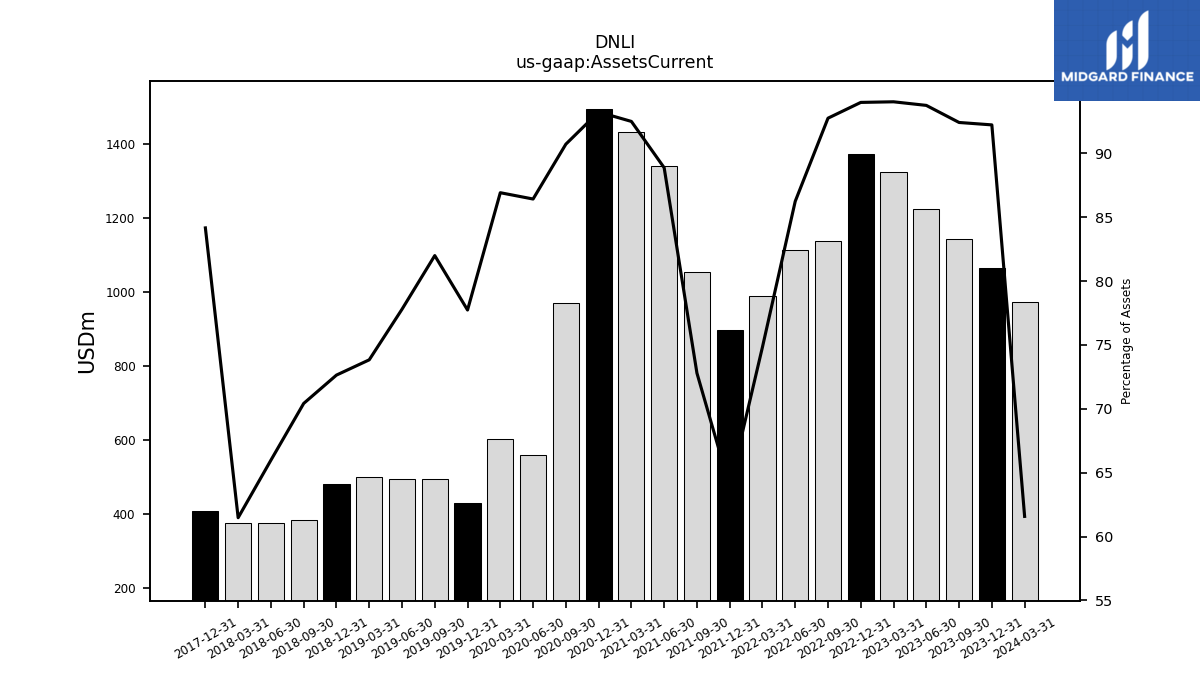
| Assets Current | 1064.14 | 1142.88 | 1224.06 | 1325.16 | 1372.32 | 1138.53 | 1114.60 | 988.44 | 897.23 | 1055.51 | 1341.74 | 1431.62 | 1495.65 | 970.87 | 559.41 | 604.78 | 430.03 | 494.38 | 495.98 | 499.53 | 480.84 | 383.40 | 377.42 | 377.42 | 409.61 | NA | NA | |
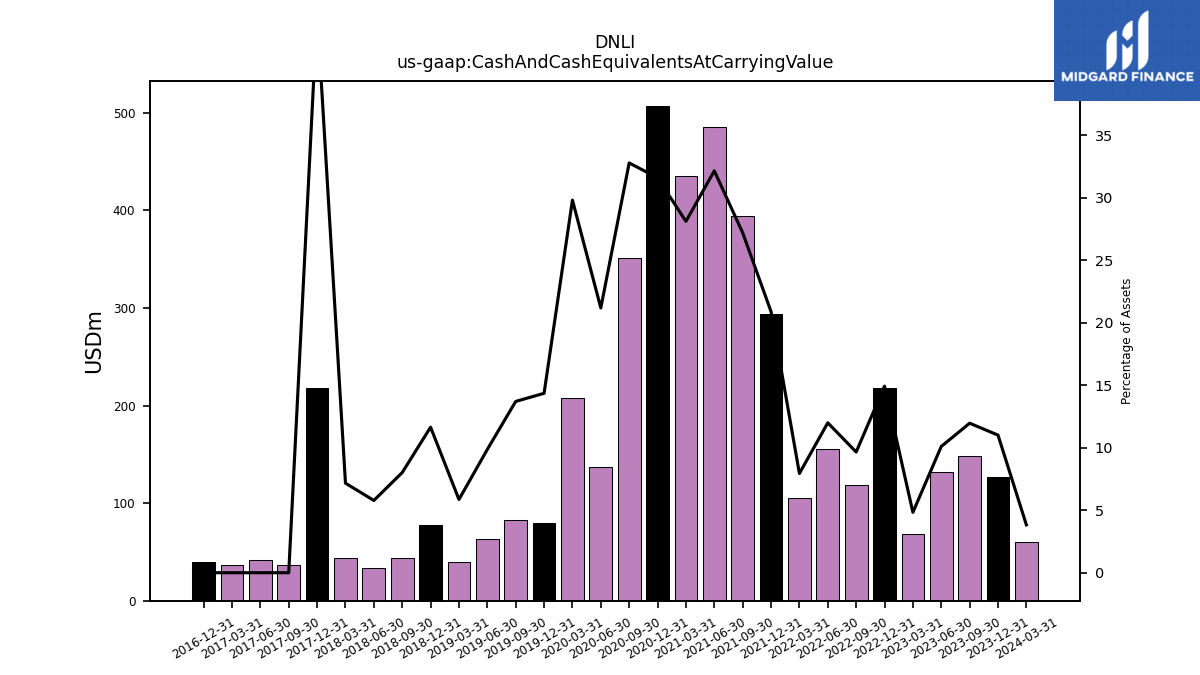
| Cash And Cash Equivalents At Carrying Value | 127.11 | 148.01 | 131.97 | 68.13 | 218.04 | 118.61 | 155.09 | 104.95 | 293.48 | 394.55 | 485.68 | 435.32 | 507.14 | 351.05 | 137.18 | 207.54 | 79.45 | 82.67 | 62.94 | 39.66 | 77.12 | 43.65 | 33.09 | 44.00 | 218.38 | 36.27 | 41.31 | |
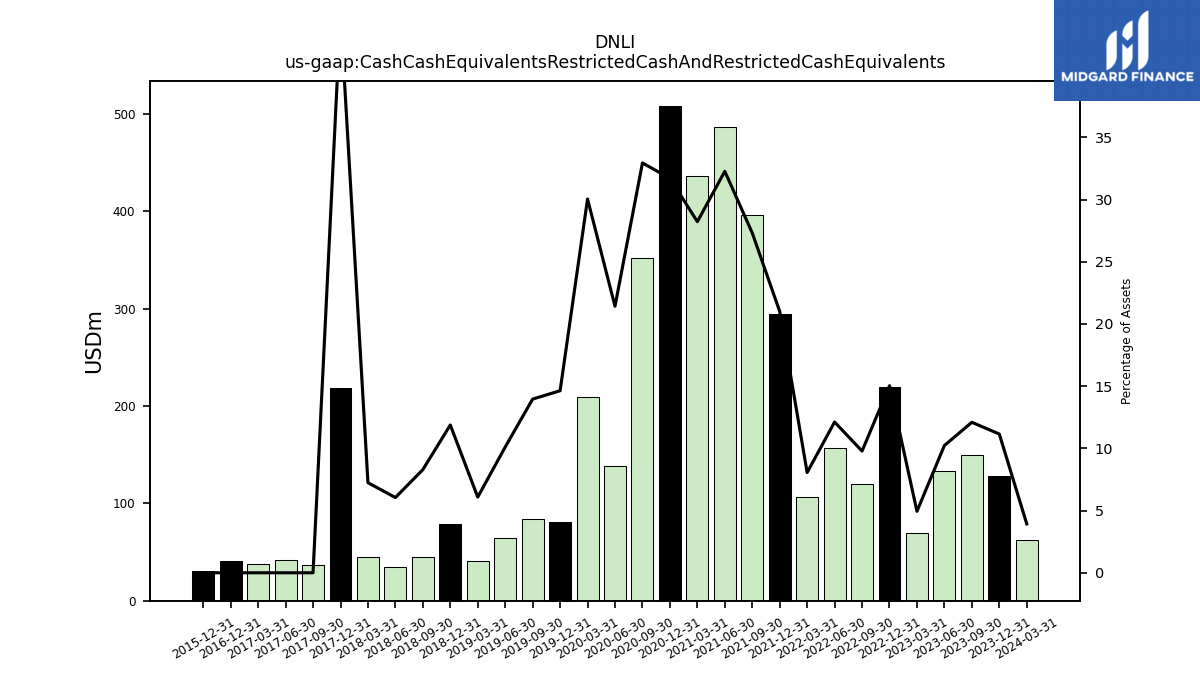
| Cash Cash Equivalents Restricted Cash And Restricted Cash Equivalents | 128.68 | 149.59 | 133.55 | 69.63 | 219.54 | 120.11 | 156.59 | 106.45 | 294.98 | 396.05 | 487.18 | 436.82 | 508.64 | 352.55 | 138.68 | 209.04 | 80.95 | 84.17 | 64.44 | 41.16 | 78.62 | 45.15 | 34.59 | 44.45 | 218.91 | 36.80 | 41.84 | |
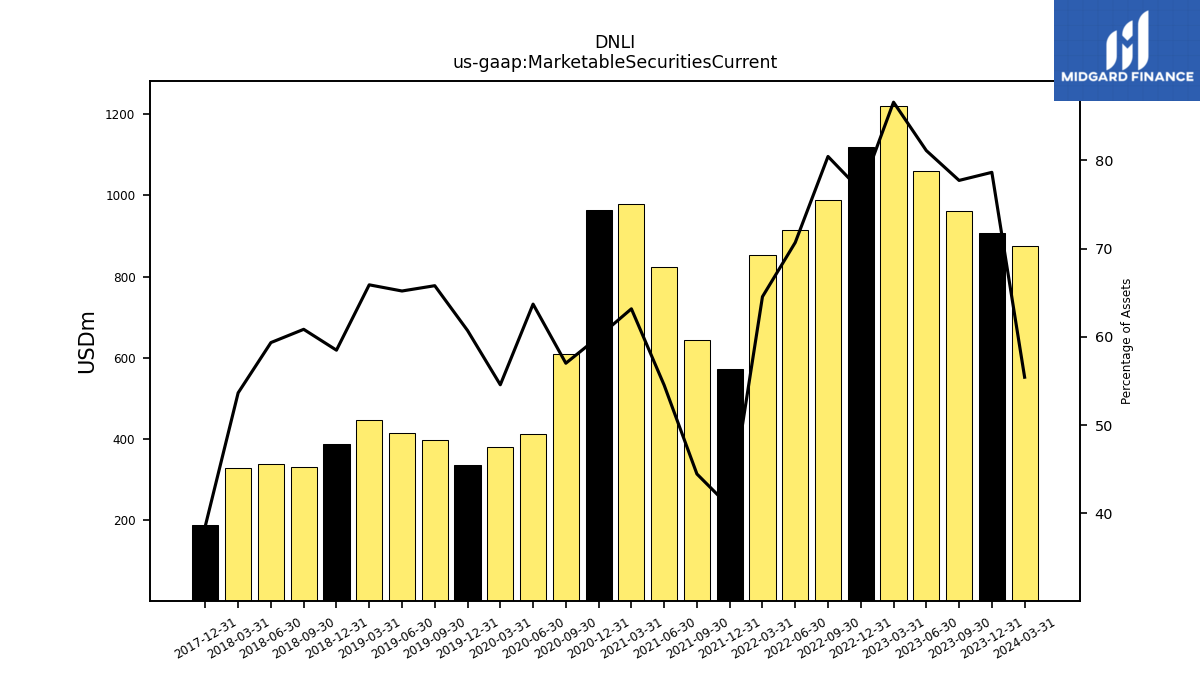
| Marketable Securities Current | 907.40 | 961.25 | 1059.01 | 1220.32 | 1118.17 | 987.44 | 913.58 | 852.57 | 571.93 | 644.62 | 823.25 | 977.83 | 962.55 | 610.15 | 412.40 | 379.71 | 335.91 | 396.72 | 415.67 | 445.82 | 387.17 | 331.31 | 339.50 | 329.40 | 187.85 | NA | NA | |
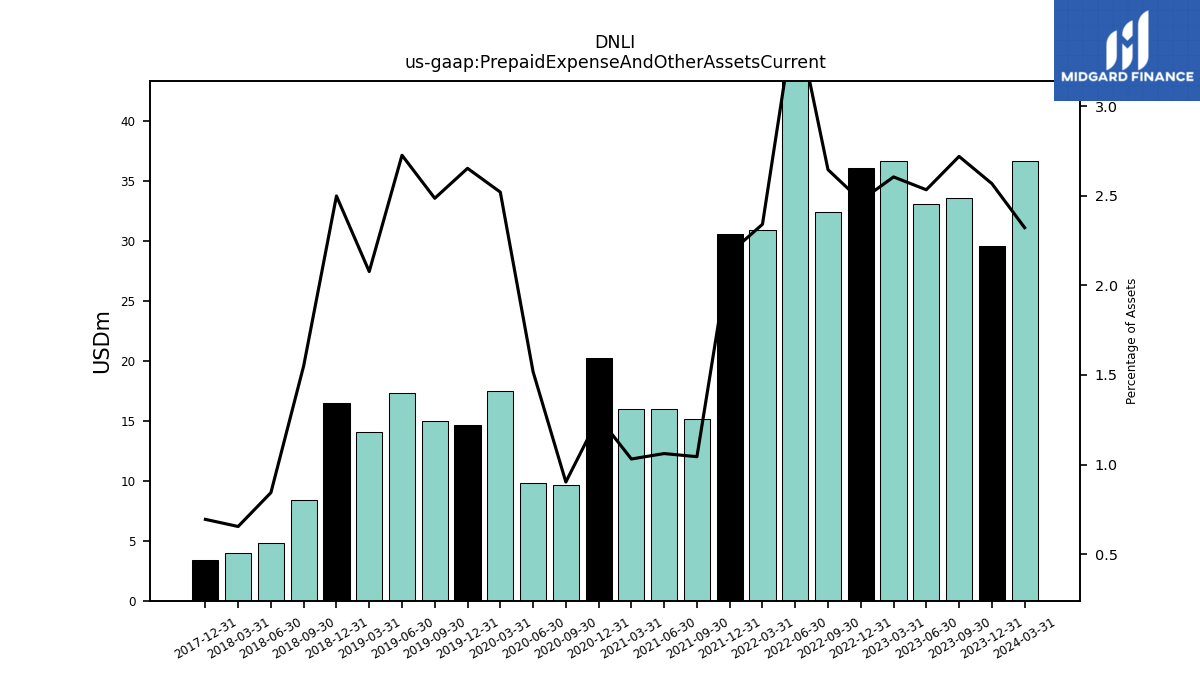
| Prepaid Expense And Other Assets Current | 29.63 | 33.63 | 33.08 | 36.71 | 36.10 | 32.47 | 45.58 | 30.91 | 30.60 | 15.14 | 16.03 | 15.96 | 20.28 | 9.66 | 9.83 | 17.54 | 14.68 | 14.99 | 17.38 | 14.05 | 16.54 | 8.45 | 4.83 | 4.02 | 3.38 | NA | NA | |
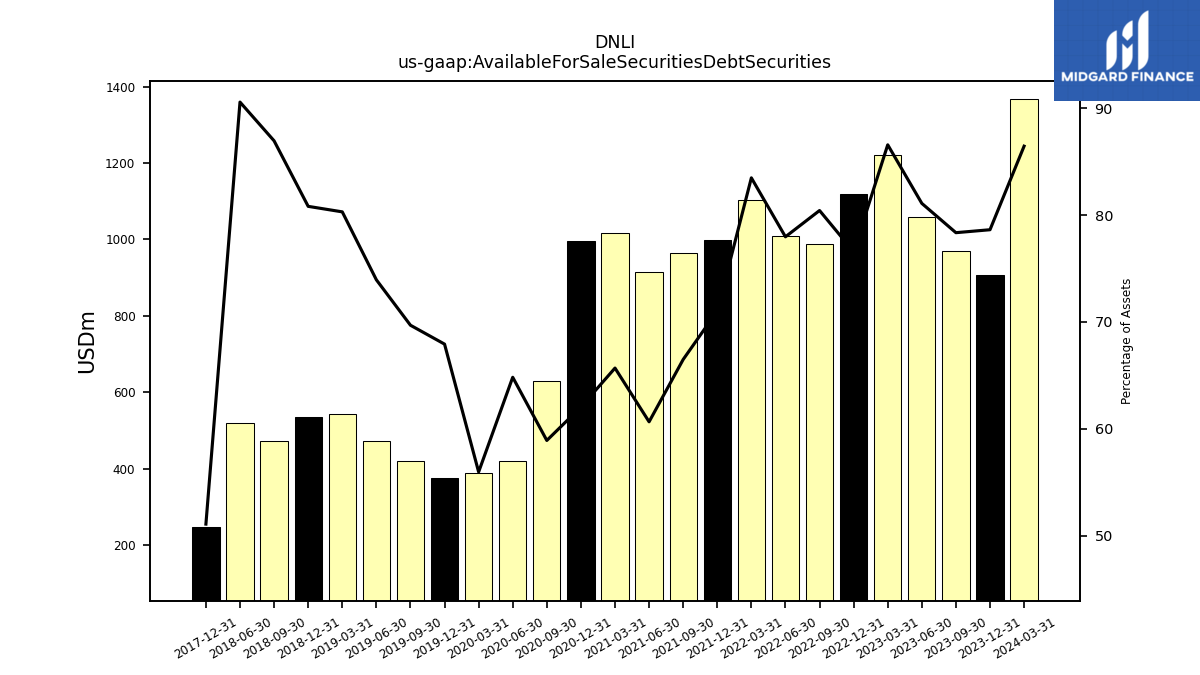
| Available For Sale Securities Debt Securities | 907.40 | 969.15 | 1059.01 | 1220.32 | 1118.17 | 987.44 | 1007.80 | 1102.84 | 997.38 | 964.09 | 915.77 | 1016.71 | 995.25 | 630.50 | 419.63 | 389.40 | 375.79 | 420.25 | 471.50 | 543.37 | 535.05 | 473.48 | 518.21 | NA | 248.60 | NA | NA |
| 2023-12-31 | 2023-09-30 | 2023-06-30 | 2023-03-31 | 2022-12-31 | 2022-09-30 | 2022-06-30 | 2022-03-31 | 2021-12-31 | 2021-09-30 | 2021-06-30 | 2021-03-31 | 2020-12-31 | 2020-09-30 | 2020-06-30 | 2020-03-31 | 2019-12-31 | 2019-09-30 | 2019-06-30 | 2019-03-31 | 2018-12-31 | 2018-09-30 | 2018-06-30 | 2018-03-31 | 2017-12-31 | 2017-09-30 | 2017-06-30 | ||
|---|---|---|---|---|---|---|---|---|---|---|---|---|---|---|---|---|---|---|---|---|---|---|---|---|---|---|---|---|
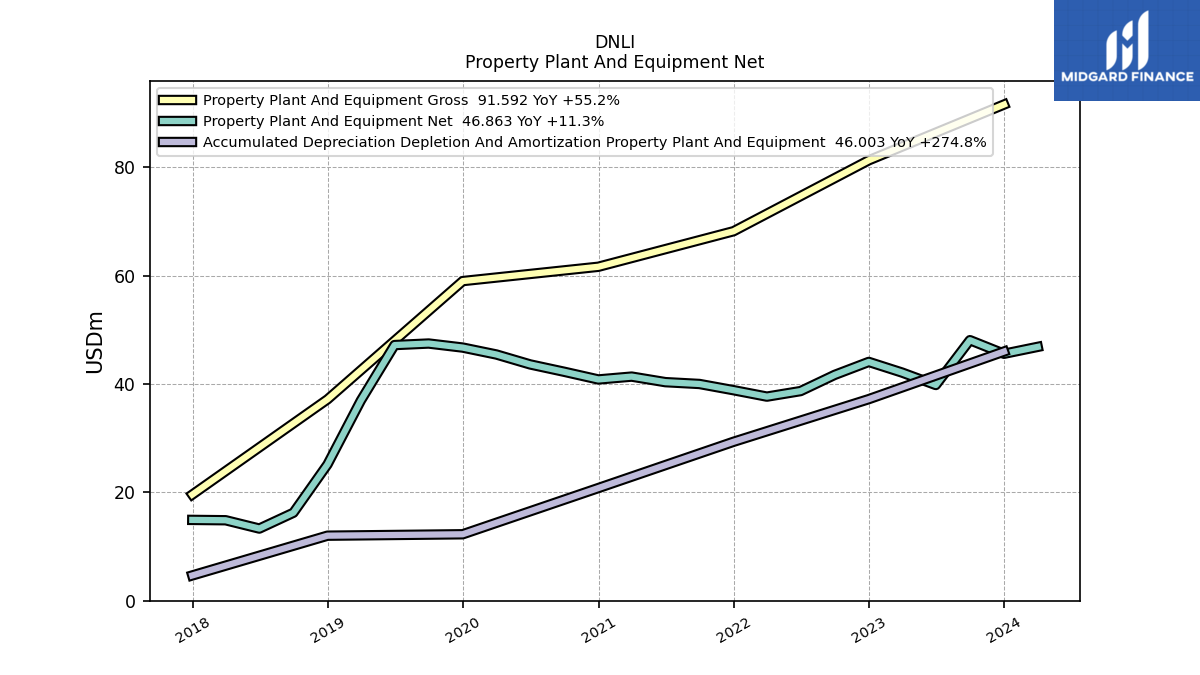
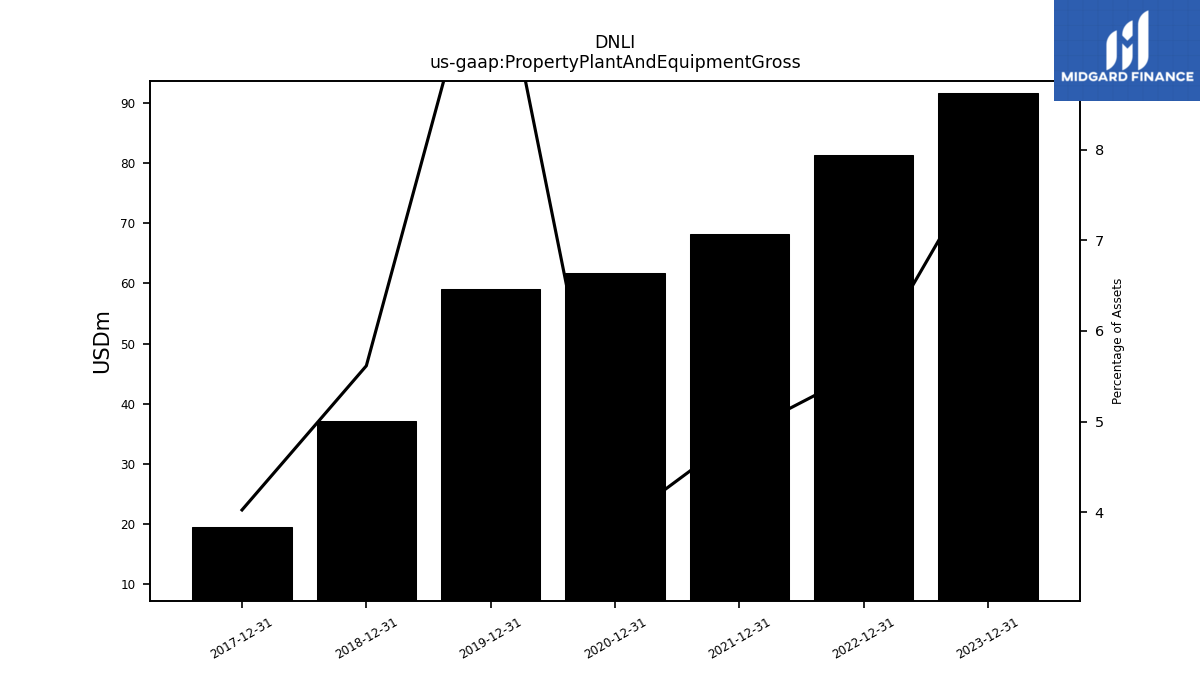
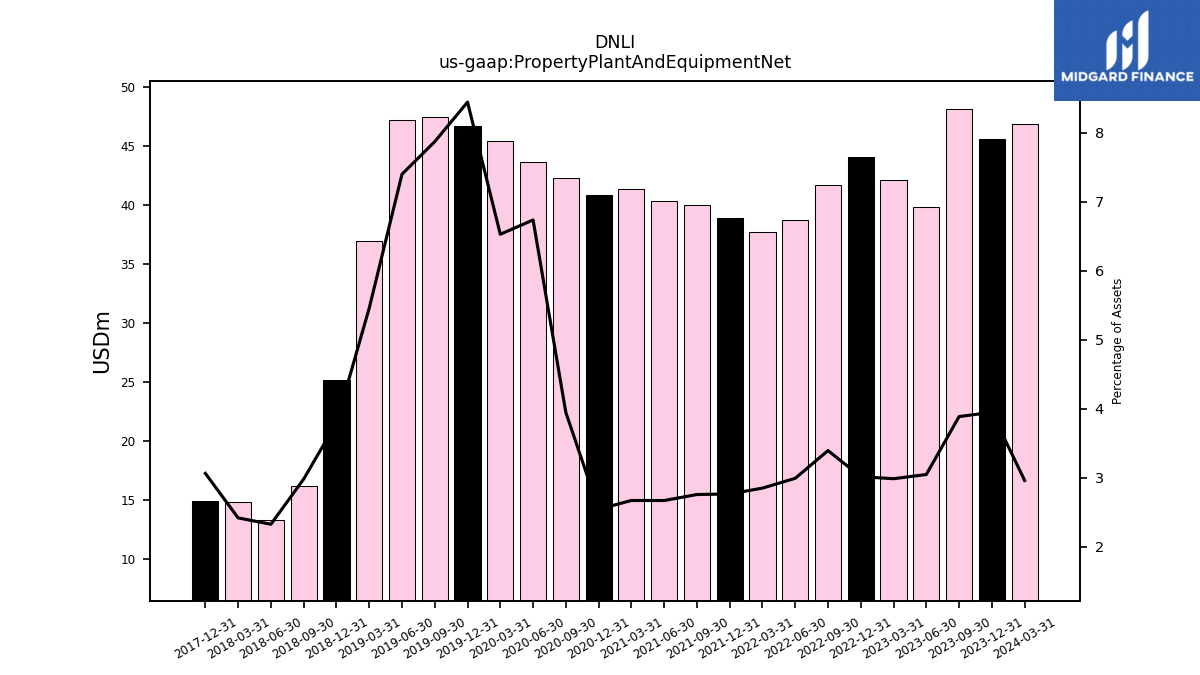
| Property Plant And Equipment Gross | 91.59 | NA | NA | NA | 81.30 | NA | NA | NA | 68.21 | NA | NA | NA | 61.65 | NA | NA | NA | 59.01 | NA | NA | NA | 37.17 | NA | NA | NA | 19.59 | NA | NA | |
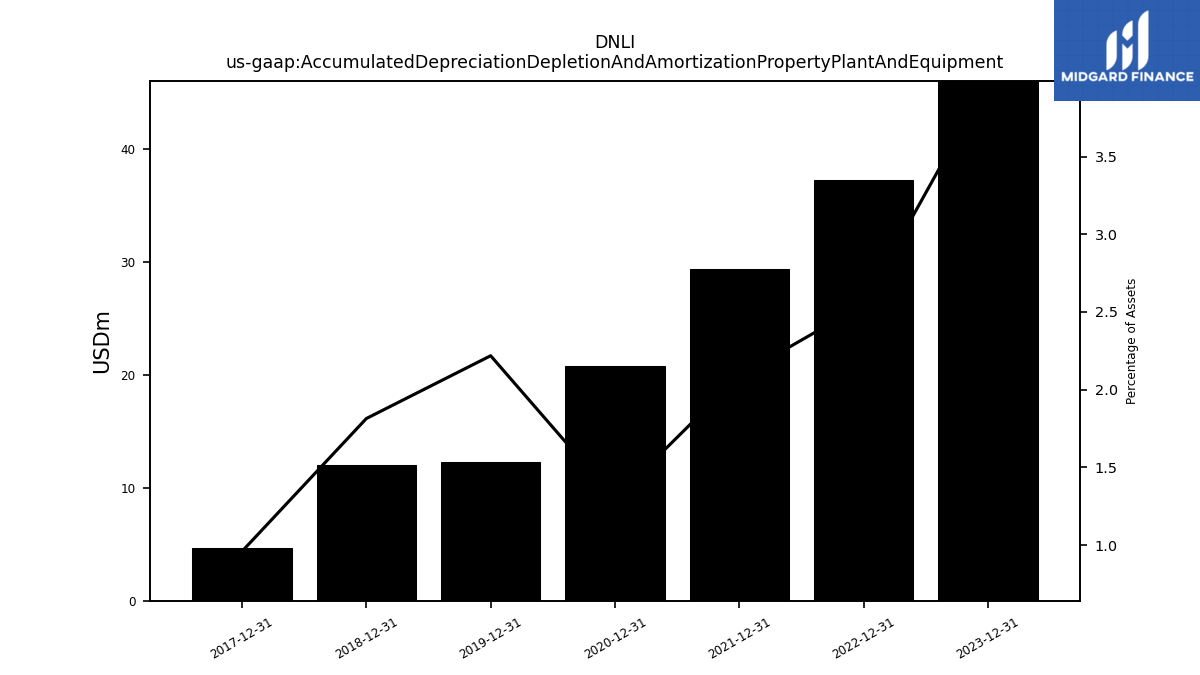
| Accumulated Depreciation Depletion And Amortization Property Plant And Equipment | 46.00 | NA | NA | NA | 37.22 | NA | NA | NA | 29.34 | NA | NA | NA | 20.80 | NA | NA | NA | 12.27 | NA | NA | NA | 12.01 | NA | NA | NA | 4.67 | NA | NA | |
| Property Plant And Equipment Net | 45.59 | 48.10 | 39.82 | 42.12 | 44.09 | 41.69 | 38.70 | 37.68 | 38.87 | 40.01 | 40.35 | 41.38 | 40.85 | 42.27 | 43.62 | 45.45 | 46.73 | 47.48 | 47.20 | 36.95 | 25.16 | 16.25 | 13.32 | 14.86 | 14.92 | NA | NA | |
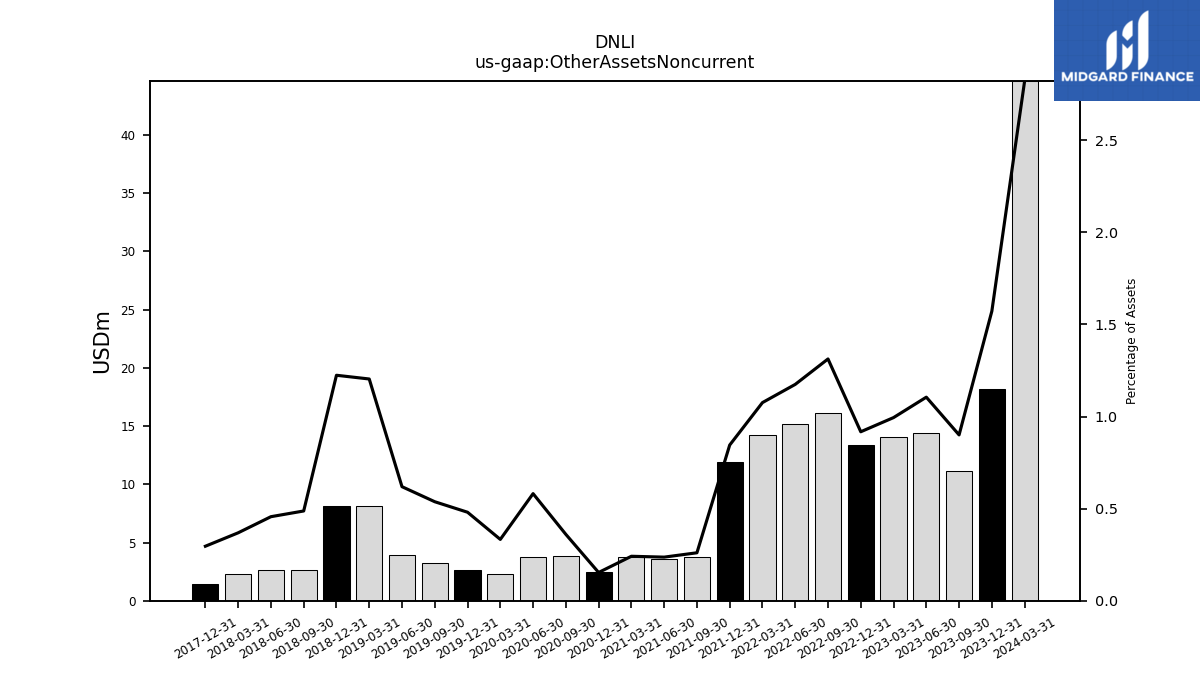
| Other Assets Noncurrent | 18.14 | 11.14 | 14.43 | 14.02 | 13.40 | 16.12 | 15.18 | 14.21 | 11.87 | 3.78 | 3.58 | 3.74 | 2.46 | 3.86 | 3.77 | 2.32 | 2.66 | 3.24 | 3.95 | 8.15 | 8.11 | 2.65 | 2.61 | 2.27 | 1.44 | NA | NA | |
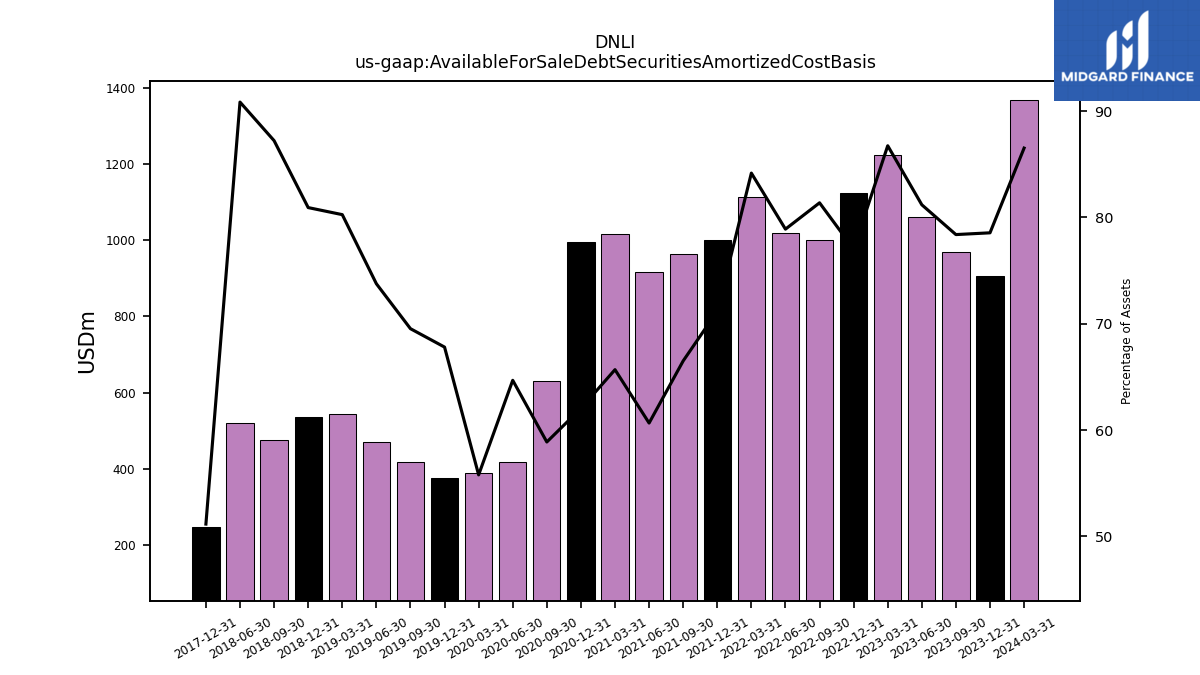
| Available For Sale Debt Securities Amortized Cost Basis | 906.41 | 969.45 | 1060.10 | 1222.49 | 1124.72 | 998.94 | 1019.72 | 1111.74 | 999.53 | 964.26 | 915.79 | 1016.59 | 995.15 | 630.13 | 418.67 | 388.15 | 375.09 | 419.26 | 470.31 | 543.04 | 535.71 | 474.89 | 519.70 | NA | 248.97 | NA | NA |
| 2023-12-31 | 2023-09-30 | 2023-06-30 | 2023-03-31 | 2022-12-31 | 2022-09-30 | 2022-06-30 | 2022-03-31 | 2021-12-31 | 2021-09-30 | 2021-06-30 | 2021-03-31 | 2020-12-31 | 2020-09-30 | 2020-06-30 | 2020-03-31 | 2019-12-31 | 2019-09-30 | 2019-06-30 | 2019-03-31 | 2018-12-31 | 2018-09-30 | 2018-06-30 | 2018-03-31 | 2017-12-31 | 2017-09-30 | 2017-06-30 | ||
|---|---|---|---|---|---|---|---|---|---|---|---|---|---|---|---|---|---|---|---|---|---|---|---|---|---|---|---|---|
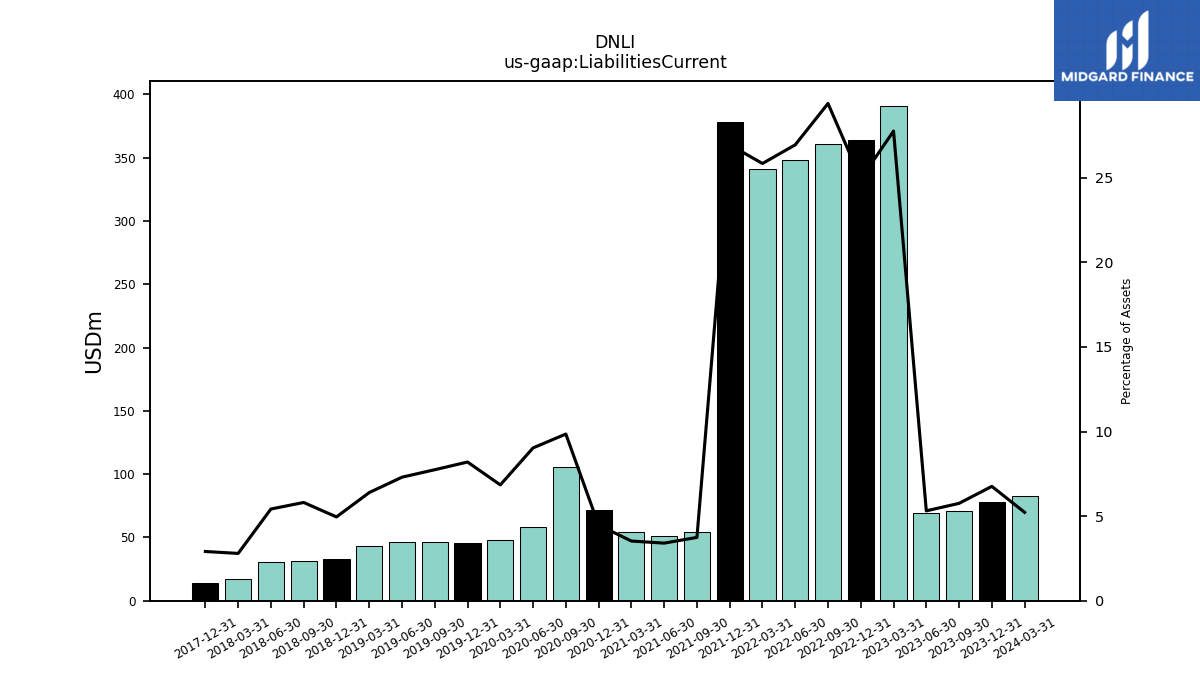
| Liabilities Current | 77.98 | 71.18 | 69.36 | 391.08 | 363.92 | 360.67 | 348.16 | 341.24 | 378.25 | 54.25 | 51.41 | 54.61 | 71.70 | 105.41 | 58.46 | 47.63 | 45.34 | 46.69 | 46.55 | 43.24 | 32.79 | 31.62 | 31.01 | 17.17 | 14.16 | NA | NA | |
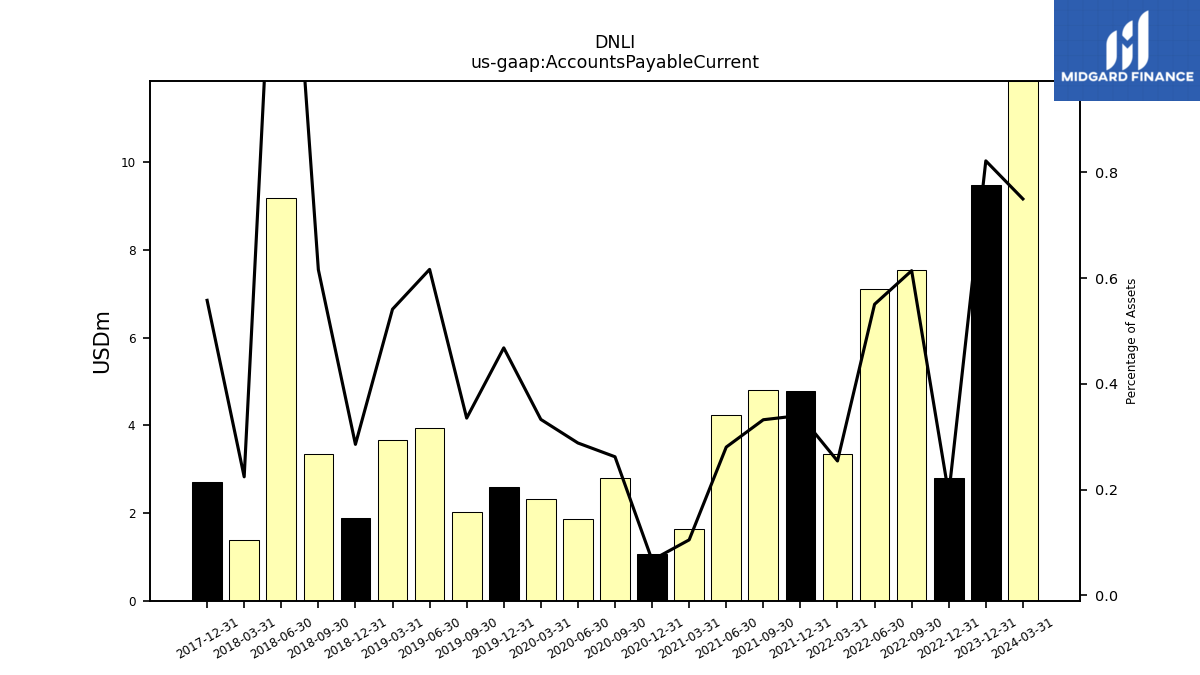
| Accounts Payable Current | 9.48 | NA | NA | NA | 2.79 | 7.54 | 7.12 | 3.36 | 4.78 | 4.82 | 4.24 | 1.63 | 1.07 | 2.81 | 1.87 | 2.32 | 2.59 | 2.02 | 3.93 | 3.66 | 1.89 | 3.35 | 9.18 | 1.38 | 2.72 | NA | NA | |
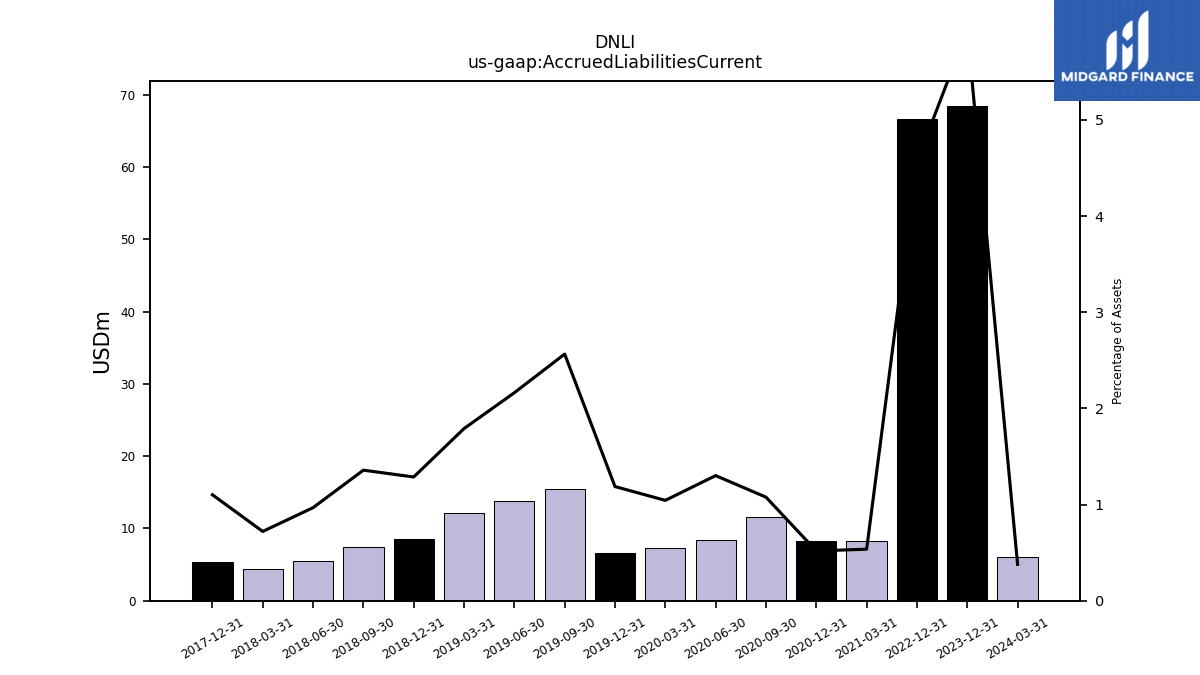
| Accrued Liabilities Current | 68.50 | NA | NA | NA | 66.69 | NA | NA | NA | NA | NA | NA | 8.30 | 8.31 | 11.53 | 8.42 | 7.26 | 6.57 | 15.47 | 13.79 | 12.11 | 8.52 | 7.39 | 5.54 | 4.42 | 5.36 | NA | NA |
| 2023-12-31 | 2023-09-30 | 2023-06-30 | 2023-03-31 | 2022-12-31 | 2022-09-30 | 2022-06-30 | 2022-03-31 | 2021-12-31 | 2021-09-30 | 2021-06-30 | 2021-03-31 | 2020-12-31 | 2020-09-30 | 2020-06-30 | 2020-03-31 | 2019-12-31 | 2019-09-30 | 2019-06-30 | 2019-03-31 | 2018-12-31 | 2018-09-30 | 2018-06-30 | 2018-03-31 | 2017-12-31 | 2017-09-30 | 2017-06-30 | ||
|---|---|---|---|---|---|---|---|---|---|---|---|---|---|---|---|---|---|---|---|---|---|---|---|---|---|---|---|---|
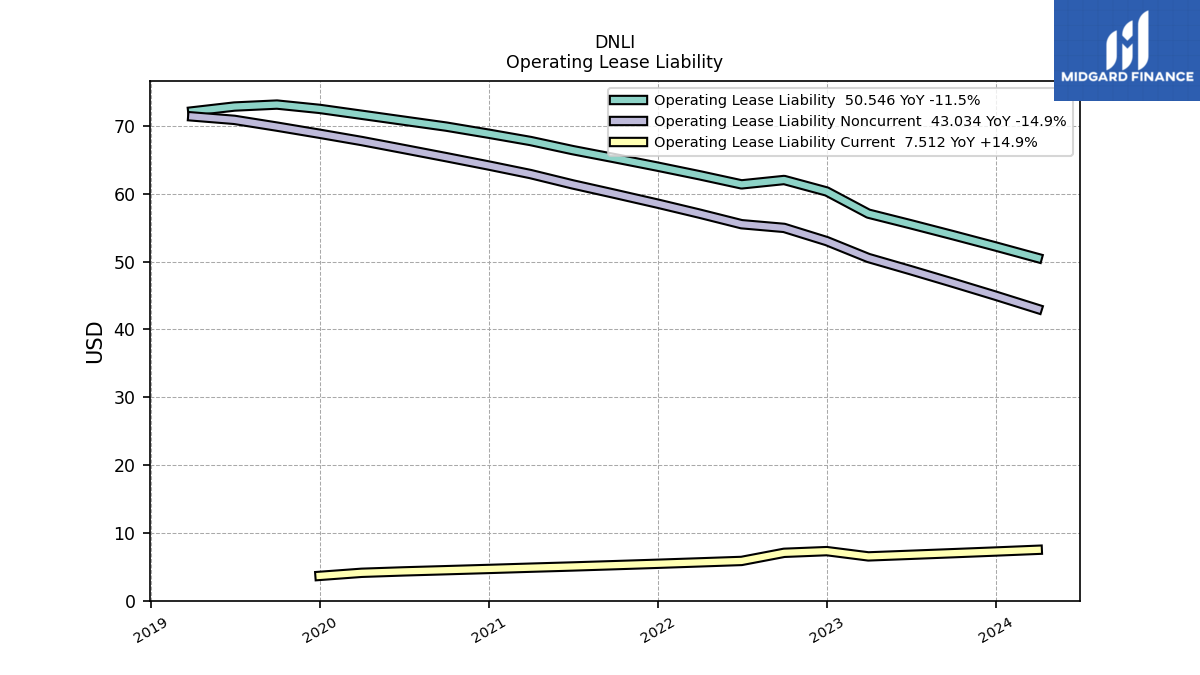
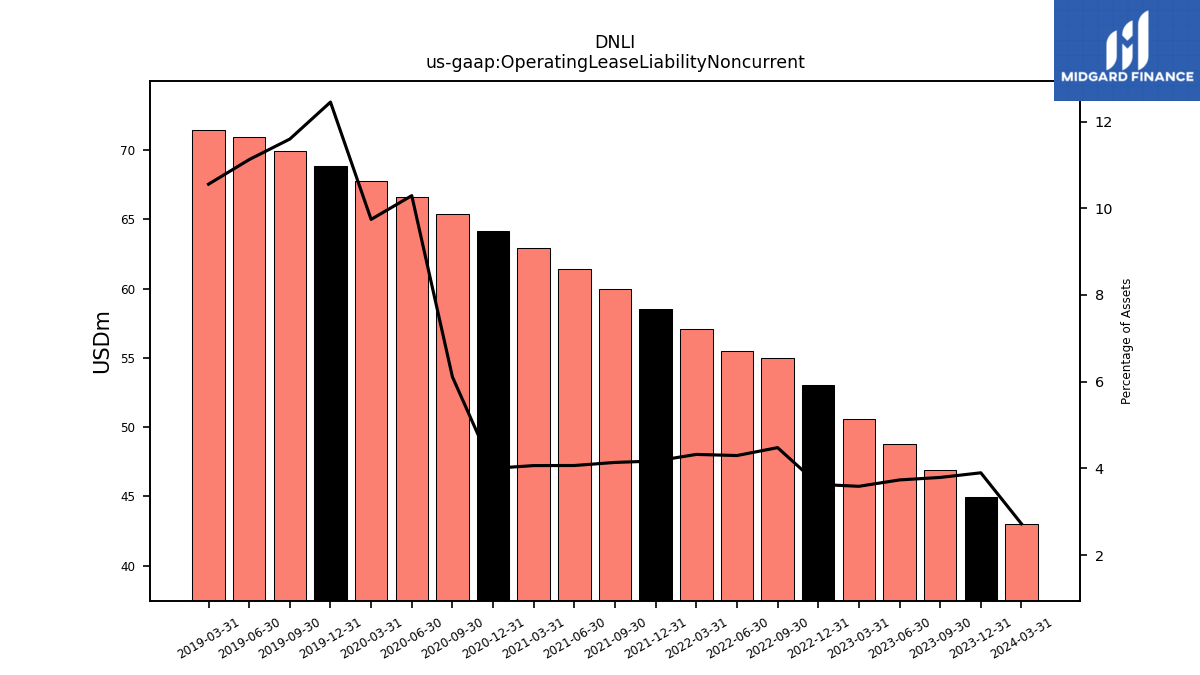
| Operating Lease Liability Noncurrent | 44.98 | 46.89 | 48.75 | 50.55 | 53.03 | 54.98 | 55.52 | 57.09 | 58.55 | 59.99 | 61.40 | 62.92 | 64.17 | 65.41 | 66.61 | 67.79 | 68.86 | 69.92 | 70.91 | 71.41 | NA | NA | NA | NA | NA | NA | NA |
| 2023-12-31 | 2023-09-30 | 2023-06-30 | 2023-03-31 | 2022-12-31 | 2022-09-30 | 2022-06-30 | 2022-03-31 | 2021-12-31 | 2021-09-30 | 2021-06-30 | 2021-03-31 | 2020-12-31 | 2020-09-30 | 2020-06-30 | 2020-03-31 | 2019-12-31 | 2019-09-30 | 2019-06-30 | 2019-03-31 | 2018-12-31 | 2018-09-30 | 2018-06-30 | 2018-03-31 | 2017-12-31 | 2017-09-30 | 2017-06-30 | ||
|---|---|---|---|---|---|---|---|---|---|---|---|---|---|---|---|---|---|---|---|---|---|---|---|---|---|---|---|---|
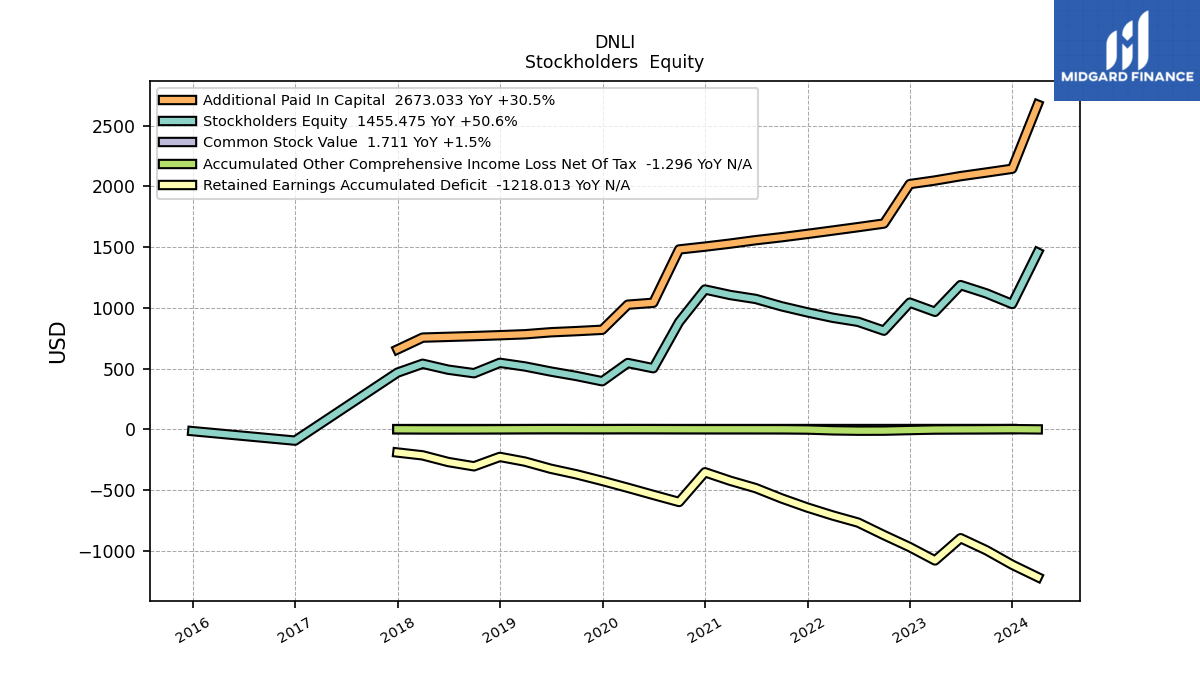
| Stockholders Equity | 1030.95 | 1118.33 | 1186.83 | 966.71 | 1042.43 | 811.30 | 884.45 | 917.93 | 962.29 | 1012.28 | 1072.70 | 1105.35 | 1150.53 | 882.55 | 502.17 | 545.31 | 394.89 | 438.20 | 475.17 | 516.65 | 546.85 | 461.18 | 490.27 | 539.03 | 465.80 | NA | NA | |
| Common Stock Value | 1.71 | 1.71 | 1.70 | 1.69 | 1.69 | 1.56 | 1.56 | 1.55 | 1.55 | 1.54 | 1.54 | 1.54 | 1.53 | 1.52 | 1.39 | 1.38 | 1.29 | 1.29 | 1.28 | 1.28 | 1.27 | 1.27 | 1.26 | 1.25 | 1.20 | NA | NA | |
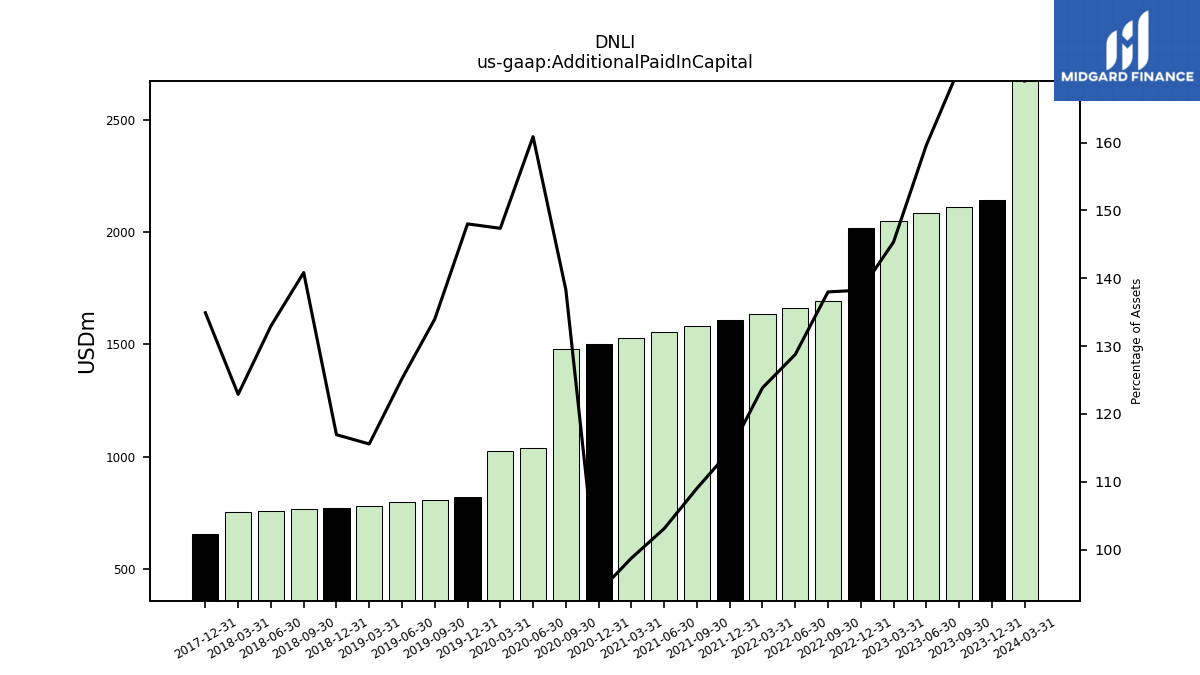
| Additional Paid In Capital | 2144.81 | 2114.01 | 2083.95 | 2048.30 | 2018.62 | 1693.90 | 1664.17 | 1635.84 | 1608.24 | 1580.99 | 1556.68 | 1528.50 | 1503.66 | 1480.32 | 1041.30 | 1025.41 | 818.80 | 807.88 | 798.28 | 781.97 | 774.16 | 766.80 | 760.61 | 754.44 | 656.66 | NA | NA | |
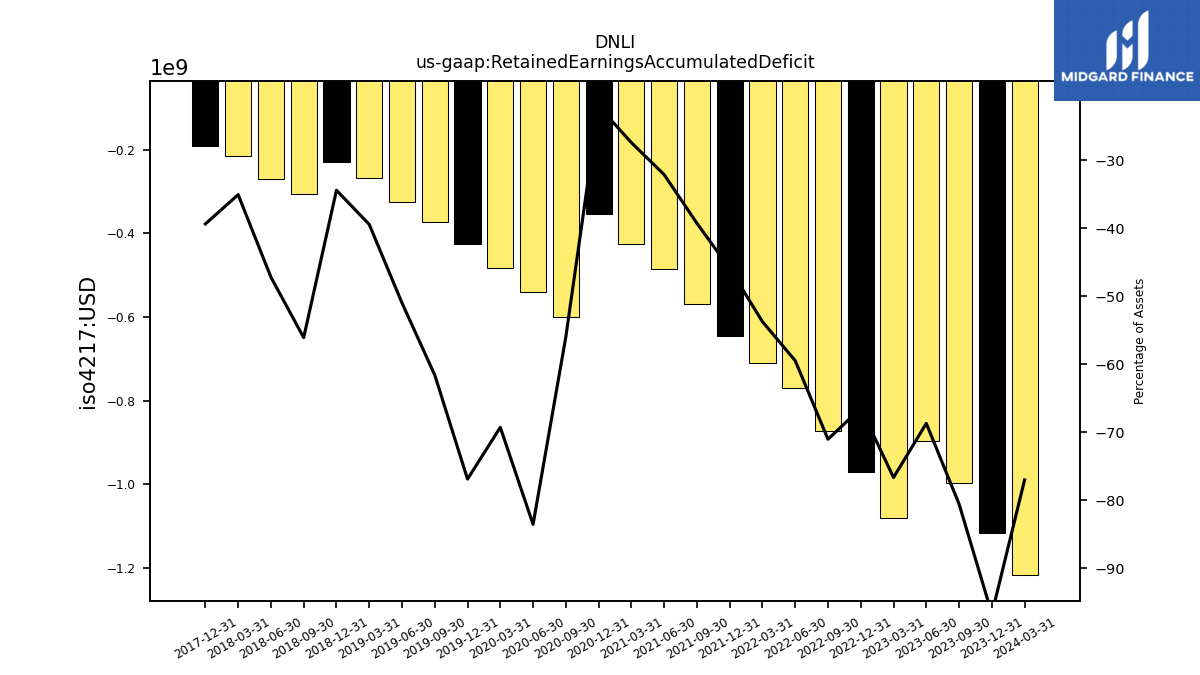
| Retained Earnings Accumulated Deficit | -1116.21 | -996.74 | -897.38 | -1080.77 | -970.99 | -872.31 | -769.01 | -710.22 | -645.00 | -569.74 | -485.15 | -424.46 | -354.42 | -599.30 | -541.07 | -482.31 | -425.55 | -371.53 | -325.27 | -266.93 | -227.94 | -305.47 | -270.10 | -215.38 | -191.70 | NA | NA | |
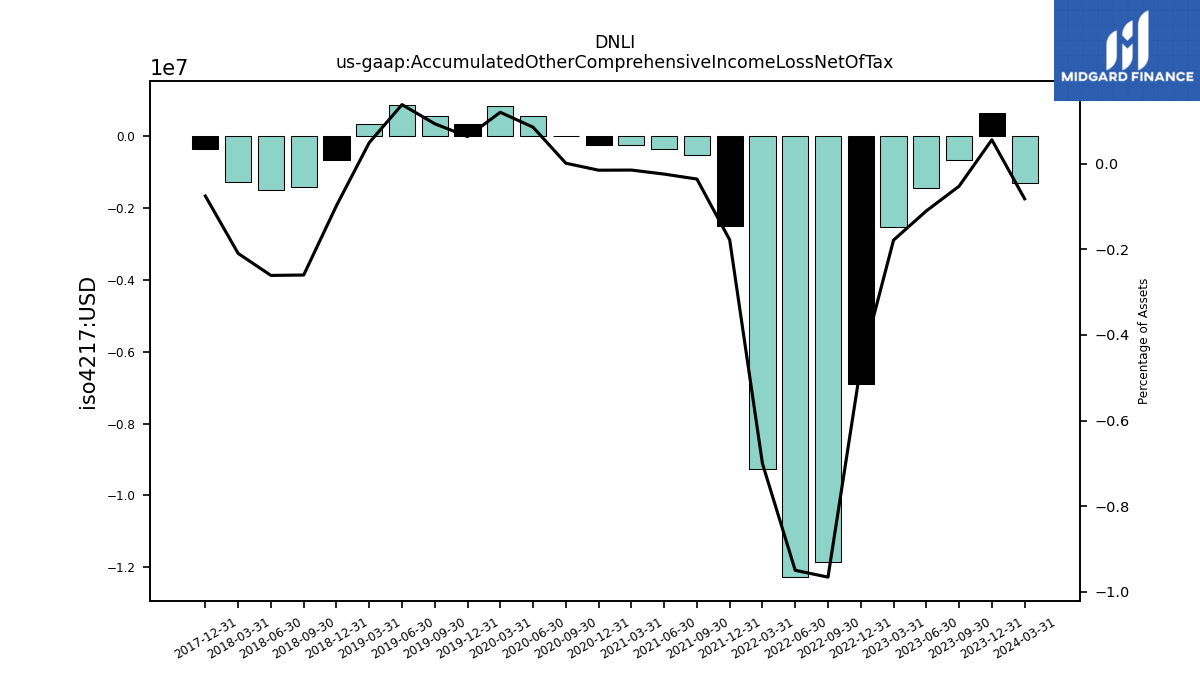
| Accumulated Other Comprehensive Income Loss Net Of Tax | 0.64 | -0.65 | -1.44 | -2.52 | -6.89 | -11.85 | -12.27 | -9.25 | -2.50 | -0.52 | -0.37 | -0.23 | -0.24 | 0.01 | 0.55 | 0.83 | 0.35 | 0.56 | 0.88 | 0.33 | -0.65 | -1.42 | -1.49 | -1.29 | -0.37 | NA | NA | |
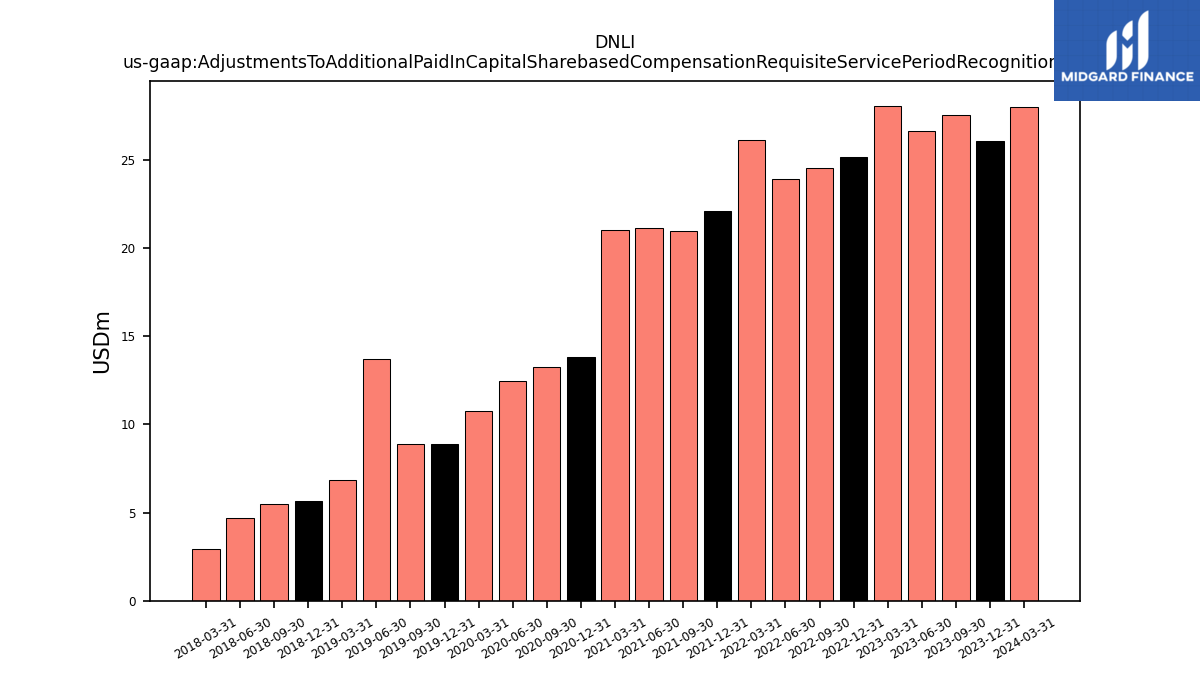
| Adjustments To Additional Paid In Capital Sharebased Compensation Requisite Service Period Recognition Value | 26.10 | 27.58 | 26.64 | 28.08 | 25.19 | 24.58 | 23.94 | 26.14 | 22.09 | 21.00 | 21.14 | 21.03 | 13.83 | 13.25 | 12.48 | 10.79 | 8.89 | 8.90 | 13.71 | 6.87 | 5.65 | 5.51 | 4.71 | 2.92 | NA | NA | NA |
| 2023-12-31 | 2023-09-30 | 2023-06-30 | 2023-03-31 | 2022-12-31 | 2022-09-30 | 2022-06-30 | 2022-03-31 | 2021-12-31 | 2021-09-30 | 2021-06-30 | 2021-03-31 | 2020-12-31 | 2020-09-30 | 2020-06-30 | 2020-03-31 | 2019-12-31 | 2019-09-30 | 2019-06-30 | 2019-03-31 | 2018-12-31 | 2018-09-30 | 2018-06-30 | 2018-03-31 | 2017-12-31 | 2017-09-30 | 2017-06-30 | ||
|---|---|---|---|---|---|---|---|---|---|---|---|---|---|---|---|---|---|---|---|---|---|---|---|---|---|---|---|---|
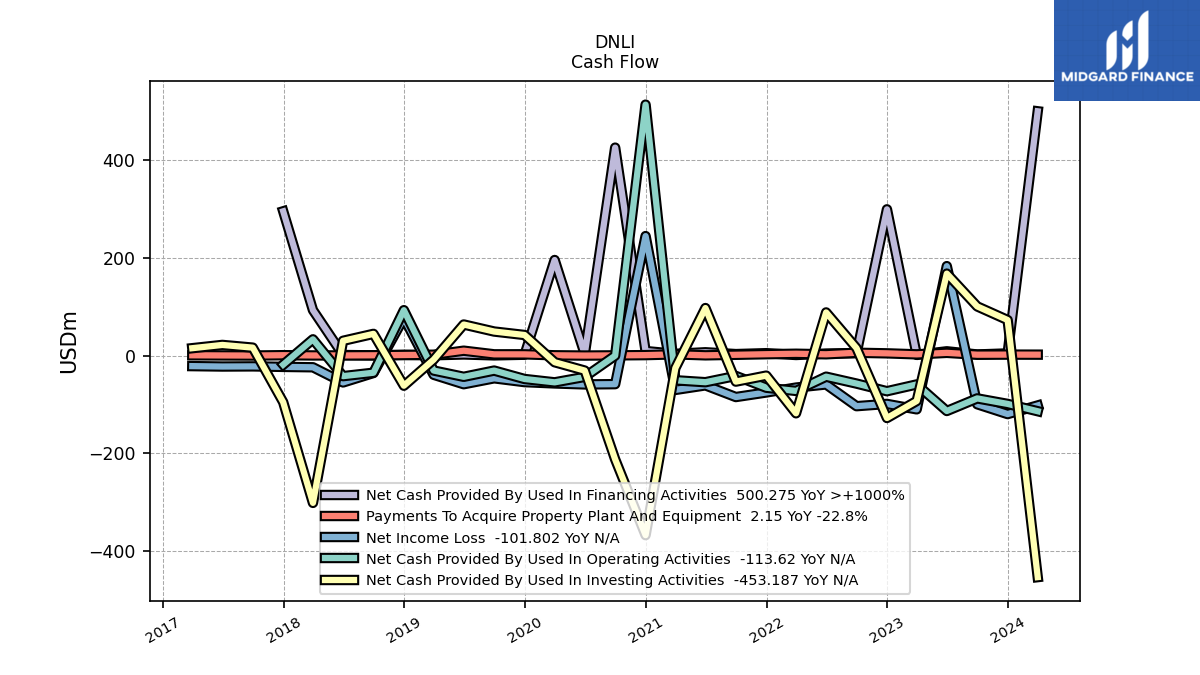
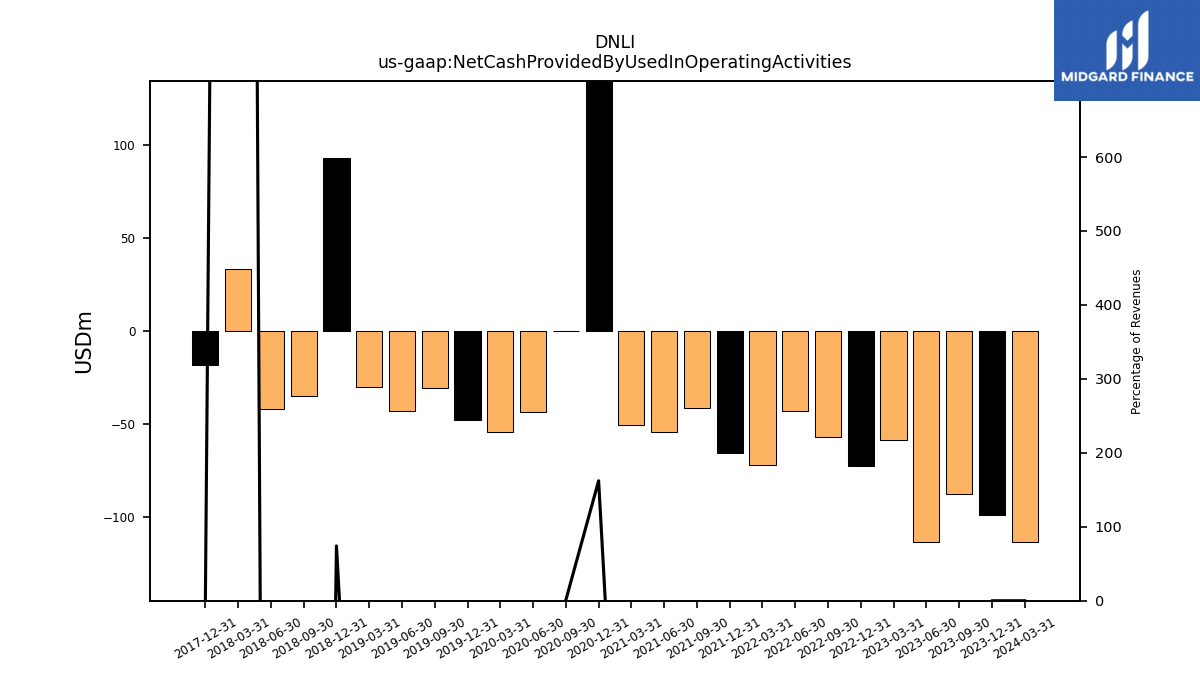
| Net Cash Provided By Used In Operating Activities | -98.66 | -87.36 | -113.17 | -58.80 | -72.66 | -57.05 | -42.90 | -72.11 | -65.49 | -41.43 | -54.22 | -50.24 | 513.91 | 0.09 | -43.36 | -54.49 | -47.64 | -30.43 | -43.17 | -30.32 | 93.19 | -34.82 | -41.82 | 33.58 | -18.34 | NA | NA | |
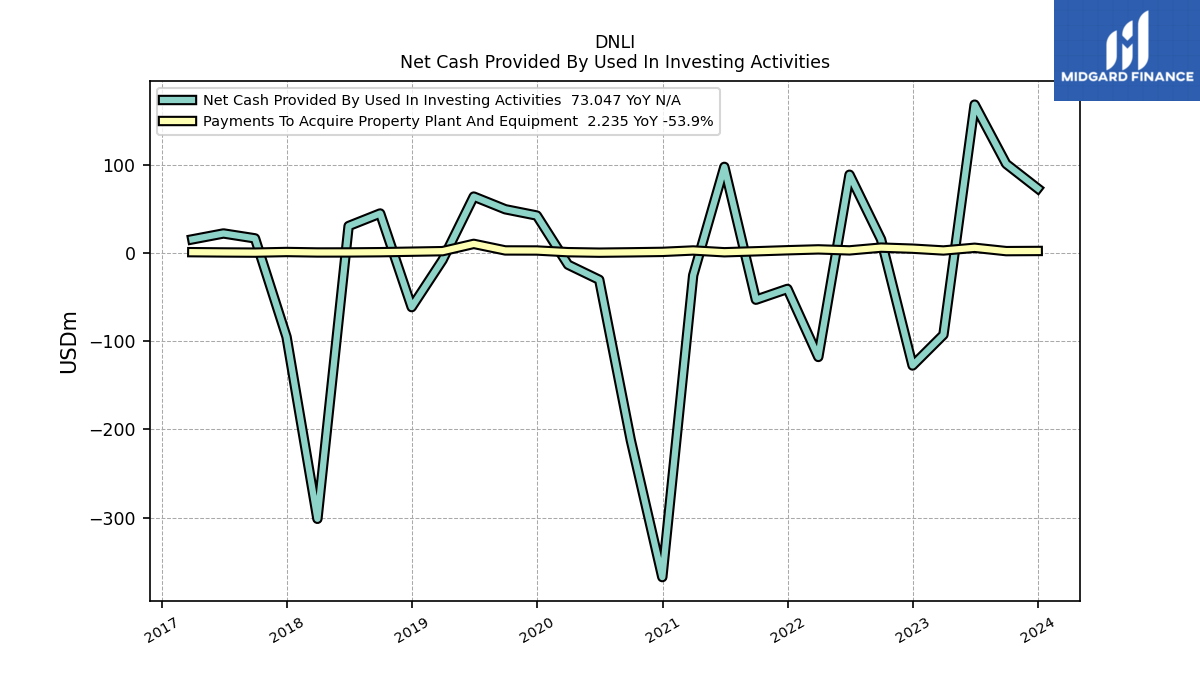
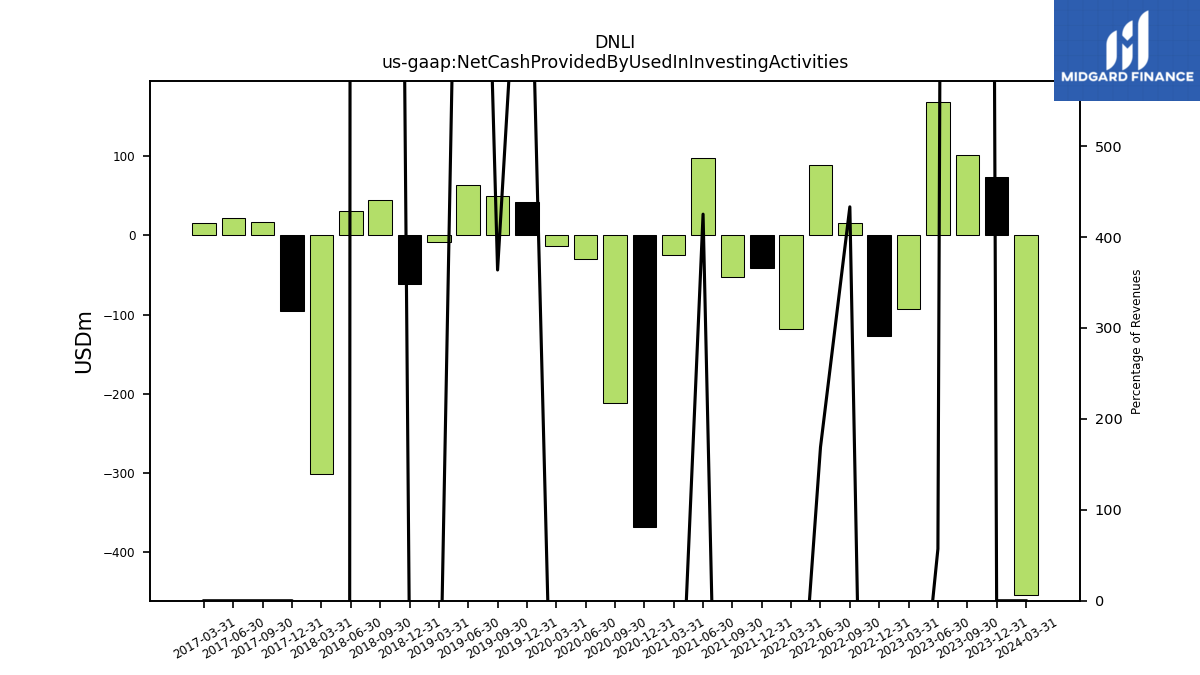
| Net Cash Provided By Used In Investing Activities | 73.05 | 100.91 | 168.07 | -92.72 | -127.56 | 15.42 | 88.63 | -117.88 | -40.75 | -53.01 | 97.54 | -25.41 | -367.34 | -212.12 | -30.41 | -13.33 | 42.38 | 49.49 | 63.88 | -8.05 | -61.40 | 44.73 | 30.53 | -301.27 | -95.15 | 16.53 | 22.07 | |
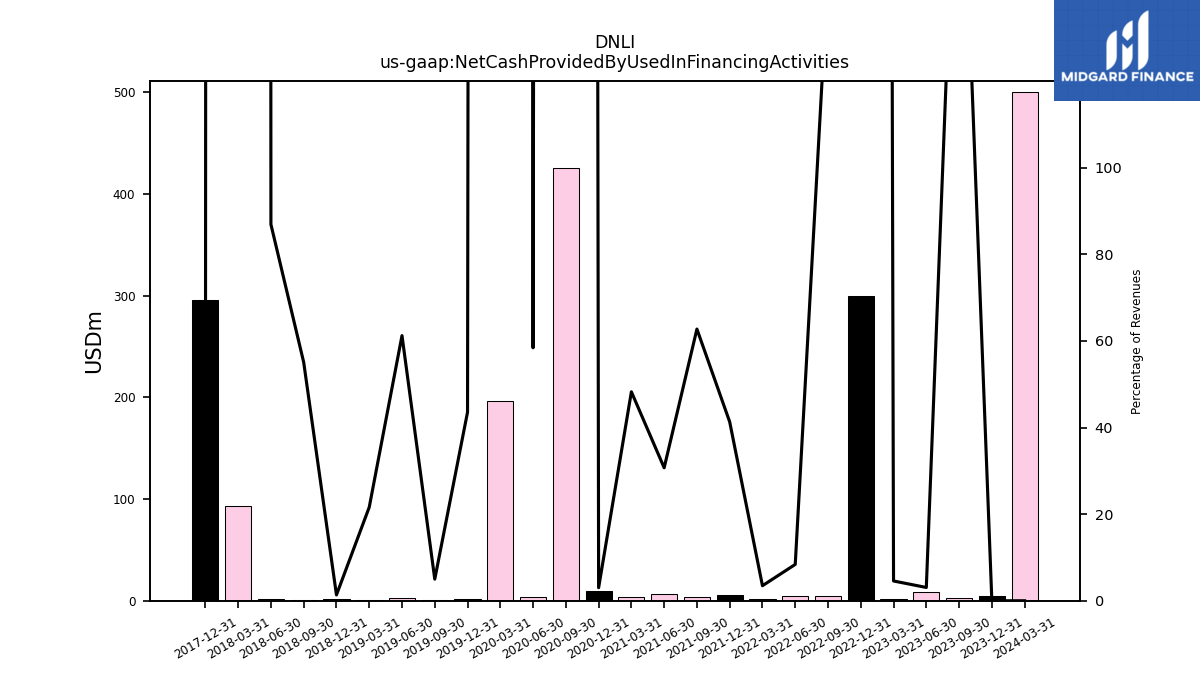
| Net Cash Provided By Used In Financing Activities | 4.71 | 2.49 | 9.02 | 1.60 | 299.65 | 5.15 | 4.40 | 1.46 | 5.17 | 3.31 | 7.04 | 3.82 | 9.52 | 425.90 | 3.42 | 195.91 | 2.03 | 0.68 | 2.57 | 0.91 | 1.69 | 0.66 | 1.43 | 93.24 | 295.59 | NA | NA |
| 2023-12-31 | 2023-09-30 | 2023-06-30 | 2023-03-31 | 2022-12-31 | 2022-09-30 | 2022-06-30 | 2022-03-31 | 2021-12-31 | 2021-09-30 | 2021-06-30 | 2021-03-31 | 2020-12-31 | 2020-09-30 | 2020-06-30 | 2020-03-31 | 2019-12-31 | 2019-09-30 | 2019-06-30 | 2019-03-31 | 2018-12-31 | 2018-09-30 | 2018-06-30 | 2018-03-31 | 2017-12-31 | 2017-09-30 | 2017-06-30 | ||
|---|---|---|---|---|---|---|---|---|---|---|---|---|---|---|---|---|---|---|---|---|---|---|---|---|---|---|---|---|
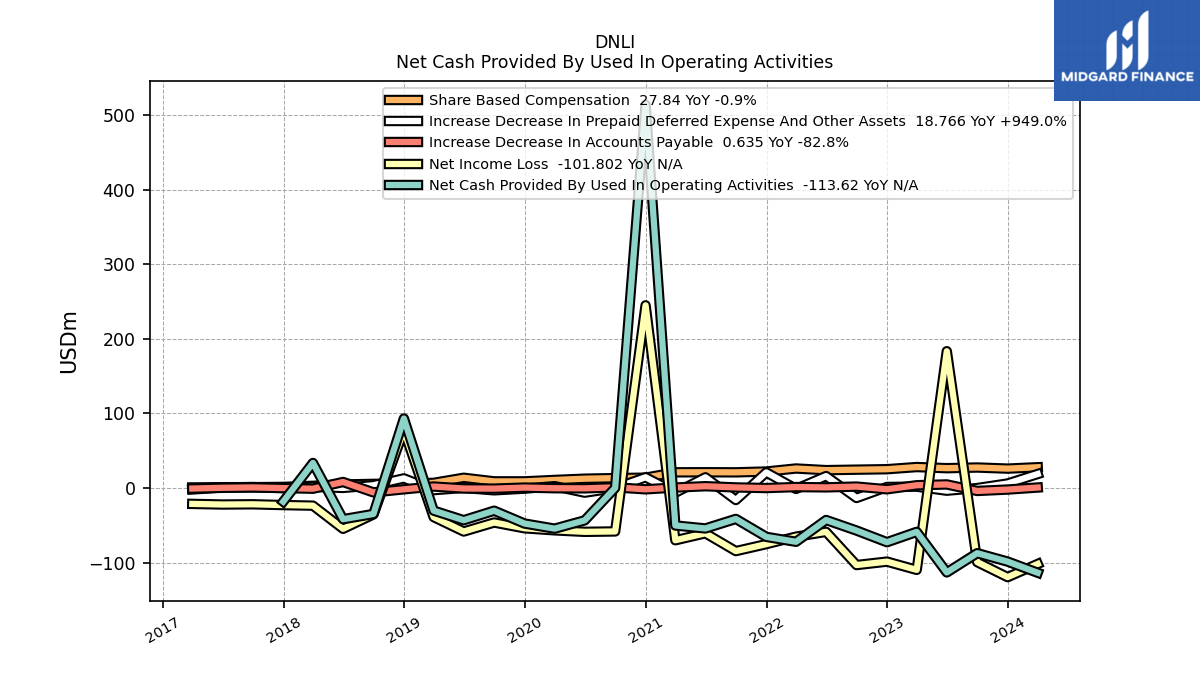
| Net Cash Provided By Used In Operating Activities | -98.66 | -87.36 | -113.17 | -58.80 | -72.66 | -57.05 | -42.90 | -72.11 | -65.49 | -41.43 | -54.22 | -50.24 | 513.91 | 0.09 | -43.36 | -54.49 | -47.64 | -30.43 | -43.17 | -30.32 | 93.19 | -34.82 | -41.82 | 33.58 | -18.34 | NA | NA | |
| Net Income Loss | -119.47 | -99.35 | 183.38 | -109.78 | -98.68 | -103.30 | -58.79 | -65.22 | -75.26 | -84.59 | -60.69 | -70.04 | 244.88 | -58.23 | -58.76 | -56.76 | -54.02 | -46.26 | -58.34 | -38.99 | 77.53 | -35.37 | -54.72 | -23.68 | -22.89 | -21.84 | -22.13 | |
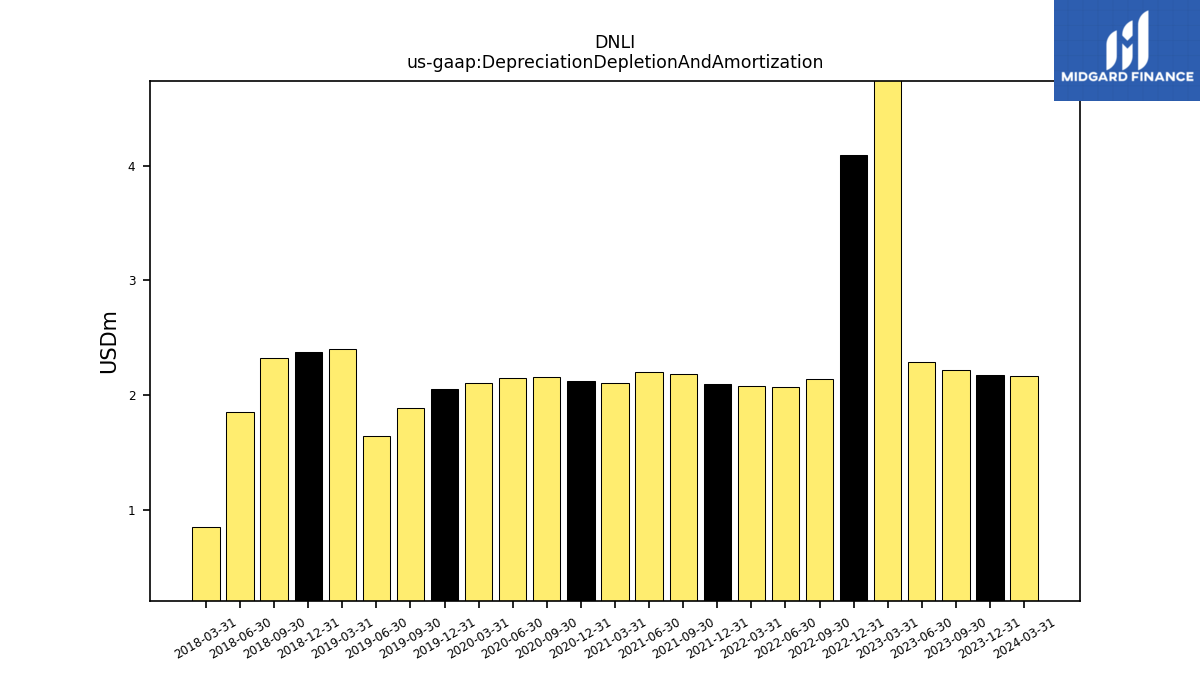
| Depreciation Depletion And Amortization | 2.18 | 2.22 | 2.29 | 10.05 | 4.09 | 2.14 | 2.07 | 2.08 | 2.09 | 2.19 | 2.20 | 2.11 | 2.12 | 2.16 | 2.15 | 2.11 | 2.06 | 1.89 | 1.64 | 2.40 | 2.38 | 2.33 | 1.85 | 0.85 | NA | NA | NA | |
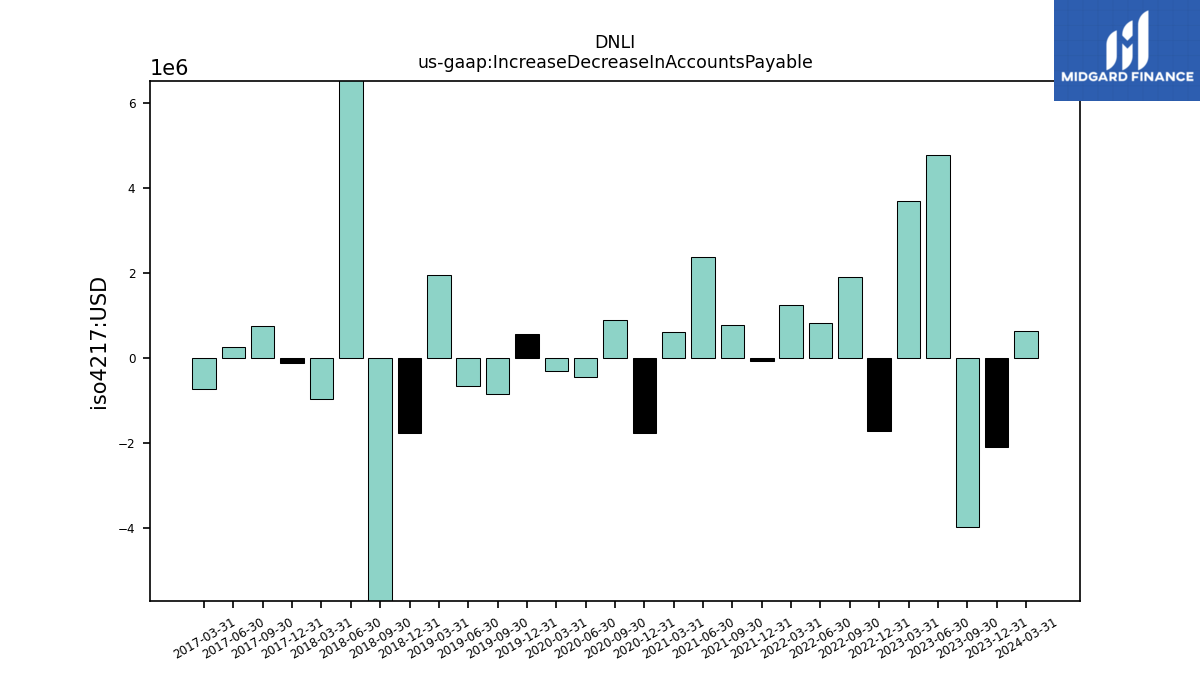
| Increase Decrease In Accounts Payable | -2.08 | -3.96 | 4.77 | 3.70 | -1.72 | 1.90 | 0.84 | 1.25 | -0.08 | 0.78 | 2.38 | 0.62 | -1.77 | 0.89 | -0.45 | -0.29 | 0.57 | -0.84 | -0.66 | 1.97 | -1.76 | -5.86 | 8.04 | -0.95 | -0.11 | 0.76 | 0.27 | |
| Share Based Compensation | 25.99 | 27.46 | 26.57 | 28.08 | 25.19 | 24.58 | 23.94 | 26.14 | 22.09 | 21.00 | 21.14 | 21.03 | 13.83 | 13.25 | 12.48 | 10.79 | 8.89 | 8.90 | 13.71 | 6.87 | 5.65 | 5.51 | 4.71 | 2.92 | 1.46 | 1.13 | 1.06 |
| 2023-12-31 | 2023-09-30 | 2023-06-30 | 2023-03-31 | 2022-12-31 | 2022-09-30 | 2022-06-30 | 2022-03-31 | 2021-12-31 | 2021-09-30 | 2021-06-30 | 2021-03-31 | 2020-12-31 | 2020-09-30 | 2020-06-30 | 2020-03-31 | 2019-12-31 | 2019-09-30 | 2019-06-30 | 2019-03-31 | 2018-12-31 | 2018-09-30 | 2018-06-30 | 2018-03-31 | 2017-12-31 | 2017-09-30 | 2017-06-30 | ||
|---|---|---|---|---|---|---|---|---|---|---|---|---|---|---|---|---|---|---|---|---|---|---|---|---|---|---|---|---|
| Net Cash Provided By Used In Investing Activities | 73.05 | 100.91 | 168.07 | -92.72 | -127.56 | 15.42 | 88.63 | -117.88 | -40.75 | -53.01 | 97.54 | -25.41 | -367.34 | -212.12 | -30.41 | -13.33 | 42.38 | 49.49 | 63.88 | -8.05 | -61.40 | 44.73 | 30.53 | -301.27 | -95.15 | 16.53 | 22.07 | |
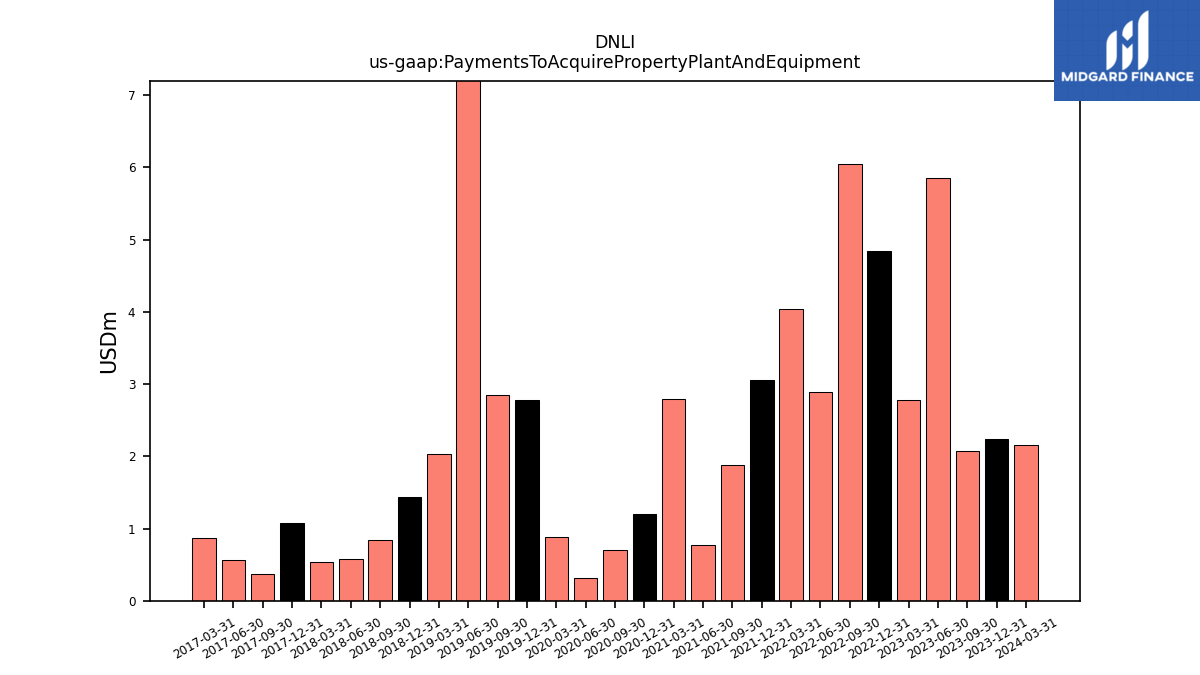
| Payments To Acquire Property Plant And Equipment | 2.23 | 2.07 | 5.85 | 2.79 | 4.85 | 6.05 | 2.89 | 4.04 | 3.05 | 1.88 | 0.77 | 2.80 | 1.20 | 0.71 | 0.32 | 0.88 | 2.77 | 2.85 | 10.27 | 2.03 | 1.44 | 0.85 | 0.57 | 0.54 | 1.07 | 0.37 | 0.57 |
| 2023-12-31 | 2023-09-30 | 2023-06-30 | 2023-03-31 | 2022-12-31 | 2022-09-30 | 2022-06-30 | 2022-03-31 | 2021-12-31 | 2021-09-30 | 2021-06-30 | 2021-03-31 | 2020-12-31 | 2020-09-30 | 2020-06-30 | 2020-03-31 | 2019-12-31 | 2019-09-30 | 2019-06-30 | 2019-03-31 | 2018-12-31 | 2018-09-30 | 2018-06-30 | 2018-03-31 | 2017-12-31 | 2017-09-30 | 2017-06-30 | ||
|---|---|---|---|---|---|---|---|---|---|---|---|---|---|---|---|---|---|---|---|---|---|---|---|---|---|---|---|---|
| Net Cash Provided By Used In Financing Activities | 4.71 | 2.49 | 9.02 | 1.60 | 299.65 | 5.15 | 4.40 | 1.46 | 5.17 | 3.31 | 7.04 | 3.82 | 9.52 | 425.90 | 3.42 | 195.91 | 2.03 | 0.68 | 2.57 | 0.91 | 1.69 | 0.66 | 1.43 | 93.24 | 295.59 | NA | NA |
| 2023-12-31 | 2023-09-30 | 2023-06-30 | 2023-03-31 | 2022-12-31 | 2022-09-30 | 2022-06-30 | 2022-03-31 | 2021-12-31 | 2021-09-30 | 2021-06-30 | 2021-03-31 | 2020-12-31 | 2020-09-30 | 2020-06-30 | 2020-03-31 | 2019-12-31 | 2019-09-30 | 2019-06-30 | 2019-03-31 | 2018-12-31 | 2018-09-30 | 2018-06-30 | 2018-03-31 | 2017-12-31 | 2017-09-30 | 2017-06-30 | ||
|---|---|---|---|---|---|---|---|---|---|---|---|---|---|---|---|---|---|---|---|---|---|---|---|---|---|---|---|---|
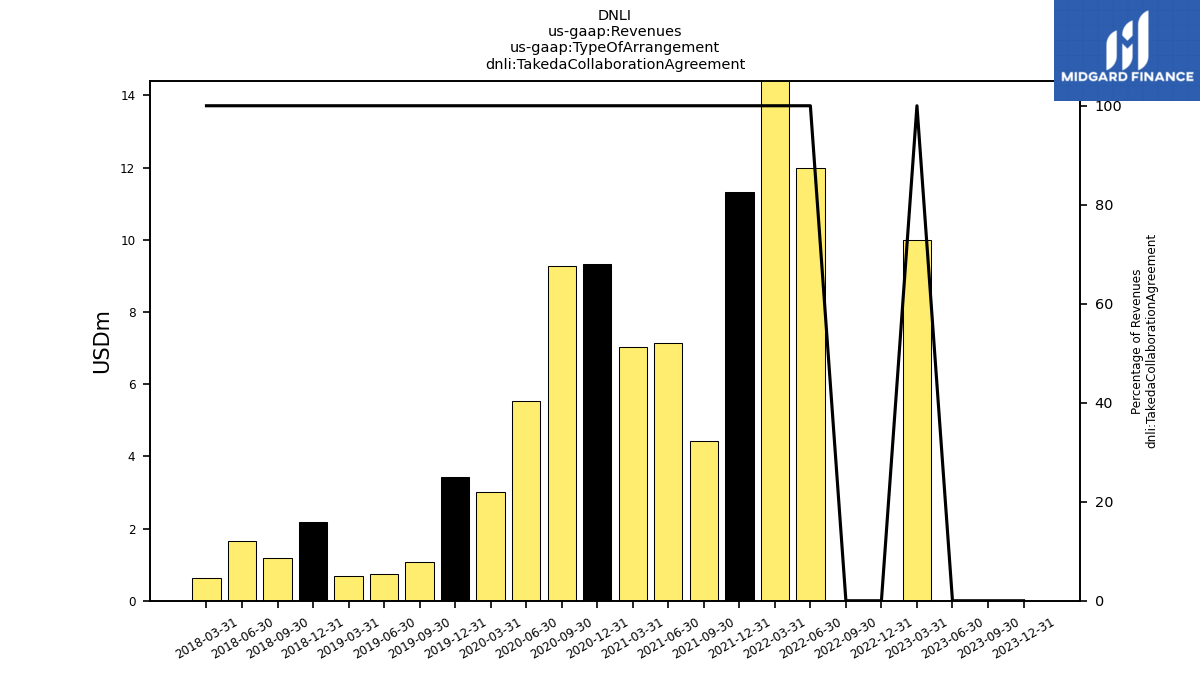
| Revenues | 0.00 | 1.27 | 294.12 | 35.14 | 10.28 | 3.56 | 52.48 | 42.14 | 12.51 | 5.29 | 22.94 | 7.92 | 316.81 | 9.39 | 5.85 | 3.60 | 4.67 | 13.60 | 4.20 | 4.21 | 125.68 | 1.20 | 1.65 | 0.64 | 0.00 | 0.00 | 0.00 | |
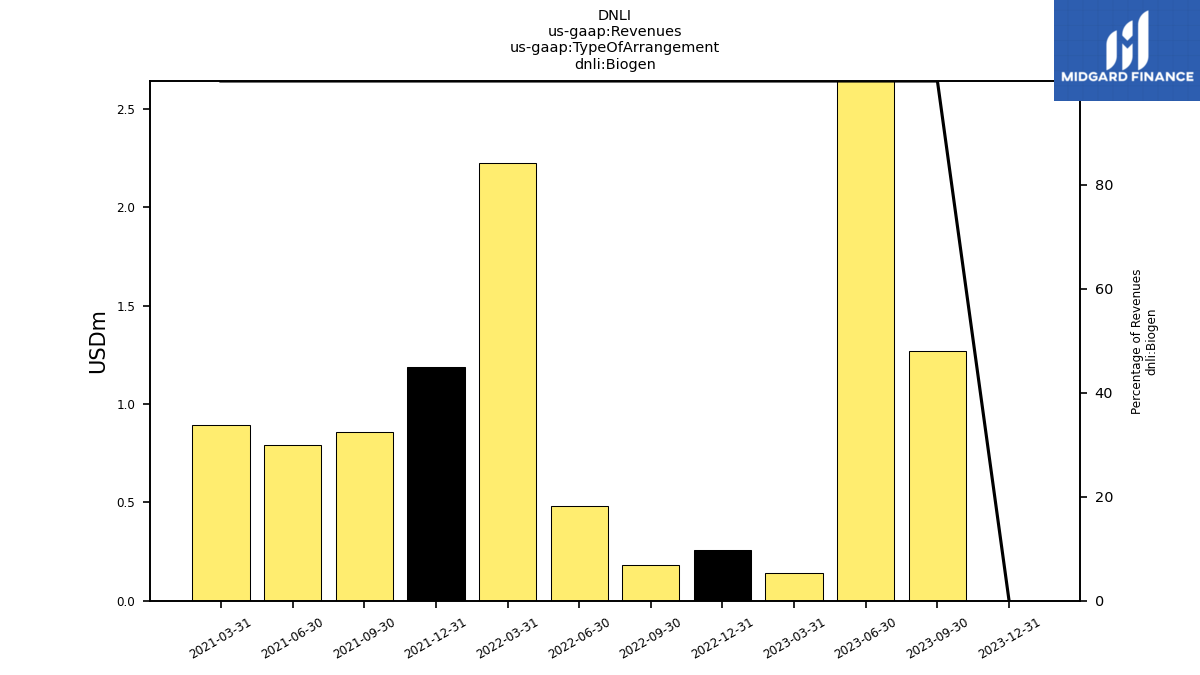
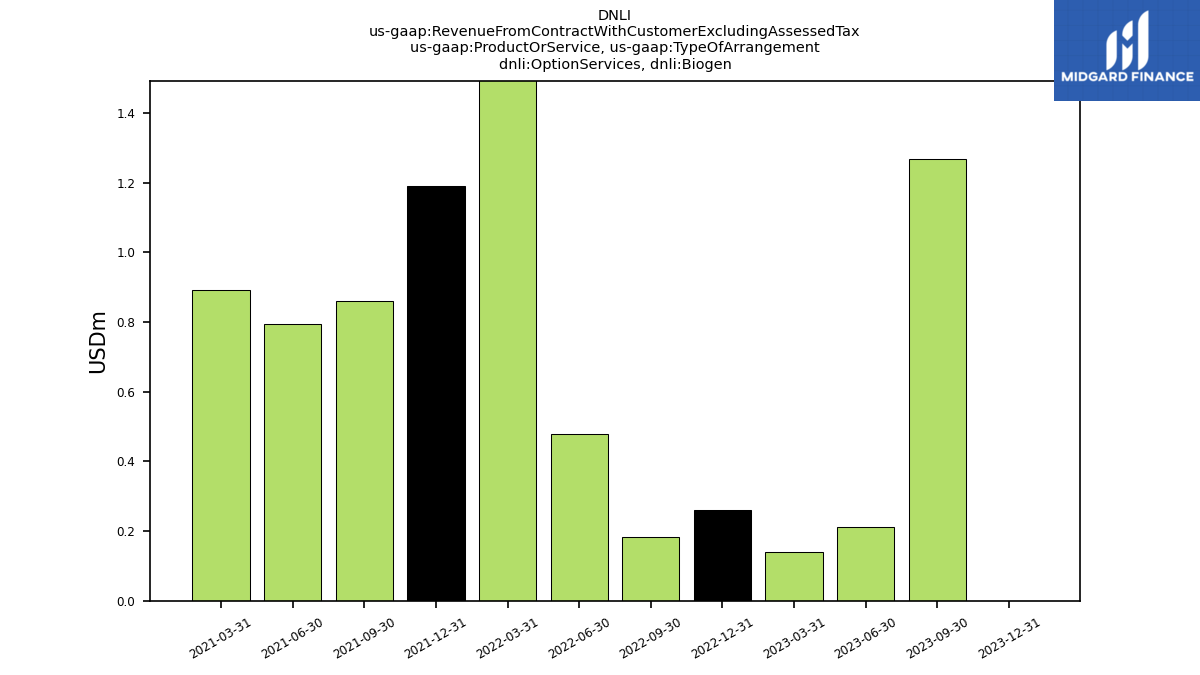
| Biogen | 0.00 | 1.27 | 294.12 | 0.14 | 0.26 | 0.18 | 0.48 | 2.23 | 1.19 | 0.86 | 0.79 | 0.89 | NA | NA | NA | NA | NA | NA | NA | NA | NA | NA | NA | NA | NA | NA | NA | |
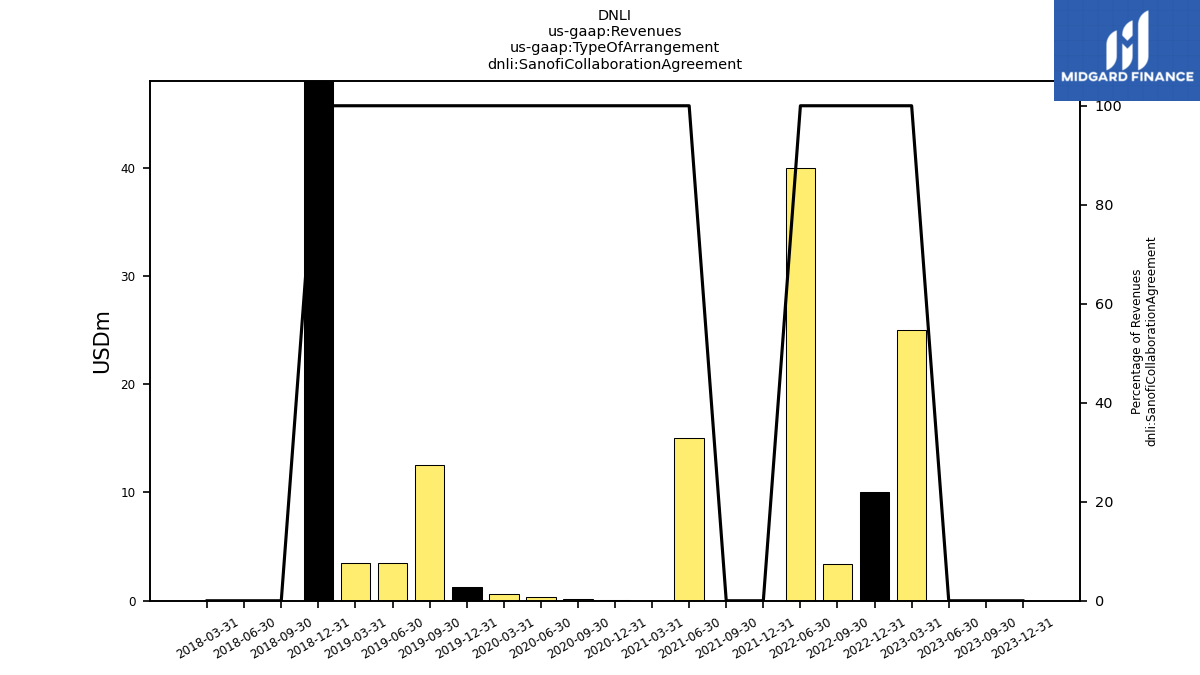
| Sanofi Collaboration Agreement | 0.00 | 0.00 | 0.00 | 25.00 | 10.02 | 3.38 | 40.00 | NA | 0.00 | 0.00 | 15.00 | 0.00 | 0.05 | 0.12 | 0.31 | 0.59 | 1.25 | 12.52 | 3.46 | 3.52 | 123.48 | 0.00 | 0.00 | 0.00 | NA | NA | NA | |
| Takeda Collaboration Agreement | 0.00 | 0.00 | 0.00 | 10.00 | 0.00 | 0.00 | 12.00 | 39.92 | 11.32 | 4.42 | 7.14 | 7.03 | 9.33 | 9.27 | 5.54 | 3.02 | 3.42 | 1.08 | 0.74 | 0.68 | 2.19 | 1.20 | 1.65 | 0.64 | NA | NA | NA | |
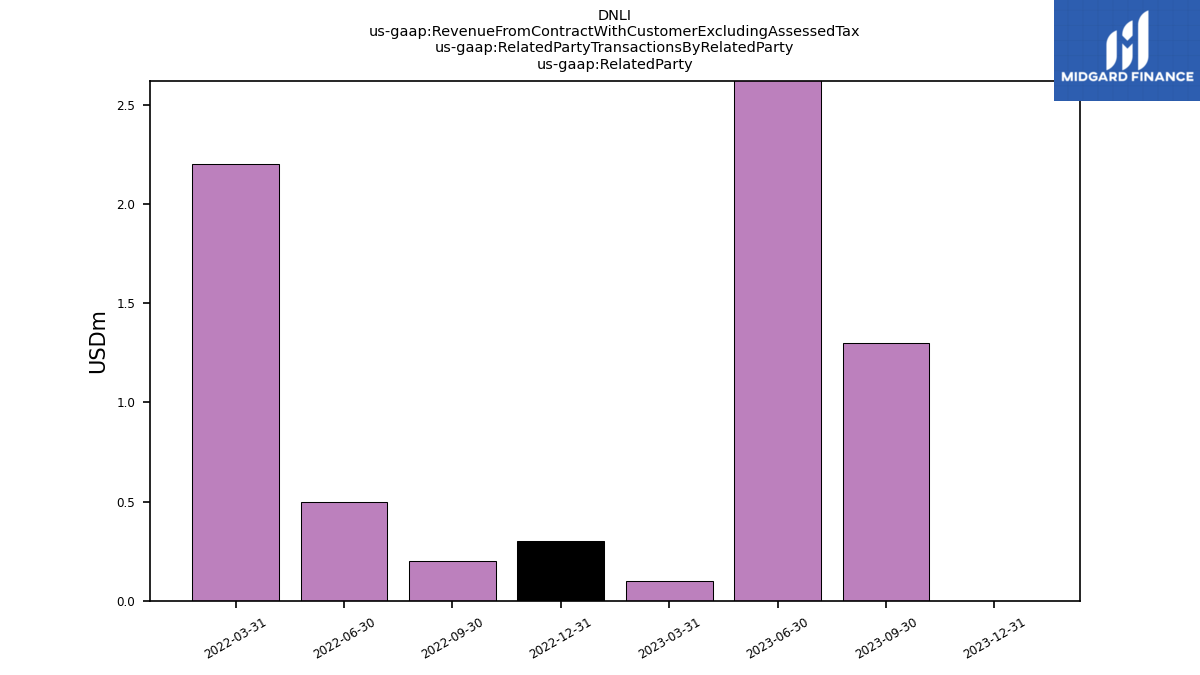
| Revenue From Contract With Customer Excluding Assessed Tax | 0.00 | 1.27 | 294.12 | 35.14 | 10.26 | 0.18 | 52.48 | 42.14 | 12.51 | 5.29 | 22.94 | 7.92 | 316.81 | 9.39 | 5.81 | 3.55 | 4.67 | 13.60 | 4.20 | 4.21 | 125.68 | 1.20 | 1.65 | 0.64 | 0.00 | 0.00 | 0.00 | |
| Takeda Pharmaceutical Company Limited, Option Fee Payment, Collaborative Arrangement P T V P G R N And A T V T R E M2 | 0.00 | NA | 0.00 | 10.00 | 0.00 | 0.00 | NA | NA | NA | NA | NA | NA | NA | NA | NA | NA | NA | NA | NA | NA | NA | NA | NA | NA | NA | NA | NA | |
| C N S Program License, Sanofi Collaboration Agreement | 0.00 | 0.00 | 0.00 | 25.00 | 0.00 | 0.00 | 40.00 | NA | NA | NA | NA | NA | NA | NA | NA | NA | NA | NA | NA | NA | NA | NA | NA | NA | NA | NA | NA | |
| Option Services, Biogen | 0.00 | 1.27 | 0.21 | 0.14 | 0.26 | 0.18 | 0.48 | 2.23 | 1.19 | 0.86 | 0.79 | 0.89 | NA | NA | NA | NA | NA | NA | NA | NA | NA | NA | NA | NA | NA | NA | NA | |
| Related Party | 0.00 | 1.30 | 294.10 | 0.10 | 0.30 | 0.20 | 0.50 | 2.20 | NA | NA | NA | NA | NA | NA | NA | NA | NA | NA | NA | NA | NA | NA | NA | NA | NA | NA | NA |