
| 2024-03-31 | 2023-12-31 | 2023-09-30 | 2023-06-30 | 2023-03-31 | 2022-12-31 | 2022-09-30 | 2022-06-30 | 2022-03-31 | 2021-12-31 | 2021-09-30 | 2021-06-30 | 2021-03-31 | 2020-12-31 | 2020-09-30 | 2020-06-30 | 2020-03-31 | 2019-12-31 | 2019-09-30 | 2019-06-30 | 2019-03-31 | 2018-12-31 | 2018-09-30 | 2018-06-30 | 2018-03-31 | 2017-12-31 | 2017-09-30 | 2017-06-30 | 2017-03-31 | 2016-12-31 | 2016-09-30 | 2016-06-30 | 2016-03-31 | 2015-12-31 | 2015-09-30 | 2015-06-30 | 2015-03-31 | 2014-12-31 | 2014-09-30 | 2014-06-30 | 2014-03-31 | 2013-12-31 | 2013-09-30 | 2013-06-30 | 2013-03-31 | 2012-12-31 | 2012-09-30 | 2012-06-30 | 2012-03-31 | 2011-12-31 | 2011-09-30 | 2011-06-30 | 2011-03-31 | 2010-12-31 | 2010-09-30 | 2010-06-30 | 2010-03-31 | 2009-12-31 | 2009-09-30 | 2009-06-30 | 2009-03-31 | ||
|---|---|---|---|---|---|---|---|---|---|---|---|---|---|---|---|---|---|---|---|---|---|---|---|---|---|---|---|---|---|---|---|---|---|---|---|---|---|---|---|---|---|---|---|---|---|---|---|---|---|---|---|---|---|---|---|---|---|---|---|---|---|---|
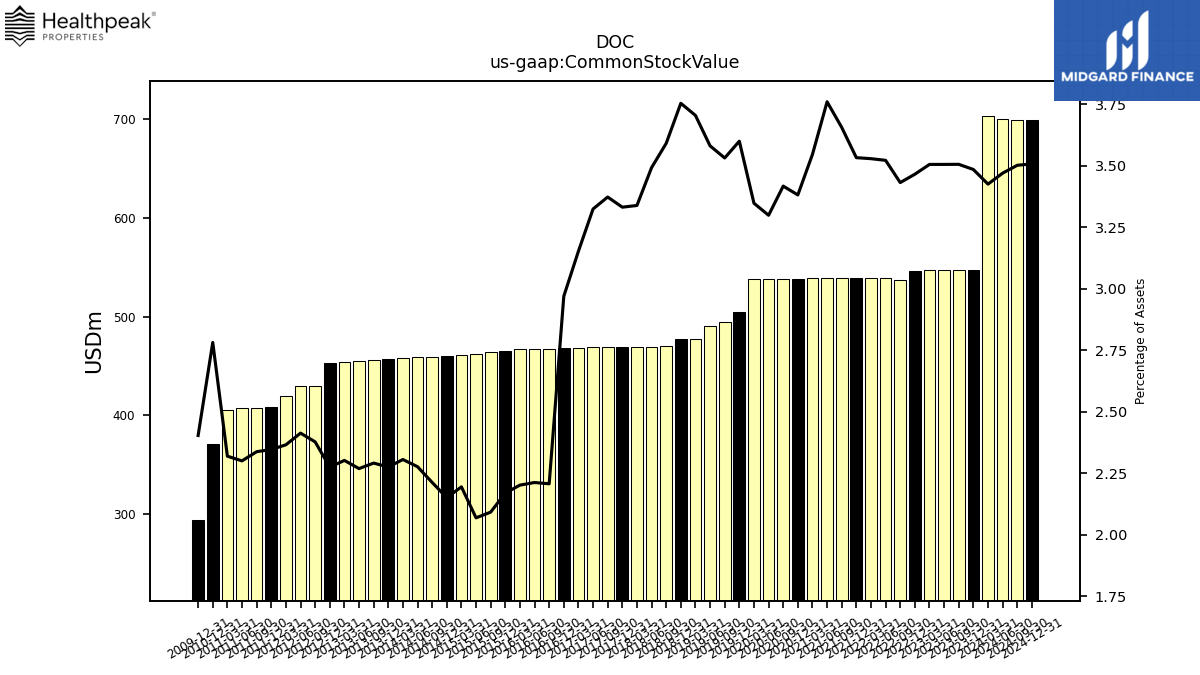
| Common Stock Value | 703.73 | 547.16 | 547.07 | 547.05 | 547.00 | 546.64 | 537.53 | 539.58 | 539.52 | 539.10 | 539.07 | 538.96 | 538.89 | 538.40 | 538.36 | 538.32 | 538.13 | 505.22 | 494.85 | 491.11 | 477.93 | 477.50 | 469.92 | 469.83 | 469.73 | 469.44 | 469.04 | 468.88 | 468.45 | 468.08 | 467.82 | 467.32 | 466.93 | 465.49 | 464.44 | 462.49 | 461.58 | 459.75 | 459.15 | 458.74 | 458.04 | 456.96 | 455.87 | 455.09 | 454.42 | 453.19 | 429.98 | 429.40 | 419.43 | 408.63 | 407.78 | 407.12 | 406.01 | 370.93 | NA | NA | NA | 293.55 | NA | NA | NA | |
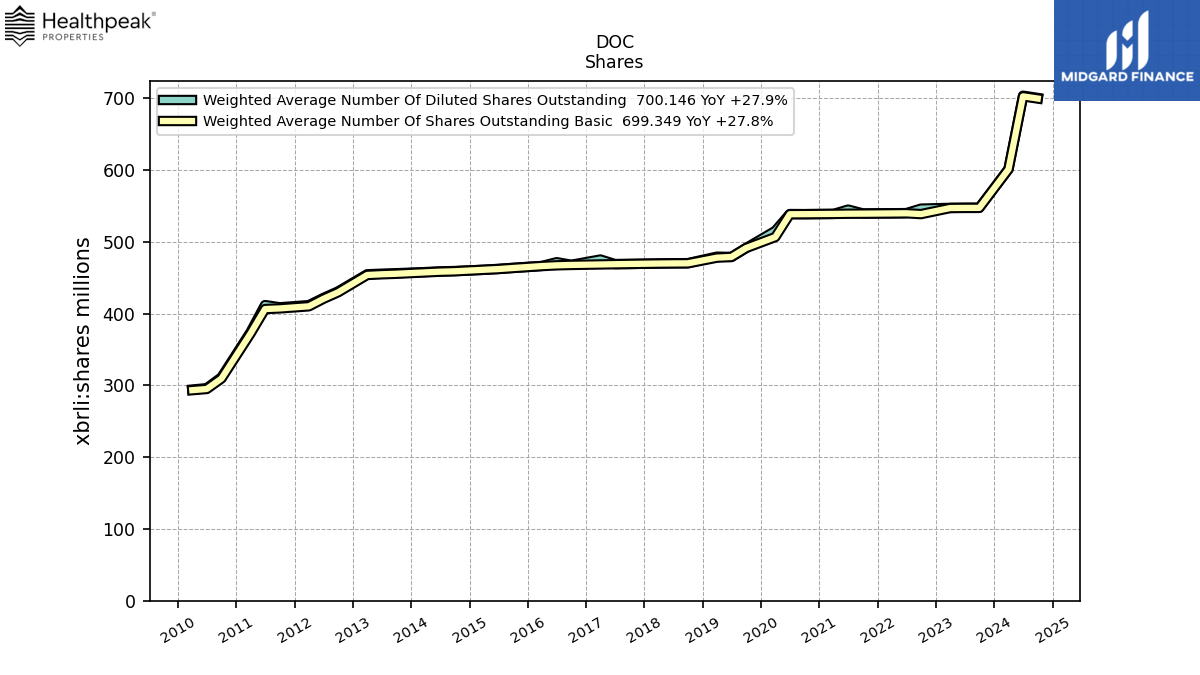
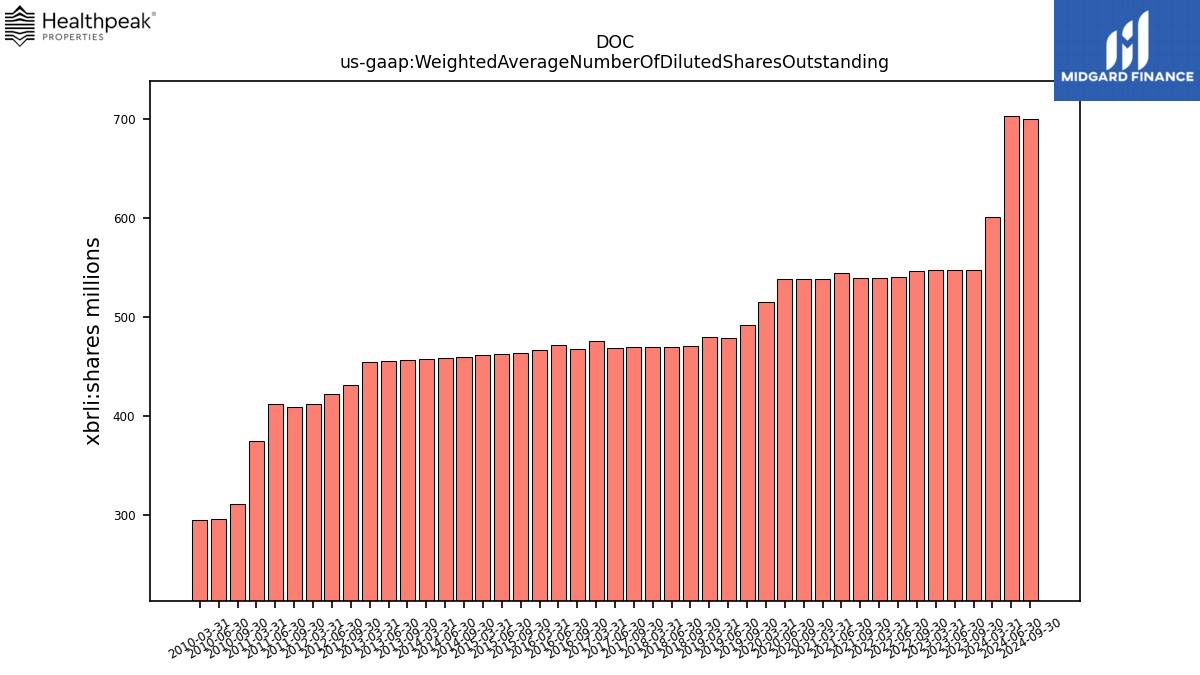
| Weighted Average Number Of Diluted Shares Outstanding | 601.19 | NA | 547.33 | 547.29 | 547.11 | NA | 546.01 | 539.82 | 539.59 | NA | 539.39 | 544.69 | 538.68 | NA | 538.33 | 538.52 | 515.04 | NA | 491.20 | 478.74 | 479.13 | NA | 470.12 | 469.94 | 469.69 | NA | 468.98 | 468.84 | 475.17 | NA | 467.83 | 471.43 | 466.26 | NA | 463.59 | 462.11 | 460.88 | NA | 459.14 | 458.59 | 457.67 | NA | 456.08 | 455.43 | 454.61 | NA | 430.78 | 421.67 | 411.66 | NA | 408.65 | 411.71 | 373.96 | NA | 311.09 | 296.04 | 294.09 | NA | NA | NA | NA | |
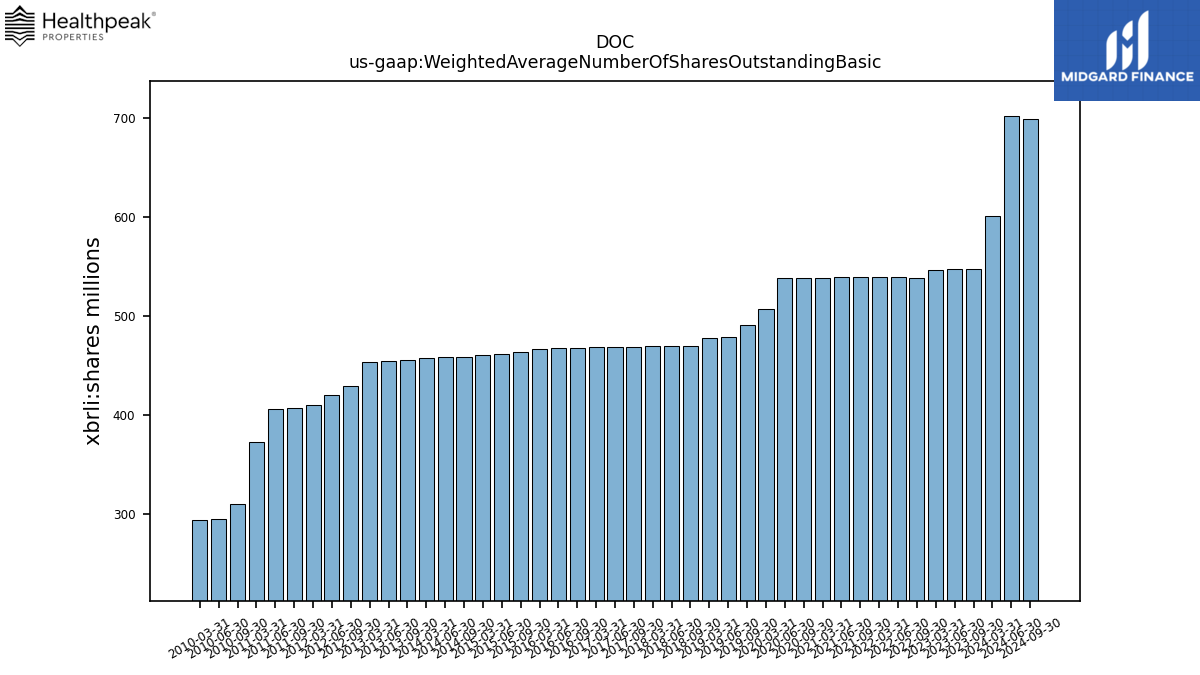
| Weighted Average Number Of Shares Outstanding Basic | 600.90 | NA | 547.06 | 547.03 | 546.84 | NA | 538.42 | 539.56 | 539.35 | NA | 539.02 | 538.93 | 538.68 | NA | 538.33 | 538.26 | 506.48 | NA | 491.20 | 478.74 | 477.77 | NA | 469.87 | 469.77 | 469.56 | NA | 468.98 | 468.65 | 468.30 | NA | 467.63 | 467.08 | 466.07 | NA | 463.34 | 461.87 | 460.88 | NA | 458.80 | 458.25 | 457.29 | NA | 455.35 | 454.62 | 453.65 | NA | 429.56 | 420.47 | 410.02 | NA | 407.08 | 406.19 | 372.12 | NA | 309.45 | 294.88 | 293.22 | NA | NA | NA | NA | |
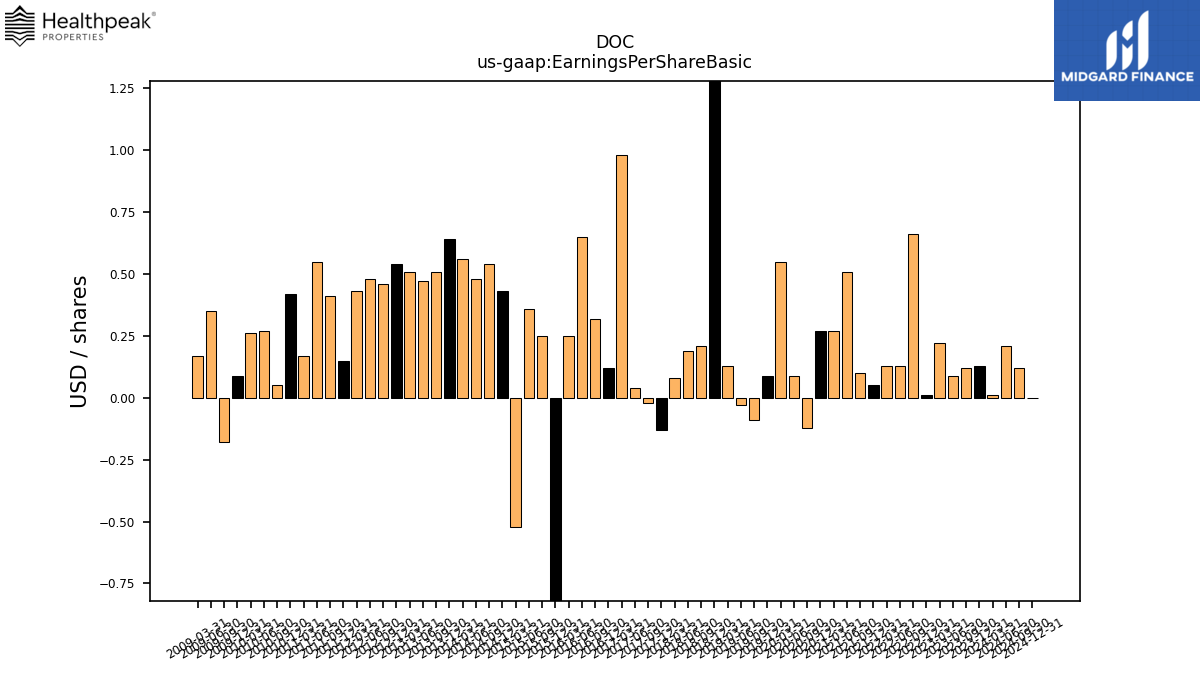
| Earnings Per Share Basic | 0.01 | 0.13 | 0.12 | 0.09 | 0.22 | 0.01 | 0.66 | 0.13 | 0.13 | 0.05 | 0.10 | 0.51 | 0.27 | 0.27 | -0.12 | 0.09 | 0.55 | 0.09 | -0.09 | -0.03 | 0.13 | 1.75 | 0.21 | 0.19 | 0.08 | -0.13 | -0.02 | 0.04 | 0.98 | 0.12 | 0.32 | 0.65 | 0.25 | -1.29 | 0.25 | 0.36 | -0.52 | 0.43 | 0.54 | 0.48 | 0.56 | 0.64 | 0.51 | 0.47 | 0.51 | 0.54 | 0.46 | 0.48 | 0.43 | 0.15 | 0.41 | 0.55 | 0.17 | 0.42 | 0.05 | 0.27 | 0.26 | 0.09 | -0.18 | 0.35 | 0.17 | |
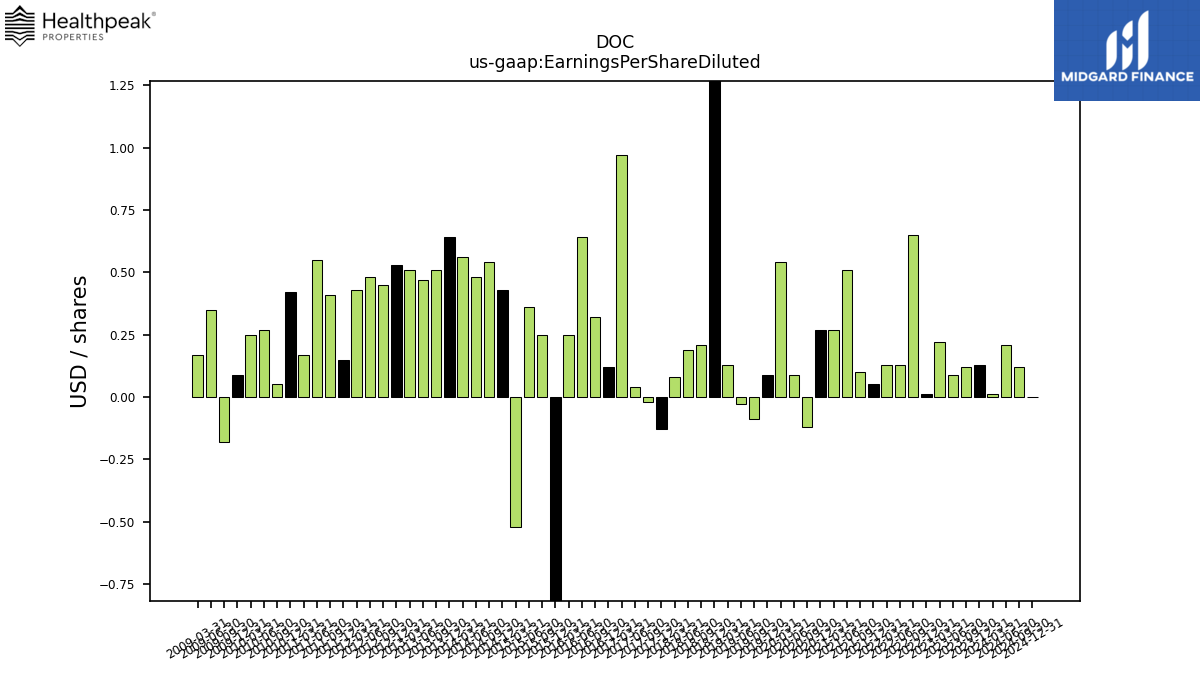
| Earnings Per Share Diluted | 0.01 | 0.13 | 0.12 | 0.09 | 0.22 | 0.01 | 0.65 | 0.13 | 0.13 | 0.05 | 0.10 | 0.51 | 0.27 | 0.27 | -0.12 | 0.09 | 0.54 | 0.09 | -0.09 | -0.03 | 0.13 | 1.73 | 0.21 | 0.19 | 0.08 | -0.13 | -0.02 | 0.04 | 0.97 | 0.12 | 0.32 | 0.64 | 0.25 | -1.29 | 0.25 | 0.36 | -0.52 | 0.43 | 0.54 | 0.48 | 0.56 | 0.64 | 0.51 | 0.47 | 0.51 | 0.53 | 0.45 | 0.48 | 0.43 | 0.15 | 0.41 | 0.55 | 0.17 | 0.42 | 0.05 | 0.27 | 0.25 | 0.09 | -0.18 | 0.35 | 0.17 | |
| Income Loss From Continuing Operations Per Basic Share | NA | 0.00 | 0.00 | 0.00 | 0.00 | 0.00 | 0.00 | 0.00 | 0.00 | 0.00 | 0.00 | 0.00 | -0.00 | -0.00 | -0.00 | 0.00 | 0.00 | 0.00 | -0.00 | 0.00 | 0.00 | NA | NA | NA | NA | -0.00 | -0.00 | 0.00 | 0.00 | -0.00 | 0.00 | 0.00 | 0.00 | -0.00 | 0.00 | 0.00 | -0.00 | 0.00 | 0.00 | 0.00 | 0.00 | 0.00 | 0.00 | 0.00 | 0.00 | 0.00 | 0.00 | 0.00 | 0.00 | 0.00 | 0.00 | 0.00 | 0.00 | 0.00 | 0.00 | 0.00 | 0.00 | NA | NA | NA | NA | |
| Income Loss From Continuing Operations Per Diluted Share | NA | 0.00 | 0.00 | 0.00 | 0.00 | 0.00 | 0.00 | 0.00 | 0.00 | 0.00 | 0.00 | 0.00 | -0.00 | -0.00 | -0.00 | 0.00 | 0.00 | 0.00 | -0.00 | 0.00 | 0.00 | NA | NA | NA | NA | -0.00 | -0.00 | 0.00 | 0.00 | -0.00 | 0.00 | 0.00 | 0.00 | -0.00 | 0.00 | 0.00 | -0.00 | 0.00 | 0.00 | 0.00 | 0.00 | 0.00 | 0.00 | 0.00 | 0.00 | 0.00 | 0.00 | 0.00 | 0.00 | 0.00 | 0.00 | 0.00 | 0.00 | 0.00 | 0.00 | 0.00 | 0.00 | NA | NA | NA | NA |
| 2024-03-31 | 2023-12-31 | 2023-09-30 | 2023-06-30 | 2023-03-31 | 2022-12-31 | 2022-09-30 | 2022-06-30 | 2022-03-31 | 2021-12-31 | 2021-09-30 | 2021-06-30 | 2021-03-31 | 2020-12-31 | 2020-09-30 | 2020-06-30 | 2020-03-31 | 2019-12-31 | 2019-09-30 | 2019-06-30 | 2019-03-31 | 2018-12-31 | 2018-09-30 | 2018-06-30 | 2018-03-31 | 2017-12-31 | 2017-09-30 | 2017-06-30 | 2017-03-31 | 2016-12-31 | 2016-09-30 | 2016-06-30 | 2016-03-31 | 2015-12-31 | 2015-09-30 | 2015-06-30 | 2015-03-31 | 2014-12-31 | 2014-09-30 | 2014-06-30 | 2014-03-31 | 2013-12-31 | 2013-09-30 | 2013-06-30 | 2013-03-31 | 2012-12-31 | 2012-09-30 | 2012-06-30 | 2012-03-31 | 2011-12-31 | 2011-09-30 | 2011-06-30 | 2011-03-31 | 2010-12-31 | 2010-09-30 | 2010-06-30 | 2010-03-31 | 2009-12-31 | 2009-09-30 | 2009-06-30 | 2009-03-31 | ||
|---|---|---|---|---|---|---|---|---|---|---|---|---|---|---|---|---|---|---|---|---|---|---|---|---|---|---|---|---|---|---|---|---|---|---|---|---|---|---|---|---|---|---|---|---|---|---|---|---|---|---|---|---|---|---|---|---|---|---|---|---|---|---|
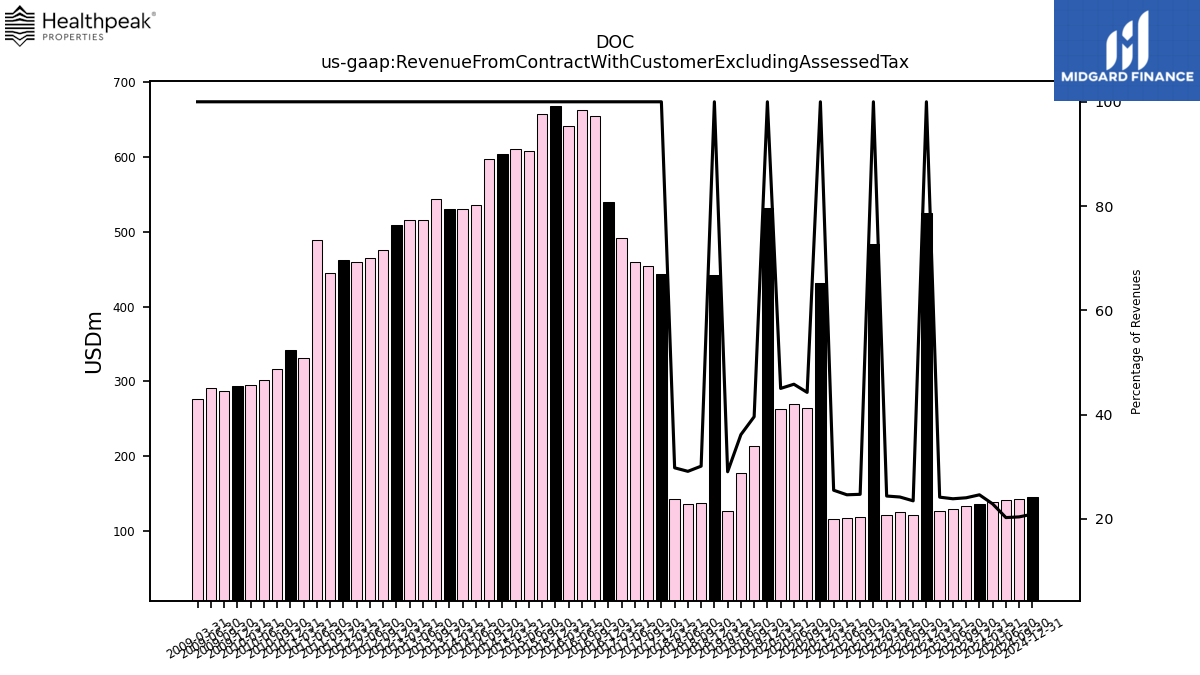
| Revenue From Contract With Customer Excluding Assessed Tax | 138.78 | 136.34 | 133.81 | 130.18 | 127.08 | 524.47 | 122.14 | 125.36 | 121.56 | 483.20 | 119.02 | 117.31 | 116.13 | 431.70 | 264.62 | 269.70 | 263.50 | 531.69 | 213.04 | 177.77 | 126.69 | 441.92 | 137.36 | 136.77 | 142.81 | 443.26 | 454.02 | 458.93 | 492.17 | 539.95 | 654.27 | 662.18 | 640.78 | 668.04 | 657.95 | 607.53 | 610.79 | 603.53 | 596.64 | 536.12 | 529.99 | 530.30 | 543.96 | 516.28 | 516.27 | 508.49 | 475.48 | 464.44 | 459.01 | 461.60 | 444.67 | 488.71 | 331.70 | 341.39 | 317.05 | 301.88 | 294.82 | 294.47 | 286.97 | 291.42 | 276.04 | |
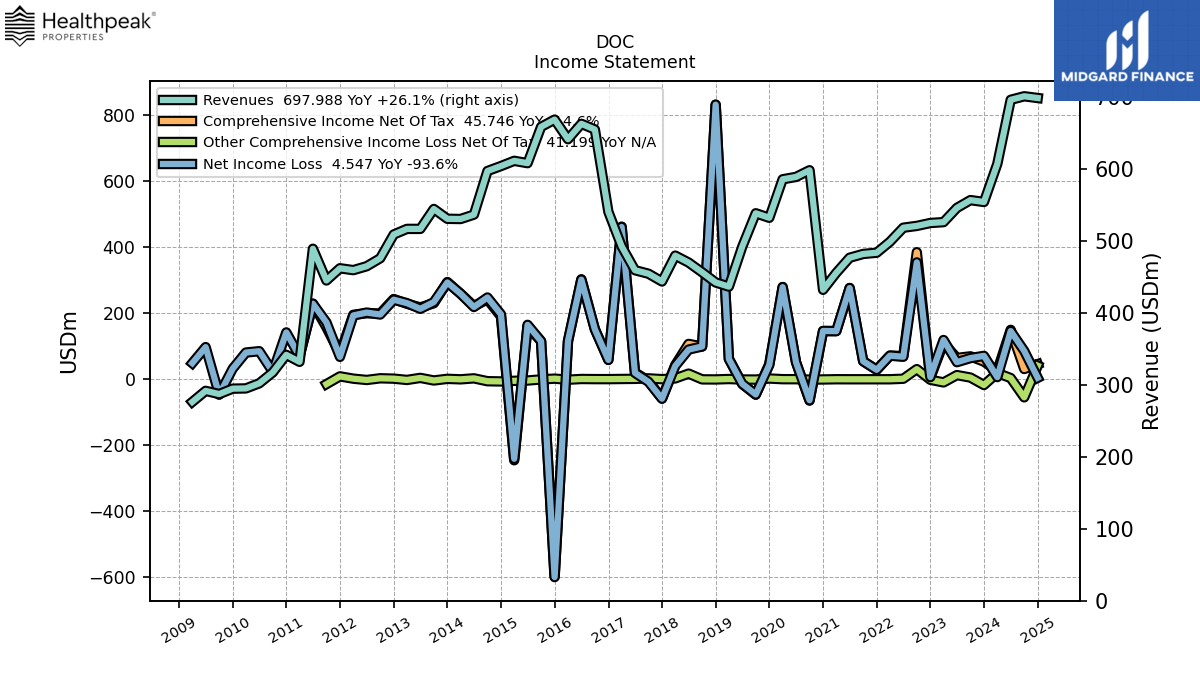
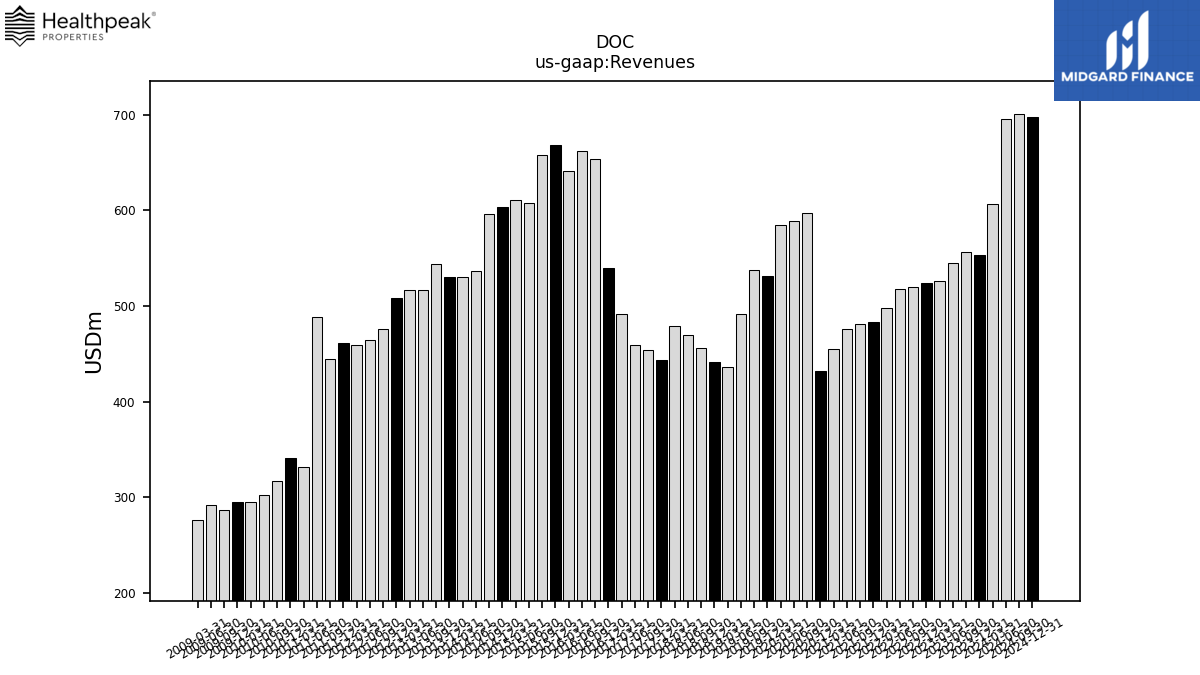
| Revenues | 606.56 | 553.65 | 556.24 | 545.43 | 525.68 | 524.47 | 520.41 | 517.93 | 498.37 | 483.20 | 481.46 | 476.24 | 455.28 | 431.70 | 597.74 | 588.44 | 585.15 | 531.69 | 537.97 | 491.57 | 436.15 | 441.92 | 456.02 | 469.55 | 479.20 | 443.26 | 454.02 | 458.93 | 492.17 | 539.95 | 654.27 | 662.18 | 640.78 | 668.04 | 657.95 | 607.53 | 610.79 | 603.53 | 596.64 | 536.12 | 529.99 | 530.30 | 543.96 | 516.28 | 516.27 | 508.49 | 475.48 | 464.44 | 459.01 | 461.60 | 444.67 | 488.71 | 331.70 | 341.39 | 317.05 | 301.88 | 294.82 | 294.47 | 286.97 | 291.42 | 276.04 | |
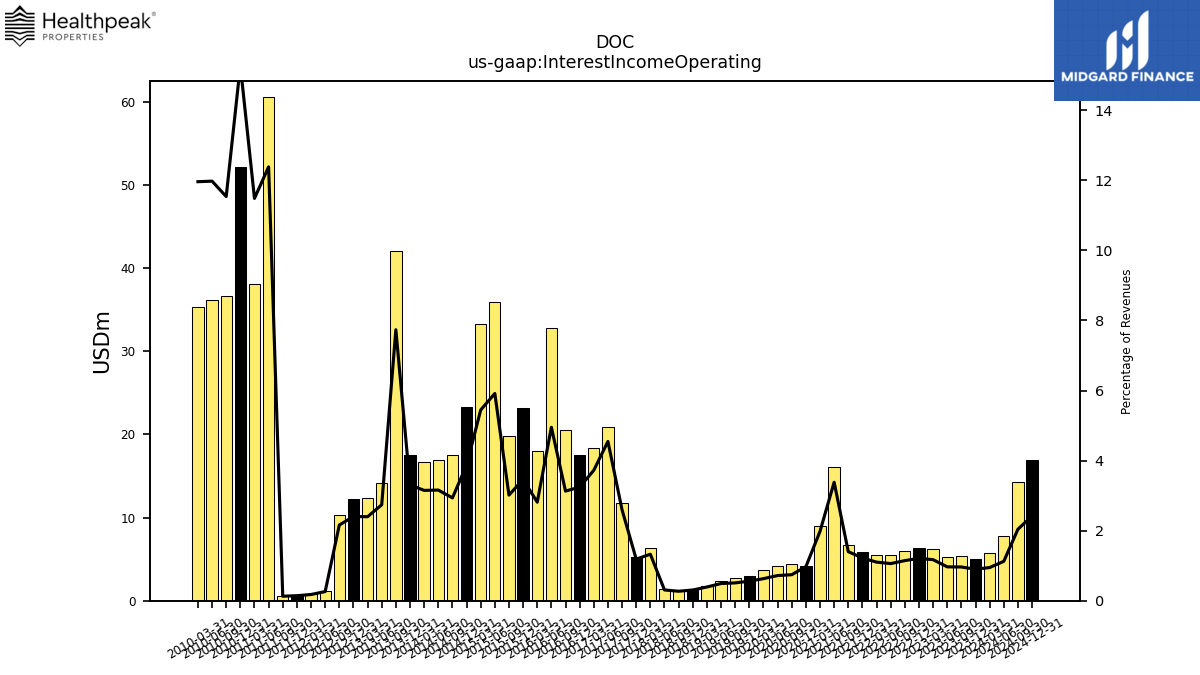
| Interest Income Operating | 5.75 | 4.98 | 5.36 | 5.28 | 6.16 | 6.35 | 5.96 | 5.49 | 5.49 | 5.90 | 6.75 | 16.11 | 9.01 | 4.19 | 4.44 | 4.23 | 3.69 | 2.98 | 2.74 | 2.41 | 1.71 | 1.36 | 1.24 | 1.45 | 6.37 | 5.26 | 11.77 | 20.87 | 18.33 | 17.51 | 20.48 | 32.79 | 18.03 | 23.14 | 19.84 | 35.95 | 33.26 | 23.34 | 17.52 | 16.94 | 16.70 | 17.55 | 42.08 | 14.15 | 12.39 | 12.22 | 10.28 | 1.22 | 0.82 | 0.67 | 0.58 | 60.53 | 38.10 | 52.16 | 36.58 | 36.16 | 35.27 | NA | NA | NA | NA | |
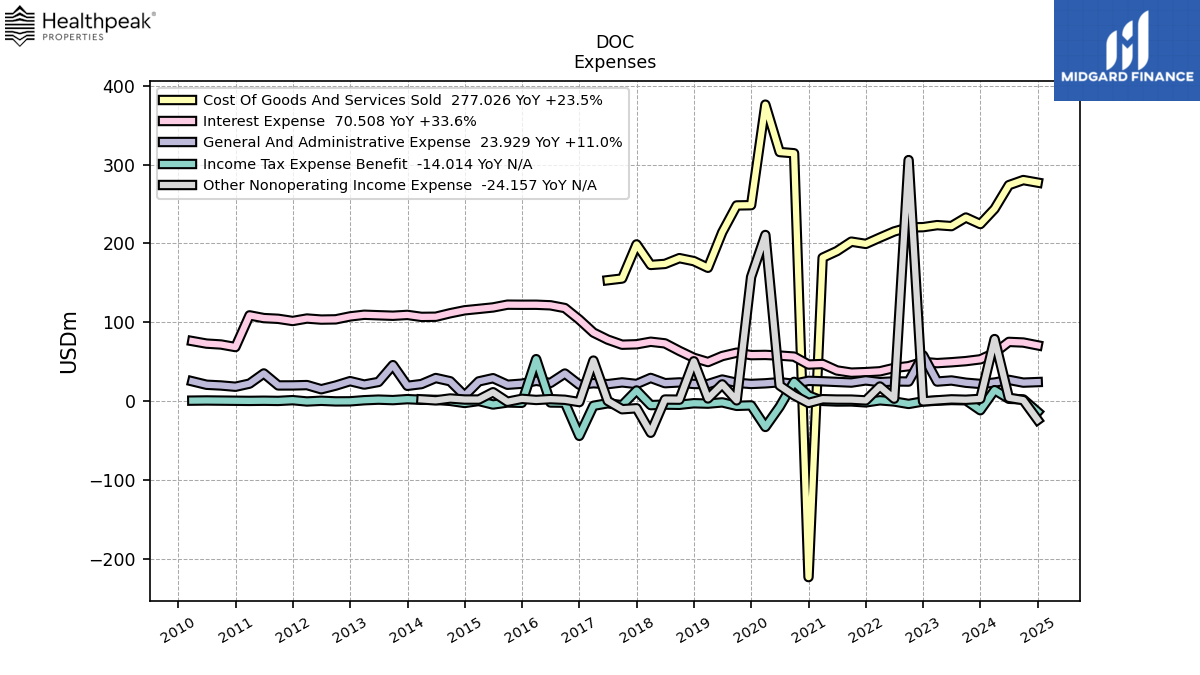
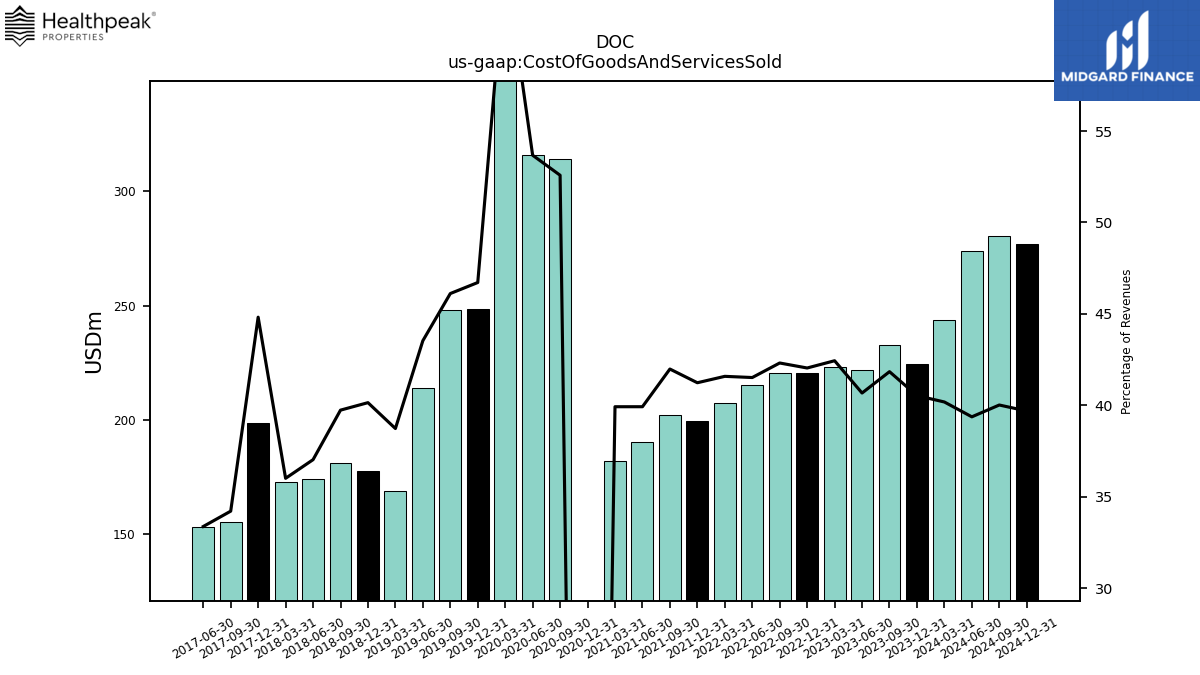
| Cost Of Goods And Services Sold | 243.73 | 224.40 | 232.73 | 221.84 | 223.09 | 220.49 | 220.21 | 215.04 | 207.25 | 199.25 | 202.14 | 190.13 | 181.76 | -223.60 | 314.29 | 315.84 | 376.01 | 248.38 | 248.07 | 213.99 | 168.93 | 177.41 | 181.21 | 173.87 | 172.55 | 198.67 | 155.34 | 153.16 | NA | NA | NA | NA | NA | NA | NA | NA | NA | NA | NA | NA | NA | NA | NA | NA | NA | NA | NA | NA | NA | NA | NA | NA | NA | NA | NA | NA | NA | NA | NA | NA | NA | |
| Operating Expenses | 243.73 | 224.40 | 232.73 | 221.84 | 223.09 | 220.49 | 220.21 | 215.04 | 207.25 | 199.25 | 202.14 | 190.13 | 181.76 | -223.60 | 314.29 | 315.84 | 376.01 | 248.38 | 248.07 | 213.99 | 168.93 | 177.41 | 181.21 | 173.87 | 172.55 | 198.67 | 155.34 | 153.16 | 159.08 | 192.57 | 188.75 | 180.12 | 176.96 | 172.49 | 173.51 | 136.34 | 132.03 | 130.43 | 99.60 | NA | NA | NA | NA | NA | NA | NA | NA | NA | NA | NA | NA | NA | NA | NA | NA | NA | NA | NA | NA | NA | NA | |
| Costs And Expenses | 665.83 | 496.26 | 490.38 | 497.66 | 475.04 | 513.48 | 466.16 | 462.93 | 446.82 | 459.08 | 438.77 | 425.91 | 415.08 | -193.90 | 602.95 | 600.28 | 699.99 | 630.67 | 543.79 | 533.23 | 384.94 | 422.16 | 410.15 | 429.03 | 422.27 | 518.70 | 406.69 | 440.54 | 405.89 | 434.03 | 501.84 | 480.16 | 468.31 | 1272.43 | 522.09 | 467.46 | 869.96 | 385.82 | 358.80 | 327.90 | 311.13 | 307.49 | 334.94 | 318.29 | 308.42 | 305.47 | 292.19 | 276.05 | 280.26 | 401.95 | 285.47 | 276.67 | 268.79 | 222.72 | 229.93 | 216.39 | 213.00 | NA | NA | NA | NA | |
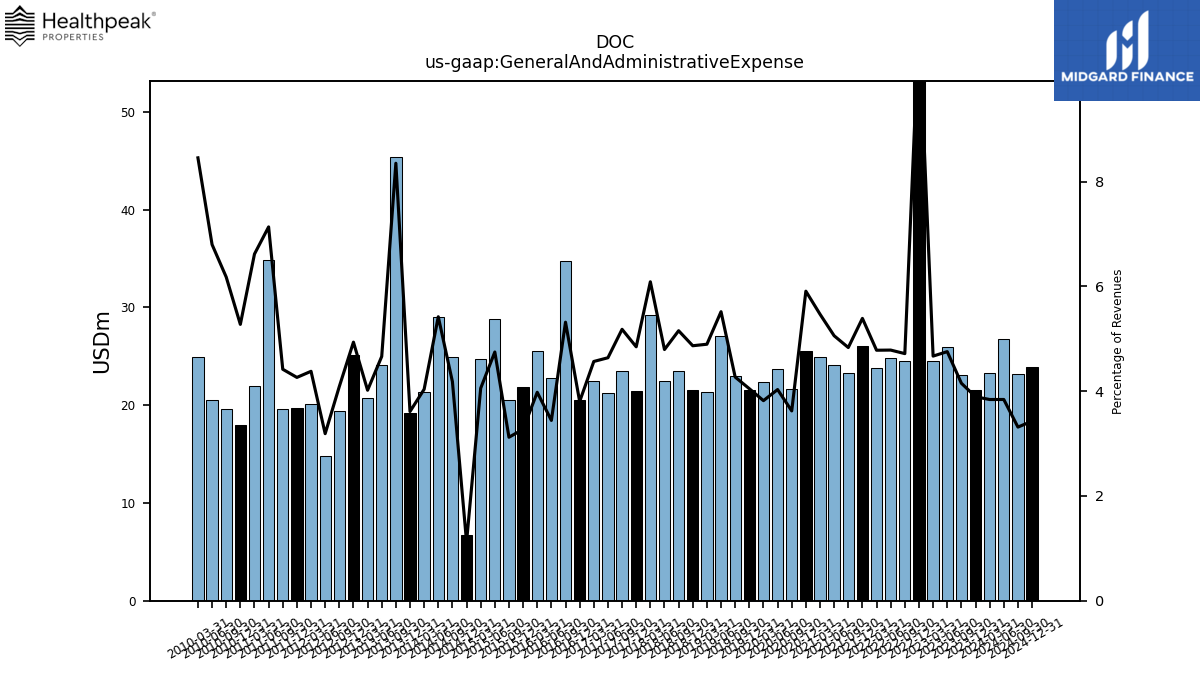
| General And Administrative Expense | 23.30 | 21.56 | 23.09 | 25.94 | 24.55 | 57.87 | 24.55 | 24.78 | 23.83 | 26.04 | 23.27 | 24.09 | 24.90 | 25.51 | 21.66 | 23.72 | 22.35 | 21.52 | 22.97 | 27.12 | 21.36 | 21.51 | 23.50 | 22.51 | 29.18 | 21.48 | 23.52 | 21.29 | 22.48 | 20.53 | 34.79 | 22.79 | 25.50 | 21.87 | 20.53 | 28.84 | 24.77 | 6.76 | 24.95 | 29.06 | 21.39 | 19.15 | 45.42 | 24.07 | 20.74 | 25.10 | 19.44 | 14.81 | 20.10 | 19.68 | 19.65 | 34.87 | 21.95 | 18.01 | 19.59 | 20.52 | 24.92 | NA | NA | NA | NA | |
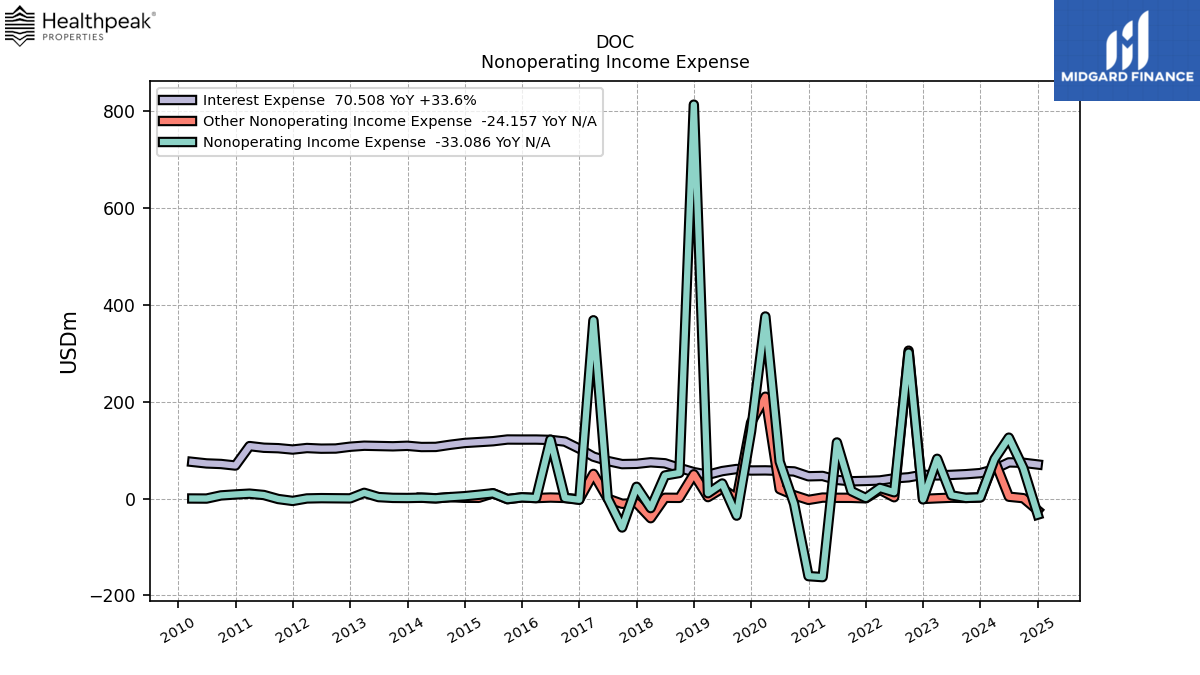
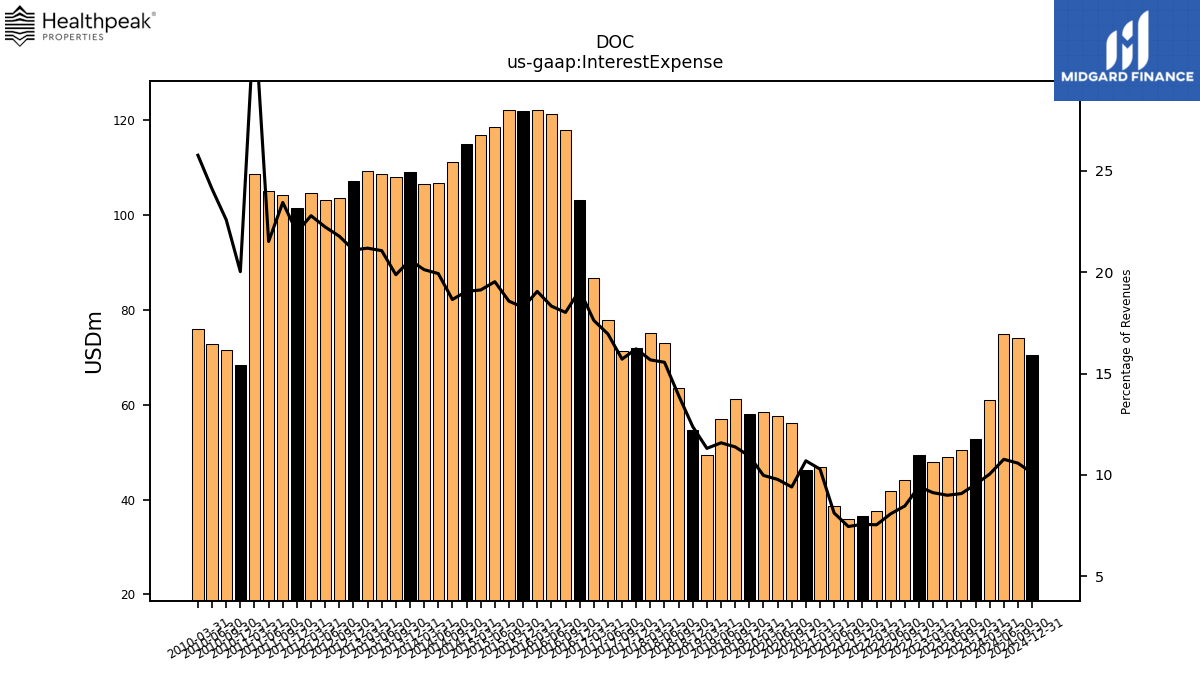
| Interest Expense | 60.91 | 52.78 | 50.51 | 49.07 | 47.96 | 49.41 | 44.08 | 41.87 | 37.59 | 36.55 | 35.91 | 38.68 | 46.84 | 46.17 | 56.23 | 57.55 | 58.38 | 58.12 | 61.23 | 56.94 | 49.33 | 54.72 | 63.49 | 73.04 | 75.10 | 71.88 | 71.33 | 77.79 | 86.72 | 103.15 | 117.86 | 121.33 | 122.06 | 122.03 | 122.16 | 118.63 | 116.78 | 114.99 | 111.28 | 106.84 | 106.64 | 109.16 | 108.09 | 108.72 | 109.35 | 107.25 | 103.51 | 103.22 | 104.57 | 101.43 | 104.20 | 105.13 | 108.58 | 68.36 | 71.60 | 72.75 | 75.95 | NA | NA | NA | NA | |
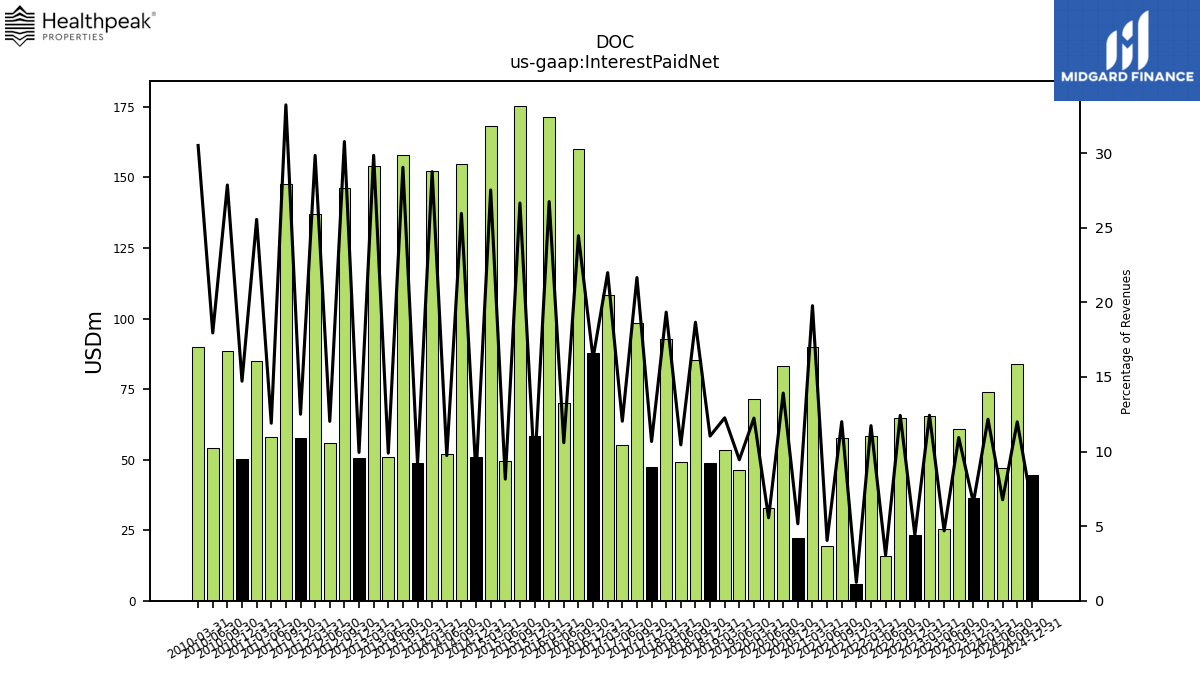
| Interest Paid Net | 73.79 | 36.46 | 60.84 | 25.54 | 65.37 | 23.14 | 64.64 | 15.84 | 58.49 | 5.98 | 57.78 | 19.25 | 90.03 | 22.27 | 83.20 | 32.75 | 71.62 | NA | NA | 46.46 | 53.48 | 48.78 | 85.13 | 49.08 | 92.70 | 47.31 | 98.34 | 55.22 | 108.23 | 87.83 | 160.04 | 70.16 | 171.42 | 58.52 | 175.38 | 49.55 | 168.16 | 50.80 | 154.89 | 52.17 | 152.42 | 48.78 | 158.02 | 51.08 | 154.13 | 50.56 | 146.34 | 55.85 | 137.00 | 57.72 | 147.80 | 58.15 | 84.79 | 50.25 | 88.35 | 54.19 | 89.97 | NA | NA | NA | NA | |
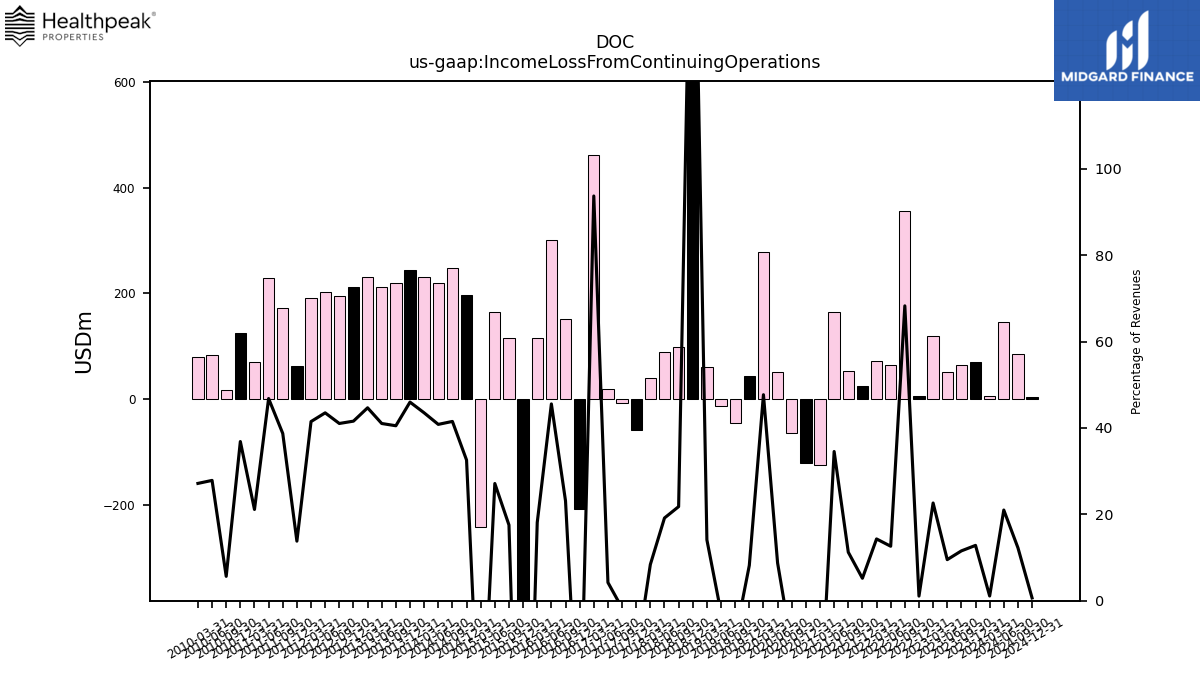
| Income Loss From Continuing Operations | 6.68 | 70.94 | 64.21 | 51.90 | 118.95 | 5.66 | 355.27 | 65.35 | 71.30 | 25.13 | 54.11 | 164.53 | -123.89 | -121.06 | -63.42 | 51.51 | 279.08 | 43.52 | -45.86 | -13.60 | 61.47 | 831.55 | 99.37 | 89.94 | 40.23 | -58.70 | -7.66 | 19.38 | 461.14 | -207.09 | 151.25 | 301.72 | 116.12 | -598.87 | 115.36 | 164.88 | -240.61 | 196.58 | 247.65 | 218.88 | 230.54 | 243.84 | 220.36 | 211.84 | 230.59 | 211.40 | 195.12 | 202.02 | 190.39 | 63.68 | 172.19 | 228.76 | 70.09 | 125.82 | 17.91 | 84.09 | 80.08 | NA | NA | NA | NA | |
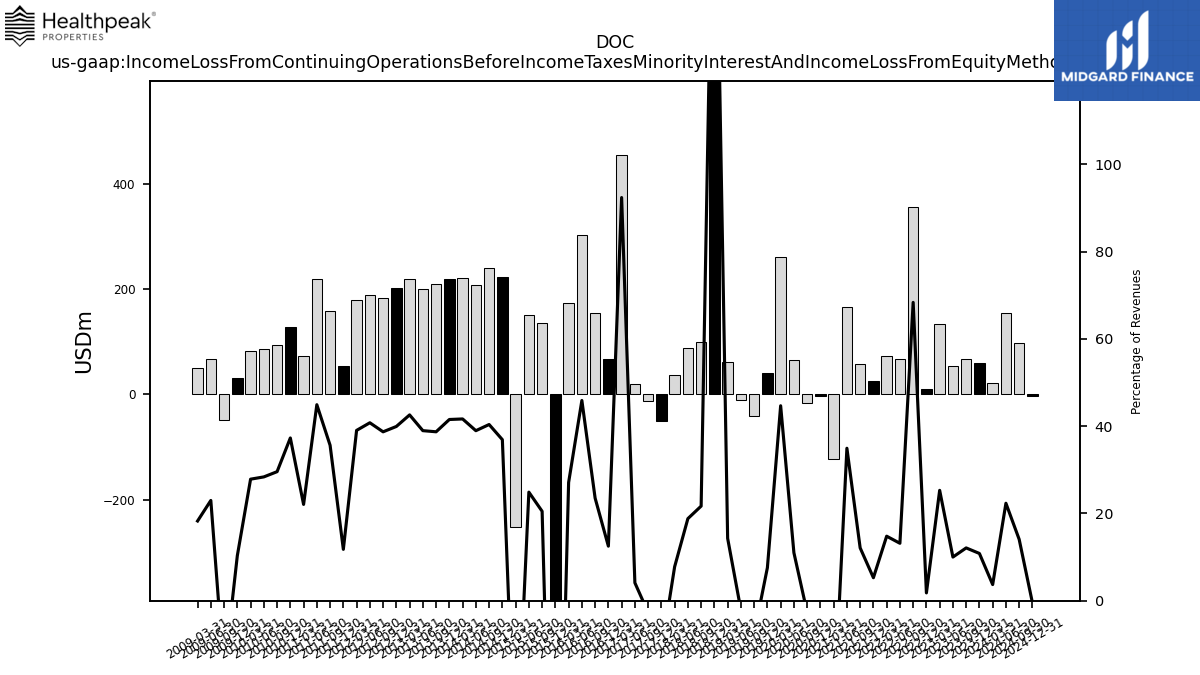
| Income Loss From Continuing Operations Before Income Taxes Minority Interest And Income Loss From Equity Method Investments | 22.50 | 59.99 | 67.34 | 54.61 | 132.99 | 9.44 | 355.77 | 68.20 | 73.72 | 25.50 | 58.33 | 166.44 | -121.90 | -2.87 | -15.93 | 64.79 | 261.48 | 40.29 | -40.93 | -10.34 | 62.40 | 833.60 | 98.91 | 88.38 | 37.33 | -50.96 | -12.26 | 18.87 | 454.75 | 67.53 | 153.88 | 303.91 | 173.69 | -601.74 | 134.89 | 151.18 | -251.18 | 222.77 | 240.95 | 208.93 | 220.79 | 220.26 | 210.60 | 201.24 | 219.86 | 203.07 | 184.06 | 189.42 | 179.19 | 54.36 | 158.43 | 219.55 | 73.22 | 127.34 | 93.78 | 85.67 | 82.14 | 30.44 | -48.32 | 66.97 | 50.45 | |
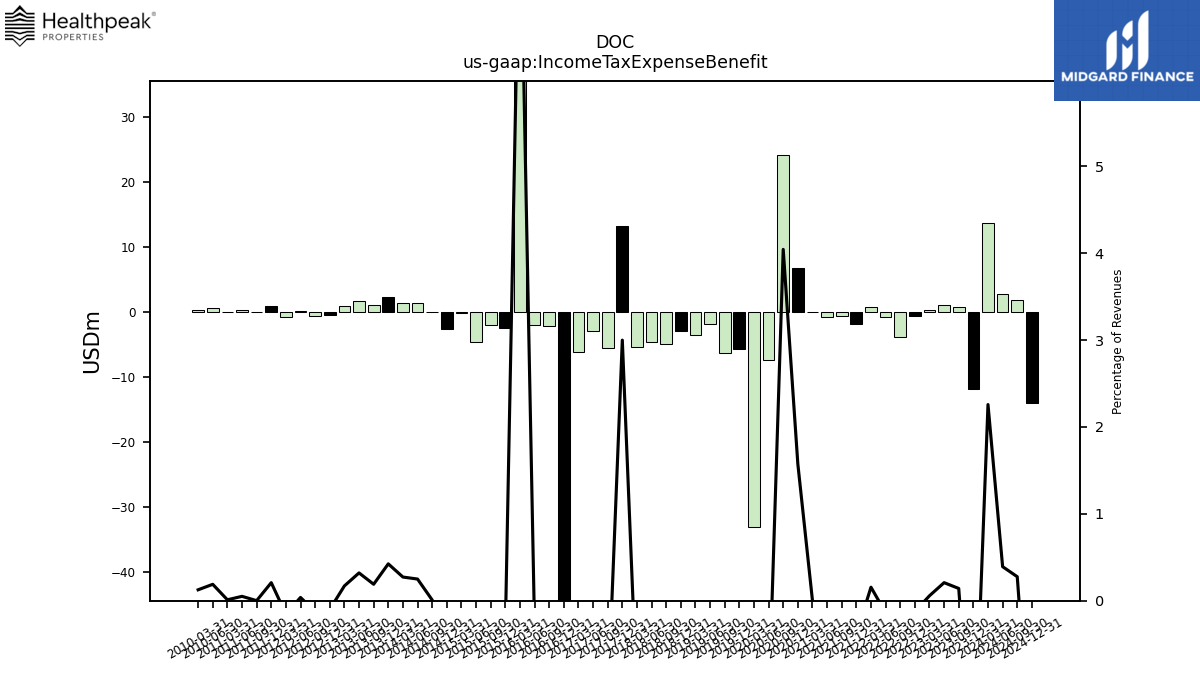
| Income Tax Expense Benefit | 13.70 | -11.84 | 0.79 | 1.14 | 0.30 | -0.65 | -3.83 | -0.72 | 0.78 | -1.86 | -0.65 | -0.76 | 0.01 | 6.79 | 24.17 | -7.35 | -33.04 | -5.68 | -6.26 | -1.86 | -3.46 | -2.94 | -4.93 | -4.65 | -5.34 | 13.30 | -5.48 | -2.99 | -6.16 | -44.35 | -2.21 | -2.00 | 53.04 | -2.39 | -1.98 | -4.56 | -0.08 | -2.59 | 0.06 | 1.34 | 1.45 | 2.25 | 1.03 | 1.65 | 0.88 | -0.51 | -0.60 | 0.18 | -0.71 | 0.96 | 0.01 | 0.25 | 0.04 | NA | NA | 0.57 | 0.37 | NA | NA | NA | NA | |
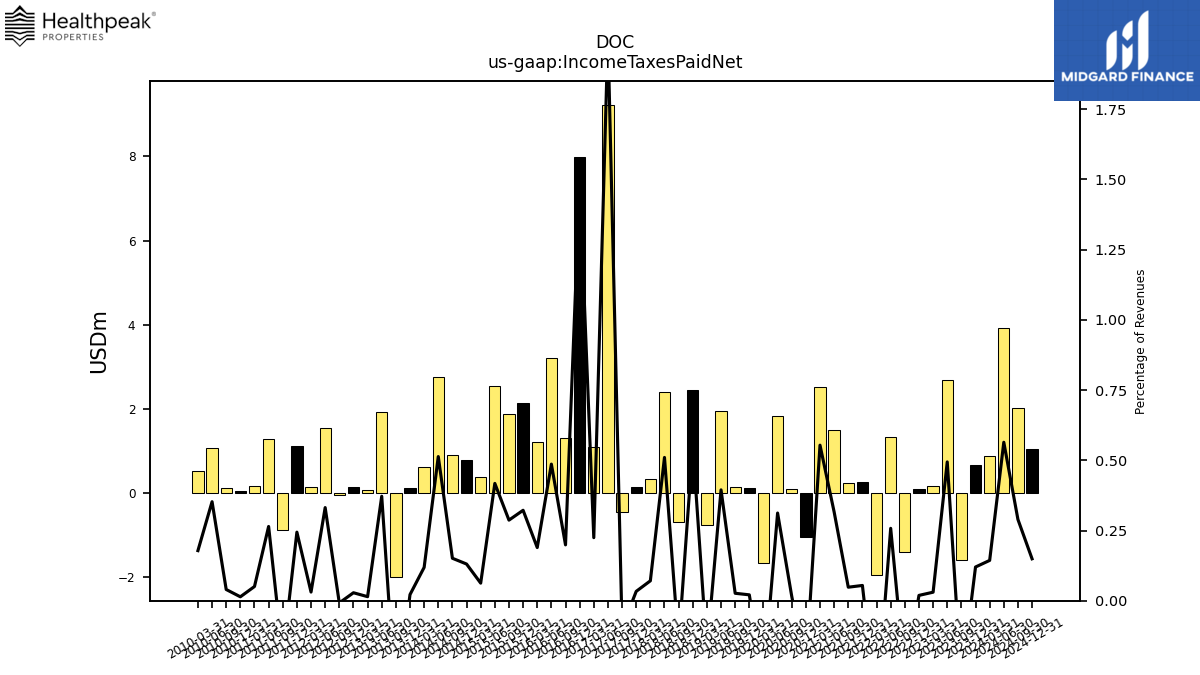
| Income Taxes Paid Net | 0.87 | 0.67 | -1.60 | 2.69 | 0.16 | 0.10 | -1.39 | 1.33 | -1.95 | 0.26 | 0.23 | 1.50 | 2.52 | -1.05 | 0.10 | 1.84 | -1.67 | 0.11 | 0.14 | 1.94 | -0.77 | 2.44 | -0.69 | 2.40 | 0.34 | 0.15 | -0.44 | 9.23 | 1.10 | 7.99 | 1.30 | 3.22 | 1.21 | 2.15 | 1.89 | 2.54 | 0.38 | 0.79 | 0.90 | 2.75 | 0.63 | 0.12 | -2.00 | 1.92 | 0.07 | 0.14 | -0.04 | 1.54 | 0.14 | 1.13 | -0.88 | 1.29 | 0.17 | 0.05 | 0.13 | 1.06 | 0.53 | NA | NA | NA | NA | |
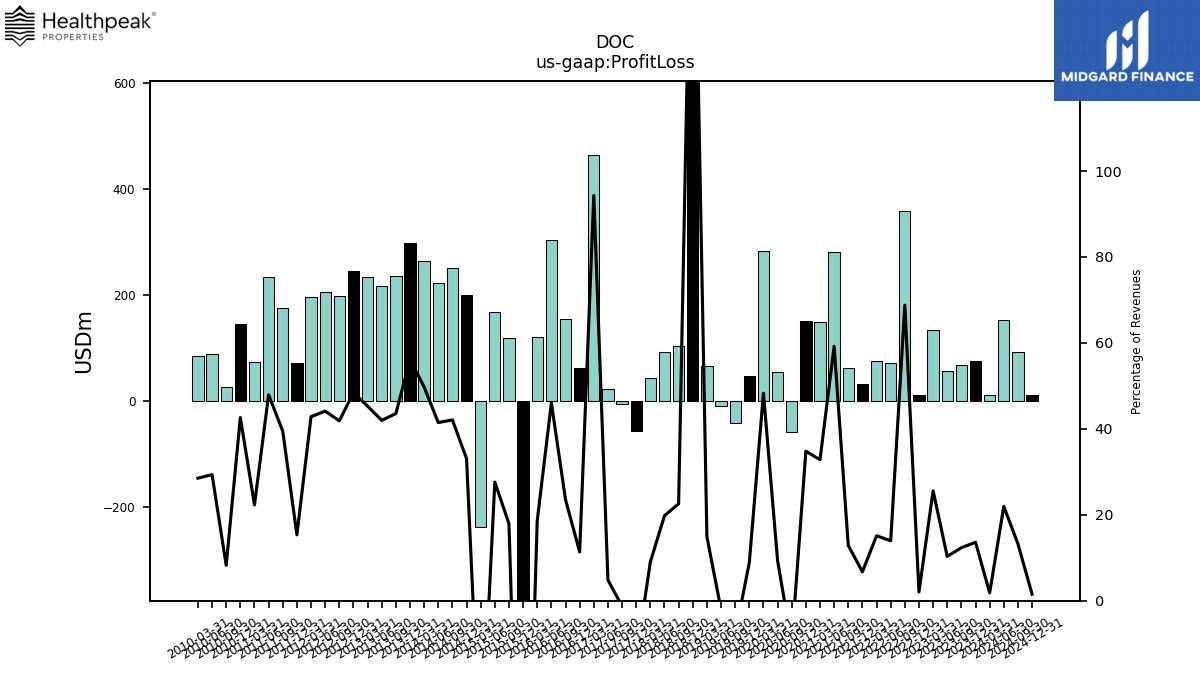
| Profit Loss | 11.18 | 75.39 | 68.66 | 56.20 | 134.51 | 10.80 | 357.99 | 72.29 | 75.34 | 32.58 | 61.91 | 282.02 | 149.42 | 150.25 | -59.58 | 55.05 | 282.54 | 47.36 | -42.31 | -9.98 | 64.99 | 834.38 | 102.93 | 92.93 | 43.24 | -57.92 | -5.72 | 22.10 | 464.18 | 61.30 | 154.04 | 304.84 | 119.75 | -594.62 | 117.95 | 167.75 | -237.50 | 199.63 | 251.06 | 222.28 | 263.62 | 297.64 | 236.86 | 216.72 | 233.78 | 246.26 | 199.04 | 204.97 | 196.56 | 70.79 | 175.47 | 234.25 | 73.98 | 145.53 | 26.17 | 88.59 | 84.10 | NA | NA | NA | NA | |
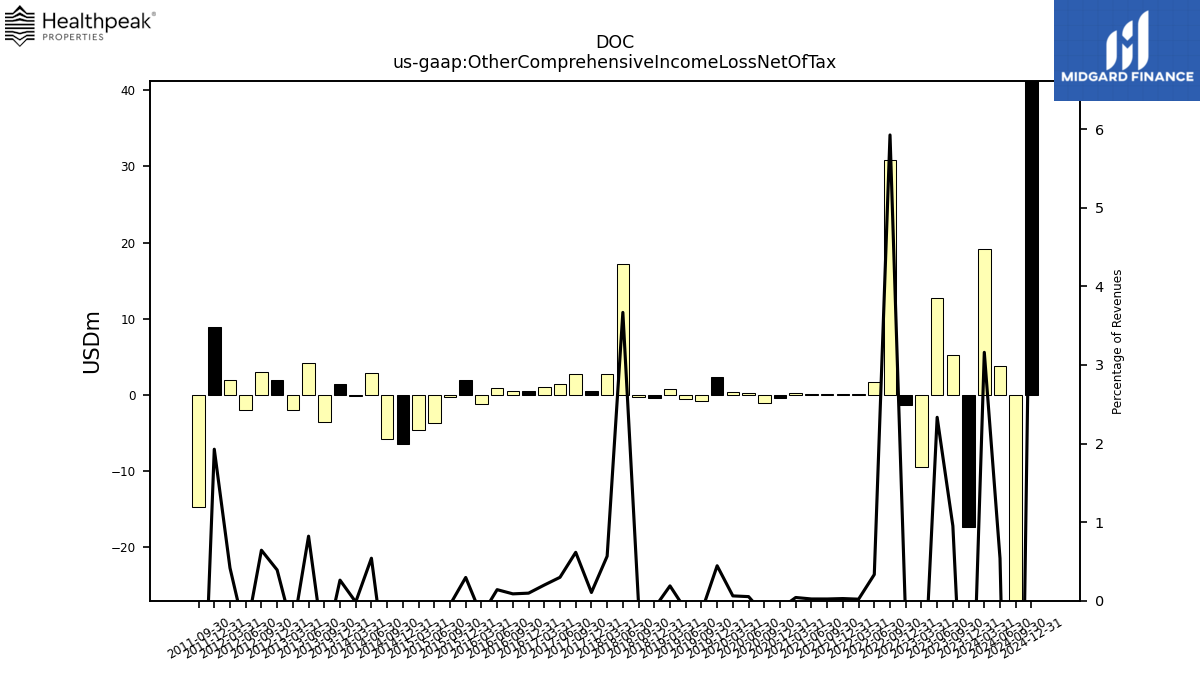
| Other Comprehensive Income Loss Net Of Tax | 19.17 | -17.38 | 5.29 | 12.73 | -9.41 | -1.39 | 30.84 | 1.73 | 0.10 | 0.13 | 0.11 | 0.11 | 0.19 | -0.45 | -1.05 | 0.31 | 0.36 | 2.37 | -0.76 | -0.58 | 0.82 | -0.41 | -0.22 | 17.23 | 2.72 | 0.47 | 2.80 | 1.37 | 0.98 | 0.52 | 0.57 | 0.94 | -1.20 | 1.98 | -0.34 | -3.65 | -4.57 | -6.43 | -5.79 | 2.90 | -0.08 | 1.39 | -3.52 | 4.24 | -1.95 | 1.99 | 3.06 | -2.04 | 1.92 | 8.90 | -14.65 | NA | NA | NA | NA | NA | NA | NA | NA | NA | NA | |
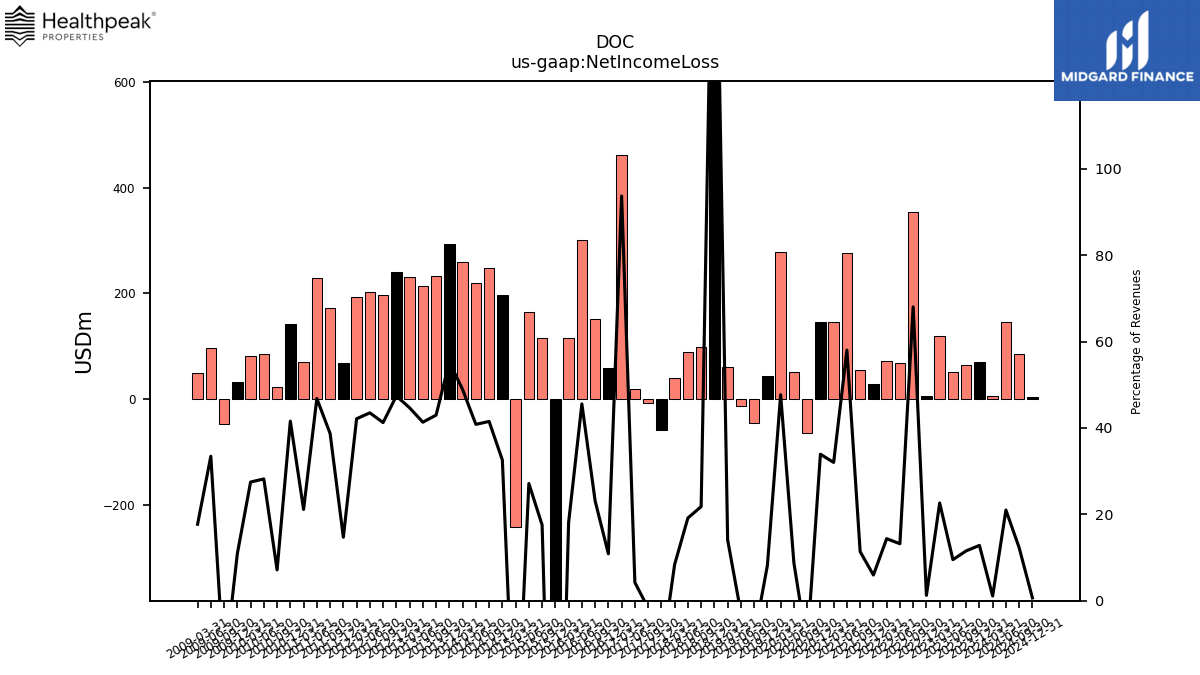
| Net Income Loss | 6.68 | 70.94 | 64.21 | 51.90 | 118.95 | 6.53 | 353.97 | 68.34 | 71.61 | 28.76 | 54.71 | 276.28 | 145.79 | 146.39 | -63.42 | 51.51 | 279.08 | 43.52 | -45.86 | -13.60 | 61.47 | 831.55 | 99.37 | 89.94 | 40.23 | -58.70 | -7.66 | 19.38 | 461.14 | 58.66 | 151.25 | 301.72 | 116.12 | -598.87 | 115.36 | 164.88 | -240.61 | 196.58 | 247.65 | 218.88 | 259.11 | 293.10 | 233.76 | 213.40 | 230.59 | 241.03 | 196.11 | 202.02 | 193.38 | 67.84 | 172.19 | 228.76 | 70.09 | 141.92 | 22.66 | 85.10 | 81.04 | 32.03 | -46.69 | 97.46 | 48.88 | |
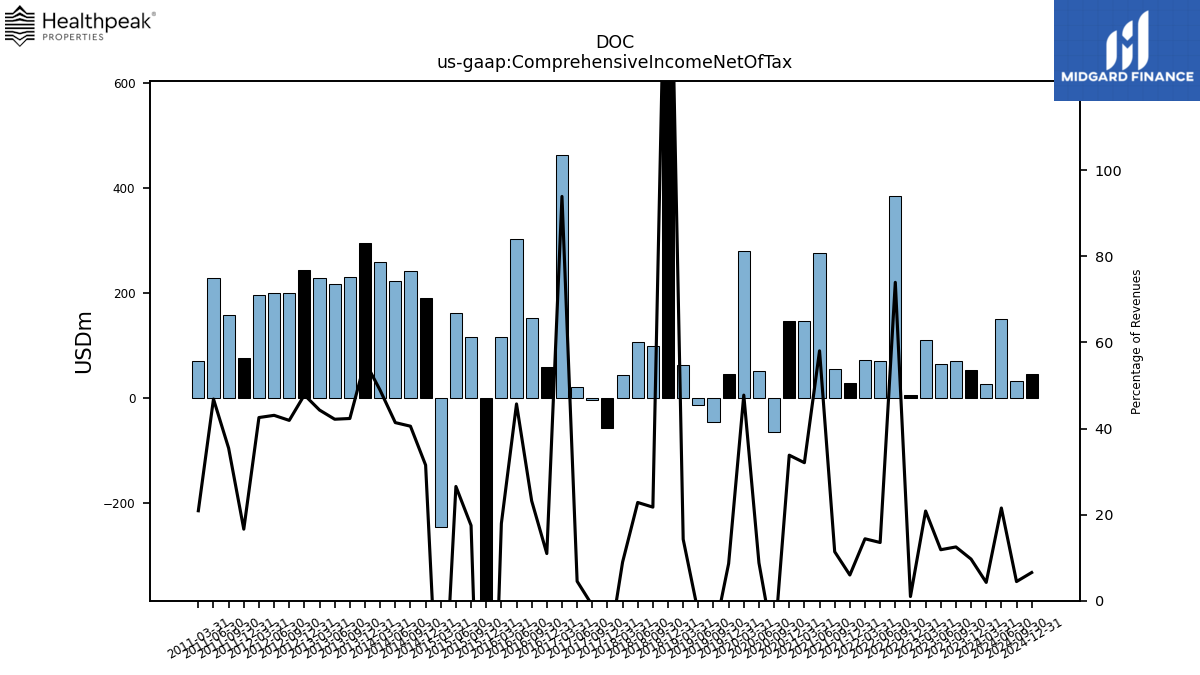
| Comprehensive Income Net Of Tax | 25.85 | 53.57 | 69.51 | 64.63 | 109.54 | 5.14 | 384.81 | 70.07 | 71.71 | 28.89 | 54.82 | 276.39 | 145.98 | 145.94 | -64.47 | 51.81 | 279.44 | 45.89 | -46.63 | -14.17 | 62.30 | 831.14 | 99.15 | 107.17 | 42.95 | -58.23 | -4.86 | 20.75 | 462.13 | 59.18 | 151.82 | 302.65 | 114.92 | -596.89 | 115.03 | 161.23 | -245.18 | 190.15 | 241.86 | 221.79 | 259.03 | 294.49 | 230.24 | 217.64 | 228.63 | 243.02 | 199.17 | 199.99 | 195.30 | 76.75 | 157.54 | 228.93 | 69.32 | NA | NA | NA | NA | NA | NA | NA | NA | |
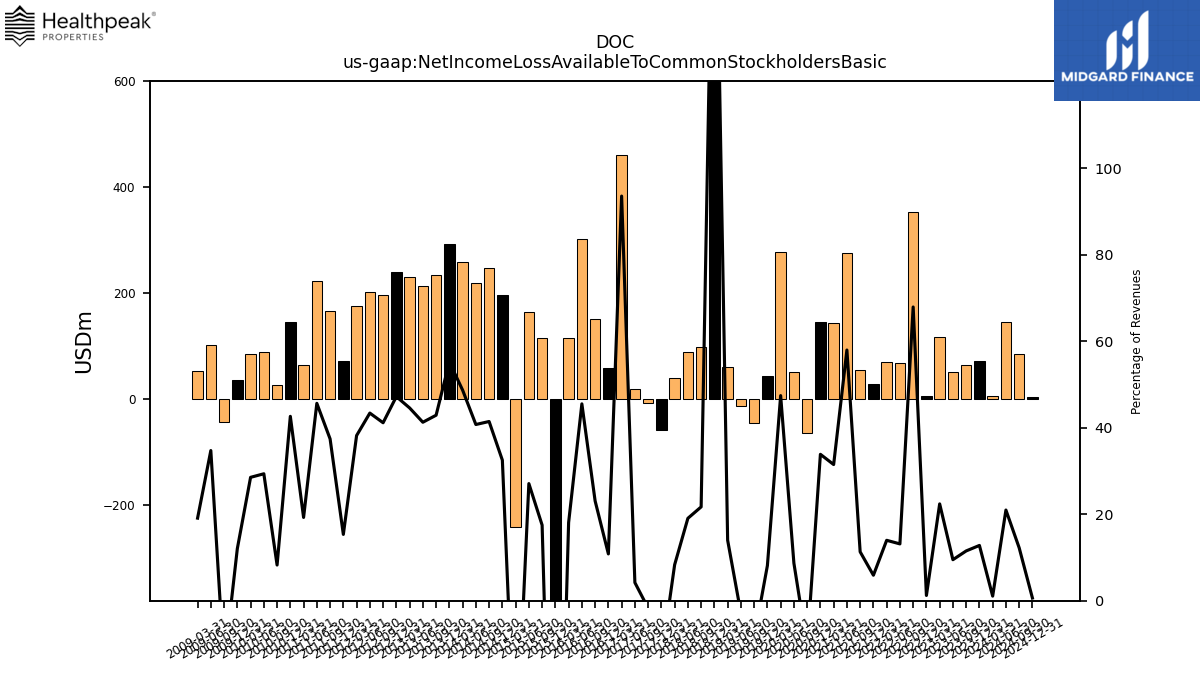
| Net Income Loss Available To Common Stockholders Basic | 6.48 | 70.79 | 64.05 | 51.75 | 117.70 | 6.39 | 353.37 | 68.06 | 69.64 | 28.49 | 54.44 | 275.99 | 143.34 | 146.13 | -63.77 | 51.13 | 277.46 | 43.20 | -46.25 | -13.99 | 61.03 | 830.16 | 98.95 | 89.48 | 39.84 | -59.30 | -7.79 | 19.28 | 460.38 | 58.44 | 150.92 | 301.38 | 115.76 | -599.16 | 115.05 | 164.51 | -240.95 | 196.15 | 247.21 | 218.40 | 258.05 | 292.69 | 233.28 | 213.02 | 230.11 | 239.94 | 195.63 | 201.47 | 175.26 | 70.79 | 166.37 | 222.99 | 63.88 | 145.53 | 26.17 | 88.59 | 84.10 | 35.48 | -43.22 | 101.18 | 52.71 | |
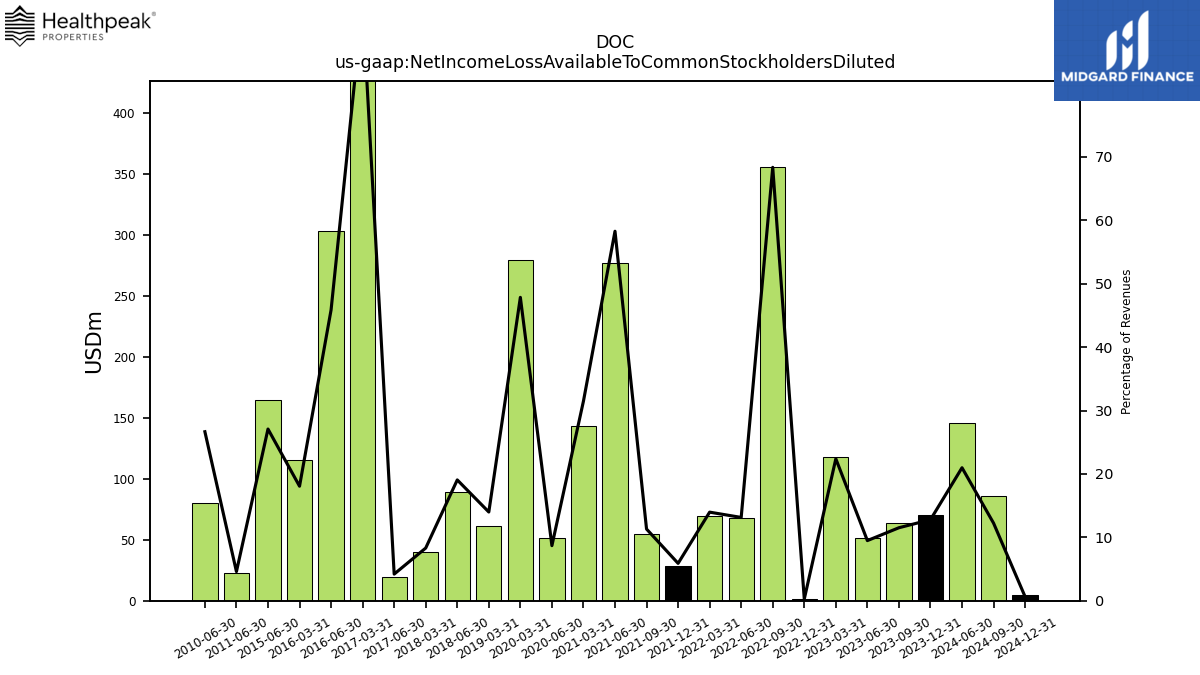
| Net Income Loss Available To Common Stockholders Diluted | NA | 70.79 | 64.05 | 51.75 | 117.70 | 1.45 | 355.72 | 68.06 | 69.64 | 28.49 | 54.44 | 277.53 | 143.34 | NA | NA | 51.13 | 279.98 | NA | NA | NA | 61.03 | NA | NA | 89.48 | 39.84 | NA | NA | 19.28 | 463.18 | NA | NA | 303.76 | 115.76 | NA | NA | 164.51 | NA | NA | NA | NA | NA | NA | NA | NA | NA | NA | NA | NA | NA | NA | NA | 22.47 | NA | NA | NA | 80.47 | NA | NA | NA | NA | NA |
| 2024-03-31 | 2023-12-31 | 2023-09-30 | 2023-06-30 | 2023-03-31 | 2022-12-31 | 2022-09-30 | 2022-06-30 | 2022-03-31 | 2021-12-31 | 2021-09-30 | 2021-06-30 | 2021-03-31 | 2020-12-31 | 2020-09-30 | 2020-06-30 | 2020-03-31 | 2019-12-31 | 2019-09-30 | 2019-06-30 | 2019-03-31 | 2018-12-31 | 2018-09-30 | 2018-06-30 | 2018-03-31 | 2017-12-31 | 2017-09-30 | 2017-06-30 | 2017-03-31 | 2016-12-31 | 2016-09-30 | 2016-06-30 | 2016-03-31 | 2015-12-31 | 2015-09-30 | 2015-06-30 | 2015-03-31 | 2014-12-31 | 2014-09-30 | 2014-06-30 | 2014-03-31 | 2013-12-31 | 2013-09-30 | 2013-06-30 | 2013-03-31 | 2012-12-31 | 2012-09-30 | 2012-06-30 | 2012-03-31 | 2011-12-31 | 2011-09-30 | 2011-06-30 | 2011-03-31 | 2010-12-31 | 2010-09-30 | 2010-06-30 | 2010-03-31 | 2009-12-31 | 2009-09-30 | 2009-06-30 | 2009-03-31 | ||
|---|---|---|---|---|---|---|---|---|---|---|---|---|---|---|---|---|---|---|---|---|---|---|---|---|---|---|---|---|---|---|---|---|---|---|---|---|---|---|---|---|---|---|---|---|---|---|---|---|---|---|---|---|---|---|---|---|---|---|---|---|---|---|
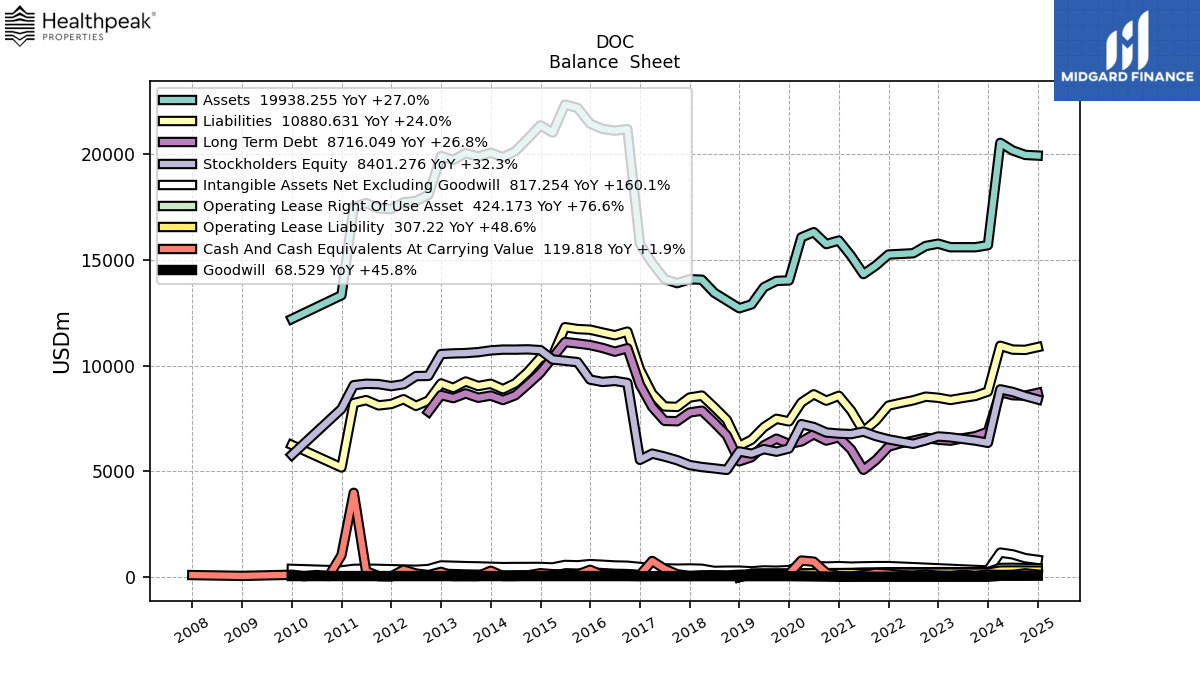
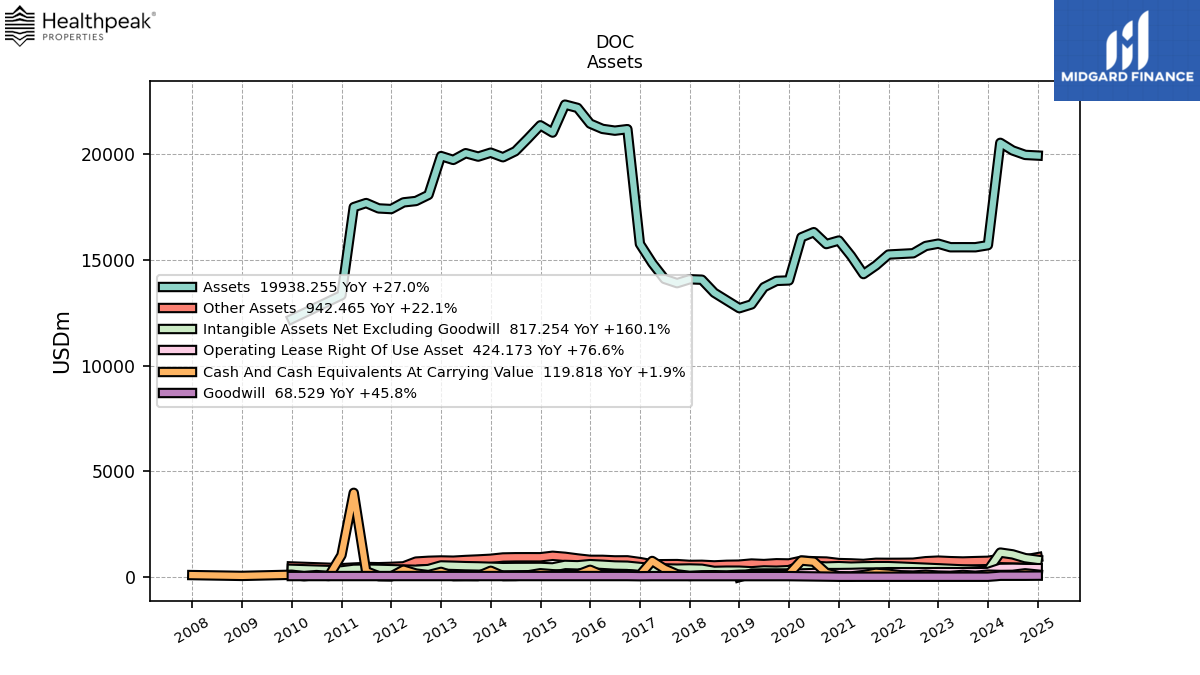
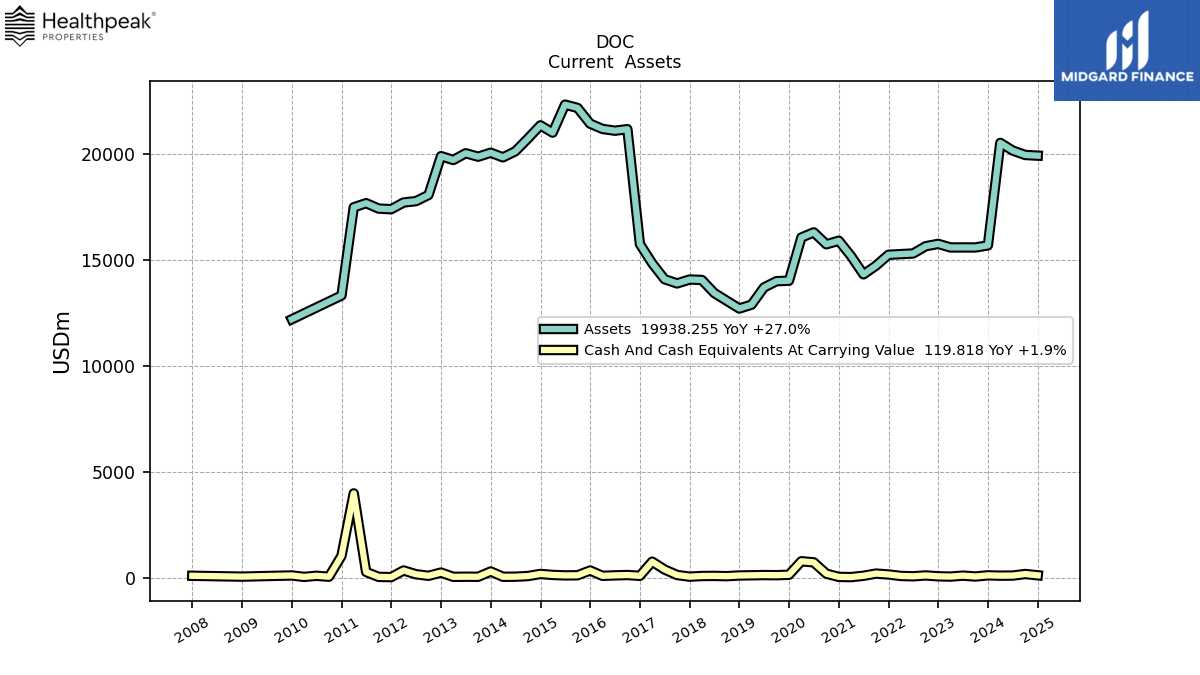
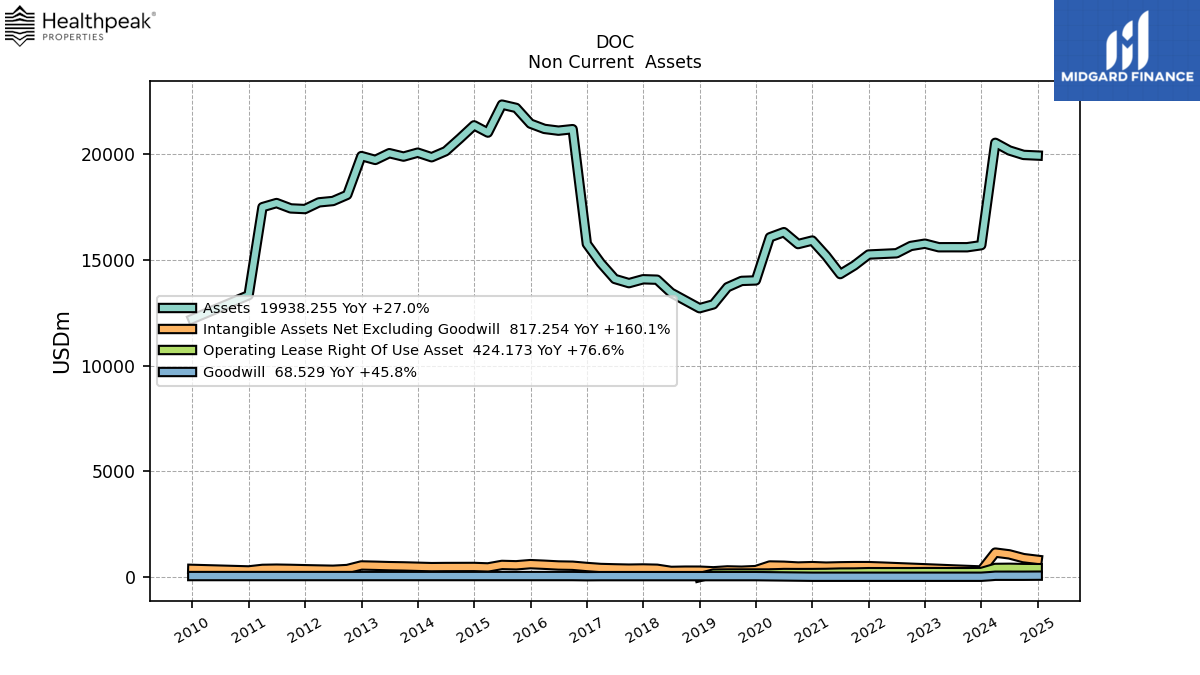
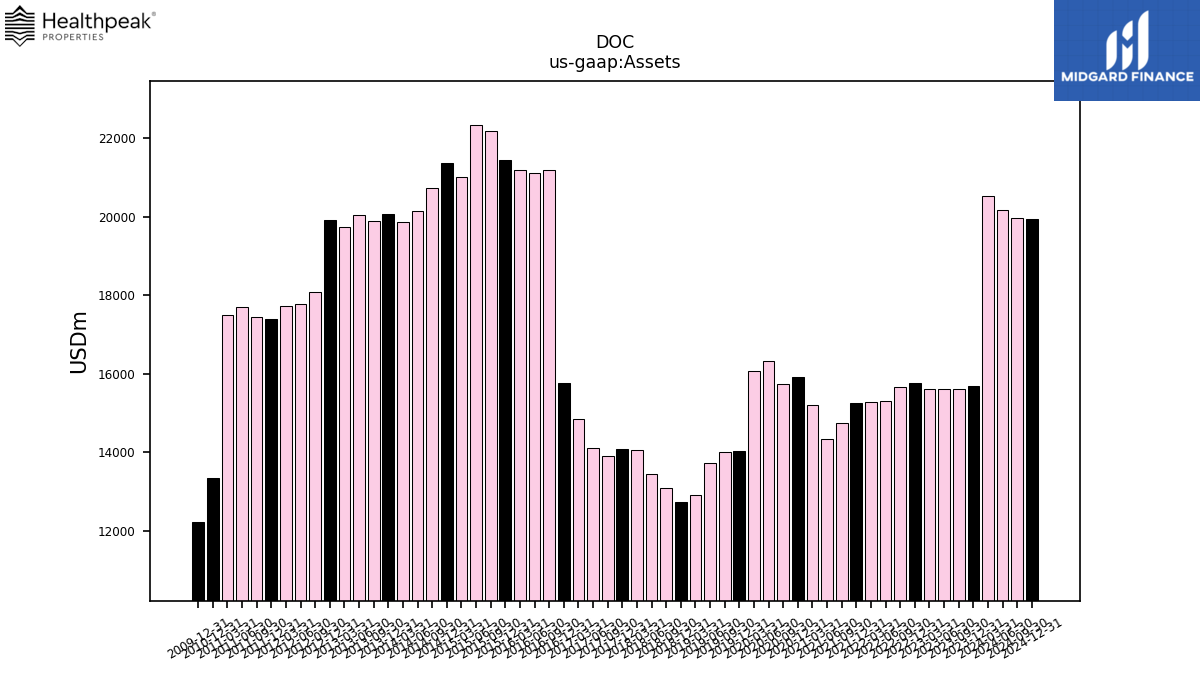
| Assets | 20542.04 | 15698.85 | 15602.53 | 15603.54 | 15602.29 | 15771.23 | 15661.96 | 15318.20 | 15287.25 | 15257.52 | 14743.50 | 14332.37 | 15193.93 | 15920.09 | 15751.82 | 16316.44 | 16072.68 | 14032.89 | 14010.21 | 13713.09 | 12899.50 | 12718.55 | 13083.96 | 13451.39 | 14067.57 | 14088.46 | 13904.08 | 14102.58 | 14855.87 | 15759.26 | 21188.54 | 21116.46 | 21199.93 | 21449.85 | 22192.97 | 22348.13 | 21024.44 | 21369.94 | 20744.89 | 20144.17 | 19858.68 | 20075.87 | 19889.51 | 20051.79 | 19732.73 | 19915.56 | 18079.34 | 17789.77 | 17725.32 | 17408.47 | 17439.38 | 17693.06 | 17499.65 | 13331.92 | NA | NA | NA | 12209.74 | NA | NA | NA | |
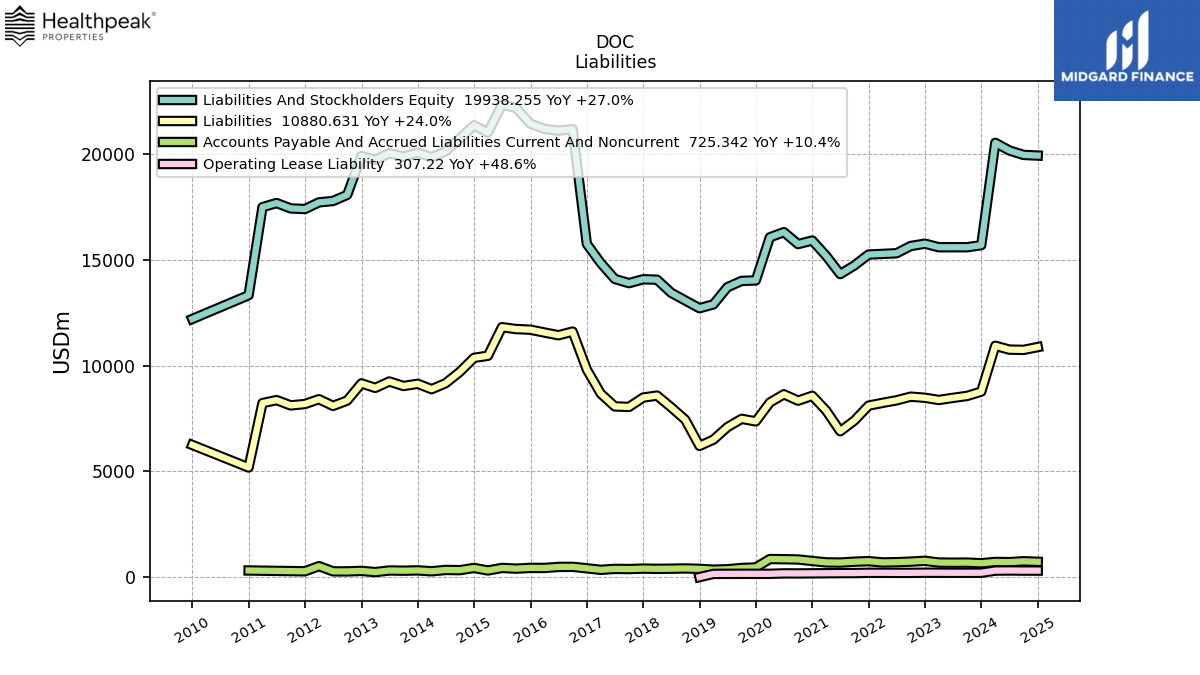
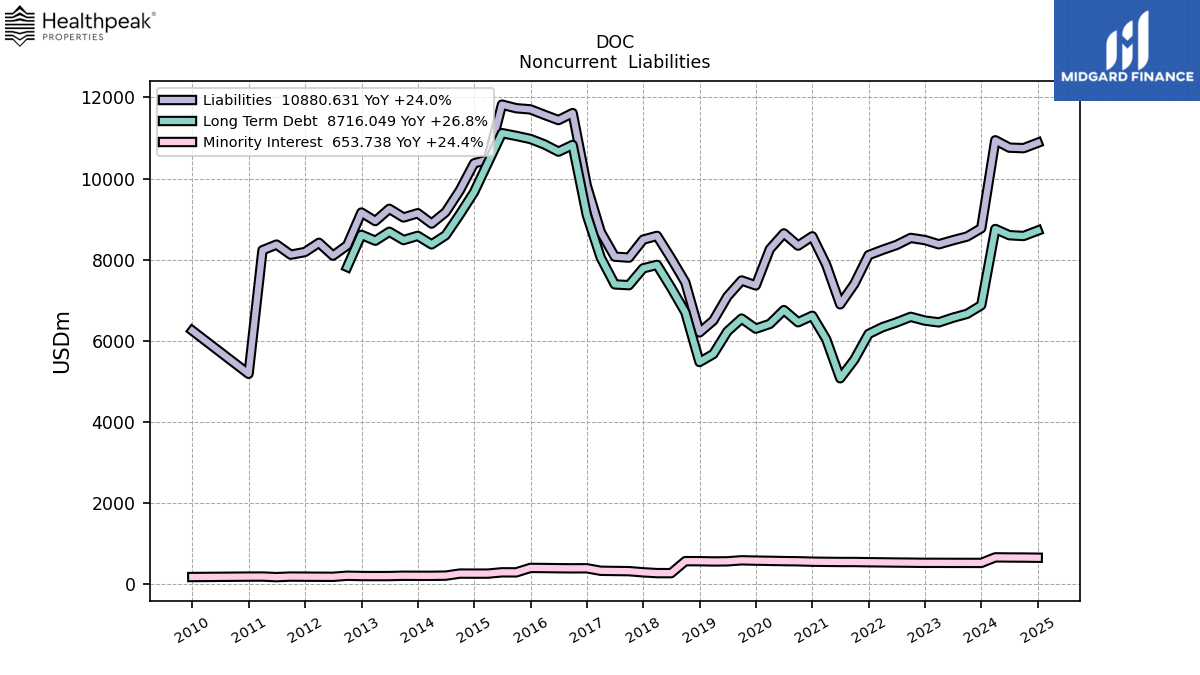
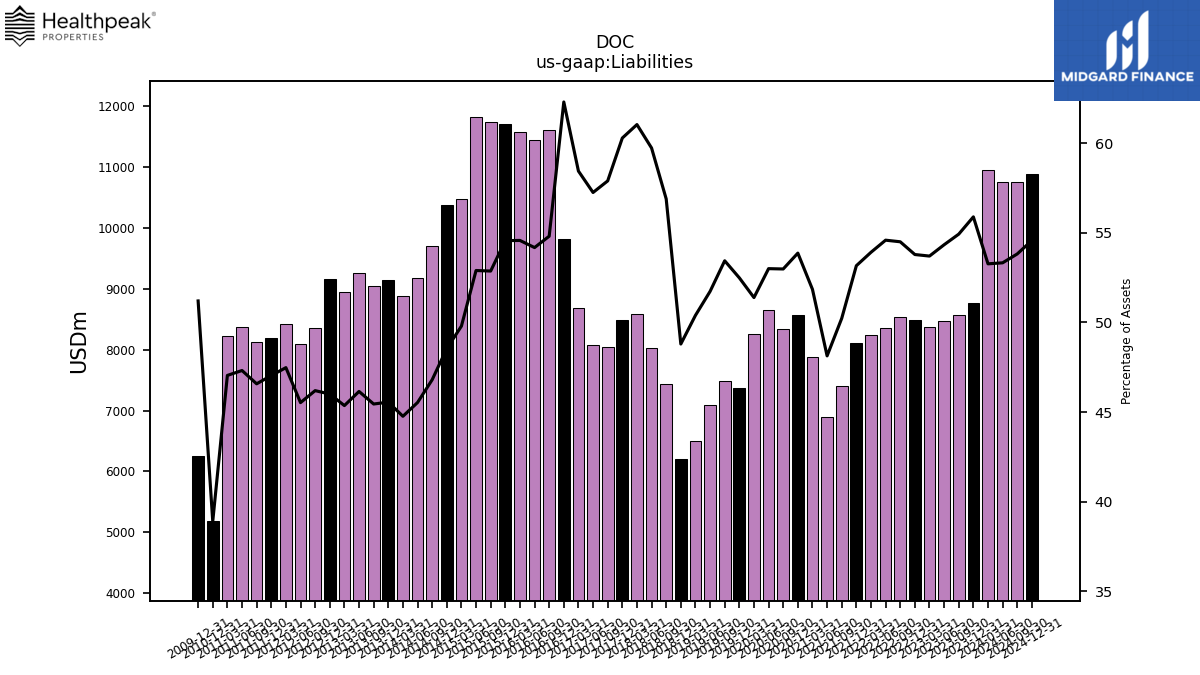
| Liabilities | 10942.54 | 8773.98 | 8569.71 | 8477.89 | 8378.65 | 8482.95 | 8535.61 | 8361.94 | 8241.64 | 8111.41 | 7405.11 | 6898.64 | 7877.24 | 8575.52 | 8345.51 | 8647.72 | 8259.24 | 7365.42 | 7486.85 | 7093.82 | 6500.44 | 6205.96 | 7443.58 | 8034.66 | 8586.65 | 8493.52 | 8049.85 | 8073.63 | 8682.39 | 9817.96 | 11613.11 | 11440.07 | 11569.60 | 11703.53 | 11732.52 | 11821.13 | 10468.80 | 10372.84 | 9708.72 | 9171.58 | 8889.10 | 9144.74 | 9039.27 | 9253.53 | 8950.67 | 9161.78 | 8351.48 | 8098.83 | 8415.36 | 8187.85 | 8122.32 | 8371.79 | 8232.20 | 5185.88 | NA | NA | NA | 6251.13 | NA | NA | NA | |
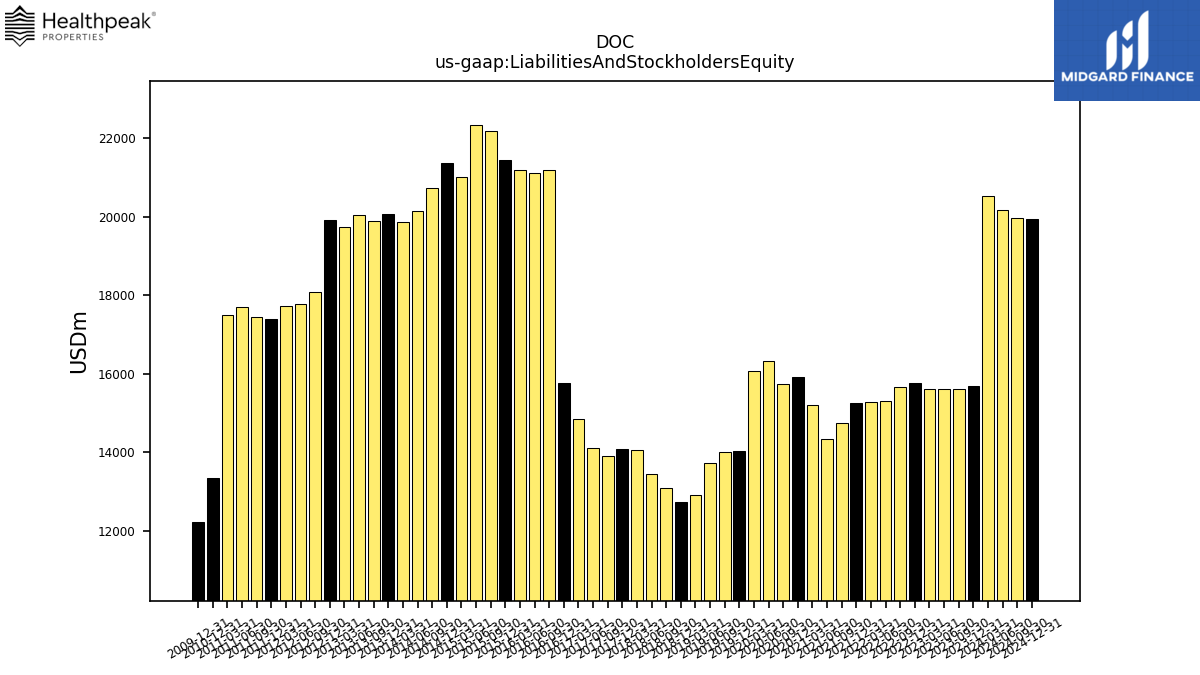
| Liabilities And Stockholders Equity | 20542.04 | 15698.85 | 15602.53 | 15603.54 | 15602.29 | 15771.23 | 15661.96 | 15318.20 | 15287.25 | 15257.52 | 14743.50 | 14332.37 | 15193.93 | 15920.09 | 15751.82 | 16316.44 | 16072.68 | 14032.89 | 14010.21 | 13713.09 | 12899.50 | 12718.55 | 13083.96 | 13451.39 | 14067.57 | 14088.46 | 13904.08 | 14102.58 | 14855.87 | 15759.26 | 21188.54 | 21116.46 | 21199.93 | 21449.85 | 22192.97 | 22348.13 | 21024.44 | 21369.94 | 20744.89 | 20144.17 | 19858.68 | 20075.87 | 19889.51 | 20051.79 | 19732.73 | 19915.56 | 18079.34 | 17789.77 | 17725.32 | 17408.47 | 17439.38 | 17693.06 | 17499.65 | 13331.92 | NA | NA | NA | 12209.74 | NA | NA | NA | |
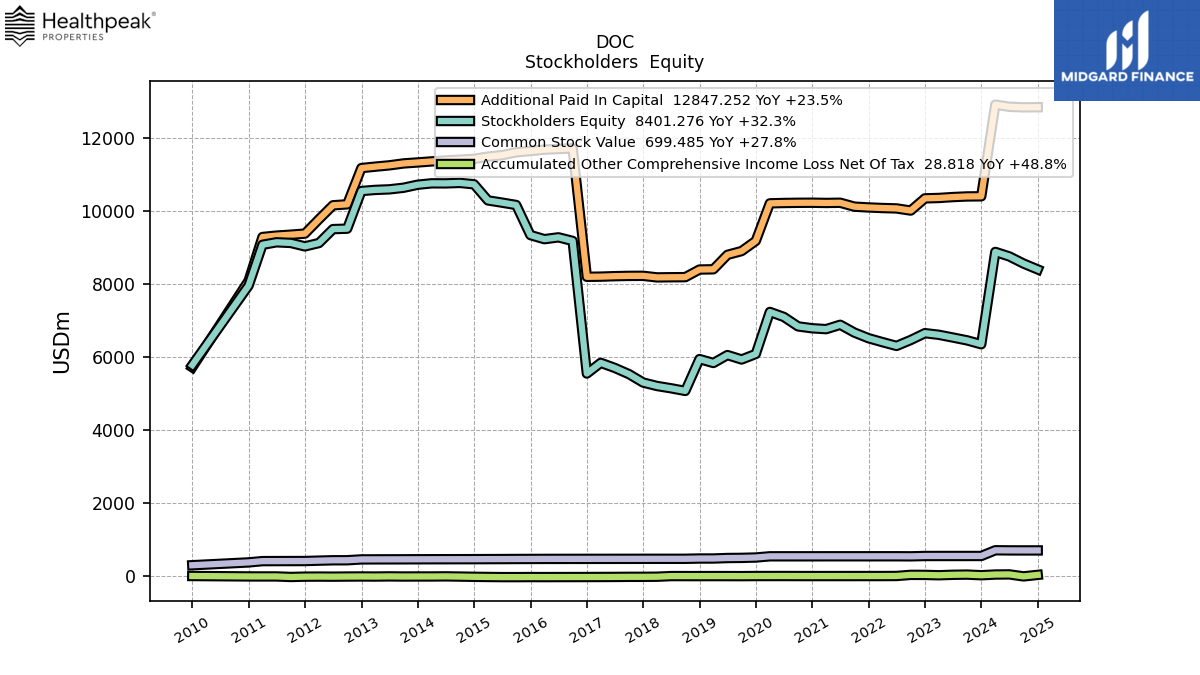
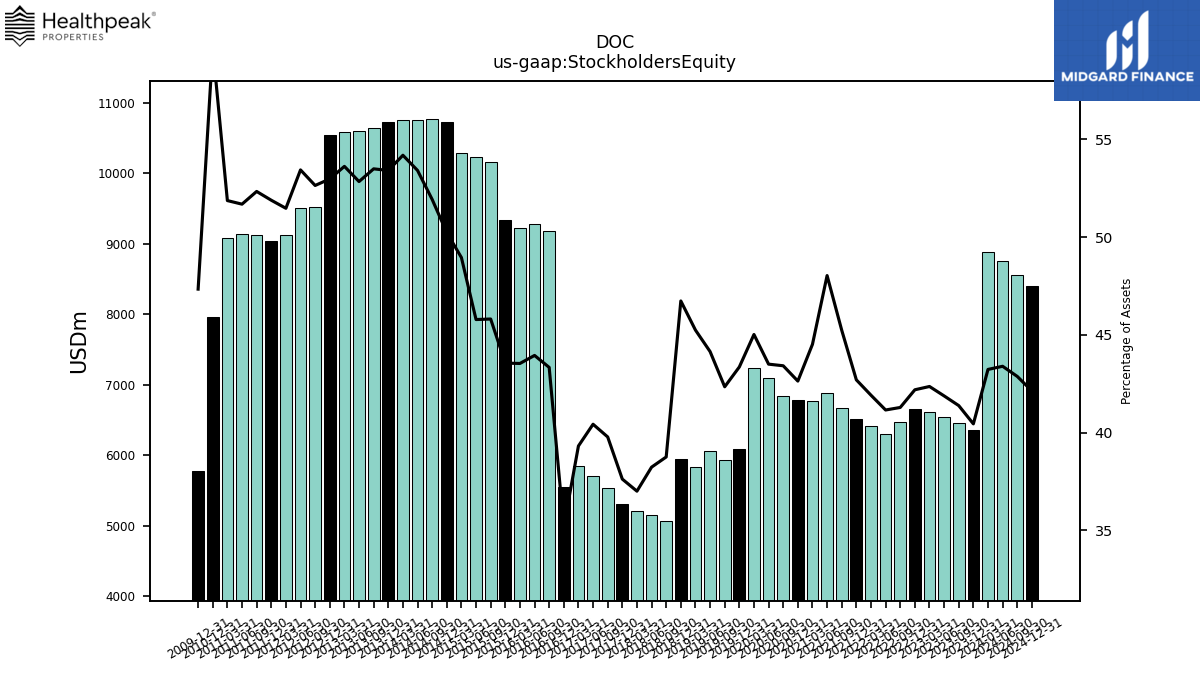
| Stockholders Equity | 8881.61 | 6350.45 | 6457.31 | 6535.06 | 6609.74 | 6654.70 | 6466.96 | 6305.21 | 6408.22 | 6515.47 | 6670.36 | 6884.86 | 6764.54 | 6788.35 | 6840.06 | 7098.67 | 7236.51 | 6085.06 | 5933.13 | 6054.40 | 5836.88 | 5944.44 | 5071.17 | 5143.49 | 5206.29 | 5301.01 | 5531.43 | 5702.05 | 5841.35 | 5547.60 | 9183.11 | 9281.13 | 9230.75 | 9343.64 | 10167.75 | 10232.79 | 10293.27 | 10735.30 | 10773.12 | 10760.13 | 10761.75 | 10723.30 | 10640.22 | 10596.56 | 10581.27 | 10551.24 | 9518.00 | 9507.23 | 9124.79 | 9033.48 | 9127.78 | 9145.53 | 9077.53 | 7957.37 | NA | NA | NA | 5780.54 | NA | NA | NA |
| 2024-03-31 | 2023-12-31 | 2023-09-30 | 2023-06-30 | 2023-03-31 | 2022-12-31 | 2022-09-30 | 2022-06-30 | 2022-03-31 | 2021-12-31 | 2021-09-30 | 2021-06-30 | 2021-03-31 | 2020-12-31 | 2020-09-30 | 2020-06-30 | 2020-03-31 | 2019-12-31 | 2019-09-30 | 2019-06-30 | 2019-03-31 | 2018-12-31 | 2018-09-30 | 2018-06-30 | 2018-03-31 | 2017-12-31 | 2017-09-30 | 2017-06-30 | 2017-03-31 | 2016-12-31 | 2016-09-30 | 2016-06-30 | 2016-03-31 | 2015-12-31 | 2015-09-30 | 2015-06-30 | 2015-03-31 | 2014-12-31 | 2014-09-30 | 2014-06-30 | 2014-03-31 | 2013-12-31 | 2013-09-30 | 2013-06-30 | 2013-03-31 | 2012-12-31 | 2012-09-30 | 2012-06-30 | 2012-03-31 | 2011-12-31 | 2011-09-30 | 2011-06-30 | 2011-03-31 | 2010-12-31 | 2010-09-30 | 2010-06-30 | 2010-03-31 | 2009-12-31 | 2009-09-30 | 2009-06-30 | 2009-03-31 | ||
|---|---|---|---|---|---|---|---|---|---|---|---|---|---|---|---|---|---|---|---|---|---|---|---|---|---|---|---|---|---|---|---|---|---|---|---|---|---|---|---|---|---|---|---|---|---|---|---|---|---|---|---|---|---|---|---|---|---|---|---|---|---|---|
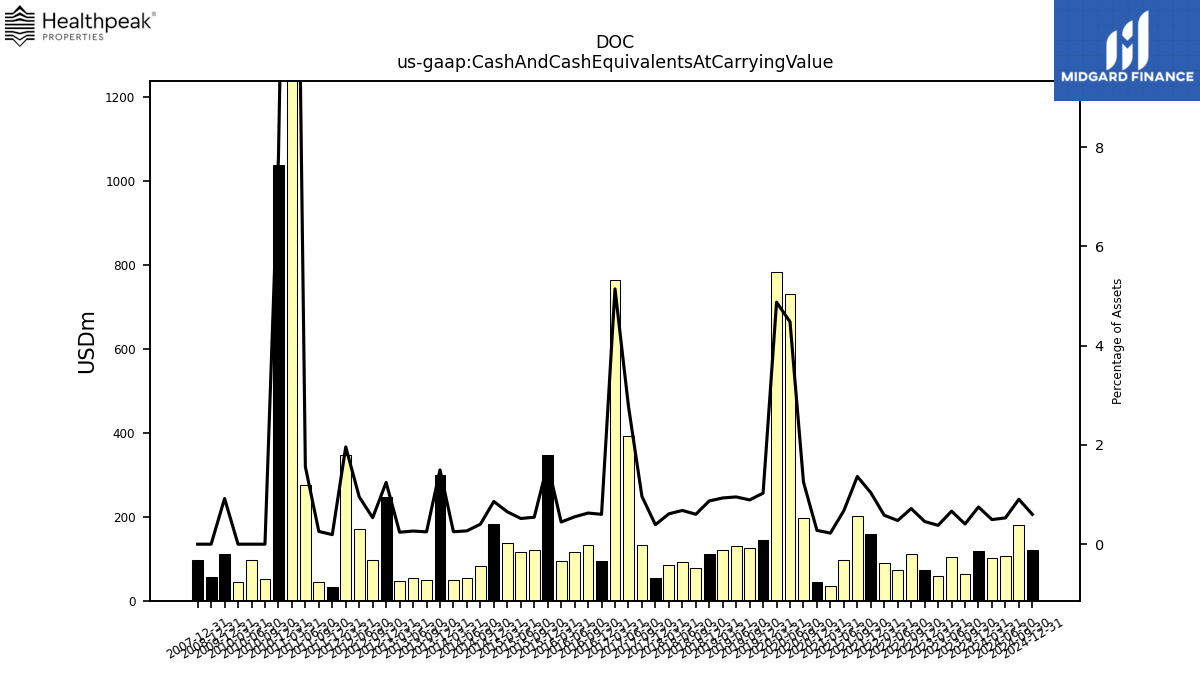
| Cash And Cash Equivalents At Carrying Value | 101.76 | 117.64 | 63.48 | 103.78 | 59.23 | 72.03 | 112.45 | 73.01 | 89.07 | 158.29 | 201.10 | 96.92 | 34.01 | 44.23 | 197.12 | 730.96 | 783.54 | 144.23 | 124.99 | 130.52 | 120.12 | 110.79 | 78.86 | 91.38 | 86.02 | 55.31 | 133.89 | 391.96 | 764.11 | 94.73 | 132.89 | 116.45 | 94.67 | 346.50 | 120.50 | 115.77 | 137.17 | 183.81 | 83.53 | 54.07 | 49.74 | 300.56 | 49.41 | 53.11 | 47.55 | 247.67 | 96.48 | 169.64 | 347.43 | 33.51 | 44.86 | 276.20 | 3988.62 | 1036.70 | 52.63 | 96.26 | 44.60 | 112.26 | NA | NA | NA | |
| Cash Cash Equivalents Restricted Cash And Restricted Cash Equivalents | 157.16 | 169.02 | 113.93 | 160.53 | 117.22 | 126.83 | 166.95 | 127.83 | 141.17 | 211.74 | 254.80 | 225.97 | 102.04 | 111.43 | 299.54 | 836.64 | 890.10 | 184.66 | 155.10 | 156.05 | 146.65 | 139.85 | 108.74 | 121.93 | 117.97 | 82.20 | 161.02 | 453.45 | 824.92 | 136.99 | NA | NA | NA | 401.06 | NA | NA | NA | NA | NA | NA | NA | NA | NA | NA | NA | NA | NA | NA | NA | NA | NA | NA | NA | NA | NA | NA | NA | NA | NA | NA | NA |
| 2024-03-31 | 2023-12-31 | 2023-09-30 | 2023-06-30 | 2023-03-31 | 2022-12-31 | 2022-09-30 | 2022-06-30 | 2022-03-31 | 2021-12-31 | 2021-09-30 | 2021-06-30 | 2021-03-31 | 2020-12-31 | 2020-09-30 | 2020-06-30 | 2020-03-31 | 2019-12-31 | 2019-09-30 | 2019-06-30 | 2019-03-31 | 2018-12-31 | 2018-09-30 | 2018-06-30 | 2018-03-31 | 2017-12-31 | 2017-09-30 | 2017-06-30 | 2017-03-31 | 2016-12-31 | 2016-09-30 | 2016-06-30 | 2016-03-31 | 2015-12-31 | 2015-09-30 | 2015-06-30 | 2015-03-31 | 2014-12-31 | 2014-09-30 | 2014-06-30 | 2014-03-31 | 2013-12-31 | 2013-09-30 | 2013-06-30 | 2013-03-31 | 2012-12-31 | 2012-09-30 | 2012-06-30 | 2012-03-31 | 2011-12-31 | 2011-09-30 | 2011-06-30 | 2011-03-31 | 2010-12-31 | 2010-09-30 | 2010-06-30 | 2010-03-31 | 2009-12-31 | 2009-09-30 | 2009-06-30 | 2009-03-31 | ||
|---|---|---|---|---|---|---|---|---|---|---|---|---|---|---|---|---|---|---|---|---|---|---|---|---|---|---|---|---|---|---|---|---|---|---|---|---|---|---|---|---|---|---|---|---|---|---|---|---|---|---|---|---|---|---|---|---|---|---|---|---|---|---|
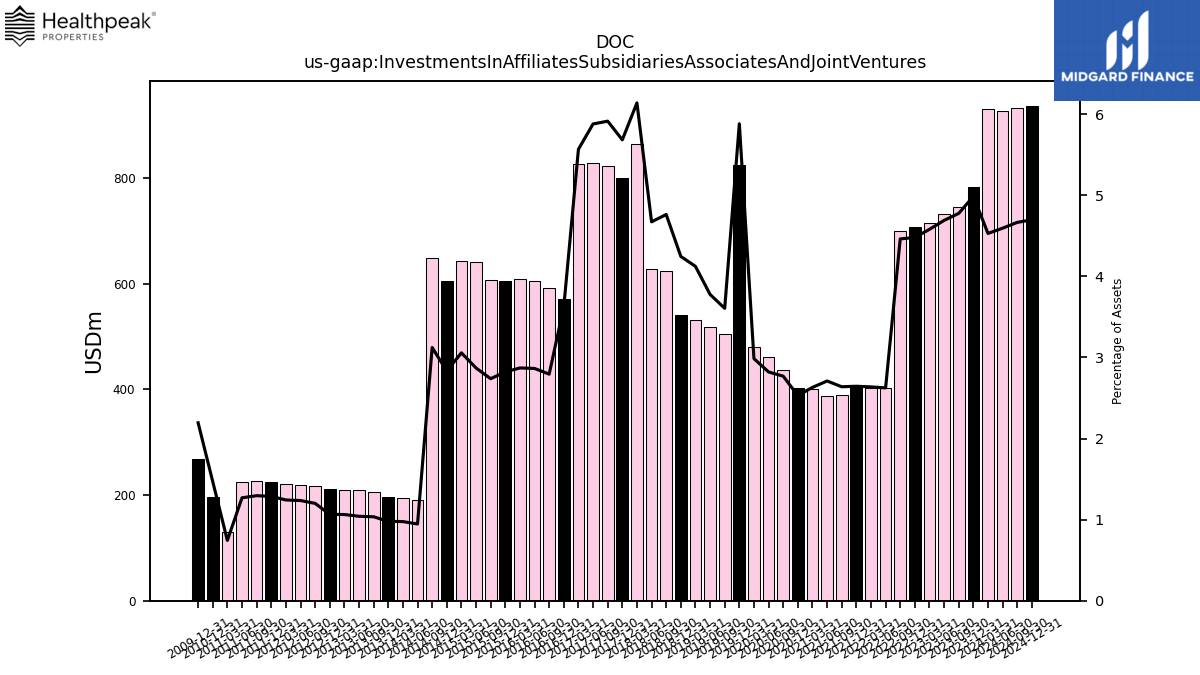
| Investments In Affiliates Subsidiaries Associates And Joint Ventures | 930.56 | 782.85 | 745.38 | 731.96 | 714.68 | 706.68 | 698.90 | 402.15 | 403.16 | 403.63 | 389.10 | 388.42 | 399.84 | 402.87 | 436.27 | 460.39 | 479.90 | 825.51 | 505.25 | 518.03 | 531.97 | 540.09 | 623.25 | 628.61 | 863.77 | 800.84 | 822.37 | 829.23 | 827.20 | 571.49 | 592.10 | 604.94 | 608.66 | 605.24 | 607.79 | 641.49 | 642.79 | 605.45 | 647.92 | 190.73 | 193.93 | 196.58 | 206.00 | 208.88 | 209.81 | 212.21 | 217.09 | 219.88 | 220.31 | 224.05 | 225.98 | 224.62 | 130.28 | 195.85 | NA | NA | NA | 267.98 | NA | NA | NA | |
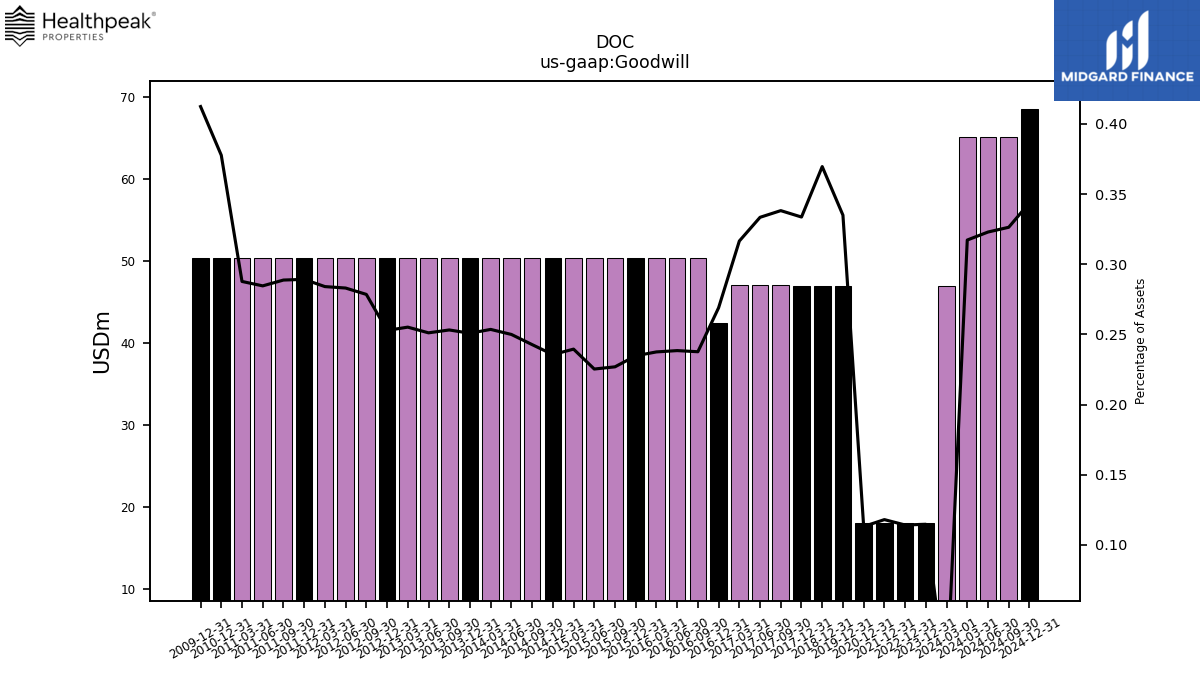
| Goodwill | 65.16 | 18.00 | NA | NA | NA | 18.00 | NA | NA | NA | 18.00 | NA | NA | NA | 18.00 | NA | NA | NA | 47.00 | NA | NA | NA | 47.00 | NA | NA | NA | 47.00 | 47.02 | 47.02 | 47.02 | 42.39 | 50.35 | 50.35 | 50.35 | 50.35 | 50.35 | 50.35 | 50.35 | 50.35 | 50.35 | 50.35 | 50.35 | 50.35 | 50.35 | 50.35 | 50.35 | 50.35 | 50.35 | 50.35 | 50.35 | 50.35 | 50.35 | 50.35 | 50.35 | 50.35 | NA | NA | NA | 50.35 | NA | NA | NA | |
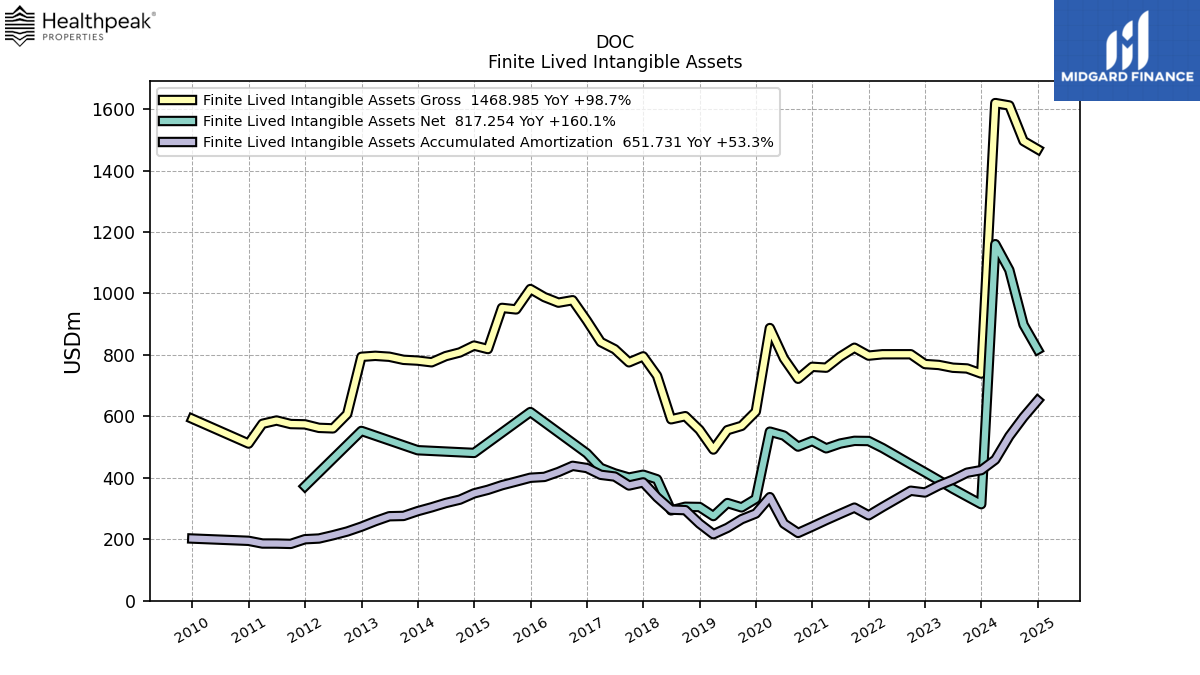
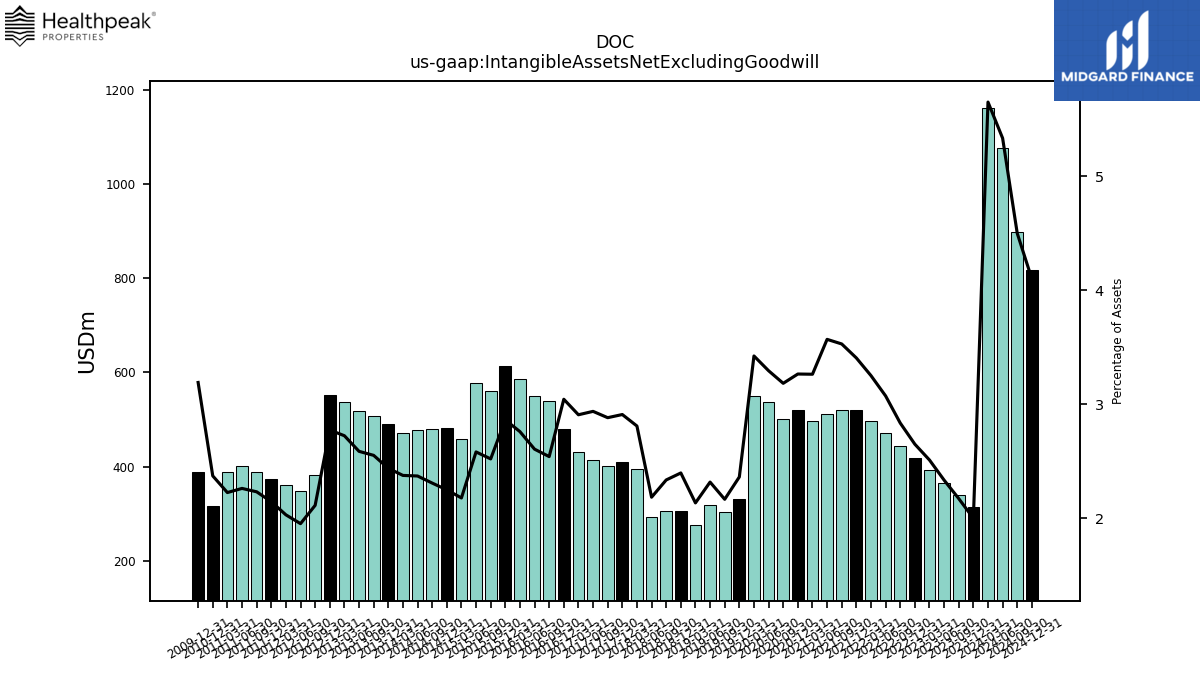
| Intangible Assets Net Excluding Goodwill | 1160.45 | 314.16 | 339.19 | 364.45 | 391.96 | 418.06 | 444.21 | 470.87 | 497.10 | 519.76 | 520.34 | 511.61 | 495.92 | 519.92 | 501.58 | 537.55 | 550.35 | 331.69 | 303.72 | 317.96 | 275.56 | 305.08 | 305.81 | 294.06 | 395.30 | 410.08 | 400.87 | 414.40 | 432.11 | 479.81 | 538.63 | 550.57 | 585.33 | 614.23 | 559.68 | 577.24 | 458.25 | 481.01 | 479.23 | 477.84 | 472.06 | 489.84 | 507.75 | 518.98 | 537.69 | 552.70 | 382.32 | 347.67 | 360.14 | 373.76 | 389.52 | 400.44 | 389.72 | 316.38 | NA | NA | NA | 389.70 | NA | NA | NA | |
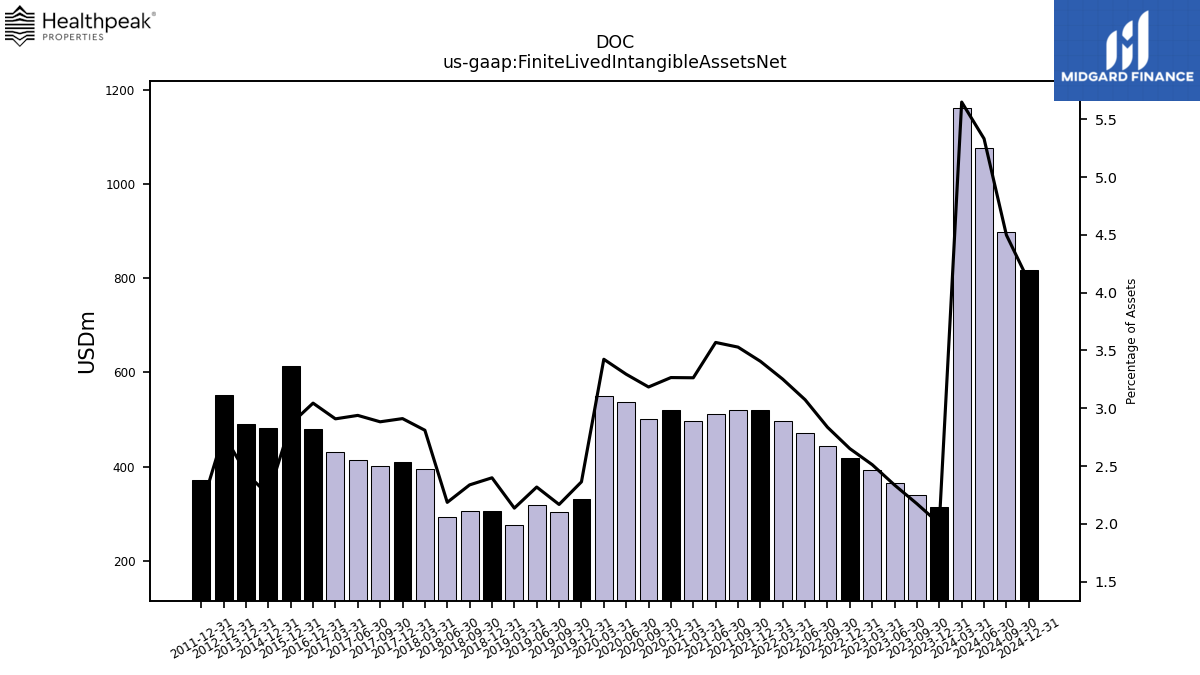
| Finite Lived Intangible Assets Net | 1160.45 | 314.16 | 339.19 | 364.45 | 391.96 | 418.06 | 444.21 | 470.87 | 497.10 | 519.76 | 520.34 | 511.61 | 495.92 | 519.92 | 501.58 | 537.55 | 550.35 | 331.69 | 303.72 | 317.96 | 275.56 | 305.08 | 305.81 | 294.06 | 395.30 | 410.08 | 400.87 | 414.40 | 432.11 | 479.81 | NA | NA | NA | 614.23 | NA | NA | NA | 481.01 | NA | NA | NA | 489.84 | NA | NA | NA | 552.70 | NA | NA | NA | 372.39 | NA | NA | NA | NA | NA | NA | NA | NA | NA | NA | NA |
| 2024-03-31 | 2023-12-31 | 2023-09-30 | 2023-06-30 | 2023-03-31 | 2022-12-31 | 2022-09-30 | 2022-06-30 | 2022-03-31 | 2021-12-31 | 2021-09-30 | 2021-06-30 | 2021-03-31 | 2020-12-31 | 2020-09-30 | 2020-06-30 | 2020-03-31 | 2019-12-31 | 2019-09-30 | 2019-06-30 | 2019-03-31 | 2018-12-31 | 2018-09-30 | 2018-06-30 | 2018-03-31 | 2017-12-31 | 2017-09-30 | 2017-06-30 | 2017-03-31 | 2016-12-31 | 2016-09-30 | 2016-06-30 | 2016-03-31 | 2015-12-31 | 2015-09-30 | 2015-06-30 | 2015-03-31 | 2014-12-31 | 2014-09-30 | 2014-06-30 | 2014-03-31 | 2013-12-31 | 2013-09-30 | 2013-06-30 | 2013-03-31 | 2012-12-31 | 2012-09-30 | 2012-06-30 | 2012-03-31 | 2011-12-31 | 2011-09-30 | 2011-06-30 | 2011-03-31 | 2010-12-31 | 2010-09-30 | 2010-06-30 | 2010-03-31 | 2009-12-31 | 2009-09-30 | 2009-06-30 | 2009-03-31 | ||
|---|---|---|---|---|---|---|---|---|---|---|---|---|---|---|---|---|---|---|---|---|---|---|---|---|---|---|---|---|---|---|---|---|---|---|---|---|---|---|---|---|---|---|---|---|---|---|---|---|---|---|---|---|---|---|---|---|---|---|---|---|---|---|
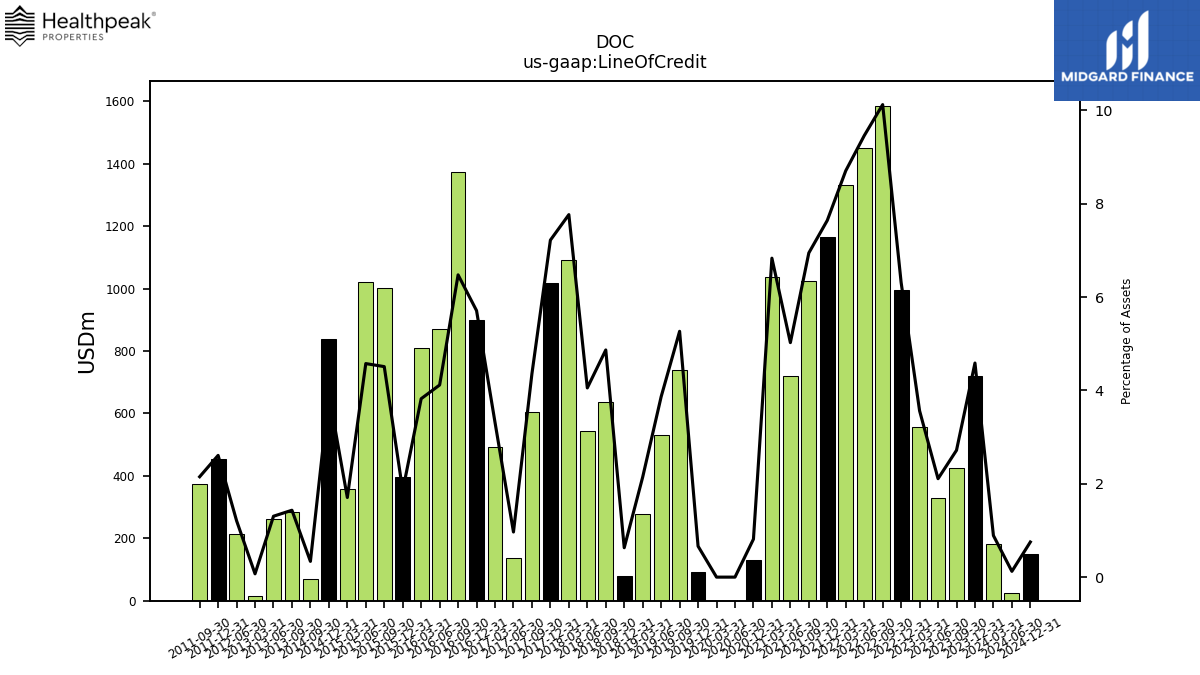
| Line Of Credit | 183.00 | 720.00 | 424.00 | 329.00 | 556.00 | 995.61 | 1585.33 | 1448.57 | 1330.81 | 1165.97 | 1024.00 | 720.00 | 1038.15 | 129.59 | NA | 0.00 | 0.00 | 93.00 | 737.79 | 530.00 | 276.50 | 80.10 | 636.71 | 545.23 | 1092.36 | 1017.08 | 605.84 | 136.31 | 492.42 | 899.72 | 1372.03 | 869.08 | 810.31 | 397.43 | 1000.82 | 1022.32 | 358.56 | 838.52 | 70.00 | NA | NA | NA | 285.00 | 261.58 | 14.00 | NA | NA | 215.01 | NA | 454.00 | 375.00 | NA | NA | NA | NA | NA | NA | NA | NA | NA | NA |
| 2024-03-31 | 2023-12-31 | 2023-09-30 | 2023-06-30 | 2023-03-31 | 2022-12-31 | 2022-09-30 | 2022-06-30 | 2022-03-31 | 2021-12-31 | 2021-09-30 | 2021-06-30 | 2021-03-31 | 2020-12-31 | 2020-09-30 | 2020-06-30 | 2020-03-31 | 2019-12-31 | 2019-09-30 | 2019-06-30 | 2019-03-31 | 2018-12-31 | 2018-09-30 | 2018-06-30 | 2018-03-31 | 2017-12-31 | 2017-09-30 | 2017-06-30 | 2017-03-31 | 2016-12-31 | 2016-09-30 | 2016-06-30 | 2016-03-31 | 2015-12-31 | 2015-09-30 | 2015-06-30 | 2015-03-31 | 2014-12-31 | 2014-09-30 | 2014-06-30 | 2014-03-31 | 2013-12-31 | 2013-09-30 | 2013-06-30 | 2013-03-31 | 2012-12-31 | 2012-09-30 | 2012-06-30 | 2012-03-31 | 2011-12-31 | 2011-09-30 | 2011-06-30 | 2011-03-31 | 2010-12-31 | 2010-09-30 | 2010-06-30 | 2010-03-31 | 2009-12-31 | 2009-09-30 | 2009-06-30 | 2009-03-31 | ||
|---|---|---|---|---|---|---|---|---|---|---|---|---|---|---|---|---|---|---|---|---|---|---|---|---|---|---|---|---|---|---|---|---|---|---|---|---|---|---|---|---|---|---|---|---|---|---|---|---|---|---|---|---|---|---|---|---|---|---|---|---|---|---|
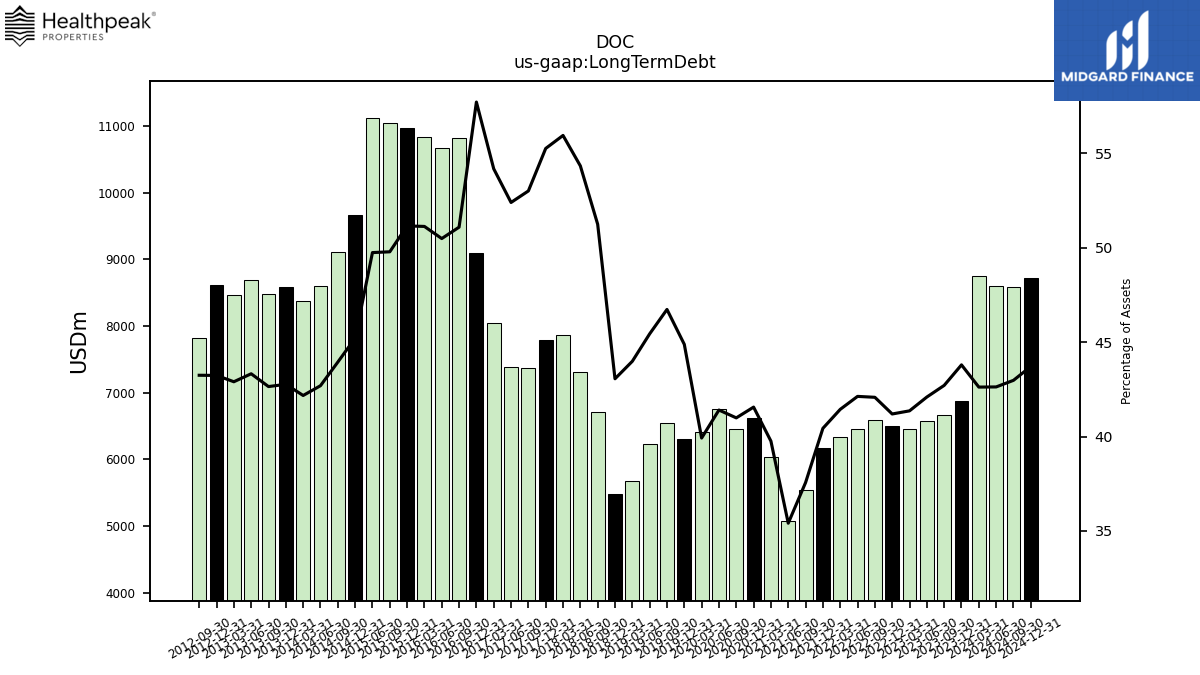
| Long Term Debt | 8755.80 | 6876.30 | 6664.41 | 6568.65 | 6453.88 | 6497.61 | 6590.97 | 6453.75 | 6335.58 | 6169.99 | 5538.40 | 5075.44 | 6041.22 | 6616.85 | 6457.12 | 6756.43 | 6416.94 | 6299.13 | 6547.96 | 6231.75 | 5674.65 | 5477.12 | 6705.76 | 7309.97 | 7871.73 | 7786.30 | 7371.39 | 7390.52 | 8050.19 | 9097.11 | 10826.66 | 10662.44 | 10840.72 | 10974.56 | 11050.32 | 11118.21 | NA | 9662.75 | 9116.79 | 8601.01 | 8376.25 | 8586.72 | 8483.09 | 8688.27 | 8466.75 | 8611.86 | 7819.42 | NA | NA | NA | NA | NA | NA | NA | NA | NA | NA | NA | NA | NA | NA | |
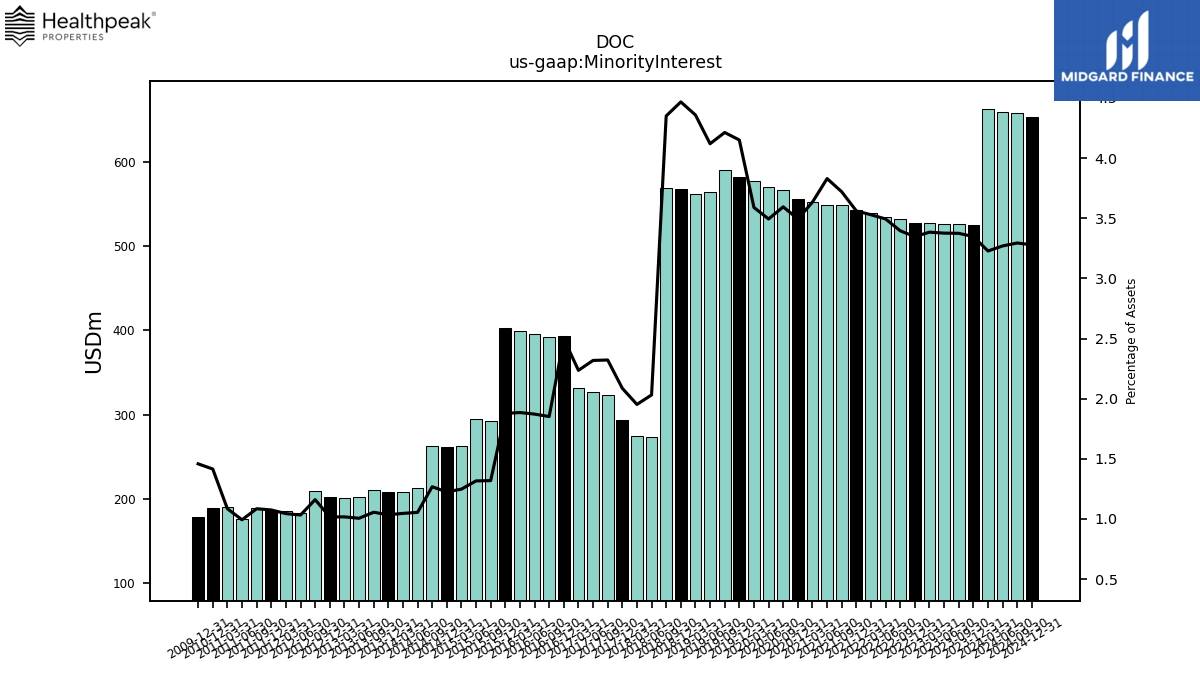
| Minority Interest | 663.04 | 525.60 | 526.51 | 526.80 | 528.00 | 527.90 | 531.80 | 535.18 | 539.50 | 543.29 | 548.44 | 548.87 | 552.14 | 556.23 | 566.25 | 570.05 | 576.93 | 582.42 | 590.23 | 564.87 | 562.18 | 568.15 | 569.21 | 273.23 | 274.63 | 293.93 | 322.80 | 326.89 | 332.13 | 393.71 | 392.32 | 395.26 | 399.58 | 402.67 | 292.70 | 294.21 | 262.38 | 261.80 | 263.05 | 212.46 | 207.82 | 207.83 | 210.02 | 201.70 | 200.79 | 202.54 | 209.85 | 183.71 | 185.17 | 187.14 | 189.28 | 175.74 | 189.91 | 188.68 | NA | NA | NA | 178.07 | NA | NA | NA |
| 2024-03-31 | 2023-12-31 | 2023-09-30 | 2023-06-30 | 2023-03-31 | 2022-12-31 | 2022-09-30 | 2022-06-30 | 2022-03-31 | 2021-12-31 | 2021-09-30 | 2021-06-30 | 2021-03-31 | 2020-12-31 | 2020-09-30 | 2020-06-30 | 2020-03-31 | 2019-12-31 | 2019-09-30 | 2019-06-30 | 2019-03-31 | 2018-12-31 | 2018-09-30 | 2018-06-30 | 2018-03-31 | 2017-12-31 | 2017-09-30 | 2017-06-30 | 2017-03-31 | 2016-12-31 | 2016-09-30 | 2016-06-30 | 2016-03-31 | 2015-12-31 | 2015-09-30 | 2015-06-30 | 2015-03-31 | 2014-12-31 | 2014-09-30 | 2014-06-30 | 2014-03-31 | 2013-12-31 | 2013-09-30 | 2013-06-30 | 2013-03-31 | 2012-12-31 | 2012-09-30 | 2012-06-30 | 2012-03-31 | 2011-12-31 | 2011-09-30 | 2011-06-30 | 2011-03-31 | 2010-12-31 | 2010-09-30 | 2010-06-30 | 2010-03-31 | 2009-12-31 | 2009-09-30 | 2009-06-30 | 2009-03-31 | ||
|---|---|---|---|---|---|---|---|---|---|---|---|---|---|---|---|---|---|---|---|---|---|---|---|---|---|---|---|---|---|---|---|---|---|---|---|---|---|---|---|---|---|---|---|---|---|---|---|---|---|---|---|---|---|---|---|---|---|---|---|---|---|---|
| Stockholders Equity | 8881.61 | 6350.45 | 6457.31 | 6535.06 | 6609.74 | 6654.70 | 6466.96 | 6305.21 | 6408.22 | 6515.47 | 6670.36 | 6884.86 | 6764.54 | 6788.35 | 6840.06 | 7098.67 | 7236.51 | 6085.06 | 5933.13 | 6054.40 | 5836.88 | 5944.44 | 5071.17 | 5143.49 | 5206.29 | 5301.01 | 5531.43 | 5702.05 | 5841.35 | 5547.60 | 9183.11 | 9281.13 | 9230.75 | 9343.64 | 10167.75 | 10232.79 | 10293.27 | 10735.30 | 10773.12 | 10760.13 | 10761.75 | 10723.30 | 10640.22 | 10596.56 | 10581.27 | 10551.24 | 9518.00 | 9507.23 | 9124.79 | 9033.48 | 9127.78 | 9145.53 | 9077.53 | 7957.37 | NA | NA | NA | 5780.54 | NA | NA | NA | |
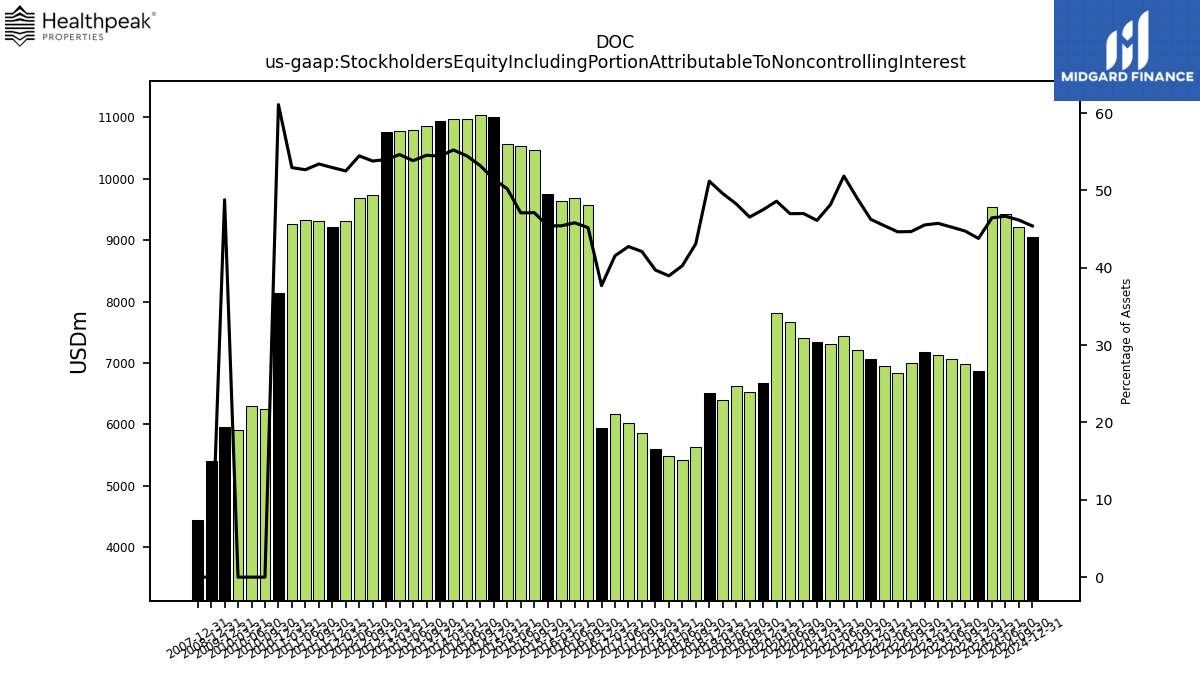
| Stockholders Equity Including Portion Attributable To Noncontrolling Interest | 9544.65 | 6876.04 | 6983.81 | 7061.86 | 7137.73 | 7182.60 | 6998.77 | 6840.39 | 6947.72 | 7058.76 | 7218.80 | 7433.73 | 7316.68 | 7344.57 | 7406.31 | 7668.72 | 7813.44 | 6667.47 | 6523.36 | 6619.27 | 6399.06 | 6512.59 | 5640.38 | 5416.72 | 5480.92 | 5594.94 | 5854.23 | 6028.94 | 6173.48 | 5941.31 | 9575.43 | 9676.39 | 9630.33 | 9746.32 | 10460.46 | 10527.00 | 10555.65 | 10997.10 | 11036.17 | 10972.59 | 10969.57 | 10931.13 | 10850.24 | 10798.26 | 10782.06 | 10753.78 | 9727.85 | 9690.94 | 9309.96 | 9220.62 | 9317.05 | 9321.27 | 9267.45 | 8146.05 | 6253.78 | 6293.32 | 5908.17 | 5958.61 | NA | NA | NA | |
| Common Stock Value | 703.73 | 547.16 | 547.07 | 547.05 | 547.00 | 546.64 | 537.53 | 539.58 | 539.52 | 539.10 | 539.07 | 538.96 | 538.89 | 538.40 | 538.36 | 538.32 | 538.13 | 505.22 | 494.85 | 491.11 | 477.93 | 477.50 | 469.92 | 469.83 | 469.73 | 469.44 | 469.04 | 468.88 | 468.45 | 468.08 | 467.82 | 467.32 | 466.93 | 465.49 | 464.44 | 462.49 | 461.58 | 459.75 | 459.15 | 458.74 | 458.04 | 456.96 | 455.87 | 455.09 | 454.42 | 453.19 | 429.98 | 429.40 | 419.43 | 408.63 | 407.78 | 407.12 | 406.01 | 370.93 | NA | NA | NA | 293.55 | NA | NA | NA | |
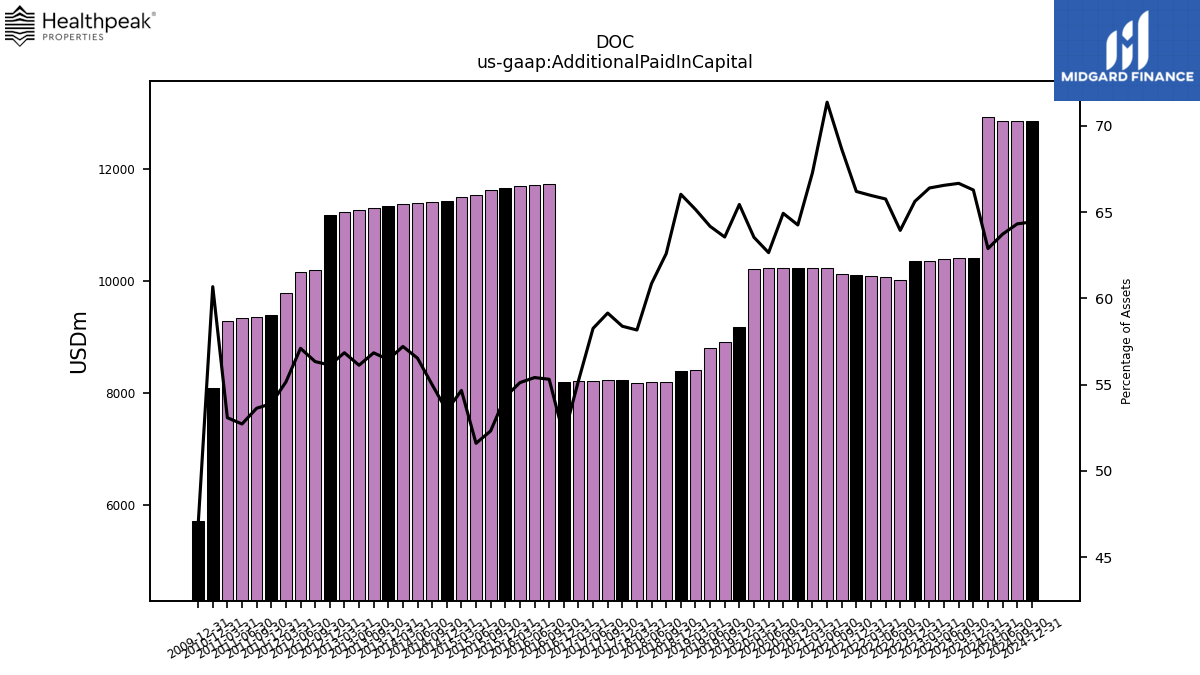
| Additional Paid In Capital | 12918.94 | 10405.78 | 10401.99 | 10384.98 | 10360.06 | 10349.61 | 10014.71 | 10073.71 | 10084.69 | 10100.29 | 10122.11 | 10229.55 | 10223.71 | 10229.86 | 10228.09 | 10222.73 | 10213.01 | 9183.89 | 8904.76 | 8801.04 | 8405.26 | 8398.85 | 8189.95 | 8187.39 | 8183.17 | 8226.11 | 8224.53 | 8216.78 | 8203.78 | 8198.89 | 11720.55 | 11701.71 | 11685.54 | 11647.04 | 11612.25 | 11532.58 | 11493.99 | 11431.99 | 11409.84 | 11388.64 | 11362.58 | 11334.04 | 11306.72 | 11254.66 | 11218.70 | 11180.07 | 10185.98 | 10159.58 | 9776.71 | 9383.54 | 9353.78 | 9328.61 | 9289.95 | 8089.98 | NA | NA | NA | 5719.40 | NA | NA | NA | |
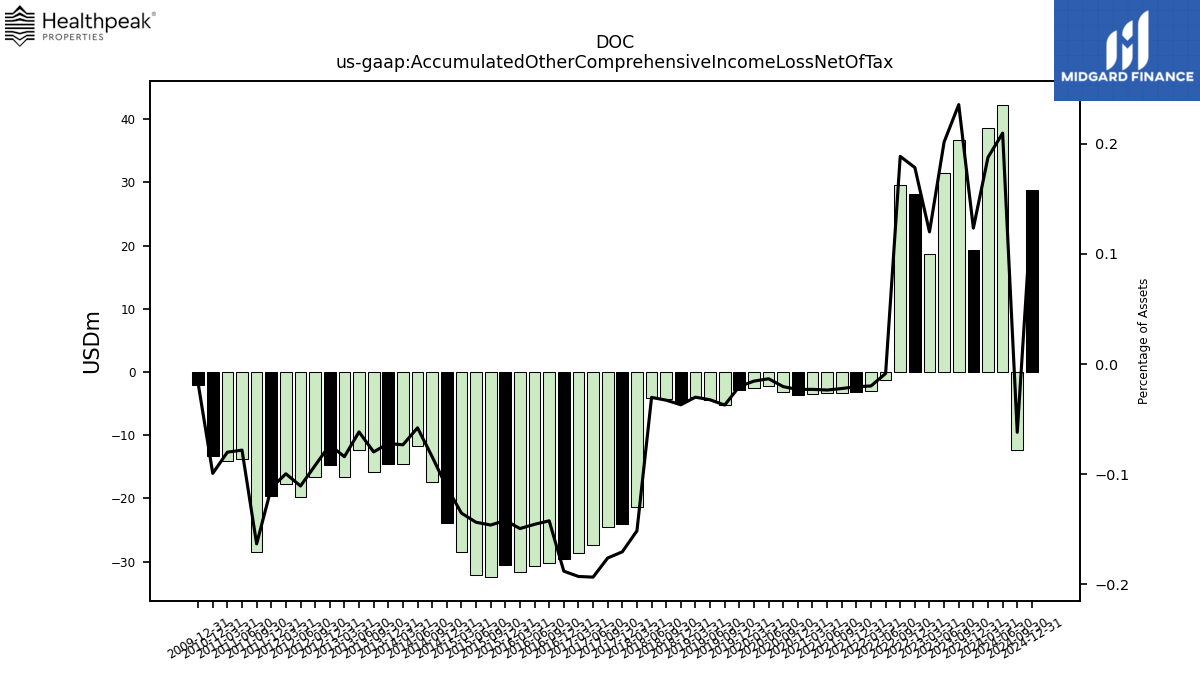
| Accumulated Other Comprehensive Income Loss Net Of Tax | 38.54 | 19.37 | 36.75 | 31.45 | 18.72 | 28.13 | 29.53 | -1.32 | -3.05 | -3.15 | -3.28 | -3.39 | -3.50 | -3.69 | -3.24 | -2.19 | -2.50 | -2.86 | -5.22 | -4.46 | -3.88 | -4.71 | -4.30 | -4.08 | -21.31 | -24.02 | -24.49 | -27.29 | -28.66 | -29.64 | -30.16 | -30.74 | -31.67 | -30.47 | -32.45 | -32.12 | -28.46 | -23.89 | -17.46 | -11.67 | -14.57 | -14.49 | -15.88 | -12.36 | -16.60 | -14.65 | -16.65 | -19.70 | -17.67 | -19.58 | -28.48 | -13.83 | -14.01 | -13.24 | NA | NA | NA | -2.13 | NA | NA | NA | |
| Minority Interest | 663.04 | 525.60 | 526.51 | 526.80 | 528.00 | 527.90 | 531.80 | 535.18 | 539.50 | 543.29 | 548.44 | 548.87 | 552.14 | 556.23 | 566.25 | 570.05 | 576.93 | 582.42 | 590.23 | 564.87 | 562.18 | 568.15 | 569.21 | 273.23 | 274.63 | 293.93 | 322.80 | 326.89 | 332.13 | 393.71 | 392.32 | 395.26 | 399.58 | 402.67 | 292.70 | 294.21 | 262.38 | 261.80 | 263.05 | 212.46 | 207.82 | 207.83 | 210.02 | 201.70 | 200.79 | 202.54 | 209.85 | 183.71 | 185.17 | 187.14 | 189.28 | 175.74 | 189.91 | 188.68 | NA | NA | NA | 178.07 | NA | NA | NA | |
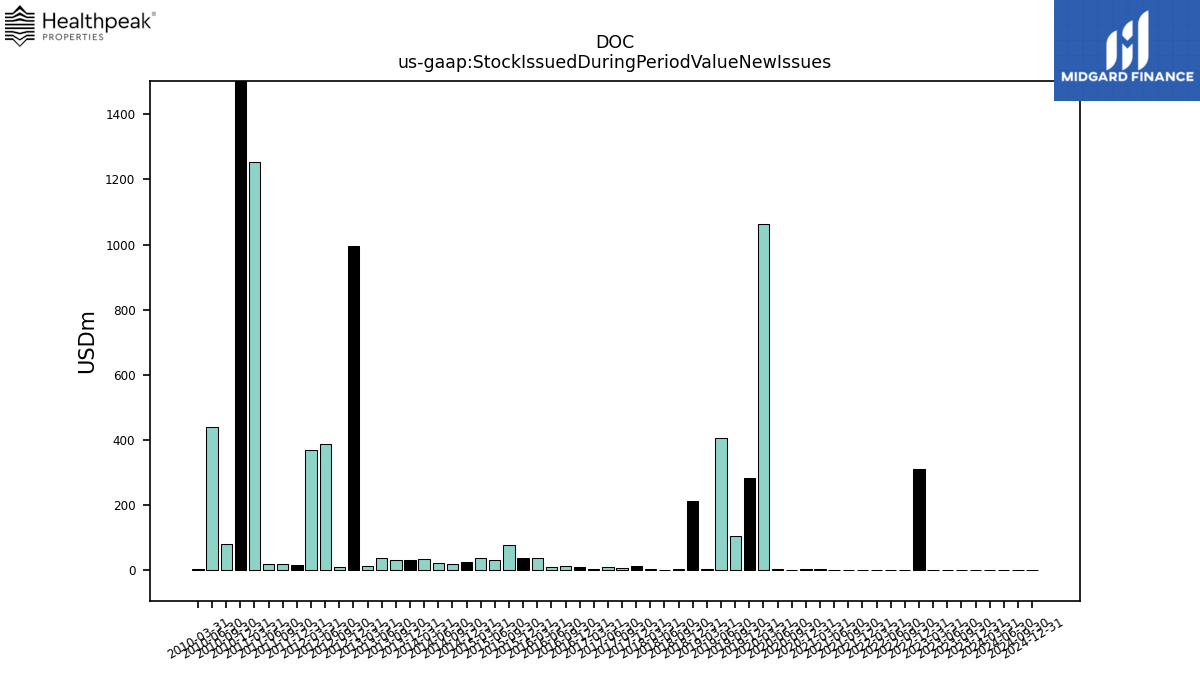
| Stock Issued During Period Value New Issues | 0.31 | 0.75 | 0.33 | 0.18 | 0.17 | 308.39 | 0.38 | 0.33 | 0.33 | 0.32 | 0.38 | -0.04 | 1.09 | 1.17 | 0.51 | 0.77 | 1064.62 | 281.81 | 102.43 | 405.28 | 1.53 | 210.87 | 0.88 | 0.66 | 2.77 | 10.00 | 4.06 | 9.82 | 3.47 | 8.47 | 12.64 | 7.67 | 35.41 | 36.90 | 76.29 | 30.49 | 35.20 | 22.38 | 16.14 | 20.98 | 32.63 | 29.51 | 30.19 | 35.04 | 12.28 | 995.73 | 7.29 | 386.86 | 366.92 | 13.68 | 18.96 | 17.00 | 1252.37 | 1905.53 | 78.09 | 439.11 | 2.39 | NA | NA | NA | NA | |
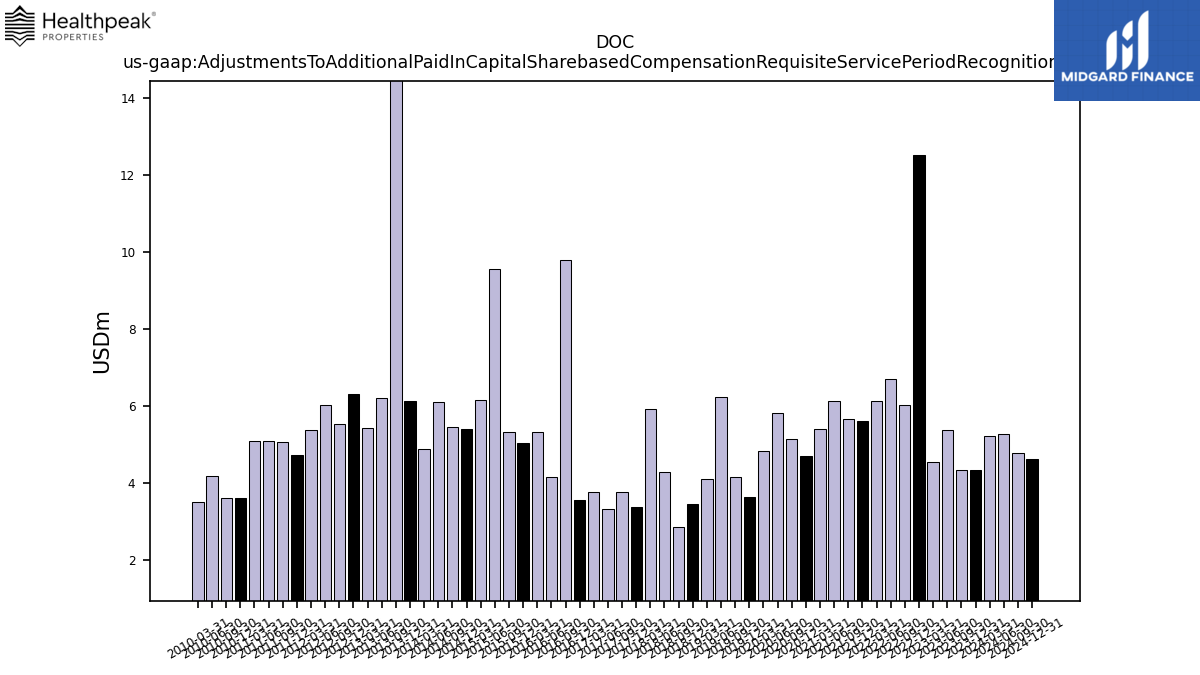
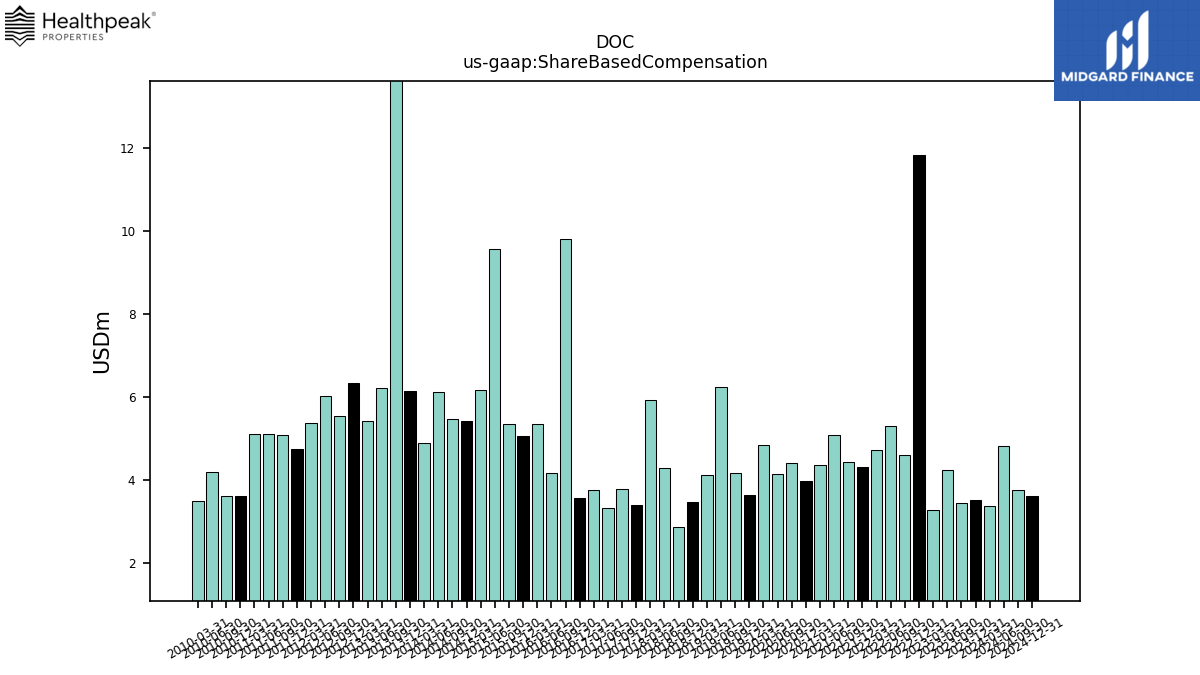
| Adjustments To Additional Paid In Capital Sharebased Compensation Requisite Service Period Recognition Value | 5.22 | 4.35 | 4.35 | 5.39 | 4.57 | 12.52 | 6.03 | 6.72 | 6.14 | 5.63 | 5.67 | 6.14 | 5.41 | 4.72 | 5.16 | 5.83 | 4.83 | 3.63 | 4.17 | 6.25 | 4.11 | 3.46 | 2.88 | 4.30 | 5.92 | 3.39 | 3.77 | 3.33 | 3.77 | 3.58 | 9.80 | 4.16 | 5.34 | 5.06 | 5.34 | 9.56 | 6.17 | 5.42 | 5.46 | 6.12 | 4.89 | 6.15 | 22.20 | 6.21 | 5.43 | 6.33 | 5.54 | 6.03 | 5.37 | 4.75 | 5.08 | 5.10 | 5.10 | 3.62 | 3.62 | 4.18 | 3.51 | NA | NA | NA | NA | |
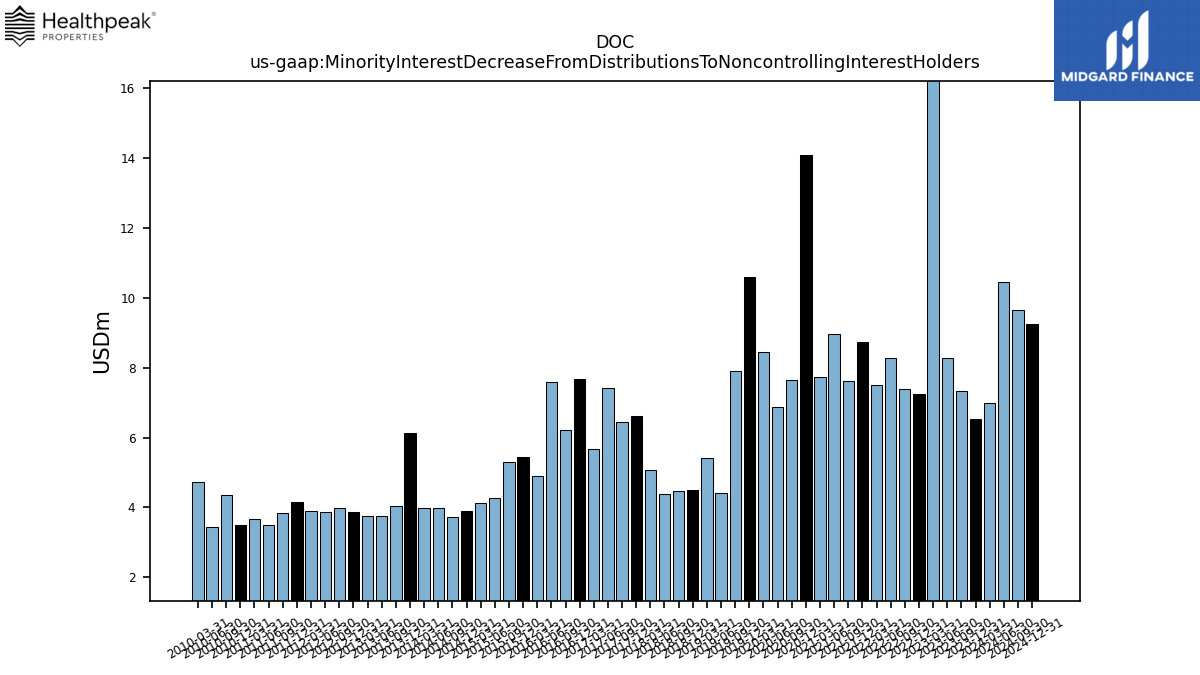
| Minority Interest Decrease From Distributions To Noncontrolling Interest Holders | 7.00 | 6.53 | 7.32 | 8.27 | 22.73 | 7.24 | 7.37 | 8.27 | 7.51 | 8.74 | 7.60 | 8.96 | 7.72 | 14.07 | 7.63 | 6.86 | 8.43 | 10.58 | 7.90 | 4.41 | 5.42 | 4.49 | 4.46 | 4.39 | 5.08 | 6.61 | 6.43 | 7.43 | 5.66 | 7.66 | 6.21 | 7.58 | 4.89 | 5.44 | 5.30 | 4.28 | 4.12 | 3.90 | 3.74 | 3.99 | 3.98 | 6.13 | 4.03 | 3.75 | 3.75 | 3.87 | 3.98 | 3.87 | 3.91 | 4.16 | 3.83 | 3.50 | 3.67 | 3.50 | 4.35 | 3.46 | 4.74 | NA | NA | NA | NA |
| 2024-03-31 | 2023-12-31 | 2023-09-30 | 2023-06-30 | 2023-03-31 | 2022-12-31 | 2022-09-30 | 2022-06-30 | 2022-03-31 | 2021-12-31 | 2021-09-30 | 2021-06-30 | 2021-03-31 | 2020-12-31 | 2020-09-30 | 2020-06-30 | 2020-03-31 | 2019-12-31 | 2019-09-30 | 2019-06-30 | 2019-03-31 | 2018-12-31 | 2018-09-30 | 2018-06-30 | 2018-03-31 | 2017-12-31 | 2017-09-30 | 2017-06-30 | 2017-03-31 | 2016-12-31 | 2016-09-30 | 2016-06-30 | 2016-03-31 | 2015-12-31 | 2015-09-30 | 2015-06-30 | 2015-03-31 | 2014-12-31 | 2014-09-30 | 2014-06-30 | 2014-03-31 | 2013-12-31 | 2013-09-30 | 2013-06-30 | 2013-03-31 | 2012-12-31 | 2012-09-30 | 2012-06-30 | 2012-03-31 | 2011-12-31 | 2011-09-30 | 2011-06-30 | 2011-03-31 | 2010-12-31 | 2010-09-30 | 2010-06-30 | 2010-03-31 | 2009-12-31 | 2009-09-30 | 2009-06-30 | 2009-03-31 | ||
|---|---|---|---|---|---|---|---|---|---|---|---|---|---|---|---|---|---|---|---|---|---|---|---|---|---|---|---|---|---|---|---|---|---|---|---|---|---|---|---|---|---|---|---|---|---|---|---|---|---|---|---|---|---|---|---|---|---|---|---|---|---|---|
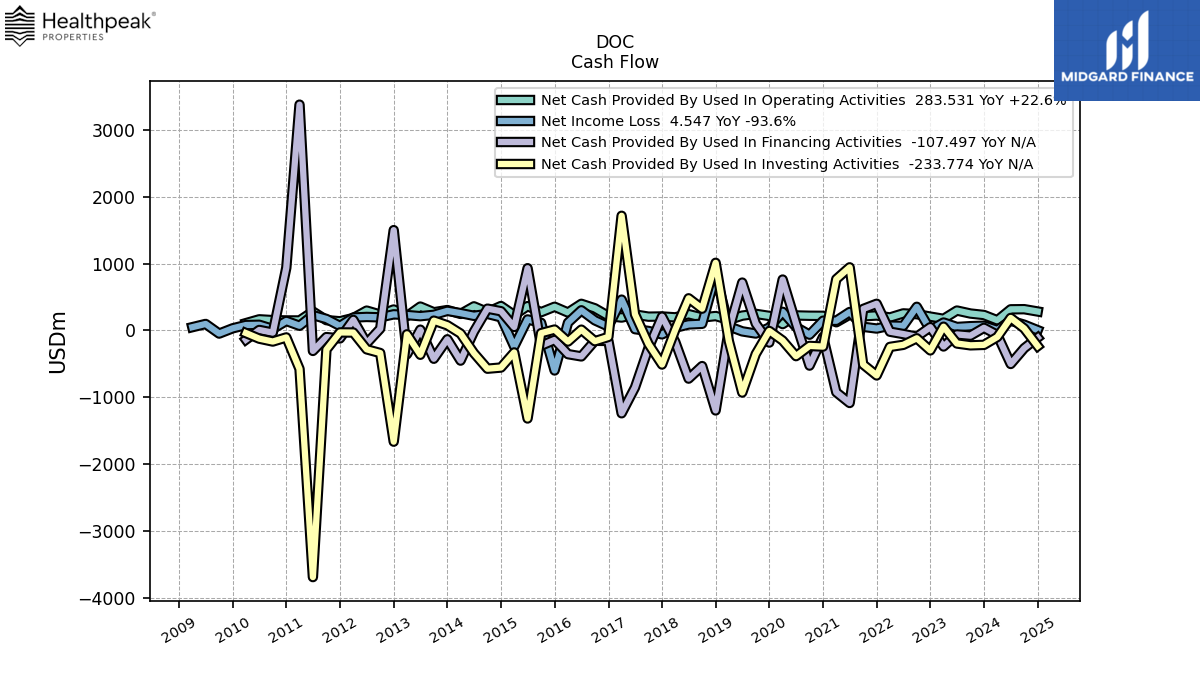
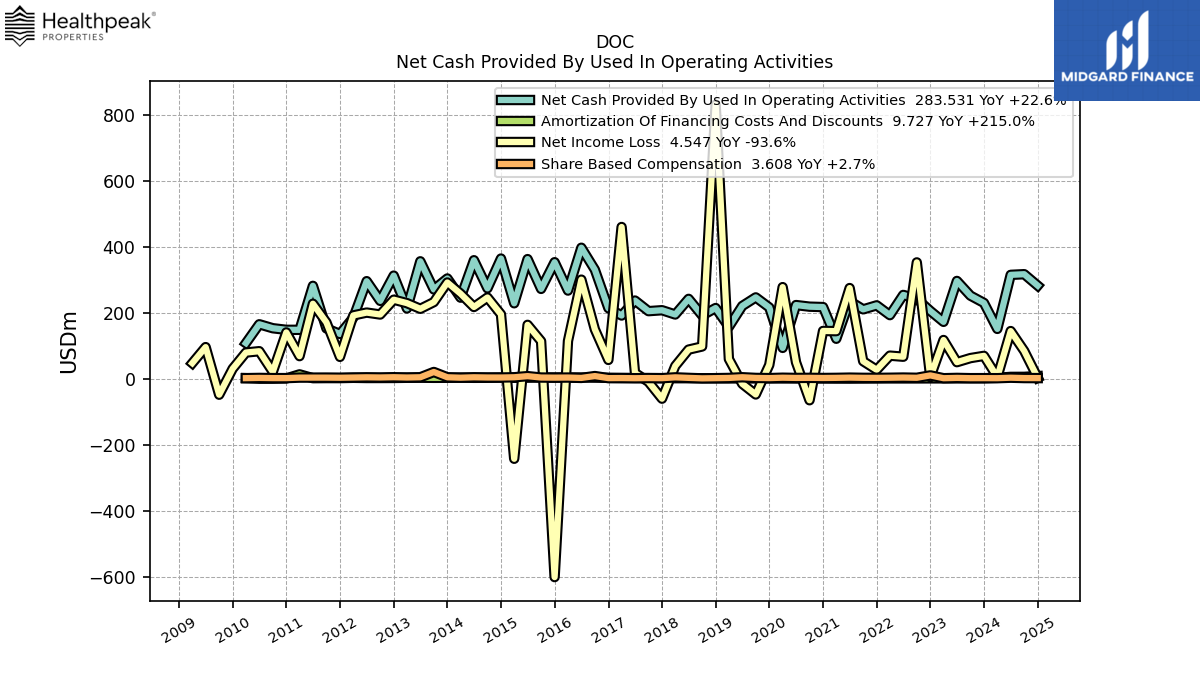
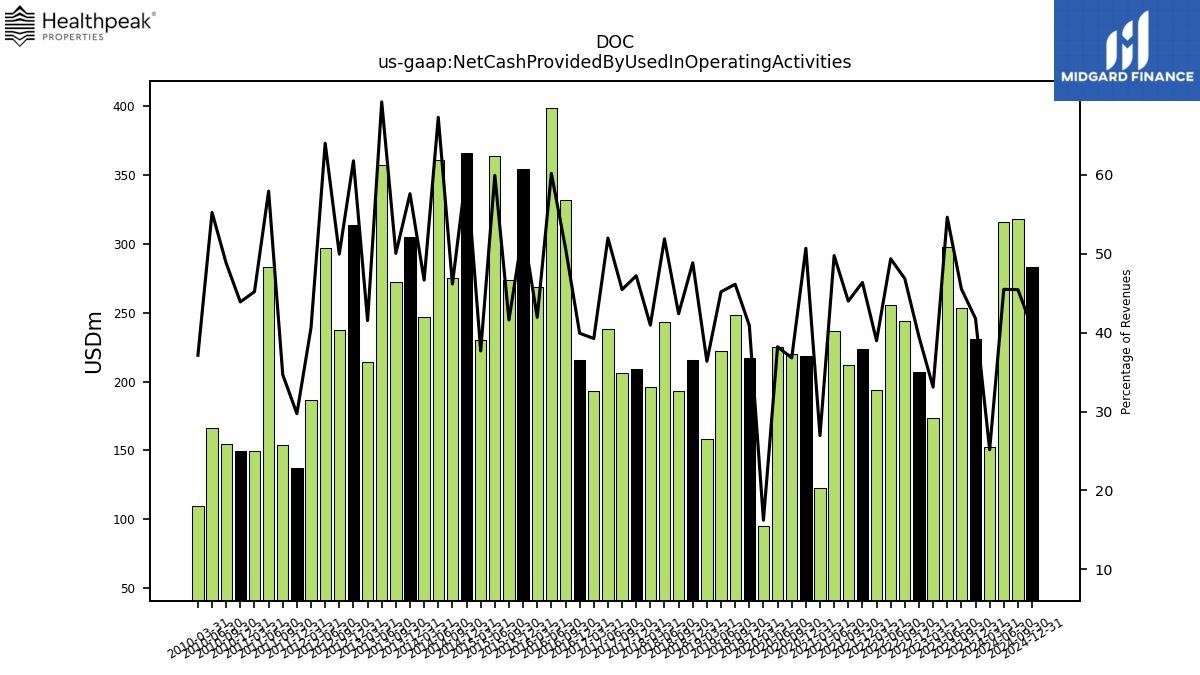
| Net Cash Provided By Used In Operating Activities | 152.56 | 231.25 | 253.26 | 297.82 | 173.92 | 206.96 | 243.64 | 255.49 | 194.18 | 223.91 | 211.74 | 236.87 | 122.73 | 218.71 | 219.90 | 224.78 | 95.04 | 217.47 | 248.04 | 221.98 | 158.58 | 215.79 | 193.24 | 243.51 | 196.16 | 209.15 | 206.31 | 238.46 | 193.13 | 215.50 | 331.72 | 398.30 | 268.62 | 354.49 | 273.67 | 363.92 | 230.07 | 365.60 | 275.32 | 360.52 | 247.18 | 305.31 | 272.08 | 357.25 | 214.35 | 313.92 | 237.40 | 297.08 | 186.47 | 137.24 | 154.11 | 282.99 | 149.83 | 149.77 | 154.63 | 166.64 | 109.46 | NA | NA | NA | NA | |
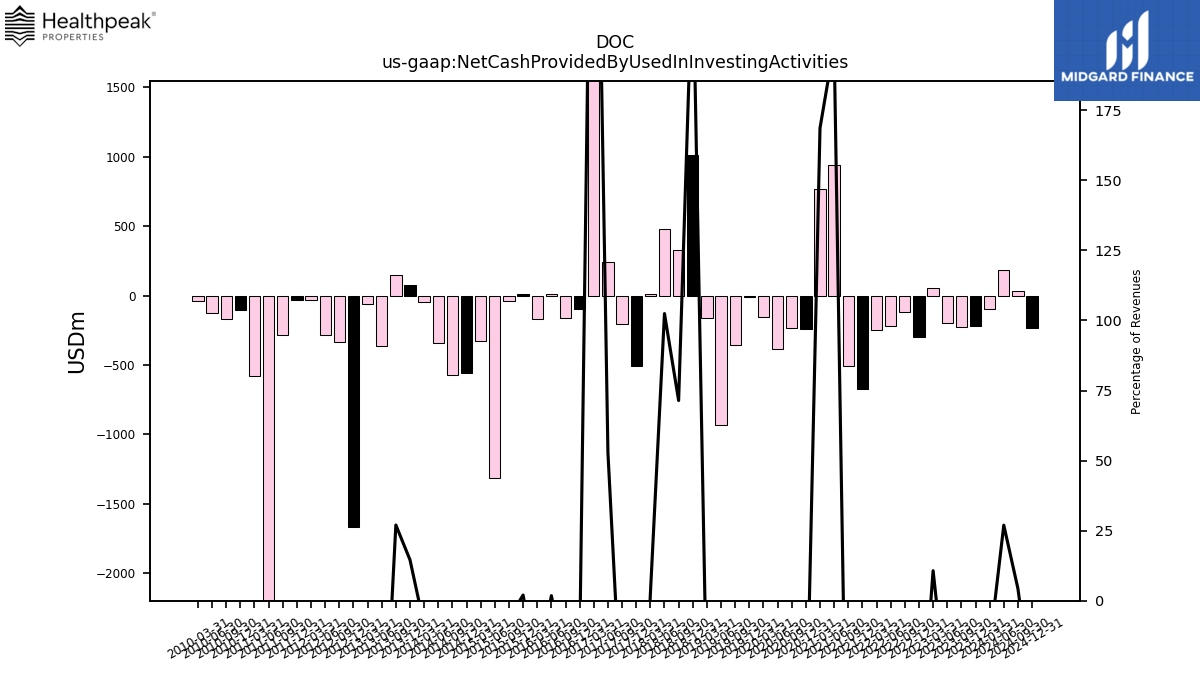
| Net Cash Provided By Used In Investing Activities | -97.78 | -215.67 | -222.42 | -195.01 | 56.34 | -298.23 | -116.98 | -215.17 | -245.96 | -672.64 | -508.62 | 944.57 | 767.73 | -241.22 | -231.21 | -384.26 | -151.01 | -7.26 | -352.54 | -928.70 | -160.28 | 1011.75 | 325.77 | 481.04 | 10.73 | -509.57 | -201.76 | 242.37 | 1715.22 | -96.46 | -160.54 | 12.14 | -165.76 | 13.58 | -40.52 | -1316.78 | -328.29 | -554.65 | -572.03 | -338.65 | -46.55 | 77.31 | 146.98 | -363.57 | -57.36 | -1663.45 | -337.16 | -282.40 | -31.15 | -29.46 | -286.37 | -3689.15 | -575.50 | -103.96 | -165.63 | -122.62 | -38.71 | NA | NA | NA | NA | |
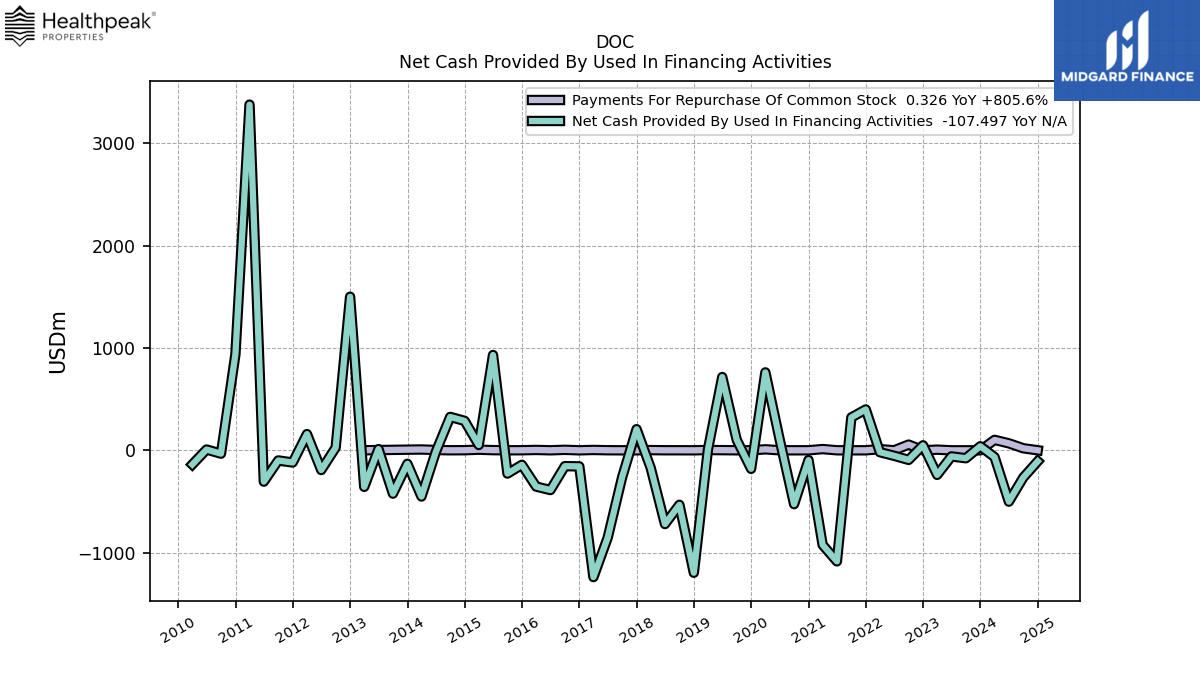
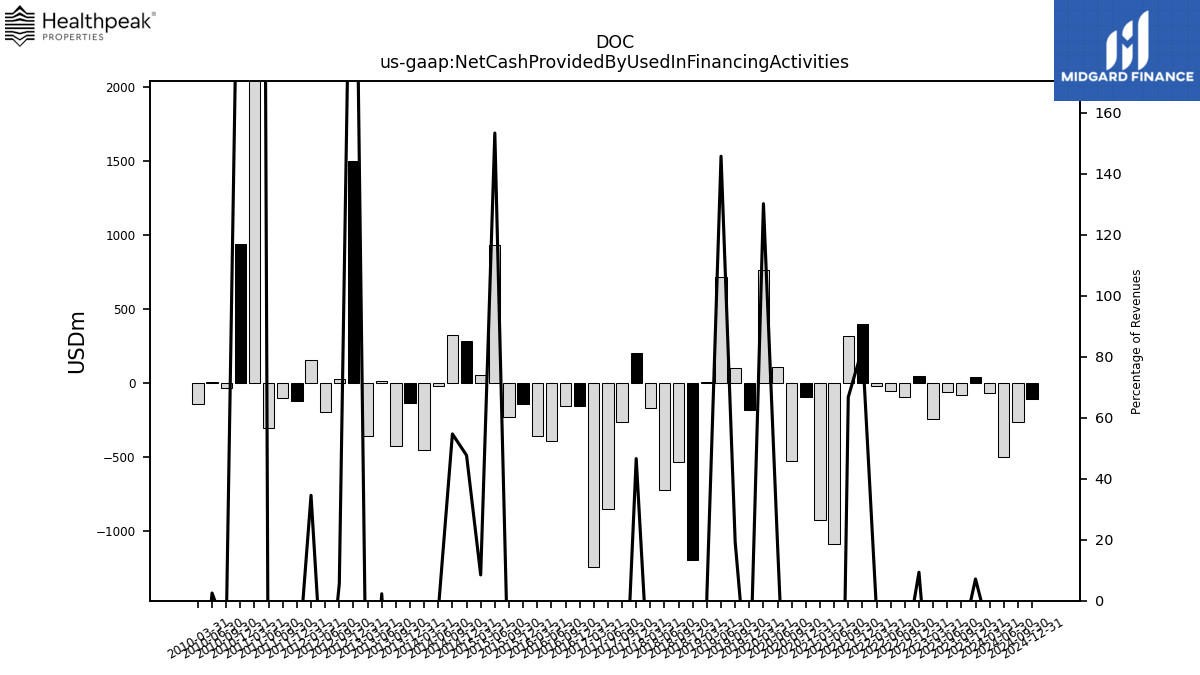
| Net Cash Provided By Used In Financing Activities | -66.65 | 39.52 | -77.44 | -59.50 | -239.88 | 48.98 | -93.44 | -53.57 | -18.51 | 399.37 | 321.38 | -1085.15 | -924.12 | -95.34 | -525.80 | 106.16 | 761.42 | -180.98 | 103.59 | 716.14 | 8.52 | -1196.38 | -532.42 | -720.50 | -171.24 | 206.50 | -262.80 | -853.20 | -1238.97 | -156.94 | -154.58 | -388.35 | -354.40 | -141.79 | -227.16 | 931.32 | 51.72 | 287.62 | 326.17 | -17.55 | -451.45 | -131.78 | -423.35 | 11.83 | -357.12 | 1500.73 | 26.59 | -192.48 | 158.60 | -119.13 | -99.08 | -306.26 | 3377.60 | 938.26 | -32.62 | 7.64 | -138.40 | NA | NA | NA | NA |
| 2024-03-31 | 2023-12-31 | 2023-09-30 | 2023-06-30 | 2023-03-31 | 2022-12-31 | 2022-09-30 | 2022-06-30 | 2022-03-31 | 2021-12-31 | 2021-09-30 | 2021-06-30 | 2021-03-31 | 2020-12-31 | 2020-09-30 | 2020-06-30 | 2020-03-31 | 2019-12-31 | 2019-09-30 | 2019-06-30 | 2019-03-31 | 2018-12-31 | 2018-09-30 | 2018-06-30 | 2018-03-31 | 2017-12-31 | 2017-09-30 | 2017-06-30 | 2017-03-31 | 2016-12-31 | 2016-09-30 | 2016-06-30 | 2016-03-31 | 2015-12-31 | 2015-09-30 | 2015-06-30 | 2015-03-31 | 2014-12-31 | 2014-09-30 | 2014-06-30 | 2014-03-31 | 2013-12-31 | 2013-09-30 | 2013-06-30 | 2013-03-31 | 2012-12-31 | 2012-09-30 | 2012-06-30 | 2012-03-31 | 2011-12-31 | 2011-09-30 | 2011-06-30 | 2011-03-31 | 2010-12-31 | 2010-09-30 | 2010-06-30 | 2010-03-31 | 2009-12-31 | 2009-09-30 | 2009-06-30 | 2009-03-31 | ||
|---|---|---|---|---|---|---|---|---|---|---|---|---|---|---|---|---|---|---|---|---|---|---|---|---|---|---|---|---|---|---|---|---|---|---|---|---|---|---|---|---|---|---|---|---|---|---|---|---|---|---|---|---|---|---|---|---|---|---|---|---|---|---|
| Net Cash Provided By Used In Operating Activities | 152.56 | 231.25 | 253.26 | 297.82 | 173.92 | 206.96 | 243.64 | 255.49 | 194.18 | 223.91 | 211.74 | 236.87 | 122.73 | 218.71 | 219.90 | 224.78 | 95.04 | 217.47 | 248.04 | 221.98 | 158.58 | 215.79 | 193.24 | 243.51 | 196.16 | 209.15 | 206.31 | 238.46 | 193.13 | 215.50 | 331.72 | 398.30 | 268.62 | 354.49 | 273.67 | 363.92 | 230.07 | 365.60 | 275.32 | 360.52 | 247.18 | 305.31 | 272.08 | 357.25 | 214.35 | 313.92 | 237.40 | 297.08 | 186.47 | 137.24 | 154.11 | 282.99 | 149.83 | 149.77 | 154.63 | 166.64 | 109.46 | NA | NA | NA | NA | |
| Net Income Loss | 6.68 | 70.94 | 64.21 | 51.90 | 118.95 | 6.53 | 353.97 | 68.34 | 71.61 | 28.76 | 54.71 | 276.28 | 145.79 | 146.39 | -63.42 | 51.51 | 279.08 | 43.52 | -45.86 | -13.60 | 61.47 | 831.55 | 99.37 | 89.94 | 40.23 | -58.70 | -7.66 | 19.38 | 461.14 | 58.66 | 151.25 | 301.72 | 116.12 | -598.87 | 115.36 | 164.88 | -240.61 | 196.58 | 247.65 | 218.88 | 259.11 | 293.10 | 233.76 | 213.40 | 230.59 | 241.03 | 196.11 | 202.02 | 193.38 | 67.84 | 172.19 | 228.76 | 70.09 | 141.92 | 22.66 | 85.10 | 81.04 | 32.03 | -46.69 | 97.46 | 48.88 | |
| Profit Loss | 11.18 | 75.39 | 68.66 | 56.20 | 134.51 | 10.80 | 357.99 | 72.29 | 75.34 | 32.58 | 61.91 | 282.02 | 149.42 | 150.25 | -59.58 | 55.05 | 282.54 | 47.36 | -42.31 | -9.98 | 64.99 | 834.38 | 102.93 | 92.93 | 43.24 | -57.92 | -5.72 | 22.10 | 464.18 | 61.30 | 154.04 | 304.84 | 119.75 | -594.62 | 117.95 | 167.75 | -237.50 | 199.63 | 251.06 | 222.28 | 263.62 | 297.64 | 236.86 | 216.72 | 233.78 | 246.26 | 199.04 | 204.97 | 196.56 | 70.79 | 175.47 | 234.25 | 73.98 | 145.53 | 26.17 | 88.59 | 84.10 | NA | NA | NA | NA | |
| Share Based Compensation | 3.37 | 3.51 | 3.43 | 4.25 | 3.29 | 11.82 | 4.61 | 5.30 | 4.72 | 4.31 | 4.44 | 5.09 | 4.36 | 3.98 | 4.42 | 4.14 | 4.83 | 3.63 | 4.17 | 6.25 | 4.11 | 3.46 | 2.88 | 4.30 | 5.92 | 3.39 | 3.77 | 3.33 | 3.77 | 3.58 | 9.80 | 4.16 | 5.34 | 5.06 | 5.34 | 9.56 | 6.17 | 5.42 | 5.46 | 6.12 | 4.89 | 6.15 | 22.20 | 6.21 | 5.43 | 6.33 | 5.54 | 6.03 | 5.37 | 4.75 | 5.08 | 5.10 | 5.10 | 3.62 | 3.62 | 4.18 | 3.51 | NA | NA | NA | NA |
| 2024-03-31 | 2023-12-31 | 2023-09-30 | 2023-06-30 | 2023-03-31 | 2022-12-31 | 2022-09-30 | 2022-06-30 | 2022-03-31 | 2021-12-31 | 2021-09-30 | 2021-06-30 | 2021-03-31 | 2020-12-31 | 2020-09-30 | 2020-06-30 | 2020-03-31 | 2019-12-31 | 2019-09-30 | 2019-06-30 | 2019-03-31 | 2018-12-31 | 2018-09-30 | 2018-06-30 | 2018-03-31 | 2017-12-31 | 2017-09-30 | 2017-06-30 | 2017-03-31 | 2016-12-31 | 2016-09-30 | 2016-06-30 | 2016-03-31 | 2015-12-31 | 2015-09-30 | 2015-06-30 | 2015-03-31 | 2014-12-31 | 2014-09-30 | 2014-06-30 | 2014-03-31 | 2013-12-31 | 2013-09-30 | 2013-06-30 | 2013-03-31 | 2012-12-31 | 2012-09-30 | 2012-06-30 | 2012-03-31 | 2011-12-31 | 2011-09-30 | 2011-06-30 | 2011-03-31 | 2010-12-31 | 2010-09-30 | 2010-06-30 | 2010-03-31 | 2009-12-31 | 2009-09-30 | 2009-06-30 | 2009-03-31 | ||
|---|---|---|---|---|---|---|---|---|---|---|---|---|---|---|---|---|---|---|---|---|---|---|---|---|---|---|---|---|---|---|---|---|---|---|---|---|---|---|---|---|---|---|---|---|---|---|---|---|---|---|---|---|---|---|---|---|---|---|---|---|---|---|
| Net Cash Provided By Used In Investing Activities | -97.78 | -215.67 | -222.42 | -195.01 | 56.34 | -298.23 | -116.98 | -215.17 | -245.96 | -672.64 | -508.62 | 944.57 | 767.73 | -241.22 | -231.21 | -384.26 | -151.01 | -7.26 | -352.54 | -928.70 | -160.28 | 1011.75 | 325.77 | 481.04 | 10.73 | -509.57 | -201.76 | 242.37 | 1715.22 | -96.46 | -160.54 | 12.14 | -165.76 | 13.58 | -40.52 | -1316.78 | -328.29 | -554.65 | -572.03 | -338.65 | -46.55 | 77.31 | 146.98 | -363.57 | -57.36 | -1663.45 | -337.16 | -282.40 | -31.15 | -29.46 | -286.37 | -3689.15 | -575.50 | -103.96 | -165.63 | -122.62 | -38.71 | NA | NA | NA | NA |
| 2024-03-31 | 2023-12-31 | 2023-09-30 | 2023-06-30 | 2023-03-31 | 2022-12-31 | 2022-09-30 | 2022-06-30 | 2022-03-31 | 2021-12-31 | 2021-09-30 | 2021-06-30 | 2021-03-31 | 2020-12-31 | 2020-09-30 | 2020-06-30 | 2020-03-31 | 2019-12-31 | 2019-09-30 | 2019-06-30 | 2019-03-31 | 2018-12-31 | 2018-09-30 | 2018-06-30 | 2018-03-31 | 2017-12-31 | 2017-09-30 | 2017-06-30 | 2017-03-31 | 2016-12-31 | 2016-09-30 | 2016-06-30 | 2016-03-31 | 2015-12-31 | 2015-09-30 | 2015-06-30 | 2015-03-31 | 2014-12-31 | 2014-09-30 | 2014-06-30 | 2014-03-31 | 2013-12-31 | 2013-09-30 | 2013-06-30 | 2013-03-31 | 2012-12-31 | 2012-09-30 | 2012-06-30 | 2012-03-31 | 2011-12-31 | 2011-09-30 | 2011-06-30 | 2011-03-31 | 2010-12-31 | 2010-09-30 | 2010-06-30 | 2010-03-31 | 2009-12-31 | 2009-09-30 | 2009-06-30 | 2009-03-31 | ||
|---|---|---|---|---|---|---|---|---|---|---|---|---|---|---|---|---|---|---|---|---|---|---|---|---|---|---|---|---|---|---|---|---|---|---|---|---|---|---|---|---|---|---|---|---|---|---|---|---|---|---|---|---|---|---|---|---|---|---|---|---|---|---|
| Net Cash Provided By Used In Financing Activities | -66.65 | 39.52 | -77.44 | -59.50 | -239.88 | 48.98 | -93.44 | -53.57 | -18.51 | 399.37 | 321.38 | -1085.15 | -924.12 | -95.34 | -525.80 | 106.16 | 761.42 | -180.98 | 103.59 | 716.14 | 8.52 | -1196.38 | -532.42 | -720.50 | -171.24 | 206.50 | -262.80 | -853.20 | -1238.97 | -156.94 | -154.58 | -388.35 | -354.40 | -141.79 | -227.16 | 931.32 | 51.72 | 287.62 | 326.17 | -17.55 | -451.45 | -131.78 | -423.35 | 11.83 | -357.12 | 1500.73 | 26.59 | -192.48 | 158.60 | -119.13 | -99.08 | -306.26 | 3377.60 | 938.26 | -32.62 | 7.64 | -138.40 | NA | NA | NA | NA | |
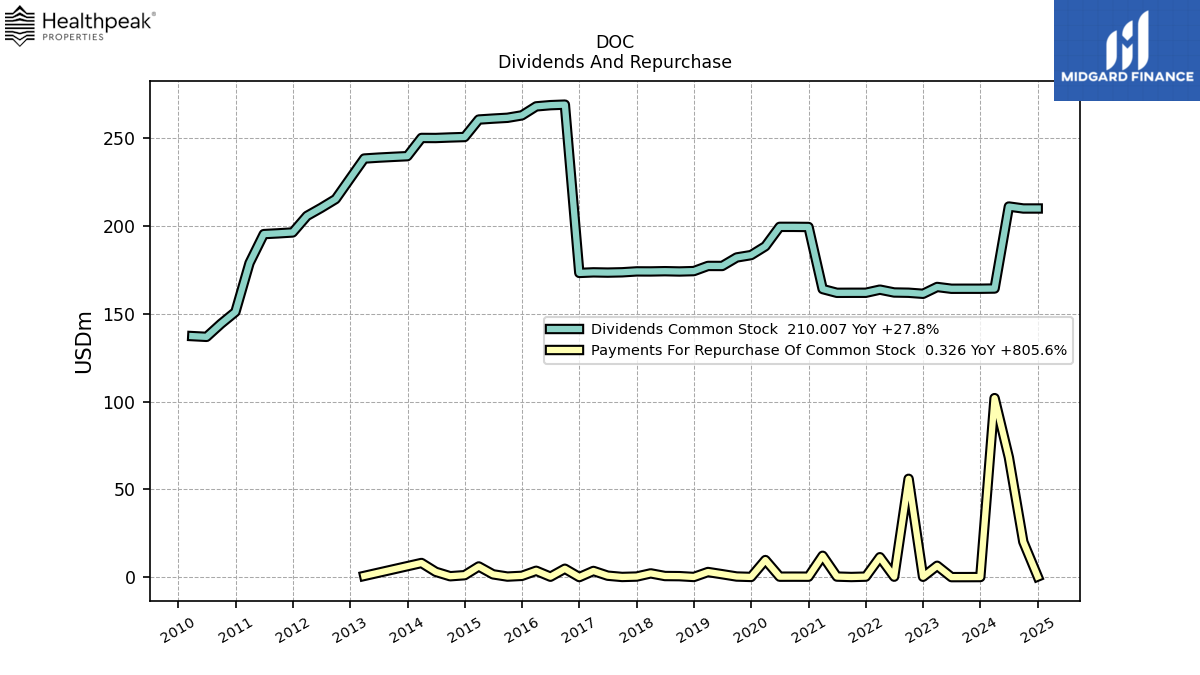
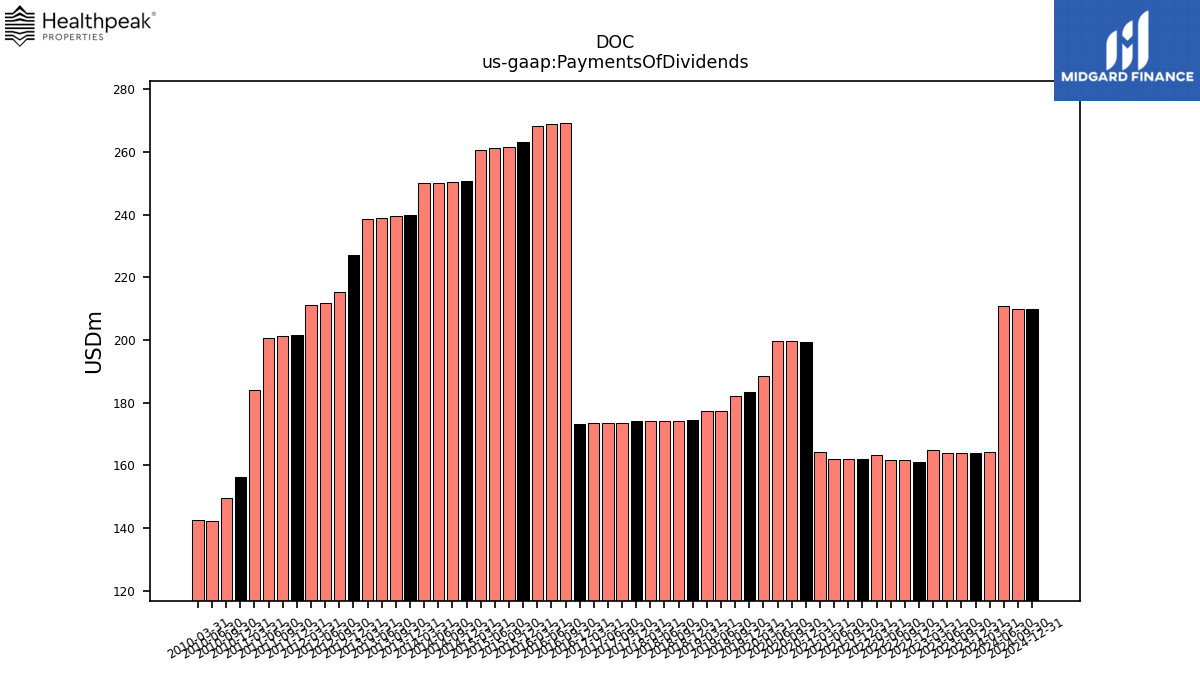
| Payments Of Dividends | 164.20 | 164.08 | 164.01 | 163.95 | 164.98 | 161.09 | 161.68 | 161.83 | 163.45 | 162.00 | 162.00 | 161.97 | 164.12 | 199.48 | 199.55 | 199.55 | 188.50 | 183.46 | 182.11 | 177.26 | 177.29 | 174.35 | 174.13 | 174.29 | 174.15 | 174.18 | 173.66 | 173.49 | 173.63 | 173.30 | 269.18 | 268.88 | 268.19 | 263.06 | 261.68 | 261.21 | 260.69 | 250.72 | 250.47 | 250.17 | 250.20 | 239.82 | 239.42 | 238.99 | 238.47 | 227.08 | 215.38 | 211.78 | 211.07 | 201.64 | 201.13 | 200.71 | 184.21 | 156.36 | 149.62 | 142.16 | 142.59 | NA | NA | NA | NA | |
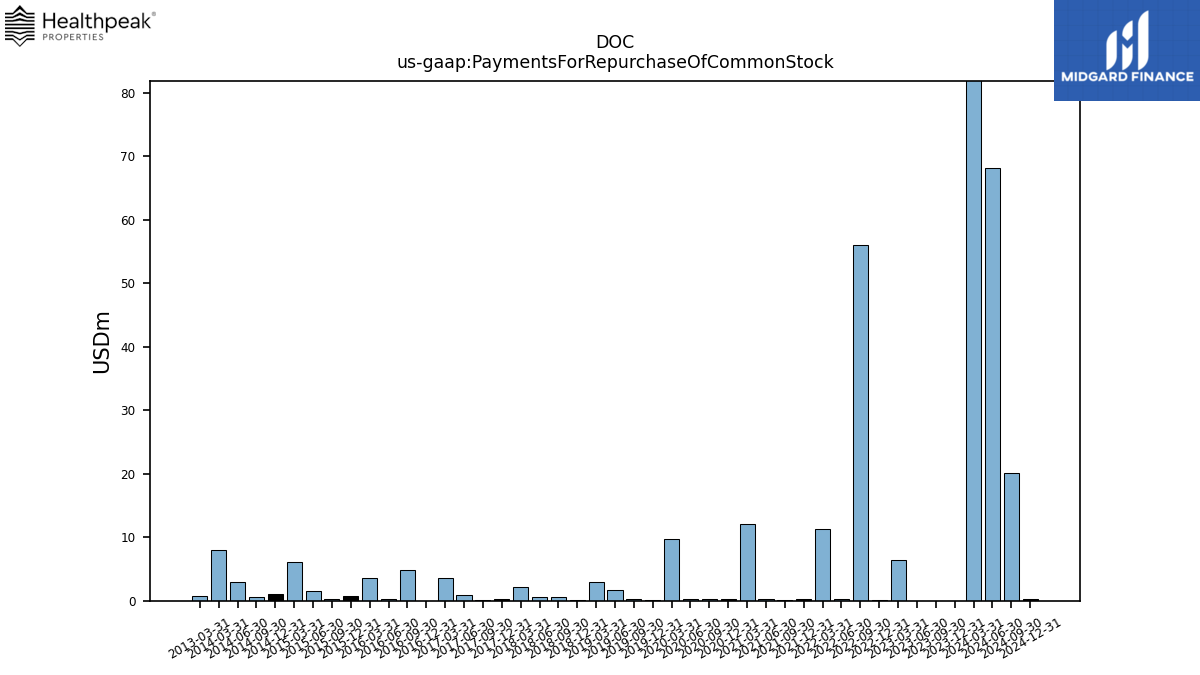
| Payments For Repurchase Of Common Stock | 102.00 | 0.04 | 0.01 | 0.01 | 6.47 | 0.20 | 56.03 | 0.26 | 11.35 | 0.29 | 0.07 | 0.32 | 12.16 | 0.26 | 0.28 | 0.26 | 9.74 | 0.11 | 0.35 | 1.66 | 2.92 | 0.09 | 0.56 | 0.63 | 2.14 | 0.33 | 0.10 | 0.83 | 3.53 | 0.02 | 4.79 | 0.25 | 3.63 | 0.73 | 0.32 | 1.59 | 6.10 | 1.10 | 0.51 | 3.02 | 8.07 | NA | NA | NA | 0.69 | NA | NA | NA | NA | NA | NA | NA | NA | NA | NA | NA | NA | NA | NA | NA | NA |
| 2024-03-31 | 2023-12-31 | 2023-09-30 | 2023-06-30 | 2023-03-31 | 2022-12-31 | 2022-09-30 | 2022-06-30 | 2022-03-31 | 2021-12-31 | 2021-09-30 | 2021-06-30 | 2021-03-31 | 2020-12-31 | 2020-09-30 | 2020-06-30 | 2020-03-31 | 2019-12-31 | 2019-09-30 | 2019-06-30 | 2019-03-31 | 2018-12-31 | 2018-09-30 | 2018-06-30 | 2018-03-31 | 2017-12-31 | 2017-09-30 | 2017-06-30 | 2017-03-31 | 2016-12-31 | 2016-09-30 | 2016-06-30 | 2016-03-31 | 2015-12-31 | 2015-09-30 | 2015-06-30 | 2015-03-31 | 2014-12-31 | 2014-09-30 | 2014-06-30 | 2014-03-31 | 2013-12-31 | 2013-09-30 | 2013-06-30 | 2013-03-31 | 2012-12-31 | 2012-09-30 | 2012-06-30 | 2012-03-31 | 2011-12-31 | 2011-09-30 | 2011-06-30 | 2011-03-31 | 2010-12-31 | 2010-09-30 | 2010-06-30 | 2010-03-31 | 2009-12-31 | 2009-09-30 | 2009-06-30 | 2009-03-31 | ||
|---|---|---|---|---|---|---|---|---|---|---|---|---|---|---|---|---|---|---|---|---|---|---|---|---|---|---|---|---|---|---|---|---|---|---|---|---|---|---|---|---|---|---|---|---|---|---|---|---|---|---|---|---|---|---|---|---|---|---|---|---|---|---|
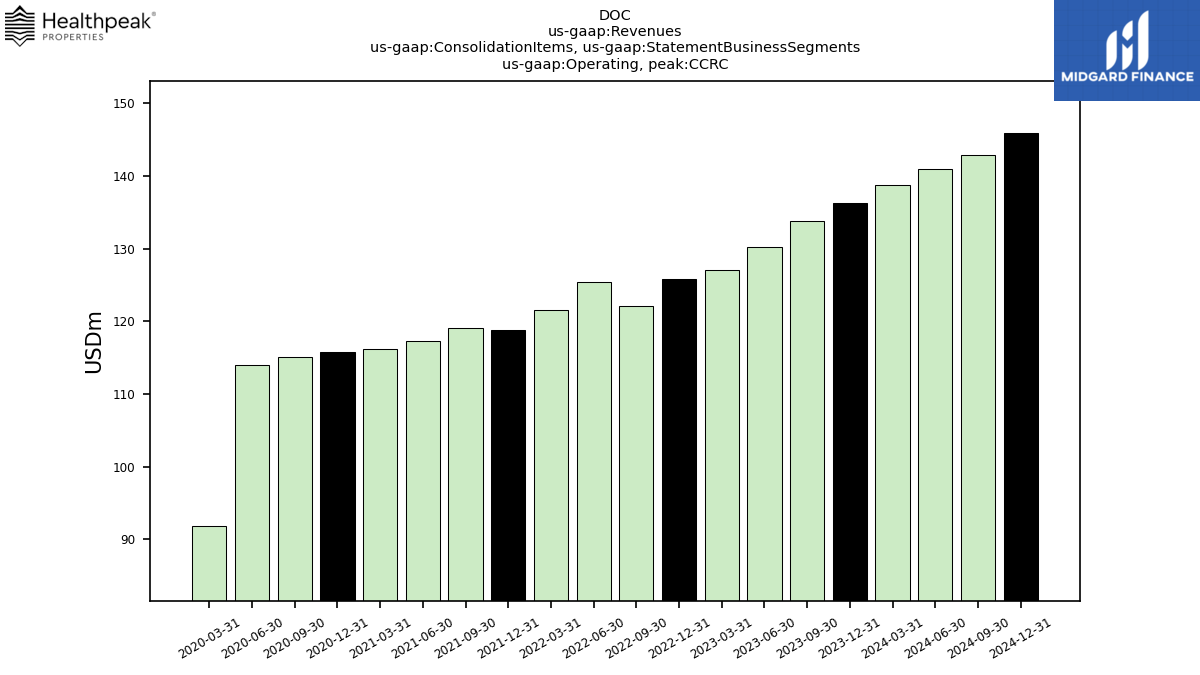
| Revenues | 606.56 | 553.65 | 556.24 | 545.43 | 525.68 | 524.47 | 520.41 | 517.93 | 498.37 | 483.20 | 481.46 | 476.24 | 455.28 | 431.70 | 597.74 | 588.44 | 585.15 | 531.69 | 537.97 | 491.57 | 436.15 | 441.92 | 456.02 | 469.55 | 479.20 | 443.26 | 454.02 | 458.93 | 492.17 | 539.95 | 654.27 | 662.18 | 640.78 | 668.04 | 657.95 | 607.53 | 610.79 | 603.53 | 596.64 | 536.12 | 529.99 | 530.30 | 543.96 | 516.28 | 516.27 | 508.49 | 475.48 | 464.44 | 459.01 | 461.60 | 444.67 | 488.71 | 331.70 | 341.39 | 317.05 | 301.88 | 294.82 | 294.47 | 286.97 | 291.42 | 276.04 | |
| Corporate Non | 0.69 | NA | NA | NA | NA | NA | NA | NA | NA | NA | NA | NA | NA | NA | NA | 0.00 | 0.00 | 0.00 | 0.00 | 0.00 | 0.00 | 0.00 | 0.00 | 0.00 | 0.00 | 0.00 | 0.00 | 0.00 | 0.00 | 0.00 | 0.00 | 0.00 | NA | NA | NA | NA | NA | NA | NA | NA | NA | NA | NA | NA | NA | NA | NA | NA | NA | NA | NA | NA | NA | NA | NA | NA | NA | NA | NA | NA | NA | |
| Operating,CCRC | 138.78 | 136.34 | 133.81 | 130.18 | 127.08 | 125.87 | 122.14 | 125.36 | 121.56 | 118.87 | 119.02 | 117.31 | 116.13 | 115.76 | 115.03 | 113.93 | 91.78 | NA | NA | NA | NA | NA | NA | NA | NA | NA | NA | NA | NA | NA | NA | NA | NA | NA | NA | NA | NA | NA | NA | NA | NA | NA | NA | NA | NA | NA | NA | NA | NA | NA | NA | NA | NA | NA | NA | NA | NA | NA | NA | NA | NA | |
| Operating, Lab | 223.76 | 223.50 | 226.06 | 223.31 | 205.46 | 207.95 | 207.79 | 207.77 | NA | NA | NA | NA | NA | NA | NA | NA | NA | NA | NA | NA | NA | NA | NA | NA | NA | NA | NA | NA | NA | NA | NA | NA | NA | NA | NA | NA | NA | NA | NA | NA | NA | NA | NA | NA | NA | NA | NA | NA | NA | NA | NA | NA | NA | NA | NA | NA | NA | NA | NA | NA | NA | |
| Operating, Other Non Reporting | 5.06 | 4.98 | 5.36 | 5.28 | 6.16 | 6.35 | 5.96 | 5.49 | 5.49 | 5.90 | 6.75 | 16.11 | 9.01 | -27.74 | 14.68 | 4.29 | 3.75 | 130.12 | 15.54 | NA | NA | NA | NA | NA | NA | NA | NA | NA | NA | NA | NA | NA | NA | NA | NA | NA | NA | NA | NA | NA | NA | NA | NA | NA | NA | NA | NA | NA | NA | NA | NA | NA | NA | NA | NA | NA | NA | NA | NA | NA | NA | |
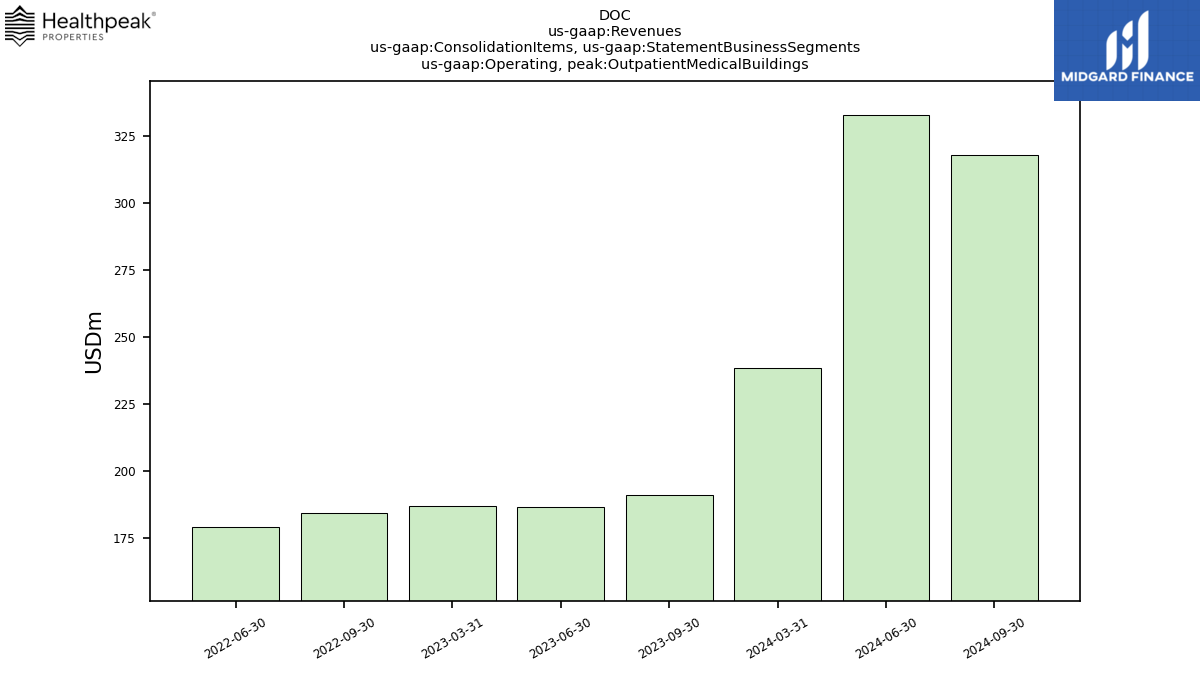
| Operating, Outpatient Medical Buildings | 238.27 | NA | 191.02 | 186.66 | 186.97 | NA | 184.51 | 179.31 | NA | NA | NA | NA | NA | NA | NA | NA | NA | NA | NA | NA | NA | NA | NA | NA | NA | NA | NA | NA | NA | NA | NA | NA | NA | NA | NA | NA | NA | NA | NA | NA | NA | NA | NA | NA | NA | NA | NA | NA | NA | NA | NA | NA | NA | NA | NA | NA | NA | NA | NA | NA | NA | |
| Revenue From Contract With Customer Excluding Assessed Tax | 138.78 | 136.34 | 133.81 | 130.18 | 127.08 | 524.47 | 122.14 | 125.36 | 121.56 | 483.20 | 119.02 | 117.31 | 116.13 | 431.70 | 264.62 | 269.70 | 263.50 | 531.69 | 213.04 | 177.77 | 126.69 | 441.92 | 137.36 | 136.77 | 142.81 | 443.26 | 454.02 | 458.93 | 492.17 | 539.95 | 654.27 | 662.18 | 640.78 | 668.04 | 657.95 | 607.53 | 610.79 | 603.53 | 596.64 | 536.12 | 529.99 | 530.30 | 543.96 | 516.28 | 516.27 | 508.49 | 475.48 | 464.44 | 459.01 | 461.60 | 444.67 | 488.71 | 331.70 | 341.39 | 317.05 | 301.88 | 294.82 | 294.47 | 286.97 | 291.42 | 276.04 | |
| Interest Income Operating | 5.75 | 4.98 | 5.36 | 5.28 | 6.16 | 6.35 | 5.96 | 5.49 | 5.49 | 5.90 | 6.75 | 16.11 | 9.01 | 4.19 | 4.44 | 4.23 | 3.69 | 2.98 | 2.74 | 2.41 | 1.71 | 1.36 | 1.24 | 1.45 | 6.37 | 5.26 | 11.77 | 20.87 | 18.33 | 17.51 | 20.48 | 32.79 | 18.03 | 23.14 | 19.84 | 35.95 | 33.26 | 23.34 | 17.52 | 16.94 | 16.70 | 17.55 | 42.08 | 14.15 | 12.39 | 12.22 | 10.28 | 1.22 | 0.82 | 0.67 | 0.58 | 60.53 | 38.10 | 52.16 | 36.58 | 36.16 | 35.27 | NA | NA | NA | NA | |
| Corporate Non | 0.69 | NA | NA | NA | NA | NA | NA | NA | NA | NA | NA | NA | NA | NA | NA | 0.00 | 0.00 | 0.00 | 0.00 | 0.00 | 0.00 | 0.00 | 0.00 | 0.00 | 0.00 | 0.00 | 0.00 | 0.00 | 0.00 | 0.00 | 0.00 | 0.00 | NA | NA | NA | NA | NA | NA | NA | NA | NA | NA | NA | NA | NA | NA | NA | NA | NA | NA | NA | NA | NA | NA | NA | NA | NA | NA | NA | NA | NA | |
| Operating, Other Non Reporting | 5.06 | 4.98 | 5.36 | 5.28 | 6.16 | 6.35 | 5.96 | 5.49 | 5.49 | 5.90 | 6.75 | 16.11 | 9.01 | 4.19 | 4.44 | 4.23 | 3.69 | 2.98 | 2.74 | NA | NA | NA | NA | NA | NA | NA | NA | NA | NA | NA | NA | NA | NA | NA | NA | NA | NA | NA | NA | NA | NA | NA | NA | NA | NA | NA | NA | NA | NA | NA | NA | NA | NA | NA | NA | NA | NA | NA | NA | NA | NA |