
| 2023-03-31 | 2022-12-31 | 2022-09-30 | 2022-06-30 | 2022-03-31 | 2021-12-31 | 2021-09-30 | 2021-06-30 | 2021-03-31 | 2020-12-31 | 2020-09-30 | 2020-06-30 | 2020-03-31 | ||
|---|---|---|---|---|---|---|---|---|---|---|---|---|---|---|
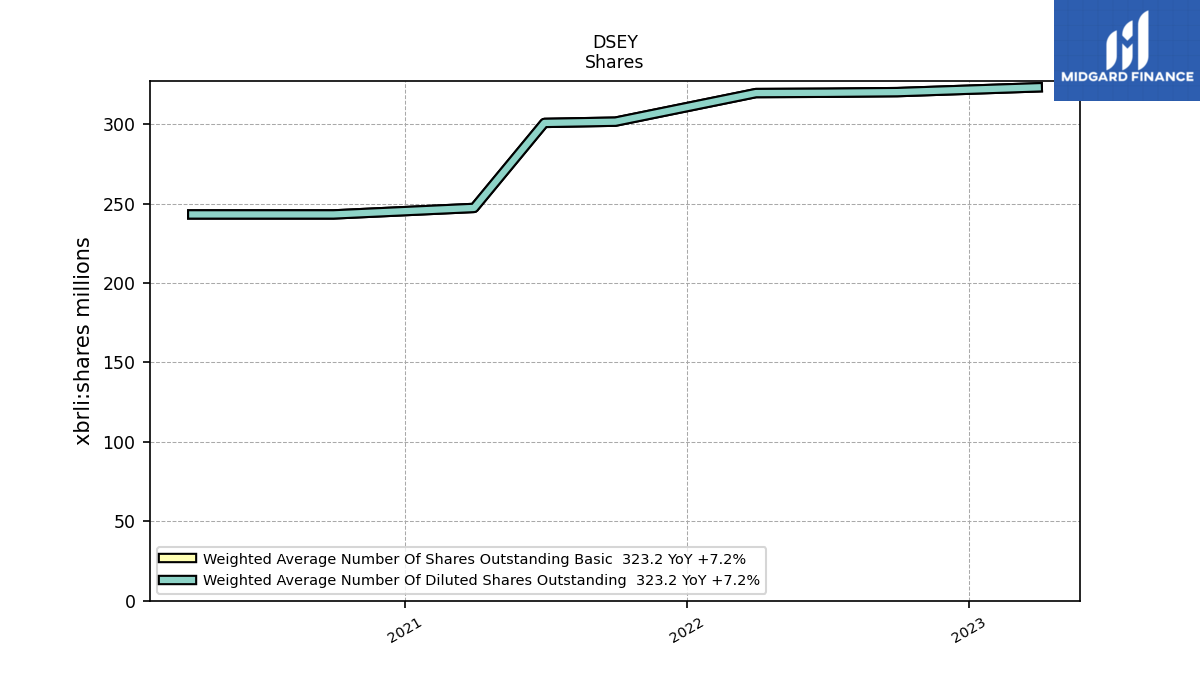
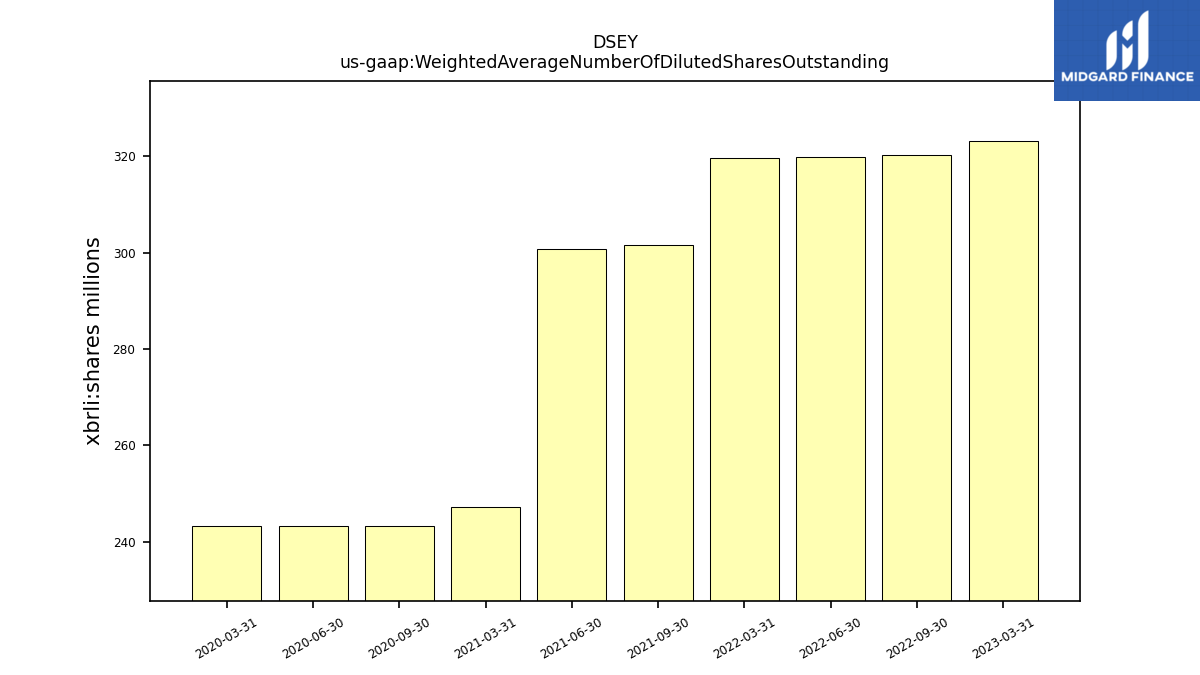
| Weighted Average Number Of Diluted Shares Outstanding | 323.20 | NA | 320.20 | 319.80 | 319.60 | NA | 301.60 | 300.80 | 247.30 | NA | 243.20 | 243.20 | 243.20 | |
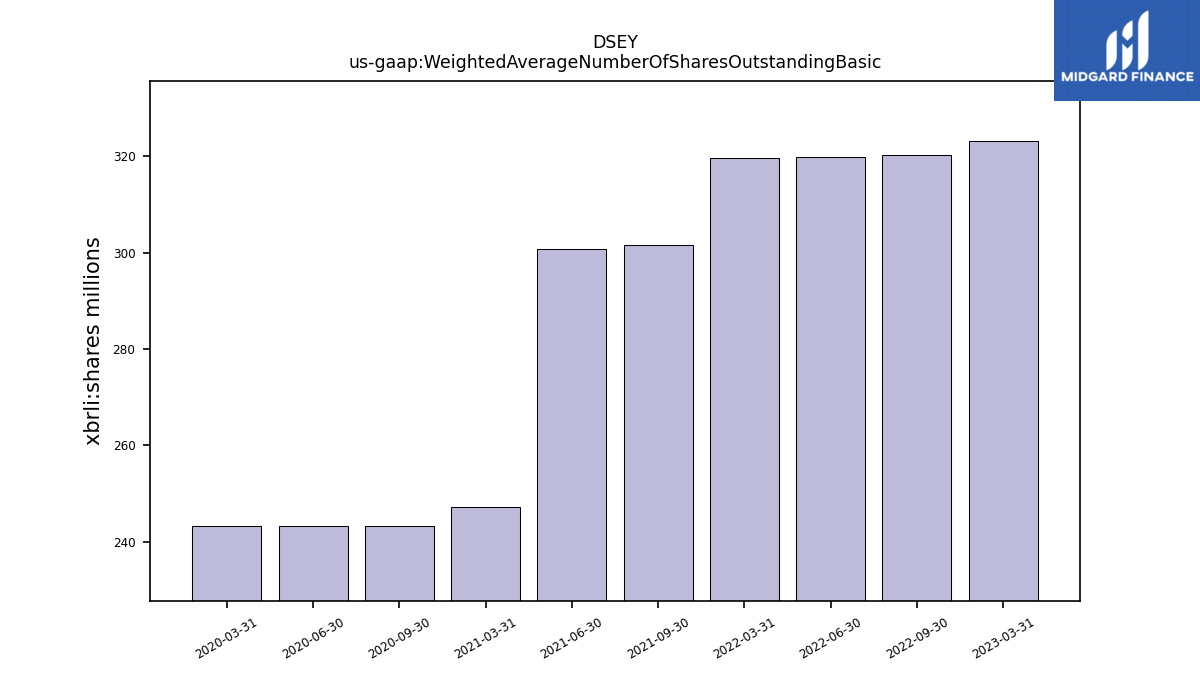
| Weighted Average Number Of Shares Outstanding Basic | 323.20 | NA | 320.20 | 319.80 | 319.60 | NA | 301.60 | 300.80 | 247.30 | NA | 243.20 | 243.20 | 243.20 | |
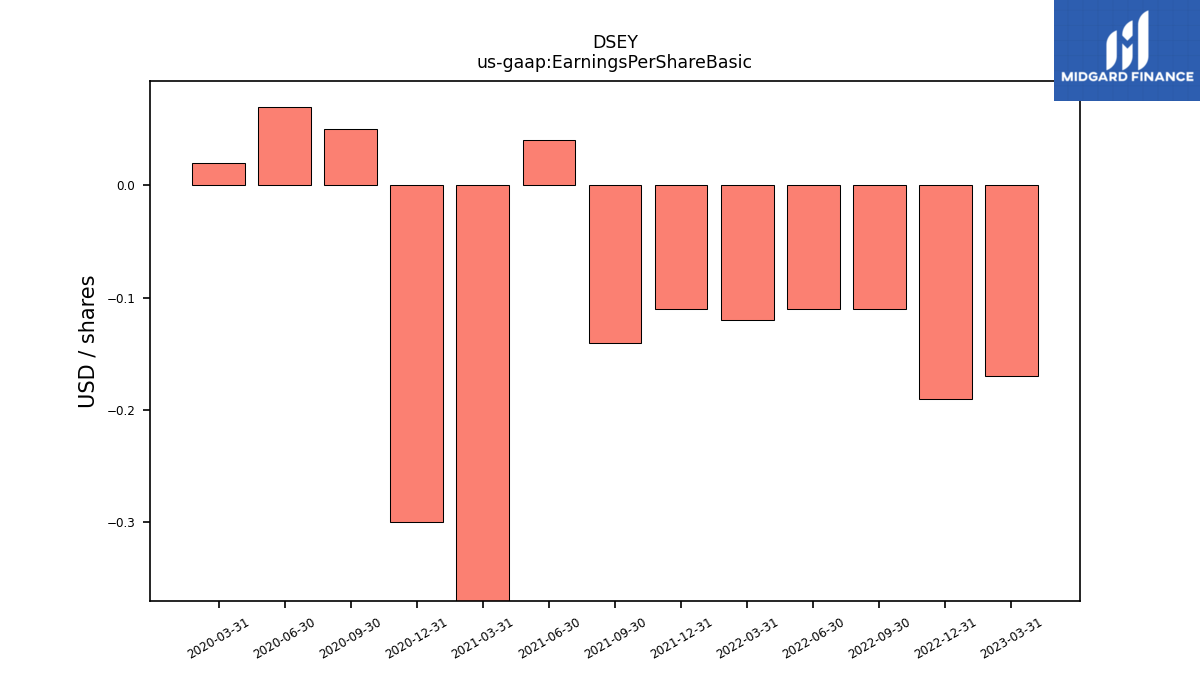
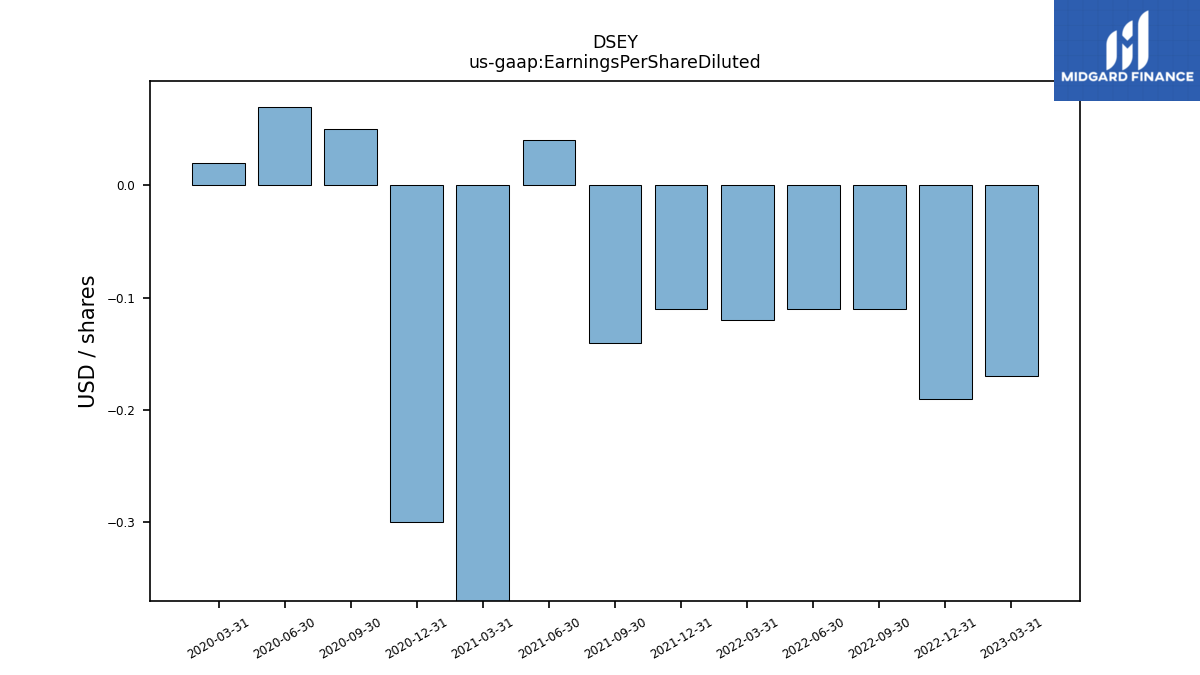
| Earnings Per Share Basic | -0.17 | -0.19 | -0.11 | -0.11 | -0.12 | -0.11 | -0.14 | 0.04 | -0.39 | -0.30 | 0.05 | 0.07 | 0.02 | |
| Earnings Per Share Diluted | -0.17 | -0.19 | -0.11 | -0.11 | -0.12 | -0.11 | -0.14 | 0.04 | -0.39 | -0.30 | 0.05 | 0.07 | 0.02 |
| 2023-03-31 | 2022-12-31 | 2022-09-30 | 2022-06-30 | 2022-03-31 | 2021-12-31 | 2021-09-30 | 2021-06-30 | 2021-03-31 | 2020-12-31 | 2020-09-30 | 2020-06-30 | 2020-03-31 | ||
|---|---|---|---|---|---|---|---|---|---|---|---|---|---|---|
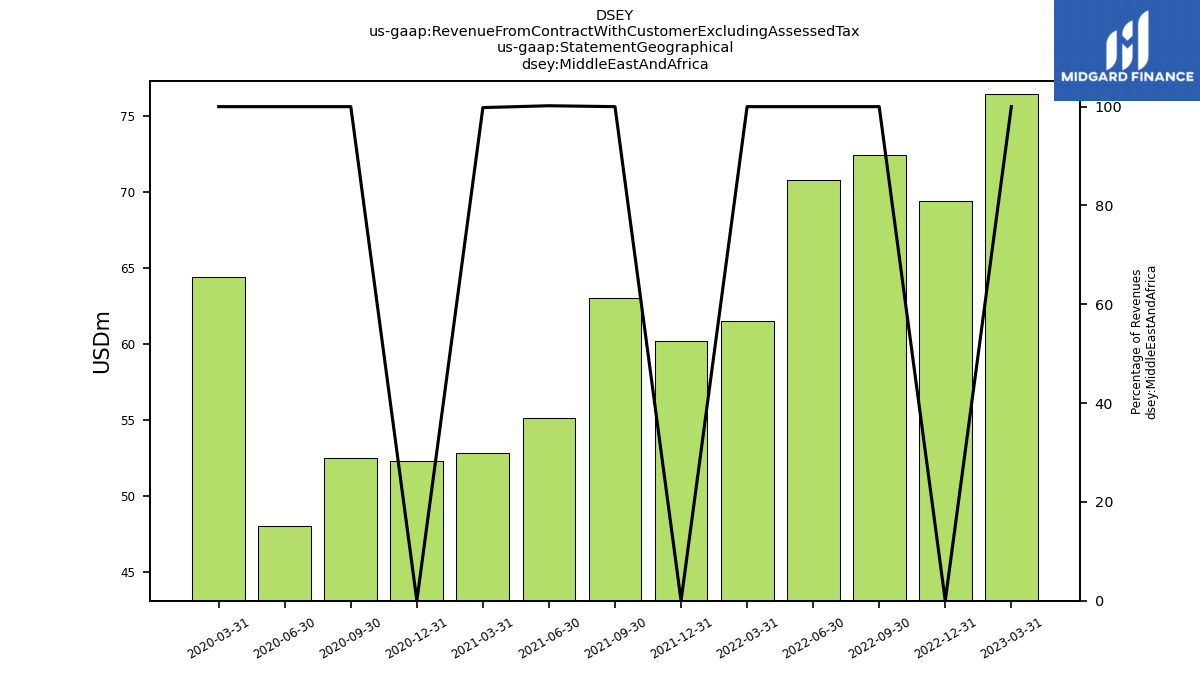
| Revenue From Contract With Customer Excluding Assessed Tax | 690.10 | 694.70 | 682.60 | 708.80 | 655.00 | 665.60 | 660.70 | 645.80 | 626.10 | 661.70 | 675.80 | 618.10 | 648.60 | |
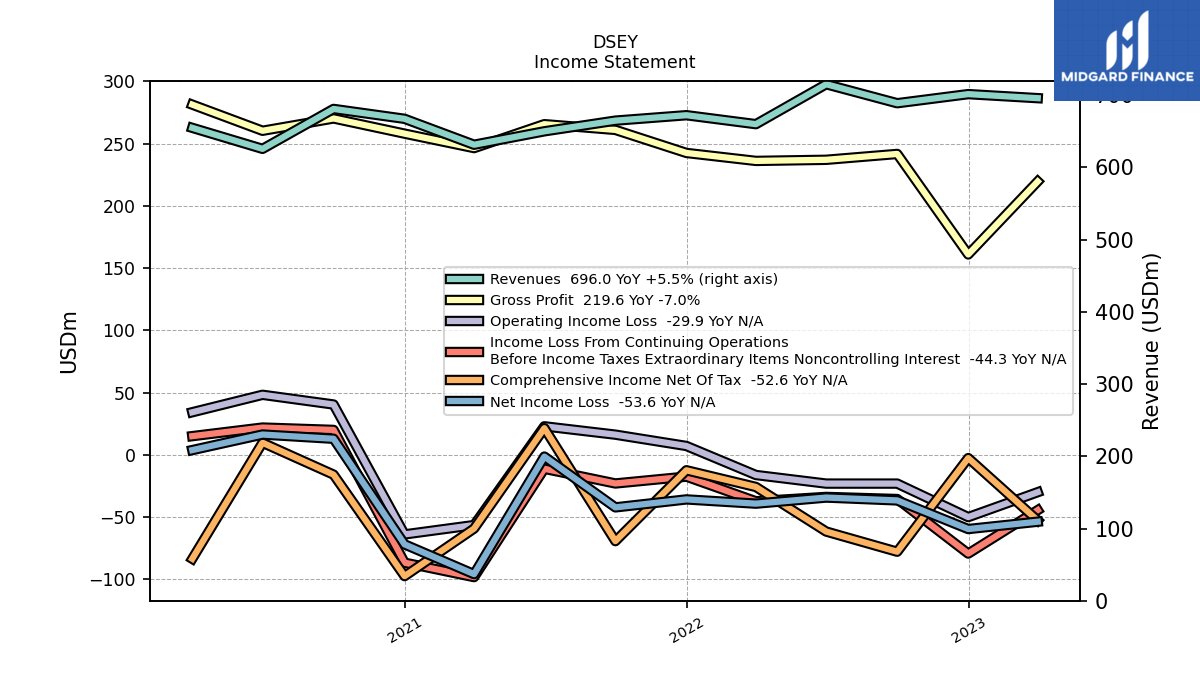
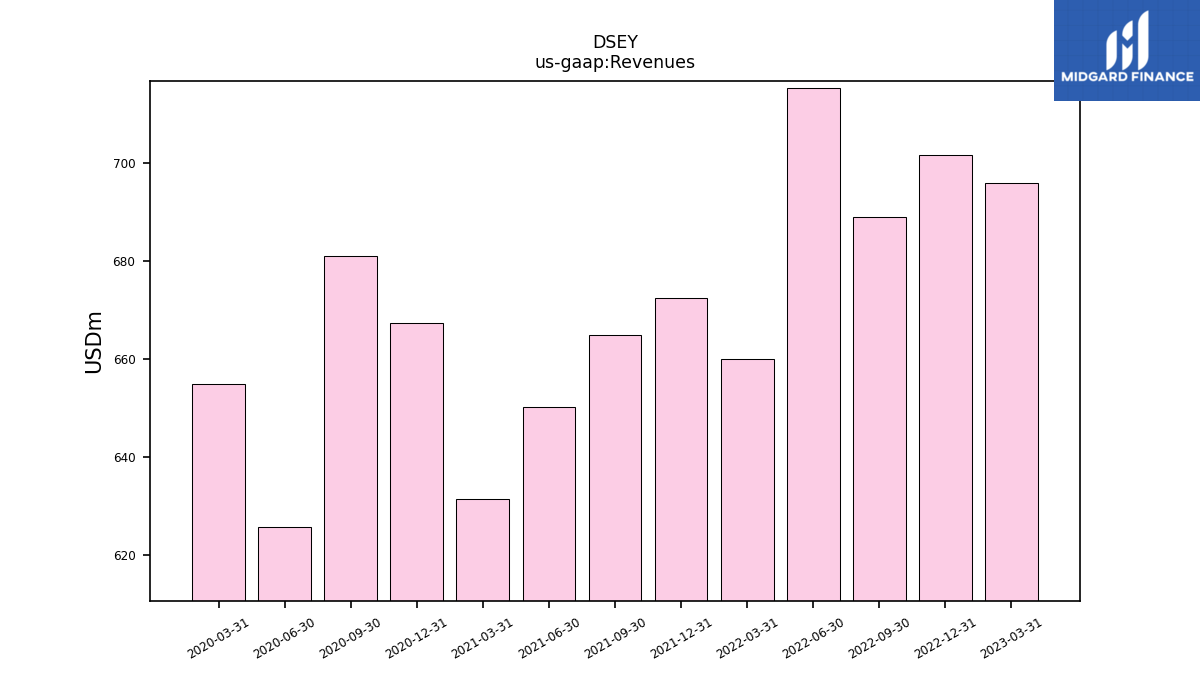
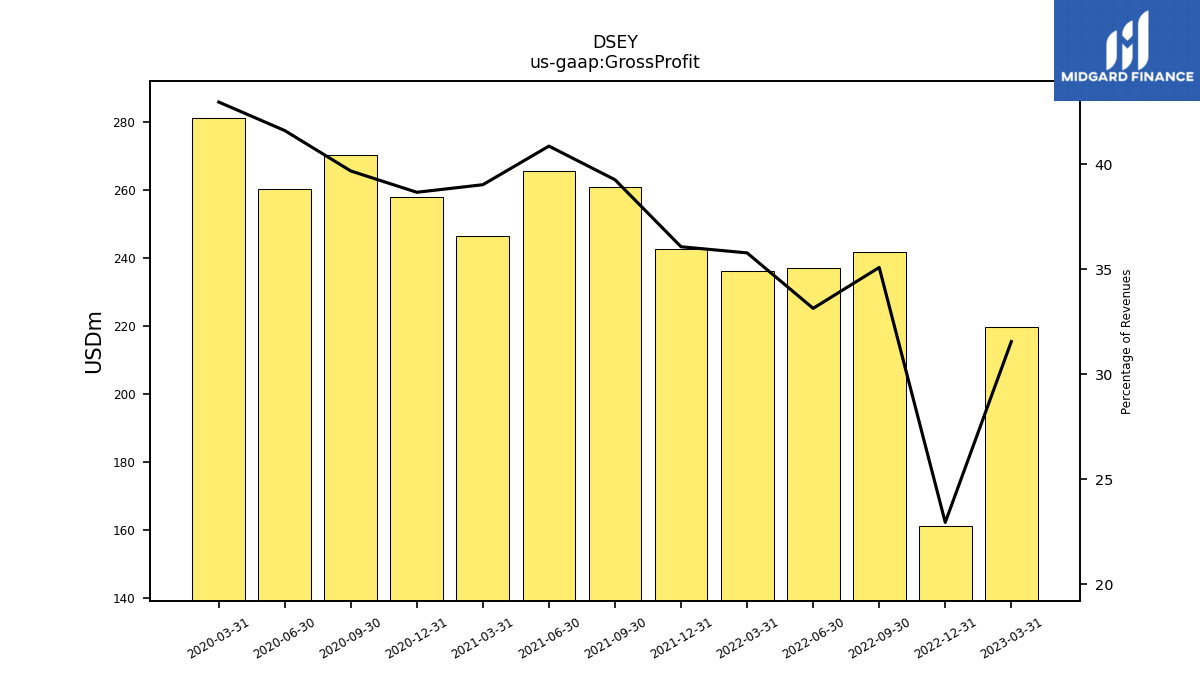
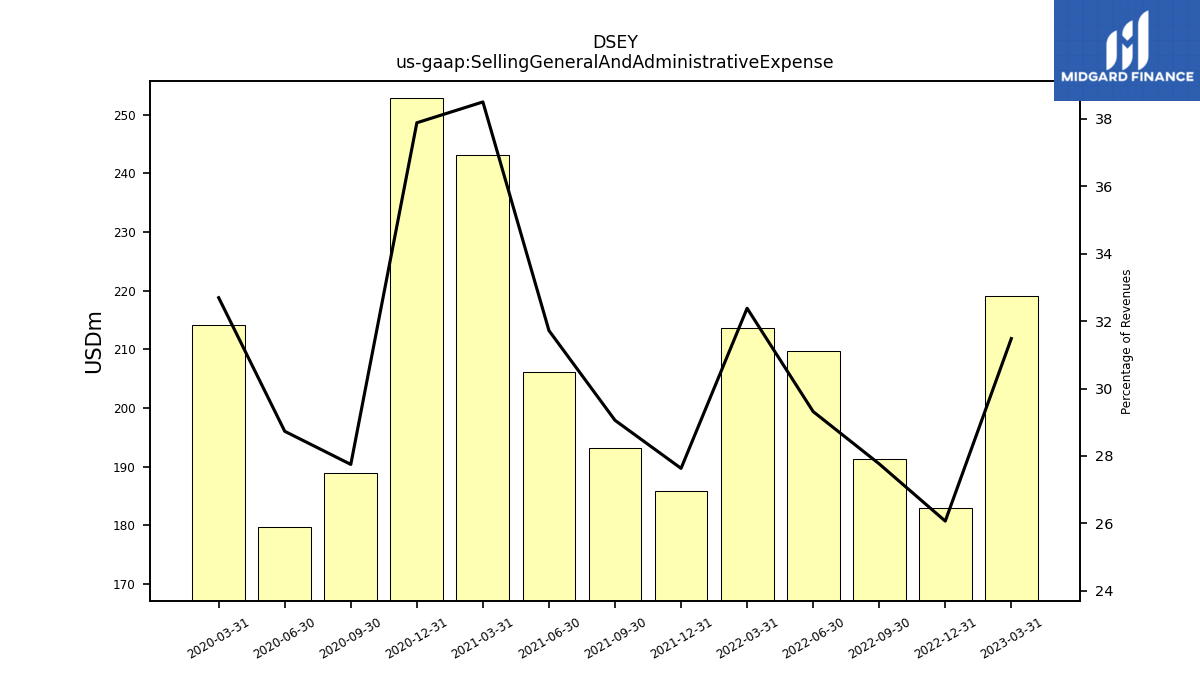
| Revenues | 696.00 | 701.60 | 689.00 | 715.30 | 660.00 | 672.40 | 664.90 | 650.10 | 631.50 | 667.40 | 681.10 | 625.80 | 654.90 | |
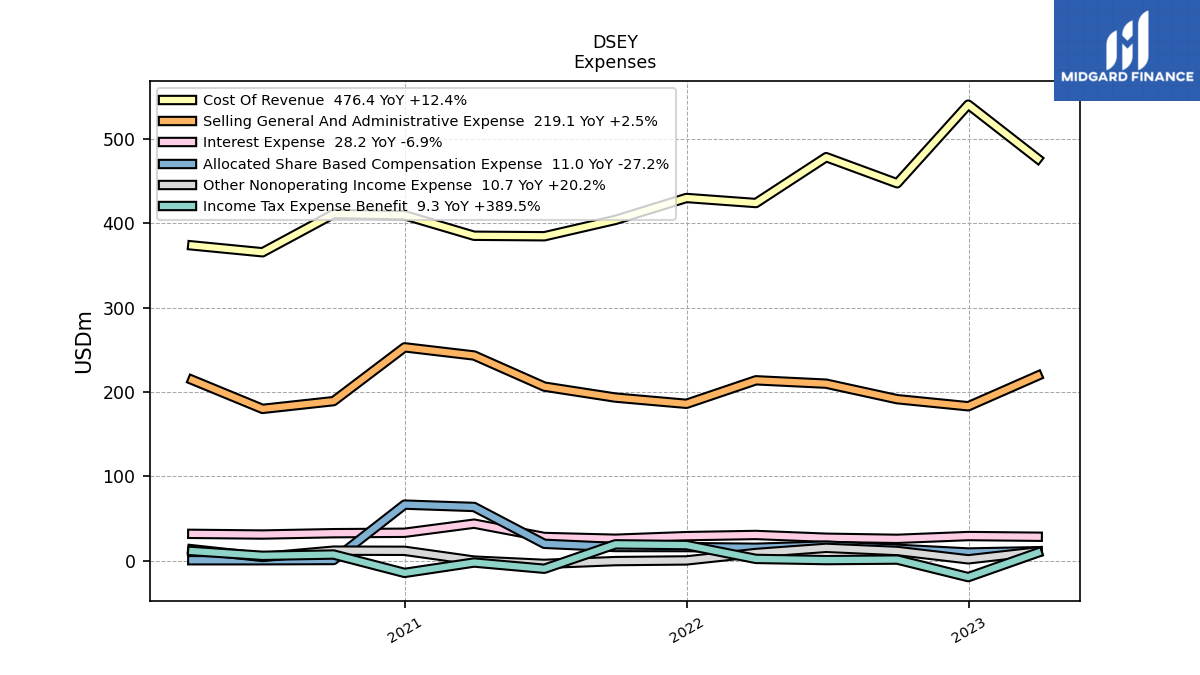
| Cost Of Revenue | 476.40 | 540.60 | 447.30 | 478.30 | 423.90 | 429.90 | 403.90 | 384.50 | 385.10 | 409.40 | 410.90 | 365.50 | 373.60 | |
| Gross Profit | 219.60 | 161.00 | 241.70 | 237.00 | 236.10 | 242.50 | 261.00 | 265.60 | 246.40 | 258.00 | 270.20 | 260.30 | 281.30 | |
| Selling General And Administrative Expense | 219.10 | 182.90 | 191.30 | 209.70 | 213.70 | 185.80 | 193.20 | 206.20 | 243.10 | 252.80 | 189.00 | 179.80 | 214.10 | |
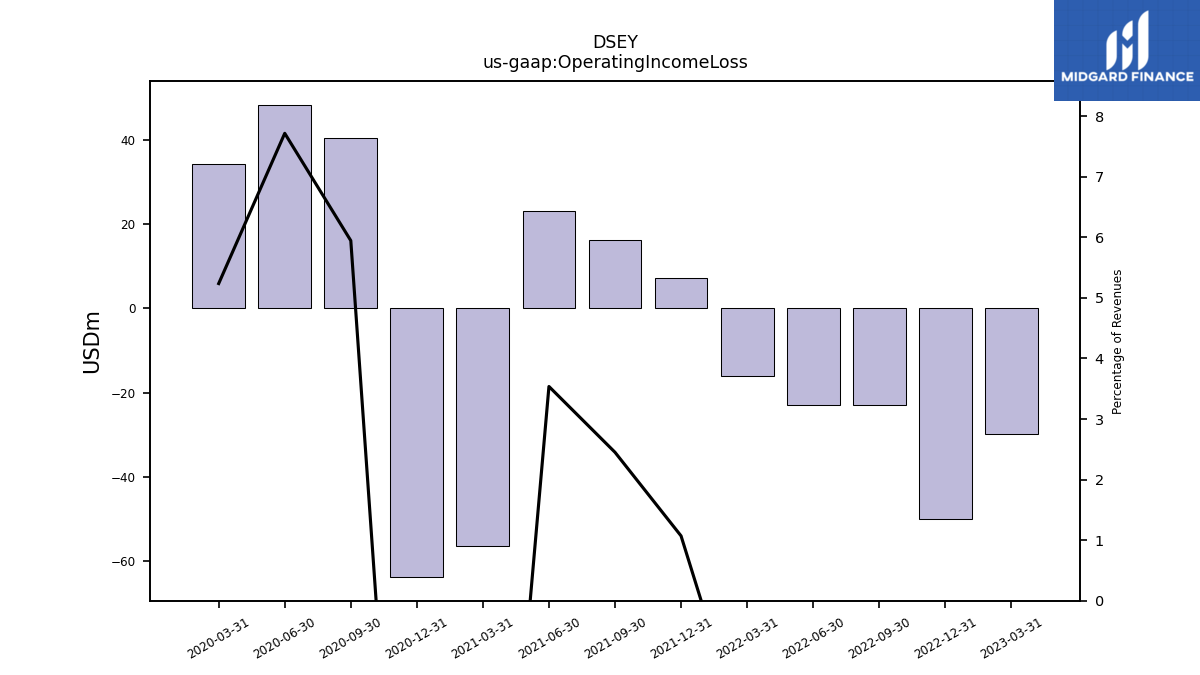
| Operating Income Loss | -29.90 | -49.90 | -23.00 | -23.00 | -16.10 | 7.20 | 16.30 | 23.00 | -56.30 | -63.80 | 40.50 | 48.30 | 34.30 | |
| Interest Expense | 28.20 | 29.00 | 25.70 | 27.00 | 30.30 | 28.90 | 25.80 | 27.90 | 43.70 | 32.90 | 32.40 | 30.80 | 31.60 | |
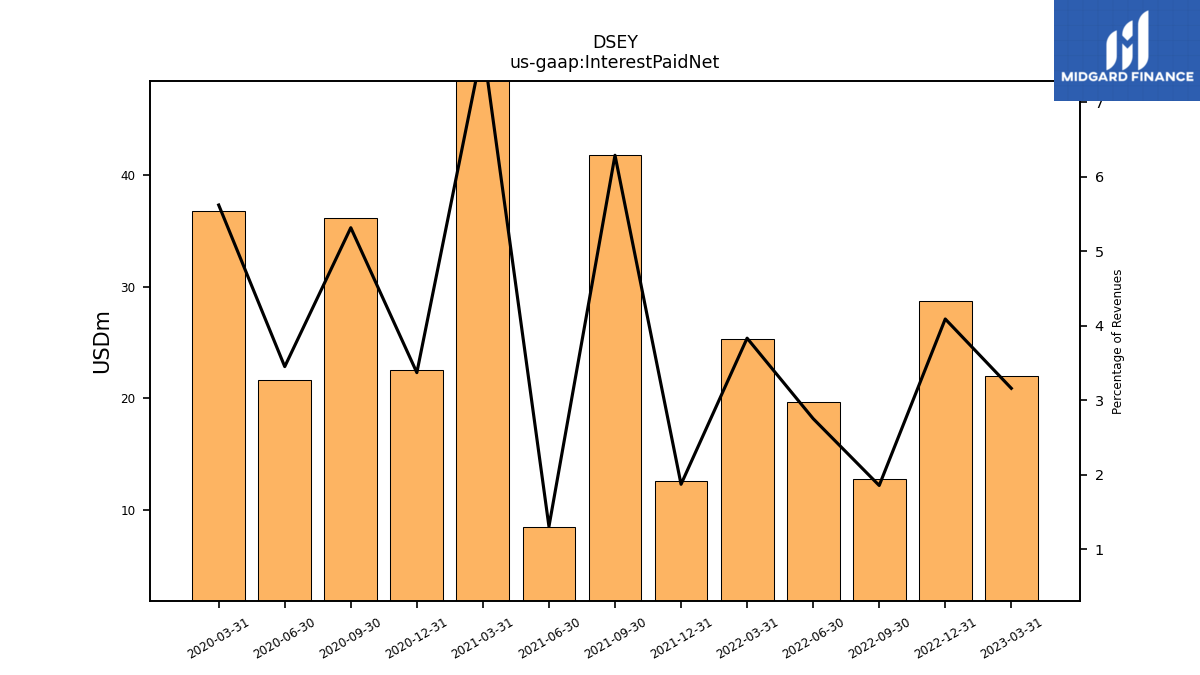
| Interest Paid Net | 22.00 | 28.70 | 12.80 | 19.70 | 25.30 | 12.60 | 41.80 | 8.50 | 49.00 | 22.50 | 36.20 | 21.60 | 36.80 | |
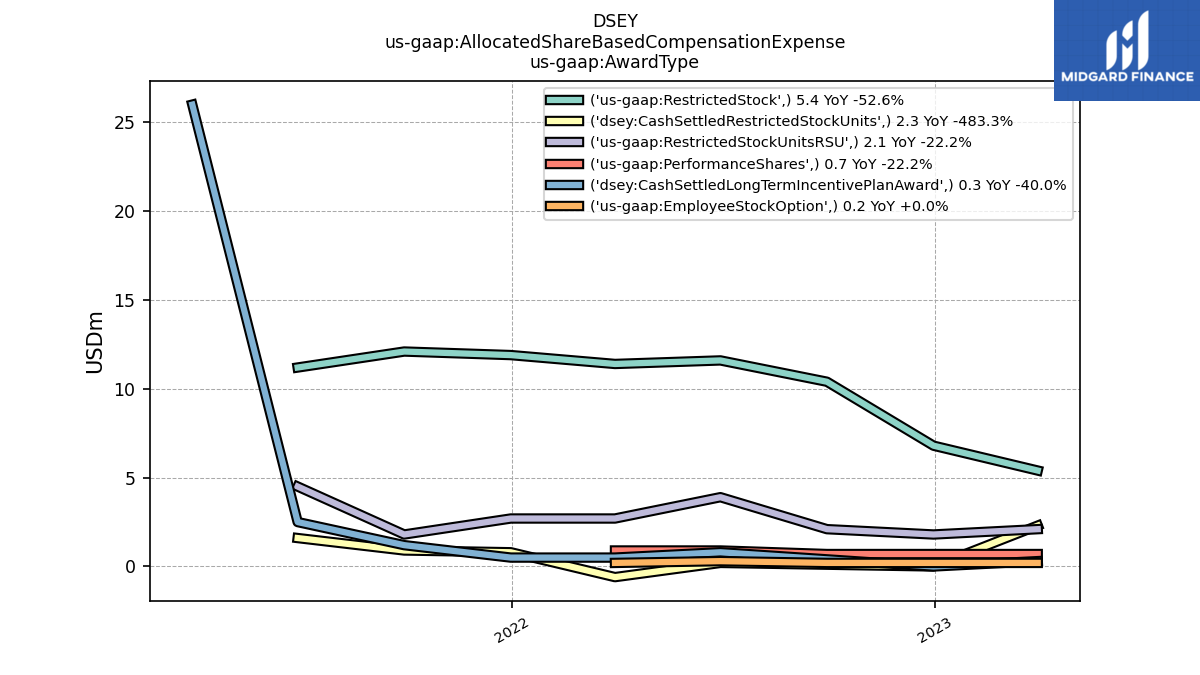
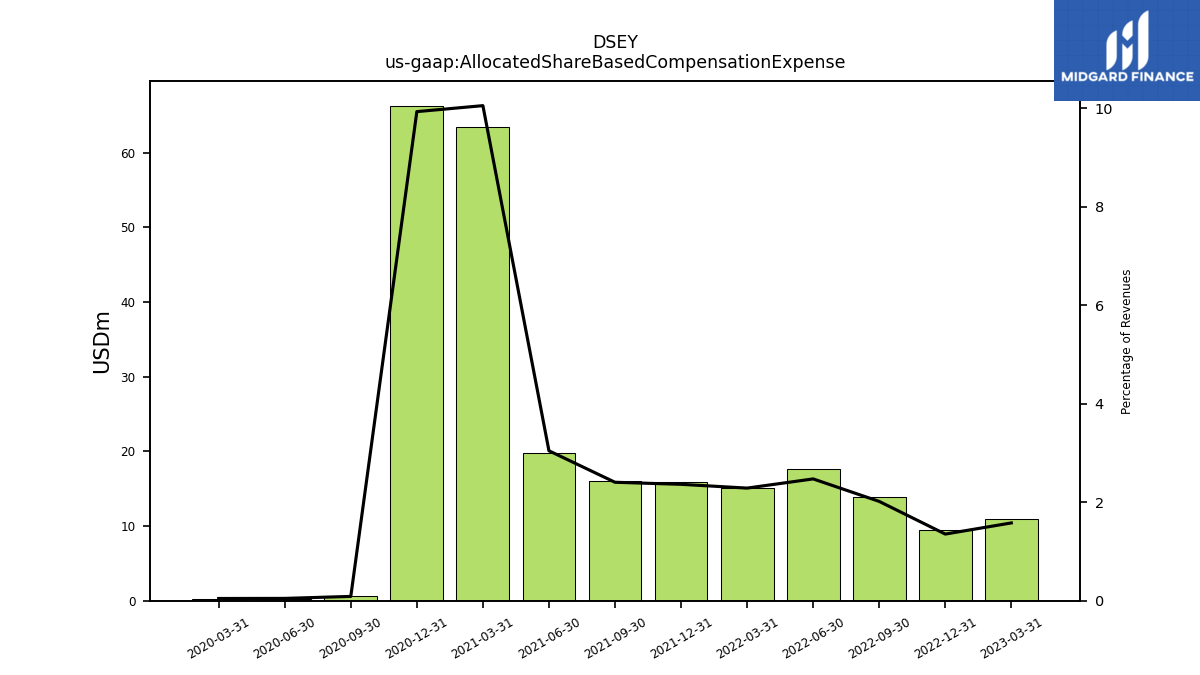
| Allocated Share Based Compensation Expense | 11.00 | 9.50 | 13.90 | 17.70 | 15.10 | 15.90 | 16.00 | 19.80 | 63.50 | 66.30 | 0.60 | 0.30 | 0.30 | |
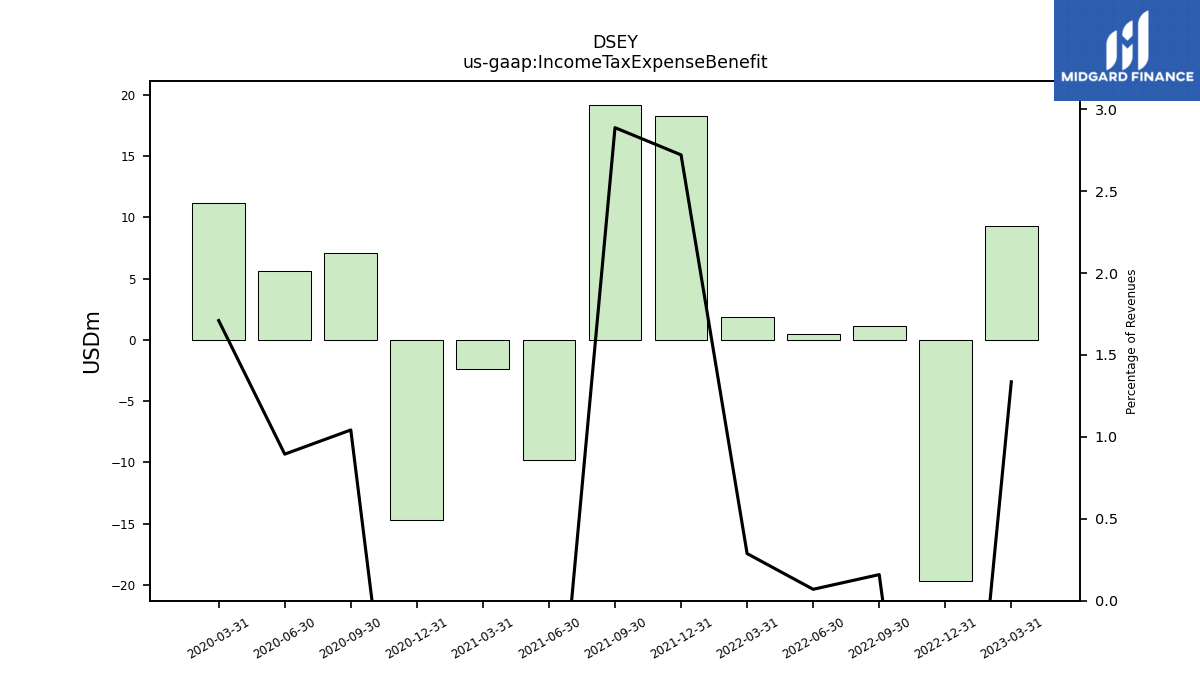
| Income Tax Expense Benefit | 9.30 | -19.70 | 1.10 | 0.50 | 1.90 | 18.30 | 19.20 | -9.80 | -2.40 | -14.70 | 7.10 | 5.60 | 11.20 | |
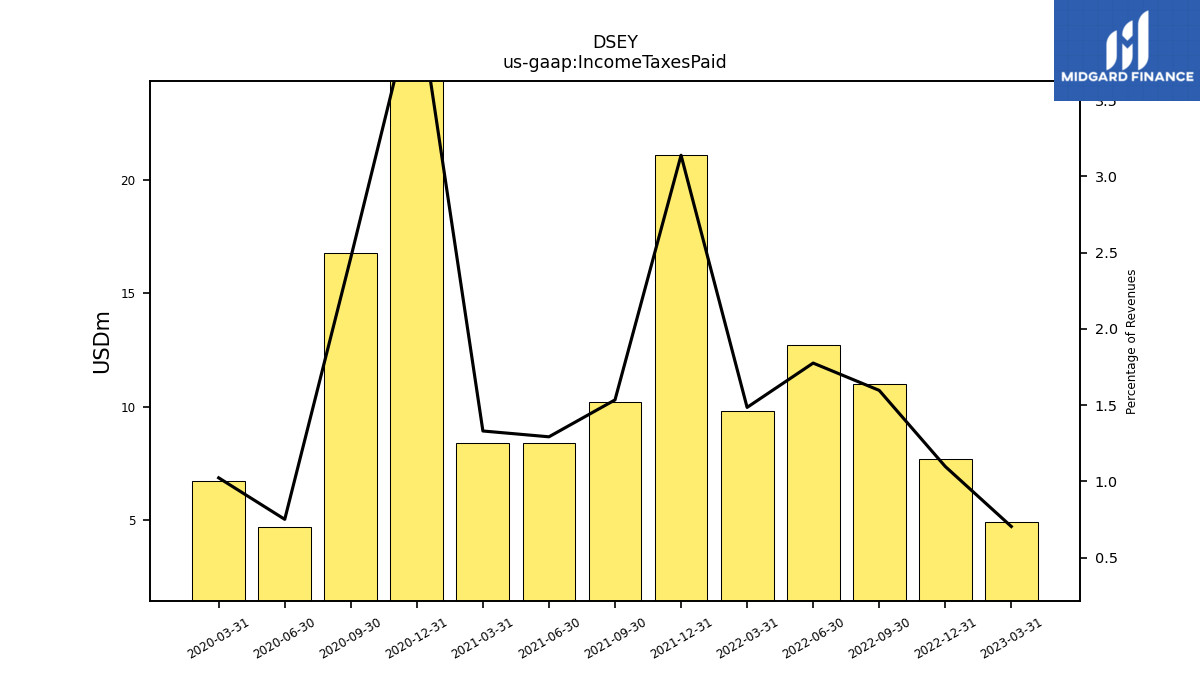
| Income Taxes Paid | 4.90 | 7.70 | 11.00 | 12.70 | 9.80 | 21.10 | 10.20 | 8.40 | 8.40 | 28.20 | 16.80 | 4.70 | 6.70 | |
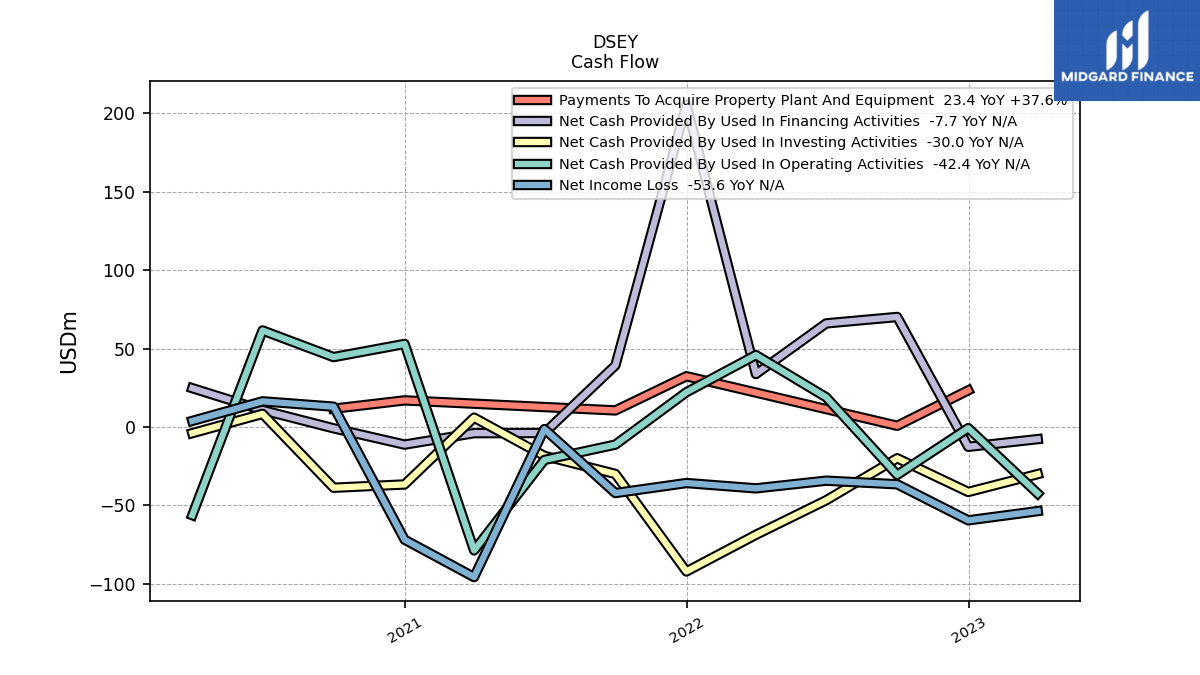
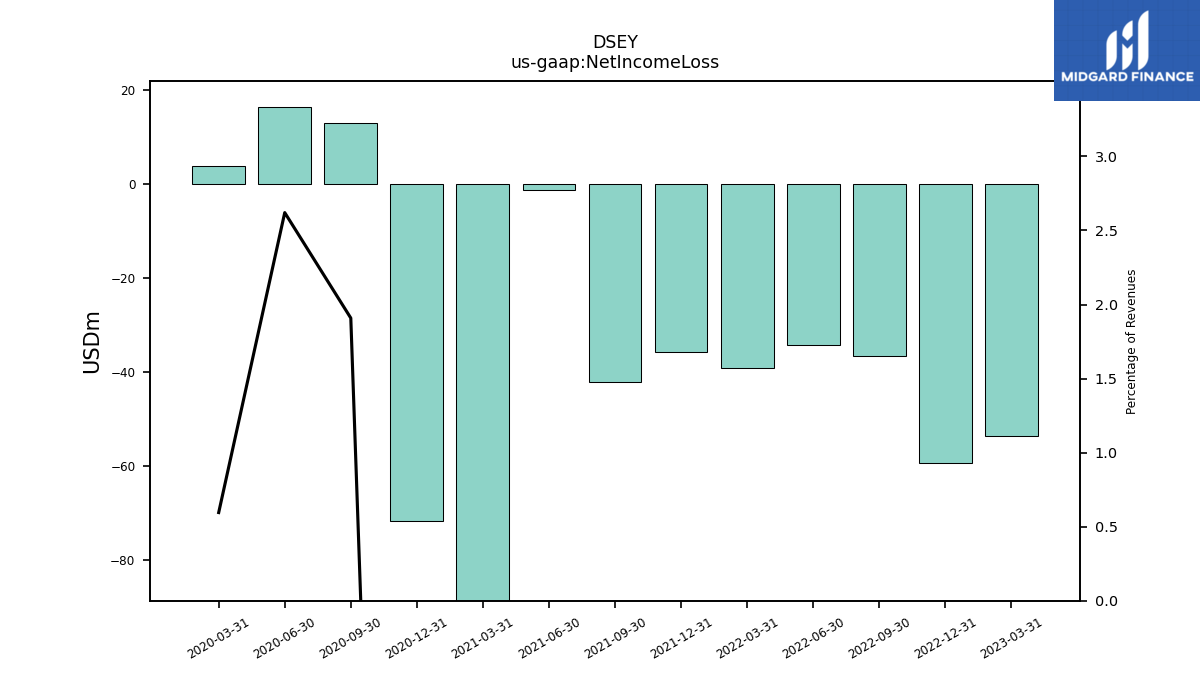
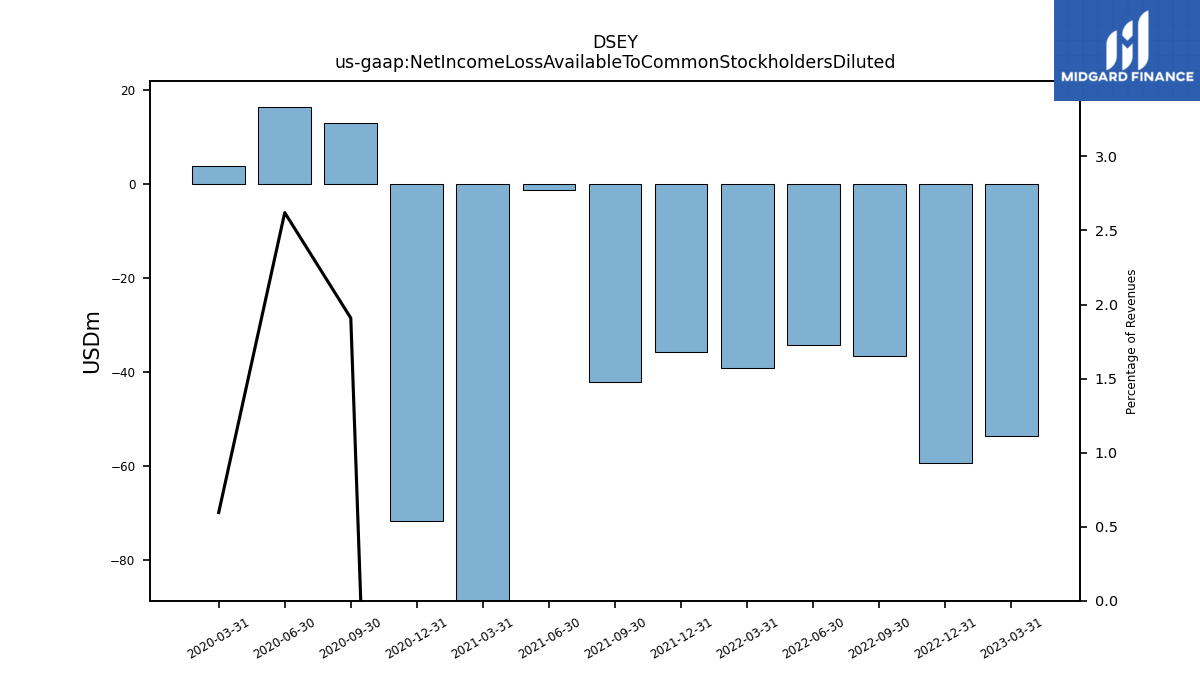
| Net Income Loss | -53.60 | -59.50 | -36.50 | -34.20 | -39.10 | -35.70 | -42.10 | -1.30 | -95.70 | -71.80 | 13.00 | 16.40 | 3.90 | |
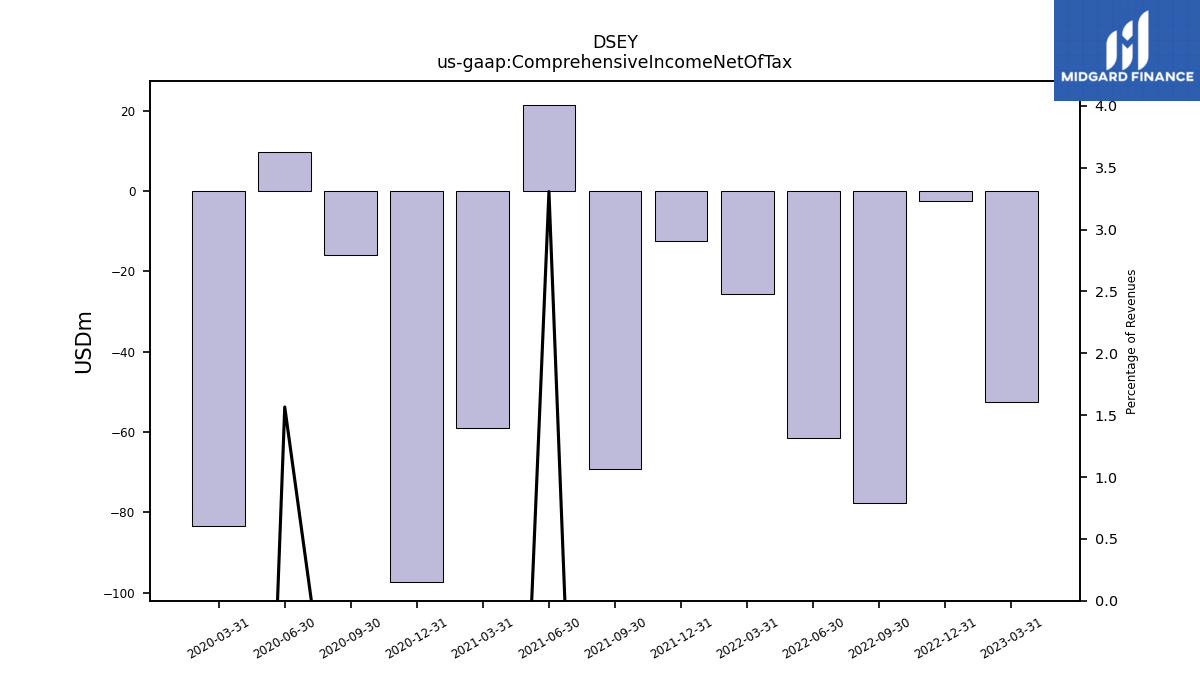
| Comprehensive Income Net Of Tax | -52.60 | -2.50 | -77.70 | -61.50 | -25.70 | -12.30 | -69.20 | 21.50 | -59.10 | -97.30 | -15.80 | 9.80 | -83.40 | |
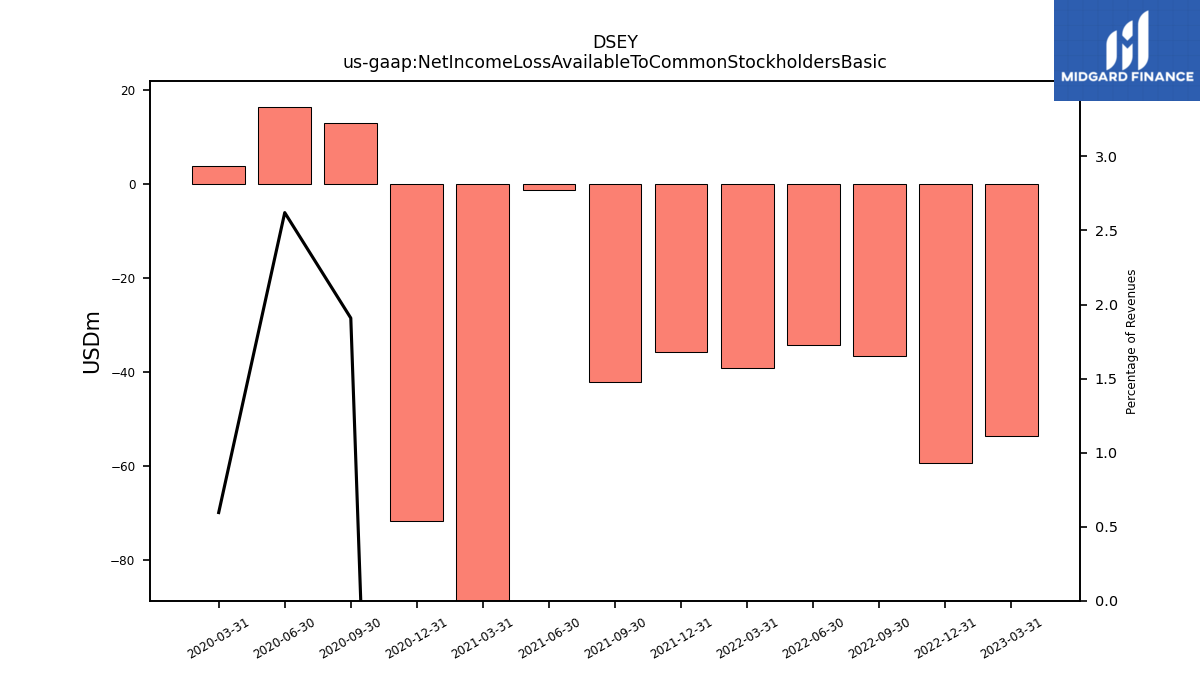
| Net Income Loss Available To Common Stockholders Basic | -53.60 | -59.50 | -36.50 | -34.20 | -39.10 | -35.70 | -42.10 | -1.30 | -95.70 | -71.80 | 13.00 | 16.40 | 3.90 | |
| Net Income Loss Available To Common Stockholders Diluted | -53.60 | -59.50 | -36.50 | -34.20 | -39.10 | -35.70 | -42.10 | -1.30 | -95.70 | -71.80 | 13.00 | 16.40 | 3.90 |
| 2023-03-31 | 2022-12-31 | 2022-09-30 | 2022-06-30 | 2022-03-31 | 2021-12-31 | 2021-09-30 | 2021-06-30 | 2021-03-31 | 2020-12-31 | 2020-09-30 | 2020-06-30 | 2020-03-31 | ||
|---|---|---|---|---|---|---|---|---|---|---|---|---|---|---|
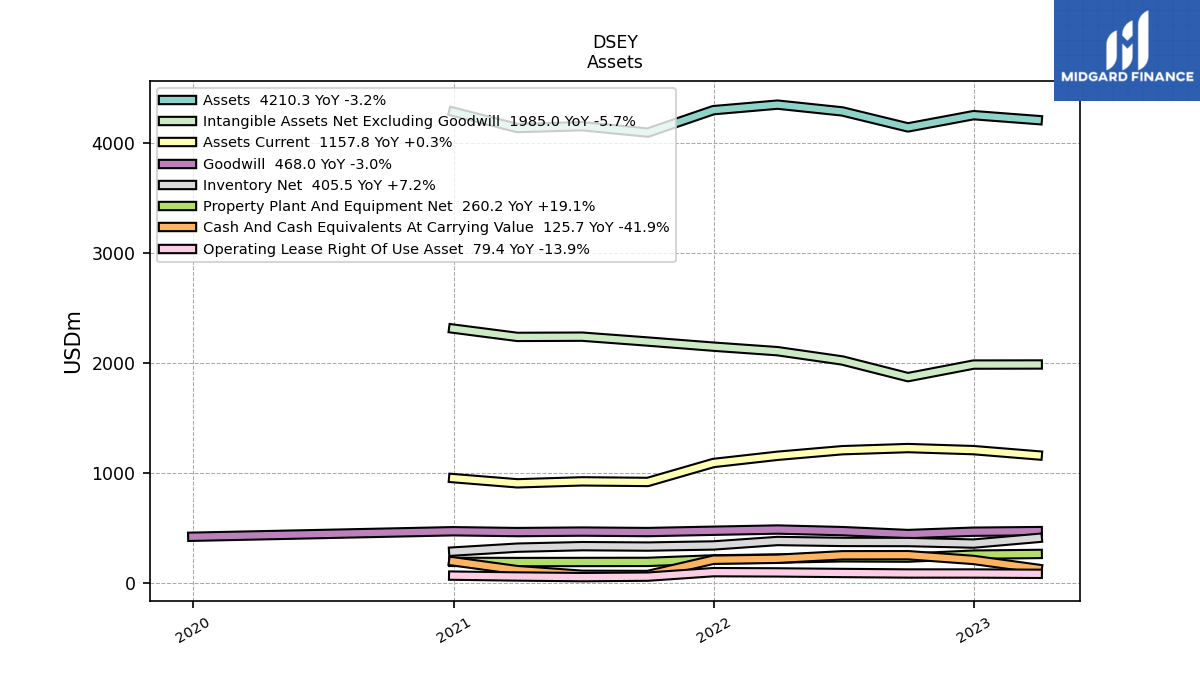
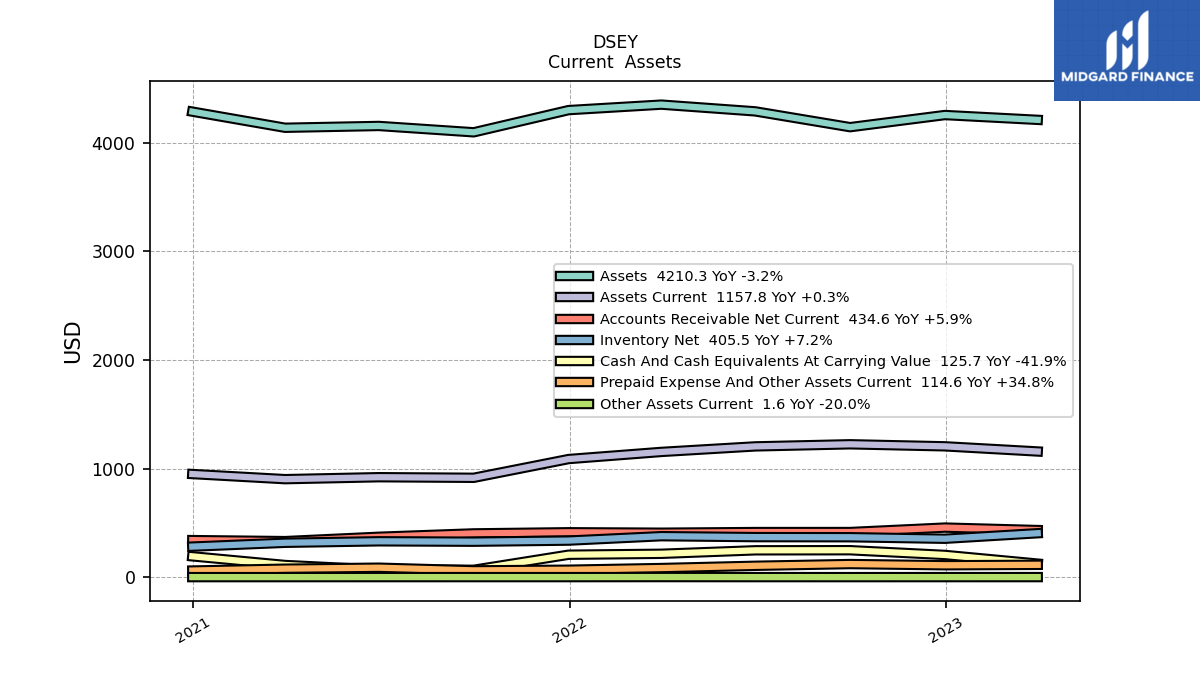
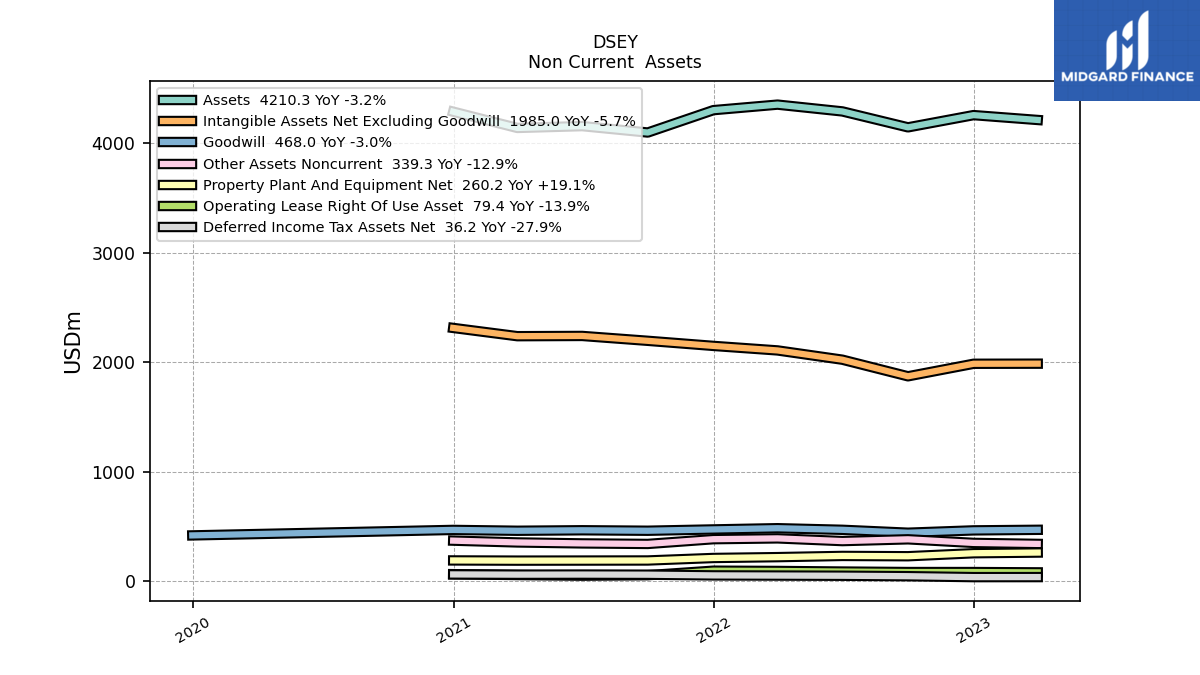
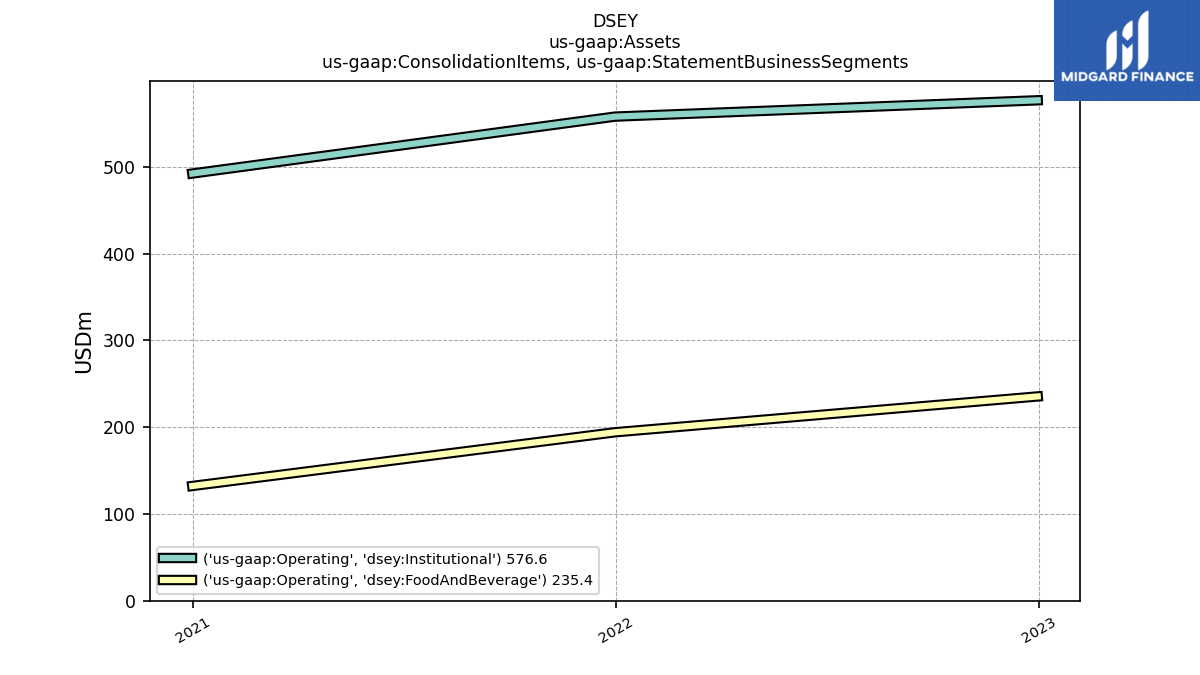
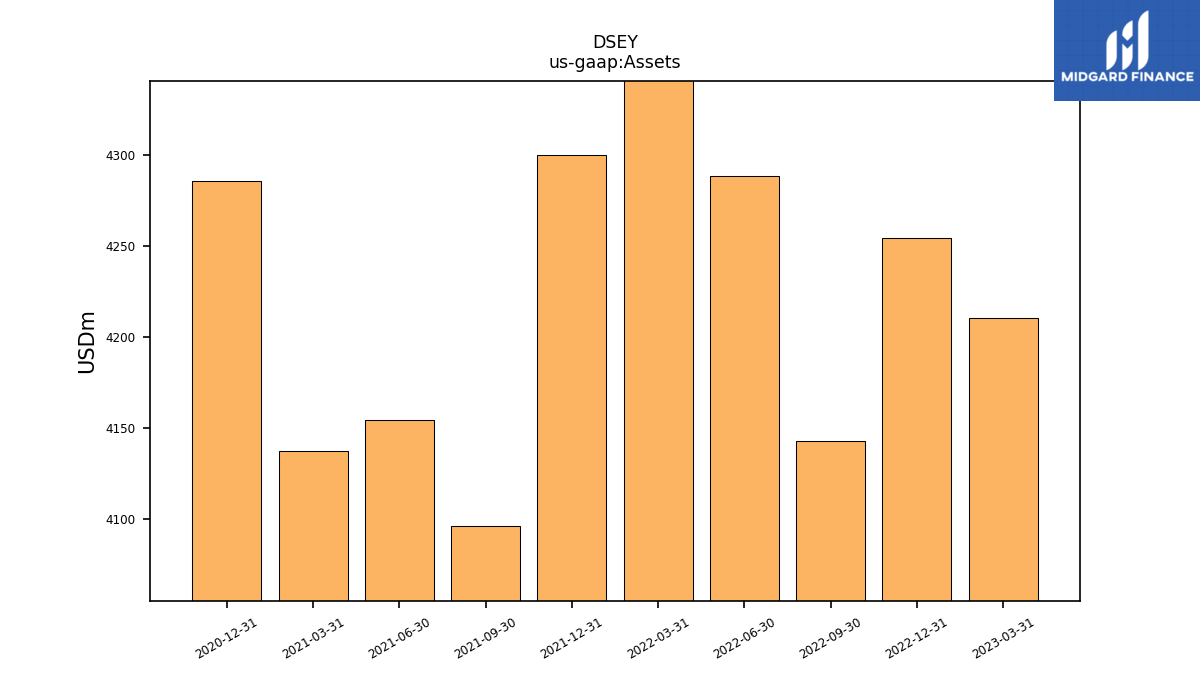
| Assets | 4210.30 | 4254.70 | 4143.00 | 4288.40 | 4350.50 | 4300.00 | 4095.70 | 4154.10 | 4137.50 | 4286.10 | NA | NA | NA | |
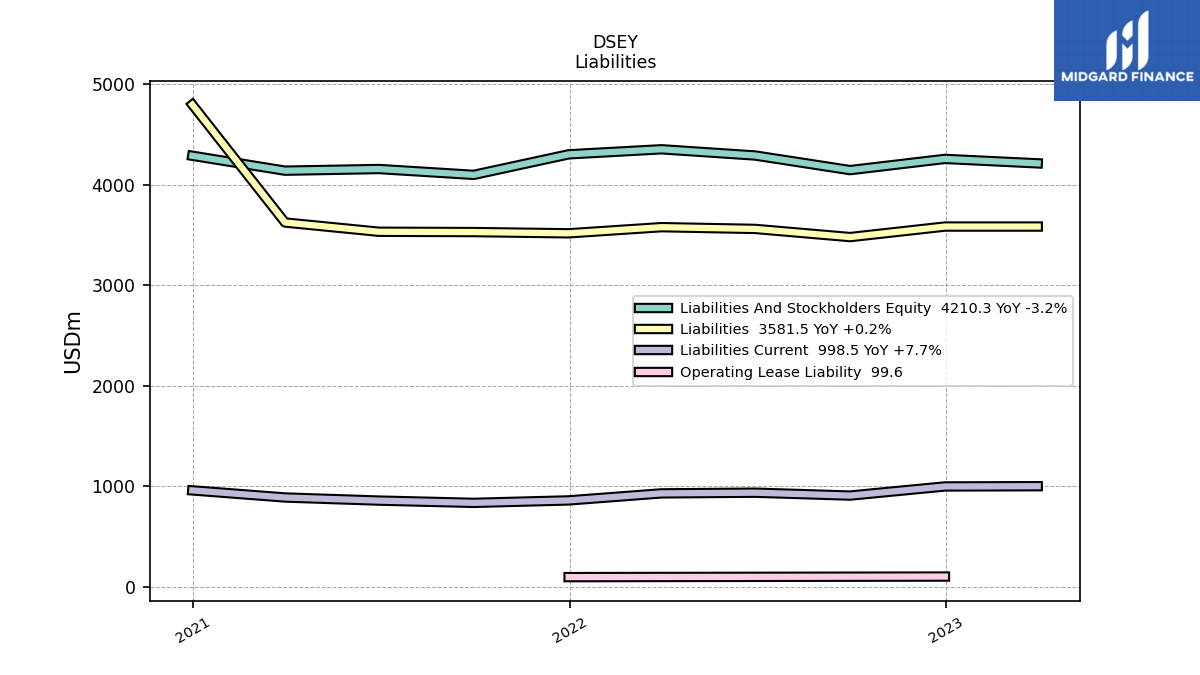
| Liabilities | 3581.50 | 3581.70 | 3476.90 | 3558.10 | 3575.50 | 3514.40 | 3526.80 | 3529.90 | 3621.90 | 4794.70 | NA | NA | NA | |
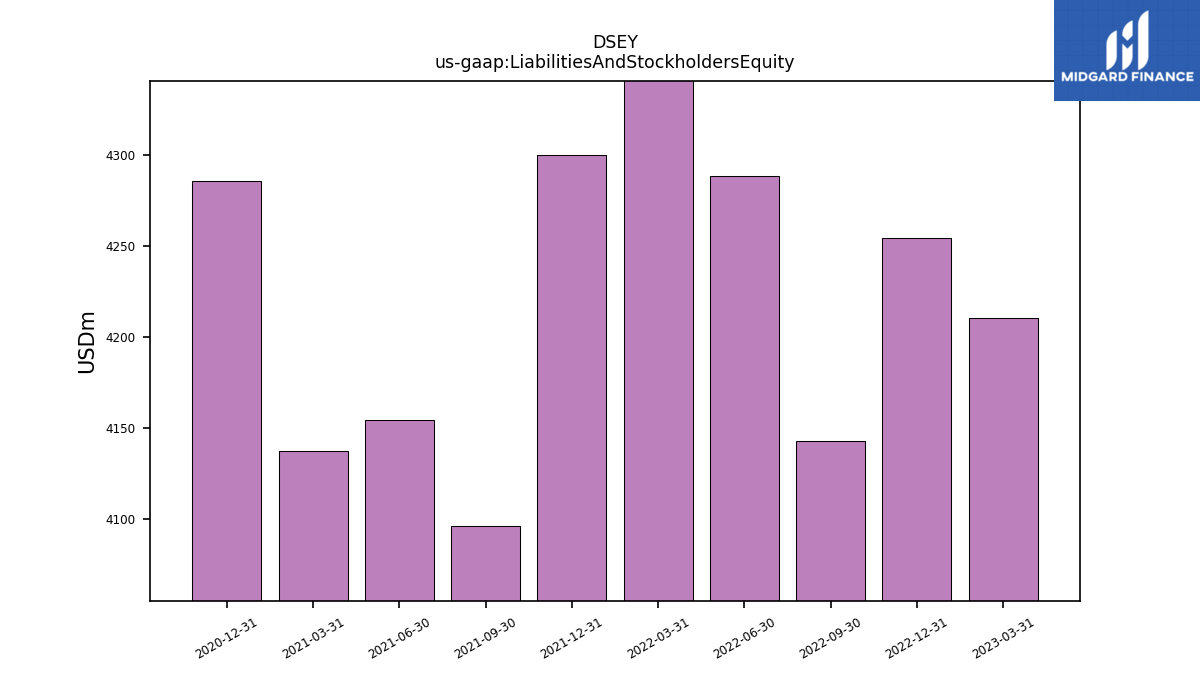
| Liabilities And Stockholders Equity | 4210.30 | 4254.70 | 4143.00 | 4288.40 | 4350.50 | 4300.00 | 4095.70 | 4154.10 | 4137.50 | 4286.10 | NA | NA | NA | |
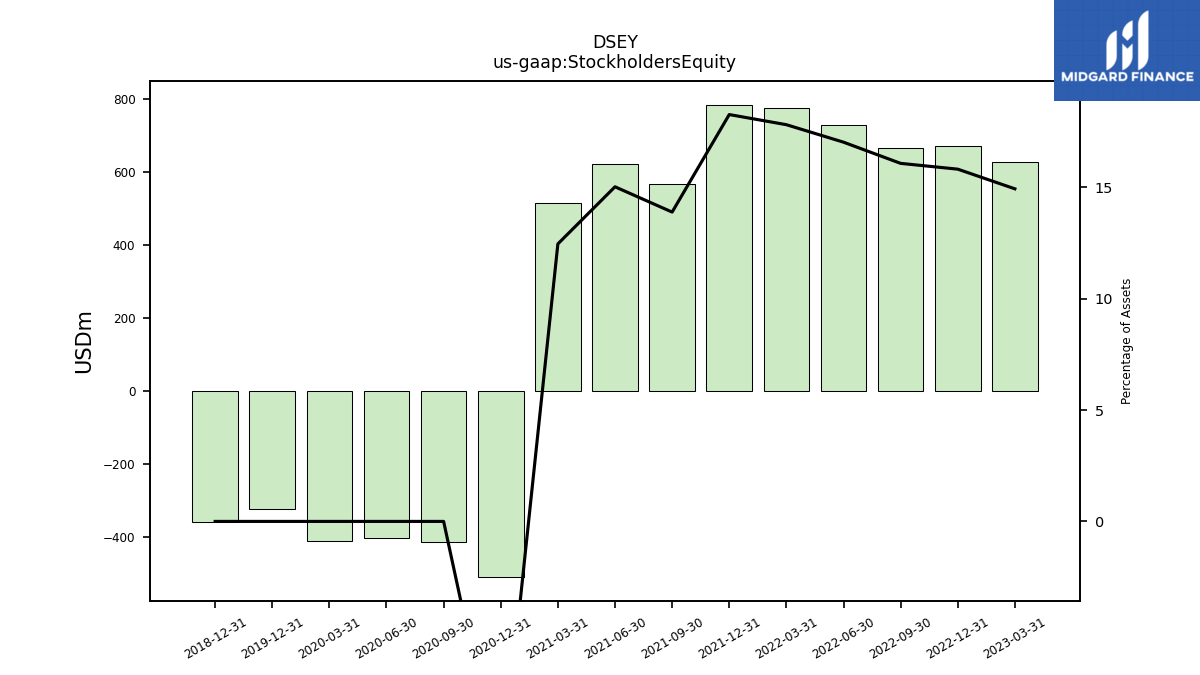
| Stockholders Equity | 628.80 | 673.00 | 666.10 | 730.30 | 775.00 | 785.60 | 568.90 | 624.20 | 515.60 | -508.60 | -411.30 | -400.50 | -410.30 |
| 2023-03-31 | 2022-12-31 | 2022-09-30 | 2022-06-30 | 2022-03-31 | 2021-12-31 | 2021-09-30 | 2021-06-30 | 2021-03-31 | 2020-12-31 | 2020-09-30 | 2020-06-30 | 2020-03-31 | ||
|---|---|---|---|---|---|---|---|---|---|---|---|---|---|---|
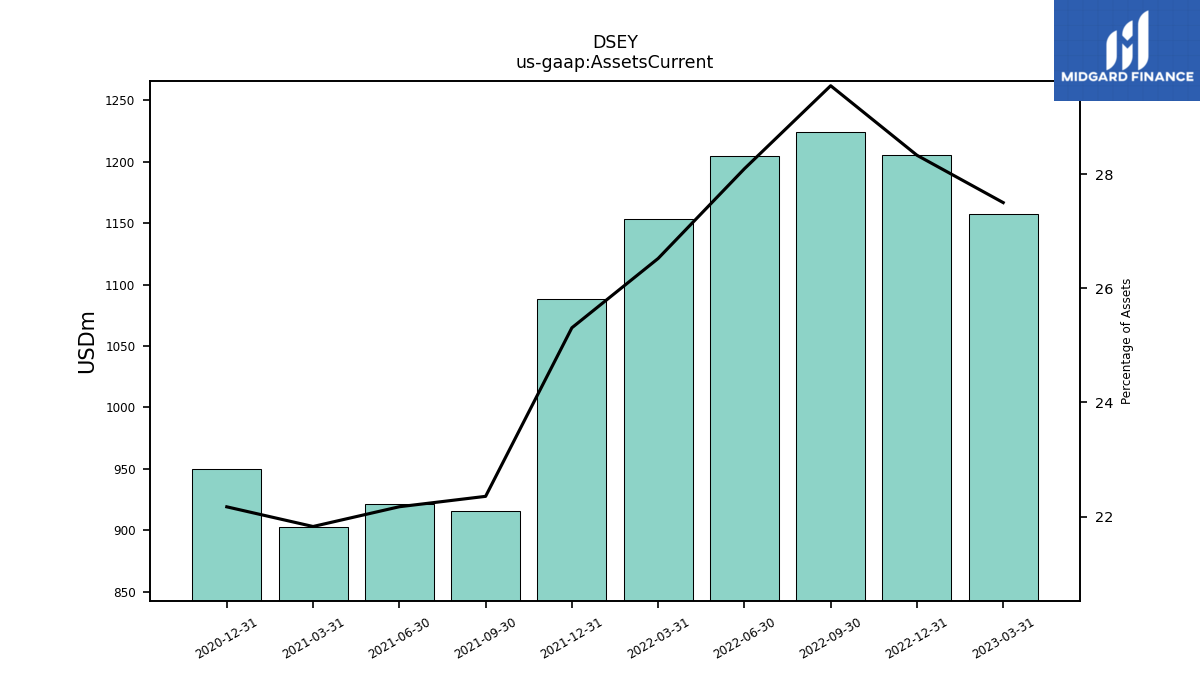
| Assets Current | 1157.80 | 1205.30 | 1224.10 | 1204.70 | 1153.80 | 1088.20 | 915.60 | 921.10 | 903.10 | 950.30 | NA | NA | NA | |
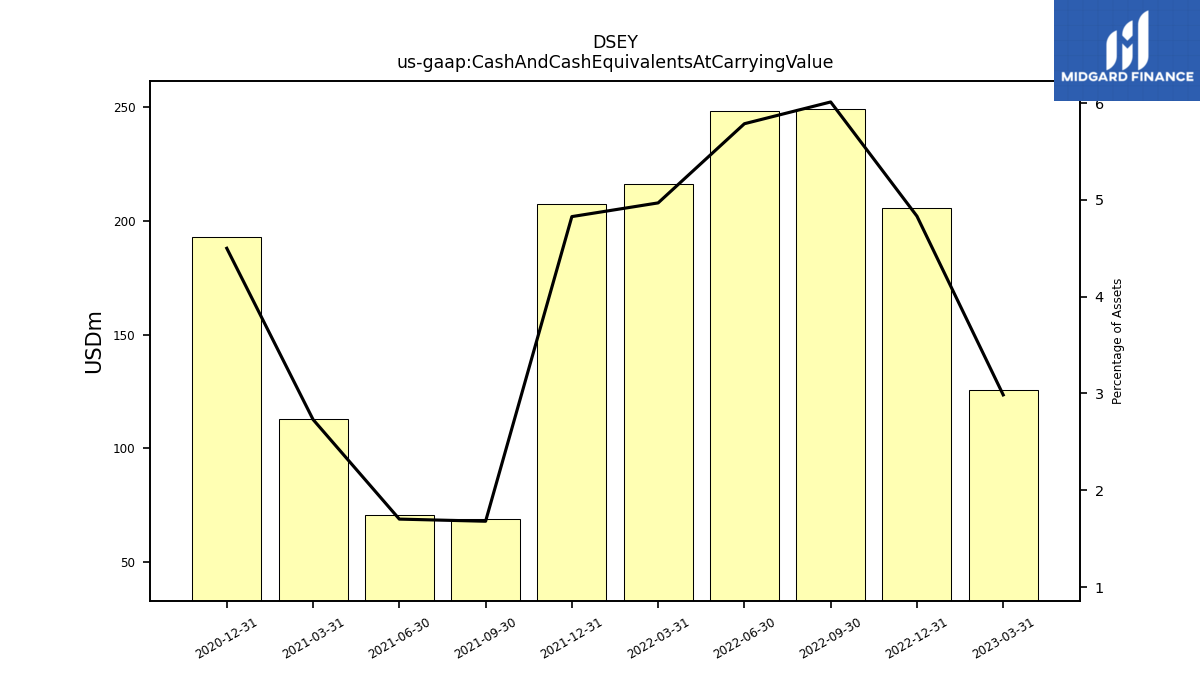
| Cash And Cash Equivalents At Carrying Value | 125.70 | 205.60 | 249.10 | 248.20 | 216.20 | 207.60 | 68.80 | 70.70 | 113.00 | 192.90 | NA | NA | NA | |
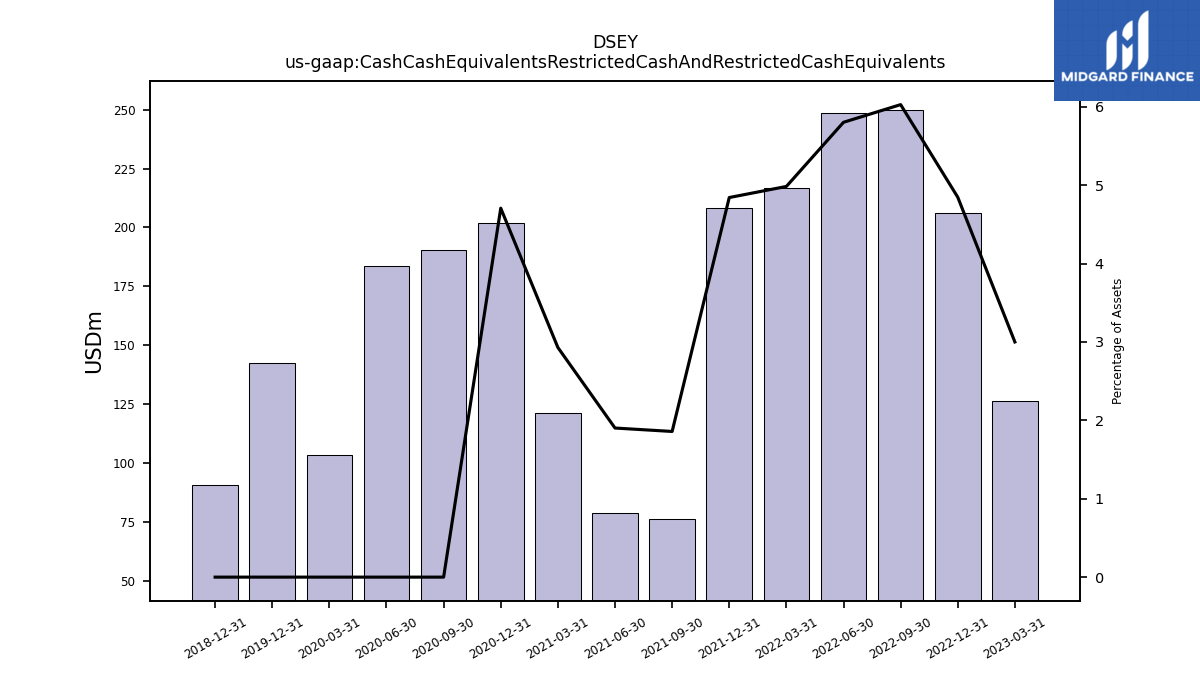
| Cash Cash Equivalents Restricted Cash And Restricted Cash Equivalents | 126.30 | 206.20 | 249.70 | 248.80 | 216.80 | 208.20 | 76.10 | 79.00 | 121.20 | 201.70 | 190.60 | 183.60 | 103.50 | |
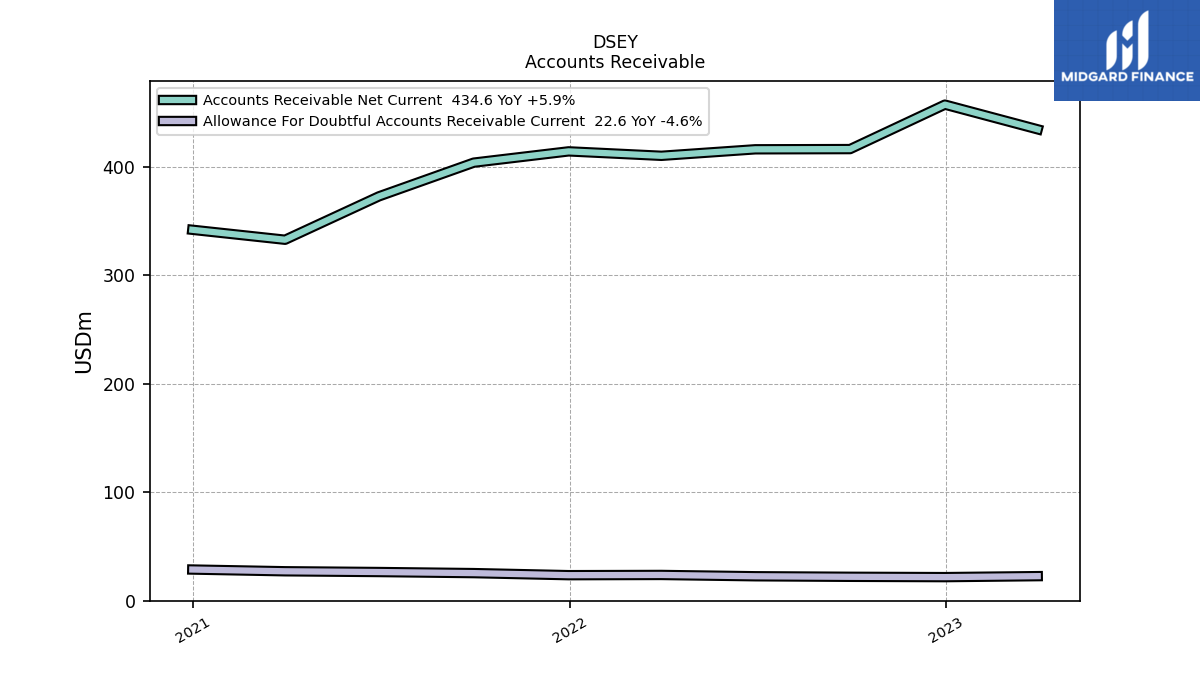
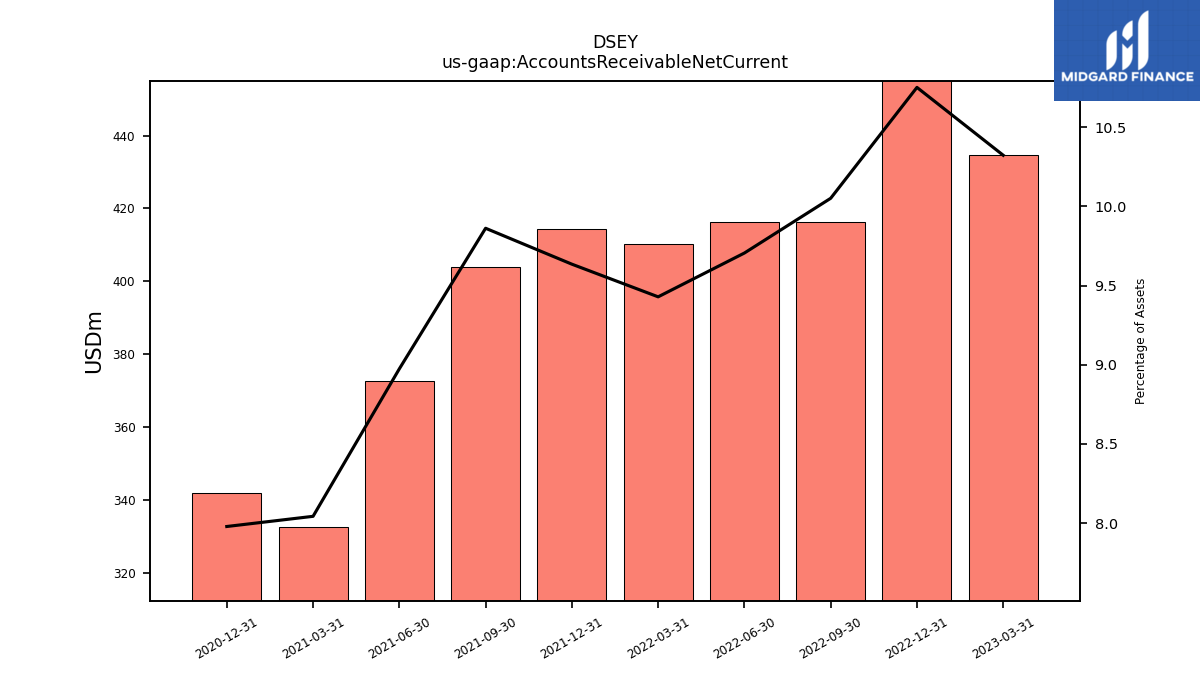
| Accounts Receivable Net Current | 434.60 | 457.40 | 416.40 | 416.20 | 410.20 | 414.30 | 403.90 | 372.80 | 332.80 | 342.00 | NA | NA | NA | |
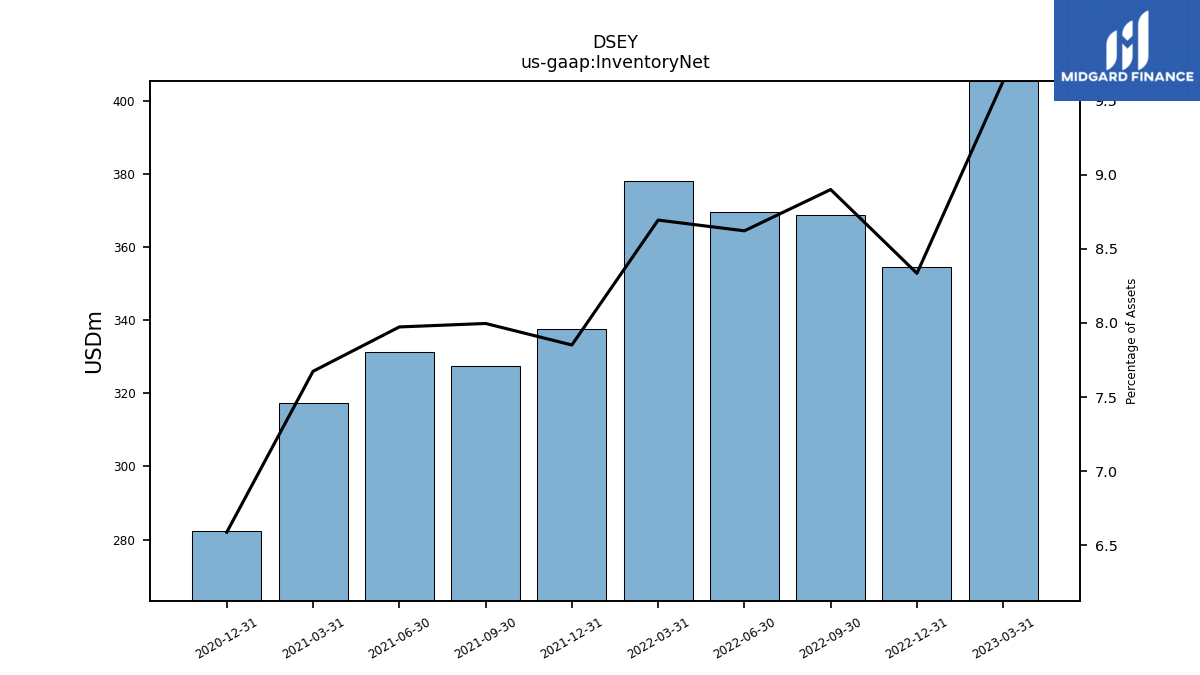
| Inventory Net | 405.50 | 354.60 | 368.70 | 369.70 | 378.20 | 337.60 | 327.50 | 331.20 | 317.50 | 282.40 | NA | NA | NA | |
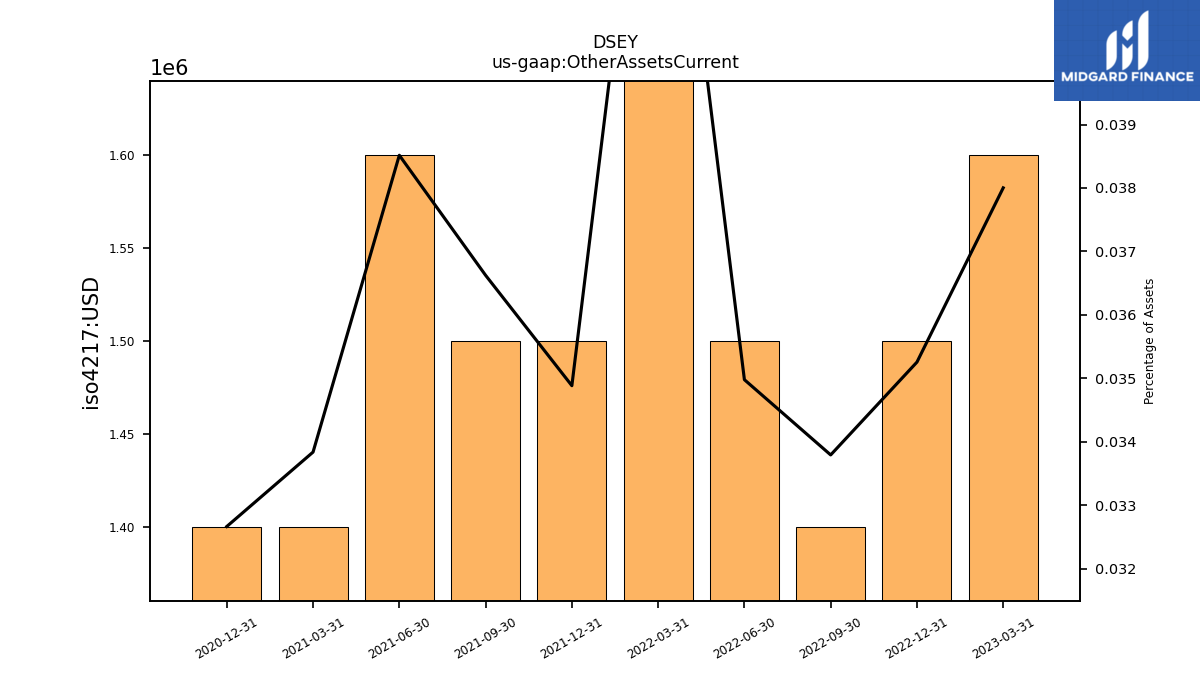
| Other Assets Current | 1.60 | 1.50 | 1.40 | 1.50 | 2.00 | 1.50 | 1.50 | 1.60 | 1.40 | 1.40 | NA | NA | NA | |
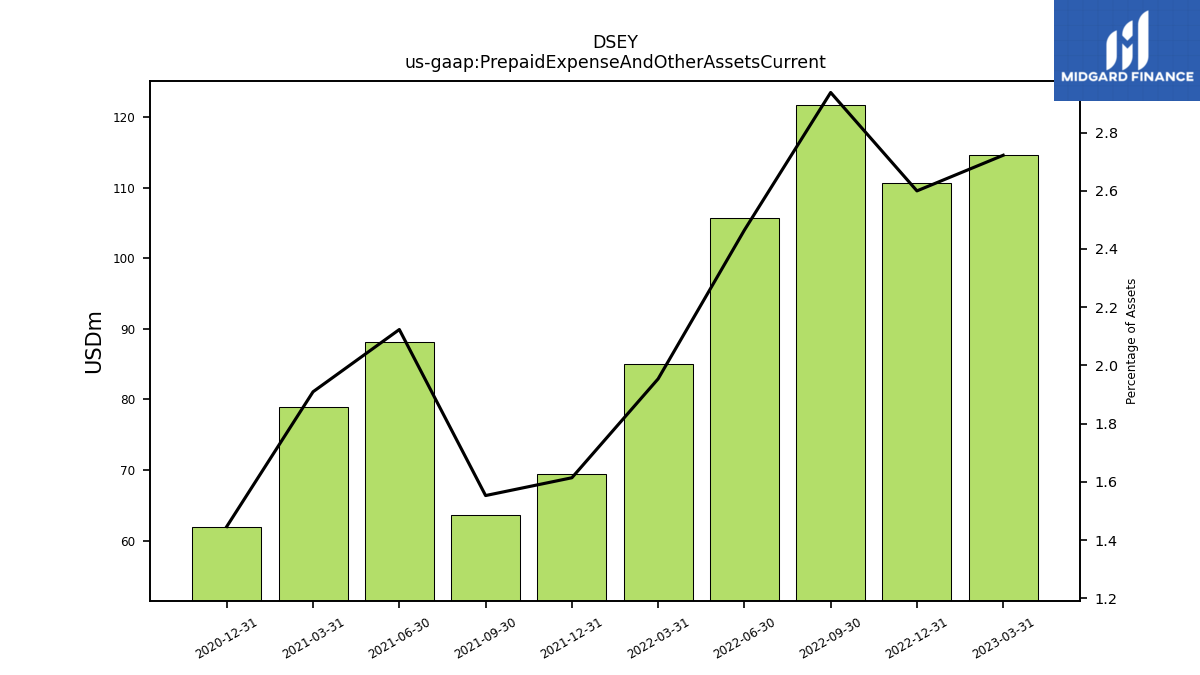
| Prepaid Expense And Other Assets Current | 114.60 | 110.60 | 121.70 | 105.70 | 85.00 | 69.40 | 63.60 | 88.20 | 79.00 | 62.00 | NA | NA | NA |
| 2023-03-31 | 2022-12-31 | 2022-09-30 | 2022-06-30 | 2022-03-31 | 2021-12-31 | 2021-09-30 | 2021-06-30 | 2021-03-31 | 2020-12-31 | 2020-09-30 | 2020-06-30 | 2020-03-31 | ||
|---|---|---|---|---|---|---|---|---|---|---|---|---|---|---|
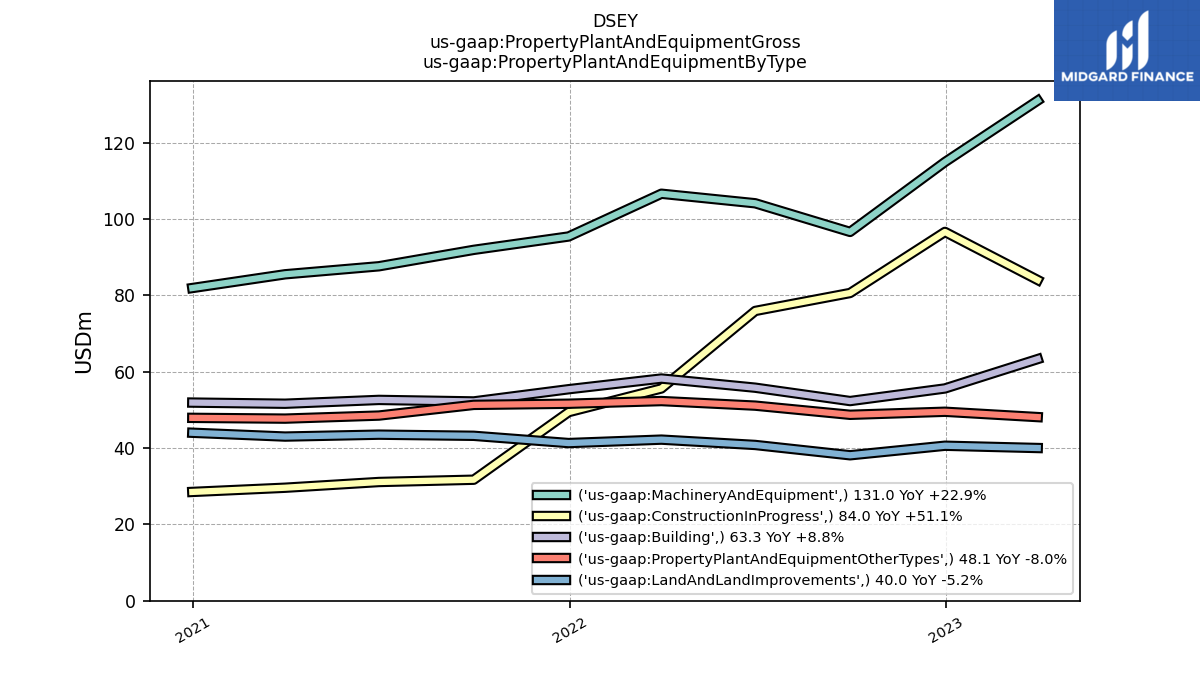
| Property Plant And Equipment Gross | 366.40 | 357.20 | 316.30 | 327.70 | 314.90 | 293.10 | 270.30 | 263.30 | 257.40 | 254.20 | NA | NA | NA | |
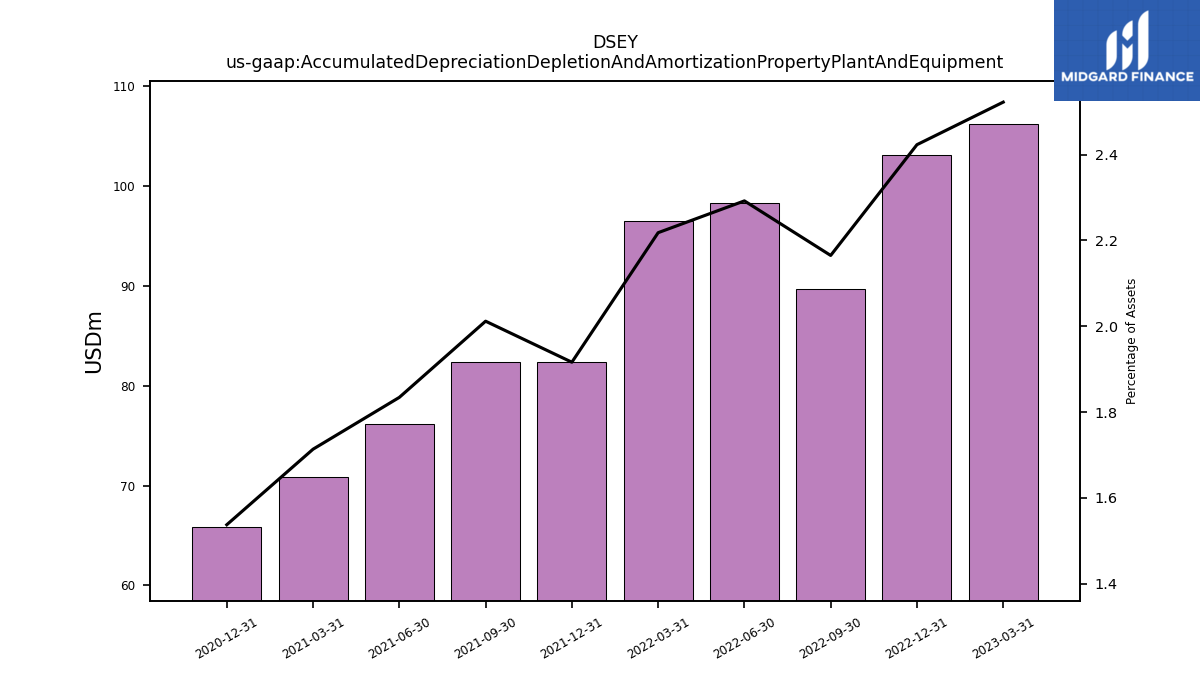
| Accumulated Depreciation Depletion And Amortization Property Plant And Equipment | 106.20 | 103.10 | 89.70 | 98.30 | 96.50 | 82.40 | 82.40 | 76.20 | 70.90 | 65.90 | NA | NA | NA | |
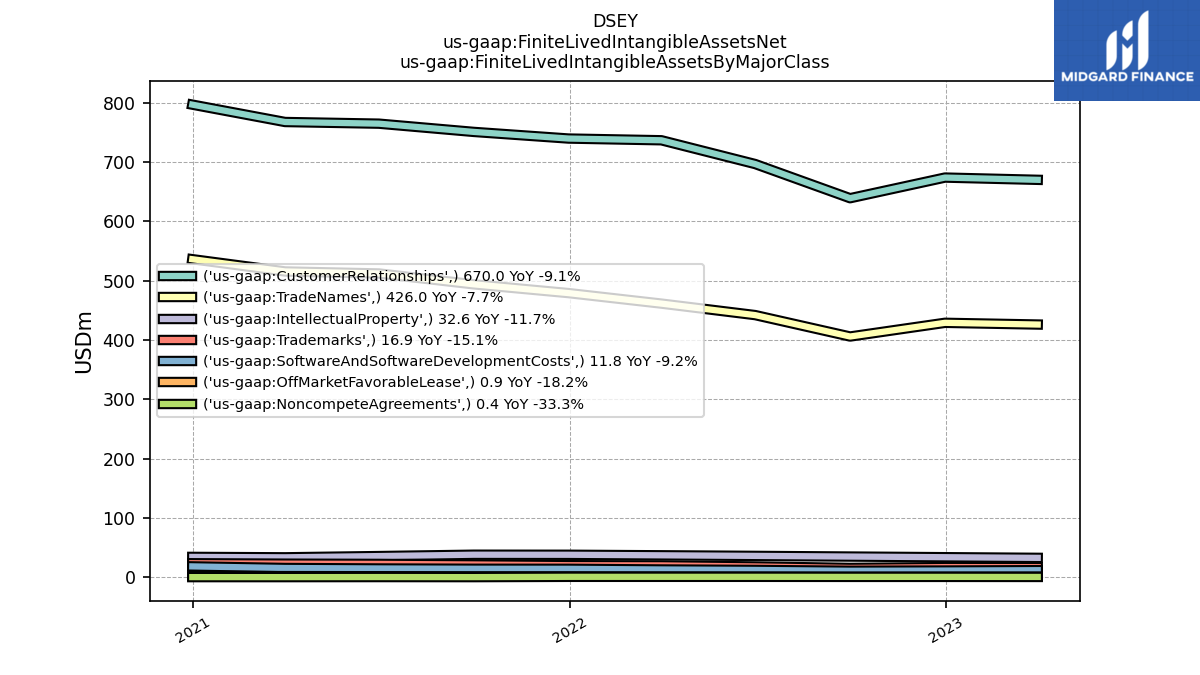
| Amortization Of Intangible Assets | 21.90 | 21.70 | 21.50 | 22.80 | 24.20 | 24.10 | 24.20 | 24.10 | 24.30 | 24.20 | 24.80 | 24.60 | 24.60 | |
| Property Plant And Equipment Net | 260.20 | 254.10 | 226.60 | 229.40 | 218.40 | 210.70 | 187.90 | 187.10 | 186.50 | 188.30 | NA | NA | NA | |
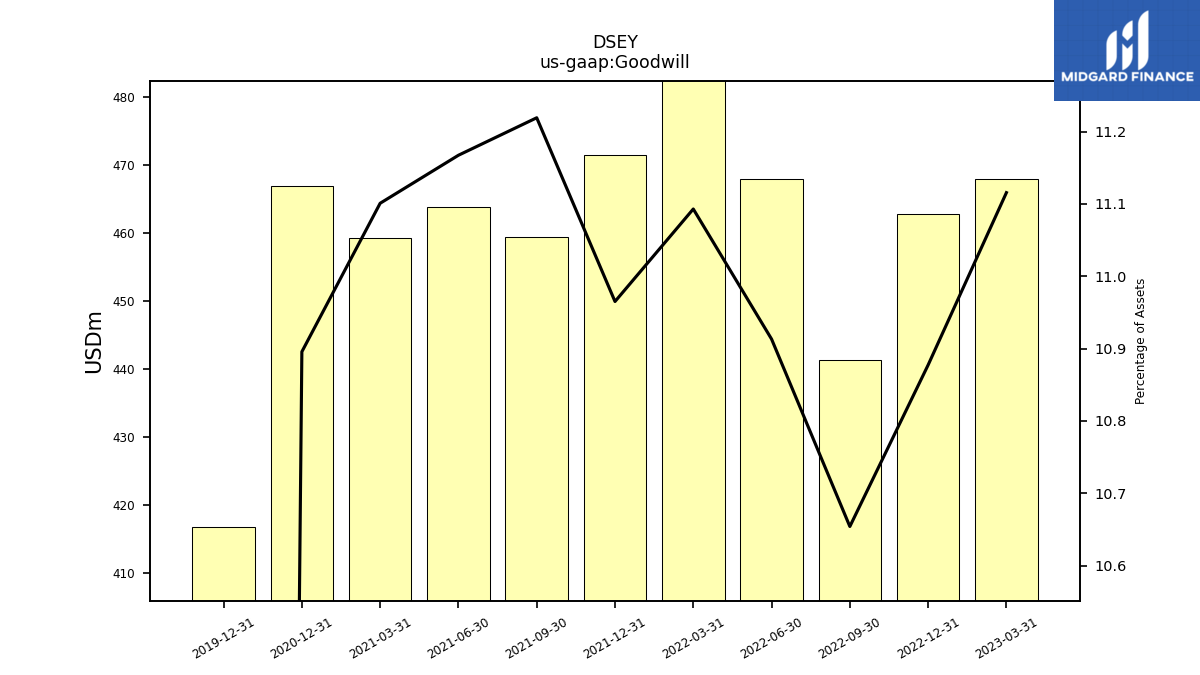
| Goodwill | 468.00 | 462.80 | 441.40 | 468.00 | 482.60 | 471.50 | 459.50 | 463.90 | 459.30 | 467.00 | NA | NA | NA | |
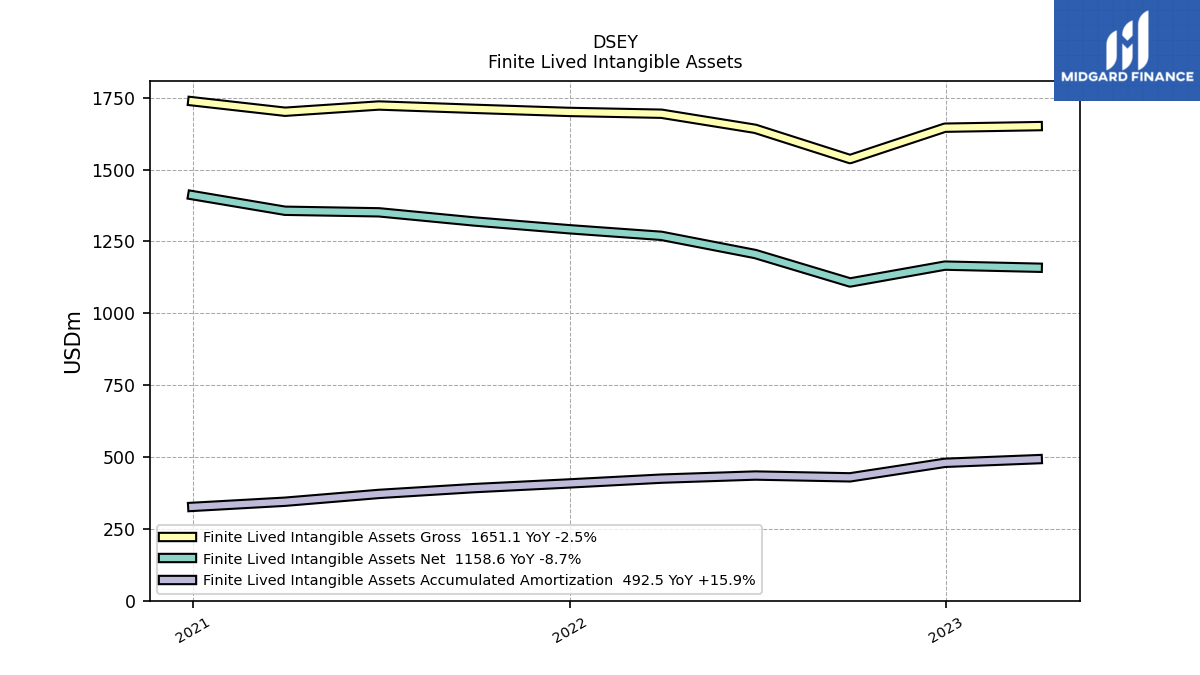
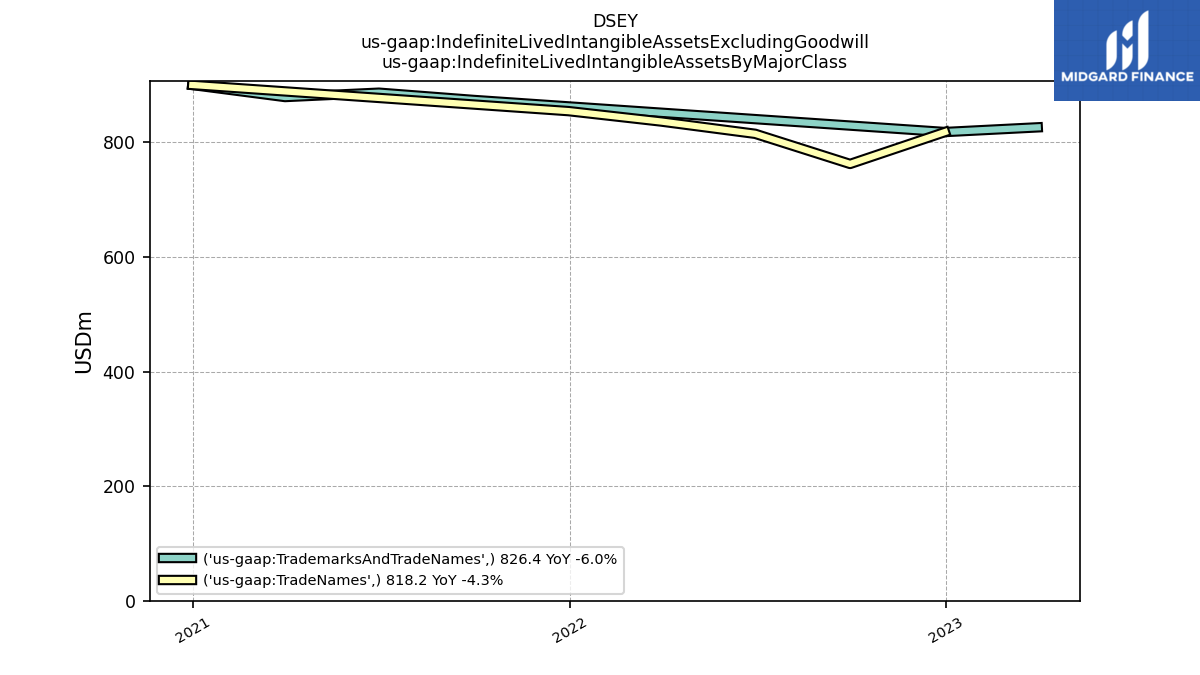
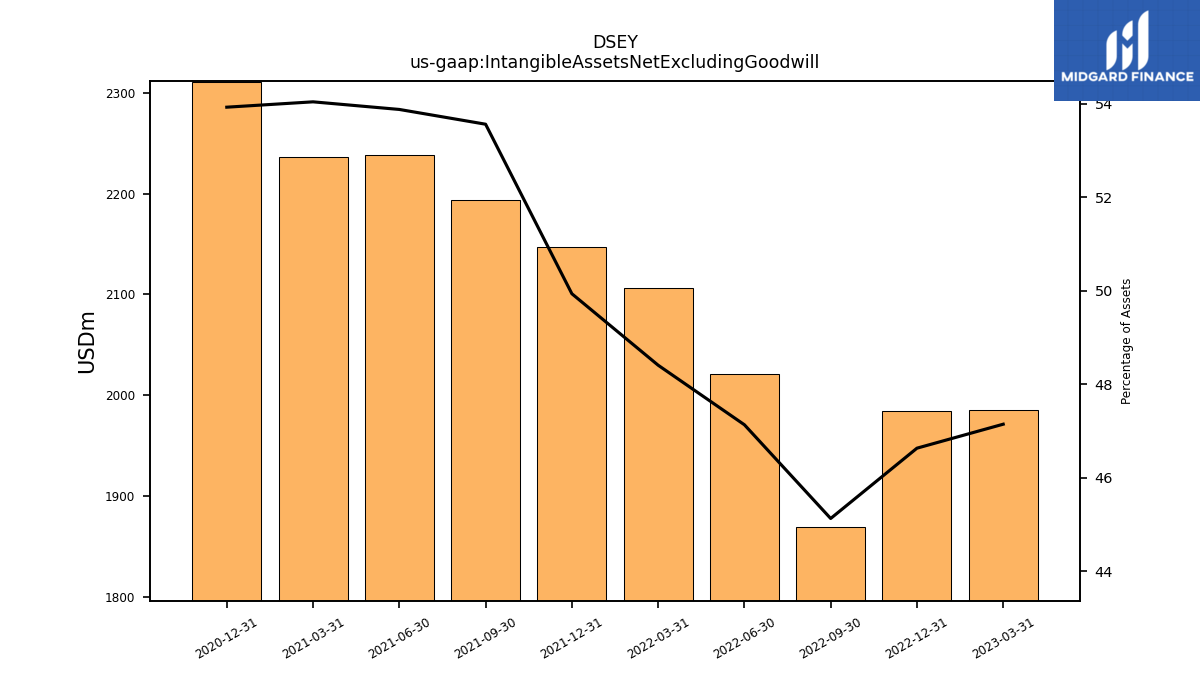
| Intangible Assets Net Excluding Goodwill | 1985.00 | 1984.10 | 1869.70 | 2021.30 | 2106.00 | 2147.30 | 2193.80 | 2238.20 | 2236.00 | 2311.40 | NA | NA | NA | |
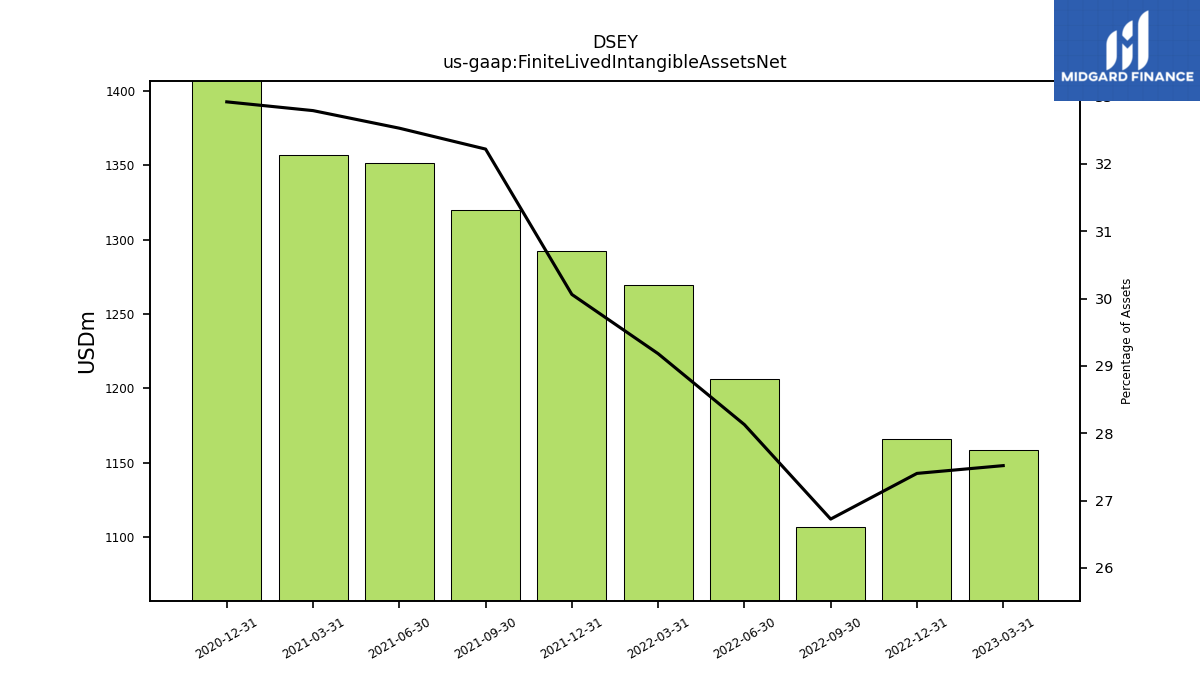
| Finite Lived Intangible Assets Net | 1158.60 | 1165.90 | 1107.20 | 1206.20 | 1269.50 | 1292.60 | 1319.60 | 1351.30 | 1356.70 | 1411.00 | NA | NA | NA | |
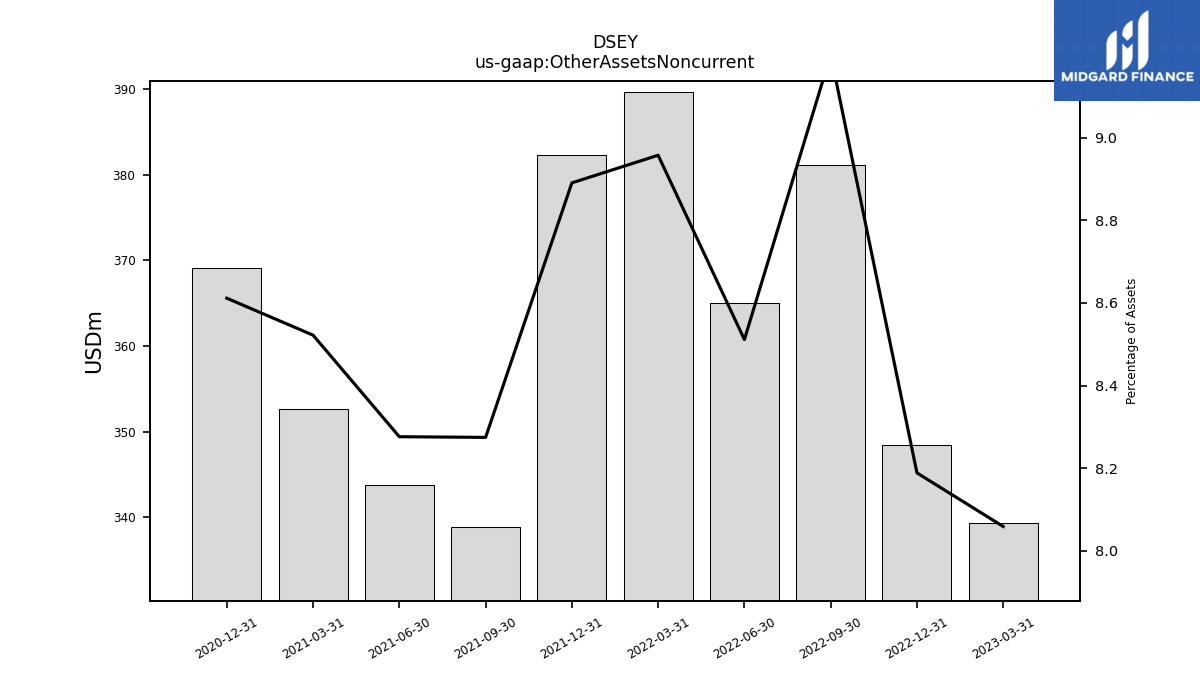
| Other Assets Noncurrent | 339.30 | 348.40 | 381.20 | 365.00 | 389.70 | 382.30 | 338.90 | 343.80 | 352.60 | 369.10 | NA | NA | NA |
| 2023-03-31 | 2022-12-31 | 2022-09-30 | 2022-06-30 | 2022-03-31 | 2021-12-31 | 2021-09-30 | 2021-06-30 | 2021-03-31 | 2020-12-31 | 2020-09-30 | 2020-06-30 | 2020-03-31 | ||
|---|---|---|---|---|---|---|---|---|---|---|---|---|---|---|
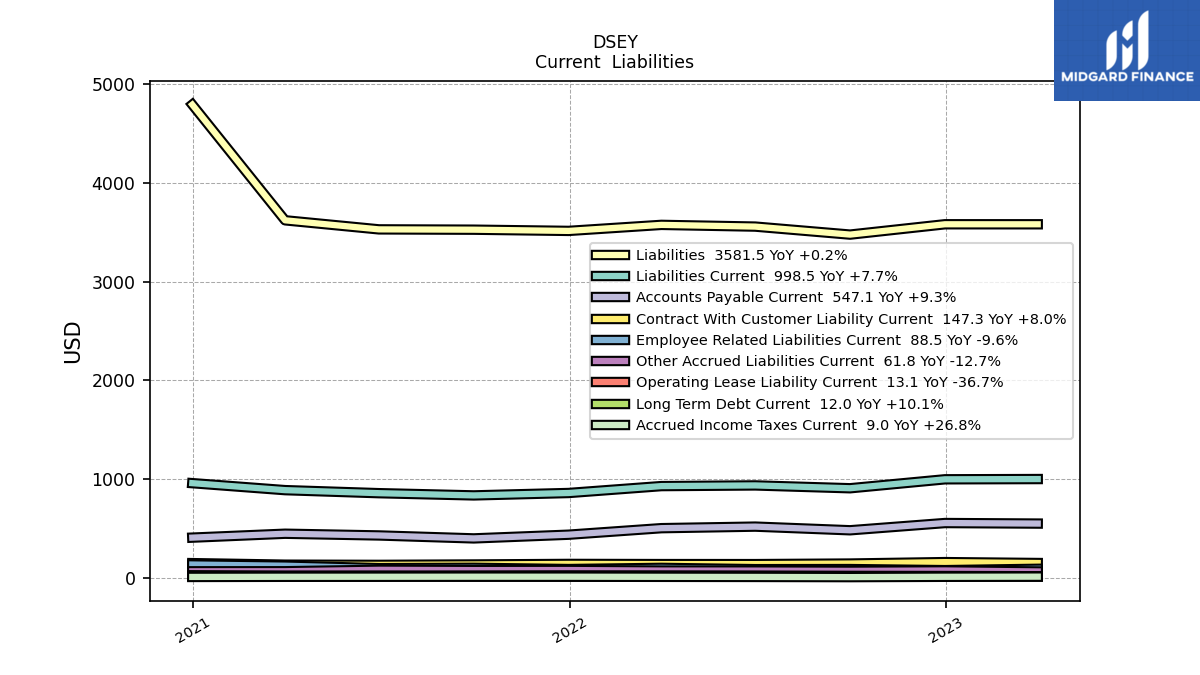
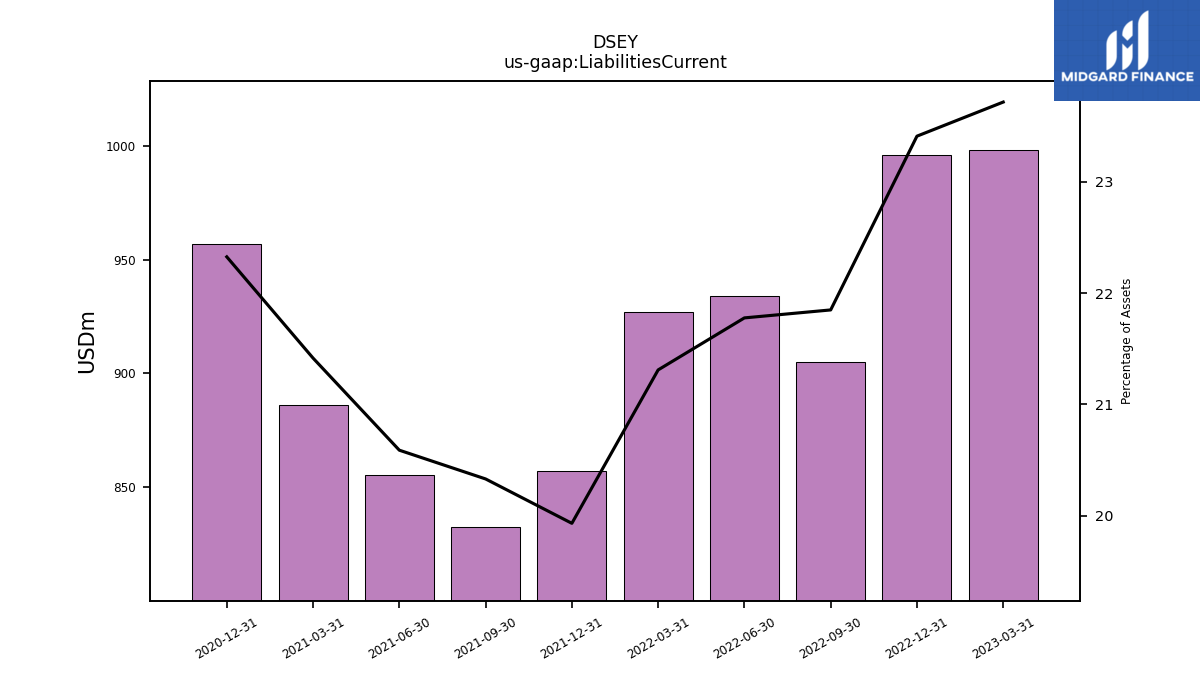
| Liabilities Current | 998.50 | 996.00 | 905.20 | 933.90 | 927.10 | 857.10 | 832.70 | 855.30 | 886.10 | 956.90 | NA | NA | NA | |
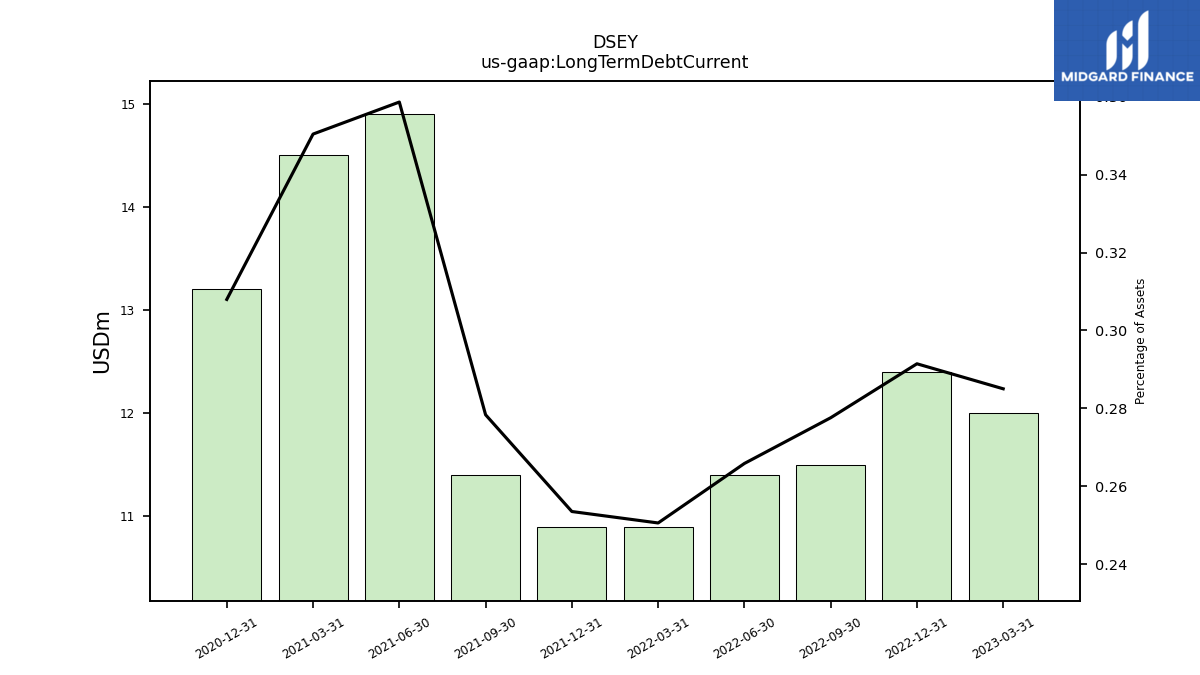
| Long Term Debt Current | 12.00 | 12.40 | 11.50 | 11.40 | 10.90 | 10.90 | 11.40 | 14.90 | 14.50 | 13.20 | NA | NA | NA | |
| Accounts Payable Current | 547.10 | 552.60 | 479.20 | 516.30 | 500.50 | 434.30 | 396.80 | 426.70 | 444.20 | 404.60 | NA | NA | NA | |
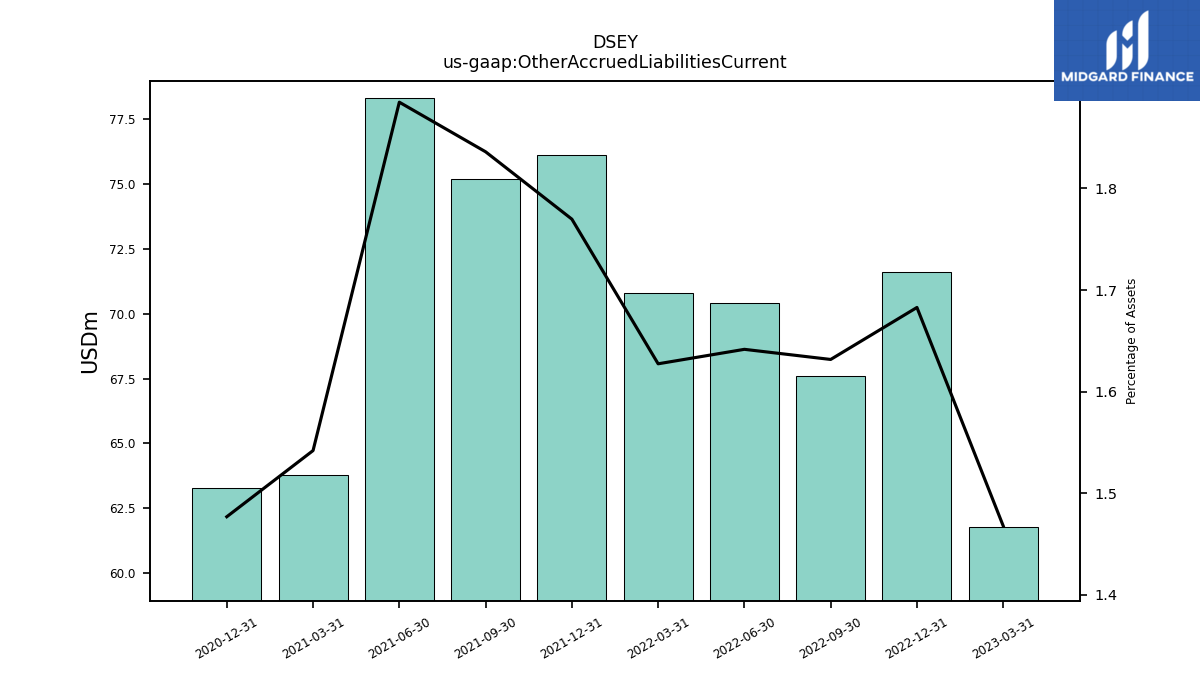
| Other Accrued Liabilities Current | 61.80 | 71.60 | 67.60 | 70.40 | 70.80 | 76.10 | 75.20 | 78.30 | 63.80 | 63.30 | NA | NA | NA | |
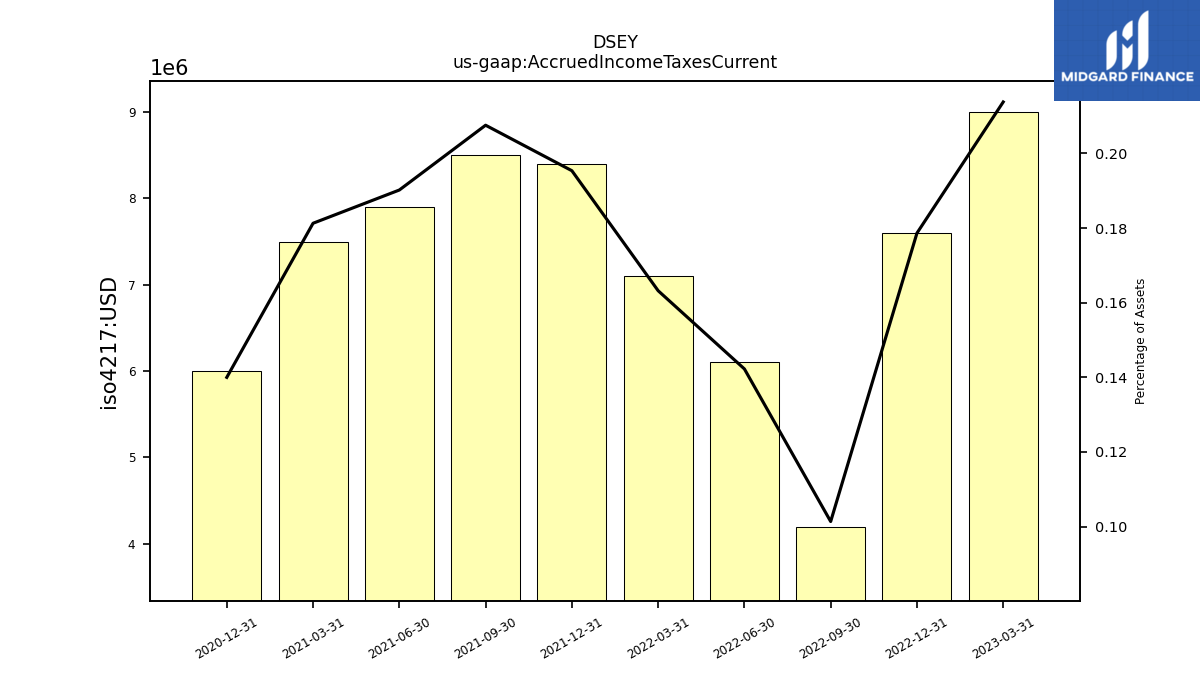
| Accrued Income Taxes Current | 9.00 | 7.60 | 4.20 | 6.10 | 7.10 | 8.40 | 8.50 | 7.90 | 7.50 | 6.00 | NA | NA | NA | |
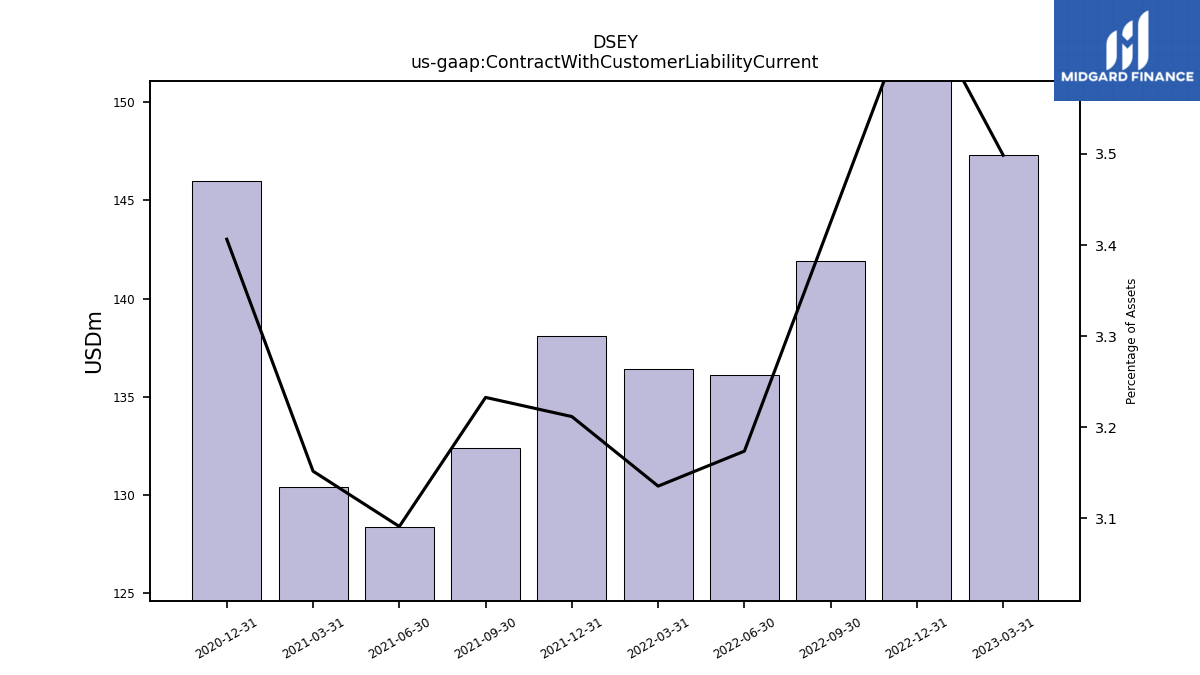
| Contract With Customer Liability Current | 147.30 | 156.40 | 141.90 | 136.10 | 136.40 | 138.10 | 132.40 | 128.40 | 130.40 | 146.00 | NA | NA | NA |
| 2023-03-31 | 2022-12-31 | 2022-09-30 | 2022-06-30 | 2022-03-31 | 2021-12-31 | 2021-09-30 | 2021-06-30 | 2021-03-31 | 2020-12-31 | 2020-09-30 | 2020-06-30 | 2020-03-31 | ||
|---|---|---|---|---|---|---|---|---|---|---|---|---|---|---|
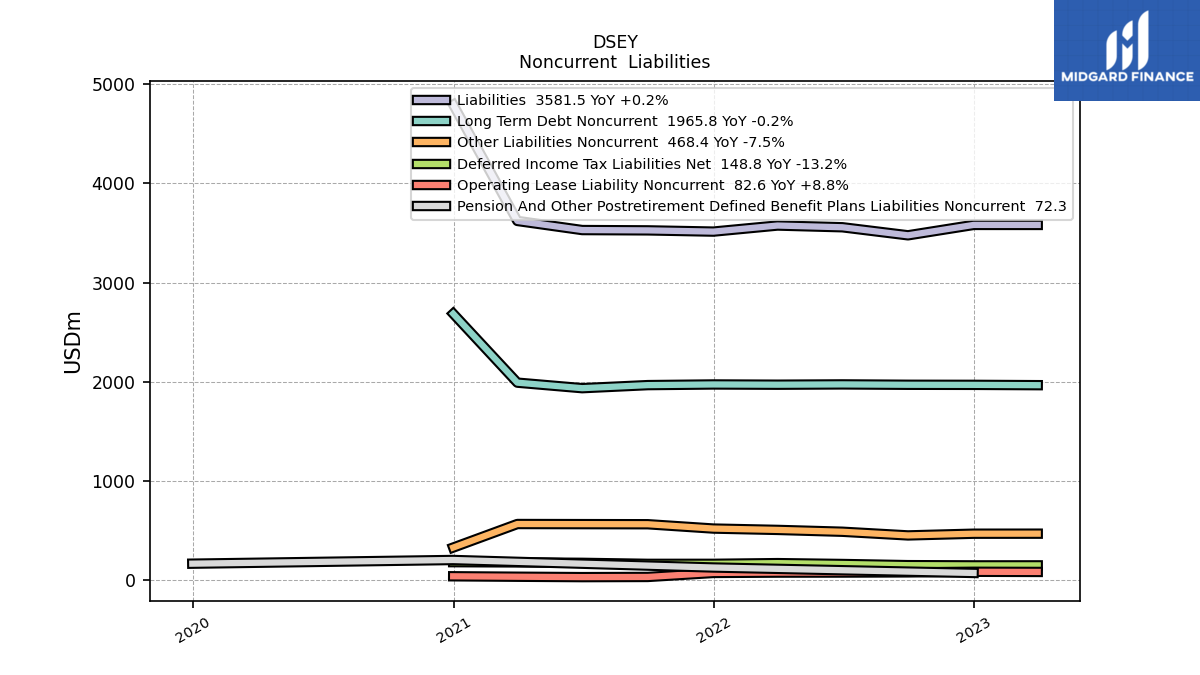
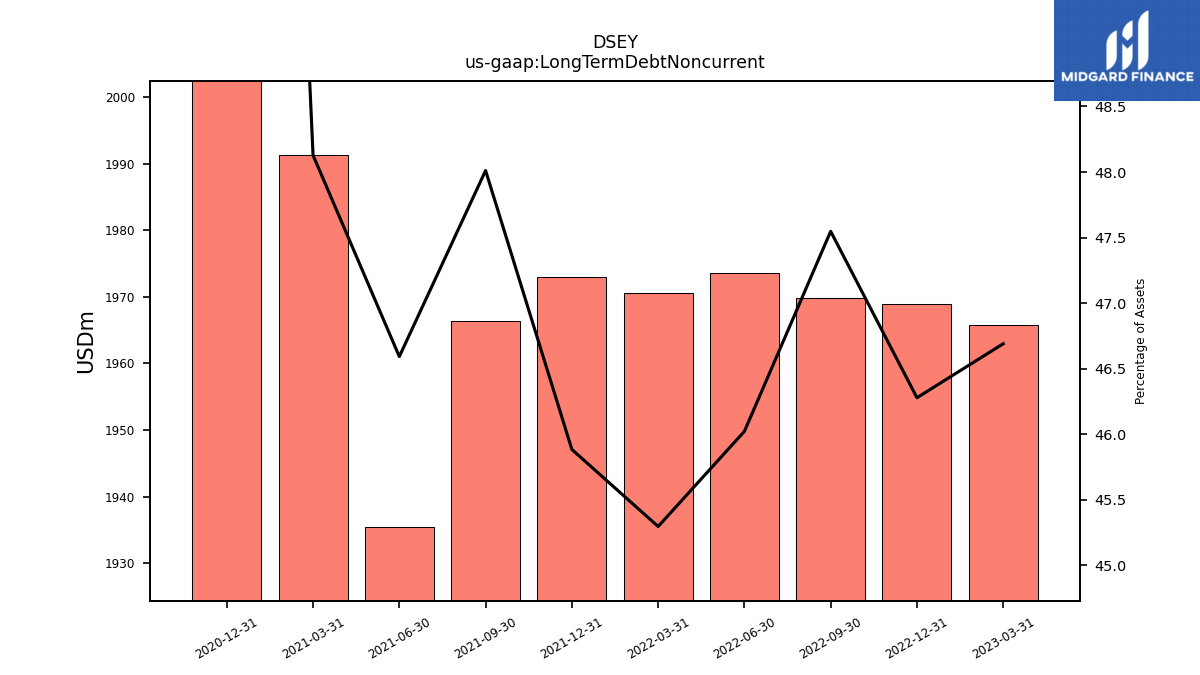
| Long Term Debt Noncurrent | 1965.80 | 1969.00 | 1969.90 | 1973.60 | 1970.60 | 1973.00 | 1966.40 | 1935.50 | 1991.30 | 2686.70 | NA | NA | NA | |
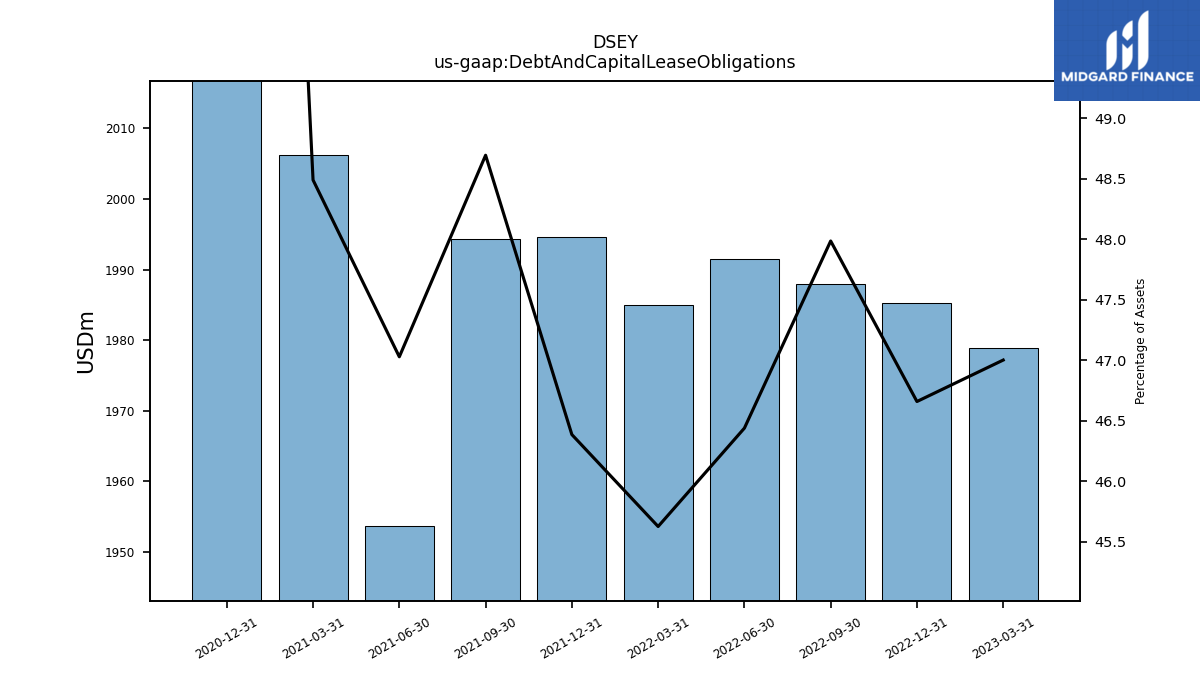
| Debt And Capital Lease Obligations | 1978.90 | 1985.20 | 1988.00 | 1991.50 | 1985.00 | 1994.60 | 1994.30 | 1953.60 | 2006.20 | 2700.30 | NA | NA | NA | |
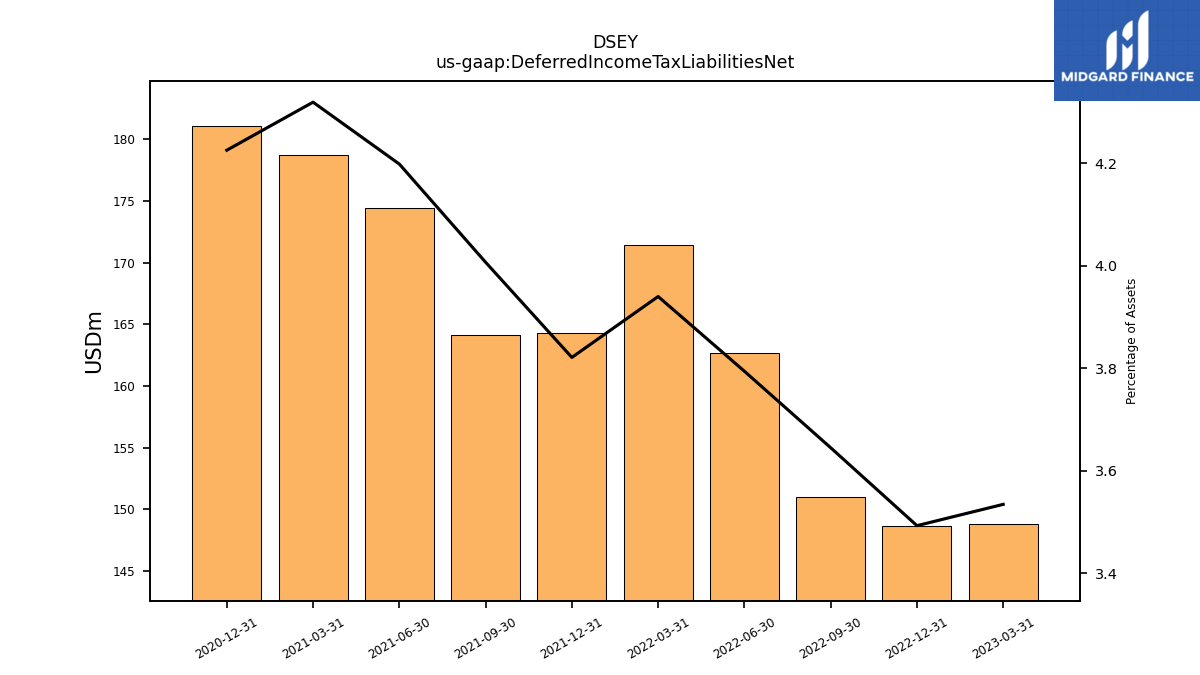
| Deferred Income Tax Liabilities Net | 148.80 | 148.60 | 151.00 | 162.70 | 171.40 | 164.30 | 164.10 | 174.40 | 178.70 | 181.10 | NA | NA | NA | |
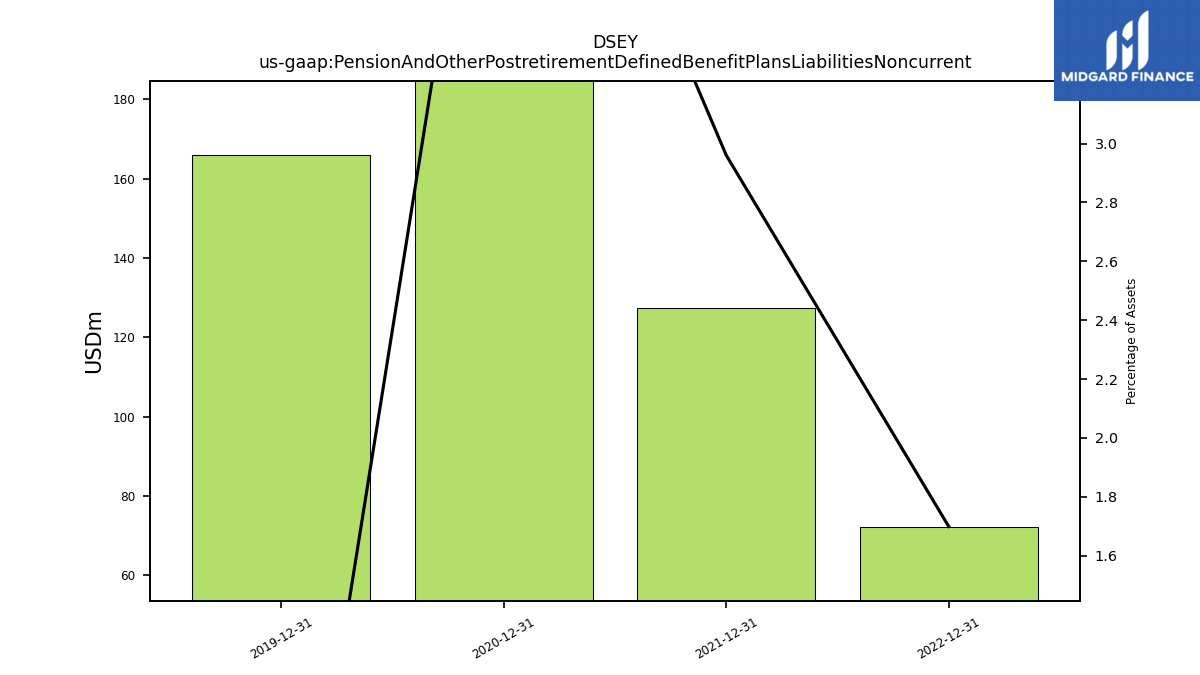
| Pension And Other Postretirement Defined Benefit Plans Liabilities Noncurrent | NA | 72.30 | NA | NA | NA | 127.30 | NA | NA | NA | 203.10 | NA | NA | NA | |
| Other Liabilities Noncurrent | 468.40 | 468.10 | 450.80 | 487.90 | 506.40 | 520.00 | 563.60 | 564.70 | 565.80 | 328.30 | NA | NA | NA | |
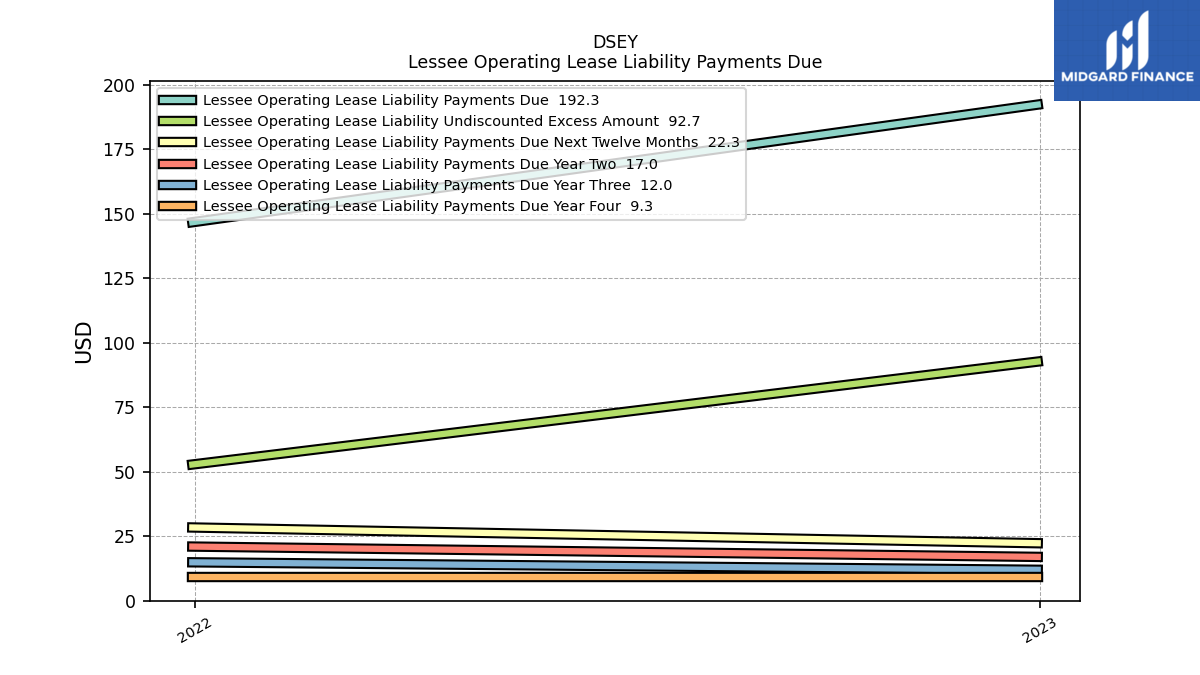
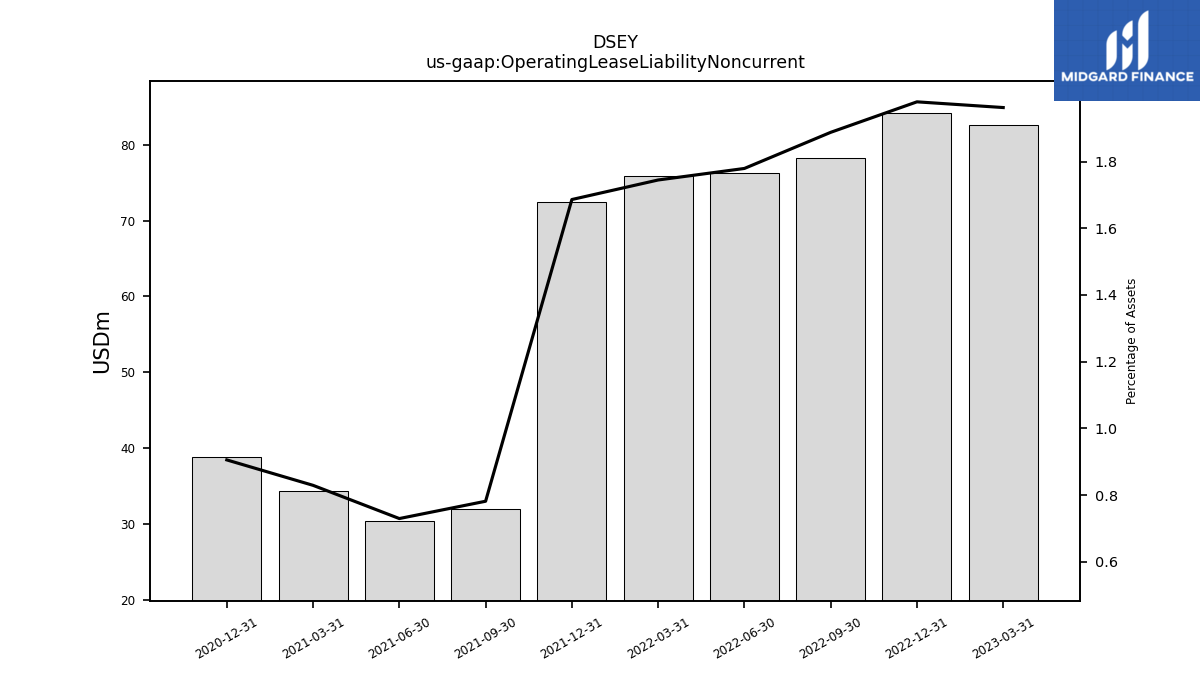
| Operating Lease Liability Noncurrent | 82.60 | 84.20 | 78.20 | 76.30 | 75.90 | 72.50 | 32.00 | 30.30 | 34.30 | 38.80 | NA | NA | NA |
| 2023-03-31 | 2022-12-31 | 2022-09-30 | 2022-06-30 | 2022-03-31 | 2021-12-31 | 2021-09-30 | 2021-06-30 | 2021-03-31 | 2020-12-31 | 2020-09-30 | 2020-06-30 | 2020-03-31 | ||
|---|---|---|---|---|---|---|---|---|---|---|---|---|---|---|
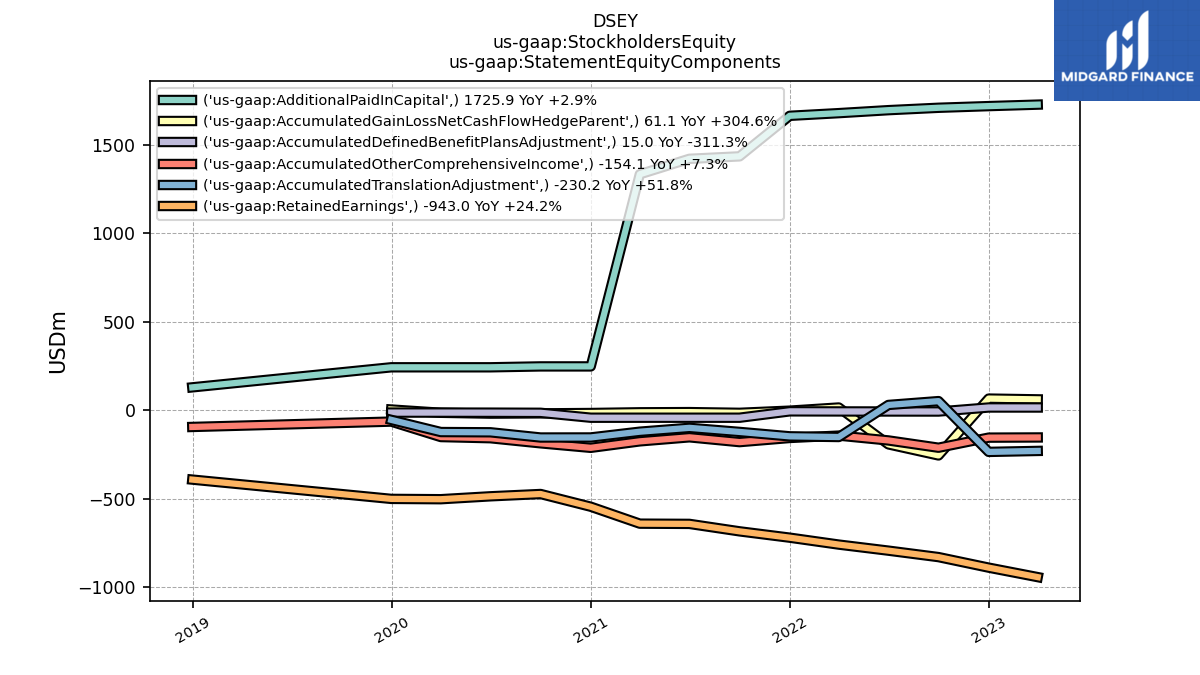
| Stockholders Equity | 628.80 | 673.00 | 666.10 | 730.30 | 775.00 | 785.60 | 568.90 | 624.20 | 515.60 | -508.60 | -411.30 | -400.50 | -410.30 | |
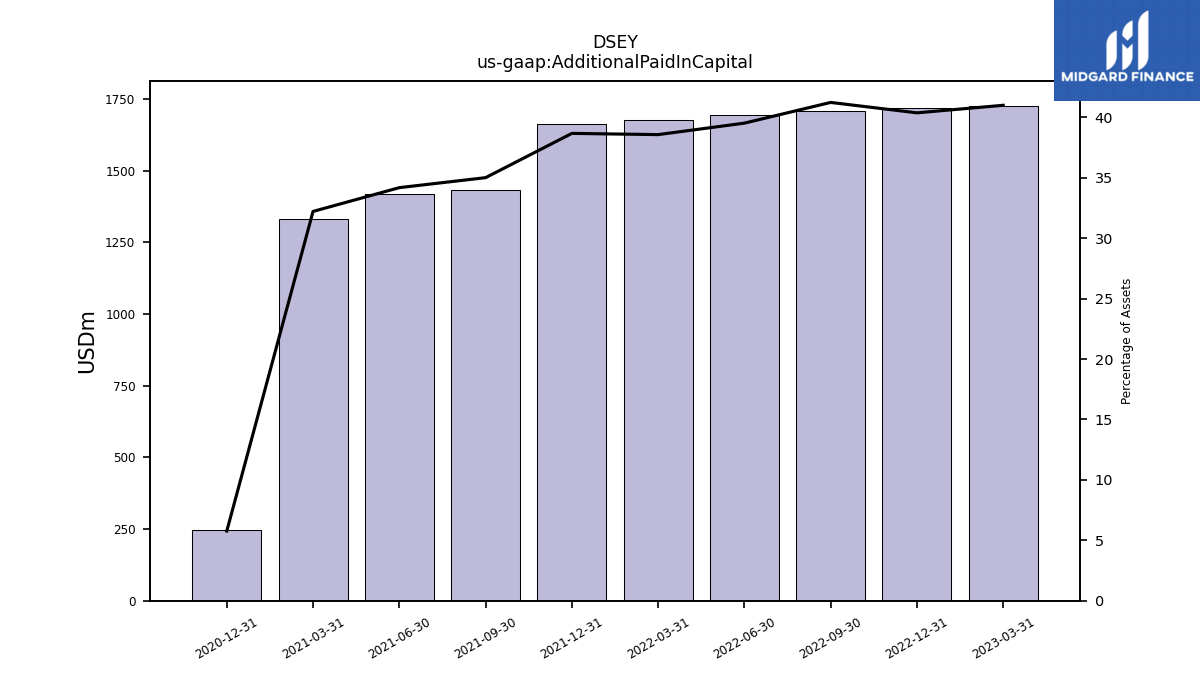
| Additional Paid In Capital | 1725.90 | 1717.50 | 1708.10 | 1694.60 | 1677.80 | 1662.70 | 1433.70 | 1419.80 | 1332.70 | 247.20 | NA | NA | NA | |
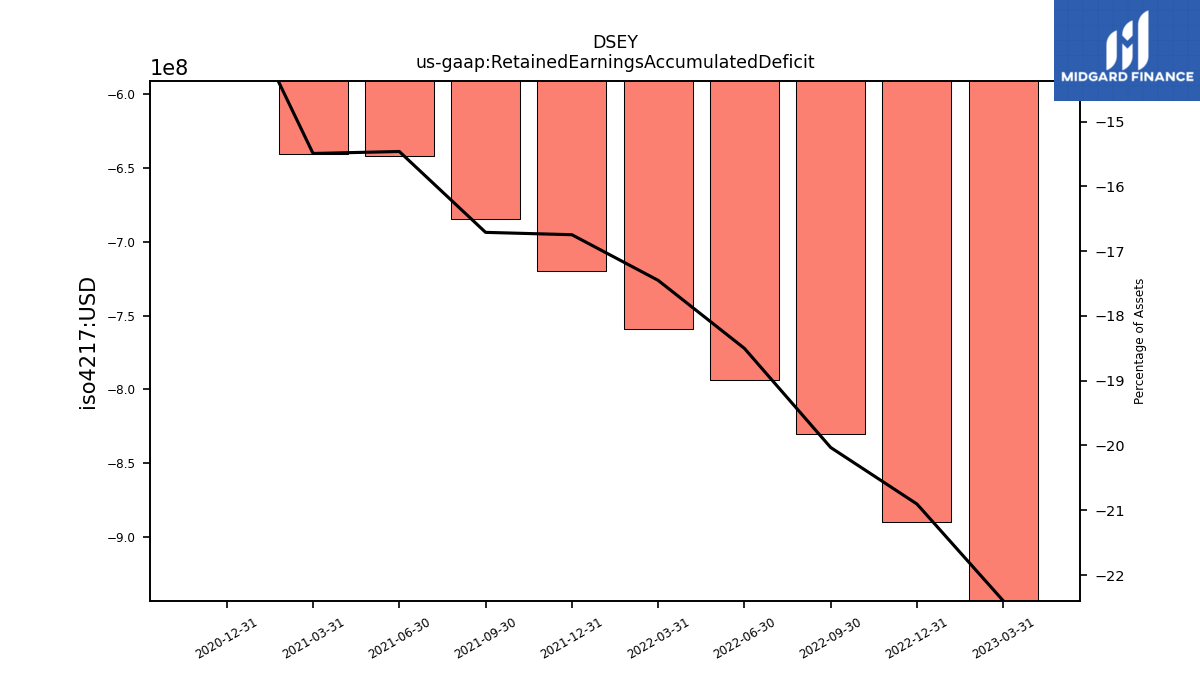
| Retained Earnings Accumulated Deficit | -943.00 | -889.40 | -829.90 | -793.40 | -759.20 | -720.10 | -684.40 | -642.30 | -641.00 | -545.30 | NA | NA | NA | |
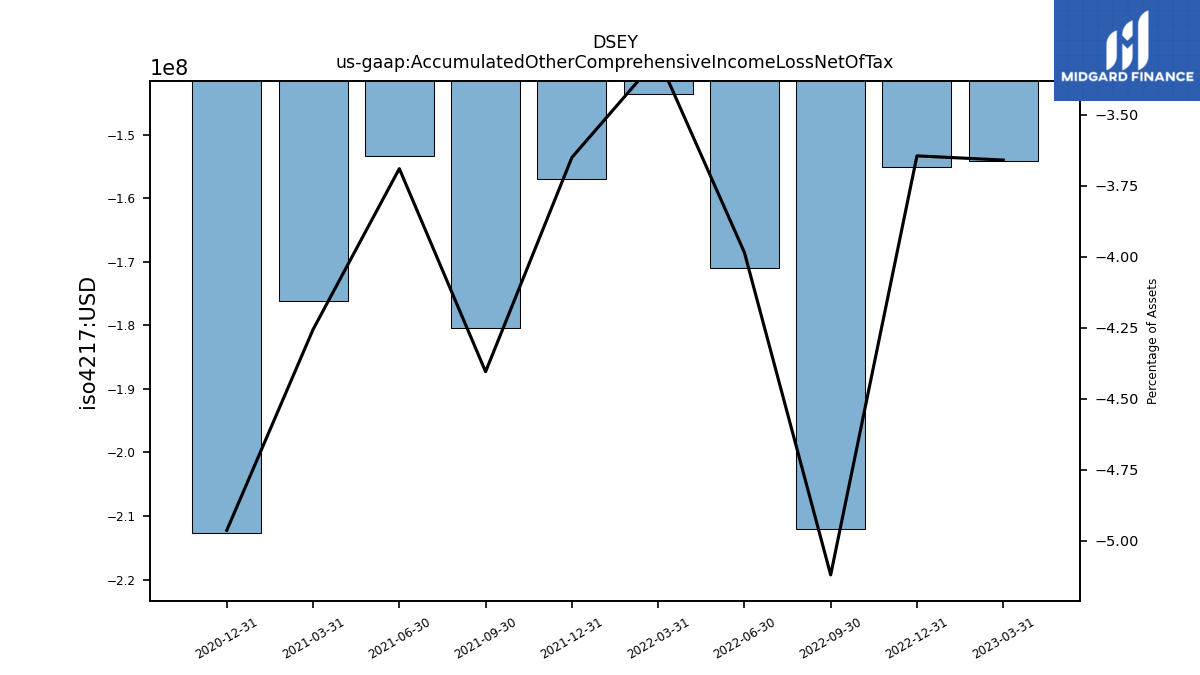
| Accumulated Other Comprehensive Income Loss Net Of Tax | -154.10 | -155.10 | -212.10 | -170.90 | -143.60 | -157.00 | -180.40 | -153.30 | -176.10 | -212.70 | NA | NA | NA | |
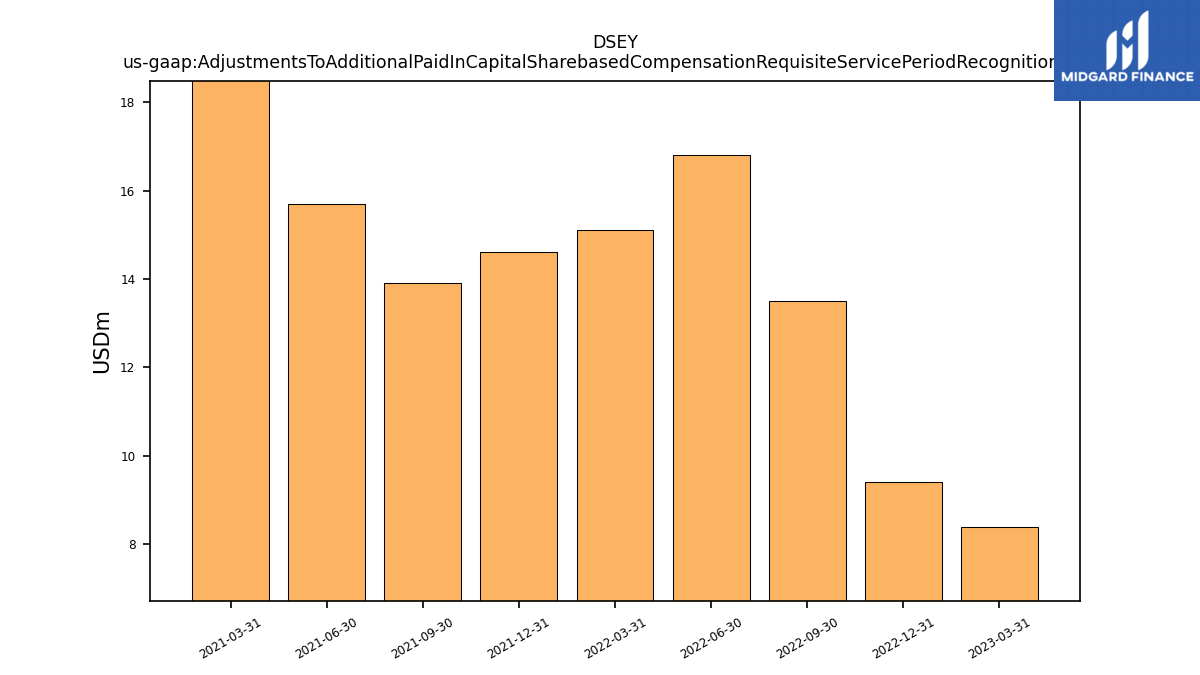
| Adjustments To Additional Paid In Capital Sharebased Compensation Requisite Service Period Recognition Value | 8.40 | 9.40 | 13.50 | 16.80 | 15.10 | 14.60 | 13.90 | 15.70 | 37.50 | NA | NA | NA | NA |
| 2023-03-31 | 2022-12-31 | 2022-09-30 | 2022-06-30 | 2022-03-31 | 2021-12-31 | 2021-09-30 | 2021-06-30 | 2021-03-31 | 2020-12-31 | 2020-09-30 | 2020-06-30 | 2020-03-31 | ||
|---|---|---|---|---|---|---|---|---|---|---|---|---|---|---|
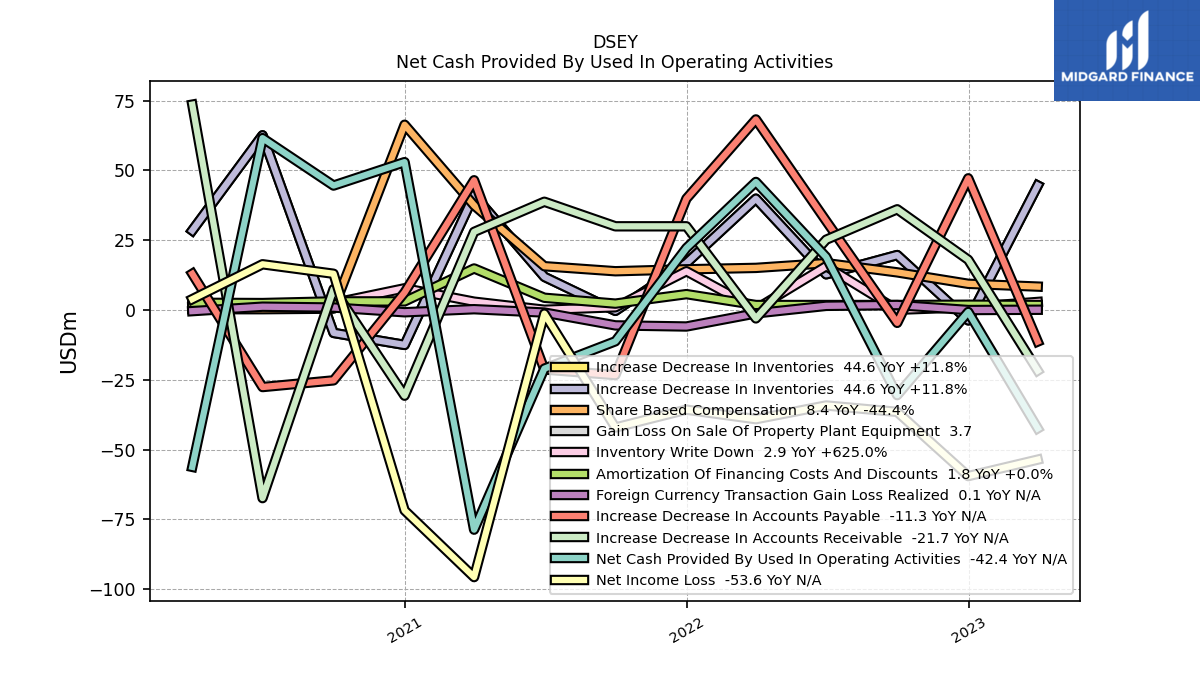
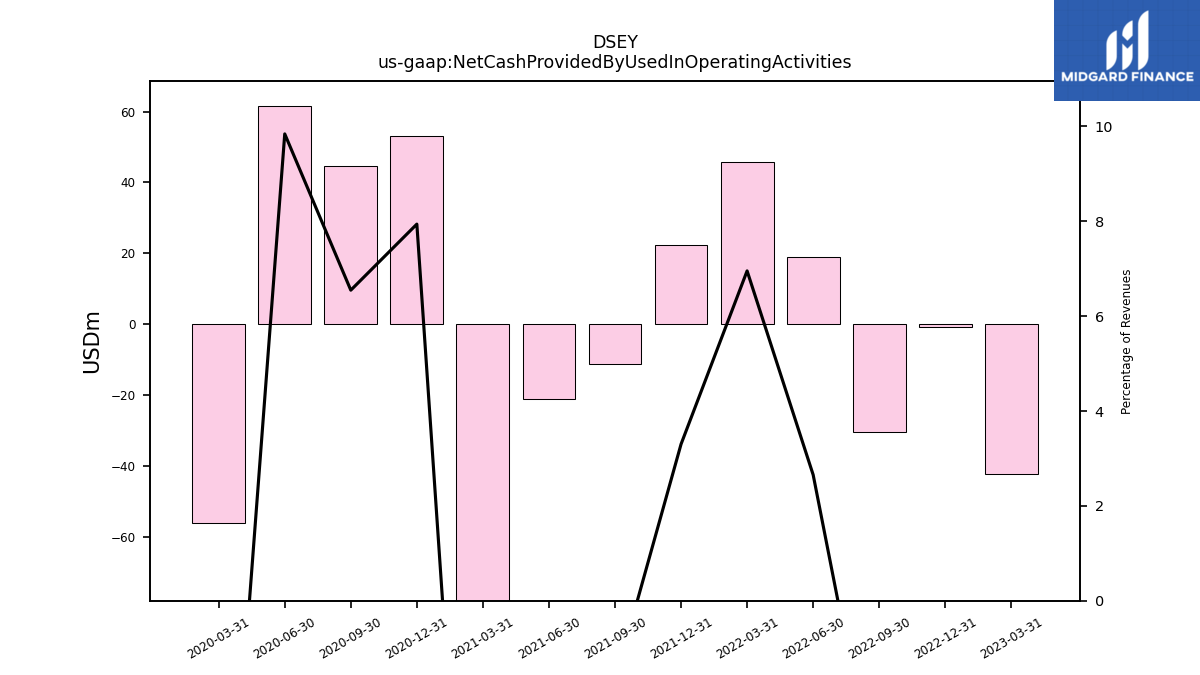
| Net Cash Provided By Used In Operating Activities | -42.40 | -0.70 | -30.50 | 19.00 | 45.90 | 22.20 | -11.20 | -21.00 | -78.70 | 53.00 | 44.60 | 61.60 | -56.20 | |
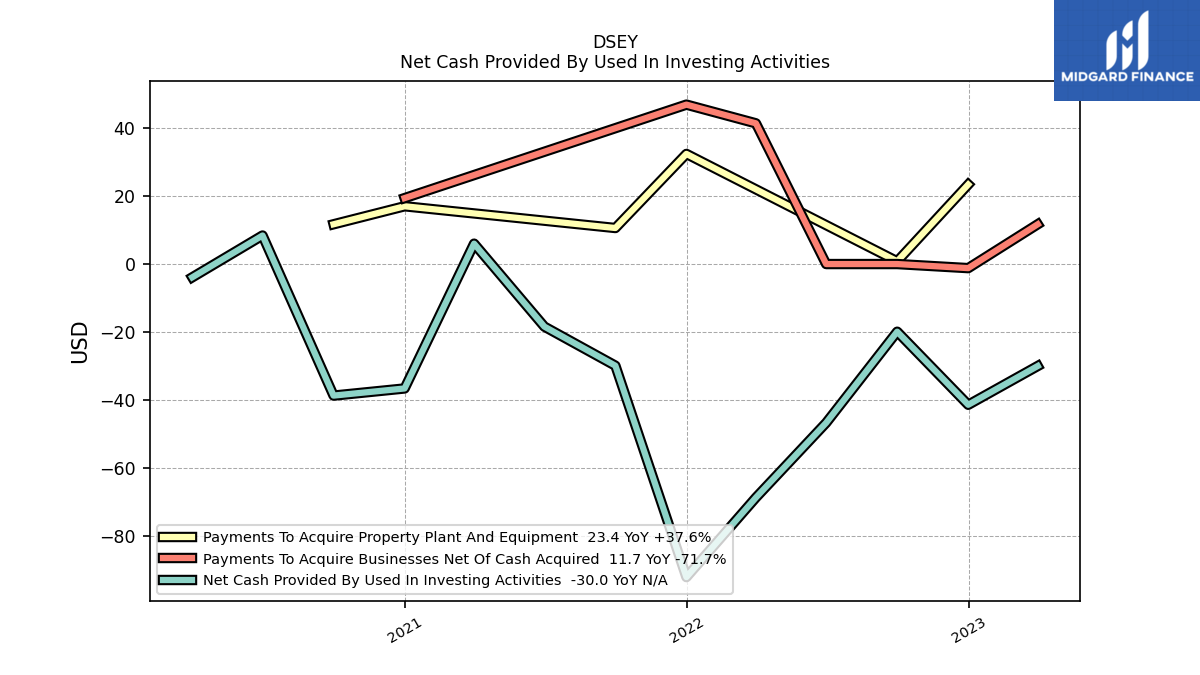
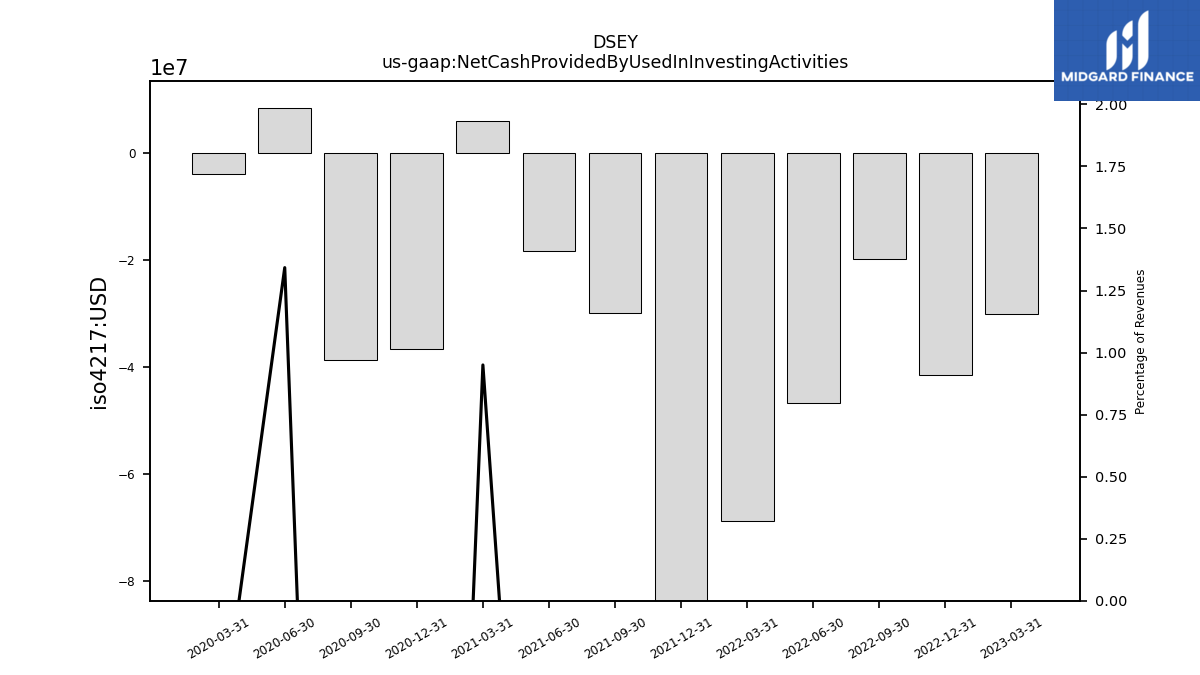
| Net Cash Provided By Used In Investing Activities | -30.00 | -41.40 | -19.90 | -46.70 | -68.70 | -92.10 | -29.90 | -18.40 | 6.00 | -36.60 | -38.70 | 8.40 | -3.90 | |
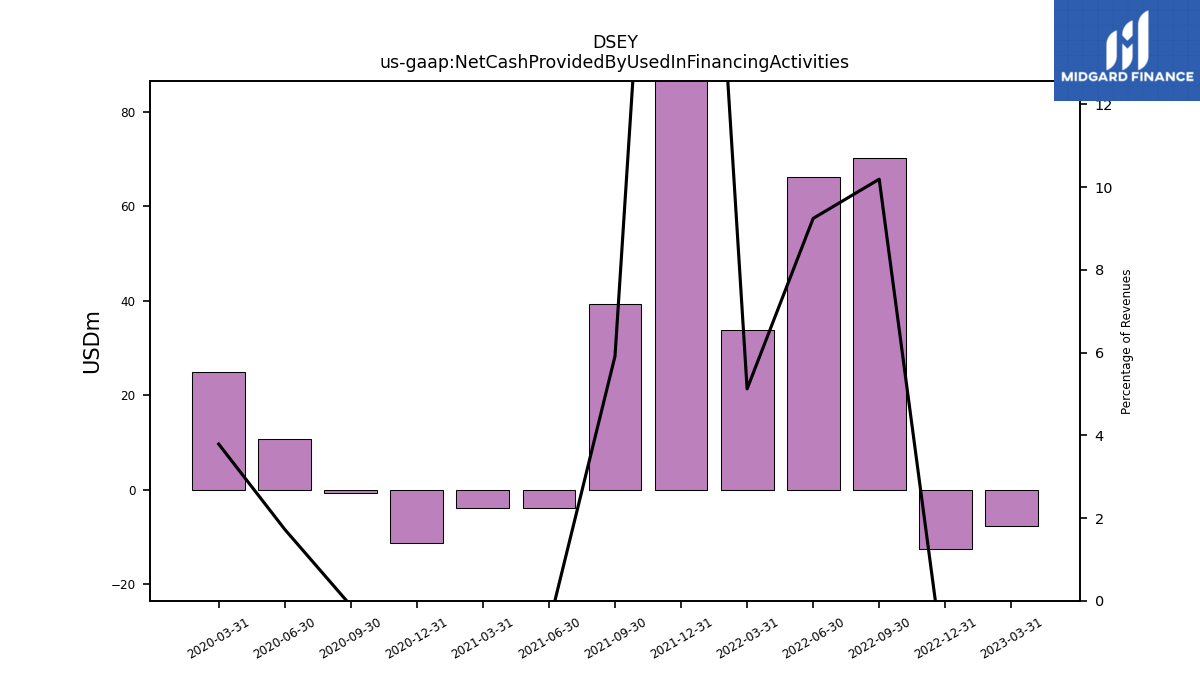
| Net Cash Provided By Used In Financing Activities | -7.70 | -12.60 | 70.20 | 66.10 | 33.80 | 205.60 | 39.30 | -3.80 | -3.90 | -11.20 | -0.80 | 10.80 | 24.80 |
| 2023-03-31 | 2022-12-31 | 2022-09-30 | 2022-06-30 | 2022-03-31 | 2021-12-31 | 2021-09-30 | 2021-06-30 | 2021-03-31 | 2020-12-31 | 2020-09-30 | 2020-06-30 | 2020-03-31 | ||
|---|---|---|---|---|---|---|---|---|---|---|---|---|---|---|
| Net Cash Provided By Used In Operating Activities | -42.40 | -0.70 | -30.50 | 19.00 | 45.90 | 22.20 | -11.20 | -21.00 | -78.70 | 53.00 | 44.60 | 61.60 | -56.20 | |
| Net Income Loss | -53.60 | -59.50 | -36.50 | -34.20 | -39.10 | -35.70 | -42.10 | -1.30 | -95.70 | -71.80 | 13.00 | 16.40 | 3.90 | |
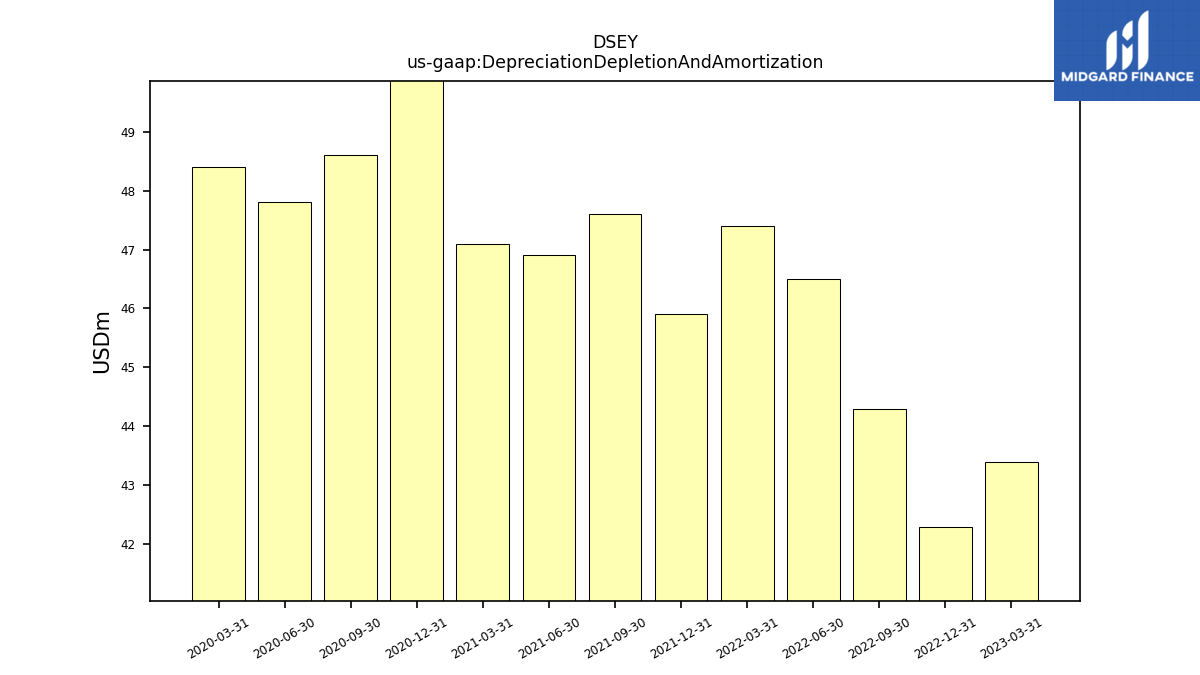
| Depreciation Depletion And Amortization | 43.40 | 42.30 | 44.30 | 46.50 | 47.40 | 45.90 | 47.60 | 46.90 | 47.10 | 50.80 | 48.60 | 47.80 | 48.40 | |
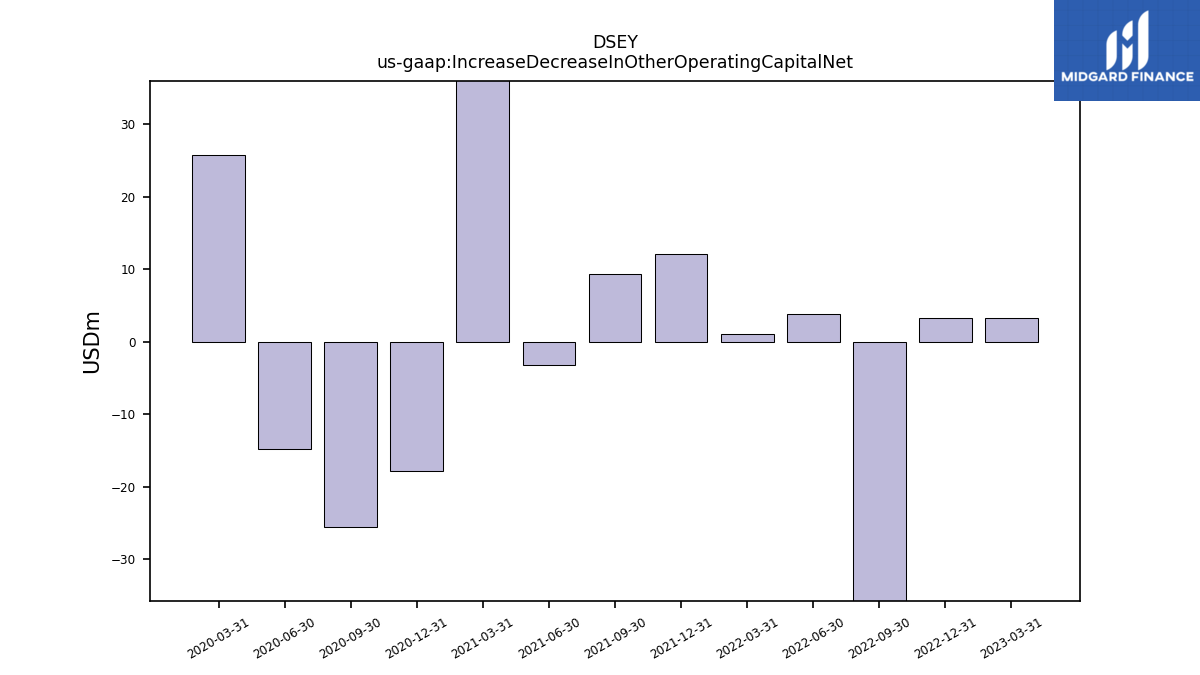
| Increase Decrease In Other Operating Capital Net | 3.30 | 3.20 | -44.80 | 3.80 | 1.00 | 12.10 | 9.30 | -3.20 | 54.40 | -17.90 | -25.50 | -14.80 | 25.70 | |
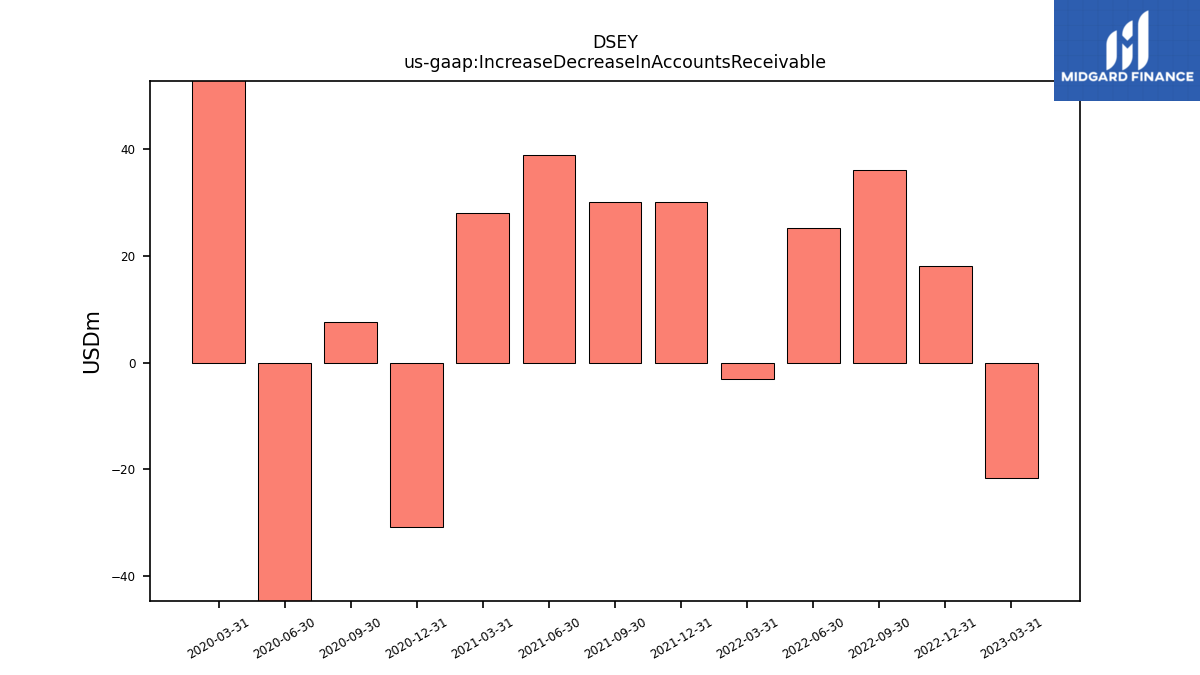
| Increase Decrease In Accounts Receivable | -21.70 | 18.00 | 36.10 | 25.20 | -3.00 | 30.00 | 30.00 | 38.80 | 28.00 | -30.70 | 7.50 | -67.40 | 73.60 | |
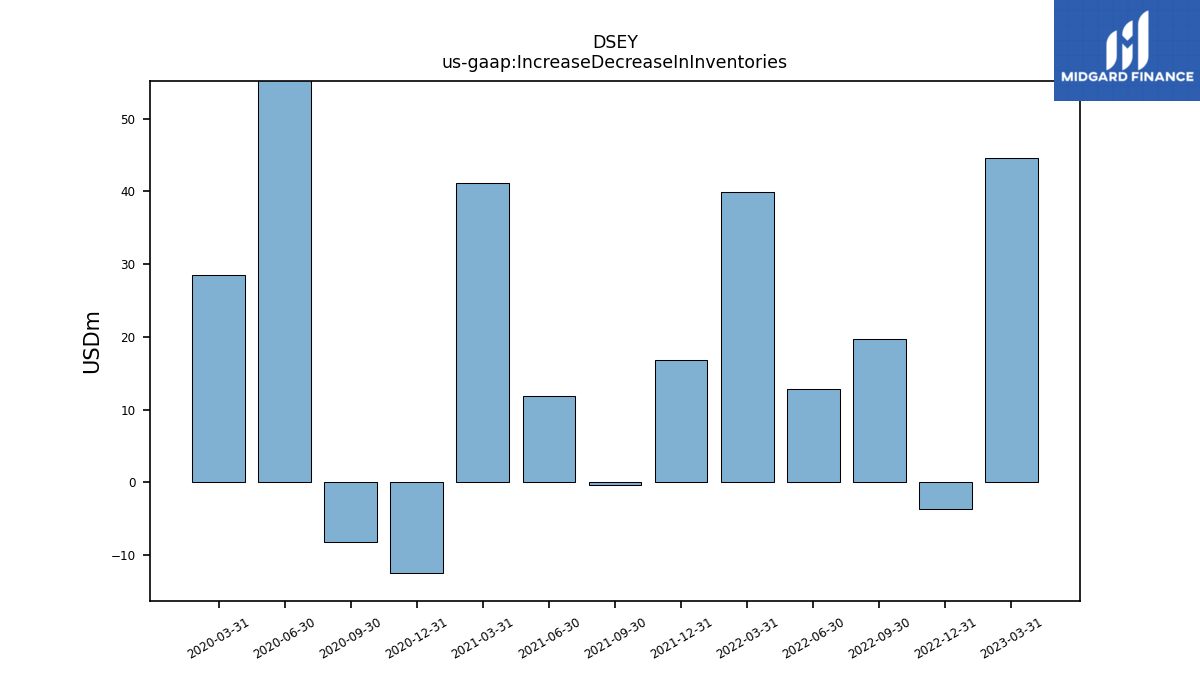
| Increase Decrease In Inventories | 44.60 | -3.70 | 19.70 | 12.80 | 39.90 | 16.80 | -0.30 | 11.90 | 41.20 | -12.50 | -8.20 | 62.60 | 28.50 | |
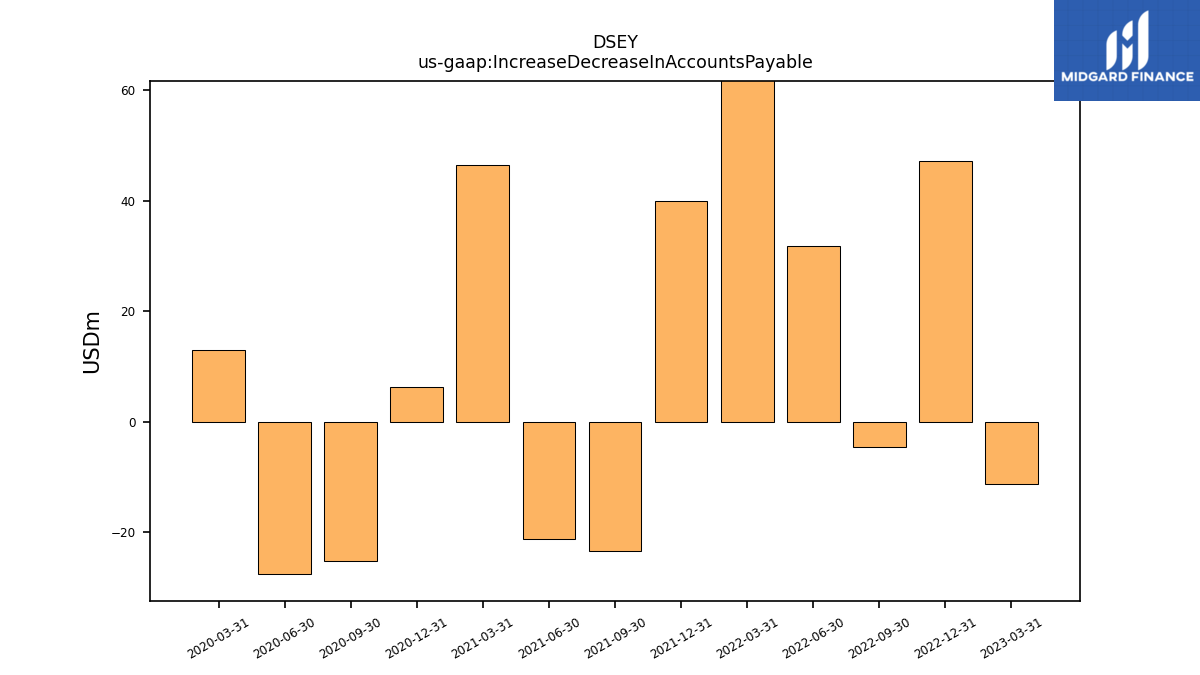
| Increase Decrease In Accounts Payable | -11.30 | 47.20 | -4.60 | 31.90 | 68.30 | 39.90 | -23.30 | -21.30 | 46.50 | 6.30 | -25.20 | -27.60 | 13.00 | |
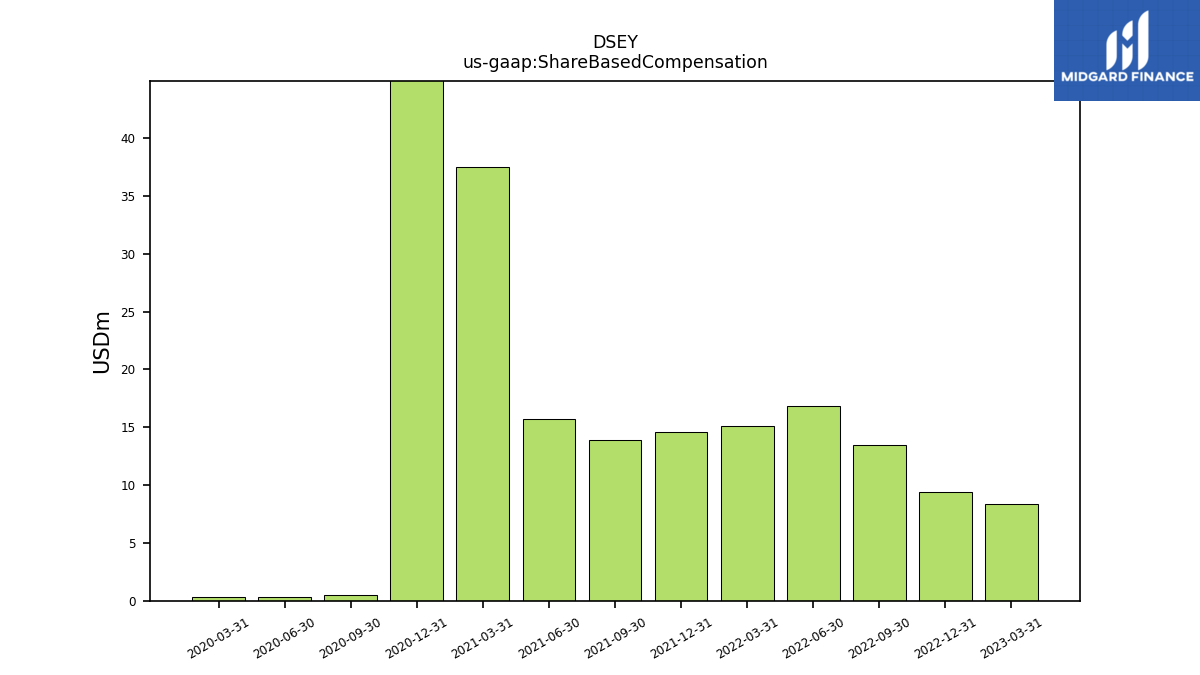
| Share Based Compensation | 8.40 | 9.40 | 13.50 | 16.80 | 15.10 | 14.60 | 13.90 | 15.70 | 37.50 | 66.40 | 0.50 | 0.30 | 0.30 |
| 2023-03-31 | 2022-12-31 | 2022-09-30 | 2022-06-30 | 2022-03-31 | 2021-12-31 | 2021-09-30 | 2021-06-30 | 2021-03-31 | 2020-12-31 | 2020-09-30 | 2020-06-30 | 2020-03-31 | ||
|---|---|---|---|---|---|---|---|---|---|---|---|---|---|---|
| Net Cash Provided By Used In Investing Activities | -30.00 | -41.40 | -19.90 | -46.70 | -68.70 | -92.10 | -29.90 | -18.40 | 6.00 | -36.60 | -38.70 | 8.40 | -3.90 | |
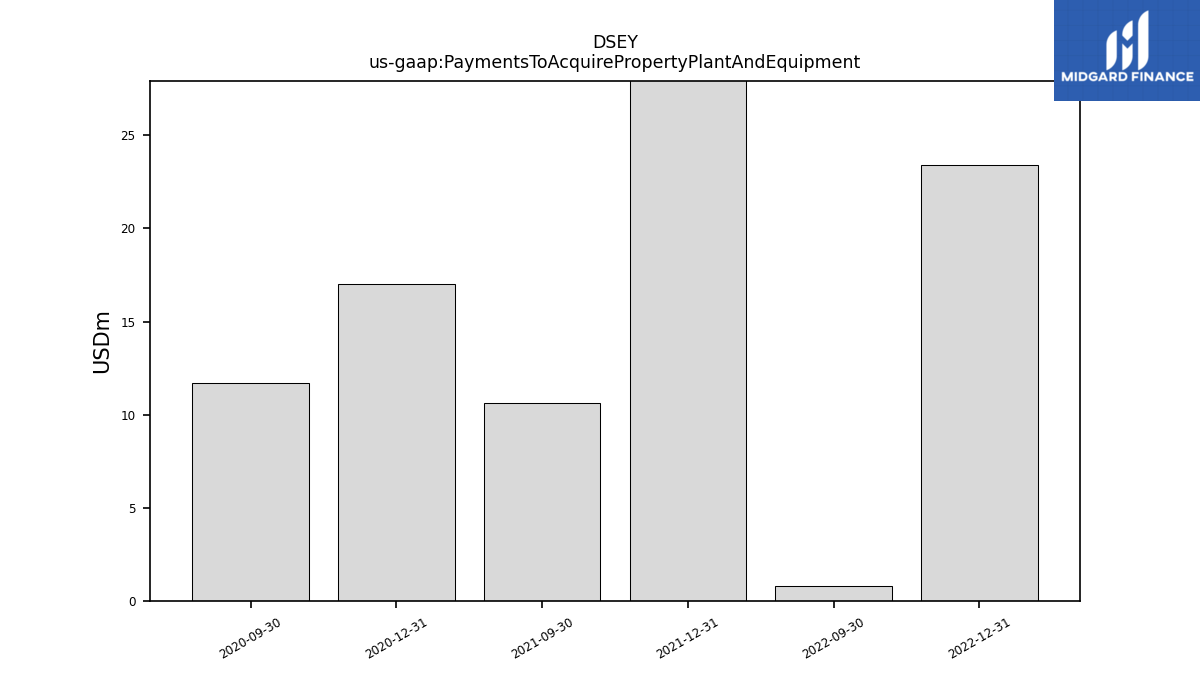
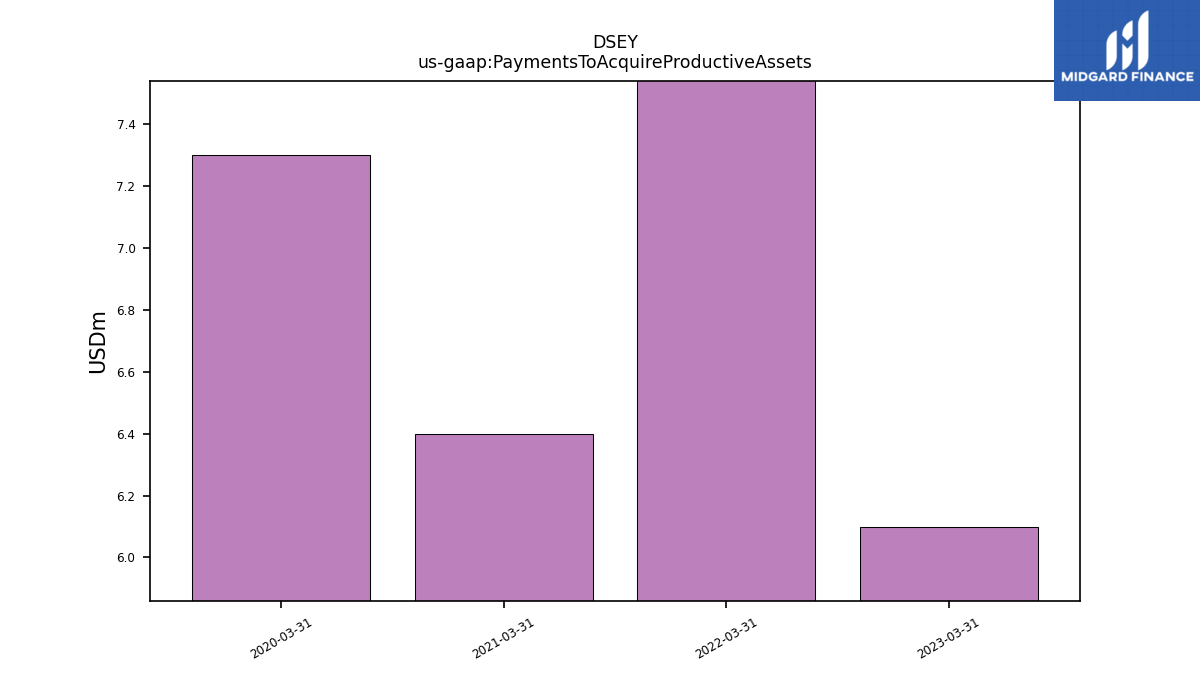
| Payments To Acquire Property Plant And Equipment | NA | 23.40 | 0.80 | NA | NA | 32.40 | 10.60 | NA | NA | 17.00 | 11.70 | NA | NA | |
| Payments To Acquire Productive Assets | 6.10 | NA | NA | NA | 10.00 | NA | NA | NA | 6.40 | NA | NA | NA | 7.30 |
| 2023-03-31 | 2022-12-31 | 2022-09-30 | 2022-06-30 | 2022-03-31 | 2021-12-31 | 2021-09-30 | 2021-06-30 | 2021-03-31 | 2020-12-31 | 2020-09-30 | 2020-06-30 | 2020-03-31 | ||
|---|---|---|---|---|---|---|---|---|---|---|---|---|---|---|
| Net Cash Provided By Used In Financing Activities | -7.70 | -12.60 | 70.20 | 66.10 | 33.80 | 205.60 | 39.30 | -3.80 | -3.90 | -11.20 | -0.80 | 10.80 | 24.80 |
| 2023-03-31 | 2022-12-31 | 2022-09-30 | 2022-06-30 | 2022-03-31 | 2021-12-31 | 2021-09-30 | 2021-06-30 | 2021-03-31 | 2020-12-31 | 2020-09-30 | 2020-06-30 | 2020-03-31 | ||
|---|---|---|---|---|---|---|---|---|---|---|---|---|---|---|
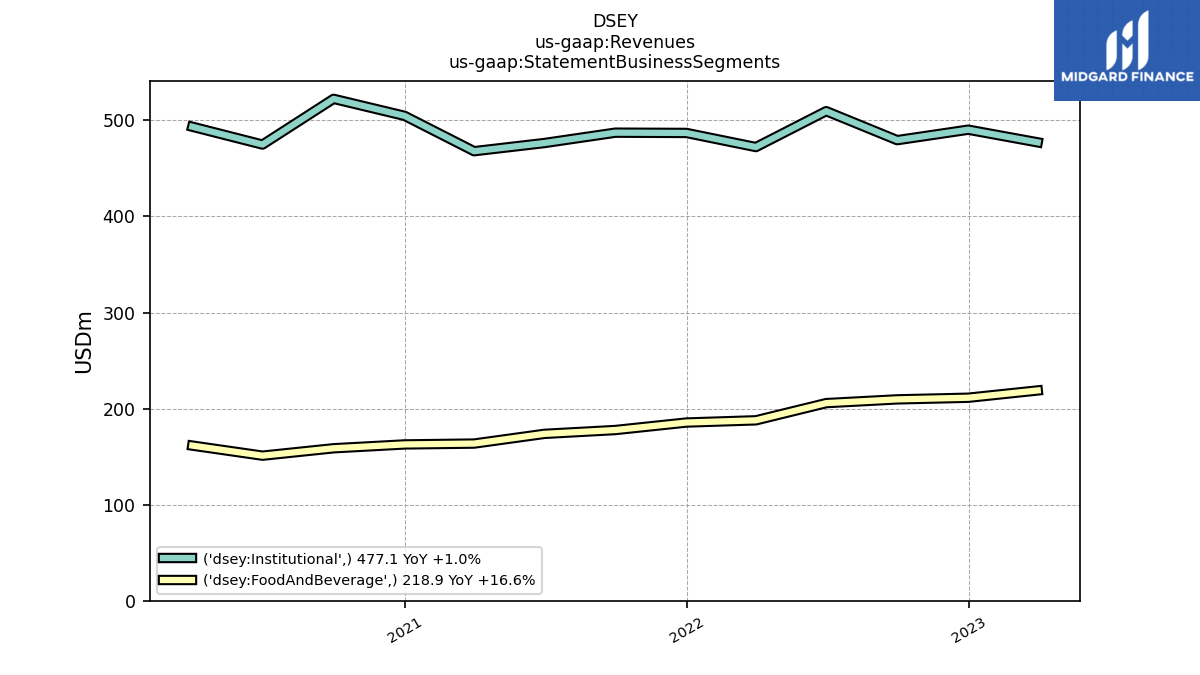
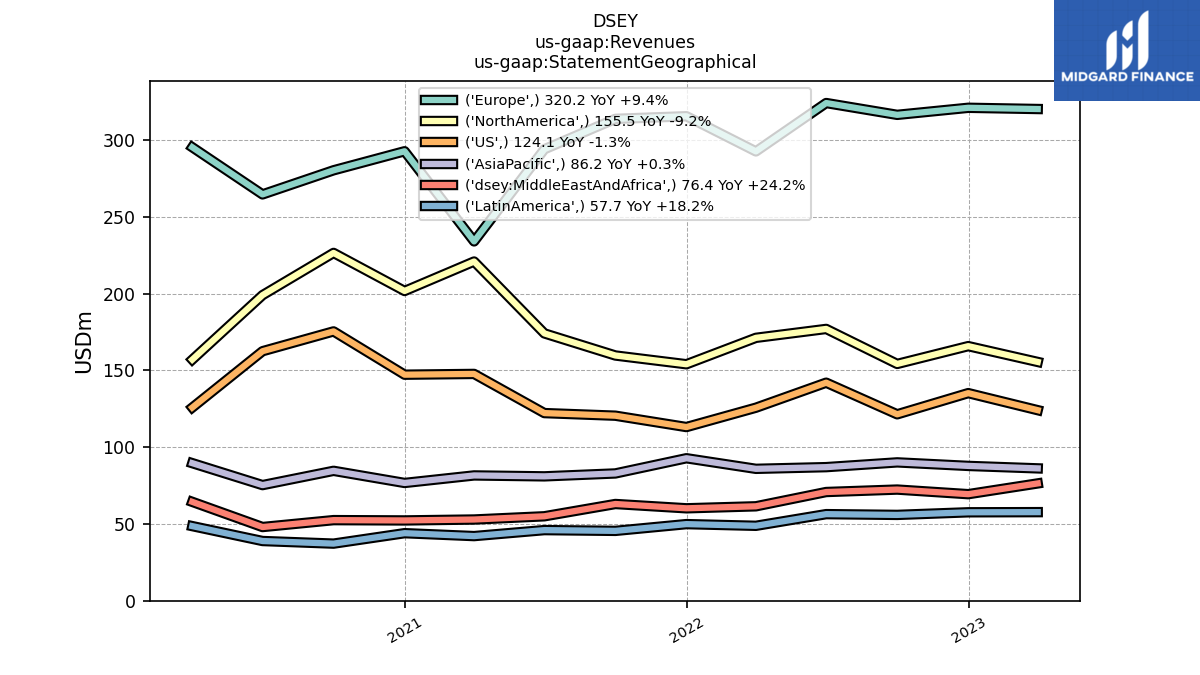
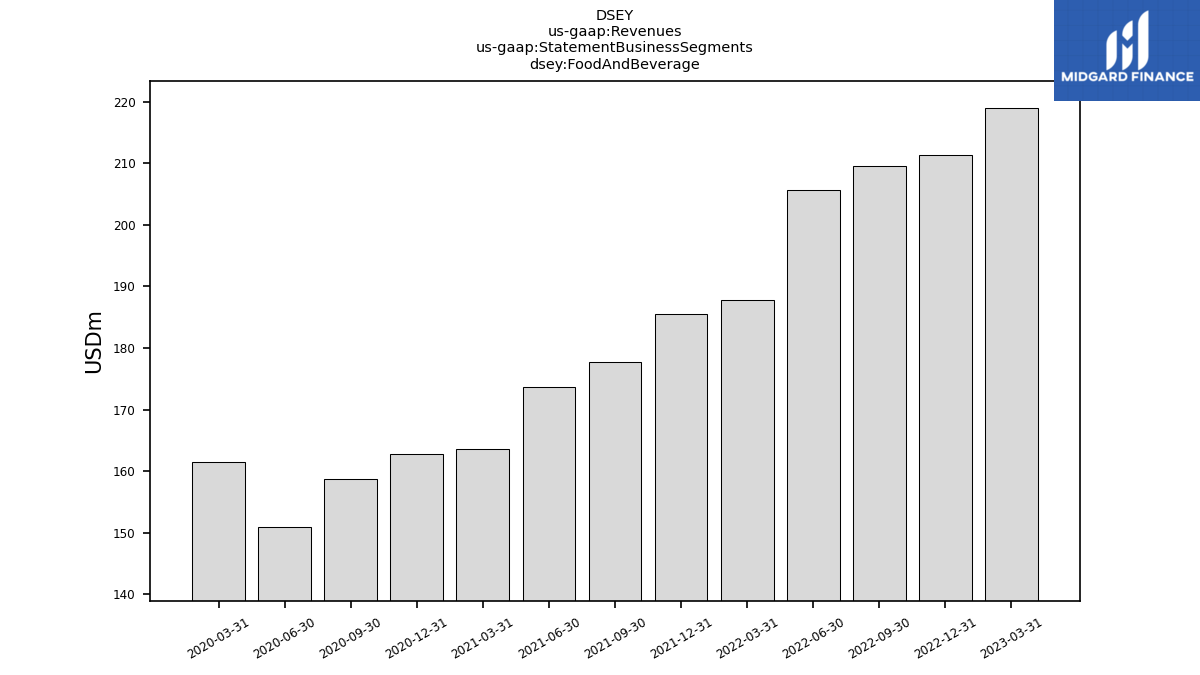
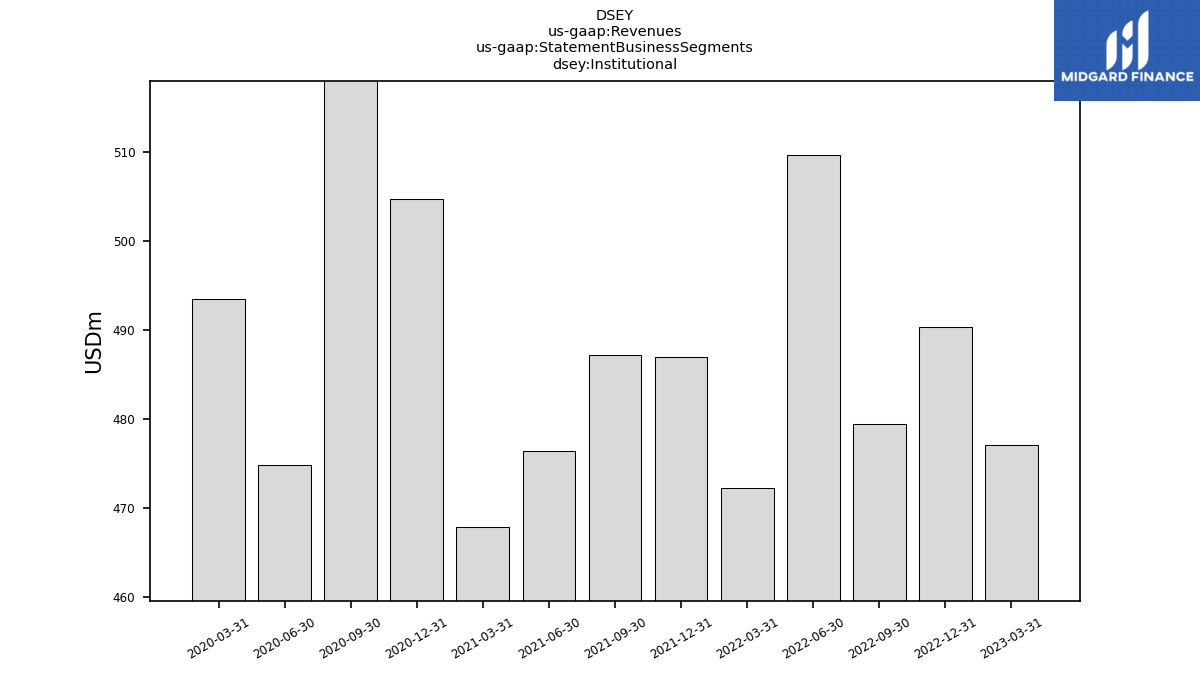
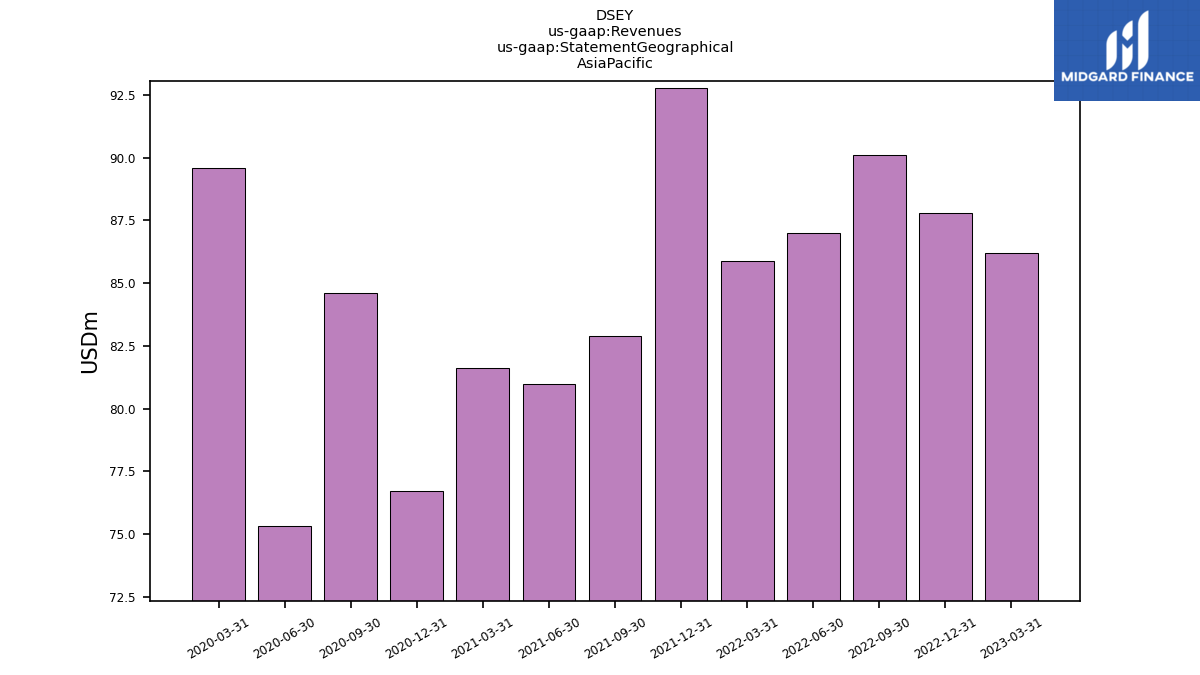
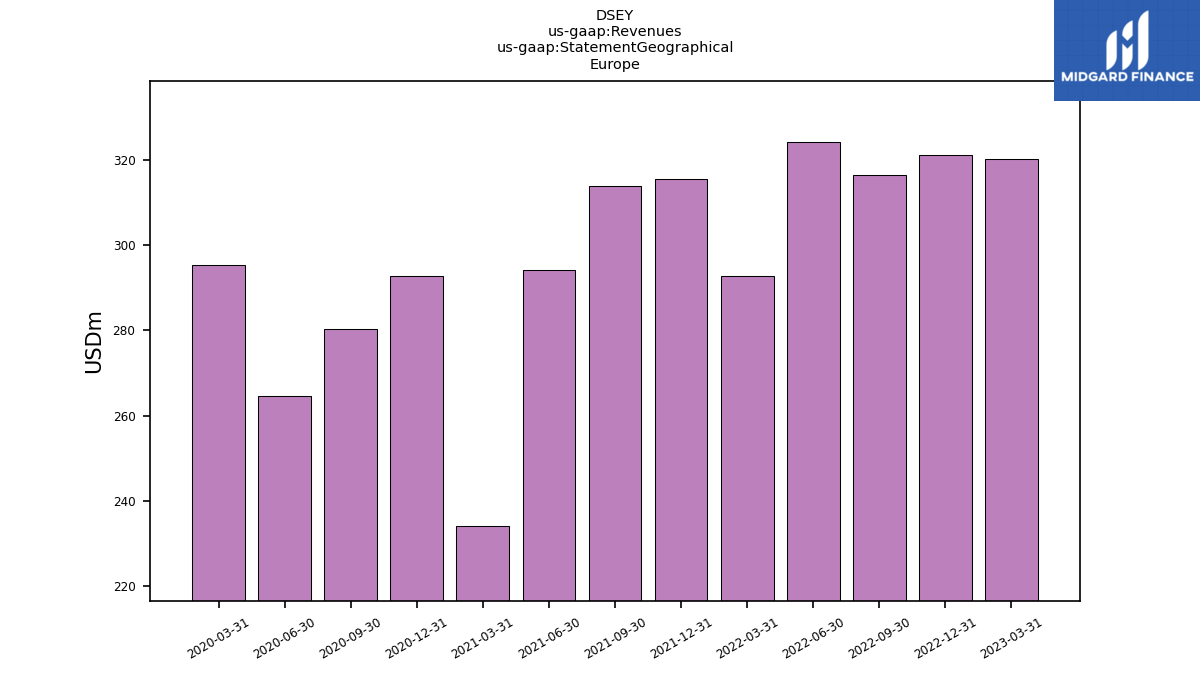
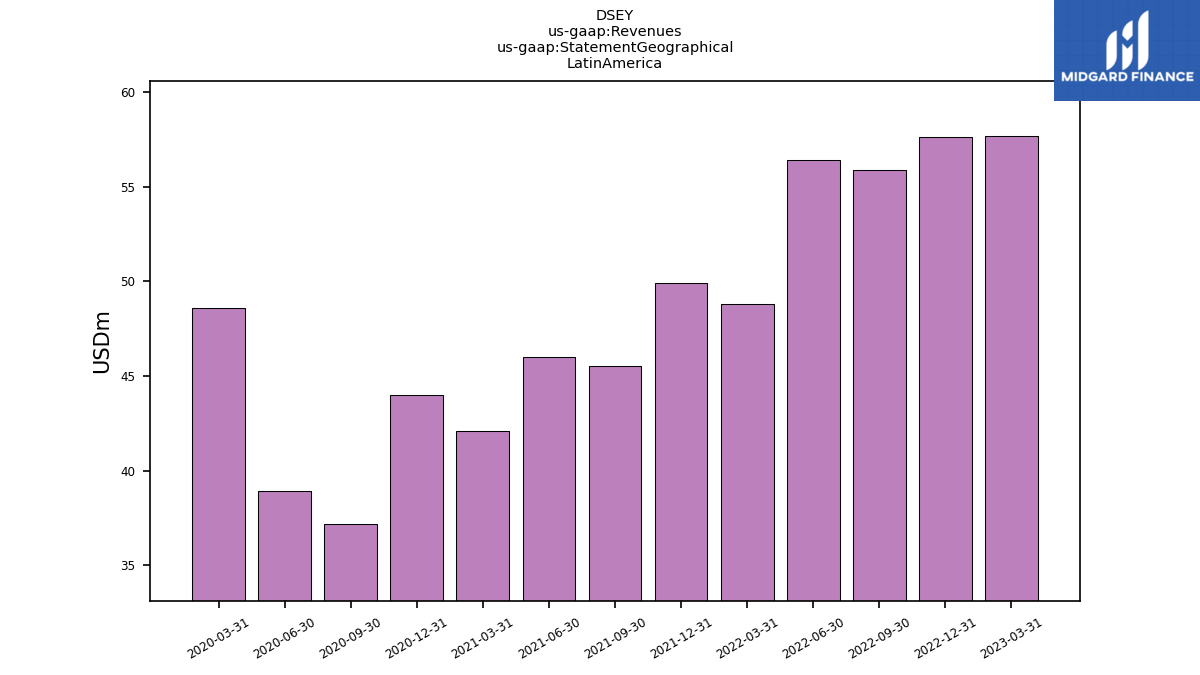
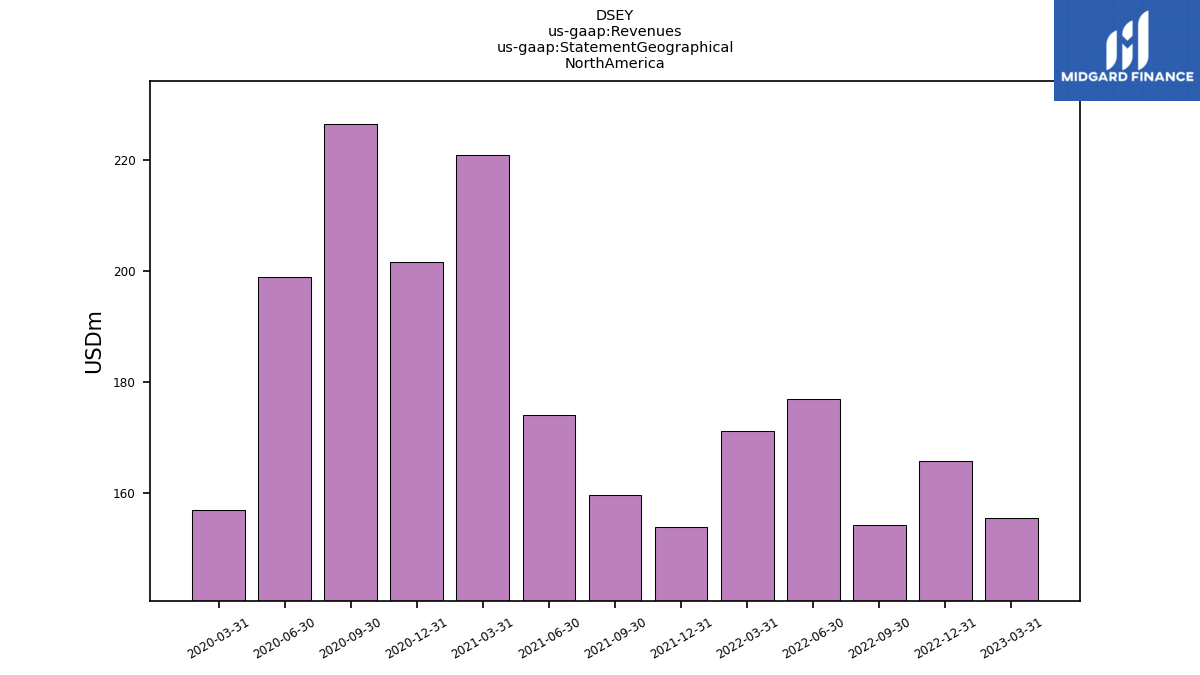
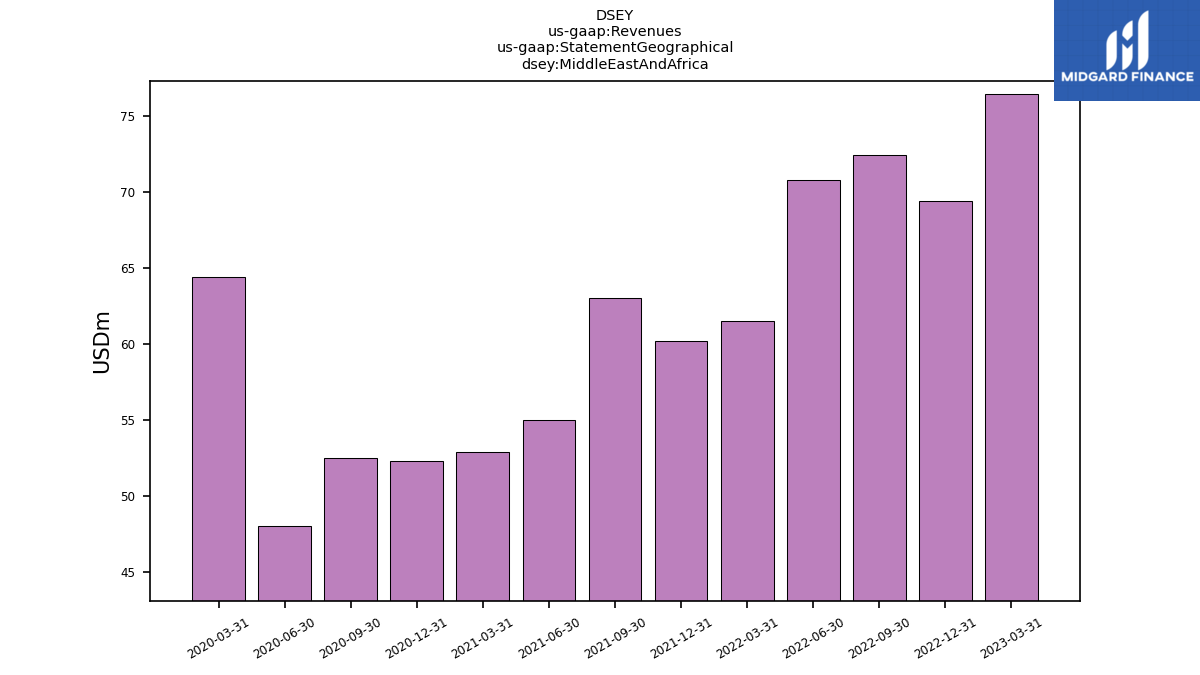
| Revenues | 696.00 | 701.60 | 689.00 | 715.30 | 660.00 | 672.40 | 664.90 | 650.10 | 631.50 | 667.40 | 681.10 | 625.80 | 654.90 | |
| Food And Beverage | 218.90 | 211.30 | 209.60 | 205.70 | 187.80 | 185.50 | 177.70 | 173.70 | 163.60 | 162.70 | 158.70 | 151.00 | 161.50 | |
| Institutional | 477.10 | 490.30 | 479.40 | 509.60 | 472.20 | 486.90 | 487.20 | 476.40 | 467.90 | 504.70 | 522.40 | 474.80 | 493.40 | |
| 86.20 | 87.80 | 90.10 | 87.00 | 85.90 | 92.80 | 82.90 | 81.00 | 81.60 | 76.70 | 84.60 | 75.30 | 89.60 | ||
| 320.20 | 321.00 | 316.40 | 324.10 | 292.60 | 315.50 | 313.80 | 294.00 | 234.00 | 292.70 | 280.30 | 264.60 | 295.30 | ||
| 57.70 | 57.60 | 55.90 | 56.40 | 48.80 | 49.90 | 45.50 | 46.00 | 42.10 | 44.00 | 37.20 | 38.90 | 48.60 | ||
| 155.50 | 165.80 | 154.20 | 177.00 | 171.20 | 154.00 | 159.70 | 174.10 | 220.90 | 201.70 | 226.50 | 199.00 | 157.00 | ||
| US | 124.10 | 135.20 | 121.40 | 142.00 | 125.70 | 113.10 | 120.50 | 122.20 | 147.70 | 147.20 | 175.40 | 162.50 | 125.80 | |
| Middle East And Africa | 76.40 | 69.40 | 72.40 | 70.80 | 61.50 | 60.20 | 63.00 | 55.00 | 52.90 | 52.30 | 52.50 | 48.00 | 64.40 | |
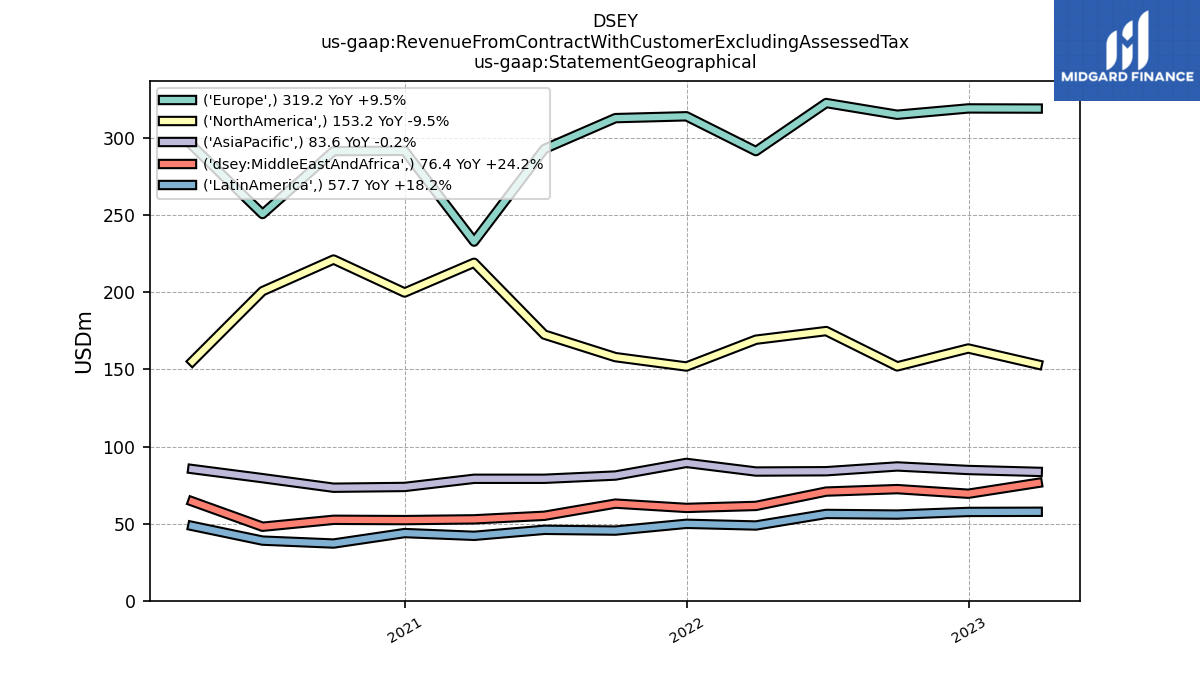
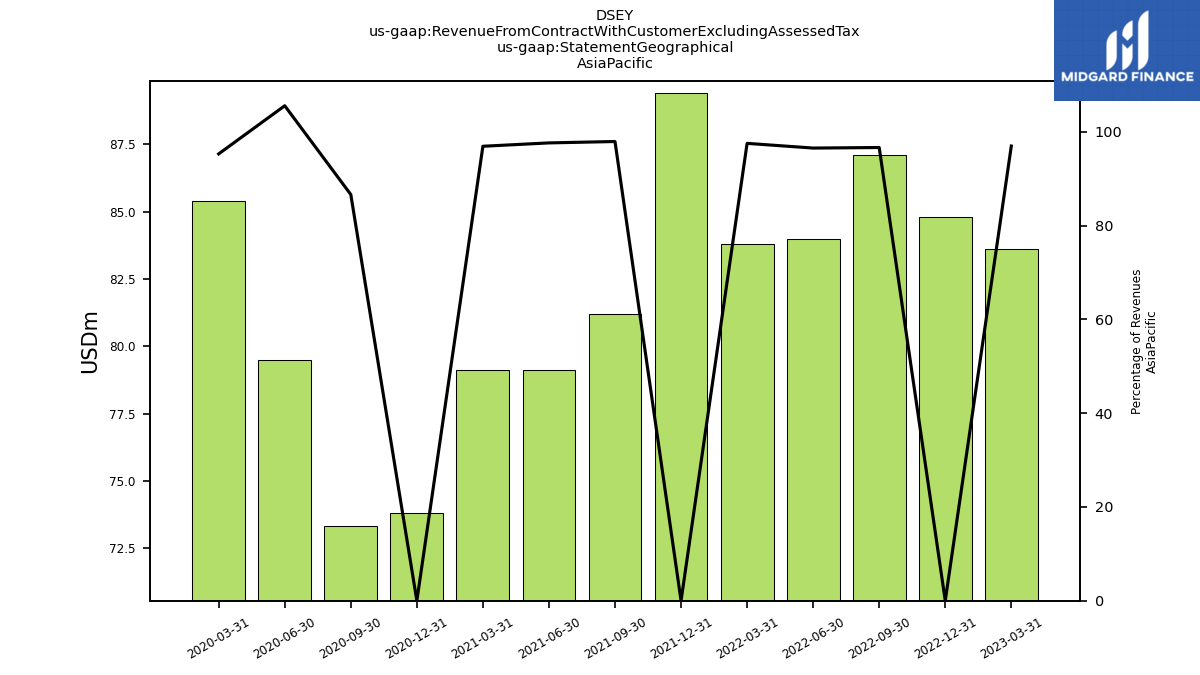
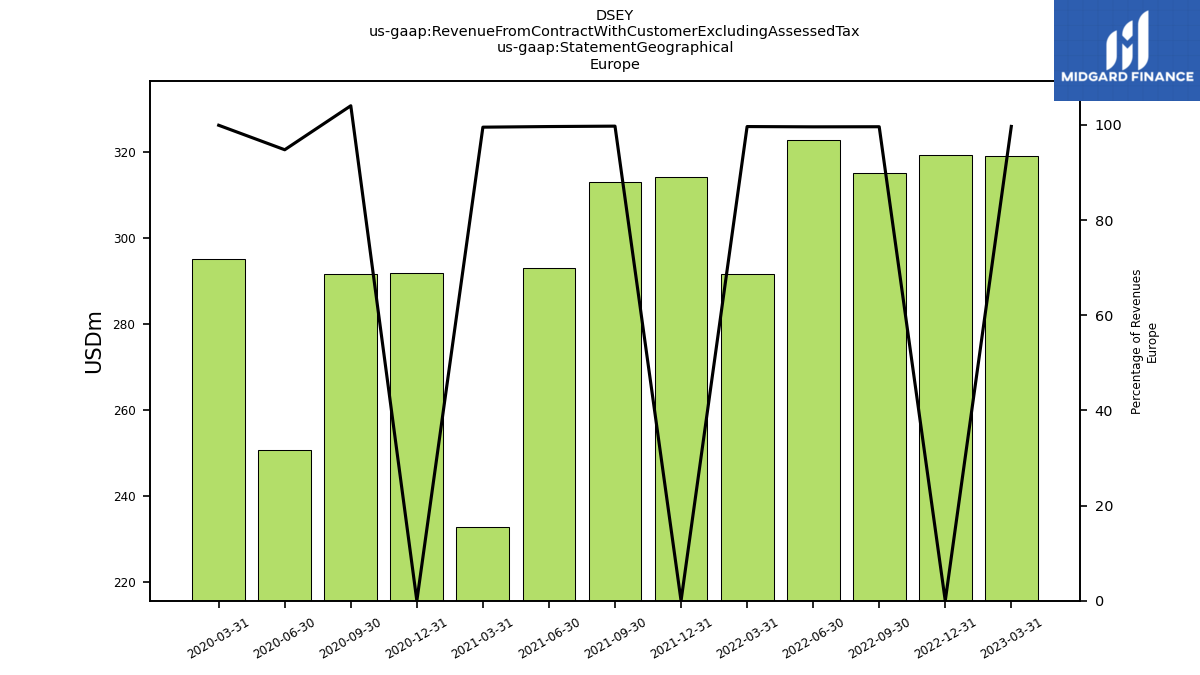
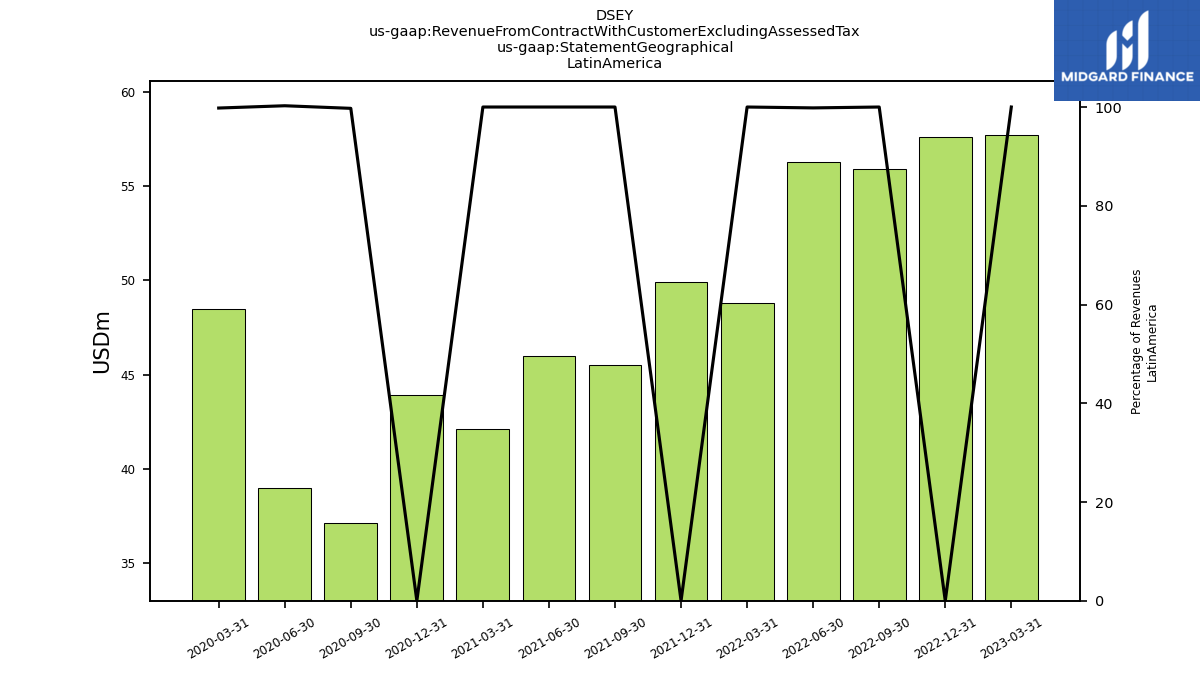
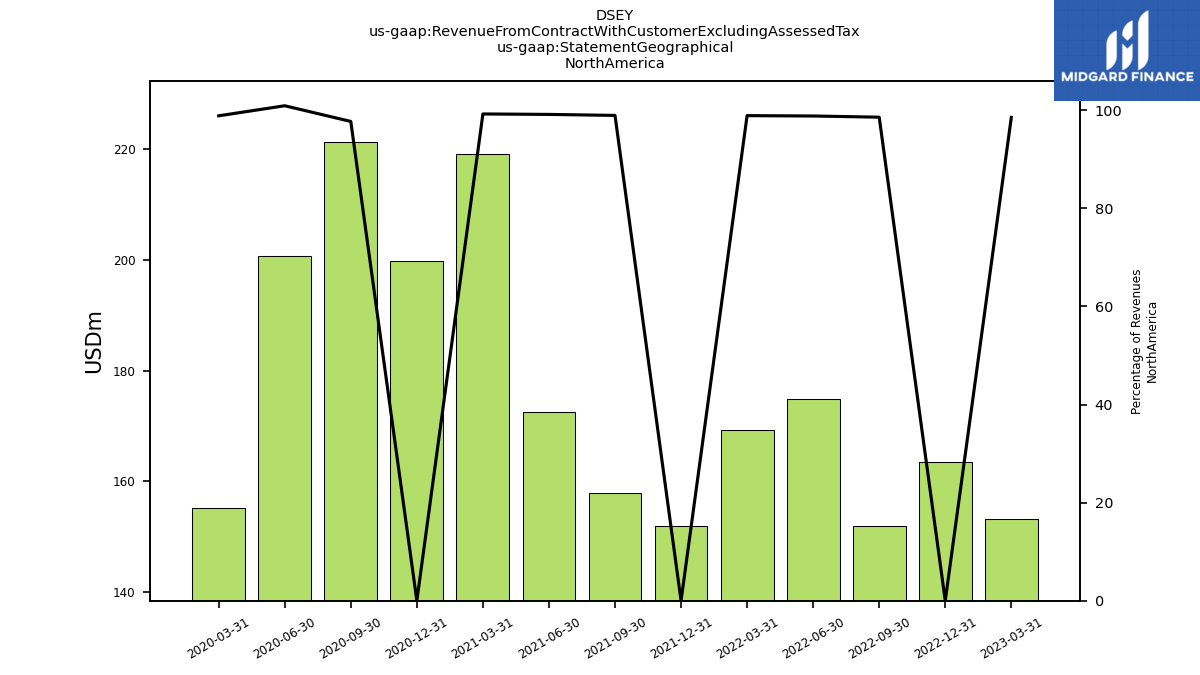
| Revenue From Contract With Customer Excluding Assessed Tax | 690.10 | 694.70 | 682.60 | 708.80 | 655.00 | 665.60 | 660.70 | 645.80 | 626.10 | 661.70 | 675.80 | 618.10 | 648.60 | |
| 83.60 | 84.80 | 87.10 | 84.00 | 83.80 | 89.40 | 81.20 | 79.10 | 79.10 | 73.80 | 73.30 | 79.50 | 85.40 | ||
| 319.20 | 319.30 | 315.20 | 322.80 | 291.60 | 314.20 | 313.00 | 293.00 | 232.90 | 291.80 | 291.60 | 250.80 | 295.10 | ||
| 57.70 | 57.60 | 55.90 | 56.30 | 48.80 | 49.90 | 45.50 | 46.00 | 42.10 | 43.90 | 37.10 | 39.00 | 48.50 | ||
| 153.20 | 163.60 | 152.00 | 174.90 | 169.30 | 151.90 | 158.00 | 172.60 | 219.20 | 199.90 | 221.30 | 200.80 | 155.20 | ||
| Middle East And Africa | 76.40 | 69.40 | 72.40 | 70.80 | 61.50 | 60.20 | 63.00 | 55.10 | 52.80 | 52.30 | 52.50 | 48.00 | 64.40 |


