
| 2023-09-30 | 2023-06-30 | 2023-03-31 | 2022-12-31 | 2022-09-30 | 2022-06-30 | 2022-03-31 | 2021-12-31 | 2021-09-30 | 2021-06-30 | 2021-03-31 | 2020-12-31 | 2020-09-30 | 2020-06-30 | 2020-03-31 | 2019-12-31 | 2019-09-30 | 2019-06-30 | 2019-03-31 | 2018-12-31 | 2018-09-30 | 2018-06-30 | 2018-03-31 | 2017-12-31 | 2017-09-30 | 2017-06-30 | 2017-03-31 | 2016-12-31 | 2016-09-30 | 2016-06-30 | 2016-03-31 | 2015-06-30 | 2015-03-31 | 2014-12-31 | 2014-09-30 | 2014-06-30 | 2014-03-31 | 2013-12-31 | 2013-09-30 | 2013-06-30 | 2013-03-31 | 2012-12-31 | 2012-09-30 | 2012-06-30 | 2012-03-31 | 2011-12-31 | 2011-09-30 | 2011-06-30 | 2011-03-31 | 2010-12-31 | 2010-09-30 | 2010-06-30 | 2010-03-31 | ||
|---|---|---|---|---|---|---|---|---|---|---|---|---|---|---|---|---|---|---|---|---|---|---|---|---|---|---|---|---|---|---|---|---|---|---|---|---|---|---|---|---|---|---|---|---|---|---|---|---|---|---|---|---|---|---|
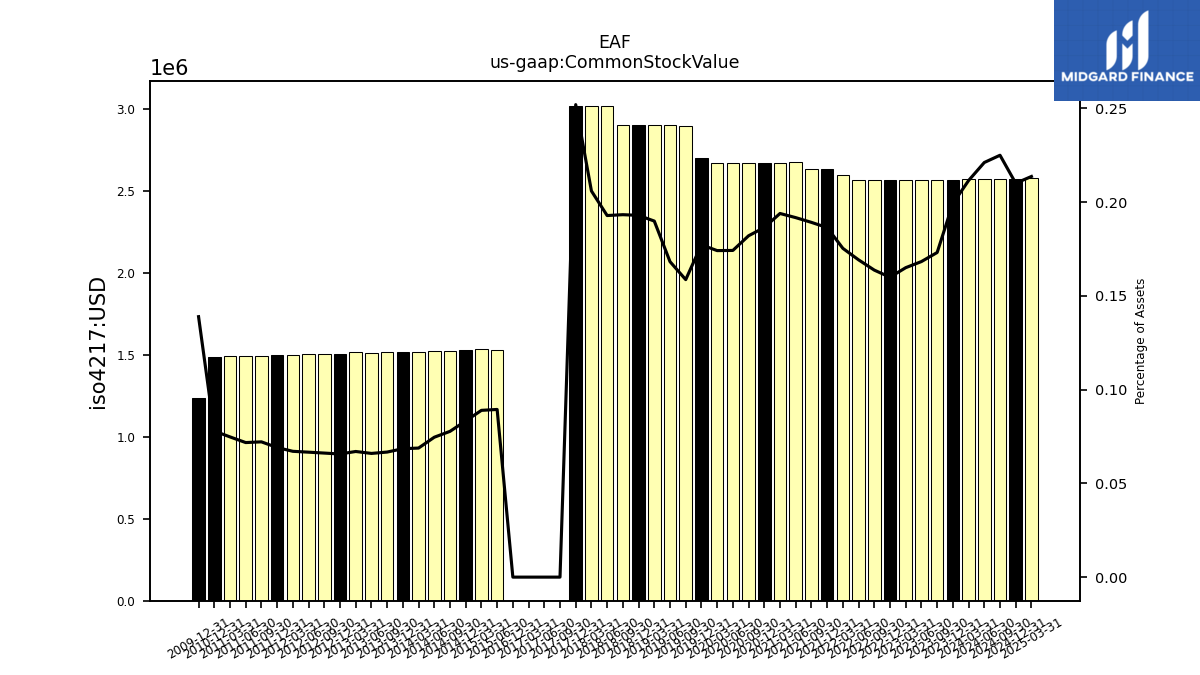
| Common Stock Value | 2.57 | 2.57 | 2.57 | 2.57 | 2.57 | 2.57 | 2.60 | 2.63 | 2.64 | 2.68 | 2.67 | 2.67 | 2.67 | 2.67 | 2.67 | 2.71 | 2.90 | 2.90 | 2.90 | 2.90 | 2.90 | 3.02 | 3.02 | 3.02 | 0.00 | 0.00 | 0.00 | 0.00 | NA | NA | NA | 1.53 | 1.53 | 1.53 | 1.52 | 1.52 | 1.52 | 1.52 | 1.52 | 1.51 | 1.52 | 1.51 | 1.51 | 1.50 | 1.50 | 1.50 | 1.50 | 1.49 | 1.49 | 1.49 | NA | NA | NA | |
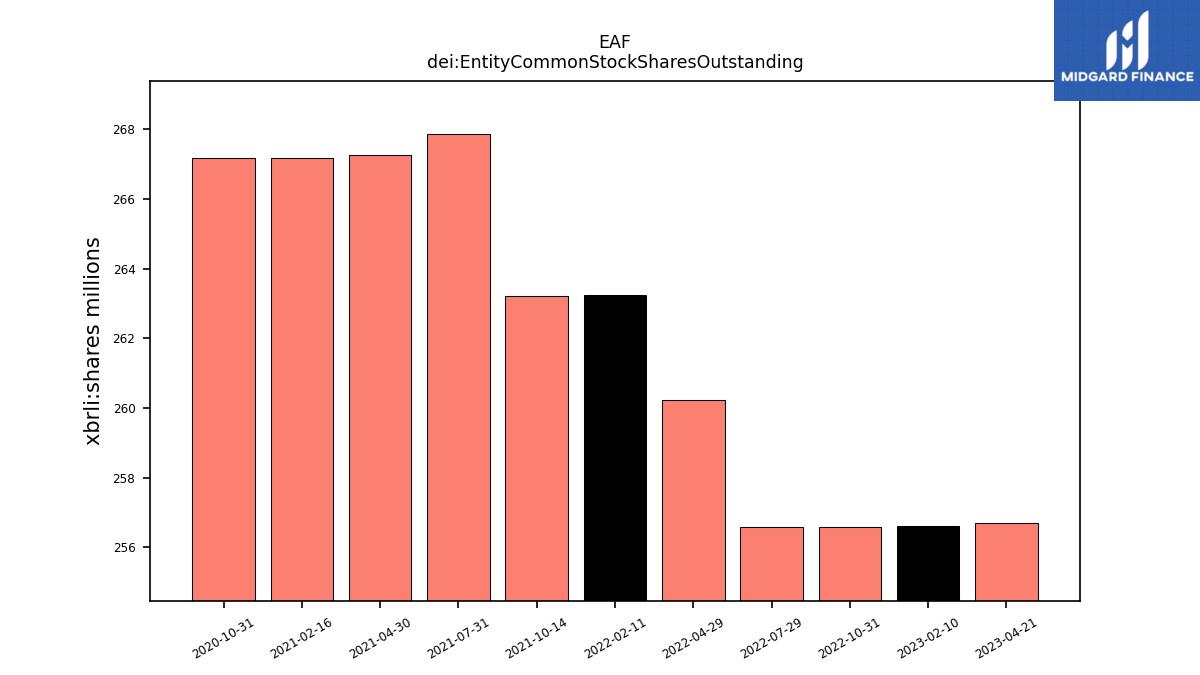
| dei: Entity Common Stock Shares Outstanding | NA | NA | NA | NA | NA | NA | NA | NA | NA | NA | NA | NA | NA | NA | NA | NA | NA | NA | NA | NA | NA | NA | NA | NA | NA | NA | NA | NA | NA | NA | NA | NA | NA | NA | NA | NA | NA | NA | NA | NA | NA | NA | NA | NA | NA | NA | NA | NA | NA | NA | NA | NA | NA | |
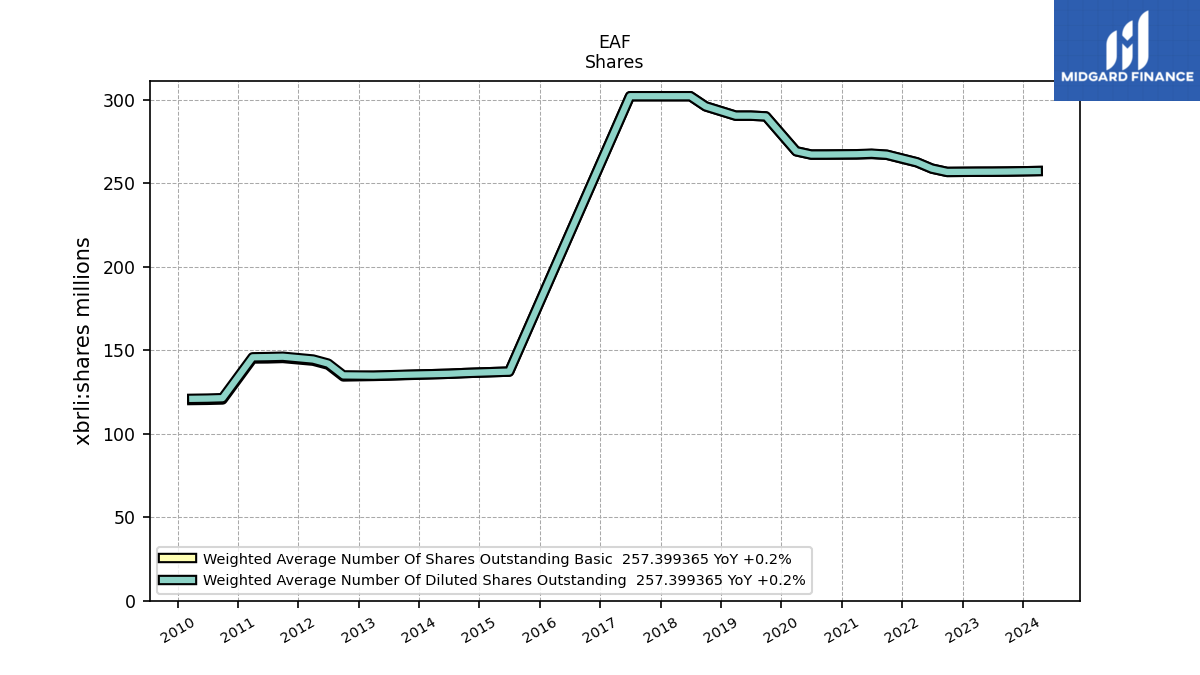
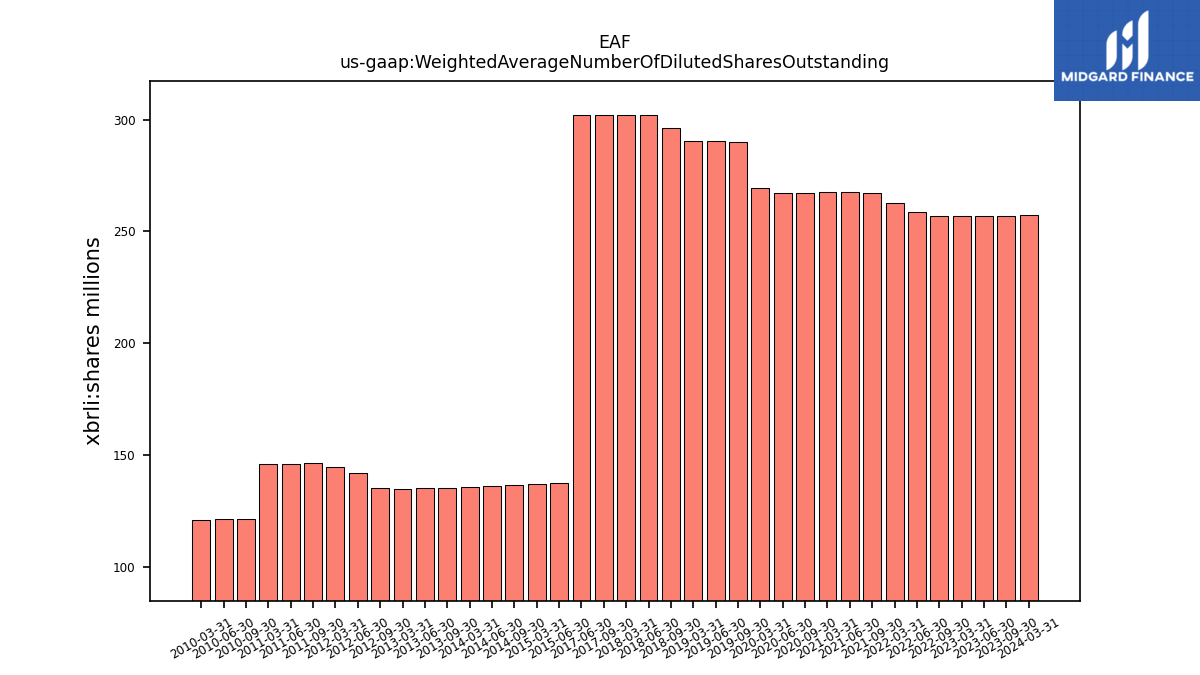
| Weighted Average Number Of Diluted Shares Outstanding | 257.09 | 257.00 | 256.97 | NA | 256.85 | 258.85 | 262.66 | NA | 267.18 | 267.81 | 267.47 | NA | 267.28 | 267.26 | 269.24 | NA | 290.13 | 290.57 | 290.57 | NA | 296.15 | 302.23 | 302.23 | NA | 302.23 | 302.23 | NA | NA | NA | NA | NA | 137.25 | 136.98 | NA | 136.37 | 135.96 | 135.73 | NA | 135.33 | 135.06 | 134.83 | NA | 135.00 | 142.05 | 144.50 | NA | 146.18 | 145.96 | 145.82 | NA | 121.36 | 121.09 | 120.96 | |
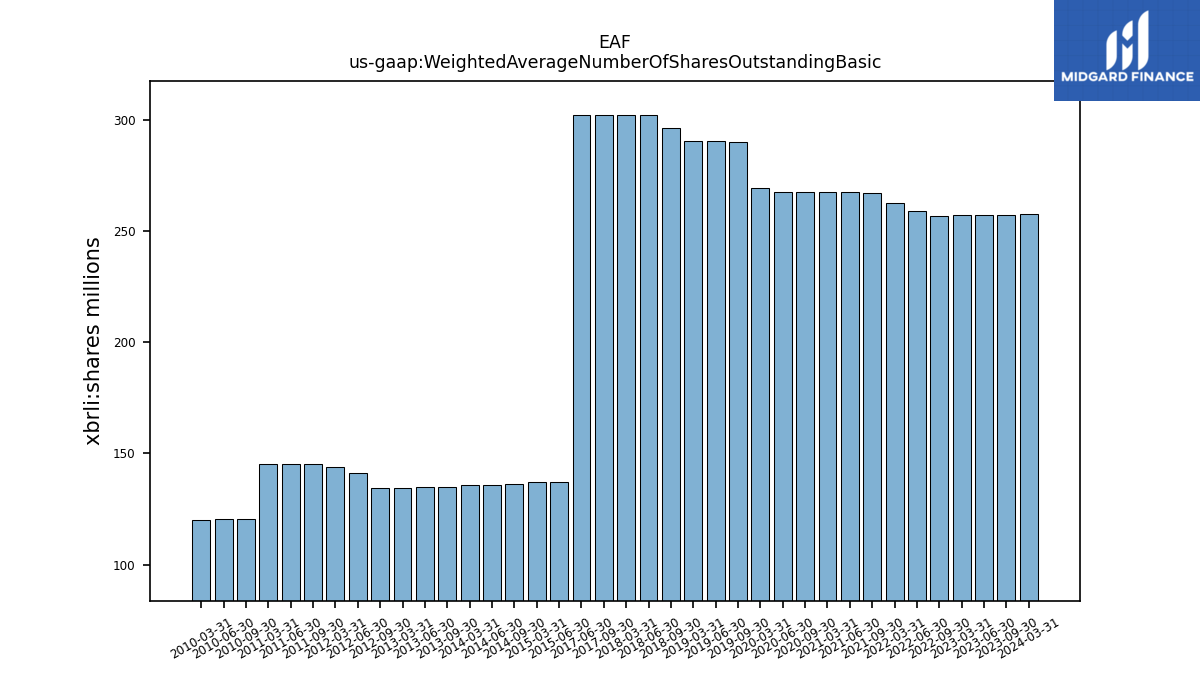
| Weighted Average Number Of Shares Outstanding Basic | 257.09 | 257.00 | 256.97 | NA | 256.85 | 258.85 | 262.59 | NA | 267.11 | 267.56 | 267.32 | NA | 267.27 | 267.25 | 269.22 | NA | 290.11 | 290.57 | 290.56 | NA | 296.14 | 302.23 | 302.23 | NA | 302.23 | 302.23 | NA | NA | NA | NA | NA | 137.25 | 136.98 | NA | 136.37 | 135.96 | 135.73 | NA | 135.13 | 134.85 | 134.65 | NA | 134.35 | 141.40 | 143.80 | NA | 145.41 | 145.17 | 145.10 | NA | 120.56 | 120.34 | 120.23 | |
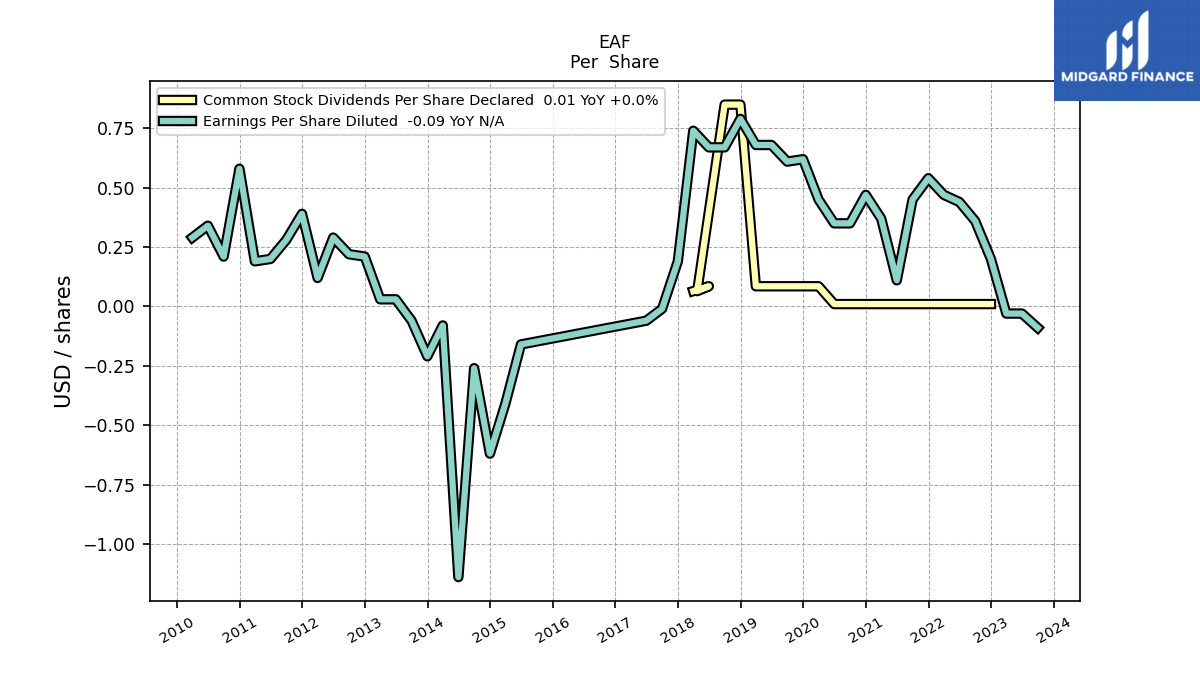
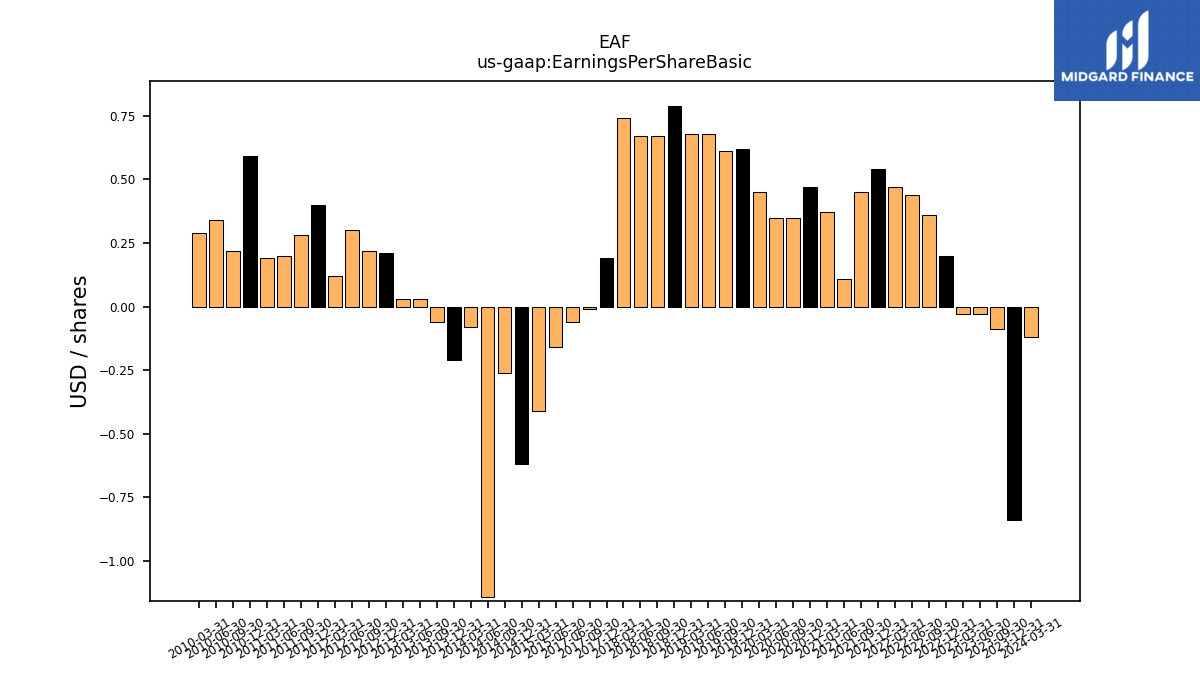
| Earnings Per Share Basic | -0.09 | -0.03 | -0.03 | 0.20 | 0.36 | 0.44 | 0.47 | 0.54 | 0.45 | 0.11 | 0.37 | 0.47 | 0.35 | 0.35 | 0.45 | 0.62 | 0.61 | 0.68 | 0.68 | 0.79 | 0.67 | 0.67 | 0.74 | 0.19 | -0.01 | -0.06 | NA | NA | NA | NA | NA | -0.16 | -0.41 | -0.62 | -0.26 | -1.14 | -0.08 | -0.21 | -0.06 | 0.03 | 0.03 | 0.21 | 0.22 | 0.30 | 0.12 | 0.40 | 0.28 | 0.20 | 0.19 | 0.59 | 0.22 | 0.34 | 0.29 | |
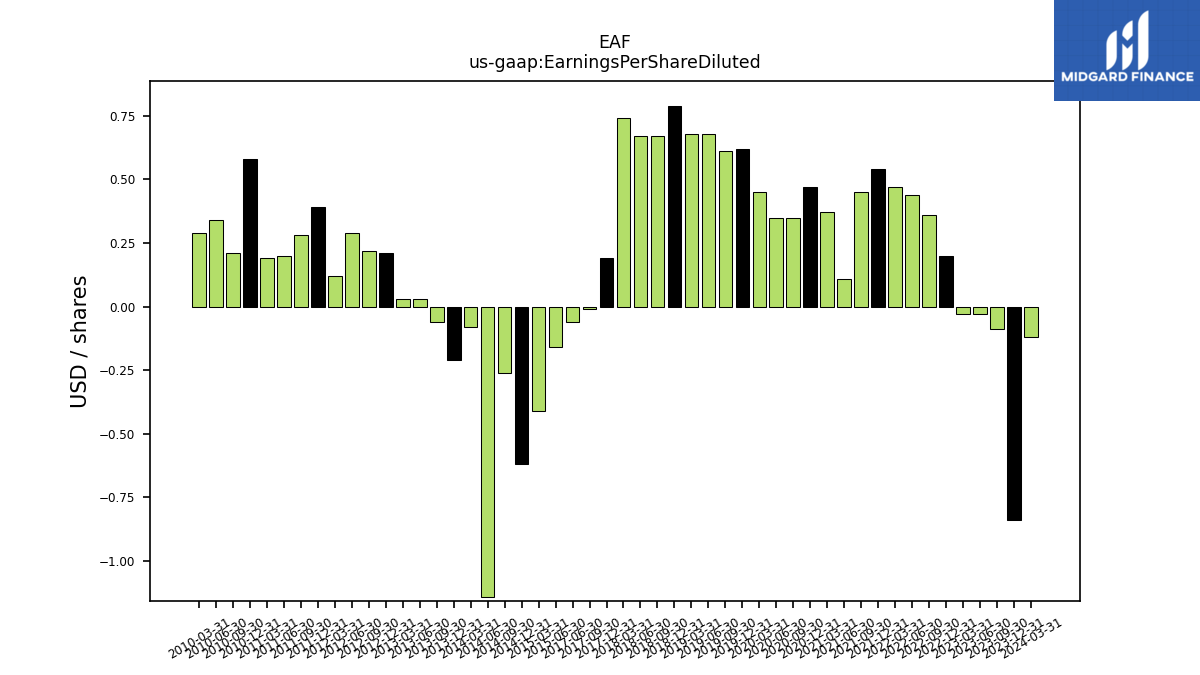
| Earnings Per Share Diluted | -0.09 | -0.03 | -0.03 | 0.20 | 0.36 | 0.44 | 0.47 | 0.54 | 0.45 | 0.11 | 0.37 | 0.47 | 0.35 | 0.35 | 0.45 | 0.62 | 0.61 | 0.68 | 0.68 | 0.79 | 0.67 | 0.67 | 0.74 | 0.19 | -0.01 | -0.06 | NA | NA | NA | NA | NA | -0.16 | -0.41 | -0.62 | -0.26 | -1.14 | -0.08 | -0.21 | -0.06 | 0.03 | 0.03 | 0.21 | 0.22 | 0.29 | 0.12 | 0.39 | 0.28 | 0.20 | 0.19 | 0.58 | 0.21 | 0.34 | 0.29 |
| 2023-09-30 | 2023-06-30 | 2023-03-31 | 2022-12-31 | 2022-09-30 | 2022-06-30 | 2022-03-31 | 2021-12-31 | 2021-09-30 | 2021-06-30 | 2021-03-31 | 2020-12-31 | 2020-09-30 | 2020-06-30 | 2020-03-31 | 2019-12-31 | 2019-09-30 | 2019-06-30 | 2019-03-31 | 2018-12-31 | 2018-09-30 | 2018-06-30 | 2018-03-31 | 2017-12-31 | 2017-09-30 | 2017-06-30 | 2017-03-31 | 2016-12-31 | 2016-09-30 | 2016-06-30 | 2016-03-31 | 2015-06-30 | 2015-03-31 | 2014-12-31 | 2014-09-30 | 2014-06-30 | 2014-03-31 | 2013-12-31 | 2013-09-30 | 2013-06-30 | 2013-03-31 | 2012-12-31 | 2012-09-30 | 2012-06-30 | 2012-03-31 | 2011-12-31 | 2011-09-30 | 2011-06-30 | 2011-03-31 | 2010-12-31 | 2010-09-30 | 2010-06-30 | 2010-03-31 | ||
|---|---|---|---|---|---|---|---|---|---|---|---|---|---|---|---|---|---|---|---|---|---|---|---|---|---|---|---|---|---|---|---|---|---|---|---|---|---|---|---|---|---|---|---|---|---|---|---|---|---|---|---|---|---|---|
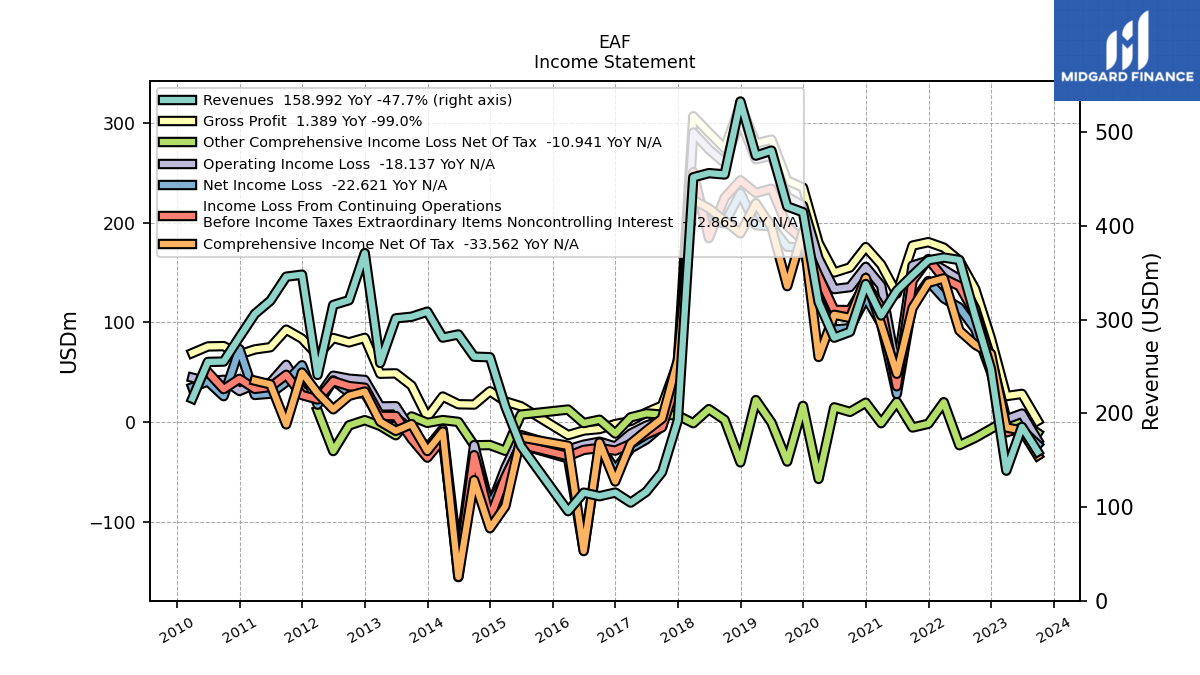
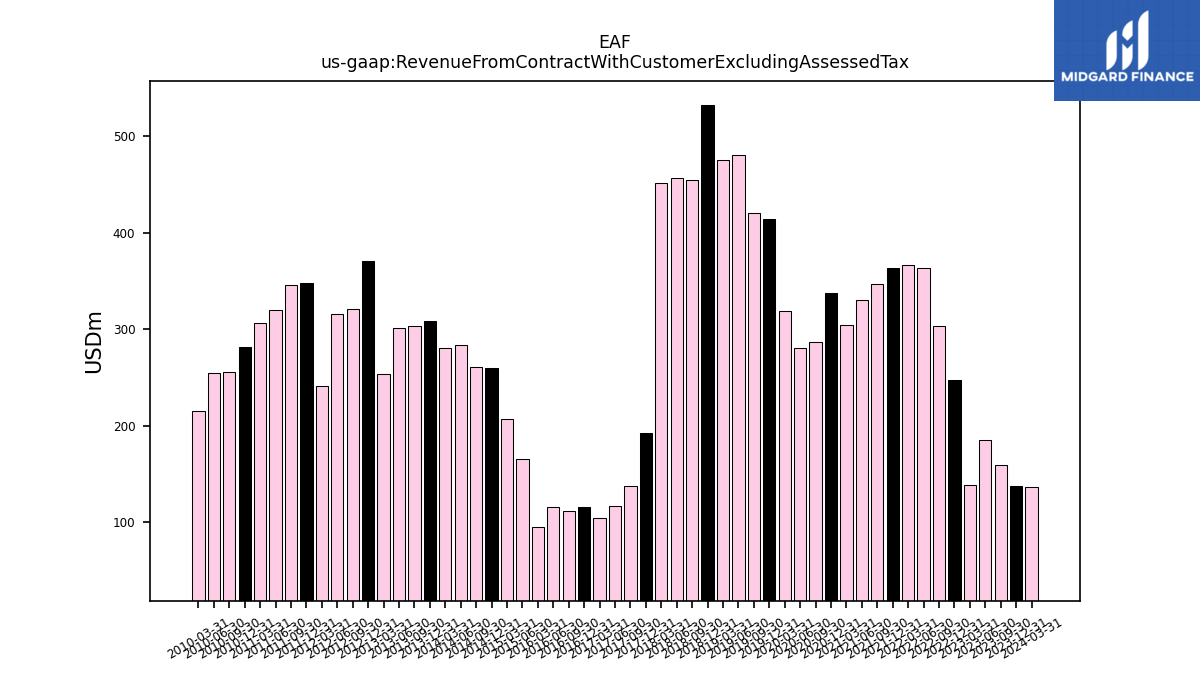
| Revenue From Contract With Customer Excluding Assessed Tax | 158.99 | 185.56 | 138.80 | 247.52 | 303.84 | 363.65 | 366.25 | 363.29 | 347.35 | 330.75 | 304.40 | 338.01 | 286.99 | 280.72 | 318.65 | 414.61 | 420.80 | 480.39 | 474.99 | 532.79 | 454.89 | 456.33 | 451.90 | 192.47 | 137.25 | 116.31 | 104.74 | 115.43 | 111.59 | 115.36 | 95.58 | 165.12 | 207.21 | 259.87 | 260.46 | 284.18 | 280.79 | 308.50 | 303.08 | 301.36 | 253.73 | 371.00 | 320.72 | 315.61 | 240.94 | 347.98 | 345.83 | 320.23 | 306.14 | 281.24 | 255.24 | 254.85 | 215.66 | |
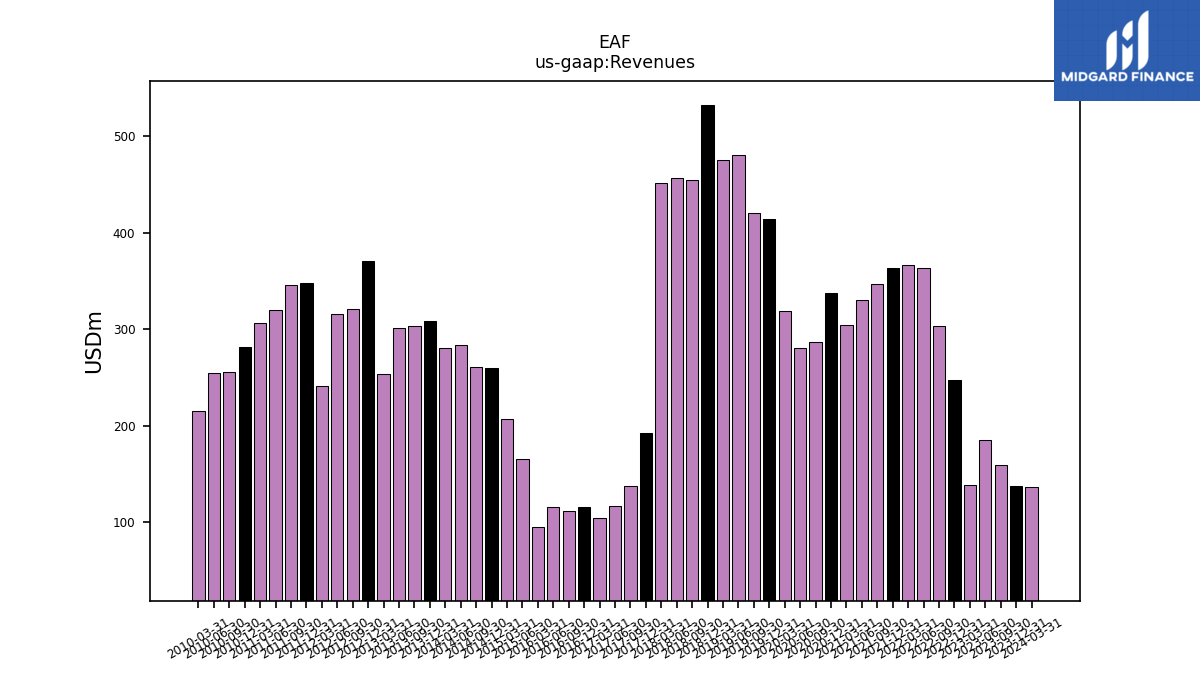
| Revenues | 158.99 | 185.56 | 138.80 | 247.52 | 303.84 | 363.65 | 366.25 | 363.29 | 347.35 | 330.75 | 304.40 | 338.01 | 286.99 | 280.72 | 318.65 | 414.61 | 420.80 | 480.39 | 474.99 | 532.79 | 454.89 | 456.33 | 451.90 | 192.47 | 137.25 | 116.31 | 104.74 | 115.43 | 111.59 | 115.36 | 95.58 | 165.12 | 207.21 | 259.87 | 260.46 | 284.18 | 280.79 | 308.50 | 303.08 | 301.36 | 253.73 | 371.00 | 320.72 | 315.61 | 240.94 | 347.98 | 345.83 | 320.23 | 306.14 | 281.24 | 255.24 | 254.85 | 215.66 | |
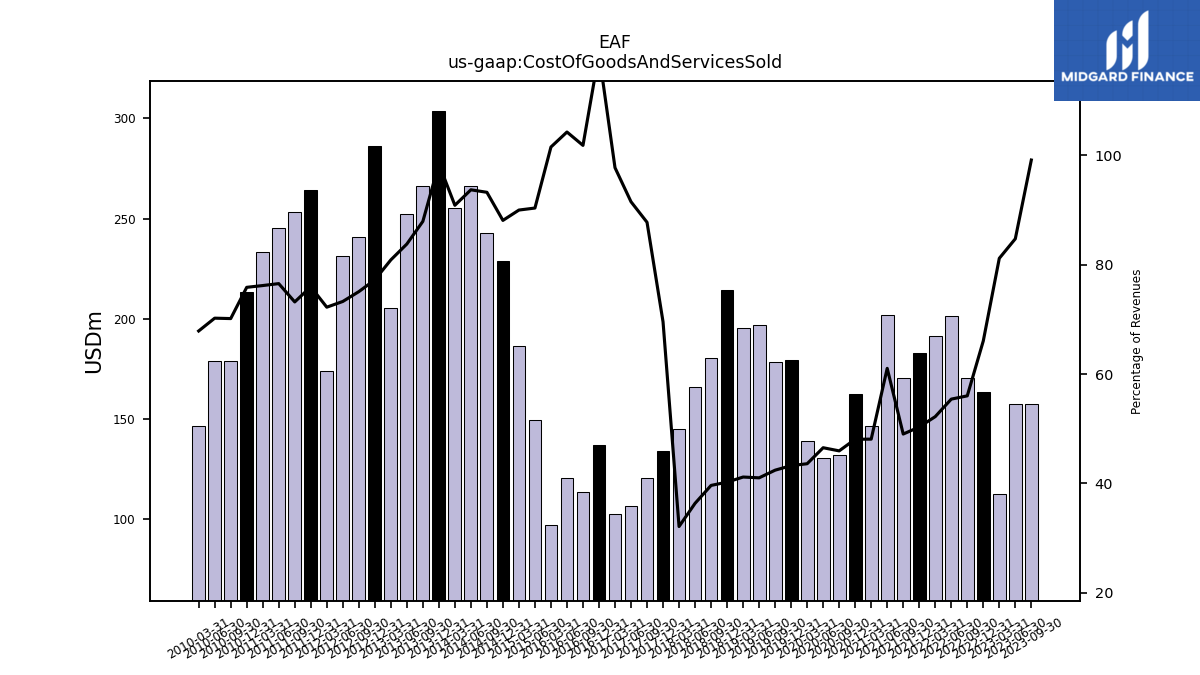
| Cost Of Goods And Services Sold | 157.60 | 157.22 | 112.64 | 163.49 | 170.17 | 201.50 | 191.21 | 182.79 | 170.29 | 201.87 | 146.40 | 162.49 | 131.86 | 130.60 | 138.92 | 179.32 | 178.50 | 197.05 | 195.52 | 214.36 | 180.28 | 165.91 | 145.15 | 133.85 | 120.42 | 106.42 | 102.36 | 136.91 | 113.60 | 120.27 | 97.01 | 149.18 | 186.45 | 228.91 | 242.81 | 266.23 | 255.10 | 303.55 | 266.44 | 252.44 | 205.18 | 286.49 | 240.73 | 231.23 | 174.01 | 264.28 | 253.09 | 245.07 | 233.20 | 213.32 | 179.01 | 178.94 | 146.37 | |
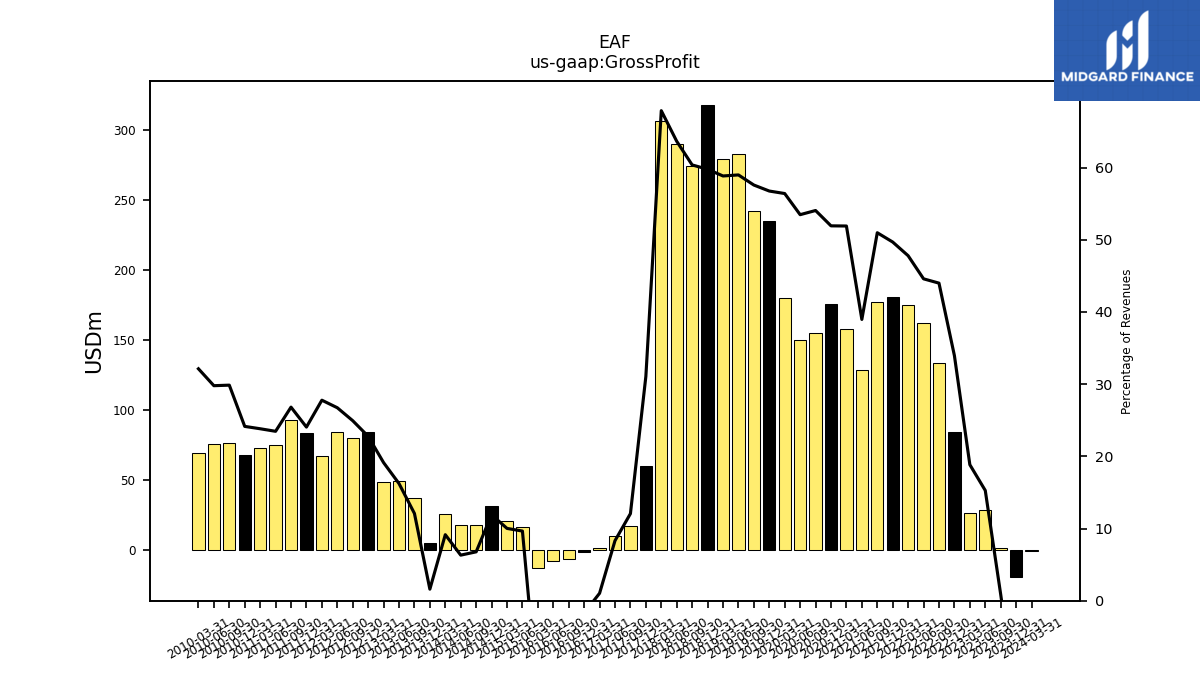
| Gross Profit | 1.39 | 28.34 | 26.16 | 84.03 | 133.67 | 162.15 | 175.03 | 180.51 | 177.06 | 128.88 | 158.00 | 175.53 | 155.12 | 150.12 | 179.73 | 235.29 | 242.30 | 283.34 | 279.47 | 318.43 | 274.61 | 290.42 | 306.75 | 59.79 | 16.56 | 9.68 | 1.08 | -1.95 | -6.91 | -8.40 | -12.97 | 15.94 | 20.76 | 30.96 | 17.64 | 17.95 | 25.69 | 4.95 | 36.64 | 48.92 | 48.55 | 84.51 | 79.99 | 84.38 | 66.93 | 83.71 | 92.74 | 75.16 | 72.94 | 67.92 | 76.22 | 75.92 | 69.29 | |
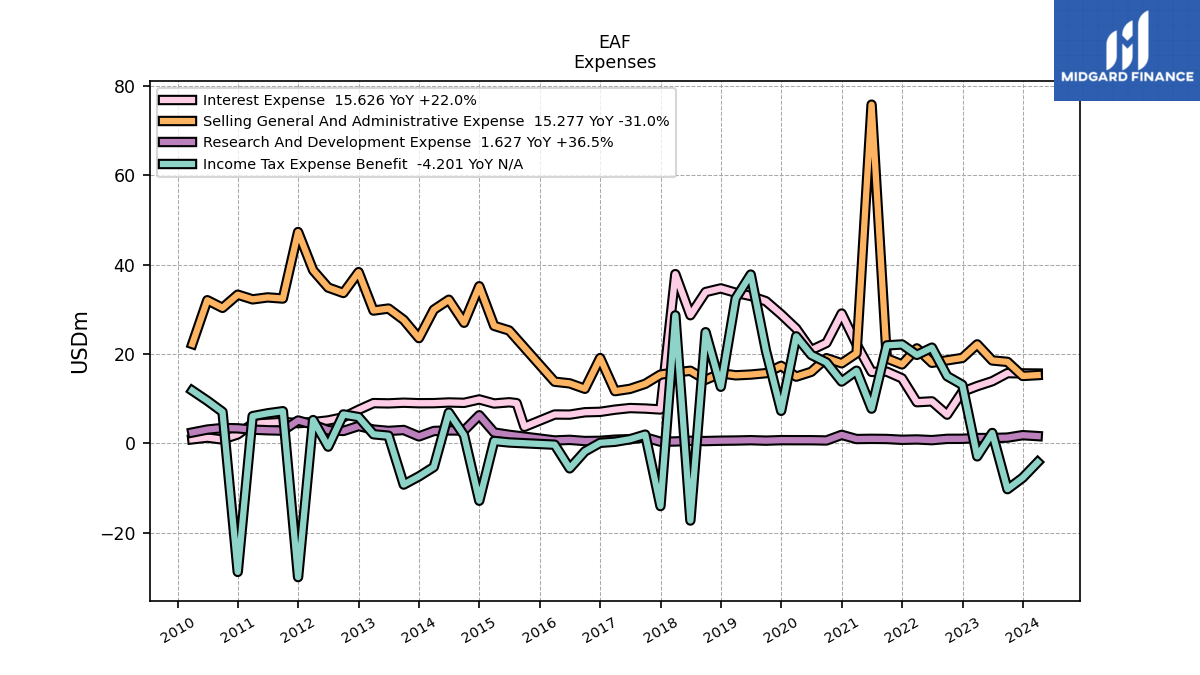
| Research And Development Expense | 1.29 | 1.20 | 1.19 | 1.02 | 1.01 | 0.72 | 0.88 | 0.80 | 0.98 | 1.02 | 0.97 | 1.90 | 0.65 | 0.71 | 0.71 | 0.72 | 0.61 | 0.71 | 0.64 | 0.60 | 0.52 | 0.58 | 0.43 | 0.37 | 1.34 | 0.94 | 0.83 | 0.57 | 0.53 | 0.79 | 0.65 | 1.91 | 2.43 | 6.30 | 2.87 | 2.90 | 2.77 | 1.56 | 2.99 | 2.79 | 3.09 | 3.88 | 2.78 | 2.94 | 4.20 | 5.12 | 2.85 | 2.93 | 3.07 | 3.37 | 3.44 | 3.09 | 2.44 | |
| Selling General And Administrative Expense | 18.23 | 18.55 | 22.15 | 19.11 | 18.58 | 18.03 | 21.25 | 17.67 | 19.01 | 75.78 | 20.15 | 17.92 | 19.06 | 16.00 | 14.93 | 17.35 | 15.71 | 15.39 | 15.23 | 15.68 | 14.23 | 16.24 | 15.88 | 15.39 | 13.32 | 12.20 | 11.68 | 19.09 | 12.21 | 13.42 | 13.79 | 25.25 | 26.29 | 35.15 | 26.98 | 32.14 | 29.91 | 23.54 | 27.63 | 30.16 | 29.71 | 38.31 | 33.65 | 34.86 | 38.73 | 47.28 | 32.40 | 32.66 | 32.22 | 33.27 | 30.32 | 32.03 | 22.23 | |
| Operating Income Loss | -18.14 | 8.60 | 2.81 | 63.89 | 114.08 | 143.40 | 152.90 | 162.04 | 157.07 | 52.08 | 136.88 | 155.70 | 135.41 | 133.41 | 164.09 | 217.22 | 225.98 | 267.24 | 263.61 | 302.15 | 259.86 | 273.60 | 290.44 | 44.74 | 1.90 | -3.46 | -11.43 | -24.45 | -19.65 | -22.61 | -27.42 | -13.00 | -45.83 | -86.01 | -23.05 | -139.49 | -7.07 | -25.72 | -8.57 | 15.97 | 15.74 | 42.32 | 43.56 | 46.58 | 24.01 | 31.30 | 57.49 | 39.57 | 37.65 | 31.29 | 42.47 | 40.80 | 44.63 | |
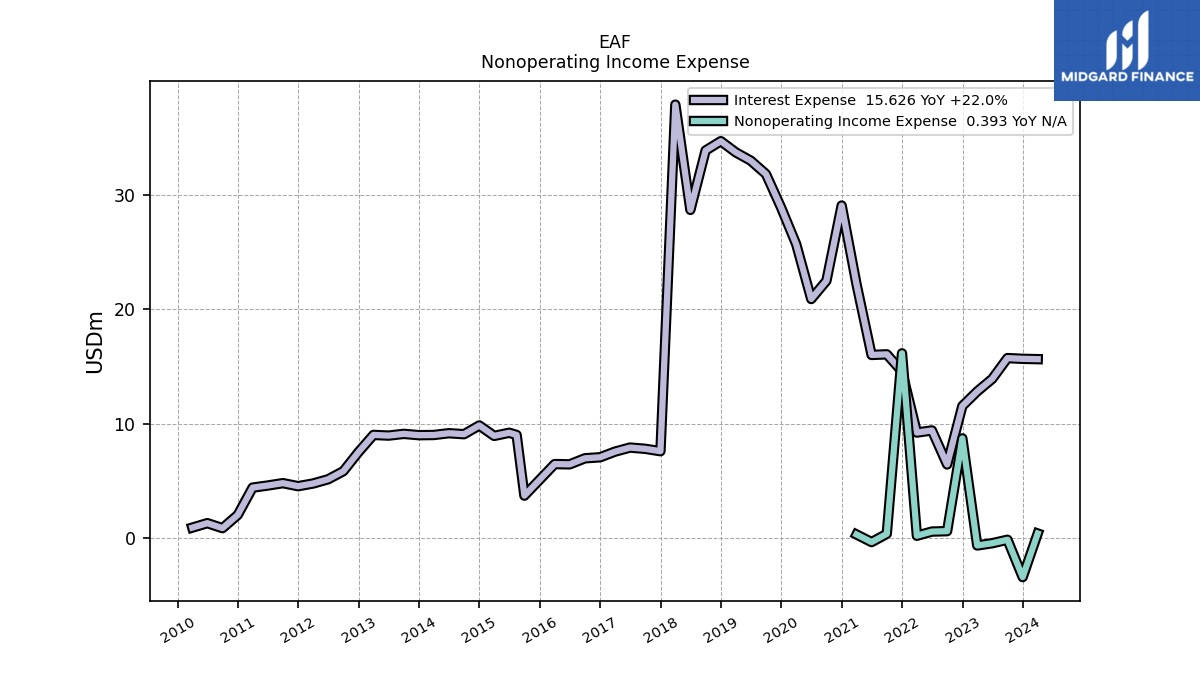
| Interest Expense | 15.72 | 13.91 | 12.81 | 11.53 | 6.42 | 9.40 | 9.21 | 14.55 | 16.05 | 15.99 | 22.17 | 29.05 | 22.47 | 20.88 | 25.67 | 28.86 | 31.80 | 32.97 | 33.70 | 34.67 | 33.85 | 28.67 | 37.87 | 7.58 | 7.79 | 7.90 | 7.55 | 7.05 | 6.96 | 6.44 | 6.46 | 9.20 | 8.92 | 9.83 | 9.07 | 9.15 | 9.00 | 8.98 | 9.10 | 8.95 | 9.01 | 7.51 | 5.84 | 5.13 | 4.76 | 4.53 | 4.79 | 4.58 | 4.40 | 2.01 | 0.86 | 1.30 | 0.91 | |
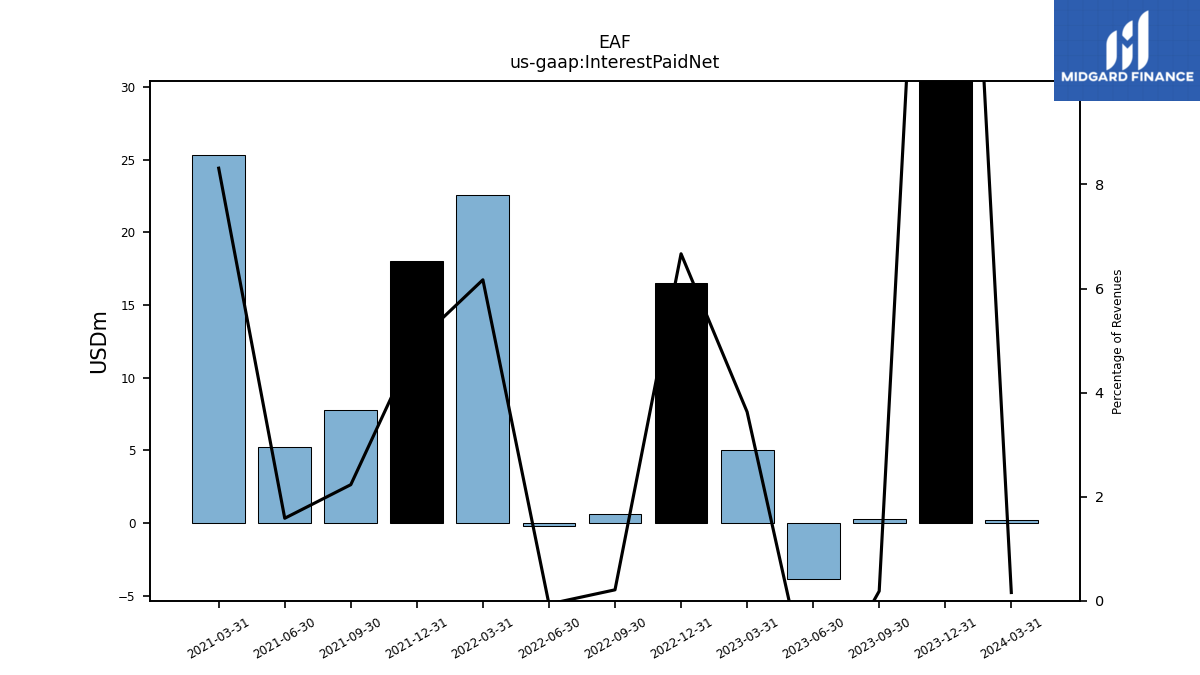
| Interest Paid Net | 0.29 | -3.86 | 5.04 | 16.50 | 0.64 | -0.23 | 22.59 | 18.04 | 7.75 | 5.24 | 25.30 | NA | NA | NA | NA | NA | NA | NA | NA | NA | NA | NA | NA | NA | NA | NA | NA | NA | NA | NA | NA | NA | NA | NA | NA | NA | NA | NA | NA | NA | NA | NA | NA | NA | NA | NA | NA | NA | NA | NA | NA | NA | NA | |
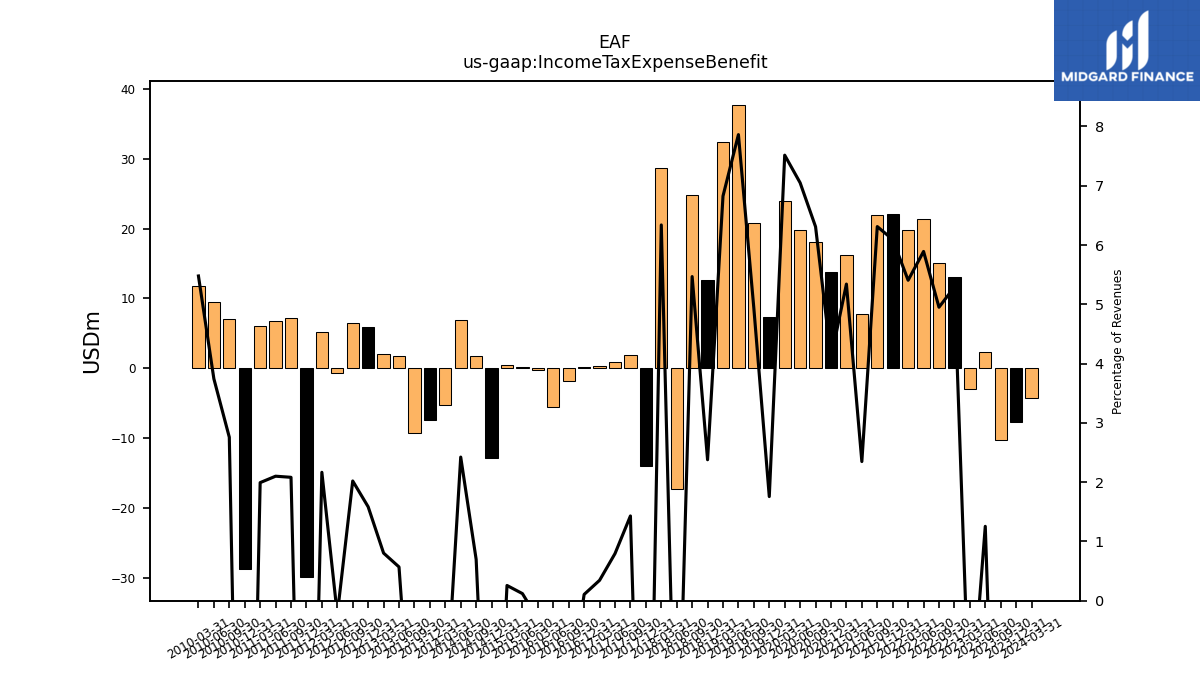
| Income Tax Expense Benefit | -10.24 | 2.33 | -2.90 | 13.10 | 15.04 | 21.42 | 19.80 | 22.13 | 21.92 | 7.76 | 16.26 | 13.83 | 18.10 | 19.79 | 23.95 | 7.29 | 20.75 | 37.77 | 32.42 | 12.67 | 24.87 | -17.26 | 28.64 | -14.03 | 1.96 | 0.93 | 0.36 | 0.12 | -1.79 | -5.59 | -0.29 | 0.20 | 0.53 | -12.83 | 1.82 | 6.89 | -5.29 | -7.38 | -9.22 | 1.72 | 2.04 | 5.88 | 6.48 | -0.73 | 5.22 | -29.92 | 7.20 | 6.73 | 6.10 | -28.75 | 7.04 | 9.54 | 11.81 | |
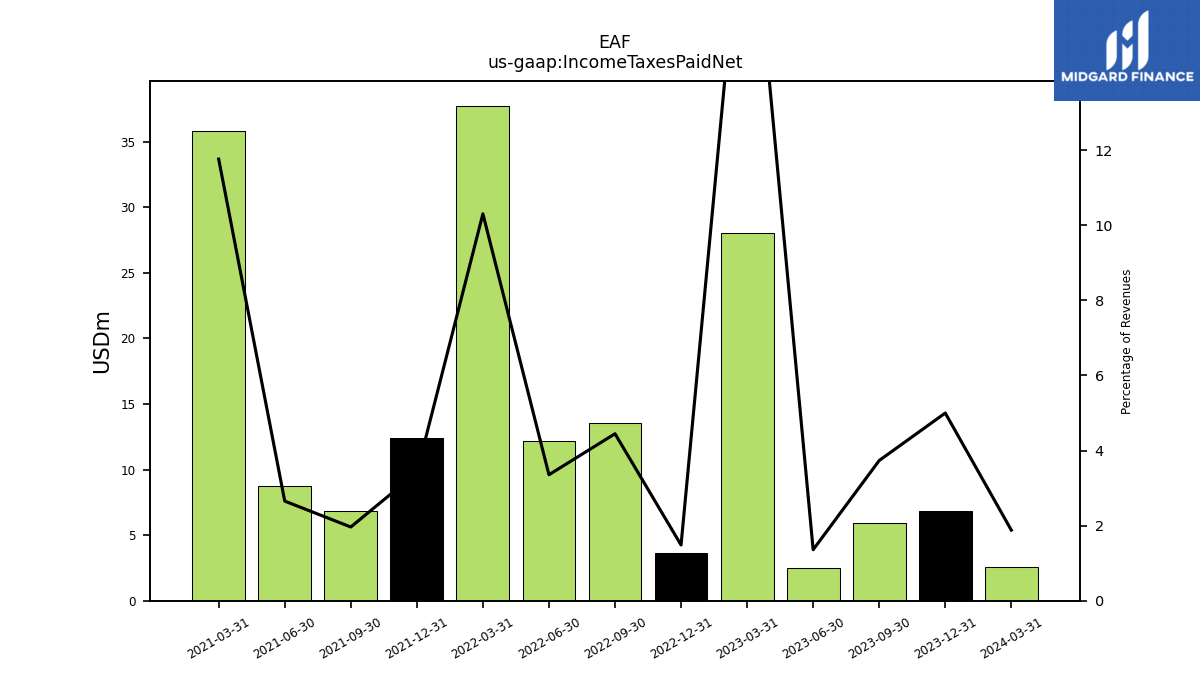
| Income Taxes Paid Net | 5.94 | 2.52 | 28.01 | 3.68 | 13.51 | 12.20 | 37.73 | 12.40 | 6.82 | 8.78 | 35.80 | NA | NA | NA | NA | NA | NA | NA | NA | NA | NA | NA | NA | NA | NA | NA | NA | NA | NA | NA | NA | NA | NA | NA | NA | NA | NA | NA | NA | NA | NA | NA | NA | NA | NA | NA | NA | NA | NA | NA | NA | NA | NA | |
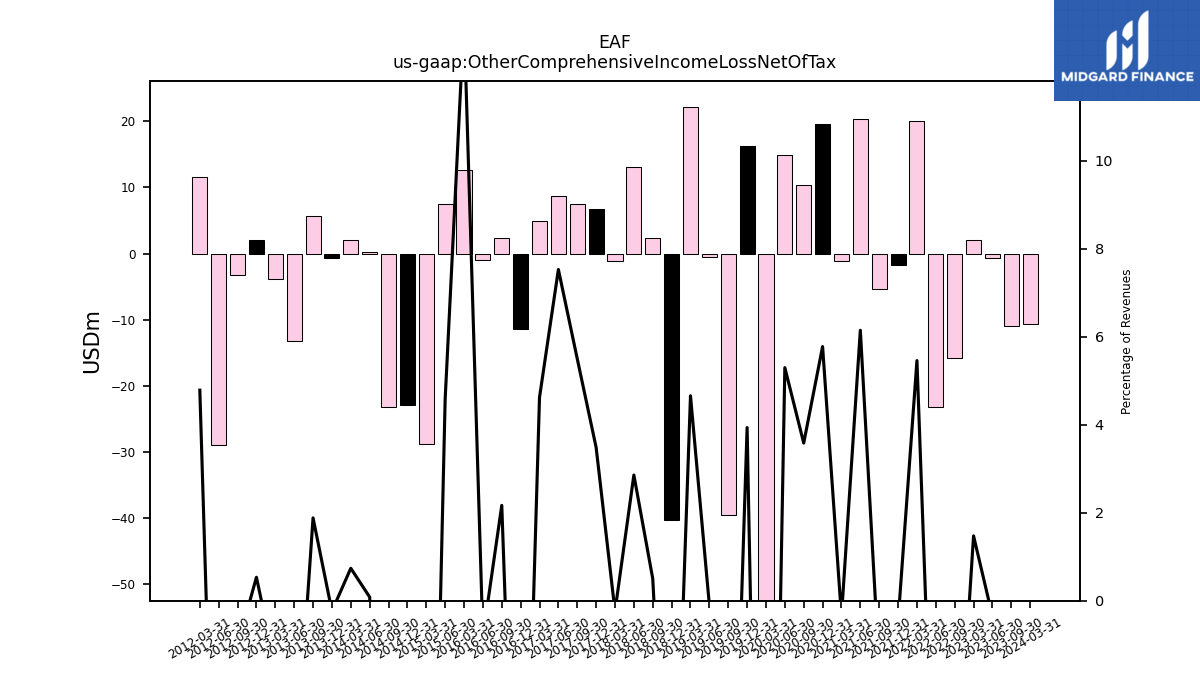
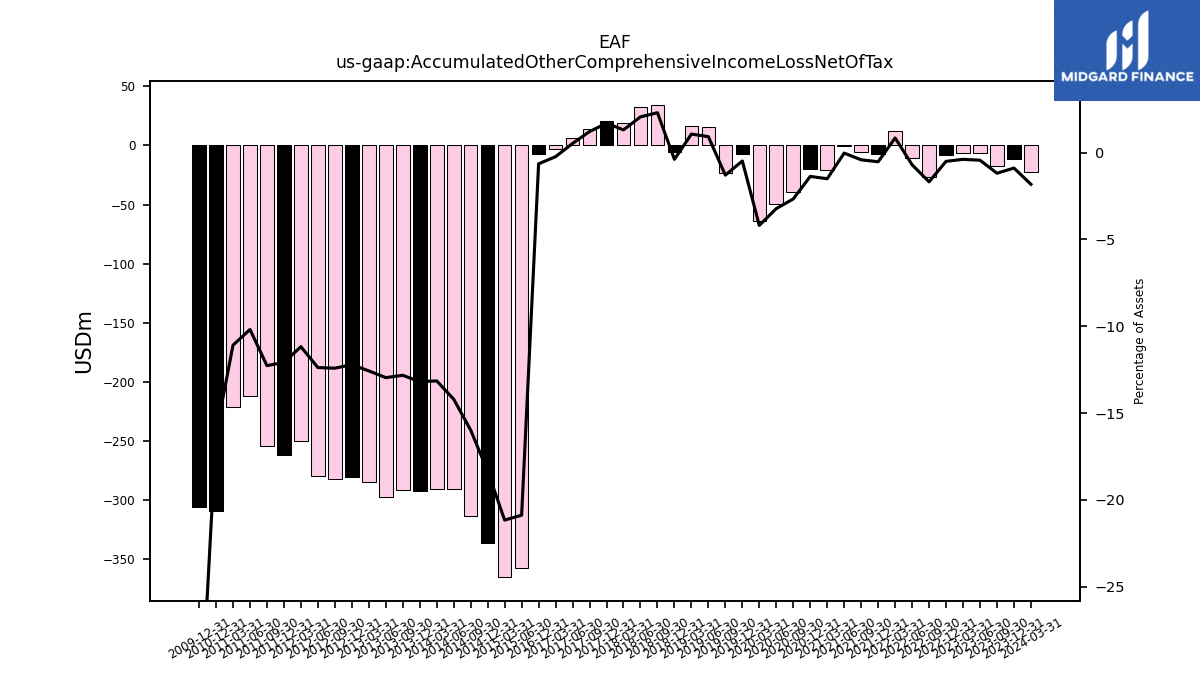
| Other Comprehensive Income Loss Net Of Tax | -10.94 | -0.65 | 2.05 | NA | -15.74 | -23.18 | 19.98 | -1.67 | -5.38 | 20.33 | -1.08 | 19.52 | 10.28 | 14.87 | -56.95 | 16.32 | -39.53 | -0.46 | 22.12 | -40.34 | 2.29 | 13.03 | -1.07 | 6.71 | 7.55 | 8.76 | 4.84 | -11.42 | 2.42 | -0.94 | 12.64 | 7.56 | -28.77 | -22.96 | -23.25 | 0.24 | 2.07 | -0.73 | 5.71 | -13.15 | -3.78 | 1.98 | -3.24 | -29.01 | 11.53 | NA | NA | NA | NA | NA | NA | NA | NA | |
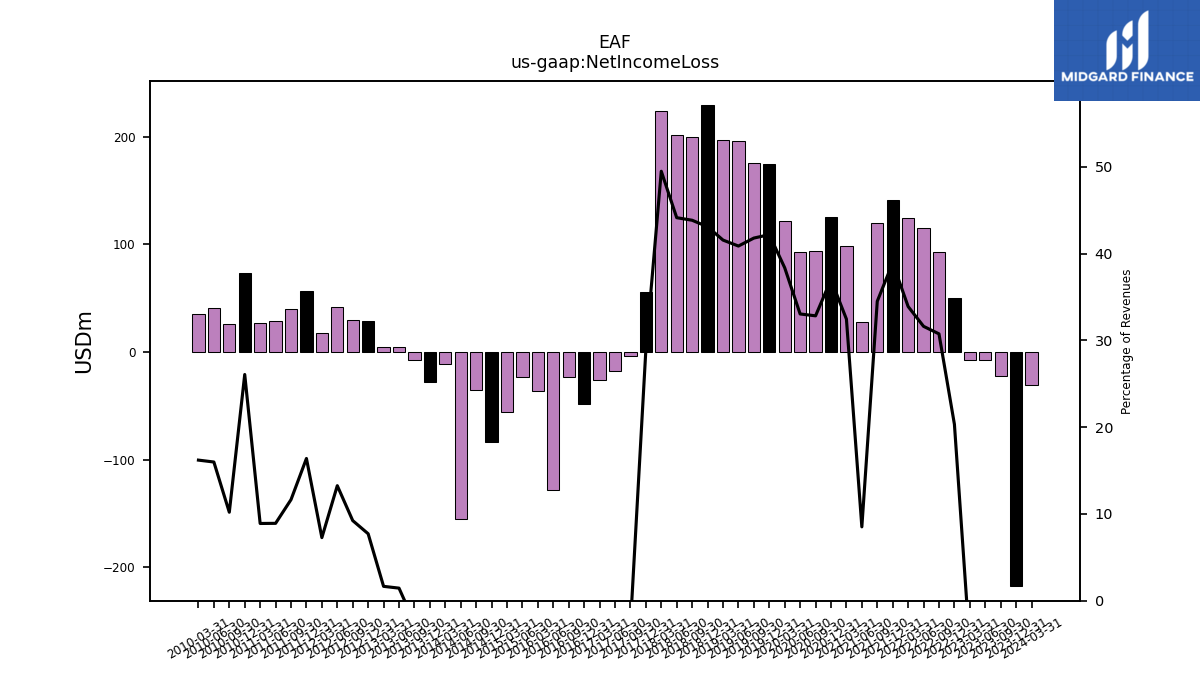
| Net Income Loss | -22.62 | -7.85 | -7.37 | 50.33 | 93.45 | 115.00 | 124.18 | 141.48 | 119.89 | 28.16 | 98.80 | 125.10 | 94.23 | 92.78 | 122.27 | 174.92 | 175.88 | 196.37 | 197.44 | 229.63 | 199.47 | 201.45 | 223.67 | 55.63 | -3.92 | -17.38 | -26.34 | -48.10 | -22.97 | -128.40 | -36.38 | -22.82 | -55.61 | -83.48 | -34.94 | -155.43 | -11.52 | -28.22 | -7.63 | 4.38 | 4.21 | 28.64 | 29.63 | 41.85 | 17.53 | 57.05 | 40.30 | 28.57 | 27.26 | 73.33 | 26.04 | 40.75 | 34.95 | |
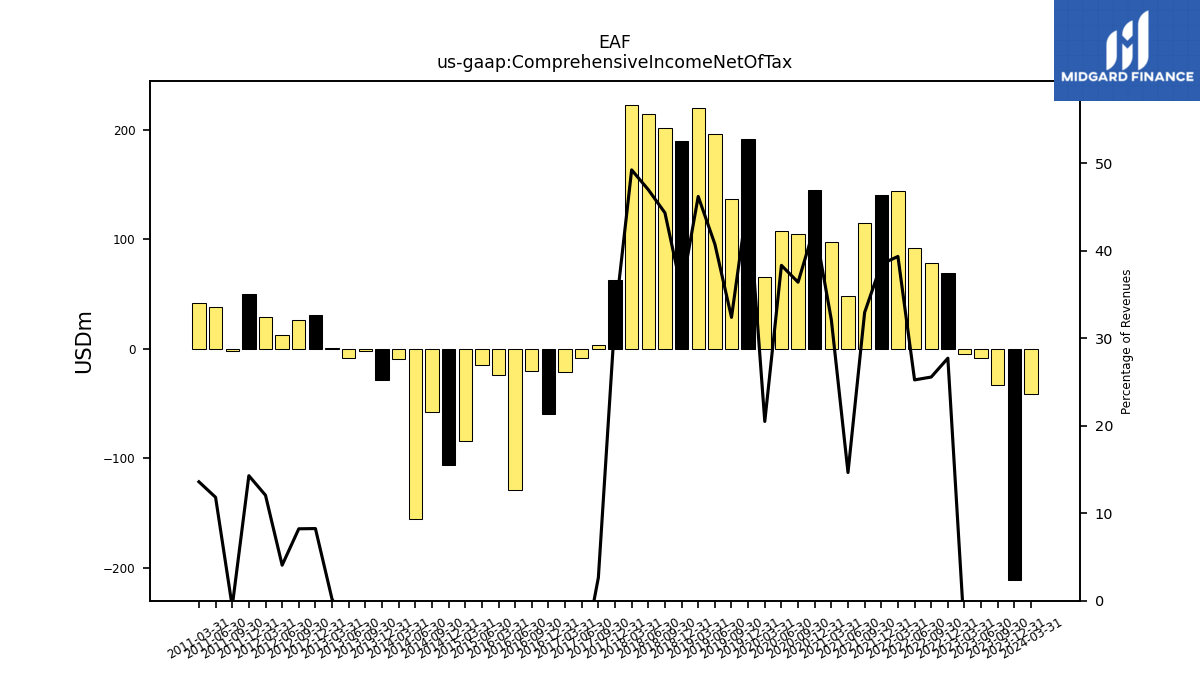
| Comprehensive Income Net Of Tax | -33.56 | -8.50 | -5.32 | 68.64 | 77.71 | 91.82 | 144.17 | 139.81 | 114.50 | 48.49 | 97.72 | 144.62 | 104.52 | 107.64 | 65.32 | 191.24 | 136.34 | 195.90 | 219.55 | 189.29 | 201.75 | 214.48 | 222.60 | 62.34 | 3.63 | -8.63 | -21.50 | -59.52 | -20.55 | -129.34 | -23.74 | -15.26 | -84.37 | -106.45 | -58.19 | -155.19 | -9.45 | -28.95 | -1.92 | -8.77 | 0.43 | 30.62 | 26.39 | 12.84 | 29.06 | 49.76 | -2.26 | 37.88 | 41.63 | NA | NA | NA | NA |
| 2023-09-30 | 2023-06-30 | 2023-03-31 | 2022-12-31 | 2022-09-30 | 2022-06-30 | 2022-03-31 | 2021-12-31 | 2021-09-30 | 2021-06-30 | 2021-03-31 | 2020-12-31 | 2020-09-30 | 2020-06-30 | 2020-03-31 | 2019-12-31 | 2019-09-30 | 2019-06-30 | 2019-03-31 | 2018-12-31 | 2018-09-30 | 2018-06-30 | 2018-03-31 | 2017-12-31 | 2017-09-30 | 2017-06-30 | 2017-03-31 | 2016-12-31 | 2016-09-30 | 2016-06-30 | 2016-03-31 | 2015-06-30 | 2015-03-31 | 2014-12-31 | 2014-09-30 | 2014-06-30 | 2014-03-31 | 2013-12-31 | 2013-09-30 | 2013-06-30 | 2013-03-31 | 2012-12-31 | 2012-09-30 | 2012-06-30 | 2012-03-31 | 2011-12-31 | 2011-09-30 | 2011-06-30 | 2011-03-31 | 2010-12-31 | 2010-09-30 | 2010-06-30 | 2010-03-31 | ||
|---|---|---|---|---|---|---|---|---|---|---|---|---|---|---|---|---|---|---|---|---|---|---|---|---|---|---|---|---|---|---|---|---|---|---|---|---|---|---|---|---|---|---|---|---|---|---|---|---|---|---|---|---|---|---|
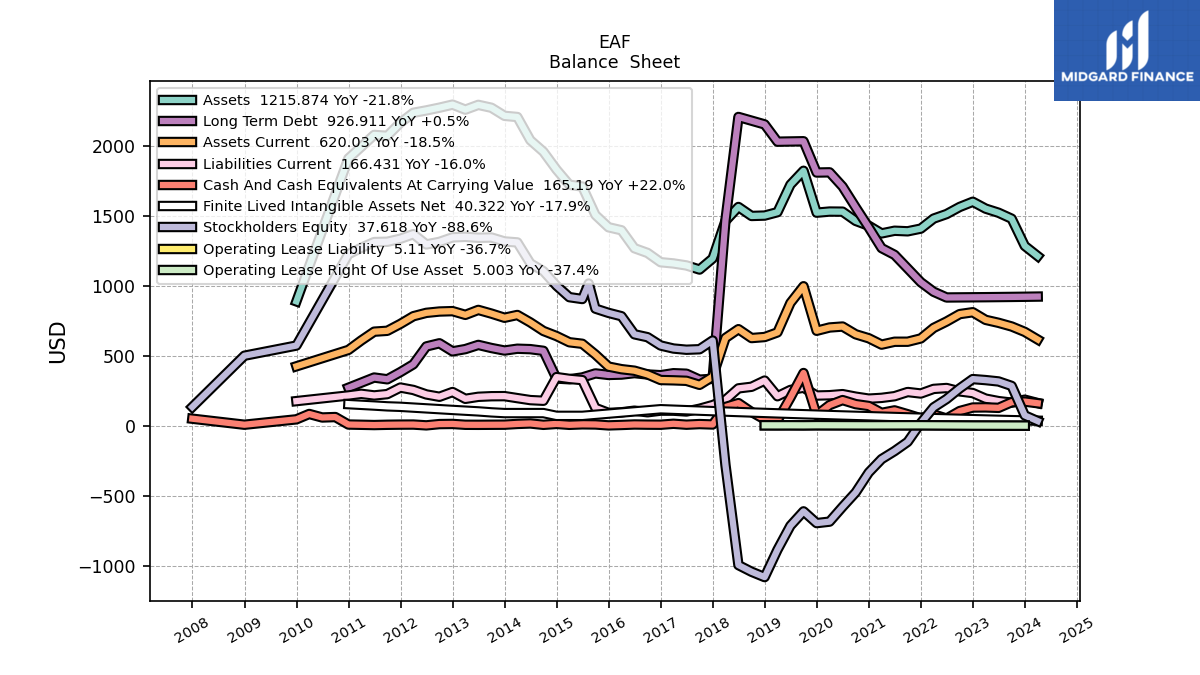
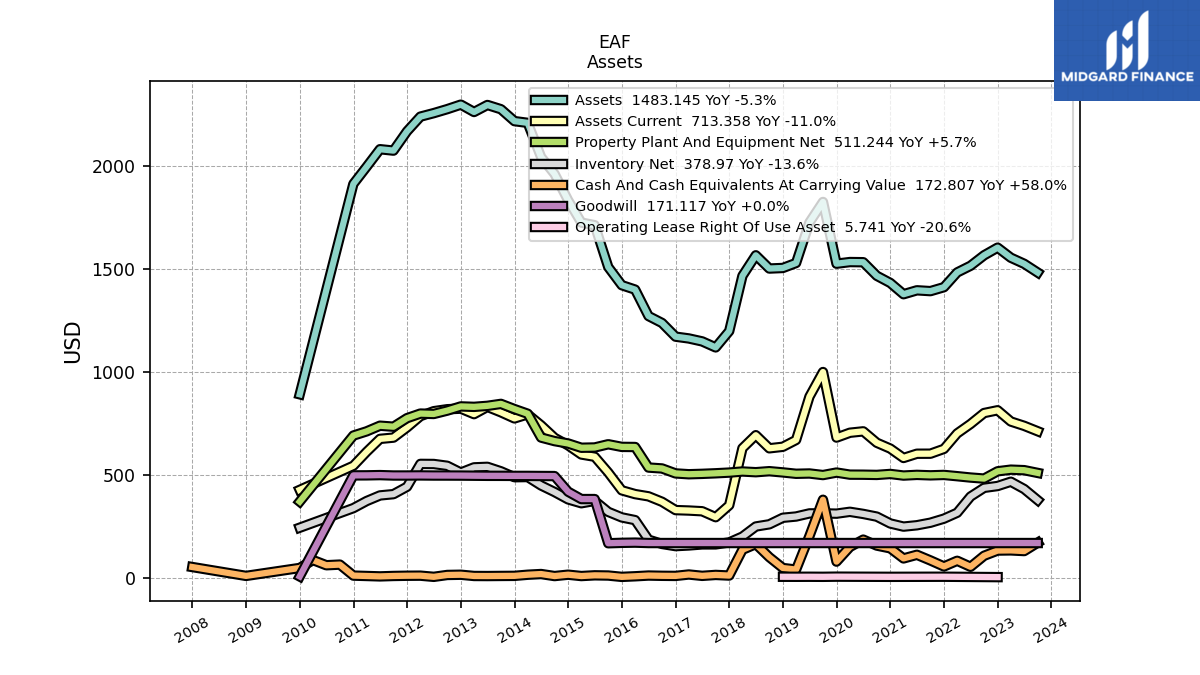
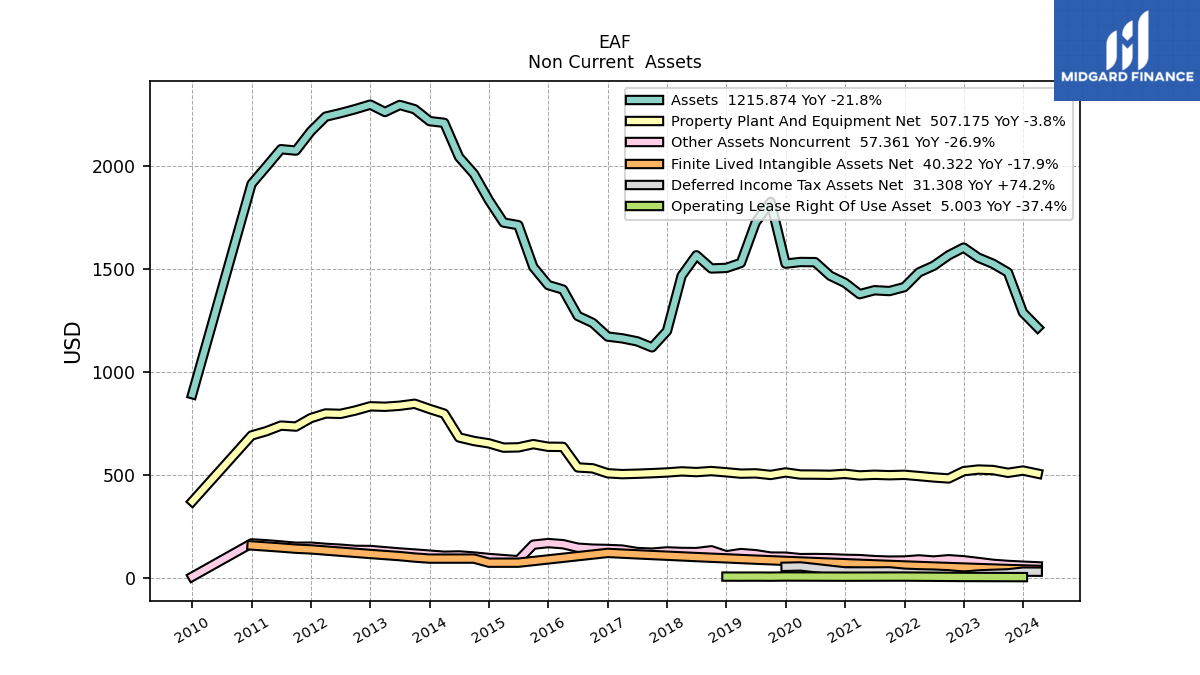
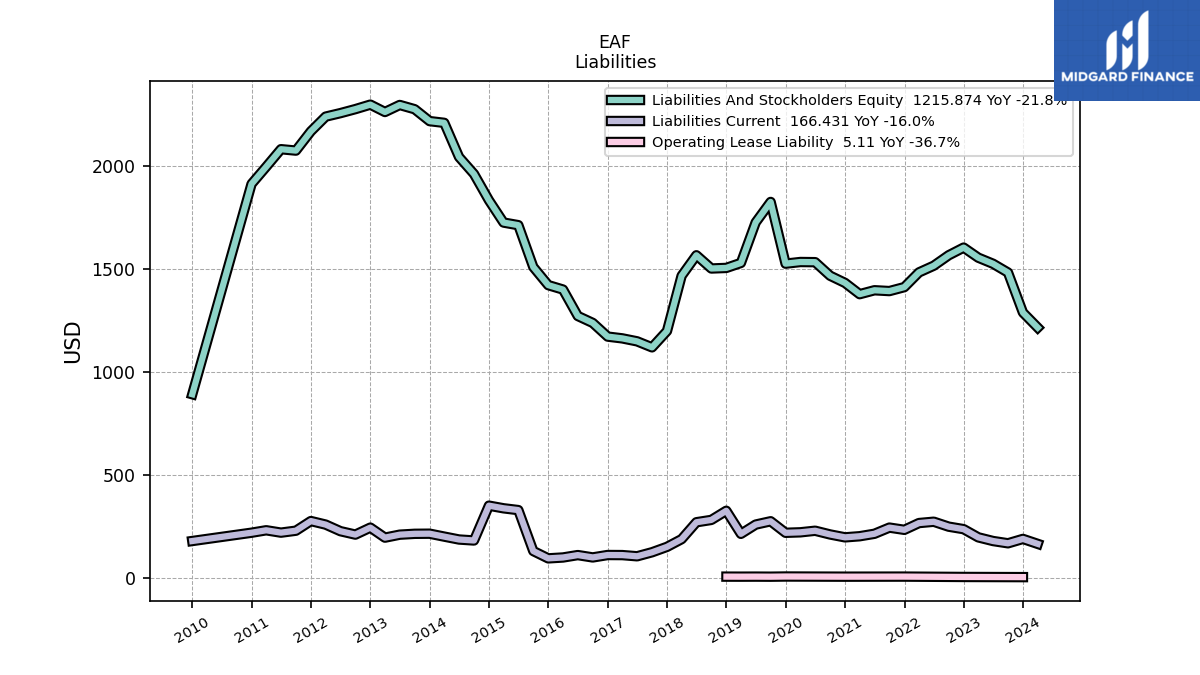
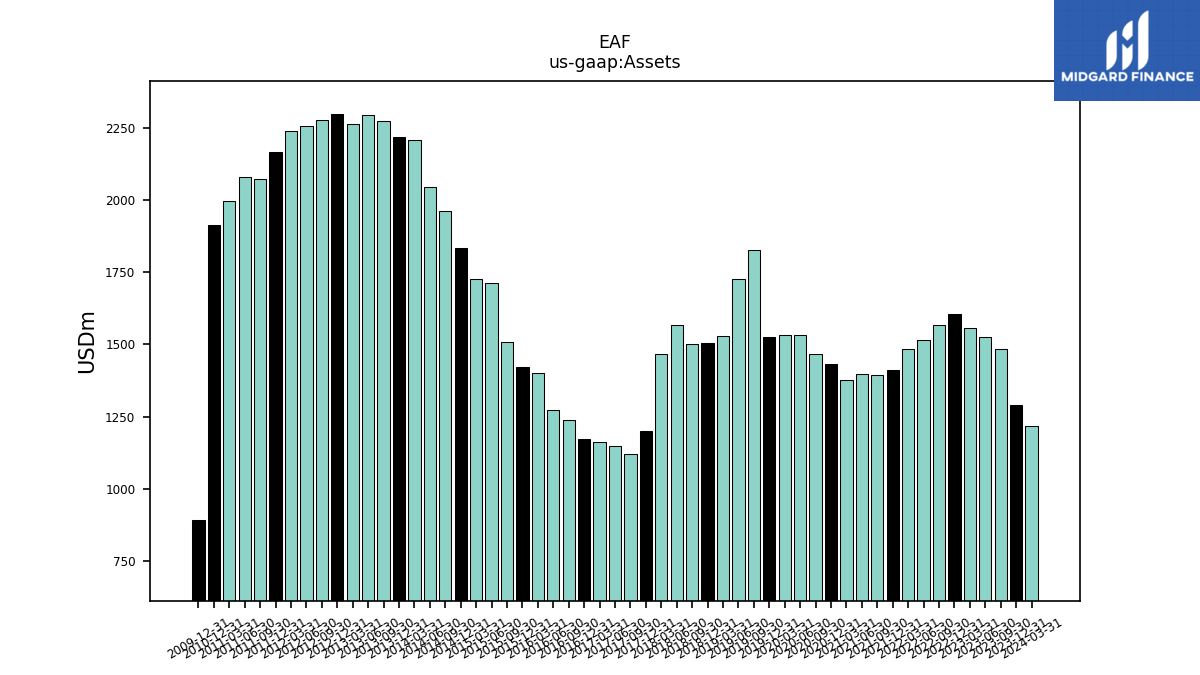
| Assets | 1483.14 | 1525.67 | 1555.25 | 1604.18 | 1566.97 | 1516.26 | 1483.80 | 1412.32 | 1393.15 | 1397.14 | 1378.12 | 1432.71 | 1467.59 | 1533.44 | 1534.22 | 1526.16 | 1825.67 | 1726.35 | 1529.70 | 1505.49 | 1502.71 | 1566.91 | 1467.18 | 1199.10 | 1120.01 | 1149.27 | 1163.63 | 1172.28 | 1238.61 | 1272.27 | 1400.54 | 1712.97 | 1725.66 | 1833.81 | 1961.44 | 2043.84 | 2209.49 | 2217.85 | 2275.62 | 2296.22 | 2262.15 | 2297.91 | 2276.10 | 2256.66 | 2239.70 | 2168.37 | 2074.80 | 2081.61 | 1996.19 | 1913.18 | NA | NA | NA | |
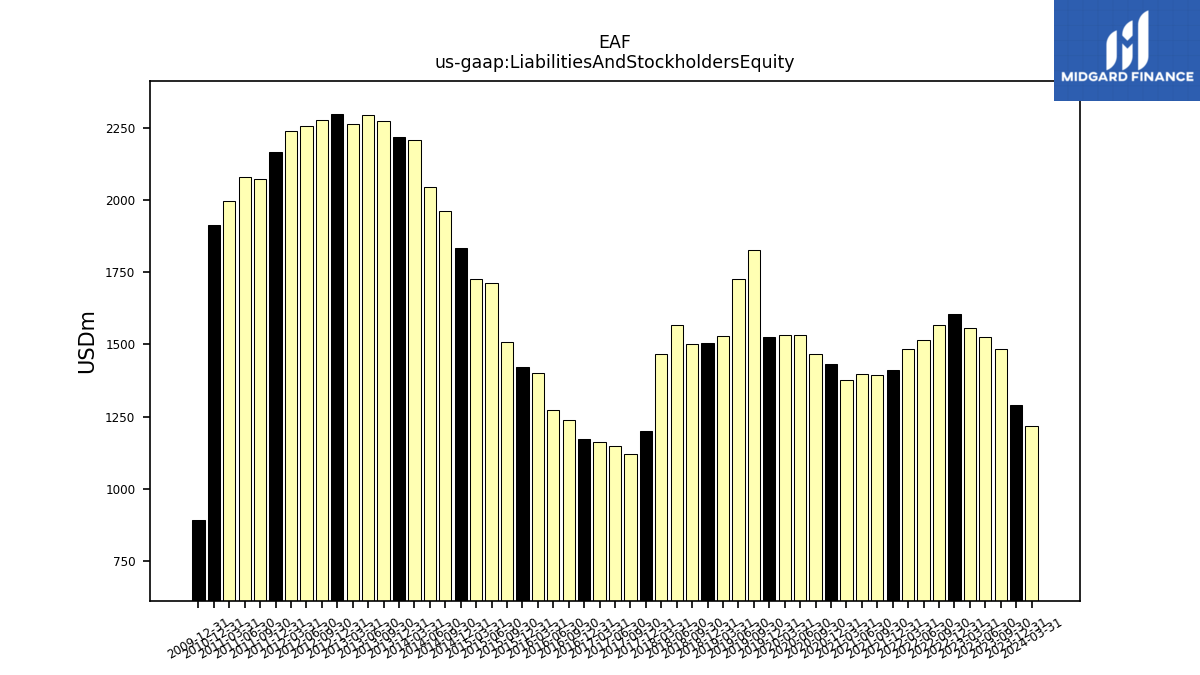
| Liabilities And Stockholders Equity | 1483.14 | 1525.67 | 1555.25 | 1604.18 | 1566.97 | 1516.26 | 1483.80 | 1412.32 | 1393.15 | 1397.14 | 1378.12 | 1432.71 | 1467.59 | 1533.44 | 1534.22 | 1526.16 | 1825.67 | 1726.35 | 1529.70 | 1505.49 | 1502.71 | 1566.91 | 1467.18 | 1199.10 | 1120.01 | 1149.27 | 1163.63 | 1172.28 | 1238.61 | 1272.27 | 1400.54 | 1712.97 | 1725.66 | 1833.81 | 1961.44 | 2043.84 | 2209.49 | 2217.85 | 2275.62 | 2296.22 | 2262.15 | 2297.91 | 2276.10 | 2256.66 | 2239.70 | 2168.37 | 2074.80 | 2081.61 | 1996.19 | 1913.18 | NA | NA | NA | |
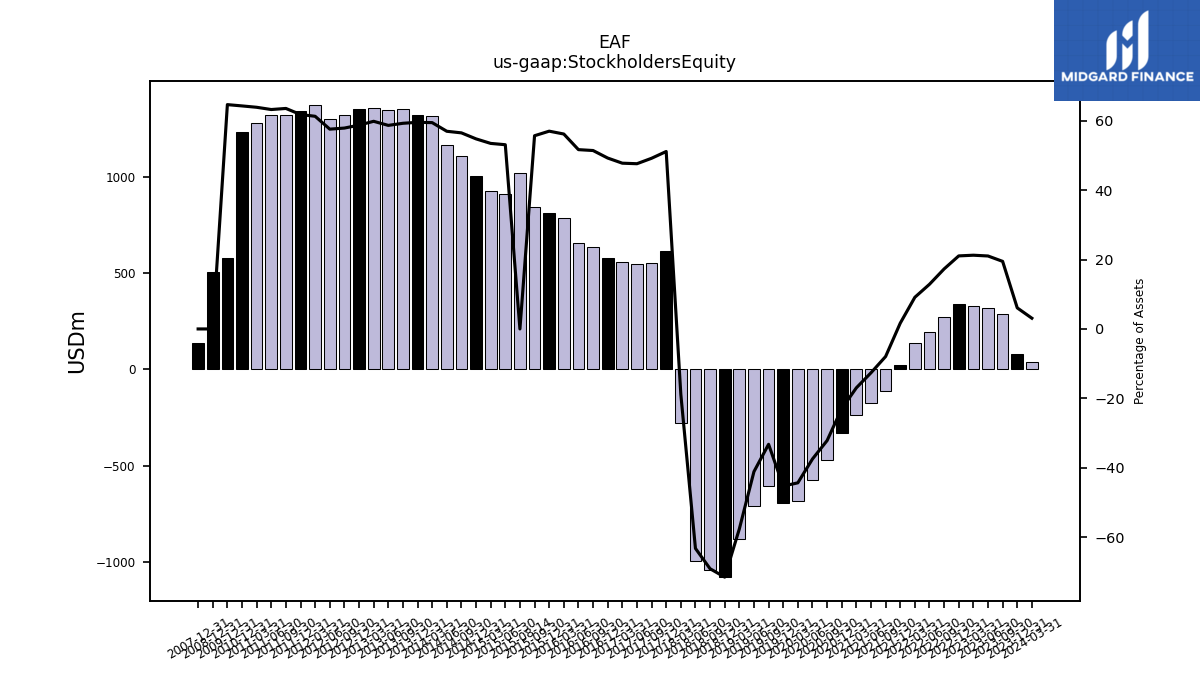
| Stockholders Equity | 288.88 | 320.81 | 330.49 | 337.71 | 271.00 | 195.22 | 135.41 | 23.40 | -110.70 | -176.56 | -233.84 | -329.38 | -472.11 | -574.71 | -680.38 | -691.07 | -606.89 | -709.84 | -881.62 | -1076.77 | -1038.48 | -991.02 | -276.19 | 613.22 | 550.88 | 547.25 | 555.88 | 577.38 | 636.91 | 657.46 | 786.79 | 909.48 | 922.75 | 1004.53 | 1108.38 | 1164.38 | 1313.81 | 1320.75 | 1348.74 | 1347.06 | 1353.71 | 1349.85 | 1317.65 | 1299.45 | 1372.64 | 1339.94 | 1318.49 | 1316.32 | 1275.23 | 1229.73 | NA | NA | NA |
| 2023-09-30 | 2023-06-30 | 2023-03-31 | 2022-12-31 | 2022-09-30 | 2022-06-30 | 2022-03-31 | 2021-12-31 | 2021-09-30 | 2021-06-30 | 2021-03-31 | 2020-12-31 | 2020-09-30 | 2020-06-30 | 2020-03-31 | 2019-12-31 | 2019-09-30 | 2019-06-30 | 2019-03-31 | 2018-12-31 | 2018-09-30 | 2018-06-30 | 2018-03-31 | 2017-12-31 | 2017-09-30 | 2017-06-30 | 2017-03-31 | 2016-12-31 | 2016-09-30 | 2016-06-30 | 2016-03-31 | 2015-06-30 | 2015-03-31 | 2014-12-31 | 2014-09-30 | 2014-06-30 | 2014-03-31 | 2013-12-31 | 2013-09-30 | 2013-06-30 | 2013-03-31 | 2012-12-31 | 2012-09-30 | 2012-06-30 | 2012-03-31 | 2011-12-31 | 2011-09-30 | 2011-06-30 | 2011-03-31 | 2010-12-31 | 2010-09-30 | 2010-06-30 | 2010-03-31 | ||
|---|---|---|---|---|---|---|---|---|---|---|---|---|---|---|---|---|---|---|---|---|---|---|---|---|---|---|---|---|---|---|---|---|---|---|---|---|---|---|---|---|---|---|---|---|---|---|---|---|---|---|---|---|---|---|
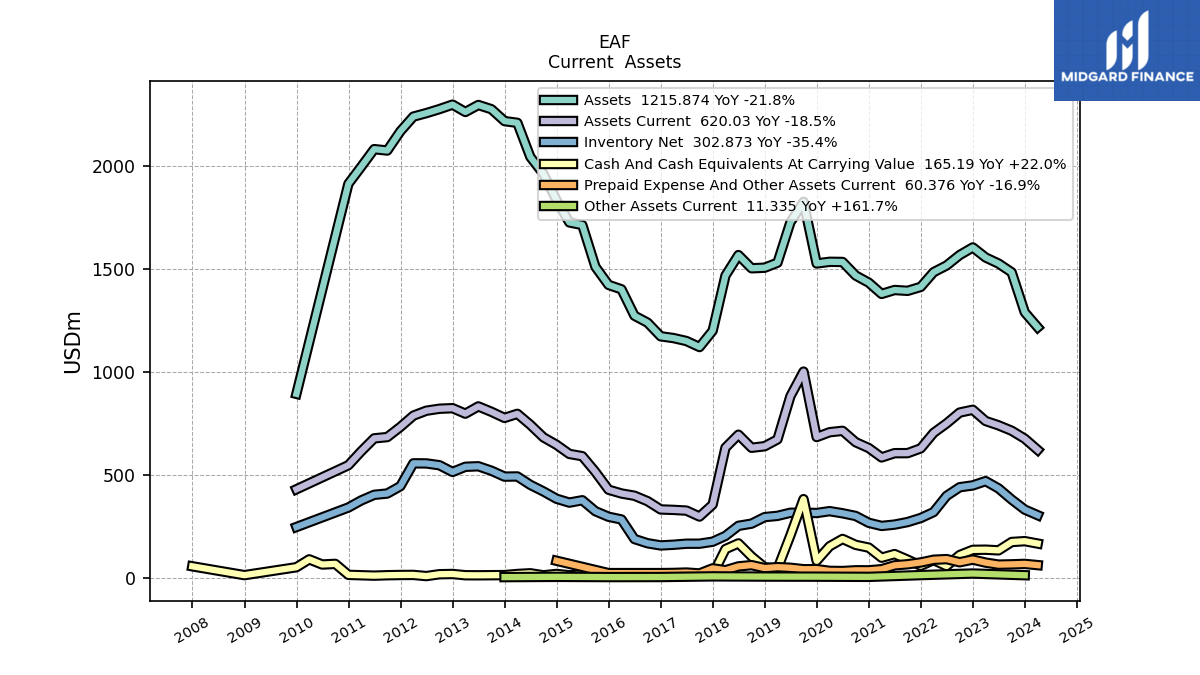
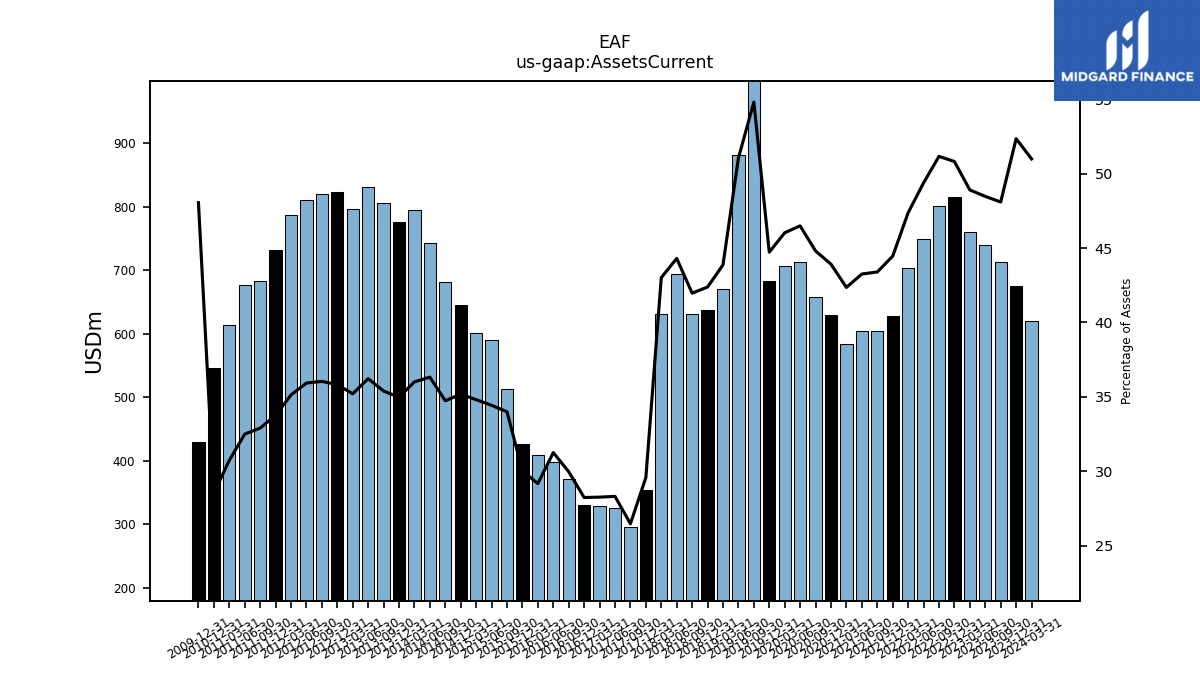
| Assets Current | 713.36 | 739.56 | 760.64 | 815.23 | 801.74 | 748.81 | 702.93 | 627.86 | 604.52 | 604.34 | 583.73 | 629.17 | 657.57 | 712.97 | 706.19 | 682.58 | 1000.76 | 881.34 | 671.09 | 638.05 | 630.64 | 694.25 | 631.08 | 354.54 | 296.43 | 325.31 | 328.78 | 330.93 | 371.12 | 397.62 | 408.49 | 589.78 | 600.70 | 645.00 | 681.31 | 742.38 | 795.57 | 775.66 | 805.34 | 831.69 | 796.37 | 823.00 | 820.24 | 810.71 | 786.72 | 731.95 | 682.54 | 676.39 | 613.41 | 545.88 | NA | NA | NA | |
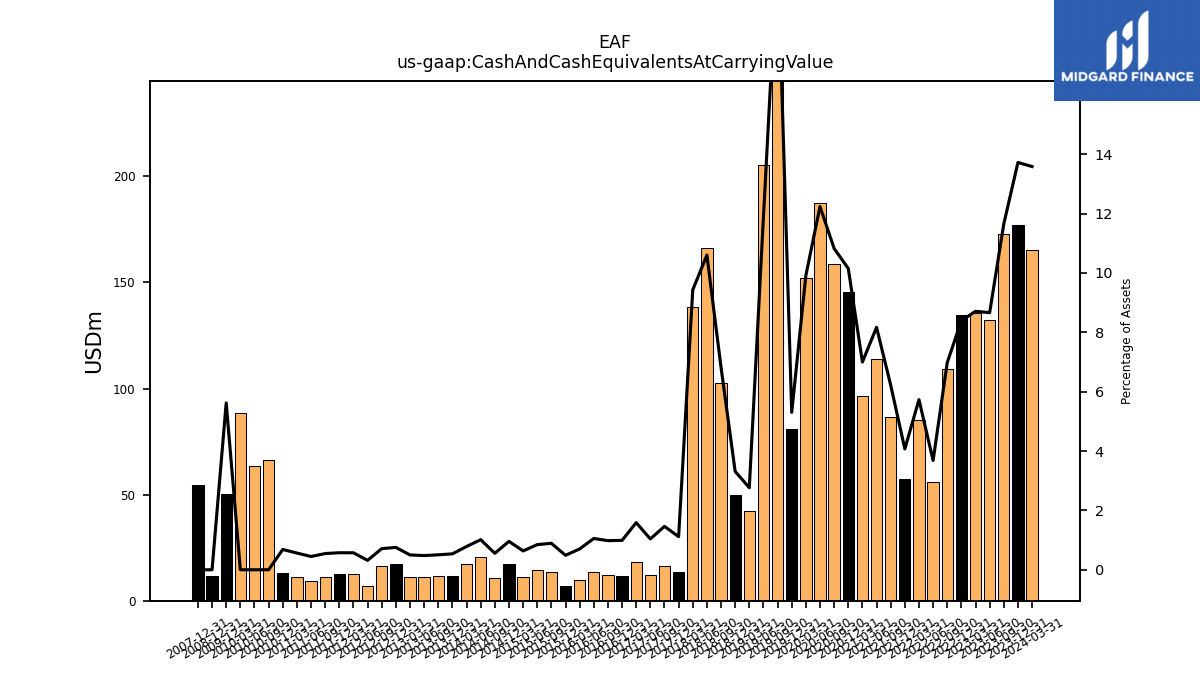
| Cash And Cash Equivalents At Carrying Value | 172.81 | 132.16 | 135.44 | 134.64 | 109.39 | 55.84 | 85.05 | 57.51 | 86.66 | 114.13 | 96.45 | 145.44 | 158.84 | 187.66 | 152.11 | 80.94 | 381.16 | 205.25 | 42.29 | 49.88 | 102.51 | 166.14 | 138.37 | 13.37 | 16.38 | 11.93 | 18.48 | 11.61 | 12.15 | 13.41 | 9.83 | 14.51 | 10.96 | 17.55 | 10.88 | 20.73 | 17.32 | 11.89 | 11.47 | 10.99 | 11.30 | 17.32 | 16.19 | 7.14 | 12.82 | 12.43 | 11.34 | 9.30 | 11.25 | 13.10 | 66.50 | 63.38 | 88.53 | |
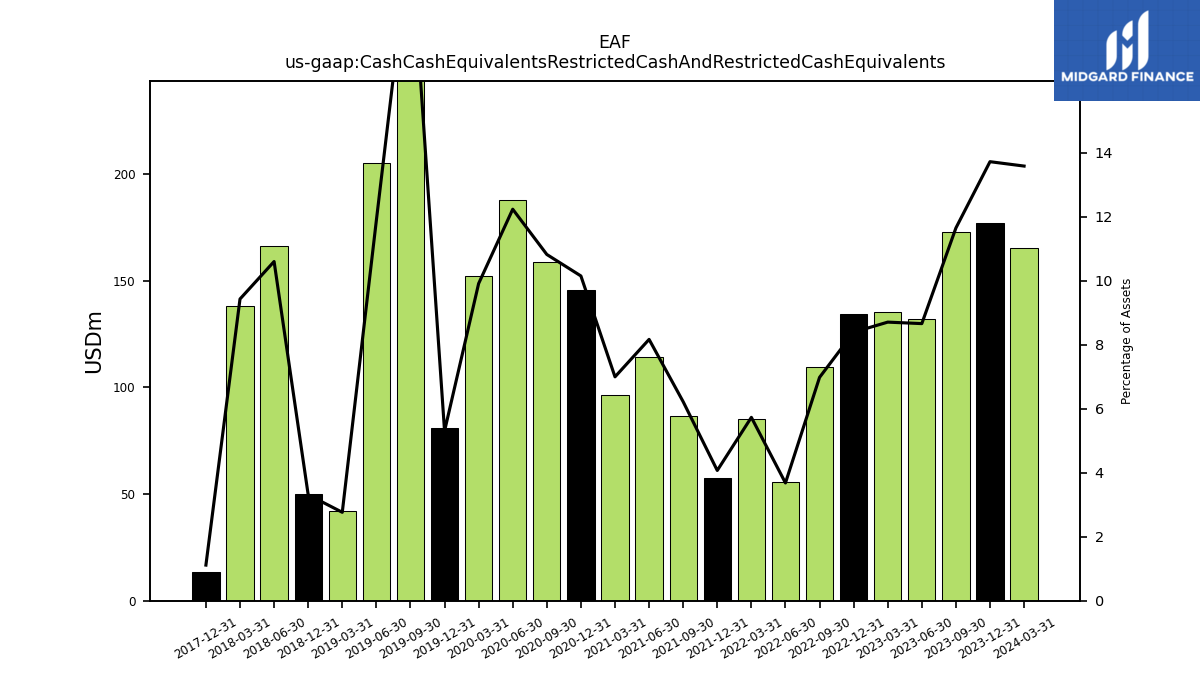
| Cash Cash Equivalents Restricted Cash And Restricted Cash Equivalents | 172.81 | 132.16 | 135.44 | 134.64 | 109.39 | 55.84 | 85.05 | 57.51 | 86.66 | 114.13 | 96.45 | 145.44 | 158.84 | 187.66 | 152.11 | 80.94 | 381.16 | 205.25 | 42.29 | 49.88 | NA | 166.14 | 138.37 | 13.37 | NA | NA | NA | NA | NA | NA | NA | NA | NA | NA | NA | NA | NA | NA | NA | NA | NA | NA | NA | NA | NA | NA | NA | NA | NA | NA | NA | NA | NA | |
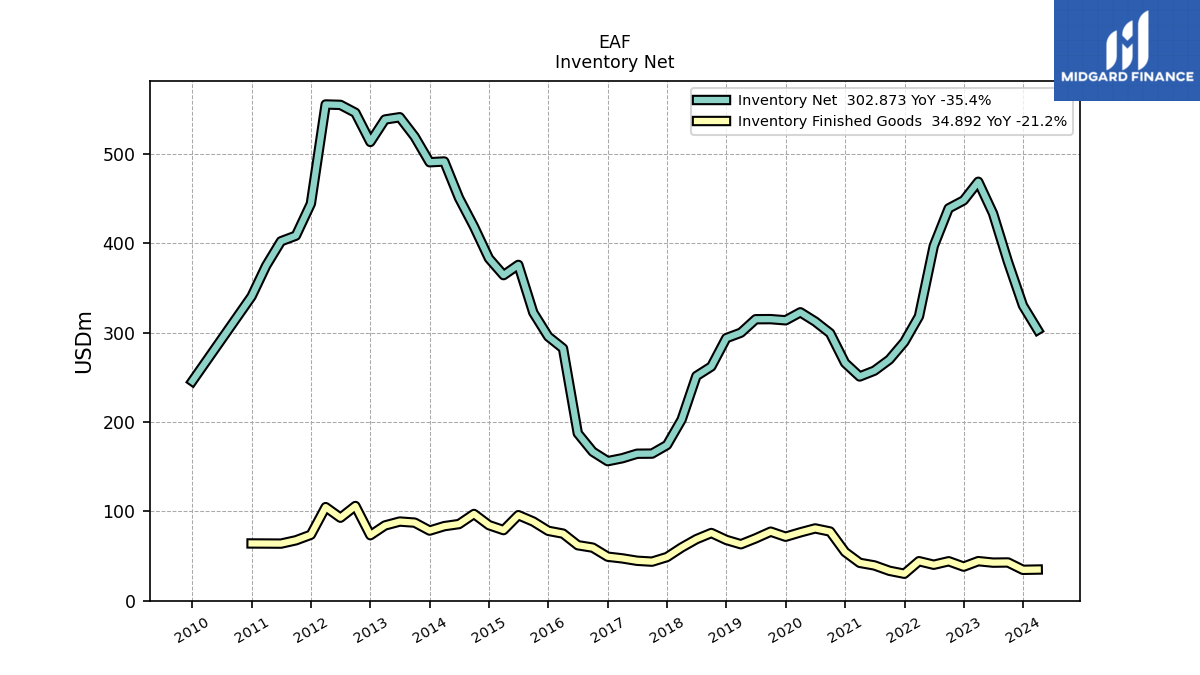
| Inventory Net | 378.97 | 433.11 | 468.61 | 447.74 | 438.87 | 396.75 | 318.06 | 289.43 | 269.71 | 257.34 | 250.81 | 265.96 | 299.24 | 312.30 | 322.62 | 313.65 | 314.95 | 314.87 | 299.79 | 293.72 | 261.98 | 251.33 | 202.52 | 174.15 | 164.57 | 164.42 | 159.39 | 156.11 | 166.68 | 187.24 | 282.27 | 375.63 | 364.15 | 382.90 | 418.48 | 450.42 | 491.27 | 490.41 | 519.01 | 540.77 | 538.22 | 513.07 | 545.78 | 554.57 | 555.04 | 444.06 | 408.33 | 402.04 | 374.79 | 340.42 | NA | NA | NA | |
| Inventory Finished Goods | 42.82 | 42.63 | 44.29 | 38.16 | 44.17 | 40.26 | 44.23 | 30.19 | 33.51 | 39.48 | 42.41 | 54.53 | 77.43 | 80.88 | 76.49 | 71.60 | 77.29 | 69.81 | 63.18 | 68.02 | 75.78 | 68.89 | 59.55 | 48.87 | 43.73 | 44.72 | 47.38 | 49.26 | 59.40 | 62.10 | 75.10 | 95.72 | 79.00 | 84.54 | 97.06 | 85.78 | 83.43 | 78.45 | 87.38 | 88.58 | 84.19 | 73.29 | 105.95 | 92.85 | 104.72 | 73.82 | 67.60 | 63.90 | NA | 64.08 | NA | NA | NA | |
| Inventory Raw Materials And Supplies | 147.53 | 185.71 | 217.59 | 216.76 | 212.04 | 195.30 | 143.97 | 132.11 | 121.87 | 98.69 | 95.99 | 101.10 | 95.14 | 106.70 | 121.19 | 104.82 | 94.47 | 99.24 | 97.95 | 99.94 | 78.08 | 73.35 | 49.39 | 39.43 | 55.49 | 50.47 | 51.04 | 54.47 | 51.17 | 60.08 | 73.56 | 111.52 | 112.42 | 122.22 | 150.34 | 168.23 | 174.25 | 184.42 | 202.16 | 209.59 | 226.23 | 230.06 | 209.04 | 203.43 | 211.65 | 168.98 | 159.39 | 173.17 | NA | 118.69 | NA | NA | NA | |
| Other Assets Current | NA | NA | NA | 19.60 | NA | NA | NA | 11.90 | NA | NA | NA | 3.38 | NA | NA | NA | 4.33 | NA | NA | NA | 4.70 | NA | NA | NA | 5.73 | NA | NA | NA | 2.58 | NA | NA | NA | NA | NA | 3.44 | NA | NA | NA | 2.12 | NA | NA | NA | NA | NA | NA | NA | NA | NA | NA | NA | NA | NA | NA | NA | |
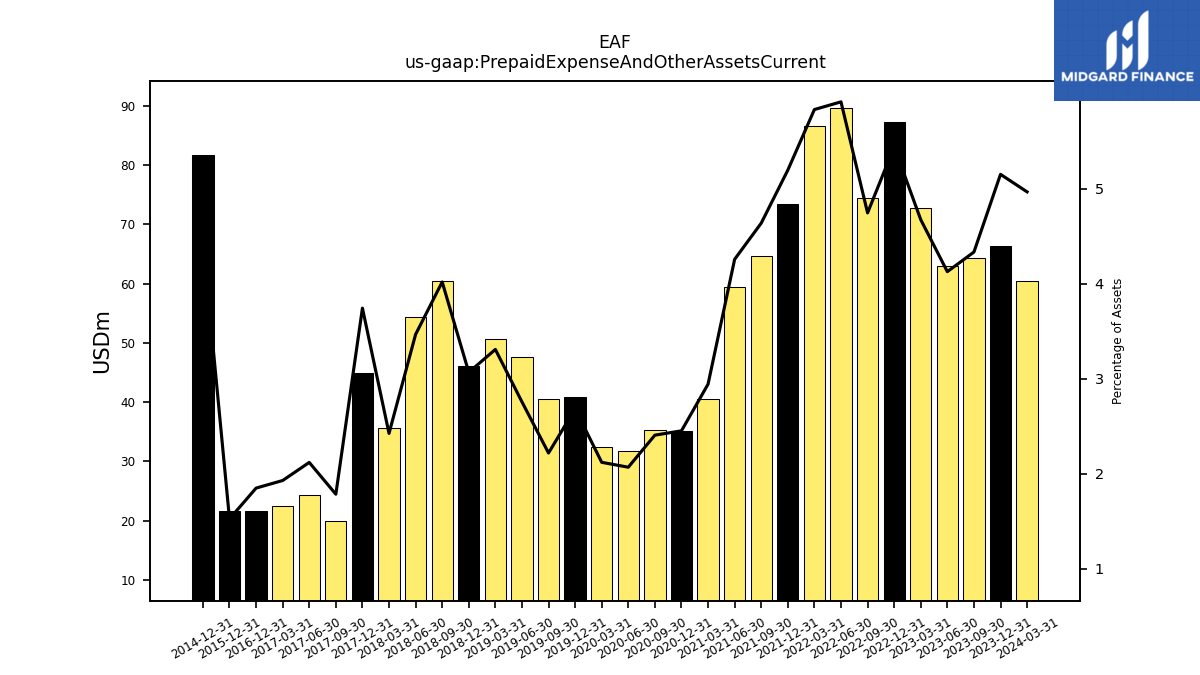
| Prepaid Expense And Other Assets Current | 64.25 | 62.95 | 72.68 | 87.27 | 74.34 | 89.66 | 86.54 | 73.36 | 64.59 | 59.46 | 40.54 | 35.11 | 35.30 | 31.71 | 32.52 | 40.95 | 40.48 | 47.58 | 50.59 | 46.17 | 60.37 | 54.30 | 35.56 | 44.87 | 19.98 | 24.34 | 22.44 | 21.66 | NA | NA | NA | NA | NA | 81.62 | NA | NA | NA | NA | NA | NA | NA | NA | NA | NA | NA | NA | NA | NA | NA | NA | NA | NA | NA | |
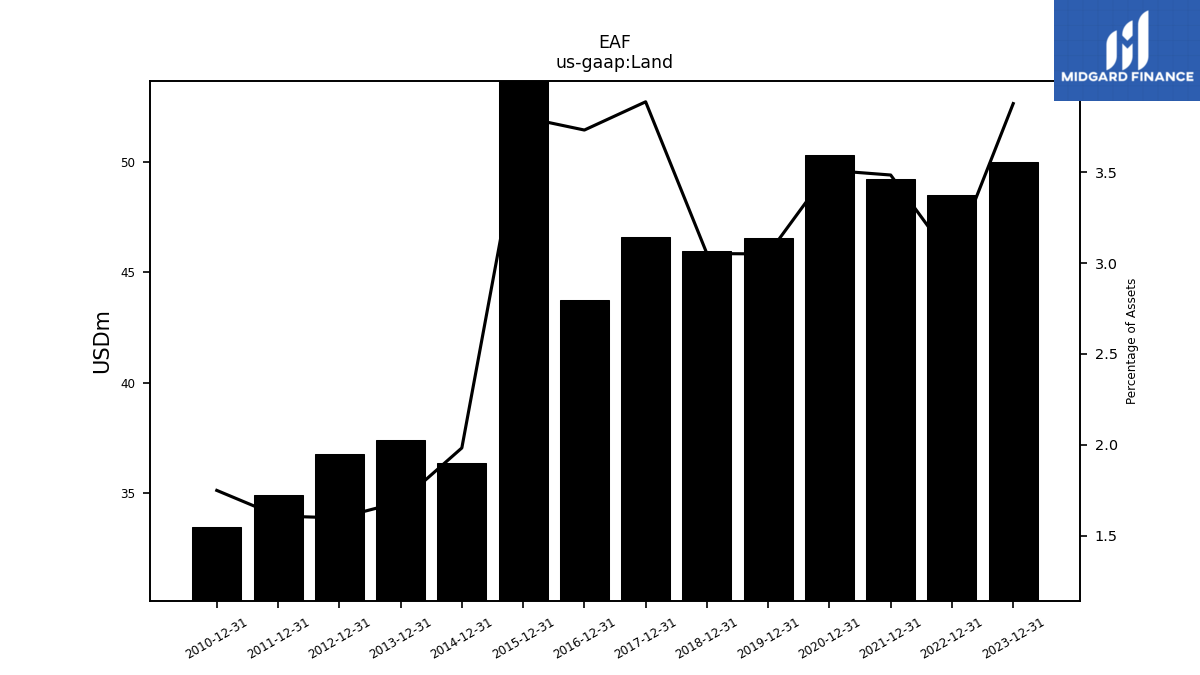
| Land | NA | NA | NA | 48.48 | NA | NA | NA | 49.20 | NA | NA | NA | 50.28 | NA | NA | NA | 46.55 | NA | NA | NA | 45.95 | NA | NA | NA | 46.60 | NA | NA | NA | 43.74 | NA | NA | NA | NA | NA | 36.38 | NA | NA | NA | 37.42 | NA | NA | NA | 36.74 | NA | NA | NA | 34.90 | NA | NA | NA | 33.48 | NA | NA | NA | |
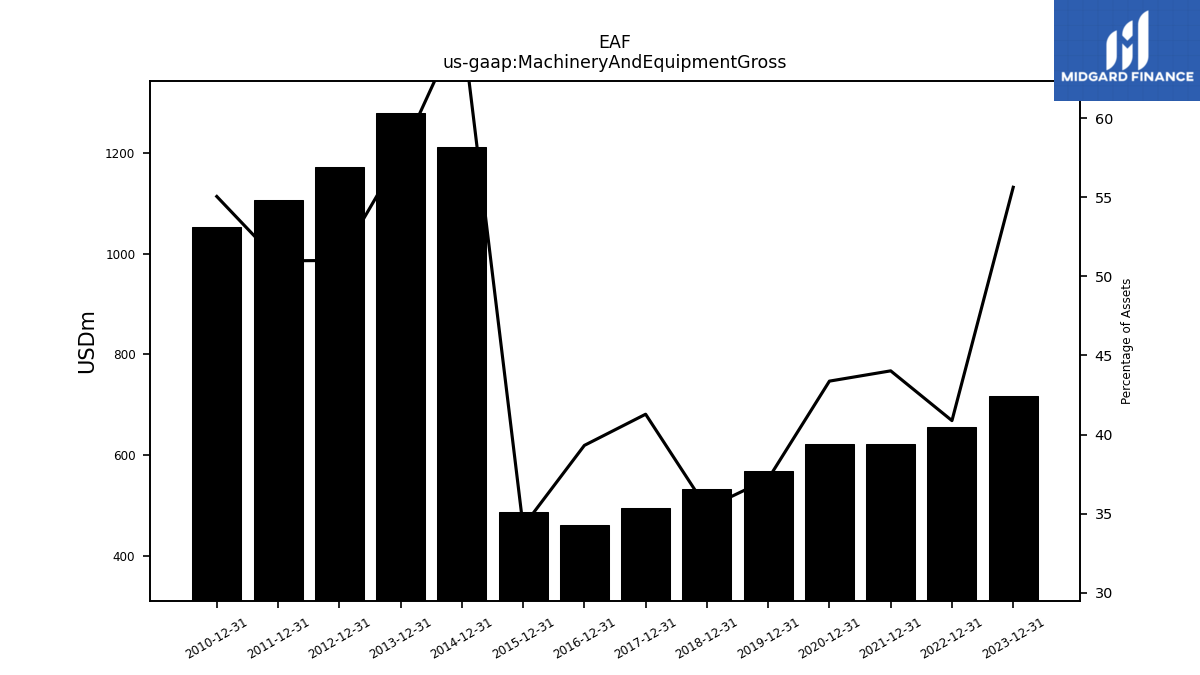
| Machinery And Equipment Gross | NA | NA | NA | 655.82 | NA | NA | NA | 621.81 | NA | NA | NA | 621.48 | NA | NA | NA | 567.72 | NA | NA | NA | 532.08 | NA | NA | NA | 495.07 | NA | NA | NA | 460.89 | NA | NA | NA | NA | NA | 1212.12 | NA | NA | NA | 1278.65 | NA | NA | NA | 1172.05 | NA | NA | NA | 1105.44 | NA | NA | NA | 1053.20 | NA | NA | NA |
| 2023-09-30 | 2023-06-30 | 2023-03-31 | 2022-12-31 | 2022-09-30 | 2022-06-30 | 2022-03-31 | 2021-12-31 | 2021-09-30 | 2021-06-30 | 2021-03-31 | 2020-12-31 | 2020-09-30 | 2020-06-30 | 2020-03-31 | 2019-12-31 | 2019-09-30 | 2019-06-30 | 2019-03-31 | 2018-12-31 | 2018-09-30 | 2018-06-30 | 2018-03-31 | 2017-12-31 | 2017-09-30 | 2017-06-30 | 2017-03-31 | 2016-12-31 | 2016-09-30 | 2016-06-30 | 2016-03-31 | 2015-06-30 | 2015-03-31 | 2014-12-31 | 2014-09-30 | 2014-06-30 | 2014-03-31 | 2013-12-31 | 2013-09-30 | 2013-06-30 | 2013-03-31 | 2012-12-31 | 2012-09-30 | 2012-06-30 | 2012-03-31 | 2011-12-31 | 2011-09-30 | 2011-06-30 | 2011-03-31 | 2010-12-31 | 2010-09-30 | 2010-06-30 | 2010-03-31 | ||
|---|---|---|---|---|---|---|---|---|---|---|---|---|---|---|---|---|---|---|---|---|---|---|---|---|---|---|---|---|---|---|---|---|---|---|---|---|---|---|---|---|---|---|---|---|---|---|---|---|---|---|---|---|---|---|
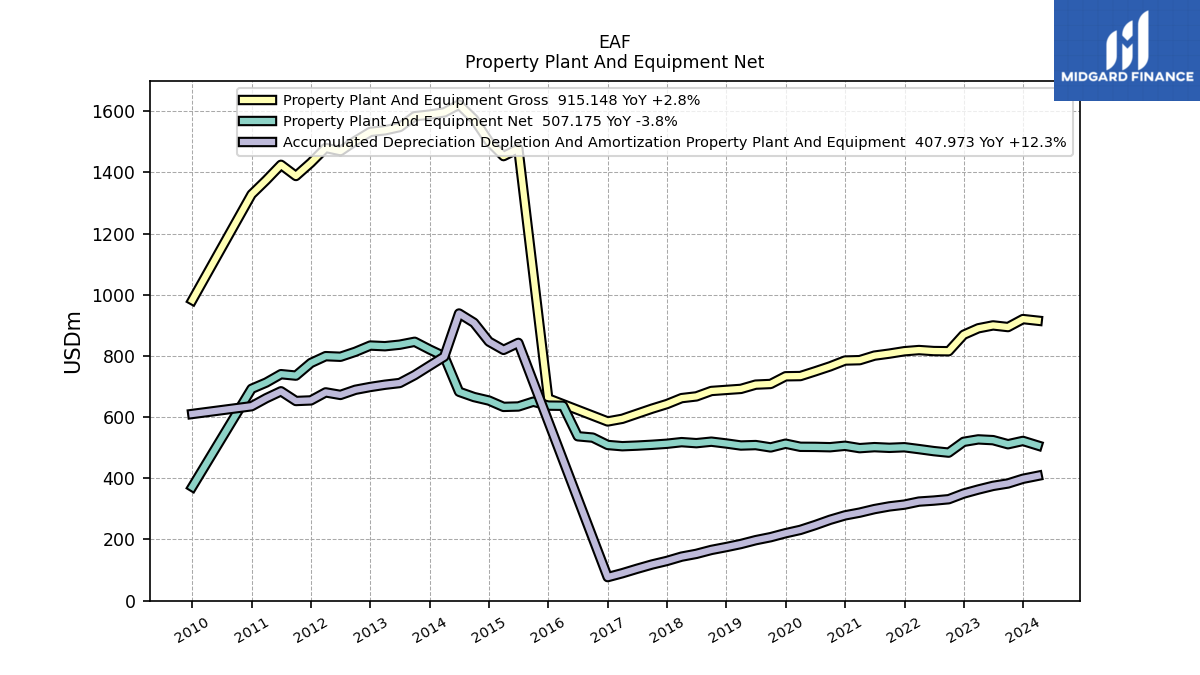
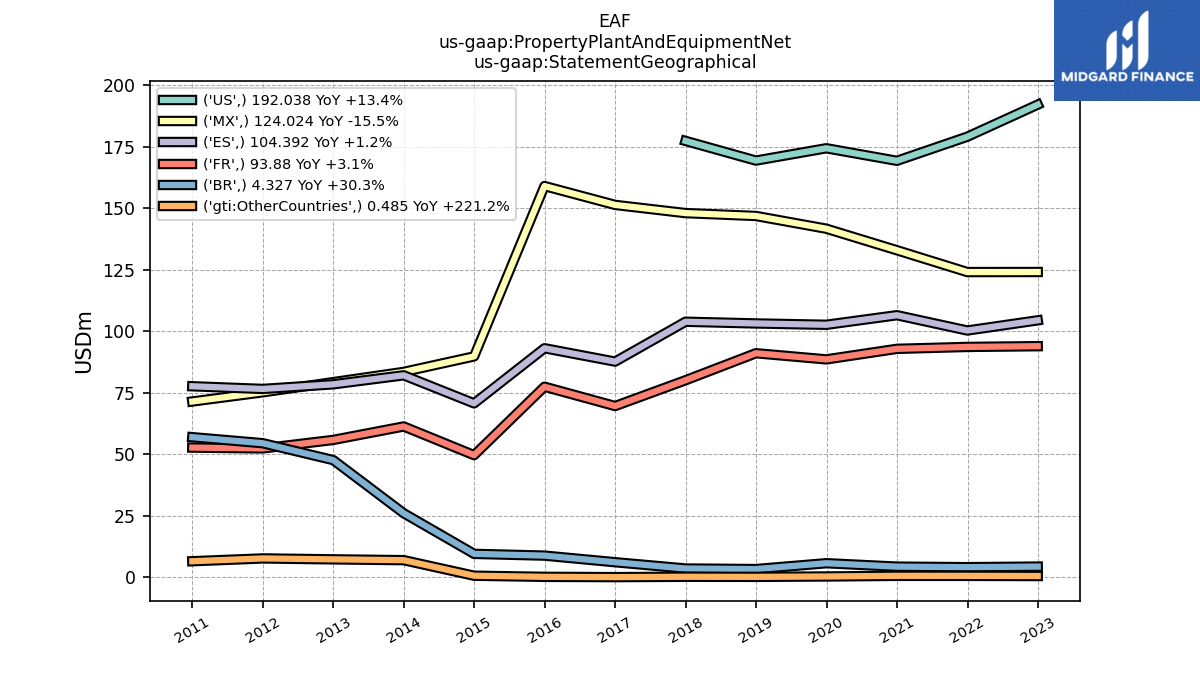
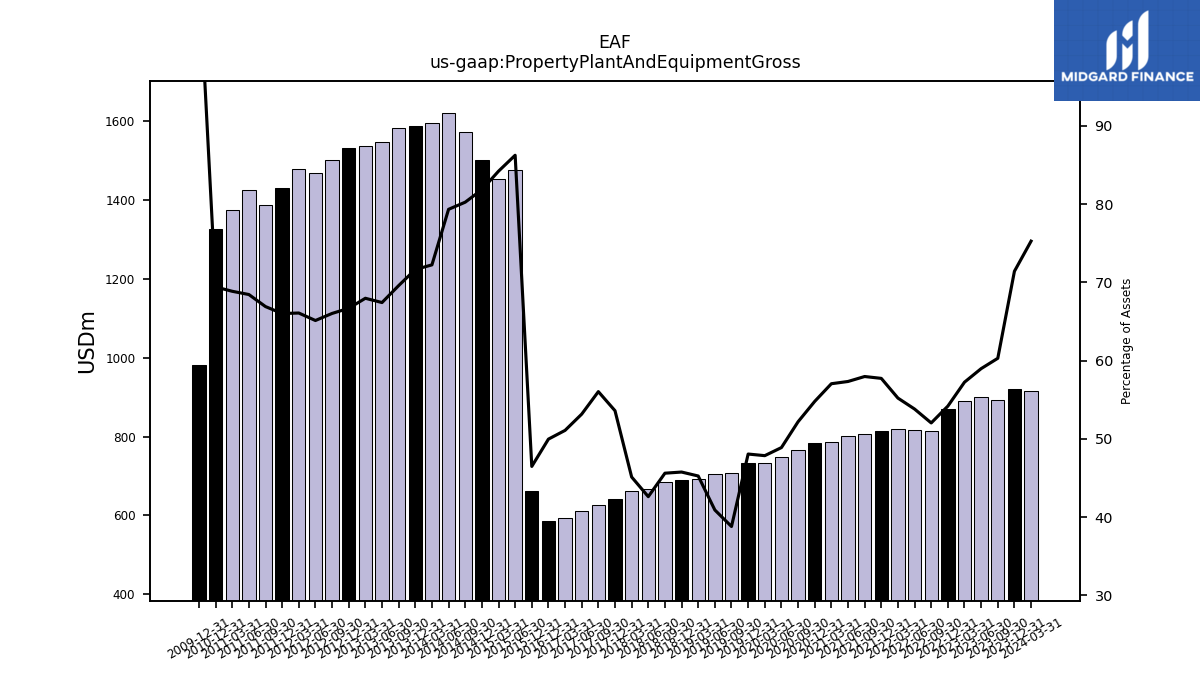
| Property Plant And Equipment Gross | 894.26 | 899.72 | 890.25 | 869.17 | 815.32 | 815.87 | 819.16 | 815.30 | 807.53 | 800.97 | 786.12 | 784.90 | 765.82 | 749.58 | 734.12 | 733.42 | 708.27 | 706.13 | 692.19 | 688.84 | 685.35 | 667.66 | 662.00 | 642.65 | 627.58 | 610.94 | 594.39 | 585.70 | NA | NA | NA | 1477.36 | 1453.08 | 1500.82 | 1573.99 | 1621.46 | 1596.01 | 1588.88 | 1583.44 | 1548.09 | 1537.49 | 1532.36 | 1502.83 | 1469.62 | 1479.99 | 1431.43 | 1388.11 | 1424.75 | 1374.56 | 1328.00 | NA | NA | NA | |
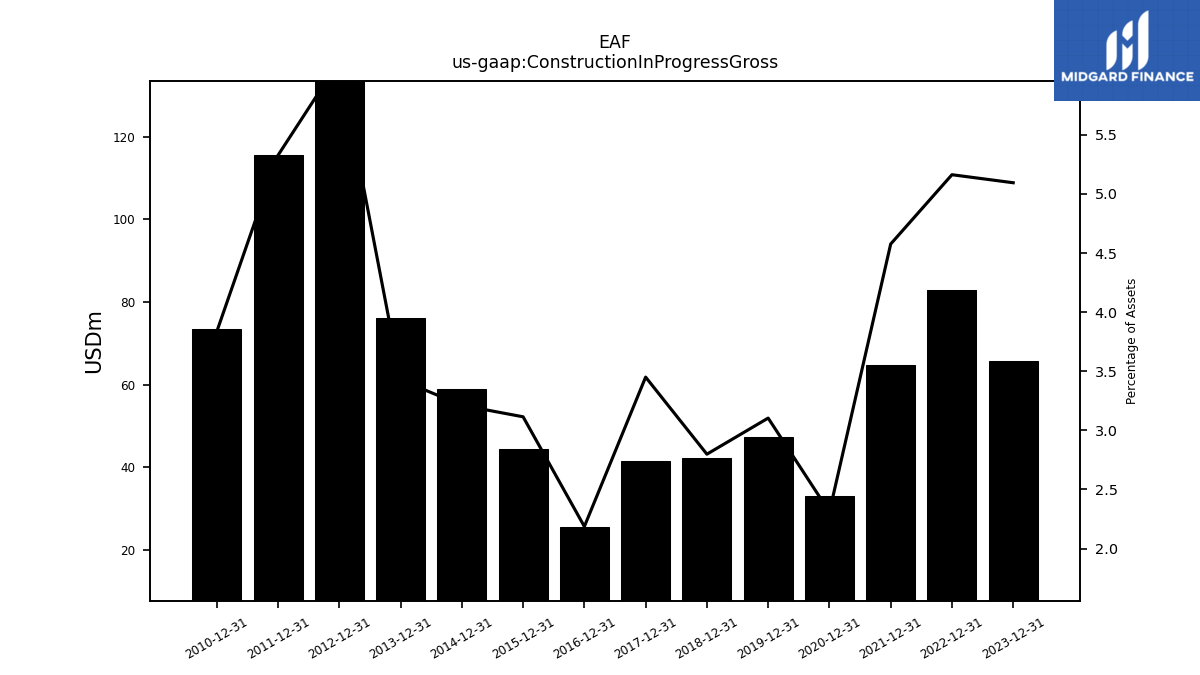
| Construction In Progress Gross | NA | NA | NA | 82.81 | NA | NA | NA | 64.63 | NA | NA | NA | 33.10 | NA | NA | NA | 47.37 | NA | NA | NA | 42.13 | NA | NA | NA | 41.38 | NA | NA | NA | 25.64 | NA | NA | NA | NA | NA | 58.90 | NA | NA | NA | 76.01 | NA | NA | NA | 140.73 | NA | NA | NA | 115.51 | NA | NA | NA | 73.37 | NA | NA | NA | |
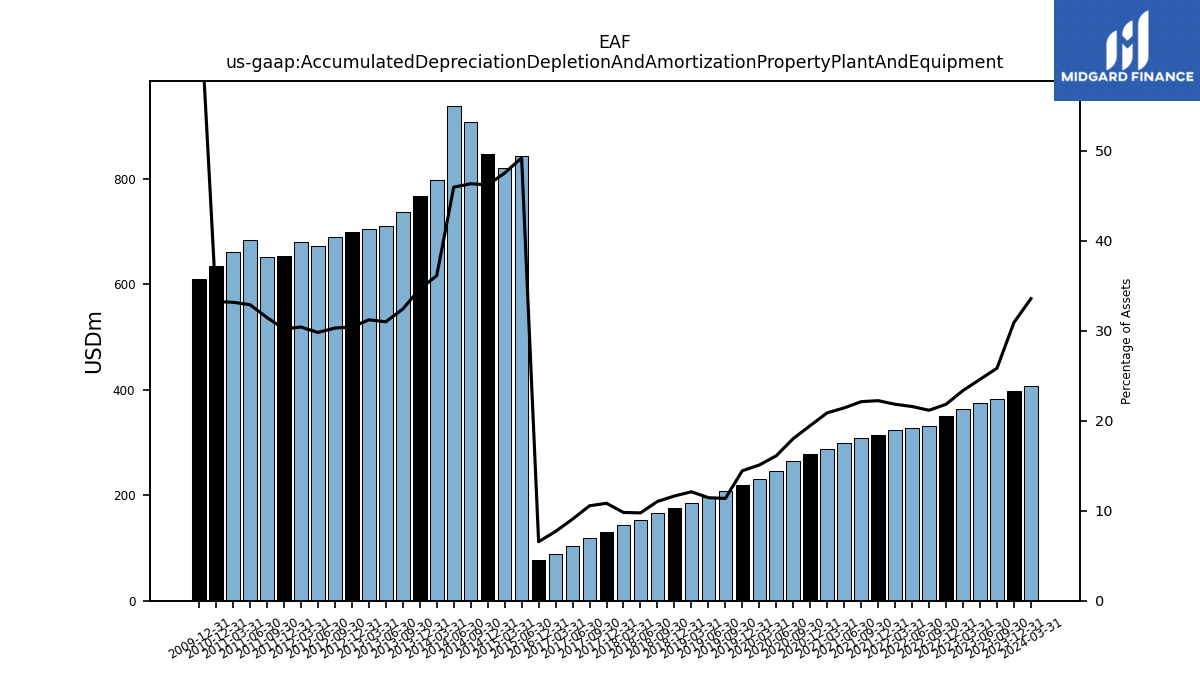
| Accumulated Depreciation Depletion And Amortization Property Plant And Equipment | 383.02 | 375.11 | 363.15 | 350.02 | 331.54 | 327.06 | 323.80 | 313.82 | 308.03 | 299.21 | 287.67 | 278.69 | 264.30 | 246.97 | 231.24 | 220.40 | 207.44 | 197.61 | 185.12 | 175.14 | 165.71 | 152.92 | 143.86 | 129.81 | 118.12 | 104.19 | 89.59 | 76.85 | NA | NA | NA | 842.69 | 819.74 | 846.78 | 908.44 | 938.68 | 797.63 | 767.89 | 737.24 | 711.41 | 705.78 | 698.45 | 689.27 | 672.43 | 680.78 | 654.55 | 652.58 | 684.41 | 661.70 | 635.53 | NA | NA | NA | |
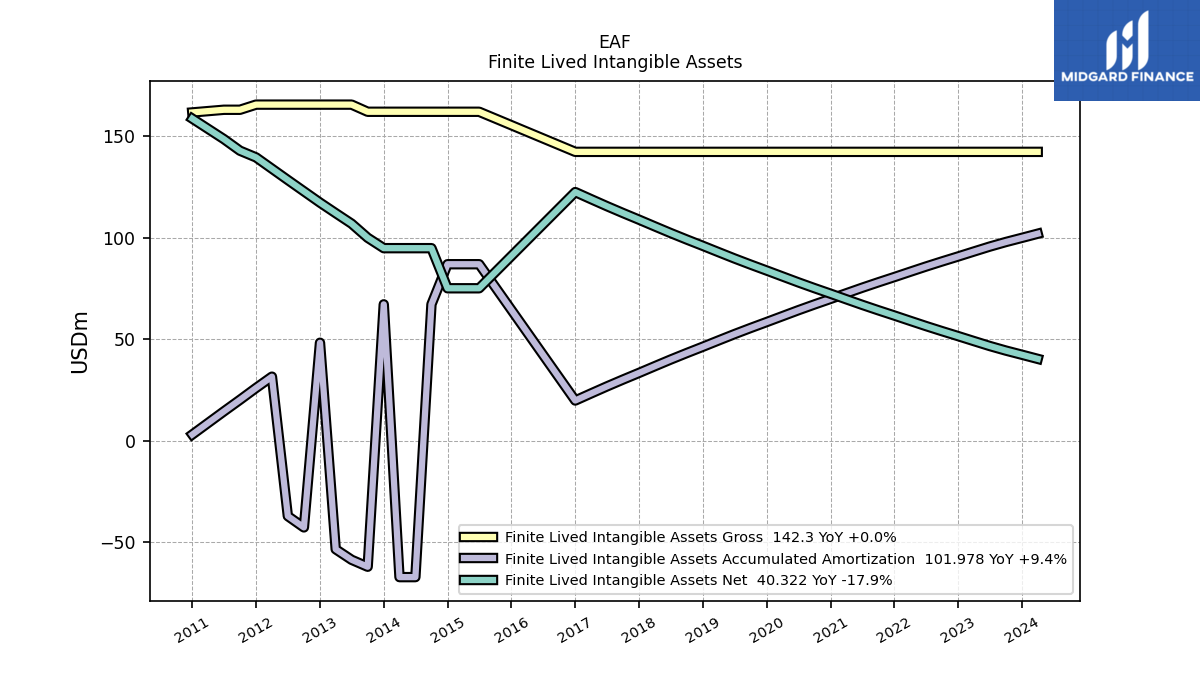
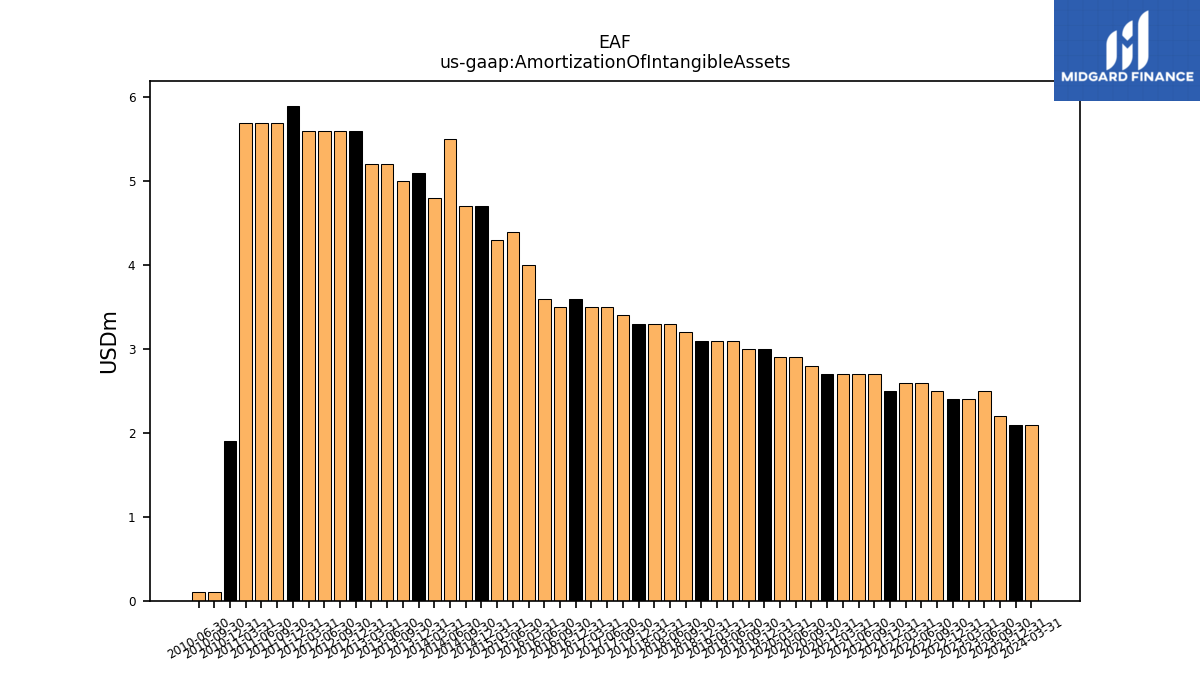
| Amortization Of Intangible Assets | 2.20 | 2.50 | 2.40 | 2.40 | 2.50 | 2.60 | 2.60 | 2.50 | 2.70 | 2.70 | 2.70 | 2.70 | 2.80 | 2.90 | 2.90 | 3.00 | 3.00 | 3.10 | 3.10 | 3.10 | 3.20 | 3.30 | 3.30 | 3.30 | 3.40 | 3.50 | 3.50 | 3.60 | 3.50 | 3.60 | 4.00 | 4.40 | 4.30 | 4.70 | 4.70 | 5.50 | 4.80 | 5.10 | 5.00 | 5.20 | 5.20 | 5.60 | 5.60 | 5.60 | 5.60 | 5.90 | 5.70 | 5.70 | 5.70 | 1.90 | 0.10 | 0.10 | NA | |
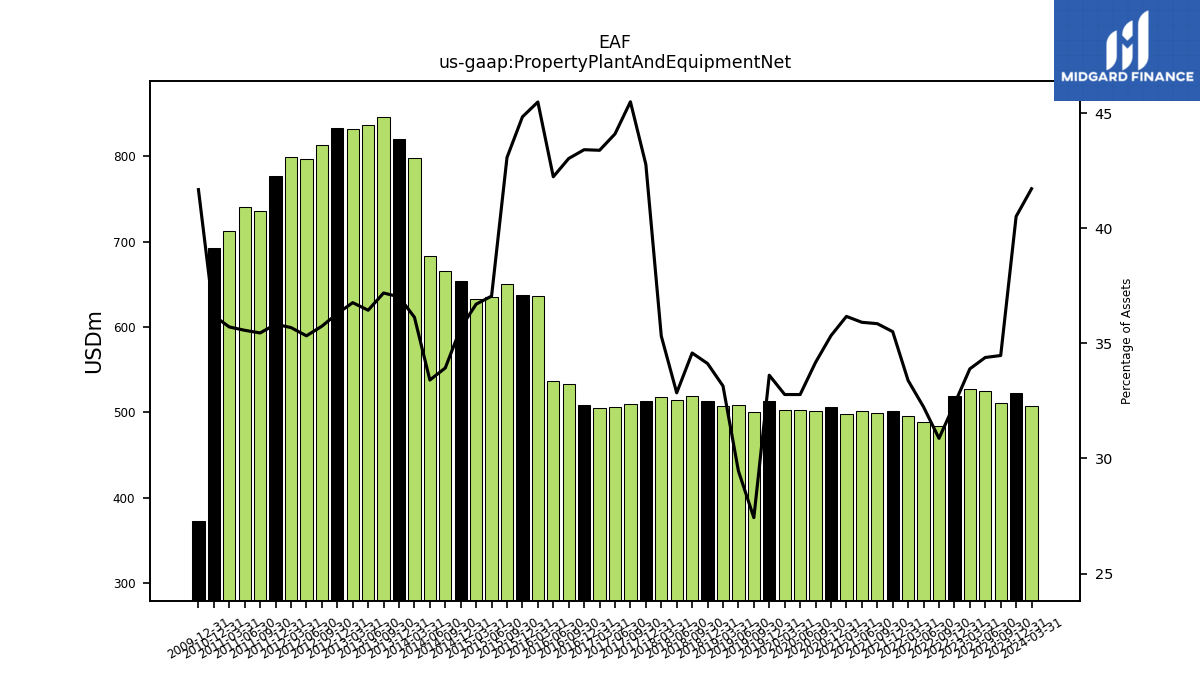
| Property Plant And Equipment Net | 511.24 | 524.61 | 527.10 | 519.15 | 483.78 | 488.81 | 495.36 | 501.47 | 499.50 | 501.76 | 498.46 | 506.22 | 501.52 | 502.61 | 502.87 | 513.02 | 500.82 | 508.53 | 507.06 | 513.71 | 519.64 | 514.74 | 518.14 | 512.84 | 509.46 | 506.75 | 504.81 | 508.86 | 532.92 | 537.30 | 636.96 | 634.67 | 633.34 | 654.04 | 665.55 | 682.78 | 798.38 | 820.99 | 846.20 | 836.68 | 831.70 | 833.91 | 813.55 | 797.19 | 799.21 | 776.88 | 735.53 | 740.34 | 712.86 | 692.47 | NA | NA | NA | |
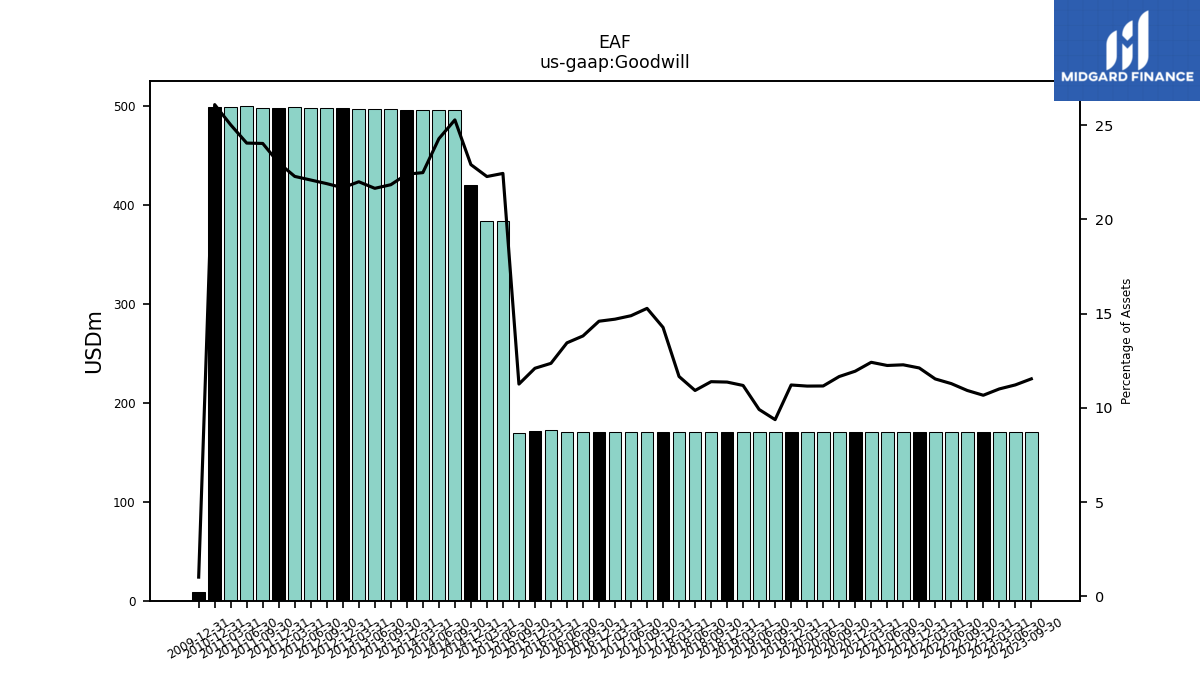
| Goodwill | 171.12 | 171.12 | 171.12 | 171.12 | 171.12 | 171.12 | 171.12 | 171.12 | 171.12 | 171.12 | 171.12 | 171.12 | 171.12 | 171.12 | 171.12 | 171.12 | 171.12 | 171.12 | 171.12 | 171.12 | 171.12 | 171.12 | 171.12 | 171.12 | 171.12 | 171.12 | 171.12 | 171.12 | 171.12 | 171.12 | 173.12 | 384.43 | 384.44 | 420.13 | 495.94 | 496.33 | 496.80 | 496.81 | 497.07 | 497.16 | 497.68 | 498.26 | 498.47 | 498.54 | 499.10 | 498.68 | 498.66 | 500.69 | 499.48 | 499.24 | NA | NA | NA | |
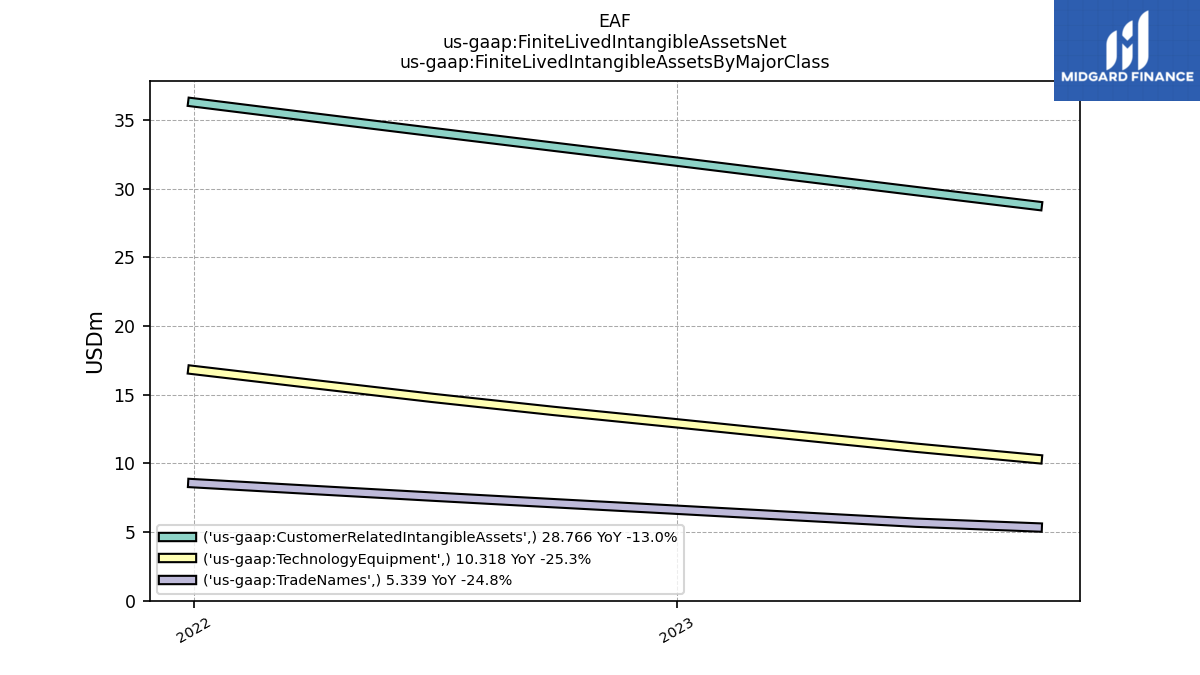
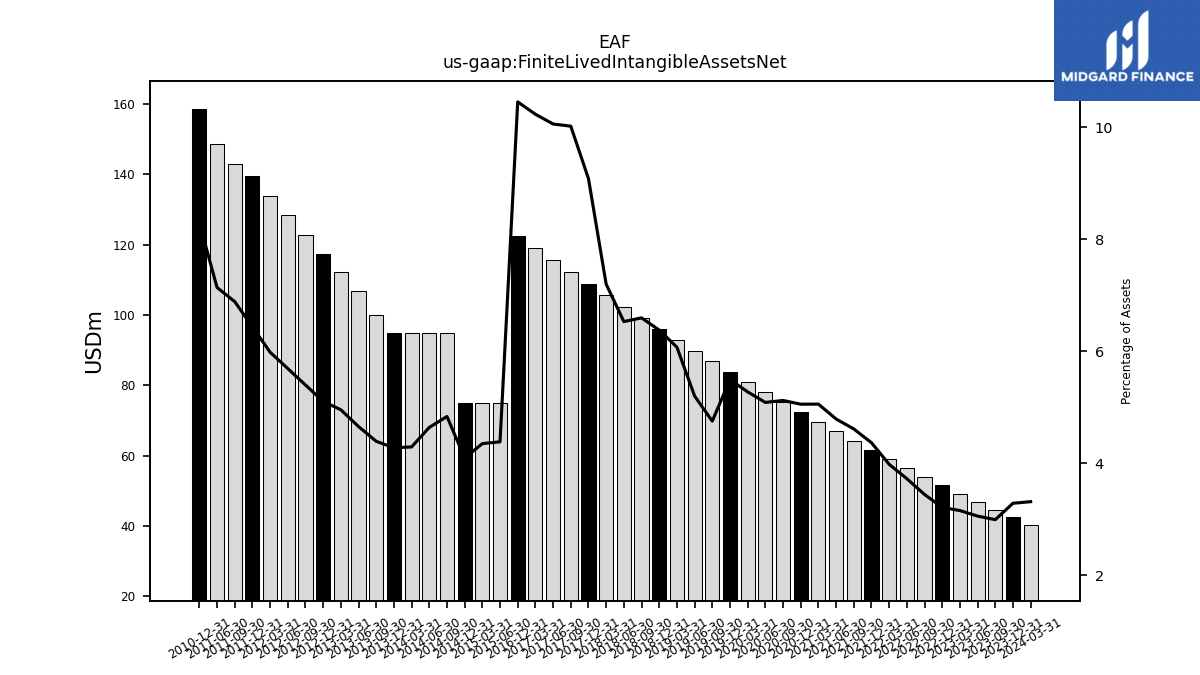
| Finite Lived Intangible Assets Net | 44.42 | 46.67 | 49.11 | 51.55 | 53.99 | 56.50 | 59.09 | 61.68 | 64.28 | 66.94 | 69.69 | 72.43 | 75.17 | 78.00 | 80.93 | 83.85 | 86.78 | 89.79 | 92.90 | 96.01 | 99.11 | 102.31 | 105.60 | 108.89 | 112.17 | 115.55 | 119.02 | 122.49 | NA | NA | NA | 75.10 | 75.10 | 75.10 | 94.86 | 94.86 | 94.86 | 94.86 | 99.97 | 106.91 | 112.10 | 117.29 | 122.86 | 128.43 | 134.00 | 139.57 | 142.87 | 148.58 | NA | 158.67 | NA | NA | NA | |
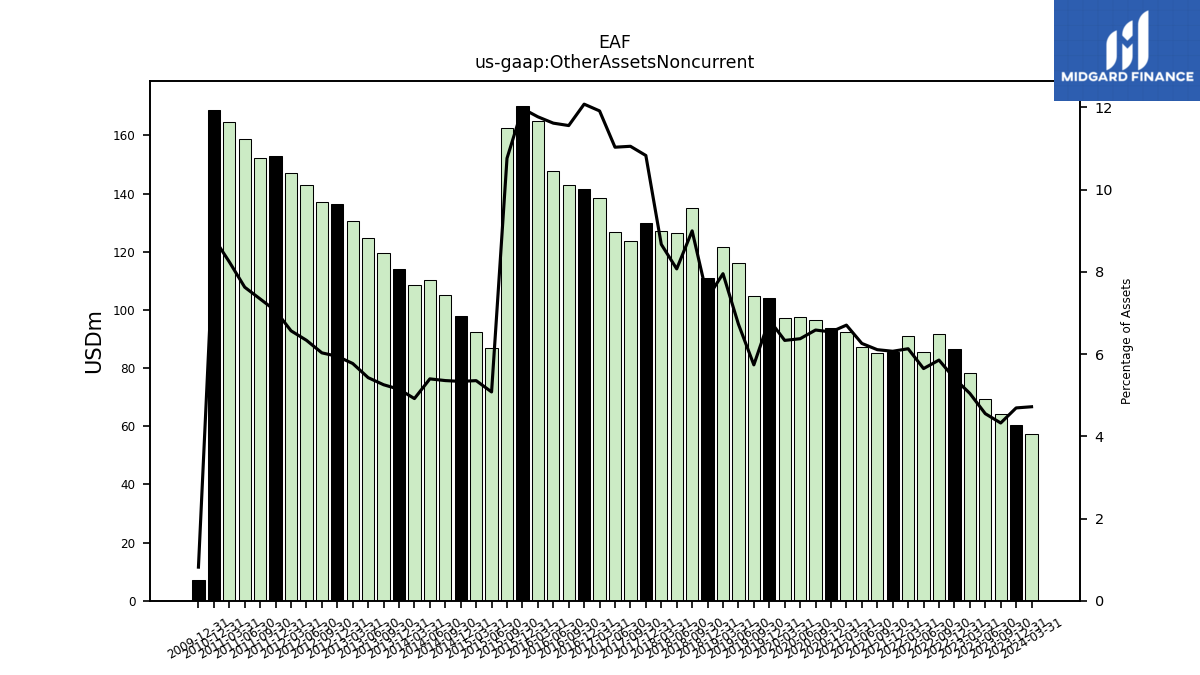
| Other Assets Noncurrent | 64.11 | 69.41 | 78.42 | 86.73 | 91.72 | 85.61 | 90.93 | 85.68 | 85.06 | 87.43 | 92.37 | 93.66 | 96.62 | 97.71 | 97.13 | 104.23 | 104.73 | 116.12 | 121.67 | 110.91 | 135.16 | 126.45 | 127.17 | 129.84 | 123.78 | 126.76 | 138.61 | 141.57 | 143.13 | 147.77 | 164.82 | 86.98 | 92.37 | 97.82 | 105.02 | 110.28 | 108.63 | 114.06 | 119.54 | 124.58 | 130.51 | 136.59 | 137.21 | 142.94 | 147.03 | 152.92 | 152.27 | 158.72 | 164.51 | 168.70 | NA | NA | NA |
| 2023-09-30 | 2023-06-30 | 2023-03-31 | 2022-12-31 | 2022-09-30 | 2022-06-30 | 2022-03-31 | 2021-12-31 | 2021-09-30 | 2021-06-30 | 2021-03-31 | 2020-12-31 | 2020-09-30 | 2020-06-30 | 2020-03-31 | 2019-12-31 | 2019-09-30 | 2019-06-30 | 2019-03-31 | 2018-12-31 | 2018-09-30 | 2018-06-30 | 2018-03-31 | 2017-12-31 | 2017-09-30 | 2017-06-30 | 2017-03-31 | 2016-12-31 | 2016-09-30 | 2016-06-30 | 2016-03-31 | 2015-06-30 | 2015-03-31 | 2014-12-31 | 2014-09-30 | 2014-06-30 | 2014-03-31 | 2013-12-31 | 2013-09-30 | 2013-06-30 | 2013-03-31 | 2012-12-31 | 2012-09-30 | 2012-06-30 | 2012-03-31 | 2011-12-31 | 2011-09-30 | 2011-06-30 | 2011-03-31 | 2010-12-31 | 2010-09-30 | 2010-06-30 | 2010-03-31 | ||
|---|---|---|---|---|---|---|---|---|---|---|---|---|---|---|---|---|---|---|---|---|---|---|---|---|---|---|---|---|---|---|---|---|---|---|---|---|---|---|---|---|---|---|---|---|---|---|---|---|---|---|---|---|---|---|
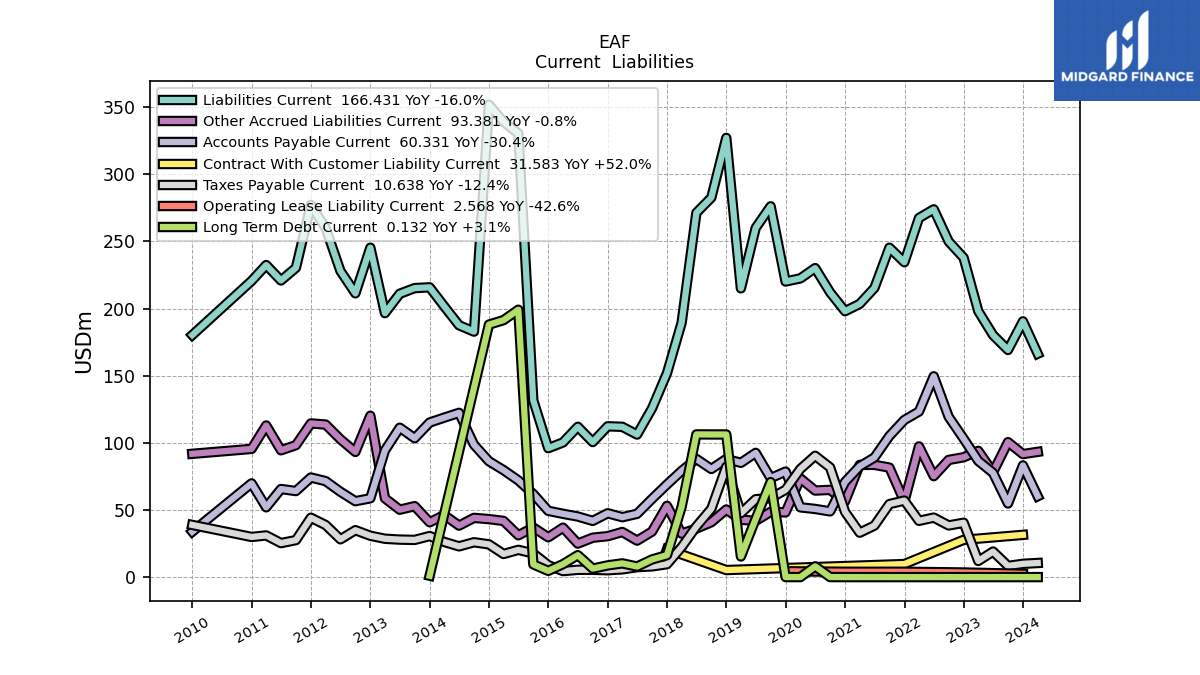
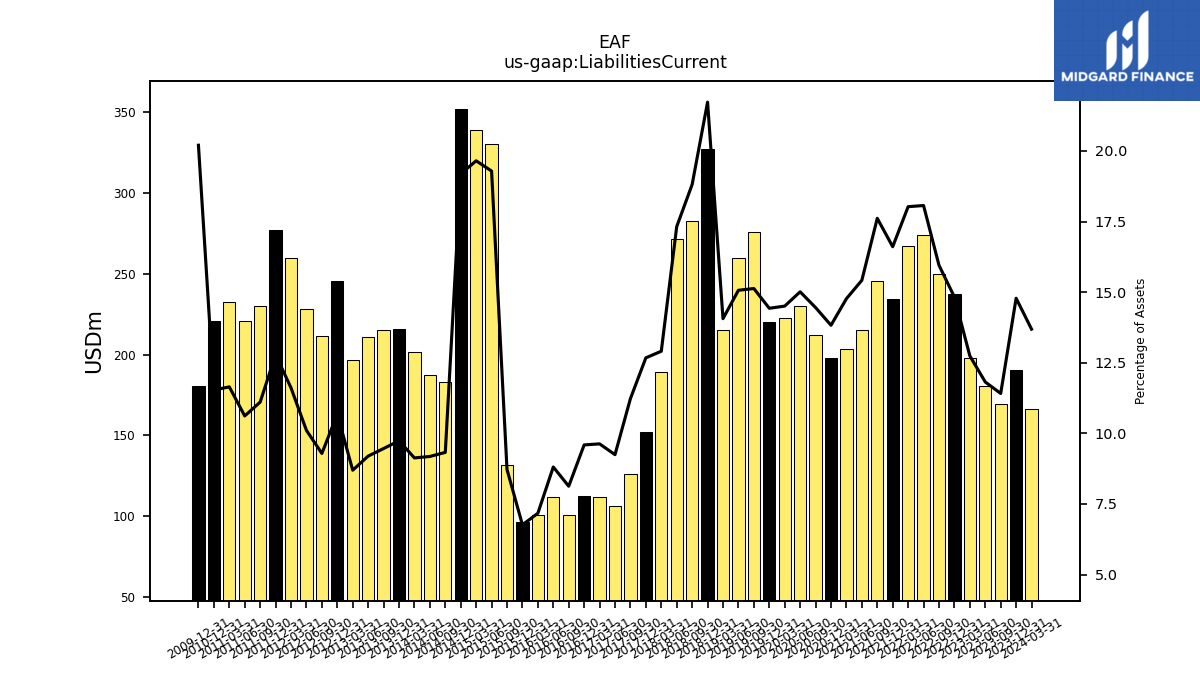
| Liabilities Current | 169.25 | 180.30 | 198.16 | 237.85 | 249.97 | 273.95 | 267.47 | 234.57 | 245.39 | 215.43 | 203.52 | 198.09 | 212.13 | 230.19 | 222.54 | 220.21 | 276.19 | 260.09 | 215.09 | 327.13 | 282.68 | 271.39 | 189.38 | 151.96 | 125.77 | 106.25 | 112.02 | 112.41 | 100.66 | 112.06 | 100.40 | 330.41 | 339.10 | 351.90 | 182.90 | 187.63 | 201.69 | 215.88 | 215.30 | 211.10 | 196.66 | 245.38 | 211.40 | 228.04 | 260.01 | 277.25 | 230.42 | 220.97 | 232.46 | 220.64 | NA | NA | NA | |
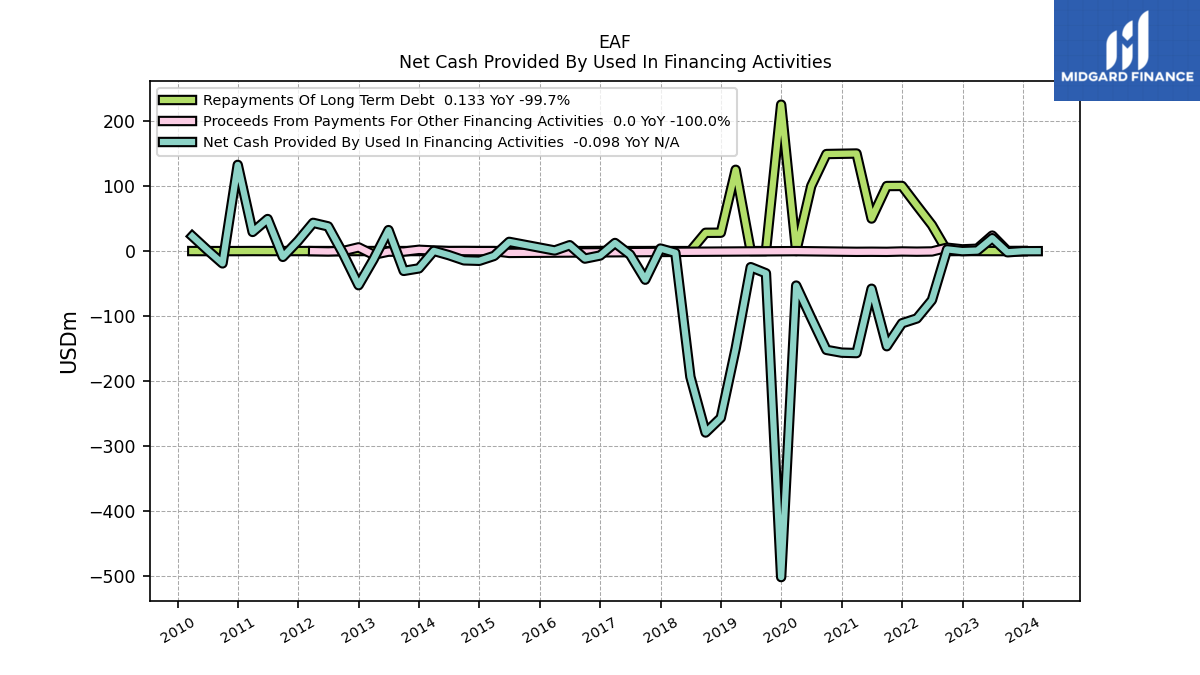
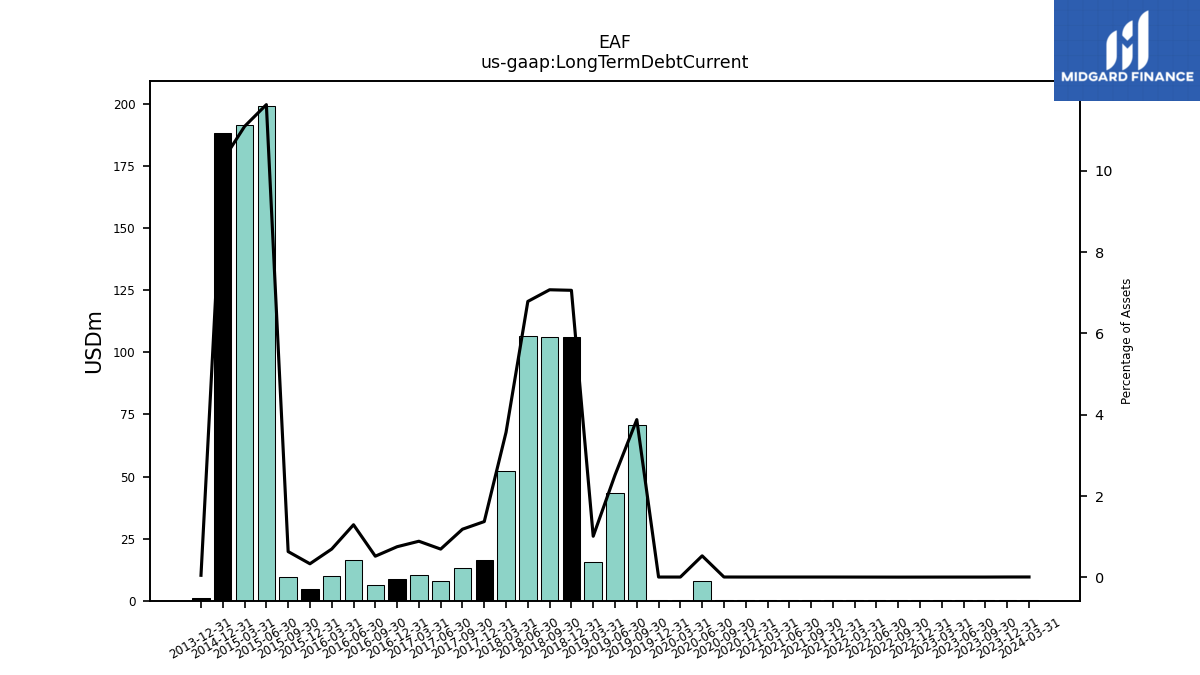
| Long Term Debt Current | 0.13 | 0.13 | 0.13 | 0.12 | 0.11 | 0.12 | 0.12 | 0.13 | 0.13 | 0.13 | 0.13 | 0.13 | 0.15 | 8.14 | 0.14 | 0.14 | 70.86 | 43.46 | 15.49 | 106.32 | 106.33 | 106.38 | 52.39 | 16.47 | 13.28 | 8.01 | 10.36 | 8.85 | 6.46 | 16.48 | 9.78 | 199.22 | 191.45 | 188.10 | NA | NA | NA | 1.16 | NA | NA | NA | NA | NA | NA | NA | NA | NA | NA | NA | NA | NA | NA | NA | |
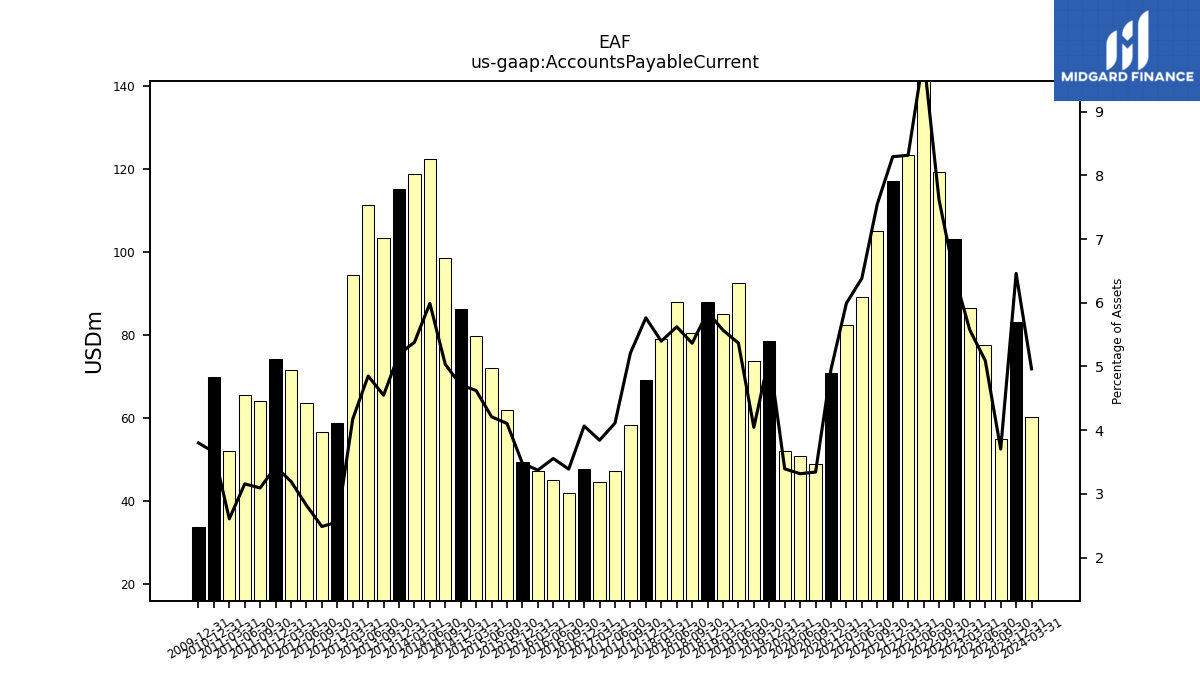
| Accounts Payable Current | 54.94 | 77.69 | 86.64 | 103.16 | 119.41 | 149.66 | 123.38 | 117.11 | 105.18 | 89.19 | 82.59 | 70.99 | 49.06 | 50.86 | 52.07 | 78.70 | 73.86 | 92.64 | 85.22 | 88.10 | 80.62 | 88.11 | 79.18 | 69.11 | 58.38 | 47.25 | 44.72 | 47.66 | 41.98 | 45.23 | 47.25 | 72.14 | 79.76 | 86.41 | 98.72 | 122.43 | 118.86 | 115.21 | 103.52 | 111.38 | 94.44 | 58.80 | 56.64 | 63.65 | 71.59 | 74.28 | 64.19 | 65.71 | 52.08 | 69.93 | NA | NA | NA | |
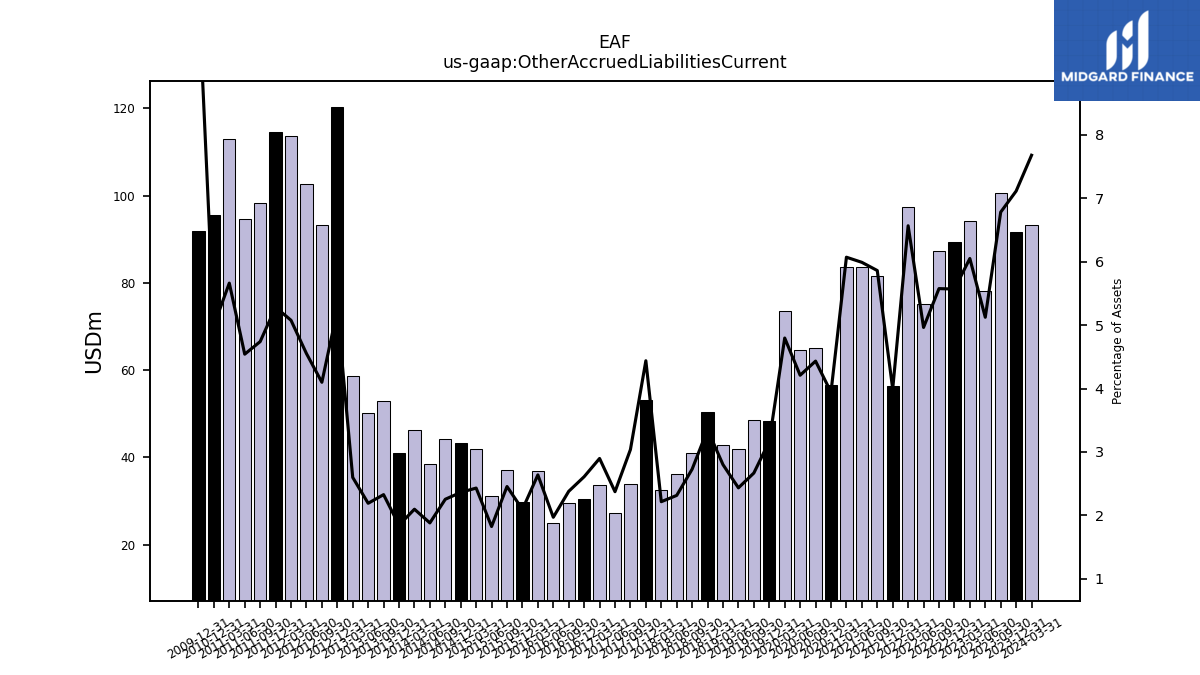
| Other Accrued Liabilities Current | 100.61 | 78.19 | 94.11 | 89.35 | 87.39 | 75.27 | 97.46 | 56.41 | 81.66 | 83.71 | 83.68 | 56.50 | 65.06 | 64.56 | 73.60 | 48.34 | 48.71 | 42.02 | 42.83 | 50.45 | 41.01 | 36.27 | 32.51 | 53.23 | 34.03 | 27.28 | 33.72 | 30.59 | 29.47 | 25.06 | 36.95 | 31.25 | 41.95 | 43.32 | 44.21 | 38.45 | 46.34 | 40.94 | 52.95 | 50.30 | 58.78 | 120.28 | 93.31 | 102.73 | 113.72 | 114.55 | 98.36 | 94.56 | 113.05 | 95.58 | NA | NA | NA | |
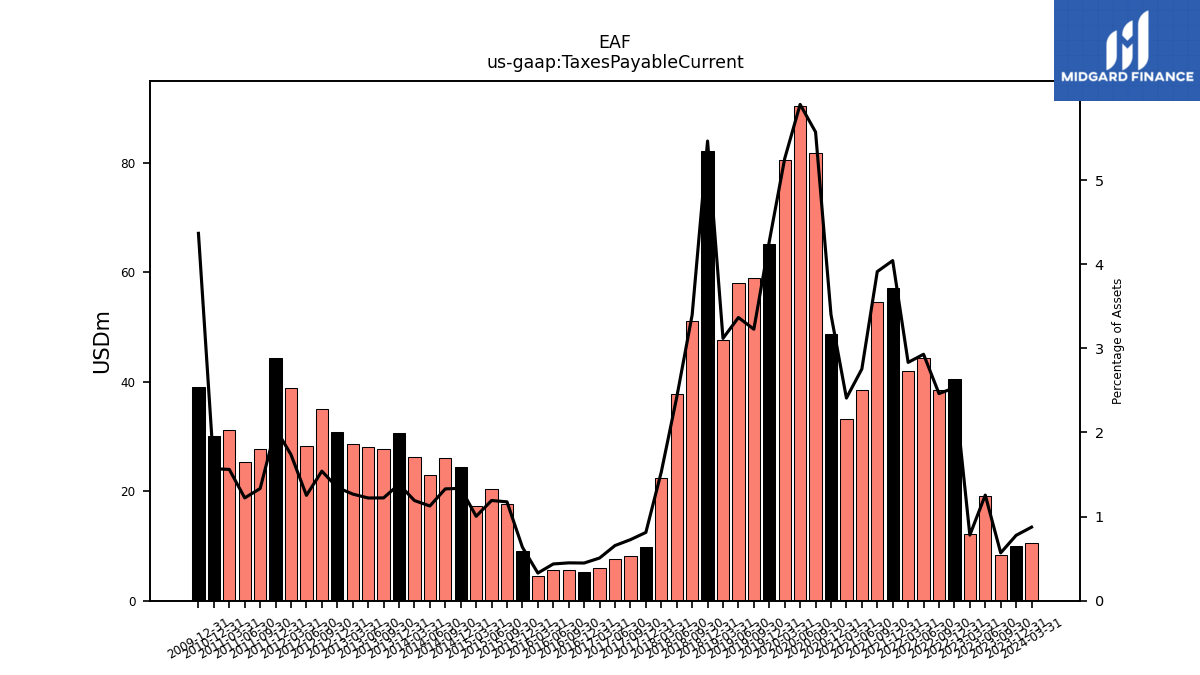
| Taxes Payable Current | 8.44 | 19.16 | 12.14 | 40.59 | 38.59 | 44.42 | 42.03 | 57.10 | 54.50 | 38.48 | 33.20 | 48.72 | 81.76 | 90.45 | 80.63 | 65.18 | 58.92 | 58.12 | 47.70 | 82.25 | 51.04 | 37.87 | 22.45 | 9.74 | 8.13 | 7.54 | 5.91 | 5.26 | 5.58 | 5.56 | 4.61 | 20.41 | 17.32 | 24.51 | 26.07 | 23.02 | 26.32 | 30.69 | 27.81 | 28.05 | 28.68 | 30.92 | 35.06 | 28.27 | 38.89 | 44.33 | 27.67 | 25.44 | 31.16 | 30.02 | NA | NA | NA | |
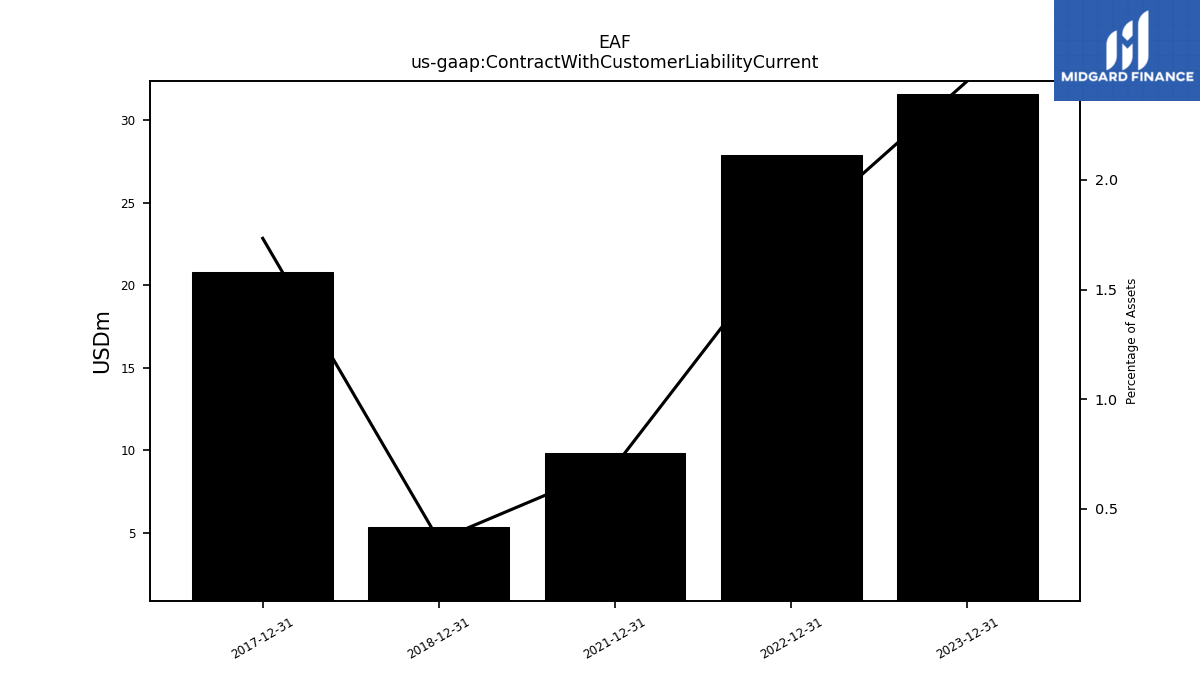
| Contract With Customer Liability Current | NA | NA | NA | 27.88 | NA | NA | NA | 9.84 | NA | NA | NA | NA | NA | NA | NA | NA | NA | NA | NA | 5.38 | NA | NA | NA | 20.78 | NA | NA | NA | NA | NA | NA | NA | NA | NA | NA | NA | NA | NA | NA | NA | NA | NA | NA | NA | NA | NA | NA | NA | NA | NA | NA | NA | NA | NA |
| 2023-09-30 | 2023-06-30 | 2023-03-31 | 2022-12-31 | 2022-09-30 | 2022-06-30 | 2022-03-31 | 2021-12-31 | 2021-09-30 | 2021-06-30 | 2021-03-31 | 2020-12-31 | 2020-09-30 | 2020-06-30 | 2020-03-31 | 2019-12-31 | 2019-09-30 | 2019-06-30 | 2019-03-31 | 2018-12-31 | 2018-09-30 | 2018-06-30 | 2018-03-31 | 2017-12-31 | 2017-09-30 | 2017-06-30 | 2017-03-31 | 2016-12-31 | 2016-09-30 | 2016-06-30 | 2016-03-31 | 2015-06-30 | 2015-03-31 | 2014-12-31 | 2014-09-30 | 2014-06-30 | 2014-03-31 | 2013-12-31 | 2013-09-30 | 2013-06-30 | 2013-03-31 | 2012-12-31 | 2012-09-30 | 2012-06-30 | 2012-03-31 | 2011-12-31 | 2011-09-30 | 2011-06-30 | 2011-03-31 | 2010-12-31 | 2010-09-30 | 2010-06-30 | 2010-03-31 | ||
|---|---|---|---|---|---|---|---|---|---|---|---|---|---|---|---|---|---|---|---|---|---|---|---|---|---|---|---|---|---|---|---|---|---|---|---|---|---|---|---|---|---|---|---|---|---|---|---|---|---|---|---|---|---|---|
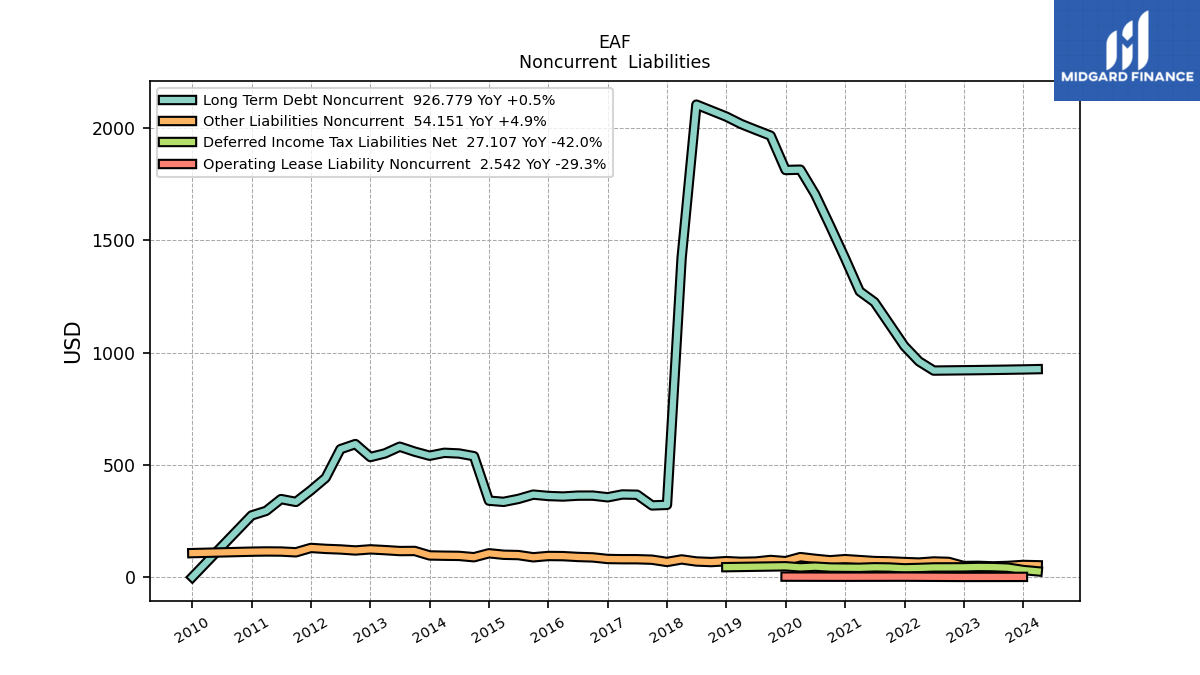
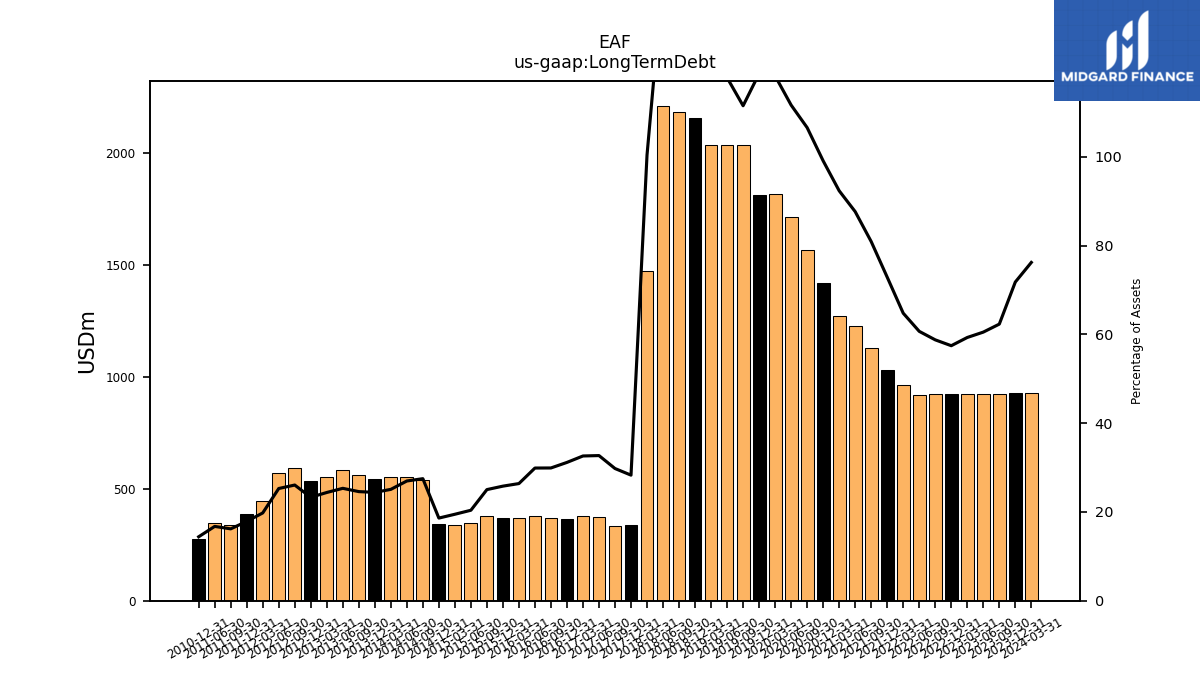
| Long Term Debt | 924.50 | 923.52 | 922.63 | 921.93 | 921.20 | 920.46 | 961.45 | 1029.69 | 1127.54 | 1225.03 | 1273.12 | 1420.13 | 1564.58 | 1712.66 | 1814.40 | 1812.82 | 2036.36 | 2034.81 | 2033.21 | 2156.63 | 2183.33 | 2210.01 | 1473.66 | 339.37 | 333.71 | 375.96 | 379.60 | 365.43 | 370.60 | 380.46 | 369.82 | 349.33 | 336.32 | 341.62 | 539.51 | 551.53 | 554.51 | 541.59 | 559.64 | 581.72 | 551.89 | 535.71 | 593.45 | 570.76 | 443.19 | 387.62 | 336.12 | 348.73 | NA | 275.80 | NA | NA | NA | |
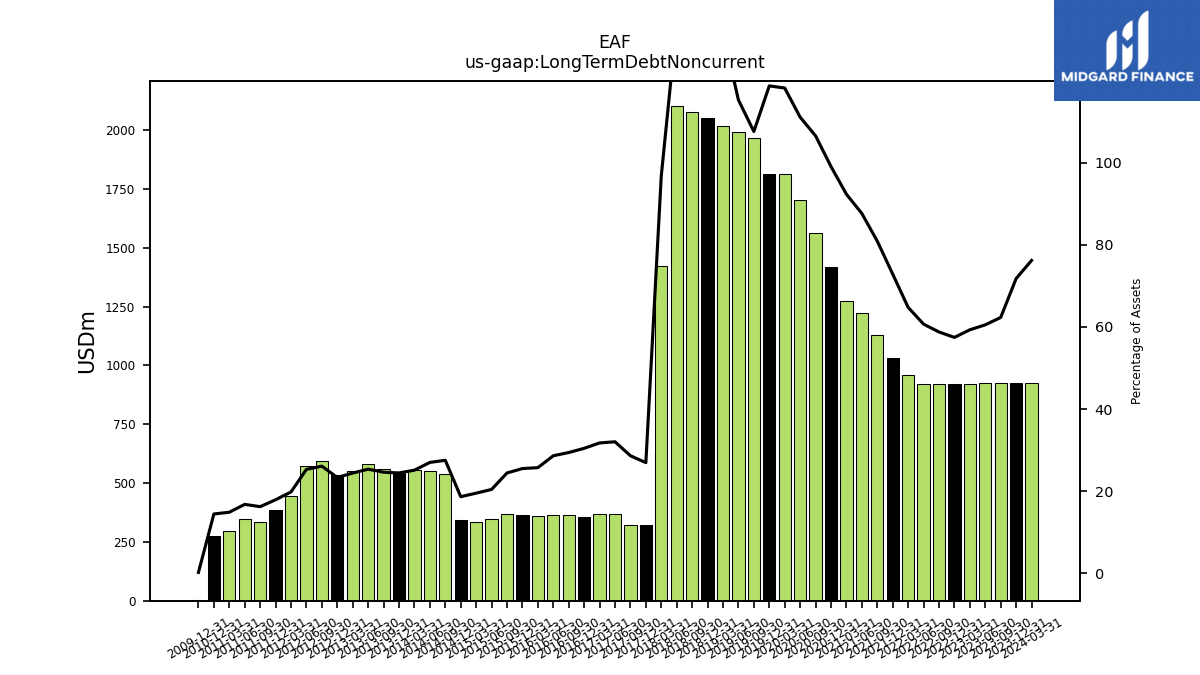
| Long Term Debt Noncurrent | 924.38 | 923.39 | 922.50 | 921.80 | 921.09 | 920.34 | 961.32 | 1029.56 | 1127.41 | 1224.90 | 1273.00 | 1420.00 | 1564.43 | 1704.52 | 1814.27 | 1812.68 | 1965.50 | 1991.35 | 2017.72 | 2050.31 | 2077.00 | 2103.63 | 1421.27 | 322.90 | 320.43 | 367.96 | 369.25 | 356.58 | 364.13 | 363.98 | 360.04 | 349.33 | 336.32 | 341.62 | 539.51 | 551.53 | 554.51 | 541.59 | 559.64 | 581.72 | 551.89 | 535.71 | 593.45 | 570.76 | 443.19 | 387.62 | 336.12 | 348.73 | 296.25 | 275.80 | NA | NA | NA | |
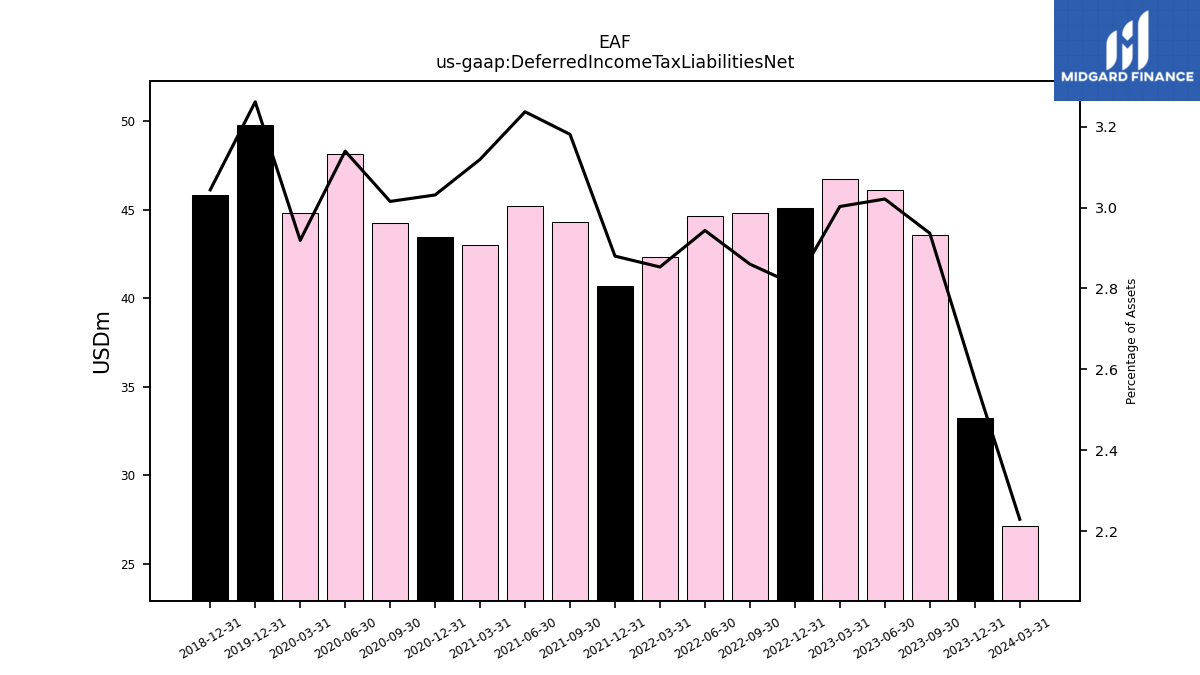
| Deferred Income Tax Liabilities Net | 43.55 | 46.09 | 46.70 | 45.06 | 44.82 | 44.63 | 42.33 | 40.67 | 44.32 | 45.22 | 42.99 | 43.43 | 44.25 | 48.14 | 44.78 | 49.77 | NA | NA | NA | 45.83 | NA | NA | NA | NA | NA | NA | NA | NA | NA | NA | NA | NA | NA | NA | NA | NA | NA | NA | NA | NA | NA | NA | NA | NA | NA | NA | NA | NA | NA | NA | NA | NA | NA | |
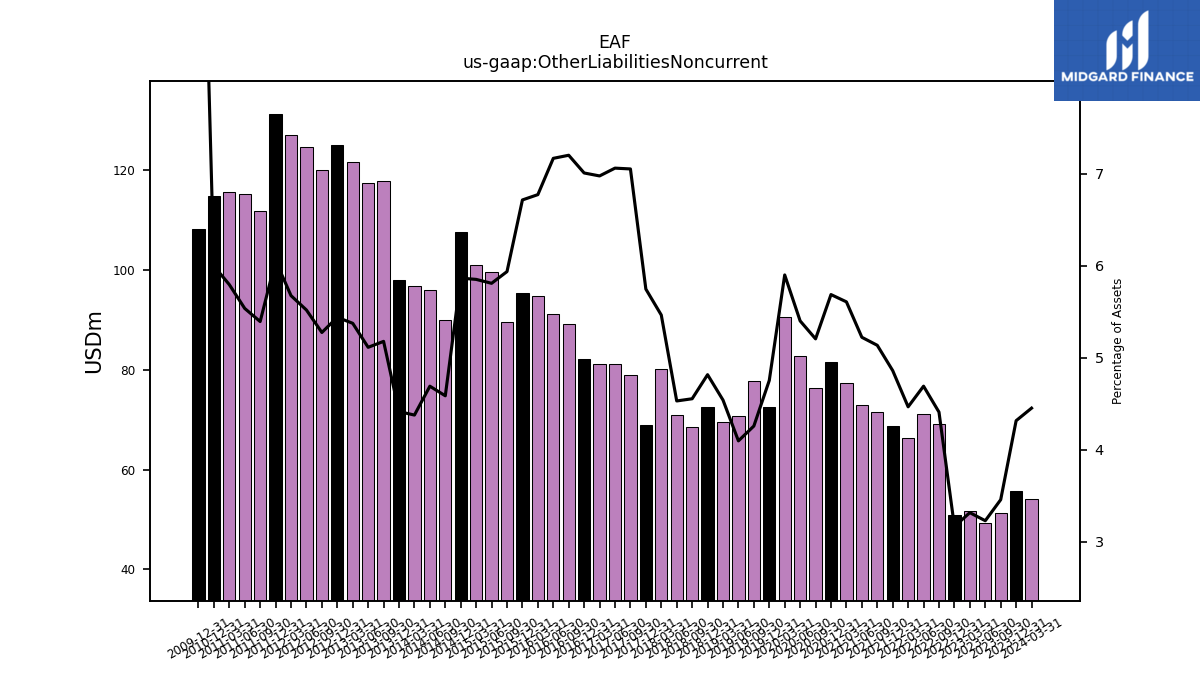
| Other Liabilities Noncurrent | 51.31 | 49.29 | 51.61 | 50.82 | 69.11 | 71.14 | 66.30 | 68.66 | 71.55 | 72.97 | 77.28 | 81.48 | 76.40 | 82.82 | 90.52 | 72.56 | 77.76 | 70.75 | 69.47 | 72.52 | 68.45 | 71.01 | 80.18 | 68.91 | 78.98 | 81.14 | 81.17 | 82.15 | 89.18 | 91.18 | 94.85 | 99.51 | 100.98 | 107.57 | 89.98 | 95.89 | 96.74 | 97.95 | 117.85 | 117.43 | 121.59 | 125.00 | 120.07 | 124.55 | 127.11 | 131.30 | 111.92 | 115.25 | 115.69 | 114.73 | NA | NA | NA | |
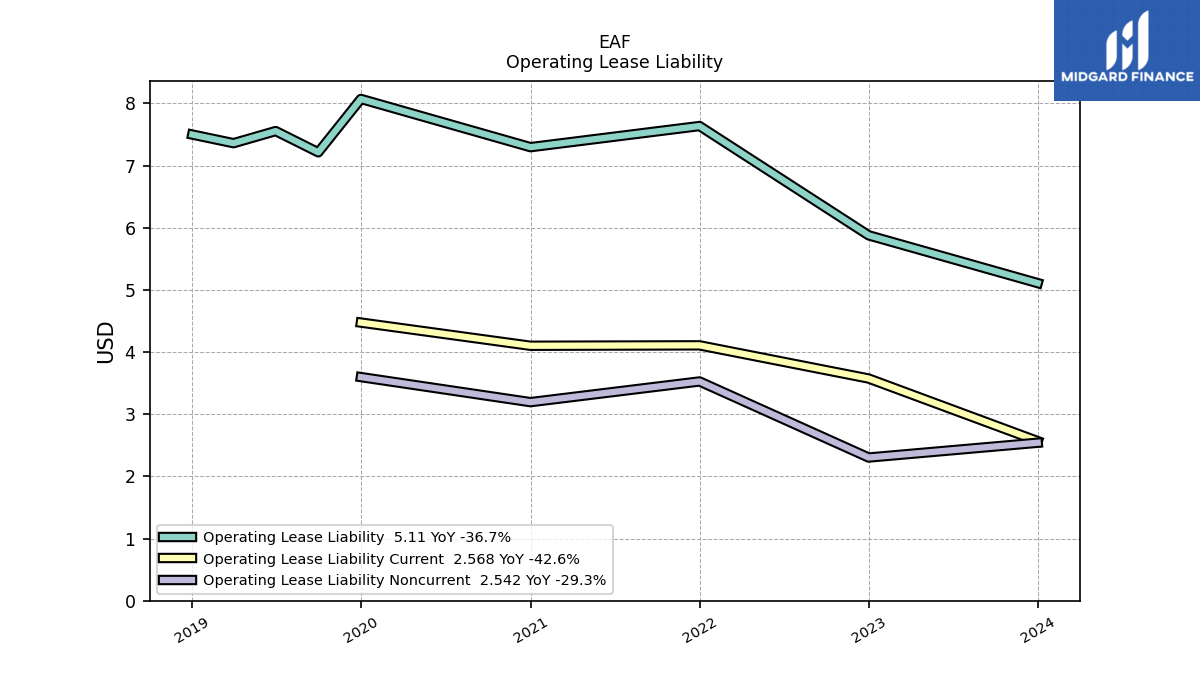
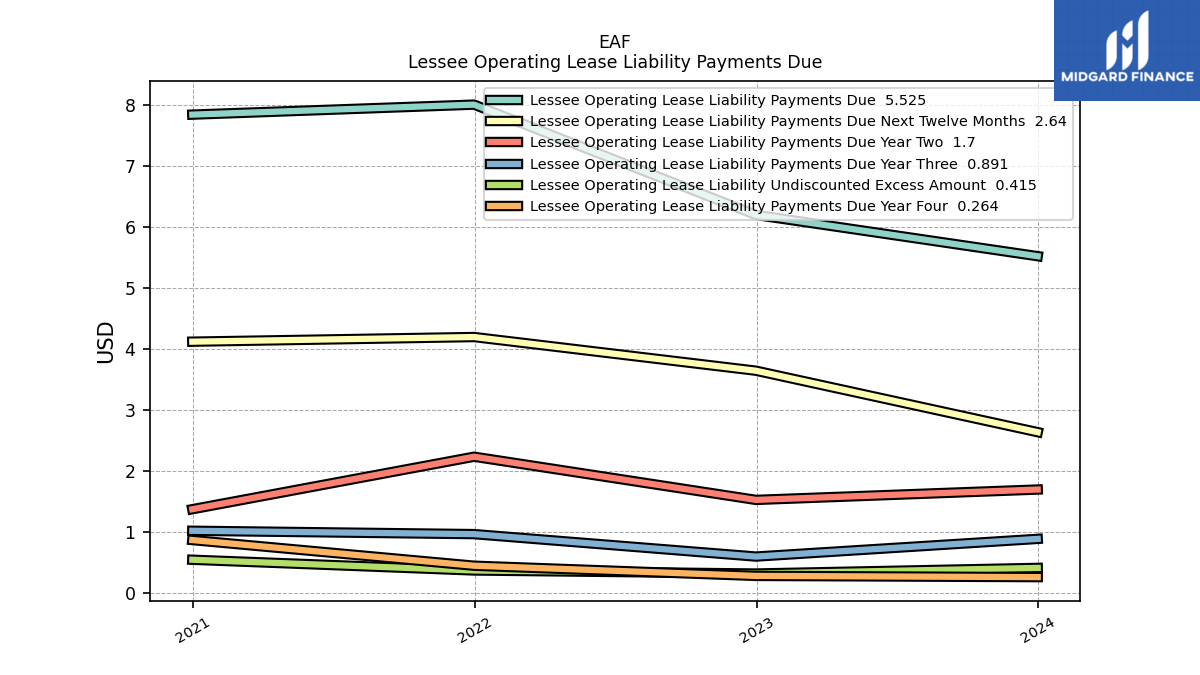
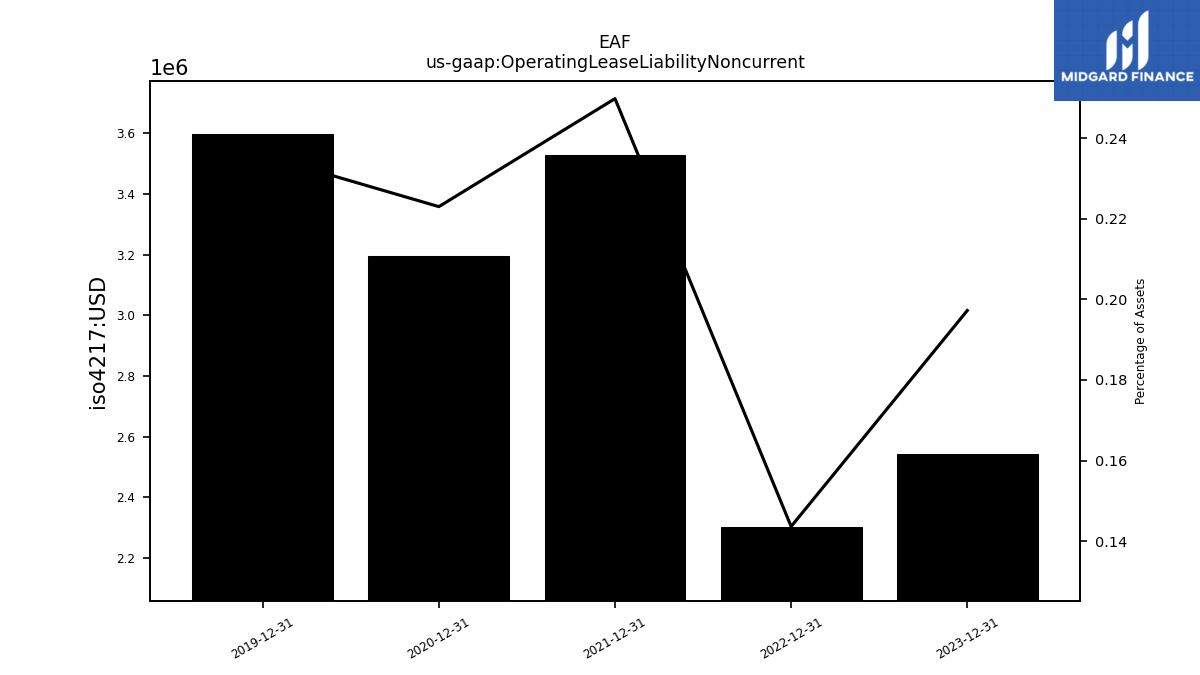
| Operating Lease Liability Noncurrent | NA | NA | NA | 2.30 | NA | NA | NA | 3.53 | NA | NA | NA | 3.19 | NA | NA | NA | 3.60 | NA | NA | NA | NA | NA | NA | NA | NA | NA | NA | NA | NA | NA | NA | NA | NA | NA | NA | NA | NA | NA | NA | NA | NA | NA | NA | NA | NA | NA | NA | NA | NA | NA | NA | NA | NA | NA |
| 2023-09-30 | 2023-06-30 | 2023-03-31 | 2022-12-31 | 2022-09-30 | 2022-06-30 | 2022-03-31 | 2021-12-31 | 2021-09-30 | 2021-06-30 | 2021-03-31 | 2020-12-31 | 2020-09-30 | 2020-06-30 | 2020-03-31 | 2019-12-31 | 2019-09-30 | 2019-06-30 | 2019-03-31 | 2018-12-31 | 2018-09-30 | 2018-06-30 | 2018-03-31 | 2017-12-31 | 2017-09-30 | 2017-06-30 | 2017-03-31 | 2016-12-31 | 2016-09-30 | 2016-06-30 | 2016-03-31 | 2015-06-30 | 2015-03-31 | 2014-12-31 | 2014-09-30 | 2014-06-30 | 2014-03-31 | 2013-12-31 | 2013-09-30 | 2013-06-30 | 2013-03-31 | 2012-12-31 | 2012-09-30 | 2012-06-30 | 2012-03-31 | 2011-12-31 | 2011-09-30 | 2011-06-30 | 2011-03-31 | 2010-12-31 | 2010-09-30 | 2010-06-30 | 2010-03-31 | ||
|---|---|---|---|---|---|---|---|---|---|---|---|---|---|---|---|---|---|---|---|---|---|---|---|---|---|---|---|---|---|---|---|---|---|---|---|---|---|---|---|---|---|---|---|---|---|---|---|---|---|---|---|---|---|---|
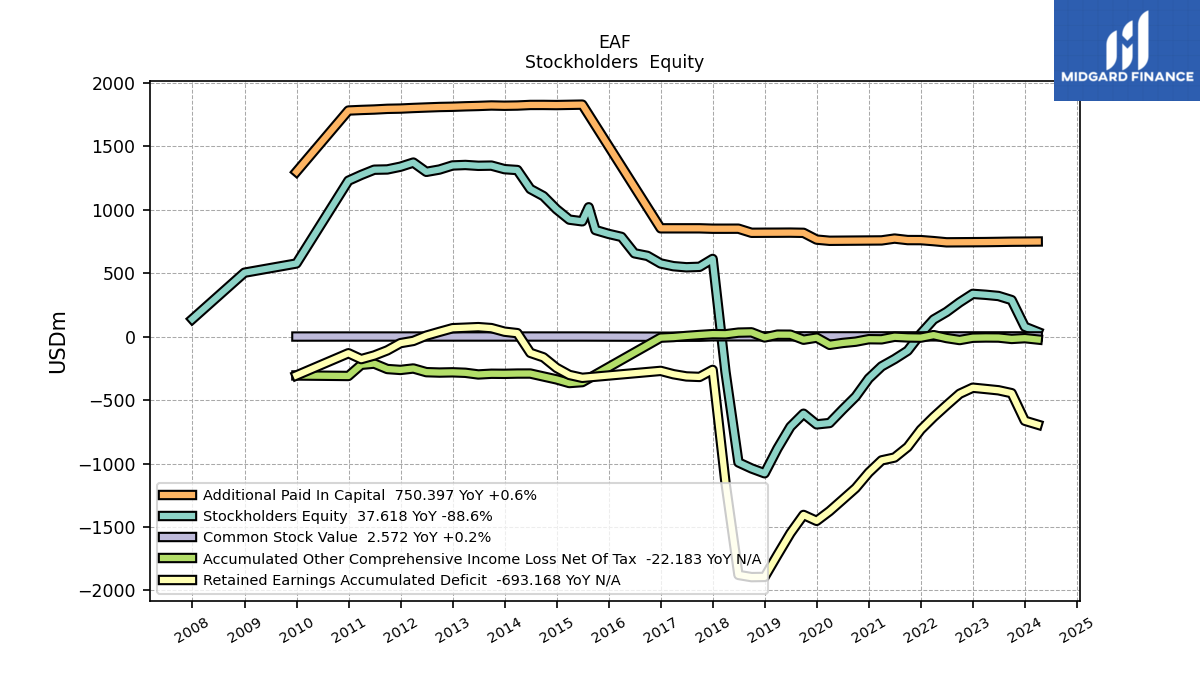
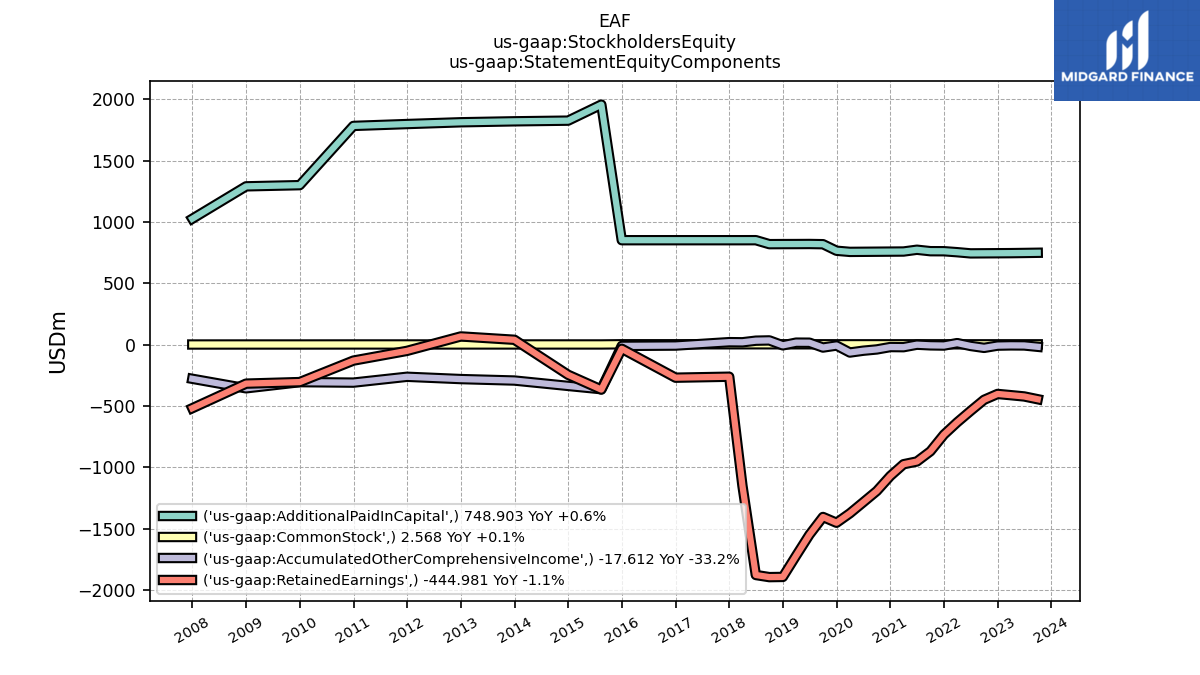
| Stockholders Equity | 288.88 | 320.81 | 330.49 | 337.71 | 271.00 | 195.22 | 135.41 | 23.40 | -110.70 | -176.56 | -233.84 | -329.38 | -472.11 | -574.71 | -680.38 | -691.07 | -606.89 | -709.84 | -881.62 | -1076.77 | -1038.48 | -991.02 | -276.19 | 613.22 | 550.88 | 547.25 | 555.88 | 577.38 | 636.91 | 657.46 | 786.79 | 909.48 | 922.75 | 1004.53 | 1108.38 | 1164.38 | 1313.81 | 1320.75 | 1348.74 | 1347.06 | 1353.71 | 1349.85 | 1317.65 | 1299.45 | 1372.64 | 1339.94 | 1318.49 | 1316.32 | 1275.23 | 1229.73 | NA | NA | NA | |
| Common Stock Value | 2.57 | 2.57 | 2.57 | 2.57 | 2.57 | 2.57 | 2.60 | 2.63 | 2.64 | 2.68 | 2.67 | 2.67 | 2.67 | 2.67 | 2.67 | 2.71 | 2.90 | 2.90 | 2.90 | 2.90 | 2.90 | 3.02 | 3.02 | 3.02 | 0.00 | 0.00 | 0.00 | 0.00 | NA | NA | NA | 1.53 | 1.53 | 1.53 | 1.52 | 1.52 | 1.52 | 1.52 | 1.52 | 1.51 | 1.52 | 1.51 | 1.51 | 1.50 | 1.50 | 1.50 | 1.50 | 1.49 | 1.49 | 1.49 | NA | NA | NA | |
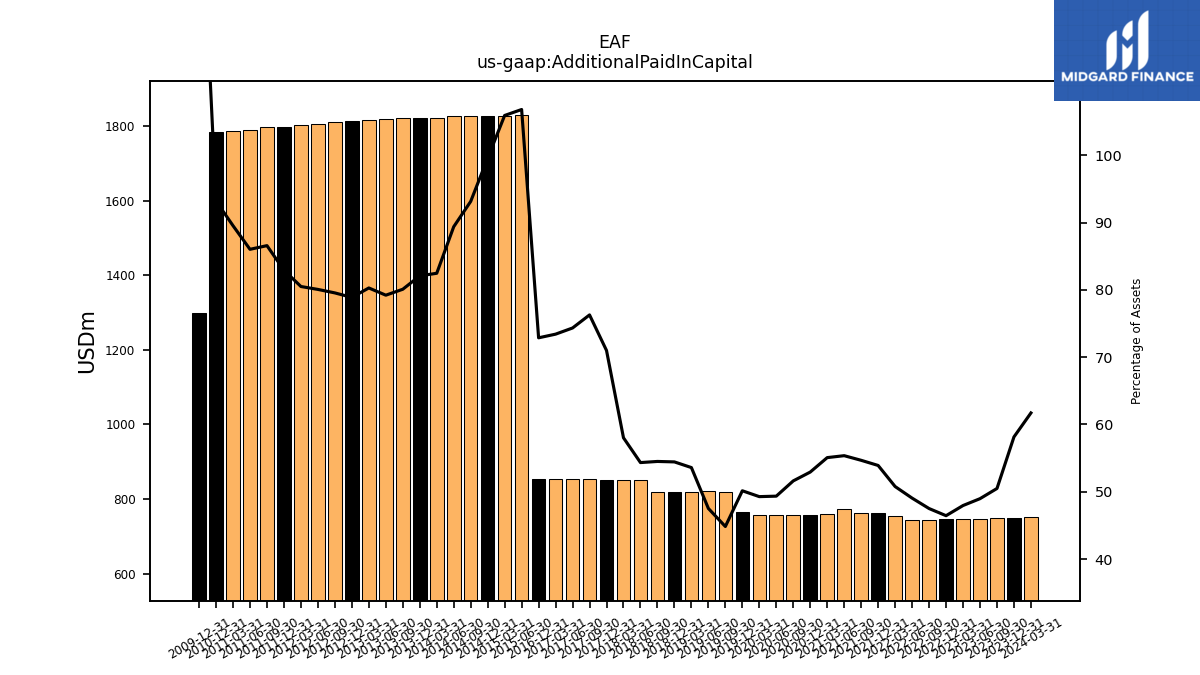
| Additional Paid In Capital | 748.90 | 747.27 | 745.89 | 745.16 | 744.52 | 743.89 | 753.51 | 761.41 | 761.75 | 773.55 | 759.05 | 758.35 | 757.58 | 756.81 | 756.10 | 765.42 | 818.72 | 820.49 | 819.91 | 819.62 | 819.13 | 851.50 | 851.32 | 851.32 | 854.34 | 854.34 | 854.34 | 854.34 | NA | NA | NA | 1829.39 | 1827.67 | 1825.88 | 1826.93 | 1826.78 | 1822.08 | 1820.45 | 1822.60 | 1818.83 | 1816.13 | 1812.59 | 1810.60 | 1806.85 | 1802.95 | 1798.16 | 1796.19 | 1790.72 | 1787.27 | 1782.86 | NA | NA | NA | |
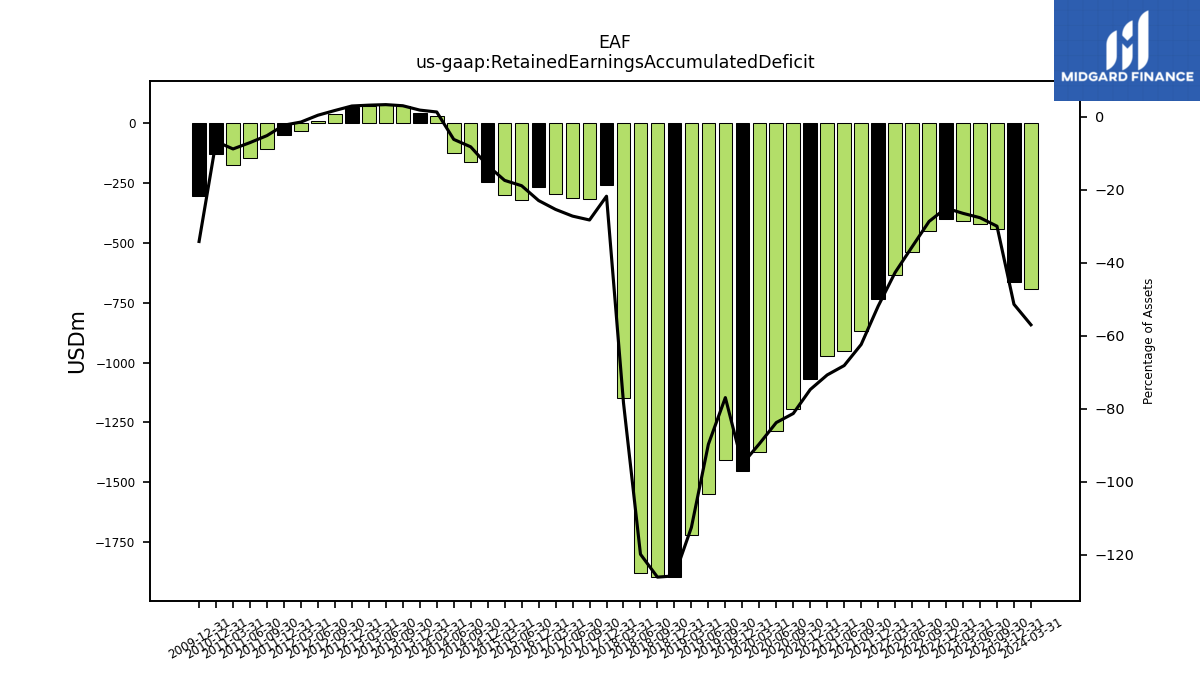
| Retained Earnings Accumulated Deficit | -444.98 | -422.36 | -411.94 | -401.94 | -449.71 | -540.59 | -633.25 | -733.20 | -869.31 | -952.40 | -974.85 | -1070.77 | -1193.19 | -1284.76 | -1374.84 | -1451.84 | -1404.83 | -1549.08 | -1720.76 | -1893.50 | -1895.06 | -1877.79 | -1149.74 | -261.41 | -317.04 | -313.12 | -295.74 | -269.39 | NA | NA | NA | -324.18 | -301.36 | -245.75 | -162.27 | -127.33 | 28.11 | 39.62 | 67.85 | 75.48 | 71.09 | 66.88 | 38.24 | 8.62 | -33.23 | -50.76 | -107.81 | -148.11 | -176.68 | -130.13 | NA | NA | NA | |
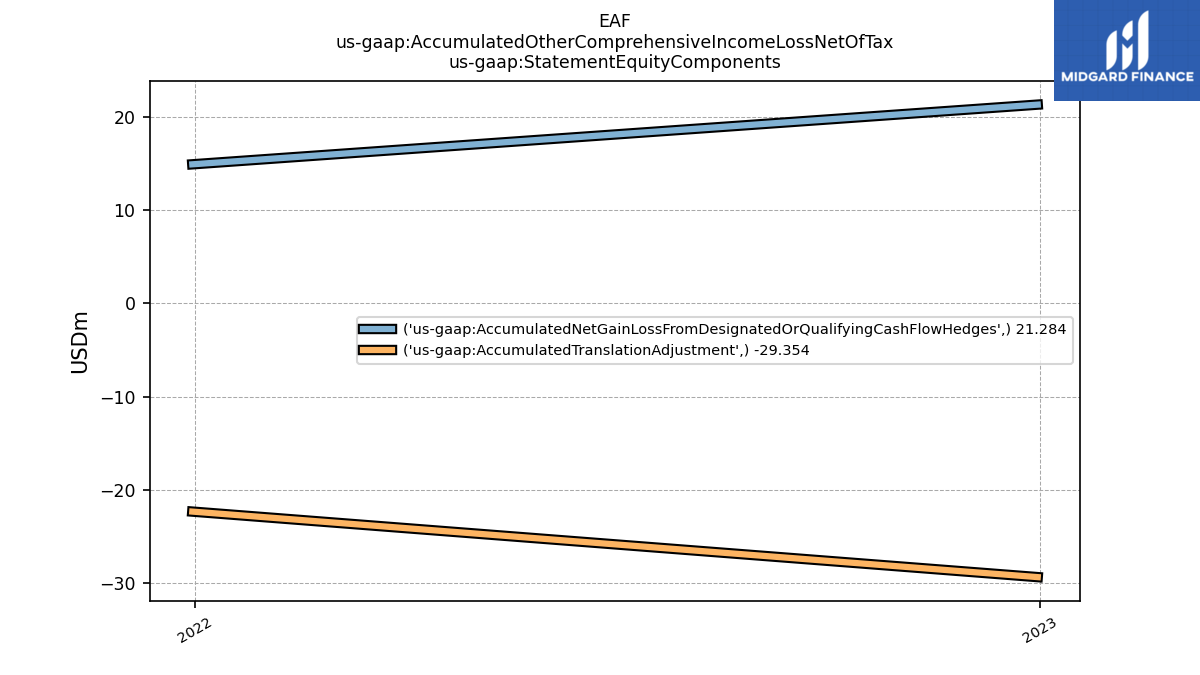
| Accumulated Other Comprehensive Income Loss Net Of Tax | -17.61 | -6.67 | -6.02 | -8.07 | -26.38 | -10.64 | 12.54 | -7.44 | -5.77 | -0.39 | -20.72 | -19.64 | -39.16 | -49.44 | -64.31 | -7.36 | -23.68 | 15.85 | 16.32 | -5.80 | 34.54 | 32.25 | 19.22 | 20.29 | 13.58 | 6.04 | -2.72 | -7.56 | NA | NA | NA | -357.73 | -365.29 | -336.52 | -313.56 | -290.31 | -290.55 | -292.62 | -291.90 | -297.60 | -284.45 | -280.68 | -282.66 | -279.42 | -250.41 | -261.94 | -254.64 | -212.08 | -221.39 | -309.56 | NA | NA | NA | |
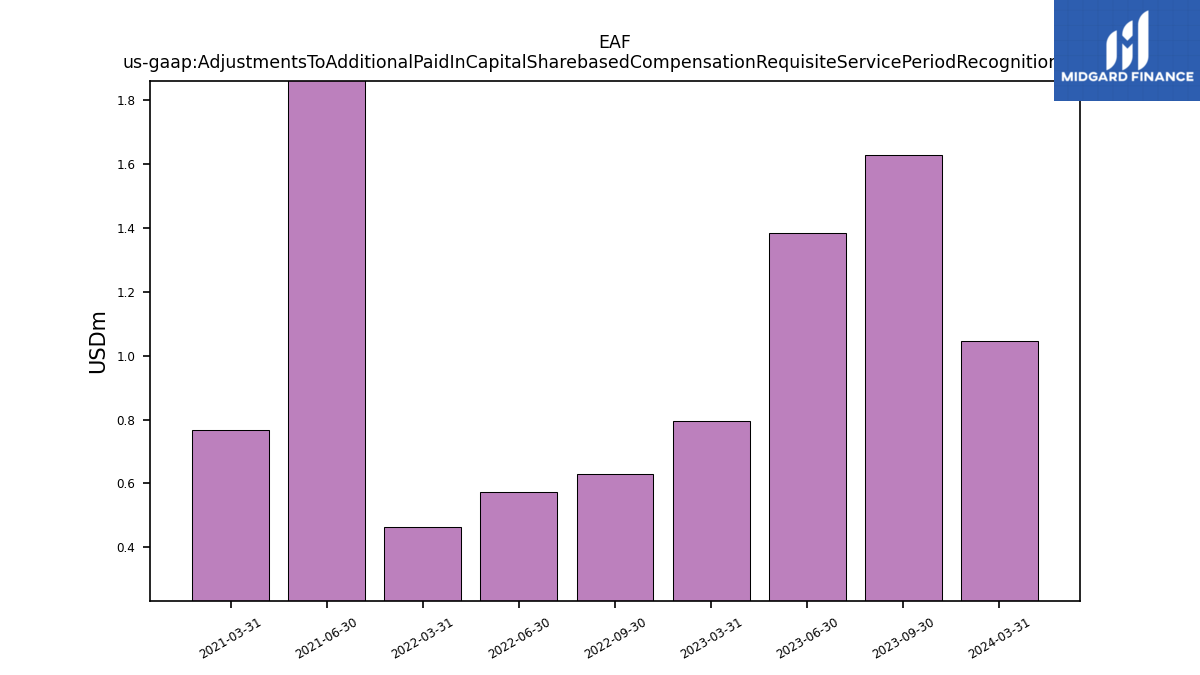
| Adjustments To Additional Paid In Capital Sharebased Compensation Requisite Service Period Recognition Value | 1.63 | 1.39 | 0.80 | NA | 0.63 | 0.57 | 0.47 | NA | NA | 15.26 | 0.77 | NA | NA | NA | NA | NA | NA | NA | NA | NA | NA | NA | NA | NA | NA | NA | NA | NA | NA | NA | NA | NA | NA | NA | NA | NA | NA | NA | NA | NA | NA | NA | NA | NA | NA | NA | NA | NA | NA | NA | NA | NA | NA |
| 2023-09-30 | 2023-06-30 | 2023-03-31 | 2022-12-31 | 2022-09-30 | 2022-06-30 | 2022-03-31 | 2021-12-31 | 2021-09-30 | 2021-06-30 | 2021-03-31 | 2020-12-31 | 2020-09-30 | 2020-06-30 | 2020-03-31 | 2019-12-31 | 2019-09-30 | 2019-06-30 | 2019-03-31 | 2018-12-31 | 2018-09-30 | 2018-06-30 | 2018-03-31 | 2017-12-31 | 2017-09-30 | 2017-06-30 | 2017-03-31 | 2016-12-31 | 2016-09-30 | 2016-06-30 | 2016-03-31 | 2015-06-30 | 2015-03-31 | 2014-12-31 | 2014-09-30 | 2014-06-30 | 2014-03-31 | 2013-12-31 | 2013-09-30 | 2013-06-30 | 2013-03-31 | 2012-12-31 | 2012-09-30 | 2012-06-30 | 2012-03-31 | 2011-12-31 | 2011-09-30 | 2011-06-30 | 2011-03-31 | 2010-12-31 | 2010-09-30 | 2010-06-30 | 2010-03-31 | ||
|---|---|---|---|---|---|---|---|---|---|---|---|---|---|---|---|---|---|---|---|---|---|---|---|---|---|---|---|---|---|---|---|---|---|---|---|---|---|---|---|---|---|---|---|---|---|---|---|---|---|---|---|---|---|---|
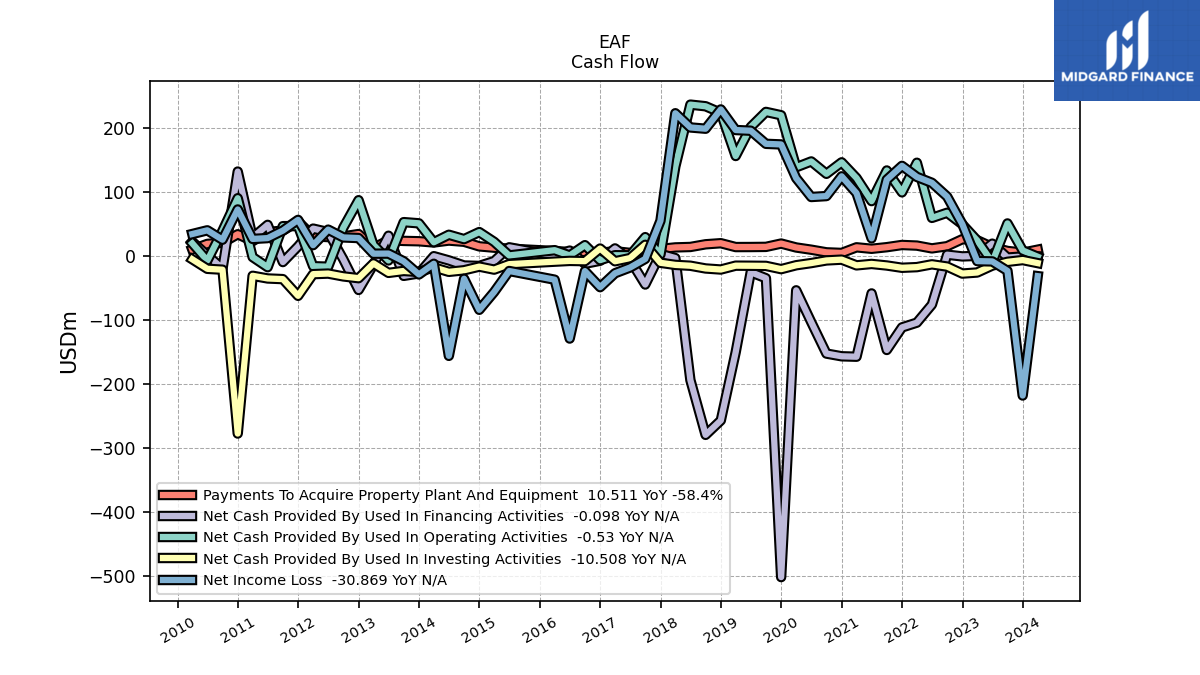
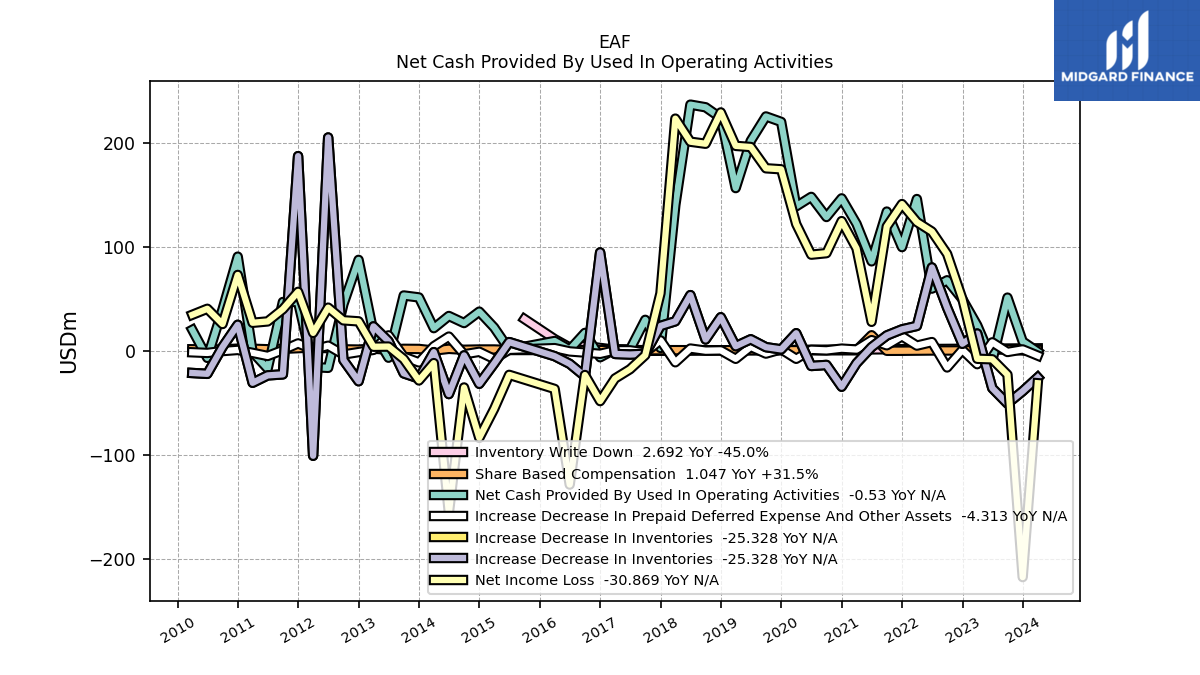
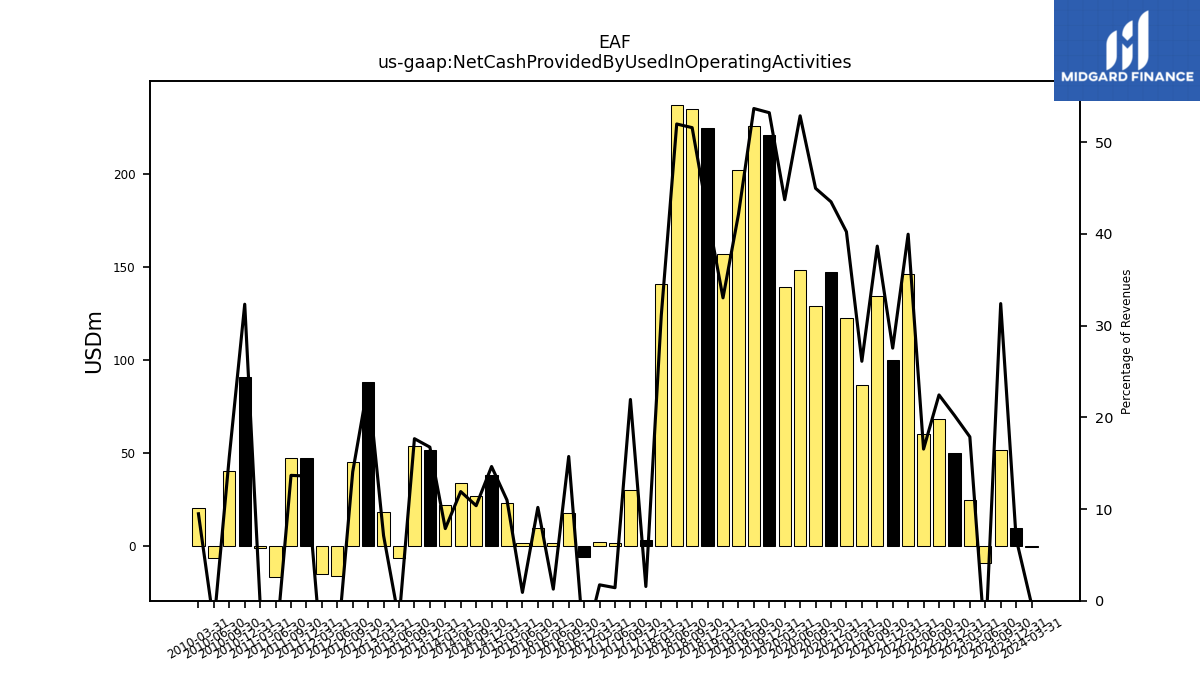
| Net Cash Provided By Used In Operating Activities | 51.49 | -9.02 | 24.80 | 50.02 | 68.17 | 60.12 | 146.32 | 100.03 | 134.26 | 86.33 | 122.42 | 146.98 | 129.01 | 148.37 | 139.28 | 220.54 | 225.75 | 202.21 | 156.82 | 224.36 | 234.57 | 237.12 | 140.55 | 2.99 | 30.11 | 1.66 | 1.82 | -5.92 | 17.55 | 1.46 | 9.72 | 1.50 | 22.72 | 38.01 | 26.99 | 33.81 | 22.09 | 51.66 | 53.53 | -6.35 | 18.00 | 87.79 | 45.07 | -16.09 | -15.37 | 47.30 | 47.26 | -16.87 | -1.09 | 90.89 | 40.09 | -6.51 | 20.44 | |
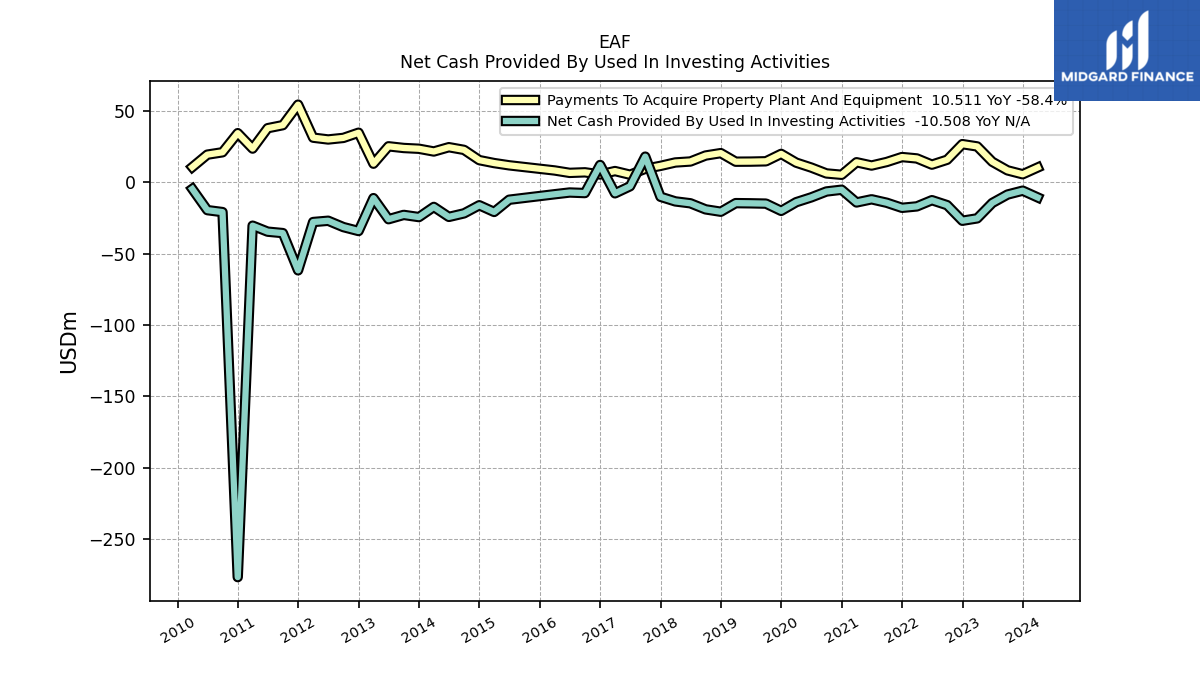
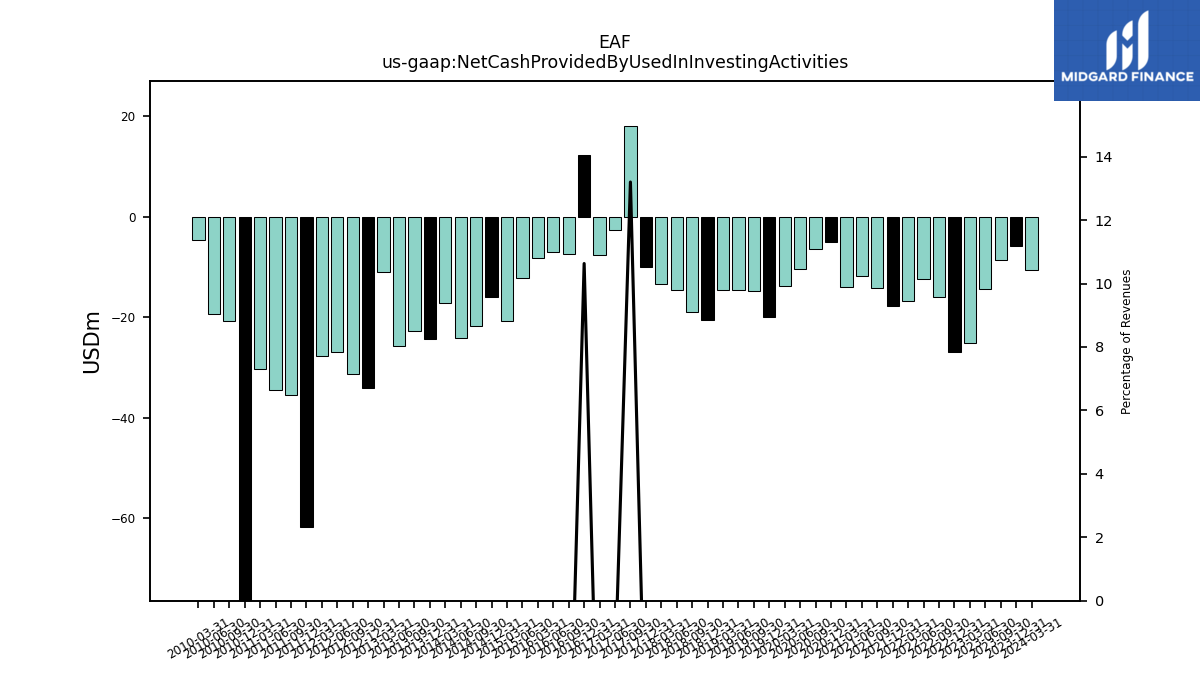
| Net Cash Provided By Used In Investing Activities | -8.49 | -14.40 | -25.18 | -26.85 | -15.91 | -12.43 | -16.78 | -17.79 | -14.24 | -11.81 | -14.02 | -5.09 | -6.32 | -10.45 | -13.84 | -19.93 | -14.84 | -14.62 | -14.49 | -20.53 | -18.87 | -14.61 | -13.29 | -10.03 | 18.12 | -2.66 | -7.63 | 12.27 | -7.44 | -7.04 | -8.26 | -12.10 | -20.68 | -15.98 | -21.67 | -24.16 | -17.14 | -24.29 | -22.75 | -25.79 | -10.97 | -34.06 | -31.30 | -26.85 | -27.75 | -61.65 | -35.51 | -34.51 | -30.30 | -276.82 | -20.78 | -19.41 | -4.54 | |
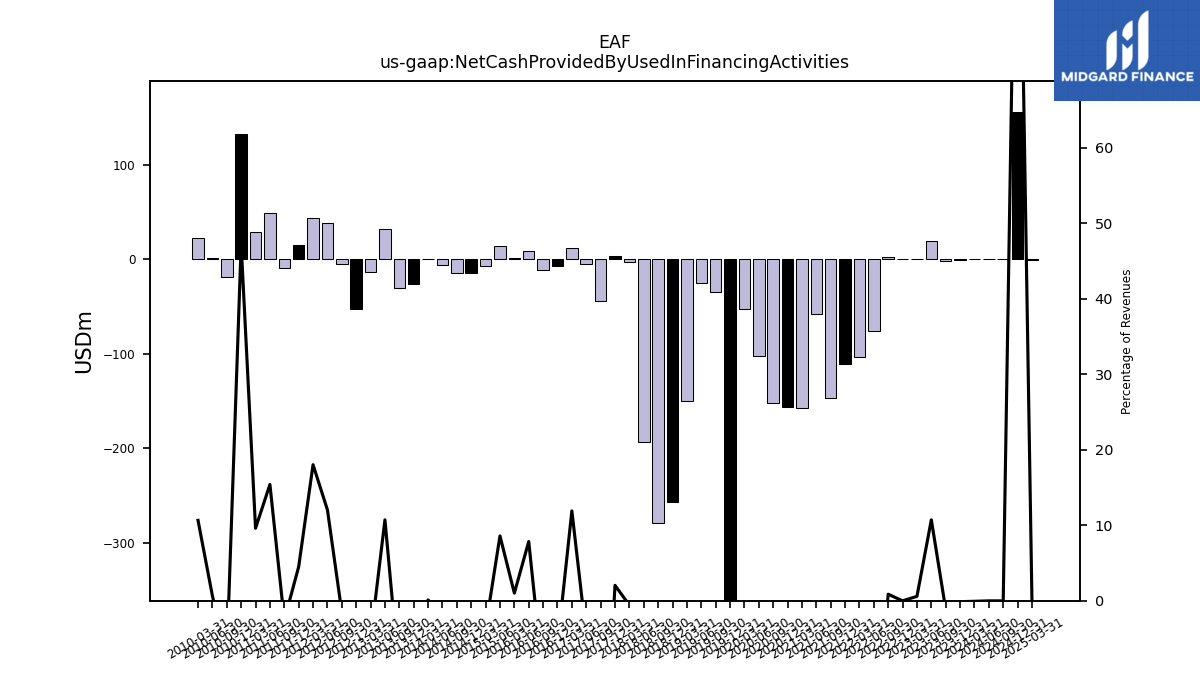
| Net Cash Provided By Used In Financing Activities | -1.82 | 19.89 | 0.81 | -0.03 | 2.63 | -75.35 | -103.52 | -110.95 | -146.23 | -57.85 | -156.76 | -156.10 | -151.86 | -102.72 | -53.00 | -501.13 | -34.10 | -24.70 | -149.70 | -256.32 | -278.90 | -193.22 | -2.60 | 3.92 | -43.99 | -5.39 | 12.47 | -6.79 | -11.54 | 9.05 | 0.97 | 14.18 | -7.37 | -14.91 | -14.23 | -6.26 | 0.32 | -26.58 | -30.44 | 32.29 | -12.92 | -52.49 | -4.79 | 37.99 | 43.41 | 15.66 | -8.89 | 49.30 | 29.40 | 132.56 | -18.94 | 1.65 | 22.96 |
| 2023-09-30 | 2023-06-30 | 2023-03-31 | 2022-12-31 | 2022-09-30 | 2022-06-30 | 2022-03-31 | 2021-12-31 | 2021-09-30 | 2021-06-30 | 2021-03-31 | 2020-12-31 | 2020-09-30 | 2020-06-30 | 2020-03-31 | 2019-12-31 | 2019-09-30 | 2019-06-30 | 2019-03-31 | 2018-12-31 | 2018-09-30 | 2018-06-30 | 2018-03-31 | 2017-12-31 | 2017-09-30 | 2017-06-30 | 2017-03-31 | 2016-12-31 | 2016-09-30 | 2016-06-30 | 2016-03-31 | 2015-06-30 | 2015-03-31 | 2014-12-31 | 2014-09-30 | 2014-06-30 | 2014-03-31 | 2013-12-31 | 2013-09-30 | 2013-06-30 | 2013-03-31 | 2012-12-31 | 2012-09-30 | 2012-06-30 | 2012-03-31 | 2011-12-31 | 2011-09-30 | 2011-06-30 | 2011-03-31 | 2010-12-31 | 2010-09-30 | 2010-06-30 | 2010-03-31 | ||
|---|---|---|---|---|---|---|---|---|---|---|---|---|---|---|---|---|---|---|---|---|---|---|---|---|---|---|---|---|---|---|---|---|---|---|---|---|---|---|---|---|---|---|---|---|---|---|---|---|---|---|---|---|---|---|
| Net Cash Provided By Used In Operating Activities | 51.49 | -9.02 | 24.80 | 50.02 | 68.17 | 60.12 | 146.32 | 100.03 | 134.26 | 86.33 | 122.42 | 146.98 | 129.01 | 148.37 | 139.28 | 220.54 | 225.75 | 202.21 | 156.82 | 224.36 | 234.57 | 237.12 | 140.55 | 2.99 | 30.11 | 1.66 | 1.82 | -5.92 | 17.55 | 1.46 | 9.72 | 1.50 | 22.72 | 38.01 | 26.99 | 33.81 | 22.09 | 51.66 | 53.53 | -6.35 | 18.00 | 87.79 | 45.07 | -16.09 | -15.37 | 47.30 | 47.26 | -16.87 | -1.09 | 90.89 | 40.09 | -6.51 | 20.44 | |
| Net Income Loss | -22.62 | -7.85 | -7.37 | 50.33 | 93.45 | 115.00 | 124.18 | 141.48 | 119.89 | 28.16 | 98.80 | 125.10 | 94.23 | 92.78 | 122.27 | 174.92 | 175.88 | 196.37 | 197.44 | 229.63 | 199.47 | 201.45 | 223.67 | 55.63 | -3.92 | -17.38 | -26.34 | -48.10 | -22.97 | -128.40 | -36.38 | -22.82 | -55.61 | -83.48 | -34.94 | -155.43 | -11.52 | -28.22 | -7.63 | 4.38 | 4.21 | 28.64 | 29.63 | 41.85 | 17.53 | 57.05 | 40.30 | 28.57 | 27.26 | 73.33 | 26.04 | 40.75 | 34.95 | |
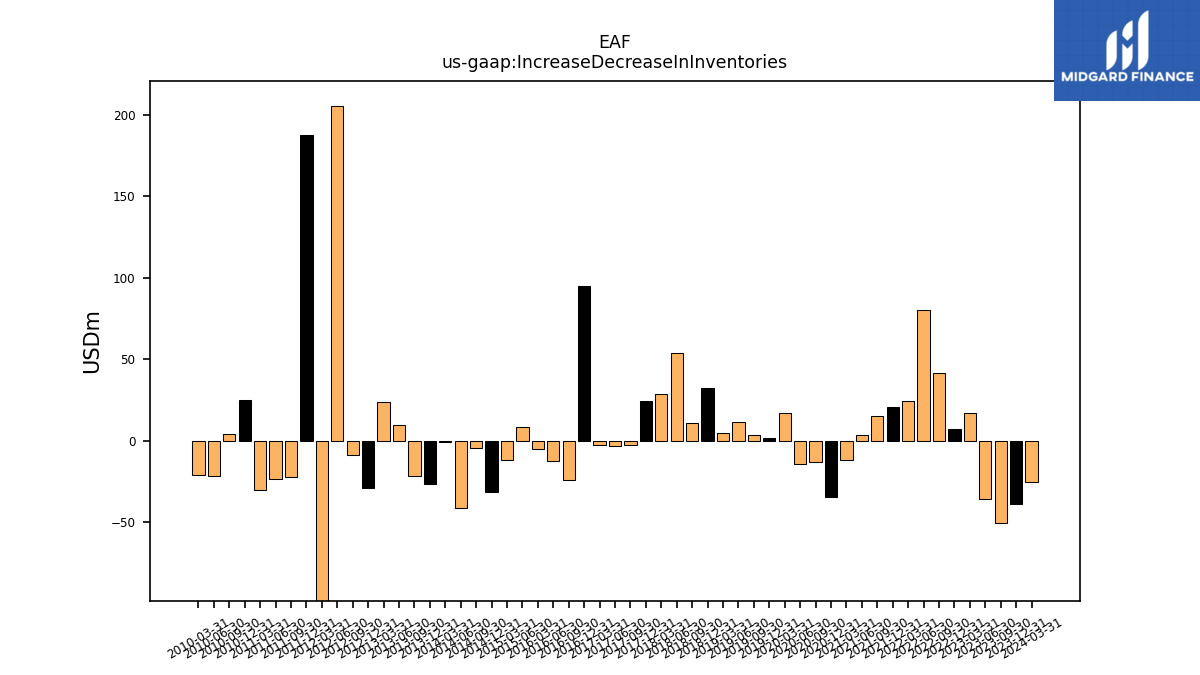
| Increase Decrease In Inventories | -50.53 | -35.63 | 16.90 | 7.08 | 41.78 | 80.50 | 24.21 | 20.92 | 15.07 | 3.83 | -11.65 | -34.26 | -13.29 | -14.31 | 17.24 | 1.64 | 3.81 | 11.39 | 4.71 | 32.60 | 11.19 | 53.89 | 28.68 | 24.24 | -2.59 | -3.28 | -2.72 | 94.95 | -24.28 | -12.25 | -4.87 | 8.70 | -11.98 | -31.45 | -4.13 | -41.34 | -0.95 | -26.30 | -21.40 | 9.60 | 23.79 | -29.00 | -8.54 | 205.53 | -100.67 | 187.60 | -22.38 | -23.36 | -30.47 | 25.33 | 3.94 | -21.87 | -21.04 | |
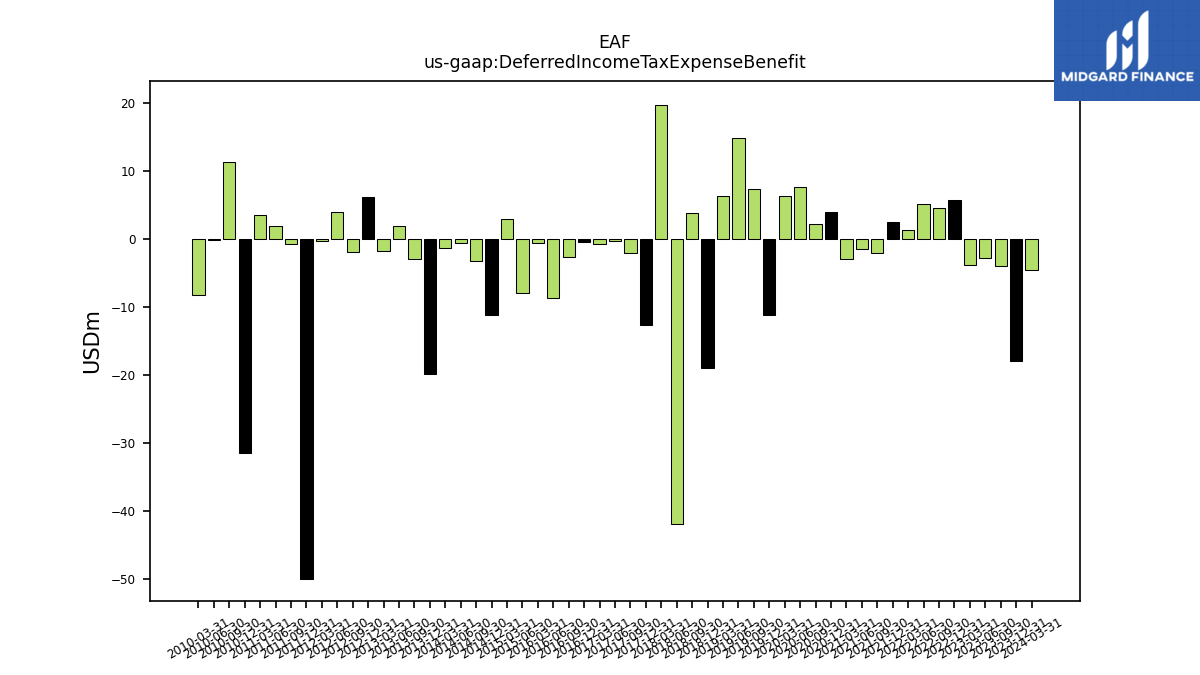
| Deferred Income Tax Expense Benefit | -3.87 | -2.67 | -3.75 | 5.81 | 4.66 | 5.16 | 1.40 | 2.52 | -1.99 | -1.35 | -2.84 | 4.00 | 2.25 | 7.64 | 6.35 | -11.19 | 7.41 | 14.86 | 6.43 | -18.89 | 3.83 | -41.80 | 19.79 | -12.65 | -2.06 | -0.23 | -0.76 | -0.32 | -2.65 | -8.61 | -0.48 | -7.92 | 2.97 | -11.06 | -3.22 | -0.50 | -1.22 | -19.81 | -2.84 | 1.94 | -1.66 | 6.22 | -1.82 | 3.94 | -0.22 | -49.87 | -0.72 | 2.02 | 3.52 | -31.40 | 11.38 | -0.12 | -8.12 | |
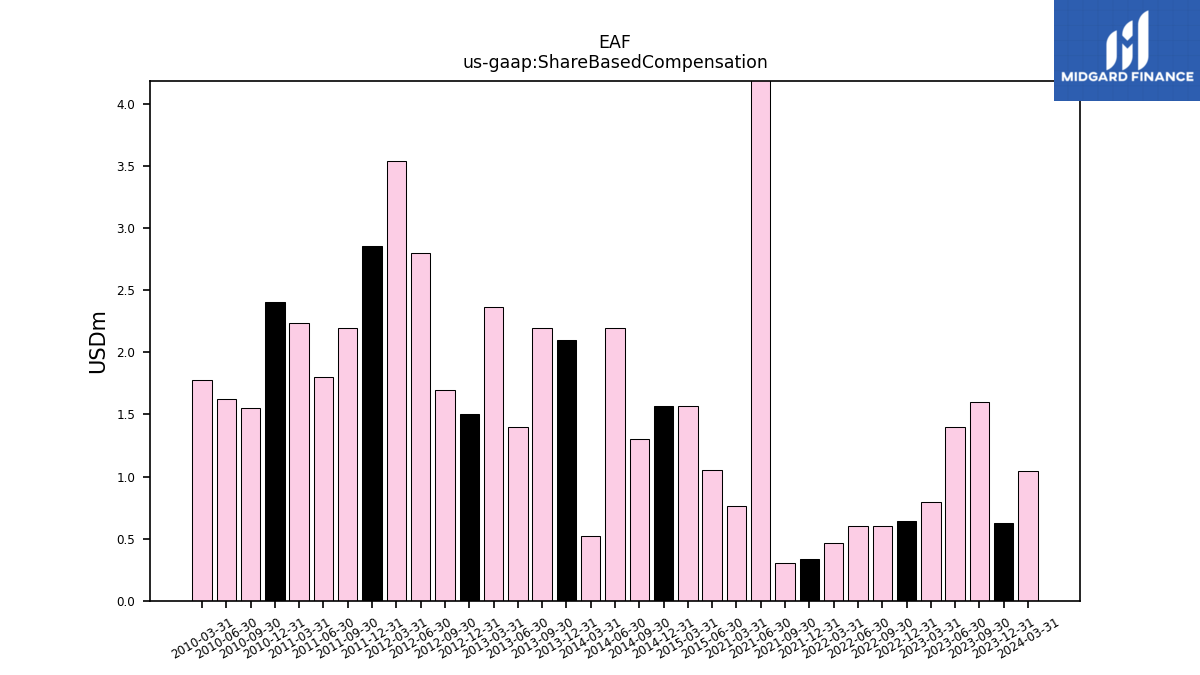
| Share Based Compensation | 1.60 | 1.40 | 0.80 | 0.65 | 0.60 | 0.60 | 0.47 | 0.34 | 0.30 | 15.30 | 0.77 | NA | NA | NA | NA | NA | NA | NA | NA | NA | NA | NA | NA | NA | NA | NA | NA | NA | NA | NA | NA | 1.06 | 1.57 | 1.57 | 1.30 | 2.20 | 0.52 | 2.10 | 2.20 | 1.40 | 2.37 | 1.50 | 1.70 | 2.80 | 3.54 | 2.86 | 2.20 | 1.80 | 2.24 | 2.40 | 1.55 | 1.62 | 1.78 | |
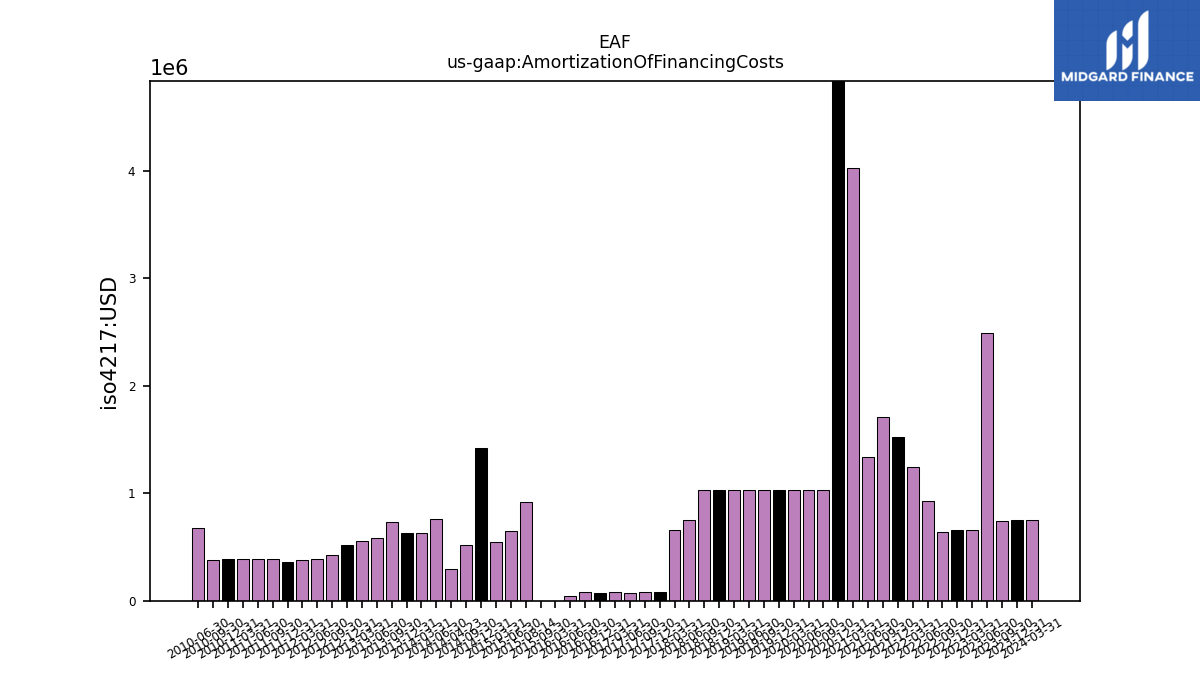
| Amortization Of Financing Costs | 0.74 | 2.49 | 0.66 | 0.66 | 0.64 | 0.93 | 1.24 | 1.52 | 1.71 | 1.34 | 4.03 | 6.08 | 1.03 | 1.03 | 1.03 | 1.03 | 1.03 | 1.03 | 1.03 | 1.03 | 1.03 | 0.76 | 0.66 | 0.08 | 0.08 | 0.08 | 0.08 | 0.08 | 0.08 | 0.05 | 0.00 | 0.65 | 0.54 | 1.42 | 0.52 | 0.76 | 0.63 | 0.63 | 0.73 | 0.59 | 0.56 | 0.52 | 0.43 | 0.39 | 0.38 | 0.36 | 0.39 | 0.39 | 0.39 | 0.38 | 0.38 | 0.68 | NA |
| 2023-09-30 | 2023-06-30 | 2023-03-31 | 2022-12-31 | 2022-09-30 | 2022-06-30 | 2022-03-31 | 2021-12-31 | 2021-09-30 | 2021-06-30 | 2021-03-31 | 2020-12-31 | 2020-09-30 | 2020-06-30 | 2020-03-31 | 2019-12-31 | 2019-09-30 | 2019-06-30 | 2019-03-31 | 2018-12-31 | 2018-09-30 | 2018-06-30 | 2018-03-31 | 2017-12-31 | 2017-09-30 | 2017-06-30 | 2017-03-31 | 2016-12-31 | 2016-09-30 | 2016-06-30 | 2016-03-31 | 2015-06-30 | 2015-03-31 | 2014-12-31 | 2014-09-30 | 2014-06-30 | 2014-03-31 | 2013-12-31 | 2013-09-30 | 2013-06-30 | 2013-03-31 | 2012-12-31 | 2012-09-30 | 2012-06-30 | 2012-03-31 | 2011-12-31 | 2011-09-30 | 2011-06-30 | 2011-03-31 | 2010-12-31 | 2010-09-30 | 2010-06-30 | 2010-03-31 | ||
|---|---|---|---|---|---|---|---|---|---|---|---|---|---|---|---|---|---|---|---|---|---|---|---|---|---|---|---|---|---|---|---|---|---|---|---|---|---|---|---|---|---|---|---|---|---|---|---|---|---|---|---|---|---|---|
| Net Cash Provided By Used In Investing Activities | -8.49 | -14.40 | -25.18 | -26.85 | -15.91 | -12.43 | -16.78 | -17.79 | -14.24 | -11.81 | -14.02 | -5.09 | -6.32 | -10.45 | -13.84 | -19.93 | -14.84 | -14.62 | -14.49 | -20.53 | -18.87 | -14.61 | -13.29 | -10.03 | 18.12 | -2.66 | -7.63 | 12.27 | -7.44 | -7.04 | -8.26 | -12.10 | -20.68 | -15.98 | -21.67 | -24.16 | -17.14 | -24.29 | -22.75 | -25.79 | -10.97 | -34.06 | -31.30 | -26.85 | -27.75 | -61.65 | -35.51 | -34.51 | -30.30 | -276.82 | -20.78 | -19.41 | -4.54 | |
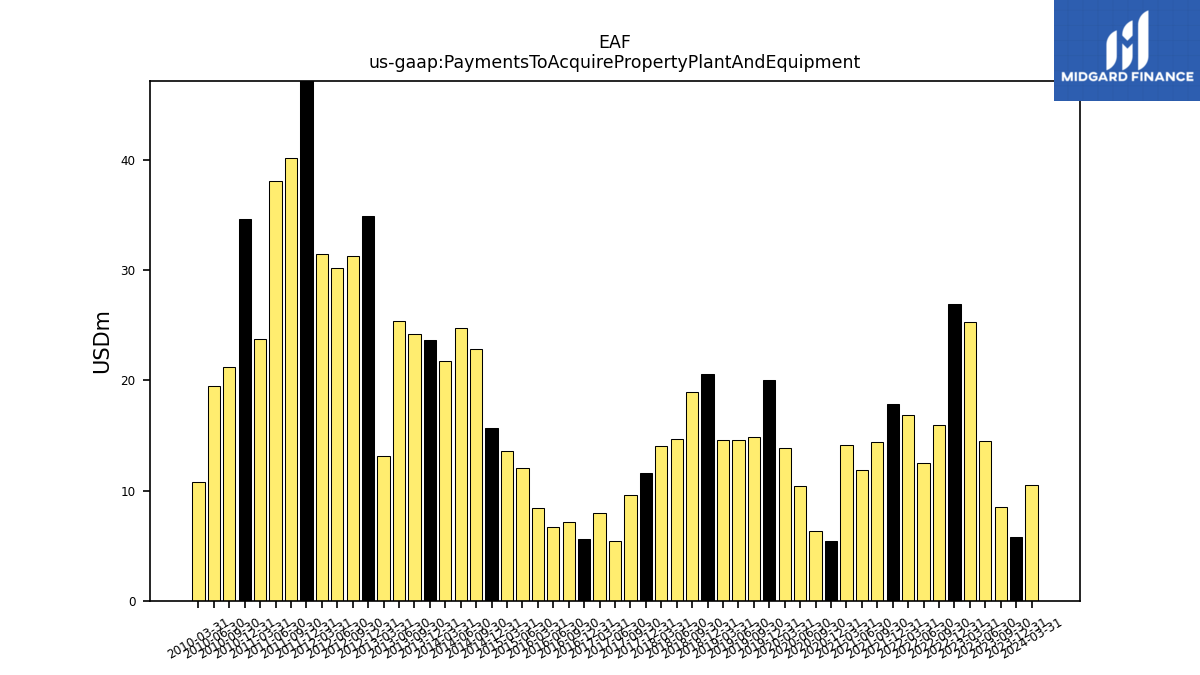
| Payments To Acquire Property Plant And Equipment | 8.50 | 14.52 | 25.27 | 26.88 | 15.93 | 12.49 | 16.86 | 17.83 | 14.37 | 11.88 | 14.17 | 5.39 | 6.33 | 10.45 | 13.90 | 20.05 | 14.85 | 14.63 | 14.57 | 20.59 | 18.90 | 14.71 | 14.03 | 11.64 | 9.58 | 5.45 | 8.00 | 5.60 | 7.12 | 6.73 | 8.41 | 12.02 | 13.60 | 15.67 | 22.85 | 24.74 | 21.73 | 23.65 | 24.18 | 25.36 | 13.16 | 34.90 | 31.25 | 30.15 | 31.42 | 54.60 | 40.20 | 38.06 | 23.76 | 34.59 | 21.17 | 19.52 | 10.76 |
| 2023-09-30 | 2023-06-30 | 2023-03-31 | 2022-12-31 | 2022-09-30 | 2022-06-30 | 2022-03-31 | 2021-12-31 | 2021-09-30 | 2021-06-30 | 2021-03-31 | 2020-12-31 | 2020-09-30 | 2020-06-30 | 2020-03-31 | 2019-12-31 | 2019-09-30 | 2019-06-30 | 2019-03-31 | 2018-12-31 | 2018-09-30 | 2018-06-30 | 2018-03-31 | 2017-12-31 | 2017-09-30 | 2017-06-30 | 2017-03-31 | 2016-12-31 | 2016-09-30 | 2016-06-30 | 2016-03-31 | 2015-06-30 | 2015-03-31 | 2014-12-31 | 2014-09-30 | 2014-06-30 | 2014-03-31 | 2013-12-31 | 2013-09-30 | 2013-06-30 | 2013-03-31 | 2012-12-31 | 2012-09-30 | 2012-06-30 | 2012-03-31 | 2011-12-31 | 2011-09-30 | 2011-06-30 | 2011-03-31 | 2010-12-31 | 2010-09-30 | 2010-06-30 | 2010-03-31 | ||
|---|---|---|---|---|---|---|---|---|---|---|---|---|---|---|---|---|---|---|---|---|---|---|---|---|---|---|---|---|---|---|---|---|---|---|---|---|---|---|---|---|---|---|---|---|---|---|---|---|---|---|---|---|---|---|
| Net Cash Provided By Used In Financing Activities | -1.82 | 19.89 | 0.81 | -0.03 | 2.63 | -75.35 | -103.52 | -110.95 | -146.23 | -57.85 | -156.76 | -156.10 | -151.86 | -102.72 | -53.00 | -501.13 | -34.10 | -24.70 | -149.70 | -256.32 | -278.90 | -193.22 | -2.60 | 3.92 | -43.99 | -5.39 | 12.47 | -6.79 | -11.54 | 9.05 | 0.97 | 14.18 | -7.37 | -14.91 | -14.23 | -6.26 | 0.32 | -26.58 | -30.44 | 32.29 | -12.92 | -52.49 | -4.79 | 37.99 | 43.41 | 15.66 | -8.89 | 49.30 | 29.40 | 132.56 | -18.94 | 1.65 | 22.96 | |
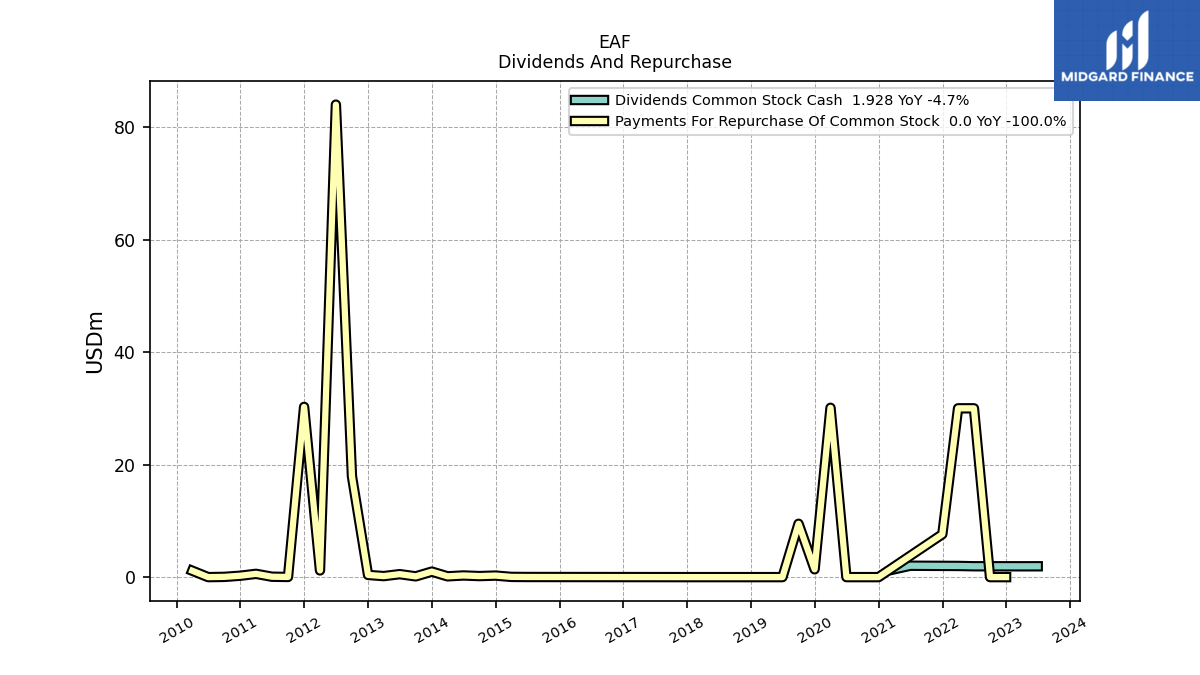
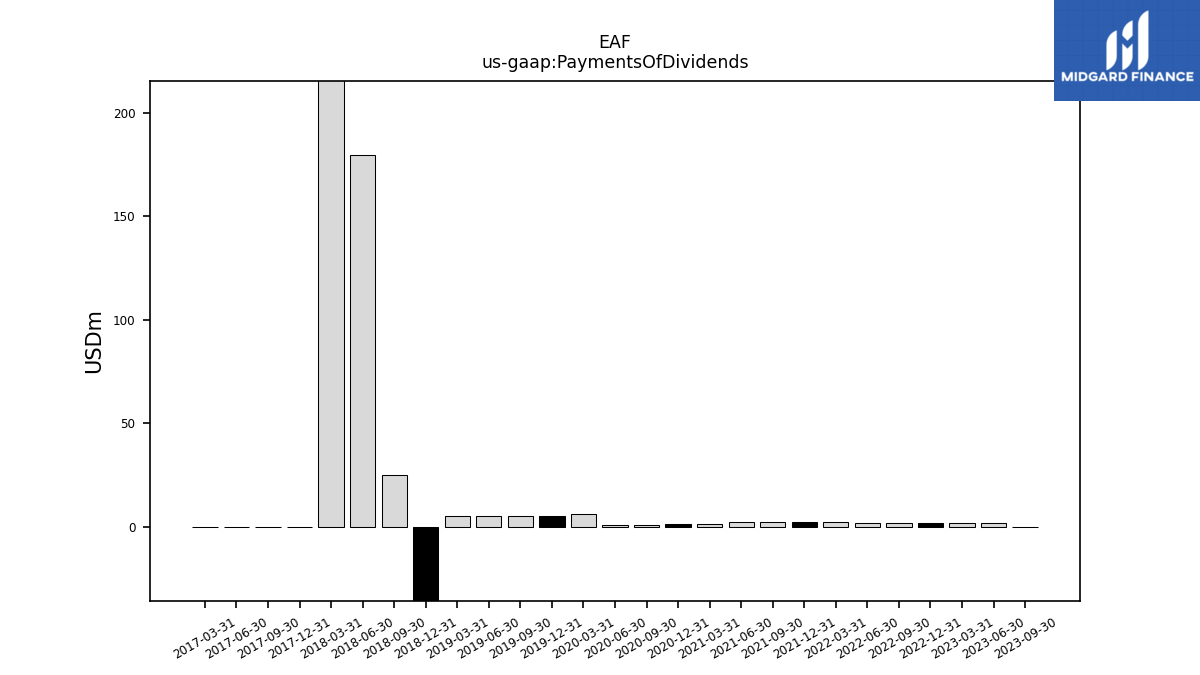
| Payments Of Dividends | 0.00 | 1.93 | 1.93 | 1.93 | 1.93 | 1.93 | 1.99 | 1.99 | 2.03 | 2.02 | 1.39 | 1.05 | 0.95 | 0.68 | 5.93 | 5.11 | 5.12 | 5.19 | 5.19 | -1260.57 | 24.70 | 179.49 | 1112.00 | 0.00 | 0.00 | 0.00 | 0.00 | NA | NA | NA | NA | NA | NA | NA | NA | NA | NA | NA | NA | NA | NA | NA | NA | NA | NA | NA | NA | NA | NA | NA | NA | NA | NA | |
| Payments For Repurchase Of Common Stock | NA | NA | NA | 0.00 | 0.00 | 30.00 | 30.00 | 7.62 | NA | NA | NA | 0.00 | 0.00 | 0.00 | 30.10 | 1.38 | 9.48 | 0.00 | 0.00 | 0.00 | NA | NA | NA | 0.00 | NA | NA | NA | NA | NA | NA | NA | 0.02 | 0.04 | 0.27 | 0.18 | 0.29 | 0.14 | 0.98 | 0.14 | 0.53 | 0.18 | 0.39 | 17.90 | 83.97 | 1.19 | 30.26 | 0.03 | 0.07 | 0.58 | 0.25 | 0.04 | 0.00 | 1.14 |
| 2023-09-30 | 2023-06-30 | 2023-03-31 | 2022-12-31 | 2022-09-30 | 2022-06-30 | 2022-03-31 | 2021-12-31 | 2021-09-30 | 2021-06-30 | 2021-03-31 | 2020-12-31 | 2020-09-30 | 2020-06-30 | 2020-03-31 | 2019-12-31 | 2019-09-30 | 2019-06-30 | 2019-03-31 | 2018-12-31 | 2018-09-30 | 2018-06-30 | 2018-03-31 | 2017-12-31 | 2017-09-30 | 2017-06-30 | 2017-03-31 | 2016-12-31 | 2016-09-30 | 2016-06-30 | 2016-03-31 | 2015-06-30 | 2015-03-31 | 2014-12-31 | 2014-09-30 | 2014-06-30 | 2014-03-31 | 2013-12-31 | 2013-09-30 | 2013-06-30 | 2013-03-31 | 2012-12-31 | 2012-09-30 | 2012-06-30 | 2012-03-31 | 2011-12-31 | 2011-09-30 | 2011-06-30 | 2011-03-31 | 2010-12-31 | 2010-09-30 | 2010-06-30 | 2010-03-31 | ||
|---|---|---|---|---|---|---|---|---|---|---|---|---|---|---|---|---|---|---|---|---|---|---|---|---|---|---|---|---|---|---|---|---|---|---|---|---|---|---|---|---|---|---|---|---|---|---|---|---|---|---|---|---|---|---|
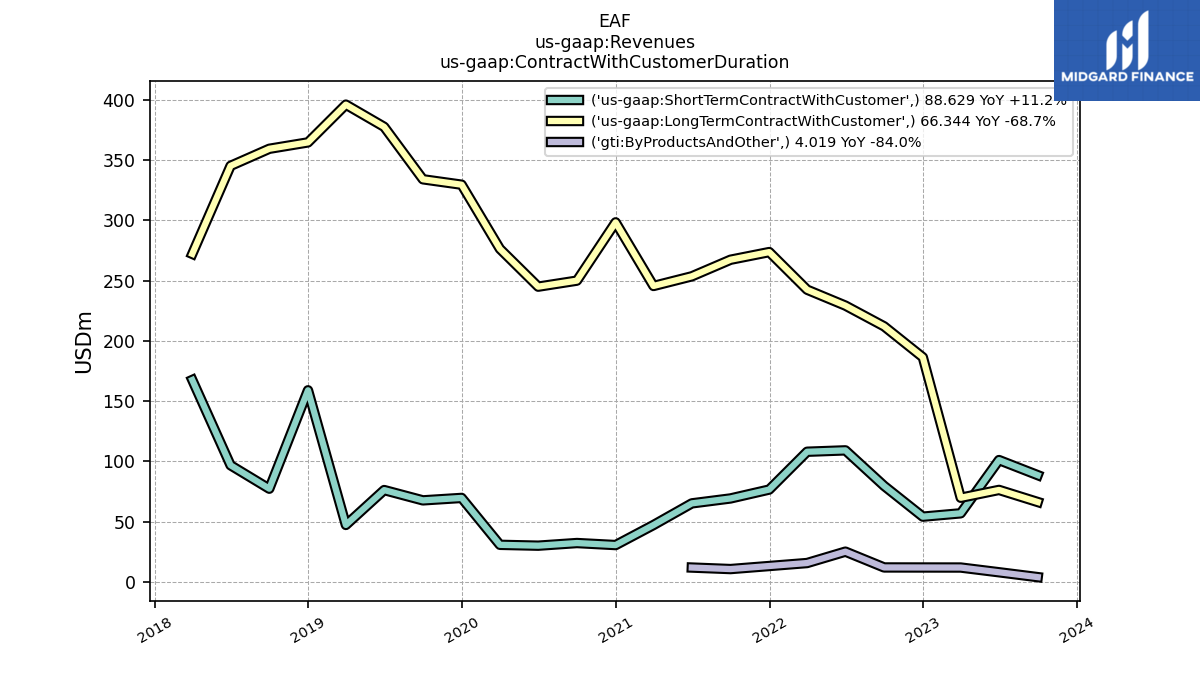
| Revenues | 158.99 | 185.56 | 138.80 | 247.52 | 303.84 | 363.65 | 366.25 | 363.29 | 347.35 | 330.75 | 304.40 | 338.01 | 286.99 | 280.72 | 318.65 | 414.61 | 420.80 | 480.39 | 474.99 | 532.79 | 454.89 | 456.33 | 451.90 | 192.47 | 137.25 | 116.31 | 104.74 | 115.43 | 111.59 | 115.36 | 95.58 | 165.12 | 207.21 | 259.87 | 260.46 | 284.18 | 280.79 | 308.50 | 303.08 | 301.36 | 253.73 | 371.00 | 320.72 | 315.61 | 240.94 | 347.98 | 345.83 | 320.23 | 306.14 | 281.24 | 255.24 | 254.85 | 215.66 | |
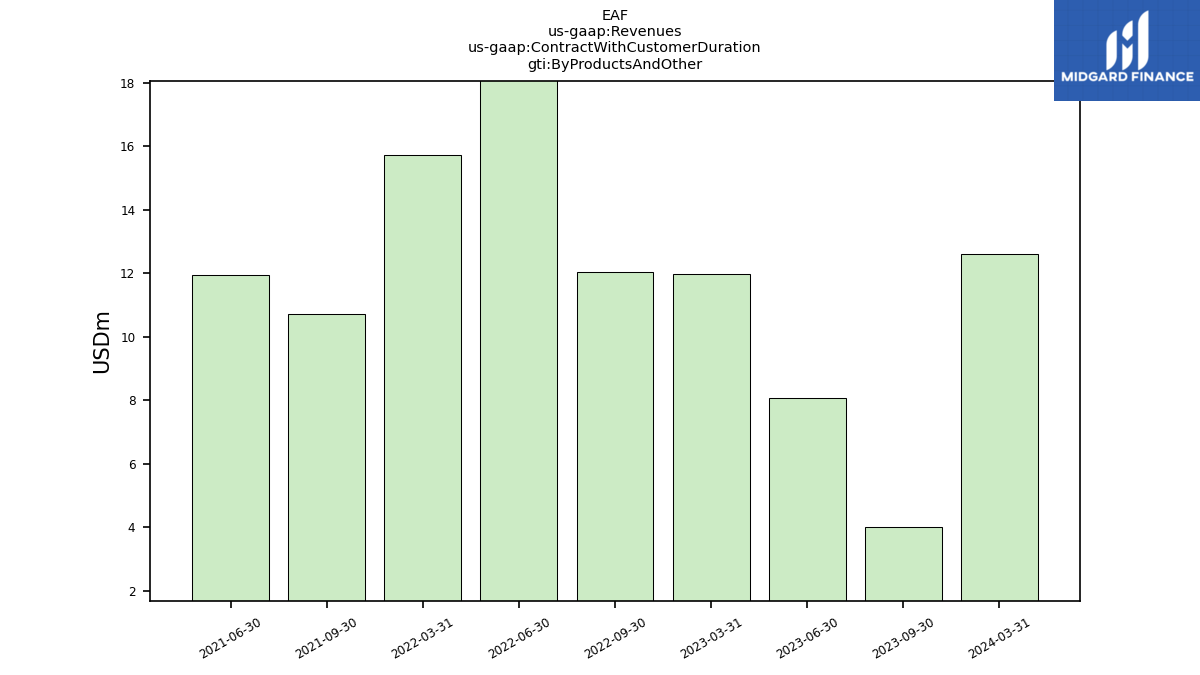
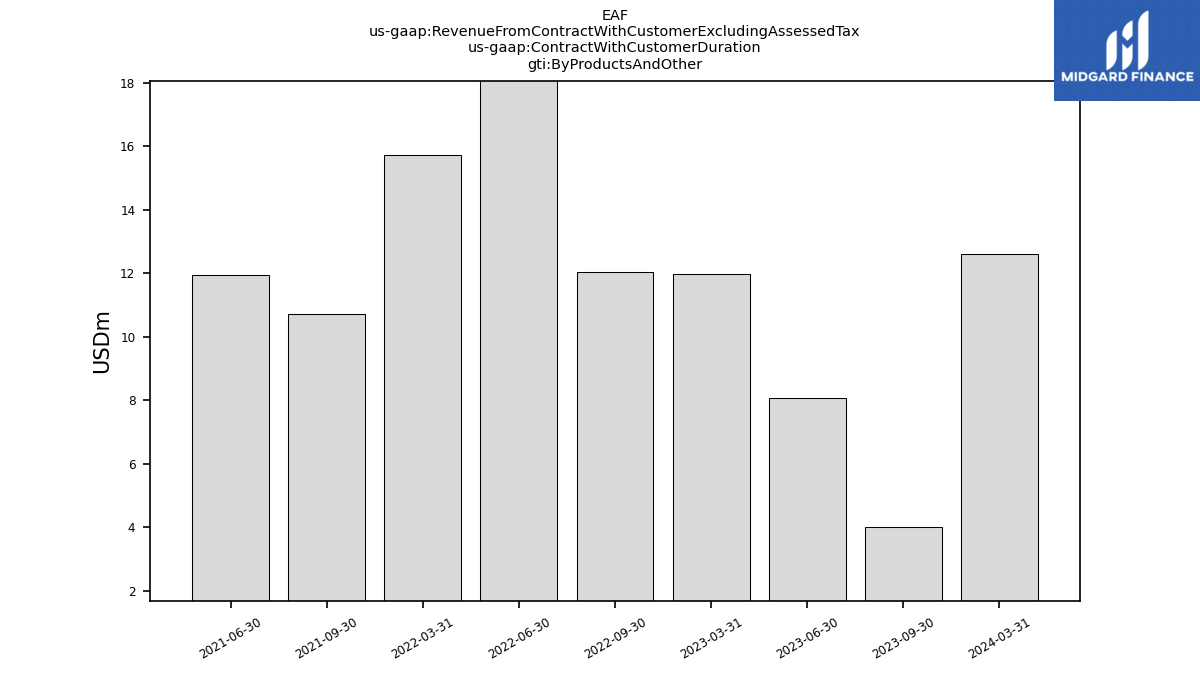
| By Products And Other | 4.02 | 8.05 | 11.98 | NA | 12.04 | 25.16 | 15.71 | NA | 10.70 | 11.96 | NA | NA | NA | NA | NA | NA | NA | NA | NA | NA | NA | NA | NA | NA | NA | NA | NA | NA | NA | NA | NA | NA | NA | NA | NA | NA | NA | NA | NA | NA | NA | NA | NA | NA | NA | NA | NA | NA | NA | NA | NA | NA | NA | |
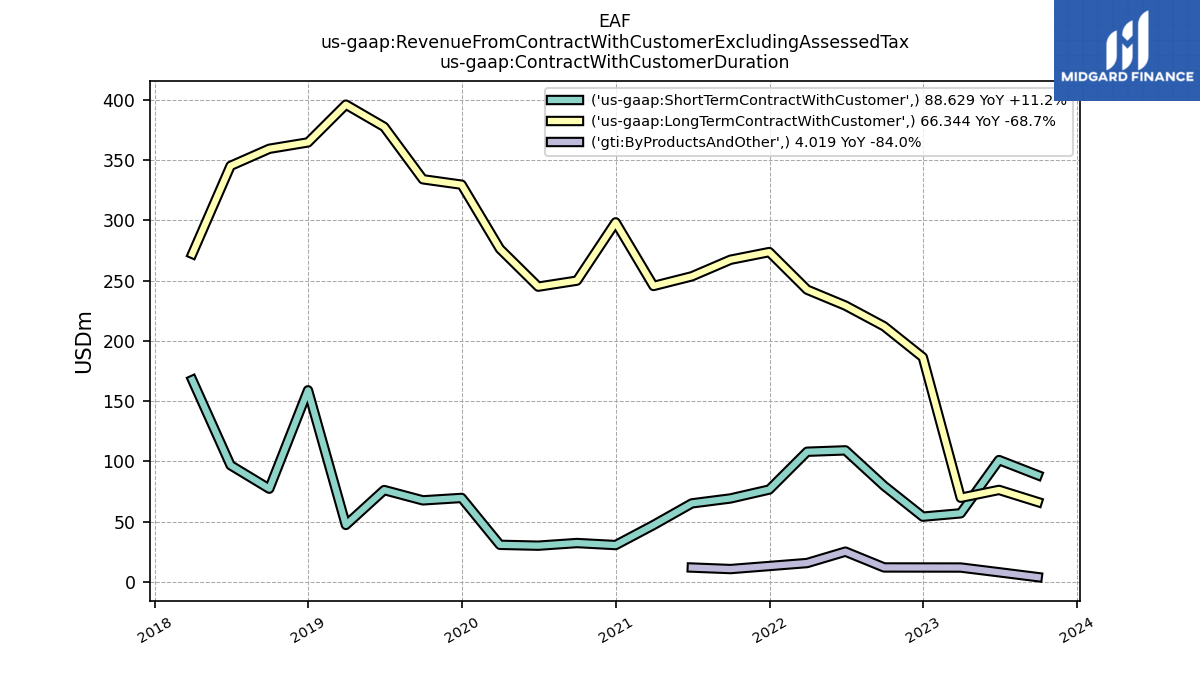
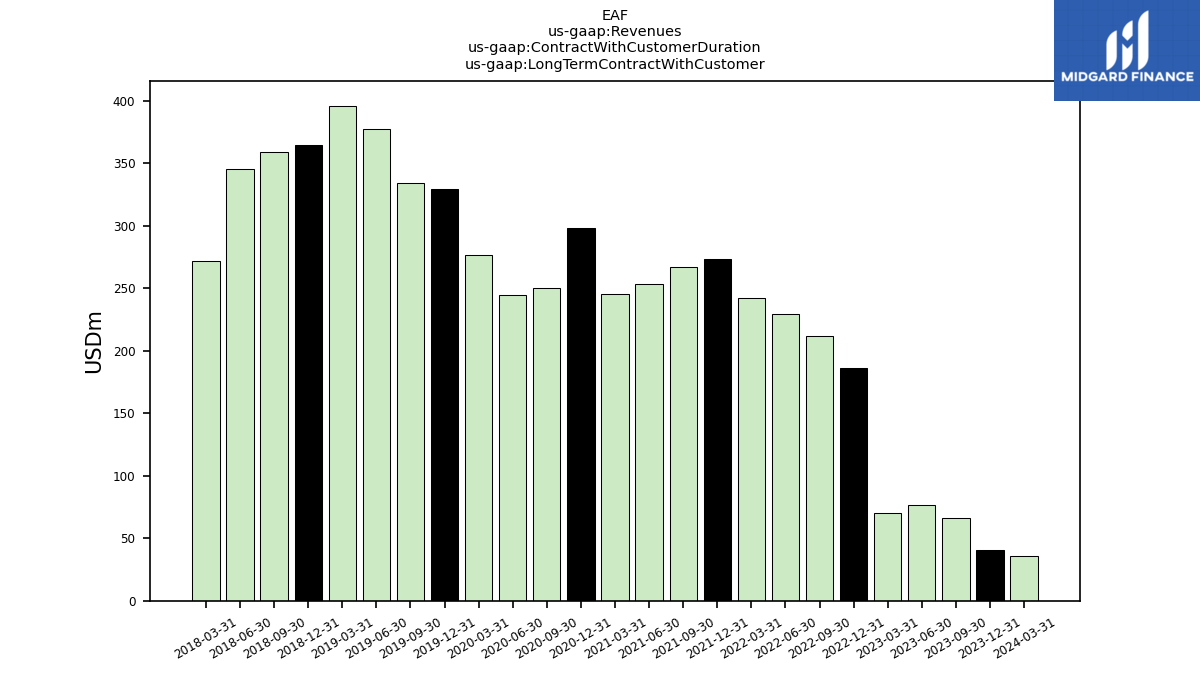
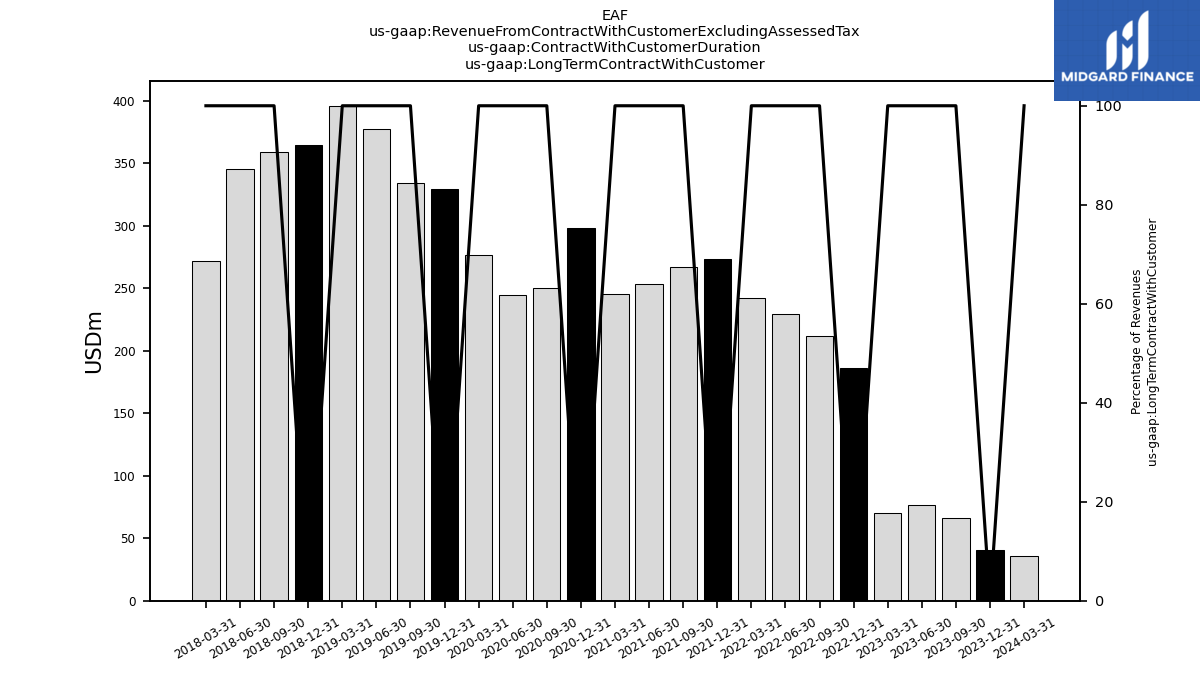
| Long Term Contract With Customer | 66.34 | 76.37 | 69.87 | 186.43 | 212.09 | 229.29 | 242.48 | 273.71 | 267.35 | 253.59 | 245.56 | 298.37 | 250.01 | 245.01 | 276.38 | 329.61 | 334.10 | 377.61 | 396.04 | 364.70 | 359.40 | 345.25 | 272.20 | NA | NA | NA | NA | NA | NA | NA | NA | NA | NA | NA | NA | NA | NA | NA | NA | NA | NA | NA | NA | NA | NA | NA | NA | NA | NA | NA | NA | NA | NA | |
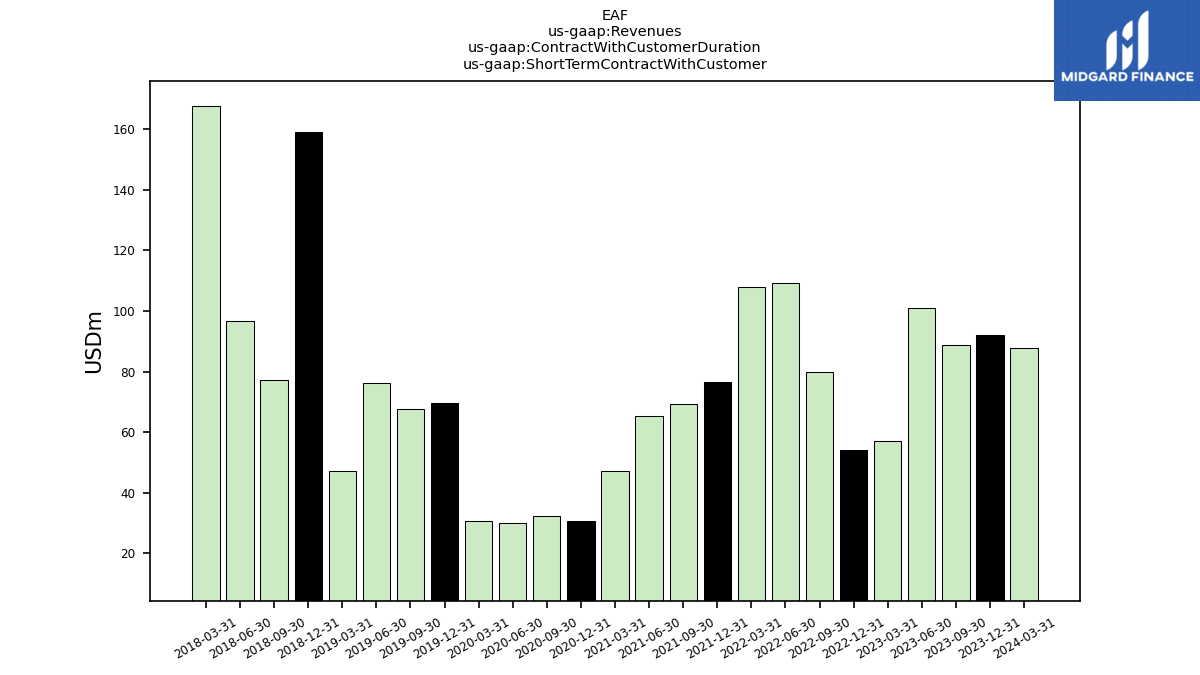
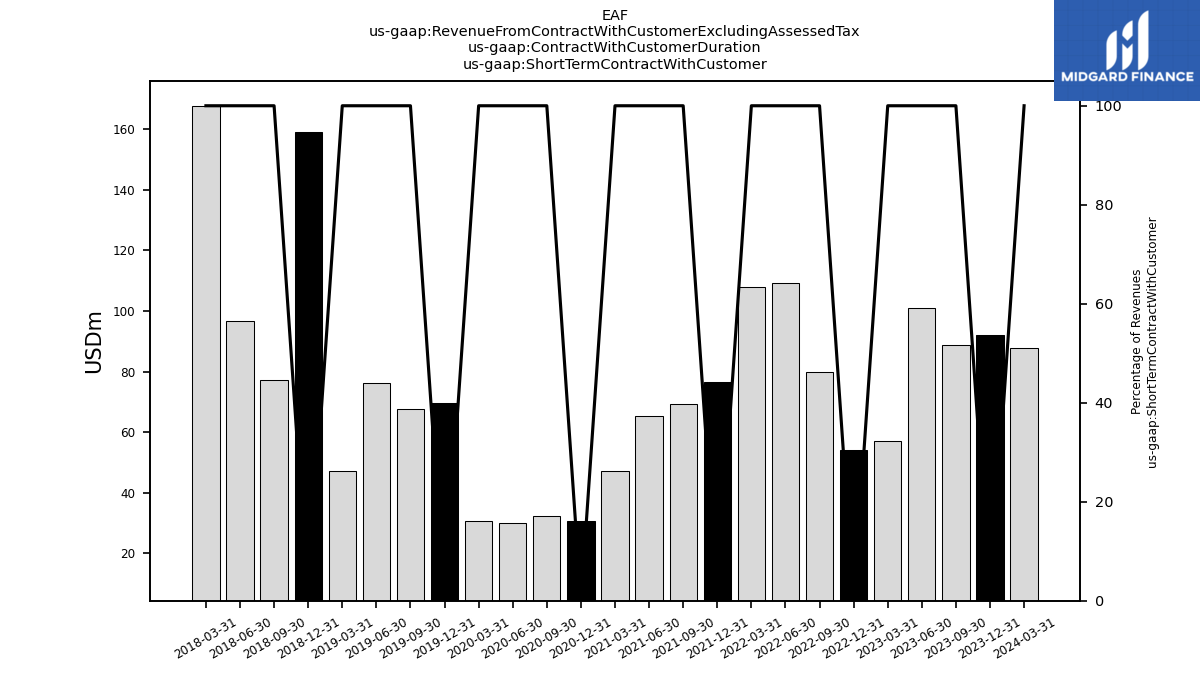
| Short Term Contract With Customer | 88.63 | 101.14 | 56.96 | 54.19 | 79.71 | 109.19 | 108.05 | 76.67 | 69.30 | 65.20 | 47.26 | 30.61 | 32.30 | 30.11 | 30.82 | 69.73 | 67.70 | 76.25 | 47.30 | 159.03 | 77.39 | 96.82 | 167.59 | NA | NA | NA | NA | NA | NA | NA | NA | NA | NA | NA | NA | NA | NA | NA | NA | NA | NA | NA | NA | NA | NA | NA | NA | NA | NA | NA | NA | NA | NA | |
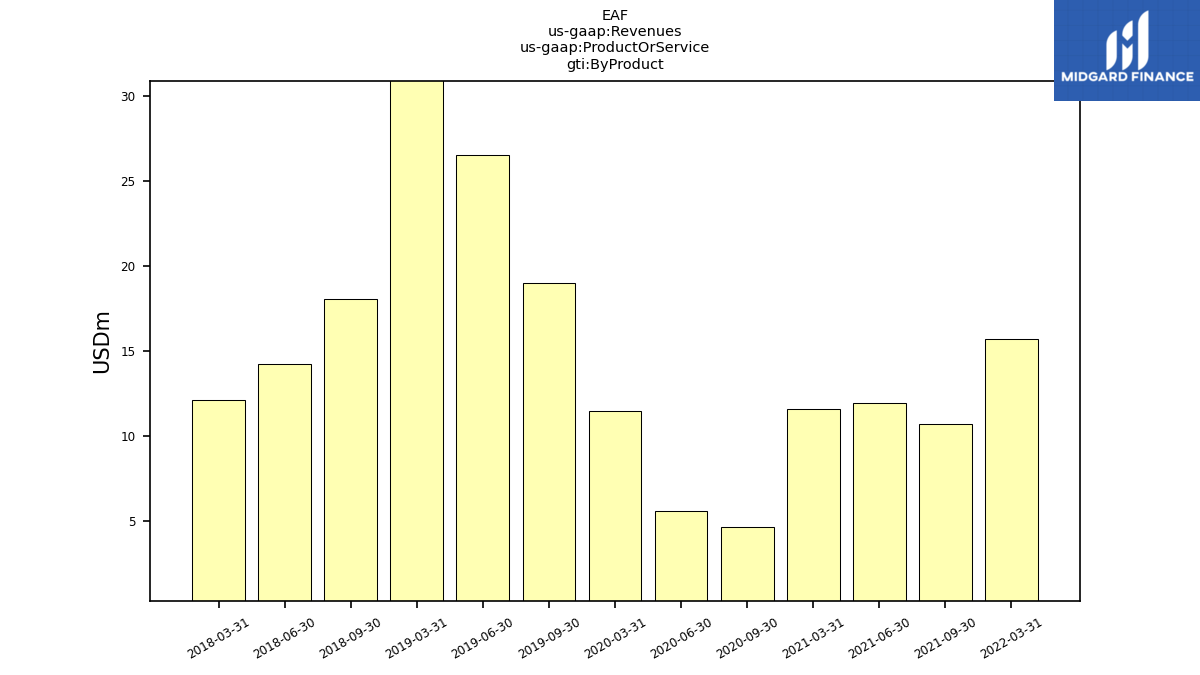
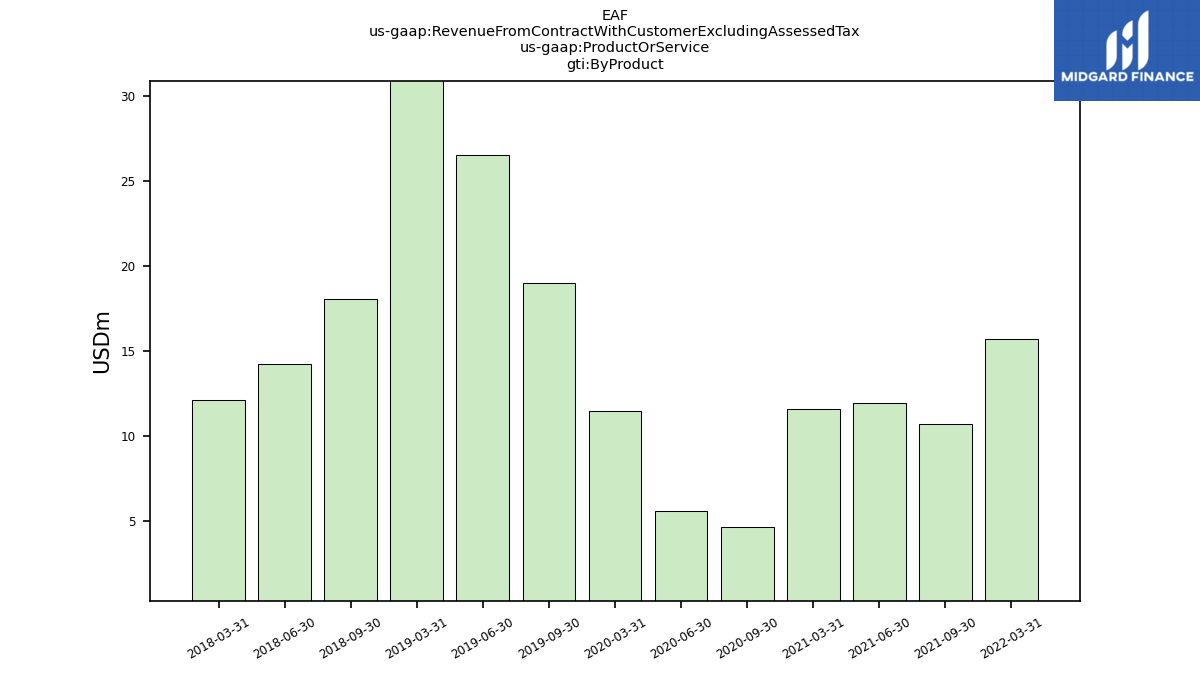
| By Product | NA | NA | NA | NA | NA | NA | 15.71 | NA | 10.70 | 11.96 | 11.58 | NA | 4.67 | 5.60 | 11.45 | NA | 19.00 | 26.54 | 31.66 | NA | 18.10 | 14.26 | 12.10 | NA | NA | NA | NA | NA | NA | NA | NA | NA | NA | NA | NA | NA | NA | NA | NA | NA | NA | NA | NA | NA | NA | NA | NA | NA | NA | NA | NA | NA | NA | |
| Revenue From Contract With Customer Excluding Assessed Tax | 158.99 | 185.56 | 138.80 | 247.52 | 303.84 | 363.65 | 366.25 | 363.29 | 347.35 | 330.75 | 304.40 | 338.01 | 286.99 | 280.72 | 318.65 | 414.61 | 420.80 | 480.39 | 474.99 | 532.79 | 454.89 | 456.33 | 451.90 | 192.47 | 137.25 | 116.31 | 104.74 | 115.43 | 111.59 | 115.36 | 95.58 | 165.12 | 207.21 | 259.87 | 260.46 | 284.18 | 280.79 | 308.50 | 303.08 | 301.36 | 253.73 | 371.00 | 320.72 | 315.61 | 240.94 | 347.98 | 345.83 | 320.23 | 306.14 | 281.24 | 255.24 | 254.85 | 215.66 | |
| By Products And Other | 4.02 | 8.05 | 11.98 | NA | 12.04 | 25.16 | 15.71 | NA | 10.70 | 11.96 | NA | NA | NA | NA | NA | NA | NA | NA | NA | NA | NA | NA | NA | NA | NA | NA | NA | NA | NA | NA | NA | NA | NA | NA | NA | NA | NA | NA | NA | NA | NA | NA | NA | NA | NA | NA | NA | NA | NA | NA | NA | NA | NA | |
| Long Term Contract With Customer | 66.34 | 76.37 | 69.87 | 186.43 | 212.09 | 229.29 | 242.48 | 273.71 | 267.35 | 253.59 | 245.56 | 298.37 | 250.01 | 245.01 | 276.38 | 329.61 | 334.10 | 377.61 | 396.04 | 364.70 | 359.40 | 345.25 | 272.20 | NA | NA | NA | NA | NA | NA | NA | NA | NA | NA | NA | NA | NA | NA | NA | NA | NA | NA | NA | NA | NA | NA | NA | NA | NA | NA | NA | NA | NA | NA | |
| Short Term Contract With Customer | 88.63 | 101.14 | 56.96 | 54.19 | 79.71 | 109.19 | 108.05 | 76.67 | 69.30 | 65.20 | 47.26 | 30.61 | 32.30 | 30.11 | 30.82 | 69.73 | 67.70 | 76.25 | 47.30 | 159.03 | 77.39 | 96.82 | 167.59 | NA | NA | NA | NA | NA | NA | NA | NA | NA | NA | NA | NA | NA | NA | NA | NA | NA | NA | NA | NA | NA | NA | NA | NA | NA | NA | NA | NA | NA | NA | |
| By Product | NA | NA | NA | NA | NA | NA | 15.71 | NA | 10.70 | 11.96 | 11.58 | NA | 4.67 | 5.60 | 11.45 | NA | 19.00 | 26.54 | 31.66 | NA | 18.10 | 14.26 | 12.10 | NA | NA | NA | NA | NA | NA | NA | NA | NA | NA | NA | NA | NA | NA | NA | NA | NA | NA | NA | NA | NA | NA | NA | NA | NA | NA | NA | NA | NA | NA |
