
| 2024-03-31 | 2023-12-31 | 2023-09-30 | 2023-06-30 | 2023-03-31 | 2022-12-31 | 2022-09-30 | 2022-06-30 | 2022-03-31 | 2021-12-31 | 2021-09-30 | 2021-06-30 | 2021-03-31 | 2020-12-31 | 2020-09-30 | 2020-06-30 | 2020-03-31 | 2019-12-31 | 2019-09-30 | 2019-06-30 | 2019-03-31 | 2018-12-31 | 2018-09-30 | 2018-06-30 | 2018-03-31 | 2017-12-31 | 2017-09-30 | 2017-06-30 | 2017-03-31 | 2016-12-31 | 2016-09-30 | 2016-06-30 | 2016-03-31 | ||
|---|---|---|---|---|---|---|---|---|---|---|---|---|---|---|---|---|---|---|---|---|---|---|---|---|---|---|---|---|---|---|---|---|---|---|
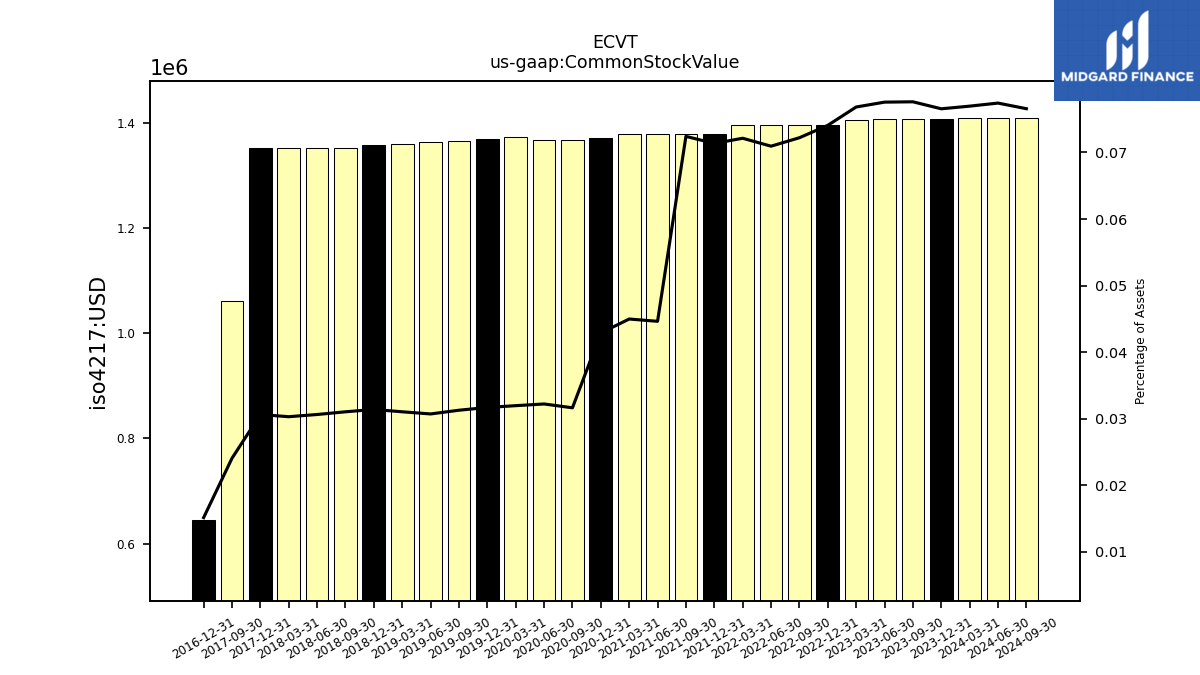
| Common Stock Value | 1.41 | 1.41 | 1.41 | 1.41 | 1.41 | 1.40 | 1.40 | 1.40 | 1.40 | 1.38 | 1.38 | 1.38 | 1.38 | 1.37 | 1.37 | 1.37 | 1.37 | 1.37 | 1.36 | 1.36 | 1.36 | 1.36 | 1.35 | 1.35 | 1.35 | 1.35 | 1.06 | NA | NA | 0.64 | NA | NA | NA | |
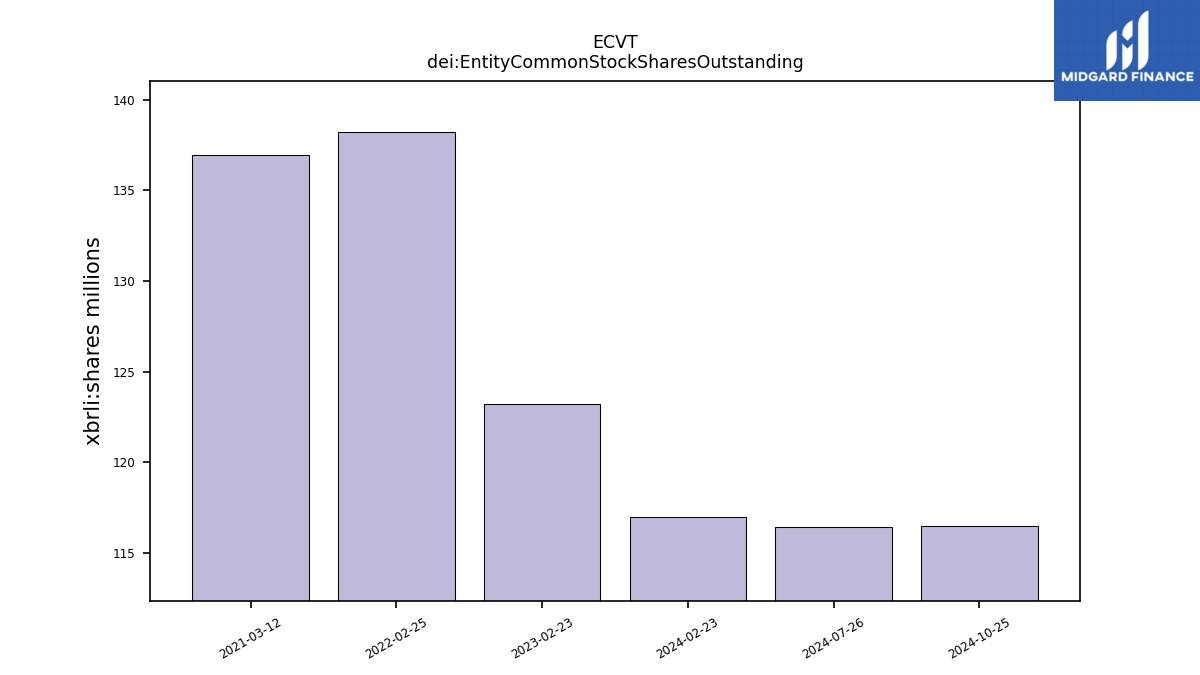
| dei: Entity Common Stock Shares Outstanding | NA | NA | NA | NA | NA | NA | NA | NA | NA | NA | NA | NA | NA | NA | NA | NA | NA | NA | NA | NA | NA | NA | NA | NA | NA | NA | NA | NA | NA | NA | NA | NA | NA | |
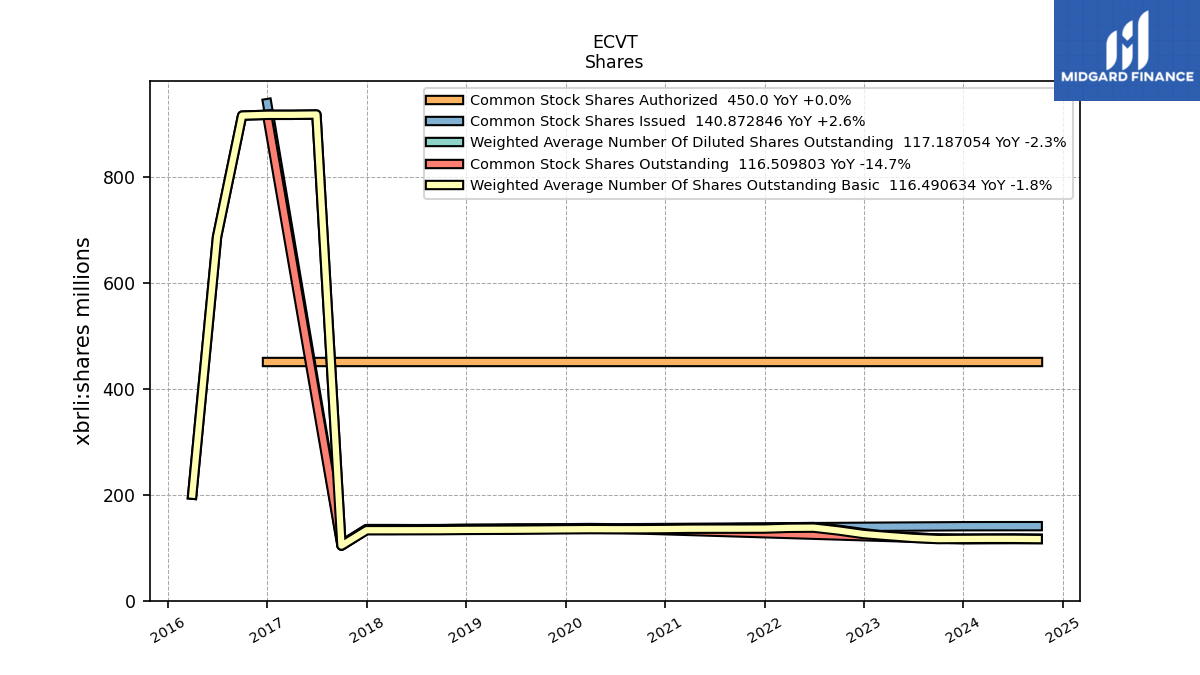
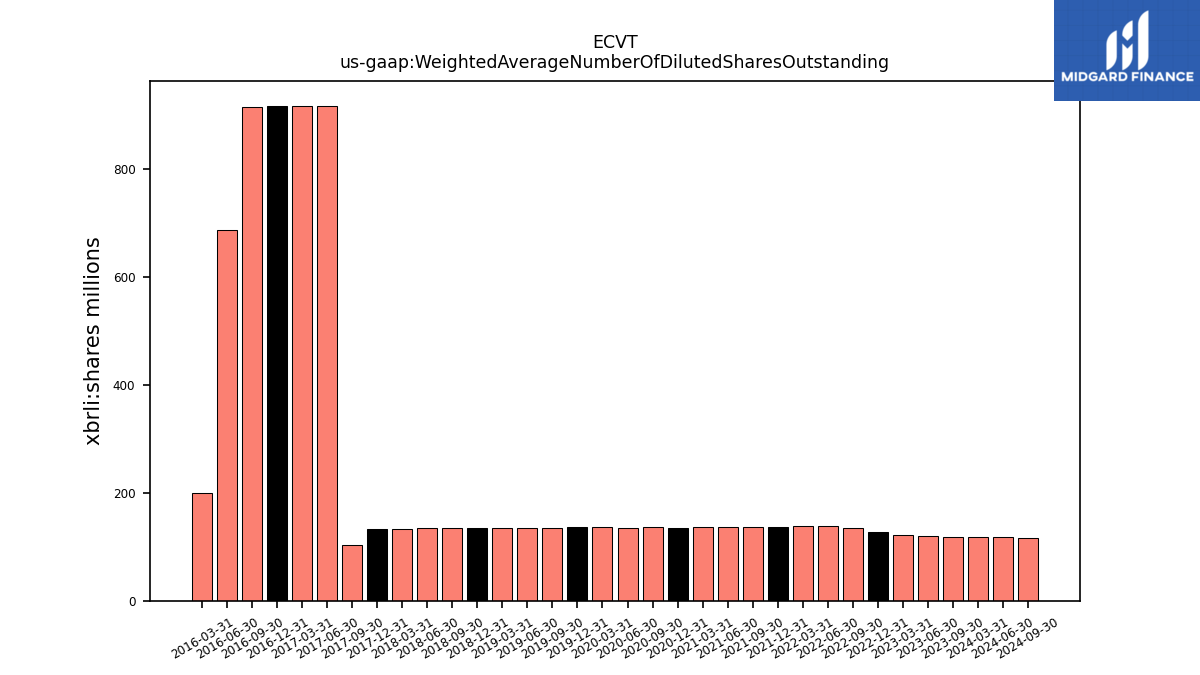
| Weighted Average Number Of Diluted Shares Outstanding | 117.45 | NA | 117.37 | 119.92 | 122.18 | 127.54 | 134.10 | 139.15 | 138.75 | 137.53 | 137.35 | 136.10 | 136.01 | 135.41 | 135.98 | 135.67 | 136.09 | 136.15 | 135.65 | 135.32 | 134.89 | 134.99 | 134.58 | 134.21 | 133.88 | 133.90 | 104.10 | 918.20 | 917.60 | 917.60 | 916.15 | 687.15 | 200.33 | |
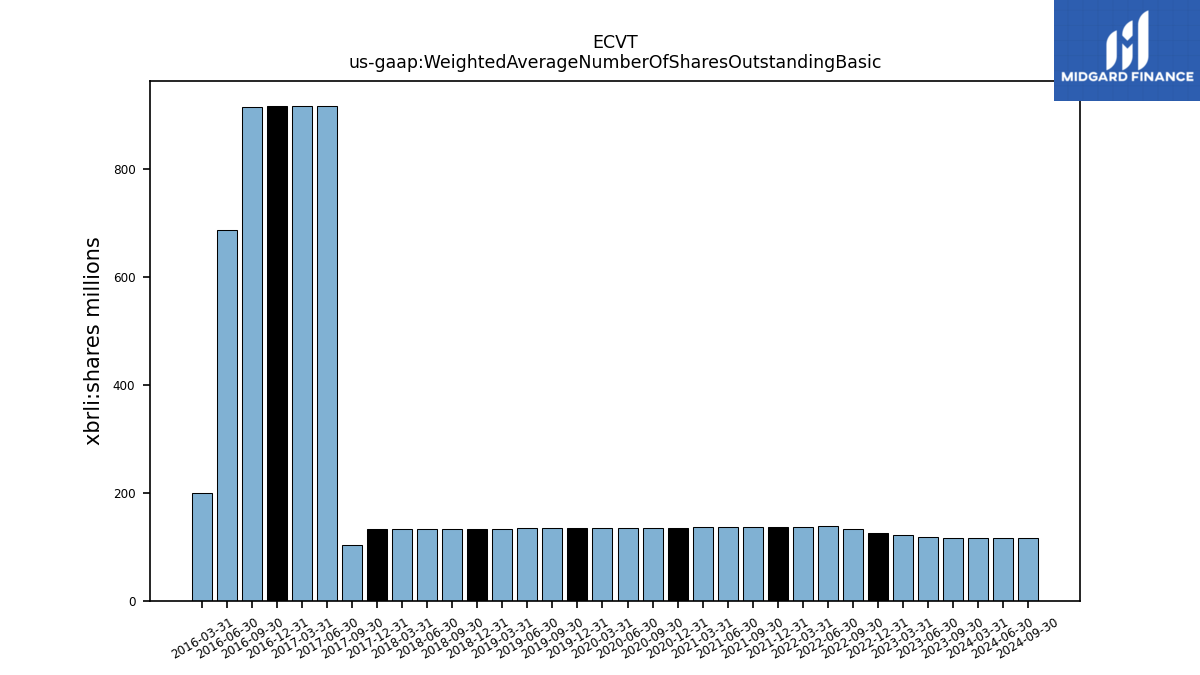
| Weighted Average Number Of Shares Outstanding Basic | 116.96 | NA | 116.45 | 118.65 | 122.18 | 125.96 | 132.62 | 138.04 | 137.68 | 136.26 | 136.13 | 136.10 | 136.01 | 135.41 | 135.11 | 135.08 | 135.24 | 134.91 | 134.51 | 134.14 | 133.95 | 133.77 | 133.34 | 133.22 | 133.15 | 133.14 | 104.10 | 918.20 | 917.60 | 917.60 | 916.15 | 687.15 | 200.33 | |
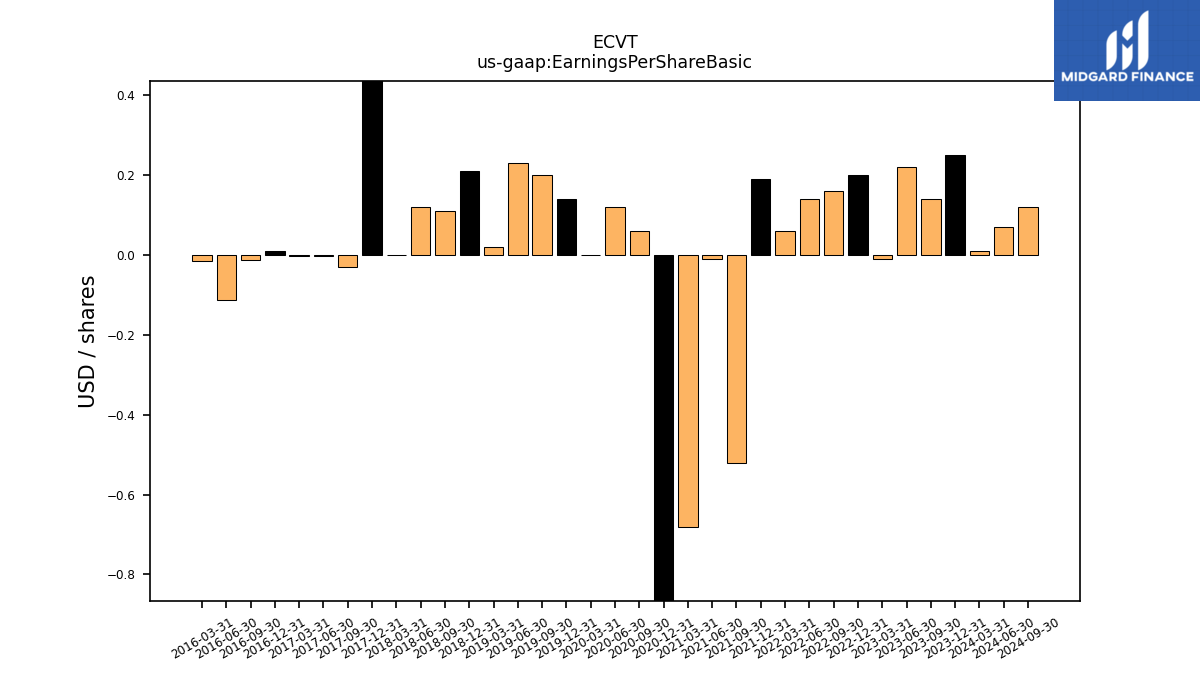
| Earnings Per Share Basic | 0.01 | 0.25 | 0.14 | 0.22 | -0.01 | 0.20 | 0.16 | 0.14 | 0.06 | 0.19 | -0.52 | -0.01 | -0.68 | -2.21 | 0.06 | 0.12 | 0.00 | 0.14 | 0.20 | 0.23 | 0.02 | 0.21 | 0.11 | 0.12 | 0.00 | 0.49 | -0.03 | -0.00 | -0.00 | 0.01 | -0.01 | -0.11 | -0.02 | |
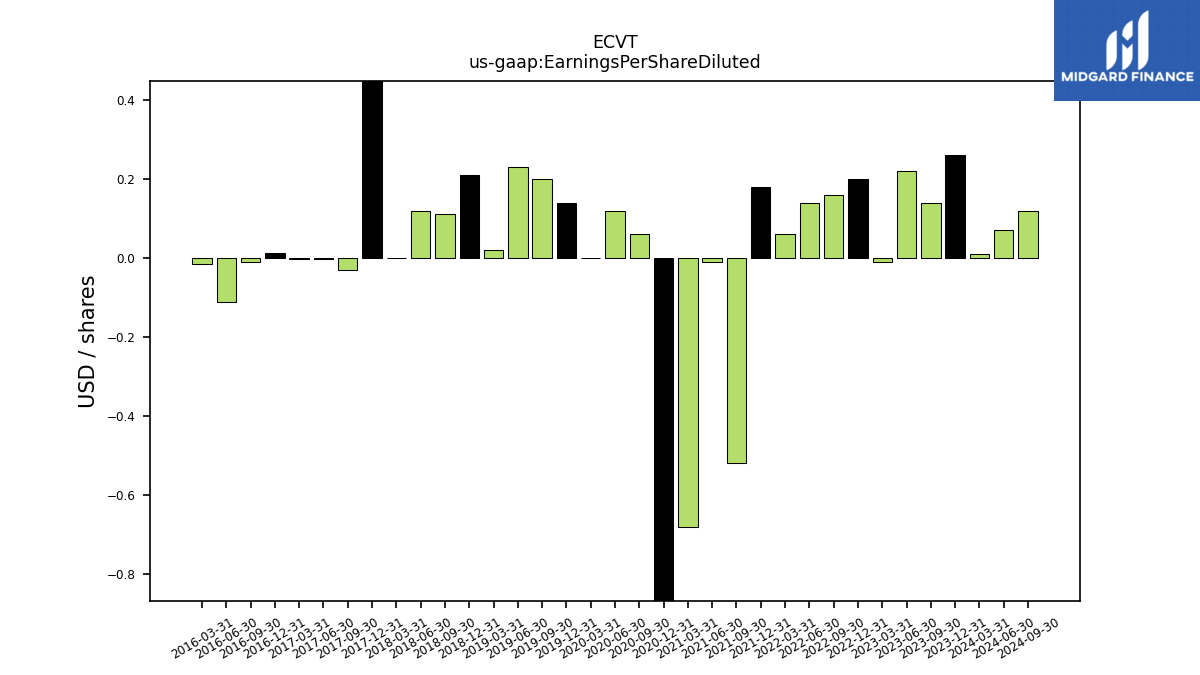
| Earnings Per Share Diluted | 0.01 | 0.26 | 0.14 | 0.22 | -0.01 | 0.20 | 0.16 | 0.14 | 0.06 | 0.18 | -0.52 | -0.01 | -0.68 | -2.21 | 0.06 | 0.12 | 0.00 | 0.14 | 0.20 | 0.23 | 0.02 | 0.21 | 0.11 | 0.12 | 0.00 | 0.49 | -0.03 | -0.00 | -0.00 | 0.01 | -0.01 | -0.11 | -0.02 |
| 2024-03-31 | 2023-12-31 | 2023-09-30 | 2023-06-30 | 2023-03-31 | 2022-12-31 | 2022-09-30 | 2022-06-30 | 2022-03-31 | 2021-12-31 | 2021-09-30 | 2021-06-30 | 2021-03-31 | 2020-12-31 | 2020-09-30 | 2020-06-30 | 2020-03-31 | 2019-12-31 | 2019-09-30 | 2019-06-30 | 2019-03-31 | 2018-12-31 | 2018-09-30 | 2018-06-30 | 2018-03-31 | 2017-12-31 | 2017-09-30 | 2017-06-30 | 2017-03-31 | 2016-12-31 | 2016-09-30 | 2016-06-30 | 2016-03-31 | ||
|---|---|---|---|---|---|---|---|---|---|---|---|---|---|---|---|---|---|---|---|---|---|---|---|---|---|---|---|---|---|---|---|---|---|---|
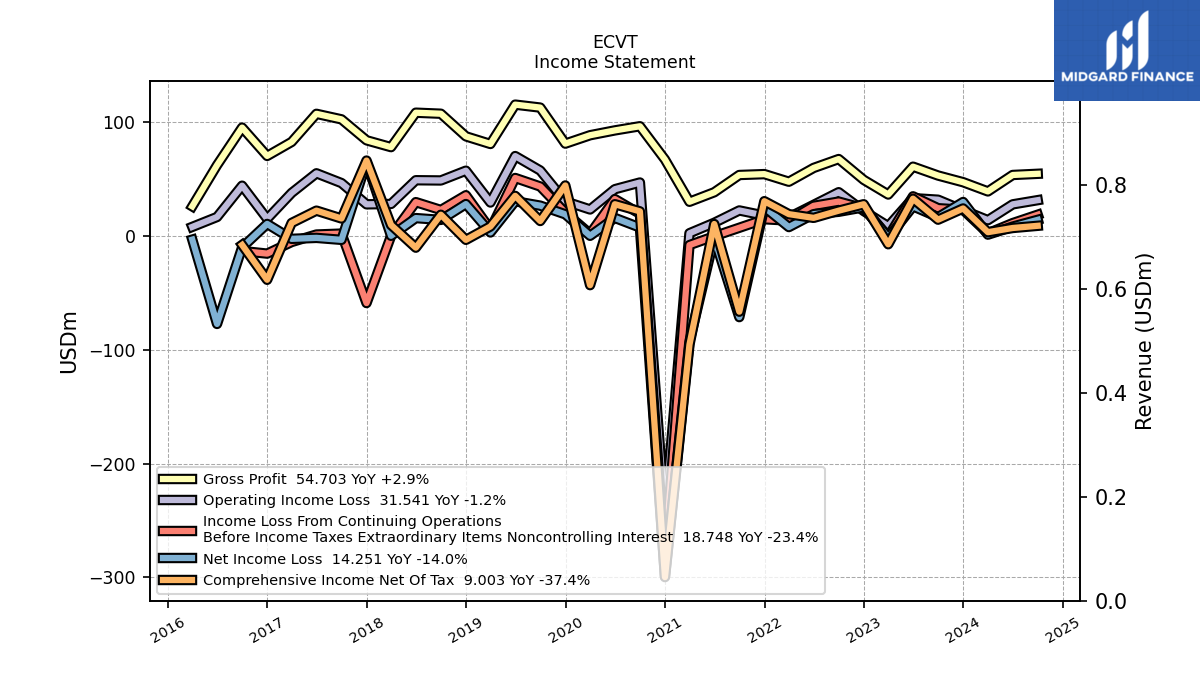
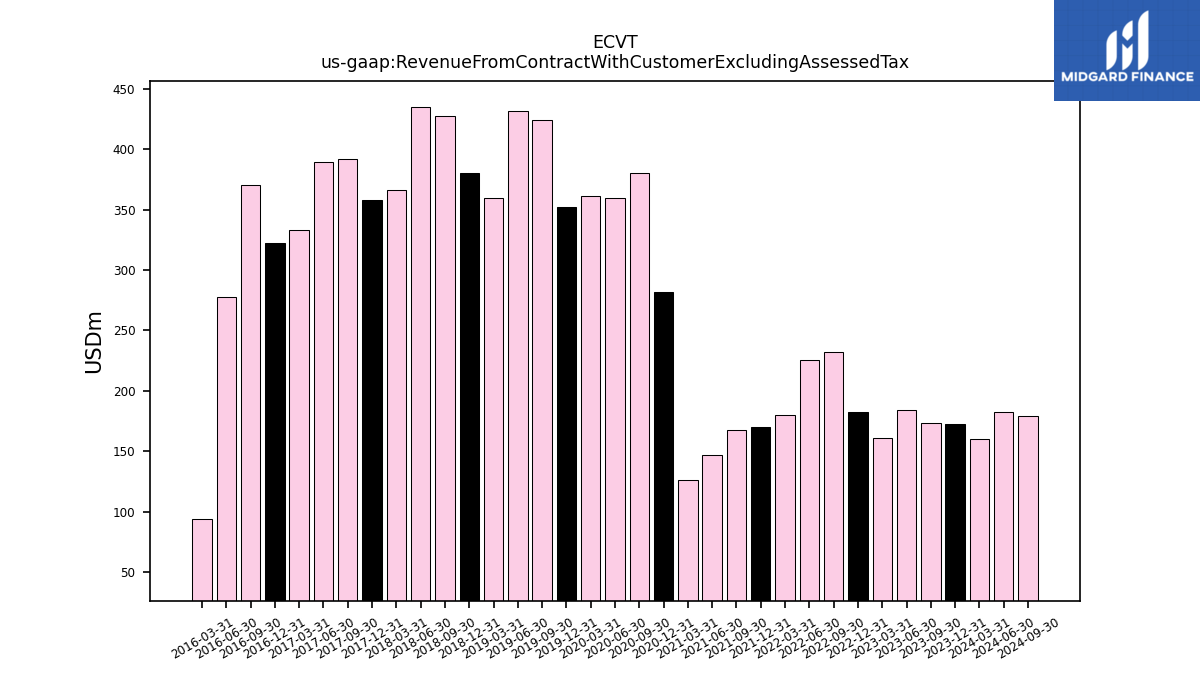
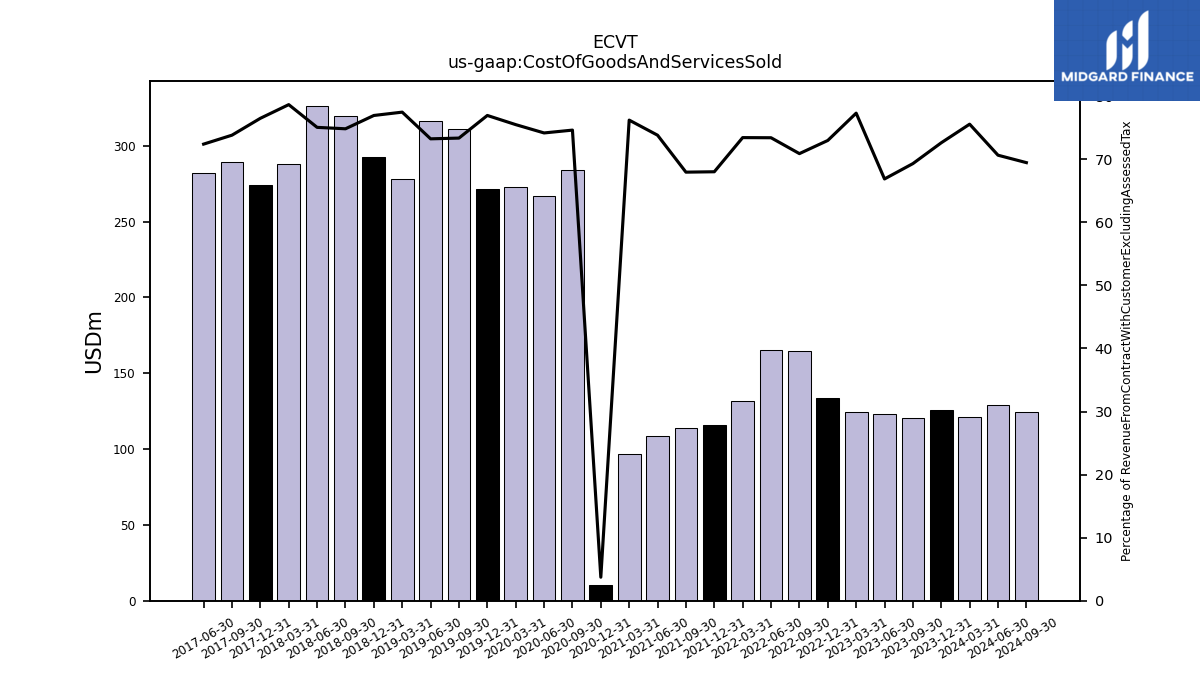
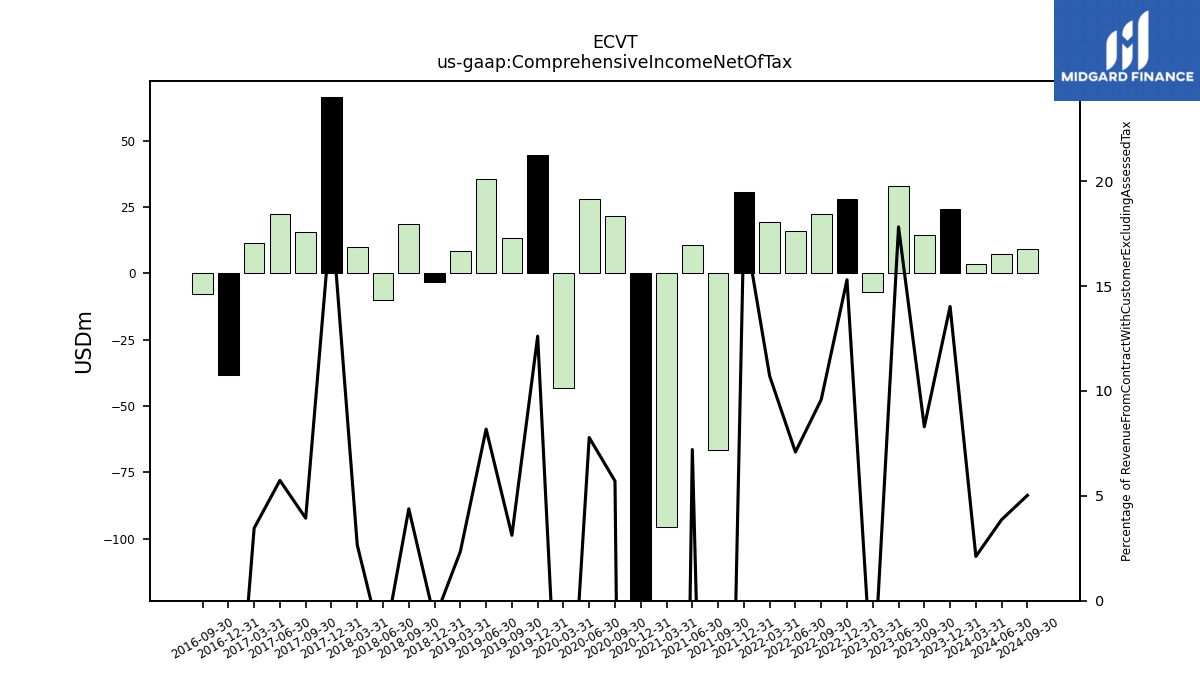
| Revenue From Contract With Customer Excluding Assessed Tax | 160.54 | 172.81 | 173.33 | 184.11 | 160.87 | 182.74 | 232.53 | 225.17 | 179.71 | 170.20 | 167.43 | 146.95 | 126.62 | 281.50 | 380.32 | 359.52 | 361.60 | 352.38 | 423.80 | 431.68 | 359.22 | 380.04 | 427.20 | 434.71 | 366.20 | 358.07 | 391.83 | 389.27 | 332.93 | 322.73 | 369.98 | 277.55 | 93.91 | |
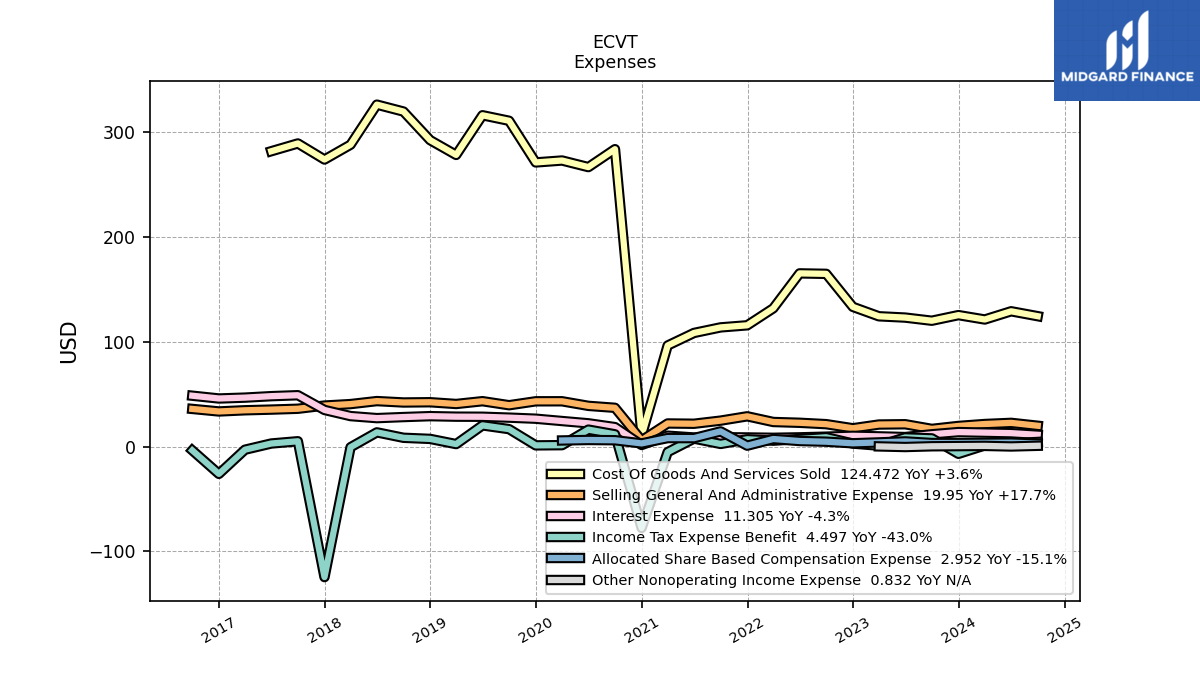
| Cost Of Goods And Services Sold | 121.31 | 125.49 | 120.14 | 123.14 | 124.38 | 133.37 | 164.86 | 165.31 | 131.98 | 115.77 | 113.78 | 108.48 | 96.50 | 10.50 | 283.82 | 266.69 | 273.00 | 271.15 | 310.90 | 316.18 | 278.31 | 292.43 | 319.70 | 326.31 | 288.08 | 273.92 | 289.27 | 281.85 | NA | NA | NA | NA | NA | |
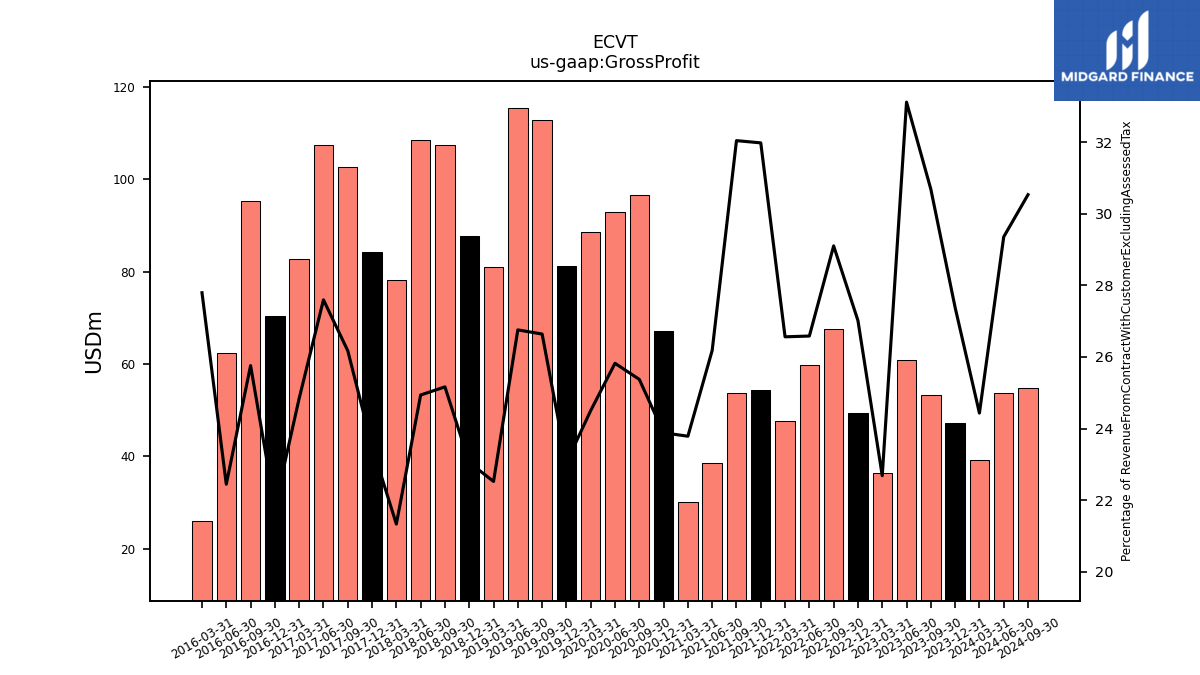
| Gross Profit | 39.22 | 47.32 | 53.18 | 60.97 | 36.49 | 49.37 | 67.67 | 59.86 | 47.73 | 54.42 | 53.64 | 38.47 | 30.12 | 67.23 | 96.50 | 92.84 | 88.60 | 81.22 | 112.90 | 115.50 | 80.91 | 87.61 | 107.50 | 108.40 | 78.12 | 84.15 | 102.56 | 107.41 | 82.71 | 70.39 | 95.30 | 62.30 | 26.10 | |
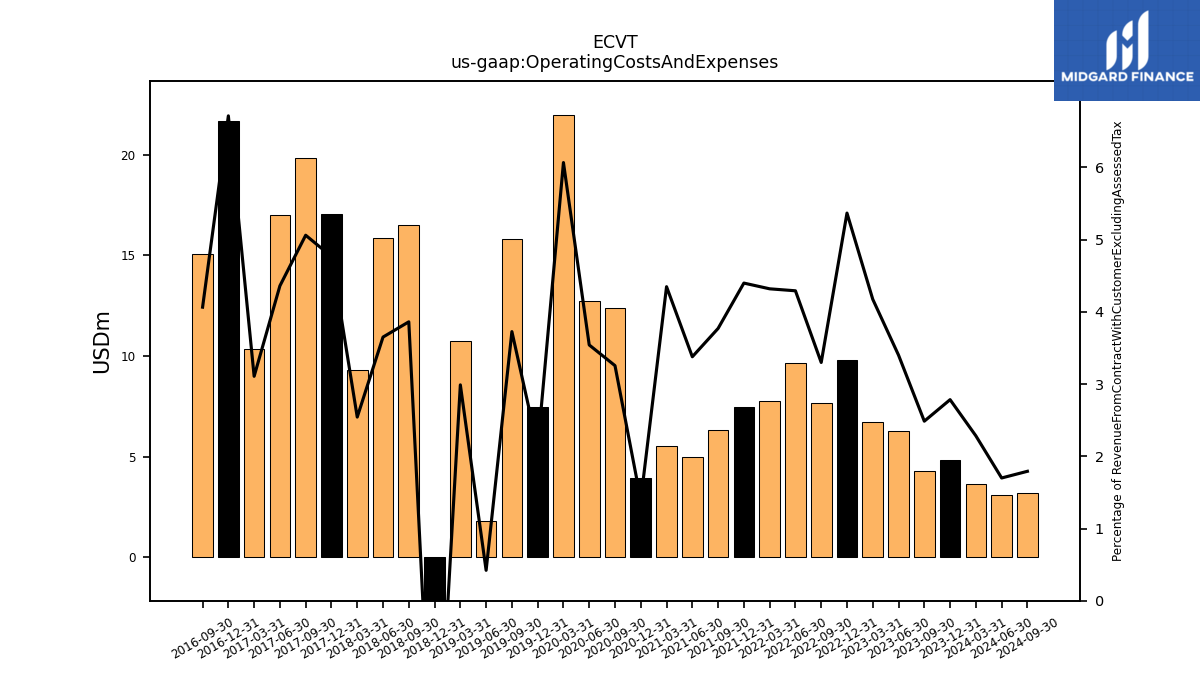
| Operating Costs And Expenses | 3.67 | 4.81 | 4.31 | 6.26 | 6.72 | 9.81 | 7.67 | 9.66 | 7.76 | 7.49 | 6.31 | 4.96 | 5.51 | 3.93 | 12.38 | 12.73 | 21.94 | 7.49 | 15.79 | 1.82 | 10.74 | -12.24 | 16.50 | 15.87 | 9.31 | 17.07 | 19.83 | 16.98 | 10.35 | 21.67 | 15.04 | NA | NA | |
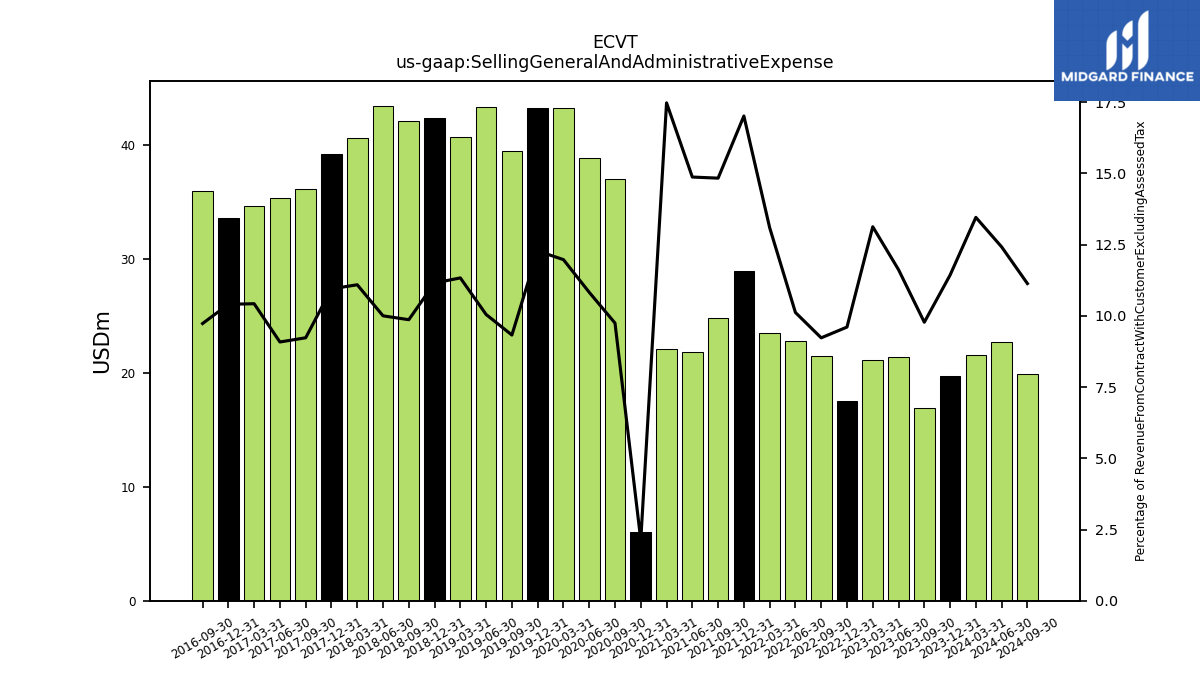
| Selling General And Administrative Expense | 21.60 | 19.75 | 16.95 | 21.39 | 21.12 | 17.55 | 21.46 | 22.78 | 23.54 | 28.96 | 24.84 | 21.86 | 22.13 | 6.00 | 37.07 | 38.93 | 43.30 | 43.27 | 39.53 | 43.38 | 40.71 | 42.39 | 42.15 | 43.48 | 40.62 | 39.20 | 36.17 | 35.36 | 34.71 | 33.58 | 36.00 | NA | NA | |
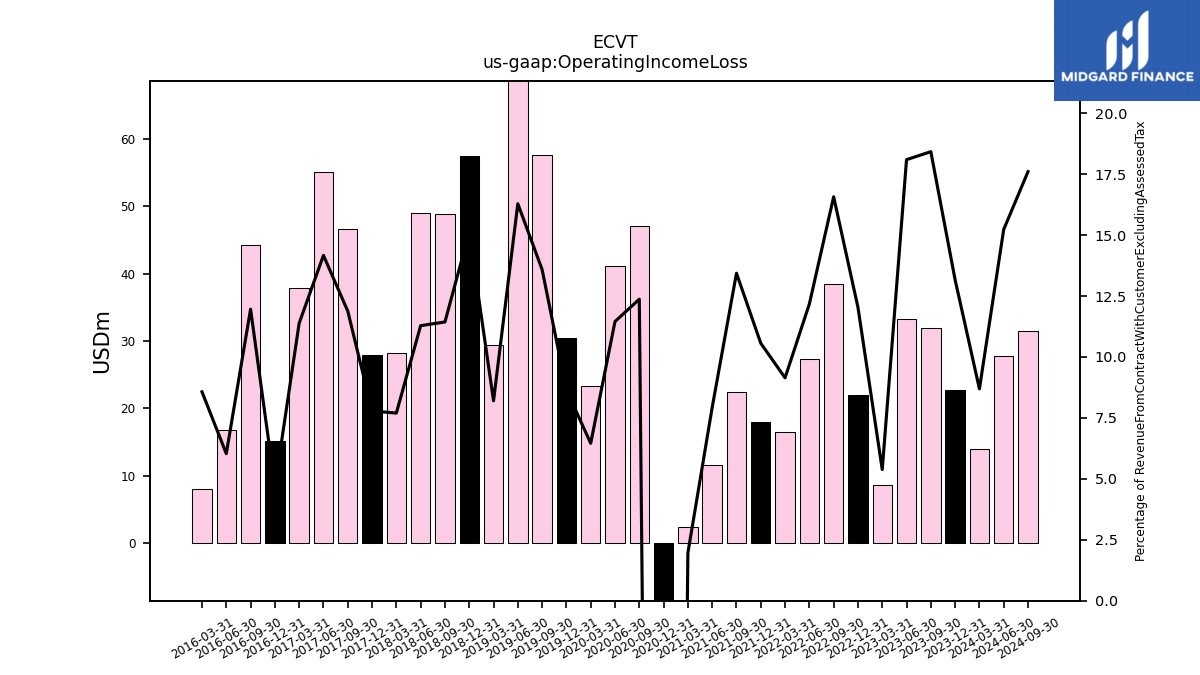
| Operating Income Loss | 13.95 | 22.75 | 31.93 | 33.31 | 8.66 | 22.00 | 38.54 | 27.41 | 16.44 | 17.98 | 22.49 | 11.65 | 2.48 | -245.62 | 47.05 | 41.18 | 23.36 | 30.46 | 57.57 | 70.30 | 29.46 | 57.46 | 48.85 | 49.05 | 28.19 | 27.88 | 46.56 | 55.15 | 37.91 | 15.14 | 44.25 | 16.75 | 8.05 | |
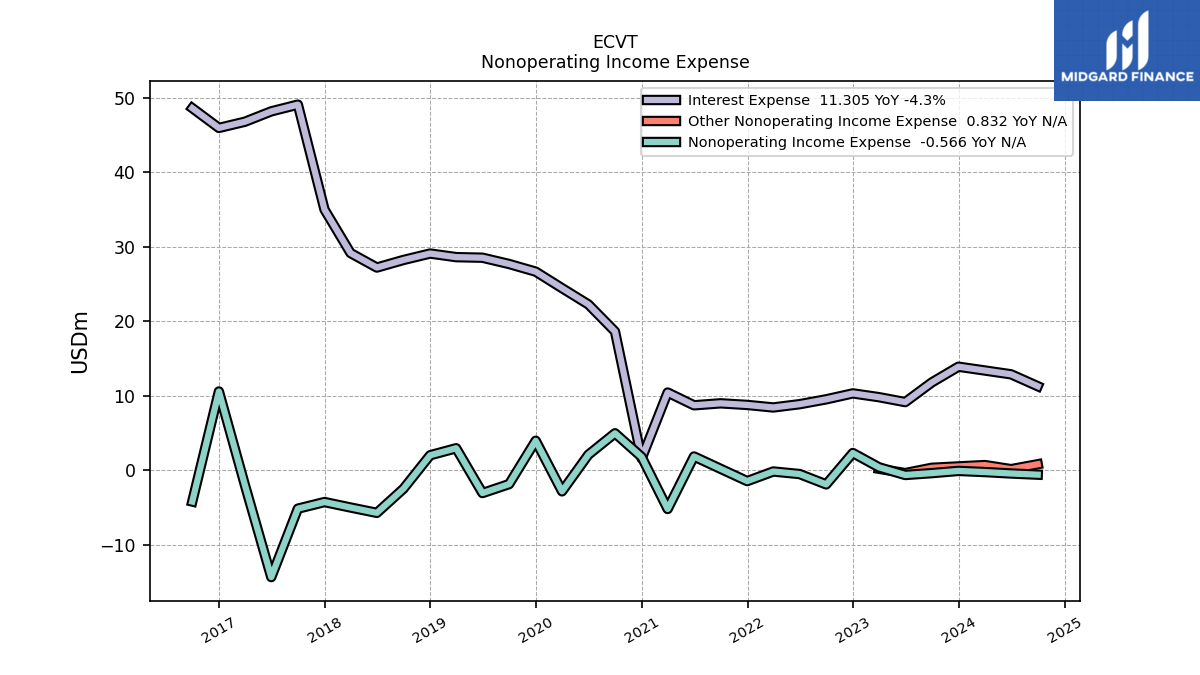
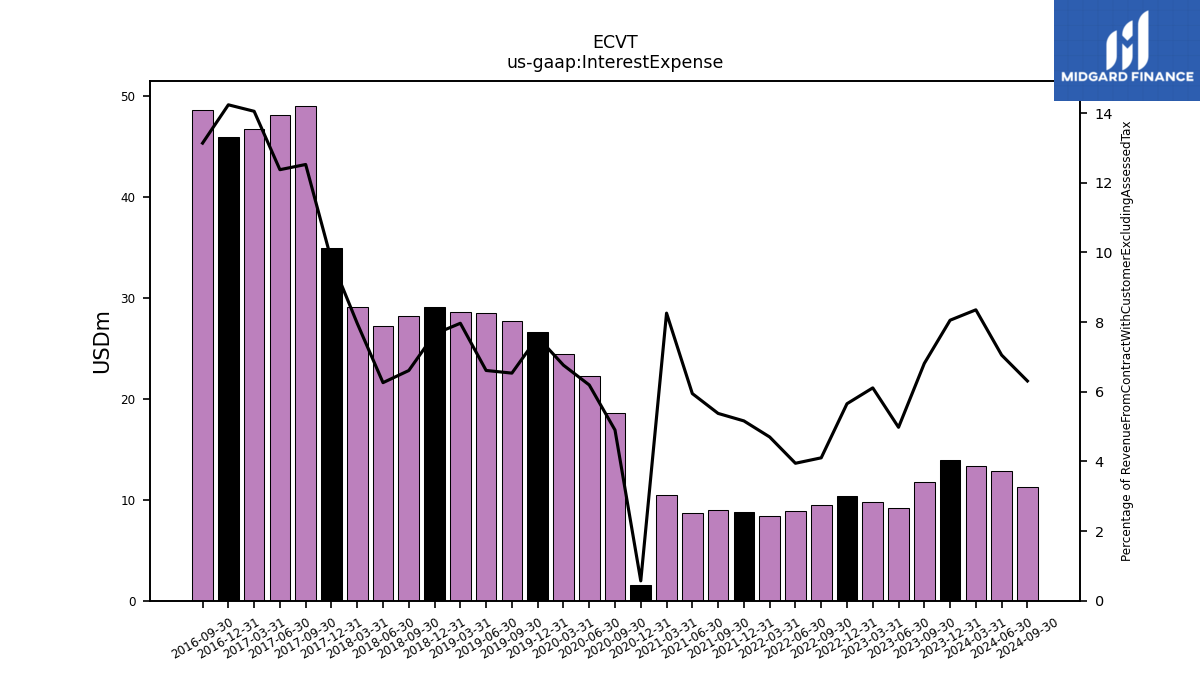
| Interest Expense | 13.41 | 13.92 | 11.81 | 9.17 | 9.83 | 10.34 | 9.54 | 8.89 | 8.45 | 8.79 | 9.01 | 8.74 | 10.46 | 1.61 | 18.64 | 22.27 | 24.45 | 26.67 | 27.70 | 28.54 | 28.62 | 29.10 | 28.24 | 27.22 | 29.16 | 35.00 | 49.08 | 48.18 | 46.78 | 45.95 | 48.61 | NA | NA | |
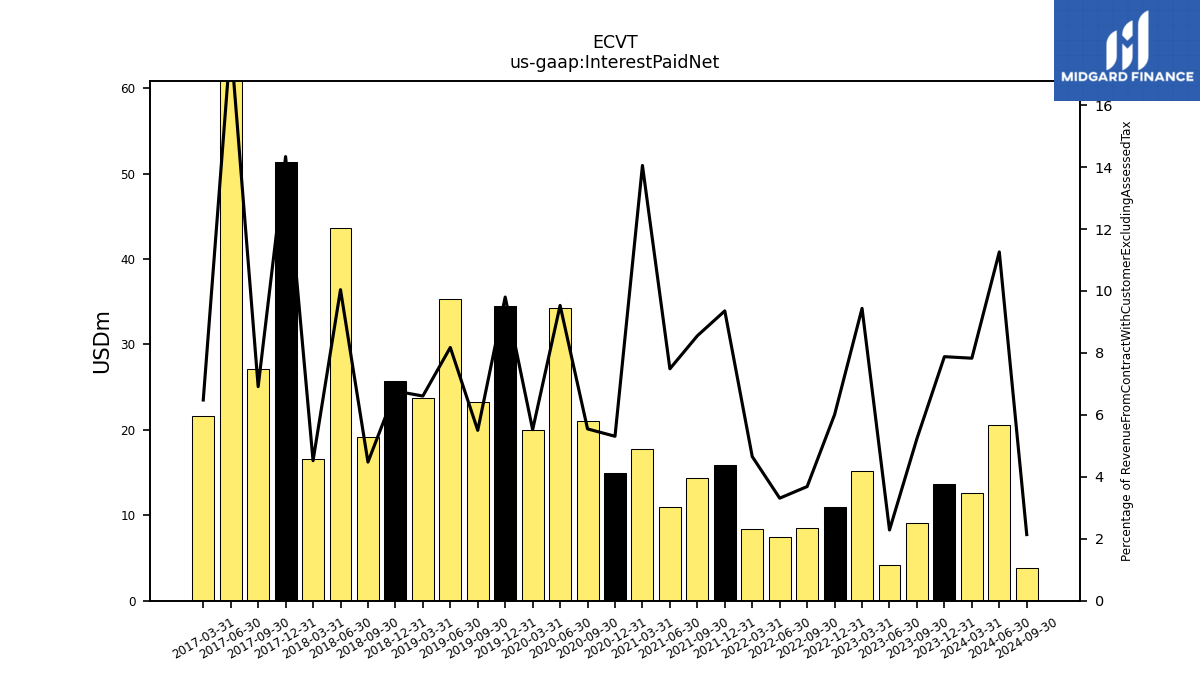
| Interest Paid Net | 12.57 | 13.62 | 9.07 | 4.21 | 15.19 | 10.98 | 8.57 | 7.46 | 8.36 | 15.93 | 14.32 | 11.00 | 17.79 | 14.95 | 21.10 | 34.27 | 19.97 | 34.54 | 23.31 | 35.30 | 23.74 | 25.72 | 19.12 | 43.65 | 16.56 | 51.34 | 27.08 | 70.13 | 21.58 | NA | NA | NA | NA | |
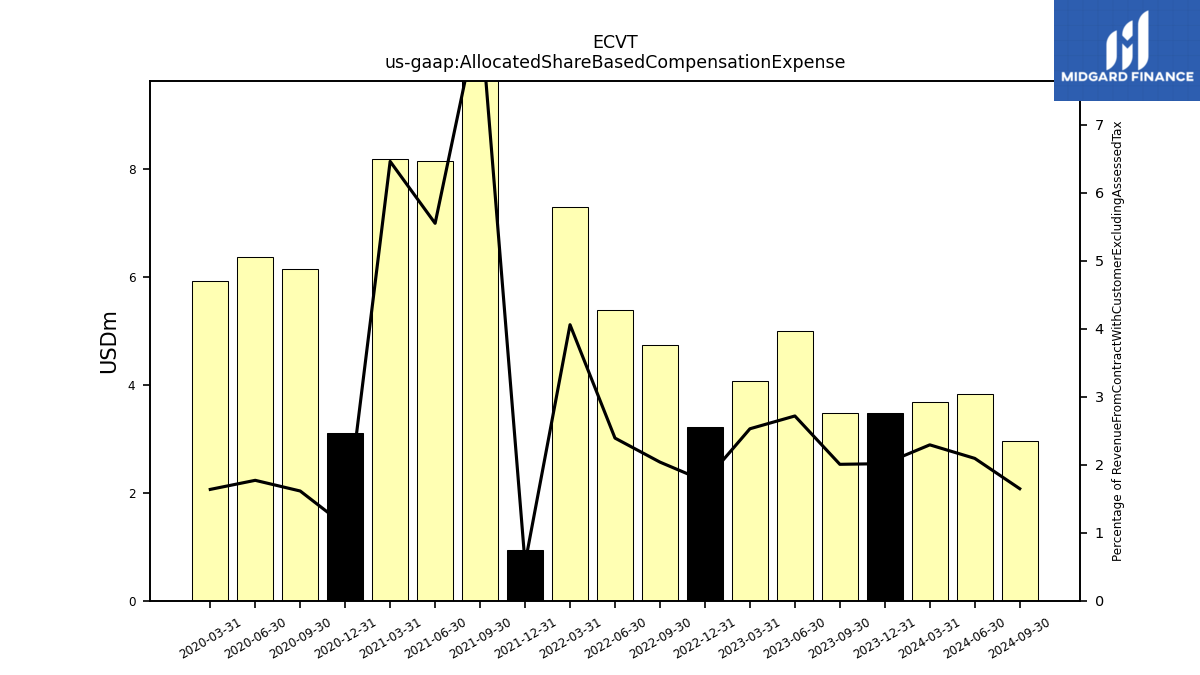
| Allocated Share Based Compensation Expense | 3.68 | 3.48 | 3.48 | 5.00 | 4.07 | 3.21 | 4.74 | 5.38 | 7.29 | 0.94 | 14.57 | 8.15 | 8.18 | 3.10 | 6.14 | 6.37 | 5.92 | NA | NA | NA | NA | NA | NA | NA | NA | NA | NA | NA | NA | NA | NA | NA | NA | |
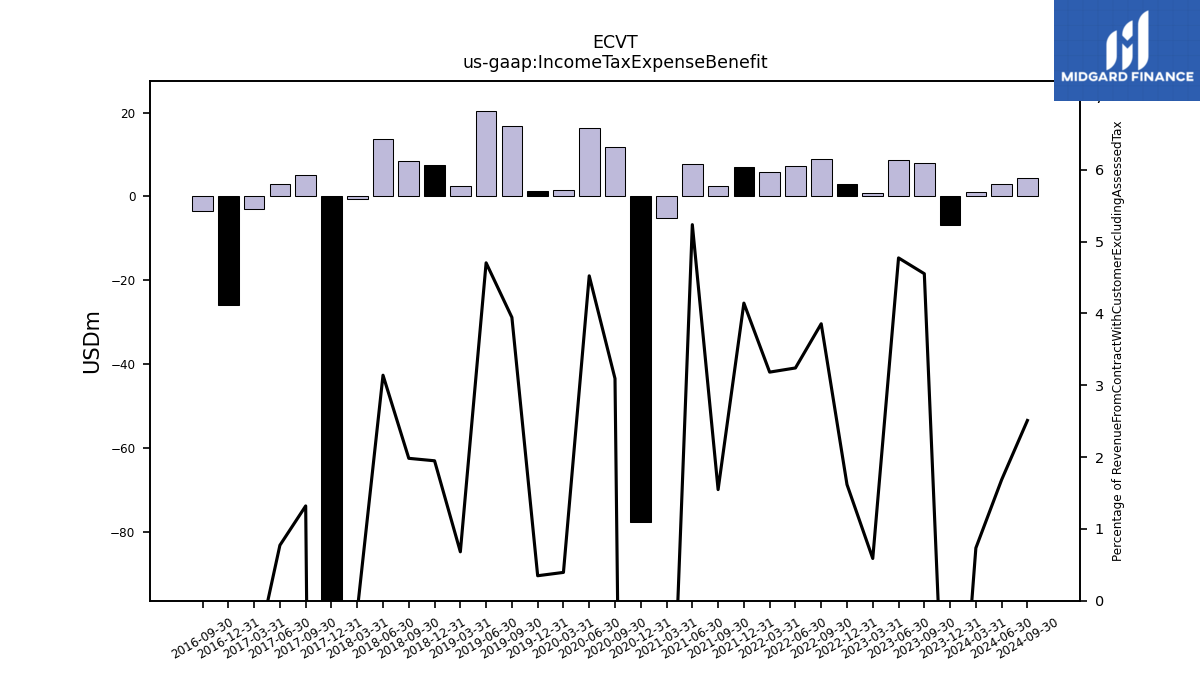
| Income Tax Expense Benefit | 1.18 | -6.84 | 7.89 | 8.79 | 0.95 | 2.96 | 8.97 | 7.30 | 5.72 | 7.05 | 2.59 | 7.69 | -5.19 | -77.58 | 11.76 | 16.26 | 1.43 | 1.23 | 16.72 | 20.31 | 2.45 | 7.41 | 8.47 | 13.65 | -0.53 | -124.47 | 5.17 | 3.01 | -2.91 | -25.97 | -3.54 | NA | NA | |
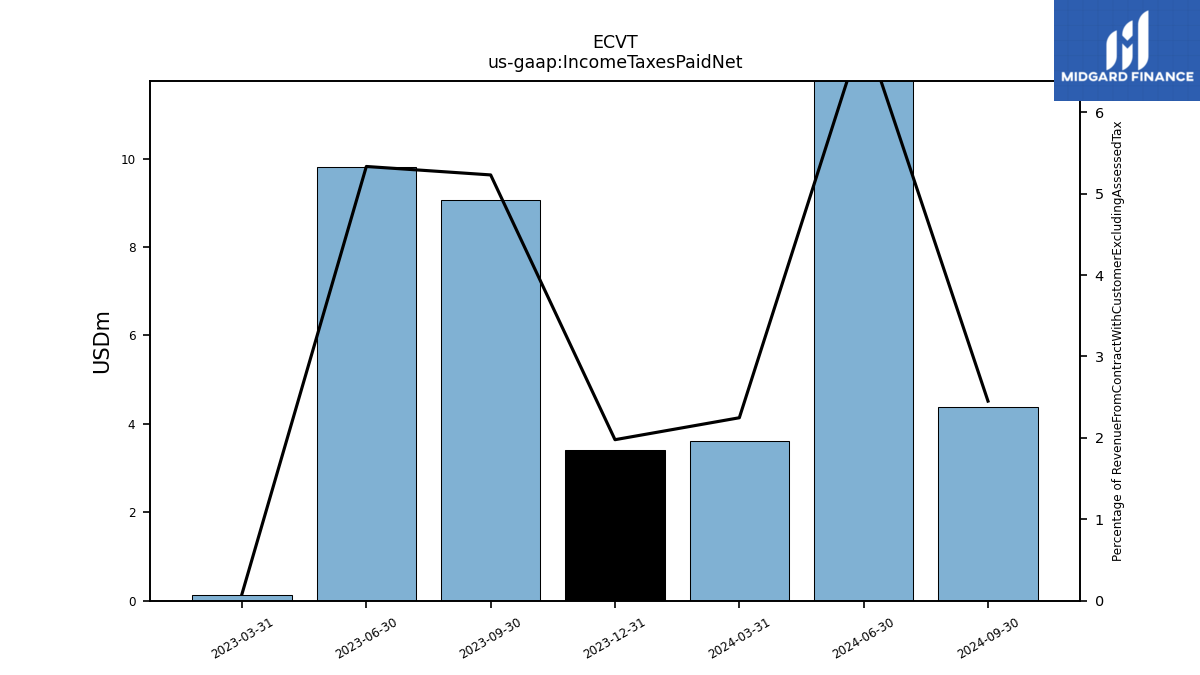
| Income Taxes Paid Net | 3.61 | NA | NA | NA | 0.14 | NA | NA | NA | NA | NA | NA | NA | NA | NA | NA | NA | NA | NA | NA | NA | NA | NA | NA | NA | NA | NA | NA | NA | NA | NA | NA | NA | NA | |
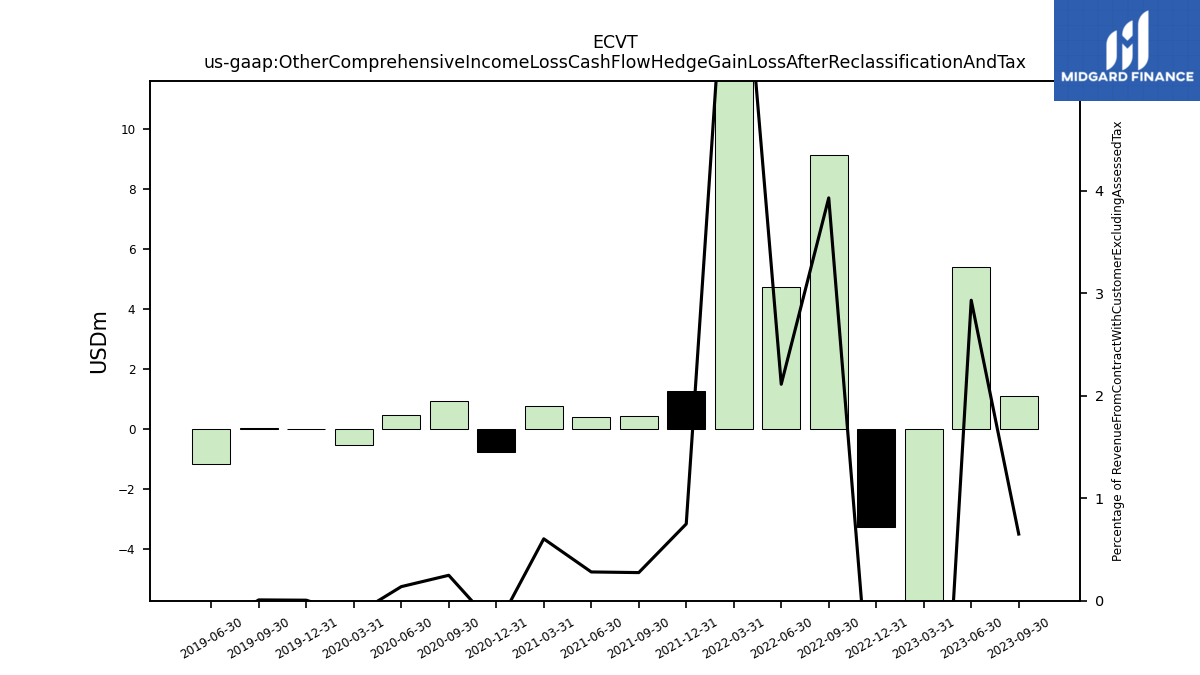
| Other Comprehensive Income Loss Cash Flow Hedge Gain Loss After Reclassification And Tax | NA | -10.73 | 1.13 | 5.40 | -7.92 | -3.24 | 9.14 | 4.76 | 13.72 | 1.28 | 0.46 | 0.41 | 0.77 | -0.74 | 0.94 | 0.49 | -0.53 | 0.02 | 0.04 | -1.17 | NA | NA | NA | NA | NA | NA | NA | NA | NA | NA | NA | NA | NA | |
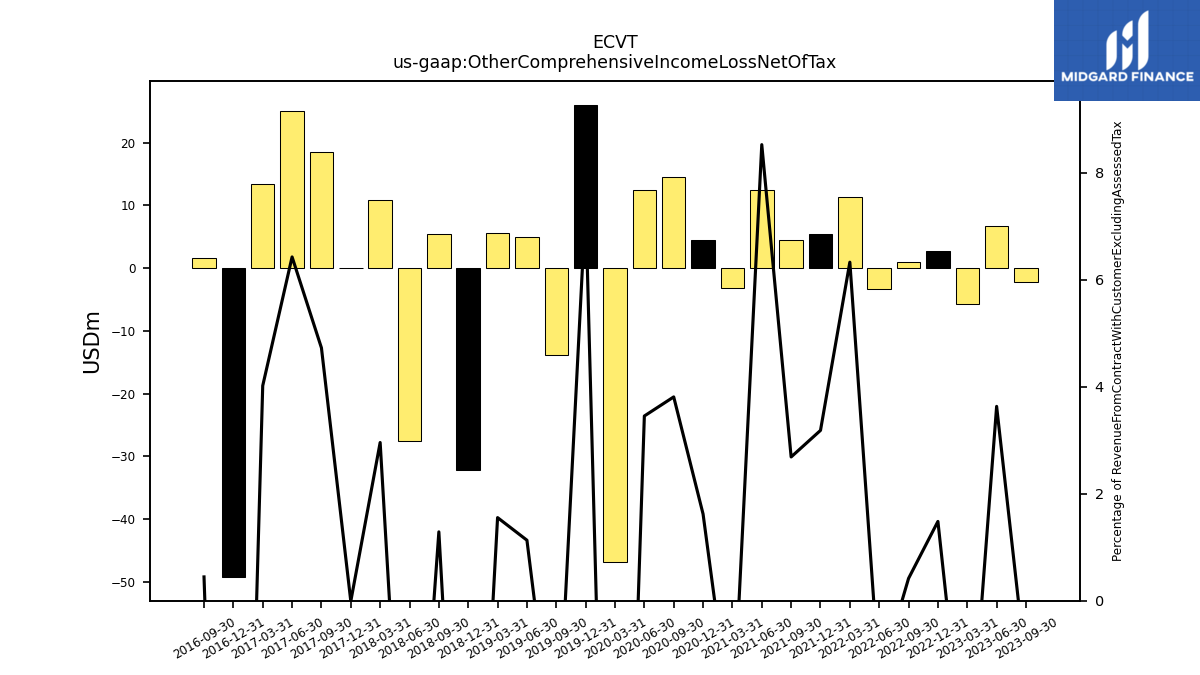
| Other Comprehensive Income Loss Net Of Tax | NA | -5.69 | -2.20 | 6.69 | -5.76 | 2.71 | 0.97 | -3.28 | 11.38 | 5.42 | 4.50 | 12.53 | -3.14 | 4.57 | 14.50 | 12.42 | -46.90 | 26.08 | -13.90 | 4.89 | 5.58 | -32.12 | 5.50 | -27.57 | 10.84 | -0.03 | 18.53 | 25.03 | 13.39 | -49.28 | 1.65 | NA | NA | |
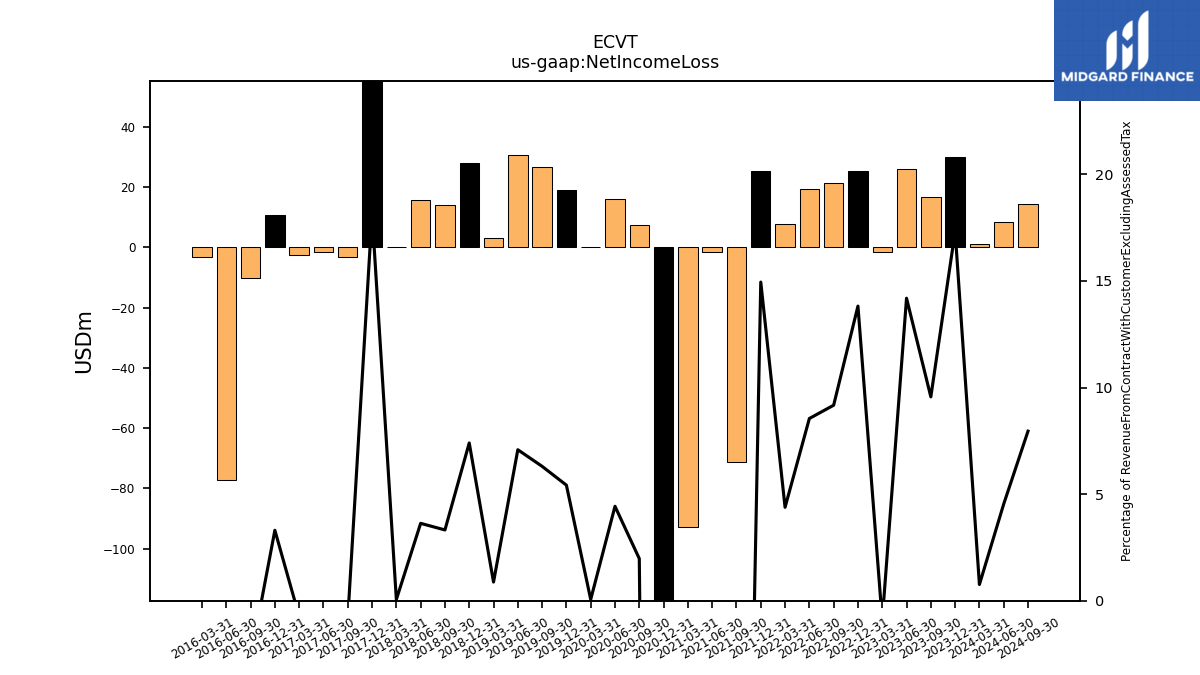
| Net Income Loss | 1.22 | 29.93 | 16.57 | 26.12 | -1.47 | 25.25 | 21.32 | 19.25 | 7.88 | 25.43 | -71.26 | -1.49 | -92.64 | -299.06 | 7.51 | 15.93 | 0.22 | 19.10 | 26.71 | 30.57 | 3.15 | 28.12 | 14.19 | 15.78 | 0.21 | 65.01 | -3.35 | -1.61 | -2.45 | 10.66 | -10.02 | -77.26 | -3.13 | |
| Comprehensive Income Net Of Tax | 3.40 | 24.24 | 14.38 | 32.81 | -7.23 | 27.96 | 22.30 | 15.97 | 19.25 | 30.64 | -66.48 | 10.59 | -95.38 | -299.75 | 21.70 | 27.97 | -43.19 | 44.45 | 13.23 | 35.32 | 8.42 | -3.34 | 18.72 | -10.24 | 9.75 | 66.34 | 15.43 | 22.33 | 11.52 | -38.45 | -7.79 | NA | NA |
| 2024-03-31 | 2023-12-31 | 2023-09-30 | 2023-06-30 | 2023-03-31 | 2022-12-31 | 2022-09-30 | 2022-06-30 | 2022-03-31 | 2021-12-31 | 2021-09-30 | 2021-06-30 | 2021-03-31 | 2020-12-31 | 2020-09-30 | 2020-06-30 | 2020-03-31 | 2019-12-31 | 2019-09-30 | 2019-06-30 | 2019-03-31 | 2018-12-31 | 2018-09-30 | 2018-06-30 | 2018-03-31 | 2017-12-31 | 2017-09-30 | 2017-06-30 | 2017-03-31 | 2016-12-31 | 2016-09-30 | 2016-06-30 | 2016-03-31 | ||
|---|---|---|---|---|---|---|---|---|---|---|---|---|---|---|---|---|---|---|---|---|---|---|---|---|---|---|---|---|---|---|---|---|---|---|
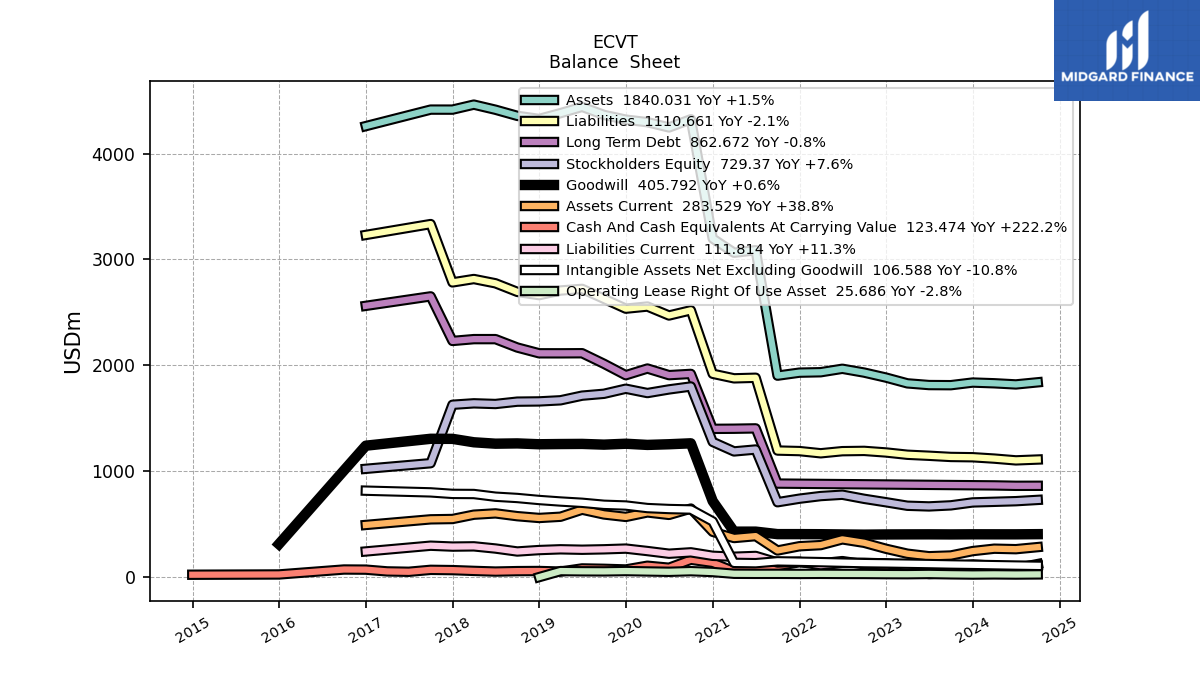
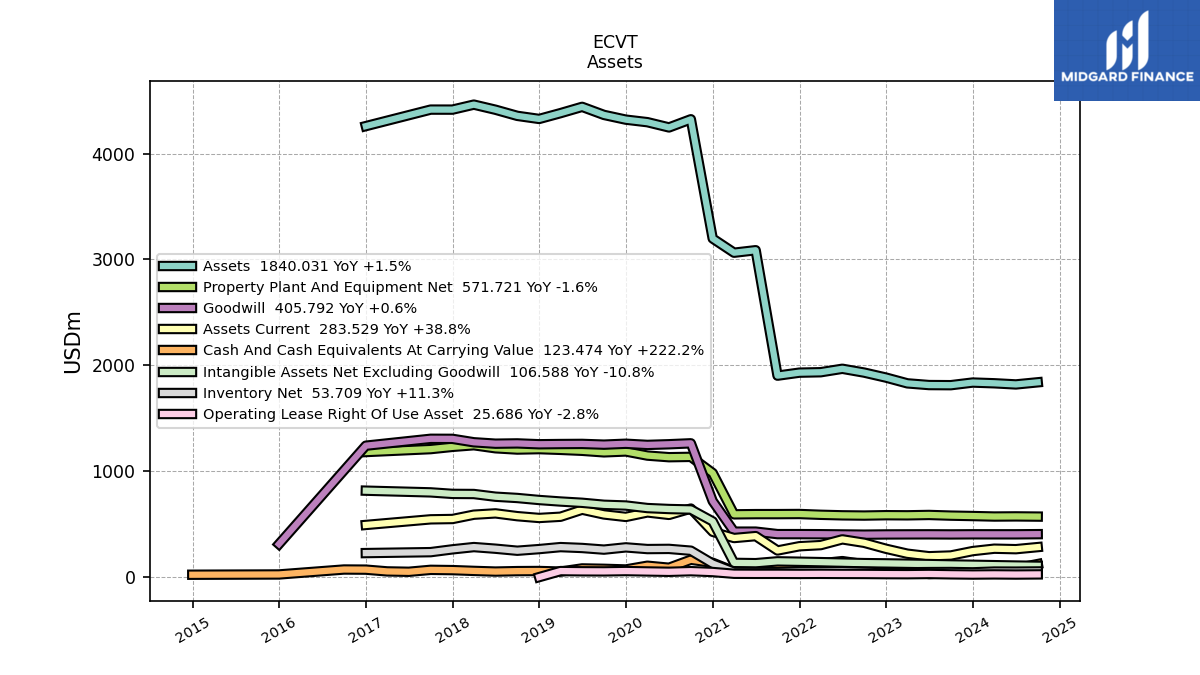
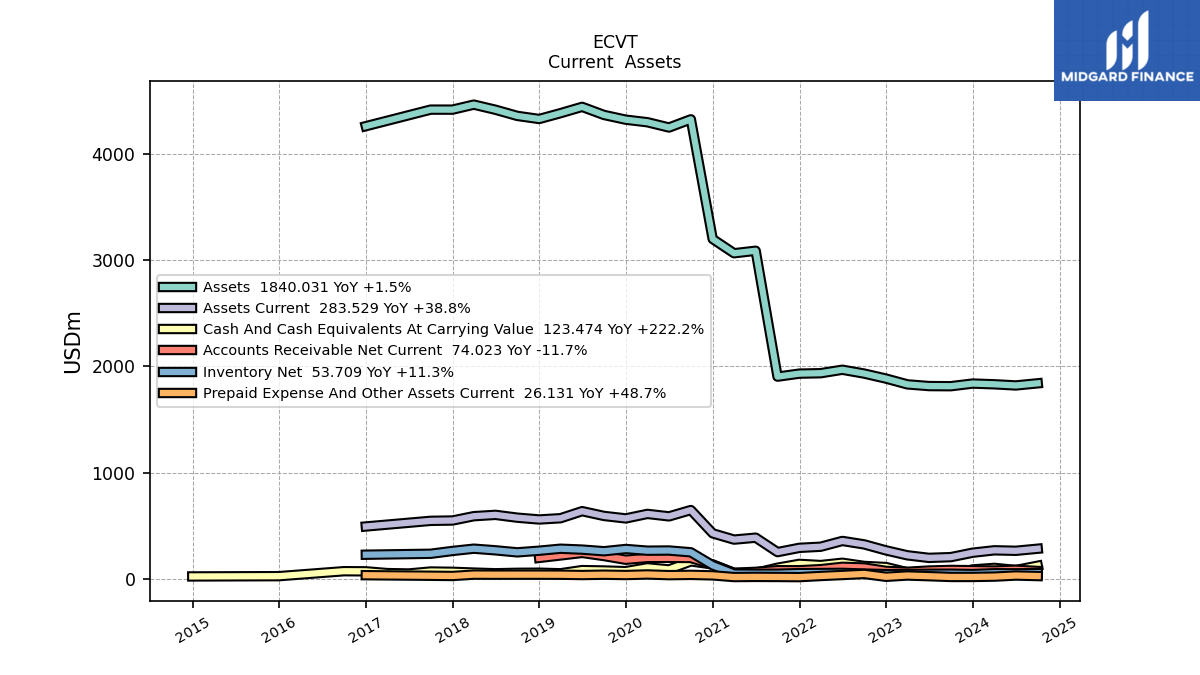
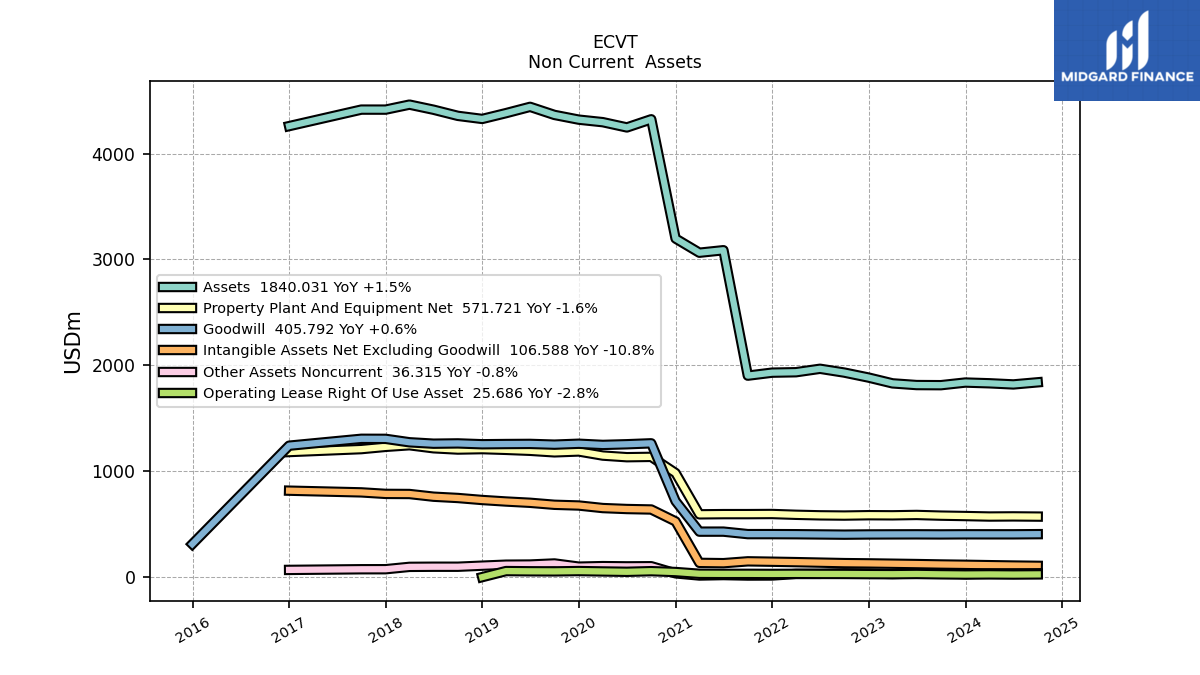
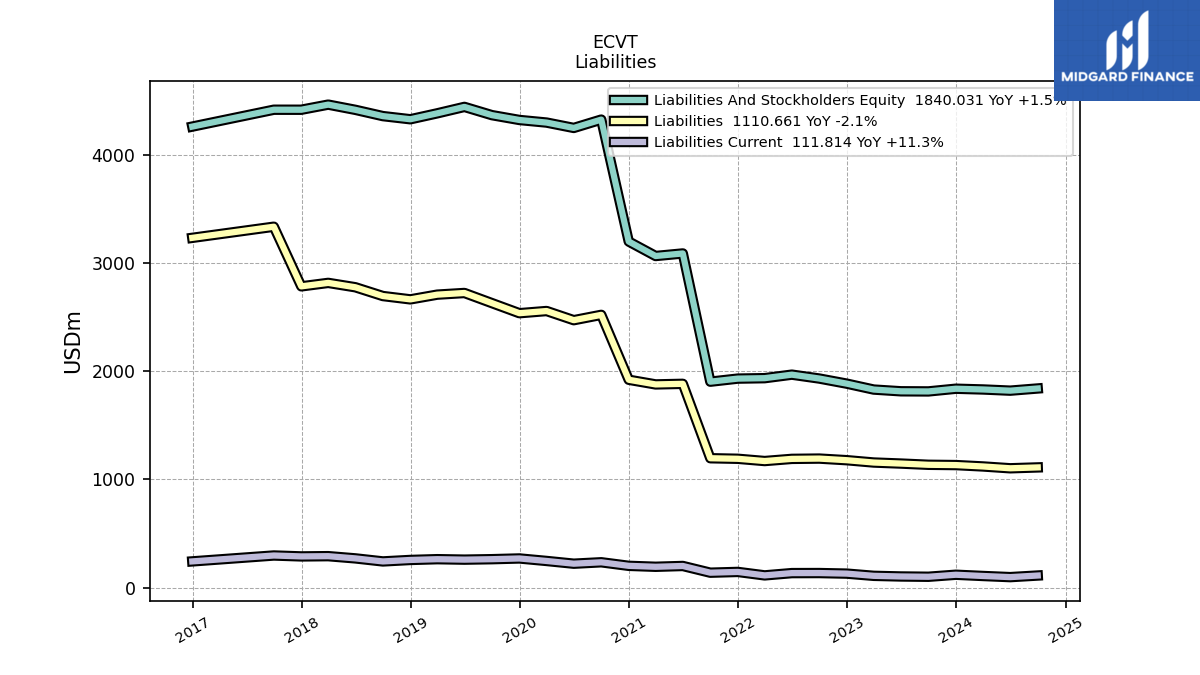
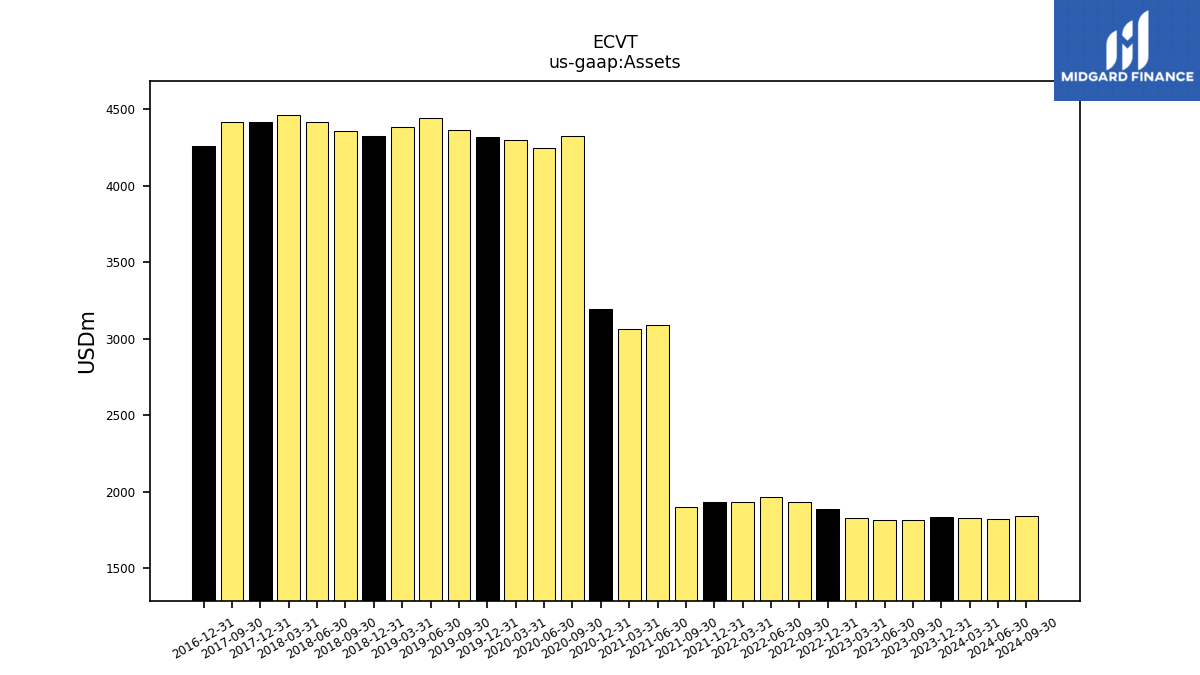
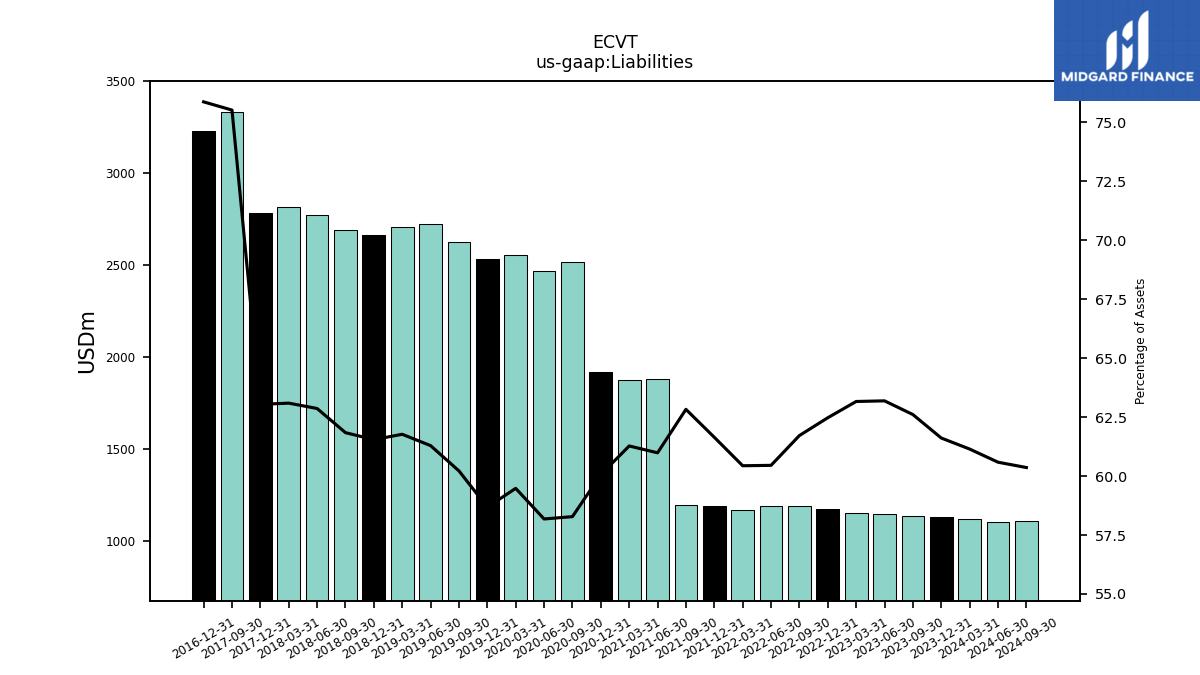
| Assets | 1830.81 | 1837.75 | 1812.83 | 1814.04 | 1830.05 | 1884.55 | 1931.80 | 1967.79 | 1935.25 | 1931.22 | 1902.83 | 3087.60 | 3063.98 | 3197.82 | 4324.44 | 4247.21 | 4296.87 | 4320.85 | 4365.48 | 4441.64 | 4382.28 | 4327.43 | 4356.59 | 4414.51 | 4462.68 | 4415.45 | 4415.60 | NA | NA | 4259.67 | NA | NA | NA | |
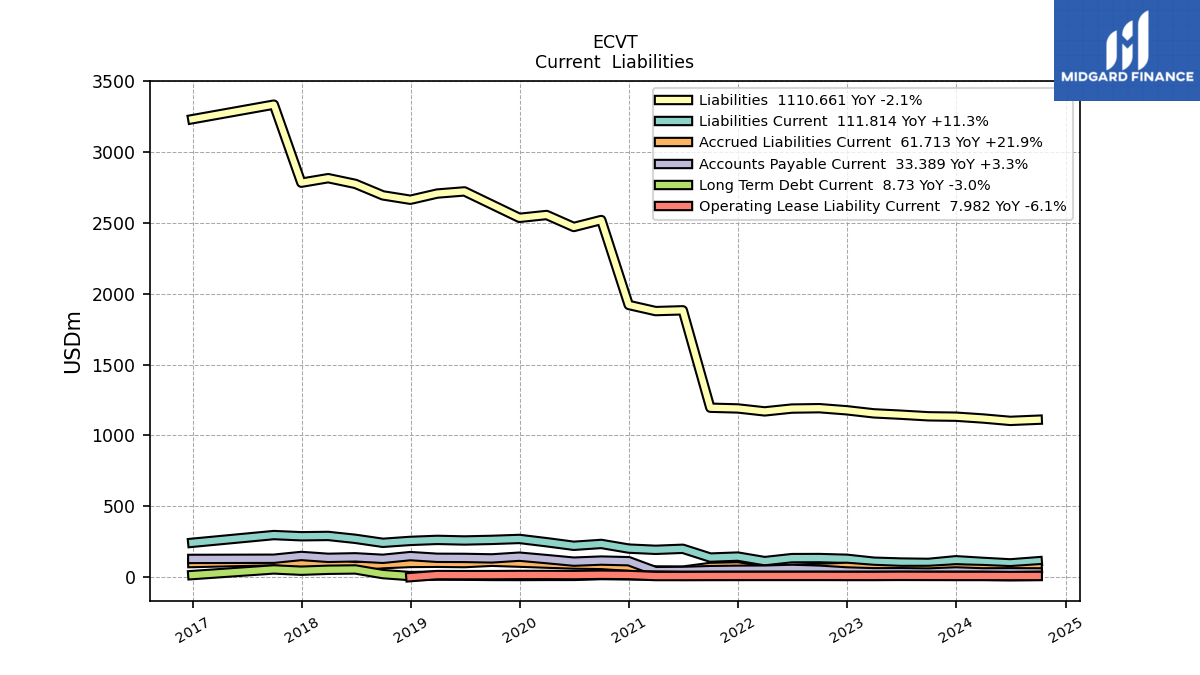
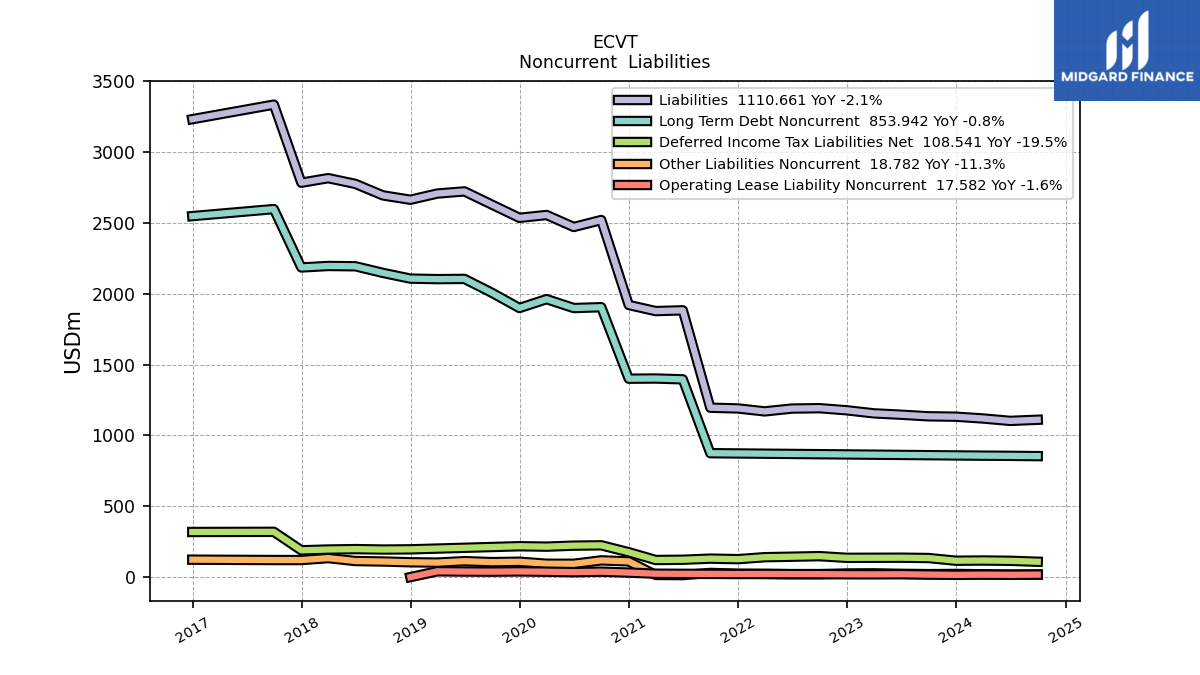
| Liabilities | 1119.46 | 1132.29 | 1134.97 | 1146.27 | 1155.90 | 1177.32 | 1192.27 | 1189.60 | 1169.62 | 1190.48 | 1195.52 | 1882.99 | 1877.49 | 1920.64 | 2520.26 | 2471.04 | 2555.73 | 2535.53 | 2628.82 | 2722.29 | 2707.00 | 2663.28 | 2694.12 | 2775.18 | 2815.59 | 2783.54 | 3334.63 | NA | NA | 3231.73 | NA | NA | NA | |
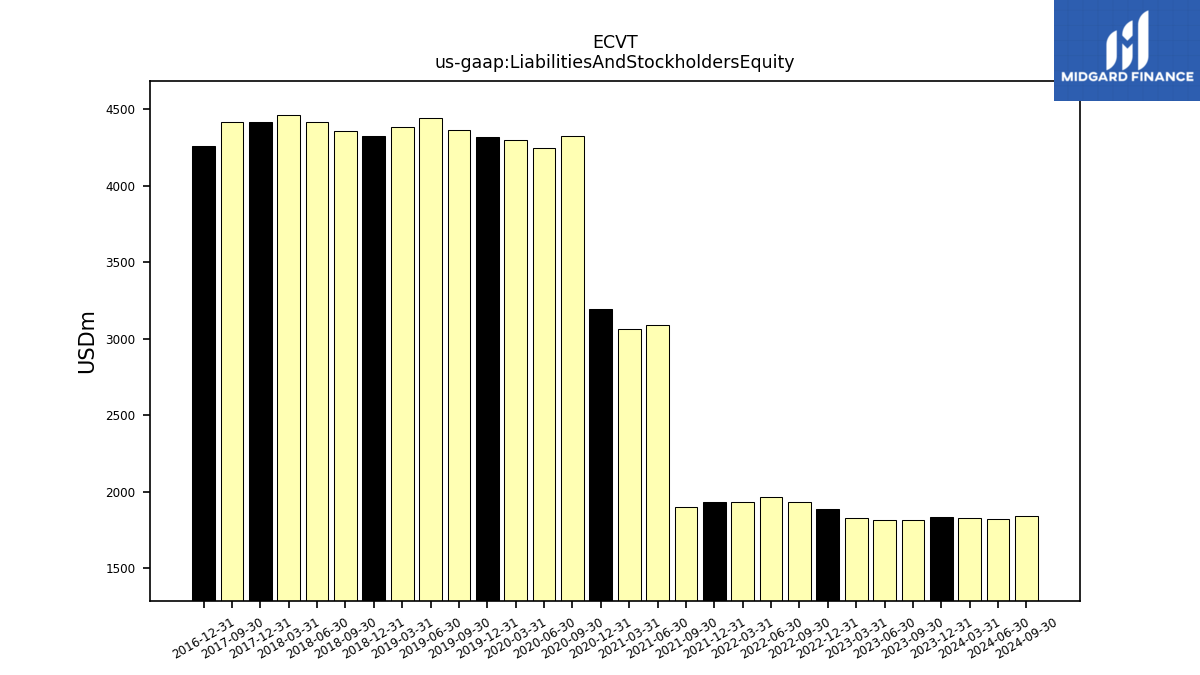
| Liabilities And Stockholders Equity | 1830.81 | 1837.75 | 1812.83 | 1814.04 | 1830.05 | 1884.55 | 1931.80 | 1967.79 | 1935.25 | 1931.22 | 1902.83 | 3087.60 | 3063.98 | 3197.82 | 4324.44 | 4247.21 | 4296.87 | 4320.85 | 4365.48 | 4441.64 | 4382.28 | 4327.43 | 4356.59 | 4414.51 | 4462.68 | 4415.45 | 4415.60 | NA | NA | 4259.67 | NA | NA | NA | |
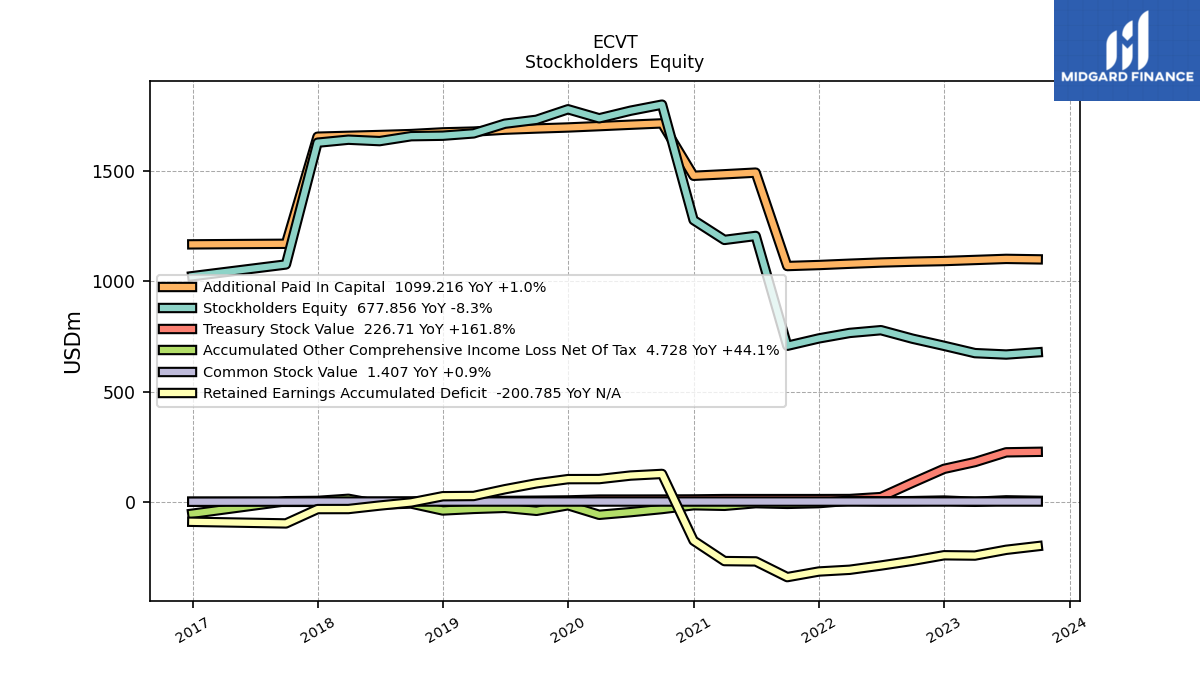
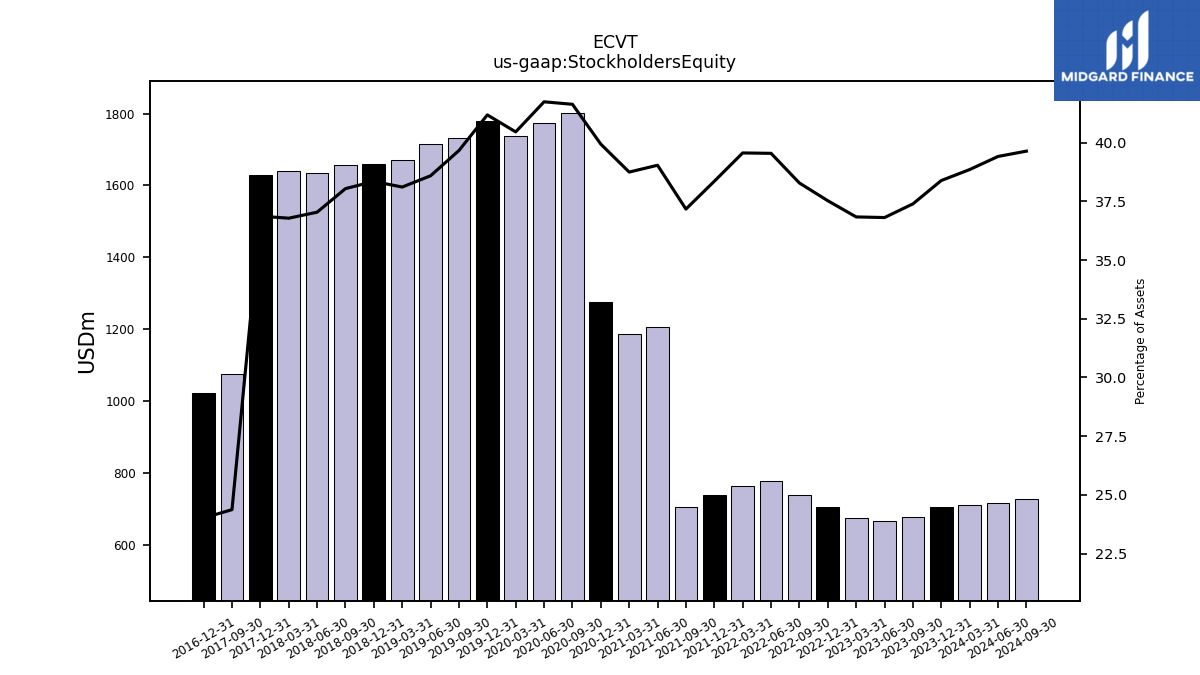
| Stockholders Equity | 711.36 | 705.46 | 677.86 | 667.76 | 674.15 | 707.23 | 739.52 | 778.18 | 765.63 | 740.74 | 707.32 | 1205.35 | 1187.22 | 1277.13 | 1800.49 | 1772.81 | 1738.47 | 1779.45 | 1731.65 | 1714.03 | 1670.08 | 1659.56 | 1657.38 | 1635.08 | 1641.52 | 1628.00 | 1076.03 | NA | NA | 1022.88 | NA | NA | NA |
| 2024-03-31 | 2023-12-31 | 2023-09-30 | 2023-06-30 | 2023-03-31 | 2022-12-31 | 2022-09-30 | 2022-06-30 | 2022-03-31 | 2021-12-31 | 2021-09-30 | 2021-06-30 | 2021-03-31 | 2020-12-31 | 2020-09-30 | 2020-06-30 | 2020-03-31 | 2019-12-31 | 2019-09-30 | 2019-06-30 | 2019-03-31 | 2018-12-31 | 2018-09-30 | 2018-06-30 | 2018-03-31 | 2017-12-31 | 2017-09-30 | 2017-06-30 | 2017-03-31 | 2016-12-31 | 2016-09-30 | 2016-06-30 | 2016-03-31 | ||
|---|---|---|---|---|---|---|---|---|---|---|---|---|---|---|---|---|---|---|---|---|---|---|---|---|---|---|---|---|---|---|---|---|---|---|
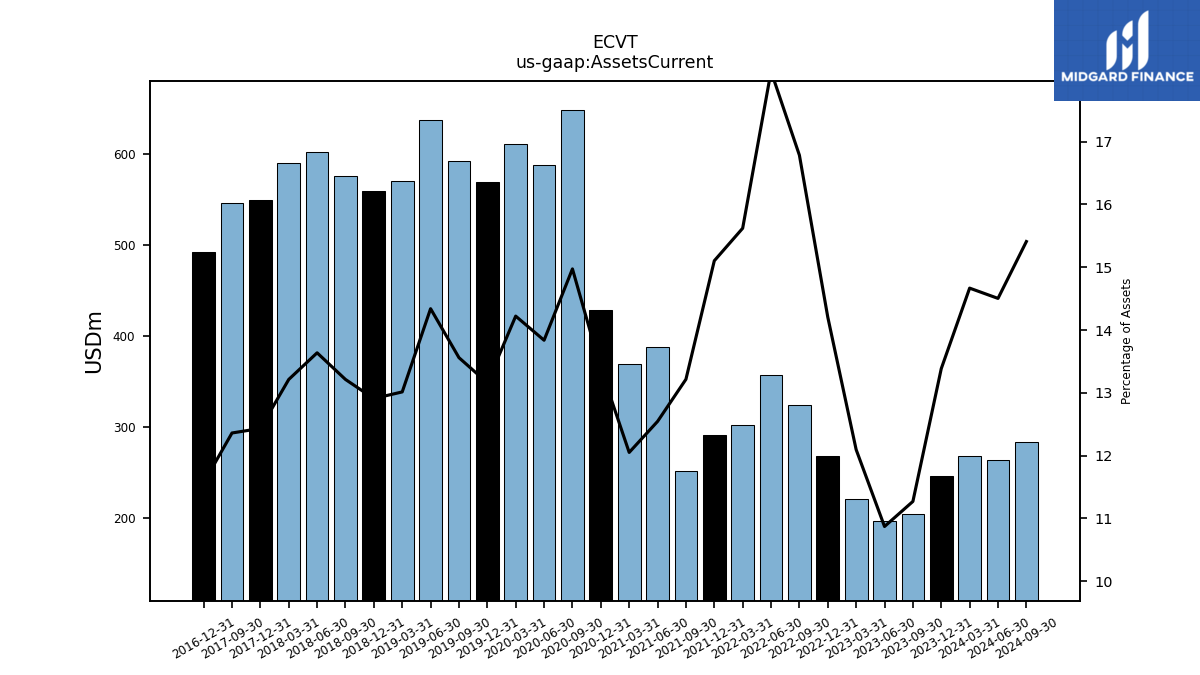
| Assets Current | 268.53 | 245.99 | 204.32 | 197.21 | 221.35 | 267.70 | 324.21 | 356.57 | 302.30 | 291.67 | 251.47 | 387.33 | 369.24 | 428.14 | 647.50 | 587.70 | 611.08 | 568.59 | 591.96 | 636.92 | 570.33 | 558.62 | 575.63 | 602.02 | 589.64 | 548.97 | 545.79 | NA | NA | 492.68 | NA | NA | NA | |
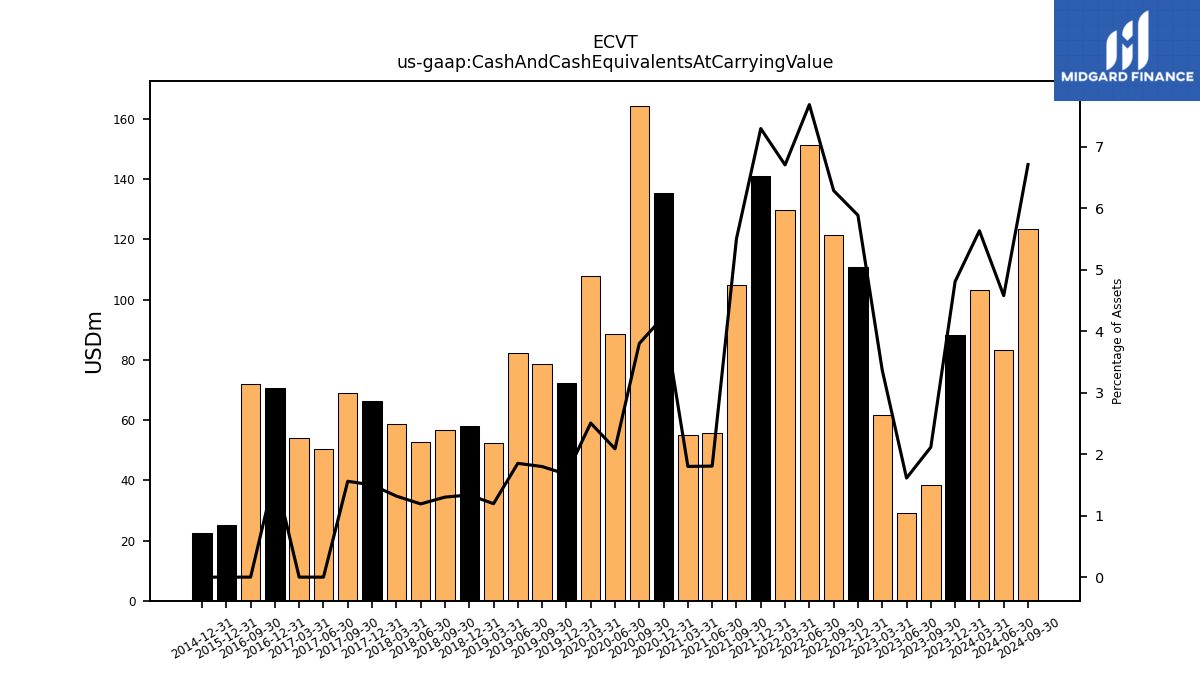
| Cash And Cash Equivalents At Carrying Value | 103.14 | 88.36 | 38.32 | 29.23 | 61.62 | 110.92 | 121.45 | 151.23 | 129.75 | 140.89 | 104.75 | 55.76 | 55.17 | 135.53 | 164.35 | 88.64 | 107.67 | 72.28 | 78.51 | 82.20 | 52.34 | 57.85 | 56.68 | 52.55 | 58.83 | 66.19 | 68.84 | 50.46 | 54.13 | 70.74 | 71.92 | NA | NA | |
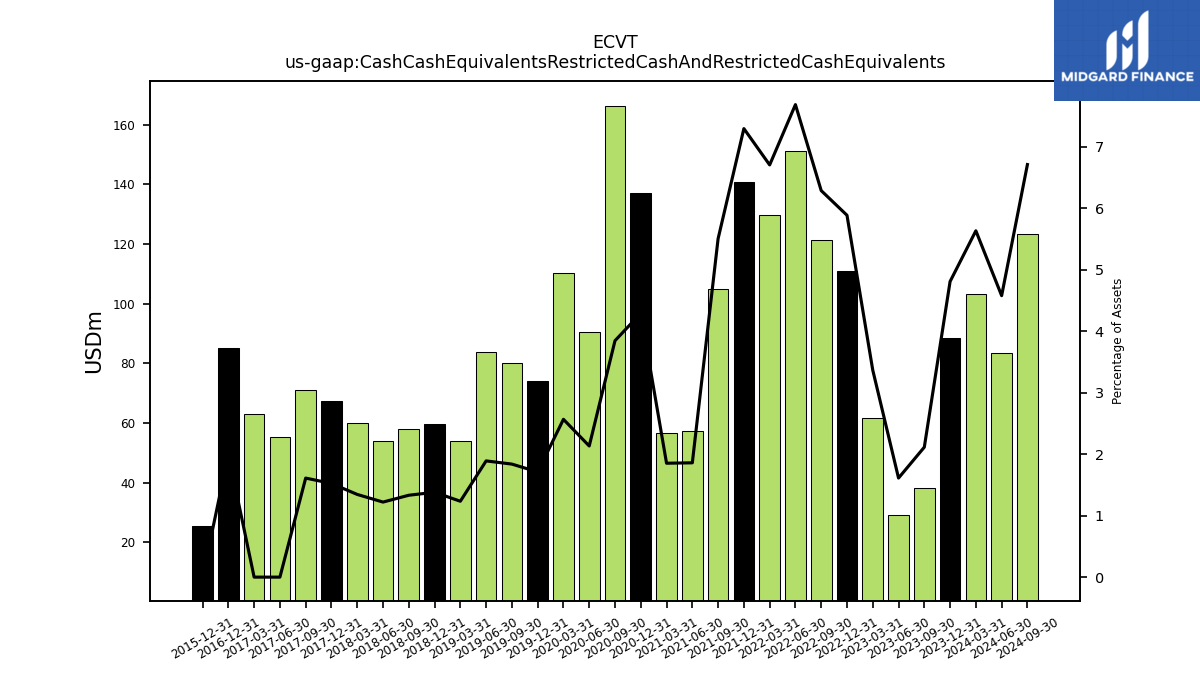
| Cash Cash Equivalents Restricted Cash And Restricted Cash Equivalents | 103.14 | 88.36 | 38.32 | 29.23 | 61.62 | 110.92 | 121.45 | 151.23 | 129.75 | 140.89 | 104.75 | 57.41 | 56.76 | 137.22 | 166.29 | 90.59 | 110.29 | 73.92 | 80.25 | 83.96 | 54.09 | 59.73 | 58.02 | 53.88 | 60.02 | 67.24 | 71.14 | 55.43 | 63.11 | 85.08 | NA | NA | NA | |
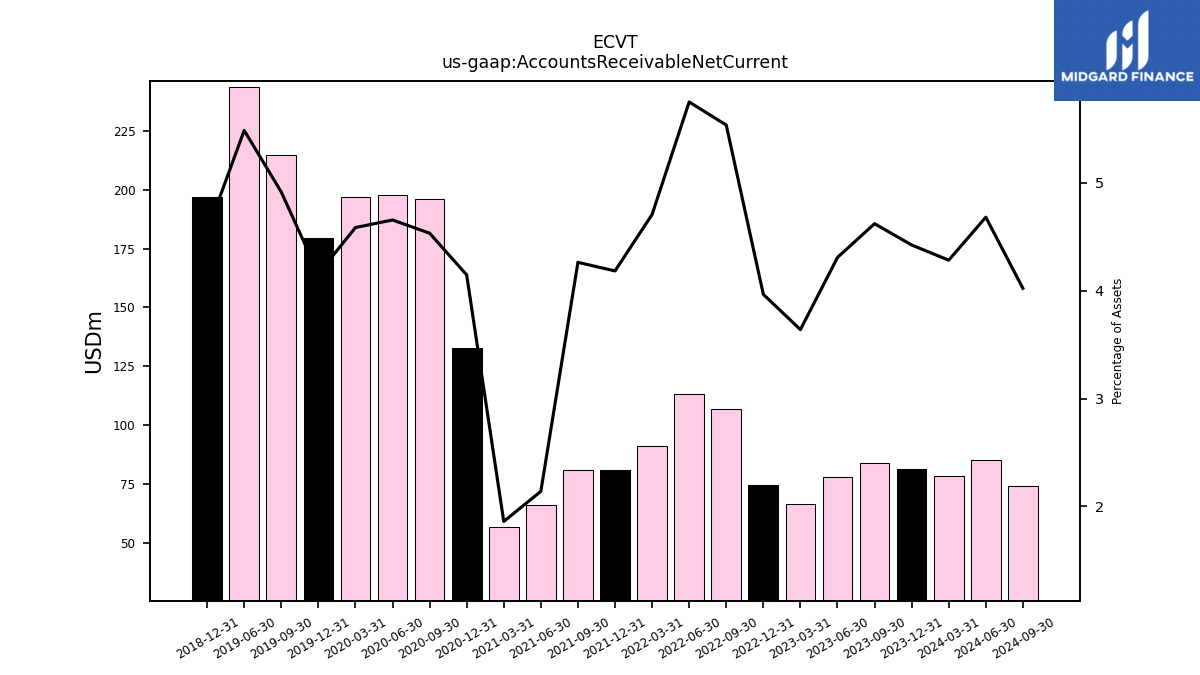
| Accounts Receivable Net Current | 78.43 | 81.31 | 83.79 | 78.17 | 66.61 | 74.76 | 106.97 | 113.18 | 91.11 | 80.80 | 81.13 | 66.05 | 56.99 | 132.62 | 196.08 | 197.78 | 197.08 | 179.63 | 214.63 | 243.74 | NA | 196.77 | NA | NA | NA | NA | NA | NA | NA | NA | NA | NA | NA | |
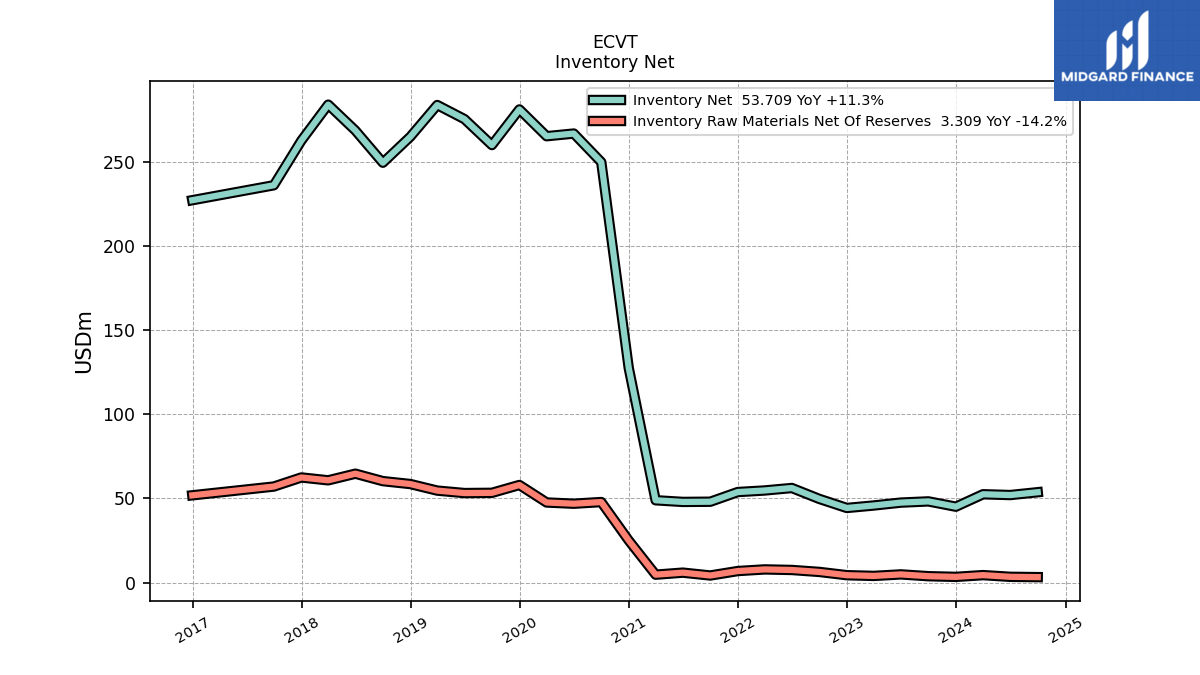
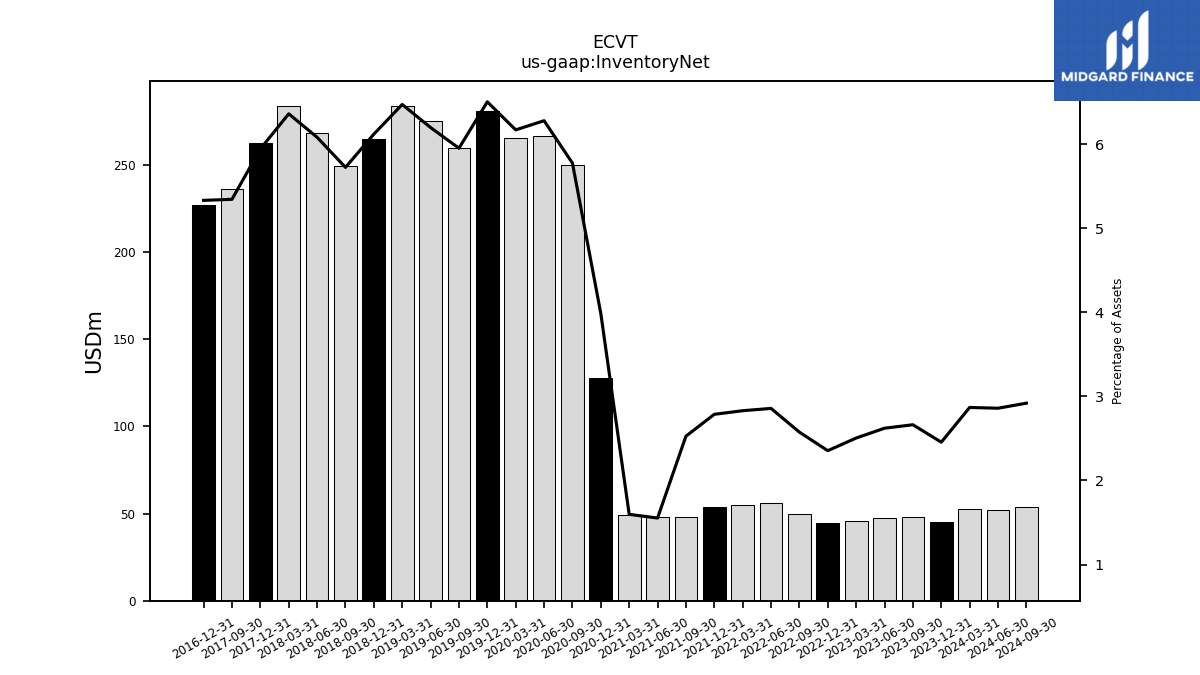
| Inventory Net | 52.50 | 45.12 | 48.26 | 47.55 | 45.83 | 44.36 | 49.73 | 56.21 | 54.75 | 53.81 | 48.07 | 47.95 | 48.93 | 127.44 | 249.66 | 266.62 | 265.04 | 280.94 | 259.77 | 275.21 | 283.55 | 264.75 | 249.30 | 268.41 | 283.79 | 262.39 | 235.92 | NA | NA | 227.05 | NA | NA | NA | |
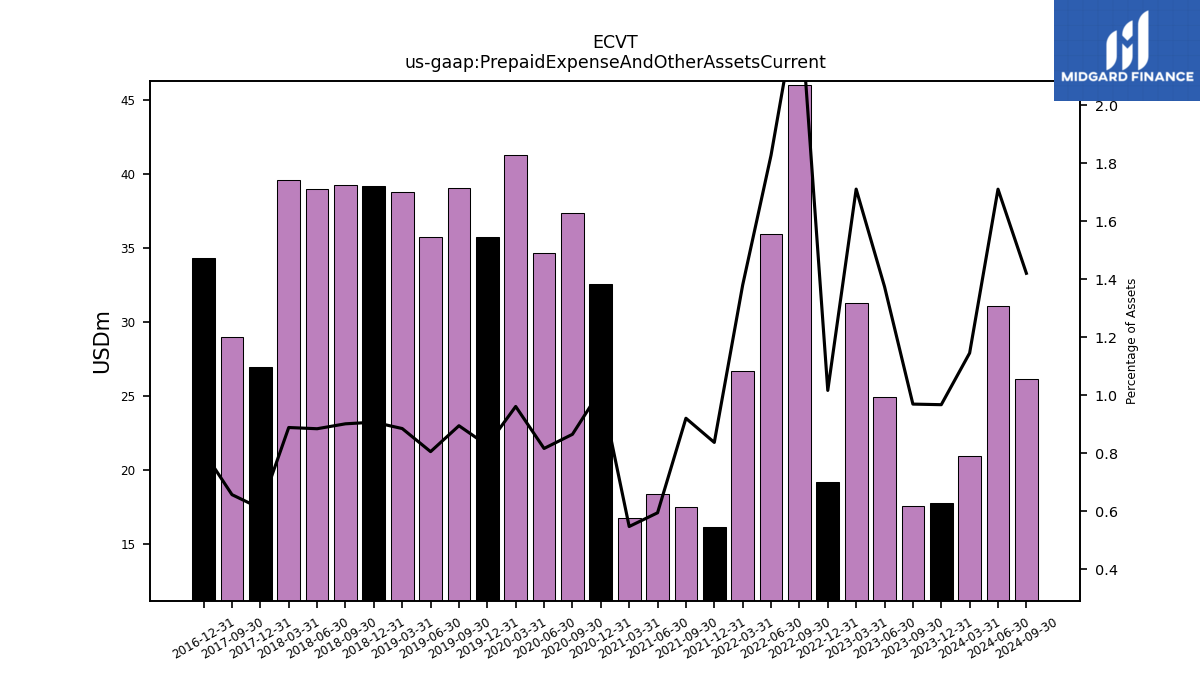
| Prepaid Expense And Other Assets Current | 20.97 | 17.77 | 17.57 | 24.93 | 31.30 | 19.15 | 46.07 | 35.95 | 26.70 | 16.16 | 17.51 | 18.36 | 16.77 | 32.55 | 37.41 | 34.67 | 41.29 | 35.73 | 39.05 | 35.77 | 38.78 | 39.24 | 39.26 | 39.04 | 39.65 | 26.93 | 29.01 | NA | NA | 34.31 | NA | NA | NA |
| 2024-03-31 | 2023-12-31 | 2023-09-30 | 2023-06-30 | 2023-03-31 | 2022-12-31 | 2022-09-30 | 2022-06-30 | 2022-03-31 | 2021-12-31 | 2021-09-30 | 2021-06-30 | 2021-03-31 | 2020-12-31 | 2020-09-30 | 2020-06-30 | 2020-03-31 | 2019-12-31 | 2019-09-30 | 2019-06-30 | 2019-03-31 | 2018-12-31 | 2018-09-30 | 2018-06-30 | 2018-03-31 | 2017-12-31 | 2017-09-30 | 2017-06-30 | 2017-03-31 | 2016-12-31 | 2016-09-30 | 2016-06-30 | 2016-03-31 | ||
|---|---|---|---|---|---|---|---|---|---|---|---|---|---|---|---|---|---|---|---|---|---|---|---|---|---|---|---|---|---|---|---|---|---|---|
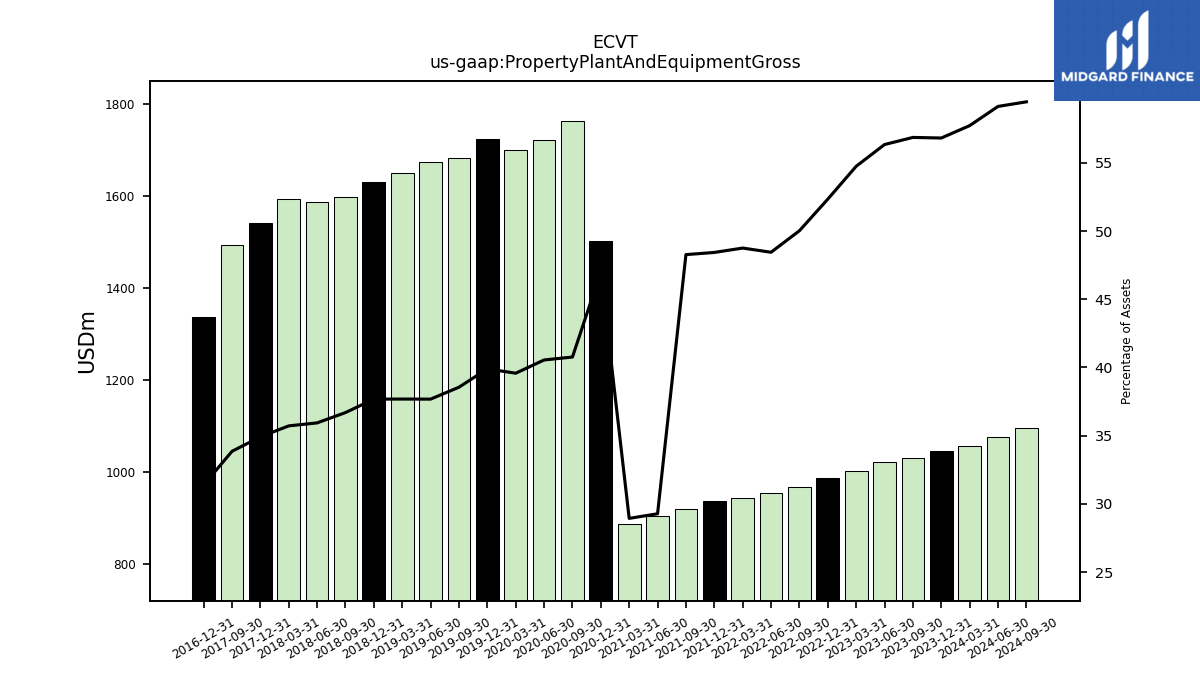
| Property Plant And Equipment Gross | 1056.87 | 1044.20 | 1030.83 | 1022.04 | 1001.88 | 986.31 | 966.29 | 953.27 | 943.46 | 935.28 | 918.52 | 903.75 | 886.52 | 1503.31 | 1762.71 | 1722.08 | 1700.52 | 1723.78 | 1682.87 | 1673.44 | 1651.32 | 1630.36 | 1598.46 | 1586.28 | 1593.81 | 1541.50 | 1494.62 | NA | NA | 1336.58 | NA | NA | NA | |
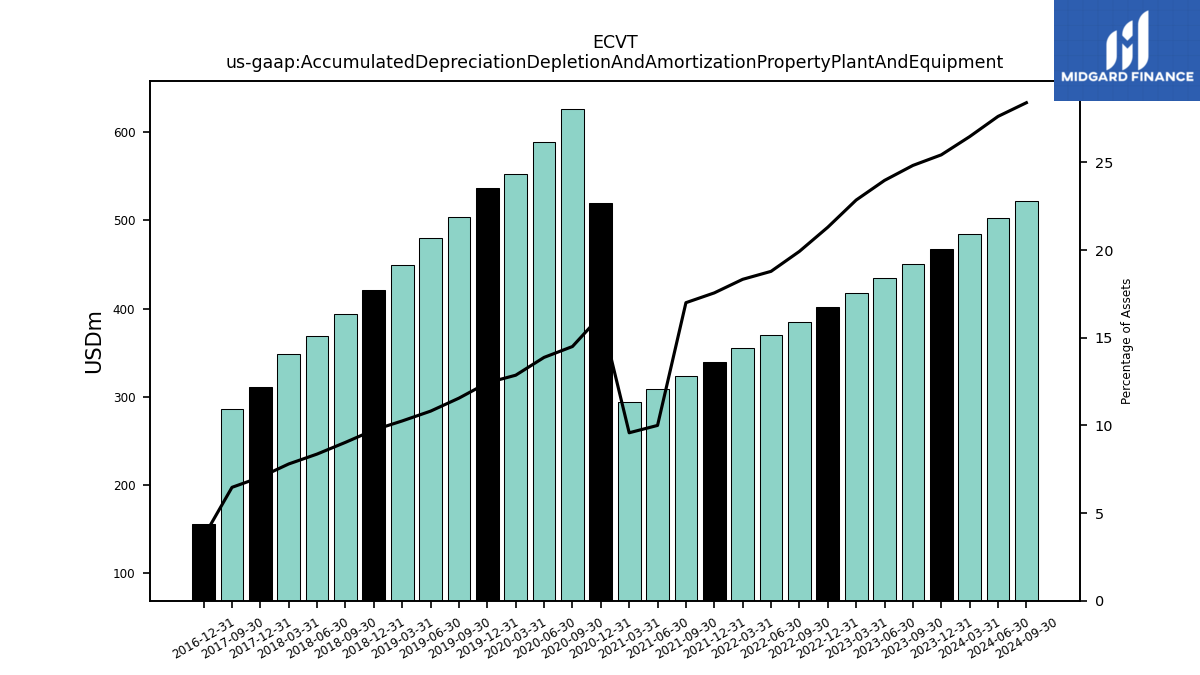
| Accumulated Depreciation Depletion And Amortization Property Plant And Equipment | 484.56 | 467.30 | 450.02 | 434.84 | 418.17 | 401.42 | 384.87 | 369.63 | 354.73 | 339.05 | 323.44 | 308.73 | 293.51 | 520.08 | 626.96 | 589.42 | 552.64 | 537.01 | 504.39 | 480.26 | 449.36 | 421.38 | 393.56 | 369.28 | 348.14 | 311.12 | 285.57 | NA | NA | 155.20 | NA | NA | NA | |
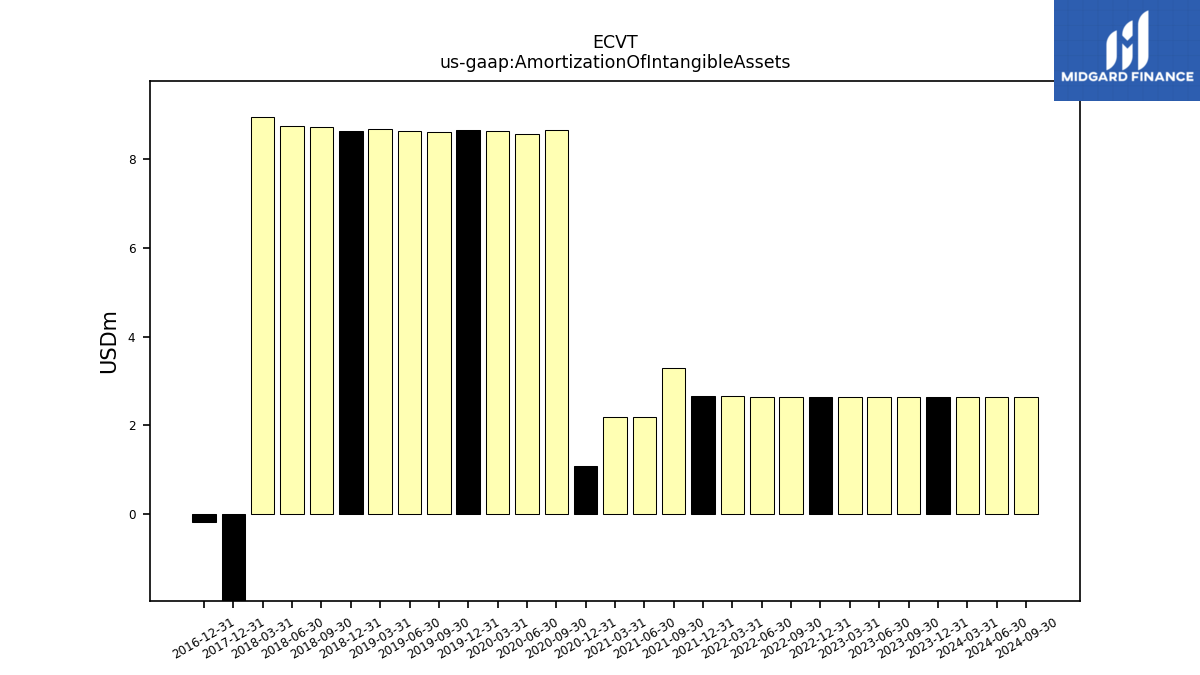
| Amortization Of Intangible Assets | 2.65 | 2.64 | 2.65 | 2.64 | 2.64 | 2.63 | 2.63 | 2.64 | 2.66 | 2.65 | 3.29 | 2.19 | 2.19 | 1.08 | 8.65 | 8.55 | 8.64 | 8.65 | 8.61 | 8.64 | 8.66 | 8.62 | 8.71 | 8.74 | 8.95 | -7.14 | NA | NA | NA | -0.17 | NA | NA | NA | |
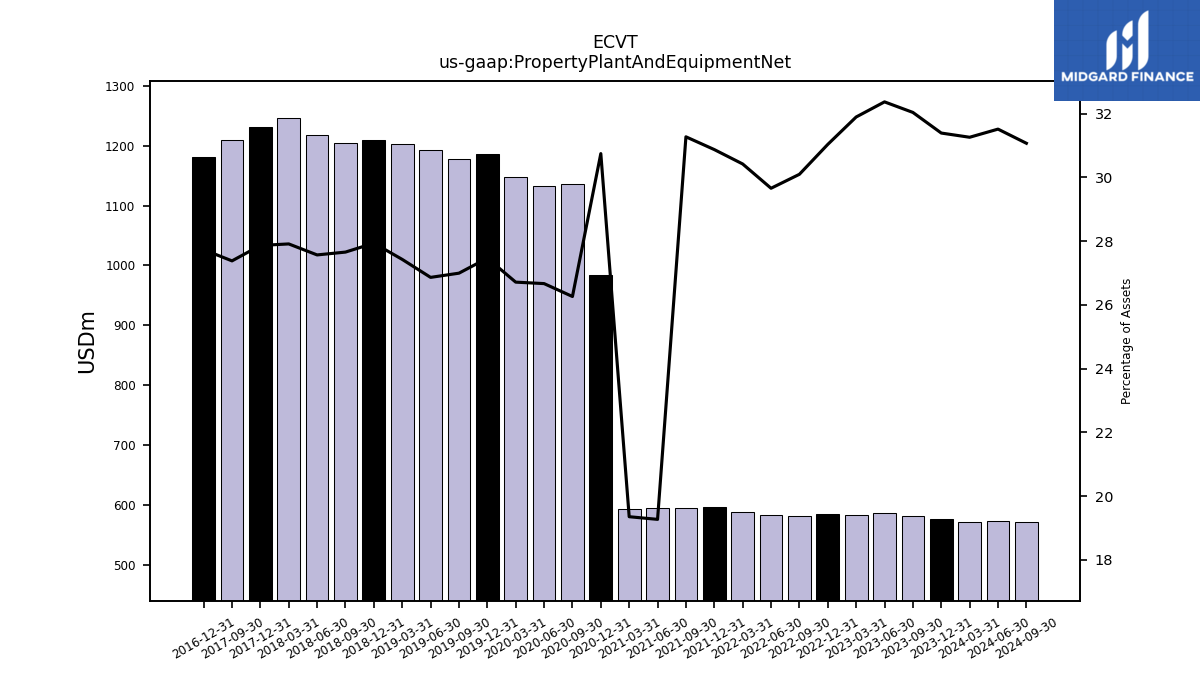
| Property Plant And Equipment Net | 572.31 | 576.90 | 580.81 | 587.20 | 583.70 | 584.89 | 581.42 | 583.64 | 588.73 | 596.23 | 595.09 | 595.02 | 593.02 | 983.24 | 1135.76 | 1132.66 | 1147.88 | 1186.77 | 1178.48 | 1193.18 | 1201.96 | 1208.98 | 1204.90 | 1217.00 | 1245.67 | 1230.38 | 1209.05 | NA | NA | 1181.39 | NA | NA | NA | |
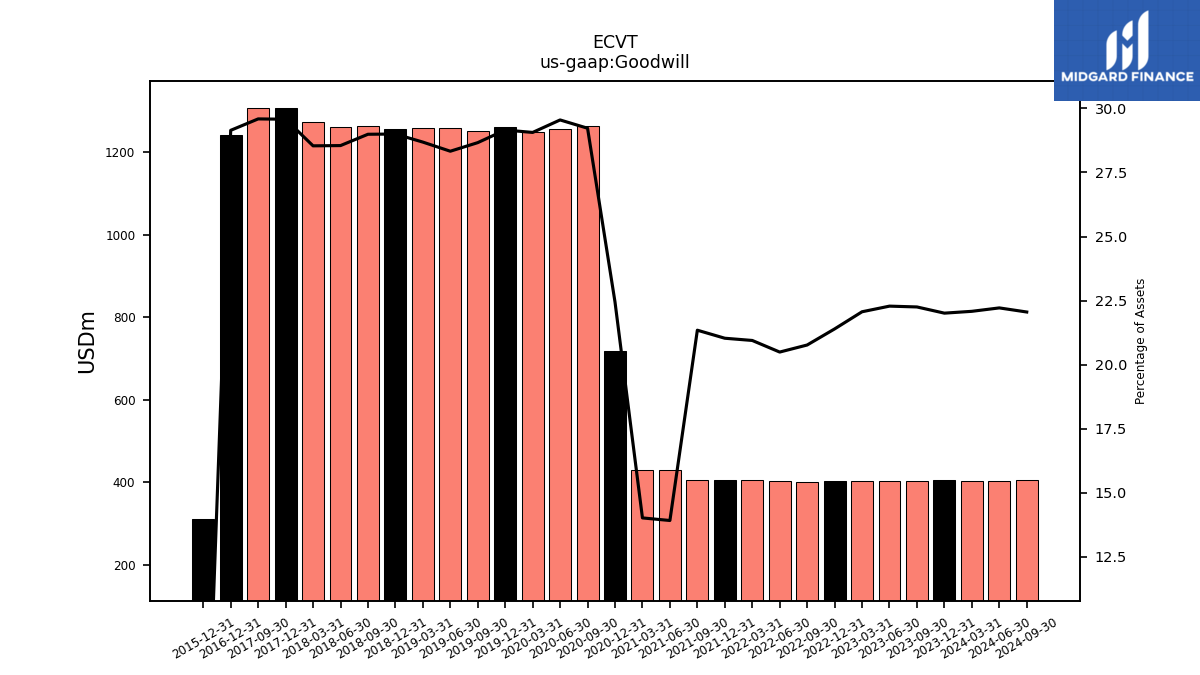
| Goodwill | 404.25 | 404.47 | 403.37 | 404.22 | 403.76 | 403.16 | 401.15 | 403.21 | 405.30 | 406.14 | 406.13 | 429.70 | 429.50 | 717.74 | 1263.85 | 1255.00 | 1248.73 | 1259.81 | 1251.30 | 1258.24 | 1257.03 | 1254.93 | 1262.98 | 1260.29 | 1273.59 | 1305.96 | 1306.55 | NA | NA | 1241.43 | NA | NA | NA | |
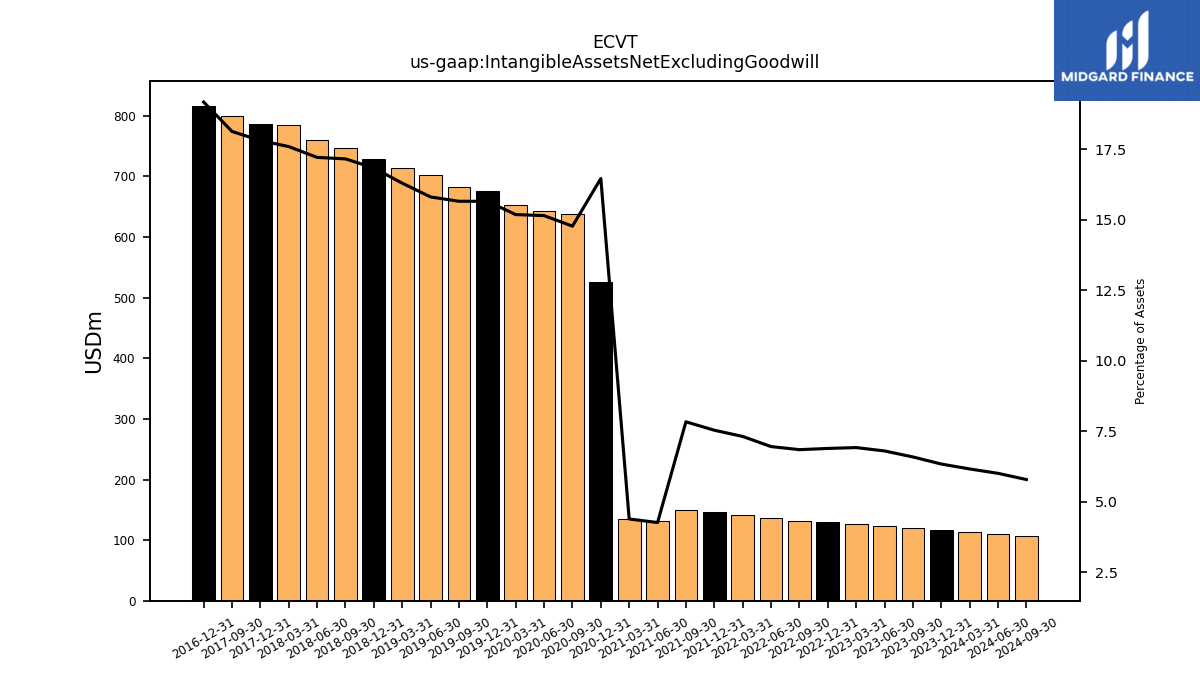
| Intangible Assets Net Excluding Goodwill | 112.93 | 116.55 | 119.52 | 123.46 | 126.74 | 129.93 | 132.35 | 136.97 | 141.65 | 145.62 | 149.15 | 131.81 | 134.66 | 526.30 | 638.77 | 643.23 | 652.32 | 676.38 | 683.30 | 702.06 | 714.11 | 728.44 | 747.35 | 759.64 | 785.03 | 786.14 | 800.42 | NA | NA | 816.57 | NA | NA | NA | |
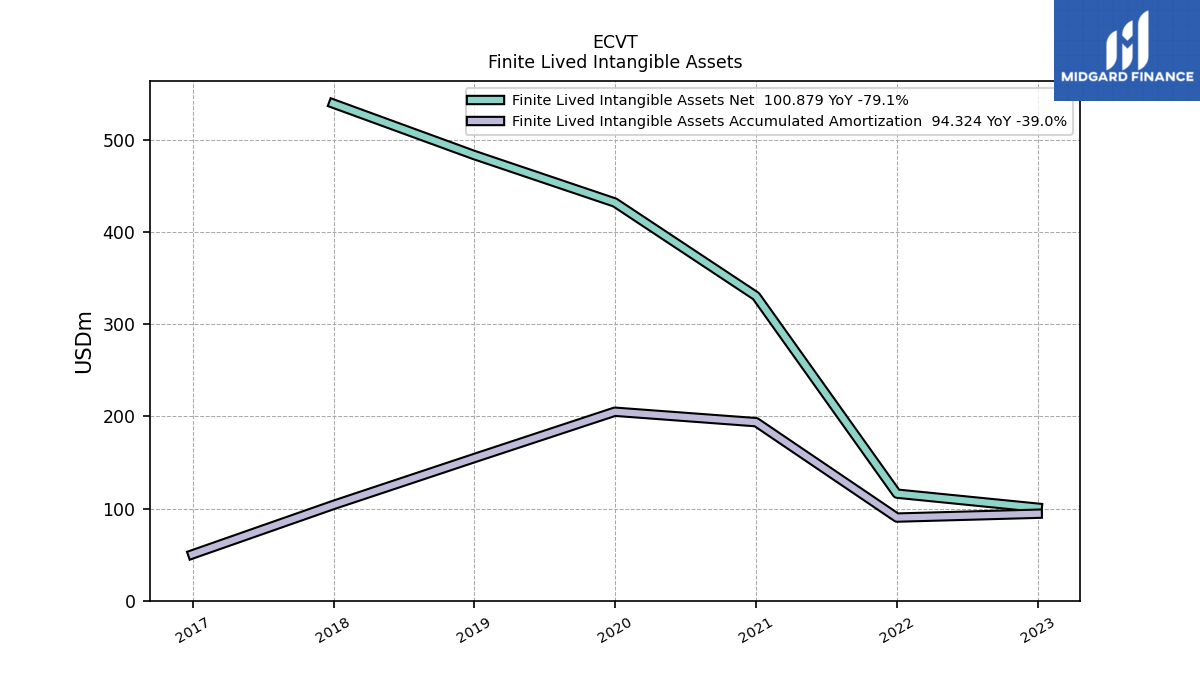
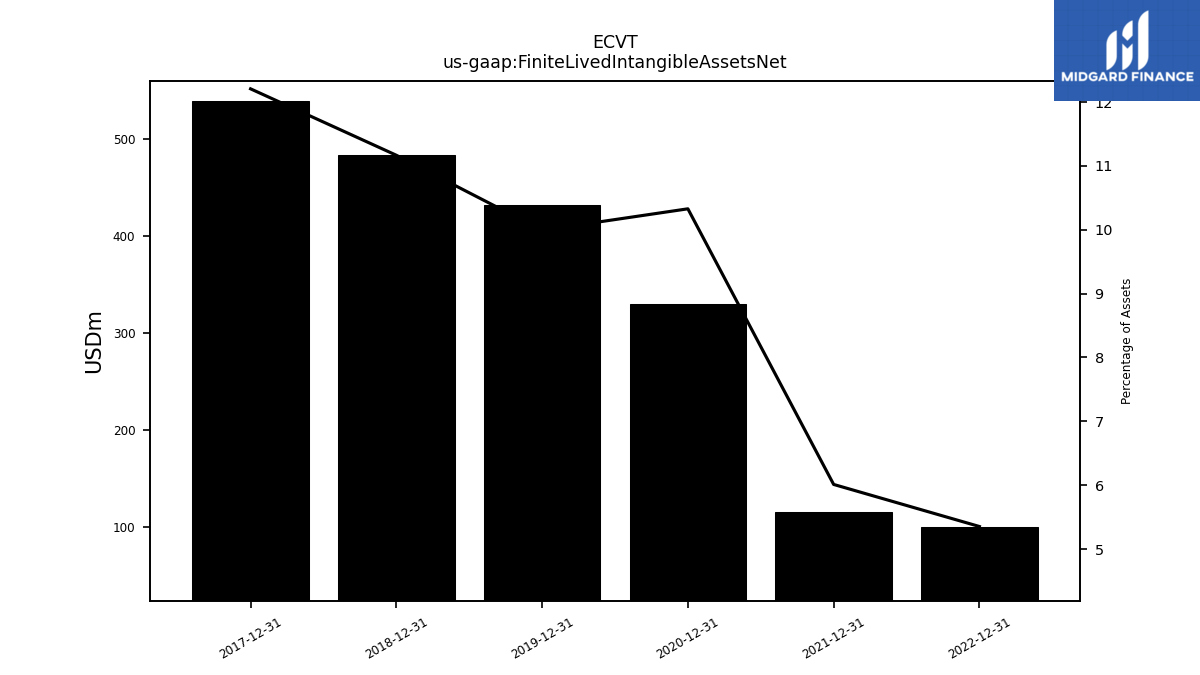
| Finite Lived Intangible Assets Net | NA | 87.28 | NA | NA | NA | 100.88 | NA | NA | NA | 116.10 | NA | NA | NA | 330.28 | NA | NA | NA | 431.71 | NA | NA | NA | 483.24 | NA | NA | NA | 539.00 | NA | NA | NA | NA | NA | NA | NA | |
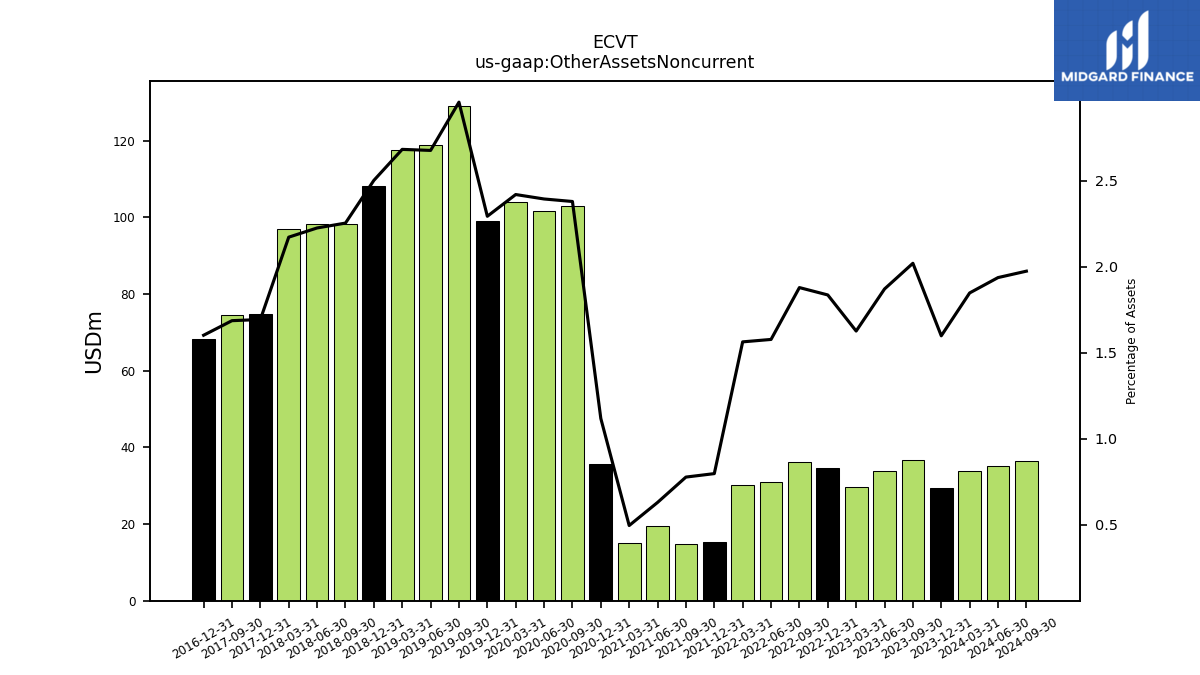
| Other Assets Noncurrent | 33.81 | 29.36 | 36.61 | 33.92 | 29.75 | 34.59 | 36.28 | 31.02 | 30.24 | 15.37 | 14.77 | 19.41 | 15.14 | 35.71 | 102.87 | 101.66 | 103.96 | 99.07 | 129.07 | 118.86 | 117.53 | 108.25 | 98.17 | 98.22 | 96.90 | 74.73 | 74.43 | NA | NA | 68.20 | NA | NA | NA |
| 2024-03-31 | 2023-12-31 | 2023-09-30 | 2023-06-30 | 2023-03-31 | 2022-12-31 | 2022-09-30 | 2022-06-30 | 2022-03-31 | 2021-12-31 | 2021-09-30 | 2021-06-30 | 2021-03-31 | 2020-12-31 | 2020-09-30 | 2020-06-30 | 2020-03-31 | 2019-12-31 | 2019-09-30 | 2019-06-30 | 2019-03-31 | 2018-12-31 | 2018-09-30 | 2018-06-30 | 2018-03-31 | 2017-12-31 | 2017-09-30 | 2017-06-30 | 2017-03-31 | 2016-12-31 | 2016-09-30 | 2016-06-30 | 2016-03-31 | ||
|---|---|---|---|---|---|---|---|---|---|---|---|---|---|---|---|---|---|---|---|---|---|---|---|---|---|---|---|---|---|---|---|---|---|---|
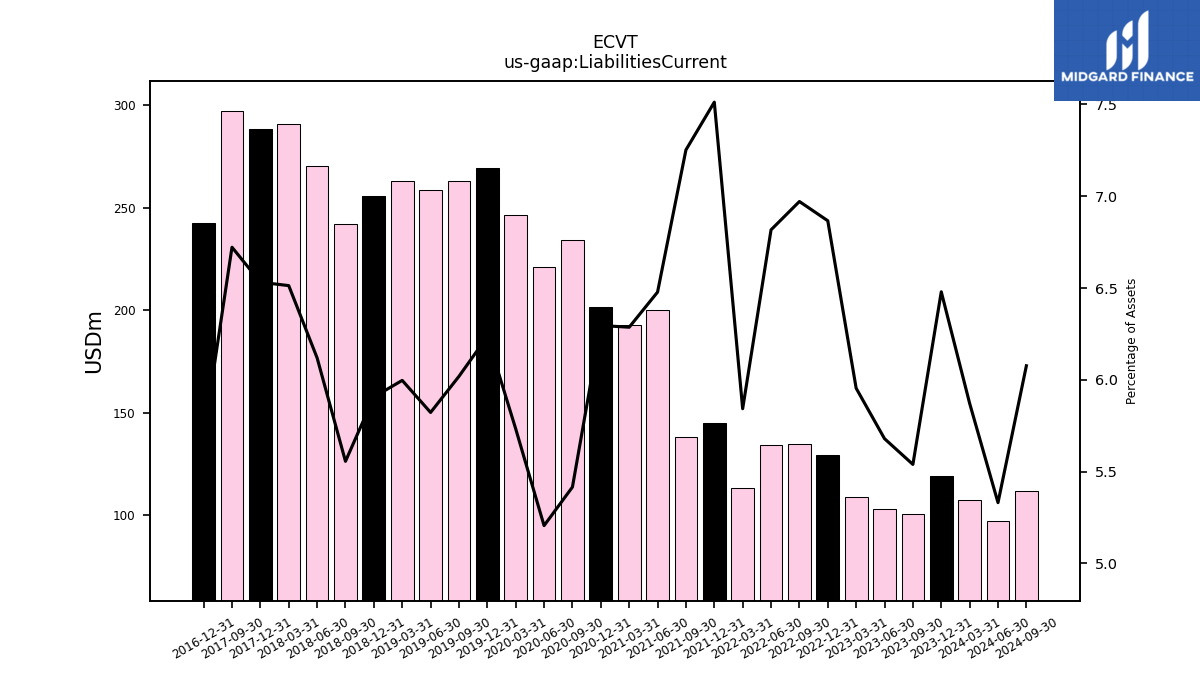
| Liabilities Current | 107.51 | 119.08 | 100.42 | 103.03 | 108.97 | 129.40 | 134.67 | 134.15 | 113.07 | 145.08 | 138.00 | 200.02 | 192.62 | 201.34 | 234.23 | 221.12 | 246.35 | 269.47 | 262.77 | 258.62 | 262.81 | 255.61 | 242.07 | 270.16 | 290.67 | 288.41 | 296.84 | NA | NA | 242.39 | NA | NA | NA | |
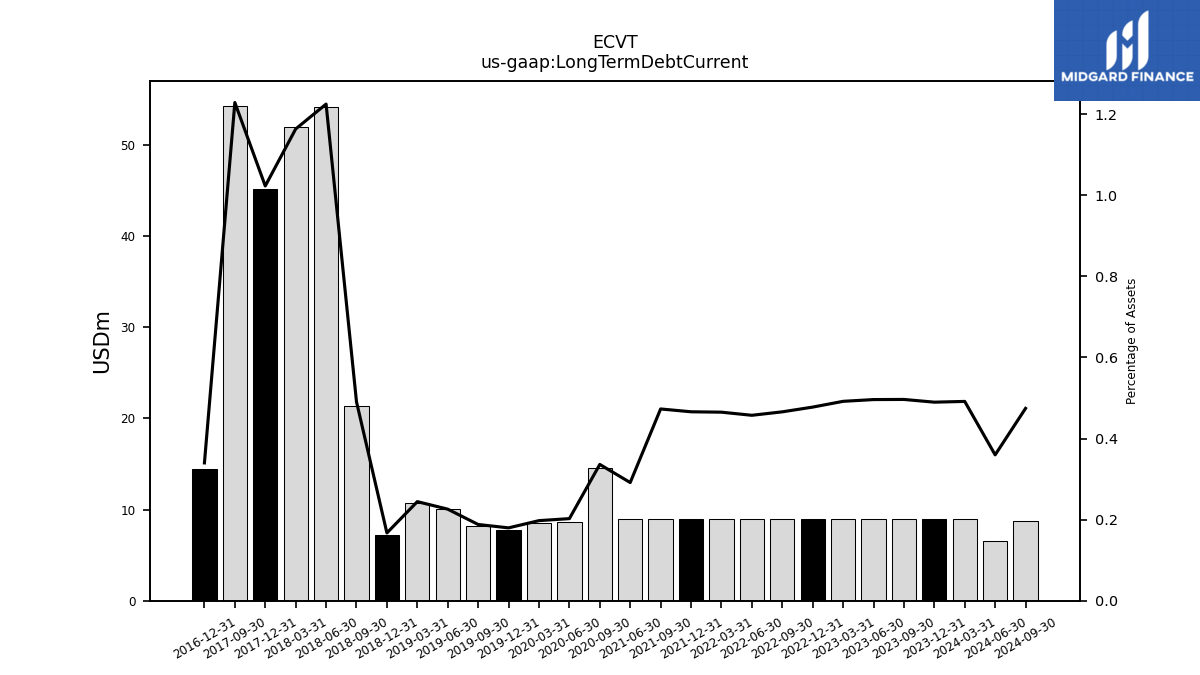
| Long Term Debt Current | 9.00 | 9.00 | 9.00 | 9.00 | 9.00 | 9.00 | 9.00 | 9.00 | 9.00 | 9.00 | 9.00 | 9.00 | NA | NA | 14.54 | 8.60 | 8.49 | 7.77 | 8.21 | 10.03 | 10.71 | 7.24 | 21.37 | 54.07 | 51.92 | 45.17 | 54.26 | NA | NA | 14.48 | NA | NA | NA | |
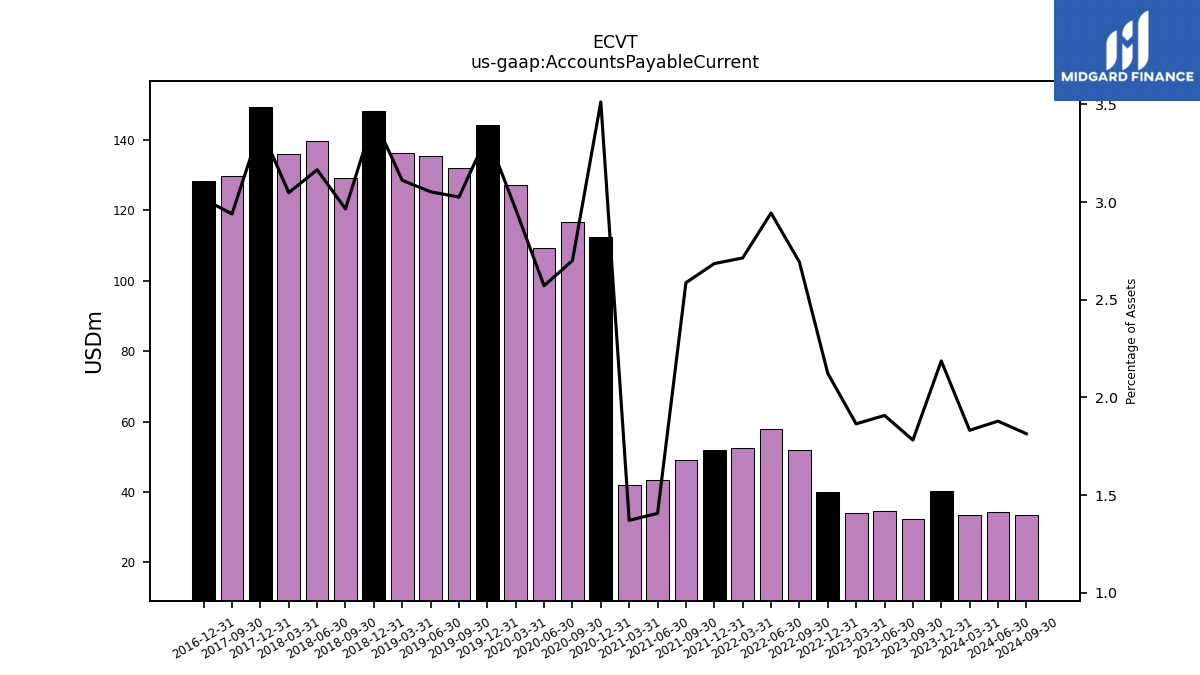
| Accounts Payable Current | 33.54 | 40.20 | 32.31 | 34.62 | 34.13 | 40.02 | 52.03 | 57.94 | 52.52 | 51.86 | 49.23 | 43.44 | 42.01 | 112.33 | 116.80 | 109.23 | 127.32 | 144.37 | 132.10 | 135.59 | 136.36 | 148.37 | 129.19 | 139.73 | 136.03 | 149.33 | 129.79 | NA | NA | 128.48 | NA | NA | NA | |
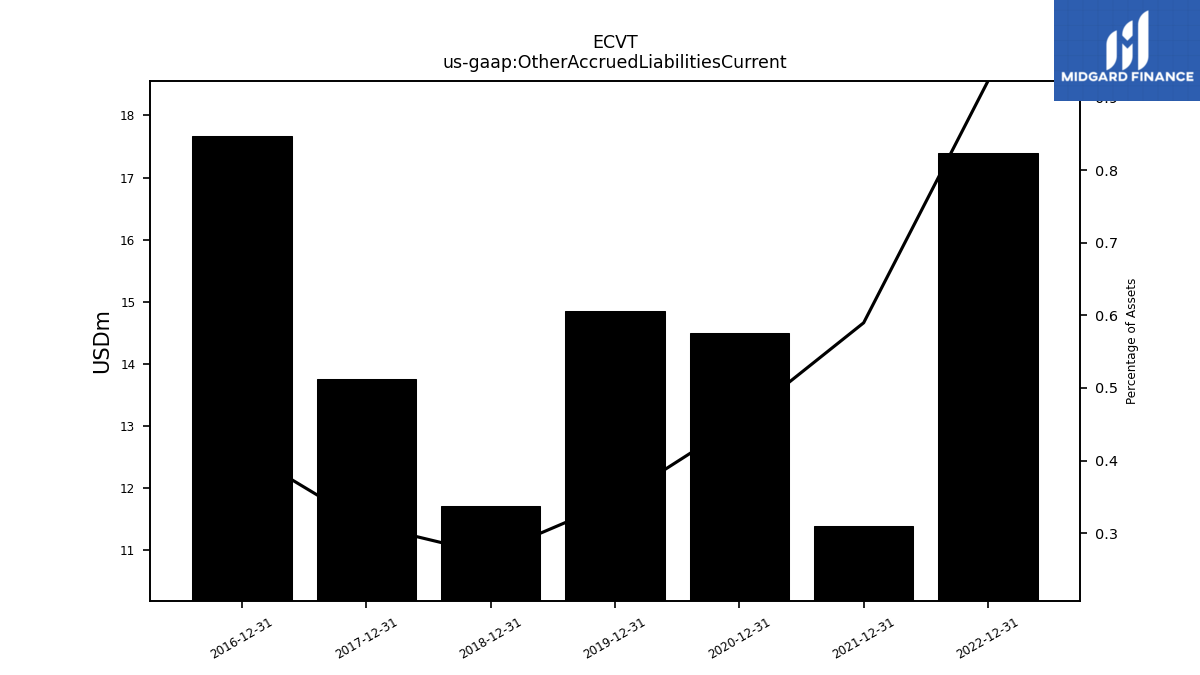
| Other Accrued Liabilities Current | NA | 18.05 | NA | NA | NA | 17.39 | NA | NA | NA | 11.39 | NA | NA | NA | 14.49 | NA | NA | NA | 14.85 | NA | NA | NA | 11.71 | NA | NA | NA | 13.77 | NA | NA | NA | 17.67 | NA | NA | NA | |
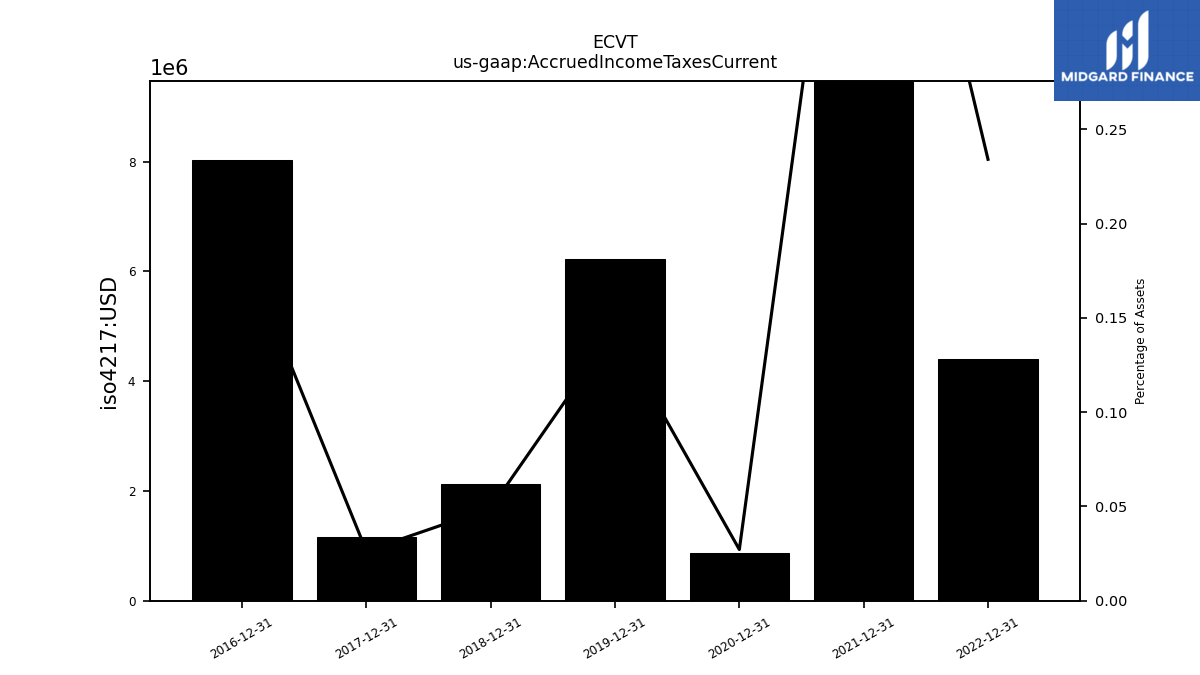
| Accrued Income Taxes Current | NA | 7.71 | NA | NA | NA | 4.41 | NA | NA | NA | 9.86 | NA | NA | NA | 0.87 | NA | NA | NA | 6.22 | NA | NA | NA | 2.12 | NA | NA | NA | 1.17 | NA | NA | NA | 8.04 | NA | NA | NA | |
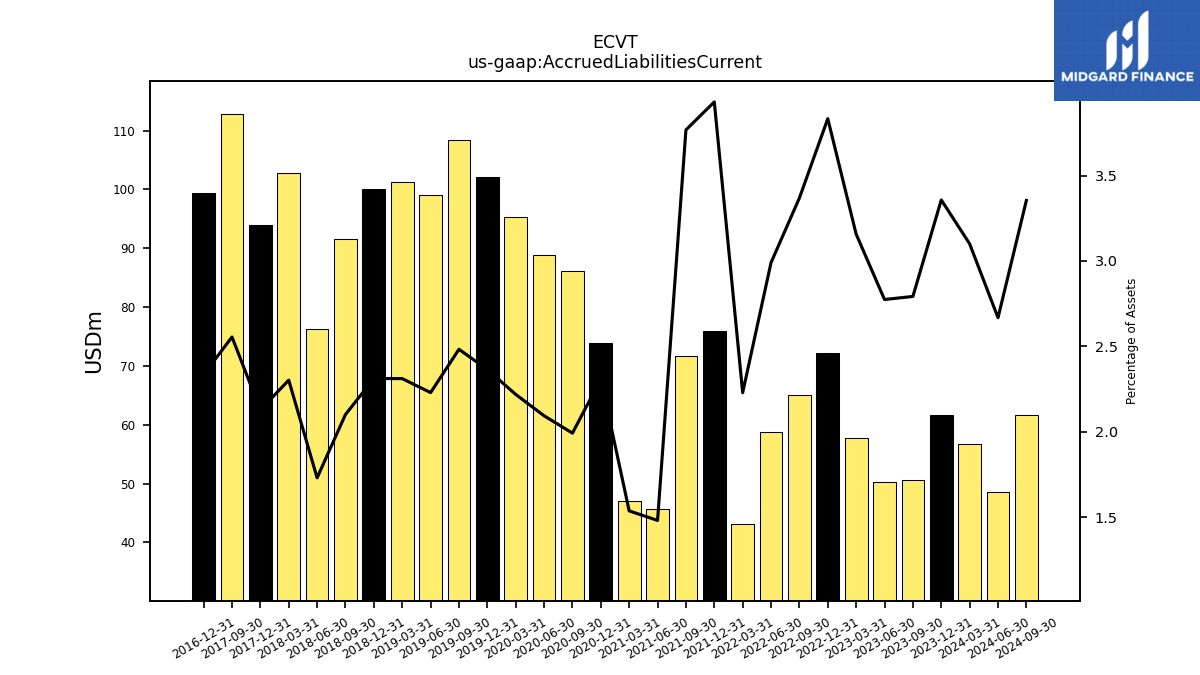
| Accrued Liabilities Current | 56.76 | 61.69 | 50.61 | 50.32 | 57.77 | 72.23 | 65.07 | 58.84 | 43.13 | 75.92 | 71.68 | 45.70 | 47.06 | 73.81 | 86.12 | 88.89 | 95.31 | 102.15 | 108.36 | 98.99 | 101.26 | 100.01 | 91.51 | 76.36 | 102.72 | 93.92 | 112.79 | NA | NA | 99.43 | NA | NA | NA |
| 2024-03-31 | 2023-12-31 | 2023-09-30 | 2023-06-30 | 2023-03-31 | 2022-12-31 | 2022-09-30 | 2022-06-30 | 2022-03-31 | 2021-12-31 | 2021-09-30 | 2021-06-30 | 2021-03-31 | 2020-12-31 | 2020-09-30 | 2020-06-30 | 2020-03-31 | 2019-12-31 | 2019-09-30 | 2019-06-30 | 2019-03-31 | 2018-12-31 | 2018-09-30 | 2018-06-30 | 2018-03-31 | 2017-12-31 | 2017-09-30 | 2017-06-30 | 2017-03-31 | 2016-12-31 | 2016-09-30 | 2016-06-30 | 2016-03-31 | ||
|---|---|---|---|---|---|---|---|---|---|---|---|---|---|---|---|---|---|---|---|---|---|---|---|---|---|---|---|---|---|---|---|---|---|---|
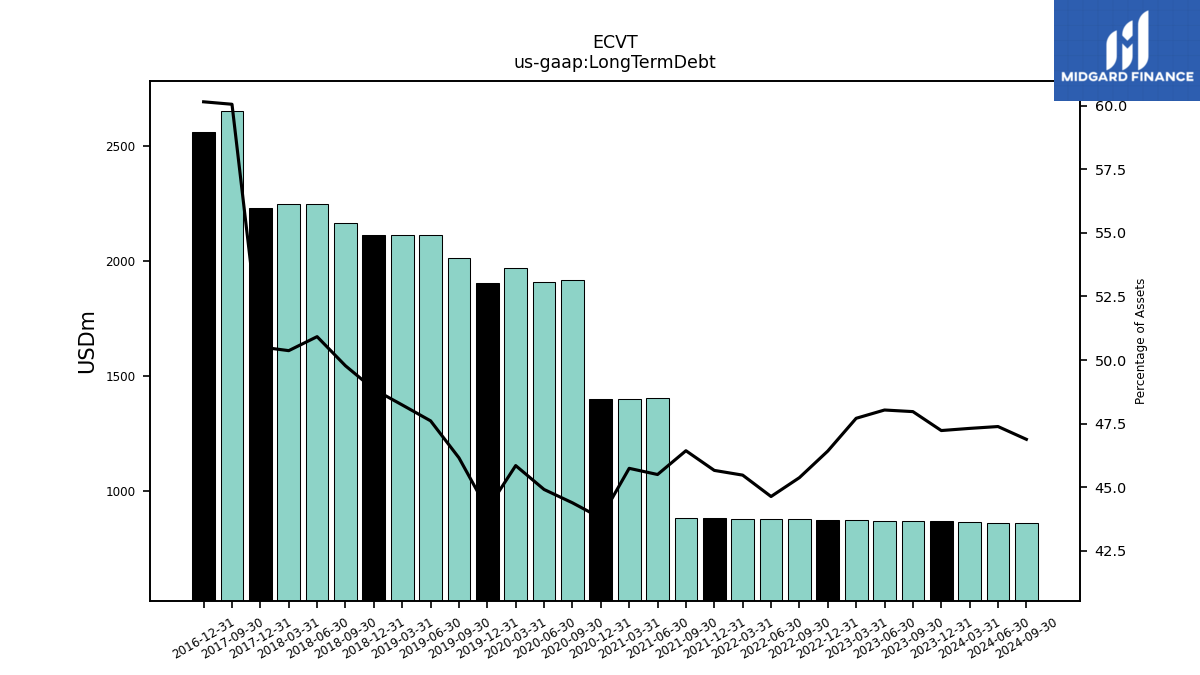
| Long Term Debt | 866.22 | 867.95 | 869.67 | 871.39 | 873.13 | 874.87 | 876.60 | 878.34 | 880.09 | 881.84 | 883.59 | 1404.89 | 1401.57 | 1400.37 | 1919.55 | 1907.55 | 1970.18 | 1906.96 | 2014.93 | 2114.68 | 2113.78 | 2113.96 | 2168.46 | 2247.84 | 2247.82 | 2230.49 | 2651.74 | NA | NA | 2562.20 | NA | NA | NA | |
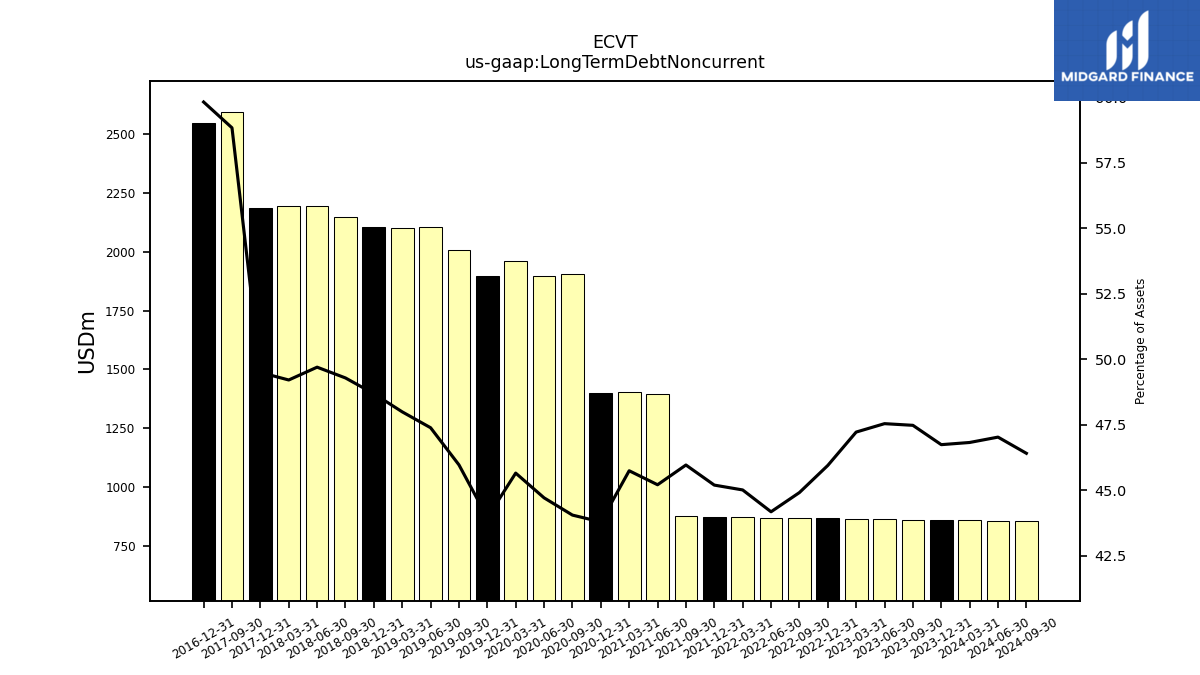
| Long Term Debt Noncurrent | 857.22 | 858.95 | 860.67 | 862.39 | 864.13 | 865.87 | 867.60 | 869.34 | 871.09 | 872.84 | 874.59 | 1395.89 | 1401.57 | 1400.37 | 1905.01 | 1898.94 | 1961.69 | 1899.20 | 2006.72 | 2104.65 | 2103.07 | 2106.72 | 2147.09 | 2193.77 | 2195.90 | 2185.32 | 2597.48 | NA | NA | 2547.72 | NA | NA | NA | |
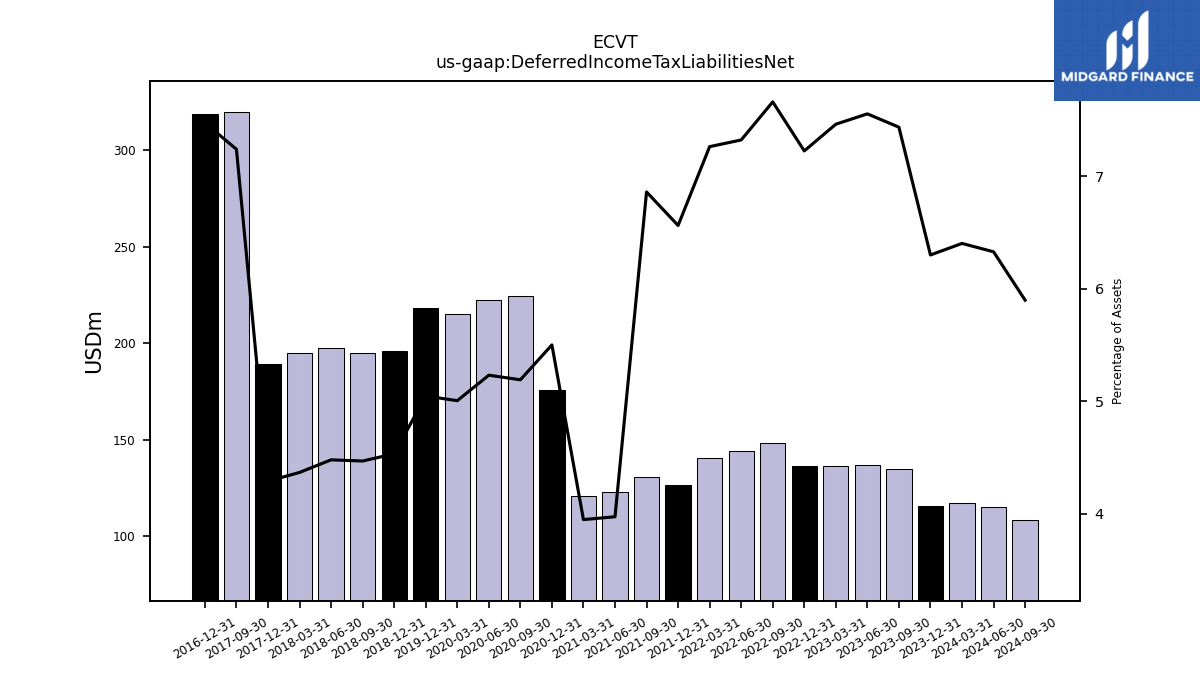
| Deferred Income Tax Liabilities Net | 117.23 | 115.79 | 134.83 | 137.07 | 136.59 | 136.18 | 148.02 | 144.11 | 140.58 | 126.75 | 130.56 | 122.64 | 120.93 | 175.90 | 224.46 | 222.18 | 215.04 | 218.04 | NA | NA | NA | 196.12 | 194.65 | 197.70 | 194.85 | 189.34 | 319.74 | NA | NA | 318.46 | NA | NA | NA | |
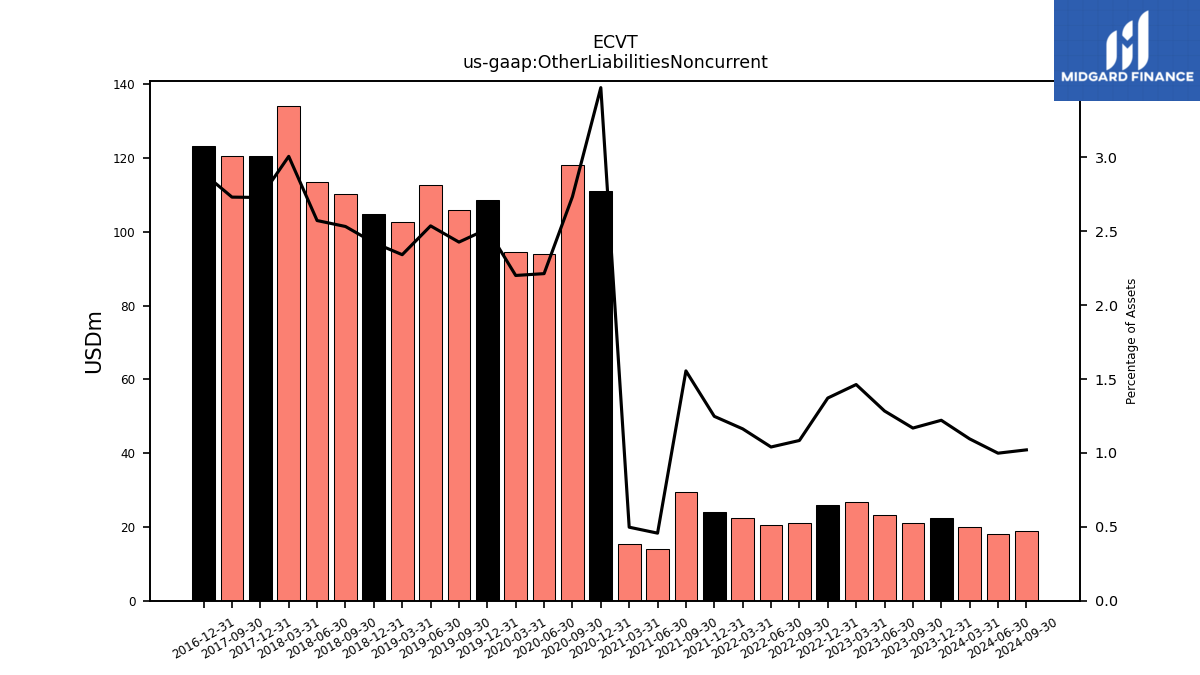
| Other Liabilities Noncurrent | 20.05 | 22.44 | 21.18 | 23.29 | 26.77 | 25.85 | 20.95 | 20.47 | 22.51 | 24.09 | 29.59 | 14.12 | 15.25 | 111.02 | 118.22 | 94.00 | 94.56 | 108.67 | 105.93 | 112.65 | 102.60 | 104.83 | 110.31 | 113.55 | 134.17 | 120.47 | 120.58 | NA | NA | 123.16 | NA | NA | NA | |
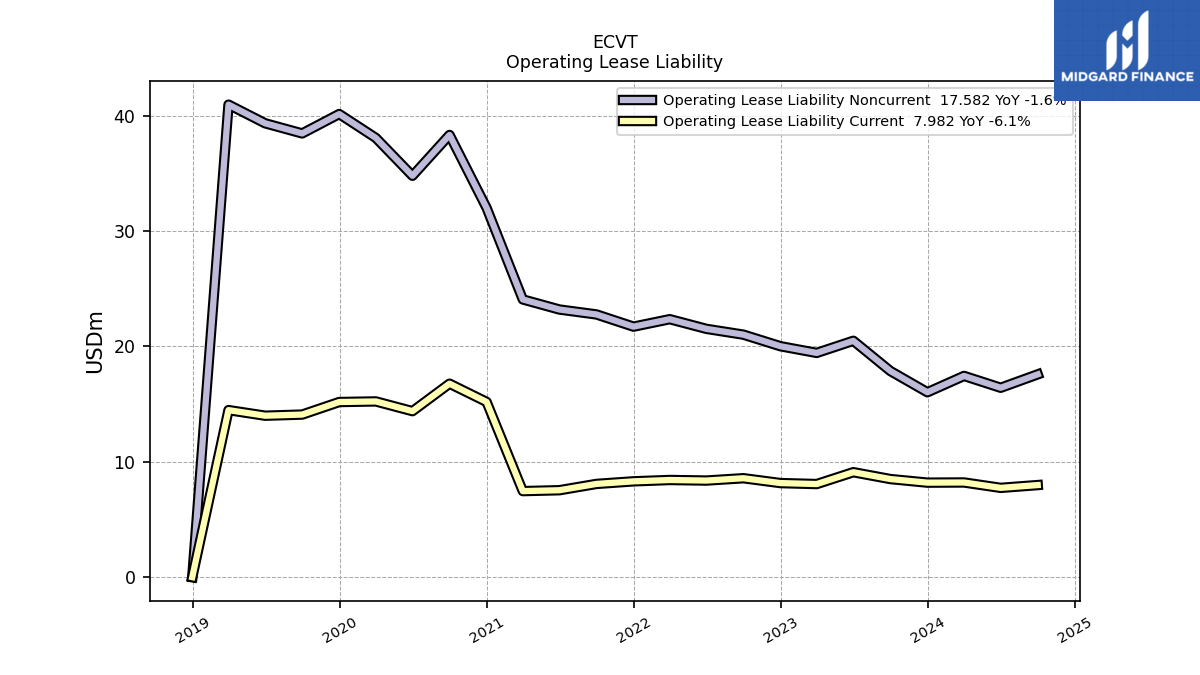
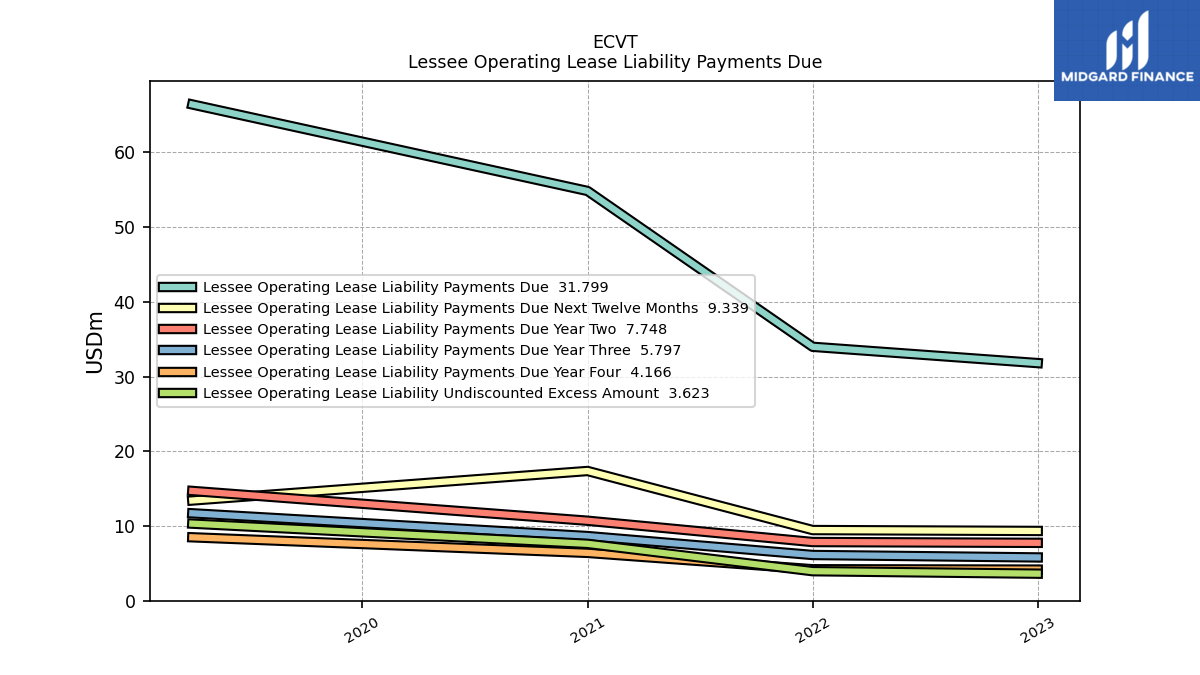
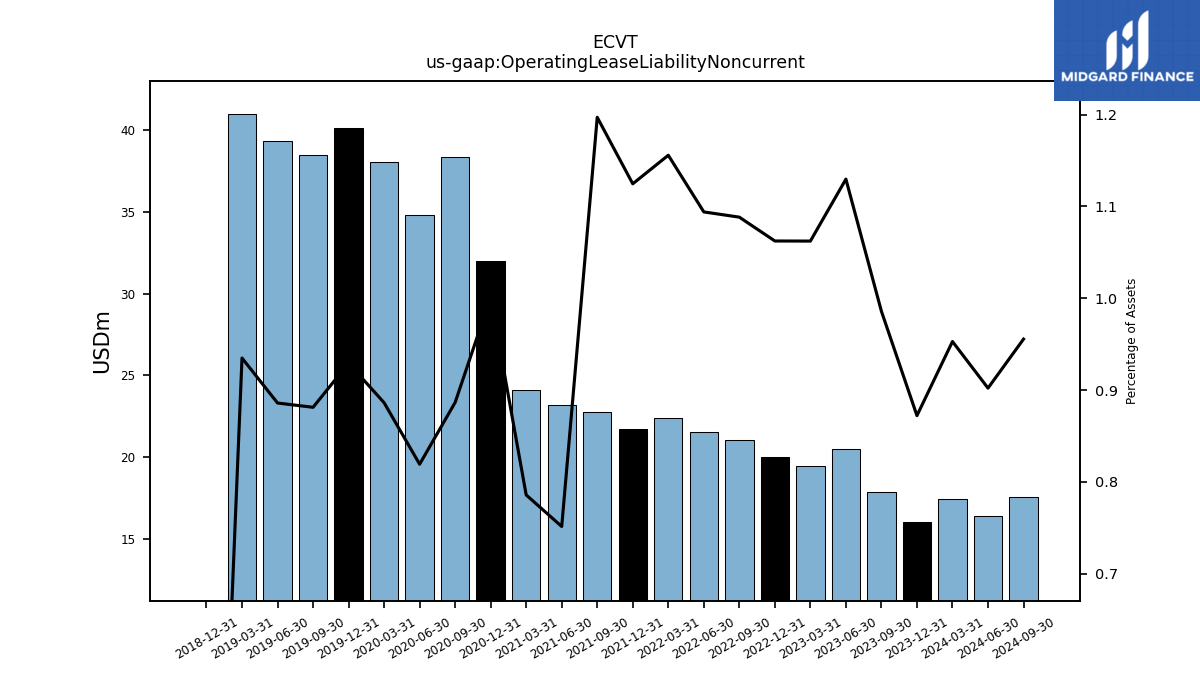
| Operating Lease Liability Noncurrent | 17.45 | 16.03 | 17.87 | 20.49 | 19.44 | 20.02 | 21.02 | 21.53 | 22.37 | 21.72 | 22.78 | 23.20 | 24.08 | 32.02 | 38.34 | 34.80 | 38.08 | 40.16 | 38.47 | 39.35 | 40.97 | 0.00 | NA | NA | NA | NA | NA | NA | NA | NA | NA | NA | NA |
| 2024-03-31 | 2023-12-31 | 2023-09-30 | 2023-06-30 | 2023-03-31 | 2022-12-31 | 2022-09-30 | 2022-06-30 | 2022-03-31 | 2021-12-31 | 2021-09-30 | 2021-06-30 | 2021-03-31 | 2020-12-31 | 2020-09-30 | 2020-06-30 | 2020-03-31 | 2019-12-31 | 2019-09-30 | 2019-06-30 | 2019-03-31 | 2018-12-31 | 2018-09-30 | 2018-06-30 | 2018-03-31 | 2017-12-31 | 2017-09-30 | 2017-06-30 | 2017-03-31 | 2016-12-31 | 2016-09-30 | 2016-06-30 | 2016-03-31 | ||
|---|---|---|---|---|---|---|---|---|---|---|---|---|---|---|---|---|---|---|---|---|---|---|---|---|---|---|---|---|---|---|---|---|---|---|
| Stockholders Equity | 711.36 | 705.46 | 677.86 | 667.76 | 674.15 | 707.23 | 739.52 | 778.18 | 765.63 | 740.74 | 707.32 | 1205.35 | 1187.22 | 1277.13 | 1800.49 | 1772.81 | 1738.47 | 1779.45 | 1731.65 | 1714.03 | 1670.08 | 1659.56 | 1657.38 | 1635.08 | 1641.52 | 1628.00 | 1076.03 | NA | NA | 1022.88 | NA | NA | NA | |
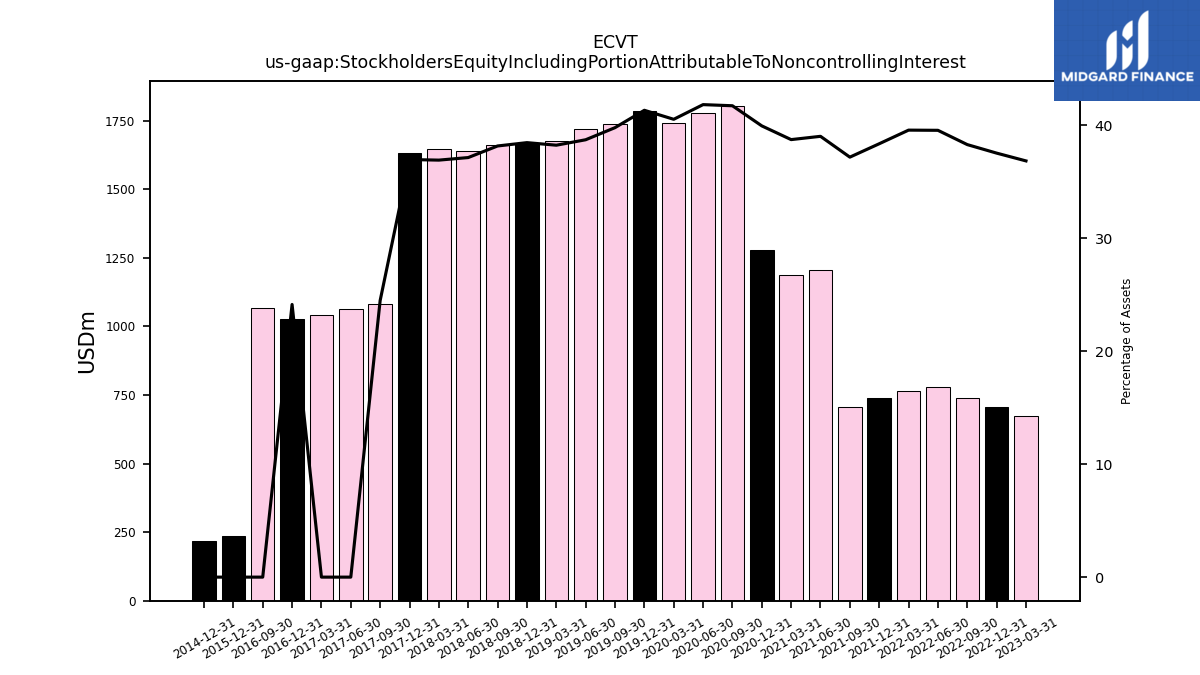
| Stockholders Equity Including Portion Attributable To Noncontrolling Interest | NA | 705.46 | NA | NA | 674.15 | 707.23 | 739.52 | 778.18 | 765.63 | 740.74 | 707.32 | 1204.61 | 1186.48 | 1277.18 | 1804.19 | 1776.17 | 1741.14 | 1785.32 | 1736.66 | 1719.35 | 1675.27 | 1664.14 | 1662.47 | 1639.33 | 1647.08 | 1631.92 | 1080.97 | 1064.42 | 1040.67 | 1027.94 | 1066.73 | NA | NA | |
| Common Stock Value | 1.41 | 1.41 | 1.41 | 1.41 | 1.41 | 1.40 | 1.40 | 1.40 | 1.40 | 1.38 | 1.38 | 1.38 | 1.38 | 1.37 | 1.37 | 1.37 | 1.37 | 1.37 | 1.36 | 1.36 | 1.36 | 1.36 | 1.35 | 1.35 | 1.35 | 1.35 | 1.06 | NA | NA | 0.64 | NA | NA | NA | |
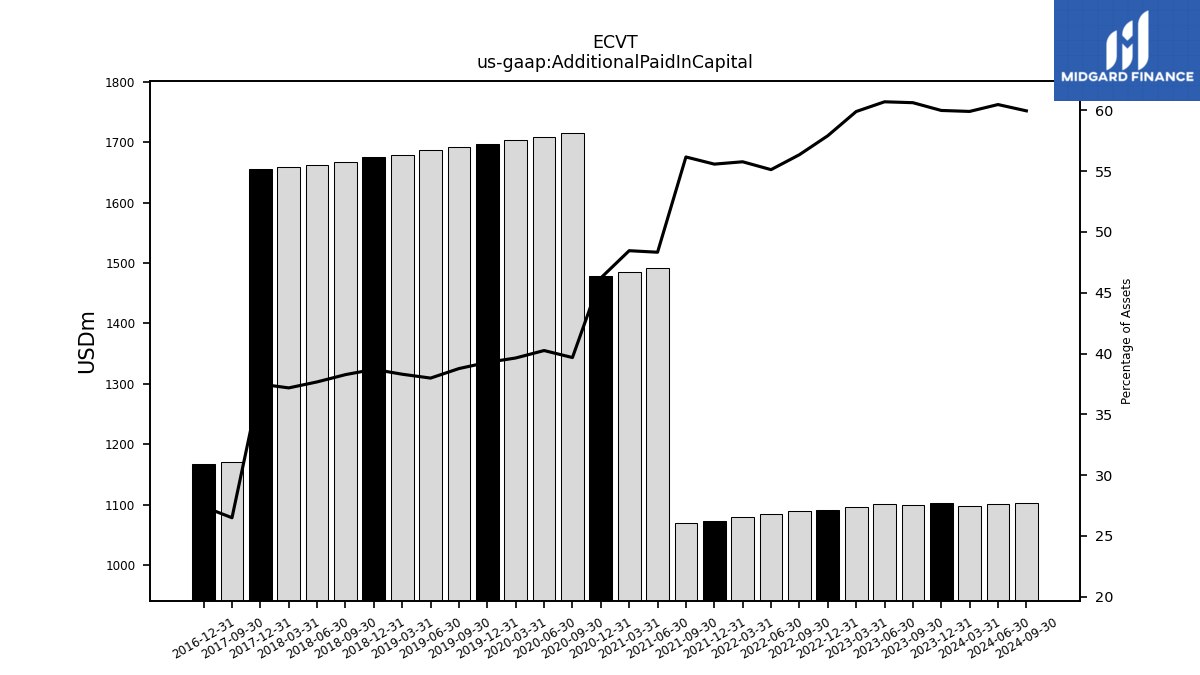
| Additional Paid In Capital | 1096.96 | 1102.58 | 1099.22 | 1101.29 | 1096.33 | 1091.47 | 1088.70 | 1084.79 | 1079.36 | 1073.41 | 1068.82 | 1492.33 | 1484.80 | 1477.86 | 1715.50 | 1709.37 | 1703.00 | 1696.90 | 1692.22 | 1686.94 | 1678.32 | 1674.70 | 1667.04 | 1662.75 | 1658.94 | 1655.11 | 1169.78 | NA | NA | 1167.14 | NA | NA | NA | |
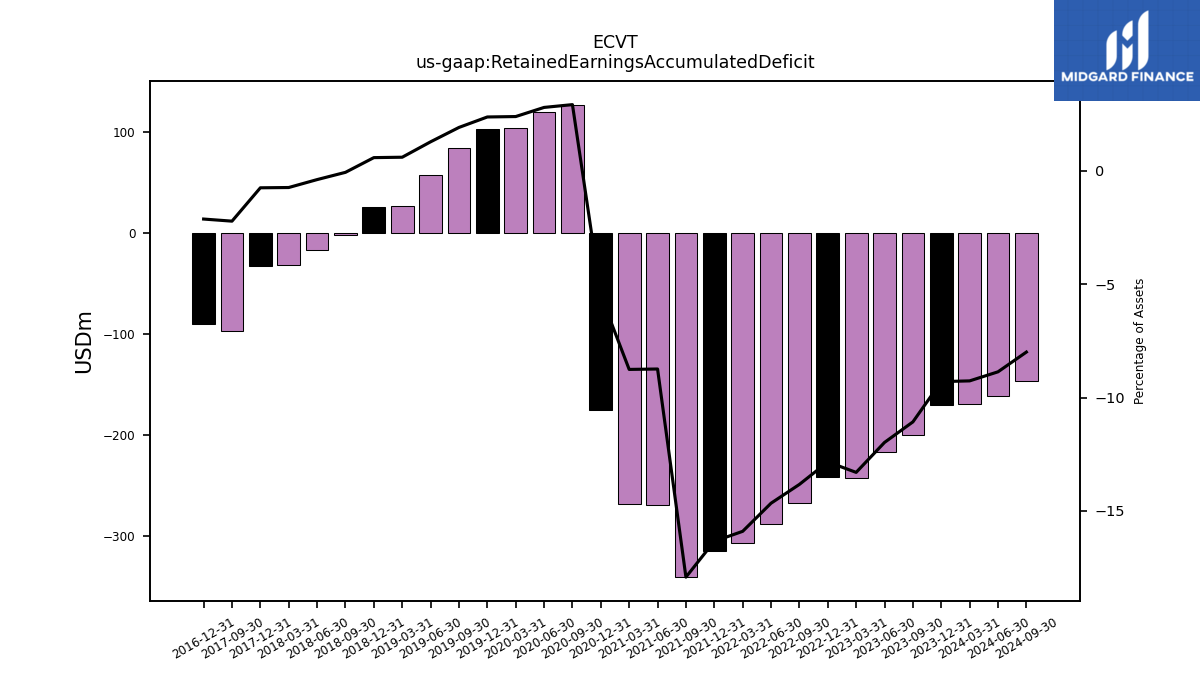
| Retained Earnings Accumulated Deficit | -169.63 | -170.86 | -200.78 | -217.36 | -243.48 | -242.01 | -267.26 | -288.59 | -307.83 | -315.71 | -341.14 | -269.88 | -268.39 | -175.76 | 126.67 | 119.16 | 103.24 | 103.01 | 83.91 | 57.20 | 26.62 | 25.52 | -2.60 | -16.78 | -32.56 | -32.78 | -97.79 | NA | NA | -90.38 | NA | NA | NA | |
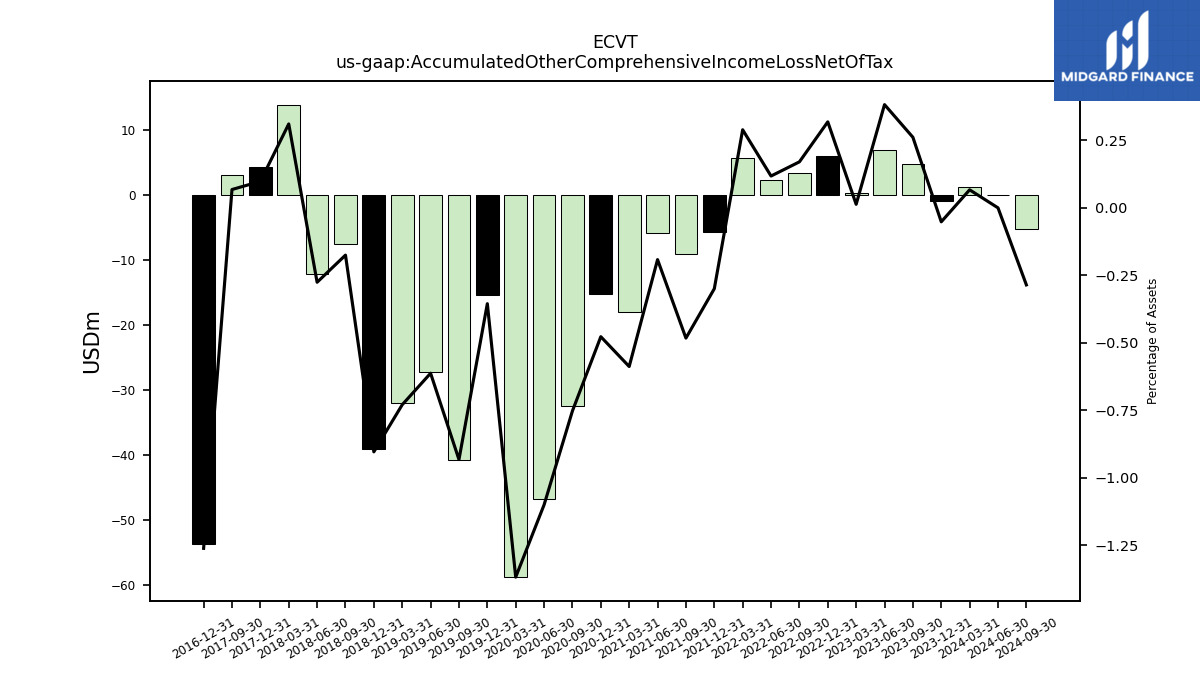
| Accumulated Other Comprehensive Income Loss Net Of Tax | 1.22 | -0.96 | 4.73 | 6.92 | 0.23 | 5.99 | 3.28 | 2.31 | 5.59 | -5.79 | -9.18 | -5.93 | -18.01 | -15.27 | -32.53 | -46.71 | -58.76 | -15.35 | -40.70 | -27.21 | -31.96 | -39.10 | -7.64 | -12.18 | 13.84 | 4.31 | 2.98 | NA | NA | -53.71 | NA | NA | NA | |
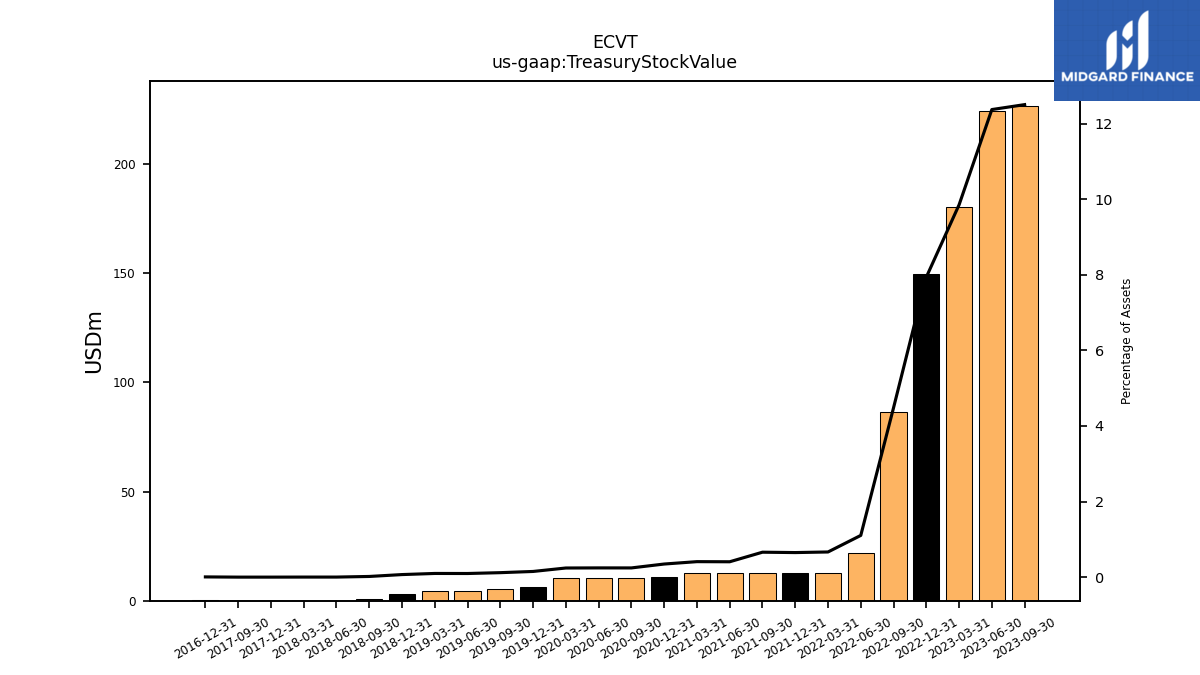
| Treasury Stock Value | NA | 226.71 | 226.71 | 224.49 | 180.34 | 149.62 | 86.59 | 21.73 | 12.88 | 12.55 | 12.55 | 12.55 | 12.55 | 11.08 | 10.53 | 10.37 | 10.37 | 6.48 | 5.16 | 4.26 | 4.26 | 2.92 | 0.77 | 0.06 | 0.06 | 0.00 | 0.00 | NA | NA | 0.24 | NA | NA | NA | |
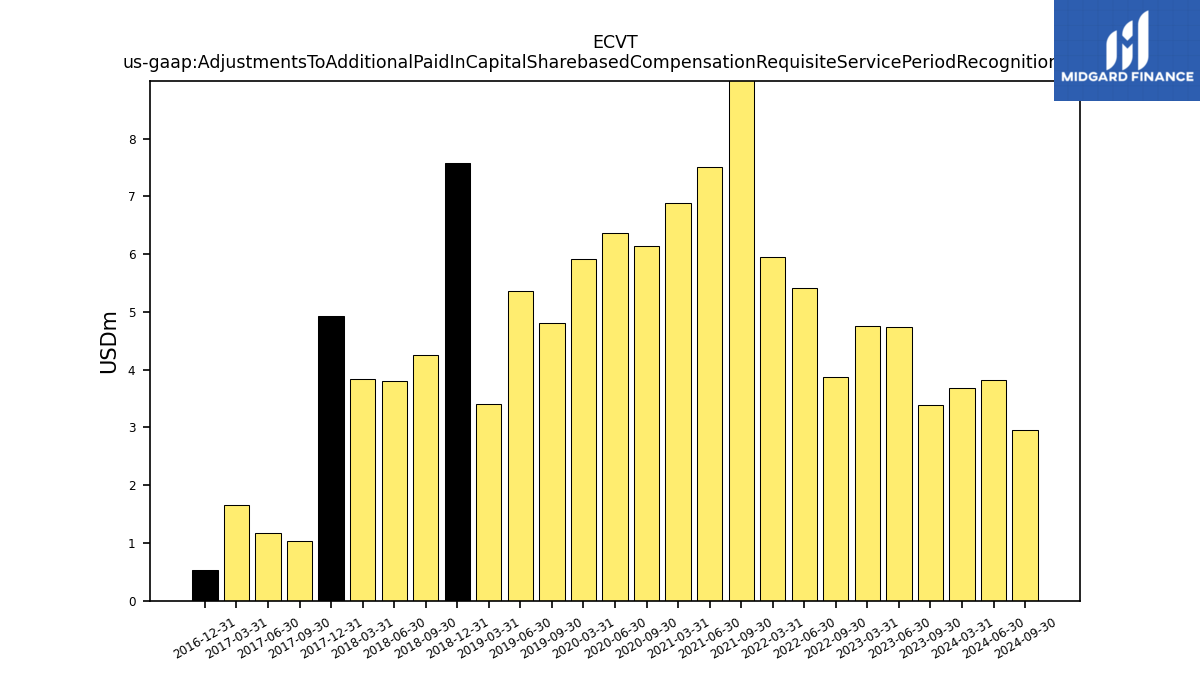
| Adjustments To Additional Paid In Capital Sharebased Compensation Requisite Service Period Recognition Value | 3.67 | NA | 3.39 | 4.74 | 4.76 | NA | 3.87 | 5.41 | 5.95 | NA | 11.96 | 7.50 | 6.88 | NA | 6.14 | 6.37 | 5.92 | NA | 4.81 | 5.37 | 3.40 | 7.58 | 4.25 | 3.80 | 3.83 | 4.93 | 1.04 | 1.18 | 1.65 | 0.53 | NA | NA | NA |
| 2024-03-31 | 2023-12-31 | 2023-09-30 | 2023-06-30 | 2023-03-31 | 2022-12-31 | 2022-09-30 | 2022-06-30 | 2022-03-31 | 2021-12-31 | 2021-09-30 | 2021-06-30 | 2021-03-31 | 2020-12-31 | 2020-09-30 | 2020-06-30 | 2020-03-31 | 2019-12-31 | 2019-09-30 | 2019-06-30 | 2019-03-31 | 2018-12-31 | 2018-09-30 | 2018-06-30 | 2018-03-31 | 2017-12-31 | 2017-09-30 | 2017-06-30 | 2017-03-31 | 2016-12-31 | 2016-09-30 | 2016-06-30 | 2016-03-31 | ||
|---|---|---|---|---|---|---|---|---|---|---|---|---|---|---|---|---|---|---|---|---|---|---|---|---|---|---|---|---|---|---|---|---|---|---|
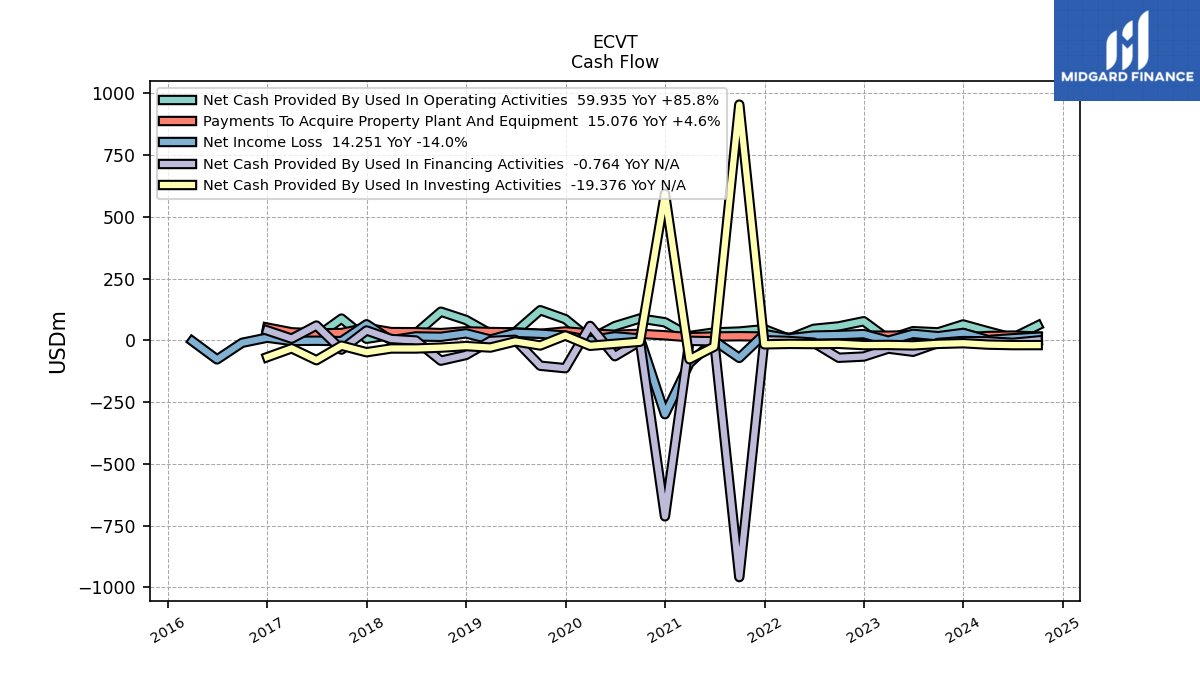
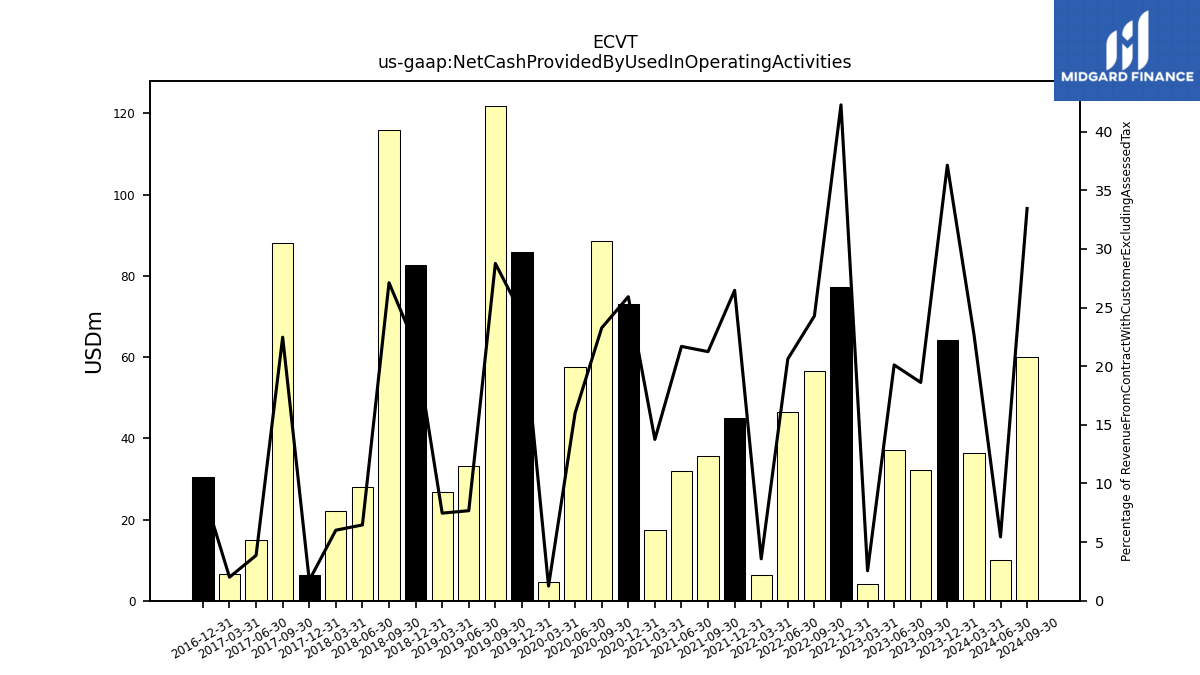
| Net Cash Provided By Used In Operating Activities | 36.50 | 64.19 | 32.27 | 37.03 | 4.11 | 77.28 | 56.47 | 46.43 | 6.42 | 45.05 | 35.57 | 31.88 | 17.42 | 72.99 | 88.50 | 57.58 | 4.53 | 85.87 | 121.90 | 33.15 | 26.84 | 82.64 | 115.86 | 28.10 | 22.04 | 6.25 | 88.06 | 15.05 | 6.70 | 30.41 | NA | NA | NA | |
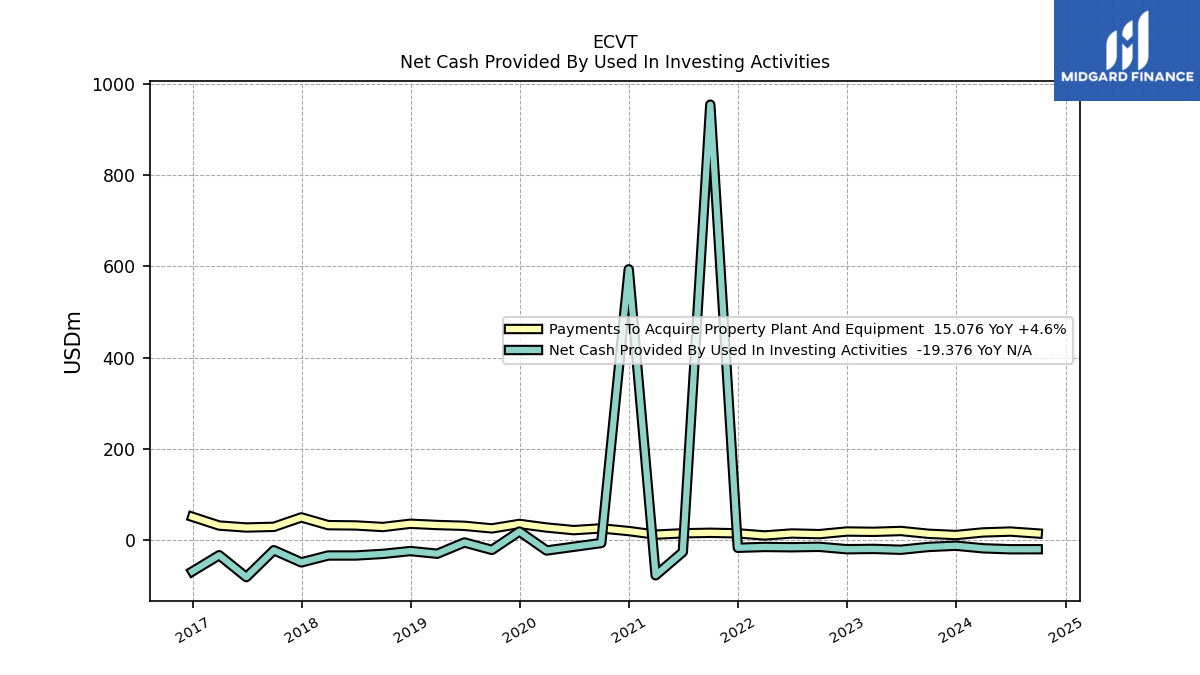
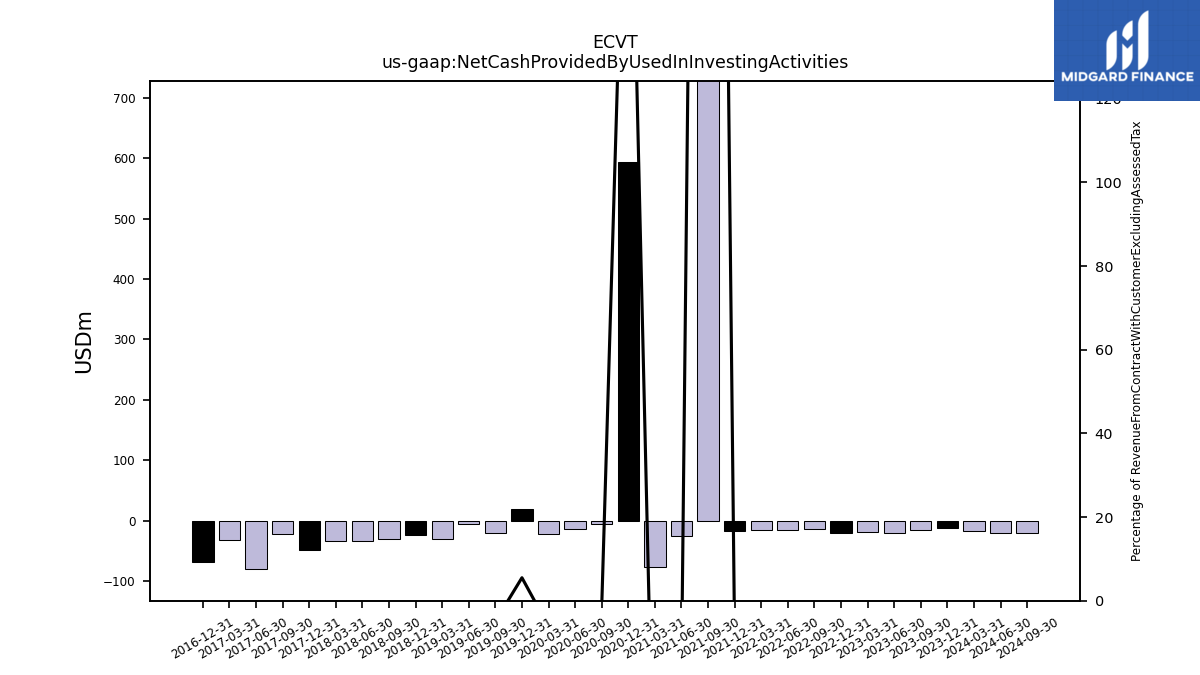
| Net Cash Provided By Used In Investing Activities | -17.37 | -11.69 | -14.41 | -20.53 | -18.70 | -19.40 | -14.13 | -15.09 | -14.41 | -16.24 | 954.01 | -25.47 | -76.57 | 593.52 | -5.83 | -14.02 | -22.20 | 19.38 | -20.89 | -4.59 | -29.27 | -23.38 | -29.64 | -33.13 | -33.13 | -48.20 | -21.58 | -80.47 | -32.44 | -68.12 | NA | NA | NA | |
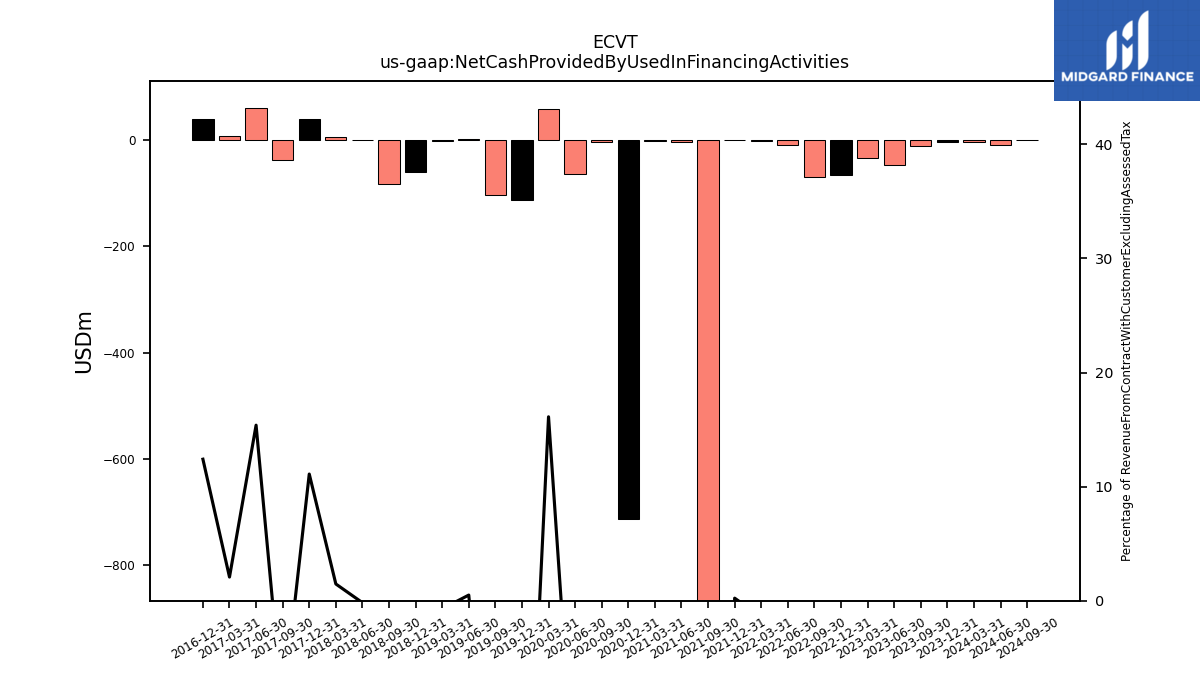
| Net Cash Provided By Used In Financing Activities | -4.18 | -3.03 | -10.59 | -46.31 | -33.57 | -65.63 | -70.64 | -9.36 | -2.56 | 0.39 | -958.50 | -4.15 | -1.98 | -712.59 | -4.27 | -64.26 | 58.30 | -112.84 | -102.85 | 2.15 | -2.55 | -59.46 | -82.42 | -0.73 | 5.38 | 39.77 | -37.64 | 59.90 | 6.92 | 40.04 | NA | NA | NA |
| 2024-03-31 | 2023-12-31 | 2023-09-30 | 2023-06-30 | 2023-03-31 | 2022-12-31 | 2022-09-30 | 2022-06-30 | 2022-03-31 | 2021-12-31 | 2021-09-30 | 2021-06-30 | 2021-03-31 | 2020-12-31 | 2020-09-30 | 2020-06-30 | 2020-03-31 | 2019-12-31 | 2019-09-30 | 2019-06-30 | 2019-03-31 | 2018-12-31 | 2018-09-30 | 2018-06-30 | 2018-03-31 | 2017-12-31 | 2017-09-30 | 2017-06-30 | 2017-03-31 | 2016-12-31 | 2016-09-30 | 2016-06-30 | 2016-03-31 | ||
|---|---|---|---|---|---|---|---|---|---|---|---|---|---|---|---|---|---|---|---|---|---|---|---|---|---|---|---|---|---|---|---|---|---|---|
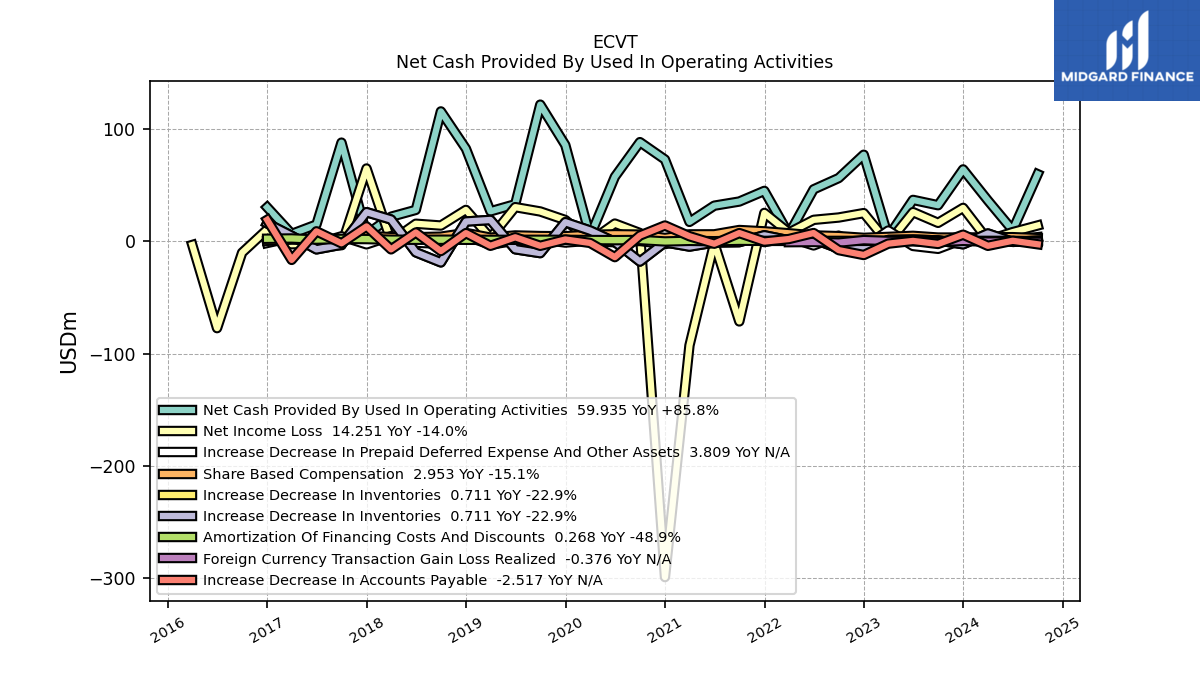
| Net Cash Provided By Used In Operating Activities | 36.50 | 64.19 | 32.27 | 37.03 | 4.11 | 77.28 | 56.47 | 46.43 | 6.42 | 45.05 | 35.57 | 31.88 | 17.42 | 72.99 | 88.50 | 57.58 | 4.53 | 85.87 | 121.90 | 33.15 | 26.84 | 82.64 | 115.86 | 28.10 | 22.04 | 6.25 | 88.06 | 15.05 | 6.70 | 30.41 | NA | NA | NA | |
| Net Income Loss | 1.22 | 29.93 | 16.57 | 26.12 | -1.47 | 25.25 | 21.32 | 19.25 | 7.88 | 25.43 | -71.26 | -1.49 | -92.64 | -299.06 | 7.51 | 15.93 | 0.22 | 19.10 | 26.71 | 30.57 | 3.15 | 28.12 | 14.19 | 15.78 | 0.21 | 65.01 | -3.35 | -1.61 | -2.45 | 10.66 | -10.02 | -77.26 | -3.13 | |
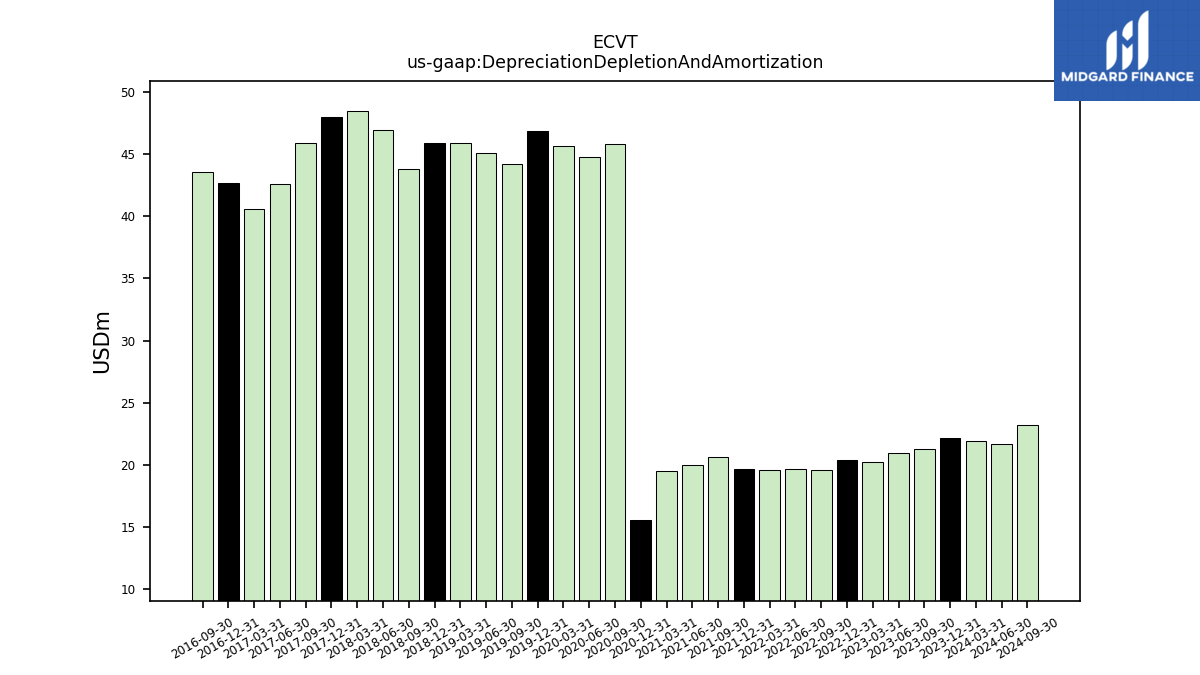
| Depreciation Depletion And Amortization | 21.93 | NA | NA | NA | 20.20 | 20.36 | 19.60 | 19.66 | 19.55 | 19.66 | 20.60 | 19.98 | 19.50 | 15.53 | 45.82 | 44.82 | 45.67 | 46.86 | 44.25 | 45.09 | 45.89 | 45.94 | 43.83 | 46.98 | 48.49 | 48.01 | 45.93 | 42.62 | 40.59 | 42.69 | 43.61 | NA | NA | |
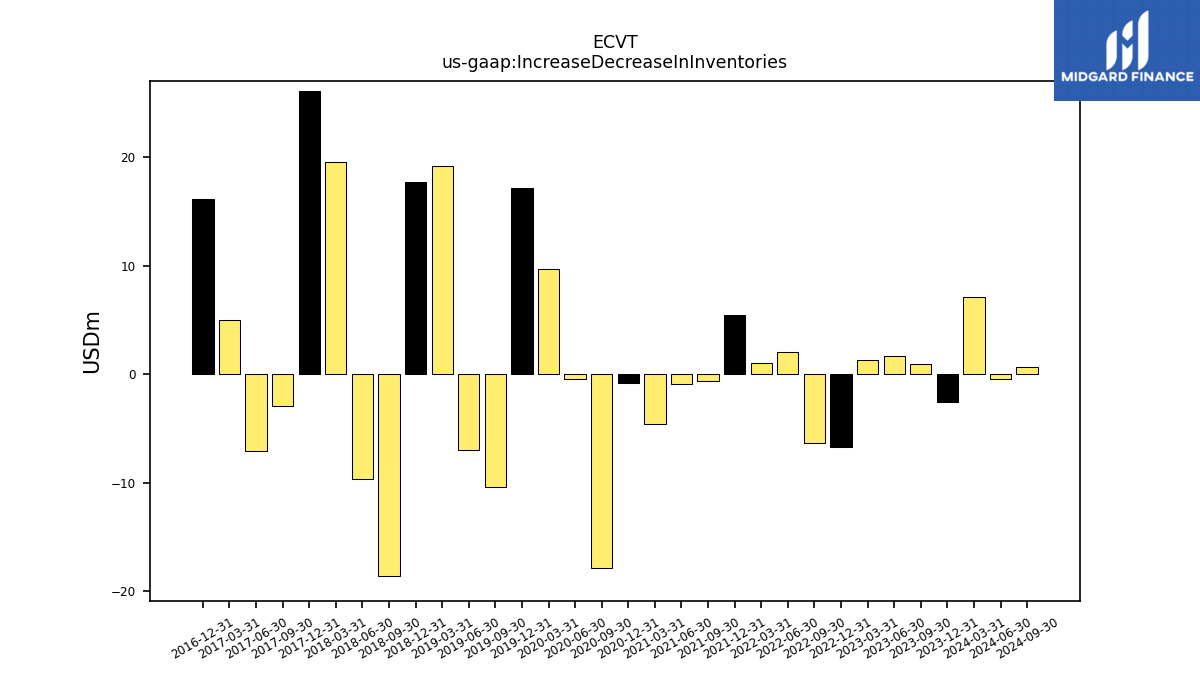
| Increase Decrease In Inventories | 7.09 | -2.51 | 0.92 | 1.66 | 1.32 | -6.70 | -6.30 | 2.06 | 1.03 | 5.49 | -0.62 | -0.94 | -4.56 | -0.78 | -17.89 | -0.46 | 9.74 | 17.15 | -10.40 | -6.96 | 19.15 | 17.76 | -18.63 | -9.69 | 19.54 | 26.10 | -2.88 | -7.04 | 5.02 | 16.14 | NA | NA | NA | |
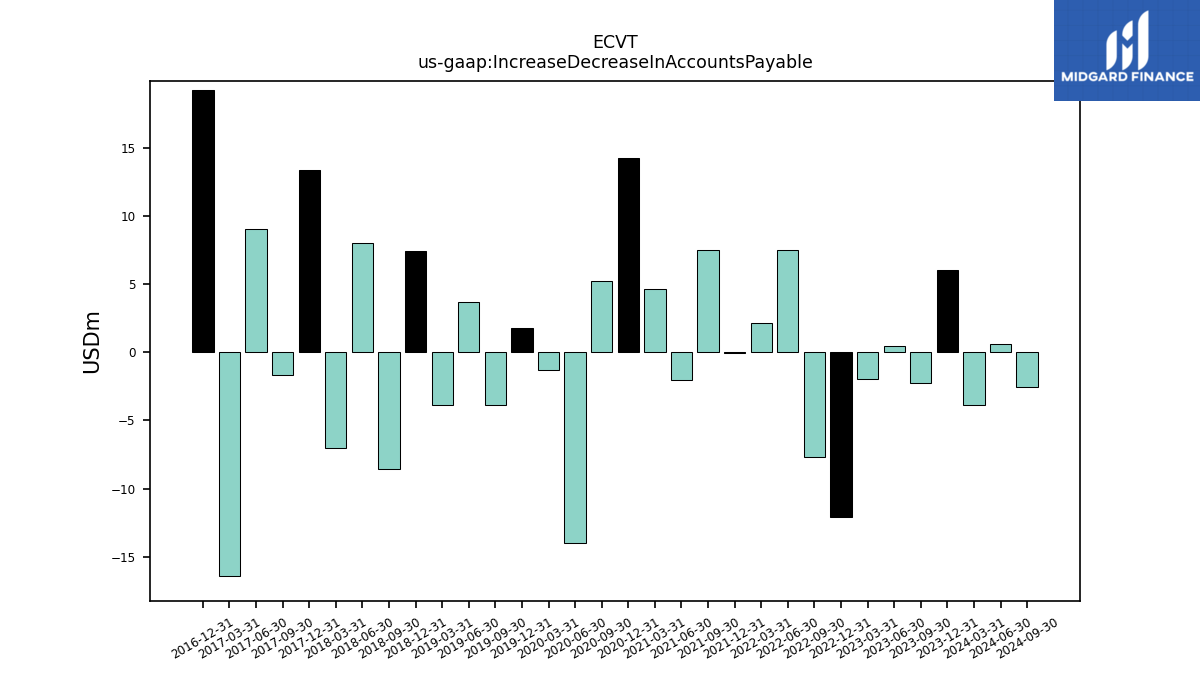
| Increase Decrease In Accounts Payable | -3.90 | 6.04 | -2.23 | 0.48 | -1.95 | -12.08 | -7.72 | 7.52 | 2.15 | -0.09 | 7.48 | -2.03 | 4.65 | 14.24 | 5.25 | -13.99 | -1.33 | 1.76 | -3.88 | 3.71 | -3.90 | 7.45 | -8.55 | 8.00 | -7.04 | 13.39 | -1.64 | 9.03 | -16.44 | 19.22 | NA | NA | NA | |
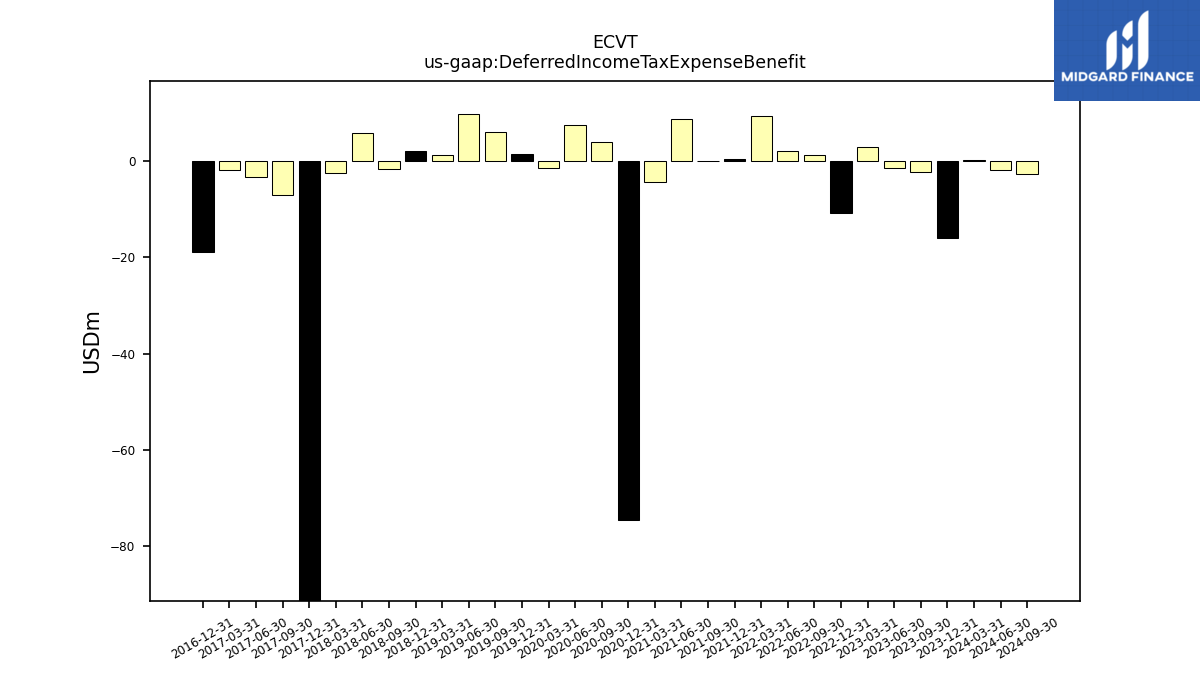
| Deferred Income Tax Expense Benefit | 0.16 | -16.06 | -2.29 | -1.51 | 2.79 | -10.80 | 1.17 | 1.94 | 9.34 | 0.29 | -0.02 | 8.62 | -4.34 | -74.51 | 3.83 | 7.51 | -1.52 | 1.49 | 5.98 | 9.66 | 1.18 | 1.95 | -1.63 | 5.74 | -2.61 | -127.77 | -7.18 | -3.30 | -1.97 | -18.88 | NA | NA | NA | |
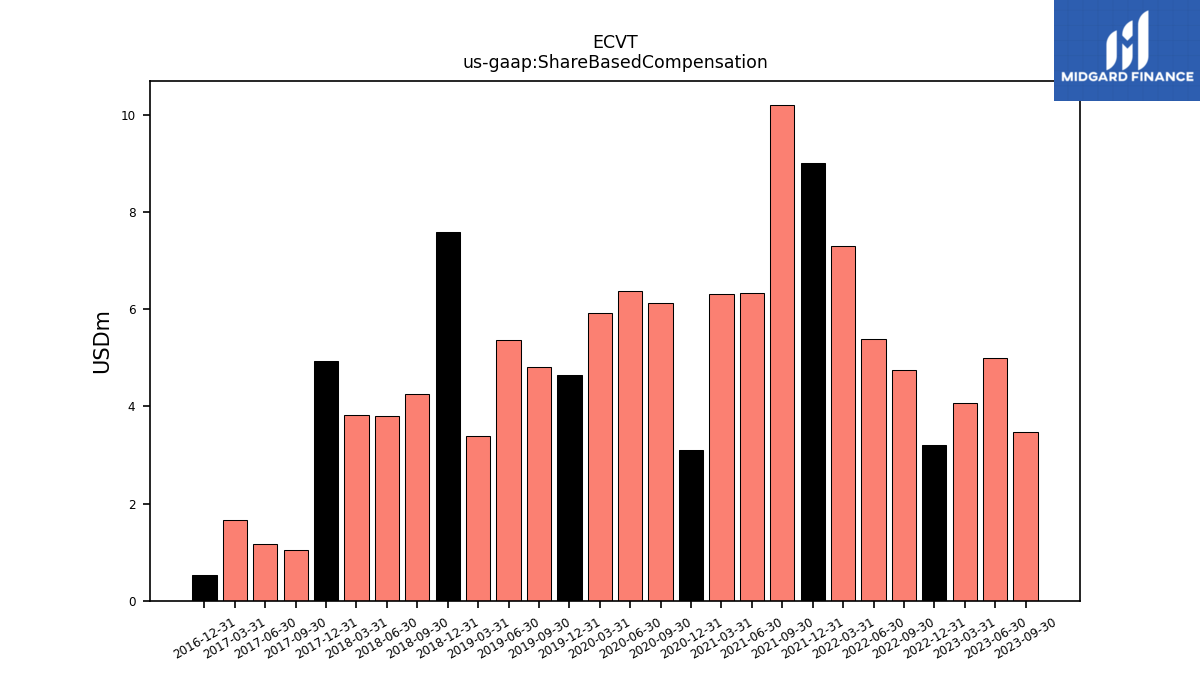
| Share Based Compensation | 3.68 | 3.48 | 3.48 | 5.00 | 4.07 | 3.21 | 4.74 | 5.38 | 7.29 | 9.00 | 10.19 | 6.34 | 6.30 | 3.10 | 6.14 | 6.37 | 5.92 | 4.65 | 4.81 | 5.37 | 3.40 | 7.58 | 4.25 | 3.80 | 3.83 | 4.93 | 1.04 | 1.18 | 1.65 | 0.53 | NA | NA | NA |
| 2024-03-31 | 2023-12-31 | 2023-09-30 | 2023-06-30 | 2023-03-31 | 2022-12-31 | 2022-09-30 | 2022-06-30 | 2022-03-31 | 2021-12-31 | 2021-09-30 | 2021-06-30 | 2021-03-31 | 2020-12-31 | 2020-09-30 | 2020-06-30 | 2020-03-31 | 2019-12-31 | 2019-09-30 | 2019-06-30 | 2019-03-31 | 2018-12-31 | 2018-09-30 | 2018-06-30 | 2018-03-31 | 2017-12-31 | 2017-09-30 | 2017-06-30 | 2017-03-31 | 2016-12-31 | 2016-09-30 | 2016-06-30 | 2016-03-31 | ||
|---|---|---|---|---|---|---|---|---|---|---|---|---|---|---|---|---|---|---|---|---|---|---|---|---|---|---|---|---|---|---|---|---|---|---|
| Net Cash Provided By Used In Investing Activities | -17.37 | -11.69 | -14.41 | -20.53 | -18.70 | -19.40 | -14.13 | -15.09 | -14.41 | -16.24 | 954.01 | -25.47 | -76.57 | 593.52 | -5.83 | -14.02 | -22.20 | 19.38 | -20.89 | -4.59 | -29.27 | -23.38 | -29.64 | -33.13 | -33.13 | -48.20 | -21.58 | -80.47 | -32.44 | -68.12 | NA | NA | NA | |
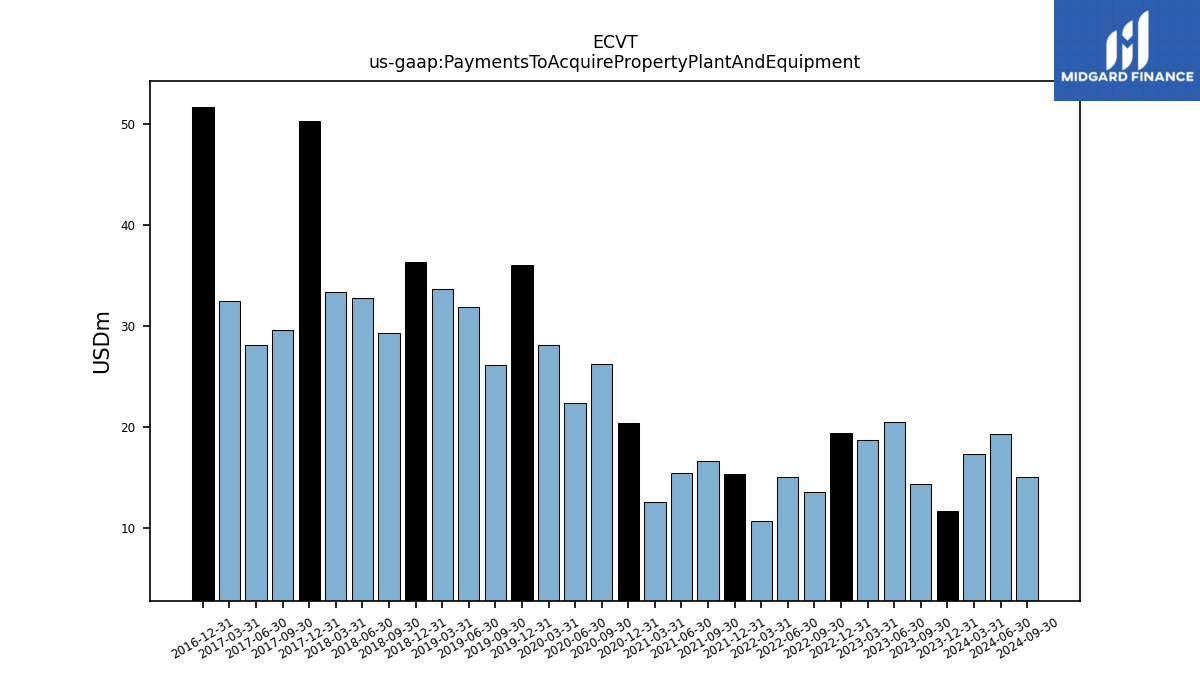
| Payments To Acquire Property Plant And Equipment | 17.37 | 11.69 | 14.41 | 20.53 | 18.70 | 19.40 | 13.64 | 15.09 | 10.75 | 15.40 | 16.61 | 15.48 | 12.56 | 20.37 | 26.25 | 22.41 | 28.11 | 35.99 | 26.18 | 31.85 | 33.63 | 36.37 | 29.26 | 32.72 | 33.34 | 50.25 | 29.62 | 28.16 | 32.45 | 51.62 | NA | NA | NA |
| 2024-03-31 | 2023-12-31 | 2023-09-30 | 2023-06-30 | 2023-03-31 | 2022-12-31 | 2022-09-30 | 2022-06-30 | 2022-03-31 | 2021-12-31 | 2021-09-30 | 2021-06-30 | 2021-03-31 | 2020-12-31 | 2020-09-30 | 2020-06-30 | 2020-03-31 | 2019-12-31 | 2019-09-30 | 2019-06-30 | 2019-03-31 | 2018-12-31 | 2018-09-30 | 2018-06-30 | 2018-03-31 | 2017-12-31 | 2017-09-30 | 2017-06-30 | 2017-03-31 | 2016-12-31 | 2016-09-30 | 2016-06-30 | 2016-03-31 | ||
|---|---|---|---|---|---|---|---|---|---|---|---|---|---|---|---|---|---|---|---|---|---|---|---|---|---|---|---|---|---|---|---|---|---|---|
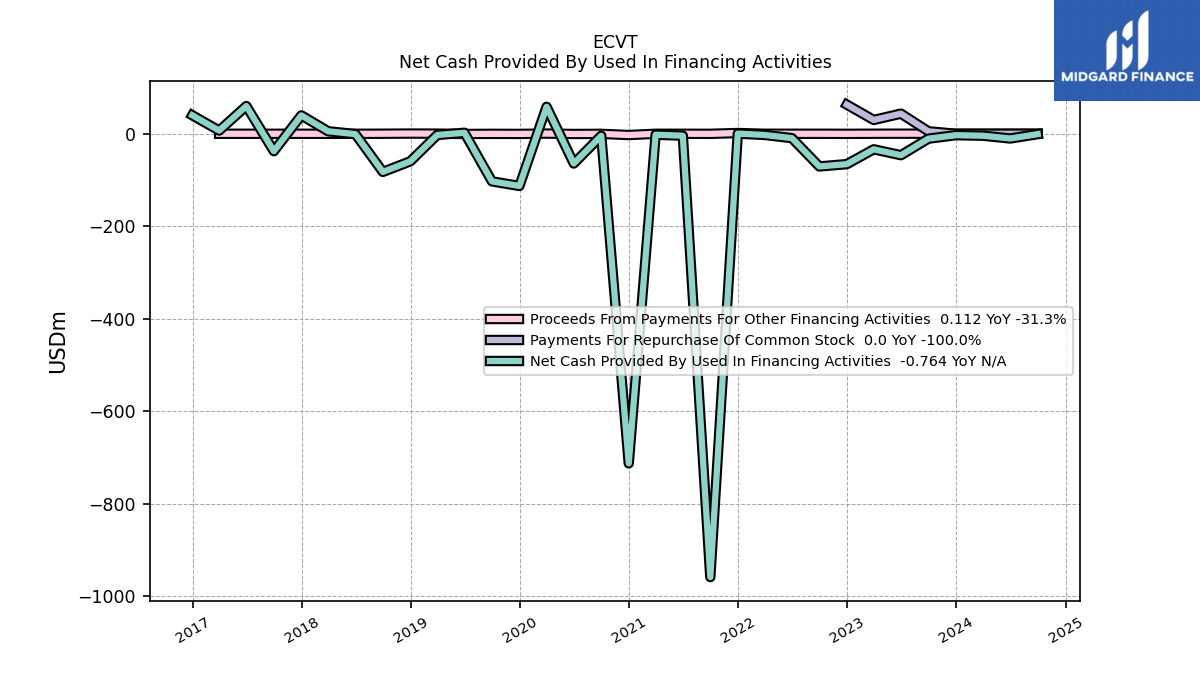
| Net Cash Provided By Used In Financing Activities | -4.18 | -3.03 | -10.59 | -46.31 | -33.57 | -65.63 | -70.64 | -9.36 | -2.56 | 0.39 | -958.50 | -4.15 | -1.98 | -712.59 | -4.27 | -64.26 | 58.30 | -112.84 | -102.85 | 2.15 | -2.55 | -59.46 | -82.42 | -0.73 | 5.38 | 39.77 | -37.64 | 59.90 | 6.92 | 40.04 | NA | NA | NA | |
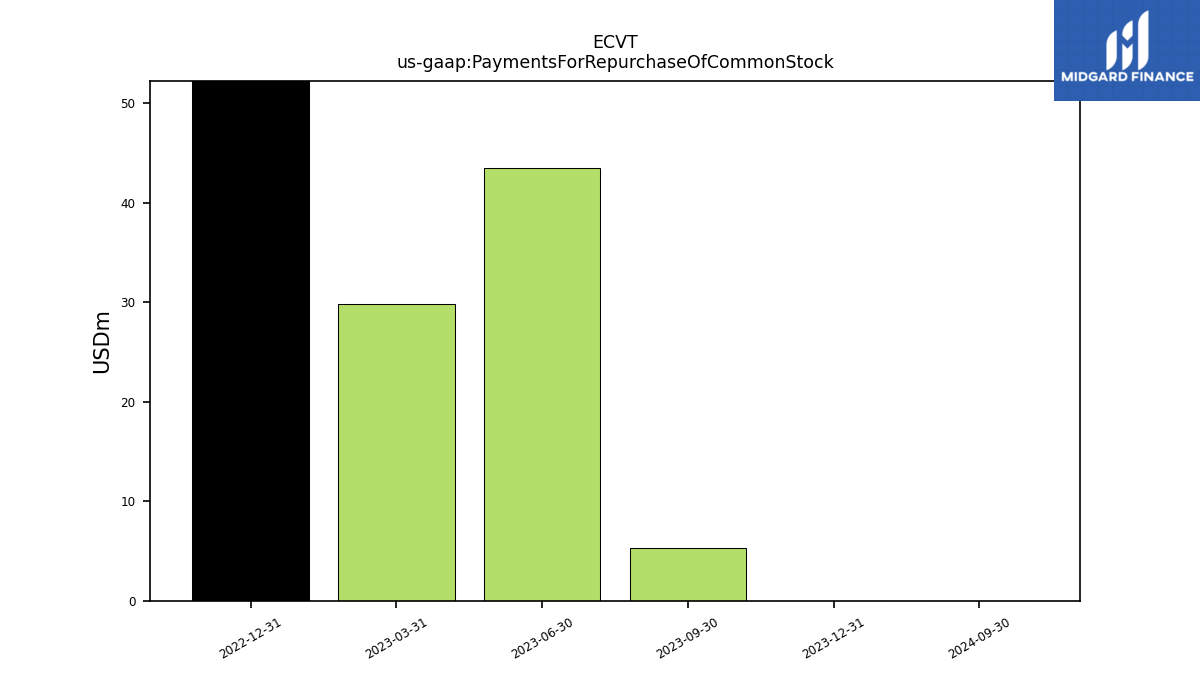
| Payments For Repurchase Of Common Stock | NA | 0.00 | NA | NA | 29.85 | 63.03 | NA | NA | NA | NA | NA | NA | NA | NA | NA | NA | NA | NA | NA | NA | NA | NA | NA | NA | NA | NA | NA | NA | NA | NA | NA | NA | NA |
| 2024-03-31 | 2023-12-31 | 2023-09-30 | 2023-06-30 | 2023-03-31 | 2022-12-31 | 2022-09-30 | 2022-06-30 | 2022-03-31 | 2021-12-31 | 2021-09-30 | 2021-06-30 | 2021-03-31 | 2020-12-31 | 2020-09-30 | 2020-06-30 | 2020-03-31 | 2019-12-31 | 2019-09-30 | 2019-06-30 | 2019-03-31 | 2018-12-31 | 2018-09-30 | 2018-06-30 | 2018-03-31 | 2017-12-31 | 2017-09-30 | 2017-06-30 | 2017-03-31 | 2016-12-31 | 2016-09-30 | 2016-06-30 | 2016-03-31 | ||
|---|---|---|---|---|---|---|---|---|---|---|---|---|---|---|---|---|---|---|---|---|---|---|---|---|---|---|---|---|---|---|---|---|---|---|
| Corporate Joint Venture, Manufacturing Costs, Related Party | 4.03 | NA | NA | NA | 5.84 | NA | NA | NA | NA | NA | NA | NA | NA | NA | NA | NA | NA | NA | NA | NA | NA | NA | NA | NA | NA | NA | NA | NA | NA | NA | NA | NA | NA | |
| Corporate Joint Venture, Product Demonstration Costs, Related Party | 0.36 | NA | NA | NA | 0.50 | NA | NA | NA | NA | NA | NA | NA | NA | NA | NA | NA | NA | NA | NA | NA | NA | NA | NA | NA | NA | NA | NA | NA | NA | NA | NA | NA | NA | |
| Corporate Joint Venture, Services, Related Party | 4.30 | NA | NA | NA | 3.63 | NA | NA | NA | NA | NA | NA | NA | NA | NA | NA | NA | NA | NA | NA | NA | NA | NA | NA | NA | NA | NA | NA | NA | NA | NA | NA | NA | NA | |
| I N E O S Capital Partners, Related Party | 1.25 | NA | NA | NA | 0.59 | NA | NA | NA | NA | NA | NA | NA | NA | NA | NA | NA | NA | NA | NA | NA | NA | NA | NA | NA | NA | NA | NA | NA | NA | NA | NA | NA | NA | |
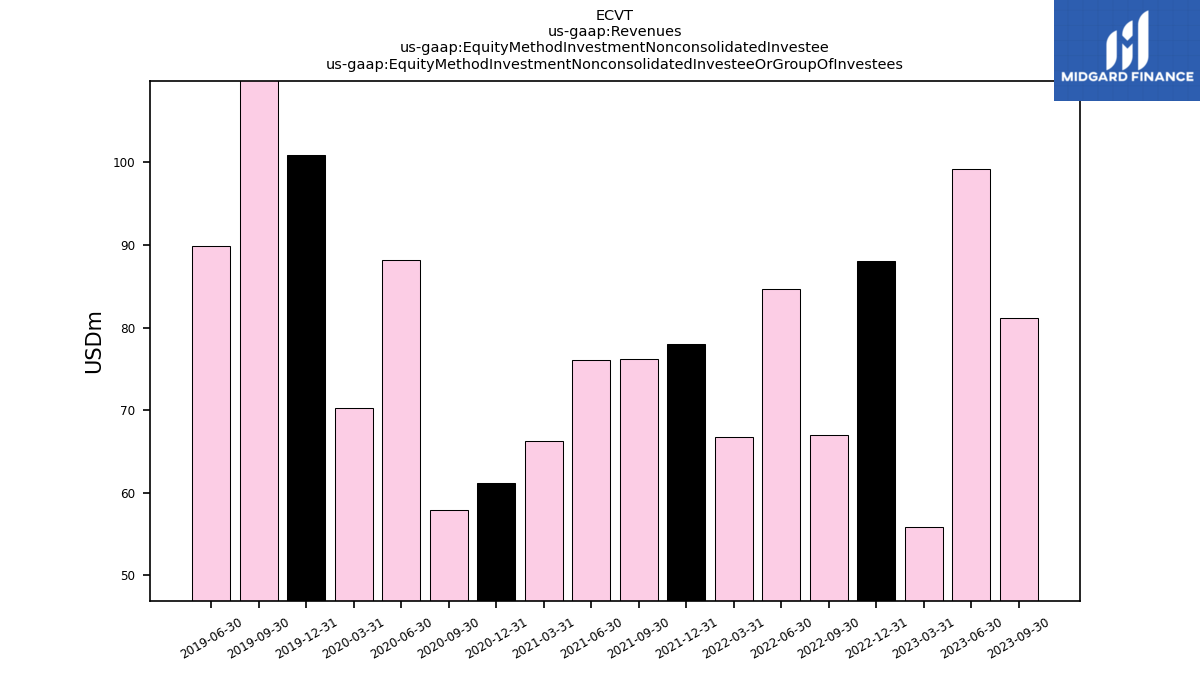
| Equity Method Investment Nonconsolidated Investee Or Group Of Investees | 56.86 | 108.80 | 81.11 | 99.19 | 55.90 | 88.12 | 67.04 | 84.66 | 66.68 | 77.96 | 76.19 | 76.06 | 66.20 | 61.12 | 57.92 | 88.16 | 70.30 | 100.88 | 121.47 | 89.94 | NA | NA | NA | NA | NA | NA | NA | NA | NA | NA | NA | NA | NA | |
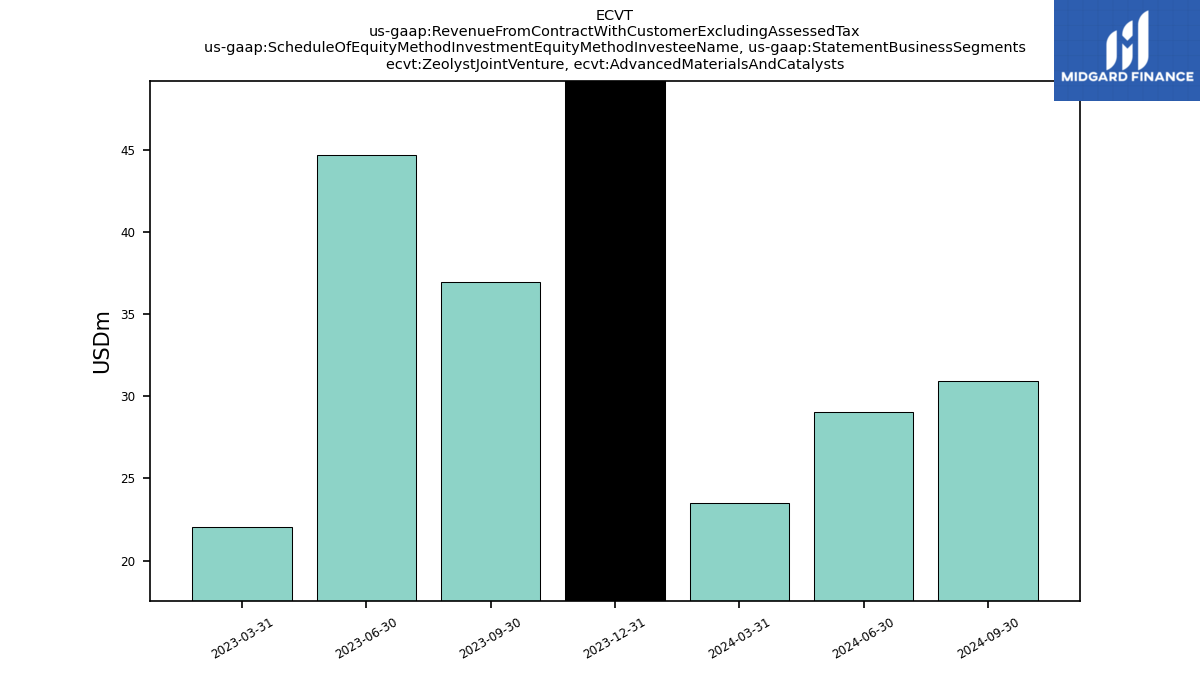
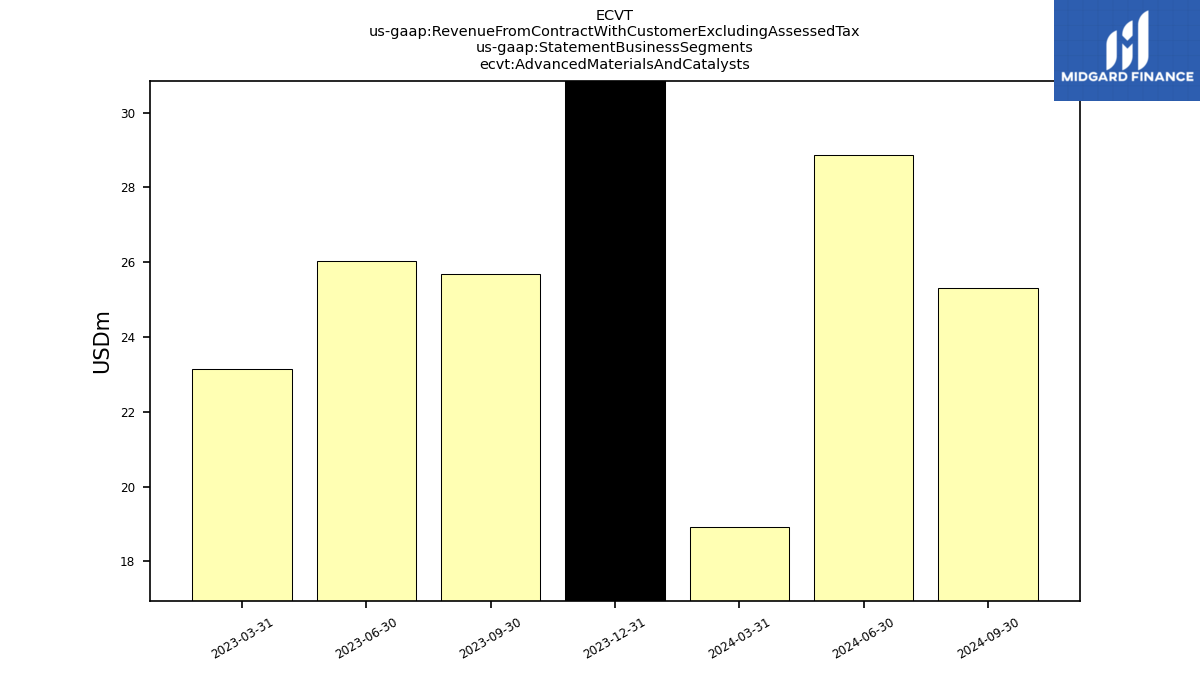
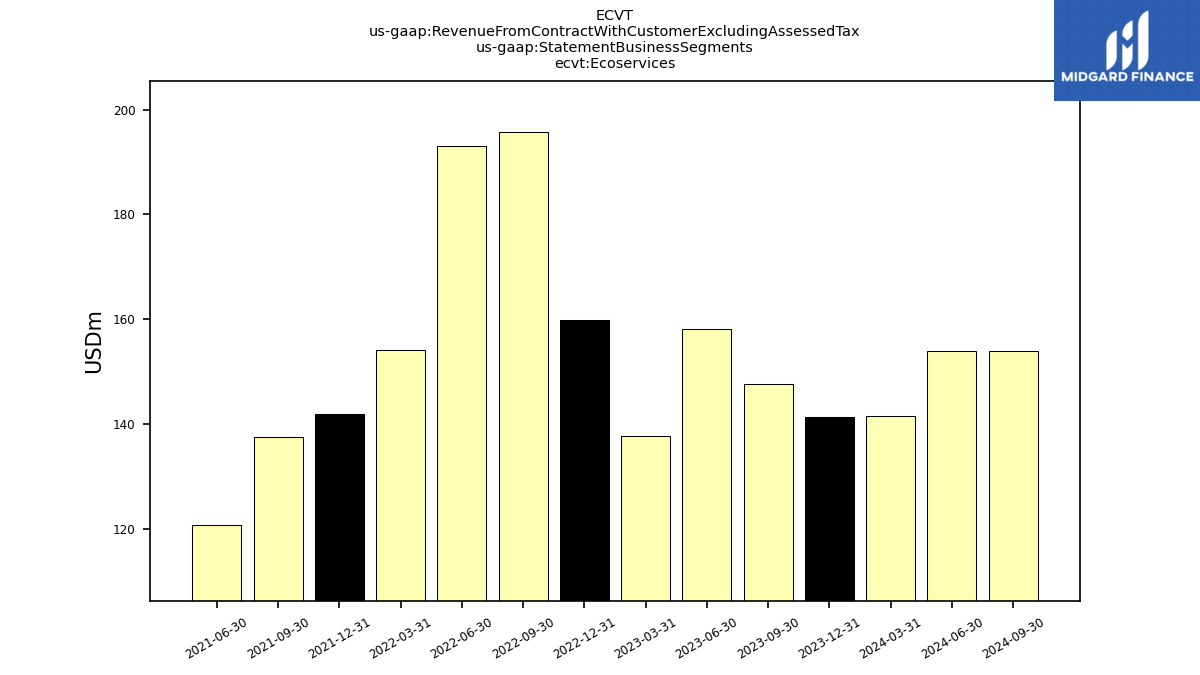
| Revenue From Contract With Customer Excluding Assessed Tax | 160.54 | 172.81 | 173.33 | 184.11 | 160.87 | 182.74 | 232.53 | 225.17 | 179.71 | 170.20 | 167.43 | 146.95 | 126.62 | 281.50 | 380.32 | 359.52 | 361.60 | 352.38 | 423.80 | 431.68 | 359.22 | 380.04 | 427.20 | 434.71 | 366.20 | 358.07 | 391.83 | 389.27 | 332.93 | 322.73 | 369.98 | 277.55 | 93.91 | |
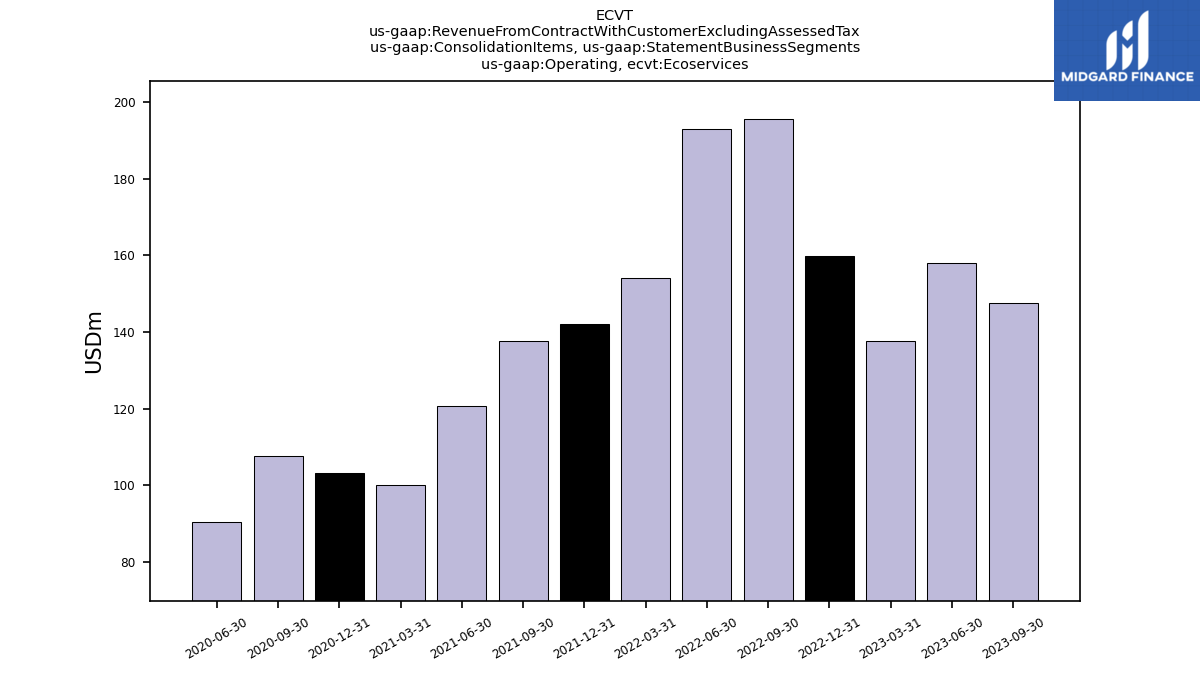
| Operating, Ecoservices | NA | 141.41 | 147.63 | 158.06 | 137.74 | 159.77 | 195.67 | 192.97 | 154.06 | 142.00 | 137.55 | 120.74 | 100.22 | 103.19 | 107.60 | 90.43 | NA | NA | NA | NA | NA | NA | NA | NA | NA | NA | NA | NA | NA | NA | NA | NA | NA | |
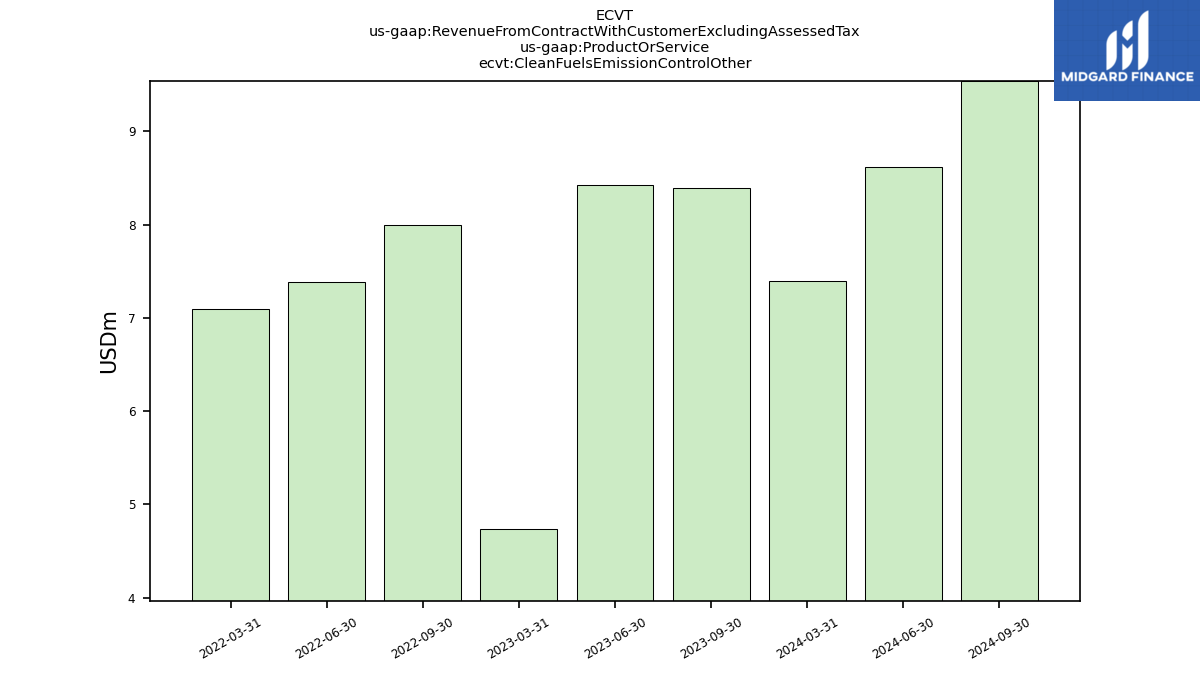
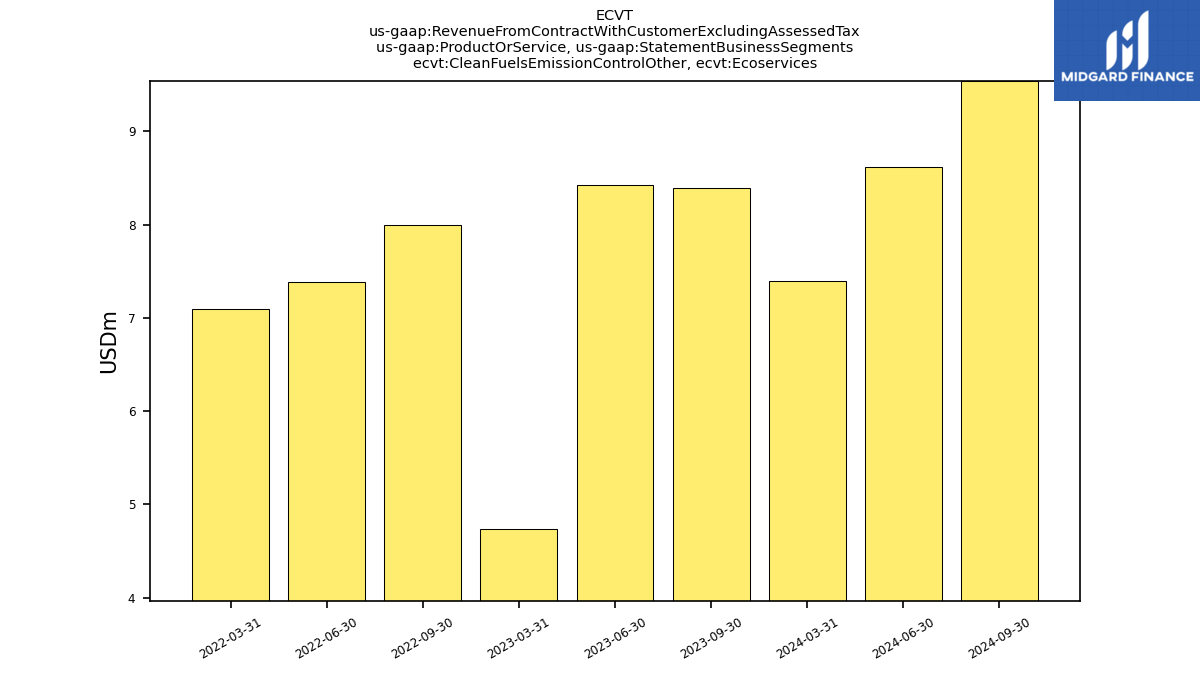
| Clean Fuels Emission Control Other | 7.39 | NA | 8.39 | 8.43 | 4.74 | NA | 7.99 | 7.39 | 7.10 | NA | NA | NA | NA | NA | NA | NA | NA | NA | NA | NA | NA | NA | NA | NA | NA | NA | NA | NA | NA | NA | NA | NA | NA | |
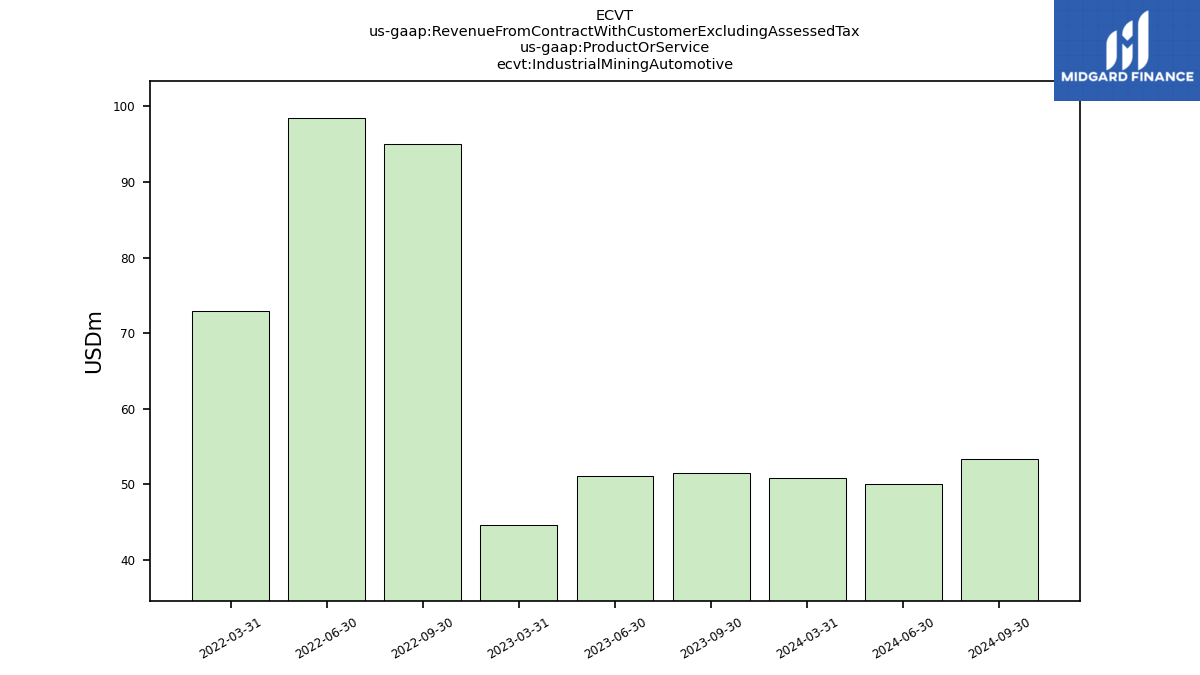
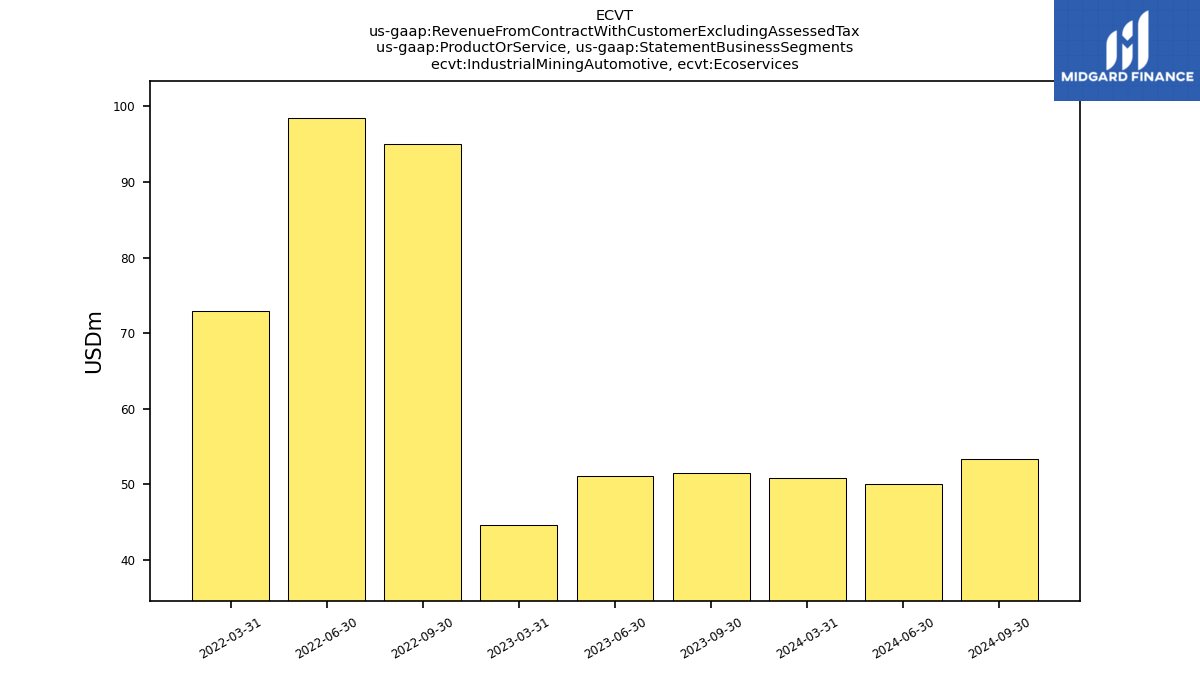
| Industrial Mining Automotive | 50.89 | NA | 51.54 | 51.15 | 44.66 | NA | 95.01 | 98.44 | 72.99 | NA | NA | NA | NA | NA | NA | NA | NA | NA | NA | NA | NA | NA | NA | NA | NA | NA | NA | NA | NA | NA | NA | NA | NA | |
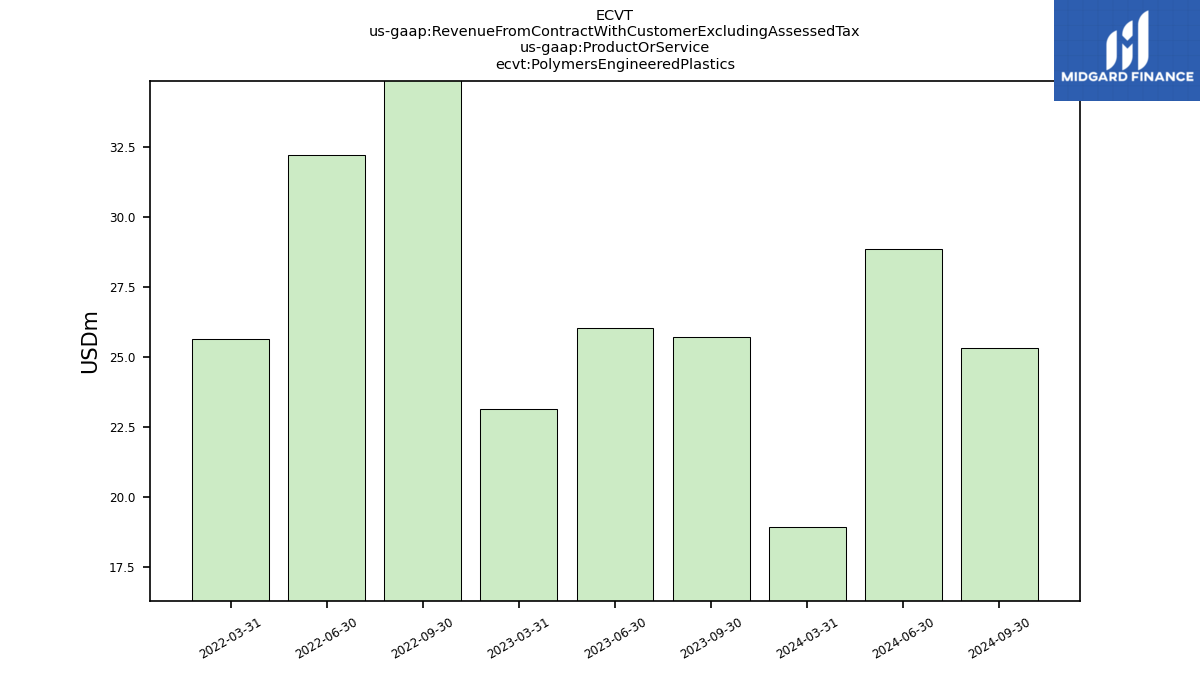
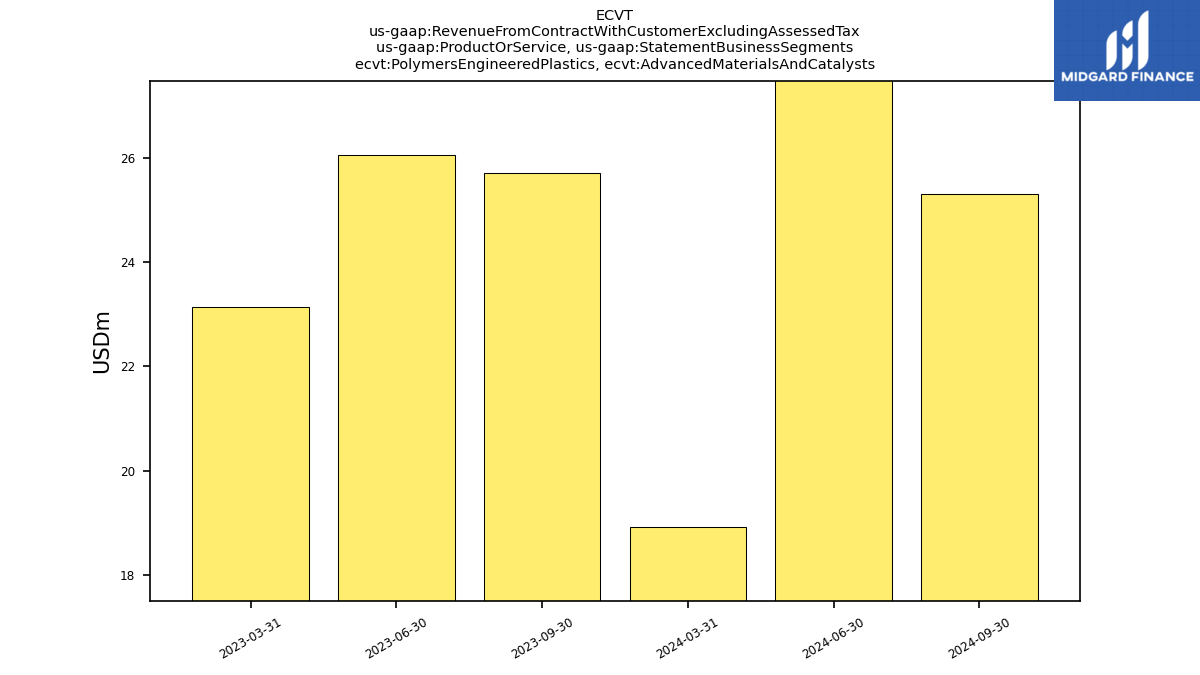
| Polymers Engineered Plastics | 18.93 | NA | 25.70 | 26.05 | 23.13 | NA | 36.86 | 32.20 | 25.65 | NA | NA | NA | NA | NA | NA | NA | NA | NA | NA | NA | NA | NA | NA | NA | NA | NA | NA | NA | NA | NA | NA | NA | NA | |
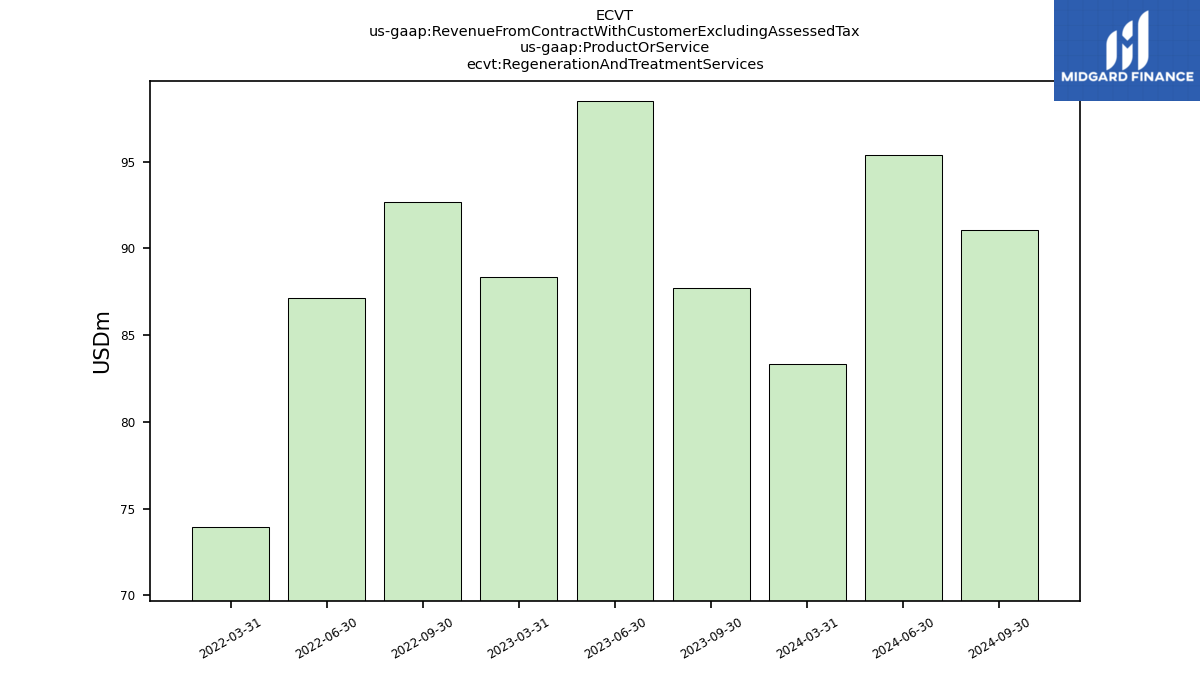
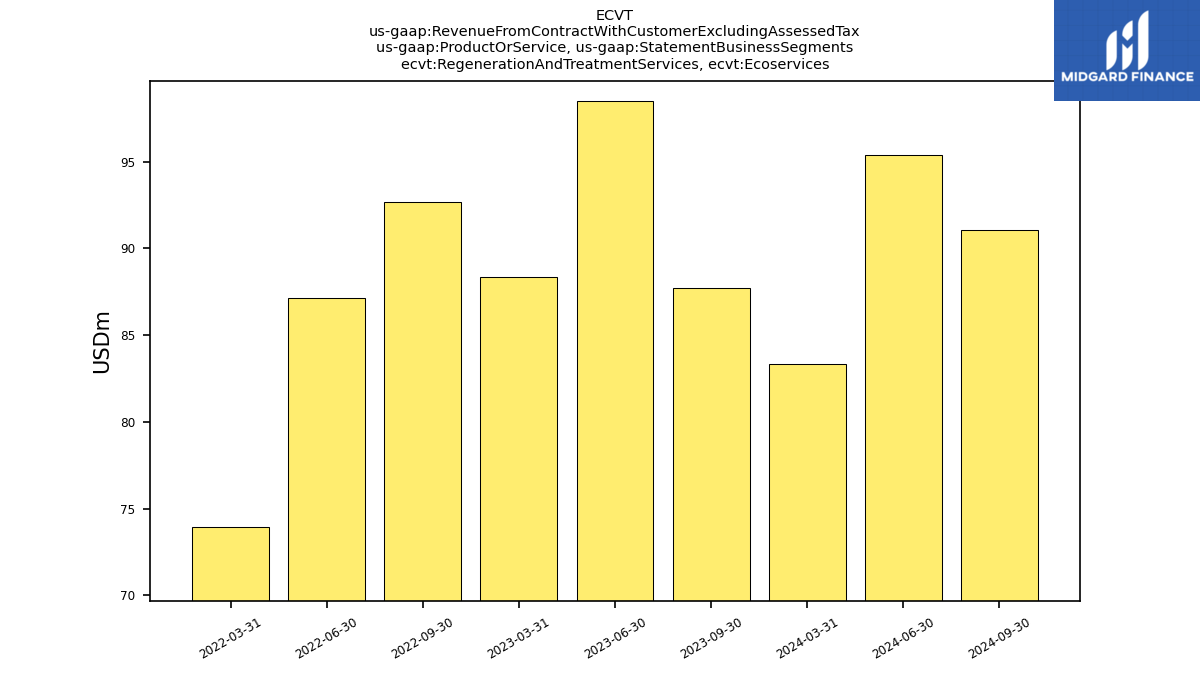
| Regeneration And Treatment Services | 83.32 | NA | 87.69 | 98.49 | 88.34 | NA | 92.68 | 87.14 | 73.97 | NA | NA | NA | NA | NA | NA | NA | NA | NA | NA | NA | NA | NA | NA | NA | NA | NA | NA | NA | NA | NA | NA | NA | NA | |
| Clean Fuels Emission Control Other, Ecoservices | 7.39 | NA | 8.39 | 8.43 | 4.74 | NA | 7.99 | 7.39 | 7.10 | NA | NA | NA | NA | NA | NA | NA | NA | NA | NA | NA | NA | NA | NA | NA | NA | NA | NA | NA | NA | NA | NA | NA | NA | |
| Industrial Mining Automotive, Ecoservices | 50.89 | NA | 51.54 | 51.15 | 44.66 | NA | 95.01 | 98.44 | 72.99 | NA | NA | NA | NA | NA | NA | NA | NA | NA | NA | NA | NA | NA | NA | NA | NA | NA | NA | NA | NA | NA | NA | NA | NA | |
| Polymers Engineered Plastics, Advanced Materials And Catalysts | 18.93 | NA | NA | NA | 23.13 | NA | NA | NA | NA | NA | NA | NA | NA | NA | NA | NA | NA | NA | NA | NA | NA | NA | NA | NA | NA | NA | NA | NA | NA | NA | NA | NA | NA | |
| Regeneration And Treatment Services, Ecoservices | 83.32 | NA | 87.69 | 98.49 | 88.34 | NA | 92.68 | 87.14 | 73.97 | NA | NA | NA | NA | NA | NA | NA | NA | NA | NA | NA | NA | NA | NA | NA | NA | NA | NA | NA | NA | NA | NA | NA | NA | |
| Zeolyst Joint Venture, Advanced Materials And Catalysts | 23.48 | NA | NA | NA | 22.07 | NA | NA | NA | NA | NA | NA | NA | NA | NA | NA | NA | NA | NA | NA | NA | NA | NA | NA | NA | NA | NA | NA | NA | NA | NA | NA | NA | NA | |
| Advanced Materials And Catalysts | 18.93 | NA | NA | NA | 23.13 | NA | NA | NA | NA | NA | NA | NA | NA | NA | NA | NA | NA | NA | NA | NA | NA | NA | NA | NA | NA | NA | NA | NA | NA | NA | NA | NA | NA | |
| Ecoservices | 141.60 | 141.41 | 147.63 | 158.06 | 137.74 | 159.77 | 195.67 | 192.97 | 154.06 | 142.00 | 137.55 | 120.74 | NA | NA | NA | NA | NA | NA | NA | NA | NA | NA | NA | NA | NA | NA | NA | NA | NA | NA | NA | NA | NA |

