
| 2023-12-31 | 2023-09-30 | 2023-06-30 | 2023-03-31 | 2022-12-31 | 2022-09-30 | 2022-06-30 | 2022-03-31 | 2021-12-31 | 2021-09-30 | 2021-06-30 | 2021-03-31 | 2020-12-31 | 2020-09-30 | 2020-06-30 | 2020-03-31 | 2019-12-31 | 2019-09-30 | 2019-06-30 | 2019-03-31 | 2018-12-31 | 2018-09-30 | 2018-06-30 | 2018-03-31 | 2017-12-31 | 2017-09-30 | 2017-06-30 | 2017-03-31 | 2016-12-31 | 2016-09-30 | 2016-06-30 | 2016-03-31 | 2015-12-31 | 2015-09-30 | 2015-06-30 | 2015-03-31 | 2014-12-31 | 2014-09-30 | 2014-06-30 | 2014-03-31 | 2013-12-31 | 2013-09-30 | 2013-06-30 | 2013-03-31 | 2012-12-31 | 2012-09-30 | 2012-06-30 | 2012-03-31 | 2011-12-31 | 2011-09-30 | 2011-06-30 | 2011-03-31 | 2010-12-31 | 2010-09-30 | 2010-06-30 | 2010-03-31 | ||
|---|---|---|---|---|---|---|---|---|---|---|---|---|---|---|---|---|---|---|---|---|---|---|---|---|---|---|---|---|---|---|---|---|---|---|---|---|---|---|---|---|---|---|---|---|---|---|---|---|---|---|---|---|---|---|---|---|---|
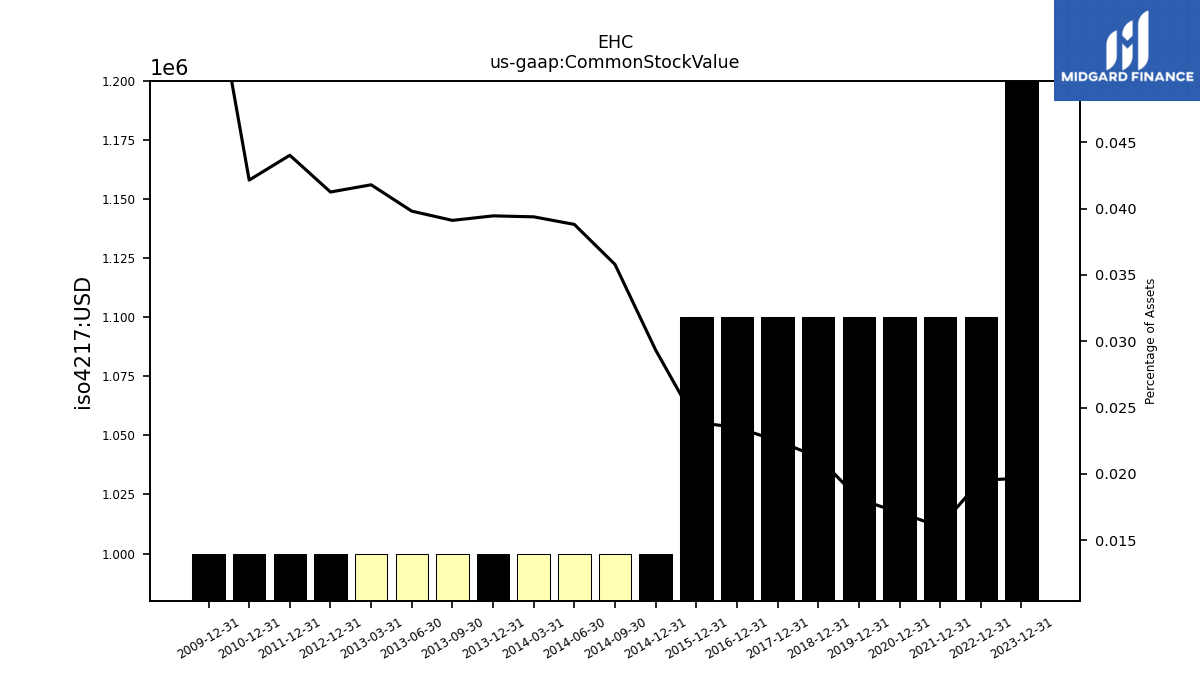
| Common Stock Value | 1.20 | NA | NA | NA | 1.10 | NA | NA | NA | 1.10 | NA | NA | NA | 1.10 | NA | NA | NA | 1.10 | NA | NA | NA | 1.10 | NA | NA | NA | 1.10 | NA | NA | NA | 1.10 | NA | NA | NA | 1.10 | NA | NA | NA | 1.00 | 1.00 | 1.00 | 1.00 | 1.00 | 1.00 | 1.00 | 1.00 | 1.00 | NA | NA | NA | 1.00 | NA | NA | NA | 1.00 | NA | NA | NA | |
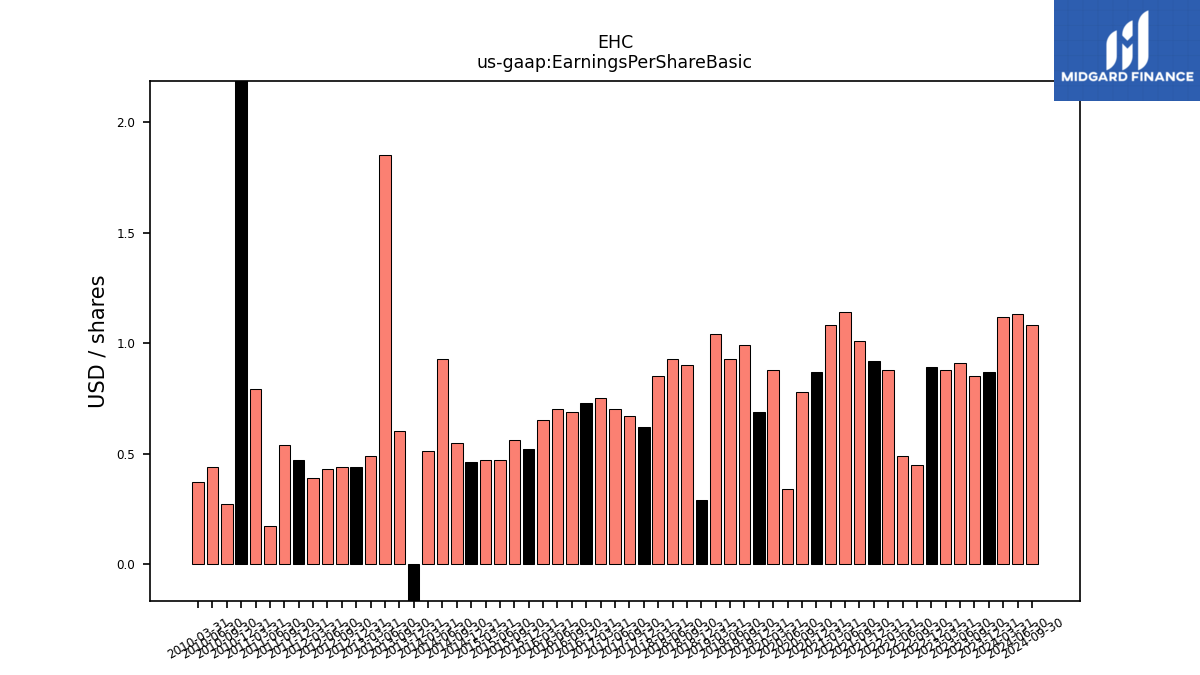
| Earnings Per Share Basic | 0.87 | 0.85 | 0.91 | 0.88 | 0.89 | 0.45 | 0.49 | 0.88 | 0.92 | 1.01 | 1.14 | 1.08 | 0.87 | 0.78 | 0.34 | 0.88 | 0.69 | 0.99 | 0.93 | 1.04 | 0.29 | 0.90 | 0.93 | 0.85 | 0.62 | 0.67 | 0.70 | 0.75 | 0.73 | 0.69 | 0.70 | 0.65 | 0.52 | 0.56 | 0.47 | 0.47 | 0.46 | 0.55 | 0.93 | 0.51 | -0.31 | 0.60 | 1.85 | 0.49 | 0.44 | 0.44 | 0.43 | 0.39 | 0.47 | 0.54 | 0.17 | 0.79 | 8.33 | 0.27 | 0.44 | 0.37 | |
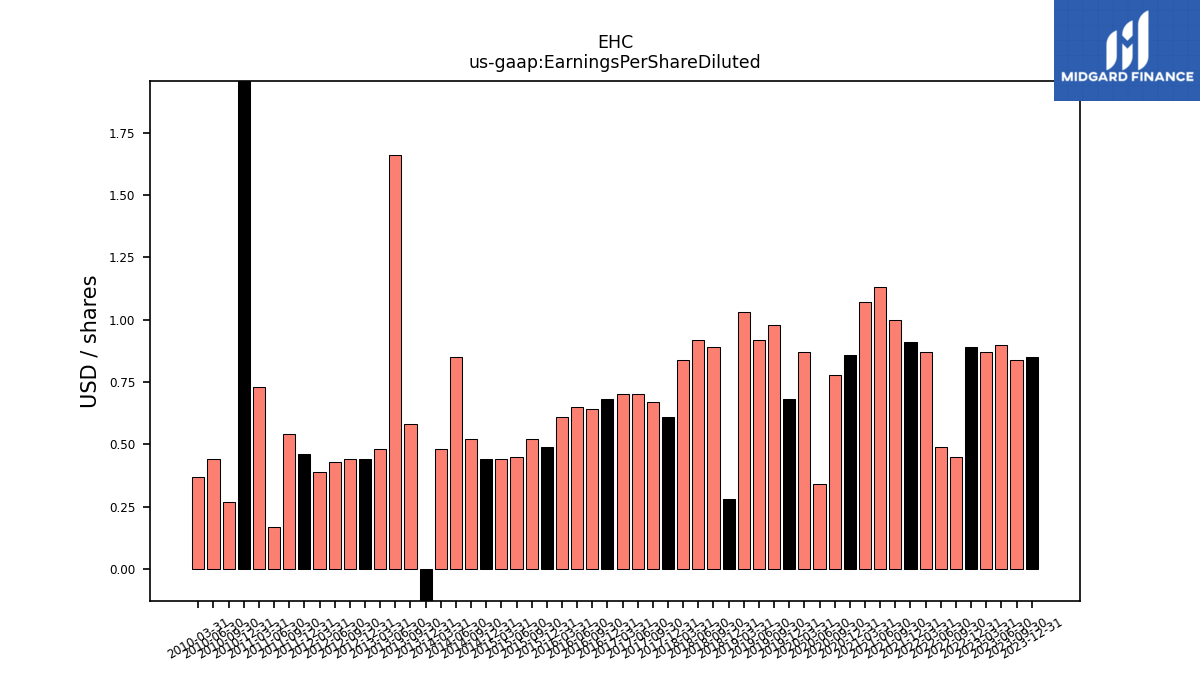
| Earnings Per Share Diluted | 0.85 | 0.84 | 0.90 | 0.87 | 0.89 | 0.45 | 0.49 | 0.87 | 0.91 | 1.00 | 1.13 | 1.07 | 0.86 | 0.78 | 0.34 | 0.87 | 0.68 | 0.98 | 0.92 | 1.03 | 0.28 | 0.89 | 0.92 | 0.84 | 0.61 | 0.67 | 0.70 | 0.70 | 0.68 | 0.64 | 0.65 | 0.61 | 0.49 | 0.52 | 0.45 | 0.44 | 0.44 | 0.52 | 0.85 | 0.48 | -0.31 | 0.58 | 1.66 | 0.48 | 0.44 | 0.44 | 0.43 | 0.39 | 0.46 | 0.54 | 0.17 | 0.73 | 7.16 | 0.27 | 0.44 | 0.37 | |
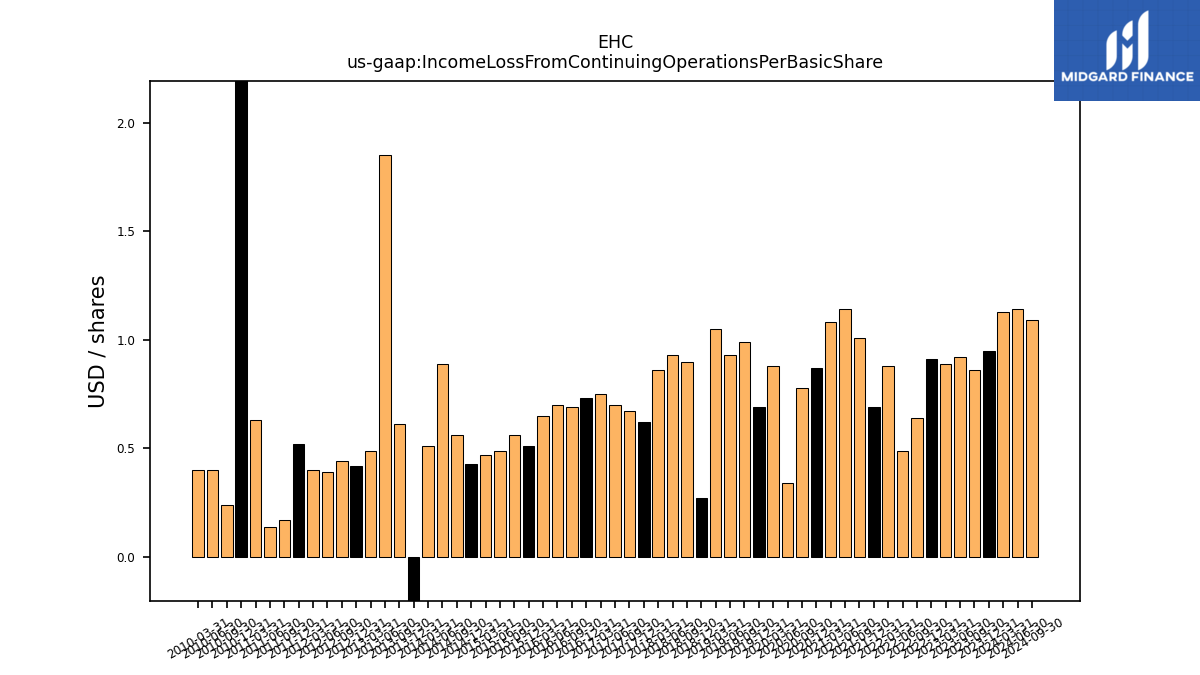
| Income Loss From Continuing Operations Per Basic Share | 0.00 | 0.00 | 0.00 | 0.00 | 0.00 | 0.00 | 0.00 | 0.00 | 0.00 | 0.00 | 0.00 | 0.00 | 0.00 | 0.00 | 0.00 | 0.00 | 0.00 | 0.00 | 0.00 | 0.00 | 0.00 | 0.00 | 0.00 | 0.00 | 0.00 | 0.00 | 0.00 | 0.00 | 0.00 | 0.00 | 0.00 | 0.00 | 0.00 | 0.00 | 0.00 | 0.00 | 0.00 | 0.00 | 0.00 | 0.00 | -0.00 | 0.00 | 0.00 | 0.00 | 0.00 | 0.00 | 0.00 | 0.00 | 0.00 | 0.00 | 0.00 | 0.00 | 0.00 | 0.00 | 0.00 | 0.00 | |
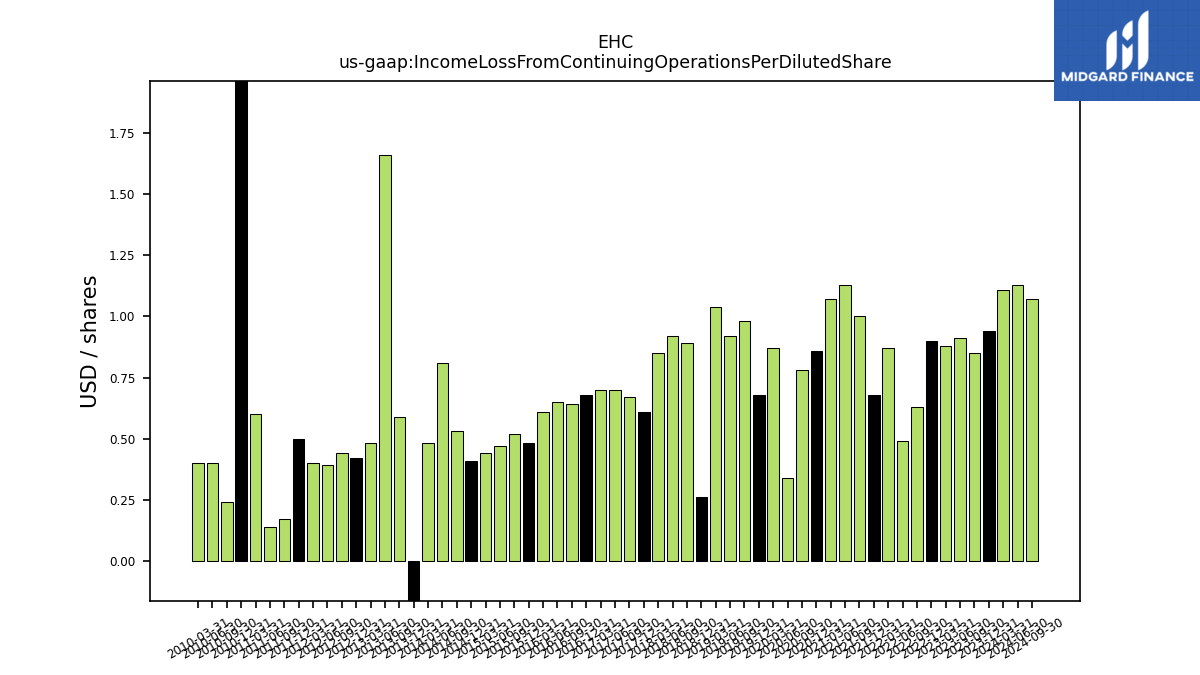
| Income Loss From Continuing Operations Per Diluted Share | 0.00 | 0.00 | 0.00 | 0.00 | 0.00 | 0.00 | 0.00 | 0.00 | 0.00 | 0.00 | 0.00 | 0.00 | 0.00 | 0.00 | 0.00 | 0.00 | 0.00 | 0.00 | 0.00 | 0.00 | 0.00 | 0.00 | 0.00 | 0.00 | 0.00 | 0.00 | 0.00 | 0.00 | 0.00 | 0.00 | 0.00 | 0.00 | 0.00 | 0.00 | 0.00 | 0.00 | 0.00 | 0.00 | 0.00 | 0.00 | -0.00 | 0.00 | 0.00 | 0.00 | 0.00 | 0.00 | 0.00 | 0.00 | 0.00 | 0.00 | 0.00 | 0.00 | 0.00 | 0.00 | 0.00 | 0.00 |
| 2023-12-31 | 2023-09-30 | 2023-06-30 | 2023-03-31 | 2022-12-31 | 2022-09-30 | 2022-06-30 | 2022-03-31 | 2021-12-31 | 2021-09-30 | 2021-06-30 | 2021-03-31 | 2020-12-31 | 2020-09-30 | 2020-06-30 | 2020-03-31 | 2019-12-31 | 2019-09-30 | 2019-06-30 | 2019-03-31 | 2018-12-31 | 2018-09-30 | 2018-06-30 | 2018-03-31 | 2017-12-31 | 2017-09-30 | 2017-06-30 | 2017-03-31 | 2016-12-31 | 2016-09-30 | 2016-06-30 | 2016-03-31 | 2015-12-31 | 2015-09-30 | 2015-06-30 | 2015-03-31 | 2014-12-31 | 2014-09-30 | 2014-06-30 | 2014-03-31 | 2013-12-31 | 2013-09-30 | 2013-06-30 | 2013-03-31 | 2012-12-31 | 2012-09-30 | 2012-06-30 | 2012-03-31 | 2011-12-31 | 2011-09-30 | 2011-06-30 | 2011-03-31 | 2010-12-31 | 2010-09-30 | 2010-06-30 | 2010-03-31 | ||
|---|---|---|---|---|---|---|---|---|---|---|---|---|---|---|---|---|---|---|---|---|---|---|---|---|---|---|---|---|---|---|---|---|---|---|---|---|---|---|---|---|---|---|---|---|---|---|---|---|---|---|---|---|---|---|---|---|---|
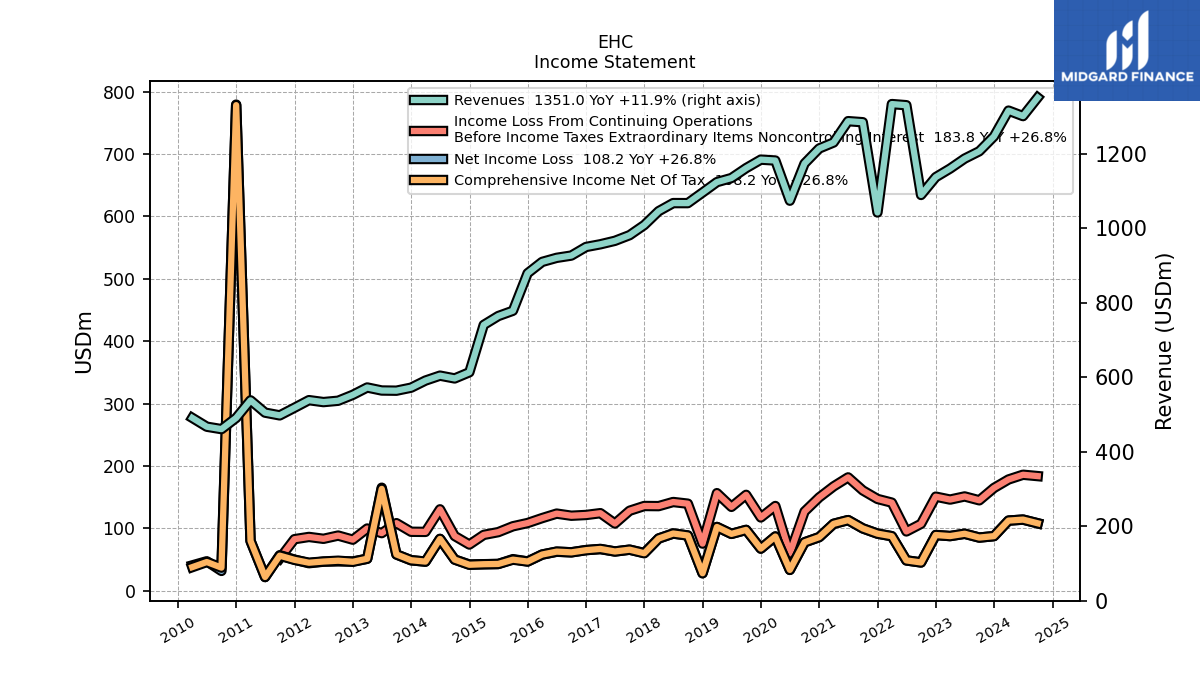
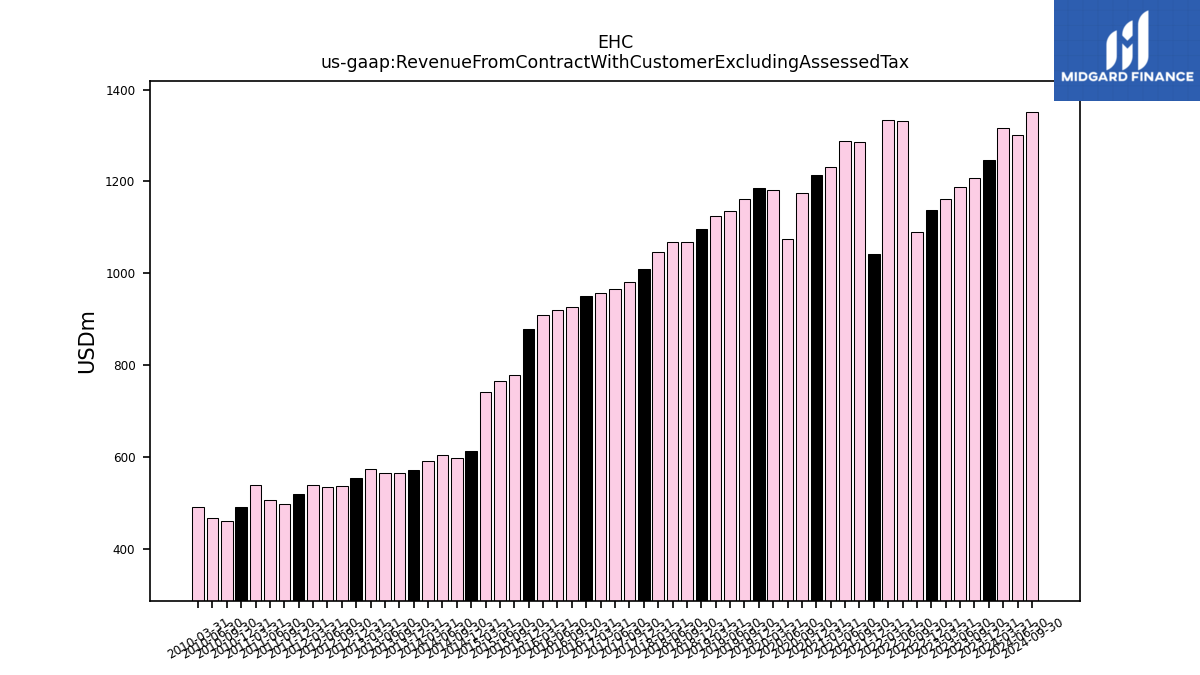
| Revenue From Contract With Customer Excluding Assessed Tax | 1246.80 | 1206.90 | 1187.10 | 1160.40 | 1137.30 | 1089.50 | 1330.50 | 1333.60 | 1042.50 | 1284.80 | 1287.70 | 1230.40 | 1214.40 | 1173.90 | 1074.10 | 1182.00 | 1184.40 | 1161.60 | 1135.00 | 1124.00 | 1096.00 | 1067.60 | 1067.70 | 1046.00 | 1008.80 | 981.60 | 966.40 | 957.10 | 949.90 | 926.80 | 920.70 | 909.80 | 879.30 | 778.60 | 764.40 | 740.60 | 613.40 | 596.90 | 604.40 | 591.20 | 572.10 | 564.00 | 564.50 | 572.60 | 552.90 | 537.00 | 533.40 | 538.60 | 518.10 | 497.70 | 505.10 | 538.10 | 490.90 | 460.80 | 467.30 | 491.00 | |
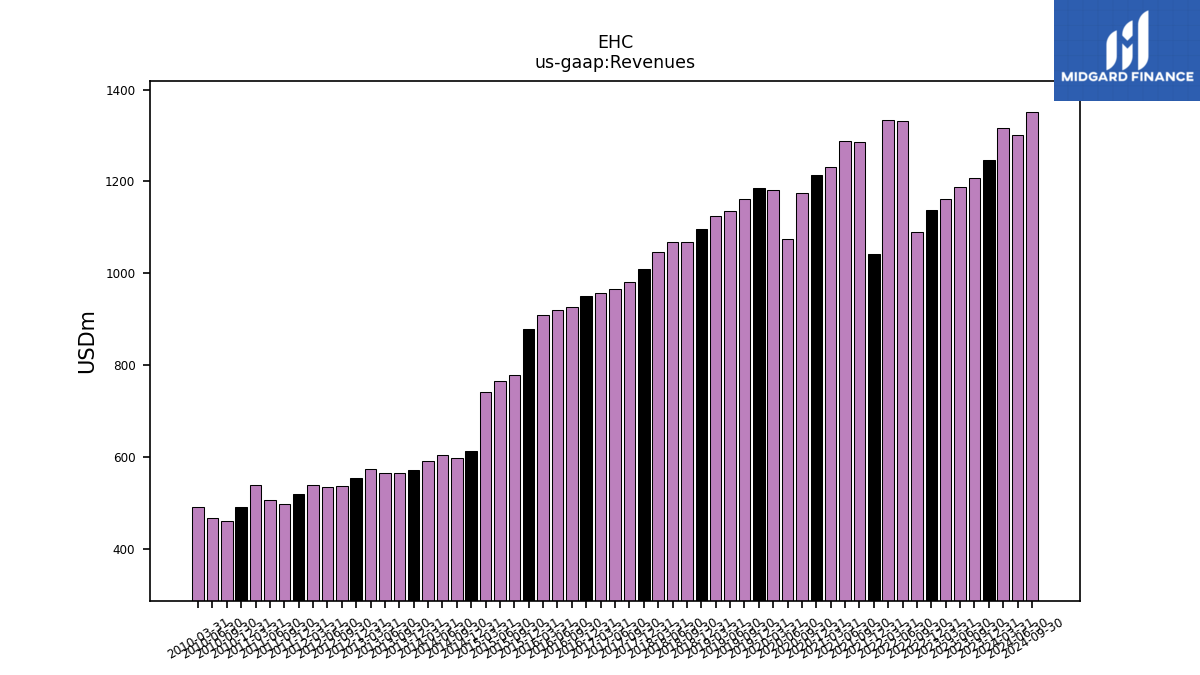
| Revenues | 1246.80 | 1206.90 | 1187.10 | 1160.40 | 1137.30 | 1089.50 | 1330.50 | 1333.60 | 1042.50 | 1284.80 | 1287.70 | 1230.40 | 1214.40 | 1173.90 | 1074.10 | 1182.00 | 1184.40 | 1161.60 | 1135.00 | 1124.00 | 1096.00 | 1067.60 | 1067.70 | 1046.00 | 1008.80 | 981.60 | 966.40 | 957.10 | 949.90 | 926.80 | 920.70 | 909.80 | 879.30 | 778.60 | 764.40 | 740.60 | 613.40 | 596.90 | 604.40 | 591.20 | 572.10 | 564.00 | 564.50 | 572.60 | 552.90 | 537.00 | 533.40 | 538.60 | 518.10 | 497.70 | 505.10 | 538.10 | 490.90 | 460.80 | 467.30 | 491.00 | |
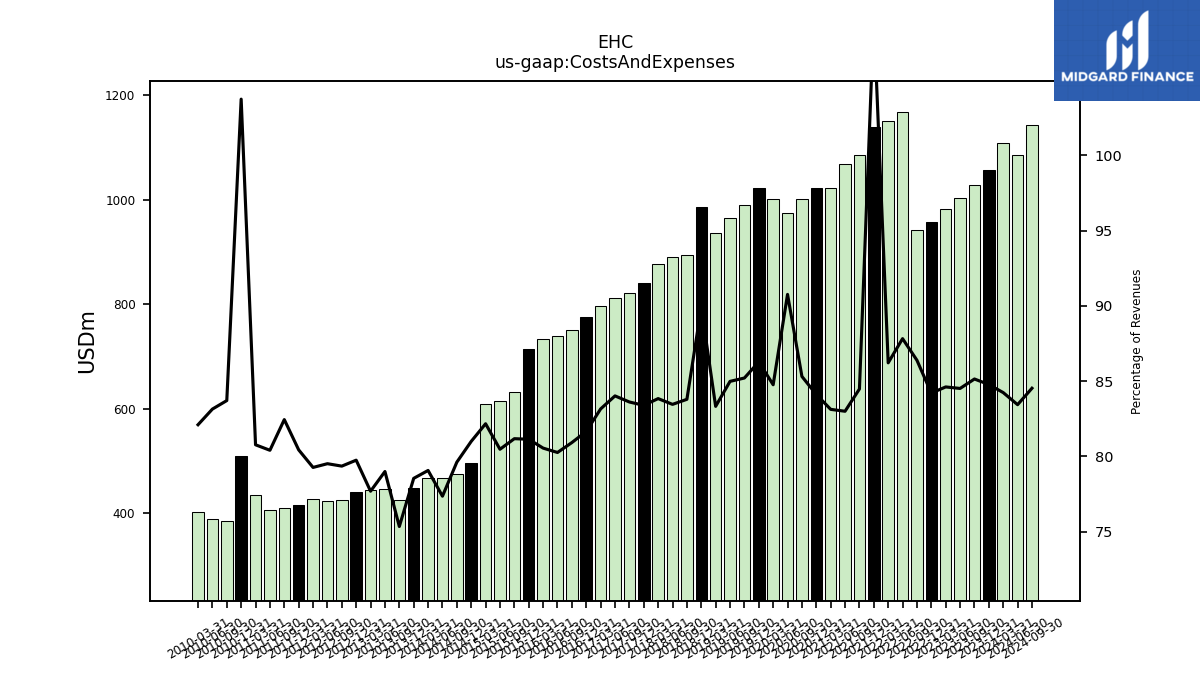
| Costs And Expenses | 1056.90 | 1027.50 | 1003.20 | 981.80 | 957.60 | 941.10 | 1168.40 | 1149.70 | 1138.40 | 1085.30 | 1068.70 | 1022.70 | 1021.40 | 1001.40 | 974.80 | 1001.80 | 1021.80 | 989.70 | 964.50 | 936.50 | 985.30 | 894.50 | 891.00 | 876.90 | 841.20 | 820.70 | 811.90 | 795.80 | 775.60 | 749.90 | 738.90 | 732.80 | 713.40 | 632.00 | 615.10 | 608.50 | 496.80 | 475.20 | 467.50 | 467.40 | 449.30 | 424.90 | 445.90 | 444.80 | 440.90 | 426.10 | 424.10 | 426.90 | 416.70 | 410.30 | 406.10 | 434.60 | 509.20 | 385.70 | 388.50 | 403.10 | |
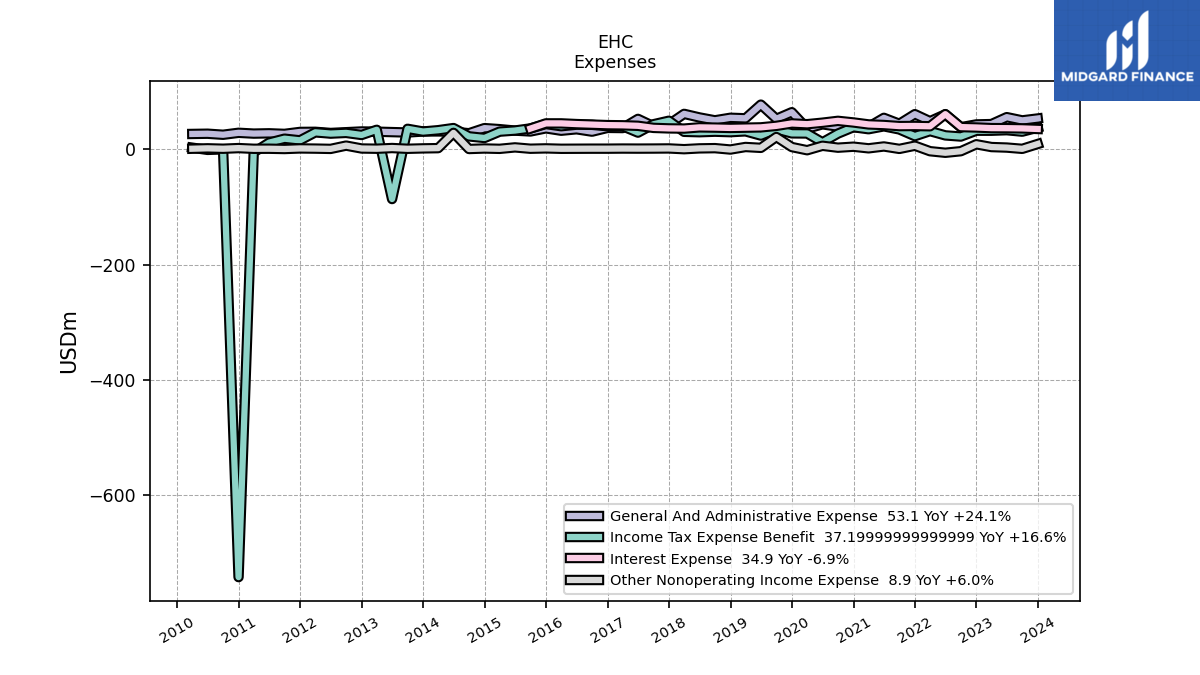
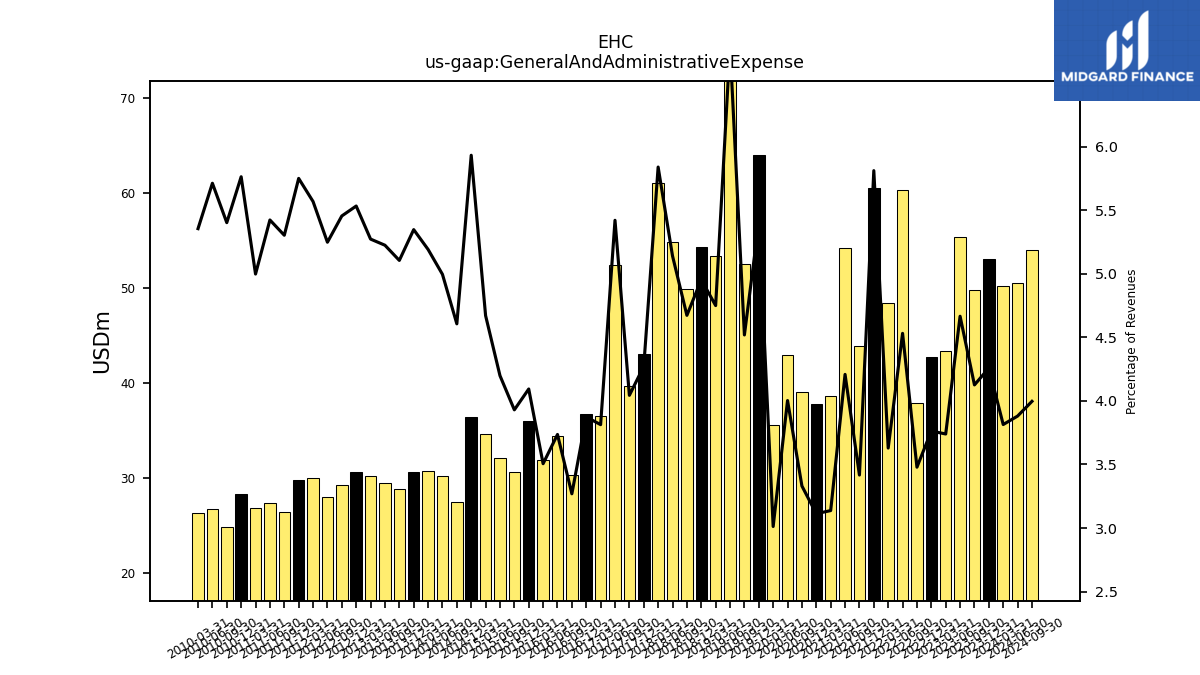
| General And Administrative Expense | 53.10 | 49.80 | 55.40 | 43.40 | 42.80 | 37.90 | 60.30 | 48.40 | 60.60 | 43.90 | 54.20 | 38.60 | 37.80 | 39.10 | 43.00 | 35.60 | 64.00 | 52.50 | 77.10 | 53.40 | 54.30 | 49.90 | 54.90 | 61.10 | 43.10 | 39.70 | 52.40 | 36.50 | 36.80 | 30.30 | 34.40 | 31.90 | 36.00 | 30.60 | 32.10 | 34.60 | 36.40 | 27.50 | 30.20 | 30.70 | 30.60 | 28.80 | 29.50 | 30.20 | 30.60 | 29.30 | 28.00 | 30.00 | 29.80 | 26.40 | 27.40 | 26.90 | 28.30 | 24.90 | 26.70 | 26.30 | |
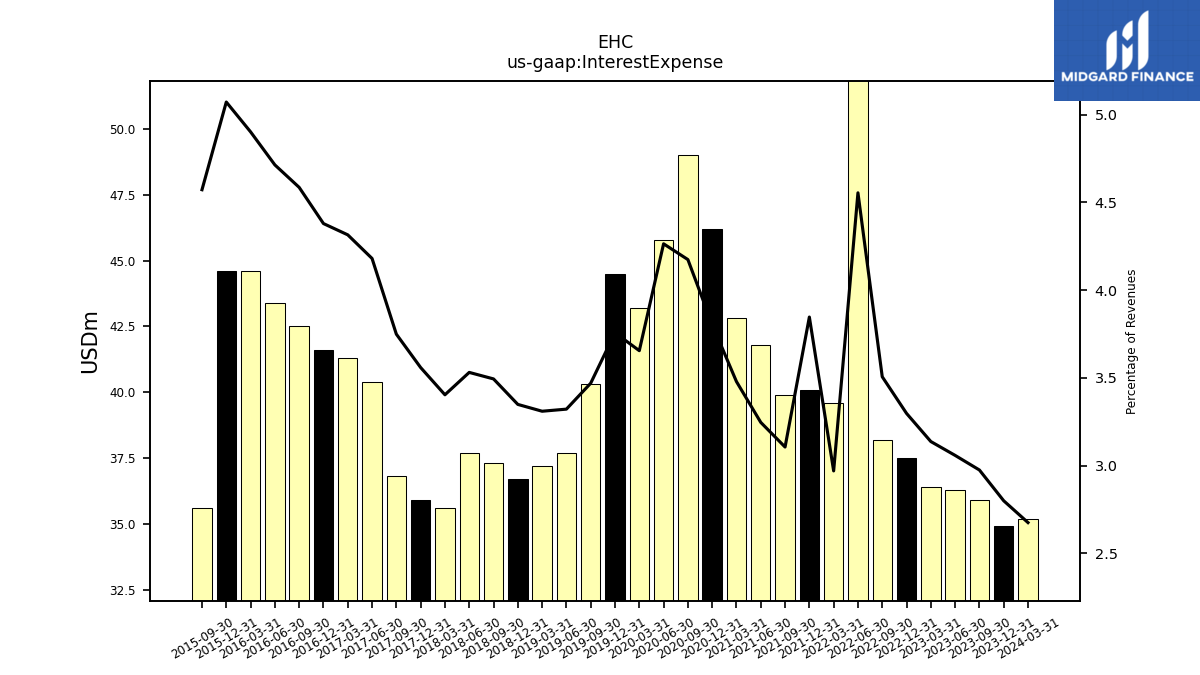
| Interest Expense | 34.90 | 35.90 | 36.30 | 36.40 | 37.50 | 38.20 | 60.60 | 39.60 | 40.10 | 39.90 | 41.80 | 42.80 | 46.20 | 49.00 | 45.80 | 43.20 | 44.50 | 40.30 | 37.70 | 37.20 | 36.70 | 37.30 | 37.70 | 35.60 | 35.90 | 36.80 | 40.40 | 41.30 | 41.60 | 42.50 | 43.40 | 44.60 | 44.60 | 35.60 | NA | NA | NA | NA | NA | NA | NA | NA | NA | NA | NA | NA | NA | NA | NA | NA | NA | NA | NA | NA | NA | NA | |
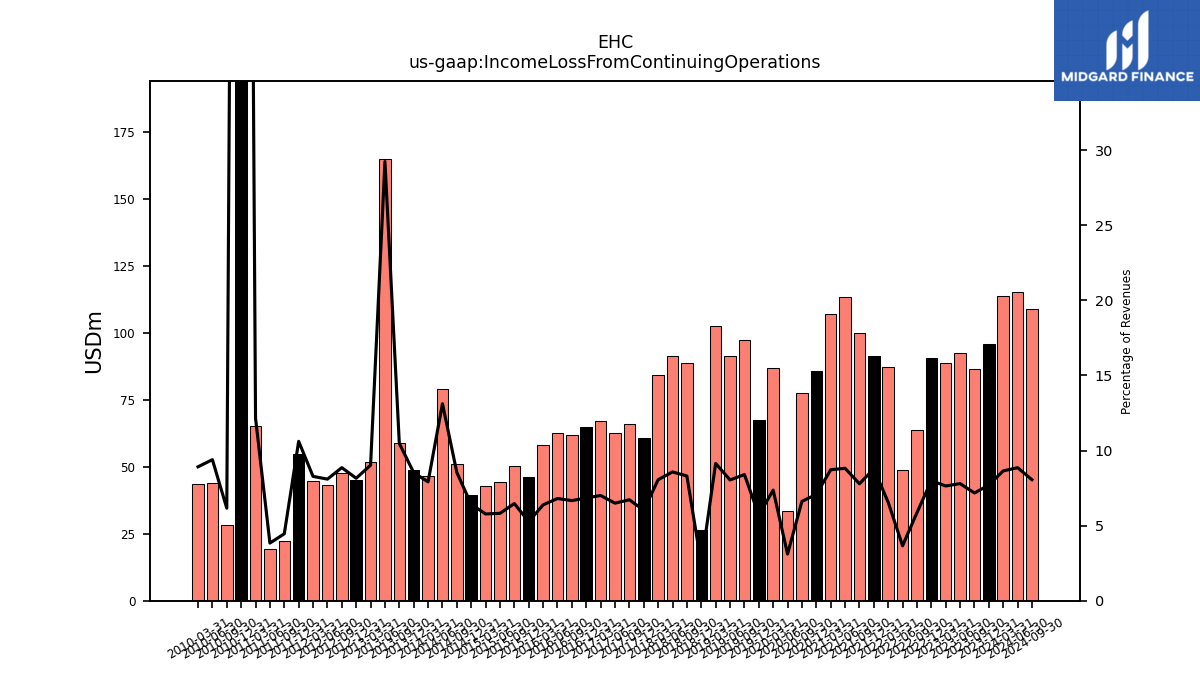
| Income Loss From Continuing Operations | 96.10 | 86.60 | 92.60 | 88.70 | 90.90 | 63.90 | 48.70 | 87.50 | 91.60 | 100.10 | 113.60 | 107.30 | 86.00 | 77.70 | 33.40 | 87.10 | 67.60 | 97.60 | 91.30 | 102.80 | 26.60 | 88.70 | 91.60 | 84.30 | 60.80 | 66.00 | 62.80 | 67.10 | 65.00 | 61.80 | 62.70 | 58.10 | 46.30 | 50.40 | 44.50 | 42.80 | 39.40 | 51.00 | 79.30 | 46.80 | 48.80 | 59.10 | 165.10 | 51.70 | 45.10 | 47.60 | 43.20 | 44.60 | 55.00 | 22.20 | 19.40 | 65.40 | 787.90 | 28.40 | 43.90 | 43.80 | |
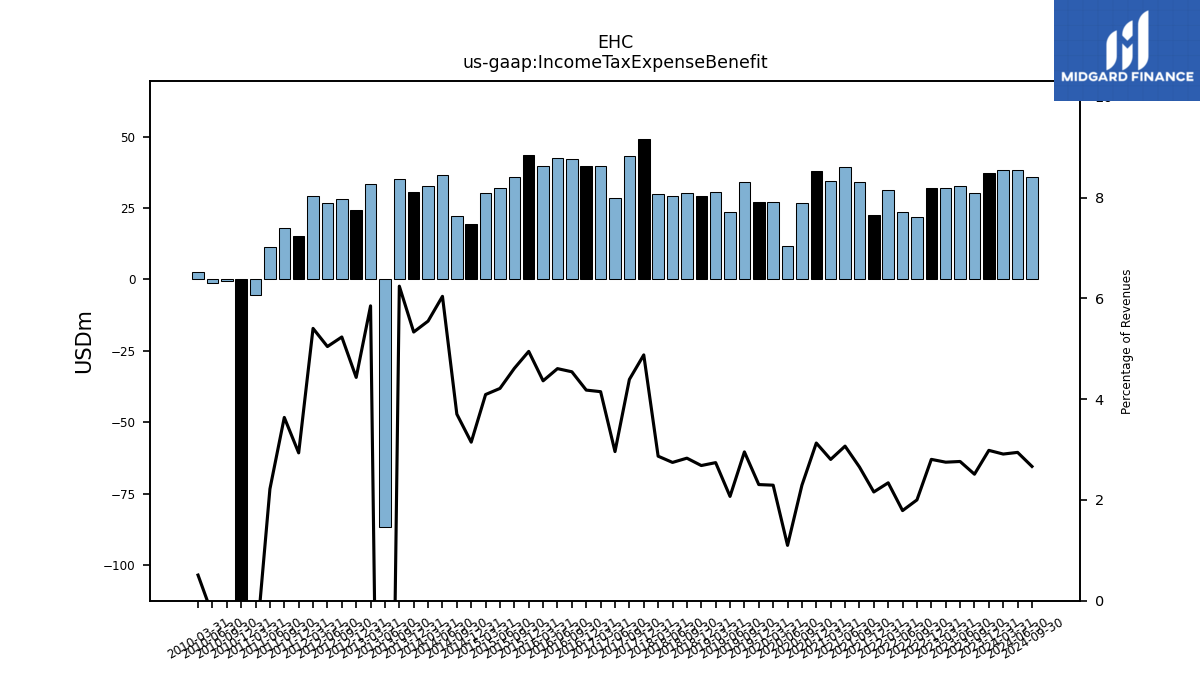
| Income Tax Expense Benefit | 37.20 | 30.30 | 32.80 | 31.90 | 31.90 | 21.80 | 23.80 | 31.20 | 22.50 | 34.10 | 39.50 | 34.50 | 38.00 | 26.90 | 11.80 | 27.10 | 27.30 | 34.30 | 23.50 | 30.80 | 29.40 | 30.20 | 29.30 | 30.00 | 49.20 | 43.10 | 28.60 | 39.70 | 39.70 | 42.10 | 42.40 | 39.70 | 43.50 | 35.90 | 32.20 | 30.30 | 19.30 | 22.10 | 36.50 | 32.80 | 30.50 | 35.20 | -86.50 | 33.50 | 24.50 | 28.10 | 26.90 | 29.10 | 15.20 | 18.10 | 11.20 | -5.60 | -741.50 | -0.40 | -1.30 | 2.50 | |
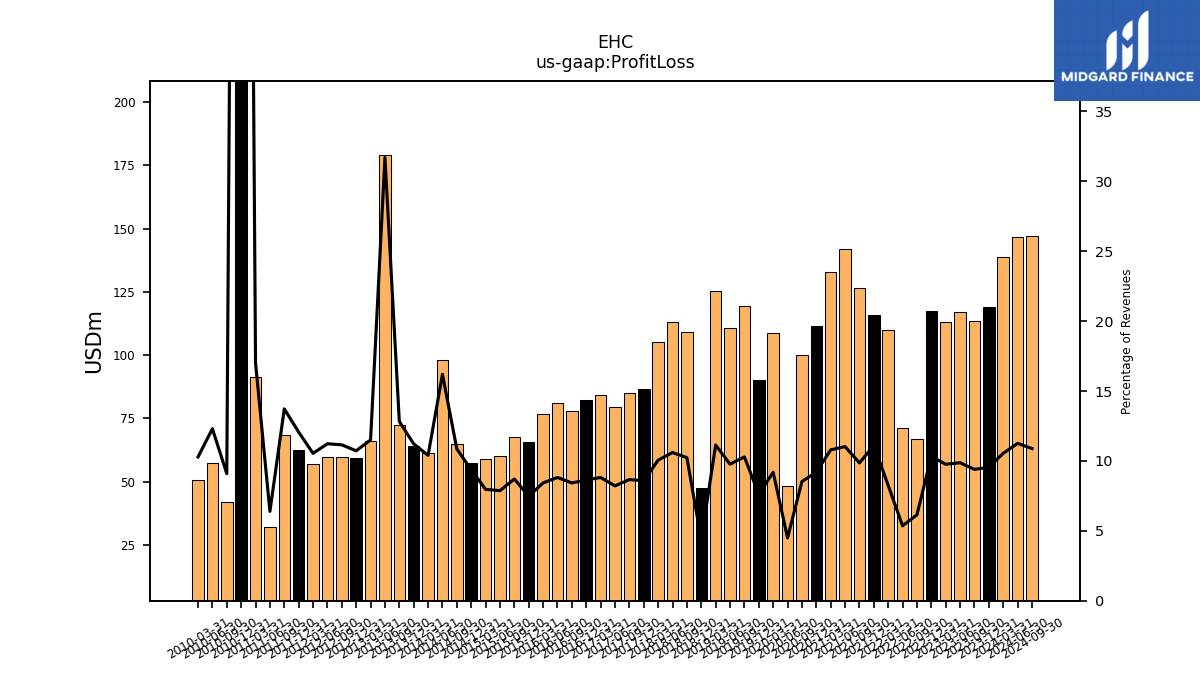
| Profit Loss | 119.10 | 113.40 | 117.20 | 113.30 | 117.50 | 67.00 | 71.30 | 110.10 | 115.70 | 126.70 | 142.00 | 132.80 | 111.70 | 100.10 | 48.30 | 108.70 | 90.20 | 119.50 | 110.90 | 125.20 | 47.70 | 109.30 | 113.20 | 105.20 | 86.50 | 85.10 | 79.40 | 84.40 | 82.10 | 78.10 | 81.20 | 76.70 | 65.80 | 67.80 | 60.20 | 59.00 | 57.50 | 64.80 | 97.90 | 61.50 | 64.20 | 72.30 | 179.00 | 65.90 | 59.30 | 59.90 | 59.90 | 56.80 | 62.50 | 68.30 | 32.30 | 91.50 | 789.90 | 41.90 | 57.50 | 50.50 | |
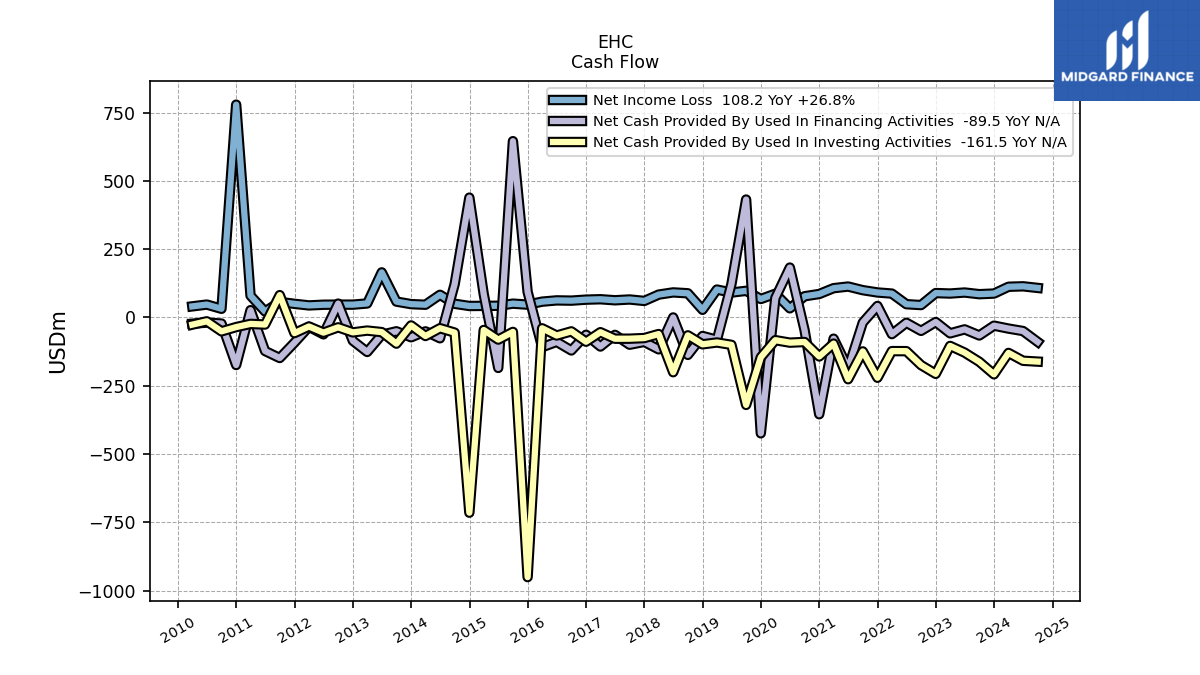
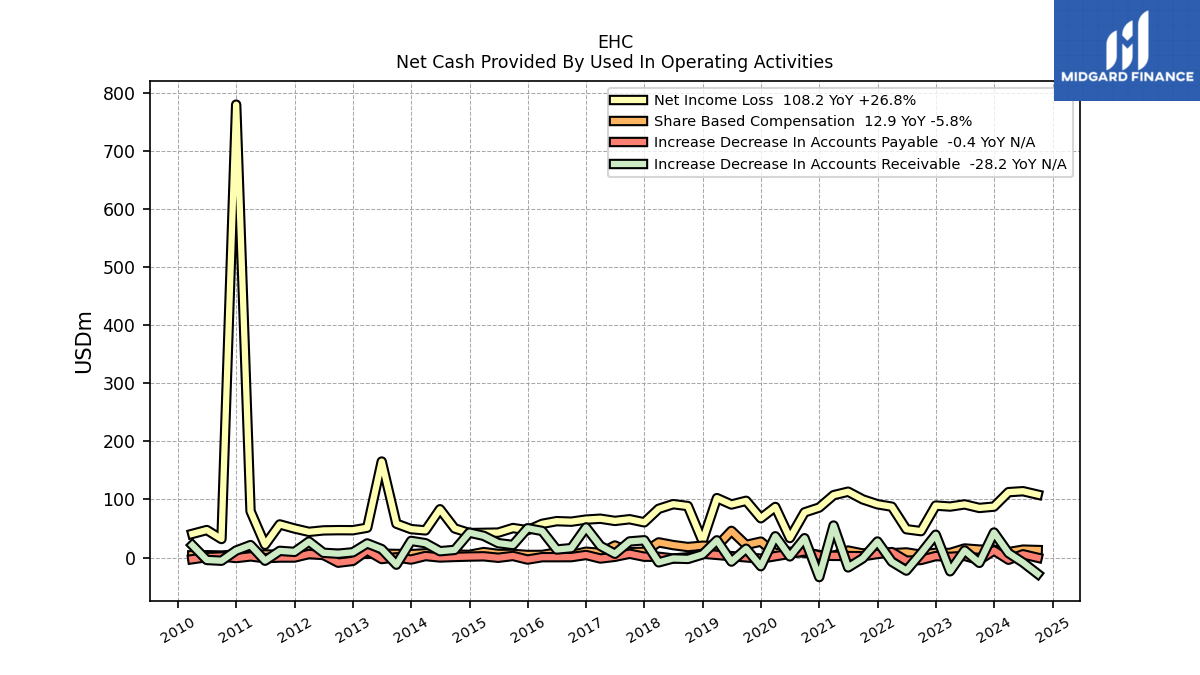
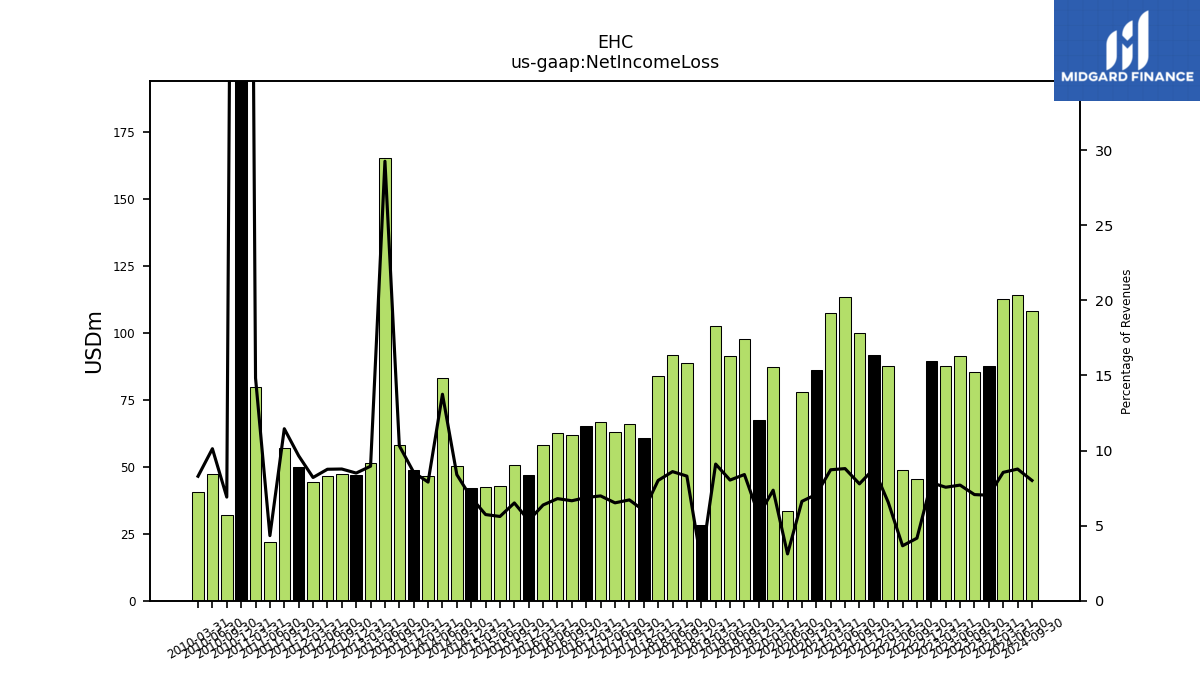
| Net Income Loss | 87.60 | 85.30 | 91.40 | 87.70 | 89.40 | 45.40 | 48.70 | 87.50 | 91.60 | 100.00 | 113.30 | 107.30 | 86.00 | 77.70 | 33.50 | 87.00 | 67.60 | 97.60 | 91.20 | 102.30 | 28.10 | 88.60 | 91.80 | 83.80 | 60.60 | 65.90 | 63.00 | 66.80 | 65.30 | 61.70 | 62.60 | 58.00 | 47.00 | 50.70 | 42.90 | 42.50 | 42.10 | 50.10 | 83.10 | 46.70 | 48.90 | 58.20 | 165.20 | 51.30 | 47.00 | 47.10 | 46.70 | 44.20 | 50.00 | 57.00 | 21.90 | 79.80 | 779.20 | 31.80 | 47.30 | 40.70 | |
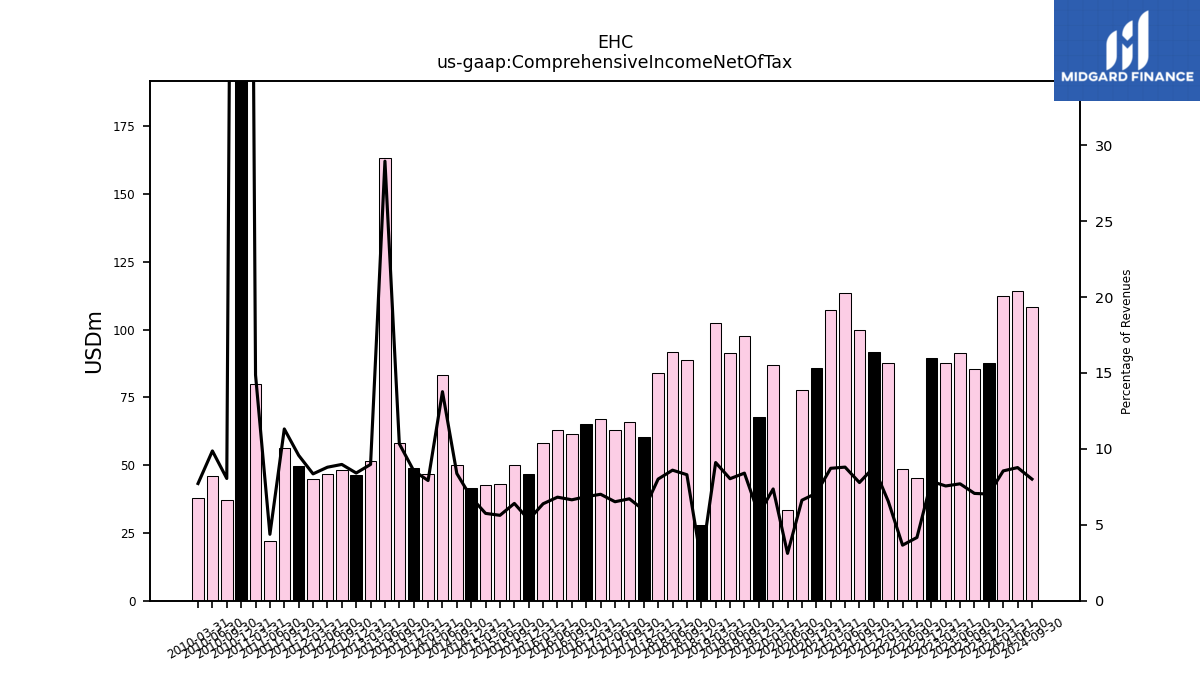
| Comprehensive Income Net Of Tax | 87.60 | 85.30 | 91.40 | 87.70 | 89.40 | 45.40 | 48.70 | 87.50 | 91.60 | 100.00 | 113.30 | 107.30 | 86.00 | 77.70 | 33.50 | 87.00 | 67.60 | 97.60 | 91.20 | 102.30 | 28.10 | 88.60 | 91.80 | 83.80 | 60.20 | 65.90 | 63.00 | 67.10 | 65.10 | 61.60 | 62.80 | 58.10 | 46.90 | 49.90 | 43.00 | 42.60 | 41.70 | 50.00 | 83.20 | 46.80 | 49.00 | 58.30 | 163.40 | 51.40 | 46.50 | 48.20 | 46.90 | 45.00 | 49.60 | 56.30 | 22.10 | 80.00 | 778.40 | 37.10 | 46.10 | 37.90 | |
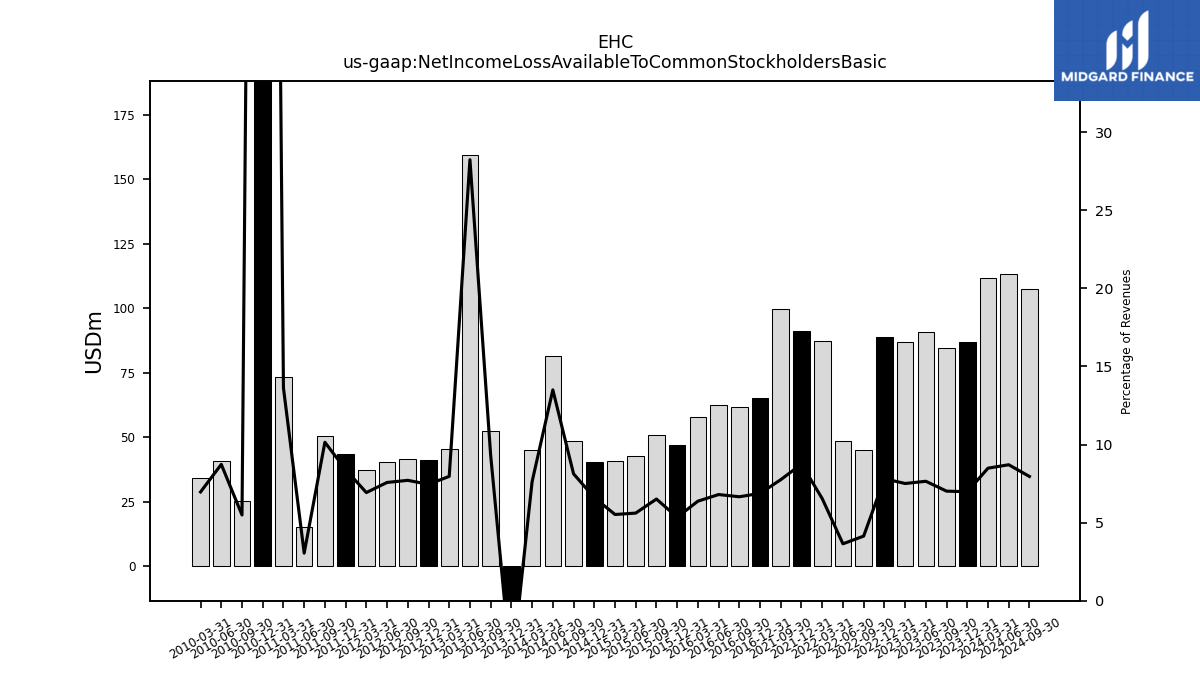
| Net Income Loss Available To Common Stockholders Basic | 87.00 | 84.70 | 90.80 | 87.10 | 88.90 | 45.10 | 48.50 | 87.20 | 91.20 | 99.60 | NA | NA | NA | NA | NA | NA | NA | NA | NA | NA | NA | NA | NA | NA | NA | NA | NA | NA | 65.30 | 61.70 | 62.60 | 58.00 | 47.00 | 50.70 | 42.90 | 40.90 | 40.50 | 48.50 | 81.60 | 45.10 | -26.50 | 52.50 | 159.40 | 45.60 | 41.20 | 41.40 | 40.40 | 37.30 | 43.50 | 50.50 | 15.40 | 73.30 | 772.70 | 25.30 | 40.80 | 34.20 | |
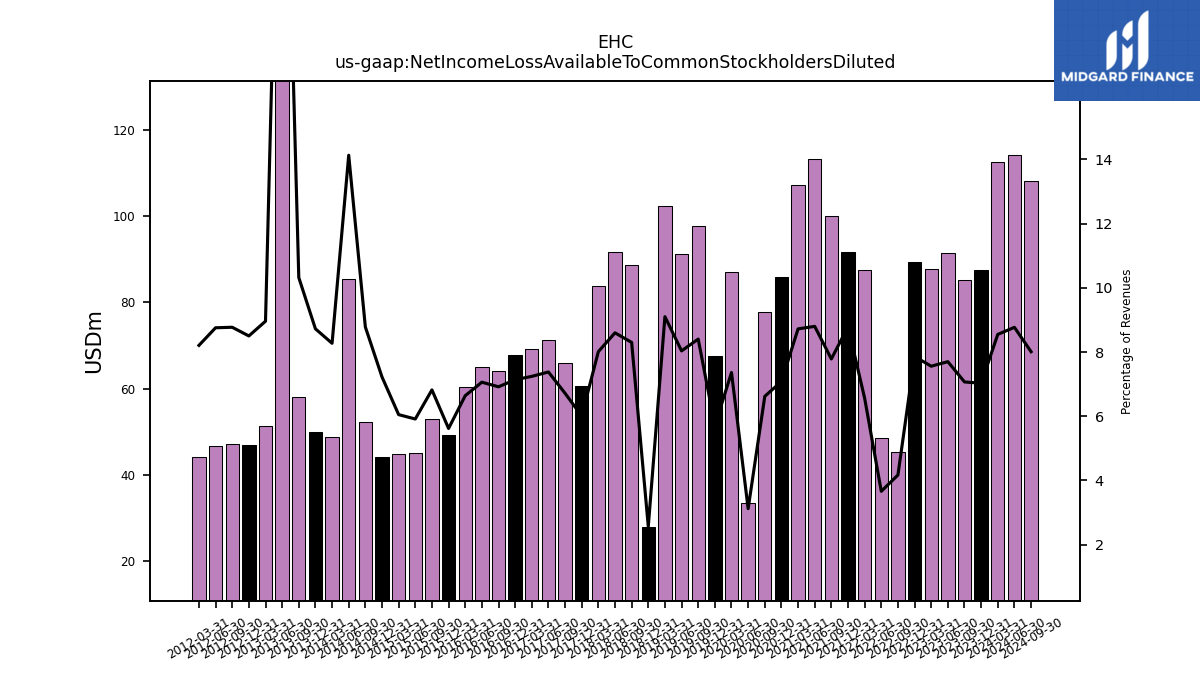
| Net Income Loss Available To Common Stockholders Diluted | 87.60 | 85.30 | 91.40 | 87.70 | 89.40 | 45.40 | 48.70 | 87.50 | 91.60 | 100.00 | 113.30 | 107.30 | 86.00 | 77.70 | 33.50 | 87.00 | 67.60 | 97.60 | 91.20 | 102.30 | 28.10 | 88.60 | 91.80 | 83.80 | 60.60 | 65.90 | 71.30 | 69.30 | 67.80 | 64.10 | 65.00 | 60.40 | 49.40 | 53.10 | 45.20 | 44.80 | 44.30 | 52.40 | 85.40 | 48.90 | 49.90 | 58.20 | 165.20 | 51.30 | 47.00 | 47.10 | 46.70 | 44.20 | NA | NA | NA | NA | NA | NA | NA | NA |
| 2023-12-31 | 2023-09-30 | 2023-06-30 | 2023-03-31 | 2022-12-31 | 2022-09-30 | 2022-06-30 | 2022-03-31 | 2021-12-31 | 2021-09-30 | 2021-06-30 | 2021-03-31 | 2020-12-31 | 2020-09-30 | 2020-06-30 | 2020-03-31 | 2019-12-31 | 2019-09-30 | 2019-06-30 | 2019-03-31 | 2018-12-31 | 2018-09-30 | 2018-06-30 | 2018-03-31 | 2017-12-31 | 2017-09-30 | 2017-06-30 | 2017-03-31 | 2016-12-31 | 2016-09-30 | 2016-06-30 | 2016-03-31 | 2015-12-31 | 2015-09-30 | 2015-06-30 | 2015-03-31 | 2014-12-31 | 2014-09-30 | 2014-06-30 | 2014-03-31 | 2013-12-31 | 2013-09-30 | 2013-06-30 | 2013-03-31 | 2012-12-31 | 2012-09-30 | 2012-06-30 | 2012-03-31 | 2011-12-31 | 2011-09-30 | 2011-06-30 | 2011-03-31 | 2010-12-31 | 2010-09-30 | 2010-06-30 | 2010-03-31 | ||
|---|---|---|---|---|---|---|---|---|---|---|---|---|---|---|---|---|---|---|---|---|---|---|---|---|---|---|---|---|---|---|---|---|---|---|---|---|---|---|---|---|---|---|---|---|---|---|---|---|---|---|---|---|---|---|---|---|---|
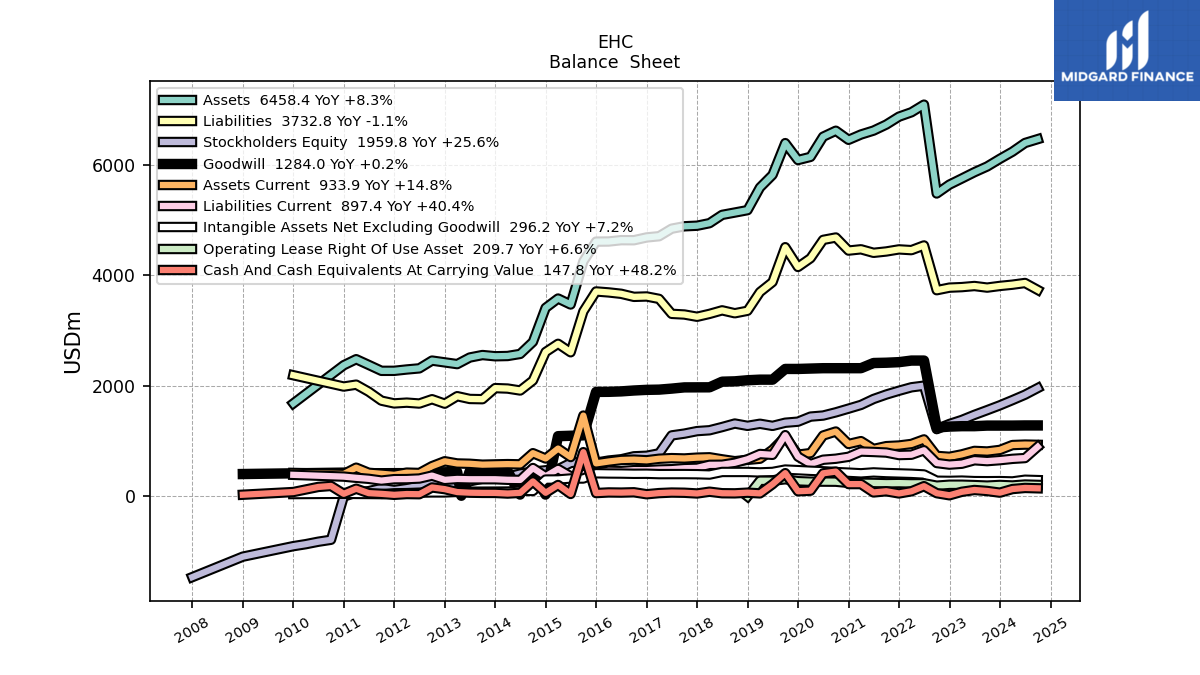
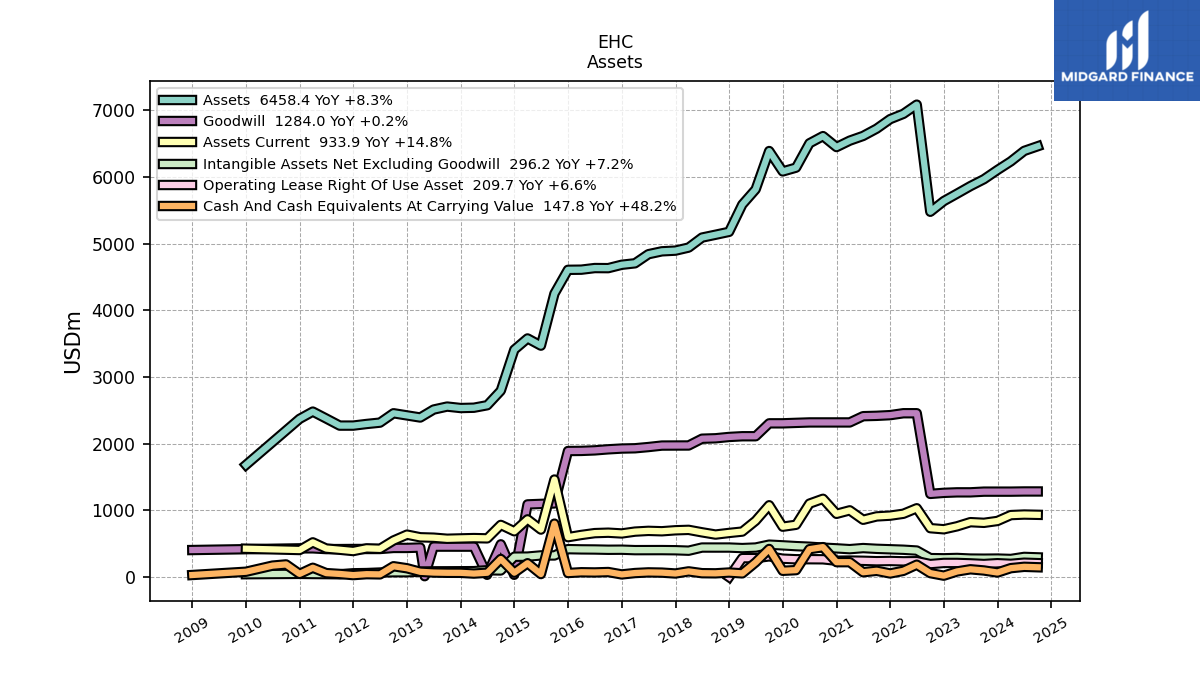
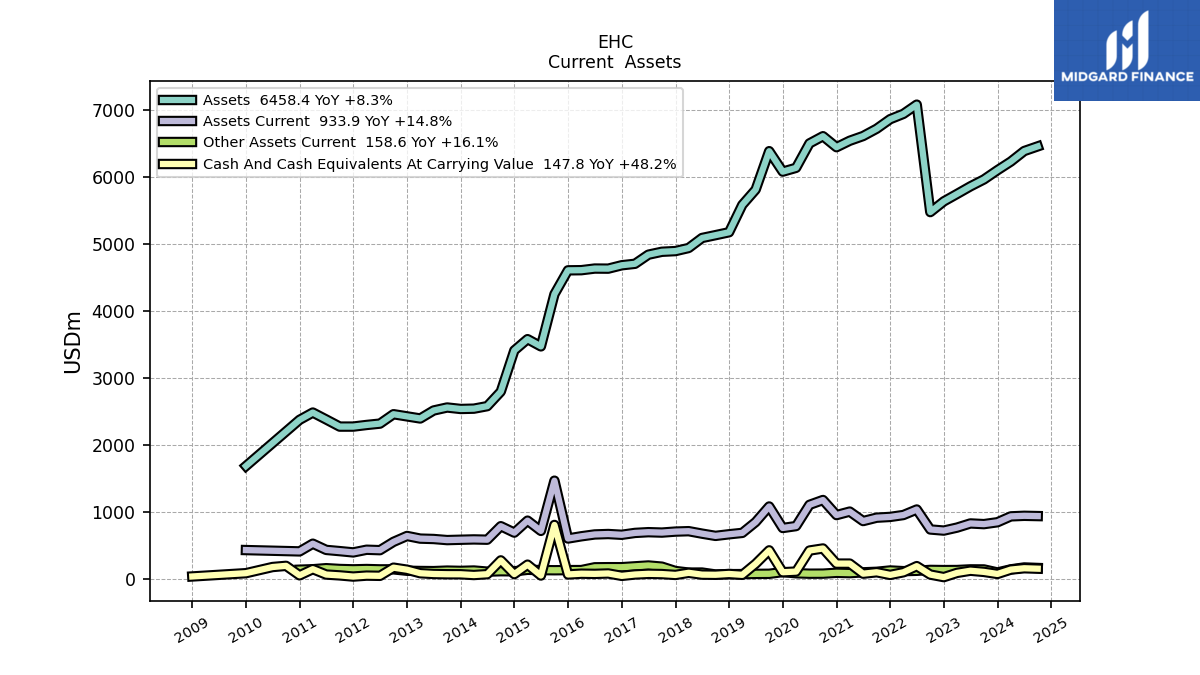
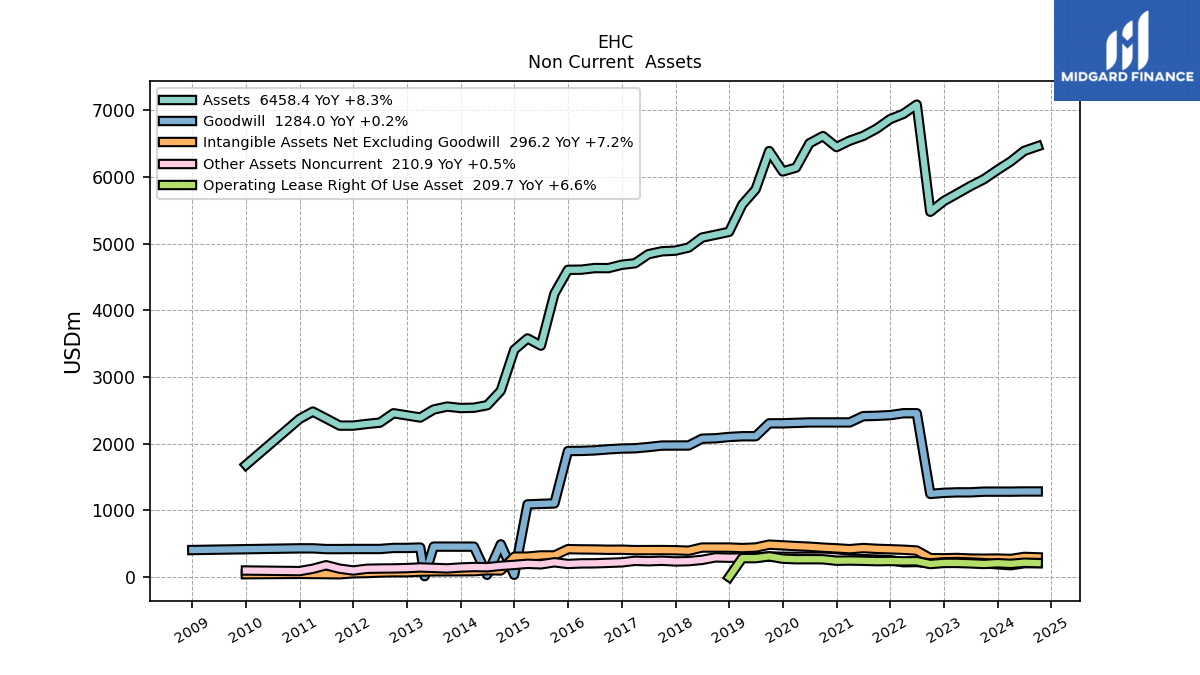
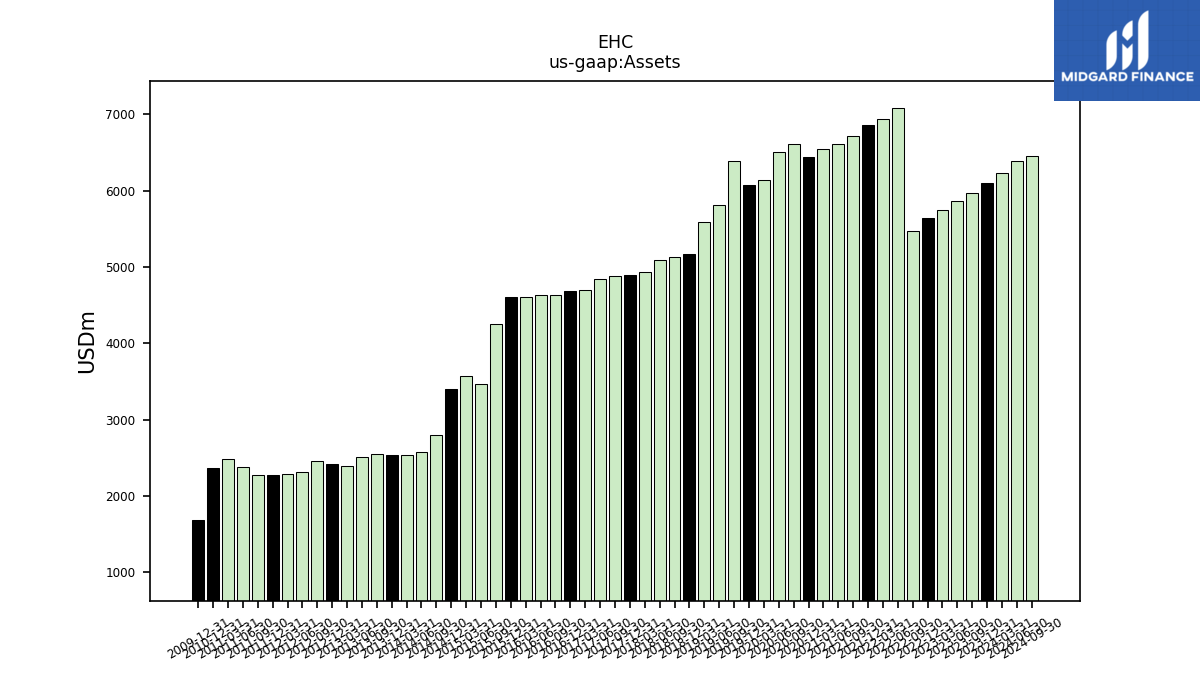
| Assets | 6102.40 | 5964.30 | 5860.90 | 5747.30 | 5636.50 | 5475.90 | 7082.20 | 6944.00 | 6864.90 | 6721.70 | 6612.90 | 6542.20 | 6445.90 | 6610.50 | 6502.50 | 6137.70 | 6080.70 | 6386.80 | 5812.10 | 5583.80 | 5175.00 | 5131.90 | 5089.40 | 4939.60 | 4893.70 | 4883.40 | 4840.00 | 4703.80 | 4681.90 | 4631.30 | 4632.60 | 4608.30 | 4606.10 | 4249.30 | 3469.50 | 3577.90 | 3408.80 | 2794.00 | 2576.50 | 2539.10 | 2534.40 | 2556.50 | 2511.70 | 2392.30 | 2423.80 | 2456.20 | 2315.70 | 2295.40 | 2271.20 | 2271.00 | 2377.40 | 2481.10 | 2372.10 | NA | NA | NA | |
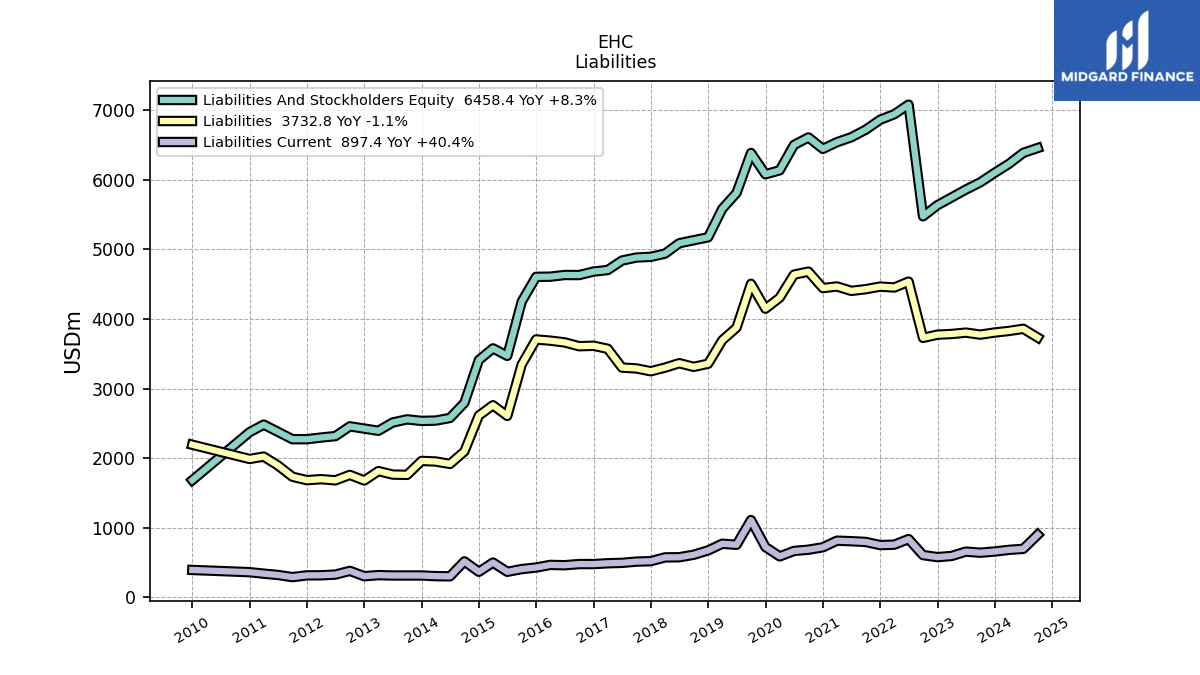
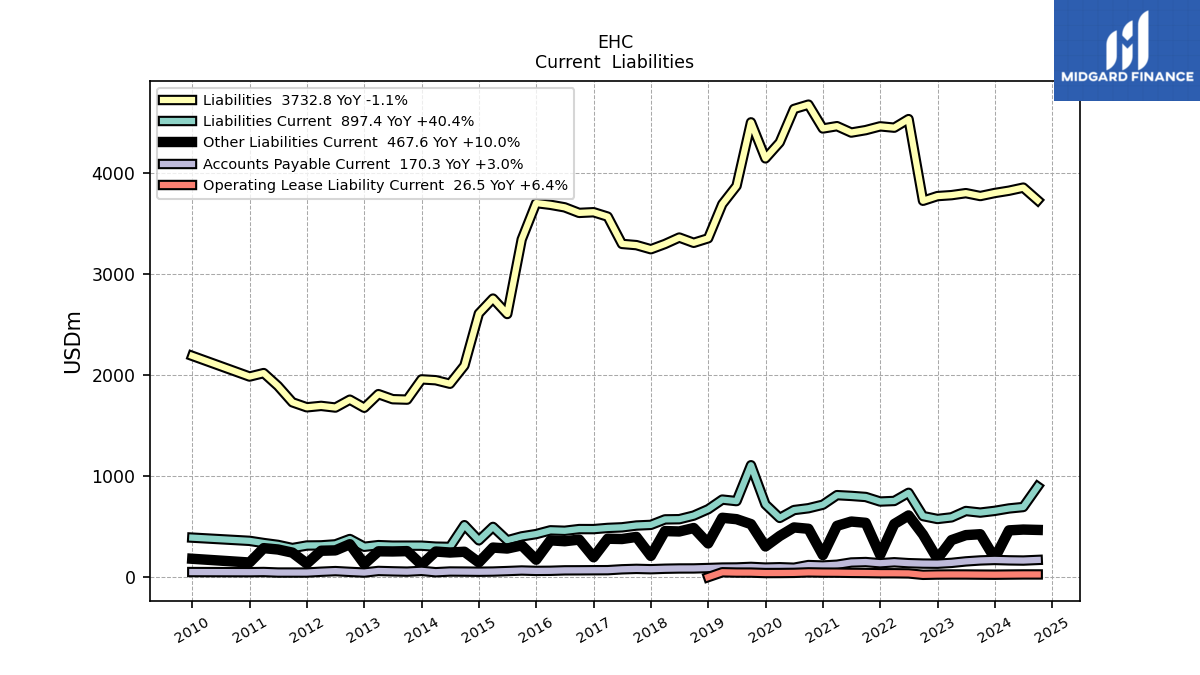
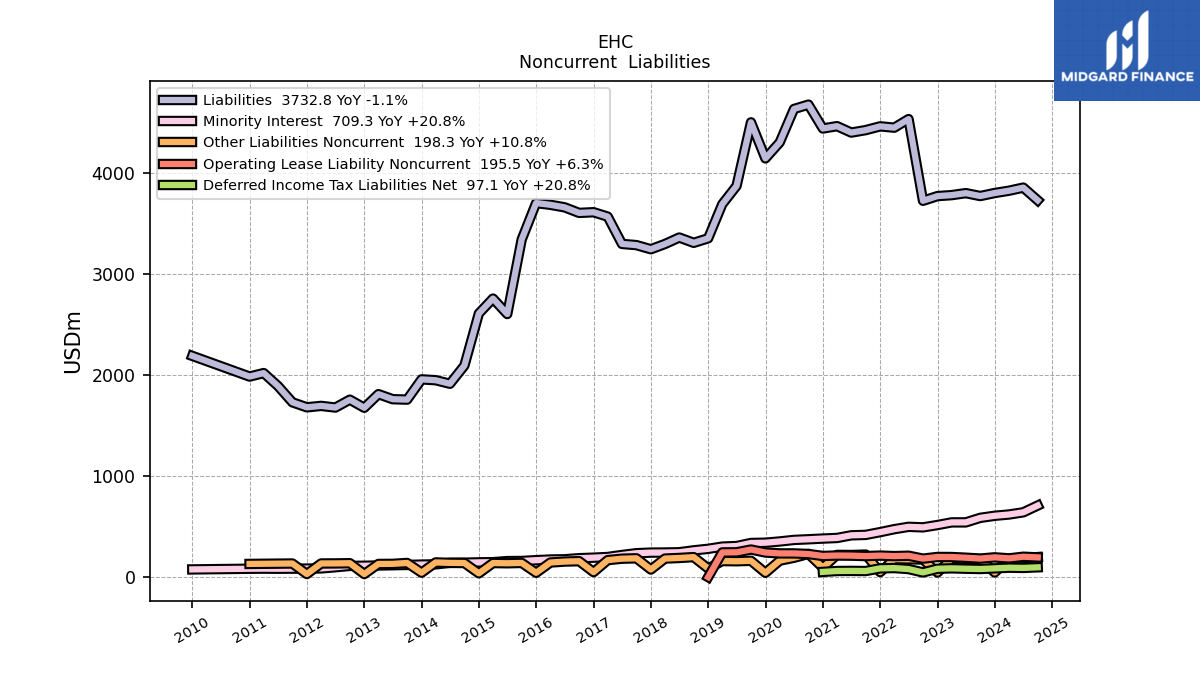
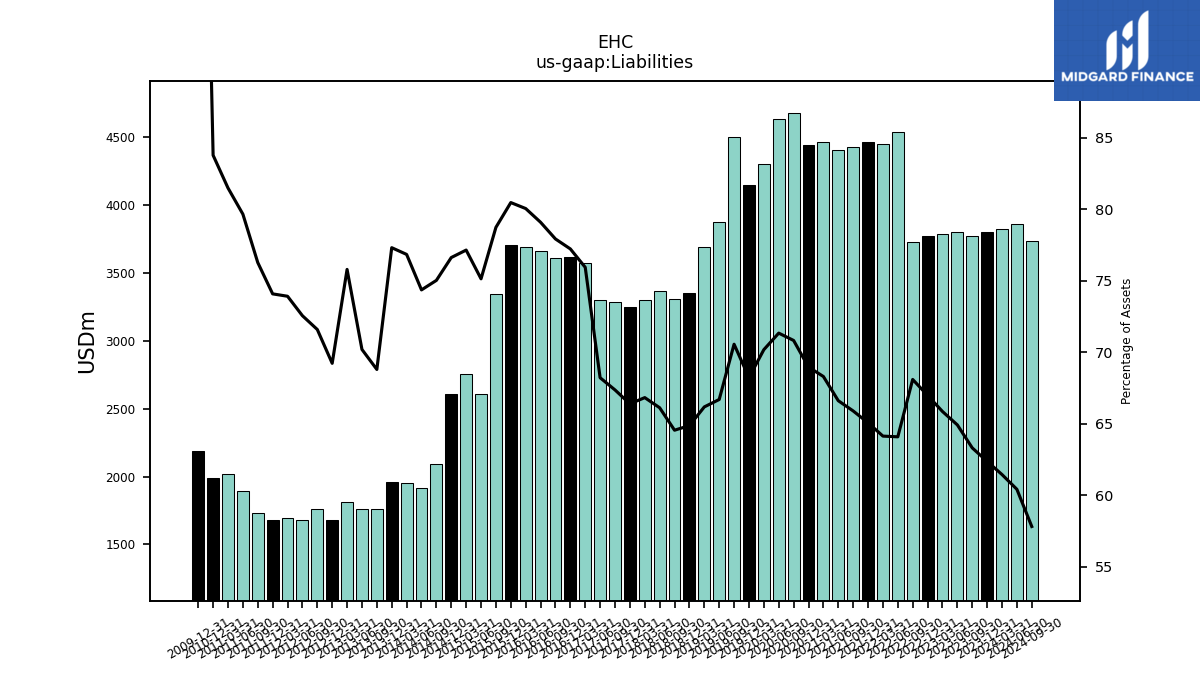
| Liabilities | 3805.20 | 3775.10 | 3803.90 | 3784.10 | 3774.60 | 3728.10 | 4537.60 | 4452.40 | 4465.70 | 4428.20 | 4403.90 | 4467.50 | 4444.30 | 4680.80 | 4637.70 | 4306.50 | 4148.00 | 4505.50 | 3875.50 | 3694.30 | 3356.30 | 3311.70 | 3364.20 | 3300.20 | 3248.20 | 3288.90 | 3301.00 | 3571.30 | 3614.90 | 3608.10 | 3663.20 | 3688.20 | 3705.70 | 3345.00 | 2606.30 | 2759.60 | 2611.40 | 2095.80 | 1915.50 | 1950.70 | 1959.00 | 1758.40 | 1762.70 | 1812.80 | 1677.50 | 1758.00 | 1679.80 | 1696.30 | 1682.20 | 1731.80 | 1893.40 | 2021.40 | 1986.90 | NA | NA | NA | |
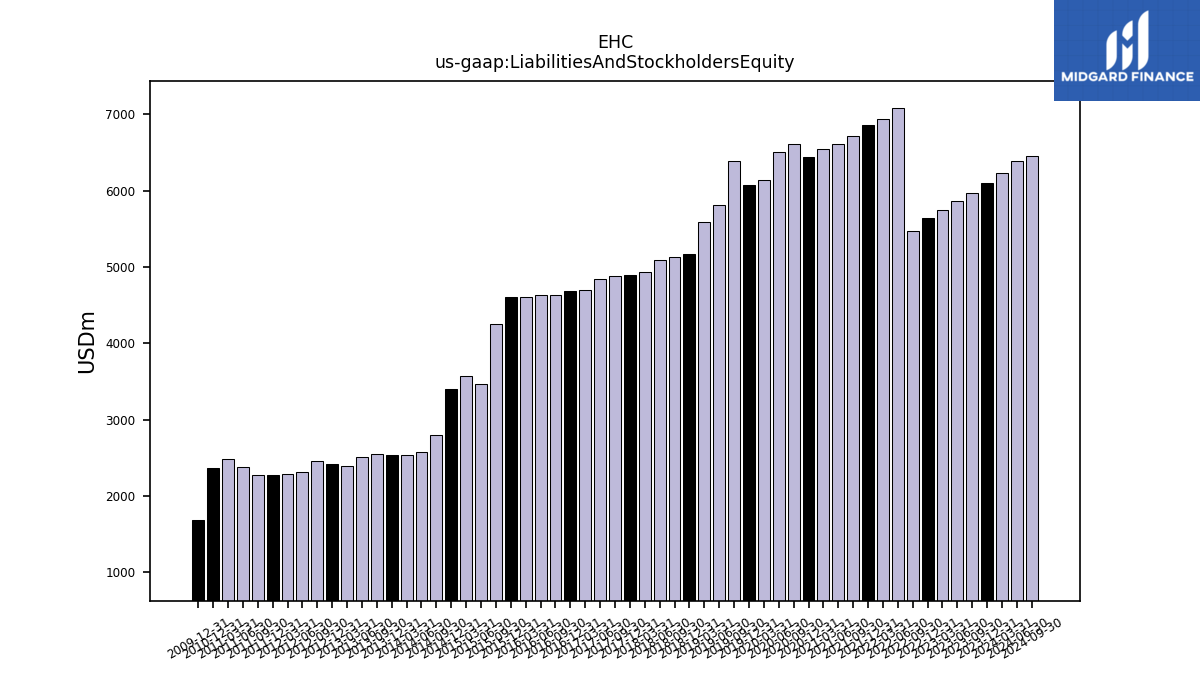
| Liabilities And Stockholders Equity | 6102.40 | 5964.30 | 5860.90 | 5747.30 | 5636.50 | 5475.90 | 7082.20 | 6944.00 | 6864.90 | 6721.70 | 6612.90 | 6542.20 | 6445.90 | 6610.50 | 6502.50 | 6137.70 | 6080.70 | 6386.80 | 5812.10 | 5583.80 | 5175.00 | 5131.90 | 5089.40 | 4939.60 | 4893.70 | 4883.40 | 4840.00 | 4703.80 | 4681.90 | 4631.30 | 4632.60 | 4608.30 | 4606.10 | 4249.30 | 3469.50 | 3577.90 | 3408.80 | 2794.00 | 2576.50 | 2539.10 | 2534.40 | 2556.50 | 2511.70 | 2392.30 | 2423.80 | 2456.20 | 2315.70 | 2295.40 | 2271.20 | 2271.00 | 2377.40 | 2481.10 | 2372.10 | NA | NA | NA | |
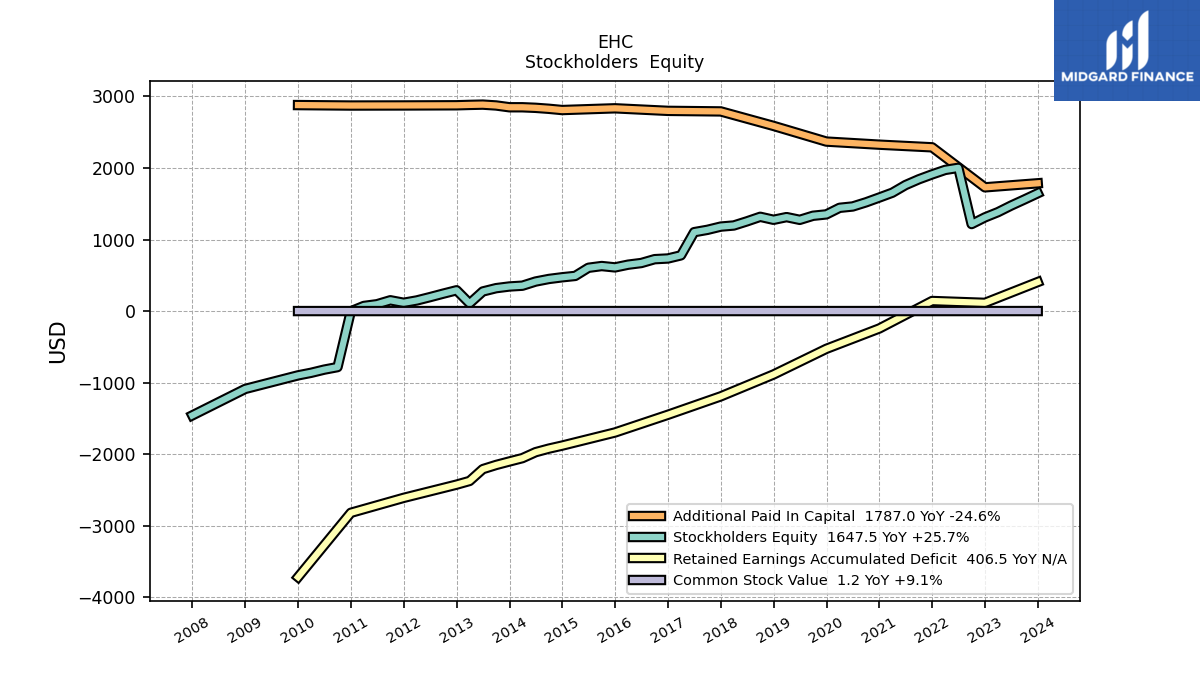
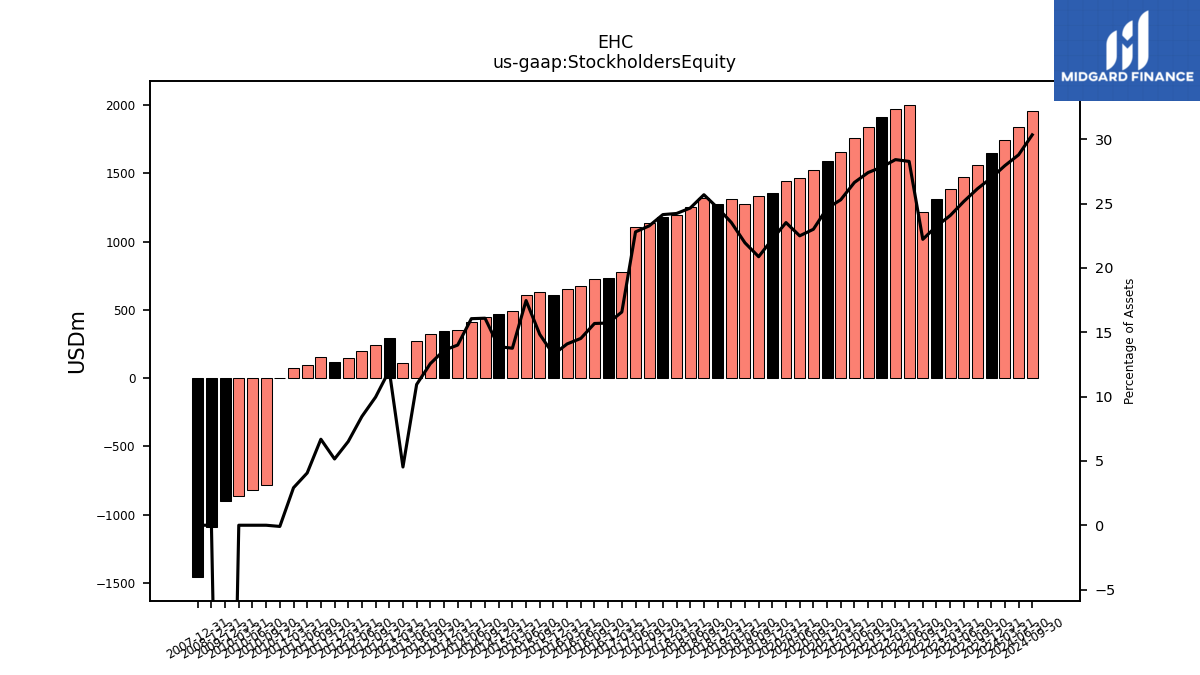
| Stockholders Equity | 1647.50 | 1560.40 | 1475.30 | 1383.50 | 1310.30 | 1217.00 | 2003.00 | 1973.50 | 1911.30 | 1842.70 | 1762.00 | 1655.10 | 1588.00 | 1520.80 | 1462.80 | 1443.90 | 1352.20 | 1333.10 | 1275.90 | 1314.30 | 1276.70 | 1318.50 | 1254.90 | 1197.00 | 1181.70 | 1136.40 | 1103.70 | 779.70 | 735.90 | 726.30 | 672.70 | 649.50 | 611.40 | 630.40 | 605.90 | 492.30 | 473.20 | 449.60 | 413.70 | 355.60 | 344.60 | 321.10 | 274.80 | 108.30 | 291.60 | 244.70 | 195.80 | 149.40 | 117.00 | 151.80 | 96.60 | 72.30 | -2.20 | -782.30 | -817.30 | -861.90 |
| 2023-12-31 | 2023-09-30 | 2023-06-30 | 2023-03-31 | 2022-12-31 | 2022-09-30 | 2022-06-30 | 2022-03-31 | 2021-12-31 | 2021-09-30 | 2021-06-30 | 2021-03-31 | 2020-12-31 | 2020-09-30 | 2020-06-30 | 2020-03-31 | 2019-12-31 | 2019-09-30 | 2019-06-30 | 2019-03-31 | 2018-12-31 | 2018-09-30 | 2018-06-30 | 2018-03-31 | 2017-12-31 | 2017-09-30 | 2017-06-30 | 2017-03-31 | 2016-12-31 | 2016-09-30 | 2016-06-30 | 2016-03-31 | 2015-12-31 | 2015-09-30 | 2015-06-30 | 2015-03-31 | 2014-12-31 | 2014-09-30 | 2014-06-30 | 2014-03-31 | 2013-12-31 | 2013-09-30 | 2013-06-30 | 2013-03-31 | 2012-12-31 | 2012-09-30 | 2012-06-30 | 2012-03-31 | 2011-12-31 | 2011-09-30 | 2011-06-30 | 2011-03-31 | 2010-12-31 | 2010-09-30 | 2010-06-30 | 2010-03-31 | ||
|---|---|---|---|---|---|---|---|---|---|---|---|---|---|---|---|---|---|---|---|---|---|---|---|---|---|---|---|---|---|---|---|---|---|---|---|---|---|---|---|---|---|---|---|---|---|---|---|---|---|---|---|---|---|---|---|---|---|
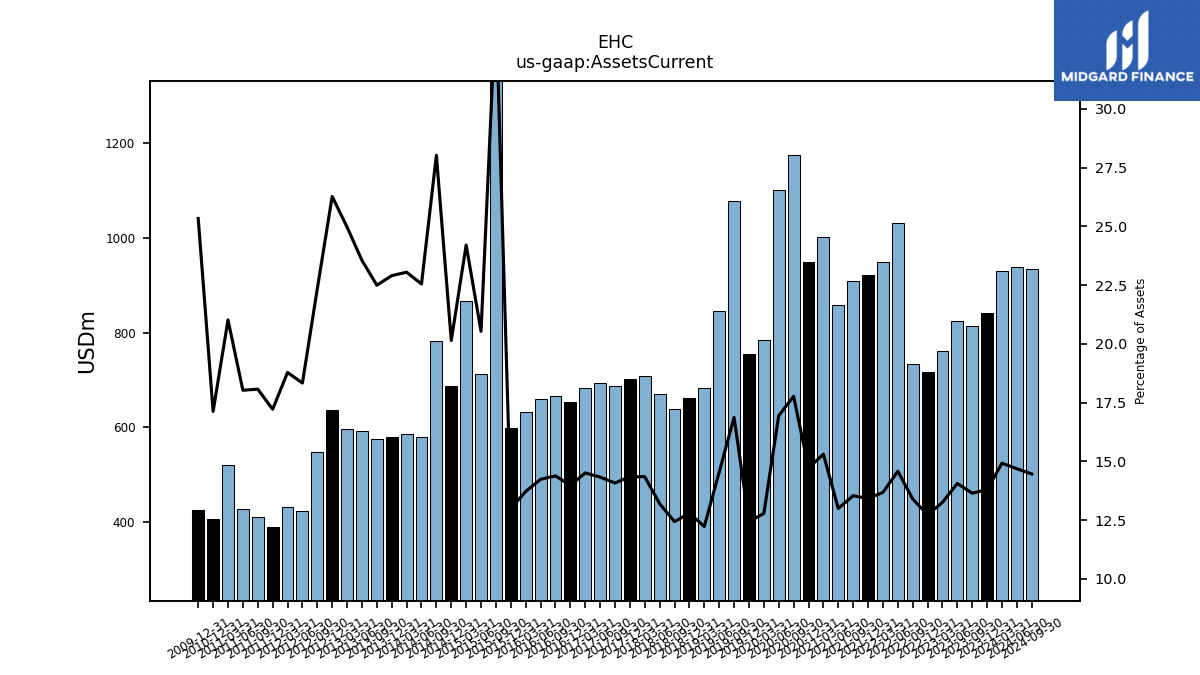
| Assets Current | 841.80 | 813.70 | 824.00 | 761.70 | 717.20 | 733.80 | 1032.40 | 949.70 | 921.40 | 909.80 | 859.30 | 1001.10 | 948.60 | 1174.40 | 1101.70 | 784.50 | 755.80 | 1077.40 | 844.90 | 682.70 | 662.10 | 638.00 | 671.60 | 708.50 | 702.20 | 687.40 | 693.50 | 682.30 | 654.50 | 666.00 | 659.50 | 632.10 | 598.70 | 1463.00 | 712.40 | 866.00 | 686.60 | 783.00 | 580.90 | 585.20 | 580.40 | 575.10 | 591.50 | 597.30 | 636.80 | 548.80 | 424.50 | 431.10 | 391.00 | 410.40 | 428.50 | 521.40 | 406.20 | NA | NA | NA | |
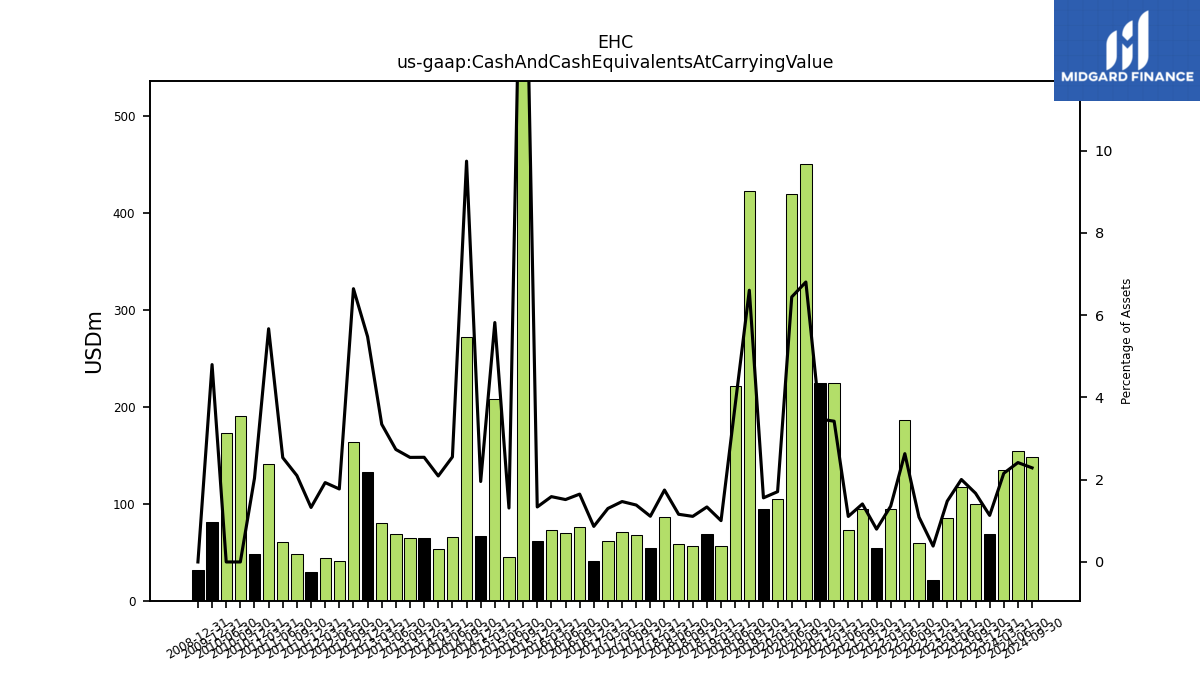
| Cash And Cash Equivalents At Carrying Value | 69.10 | 99.70 | 117.50 | 85.00 | 21.80 | 59.80 | 186.50 | 94.20 | 54.80 | 94.80 | 73.20 | 223.90 | 224.00 | 450.00 | 419.00 | 104.90 | 94.80 | 422.00 | 221.70 | 56.10 | 69.20 | 56.90 | 59.00 | 86.40 | 54.40 | 67.60 | 71.10 | 61.20 | 40.50 | 76.40 | 70.30 | 73.20 | 61.60 | 801.60 | 45.50 | 208.30 | 66.70 | 272.30 | 65.80 | 53.10 | 64.50 | 65.00 | 68.70 | 80.10 | 132.80 | 163.20 | 41.10 | 44.30 | 30.10 | 47.70 | 60.30 | 140.70 | 48.30 | 190.40 | 172.60 | NA | |
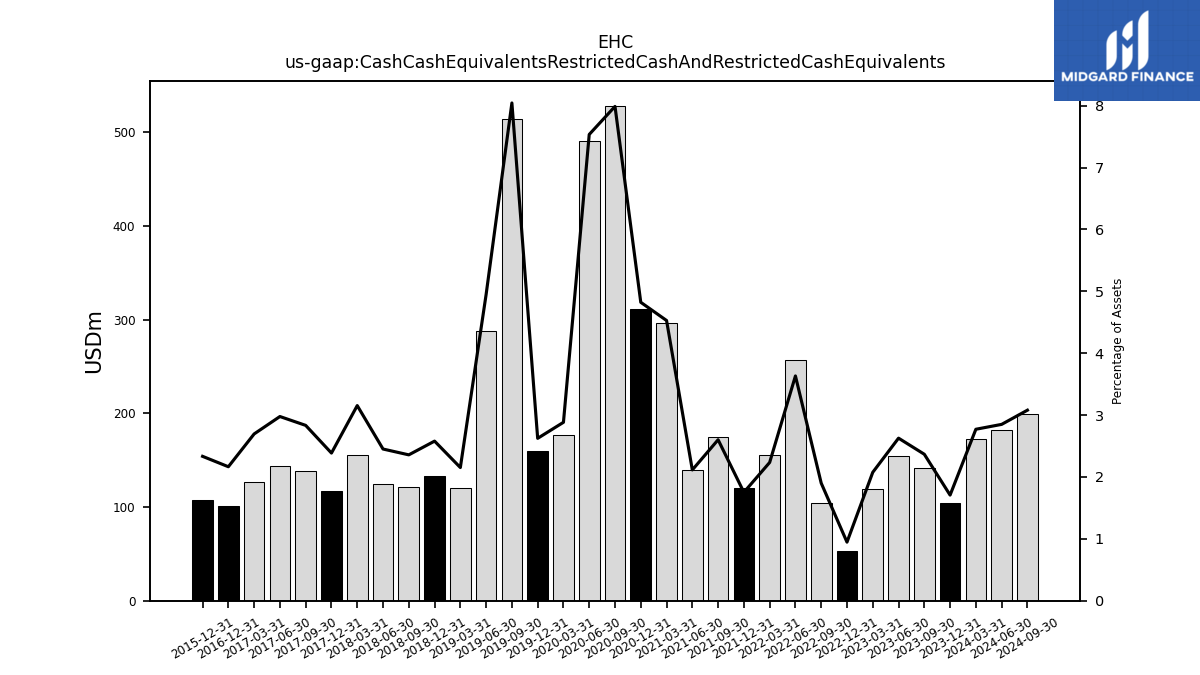
| Cash Cash Equivalents Restricted Cash And Restricted Cash Equivalents | 104.20 | 141.20 | 154.00 | 119.30 | 53.40 | 104.10 | 257.30 | 155.20 | 120.30 | 174.90 | 139.80 | 296.30 | 310.90 | 528.10 | 490.00 | 177.00 | 159.60 | 513.80 | 287.70 | 120.20 | 133.50 | 121.00 | 124.80 | 155.80 | 116.80 | 138.40 | 144.10 | 126.80 | 101.40 | NA | NA | NA | 107.50 | NA | NA | NA | NA | NA | NA | NA | NA | NA | NA | NA | NA | NA | NA | NA | NA | NA | NA | NA | NA | NA | NA | NA | |
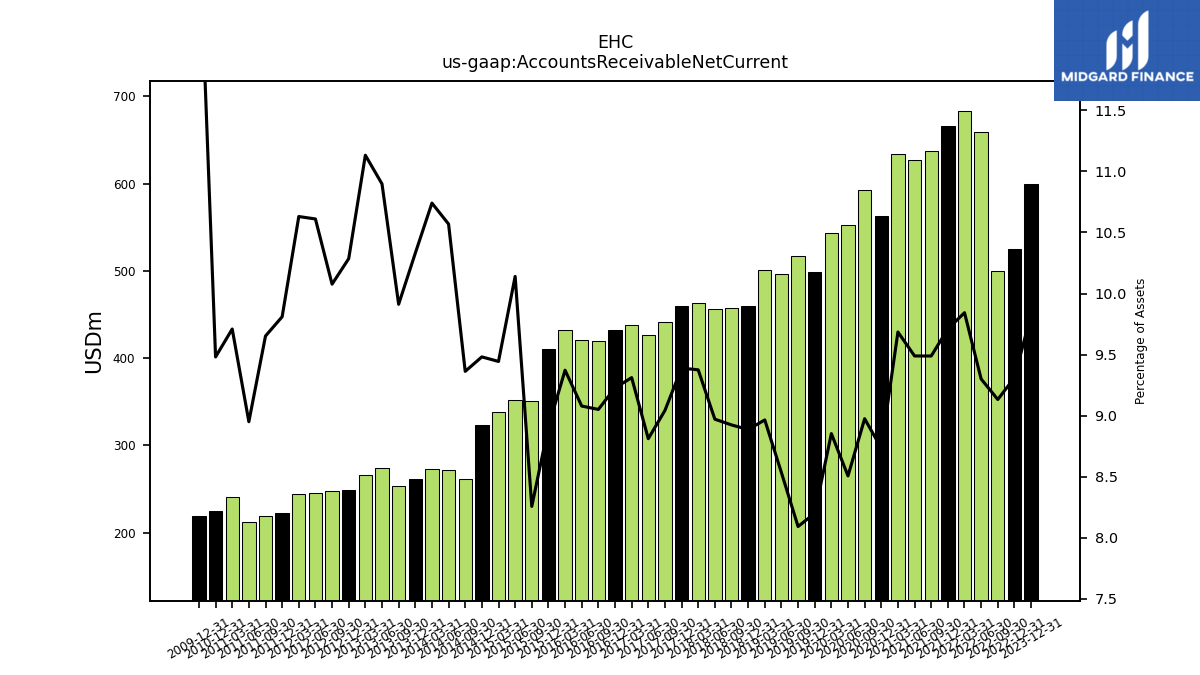
| Accounts Receivable Net Current | 599.80 | NA | NA | NA | 524.80 | 500.10 | 658.70 | 683.50 | 666.60 | 637.80 | 627.50 | 633.60 | 563.00 | 593.30 | 553.20 | 543.40 | 498.70 | 516.90 | 496.00 | 500.60 | 459.90 | 458.00 | 456.60 | 463.10 | 459.50 | 441.60 | 426.50 | 438.00 | 432.00 | 419.20 | 420.60 | 431.90 | 410.50 | 350.90 | 351.80 | 337.90 | 323.20 | 261.60 | 272.30 | 272.70 | 261.80 | 253.40 | 273.70 | 266.30 | 249.30 | 247.50 | 245.70 | 244.00 | 222.80 | 219.20 | 212.80 | 240.90 | 224.90 | NA | NA | NA | |
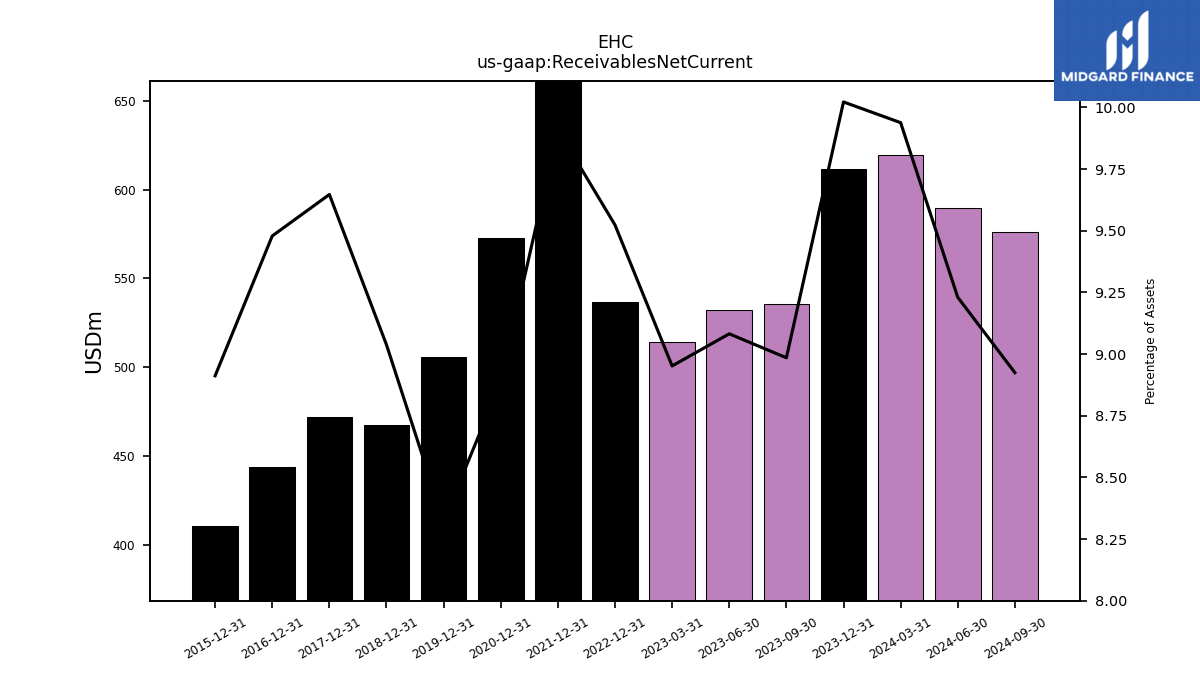
| Receivables Net Current | 611.60 | 535.90 | 532.30 | 514.50 | 536.80 | NA | NA | NA | 680.30 | NA | NA | NA | 572.80 | NA | NA | NA | 506.10 | NA | NA | NA | 467.70 | NA | NA | NA | 472.10 | NA | NA | NA | 443.80 | NA | NA | NA | 410.50 | NA | NA | NA | NA | NA | NA | NA | NA | NA | NA | NA | NA | NA | NA | NA | NA | NA | NA | NA | NA | NA | NA | NA | |
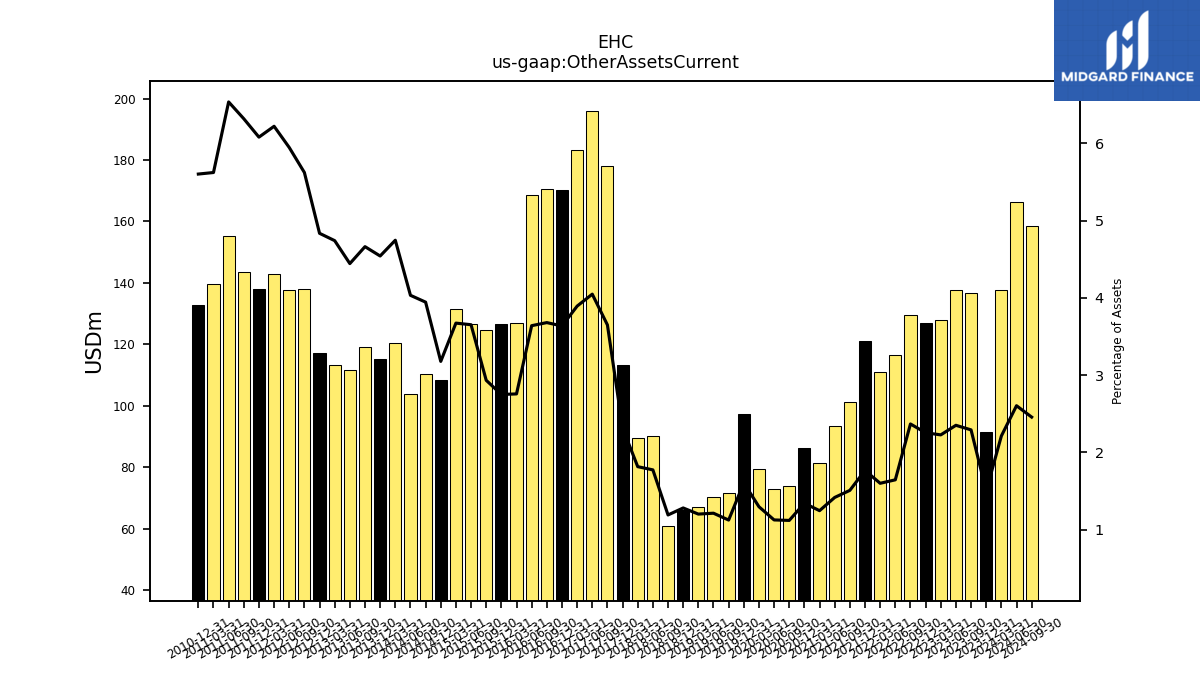
| Other Assets Current | 91.50 | 136.60 | 137.70 | 127.90 | 127.00 | 129.60 | 116.40 | 111.00 | 121.20 | 101.30 | 93.60 | 81.40 | 86.40 | 73.90 | 73.10 | 79.50 | 97.50 | 71.70 | 70.40 | 67.00 | 66.20 | 61.00 | 90.20 | 89.60 | 113.30 | 178.20 | 195.90 | 183.10 | 170.20 | 170.40 | 168.60 | 127.00 | 126.60 | 124.60 | 126.70 | 131.40 | 108.30 | 110.20 | 103.90 | 120.50 | 115.10 | 119.20 | 111.60 | 113.40 | 117.20 | 138.10 | 137.70 | 142.80 | 138.10 | 143.50 | 155.40 | 139.50 | 132.90 | NA | NA | NA |
| 2023-12-31 | 2023-09-30 | 2023-06-30 | 2023-03-31 | 2022-12-31 | 2022-09-30 | 2022-06-30 | 2022-03-31 | 2021-12-31 | 2021-09-30 | 2021-06-30 | 2021-03-31 | 2020-12-31 | 2020-09-30 | 2020-06-30 | 2020-03-31 | 2019-12-31 | 2019-09-30 | 2019-06-30 | 2019-03-31 | 2018-12-31 | 2018-09-30 | 2018-06-30 | 2018-03-31 | 2017-12-31 | 2017-09-30 | 2017-06-30 | 2017-03-31 | 2016-12-31 | 2016-09-30 | 2016-06-30 | 2016-03-31 | 2015-12-31 | 2015-09-30 | 2015-06-30 | 2015-03-31 | 2014-12-31 | 2014-09-30 | 2014-06-30 | 2014-03-31 | 2013-12-31 | 2013-09-30 | 2013-06-30 | 2013-03-31 | 2012-12-31 | 2012-09-30 | 2012-06-30 | 2012-03-31 | 2011-12-31 | 2011-09-30 | 2011-06-30 | 2011-03-31 | 2010-12-31 | 2010-09-30 | 2010-06-30 | 2010-03-31 | ||
|---|---|---|---|---|---|---|---|---|---|---|---|---|---|---|---|---|---|---|---|---|---|---|---|---|---|---|---|---|---|---|---|---|---|---|---|---|---|---|---|---|---|---|---|---|---|---|---|---|---|---|---|---|---|---|---|---|---|
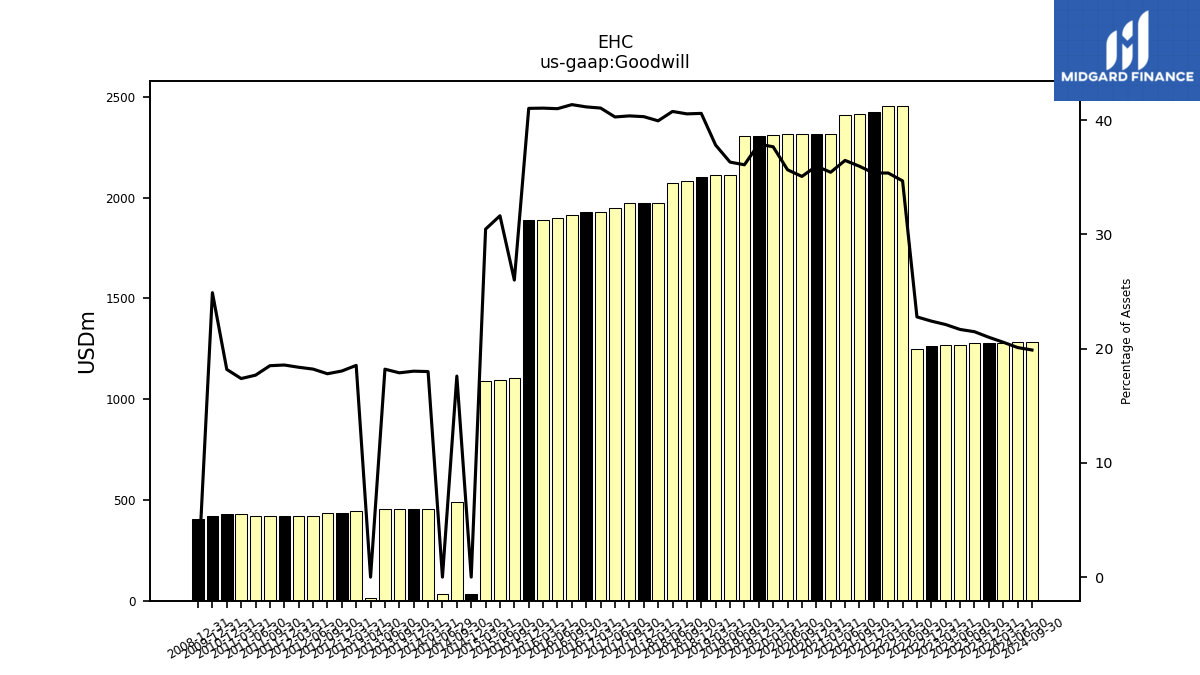
| Goodwill | 1281.30 | 1281.30 | 1270.70 | 1270.70 | 1263.20 | 1247.40 | 2456.50 | 2456.50 | 2427.90 | 2417.60 | 2412.30 | 2318.70 | 2318.70 | 2318.70 | 2318.70 | 2312.10 | 2305.20 | 2305.20 | 2111.60 | 2111.60 | 2100.80 | 2081.10 | 2074.70 | 1973.10 | 1972.60 | 1971.70 | 1949.60 | 1931.40 | 1927.20 | 1915.60 | 1899.70 | 1891.90 | 1890.10 | 1105.00 | 1097.50 | 1090.00 | NA | 491.70 | NA | 456.90 | 456.90 | 457.20 | 457.20 | 443.40 | 437.30 | 437.30 | 421.70 | 421.70 | 421.70 | 420.30 | 420.30 | 431.30 | 431.30 | NA | NA | NA | |
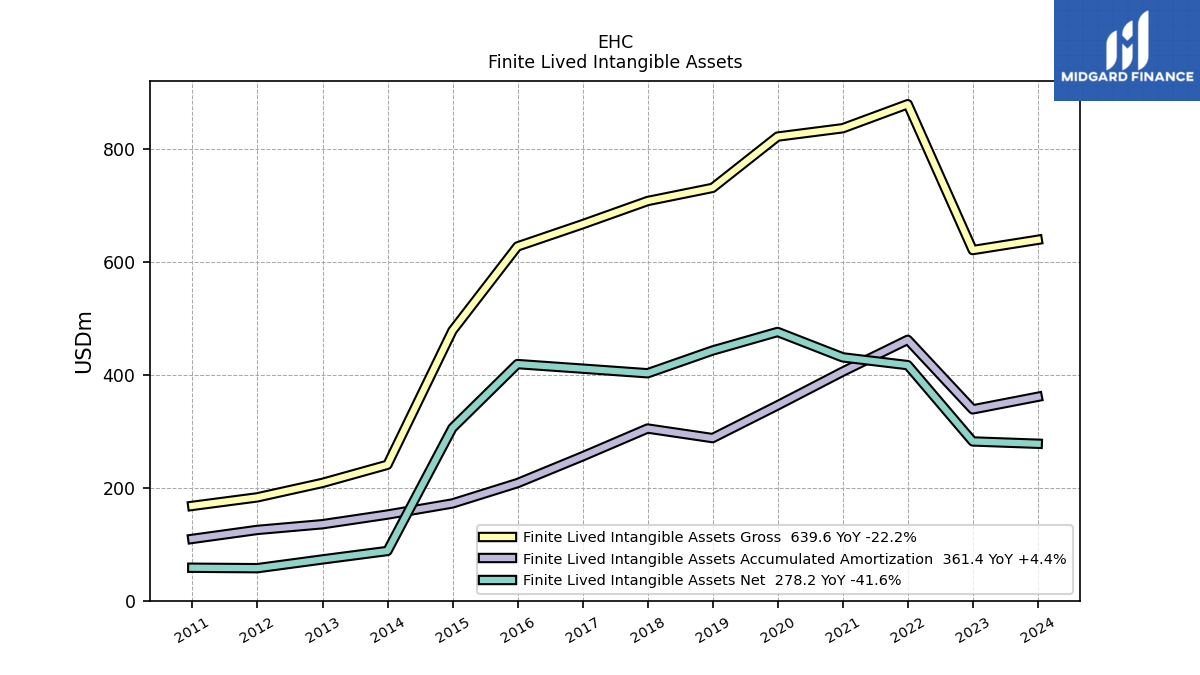
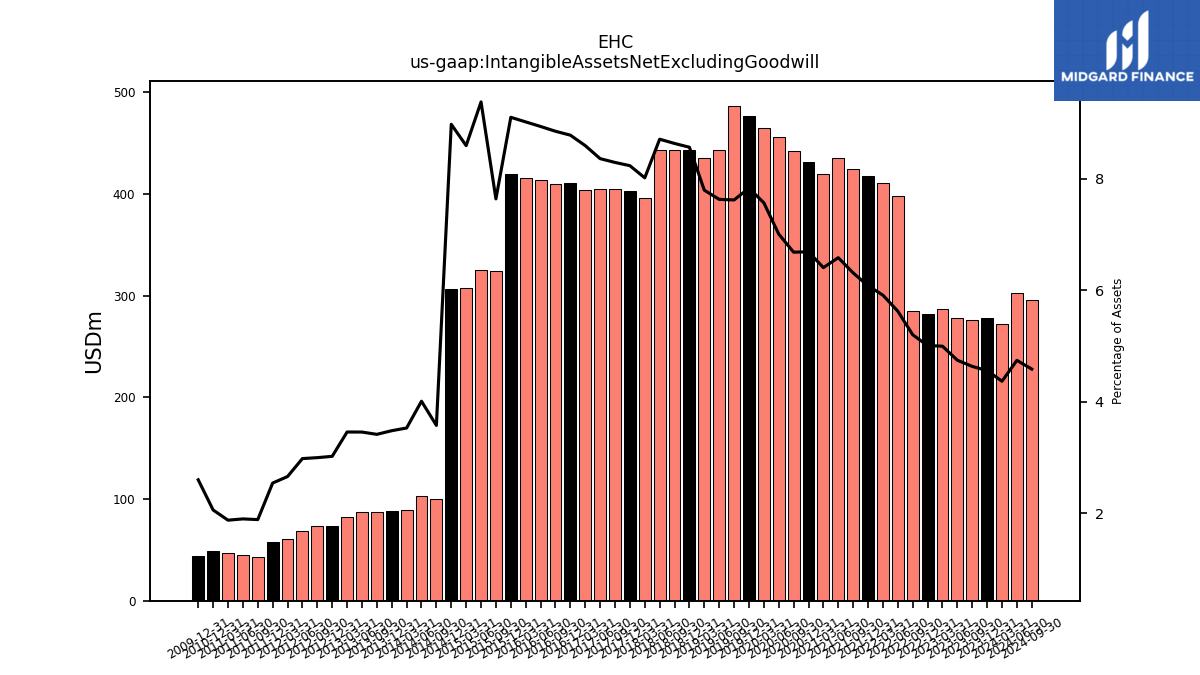
| Intangible Assets Net Excluding Goodwill | 278.20 | 276.40 | 278.10 | 287.20 | 282.30 | 284.90 | 398.40 | 410.60 | 417.50 | 424.30 | 435.50 | 419.20 | 431.30 | 441.90 | 455.80 | 464.70 | 476.30 | 486.80 | 443.60 | 435.40 | 443.40 | 443.20 | 443.40 | 396.10 | 403.10 | 405.10 | 404.80 | 404.40 | 411.30 | 410.10 | 414.20 | 415.80 | 419.40 | 324.70 | 325.50 | 307.60 | 306.10 | 99.90 | 103.30 | 89.60 | 88.20 | 87.30 | 86.80 | 82.70 | 73.20 | 73.60 | 69.00 | 61.00 | 57.70 | 42.80 | 45.10 | 46.50 | 48.80 | NA | NA | NA | |
| Finite Lived Intangible Assets Net | 278.20 | NA | NA | NA | 282.30 | NA | NA | NA | 417.50 | NA | NA | NA | 431.30 | NA | NA | NA | 476.30 | NA | NA | NA | 443.40 | NA | NA | NA | 403.10 | NA | NA | NA | 411.30 | NA | NA | NA | 419.40 | NA | NA | NA | 306.10 | NA | NA | NA | 88.20 | NA | NA | NA | 73.20 | NA | NA | NA | 57.70 | NA | NA | NA | 58.50 | NA | NA | NA | |
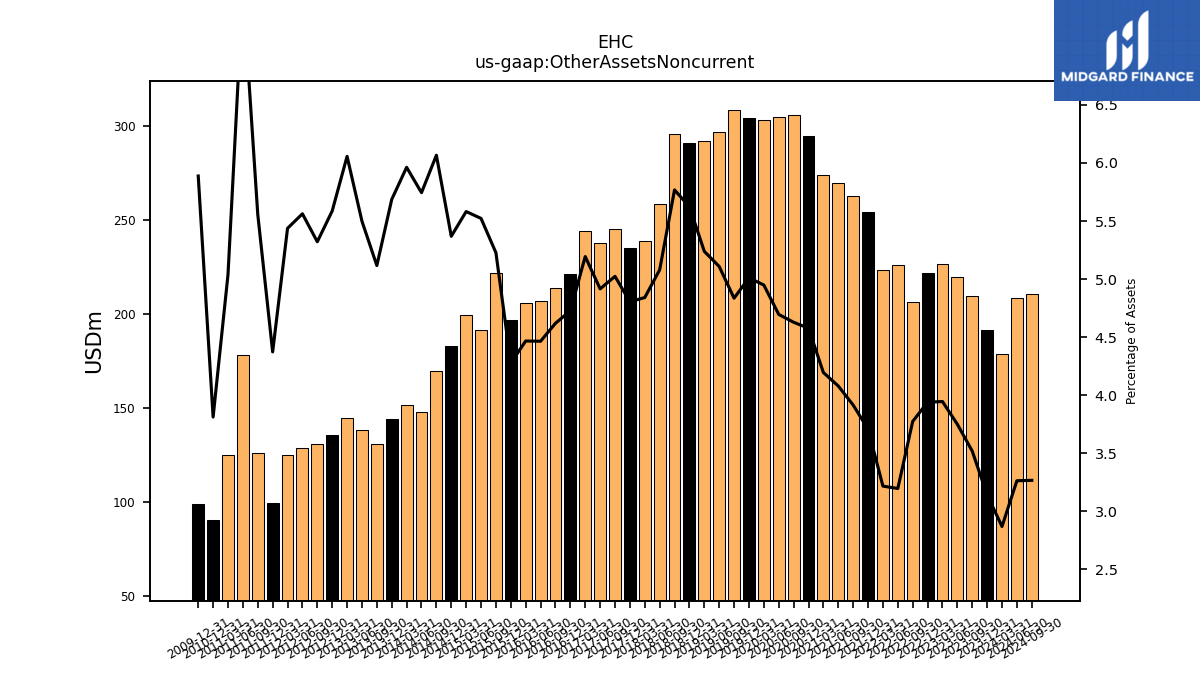
| Other Assets Noncurrent | 191.60 | 209.80 | 219.70 | 226.70 | 222.00 | 206.60 | 226.30 | 223.30 | 254.50 | 263.10 | 269.70 | 274.40 | 295.00 | 305.90 | 305.30 | 303.70 | 304.70 | 308.80 | 296.90 | 292.50 | 291.00 | 296.00 | 258.50 | 239.10 | 235.10 | 245.30 | 237.90 | 244.30 | 221.30 | 213.90 | 206.80 | 205.80 | 197.00 | 222.10 | 191.60 | 199.70 | 183.00 | 169.50 | 148.00 | 151.40 | 144.10 | 130.80 | 138.10 | 144.90 | 135.40 | 130.70 | 128.80 | 124.80 | 99.30 | 126.20 | 178.30 | 125.00 | 90.40 | NA | NA | NA |
| 2023-12-31 | 2023-09-30 | 2023-06-30 | 2023-03-31 | 2022-12-31 | 2022-09-30 | 2022-06-30 | 2022-03-31 | 2021-12-31 | 2021-09-30 | 2021-06-30 | 2021-03-31 | 2020-12-31 | 2020-09-30 | 2020-06-30 | 2020-03-31 | 2019-12-31 | 2019-09-30 | 2019-06-30 | 2019-03-31 | 2018-12-31 | 2018-09-30 | 2018-06-30 | 2018-03-31 | 2017-12-31 | 2017-09-30 | 2017-06-30 | 2017-03-31 | 2016-12-31 | 2016-09-30 | 2016-06-30 | 2016-03-31 | 2015-12-31 | 2015-09-30 | 2015-06-30 | 2015-03-31 | 2014-12-31 | 2014-09-30 | 2014-06-30 | 2014-03-31 | 2013-12-31 | 2013-09-30 | 2013-06-30 | 2013-03-31 | 2012-12-31 | 2012-09-30 | 2012-06-30 | 2012-03-31 | 2011-12-31 | 2011-09-30 | 2011-06-30 | 2011-03-31 | 2010-12-31 | 2010-09-30 | 2010-06-30 | 2010-03-31 | ||
|---|---|---|---|---|---|---|---|---|---|---|---|---|---|---|---|---|---|---|---|---|---|---|---|---|---|---|---|---|---|---|---|---|---|---|---|---|---|---|---|---|---|---|---|---|---|---|---|---|---|---|---|---|---|---|---|---|---|
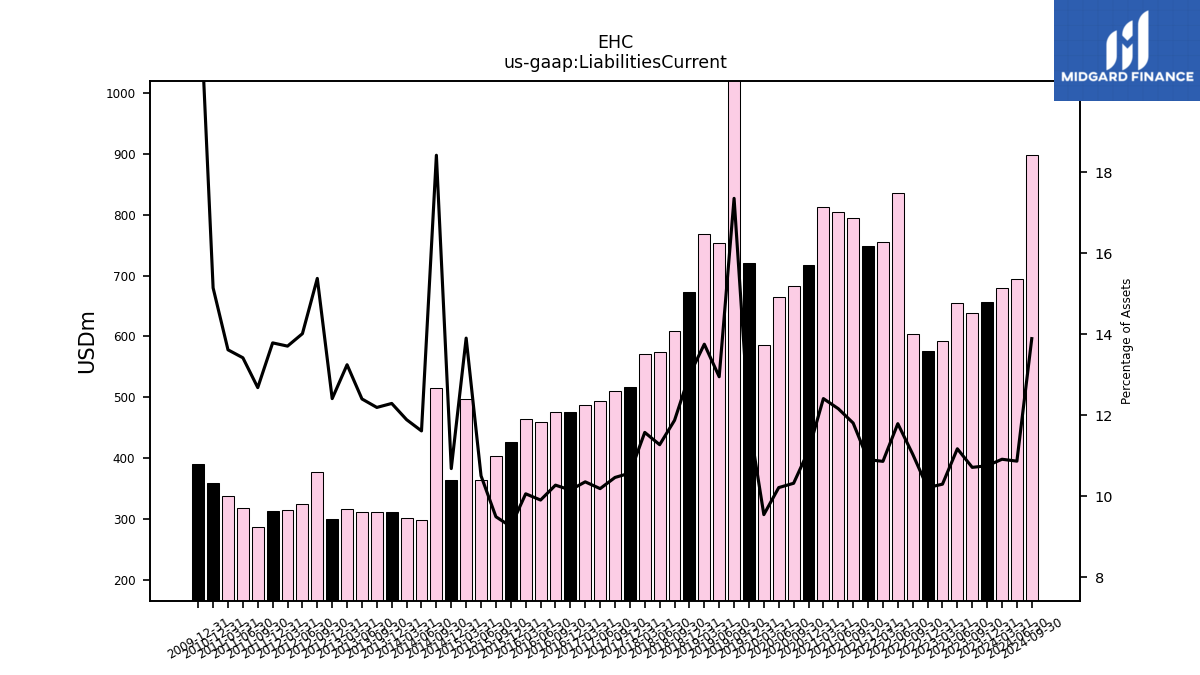
| Liabilities Current | 656.40 | 639.20 | 655.00 | 592.10 | 575.90 | 604.70 | 835.40 | 754.50 | 748.80 | 793.90 | 804.50 | 812.20 | 717.30 | 682.50 | 664.40 | 586.20 | 721.00 | 1108.60 | 752.90 | 768.20 | 672.50 | 609.60 | 573.90 | 572.00 | 517.50 | 511.20 | 493.30 | 487.30 | 475.60 | 476.00 | 459.10 | 463.80 | 426.40 | 403.60 | 364.60 | 497.60 | 364.30 | 514.70 | 299.30 | 302.00 | 311.60 | 311.80 | 311.60 | 317.00 | 300.90 | 377.80 | 324.60 | 314.70 | 313.20 | 288.10 | 319.10 | 337.90 | 359.30 | NA | NA | NA | |
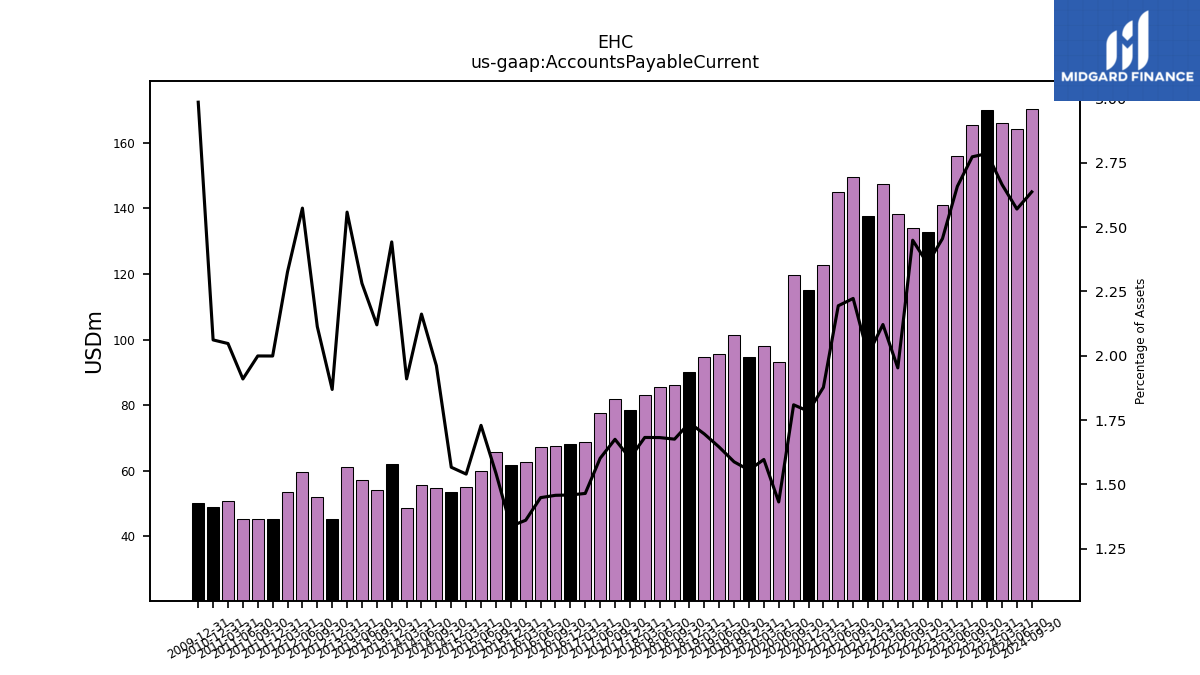
| Accounts Payable Current | 170.00 | 165.40 | 155.80 | 141.10 | 132.90 | 134.10 | 138.30 | 147.30 | 137.60 | 149.40 | 145.10 | 122.80 | 115.00 | 119.60 | 93.10 | 98.00 | 94.60 | 101.40 | 95.60 | 94.70 | 90.00 | 86.00 | 85.60 | 83.10 | 78.40 | 81.80 | 77.50 | 68.90 | 68.30 | 67.50 | 67.10 | 62.70 | 61.60 | 65.60 | 60.00 | 55.10 | 53.40 | 54.80 | 55.70 | 48.50 | 61.90 | 54.20 | 57.30 | 61.20 | 45.30 | 51.90 | 59.60 | 53.40 | 45.40 | 45.40 | 45.40 | 50.80 | 48.90 | NA | NA | NA | |
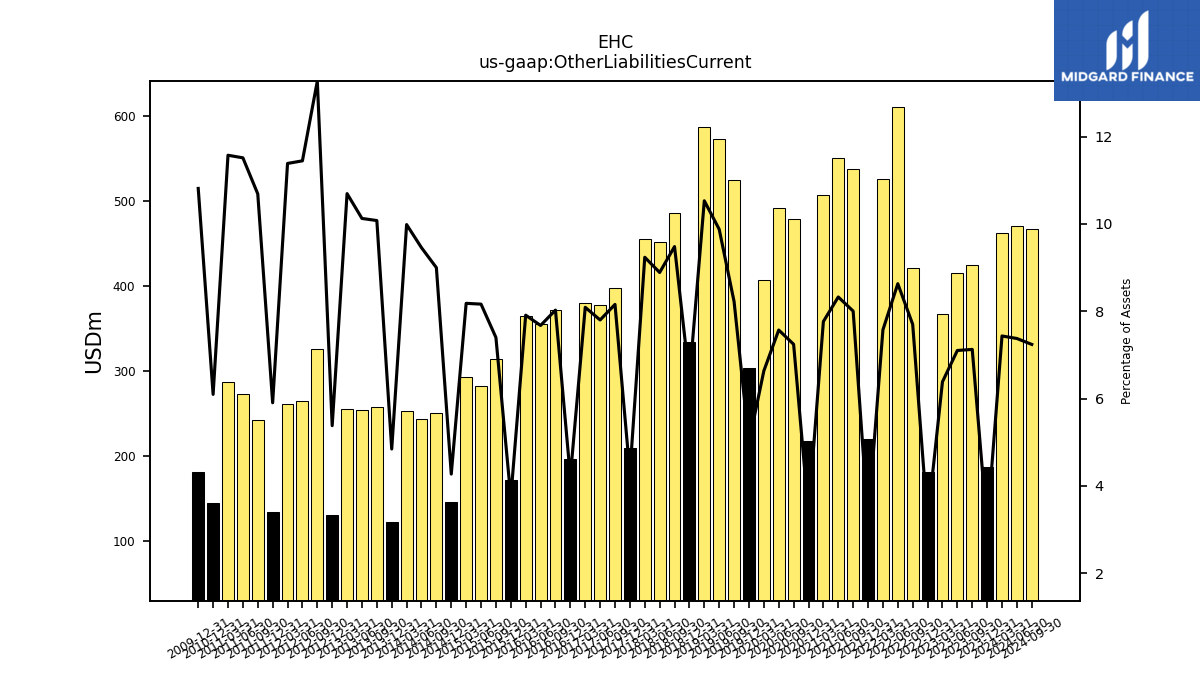
| Other Liabilities Current | 187.40 | 425.00 | 416.20 | 366.90 | 181.00 | 421.60 | 611.20 | 526.00 | 219.70 | 537.90 | 550.60 | 508.00 | 218.30 | 478.80 | 492.20 | 407.20 | 303.80 | 525.10 | 574.00 | 587.90 | 333.90 | 486.50 | 452.30 | 456.20 | 210.00 | 398.30 | 377.50 | 380.50 | 197.10 | 371.70 | 355.50 | 364.50 | 172.10 | 314.40 | 283.20 | 292.70 | 145.60 | 251.40 | 243.60 | 253.50 | 122.80 | 257.60 | 254.30 | 255.80 | 130.40 | 325.90 | 265.00 | 261.30 | 134.10 | 242.70 | 273.70 | 287.10 | 144.60 | NA | NA | NA |
| 2023-12-31 | 2023-09-30 | 2023-06-30 | 2023-03-31 | 2022-12-31 | 2022-09-30 | 2022-06-30 | 2022-03-31 | 2021-12-31 | 2021-09-30 | 2021-06-30 | 2021-03-31 | 2020-12-31 | 2020-09-30 | 2020-06-30 | 2020-03-31 | 2019-12-31 | 2019-09-30 | 2019-06-30 | 2019-03-31 | 2018-12-31 | 2018-09-30 | 2018-06-30 | 2018-03-31 | 2017-12-31 | 2017-09-30 | 2017-06-30 | 2017-03-31 | 2016-12-31 | 2016-09-30 | 2016-06-30 | 2016-03-31 | 2015-12-31 | 2015-09-30 | 2015-06-30 | 2015-03-31 | 2014-12-31 | 2014-09-30 | 2014-06-30 | 2014-03-31 | 2013-12-31 | 2013-09-30 | 2013-06-30 | 2013-03-31 | 2012-12-31 | 2012-09-30 | 2012-06-30 | 2012-03-31 | 2011-12-31 | 2011-09-30 | 2011-06-30 | 2011-03-31 | 2010-12-31 | 2010-09-30 | 2010-06-30 | 2010-03-31 | ||
|---|---|---|---|---|---|---|---|---|---|---|---|---|---|---|---|---|---|---|---|---|---|---|---|---|---|---|---|---|---|---|---|---|---|---|---|---|---|---|---|---|---|---|---|---|---|---|---|---|---|---|---|---|---|---|---|---|---|
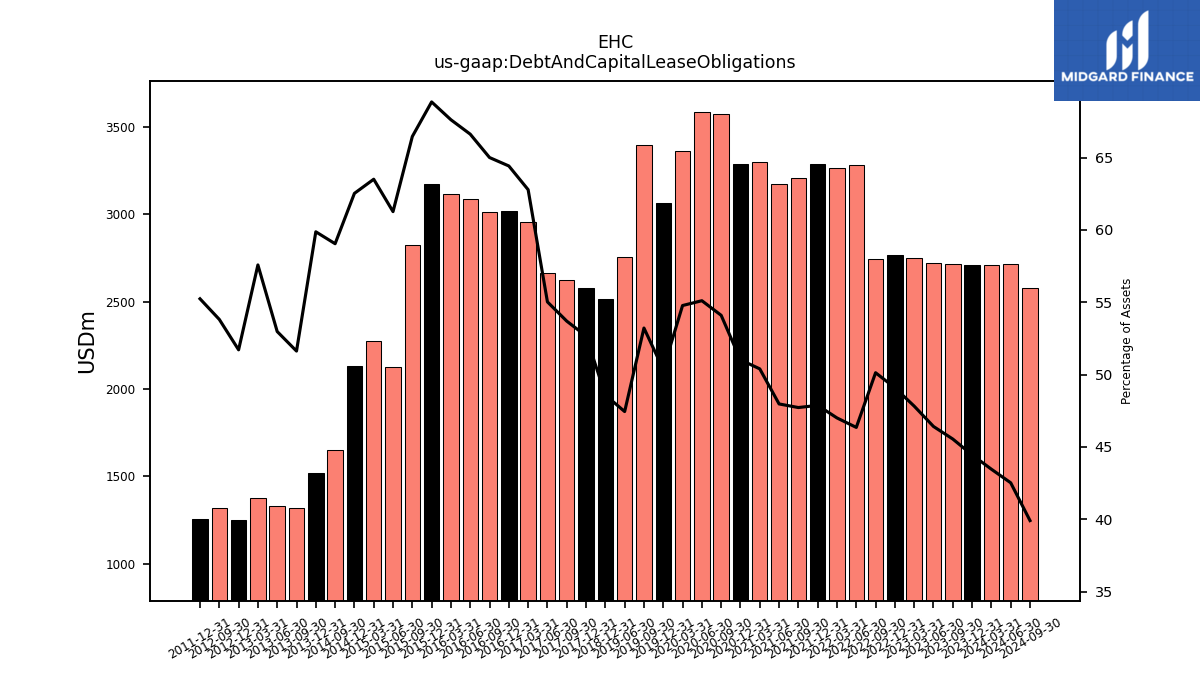
| Debt And Capital Lease Obligations | 2712.60 | 2716.60 | 2720.40 | 2748.50 | 2767.00 | 2745.20 | 3282.70 | 3264.10 | 3286.70 | 3207.90 | 3172.50 | 3297.20 | 3288.90 | 3576.40 | 3583.60 | 3362.10 | 3062.60 | 3399.10 | 2757.70 | NA | 2514.40 | NA | NA | NA | 2577.70 | 2622.40 | 2663.40 | 2953.40 | 3016.40 | 3010.80 | 3086.50 | 3116.20 | 3171.50 | 2824.30 | 2125.80 | 2272.30 | 2131.60 | 1649.90 | NA | NA | 1517.50 | 1319.90 | 1330.70 | 1377.60 | 1253.50 | 1321.90 | NA | NA | 1254.70 | NA | NA | NA | NA | NA | NA | NA | |
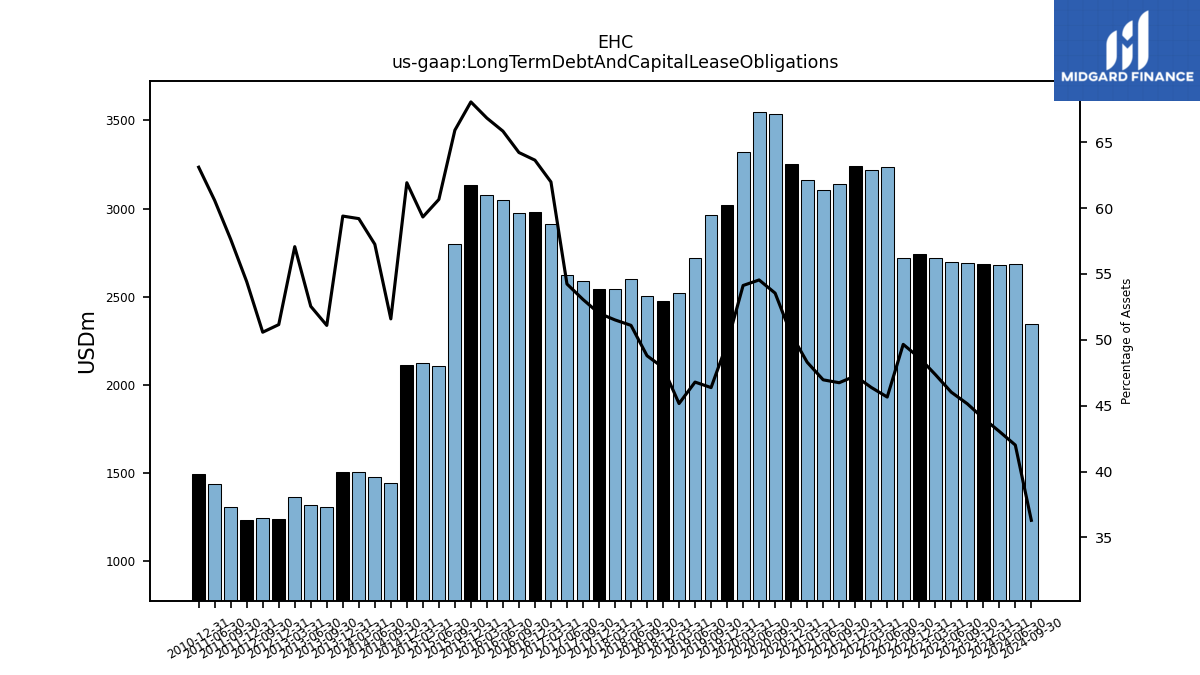
| Long Term Debt And Capital Lease Obligations | 2687.80 | 2692.70 | 2697.60 | 2722.50 | 2741.80 | 2719.00 | 3233.50 | 3221.30 | 3243.90 | 3142.00 | 3105.70 | 3160.00 | 3250.60 | 3539.40 | 3546.70 | 3321.90 | 3023.30 | 2961.90 | 2719.60 | 2521.80 | 2478.60 | 2503.90 | 2600.50 | 2544.40 | 2545.40 | 2591.30 | 2625.10 | 2915.50 | 2979.30 | 2974.00 | 3050.00 | 3079.60 | 3134.70 | 2800.70 | 2104.40 | 2122.50 | 2110.80 | 1441.40 | 1475.10 | 1503.10 | 1505.20 | 1306.20 | 1319.70 | 1365.30 | 1239.90 | 1242.30 | NA | NA | 1235.80 | 1308.70 | 1440.10 | NA | 1496.80 | NA | NA | NA | |
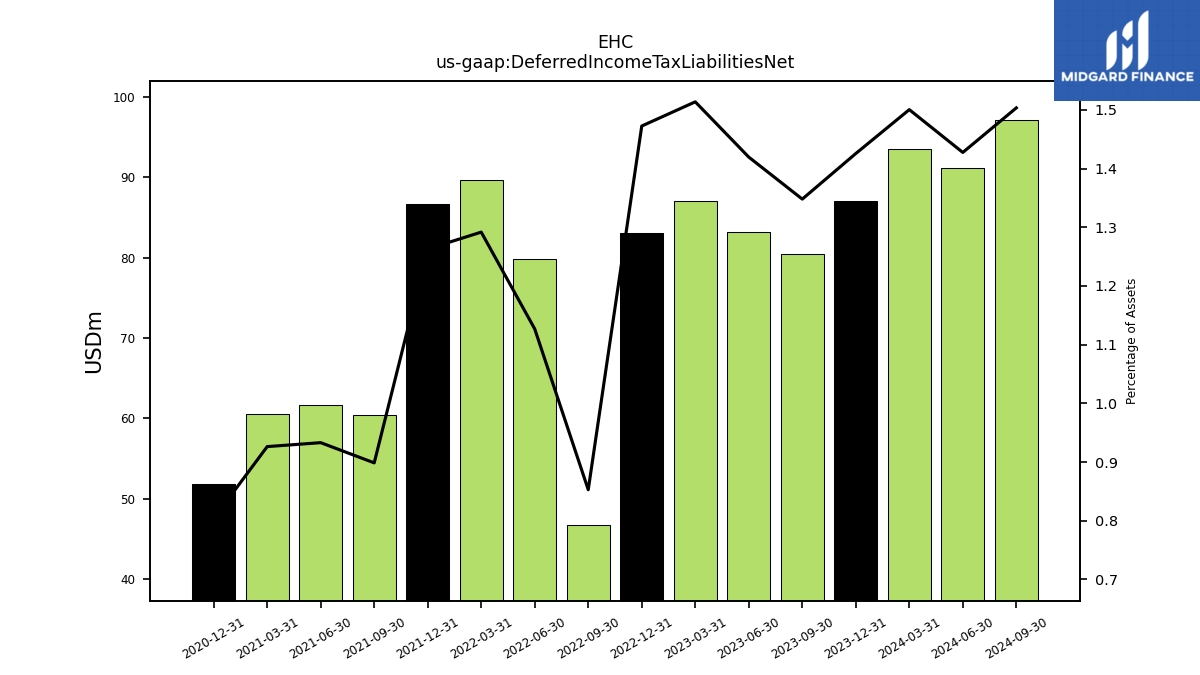
| Deferred Income Tax Liabilities Net | 87.00 | 80.40 | 83.20 | 87.00 | 83.00 | 46.70 | 79.80 | 89.70 | 86.70 | 60.40 | 61.70 | 60.60 | 51.80 | NA | NA | NA | NA | NA | NA | NA | NA | NA | NA | NA | NA | NA | NA | NA | NA | NA | NA | NA | NA | NA | NA | NA | NA | NA | NA | NA | NA | NA | NA | NA | NA | NA | NA | NA | NA | NA | NA | NA | NA | NA | NA | NA | |
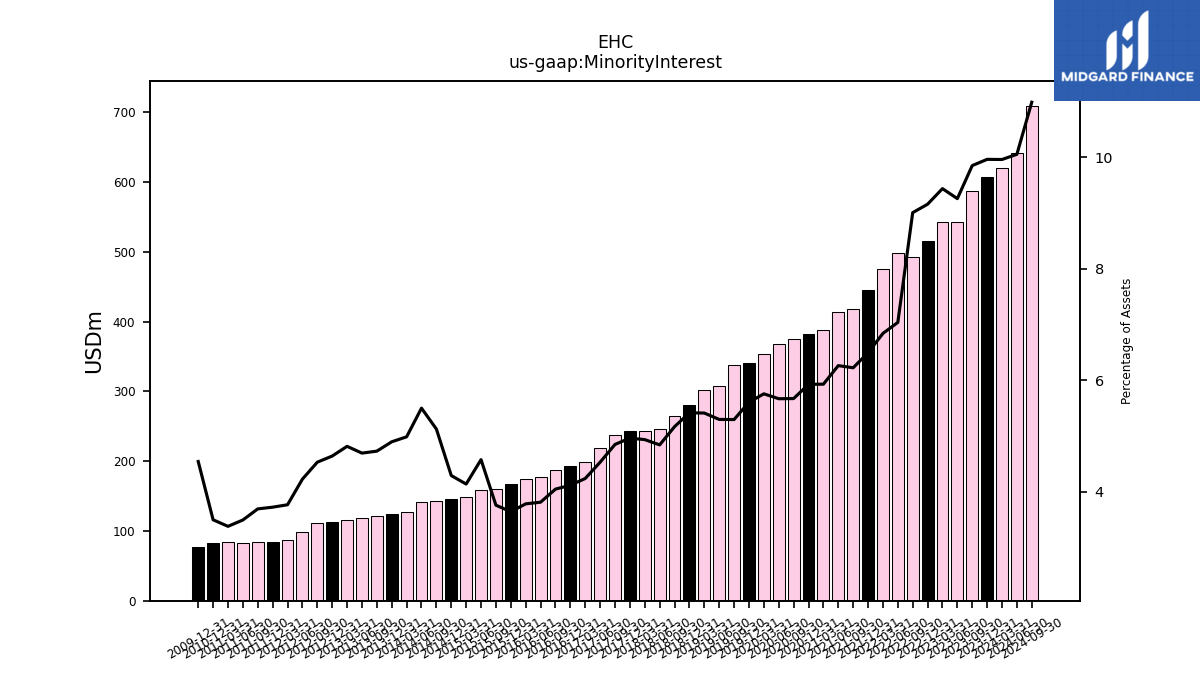
| Minority Interest | 607.70 | 587.30 | 542.40 | 542.20 | 516.00 | 493.00 | 498.30 | 474.90 | 445.70 | 418.30 | 414.10 | 387.90 | 382.00 | 374.90 | 368.60 | 353.30 | 340.90 | 338.20 | 307.90 | 302.20 | 280.30 | 265.20 | 246.40 | 243.80 | 242.90 | 236.80 | 219.30 | 199.40 | 192.80 | 187.50 | 176.70 | 174.40 | 167.90 | 159.80 | 158.80 | 148.10 | 146.30 | 143.20 | 141.70 | 126.60 | 124.10 | 120.90 | 117.90 | 115.20 | 112.50 | 111.30 | 97.90 | 86.50 | 84.60 | 83.90 | 83.10 | 83.90 | 83.00 | NA | NA | NA | |
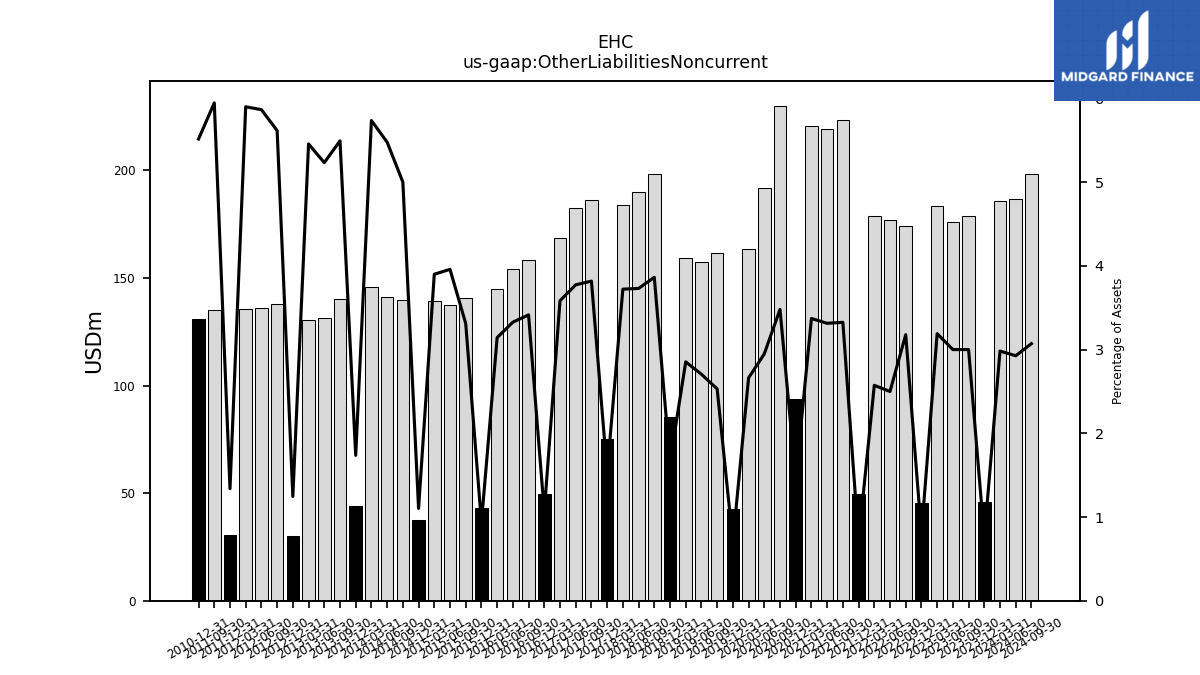
| Other Liabilities Noncurrent | 46.10 | 178.90 | 175.80 | 183.30 | 45.30 | 174.00 | 177.00 | 178.60 | 49.40 | 223.50 | 219.10 | 220.50 | 93.80 | 230.00 | 191.70 | 163.30 | 42.70 | 161.60 | 157.20 | 159.30 | 85.60 | 198.20 | 189.80 | 183.80 | 75.20 | 186.40 | 182.60 | 168.50 | 49.60 | 158.10 | 154.10 | 144.80 | 43.00 | 140.70 | 137.30 | 139.50 | 37.60 | 139.70 | 141.10 | 145.60 | 44.00 | 140.40 | 131.40 | 130.50 | 30.20 | 137.90 | 135.80 | 135.40 | 30.40 | 135.00 | NA | NA | 130.80 | NA | NA | NA | |
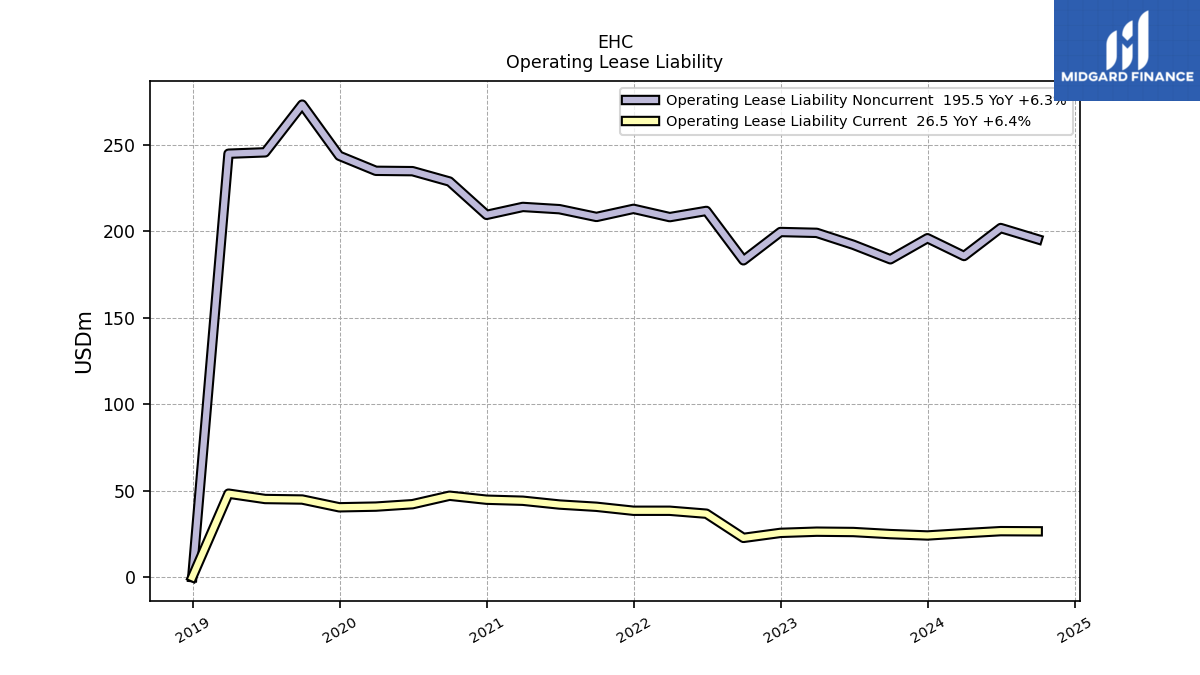
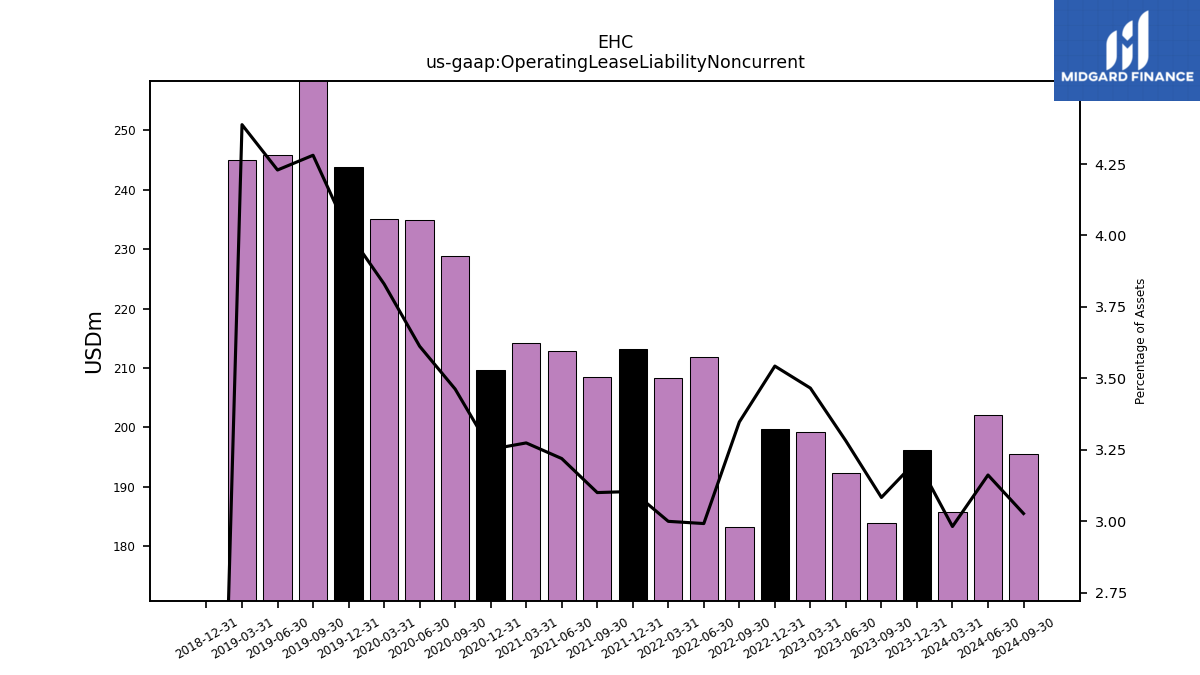
| Operating Lease Liability Noncurrent | 196.10 | 183.90 | 192.30 | 199.20 | 199.70 | 183.30 | 211.90 | 208.30 | 213.10 | 208.40 | 212.90 | 214.20 | 209.60 | 228.90 | 234.90 | 235.10 | 243.80 | 273.40 | 245.80 | 245.00 | 0.00 | NA | NA | NA | NA | NA | NA | NA | NA | NA | NA | NA | NA | NA | NA | NA | NA | NA | NA | NA | NA | NA | NA | NA | NA | NA | NA | NA | NA | NA | NA | NA | NA | NA | NA | NA |
| 2023-12-31 | 2023-09-30 | 2023-06-30 | 2023-03-31 | 2022-12-31 | 2022-09-30 | 2022-06-30 | 2022-03-31 | 2021-12-31 | 2021-09-30 | 2021-06-30 | 2021-03-31 | 2020-12-31 | 2020-09-30 | 2020-06-30 | 2020-03-31 | 2019-12-31 | 2019-09-30 | 2019-06-30 | 2019-03-31 | 2018-12-31 | 2018-09-30 | 2018-06-30 | 2018-03-31 | 2017-12-31 | 2017-09-30 | 2017-06-30 | 2017-03-31 | 2016-12-31 | 2016-09-30 | 2016-06-30 | 2016-03-31 | 2015-12-31 | 2015-09-30 | 2015-06-30 | 2015-03-31 | 2014-12-31 | 2014-09-30 | 2014-06-30 | 2014-03-31 | 2013-12-31 | 2013-09-30 | 2013-06-30 | 2013-03-31 | 2012-12-31 | 2012-09-30 | 2012-06-30 | 2012-03-31 | 2011-12-31 | 2011-09-30 | 2011-06-30 | 2011-03-31 | 2010-12-31 | 2010-09-30 | 2010-06-30 | 2010-03-31 | ||
|---|---|---|---|---|---|---|---|---|---|---|---|---|---|---|---|---|---|---|---|---|---|---|---|---|---|---|---|---|---|---|---|---|---|---|---|---|---|---|---|---|---|---|---|---|---|---|---|---|---|---|---|---|---|---|---|---|---|
| Stockholders Equity | 1647.50 | 1560.40 | 1475.30 | 1383.50 | 1310.30 | 1217.00 | 2003.00 | 1973.50 | 1911.30 | 1842.70 | 1762.00 | 1655.10 | 1588.00 | 1520.80 | 1462.80 | 1443.90 | 1352.20 | 1333.10 | 1275.90 | 1314.30 | 1276.70 | 1318.50 | 1254.90 | 1197.00 | 1181.70 | 1136.40 | 1103.70 | 779.70 | 735.90 | 726.30 | 672.70 | 649.50 | 611.40 | 630.40 | 605.90 | 492.30 | 473.20 | 449.60 | 413.70 | 355.60 | 344.60 | 321.10 | 274.80 | 108.30 | 291.60 | 244.70 | 195.80 | 149.40 | 117.00 | 151.80 | 96.60 | 72.30 | -2.20 | -782.30 | -817.30 | -861.90 | |
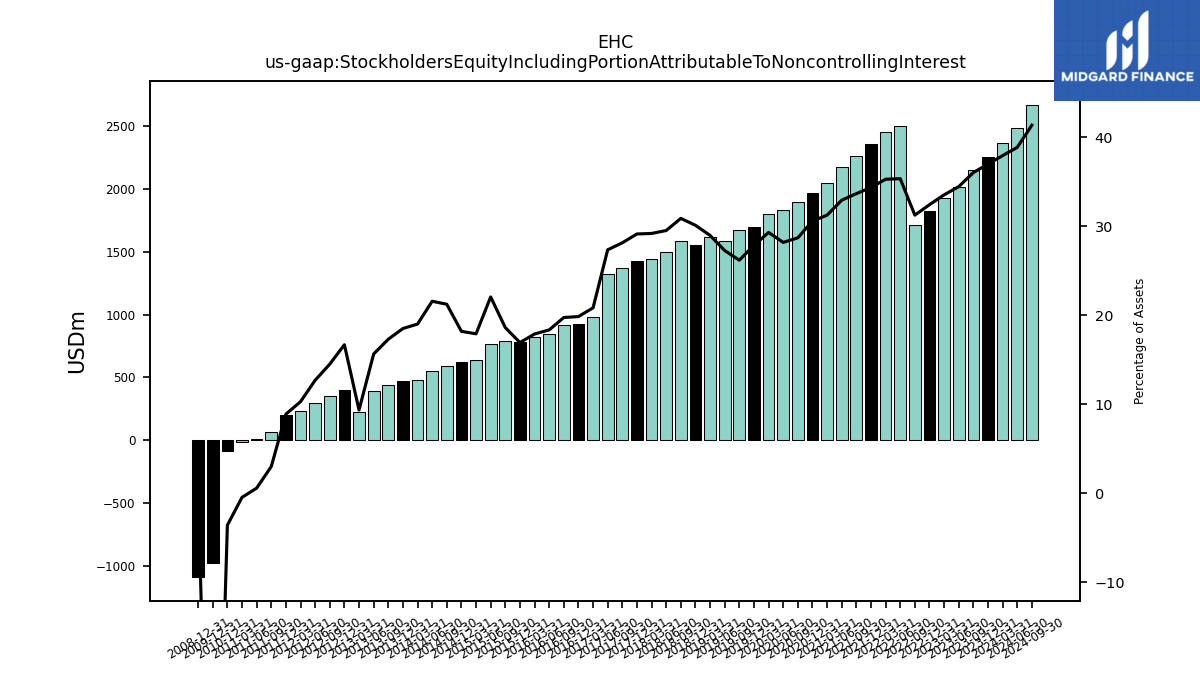
| Stockholders Equity Including Portion Attributable To Noncontrolling Interest | 2255.20 | 2147.70 | 2017.70 | 1925.70 | 1826.30 | 1710.00 | 2501.30 | 2448.40 | 2357.00 | 2261.00 | 2176.10 | 2043.00 | 1970.00 | 1895.70 | 1831.40 | 1797.20 | 1693.10 | 1671.30 | 1583.80 | 1616.50 | 1557.00 | 1583.70 | 1501.30 | 1440.80 | 1424.60 | 1373.20 | 1323.00 | 979.10 | 928.70 | 913.80 | 849.40 | 823.90 | 779.30 | 790.20 | 764.70 | 640.40 | 619.50 | 592.80 | 555.40 | 482.20 | 468.70 | 442.00 | 392.70 | 223.50 | 404.10 | 356.00 | 293.70 | 235.90 | 201.60 | 67.90 | 13.50 | -11.60 | -85.20 | NA | NA | NA | |
| Common Stock Value | 1.20 | NA | NA | NA | 1.10 | NA | NA | NA | 1.10 | NA | NA | NA | 1.10 | NA | NA | NA | 1.10 | NA | NA | NA | 1.10 | NA | NA | NA | 1.10 | NA | NA | NA | 1.10 | NA | NA | NA | 1.10 | NA | NA | NA | 1.00 | 1.00 | 1.00 | 1.00 | 1.00 | 1.00 | 1.00 | 1.00 | 1.00 | NA | NA | NA | 1.00 | NA | NA | NA | 1.00 | NA | NA | NA | |
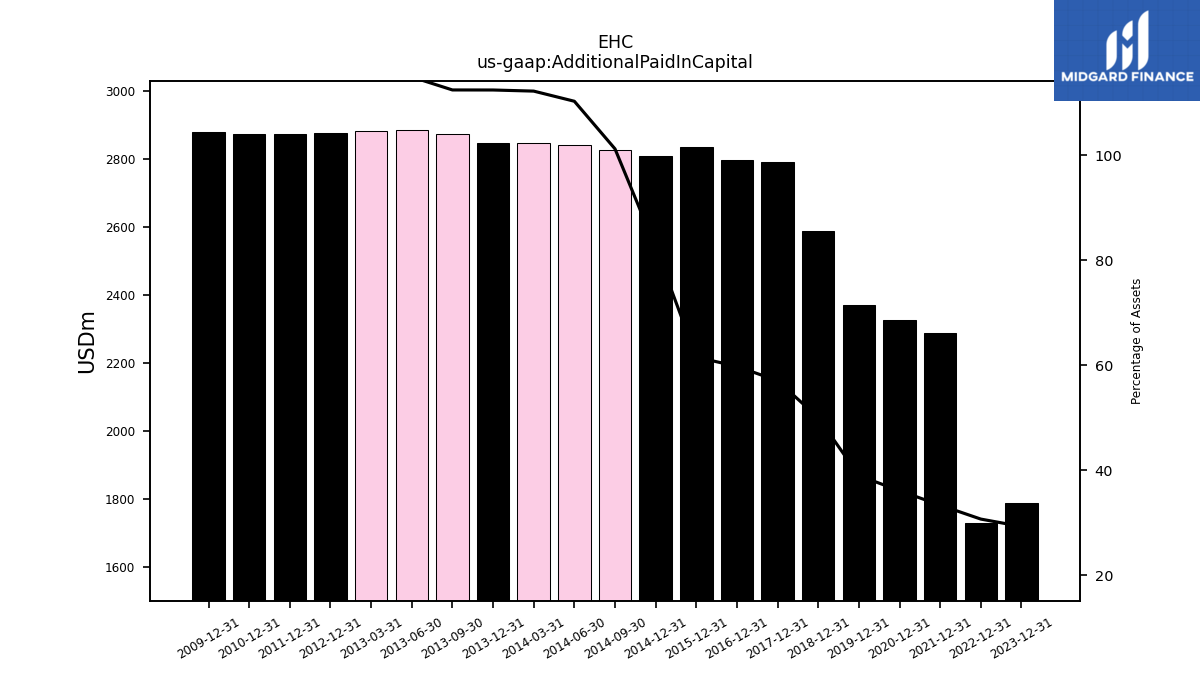
| Additional Paid In Capital | 1787.00 | NA | NA | NA | 1730.20 | NA | NA | NA | 2289.60 | NA | NA | NA | 2326.60 | NA | NA | NA | 2369.90 | NA | NA | NA | 2588.70 | NA | NA | NA | 2791.40 | NA | NA | NA | 2799.10 | NA | NA | NA | 2834.90 | NA | NA | NA | 2810.50 | 2828.00 | 2841.50 | 2849.30 | 2849.40 | 2874.50 | 2886.30 | 2882.30 | 2877.20 | NA | NA | NA | 2874.70 | NA | NA | NA | 2873.50 | NA | NA | NA | |
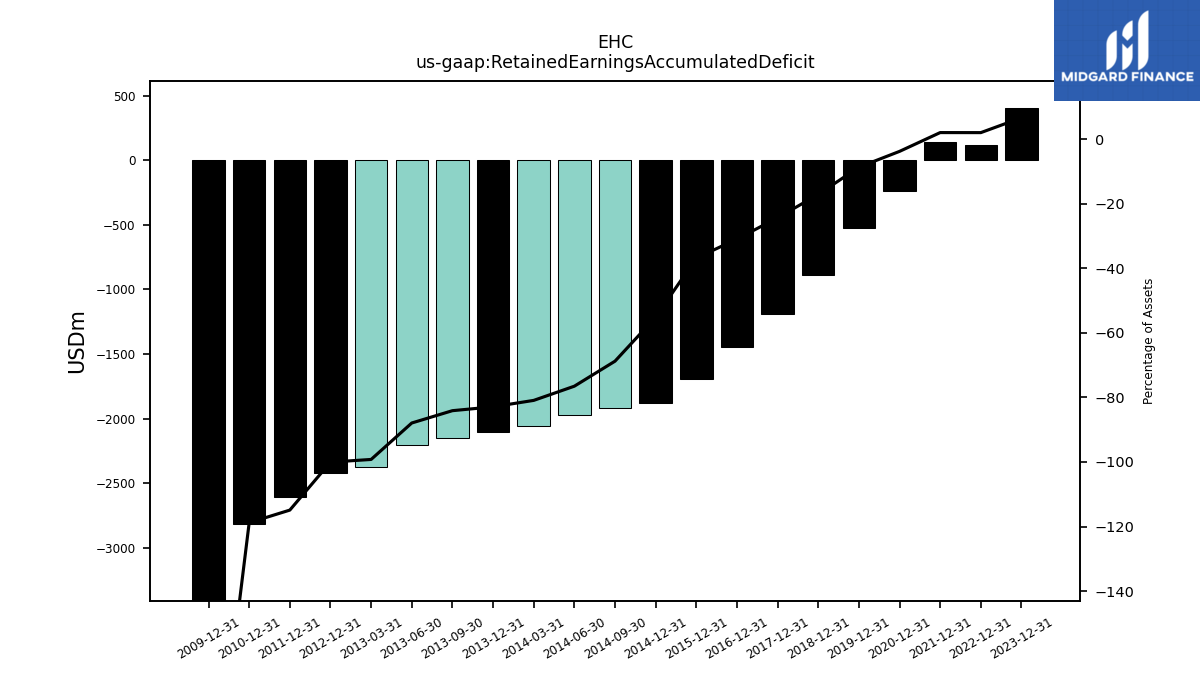
| Retained Earnings Accumulated Deficit | 406.50 | NA | NA | NA | 115.70 | NA | NA | NA | 141.80 | NA | NA | NA | -242.30 | NA | NA | NA | -526.50 | NA | NA | NA | -885.20 | NA | NA | NA | -1191.00 | NA | NA | NA | -1448.40 | NA | NA | NA | -1696.00 | NA | NA | NA | -1879.10 | -1921.20 | -1971.30 | -2054.40 | -2101.10 | -2150.00 | -2208.20 | -2373.40 | -2424.70 | NA | NA | NA | -2609.70 | NA | NA | NA | -2818.40 | NA | NA | NA | |
| Minority Interest | 607.70 | 587.30 | 542.40 | 542.20 | 516.00 | 493.00 | 498.30 | 474.90 | 445.70 | 418.30 | 414.10 | 387.90 | 382.00 | 374.90 | 368.60 | 353.30 | 340.90 | 338.20 | 307.90 | 302.20 | 280.30 | 265.20 | 246.40 | 243.80 | 242.90 | 236.80 | 219.30 | 199.40 | 192.80 | 187.50 | 176.70 | 174.40 | 167.90 | 159.80 | 158.80 | 148.10 | 146.30 | 143.20 | 141.70 | 126.60 | 124.10 | 120.90 | 117.90 | 115.20 | 112.50 | 111.30 | 97.90 | 86.50 | 84.60 | 83.90 | 83.10 | 83.90 | 83.00 | NA | NA | NA | |
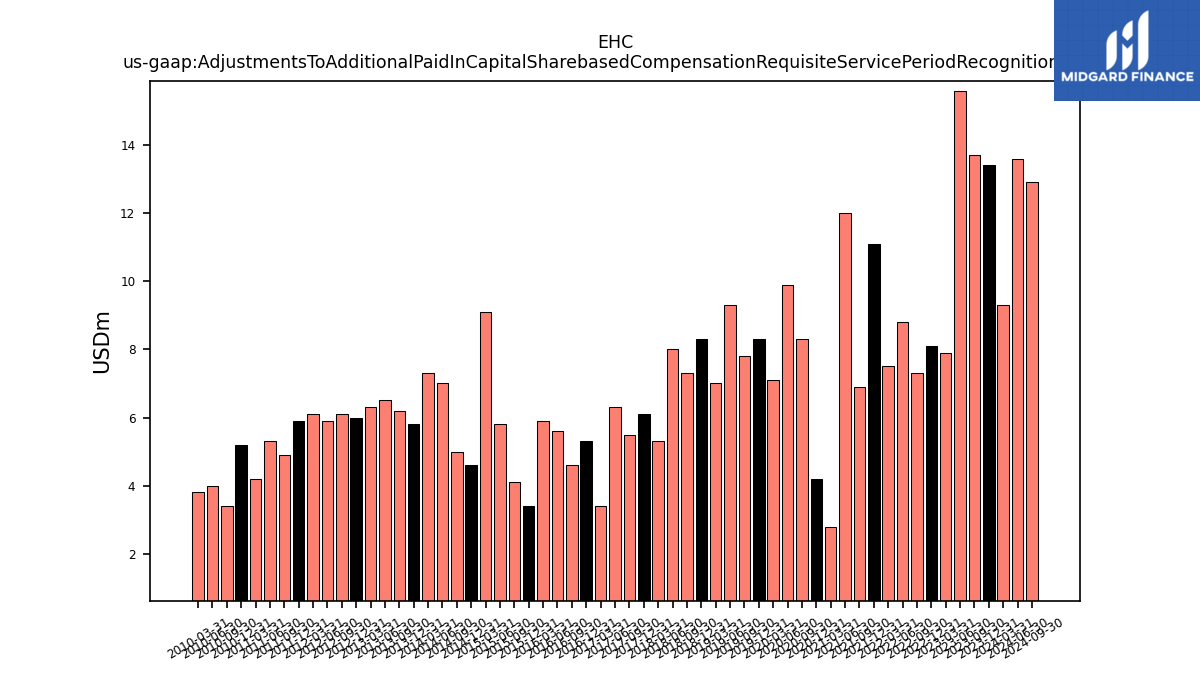
| Adjustments To Additional Paid In Capital Sharebased Compensation Requisite Service Period Recognition Value | 13.40 | 13.70 | 15.60 | 7.90 | 8.10 | 7.30 | 8.80 | 7.50 | 11.10 | 6.90 | 12.00 | 2.80 | 4.20 | 8.30 | 9.90 | 7.10 | 8.30 | 7.80 | 9.30 | 7.00 | 8.30 | 7.30 | 8.00 | 5.30 | 6.10 | 5.50 | 6.30 | 3.40 | 5.30 | 4.60 | 5.60 | 5.90 | 3.40 | 4.10 | 5.80 | 9.10 | 4.60 | 5.00 | 7.00 | 7.30 | 5.80 | 6.20 | 6.50 | 6.30 | 6.00 | 6.10 | 5.90 | 6.10 | 5.90 | 4.90 | 5.30 | 4.20 | 5.20 | 3.40 | 4.00 | 3.80 | |
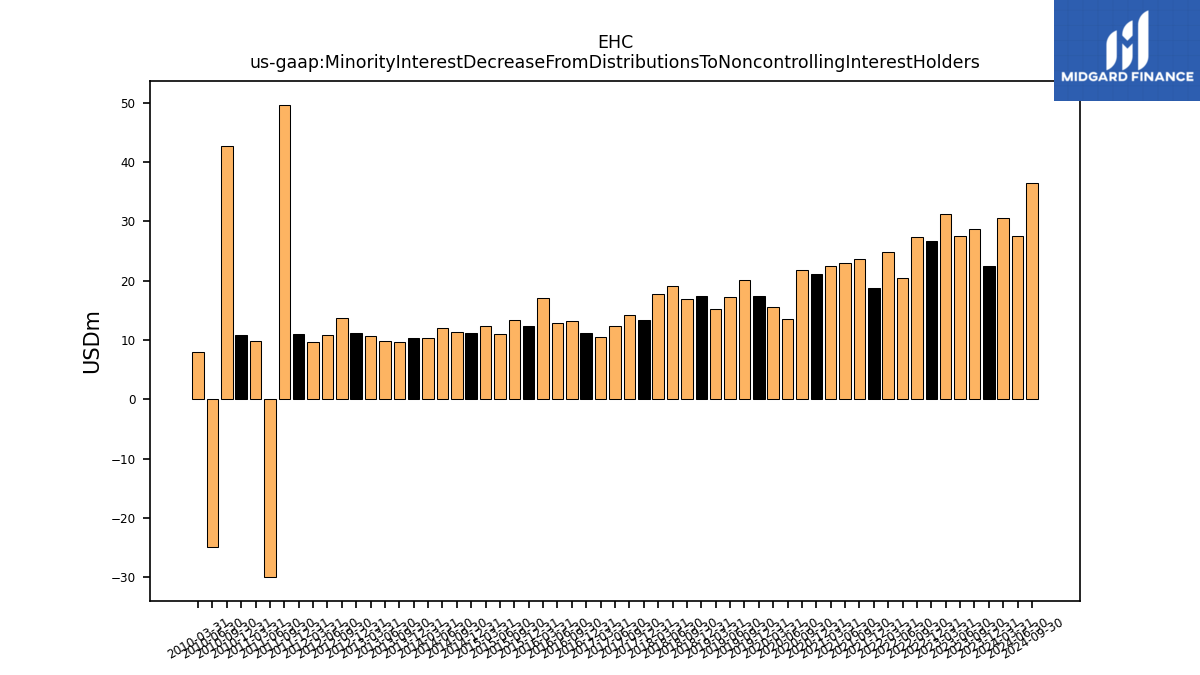
| Minority Interest Decrease From Distributions To Noncontrolling Interest Holders | 22.50 | 28.80 | 27.50 | 31.20 | 26.70 | 27.40 | 20.50 | 24.90 | 18.70 | 23.70 | 23.00 | 22.40 | 21.20 | 21.80 | 13.60 | 15.50 | 17.40 | 20.20 | 17.30 | 15.30 | 17.40 | 16.90 | 19.10 | 17.70 | 13.40 | 14.20 | 12.40 | 10.50 | 11.10 | 13.20 | 12.80 | 17.10 | 12.30 | 13.30 | 11.00 | 12.40 | 11.20 | 11.40 | 12.00 | 10.30 | 10.30 | 9.70 | 9.80 | 10.60 | 11.20 | 13.70 | 10.80 | 9.70 | 11.00 | 49.70 | -30.00 | 9.80 | 10.90 | 42.70 | -24.90 | 7.90 |
| 2023-12-31 | 2023-09-30 | 2023-06-30 | 2023-03-31 | 2022-12-31 | 2022-09-30 | 2022-06-30 | 2022-03-31 | 2021-12-31 | 2021-09-30 | 2021-06-30 | 2021-03-31 | 2020-12-31 | 2020-09-30 | 2020-06-30 | 2020-03-31 | 2019-12-31 | 2019-09-30 | 2019-06-30 | 2019-03-31 | 2018-12-31 | 2018-09-30 | 2018-06-30 | 2018-03-31 | 2017-12-31 | 2017-09-30 | 2017-06-30 | 2017-03-31 | 2016-12-31 | 2016-09-30 | 2016-06-30 | 2016-03-31 | 2015-12-31 | 2015-09-30 | 2015-06-30 | 2015-03-31 | 2014-12-31 | 2014-09-30 | 2014-06-30 | 2014-03-31 | 2013-12-31 | 2013-09-30 | 2013-06-30 | 2013-03-31 | 2012-12-31 | 2012-09-30 | 2012-06-30 | 2012-03-31 | 2011-12-31 | 2011-09-30 | 2011-06-30 | 2011-03-31 | 2010-12-31 | 2010-09-30 | 2010-06-30 | 2010-03-31 | ||
|---|---|---|---|---|---|---|---|---|---|---|---|---|---|---|---|---|---|---|---|---|---|---|---|---|---|---|---|---|---|---|---|---|---|---|---|---|---|---|---|---|---|---|---|---|---|---|---|---|---|---|---|---|---|---|---|---|---|
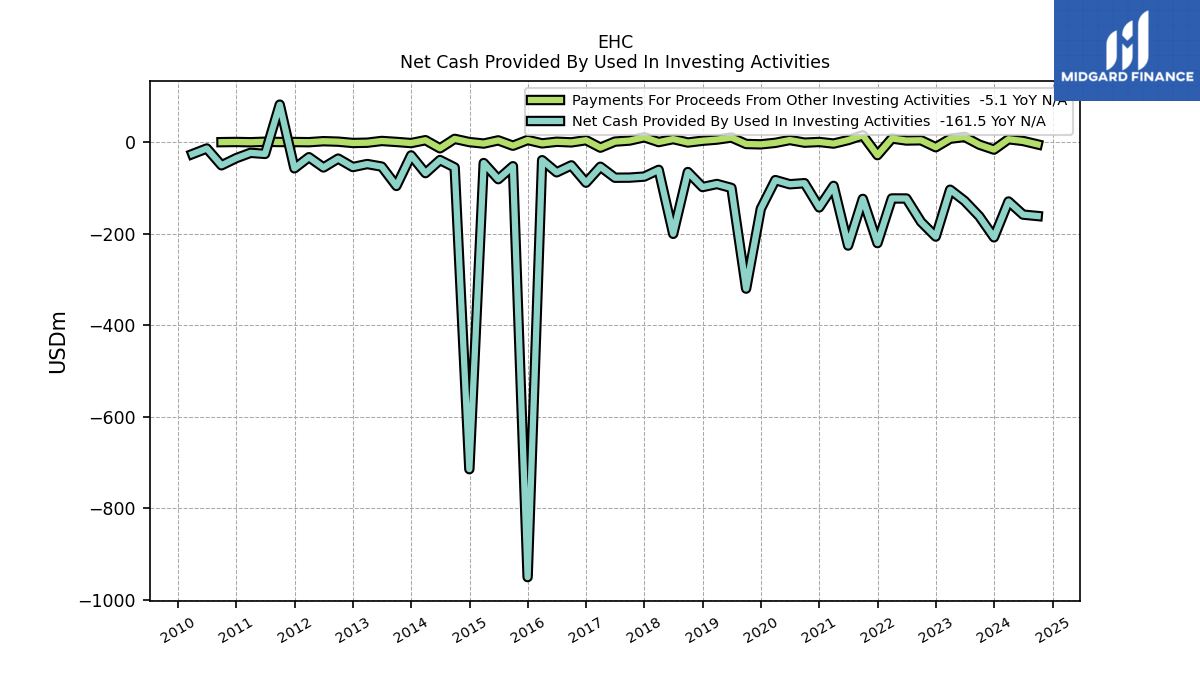
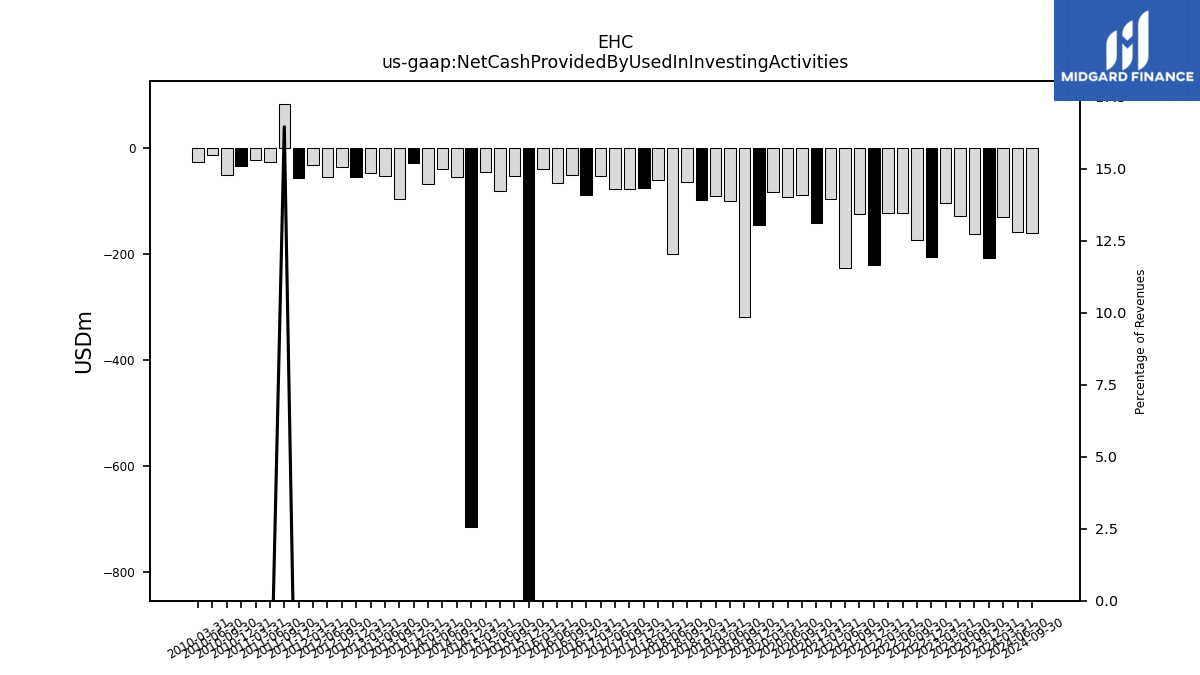
| Net Cash Provided By Used In Investing Activities | -208.10 | -162.20 | -128.50 | -104.00 | -206.40 | -174.30 | -123.20 | -123.10 | -220.70 | -124.00 | -226.00 | -95.60 | -142.70 | -89.70 | -92.10 | -83.00 | -145.70 | -320.10 | -100.10 | -91.50 | -98.20 | -65.30 | -200.40 | -60.60 | -75.30 | -77.60 | -77.80 | -53.80 | -88.70 | -50.80 | -66.00 | -39.50 | -950.40 | -52.70 | -81.00 | -45.70 | -714.60 | -55.30 | -39.20 | -67.80 | -29.00 | -95.80 | -53.50 | -47.90 | -54.50 | -36.00 | -55.40 | -32.90 | -57.30 | 81.90 | -25.80 | -23.40 | -35.10 | -50.70 | -13.90 | -26.20 | |
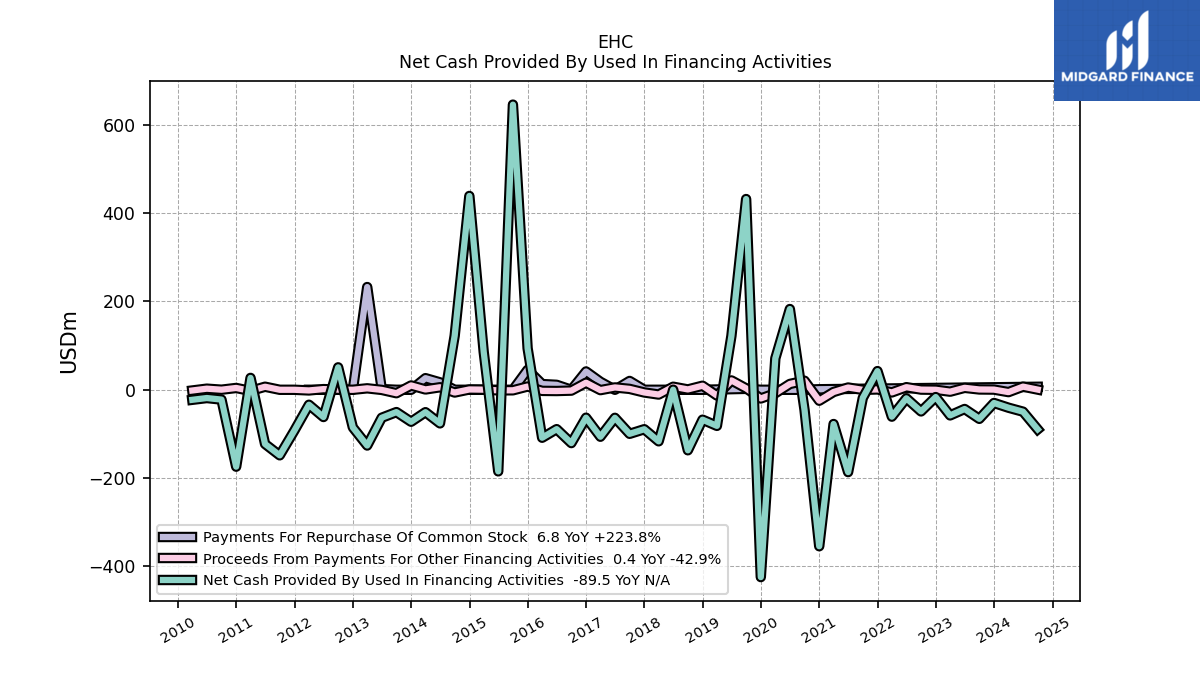
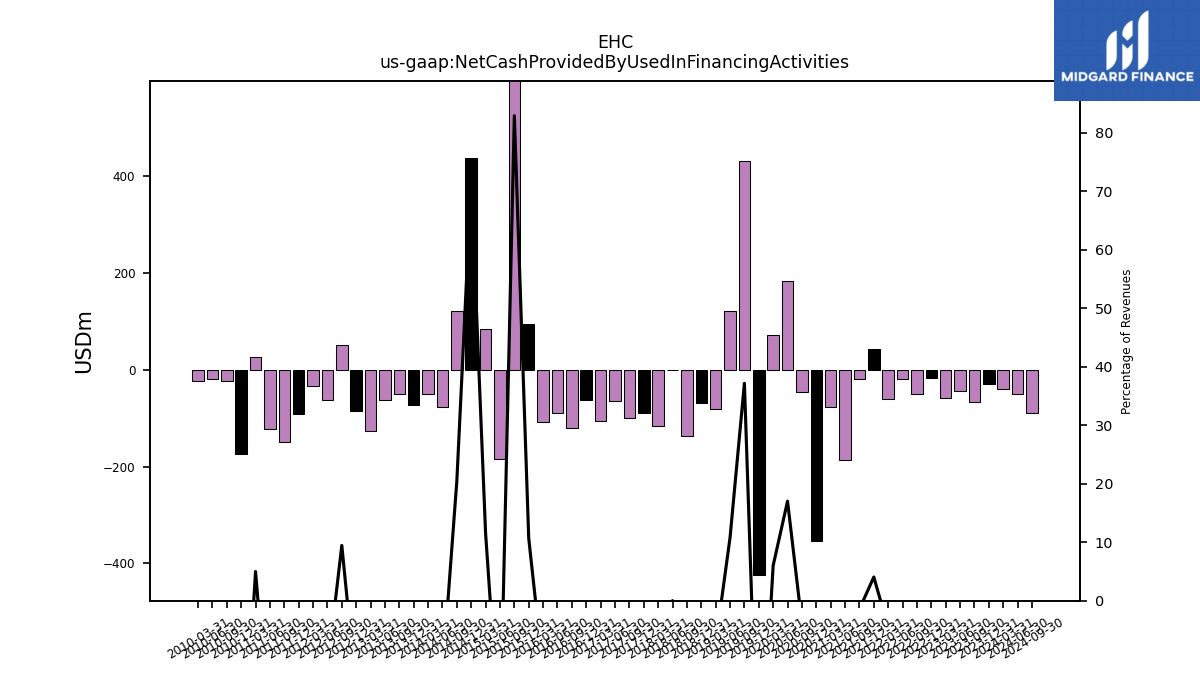
| Net Cash Provided By Used In Financing Activities | -29.90 | -65.80 | -43.50 | -58.00 | -16.50 | -49.00 | -19.30 | -60.90 | 42.30 | -18.50 | -186.40 | -77.50 | -354.20 | -45.60 | 182.80 | 71.10 | -424.10 | 431.80 | 122.20 | -81.70 | -67.70 | -137.00 | 0.20 | -116.70 | -89.30 | -99.70 | -63.50 | -106.30 | -63.20 | -120.70 | -89.10 | -108.60 | 93.80 | 645.50 | -184.70 | 85.30 | 438.80 | 122.20 | -76.10 | -50.70 | -72.40 | -50.50 | -63.30 | -126.20 | -85.20 | 50.80 | -61.70 | -33.90 | -92.20 | -148.40 | -122.70 | 26.90 | -174.10 | -22.20 | -18.70 | -22.70 |
| 2023-12-31 | 2023-09-30 | 2023-06-30 | 2023-03-31 | 2022-12-31 | 2022-09-30 | 2022-06-30 | 2022-03-31 | 2021-12-31 | 2021-09-30 | 2021-06-30 | 2021-03-31 | 2020-12-31 | 2020-09-30 | 2020-06-30 | 2020-03-31 | 2019-12-31 | 2019-09-30 | 2019-06-30 | 2019-03-31 | 2018-12-31 | 2018-09-30 | 2018-06-30 | 2018-03-31 | 2017-12-31 | 2017-09-30 | 2017-06-30 | 2017-03-31 | 2016-12-31 | 2016-09-30 | 2016-06-30 | 2016-03-31 | 2015-12-31 | 2015-09-30 | 2015-06-30 | 2015-03-31 | 2014-12-31 | 2014-09-30 | 2014-06-30 | 2014-03-31 | 2013-12-31 | 2013-09-30 | 2013-06-30 | 2013-03-31 | 2012-12-31 | 2012-09-30 | 2012-06-30 | 2012-03-31 | 2011-12-31 | 2011-09-30 | 2011-06-30 | 2011-03-31 | 2010-12-31 | 2010-09-30 | 2010-06-30 | 2010-03-31 | ||
|---|---|---|---|---|---|---|---|---|---|---|---|---|---|---|---|---|---|---|---|---|---|---|---|---|---|---|---|---|---|---|---|---|---|---|---|---|---|---|---|---|---|---|---|---|---|---|---|---|---|---|---|---|---|---|---|---|---|
| Net Income Loss | 87.60 | 85.30 | 91.40 | 87.70 | 89.40 | 45.40 | 48.70 | 87.50 | 91.60 | 100.00 | 113.30 | 107.30 | 86.00 | 77.70 | 33.50 | 87.00 | 67.60 | 97.60 | 91.20 | 102.30 | 28.10 | 88.60 | 91.80 | 83.80 | 60.60 | 65.90 | 63.00 | 66.80 | 65.30 | 61.70 | 62.60 | 58.00 | 47.00 | 50.70 | 42.90 | 42.50 | 42.10 | 50.10 | 83.10 | 46.70 | 48.90 | 58.20 | 165.20 | 51.30 | 47.00 | 47.10 | 46.70 | 44.20 | 50.00 | 57.00 | 21.90 | 79.80 | 779.20 | 31.80 | 47.30 | 40.70 | |
| Profit Loss | 119.10 | 113.40 | 117.20 | 113.30 | 117.50 | 67.00 | 71.30 | 110.10 | 115.70 | 126.70 | 142.00 | 132.80 | 111.70 | 100.10 | 48.30 | 108.70 | 90.20 | 119.50 | 110.90 | 125.20 | 47.70 | 109.30 | 113.20 | 105.20 | 86.50 | 85.10 | 79.40 | 84.40 | 82.10 | 78.10 | 81.20 | 76.70 | 65.80 | 67.80 | 60.20 | 59.00 | 57.50 | 64.80 | 97.90 | 61.50 | 64.20 | 72.30 | 179.00 | 65.90 | 59.30 | 59.90 | 59.90 | 56.80 | 62.50 | 68.30 | 32.30 | 91.50 | 789.90 | 41.90 | 57.50 | 50.50 | |
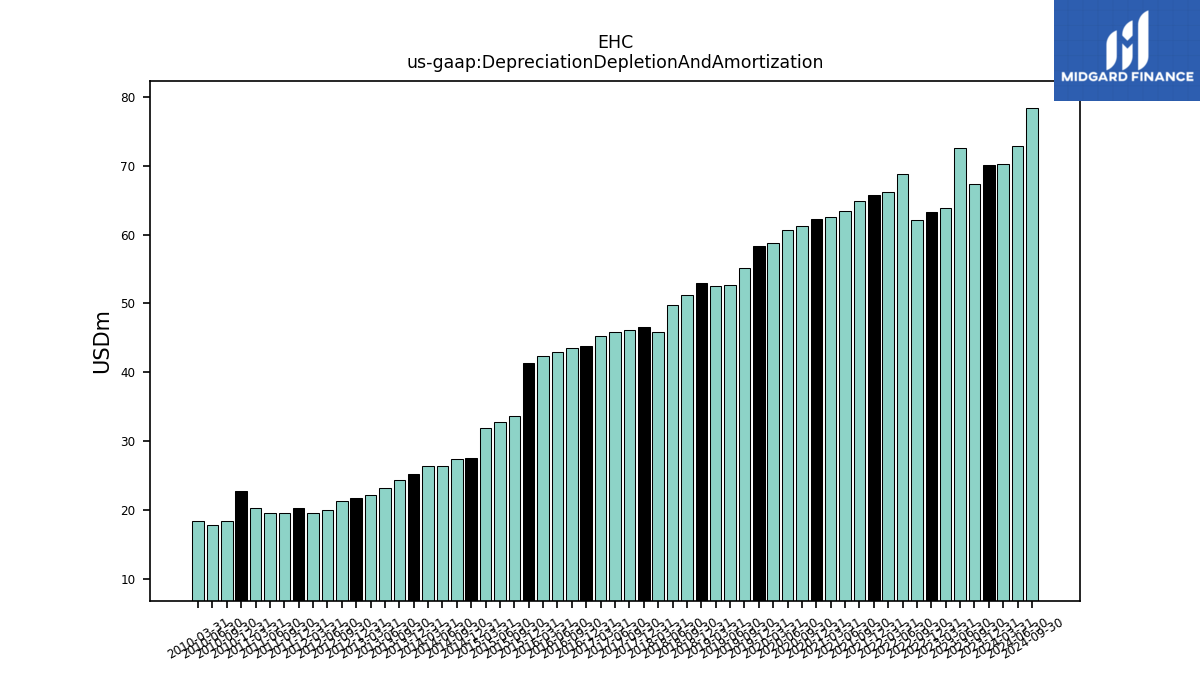
| Depreciation Depletion And Amortization | 70.10 | 67.30 | 72.60 | 63.90 | 63.30 | 62.10 | 68.80 | 66.20 | 65.80 | 64.90 | 63.40 | 62.50 | 62.30 | 61.20 | 60.70 | 58.80 | 58.40 | 55.10 | 52.70 | 52.50 | 52.90 | 51.20 | 49.70 | 45.90 | 46.60 | 46.20 | 45.80 | 45.20 | 43.80 | 43.50 | 42.90 | 42.40 | 41.40 | 33.70 | 32.70 | 31.90 | 27.50 | 27.40 | 26.40 | 26.40 | 25.20 | 24.30 | 23.10 | 22.10 | 21.70 | 21.30 | 20.00 | 19.50 | 20.20 | 19.50 | 19.60 | 20.30 | 22.70 | 18.40 | 17.80 | 18.30 | |
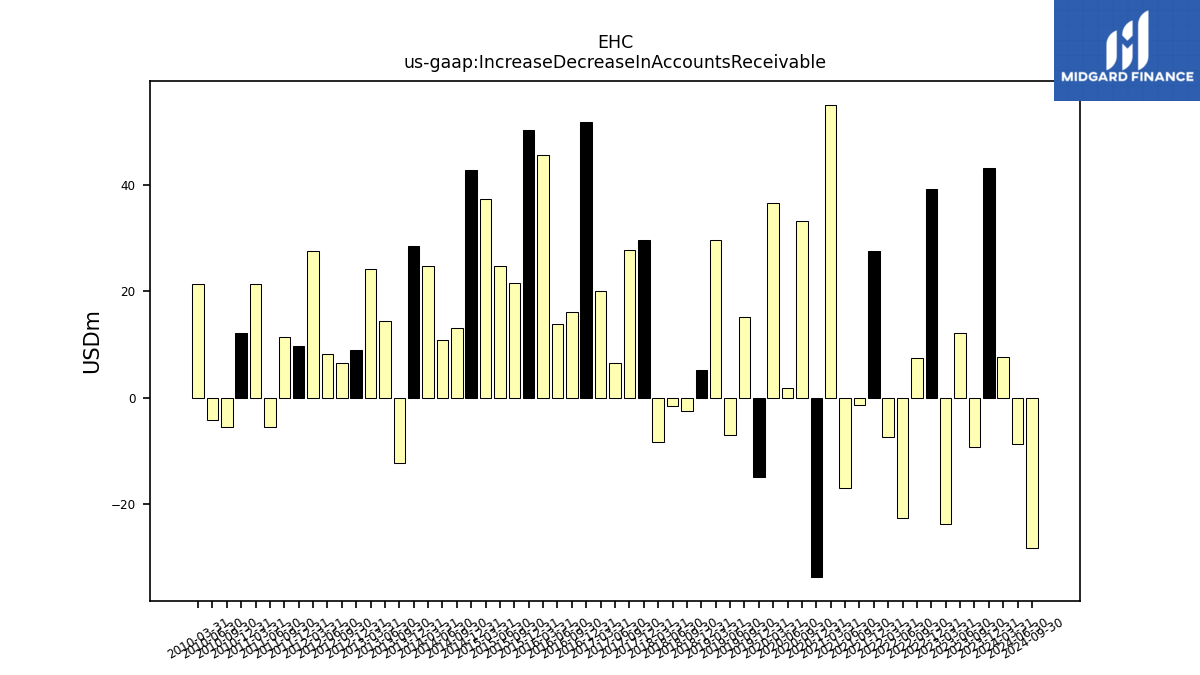
| Increase Decrease In Accounts Receivable | 43.10 | -9.20 | 12.20 | -23.70 | 39.30 | 7.40 | -22.50 | -7.30 | 27.60 | -1.40 | -17.00 | 55.10 | -33.70 | 33.30 | 1.90 | 36.60 | -14.90 | 15.20 | -7.00 | 29.60 | 5.30 | -2.40 | -1.60 | -8.30 | 29.70 | 27.70 | 6.50 | 20.00 | 51.80 | 16.20 | 13.80 | 45.70 | 50.40 | 21.60 | 24.80 | 37.30 | 42.90 | 13.10 | 10.90 | 24.70 | 28.60 | -12.30 | 14.50 | 24.30 | 9.00 | 6.60 | 8.20 | 27.50 | 9.70 | 11.50 | -5.50 | 21.40 | 12.10 | -5.50 | -4.20 | 21.30 | |
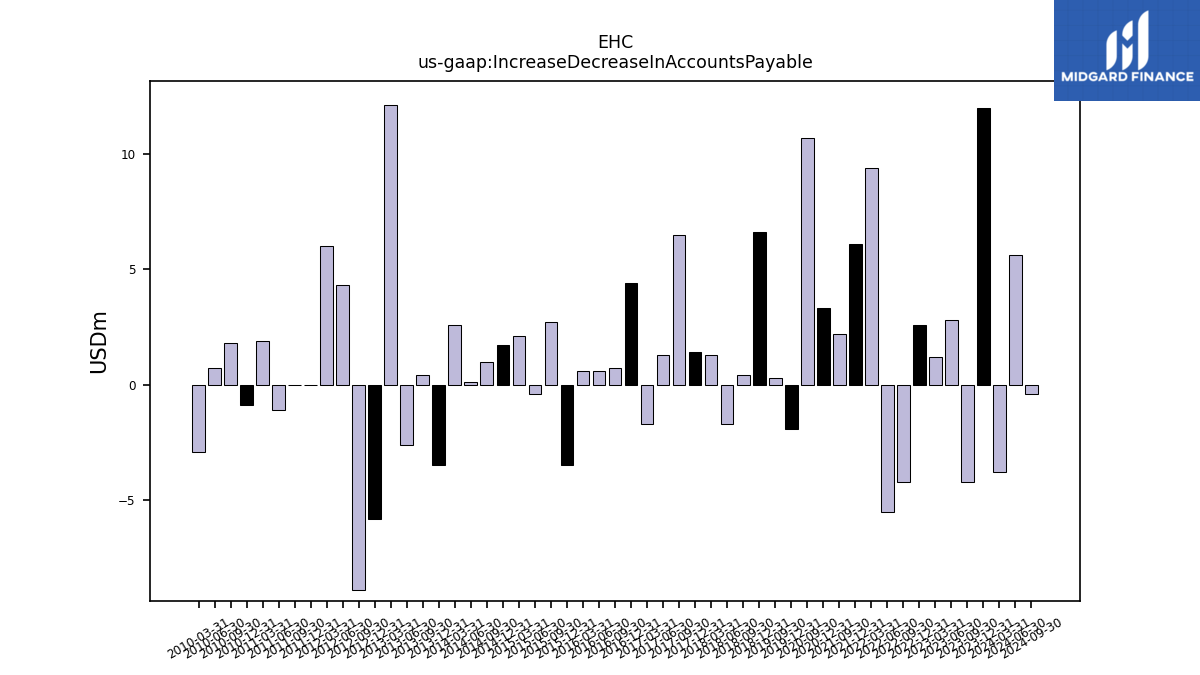
| Increase Decrease In Accounts Payable | 12.00 | -4.20 | 2.80 | 1.20 | 2.60 | -4.20 | -5.50 | 9.40 | 6.10 | 2.20 | NA | NA | 3.30 | 10.70 | NA | NA | -1.90 | 0.30 | NA | NA | 6.60 | 0.40 | -1.70 | 1.30 | 1.40 | 6.50 | 1.30 | -1.70 | 4.40 | 0.70 | 0.60 | 0.60 | -3.50 | 2.70 | -0.40 | 2.10 | 1.70 | 1.00 | 0.10 | 2.60 | -3.50 | 0.40 | -2.60 | 12.10 | -5.80 | -8.90 | 4.30 | 6.00 | 0.00 | 0.00 | -1.10 | 1.90 | -0.90 | 1.80 | 0.70 | -2.90 | |
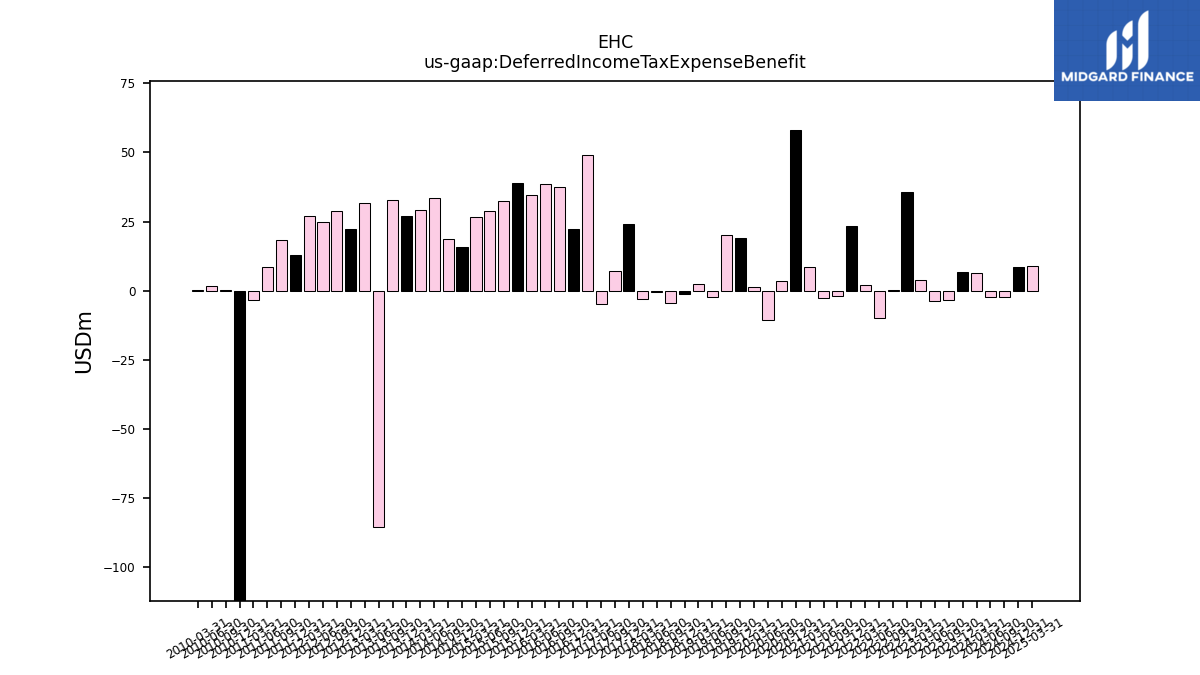
| Deferred Income Tax Expense Benefit | 6.80 | -3.20 | -3.70 | 4.00 | 35.60 | 0.20 | -9.90 | 2.00 | 23.40 | -1.80 | -2.50 | 8.70 | 58.10 | 3.40 | -10.50 | 1.40 | 19.20 | 20.30 | -2.10 | 2.60 | -1.10 | -4.40 | -0.60 | -3.00 | 24.30 | 7.10 | -4.80 | 49.00 | 22.30 | 37.40 | 38.50 | 34.70 | 39.10 | 32.40 | 28.80 | 26.80 | 15.80 | 18.90 | 33.50 | 29.20 | 27.20 | 32.70 | -85.20 | 31.70 | 22.30 | 28.70 | 24.70 | 27.00 | 13.10 | 18.20 | 8.60 | -3.40 | -740.90 | 0.30 | 1.70 | 0.40 | |
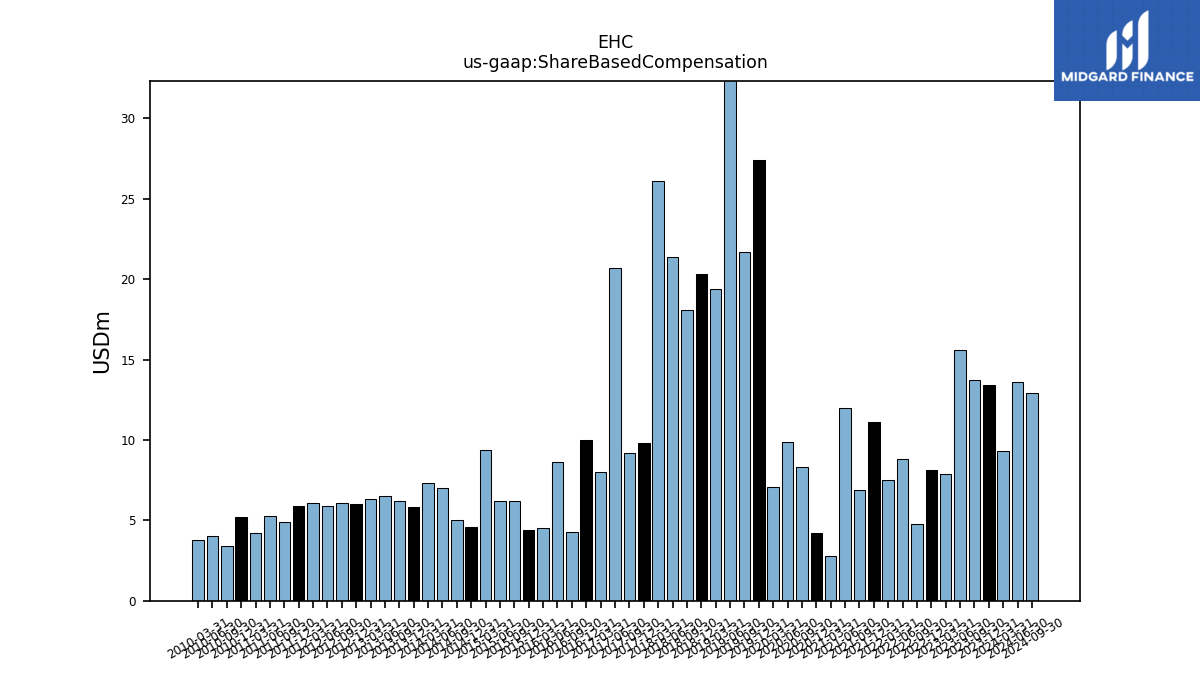
| Share Based Compensation | 13.40 | 13.70 | 15.60 | 7.90 | 8.10 | 4.80 | 8.80 | 7.50 | 11.10 | 6.90 | 12.00 | 2.80 | 4.20 | 8.30 | 9.90 | 7.10 | 27.40 | 21.70 | 45.90 | 19.40 | 20.30 | 18.10 | 21.40 | 26.10 | 9.80 | 9.20 | 20.70 | 8.00 | 10.00 | 4.30 | 8.60 | 4.50 | 4.40 | 6.20 | 6.20 | 9.40 | 4.60 | 5.00 | 7.00 | 7.30 | 5.80 | 6.20 | 6.50 | 6.30 | 6.00 | 6.10 | 5.90 | 6.10 | 5.90 | 4.90 | 5.30 | 4.20 | 5.20 | 3.40 | 4.00 | 3.80 |
| 2023-12-31 | 2023-09-30 | 2023-06-30 | 2023-03-31 | 2022-12-31 | 2022-09-30 | 2022-06-30 | 2022-03-31 | 2021-12-31 | 2021-09-30 | 2021-06-30 | 2021-03-31 | 2020-12-31 | 2020-09-30 | 2020-06-30 | 2020-03-31 | 2019-12-31 | 2019-09-30 | 2019-06-30 | 2019-03-31 | 2018-12-31 | 2018-09-30 | 2018-06-30 | 2018-03-31 | 2017-12-31 | 2017-09-30 | 2017-06-30 | 2017-03-31 | 2016-12-31 | 2016-09-30 | 2016-06-30 | 2016-03-31 | 2015-12-31 | 2015-09-30 | 2015-06-30 | 2015-03-31 | 2014-12-31 | 2014-09-30 | 2014-06-30 | 2014-03-31 | 2013-12-31 | 2013-09-30 | 2013-06-30 | 2013-03-31 | 2012-12-31 | 2012-09-30 | 2012-06-30 | 2012-03-31 | 2011-12-31 | 2011-09-30 | 2011-06-30 | 2011-03-31 | 2010-12-31 | 2010-09-30 | 2010-06-30 | 2010-03-31 | ||
|---|---|---|---|---|---|---|---|---|---|---|---|---|---|---|---|---|---|---|---|---|---|---|---|---|---|---|---|---|---|---|---|---|---|---|---|---|---|---|---|---|---|---|---|---|---|---|---|---|---|---|---|---|---|---|---|---|---|
| Net Cash Provided By Used In Investing Activities | -208.10 | -162.20 | -128.50 | -104.00 | -206.40 | -174.30 | -123.20 | -123.10 | -220.70 | -124.00 | -226.00 | -95.60 | -142.70 | -89.70 | -92.10 | -83.00 | -145.70 | -320.10 | -100.10 | -91.50 | -98.20 | -65.30 | -200.40 | -60.60 | -75.30 | -77.60 | -77.80 | -53.80 | -88.70 | -50.80 | -66.00 | -39.50 | -950.40 | -52.70 | -81.00 | -45.70 | -714.60 | -55.30 | -39.20 | -67.80 | -29.00 | -95.80 | -53.50 | -47.90 | -54.50 | -36.00 | -55.40 | -32.90 | -57.30 | 81.90 | -25.80 | -23.40 | -35.10 | -50.70 | -13.90 | -26.20 |
| 2023-12-31 | 2023-09-30 | 2023-06-30 | 2023-03-31 | 2022-12-31 | 2022-09-30 | 2022-06-30 | 2022-03-31 | 2021-12-31 | 2021-09-30 | 2021-06-30 | 2021-03-31 | 2020-12-31 | 2020-09-30 | 2020-06-30 | 2020-03-31 | 2019-12-31 | 2019-09-30 | 2019-06-30 | 2019-03-31 | 2018-12-31 | 2018-09-30 | 2018-06-30 | 2018-03-31 | 2017-12-31 | 2017-09-30 | 2017-06-30 | 2017-03-31 | 2016-12-31 | 2016-09-30 | 2016-06-30 | 2016-03-31 | 2015-12-31 | 2015-09-30 | 2015-06-30 | 2015-03-31 | 2014-12-31 | 2014-09-30 | 2014-06-30 | 2014-03-31 | 2013-12-31 | 2013-09-30 | 2013-06-30 | 2013-03-31 | 2012-12-31 | 2012-09-30 | 2012-06-30 | 2012-03-31 | 2011-12-31 | 2011-09-30 | 2011-06-30 | 2011-03-31 | 2010-12-31 | 2010-09-30 | 2010-06-30 | 2010-03-31 | ||
|---|---|---|---|---|---|---|---|---|---|---|---|---|---|---|---|---|---|---|---|---|---|---|---|---|---|---|---|---|---|---|---|---|---|---|---|---|---|---|---|---|---|---|---|---|---|---|---|---|---|---|---|---|---|---|---|---|---|
| Net Cash Provided By Used In Financing Activities | -29.90 | -65.80 | -43.50 | -58.00 | -16.50 | -49.00 | -19.30 | -60.90 | 42.30 | -18.50 | -186.40 | -77.50 | -354.20 | -45.60 | 182.80 | 71.10 | -424.10 | 431.80 | 122.20 | -81.70 | -67.70 | -137.00 | 0.20 | -116.70 | -89.30 | -99.70 | -63.50 | -106.30 | -63.20 | -120.70 | -89.10 | -108.60 | 93.80 | 645.50 | -184.70 | 85.30 | 438.80 | 122.20 | -76.10 | -50.70 | -72.40 | -50.50 | -63.30 | -126.20 | -85.20 | 50.80 | -61.70 | -33.90 | -92.20 | -148.40 | -122.70 | 26.90 | -174.10 | -22.20 | -18.70 | -22.70 | |
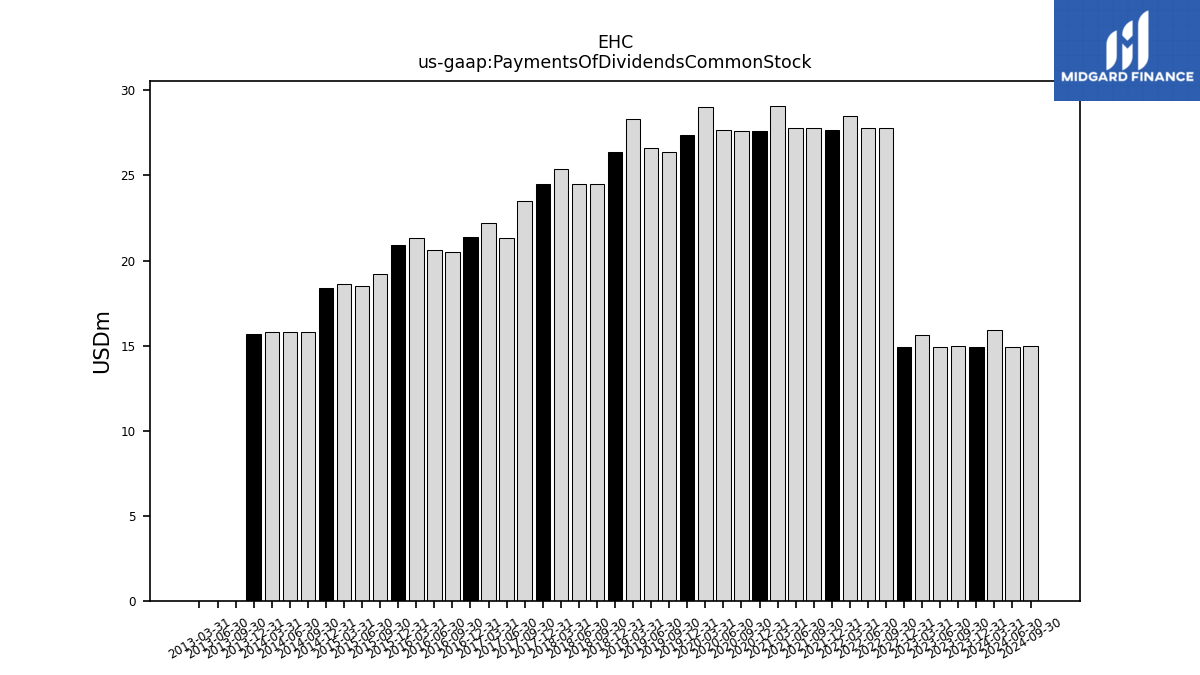
| Payments Of Dividends Common Stock | 14.90 | 15.00 | 14.90 | 15.60 | 14.90 | 27.80 | 27.80 | 28.50 | 27.70 | 27.80 | 27.80 | 29.10 | 27.60 | 27.60 | 27.70 | 29.00 | 27.40 | 26.40 | 26.60 | 28.30 | 26.40 | 24.50 | 24.50 | 25.40 | 24.50 | 23.50 | 21.30 | 22.20 | 21.40 | 20.50 | 20.60 | 21.30 | 20.90 | 19.20 | 18.50 | 18.60 | 18.40 | 15.80 | 15.80 | 15.80 | 15.70 | 0.00 | 0.00 | 0.00 | NA | NA | NA | NA | NA | NA | NA | NA | NA | NA | NA | NA |
| 2023-12-31 | 2023-09-30 | 2023-06-30 | 2023-03-31 | 2022-12-31 | 2022-09-30 | 2022-06-30 | 2022-03-31 | 2021-12-31 | 2021-09-30 | 2021-06-30 | 2021-03-31 | 2020-12-31 | 2020-09-30 | 2020-06-30 | 2020-03-31 | 2019-12-31 | 2019-09-30 | 2019-06-30 | 2019-03-31 | 2018-12-31 | 2018-09-30 | 2018-06-30 | 2018-03-31 | 2017-12-31 | 2017-09-30 | 2017-06-30 | 2017-03-31 | 2016-12-31 | 2016-09-30 | 2016-06-30 | 2016-03-31 | 2015-12-31 | 2015-09-30 | 2015-06-30 | 2015-03-31 | 2014-12-31 | 2014-09-30 | 2014-06-30 | 2014-03-31 | 2013-12-31 | 2013-09-30 | 2013-06-30 | 2013-03-31 | 2012-12-31 | 2012-09-30 | 2012-06-30 | 2012-03-31 | 2011-12-31 | 2011-09-30 | 2011-06-30 | 2011-03-31 | 2010-12-31 | 2010-09-30 | 2010-06-30 | 2010-03-31 | ||
|---|---|---|---|---|---|---|---|---|---|---|---|---|---|---|---|---|---|---|---|---|---|---|---|---|---|---|---|---|---|---|---|---|---|---|---|---|---|---|---|---|---|---|---|---|---|---|---|---|---|---|---|---|---|---|---|---|---|
| Revenues | 1246.80 | 1206.90 | 1187.10 | 1160.40 | 1137.30 | 1089.50 | 1330.50 | 1333.60 | 1042.50 | 1284.80 | 1287.70 | 1230.40 | 1214.40 | 1173.90 | 1074.10 | 1182.00 | 1184.40 | 1161.60 | 1135.00 | 1124.00 | 1096.00 | 1067.60 | 1067.70 | 1046.00 | 1008.80 | 981.60 | 966.40 | 957.10 | 949.90 | 926.80 | 920.70 | 909.80 | 879.30 | 778.60 | 764.40 | 740.60 | 613.40 | 596.90 | 604.40 | 591.20 | 572.10 | 564.00 | 564.50 | 572.60 | 552.90 | 537.00 | 533.40 | 538.60 | 518.10 | 497.70 | 505.10 | 538.10 | 490.90 | 460.80 | 467.30 | 491.00 | |
| Revenue From Contract With Customer Excluding Assessed Tax | 1246.80 | 1206.90 | 1187.10 | 1160.40 | 1137.30 | 1089.50 | 1330.50 | 1333.60 | 1042.50 | 1284.80 | 1287.70 | 1230.40 | 1214.40 | 1173.90 | 1074.10 | 1182.00 | 1184.40 | 1161.60 | 1135.00 | 1124.00 | 1096.00 | 1067.60 | 1067.70 | 1046.00 | 1008.80 | 981.60 | 966.40 | 957.10 | 949.90 | 926.80 | 920.70 | 909.80 | 879.30 | 778.60 | 764.40 | 740.60 | 613.40 | 596.90 | 604.40 | 591.20 | 572.10 | 564.00 | 564.50 | 572.60 | 552.90 | 537.00 | 533.40 | 538.60 | 518.10 | 497.70 | 505.10 | 538.10 | 490.90 | 460.80 | 467.30 | 491.00 |