
| 2024-03-31 | 2023-12-31 | 2023-09-30 | 2023-06-30 | 2023-03-31 | 2022-12-31 | 2022-09-30 | 2022-06-30 | 2022-03-31 | 2021-12-31 | 2021-09-30 | 2021-06-30 | 2021-03-31 | 2020-12-31 | 2020-09-30 | 2020-06-30 | 2020-03-31 | 2019-12-31 | 2019-09-30 | 2019-06-30 | 2019-03-31 | 2018-12-31 | 2018-09-30 | 2018-06-30 | 2018-03-31 | 2017-12-31 | 2017-09-30 | 2017-06-30 | 2017-03-31 | 2016-12-31 | 2016-09-30 | 2016-06-30 | 2016-03-31 | 2015-12-31 | 2015-09-30 | 2015-06-30 | 2015-03-31 | 2014-12-31 | 2014-09-30 | 2014-06-30 | 2014-03-31 | 2013-12-31 | 2013-09-30 | 2013-06-30 | 2013-03-31 | 2012-12-31 | 2012-09-30 | 2012-06-30 | 2012-03-31 | 2011-12-31 | 2011-09-30 | 2011-06-30 | 2011-03-31 | 2010-12-31 | 2010-09-30 | 2010-06-30 | 2010-03-31 | ||
|---|---|---|---|---|---|---|---|---|---|---|---|---|---|---|---|---|---|---|---|---|---|---|---|---|---|---|---|---|---|---|---|---|---|---|---|---|---|---|---|---|---|---|---|---|---|---|---|---|---|---|---|---|---|---|---|---|---|---|
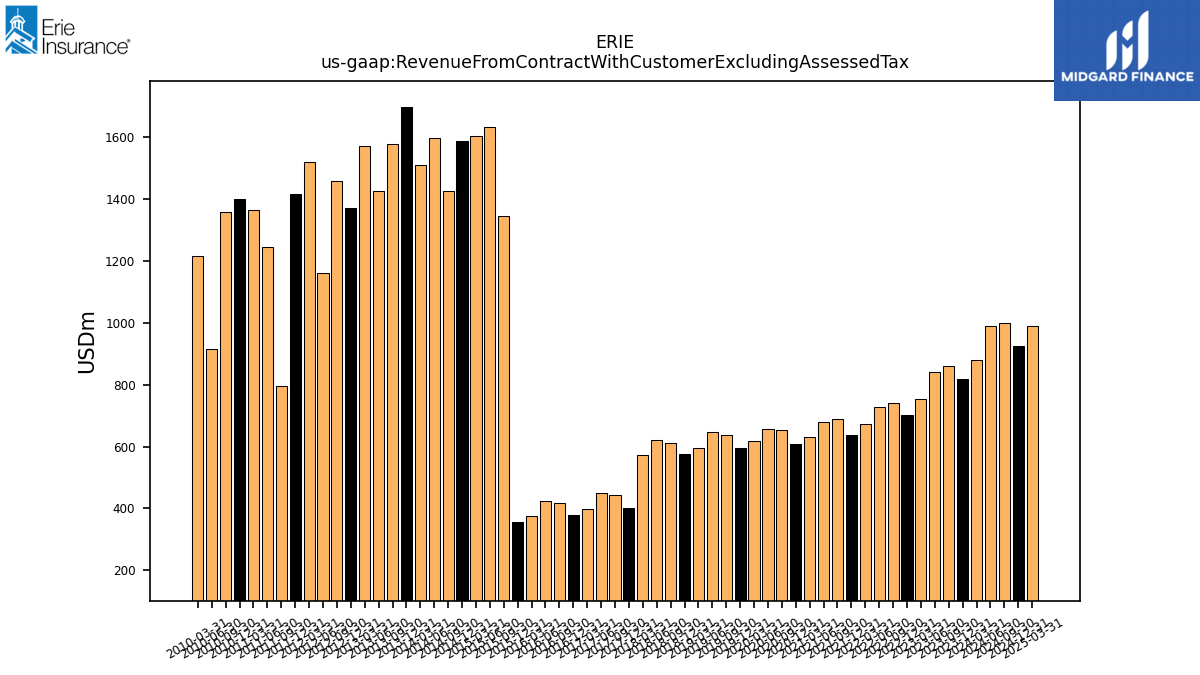
| Revenue From Contract With Customer Excluding Assessed Tax | 880.70 | 817.67 | 858.94 | 839.87 | 752.47 | 700.63 | 741.24 | 726.14 | 672.11 | 635.93 | 687.84 | 680.03 | 630.18 | 609.25 | 653.48 | 657.02 | 616.74 | 596.74 | 638.74 | 647.71 | 594.11 | 576.47 | 612.13 | 621.46 | 572.16 | 401.40 | 442.49 | 448.56 | 399.32 | 379.61 | 418.41 | 423.88 | 374.73 | 356.38 | 1346.00 | 1632.00 | 1605.00 | 1589.00 | 1426.00 | 1598.00 | 1511.00 | 1697.00 | 1577.00 | 1426.00 | 1571.00 | 1372.00 | 1460.00 | 1160.00 | 1520.00 | 1418.00 | 796.00 | 1245.00 | 1365.00 | 1401.00 | 1357.00 | 916.00 | 1216.00 | |
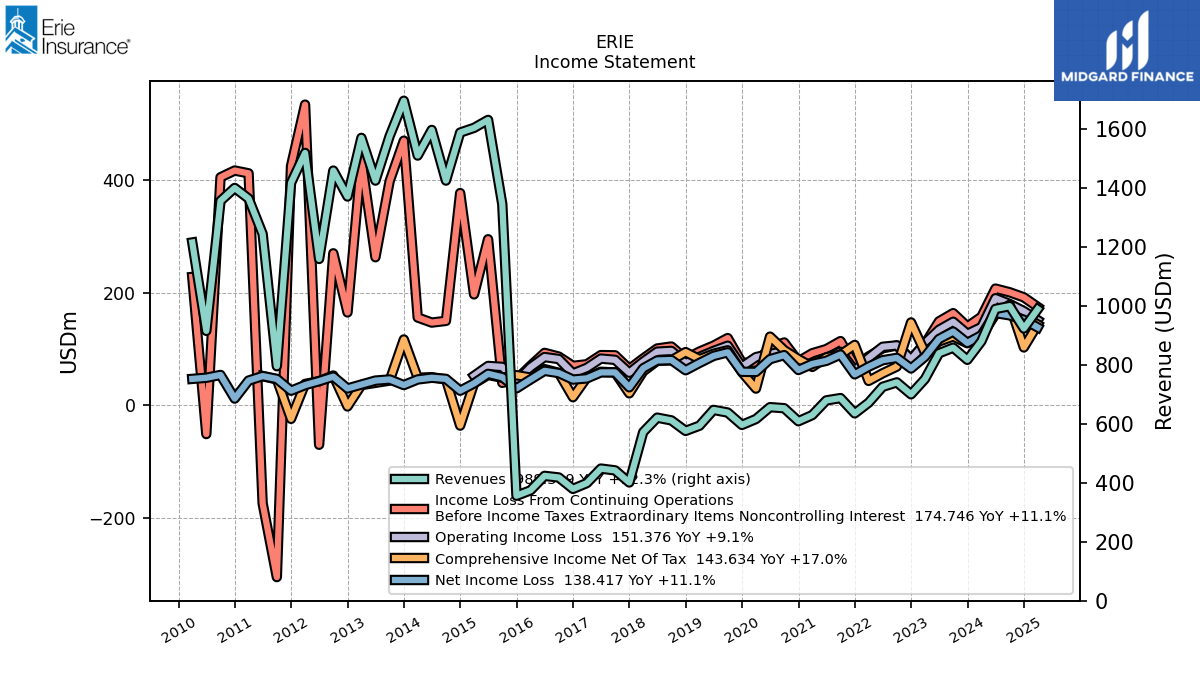
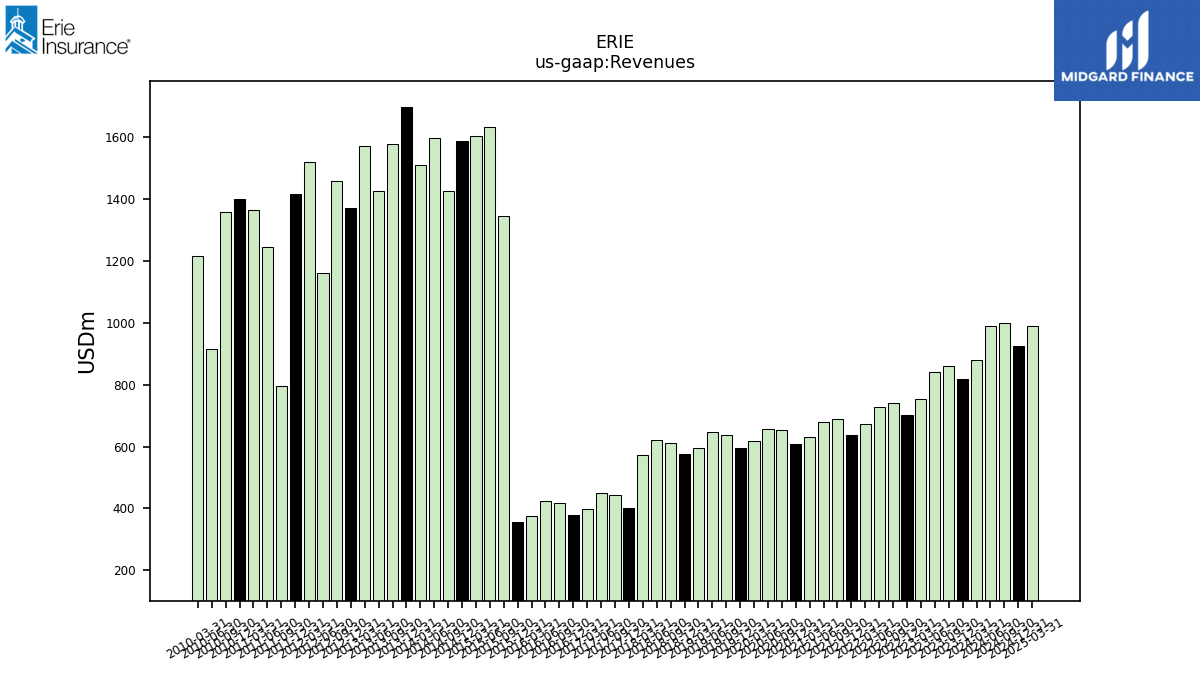
| Revenues | 880.70 | 817.67 | 858.94 | 839.87 | 752.47 | 700.63 | 741.24 | 726.14 | 672.11 | 635.93 | 687.84 | 680.03 | 630.18 | 609.25 | 653.48 | 657.02 | 616.74 | 596.74 | 638.74 | 647.71 | 594.11 | 576.47 | 612.13 | 621.46 | 572.16 | 401.40 | 442.49 | 448.56 | 399.32 | 379.61 | 418.41 | 423.88 | 374.73 | 356.38 | 1346.00 | 1632.00 | 1605.00 | 1589.00 | 1426.00 | 1598.00 | 1511.00 | 1697.00 | 1577.00 | 1426.00 | 1571.00 | 1372.00 | 1460.00 | 1160.00 | 1520.00 | 1418.00 | 796.00 | 1245.00 | 1365.00 | 1401.00 | 1357.00 | 916.00 | 1216.00 | |
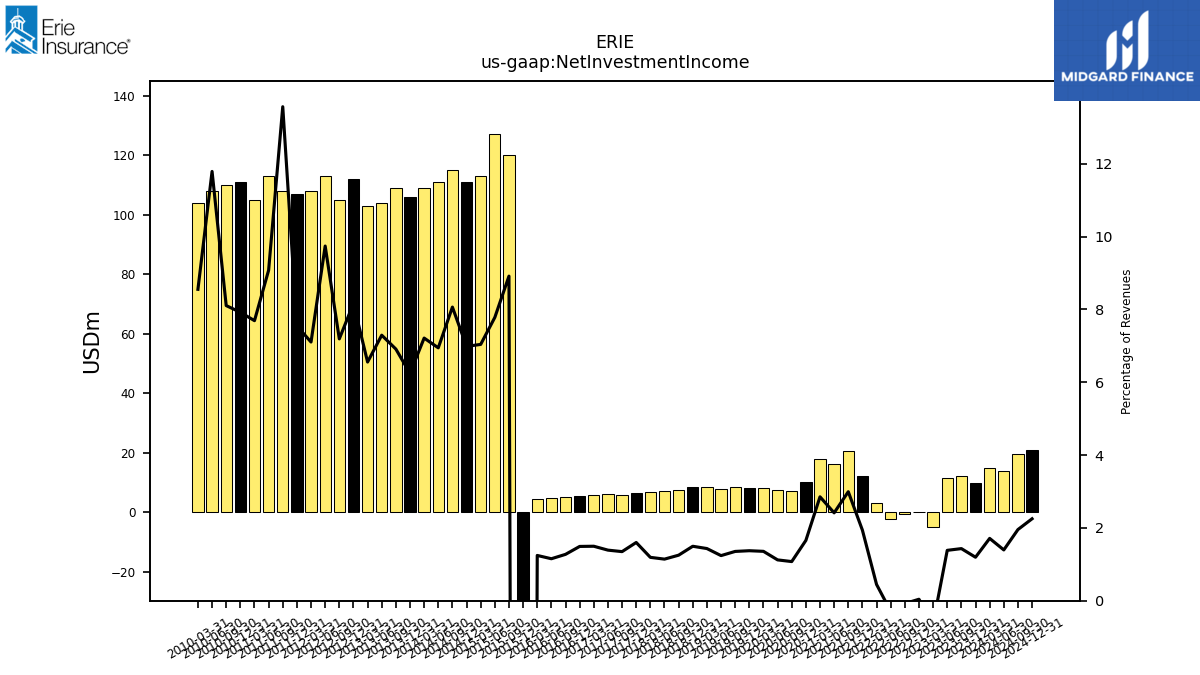
| Net Investment Income | 15.08 | 9.77 | 12.30 | 11.63 | -4.73 | 0.29 | -0.57 | -2.09 | 3.01 | 12.33 | 20.60 | 16.42 | 17.99 | 10.10 | 7.03 | 7.37 | 8.37 | 8.20 | 8.65 | 8.03 | 8.52 | 8.63 | 7.66 | 7.10 | 6.82 | 6.42 | 5.97 | 6.24 | 5.98 | 5.66 | 5.33 | 4.89 | 4.66 | -342.21 | 120.00 | 127.00 | 113.00 | 111.00 | 115.00 | 111.00 | 109.00 | 106.00 | 109.00 | 104.00 | 103.00 | 112.00 | 105.00 | 113.00 | 108.00 | 107.00 | 108.00 | 113.00 | 105.00 | 111.00 | 110.00 | 108.00 | 104.00 | |
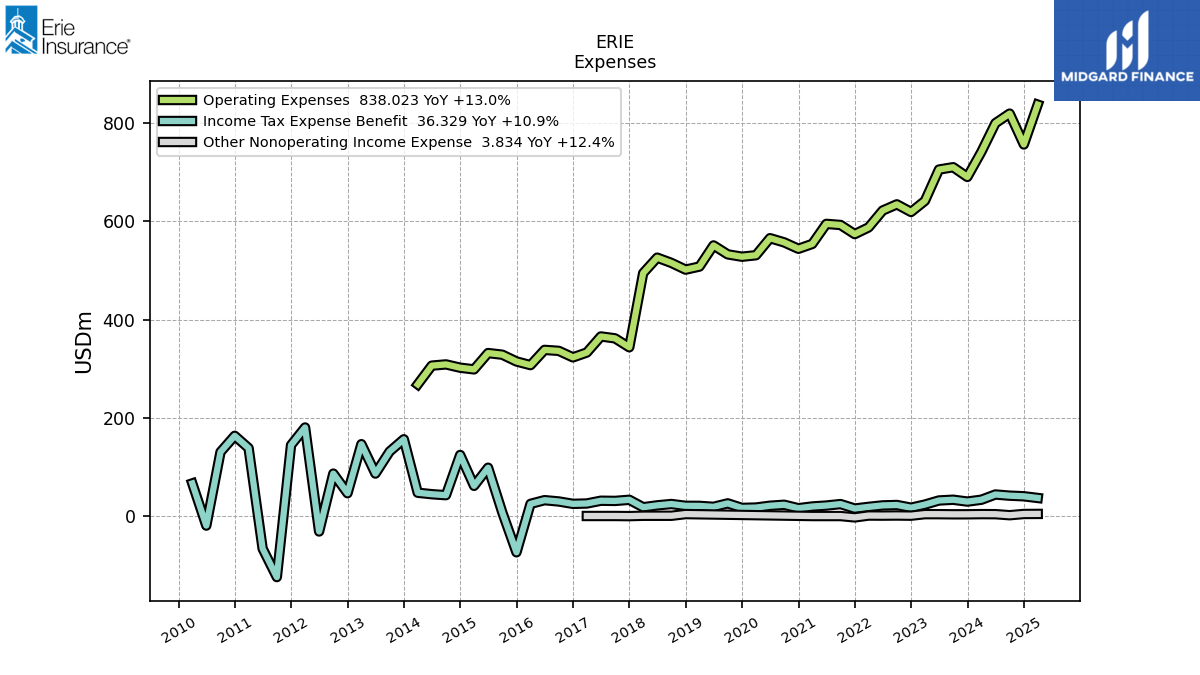
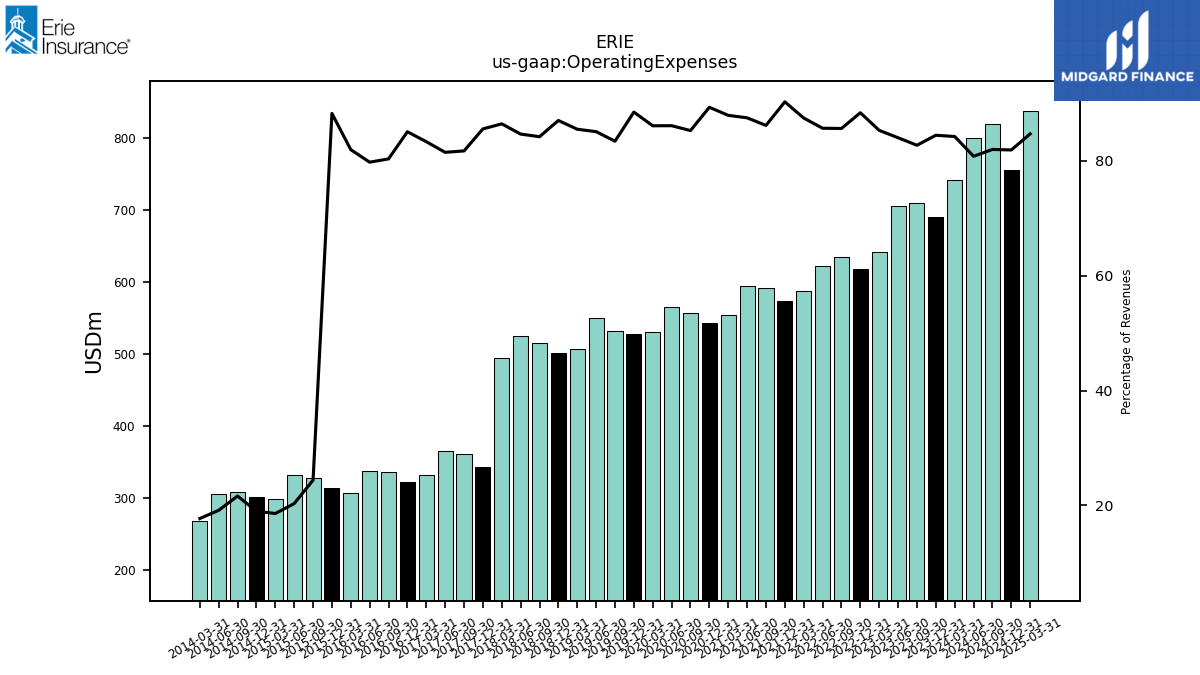
| Operating Expenses | 741.89 | 690.58 | 710.47 | 705.71 | 641.92 | 619.21 | 634.76 | 622.14 | 587.80 | 574.10 | 592.74 | 594.97 | 554.08 | 544.20 | 557.26 | 565.83 | 531.05 | 528.04 | 532.84 | 551.10 | 507.98 | 501.71 | 515.43 | 526.13 | 494.59 | 343.44 | 361.66 | 365.52 | 332.78 | 322.93 | 336.15 | 338.12 | 307.06 | 314.54 | 328.35 | 331.68 | 298.40 | 301.84 | 308.55 | 306.06 | 267.82 | NA | NA | NA | NA | NA | NA | NA | NA | NA | NA | NA | NA | NA | NA | NA | NA | |
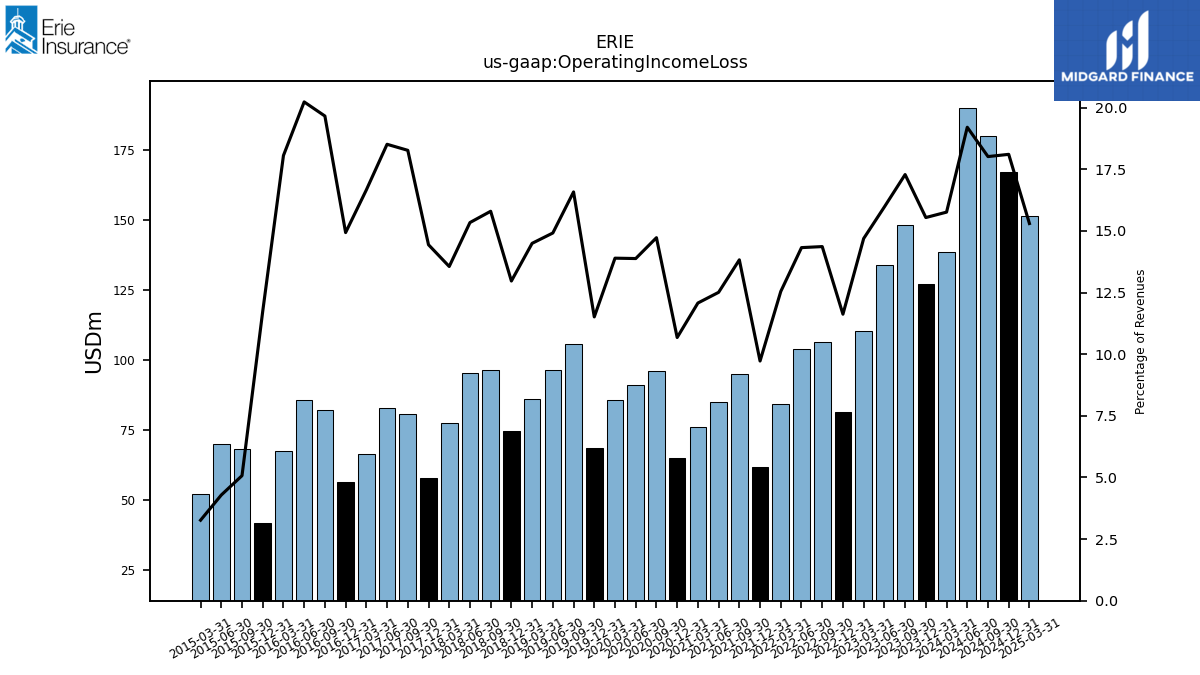
| Operating Income Loss | 138.81 | 127.08 | 148.47 | 134.16 | 110.54 | 81.43 | 106.47 | 104.00 | 84.31 | 61.83 | 95.10 | 85.06 | 76.09 | 65.05 | 96.22 | 91.19 | 85.69 | 68.70 | 105.91 | 96.61 | 86.12 | 74.76 | 96.69 | 95.32 | 77.57 | 57.96 | 80.84 | 83.04 | 66.53 | 56.69 | 82.25 | 85.76 | 67.67 | 41.84 | 68.29 | 69.98 | 52.43 | NA | NA | NA | NA | NA | NA | NA | NA | NA | NA | NA | NA | NA | NA | NA | NA | NA | NA | NA | NA | |
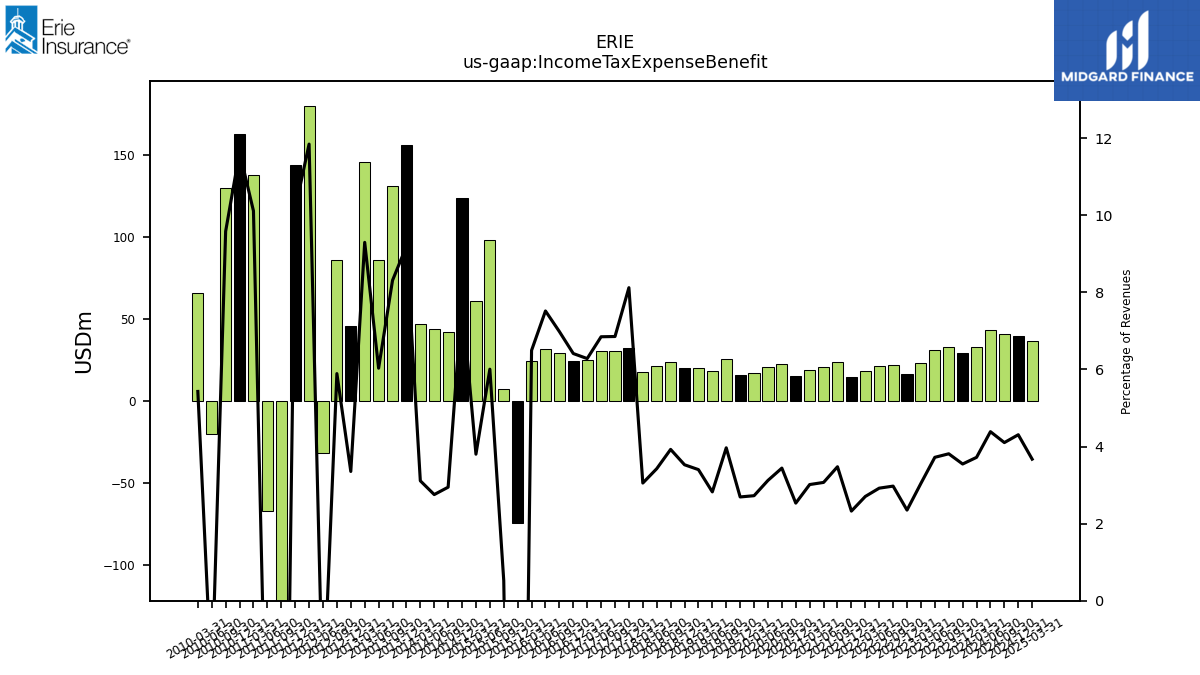
| Income Tax Expense Benefit | 32.75 | 29.00 | 32.73 | 31.24 | 22.91 | 16.47 | 22.04 | 21.20 | 18.18 | 14.79 | 23.90 | 20.87 | 18.99 | 15.43 | 22.48 | 20.50 | 16.80 | 16.06 | 25.33 | 18.28 | 20.20 | 20.33 | 24.02 | 21.28 | 17.46 | 32.59 | 30.32 | 30.71 | 25.08 | 24.34 | 29.20 | 31.85 | 24.33 | -74.43 | 7.00 | 98.00 | 61.00 | 124.00 | 42.00 | 44.00 | 47.00 | 156.00 | 131.00 | 86.00 | 146.00 | 46.00 | 86.00 | -32.00 | 180.00 | 144.00 | -125.00 | -67.00 | 138.00 | 163.00 | 130.00 | -20.00 | 66.00 | |
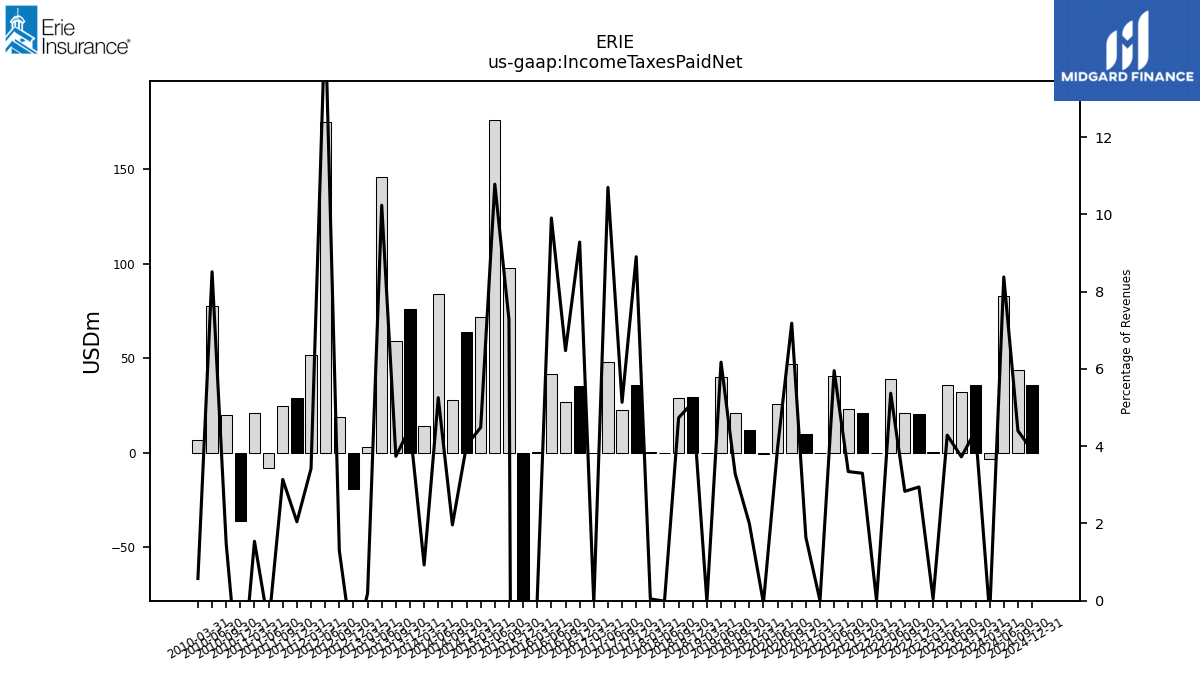
| Income Taxes Paid Net | -3.14 | 36.00 | 32.00 | 36.00 | 0.37 | 20.63 | 21.00 | 39.01 | -0.02 | 20.99 | 23.00 | 40.50 | 0.00 | 10.00 | 46.95 | 26.00 | -0.38 | 11.95 | 21.00 | 40.00 | -0.14 | 29.61 | 29.00 | -0.07 | 0.28 | 35.75 | 22.74 | 48.00 | -0.23 | 35.25 | 27.10 | 42.00 | 0.26 | -239.65 | 98.00 | 176.00 | 72.00 | 64.00 | 28.00 | 84.00 | 14.00 | 76.00 | 59.00 | 146.00 | 3.00 | -19.00 | 19.00 | 175.00 | 52.00 | 29.00 | 25.00 | -8.00 | 21.00 | -36.00 | 20.00 | 78.00 | 7.00 | |
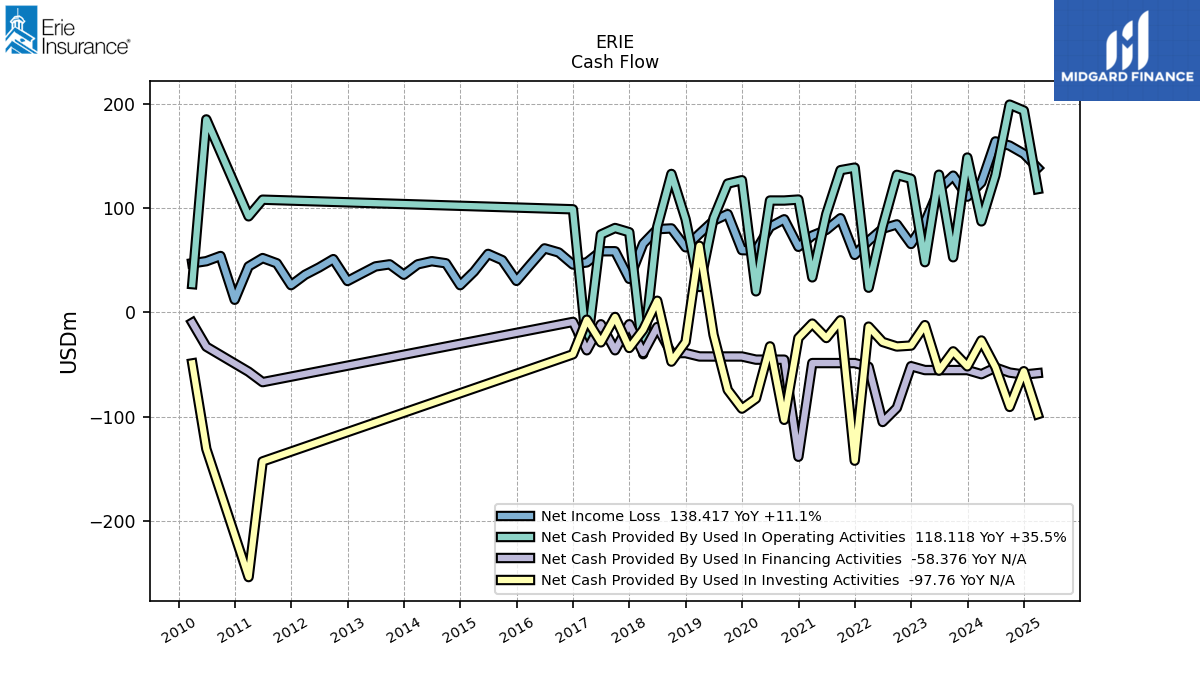
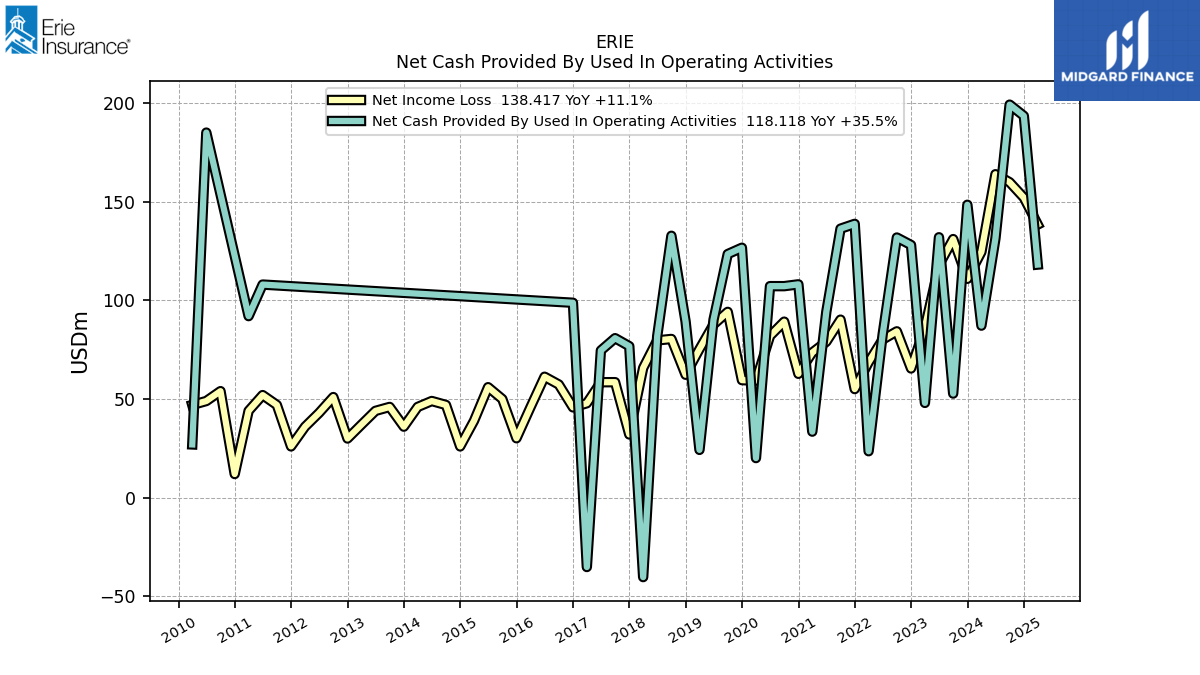
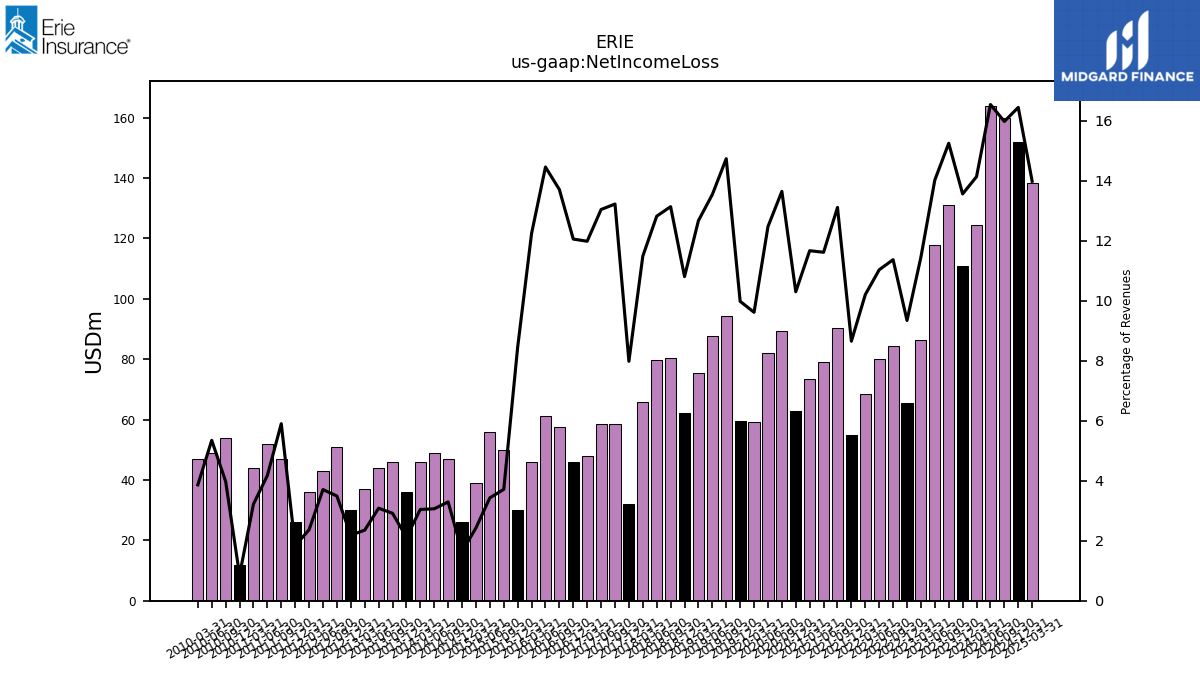
| Net Income Loss | 124.55 | 110.93 | 131.04 | 117.85 | 86.24 | 65.49 | 84.31 | 80.15 | 68.62 | 55.04 | 90.22 | 79.03 | 73.57 | 62.78 | 89.22 | 81.98 | 59.33 | 59.59 | 94.17 | 87.75 | 75.31 | 62.31 | 80.45 | 79.71 | 65.76 | 32.05 | 58.54 | 58.53 | 47.88 | 45.79 | 57.38 | 61.31 | 45.90 | 30.13 | 50.00 | 56.00 | 39.00 | 26.00 | 47.00 | 49.00 | 46.00 | 36.00 | 46.00 | 44.00 | 37.00 | 30.00 | 51.00 | 43.00 | 36.00 | 26.00 | 47.00 | 52.00 | 44.00 | 12.00 | 54.00 | 49.00 | 47.00 | |
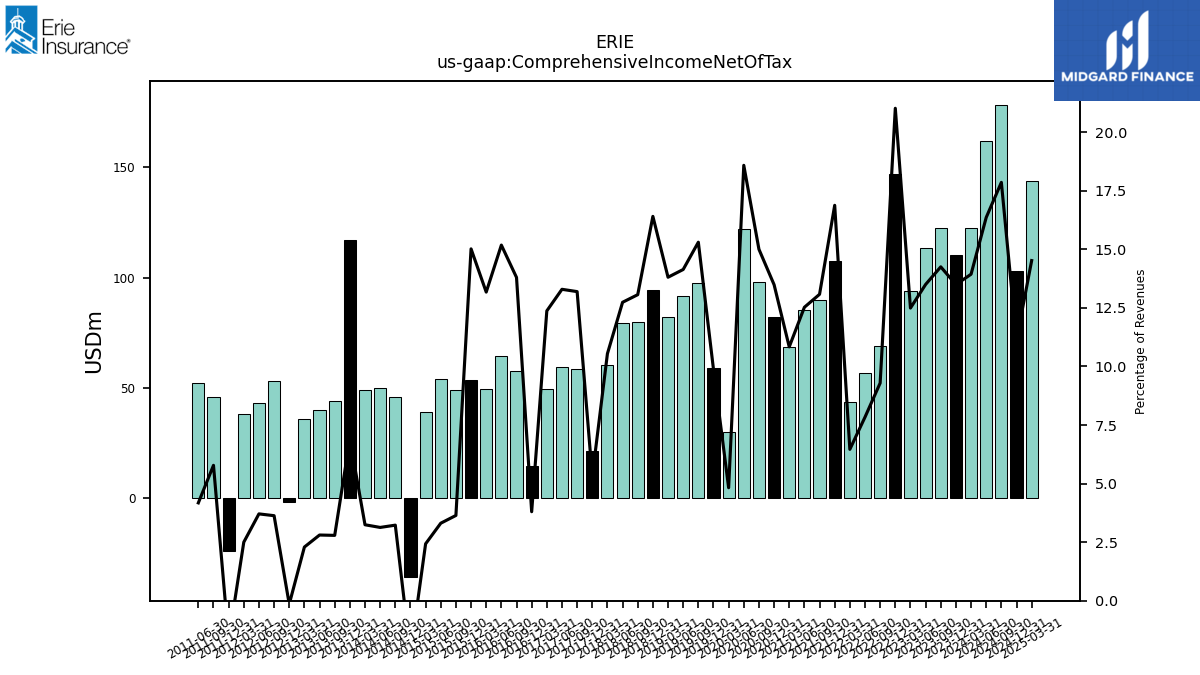
| Comprehensive Income Net Of Tax | 122.72 | 110.32 | 122.40 | 113.36 | 93.99 | 147.25 | 68.87 | 56.90 | 43.43 | 107.32 | 89.95 | 85.17 | 68.28 | 82.17 | 98.02 | 122.09 | 29.75 | 58.92 | 97.73 | 91.56 | 82.02 | 94.56 | 79.95 | 79.16 | 60.33 | 21.31 | 58.38 | 59.62 | 49.40 | 14.42 | 57.73 | 64.33 | 49.36 | 53.52 | 49.00 | 54.00 | 39.00 | -36.00 | 46.00 | 50.00 | 49.00 | 117.00 | 44.00 | 40.00 | 36.00 | -2.00 | 53.00 | 43.00 | 38.00 | -24.00 | 46.00 | 52.00 | NA | NA | NA | NA | NA |
| 2024-03-31 | 2023-12-31 | 2023-09-30 | 2023-06-30 | 2023-03-31 | 2022-12-31 | 2022-09-30 | 2022-06-30 | 2022-03-31 | 2021-12-31 | 2021-09-30 | 2021-06-30 | 2021-03-31 | 2020-12-31 | 2020-09-30 | 2020-06-30 | 2020-03-31 | 2019-12-31 | 2019-09-30 | 2019-06-30 | 2019-03-31 | 2018-12-31 | 2018-09-30 | 2018-06-30 | 2018-03-31 | 2017-12-31 | 2017-09-30 | 2017-06-30 | 2017-03-31 | 2016-12-31 | 2016-09-30 | 2016-06-30 | 2016-03-31 | 2015-12-31 | 2015-09-30 | 2015-06-30 | 2015-03-31 | 2014-12-31 | 2014-09-30 | 2014-06-30 | 2014-03-31 | 2013-12-31 | 2013-09-30 | 2013-06-30 | 2013-03-31 | 2012-12-31 | 2012-09-30 | 2012-06-30 | 2012-03-31 | 2011-12-31 | 2011-09-30 | 2011-06-30 | 2011-03-31 | 2010-12-31 | 2010-09-30 | 2010-06-30 | 2010-03-31 | ||
|---|---|---|---|---|---|---|---|---|---|---|---|---|---|---|---|---|---|---|---|---|---|---|---|---|---|---|---|---|---|---|---|---|---|---|---|---|---|---|---|---|---|---|---|---|---|---|---|---|---|---|---|---|---|---|---|---|---|---|
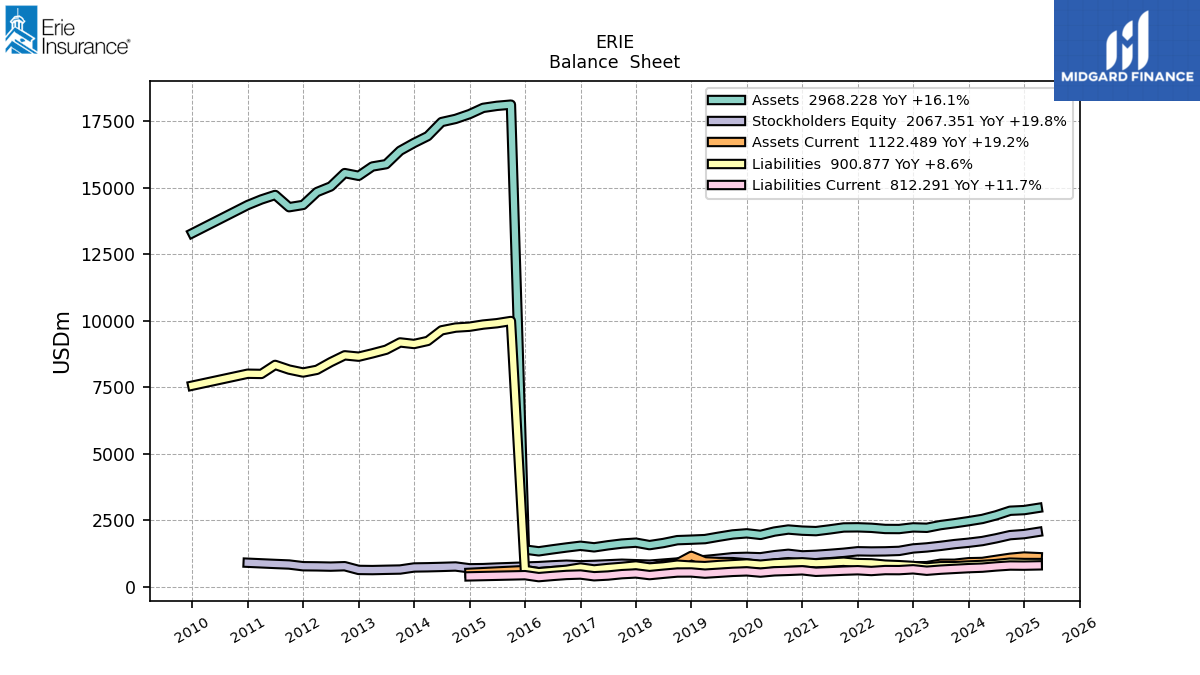
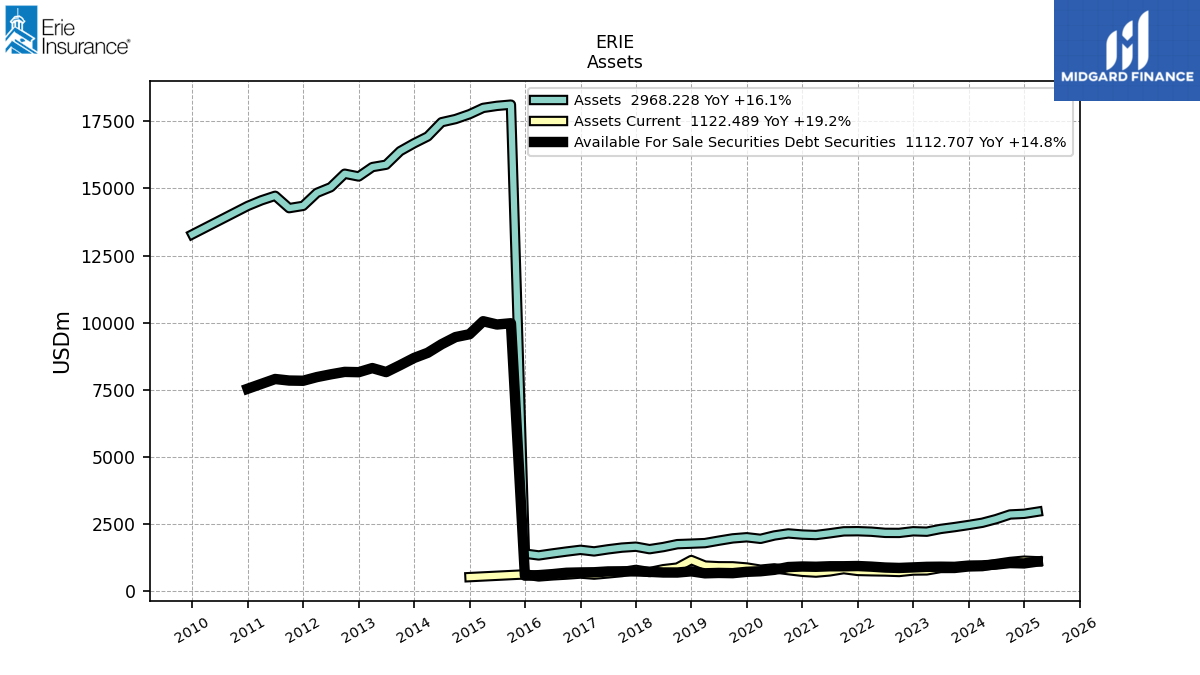
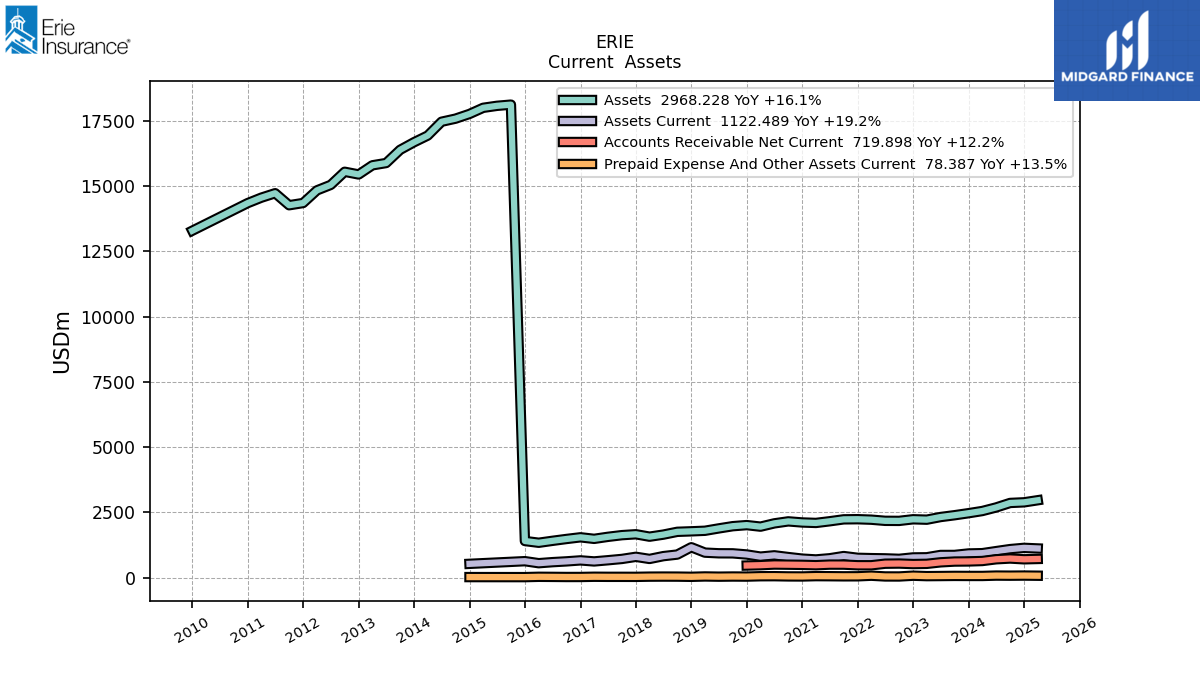
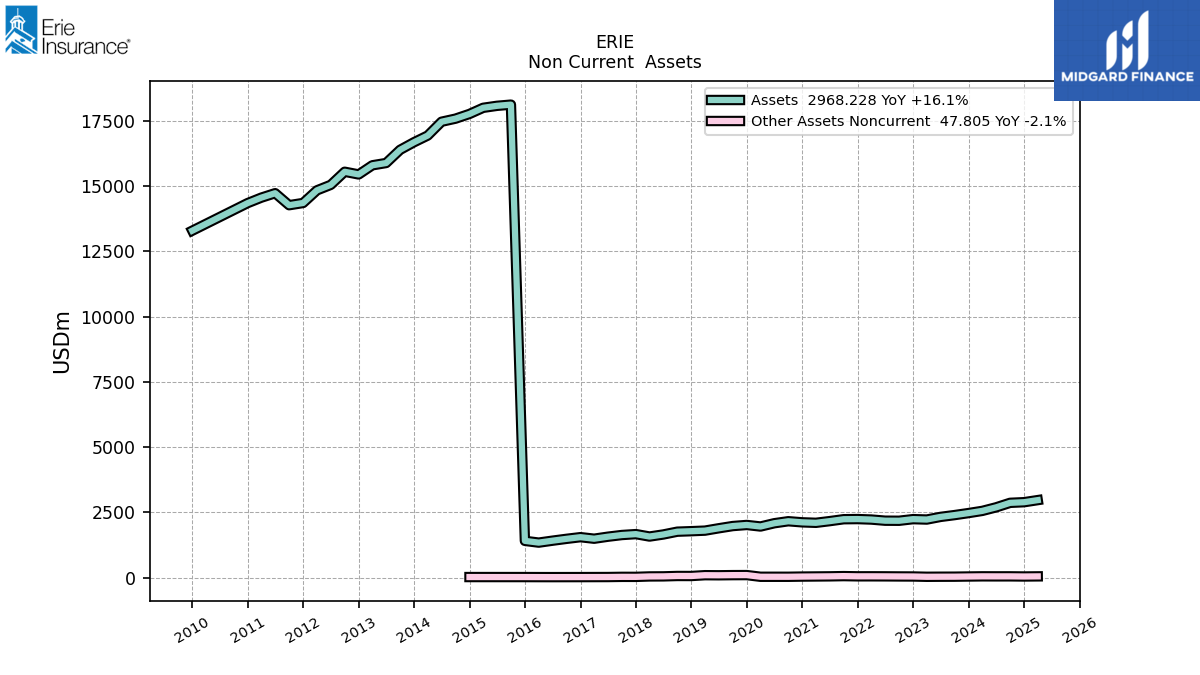
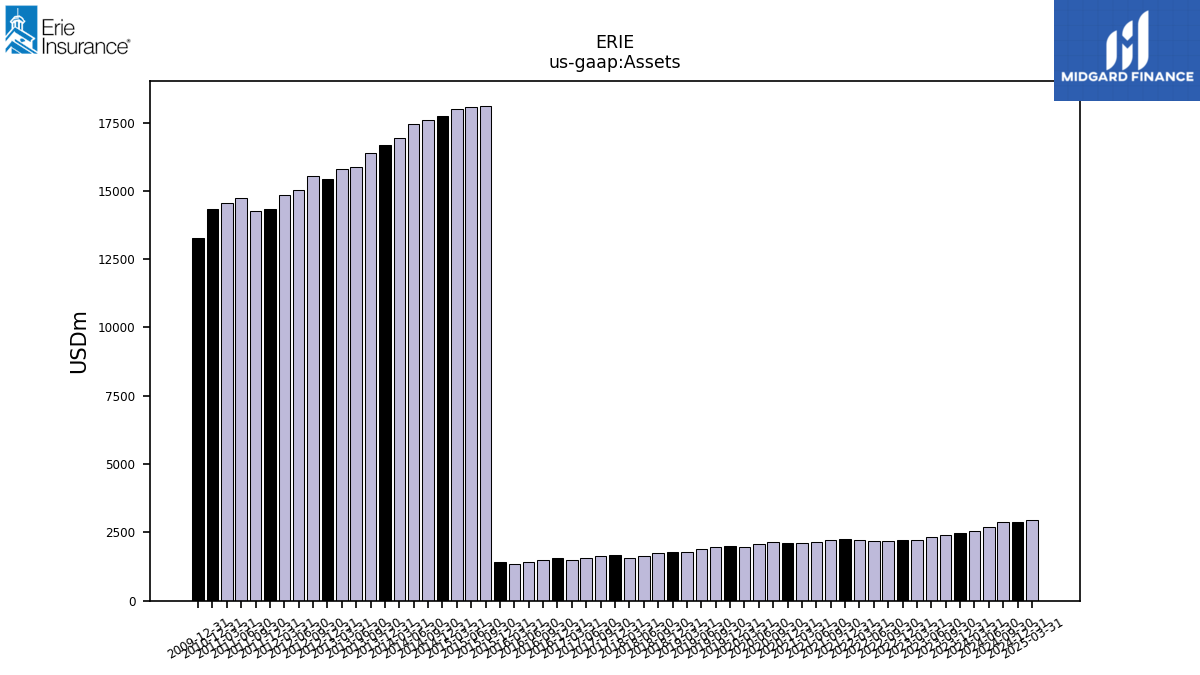
| Assets | 2555.79 | 2471.96 | 2394.55 | 2325.51 | 2223.97 | 2239.46 | 2177.75 | 2180.22 | 2223.85 | 2242.06 | 2236.56 | 2163.64 | 2099.10 | 2117.12 | 2159.34 | 2082.86 | 1957.49 | 2016.24 | 1974.58 | 1889.65 | 1799.46 | 1778.33 | 1759.50 | 1652.28 | 1573.48 | 1665.86 | 1631.43 | 1567.22 | 1490.04 | 1548.95 | 1485.02 | 1414.83 | 1340.62 | 1407.30 | 18115.00 | 18069.00 | 17993.00 | 17758.00 | 17578.00 | 17460.00 | 16931.00 | 16676.00 | 16384.00 | 15879.00 | 15791.00 | 15441.00 | 15544.00 | 15042.00 | 14832.00 | 14348.00 | 14263.00 | 14723.00 | 14553.00 | 14344.00 | NA | NA | NA | |
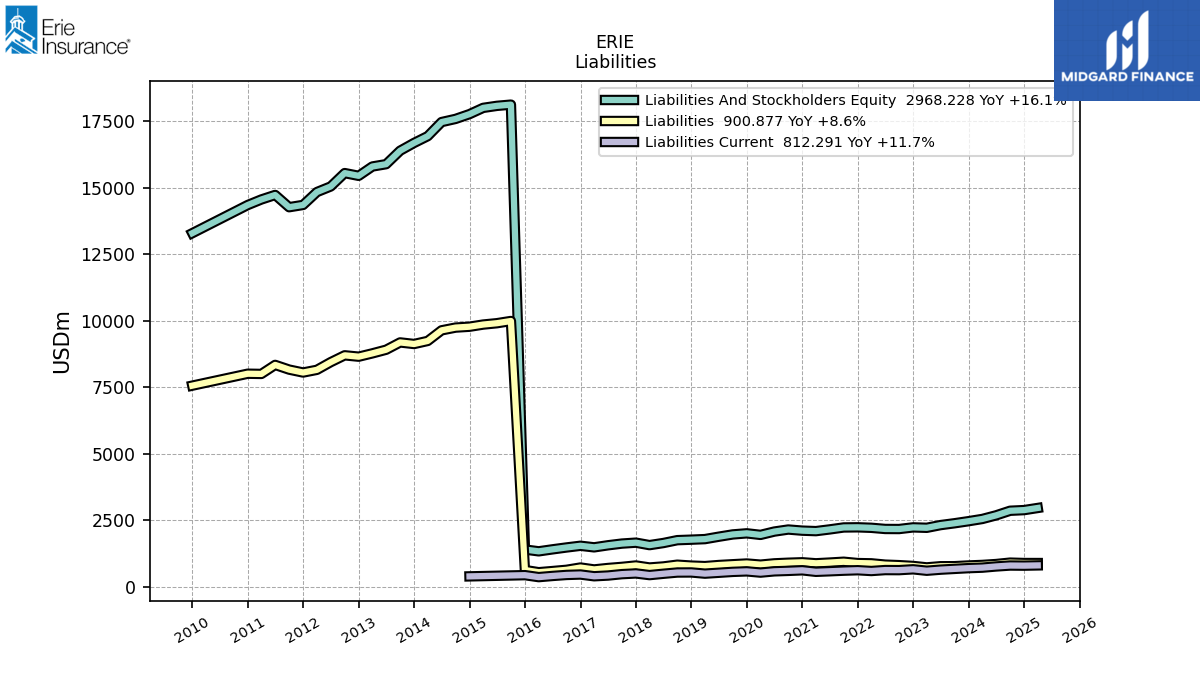
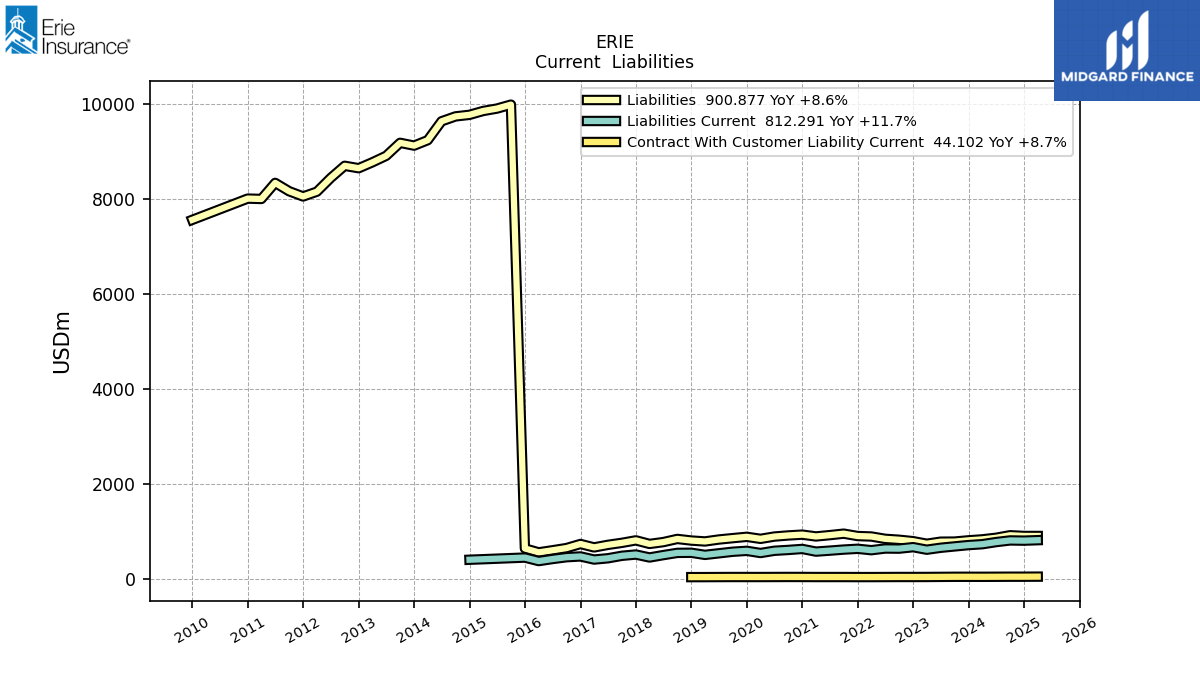
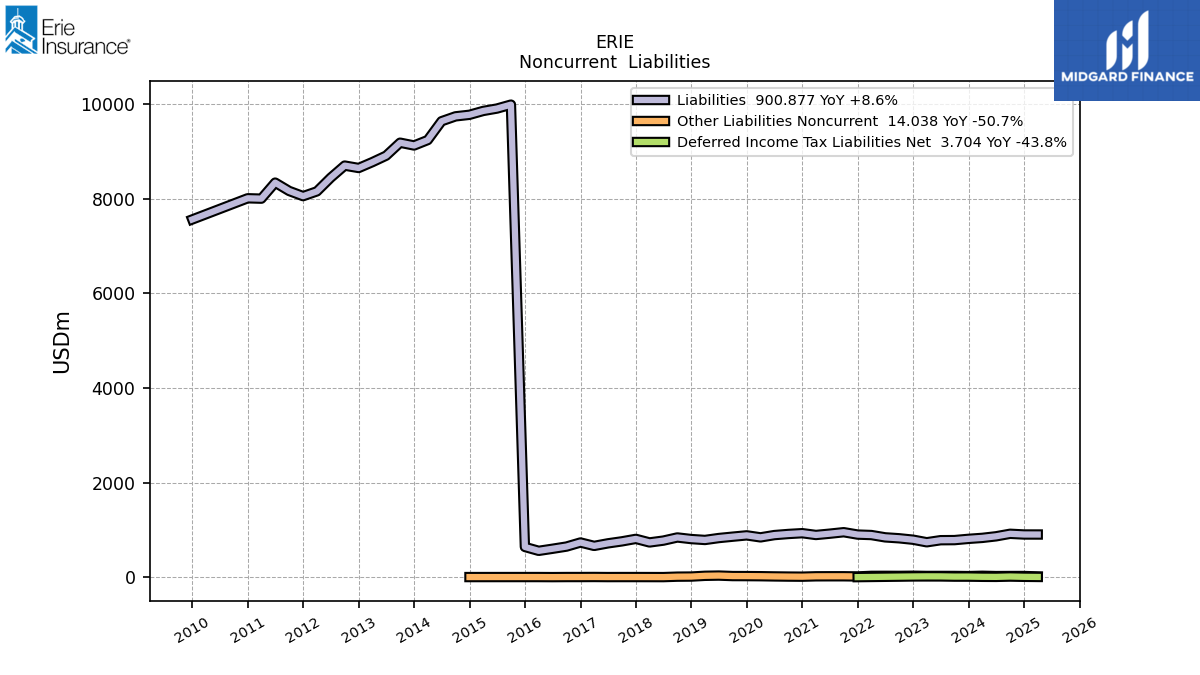
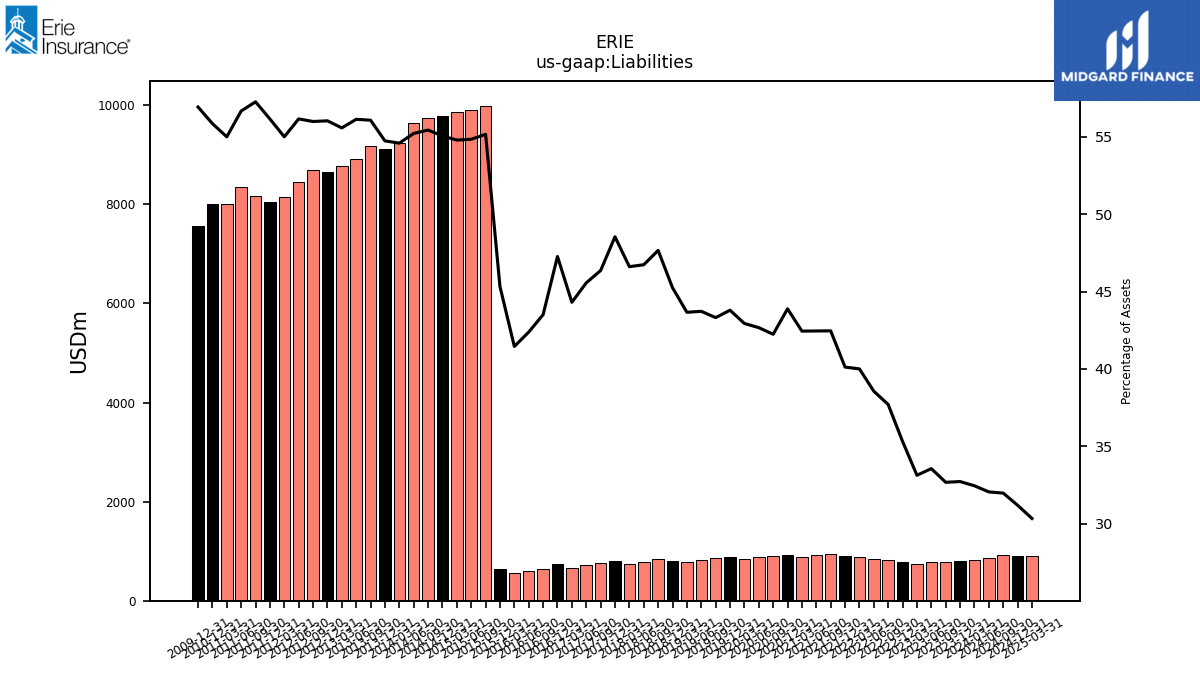
| Liabilities | 829.61 | 809.13 | 782.66 | 780.60 | 737.00 | 791.05 | 821.17 | 840.82 | 889.65 | 899.58 | 949.70 | 918.54 | 890.97 | 929.07 | 912.12 | 888.72 | 840.50 | 882.99 | 855.31 | 826.19 | 785.65 | 804.65 | 838.48 | 772.09 | 733.32 | 808.51 | 756.28 | 714.01 | 660.18 | 732.04 | 646.09 | 599.63 | 555.76 | 637.79 | 9990.00 | 9907.00 | 9856.00 | 9775.00 | 9742.00 | 9639.00 | 9241.00 | 9126.00 | 9185.00 | 8911.00 | 8774.00 | 8650.00 | 8701.00 | 8445.00 | 8156.00 | 8055.00 | 8165.00 | 8341.00 | 8002.00 | 8010.00 | NA | NA | NA | |
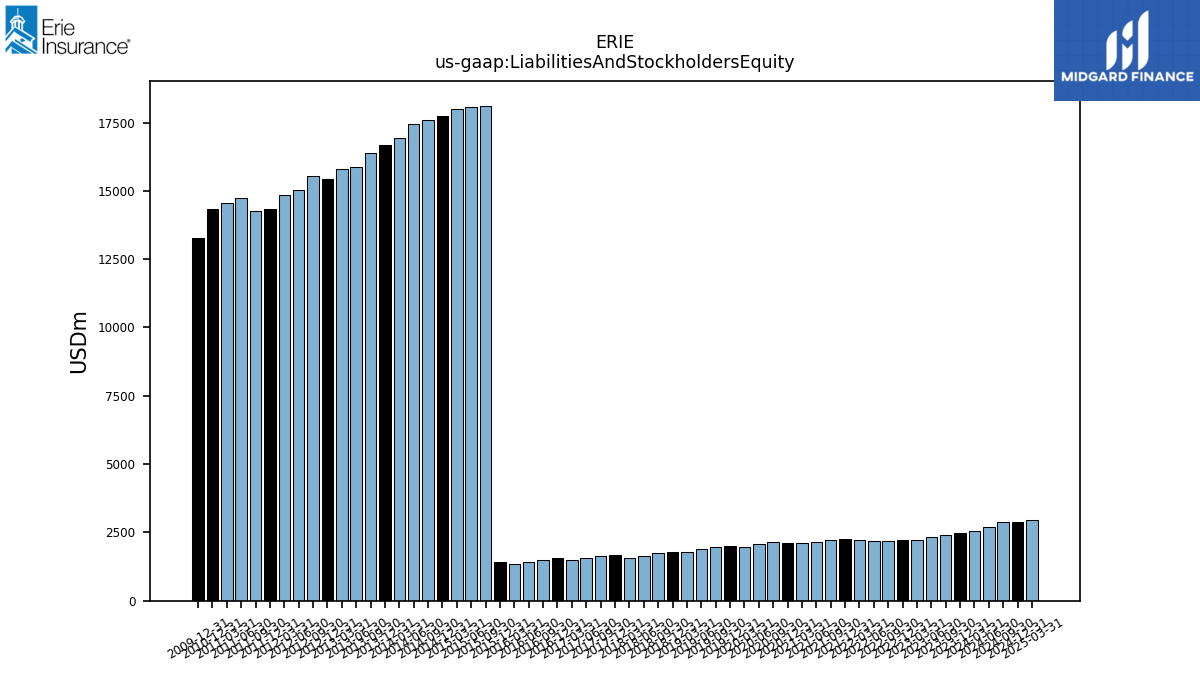
| Liabilities And Stockholders Equity | 2555.79 | 2471.96 | 2394.55 | 2325.51 | 2223.97 | 2239.46 | 2177.75 | 2180.22 | 2223.85 | 2242.06 | 2236.56 | 2163.64 | 2099.10 | 2117.12 | 2159.34 | 2082.86 | 1957.49 | 2016.24 | 1974.58 | 1889.65 | 1799.46 | 1778.33 | 1759.50 | 1652.28 | 1573.48 | 1665.86 | 1631.43 | 1567.22 | 1490.04 | 1548.95 | 1485.02 | 1414.83 | 1340.62 | 1407.30 | 18115.00 | 18069.00 | 17993.00 | 17758.00 | 17578.00 | 17460.00 | 16931.00 | 16676.00 | 16384.00 | 15879.00 | 15791.00 | 15441.00 | 15544.00 | 15042.00 | 14832.00 | 14348.00 | 14263.00 | 14723.00 | 14553.00 | 14344.00 | NA | NA | NA | |
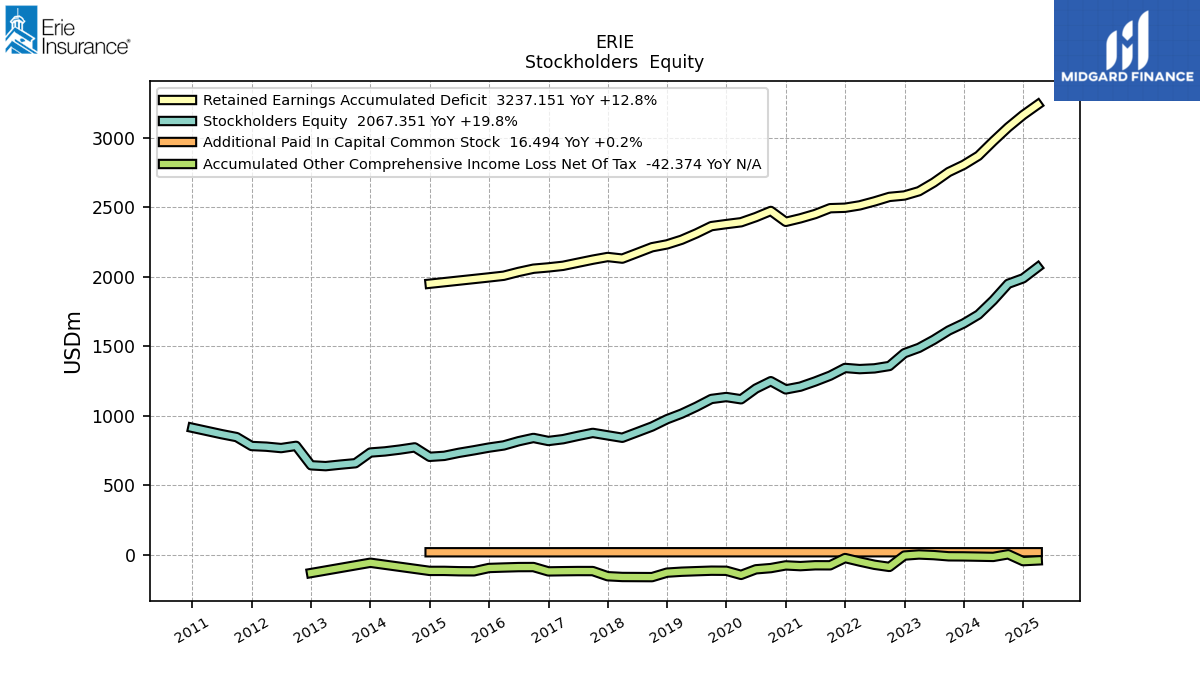
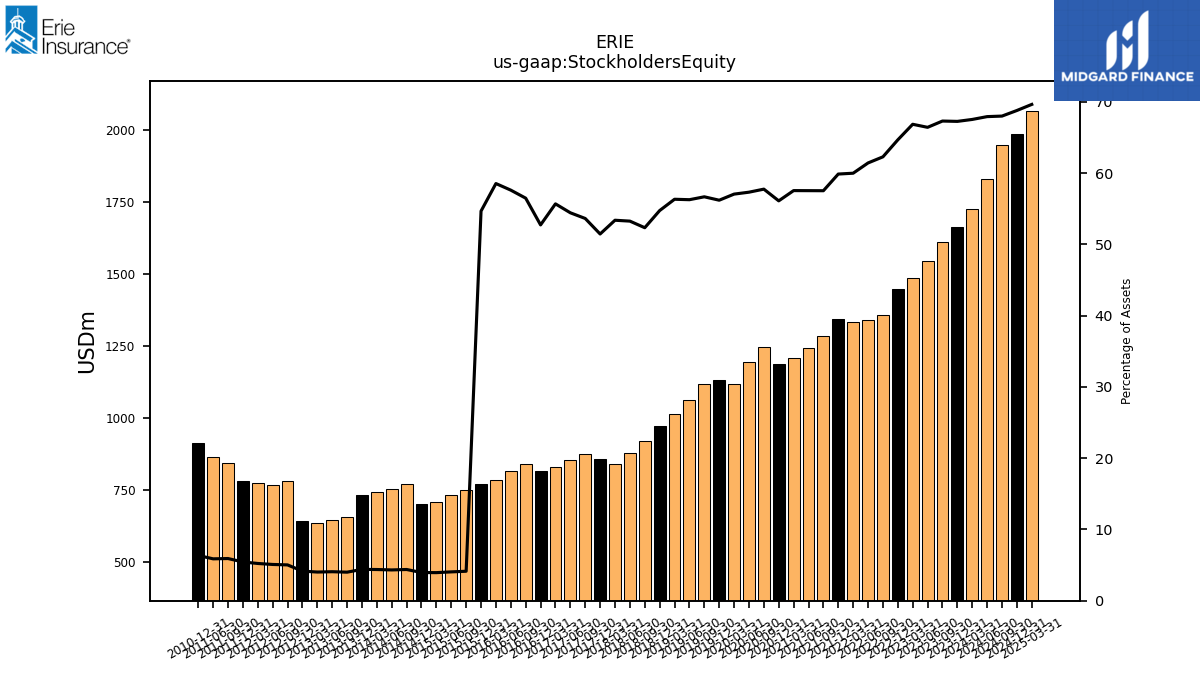
| Stockholders Equity | 1726.18 | 1662.84 | 1611.89 | 1544.91 | 1486.97 | 1448.41 | 1356.58 | 1339.41 | 1334.20 | 1342.48 | 1286.86 | 1245.10 | 1208.13 | 1188.05 | 1247.22 | 1194.14 | 1116.99 | 1133.25 | 1119.27 | 1063.45 | 1013.80 | 973.67 | 921.02 | 880.19 | 840.15 | 857.34 | 875.15 | 853.21 | 829.86 | 816.91 | 838.93 | 815.19 | 784.87 | 769.50 | 750.00 | 732.00 | 710.00 | 703.00 | 771.00 | 755.00 | 742.00 | 734.00 | 657.00 | 647.00 | 636.00 | 642.00 | 782.00 | 766.00 | 776.00 | 781.00 | 845.00 | 866.00 | NA | 912.00 | NA | NA | NA |
| 2024-03-31 | 2023-12-31 | 2023-09-30 | 2023-06-30 | 2023-03-31 | 2022-12-31 | 2022-09-30 | 2022-06-30 | 2022-03-31 | 2021-12-31 | 2021-09-30 | 2021-06-30 | 2021-03-31 | 2020-12-31 | 2020-09-30 | 2020-06-30 | 2020-03-31 | 2019-12-31 | 2019-09-30 | 2019-06-30 | 2019-03-31 | 2018-12-31 | 2018-09-30 | 2018-06-30 | 2018-03-31 | 2017-12-31 | 2017-09-30 | 2017-06-30 | 2017-03-31 | 2016-12-31 | 2016-09-30 | 2016-06-30 | 2016-03-31 | 2015-12-31 | 2015-09-30 | 2015-06-30 | 2015-03-31 | 2014-12-31 | 2014-09-30 | 2014-06-30 | 2014-03-31 | 2013-12-31 | 2013-09-30 | 2013-06-30 | 2013-03-31 | 2012-12-31 | 2012-09-30 | 2012-06-30 | 2012-03-31 | 2011-12-31 | 2011-09-30 | 2011-06-30 | 2011-03-31 | 2010-12-31 | 2010-09-30 | 2010-06-30 | 2010-03-31 | ||
|---|---|---|---|---|---|---|---|---|---|---|---|---|---|---|---|---|---|---|---|---|---|---|---|---|---|---|---|---|---|---|---|---|---|---|---|---|---|---|---|---|---|---|---|---|---|---|---|---|---|---|---|---|---|---|---|---|---|---|
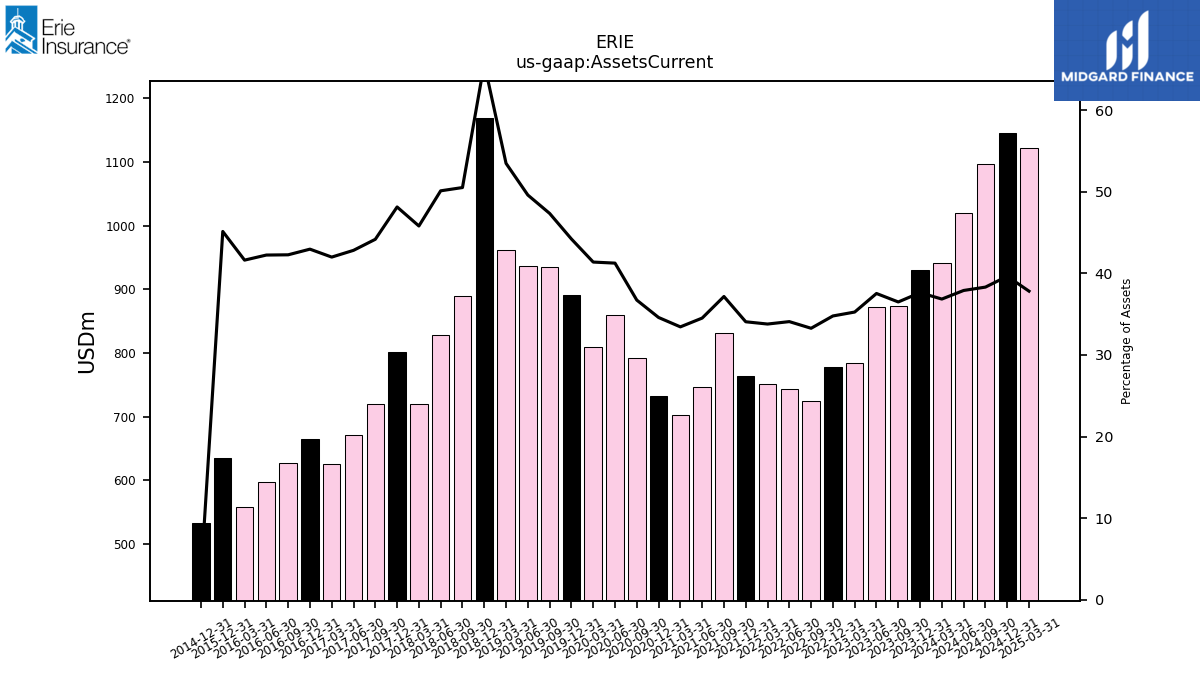
| Assets Current | 941.77 | 930.19 | 873.83 | 872.80 | 784.08 | 778.80 | 724.48 | 743.10 | 751.35 | 763.73 | 831.15 | 746.81 | 701.93 | 732.30 | 792.92 | 859.24 | 810.07 | 891.40 | 934.89 | 937.25 | 962.39 | 1168.95 | 888.86 | 828.07 | 720.75 | 801.88 | 720.68 | 671.09 | 625.72 | 665.52 | 627.75 | 597.67 | 557.97 | 635.15 | NA | NA | NA | 533.25 | NA | NA | NA | NA | NA | NA | NA | NA | NA | NA | NA | NA | NA | NA | NA | NA | NA | NA | NA | |
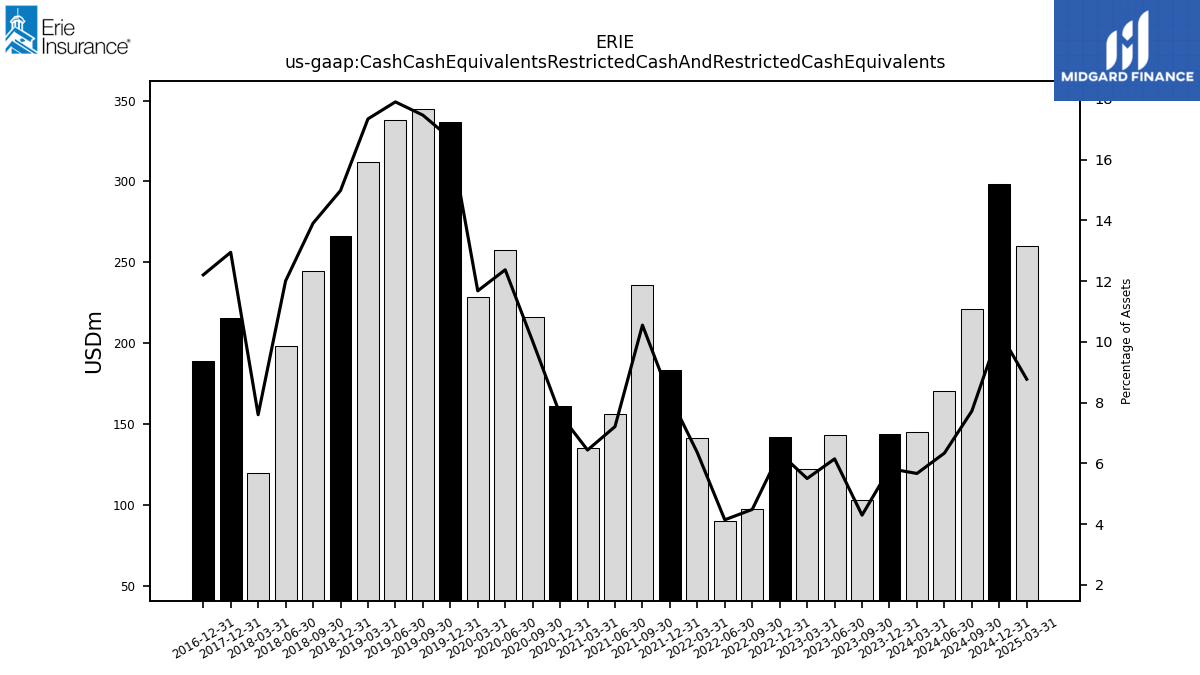
| Cash Cash Equivalents Restricted Cash And Restricted Cash Equivalents | 144.87 | 144.06 | 102.87 | 143.00 | 122.38 | 142.09 | 97.66 | 90.32 | 141.31 | 183.70 | 236.00 | 156.04 | 135.19 | 161.24 | 216.35 | 257.74 | 228.65 | 336.74 | 344.87 | 338.26 | 312.05 | 266.42 | 244.69 | 198.41 | 119.63 | 215.72 | NA | NA | NA | 189.07 | NA | NA | NA | NA | NA | NA | NA | NA | NA | NA | NA | NA | NA | NA | NA | NA | NA | NA | NA | NA | NA | NA | NA | NA | NA | NA | NA | |
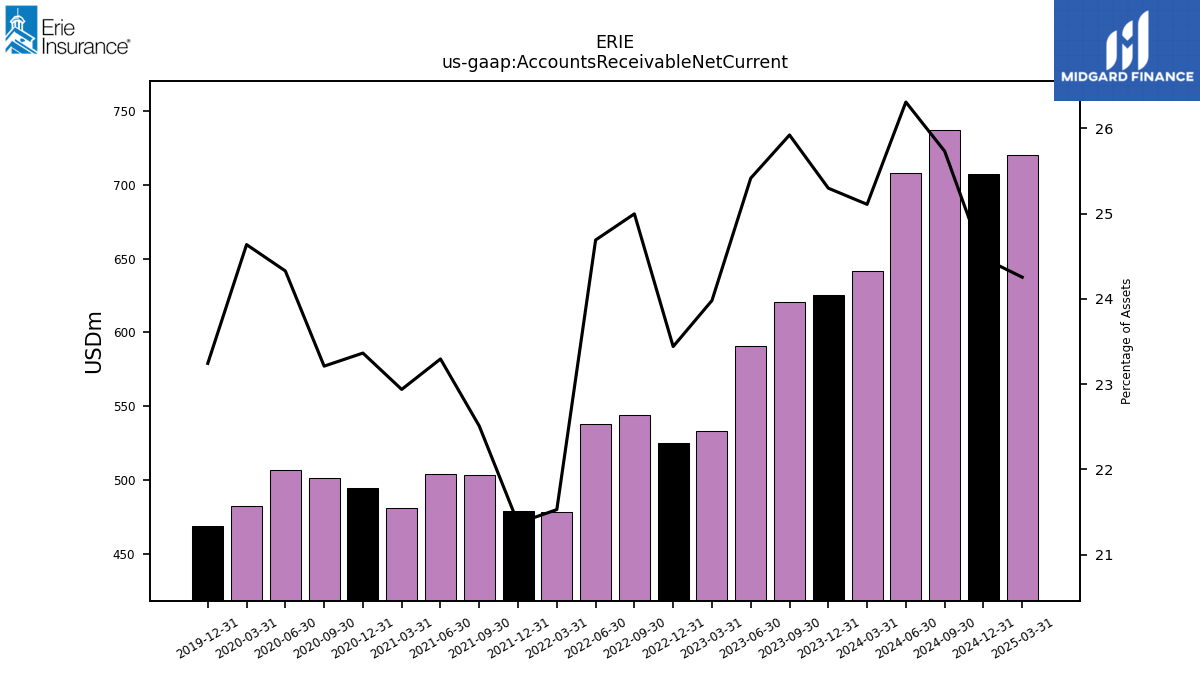
| Accounts Receivable Net Current | 641.69 | 625.34 | 620.68 | 591.01 | 533.31 | 524.94 | 544.35 | 538.28 | 478.75 | 479.12 | 503.41 | 504.01 | 481.48 | 494.64 | 501.19 | 506.69 | 482.24 | 468.64 | NA | NA | NA | NA | NA | NA | NA | NA | NA | NA | NA | NA | NA | NA | NA | NA | NA | NA | NA | NA | NA | NA | NA | NA | NA | NA | NA | NA | NA | NA | NA | NA | NA | NA | NA | NA | NA | NA | NA | |
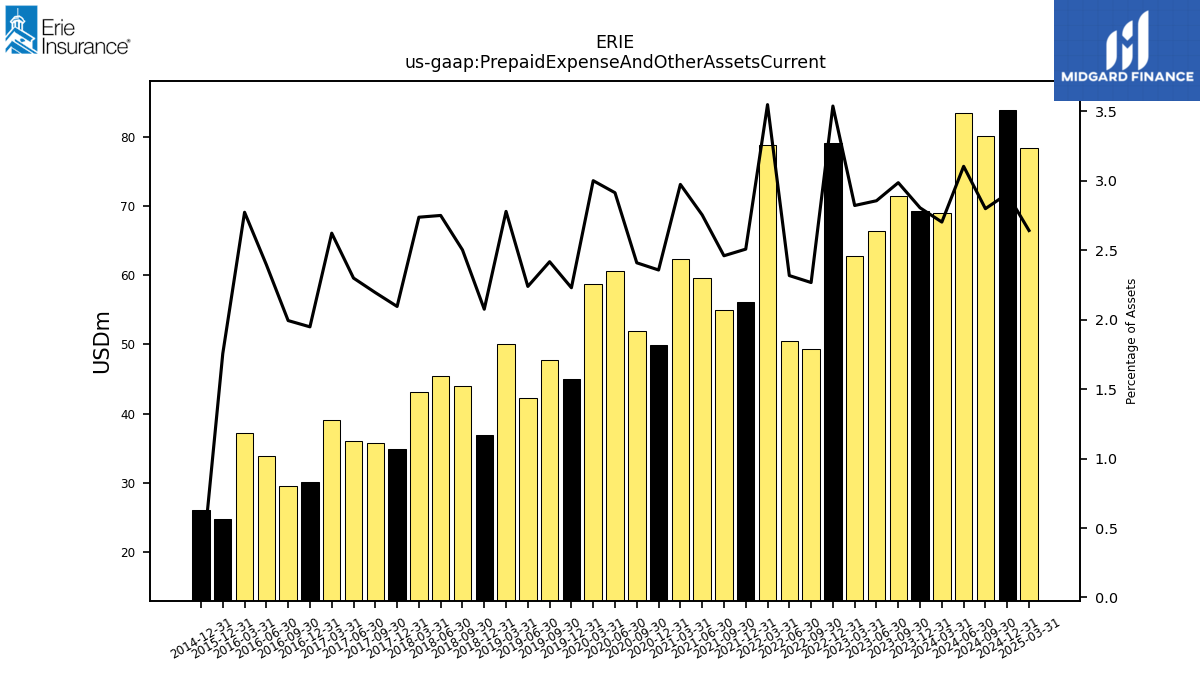
| Prepaid Expense And Other Assets Current | 69.05 | 69.32 | 71.48 | 66.40 | 62.74 | 79.20 | 49.36 | 50.51 | 78.88 | 56.21 | 55.00 | 59.57 | 62.40 | 49.90 | 52.01 | 60.67 | 58.72 | 44.94 | 47.71 | 42.30 | 50.00 | 36.89 | 44.01 | 45.43 | 43.06 | 34.89 | 35.80 | 36.02 | 39.06 | 30.17 | 29.59 | 33.88 | 37.16 | 24.70 | NA | NA | NA | 26.02 | NA | NA | NA | NA | NA | NA | NA | NA | NA | NA | NA | NA | NA | NA | NA | NA | NA | NA | NA | |
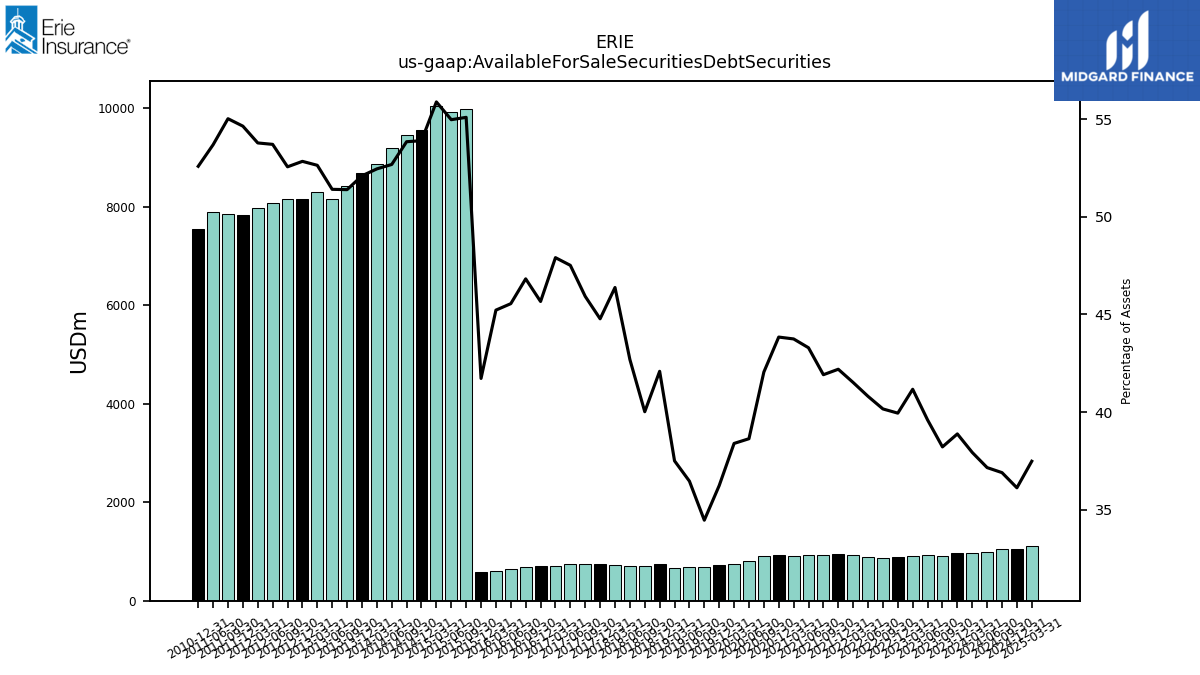
| Available For Sale Securities Debt Securities | 969.64 | 961.24 | 915.24 | 920.95 | 915.67 | 894.66 | 874.69 | 889.73 | 923.32 | 946.09 | 937.50 | 936.80 | 918.32 | 928.24 | 908.05 | 804.83 | 751.65 | 730.70 | 680.63 | 689.11 | 674.92 | 748.52 | 704.20 | 705.43 | 729.80 | 745.96 | 749.27 | 744.68 | 713.88 | 707.34 | 695.36 | 644.52 | 606.28 | 587.21 | 9980.00 | 9933.00 | 10055.00 | 9571.00 | 9465.00 | 9198.00 | 8881.00 | 8688.00 | 8420.00 | 8163.00 | 8312.00 | 8159.00 | 8170.00 | 8079.00 | 7977.00 | 7840.00 | 7848.00 | 7905.00 | NA | 7543.00 | NA | NA | NA |
| 2024-03-31 | 2023-12-31 | 2023-09-30 | 2023-06-30 | 2023-03-31 | 2022-12-31 | 2022-09-30 | 2022-06-30 | 2022-03-31 | 2021-12-31 | 2021-09-30 | 2021-06-30 | 2021-03-31 | 2020-12-31 | 2020-09-30 | 2020-06-30 | 2020-03-31 | 2019-12-31 | 2019-09-30 | 2019-06-30 | 2019-03-31 | 2018-12-31 | 2018-09-30 | 2018-06-30 | 2018-03-31 | 2017-12-31 | 2017-09-30 | 2017-06-30 | 2017-03-31 | 2016-12-31 | 2016-09-30 | 2016-06-30 | 2016-03-31 | 2015-12-31 | 2015-09-30 | 2015-06-30 | 2015-03-31 | 2014-12-31 | 2014-09-30 | 2014-06-30 | 2014-03-31 | 2013-12-31 | 2013-09-30 | 2013-06-30 | 2013-03-31 | 2012-12-31 | 2012-09-30 | 2012-06-30 | 2012-03-31 | 2011-12-31 | 2011-09-30 | 2011-06-30 | 2011-03-31 | 2010-12-31 | 2010-09-30 | 2010-06-30 | 2010-03-31 | ||
|---|---|---|---|---|---|---|---|---|---|---|---|---|---|---|---|---|---|---|---|---|---|---|---|---|---|---|---|---|---|---|---|---|---|---|---|---|---|---|---|---|---|---|---|---|---|---|---|---|---|---|---|---|---|---|---|---|---|---|
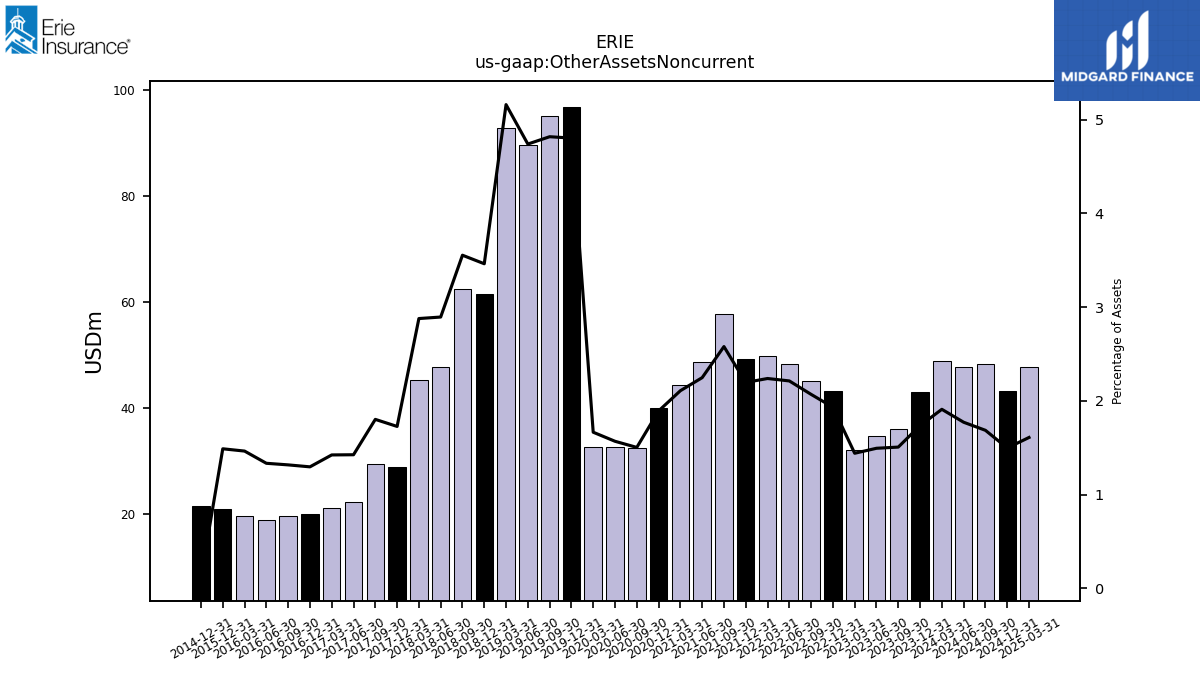
| Other Assets Noncurrent | 48.84 | 42.93 | 36.11 | 34.78 | 32.08 | 43.30 | 45.09 | 48.26 | 49.80 | 49.27 | 57.70 | 48.65 | 44.27 | 40.08 | 32.49 | 32.70 | 32.62 | 96.85 | 95.14 | 89.57 | 92.86 | 61.59 | 62.54 | 47.83 | 45.30 | 28.79 | 29.42 | 22.36 | 21.22 | 20.10 | 19.58 | 18.89 | 19.65 | 20.97 | NA | NA | NA | 21.53 | NA | NA | NA | NA | NA | NA | NA | NA | NA | NA | NA | NA | NA | NA | NA | NA | NA | NA | NA | |
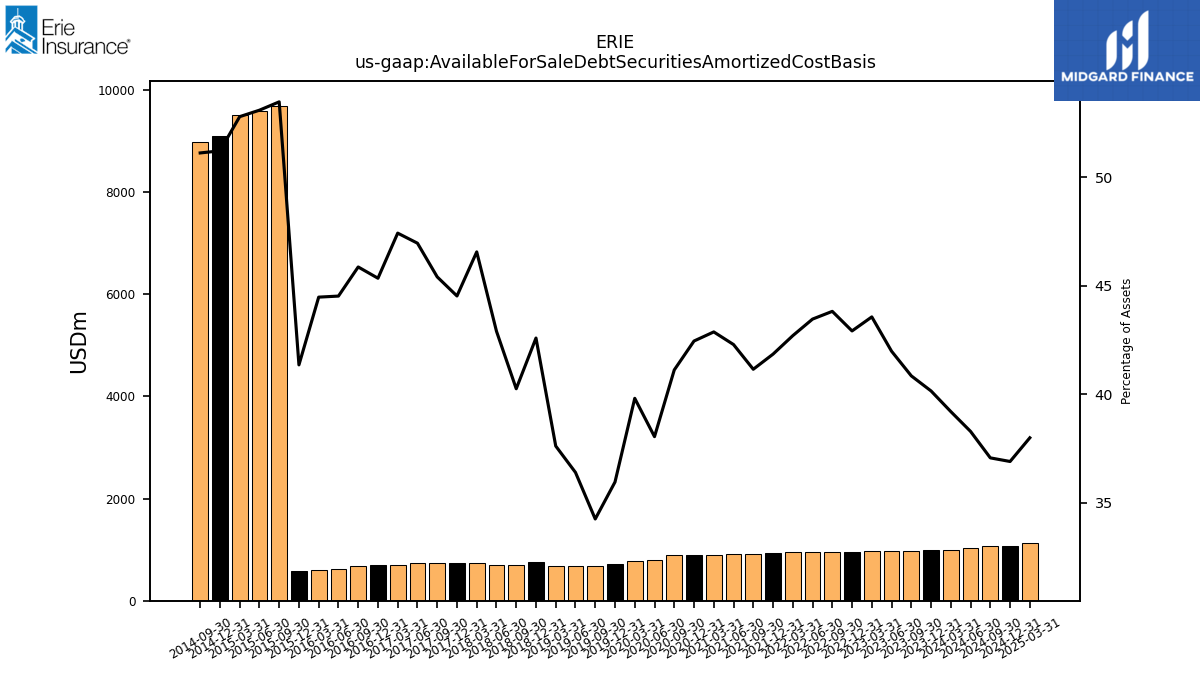
| Available For Sale Debt Securities Amortized Cost Basis | 1001.91 | 992.55 | 978.11 | 976.36 | 968.86 | 961.13 | 954.30 | 947.61 | 949.58 | 938.28 | 920.40 | 915.03 | 899.94 | 898.79 | 887.94 | 792.47 | 779.32 | 724.95 | 676.34 | 687.78 | 676.85 | 757.39 | 708.28 | 708.89 | 732.62 | 741.80 | 740.81 | 735.99 | 706.65 | 702.40 | 681.12 | 629.95 | 596.25 | 581.97 | 9687.00 | 9593.00 | 9499.00 | 9095.00 | 8986.00 | NA | NA | NA | NA | NA | NA | NA | NA | NA | NA | NA | NA | NA | NA | NA | NA | NA | NA | |
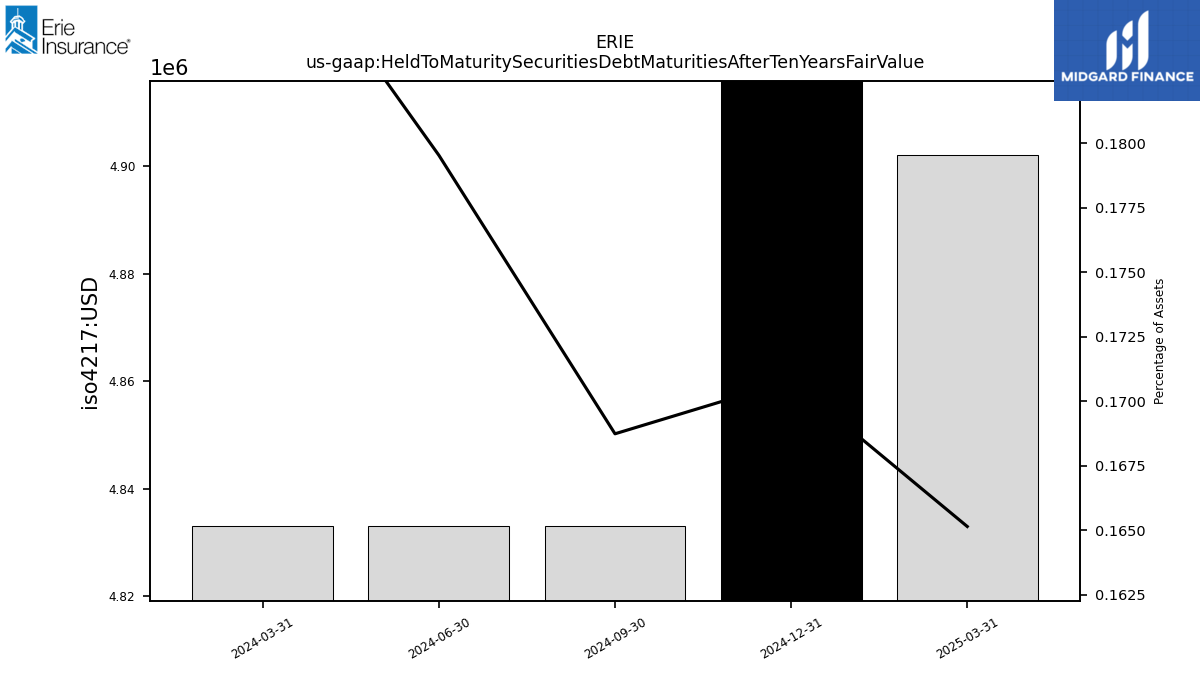
| Held To Maturity Securities Debt Maturities After Ten Years Fair Value | 4.83 | NA | NA | NA | NA | NA | NA | NA | NA | NA | NA | NA | NA | NA | NA | NA | NA | NA | NA | NA | NA | NA | NA | NA | NA | NA | NA | NA | NA | NA | NA | NA | NA | NA | NA | NA | NA | NA | NA | NA | NA | NA | NA | NA | NA | NA | NA | NA | NA | NA | NA | NA | NA | NA | NA | NA | NA |
| 2024-03-31 | 2023-12-31 | 2023-09-30 | 2023-06-30 | 2023-03-31 | 2022-12-31 | 2022-09-30 | 2022-06-30 | 2022-03-31 | 2021-12-31 | 2021-09-30 | 2021-06-30 | 2021-03-31 | 2020-12-31 | 2020-09-30 | 2020-06-30 | 2020-03-31 | 2019-12-31 | 2019-09-30 | 2019-06-30 | 2019-03-31 | 2018-12-31 | 2018-09-30 | 2018-06-30 | 2018-03-31 | 2017-12-31 | 2017-09-30 | 2017-06-30 | 2017-03-31 | 2016-12-31 | 2016-09-30 | 2016-06-30 | 2016-03-31 | 2015-12-31 | 2015-09-30 | 2015-06-30 | 2015-03-31 | 2014-12-31 | 2014-09-30 | 2014-06-30 | 2014-03-31 | 2013-12-31 | 2013-09-30 | 2013-06-30 | 2013-03-31 | 2012-12-31 | 2012-09-30 | 2012-06-30 | 2012-03-31 | 2011-12-31 | 2011-09-30 | 2011-06-30 | 2011-03-31 | 2010-12-31 | 2010-09-30 | 2010-06-30 | 2010-03-31 | ||
|---|---|---|---|---|---|---|---|---|---|---|---|---|---|---|---|---|---|---|---|---|---|---|---|---|---|---|---|---|---|---|---|---|---|---|---|---|---|---|---|---|---|---|---|---|---|---|---|---|---|---|---|---|---|---|---|---|---|---|
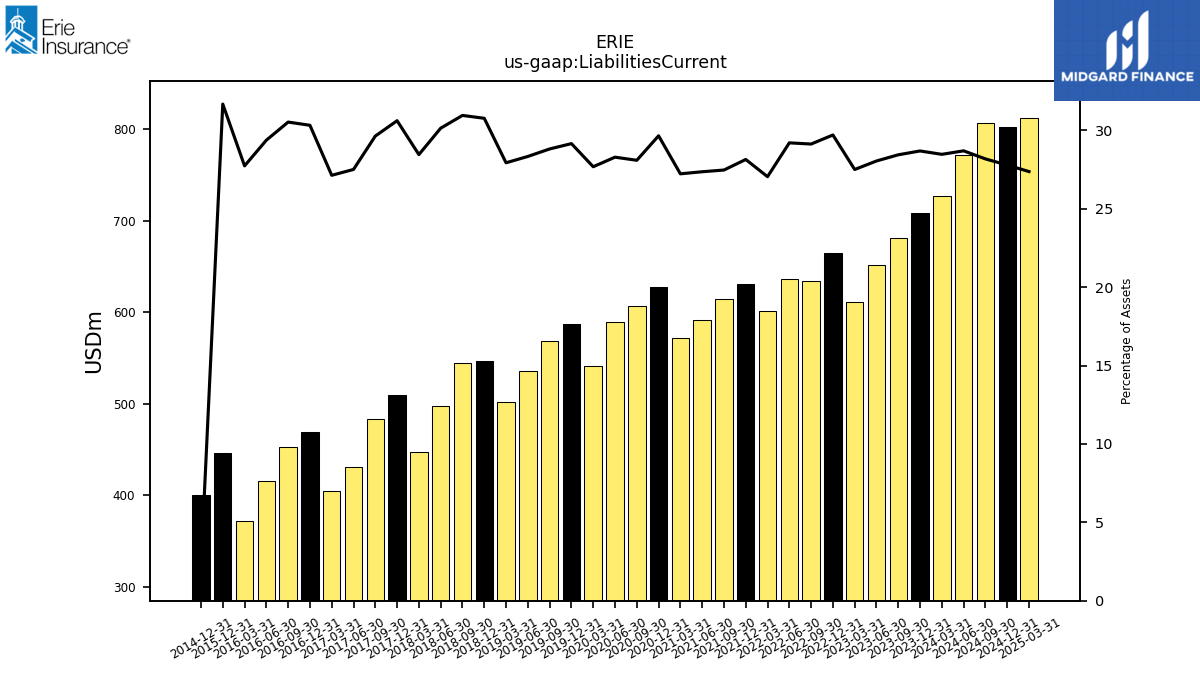
| Liabilities Current | 727.52 | 708.98 | 680.91 | 652.09 | 611.57 | 665.11 | 634.19 | 636.57 | 601.33 | 630.86 | 614.26 | 591.86 | 571.44 | 627.67 | 606.46 | 589.12 | 541.72 | 587.71 | 568.82 | 535.36 | 502.52 | 547.07 | 544.51 | 497.86 | 447.65 | 509.91 | 483.40 | 431.02 | 404.22 | 469.60 | 453.26 | 415.50 | 371.76 | 445.70 | NA | NA | NA | 400.15 | NA | NA | NA | NA | NA | NA | NA | NA | NA | NA | NA | NA | NA | NA | NA | NA | NA | NA | NA | |
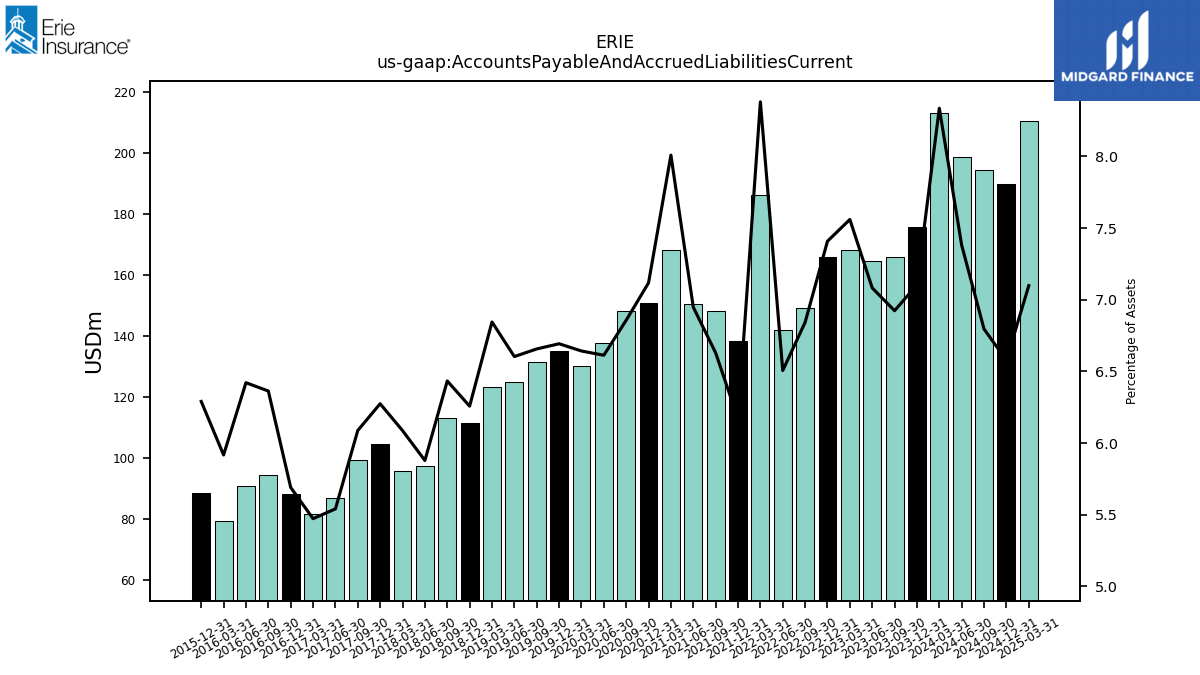
| Accounts Payable And Accrued Liabilities Current | 213.06 | 175.62 | 165.80 | 164.72 | 168.14 | 165.91 | 149.02 | 141.86 | 186.39 | 138.32 | 148.28 | 150.35 | 168.13 | 150.71 | 148.07 | 137.75 | 130.03 | 134.96 | 131.45 | 124.79 | 123.18 | 111.29 | 113.20 | 97.14 | 95.79 | 104.53 | 99.33 | 86.84 | 81.55 | 88.15 | 94.50 | 90.86 | 79.33 | 88.53 | NA | NA | NA | NA | NA | NA | NA | NA | NA | NA | NA | NA | NA | NA | NA | NA | NA | NA | NA | NA | NA | NA | NA | |
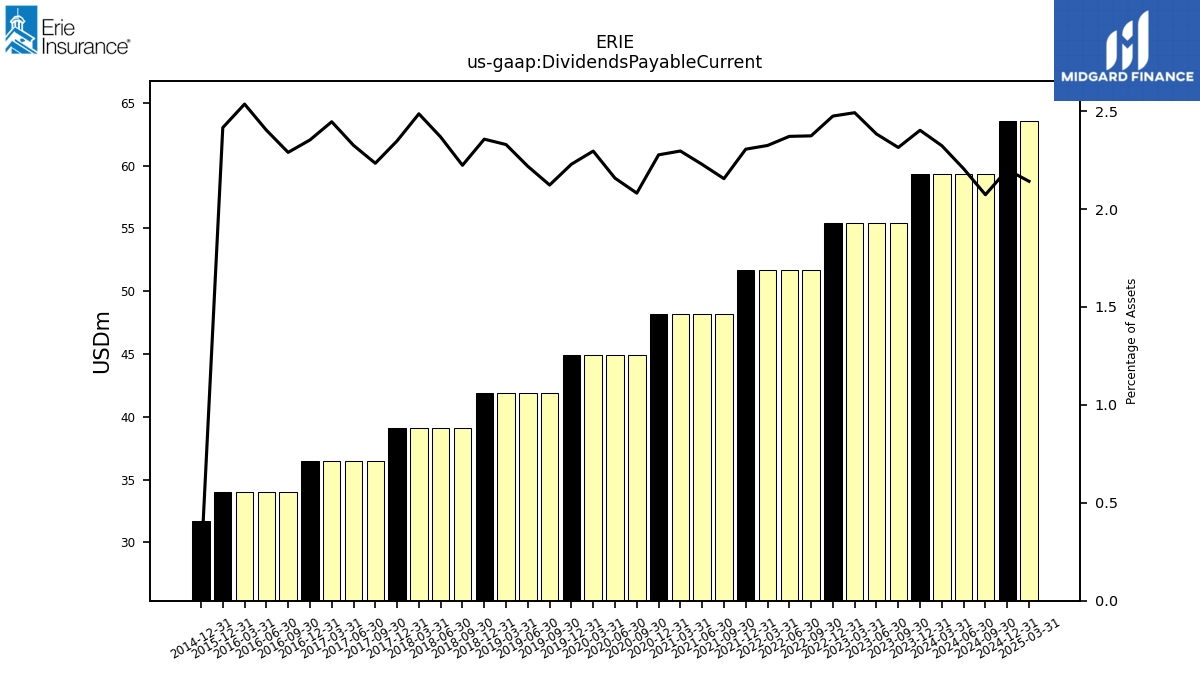
| Dividends Payable Current | 59.38 | 59.38 | 55.42 | 55.42 | 55.42 | 55.42 | 51.69 | 51.69 | 51.69 | 51.69 | 48.20 | 48.20 | 48.20 | 48.20 | 44.94 | 44.94 | 44.94 | 44.94 | 41.91 | 41.91 | 41.91 | 41.91 | 39.12 | 39.12 | 39.12 | 39.12 | 36.44 | 36.44 | 36.44 | 36.44 | 34.00 | 34.00 | 34.00 | 34.00 | NA | NA | NA | 31.71 | NA | NA | NA | NA | NA | NA | NA | NA | NA | NA | NA | NA | NA | NA | NA | NA | NA | NA | NA | |
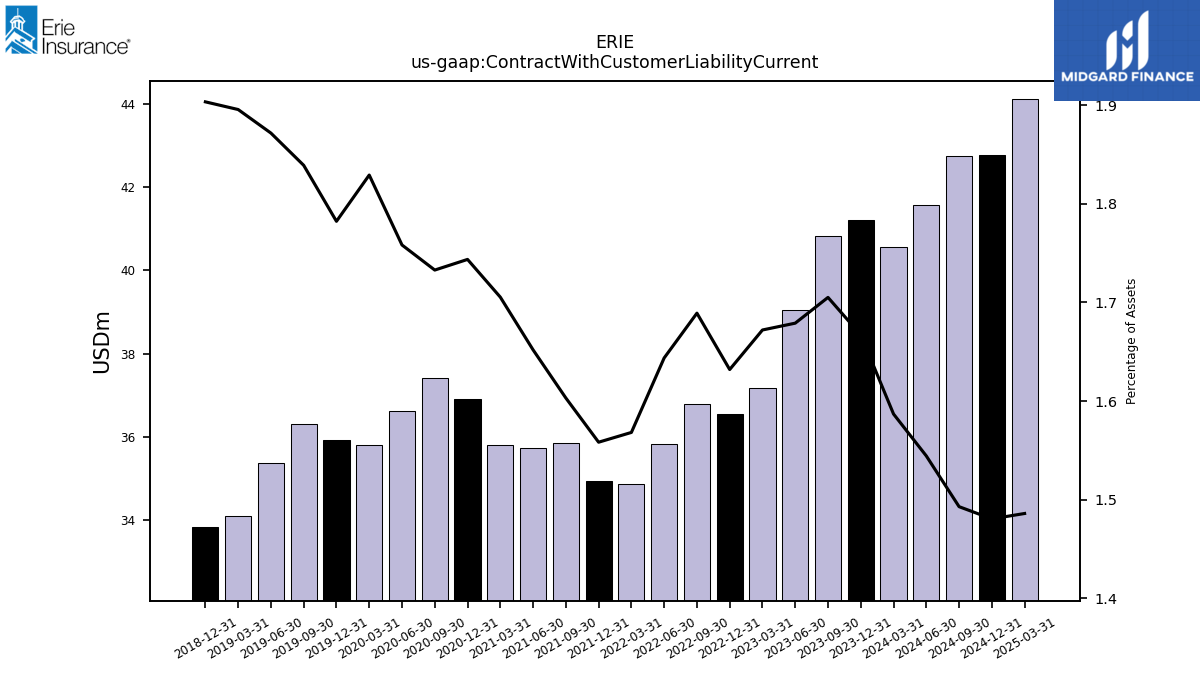
| Contract With Customer Liability Current | 40.55 | 41.21 | 40.83 | 39.05 | 37.19 | 36.55 | 36.79 | 35.84 | 34.87 | 34.94 | 35.85 | 35.74 | 35.80 | 36.92 | 37.42 | 36.62 | 35.81 | 35.94 | 36.32 | 35.37 | 34.12 | 33.85 | NA | NA | NA | NA | NA | NA | NA | NA | NA | NA | NA | NA | NA | NA | NA | NA | NA | NA | NA | NA | NA | NA | NA | NA | NA | NA | NA | NA | NA | NA | NA | NA | NA | NA | NA |
| 2024-03-31 | 2023-12-31 | 2023-09-30 | 2023-06-30 | 2023-03-31 | 2022-12-31 | 2022-09-30 | 2022-06-30 | 2022-03-31 | 2021-12-31 | 2021-09-30 | 2021-06-30 | 2021-03-31 | 2020-12-31 | 2020-09-30 | 2020-06-30 | 2020-03-31 | 2019-12-31 | 2019-09-30 | 2019-06-30 | 2019-03-31 | 2018-12-31 | 2018-09-30 | 2018-06-30 | 2018-03-31 | 2017-12-31 | 2017-09-30 | 2017-06-30 | 2017-03-31 | 2016-12-31 | 2016-09-30 | 2016-06-30 | 2016-03-31 | 2015-12-31 | 2015-09-30 | 2015-06-30 | 2015-03-31 | 2014-12-31 | 2014-09-30 | 2014-06-30 | 2014-03-31 | 2013-12-31 | 2013-09-30 | 2013-06-30 | 2013-03-31 | 2012-12-31 | 2012-09-30 | 2012-06-30 | 2012-03-31 | 2011-12-31 | 2011-09-30 | 2011-06-30 | 2011-03-31 | 2010-12-31 | 2010-09-30 | 2010-06-30 | 2010-03-31 | ||
|---|---|---|---|---|---|---|---|---|---|---|---|---|---|---|---|---|---|---|---|---|---|---|---|---|---|---|---|---|---|---|---|---|---|---|---|---|---|---|---|---|---|---|---|---|---|---|---|---|---|---|---|---|---|---|---|---|---|---|
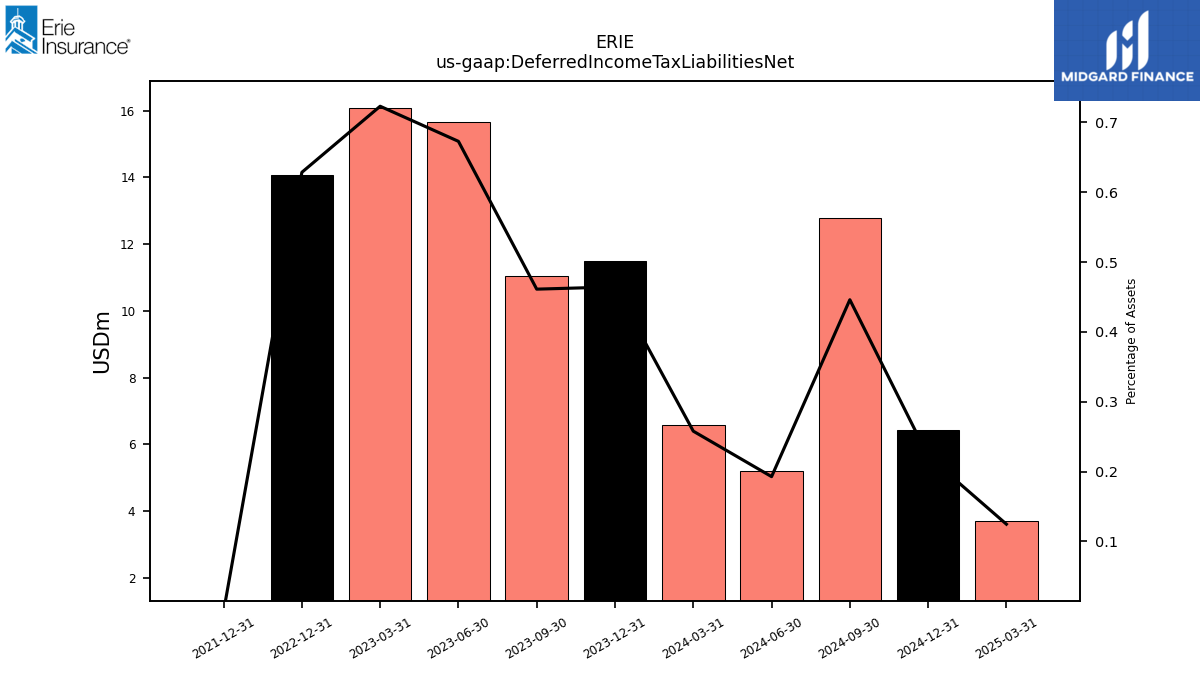
| Deferred Income Tax Liabilities Net | 6.59 | 11.48 | 11.04 | 15.65 | 16.08 | 14.07 | NA | NA | NA | 0.00 | NA | NA | NA | NA | NA | NA | NA | NA | NA | NA | NA | NA | NA | NA | NA | NA | NA | NA | NA | NA | NA | NA | NA | NA | NA | NA | NA | NA | NA | NA | NA | NA | NA | NA | NA | NA | NA | NA | NA | NA | NA | NA | NA | NA | NA | NA | NA | |
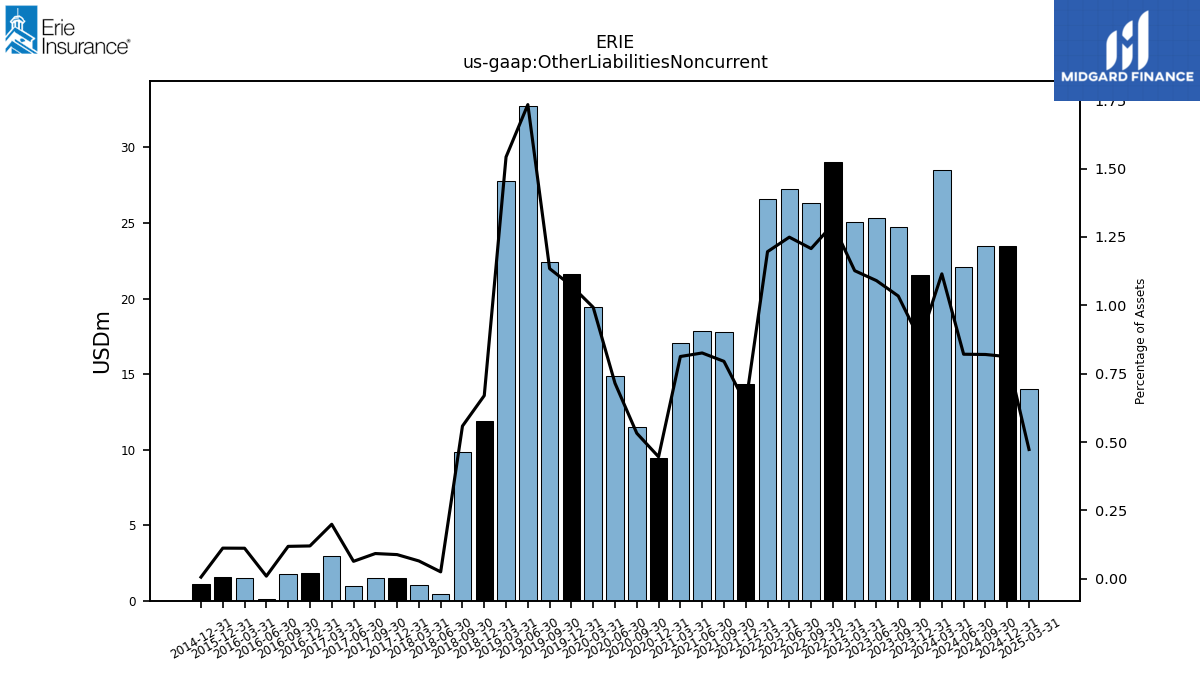
| Other Liabilities Noncurrent | 28.50 | 21.57 | 24.76 | 25.35 | 25.05 | 29.02 | 26.29 | 27.23 | 26.60 | 14.34 | 17.78 | 17.87 | 17.06 | 9.44 | 11.49 | 14.89 | 19.43 | 21.61 | 22.40 | 32.76 | 27.75 | 11.91 | 9.83 | 0.42 | 1.03 | 1.48 | 1.51 | 1.00 | 2.97 | 1.86 | 1.76 | 0.14 | 1.50 | 1.58 | NA | NA | NA | 1.11 | NA | NA | NA | NA | NA | NA | NA | NA | NA | NA | NA | NA | NA | NA | NA | NA | NA | NA | NA |
| 2024-03-31 | 2023-12-31 | 2023-09-30 | 2023-06-30 | 2023-03-31 | 2022-12-31 | 2022-09-30 | 2022-06-30 | 2022-03-31 | 2021-12-31 | 2021-09-30 | 2021-06-30 | 2021-03-31 | 2020-12-31 | 2020-09-30 | 2020-06-30 | 2020-03-31 | 2019-12-31 | 2019-09-30 | 2019-06-30 | 2019-03-31 | 2018-12-31 | 2018-09-30 | 2018-06-30 | 2018-03-31 | 2017-12-31 | 2017-09-30 | 2017-06-30 | 2017-03-31 | 2016-12-31 | 2016-09-30 | 2016-06-30 | 2016-03-31 | 2015-12-31 | 2015-09-30 | 2015-06-30 | 2015-03-31 | 2014-12-31 | 2014-09-30 | 2014-06-30 | 2014-03-31 | 2013-12-31 | 2013-09-30 | 2013-06-30 | 2013-03-31 | 2012-12-31 | 2012-09-30 | 2012-06-30 | 2012-03-31 | 2011-12-31 | 2011-09-30 | 2011-06-30 | 2011-03-31 | 2010-12-31 | 2010-09-30 | 2010-06-30 | 2010-03-31 | ||
|---|---|---|---|---|---|---|---|---|---|---|---|---|---|---|---|---|---|---|---|---|---|---|---|---|---|---|---|---|---|---|---|---|---|---|---|---|---|---|---|---|---|---|---|---|---|---|---|---|---|---|---|---|---|---|---|---|---|---|
| Stockholders Equity | 1726.18 | 1662.84 | 1611.89 | 1544.91 | 1486.97 | 1448.41 | 1356.58 | 1339.41 | 1334.20 | 1342.48 | 1286.86 | 1245.10 | 1208.13 | 1188.05 | 1247.22 | 1194.14 | 1116.99 | 1133.25 | 1119.27 | 1063.45 | 1013.80 | 973.67 | 921.02 | 880.19 | 840.15 | 857.34 | 875.15 | 853.21 | 829.86 | 816.91 | 838.93 | 815.19 | 784.87 | 769.50 | 750.00 | 732.00 | 710.00 | 703.00 | 771.00 | 755.00 | 742.00 | 734.00 | 657.00 | 647.00 | 636.00 | 642.00 | 782.00 | 766.00 | 776.00 | 781.00 | 845.00 | 866.00 | NA | 912.00 | NA | NA | NA | |
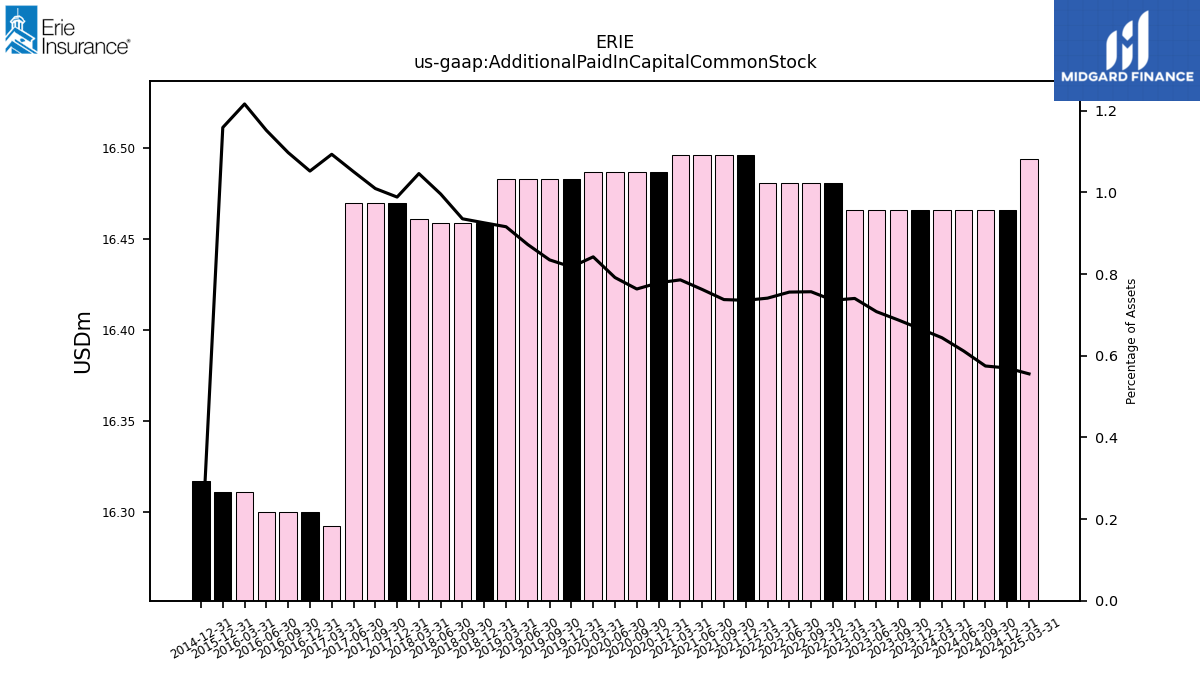
| Additional Paid In Capital Common Stock | 16.47 | 16.47 | 16.47 | 16.47 | 16.47 | 16.48 | 16.48 | 16.48 | 16.48 | 16.50 | 16.50 | 16.50 | 16.50 | 16.49 | 16.49 | 16.49 | 16.49 | 16.48 | 16.48 | 16.48 | 16.48 | 16.46 | 16.46 | 16.46 | 16.46 | 16.47 | 16.47 | 16.47 | 16.29 | 16.30 | 16.30 | 16.30 | 16.31 | 16.31 | NA | NA | NA | 16.32 | NA | NA | NA | NA | NA | NA | NA | NA | NA | NA | NA | NA | NA | NA | NA | NA | NA | NA | NA | |
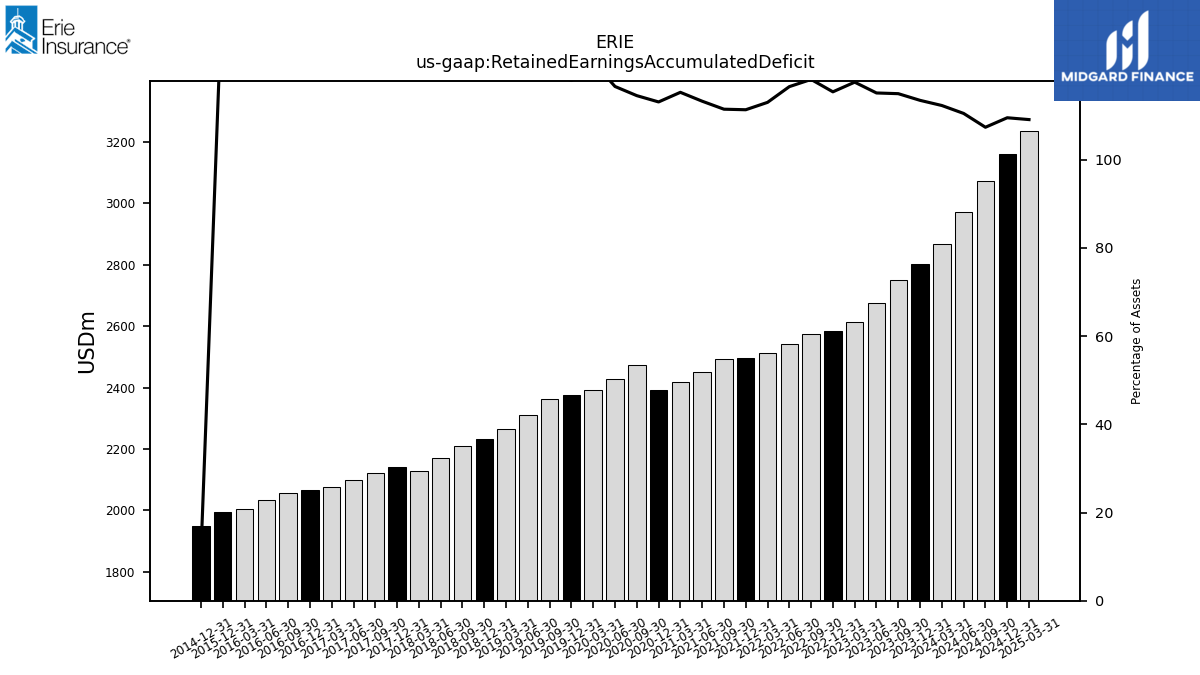
| Retained Earnings Accumulated Deficit | 2868.86 | 2803.69 | 2752.14 | 2676.52 | 2614.08 | 2583.26 | 2573.19 | 2540.57 | 2512.12 | 2495.19 | 2491.84 | 2449.82 | 2418.99 | 2393.62 | 2472.18 | 2427.91 | 2390.87 | 2377.56 | 2362.91 | 2310.66 | 2264.82 | 2231.42 | 2211.01 | 2169.69 | 2129.10 | 2140.85 | 2121.53 | 2099.43 | 2077.35 | 2065.91 | 2056.57 | 2033.19 | 2005.88 | 1993.98 | NA | NA | NA | 1948.44 | NA | NA | NA | NA | NA | NA | NA | NA | NA | NA | NA | NA | NA | NA | NA | NA | NA | NA | NA | |
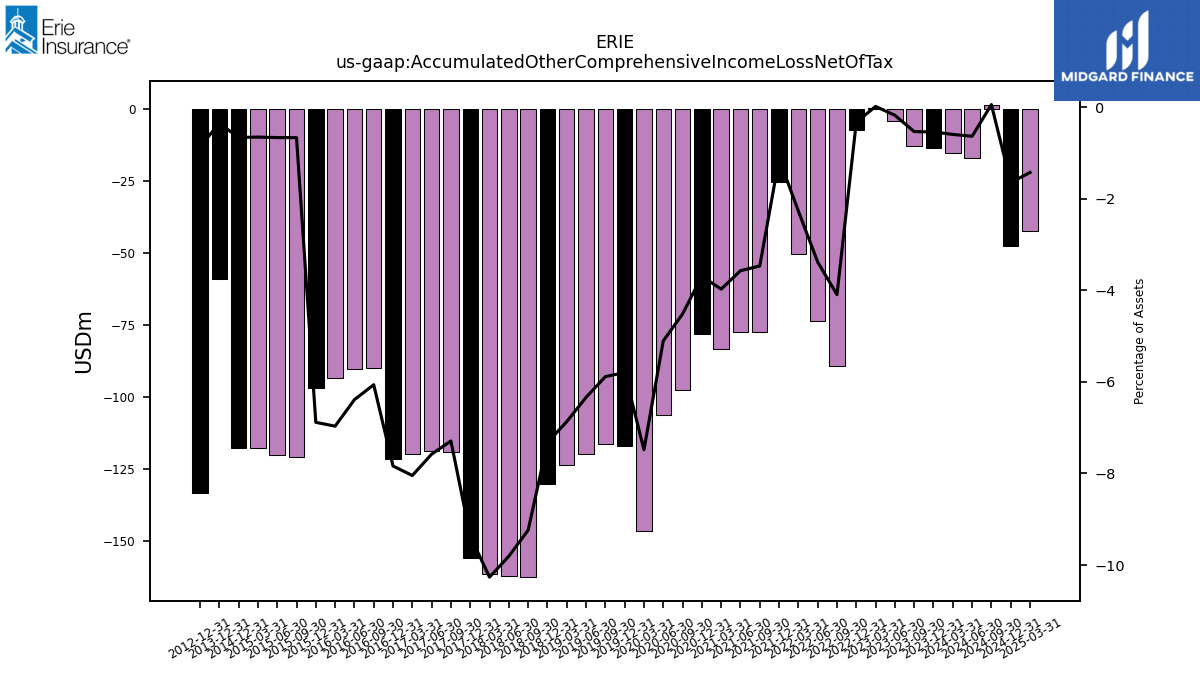
| Accumulated Other Comprehensive Income Loss Net Of Tax | -15.23 | -13.40 | -12.79 | -4.15 | 0.34 | -7.41 | -89.17 | -73.72 | -50.48 | -25.29 | -77.56 | -77.29 | -83.43 | -78.14 | -97.53 | -106.33 | -146.44 | -116.87 | -116.20 | -119.76 | -123.57 | -130.28 | -162.53 | -162.04 | -161.49 | -156.06 | -118.94 | -118.77 | -119.86 | -121.38 | -90.02 | -90.37 | -93.40 | -96.86 | -120.70 | -120.18 | -117.60 | -117.70 | NA | NA | NA | -59.10 | NA | NA | NA | -133.19 | NA | NA | NA | NA | NA | NA | NA | NA | NA | NA | NA |
| 2024-03-31 | 2023-12-31 | 2023-09-30 | 2023-06-30 | 2023-03-31 | 2022-12-31 | 2022-09-30 | 2022-06-30 | 2022-03-31 | 2021-12-31 | 2021-09-30 | 2021-06-30 | 2021-03-31 | 2020-12-31 | 2020-09-30 | 2020-06-30 | 2020-03-31 | 2019-12-31 | 2019-09-30 | 2019-06-30 | 2019-03-31 | 2018-12-31 | 2018-09-30 | 2018-06-30 | 2018-03-31 | 2017-12-31 | 2017-09-30 | 2017-06-30 | 2017-03-31 | 2016-12-31 | 2016-09-30 | 2016-06-30 | 2016-03-31 | 2015-12-31 | 2015-09-30 | 2015-06-30 | 2015-03-31 | 2014-12-31 | 2014-09-30 | 2014-06-30 | 2014-03-31 | 2013-12-31 | 2013-09-30 | 2013-06-30 | 2013-03-31 | 2012-12-31 | 2012-09-30 | 2012-06-30 | 2012-03-31 | 2011-12-31 | 2011-09-30 | 2011-06-30 | 2011-03-31 | 2010-12-31 | 2010-09-30 | 2010-06-30 | 2010-03-31 | ||
|---|---|---|---|---|---|---|---|---|---|---|---|---|---|---|---|---|---|---|---|---|---|---|---|---|---|---|---|---|---|---|---|---|---|---|---|---|---|---|---|---|---|---|---|---|---|---|---|---|---|---|---|---|---|---|---|---|---|---|
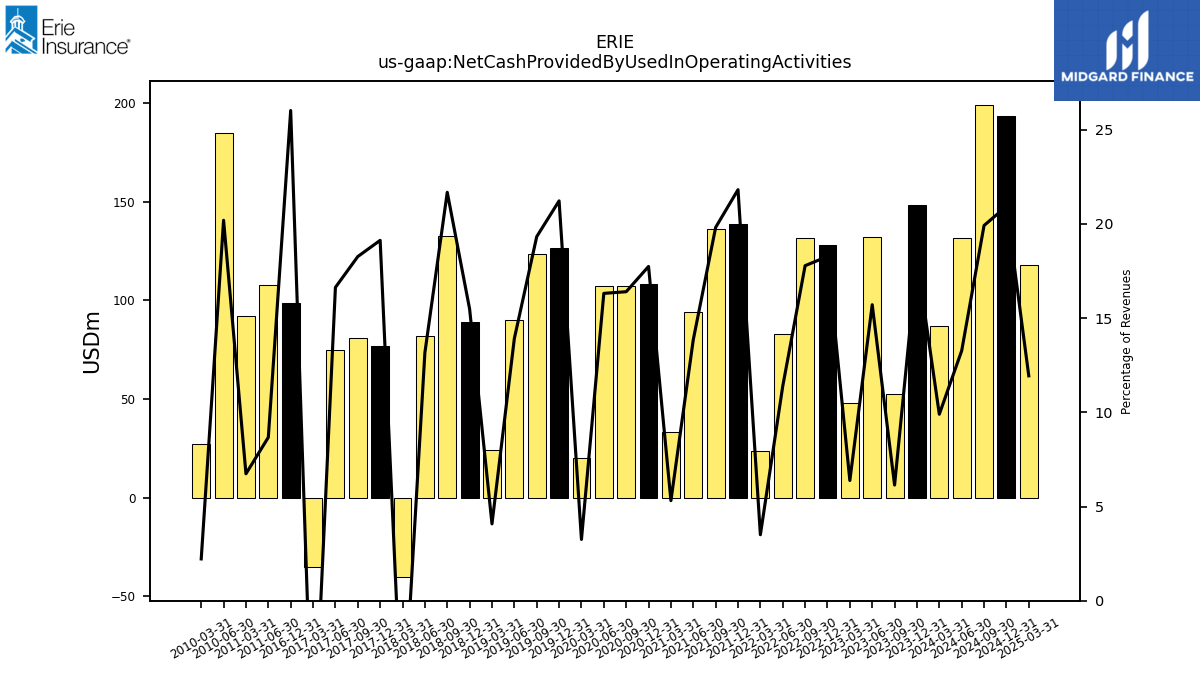
| Net Cash Provided By Used In Operating Activities | 87.19 | 148.44 | 52.76 | 131.98 | 48.03 | 128.04 | 131.83 | 82.72 | 23.55 | 138.76 | 136.32 | 94.24 | 33.48 | 108.12 | 107.20 | 107.20 | 20.08 | 126.66 | 123.45 | 90.18 | 24.24 | 89.27 | 132.72 | 81.82 | -40.23 | 76.79 | 80.84 | 74.61 | -35.12 | 98.78 | NA | NA | NA | NA | NA | NA | NA | NA | NA | NA | NA | NA | NA | NA | NA | NA | NA | NA | NA | NA | NA | 108.00 | 92.00 | NA | NA | 185.00 | 27.00 | |
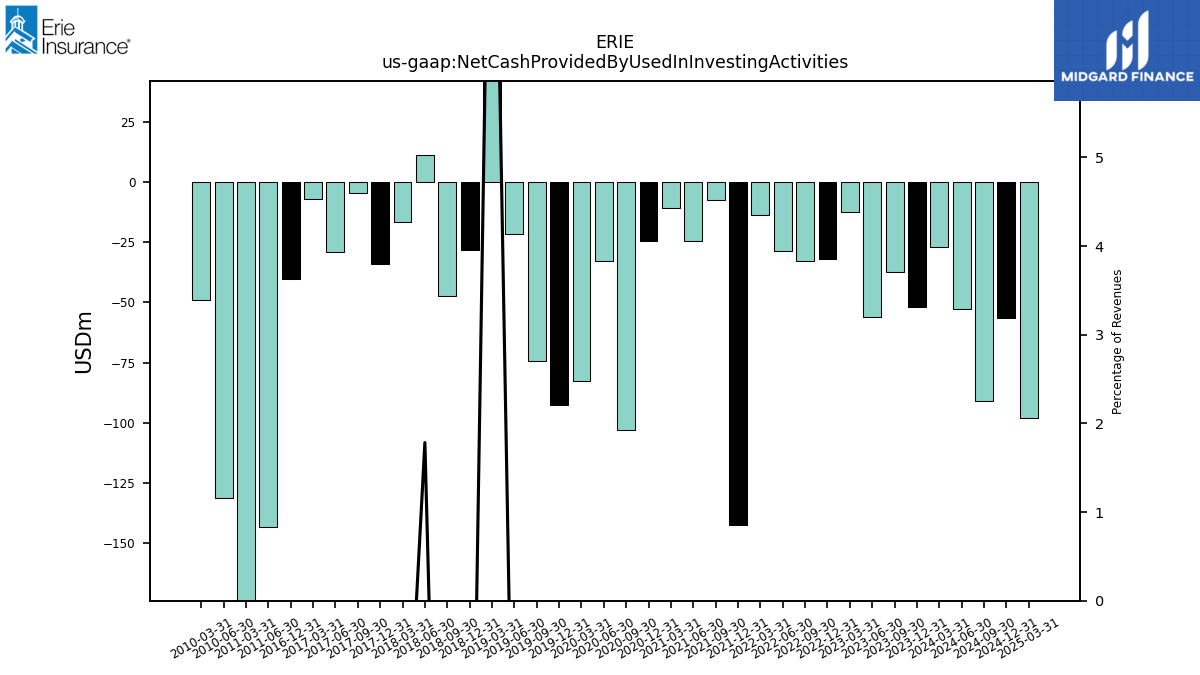
| Net Cash Provided By Used In Investing Activities | -27.00 | -51.84 | -37.47 | -55.94 | -12.33 | -31.93 | -32.80 | -28.46 | -13.73 | -142.33 | -7.65 | -24.68 | -10.83 | -24.65 | -103.15 | -32.67 | -82.75 | -92.39 | -74.46 | -21.54 | 63.76 | -28.42 | -47.32 | 11.09 | -16.74 | -34.25 | -4.47 | -28.86 | -7.08 | -40.31 | NA | NA | NA | NA | NA | NA | NA | NA | NA | NA | NA | NA | NA | NA | NA | NA | NA | NA | NA | NA | NA | -143.00 | -254.00 | NA | NA | -131.00 | -49.00 | |
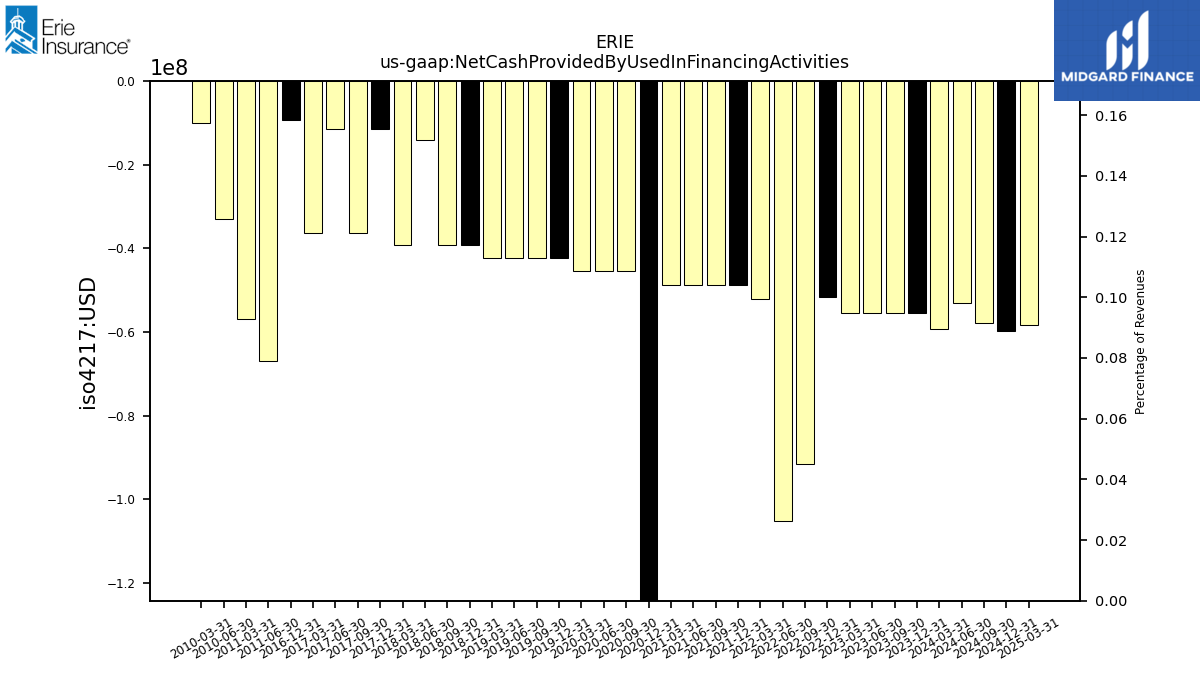
| Net Cash Provided By Used In Financing Activities | -59.38 | -55.42 | -55.42 | -55.42 | -55.42 | -51.69 | -91.69 | -105.24 | -52.22 | -48.72 | -48.71 | -48.71 | -48.70 | -138.58 | -45.43 | -45.44 | -45.42 | -42.40 | -42.38 | -42.42 | -42.37 | -39.12 | -39.12 | -14.12 | -39.12 | -11.45 | -36.45 | -11.46 | -36.45 | -9.22 | NA | NA | NA | NA | NA | NA | NA | NA | NA | NA | NA | NA | NA | NA | NA | NA | NA | NA | NA | NA | NA | -67.00 | -57.00 | NA | NA | -33.00 | -10.00 |
| 2024-03-31 | 2023-12-31 | 2023-09-30 | 2023-06-30 | 2023-03-31 | 2022-12-31 | 2022-09-30 | 2022-06-30 | 2022-03-31 | 2021-12-31 | 2021-09-30 | 2021-06-30 | 2021-03-31 | 2020-12-31 | 2020-09-30 | 2020-06-30 | 2020-03-31 | 2019-12-31 | 2019-09-30 | 2019-06-30 | 2019-03-31 | 2018-12-31 | 2018-09-30 | 2018-06-30 | 2018-03-31 | 2017-12-31 | 2017-09-30 | 2017-06-30 | 2017-03-31 | 2016-12-31 | 2016-09-30 | 2016-06-30 | 2016-03-31 | 2015-12-31 | 2015-09-30 | 2015-06-30 | 2015-03-31 | 2014-12-31 | 2014-09-30 | 2014-06-30 | 2014-03-31 | 2013-12-31 | 2013-09-30 | 2013-06-30 | 2013-03-31 | 2012-12-31 | 2012-09-30 | 2012-06-30 | 2012-03-31 | 2011-12-31 | 2011-09-30 | 2011-06-30 | 2011-03-31 | 2010-12-31 | 2010-09-30 | 2010-06-30 | 2010-03-31 | ||
|---|---|---|---|---|---|---|---|---|---|---|---|---|---|---|---|---|---|---|---|---|---|---|---|---|---|---|---|---|---|---|---|---|---|---|---|---|---|---|---|---|---|---|---|---|---|---|---|---|---|---|---|---|---|---|---|---|---|---|
| Net Cash Provided By Used In Operating Activities | 87.19 | 148.44 | 52.76 | 131.98 | 48.03 | 128.04 | 131.83 | 82.72 | 23.55 | 138.76 | 136.32 | 94.24 | 33.48 | 108.12 | 107.20 | 107.20 | 20.08 | 126.66 | 123.45 | 90.18 | 24.24 | 89.27 | 132.72 | 81.82 | -40.23 | 76.79 | 80.84 | 74.61 | -35.12 | 98.78 | NA | NA | NA | NA | NA | NA | NA | NA | NA | NA | NA | NA | NA | NA | NA | NA | NA | NA | NA | NA | NA | 108.00 | 92.00 | NA | NA | 185.00 | 27.00 | |
| Net Income Loss | 124.55 | 110.93 | 131.04 | 117.85 | 86.24 | 65.49 | 84.31 | 80.15 | 68.62 | 55.04 | 90.22 | 79.03 | 73.57 | 62.78 | 89.22 | 81.98 | 59.33 | 59.59 | 94.17 | 87.75 | 75.31 | 62.31 | 80.45 | 79.71 | 65.76 | 32.05 | 58.54 | 58.53 | 47.88 | 45.79 | 57.38 | 61.31 | 45.90 | 30.13 | 50.00 | 56.00 | 39.00 | 26.00 | 47.00 | 49.00 | 46.00 | 36.00 | 46.00 | 44.00 | 37.00 | 30.00 | 51.00 | 43.00 | 36.00 | 26.00 | 47.00 | 52.00 | 44.00 | 12.00 | 54.00 | 49.00 | 47.00 |
| 2024-03-31 | 2023-12-31 | 2023-09-30 | 2023-06-30 | 2023-03-31 | 2022-12-31 | 2022-09-30 | 2022-06-30 | 2022-03-31 | 2021-12-31 | 2021-09-30 | 2021-06-30 | 2021-03-31 | 2020-12-31 | 2020-09-30 | 2020-06-30 | 2020-03-31 | 2019-12-31 | 2019-09-30 | 2019-06-30 | 2019-03-31 | 2018-12-31 | 2018-09-30 | 2018-06-30 | 2018-03-31 | 2017-12-31 | 2017-09-30 | 2017-06-30 | 2017-03-31 | 2016-12-31 | 2016-09-30 | 2016-06-30 | 2016-03-31 | 2015-12-31 | 2015-09-30 | 2015-06-30 | 2015-03-31 | 2014-12-31 | 2014-09-30 | 2014-06-30 | 2014-03-31 | 2013-12-31 | 2013-09-30 | 2013-06-30 | 2013-03-31 | 2012-12-31 | 2012-09-30 | 2012-06-30 | 2012-03-31 | 2011-12-31 | 2011-09-30 | 2011-06-30 | 2011-03-31 | 2010-12-31 | 2010-09-30 | 2010-06-30 | 2010-03-31 | ||
|---|---|---|---|---|---|---|---|---|---|---|---|---|---|---|---|---|---|---|---|---|---|---|---|---|---|---|---|---|---|---|---|---|---|---|---|---|---|---|---|---|---|---|---|---|---|---|---|---|---|---|---|---|---|---|---|---|---|---|
| Net Cash Provided By Used In Investing Activities | -27.00 | -51.84 | -37.47 | -55.94 | -12.33 | -31.93 | -32.80 | -28.46 | -13.73 | -142.33 | -7.65 | -24.68 | -10.83 | -24.65 | -103.15 | -32.67 | -82.75 | -92.39 | -74.46 | -21.54 | 63.76 | -28.42 | -47.32 | 11.09 | -16.74 | -34.25 | -4.47 | -28.86 | -7.08 | -40.31 | NA | NA | NA | NA | NA | NA | NA | NA | NA | NA | NA | NA | NA | NA | NA | NA | NA | NA | NA | NA | NA | -143.00 | -254.00 | NA | NA | -131.00 | -49.00 | |
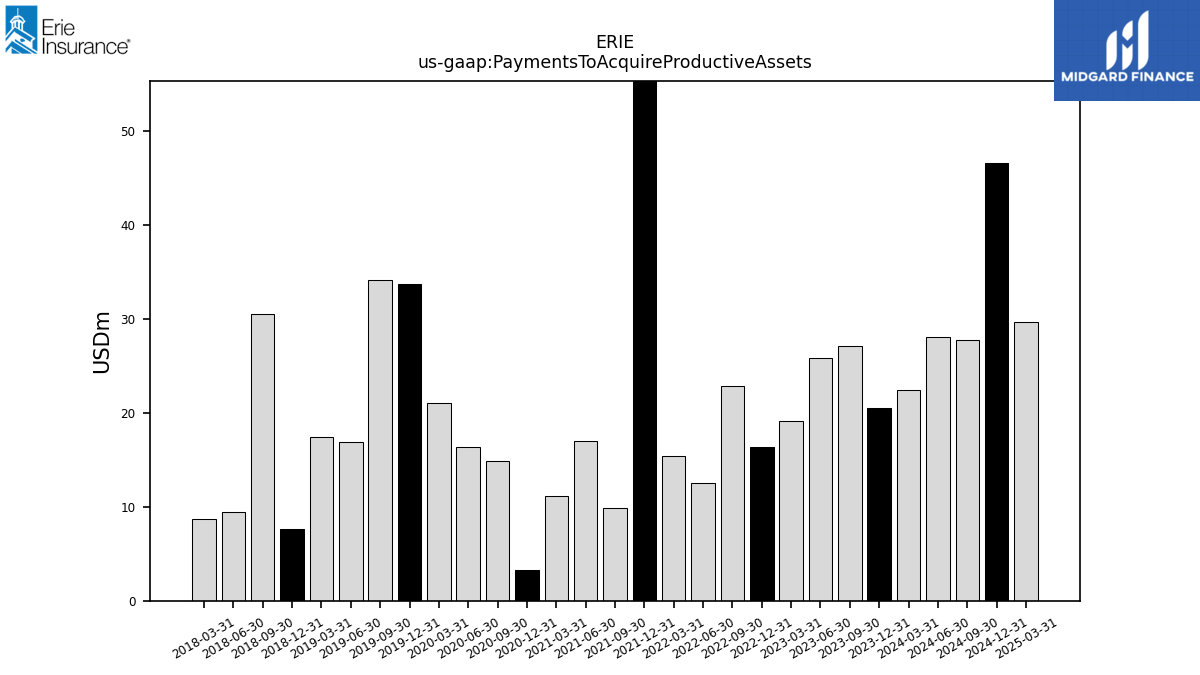
| Payments To Acquire Productive Assets | 22.45 | 20.55 | 27.10 | 25.86 | 19.14 | 16.32 | 22.86 | 12.56 | 15.46 | 110.70 | 9.90 | 17.05 | 11.15 | 3.24 | 14.86 | 16.34 | 21.09 | 33.68 | 34.10 | 16.85 | 17.41 | 7.63 | 30.55 | 9.43 | 8.69 | NA | NA | NA | NA | NA | NA | NA | NA | NA | NA | NA | NA | NA | NA | NA | NA | NA | NA | NA | NA | NA | NA | NA | NA | NA | NA | NA | NA | NA | NA | NA | NA |
| 2024-03-31 | 2023-12-31 | 2023-09-30 | 2023-06-30 | 2023-03-31 | 2022-12-31 | 2022-09-30 | 2022-06-30 | 2022-03-31 | 2021-12-31 | 2021-09-30 | 2021-06-30 | 2021-03-31 | 2020-12-31 | 2020-09-30 | 2020-06-30 | 2020-03-31 | 2019-12-31 | 2019-09-30 | 2019-06-30 | 2019-03-31 | 2018-12-31 | 2018-09-30 | 2018-06-30 | 2018-03-31 | 2017-12-31 | 2017-09-30 | 2017-06-30 | 2017-03-31 | 2016-12-31 | 2016-09-30 | 2016-06-30 | 2016-03-31 | 2015-12-31 | 2015-09-30 | 2015-06-30 | 2015-03-31 | 2014-12-31 | 2014-09-30 | 2014-06-30 | 2014-03-31 | 2013-12-31 | 2013-09-30 | 2013-06-30 | 2013-03-31 | 2012-12-31 | 2012-09-30 | 2012-06-30 | 2012-03-31 | 2011-12-31 | 2011-09-30 | 2011-06-30 | 2011-03-31 | 2010-12-31 | 2010-09-30 | 2010-06-30 | 2010-03-31 | ||
|---|---|---|---|---|---|---|---|---|---|---|---|---|---|---|---|---|---|---|---|---|---|---|---|---|---|---|---|---|---|---|---|---|---|---|---|---|---|---|---|---|---|---|---|---|---|---|---|---|---|---|---|---|---|---|---|---|---|---|
| Net Cash Provided By Used In Financing Activities | -59.38 | -55.42 | -55.42 | -55.42 | -55.42 | -51.69 | -91.69 | -105.24 | -52.22 | -48.72 | -48.71 | -48.71 | -48.70 | -138.58 | -45.43 | -45.44 | -45.42 | -42.40 | -42.38 | -42.42 | -42.37 | -39.12 | -39.12 | -14.12 | -39.12 | -11.45 | -36.45 | -11.46 | -36.45 | -9.22 | NA | NA | NA | NA | NA | NA | NA | NA | NA | NA | NA | NA | NA | NA | NA | NA | NA | NA | NA | NA | NA | -67.00 | -57.00 | NA | NA | -33.00 | -10.00 | |
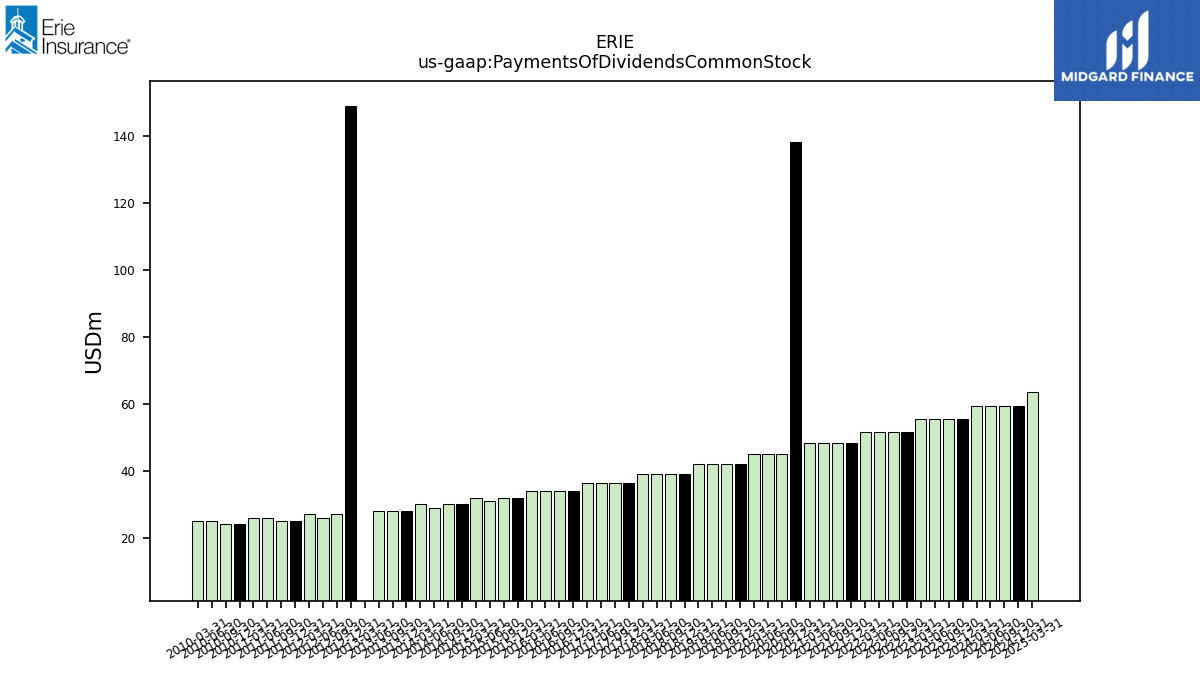
| Payments Of Dividends Common Stock | 59.38 | 55.42 | 55.42 | 55.42 | 55.42 | 51.69 | 51.69 | 51.69 | 51.69 | 48.20 | 48.20 | 48.20 | 48.20 | 138.08 | 44.94 | 44.94 | 44.94 | 41.91 | 41.91 | 41.91 | 41.91 | 39.12 | 39.12 | 39.12 | 39.12 | 36.44 | 36.44 | 36.44 | 36.44 | 34.00 | 34.00 | 34.00 | 34.00 | 31.86 | 32.00 | 31.00 | 32.00 | 30.00 | 30.00 | 29.00 | 30.00 | 28.00 | 28.00 | 28.00 | 0.00 | 149.00 | 27.00 | 26.00 | 27.00 | 25.00 | 25.00 | 26.00 | 26.00 | 24.00 | 24.00 | 25.00 | 25.00 |
| 2024-03-31 | 2023-12-31 | 2023-09-30 | 2023-06-30 | 2023-03-31 | 2022-12-31 | 2022-09-30 | 2022-06-30 | 2022-03-31 | 2021-12-31 | 2021-09-30 | 2021-06-30 | 2021-03-31 | 2020-12-31 | 2020-09-30 | 2020-06-30 | 2020-03-31 | 2019-12-31 | 2019-09-30 | 2019-06-30 | 2019-03-31 | 2018-12-31 | 2018-09-30 | 2018-06-30 | 2018-03-31 | 2017-12-31 | 2017-09-30 | 2017-06-30 | 2017-03-31 | 2016-12-31 | 2016-09-30 | 2016-06-30 | 2016-03-31 | 2015-12-31 | 2015-09-30 | 2015-06-30 | 2015-03-31 | 2014-12-31 | 2014-09-30 | 2014-06-30 | 2014-03-31 | 2013-12-31 | 2013-09-30 | 2013-06-30 | 2013-03-31 | 2012-12-31 | 2012-09-30 | 2012-06-30 | 2012-03-31 | 2011-12-31 | 2011-09-30 | 2011-06-30 | 2011-03-31 | 2010-12-31 | 2010-09-30 | 2010-06-30 | 2010-03-31 | ||
|---|---|---|---|---|---|---|---|---|---|---|---|---|---|---|---|---|---|---|---|---|---|---|---|---|---|---|---|---|---|---|---|---|---|---|---|---|---|---|---|---|---|---|---|---|---|---|---|---|---|---|---|---|---|---|---|---|---|---|
| Revenues | 880.70 | 817.67 | 858.94 | 839.87 | 752.47 | 700.63 | 741.24 | 726.14 | 672.11 | 635.93 | 687.84 | 680.03 | 630.18 | 609.25 | 653.48 | 657.02 | 616.74 | 596.74 | 638.74 | 647.71 | 594.11 | 576.47 | 612.13 | 621.46 | 572.16 | 401.40 | 442.49 | 448.56 | 399.32 | 379.61 | 418.41 | 423.88 | 374.73 | 356.38 | 1346.00 | 1632.00 | 1605.00 | 1589.00 | 1426.00 | 1598.00 | 1511.00 | 1697.00 | 1577.00 | 1426.00 | 1571.00 | 1372.00 | 1460.00 | 1160.00 | 1520.00 | 1418.00 | 796.00 | 1245.00 | 1365.00 | 1401.00 | 1357.00 | 916.00 | 1216.00 | |
| Revenue From Contract With Customer Excluding Assessed Tax | 880.70 | 817.67 | 858.94 | 839.87 | 752.47 | 700.63 | 741.24 | 726.14 | 672.11 | 635.93 | 687.84 | 680.03 | 630.18 | 609.25 | 653.48 | 657.02 | 616.74 | 596.74 | 638.74 | 647.71 | 594.11 | 576.47 | 612.13 | 621.46 | 572.16 | 401.40 | 442.49 | 448.56 | 399.32 | 379.61 | 418.41 | 423.88 | 374.73 | 356.38 | 1346.00 | 1632.00 | 1605.00 | 1589.00 | 1426.00 | 1598.00 | 1511.00 | 1697.00 | 1577.00 | 1426.00 | 1571.00 | 1372.00 | 1460.00 | 1160.00 | 1520.00 | 1418.00 | 796.00 | 1245.00 | 1365.00 | 1401.00 | 1357.00 | 916.00 | 1216.00 | |
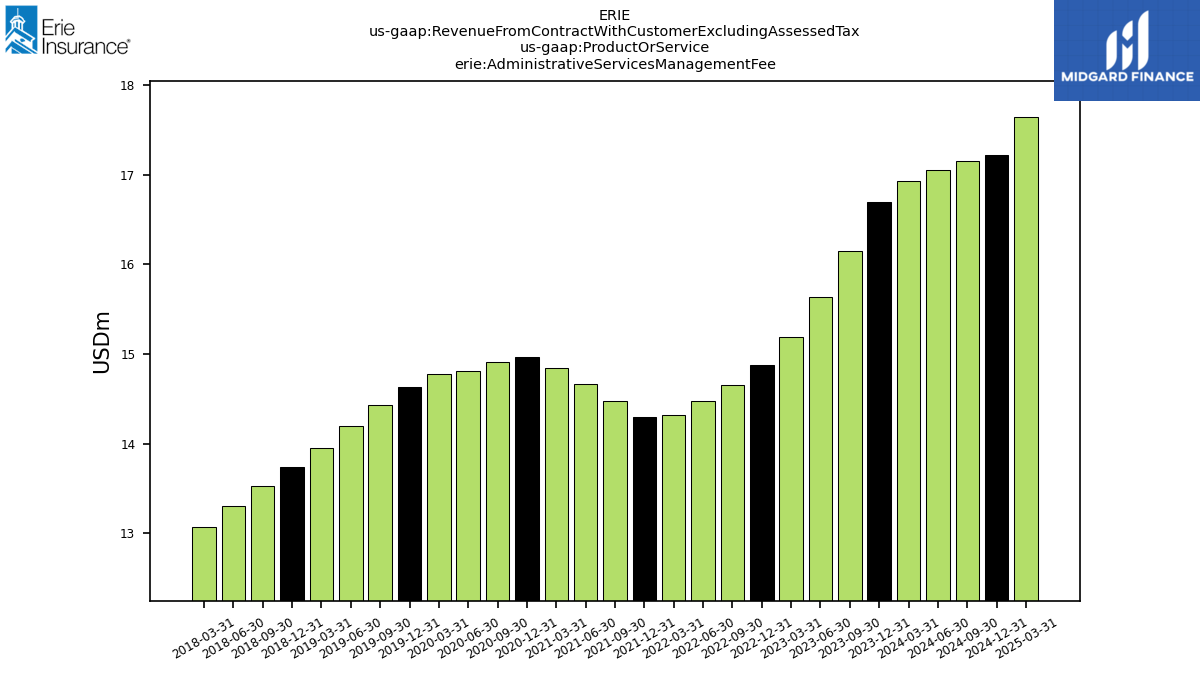
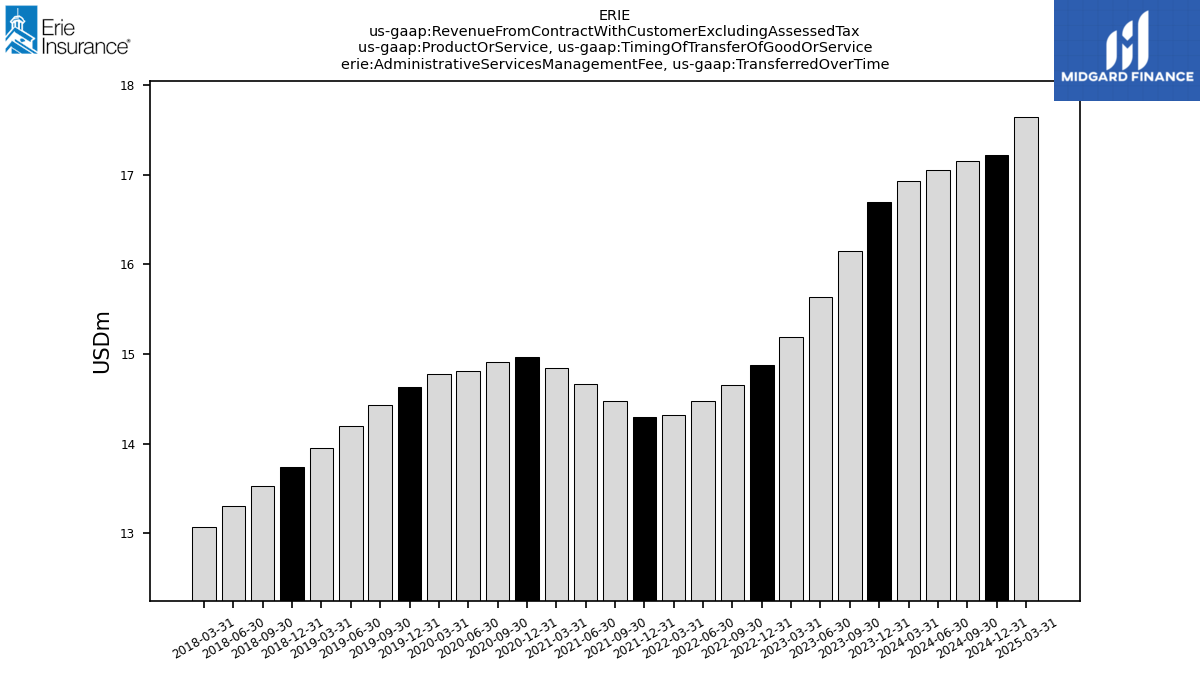
| Administrative Services Management Fee | 16.93 | 16.69 | 16.15 | 15.64 | 15.19 | 14.88 | 14.66 | 14.48 | 14.31 | 14.30 | 14.47 | 14.67 | 14.85 | 14.97 | 14.91 | 14.81 | 14.77 | 14.63 | 14.43 | 14.20 | 13.95 | 13.74 | 13.52 | 13.30 | 13.07 | NA | NA | NA | NA | NA | NA | NA | NA | NA | NA | NA | NA | NA | NA | NA | NA | NA | NA | NA | NA | NA | NA | NA | NA | NA | NA | NA | NA | NA | NA | NA | NA | |
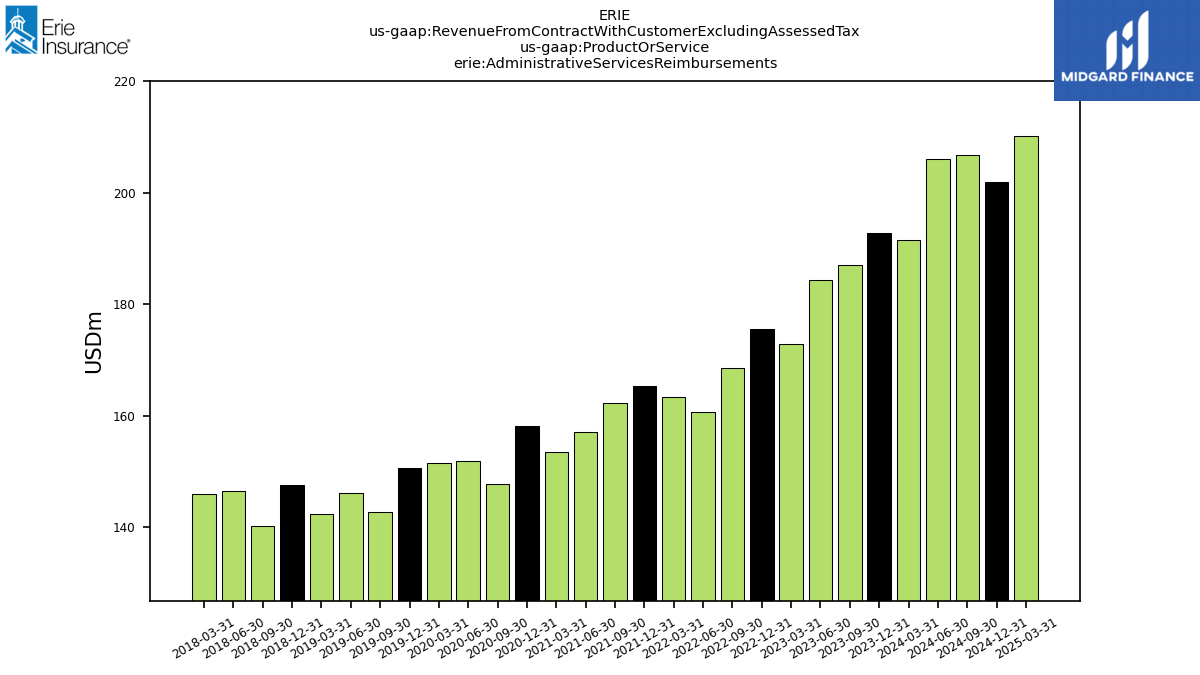
| Administrative Services Reimbursements | 191.57 | 192.73 | 187.12 | 184.47 | 172.83 | 175.61 | 168.65 | 160.68 | 163.33 | 165.35 | 162.41 | 157.19 | 153.53 | 158.21 | 147.71 | 151.97 | 151.55 | 150.71 | 142.73 | 146.09 | 142.48 | 147.69 | 140.17 | 146.51 | 145.96 | NA | NA | NA | NA | NA | NA | NA | NA | NA | NA | NA | NA | NA | NA | NA | NA | NA | NA | NA | NA | NA | NA | NA | NA | NA | NA | NA | NA | NA | NA | NA | NA | |
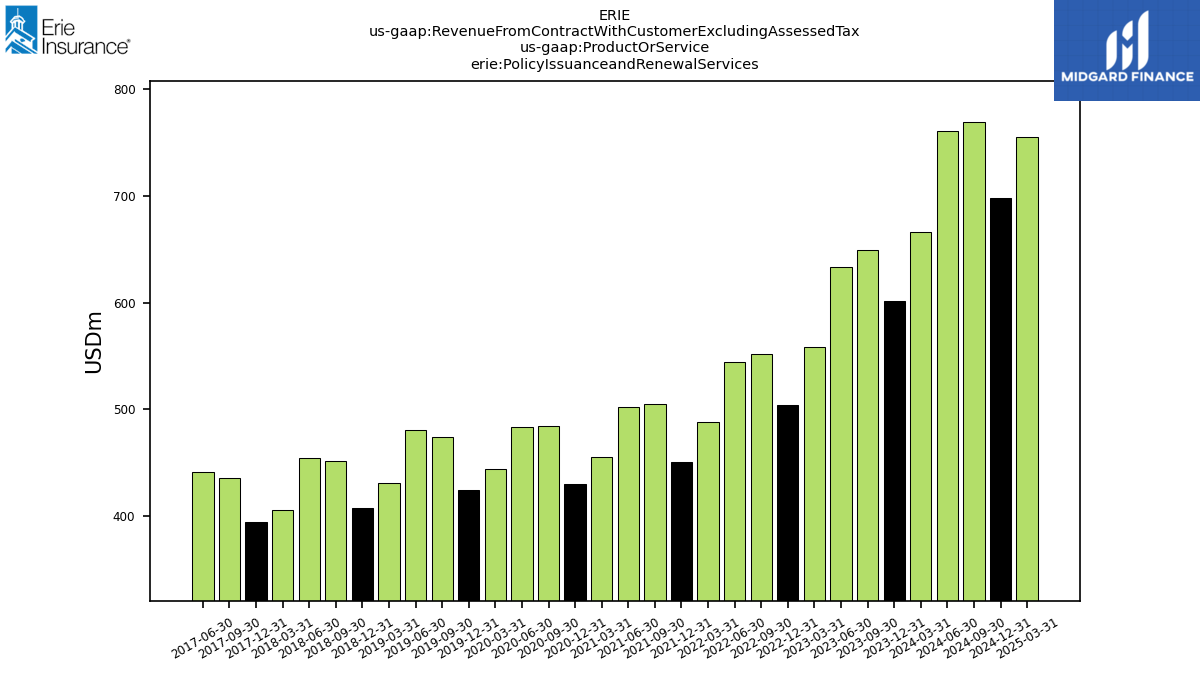
| Policy Issuanceand Renewal Services | 665.69 | 601.60 | 649.05 | 633.34 | 558.09 | 503.63 | 551.67 | 544.55 | 487.99 | 450.29 | 504.89 | 502.27 | 455.72 | 429.70 | 484.55 | 483.80 | 443.75 | 424.53 | 474.43 | 480.51 | 430.98 | 407.66 | 451.36 | 454.57 | 405.98 | 394.03 | 435.21 | 441.32 | NA | NA | NA | NA | NA | NA | NA | NA | NA | NA | NA | NA | NA | NA | NA | NA | NA | NA | NA | NA | NA | NA | NA | NA | NA | NA | NA | NA | NA | |
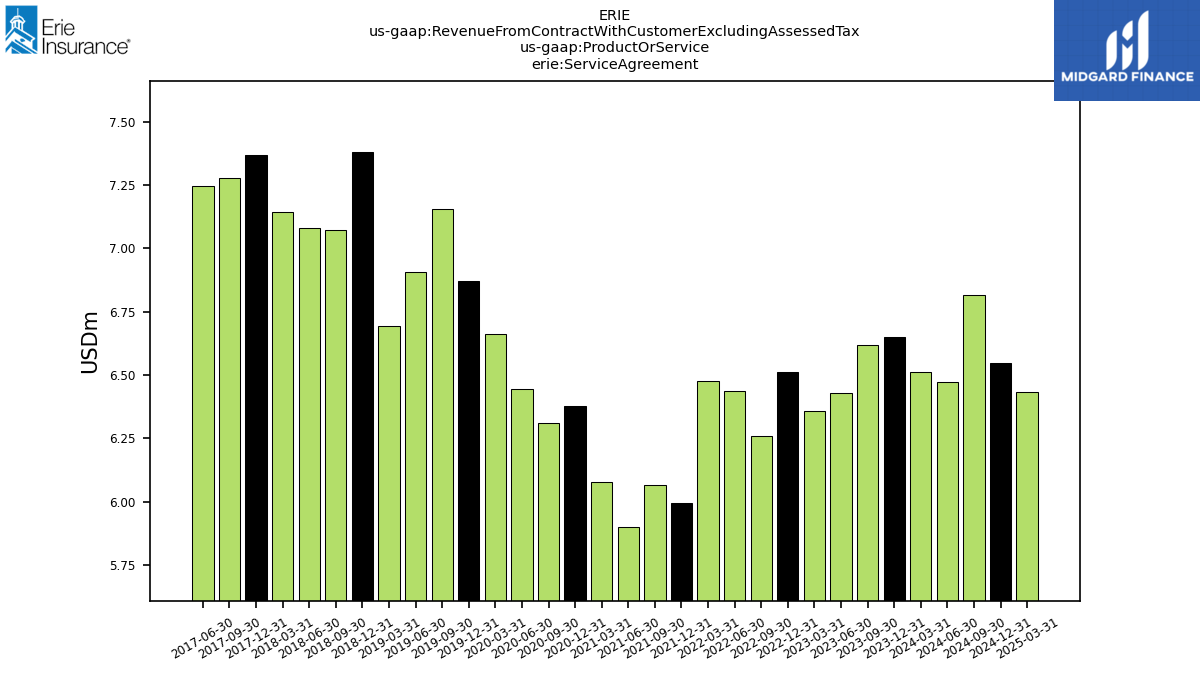
| Service Agreement | 6.51 | 6.65 | 6.62 | 6.43 | 6.36 | 6.51 | 6.26 | 6.44 | 6.48 | 5.99 | 6.07 | 5.90 | 6.08 | 6.38 | 6.31 | 6.45 | 6.66 | 6.87 | 7.16 | 6.91 | 6.69 | 7.38 | 7.07 | 7.08 | 7.14 | 7.37 | 7.28 | 7.25 | NA | NA | NA | NA | NA | NA | NA | NA | NA | NA | NA | NA | NA | NA | NA | NA | NA | NA | NA | NA | NA | NA | NA | NA | NA | NA | NA | NA | NA | |
| Administrative Services, Transferred Over Time | 208.50 | 209.42 | 203.27 | 200.10 | 188.02 | 190.49 | 183.31 | 175.15 | 177.64 | 179.65 | 176.88 | 171.86 | 168.38 | 173.18 | 162.62 | 166.78 | 166.32 | 165.33 | 157.16 | 160.29 | 156.43 | 161.43 | 153.69 | 159.81 | 159.04 | NA | NA | NA | NA | NA | NA | NA | NA | NA | NA | NA | NA | NA | NA | NA | NA | NA | NA | NA | NA | NA | NA | NA | NA | NA | NA | NA | NA | NA | NA | NA | NA | |
| Administrative Services Management Fee, Transferred Over Time | 16.93 | 16.69 | 16.15 | 15.64 | 15.19 | 14.88 | 14.66 | 14.48 | 14.31 | 14.30 | 14.47 | 14.67 | 14.85 | 14.97 | 14.91 | 14.81 | 14.77 | 14.63 | 14.43 | 14.20 | 13.95 | 13.74 | 13.52 | 13.30 | 13.07 | NA | NA | NA | NA | NA | NA | NA | NA | NA | NA | NA | NA | NA | NA | NA | NA | NA | NA | NA | NA | NA | NA | NA | NA | NA | NA | NA | NA | NA | NA | NA | NA | |
| Administrative Services Reimbursements, Transferred Over Time | 191.57 | 192.73 | 187.12 | 184.47 | 172.83 | 175.61 | 168.65 | 160.68 | 163.33 | 165.35 | 162.41 | 157.19 | 153.53 | 158.21 | 147.71 | 151.97 | 151.55 | 150.71 | 142.73 | 146.09 | 142.48 | 147.69 | 140.17 | 146.51 | 145.96 | NA | NA | NA | NA | NA | NA | NA | NA | NA | NA | NA | NA | NA | NA | NA | NA | NA | NA | NA | NA | NA | NA | NA | NA | NA | NA | NA | NA | NA | NA | NA | NA | |
| Policy Issuanceand Renewal Services, Transferred At Point In Time | 665.69 | 601.60 | 649.05 | 633.34 | 558.09 | 503.63 | 551.67 | 544.55 | 487.99 | 450.29 | 504.89 | 502.27 | 455.72 | 429.70 | 484.55 | 483.80 | 443.75 | 424.53 | 474.43 | 480.51 | 430.98 | 407.66 | 451.36 | 454.57 | 405.98 | 394.03 | 435.21 | 441.32 | NA | NA | NA | NA | NA | NA | NA | NA | NA | NA | NA | NA | NA | NA | NA | NA | NA | NA | NA | NA | NA | NA | NA | NA | NA | NA | NA | NA | NA |