
| 2024-03-31 | 2023-12-31 | 2023-09-30 | 2023-06-30 | 2023-03-31 | 2022-12-31 | 2022-09-30 | 2022-06-30 | 2022-03-31 | 2021-12-31 | 2021-09-30 | 2021-06-30 | 2021-03-31 | 2020-12-31 | 2020-09-30 | 2020-06-30 | 2020-03-31 | 2019-12-31 | 2019-09-30 | 2019-06-30 | 2019-03-31 | 2018-12-31 | 2018-09-30 | 2018-06-30 | 2018-03-31 | 2017-12-31 | 2017-09-30 | 2017-06-30 | 2017-03-31 | 2016-12-31 | 2016-09-30 | 2016-06-30 | 2016-03-31 | 2015-12-31 | 2015-09-30 | 2015-06-30 | 2015-03-31 | 2014-12-31 | 2014-09-30 | 2014-06-30 | 2014-03-31 | 2013-12-31 | 2013-09-30 | 2013-06-30 | 2013-03-31 | 2012-12-31 | 2012-09-30 | 2012-06-30 | 2012-03-31 | ||
|---|---|---|---|---|---|---|---|---|---|---|---|---|---|---|---|---|---|---|---|---|---|---|---|---|---|---|---|---|---|---|---|---|---|---|---|---|---|---|---|---|---|---|---|---|---|---|---|---|---|---|
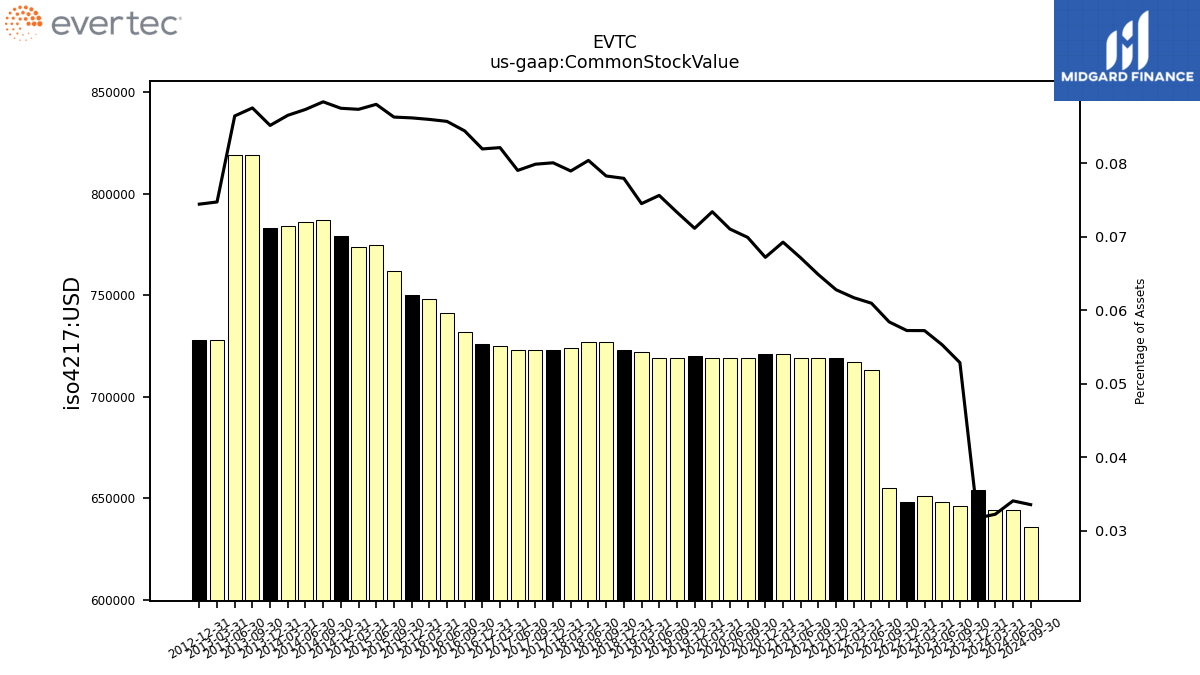
| Common Stock Value | 0.64 | 0.65 | 0.65 | 0.65 | 0.65 | 0.65 | 0.66 | 0.71 | 0.72 | 0.72 | 0.72 | 0.72 | 0.72 | 0.72 | 0.72 | 0.72 | 0.72 | 0.72 | 0.72 | 0.72 | 0.72 | 0.72 | 0.73 | 0.73 | 0.72 | 0.72 | 0.72 | 0.72 | 0.72 | 0.73 | 0.73 | 0.74 | 0.75 | 0.75 | 0.76 | 0.78 | 0.77 | 0.78 | 0.79 | 0.79 | 0.78 | 0.78 | 0.82 | 0.82 | 0.73 | 0.73 | NA | NA | NA | |
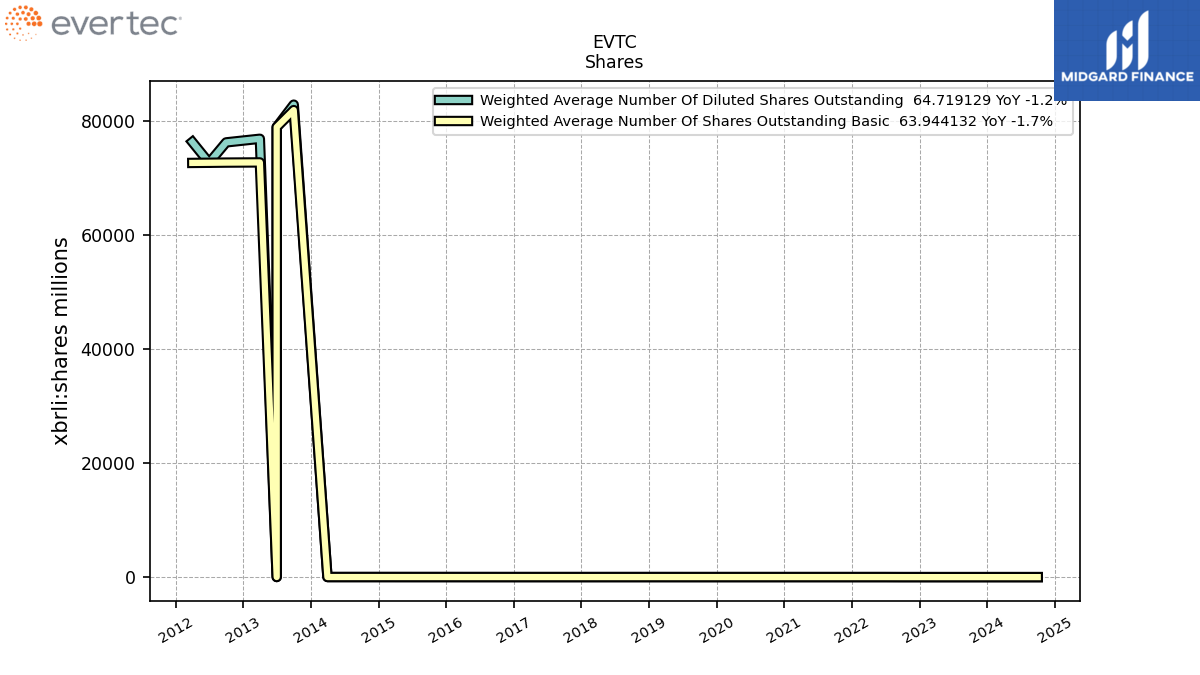
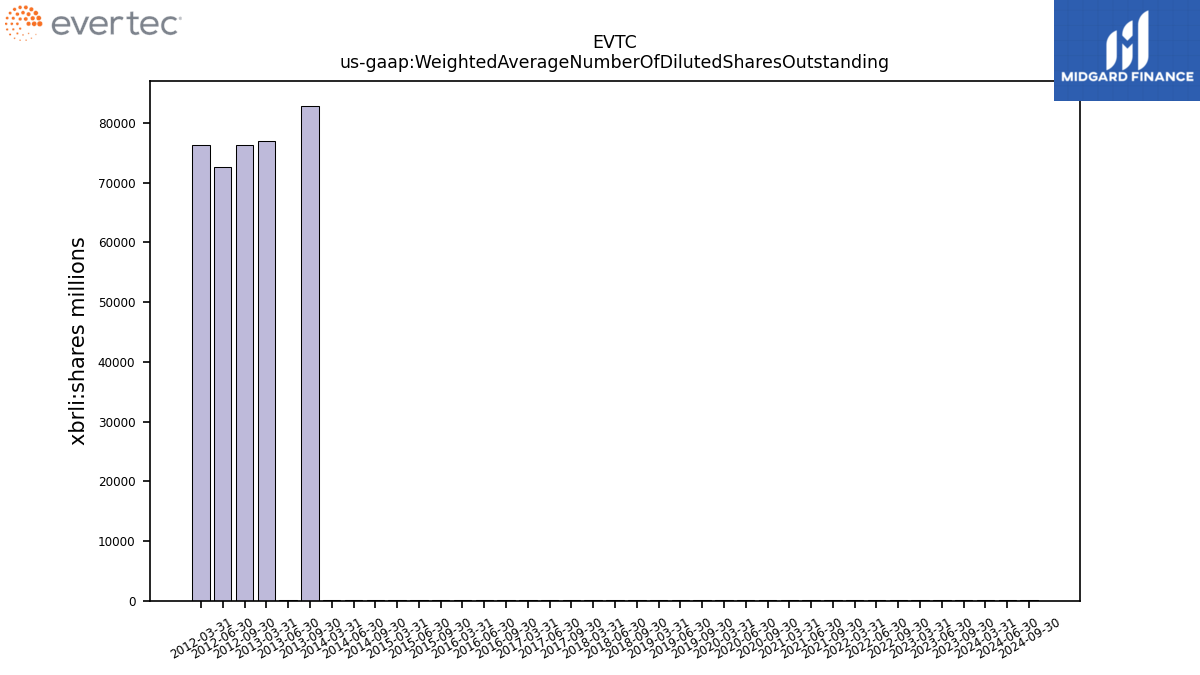
| Weighted Average Number Of Diluted Shares Outstanding | 66.34 | NA | 65.78 | 65.51 | 65.61 | NA | 67.05 | 72.15 | 72.85 | NA | 72.88 | 72.83 | 72.95 | NA | 73.00 | 72.77 | 73.29 | NA | 73.31 | 73.30 | 73.77 | NA | 74.66 | 74.39 | 73.37 | NA | 73.09 | 73.07 | 73.15 | NA | 74.29 | 75.02 | 75.02 | NA | 77.29 | 77.70 | 77.87 | NA | 79.22 | 79.20 | 79.24 | NA | 82862.54 | 78.93 | 76879.26 | NA | 76245.40 | 72672.85 | 76317.07 | |
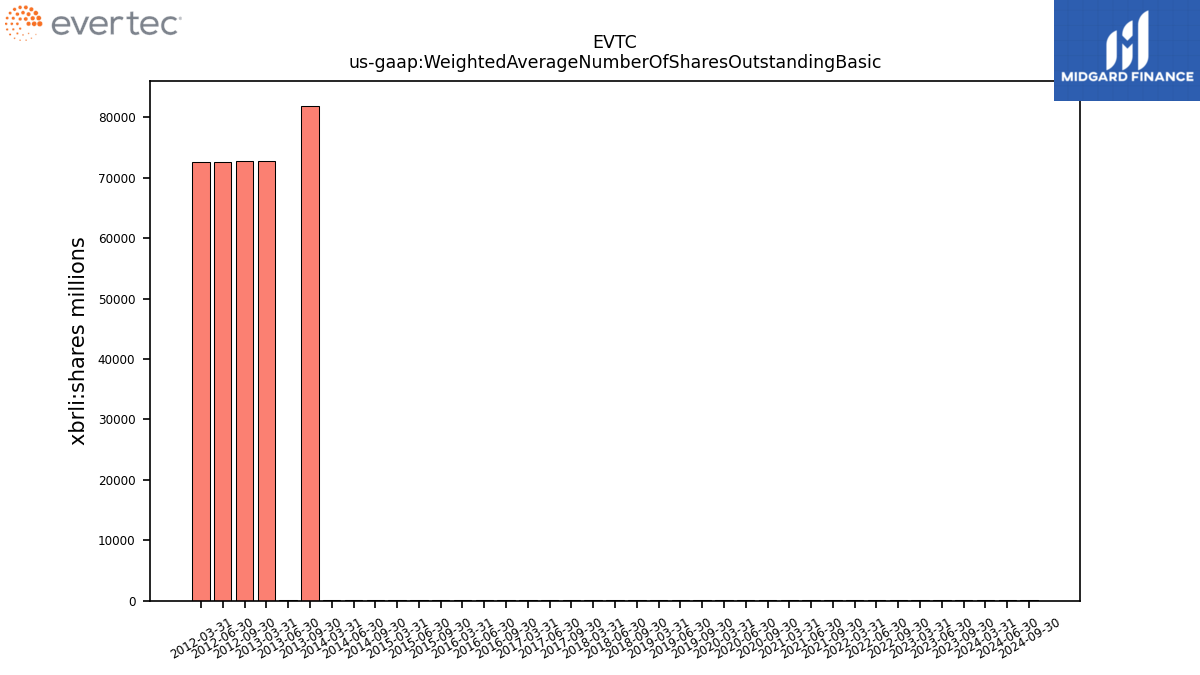
| Weighted Average Number Of Shares Outstanding Basic | 65.18 | NA | 64.65 | 65.05 | 64.97 | NA | 66.40 | 71.48 | 71.97 | NA | 71.97 | 72.13 | 72.15 | NA | 71.89 | 71.86 | 72.01 | NA | 71.94 | 72.13 | 72.38 | NA | 72.72 | 72.64 | 72.41 | NA | 72.39 | 72.51 | 72.64 | NA | 73.87 | 74.71 | 74.95 | NA | 77.16 | 77.46 | 77.81 | NA | 78.67 | 78.41 | 78.38 | NA | 81905.57 | 78.93 | 72736.11 | NA | 72704.84 | 72672.85 | 72646.07 | |
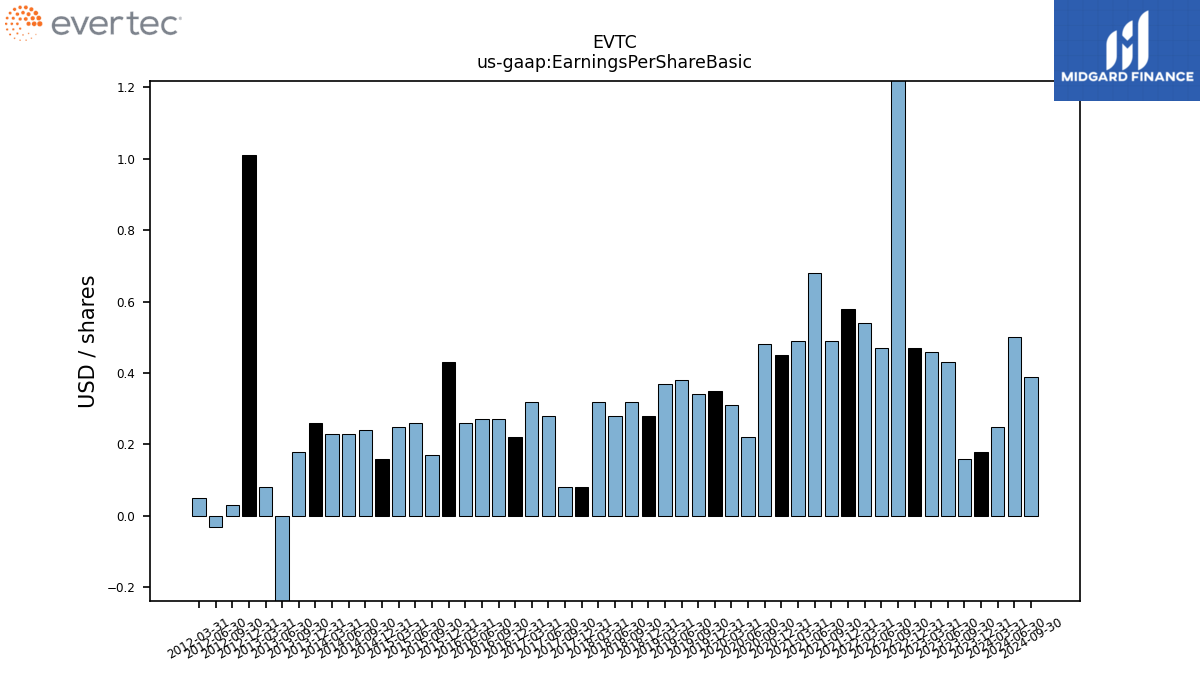
| Earnings Per Share Basic | 0.25 | 0.18 | 0.16 | 0.43 | 0.46 | 0.47 | 2.08 | 0.47 | 0.54 | 0.58 | 0.49 | 0.68 | 0.49 | 0.45 | 0.48 | 0.22 | 0.31 | 0.35 | 0.34 | 0.38 | 0.37 | 0.28 | 0.32 | 0.28 | 0.32 | 0.08 | 0.08 | 0.28 | 0.32 | 0.22 | 0.27 | 0.27 | 0.26 | 0.43 | 0.17 | 0.26 | 0.25 | 0.16 | 0.24 | 0.23 | 0.23 | 0.26 | 0.18 | -0.82 | 0.08 | 1.01 | 0.03 | -0.03 | 0.05 | |
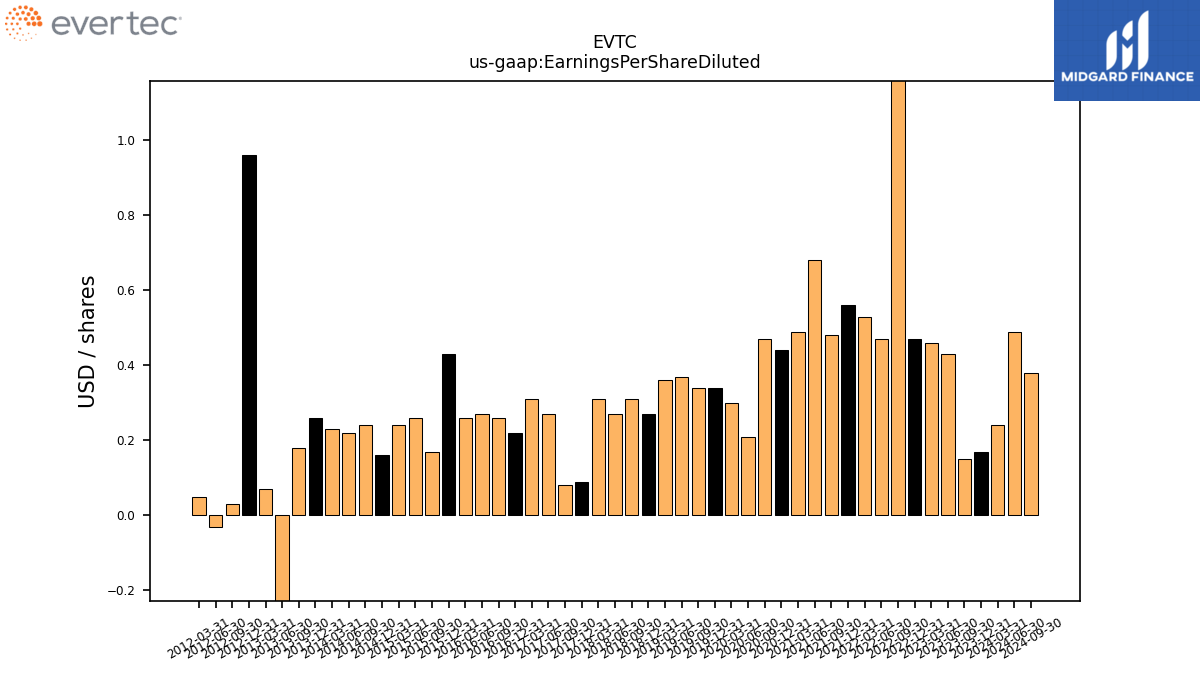
| Earnings Per Share Diluted | 0.24 | 0.17 | 0.15 | 0.43 | 0.46 | 0.47 | 2.06 | 0.47 | 0.53 | 0.56 | 0.48 | 0.68 | 0.49 | 0.44 | 0.47 | 0.21 | 0.30 | 0.34 | 0.34 | 0.37 | 0.36 | 0.27 | 0.31 | 0.27 | 0.31 | 0.09 | 0.08 | 0.27 | 0.31 | 0.22 | 0.26 | 0.27 | 0.26 | 0.43 | 0.17 | 0.26 | 0.24 | 0.16 | 0.24 | 0.22 | 0.23 | 0.26 | 0.18 | -0.82 | 0.07 | 0.96 | 0.03 | -0.03 | 0.05 |
| 2024-03-31 | 2023-12-31 | 2023-09-30 | 2023-06-30 | 2023-03-31 | 2022-12-31 | 2022-09-30 | 2022-06-30 | 2022-03-31 | 2021-12-31 | 2021-09-30 | 2021-06-30 | 2021-03-31 | 2020-12-31 | 2020-09-30 | 2020-06-30 | 2020-03-31 | 2019-12-31 | 2019-09-30 | 2019-06-30 | 2019-03-31 | 2018-12-31 | 2018-09-30 | 2018-06-30 | 2018-03-31 | 2017-12-31 | 2017-09-30 | 2017-06-30 | 2017-03-31 | 2016-12-31 | 2016-09-30 | 2016-06-30 | 2016-03-31 | 2015-12-31 | 2015-09-30 | 2015-06-30 | 2015-03-31 | 2014-12-31 | 2014-09-30 | 2014-06-30 | 2014-03-31 | 2013-12-31 | 2013-09-30 | 2013-06-30 | 2013-03-31 | 2012-12-31 | 2012-09-30 | 2012-06-30 | 2012-03-31 | ||
|---|---|---|---|---|---|---|---|---|---|---|---|---|---|---|---|---|---|---|---|---|---|---|---|---|---|---|---|---|---|---|---|---|---|---|---|---|---|---|---|---|---|---|---|---|---|---|---|---|---|---|
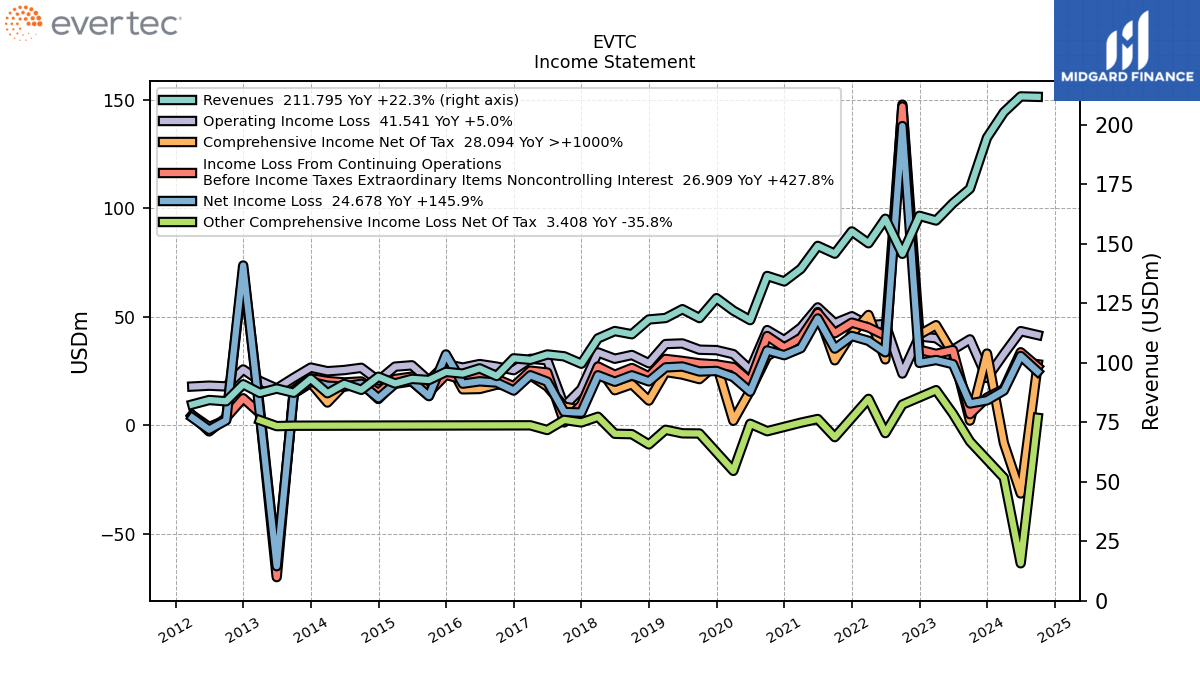
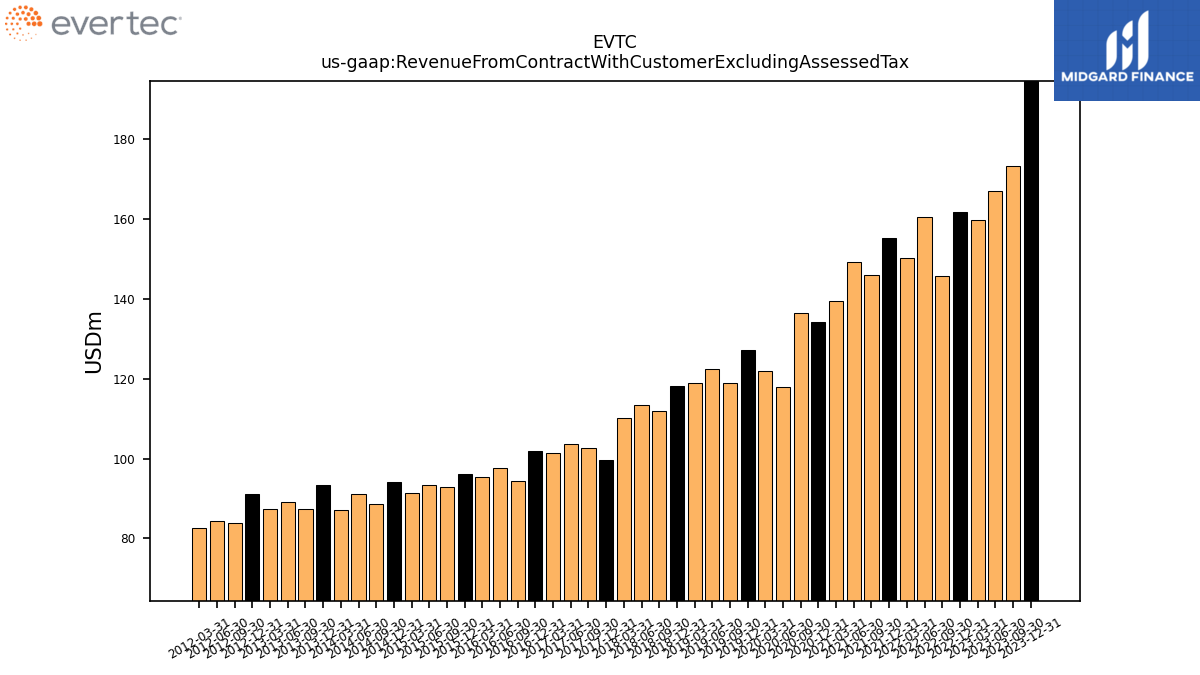
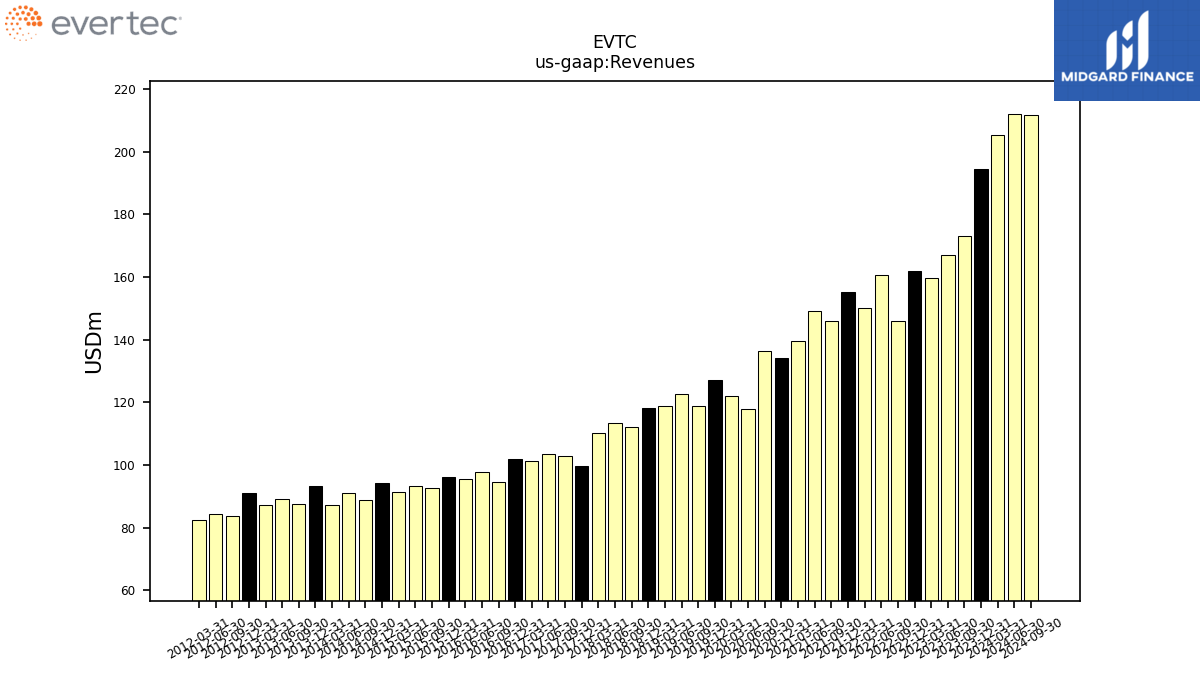
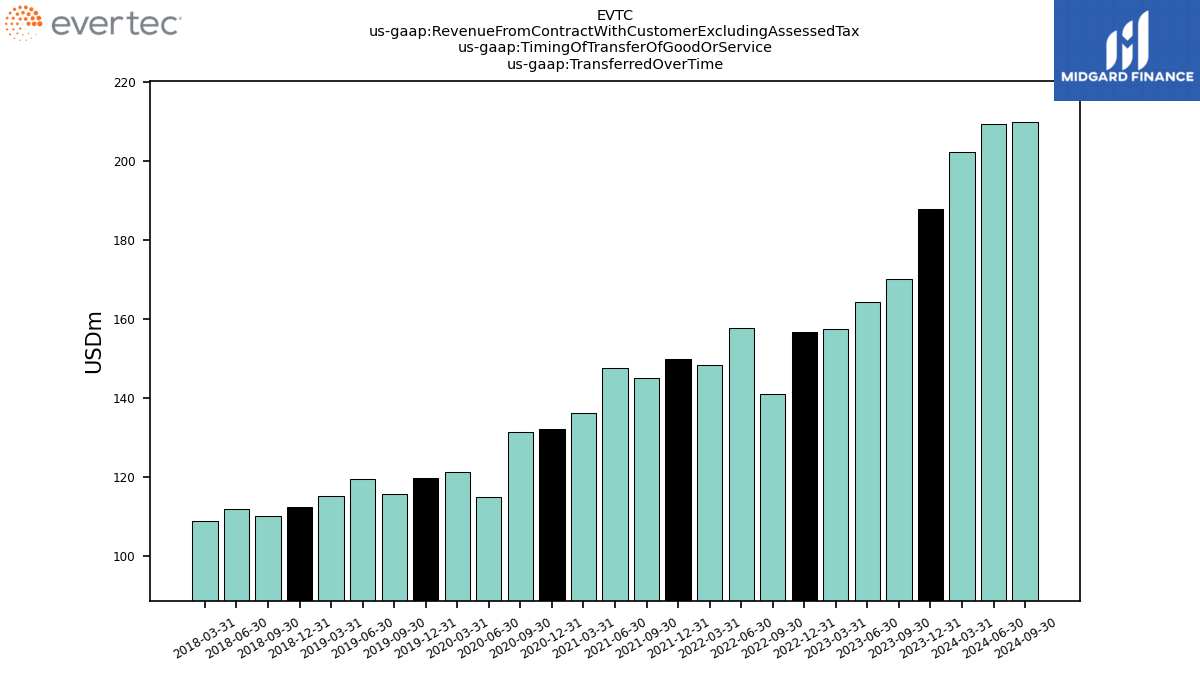
| Revenue From Contract With Customer Excluding Assessed Tax | 205.32 | 194.62 | 173.20 | 167.08 | 159.81 | 161.79 | 145.80 | 160.57 | 150.25 | 155.24 | 145.88 | 149.15 | 139.53 | 134.20 | 136.51 | 117.94 | 121.94 | 127.19 | 118.80 | 122.55 | 118.84 | 118.23 | 112.02 | 113.35 | 110.27 | 99.63 | 102.72 | 103.51 | 101.28 | 101.89 | 94.47 | 97.67 | 95.48 | 96.18 | 92.78 | 93.24 | 91.33 | 94.16 | 88.64 | 91.12 | 87.21 | 93.31 | 87.41 | 89.17 | 87.34 | 90.98 | 83.84 | 84.37 | 82.49 | |
| Revenues | 205.32 | 194.62 | 173.20 | 167.08 | 159.81 | 161.79 | 145.80 | 160.57 | 150.25 | 155.24 | 145.88 | 149.15 | 139.53 | 134.20 | 136.51 | 117.94 | 121.94 | 127.19 | 118.80 | 122.55 | 118.84 | 118.23 | 112.02 | 113.35 | 110.27 | 99.63 | 102.72 | 103.51 | 101.28 | 101.89 | 94.47 | 97.67 | 95.48 | 96.18 | 92.78 | 93.24 | 91.33 | 94.16 | 88.64 | 91.12 | 87.21 | 93.31 | 87.41 | 89.17 | 87.34 | 90.98 | 83.84 | 84.37 | 82.49 | |
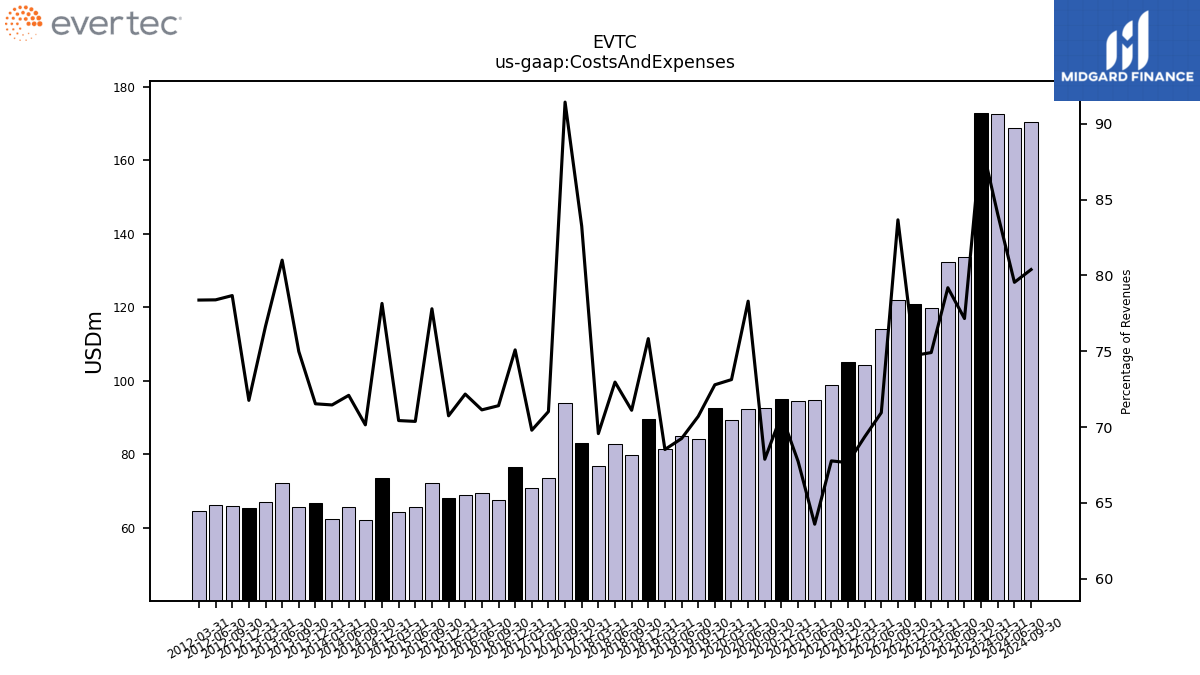
| Costs And Expenses | 172.51 | 172.89 | 133.64 | 132.30 | 119.72 | 120.90 | 121.98 | 113.92 | 104.20 | 105.03 | 98.87 | 94.86 | 94.53 | 95.01 | 92.66 | 92.35 | 89.18 | 92.58 | 84.00 | 84.86 | 81.43 | 89.66 | 79.66 | 82.71 | 76.72 | 82.94 | 93.92 | 73.52 | 70.69 | 76.51 | 67.46 | 69.48 | 68.91 | 68.04 | 72.18 | 65.62 | 64.33 | 73.59 | 62.18 | 65.69 | 62.32 | 66.75 | 65.55 | 72.24 | 66.94 | 65.29 | 65.96 | 66.14 | 64.65 | |
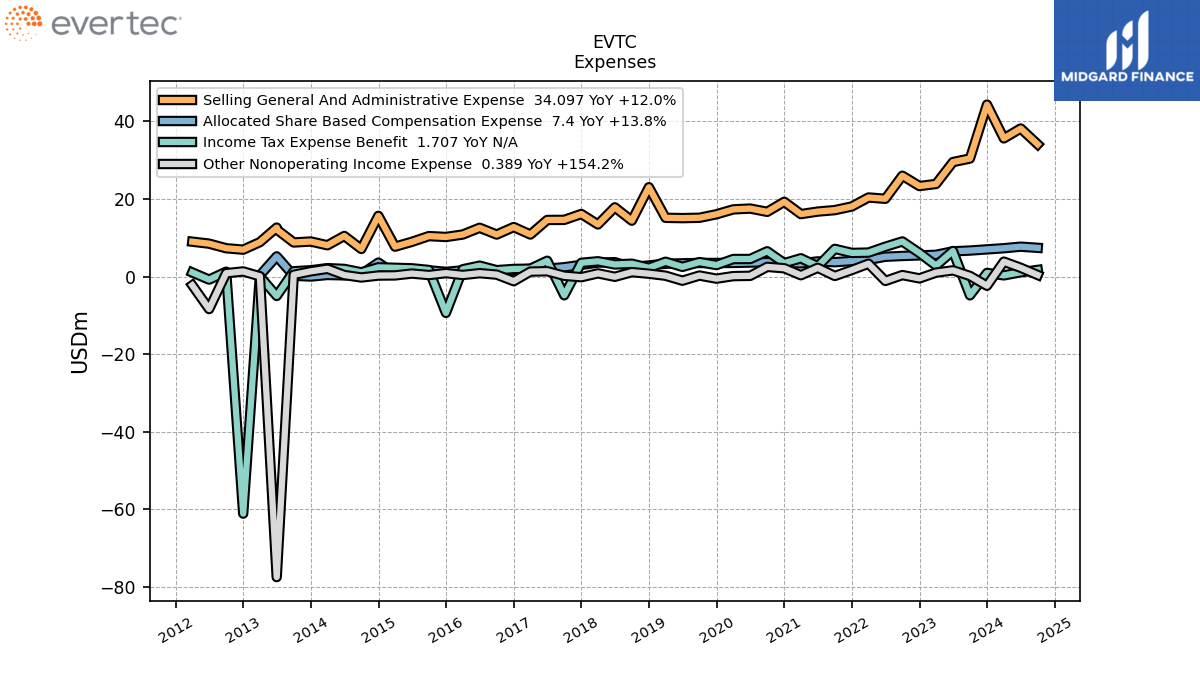
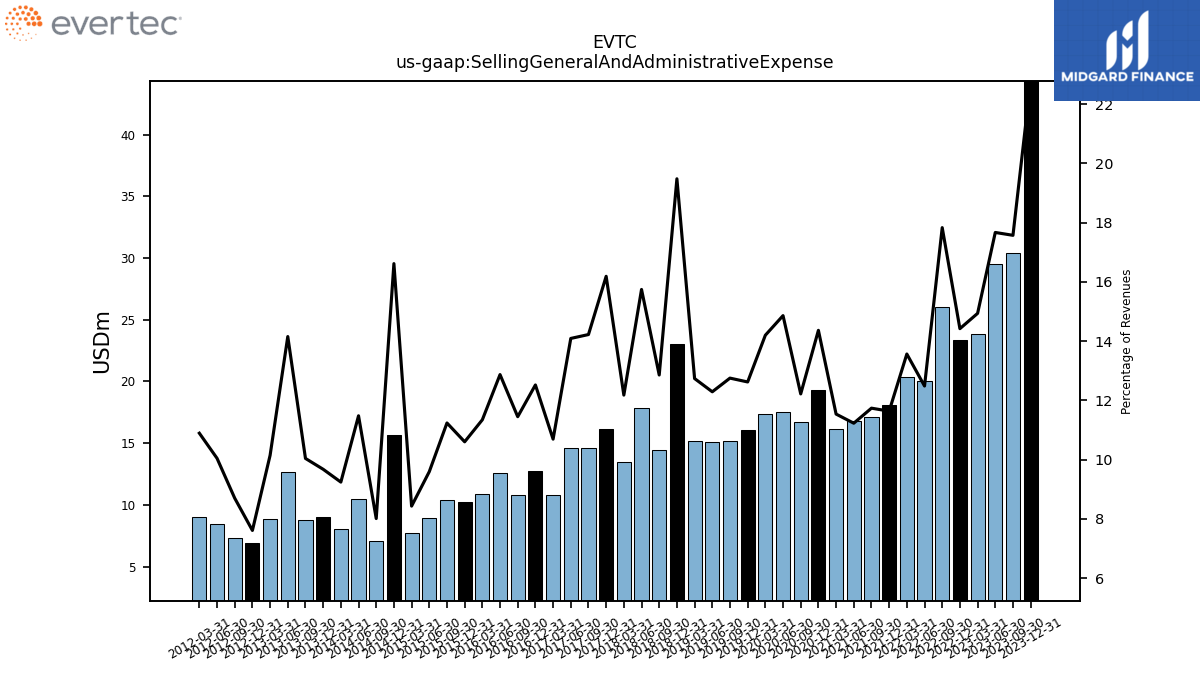
| Selling General And Administrative Expense | 35.63 | 44.34 | 30.44 | 29.52 | 23.88 | 23.33 | 26.00 | 20.05 | 20.38 | 18.07 | 17.13 | 16.75 | 16.10 | 19.28 | 16.68 | 17.53 | 17.32 | 16.06 | 15.15 | 15.06 | 15.14 | 23.03 | 14.40 | 17.85 | 13.43 | 16.13 | 14.61 | 14.59 | 10.83 | 12.76 | 10.82 | 12.57 | 10.84 | 10.20 | 10.43 | 8.95 | 7.70 | 15.65 | 7.10 | 10.46 | 8.06 | 9.03 | 8.78 | 12.62 | 8.86 | 6.93 | 7.29 | 8.48 | 8.99 | |
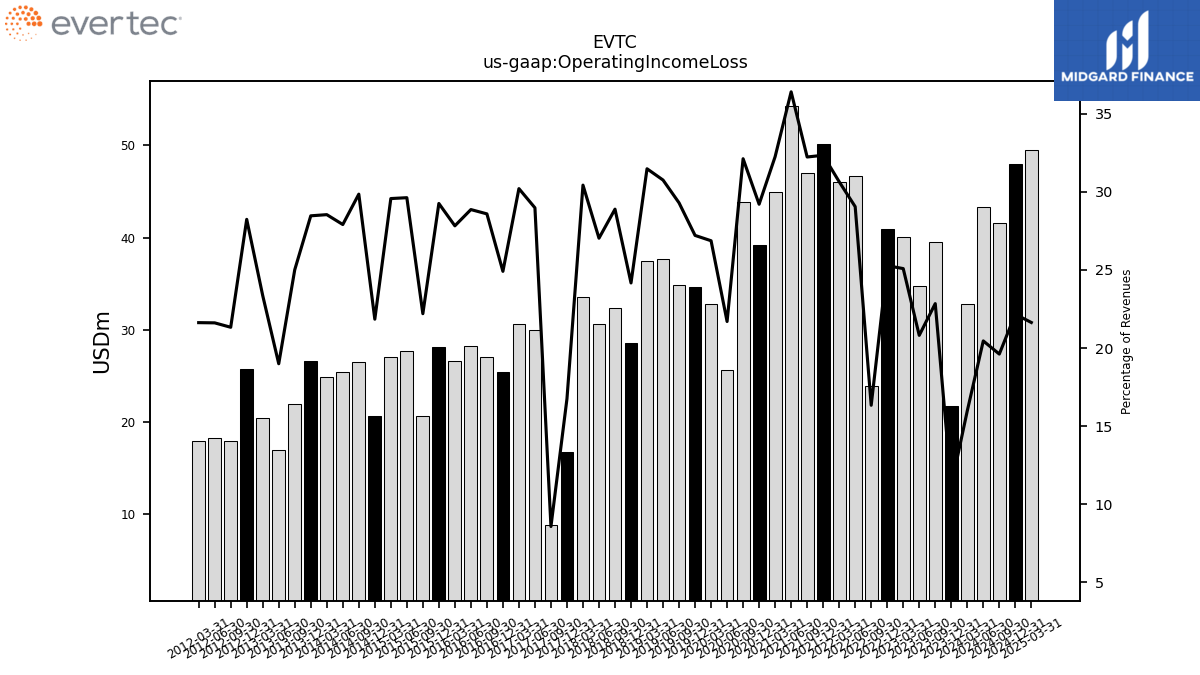
| Operating Income Loss | 32.80 | 21.73 | 39.56 | 34.77 | 40.09 | 40.89 | 23.82 | 46.65 | 46.05 | 50.21 | 47.02 | 54.29 | 45.00 | 39.20 | 43.84 | 25.59 | 32.76 | 34.61 | 34.80 | 37.69 | 37.41 | 28.57 | 32.36 | 30.64 | 33.55 | 16.69 | 8.81 | 29.99 | 30.59 | 25.38 | 27.01 | 28.19 | 26.57 | 28.14 | 20.59 | 27.62 | 27.01 | 20.57 | 26.46 | 25.43 | 24.89 | 26.56 | 21.86 | 16.94 | 20.40 | 25.69 | 17.88 | 18.23 | 17.84 | |
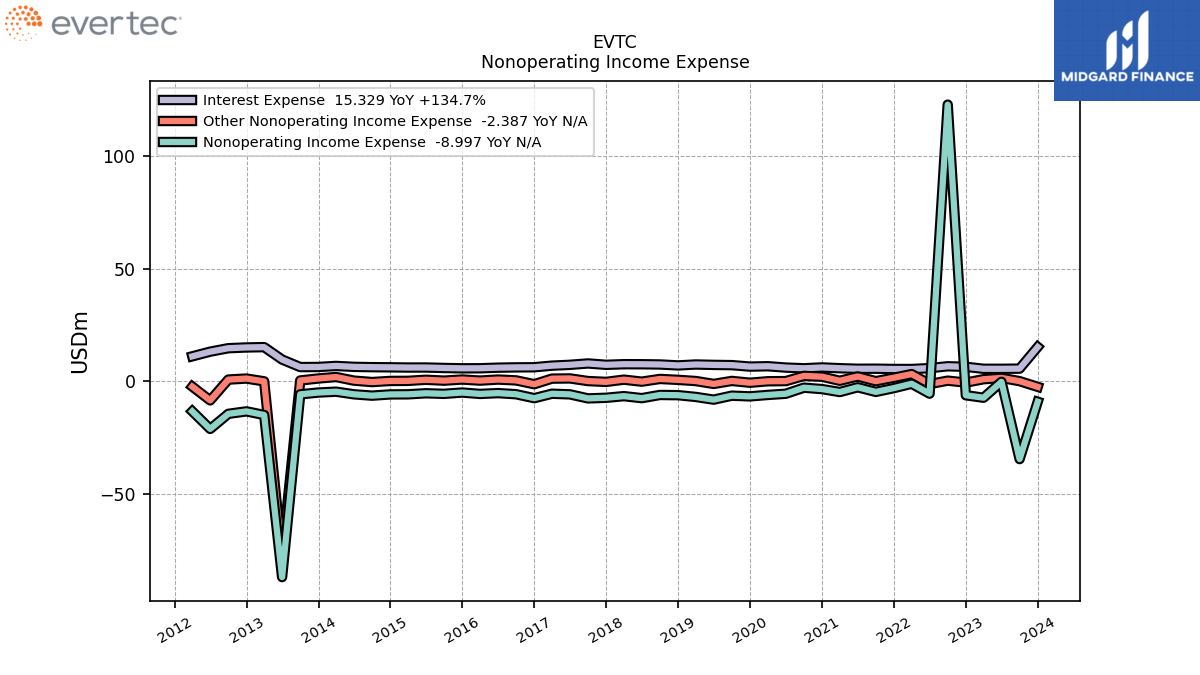
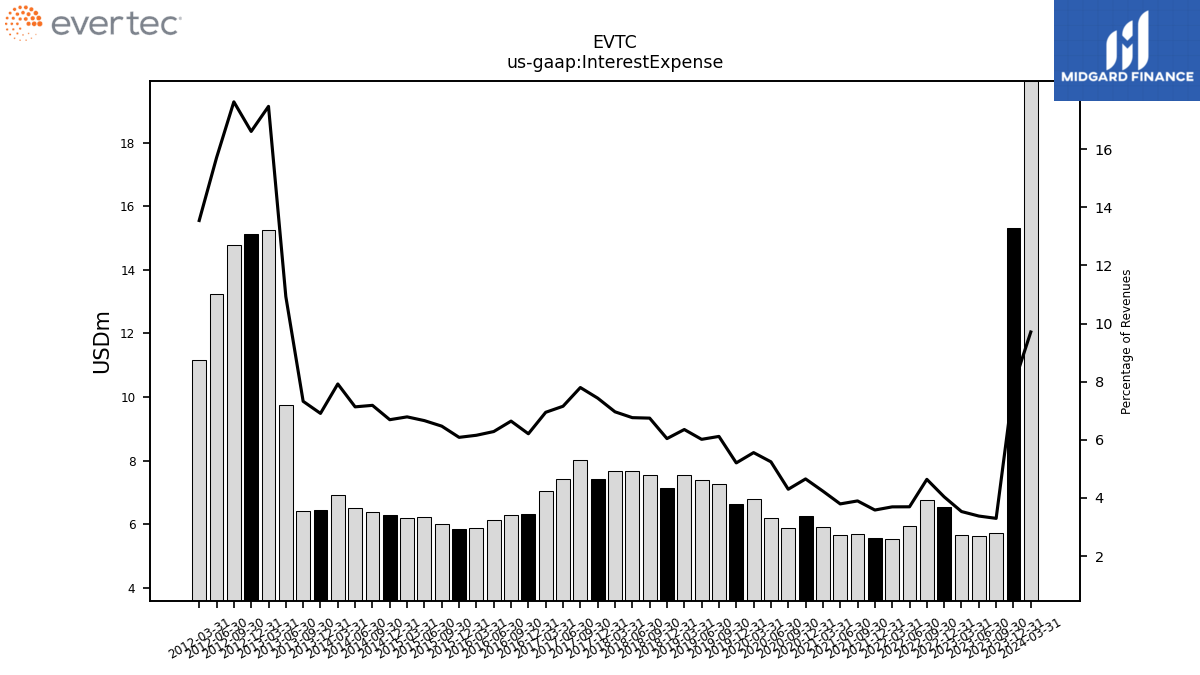
| Interest Expense | 19.94 | 15.33 | 5.71 | 5.64 | 5.64 | 6.53 | 6.76 | 5.93 | 5.55 | 5.56 | 5.68 | 5.66 | 5.91 | 6.25 | 5.87 | 6.18 | 6.78 | 6.62 | 7.27 | 7.37 | 7.55 | 7.14 | 7.56 | 7.67 | 7.68 | 7.41 | 8.01 | 7.41 | 7.04 | 6.33 | 6.28 | 6.14 | 5.88 | 5.85 | 6.00 | 6.21 | 6.20 | 6.30 | 6.37 | 6.50 | 6.91 | 6.45 | 6.40 | 9.75 | 15.26 | 15.12 | 14.78 | 13.25 | 11.18 | |
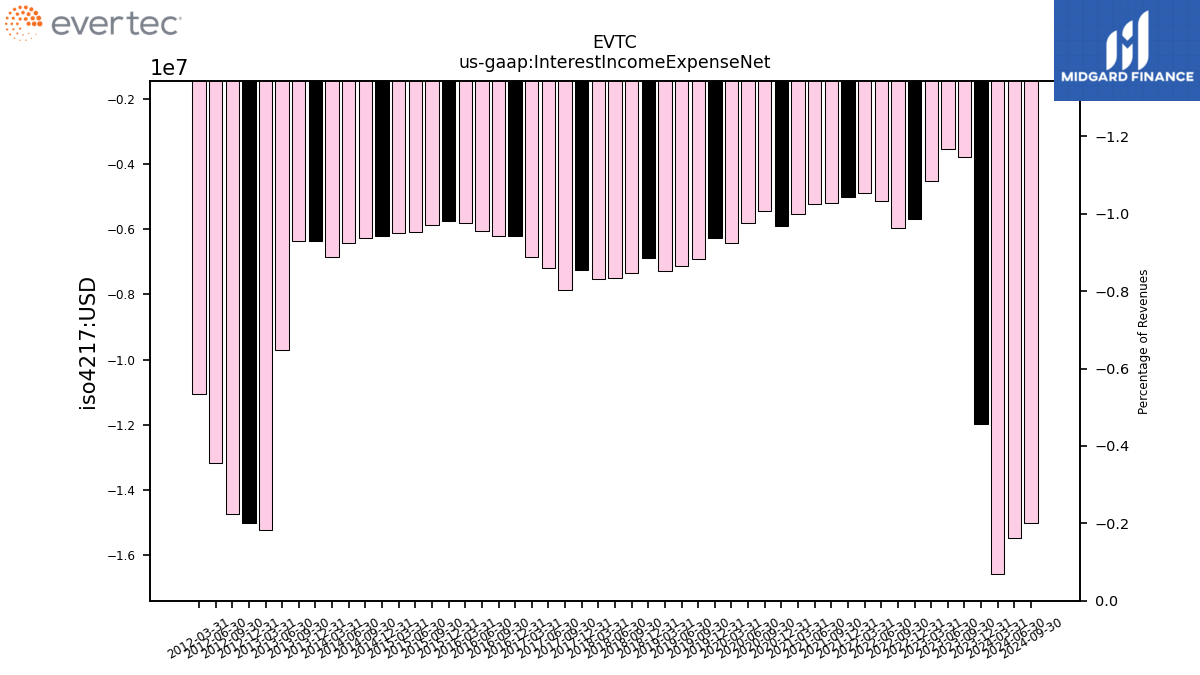
| Interest Income Expense Net | -16.58 | -11.98 | -3.78 | -3.54 | -4.51 | -5.69 | -5.96 | -5.13 | -4.88 | -5.02 | -5.18 | -5.21 | -5.52 | -5.91 | -5.44 | -5.81 | -6.42 | -6.27 | -6.92 | -7.12 | -7.29 | -6.88 | -7.35 | -7.50 | -7.52 | -7.25 | -7.85 | -7.19 | -6.85 | -6.21 | -6.19 | -6.05 | -5.79 | -5.73 | -5.86 | -6.08 | -6.10 | -6.22 | -6.28 | -6.42 | -6.83 | -6.36 | -6.35 | -9.70 | -15.22 | -15.03 | -14.75 | -13.18 | -11.05 | |
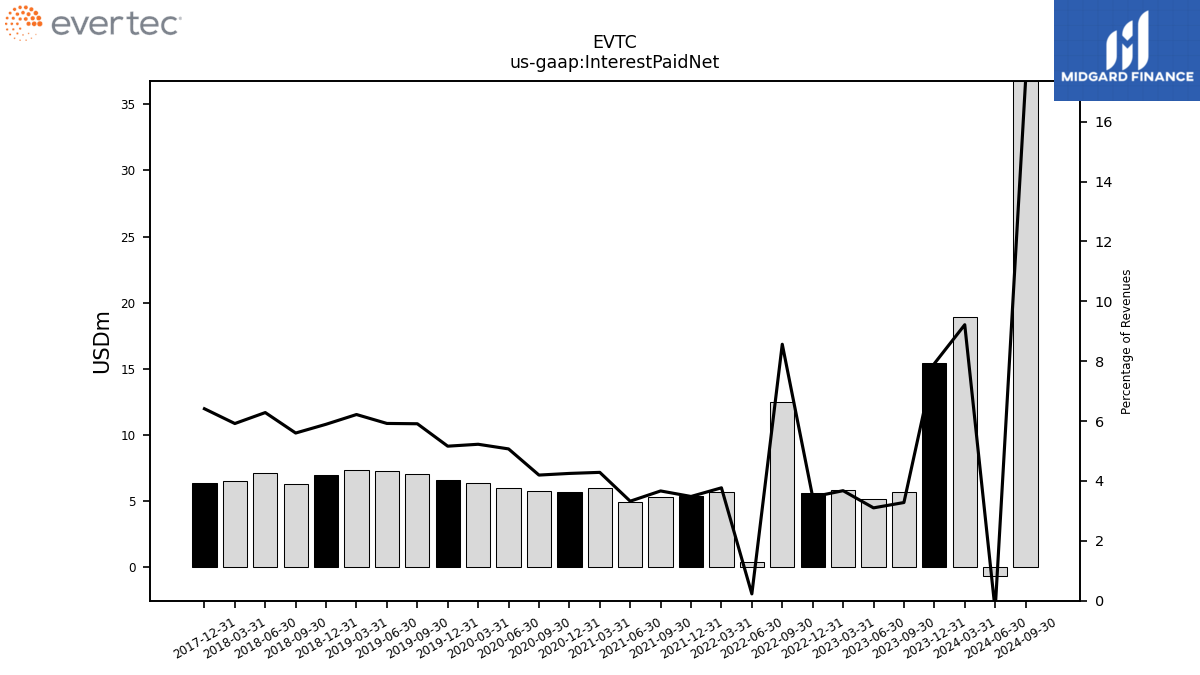
| Interest Paid Net | 18.92 | 15.41 | 5.68 | 5.18 | 5.87 | 5.61 | 12.49 | 0.37 | 5.67 | 5.41 | 5.35 | 4.96 | 5.98 | 5.71 | 5.73 | 5.98 | 6.37 | 6.57 | 7.02 | 7.26 | 7.39 | 6.97 | 6.27 | 7.12 | 6.53 | 6.39 | NA | NA | NA | NA | NA | NA | NA | NA | NA | NA | NA | NA | NA | NA | NA | NA | NA | NA | NA | NA | NA | NA | NA | |
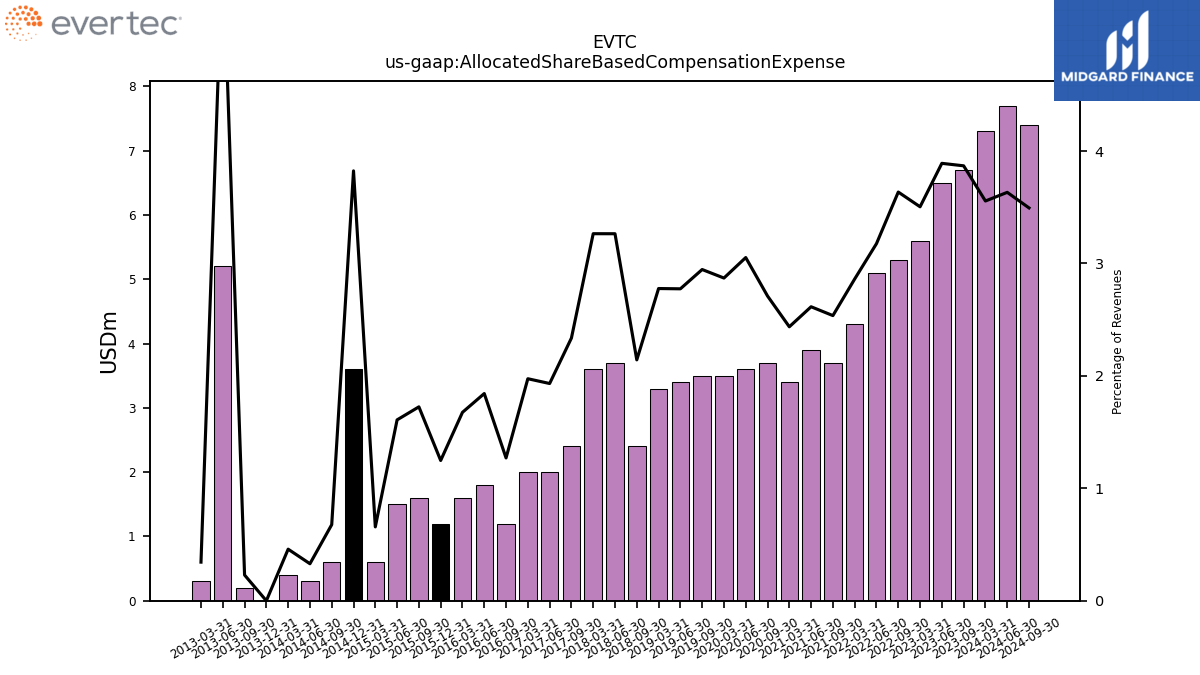
| Allocated Share Based Compensation Expense | 7.30 | NA | 6.70 | 6.50 | 5.60 | NA | 5.30 | 5.10 | 4.30 | NA | 3.70 | 3.90 | 3.40 | NA | 3.70 | 3.60 | 3.50 | NA | 3.50 | 3.40 | 3.30 | NA | 2.40 | 3.70 | 3.60 | NA | 2.40 | 2.00 | 2.00 | NA | 1.20 | 1.80 | 1.60 | 1.20 | 1.60 | 1.50 | 0.60 | 3.60 | 0.60 | 0.30 | 0.40 | 0.00 | 0.20 | 5.20 | 0.30 | NA | NA | NA | NA | |
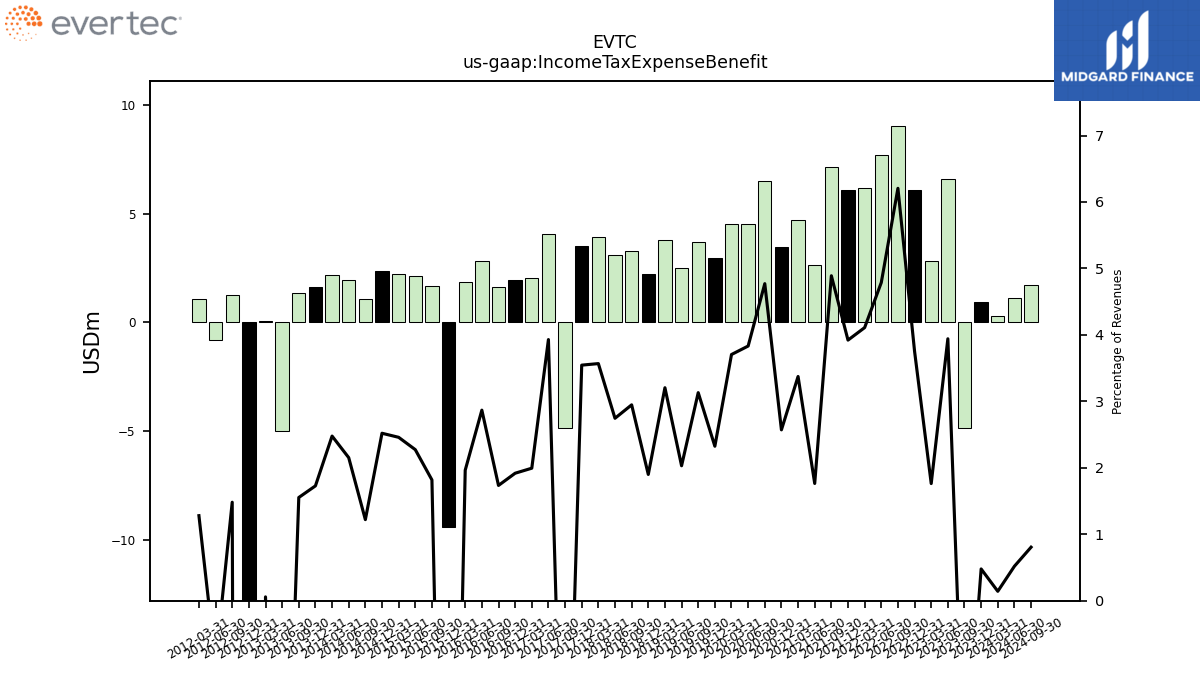
| Income Tax Expense Benefit | 0.29 | 0.93 | -4.86 | 6.59 | 2.82 | 6.07 | 9.05 | 7.69 | 6.17 | 6.09 | 7.13 | 2.63 | 4.71 | 3.45 | 6.51 | 4.52 | 4.52 | 2.96 | 3.72 | 2.49 | 3.81 | 2.25 | 3.30 | 3.11 | 3.94 | 3.53 | -4.84 | 4.07 | 2.02 | 1.96 | 1.64 | 2.80 | 1.88 | -9.39 | 1.69 | 2.12 | 2.25 | 2.37 | 1.08 | 1.96 | 2.16 | 1.61 | 1.36 | -5.01 | 0.05 | -61.16 | 1.24 | -0.80 | 1.06 | |
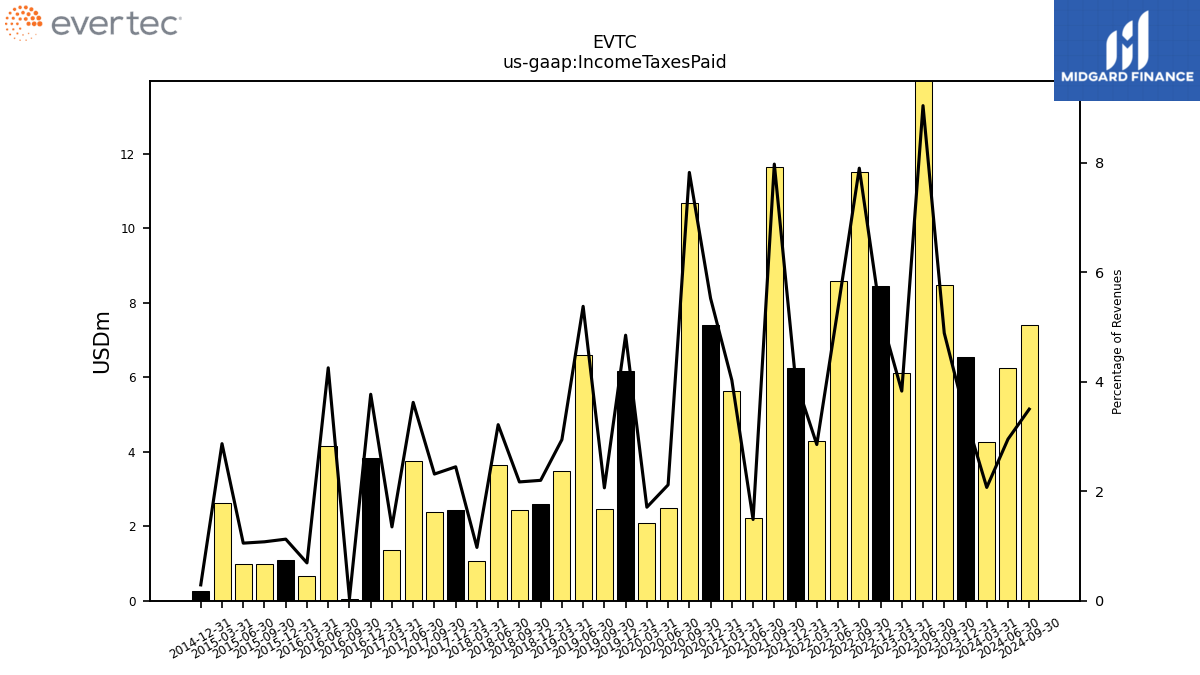
| Income Taxes Paid | 4.25 | 6.55 | 8.47 | 15.11 | 6.12 | 8.44 | 11.52 | 8.58 | 4.29 | 6.26 | 11.63 | 2.21 | 5.62 | 7.41 | 10.68 | 2.50 | 2.08 | 6.17 | 2.45 | 6.59 | 3.50 | 2.60 | 2.43 | 3.65 | 1.07 | 2.44 | 2.38 | 3.75 | 1.37 | 3.84 | 0.04 | 4.16 | 0.66 | 1.08 | 1.00 | 0.98 | 2.62 | 0.27 | NA | NA | NA | NA | NA | NA | NA | NA | NA | NA | NA | |
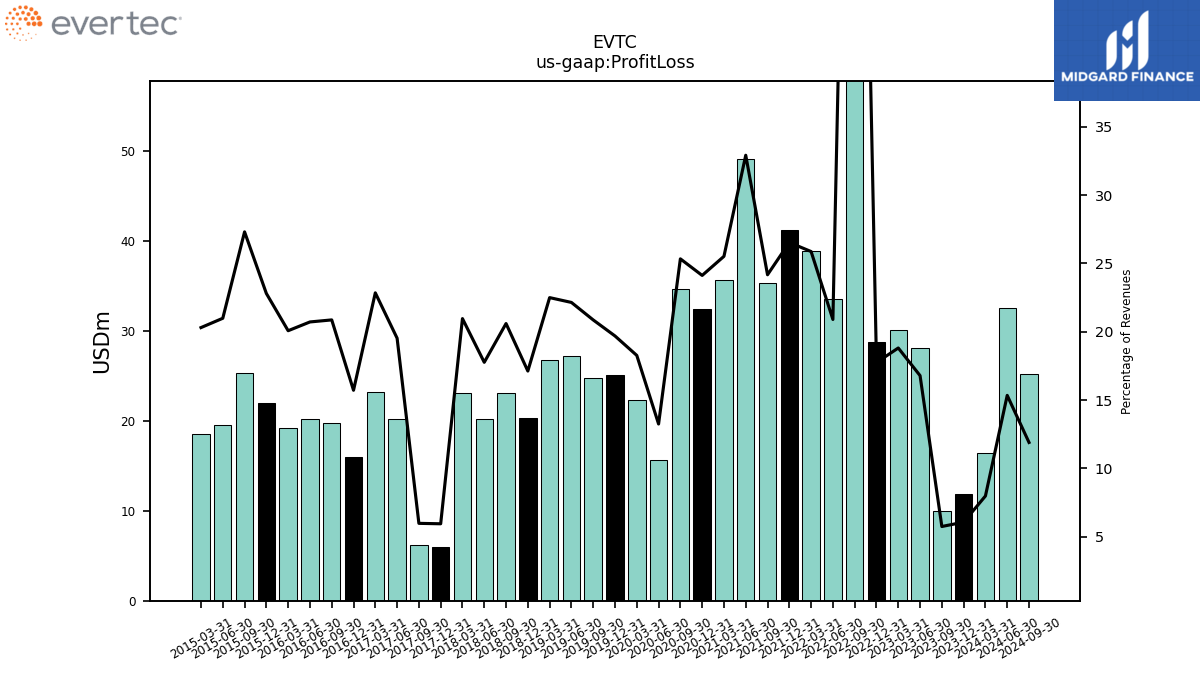
| Profit Loss | 16.39 | 11.81 | 9.96 | 28.05 | 30.06 | 28.71 | 137.74 | 33.56 | 38.87 | 41.19 | 35.26 | 49.09 | 35.60 | 32.37 | 34.58 | 15.62 | 22.27 | 25.04 | 24.79 | 27.14 | 26.73 | 20.25 | 23.07 | 20.13 | 23.11 | 5.92 | 6.14 | 20.21 | 23.14 | 16.01 | 19.71 | 20.23 | 19.17 | 21.93 | 25.34 | 19.57 | 18.54 | NA | NA | NA | NA | NA | NA | NA | NA | NA | NA | NA | NA | |
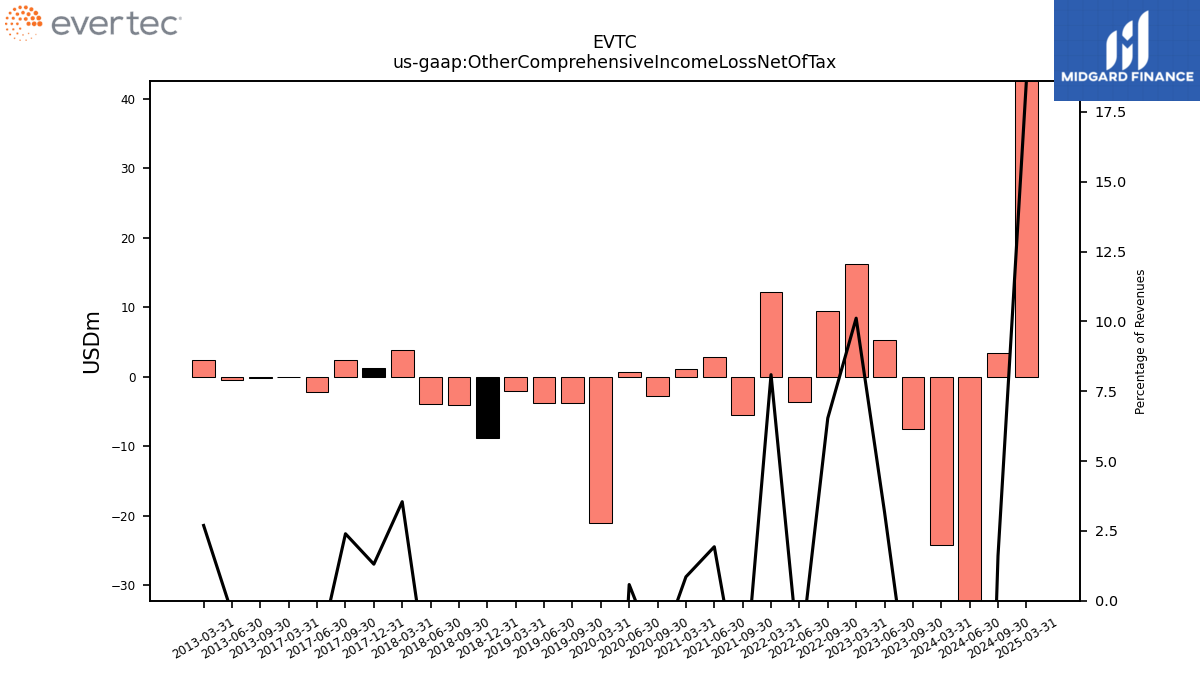
| Other Comprehensive Income Loss Net Of Tax | -24.15 | NA | -7.46 | 5.31 | 16.16 | NA | 9.53 | -3.62 | 12.16 | NA | -5.48 | 2.88 | 1.20 | NA | -2.73 | 0.68 | -21.02 | NA | -3.79 | -3.72 | -2.09 | -8.82 | -4.11 | -3.92 | 3.91 | 1.30 | 2.46 | -2.20 | -0.03 | NA | NA | NA | NA | NA | NA | NA | NA | NA | NA | NA | NA | NA | -0.21 | -0.39 | 2.35 | NA | NA | NA | NA | |
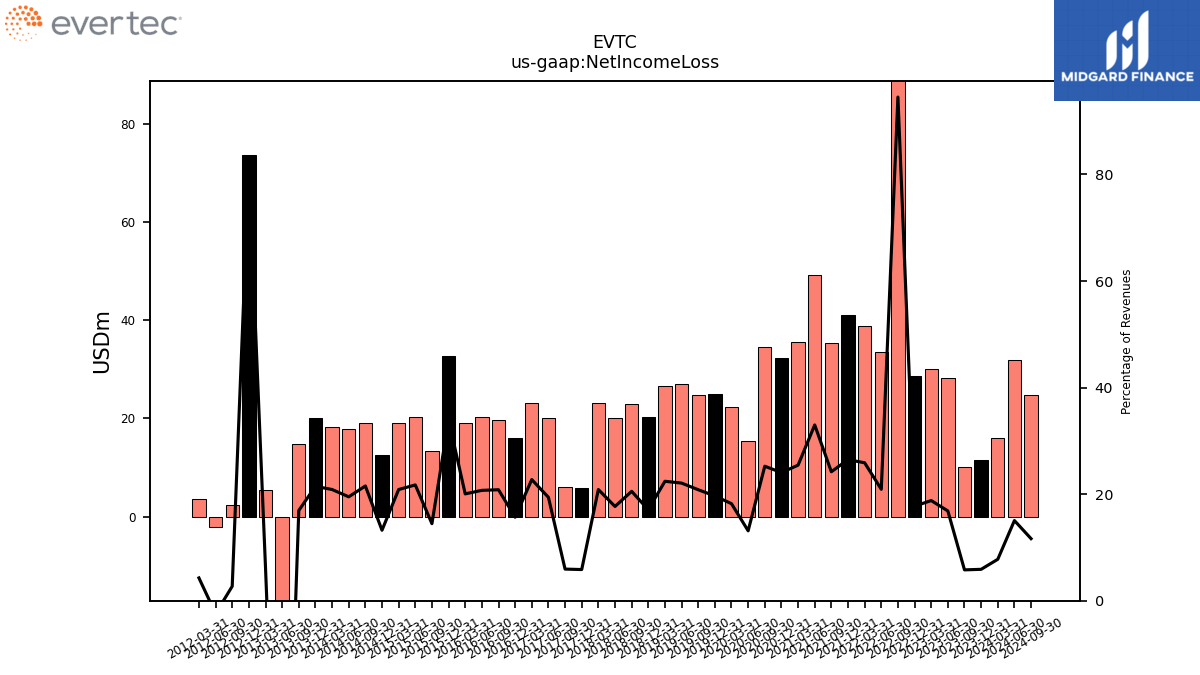
| Net Income Loss | 15.98 | 11.48 | 10.04 | 28.16 | 30.05 | 28.71 | 137.81 | 33.59 | 38.90 | 41.12 | 35.31 | 49.20 | 35.50 | 32.28 | 34.46 | 15.48 | 22.21 | 25.01 | 24.75 | 27.06 | 26.64 | 20.20 | 23.00 | 20.05 | 23.02 | 5.83 | 6.10 | 20.09 | 23.03 | 15.97 | 19.68 | 20.23 | 19.15 | 32.62 | 13.42 | 20.27 | 19.06 | 12.46 | 19.09 | 17.77 | 18.21 | 20.04 | 14.80 | -64.94 | 5.47 | 73.59 | 2.28 | -2.03 | 3.53 | |
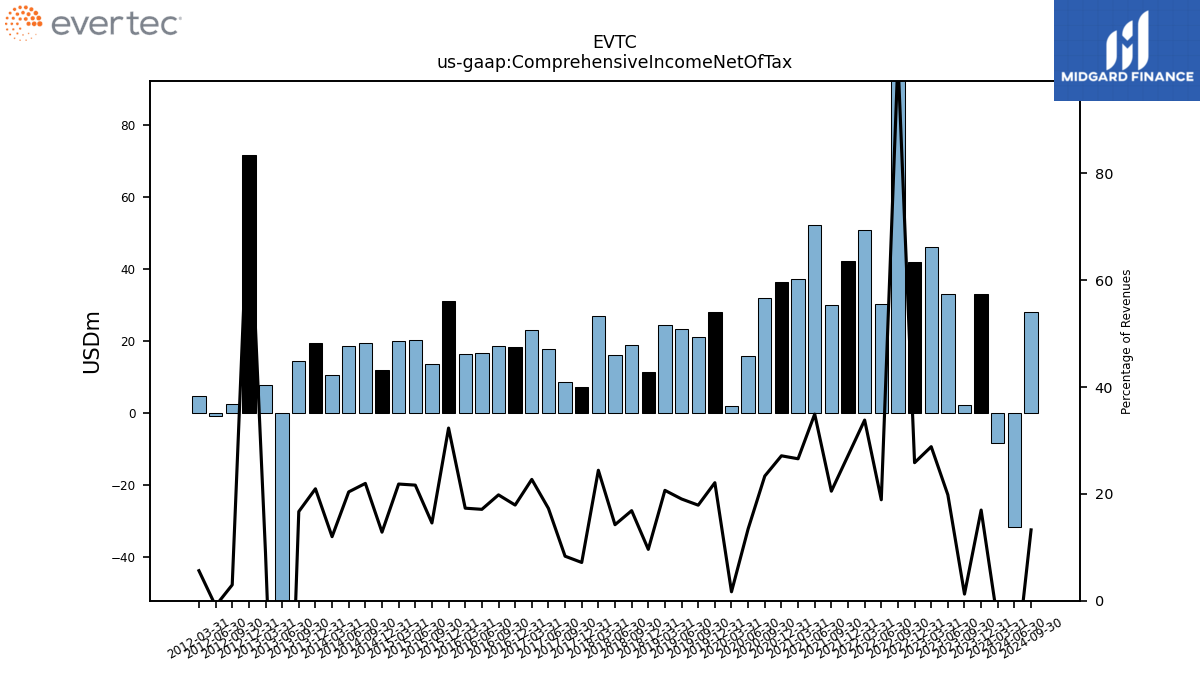
| Comprehensive Income Net Of Tax | -8.15 | 33.04 | 2.16 | 33.12 | 46.09 | 41.81 | 147.68 | 30.35 | 50.81 | 42.16 | 29.92 | 52.11 | 37.08 | 36.41 | 31.86 | 15.87 | 2.05 | 28.10 | 21.26 | 23.34 | 24.55 | 11.37 | 18.89 | 16.13 | 26.93 | 7.14 | 8.57 | 17.89 | 23.00 | 18.25 | 18.72 | 16.71 | 16.54 | 31.09 | 13.51 | 20.18 | 19.95 | 12.09 | 19.47 | 18.57 | 10.46 | 19.56 | 14.59 | -65.33 | 7.83 | 71.51 | 2.49 | -0.80 | 4.64 | |
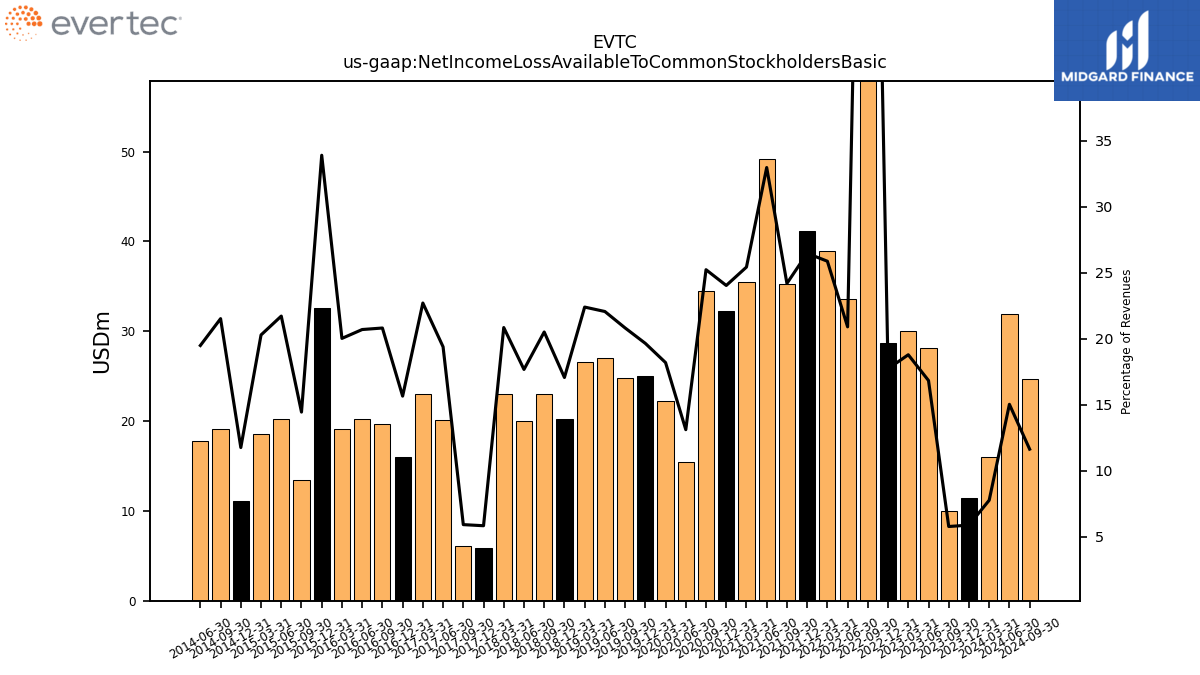
| Net Income Loss Available To Common Stockholders Basic | 15.98 | 11.48 | 10.04 | 28.16 | 30.05 | 28.71 | 137.81 | 33.59 | 38.90 | 41.12 | 35.31 | 49.20 | 35.50 | 32.28 | 34.46 | 15.48 | 22.20 | 25.01 | 24.75 | 27.06 | 26.64 | 20.20 | 23.00 | 20.05 | 23.01 | 5.83 | 6.10 | 20.09 | 23.01 | 15.97 | 19.68 | 20.23 | 19.14 | 32.62 | 13.42 | 20.26 | 18.54 | 11.09 | 19.09 | 17.77 | NA | NA | NA | NA | NA | NA | NA | NA | NA |
| 2024-03-31 | 2023-12-31 | 2023-09-30 | 2023-06-30 | 2023-03-31 | 2022-12-31 | 2022-09-30 | 2022-06-30 | 2022-03-31 | 2021-12-31 | 2021-09-30 | 2021-06-30 | 2021-03-31 | 2020-12-31 | 2020-09-30 | 2020-06-30 | 2020-03-31 | 2019-12-31 | 2019-09-30 | 2019-06-30 | 2019-03-31 | 2018-12-31 | 2018-09-30 | 2018-06-30 | 2018-03-31 | 2017-12-31 | 2017-09-30 | 2017-06-30 | 2017-03-31 | 2016-12-31 | 2016-09-30 | 2016-06-30 | 2016-03-31 | 2015-12-31 | 2015-09-30 | 2015-06-30 | 2015-03-31 | 2014-12-31 | 2014-09-30 | 2014-06-30 | 2014-03-31 | 2013-12-31 | 2013-09-30 | 2013-06-30 | 2013-03-31 | 2012-12-31 | 2012-09-30 | 2012-06-30 | 2012-03-31 | ||
|---|---|---|---|---|---|---|---|---|---|---|---|---|---|---|---|---|---|---|---|---|---|---|---|---|---|---|---|---|---|---|---|---|---|---|---|---|---|---|---|---|---|---|---|---|---|---|---|---|---|---|
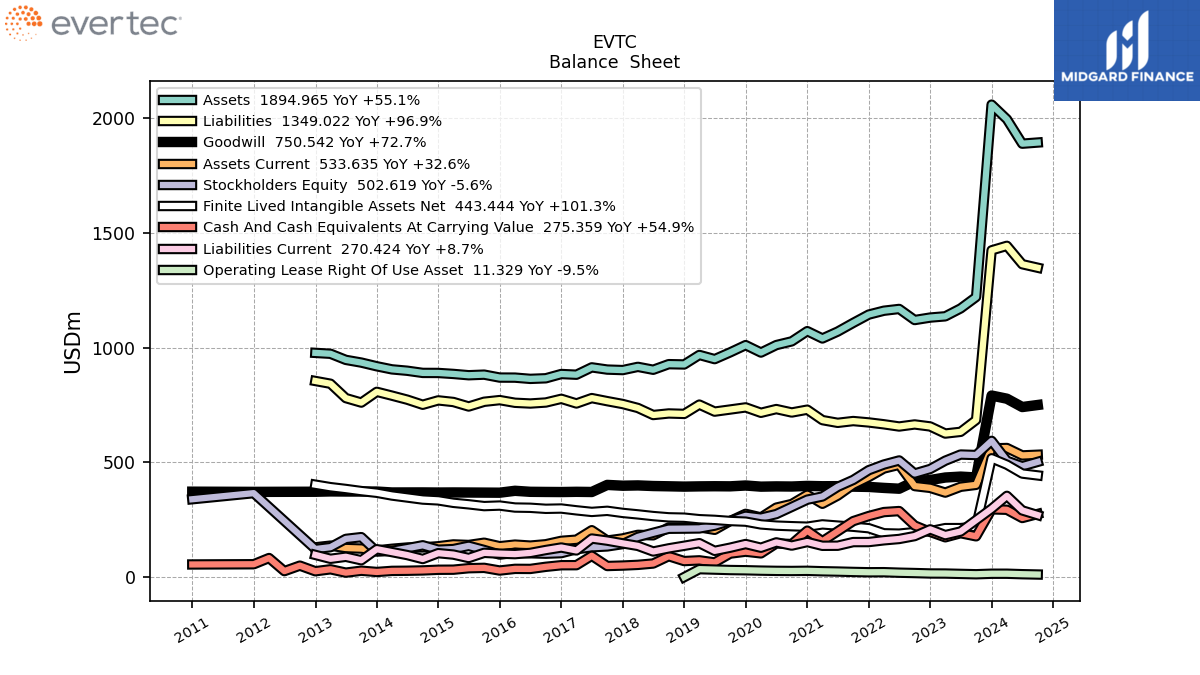
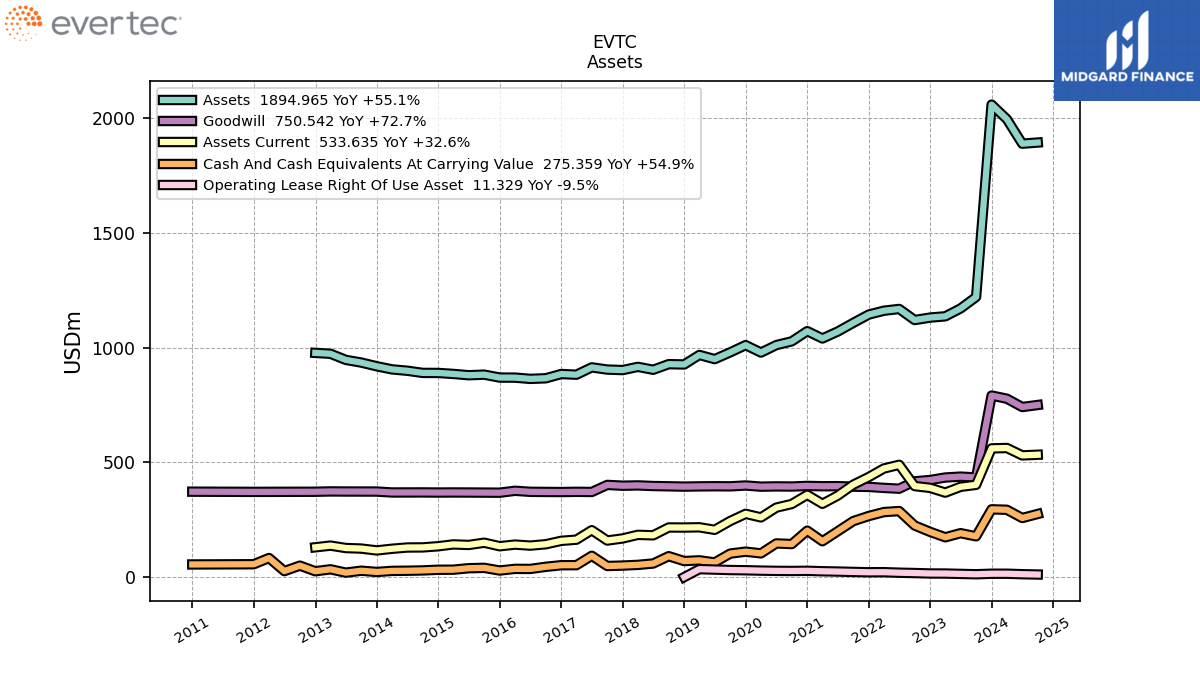
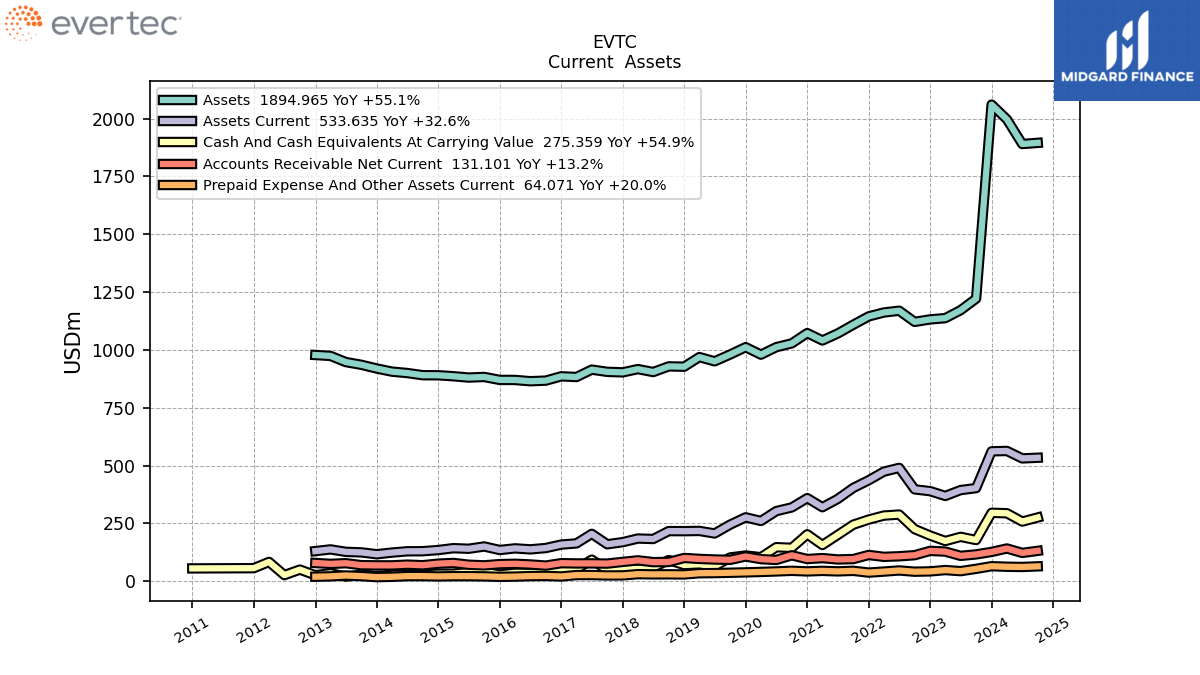
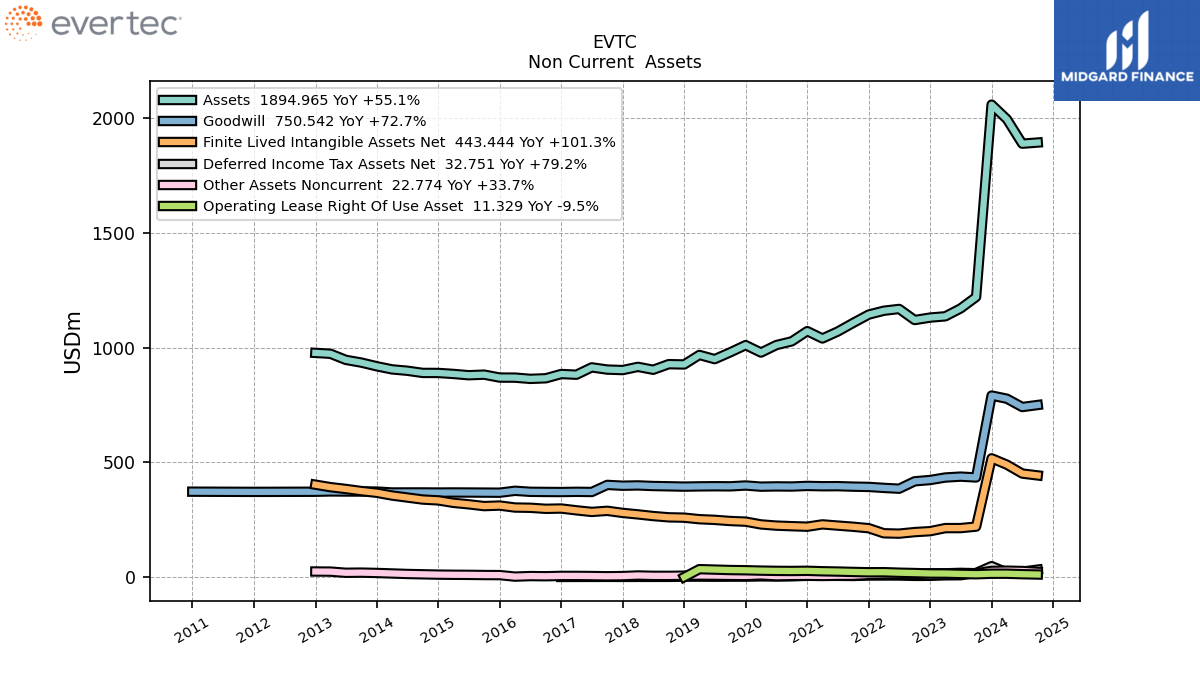
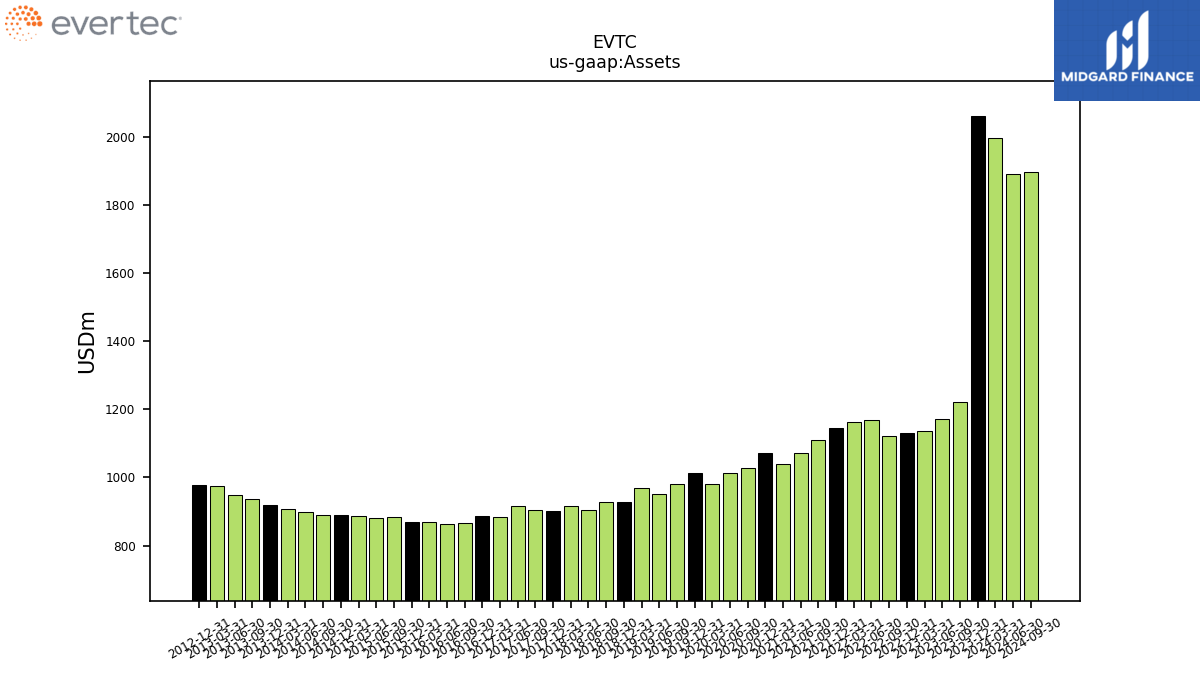
| Assets | 1996.49 | 2060.26 | 1221.46 | 1171.63 | 1137.19 | 1131.74 | 1120.97 | 1169.34 | 1161.57 | 1144.76 | 1108.49 | 1070.78 | 1040.65 | 1072.58 | 1028.07 | 1011.74 | 979.22 | 1011.68 | 980.07 | 950.49 | 968.78 | 927.29 | 928.60 | 904.17 | 916.83 | 902.79 | 904.97 | 914.63 | 882.56 | 885.66 | 867.04 | 864.45 | 869.88 | 870.10 | 882.90 | 880.29 | 885.98 | 890.24 | 890.44 | 899.88 | 905.88 | 919.35 | 935.48 | 947.28 | 973.88 | 977.75 | NA | NA | NA | |
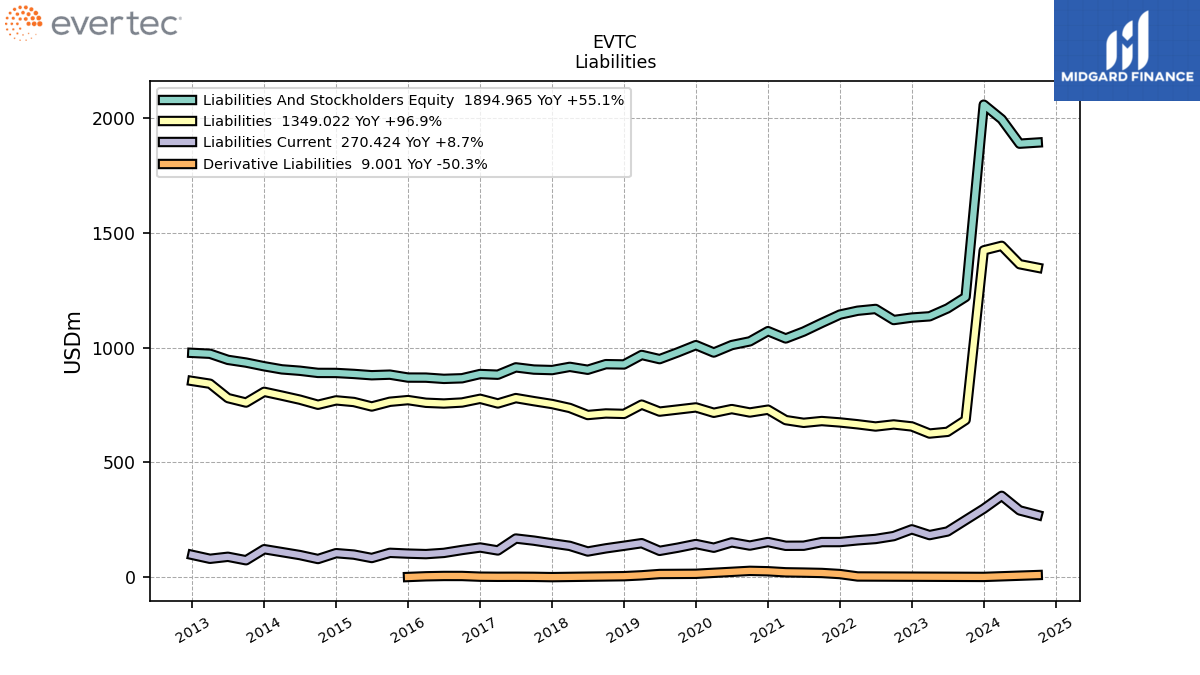
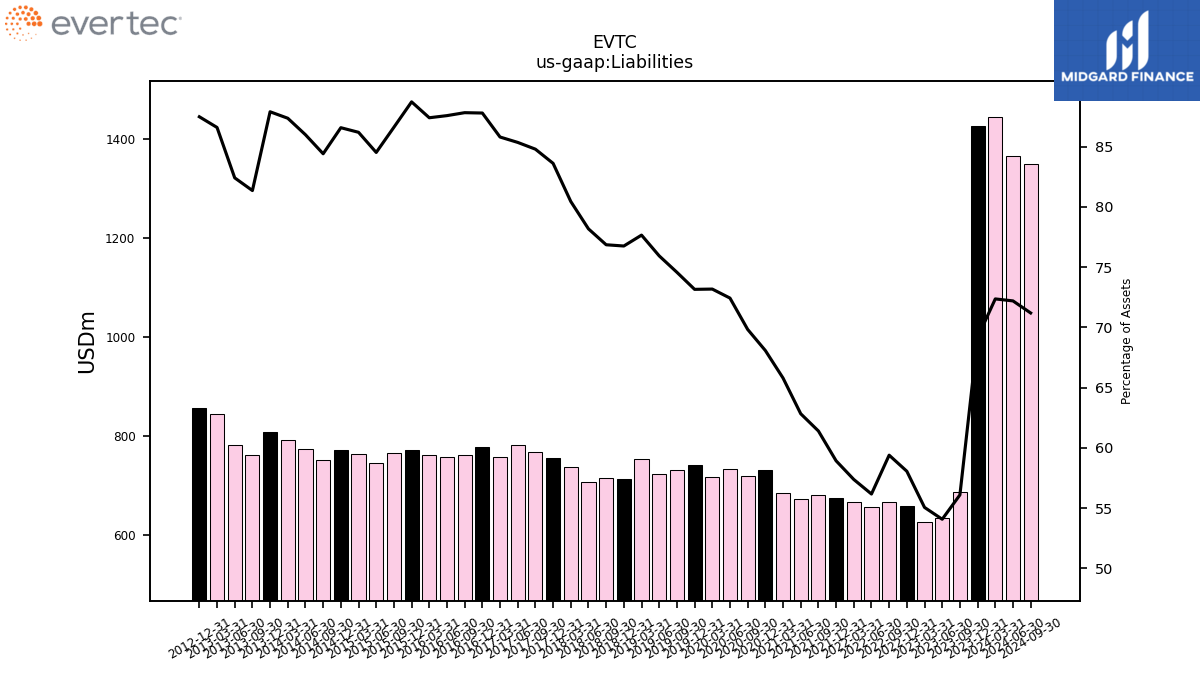
| Liabilities | 1444.59 | 1424.89 | 685.11 | 633.49 | 626.05 | 657.00 | 665.71 | 656.74 | 666.42 | 674.49 | 680.56 | 672.74 | 684.64 | 730.15 | 717.87 | 732.77 | 716.53 | 740.05 | 730.81 | 721.69 | 752.28 | 711.69 | 713.65 | 706.81 | 737.54 | 754.81 | 767.29 | 780.61 | 757.19 | 777.49 | 761.39 | 757.01 | 760.22 | 771.89 | 764.64 | 743.98 | 763.59 | 770.66 | 751.58 | 773.75 | 791.32 | 808.02 | 761.02 | 780.60 | 843.27 | 855.29 | NA | NA | NA | |
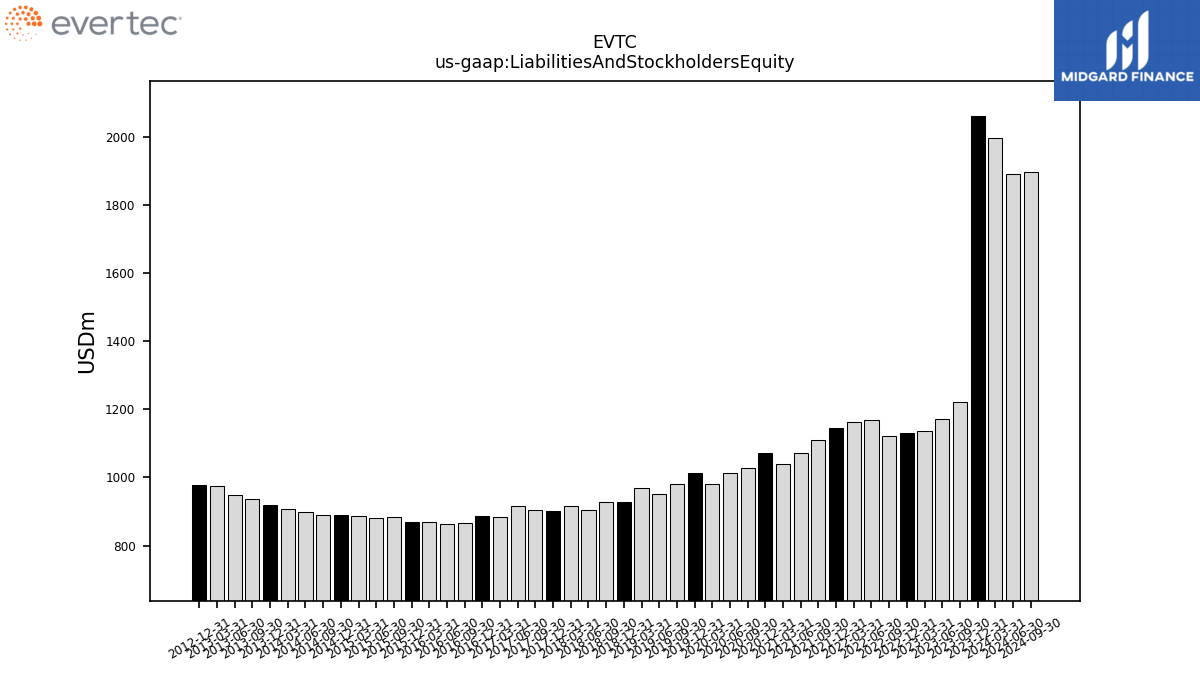
| Liabilities And Stockholders Equity | 1996.49 | 2060.26 | 1221.46 | 1171.63 | 1137.19 | 1131.74 | 1120.97 | 1169.34 | 1161.57 | 1144.76 | 1108.49 | 1070.78 | 1040.65 | 1072.58 | 1028.07 | 1011.74 | 979.22 | 1011.68 | 980.07 | 950.49 | 968.78 | 927.29 | 928.60 | 904.17 | 916.83 | 902.79 | 904.97 | 914.63 | 882.56 | 885.66 | 867.04 | 864.45 | 869.88 | 870.10 | 882.90 | 880.29 | 885.98 | 890.24 | 890.44 | 899.88 | 905.88 | 919.35 | 935.48 | 947.28 | 973.88 | 977.75 | NA | NA | NA | |
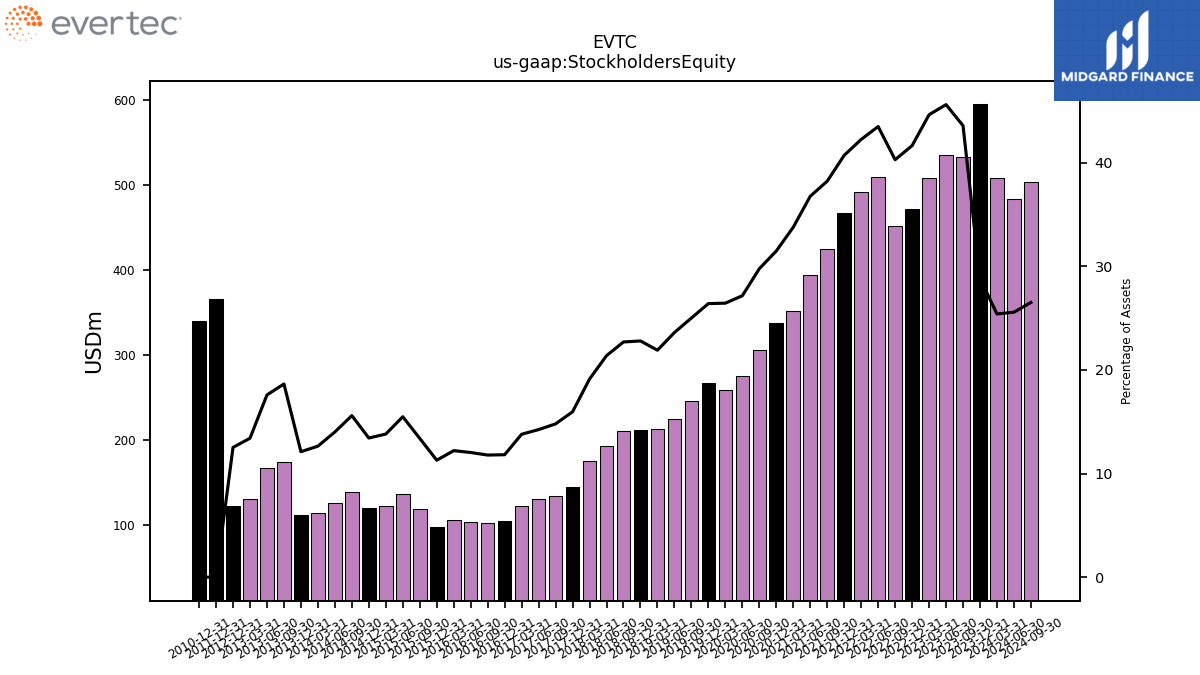
| Stockholders Equity | 507.26 | 594.29 | 532.41 | 534.53 | 507.77 | 471.51 | 451.81 | 508.75 | 490.88 | 466.21 | 423.79 | 393.77 | 351.60 | 337.74 | 306.14 | 274.88 | 259.04 | 267.19 | 245.20 | 224.48 | 212.26 | 211.46 | 210.85 | 193.34 | 175.34 | 144.11 | 133.91 | 130.28 | 121.76 | 104.68 | 102.19 | 104.02 | 106.23 | 98.21 | 118.25 | 136.32 | 122.39 | 119.57 | 138.86 | 126.13 | 114.57 | 111.33 | 174.46 | 166.68 | 130.61 | 122.45 | NA | NA | NA |
| 2024-03-31 | 2023-12-31 | 2023-09-30 | 2023-06-30 | 2023-03-31 | 2022-12-31 | 2022-09-30 | 2022-06-30 | 2022-03-31 | 2021-12-31 | 2021-09-30 | 2021-06-30 | 2021-03-31 | 2020-12-31 | 2020-09-30 | 2020-06-30 | 2020-03-31 | 2019-12-31 | 2019-09-30 | 2019-06-30 | 2019-03-31 | 2018-12-31 | 2018-09-30 | 2018-06-30 | 2018-03-31 | 2017-12-31 | 2017-09-30 | 2017-06-30 | 2017-03-31 | 2016-12-31 | 2016-09-30 | 2016-06-30 | 2016-03-31 | 2015-12-31 | 2015-09-30 | 2015-06-30 | 2015-03-31 | 2014-12-31 | 2014-09-30 | 2014-06-30 | 2014-03-31 | 2013-12-31 | 2013-09-30 | 2013-06-30 | 2013-03-31 | 2012-12-31 | 2012-09-30 | 2012-06-30 | 2012-03-31 | ||
|---|---|---|---|---|---|---|---|---|---|---|---|---|---|---|---|---|---|---|---|---|---|---|---|---|---|---|---|---|---|---|---|---|---|---|---|---|---|---|---|---|---|---|---|---|---|---|---|---|---|---|
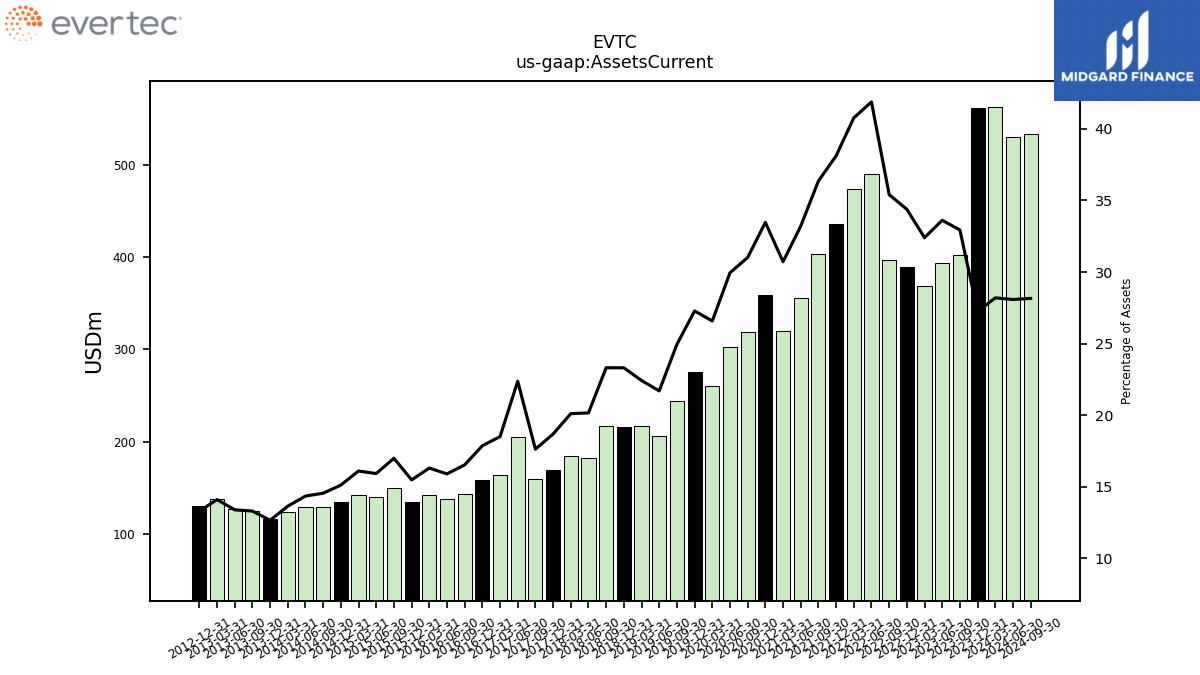
| Assets Current | 563.00 | 561.35 | 402.35 | 393.89 | 368.50 | 389.13 | 396.96 | 489.79 | 473.58 | 436.35 | 403.07 | 355.54 | 319.73 | 359.05 | 318.88 | 303.01 | 260.31 | 276.02 | 244.53 | 206.24 | 217.26 | 216.19 | 216.53 | 182.30 | 184.37 | 168.71 | 159.53 | 204.66 | 163.32 | 158.26 | 143.34 | 137.47 | 141.86 | 134.72 | 150.03 | 140.19 | 142.66 | 134.61 | 129.58 | 129.16 | 123.63 | 116.41 | 124.49 | 126.86 | 137.38 | 129.97 | NA | NA | NA | |
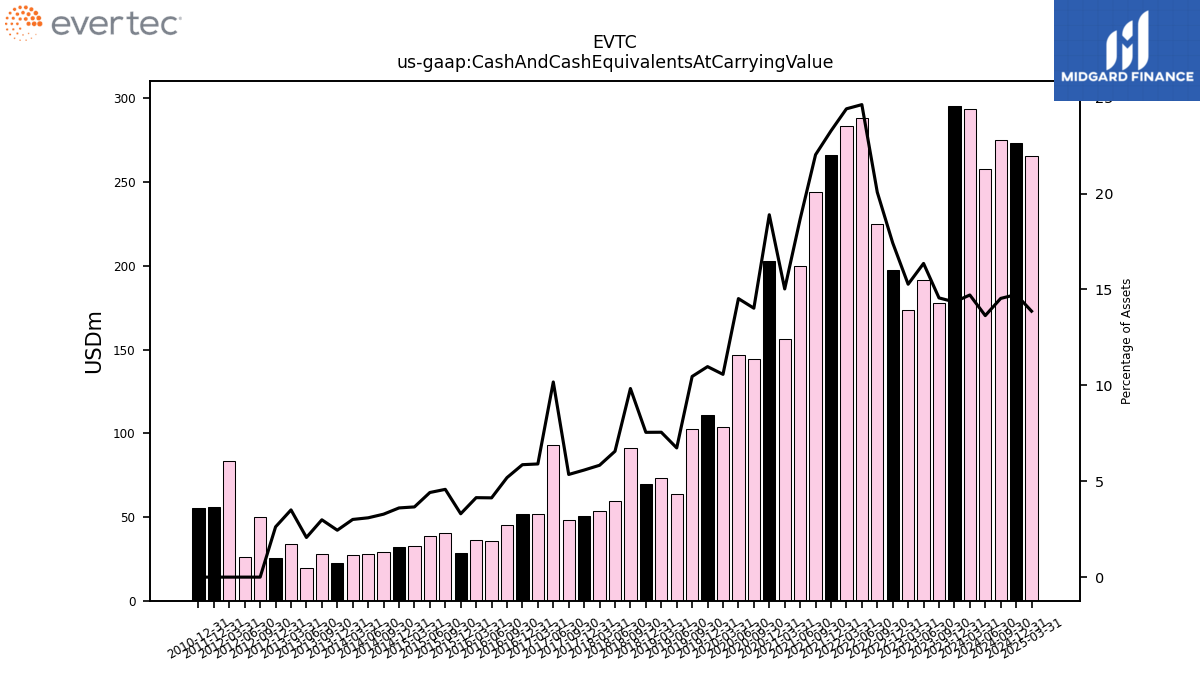
| Cash And Cash Equivalents At Carrying Value | 293.67 | 295.60 | 177.82 | 191.62 | 173.66 | 197.23 | 224.97 | 288.06 | 283.61 | 266.35 | 244.13 | 199.89 | 156.36 | 202.65 | 144.15 | 146.92 | 103.52 | 111.03 | 102.53 | 64.03 | 73.18 | 70.00 | 91.31 | 59.33 | 53.47 | 50.40 | 48.44 | 93.06 | 52.07 | 51.92 | 44.98 | 35.73 | 36.04 | 28.75 | 40.40 | 38.84 | 32.43 | 32.11 | 29.23 | 27.83 | 27.24 | 22.48 | 27.96 | 19.59 | 34.13 | 25.63 | 50.11 | 26.16 | 83.29 | |
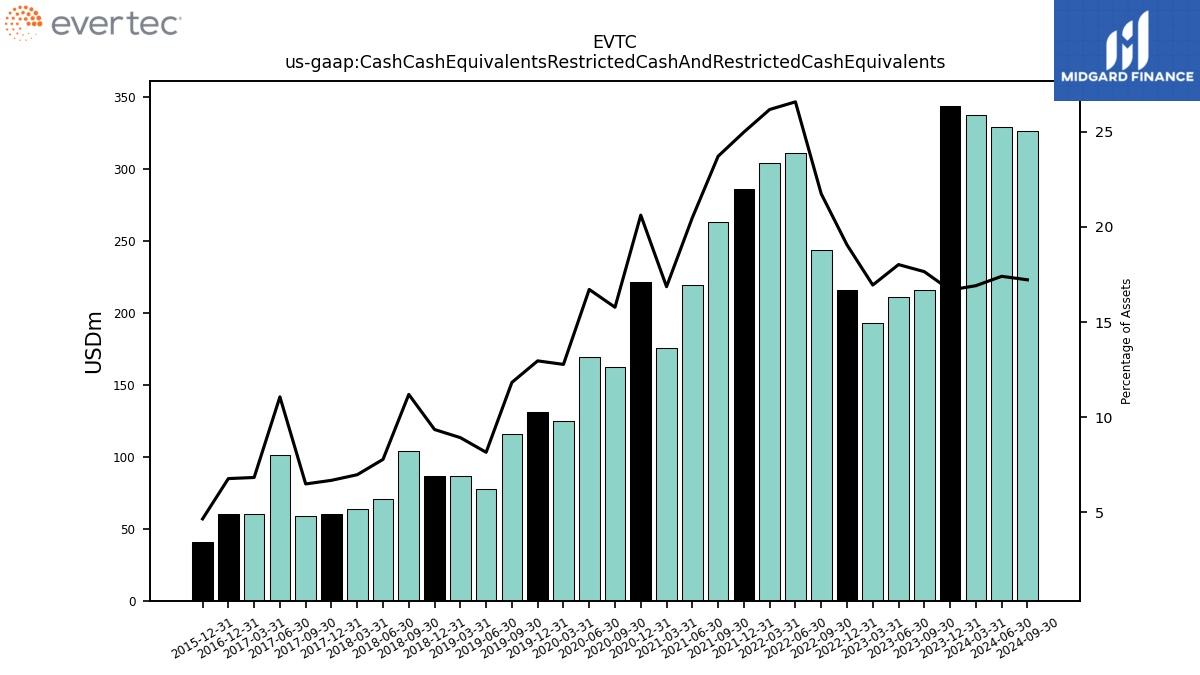
| Cash Cash Equivalents Restricted Cash And Restricted Cash Equivalents | 337.59 | 343.72 | 215.55 | 211.10 | 192.68 | 215.66 | 243.68 | 310.64 | 303.90 | 285.92 | 262.79 | 219.30 | 175.42 | 221.10 | 162.20 | 169.09 | 125.10 | 131.12 | 115.93 | 77.55 | 86.50 | 86.75 | 104.00 | 70.41 | 64.01 | 60.37 | 58.79 | 101.25 | 60.33 | 60.03 | NA | NA | NA | 40.56 | NA | NA | NA | NA | NA | NA | NA | NA | NA | NA | NA | NA | NA | NA | NA | |
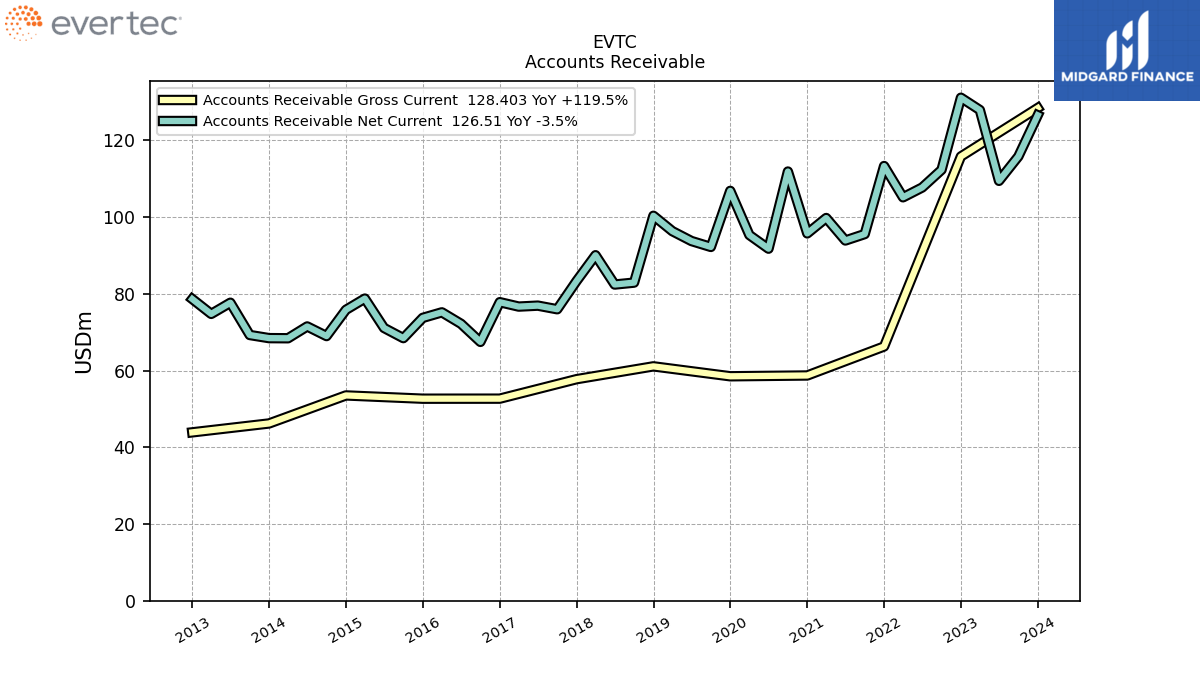
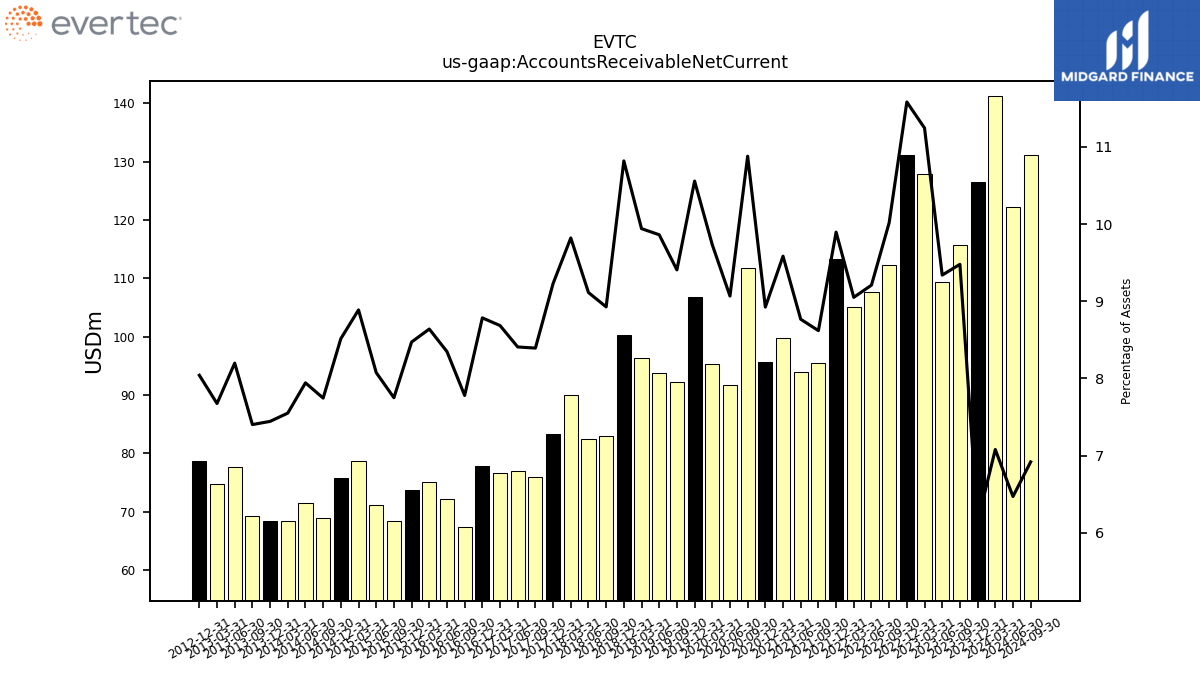
| Accounts Receivable Net Current | 141.33 | 126.51 | 115.78 | 109.42 | 127.88 | 131.08 | 112.29 | 107.69 | 105.13 | 113.28 | 95.55 | 93.88 | 99.74 | 95.73 | 111.85 | 91.74 | 95.31 | 106.81 | 92.19 | 93.73 | 96.31 | 100.32 | 82.90 | 82.40 | 90.04 | 83.33 | 75.96 | 76.90 | 76.66 | 77.80 | 67.45 | 72.16 | 75.16 | 73.72 | 68.43 | 71.09 | 78.75 | 75.81 | 68.97 | 71.48 | 68.40 | 68.43 | 69.25 | 77.66 | 74.75 | 78.62 | NA | NA | NA | |
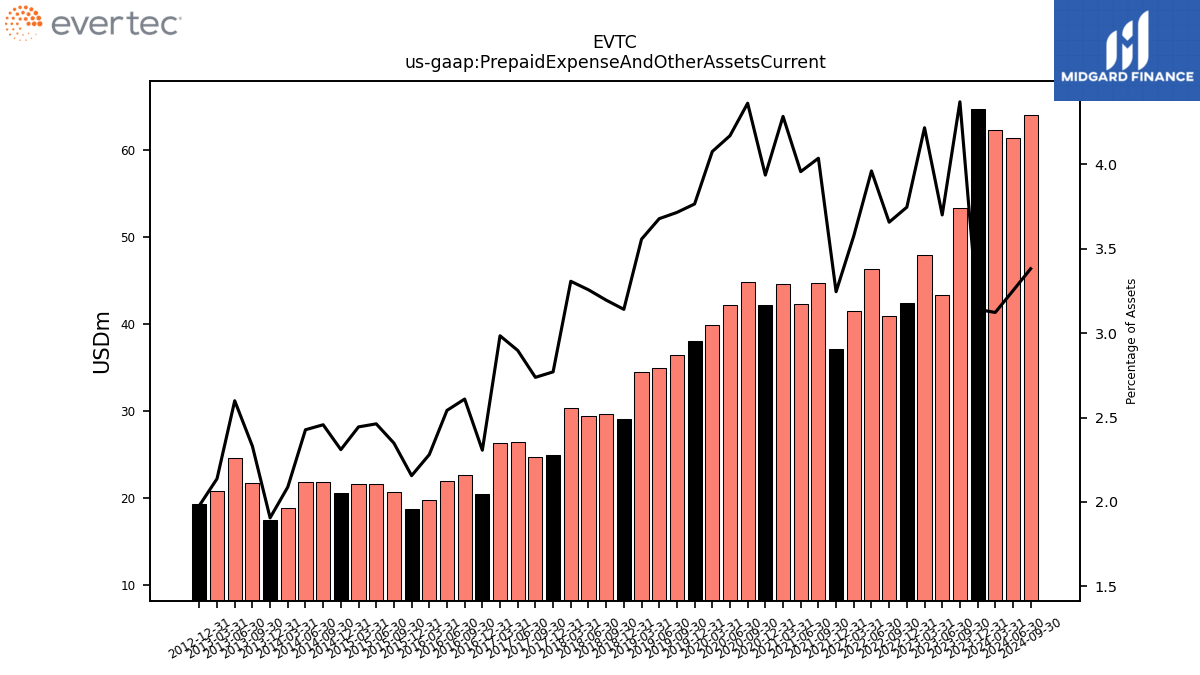
| Prepaid Expense And Other Assets Current | 62.34 | 64.70 | 53.37 | 43.35 | 47.94 | 42.39 | 40.99 | 46.31 | 41.53 | 37.15 | 44.73 | 42.36 | 44.57 | 42.21 | 44.84 | 42.18 | 39.90 | 38.09 | 36.41 | 34.95 | 34.45 | 29.12 | 29.67 | 29.44 | 30.32 | 25.01 | 24.78 | 26.50 | 26.34 | 20.43 | 22.62 | 21.98 | 19.84 | 18.76 | 20.74 | 21.68 | 21.66 | 20.57 | 21.88 | 21.85 | 18.92 | 17.52 | 21.80 | 24.62 | 20.82 | 19.34 | NA | NA | NA |
| 2024-03-31 | 2023-12-31 | 2023-09-30 | 2023-06-30 | 2023-03-31 | 2022-12-31 | 2022-09-30 | 2022-06-30 | 2022-03-31 | 2021-12-31 | 2021-09-30 | 2021-06-30 | 2021-03-31 | 2020-12-31 | 2020-09-30 | 2020-06-30 | 2020-03-31 | 2019-12-31 | 2019-09-30 | 2019-06-30 | 2019-03-31 | 2018-12-31 | 2018-09-30 | 2018-06-30 | 2018-03-31 | 2017-12-31 | 2017-09-30 | 2017-06-30 | 2017-03-31 | 2016-12-31 | 2016-09-30 | 2016-06-30 | 2016-03-31 | 2015-12-31 | 2015-09-30 | 2015-06-30 | 2015-03-31 | 2014-12-31 | 2014-09-30 | 2014-06-30 | 2014-03-31 | 2013-12-31 | 2013-09-30 | 2013-06-30 | 2013-03-31 | 2012-12-31 | 2012-09-30 | 2012-06-30 | 2012-03-31 | ||
|---|---|---|---|---|---|---|---|---|---|---|---|---|---|---|---|---|---|---|---|---|---|---|---|---|---|---|---|---|---|---|---|---|---|---|---|---|---|---|---|---|---|---|---|---|---|---|---|---|---|---|
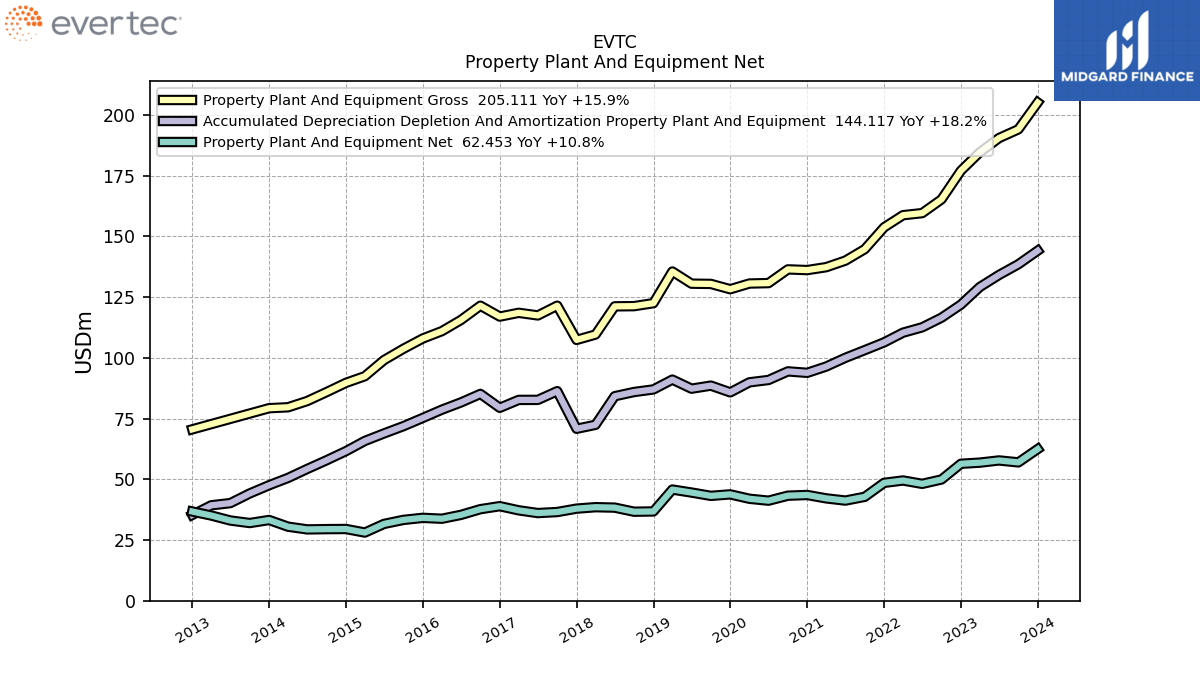
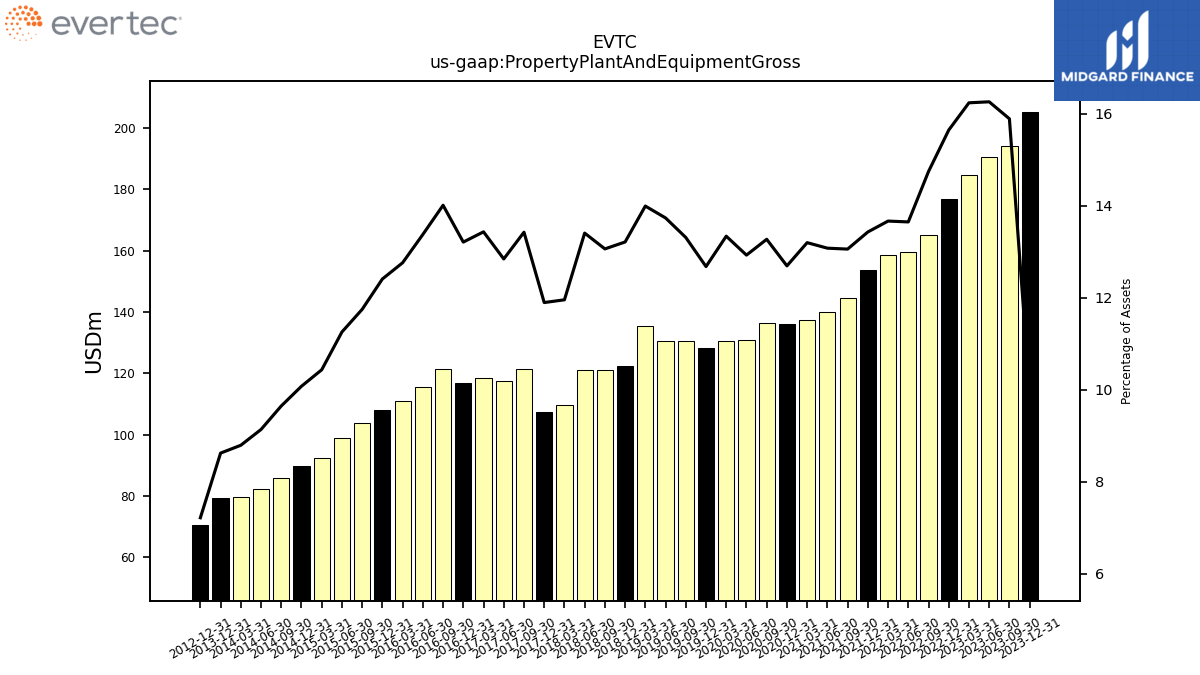
| Property Plant And Equipment Gross | 208.08 | 205.11 | 194.06 | 190.47 | 184.63 | 177.03 | 165.25 | 159.57 | 158.72 | 153.71 | 144.72 | 140.01 | 137.32 | 136.12 | 136.41 | 130.77 | 130.59 | 128.24 | 130.43 | 130.53 | 135.54 | 122.50 | 121.28 | 121.19 | 109.59 | 107.38 | 121.47 | 117.45 | 118.53 | 116.98 | 121.46 | 115.61 | 110.99 | 107.95 | 103.71 | 99.07 | 92.43 | 89.69 | 85.89 | 82.21 | 79.65 | 79.26 | NA | NA | NA | 70.56 | NA | NA | NA | |
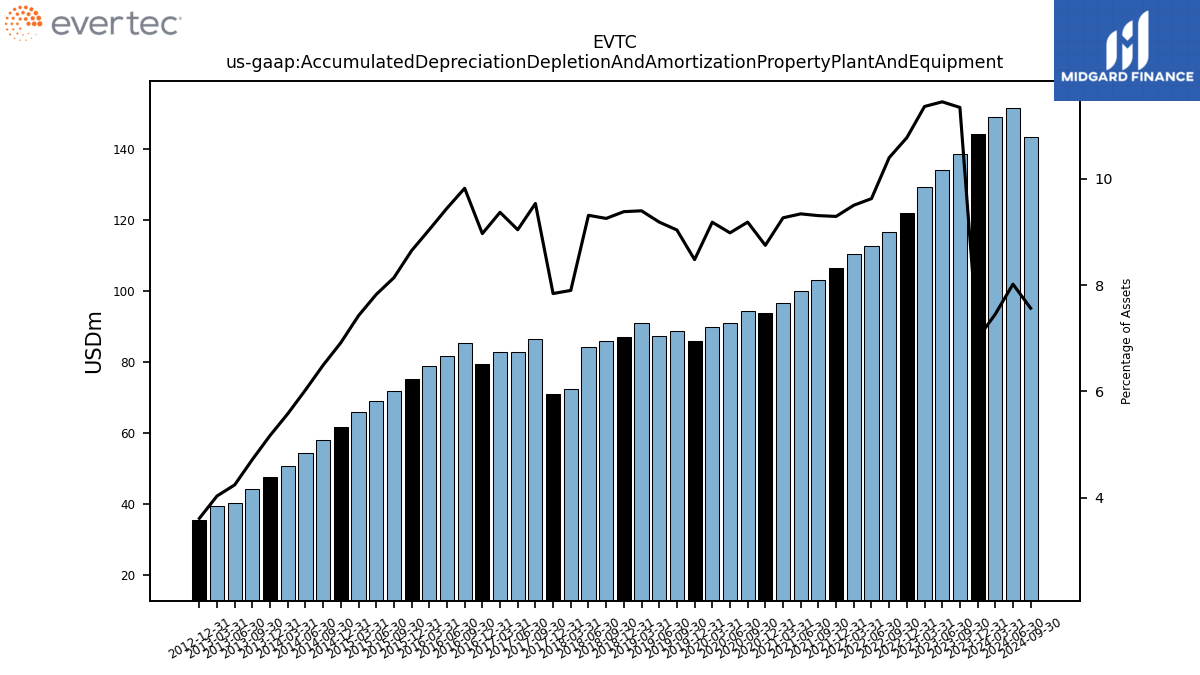
| Accumulated Depreciation Depletion And Amortization Property Plant And Equipment | 148.82 | 144.12 | 138.53 | 134.11 | 129.17 | 121.92 | 116.53 | 112.56 | 110.36 | 106.36 | 103.16 | 100.01 | 96.42 | 93.83 | 94.42 | 90.88 | 89.92 | 85.78 | 88.56 | 87.30 | 91.04 | 86.99 | 85.93 | 84.20 | 72.43 | 70.79 | 86.28 | 82.69 | 82.68 | 79.43 | 85.15 | 81.65 | 78.66 | 75.24 | 71.86 | 68.88 | 65.79 | 61.58 | 57.83 | 54.25 | 50.56 | 47.55 | 44.17 | 40.20 | 39.29 | 35.33 | NA | NA | NA | |
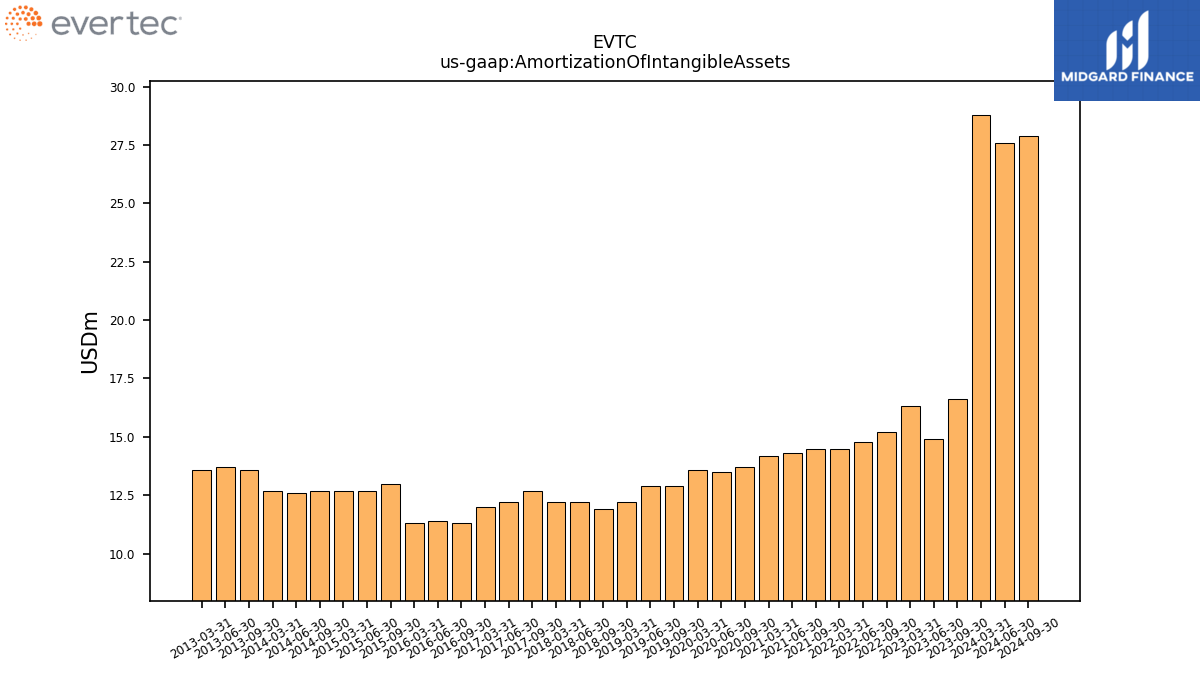
| Amortization Of Intangible Assets | 28.80 | NA | 16.60 | 14.90 | 16.30 | NA | 15.20 | 14.80 | 14.50 | NA | 14.50 | 14.30 | 14.20 | NA | 13.70 | 13.50 | 13.60 | NA | 12.90 | 12.90 | 12.20 | NA | 11.90 | 12.20 | 12.20 | NA | 12.70 | 12.20 | 12.00 | NA | 11.30 | 11.40 | 11.30 | NA | 13.00 | 12.70 | 12.70 | NA | 12.70 | 12.60 | 12.70 | NA | 13.60 | 13.70 | 13.60 | NA | NA | NA | NA | |
| Property Plant And Equipment Net | 60.78 | 62.45 | 56.96 | 57.76 | 56.86 | 56.39 | 49.93 | 48.12 | 49.51 | 48.53 | 42.78 | 41.24 | 42.15 | 43.54 | 43.26 | 41.20 | 41.98 | 43.79 | 43.18 | 44.54 | 45.78 | 36.76 | 36.66 | 38.34 | 38.52 | 37.92 | 36.52 | 36.09 | 37.22 | 38.93 | 37.70 | 35.36 | 33.76 | 34.13 | 33.28 | 31.63 | 28.08 | 29.54 | 29.48 | 29.37 | 30.49 | 33.24 | 31.99 | 33.03 | 35.09 | 36.74 | NA | NA | NA | |
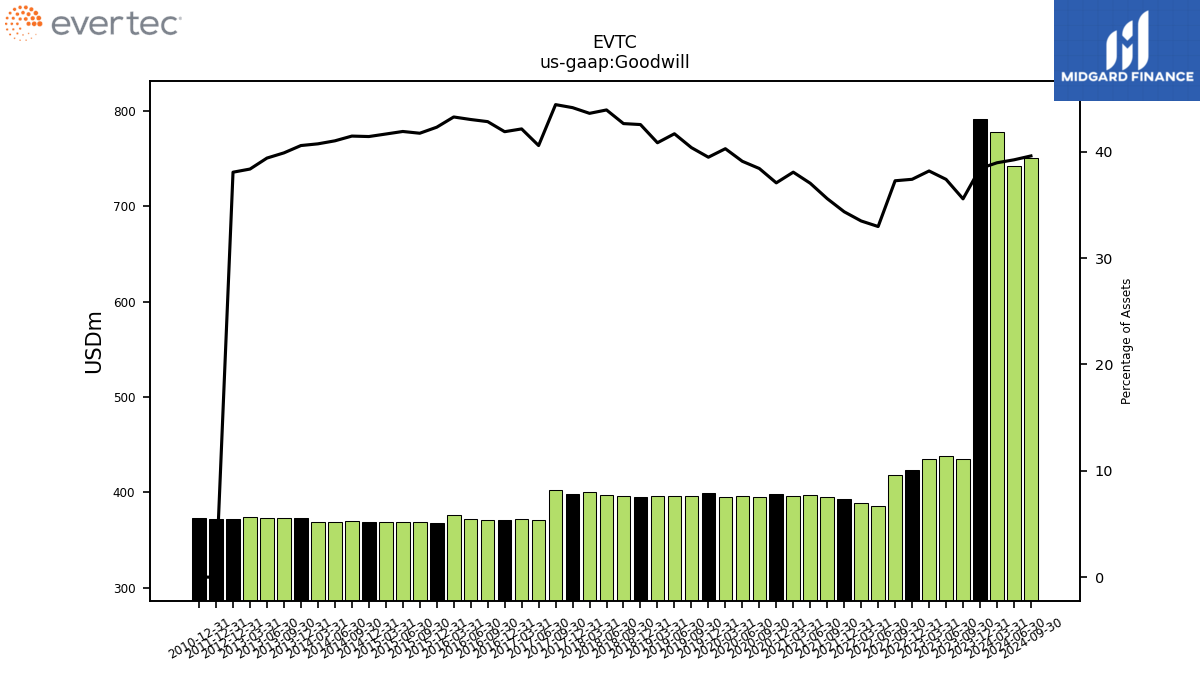
| Goodwill | 777.93 | 791.70 | 434.50 | 438.26 | 434.34 | 423.39 | 417.82 | 385.54 | 389.03 | 393.32 | 394.54 | 396.60 | 396.30 | 397.67 | 395.05 | 395.62 | 394.50 | 399.49 | 395.85 | 396.27 | 395.72 | 394.64 | 396.04 | 397.22 | 399.86 | 398.57 | 402.10 | 371.20 | 371.99 | 370.99 | 371.38 | 372.00 | 376.41 | 368.13 | 368.54 | 368.91 | 369.17 | 368.84 | 369.30 | 369.20 | 369.10 | 373.12 | 373.22 | 373.30 | 373.72 | 372.31 | NA | NA | NA | |
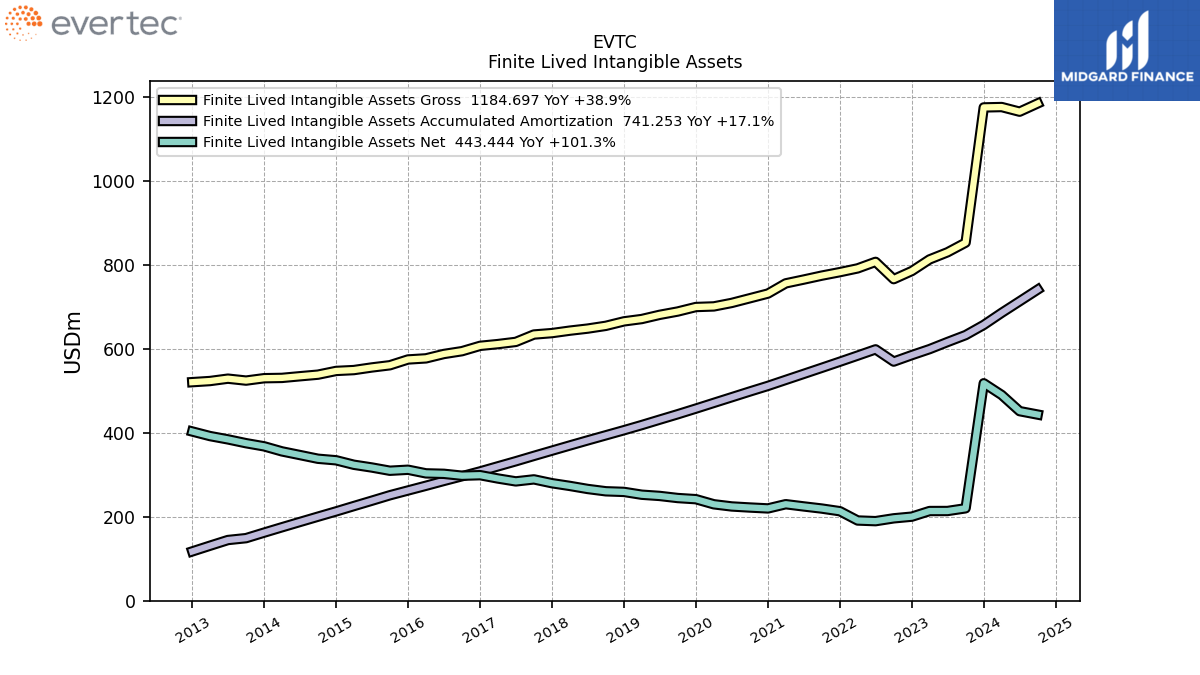
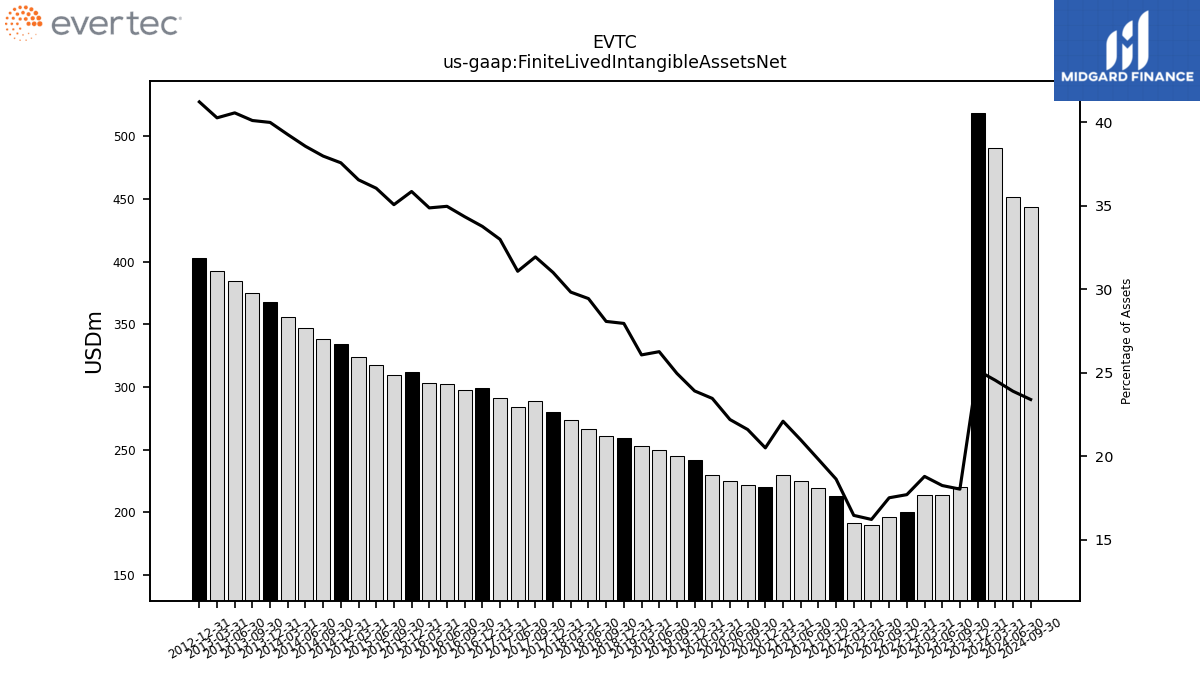
| Finite Lived Intangible Assets Net | 490.19 | 518.07 | 220.24 | 213.78 | 213.71 | 200.32 | 196.32 | 189.60 | 191.16 | 213.29 | 219.62 | 224.69 | 229.97 | 219.91 | 222.09 | 224.60 | 229.79 | 241.94 | 244.67 | 249.67 | 252.59 | 259.27 | 260.74 | 266.25 | 273.54 | 279.96 | 289.10 | 284.32 | 291.22 | 299.12 | 297.87 | 302.36 | 303.44 | 312.06 | 309.68 | 317.43 | 323.94 | 334.58 | 338.25 | 347.11 | 355.80 | 367.78 | 375.29 | 384.38 | 392.27 | 403.17 | NA | NA | NA | |
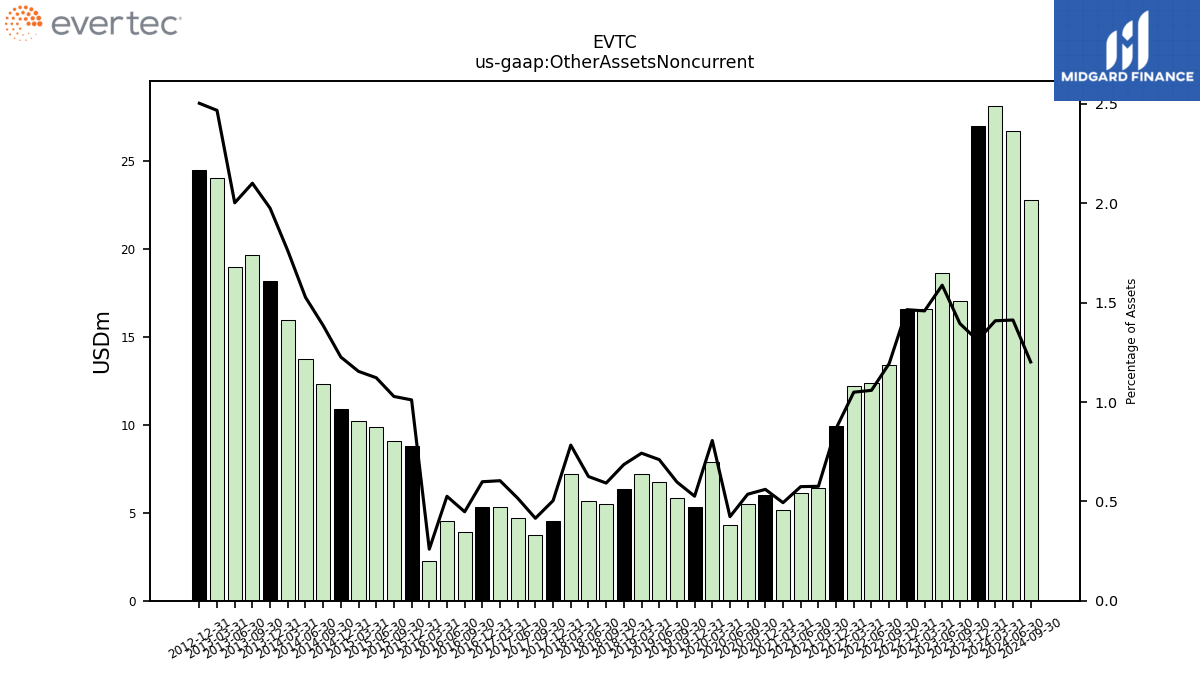
| Other Assets Noncurrent | 28.13 | 27.00 | 17.04 | 18.61 | 16.59 | 16.58 | 13.38 | 12.38 | 12.19 | 9.93 | 6.38 | 6.15 | 5.14 | 6.01 | 5.51 | 4.28 | 7.90 | 5.32 | 5.86 | 6.75 | 7.20 | 6.36 | 5.50 | 5.65 | 7.18 | 4.55 | 3.76 | 4.72 | 5.33 | 5.30 | 3.88 | 4.54 | 2.26 | 8.79 | 9.08 | 9.88 | 10.23 | 10.92 | 12.34 | 13.74 | 15.96 | 18.16 | 19.66 | 18.97 | 24.03 | 24.48 | NA | NA | NA |
| 2024-03-31 | 2023-12-31 | 2023-09-30 | 2023-06-30 | 2023-03-31 | 2022-12-31 | 2022-09-30 | 2022-06-30 | 2022-03-31 | 2021-12-31 | 2021-09-30 | 2021-06-30 | 2021-03-31 | 2020-12-31 | 2020-09-30 | 2020-06-30 | 2020-03-31 | 2019-12-31 | 2019-09-30 | 2019-06-30 | 2019-03-31 | 2018-12-31 | 2018-09-30 | 2018-06-30 | 2018-03-31 | 2017-12-31 | 2017-09-30 | 2017-06-30 | 2017-03-31 | 2016-12-31 | 2016-09-30 | 2016-06-30 | 2016-03-31 | 2015-12-31 | 2015-09-30 | 2015-06-30 | 2015-03-31 | 2014-12-31 | 2014-09-30 | 2014-06-30 | 2014-03-31 | 2013-12-31 | 2013-09-30 | 2013-06-30 | 2013-03-31 | 2012-12-31 | 2012-09-30 | 2012-06-30 | 2012-03-31 | ||
|---|---|---|---|---|---|---|---|---|---|---|---|---|---|---|---|---|---|---|---|---|---|---|---|---|---|---|---|---|---|---|---|---|---|---|---|---|---|---|---|---|---|---|---|---|---|---|---|---|---|---|
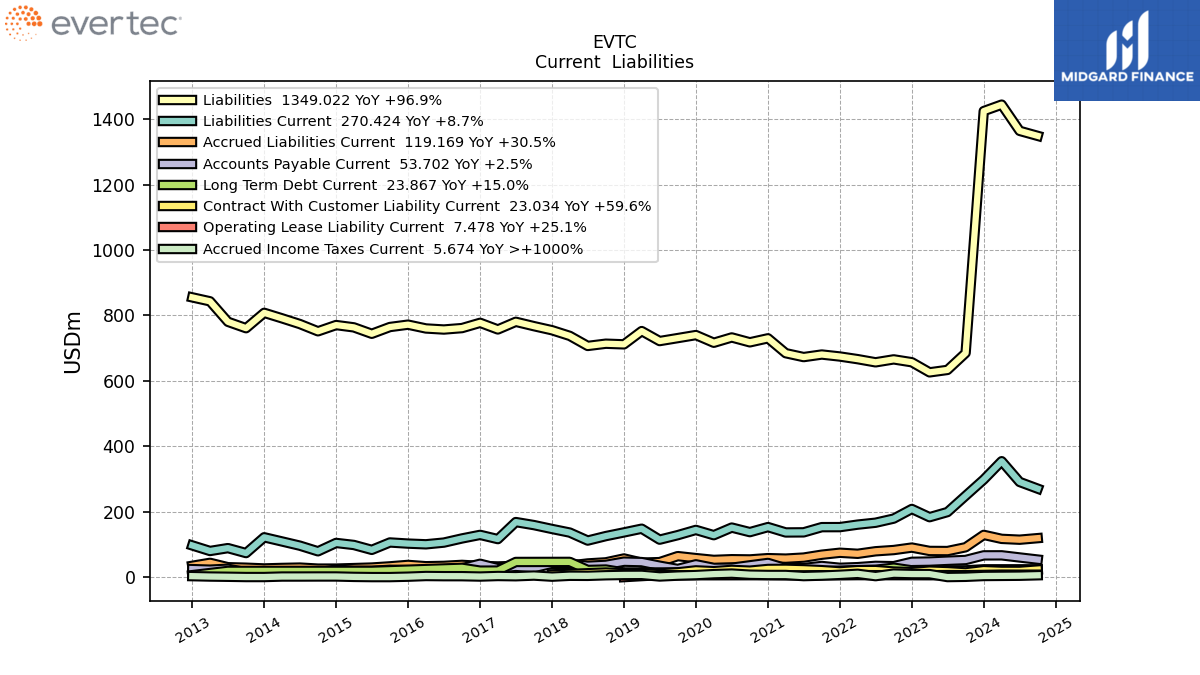
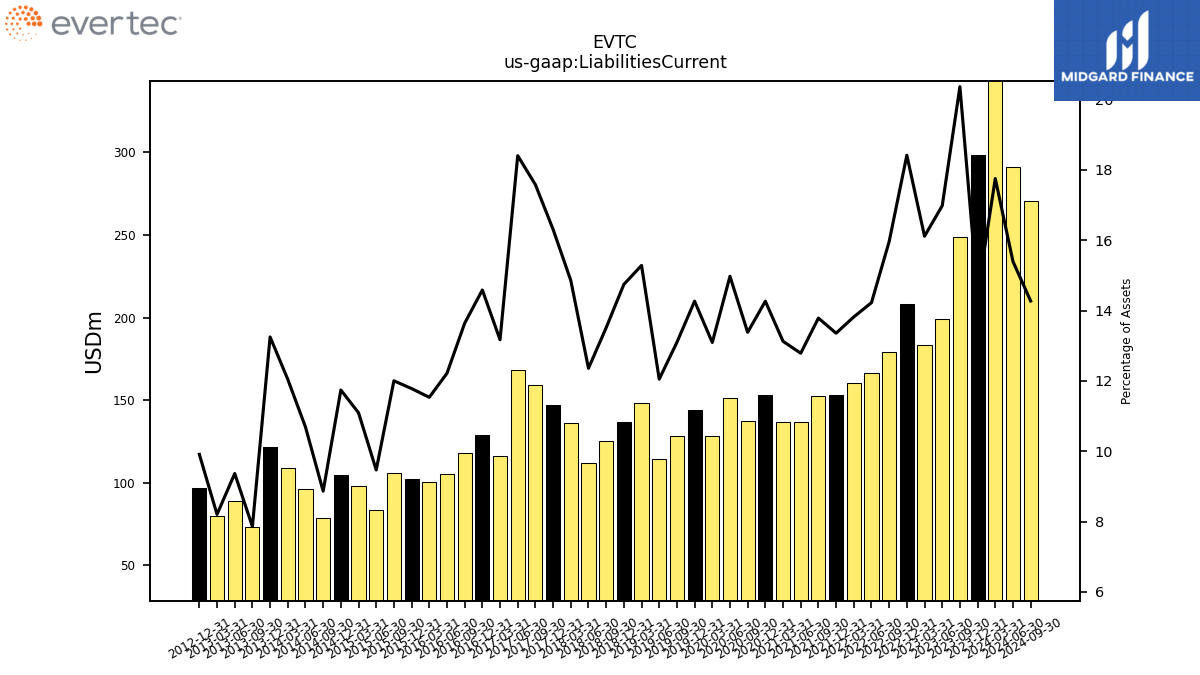
| Liabilities Current | 354.43 | 298.31 | 248.74 | 198.93 | 183.23 | 208.41 | 178.91 | 166.31 | 160.51 | 152.88 | 152.80 | 136.91 | 136.58 | 152.99 | 137.56 | 151.49 | 128.20 | 144.31 | 128.34 | 114.52 | 148.05 | 136.71 | 125.46 | 111.73 | 136.20 | 147.22 | 159.08 | 168.31 | 116.23 | 129.16 | 118.25 | 105.59 | 100.32 | 102.50 | 105.95 | 83.33 | 98.28 | 104.51 | 78.93 | 96.17 | 109.09 | 121.80 | 73.52 | 88.71 | 79.89 | 96.89 | NA | NA | NA | |
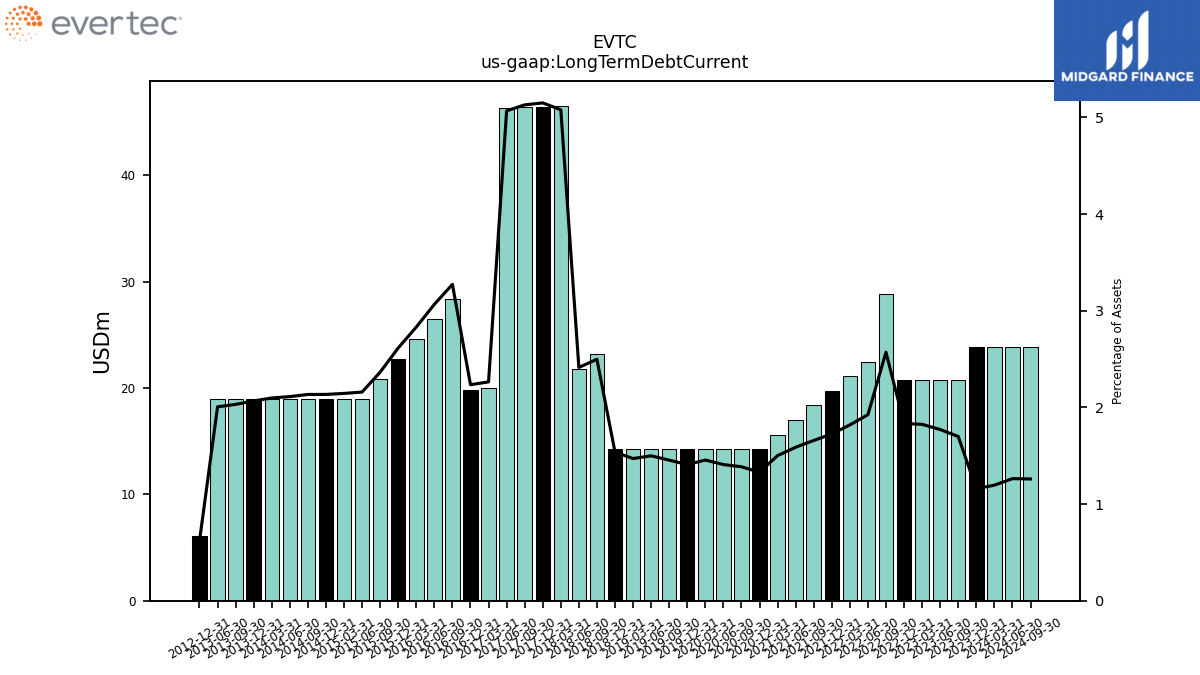
| Long Term Debt Current | 23.87 | 23.87 | 20.75 | 20.75 | 20.75 | 20.75 | 28.81 | 22.50 | 21.12 | 19.75 | 18.38 | 17.00 | 15.62 | 14.25 | 14.25 | 14.25 | 14.25 | 14.25 | 14.25 | 14.25 | 14.25 | 14.25 | 23.19 | 21.82 | 46.56 | 46.49 | 46.41 | 46.34 | 19.98 | 19.79 | 28.38 | 26.50 | 24.62 | 22.75 | 20.88 | 19.00 | 19.00 | 19.00 | 19.00 | 19.00 | 19.00 | 19.00 | 19.00 | 19.00 | NA | 6.05 | NA | NA | NA | |
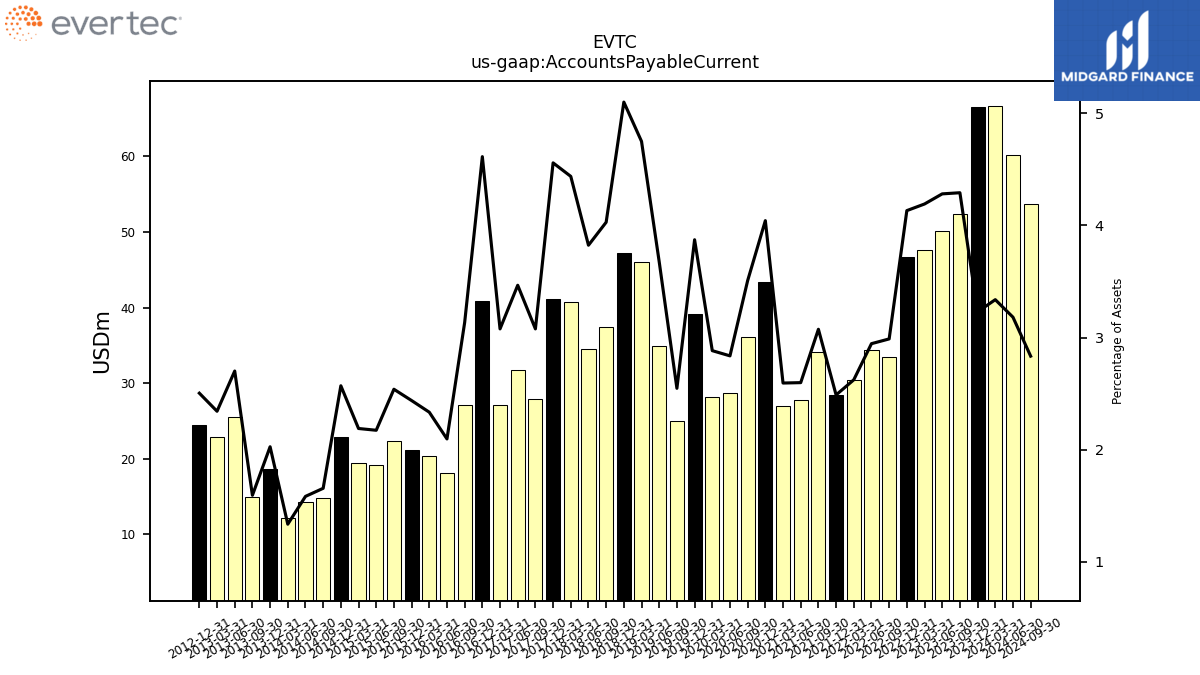
| Accounts Payable Current | 66.63 | 66.52 | 52.40 | 50.15 | 47.65 | 46.75 | 33.49 | 34.44 | 30.47 | 28.48 | 34.07 | 27.82 | 27.00 | 43.35 | 36.06 | 28.70 | 28.23 | 39.16 | 24.97 | 34.92 | 45.99 | 47.27 | 37.40 | 34.56 | 40.67 | 41.13 | 27.84 | 31.70 | 27.16 | 40.84 | 27.17 | 18.12 | 20.31 | 21.22 | 22.42 | 19.13 | 19.40 | 22.88 | 14.75 | 14.26 | 12.11 | 18.63 | 14.91 | 25.59 | 22.82 | 24.48 | NA | NA | NA | |
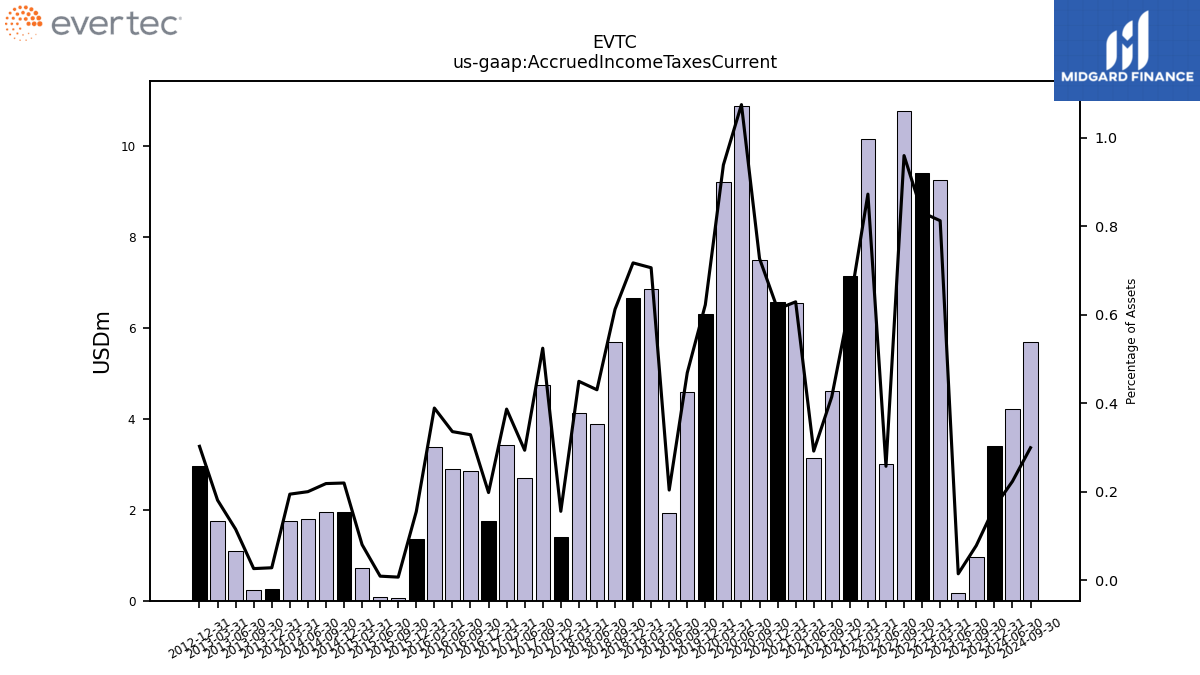
| Accrued Income Taxes Current | NA | 3.40 | 0.96 | 0.17 | 9.24 | 9.41 | 10.76 | 3.01 | 10.13 | 7.13 | 4.60 | 3.12 | 6.55 | 6.57 | 7.47 | 10.87 | 9.19 | 6.30 | 4.59 | 1.94 | 6.84 | 6.65 | 5.68 | 3.89 | 4.12 | 1.41 | 4.75 | 2.69 | 3.41 | 1.75 | 2.85 | 2.90 | 3.38 | 1.35 | 0.06 | 0.08 | 0.71 | 1.96 | 1.95 | 1.80 | 1.76 | 0.26 | 0.25 | 1.09 | 1.76 | 2.96 | NA | NA | NA | |
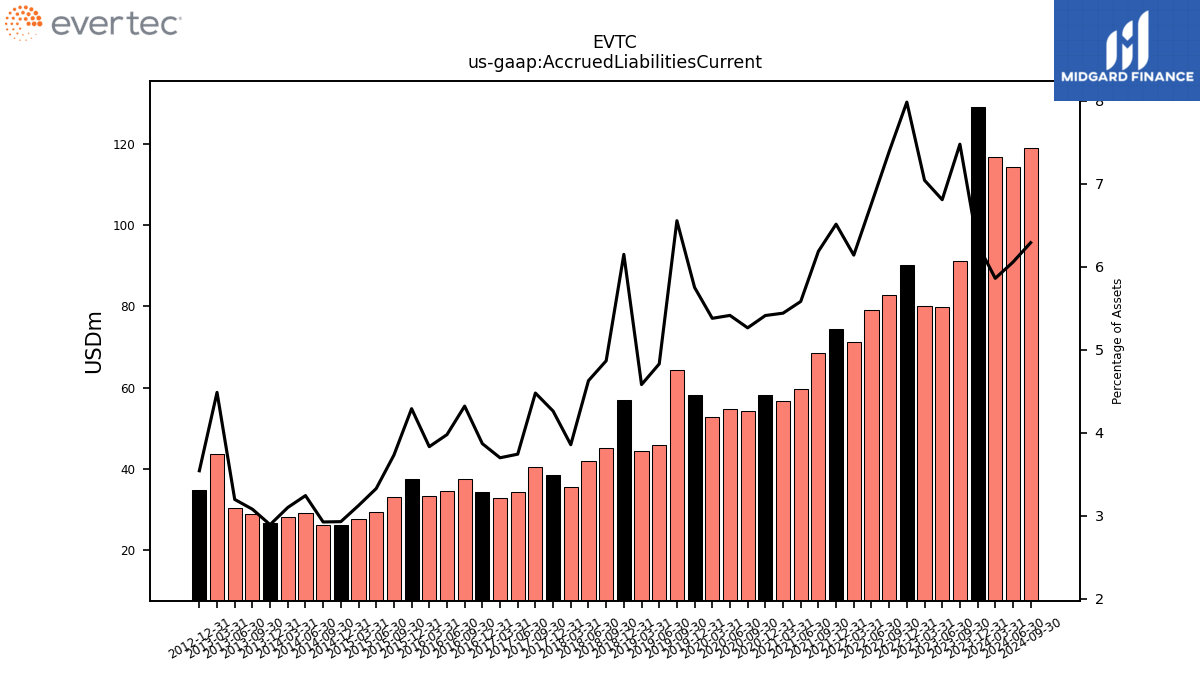
| Accrued Liabilities Current | 116.98 | 129.16 | 91.31 | 79.75 | 80.06 | 90.34 | 82.80 | 79.04 | 71.30 | 74.54 | 68.56 | 59.75 | 56.60 | 58.03 | 54.10 | 54.76 | 52.65 | 58.16 | 64.23 | 45.88 | 44.35 | 57.01 | 45.17 | 41.82 | 35.33 | 38.45 | 40.51 | 34.20 | 32.62 | 34.24 | 37.45 | 34.37 | 33.32 | 37.31 | 32.92 | 29.27 | 27.65 | 26.05 | 26.02 | 29.16 | 28.06 | 26.57 | 28.78 | 30.26 | 43.67 | 34.61 | NA | NA | NA | |
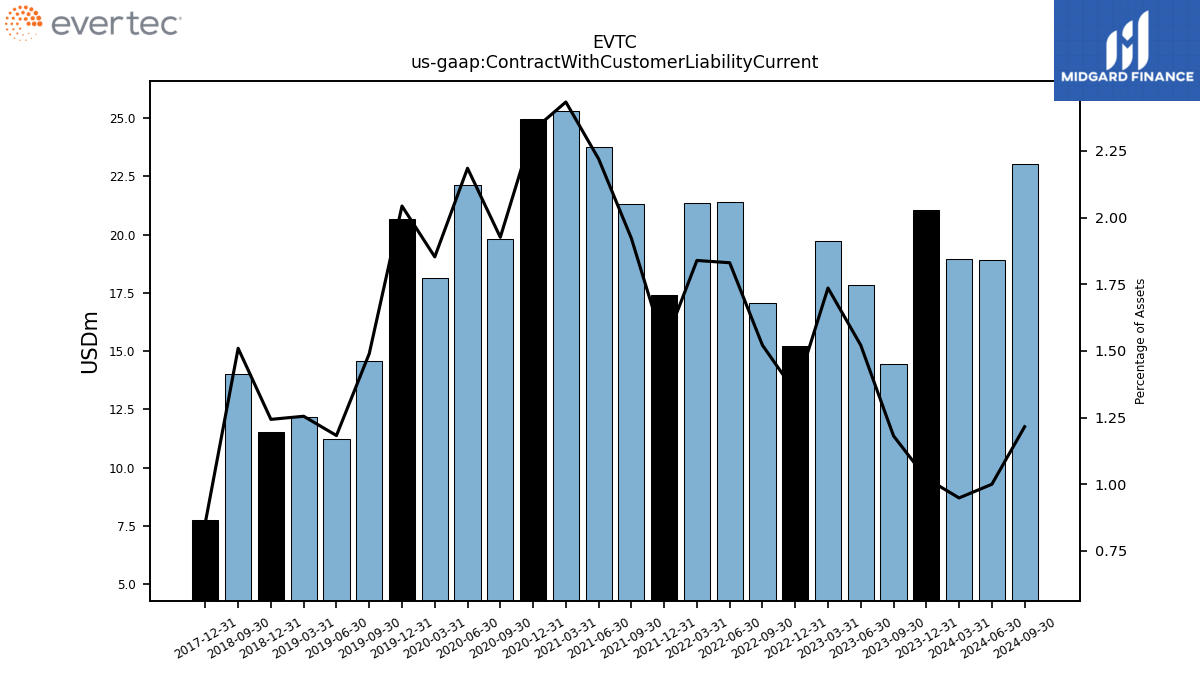
| Contract With Customer Liability Current | 18.94 | 21.05 | 14.43 | 17.82 | 19.74 | 15.23 | 17.05 | 21.40 | 21.36 | 17.40 | 21.30 | 23.77 | 25.32 | 24.96 | 19.80 | 22.10 | 18.14 | 20.67 | 14.60 | 11.24 | 12.16 | 11.53 | 14.02 | NA | NA | 7.74 | NA | NA | NA | NA | NA | NA | NA | NA | NA | NA | NA | NA | NA | NA | NA | NA | NA | NA | NA | NA | NA | NA | NA |
| 2024-03-31 | 2023-12-31 | 2023-09-30 | 2023-06-30 | 2023-03-31 | 2022-12-31 | 2022-09-30 | 2022-06-30 | 2022-03-31 | 2021-12-31 | 2021-09-30 | 2021-06-30 | 2021-03-31 | 2020-12-31 | 2020-09-30 | 2020-06-30 | 2020-03-31 | 2019-12-31 | 2019-09-30 | 2019-06-30 | 2019-03-31 | 2018-12-31 | 2018-09-30 | 2018-06-30 | 2018-03-31 | 2017-12-31 | 2017-09-30 | 2017-06-30 | 2017-03-31 | 2016-12-31 | 2016-09-30 | 2016-06-30 | 2016-03-31 | 2015-12-31 | 2015-09-30 | 2015-06-30 | 2015-03-31 | 2014-12-31 | 2014-09-30 | 2014-06-30 | 2014-03-31 | 2013-12-31 | 2013-09-30 | 2013-06-30 | 2013-03-31 | 2012-12-31 | 2012-09-30 | 2012-06-30 | 2012-03-31 | ||
|---|---|---|---|---|---|---|---|---|---|---|---|---|---|---|---|---|---|---|---|---|---|---|---|---|---|---|---|---|---|---|---|---|---|---|---|---|---|---|---|---|---|---|---|---|---|---|---|---|---|---|
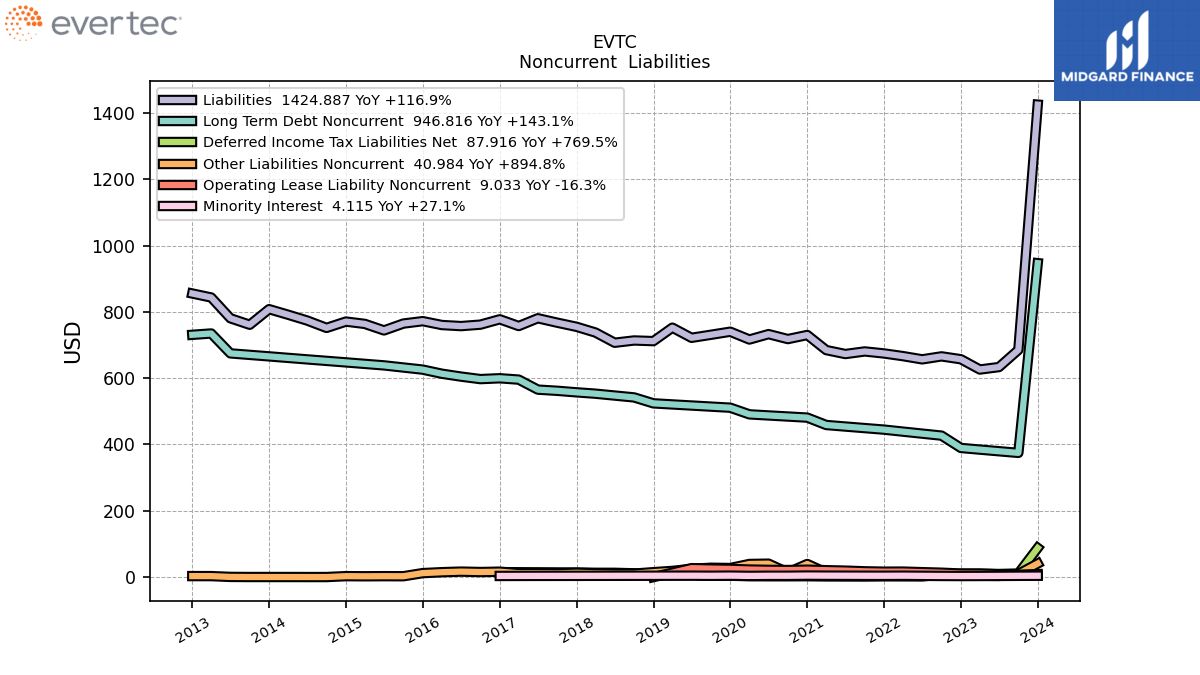
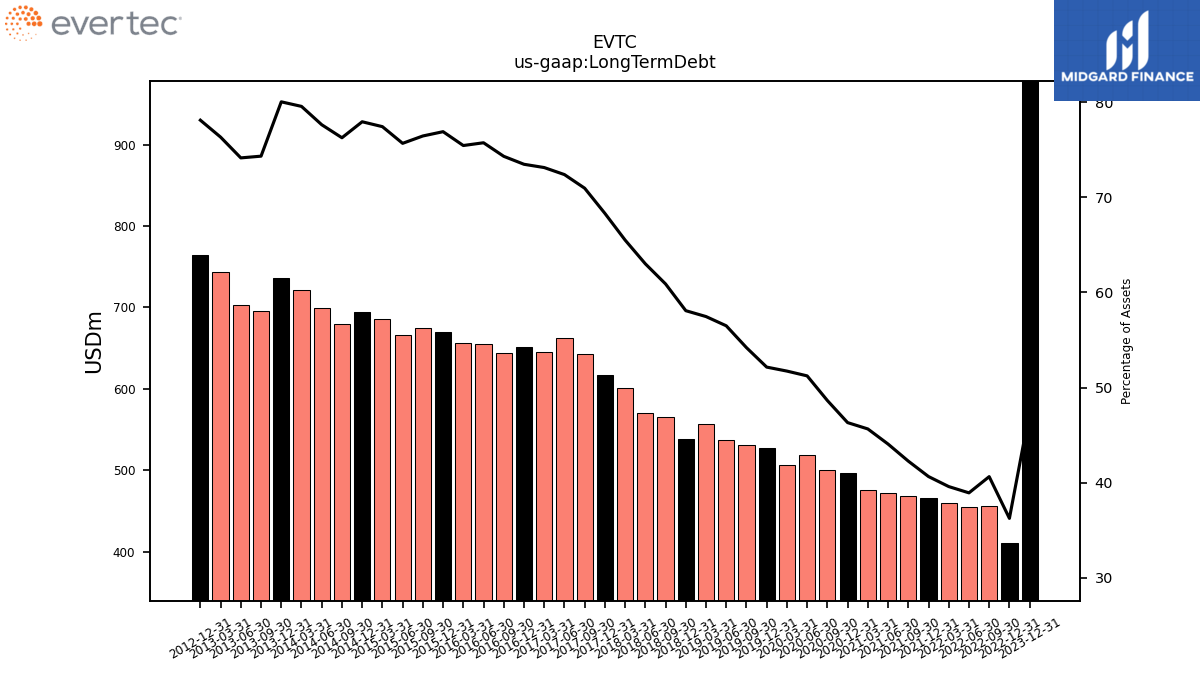
| Long Term Debt | NA | 978.09 | NA | NA | NA | 410.25 | 455.50 | 455.22 | 459.88 | 465.29 | 468.55 | 471.81 | 475.07 | 496.78 | 500.04 | 518.31 | 506.58 | 527.60 | 531.17 | 536.98 | 556.72 | 538.61 | 565.47 | 569.73 | 600.59 | 616.74 | 642.17 | 662.13 | 645.44 | 650.76 | 644.33 | 654.73 | 656.31 | 669.15 | 675.00 | 666.20 | 686.04 | 693.91 | 679.10 | 698.63 | 720.75 | 735.88 | 695.34 | 702.40 | 743.38 | 763.76 | NA | NA | NA | |
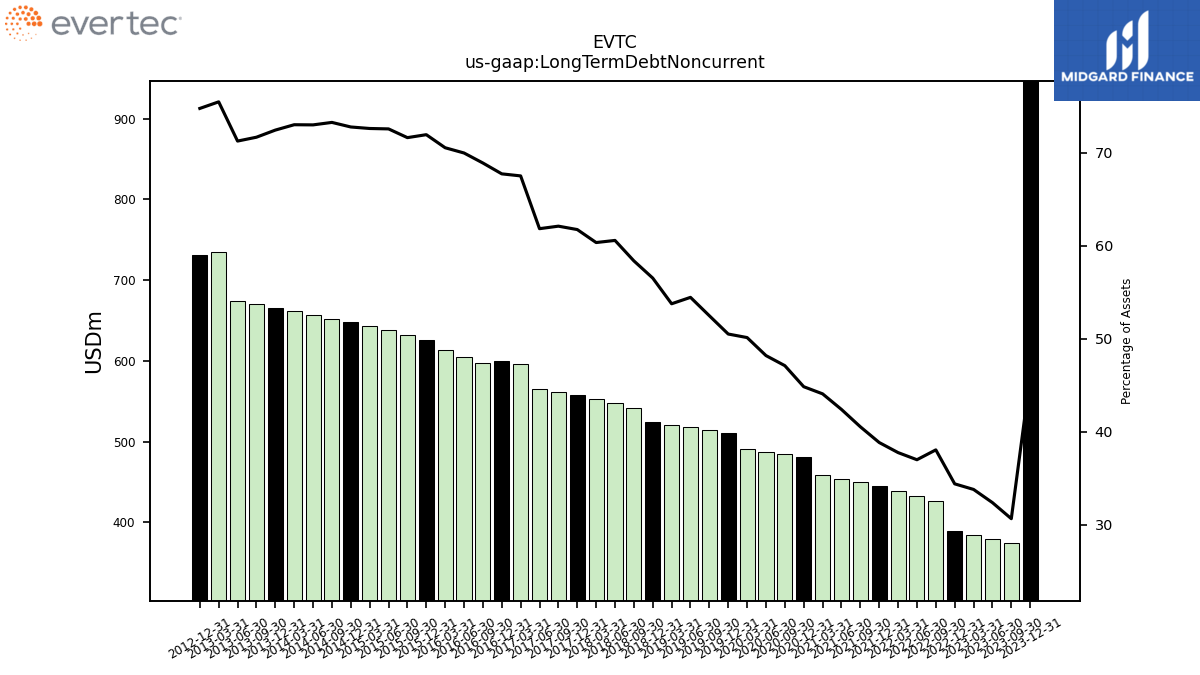
| Long Term Debt Noncurrent | 941.72 | 946.82 | 374.66 | 379.60 | 384.55 | 389.50 | 426.69 | 432.72 | 438.75 | 444.79 | 449.44 | 454.08 | 458.74 | 481.04 | 484.31 | 487.57 | 490.84 | 510.95 | 514.22 | 517.49 | 520.77 | 524.06 | 541.95 | 547.55 | 553.14 | 557.25 | 561.90 | 565.42 | 595.63 | 599.67 | 597.15 | 604.68 | 613.38 | 625.75 | 632.14 | 638.53 | 643.05 | 647.58 | 652.10 | 656.63 | 661.15 | 665.68 | 670.21 | 674.74 | 734.72 | 730.71 | NA | NA | NA | |
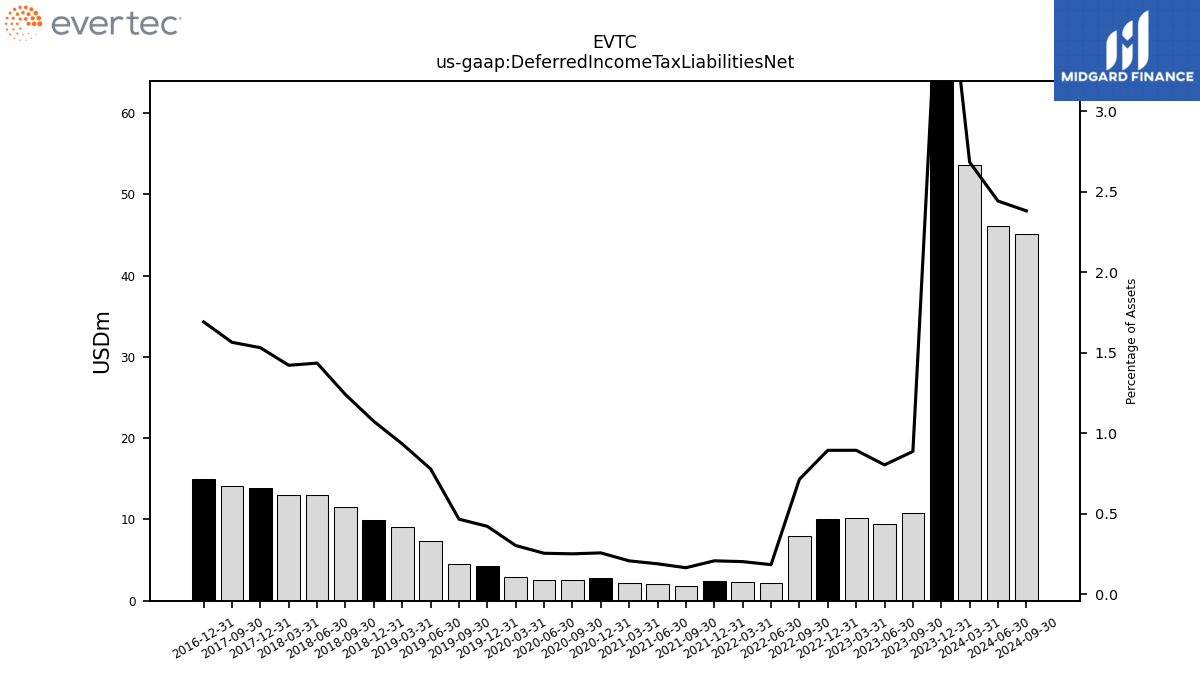
| Deferred Income Tax Liabilities Net | 53.58 | 87.92 | 10.83 | 9.41 | 10.16 | 10.11 | 8.00 | 2.14 | 2.35 | 2.37 | 1.82 | 2.02 | 2.15 | 2.75 | 2.58 | 2.57 | 2.96 | 4.26 | 4.57 | 7.40 | 9.04 | 9.95 | 11.51 | 12.98 | 13.03 | 13.82 | 14.16 | NA | NA | 14.98 | NA | NA | NA | NA | NA | NA | NA | NA | NA | NA | NA | NA | NA | NA | NA | NA | NA | NA | NA | |
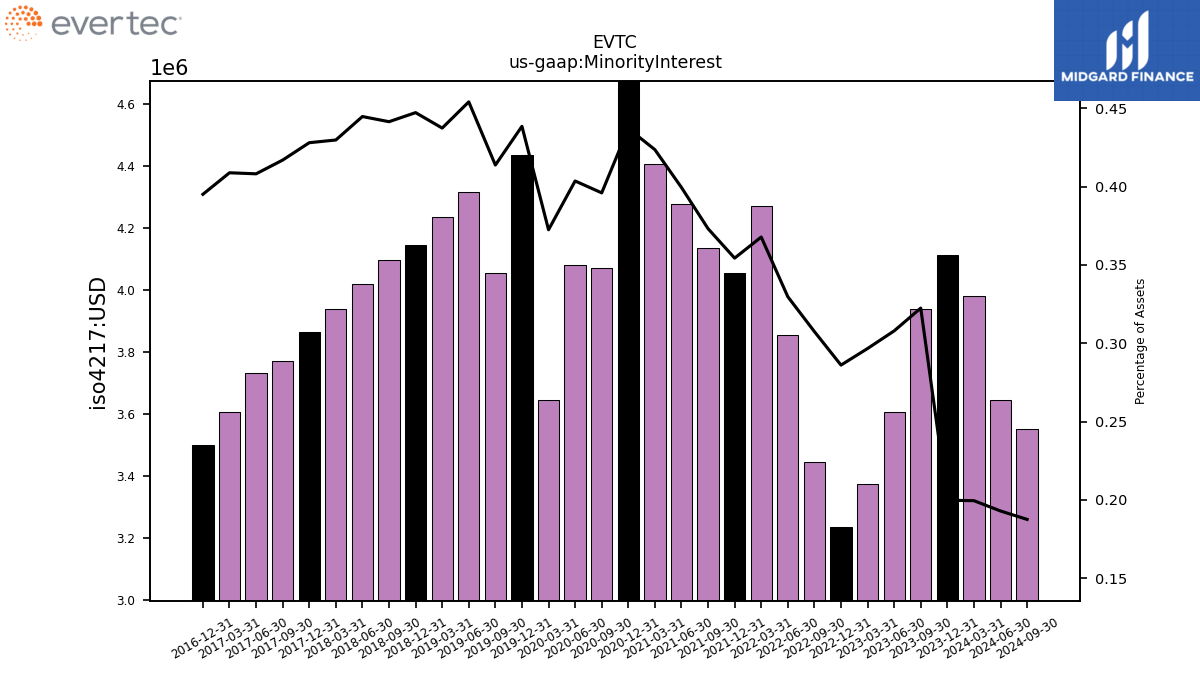
| Minority Interest | 3.98 | 4.12 | 3.94 | 3.61 | 3.37 | 3.24 | 3.45 | 3.85 | 4.27 | 4.06 | 4.14 | 4.28 | 4.41 | 4.69 | 4.07 | 4.08 | 3.65 | 4.44 | 4.05 | 4.32 | 4.24 | 4.15 | 4.10 | 4.02 | 3.94 | 3.86 | 3.77 | 3.73 | 3.61 | 3.50 | NA | NA | NA | NA | NA | NA | NA | NA | NA | NA | NA | NA | NA | NA | NA | NA | NA | NA | NA | |
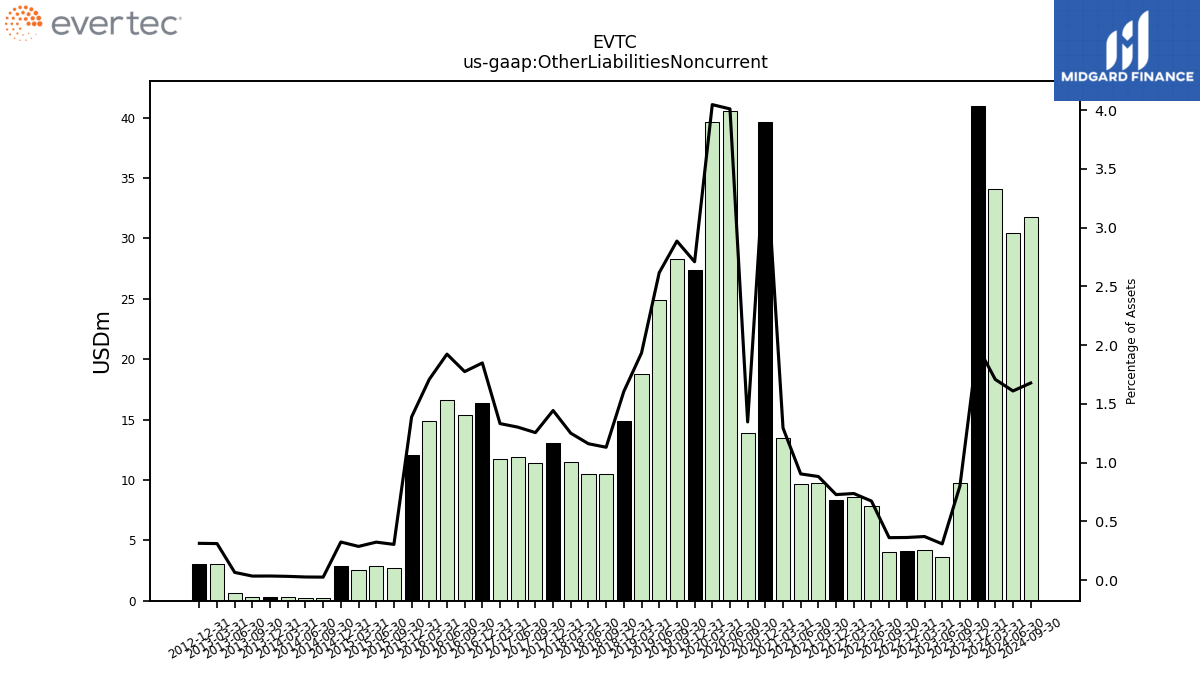
| Other Liabilities Noncurrent | 34.12 | 40.98 | 9.78 | 3.63 | 4.23 | 4.12 | 4.06 | 7.88 | 8.57 | 8.34 | 9.79 | 9.69 | 13.48 | 39.63 | 13.85 | 40.57 | 39.63 | 27.41 | 28.28 | 24.87 | 18.74 | 14.90 | 10.51 | 10.50 | 11.47 | 13.04 | 11.37 | 11.92 | 11.77 | 16.38 | 15.39 | 16.63 | 14.87 | 12.09 | 2.69 | 2.86 | 2.55 | 2.90 | 0.24 | 0.25 | 0.30 | 0.33 | 0.33 | 0.63 | 3.04 | 3.07 | NA | NA | NA | |
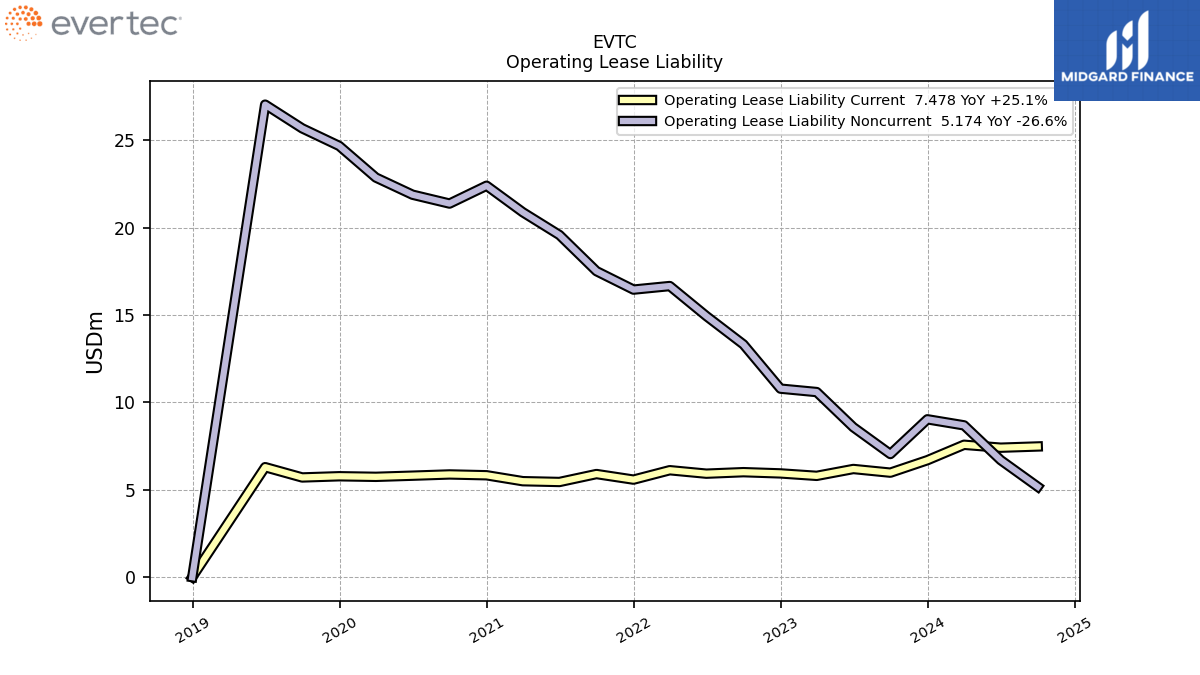
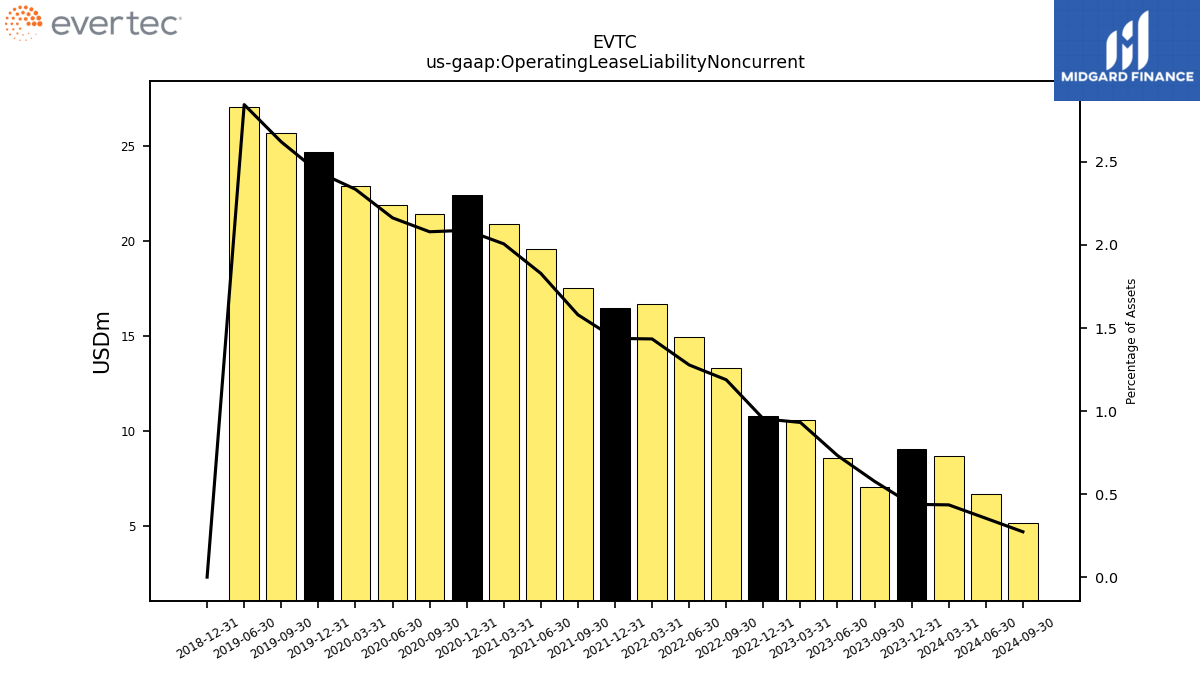
| Operating Lease Liability Noncurrent | 8.69 | 9.03 | 7.04 | 8.58 | 10.59 | 10.79 | 13.32 | 14.94 | 16.66 | 16.46 | 17.51 | 19.58 | 20.88 | 22.40 | 21.38 | 21.89 | 22.87 | 24.68 | 25.69 | 27.04 | NA | 0.00 | NA | NA | NA | NA | NA | NA | NA | NA | NA | NA | NA | NA | NA | NA | NA | NA | NA | NA | NA | NA | NA | NA | NA | NA | NA | NA | NA |
| 2024-03-31 | 2023-12-31 | 2023-09-30 | 2023-06-30 | 2023-03-31 | 2022-12-31 | 2022-09-30 | 2022-06-30 | 2022-03-31 | 2021-12-31 | 2021-09-30 | 2021-06-30 | 2021-03-31 | 2020-12-31 | 2020-09-30 | 2020-06-30 | 2020-03-31 | 2019-12-31 | 2019-09-30 | 2019-06-30 | 2019-03-31 | 2018-12-31 | 2018-09-30 | 2018-06-30 | 2018-03-31 | 2017-12-31 | 2017-09-30 | 2017-06-30 | 2017-03-31 | 2016-12-31 | 2016-09-30 | 2016-06-30 | 2016-03-31 | 2015-12-31 | 2015-09-30 | 2015-06-30 | 2015-03-31 | 2014-12-31 | 2014-09-30 | 2014-06-30 | 2014-03-31 | 2013-12-31 | 2013-09-30 | 2013-06-30 | 2013-03-31 | 2012-12-31 | 2012-09-30 | 2012-06-30 | 2012-03-31 | ||
|---|---|---|---|---|---|---|---|---|---|---|---|---|---|---|---|---|---|---|---|---|---|---|---|---|---|---|---|---|---|---|---|---|---|---|---|---|---|---|---|---|---|---|---|---|---|---|---|---|---|---|
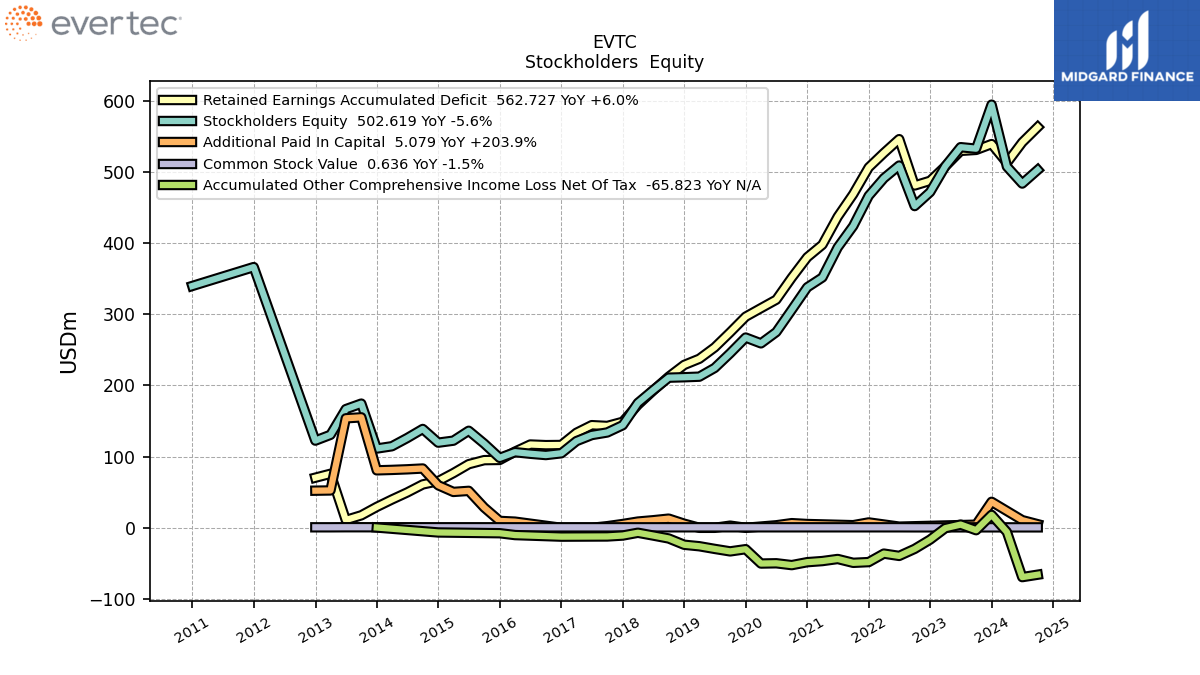
| Stockholders Equity | 507.26 | 594.29 | 532.41 | 534.53 | 507.77 | 471.51 | 451.81 | 508.75 | 490.88 | 466.21 | 423.79 | 393.77 | 351.60 | 337.74 | 306.14 | 274.88 | 259.04 | 267.19 | 245.20 | 224.48 | 212.26 | 211.46 | 210.85 | 193.34 | 175.34 | 144.11 | 133.91 | 130.28 | 121.76 | 104.68 | 102.19 | 104.02 | 106.23 | 98.21 | 118.25 | 136.32 | 122.39 | 119.57 | 138.86 | 126.13 | 114.57 | 111.33 | 174.46 | 166.68 | 130.61 | 122.45 | NA | NA | NA | |
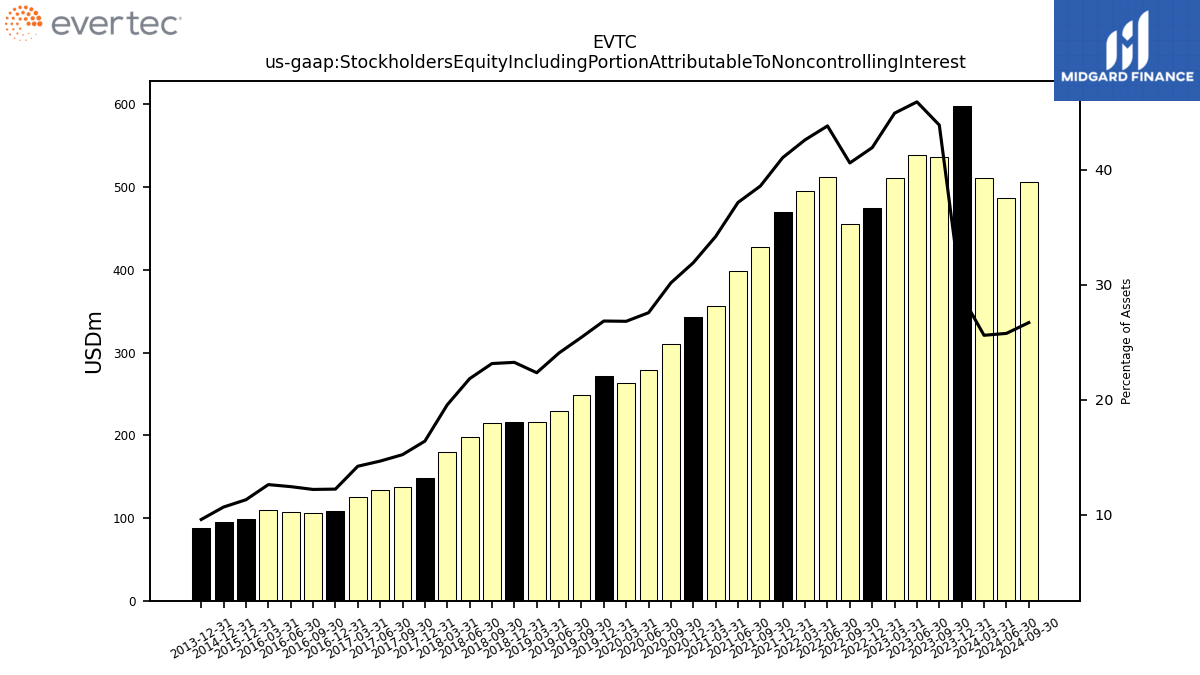
| Stockholders Equity Including Portion Attributable To Noncontrolling Interest | 511.24 | 598.41 | 536.35 | 538.14 | 511.14 | 474.75 | 455.25 | 512.60 | 495.15 | 470.27 | 427.93 | 398.04 | 356.01 | 342.43 | 310.21 | 278.97 | 262.68 | 271.62 | 249.26 | 228.80 | 216.50 | 215.61 | 214.95 | 197.36 | 179.28 | 147.98 | 137.68 | 134.01 | 125.37 | 108.17 | 105.65 | 107.45 | 109.66 | 98.21 | NA | NA | NA | 94.84 | NA | NA | NA | 87.97 | NA | NA | NA | NA | NA | NA | NA | |
| Common Stock Value | 0.64 | 0.65 | 0.65 | 0.65 | 0.65 | 0.65 | 0.66 | 0.71 | 0.72 | 0.72 | 0.72 | 0.72 | 0.72 | 0.72 | 0.72 | 0.72 | 0.72 | 0.72 | 0.72 | 0.72 | 0.72 | 0.72 | 0.73 | 0.73 | 0.72 | 0.72 | 0.72 | 0.72 | 0.72 | 0.73 | 0.73 | 0.74 | 0.75 | 0.75 | 0.76 | 0.78 | 0.77 | 0.78 | 0.79 | 0.79 | 0.78 | 0.78 | 0.82 | 0.82 | 0.73 | 0.73 | NA | NA | NA | |
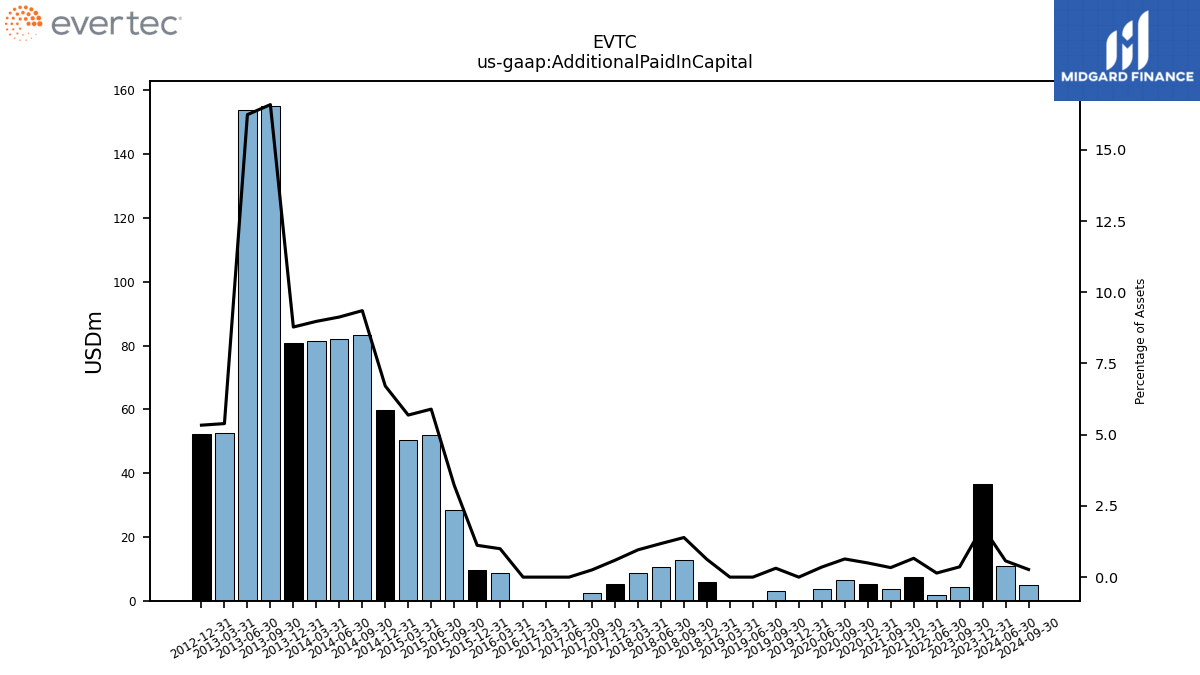
| Additional Paid In Capital | NA | 36.53 | 4.40 | NA | NA | NA | NA | 1.67 | NA | 7.57 | 3.71 | NA | NA | 5.34 | 6.55 | 3.57 | NA | 0.00 | 3.06 | 0.00 | 0.00 | 5.78 | 12.91 | 10.65 | 8.78 | 5.35 | 2.30 | 0.00 | 0.00 | 0.00 | NA | NA | 8.67 | 9.72 | 28.50 | 51.91 | 50.40 | 59.74 | 83.30 | 82.17 | 81.33 | 80.72 | 155.17 | 153.79 | 52.49 | 52.16 | NA | NA | NA | |
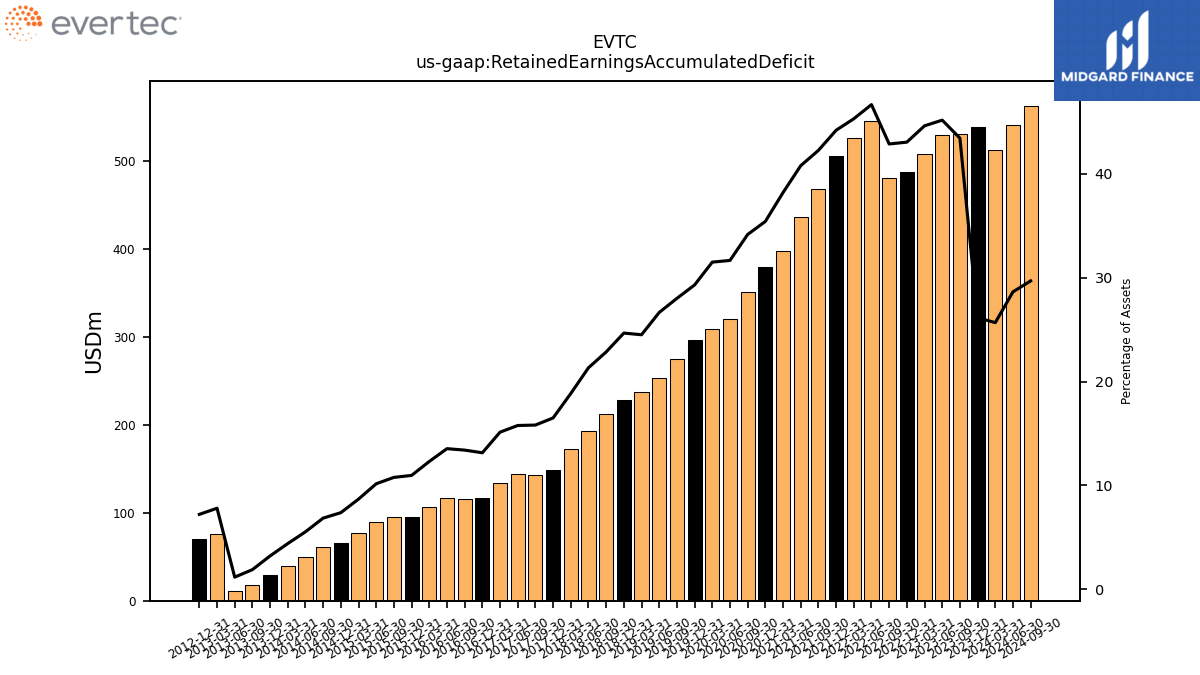
| Retained Earnings Accumulated Deficit | 512.53 | 538.90 | 530.71 | 529.36 | 507.56 | 487.35 | 480.74 | 545.81 | 526.37 | 506.05 | 468.53 | 436.82 | 397.56 | 379.93 | 351.25 | 320.38 | 308.49 | 296.48 | 274.52 | 253.36 | 237.42 | 228.74 | 212.18 | 192.82 | 172.78 | 148.89 | 143.04 | 144.18 | 133.46 | 116.34 | 116.12 | 116.99 | 107.00 | 95.33 | 95.04 | 89.35 | 76.84 | 65.58 | 60.92 | 49.70 | 39.77 | 29.40 | 17.56 | 10.95 | 75.89 | 70.41 | NA | NA | NA | |
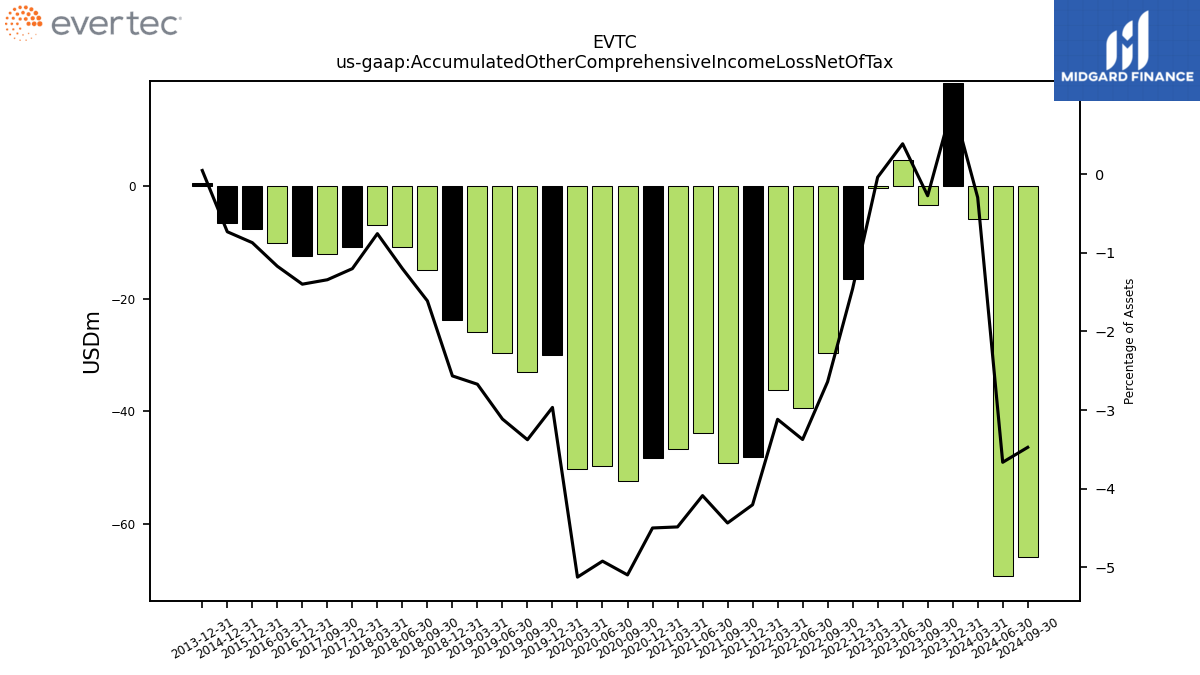
| Accumulated Other Comprehensive Income Loss Net Of Tax | -5.92 | 18.21 | -3.35 | 4.52 | -0.45 | -16.49 | -29.59 | -39.45 | -36.21 | -48.12 | -49.17 | -43.77 | -46.68 | -48.25 | -52.39 | -49.78 | -50.17 | -30.01 | -33.09 | -29.60 | -25.88 | -23.79 | -14.96 | -10.86 | -6.94 | -10.85 | -12.15 | NA | NA | -12.39 | NA | NA | -10.19 | -7.58 | NA | NA | NA | -6.52 | NA | NA | NA | 0.43 | NA | NA | NA | NA | NA | NA | NA | |
| Minority Interest | 3.98 | 4.12 | 3.94 | 3.61 | 3.37 | 3.24 | 3.45 | 3.85 | 4.27 | 4.06 | 4.14 | 4.28 | 4.41 | 4.69 | 4.07 | 4.08 | 3.65 | 4.44 | 4.05 | 4.32 | 4.24 | 4.15 | 4.10 | 4.02 | 3.94 | 3.86 | 3.77 | 3.73 | 3.61 | 3.50 | NA | NA | NA | NA | NA | NA | NA | NA | NA | NA | NA | NA | NA | NA | NA | NA | NA | NA | NA | |
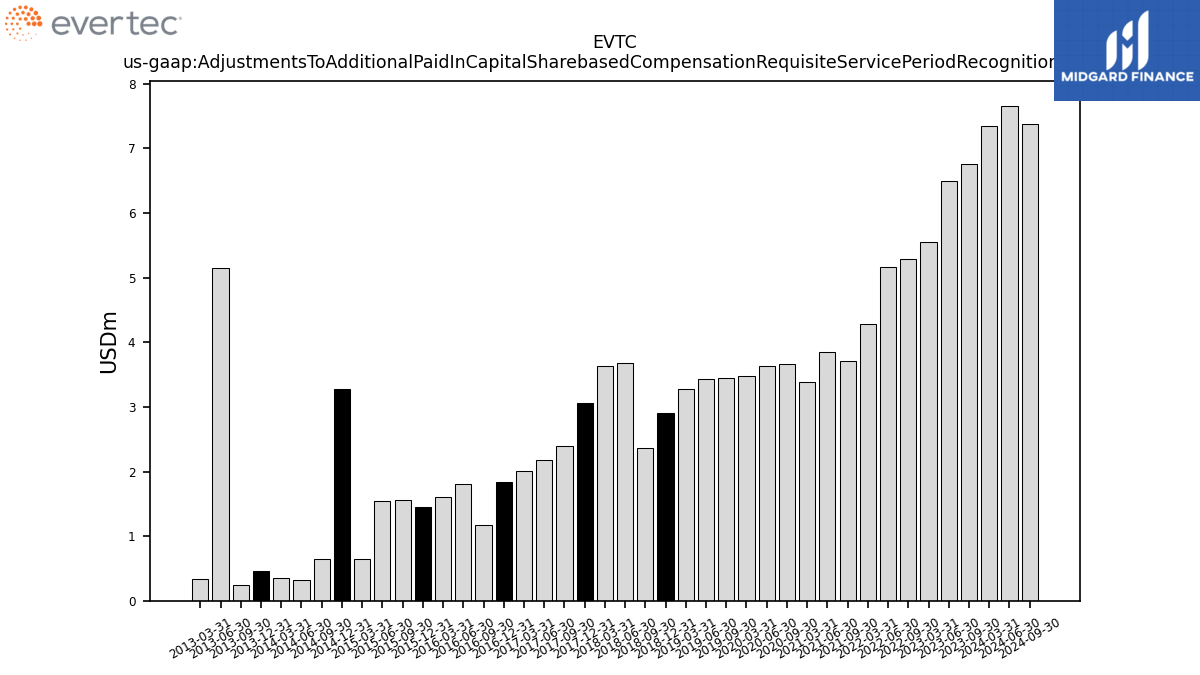
| Adjustments To Additional Paid In Capital Sharebased Compensation Requisite Service Period Recognition Value | 7.35 | NA | 6.76 | 6.50 | 5.56 | NA | 5.30 | 5.17 | 4.28 | NA | 3.71 | 3.85 | 3.38 | NA | 3.66 | 3.64 | 3.48 | NA | 3.45 | 3.44 | 3.28 | 2.90 | 2.37 | 3.69 | 3.64 | 3.06 | 2.39 | 2.18 | 2.01 | 1.84 | 1.17 | 1.80 | 1.60 | 1.46 | 1.56 | 1.54 | 0.65 | 3.27 | 0.65 | 0.32 | 0.35 | 0.46 | 0.24 | 5.15 | 0.33 | NA | NA | NA | NA |
| 2024-03-31 | 2023-12-31 | 2023-09-30 | 2023-06-30 | 2023-03-31 | 2022-12-31 | 2022-09-30 | 2022-06-30 | 2022-03-31 | 2021-12-31 | 2021-09-30 | 2021-06-30 | 2021-03-31 | 2020-12-31 | 2020-09-30 | 2020-06-30 | 2020-03-31 | 2019-12-31 | 2019-09-30 | 2019-06-30 | 2019-03-31 | 2018-12-31 | 2018-09-30 | 2018-06-30 | 2018-03-31 | 2017-12-31 | 2017-09-30 | 2017-06-30 | 2017-03-31 | 2016-12-31 | 2016-09-30 | 2016-06-30 | 2016-03-31 | 2015-12-31 | 2015-09-30 | 2015-06-30 | 2015-03-31 | 2014-12-31 | 2014-09-30 | 2014-06-30 | 2014-03-31 | 2013-12-31 | 2013-09-30 | 2013-06-30 | 2013-03-31 | 2012-12-31 | 2012-09-30 | 2012-06-30 | 2012-03-31 | ||
|---|---|---|---|---|---|---|---|---|---|---|---|---|---|---|---|---|---|---|---|---|---|---|---|---|---|---|---|---|---|---|---|---|---|---|---|---|---|---|---|---|---|---|---|---|---|---|---|---|---|---|
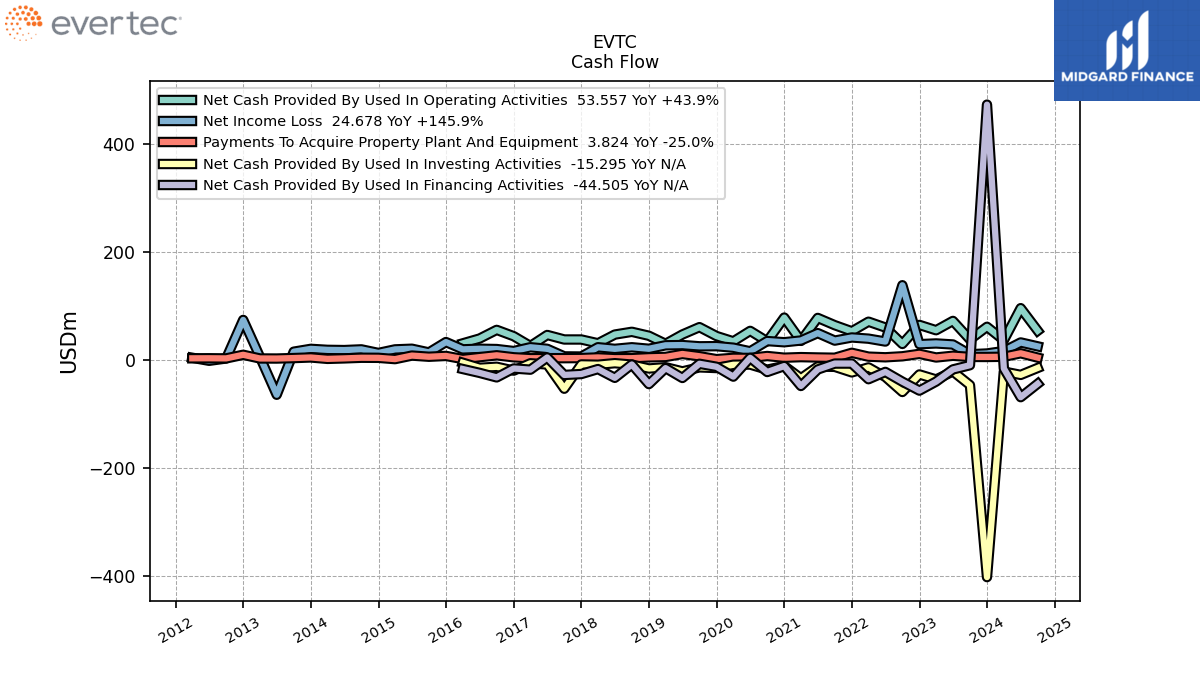
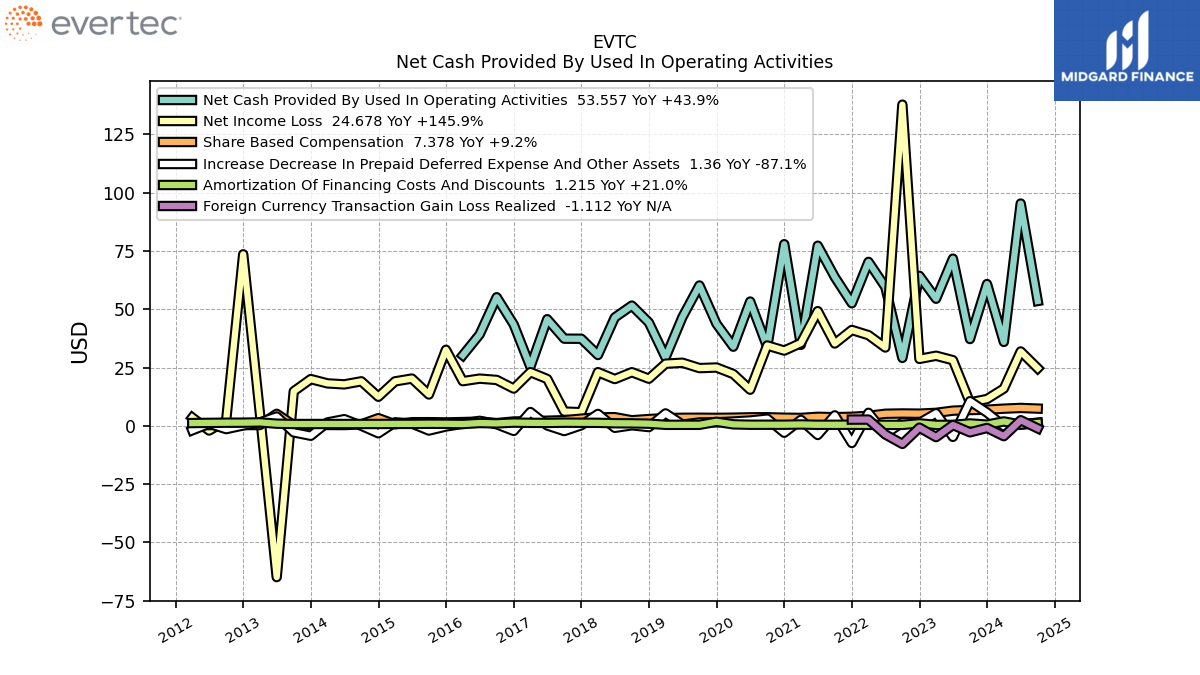
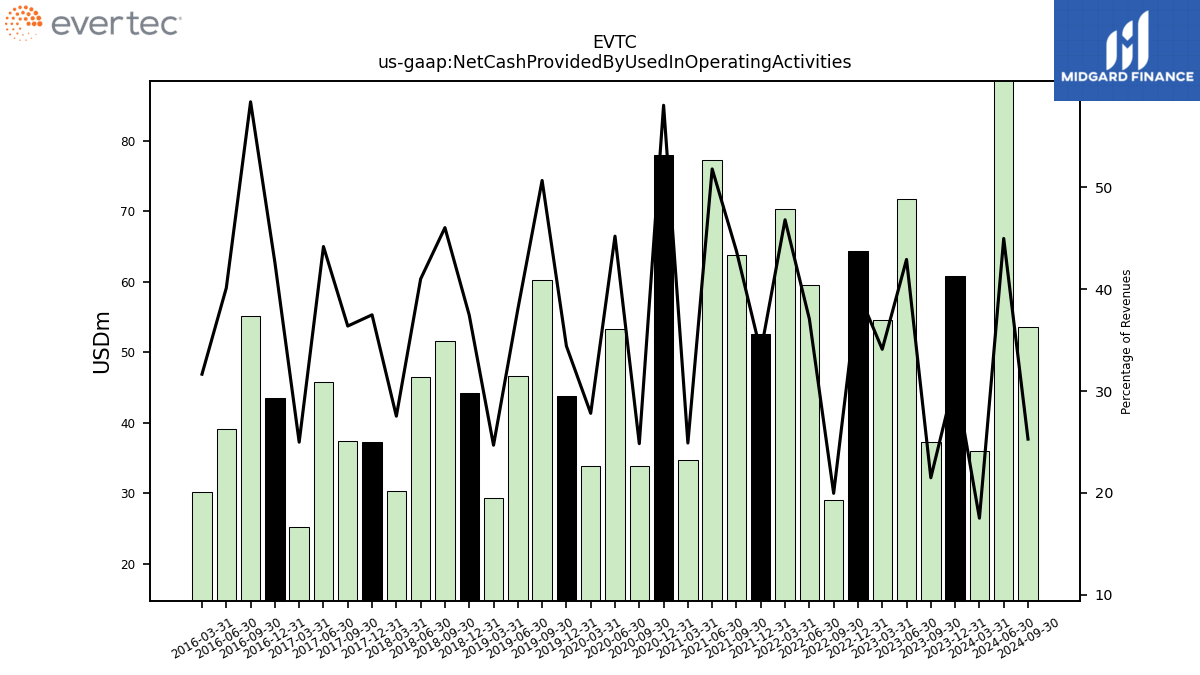
| Net Cash Provided By Used In Operating Activities | 35.98 | 60.83 | 37.22 | 71.73 | 54.51 | 64.35 | 29.11 | 59.55 | 70.35 | 52.56 | 63.83 | 77.28 | 34.75 | 77.93 | 33.91 | 53.33 | 33.92 | 43.78 | 60.22 | 46.61 | 29.34 | 44.29 | 51.59 | 46.49 | 30.37 | 37.35 | 37.38 | 45.75 | 25.30 | 43.45 | 55.18 | 39.19 | 30.23 | NA | NA | NA | NA | NA | NA | NA | NA | NA | NA | NA | NA | NA | NA | NA | NA | |
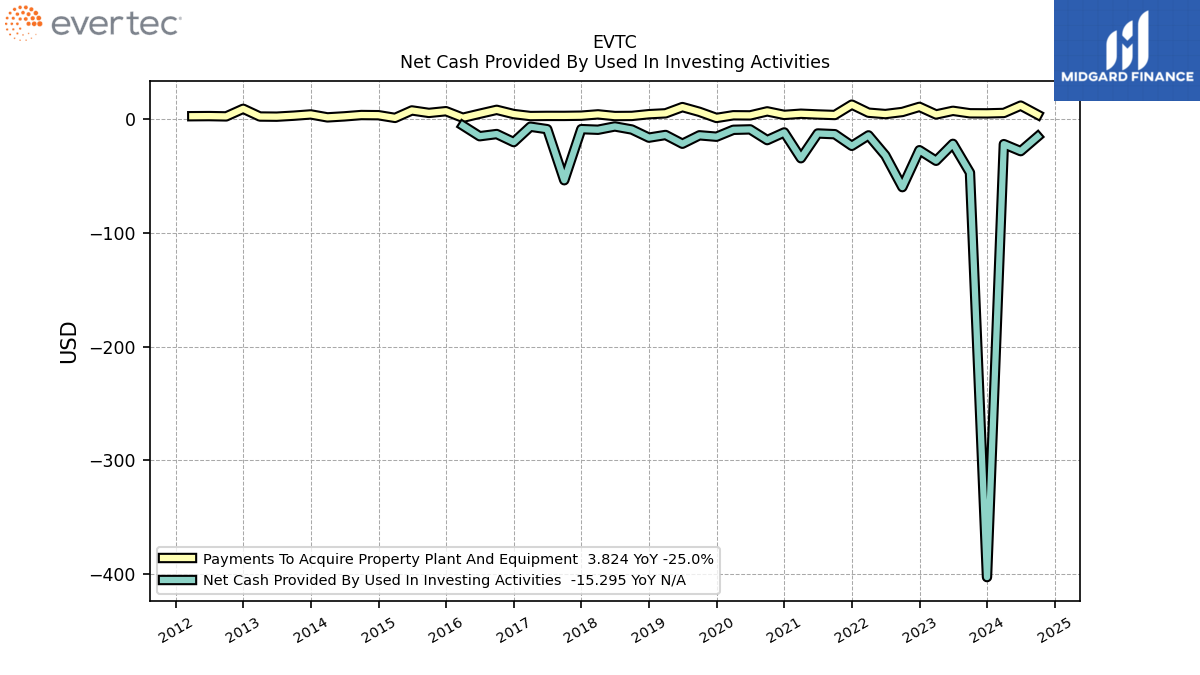
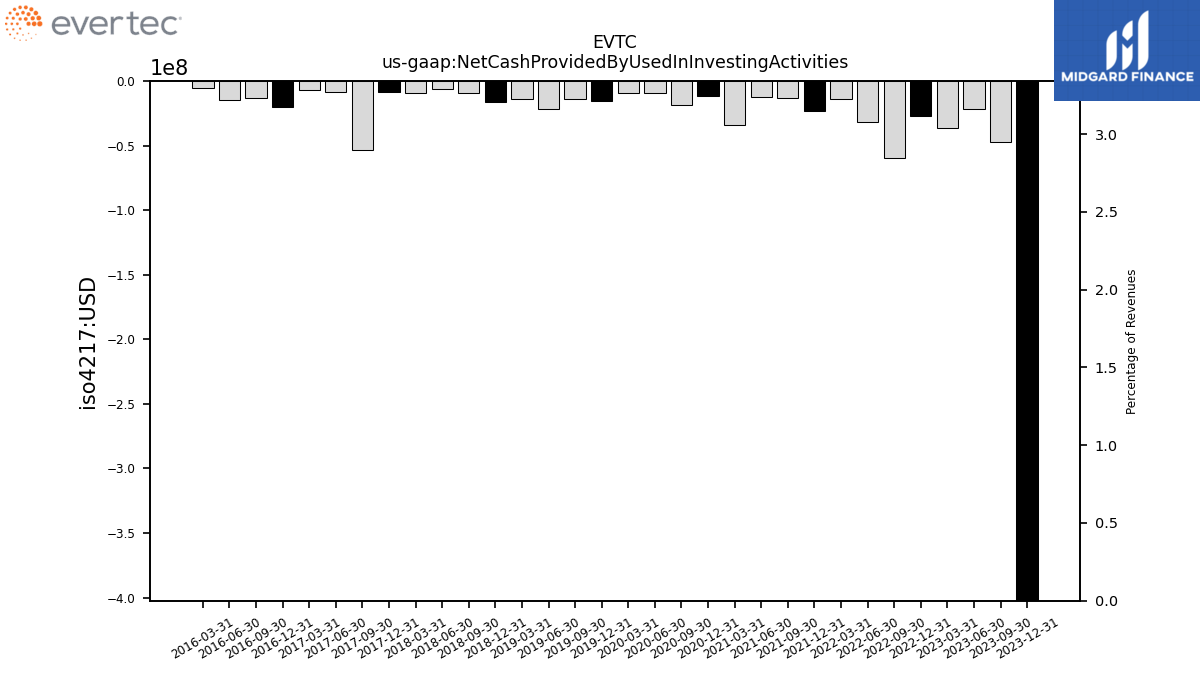
| Net Cash Provided By Used In Investing Activities | -21.99 | -402.50 | -47.06 | -21.73 | -36.64 | -27.32 | -59.81 | -31.90 | -14.29 | -23.52 | -13.27 | -12.62 | -34.41 | -11.71 | -18.47 | -9.04 | -9.41 | -15.48 | -14.24 | -21.66 | -13.96 | -16.31 | -9.15 | -6.47 | -9.37 | -8.81 | -53.75 | -8.86 | -6.68 | -20.23 | -13.13 | -15.05 | -5.67 | NA | NA | NA | NA | NA | NA | NA | NA | NA | NA | NA | NA | NA | NA | NA | NA | |
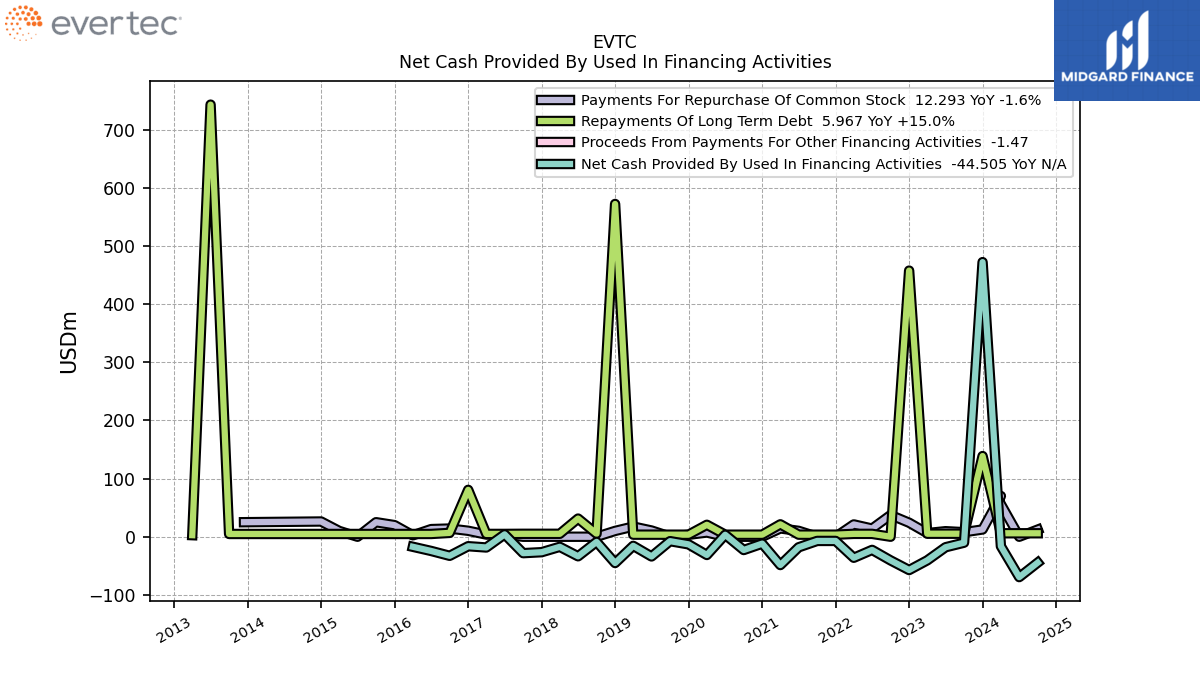
| Net Cash Provided By Used In Financing Activities | -16.35 | 472.12 | -10.23 | -18.04 | -40.58 | -57.26 | -40.71 | -22.63 | -36.17 | -7.21 | -7.21 | -18.15 | -48.72 | -11.84 | -22.83 | 3.41 | -31.36 | -13.11 | -7.59 | -33.90 | -15.63 | -45.23 | -8.85 | -33.62 | -17.36 | -26.55 | -28.25 | 4.09 | -18.48 | -16.29 | -32.79 | -24.45 | -17.27 | NA | NA | NA | NA | NA | NA | NA | NA | NA | NA | NA | NA | NA | NA | NA | NA |
| 2024-03-31 | 2023-12-31 | 2023-09-30 | 2023-06-30 | 2023-03-31 | 2022-12-31 | 2022-09-30 | 2022-06-30 | 2022-03-31 | 2021-12-31 | 2021-09-30 | 2021-06-30 | 2021-03-31 | 2020-12-31 | 2020-09-30 | 2020-06-30 | 2020-03-31 | 2019-12-31 | 2019-09-30 | 2019-06-30 | 2019-03-31 | 2018-12-31 | 2018-09-30 | 2018-06-30 | 2018-03-31 | 2017-12-31 | 2017-09-30 | 2017-06-30 | 2017-03-31 | 2016-12-31 | 2016-09-30 | 2016-06-30 | 2016-03-31 | 2015-12-31 | 2015-09-30 | 2015-06-30 | 2015-03-31 | 2014-12-31 | 2014-09-30 | 2014-06-30 | 2014-03-31 | 2013-12-31 | 2013-09-30 | 2013-06-30 | 2013-03-31 | 2012-12-31 | 2012-09-30 | 2012-06-30 | 2012-03-31 | ||
|---|---|---|---|---|---|---|---|---|---|---|---|---|---|---|---|---|---|---|---|---|---|---|---|---|---|---|---|---|---|---|---|---|---|---|---|---|---|---|---|---|---|---|---|---|---|---|---|---|---|---|
| Net Cash Provided By Used In Operating Activities | 35.98 | 60.83 | 37.22 | 71.73 | 54.51 | 64.35 | 29.11 | 59.55 | 70.35 | 52.56 | 63.83 | 77.28 | 34.75 | 77.93 | 33.91 | 53.33 | 33.92 | 43.78 | 60.22 | 46.61 | 29.34 | 44.29 | 51.59 | 46.49 | 30.37 | 37.35 | 37.38 | 45.75 | 25.30 | 43.45 | 55.18 | 39.19 | 30.23 | NA | NA | NA | NA | NA | NA | NA | NA | NA | NA | NA | NA | NA | NA | NA | NA | |
| Net Income Loss | 15.98 | 11.48 | 10.04 | 28.16 | 30.05 | 28.71 | 137.81 | 33.59 | 38.90 | 41.12 | 35.31 | 49.20 | 35.50 | 32.28 | 34.46 | 15.48 | 22.21 | 25.01 | 24.75 | 27.06 | 26.64 | 20.20 | 23.00 | 20.05 | 23.02 | 5.83 | 6.10 | 20.09 | 23.03 | 15.97 | 19.68 | 20.23 | 19.15 | 32.62 | 13.42 | 20.27 | 19.06 | 12.46 | 19.09 | 17.77 | 18.21 | 20.04 | 14.80 | -64.94 | 5.47 | 73.59 | 2.28 | -2.03 | 3.53 | |
| Profit Loss | 16.39 | 11.81 | 9.96 | 28.05 | 30.06 | 28.71 | 137.74 | 33.56 | 38.87 | 41.19 | 35.26 | 49.09 | 35.60 | 32.37 | 34.58 | 15.62 | 22.27 | 25.04 | 24.79 | 27.14 | 26.73 | 20.25 | 23.07 | 20.13 | 23.11 | 5.92 | 6.14 | 20.21 | 23.14 | 16.01 | 19.71 | 20.23 | 19.17 | 21.93 | 25.34 | 19.57 | 18.54 | NA | NA | NA | NA | NA | NA | NA | NA | NA | NA | NA | NA | |
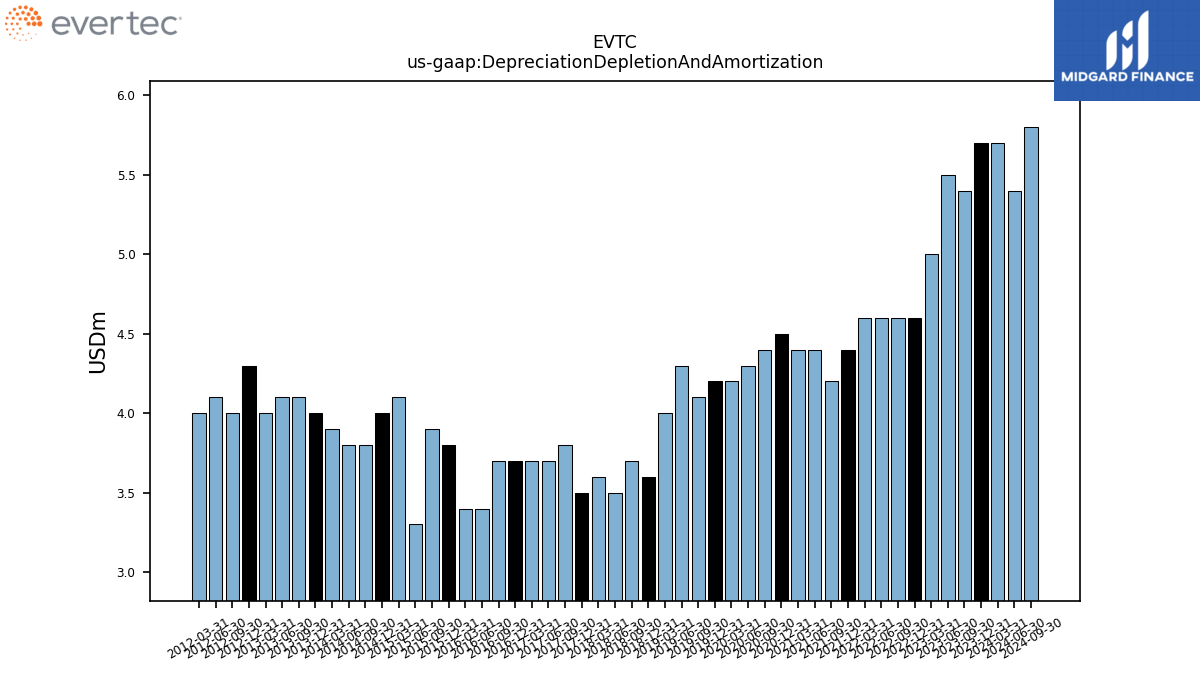
| Depreciation Depletion And Amortization | 5.70 | 5.70 | 5.40 | 5.50 | 5.00 | 4.60 | 4.60 | 4.60 | 4.60 | 4.40 | 4.20 | 4.40 | 4.40 | 4.50 | 4.40 | 4.30 | 4.20 | 4.20 | 4.10 | 4.30 | 4.00 | 3.60 | 3.70 | 3.50 | 3.60 | 3.50 | 3.80 | 3.70 | 3.70 | 3.70 | 3.70 | 3.40 | 3.40 | 3.80 | 3.90 | 3.30 | 4.10 | 4.00 | 3.80 | 3.80 | 3.90 | 4.00 | 4.10 | 4.10 | 4.00 | 4.30 | 4.00 | 4.10 | 4.00 | |
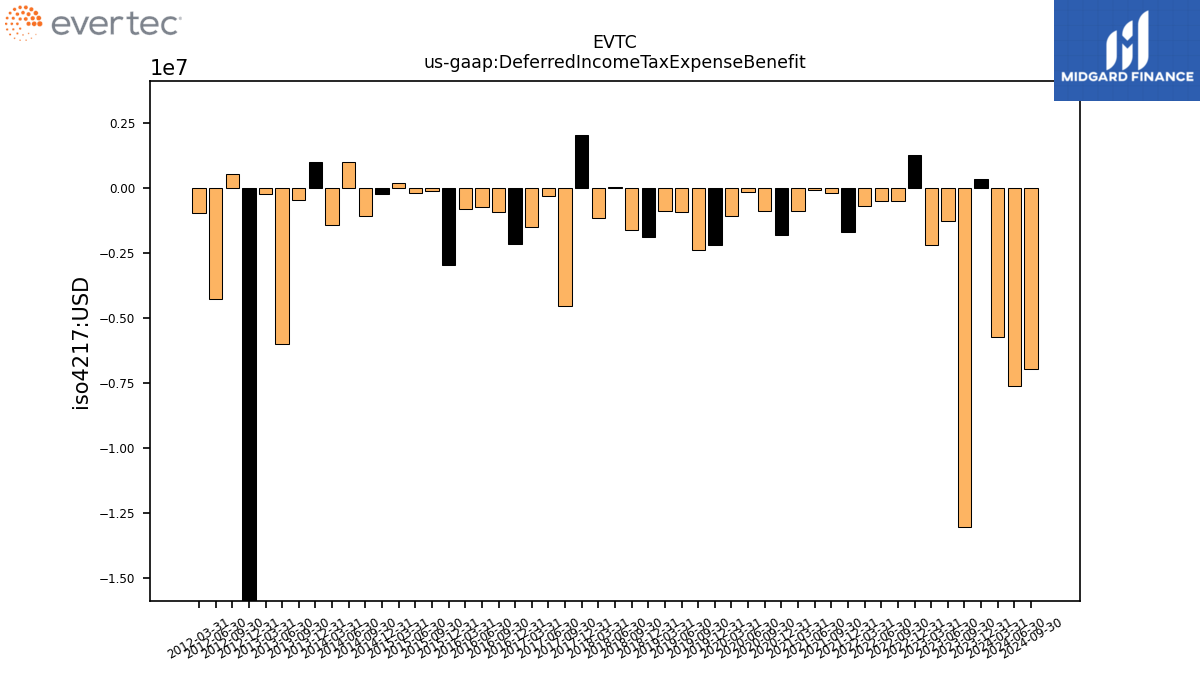
| Deferred Income Tax Expense Benefit | -5.72 | 0.35 | -13.02 | -1.26 | -2.21 | 1.26 | -0.49 | -0.51 | -0.70 | -1.71 | -0.17 | -0.06 | -0.89 | -1.82 | -0.87 | -0.13 | -1.08 | -2.19 | -2.38 | -0.94 | -0.88 | -1.88 | -1.62 | 0.04 | -1.15 | 2.03 | -4.54 | -0.31 | -1.49 | -2.14 | -0.92 | -0.73 | -0.80 | -2.98 | -0.12 | -0.19 | 0.20 | -0.23 | -1.06 | 1.00 | -1.43 | 1.02 | -0.47 | -6.02 | -0.23 | -61.91 | 0.55 | -4.25 | -0.96 | |
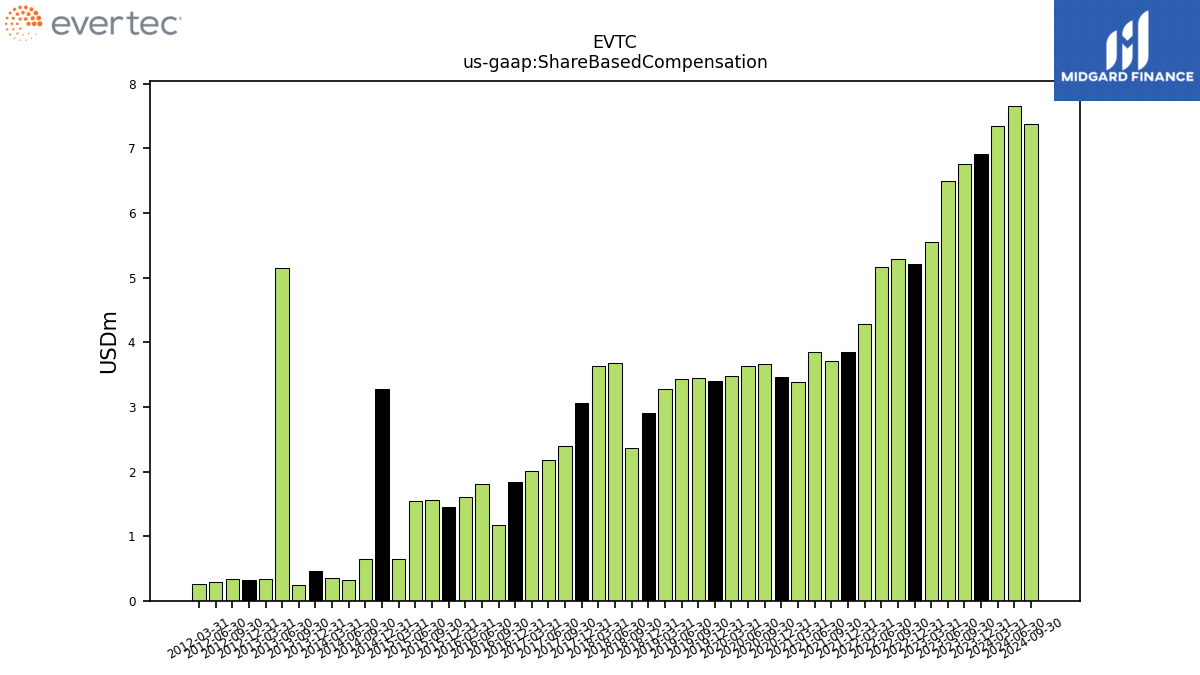
| Share Based Compensation | 7.35 | 6.92 | 6.76 | 6.50 | 5.56 | 5.22 | 5.30 | 5.17 | 4.28 | 3.86 | 3.71 | 3.85 | 3.38 | 3.47 | 3.66 | 3.64 | 3.48 | 3.40 | 3.45 | 3.44 | 3.28 | 2.90 | 2.37 | 3.69 | 3.64 | 3.06 | 2.39 | 2.18 | 2.01 | 1.84 | 1.17 | 1.80 | 1.60 | 1.46 | 1.56 | 1.54 | 0.65 | 3.27 | 0.65 | 0.32 | 0.35 | 0.46 | 0.24 | 5.15 | 0.33 | 0.32 | 0.33 | 0.30 | 0.26 |
| 2024-03-31 | 2023-12-31 | 2023-09-30 | 2023-06-30 | 2023-03-31 | 2022-12-31 | 2022-09-30 | 2022-06-30 | 2022-03-31 | 2021-12-31 | 2021-09-30 | 2021-06-30 | 2021-03-31 | 2020-12-31 | 2020-09-30 | 2020-06-30 | 2020-03-31 | 2019-12-31 | 2019-09-30 | 2019-06-30 | 2019-03-31 | 2018-12-31 | 2018-09-30 | 2018-06-30 | 2018-03-31 | 2017-12-31 | 2017-09-30 | 2017-06-30 | 2017-03-31 | 2016-12-31 | 2016-09-30 | 2016-06-30 | 2016-03-31 | 2015-12-31 | 2015-09-30 | 2015-06-30 | 2015-03-31 | 2014-12-31 | 2014-09-30 | 2014-06-30 | 2014-03-31 | 2013-12-31 | 2013-09-30 | 2013-06-30 | 2013-03-31 | 2012-12-31 | 2012-09-30 | 2012-06-30 | 2012-03-31 | ||
|---|---|---|---|---|---|---|---|---|---|---|---|---|---|---|---|---|---|---|---|---|---|---|---|---|---|---|---|---|---|---|---|---|---|---|---|---|---|---|---|---|---|---|---|---|---|---|---|---|---|---|
| Net Cash Provided By Used In Investing Activities | -21.99 | -402.50 | -47.06 | -21.73 | -36.64 | -27.32 | -59.81 | -31.90 | -14.29 | -23.52 | -13.27 | -12.62 | -34.41 | -11.71 | -18.47 | -9.04 | -9.41 | -15.48 | -14.24 | -21.66 | -13.96 | -16.31 | -9.15 | -6.47 | -9.37 | -8.81 | -53.75 | -8.86 | -6.68 | -20.23 | -13.13 | -15.05 | -5.67 | NA | NA | NA | NA | NA | NA | NA | NA | NA | NA | NA | NA | NA | NA | NA | NA | |
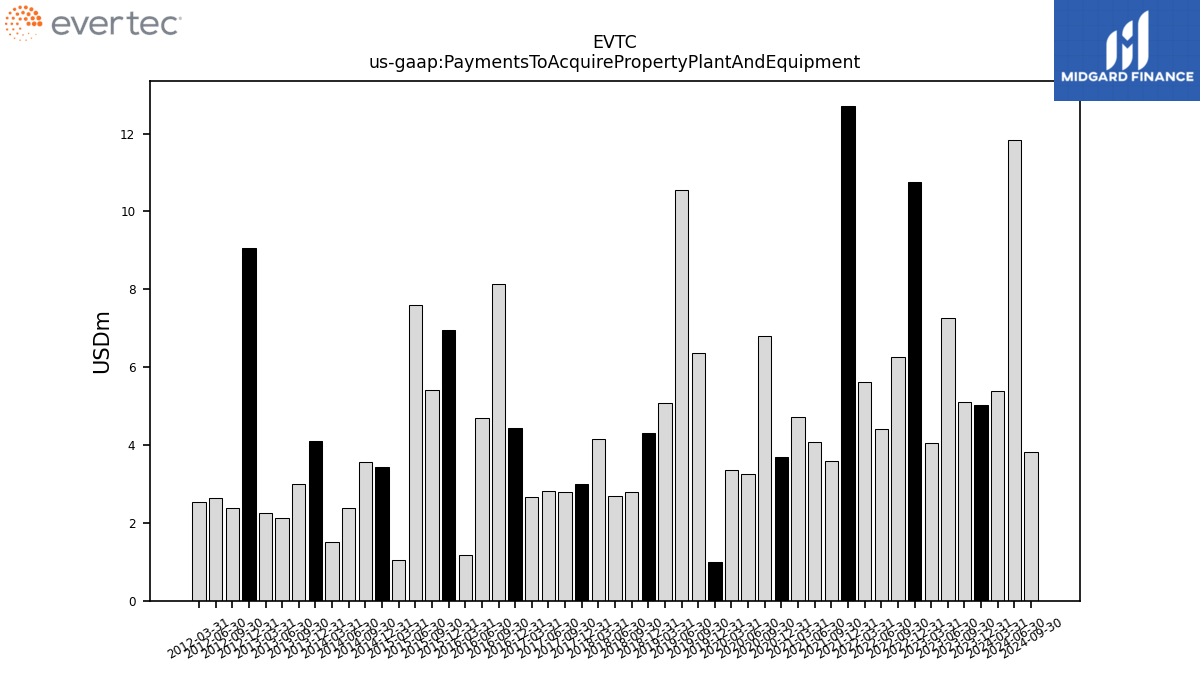
| Payments To Acquire Property Plant And Equipment | 5.39 | 5.02 | 5.10 | 7.26 | 4.06 | 10.76 | 6.26 | 4.42 | 5.63 | 12.71 | 3.58 | 4.08 | 4.72 | 3.68 | 6.79 | 3.26 | 3.36 | 1.01 | 6.37 | 10.55 | 5.07 | 4.31 | 2.78 | 2.68 | 4.16 | 3.00 | 2.80 | 2.81 | 2.67 | 4.43 | 8.14 | 4.70 | 1.18 | 6.95 | 5.42 | 7.61 | 1.04 | 3.44 | 3.57 | 2.39 | 1.50 | 4.11 | 3.00 | 2.13 | 2.26 | 9.07 | 2.37 | 2.63 | 2.53 |
| 2024-03-31 | 2023-12-31 | 2023-09-30 | 2023-06-30 | 2023-03-31 | 2022-12-31 | 2022-09-30 | 2022-06-30 | 2022-03-31 | 2021-12-31 | 2021-09-30 | 2021-06-30 | 2021-03-31 | 2020-12-31 | 2020-09-30 | 2020-06-30 | 2020-03-31 | 2019-12-31 | 2019-09-30 | 2019-06-30 | 2019-03-31 | 2018-12-31 | 2018-09-30 | 2018-06-30 | 2018-03-31 | 2017-12-31 | 2017-09-30 | 2017-06-30 | 2017-03-31 | 2016-12-31 | 2016-09-30 | 2016-06-30 | 2016-03-31 | 2015-12-31 | 2015-09-30 | 2015-06-30 | 2015-03-31 | 2014-12-31 | 2014-09-30 | 2014-06-30 | 2014-03-31 | 2013-12-31 | 2013-09-30 | 2013-06-30 | 2013-03-31 | 2012-12-31 | 2012-09-30 | 2012-06-30 | 2012-03-31 | ||
|---|---|---|---|---|---|---|---|---|---|---|---|---|---|---|---|---|---|---|---|---|---|---|---|---|---|---|---|---|---|---|---|---|---|---|---|---|---|---|---|---|---|---|---|---|---|---|---|---|---|---|
| Net Cash Provided By Used In Financing Activities | -16.35 | 472.12 | -10.23 | -18.04 | -40.58 | -57.26 | -40.71 | -22.63 | -36.17 | -7.21 | -7.21 | -18.15 | -48.72 | -11.84 | -22.83 | 3.41 | -31.36 | -13.11 | -7.59 | -33.90 | -15.63 | -45.23 | -8.85 | -33.62 | -17.36 | -26.55 | -28.25 | 4.09 | -18.48 | -16.29 | -32.79 | -24.45 | -17.27 | NA | NA | NA | NA | NA | NA | NA | NA | NA | NA | NA | NA | NA | NA | NA | NA | |
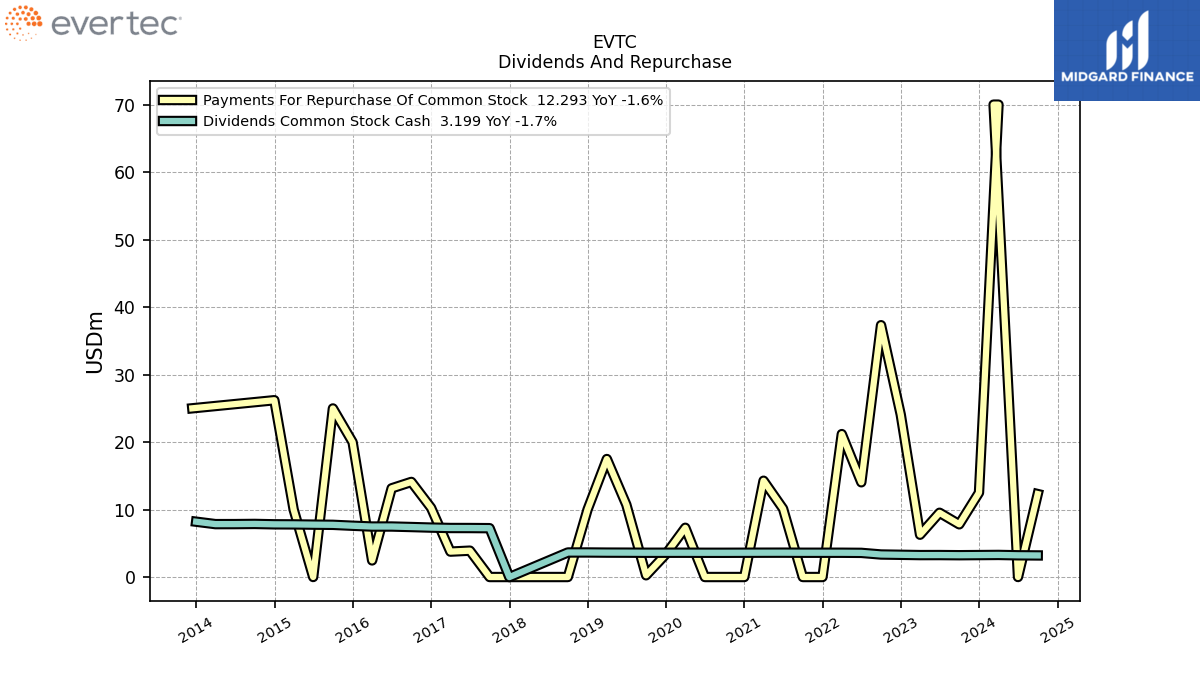
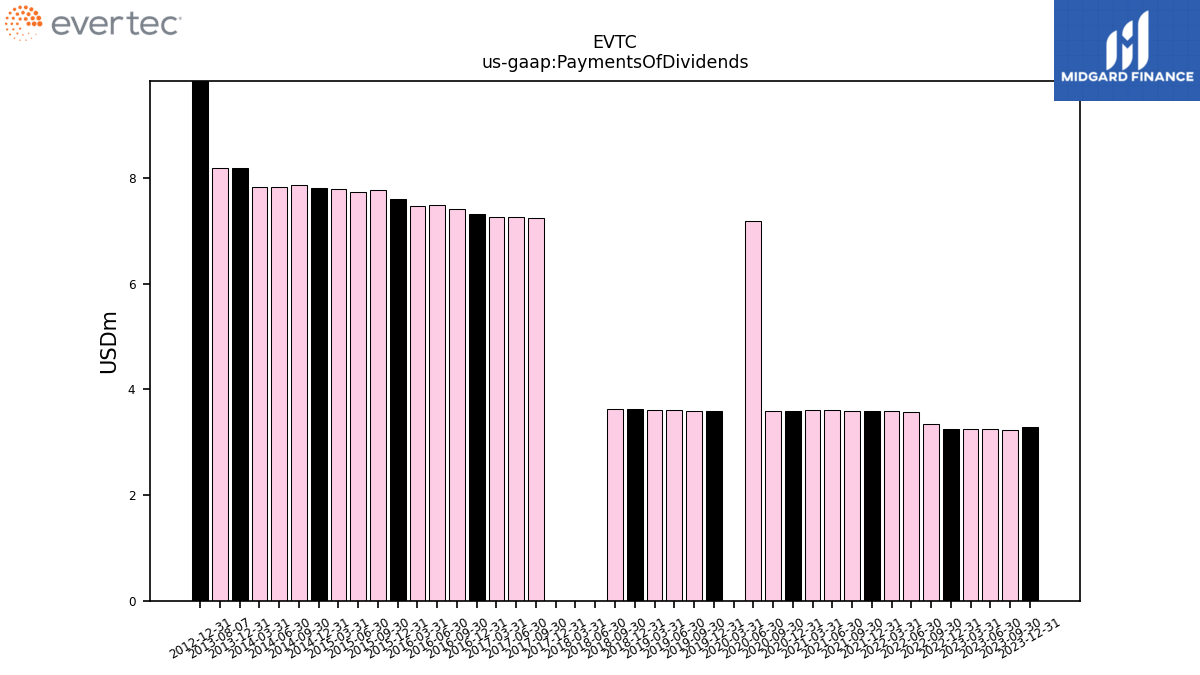
| Payments Of Dividends | NA | 3.29 | 3.23 | 3.25 | 3.25 | 3.26 | 3.34 | 3.58 | 3.60 | 3.60 | 3.60 | 3.61 | 3.60 | 3.60 | 3.59 | 7.19 | 0.00 | 3.60 | 3.60 | 3.61 | 3.62 | 3.64 | 3.64 | 0.00 | 0.00 | 0.00 | 7.24 | 7.26 | 7.26 | 7.32 | 7.41 | 7.48 | 7.48 | 7.60 | 7.78 | 7.74 | 7.80 | 7.81 | 7.87 | 7.84 | 7.84 | 8.20 | NA | NA | NA | 50.19 | NA | NA | NA | |
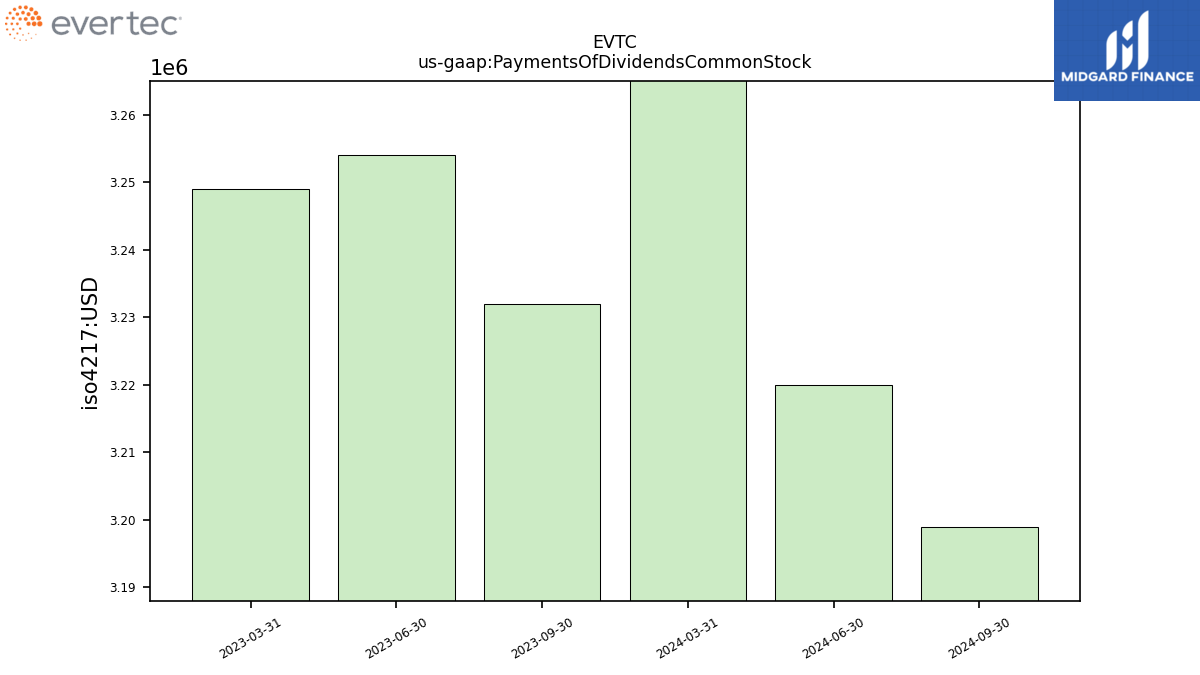
| Payments Of Dividends Common Stock | 3.27 | NA | NA | NA | 3.25 | NA | NA | NA | NA | NA | NA | NA | NA | NA | NA | NA | NA | NA | NA | NA | NA | NA | NA | NA | NA | NA | NA | NA | NA | NA | NA | NA | NA | NA | NA | NA | NA | NA | NA | NA | NA | NA | NA | NA | NA | NA | NA | NA | NA | |
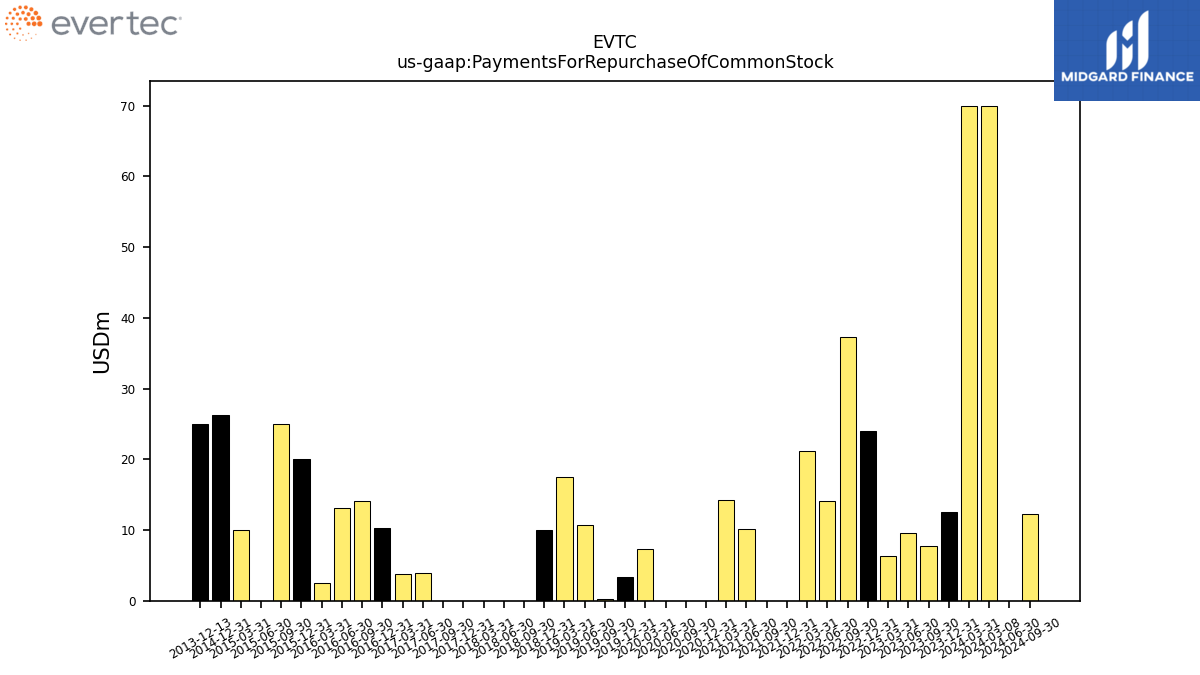
| Payments For Repurchase Of Common Stock | 70.00 | 12.50 | 7.81 | 9.52 | 6.27 | 24.06 | 37.32 | 14.04 | 21.18 | 0.00 | 0.00 | 10.12 | 14.27 | 0.00 | 0.00 | 0.00 | 7.30 | 3.37 | 0.25 | 10.71 | 17.49 | 10.00 | 0.00 | 0.00 | 0.00 | 0.00 | 0.00 | 3.91 | 3.77 | 10.25 | 14.09 | 13.14 | 2.46 | 19.98 | 24.98 | 0.00 | 9.99 | 26.20 | NA | NA | NA | NA | NA | NA | NA | NA | NA | NA | NA |
| 2024-03-31 | 2023-12-31 | 2023-09-30 | 2023-06-30 | 2023-03-31 | 2022-12-31 | 2022-09-30 | 2022-06-30 | 2022-03-31 | 2021-12-31 | 2021-09-30 | 2021-06-30 | 2021-03-31 | 2020-12-31 | 2020-09-30 | 2020-06-30 | 2020-03-31 | 2019-12-31 | 2019-09-30 | 2019-06-30 | 2019-03-31 | 2018-12-31 | 2018-09-30 | 2018-06-30 | 2018-03-31 | 2017-12-31 | 2017-09-30 | 2017-06-30 | 2017-03-31 | 2016-12-31 | 2016-09-30 | 2016-06-30 | 2016-03-31 | 2015-12-31 | 2015-09-30 | 2015-06-30 | 2015-03-31 | 2014-12-31 | 2014-09-30 | 2014-06-30 | 2014-03-31 | 2013-12-31 | 2013-09-30 | 2013-06-30 | 2013-03-31 | 2012-12-31 | 2012-09-30 | 2012-06-30 | 2012-03-31 | ||
|---|---|---|---|---|---|---|---|---|---|---|---|---|---|---|---|---|---|---|---|---|---|---|---|---|---|---|---|---|---|---|---|---|---|---|---|---|---|---|---|---|---|---|---|---|---|---|---|---|---|---|
| Revenues | 205.32 | 194.62 | 173.20 | 167.08 | 159.81 | 161.79 | 145.80 | 160.57 | 150.25 | 155.24 | 145.88 | 149.15 | 139.53 | 134.20 | 136.51 | 117.94 | 121.94 | 127.19 | 118.80 | 122.55 | 118.84 | 118.23 | 112.02 | 113.35 | 110.27 | 99.63 | 102.72 | 103.51 | 101.28 | 101.89 | 94.47 | 97.67 | 95.48 | 96.18 | 92.78 | 93.24 | 91.33 | 94.16 | 88.64 | 91.12 | 87.21 | 93.31 | 87.41 | 89.17 | 87.34 | 90.98 | 83.84 | 84.37 | 82.49 | |
| Revenue From Contract With Customer Excluding Assessed Tax | 205.32 | 194.62 | 173.20 | 167.08 | 159.81 | 161.79 | 145.80 | 160.57 | 150.25 | 155.24 | 145.88 | 149.15 | 139.53 | 134.20 | 136.51 | 117.94 | 121.94 | 127.19 | 118.80 | 122.55 | 118.84 | 118.23 | 112.02 | 113.35 | 110.27 | 99.63 | 102.72 | 103.51 | 101.28 | 101.89 | 94.47 | 97.67 | 95.48 | 96.18 | 92.78 | 93.24 | 91.33 | 94.16 | 88.64 | 91.12 | 87.21 | 93.31 | 87.41 | 89.17 | 87.34 | 90.98 | 83.84 | 84.37 | 82.49 | |
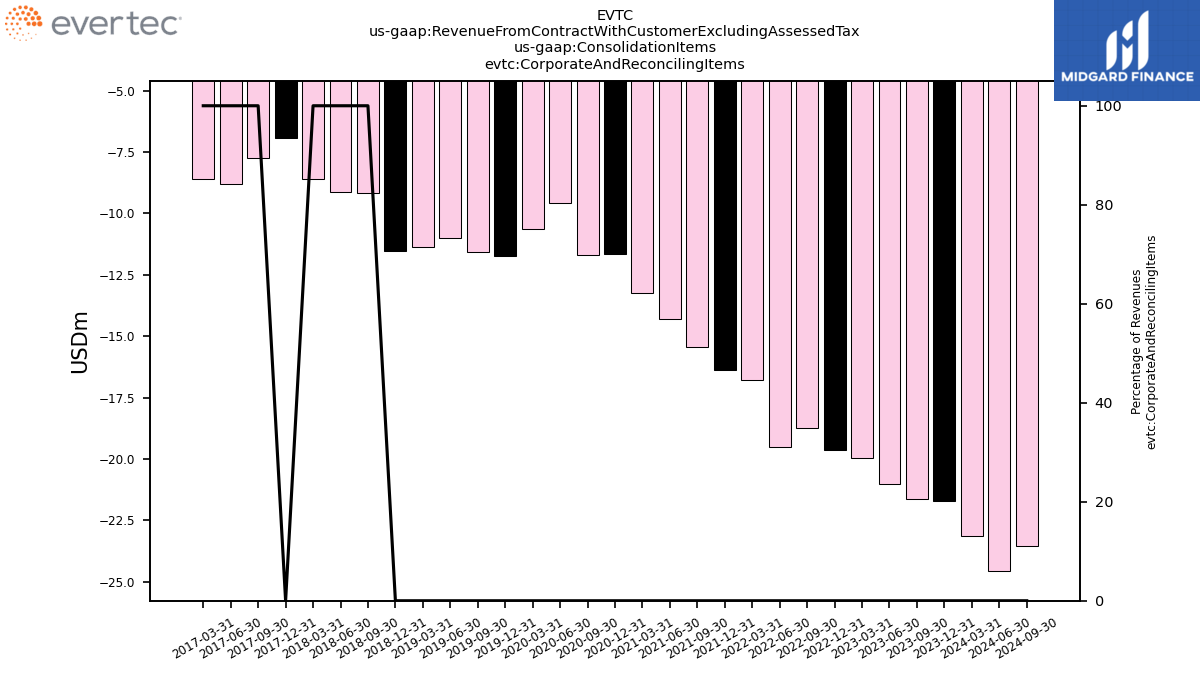
| Corporate And Reconciling Items | -23.16 | -21.73 | -21.64 | -21.01 | -19.97 | -19.61 | -18.75 | -19.52 | -16.80 | -16.38 | -15.42 | -14.30 | -13.23 | -11.67 | -11.68 | -9.58 | -10.65 | -11.72 | -11.58 | -11.02 | -11.35 | -11.53 | -9.16 | -9.13 | -8.59 | -6.94 | -7.76 | -8.80 | -8.60 | NA | NA | NA | NA | NA | NA | NA | NA | NA | NA | NA | NA | NA | NA | NA | NA | NA | NA | NA | NA | |
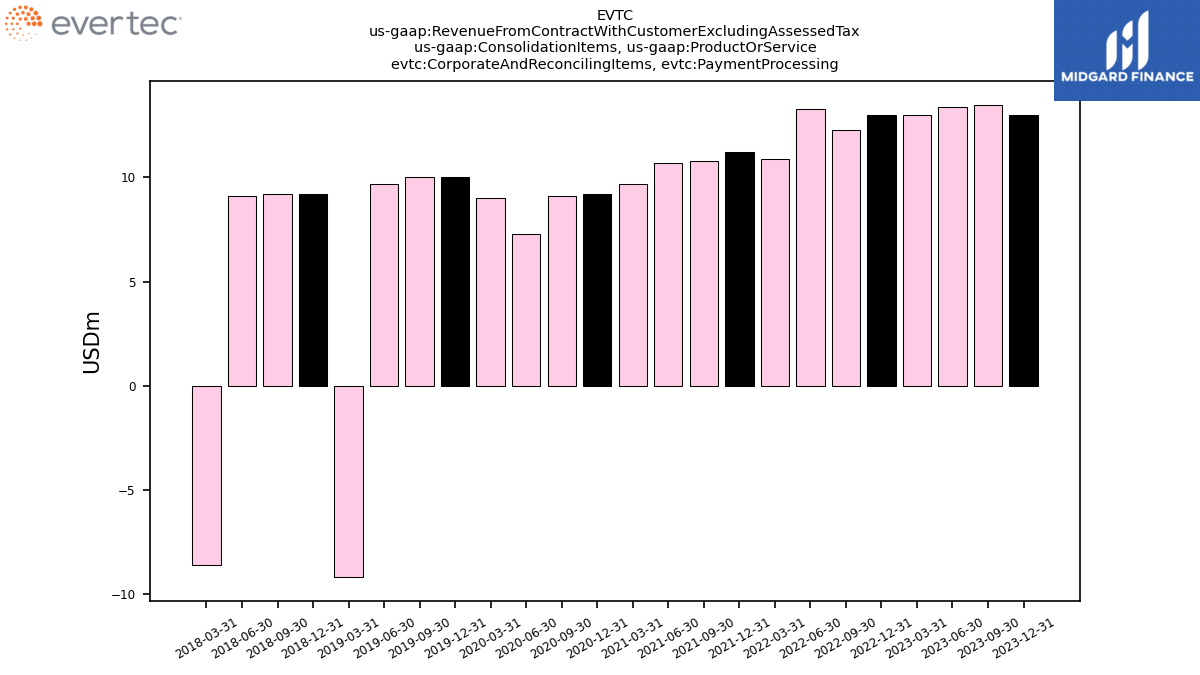
| Corporate And Reconciling Items, Payment Processing | 14.60 | 13.00 | 13.50 | 13.40 | 13.00 | 13.00 | 12.30 | 13.30 | 10.90 | 11.20 | 10.80 | 10.70 | 9.70 | 9.20 | 9.10 | 7.30 | 9.00 | 10.00 | 10.00 | 9.70 | -9.20 | 9.20 | 9.20 | 9.10 | -8.60 | NA | NA | NA | NA | NA | NA | NA | NA | NA | NA | NA | NA | NA | NA | NA | NA | NA | NA | NA | NA | NA | NA | NA | NA | |
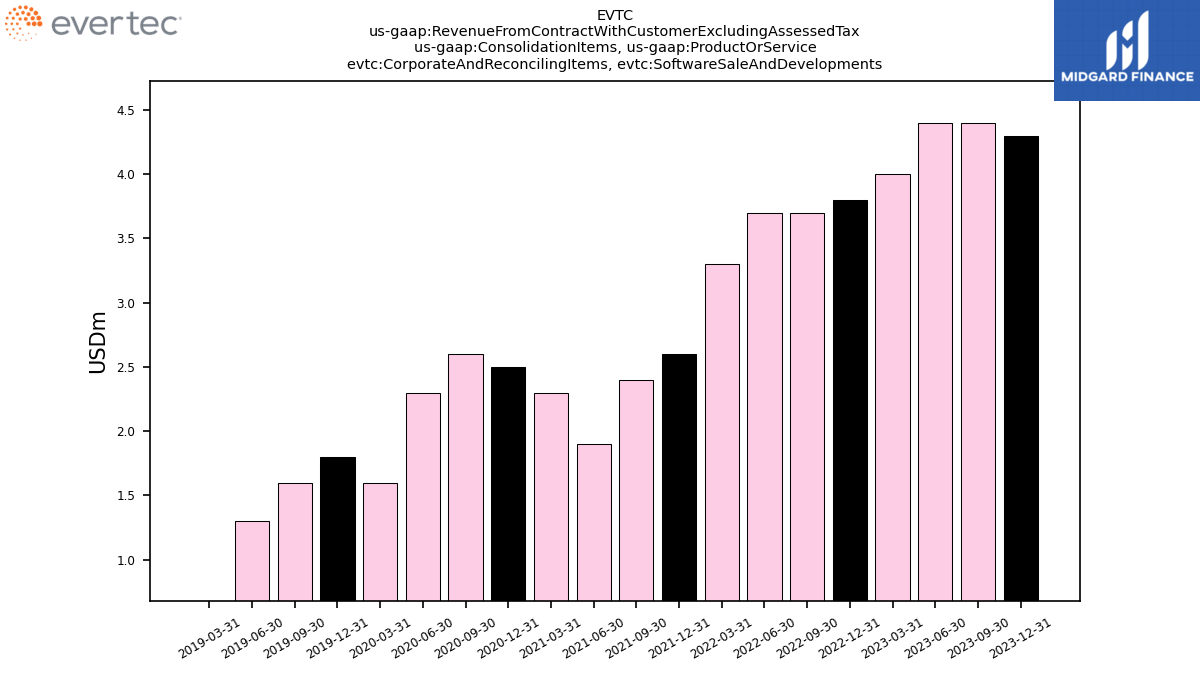
| Corporate And Reconciling Items, Software Sale And Developments | 4.10 | 4.30 | 4.40 | 4.40 | 4.00 | 3.80 | 3.70 | 3.70 | 3.30 | 2.60 | 2.40 | 1.90 | 2.30 | 2.50 | 2.60 | 2.30 | 1.60 | 1.80 | 1.60 | 1.30 | -2.10 | NA | NA | NA | NA | NA | NA | NA | NA | NA | NA | NA | NA | NA | NA | NA | NA | NA | NA | NA | NA | NA | NA | NA | NA | NA | NA | NA | NA | |
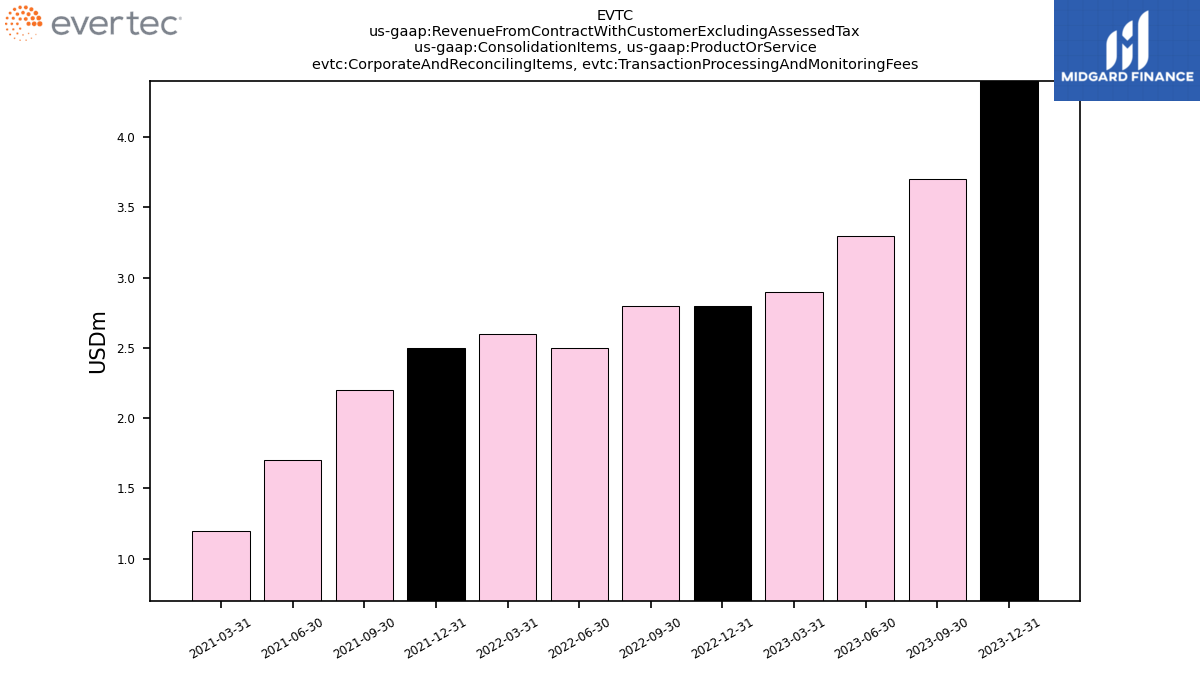
| Corporate And Reconciling Items, Transaction Processing And Monitoring Fees | 4.50 | 4.40 | 3.70 | 3.30 | 2.90 | 2.80 | 2.80 | 2.50 | 2.60 | 2.50 | 2.20 | 1.70 | 1.20 | NA | NA | NA | NA | NA | NA | NA | NA | NA | NA | NA | NA | NA | NA | NA | NA | NA | NA | NA | NA | NA | NA | NA | NA | NA | NA | NA | NA | NA | NA | NA | NA | NA | NA | NA | NA | |
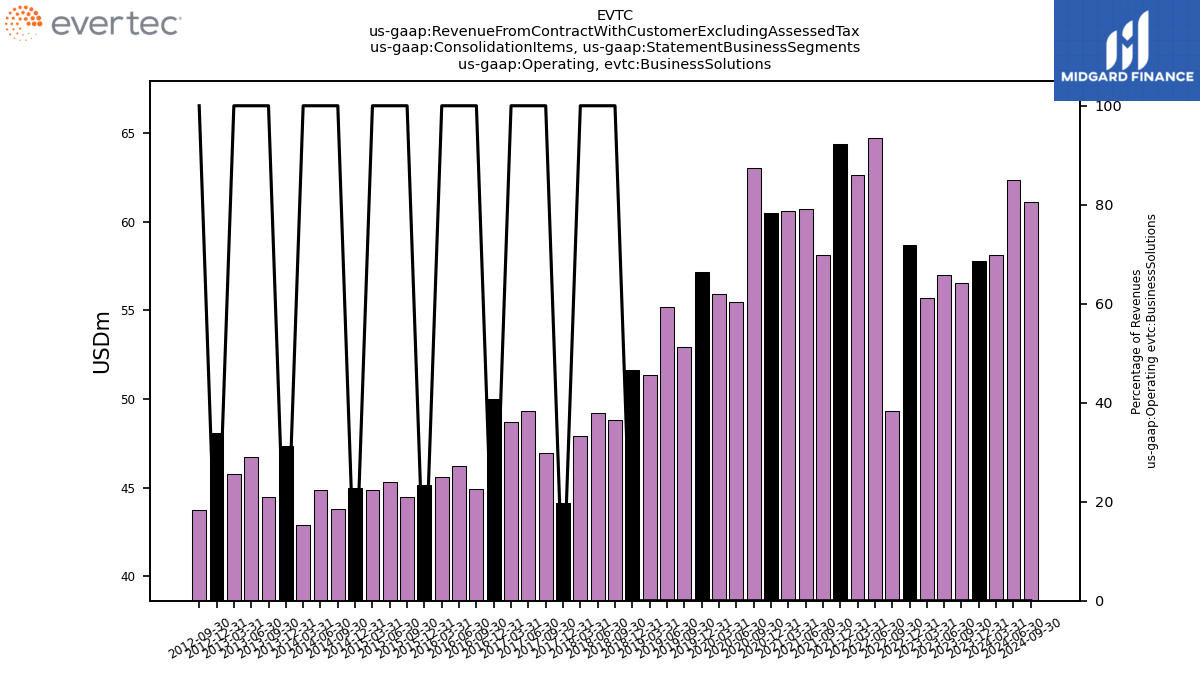
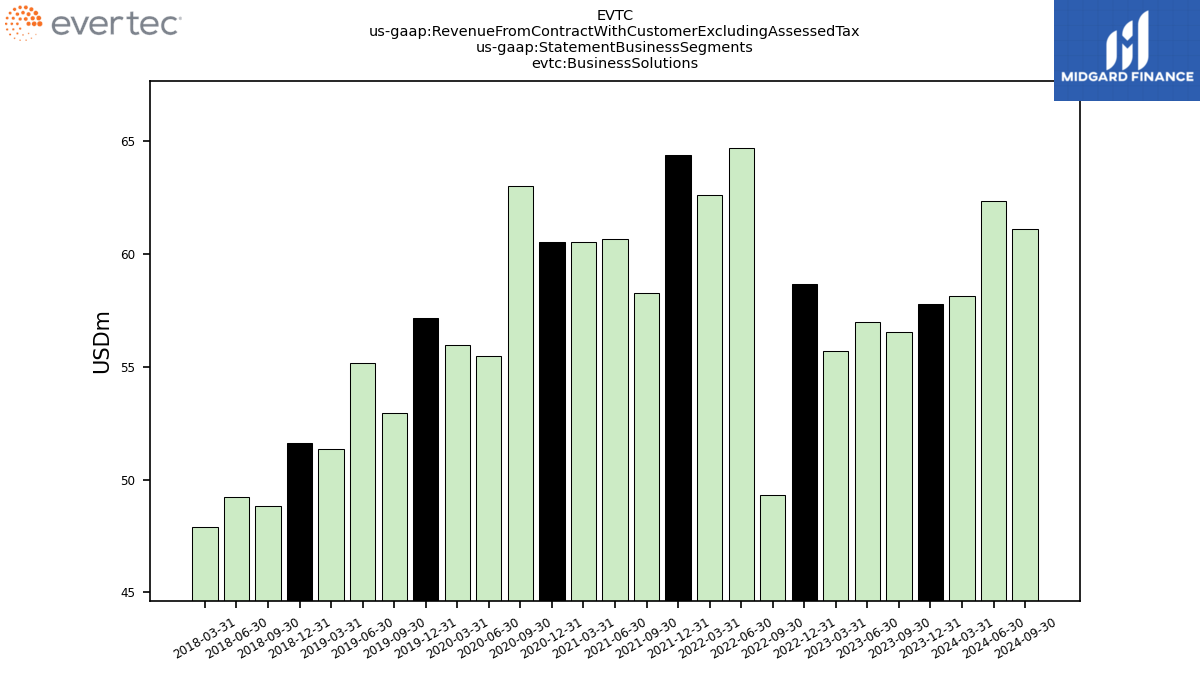
| Operating, Business Solutions | 58.13 | 57.77 | 56.52 | 56.97 | 55.70 | 58.68 | 49.31 | 64.69 | 62.62 | 64.37 | 58.13 | 60.69 | 60.61 | 60.51 | 63.02 | 55.49 | 55.94 | 57.17 | 52.95 | 55.18 | 51.36 | 51.62 | 48.83 | 49.23 | 47.92 | 44.13 | 46.95 | 49.31 | 48.68 | 49.99 | 44.91 | 46.24 | 45.61 | 45.12 | 44.49 | 45.32 | 44.86 | 44.96 | 43.80 | 44.89 | 42.92 | 47.33 | 44.47 | 46.73 | 45.77 | 48.08 | 43.74 | NA | NA | |
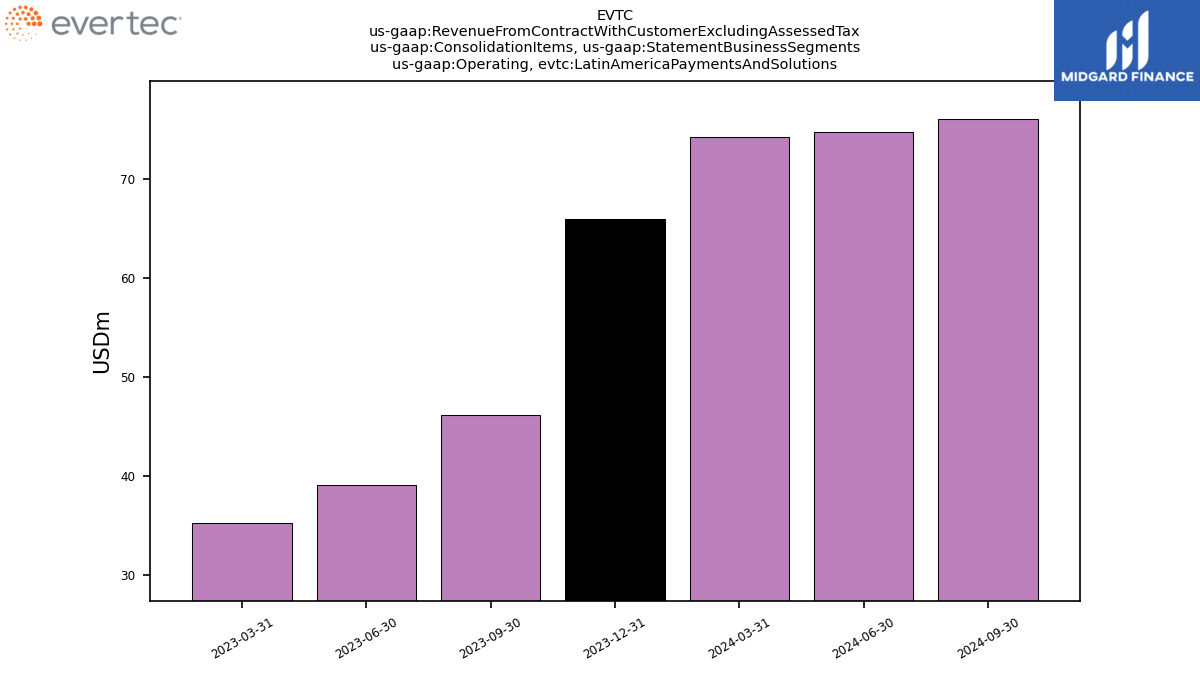
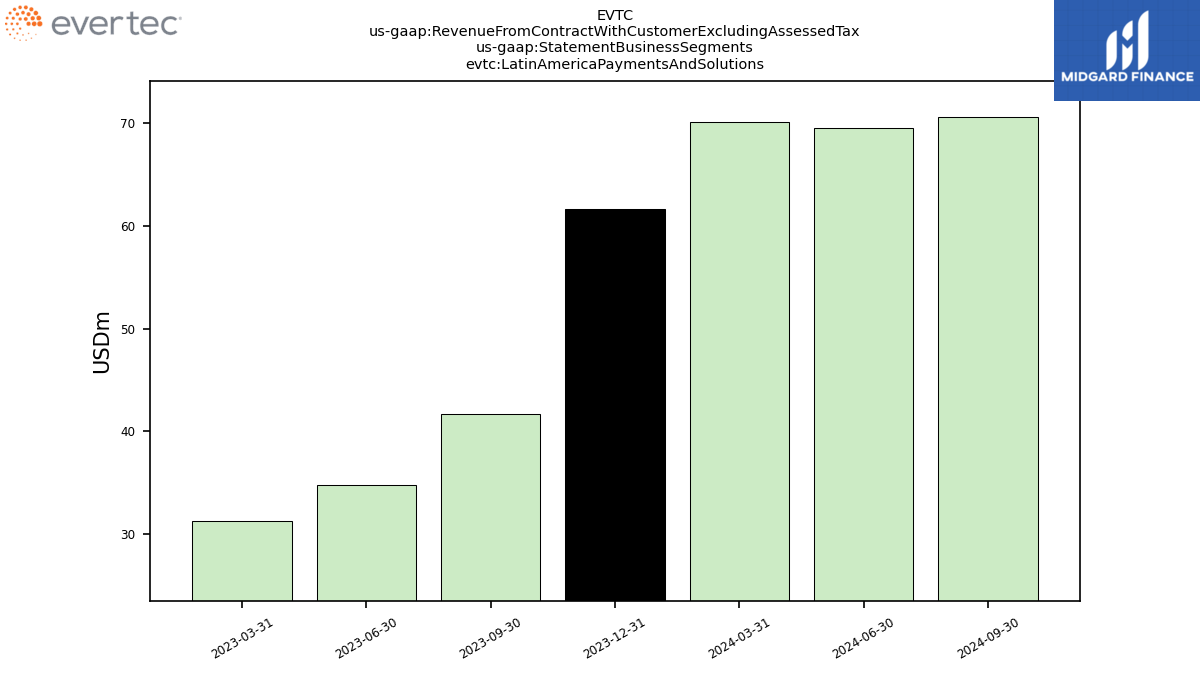
| Operating, Latin America Payments And Solutions | 74.22 | NA | NA | NA | 35.32 | NA | NA | NA | NA | NA | NA | NA | NA | NA | NA | NA | NA | NA | NA | NA | NA | NA | NA | NA | NA | NA | NA | NA | NA | NA | NA | NA | NA | NA | NA | NA | NA | NA | NA | NA | NA | NA | NA | NA | NA | NA | NA | NA | NA | |
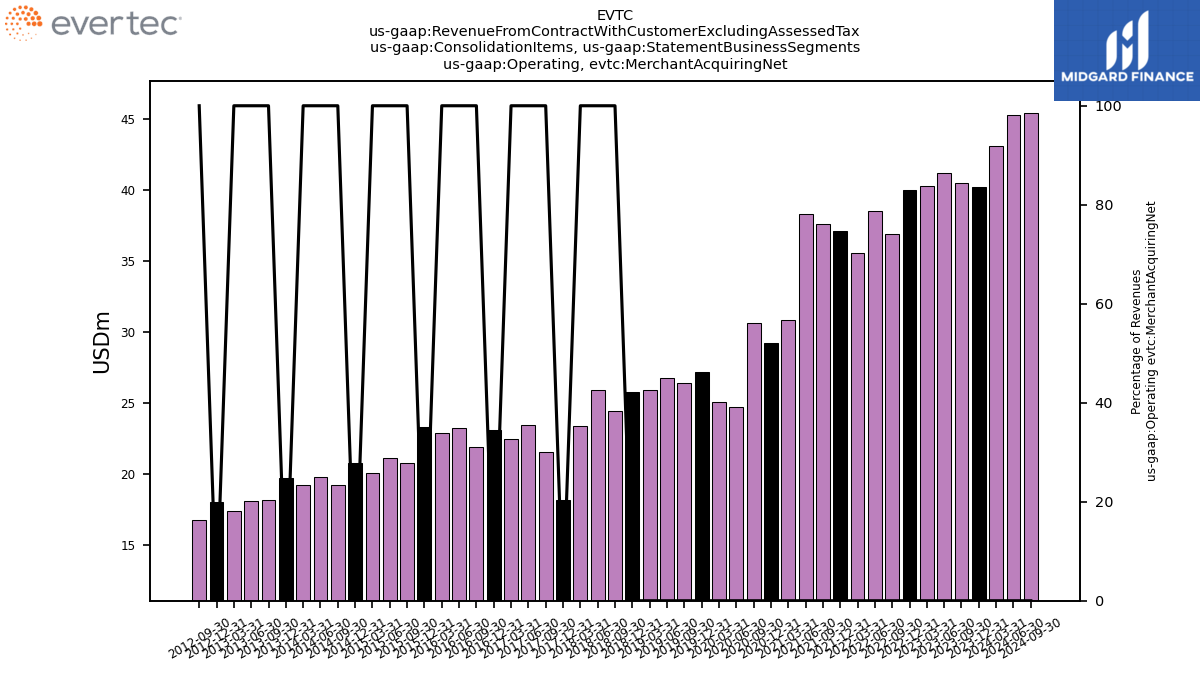
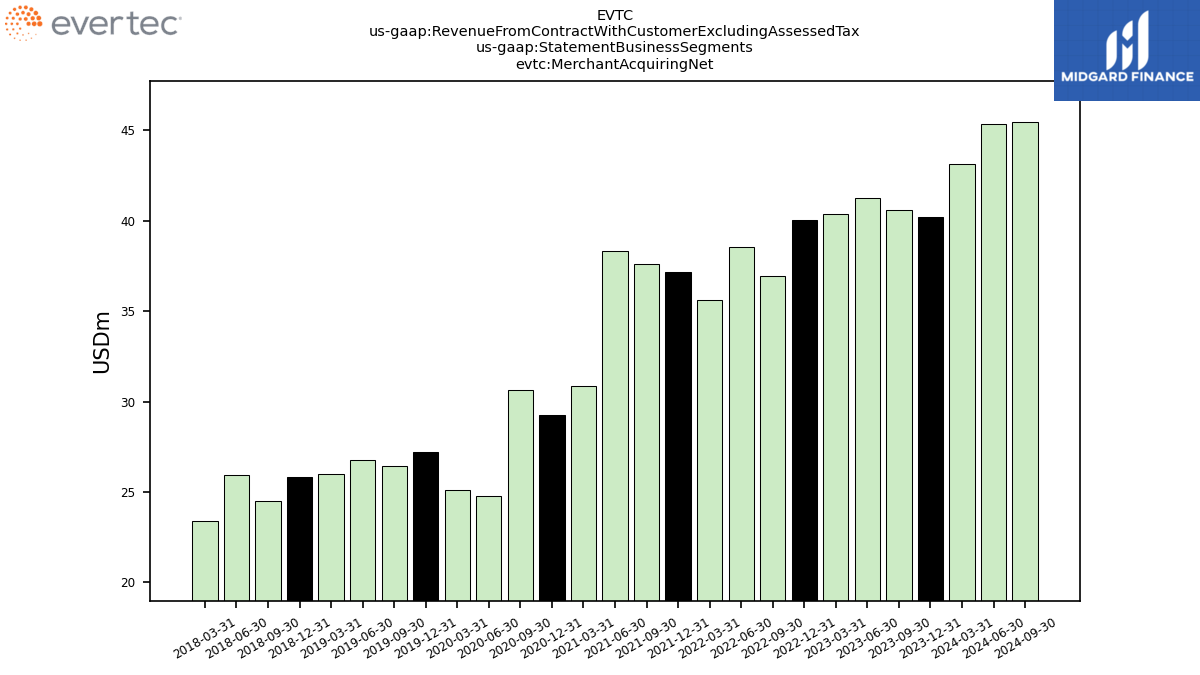
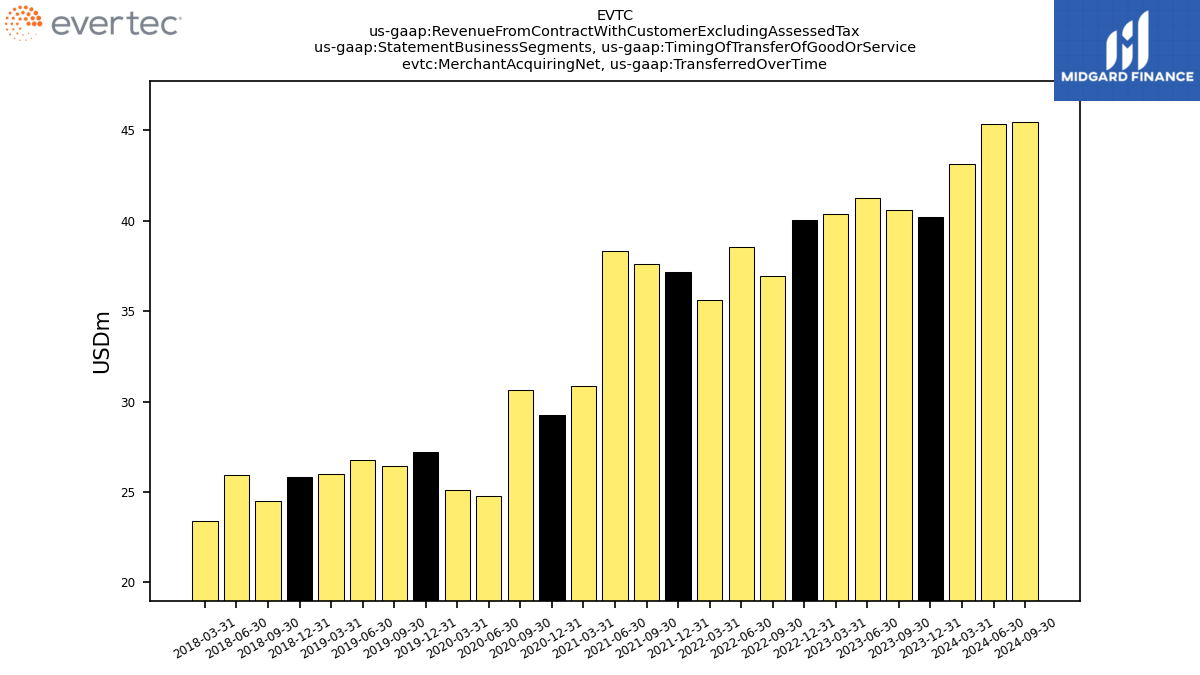
| Operating, Merchant Acquiring Net | 43.10 | 40.21 | 40.56 | 41.25 | 40.35 | 40.01 | 36.91 | 38.54 | 35.63 | 37.16 | 37.61 | 38.34 | 30.87 | 29.26 | 30.65 | 24.76 | 25.12 | 27.18 | 26.44 | 26.79 | 25.97 | 25.83 | 24.49 | 25.96 | 23.38 | 18.23 | 21.55 | 23.51 | 22.48 | 23.11 | 21.97 | 23.28 | 22.89 | 23.37 | 20.78 | 21.16 | 20.09 | 20.79 | 19.23 | 19.83 | 19.29 | 19.78 | 18.21 | 18.16 | 17.46 | 18.09 | 16.81 | NA | NA | |
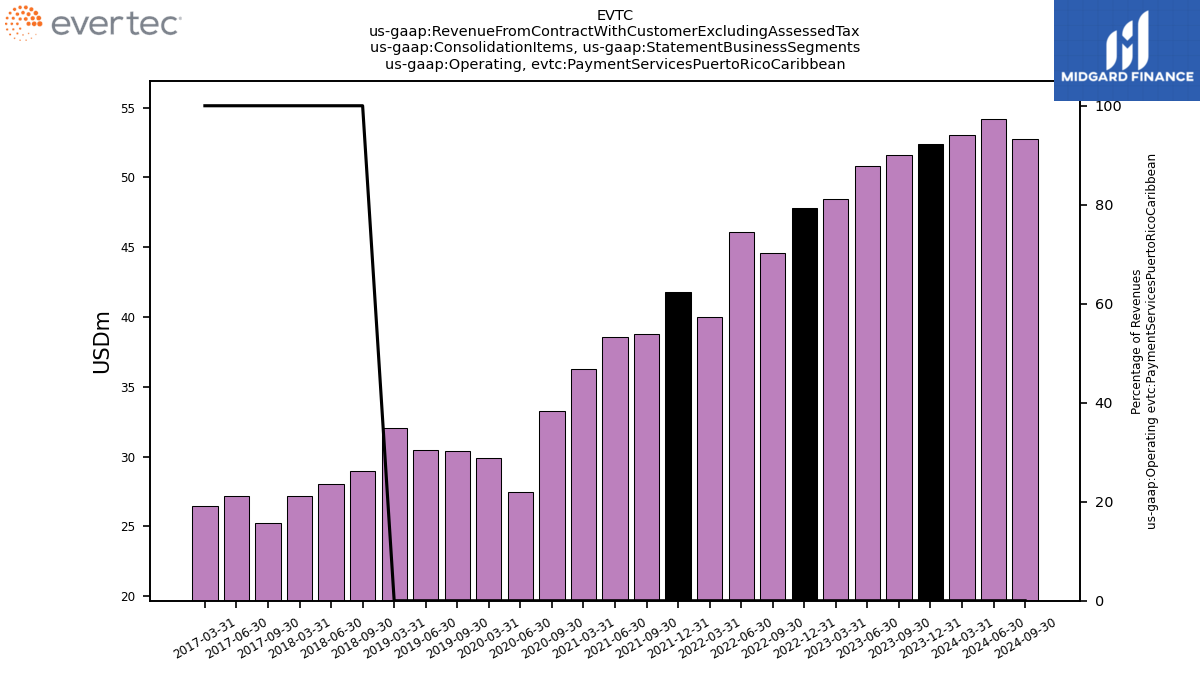
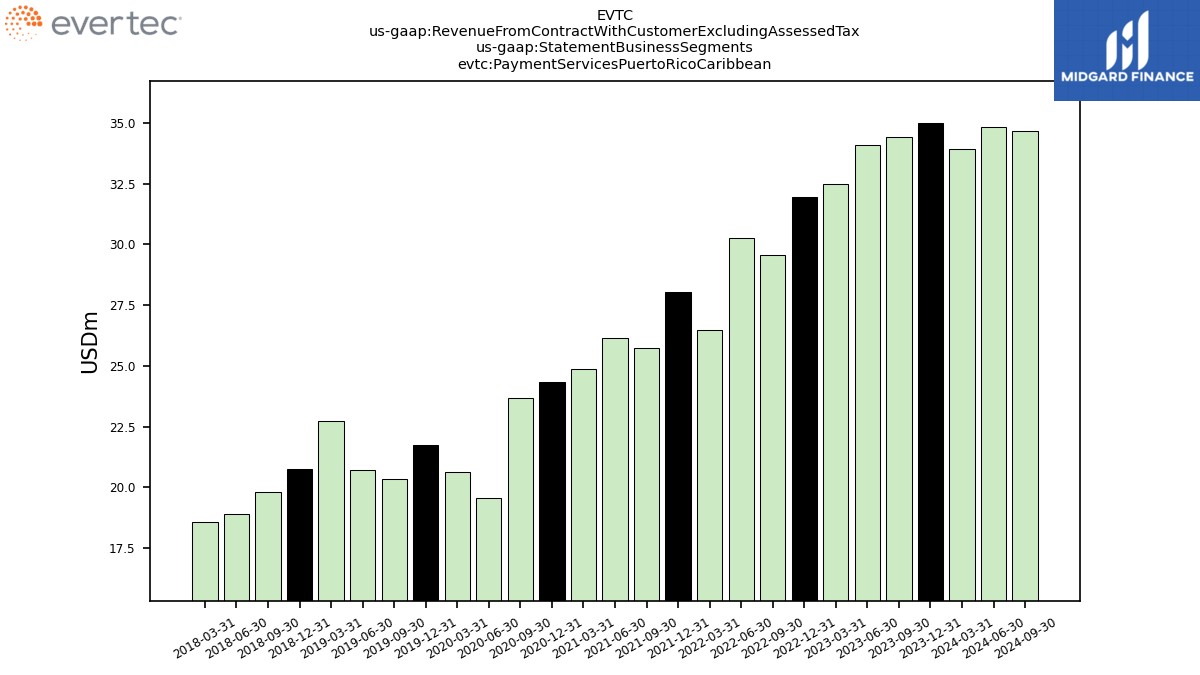
| Operating, Payment Services Puerto Rico Caribbean | 53.03 | 52.41 | 51.60 | 50.80 | 48.43 | 47.80 | 44.59 | 46.08 | 40.01 | 41.77 | 38.77 | 38.59 | 36.26 | NA | 33.28 | 27.46 | 29.89 | NA | 30.41 | 30.48 | 32.02 | NA | 28.95 | 28.04 | 27.17 | NA | 25.23 | 27.14 | 26.45 | NA | NA | NA | NA | NA | NA | NA | NA | NA | NA | NA | NA | NA | NA | NA | NA | NA | NA | NA | NA | |
| Business Solutions | 58.13 | 57.77 | 56.52 | 56.97 | 55.70 | 58.68 | 49.31 | 64.69 | 62.62 | 64.37 | 58.28 | 60.66 | 60.50 | 60.51 | 63.02 | 55.49 | 55.94 | 57.17 | 52.95 | 55.18 | 51.36 | 51.62 | 48.83 | 49.23 | 47.92 | NA | NA | NA | NA | NA | NA | NA | NA | NA | NA | NA | NA | NA | NA | NA | NA | NA | NA | NA | NA | NA | NA | NA | NA | |
| Latin America Payments And Solutions | 70.15 | NA | NA | NA | 31.29 | NA | NA | NA | NA | NA | NA | NA | NA | NA | NA | NA | NA | NA | NA | NA | NA | NA | NA | NA | NA | NA | NA | NA | NA | NA | NA | NA | NA | NA | NA | NA | NA | NA | NA | NA | NA | NA | NA | NA | NA | NA | NA | NA | NA | |
| Merchant Acquiring Net | 43.10 | 40.21 | 40.56 | 41.25 | 40.35 | 40.01 | 36.91 | 38.54 | 35.63 | 37.16 | 37.61 | 38.34 | 30.87 | 29.26 | 30.65 | 24.77 | 25.12 | 27.18 | 26.44 | 26.79 | 25.97 | 25.83 | 24.49 | 25.96 | 23.38 | NA | NA | NA | NA | NA | NA | NA | NA | NA | NA | NA | NA | NA | NA | NA | NA | NA | NA | NA | NA | NA | NA | NA | NA | |
| Payment Services Puerto Rico Caribbean | 33.94 | 34.98 | 34.41 | 34.11 | 32.48 | 31.97 | 29.55 | 30.26 | 26.48 | 28.03 | 25.74 | 26.16 | 24.86 | 24.35 | 23.70 | 19.59 | 20.64 | 21.74 | 20.34 | 20.70 | 22.75 | 20.75 | 19.79 | 18.91 | 18.58 | NA | NA | NA | NA | NA | NA | NA | NA | NA | NA | NA | NA | NA | NA | NA | NA | NA | NA | NA | NA | NA | NA | NA | NA | |
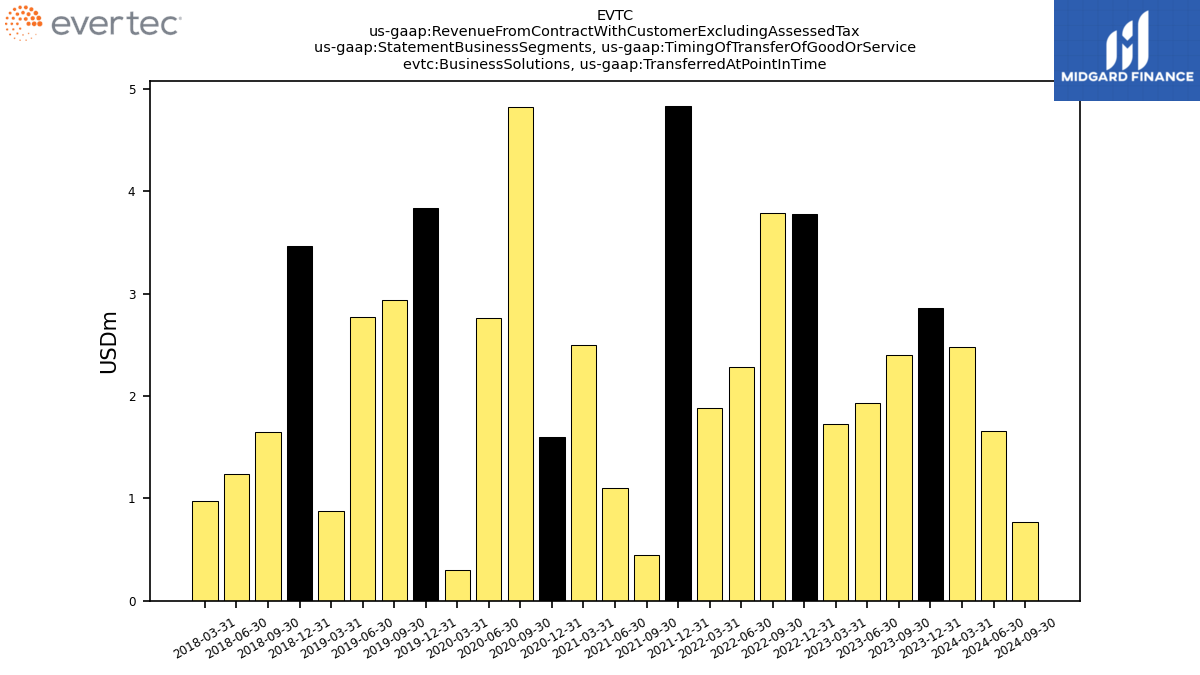
| Business Solutions, Transferred At Point In Time | 2.48 | 2.86 | 2.40 | 1.93 | 1.73 | 3.78 | 3.79 | 2.28 | 1.89 | 4.83 | 0.45 | 1.10 | 2.50 | 1.60 | 4.82 | 2.77 | 0.30 | 3.83 | 2.94 | 2.77 | 0.88 | 3.47 | 1.65 | 1.24 | 0.97 | NA | NA | NA | NA | NA | NA | NA | NA | NA | NA | NA | NA | NA | NA | NA | NA | NA | NA | NA | NA | NA | NA | NA | NA | |
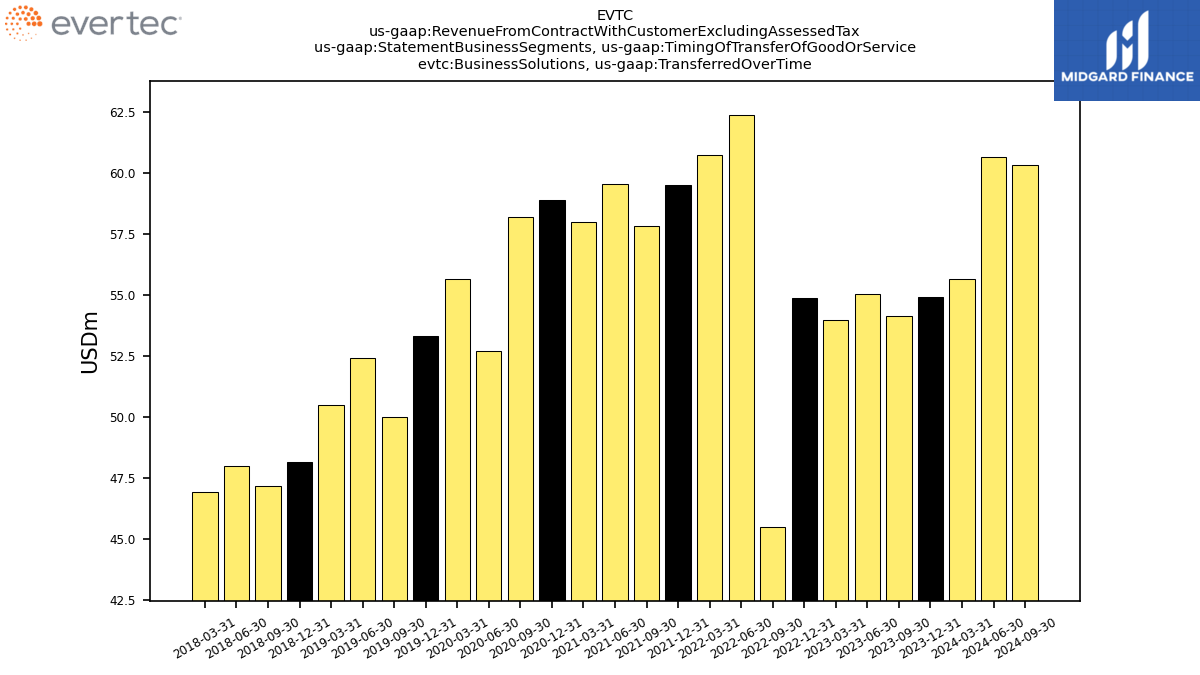
| Business Solutions, Transferred Over Time | 55.65 | 54.91 | 54.13 | 55.04 | 53.97 | 54.90 | 45.52 | 62.41 | 60.74 | 59.53 | 57.83 | 59.55 | 58.01 | 58.91 | 58.19 | 52.73 | 55.65 | 53.34 | 50.01 | 52.41 | 50.49 | 48.15 | 47.18 | 48.00 | 46.95 | NA | NA | NA | NA | NA | NA | NA | NA | NA | NA | NA | NA | NA | NA | NA | NA | NA | NA | NA | NA | NA | NA | NA | NA | |
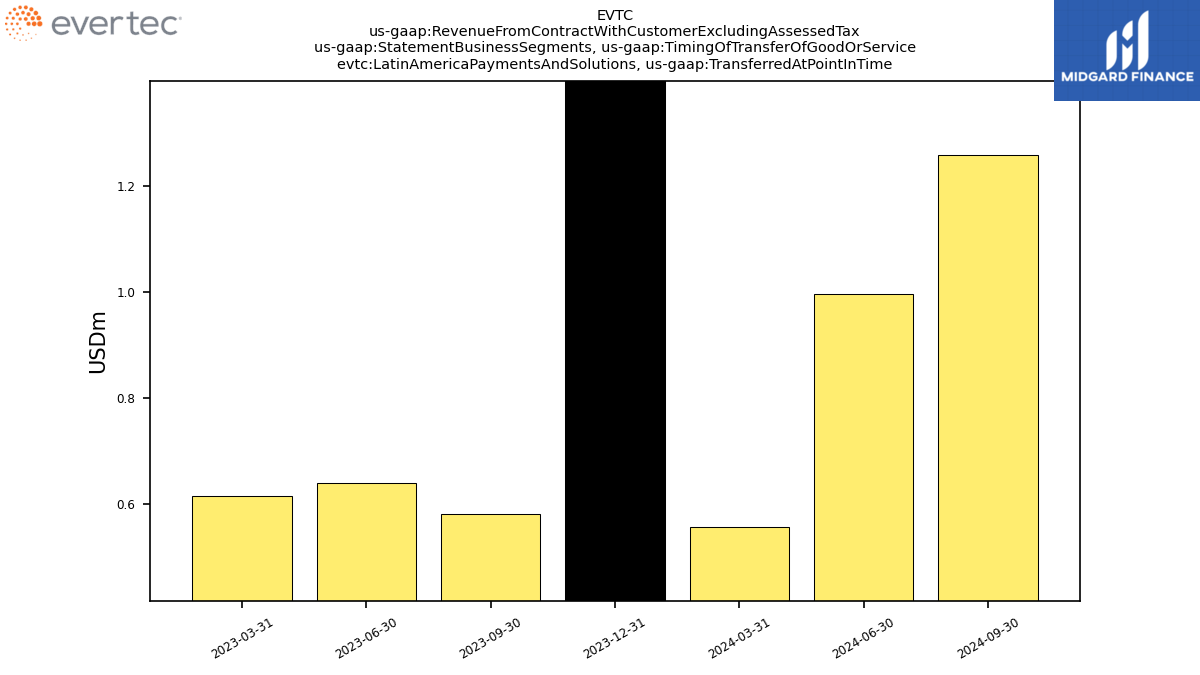
| Latin America Payments And Solutions, Transferred At Point In Time | 0.56 | NA | NA | NA | 0.61 | NA | NA | NA | NA | NA | NA | NA | NA | NA | NA | NA | NA | NA | NA | NA | NA | NA | NA | NA | NA | NA | NA | NA | NA | NA | NA | NA | NA | NA | NA | NA | NA | NA | NA | NA | NA | NA | NA | NA | NA | NA | NA | NA | NA | |
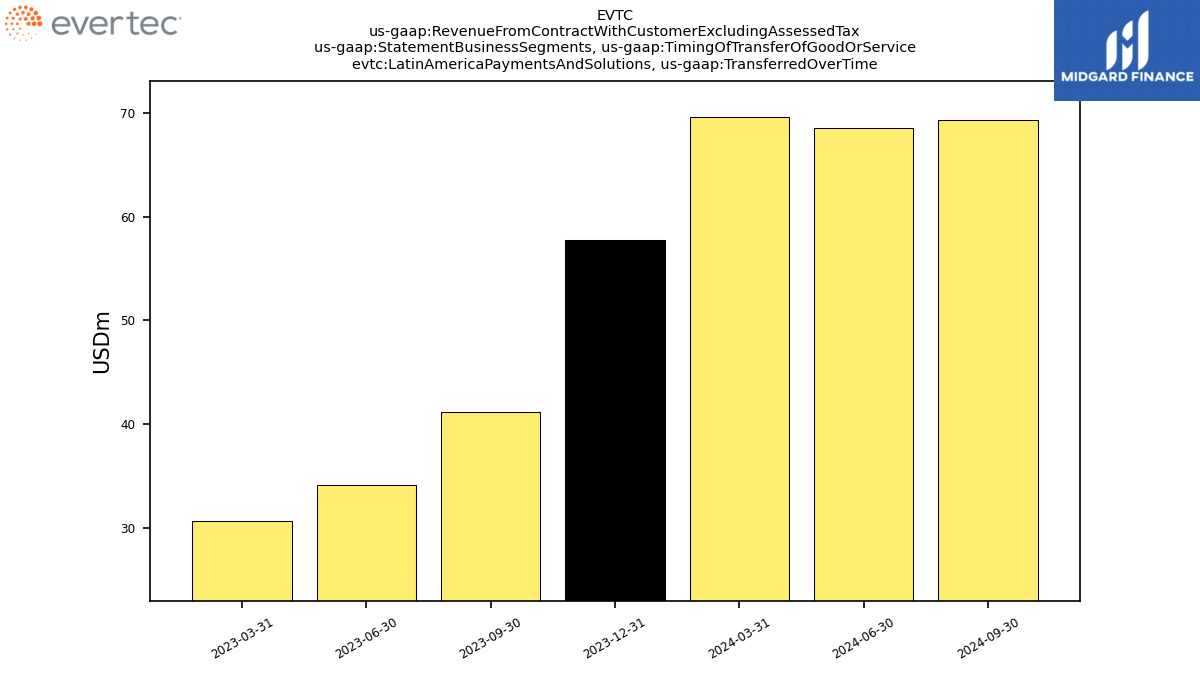
| Latin America Payments And Solutions, Transferred Over Time | 69.59 | NA | NA | NA | 30.68 | NA | NA | NA | NA | NA | NA | NA | NA | NA | NA | NA | NA | NA | NA | NA | NA | NA | NA | NA | NA | NA | NA | NA | NA | NA | NA | NA | NA | NA | NA | NA | NA | NA | NA | NA | NA | NA | NA | NA | NA | NA | NA | NA | NA | |
| Merchant Acquiring Net, Transferred Over Time | 43.10 | 40.21 | 40.56 | 41.25 | 40.35 | 40.01 | 36.91 | 38.54 | 35.63 | 37.16 | 37.61 | 38.34 | 30.87 | 29.26 | 30.65 | 24.77 | 25.12 | 27.18 | 26.44 | 26.79 | 25.97 | 25.83 | 24.49 | 25.96 | 23.38 | NA | NA | NA | NA | NA | NA | NA | NA | NA | NA | NA | NA | NA | NA | NA | NA | NA | NA | NA | NA | NA | NA | NA | NA | |
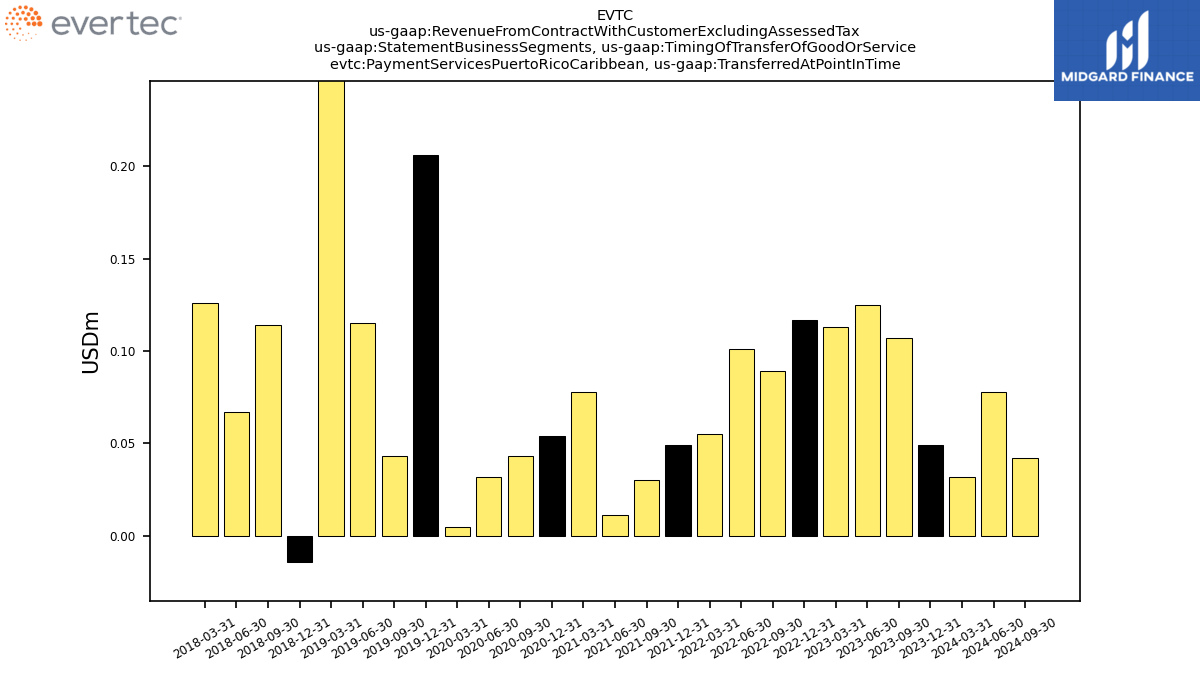
| Payment Services Puerto Rico Caribbean, Transferred At Point In Time | 0.03 | 0.05 | 0.11 | 0.12 | 0.11 | 0.12 | 0.09 | 0.10 | 0.06 | 0.05 | 0.03 | 0.01 | 0.08 | 0.05 | 0.04 | 0.03 | 0.01 | 0.21 | 0.04 | 0.12 | 2.68 | -0.01 | 0.11 | 0.07 | 0.13 | NA | NA | NA | NA | NA | NA | NA | NA | NA | NA | NA | NA | NA | NA | NA | NA | NA | NA | NA | NA | NA | NA | NA | NA | |
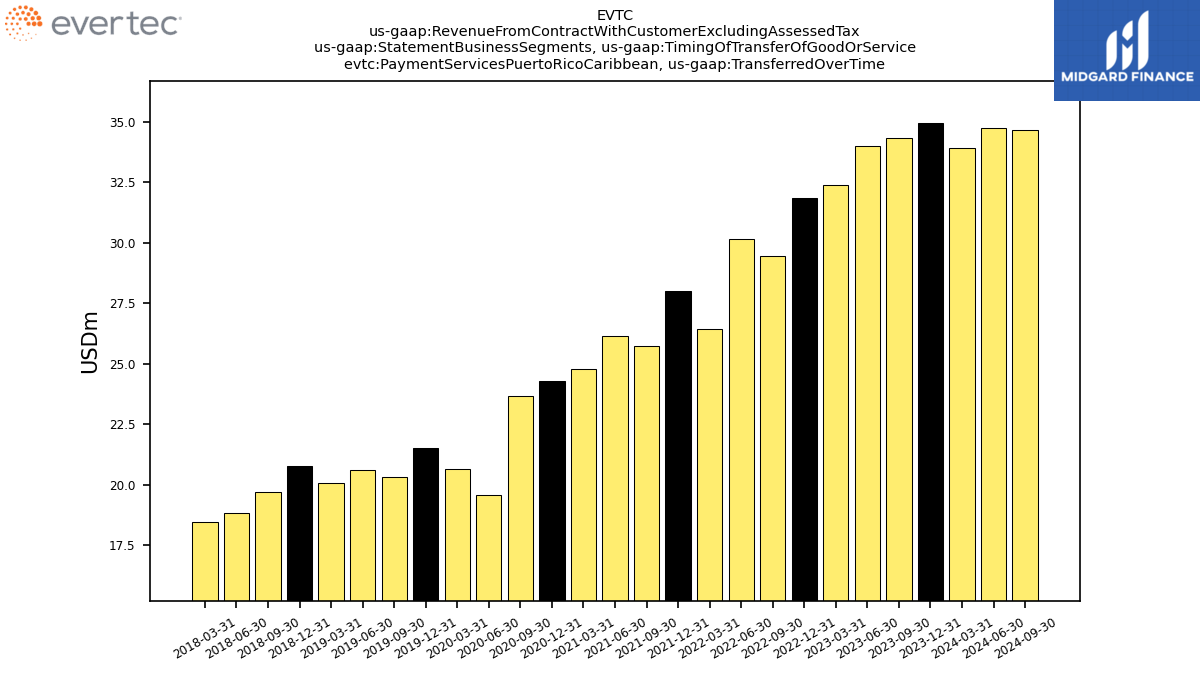
| Payment Services Puerto Rico Caribbean, Transferred Over Time | 33.91 | 34.93 | 34.30 | 33.98 | 32.37 | 31.86 | 29.46 | 30.16 | 26.43 | 27.98 | 25.71 | 26.15 | 24.78 | 24.30 | 23.65 | 19.55 | 20.63 | 21.53 | 20.30 | 20.59 | 20.07 | 20.76 | 19.68 | 18.85 | 18.46 | NA | NA | NA | NA | NA | NA | NA | NA | NA | NA | NA | NA | NA | NA | NA | NA | NA | NA | NA | NA | NA | NA | NA | NA | |
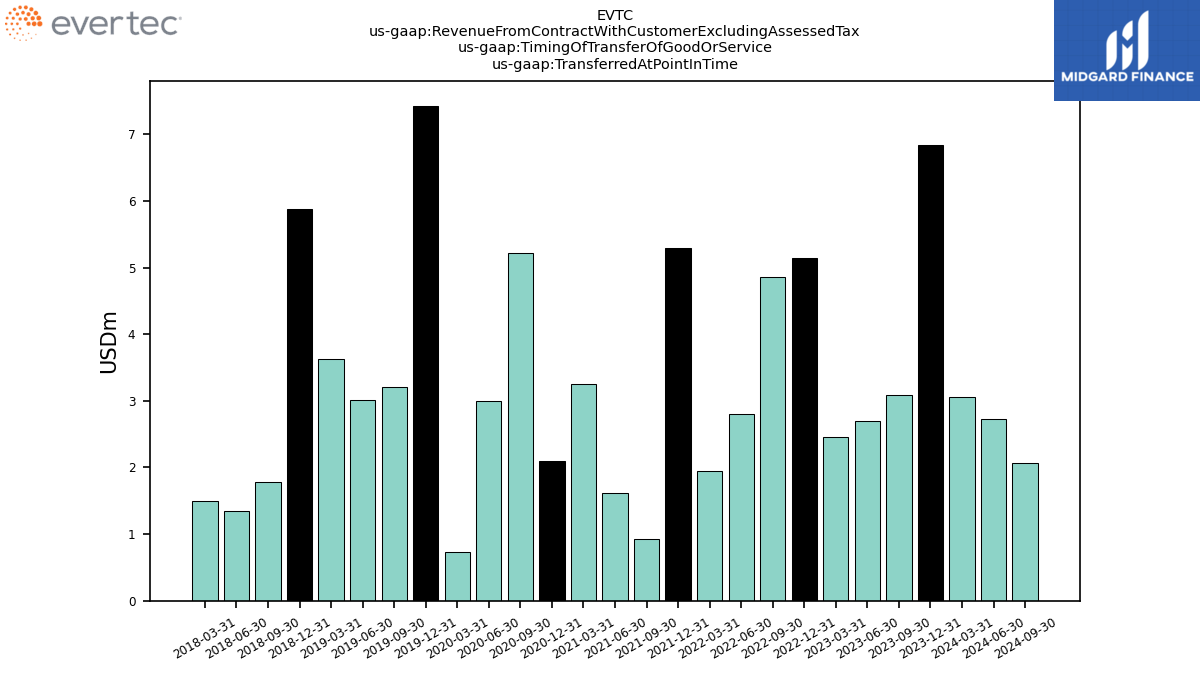
| Transferred At Point In Time | 3.06 | 6.84 | 3.08 | 2.69 | 2.45 | 5.14 | 4.85 | 2.80 | 1.95 | 5.29 | 0.93 | 1.62 | 3.25 | 2.10 | 5.22 | 3.00 | 0.73 | 7.43 | 3.21 | 3.01 | 3.62 | 5.87 | 1.78 | 1.34 | 1.49 | NA | NA | NA | NA | NA | NA | NA | NA | NA | NA | NA | NA | NA | NA | NA | NA | NA | NA | NA | NA | NA | NA | NA | NA | |
| Transferred Over Time | 202.25 | 187.78 | 170.11 | 164.38 | 157.36 | 156.65 | 140.95 | 157.77 | 148.29 | 149.94 | 144.96 | 147.53 | 136.28 | 132.10 | 131.28 | 114.93 | 121.21 | 119.76 | 115.59 | 119.54 | 115.21 | 112.36 | 110.24 | 112.01 | 108.78 | NA | NA | NA | NA | NA | NA | NA | NA | NA | NA | NA | NA | NA | NA | NA | NA | NA | NA | NA | NA | NA | NA | NA | NA |