
| 2024-03-31 | 2023-12-31 | 2023-09-30 | 2023-06-30 | 2023-03-31 | 2022-12-31 | 2022-09-30 | 2022-06-30 | 2022-03-31 | 2021-12-31 | 2021-09-30 | 2021-06-30 | 2021-03-31 | 2020-12-31 | 2020-09-30 | 2020-06-30 | 2020-03-31 | 2019-12-31 | 2019-09-30 | 2019-06-30 | 2019-03-31 | 2018-12-31 | 2018-09-30 | 2018-06-30 | 2018-03-31 | 2017-12-31 | 2017-09-30 | 2017-06-30 | 2017-03-31 | 2016-12-31 | 2016-09-30 | 2016-06-30 | 2016-03-31 | 2015-12-31 | 2015-09-30 | 2015-06-30 | 2015-03-31 | 2014-12-31 | 2014-09-30 | 2014-06-30 | 2014-03-31 | 2013-12-31 | 2013-09-30 | 2013-06-30 | 2013-03-31 | 2012-12-31 | 2012-09-30 | 2012-06-30 | 2012-03-31 | ||
|---|---|---|---|---|---|---|---|---|---|---|---|---|---|---|---|---|---|---|---|---|---|---|---|---|---|---|---|---|---|---|---|---|---|---|---|---|---|---|---|---|---|---|---|---|---|---|---|---|---|---|
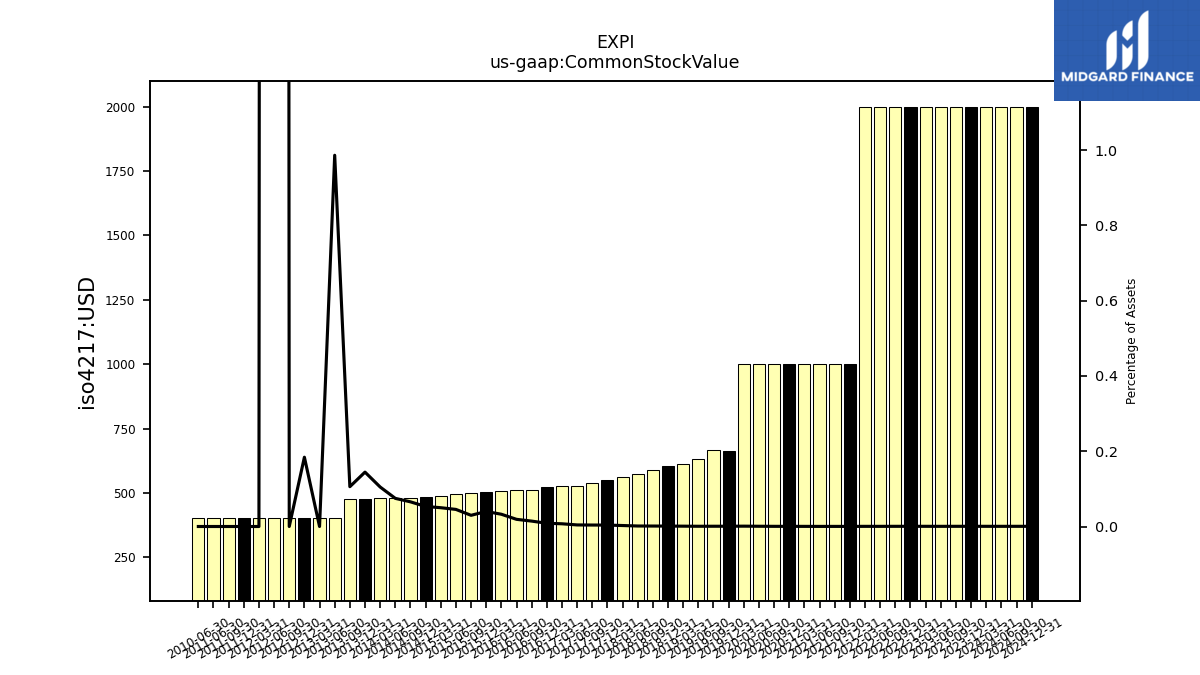
| Common Stock Value | 0.00 | 0.00 | 0.00 | 0.00 | 0.00 | 0.00 | 0.00 | 0.00 | 0.00 | 0.00 | 0.00 | 0.00 | 0.00 | 0.00 | 0.00 | 0.00 | 0.00 | 0.00 | 0.00 | 0.00 | 0.00 | 0.00 | 0.00 | 0.00 | 0.00 | 0.00 | 0.00 | 0.00 | 0.00 | 0.00 | 0.00 | 0.00 | 0.00 | 0.00 | 0.00 | 0.00 | 0.00 | 0.00 | 0.00 | 0.00 | 0.00 | 0.00 | 0.00 | 0.00 | 0.00 | 0.00 | 0.00 | 0.00 | 0.00 | |
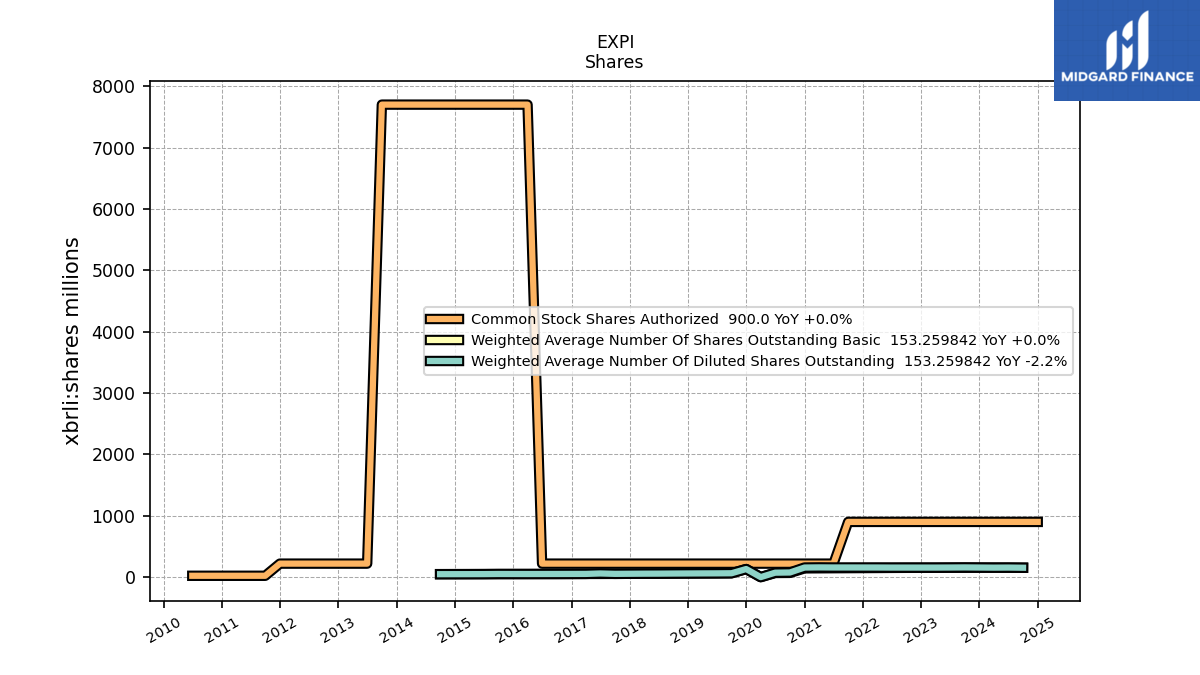
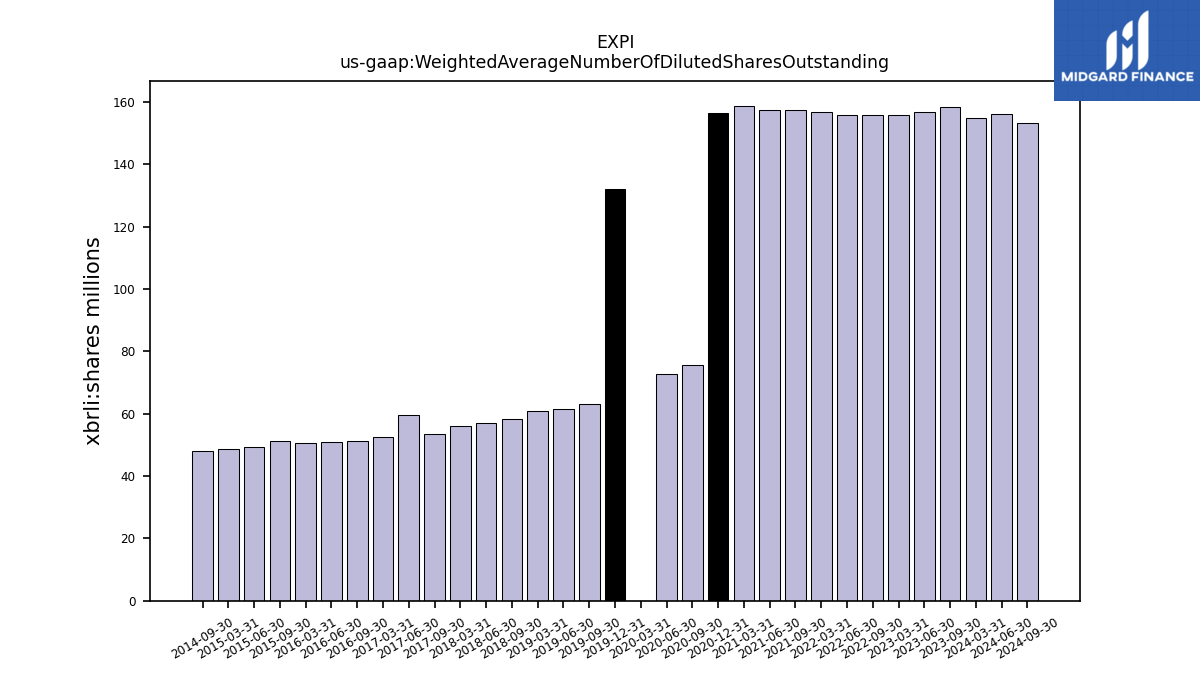
| Weighted Average Number Of Diluted Shares Outstanding | 154.74 | NA | 158.18 | 156.69 | 155.67 | NA | 155.92 | 155.82 | 156.84 | NA | 157.35 | 157.29 | 158.72 | 156.54 | 75.65 | 72.66 | 0.07 | 131.91 | 63.20 | 61.53 | 60.75 | NA | 58.36 | 56.88 | 56.19 | NA | 53.34 | 59.64 | 52.42 | NA | 51.23 | 50.94 | 50.62 | NA | 51.16 | 49.18 | 48.73 | NA | 48.07 | NA | NA | NA | NA | NA | NA | NA | NA | NA | NA | |
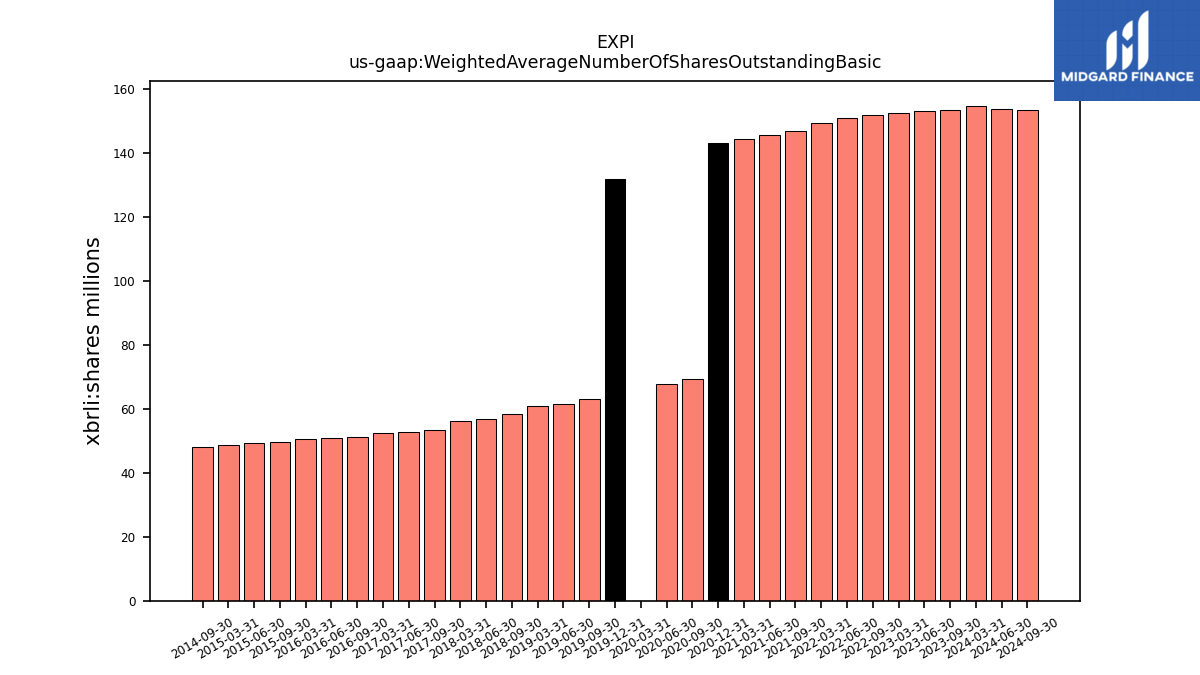
| Weighted Average Number Of Shares Outstanding Basic | 154.74 | NA | 153.39 | 153.25 | 152.55 | NA | 151.83 | 150.78 | 149.23 | NA | 146.86 | 145.58 | 144.35 | 143.03 | 69.26 | 67.76 | 0.07 | 131.91 | 63.20 | 61.53 | 60.75 | NA | 58.36 | 56.88 | 56.19 | NA | 53.34 | 52.75 | 52.42 | NA | 51.23 | 50.94 | 50.62 | NA | 49.71 | 49.18 | 48.73 | NA | 48.07 | NA | NA | NA | NA | NA | NA | NA | NA | NA | NA | |
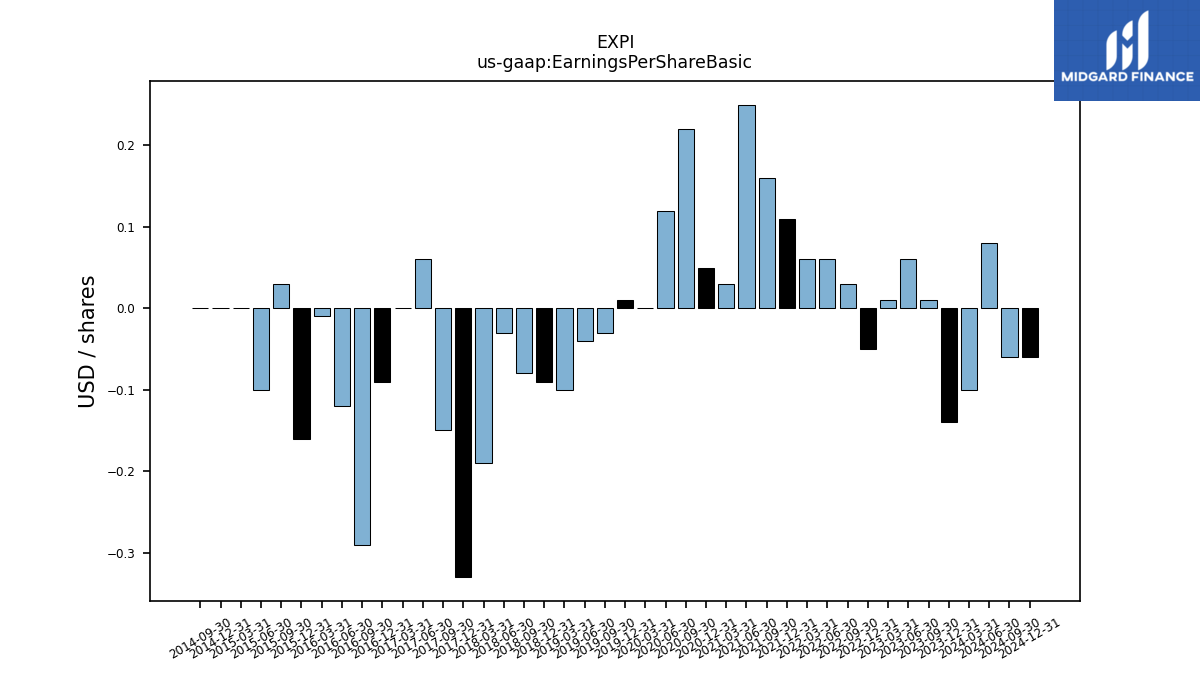
| Earnings Per Share Basic | -0.10 | -0.14 | 0.01 | 0.06 | 0.01 | -0.05 | 0.03 | 0.06 | 0.06 | 0.11 | 0.16 | 0.25 | 0.03 | 0.05 | 0.22 | 0.12 | 0.00 | 0.01 | -0.03 | -0.04 | -0.10 | -0.09 | -0.08 | -0.03 | -0.19 | -0.33 | -0.15 | 0.06 | 0.00 | -0.09 | -0.29 | -0.12 | -0.01 | -0.16 | 0.03 | -0.10 | 0.00 | 0.00 | 0.00 | NA | NA | NA | NA | NA | NA | NA | NA | NA | NA | |
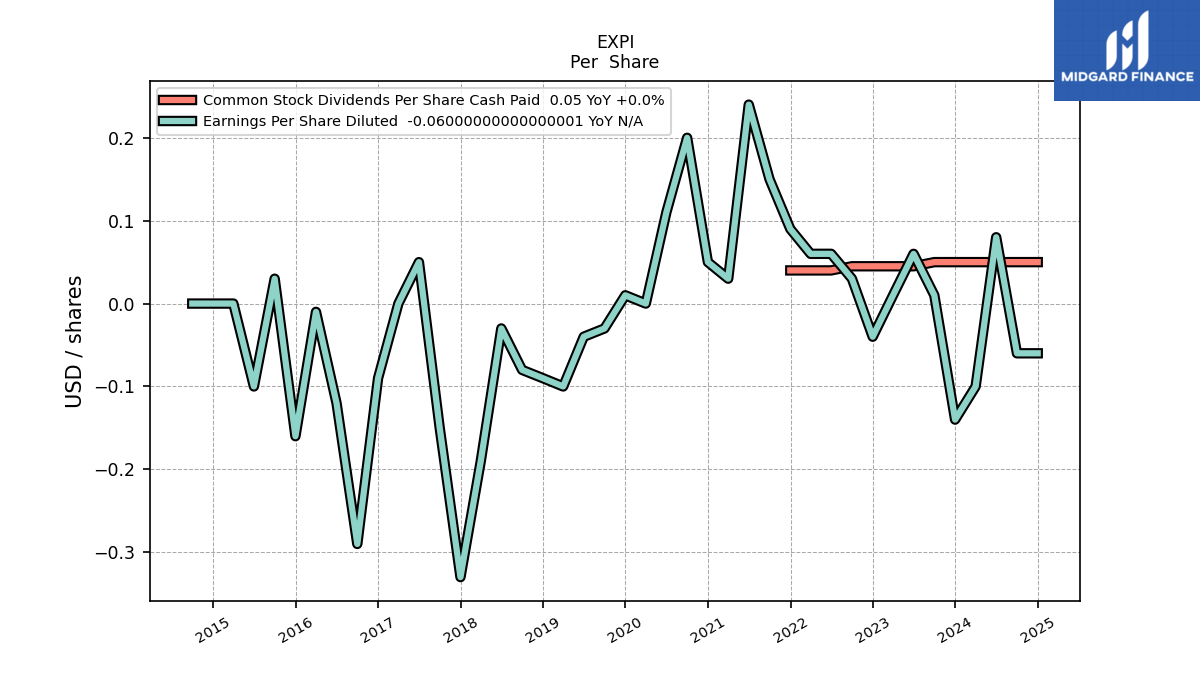
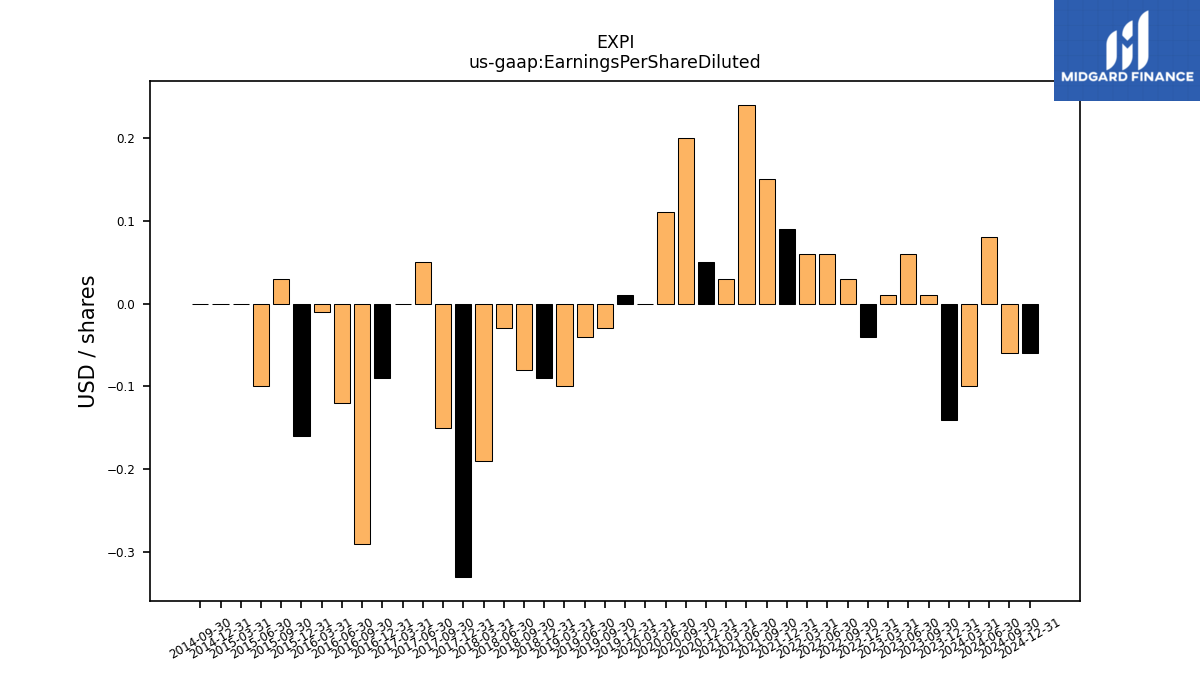
| Earnings Per Share Diluted | -0.10 | -0.14 | 0.01 | 0.06 | 0.01 | -0.04 | 0.03 | 0.06 | 0.06 | 0.09 | 0.15 | 0.24 | 0.03 | 0.05 | 0.20 | 0.11 | 0.00 | 0.01 | -0.03 | -0.04 | -0.10 | -0.09 | -0.08 | -0.03 | -0.19 | -0.33 | -0.15 | 0.05 | 0.00 | -0.09 | -0.29 | -0.12 | -0.01 | -0.16 | 0.03 | -0.10 | 0.00 | 0.00 | 0.00 | NA | NA | NA | NA | NA | NA | NA | NA | NA | NA | |
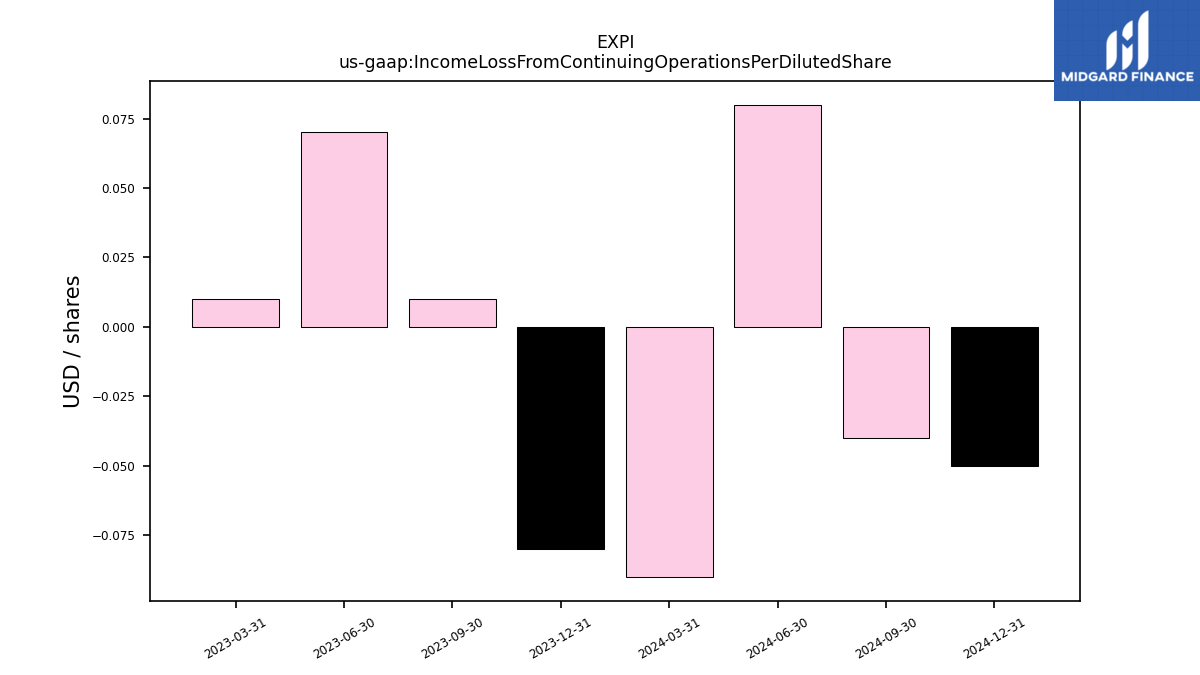
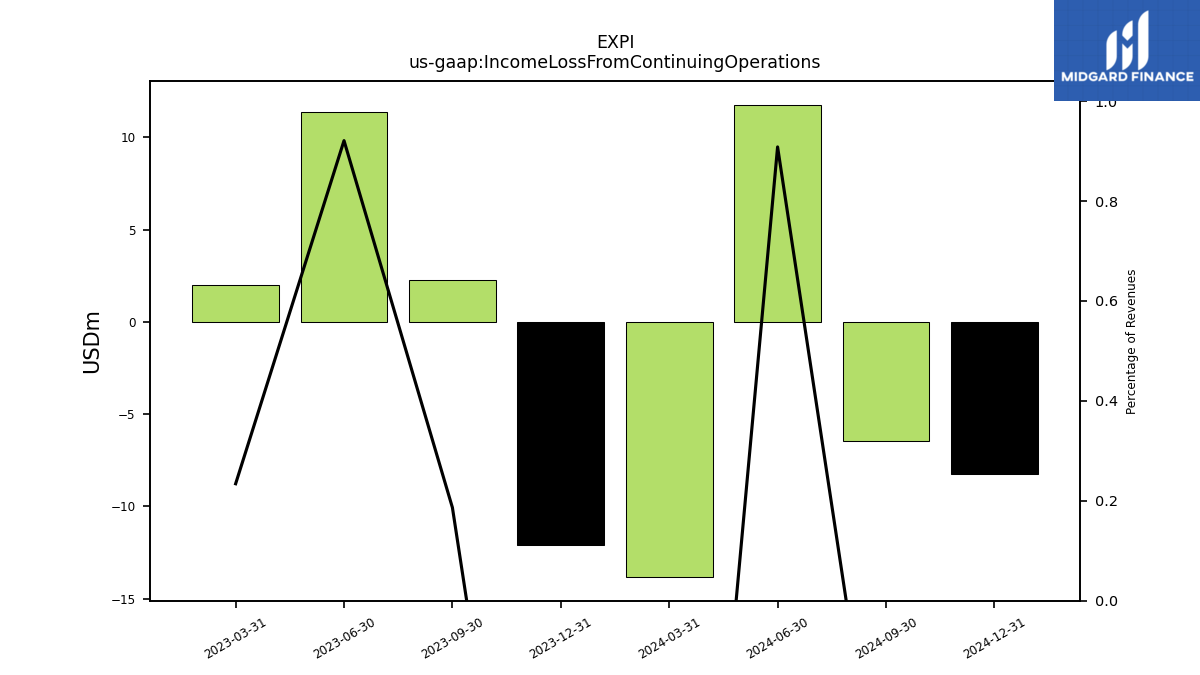
| Income Loss From Continuing Operations Per Basic Share | -0.00 | NA | NA | NA | 0.00 | NA | NA | NA | NA | NA | NA | NA | NA | NA | NA | NA | NA | NA | NA | NA | NA | NA | NA | NA | NA | NA | NA | NA | NA | NA | NA | NA | NA | NA | NA | NA | NA | NA | NA | NA | NA | NA | NA | NA | NA | NA | NA | NA | NA | |
| Income Loss From Continuing Operations Per Diluted Share | -0.00 | NA | NA | NA | 0.00 | NA | NA | NA | NA | NA | NA | NA | NA | NA | NA | NA | NA | NA | NA | NA | NA | NA | NA | NA | NA | NA | NA | NA | NA | NA | NA | NA | NA | NA | NA | NA | NA | NA | NA | NA | NA | NA | NA | NA | NA | NA | NA | NA | NA |
| 2024-03-31 | 2023-12-31 | 2023-09-30 | 2023-06-30 | 2023-03-31 | 2022-12-31 | 2022-09-30 | 2022-06-30 | 2022-03-31 | 2021-12-31 | 2021-09-30 | 2021-06-30 | 2021-03-31 | 2020-12-31 | 2020-09-30 | 2020-06-30 | 2020-03-31 | 2019-12-31 | 2019-09-30 | 2019-06-30 | 2019-03-31 | 2018-12-31 | 2018-09-30 | 2018-06-30 | 2018-03-31 | 2017-12-31 | 2017-09-30 | 2017-06-30 | 2017-03-31 | 2016-12-31 | 2016-09-30 | 2016-06-30 | 2016-03-31 | 2015-12-31 | 2015-09-30 | 2015-06-30 | 2015-03-31 | 2014-12-31 | 2014-09-30 | 2014-06-30 | 2014-03-31 | 2013-12-31 | 2013-09-30 | 2013-06-30 | 2013-03-31 | 2012-12-31 | 2012-09-30 | 2012-06-30 | 2012-03-31 | ||
|---|---|---|---|---|---|---|---|---|---|---|---|---|---|---|---|---|---|---|---|---|---|---|---|---|---|---|---|---|---|---|---|---|---|---|---|---|---|---|---|---|---|---|---|---|---|---|---|---|---|---|
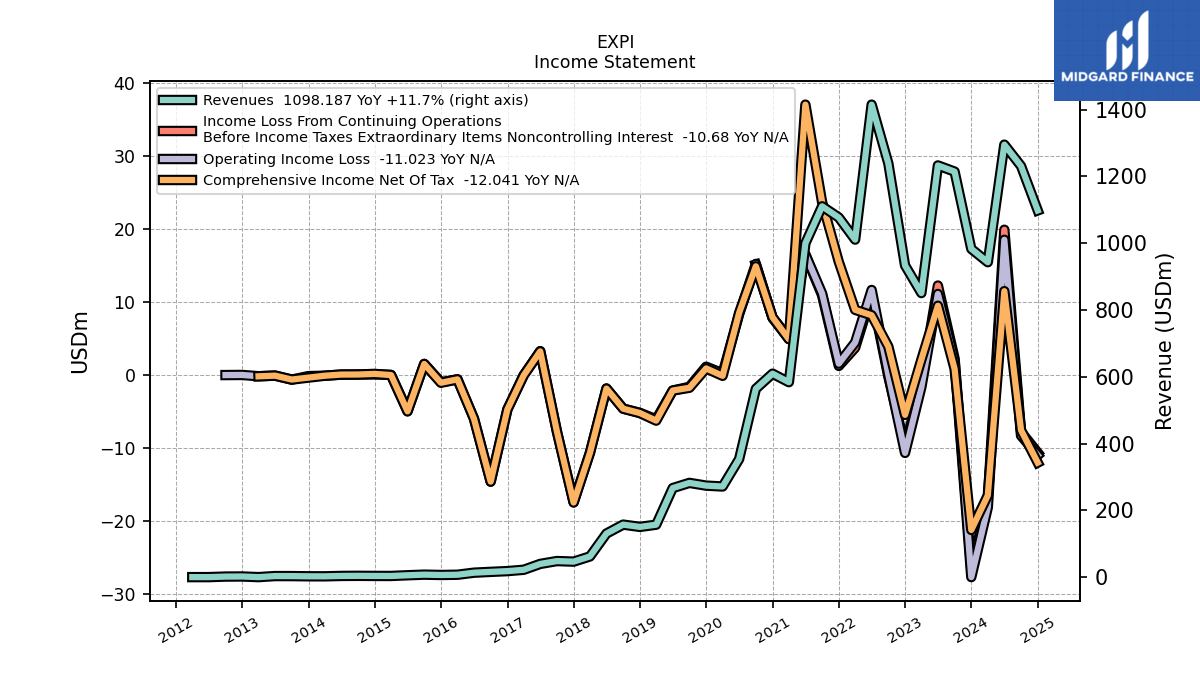
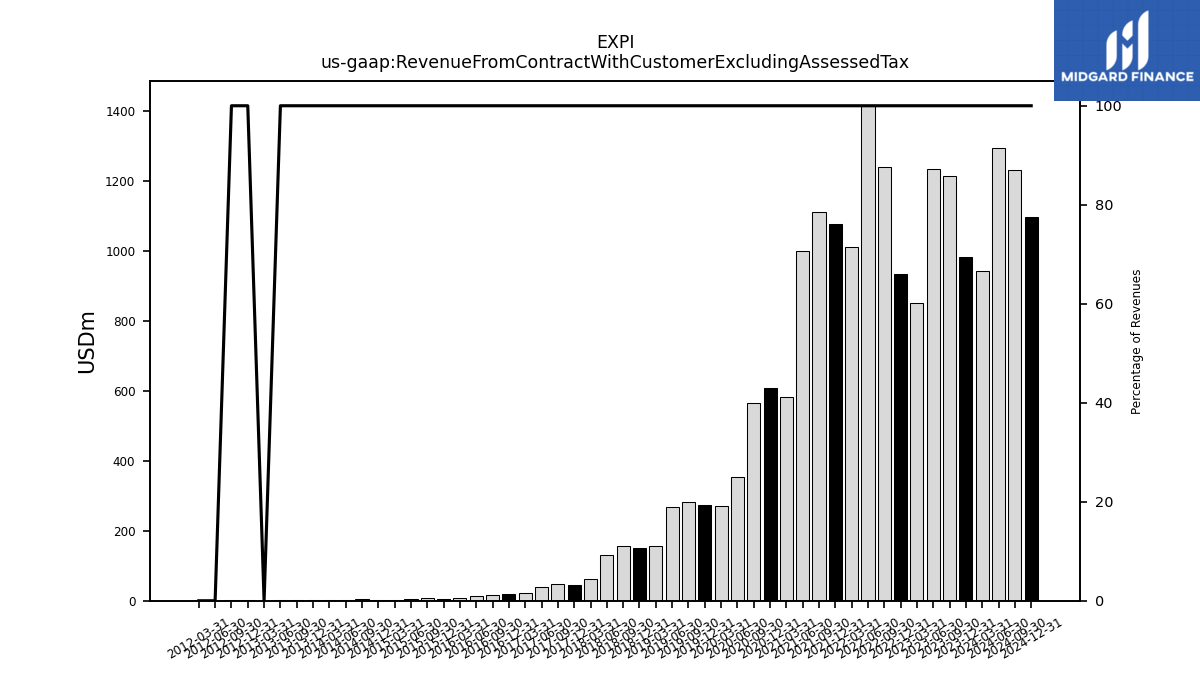
| Revenue From Contract With Customer Excluding Assessed Tax | 943.05 | 983.05 | 1214.51 | 1232.93 | 850.62 | 933.39 | 1238.97 | 1415.06 | 1010.73 | 1076.97 | 1110.48 | 999.89 | 583.83 | 609.32 | 564.02 | 353.52 | 271.42 | 274.02 | 282.18 | 266.70 | 157.03 | 150.41 | 157.24 | 130.54 | 61.96 | 46.41 | 48.11 | 39.57 | 22.01 | 18.00 | 15.76 | 13.28 | 7.14 | 6.41 | 7.42 | 5.58 | 3.45 | 3.56 | 3.88 | 3.55 | 2.38 | 2.49 | 3.07 | 3.17 | 0.00 | 1.92 | 1.64 | 0.00 | 0.00 | |
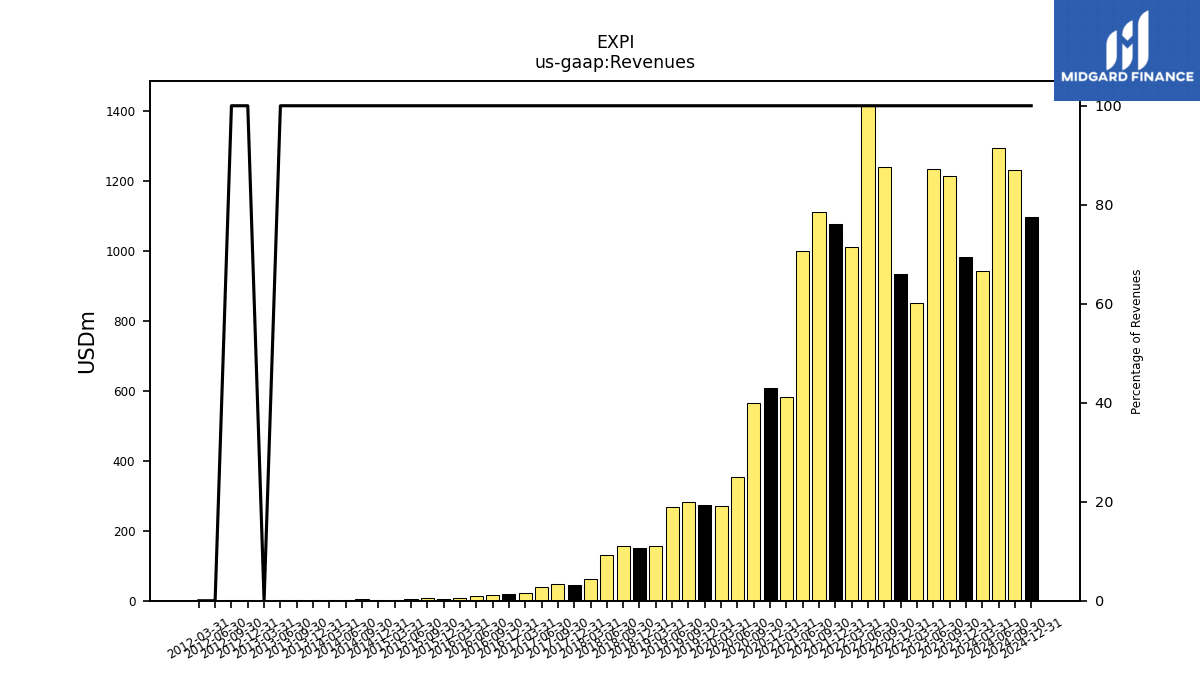
| Revenues | 943.05 | 983.05 | 1214.51 | 1232.93 | 850.62 | 933.39 | 1238.97 | 1415.06 | 1010.73 | 1076.97 | 1110.48 | 999.89 | 583.83 | 609.32 | 564.02 | 353.52 | 271.42 | 274.02 | 282.18 | 266.70 | 157.03 | 150.41 | 157.24 | 130.54 | 61.96 | 46.41 | 48.11 | 39.57 | 22.01 | 18.00 | 15.76 | 13.28 | 7.14 | 6.41 | 7.42 | 5.58 | 3.45 | 3.56 | 3.88 | 3.55 | 2.38 | 2.49 | 3.07 | 3.17 | 0.00 | 1.92 | 1.64 | 0.00 | 0.00 | |
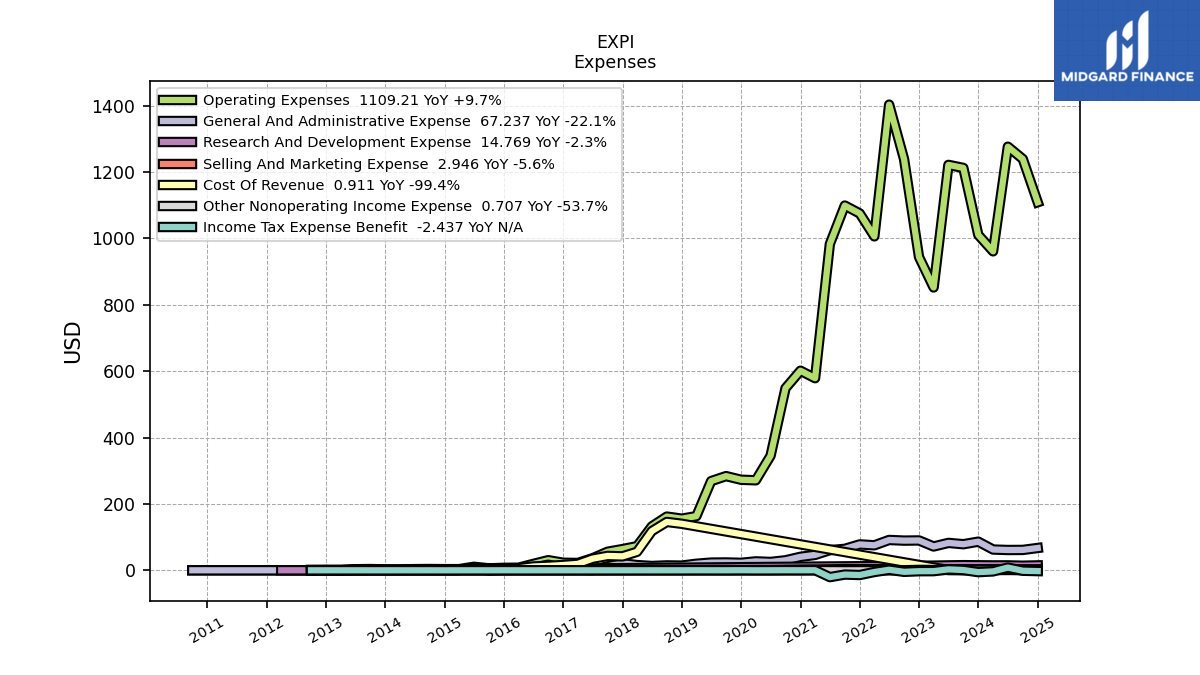
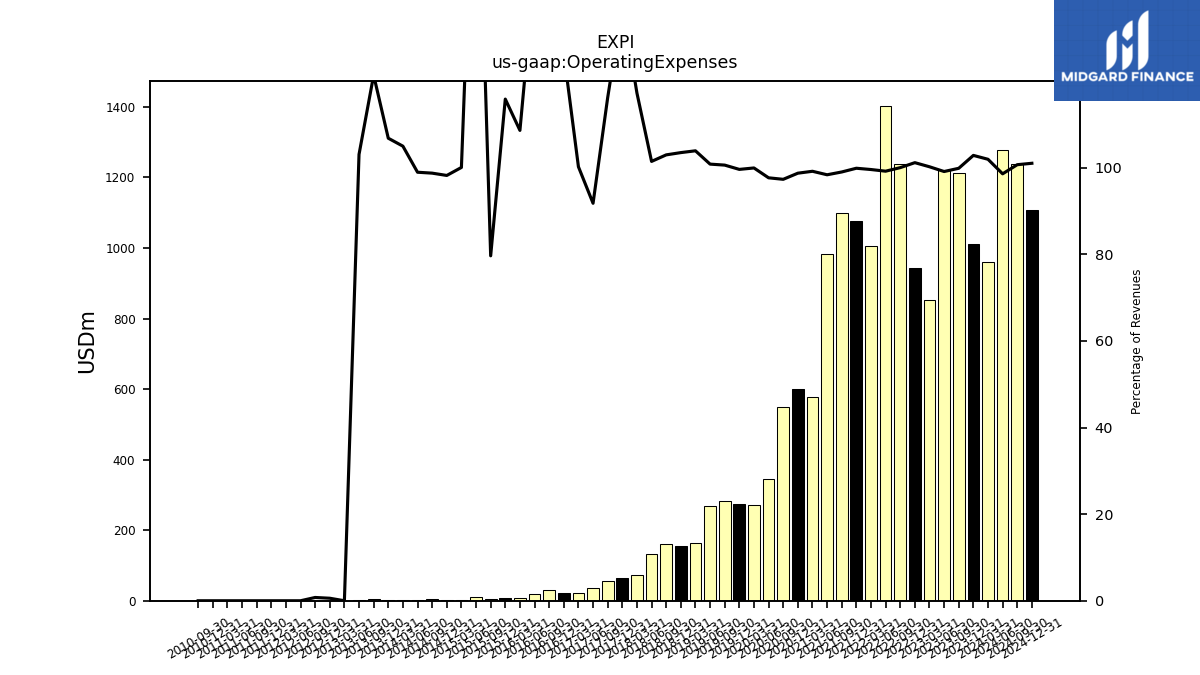
| Operating Expenses | 961.23 | 1010.80 | 1212.65 | 1221.83 | 852.29 | 944.10 | 1238.95 | 1403.41 | 1006.29 | 1075.43 | 1099.31 | 983.37 | 578.90 | 601.49 | 548.79 | 345.21 | 271.21 | 272.90 | 283.82 | 268.86 | 163.13 | 155.62 | 161.87 | 132.42 | 72.63 | 63.88 | 55.88 | 36.32 | 22.05 | 22.74 | 30.40 | 19.28 | 7.76 | 7.43 | 5.91 | 10.58 | 3.45 | 3.49 | 3.83 | 3.51 | 2.50 | 2.66 | 3.73 | 3.26 | 0.01 | 0.01 | 0.01 | 0.01 | 0.00 | |
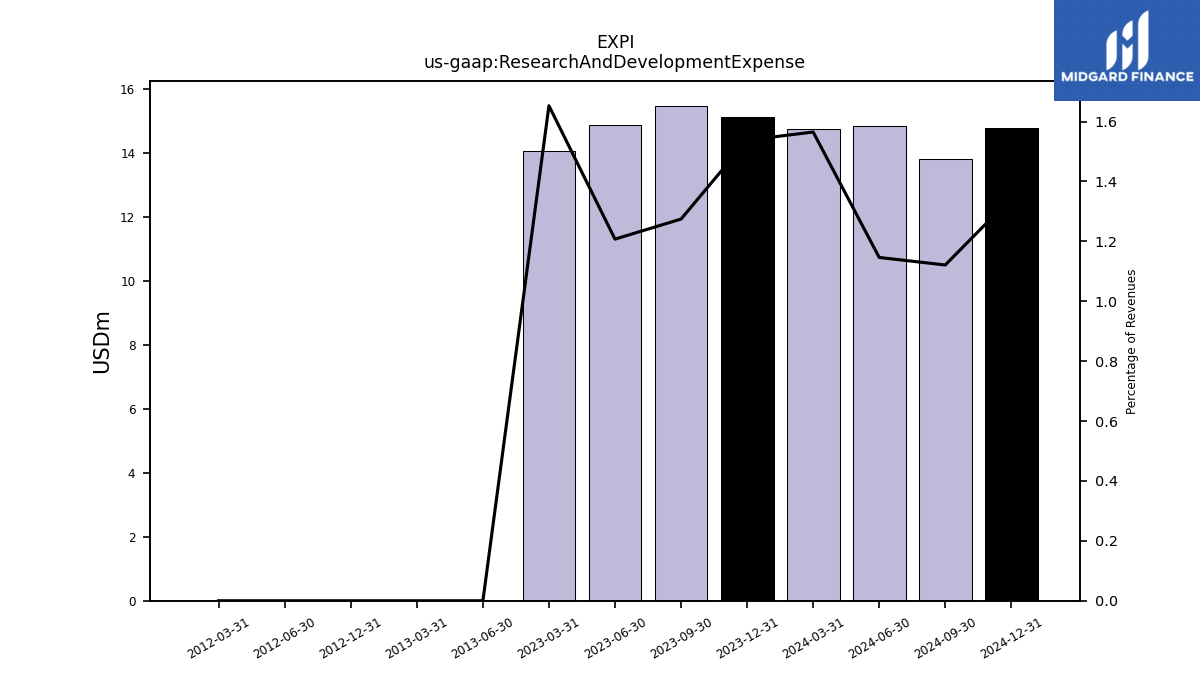
| Research And Development Expense | 14.76 | NA | NA | NA | 14.06 | NA | NA | NA | NA | NA | NA | NA | NA | NA | NA | NA | NA | NA | NA | NA | NA | NA | NA | NA | NA | NA | NA | NA | NA | NA | NA | NA | NA | NA | NA | NA | NA | NA | NA | NA | NA | NA | NA | 0.00 | 0.00 | 0.00 | NA | 0.00 | 0.00 | |
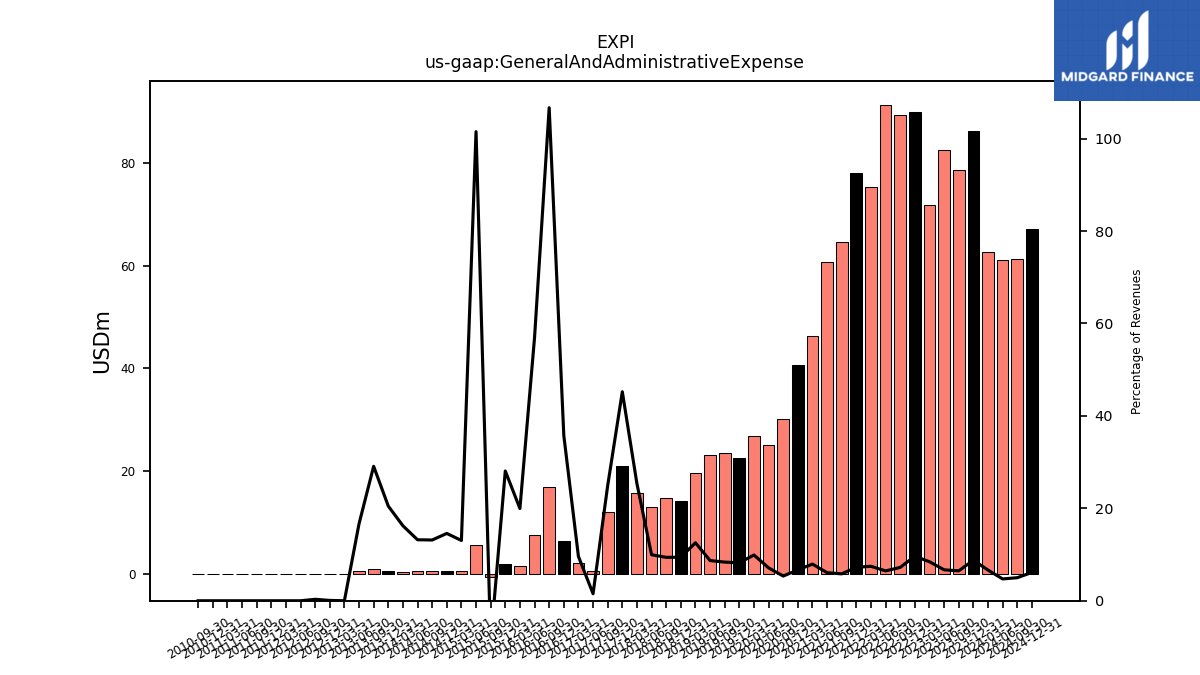
| General And Administrative Expense | 62.58 | 86.28 | 78.57 | 82.54 | 71.77 | 89.96 | 89.46 | 91.39 | 75.32 | 78.06 | 64.61 | 60.72 | 46.30 | 40.66 | 30.13 | 25.16 | 26.86 | 22.53 | 23.60 | 23.20 | 19.70 | 14.17 | 14.77 | 12.99 | 15.69 | 20.99 | 11.99 | 0.60 | 2.11 | 6.44 | 16.81 | 7.57 | 1.43 | 1.80 | -0.66 | 5.67 | 0.45 | 0.52 | 0.51 | 0.47 | 0.39 | 0.51 | 0.89 | 0.53 | 0.00 | 0.00 | 0.01 | 0.00 | 0.01 | |
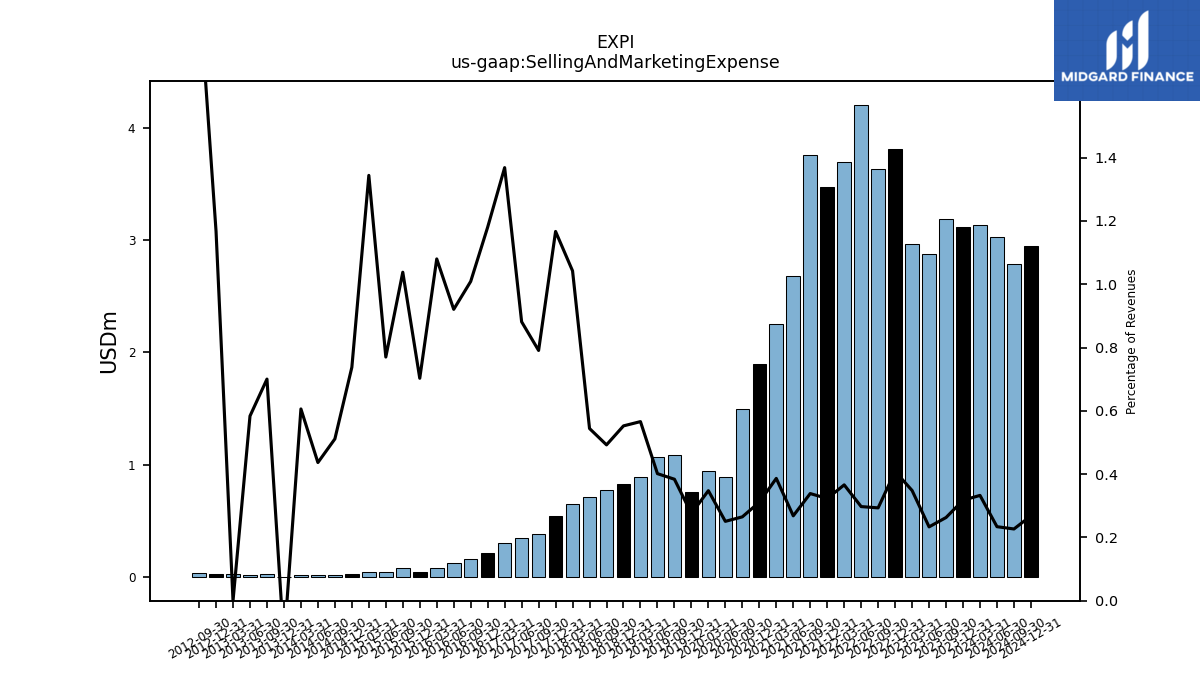
| Selling And Marketing Expense | 3.14 | 3.12 | 3.19 | 2.88 | 2.96 | 3.81 | 3.64 | 4.21 | 3.70 | 3.48 | 3.76 | 2.68 | 2.26 | 1.90 | 1.50 | 0.89 | 0.94 | 0.76 | 1.08 | 1.07 | 0.89 | 0.83 | 0.77 | 0.71 | 0.65 | 0.54 | 0.38 | 0.35 | 0.30 | 0.21 | 0.16 | 0.12 | 0.08 | 0.05 | 0.08 | 0.04 | 0.05 | 0.03 | 0.02 | 0.02 | 0.01 | -0.00 | 0.02 | 0.02 | 0.02 | 0.02 | 0.03 | NA | NA | |
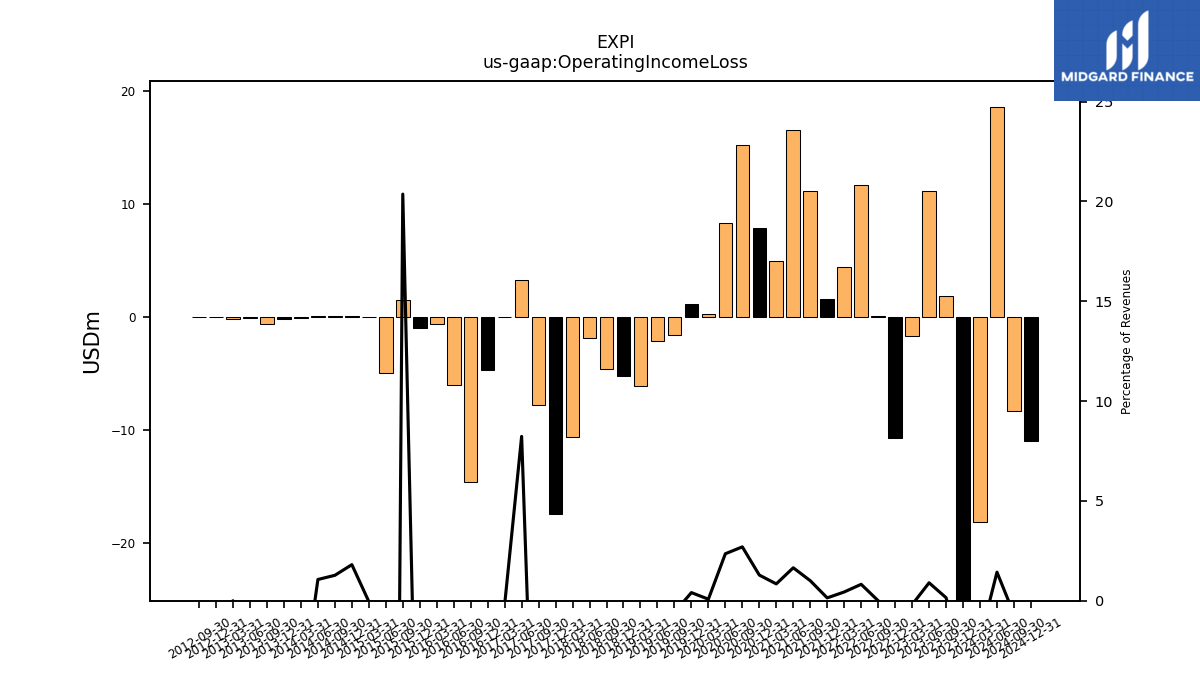
| Operating Income Loss | -18.17 | -27.75 | 1.86 | 11.10 | -1.67 | -10.71 | 0.03 | 11.65 | 4.44 | 1.54 | 11.17 | 16.51 | 4.93 | 7.83 | 15.22 | 8.32 | 0.21 | 1.12 | -1.64 | -2.16 | -6.10 | -5.22 | -4.63 | -1.87 | -10.67 | -17.47 | -7.78 | 3.26 | -0.04 | -4.74 | -14.65 | -6.00 | -0.61 | -1.01 | 1.51 | -4.99 | -0.00 | 0.06 | 0.05 | 0.04 | -0.12 | -0.17 | -0.66 | -0.10 | -0.19 | -0.01 | -0.03 | NA | NA | |
| Income Loss From Continuing Operations | -13.83 | NA | NA | NA | 1.99 | NA | NA | NA | NA | NA | NA | NA | NA | NA | NA | NA | NA | NA | NA | NA | NA | NA | NA | NA | NA | NA | NA | NA | NA | NA | NA | NA | NA | NA | NA | NA | NA | NA | NA | NA | NA | NA | NA | NA | NA | NA | NA | NA | NA | |
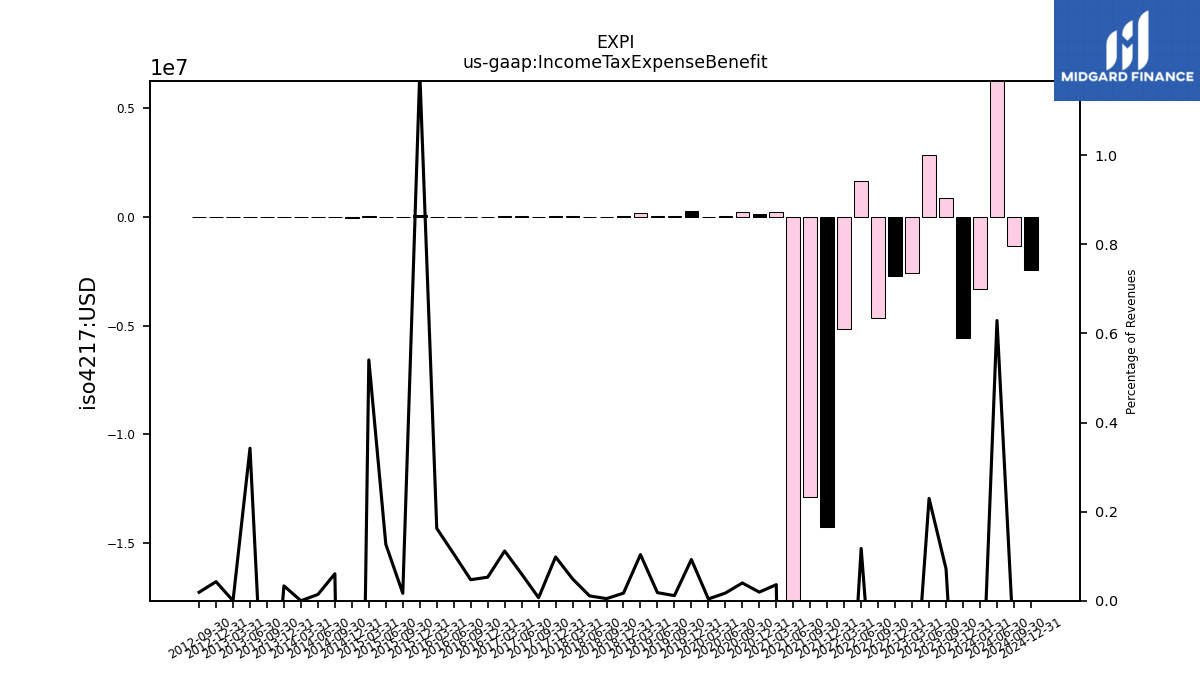
| Income Tax Expense Benefit | -3.31 | -5.57 | 0.87 | 2.83 | -2.59 | -2.72 | -4.63 | 1.66 | -5.15 | -14.23 | -12.88 | -20.59 | 0.21 | 0.12 | 0.23 | 0.06 | 0.01 | 0.25 | 0.03 | 0.05 | 0.16 | 0.03 | 0.01 | 0.01 | 0.03 | 0.05 | 0.00 | 0.02 | 0.02 | 0.01 | 0.01 | 0.01 | 0.01 | 0.08 | 0.00 | 0.01 | 0.02 | -0.07 | 0.00 | 0.00 | 0.00 | 0.00 | -0.01 | 0.01 | 0.01 | 0.00 | 0.00 | NA | NA | |
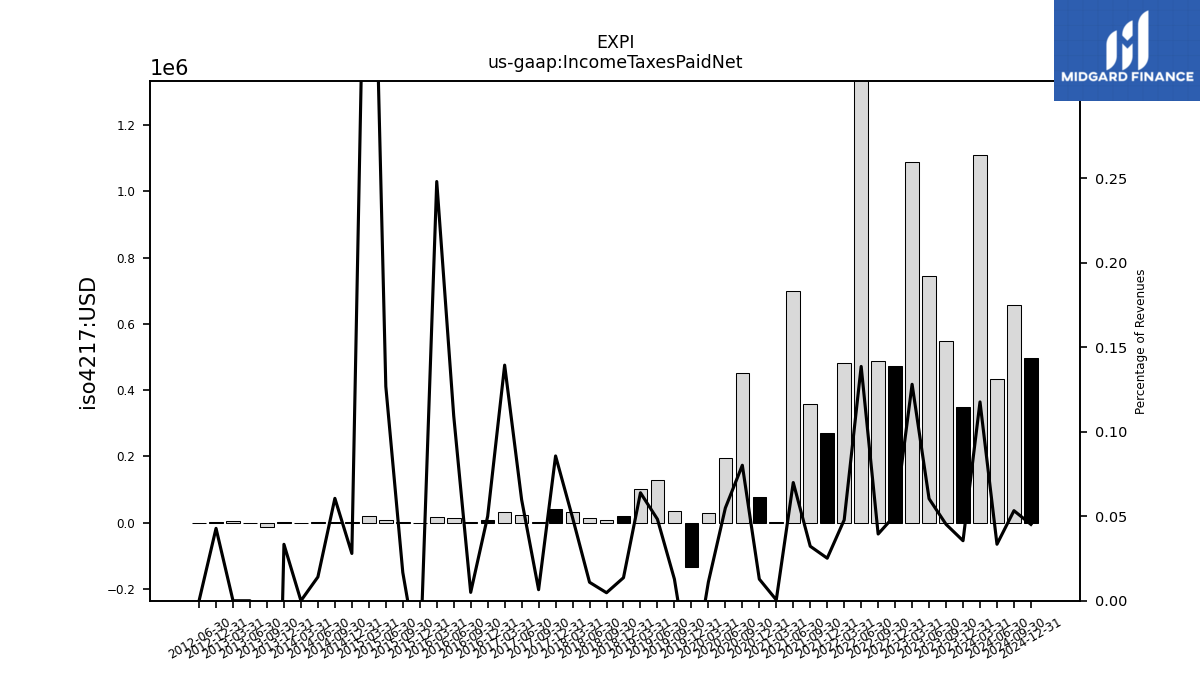
| Income Taxes Paid Net | 1.11 | 0.35 | 0.55 | 0.74 | 1.09 | 0.47 | 0.49 | 1.96 | 0.48 | 0.27 | 0.36 | 0.70 | 0.00 | 0.08 | 0.45 | 0.19 | 0.03 | -0.14 | 0.04 | 0.13 | 0.10 | 0.02 | 0.01 | 0.01 | 0.03 | 0.04 | 0.00 | 0.02 | 0.03 | 0.01 | 0.00 | 0.01 | 0.02 | -0.00 | 0.00 | 0.01 | 0.02 | 0.00 | 0.00 | 0.00 | 0.00 | 0.00 | -0.01 | 0.00 | 0.01 | 0.00 | NA | 0.00 | NA | |
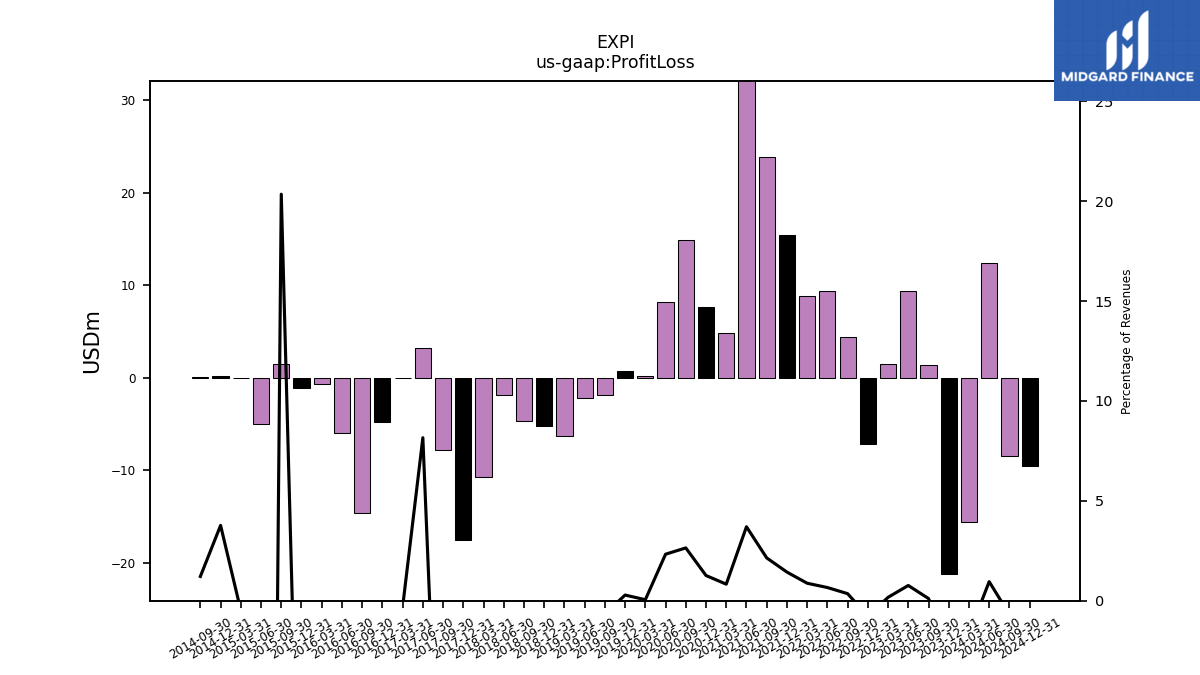
| Profit Loss | -15.64 | -21.20 | 1.35 | 9.42 | 1.45 | -7.20 | 4.40 | 9.36 | 8.86 | 15.46 | 23.81 | 37.04 | 4.85 | 7.70 | 14.92 | 8.23 | 0.14 | 0.78 | -1.85 | -2.20 | -6.30 | -5.22 | -4.63 | -1.89 | -10.70 | -17.51 | -7.78 | 3.23 | -0.07 | -4.75 | -14.66 | -6.01 | -0.63 | -1.10 | 1.51 | -5.00 | -0.02 | 0.13 | 0.05 | NA | NA | NA | NA | NA | NA | NA | NA | NA | NA | |
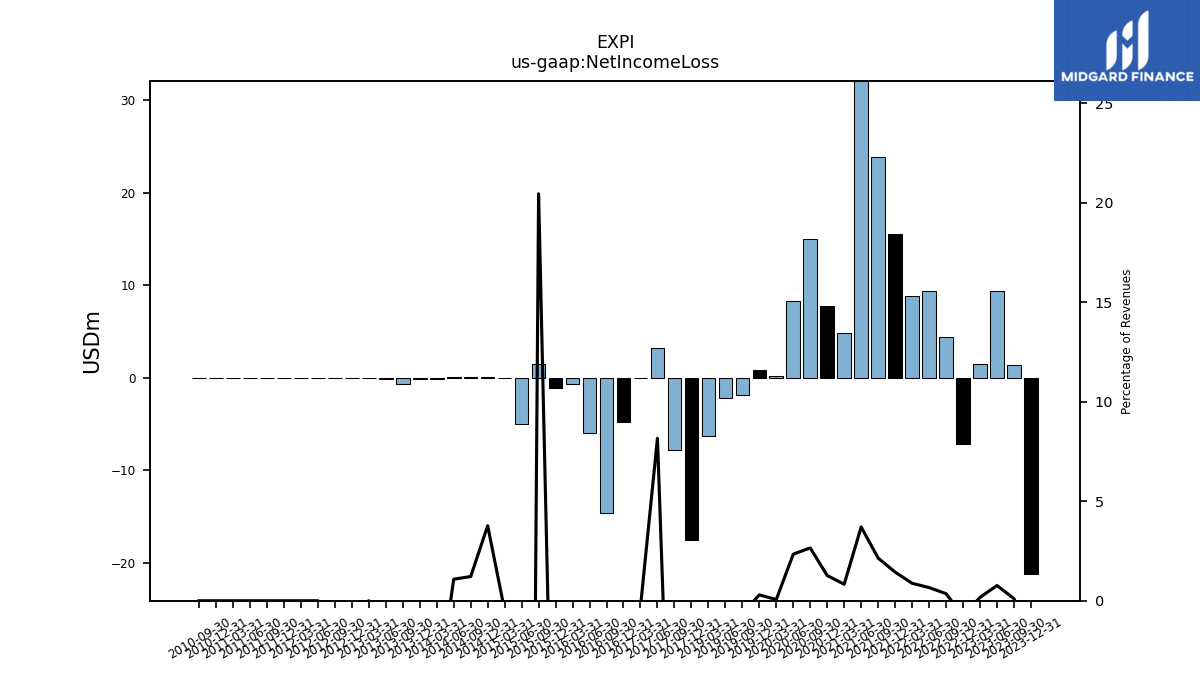
| Net Income Loss | NA | -21.20 | 1.35 | 9.42 | 1.45 | -7.20 | 4.40 | 9.36 | 8.88 | 15.50 | 23.82 | 37.05 | 4.85 | 7.72 | 14.97 | 8.28 | 0.17 | 0.81 | -1.85 | -2.19 | -6.30 | NA | NA | NA | NA | -17.51 | -7.78 | 3.23 | -0.07 | -4.74 | -14.65 | -6.01 | -0.62 | -1.08 | 1.52 | -5.00 | -0.02 | 0.13 | 0.05 | 0.04 | -0.12 | -0.17 | -0.64 | -0.11 | -0.01 | -0.01 | -0.01 | -0.01 | -0.00 | |
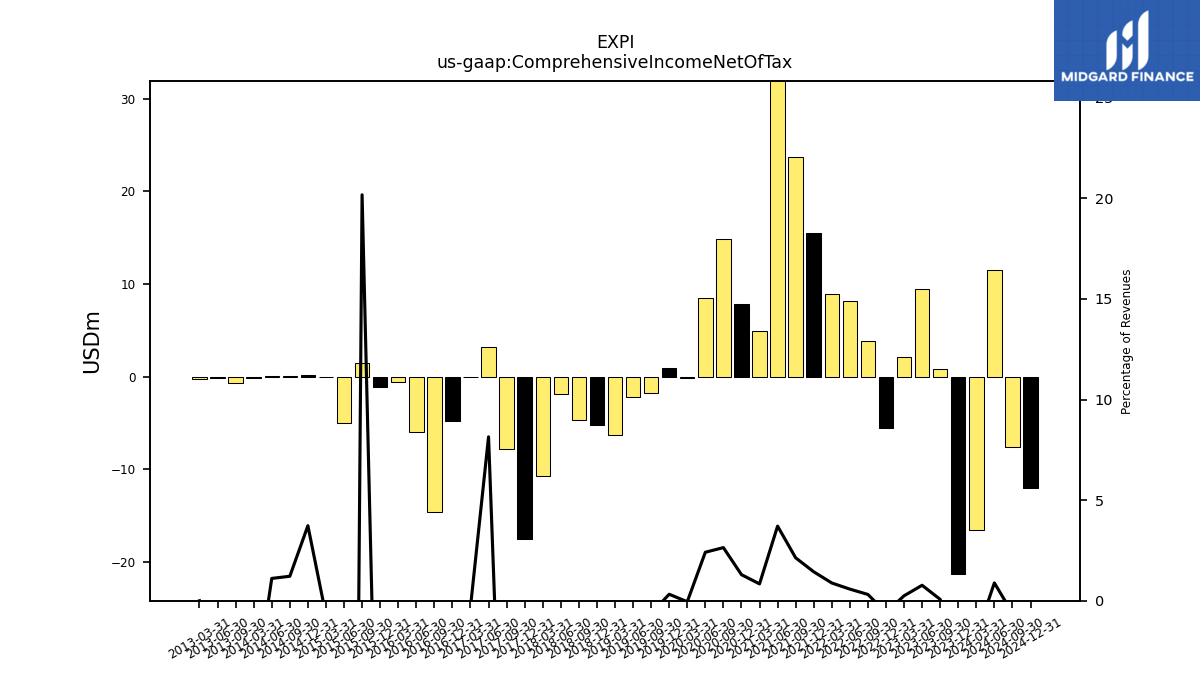
| Comprehensive Income Net Of Tax | -16.53 | -21.28 | 0.82 | 9.49 | 2.10 | -5.49 | 3.88 | 8.18 | 8.92 | 15.50 | 23.69 | 37.07 | 4.89 | 7.90 | 14.89 | 8.52 | -0.13 | 0.88 | -1.77 | -2.15 | -6.28 | -5.24 | -4.64 | -1.88 | -10.70 | -17.51 | -7.78 | 3.22 | -0.07 | -4.75 | -14.65 | -6.01 | -0.62 | -1.08 | 1.50 | -5.00 | -0.02 | 0.13 | 0.05 | 0.04 | -0.12 | NA | -0.64 | -0.11 | -0.20 | NA | NA | NA | NA |
| 2024-03-31 | 2023-12-31 | 2023-09-30 | 2023-06-30 | 2023-03-31 | 2022-12-31 | 2022-09-30 | 2022-06-30 | 2022-03-31 | 2021-12-31 | 2021-09-30 | 2021-06-30 | 2021-03-31 | 2020-12-31 | 2020-09-30 | 2020-06-30 | 2020-03-31 | 2019-12-31 | 2019-09-30 | 2019-06-30 | 2019-03-31 | 2018-12-31 | 2018-09-30 | 2018-06-30 | 2018-03-31 | 2017-12-31 | 2017-09-30 | 2017-06-30 | 2017-03-31 | 2016-12-31 | 2016-09-30 | 2016-06-30 | 2016-03-31 | 2015-12-31 | 2015-09-30 | 2015-06-30 | 2015-03-31 | 2014-12-31 | 2014-09-30 | 2014-06-30 | 2014-03-31 | 2013-12-31 | 2013-09-30 | 2013-06-30 | 2013-03-31 | 2012-12-31 | 2012-09-30 | 2012-06-30 | 2012-03-31 | ||
|---|---|---|---|---|---|---|---|---|---|---|---|---|---|---|---|---|---|---|---|---|---|---|---|---|---|---|---|---|---|---|---|---|---|---|---|---|---|---|---|---|---|---|---|---|---|---|---|---|---|---|
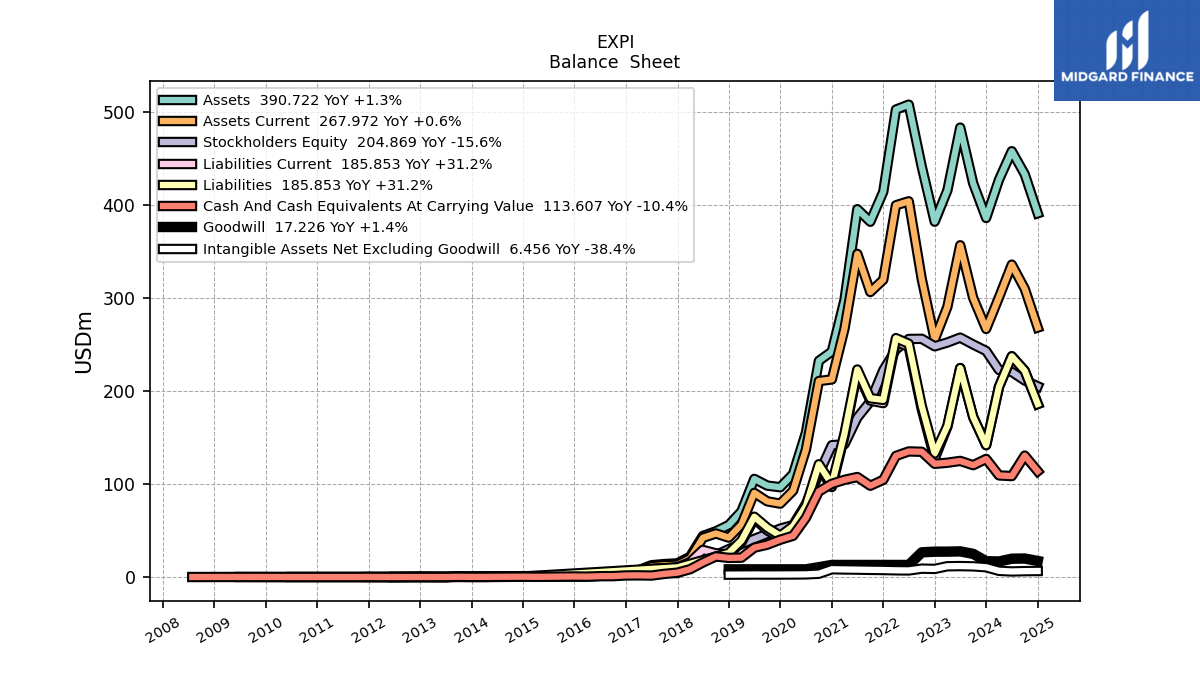
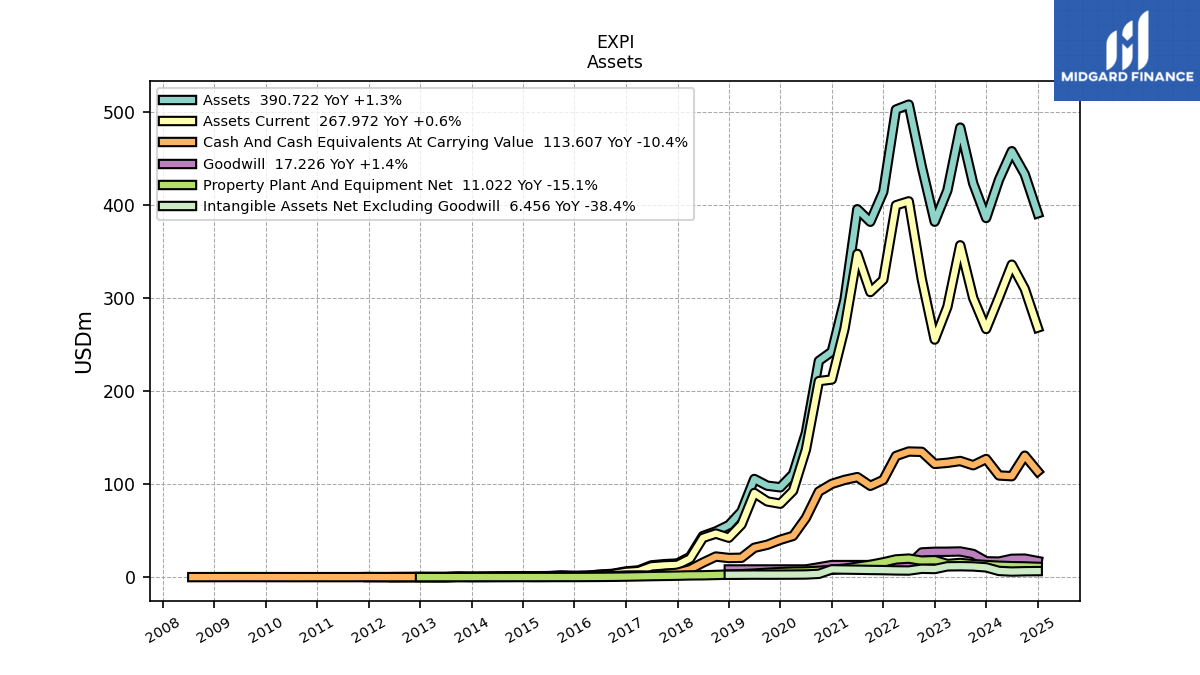
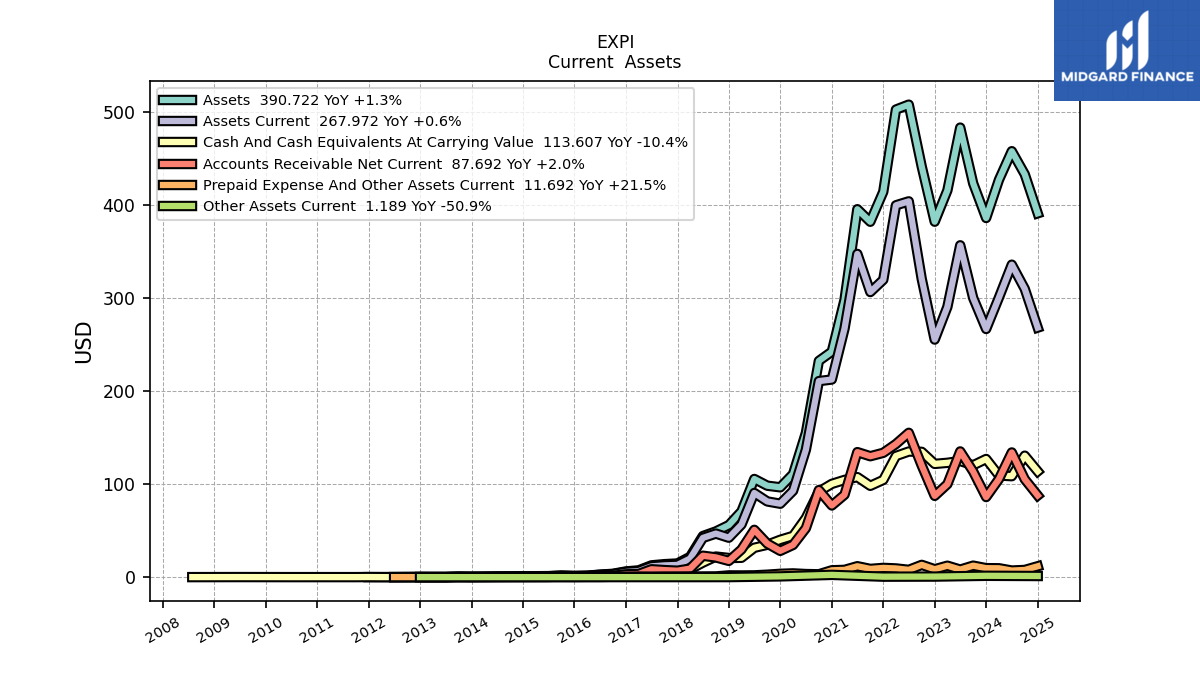
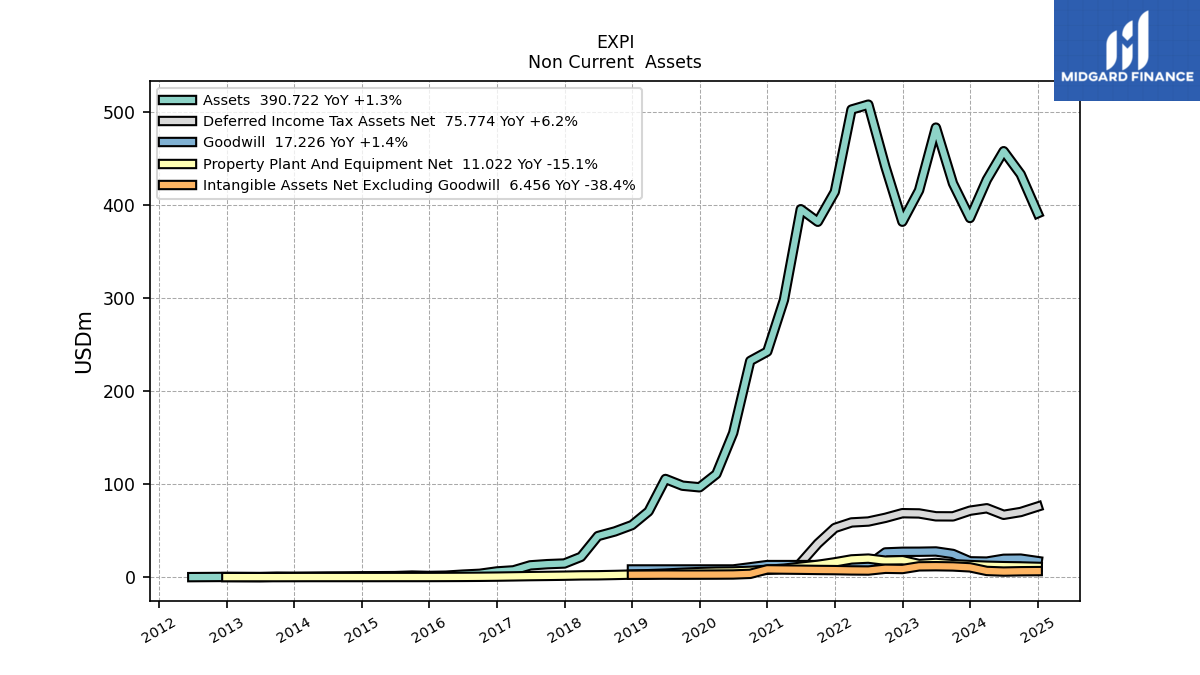
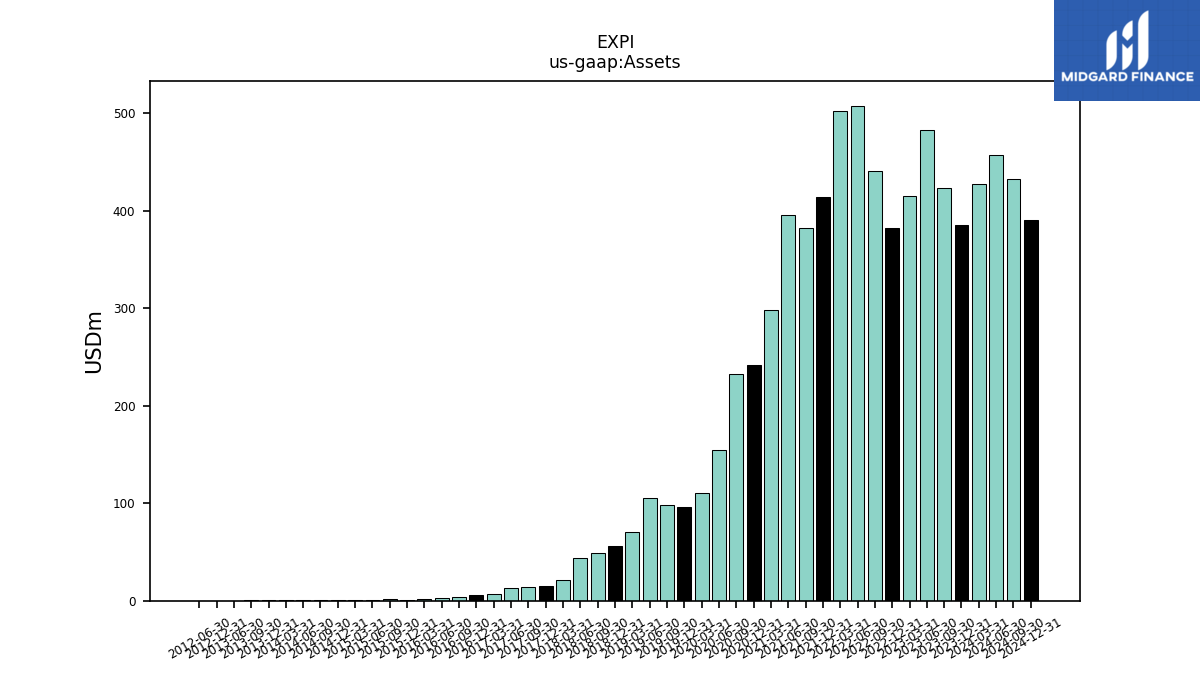
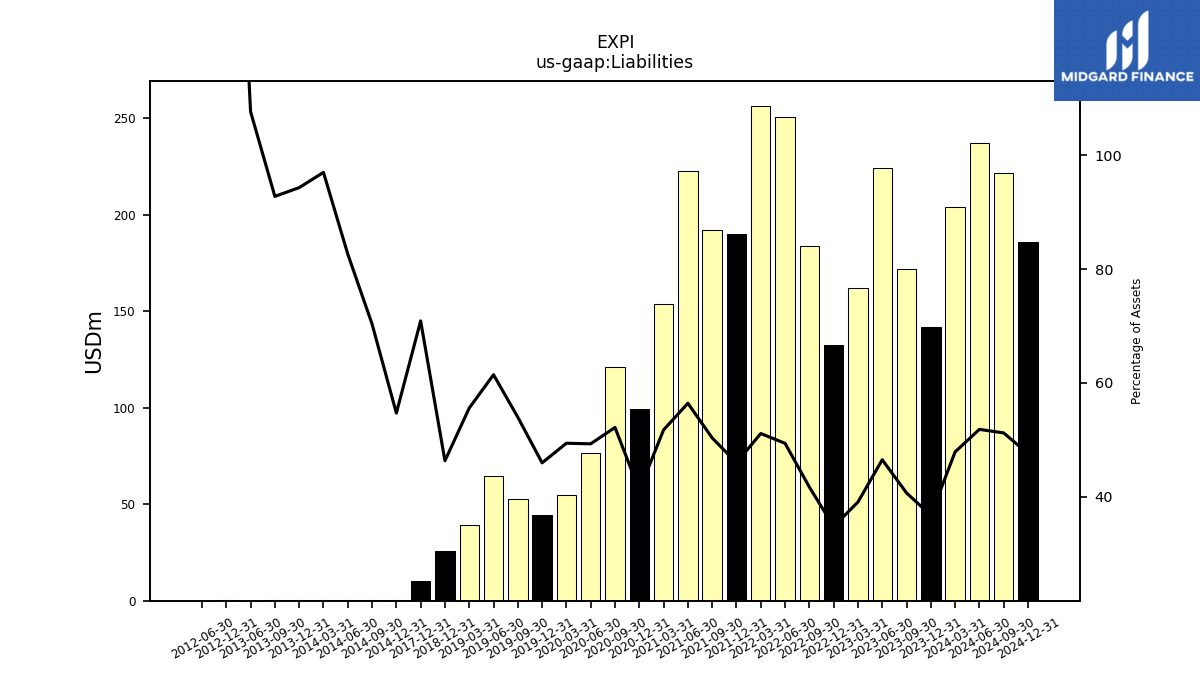
| Assets | 426.75 | 385.67 | 422.86 | 482.78 | 415.33 | 381.68 | 440.87 | 507.45 | 502.14 | 413.83 | 381.63 | 395.13 | 297.60 | 242.19 | 232.20 | 154.88 | 110.67 | 96.45 | 98.19 | 105.43 | 70.60 | 55.85 | 49.07 | 44.09 | 21.77 | 14.64 | 13.92 | 12.65 | 7.27 | 6.10 | 3.57 | 2.68 | 1.56 | 1.26 | 1.68 | 1.09 | 0.98 | 0.91 | 0.73 | 0.64 | 0.46 | 0.33 | 0.45 | 0.04 | NA | 0.22 | NA | 0.00 | NA | |
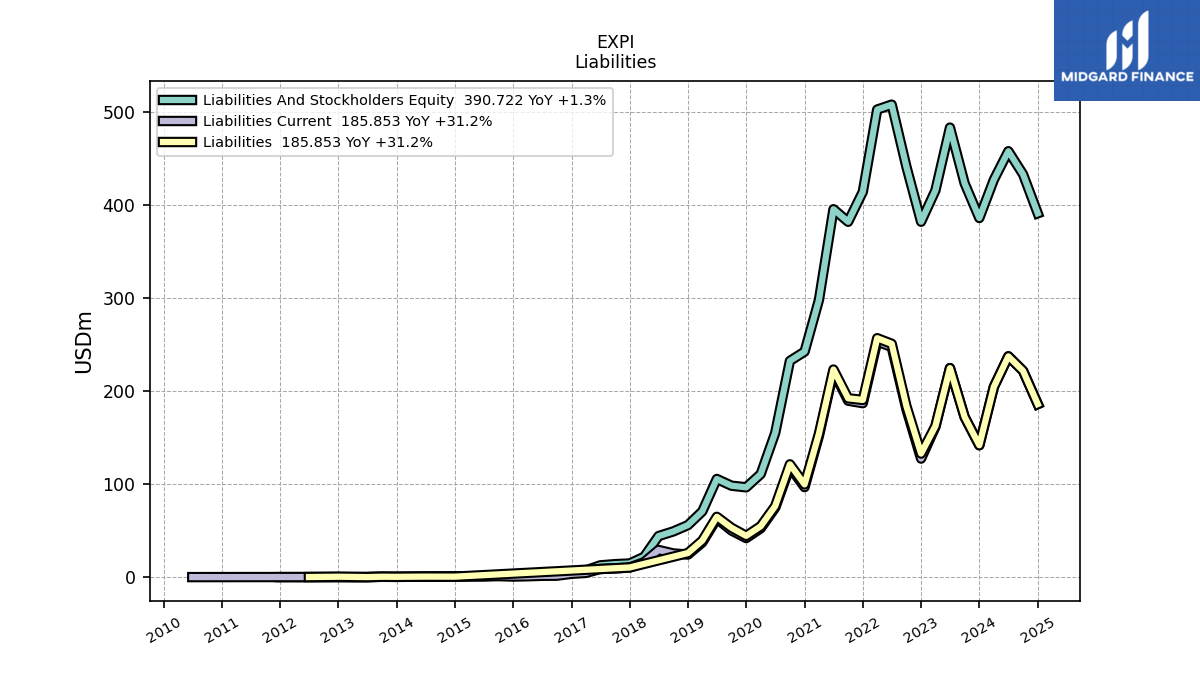
| Liabilities | 204.31 | 141.66 | 171.94 | 224.46 | 162.25 | 132.69 | 183.80 | 250.58 | 256.60 | 190.29 | 192.06 | 222.94 | 153.99 | 99.60 | 121.14 | 76.34 | 54.66 | 44.32 | 52.99 | 64.77 | 39.24 | 25.87 | NA | NA | NA | 10.38 | NA | NA | NA | NA | NA | NA | NA | NA | NA | NA | NA | 0.50 | 0.52 | 0.53 | 0.44 | 0.31 | 0.42 | 0.04 | NA | 0.42 | NA | 0.09 | NA | |
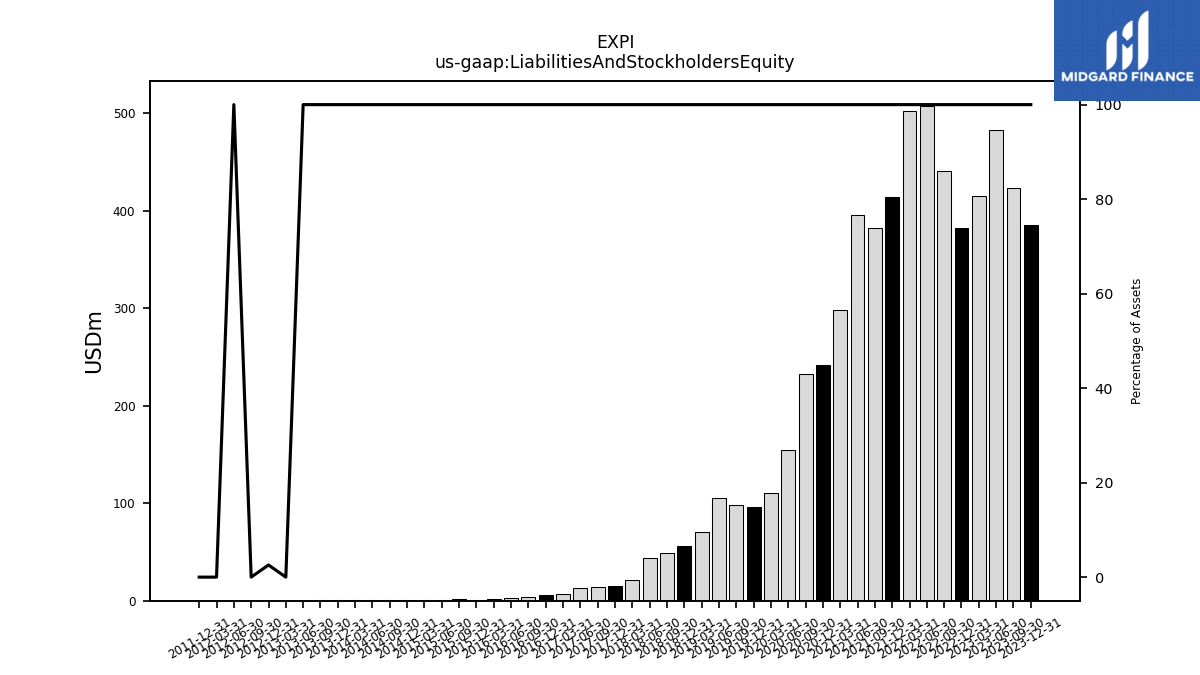
| Liabilities And Stockholders Equity | 426.75 | 385.67 | 422.86 | 482.78 | 415.33 | 381.68 | 440.87 | 507.45 | 502.14 | 413.83 | 381.63 | 395.13 | 297.60 | 242.19 | 232.20 | 154.88 | 110.67 | 96.45 | 98.19 | 105.43 | 70.60 | 55.85 | 49.07 | 44.09 | 21.77 | 14.64 | 13.92 | 12.65 | 7.27 | 6.10 | 3.57 | 2.68 | 1.56 | 1.26 | 1.68 | 1.09 | 0.98 | 0.91 | 0.73 | 0.64 | 0.46 | 0.33 | 0.45 | 0.04 | 0.00 | 0.01 | 0.00 | 0.00 | 0.00 | |
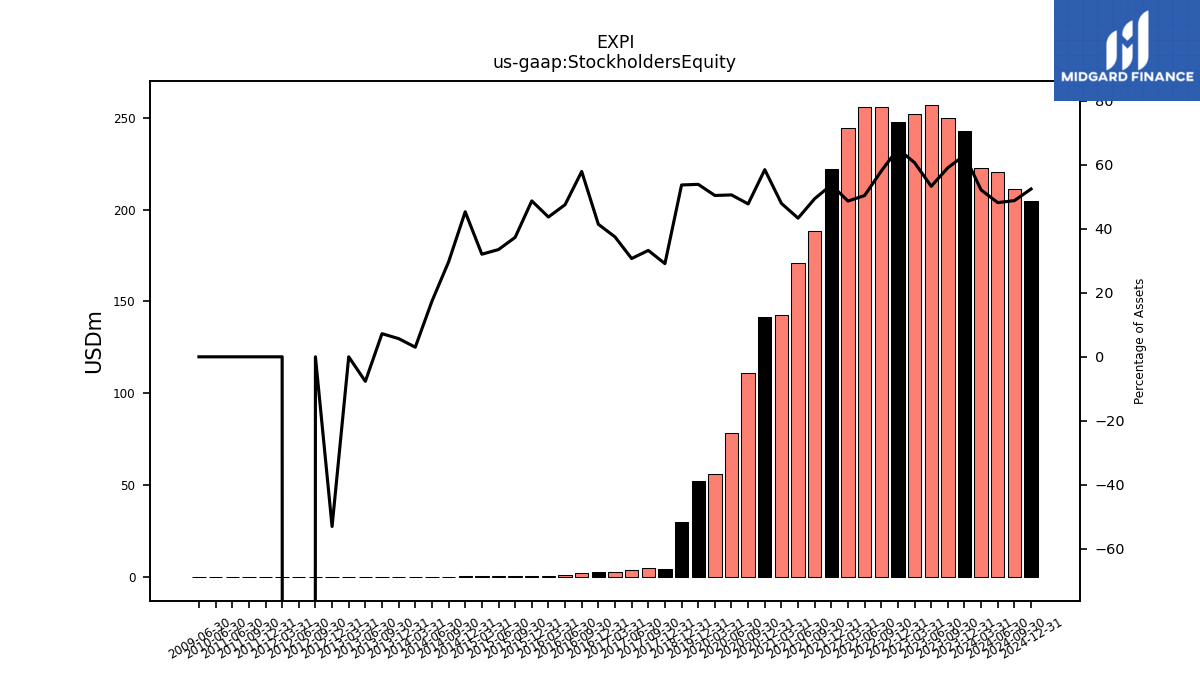
| Stockholders Equity | 222.44 | 242.84 | 249.76 | 257.15 | 251.92 | 247.82 | 255.89 | 255.70 | 244.37 | 222.17 | 188.56 | 171.18 | 142.61 | 141.58 | 110.91 | 78.33 | 55.78 | 51.97 | NA | NA | NA | 29.98 | NA | NA | NA | 4.26 | 4.63 | 3.88 | 2.72 | 2.53 | 2.07 | 1.27 | 0.68 | 0.61 | 0.63 | 0.37 | 0.31 | 0.41 | 0.22 | 0.11 | 0.01 | 0.02 | 0.03 | -0.00 | -0.01 | -0.12 | -0.10 | -0.09 | -0.08 |
| 2024-03-31 | 2023-12-31 | 2023-09-30 | 2023-06-30 | 2023-03-31 | 2022-12-31 | 2022-09-30 | 2022-06-30 | 2022-03-31 | 2021-12-31 | 2021-09-30 | 2021-06-30 | 2021-03-31 | 2020-12-31 | 2020-09-30 | 2020-06-30 | 2020-03-31 | 2019-12-31 | 2019-09-30 | 2019-06-30 | 2019-03-31 | 2018-12-31 | 2018-09-30 | 2018-06-30 | 2018-03-31 | 2017-12-31 | 2017-09-30 | 2017-06-30 | 2017-03-31 | 2016-12-31 | 2016-09-30 | 2016-06-30 | 2016-03-31 | 2015-12-31 | 2015-09-30 | 2015-06-30 | 2015-03-31 | 2014-12-31 | 2014-09-30 | 2014-06-30 | 2014-03-31 | 2013-12-31 | 2013-09-30 | 2013-06-30 | 2013-03-31 | 2012-12-31 | 2012-09-30 | 2012-06-30 | 2012-03-31 | ||
|---|---|---|---|---|---|---|---|---|---|---|---|---|---|---|---|---|---|---|---|---|---|---|---|---|---|---|---|---|---|---|---|---|---|---|---|---|---|---|---|---|---|---|---|---|---|---|---|---|---|---|
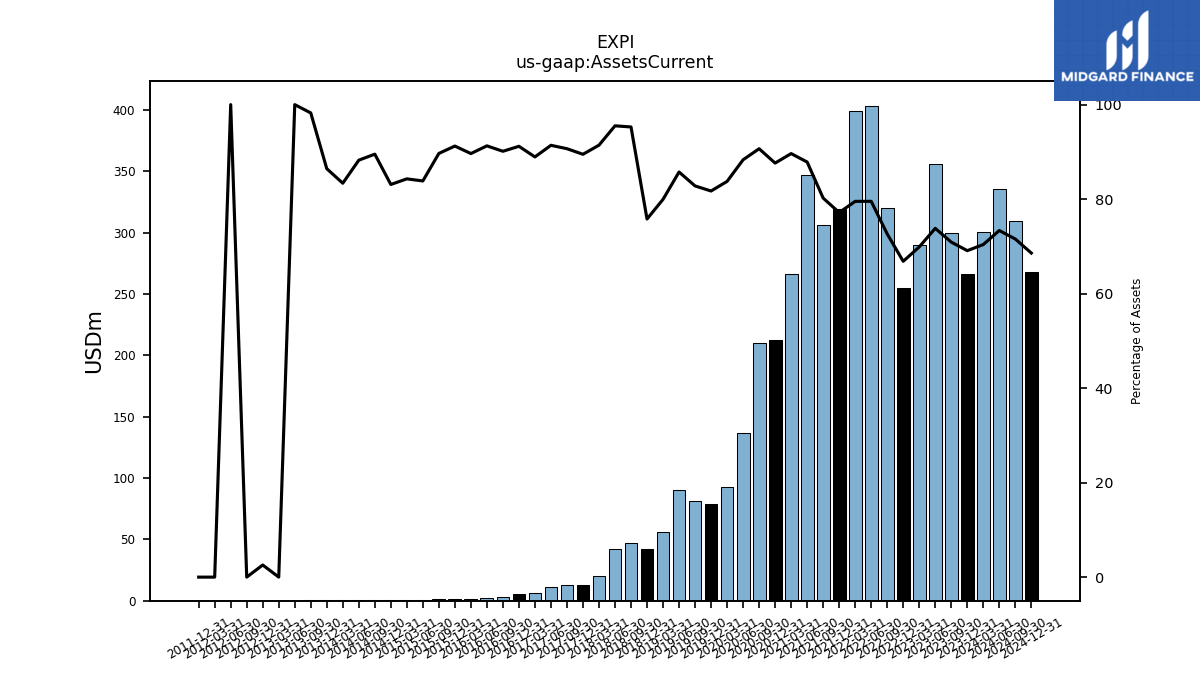
| Assets Current | 300.38 | 266.48 | 299.81 | 356.37 | 290.25 | 255.11 | 320.19 | 403.60 | 399.34 | 319.31 | 306.14 | 347.13 | 266.76 | 212.22 | 210.52 | 136.80 | 92.69 | 78.82 | 81.29 | 90.39 | 56.45 | 42.33 | 46.75 | 42.12 | 19.90 | 13.10 | 12.62 | 11.56 | 6.46 | 5.57 | 3.22 | 2.45 | 1.40 | 1.15 | 1.50 | 0.92 | 0.83 | 0.76 | 0.66 | 0.57 | 0.38 | 0.29 | 0.44 | 0.04 | 0.00 | 0.01 | 0.00 | 0.00 | 0.00 | |
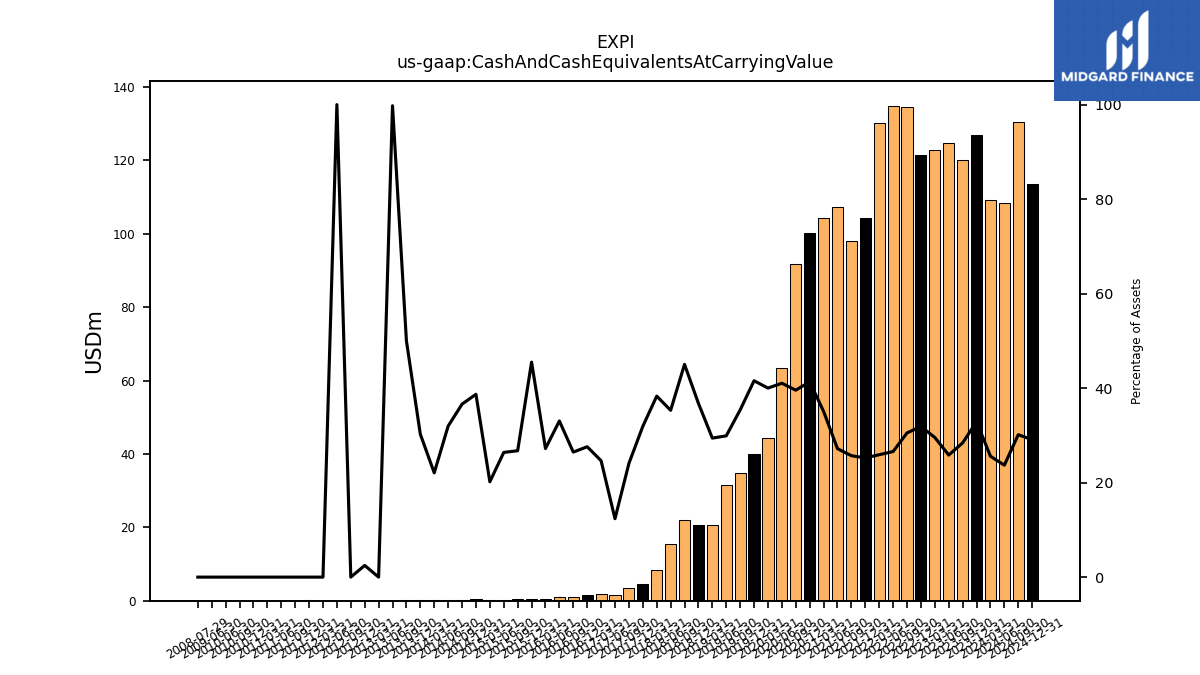
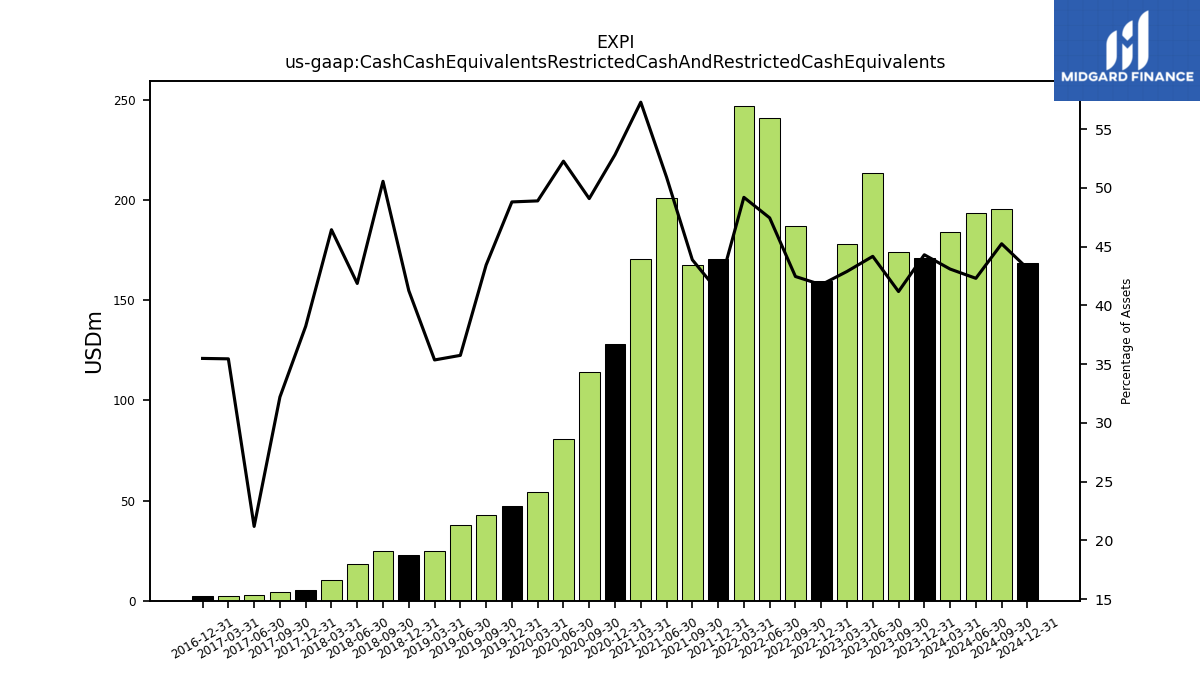
| Cash And Cash Equivalents At Carrying Value | 109.17 | 126.86 | 120.14 | 124.71 | 122.77 | 121.59 | 134.54 | 134.90 | 130.09 | 104.39 | 98.06 | 107.41 | 104.39 | 100.14 | 91.87 | 63.55 | 44.28 | 40.09 | 34.74 | 31.52 | 20.77 | 20.54 | 22.09 | 15.57 | 8.34 | 4.67 | 3.35 | 1.56 | 1.79 | 1.68 | 0.94 | 0.89 | 0.42 | 0.57 | 0.45 | 0.29 | 0.20 | 0.35 | 0.27 | 0.21 | 0.10 | 0.10 | 0.23 | 0.04 | 0.00 | 0.01 | 0.00 | 0.00 | 0.00 | |
| Cash Cash Equivalents Restricted Cash And Restricted Cash Equivalents | 183.90 | 170.88 | 174.14 | 213.27 | 178.13 | 159.38 | 187.20 | 240.78 | 247.03 | 170.50 | 167.47 | 201.18 | 170.50 | 127.92 | 113.99 | 80.96 | 54.11 | 47.07 | 42.65 | 37.69 | 24.97 | 23.04 | 24.81 | 18.46 | 10.11 | 5.60 | 4.48 | 2.68 | 2.58 | 2.17 | NA | NA | NA | NA | NA | NA | NA | NA | NA | NA | NA | NA | NA | NA | NA | NA | NA | NA | NA | |
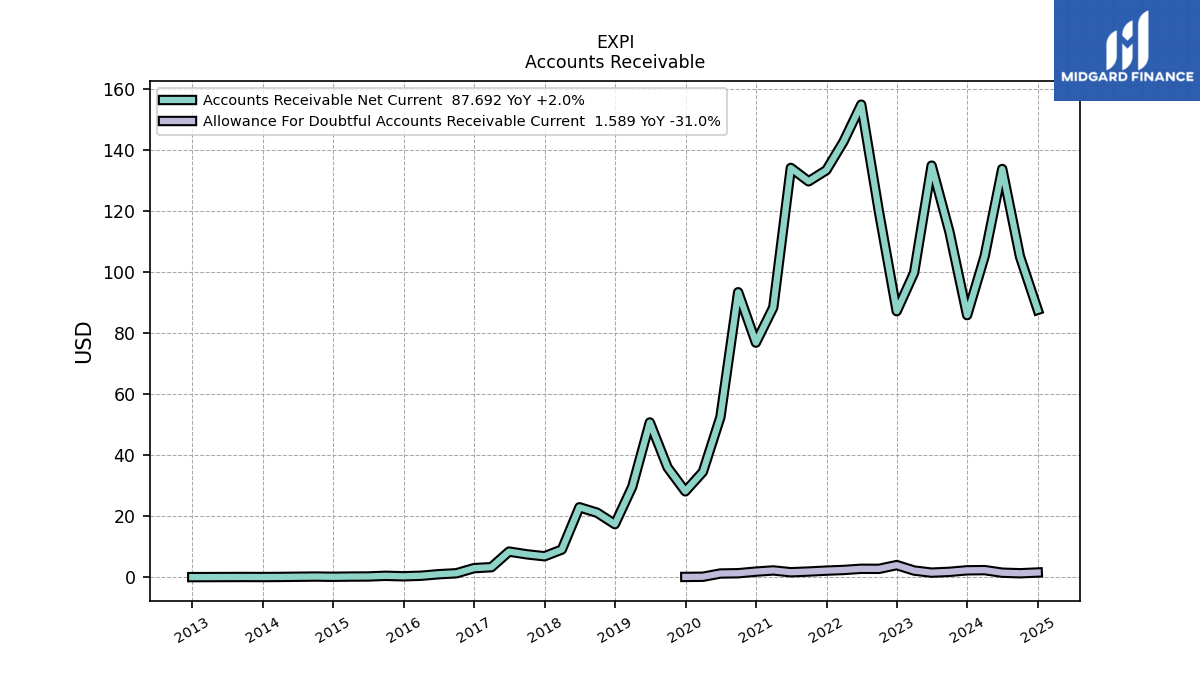
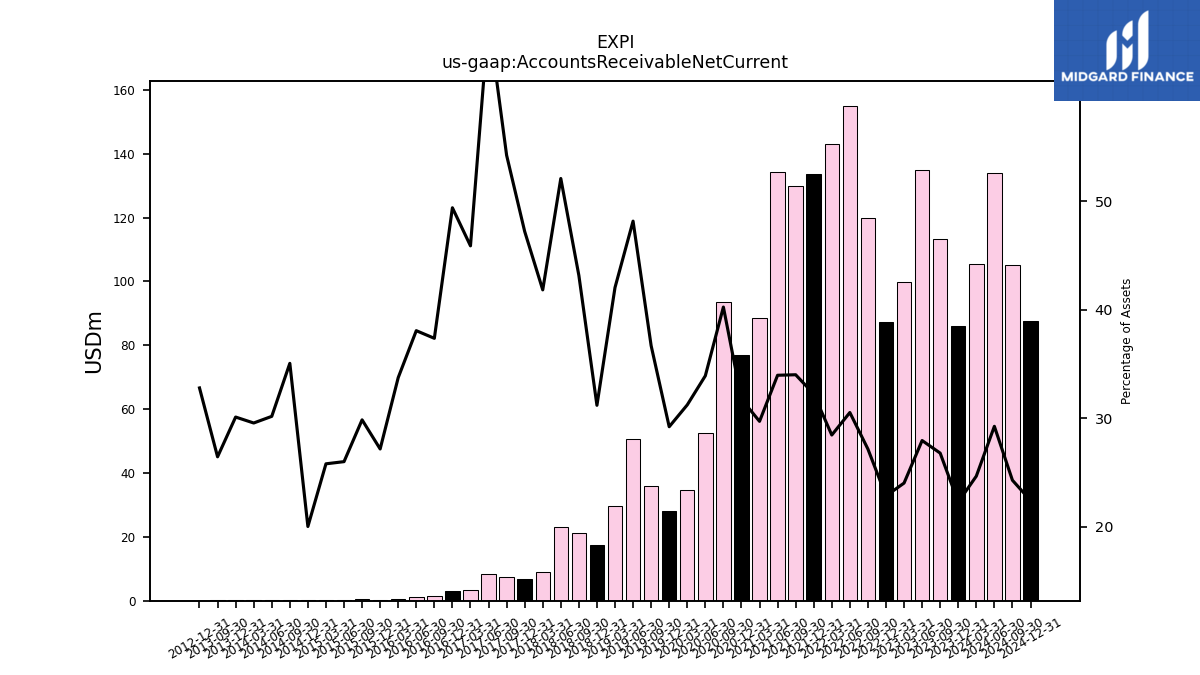
| Accounts Receivable Net Current | 105.33 | 85.97 | 113.34 | 135.00 | 99.86 | 87.26 | 119.82 | 155.00 | 142.96 | 133.49 | 129.84 | 134.25 | 88.47 | 76.95 | 93.48 | 52.54 | 34.58 | 28.20 | 36.04 | 50.79 | 29.69 | 17.43 | 21.18 | 22.97 | 9.11 | 6.91 | 7.55 | 8.44 | 3.34 | 3.02 | 1.33 | 1.02 | 0.53 | 0.34 | 0.50 | 0.28 | 0.25 | 0.18 | 0.26 | 0.19 | 0.14 | 0.10 | 0.12 | NA | NA | 0.07 | NA | NA | NA | |
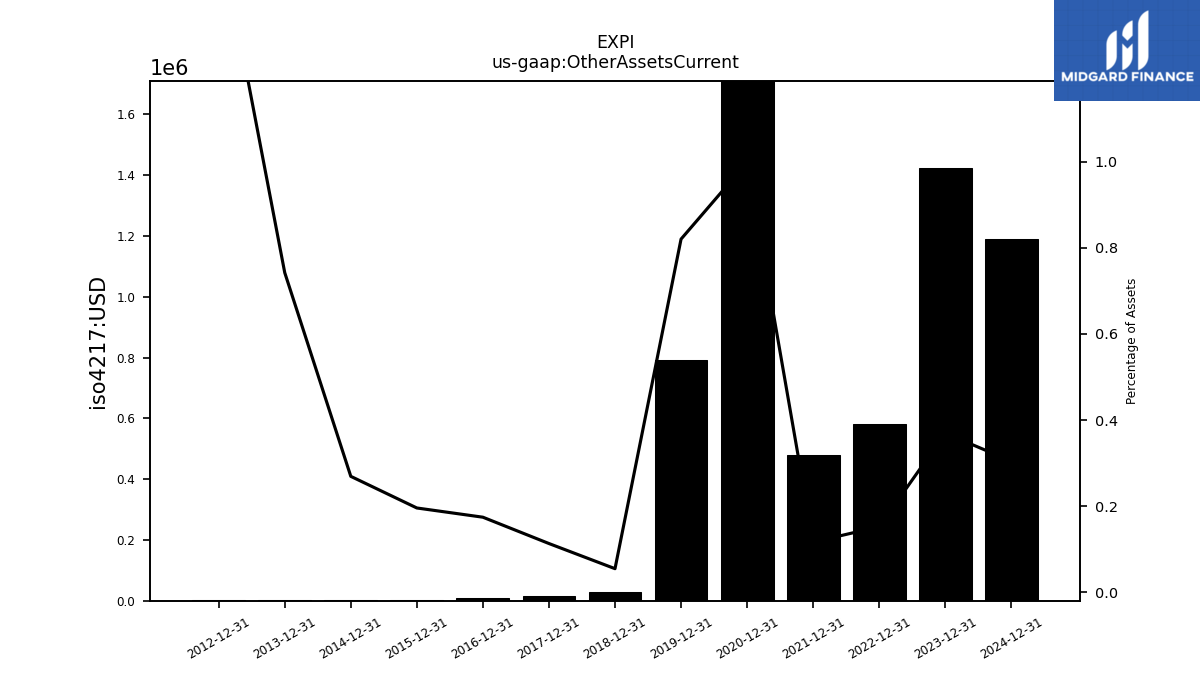
| Other Assets Current | NA | 1.43 | NA | NA | NA | 0.58 | NA | NA | NA | 0.48 | NA | NA | NA | 2.42 | NA | NA | NA | 0.79 | NA | NA | NA | 0.03 | NA | NA | NA | 0.02 | NA | NA | NA | 0.01 | NA | NA | NA | 0.00 | NA | NA | NA | 0.00 | NA | NA | NA | 0.00 | NA | NA | NA | 0.00 | NA | NA | NA | |
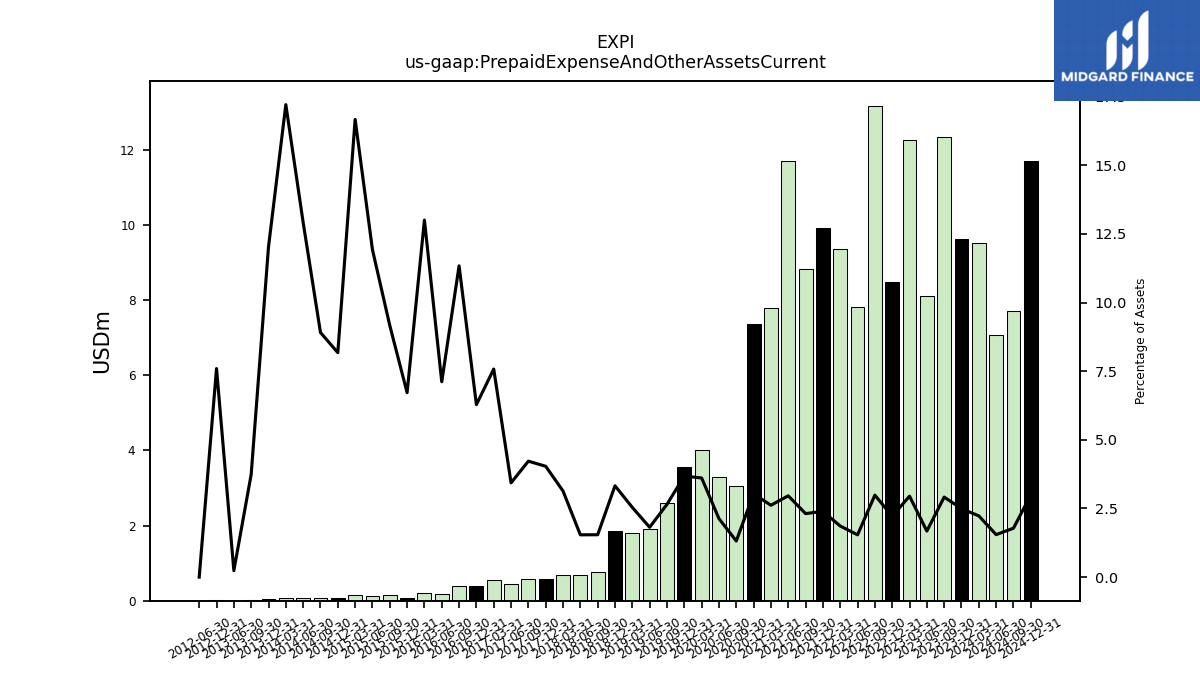
| Prepaid Expense And Other Assets Current | 9.52 | 9.62 | 12.32 | 8.10 | 12.25 | 8.47 | 13.17 | 7.82 | 9.35 | 9.92 | 8.83 | 11.71 | 7.79 | 7.35 | 3.06 | 3.30 | 4.00 | 3.55 | 2.60 | 1.91 | 1.79 | 1.86 | 0.76 | 0.68 | 0.68 | 0.59 | 0.59 | 0.43 | 0.55 | 0.38 | 0.40 | 0.19 | 0.20 | 0.08 | 0.15 | 0.13 | 0.16 | 0.07 | 0.07 | 0.08 | 0.08 | 0.04 | 0.02 | 0.00 | NA | 0.02 | NA | 0.00 | NA |
| 2024-03-31 | 2023-12-31 | 2023-09-30 | 2023-06-30 | 2023-03-31 | 2022-12-31 | 2022-09-30 | 2022-06-30 | 2022-03-31 | 2021-12-31 | 2021-09-30 | 2021-06-30 | 2021-03-31 | 2020-12-31 | 2020-09-30 | 2020-06-30 | 2020-03-31 | 2019-12-31 | 2019-09-30 | 2019-06-30 | 2019-03-31 | 2018-12-31 | 2018-09-30 | 2018-06-30 | 2018-03-31 | 2017-12-31 | 2017-09-30 | 2017-06-30 | 2017-03-31 | 2016-12-31 | 2016-09-30 | 2016-06-30 | 2016-03-31 | 2015-12-31 | 2015-09-30 | 2015-06-30 | 2015-03-31 | 2014-12-31 | 2014-09-30 | 2014-06-30 | 2014-03-31 | 2013-12-31 | 2013-09-30 | 2013-06-30 | 2013-03-31 | 2012-12-31 | 2012-09-30 | 2012-06-30 | 2012-03-31 | ||
|---|---|---|---|---|---|---|---|---|---|---|---|---|---|---|---|---|---|---|---|---|---|---|---|---|---|---|---|---|---|---|---|---|---|---|---|---|---|---|---|---|---|---|---|---|---|---|---|---|---|---|
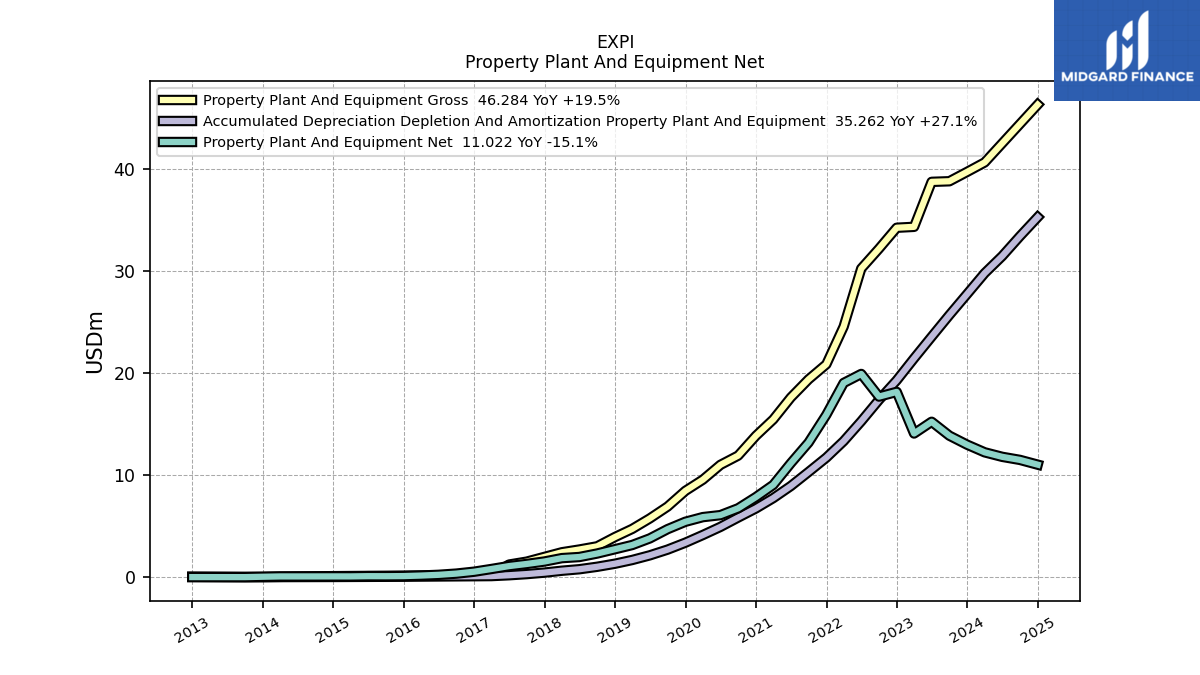
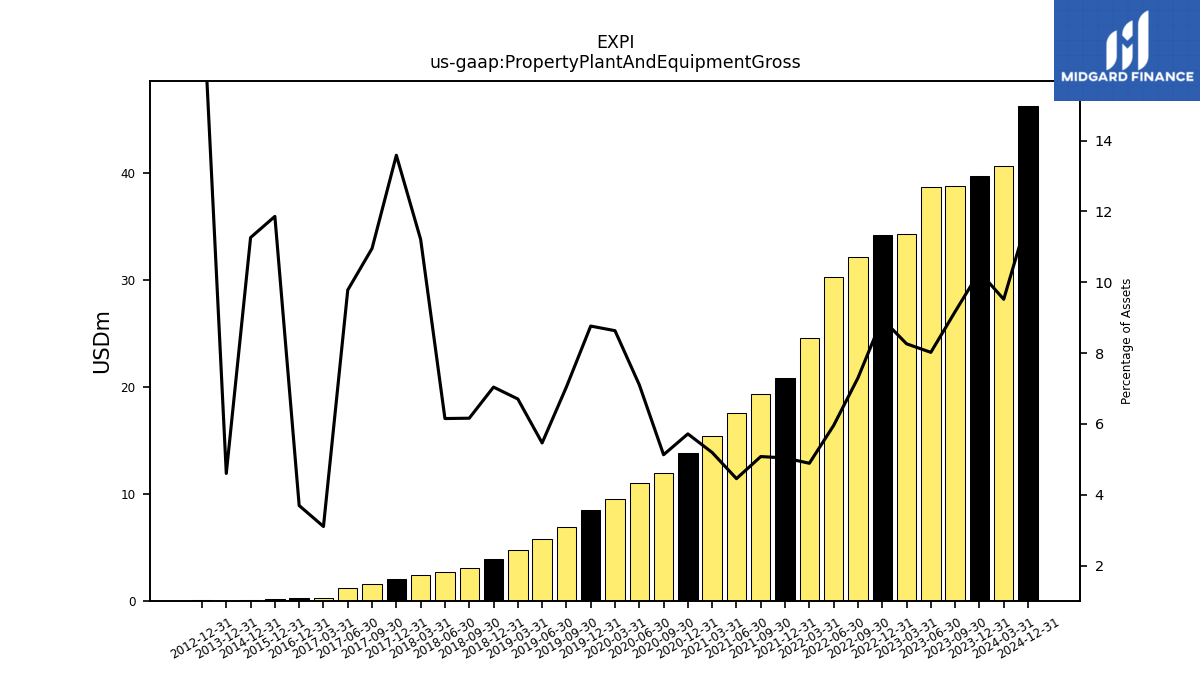
| Property Plant And Equipment Gross | 40.62 | 39.70 | 38.78 | 38.72 | 34.31 | 34.23 | 32.17 | 30.23 | 24.55 | 20.85 | 19.38 | 17.60 | 15.45 | 13.85 | 11.91 | 11.00 | 9.55 | 8.45 | 6.92 | 5.76 | 4.73 | 3.93 | 3.02 | 2.71 | 2.44 | 1.99 | 1.52 | 1.24 | 0.23 | 0.23 | NA | NA | NA | 0.15 | NA | NA | NA | 0.10 | NA | NA | NA | 0.02 | NA | NA | NA | 0.04 | NA | NA | NA | |
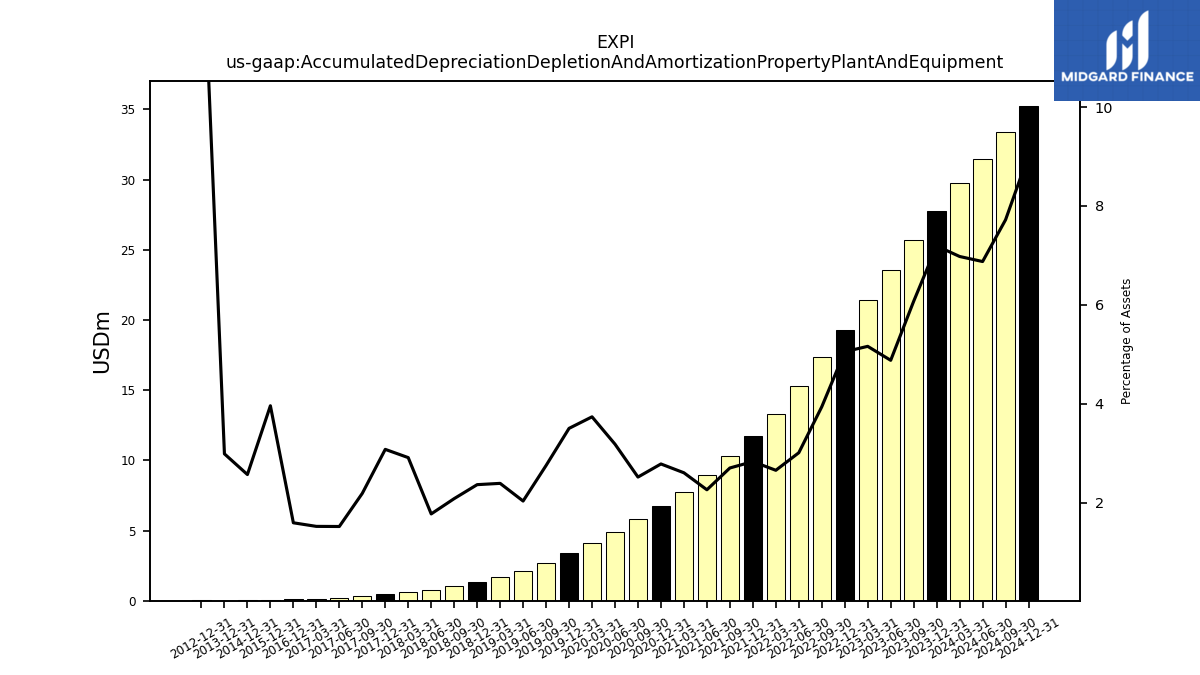
| Accumulated Depreciation Depletion And Amortization Property Plant And Equipment | 29.78 | 27.73 | 25.68 | 23.55 | 21.43 | 19.28 | 17.36 | 15.27 | 13.33 | 11.71 | 10.31 | 8.93 | 7.75 | 6.74 | 5.84 | 4.93 | 4.13 | 3.38 | 2.70 | 2.14 | 1.69 | 1.32 | 1.02 | 0.78 | 0.63 | 0.45 | 0.30 | 0.19 | 0.11 | 0.10 | NA | NA | NA | 0.05 | NA | NA | NA | 0.02 | NA | NA | NA | 0.01 | NA | NA | NA | 0.03 | NA | NA | NA | |
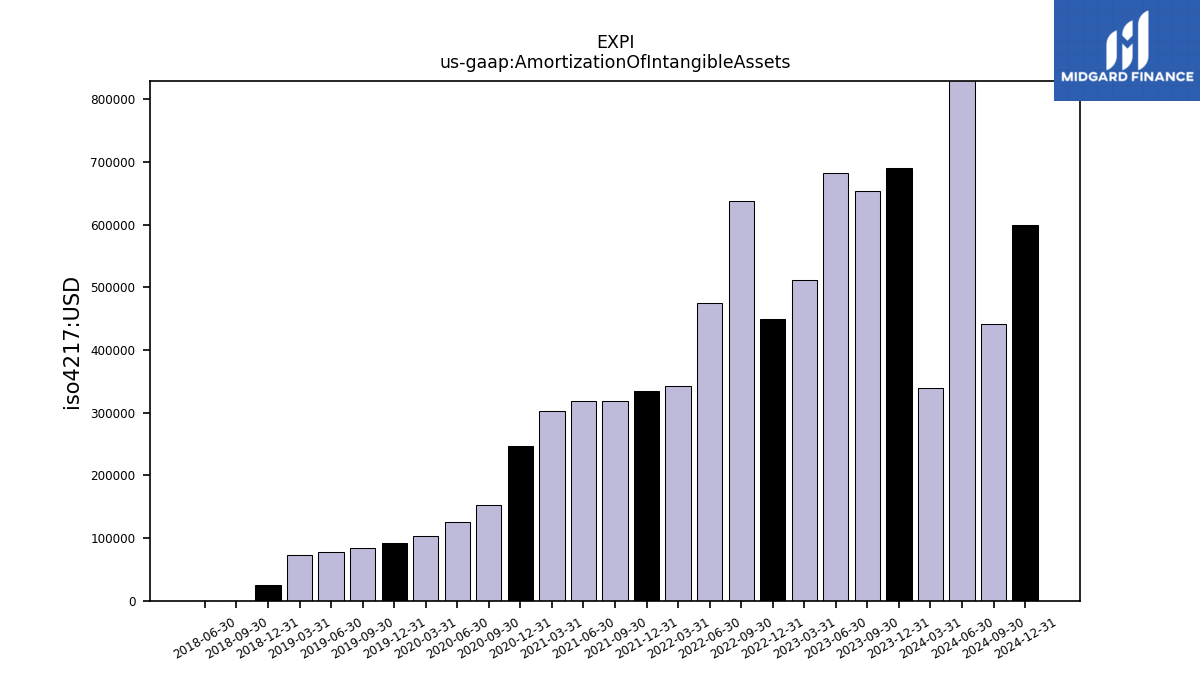
| Amortization Of Intangible Assets | 0.34 | 0.69 | 0.65 | 0.68 | 0.51 | 0.45 | 0.64 | 0.47 | 0.34 | 0.34 | 0.32 | 0.32 | 0.30 | 0.25 | 0.15 | 0.13 | 0.10 | 0.09 | 0.08 | 0.08 | 0.07 | 0.02 | 0.00 | 0.00 | NA | NA | NA | NA | NA | NA | NA | NA | NA | NA | NA | NA | NA | NA | NA | NA | NA | NA | NA | NA | NA | NA | NA | NA | NA | |
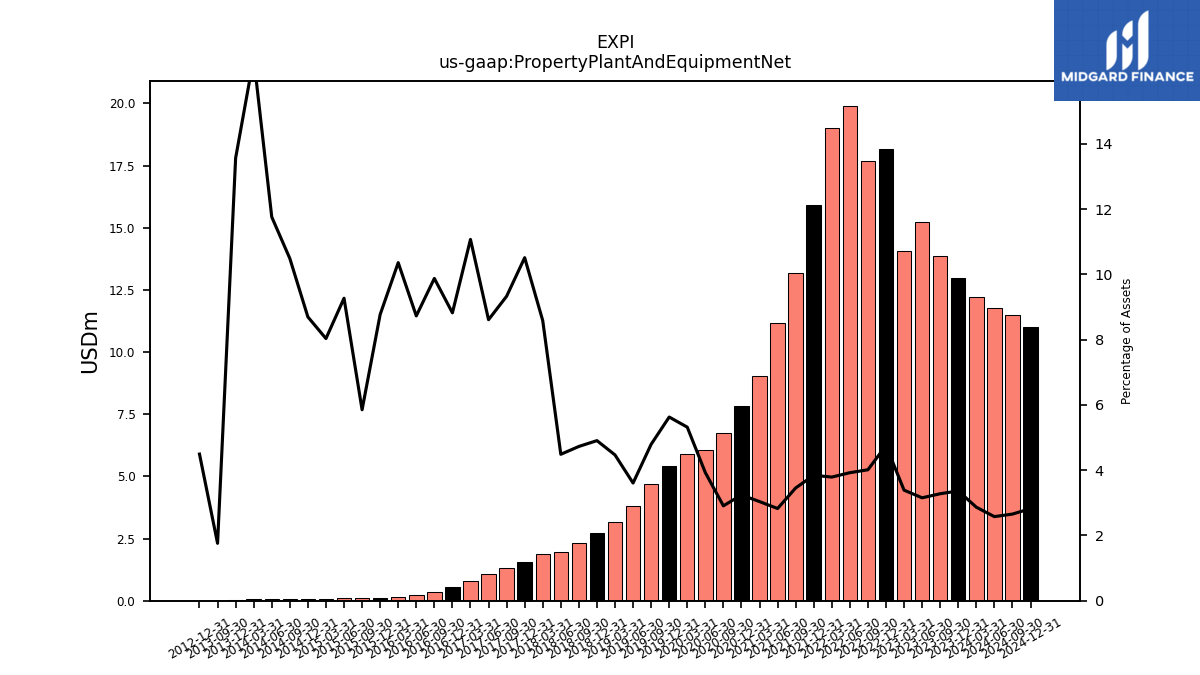
| Property Plant And Equipment Net | 12.23 | 12.98 | 13.86 | 15.22 | 14.07 | 18.15 | 17.69 | 19.91 | 19.02 | 15.90 | 13.19 | 11.16 | 9.04 | 7.85 | 6.75 | 6.08 | 5.88 | 5.43 | 4.70 | 3.80 | 3.15 | 2.74 | 2.32 | 1.98 | 1.87 | 1.54 | 1.30 | 1.09 | 0.80 | 0.54 | 0.35 | 0.23 | 0.16 | 0.11 | 0.10 | 0.10 | 0.08 | 0.08 | 0.08 | 0.08 | 0.08 | 0.04 | 0.01 | NA | NA | 0.01 | NA | NA | NA | |
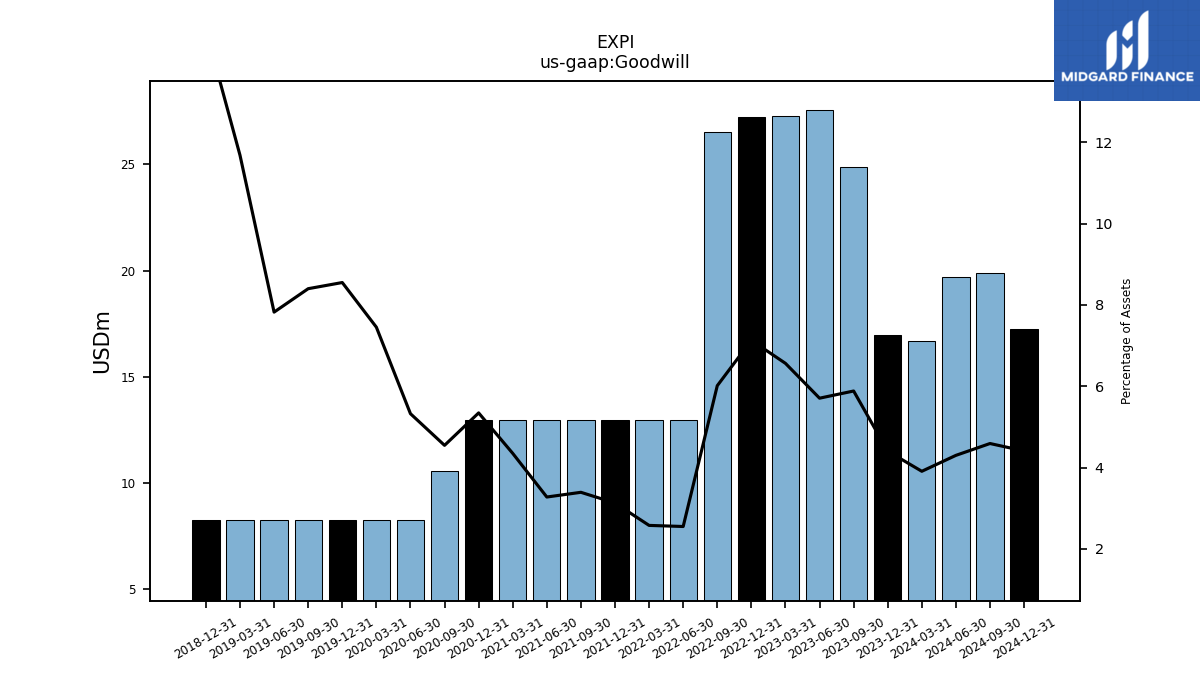
| Goodwill | 16.68 | 16.98 | 24.88 | 27.55 | 27.26 | 27.21 | 26.51 | 12.95 | 12.95 | 12.95 | 12.95 | 12.95 | 12.95 | 12.95 | 10.56 | 8.25 | 8.25 | 8.25 | 8.25 | 8.25 | 8.25 | 8.25 | NA | NA | NA | NA | NA | NA | NA | NA | NA | NA | NA | NA | NA | NA | NA | NA | NA | NA | NA | NA | NA | NA | NA | NA | NA | NA | NA | |
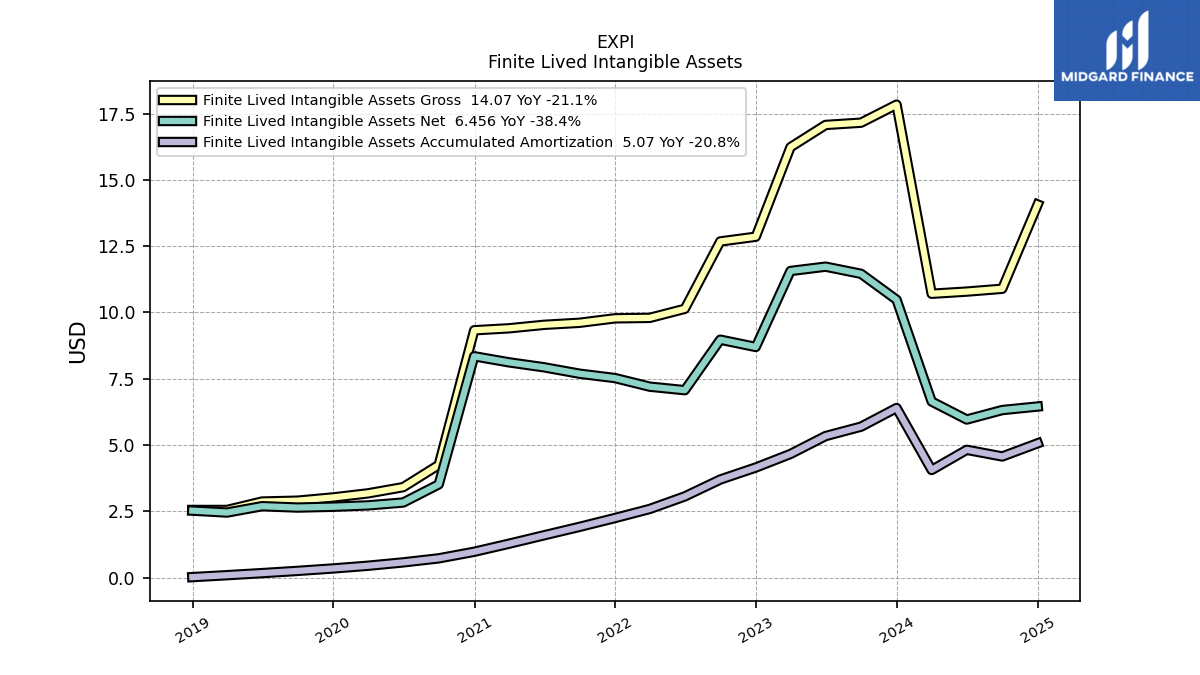
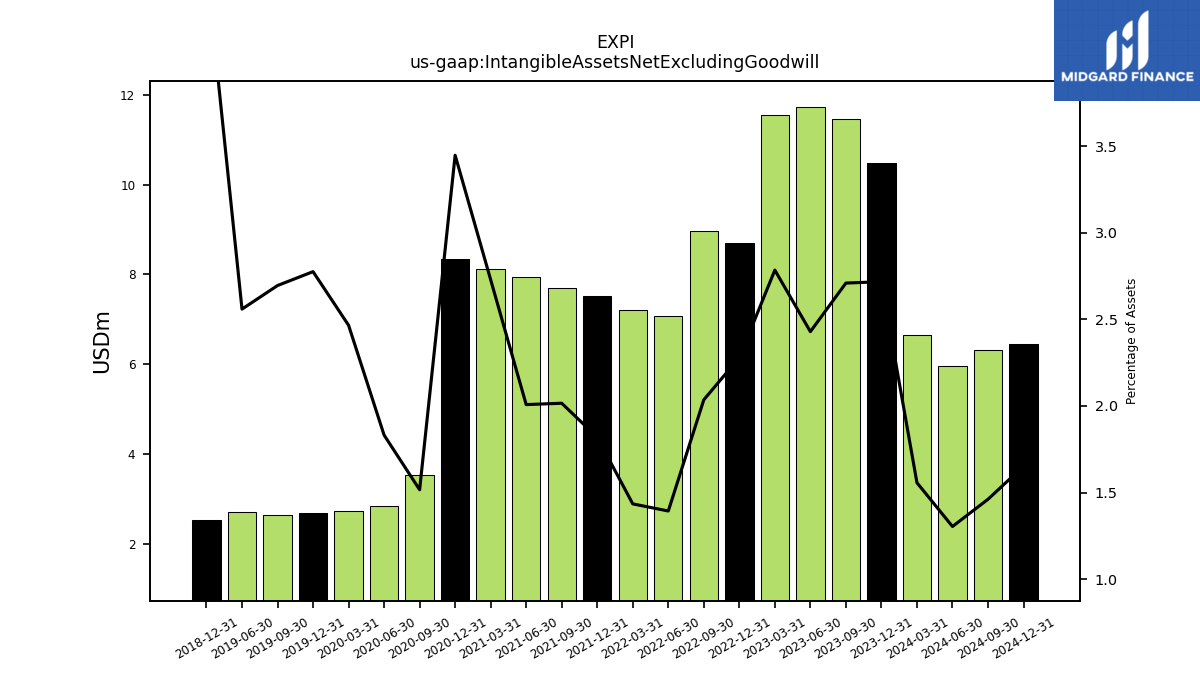
| Intangible Assets Net Excluding Goodwill | 6.64 | 10.48 | 11.46 | 11.73 | 11.56 | 8.70 | 8.97 | 7.07 | 7.20 | 7.53 | 7.69 | 7.93 | 8.12 | 8.35 | 3.52 | 2.84 | 2.73 | 2.68 | 2.65 | 2.70 | NA | 2.53 | NA | NA | NA | NA | NA | NA | NA | NA | NA | NA | NA | NA | NA | NA | NA | NA | NA | NA | NA | NA | NA | NA | NA | NA | NA | NA | NA | |
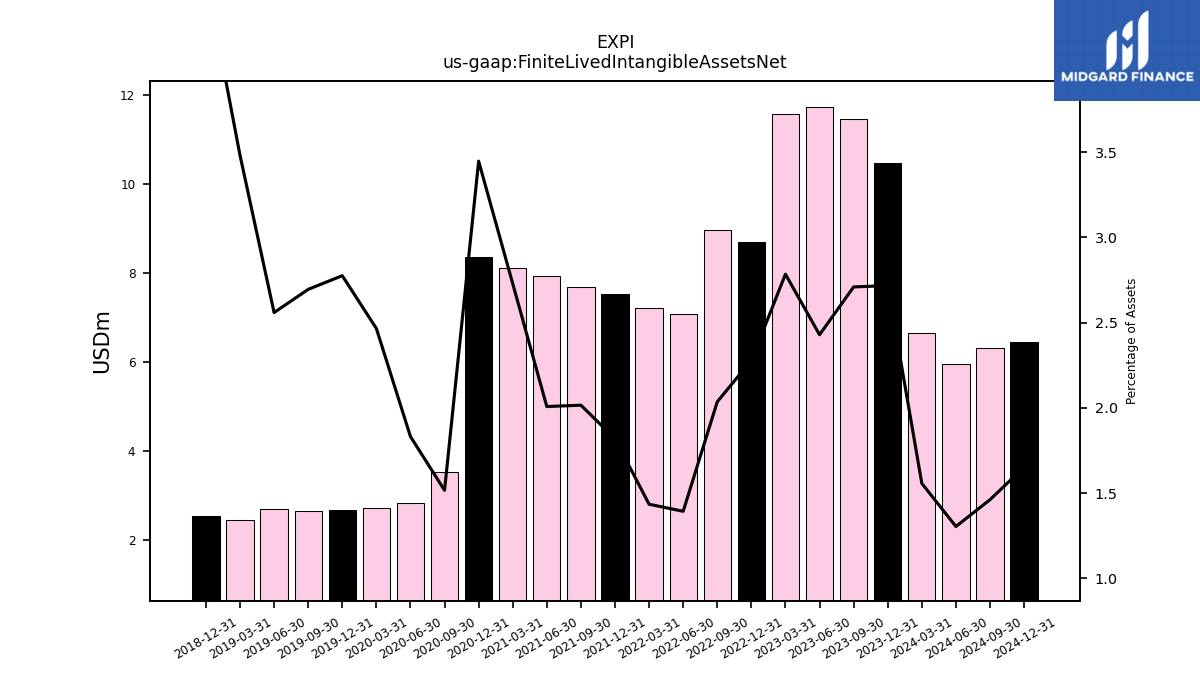
| Finite Lived Intangible Assets Net | 6.64 | 10.48 | 11.46 | 11.73 | 11.56 | 8.70 | 8.97 | 7.07 | 7.20 | 7.53 | 7.69 | 7.93 | 8.12 | 8.35 | 3.52 | 2.84 | 2.73 | 2.68 | 2.65 | 2.70 | 2.46 | 2.53 | NA | NA | NA | NA | NA | NA | NA | NA | NA | NA | NA | NA | NA | NA | NA | NA | NA | NA | NA | NA | NA | NA | NA | NA | NA | NA | NA |
| 2024-03-31 | 2023-12-31 | 2023-09-30 | 2023-06-30 | 2023-03-31 | 2022-12-31 | 2022-09-30 | 2022-06-30 | 2022-03-31 | 2021-12-31 | 2021-09-30 | 2021-06-30 | 2021-03-31 | 2020-12-31 | 2020-09-30 | 2020-06-30 | 2020-03-31 | 2019-12-31 | 2019-09-30 | 2019-06-30 | 2019-03-31 | 2018-12-31 | 2018-09-30 | 2018-06-30 | 2018-03-31 | 2017-12-31 | 2017-09-30 | 2017-06-30 | 2017-03-31 | 2016-12-31 | 2016-09-30 | 2016-06-30 | 2016-03-31 | 2015-12-31 | 2015-09-30 | 2015-06-30 | 2015-03-31 | 2014-12-31 | 2014-09-30 | 2014-06-30 | 2014-03-31 | 2013-12-31 | 2013-09-30 | 2013-06-30 | 2013-03-31 | 2012-12-31 | 2012-09-30 | 2012-06-30 | 2012-03-31 | ||
|---|---|---|---|---|---|---|---|---|---|---|---|---|---|---|---|---|---|---|---|---|---|---|---|---|---|---|---|---|---|---|---|---|---|---|---|---|---|---|---|---|---|---|---|---|---|---|---|---|---|---|
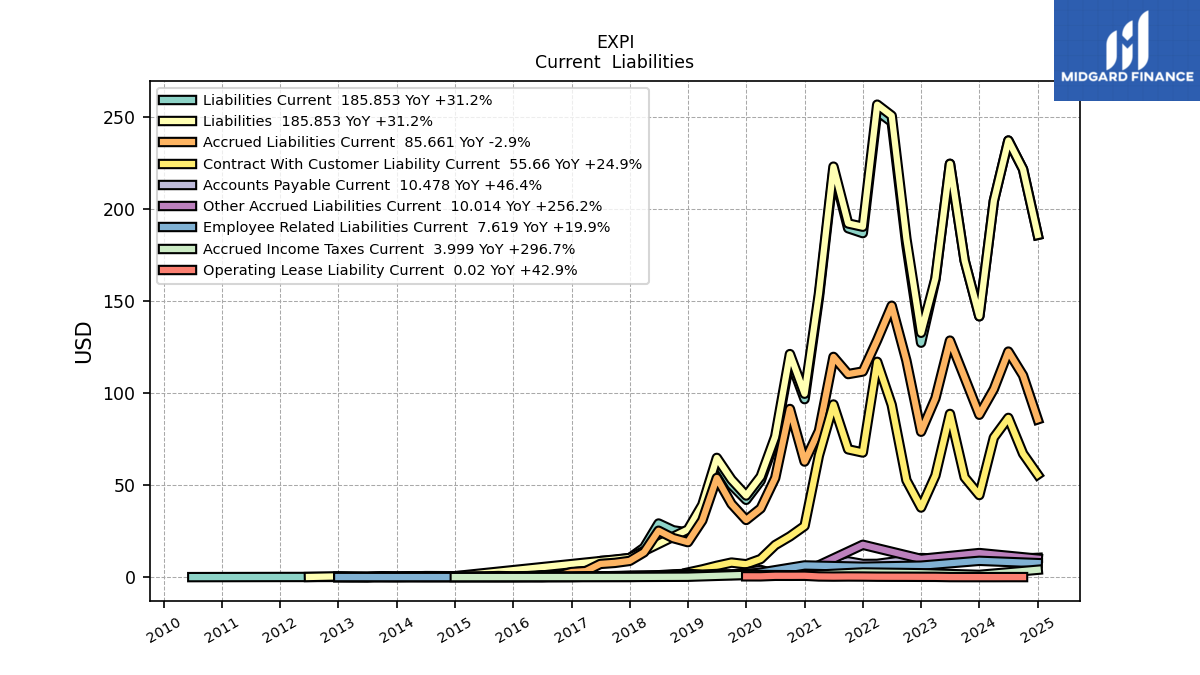
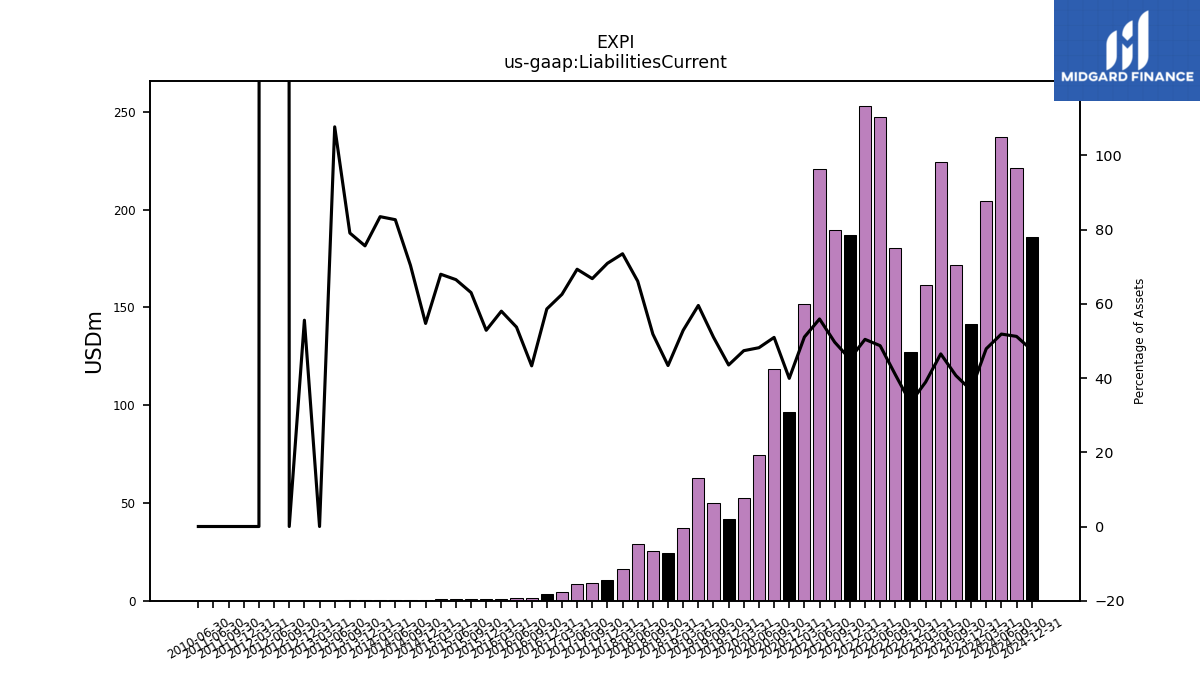
| Liabilities Current | 204.29 | 141.64 | 171.93 | 224.45 | 161.55 | 127.30 | 180.37 | 247.14 | 253.11 | 186.81 | 189.48 | 220.89 | 151.89 | 96.65 | 118.27 | 74.58 | 52.41 | 41.97 | 50.06 | 62.77 | 37.31 | 24.21 | 25.43 | 29.13 | 15.99 | 10.38 | 9.29 | 8.76 | 4.55 | 3.58 | 1.54 | 1.44 | 0.90 | 0.66 | 1.06 | 0.73 | 0.67 | 0.50 | 0.52 | 0.53 | 0.38 | 0.25 | 0.36 | 0.04 | 0.01 | 0.12 | 0.10 | 0.09 | 0.09 | |
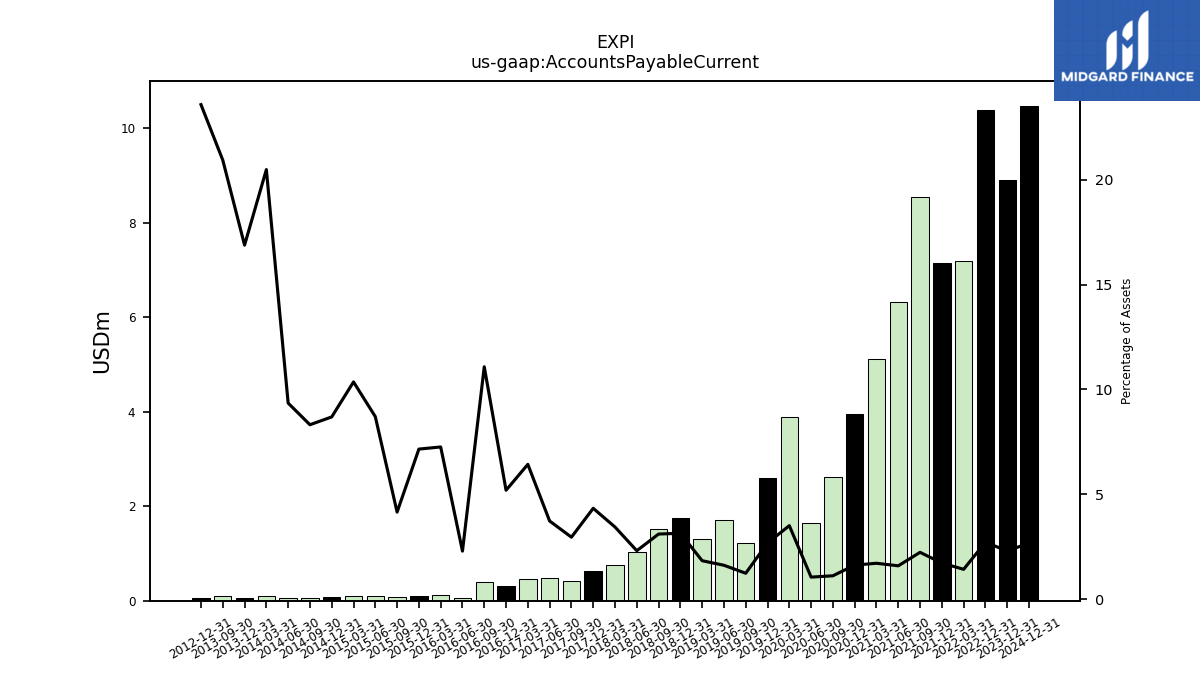
| Accounts Payable Current | NA | 8.90 | NA | NA | NA | 10.39 | NA | NA | 7.19 | 7.16 | 8.55 | 6.32 | 5.12 | 3.96 | 2.61 | 1.64 | 3.89 | 2.59 | 1.22 | 1.71 | 1.30 | 1.76 | 1.53 | 1.02 | 0.75 | 0.64 | 0.41 | 0.47 | 0.47 | 0.32 | 0.40 | 0.06 | 0.11 | 0.09 | 0.07 | 0.10 | 0.10 | 0.08 | 0.06 | 0.06 | 0.09 | 0.06 | 0.09 | NA | NA | 0.05 | NA | NA | NA | |
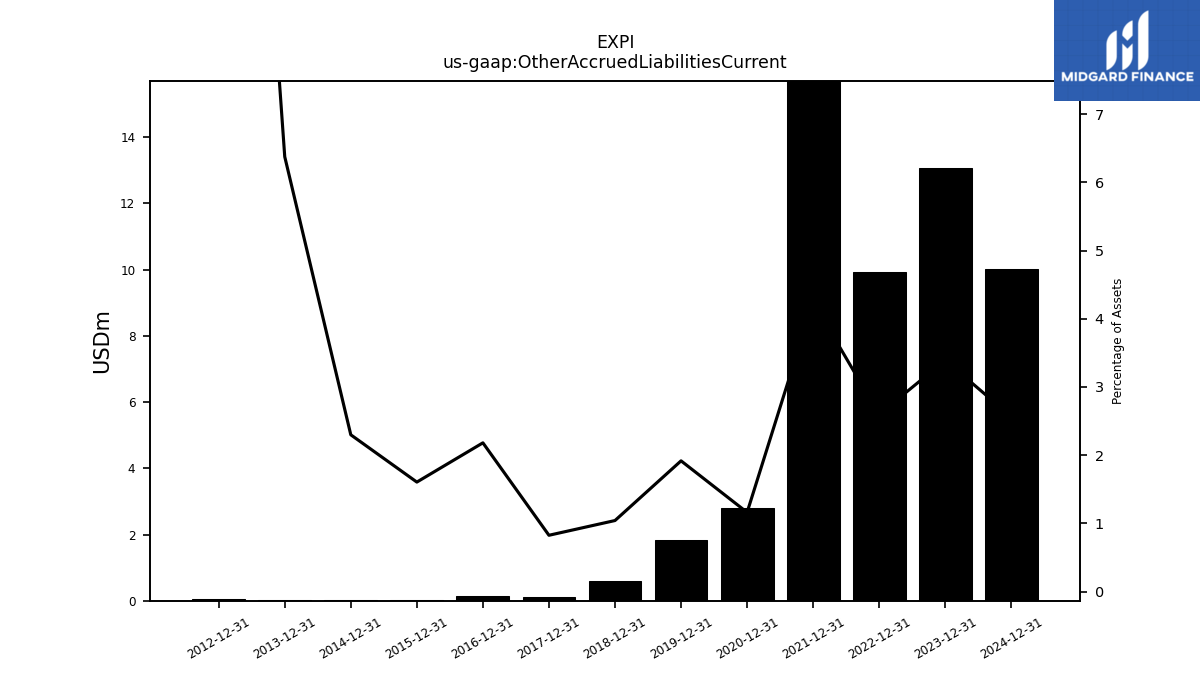
| Other Accrued Liabilities Current | NA | 13.08 | NA | NA | NA | 9.91 | NA | NA | NA | 17.57 | NA | NA | NA | 2.81 | NA | NA | NA | 1.85 | NA | NA | NA | 0.58 | NA | NA | NA | 0.12 | NA | NA | NA | 0.13 | NA | NA | NA | 0.02 | NA | NA | NA | 0.02 | NA | NA | NA | 0.02 | NA | NA | NA | 0.04 | NA | NA | NA | |
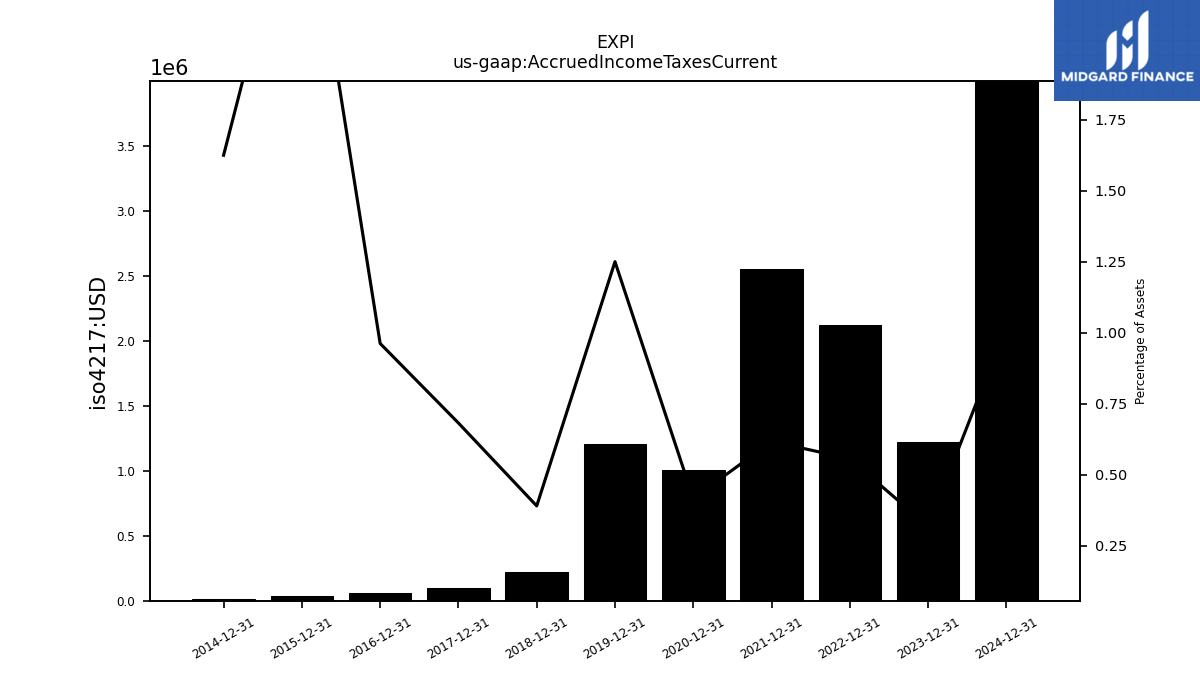
| Accrued Income Taxes Current | NA | 1.23 | NA | NA | NA | 2.12 | NA | NA | NA | 2.55 | NA | NA | NA | 1.01 | NA | NA | NA | 1.21 | NA | NA | NA | 0.22 | NA | NA | NA | 0.10 | NA | NA | NA | 0.06 | NA | NA | NA | 0.03 | NA | NA | NA | 0.01 | NA | NA | NA | NA | NA | NA | NA | NA | NA | NA | NA | |
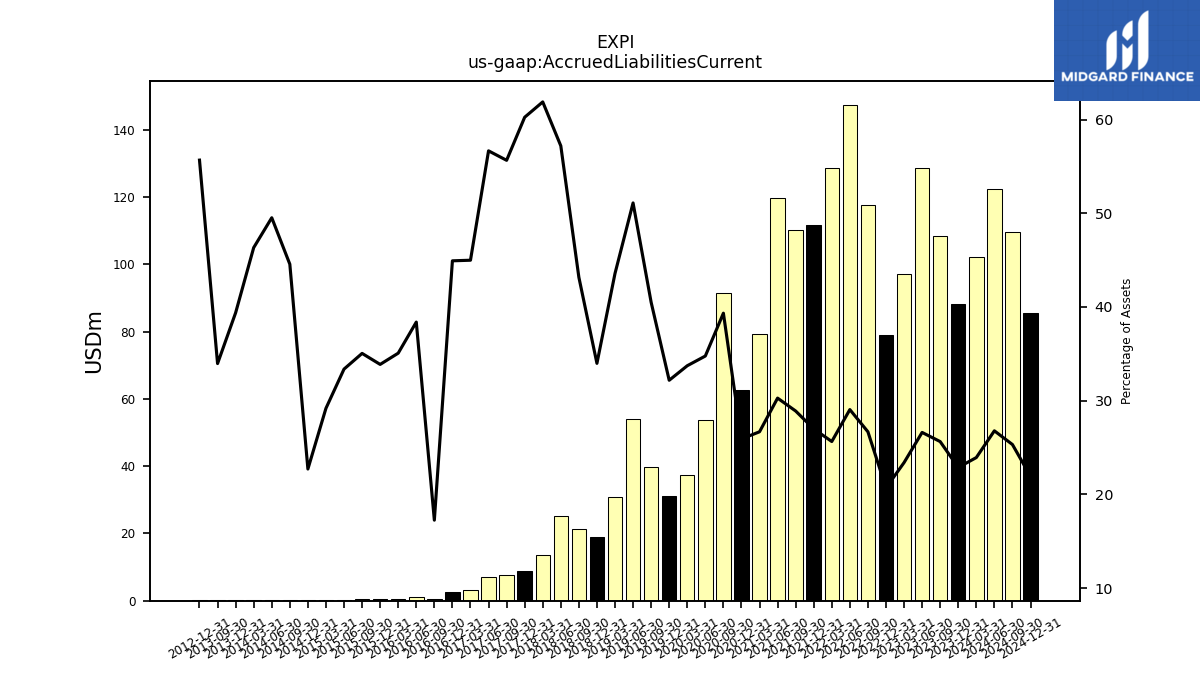
| Accrued Liabilities Current | 102.10 | 88.18 | 108.39 | 128.46 | 97.14 | 78.94 | 117.61 | 147.39 | 128.74 | 111.67 | 110.27 | 119.61 | 79.39 | 62.75 | 91.33 | 53.84 | 37.32 | 31.03 | 39.77 | 53.87 | 30.76 | 18.98 | 21.18 | 25.22 | 13.47 | 8.82 | 7.75 | 7.17 | 3.27 | 2.74 | 0.62 | 1.03 | 0.55 | 0.43 | 0.59 | 0.36 | 0.29 | 0.21 | 0.33 | 0.32 | 0.21 | 0.13 | 0.15 | NA | NA | 0.12 | NA | NA | NA | |
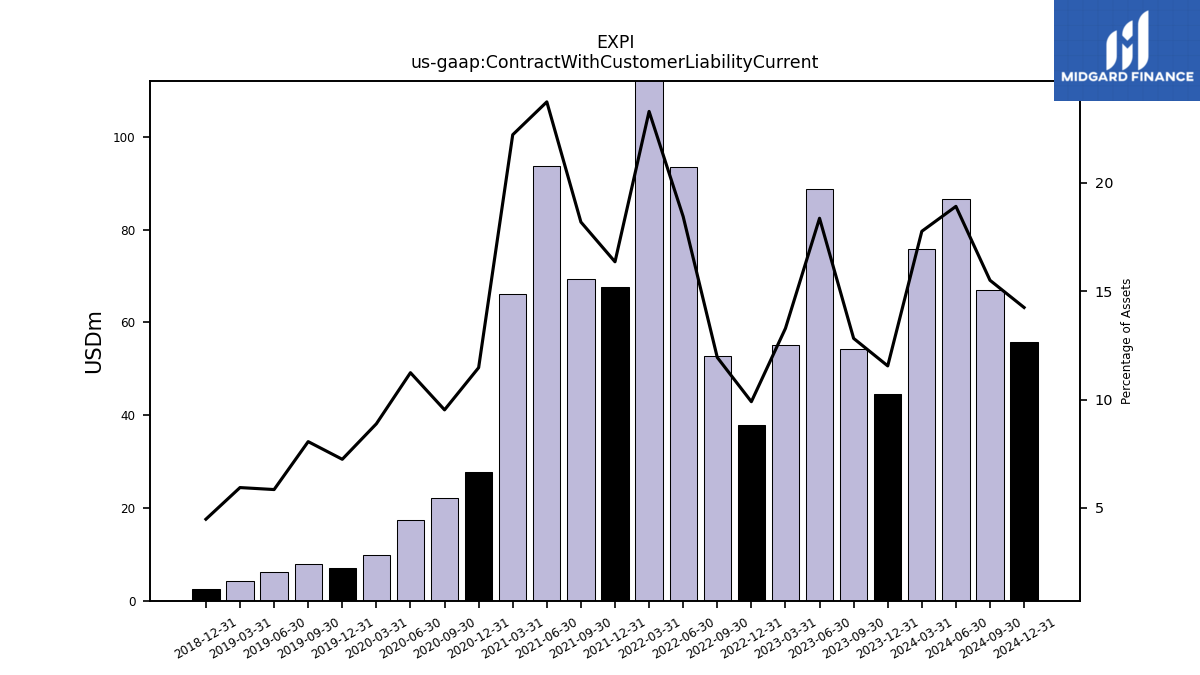
| Contract With Customer Liability Current | 75.79 | 44.55 | 54.21 | 88.64 | 55.17 | 37.79 | 52.65 | 93.57 | 116.94 | 67.67 | 69.41 | 93.76 | 66.11 | 27.78 | 22.11 | 17.41 | 9.83 | 6.99 | 7.91 | 6.17 | 4.19 | 2.50 | NA | NA | NA | NA | NA | NA | NA | NA | NA | NA | NA | NA | NA | NA | NA | NA | NA | NA | NA | NA | NA | NA | NA | NA | NA | NA | NA |
| 2024-03-31 | 2023-12-31 | 2023-09-30 | 2023-06-30 | 2023-03-31 | 2022-12-31 | 2022-09-30 | 2022-06-30 | 2022-03-31 | 2021-12-31 | 2021-09-30 | 2021-06-30 | 2021-03-31 | 2020-12-31 | 2020-09-30 | 2020-06-30 | 2020-03-31 | 2019-12-31 | 2019-09-30 | 2019-06-30 | 2019-03-31 | 2018-12-31 | 2018-09-30 | 2018-06-30 | 2018-03-31 | 2017-12-31 | 2017-09-30 | 2017-06-30 | 2017-03-31 | 2016-12-31 | 2016-09-30 | 2016-06-30 | 2016-03-31 | 2015-12-31 | 2015-09-30 | 2015-06-30 | 2015-03-31 | 2014-12-31 | 2014-09-30 | 2014-06-30 | 2014-03-31 | 2013-12-31 | 2013-09-30 | 2013-06-30 | 2013-03-31 | 2012-12-31 | 2012-09-30 | 2012-06-30 | 2012-03-31 | ||
|---|---|---|---|---|---|---|---|---|---|---|---|---|---|---|---|---|---|---|---|---|---|---|---|---|---|---|---|---|---|---|---|---|---|---|---|---|---|---|---|---|---|---|---|---|---|---|---|---|---|---|
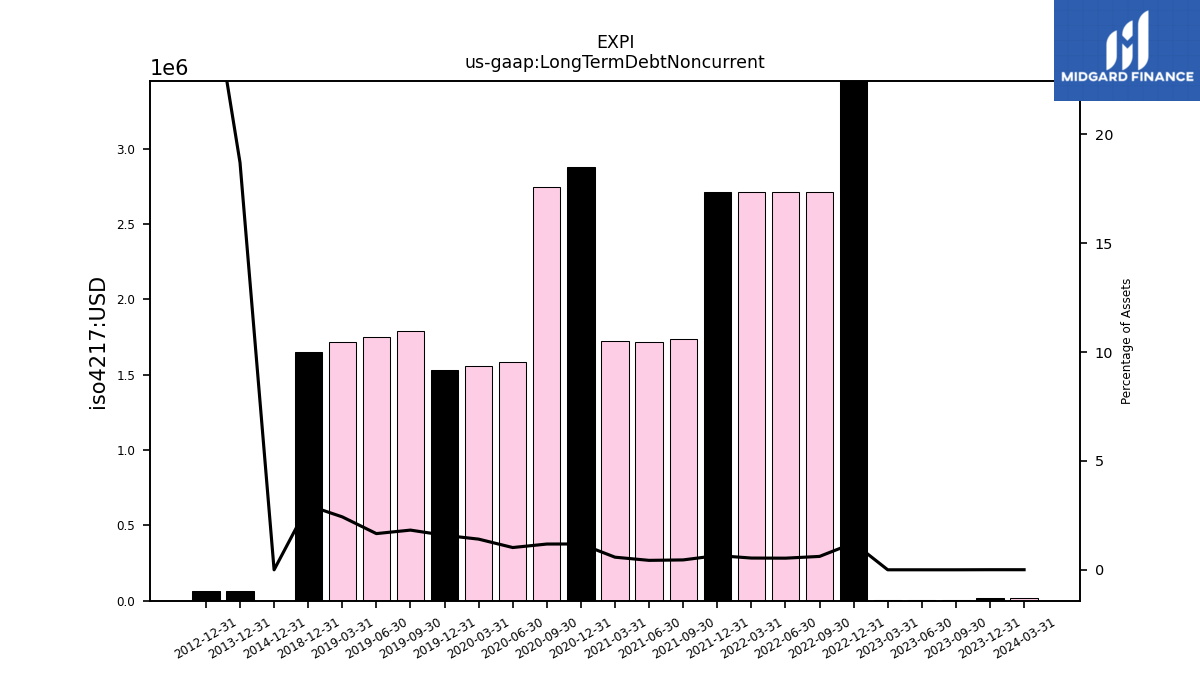
| Long Term Debt Noncurrent | 0.02 | 0.02 | 0.01 | 0.01 | 0.01 | 4.70 | 2.71 | 2.71 | 2.71 | 2.71 | 1.74 | 1.72 | 1.73 | 2.88 | 2.75 | 1.58 | 1.56 | 1.53 | 1.79 | 1.75 | 1.72 | 1.65 | NA | NA | NA | NA | NA | NA | NA | NA | NA | NA | NA | NA | NA | NA | NA | 0.00 | NA | NA | NA | 0.06 | NA | NA | NA | 0.06 | NA | NA | NA | |
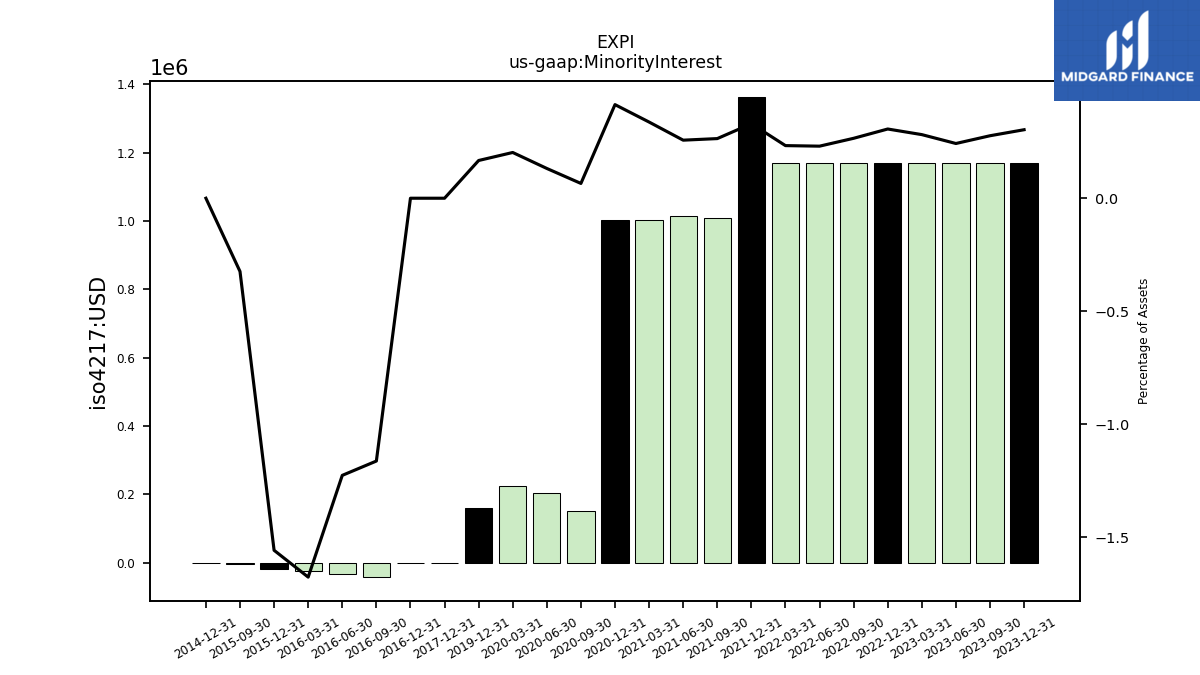
| Minority Interest | NA | 1.17 | 1.17 | 1.17 | 1.17 | 1.17 | 1.17 | 1.17 | 1.17 | 1.36 | 1.01 | 1.01 | 1.00 | 1.00 | 0.15 | 0.20 | 0.22 | 0.16 | NA | NA | NA | NA | NA | NA | NA | 0.00 | NA | NA | NA | 0.00 | -0.04 | -0.03 | -0.03 | -0.02 | -0.01 | NA | NA | 0.00 | NA | NA | NA | NA | NA | NA | NA | NA | NA | NA | NA |
| 2024-03-31 | 2023-12-31 | 2023-09-30 | 2023-06-30 | 2023-03-31 | 2022-12-31 | 2022-09-30 | 2022-06-30 | 2022-03-31 | 2021-12-31 | 2021-09-30 | 2021-06-30 | 2021-03-31 | 2020-12-31 | 2020-09-30 | 2020-06-30 | 2020-03-31 | 2019-12-31 | 2019-09-30 | 2019-06-30 | 2019-03-31 | 2018-12-31 | 2018-09-30 | 2018-06-30 | 2018-03-31 | 2017-12-31 | 2017-09-30 | 2017-06-30 | 2017-03-31 | 2016-12-31 | 2016-09-30 | 2016-06-30 | 2016-03-31 | 2015-12-31 | 2015-09-30 | 2015-06-30 | 2015-03-31 | 2014-12-31 | 2014-09-30 | 2014-06-30 | 2014-03-31 | 2013-12-31 | 2013-09-30 | 2013-06-30 | 2013-03-31 | 2012-12-31 | 2012-09-30 | 2012-06-30 | 2012-03-31 | ||
|---|---|---|---|---|---|---|---|---|---|---|---|---|---|---|---|---|---|---|---|---|---|---|---|---|---|---|---|---|---|---|---|---|---|---|---|---|---|---|---|---|---|---|---|---|---|---|---|---|---|---|
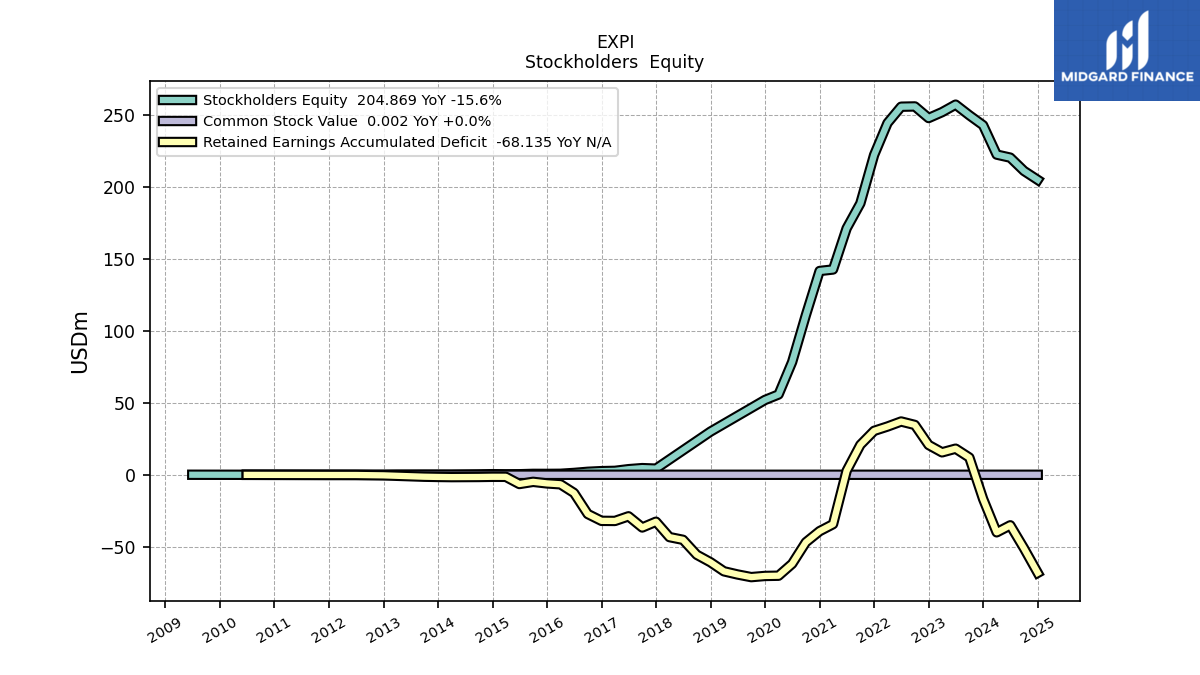
| Stockholders Equity | 222.44 | 242.84 | 249.76 | 257.15 | 251.92 | 247.82 | 255.89 | 255.70 | 244.37 | 222.17 | 188.56 | 171.18 | 142.61 | 141.58 | 110.91 | 78.33 | 55.78 | 51.97 | NA | NA | NA | 29.98 | NA | NA | NA | 4.26 | 4.63 | 3.88 | 2.72 | 2.53 | 2.07 | 1.27 | 0.68 | 0.61 | 0.63 | 0.37 | 0.31 | 0.41 | 0.22 | 0.11 | 0.01 | 0.02 | 0.03 | -0.00 | -0.01 | -0.12 | -0.10 | -0.09 | -0.08 | |
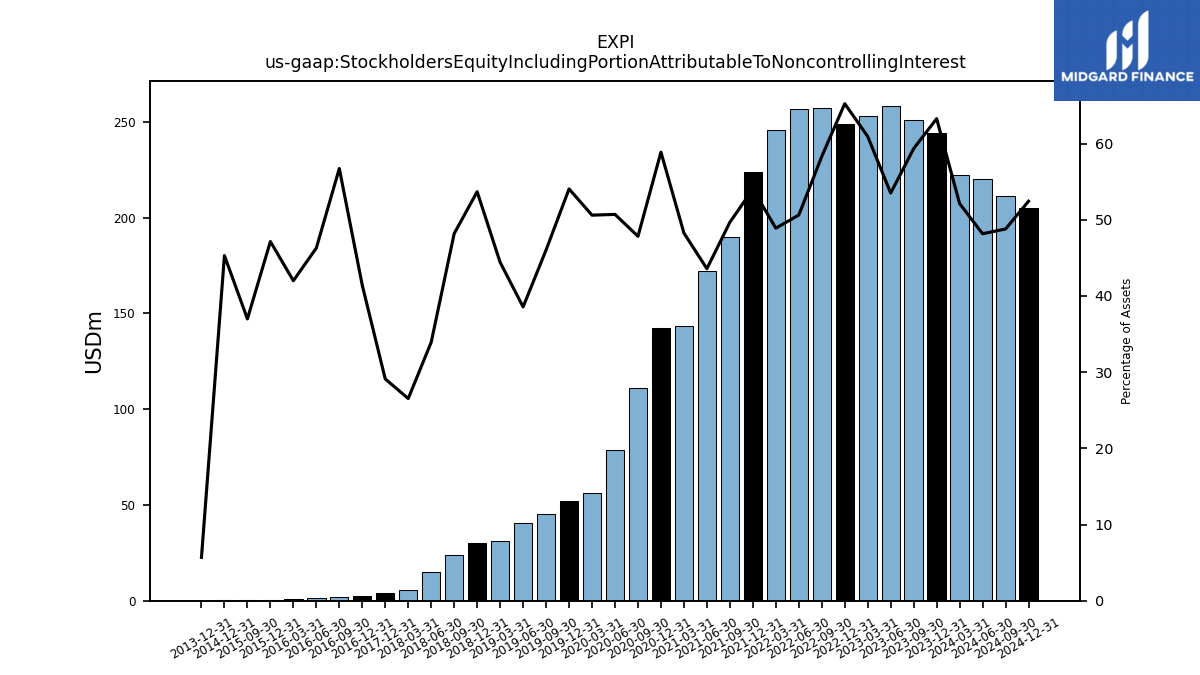
| Stockholders Equity Including Portion Attributable To Noncontrolling Interest | 222.44 | 244.01 | 250.93 | 258.32 | 253.09 | 248.99 | 257.06 | 256.87 | 245.54 | 223.53 | 189.57 | 172.20 | 143.61 | 142.59 | 111.06 | 78.53 | 56.00 | 52.13 | 45.20 | 40.66 | 31.36 | 29.98 | 23.64 | 14.96 | 5.78 | 4.26 | NA | NA | NA | 2.53 | 2.02 | 1.24 | 0.66 | 0.59 | 0.62 | NA | NA | 0.41 | NA | NA | NA | 0.02 | NA | NA | NA | NA | NA | NA | NA | |
| Common Stock Value | 0.00 | 0.00 | 0.00 | 0.00 | 0.00 | 0.00 | 0.00 | 0.00 | 0.00 | 0.00 | 0.00 | 0.00 | 0.00 | 0.00 | 0.00 | 0.00 | 0.00 | 0.00 | 0.00 | 0.00 | 0.00 | 0.00 | 0.00 | 0.00 | 0.00 | 0.00 | 0.00 | 0.00 | 0.00 | 0.00 | 0.00 | 0.00 | 0.00 | 0.00 | 0.00 | 0.00 | 0.00 | 0.00 | 0.00 | 0.00 | 0.00 | 0.00 | 0.00 | 0.00 | 0.00 | 0.00 | 0.00 | 0.00 | 0.00 | |
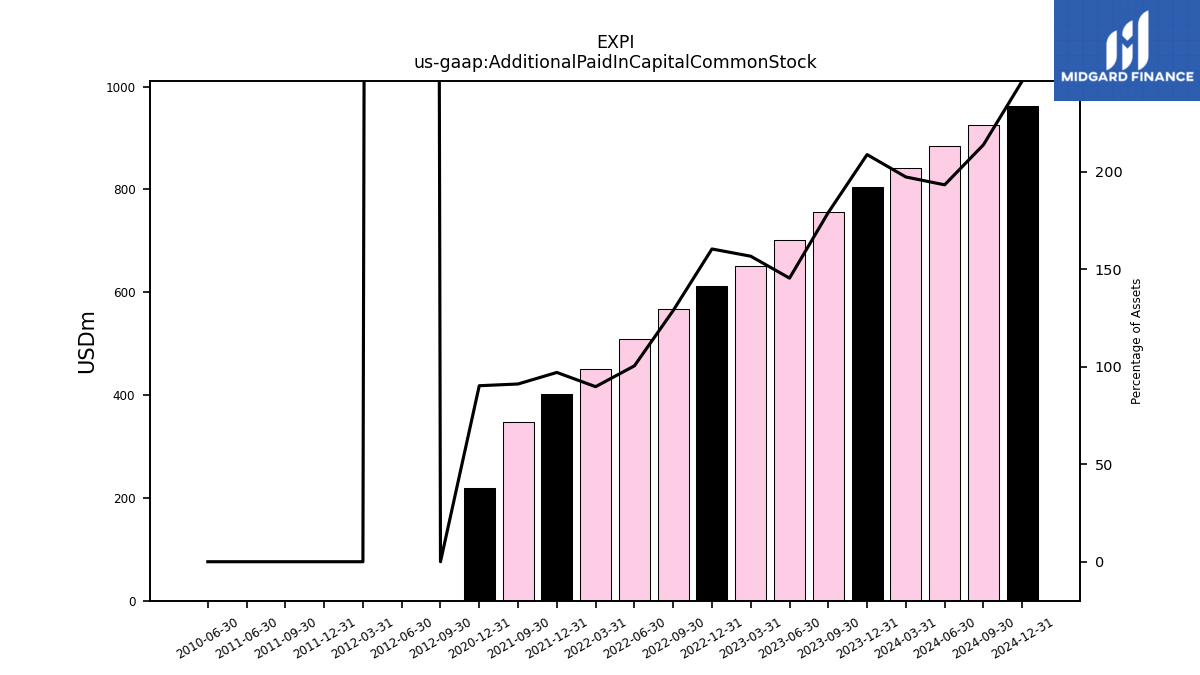
| Additional Paid In Capital Common Stock | 841.58 | 804.83 | 757.01 | 701.81 | 650.38 | 611.87 | 567.59 | 509.48 | 450.57 | 401.48 | 347.67 | NA | NA | 218.49 | NA | NA | NA | NA | NA | NA | NA | NA | NA | NA | NA | NA | NA | NA | NA | NA | NA | NA | NA | NA | NA | NA | NA | NA | NA | NA | NA | NA | NA | NA | NA | NA | 0.06 | 0.06 | 0.06 | |
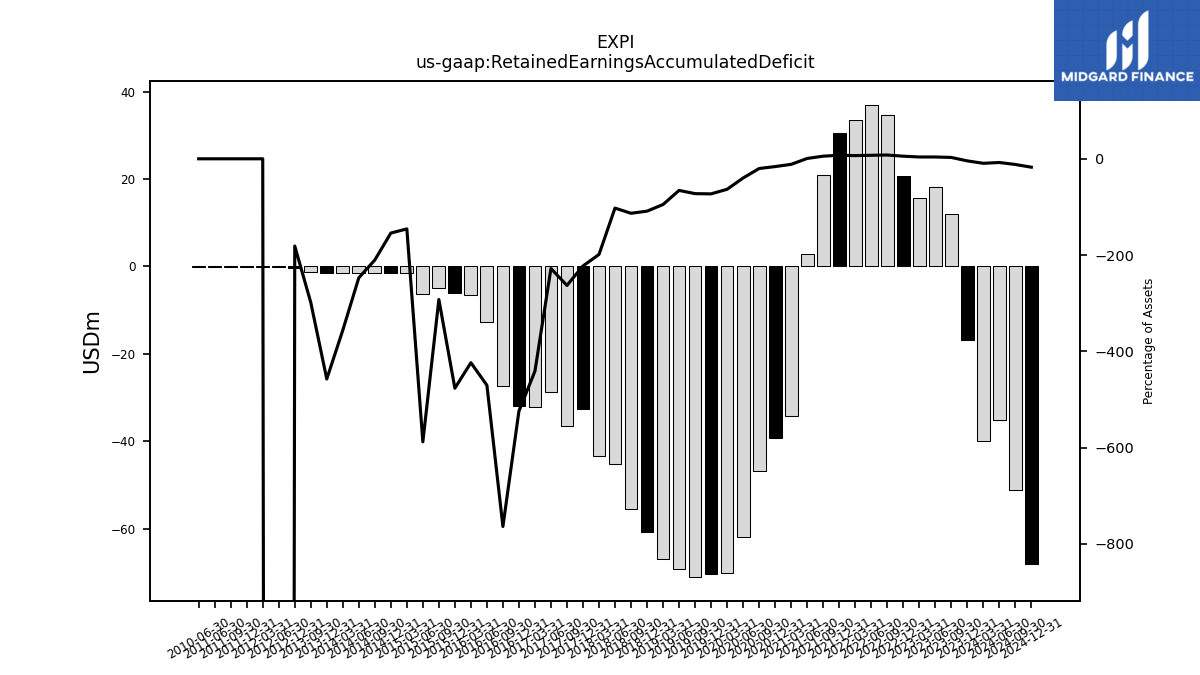
| Retained Earnings Accumulated Deficit | -39.99 | -16.77 | 11.97 | 18.14 | 15.58 | 20.72 | 34.62 | 37.01 | 33.53 | 30.51 | 20.80 | 2.73 | -34.32 | -39.16 | -46.88 | -61.85 | -70.13 | -70.29 | -71.10 | -69.26 | -67.06 | -60.77 | -55.56 | -45.18 | -43.29 | -32.60 | -36.62 | -28.84 | -32.07 | -32.00 | -27.26 | -12.62 | -6.61 | -5.99 | -4.91 | -6.42 | -1.43 | -1.41 | -1.54 | -1.59 | -1.63 | -1.51 | -1.35 | NA | NA | -0.39 | NA | -0.15 | -0.15 | |
| Minority Interest | NA | 1.17 | 1.17 | 1.17 | 1.17 | 1.17 | 1.17 | 1.17 | 1.17 | 1.36 | 1.01 | 1.01 | 1.00 | 1.00 | 0.15 | 0.20 | 0.22 | 0.16 | NA | NA | NA | NA | NA | NA | NA | 0.00 | NA | NA | NA | 0.00 | -0.04 | -0.03 | -0.03 | -0.02 | -0.01 | NA | NA | 0.00 | NA | NA | NA | NA | NA | NA | NA | NA | NA | NA | NA |
| 2024-03-31 | 2023-12-31 | 2023-09-30 | 2023-06-30 | 2023-03-31 | 2022-12-31 | 2022-09-30 | 2022-06-30 | 2022-03-31 | 2021-12-31 | 2021-09-30 | 2021-06-30 | 2021-03-31 | 2020-12-31 | 2020-09-30 | 2020-06-30 | 2020-03-31 | 2019-12-31 | 2019-09-30 | 2019-06-30 | 2019-03-31 | 2018-12-31 | 2018-09-30 | 2018-06-30 | 2018-03-31 | 2017-12-31 | 2017-09-30 | 2017-06-30 | 2017-03-31 | 2016-12-31 | 2016-09-30 | 2016-06-30 | 2016-03-31 | 2015-12-31 | 2015-09-30 | 2015-06-30 | 2015-03-31 | 2014-12-31 | 2014-09-30 | 2014-06-30 | 2014-03-31 | 2013-12-31 | 2013-09-30 | 2013-06-30 | 2013-03-31 | 2012-12-31 | 2012-09-30 | 2012-06-30 | 2012-03-31 | ||
|---|---|---|---|---|---|---|---|---|---|---|---|---|---|---|---|---|---|---|---|---|---|---|---|---|---|---|---|---|---|---|---|---|---|---|---|---|---|---|---|---|---|---|---|---|---|---|---|---|---|---|
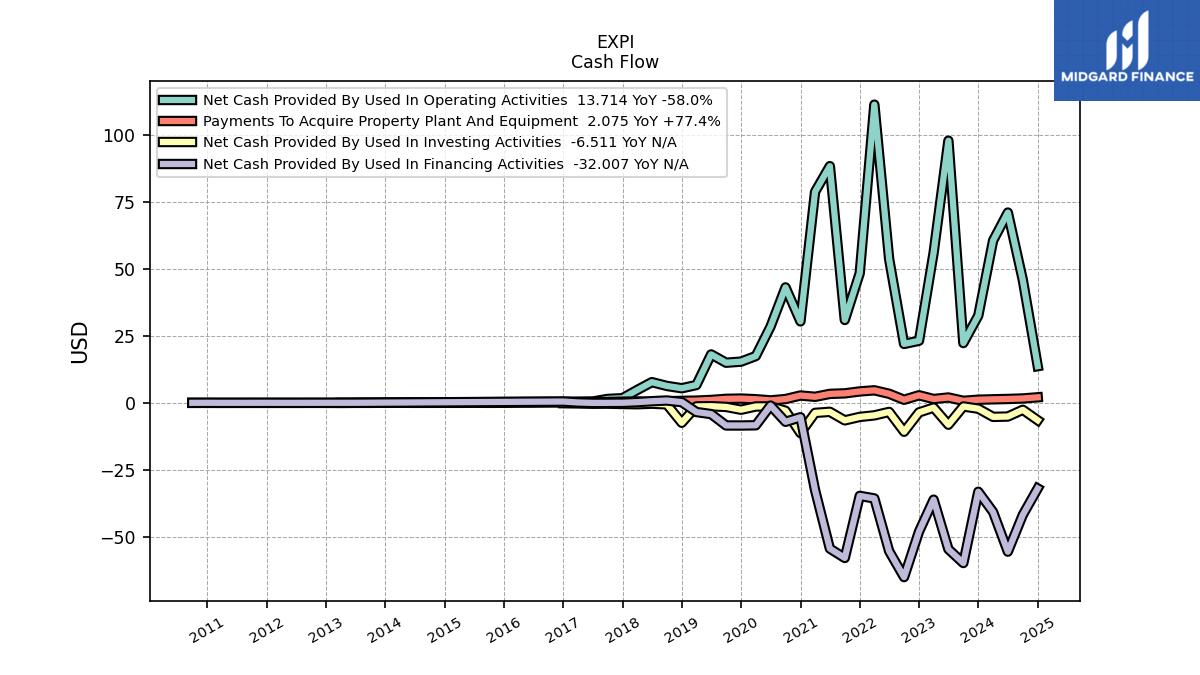
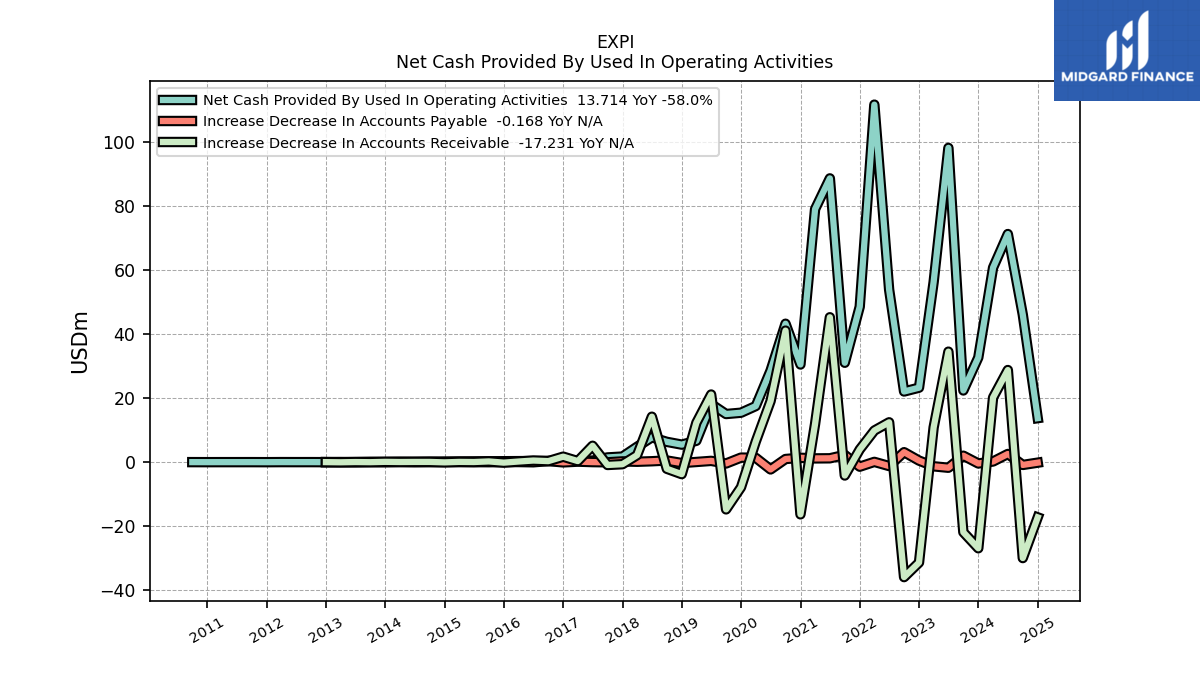
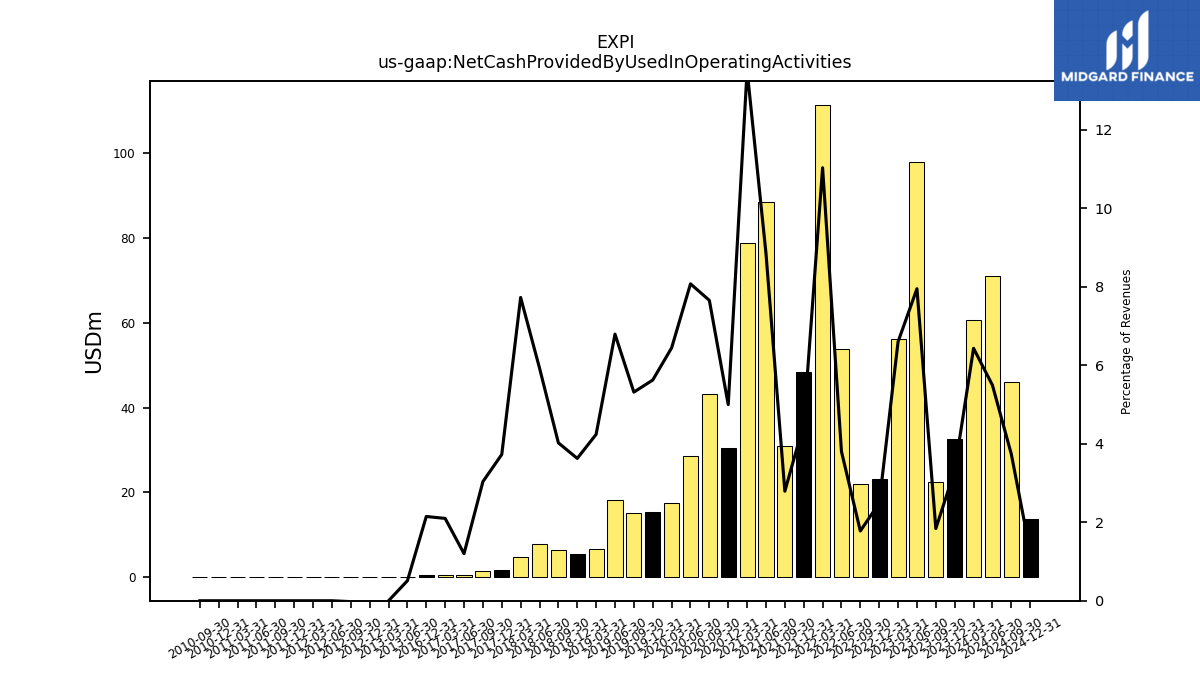
| Net Cash Provided By Used In Operating Activities | 60.65 | 32.62 | 22.35 | 98.02 | 56.14 | 23.21 | 22.03 | 53.79 | 111.51 | 48.48 | 30.99 | 88.51 | 78.92 | 30.45 | 43.17 | 28.55 | 17.49 | 15.41 | 15.00 | 18.12 | 6.66 | 5.46 | 6.33 | 7.74 | 4.79 | 1.73 | 1.46 | 0.48 | 0.46 | 0.39 | NA | NA | NA | NA | NA | NA | NA | NA | NA | NA | NA | NA | NA | 0.02 | -0.02 | -0.01 | -0.00 | -0.00 | 0.00 | |
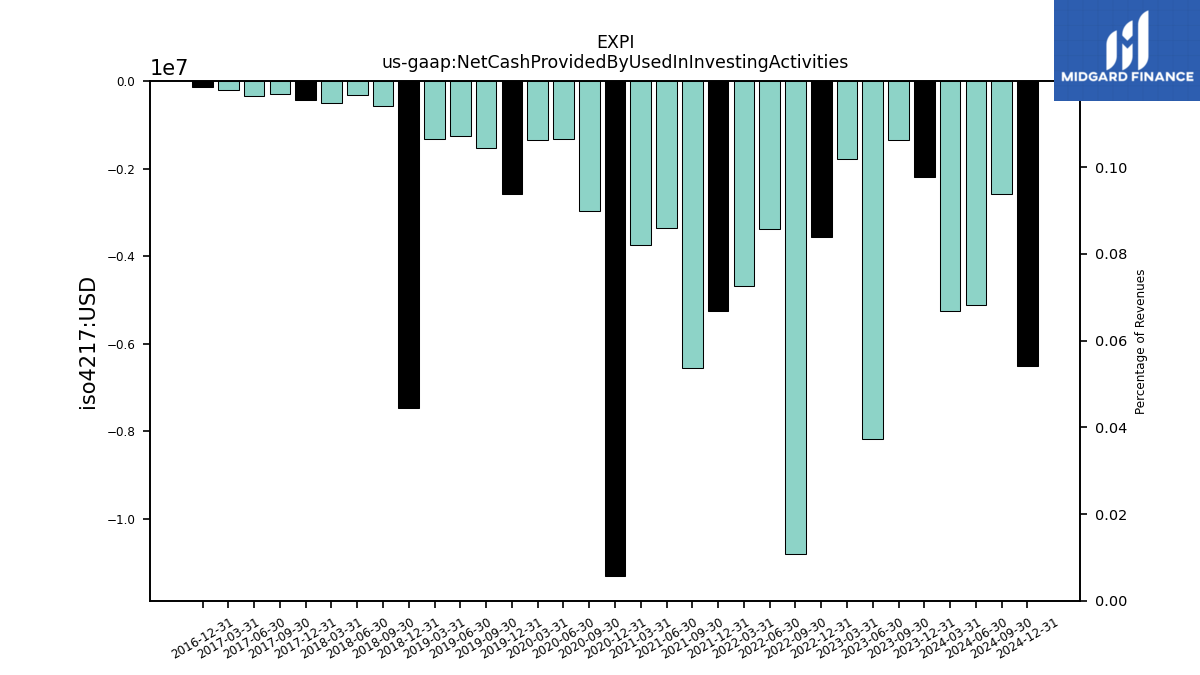
| Net Cash Provided By Used In Investing Activities | -5.25 | -2.19 | -1.36 | -8.18 | -1.78 | -3.57 | -10.81 | -3.39 | -4.68 | -5.26 | -6.55 | -3.35 | -3.76 | -11.31 | -2.96 | -1.33 | -1.35 | -2.58 | -1.53 | -1.26 | -1.33 | -7.46 | -0.57 | -0.32 | -0.51 | -0.43 | -0.30 | -0.34 | -0.21 | -0.14 | NA | NA | NA | NA | NA | NA | NA | NA | NA | NA | NA | NA | NA | NA | NA | NA | NA | NA | NA | |
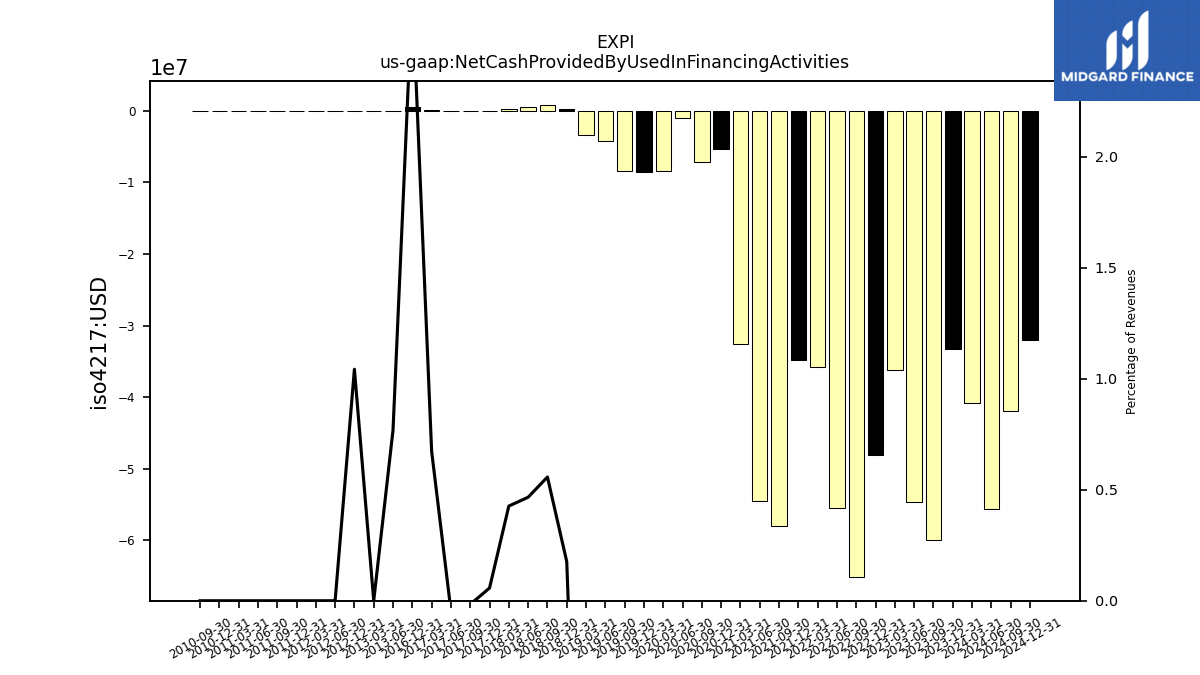
| Net Cash Provided By Used In Financing Activities | -40.81 | -33.25 | -59.91 | -54.73 | -36.20 | -48.14 | -65.17 | -55.47 | -35.74 | -34.78 | -58.01 | -54.50 | -32.64 | -5.38 | -7.10 | -1.02 | -8.39 | -8.47 | -8.46 | -4.21 | -3.43 | 0.27 | 0.88 | 0.61 | 0.26 | 0.03 | -0.01 | -0.02 | 0.15 | 0.49 | NA | NA | NA | NA | NA | NA | NA | NA | NA | NA | NA | NA | NA | 0.02 | 0.02 | 0.02 | NA | 0.00 | -0.00 |
| 2024-03-31 | 2023-12-31 | 2023-09-30 | 2023-06-30 | 2023-03-31 | 2022-12-31 | 2022-09-30 | 2022-06-30 | 2022-03-31 | 2021-12-31 | 2021-09-30 | 2021-06-30 | 2021-03-31 | 2020-12-31 | 2020-09-30 | 2020-06-30 | 2020-03-31 | 2019-12-31 | 2019-09-30 | 2019-06-30 | 2019-03-31 | 2018-12-31 | 2018-09-30 | 2018-06-30 | 2018-03-31 | 2017-12-31 | 2017-09-30 | 2017-06-30 | 2017-03-31 | 2016-12-31 | 2016-09-30 | 2016-06-30 | 2016-03-31 | 2015-12-31 | 2015-09-30 | 2015-06-30 | 2015-03-31 | 2014-12-31 | 2014-09-30 | 2014-06-30 | 2014-03-31 | 2013-12-31 | 2013-09-30 | 2013-06-30 | 2013-03-31 | 2012-12-31 | 2012-09-30 | 2012-06-30 | 2012-03-31 | ||
|---|---|---|---|---|---|---|---|---|---|---|---|---|---|---|---|---|---|---|---|---|---|---|---|---|---|---|---|---|---|---|---|---|---|---|---|---|---|---|---|---|---|---|---|---|---|---|---|---|---|---|
| Net Cash Provided By Used In Operating Activities | 60.65 | 32.62 | 22.35 | 98.02 | 56.14 | 23.21 | 22.03 | 53.79 | 111.51 | 48.48 | 30.99 | 88.51 | 78.92 | 30.45 | 43.17 | 28.55 | 17.49 | 15.41 | 15.00 | 18.12 | 6.66 | 5.46 | 6.33 | 7.74 | 4.79 | 1.73 | 1.46 | 0.48 | 0.46 | 0.39 | NA | NA | NA | NA | NA | NA | NA | NA | NA | NA | NA | NA | NA | 0.02 | -0.02 | -0.01 | -0.00 | -0.00 | 0.00 | |
| Net Income Loss | NA | -21.20 | 1.35 | 9.42 | 1.45 | -7.20 | 4.40 | 9.36 | 8.88 | 15.50 | 23.82 | 37.05 | 4.85 | 7.72 | 14.97 | 8.28 | 0.17 | 0.81 | -1.85 | -2.19 | -6.30 | NA | NA | NA | NA | -17.51 | -7.78 | 3.23 | -0.07 | -4.74 | -14.65 | -6.01 | -0.62 | -1.08 | 1.52 | -5.00 | -0.02 | 0.13 | 0.05 | 0.04 | -0.12 | -0.17 | -0.64 | -0.11 | -0.01 | -0.01 | -0.01 | -0.01 | -0.00 | |
| Profit Loss | -15.64 | -21.20 | 1.35 | 9.42 | 1.45 | -7.20 | 4.40 | 9.36 | 8.86 | 15.46 | 23.81 | 37.04 | 4.85 | 7.70 | 14.92 | 8.23 | 0.14 | 0.78 | -1.85 | -2.20 | -6.30 | -5.22 | -4.63 | -1.89 | -10.70 | -17.51 | -7.78 | 3.23 | -0.07 | -4.75 | -14.66 | -6.01 | -0.63 | -1.10 | 1.51 | -5.00 | -0.02 | 0.13 | 0.05 | NA | NA | NA | NA | NA | NA | NA | NA | NA | NA | |
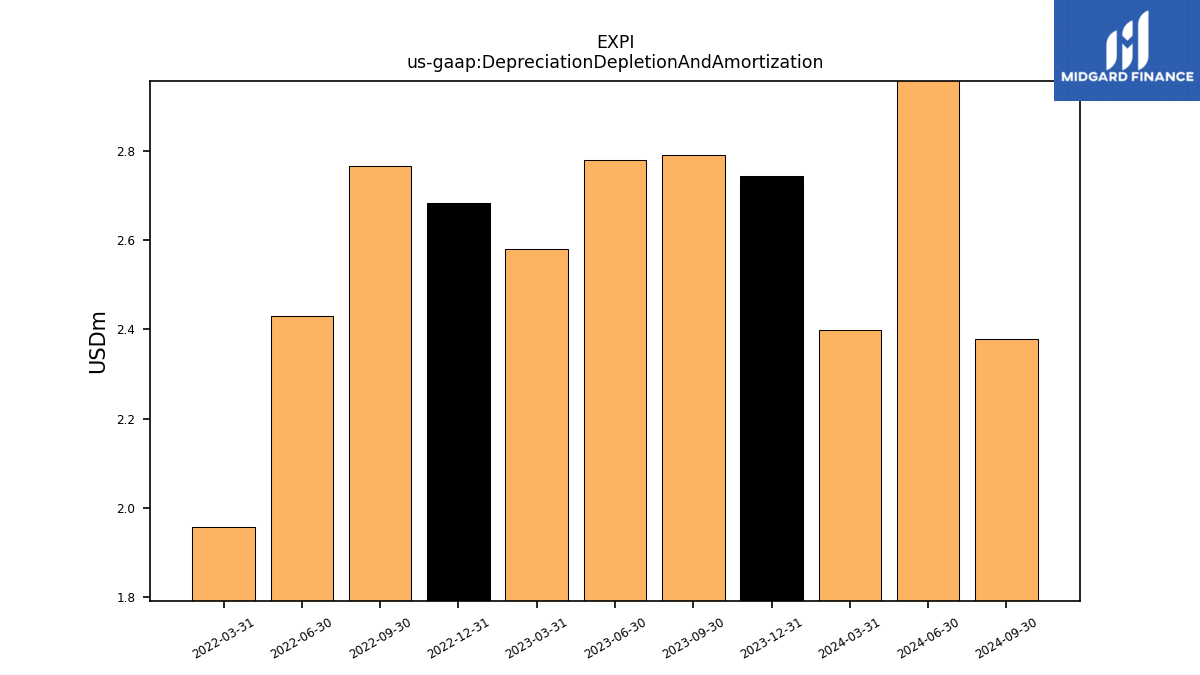
| Depreciation Depletion And Amortization | 2.40 | 2.74 | 2.79 | 2.78 | 2.58 | 2.68 | 2.77 | 2.43 | 1.96 | NA | NA | NA | NA | NA | NA | NA | NA | NA | NA | NA | NA | NA | NA | NA | NA | NA | NA | NA | NA | NA | NA | NA | NA | NA | NA | NA | NA | NA | NA | NA | NA | NA | NA | NA | NA | NA | NA | NA | NA | |
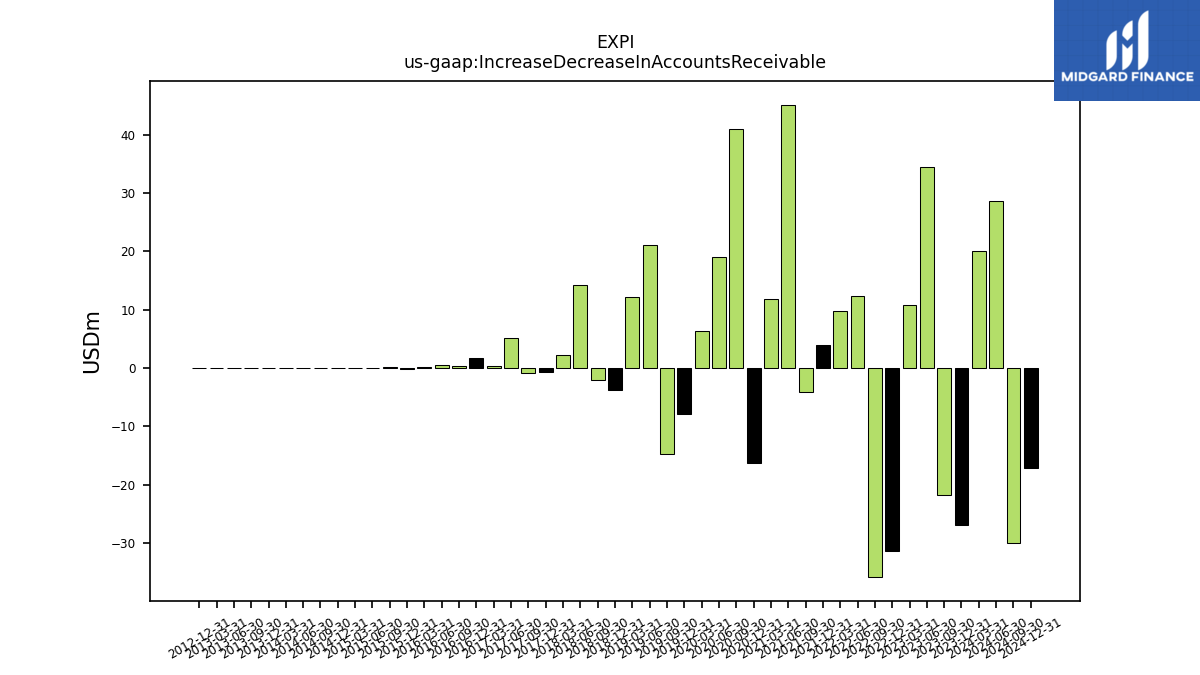
| Increase Decrease In Accounts Receivable | 20.14 | -26.88 | -21.86 | 34.46 | 10.81 | -31.33 | -35.87 | 12.42 | 9.85 | 3.94 | -4.18 | 45.19 | 11.91 | -16.30 | 41.02 | 19.04 | 6.43 | -7.85 | -14.75 | 21.09 | 12.26 | -3.75 | -2.07 | 14.17 | 2.18 | -0.65 | -0.89 | 5.11 | 0.32 | 1.70 | 0.31 | 0.49 | 0.19 | -0.16 | 0.22 | 0.03 | 0.07 | -0.07 | 0.06 | 0.06 | 0.04 | 0.08 | -0.02 | 0.02 | -0.05 | -0.00 | NA | NA | NA | |
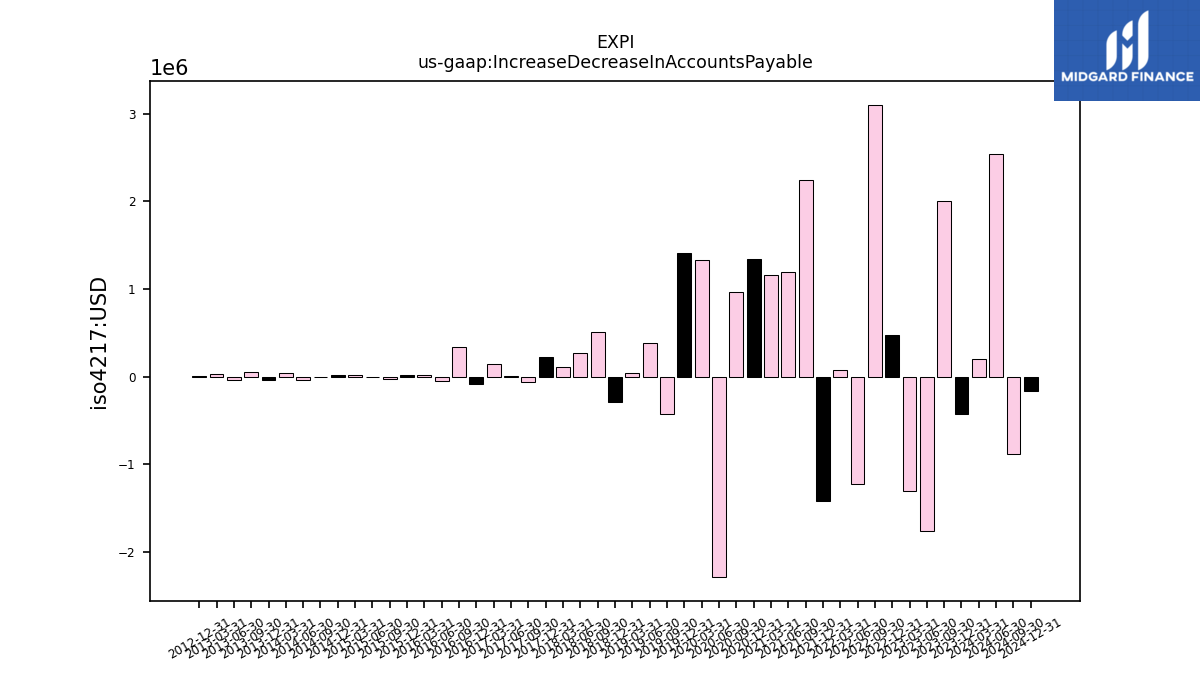
| Increase Decrease In Accounts Payable | 0.20 | -0.42 | 2.00 | -1.76 | -1.31 | 0.48 | 3.10 | -1.23 | 0.07 | -1.42 | 2.24 | 1.19 | 1.16 | 1.35 | 0.97 | -2.29 | 1.34 | 1.41 | -0.43 | 0.39 | 0.04 | -0.28 | 0.50 | 0.27 | 0.12 | 0.22 | -0.06 | 0.00 | 0.15 | -0.08 | 0.33 | -0.05 | 0.02 | 0.02 | -0.03 | -0.01 | 0.02 | 0.02 | 0.00 | -0.03 | 0.04 | -0.04 | 0.05 | -0.03 | 0.03 | 0.01 | NA | NA | NA |
| 2024-03-31 | 2023-12-31 | 2023-09-30 | 2023-06-30 | 2023-03-31 | 2022-12-31 | 2022-09-30 | 2022-06-30 | 2022-03-31 | 2021-12-31 | 2021-09-30 | 2021-06-30 | 2021-03-31 | 2020-12-31 | 2020-09-30 | 2020-06-30 | 2020-03-31 | 2019-12-31 | 2019-09-30 | 2019-06-30 | 2019-03-31 | 2018-12-31 | 2018-09-30 | 2018-06-30 | 2018-03-31 | 2017-12-31 | 2017-09-30 | 2017-06-30 | 2017-03-31 | 2016-12-31 | 2016-09-30 | 2016-06-30 | 2016-03-31 | 2015-12-31 | 2015-09-30 | 2015-06-30 | 2015-03-31 | 2014-12-31 | 2014-09-30 | 2014-06-30 | 2014-03-31 | 2013-12-31 | 2013-09-30 | 2013-06-30 | 2013-03-31 | 2012-12-31 | 2012-09-30 | 2012-06-30 | 2012-03-31 | ||
|---|---|---|---|---|---|---|---|---|---|---|---|---|---|---|---|---|---|---|---|---|---|---|---|---|---|---|---|---|---|---|---|---|---|---|---|---|---|---|---|---|---|---|---|---|---|---|---|---|---|---|
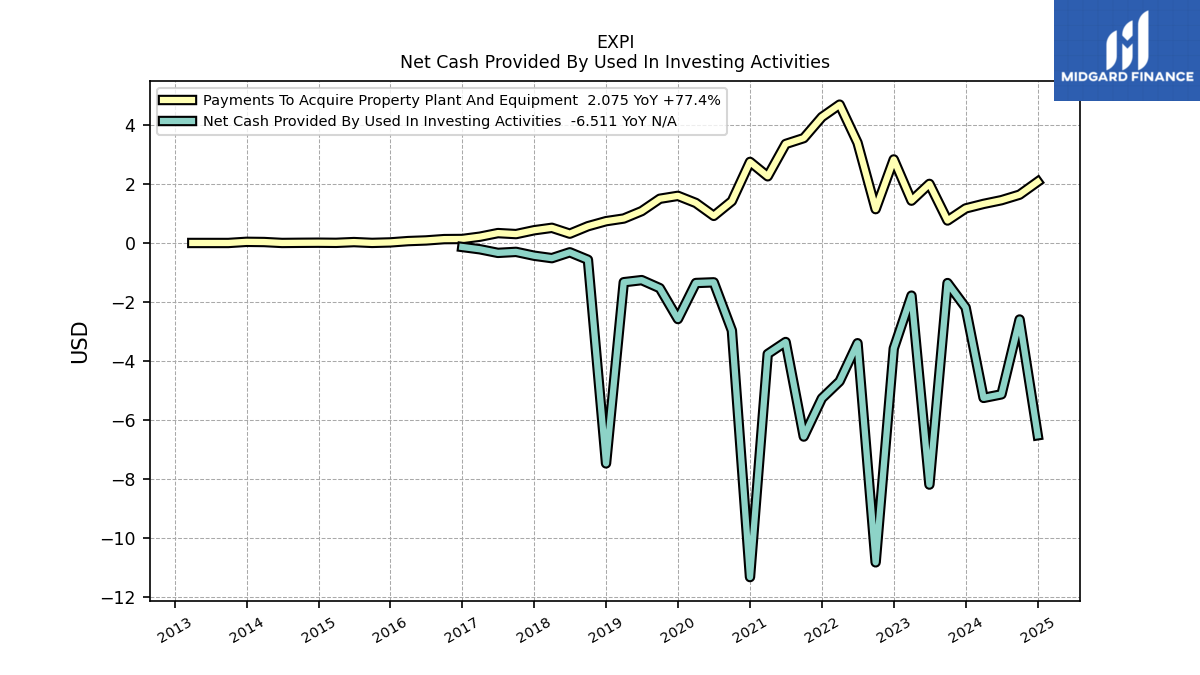
| Net Cash Provided By Used In Investing Activities | -5.25 | -2.19 | -1.36 | -8.18 | -1.78 | -3.57 | -10.81 | -3.39 | -4.68 | -5.26 | -6.55 | -3.35 | -3.76 | -11.31 | -2.96 | -1.33 | -1.35 | -2.58 | -1.53 | -1.26 | -1.33 | -7.46 | -0.57 | -0.32 | -0.51 | -0.43 | -0.30 | -0.34 | -0.21 | -0.14 | NA | NA | NA | NA | NA | NA | NA | NA | NA | NA | NA | NA | NA | NA | NA | NA | NA | NA | NA | |
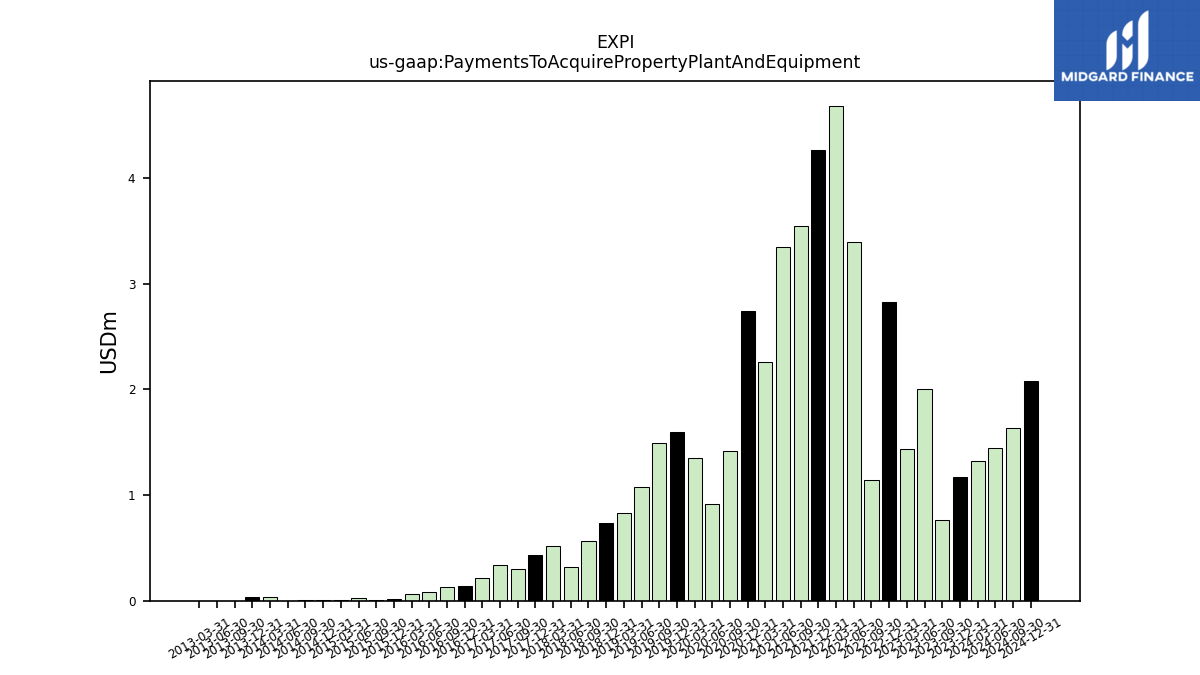
| Payments To Acquire Property Plant And Equipment | 1.32 | 1.17 | 0.76 | 2.00 | 1.43 | 2.83 | 1.15 | 3.39 | 4.68 | 4.26 | 3.55 | 3.35 | 2.26 | 2.75 | 1.42 | 0.92 | 1.35 | 1.60 | 1.50 | 1.08 | 0.83 | 0.74 | 0.57 | 0.32 | 0.51 | 0.43 | 0.30 | 0.34 | 0.21 | 0.14 | 0.13 | 0.09 | 0.06 | 0.02 | 0.00 | 0.03 | 0.00 | 0.01 | 0.01 | 0.00 | 0.03 | 0.04 | 0.00 | 0.00 | 0.00 | NA | NA | NA | NA |
| 2024-03-31 | 2023-12-31 | 2023-09-30 | 2023-06-30 | 2023-03-31 | 2022-12-31 | 2022-09-30 | 2022-06-30 | 2022-03-31 | 2021-12-31 | 2021-09-30 | 2021-06-30 | 2021-03-31 | 2020-12-31 | 2020-09-30 | 2020-06-30 | 2020-03-31 | 2019-12-31 | 2019-09-30 | 2019-06-30 | 2019-03-31 | 2018-12-31 | 2018-09-30 | 2018-06-30 | 2018-03-31 | 2017-12-31 | 2017-09-30 | 2017-06-30 | 2017-03-31 | 2016-12-31 | 2016-09-30 | 2016-06-30 | 2016-03-31 | 2015-12-31 | 2015-09-30 | 2015-06-30 | 2015-03-31 | 2014-12-31 | 2014-09-30 | 2014-06-30 | 2014-03-31 | 2013-12-31 | 2013-09-30 | 2013-06-30 | 2013-03-31 | 2012-12-31 | 2012-09-30 | 2012-06-30 | 2012-03-31 | ||
|---|---|---|---|---|---|---|---|---|---|---|---|---|---|---|---|---|---|---|---|---|---|---|---|---|---|---|---|---|---|---|---|---|---|---|---|---|---|---|---|---|---|---|---|---|---|---|---|---|---|---|
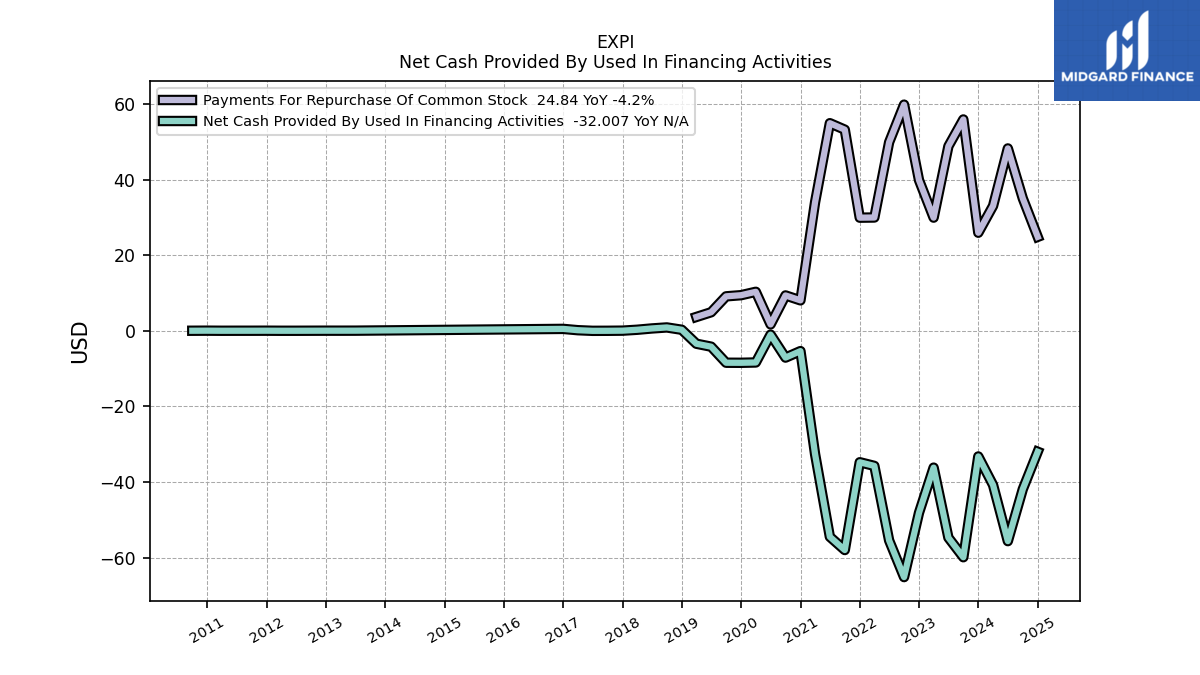
| Net Cash Provided By Used In Financing Activities | -40.81 | -33.25 | -59.91 | -54.73 | -36.20 | -48.14 | -65.17 | -55.47 | -35.74 | -34.78 | -58.01 | -54.50 | -32.64 | -5.38 | -7.10 | -1.02 | -8.39 | -8.47 | -8.46 | -4.21 | -3.43 | 0.27 | 0.88 | 0.61 | 0.26 | 0.03 | -0.01 | -0.02 | 0.15 | 0.49 | NA | NA | NA | NA | NA | NA | NA | NA | NA | NA | NA | NA | NA | 0.02 | 0.02 | 0.02 | NA | 0.00 | -0.00 | |
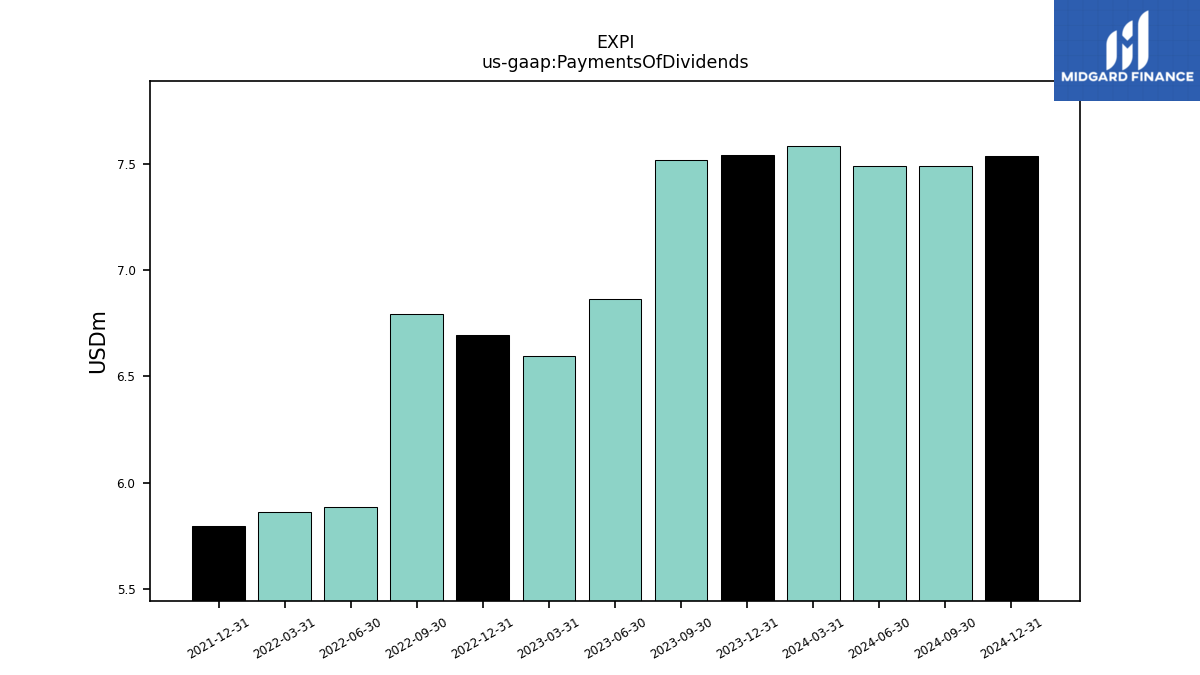
| Payments Of Dividends | 7.58 | 7.54 | 7.52 | 6.86 | 6.60 | 6.69 | 6.79 | 5.88 | 5.86 | 5.79 | NA | NA | NA | NA | NA | NA | NA | NA | NA | NA | NA | NA | NA | NA | NA | NA | NA | NA | NA | NA | NA | NA | NA | NA | NA | NA | NA | NA | NA | NA | NA | NA | NA | NA | NA | NA | NA | NA | NA | |
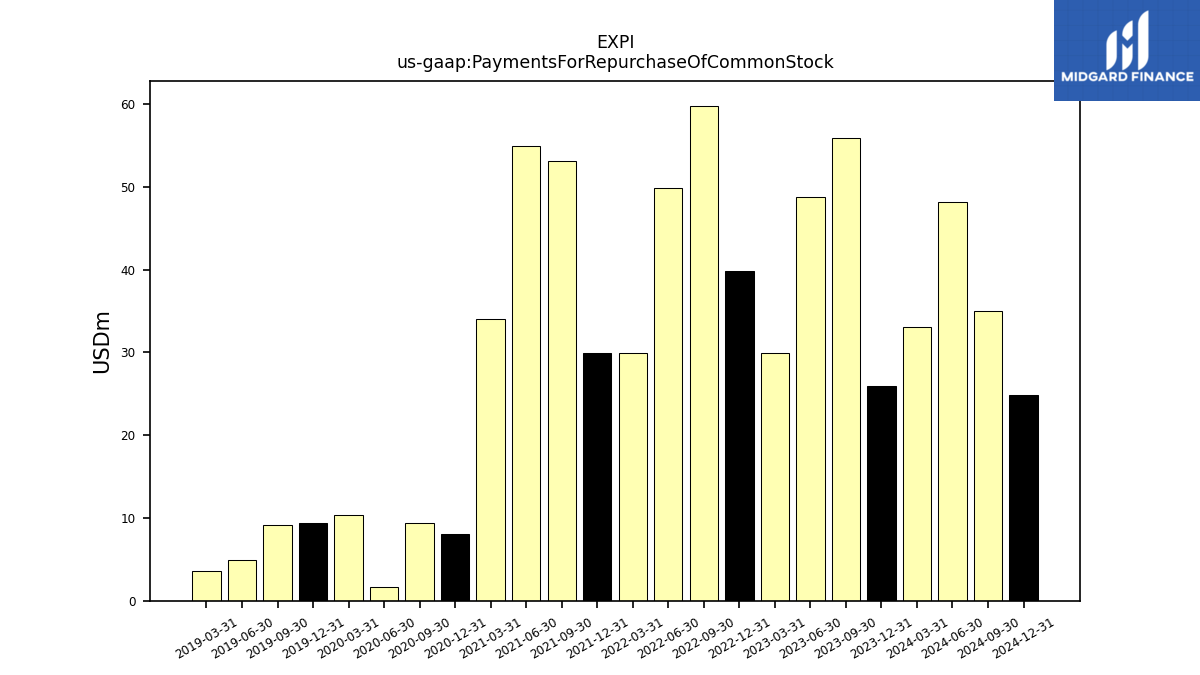
| Payments For Repurchase Of Common Stock | 33.03 | 25.93 | 55.90 | 48.81 | 29.92 | 39.84 | 59.81 | 49.86 | 29.96 | 29.91 | 53.19 | 54.90 | 34.01 | 8.04 | 9.34 | 1.68 | 10.30 | 9.41 | 9.10 | 4.90 | 3.65 | NA | NA | NA | NA | NA | NA | NA | NA | NA | NA | NA | NA | NA | NA | NA | NA | NA | NA | NA | NA | NA | NA | NA | NA | NA | NA | NA | NA |
| 2024-03-31 | 2023-12-31 | 2023-09-30 | 2023-06-30 | 2023-03-31 | 2022-12-31 | 2022-09-30 | 2022-06-30 | 2022-03-31 | 2021-12-31 | 2021-09-30 | 2021-06-30 | 2021-03-31 | 2020-12-31 | 2020-09-30 | 2020-06-30 | 2020-03-31 | 2019-12-31 | 2019-09-30 | 2019-06-30 | 2019-03-31 | 2018-12-31 | 2018-09-30 | 2018-06-30 | 2018-03-31 | 2017-12-31 | 2017-09-30 | 2017-06-30 | 2017-03-31 | 2016-12-31 | 2016-09-30 | 2016-06-30 | 2016-03-31 | 2015-12-31 | 2015-09-30 | 2015-06-30 | 2015-03-31 | 2014-12-31 | 2014-09-30 | 2014-06-30 | 2014-03-31 | 2013-12-31 | 2013-09-30 | 2013-06-30 | 2013-03-31 | 2012-12-31 | 2012-09-30 | 2012-06-30 | 2012-03-31 | ||
|---|---|---|---|---|---|---|---|---|---|---|---|---|---|---|---|---|---|---|---|---|---|---|---|---|---|---|---|---|---|---|---|---|---|---|---|---|---|---|---|---|---|---|---|---|---|---|---|---|---|---|
| Revenues | 943.05 | 983.05 | 1214.51 | 1232.93 | 850.62 | 933.39 | 1238.97 | 1415.06 | 1010.73 | 1076.97 | 1110.48 | 999.89 | 583.83 | 609.32 | 564.02 | 353.52 | 271.42 | 274.02 | 282.18 | 266.70 | 157.03 | 150.41 | 157.24 | 130.54 | 61.96 | 46.41 | 48.11 | 39.57 | 22.01 | 18.00 | 15.76 | 13.28 | 7.14 | 6.41 | 7.42 | 5.58 | 3.45 | 3.56 | 3.88 | 3.55 | 2.38 | 2.49 | 3.07 | 3.17 | 0.00 | 1.92 | 1.64 | 0.00 | 0.00 | |
| Revenue From Contract With Customer Excluding Assessed Tax | 943.05 | 983.05 | 1214.51 | 1232.93 | 850.62 | 933.39 | 1238.97 | 1415.06 | 1010.73 | 1076.97 | 1110.48 | 999.89 | 583.83 | 609.32 | 564.02 | 353.52 | 271.42 | 274.02 | 282.18 | 266.70 | 157.03 | 150.41 | 157.24 | 130.54 | 61.96 | 46.41 | 48.11 | 39.57 | 22.01 | 18.00 | 15.76 | 13.28 | 7.14 | 6.41 | 7.42 | 5.58 | 3.45 | 3.56 | 3.88 | 3.55 | 2.38 | 2.49 | 3.07 | 3.17 | 0.00 | 1.92 | 1.64 | 0.00 | 0.00 | |
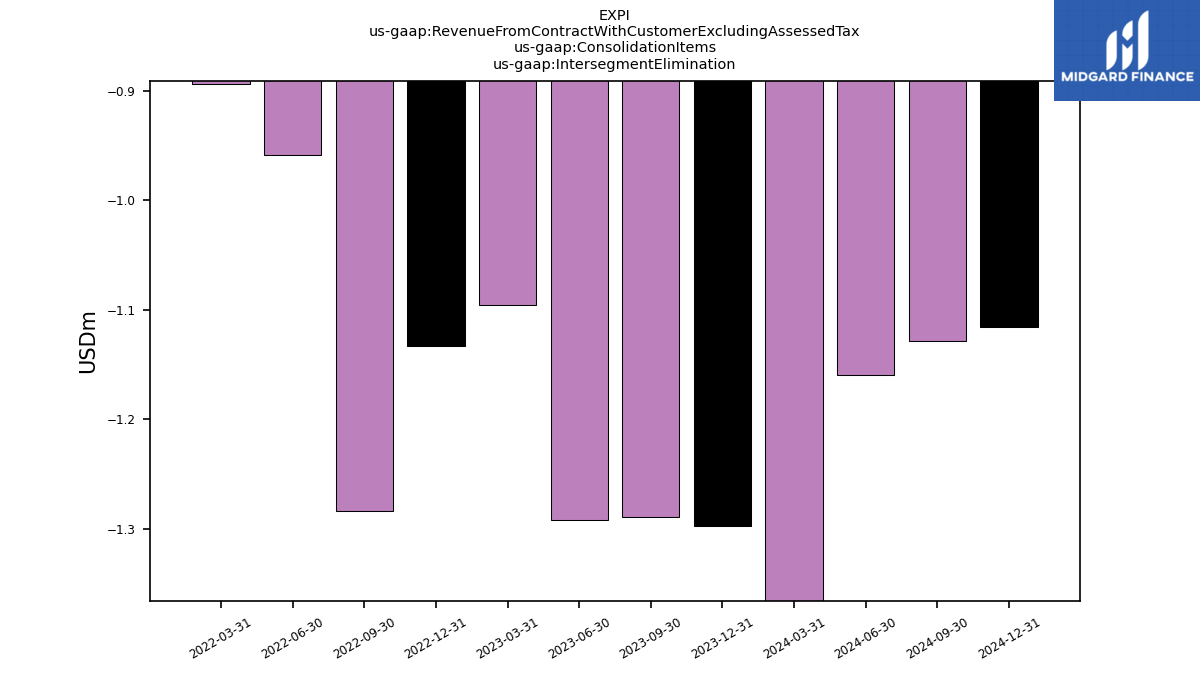
| Intersegment Elimination | -1.47 | -1.30 | -1.29 | -1.29 | -1.10 | -1.13 | -1.28 | -0.96 | -0.89 | NA | NA | NA | NA | NA | NA | NA | NA | NA | NA | NA | NA | NA | NA | NA | NA | NA | NA | NA | NA | NA | NA | NA | NA | NA | NA | NA | NA | NA | NA | NA | NA | NA | NA | NA | NA | NA | NA | NA | NA | |
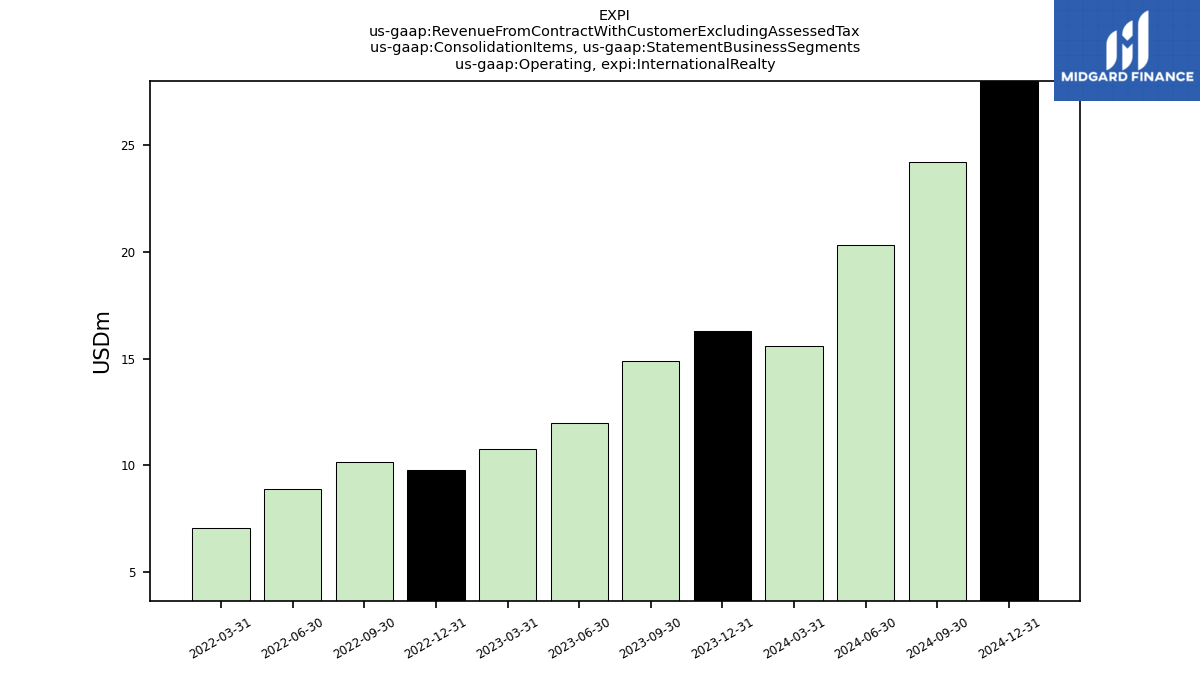
| Operating, International Realty | 15.60 | 16.29 | 14.90 | 11.99 | 10.76 | 9.78 | 10.15 | 8.91 | 7.09 | NA | NA | NA | NA | NA | NA | NA | NA | NA | NA | NA | NA | NA | NA | NA | NA | NA | NA | NA | NA | NA | NA | NA | NA | NA | NA | NA | NA | NA | NA | NA | NA | NA | NA | NA | NA | NA | NA | NA | NA | |
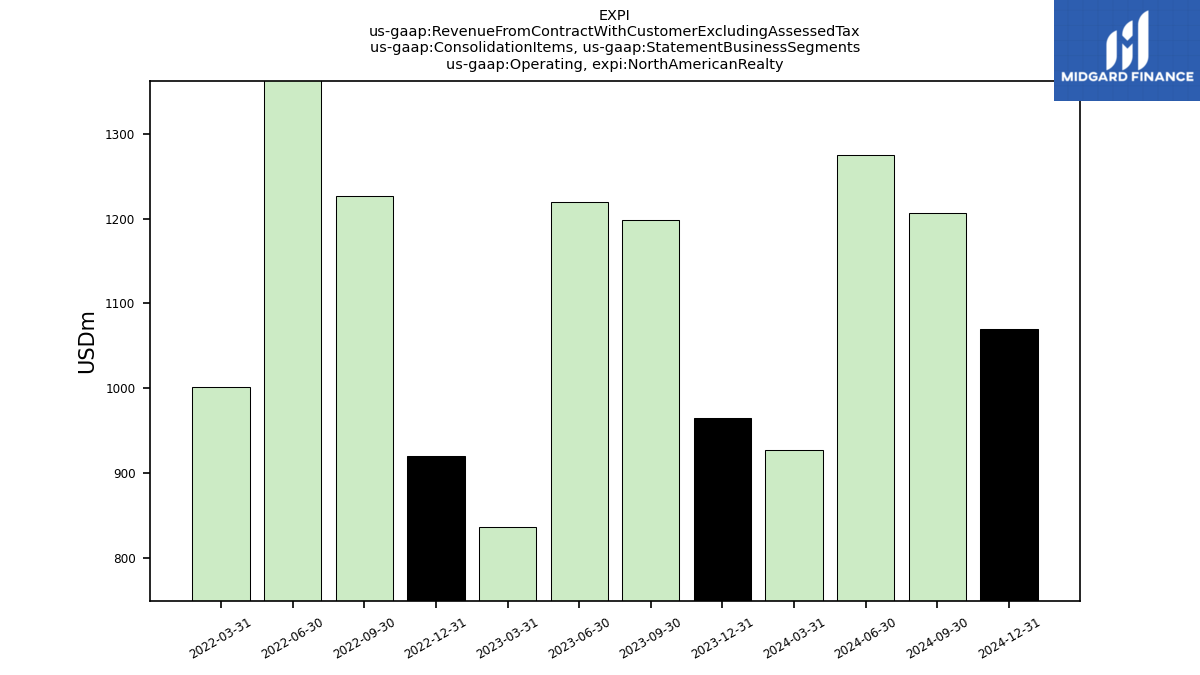
| Operating, North American Realty | 927.14 | 965.40 | 1198.21 | 1219.35 | 837.11 | 920.66 | 1226.37 | 1404.03 | 1001.88 | NA | NA | NA | NA | NA | NA | NA | NA | NA | NA | NA | NA | NA | NA | NA | NA | NA | NA | NA | NA | NA | NA | NA | NA | NA | NA | NA | NA | NA | NA | NA | NA | NA | NA | NA | NA | NA | NA | NA | NA | |
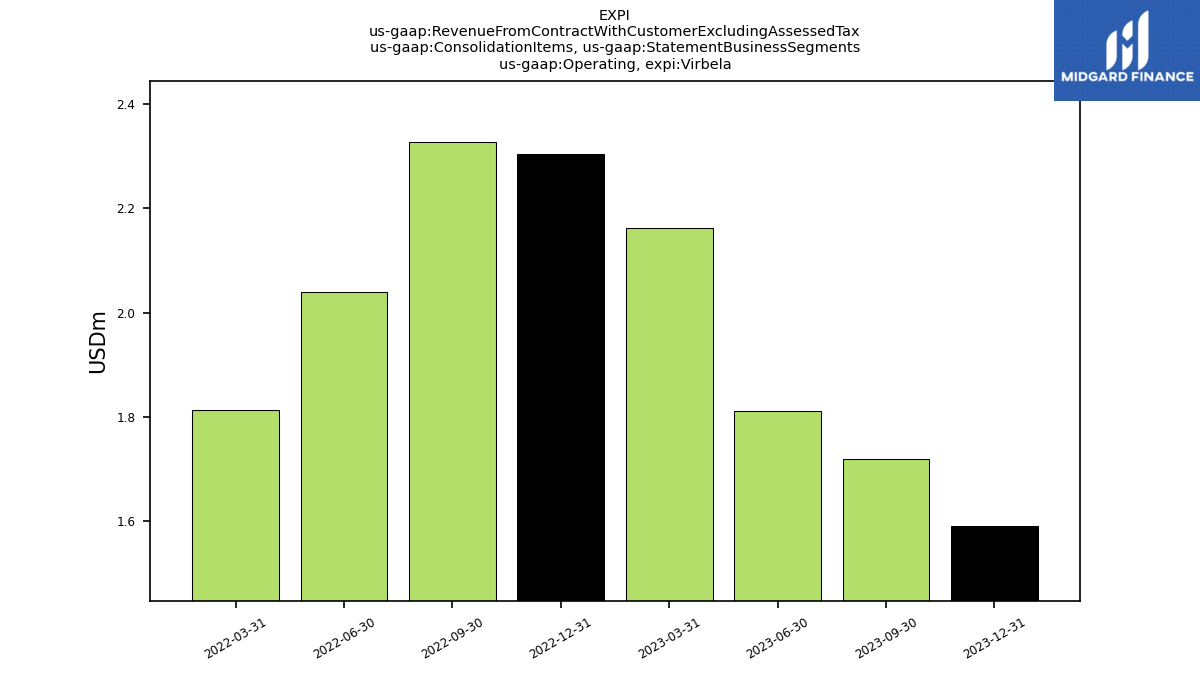
| Operating, Virbela | NA | 1.59 | 1.72 | 1.81 | 2.16 | 2.30 | 2.33 | 2.04 | 1.81 | NA | NA | NA | NA | NA | NA | NA | NA | NA | NA | NA | NA | NA | NA | NA | NA | NA | NA | NA | NA | NA | NA | NA | NA | NA | NA | NA | NA | NA | NA | NA | NA | NA | NA | NA | NA | NA | NA | NA | NA | |
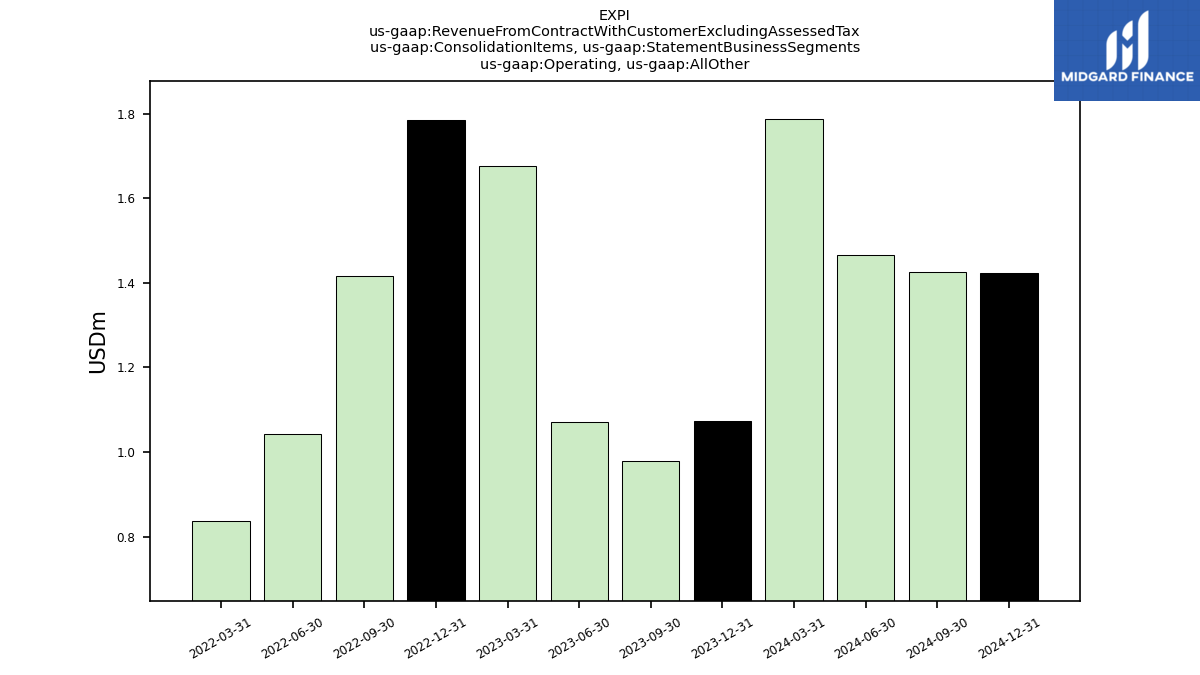
| Operating, All Other | 1.79 | 1.07 | 0.98 | 1.07 | 1.68 | 1.79 | 1.42 | 1.04 | 0.84 | NA | NA | NA | NA | NA | NA | NA | NA | NA | NA | NA | NA | NA | NA | NA | NA | NA | NA | NA | NA | NA | NA | NA | NA | NA | NA | NA | NA | NA | NA | NA | NA | NA | NA | NA | NA | NA | NA | NA | NA |
