
| 2024-03-31 | 2023-12-31 | 2023-09-30 | 2023-06-30 | 2023-03-31 | 2022-12-31 | 2022-09-30 | 2022-06-30 | 2022-03-31 | 2021-12-31 | 2021-09-30 | 2021-06-30 | 2021-03-31 | 2020-12-31 | 2020-09-30 | 2020-06-30 | 2020-03-31 | 2019-12-31 | 2019-09-30 | 2019-06-30 | 2019-03-31 | 2018-12-31 | 2018-09-30 | 2018-06-30 | 2018-03-31 | 2017-12-31 | 2017-09-30 | 2017-06-30 | 2017-03-31 | 2016-12-31 | 2016-09-30 | 2016-06-30 | 2016-03-31 | 2015-12-31 | 2015-09-30 | 2015-06-30 | 2015-03-31 | 2014-12-31 | 2014-09-30 | 2014-06-30 | 2014-03-31 | 2013-12-31 | 2013-09-30 | 2013-06-30 | 2013-03-31 | 2012-12-31 | 2012-09-30 | 2012-06-30 | 2012-03-31 | 2011-12-31 | 2011-09-30 | 2011-06-30 | 2011-03-31 | 2010-12-31 | 2010-09-30 | 2010-06-30 | 2010-03-31 | 2009-12-31 | 2009-09-30 | 2009-06-30 | 2009-03-31 | ||
|---|---|---|---|---|---|---|---|---|---|---|---|---|---|---|---|---|---|---|---|---|---|---|---|---|---|---|---|---|---|---|---|---|---|---|---|---|---|---|---|---|---|---|---|---|---|---|---|---|---|---|---|---|---|---|---|---|---|---|---|---|---|---|
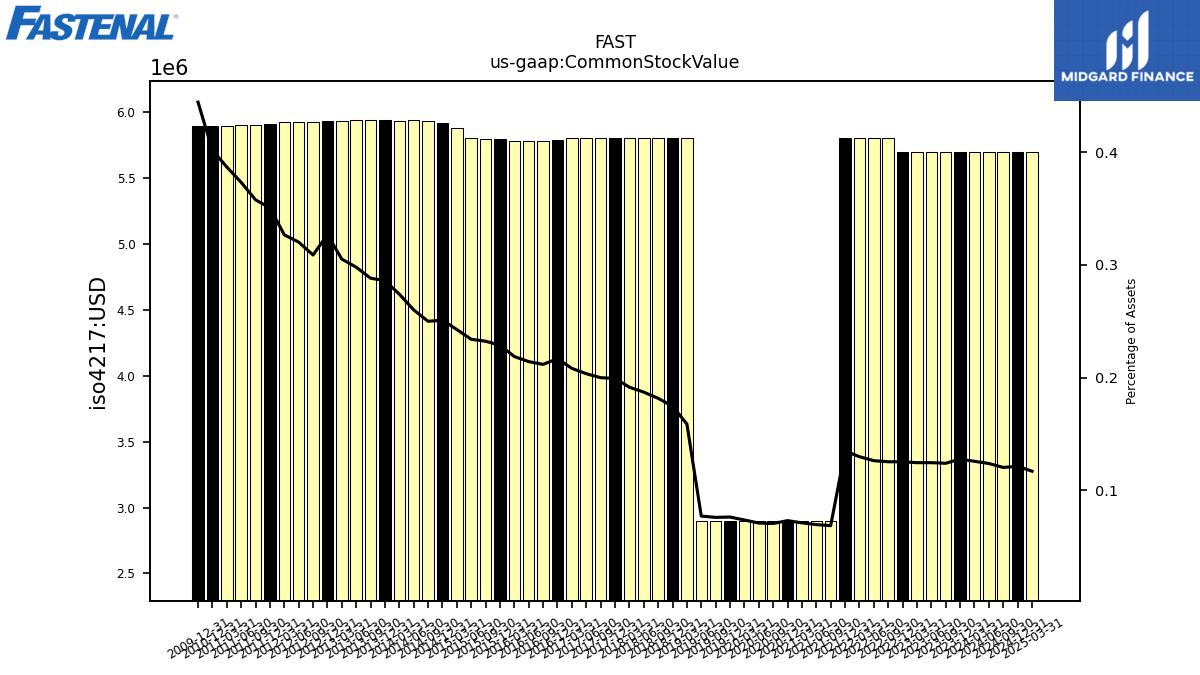
| Common Stock Value | 5.70 | 5.70 | 5.70 | 5.70 | 5.70 | 5.70 | 5.80 | 5.80 | 5.80 | 5.80 | 2.90 | 2.90 | 2.90 | 2.90 | 2.90 | 2.90 | 2.90 | 2.90 | 2.90 | 2.90 | 5.80 | 5.80 | 5.80 | 5.80 | 5.80 | 5.80 | 5.80 | 5.80 | 5.80 | 5.78 | 5.78 | 5.78 | 5.78 | 5.79 | 5.79 | 5.80 | 5.88 | 5.92 | 5.93 | 5.94 | 5.93 | 5.94 | 5.94 | 5.94 | 5.93 | 5.93 | 5.93 | 5.92 | 5.92 | 5.91 | 5.90 | 5.90 | 5.90 | 5.90 | NA | NA | NA | 5.90 | NA | NA | NA | |
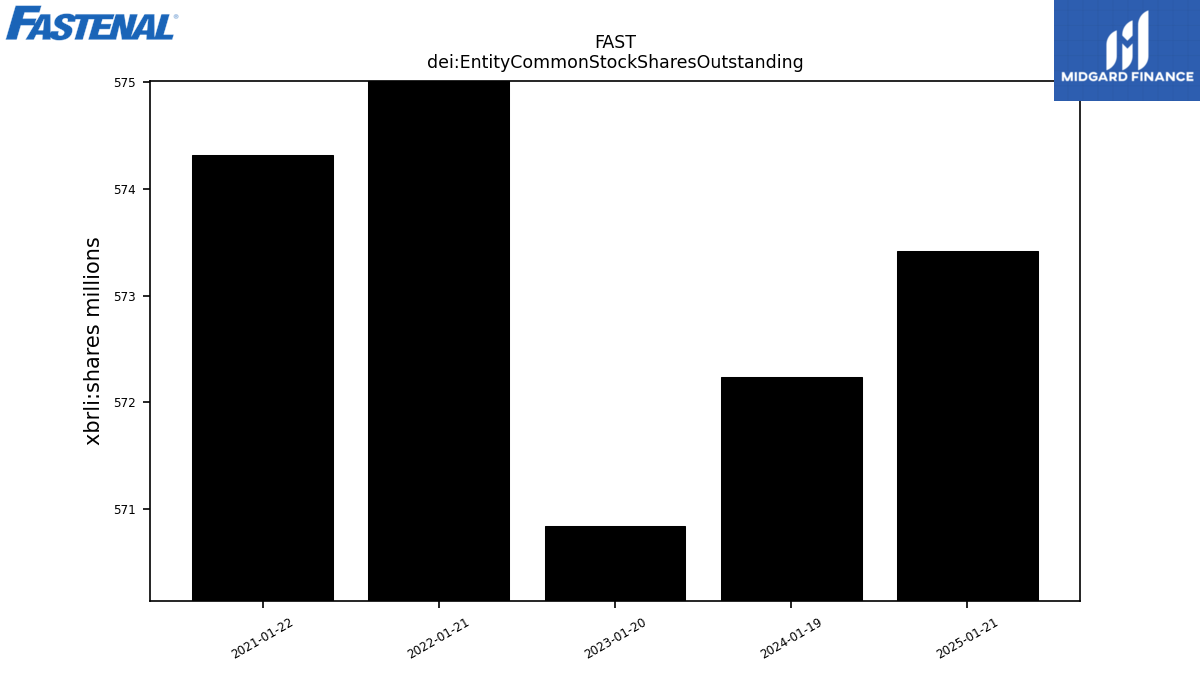
| dei: Entity Common Stock Shares Outstanding | NA | NA | NA | NA | NA | NA | NA | NA | NA | NA | NA | NA | NA | NA | NA | NA | NA | NA | NA | NA | NA | NA | NA | NA | NA | NA | NA | NA | NA | NA | NA | NA | NA | NA | NA | NA | NA | NA | NA | NA | NA | NA | NA | NA | NA | NA | NA | NA | NA | NA | NA | NA | NA | NA | NA | NA | NA | NA | NA | NA | NA | |
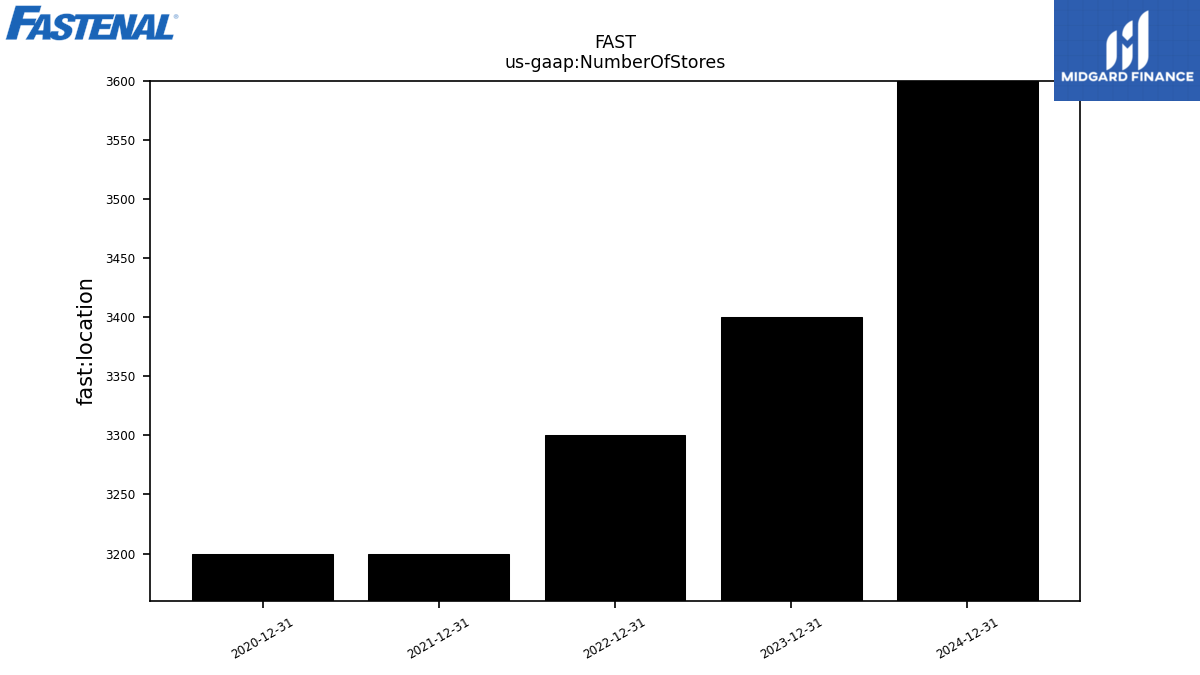
| Number Of Stores | NA | 0.00 | NA | NA | NA | 0.00 | NA | NA | NA | 0.00 | NA | NA | NA | 0.00 | NA | NA | NA | NA | NA | NA | NA | NA | NA | NA | NA | NA | NA | NA | NA | NA | NA | NA | NA | NA | NA | NA | NA | NA | NA | NA | NA | NA | NA | NA | NA | NA | NA | NA | NA | NA | NA | NA | NA | NA | NA | NA | NA | NA | NA | NA | NA | |
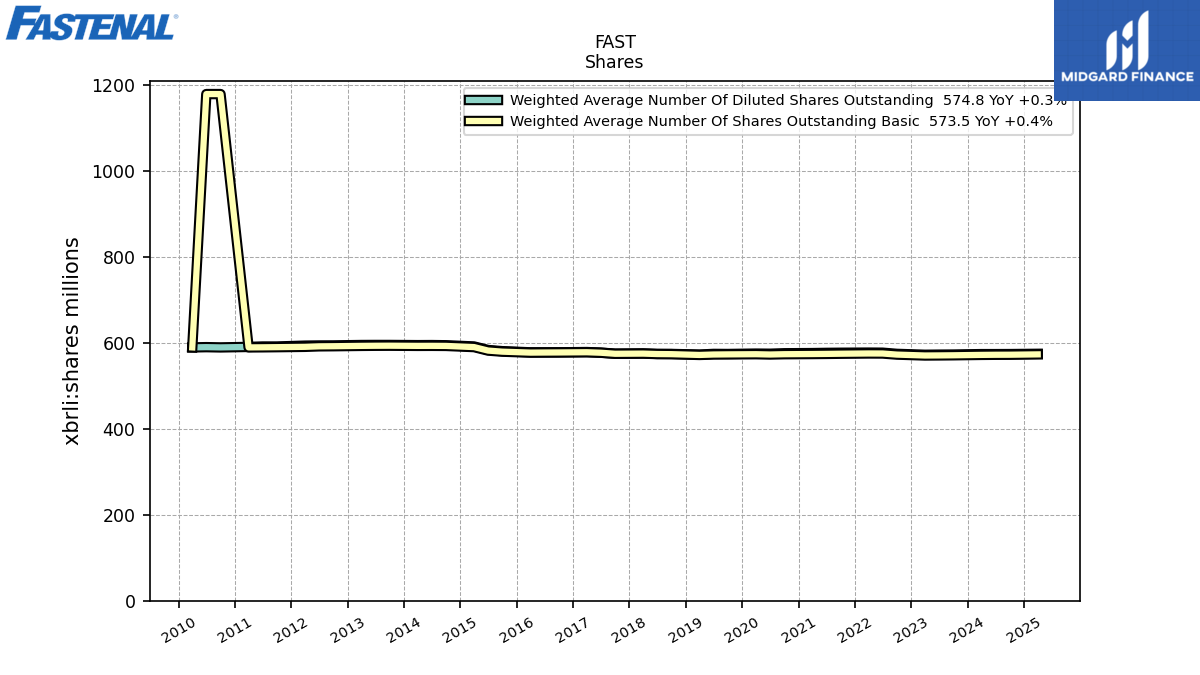
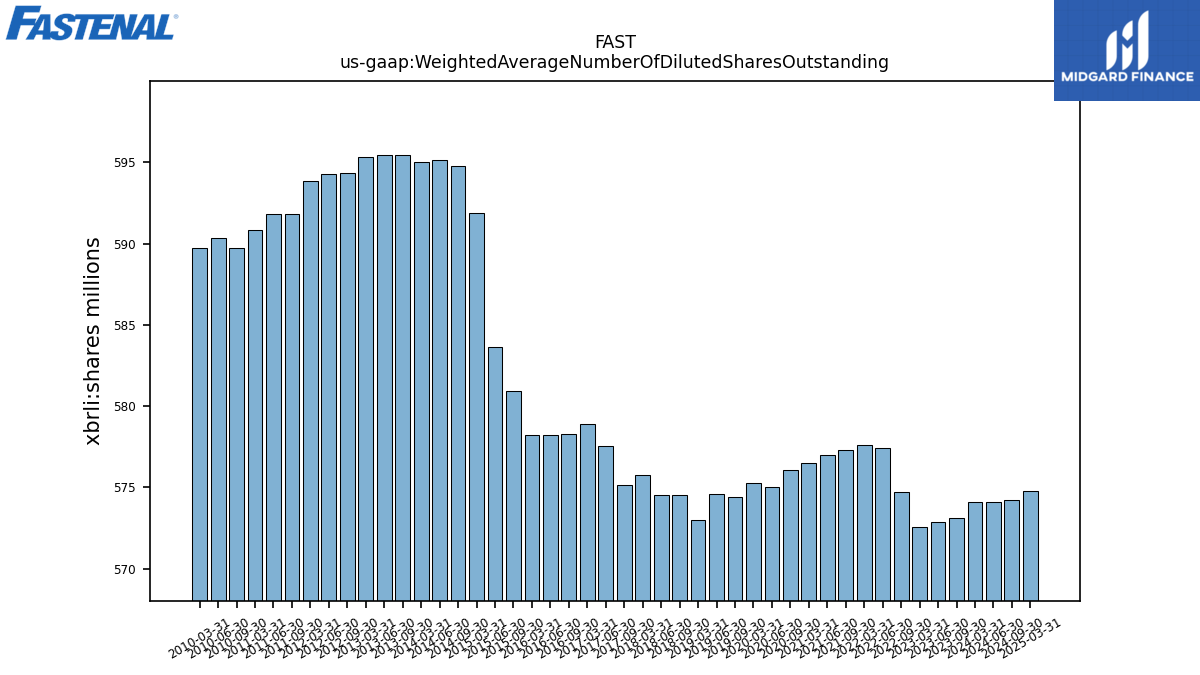
| Weighted Average Number Of Diluted Shares Outstanding | 574.10 | NA | 573.10 | 572.90 | 572.60 | NA | 574.70 | 577.40 | 577.60 | NA | 577.30 | 577.00 | 576.50 | NA | 576.10 | 575.00 | 575.30 | NA | 574.40 | 574.60 | 572.99 | NA | 574.53 | 574.51 | 575.75 | NA | 575.16 | 577.58 | 578.91 | NA | 578.30 | 578.24 | 578.25 | NA | 580.95 | 583.66 | 591.87 | NA | 594.76 | 595.16 | 594.99 | NA | 595.43 | 595.44 | 595.30 | NA | 594.36 | 594.26 | 593.85 | NA | 591.79 | 591.83 | 590.86 | NA | 589.72 | 590.32 | 589.72 | NA | NA | NA | NA | |
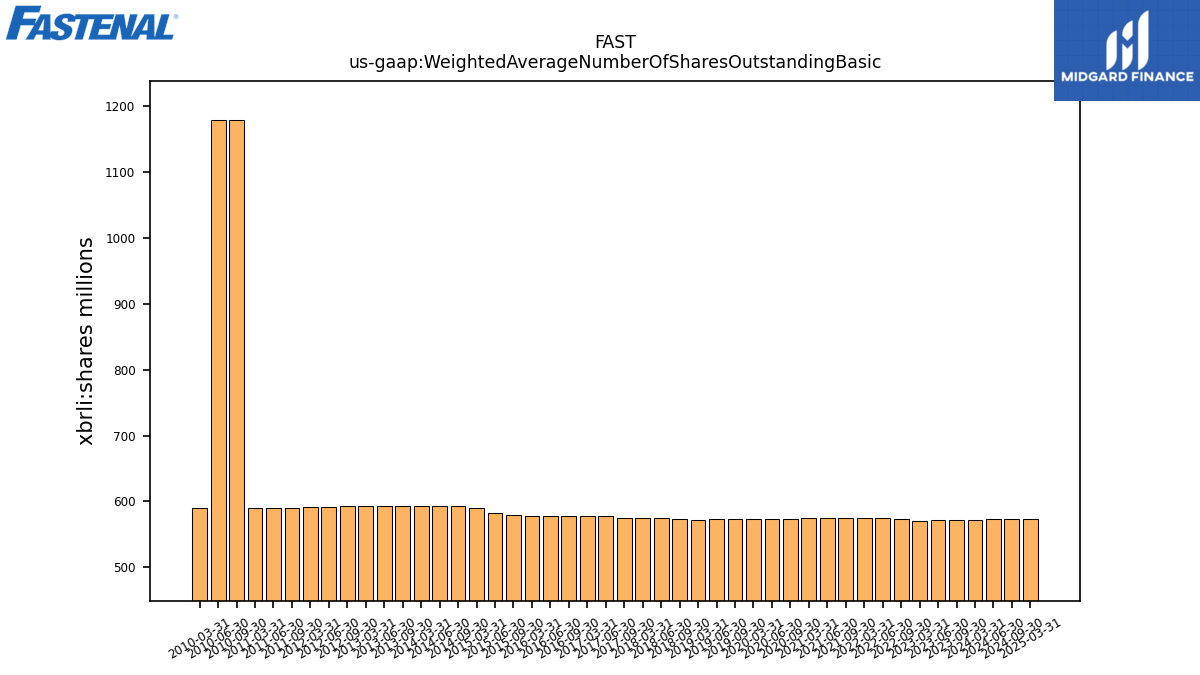
| Weighted Average Number Of Shares Outstanding Basic | 572.30 | NA | 571.40 | 571.10 | 570.90 | NA | 573.00 | 575.50 | 575.60 | NA | 575.00 | 574.60 | 574.30 | NA | 573.90 | 573.20 | 573.90 | NA | 573.50 | 573.20 | 572.17 | NA | 574.01 | 574.28 | 575.29 | NA | 574.91 | 577.31 | 578.48 | NA | 577.99 | 577.84 | 577.62 | NA | 579.84 | 582.35 | 590.48 | NA | 593.19 | 593.38 | 593.28 | NA | 593.69 | 593.56 | 593.29 | NA | 592.48 | 592.22 | 591.08 | NA | 590.29 | 589.95 | 589.72 | NA | 1179.45 | 1179.45 | 589.72 | NA | NA | NA | NA | |
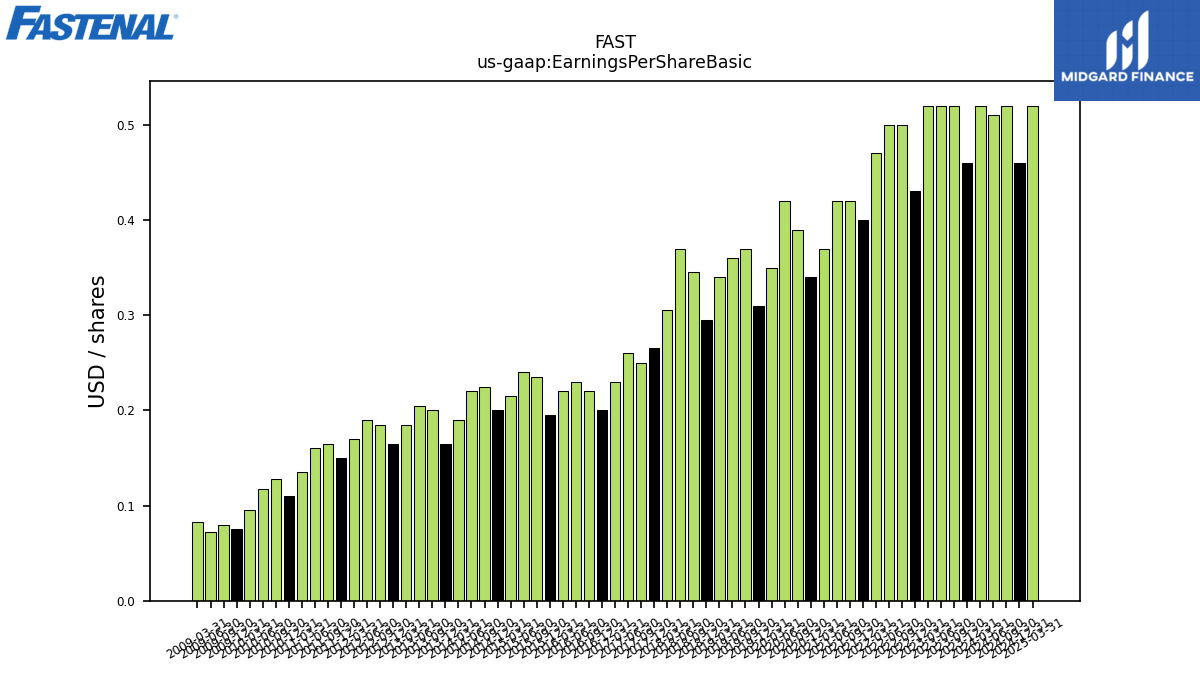
| Earnings Per Share Basic | 0.52 | 0.46 | 0.52 | 0.52 | 0.52 | 0.43 | 0.50 | 0.50 | 0.47 | 0.40 | 0.42 | 0.42 | 0.37 | 0.34 | 0.39 | 0.42 | 0.35 | 0.31 | 0.37 | 0.36 | 0.34 | 0.29 | 0.34 | 0.37 | 0.30 | 0.27 | 0.25 | 0.26 | 0.23 | 0.20 | 0.22 | 0.23 | 0.22 | 0.20 | 0.23 | 0.24 | 0.21 | 0.20 | 0.23 | 0.22 | 0.19 | 0.17 | 0.20 | 0.20 | 0.18 | 0.17 | 0.18 | 0.19 | 0.17 | 0.15 | 0.17 | 0.16 | 0.14 | 0.11 | 0.13 | 0.12 | 0.10 | 0.07 | 0.08 | 0.07 | 0.08 | |
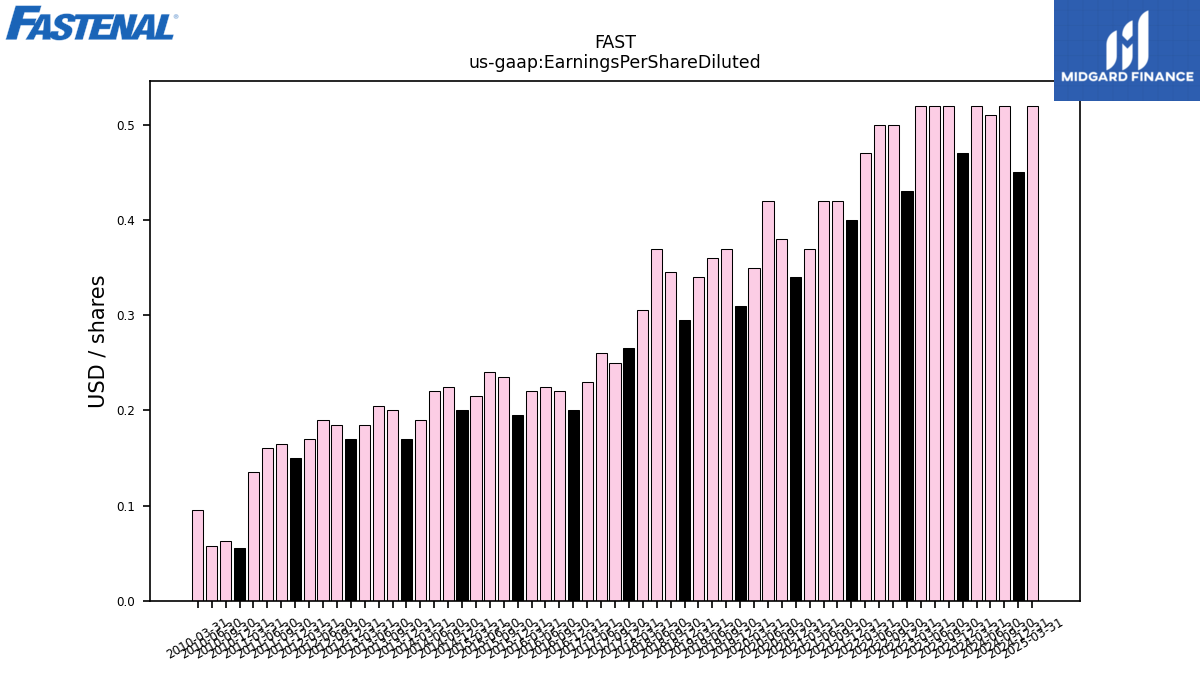
| Earnings Per Share Diluted | 0.52 | 0.47 | 0.52 | 0.52 | 0.52 | 0.43 | 0.50 | 0.50 | 0.47 | 0.40 | 0.42 | 0.42 | 0.37 | 0.34 | 0.38 | 0.42 | 0.35 | 0.31 | 0.37 | 0.36 | 0.34 | 0.29 | 0.34 | 0.37 | 0.30 | 0.27 | 0.25 | 0.26 | 0.23 | 0.20 | 0.22 | 0.23 | 0.22 | 0.20 | 0.23 | 0.24 | 0.21 | 0.20 | 0.23 | 0.22 | 0.19 | 0.17 | 0.20 | 0.20 | 0.18 | 0.17 | 0.18 | 0.19 | 0.17 | 0.15 | 0.17 | 0.16 | 0.14 | 0.05 | 0.06 | 0.06 | 0.10 | NA | NA | NA | NA |
| 2024-03-31 | 2023-12-31 | 2023-09-30 | 2023-06-30 | 2023-03-31 | 2022-12-31 | 2022-09-30 | 2022-06-30 | 2022-03-31 | 2021-12-31 | 2021-09-30 | 2021-06-30 | 2021-03-31 | 2020-12-31 | 2020-09-30 | 2020-06-30 | 2020-03-31 | 2019-12-31 | 2019-09-30 | 2019-06-30 | 2019-03-31 | 2018-12-31 | 2018-09-30 | 2018-06-30 | 2018-03-31 | 2017-12-31 | 2017-09-30 | 2017-06-30 | 2017-03-31 | 2016-12-31 | 2016-09-30 | 2016-06-30 | 2016-03-31 | 2015-12-31 | 2015-09-30 | 2015-06-30 | 2015-03-31 | 2014-12-31 | 2014-09-30 | 2014-06-30 | 2014-03-31 | 2013-12-31 | 2013-09-30 | 2013-06-30 | 2013-03-31 | 2012-12-31 | 2012-09-30 | 2012-06-30 | 2012-03-31 | 2011-12-31 | 2011-09-30 | 2011-06-30 | 2011-03-31 | 2010-12-31 | 2010-09-30 | 2010-06-30 | 2010-03-31 | 2009-12-31 | 2009-09-30 | 2009-06-30 | 2009-03-31 | ||
|---|---|---|---|---|---|---|---|---|---|---|---|---|---|---|---|---|---|---|---|---|---|---|---|---|---|---|---|---|---|---|---|---|---|---|---|---|---|---|---|---|---|---|---|---|---|---|---|---|---|---|---|---|---|---|---|---|---|---|---|---|---|---|
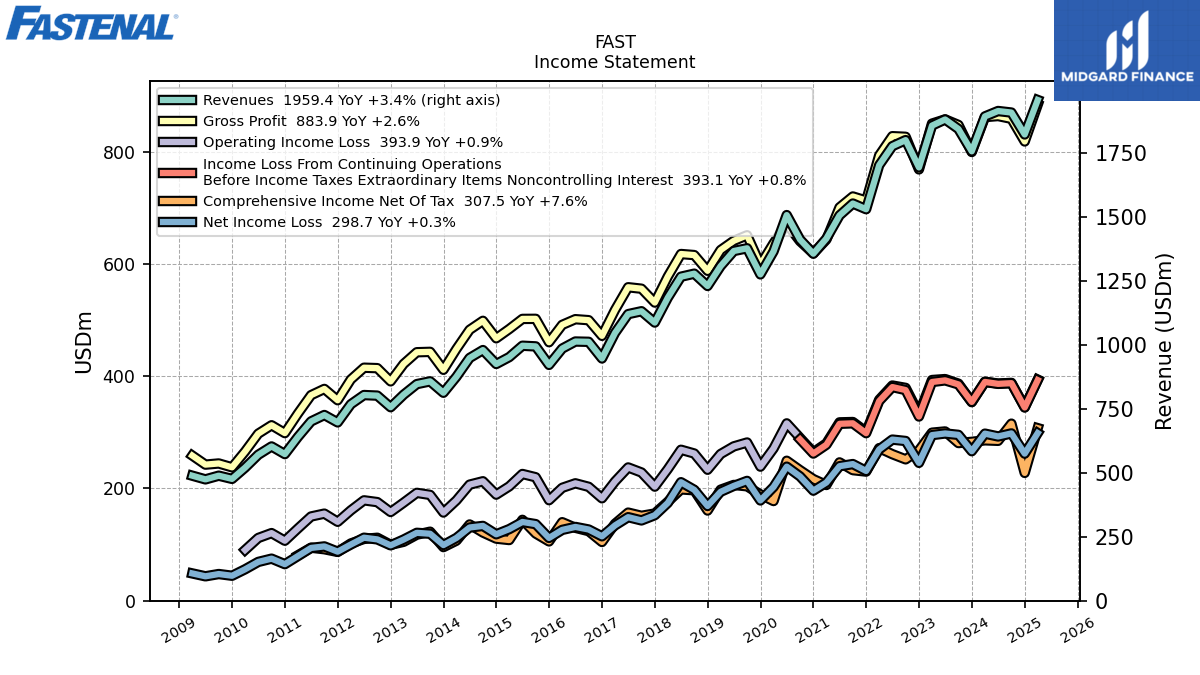
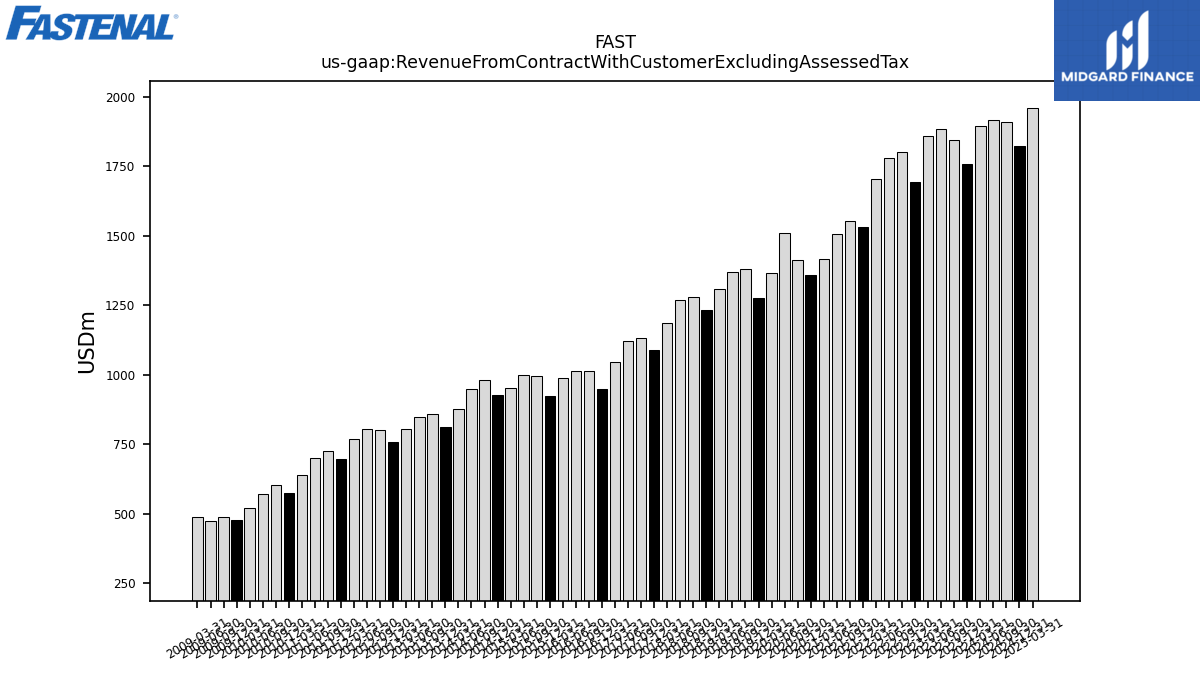
| Revenue From Contract With Customer Excluding Assessed Tax | 1895.10 | 1758.60 | 1845.90 | 1883.10 | 1859.10 | 1695.60 | 1802.40 | 1778.60 | 1704.10 | 1531.90 | 1554.20 | 1507.70 | 1417.00 | 1358.00 | 1413.30 | 1509.00 | 1367.00 | 1276.90 | 1379.10 | 1368.40 | 1309.30 | 1231.60 | 1279.80 | 1267.90 | 1185.80 | 1088.50 | 1132.80 | 1121.50 | 1047.70 | 947.95 | 1013.12 | 1014.29 | 986.68 | 922.79 | 995.25 | 997.83 | 953.32 | 926.25 | 980.81 | 949.94 | 876.50 | 813.76 | 858.42 | 847.60 | 806.33 | 757.24 | 802.58 | 804.89 | 768.88 | 697.80 | 726.74 | 701.73 | 640.58 | 573.77 | 603.75 | 571.18 | 520.77 | 476.75 | 489.34 | 474.89 | 489.35 | |
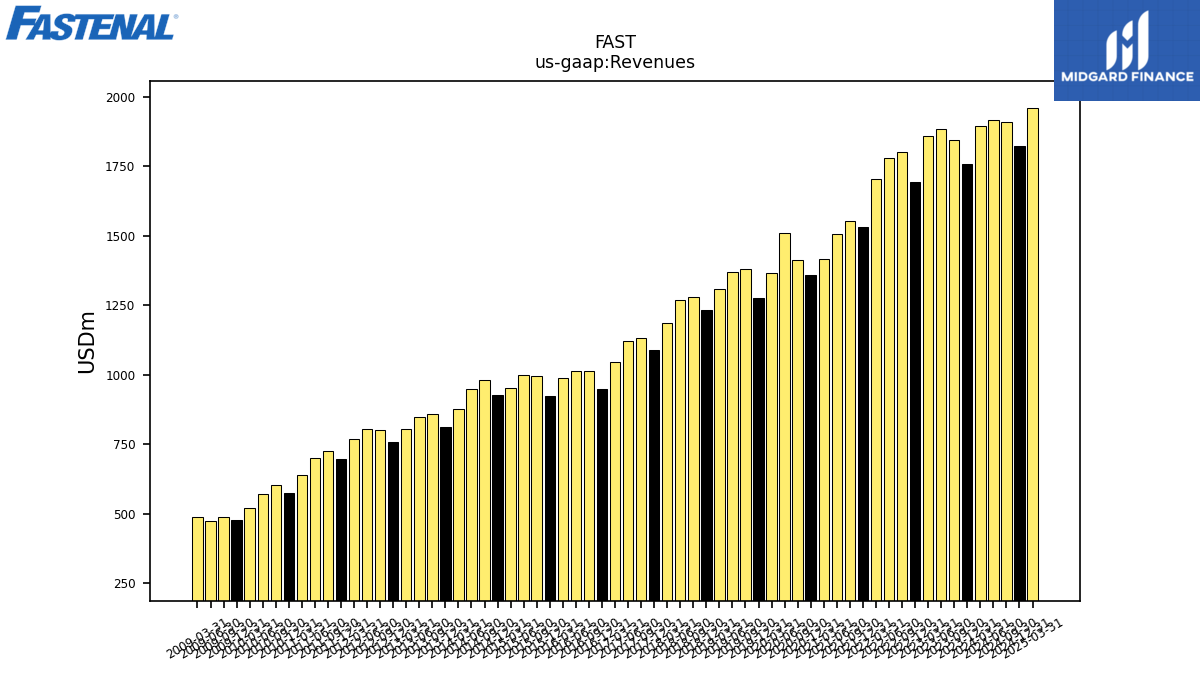
| Revenues | 1895.10 | 1758.60 | 1845.90 | 1883.10 | 1859.10 | 1695.60 | 1802.40 | 1778.60 | 1704.10 | 1531.90 | 1554.20 | 1507.70 | 1417.00 | 1358.00 | 1413.30 | 1509.00 | 1367.00 | 1276.90 | 1379.10 | 1368.40 | 1309.30 | 1231.60 | 1279.80 | 1267.90 | 1185.80 | 1088.50 | 1132.80 | 1121.50 | 1047.70 | 947.95 | 1013.12 | 1014.29 | 986.68 | 922.79 | 995.25 | 997.83 | 953.32 | 926.25 | 980.81 | 949.94 | 876.50 | 813.76 | 858.42 | 847.60 | 806.33 | 757.24 | 802.58 | 804.89 | 768.88 | 697.80 | 726.74 | 701.73 | 640.58 | 573.77 | 603.75 | 571.18 | 520.77 | 476.75 | 489.34 | 474.89 | 489.35 | |
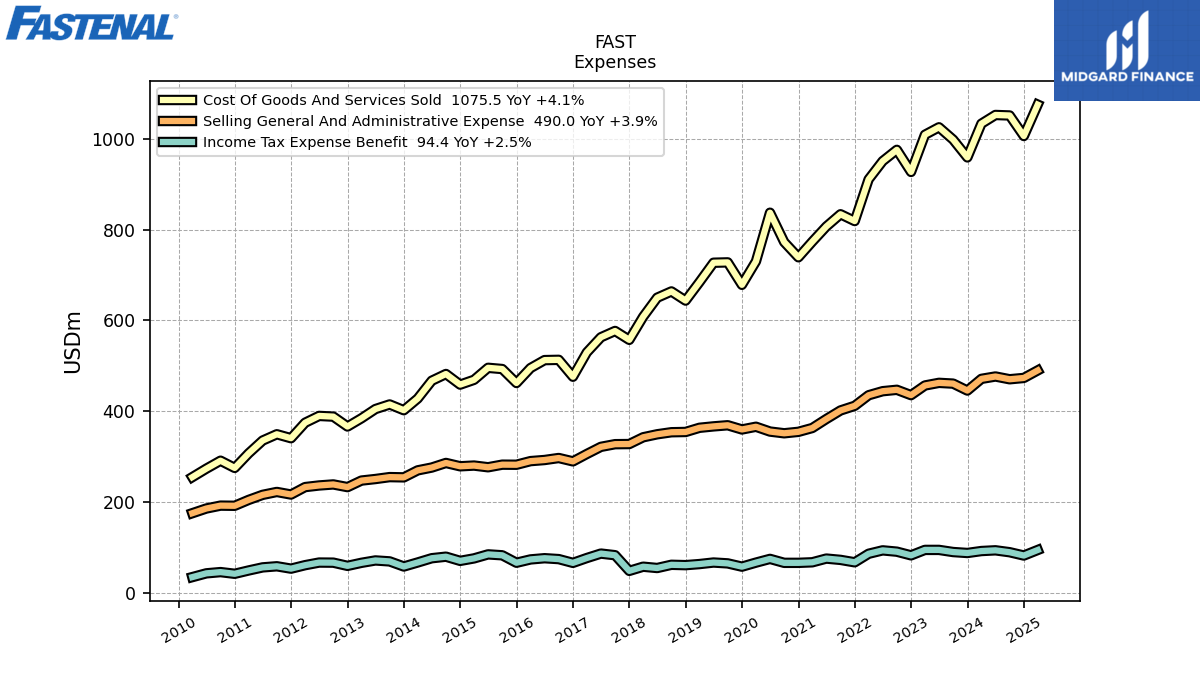
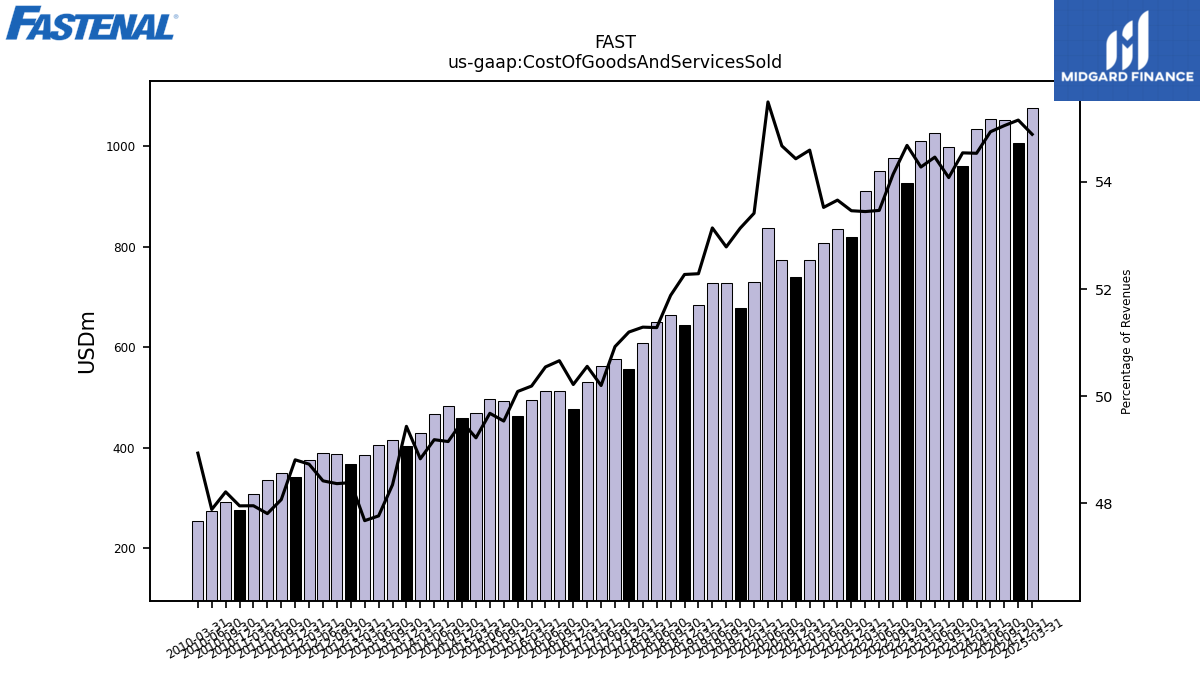
| Cost Of Goods And Services Sold | 1033.50 | 959.20 | 998.30 | 1025.60 | 1009.10 | 927.20 | 975.90 | 951.00 | 910.80 | 819.00 | 834.00 | 807.00 | 773.60 | 739.20 | 772.70 | 837.40 | 730.20 | 678.50 | 728.00 | 727.20 | 684.60 | 643.80 | 664.00 | 650.20 | 608.20 | 557.30 | 576.90 | 563.00 | 529.70 | 476.06 | 513.29 | 512.70 | 495.22 | 462.22 | 493.02 | 495.74 | 469.27 | 458.69 | 482.12 | 467.27 | 428.02 | 402.31 | 415.03 | 404.88 | 384.45 | 366.41 | 388.20 | 389.74 | 374.70 | 340.63 | 349.36 | 335.50 | 307.20 | 275.15 | 291.10 | 273.52 | 254.86 | NA | NA | NA | NA | |
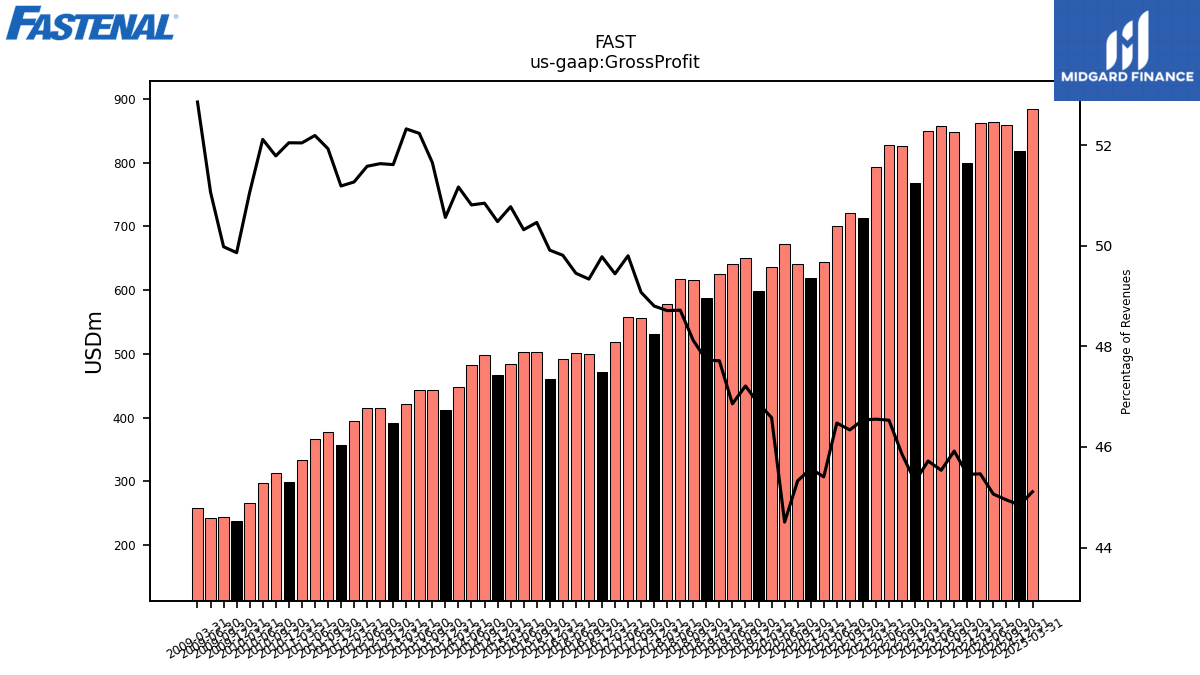
| Gross Profit | 861.60 | 799.40 | 847.60 | 857.50 | 850.00 | 768.40 | 826.50 | 827.60 | 793.30 | 712.90 | 720.20 | 700.70 | 643.40 | 618.80 | 640.60 | 671.60 | 636.80 | 598.40 | 651.10 | 641.20 | 624.70 | 587.80 | 615.80 | 617.70 | 577.60 | 531.20 | 555.90 | 558.50 | 518.00 | 471.89 | 499.83 | 501.59 | 491.46 | 460.57 | 502.23 | 502.09 | 484.05 | 467.56 | 498.69 | 482.67 | 448.48 | 411.45 | 443.39 | 442.72 | 421.88 | 390.82 | 414.38 | 415.15 | 394.18 | 357.18 | 377.38 | 366.23 | 333.38 | 298.62 | 312.65 | 297.66 | 265.91 | 237.72 | 244.57 | 242.50 | 258.65 | |
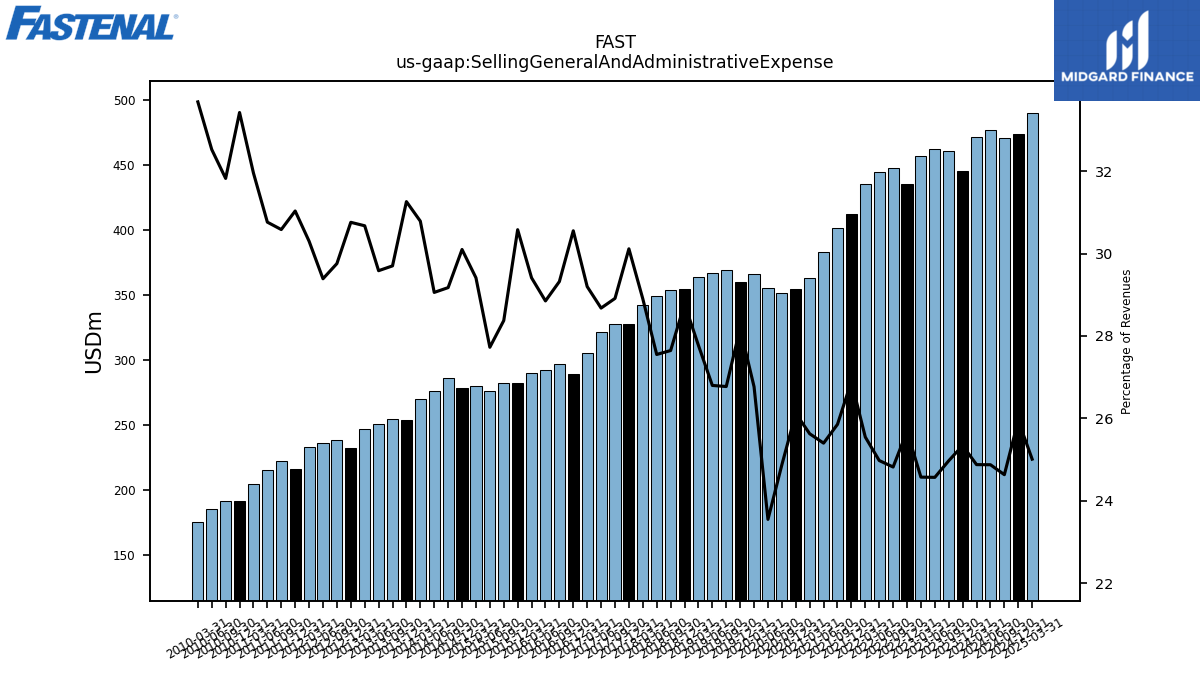
| Selling General And Administrative Expense | 471.40 | 445.60 | 460.90 | 462.60 | 456.80 | 435.50 | 447.30 | 444.20 | 435.30 | 412.00 | 401.80 | 382.90 | 363.10 | 354.70 | 351.50 | 355.30 | 365.90 | 359.90 | 369.20 | 366.70 | 363.60 | 354.40 | 353.80 | 349.30 | 342.70 | 327.80 | 327.50 | 321.60 | 305.90 | 289.62 | 297.05 | 292.62 | 290.18 | 282.18 | 282.38 | 276.64 | 280.39 | 278.79 | 286.13 | 276.02 | 269.84 | 254.39 | 254.96 | 250.75 | 247.33 | 232.91 | 238.81 | 236.54 | 232.97 | 216.55 | 222.26 | 215.87 | 204.69 | 191.78 | 192.14 | 185.78 | 175.41 | NA | NA | NA | NA | |
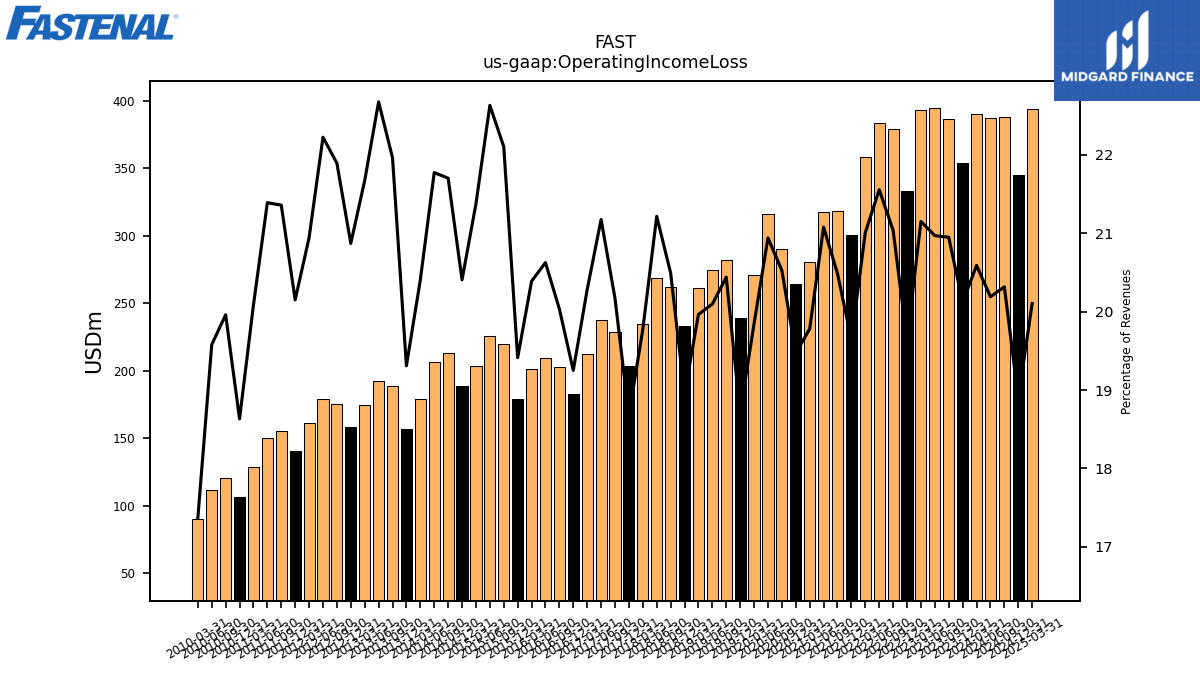
| Operating Income Loss | 390.20 | 353.80 | 386.70 | 394.90 | 393.20 | 332.90 | 379.20 | 383.40 | 358.00 | 300.90 | 318.40 | 317.80 | 280.30 | 264.40 | 290.10 | 316.00 | 271.30 | 238.90 | 281.90 | 275.00 | 261.40 | 233.40 | 262.30 | 269.00 | 234.50 | 203.30 | 228.50 | 237.50 | 212.50 | 182.49 | 202.97 | 209.21 | 201.17 | 179.14 | 220.01 | 225.83 | 203.77 | 189.02 | 212.87 | 206.85 | 178.85 | 157.13 | 188.55 | 192.21 | 174.76 | 158.04 | 175.72 | 178.90 | 161.03 | 140.62 | 155.22 | 150.11 | 128.66 | 106.91 | 120.51 | 111.84 | 90.44 | NA | NA | NA | NA | |
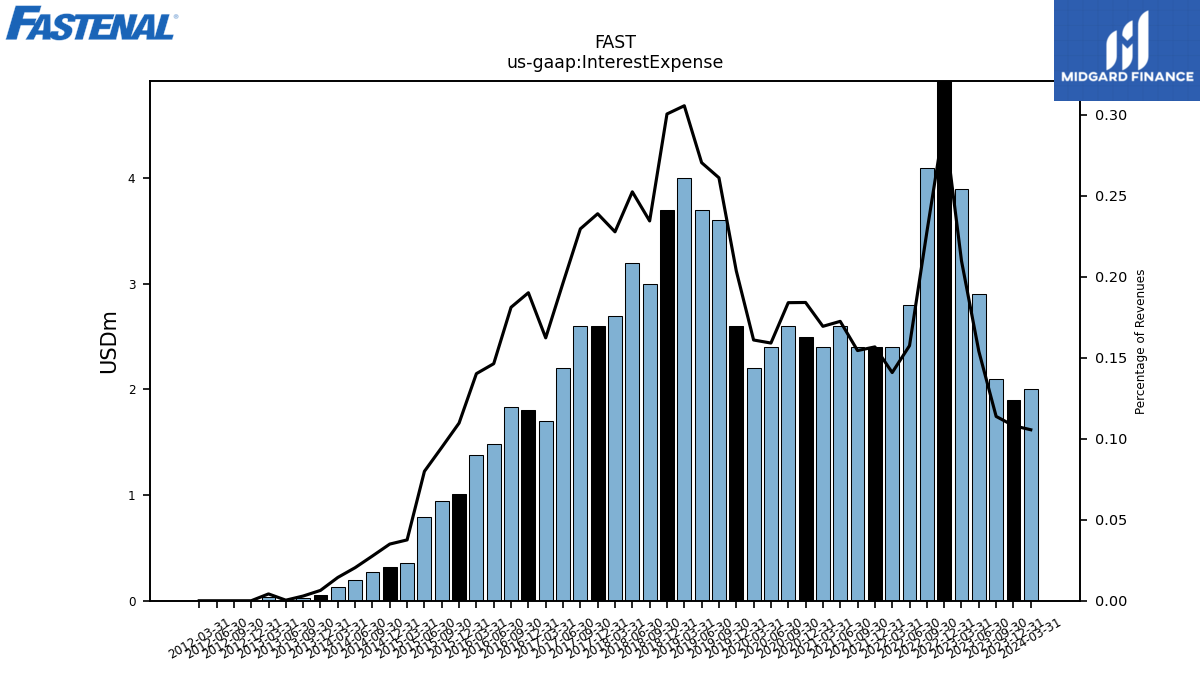
| Interest Expense | 2.00 | 1.90 | 2.10 | 2.90 | 3.90 | 5.00 | 4.10 | 2.80 | 2.40 | 2.40 | 2.40 | 2.60 | 2.40 | 2.50 | 2.60 | 2.40 | 2.20 | 2.60 | 3.60 | 3.70 | 4.00 | 3.70 | 3.00 | 3.20 | 2.70 | 2.60 | 2.60 | 2.20 | 1.70 | 1.80 | 1.83 | 1.48 | 1.38 | 1.01 | 0.94 | 0.80 | 0.36 | 0.32 | 0.27 | 0.19 | 0.13 | 0.05 | 0.03 | 0.00 | 0.03 | 0.00 | 0.00 | 0.00 | 0.00 | NA | NA | NA | NA | NA | NA | NA | NA | NA | NA | NA | NA | |
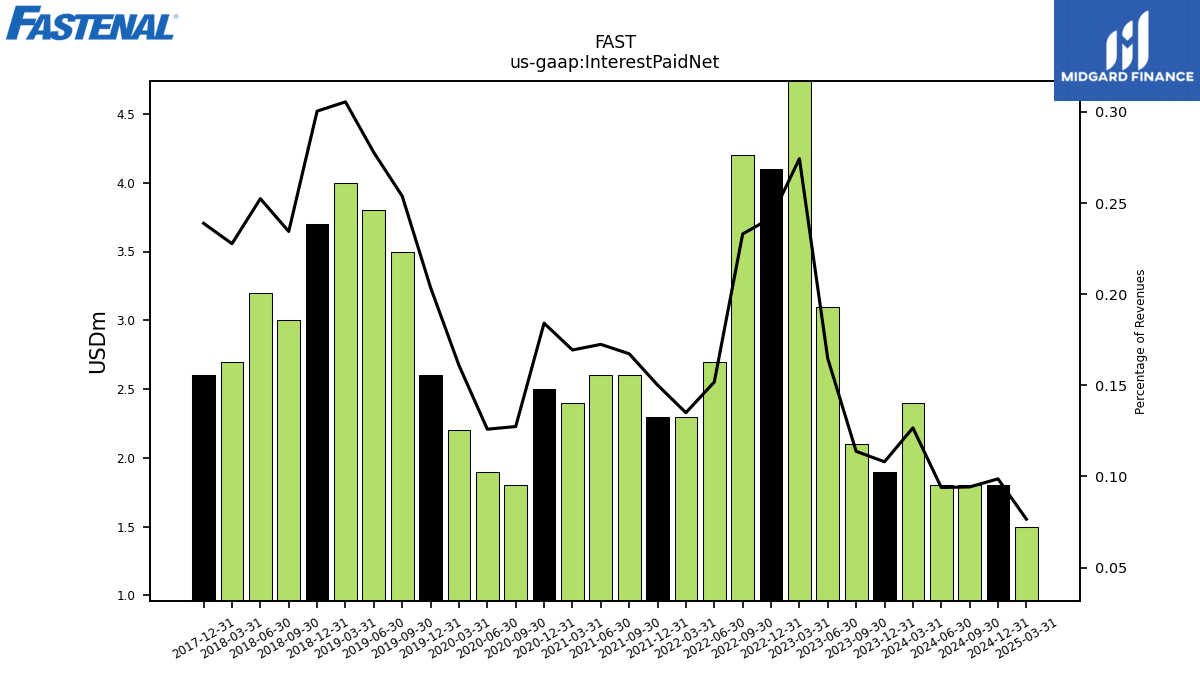
| Interest Paid Net | 2.40 | 1.90 | 2.10 | 3.10 | 5.10 | 4.10 | 4.20 | 2.70 | 2.30 | 2.30 | 2.60 | 2.60 | 2.40 | 2.50 | 1.80 | 1.90 | 2.20 | 2.60 | 3.50 | 3.80 | 4.00 | 3.70 | 3.00 | 3.20 | 2.70 | 2.60 | NA | NA | NA | NA | NA | NA | NA | NA | NA | NA | NA | NA | NA | NA | NA | NA | NA | NA | NA | NA | NA | NA | NA | NA | NA | NA | NA | NA | NA | NA | NA | NA | NA | NA | NA | |
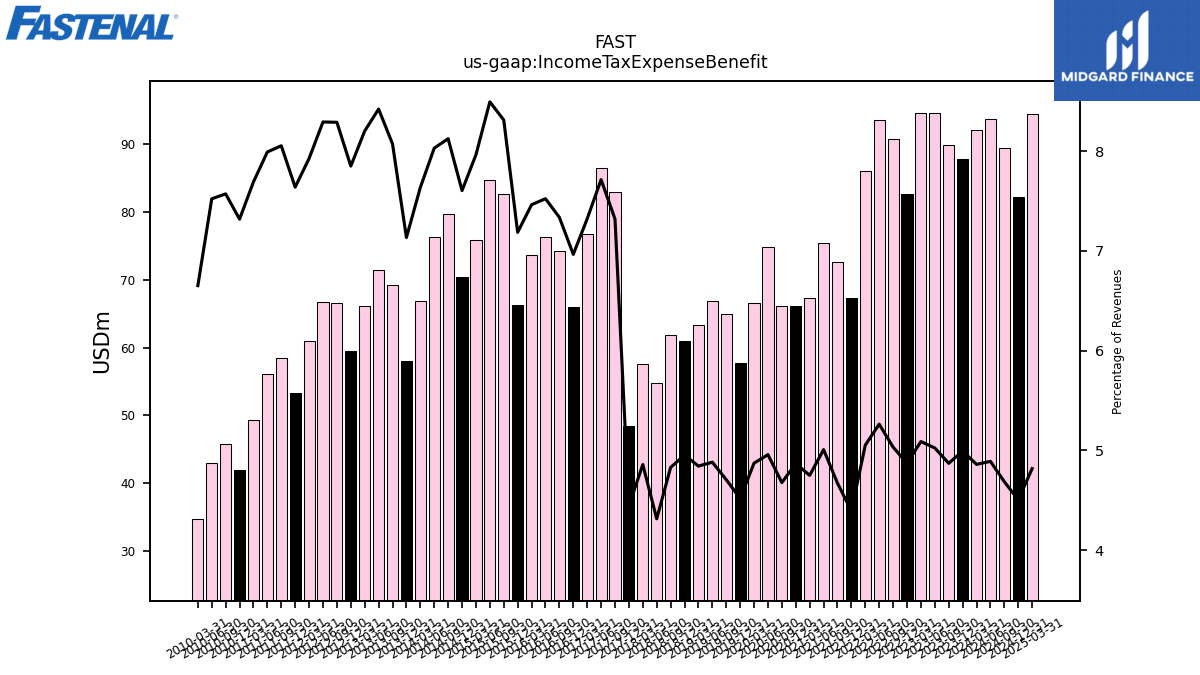
| Income Tax Expense Benefit | 92.10 | 87.80 | 89.90 | 94.60 | 94.60 | 82.60 | 90.70 | 93.60 | 86.10 | 67.30 | 72.60 | 75.50 | 67.30 | 66.10 | 66.10 | 74.80 | 66.60 | 57.70 | 64.90 | 66.80 | 63.40 | 61.00 | 61.80 | 54.70 | 57.60 | 48.40 | 82.90 | 86.50 | 76.70 | 66.02 | 74.31 | 76.30 | 73.62 | 66.30 | 82.71 | 84.74 | 75.91 | 70.43 | 79.67 | 76.27 | 66.91 | 58.05 | 69.29 | 71.37 | 66.12 | 59.44 | 66.52 | 66.73 | 60.94 | 53.30 | 58.52 | 56.07 | 49.26 | 41.98 | 45.71 | 42.96 | 34.63 | NA | NA | NA | NA | |
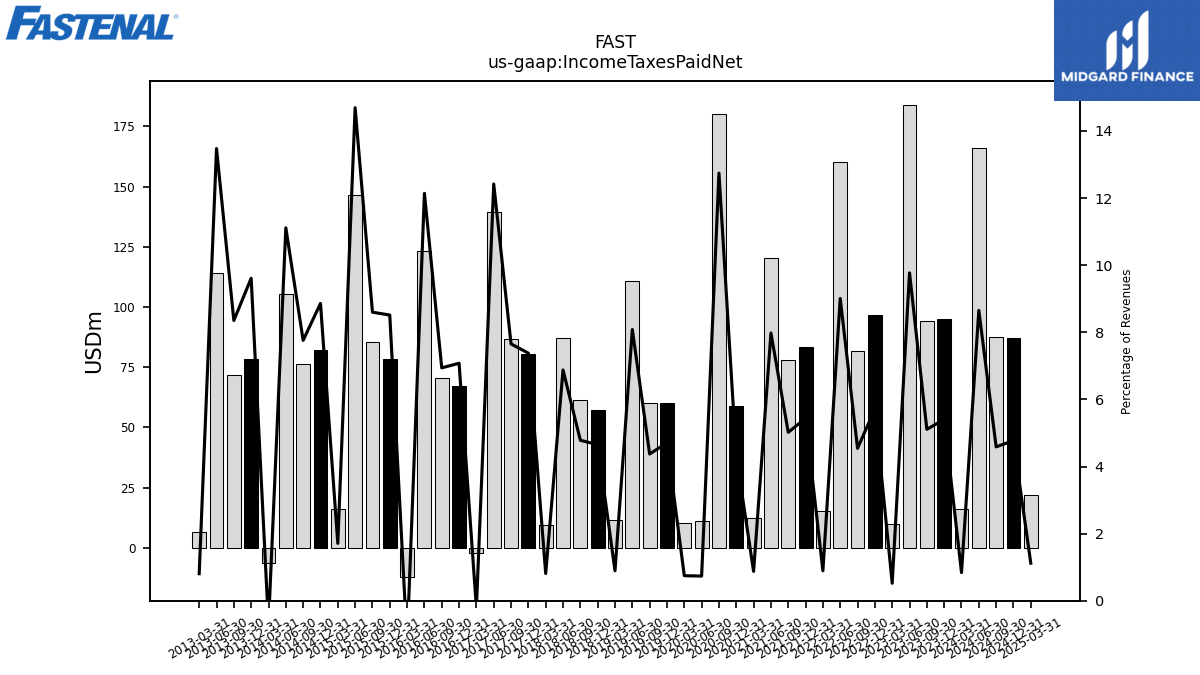
| Income Taxes Paid Net | 15.90 | 95.00 | 94.30 | 184.00 | 9.70 | 96.80 | 81.90 | 160.20 | 15.20 | 83.30 | 78.00 | 120.30 | 12.40 | 58.70 | 180.10 | 11.10 | 10.20 | 60.10 | 60.30 | 110.60 | 11.70 | 57.30 | 61.20 | 87.20 | 9.60 | 80.30 | 86.70 | 139.30 | -2.20 | 67.08 | 70.31 | 123.13 | -12.20 | 78.56 | 85.58 | 146.60 | 16.29 | 82.06 | 76.11 | 105.56 | -6.22 | 78.21 | 71.69 | 114.21 | 6.50 | NA | NA | NA | NA | NA | NA | NA | NA | NA | NA | NA | NA | NA | NA | NA | NA | |
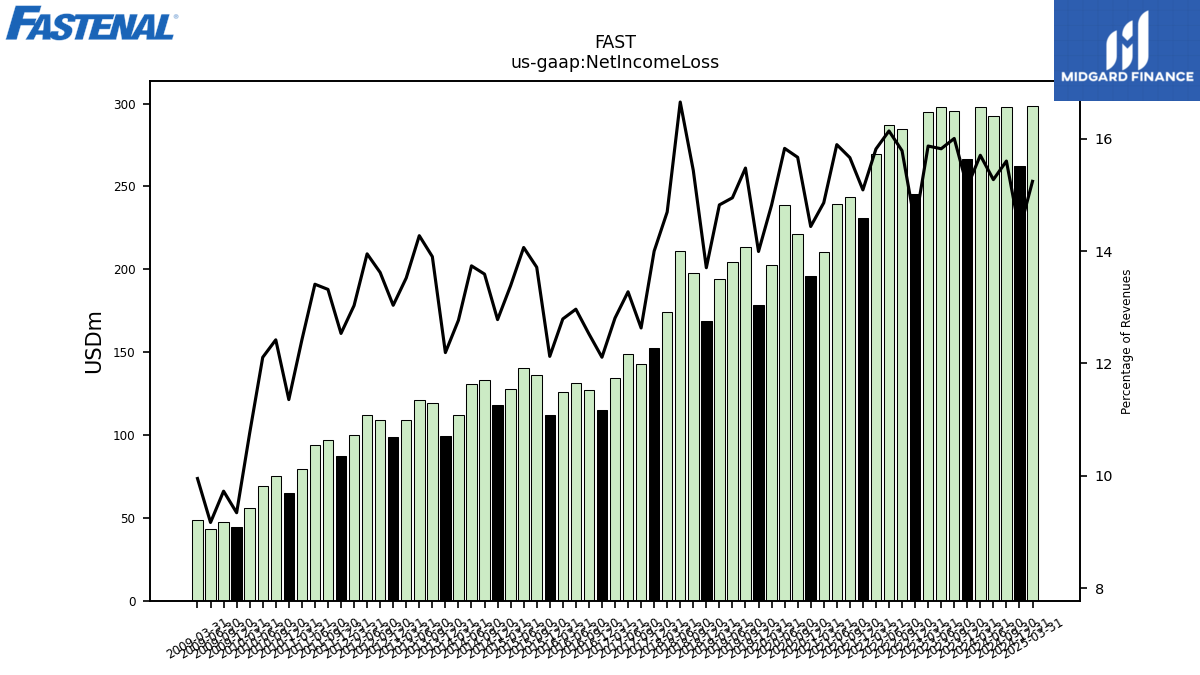
| Net Income Loss | 297.70 | 266.40 | 295.50 | 298.00 | 295.10 | 245.60 | 284.60 | 287.10 | 269.60 | 231.20 | 243.50 | 239.70 | 210.60 | 196.10 | 221.50 | 238.90 | 202.60 | 178.70 | 213.50 | 204.60 | 194.10 | 168.80 | 197.60 | 211.20 | 174.30 | 152.40 | 143.10 | 148.90 | 134.20 | 114.81 | 126.92 | 131.52 | 126.23 | 111.90 | 136.49 | 140.36 | 127.61 | 118.39 | 133.31 | 130.51 | 111.93 | 99.23 | 119.35 | 121.01 | 109.05 | 98.72 | 109.32 | 112.31 | 100.19 | 87.47 | 96.80 | 94.11 | 79.55 | 65.16 | 74.99 | 69.17 | 56.03 | 44.54 | 47.59 | 43.54 | 48.69 | |
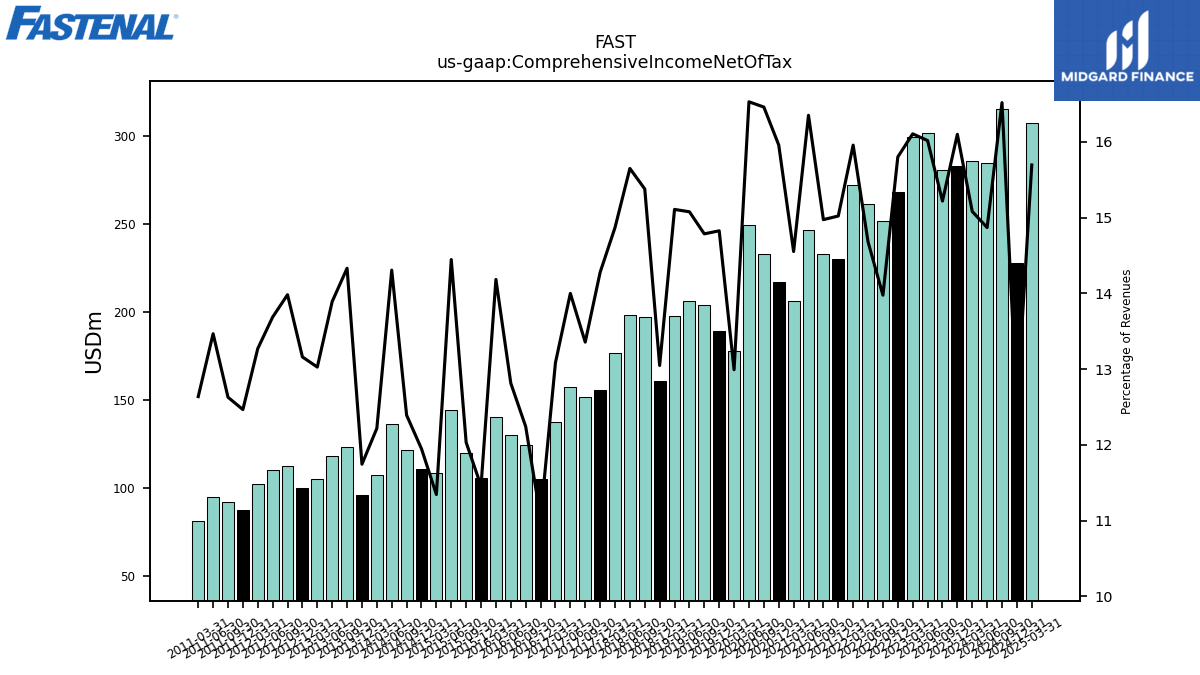
| Comprehensive Income Net Of Tax | 285.80 | 283.10 | 280.90 | 301.60 | 299.40 | 267.90 | 251.90 | 261.10 | 271.90 | 230.10 | 232.70 | 246.50 | 206.20 | 216.70 | 232.60 | 249.40 | 177.60 | 189.30 | 203.90 | 206.30 | 197.80 | 160.70 | 196.80 | 198.40 | 176.30 | 155.40 | 151.30 | 157.00 | 137.10 | 104.64 | 124.02 | 129.97 | 139.94 | 105.73 | 119.76 | 144.15 | 108.16 | 110.67 | 121.54 | 135.90 | 107.10 | 95.58 | 123.02 | 117.74 | 105.04 | 99.66 | 112.22 | 110.16 | 102.04 | 86.99 | 91.78 | 94.50 | 80.95 | NA | NA | NA | NA | NA | NA | NA | NA |
| 2024-03-31 | 2023-12-31 | 2023-09-30 | 2023-06-30 | 2023-03-31 | 2022-12-31 | 2022-09-30 | 2022-06-30 | 2022-03-31 | 2021-12-31 | 2021-09-30 | 2021-06-30 | 2021-03-31 | 2020-12-31 | 2020-09-30 | 2020-06-30 | 2020-03-31 | 2019-12-31 | 2019-09-30 | 2019-06-30 | 2019-03-31 | 2018-12-31 | 2018-09-30 | 2018-06-30 | 2018-03-31 | 2017-12-31 | 2017-09-30 | 2017-06-30 | 2017-03-31 | 2016-12-31 | 2016-09-30 | 2016-06-30 | 2016-03-31 | 2015-12-31 | 2015-09-30 | 2015-06-30 | 2015-03-31 | 2014-12-31 | 2014-09-30 | 2014-06-30 | 2014-03-31 | 2013-12-31 | 2013-09-30 | 2013-06-30 | 2013-03-31 | 2012-12-31 | 2012-09-30 | 2012-06-30 | 2012-03-31 | 2011-12-31 | 2011-09-30 | 2011-06-30 | 2011-03-31 | 2010-12-31 | 2010-09-30 | 2010-06-30 | 2010-03-31 | 2009-12-31 | 2009-09-30 | 2009-06-30 | 2009-03-31 | ||
|---|---|---|---|---|---|---|---|---|---|---|---|---|---|---|---|---|---|---|---|---|---|---|---|---|---|---|---|---|---|---|---|---|---|---|---|---|---|---|---|---|---|---|---|---|---|---|---|---|---|---|---|---|---|---|---|---|---|---|---|---|---|---|
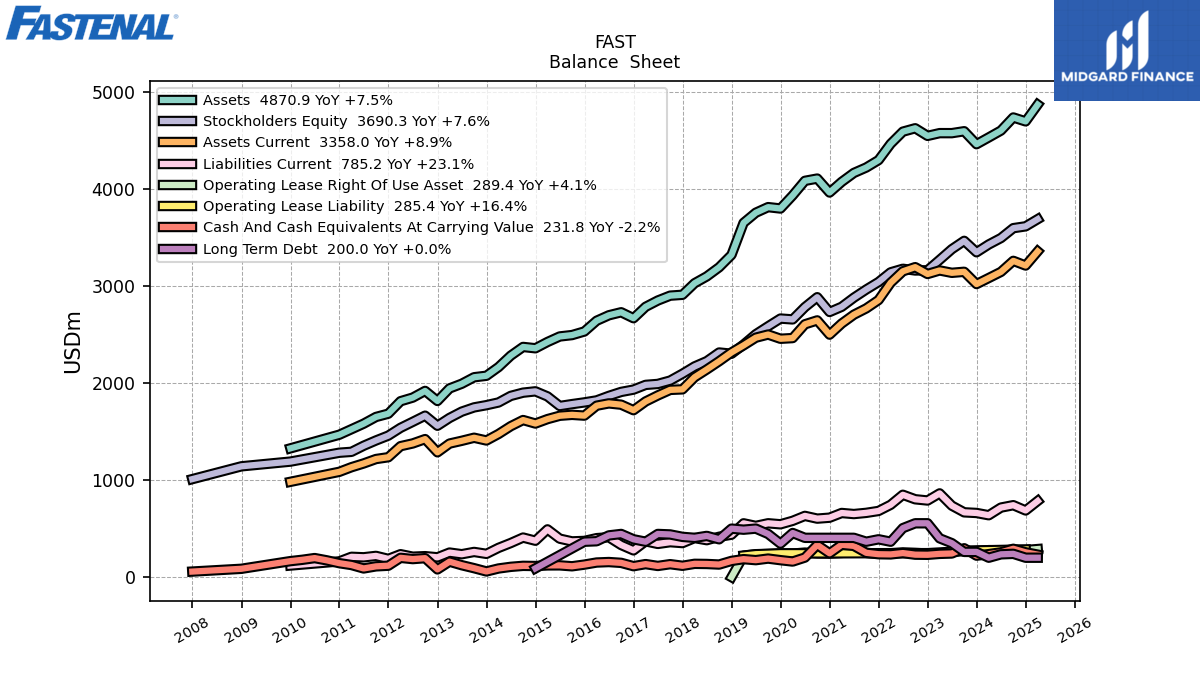
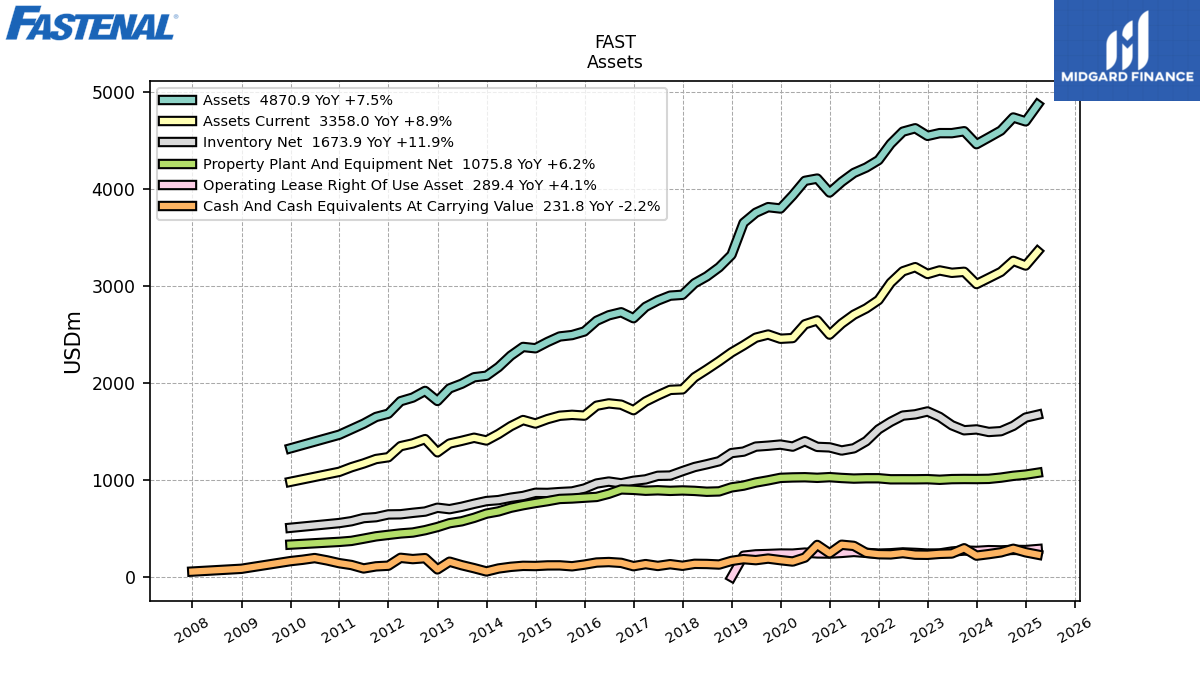
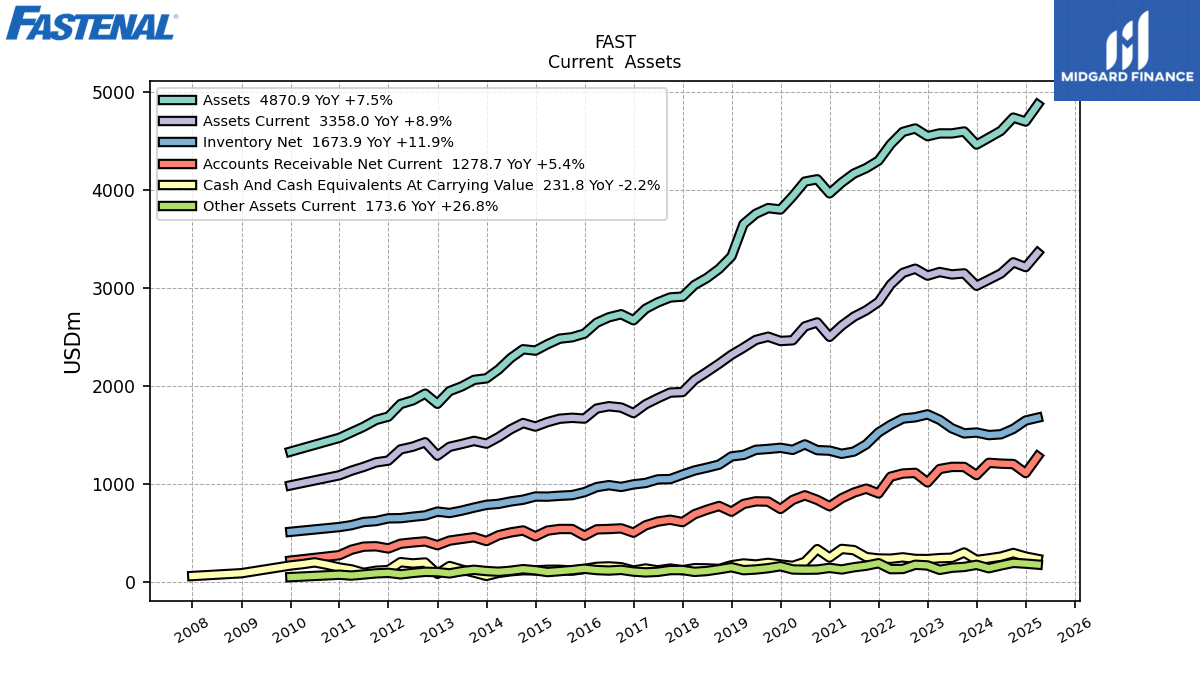
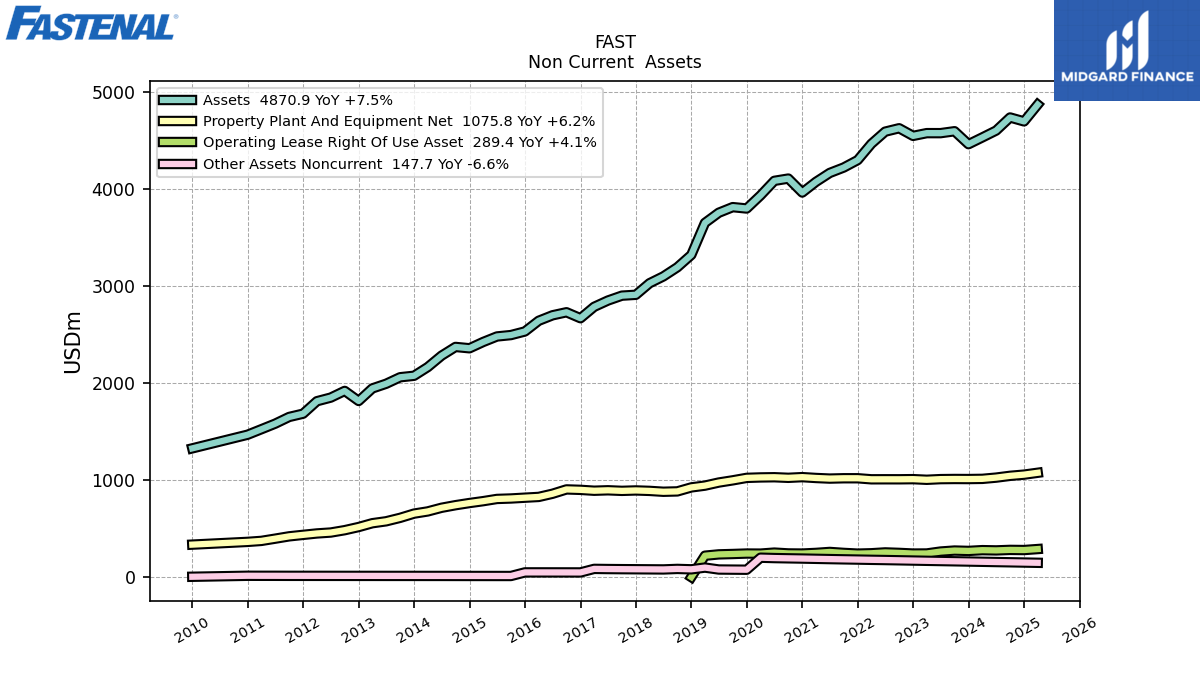
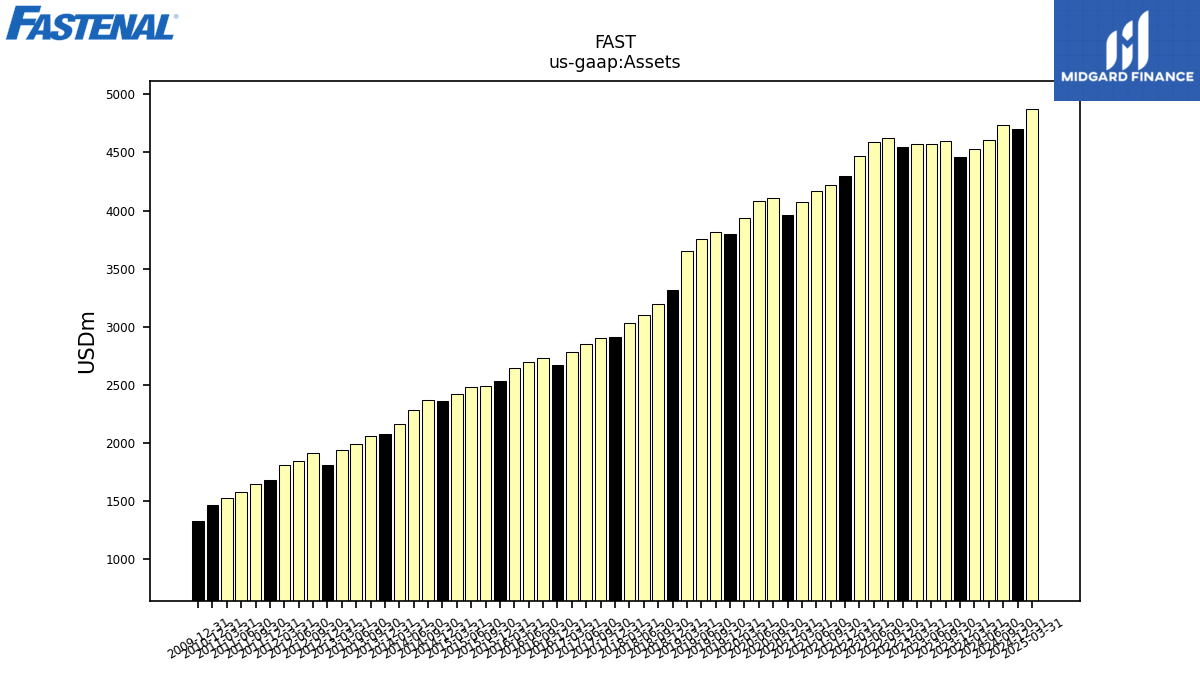
| Assets | 4532.70 | 4462.90 | 4596.60 | 4576.80 | 4577.00 | 4548.60 | 4627.40 | 4592.30 | 4466.70 | 4299.00 | 4222.50 | 4166.60 | 4074.40 | 3964.70 | 4108.60 | 4085.20 | 3934.70 | 3799.90 | 3814.20 | 3756.40 | 3651.80 | 3321.50 | 3193.90 | 3100.10 | 3029.60 | 2910.50 | 2901.60 | 2851.40 | 2786.40 | 2668.88 | 2730.47 | 2699.14 | 2642.78 | 2532.46 | 2495.28 | 2480.93 | 2423.94 | 2359.10 | 2372.99 | 2282.97 | 2165.11 | 2075.78 | 2060.42 | 1993.44 | 1945.30 | 1815.83 | 1919.71 | 1850.75 | 1813.33 | 1684.95 | 1651.02 | 1581.87 | 1524.61 | 1468.28 | NA | NA | NA | 1327.36 | NA | NA | NA | |
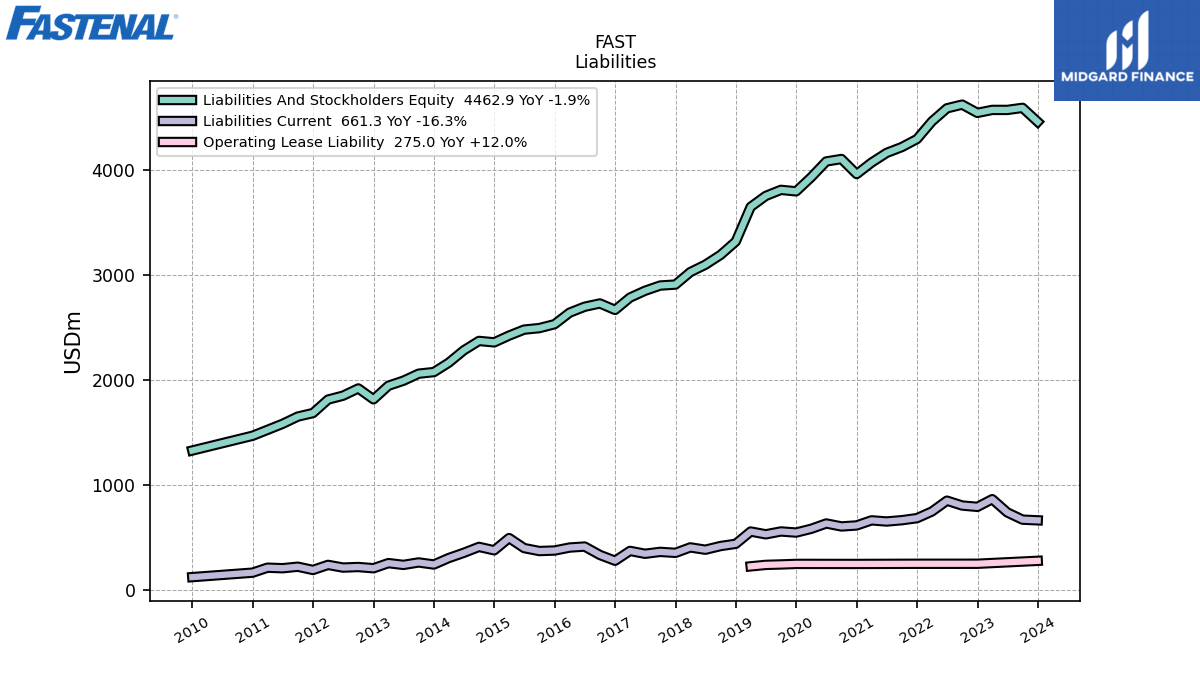
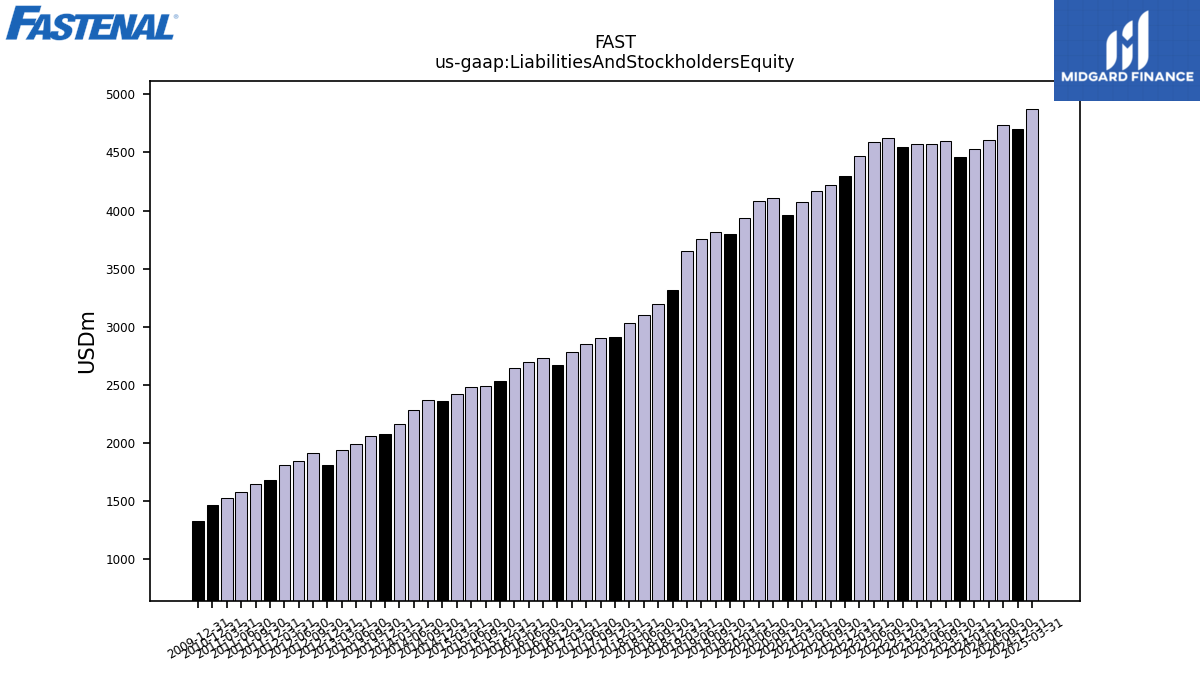
| Liabilities And Stockholders Equity | 4532.70 | 4462.90 | 4596.60 | 4576.80 | 4577.00 | 4548.60 | 4627.40 | 4592.30 | 4466.70 | 4299.00 | 4222.50 | 4166.60 | 4074.40 | 3964.70 | 4108.60 | 4085.20 | 3934.70 | 3799.90 | 3814.20 | 3756.40 | 3651.80 | 3321.50 | 3193.90 | 3100.10 | 3029.60 | 2910.50 | 2901.60 | 2851.40 | 2786.40 | 2668.88 | 2730.47 | 2699.14 | 2642.78 | 2532.46 | 2495.28 | 2480.93 | 2423.94 | 2359.10 | 2372.99 | 2282.97 | 2165.11 | 2075.78 | 2060.42 | 1993.44 | 1945.30 | 1815.83 | 1919.71 | 1850.75 | 1813.33 | 1684.95 | 1651.02 | 1581.87 | 1524.61 | 1468.28 | NA | NA | NA | 1327.36 | NA | NA | NA | |
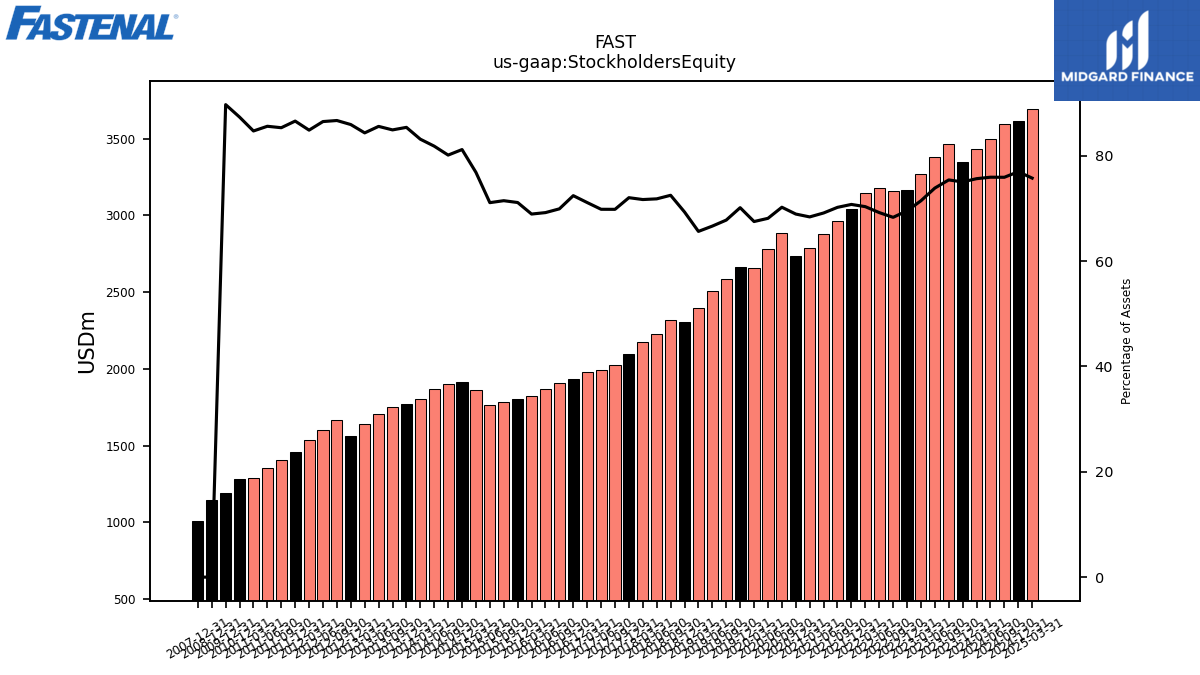
| Stockholders Equity | 3429.20 | 3348.80 | 3466.60 | 3380.80 | 3270.60 | 3163.20 | 3161.20 | 3178.70 | 3142.00 | 3042.20 | 2964.70 | 2880.80 | 2786.70 | 2733.20 | 2885.60 | 2783.00 | 2656.60 | 2665.60 | 2585.70 | 2503.70 | 2397.20 | 2302.70 | 2315.60 | 2226.60 | 2172.00 | 2096.90 | 2026.30 | 1991.50 | 1981.70 | 1933.09 | 1909.30 | 1868.16 | 1821.88 | 1801.29 | 1783.49 | 1763.98 | 1862.81 | 1915.22 | 1901.57 | 1868.12 | 1800.32 | 1772.70 | 1749.63 | 1706.05 | 1640.86 | 1560.36 | 1664.38 | 1600.90 | 1538.97 | 1458.98 | 1408.83 | 1354.17 | 1291.52 | 1282.51 | NA | NA | NA | 1190.84 | NA | NA | NA |
| 2024-03-31 | 2023-12-31 | 2023-09-30 | 2023-06-30 | 2023-03-31 | 2022-12-31 | 2022-09-30 | 2022-06-30 | 2022-03-31 | 2021-12-31 | 2021-09-30 | 2021-06-30 | 2021-03-31 | 2020-12-31 | 2020-09-30 | 2020-06-30 | 2020-03-31 | 2019-12-31 | 2019-09-30 | 2019-06-30 | 2019-03-31 | 2018-12-31 | 2018-09-30 | 2018-06-30 | 2018-03-31 | 2017-12-31 | 2017-09-30 | 2017-06-30 | 2017-03-31 | 2016-12-31 | 2016-09-30 | 2016-06-30 | 2016-03-31 | 2015-12-31 | 2015-09-30 | 2015-06-30 | 2015-03-31 | 2014-12-31 | 2014-09-30 | 2014-06-30 | 2014-03-31 | 2013-12-31 | 2013-09-30 | 2013-06-30 | 2013-03-31 | 2012-12-31 | 2012-09-30 | 2012-06-30 | 2012-03-31 | 2011-12-31 | 2011-09-30 | 2011-06-30 | 2011-03-31 | 2010-12-31 | 2010-09-30 | 2010-06-30 | 2010-03-31 | 2009-12-31 | 2009-09-30 | 2009-06-30 | 2009-03-31 | ||
|---|---|---|---|---|---|---|---|---|---|---|---|---|---|---|---|---|---|---|---|---|---|---|---|---|---|---|---|---|---|---|---|---|---|---|---|---|---|---|---|---|---|---|---|---|---|---|---|---|---|---|---|---|---|---|---|---|---|---|---|---|---|---|
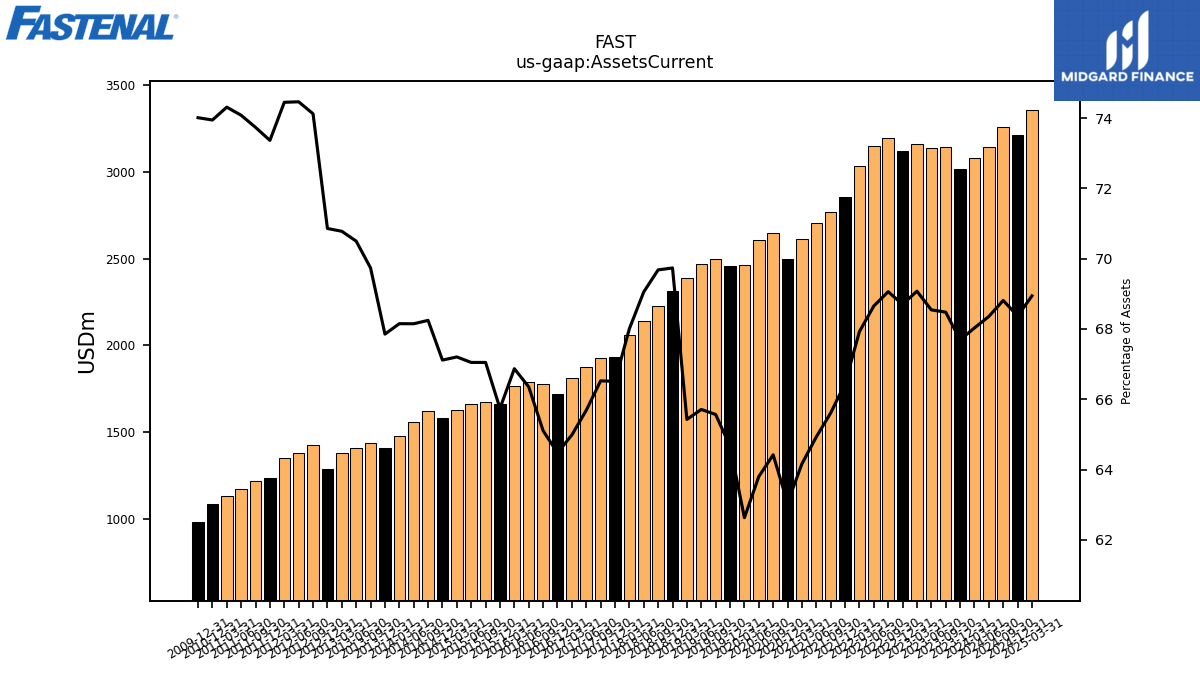
| Assets Current | 3083.50 | 3020.90 | 3147.60 | 3137.00 | 3161.50 | 3124.80 | 3195.60 | 3152.70 | 3034.00 | 2856.60 | 2770.30 | 2705.30 | 2614.20 | 2499.60 | 2646.70 | 2606.30 | 2464.30 | 2457.20 | 2500.80 | 2468.30 | 2389.20 | 2316.20 | 2225.50 | 2140.70 | 2060.30 | 1935.70 | 1930.20 | 1872.90 | 1810.70 | 1720.77 | 1777.66 | 1790.91 | 1767.18 | 1664.78 | 1672.99 | 1663.37 | 1628.95 | 1583.27 | 1619.40 | 1555.78 | 1475.49 | 1408.46 | 1436.83 | 1405.32 | 1376.84 | 1286.66 | 1422.89 | 1378.10 | 1349.97 | 1236.14 | 1217.36 | 1171.82 | 1132.92 | 1085.70 | NA | NA | NA | 982.36 | NA | NA | NA | |
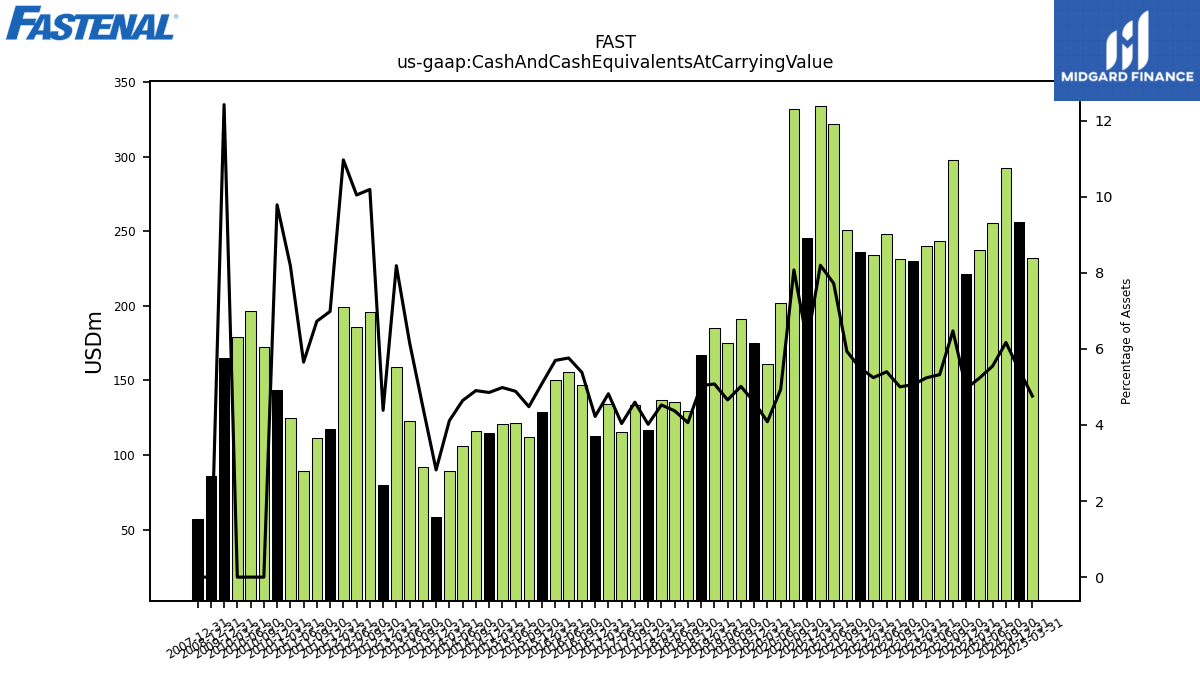
| Cash And Cash Equivalents At Carrying Value | 237.10 | 221.30 | 297.50 | 243.60 | 239.80 | 230.10 | 231.50 | 247.90 | 234.20 | 236.20 | 250.50 | 321.80 | 333.90 | 245.70 | 331.80 | 201.50 | 160.70 | 174.90 | 191.20 | 175.00 | 185.40 | 167.20 | 129.70 | 135.50 | 137.10 | 116.90 | 133.40 | 115.10 | 134.30 | 112.73 | 146.98 | 155.46 | 150.55 | 129.02 | 111.78 | 121.17 | 120.79 | 114.50 | 116.33 | 105.94 | 89.02 | 58.51 | 92.19 | 122.85 | 159.24 | 79.61 | 195.60 | 185.92 | 198.88 | 117.68 | 111.05 | 89.41 | 124.85 | 143.69 | 172.56 | 196.39 | 178.82 | 164.85 | NA | NA | NA | |
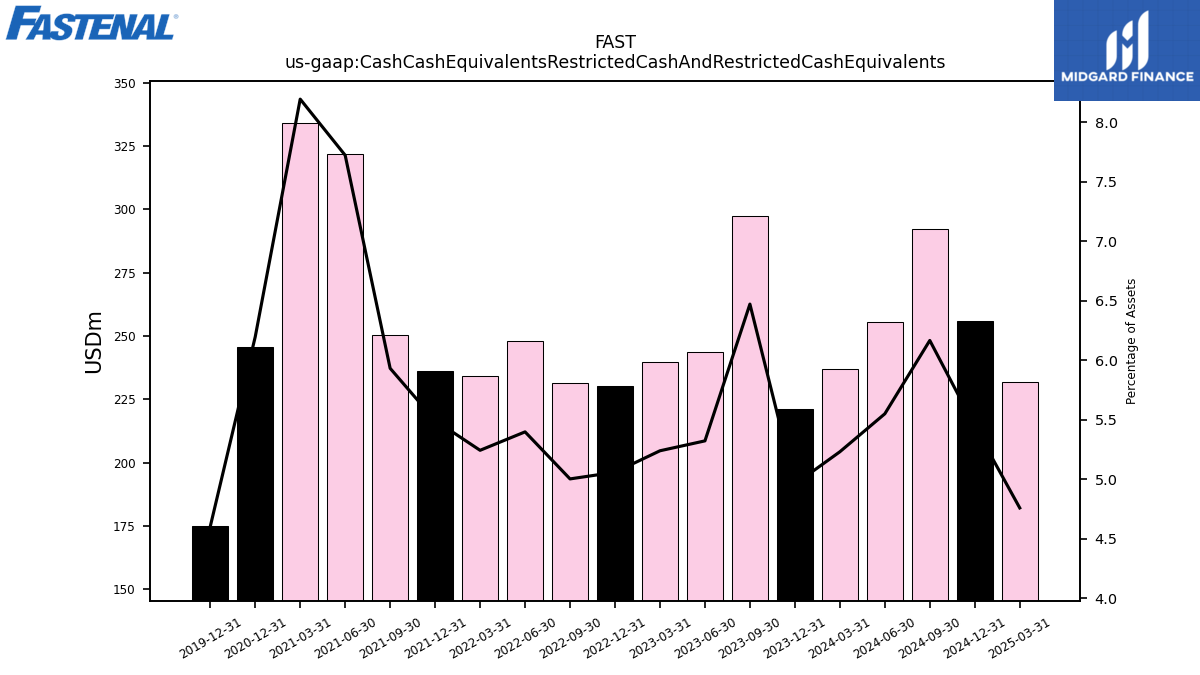
| Cash Cash Equivalents Restricted Cash And Restricted Cash Equivalents | 237.10 | 221.30 | 297.50 | 243.60 | 239.80 | 230.10 | 231.50 | 247.90 | 234.20 | 236.20 | 250.50 | 321.80 | 333.90 | 245.70 | NA | NA | NA | 174.90 | NA | NA | NA | NA | NA | NA | NA | NA | NA | NA | NA | NA | NA | NA | NA | NA | NA | NA | NA | NA | NA | NA | NA | NA | NA | NA | NA | NA | NA | NA | NA | NA | NA | NA | NA | NA | NA | NA | NA | NA | NA | NA | NA | |
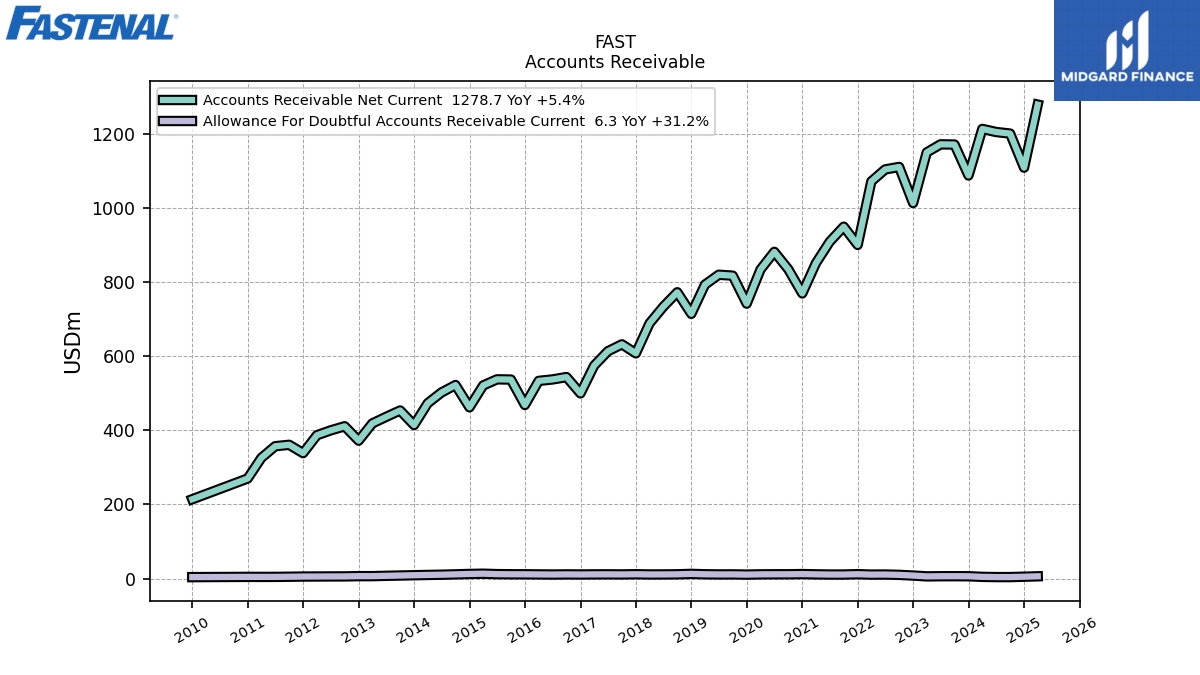
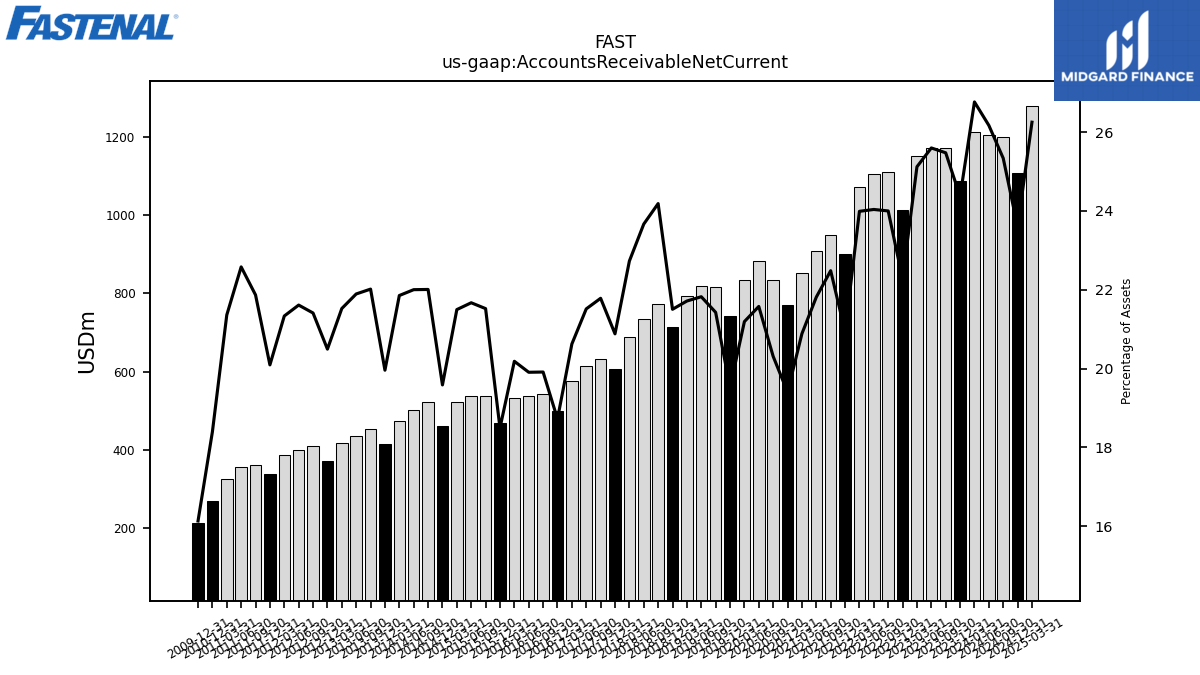
| Accounts Receivable Net Current | 1213.20 | 1087.60 | 1171.00 | 1171.60 | 1149.80 | 1013.20 | 1110.60 | 1103.90 | 1071.60 | 900.20 | 949.40 | 908.90 | 851.00 | 769.40 | 834.50 | 881.50 | 833.90 | 741.80 | 817.30 | 819.80 | 793.00 | 714.30 | 772.50 | 733.70 | 688.60 | 607.80 | 632.10 | 613.50 | 574.70 | 499.72 | 543.74 | 537.34 | 533.49 | 468.38 | 537.05 | 537.65 | 521.09 | 462.08 | 522.26 | 502.33 | 473.18 | 414.33 | 453.65 | 436.45 | 418.73 | 372.16 | 411.03 | 399.99 | 386.88 | 338.59 | 361.07 | 357.19 | 325.69 | 270.13 | NA | NA | NA | 214.17 | NA | NA | NA | |
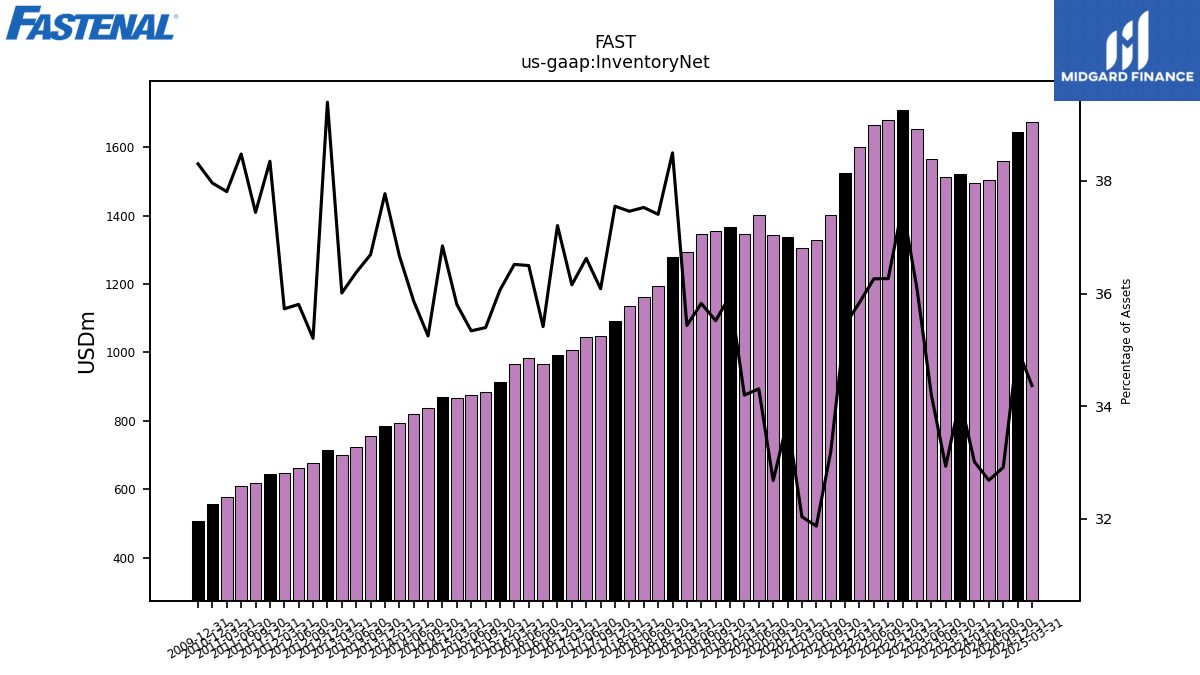
| Inventory Net | 1496.30 | 1522.70 | 1513.80 | 1565.40 | 1651.90 | 1708.00 | 1678.10 | 1665.20 | 1600.80 | 1523.60 | 1401.10 | 1327.90 | 1305.30 | 1337.50 | 1342.60 | 1401.50 | 1345.50 | 1366.40 | 1354.70 | 1345.70 | 1293.90 | 1278.70 | 1194.70 | 1163.40 | 1134.90 | 1092.90 | 1047.00 | 1044.30 | 1007.40 | 992.99 | 966.93 | 985.09 | 965.05 | 913.26 | 883.21 | 876.70 | 867.92 | 869.22 | 836.38 | 818.77 | 793.99 | 784.07 | 755.99 | 725.11 | 700.48 | 715.38 | 675.83 | 662.69 | 647.89 | 646.15 | 618.15 | 608.66 | 576.45 | 557.37 | NA | NA | NA | 508.40 | NA | NA | NA | |
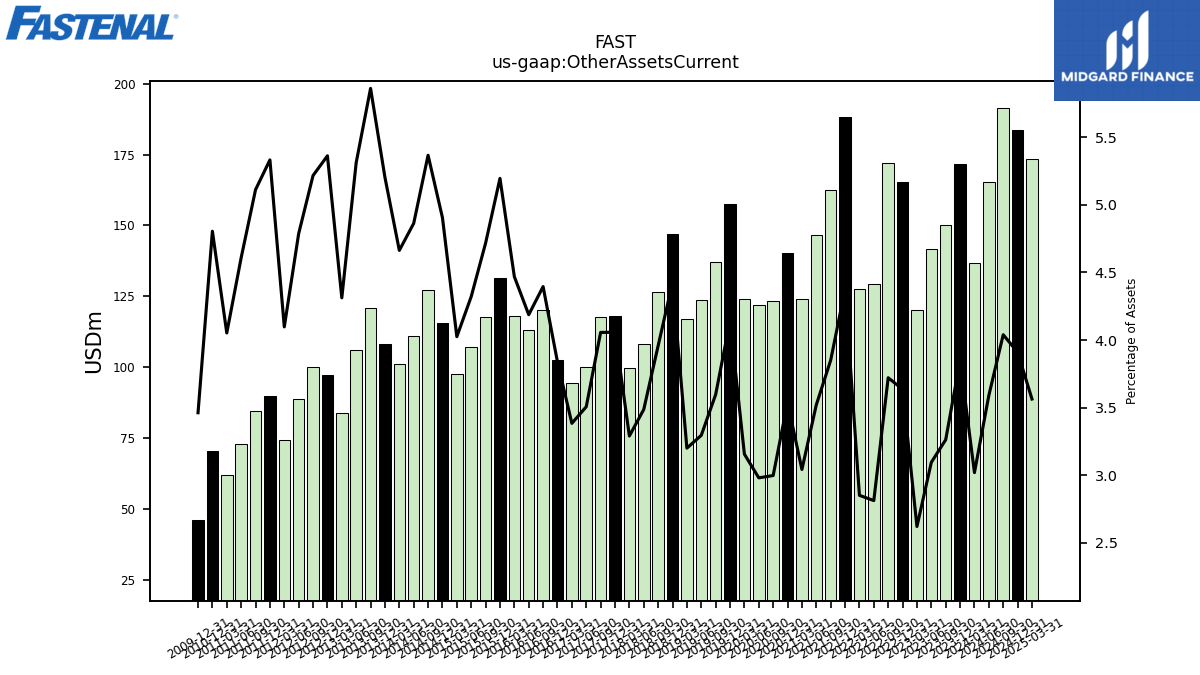
| Other Assets Current | 136.90 | 171.80 | 150.00 | 141.70 | 120.00 | 165.40 | 172.20 | 129.20 | 127.40 | 188.10 | 162.60 | 146.70 | 124.00 | 140.30 | 123.20 | 121.80 | 124.20 | 157.40 | 137.20 | 123.80 | 116.90 | 147.00 | 126.40 | 108.10 | 99.70 | 118.10 | 117.70 | 100.00 | 94.30 | 102.42 | 120.00 | 113.02 | 118.09 | 131.56 | 117.69 | 107.21 | 97.56 | 115.70 | 127.33 | 111.01 | 100.96 | 107.99 | 120.75 | 105.88 | 83.88 | 97.36 | 100.13 | 88.59 | 74.30 | 89.83 | 84.39 | 72.90 | 61.78 | 70.54 | NA | NA | NA | 45.96 | NA | NA | NA |
| 2024-03-31 | 2023-12-31 | 2023-09-30 | 2023-06-30 | 2023-03-31 | 2022-12-31 | 2022-09-30 | 2022-06-30 | 2022-03-31 | 2021-12-31 | 2021-09-30 | 2021-06-30 | 2021-03-31 | 2020-12-31 | 2020-09-30 | 2020-06-30 | 2020-03-31 | 2019-12-31 | 2019-09-30 | 2019-06-30 | 2019-03-31 | 2018-12-31 | 2018-09-30 | 2018-06-30 | 2018-03-31 | 2017-12-31 | 2017-09-30 | 2017-06-30 | 2017-03-31 | 2016-12-31 | 2016-09-30 | 2016-06-30 | 2016-03-31 | 2015-12-31 | 2015-09-30 | 2015-06-30 | 2015-03-31 | 2014-12-31 | 2014-09-30 | 2014-06-30 | 2014-03-31 | 2013-12-31 | 2013-09-30 | 2013-06-30 | 2013-03-31 | 2012-12-31 | 2012-09-30 | 2012-06-30 | 2012-03-31 | 2011-12-31 | 2011-09-30 | 2011-06-30 | 2011-03-31 | 2010-12-31 | 2010-09-30 | 2010-06-30 | 2010-03-31 | 2009-12-31 | 2009-09-30 | 2009-06-30 | 2009-03-31 | ||
|---|---|---|---|---|---|---|---|---|---|---|---|---|---|---|---|---|---|---|---|---|---|---|---|---|---|---|---|---|---|---|---|---|---|---|---|---|---|---|---|---|---|---|---|---|---|---|---|---|---|---|---|---|---|---|---|---|---|---|---|---|---|---|
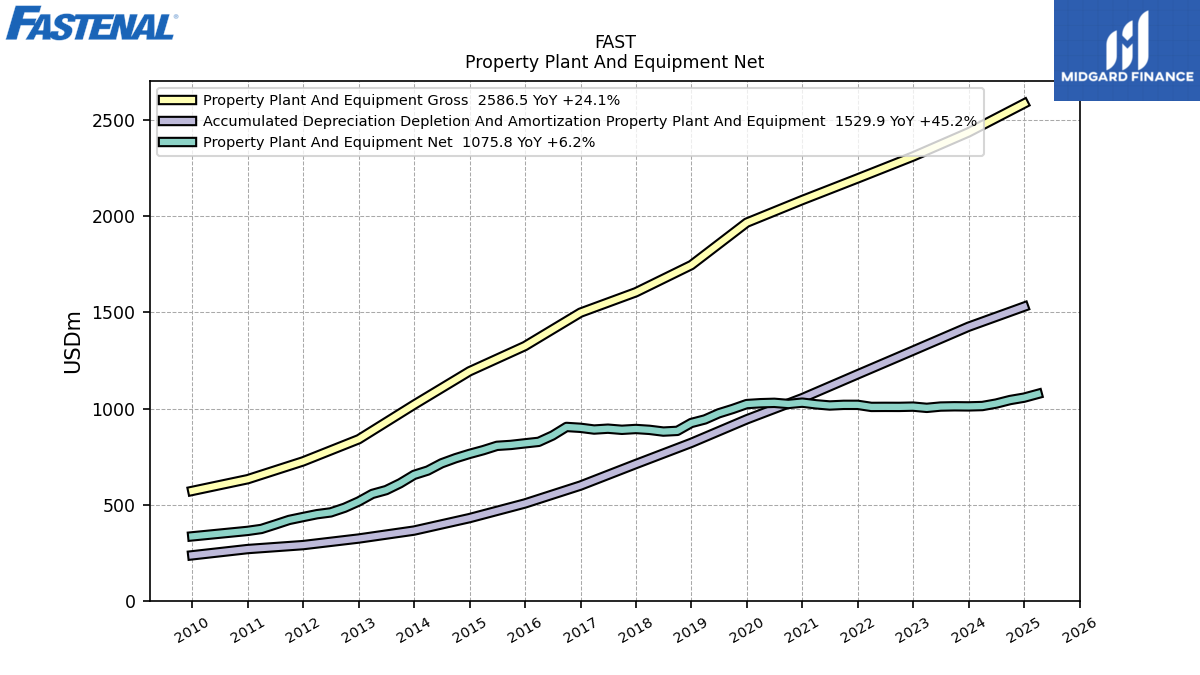
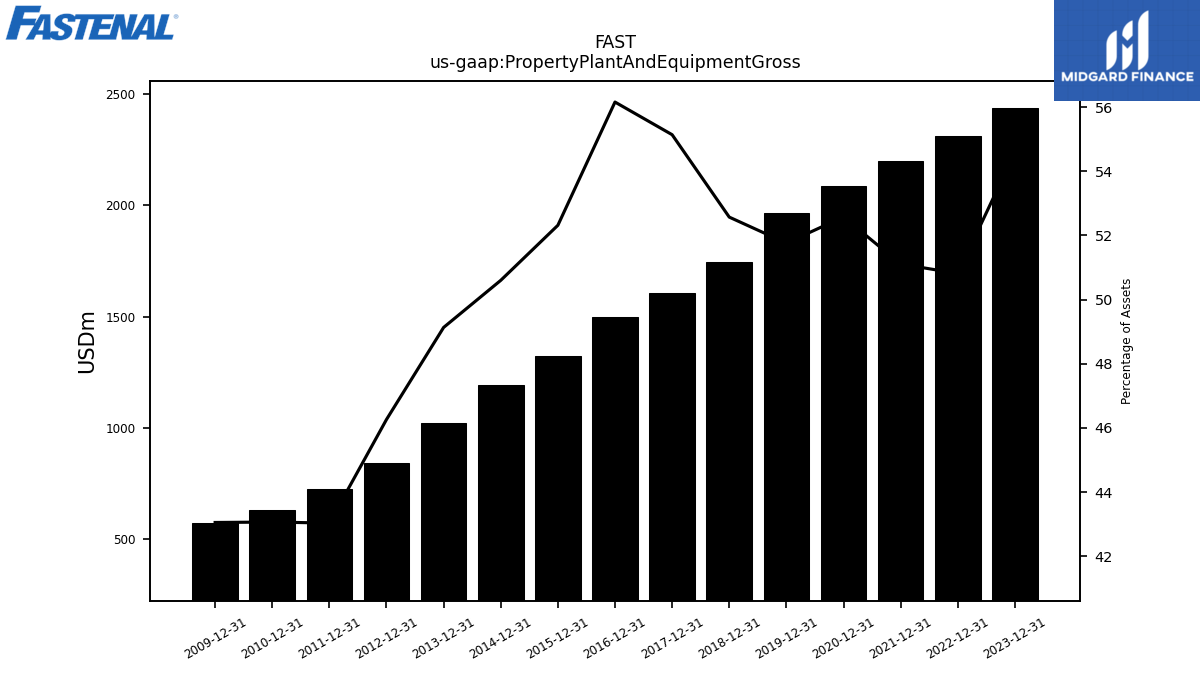
| Property Plant And Equipment Gross | NA | 2436.60 | NA | NA | NA | 2311.40 | NA | NA | NA | 2197.20 | NA | NA | NA | 2084.60 | NA | NA | NA | 1966.90 | NA | NA | NA | 1746.20 | NA | NA | NA | 1604.90 | NA | NA | NA | 1498.84 | NA | NA | NA | 1324.92 | NA | NA | NA | 1193.73 | NA | NA | NA | 1019.90 | NA | NA | NA | 840.08 | NA | NA | NA | 725.10 | NA | NA | NA | 632.33 | NA | NA | NA | 571.47 | NA | NA | NA | |
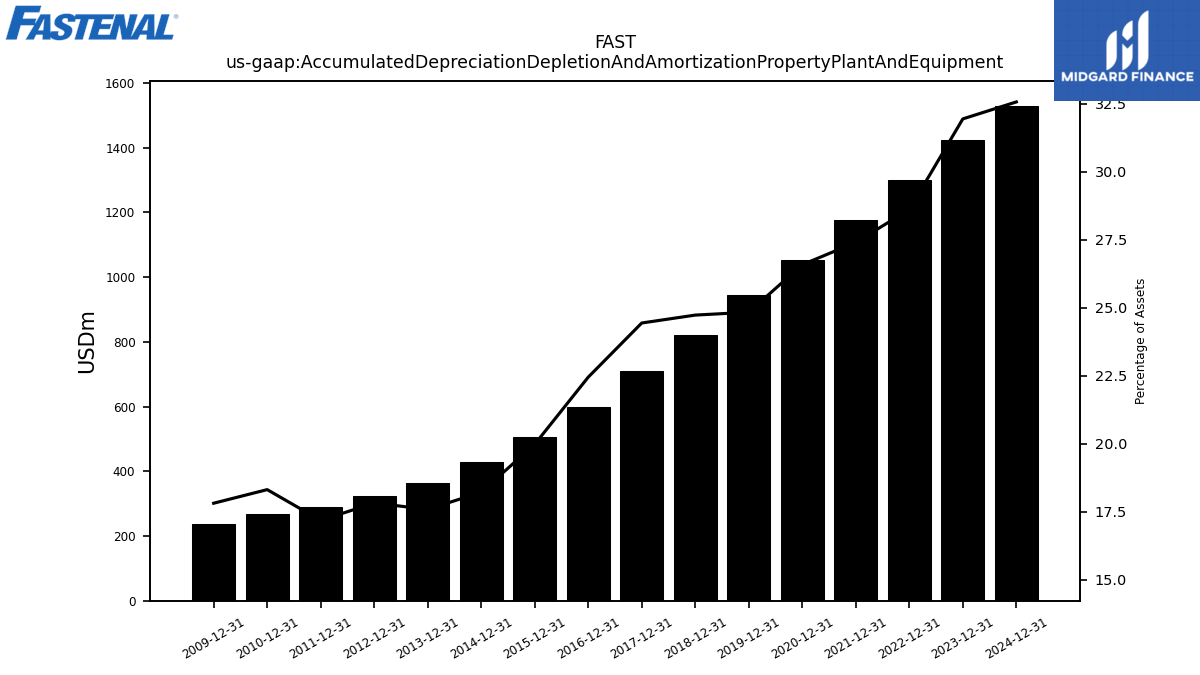
| Accumulated Depreciation Depletion And Amortization Property Plant And Equipment | NA | 1425.50 | NA | NA | NA | 1301.40 | NA | NA | NA | 1178.00 | NA | NA | NA | 1053.90 | NA | NA | NA | 943.70 | NA | NA | NA | 821.40 | NA | NA | NA | 711.30 | NA | NA | NA | 599.14 | NA | NA | NA | 506.03 | NA | NA | NA | 429.85 | NA | NA | NA | 365.05 | NA | NA | NA | 323.65 | NA | NA | NA | 289.50 | NA | NA | NA | 268.91 | NA | NA | NA | 236.46 | NA | NA | NA | |
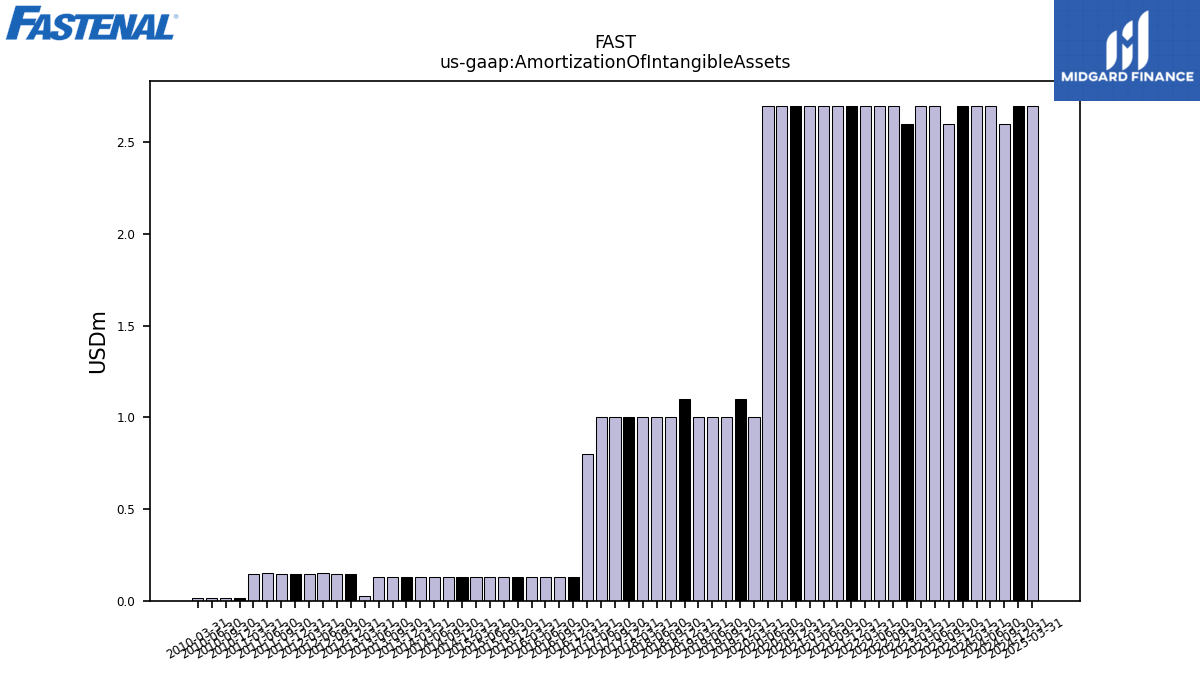
| Amortization Of Intangible Assets | 2.70 | 2.70 | 2.60 | 2.70 | 2.70 | 2.60 | 2.70 | 2.70 | 2.70 | 2.70 | 2.70 | 2.70 | 2.70 | 2.70 | 2.70 | 2.70 | 1.00 | 1.10 | 1.00 | 1.00 | 1.00 | 1.10 | 1.00 | 1.00 | 1.00 | 1.00 | 1.00 | 1.00 | 0.80 | 0.13 | 0.13 | 0.13 | 0.13 | 0.13 | 0.13 | 0.13 | 0.13 | 0.13 | 0.13 | 0.13 | 0.13 | 0.13 | 0.13 | 0.13 | 0.03 | 0.15 | 0.15 | 0.15 | 0.15 | 0.15 | 0.15 | 0.15 | 0.15 | 0.02 | 0.02 | 0.02 | 0.02 | NA | NA | NA | NA | |
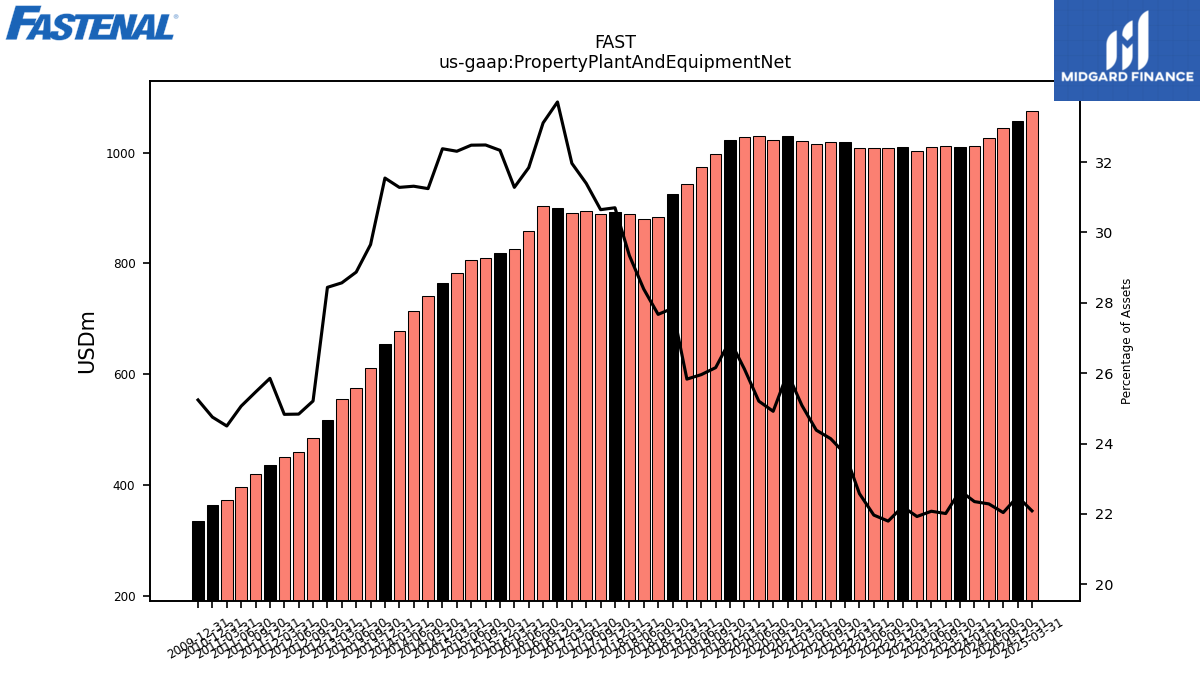
| Property Plant And Equipment Net | 1013.00 | 1011.10 | 1011.70 | 1010.30 | 1003.50 | 1010.00 | 1008.50 | 1008.70 | 1008.40 | 1019.20 | 1019.20 | 1015.80 | 1022.00 | 1030.70 | 1023.70 | 1029.70 | 1027.70 | 1023.20 | 997.70 | 975.10 | 943.30 | 924.80 | 883.80 | 880.10 | 889.00 | 893.60 | 889.30 | 895.20 | 890.70 | 899.70 | 904.20 | 859.49 | 826.74 | 818.89 | 810.65 | 805.85 | 783.15 | 763.89 | 741.49 | 714.91 | 677.29 | 654.85 | 611.05 | 575.57 | 555.73 | 516.43 | 483.94 | 459.65 | 450.24 | 435.60 | 420.39 | 396.46 | 373.50 | 363.42 | NA | NA | NA | 335.00 | NA | NA | NA | |
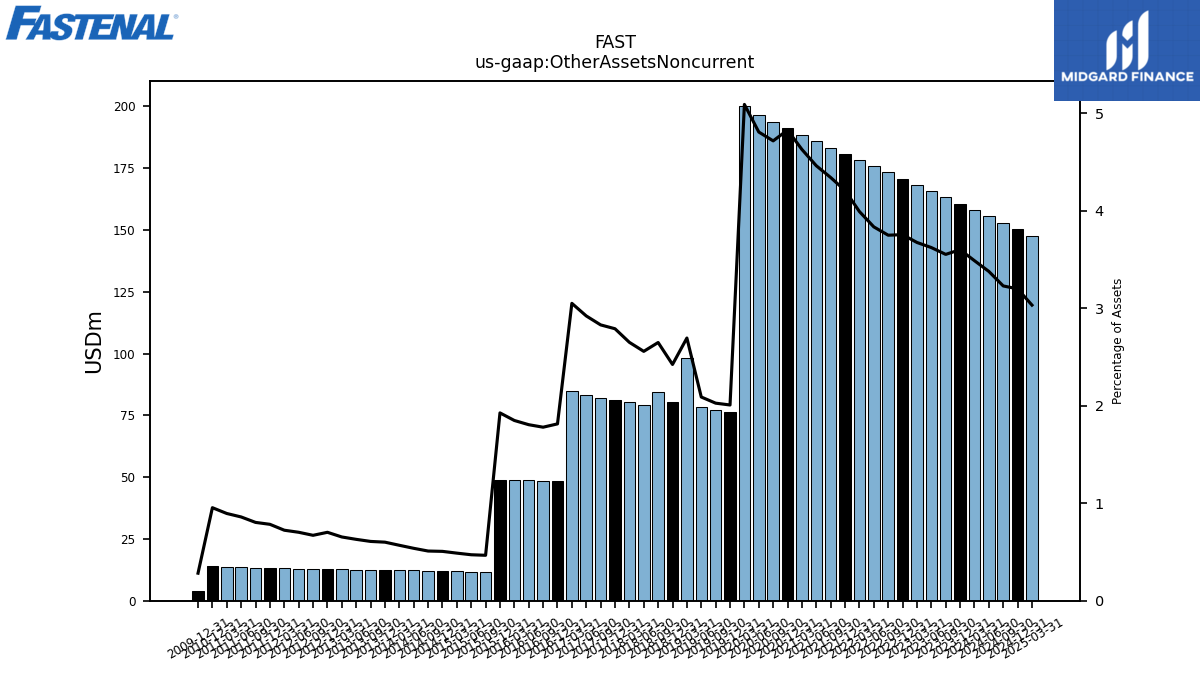
| Other Assets Noncurrent | 158.10 | 160.70 | 163.30 | 165.80 | 168.20 | 170.80 | 173.50 | 176.10 | 178.30 | 180.90 | 183.30 | 185.90 | 188.60 | 191.40 | 193.80 | 196.40 | 200.30 | 76.30 | 77.30 | 78.50 | 98.40 | 80.50 | 84.60 | 79.30 | 80.30 | 81.20 | 82.10 | 83.30 | 85.00 | 48.42 | 48.60 | 48.74 | 48.87 | 48.80 | 11.63 | 11.71 | 11.84 | 11.95 | 12.10 | 12.28 | 12.32 | 12.47 | 12.54 | 12.55 | 12.73 | 12.75 | 12.89 | 13.00 | 13.12 | 13.21 | 13.27 | 13.60 | 13.65 | 14.01 | NA | NA | NA | 3.75 | NA | NA | NA |
| 2024-03-31 | 2023-12-31 | 2023-09-30 | 2023-06-30 | 2023-03-31 | 2022-12-31 | 2022-09-30 | 2022-06-30 | 2022-03-31 | 2021-12-31 | 2021-09-30 | 2021-06-30 | 2021-03-31 | 2020-12-31 | 2020-09-30 | 2020-06-30 | 2020-03-31 | 2019-12-31 | 2019-09-30 | 2019-06-30 | 2019-03-31 | 2018-12-31 | 2018-09-30 | 2018-06-30 | 2018-03-31 | 2017-12-31 | 2017-09-30 | 2017-06-30 | 2017-03-31 | 2016-12-31 | 2016-09-30 | 2016-06-30 | 2016-03-31 | 2015-12-31 | 2015-09-30 | 2015-06-30 | 2015-03-31 | 2014-12-31 | 2014-09-30 | 2014-06-30 | 2014-03-31 | 2013-12-31 | 2013-09-30 | 2013-06-30 | 2013-03-31 | 2012-12-31 | 2012-09-30 | 2012-06-30 | 2012-03-31 | 2011-12-31 | 2011-09-30 | 2011-06-30 | 2011-03-31 | 2010-12-31 | 2010-09-30 | 2010-06-30 | 2010-03-31 | 2009-12-31 | 2009-09-30 | 2009-06-30 | 2009-03-31 | ||
|---|---|---|---|---|---|---|---|---|---|---|---|---|---|---|---|---|---|---|---|---|---|---|---|---|---|---|---|---|---|---|---|---|---|---|---|---|---|---|---|---|---|---|---|---|---|---|---|---|---|---|---|---|---|---|---|---|---|---|---|---|---|---|
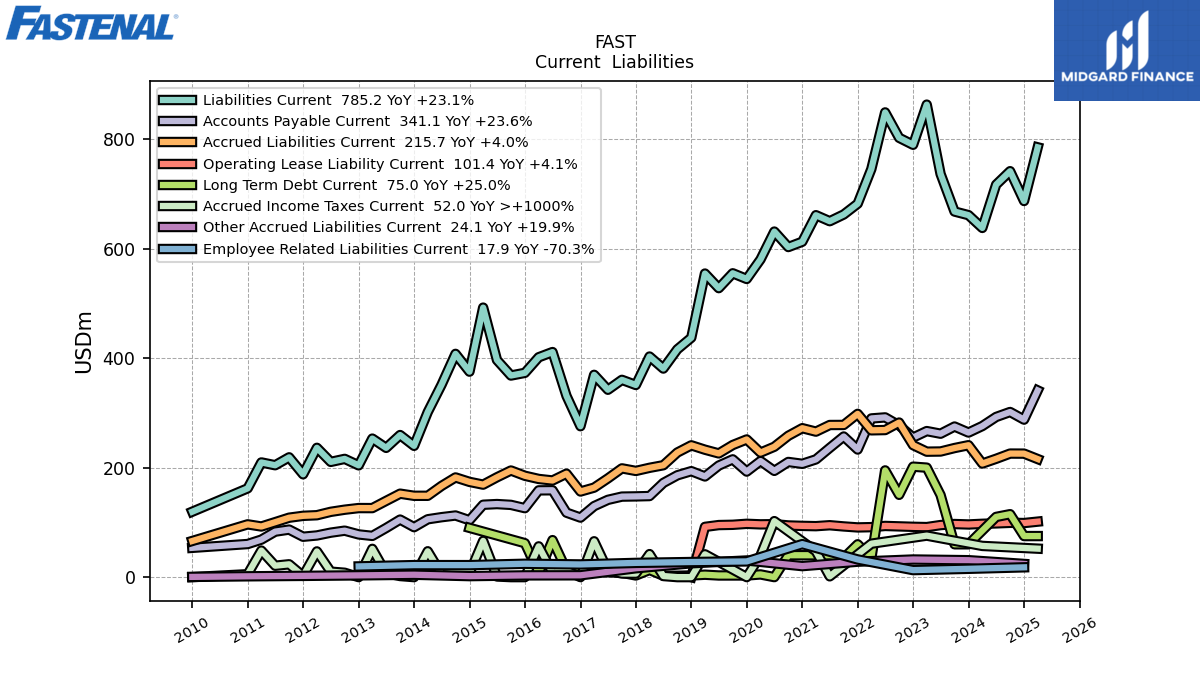
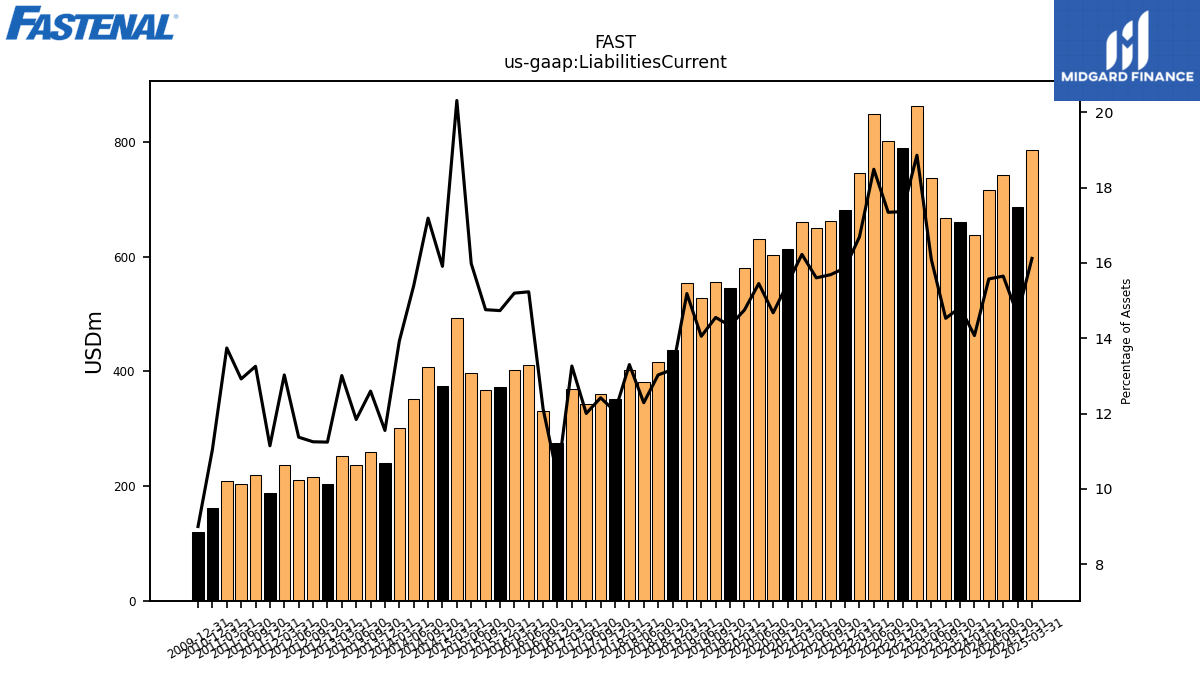
| Liabilities Current | 637.90 | 661.30 | 667.90 | 736.60 | 863.20 | 789.80 | 802.60 | 849.00 | 745.50 | 682.20 | 662.50 | 650.20 | 661.20 | 612.70 | 603.00 | 631.30 | 580.40 | 544.70 | 555.10 | 527.90 | 554.60 | 437.40 | 416.10 | 381.00 | 403.00 | 351.00 | 360.40 | 342.30 | 369.60 | 275.64 | 331.06 | 411.18 | 401.67 | 373.17 | 368.28 | 396.58 | 492.36 | 375.35 | 407.90 | 351.46 | 301.53 | 239.83 | 259.57 | 236.14 | 253.10 | 204.17 | 216.02 | 210.52 | 236.23 | 187.82 | 218.87 | 204.39 | 209.52 | 162.19 | NA | NA | NA | 119.51 | NA | NA | NA | |
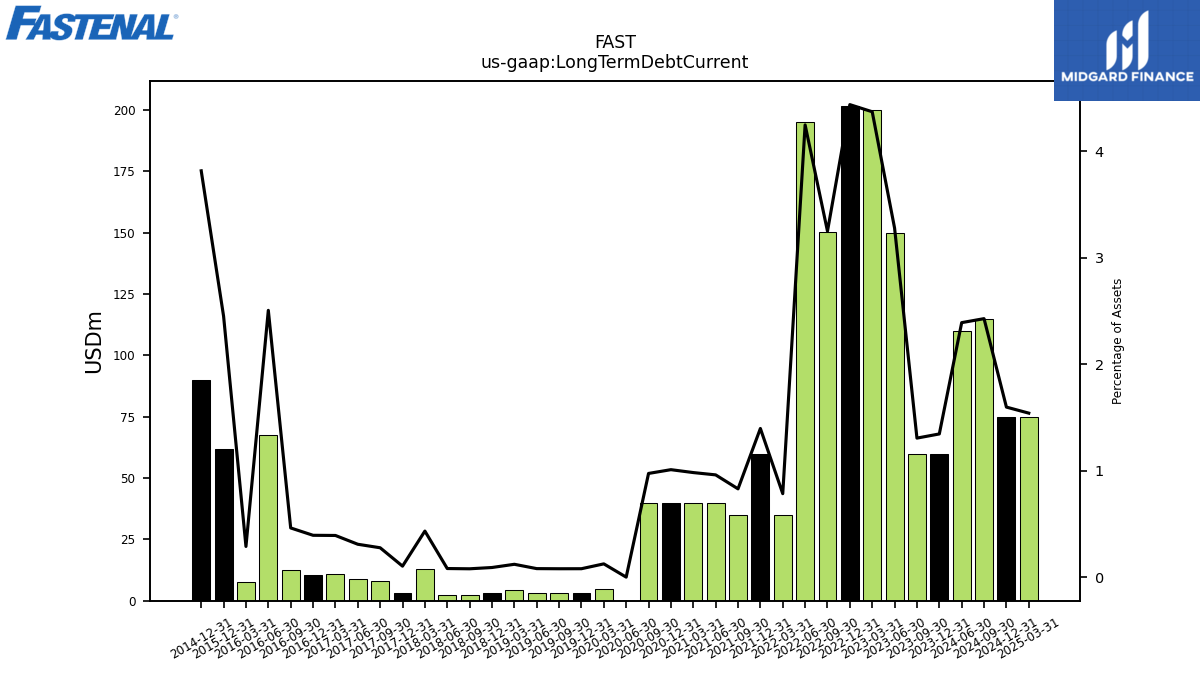
| Long Term Debt Current | NA | 60.00 | 60.00 | 150.00 | 200.00 | 201.80 | 150.30 | 195.00 | 35.00 | 60.00 | 35.00 | 40.00 | 40.00 | 40.00 | 40.00 | 0.00 | 4.90 | 3.00 | 3.00 | 3.00 | 4.40 | 3.00 | 2.50 | 2.50 | 13.10 | 3.00 | 8.00 | 8.80 | 10.90 | 10.48 | 12.61 | 67.61 | 7.61 | 62.05 | NA | NA | NA | 90.00 | NA | NA | NA | NA | NA | NA | NA | NA | NA | NA | NA | NA | NA | NA | NA | NA | NA | NA | NA | NA | NA | NA | NA | |
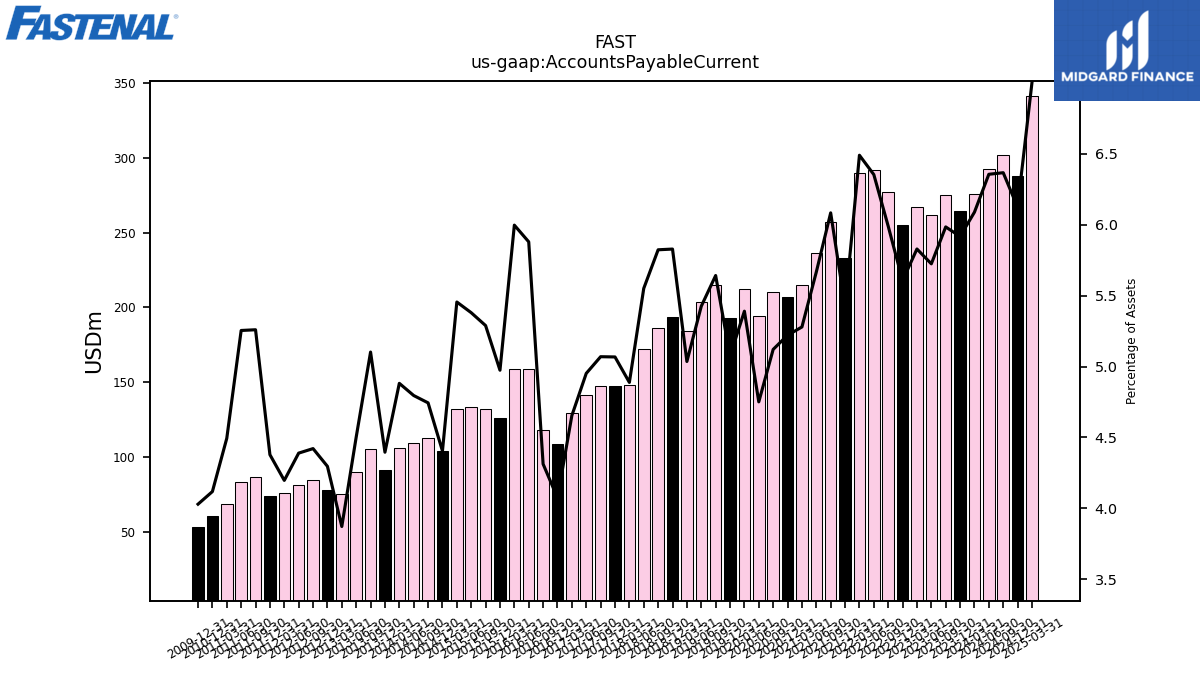
| Accounts Payable Current | 276.00 | 264.10 | 275.10 | 262.00 | 266.80 | 255.00 | 277.20 | 291.80 | 289.90 | 233.10 | 256.90 | 236.10 | 215.10 | 207.00 | 210.40 | 194.10 | 212.10 | 192.80 | 215.20 | 203.80 | 183.90 | 193.60 | 186.00 | 172.10 | 148.10 | 147.50 | 147.10 | 141.20 | 129.70 | 108.74 | 117.77 | 158.70 | 158.50 | 125.97 | 131.98 | 133.47 | 132.23 | 103.91 | 112.58 | 109.49 | 105.70 | 91.25 | 105.13 | 89.75 | 75.33 | 78.02 | 84.88 | 81.24 | 76.11 | 73.78 | 86.84 | 83.12 | 68.52 | 60.47 | NA | NA | NA | 53.49 | NA | NA | NA | |
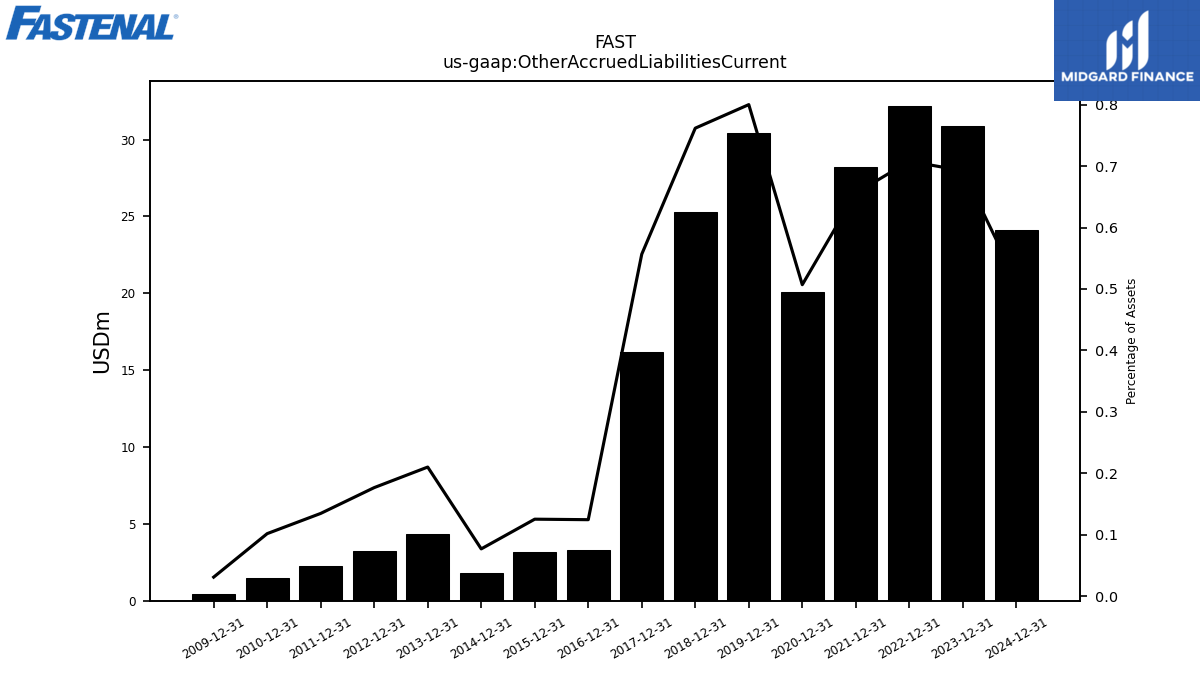
| Other Accrued Liabilities Current | NA | 30.90 | NA | NA | NA | 32.20 | NA | NA | NA | 28.20 | NA | NA | NA | 20.10 | NA | NA | NA | 30.40 | NA | NA | NA | 25.30 | NA | NA | NA | 16.20 | NA | NA | NA | 3.33 | NA | NA | NA | 3.18 | NA | NA | NA | 1.82 | NA | NA | NA | 4.36 | NA | NA | NA | 3.21 | NA | NA | NA | 2.27 | NA | NA | NA | 1.50 | NA | NA | NA | 0.41 | NA | NA | NA | |
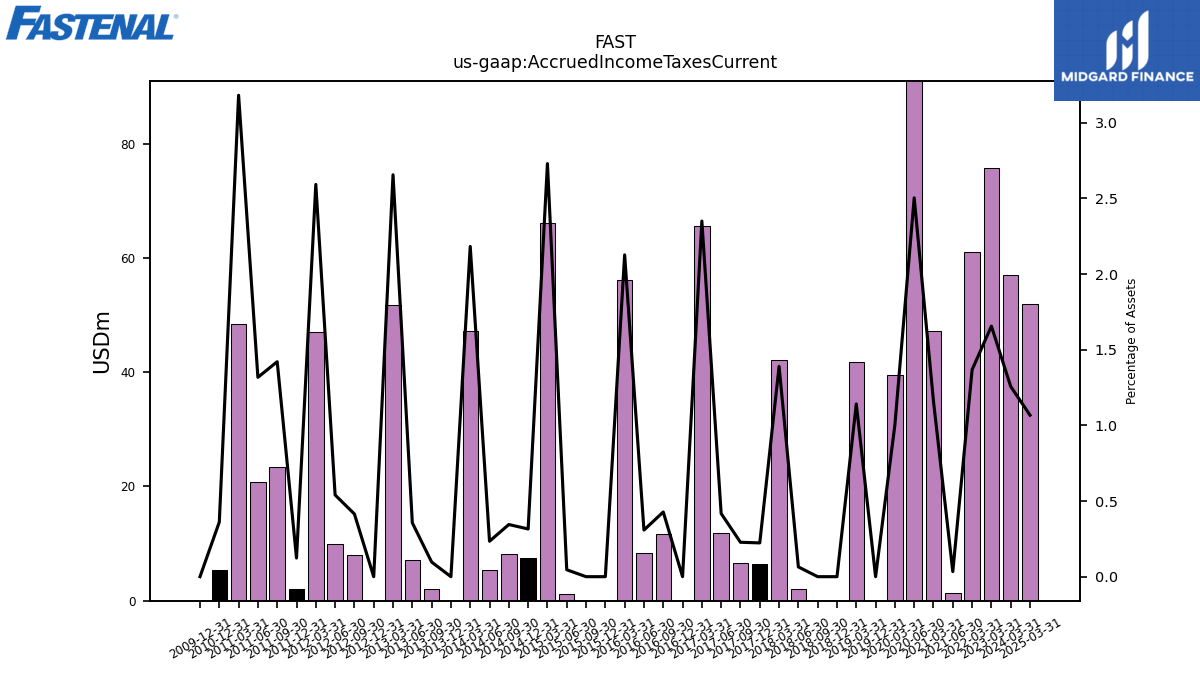
| Accrued Income Taxes Current | 57.00 | NA | NA | NA | 75.80 | NA | NA | NA | 61.10 | NA | NA | 1.40 | 47.20 | NA | NA | 102.30 | 39.50 | 0.00 | NA | NA | 41.70 | 0.00 | 0.00 | 2.00 | 42.10 | 6.50 | 6.60 | 11.90 | 65.50 | 0.00 | 11.68 | 8.32 | 56.22 | 0.00 | 0.00 | 1.13 | 66.19 | 7.44 | 8.18 | 5.35 | 47.26 | 0.00 | 1.99 | 7.10 | 51.68 | 0.00 | 7.96 | 10.00 | 47.02 | 2.08 | 23.46 | 20.85 | 48.52 | 5.30 | NA | NA | NA | 0.00 | NA | NA | NA | |
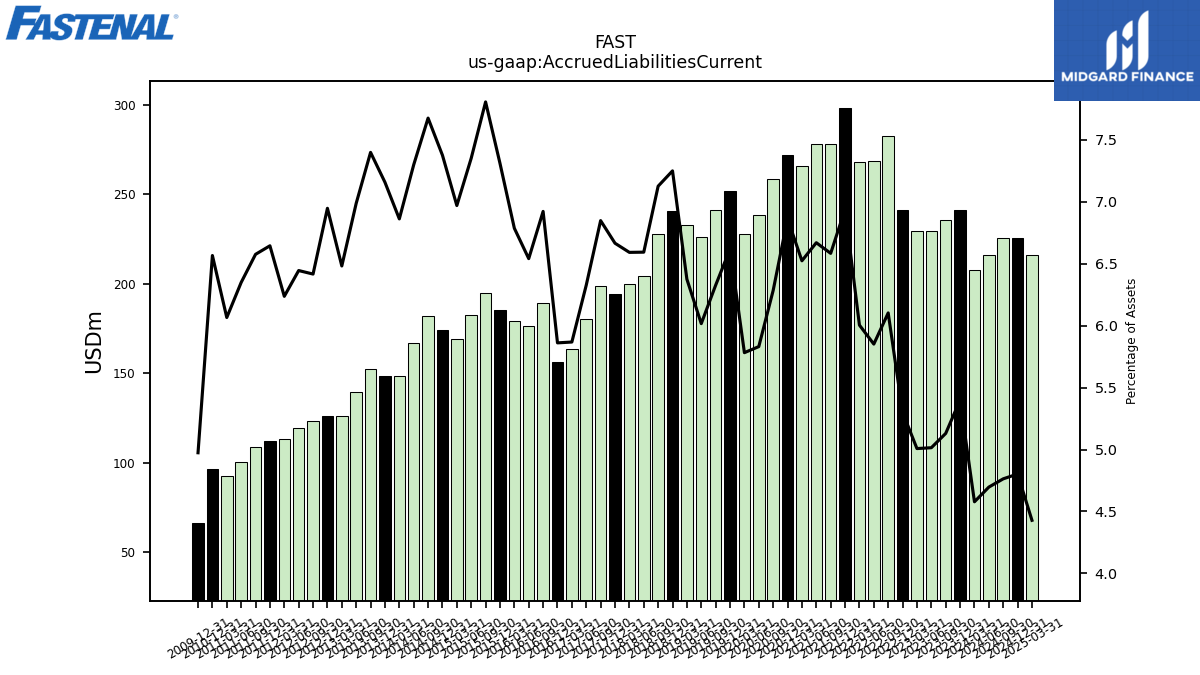
| Accrued Liabilities Current | 207.50 | 241.00 | 235.80 | 229.50 | 229.20 | 241.10 | 282.40 | 268.70 | 268.20 | 298.30 | 278.00 | 277.90 | 265.80 | 272.10 | 258.20 | 238.20 | 227.50 | 251.50 | 241.30 | 226.00 | 232.80 | 240.80 | 227.60 | 204.40 | 199.70 | 194.00 | 198.70 | 180.40 | 163.50 | 156.42 | 189.01 | 176.56 | 179.35 | 185.14 | 194.79 | 182.40 | 168.94 | 174.00 | 182.14 | 166.62 | 148.57 | 148.58 | 152.45 | 139.29 | 126.09 | 126.16 | 123.18 | 119.28 | 113.10 | 111.96 | 108.57 | 100.43 | 92.48 | 96.41 | NA | NA | NA | 66.02 | NA | NA | NA |
| 2024-03-31 | 2023-12-31 | 2023-09-30 | 2023-06-30 | 2023-03-31 | 2022-12-31 | 2022-09-30 | 2022-06-30 | 2022-03-31 | 2021-12-31 | 2021-09-30 | 2021-06-30 | 2021-03-31 | 2020-12-31 | 2020-09-30 | 2020-06-30 | 2020-03-31 | 2019-12-31 | 2019-09-30 | 2019-06-30 | 2019-03-31 | 2018-12-31 | 2018-09-30 | 2018-06-30 | 2018-03-31 | 2017-12-31 | 2017-09-30 | 2017-06-30 | 2017-03-31 | 2016-12-31 | 2016-09-30 | 2016-06-30 | 2016-03-31 | 2015-12-31 | 2015-09-30 | 2015-06-30 | 2015-03-31 | 2014-12-31 | 2014-09-30 | 2014-06-30 | 2014-03-31 | 2013-12-31 | 2013-09-30 | 2013-06-30 | 2013-03-31 | 2012-12-31 | 2012-09-30 | 2012-06-30 | 2012-03-31 | 2011-12-31 | 2011-09-30 | 2011-06-30 | 2011-03-31 | 2010-12-31 | 2010-09-30 | 2010-06-30 | 2010-03-31 | 2009-12-31 | 2009-09-30 | 2009-06-30 | 2009-03-31 | ||
|---|---|---|---|---|---|---|---|---|---|---|---|---|---|---|---|---|---|---|---|---|---|---|---|---|---|---|---|---|---|---|---|---|---|---|---|---|---|---|---|---|---|---|---|---|---|---|---|---|---|---|---|---|---|---|---|---|---|---|---|---|---|---|
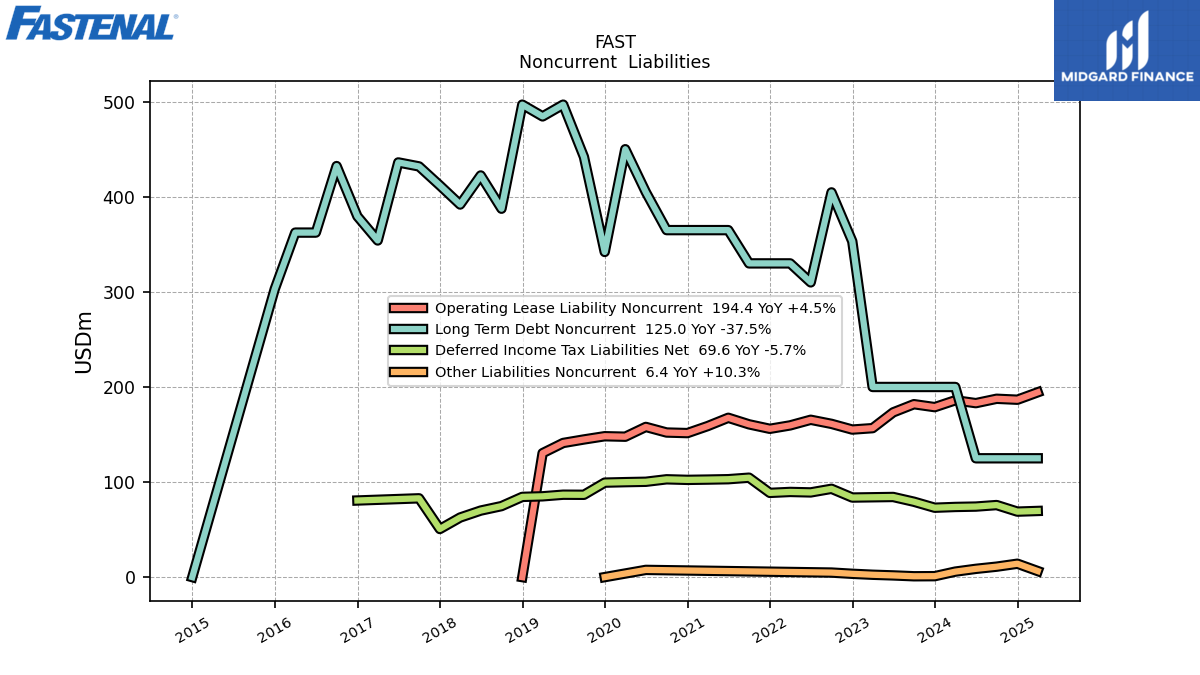
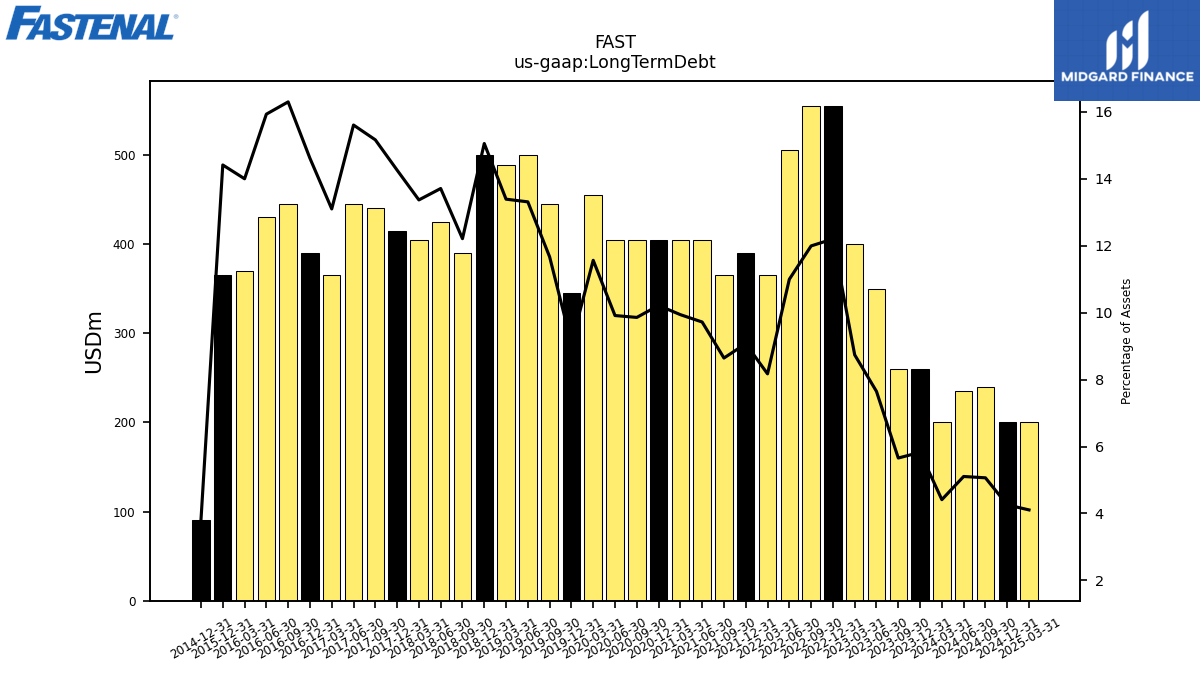
| Long Term Debt | 200.00 | 260.00 | 260.00 | 350.00 | 400.00 | 555.00 | 555.00 | 505.00 | 365.00 | 390.00 | 365.00 | 405.00 | 405.00 | 405.00 | 405.00 | 405.00 | 455.00 | 345.00 | 445.00 | 500.00 | 489.00 | 500.00 | 390.00 | 425.00 | 405.00 | 415.00 | 440.00 | 445.00 | 365.00 | 390.00 | 445.00 | 430.00 | 370.00 | 365.00 | NA | NA | NA | 90.00 | NA | NA | NA | NA | NA | NA | NA | NA | NA | NA | NA | NA | NA | NA | NA | NA | NA | NA | NA | NA | NA | NA | NA | |
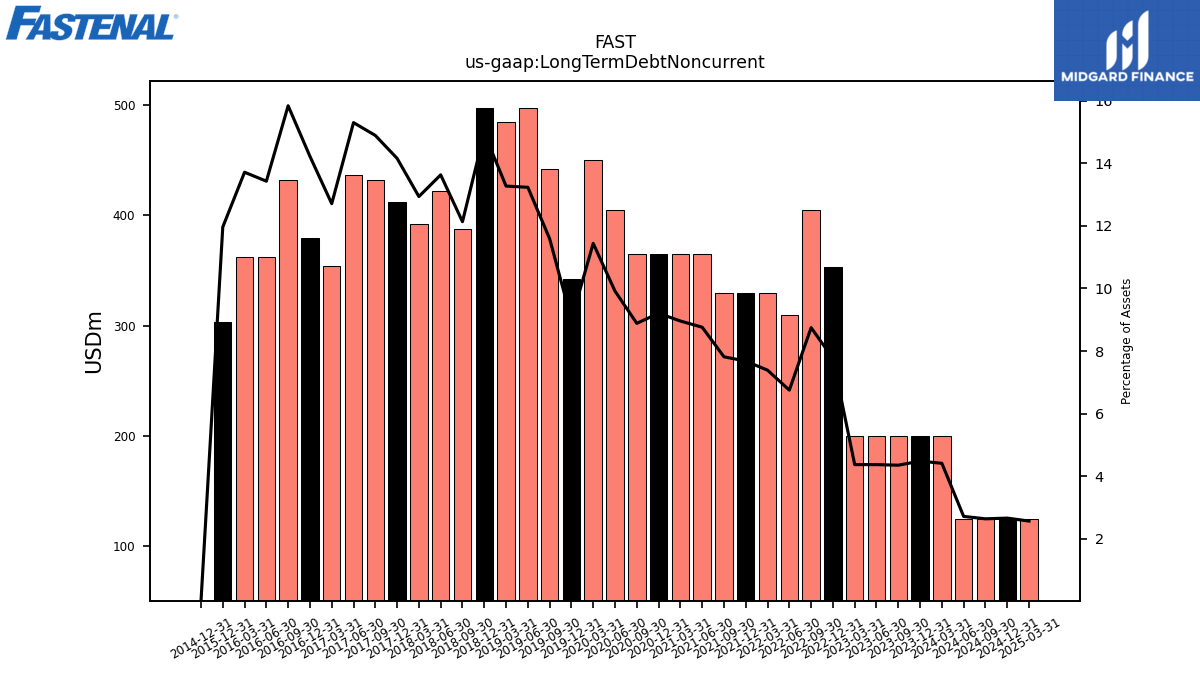
| Long Term Debt Noncurrent | 200.00 | 200.00 | 200.00 | 200.00 | 200.00 | 353.20 | 404.70 | 310.00 | 330.00 | 330.00 | 330.00 | 365.00 | 365.00 | 365.00 | 365.00 | 405.00 | 450.10 | 342.00 | 442.00 | 497.00 | 484.60 | 497.00 | 387.50 | 422.50 | 391.90 | 412.00 | 432.00 | 436.20 | 354.10 | 379.52 | 432.39 | 362.39 | 362.39 | 302.95 | NA | NA | NA | 0.00 | NA | NA | NA | NA | NA | NA | NA | NA | NA | NA | NA | NA | NA | NA | NA | NA | NA | NA | NA | NA | NA | NA | NA | |
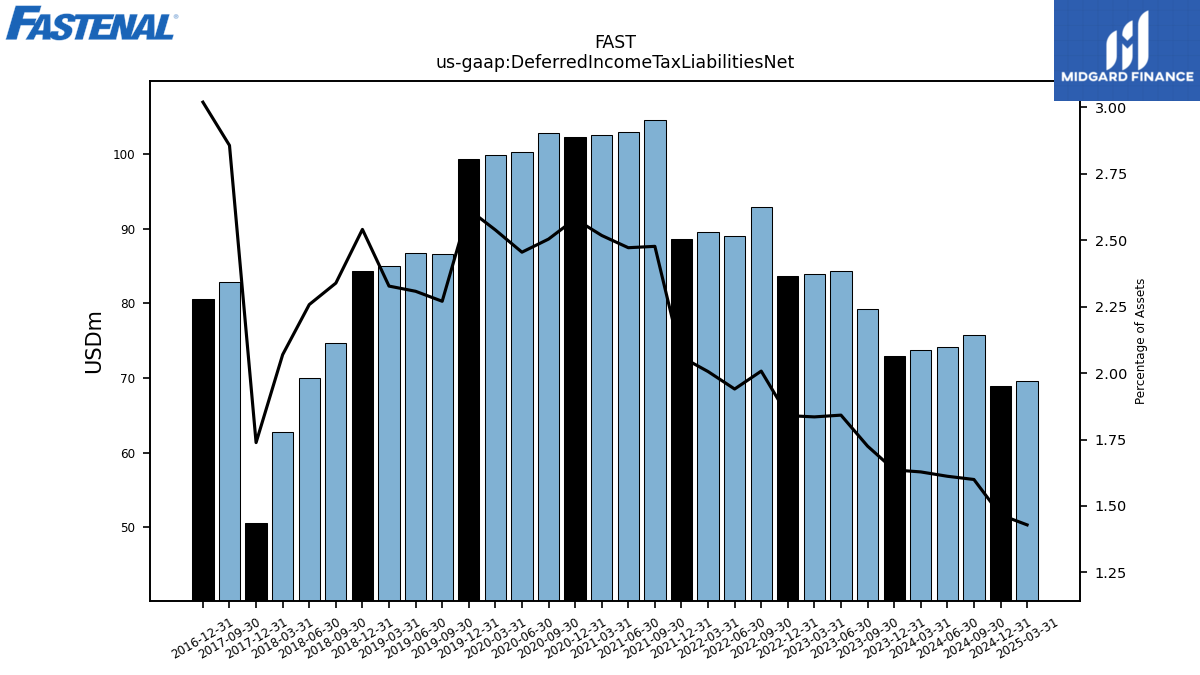
| Deferred Income Tax Liabilities Net | 73.80 | 73.00 | 79.30 | 84.30 | 84.00 | 83.70 | 92.90 | 89.10 | 89.60 | 88.60 | 104.60 | 103.00 | 102.60 | 102.30 | 102.90 | 100.30 | 99.90 | 99.40 | 86.60 | 86.70 | 85.00 | 84.40 | 74.70 | 70.00 | 62.70 | 50.60 | 82.90 | NA | NA | 80.60 | NA | NA | NA | NA | NA | NA | NA | NA | NA | NA | NA | NA | NA | NA | NA | NA | NA | NA | NA | NA | NA | NA | NA | NA | NA | NA | NA | NA | NA | NA | NA | |
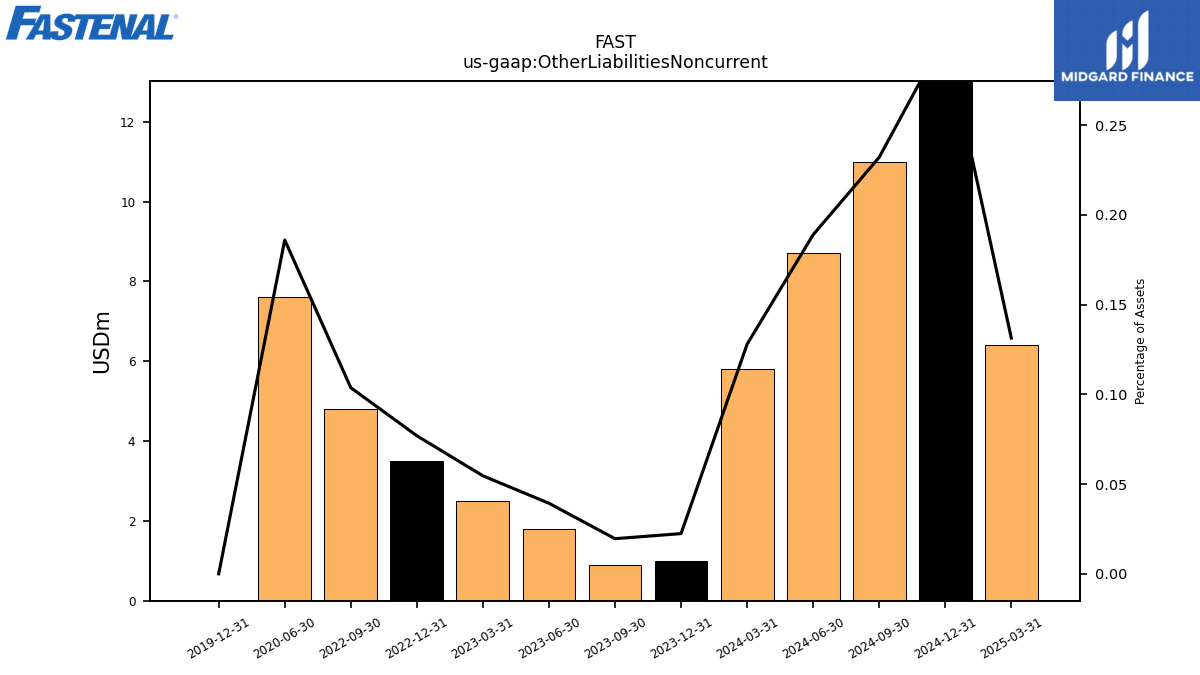
| Other Liabilities Noncurrent | 5.80 | 1.00 | 0.90 | 1.80 | 2.50 | 3.50 | 4.80 | NA | NA | NA | NA | NA | NA | NA | NA | 7.60 | NA | 0.00 | NA | NA | NA | NA | NA | NA | NA | NA | NA | NA | NA | NA | NA | NA | NA | NA | NA | NA | NA | NA | NA | NA | NA | NA | NA | NA | NA | NA | NA | NA | NA | NA | NA | NA | NA | NA | NA | NA | NA | NA | NA | NA | NA | |
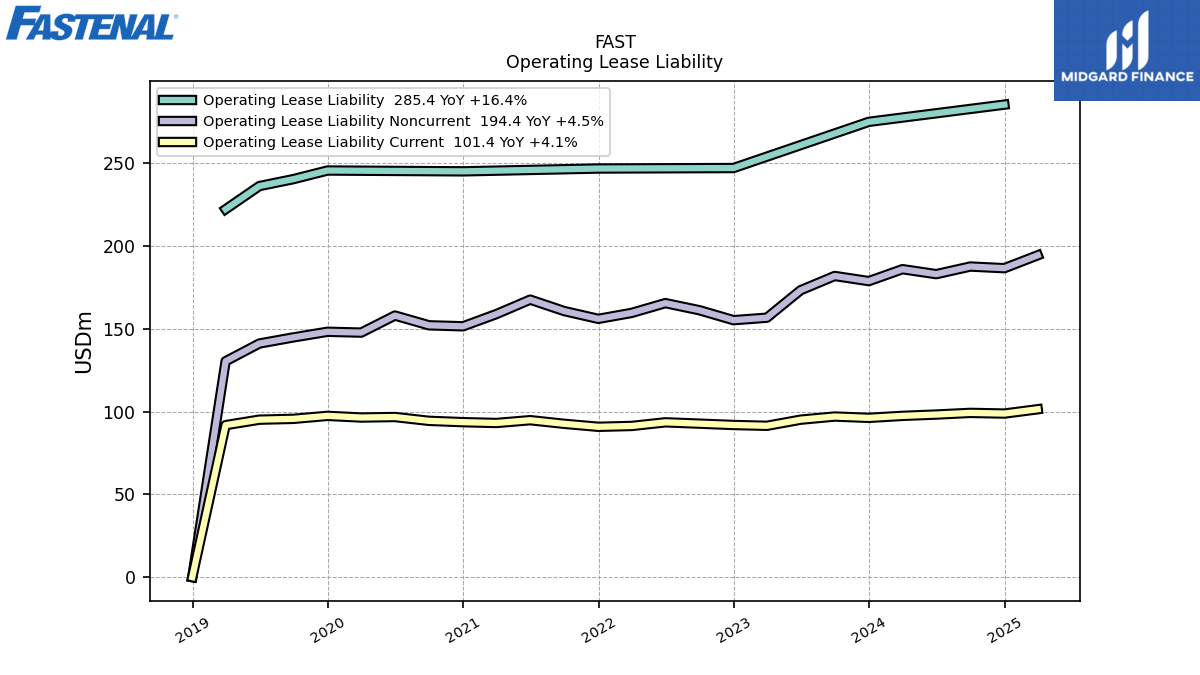
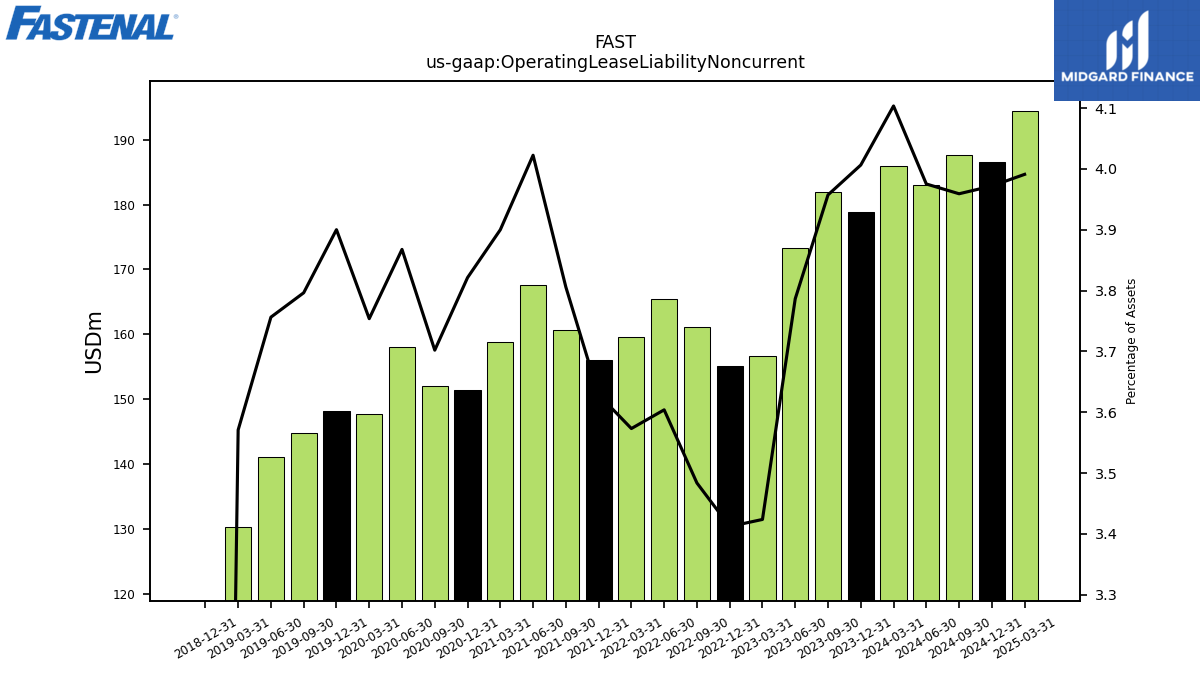
| Operating Lease Liability Noncurrent | 186.00 | 178.80 | 181.90 | 173.30 | 156.70 | 155.20 | 161.20 | 165.50 | 159.60 | 156.00 | 160.70 | 167.60 | 158.90 | 151.50 | 152.10 | 158.00 | 147.70 | 148.20 | 144.80 | 141.10 | 130.40 | 0.00 | NA | NA | NA | NA | NA | NA | NA | NA | NA | NA | NA | NA | NA | NA | NA | NA | NA | NA | NA | NA | NA | NA | NA | NA | NA | NA | NA | NA | NA | NA | NA | NA | NA | NA | NA | NA | NA | NA | NA |
| 2024-03-31 | 2023-12-31 | 2023-09-30 | 2023-06-30 | 2023-03-31 | 2022-12-31 | 2022-09-30 | 2022-06-30 | 2022-03-31 | 2021-12-31 | 2021-09-30 | 2021-06-30 | 2021-03-31 | 2020-12-31 | 2020-09-30 | 2020-06-30 | 2020-03-31 | 2019-12-31 | 2019-09-30 | 2019-06-30 | 2019-03-31 | 2018-12-31 | 2018-09-30 | 2018-06-30 | 2018-03-31 | 2017-12-31 | 2017-09-30 | 2017-06-30 | 2017-03-31 | 2016-12-31 | 2016-09-30 | 2016-06-30 | 2016-03-31 | 2015-12-31 | 2015-09-30 | 2015-06-30 | 2015-03-31 | 2014-12-31 | 2014-09-30 | 2014-06-30 | 2014-03-31 | 2013-12-31 | 2013-09-30 | 2013-06-30 | 2013-03-31 | 2012-12-31 | 2012-09-30 | 2012-06-30 | 2012-03-31 | 2011-12-31 | 2011-09-30 | 2011-06-30 | 2011-03-31 | 2010-12-31 | 2010-09-30 | 2010-06-30 | 2010-03-31 | 2009-12-31 | 2009-09-30 | 2009-06-30 | 2009-03-31 | ||
|---|---|---|---|---|---|---|---|---|---|---|---|---|---|---|---|---|---|---|---|---|---|---|---|---|---|---|---|---|---|---|---|---|---|---|---|---|---|---|---|---|---|---|---|---|---|---|---|---|---|---|---|---|---|---|---|---|---|---|---|---|---|---|
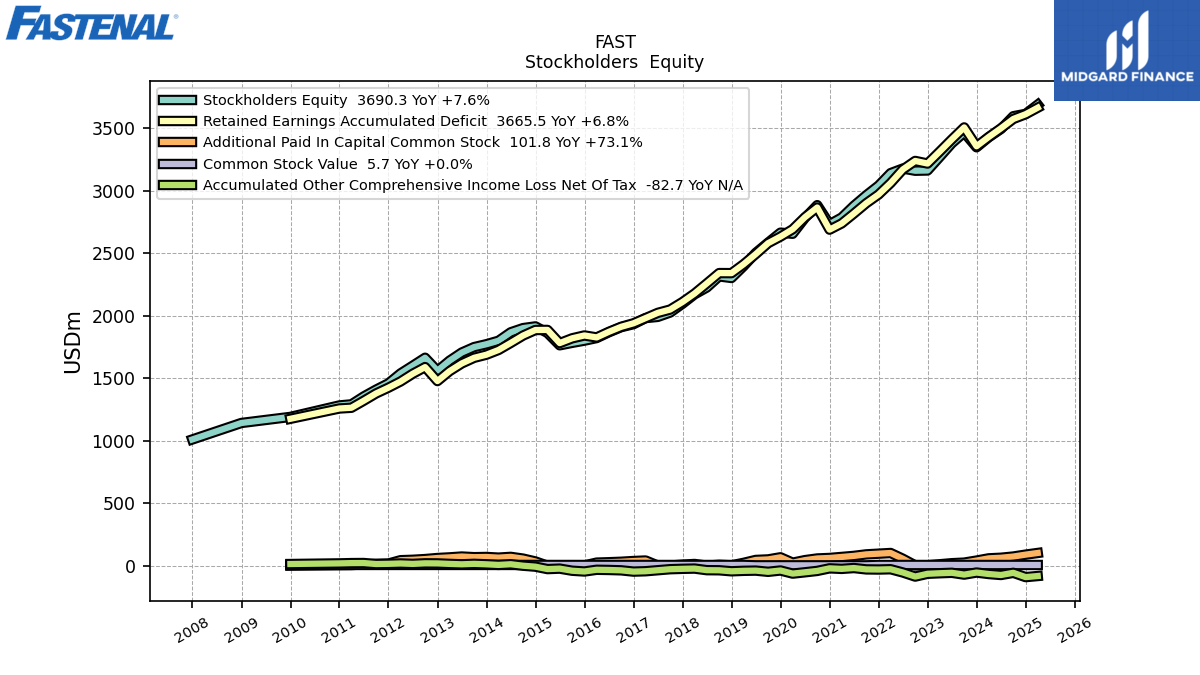
| Stockholders Equity | 3429.20 | 3348.80 | 3466.60 | 3380.80 | 3270.60 | 3163.20 | 3161.20 | 3178.70 | 3142.00 | 3042.20 | 2964.70 | 2880.80 | 2786.70 | 2733.20 | 2885.60 | 2783.00 | 2656.60 | 2665.60 | 2585.70 | 2503.70 | 2397.20 | 2302.70 | 2315.60 | 2226.60 | 2172.00 | 2096.90 | 2026.30 | 1991.50 | 1981.70 | 1933.09 | 1909.30 | 1868.16 | 1821.88 | 1801.29 | 1783.49 | 1763.98 | 1862.81 | 1915.22 | 1901.57 | 1868.12 | 1800.32 | 1772.70 | 1749.63 | 1706.05 | 1640.86 | 1560.36 | 1664.38 | 1600.90 | 1538.97 | 1458.98 | 1408.83 | 1354.17 | 1291.52 | 1282.51 | NA | NA | NA | 1190.84 | NA | NA | NA | |
| Common Stock Value | 5.70 | 5.70 | 5.70 | 5.70 | 5.70 | 5.70 | 5.80 | 5.80 | 5.80 | 5.80 | 2.90 | 2.90 | 2.90 | 2.90 | 2.90 | 2.90 | 2.90 | 2.90 | 2.90 | 2.90 | 5.80 | 5.80 | 5.80 | 5.80 | 5.80 | 5.80 | 5.80 | 5.80 | 5.80 | 5.78 | 5.78 | 5.78 | 5.78 | 5.79 | 5.79 | 5.80 | 5.88 | 5.92 | 5.93 | 5.94 | 5.93 | 5.94 | 5.94 | 5.94 | 5.93 | 5.93 | 5.93 | 5.92 | 5.92 | 5.91 | 5.90 | 5.90 | 5.90 | 5.90 | NA | NA | NA | 5.90 | NA | NA | NA | |
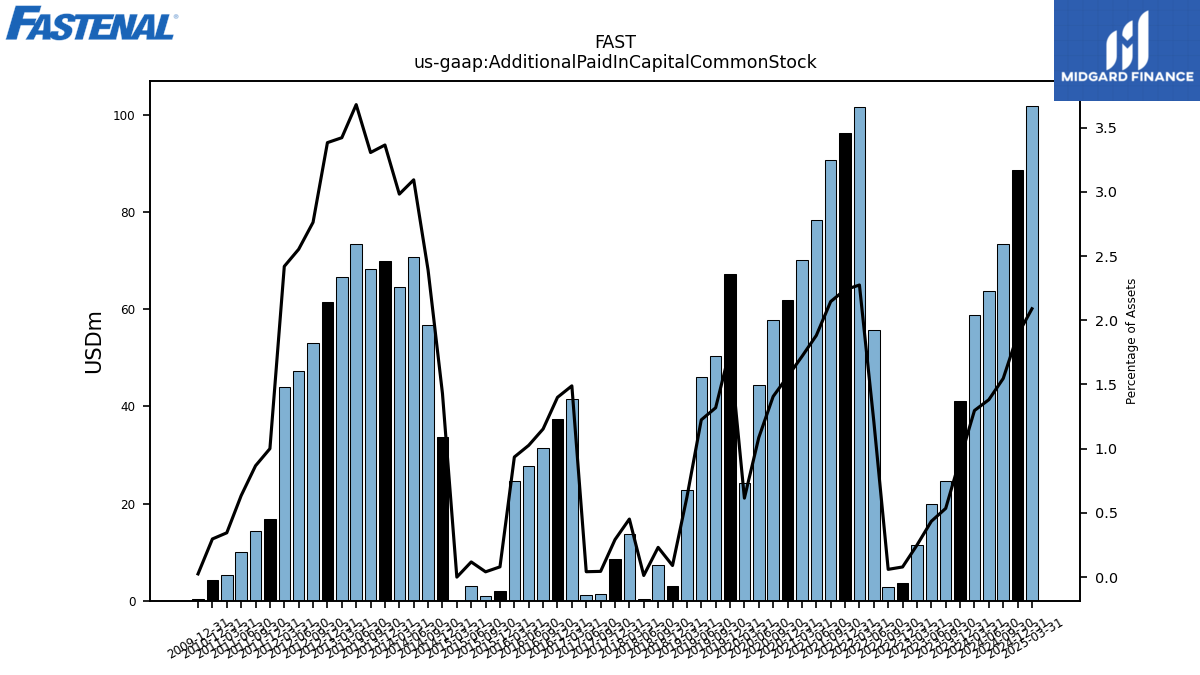
| Additional Paid In Capital Common Stock | 58.80 | 41.00 | 24.60 | 19.90 | 11.40 | 3.60 | 2.80 | 55.70 | 101.60 | 96.20 | 90.60 | 78.40 | 70.00 | 61.90 | 57.80 | 44.40 | 24.20 | 67.20 | 50.30 | 46.00 | 22.70 | 3.00 | 7.40 | 0.40 | 13.70 | 8.50 | 1.30 | 1.20 | 41.50 | 37.36 | 31.50 | 27.70 | 24.72 | 2.02 | 1.03 | 2.93 | 0.00 | 33.74 | 56.73 | 70.63 | 64.57 | 69.85 | 68.12 | 73.34 | 66.56 | 61.44 | 53.04 | 47.25 | 43.88 | 16.86 | 14.32 | 10.04 | 5.26 | 4.36 | NA | NA | NA | 0.33 | NA | NA | NA | |
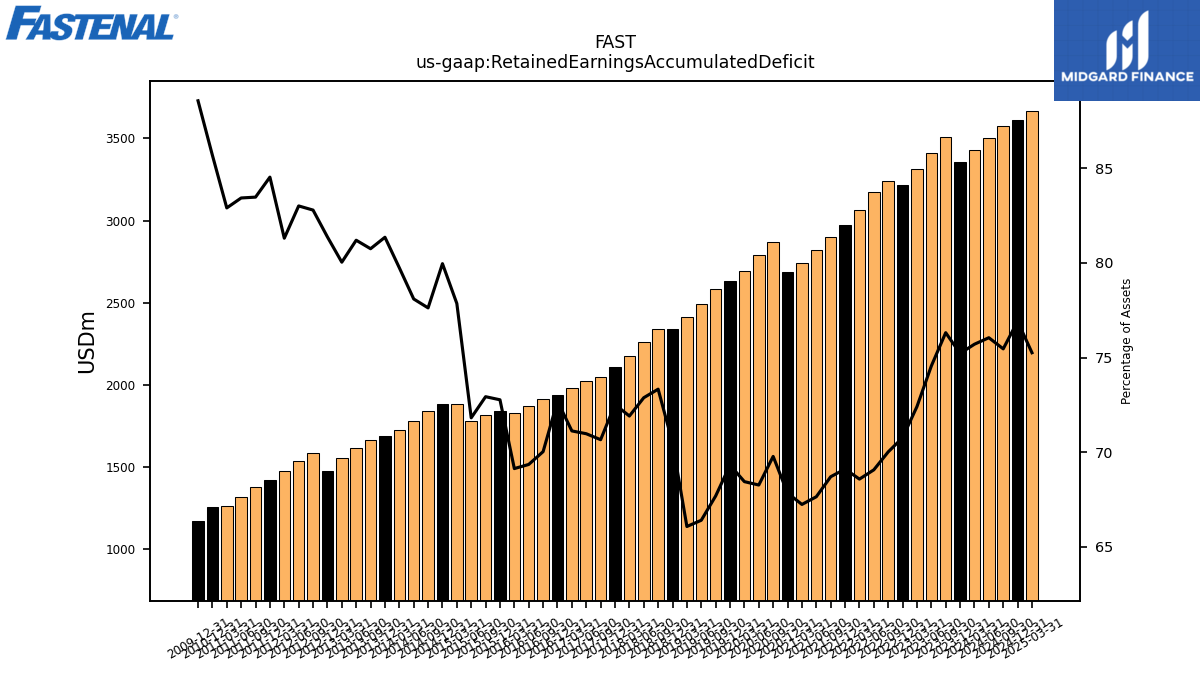
| Retained Earnings Accumulated Deficit | 3431.40 | 3356.90 | 3507.80 | 3412.10 | 3314.00 | 3218.70 | 3239.70 | 3171.60 | 3063.00 | 2970.90 | 2900.80 | 2818.30 | 2739.40 | 2689.60 | 2866.70 | 2788.60 | 2692.90 | 2633.90 | 2581.50 | 2494.20 | 2412.70 | 2341.60 | 2342.00 | 2259.20 | 2178.50 | 2110.60 | 2050.20 | 2023.70 | 1981.70 | 1940.14 | 1912.05 | 1871.81 | 1826.96 | 1842.77 | 1819.79 | 1781.64 | 1887.16 | 1886.35 | 1841.99 | 1782.87 | 1726.52 | 1688.78 | 1663.79 | 1618.66 | 1556.99 | 1477.60 | 1589.38 | 1536.34 | 1474.37 | 1424.37 | 1378.23 | 1319.80 | 1264.02 | 1258.18 | NA | NA | NA | 1175.64 | NA | NA | NA | |
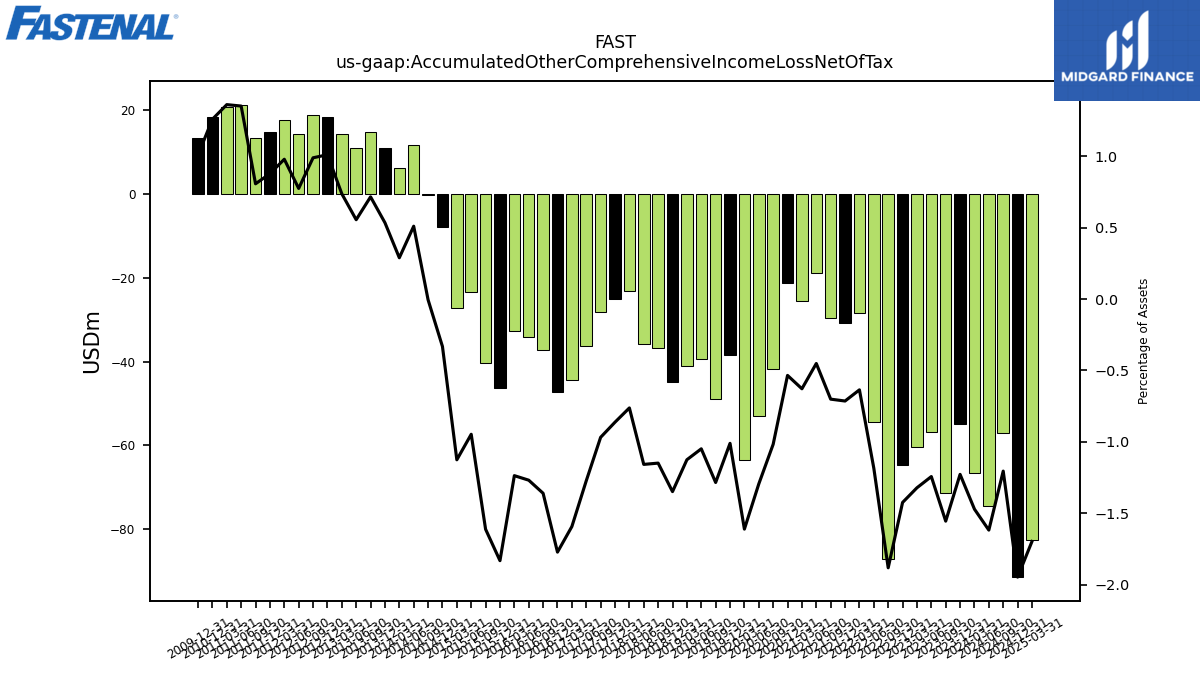
| Accumulated Other Comprehensive Income Loss Net Of Tax | -66.70 | -54.80 | -71.50 | -56.90 | -60.50 | -64.80 | -87.10 | -54.40 | -28.40 | -30.70 | -29.60 | -18.80 | -25.60 | -21.20 | -41.80 | -52.90 | -63.40 | -38.40 | -49.00 | -39.40 | -41.10 | -44.80 | -36.70 | -35.90 | -23.10 | -25.10 | -28.10 | -36.30 | -44.40 | -47.30 | -37.14 | -34.24 | -32.69 | -46.40 | -40.23 | -23.50 | -27.29 | -7.84 | -0.12 | 11.65 | 6.27 | 11.10 | 14.75 | 11.08 | 14.35 | 18.36 | 19.00 | 14.34 | 17.76 | 14.80 | 13.33 | 21.39 | 20.77 | 18.49 | NA | NA | NA | 13.39 | NA | NA | NA |
| 2024-03-31 | 2023-12-31 | 2023-09-30 | 2023-06-30 | 2023-03-31 | 2022-12-31 | 2022-09-30 | 2022-06-30 | 2022-03-31 | 2021-12-31 | 2021-09-30 | 2021-06-30 | 2021-03-31 | 2020-12-31 | 2020-09-30 | 2020-06-30 | 2020-03-31 | 2019-12-31 | 2019-09-30 | 2019-06-30 | 2019-03-31 | 2018-12-31 | 2018-09-30 | 2018-06-30 | 2018-03-31 | 2017-12-31 | 2017-09-30 | 2017-06-30 | 2017-03-31 | 2016-12-31 | 2016-09-30 | 2016-06-30 | 2016-03-31 | 2015-12-31 | 2015-09-30 | 2015-06-30 | 2015-03-31 | 2014-12-31 | 2014-09-30 | 2014-06-30 | 2014-03-31 | 2013-12-31 | 2013-09-30 | 2013-06-30 | 2013-03-31 | 2012-12-31 | 2012-09-30 | 2012-06-30 | 2012-03-31 | 2011-12-31 | 2011-09-30 | 2011-06-30 | 2011-03-31 | 2010-12-31 | 2010-09-30 | 2010-06-30 | 2010-03-31 | 2009-12-31 | 2009-09-30 | 2009-06-30 | 2009-03-31 | ||
|---|---|---|---|---|---|---|---|---|---|---|---|---|---|---|---|---|---|---|---|---|---|---|---|---|---|---|---|---|---|---|---|---|---|---|---|---|---|---|---|---|---|---|---|---|---|---|---|---|---|---|---|---|---|---|---|---|---|---|---|---|---|---|
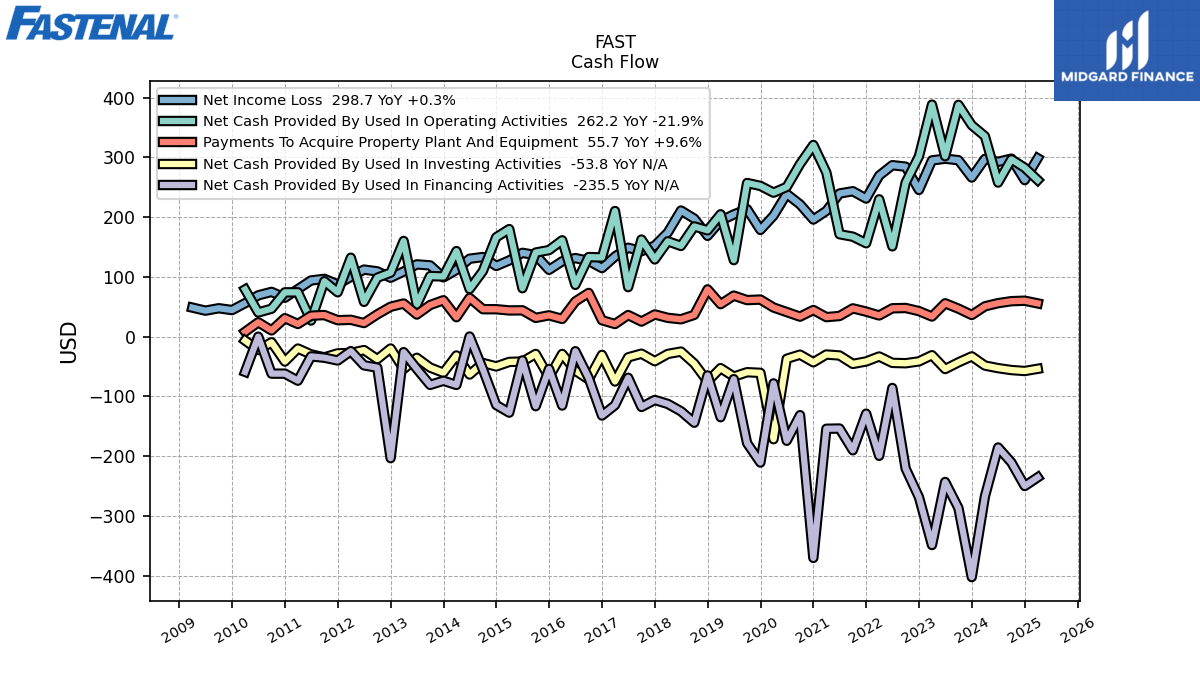
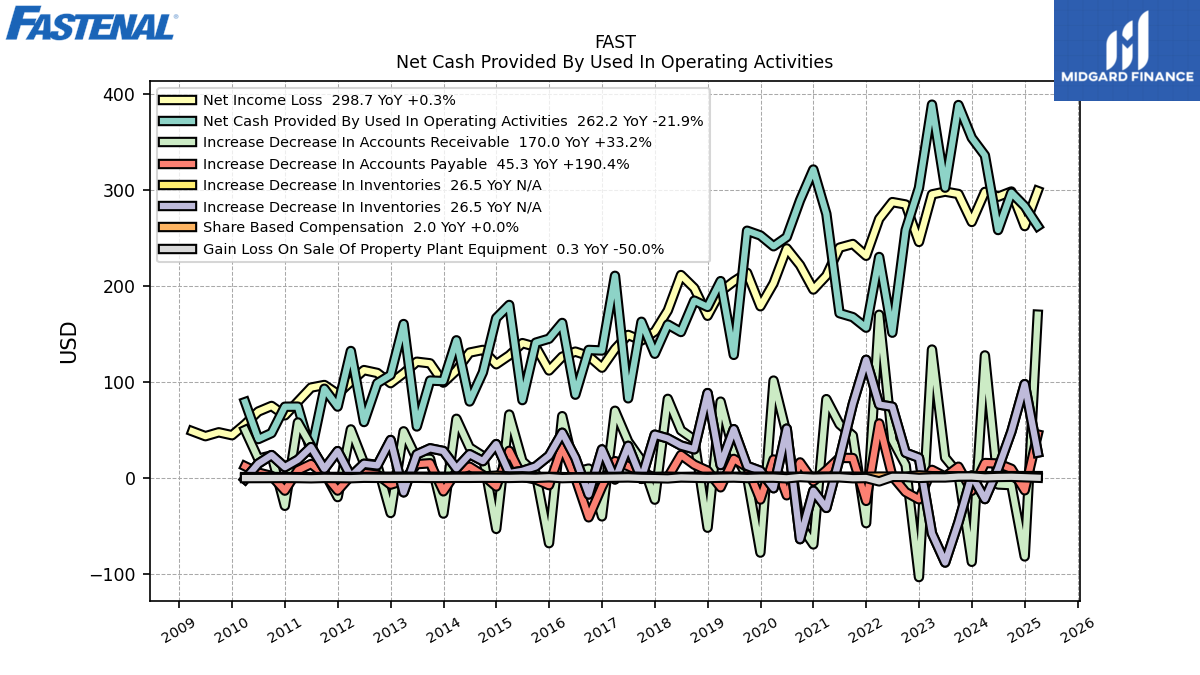
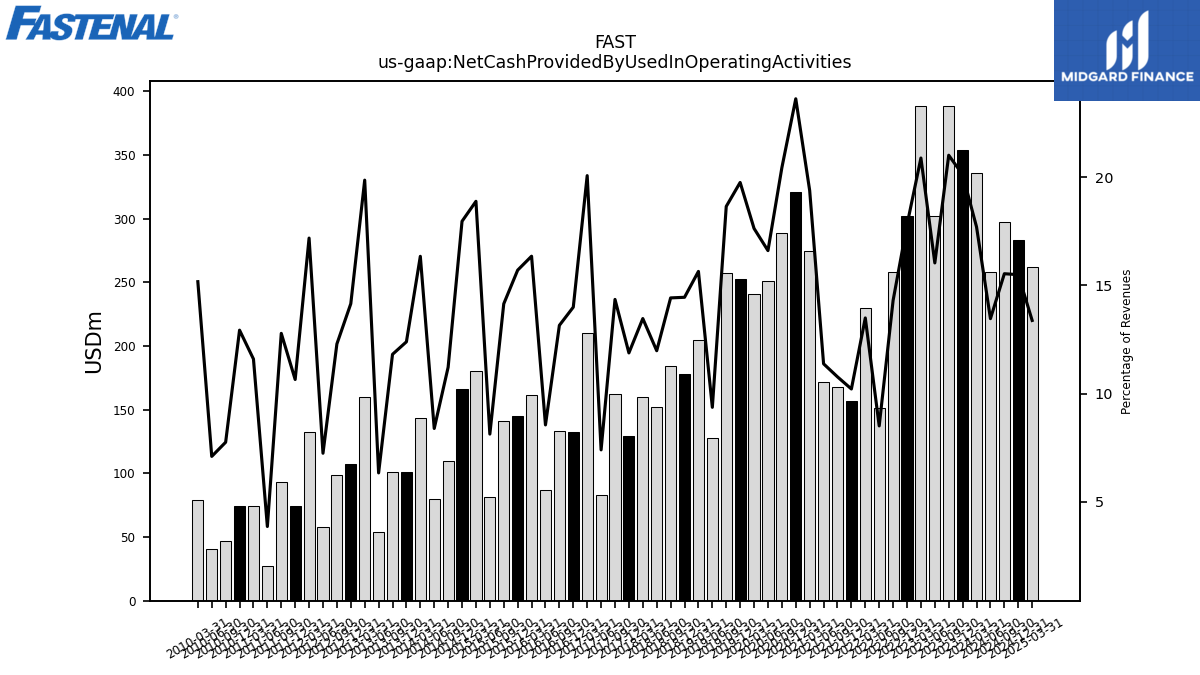
| Net Cash Provided By Used In Operating Activities | 335.60 | 354.00 | 388.10 | 302.10 | 388.50 | 301.90 | 257.90 | 151.20 | 230.00 | 156.40 | 167.40 | 171.50 | 274.80 | 321.00 | 289.00 | 250.70 | 241.10 | 252.40 | 257.30 | 128.10 | 204.90 | 178.00 | 184.60 | 151.90 | 159.70 | 129.30 | 162.60 | 82.90 | 210.40 | 132.68 | 133.26 | 86.69 | 161.36 | 144.96 | 140.83 | 81.05 | 180.10 | 166.45 | 110.01 | 79.63 | 143.30 | 100.85 | 101.41 | 53.62 | 160.24 | 107.20 | 98.67 | 58.24 | 132.19 | 74.31 | 92.90 | 26.99 | 74.28 | 74.19 | 46.77 | 40.50 | 79.03 | NA | NA | NA | NA | |
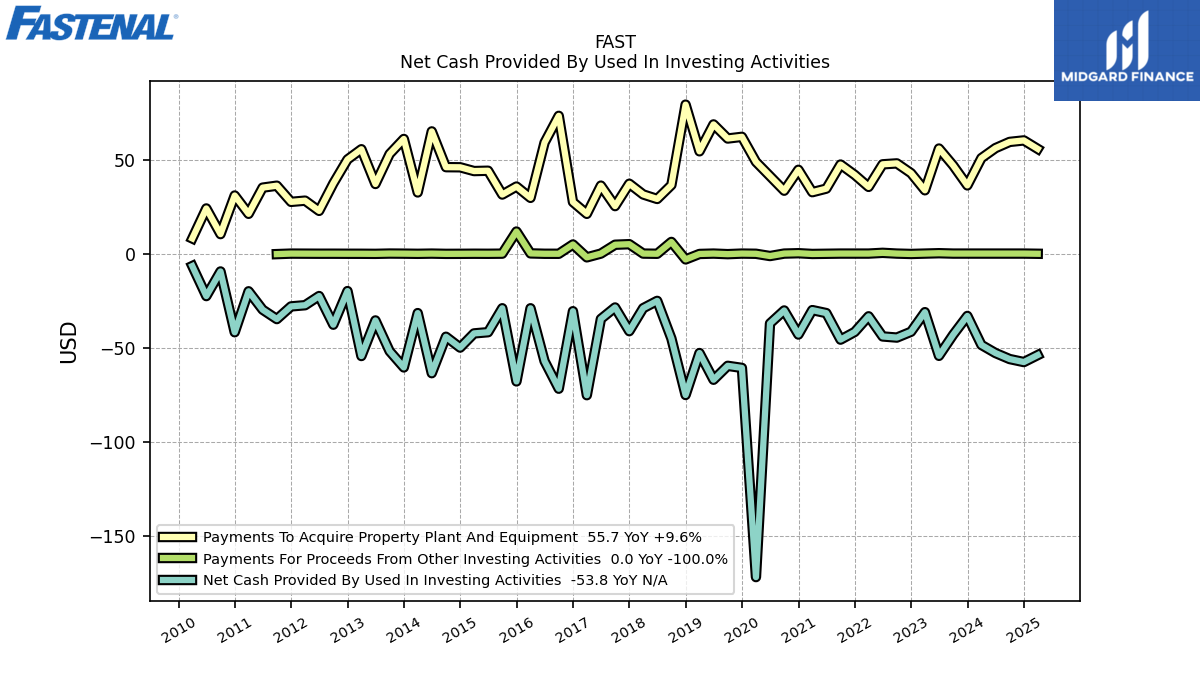
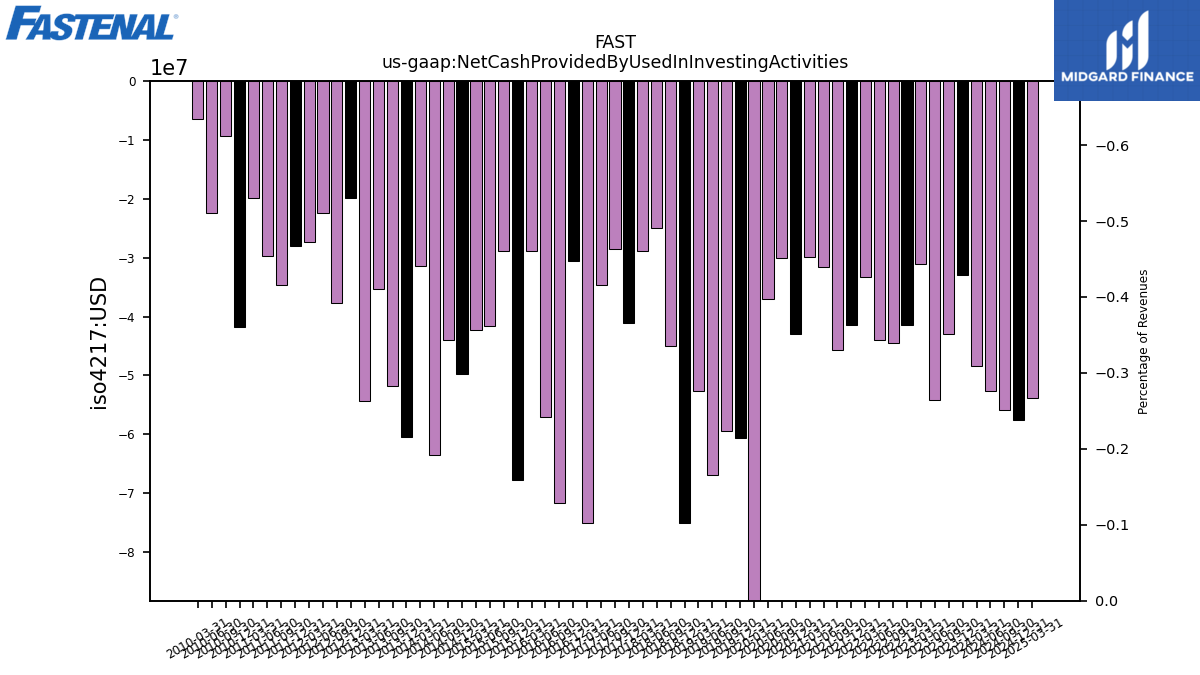
| Net Cash Provided By Used In Investing Activities | -48.40 | -33.00 | -43.00 | -54.20 | -31.00 | -41.40 | -44.50 | -43.90 | -33.20 | -41.50 | -45.60 | -31.50 | -29.90 | -42.90 | -30.10 | -37.00 | -171.70 | -60.60 | -59.50 | -66.90 | -52.70 | -75.00 | -45.00 | -25.00 | -28.90 | -41.10 | -28.50 | -34.60 | -75.10 | -30.49 | -71.66 | -57.01 | -28.93 | -67.78 | -28.92 | -41.65 | -42.28 | -49.82 | -44.05 | -63.42 | -31.49 | -60.36 | -51.73 | -35.39 | -54.31 | -19.80 | -37.66 | -22.43 | -27.31 | -27.95 | -34.69 | -29.69 | -19.90 | -41.68 | -9.38 | -22.47 | -6.51 | NA | NA | NA | NA | |
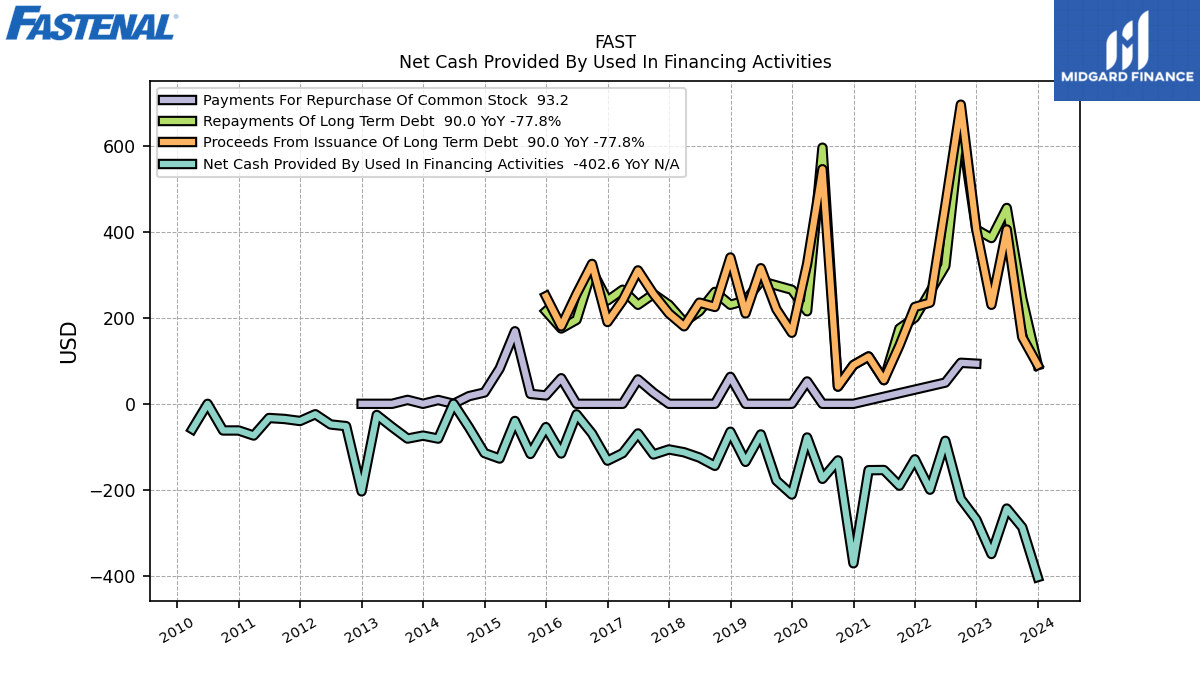
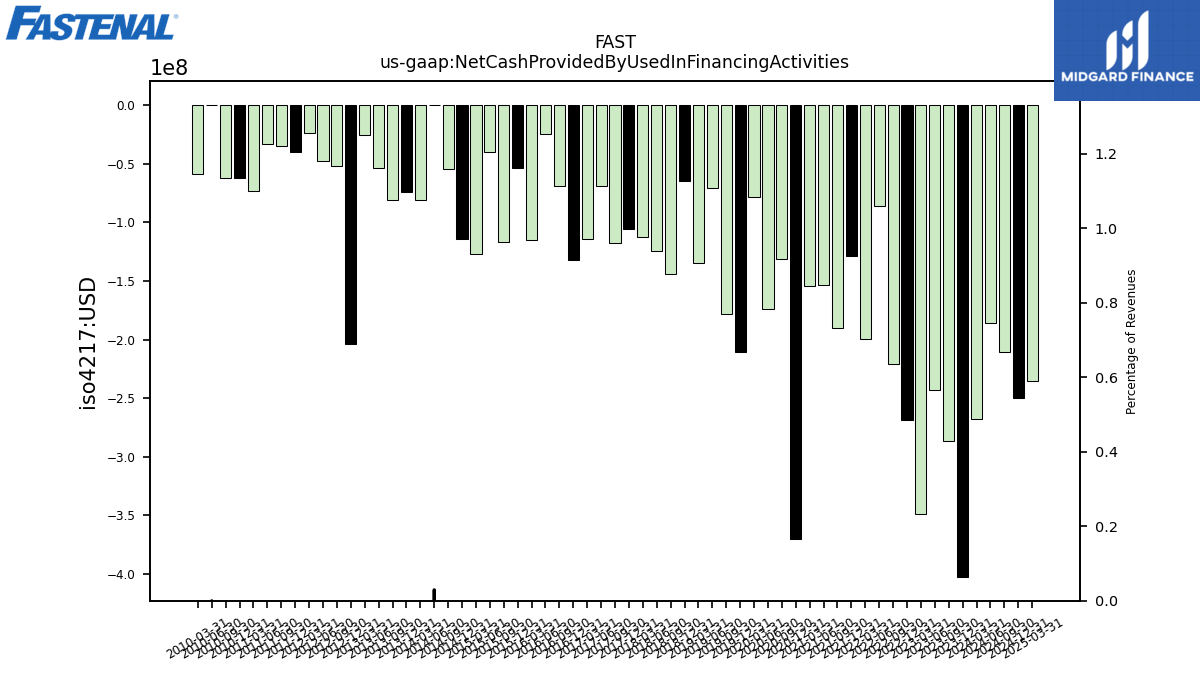
| Net Cash Provided By Used In Financing Activities | -267.40 | -402.60 | -286.90 | -243.30 | -348.90 | -268.70 | -220.80 | -85.90 | -199.50 | -128.90 | -190.20 | -153.80 | -154.20 | -370.50 | -131.40 | -174.30 | -78.20 | -210.80 | -178.30 | -71.10 | -134.90 | -64.90 | -144.10 | -124.90 | -112.60 | -106.00 | -117.70 | -68.80 | -114.70 | -132.05 | -69.09 | -24.38 | -115.36 | -54.13 | -116.45 | -39.80 | -127.18 | -114.45 | -54.71 | 0.28 | -80.85 | -73.86 | -80.79 | -53.90 | -25.89 | -203.44 | -51.84 | -48.01 | -24.21 | -39.91 | -35.21 | -32.98 | -73.72 | -61.92 | -61.92 | 0.00 | -58.97 | NA | NA | NA | NA |
| 2024-03-31 | 2023-12-31 | 2023-09-30 | 2023-06-30 | 2023-03-31 | 2022-12-31 | 2022-09-30 | 2022-06-30 | 2022-03-31 | 2021-12-31 | 2021-09-30 | 2021-06-30 | 2021-03-31 | 2020-12-31 | 2020-09-30 | 2020-06-30 | 2020-03-31 | 2019-12-31 | 2019-09-30 | 2019-06-30 | 2019-03-31 | 2018-12-31 | 2018-09-30 | 2018-06-30 | 2018-03-31 | 2017-12-31 | 2017-09-30 | 2017-06-30 | 2017-03-31 | 2016-12-31 | 2016-09-30 | 2016-06-30 | 2016-03-31 | 2015-12-31 | 2015-09-30 | 2015-06-30 | 2015-03-31 | 2014-12-31 | 2014-09-30 | 2014-06-30 | 2014-03-31 | 2013-12-31 | 2013-09-30 | 2013-06-30 | 2013-03-31 | 2012-12-31 | 2012-09-30 | 2012-06-30 | 2012-03-31 | 2011-12-31 | 2011-09-30 | 2011-06-30 | 2011-03-31 | 2010-12-31 | 2010-09-30 | 2010-06-30 | 2010-03-31 | 2009-12-31 | 2009-09-30 | 2009-06-30 | 2009-03-31 | ||
|---|---|---|---|---|---|---|---|---|---|---|---|---|---|---|---|---|---|---|---|---|---|---|---|---|---|---|---|---|---|---|---|---|---|---|---|---|---|---|---|---|---|---|---|---|---|---|---|---|---|---|---|---|---|---|---|---|---|---|---|---|---|---|
| Net Cash Provided By Used In Operating Activities | 335.60 | 354.00 | 388.10 | 302.10 | 388.50 | 301.90 | 257.90 | 151.20 | 230.00 | 156.40 | 167.40 | 171.50 | 274.80 | 321.00 | 289.00 | 250.70 | 241.10 | 252.40 | 257.30 | 128.10 | 204.90 | 178.00 | 184.60 | 151.90 | 159.70 | 129.30 | 162.60 | 82.90 | 210.40 | 132.68 | 133.26 | 86.69 | 161.36 | 144.96 | 140.83 | 81.05 | 180.10 | 166.45 | 110.01 | 79.63 | 143.30 | 100.85 | 101.41 | 53.62 | 160.24 | 107.20 | 98.67 | 58.24 | 132.19 | 74.31 | 92.90 | 26.99 | 74.28 | 74.19 | 46.77 | 40.50 | 79.03 | NA | NA | NA | NA | |
| Net Income Loss | 297.70 | 266.40 | 295.50 | 298.00 | 295.10 | 245.60 | 284.60 | 287.10 | 269.60 | 231.20 | 243.50 | 239.70 | 210.60 | 196.10 | 221.50 | 238.90 | 202.60 | 178.70 | 213.50 | 204.60 | 194.10 | 168.80 | 197.60 | 211.20 | 174.30 | 152.40 | 143.10 | 148.90 | 134.20 | 114.81 | 126.92 | 131.52 | 126.23 | 111.90 | 136.49 | 140.36 | 127.61 | 118.39 | 133.31 | 130.51 | 111.93 | 99.23 | 119.35 | 121.01 | 109.05 | 98.72 | 109.32 | 112.31 | 100.19 | 87.47 | 96.80 | 94.11 | 79.55 | 65.16 | 74.99 | 69.17 | 56.03 | 44.54 | 47.59 | 43.54 | 48.69 | |
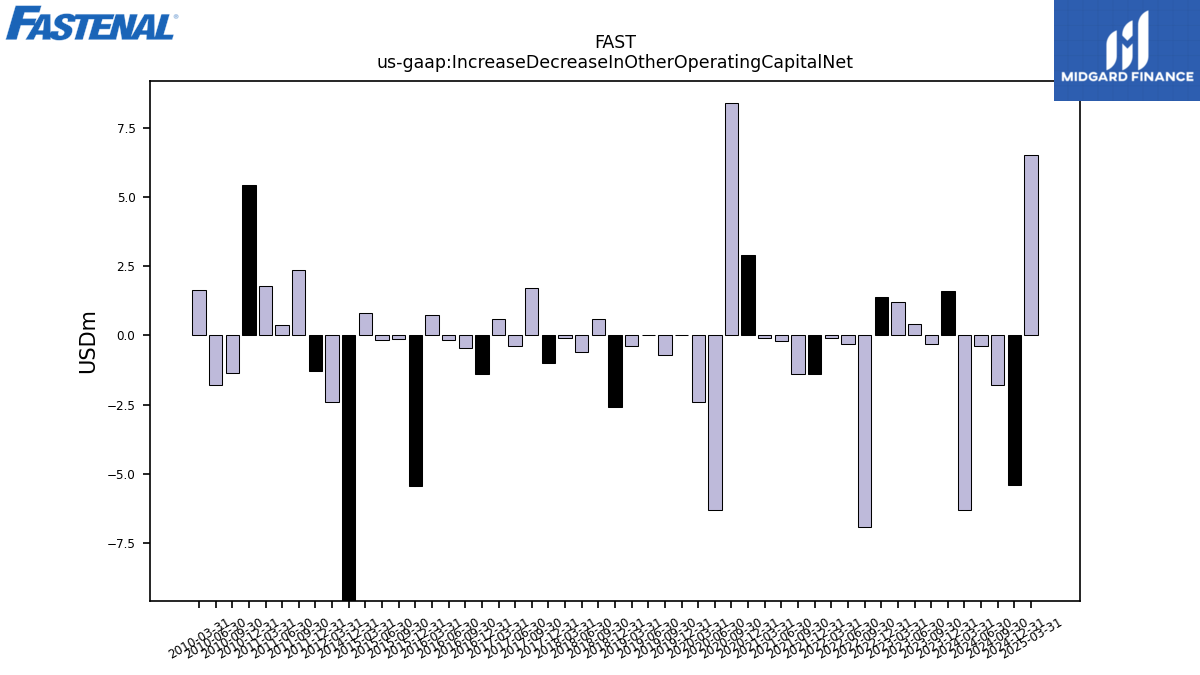
| Increase Decrease In Other Operating Capital Net | -6.30 | 1.60 | -0.30 | 0.40 | 1.20 | 1.40 | -6.90 | -0.30 | -0.10 | -1.40 | -1.40 | -0.20 | -0.10 | 2.90 | 8.40 | -6.30 | -2.40 | 0.00 | -0.70 | 0.00 | -0.40 | -2.60 | 0.60 | -0.60 | -0.10 | -1.00 | 1.70 | -0.40 | 0.60 | -1.39 | -0.45 | -0.18 | 0.74 | -5.44 | -0.13 | -0.17 | 0.79 | -12.08 | NA | NA | NA | NA | NA | NA | NA | NA | NA | NA | -2.42 | -1.29 | 2.35 | 0.39 | 1.78 | 5.42 | -1.36 | -1.81 | 1.64 | NA | NA | NA | NA | |
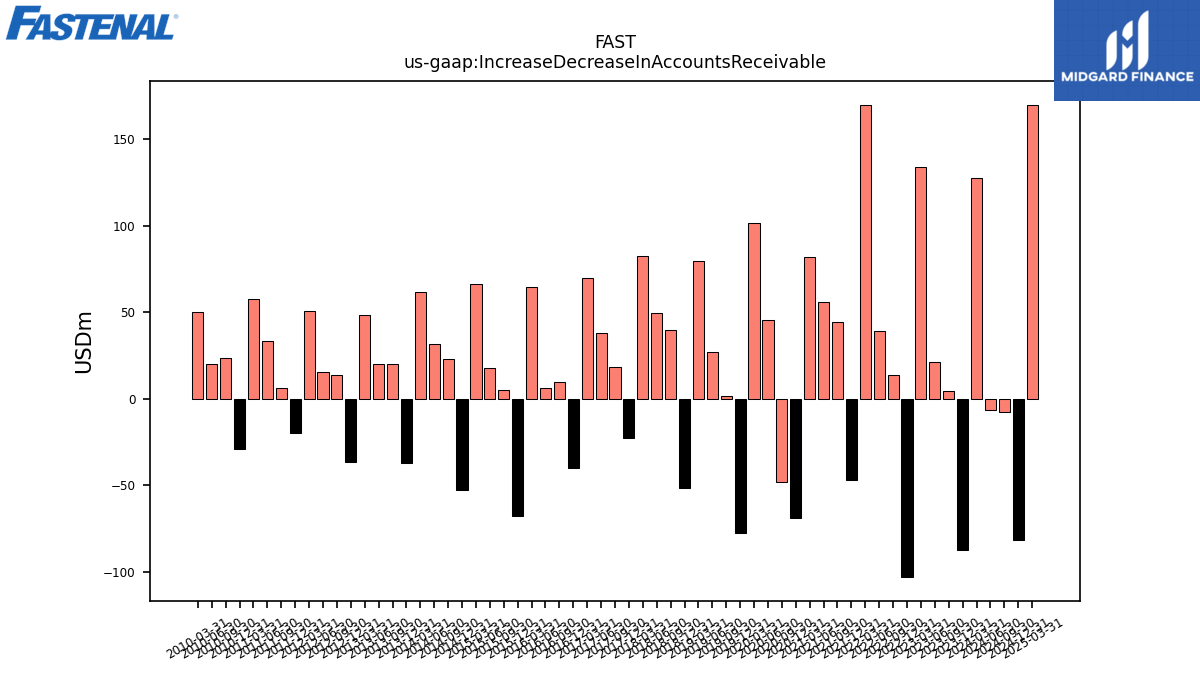
| Increase Decrease In Accounts Receivable | 127.60 | -87.20 | 4.50 | 21.30 | 133.70 | -103.10 | 13.60 | 39.40 | 169.90 | -47.00 | 44.20 | 55.90 | 82.10 | -69.10 | -48.40 | 45.80 | 101.40 | -77.60 | 1.60 | 26.90 | 79.50 | -51.70 | 40.00 | 49.60 | 82.40 | -22.50 | 18.20 | 38.00 | 70.00 | -39.92 | 9.85 | 6.19 | 64.37 | -67.81 | 4.87 | 17.49 | 66.06 | -52.95 | 22.94 | 31.77 | 61.65 | -36.99 | 19.95 | 20.01 | 48.62 | -36.39 | 13.49 | 15.57 | 50.62 | -19.86 | 6.21 | 33.50 | 57.82 | -28.93 | 23.53 | 20.11 | 49.92 | NA | NA | NA | NA | |
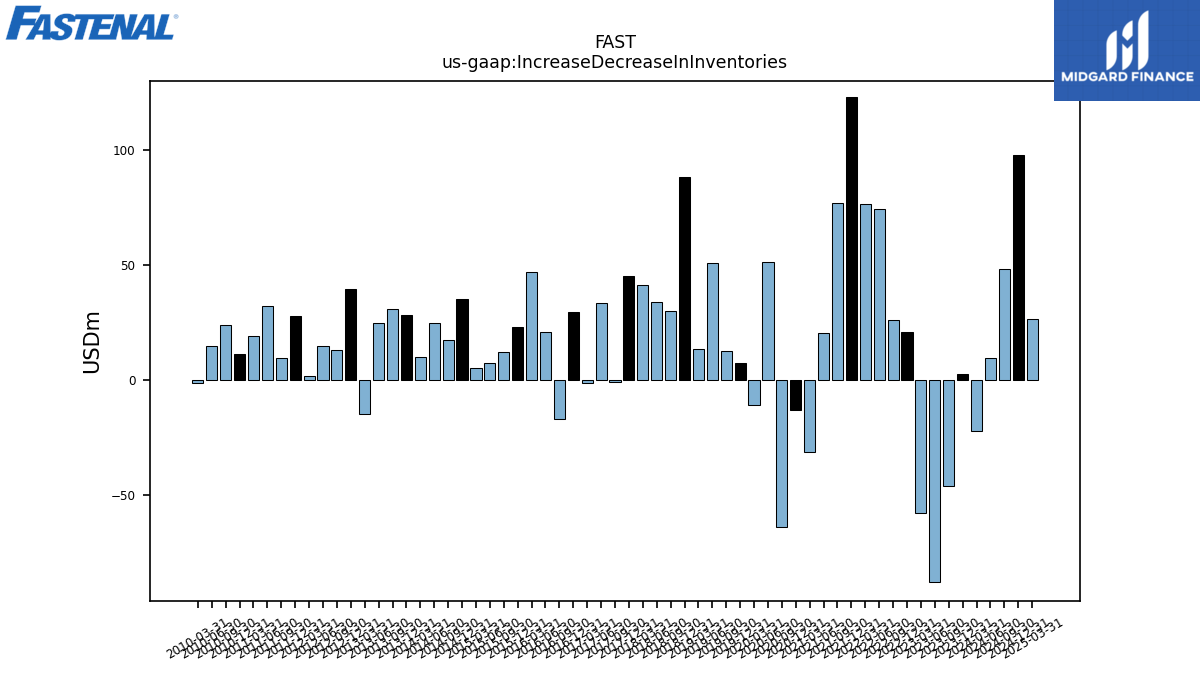
| Increase Decrease In Inventories | -21.90 | 2.60 | -46.10 | -87.90 | -57.70 | 21.10 | 26.30 | 74.20 | 76.40 | 123.00 | 77.10 | 20.50 | -31.10 | -13.20 | -63.60 | 51.40 | -10.60 | 7.50 | 12.60 | 50.80 | 13.50 | 88.40 | 29.90 | 33.80 | 41.20 | 45.10 | -0.90 | 33.50 | -1.40 | 29.81 | -17.10 | 21.03 | 47.11 | 23.21 | 12.01 | 7.46 | 5.15 | 35.31 | 17.61 | 24.78 | 9.92 | 28.08 | 30.88 | 24.62 | -14.90 | 39.55 | 13.14 | 14.80 | 1.73 | 28.00 | 9.49 | 32.21 | 19.08 | 11.31 | 23.85 | 14.97 | -1.16 | NA | NA | NA | NA | |
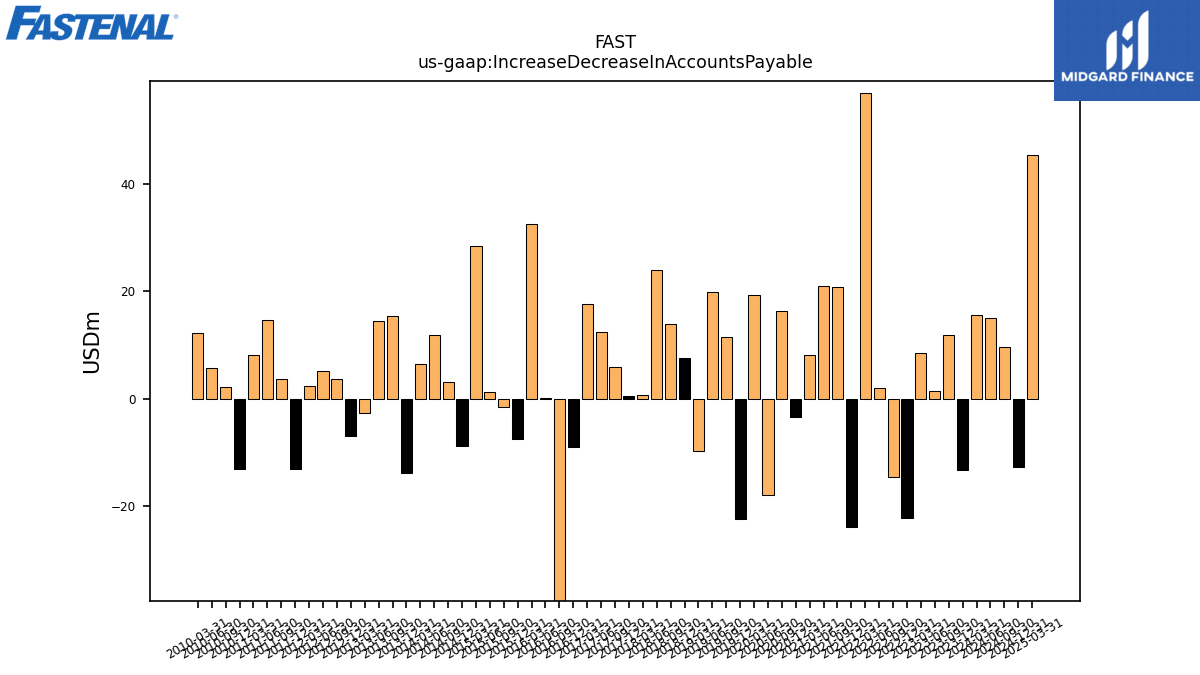
| Increase Decrease In Accounts Payable | 15.60 | -13.30 | 11.80 | 1.40 | 8.50 | -22.20 | -14.60 | 1.90 | 56.80 | -23.80 | 20.80 | 21.00 | 8.10 | -3.40 | 16.30 | -18.00 | 19.30 | -22.40 | 11.40 | 19.90 | -9.70 | 7.60 | 13.90 | 24.00 | 0.60 | 0.40 | 5.90 | 12.40 | 17.60 | -9.03 | -40.93 | 0.20 | 32.52 | -7.45 | -1.49 | 1.24 | 28.32 | -8.82 | 3.09 | 11.79 | 6.44 | -13.88 | 15.38 | 14.43 | -2.69 | -6.86 | 3.64 | 5.13 | 2.33 | -13.06 | 3.72 | 14.60 | 8.04 | -13.13 | 2.17 | 5.66 | 12.29 | NA | NA | NA | NA | |
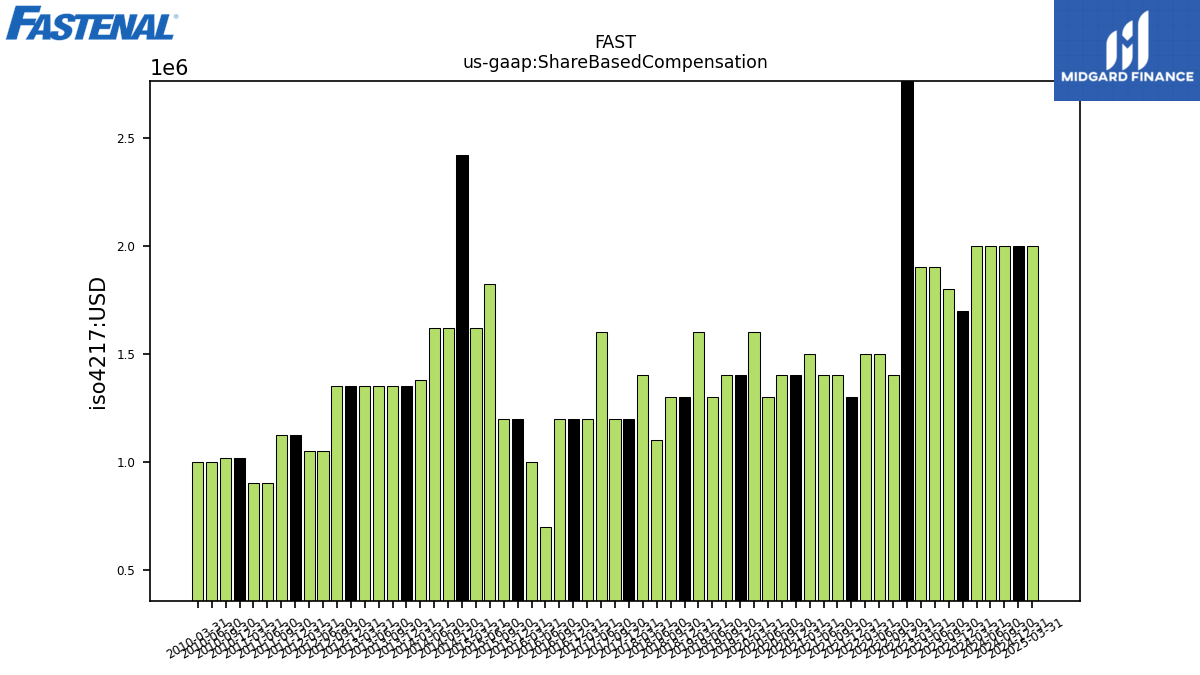
| Share Based Compensation | 2.00 | 1.70 | 1.80 | 1.90 | 1.90 | 2.80 | 1.40 | 1.50 | 1.50 | 1.30 | 1.40 | 1.40 | 1.50 | 1.40 | 1.40 | 1.30 | 1.60 | 1.40 | 1.40 | 1.30 | 1.60 | 1.30 | 1.30 | 1.10 | 1.40 | 1.20 | 1.20 | 1.60 | 1.20 | 1.20 | 1.20 | 0.70 | 1.00 | 1.20 | 1.20 | 1.82 | 1.62 | 2.42 | 1.62 | 1.62 | 1.38 | 1.35 | 1.35 | 1.35 | 1.35 | 1.35 | 1.35 | 1.05 | 1.05 | 1.12 | 1.12 | 0.90 | 0.90 | 1.01 | 1.01 | 1.00 | 1.00 | NA | NA | NA | NA |
| 2024-03-31 | 2023-12-31 | 2023-09-30 | 2023-06-30 | 2023-03-31 | 2022-12-31 | 2022-09-30 | 2022-06-30 | 2022-03-31 | 2021-12-31 | 2021-09-30 | 2021-06-30 | 2021-03-31 | 2020-12-31 | 2020-09-30 | 2020-06-30 | 2020-03-31 | 2019-12-31 | 2019-09-30 | 2019-06-30 | 2019-03-31 | 2018-12-31 | 2018-09-30 | 2018-06-30 | 2018-03-31 | 2017-12-31 | 2017-09-30 | 2017-06-30 | 2017-03-31 | 2016-12-31 | 2016-09-30 | 2016-06-30 | 2016-03-31 | 2015-12-31 | 2015-09-30 | 2015-06-30 | 2015-03-31 | 2014-12-31 | 2014-09-30 | 2014-06-30 | 2014-03-31 | 2013-12-31 | 2013-09-30 | 2013-06-30 | 2013-03-31 | 2012-12-31 | 2012-09-30 | 2012-06-30 | 2012-03-31 | 2011-12-31 | 2011-09-30 | 2011-06-30 | 2011-03-31 | 2010-12-31 | 2010-09-30 | 2010-06-30 | 2010-03-31 | 2009-12-31 | 2009-09-30 | 2009-06-30 | 2009-03-31 | ||
|---|---|---|---|---|---|---|---|---|---|---|---|---|---|---|---|---|---|---|---|---|---|---|---|---|---|---|---|---|---|---|---|---|---|---|---|---|---|---|---|---|---|---|---|---|---|---|---|---|---|---|---|---|---|---|---|---|---|---|---|---|---|---|
| Net Cash Provided By Used In Investing Activities | -48.40 | -33.00 | -43.00 | -54.20 | -31.00 | -41.40 | -44.50 | -43.90 | -33.20 | -41.50 | -45.60 | -31.50 | -29.90 | -42.90 | -30.10 | -37.00 | -171.70 | -60.60 | -59.50 | -66.90 | -52.70 | -75.00 | -45.00 | -25.00 | -28.90 | -41.10 | -28.50 | -34.60 | -75.10 | -30.49 | -71.66 | -57.01 | -28.93 | -67.78 | -28.92 | -41.65 | -42.28 | -49.82 | -44.05 | -63.42 | -31.49 | -60.36 | -51.73 | -35.39 | -54.31 | -19.80 | -37.66 | -22.43 | -27.31 | -27.95 | -34.69 | -29.69 | -19.90 | -41.68 | -9.38 | -22.47 | -6.51 | NA | NA | NA | NA | |
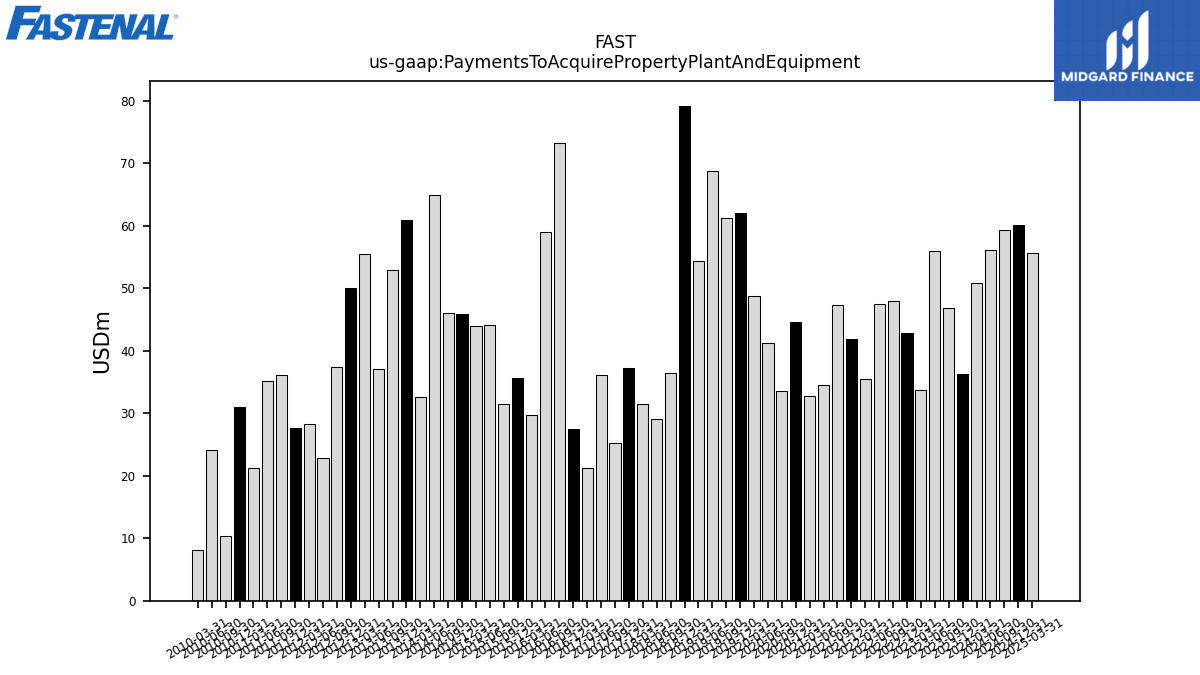
| Payments To Acquire Property Plant And Equipment | 50.80 | 36.30 | 46.90 | 55.90 | 33.70 | 42.80 | 48.00 | 47.50 | 35.50 | 41.90 | 47.40 | 34.60 | 32.70 | 44.60 | 33.50 | 41.20 | 48.80 | 62.10 | 61.20 | 68.70 | 54.40 | 79.20 | 36.50 | 29.10 | 31.50 | 37.20 | 25.30 | 36.20 | 21.20 | 27.48 | 73.25 | 59.04 | 29.68 | 35.71 | 31.44 | 44.10 | 43.92 | 45.93 | 45.99 | 65.00 | 32.56 | 60.98 | 53.00 | 37.05 | 55.51 | 50.08 | 37.34 | 22.77 | 28.21 | 27.56 | 36.16 | 35.12 | 21.21 | 30.95 | 10.43 | 24.07 | 8.14 | NA | NA | NA | NA |
| 2024-03-31 | 2023-12-31 | 2023-09-30 | 2023-06-30 | 2023-03-31 | 2022-12-31 | 2022-09-30 | 2022-06-30 | 2022-03-31 | 2021-12-31 | 2021-09-30 | 2021-06-30 | 2021-03-31 | 2020-12-31 | 2020-09-30 | 2020-06-30 | 2020-03-31 | 2019-12-31 | 2019-09-30 | 2019-06-30 | 2019-03-31 | 2018-12-31 | 2018-09-30 | 2018-06-30 | 2018-03-31 | 2017-12-31 | 2017-09-30 | 2017-06-30 | 2017-03-31 | 2016-12-31 | 2016-09-30 | 2016-06-30 | 2016-03-31 | 2015-12-31 | 2015-09-30 | 2015-06-30 | 2015-03-31 | 2014-12-31 | 2014-09-30 | 2014-06-30 | 2014-03-31 | 2013-12-31 | 2013-09-30 | 2013-06-30 | 2013-03-31 | 2012-12-31 | 2012-09-30 | 2012-06-30 | 2012-03-31 | 2011-12-31 | 2011-09-30 | 2011-06-30 | 2011-03-31 | 2010-12-31 | 2010-09-30 | 2010-06-30 | 2010-03-31 | 2009-12-31 | 2009-09-30 | 2009-06-30 | 2009-03-31 | ||
|---|---|---|---|---|---|---|---|---|---|---|---|---|---|---|---|---|---|---|---|---|---|---|---|---|---|---|---|---|---|---|---|---|---|---|---|---|---|---|---|---|---|---|---|---|---|---|---|---|---|---|---|---|---|---|---|---|---|---|---|---|---|---|
| Net Cash Provided By Used In Financing Activities | -267.40 | -402.60 | -286.90 | -243.30 | -348.90 | -268.70 | -220.80 | -85.90 | -199.50 | -128.90 | -190.20 | -153.80 | -154.20 | -370.50 | -131.40 | -174.30 | -78.20 | -210.80 | -178.30 | -71.10 | -134.90 | -64.90 | -144.10 | -124.90 | -112.60 | -106.00 | -117.70 | -68.80 | -114.70 | -132.05 | -69.09 | -24.38 | -115.36 | -54.13 | -116.45 | -39.80 | -127.18 | -114.45 | -54.71 | 0.28 | -80.85 | -73.86 | -80.79 | -53.90 | -25.89 | -203.44 | -51.84 | -48.01 | -24.21 | -39.91 | -35.21 | -32.98 | -73.72 | -61.92 | -61.92 | 0.00 | -58.97 | NA | NA | NA | NA | |
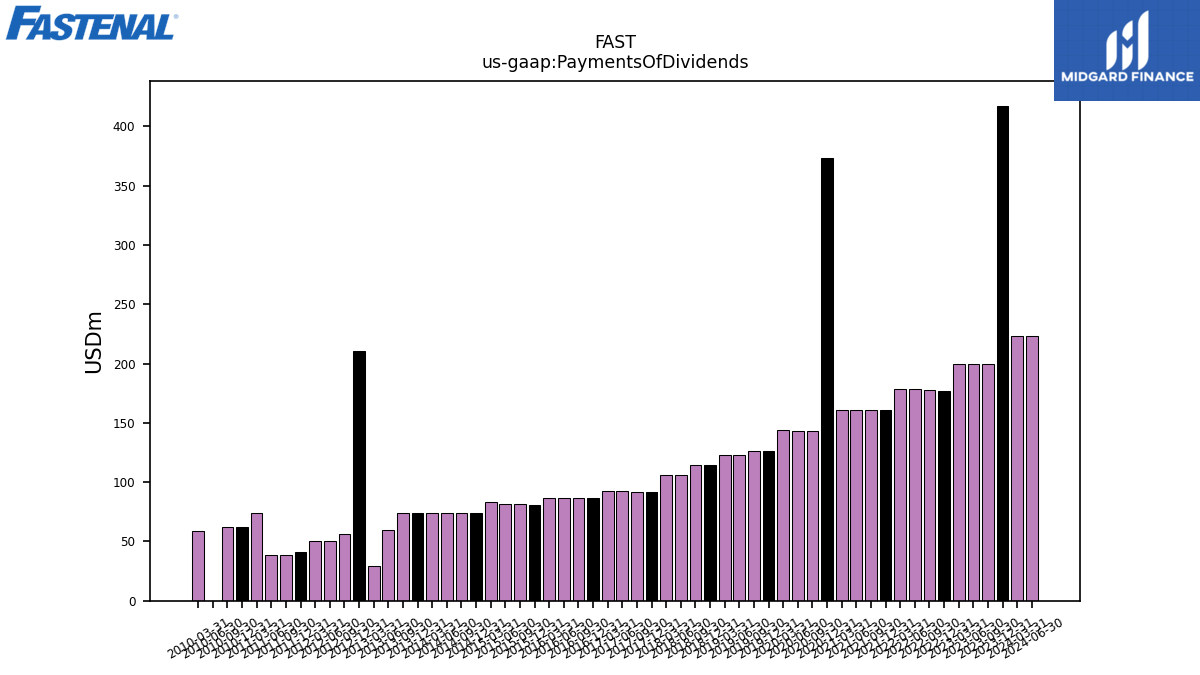
| Payments Of Dividends | 223.20 | 417.30 | 199.80 | 199.90 | 199.80 | 176.90 | 177.50 | 178.50 | 178.40 | 161.10 | 161.00 | 160.80 | 160.80 | 373.20 | 143.40 | 143.20 | 143.60 | 126.30 | 126.20 | 123.10 | 123.00 | 114.40 | 114.80 | 106.30 | 106.40 | 92.00 | 92.00 | 92.50 | 92.60 | 86.71 | 86.69 | 86.67 | 86.52 | 81.12 | 81.25 | 81.89 | 82.85 | 74.03 | 74.19 | 74.16 | 74.19 | 74.24 | 74.22 | 59.34 | 29.66 | 210.50 | 56.28 | 50.33 | 50.20 | 41.33 | 38.37 | 38.33 | 73.72 | 61.92 | 61.92 | 0.00 | 58.97 | NA | NA | NA | NA |
| 2024-03-31 | 2023-12-31 | 2023-09-30 | 2023-06-30 | 2023-03-31 | 2022-12-31 | 2022-09-30 | 2022-06-30 | 2022-03-31 | 2021-12-31 | 2021-09-30 | 2021-06-30 | 2021-03-31 | 2020-12-31 | 2020-09-30 | 2020-06-30 | 2020-03-31 | 2019-12-31 | 2019-09-30 | 2019-06-30 | 2019-03-31 | 2018-12-31 | 2018-09-30 | 2018-06-30 | 2018-03-31 | 2017-12-31 | 2017-09-30 | 2017-06-30 | 2017-03-31 | 2016-12-31 | 2016-09-30 | 2016-06-30 | 2016-03-31 | 2015-12-31 | 2015-09-30 | 2015-06-30 | 2015-03-31 | 2014-12-31 | 2014-09-30 | 2014-06-30 | 2014-03-31 | 2013-12-31 | 2013-09-30 | 2013-06-30 | 2013-03-31 | 2012-12-31 | 2012-09-30 | 2012-06-30 | 2012-03-31 | 2011-12-31 | 2011-09-30 | 2011-06-30 | 2011-03-31 | 2010-12-31 | 2010-09-30 | 2010-06-30 | 2010-03-31 | 2009-12-31 | 2009-09-30 | 2009-06-30 | 2009-03-31 | ||
|---|---|---|---|---|---|---|---|---|---|---|---|---|---|---|---|---|---|---|---|---|---|---|---|---|---|---|---|---|---|---|---|---|---|---|---|---|---|---|---|---|---|---|---|---|---|---|---|---|---|---|---|---|---|---|---|---|---|---|---|---|---|---|
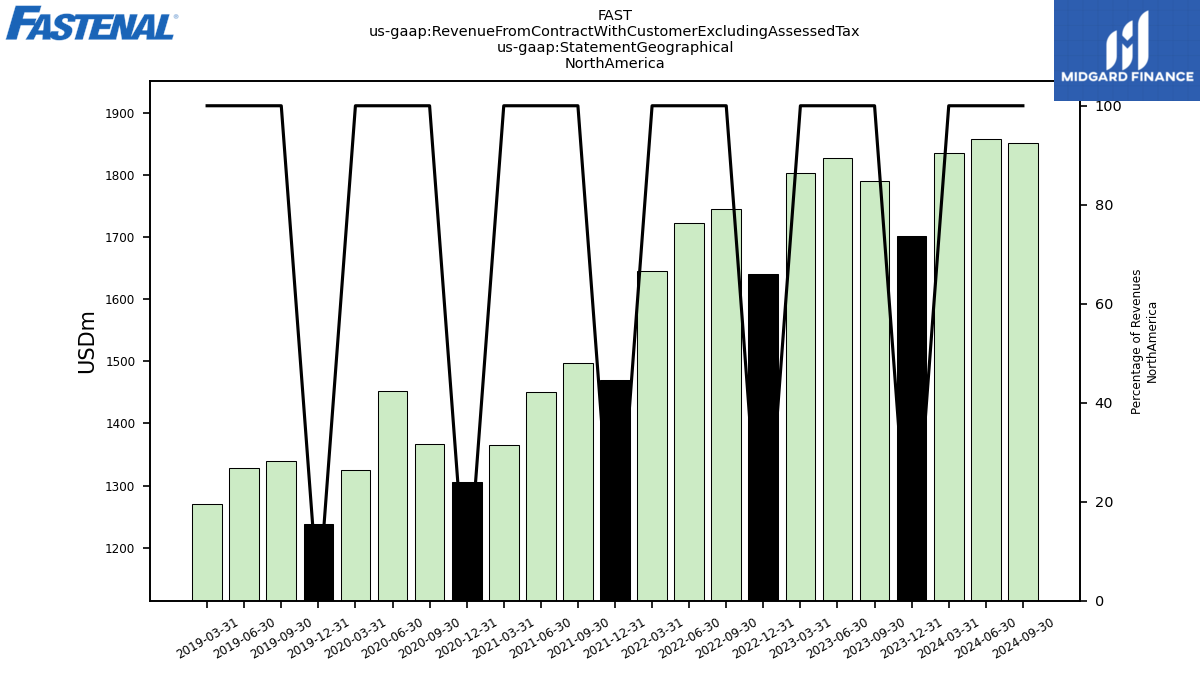
| Revenues | 1895.10 | 1758.60 | 1845.90 | 1883.10 | 1859.10 | 1695.60 | 1802.40 | 1778.60 | 1704.10 | 1531.90 | 1554.20 | 1507.70 | 1417.00 | 1358.00 | 1413.30 | 1509.00 | 1367.00 | 1276.90 | 1379.10 | 1368.40 | 1309.30 | 1231.60 | 1279.80 | 1267.90 | 1185.80 | 1088.50 | 1132.80 | 1121.50 | 1047.70 | 947.95 | 1013.12 | 1014.29 | 986.68 | 922.79 | 995.25 | 997.83 | 953.32 | 926.25 | 980.81 | 949.94 | 876.50 | 813.76 | 858.42 | 847.60 | 806.33 | 757.24 | 802.58 | 804.89 | 768.88 | 697.80 | 726.74 | 701.73 | 640.58 | 573.77 | 603.75 | 571.18 | 520.77 | 476.75 | 489.34 | 474.89 | 489.35 | |
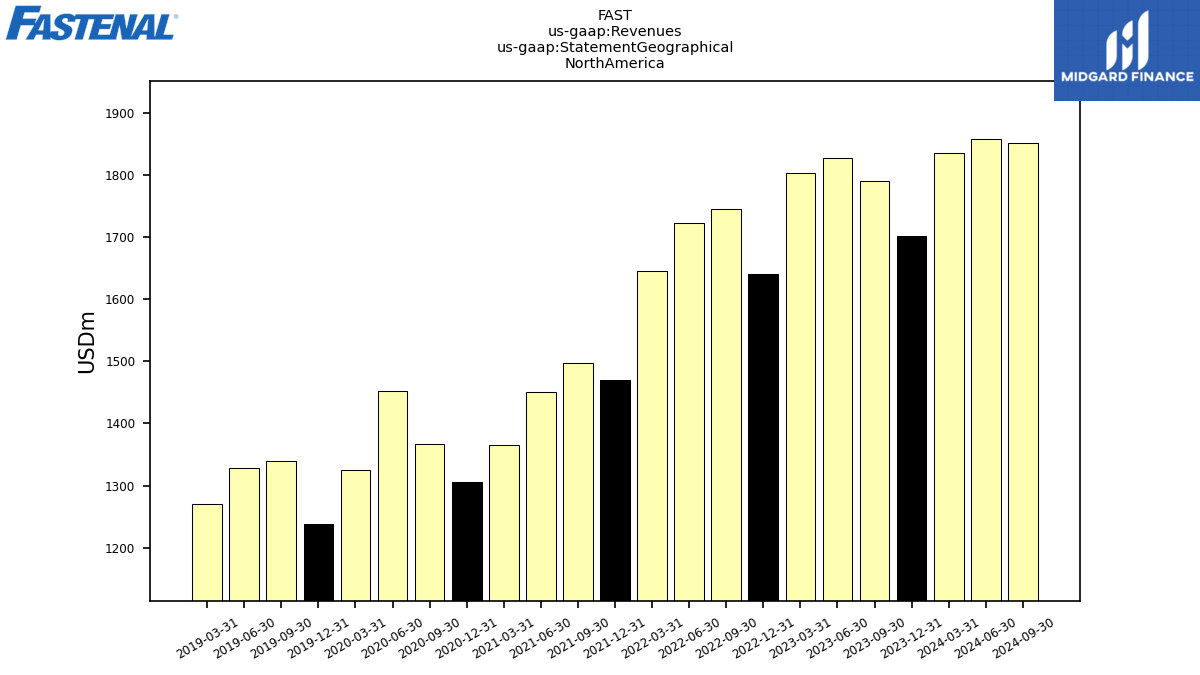
| 1834.50 | 1702.20 | 1790.30 | 1826.60 | 1802.60 | 1639.90 | 1744.80 | 1721.70 | 1645.10 | 1469.90 | 1497.40 | 1450.20 | 1364.60 | 1306.40 | 1366.30 | 1452.50 | 1325.10 | 1237.60 | 1339.20 | 1328.20 | 1270.70 | NA | NA | NA | NA | NA | NA | NA | NA | NA | NA | NA | NA | NA | NA | NA | NA | NA | NA | NA | NA | NA | NA | NA | NA | NA | NA | NA | NA | NA | NA | NA | NA | NA | NA | NA | NA | NA | NA | NA | NA | ||
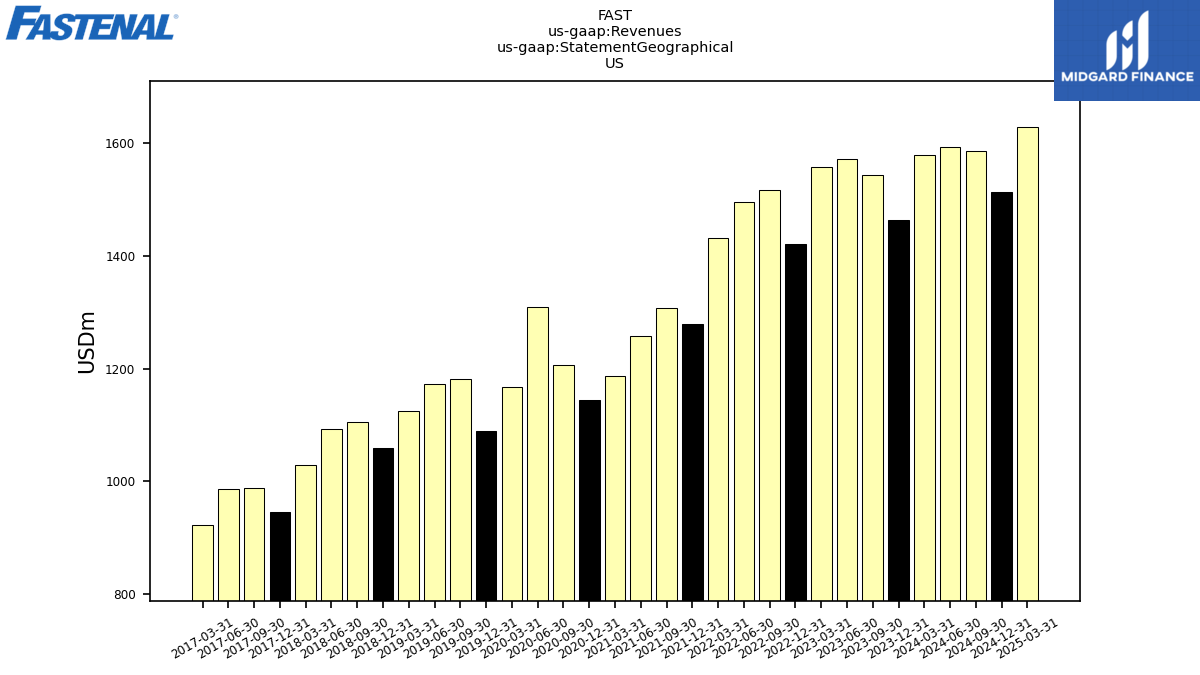
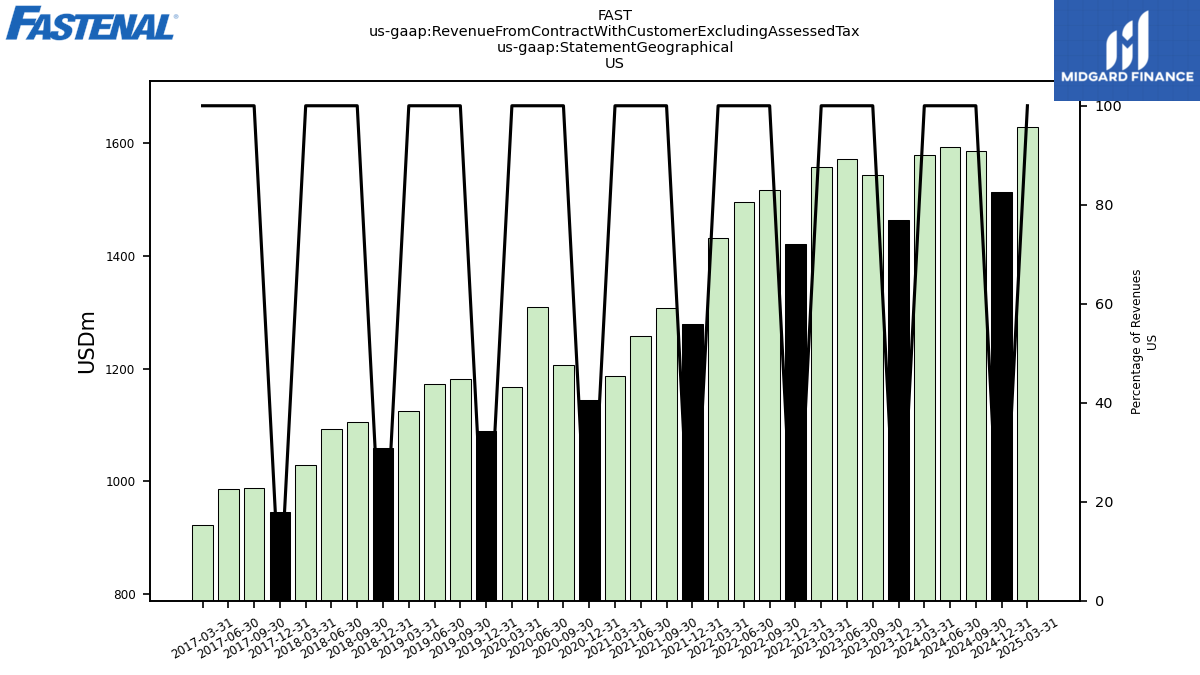
| US | 1578.90 | 1464.80 | 1544.60 | 1571.70 | 1558.70 | 1422.00 | 1516.70 | 1496.70 | 1431.70 | 1279.70 | 1307.50 | 1258.20 | 1187.80 | 1143.70 | 1205.80 | 1309.00 | 1166.70 | 1089.20 | 1182.00 | 1172.90 | 1124.80 | 1059.50 | 1104.90 | 1092.60 | 1028.50 | 945.50 | 989.00 | 986.10 | 922.30 | NA | NA | NA | NA | NA | NA | NA | NA | NA | NA | NA | NA | NA | NA | NA | NA | NA | NA | NA | NA | NA | NA | NA | NA | NA | NA | NA | NA | NA | NA | NA | NA | |
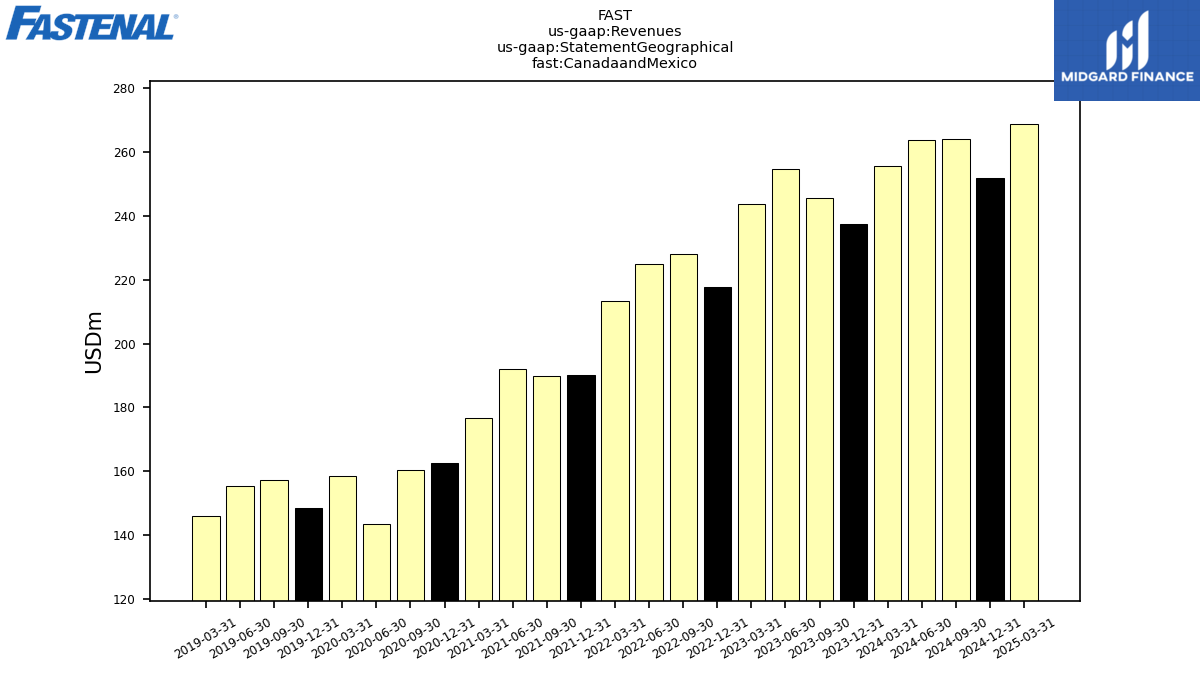
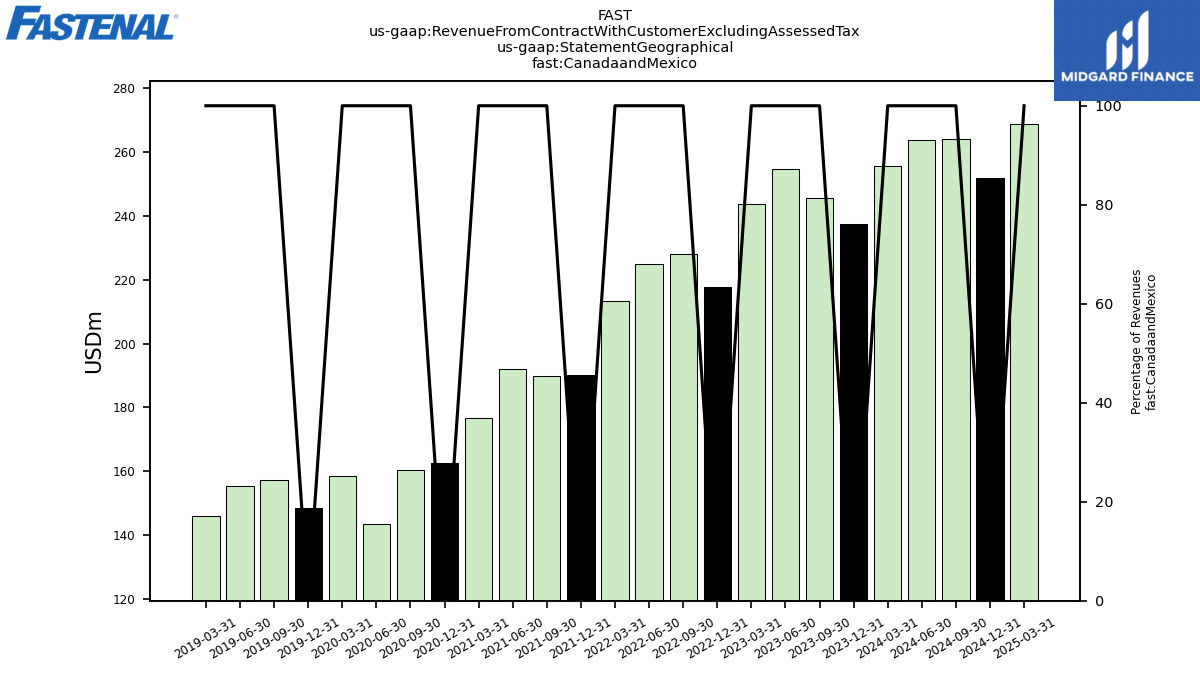
| Canadaand Mexico | 255.60 | 237.40 | 245.70 | 254.90 | 243.90 | 217.90 | 228.10 | 225.00 | 213.40 | 190.20 | 189.90 | 192.00 | 176.80 | 162.70 | 160.50 | 143.50 | 158.40 | 148.40 | 157.20 | 155.30 | 145.90 | NA | NA | NA | NA | NA | NA | NA | NA | NA | NA | NA | NA | NA | NA | NA | NA | NA | NA | NA | NA | NA | NA | NA | NA | NA | NA | NA | NA | NA | NA | NA | NA | NA | NA | NA | NA | NA | NA | NA | NA | |
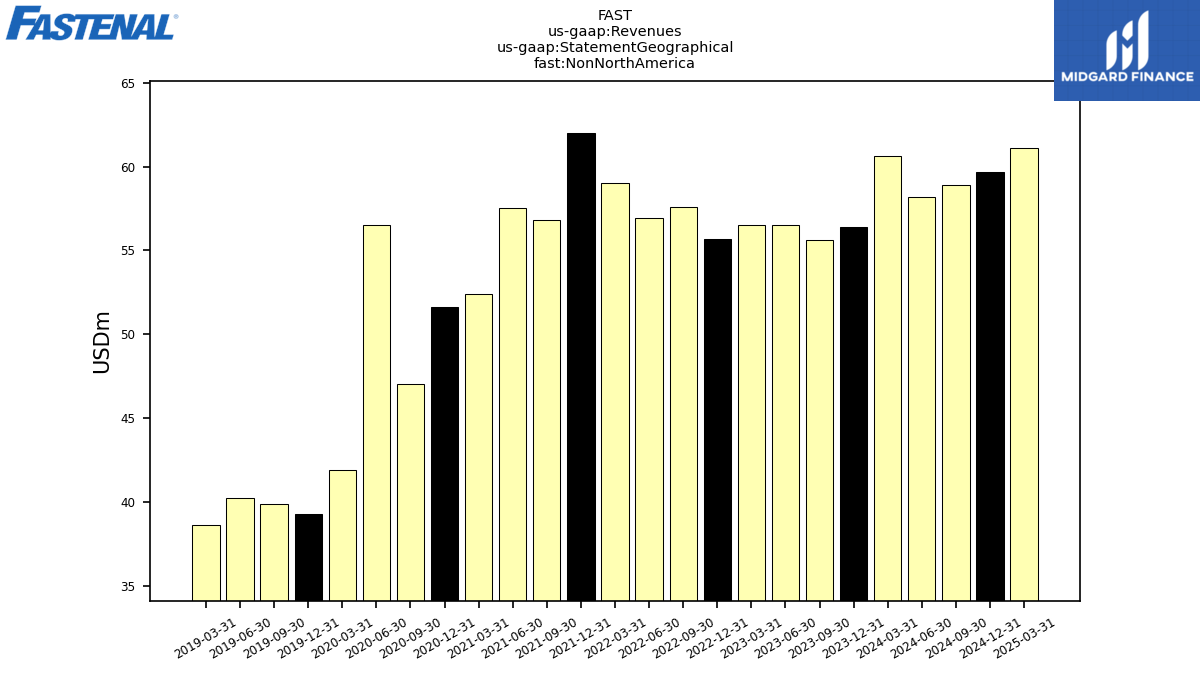
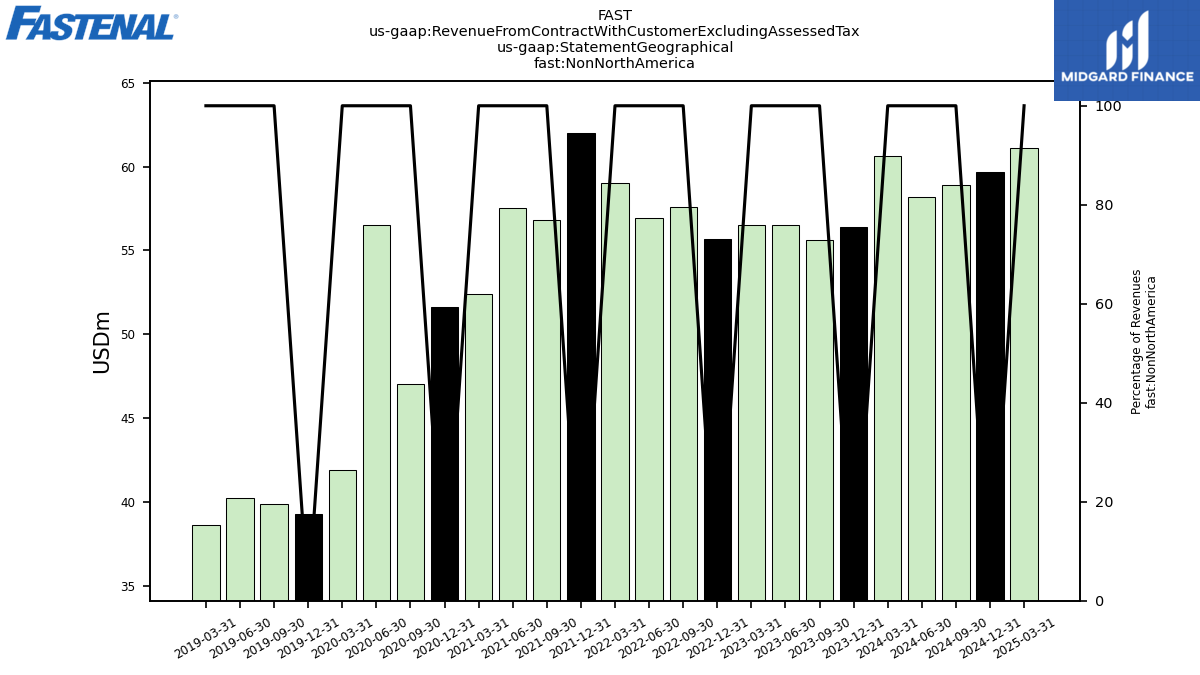
| Non North America | 60.60 | 56.40 | 55.60 | 56.50 | 56.50 | 55.70 | 57.60 | 56.90 | 59.00 | 62.00 | 56.80 | 57.50 | 52.40 | 51.60 | 47.00 | 56.50 | 41.90 | 39.30 | 39.90 | 40.20 | 38.60 | NA | NA | NA | NA | NA | NA | NA | NA | NA | NA | NA | NA | NA | NA | NA | NA | NA | NA | NA | NA | NA | NA | NA | NA | NA | NA | NA | NA | NA | NA | NA | NA | NA | NA | NA | NA | NA | NA | NA | NA | |
| Revenue From Contract With Customer Excluding Assessed Tax | 1895.10 | 1758.60 | 1845.90 | 1883.10 | 1859.10 | 1695.60 | 1802.40 | 1778.60 | 1704.10 | 1531.90 | 1554.20 | 1507.70 | 1417.00 | 1358.00 | 1413.30 | 1509.00 | 1367.00 | 1276.90 | 1379.10 | 1368.40 | 1309.30 | 1231.60 | 1279.80 | 1267.90 | 1185.80 | 1088.50 | 1132.80 | 1121.50 | 1047.70 | 947.95 | 1013.12 | 1014.29 | 986.68 | 922.79 | 995.25 | 997.83 | 953.32 | 926.25 | 980.81 | 949.94 | 876.50 | 813.76 | 858.42 | 847.60 | 806.33 | 757.24 | 802.58 | 804.89 | 768.88 | 697.80 | 726.74 | 701.73 | 640.58 | 573.77 | 603.75 | 571.18 | 520.77 | 476.75 | 489.34 | 474.89 | 489.35 | |
| 1834.50 | 1702.20 | 1790.30 | 1826.60 | 1802.60 | 1639.90 | 1744.80 | 1721.70 | 1645.10 | 1469.90 | 1497.40 | 1450.20 | 1364.60 | 1306.40 | 1366.30 | 1452.50 | 1325.10 | 1237.60 | 1339.20 | 1328.20 | 1270.70 | NA | NA | NA | NA | NA | NA | NA | NA | NA | NA | NA | NA | NA | NA | NA | NA | NA | NA | NA | NA | NA | NA | NA | NA | NA | NA | NA | NA | NA | NA | NA | NA | NA | NA | NA | NA | NA | NA | NA | NA | ||
| US | 1578.90 | 1464.80 | 1544.60 | 1571.70 | 1558.70 | 1422.00 | 1516.70 | 1496.70 | 1431.70 | 1279.70 | 1307.50 | 1258.20 | 1187.80 | 1143.70 | 1205.80 | 1309.00 | 1166.70 | 1089.20 | 1182.00 | 1172.90 | 1124.80 | 1059.50 | 1104.90 | 1092.60 | 1028.50 | 945.50 | 989.00 | 986.10 | 922.30 | NA | NA | NA | NA | NA | NA | NA | NA | NA | NA | NA | NA | NA | NA | NA | NA | NA | NA | NA | NA | NA | NA | NA | NA | NA | NA | NA | NA | NA | NA | NA | NA | |
| Canadaand Mexico | 255.60 | 237.40 | 245.70 | 254.90 | 243.90 | 217.90 | 228.10 | 225.00 | 213.40 | 190.20 | 189.90 | 192.00 | 176.80 | 162.70 | 160.50 | 143.50 | 158.40 | 148.40 | 157.20 | 155.30 | 145.90 | NA | NA | NA | NA | NA | NA | NA | NA | NA | NA | NA | NA | NA | NA | NA | NA | NA | NA | NA | NA | NA | NA | NA | NA | NA | NA | NA | NA | NA | NA | NA | NA | NA | NA | NA | NA | NA | NA | NA | NA | |
| Non North America | 60.60 | 56.40 | 55.60 | 56.50 | 56.50 | 55.70 | 57.60 | 56.90 | 59.00 | 62.00 | 56.80 | 57.50 | 52.40 | 51.60 | 47.00 | 56.50 | 41.90 | 39.30 | 39.90 | 40.20 | 38.60 | NA | NA | NA | NA | NA | NA | NA | NA | NA | NA | NA | NA | NA | NA | NA | NA | NA | NA | NA | NA | NA | NA | NA | NA | NA | NA | NA | NA | NA | NA | NA | NA | NA | NA | NA | NA | NA | NA | NA | NA |