
| 2024-03-29 | 2023-12-29 | 2023-09-29 | 2023-06-30 | 2023-03-31 | 2022-12-30 | 2022-09-30 | 2022-07-01 | 2022-04-01 | 2021-12-31 | 2021-10-01 | 2021-07-02 | 2021-04-02 | 2021-01-01 | 2020-09-25 | 2020-06-26 | 2020-03-27 | 2019-12-27 | 2019-09-27 | 2019-06-28 | 2019-03-29 | 2018-12-28 | 2018-09-28 | 2018-06-29 | 2018-03-30 | 2017-12-29 | 2017-09-29 | 2017-06-30 | 2017-03-31 | 2016-12-30 | 2016-09-30 | 2016-07-01 | 2016-04-01 | 2016-01-01 | 2015-09-25 | 2015-06-26 | 2015-03-27 | 2014-12-26 | 2014-09-26 | 2014-06-27 | 2014-03-28 | 2013-12-27 | 2013-09-27 | 2013-06-28 | 2013-03-29 | 2012-12-28 | 2012-09-28 | 2012-06-29 | 2012-03-30 | 2011-12-30 | 2011-09-30 | 2011-07-01 | 2011-04-01 | 2010-12-31 | 2010-10-01 | 2010-07-02 | 2010-04-02 | ||
|---|---|---|---|---|---|---|---|---|---|---|---|---|---|---|---|---|---|---|---|---|---|---|---|---|---|---|---|---|---|---|---|---|---|---|---|---|---|---|---|---|---|---|---|---|---|---|---|---|---|---|---|---|---|---|---|---|---|---|
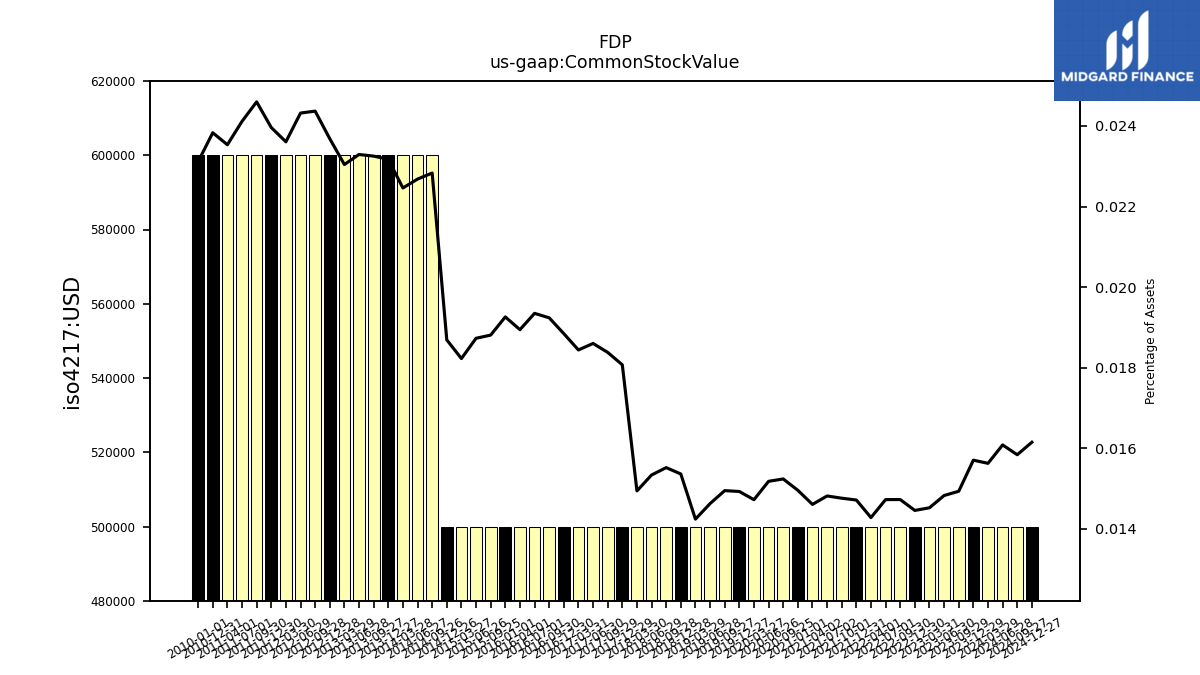
| Common Stock Value | 0.50 | 0.50 | 0.50 | 0.50 | 0.50 | 0.50 | 0.50 | 0.50 | 0.50 | 0.50 | 0.50 | 0.50 | 0.50 | 0.50 | 0.50 | 0.50 | 0.50 | 0.50 | 0.50 | 0.50 | 0.50 | 0.50 | 0.50 | 0.50 | 0.50 | 0.50 | 0.50 | 0.50 | 0.50 | 0.50 | 0.50 | 0.50 | 0.50 | 0.50 | 0.50 | 0.50 | 0.50 | 0.50 | 0.60 | 0.60 | 0.60 | 0.60 | 0.60 | 0.60 | 0.60 | 0.60 | 0.60 | 0.60 | 0.60 | 0.60 | 0.60 | 0.60 | 0.60 | 0.60 | NA | NA | NA | |
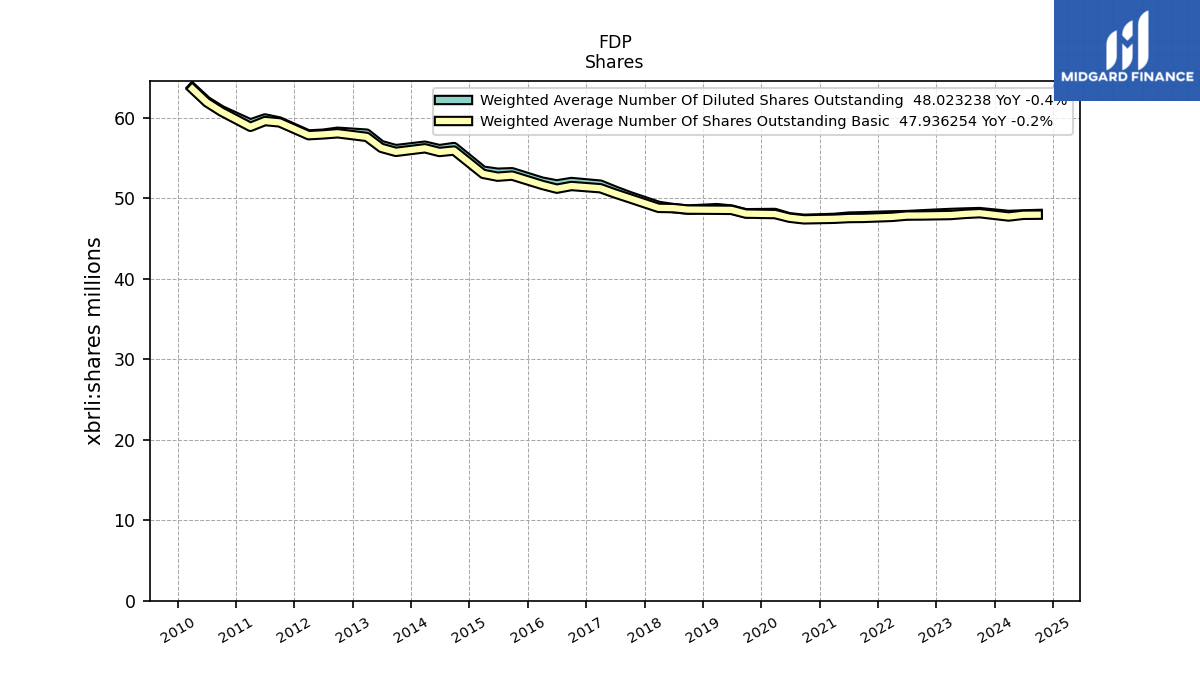
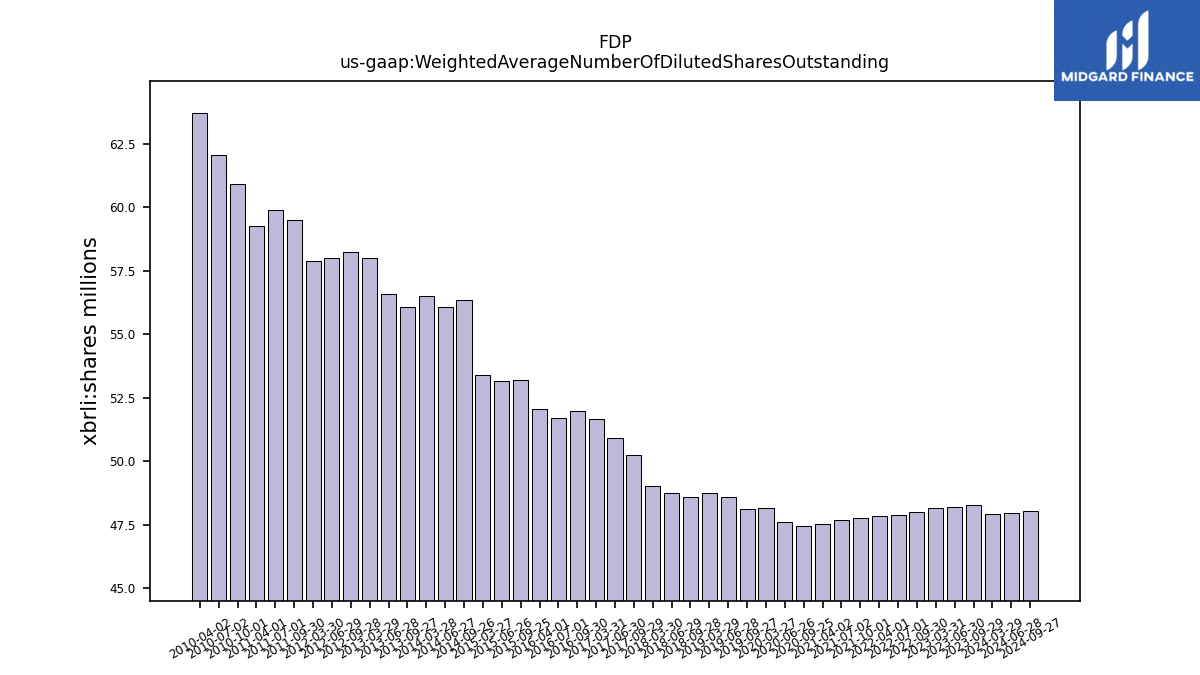
| Weighted Average Number Of Diluted Shares Outstanding | 47.90 | NA | 48.26 | 48.21 | 48.15 | NA | 47.98 | 47.89 | 47.86 | NA | 47.74 | 47.70 | 47.54 | NA | 47.43 | 47.61 | 48.15 | NA | 48.12 | 48.58 | 48.75 | NA | 48.57 | 48.75 | 49.03 | NA | 50.25 | 50.93 | 51.67 | NA | 51.99 | 51.70 | 52.04 | NA | 53.21 | 53.15 | 53.41 | NA | 56.34 | 56.08 | 56.51 | NA | 56.08 | 56.58 | 58.00 | NA | 58.24 | 58.00 | 57.90 | NA | 59.51 | 59.89 | 59.27 | NA | 60.92 | 62.05 | 63.72 | |
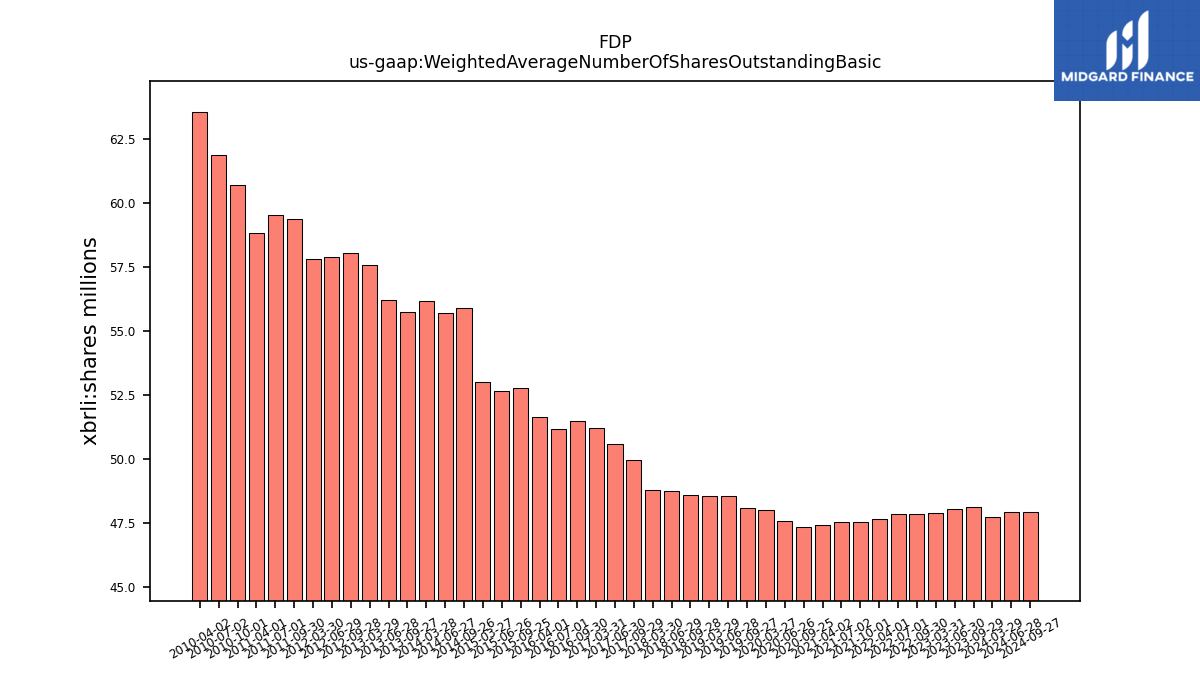
| Weighted Average Number Of Shares Outstanding Basic | 47.71 | NA | 48.12 | 48.03 | 47.89 | NA | 47.84 | 47.83 | 47.67 | NA | 47.54 | 47.52 | 47.43 | NA | 47.36 | 47.56 | 48.01 | NA | 48.07 | 48.53 | 48.55 | NA | 48.57 | 48.75 | 48.78 | NA | 49.98 | 50.57 | 51.22 | NA | 51.50 | 51.16 | 51.63 | NA | 52.79 | 52.66 | 53.01 | NA | 55.90 | 55.72 | 56.18 | NA | 55.74 | 56.24 | 57.59 | NA | 58.04 | 57.91 | 57.81 | NA | 59.39 | 59.56 | 58.84 | NA | 60.74 | 61.88 | 63.57 | |
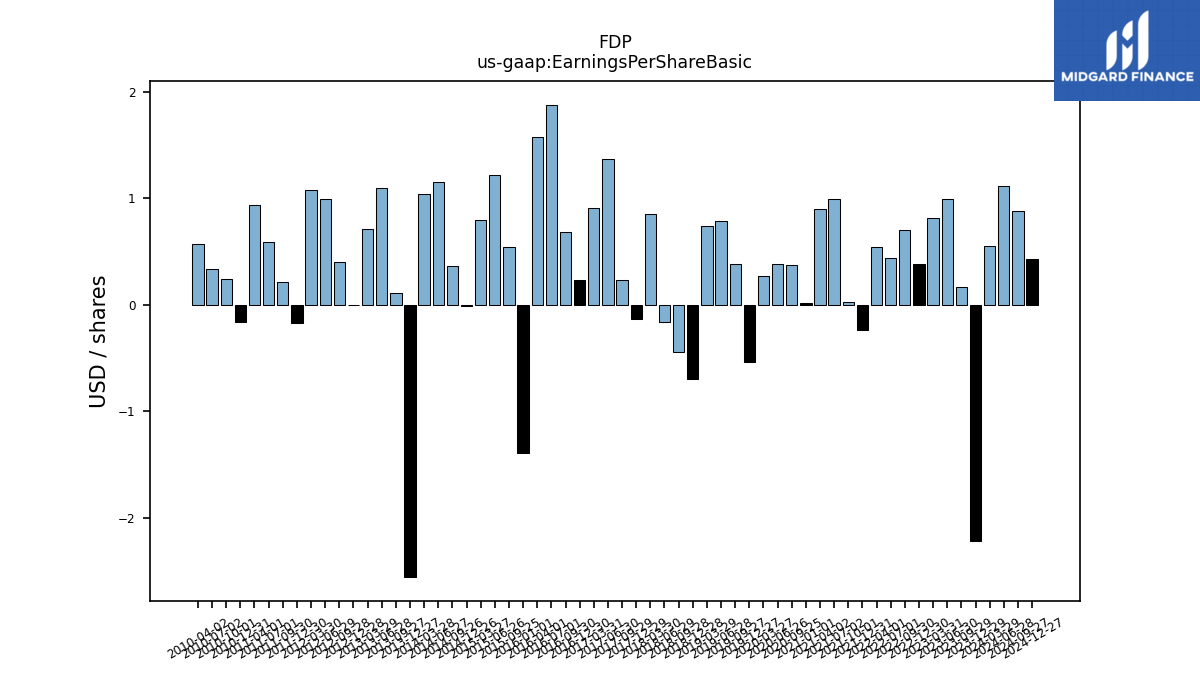
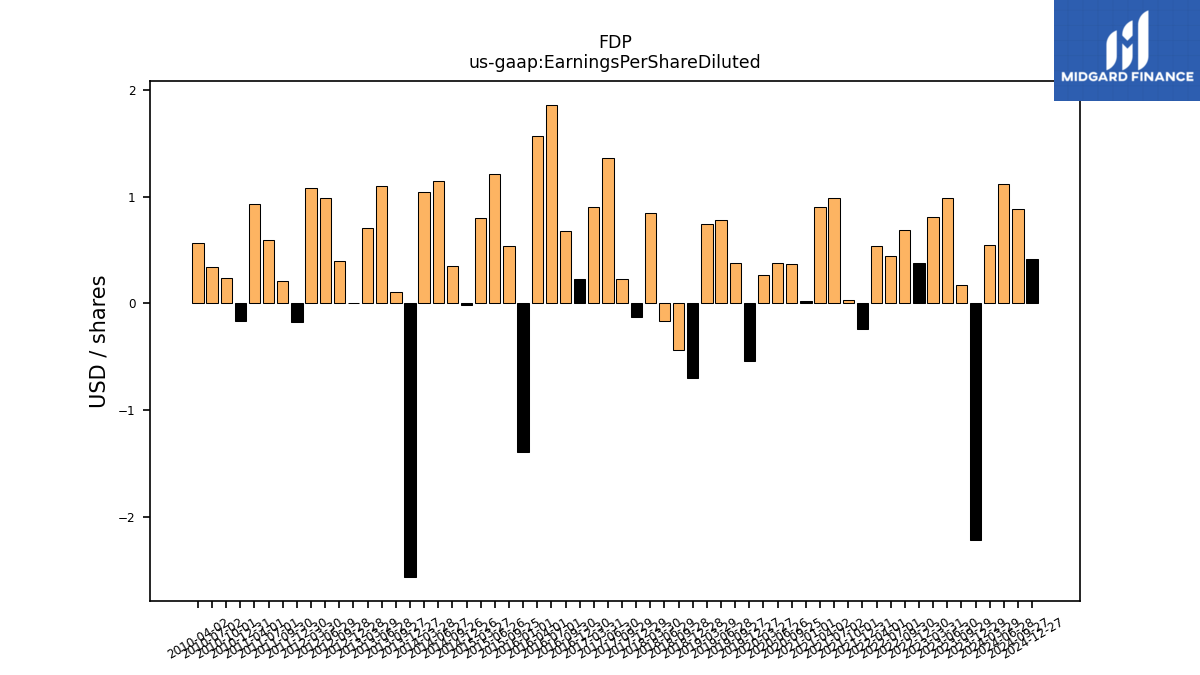
| Earnings Per Share Basic | 0.55 | -2.22 | 0.17 | 0.99 | 0.81 | 0.38 | 0.70 | 0.44 | 0.54 | -0.24 | 0.03 | 0.99 | 0.90 | 0.02 | 0.37 | 0.38 | 0.27 | -0.54 | 0.38 | 0.79 | 0.74 | -0.70 | -0.44 | -0.16 | 0.85 | -0.13 | 0.23 | 1.37 | 0.91 | 0.23 | 0.68 | 1.88 | 1.58 | -1.39 | 0.54 | 1.22 | 0.80 | -0.01 | 0.36 | 1.15 | 1.04 | -2.56 | 0.11 | 1.10 | 0.71 | 0.00 | 0.40 | 0.99 | 1.08 | -0.17 | 0.21 | 0.59 | 0.94 | -0.16 | 0.24 | 0.34 | 0.57 | |
| Earnings Per Share Diluted | 0.55 | -2.21 | 0.17 | 0.99 | 0.81 | 0.38 | 0.69 | 0.44 | 0.54 | -0.24 | 0.03 | 0.99 | 0.90 | 0.02 | 0.37 | 0.38 | 0.27 | -0.54 | 0.38 | 0.78 | 0.74 | -0.70 | -0.44 | -0.16 | 0.85 | -0.13 | 0.23 | 1.36 | 0.90 | 0.23 | 0.68 | 1.86 | 1.57 | -1.39 | 0.54 | 1.21 | 0.80 | -0.01 | 0.35 | 1.15 | 1.04 | -2.56 | 0.11 | 1.10 | 0.71 | 0.00 | 0.40 | 0.99 | 1.08 | -0.17 | 0.21 | 0.59 | 0.93 | -0.16 | 0.24 | 0.34 | 0.57 |
| 2024-03-29 | 2023-12-29 | 2023-09-29 | 2023-06-30 | 2023-03-31 | 2022-12-30 | 2022-09-30 | 2022-07-01 | 2022-04-01 | 2021-12-31 | 2021-10-01 | 2021-07-02 | 2021-04-02 | 2021-01-01 | 2020-09-25 | 2020-06-26 | 2020-03-27 | 2019-12-27 | 2019-09-27 | 2019-06-28 | 2019-03-29 | 2018-12-28 | 2018-09-28 | 2018-06-29 | 2018-03-30 | 2017-12-29 | 2017-09-29 | 2017-06-30 | 2017-03-31 | 2016-12-30 | 2016-09-30 | 2016-07-01 | 2016-04-01 | 2016-01-01 | 2015-09-25 | 2015-06-26 | 2015-03-27 | 2014-12-26 | 2014-09-26 | 2014-06-27 | 2014-03-28 | 2013-12-27 | 2013-09-27 | 2013-06-28 | 2013-03-29 | 2012-12-28 | 2012-09-28 | 2012-06-29 | 2012-03-30 | 2011-12-30 | 2011-09-30 | 2011-07-01 | 2011-04-01 | 2010-12-31 | 2010-10-01 | 2010-07-02 | 2010-04-02 | ||
|---|---|---|---|---|---|---|---|---|---|---|---|---|---|---|---|---|---|---|---|---|---|---|---|---|---|---|---|---|---|---|---|---|---|---|---|---|---|---|---|---|---|---|---|---|---|---|---|---|---|---|---|---|---|---|---|---|---|---|
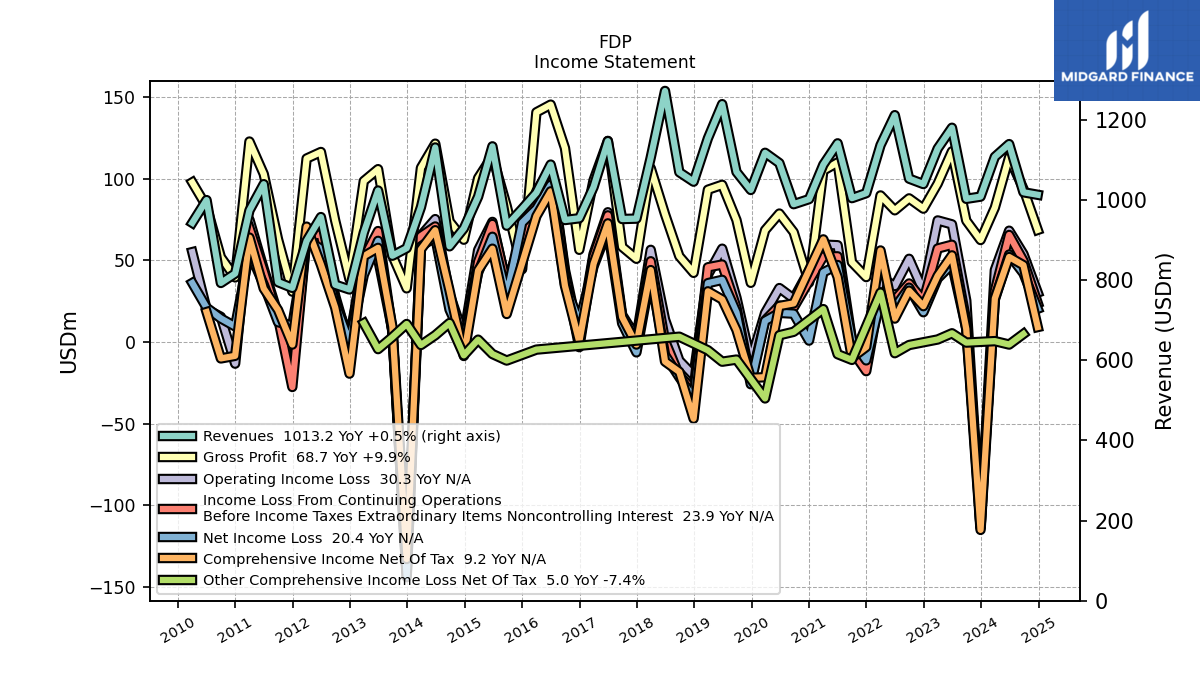
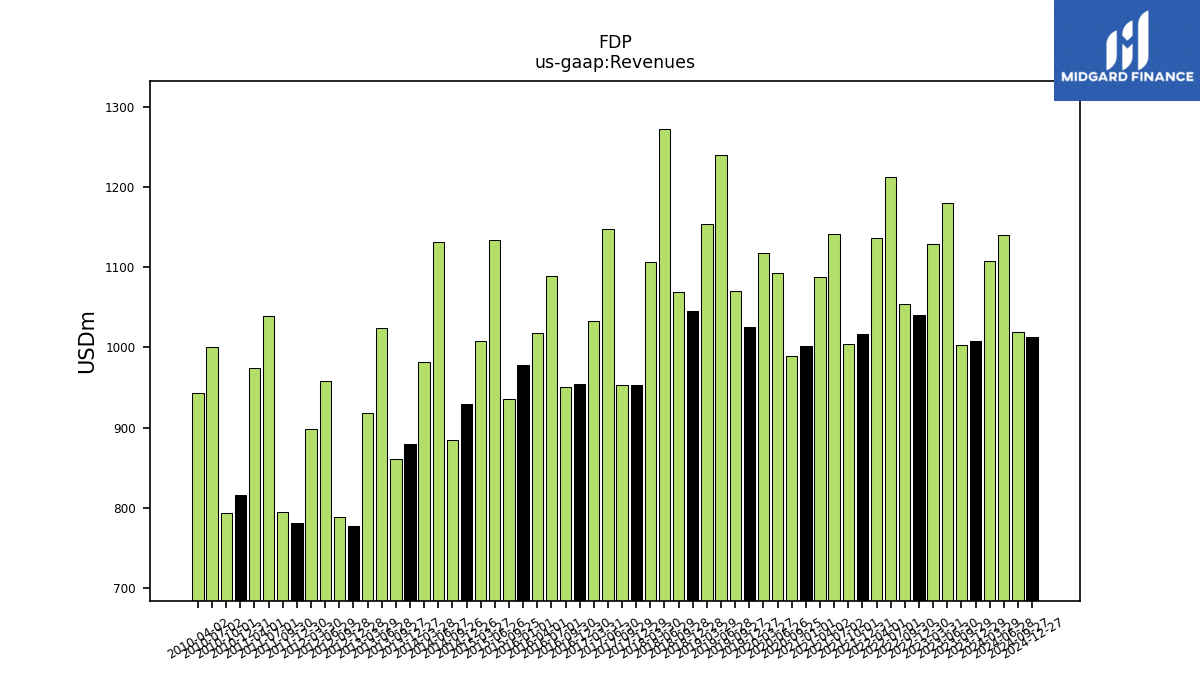
| Revenues | 1107.90 | 1008.60 | 1003.10 | 1180.50 | 1128.50 | 1040.00 | 1053.50 | 1211.90 | 1136.90 | 1017.30 | 1004.80 | 1141.60 | 1088.30 | 1002.30 | 989.70 | 1092.30 | 1118.00 | 1025.20 | 1070.20 | 1239.40 | 1154.20 | 1045.90 | 1069.50 | 1272.40 | 1106.10 | 953.70 | 952.70 | 1147.10 | 1032.40 | 954.60 | 950.20 | 1088.60 | 1018.10 | 977.90 | 936.10 | 1134.10 | 1008.40 | 929.30 | 884.60 | 1131.30 | 982.30 | 879.90 | 861.10 | 1023.90 | 918.80 | 776.90 | 788.80 | 957.60 | 897.90 | 780.80 | 795.20 | 1039.70 | 974.00 | 816.70 | 793.10 | 1000.00 | 943.10 | |
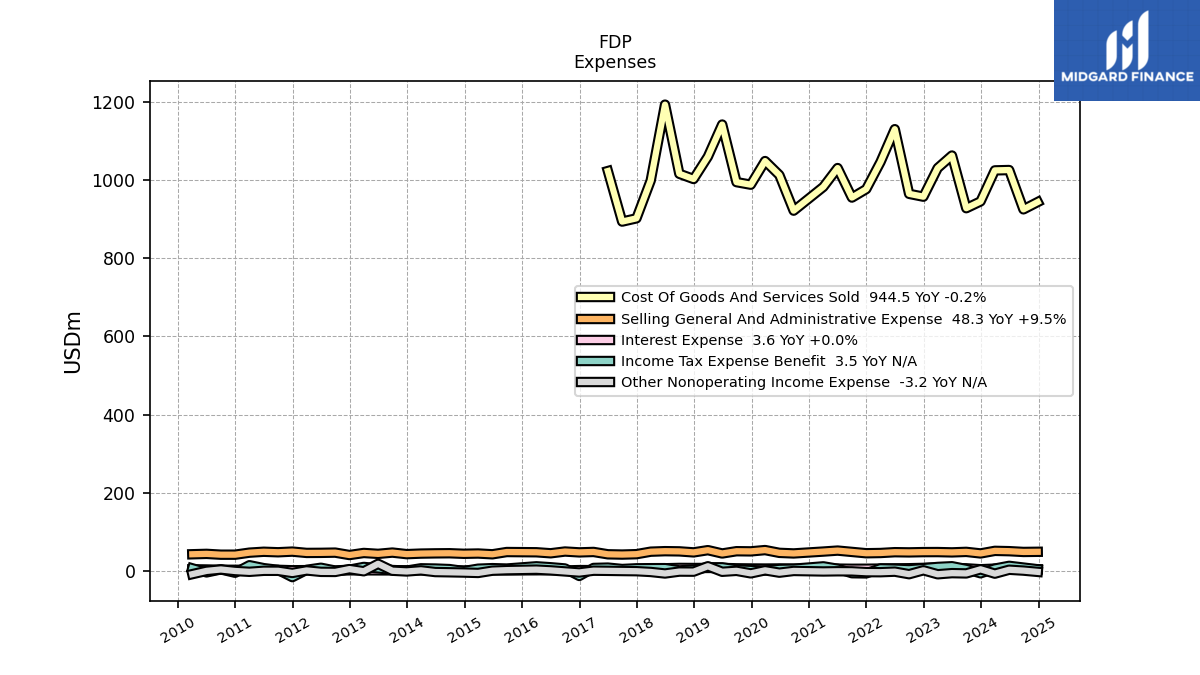
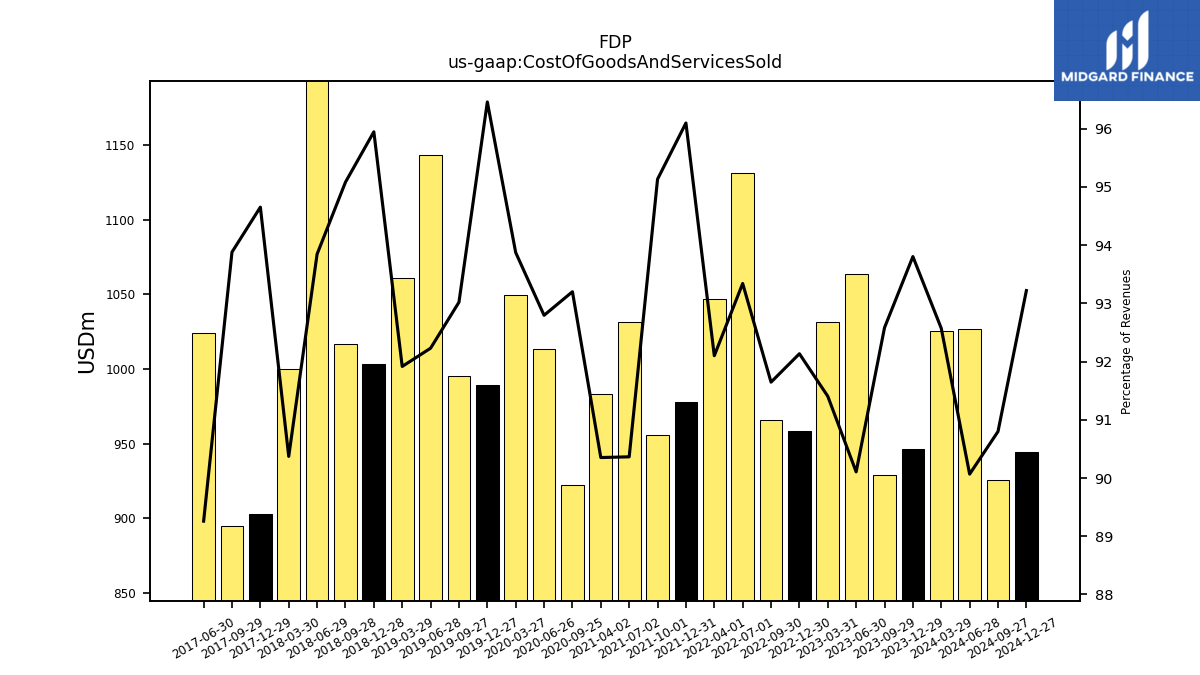
| Cost Of Goods And Services Sold | 1025.60 | 946.10 | 928.70 | 1063.70 | 1031.50 | 958.20 | 965.50 | 1131.20 | 1047.10 | 977.60 | 955.90 | 1031.60 | 983.30 | NA | 922.40 | 1013.60 | 1049.50 | 988.90 | 995.50 | 1143.10 | 1060.90 | 1003.50 | 1016.90 | 1194.10 | 999.60 | 902.70 | 894.40 | 1023.90 | NA | NA | NA | NA | NA | NA | NA | NA | NA | NA | NA | NA | NA | NA | NA | NA | NA | NA | NA | NA | NA | NA | NA | NA | NA | NA | NA | NA | NA | |
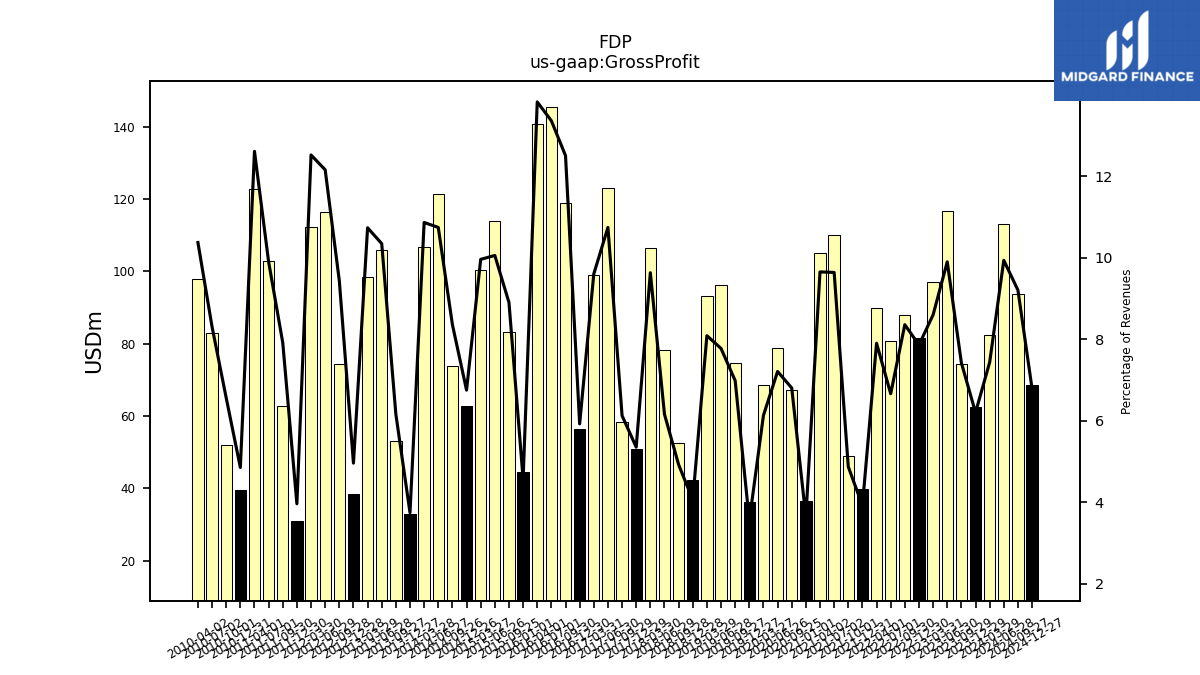
| Gross Profit | 82.30 | 62.50 | 74.40 | 116.80 | 97.00 | 81.70 | 88.00 | 80.70 | 89.80 | 39.80 | 48.90 | 110.00 | 105.00 | 36.40 | 67.30 | 78.70 | 68.50 | 36.30 | 74.70 | 96.30 | 93.30 | 42.40 | 52.60 | 78.30 | 106.50 | 51.00 | 58.30 | 123.20 | 99.10 | 56.50 | 118.80 | 145.40 | 140.70 | 44.60 | 83.30 | 114.00 | 100.40 | 62.70 | 73.90 | 121.50 | 106.70 | 32.90 | 53.00 | 105.90 | 98.60 | 38.50 | 74.40 | 116.40 | 112.40 | 30.90 | 62.90 | 102.90 | 122.80 | 39.60 | 52.00 | 83.00 | 97.80 | |
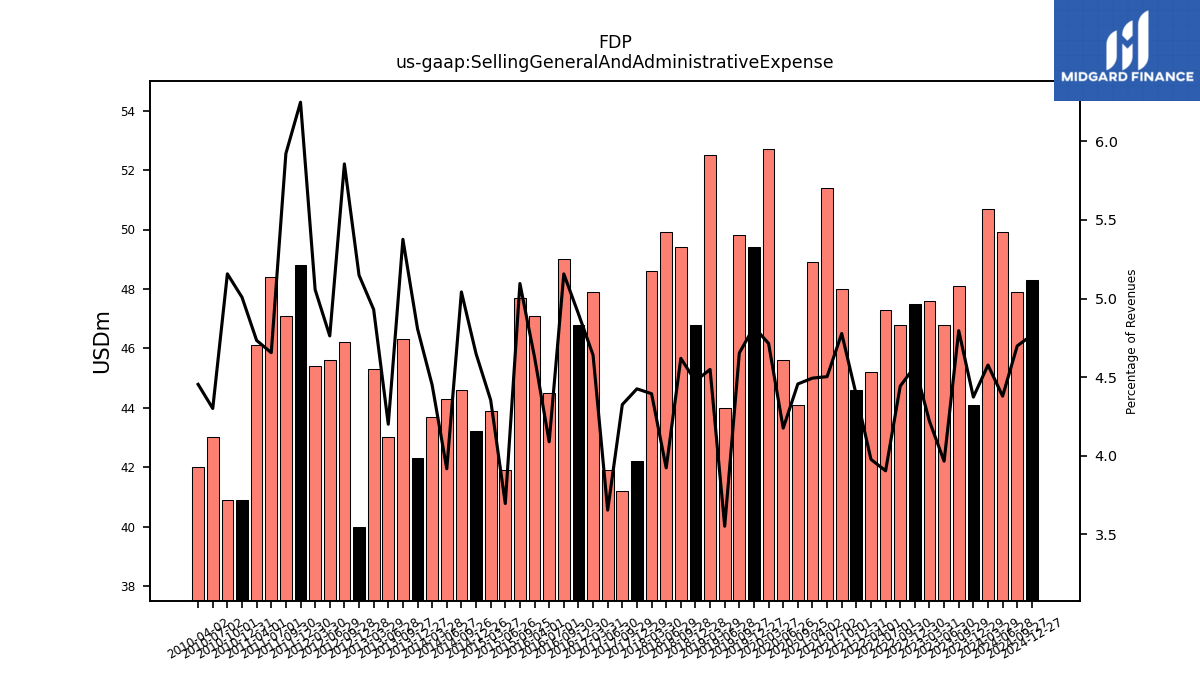
| Selling General And Administrative Expense | 50.70 | 44.10 | 48.10 | 46.80 | 47.60 | 47.50 | 46.80 | 47.30 | 45.20 | 44.60 | 48.00 | 51.40 | 48.90 | NA | 44.10 | 45.60 | 52.70 | 49.40 | 49.80 | 44.00 | 52.50 | 46.80 | 49.40 | 49.90 | 48.60 | 42.20 | 41.20 | 41.90 | 47.90 | 46.80 | 49.00 | 44.50 | 47.10 | NA | 47.70 | 41.90 | 43.90 | 43.20 | 44.60 | 44.30 | 43.70 | 42.30 | 46.30 | 43.00 | 45.30 | 40.00 | 46.20 | 45.60 | 45.40 | 48.80 | 47.10 | 48.40 | 46.10 | 40.90 | 40.90 | 43.00 | 42.00 | |
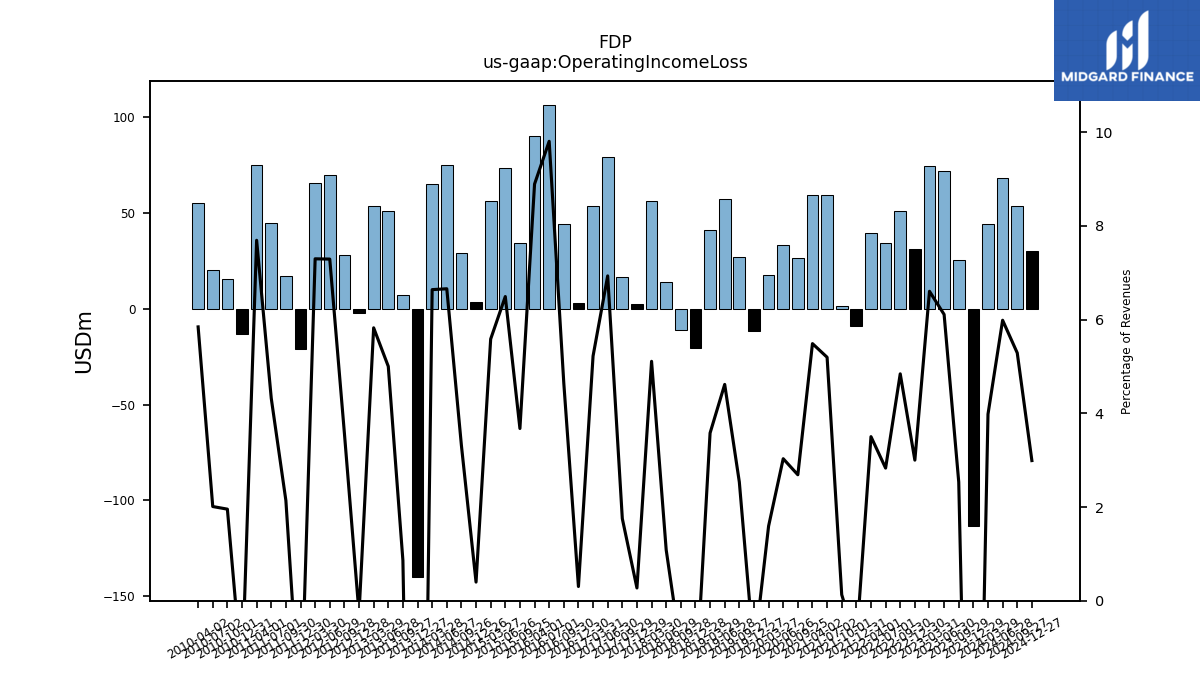
| Operating Income Loss | 44.10 | -113.40 | 25.40 | 72.10 | 74.50 | 31.20 | 51.00 | 34.30 | 39.80 | -9.20 | 1.30 | 59.30 | 59.70 | NA | 26.60 | 33.10 | 17.80 | -11.50 | 27.10 | 57.20 | 41.30 | -20.40 | -11.30 | 13.80 | 56.50 | 2.60 | 16.70 | 79.50 | 53.90 | 2.90 | 44.10 | 106.70 | 90.50 | NA | 34.40 | 73.60 | 56.30 | 3.70 | 29.30 | 75.30 | 65.20 | -140.20 | 7.40 | 51.20 | 53.50 | -2.10 | 28.20 | 69.80 | 65.50 | -20.90 | 17.00 | 44.90 | 74.90 | -13.20 | 15.50 | 20.10 | 55.10 | |
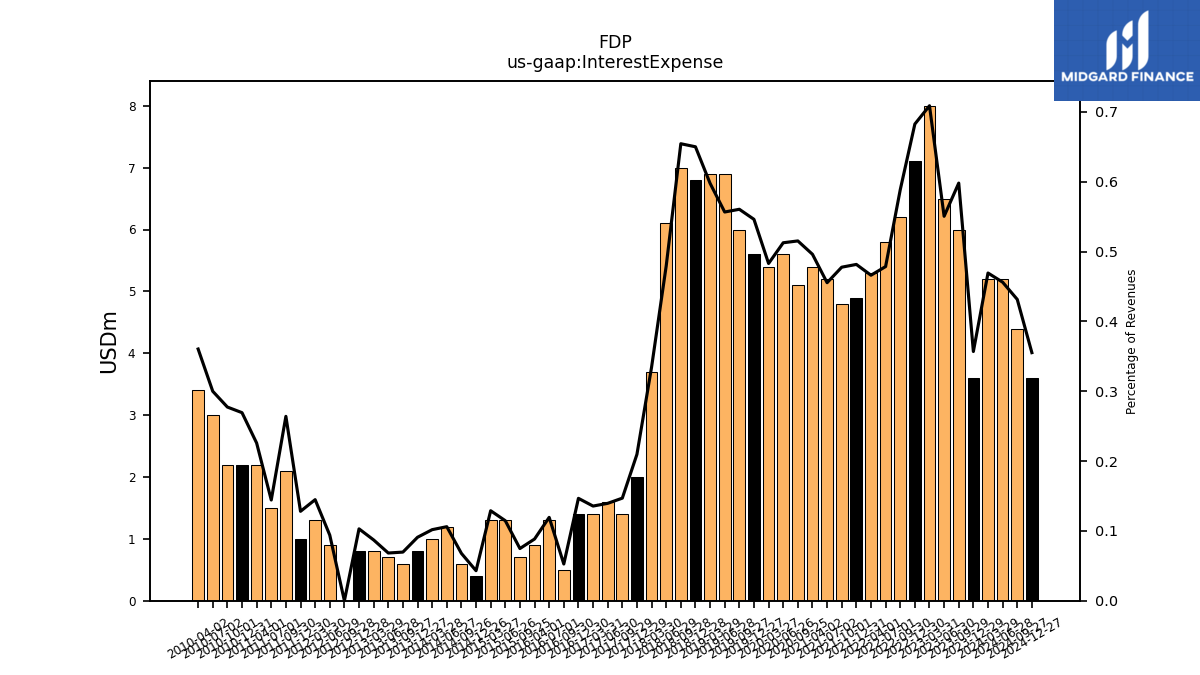
| Interest Expense | 5.20 | 3.60 | 6.00 | 6.50 | 8.00 | 7.10 | 6.20 | 5.80 | 5.30 | 4.90 | 4.80 | 5.20 | 5.40 | NA | 5.10 | 5.60 | 5.40 | 5.60 | 6.00 | 6.90 | 6.90 | 6.80 | 7.00 | 6.10 | 3.70 | 2.00 | 1.40 | 1.60 | 1.40 | 1.40 | 0.50 | 1.30 | 0.90 | NA | 0.70 | 1.30 | 1.30 | 0.40 | 0.60 | 1.20 | 1.00 | 0.80 | 0.60 | 0.70 | 0.80 | 0.80 | 0.00 | 0.90 | 1.30 | 1.00 | 2.10 | 1.50 | 2.20 | 2.20 | 2.20 | 3.00 | 3.40 | |
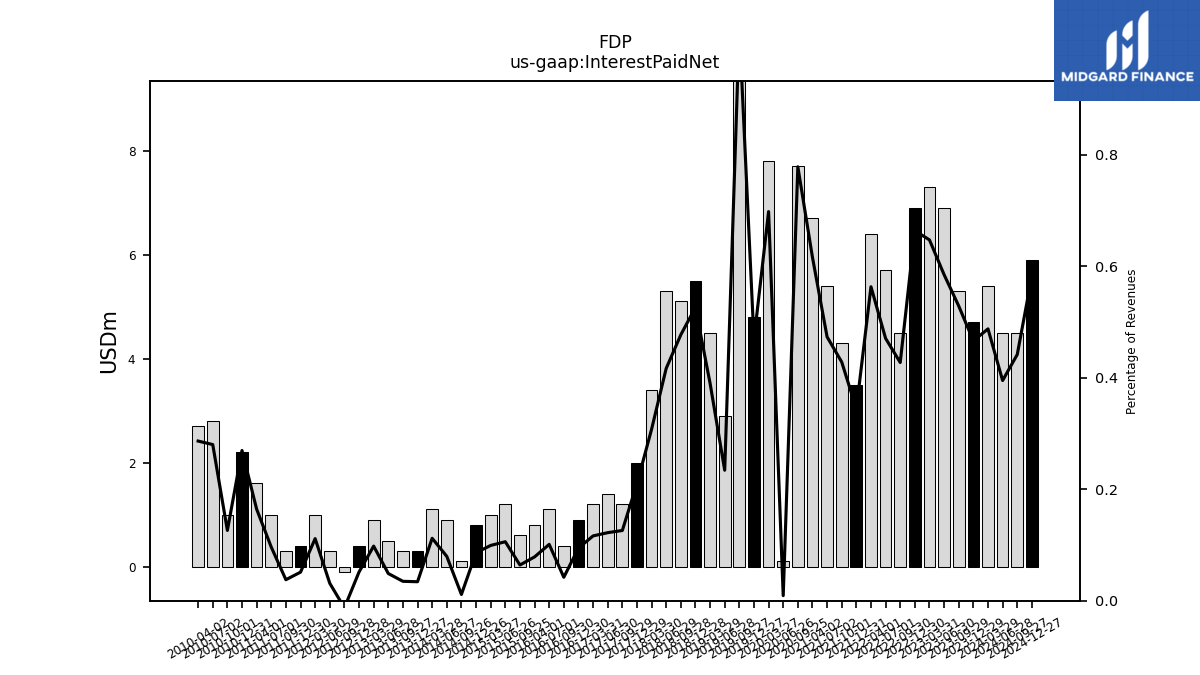
| Interest Paid Net | 5.40 | 4.70 | 5.30 | 6.90 | 7.30 | 6.90 | 4.50 | 5.70 | 6.40 | 3.50 | 4.30 | 5.40 | 6.70 | NA | 7.70 | 0.10 | 7.80 | 4.80 | 11.00 | 2.90 | 4.50 | 5.50 | 5.10 | 5.30 | 3.40 | 2.00 | 1.20 | 1.40 | 1.20 | 0.90 | 0.40 | 1.10 | 0.80 | NA | 0.60 | 1.20 | 1.00 | 0.80 | 0.10 | 0.90 | 1.10 | 0.30 | 0.30 | 0.50 | 0.90 | 0.40 | -0.10 | 0.30 | 1.00 | 0.40 | 0.30 | 1.00 | 1.60 | 2.20 | 1.00 | 2.80 | 2.70 | |
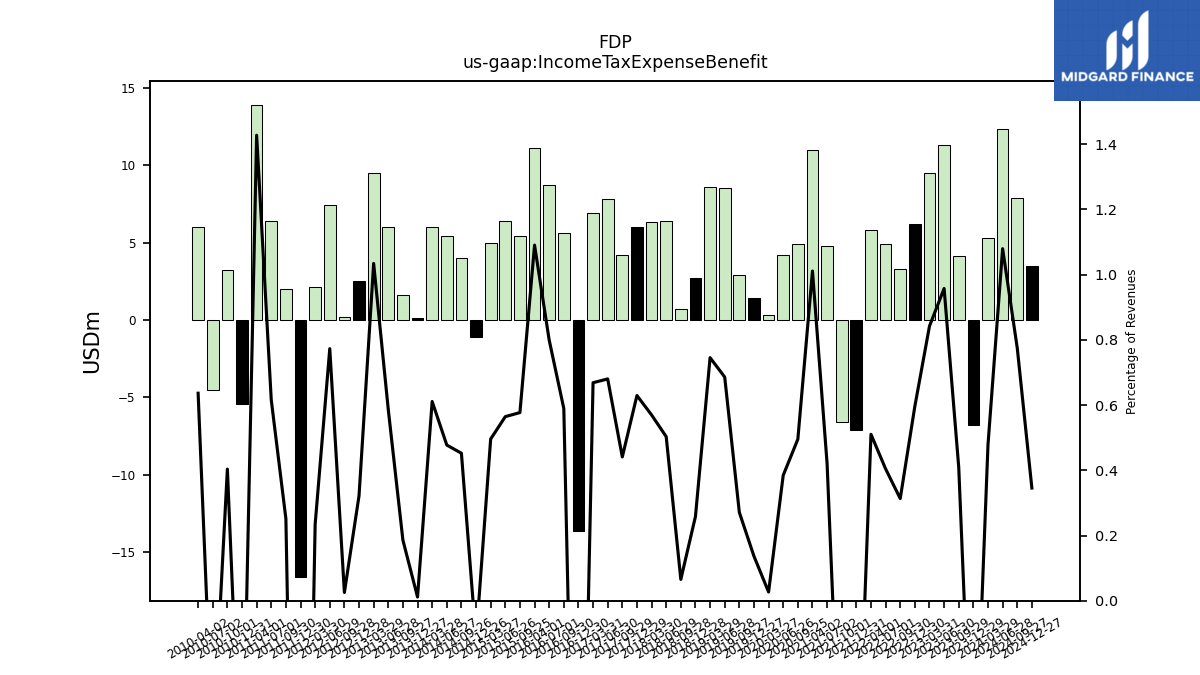
| Income Tax Expense Benefit | 5.30 | -6.80 | 4.10 | 11.30 | 9.50 | 6.20 | 3.30 | 4.90 | 5.80 | -7.10 | -6.60 | 4.80 | 11.00 | NA | 4.90 | 4.20 | 0.30 | 1.40 | 2.90 | 8.50 | 8.60 | 2.70 | 0.70 | 6.40 | 6.30 | 6.00 | 4.20 | 7.80 | 6.90 | -13.60 | 5.60 | 8.70 | 11.10 | NA | 5.40 | 6.40 | 5.00 | -1.10 | 4.00 | 5.40 | 6.00 | 0.10 | 1.60 | 6.00 | 9.50 | 2.50 | 0.20 | 7.40 | 2.10 | -16.60 | 2.00 | 6.40 | 13.90 | -5.40 | 3.20 | -4.50 | 6.00 | |
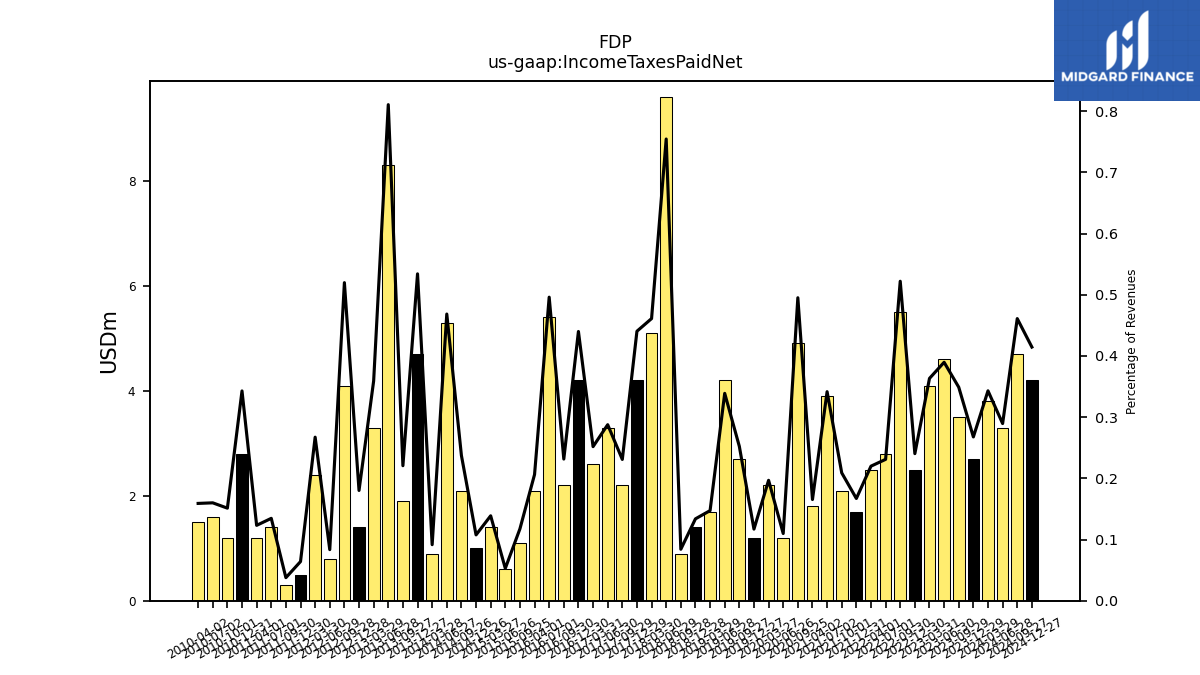
| Income Taxes Paid Net | 3.80 | 2.70 | 3.50 | 4.60 | 4.10 | 2.50 | 5.50 | 2.80 | 2.50 | 1.70 | 2.10 | 3.90 | 1.80 | NA | 4.90 | 1.20 | 2.20 | 1.20 | 2.70 | 4.20 | 1.70 | 1.40 | 0.90 | 9.60 | 5.10 | 4.20 | 2.20 | 3.30 | 2.60 | 4.20 | 2.20 | 5.40 | 2.10 | NA | 1.10 | 0.60 | 1.40 | 1.00 | 2.10 | 5.30 | 0.90 | 4.70 | 1.90 | 8.30 | 3.30 | 1.40 | 4.10 | 0.80 | 2.40 | 0.50 | 0.30 | 1.40 | 1.20 | 2.80 | 1.20 | 1.60 | 1.50 | |
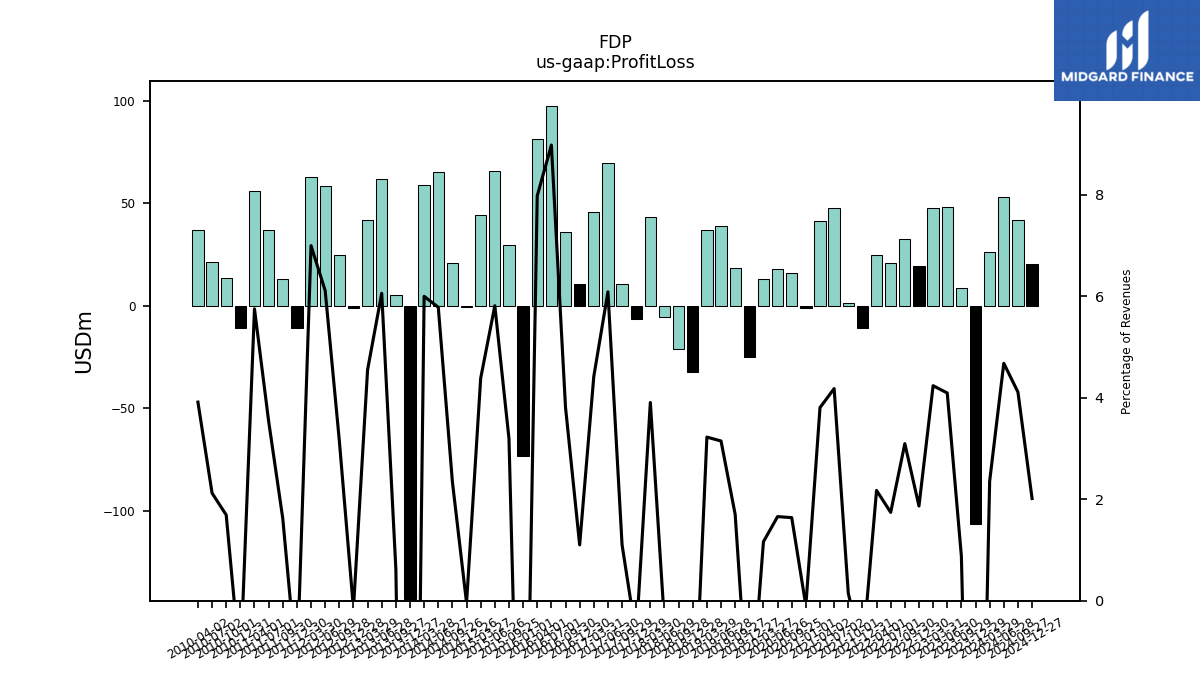
| Profit Loss | 26.10 | -106.50 | 8.80 | 48.30 | 47.80 | 19.40 | 32.60 | 21.10 | 24.70 | -10.70 | 1.50 | 47.70 | 41.40 | -1.00 | 16.20 | 18.10 | 13.00 | -25.10 | 18.20 | 39.00 | 37.20 | -32.30 | -21.20 | -5.60 | 43.20 | -6.70 | 10.50 | 69.80 | 45.60 | 10.50 | 36.20 | 97.70 | 81.20 | -73.60 | 29.90 | 65.90 | 44.20 | -0.40 | 20.70 | 65.40 | 58.90 | -143.10 | 5.40 | 62.00 | 41.80 | -1.20 | 24.90 | 58.50 | 62.80 | -10.90 | 12.90 | 36.80 | 56.00 | -10.70 | 13.40 | 21.20 | 36.90 | |
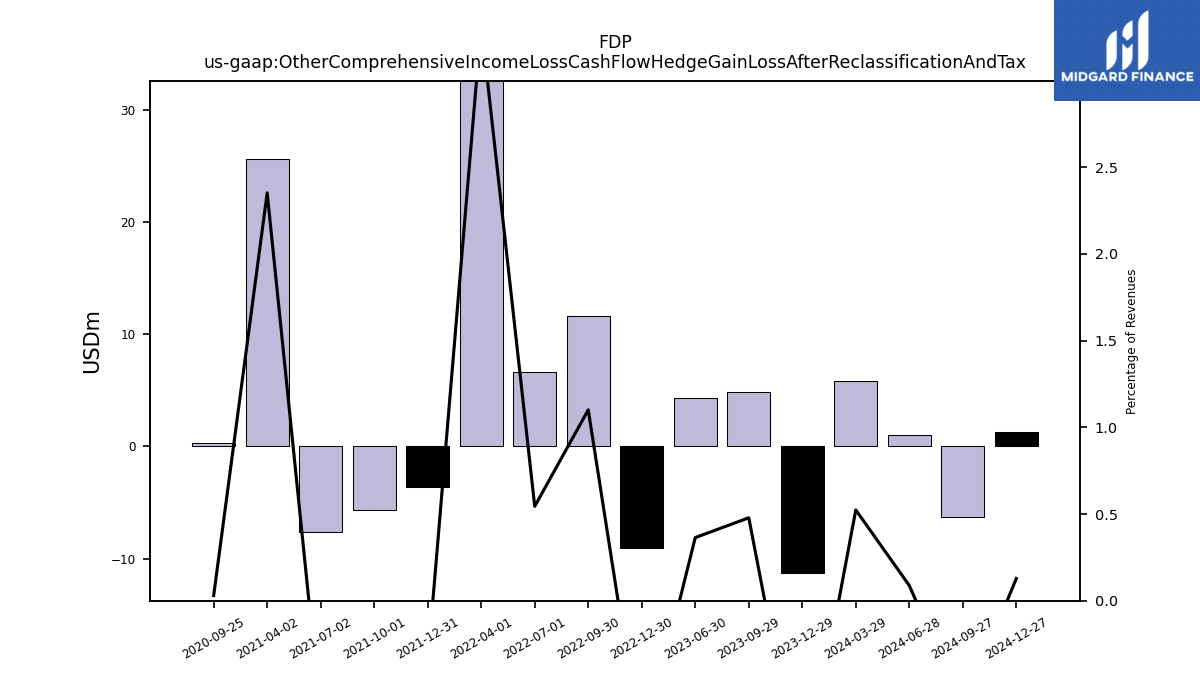
| Other Comprehensive Income Loss Cash Flow Hedge Gain Loss After Reclassification And Tax | 5.80 | -11.30 | 4.80 | 4.30 | NA | -9.10 | 11.60 | 6.60 | 37.80 | -3.60 | -5.70 | -7.60 | 25.60 | NA | 0.30 | NA | NA | NA | NA | NA | NA | NA | NA | NA | NA | NA | NA | NA | NA | NA | NA | NA | NA | NA | NA | NA | NA | NA | NA | NA | NA | NA | NA | NA | NA | NA | NA | NA | NA | NA | NA | NA | NA | NA | NA | NA | NA | |
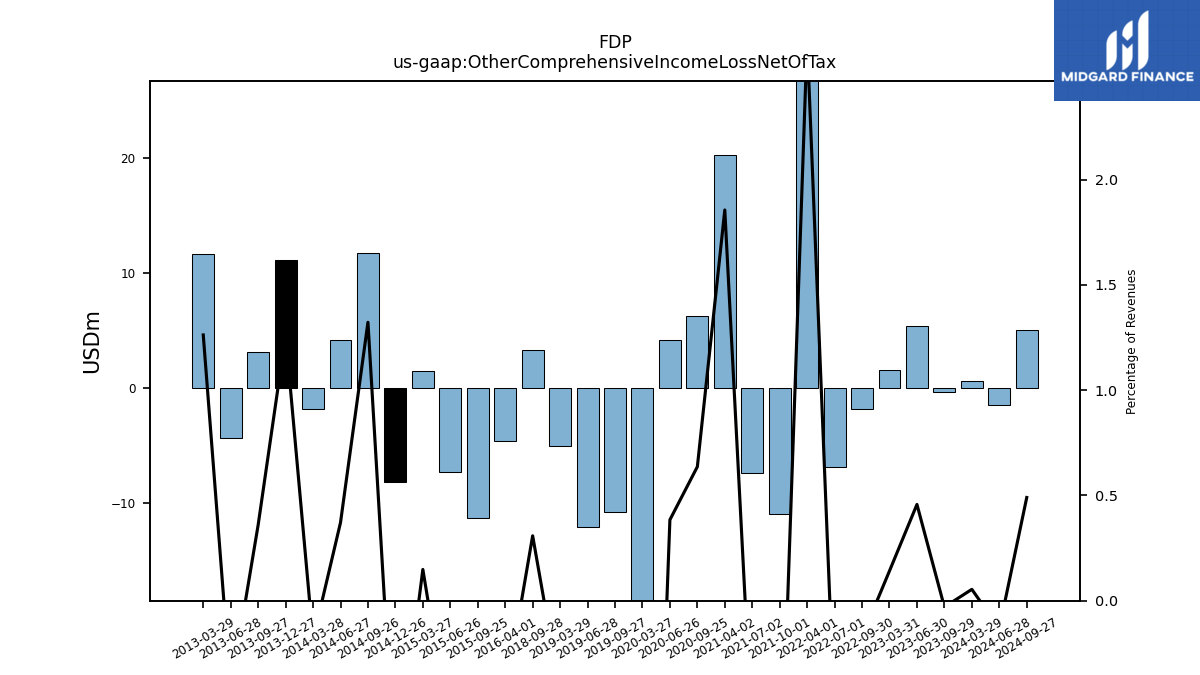
| Other Comprehensive Income Loss Net Of Tax | 0.60 | NA | -0.30 | 5.40 | 1.60 | NA | -1.80 | -6.80 | 30.30 | NA | -10.90 | -7.40 | 20.20 | NA | 6.30 | 4.20 | -34.50 | NA | -10.70 | -12.00 | -5.00 | NA | 3.30 | NA | NA | NA | NA | NA | NA | NA | NA | NA | -4.60 | NA | -11.30 | -7.30 | 1.50 | -8.10 | 11.70 | 4.20 | -1.80 | 11.10 | 3.10 | -4.30 | 11.60 | NA | NA | NA | NA | NA | NA | NA | NA | NA | NA | NA | NA | |
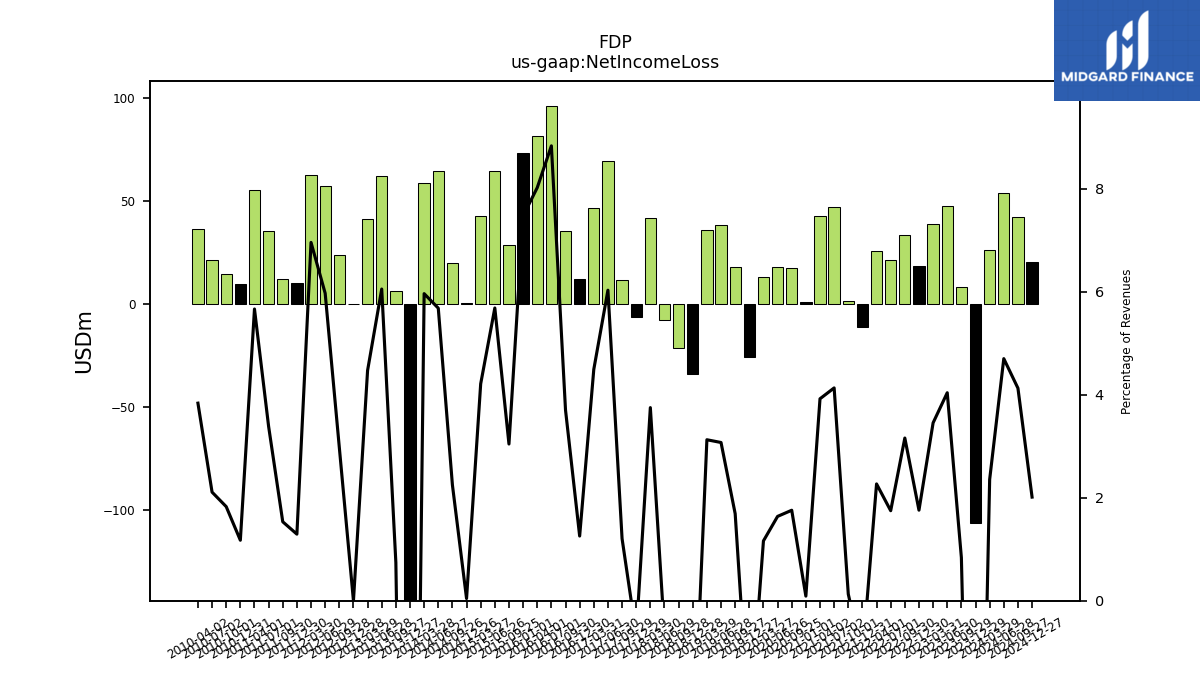
| Net Income Loss | 26.10 | -106.50 | 8.40 | 47.70 | 39.00 | 18.30 | 33.30 | 21.20 | 25.80 | -11.20 | 1.30 | 47.20 | 42.70 | 0.90 | 17.40 | 17.90 | 13.00 | -25.80 | 18.10 | 38.10 | 36.10 | -34.00 | -21.50 | -7.90 | 41.50 | -6.30 | 11.50 | 69.20 | 46.40 | 12.00 | 35.20 | 96.20 | 81.70 | 73.10 | 28.50 | 64.50 | 42.50 | 0.40 | 19.90 | 64.30 | 58.60 | -143.90 | 6.40 | 62.00 | 41.10 | 0.00 | 23.50 | 57.20 | 62.50 | 10.10 | 12.20 | 35.20 | 55.20 | 9.60 | 14.50 | 21.10 | 36.20 | |
| Comprehensive Income Net Of Tax | 26.70 | -115.00 | 8.10 | 53.10 | 40.60 | 22.00 | 31.50 | 14.40 | 56.10 | -3.00 | -9.60 | 39.80 | 62.90 | NA | 23.70 | 22.10 | -21.50 | -21.90 | 7.40 | 26.10 | 31.10 | -46.90 | -18.20 | -11.90 | 44.10 | -1.50 | 15.30 | 72.70 | 47.90 | 0.20 | 34.40 | 92.30 | 77.10 | NA | 17.20 | 57.20 | 43.90 | -8.50 | 31.60 | 68.50 | 56.80 | -132.80 | 9.50 | 57.70 | 52.60 | -19.30 | 21.10 | 47.40 | 70.70 | -1.50 | 19.70 | 32.80 | 64.00 | -8.40 | -10.00 | 18.40 | NA |
| 2024-03-29 | 2023-12-29 | 2023-09-29 | 2023-06-30 | 2023-03-31 | 2022-12-30 | 2022-09-30 | 2022-07-01 | 2022-04-01 | 2021-12-31 | 2021-10-01 | 2021-07-02 | 2021-04-02 | 2021-01-01 | 2020-09-25 | 2020-06-26 | 2020-03-27 | 2019-12-27 | 2019-09-27 | 2019-06-28 | 2019-03-29 | 2018-12-28 | 2018-09-28 | 2018-06-29 | 2018-03-30 | 2017-12-29 | 2017-09-29 | 2017-06-30 | 2017-03-31 | 2016-12-30 | 2016-09-30 | 2016-07-01 | 2016-04-01 | 2016-01-01 | 2015-09-25 | 2015-06-26 | 2015-03-27 | 2014-12-26 | 2014-09-26 | 2014-06-27 | 2014-03-28 | 2013-12-27 | 2013-09-27 | 2013-06-28 | 2013-03-29 | 2012-12-28 | 2012-09-28 | 2012-06-29 | 2012-03-30 | 2011-12-30 | 2011-09-30 | 2011-07-01 | 2011-04-01 | 2010-12-31 | 2010-10-01 | 2010-07-02 | 2010-04-02 | ||
|---|---|---|---|---|---|---|---|---|---|---|---|---|---|---|---|---|---|---|---|---|---|---|---|---|---|---|---|---|---|---|---|---|---|---|---|---|---|---|---|---|---|---|---|---|---|---|---|---|---|---|---|---|---|---|---|---|---|---|
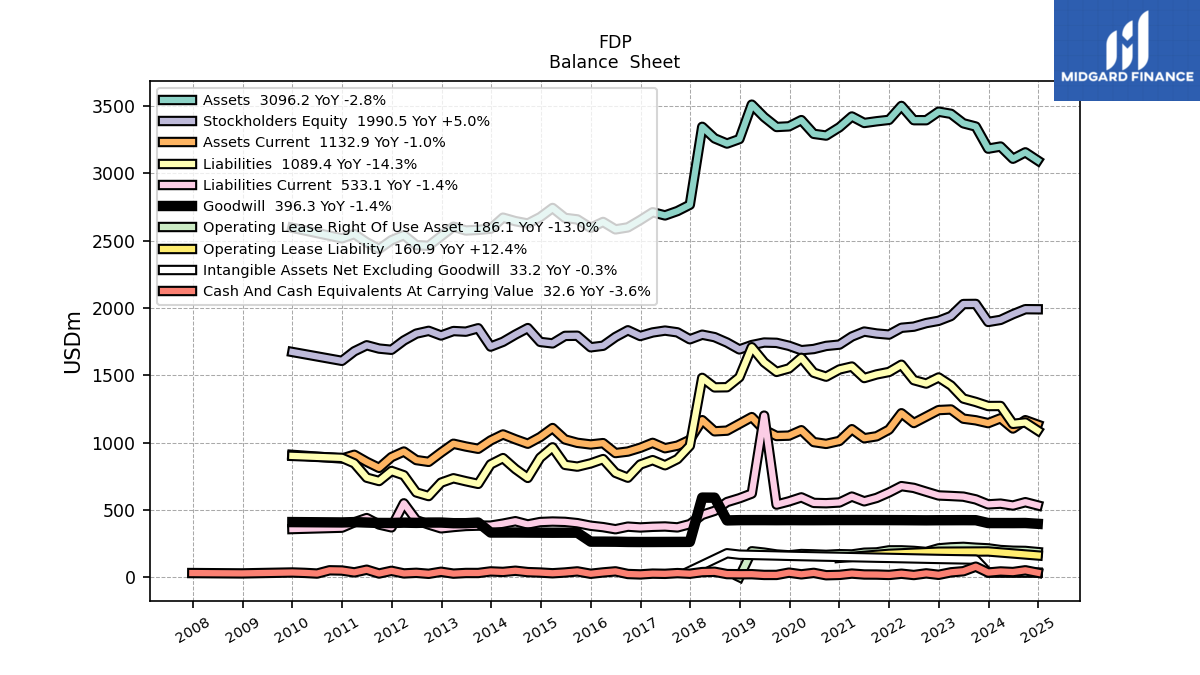
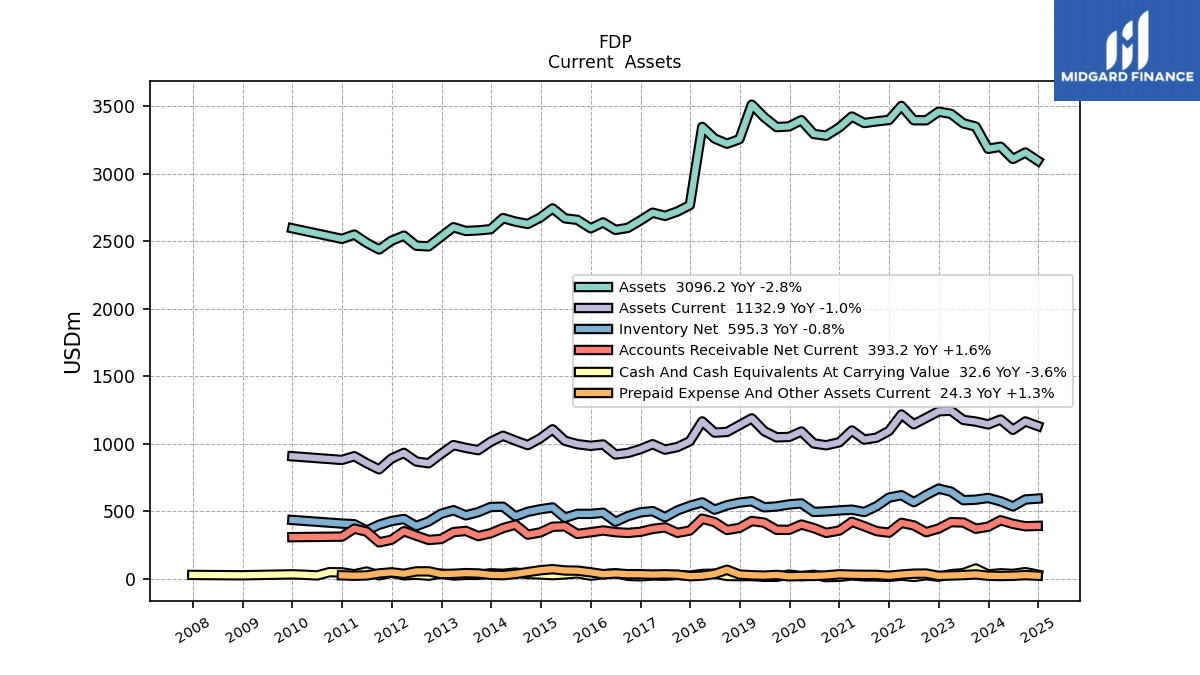
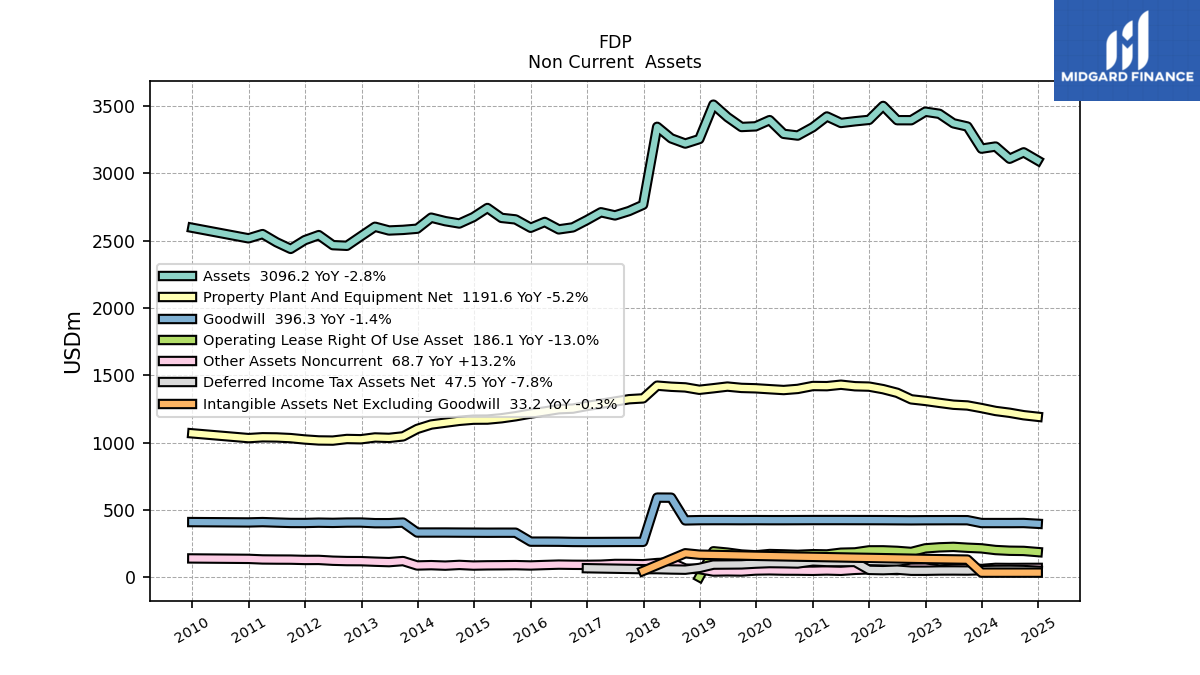
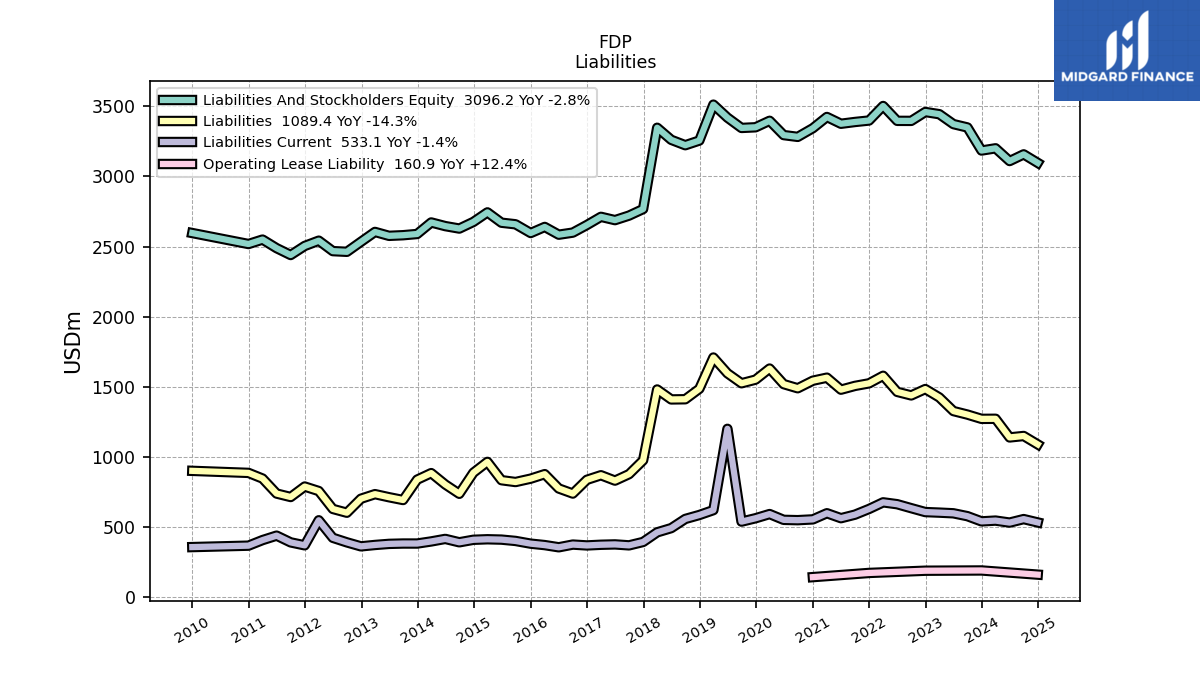
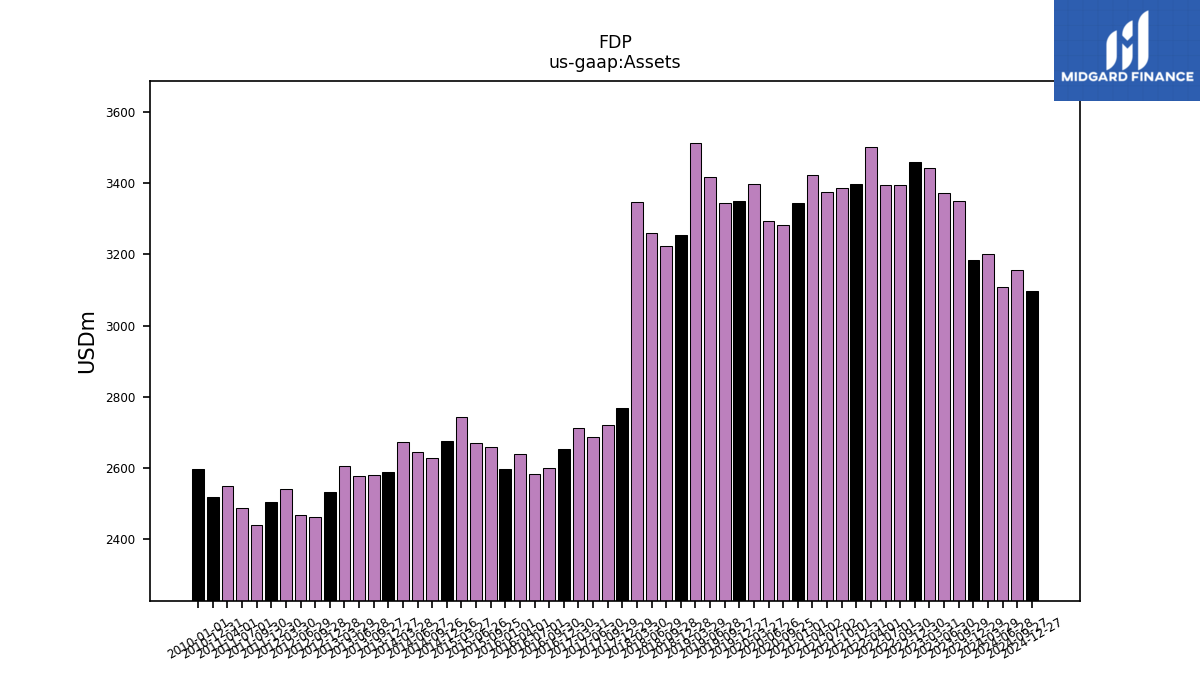
| Assets | 3200.00 | 3184.10 | 3348.60 | 3372.50 | 3443.10 | 3458.90 | 3395.50 | 3395.70 | 3501.80 | 3398.10 | 3387.70 | 3375.00 | 3423.40 | 3343.30 | 3281.40 | 3294.20 | 3396.30 | 3349.90 | 3345.10 | 3418.60 | 3511.40 | 3255.20 | 3222.00 | 3260.50 | 3346.60 | 2766.90 | 2720.50 | 2688.00 | 2711.60 | 2653.30 | 2599.10 | 2584.20 | 2639.50 | 2596.10 | 2658.40 | 2669.60 | 2743.40 | 2675.30 | 2627.90 | 2645.40 | 2671.40 | 2589.20 | 2580.50 | 2576.00 | 2603.90 | 2533.40 | 2462.20 | 2467.10 | 2541.70 | 2504.00 | 2439.20 | 2488.20 | 2549.50 | 2517.70 | NA | NA | NA | |
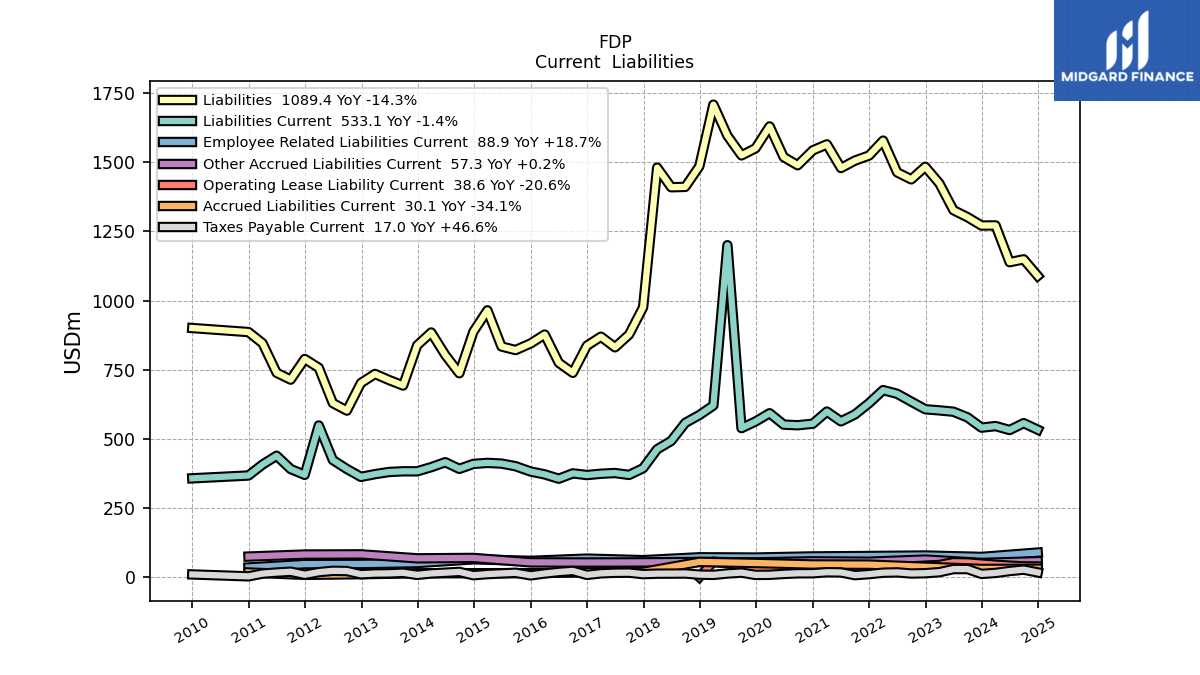
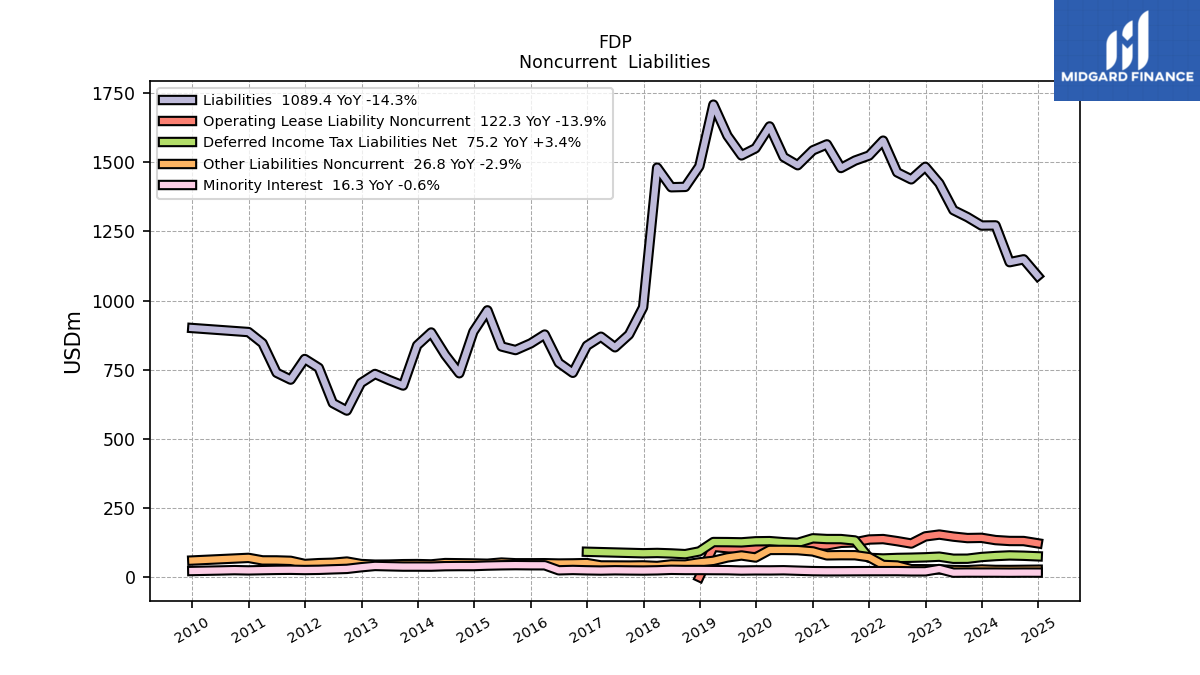
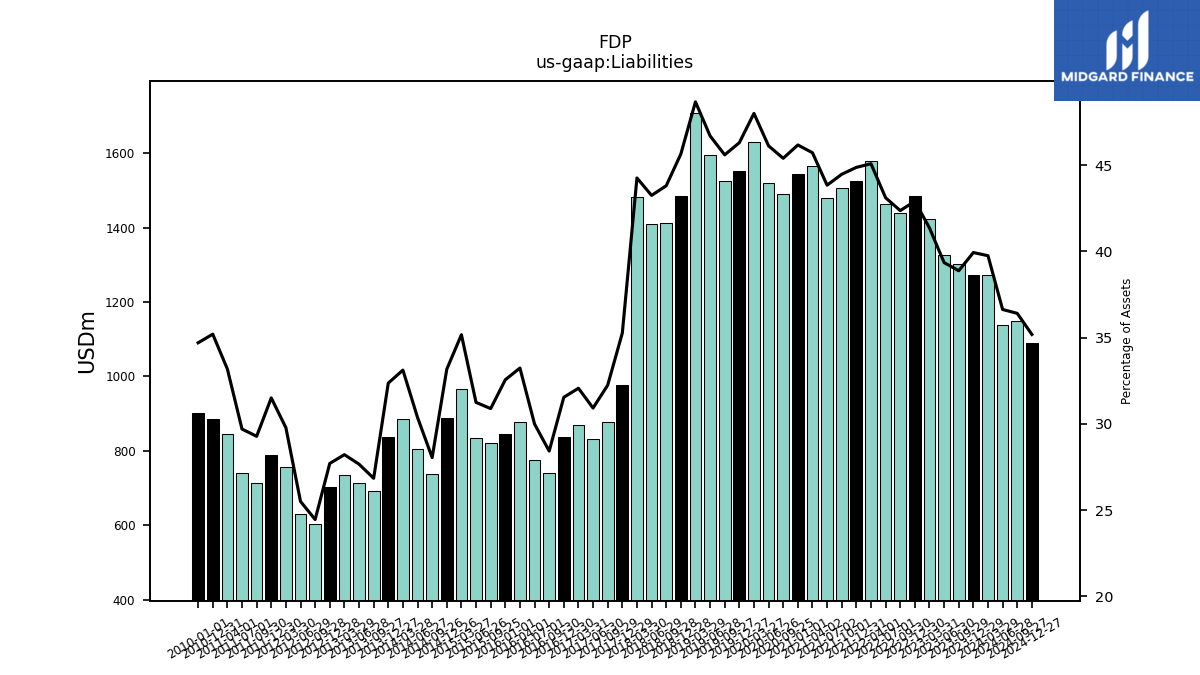
| Liabilities | 1271.90 | 1271.40 | 1301.80 | 1327.00 | 1423.90 | 1483.90 | 1438.40 | 1463.70 | 1578.50 | 1524.60 | 1506.40 | 1479.40 | 1565.00 | 1543.40 | 1489.50 | 1519.00 | 1630.00 | 1550.90 | 1525.10 | 1596.20 | 1708.70 | 1485.60 | 1411.20 | 1409.90 | 1480.90 | 975.70 | 877.20 | 831.10 | 869.50 | 836.90 | 738.80 | 775.10 | 877.30 | 845.20 | 821.10 | 834.10 | 964.80 | 887.40 | 737.10 | 803.50 | 884.70 | 838.00 | 692.80 | 712.70 | 734.70 | 702.00 | 602.20 | 629.30 | 756.90 | 788.90 | 714.20 | 739.00 | 845.90 | 886.20 | NA | NA | NA | |
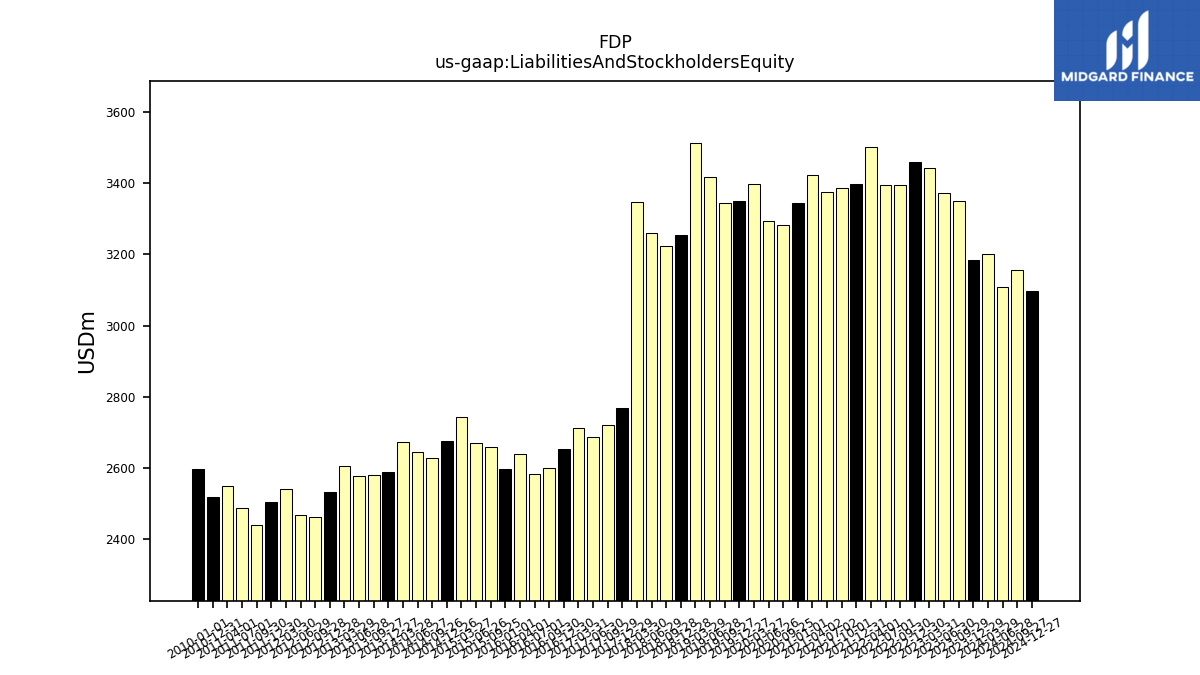
| Liabilities And Stockholders Equity | 3200.00 | 3184.10 | 3348.60 | 3372.50 | 3443.10 | 3458.90 | 3395.50 | 3395.70 | 3501.80 | 3398.10 | 3387.70 | 3375.00 | 3423.40 | 3343.30 | 3281.40 | 3294.20 | 3396.30 | 3349.90 | 3345.10 | 3418.60 | 3511.40 | 3255.20 | 3222.00 | 3260.50 | 3346.60 | 2766.90 | 2720.50 | 2688.00 | 2711.60 | 2653.30 | 2599.10 | 2584.20 | 2639.50 | 2596.10 | 2658.40 | 2669.60 | 2743.40 | 2675.30 | 2627.90 | 2645.40 | 2671.40 | 2589.20 | 2580.50 | 2576.00 | 2603.90 | 2533.40 | 2462.20 | 2467.10 | 2541.70 | 2504.00 | 2439.20 | 2488.20 | 2549.50 | 2517.70 | NA | NA | NA | |
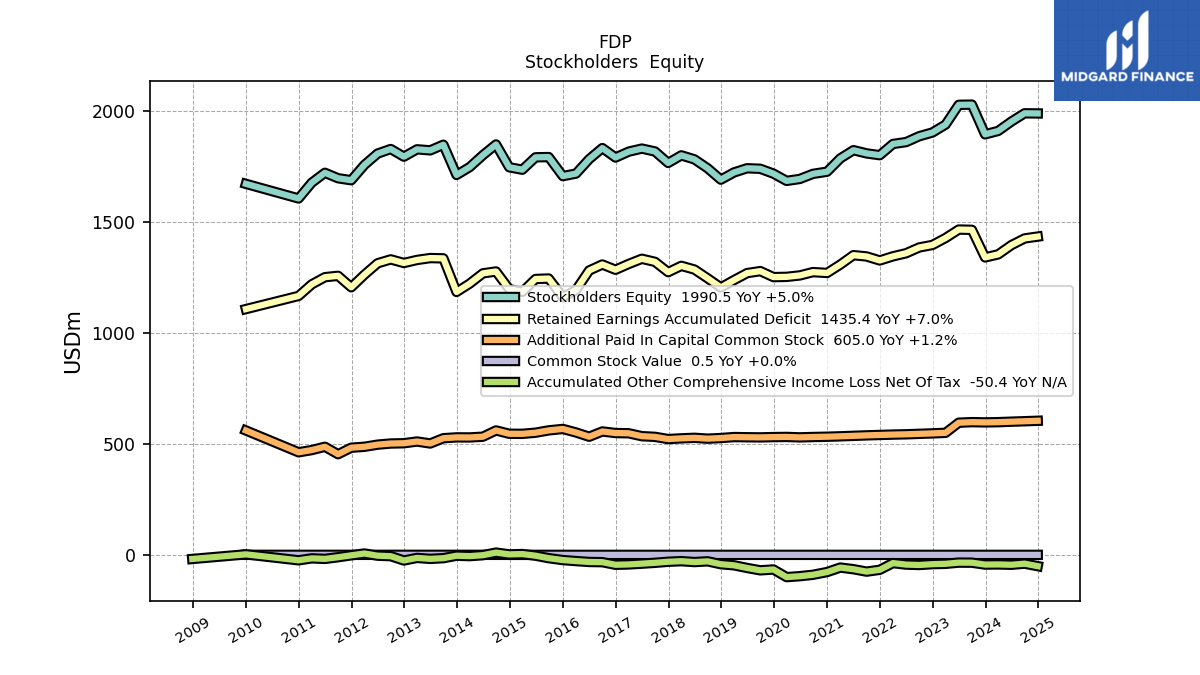
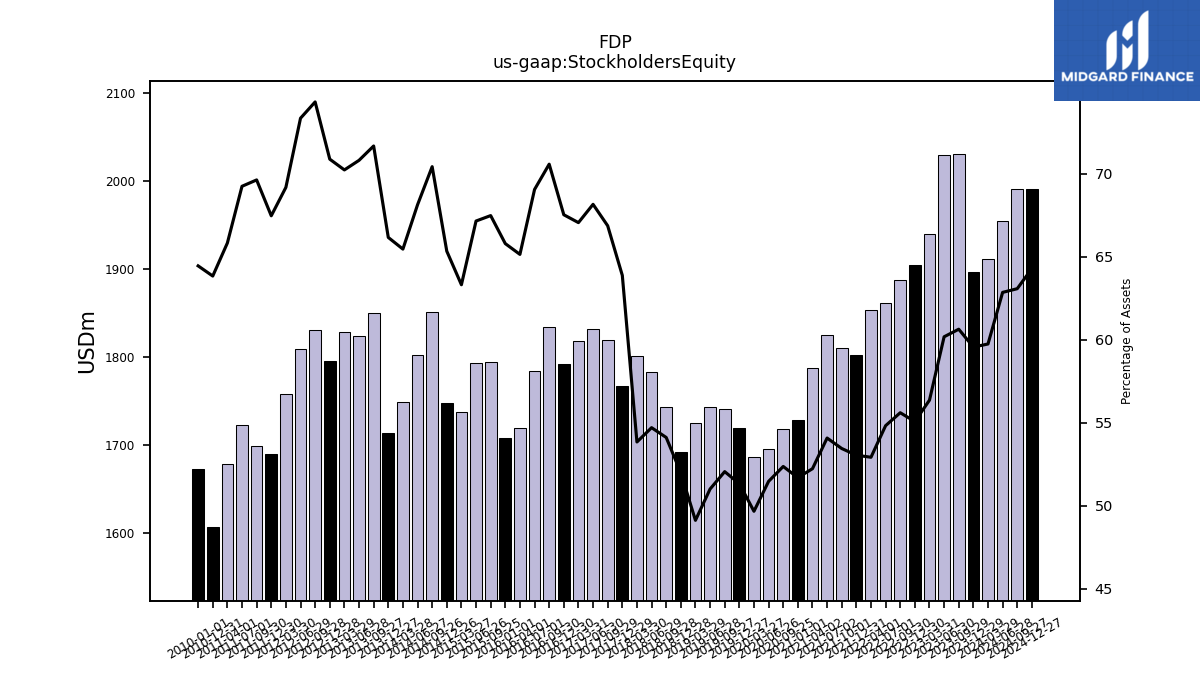
| Stockholders Equity | 1911.70 | 1896.30 | 2030.30 | 2029.40 | 1940.40 | 1904.70 | 1887.80 | 1861.40 | 1852.90 | 1802.30 | 1810.40 | 1824.90 | 1787.80 | 1728.00 | 1718.10 | 1695.20 | 1686.50 | 1719.20 | 1741.00 | 1743.40 | 1724.50 | 1692.00 | 1743.30 | 1783.40 | 1801.60 | 1767.40 | 1819.10 | 1832.10 | 1818.30 | 1791.80 | 1834.40 | 1784.50 | 1719.40 | 1708.00 | 1793.90 | 1792.70 | 1736.90 | 1747.90 | 1850.80 | 1802.30 | 1748.70 | 1713.10 | 1849.60 | 1824.10 | 1828.80 | 1795.70 | 1830.20 | 1809.60 | 1758.40 | 1689.40 | 1698.40 | 1723.00 | 1678.30 | 1607.20 | NA | NA | NA |
| 2024-03-29 | 2023-12-29 | 2023-09-29 | 2023-06-30 | 2023-03-31 | 2022-12-30 | 2022-09-30 | 2022-07-01 | 2022-04-01 | 2021-12-31 | 2021-10-01 | 2021-07-02 | 2021-04-02 | 2021-01-01 | 2020-09-25 | 2020-06-26 | 2020-03-27 | 2019-12-27 | 2019-09-27 | 2019-06-28 | 2019-03-29 | 2018-12-28 | 2018-09-28 | 2018-06-29 | 2018-03-30 | 2017-12-29 | 2017-09-29 | 2017-06-30 | 2017-03-31 | 2016-12-30 | 2016-09-30 | 2016-07-01 | 2016-04-01 | 2016-01-01 | 2015-09-25 | 2015-06-26 | 2015-03-27 | 2014-12-26 | 2014-09-26 | 2014-06-27 | 2014-03-28 | 2013-12-27 | 2013-09-27 | 2013-06-28 | 2013-03-29 | 2012-12-28 | 2012-09-28 | 2012-06-29 | 2012-03-30 | 2011-12-30 | 2011-09-30 | 2011-07-01 | 2011-04-01 | 2010-12-31 | 2010-10-01 | 2010-07-02 | 2010-04-02 | ||
|---|---|---|---|---|---|---|---|---|---|---|---|---|---|---|---|---|---|---|---|---|---|---|---|---|---|---|---|---|---|---|---|---|---|---|---|---|---|---|---|---|---|---|---|---|---|---|---|---|---|---|---|---|---|---|---|---|---|---|
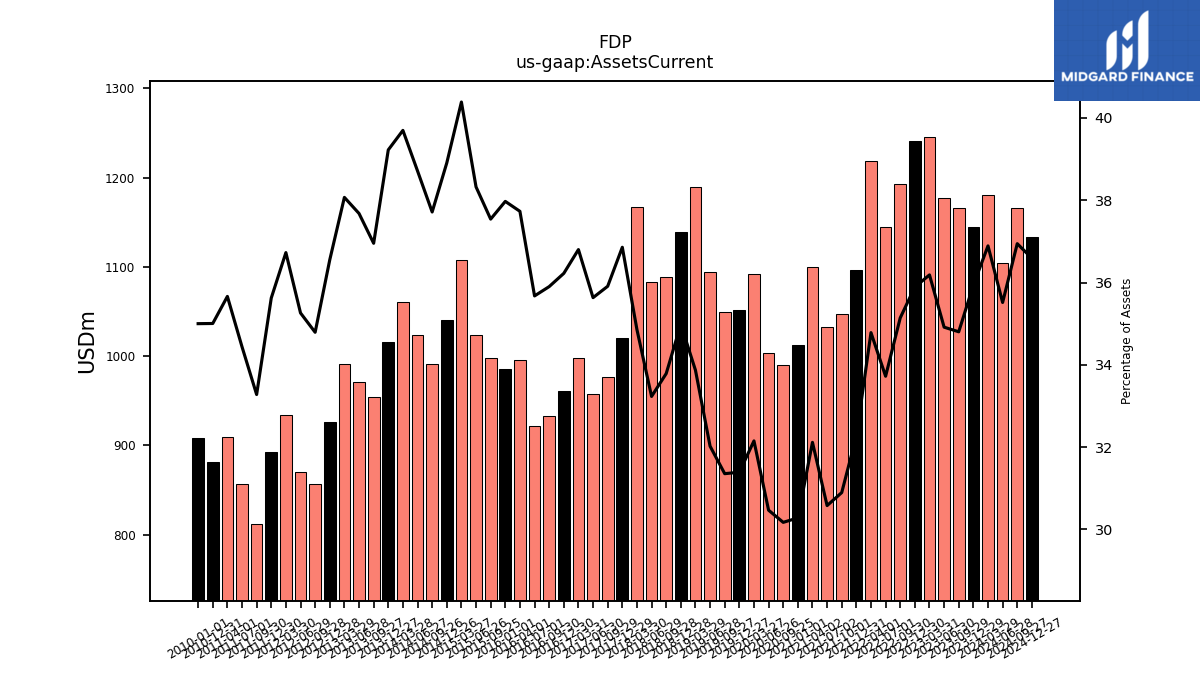
| Assets Current | 1180.50 | 1144.30 | 1165.40 | 1177.50 | 1245.90 | 1241.40 | 1193.20 | 1145.10 | 1218.00 | 1096.40 | 1046.60 | 1032.00 | 1099.40 | 1012.30 | 990.00 | 1003.60 | 1091.90 | 1051.50 | 1048.80 | 1094.70 | 1189.30 | 1138.80 | 1088.60 | 1083.50 | 1166.50 | 1019.80 | 976.90 | 957.80 | 997.90 | 961.10 | 933.10 | 921.90 | 995.90 | 985.80 | 998.00 | 1023.10 | 1108.00 | 1040.90 | 991.10 | 1024.10 | 1060.50 | 1015.60 | 953.60 | 970.60 | 991.30 | 926.00 | 856.60 | 869.90 | 933.50 | 892.00 | 811.70 | 856.90 | 909.20 | 881.30 | NA | NA | NA | |
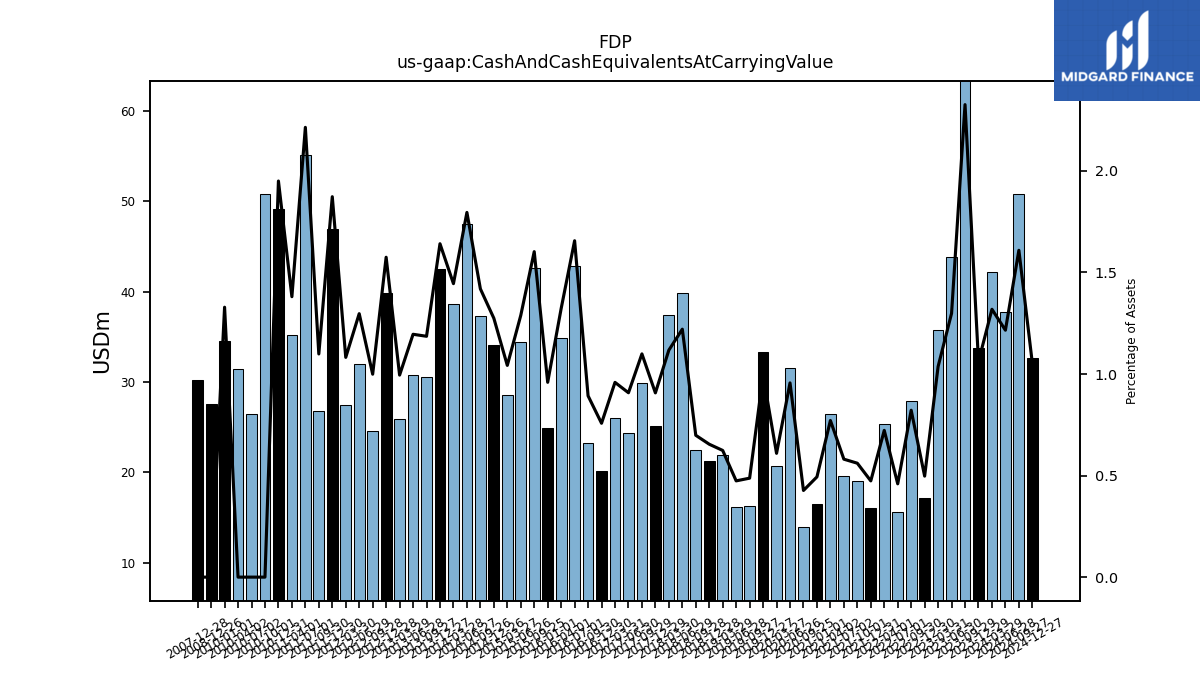
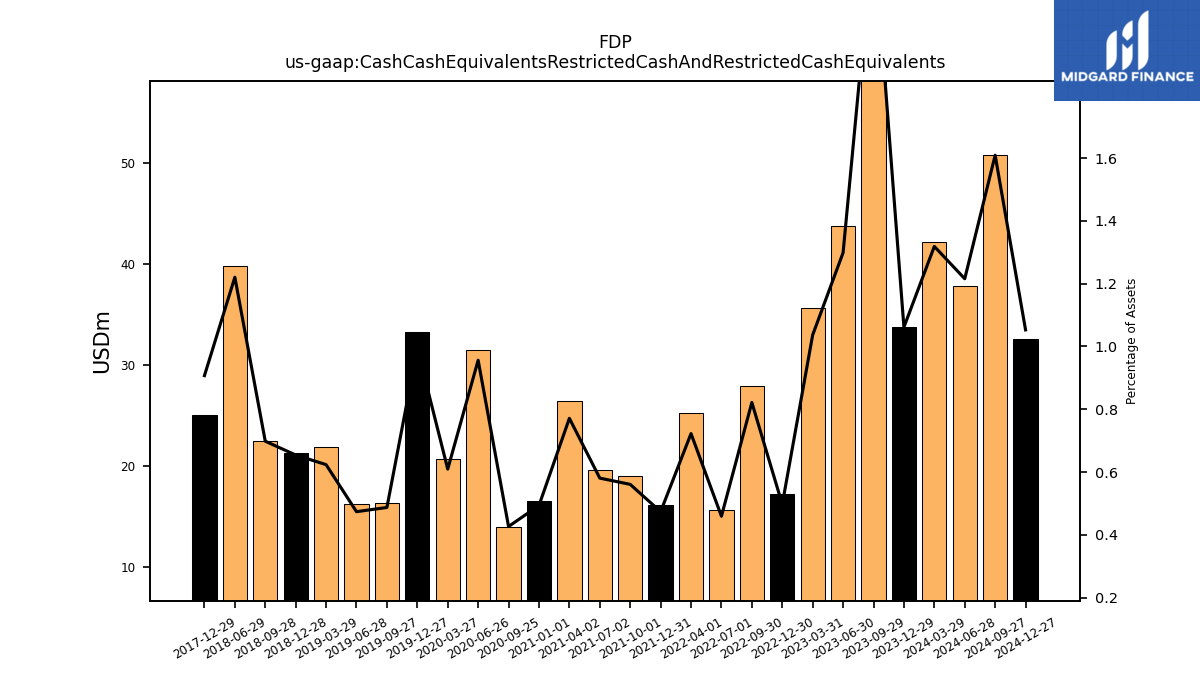
| Cash And Cash Equivalents At Carrying Value | 42.20 | 33.80 | 77.90 | 43.80 | 35.70 | 17.20 | 27.90 | 15.60 | 25.30 | 16.10 | 19.00 | 19.60 | 26.40 | 16.50 | 14.00 | 31.50 | 20.70 | 33.30 | 16.30 | 16.20 | 21.90 | 21.30 | 22.50 | 39.80 | 37.40 | 25.10 | 29.90 | 24.40 | 26.00 | 20.10 | 23.20 | 42.80 | 34.90 | 24.90 | 42.60 | 34.40 | 28.60 | 34.10 | 37.30 | 47.50 | 38.60 | 42.50 | 30.60 | 30.80 | 25.90 | 39.90 | 24.60 | 32.00 | 27.50 | 46.90 | 26.80 | 55.10 | 35.20 | 49.10 | 50.80 | 26.50 | 31.40 | |
| Cash Cash Equivalents Restricted Cash And Restricted Cash Equivalents | 42.20 | 33.80 | 77.90 | 43.80 | 35.70 | 17.20 | 27.90 | 15.60 | 25.30 | 16.10 | 19.00 | 19.60 | 26.40 | 16.50 | 14.00 | 31.50 | 20.70 | 33.30 | 16.30 | 16.20 | 21.90 | 21.30 | 22.50 | 39.80 | NA | 25.10 | NA | NA | NA | NA | NA | NA | NA | NA | NA | NA | NA | NA | NA | NA | NA | NA | NA | NA | NA | NA | NA | NA | NA | NA | NA | NA | NA | NA | NA | NA | NA | |
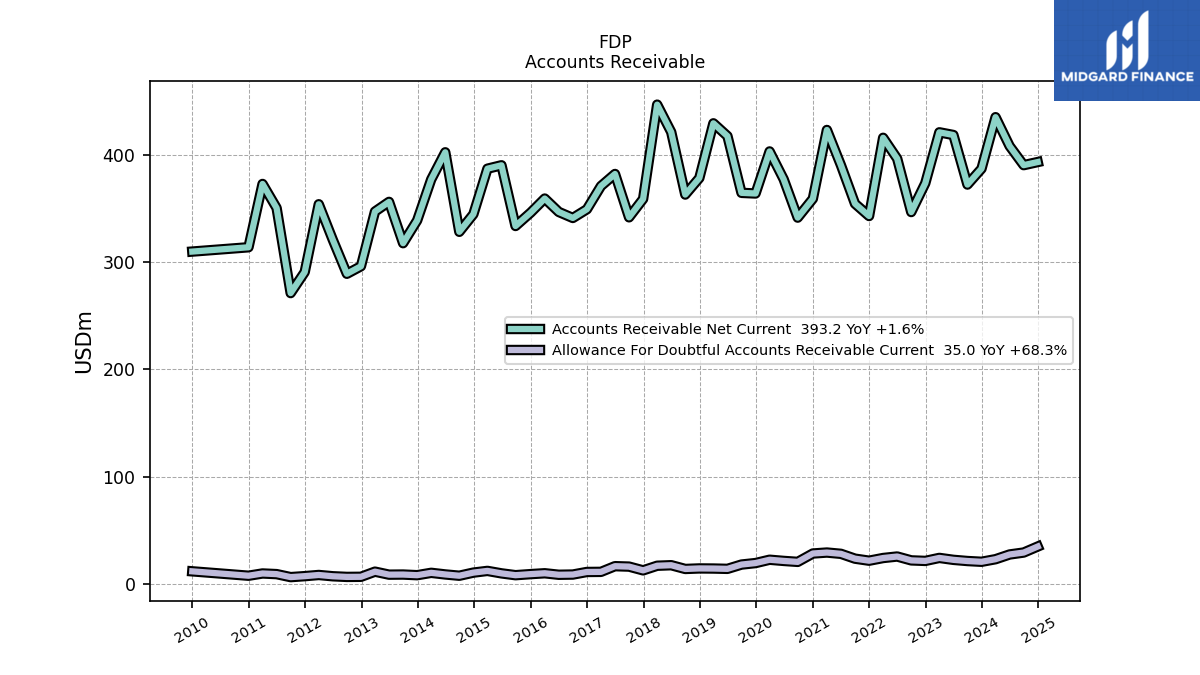
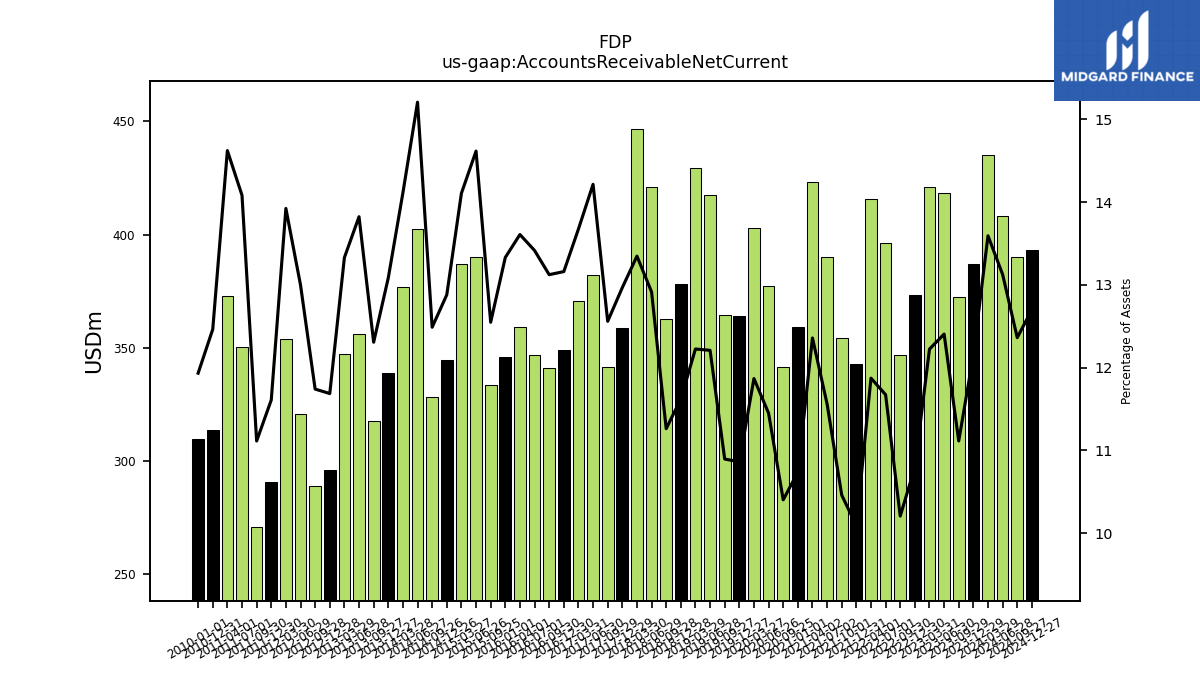
| Accounts Receivable Net Current | 435.00 | 387.00 | 372.20 | 418.40 | 420.90 | 373.50 | 346.60 | 396.40 | 415.80 | 342.90 | 354.40 | 390.20 | 423.10 | 359.00 | 341.40 | 377.20 | 403.10 | 363.90 | 364.50 | 417.40 | 429.30 | 378.30 | 362.90 | 421.10 | 446.70 | 358.80 | 341.70 | 382.10 | 370.80 | 349.20 | 341.10 | 346.70 | 359.20 | 346.10 | 333.60 | 390.20 | 387.00 | 344.60 | 328.20 | 402.30 | 377.00 | 338.80 | 317.60 | 356.10 | 347.10 | 296.10 | 289.10 | 320.70 | 353.90 | 290.70 | 271.10 | 350.40 | 372.80 | 313.80 | NA | NA | NA | |
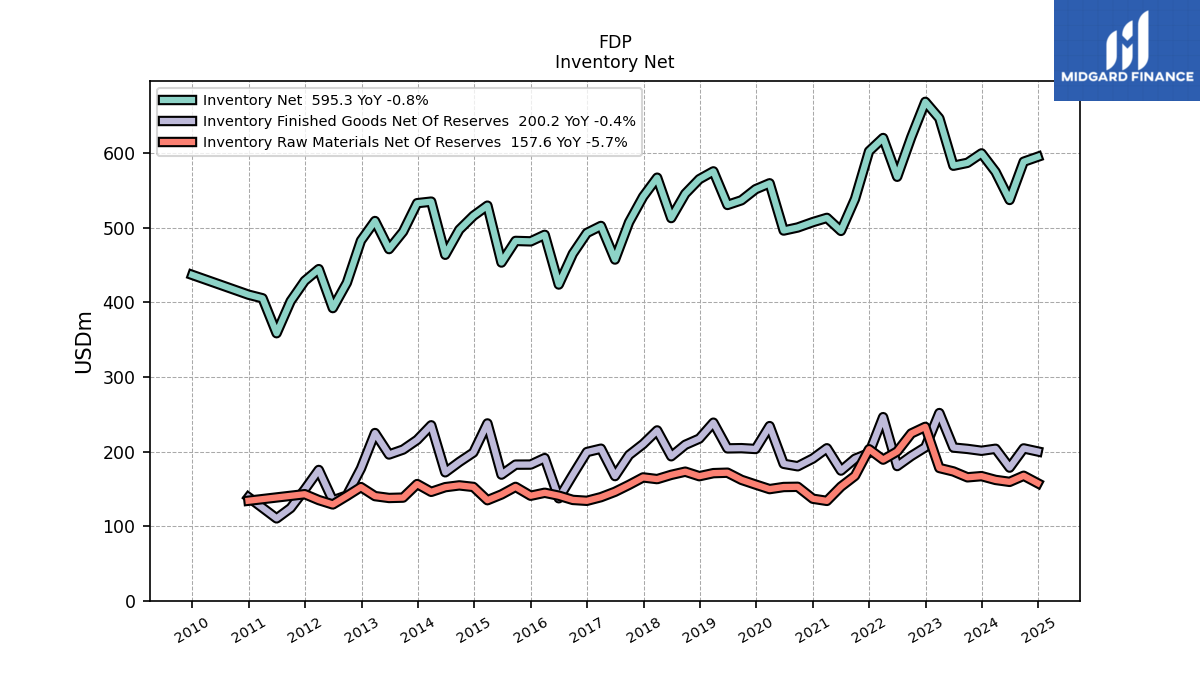
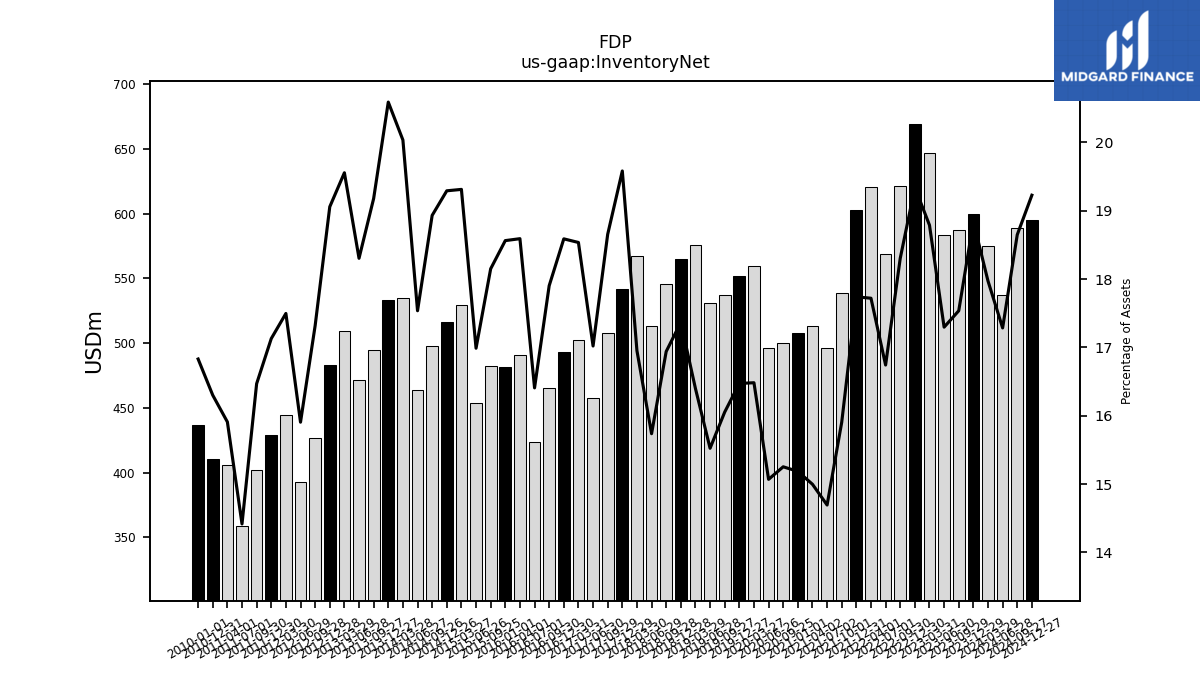
| Inventory Net | 575.10 | 599.90 | 587.20 | 583.30 | 646.90 | 669.00 | 621.50 | 568.50 | 620.50 | 602.80 | 538.80 | 495.90 | 513.40 | 507.70 | 500.50 | 496.40 | 559.80 | 551.80 | 537.00 | 530.70 | 575.80 | 565.30 | 545.80 | 513.10 | 567.30 | 541.80 | 507.50 | 457.50 | 502.60 | 493.20 | 465.30 | 424.00 | 490.70 | 481.90 | 482.50 | 453.50 | 529.80 | 516.10 | 497.50 | 463.90 | 535.20 | 533.10 | 494.90 | 471.50 | 509.20 | 482.80 | 426.40 | 392.40 | 444.70 | 428.90 | 401.70 | 358.70 | 405.60 | 410.40 | NA | NA | NA | |
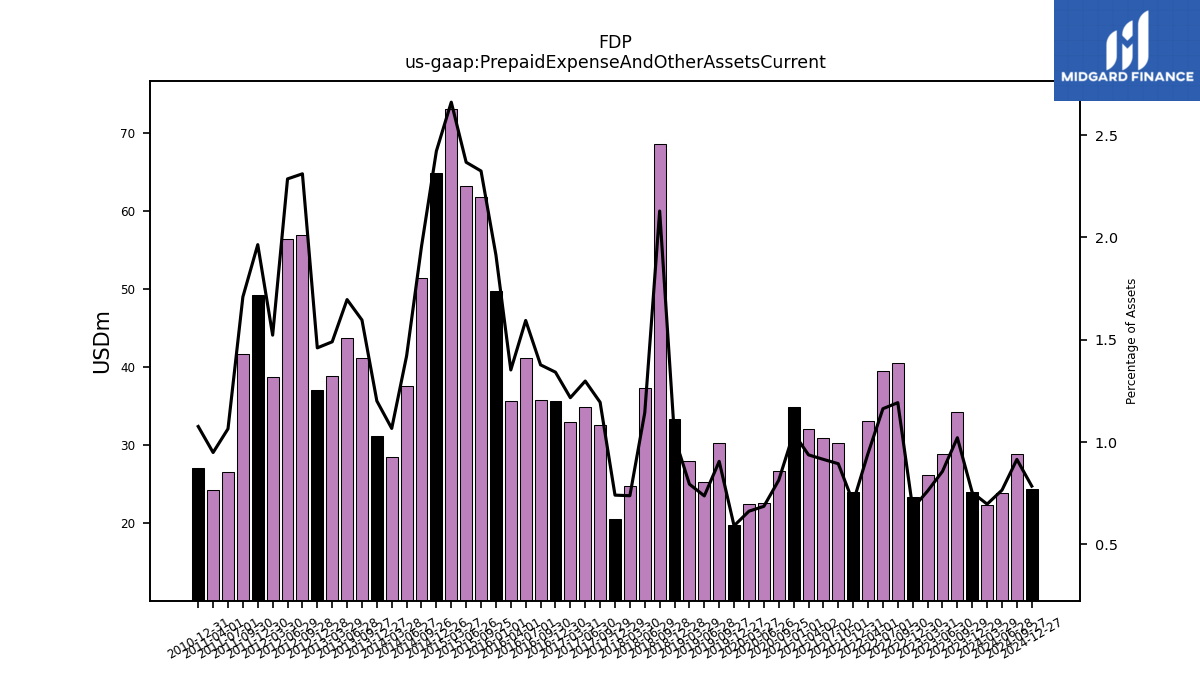
| Prepaid Expense And Other Assets Current | 22.30 | 24.00 | 34.20 | 28.90 | 26.20 | 23.40 | 40.50 | 39.50 | 33.10 | 24.00 | 30.30 | 30.90 | 32.10 | 34.90 | 26.70 | 22.60 | 22.50 | 19.80 | 30.30 | 25.20 | 27.90 | 33.30 | 68.60 | 37.30 | 24.70 | 20.50 | 32.50 | 34.90 | 33.00 | 35.60 | 35.80 | 41.20 | 35.70 | 49.70 | 61.80 | 63.20 | 73.00 | 64.80 | 51.40 | 37.60 | 28.50 | 31.10 | 41.20 | 43.70 | 38.80 | 37.00 | 56.90 | 56.40 | 38.70 | 49.20 | 41.70 | 26.50 | 24.20 | 27.10 | NA | NA | NA |
| 2024-03-29 | 2023-12-29 | 2023-09-29 | 2023-06-30 | 2023-03-31 | 2022-12-30 | 2022-09-30 | 2022-07-01 | 2022-04-01 | 2021-12-31 | 2021-10-01 | 2021-07-02 | 2021-04-02 | 2021-01-01 | 2020-09-25 | 2020-06-26 | 2020-03-27 | 2019-12-27 | 2019-09-27 | 2019-06-28 | 2019-03-29 | 2018-12-28 | 2018-09-28 | 2018-06-29 | 2018-03-30 | 2017-12-29 | 2017-09-29 | 2017-06-30 | 2017-03-31 | 2016-12-30 | 2016-09-30 | 2016-07-01 | 2016-04-01 | 2016-01-01 | 2015-09-25 | 2015-06-26 | 2015-03-27 | 2014-12-26 | 2014-09-26 | 2014-06-27 | 2014-03-28 | 2013-12-27 | 2013-09-27 | 2013-06-28 | 2013-03-29 | 2012-12-28 | 2012-09-28 | 2012-06-29 | 2012-03-30 | 2011-12-30 | 2011-09-30 | 2011-07-01 | 2011-04-01 | 2010-12-31 | 2010-10-01 | 2010-07-02 | 2010-04-02 | ||
|---|---|---|---|---|---|---|---|---|---|---|---|---|---|---|---|---|---|---|---|---|---|---|---|---|---|---|---|---|---|---|---|---|---|---|---|---|---|---|---|---|---|---|---|---|---|---|---|---|---|---|---|---|---|---|---|---|---|---|
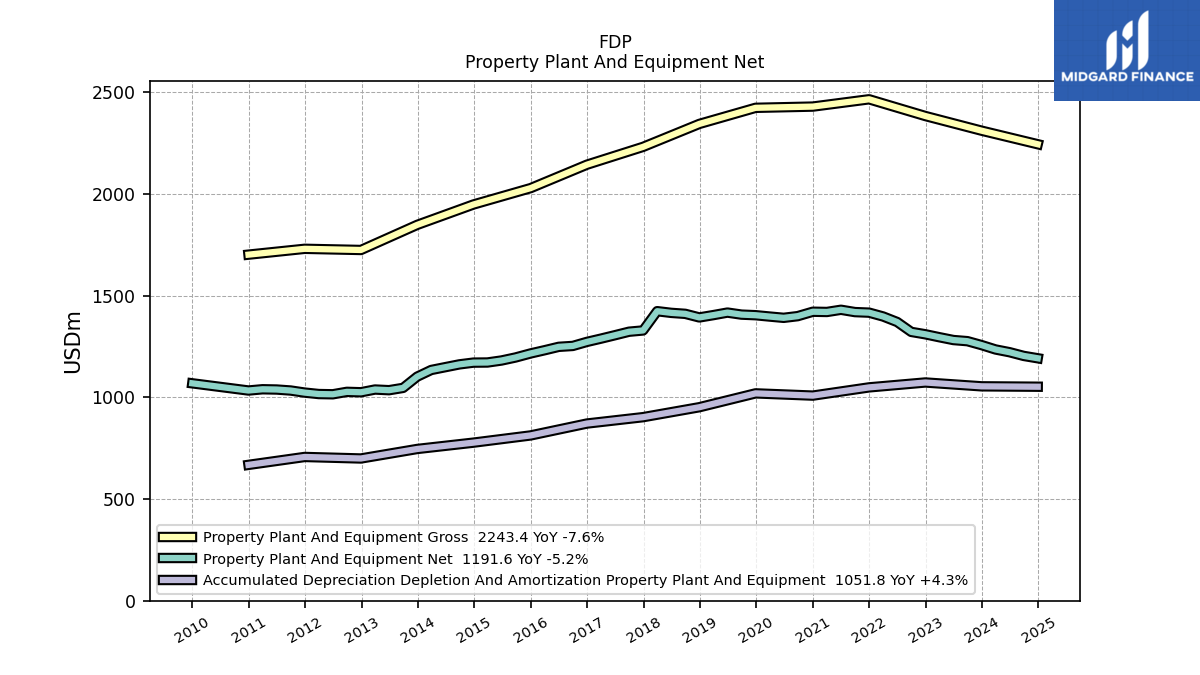
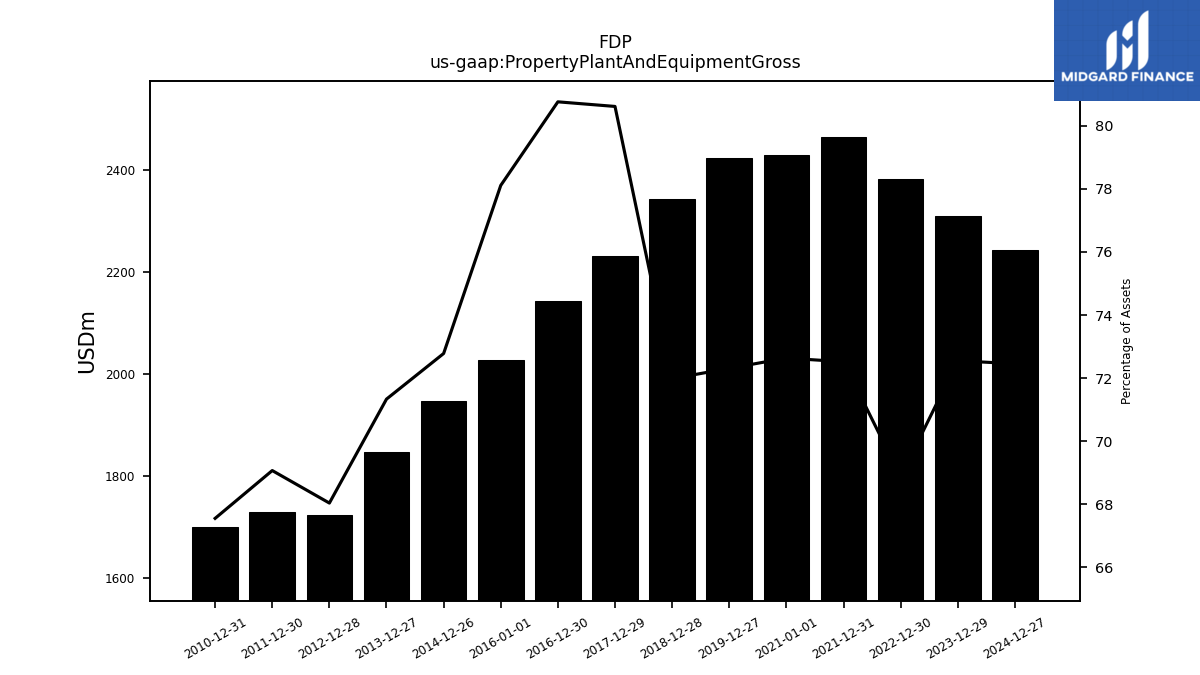
| Property Plant And Equipment Gross | NA | 2310.10 | NA | NA | NA | 2382.10 | NA | NA | NA | 2464.30 | NA | NA | NA | 2428.40 | NA | NA | NA | 2422.30 | NA | NA | NA | 2343.20 | NA | NA | NA | 2230.50 | NA | NA | NA | 2142.80 | NA | NA | NA | 2027.80 | NA | NA | NA | 1947.10 | NA | NA | NA | 1847.00 | NA | NA | NA | 1723.70 | NA | NA | NA | 1729.50 | NA | NA | NA | 1700.80 | NA | NA | NA | |
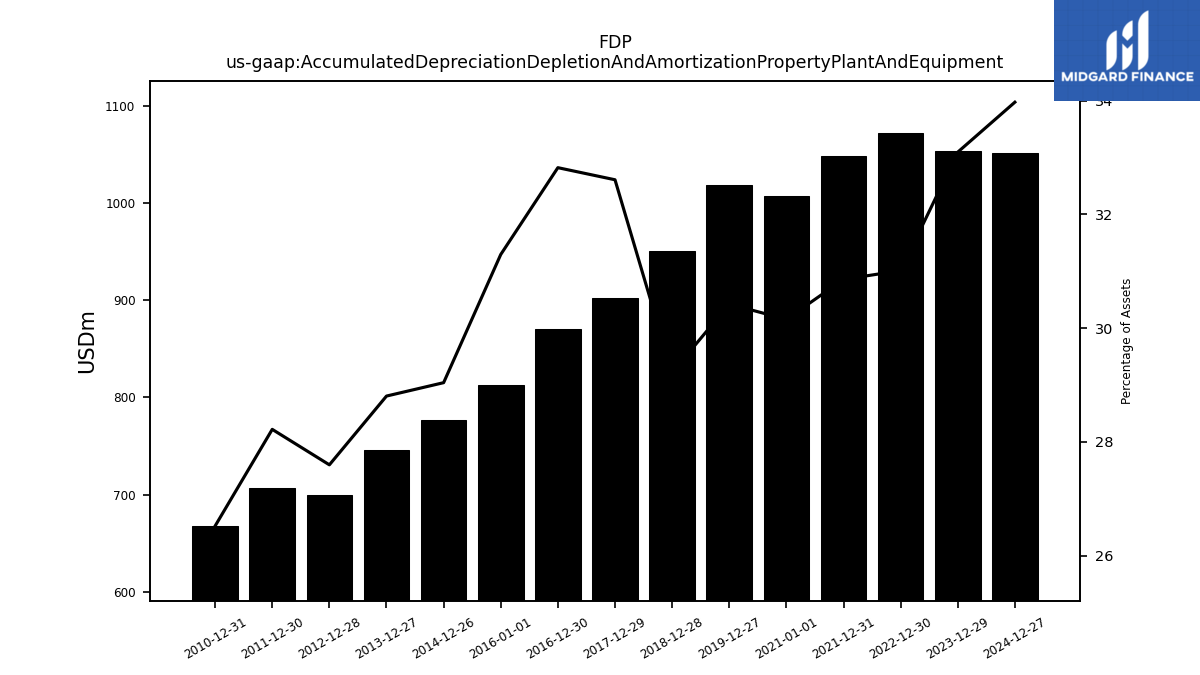
| Accumulated Depreciation Depletion And Amortization Property Plant And Equipment | NA | 1053.70 | NA | NA | NA | 1072.60 | NA | NA | NA | 1048.50 | NA | NA | NA | 1008.10 | NA | NA | NA | 1019.10 | NA | NA | NA | 951.00 | NA | NA | NA | 902.20 | NA | NA | NA | 870.80 | NA | NA | NA | 812.40 | NA | NA | NA | 776.90 | NA | NA | NA | 745.80 | NA | NA | NA | 699.10 | NA | NA | NA | 706.60 | NA | NA | NA | 667.70 | NA | NA | NA | |
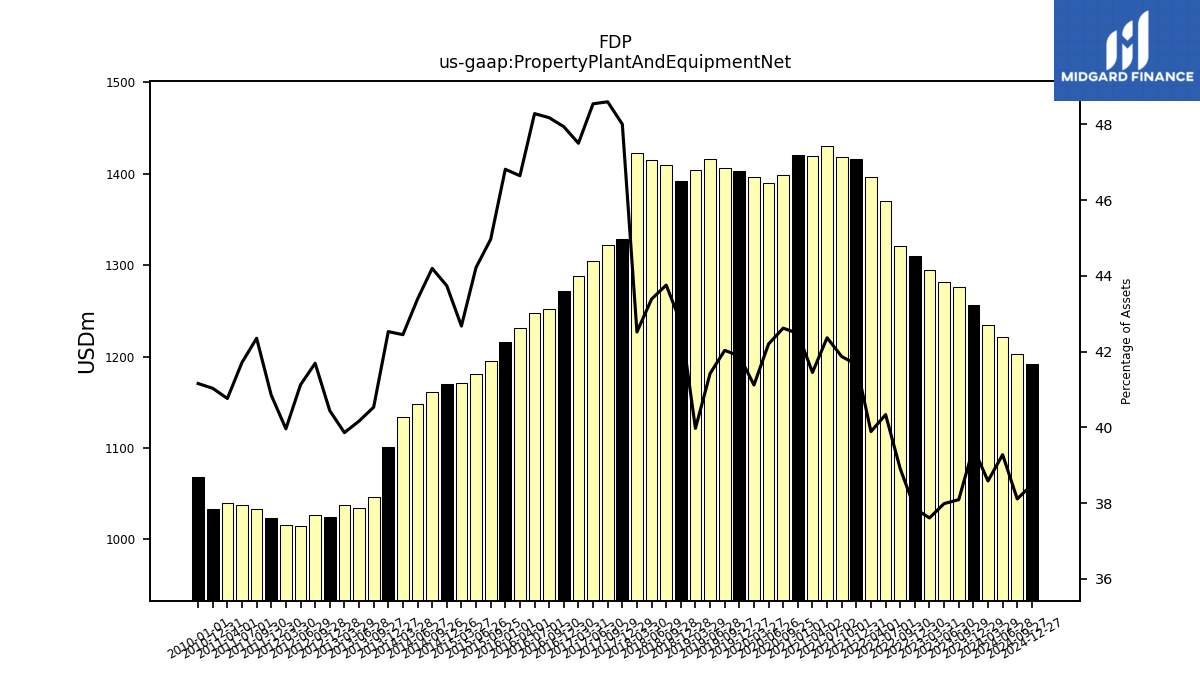
| Property Plant And Equipment Net | 1234.80 | 1256.40 | 1275.60 | 1281.20 | 1295.00 | 1309.50 | 1321.20 | 1369.80 | 1396.90 | 1415.80 | 1418.50 | 1429.90 | 1419.10 | 1420.30 | 1398.60 | 1390.30 | 1396.60 | 1403.20 | 1406.10 | 1416.10 | 1403.70 | 1392.20 | 1409.90 | 1414.70 | 1423.00 | 1328.30 | 1322.10 | 1304.90 | 1288.10 | 1272.00 | 1252.20 | 1247.80 | 1231.20 | 1215.40 | 1195.40 | 1180.60 | 1170.80 | 1170.20 | 1161.50 | 1147.80 | 1134.00 | 1101.20 | 1046.00 | 1034.70 | 1038.00 | 1024.60 | 1026.60 | 1014.60 | 1015.80 | 1022.90 | 1033.10 | 1038.00 | 1039.30 | 1033.10 | NA | NA | NA | |
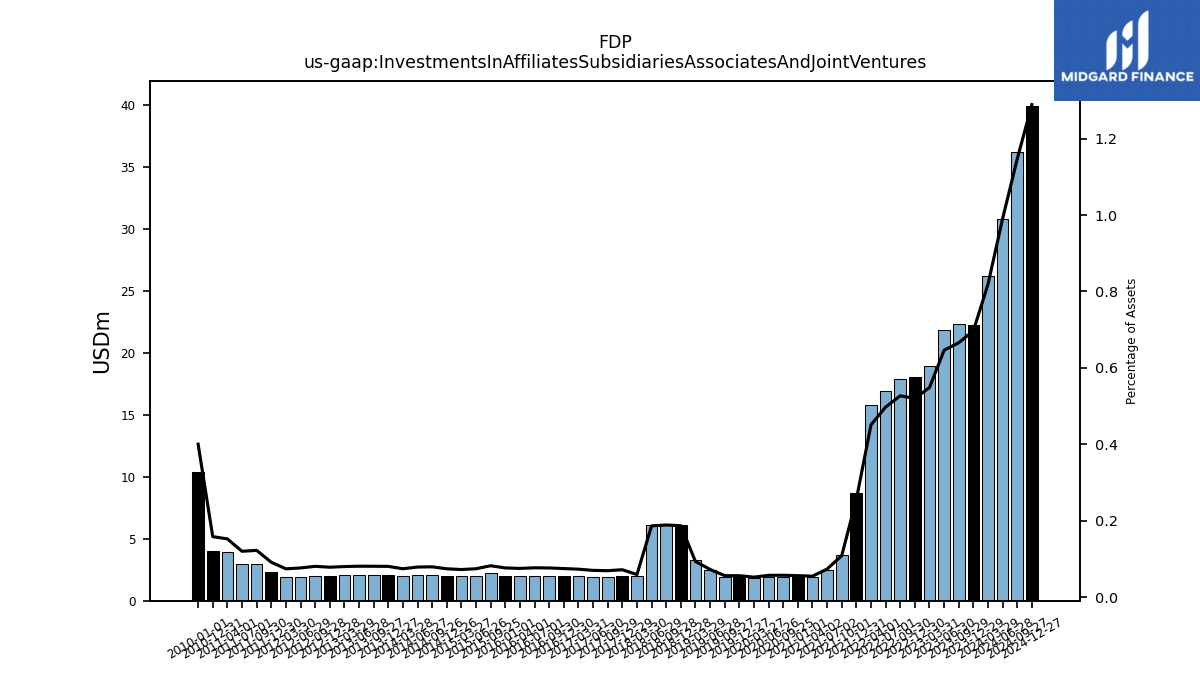
| Investments In Affiliates Subsidiaries Associates And Joint Ventures | 26.20 | 22.20 | 22.30 | 21.80 | 18.90 | 18.00 | 17.90 | 16.90 | 15.80 | 8.70 | 3.70 | 2.50 | 1.90 | 1.90 | 1.90 | 1.90 | 1.80 | 1.90 | 1.90 | 2.50 | 3.30 | 6.10 | 6.10 | 6.10 | 2.00 | 2.00 | 1.90 | 1.90 | 2.00 | 2.00 | 2.00 | 2.00 | 2.00 | 2.00 | 2.20 | 2.00 | 2.00 | 2.00 | 2.10 | 2.10 | 2.00 | 2.10 | 2.10 | 2.10 | 2.10 | 2.00 | 2.00 | 1.90 | 1.90 | 2.30 | 3.00 | 3.00 | 3.90 | 4.00 | NA | NA | NA | |
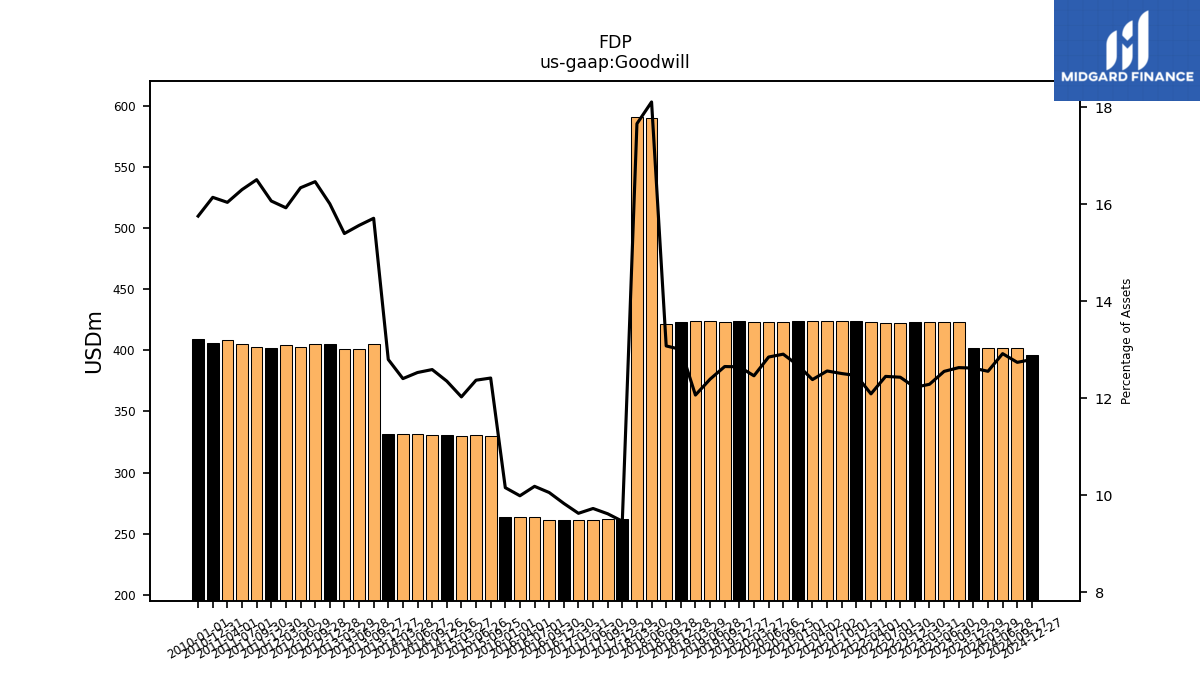
| Goodwill | 401.80 | 401.90 | 423.00 | 423.40 | 423.10 | 422.90 | 422.20 | 422.80 | 423.40 | 423.70 | 423.80 | 424.00 | 424.00 | 424.00 | 423.60 | 423.30 | 423.30 | 423.70 | 423.30 | 423.70 | 423.70 | 423.40 | 421.40 | 590.40 | 591.00 | 261.90 | 261.70 | 261.50 | 261.10 | 260.90 | 261.40 | 263.20 | 263.70 | 263.70 | 330.10 | 330.30 | 330.00 | 330.50 | 330.90 | 331.50 | 331.40 | 331.40 | 405.40 | 400.90 | 400.90 | 405.60 | 405.40 | 403.10 | 404.80 | 402.30 | 402.60 | 405.60 | 408.90 | 406.40 | NA | NA | NA | |
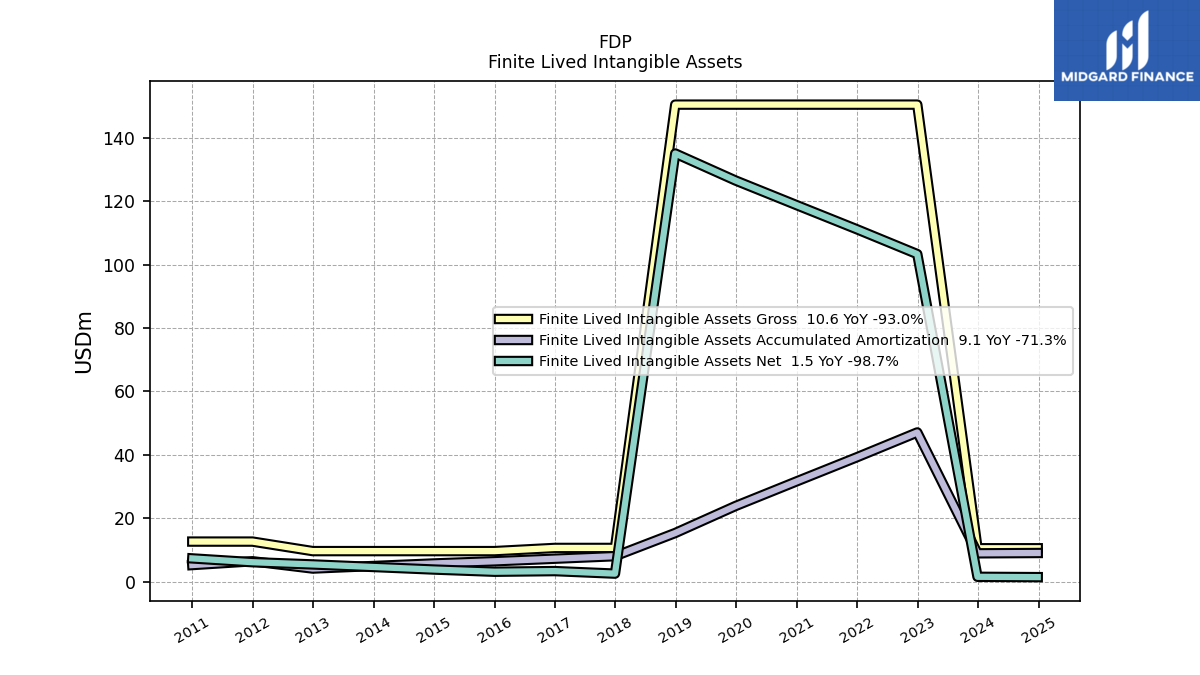
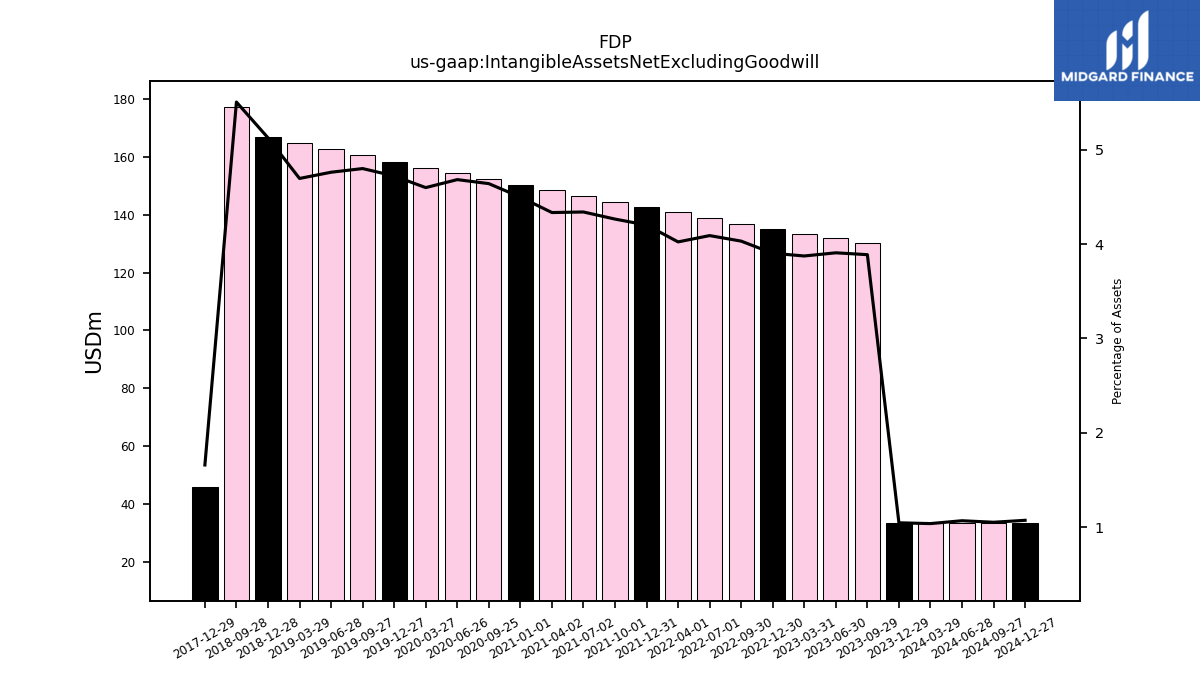
| Intangible Assets Net Excluding Goodwill | 33.20 | 33.30 | 130.20 | 131.80 | 133.40 | 135.00 | 136.90 | 138.90 | 140.90 | 142.80 | 144.50 | 146.50 | 148.40 | 150.40 | 152.30 | 154.30 | 156.20 | 158.20 | 160.60 | 162.80 | 164.90 | 166.90 | 177.40 | NA | NA | 45.90 | NA | NA | NA | NA | NA | NA | NA | NA | NA | NA | NA | NA | NA | NA | NA | NA | NA | NA | NA | NA | NA | NA | NA | NA | NA | NA | NA | NA | NA | NA | NA | |
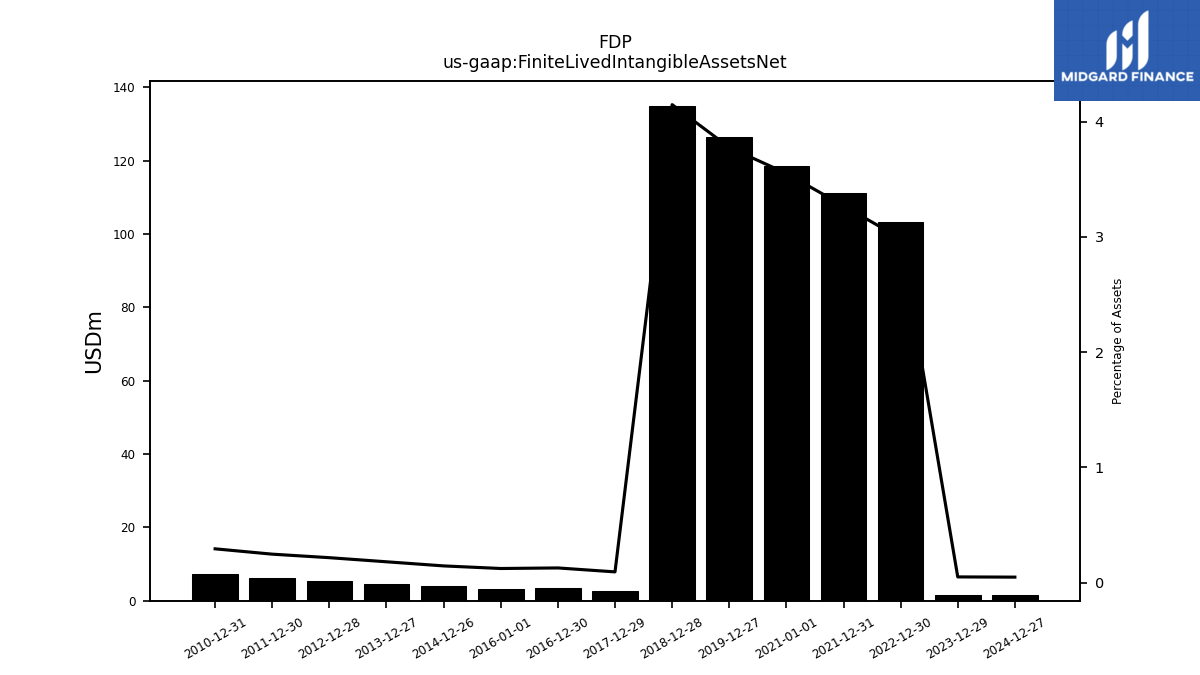
| Finite Lived Intangible Assets Net | NA | 1.60 | NA | NA | NA | 103.30 | NA | NA | NA | 111.10 | NA | NA | NA | 118.70 | NA | NA | NA | 126.50 | NA | NA | NA | 135.00 | NA | NA | NA | 2.60 | NA | NA | NA | 3.40 | NA | NA | NA | 3.20 | NA | NA | NA | 3.90 | NA | NA | NA | 4.70 | NA | NA | NA | 5.50 | NA | NA | NA | 6.20 | NA | NA | NA | 7.40 | NA | NA | NA | |
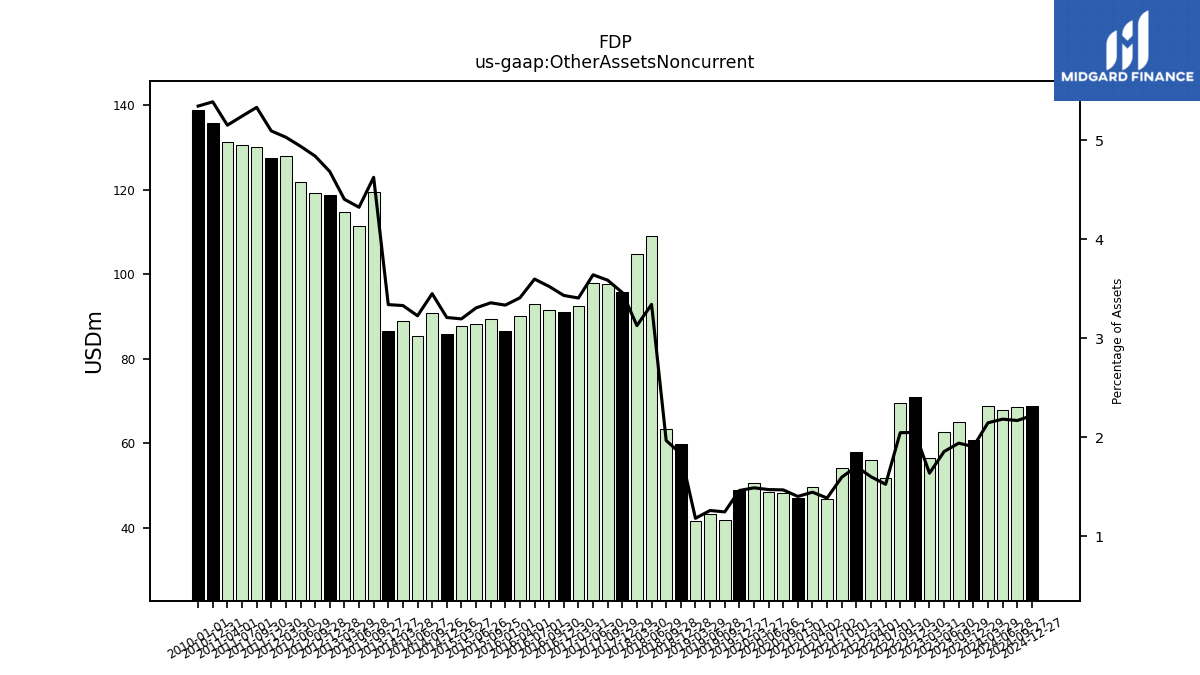
| Other Assets Noncurrent | 68.70 | 60.70 | 65.00 | 62.60 | 56.40 | 70.90 | 69.50 | 51.80 | 56.10 | 57.90 | 54.10 | 46.80 | 49.50 | 46.90 | 48.20 | 48.50 | 50.60 | 49.00 | 41.70 | 43.10 | 41.50 | 59.70 | 63.40 | 109.00 | 104.70 | 95.80 | 97.60 | 97.90 | 92.40 | 91.10 | 91.60 | 93.00 | 90.00 | 86.60 | 89.30 | 88.30 | 87.70 | 85.90 | 90.70 | 85.40 | 89.00 | 86.50 | 119.40 | 111.40 | 114.70 | 118.70 | 119.20 | 121.90 | 127.90 | 127.60 | 130.10 | 130.50 | 131.40 | 135.70 | NA | NA | NA |
| 2024-03-29 | 2023-12-29 | 2023-09-29 | 2023-06-30 | 2023-03-31 | 2022-12-30 | 2022-09-30 | 2022-07-01 | 2022-04-01 | 2021-12-31 | 2021-10-01 | 2021-07-02 | 2021-04-02 | 2021-01-01 | 2020-09-25 | 2020-06-26 | 2020-03-27 | 2019-12-27 | 2019-09-27 | 2019-06-28 | 2019-03-29 | 2018-12-28 | 2018-09-28 | 2018-06-29 | 2018-03-30 | 2017-12-29 | 2017-09-29 | 2017-06-30 | 2017-03-31 | 2016-12-30 | 2016-09-30 | 2016-07-01 | 2016-04-01 | 2016-01-01 | 2015-09-25 | 2015-06-26 | 2015-03-27 | 2014-12-26 | 2014-09-26 | 2014-06-27 | 2014-03-28 | 2013-12-27 | 2013-09-27 | 2013-06-28 | 2013-03-29 | 2012-12-28 | 2012-09-28 | 2012-06-29 | 2012-03-30 | 2011-12-30 | 2011-09-30 | 2011-07-01 | 2011-04-01 | 2010-12-31 | 2010-10-01 | 2010-07-02 | 2010-04-02 | ||
|---|---|---|---|---|---|---|---|---|---|---|---|---|---|---|---|---|---|---|---|---|---|---|---|---|---|---|---|---|---|---|---|---|---|---|---|---|---|---|---|---|---|---|---|---|---|---|---|---|---|---|---|---|---|---|---|---|---|---|
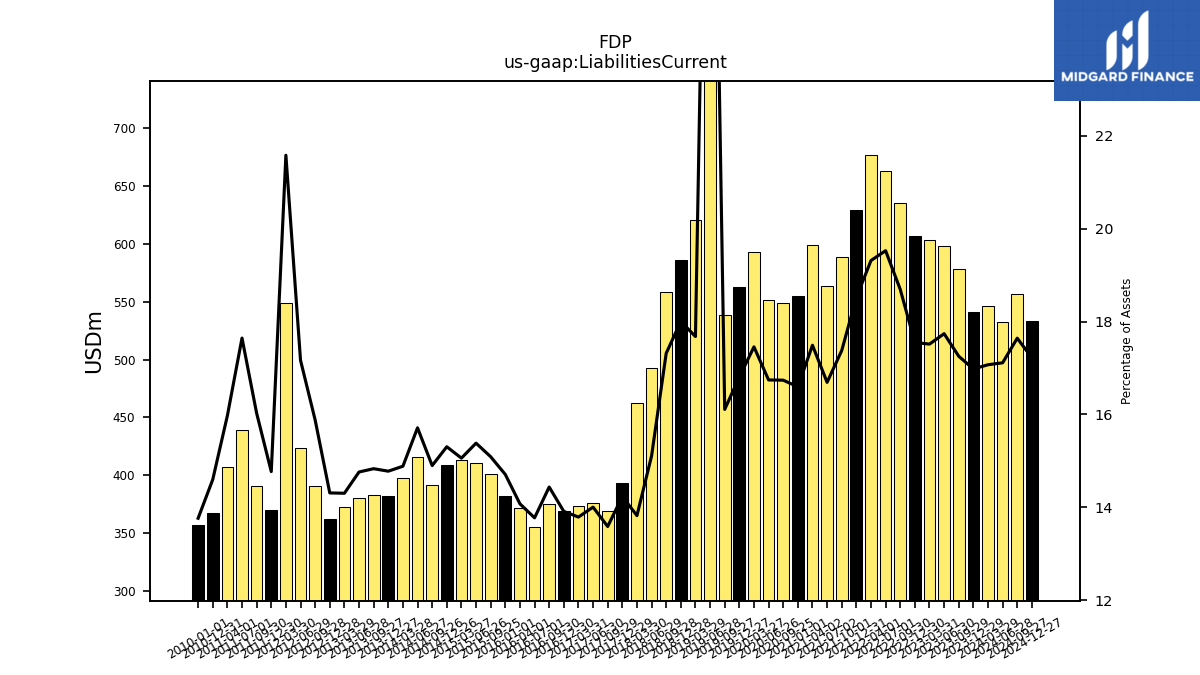
| Liabilities Current | 546.20 | 540.60 | 577.70 | 598.20 | 603.00 | 607.00 | 634.70 | 663.00 | 676.30 | 629.20 | 588.60 | 563.30 | 598.70 | 554.80 | 549.20 | 551.50 | 592.80 | 562.90 | 538.80 | 1200.40 | 620.70 | 586.00 | 557.90 | 492.50 | 462.50 | 393.80 | 369.60 | 376.40 | 373.90 | 369.10 | 375.20 | 355.90 | 371.50 | 381.80 | 401.10 | 410.60 | 413.10 | 409.40 | 391.50 | 415.60 | 397.60 | 382.60 | 382.70 | 380.20 | 372.40 | 362.50 | 391.00 | 423.50 | 548.50 | 369.80 | 390.90 | 439.00 | 407.20 | 367.50 | NA | NA | NA | |
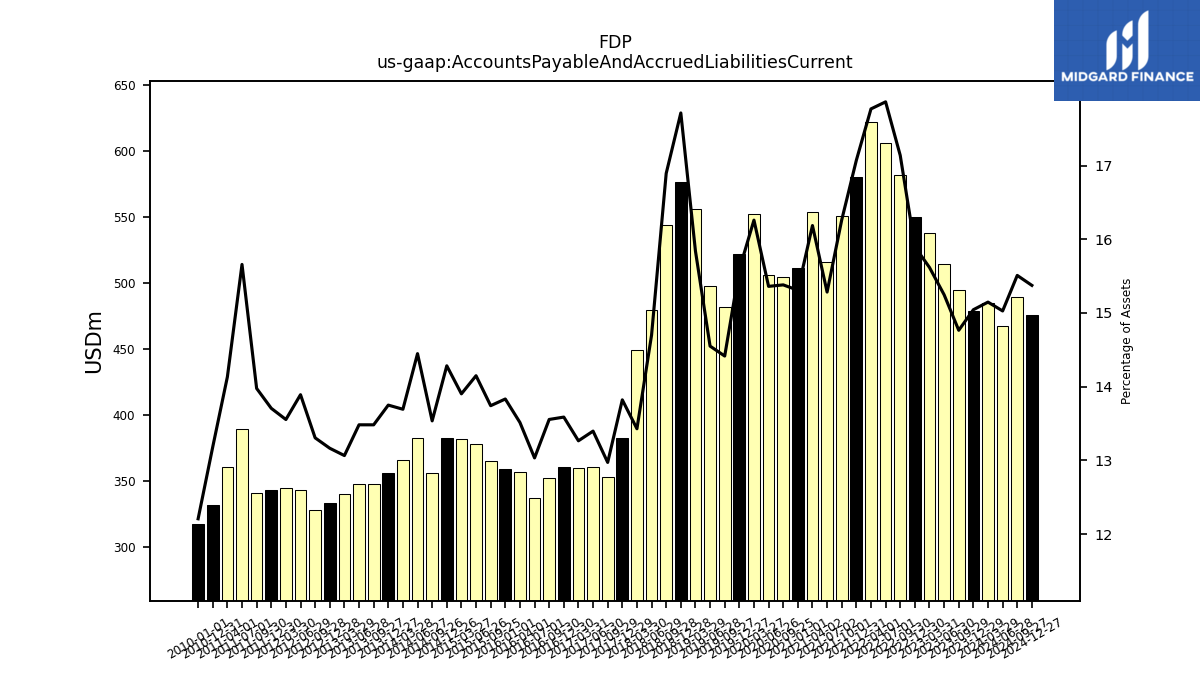
| Accounts Payable And Accrued Liabilities Current | 484.70 | 479.00 | 494.40 | 514.20 | 537.70 | 549.90 | 581.90 | 606.60 | 622.20 | 580.10 | 550.90 | 515.80 | 554.10 | 511.80 | 504.70 | 506.00 | 552.20 | 522.20 | 482.20 | 497.40 | 556.20 | 576.60 | 544.30 | 479.30 | 449.40 | 382.40 | 352.90 | 360.10 | 359.70 | 360.50 | 352.30 | 336.80 | 356.70 | 359.10 | 365.30 | 377.70 | 381.40 | 382.10 | 355.70 | 382.20 | 365.80 | 356.00 | 347.90 | 347.30 | 340.20 | 333.50 | 327.60 | 342.70 | 344.50 | 343.20 | 340.90 | 389.60 | 360.30 | 331.90 | NA | NA | NA | |
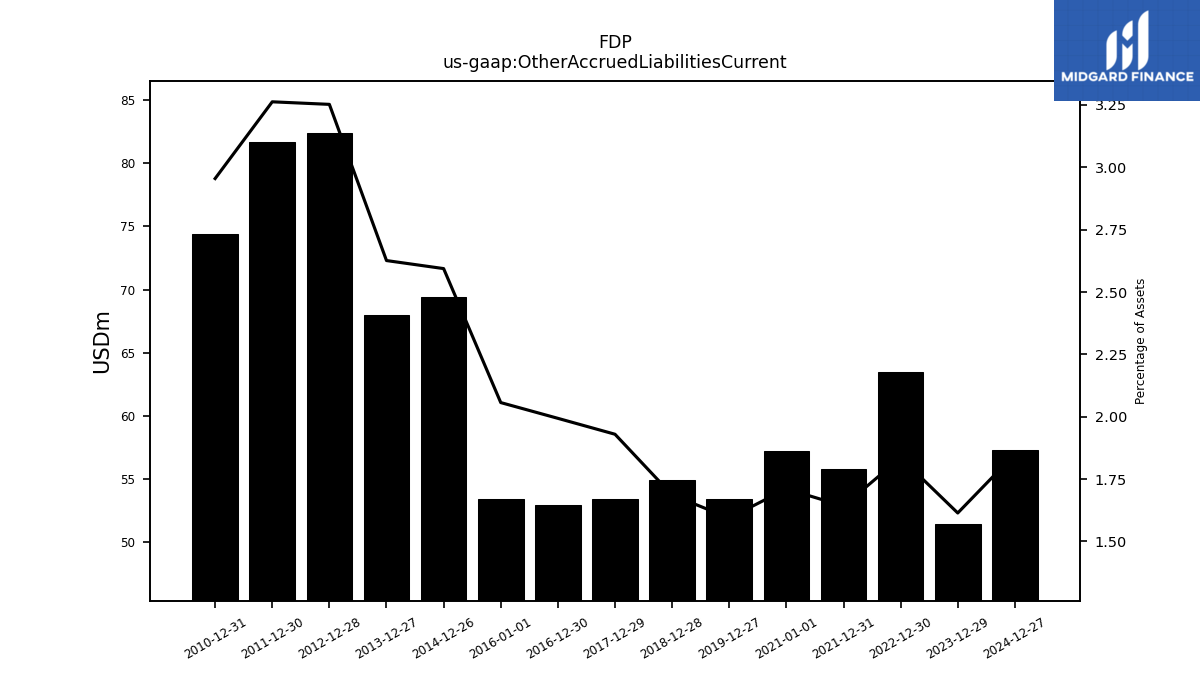
| Other Accrued Liabilities Current | NA | 51.40 | NA | NA | NA | 63.50 | NA | NA | NA | 55.80 | NA | NA | NA | 57.20 | NA | NA | NA | 53.40 | NA | NA | NA | 54.90 | NA | NA | NA | 53.40 | NA | NA | NA | 52.90 | NA | NA | NA | 53.40 | NA | NA | NA | 69.40 | NA | NA | NA | 68.00 | NA | NA | NA | 82.40 | NA | NA | NA | 81.70 | NA | NA | NA | 74.40 | NA | NA | NA | |
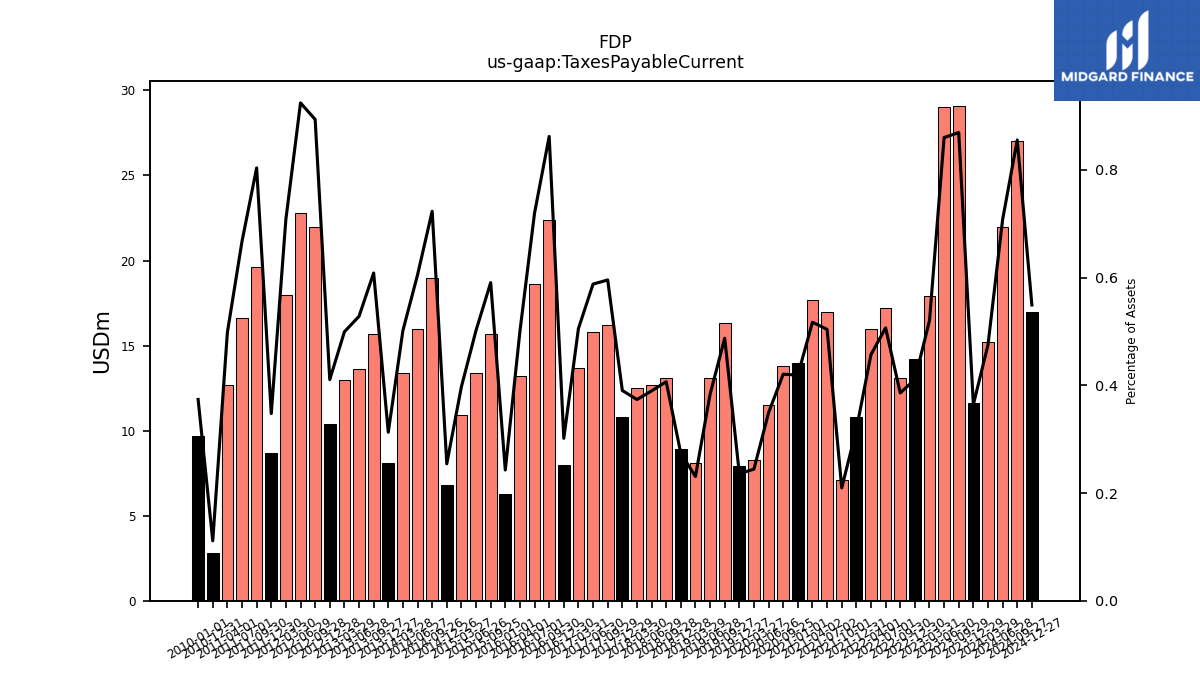
| Taxes Payable Current | 15.20 | 11.60 | 29.10 | 29.00 | 17.90 | 14.20 | 13.10 | 17.20 | 16.00 | 10.80 | 7.10 | 17.00 | 17.70 | 14.00 | 13.80 | 11.50 | 8.30 | 7.90 | 16.30 | 13.10 | 8.10 | 8.90 | 13.10 | 12.70 | 12.50 | 10.80 | 16.20 | 15.80 | 13.70 | 8.00 | 22.40 | 18.60 | 13.20 | 6.30 | 15.70 | 13.40 | 10.90 | 6.80 | 19.00 | 16.00 | 13.40 | 8.10 | 15.70 | 13.60 | 13.00 | 10.40 | 22.00 | 22.80 | 18.00 | 8.70 | 19.60 | 16.60 | 12.70 | 2.80 | NA | NA | NA | |
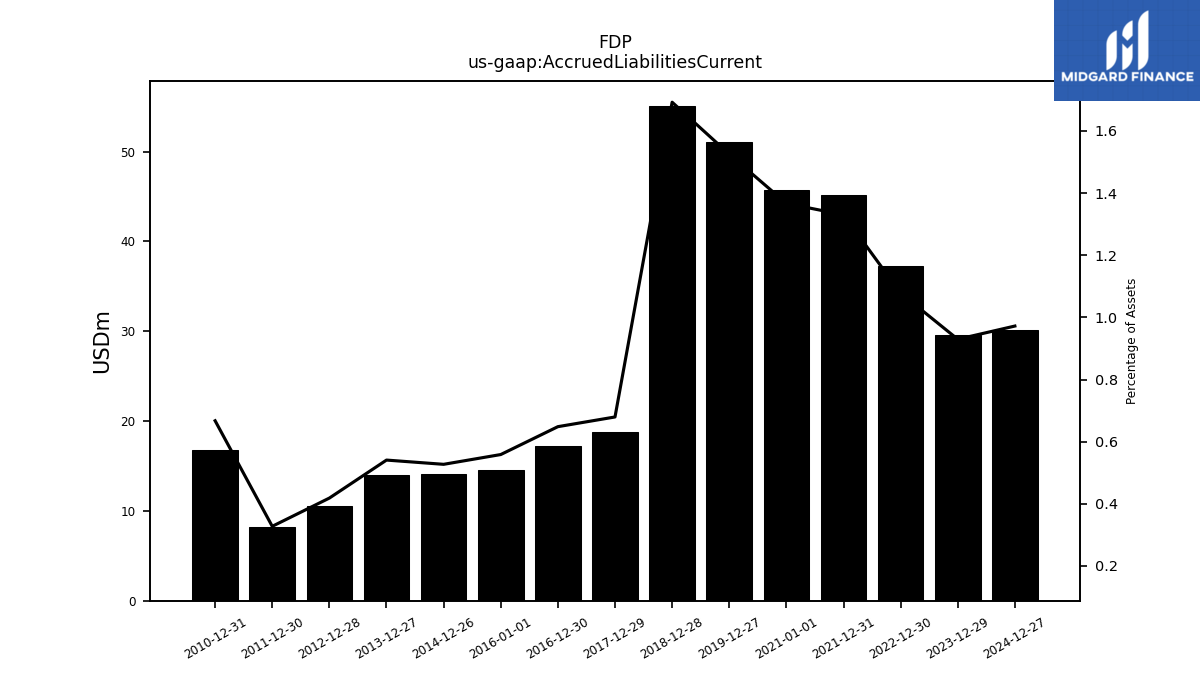
| Accrued Liabilities Current | NA | 29.60 | NA | NA | NA | 37.30 | NA | NA | NA | 45.20 | NA | NA | NA | 45.70 | NA | NA | NA | 51.10 | NA | NA | NA | 55.10 | NA | NA | NA | 18.80 | NA | NA | NA | 17.20 | NA | NA | NA | 14.50 | NA | NA | NA | 14.10 | NA | NA | NA | 14.00 | NA | NA | NA | 10.60 | NA | NA | NA | 8.20 | NA | NA | NA | 16.80 | NA | NA | NA | |
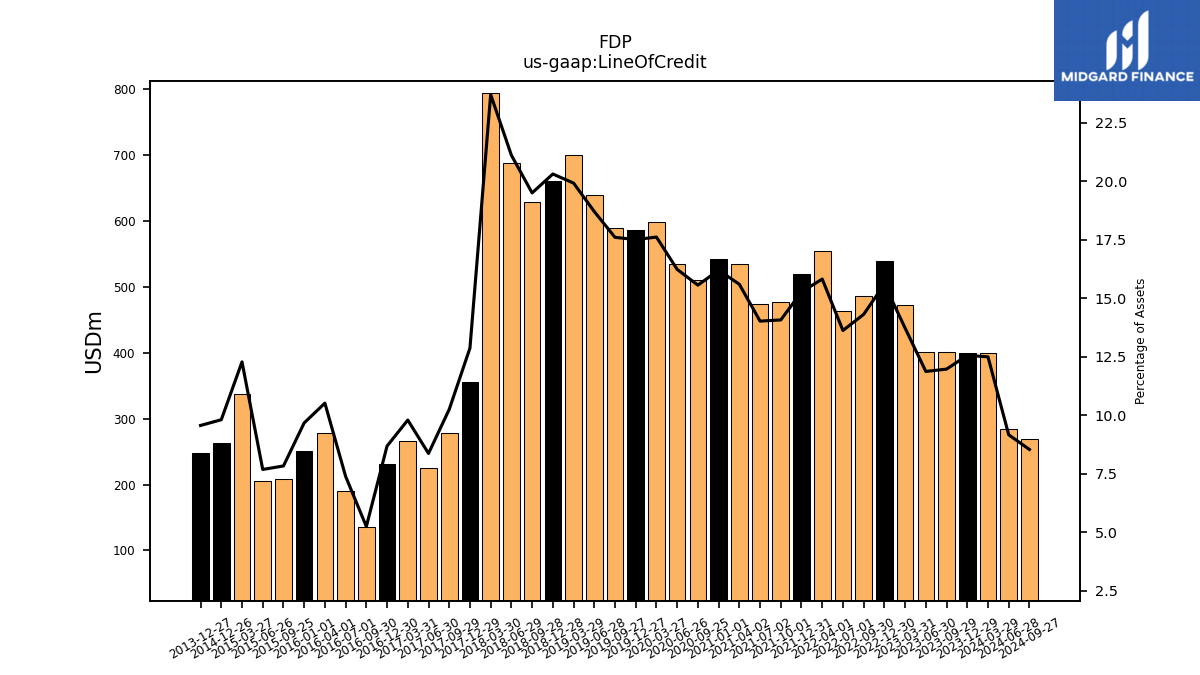
| Line Of Credit | 400.00 | 400.00 | 401.00 | 400.50 | 472.70 | 539.80 | 486.10 | 462.70 | 554.10 | 519.10 | 476.90 | 473.40 | 534.10 | 541.70 | 510.70 | 534.90 | 598.40 | 586.60 | 589.00 | 639.60 | 699.70 | 661.30 | 628.50 | 688.50 | 793.50 | 356.20 | 279.00 | 225.00 | 265.70 | 230.50 | 136.40 | 191.00 | 277.70 | 251.20 | 208.30 | 205.20 | 337.00 | 262.50 | NA | NA | NA | 247.70 | NA | NA | NA | NA | NA | NA | NA | NA | NA | NA | NA | NA | NA | NA | NA |
| 2024-03-29 | 2023-12-29 | 2023-09-29 | 2023-06-30 | 2023-03-31 | 2022-12-30 | 2022-09-30 | 2022-07-01 | 2022-04-01 | 2021-12-31 | 2021-10-01 | 2021-07-02 | 2021-04-02 | 2021-01-01 | 2020-09-25 | 2020-06-26 | 2020-03-27 | 2019-12-27 | 2019-09-27 | 2019-06-28 | 2019-03-29 | 2018-12-28 | 2018-09-28 | 2018-06-29 | 2018-03-30 | 2017-12-29 | 2017-09-29 | 2017-06-30 | 2017-03-31 | 2016-12-30 | 2016-09-30 | 2016-07-01 | 2016-04-01 | 2016-01-01 | 2015-09-25 | 2015-06-26 | 2015-03-27 | 2014-12-26 | 2014-09-26 | 2014-06-27 | 2014-03-28 | 2013-12-27 | 2013-09-27 | 2013-06-28 | 2013-03-29 | 2012-12-28 | 2012-09-28 | 2012-06-29 | 2012-03-30 | 2011-12-30 | 2011-09-30 | 2011-07-01 | 2011-04-01 | 2010-12-31 | 2010-10-01 | 2010-07-02 | 2010-04-02 | ||
|---|---|---|---|---|---|---|---|---|---|---|---|---|---|---|---|---|---|---|---|---|---|---|---|---|---|---|---|---|---|---|---|---|---|---|---|---|---|---|---|---|---|---|---|---|---|---|---|---|---|---|---|---|---|---|---|---|---|---|
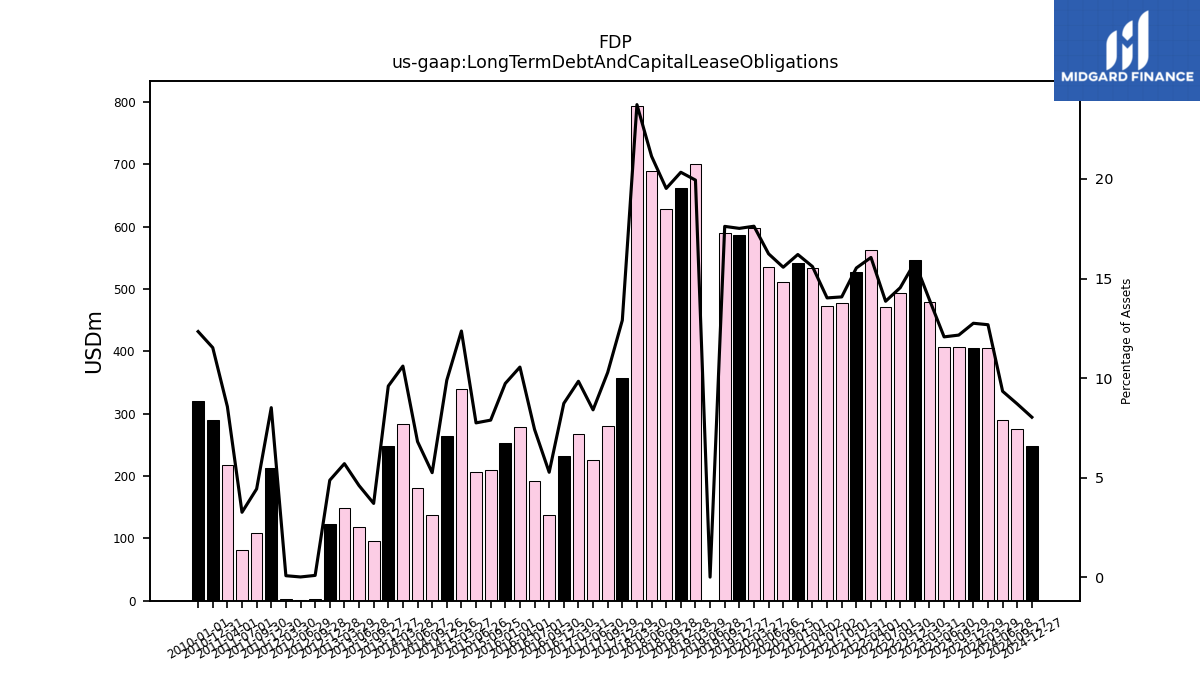
| Long Term Debt And Capital Lease Obligations | 405.80 | 406.10 | 407.20 | 407.10 | 479.60 | 547.10 | 493.70 | 470.60 | 562.30 | 527.70 | 476.90 | 473.40 | 534.10 | 541.80 | 510.80 | 535.00 | 598.60 | 586.80 | 589.30 | 0.40 | 700.20 | 661.90 | 629.00 | 689.10 | 794.10 | 357.00 | 279.80 | 226.00 | 266.90 | 231.70 | 137.10 | 191.90 | 278.60 | 252.70 | 209.80 | 207.00 | 339.20 | 264.70 | 138.10 | 180.30 | 283.30 | 248.60 | 95.80 | 118.70 | 148.60 | 123.50 | 2.40 | 0.50 | 2.10 | 213.30 | 108.30 | 81.30 | 218.50 | 290.30 | NA | NA | NA | |
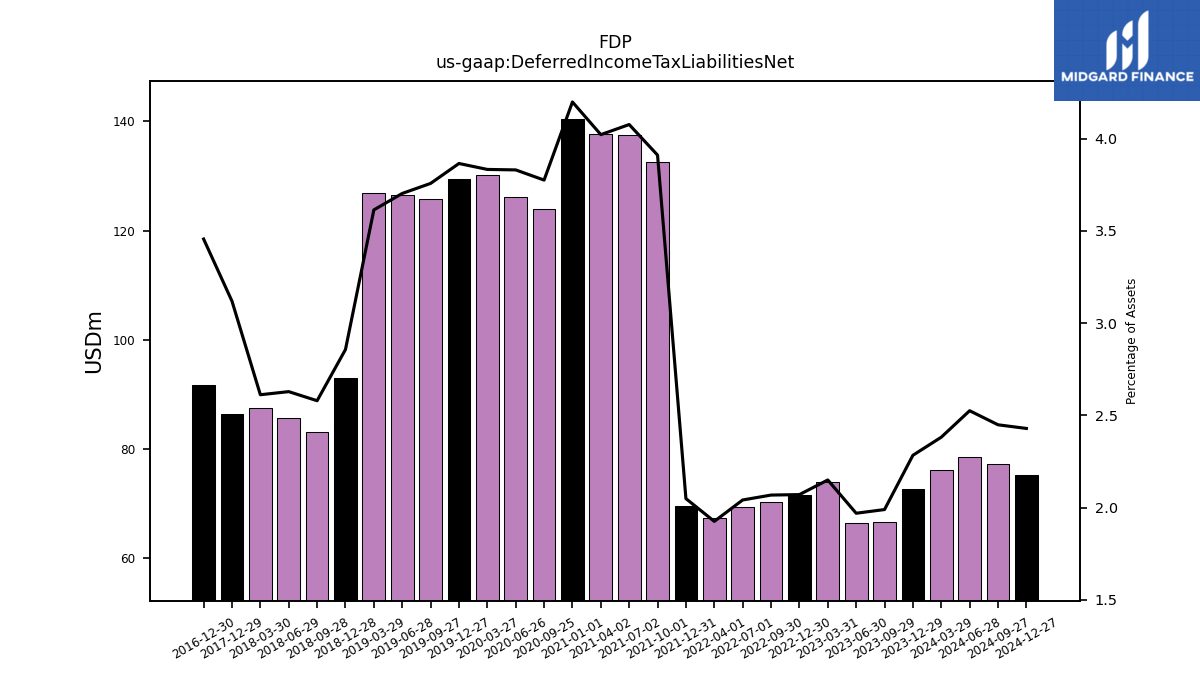
| Deferred Income Tax Liabilities Net | 76.20 | 72.70 | 66.60 | 66.40 | 74.00 | 71.60 | 70.20 | 69.30 | 67.40 | 69.60 | 132.50 | 137.60 | 137.70 | 140.40 | 123.90 | 126.20 | 130.20 | 129.50 | 125.70 | 126.60 | 126.90 | 93.00 | 83.10 | 85.70 | 87.40 | 86.30 | NA | NA | NA | 91.70 | NA | NA | NA | NA | NA | NA | NA | NA | NA | NA | NA | NA | NA | NA | NA | NA | NA | NA | NA | NA | NA | NA | NA | NA | NA | NA | NA | |
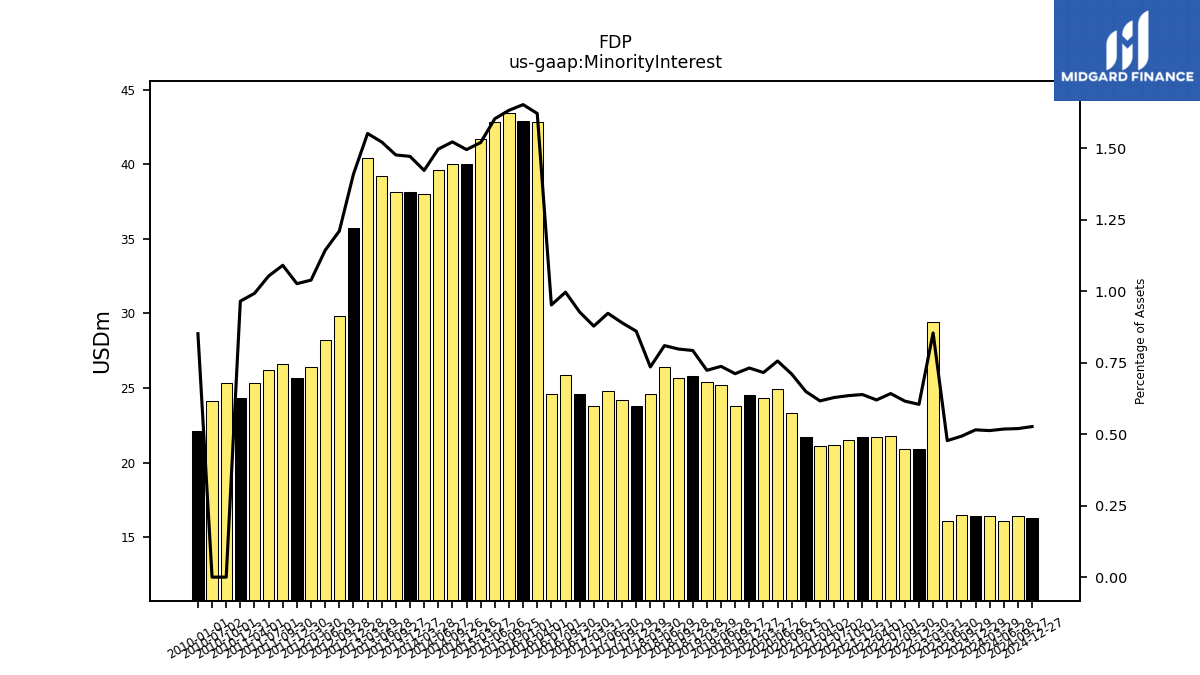
| Minority Interest | 16.40 | 16.40 | 16.50 | 16.10 | 29.40 | 20.90 | 20.90 | 21.80 | 21.70 | 21.70 | 21.50 | 21.20 | 21.10 | 21.70 | 23.30 | 24.90 | 24.30 | 24.50 | 23.80 | 25.20 | 25.40 | 25.80 | 25.70 | 26.40 | 24.60 | 23.80 | 24.20 | 24.80 | 23.80 | 24.60 | 25.90 | 24.60 | 42.80 | 42.90 | 43.40 | 42.80 | 41.70 | 40.00 | 40.00 | 39.60 | 38.00 | 38.10 | 38.10 | 39.20 | 40.40 | 35.70 | 29.80 | 28.20 | 26.40 | 25.70 | 26.60 | 26.20 | 25.30 | 24.30 | 25.30 | 24.10 | NA | |
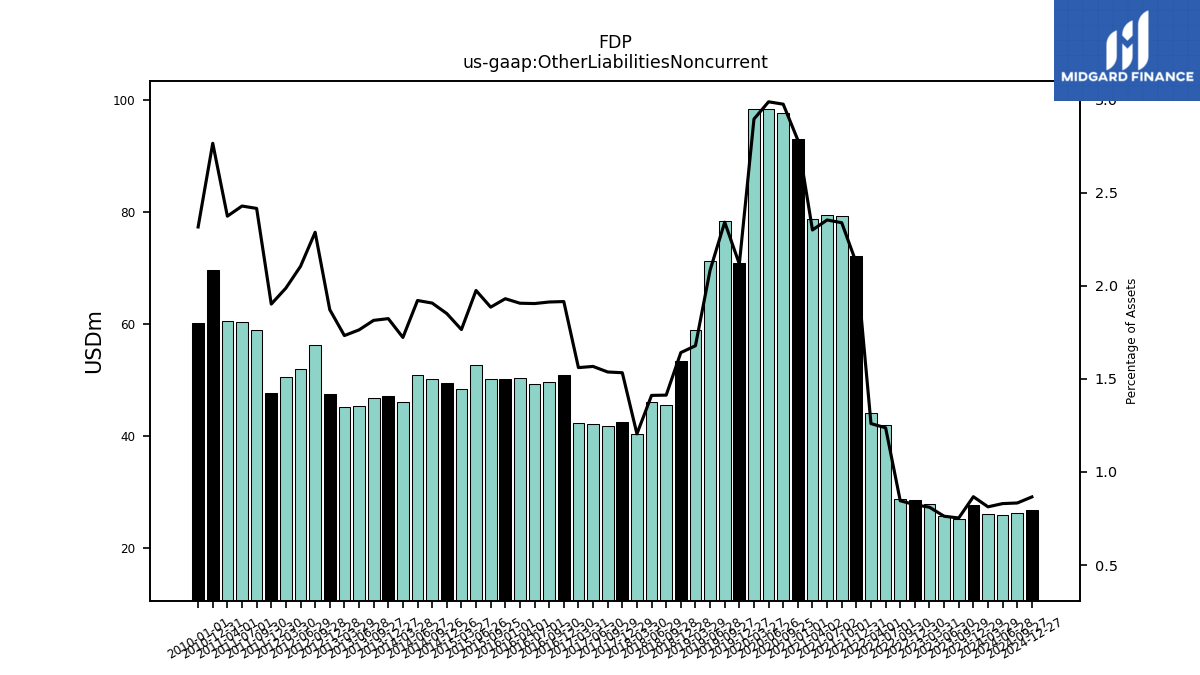
| Other Liabilities Noncurrent | 26.00 | 27.60 | 25.20 | 25.70 | 27.90 | 28.50 | 28.70 | 42.00 | 44.10 | 72.10 | 79.20 | 79.40 | 78.70 | 93.00 | 97.60 | 98.40 | 98.30 | 70.90 | 78.30 | 71.20 | 58.90 | 53.40 | 45.50 | 46.00 | 40.30 | 42.40 | 41.80 | 42.10 | 42.30 | 50.80 | 49.70 | 49.20 | 50.30 | 50.10 | 50.10 | 52.70 | 48.40 | 49.50 | 50.10 | 50.80 | 46.00 | 47.20 | 46.80 | 45.40 | 45.10 | 47.40 | 56.30 | 51.90 | 50.50 | 47.60 | 58.90 | 60.40 | 60.50 | 69.60 | NA | NA | NA | |
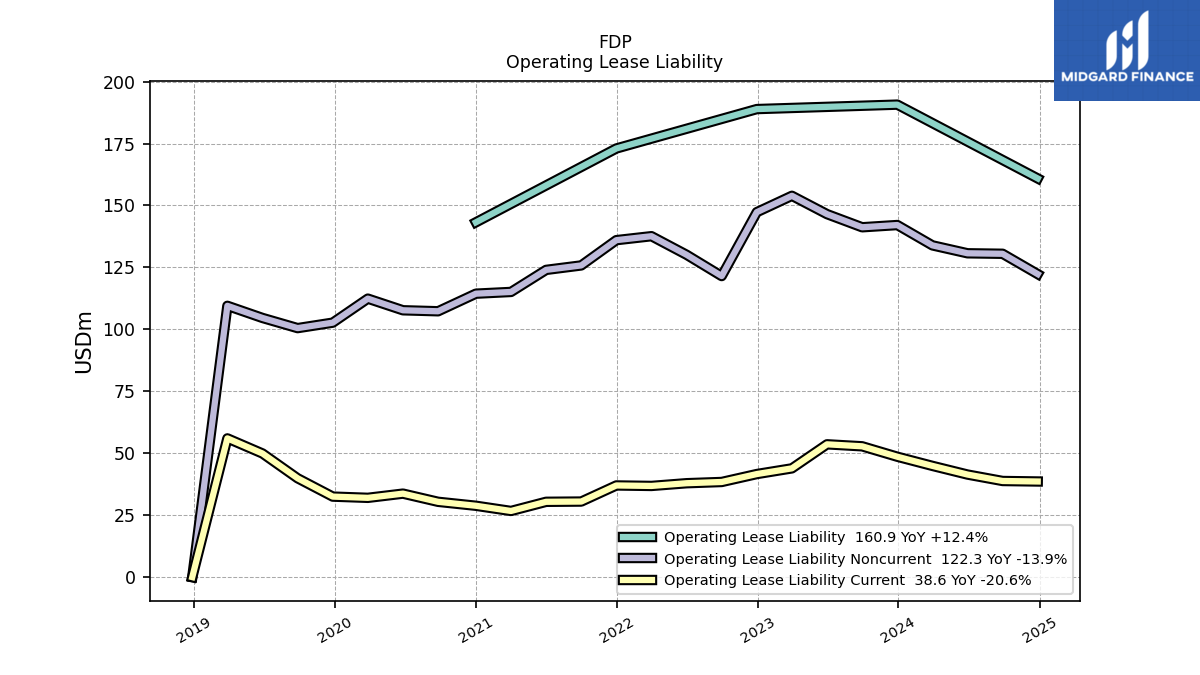
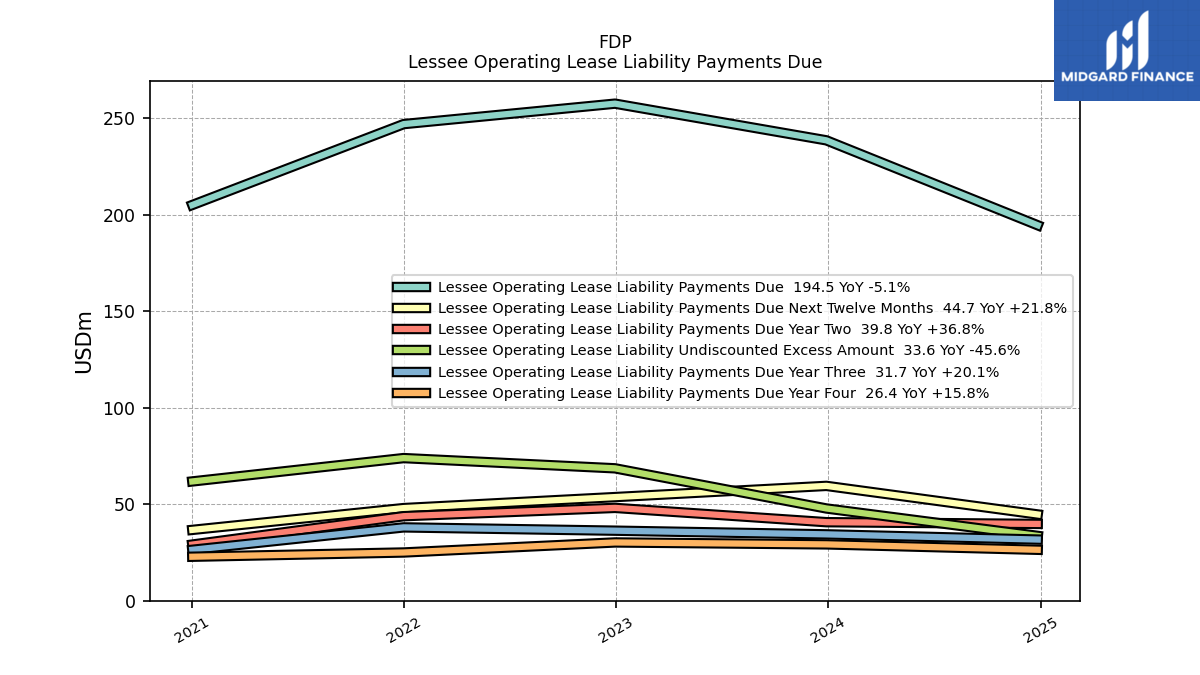
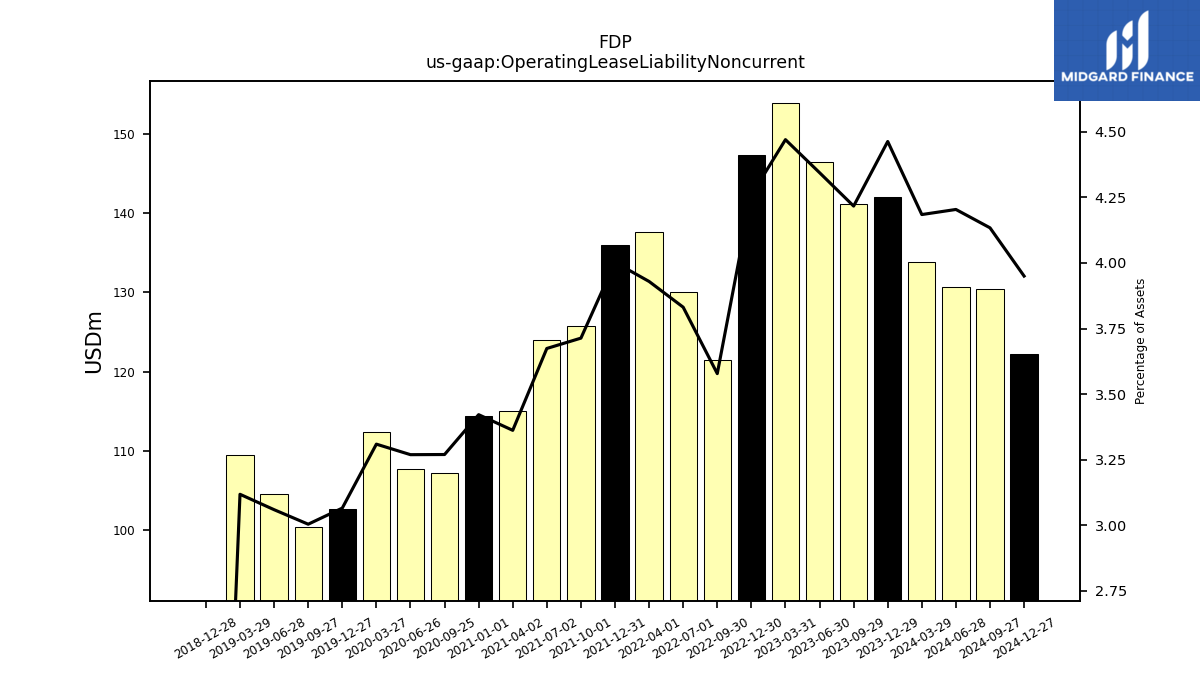
| Operating Lease Liability Noncurrent | 133.90 | 142.10 | 141.20 | 146.50 | 153.90 | 147.30 | 121.50 | 130.10 | 137.60 | 136.00 | 125.80 | 124.00 | 115.10 | 114.40 | 107.30 | 107.70 | 112.40 | 102.70 | 100.50 | 104.60 | 109.50 | 0.00 | NA | NA | NA | NA | NA | NA | NA | NA | NA | NA | NA | NA | NA | NA | NA | NA | NA | NA | NA | NA | NA | NA | NA | NA | NA | NA | NA | NA | NA | NA | NA | NA | NA | NA | NA |
| 2024-03-29 | 2023-12-29 | 2023-09-29 | 2023-06-30 | 2023-03-31 | 2022-12-30 | 2022-09-30 | 2022-07-01 | 2022-04-01 | 2021-12-31 | 2021-10-01 | 2021-07-02 | 2021-04-02 | 2021-01-01 | 2020-09-25 | 2020-06-26 | 2020-03-27 | 2019-12-27 | 2019-09-27 | 2019-06-28 | 2019-03-29 | 2018-12-28 | 2018-09-28 | 2018-06-29 | 2018-03-30 | 2017-12-29 | 2017-09-29 | 2017-06-30 | 2017-03-31 | 2016-12-30 | 2016-09-30 | 2016-07-01 | 2016-04-01 | 2016-01-01 | 2015-09-25 | 2015-06-26 | 2015-03-27 | 2014-12-26 | 2014-09-26 | 2014-06-27 | 2014-03-28 | 2013-12-27 | 2013-09-27 | 2013-06-28 | 2013-03-29 | 2012-12-28 | 2012-09-28 | 2012-06-29 | 2012-03-30 | 2011-12-30 | 2011-09-30 | 2011-07-01 | 2011-04-01 | 2010-12-31 | 2010-10-01 | 2010-07-02 | 2010-04-02 | ||
|---|---|---|---|---|---|---|---|---|---|---|---|---|---|---|---|---|---|---|---|---|---|---|---|---|---|---|---|---|---|---|---|---|---|---|---|---|---|---|---|---|---|---|---|---|---|---|---|---|---|---|---|---|---|---|---|---|---|---|
| Stockholders Equity | 1911.70 | 1896.30 | 2030.30 | 2029.40 | 1940.40 | 1904.70 | 1887.80 | 1861.40 | 1852.90 | 1802.30 | 1810.40 | 1824.90 | 1787.80 | 1728.00 | 1718.10 | 1695.20 | 1686.50 | 1719.20 | 1741.00 | 1743.40 | 1724.50 | 1692.00 | 1743.30 | 1783.40 | 1801.60 | 1767.40 | 1819.10 | 1832.10 | 1818.30 | 1791.80 | 1834.40 | 1784.50 | 1719.40 | 1708.00 | 1793.90 | 1792.70 | 1736.90 | 1747.90 | 1850.80 | 1802.30 | 1748.70 | 1713.10 | 1849.60 | 1824.10 | 1828.80 | 1795.70 | 1830.20 | 1809.60 | 1758.40 | 1689.40 | 1698.40 | 1723.00 | 1678.30 | 1607.20 | NA | NA | NA | |
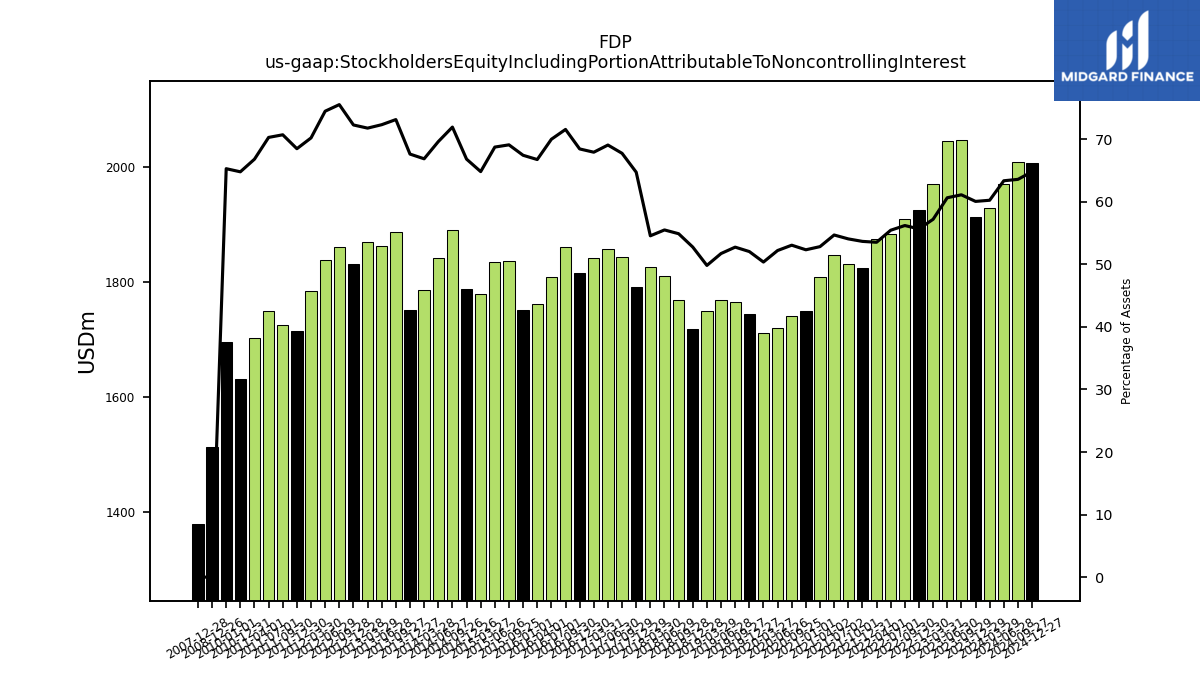
| Stockholders Equity Including Portion Attributable To Noncontrolling Interest | 1928.10 | 1912.70 | 2046.80 | 2045.50 | 1969.80 | 1925.60 | 1908.70 | 1883.20 | 1874.60 | 1824.00 | 1831.90 | 1846.10 | 1808.90 | 1749.70 | 1741.40 | 1720.10 | 1710.80 | 1743.70 | 1764.80 | 1768.60 | 1749.90 | 1717.80 | 1769.00 | 1809.80 | 1826.20 | 1791.20 | 1843.30 | 1856.90 | 1842.10 | 1816.40 | 1860.30 | 1809.10 | 1762.20 | 1750.90 | 1837.30 | 1835.50 | 1778.60 | 1787.90 | 1890.80 | 1841.90 | 1786.70 | 1751.20 | 1887.70 | 1863.30 | 1869.20 | 1831.40 | 1860.00 | 1837.80 | 1784.80 | 1715.10 | 1725.00 | 1749.20 | 1703.60 | 1631.50 | NA | NA | NA | |
| Common Stock Value | 0.50 | 0.50 | 0.50 | 0.50 | 0.50 | 0.50 | 0.50 | 0.50 | 0.50 | 0.50 | 0.50 | 0.50 | 0.50 | 0.50 | 0.50 | 0.50 | 0.50 | 0.50 | 0.50 | 0.50 | 0.50 | 0.50 | 0.50 | 0.50 | 0.50 | 0.50 | 0.50 | 0.50 | 0.50 | 0.50 | 0.50 | 0.50 | 0.50 | 0.50 | 0.50 | 0.50 | 0.50 | 0.50 | 0.60 | 0.60 | 0.60 | 0.60 | 0.60 | 0.60 | 0.60 | 0.60 | 0.60 | 0.60 | 0.60 | 0.60 | 0.60 | 0.60 | 0.60 | 0.60 | NA | NA | NA | |
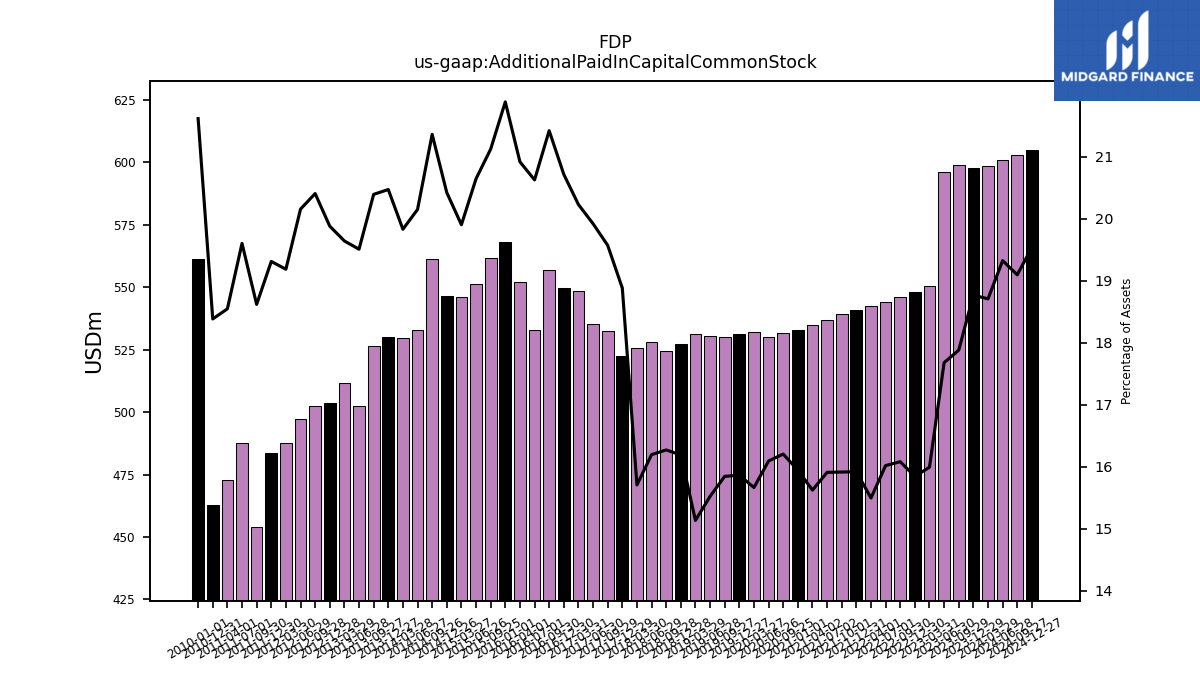
| Additional Paid In Capital Common Stock | 598.70 | 597.70 | 598.80 | 596.30 | 550.70 | 548.10 | 546.10 | 544.00 | 542.70 | 541.00 | 539.20 | 537.00 | 534.90 | 533.10 | 531.80 | 530.20 | 532.10 | 531.40 | 530.10 | 530.70 | 531.50 | 527.10 | 524.30 | 528.10 | 525.70 | 522.50 | 532.50 | 535.50 | 548.60 | 549.70 | 556.80 | 533.10 | 552.20 | 568.20 | 561.60 | 551.20 | 546.10 | 546.40 | 561.40 | 533.10 | 529.80 | 530.10 | 526.30 | 502.60 | 511.50 | 503.70 | 502.50 | 497.30 | 487.70 | 483.60 | 454.20 | 487.80 | 472.90 | 462.90 | NA | NA | NA | |
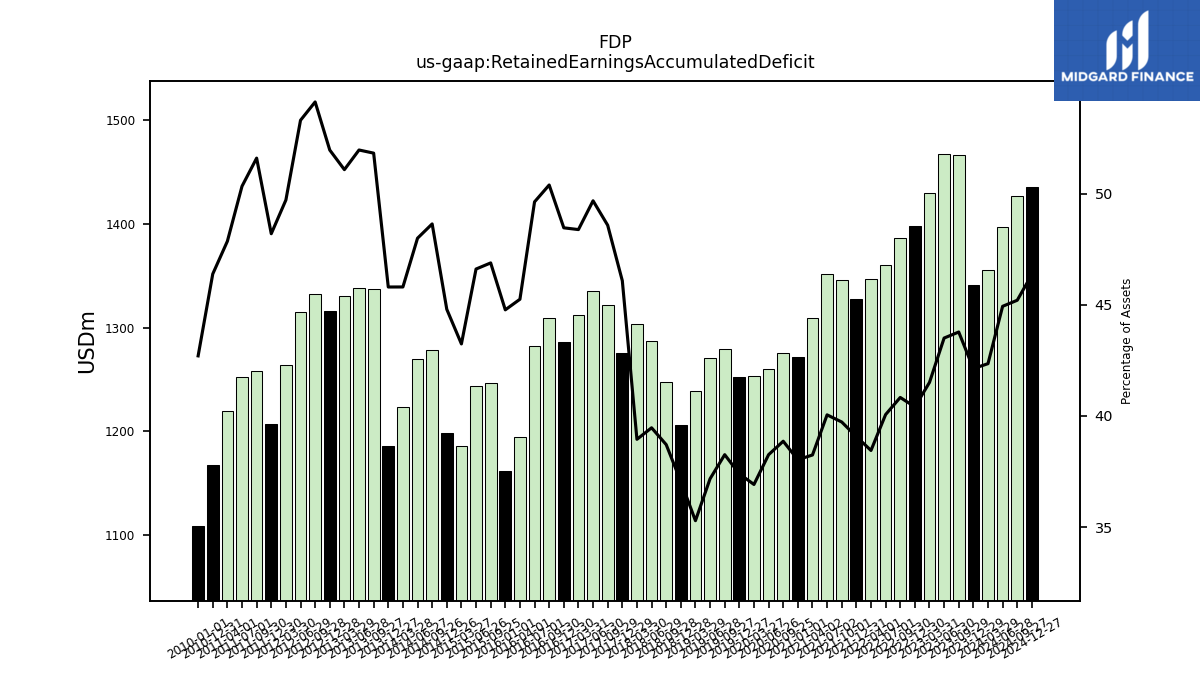
| Retained Earnings Accumulated Deficit | 1355.20 | 1341.40 | 1465.80 | 1467.10 | 1429.10 | 1397.60 | 1386.40 | 1360.30 | 1346.30 | 1327.70 | 1345.80 | 1351.60 | 1309.20 | 1271.40 | 1275.20 | 1260.20 | 1253.80 | 1252.70 | 1279.70 | 1270.80 | 1239.10 | 1206.00 | 1247.20 | 1286.80 | 1303.40 | 1275.00 | 1321.50 | 1335.30 | 1311.90 | 1285.80 | 1309.60 | 1282.50 | 1194.30 | 1162.30 | 1246.30 | 1244.20 | 1186.20 | 1198.40 | 1278.10 | 1269.60 | 1223.50 | 1185.80 | 1337.20 | 1338.50 | 1330.00 | 1316.30 | 1332.60 | 1314.90 | 1263.50 | 1206.80 | 1258.50 | 1252.30 | 1220.10 | 1167.80 | NA | NA | NA | |
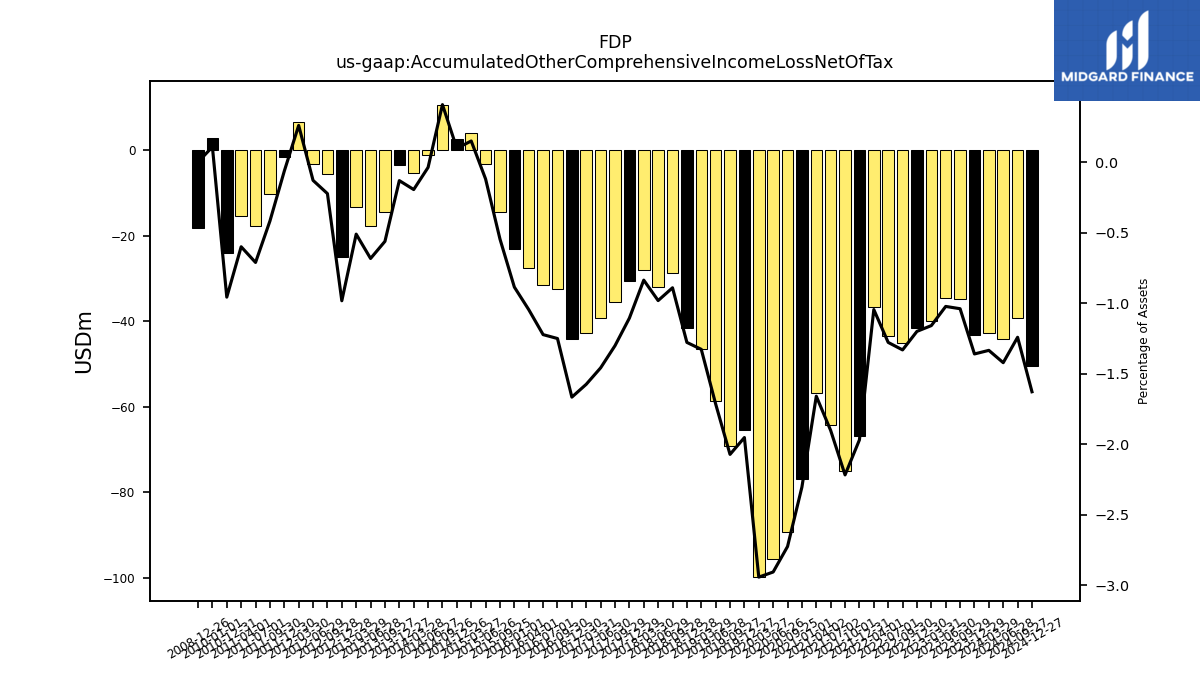
| Accumulated Other Comprehensive Income Loss Net Of Tax | -42.70 | -43.30 | -34.80 | -34.50 | -39.90 | -41.50 | -45.20 | -43.40 | -36.60 | -66.90 | -75.10 | -64.20 | -56.80 | -77.00 | -89.40 | -95.70 | -99.90 | -65.40 | -69.30 | -58.60 | -46.60 | -41.60 | -28.70 | -32.00 | -28.00 | -30.60 | -35.40 | -39.20 | -42.70 | -44.20 | -32.50 | -31.60 | -27.60 | -23.00 | -14.50 | -3.20 | 4.10 | 2.60 | 10.70 | -1.00 | -5.20 | -3.40 | -14.50 | -17.60 | -13.30 | -24.90 | -5.50 | -3.20 | 6.60 | -1.60 | -10.20 | -17.70 | -15.30 | -24.10 | NA | NA | NA | |
| Minority Interest | 16.40 | 16.40 | 16.50 | 16.10 | 29.40 | 20.90 | 20.90 | 21.80 | 21.70 | 21.70 | 21.50 | 21.20 | 21.10 | 21.70 | 23.30 | 24.90 | 24.30 | 24.50 | 23.80 | 25.20 | 25.40 | 25.80 | 25.70 | 26.40 | 24.60 | 23.80 | 24.20 | 24.80 | 23.80 | 24.60 | 25.90 | 24.60 | 42.80 | 42.90 | 43.40 | 42.80 | 41.70 | 40.00 | 40.00 | 39.60 | 38.00 | 38.10 | 38.10 | 39.20 | 40.40 | 35.70 | 29.80 | 28.20 | 26.40 | 25.70 | 26.60 | 26.20 | 25.30 | 24.30 | 25.30 | 24.10 | NA |
| 2024-03-29 | 2023-12-29 | 2023-09-29 | 2023-06-30 | 2023-03-31 | 2022-12-30 | 2022-09-30 | 2022-07-01 | 2022-04-01 | 2021-12-31 | 2021-10-01 | 2021-07-02 | 2021-04-02 | 2021-01-01 | 2020-09-25 | 2020-06-26 | 2020-03-27 | 2019-12-27 | 2019-09-27 | 2019-06-28 | 2019-03-29 | 2018-12-28 | 2018-09-28 | 2018-06-29 | 2018-03-30 | 2017-12-29 | 2017-09-29 | 2017-06-30 | 2017-03-31 | 2016-12-30 | 2016-09-30 | 2016-07-01 | 2016-04-01 | 2016-01-01 | 2015-09-25 | 2015-06-26 | 2015-03-27 | 2014-12-26 | 2014-09-26 | 2014-06-27 | 2014-03-28 | 2013-12-27 | 2013-09-27 | 2013-06-28 | 2013-03-29 | 2012-12-28 | 2012-09-28 | 2012-06-29 | 2012-03-30 | 2011-12-30 | 2011-09-30 | 2011-07-01 | 2011-04-01 | 2010-12-31 | 2010-10-01 | 2010-07-02 | 2010-04-02 | ||
|---|---|---|---|---|---|---|---|---|---|---|---|---|---|---|---|---|---|---|---|---|---|---|---|---|---|---|---|---|---|---|---|---|---|---|---|---|---|---|---|---|---|---|---|---|---|---|---|---|---|---|---|---|---|---|---|---|---|---|
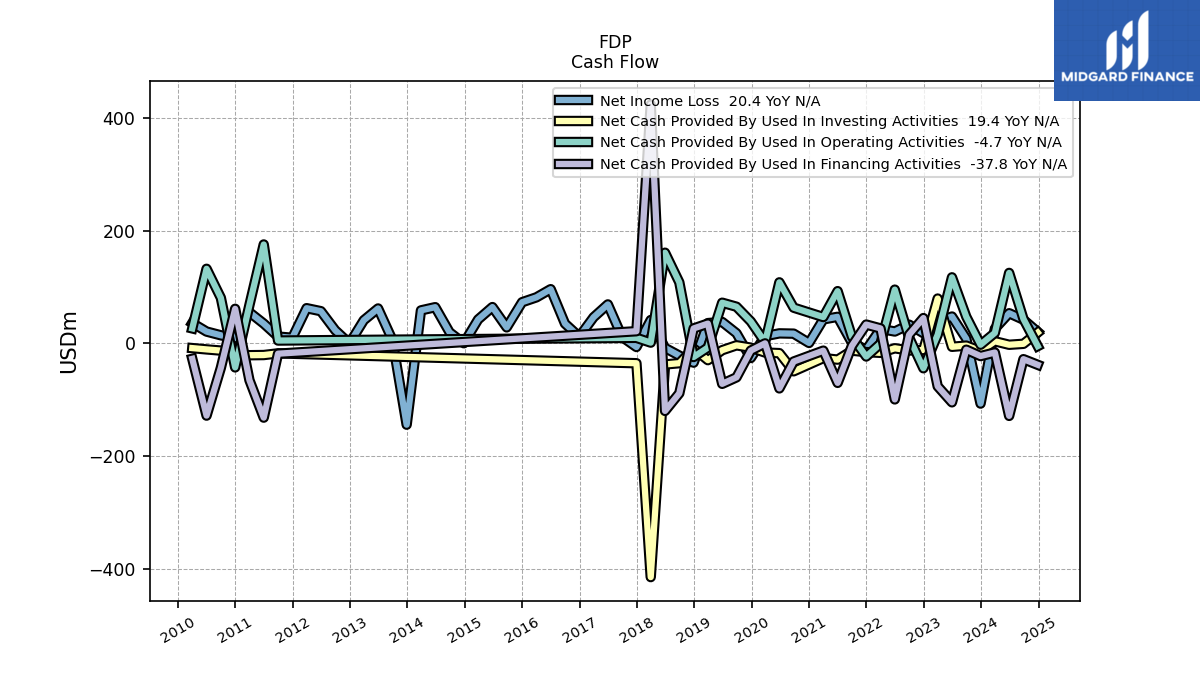
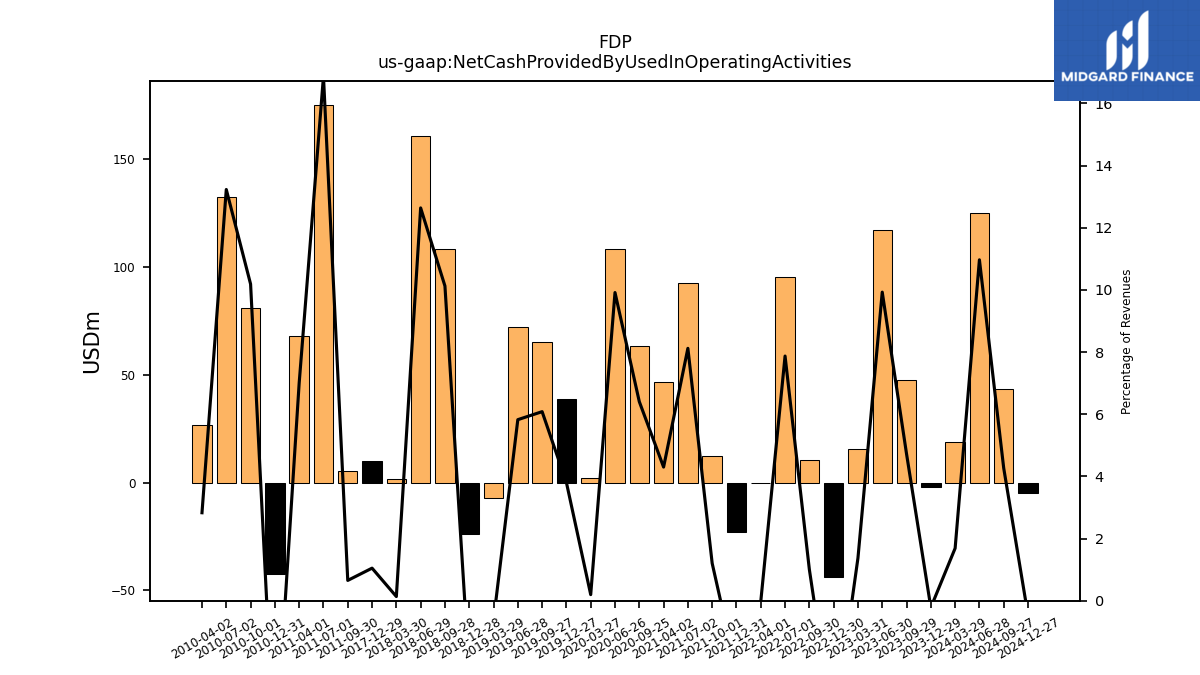
| Net Cash Provided By Used In Operating Activities | 18.70 | -2.20 | 47.40 | 117.20 | 15.50 | -43.90 | 10.60 | 95.40 | -0.30 | -23.10 | 12.10 | 92.70 | 46.80 | NA | 63.40 | 108.30 | 2.20 | 39.00 | 65.10 | 72.20 | -7.20 | -24.00 | 108.30 | 160.80 | 1.50 | 10.00 | NA | NA | NA | NA | NA | NA | NA | NA | NA | NA | NA | NA | NA | NA | NA | NA | NA | NA | NA | NA | NA | NA | NA | NA | 5.20 | 175.40 | 68.20 | -42.40 | 80.80 | 132.30 | 26.70 | |
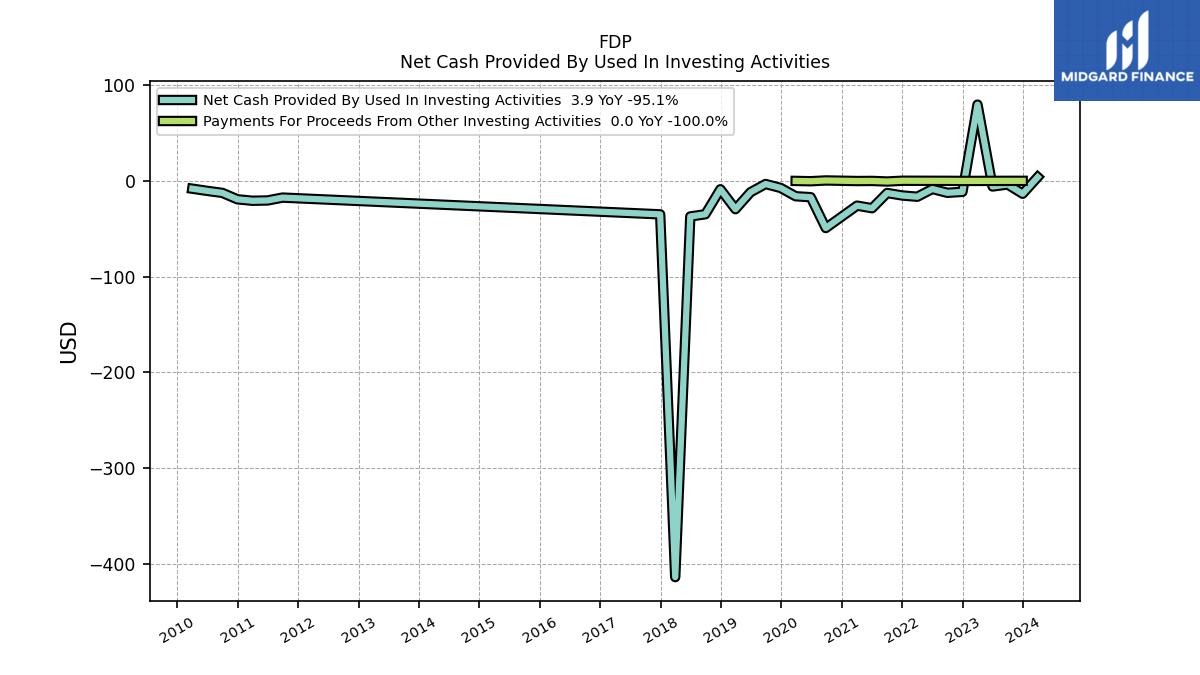
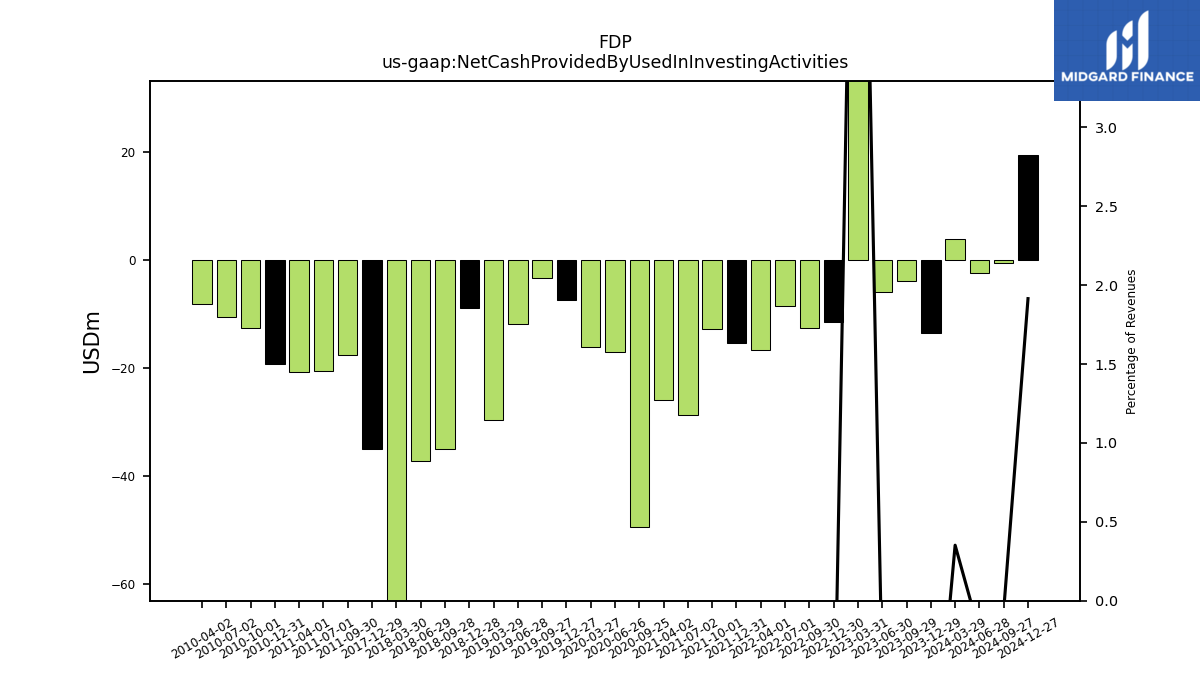
| Net Cash Provided By Used In Investing Activities | 3.90 | -13.50 | -3.80 | -5.90 | 79.60 | -11.50 | -12.50 | -8.50 | -16.60 | -15.30 | -12.70 | -28.60 | -25.90 | NA | -49.30 | -17.10 | -16.10 | -7.40 | -3.30 | -11.90 | -29.60 | -8.80 | -34.90 | -37.20 | -413.90 | -35.00 | NA | NA | NA | NA | NA | NA | NA | NA | NA | NA | NA | NA | NA | NA | NA | NA | NA | NA | NA | NA | NA | NA | NA | NA | -17.50 | -20.50 | -20.80 | -19.30 | -12.60 | -10.50 | -8.20 | |
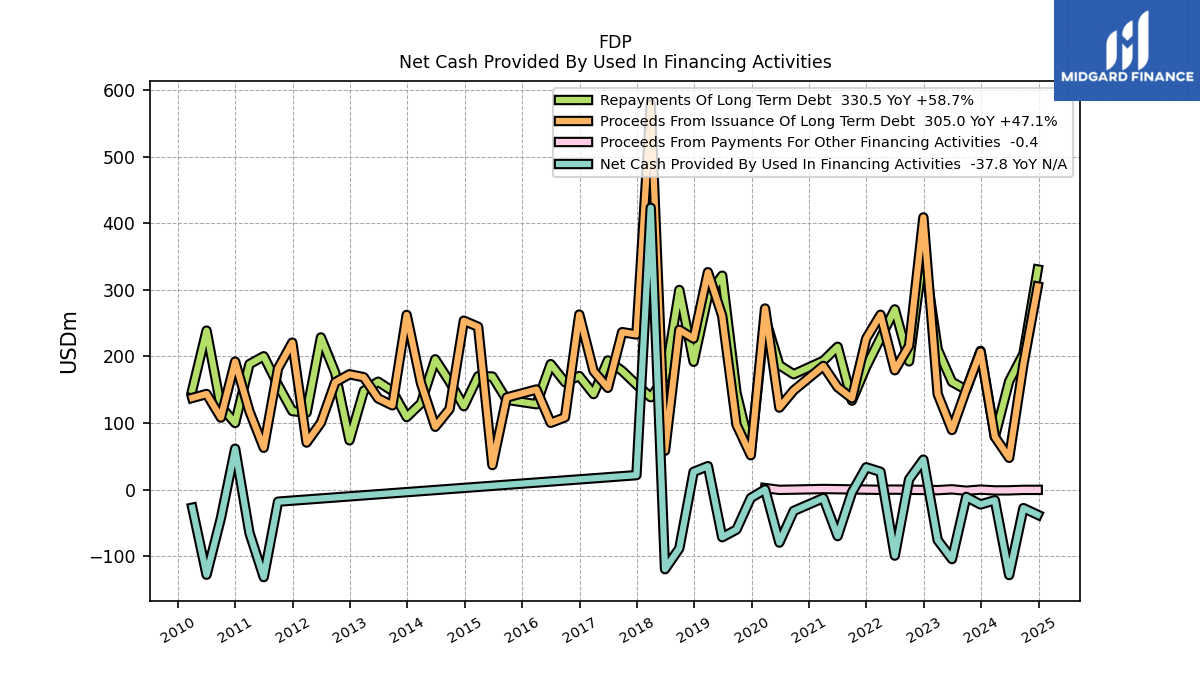
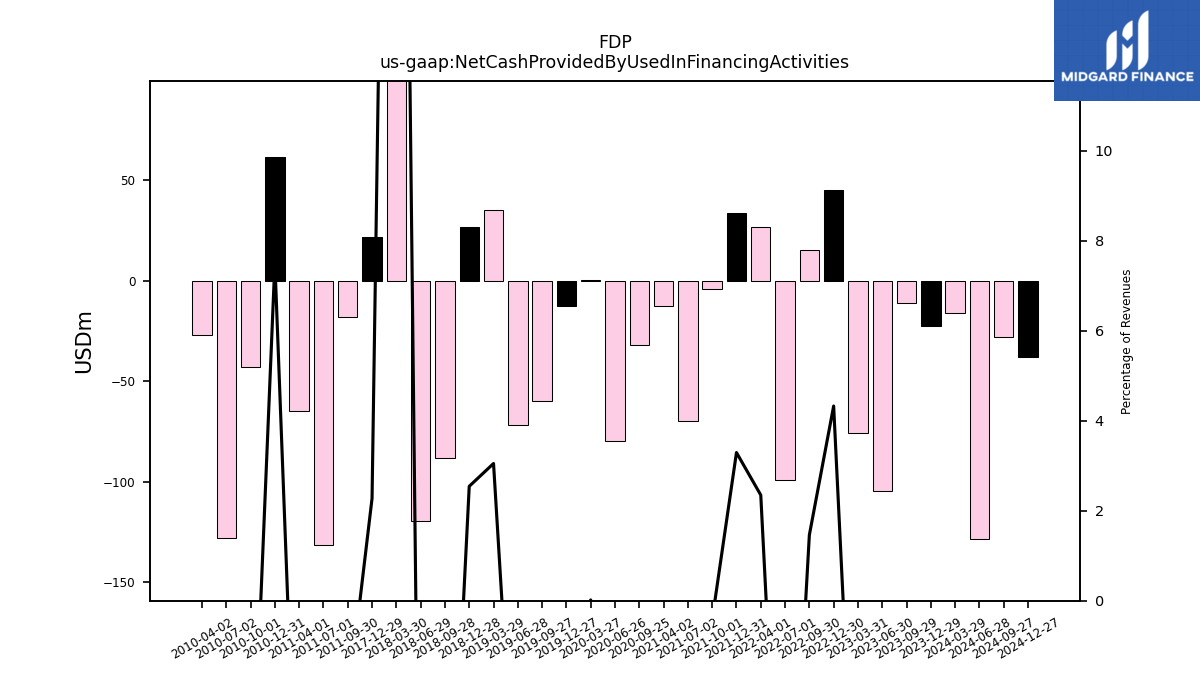
| Net Cash Provided By Used In Financing Activities | -16.00 | -22.30 | -11.00 | -104.30 | -75.90 | 45.00 | 15.40 | -99.10 | 26.70 | 33.50 | -4.20 | -69.80 | -12.70 | NA | -32.00 | -79.60 | 0.20 | -12.60 | -60.00 | -71.50 | 35.20 | 26.60 | -88.20 | -119.50 | 423.10 | 21.70 | NA | NA | NA | NA | NA | NA | NA | NA | NA | NA | NA | NA | NA | NA | NA | NA | NA | NA | NA | NA | NA | NA | NA | NA | -18.10 | -131.40 | -65.00 | 61.40 | -43.10 | -127.80 | -27.20 |
| 2024-03-29 | 2023-12-29 | 2023-09-29 | 2023-06-30 | 2023-03-31 | 2022-12-30 | 2022-09-30 | 2022-07-01 | 2022-04-01 | 2021-12-31 | 2021-10-01 | 2021-07-02 | 2021-04-02 | 2021-01-01 | 2020-09-25 | 2020-06-26 | 2020-03-27 | 2019-12-27 | 2019-09-27 | 2019-06-28 | 2019-03-29 | 2018-12-28 | 2018-09-28 | 2018-06-29 | 2018-03-30 | 2017-12-29 | 2017-09-29 | 2017-06-30 | 2017-03-31 | 2016-12-30 | 2016-09-30 | 2016-07-01 | 2016-04-01 | 2016-01-01 | 2015-09-25 | 2015-06-26 | 2015-03-27 | 2014-12-26 | 2014-09-26 | 2014-06-27 | 2014-03-28 | 2013-12-27 | 2013-09-27 | 2013-06-28 | 2013-03-29 | 2012-12-28 | 2012-09-28 | 2012-06-29 | 2012-03-30 | 2011-12-30 | 2011-09-30 | 2011-07-01 | 2011-04-01 | 2010-12-31 | 2010-10-01 | 2010-07-02 | 2010-04-02 | ||
|---|---|---|---|---|---|---|---|---|---|---|---|---|---|---|---|---|---|---|---|---|---|---|---|---|---|---|---|---|---|---|---|---|---|---|---|---|---|---|---|---|---|---|---|---|---|---|---|---|---|---|---|---|---|---|---|---|---|---|
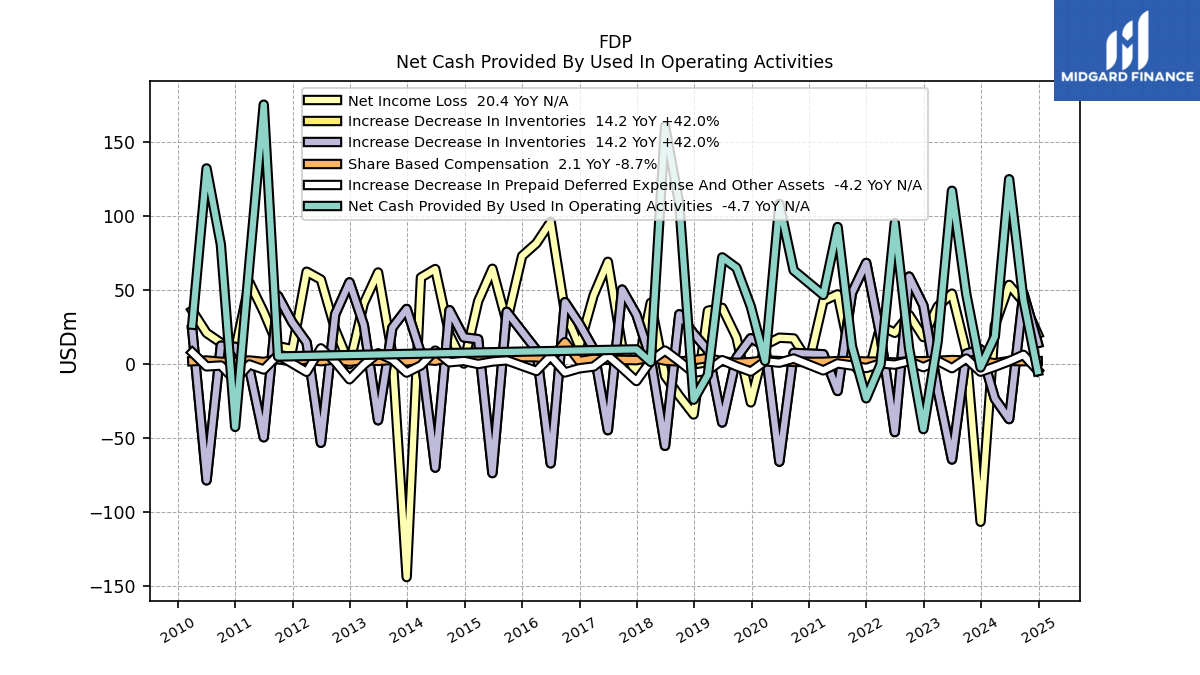
| Net Cash Provided By Used In Operating Activities | 18.70 | -2.20 | 47.40 | 117.20 | 15.50 | -43.90 | 10.60 | 95.40 | -0.30 | -23.10 | 12.10 | 92.70 | 46.80 | NA | 63.40 | 108.30 | 2.20 | 39.00 | 65.10 | 72.20 | -7.20 | -24.00 | 108.30 | 160.80 | 1.50 | 10.00 | NA | NA | NA | NA | NA | NA | NA | NA | NA | NA | NA | NA | NA | NA | NA | NA | NA | NA | NA | NA | NA | NA | NA | NA | 5.20 | 175.40 | 68.20 | -42.40 | 80.80 | 132.30 | 26.70 | |
| Net Income Loss | 26.10 | -106.50 | 8.40 | 47.70 | 39.00 | 18.30 | 33.30 | 21.20 | 25.80 | -11.20 | 1.30 | 47.20 | 42.70 | 0.90 | 17.40 | 17.90 | 13.00 | -25.80 | 18.10 | 38.10 | 36.10 | -34.00 | -21.50 | -7.90 | 41.50 | -6.30 | 11.50 | 69.20 | 46.40 | 12.00 | 35.20 | 96.20 | 81.70 | 73.10 | 28.50 | 64.50 | 42.50 | 0.40 | 19.90 | 64.30 | 58.60 | -143.90 | 6.40 | 62.00 | 41.10 | 0.00 | 23.50 | 57.20 | 62.50 | 10.10 | 12.20 | 35.20 | 55.20 | 9.60 | 14.50 | 21.10 | 36.20 | |
| Profit Loss | 26.10 | -106.50 | 8.80 | 48.30 | 47.80 | 19.40 | 32.60 | 21.10 | 24.70 | -10.70 | 1.50 | 47.70 | 41.40 | -1.00 | 16.20 | 18.10 | 13.00 | -25.10 | 18.20 | 39.00 | 37.20 | -32.30 | -21.20 | -5.60 | 43.20 | -6.70 | 10.50 | 69.80 | 45.60 | 10.50 | 36.20 | 97.70 | 81.20 | -73.60 | 29.90 | 65.90 | 44.20 | -0.40 | 20.70 | 65.40 | 58.90 | -143.10 | 5.40 | 62.00 | 41.80 | -1.20 | 24.90 | 58.50 | 62.80 | -10.90 | 12.90 | 36.80 | 56.00 | -10.70 | 13.40 | 21.20 | 36.90 | |
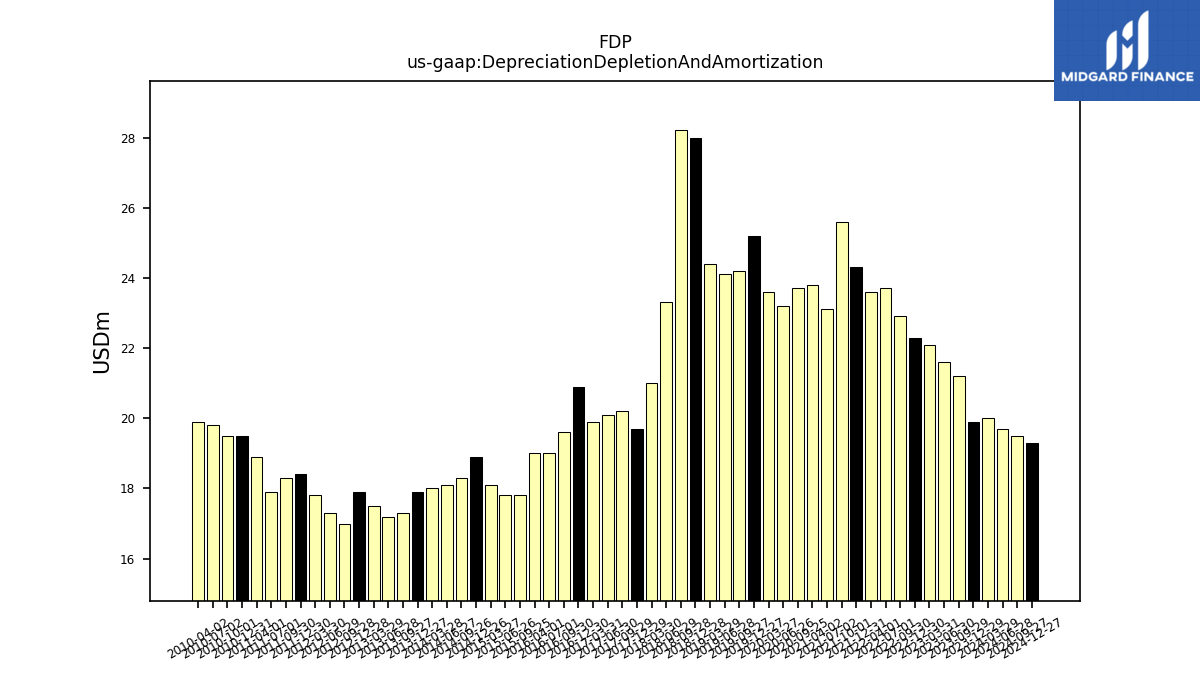
| Depreciation Depletion And Amortization | 20.00 | 19.90 | 21.20 | 21.60 | 22.10 | 22.30 | 22.90 | 23.70 | 23.60 | 24.30 | 25.60 | 23.10 | 23.80 | NA | 23.70 | 23.20 | 23.60 | 25.20 | 24.20 | 24.10 | 24.40 | 28.00 | 28.20 | 23.30 | 21.00 | 19.70 | 20.20 | 20.10 | 19.90 | 20.90 | 19.60 | 19.00 | 19.00 | NA | 17.80 | 17.80 | 18.10 | 18.90 | 18.30 | 18.10 | 18.00 | 17.90 | 17.30 | 17.20 | 17.50 | 17.90 | 17.00 | 17.30 | 17.80 | 18.40 | 18.30 | 17.90 | 18.90 | 19.50 | 19.50 | 19.80 | 19.90 | |
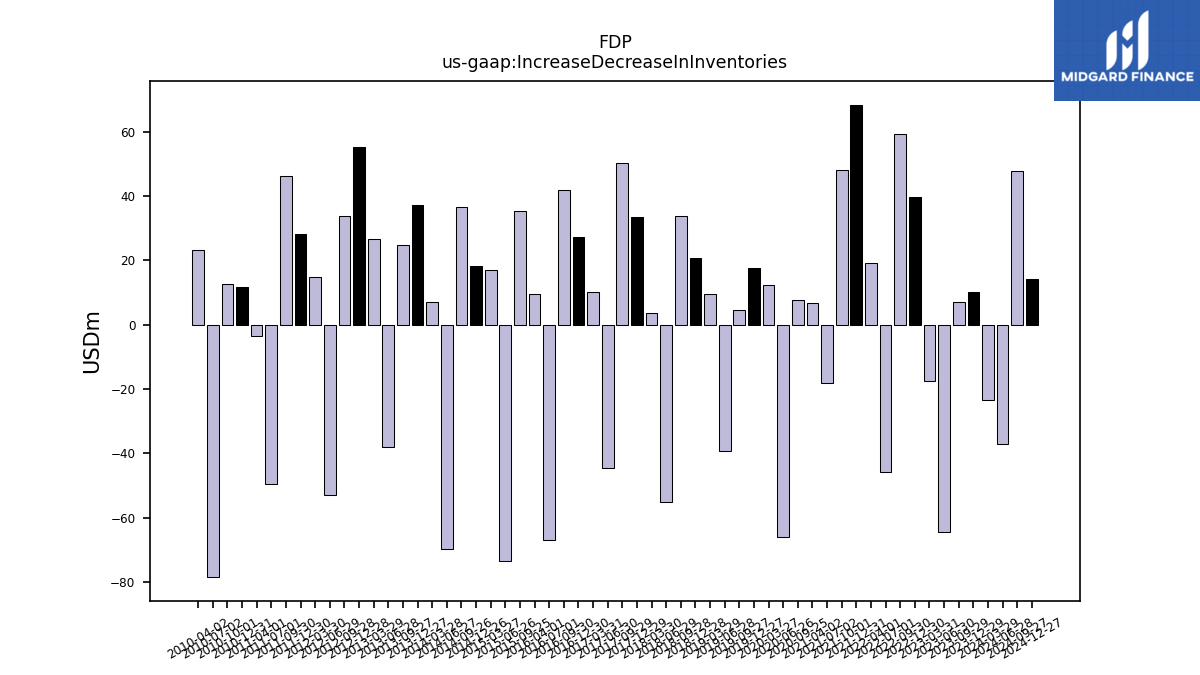
| Increase Decrease In Inventories | -23.30 | 10.00 | 7.10 | -64.40 | -17.40 | 39.60 | 59.20 | -45.90 | 19.20 | 68.40 | 48.10 | -18.10 | 6.70 | NA | 7.60 | -65.90 | 12.30 | 17.50 | 4.40 | -39.40 | 9.40 | 20.70 | 33.70 | -55.20 | 3.60 | 33.40 | 50.40 | -44.60 | 10.20 | 27.30 | 41.90 | -67.00 | 9.60 | NA | 35.40 | -73.60 | 16.90 | 18.10 | 36.50 | -69.90 | 7.10 | 37.30 | 24.70 | -37.90 | 26.50 | 55.30 | 33.70 | -53.10 | 14.70 | 28.20 | 46.10 | -49.40 | -3.40 | 11.70 | 12.50 | -78.50 | 23.20 | |
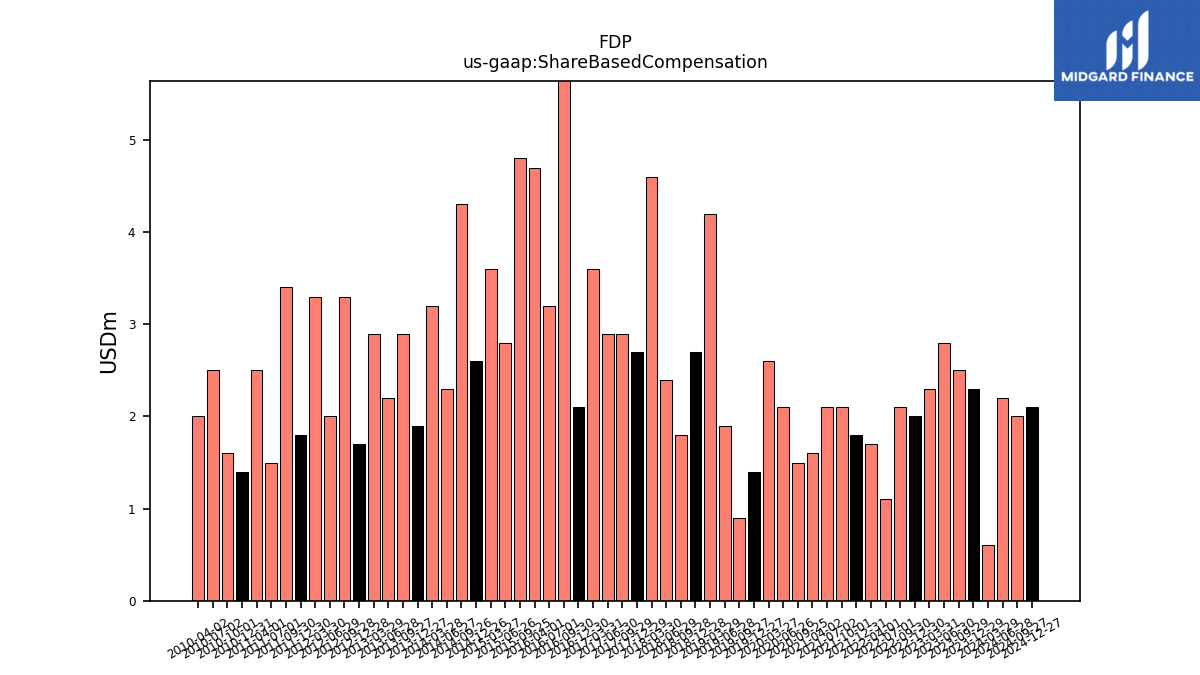
| Share Based Compensation | 0.60 | 2.30 | 2.50 | 2.80 | 2.30 | 2.00 | 2.10 | 1.10 | 1.70 | 1.80 | 2.10 | 2.10 | 1.60 | NA | 1.50 | 2.10 | 2.60 | 1.40 | 0.90 | 1.90 | 4.20 | 2.70 | 1.80 | 2.40 | 4.60 | 2.70 | 2.90 | 2.90 | 3.60 | 2.10 | 14.90 | 3.20 | 4.70 | NA | 4.80 | 2.80 | 3.60 | 2.60 | 4.30 | 2.30 | 3.20 | 1.90 | 2.90 | 2.20 | 2.90 | 1.70 | 3.30 | 2.00 | 3.30 | 1.80 | 3.40 | 1.50 | 2.50 | 1.40 | 1.60 | 2.50 | 2.00 | |
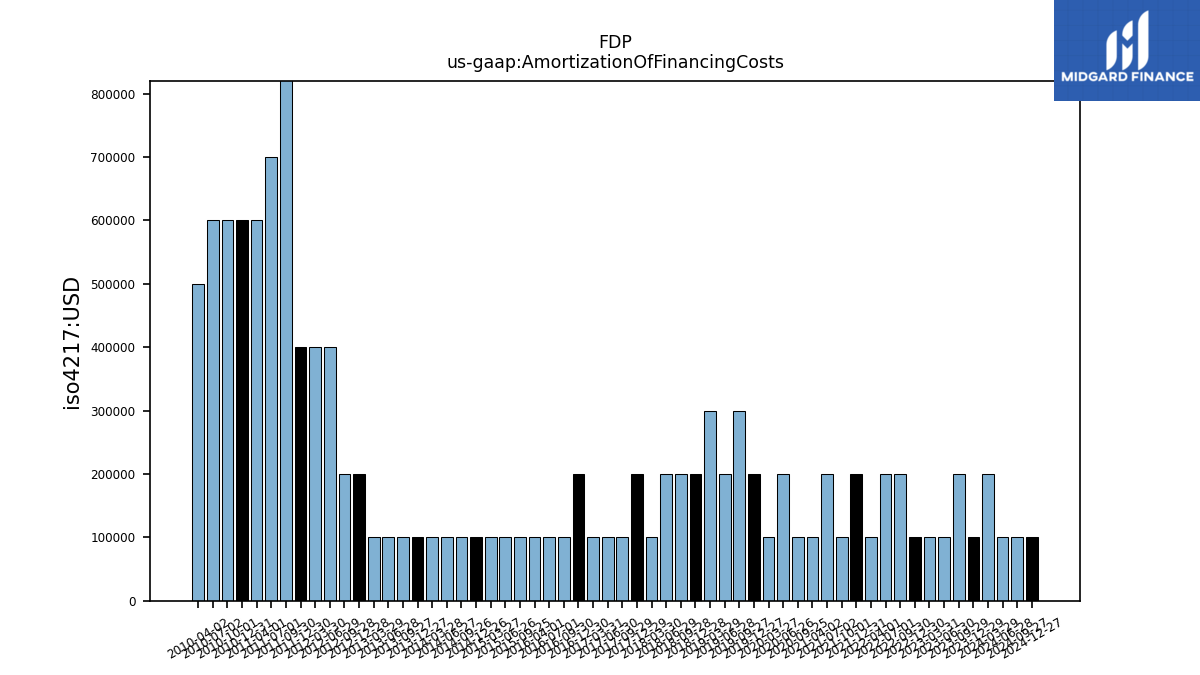
| Amortization Of Financing Costs | 0.20 | 0.10 | 0.20 | 0.10 | 0.10 | 0.10 | 0.20 | 0.20 | 0.10 | 0.20 | 0.10 | 0.20 | 0.10 | NA | 0.10 | 0.20 | 0.10 | 0.20 | 0.30 | 0.20 | 0.30 | 0.20 | 0.20 | 0.20 | 0.10 | 0.20 | 0.10 | 0.10 | 0.10 | 0.20 | 0.10 | 0.10 | 0.10 | NA | 0.10 | 0.10 | 0.10 | 0.10 | 0.10 | 0.10 | 0.10 | 0.10 | 0.10 | 0.10 | 0.10 | 0.20 | 0.20 | 0.40 | 0.40 | 0.40 | 1.70 | 0.70 | 0.60 | 0.60 | 0.60 | 0.60 | 0.50 |
| 2024-03-29 | 2023-12-29 | 2023-09-29 | 2023-06-30 | 2023-03-31 | 2022-12-30 | 2022-09-30 | 2022-07-01 | 2022-04-01 | 2021-12-31 | 2021-10-01 | 2021-07-02 | 2021-04-02 | 2021-01-01 | 2020-09-25 | 2020-06-26 | 2020-03-27 | 2019-12-27 | 2019-09-27 | 2019-06-28 | 2019-03-29 | 2018-12-28 | 2018-09-28 | 2018-06-29 | 2018-03-30 | 2017-12-29 | 2017-09-29 | 2017-06-30 | 2017-03-31 | 2016-12-30 | 2016-09-30 | 2016-07-01 | 2016-04-01 | 2016-01-01 | 2015-09-25 | 2015-06-26 | 2015-03-27 | 2014-12-26 | 2014-09-26 | 2014-06-27 | 2014-03-28 | 2013-12-27 | 2013-09-27 | 2013-06-28 | 2013-03-29 | 2012-12-28 | 2012-09-28 | 2012-06-29 | 2012-03-30 | 2011-12-30 | 2011-09-30 | 2011-07-01 | 2011-04-01 | 2010-12-31 | 2010-10-01 | 2010-07-02 | 2010-04-02 | ||
|---|---|---|---|---|---|---|---|---|---|---|---|---|---|---|---|---|---|---|---|---|---|---|---|---|---|---|---|---|---|---|---|---|---|---|---|---|---|---|---|---|---|---|---|---|---|---|---|---|---|---|---|---|---|---|---|---|---|---|
| Net Cash Provided By Used In Investing Activities | 3.90 | -13.50 | -3.80 | -5.90 | 79.60 | -11.50 | -12.50 | -8.50 | -16.60 | -15.30 | -12.70 | -28.60 | -25.90 | NA | -49.30 | -17.10 | -16.10 | -7.40 | -3.30 | -11.90 | -29.60 | -8.80 | -34.90 | -37.20 | -413.90 | -35.00 | NA | NA | NA | NA | NA | NA | NA | NA | NA | NA | NA | NA | NA | NA | NA | NA | NA | NA | NA | NA | NA | NA | NA | NA | -17.50 | -20.50 | -20.80 | -19.30 | -12.60 | -10.50 | -8.20 | |
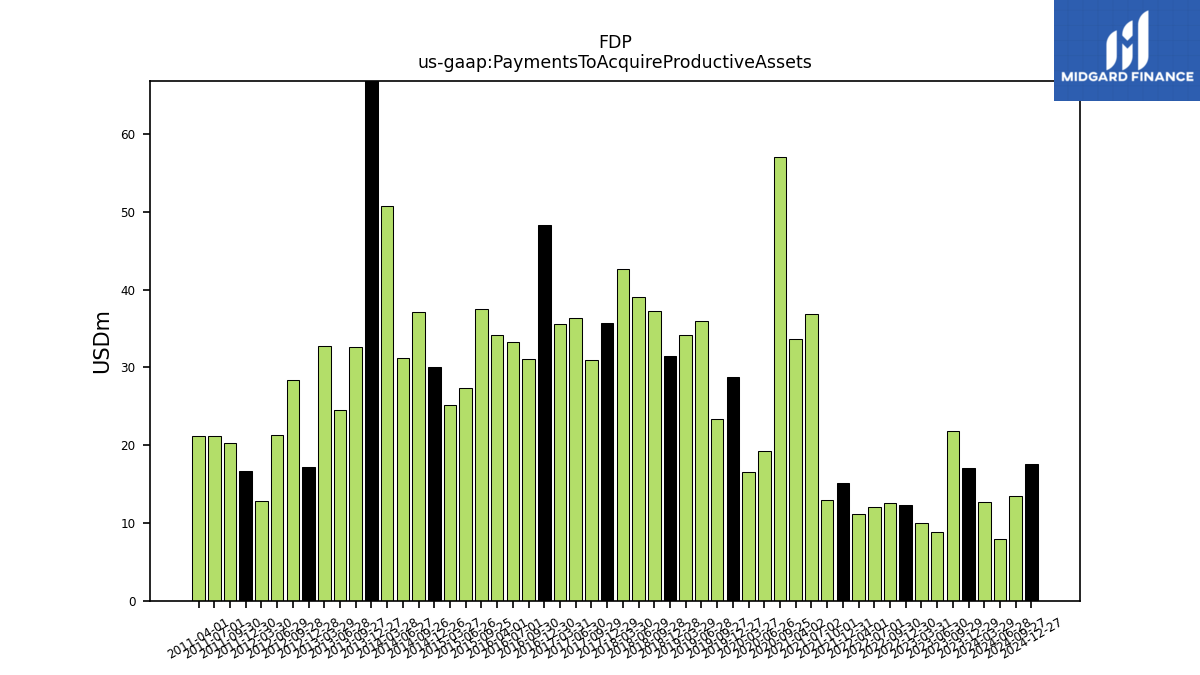
| Payments To Acquire Productive Assets | 12.70 | 17.00 | 21.80 | 8.90 | 10.00 | 12.30 | 12.60 | 12.10 | 11.10 | 15.10 | 13.00 | 36.80 | 33.60 | NA | 57.00 | 19.30 | 16.60 | 28.80 | 23.30 | 36.00 | 34.20 | 31.40 | 37.30 | 39.10 | 42.70 | 35.70 | 30.90 | 36.30 | 35.60 | 48.30 | 31.10 | 33.20 | 34.10 | NA | 37.50 | 27.30 | 25.20 | 30.10 | 37.10 | 31.20 | 50.70 | 69.60 | 32.60 | 24.50 | 32.80 | 17.20 | 28.40 | 21.30 | 12.80 | 16.70 | 20.30 | 21.20 | 21.20 | NA | NA | NA | NA |
| 2024-03-29 | 2023-12-29 | 2023-09-29 | 2023-06-30 | 2023-03-31 | 2022-12-30 | 2022-09-30 | 2022-07-01 | 2022-04-01 | 2021-12-31 | 2021-10-01 | 2021-07-02 | 2021-04-02 | 2021-01-01 | 2020-09-25 | 2020-06-26 | 2020-03-27 | 2019-12-27 | 2019-09-27 | 2019-06-28 | 2019-03-29 | 2018-12-28 | 2018-09-28 | 2018-06-29 | 2018-03-30 | 2017-12-29 | 2017-09-29 | 2017-06-30 | 2017-03-31 | 2016-12-30 | 2016-09-30 | 2016-07-01 | 2016-04-01 | 2016-01-01 | 2015-09-25 | 2015-06-26 | 2015-03-27 | 2014-12-26 | 2014-09-26 | 2014-06-27 | 2014-03-28 | 2013-12-27 | 2013-09-27 | 2013-06-28 | 2013-03-29 | 2012-12-28 | 2012-09-28 | 2012-06-29 | 2012-03-30 | 2011-12-30 | 2011-09-30 | 2011-07-01 | 2011-04-01 | 2010-12-31 | 2010-10-01 | 2010-07-02 | 2010-04-02 | ||
|---|---|---|---|---|---|---|---|---|---|---|---|---|---|---|---|---|---|---|---|---|---|---|---|---|---|---|---|---|---|---|---|---|---|---|---|---|---|---|---|---|---|---|---|---|---|---|---|---|---|---|---|---|---|---|---|---|---|---|
| Net Cash Provided By Used In Financing Activities | -16.00 | -22.30 | -11.00 | -104.30 | -75.90 | 45.00 | 15.40 | -99.10 | 26.70 | 33.50 | -4.20 | -69.80 | -12.70 | NA | -32.00 | -79.60 | 0.20 | -12.60 | -60.00 | -71.50 | 35.20 | 26.60 | -88.20 | -119.50 | 423.10 | 21.70 | NA | NA | NA | NA | NA | NA | NA | NA | NA | NA | NA | NA | NA | NA | NA | NA | NA | NA | NA | NA | NA | NA | NA | NA | -18.10 | -131.40 | -65.00 | 61.40 | -43.10 | -127.80 | -27.20 | |
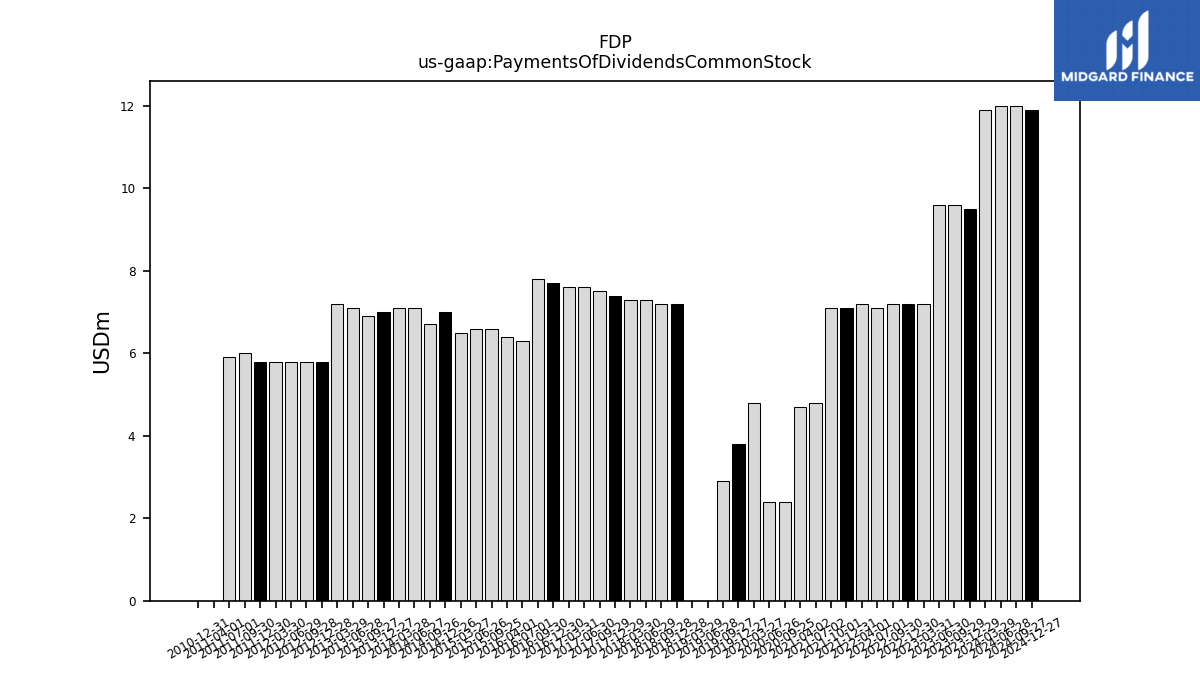
| Payments Of Dividends Common Stock | 11.90 | 9.50 | 9.60 | 9.60 | 7.20 | 7.20 | 7.20 | 7.10 | 7.20 | 7.10 | 7.10 | 4.80 | 4.70 | NA | 2.40 | 2.40 | 4.80 | 3.80 | 2.90 | 0.00 | 0.00 | 7.20 | 7.20 | 7.30 | 7.30 | 7.40 | 7.50 | 7.60 | 7.60 | 7.70 | 7.80 | 6.30 | 6.40 | NA | 6.60 | 6.60 | 6.50 | 7.00 | 6.70 | 7.10 | 7.10 | 7.00 | 6.90 | 7.10 | 7.20 | 5.80 | 5.80 | 5.80 | 5.80 | 5.80 | 6.00 | 5.90 | 0.00 | 0.00 | NA | NA | NA |
| 2024-03-29 | 2023-12-29 | 2023-09-29 | 2023-06-30 | 2023-03-31 | 2022-12-30 | 2022-09-30 | 2022-07-01 | 2022-04-01 | 2021-12-31 | 2021-10-01 | 2021-07-02 | 2021-04-02 | 2021-01-01 | 2020-09-25 | 2020-06-26 | 2020-03-27 | 2019-12-27 | 2019-09-27 | 2019-06-28 | 2019-03-29 | 2018-12-28 | 2018-09-28 | 2018-06-29 | 2018-03-30 | 2017-12-29 | 2017-09-29 | 2017-06-30 | 2017-03-31 | 2016-12-30 | 2016-09-30 | 2016-07-01 | 2016-04-01 | 2016-01-01 | 2015-09-25 | 2015-06-26 | 2015-03-27 | 2014-12-26 | 2014-09-26 | 2014-06-27 | 2014-03-28 | 2013-12-27 | 2013-09-27 | 2013-06-28 | 2013-03-29 | 2012-12-28 | 2012-09-28 | 2012-06-29 | 2012-03-30 | 2011-12-30 | 2011-09-30 | 2011-07-01 | 2011-04-01 | 2010-12-31 | 2010-10-01 | 2010-07-02 | 2010-04-02 | ||
|---|---|---|---|---|---|---|---|---|---|---|---|---|---|---|---|---|---|---|---|---|---|---|---|---|---|---|---|---|---|---|---|---|---|---|---|---|---|---|---|---|---|---|---|---|---|---|---|---|---|---|---|---|---|---|---|---|---|---|
| Revenues | 1107.90 | 1008.60 | 1003.10 | 1180.50 | 1128.50 | 1040.00 | 1053.50 | 1211.90 | 1136.90 | 1017.30 | 1004.80 | 1141.60 | 1088.30 | 1002.30 | 989.70 | 1092.30 | 1118.00 | 1025.20 | 1070.20 | 1239.40 | 1154.20 | 1045.90 | 1069.50 | 1272.40 | 1106.10 | 953.70 | 952.70 | 1147.10 | 1032.40 | 954.60 | 950.20 | 1088.60 | 1018.10 | 977.90 | 936.10 | 1134.10 | 1008.40 | 929.30 | 884.60 | 1131.30 | 982.30 | 879.90 | 861.10 | 1023.90 | 918.80 | 776.90 | 788.80 | 957.60 | 897.90 | 780.80 | 795.20 | 1039.70 | 974.00 | 816.70 | 793.10 | 1000.00 | 943.10 | |
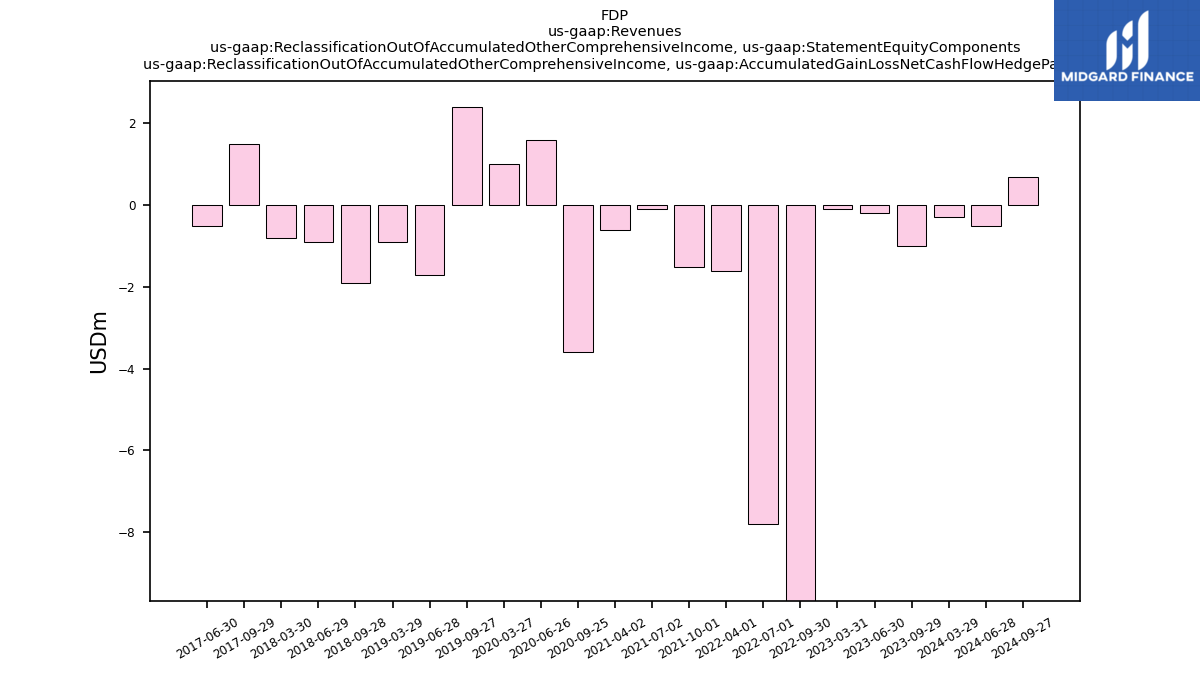
| Reclassification Out Of Accumulated Other Comprehensive Income, Accumulated Gain Loss Net Cash Flow Hedge Parent | -0.30 | NA | -1.00 | -0.20 | -0.10 | NA | -10.40 | -7.80 | -1.60 | NA | -1.50 | -0.10 | -0.60 | NA | -3.60 | 1.60 | 1.00 | NA | 2.40 | -1.70 | -0.90 | NA | -1.90 | -0.90 | -0.80 | NA | 1.50 | -0.50 | NA | NA | NA | NA | NA | NA | NA | NA | NA | NA | NA | NA | NA | NA | NA | NA | NA | NA | NA | NA | NA | NA | NA | NA | NA | NA | NA | NA | NA | |
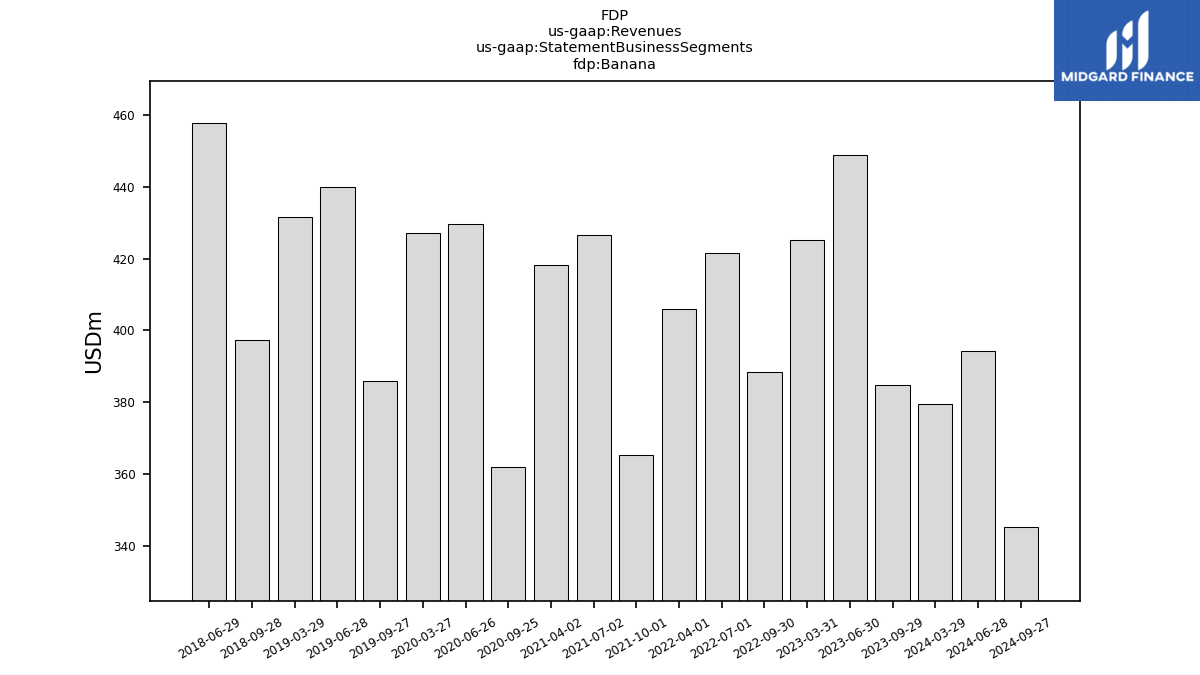
| Banana | 379.50 | NA | 384.70 | 448.80 | 425.10 | NA | 388.40 | 421.60 | 406.00 | NA | 365.30 | 426.70 | 418.20 | NA | 361.80 | 429.60 | 427.00 | NA | 385.80 | 440.00 | 431.50 | NA | 397.40 | 457.80 | NA | NA | NA | NA | NA | NA | NA | NA | NA | NA | NA | NA | NA | NA | NA | NA | NA | NA | NA | NA | NA | NA | NA | NA | NA | NA | NA | NA | NA | NA | NA | NA | NA | |
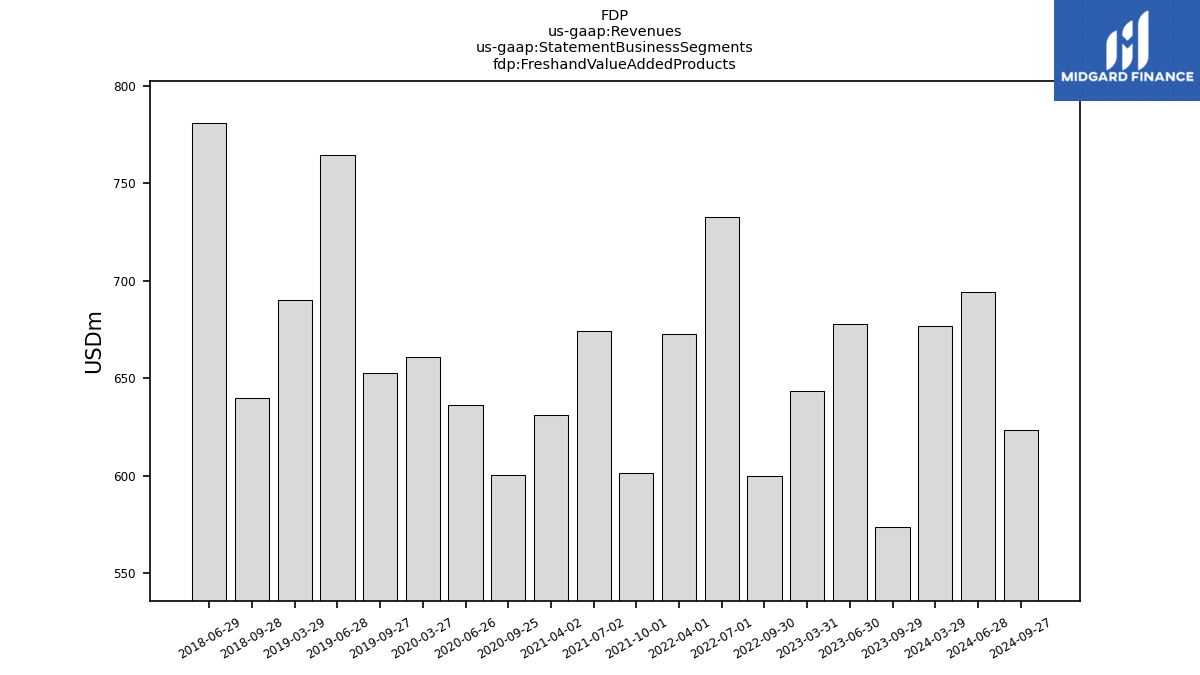
| Freshand Value Added Products | 676.80 | NA | 574.00 | 677.60 | 643.40 | NA | 599.80 | 732.40 | 672.70 | NA | 601.20 | 674.00 | 631.00 | NA | 600.60 | 636.20 | 660.90 | NA | 652.90 | 764.30 | 690.00 | NA | 639.90 | 780.70 | NA | NA | NA | NA | NA | NA | NA | NA | NA | NA | NA | NA | NA | NA | NA | NA | NA | NA | NA | NA | NA | NA | NA | NA | NA | NA | NA | NA | NA | NA | NA | NA | NA | |
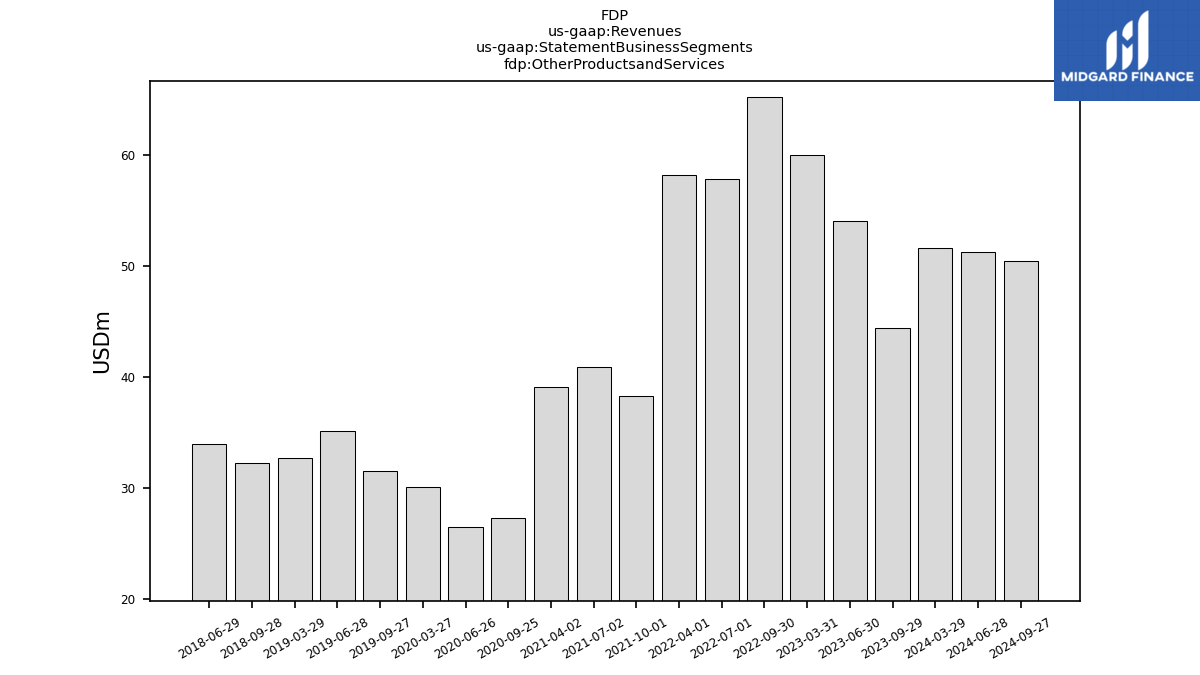
| Other Productsand Services | 51.60 | NA | 44.40 | 54.10 | 60.00 | NA | 65.30 | 57.90 | 58.20 | NA | 38.30 | 40.90 | 39.10 | NA | 27.30 | 26.50 | 30.10 | NA | 31.50 | 35.10 | 32.70 | NA | 32.20 | 33.90 | NA | NA | NA | NA | NA | NA | NA | NA | NA | NA | NA | NA | NA | NA | NA | NA | NA | NA | NA | NA | NA | NA | NA | NA | NA | NA | NA | NA | NA | NA | NA | NA | NA | |
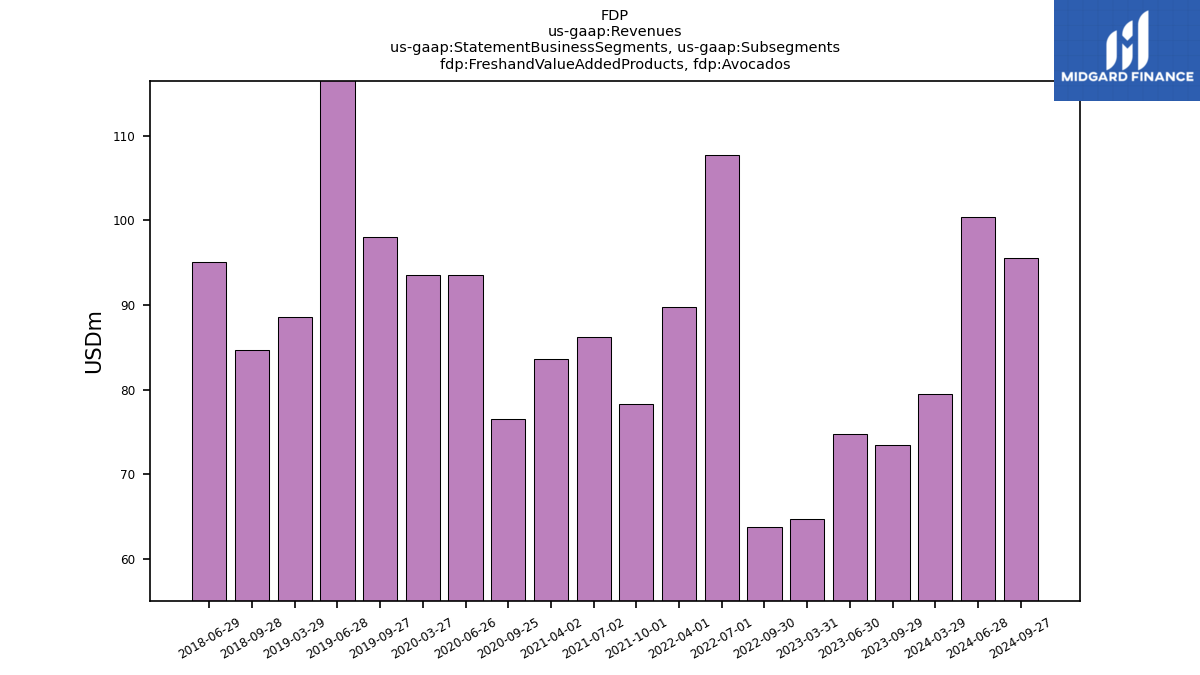
| Freshand Value Added Products, Avocados | 79.50 | NA | 73.40 | 74.70 | 64.70 | NA | 63.80 | 107.70 | 89.80 | NA | 78.30 | 86.20 | 83.60 | NA | 76.50 | 93.50 | 93.50 | NA | 98.00 | 124.90 | 88.60 | NA | 84.70 | 95.10 | NA | NA | NA | NA | NA | NA | NA | NA | NA | NA | NA | NA | NA | NA | NA | NA | NA | NA | NA | NA | NA | NA | NA | NA | NA | NA | NA | NA | NA | NA | NA | NA | NA | |
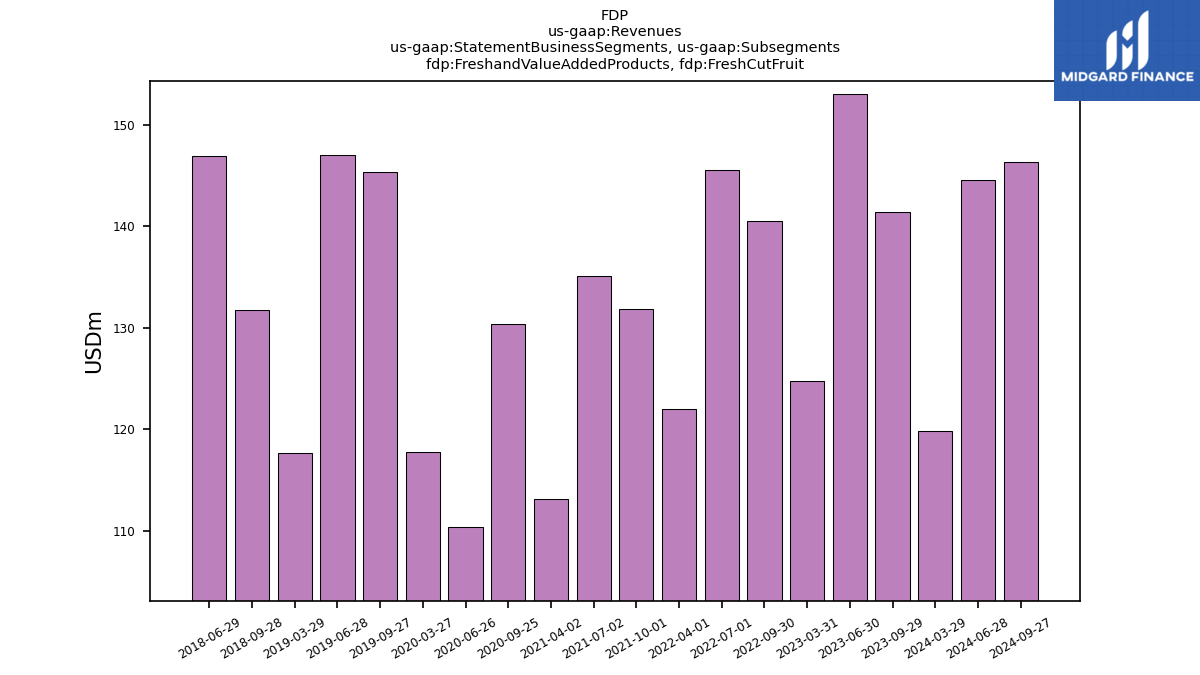
| Freshand Value Added Products, Fresh Cut Fruit | 119.80 | NA | 141.40 | 153.00 | 124.70 | NA | 140.50 | 145.50 | 122.00 | NA | 131.80 | 135.10 | 113.10 | NA | 130.40 | 110.40 | 117.70 | NA | 145.30 | 147.00 | 117.60 | NA | 131.70 | 146.90 | NA | NA | NA | NA | NA | NA | NA | NA | NA | NA | NA | NA | NA | NA | NA | NA | NA | NA | NA | NA | NA | NA | NA | NA | NA | NA | NA | NA | NA | NA | NA | NA | NA | |
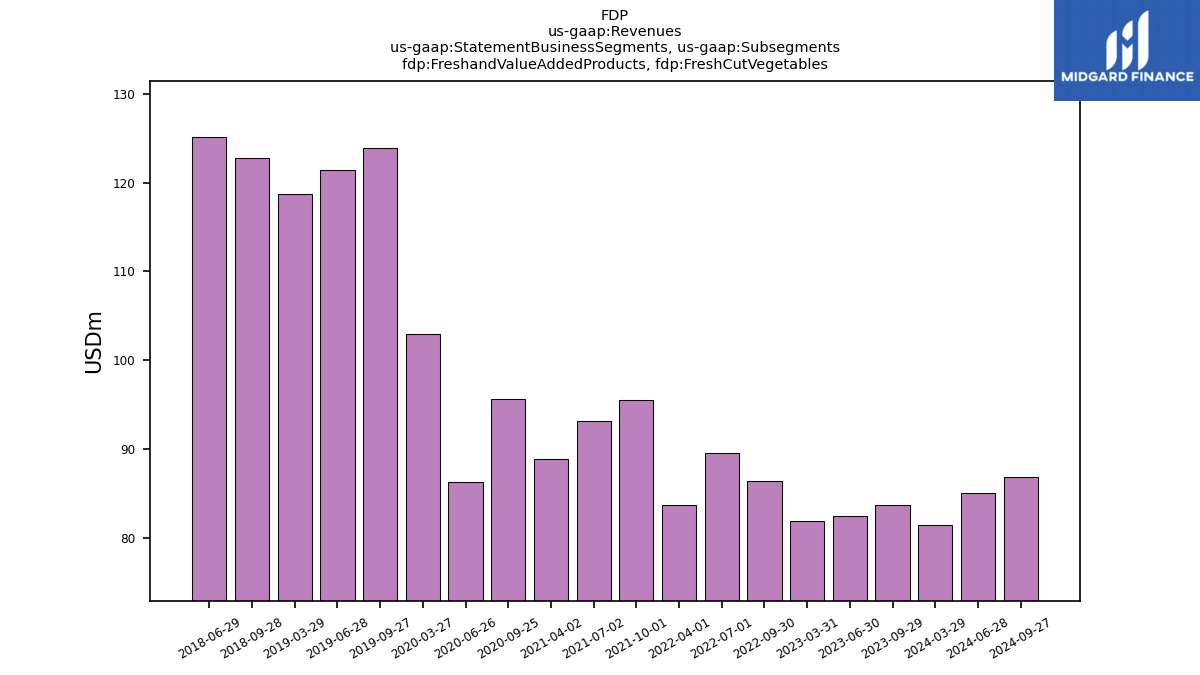
| Freshand Value Added Products, Fresh Cut Vegetables | 81.40 | NA | 83.70 | 82.50 | 81.90 | NA | 86.40 | 89.50 | 83.70 | NA | 95.50 | 93.20 | 88.90 | NA | 95.60 | 86.30 | 102.90 | NA | 123.90 | 121.40 | 118.70 | NA | 122.80 | 125.20 | NA | NA | NA | NA | NA | NA | NA | NA | NA | NA | NA | NA | NA | NA | NA | NA | NA | NA | NA | NA | NA | NA | NA | NA | NA | NA | NA | NA | NA | NA | NA | NA | NA | |
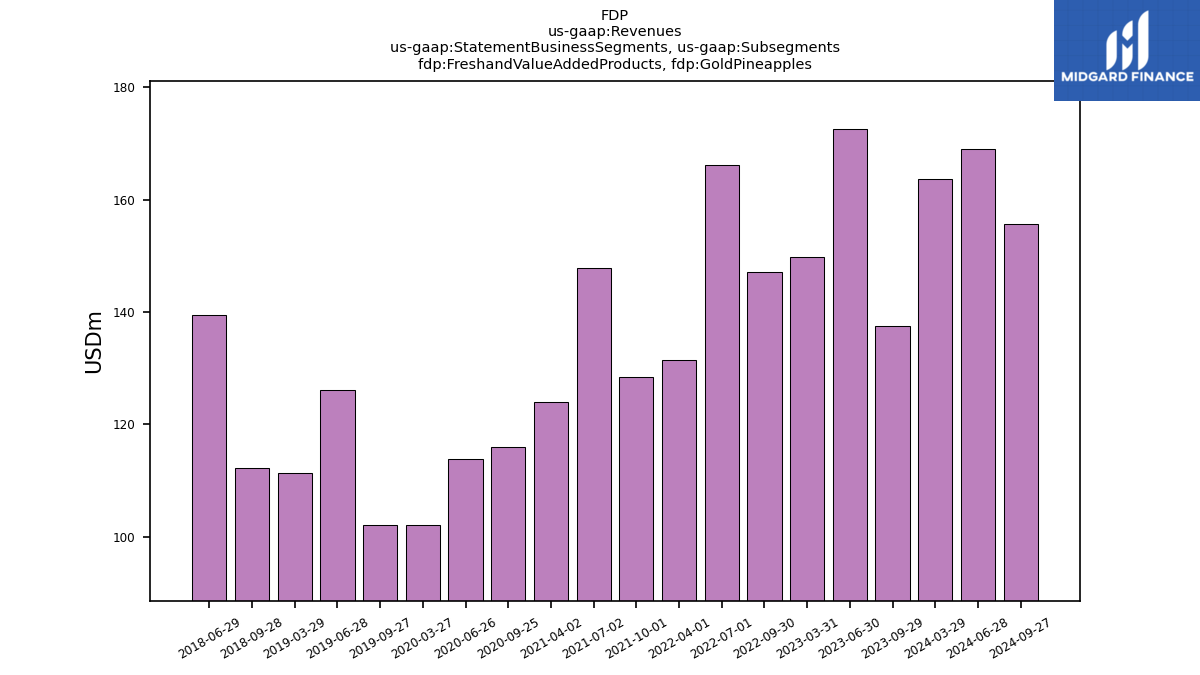
| Freshand Value Added Products, Gold Pineapples | 163.60 | NA | 137.50 | 172.50 | 149.80 | NA | 147.20 | 166.20 | 131.50 | NA | 128.50 | 147.90 | 124.00 | NA | 115.90 | 113.90 | 102.10 | NA | 102.00 | 126.10 | 111.30 | NA | 112.30 | 139.40 | NA | NA | NA | NA | NA | NA | NA | NA | NA | NA | NA | NA | NA | NA | NA | NA | NA | NA | NA | NA | NA | NA | NA | NA | NA | NA | NA | NA | NA | NA | NA | NA | NA | |
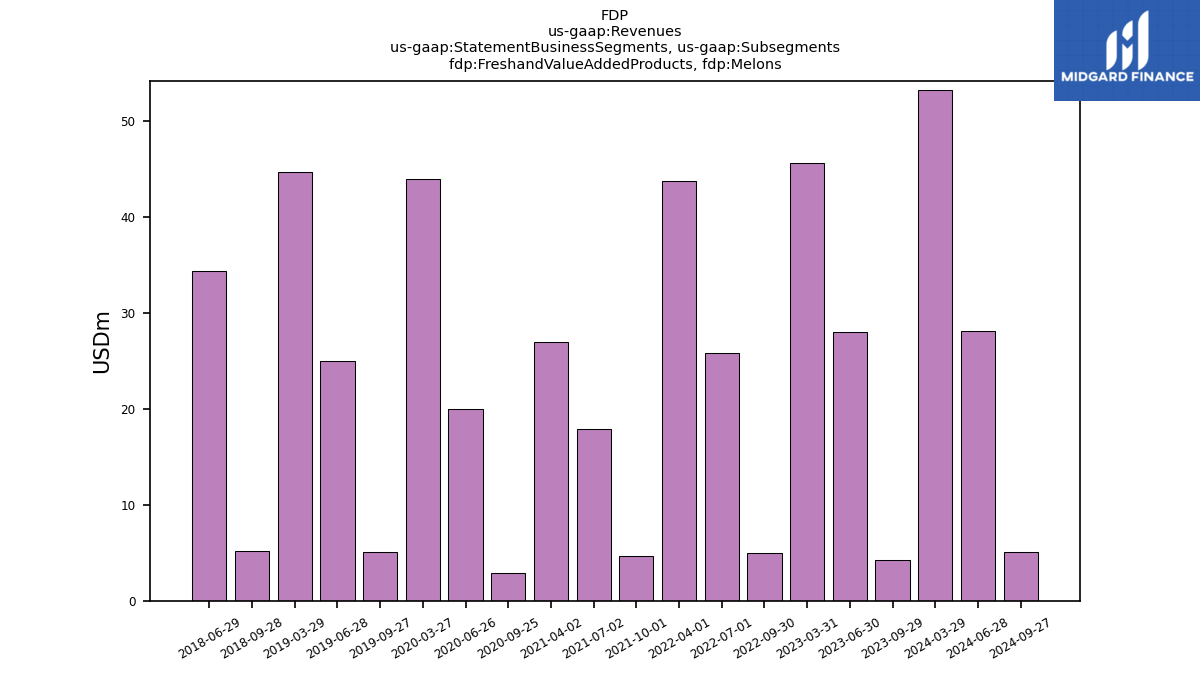
| Freshand Value Added Products, Melons | 53.20 | NA | 4.20 | 28.00 | 45.60 | NA | 5.00 | 25.80 | 43.70 | NA | 4.70 | 17.90 | 27.00 | NA | 2.90 | 20.00 | 43.90 | NA | 5.10 | 25.00 | 44.70 | NA | 5.20 | 34.30 | NA | NA | NA | NA | NA | NA | NA | NA | NA | NA | NA | NA | NA | NA | NA | NA | NA | NA | NA | NA | NA | NA | NA | NA | NA | NA | NA | NA | NA | NA | NA | NA | NA | |
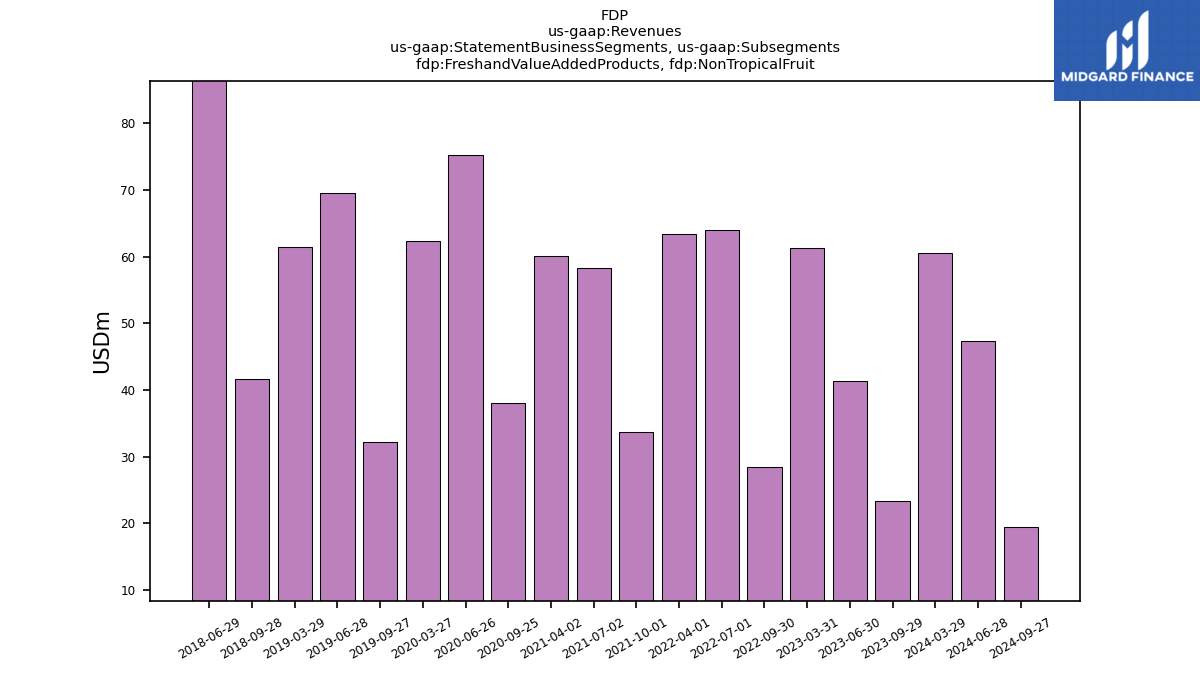
| Freshand Value Added Products, Non Tropical Fruit | 60.50 | NA | 23.40 | 41.40 | 61.30 | NA | 28.40 | 64.00 | 63.40 | NA | 33.70 | 58.30 | 60.10 | NA | 38.10 | 75.20 | 62.40 | NA | 32.20 | 69.50 | 61.40 | NA | 41.60 | 86.50 | NA | NA | NA | NA | NA | NA | NA | NA | NA | NA | NA | NA | NA | NA | NA | NA | NA | NA | NA | NA | NA | NA | NA | NA | NA | NA | NA | NA | NA | NA | NA | NA | NA | |
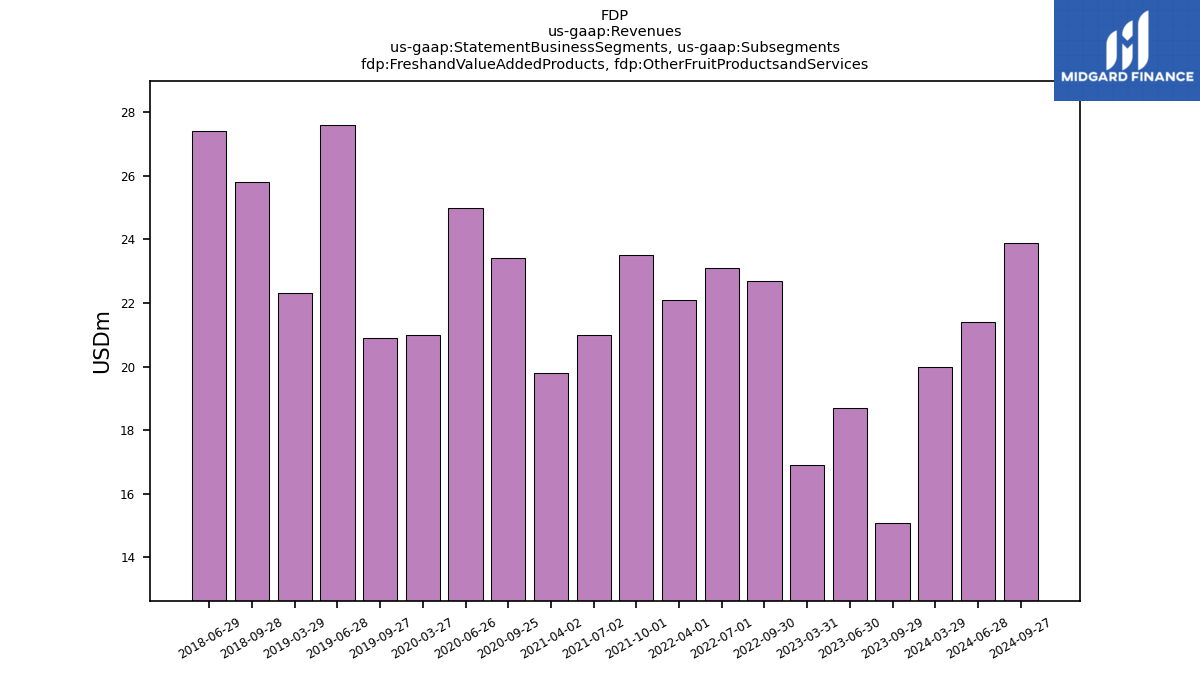
| Freshand Value Added Products, Other Fruit Productsand Services | 20.00 | NA | 15.10 | 18.70 | 16.90 | NA | 22.70 | 23.10 | 22.10 | NA | 23.50 | 21.00 | 19.80 | NA | 23.40 | 25.00 | 21.00 | NA | 20.90 | 27.60 | 22.30 | NA | 25.80 | 27.40 | NA | NA | NA | NA | NA | NA | NA | NA | NA | NA | NA | NA | NA | NA | NA | NA | NA | NA | NA | NA | NA | NA | NA | NA | NA | NA | NA | NA | NA | NA | NA | NA | NA | |
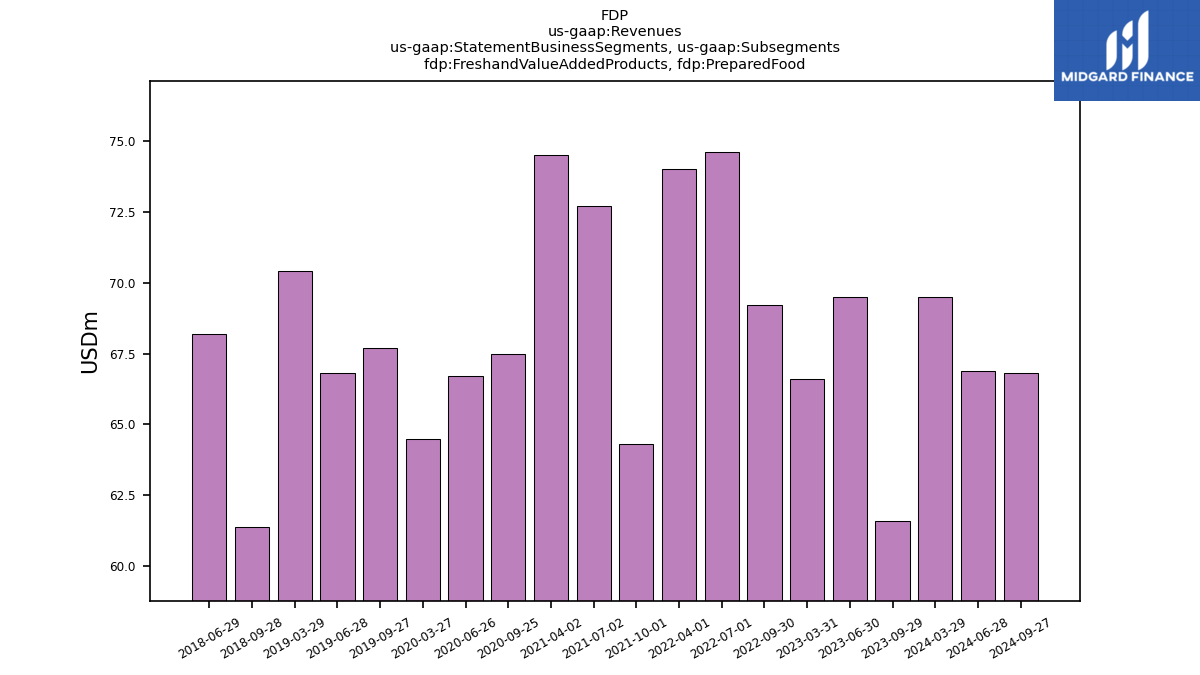
| Freshand Value Added Products, Prepared Food | 69.50 | NA | 61.60 | 69.50 | 66.60 | NA | 69.20 | 74.60 | 74.00 | NA | 64.30 | 72.70 | 74.50 | NA | 67.50 | 66.70 | 64.50 | NA | 67.70 | 66.80 | 70.40 | NA | 61.40 | 68.20 | NA | NA | NA | NA | NA | NA | NA | NA | NA | NA | NA | NA | NA | NA | NA | NA | NA | NA | NA | NA | NA | NA | NA | NA | NA | NA | NA | NA | NA | NA | NA | NA | NA | |
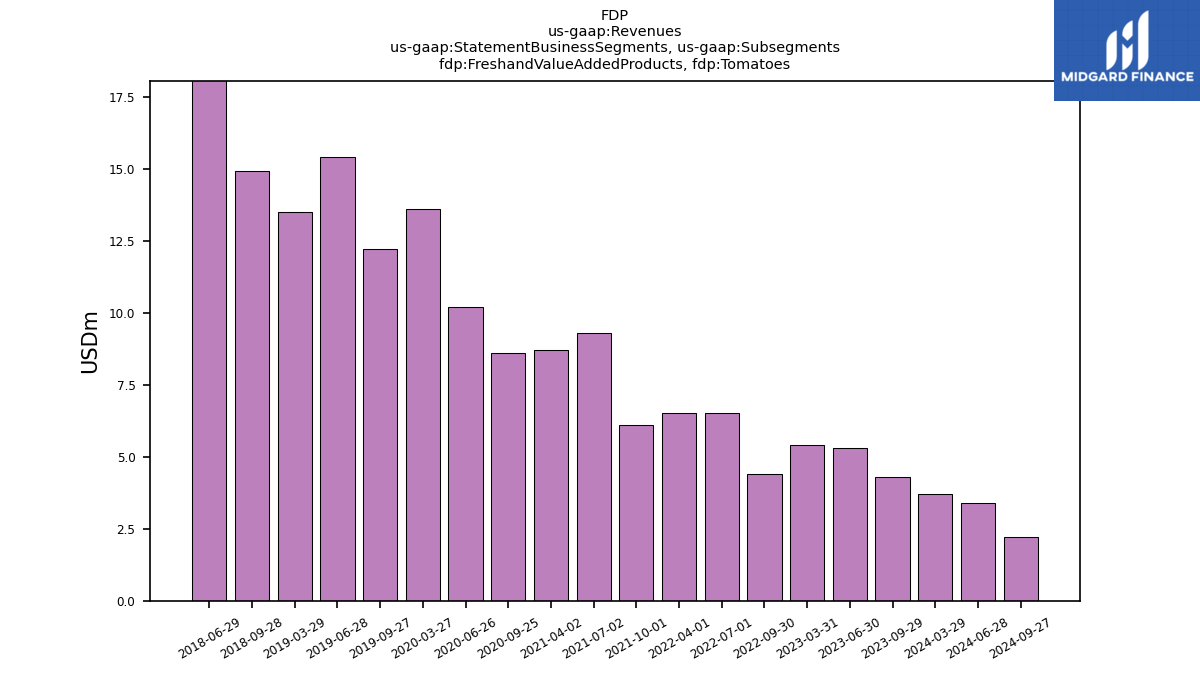
| Freshand Value Added Products, Tomatoes | 3.70 | NA | 4.30 | 5.30 | 5.40 | NA | 4.40 | 6.50 | 6.50 | NA | 6.10 | 9.30 | 8.70 | NA | 8.60 | 10.20 | 13.60 | NA | 12.20 | 15.40 | 13.50 | NA | 14.90 | 19.00 | NA | NA | NA | NA | NA | NA | NA | NA | NA | NA | NA | NA | NA | NA | NA | NA | NA | NA | NA | NA | NA | NA | NA | NA | NA | NA | NA | NA | NA | NA | NA | NA | NA | |
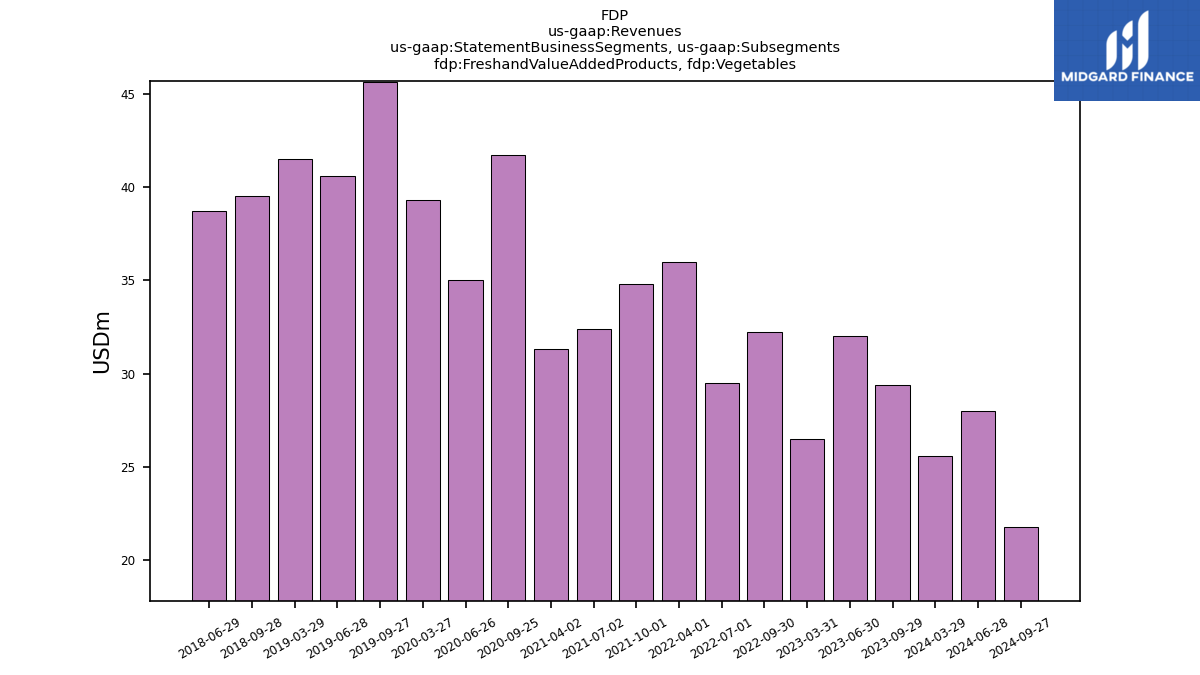
| Freshand Value Added Products, Vegetables | 25.60 | NA | 29.40 | 32.00 | 26.50 | NA | 32.20 | 29.50 | 36.00 | NA | 34.80 | 32.40 | 31.30 | NA | 41.70 | 35.00 | 39.30 | NA | 45.60 | 40.60 | 41.50 | NA | 39.50 | 38.70 | NA | NA | NA | NA | NA | NA | NA | NA | NA | NA | NA | NA | NA | NA | NA | NA | NA | NA | NA | NA | NA | NA | NA | NA | NA | NA | NA | NA | NA | NA | NA | NA | NA | |
| 106.70 | 100.90 | 101.20 | 132.20 | 112.00 | 97.60 | 105.80 | 133.40 | 114.30 | 108.20 | 111.90 | 145.50 | 122.90 | NA | 107.90 | 134.10 | 113.10 | 101.60 | 99.60 | 131.10 | 120.70 | 107.10 | 110.10 | 135.80 | 112.70 | 100.20 | 108.30 | 138.50 | NA | NA | NA | NA | NA | NA | NA | NA | NA | NA | NA | NA | NA | NA | NA | NA | NA | NA | NA | NA | NA | NA | NA | NA | NA | NA | NA | NA | NA | ||
| 209.40 | 208.00 | 181.80 | 224.50 | 216.60 | 189.70 | 169.90 | 201.40 | 199.40 | 165.30 | 150.70 | 190.50 | 190.00 | NA | 150.00 | 164.00 | 171.20 | 162.30 | 140.40 | 171.20 | 171.30 | 146.30 | 137.50 | 175.80 | 194.10 | 164.00 | 134.70 | 192.70 | NA | NA | NA | NA | NA | NA | NA | NA | NA | NA | NA | NA | NA | NA | NA | NA | NA | NA | NA | NA | NA | NA | NA | NA | NA | NA | NA | NA | NA | ||
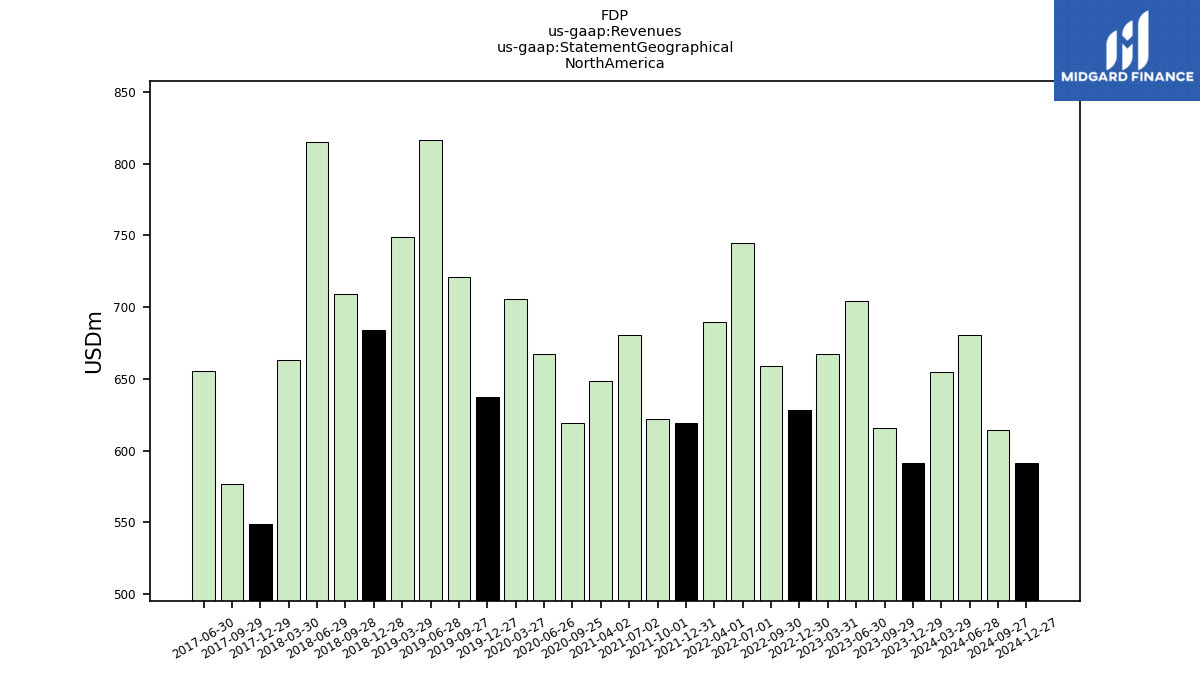
| 654.90 | 591.60 | 615.70 | 704.20 | 667.20 | 628.20 | 658.70 | 744.40 | 690.00 | 619.00 | 622.00 | 680.70 | 648.40 | NA | 619.40 | 667.10 | 705.60 | 637.40 | 720.80 | 816.80 | 748.80 | 683.80 | 709.30 | 814.80 | 663.40 | 548.60 | 576.90 | 655.50 | NA | NA | NA | NA | NA | NA | NA | NA | NA | NA | NA | NA | NA | NA | NA | NA | NA | NA | NA | NA | NA | NA | NA | NA | NA | NA | NA | NA | NA | ||
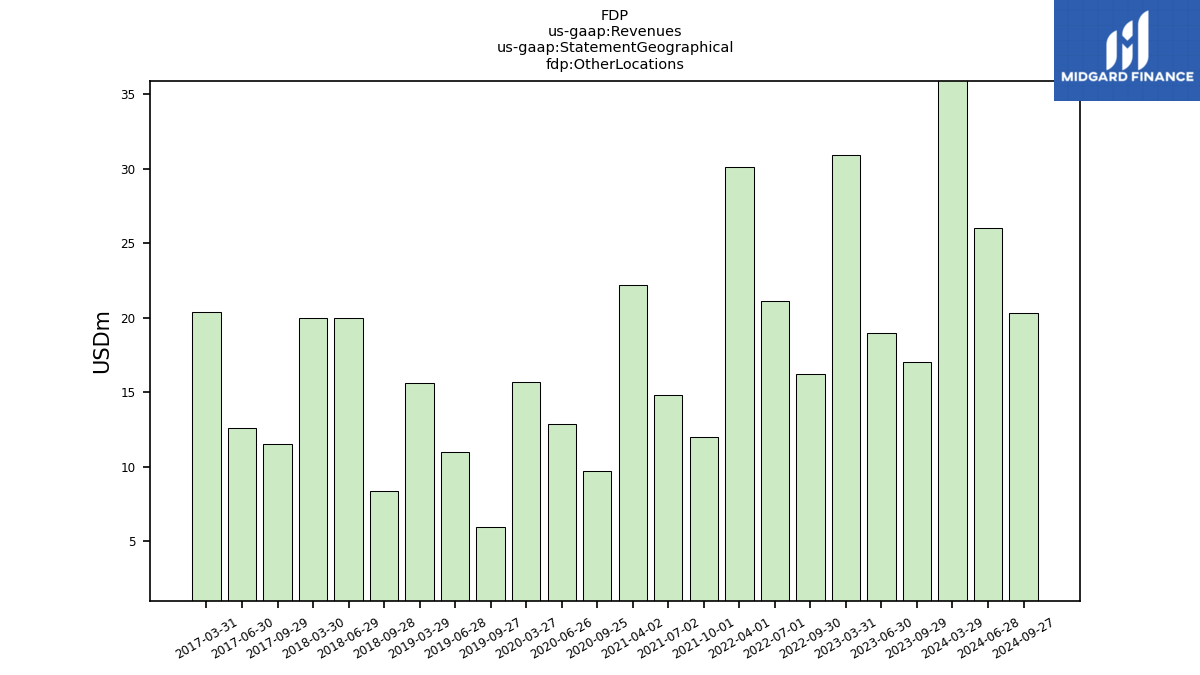
| Other Locations | 37.70 | NA | 17.00 | 19.00 | 30.90 | NA | 16.20 | 21.10 | 30.10 | NA | 12.00 | 14.80 | 22.20 | NA | 9.70 | 12.90 | 15.70 | NA | 6.00 | 11.00 | 15.60 | NA | 8.40 | 20.00 | 20.00 | NA | 11.50 | 12.60 | 20.40 | NA | NA | NA | NA | NA | NA | NA | NA | NA | NA | NA | NA | NA | NA | NA | NA | NA | NA | NA | NA | NA | NA | NA | NA | NA | NA | NA | NA | |
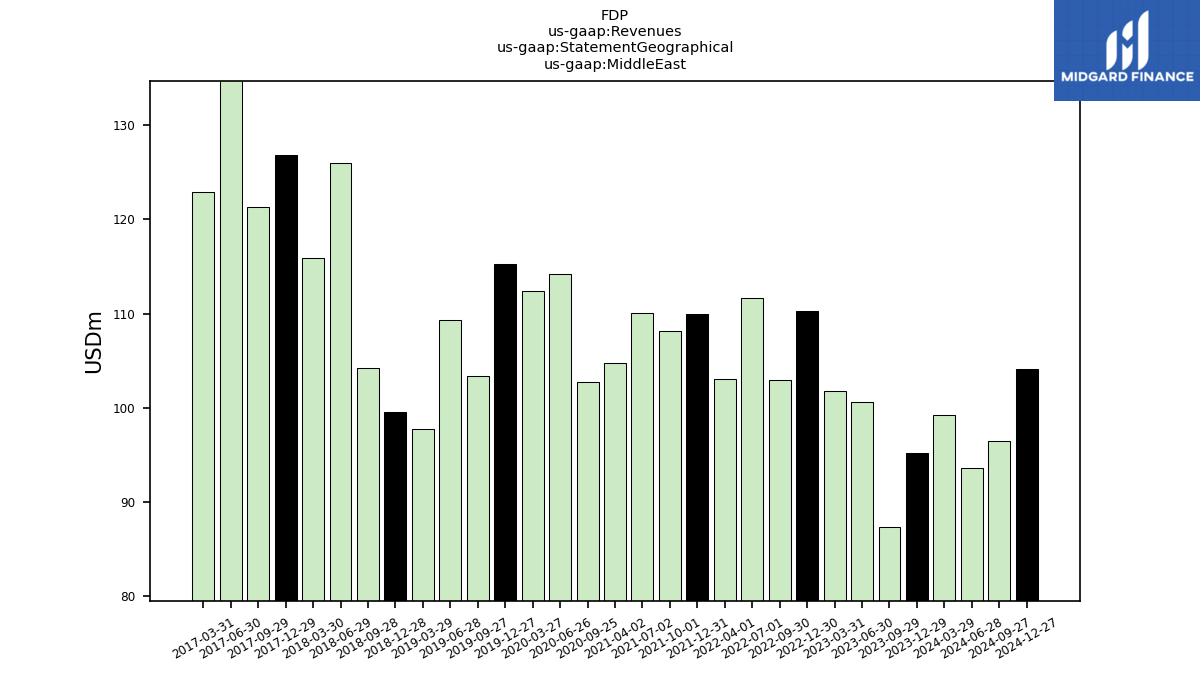
| Middle East | 99.20 | 95.20 | 87.40 | 100.60 | 101.80 | 110.30 | 102.90 | 111.60 | 103.10 | 110.00 | 108.20 | 110.10 | 104.80 | NA | 102.70 | 114.20 | 112.40 | 115.30 | 103.40 | 109.30 | 97.80 | 99.50 | 104.20 | 126.00 | 115.90 | 126.80 | 121.30 | 147.80 | 122.90 | NA | NA | NA | NA | NA | NA | NA | NA | NA | NA | NA | NA | NA | NA | NA | NA | NA | NA | NA | NA | NA | NA | NA | NA | NA | NA | NA | NA |
