
| 2024-03-31 | 2023-12-31 | 2023-09-30 | 2023-06-30 | 2023-03-31 | 2022-12-31 | 2022-09-30 | 2022-06-30 | 2022-03-31 | 2021-12-31 | 2021-09-30 | 2021-06-30 | 2021-03-31 | 2020-12-31 | 2020-09-30 | 2020-06-30 | 2020-03-31 | 2019-12-31 | 2019-09-30 | 2019-06-30 | 2019-03-31 | ||
|---|---|---|---|---|---|---|---|---|---|---|---|---|---|---|---|---|---|---|---|---|---|---|
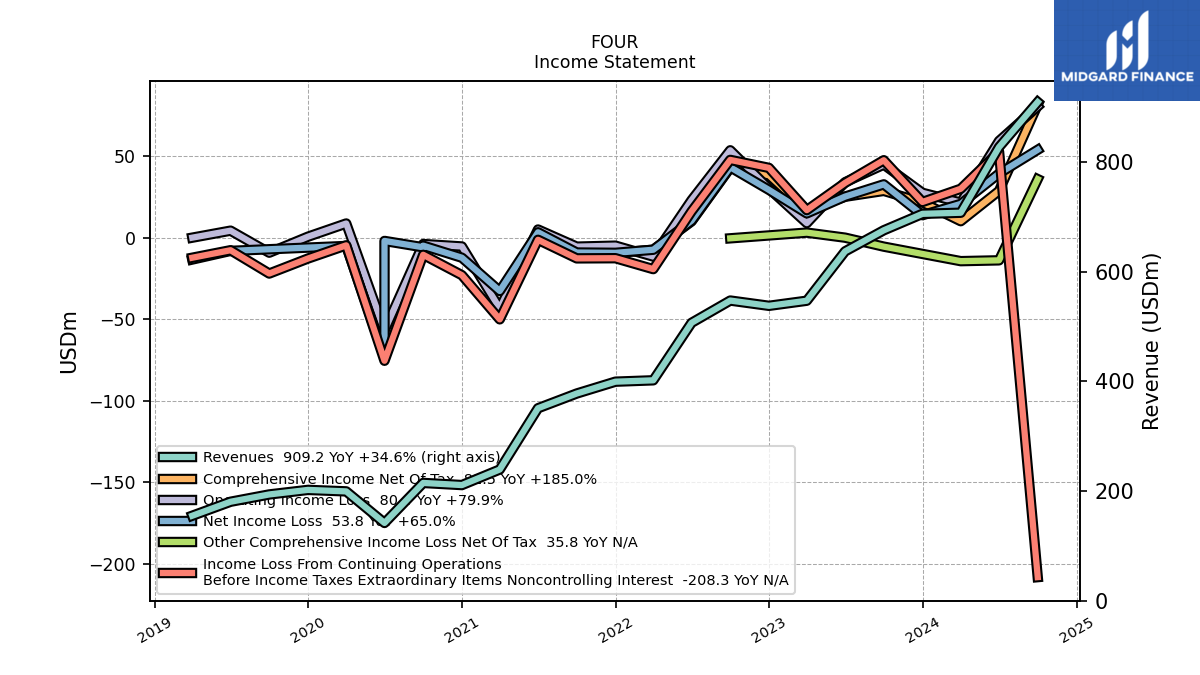
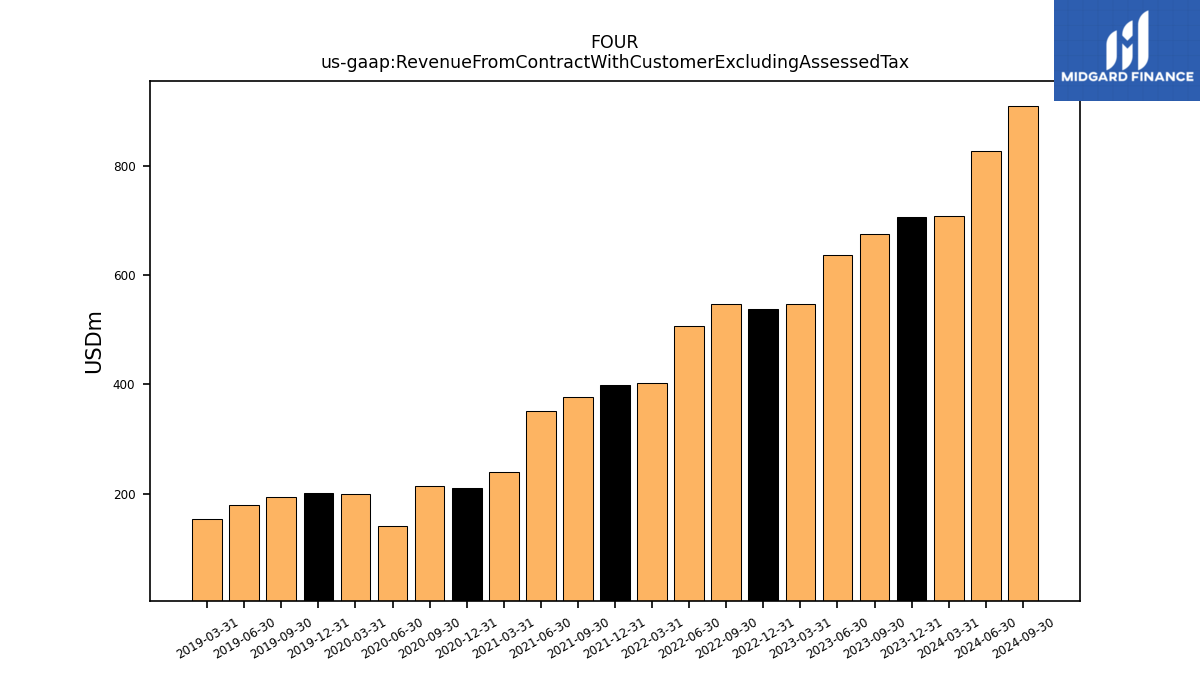
| Revenue From Contract With Customer Excluding Assessed Tax | 707.40 | 705.40 | 675.40 | 637.00 | 547.00 | 537.70 | 547.30 | 506.70 | 401.90 | 399.40 | 377.80 | 351.00 | 239.30 | 210.90 | 214.80 | 141.80 | 199.40 | 202.10 | 193.80 | 180.50 | 155.00 | |
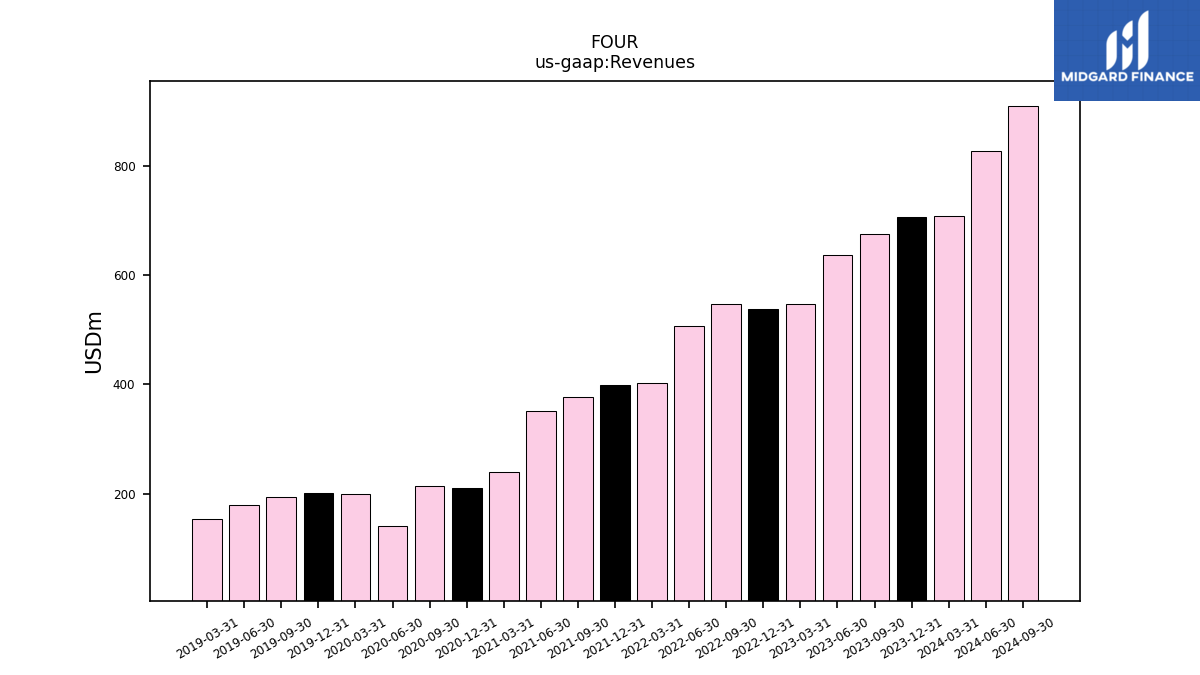
| Revenues | 707.40 | 705.40 | 675.40 | 637.00 | 547.00 | 537.70 | 547.30 | 506.70 | 401.90 | 399.40 | 377.80 | 351.00 | 239.30 | 210.90 | 214.80 | 141.80 | 199.40 | 202.10 | 193.80 | 180.50 | 155.00 | |
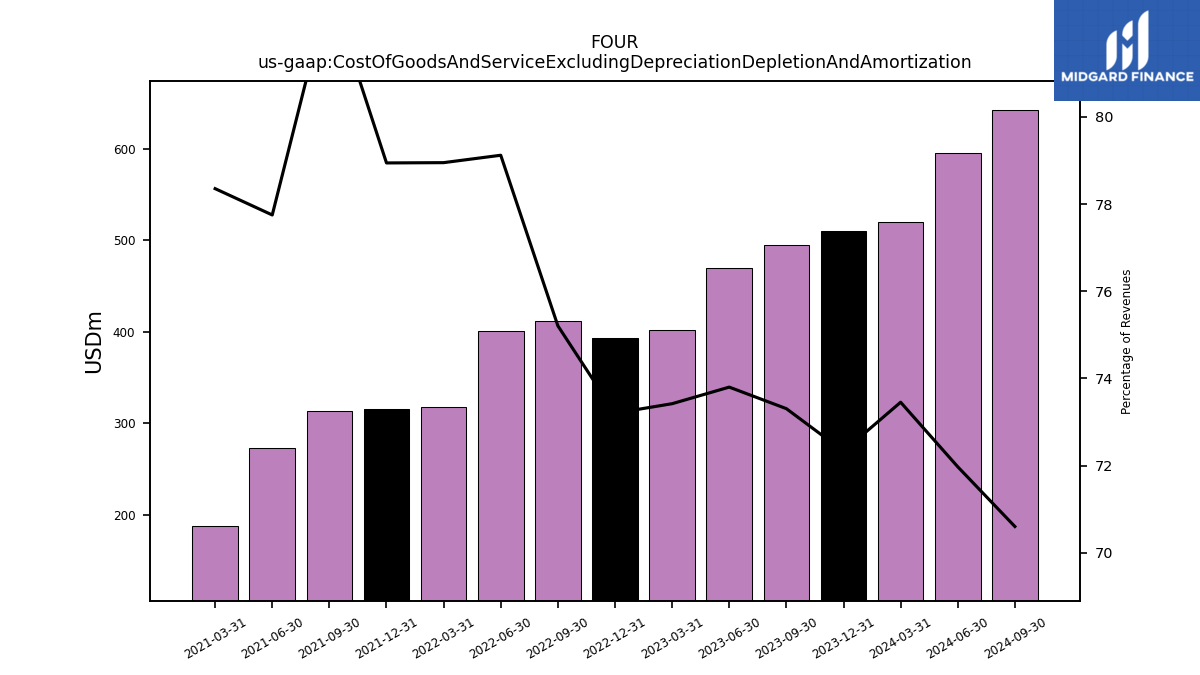
| Cost Of Goods And Service Excluding Depreciation Depletion And Amortization | 519.60 | 510.20 | 495.10 | 470.10 | 401.60 | 393.60 | 411.60 | 400.90 | 317.30 | 315.30 | 313.40 | 272.90 | 187.50 | NA | NA | NA | NA | NA | NA | NA | NA | |
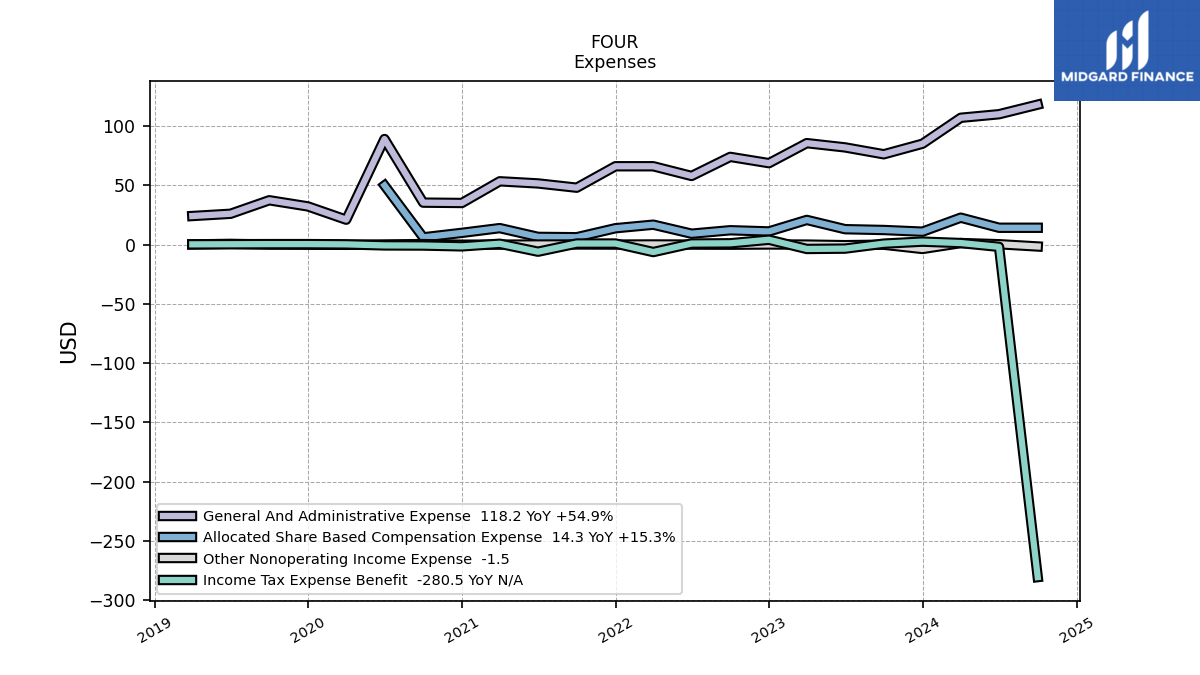
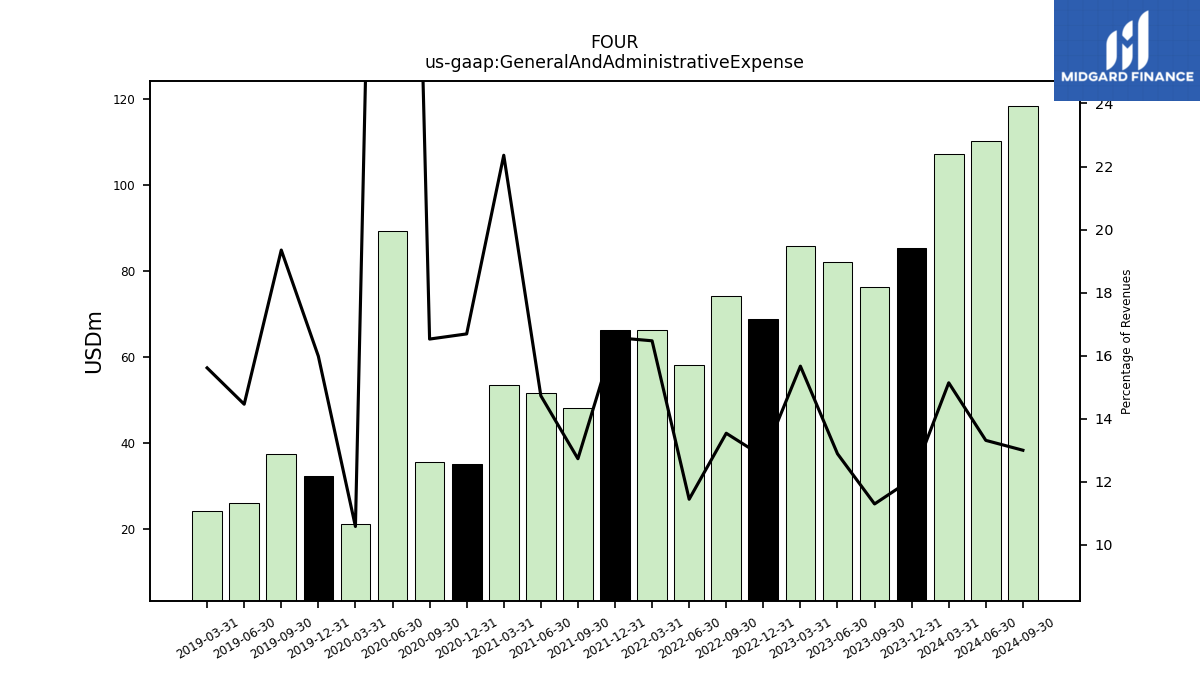
| General And Administrative Expense | 107.10 | 85.20 | 76.30 | 82.10 | 85.70 | 68.80 | 74.10 | 58.00 | 66.20 | 66.20 | 48.10 | 51.70 | 53.50 | 35.20 | 35.50 | 89.20 | 21.10 | 32.30 | 37.50 | 26.10 | 24.20 | |
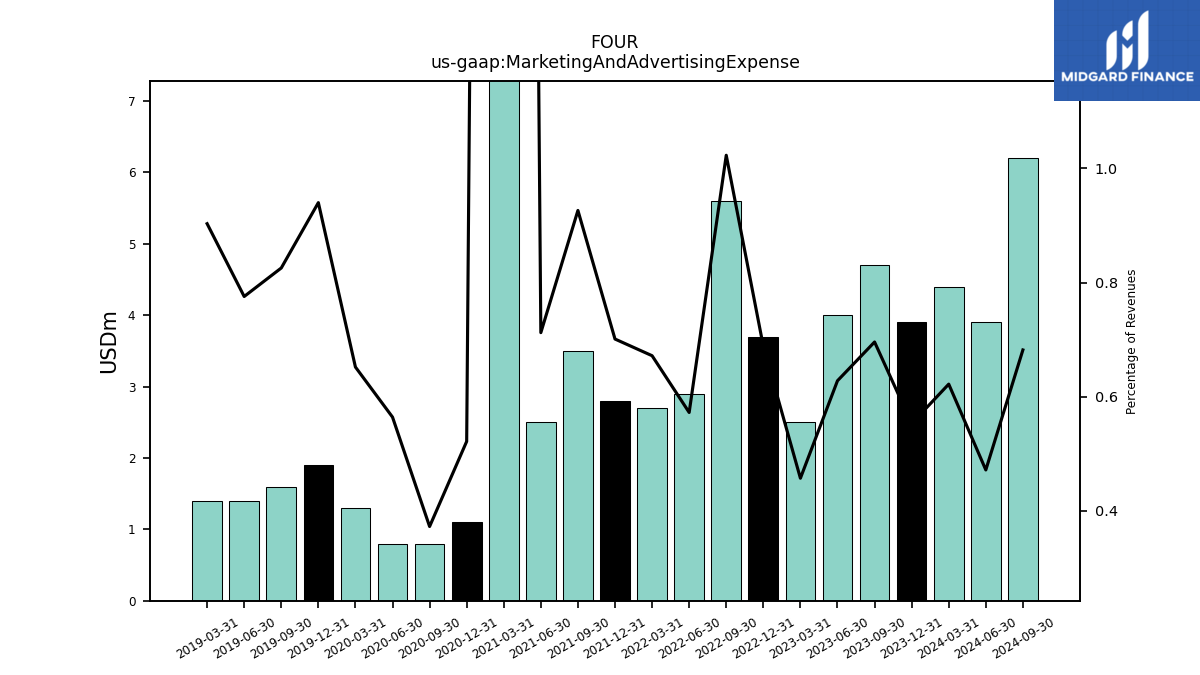
| Marketing And Advertising Expense | 4.40 | 3.90 | 4.70 | 4.00 | 2.50 | 3.70 | 5.60 | 2.90 | 2.70 | 2.80 | 3.50 | 2.50 | 20.10 | 1.10 | 0.80 | 0.80 | 1.30 | 1.90 | 1.60 | 1.40 | 1.40 | |
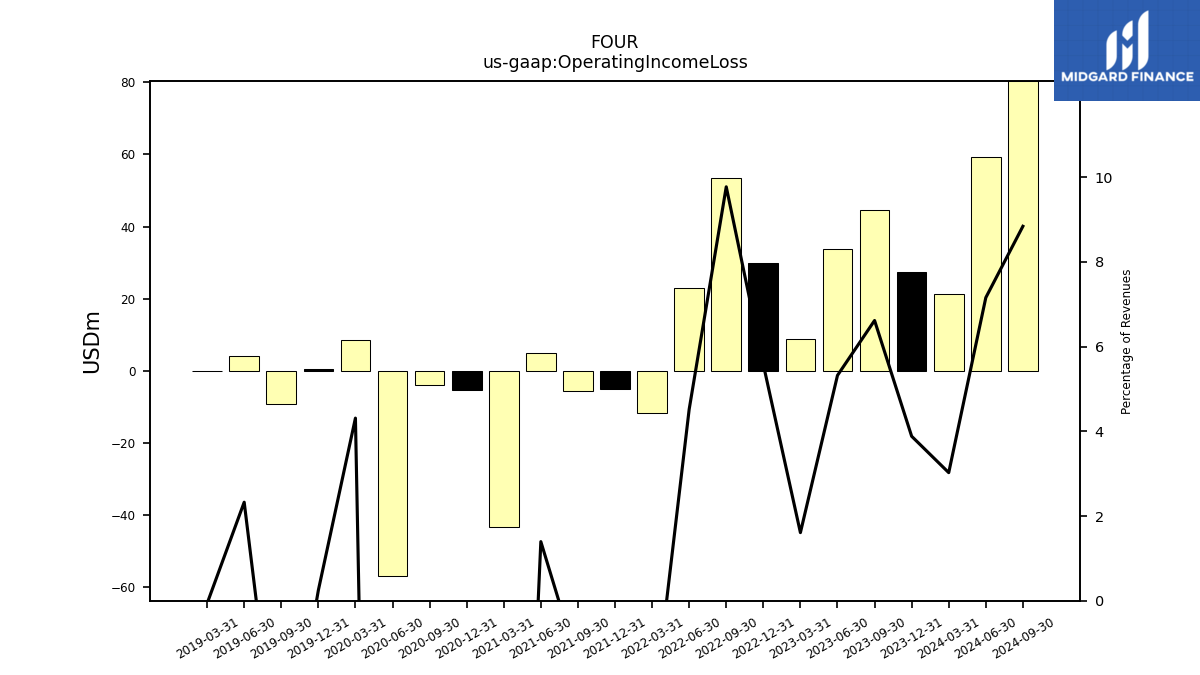
| Operating Income Loss | 21.40 | 27.40 | 44.70 | 33.90 | 8.80 | 30.00 | 53.50 | 22.90 | -11.70 | -5.00 | -5.60 | 4.90 | -43.50 | -5.50 | -4.00 | -57.00 | 8.60 | 0.50 | -9.30 | 4.20 | -0.10 | |
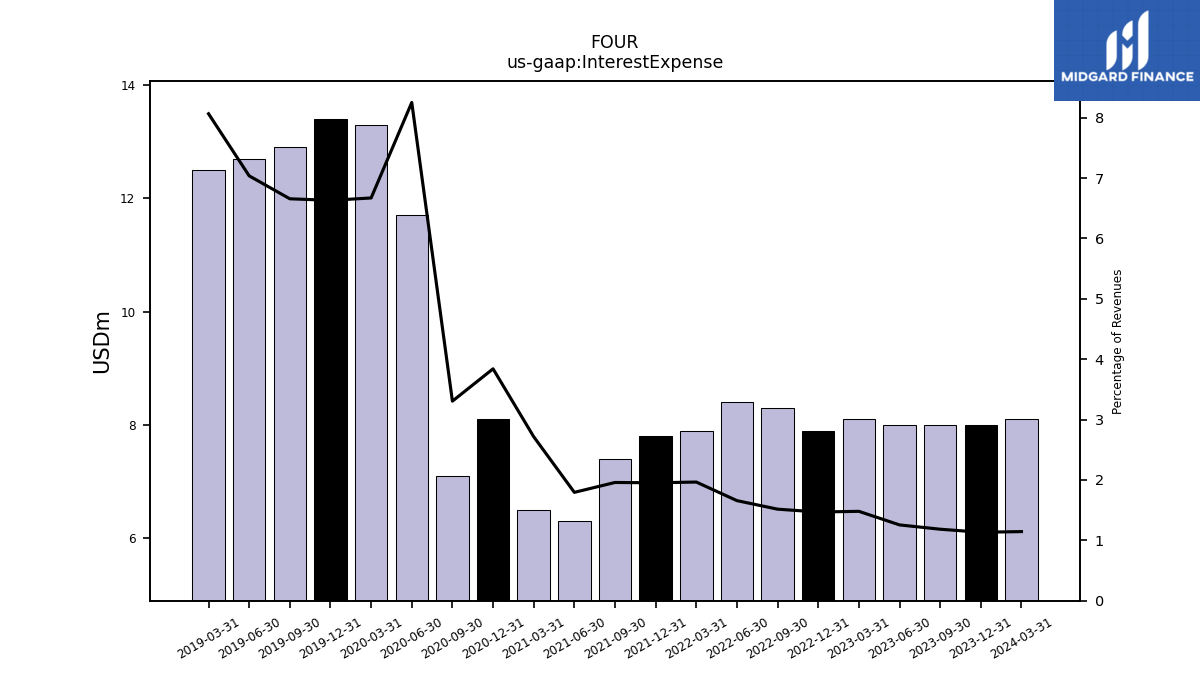
| Interest Expense | 8.10 | 8.00 | 8.00 | 8.00 | 8.10 | 7.90 | 8.30 | 8.40 | 7.90 | 7.80 | 7.40 | 6.30 | 6.50 | 8.10 | 7.10 | 11.70 | 13.30 | 13.40 | 12.90 | 12.70 | 12.50 | |
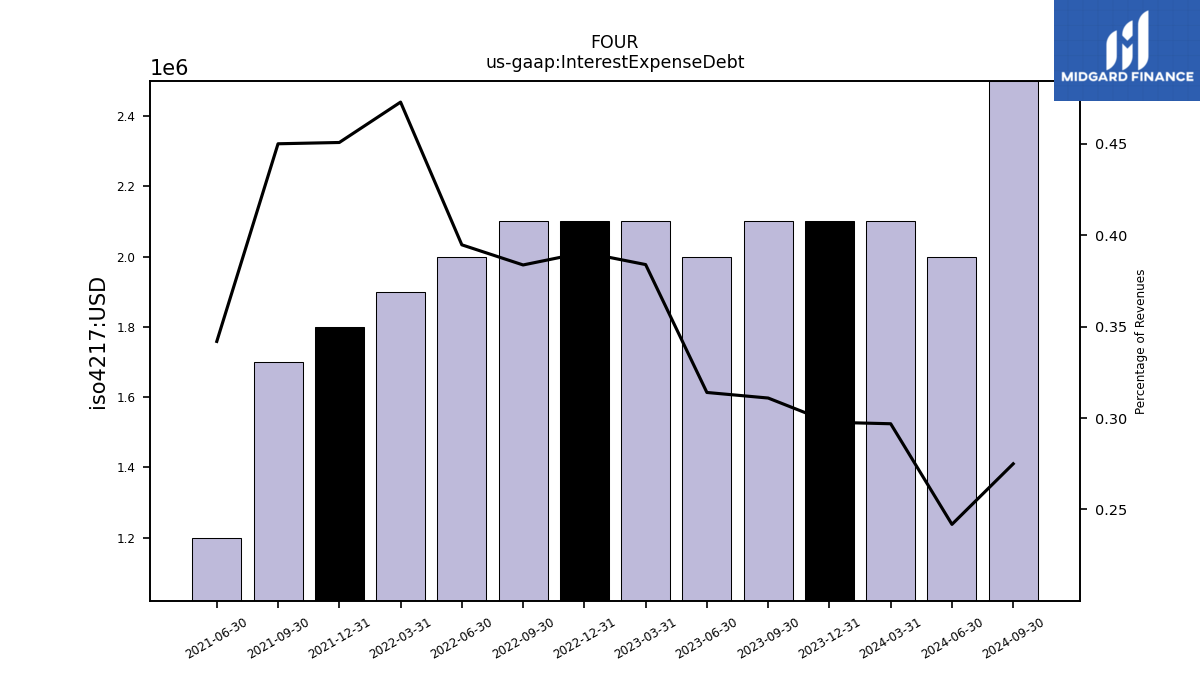
| Interest Expense Debt | 2.10 | 2.10 | 2.10 | 2.00 | 2.10 | 2.10 | 2.10 | 2.00 | 1.90 | 1.80 | 1.70 | 1.20 | NA | NA | NA | NA | NA | NA | NA | NA | NA | |
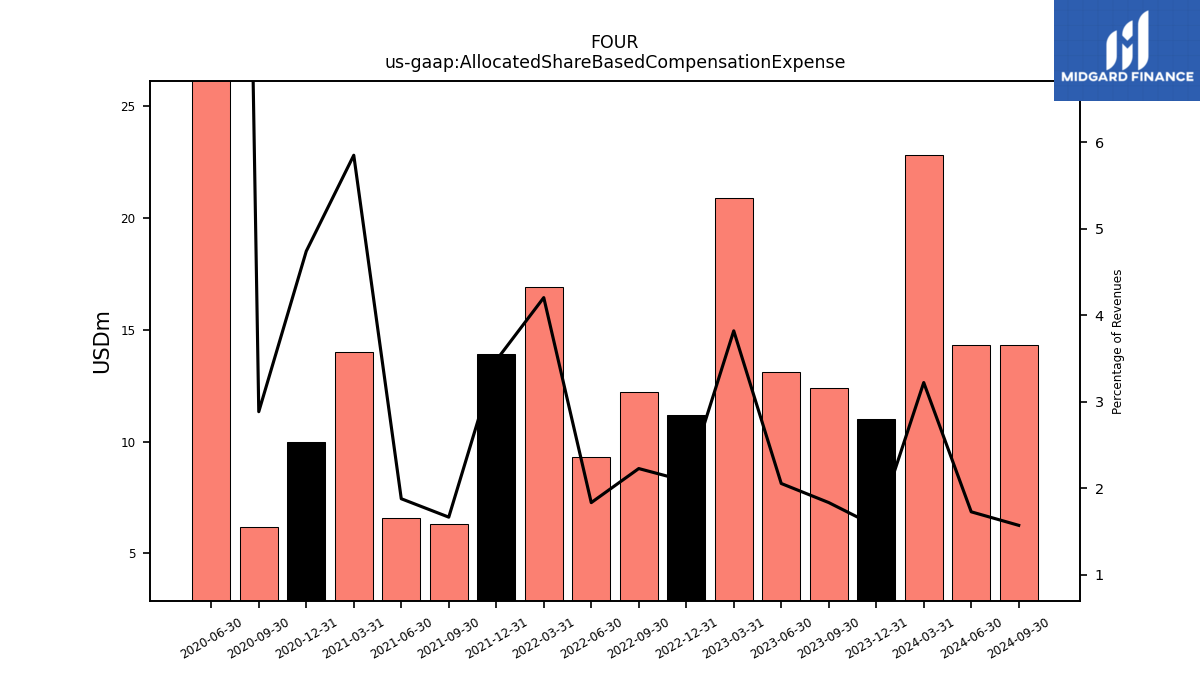
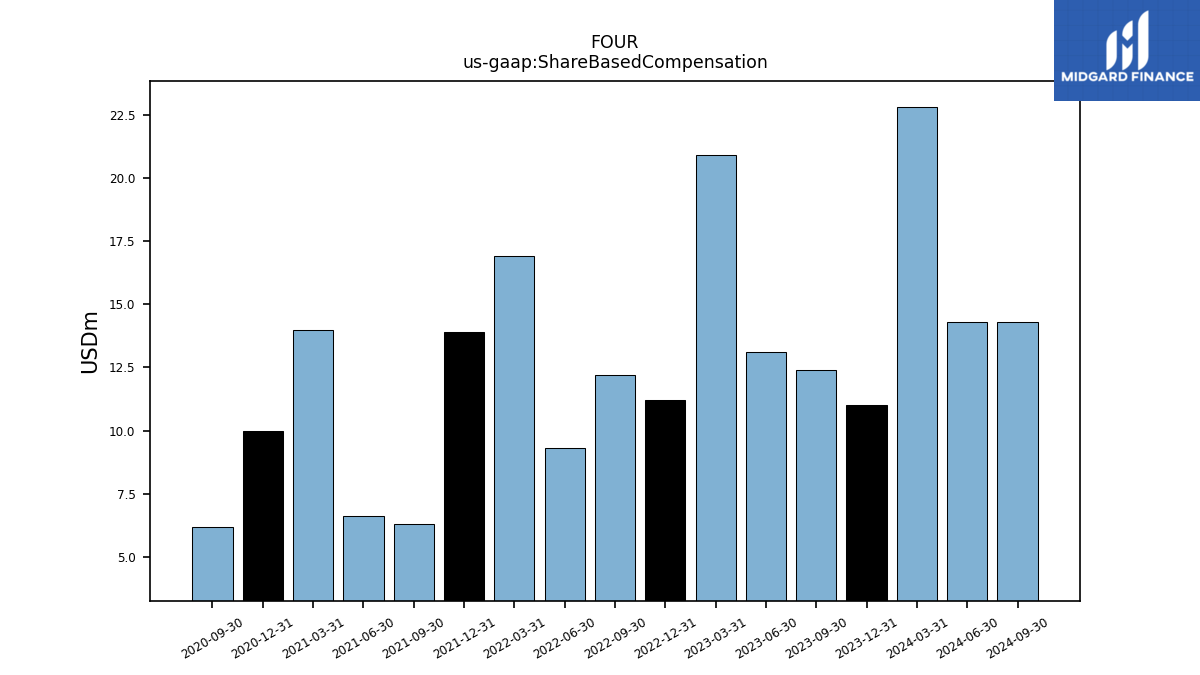
| Allocated Share Based Compensation Expense | 22.80 | 11.00 | 12.40 | 13.10 | 20.90 | 11.20 | 12.20 | 9.30 | 16.90 | 13.90 | 6.30 | 6.60 | 14.00 | 10.00 | 6.20 | 50.00 | NA | NA | NA | NA | NA | |
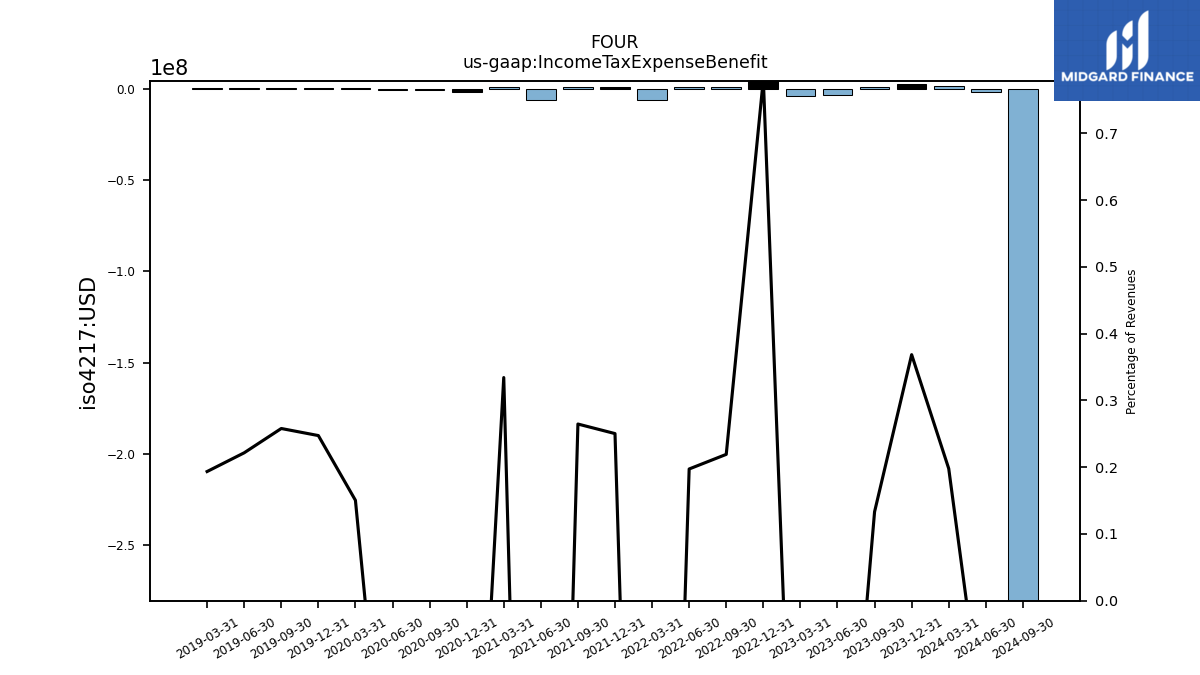
| Income Tax Expense Benefit | 1.40 | 2.60 | 0.90 | -3.30 | -3.60 | 4.20 | 1.20 | 1.00 | -6.20 | 1.00 | 1.00 | -5.90 | 0.80 | -1.40 | -0.70 | -0.60 | 0.30 | 0.50 | 0.50 | 0.40 | 0.30 | |
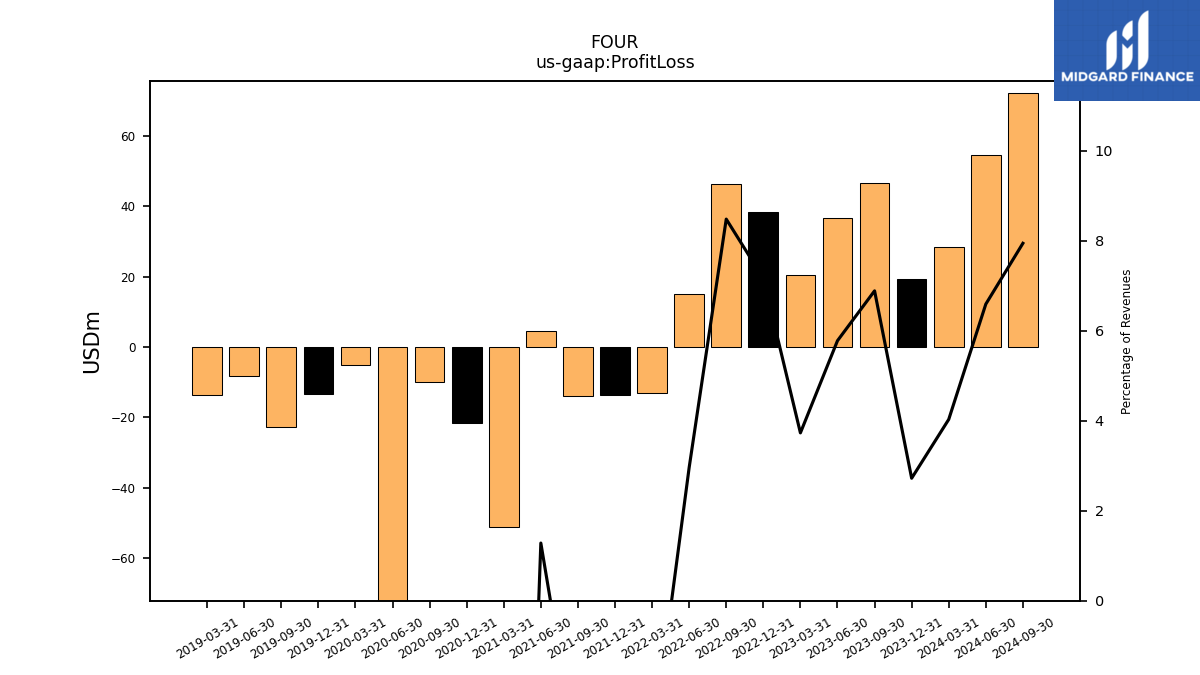
| Profit Loss | 28.50 | 19.20 | 46.50 | 36.80 | 20.40 | 38.50 | 46.40 | 15.00 | -13.20 | -13.70 | -13.80 | 4.50 | -51.00 | -21.70 | -9.90 | -75.00 | -5.20 | -13.40 | -22.60 | -8.20 | -13.50 | |
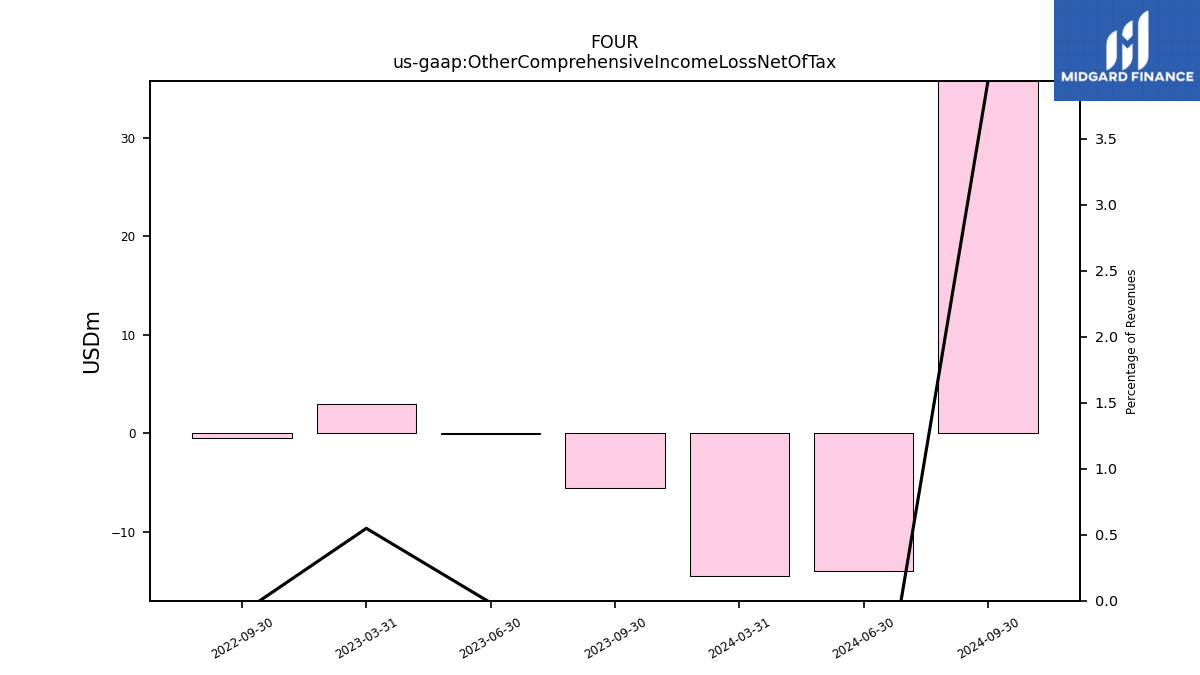
| Other Comprehensive Income Loss Net Of Tax | -14.50 | NA | -5.60 | -0.10 | 3.00 | NA | -0.50 | NA | NA | NA | NA | NA | NA | NA | NA | NA | NA | NA | NA | NA | NA | |
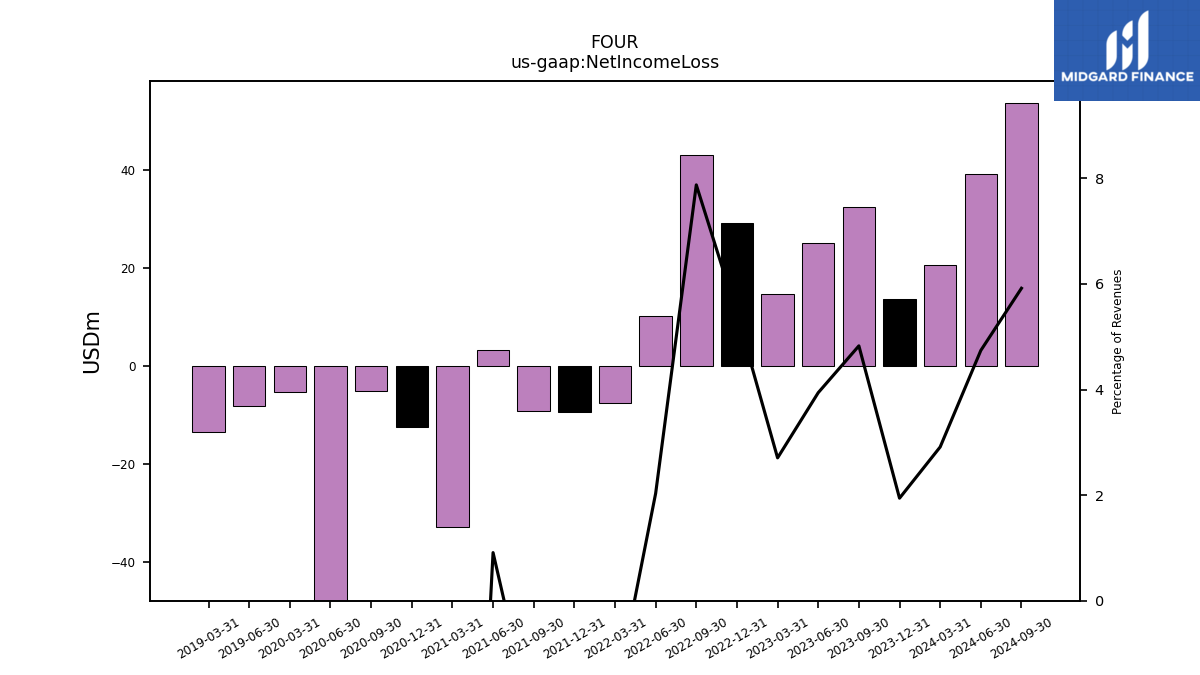
| Net Income Loss | 20.60 | 13.70 | 32.60 | 25.10 | 14.80 | 29.20 | 43.10 | 10.30 | -7.50 | -9.40 | -9.20 | 3.20 | -32.80 | -12.40 | -5.00 | -74.00 | -5.20 | NA | NA | -8.20 | -13.50 | |
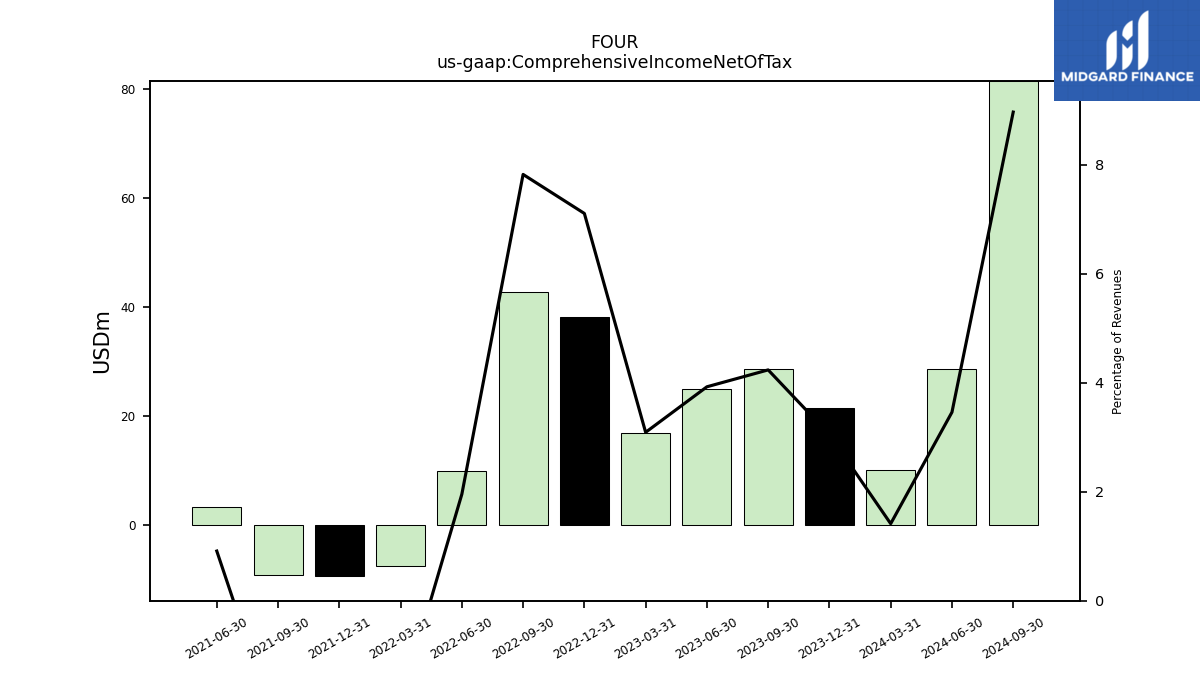
| Comprehensive Income Net Of Tax | 10.00 | 21.50 | 28.60 | 25.00 | 16.90 | 38.20 | 42.80 | 9.90 | -7.50 | -9.40 | -9.20 | 3.20 | NA | NA | NA | NA | NA | NA | NA | NA | NA |
| 2024-03-31 | 2023-12-31 | 2023-09-30 | 2023-06-30 | 2023-03-31 | 2022-12-31 | 2022-09-30 | 2022-06-30 | 2022-03-31 | 2021-12-31 | 2021-09-30 | 2021-06-30 | 2021-03-31 | 2020-12-31 | 2020-09-30 | 2020-06-30 | 2020-03-31 | 2019-12-31 | 2019-09-30 | 2019-06-30 | 2019-03-31 | ||
|---|---|---|---|---|---|---|---|---|---|---|---|---|---|---|---|---|---|---|---|---|---|---|
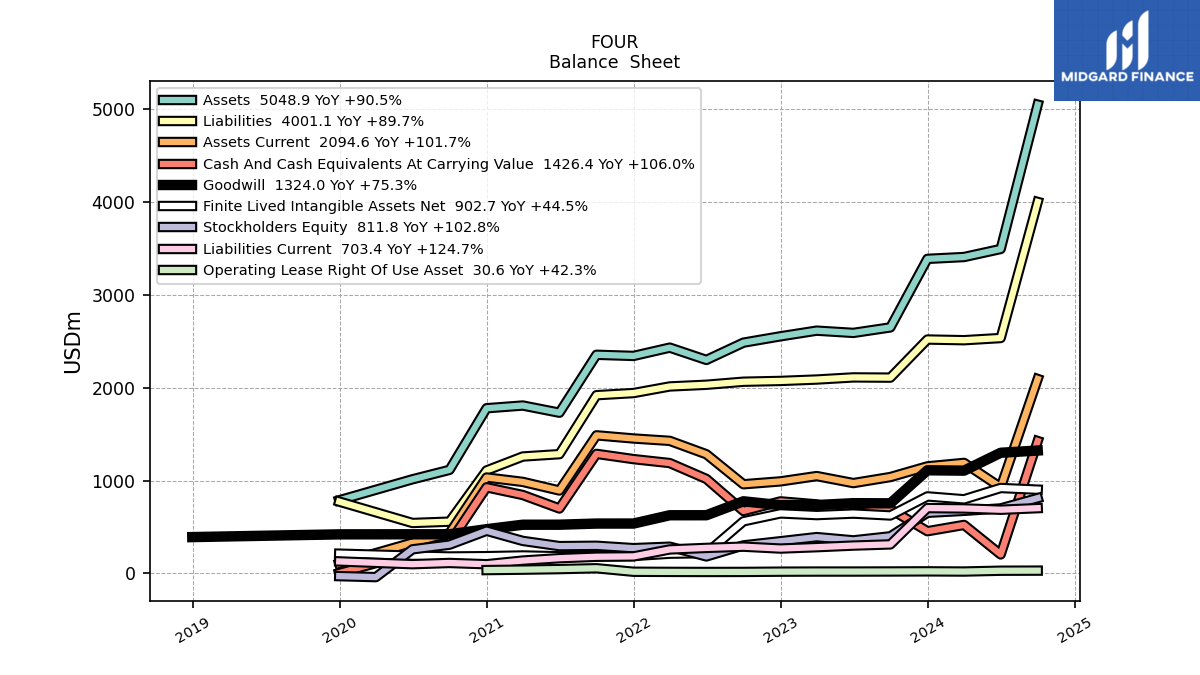
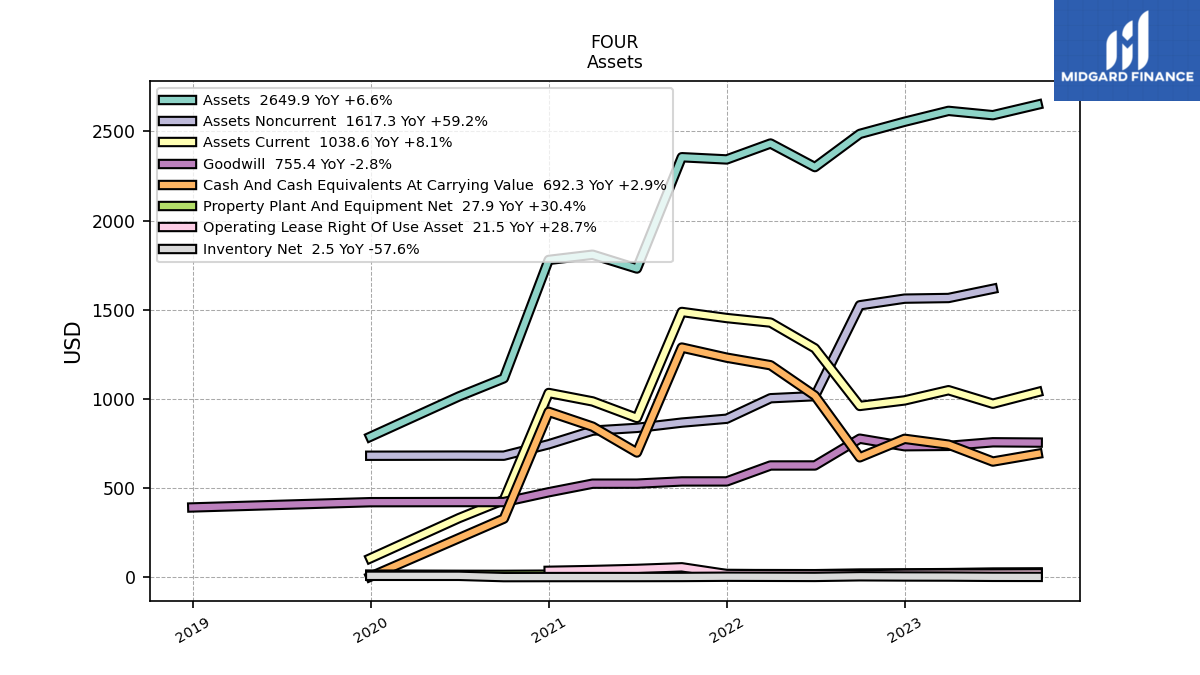
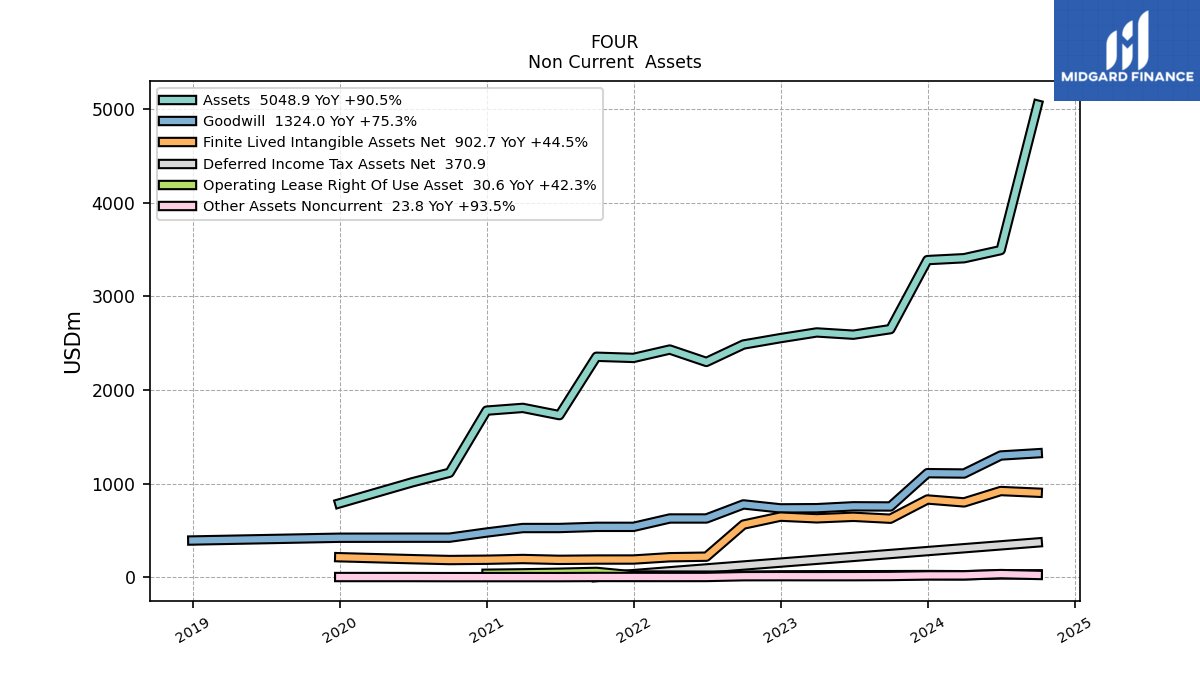
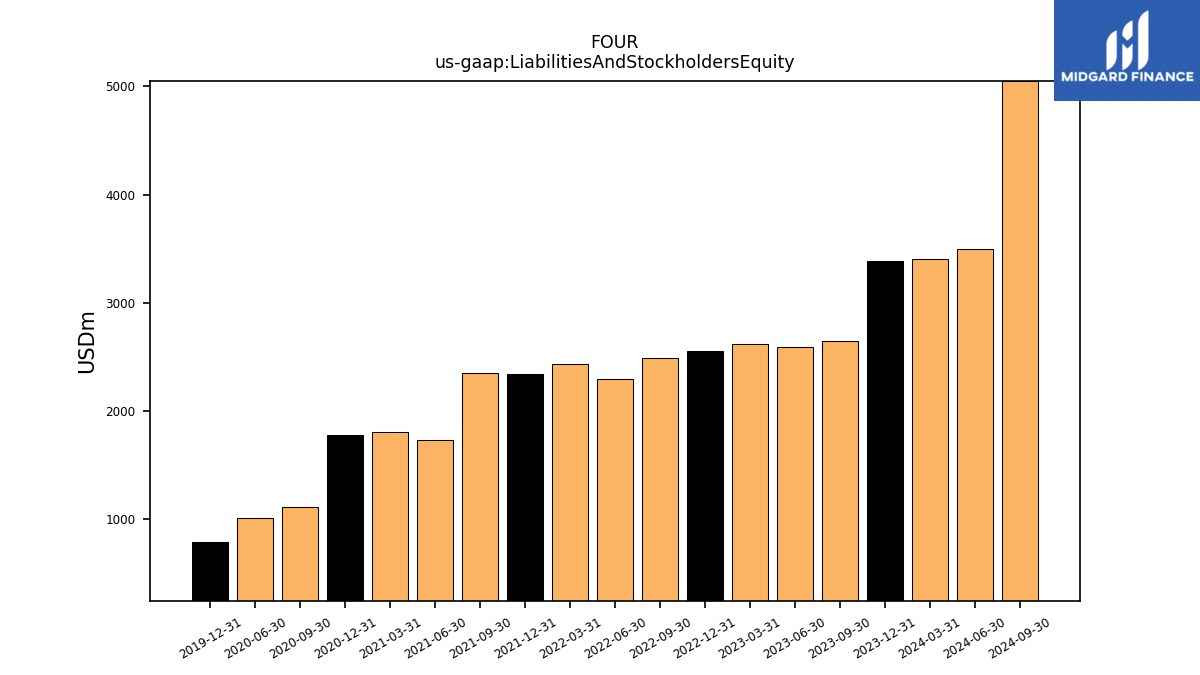
| Assets | 3407.80 | 3387.80 | 2649.90 | 2590.60 | 2614.90 | 2554.00 | 2485.70 | 2299.60 | 2432.10 | 2342.60 | 2355.10 | 1731.10 | 1808.60 | 1779.30 | 1115.60 | 1014.30 | NA | 788.00 | NA | NA | NA | |
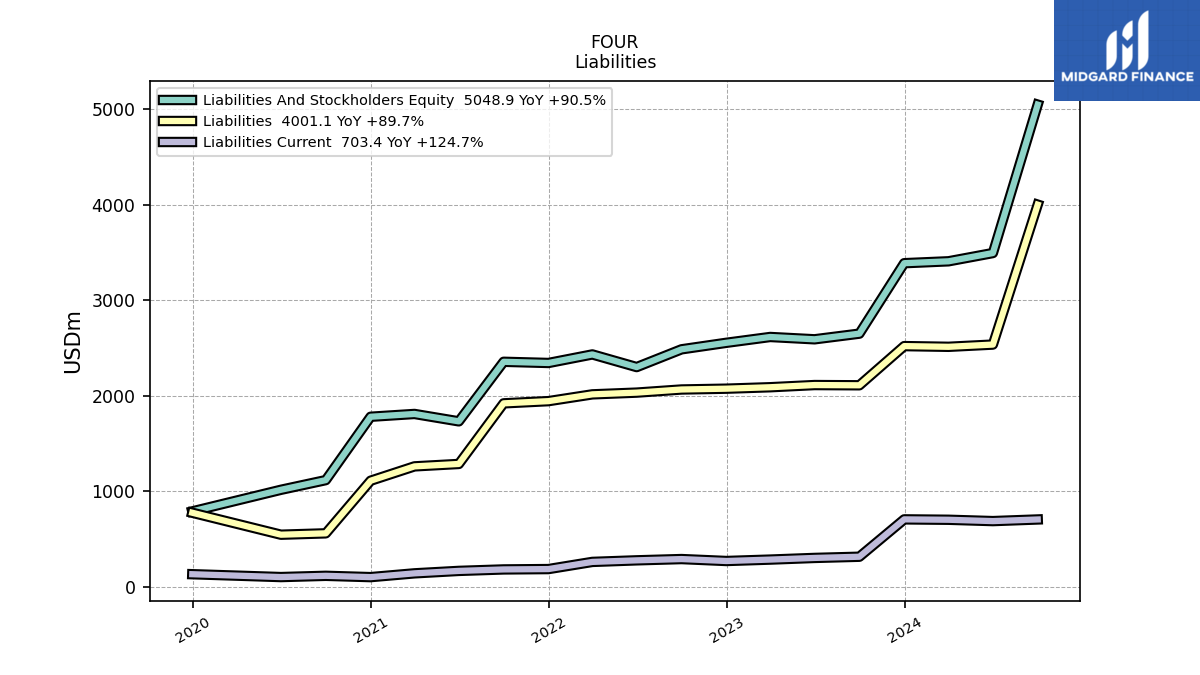
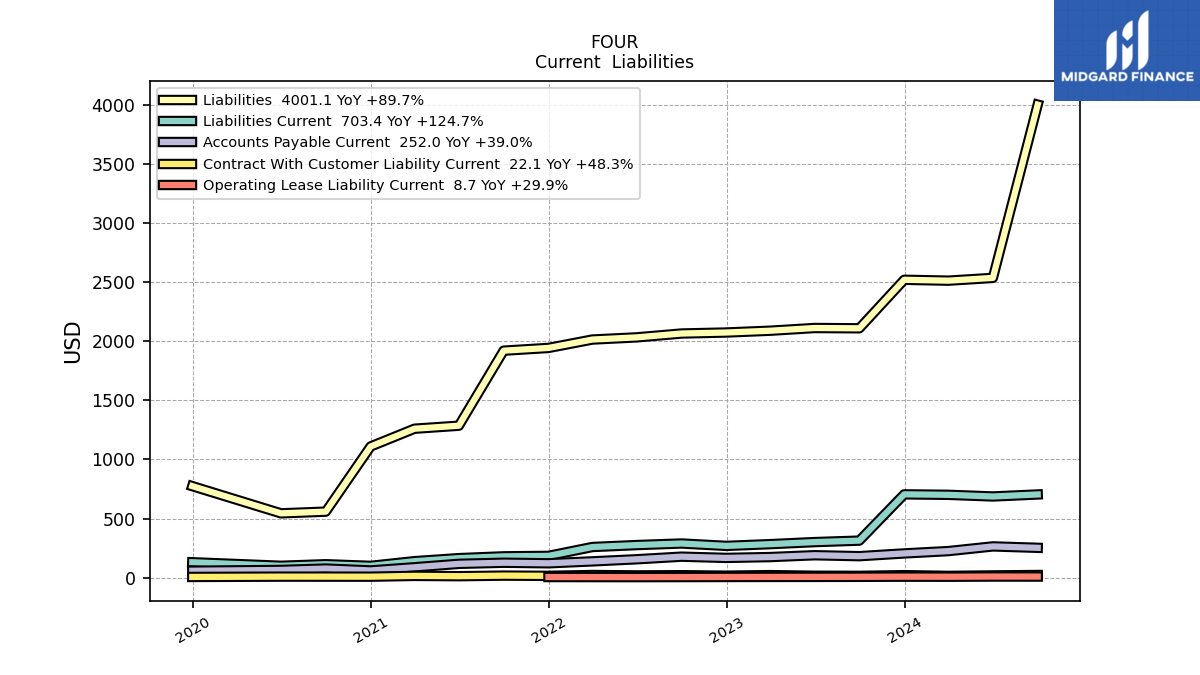
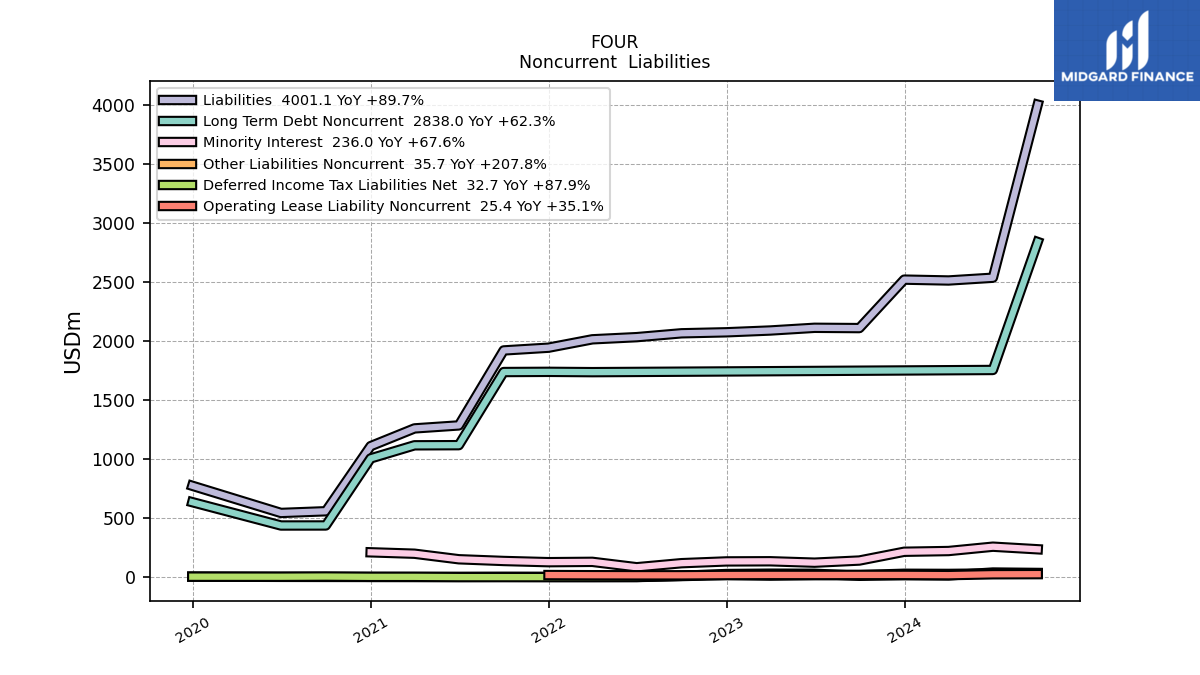
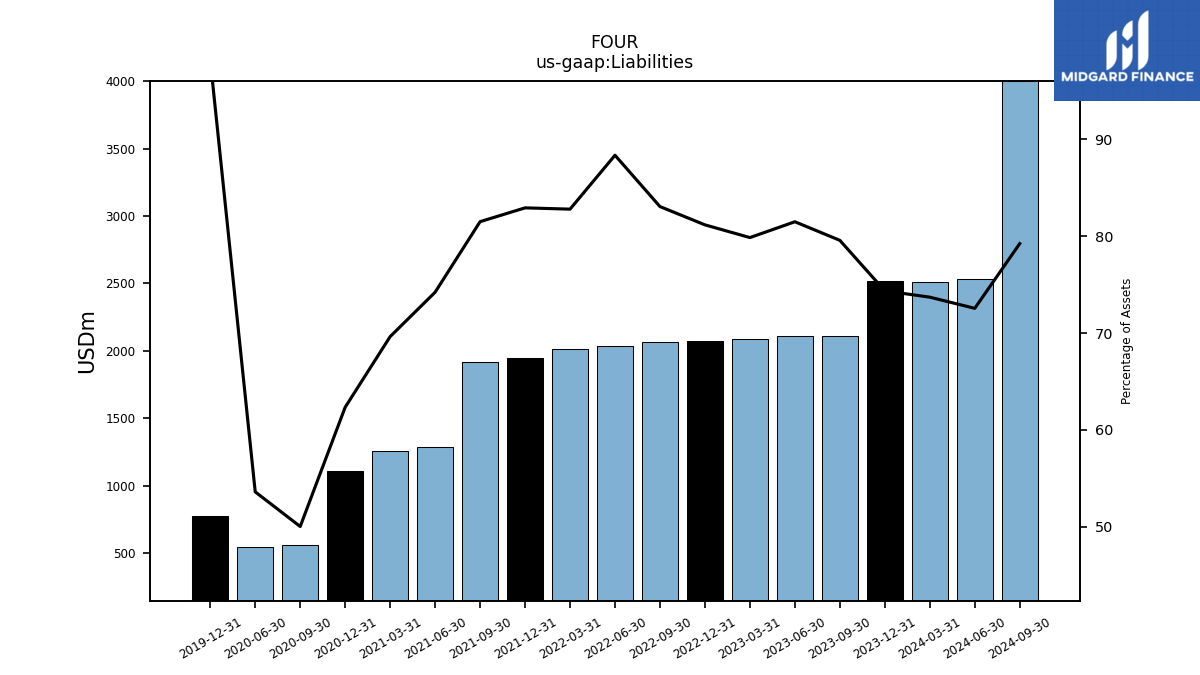
| Liabilities | 2512.00 | 2519.40 | 2108.90 | 2111.40 | 2088.50 | 2073.40 | 2064.90 | 2032.20 | 2013.90 | 1942.90 | 1919.70 | 1284.90 | 1259.50 | 1109.30 | 558.10 | 543.70 | NA | 773.90 | NA | NA | NA | |
| Liabilities And Stockholders Equity | 3407.80 | 3387.80 | 2649.90 | 2590.60 | 2614.90 | 2554.00 | 2485.70 | 2299.60 | 2432.10 | 2342.60 | 2355.10 | 1731.10 | 1808.60 | 1779.30 | 1115.60 | 1014.30 | NA | 788.00 | NA | NA | NA | |
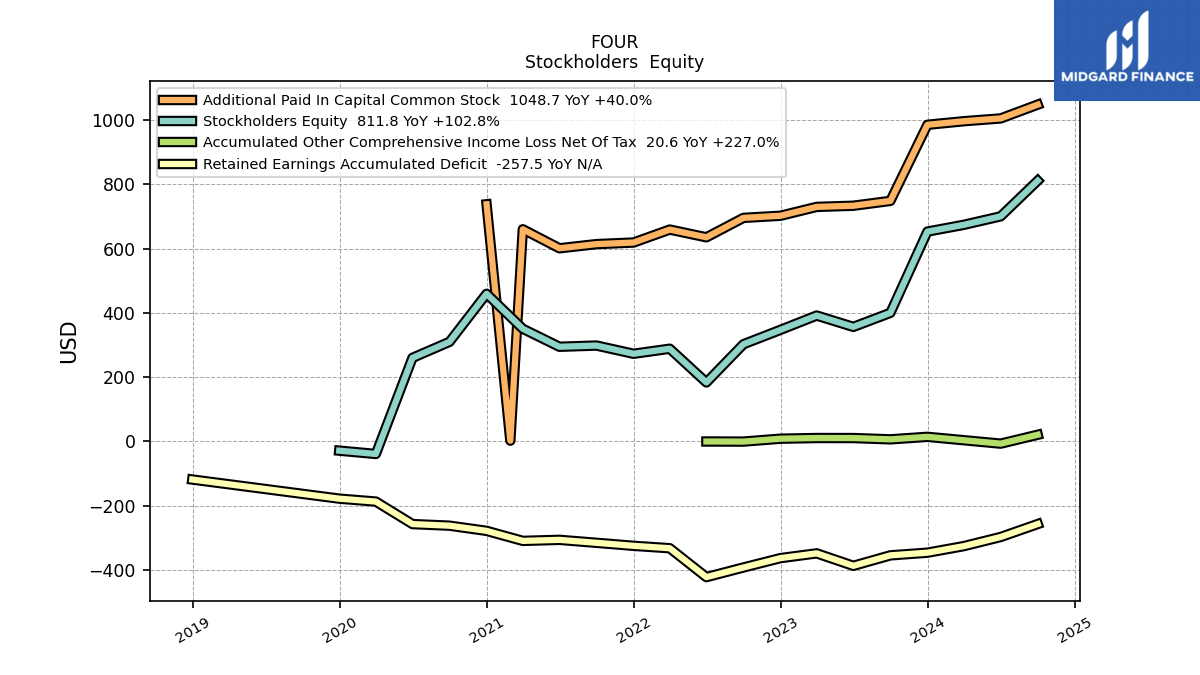
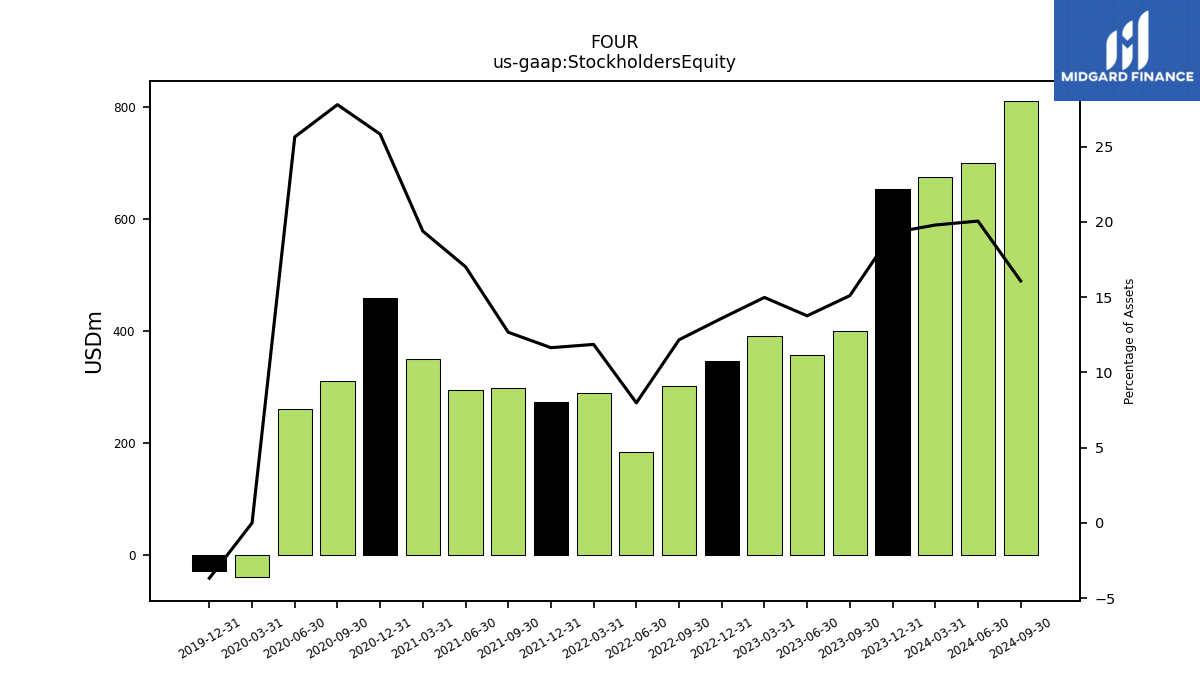
| Stockholders Equity | 674.50 | 653.30 | 400.20 | 356.50 | 391.80 | 347.30 | 302.50 | 183.50 | 288.50 | 272.80 | 298.40 | 294.60 | 350.60 | 459.60 | 310.00 | 260.10 | -39.30 | -28.90 | NA | NA | NA |
| 2024-03-31 | 2023-12-31 | 2023-09-30 | 2023-06-30 | 2023-03-31 | 2022-12-31 | 2022-09-30 | 2022-06-30 | 2022-03-31 | 2021-12-31 | 2021-09-30 | 2021-06-30 | 2021-03-31 | 2020-12-31 | 2020-09-30 | 2020-06-30 | 2020-03-31 | 2019-12-31 | 2019-09-30 | 2019-06-30 | 2019-03-31 | ||
|---|---|---|---|---|---|---|---|---|---|---|---|---|---|---|---|---|---|---|---|---|---|---|
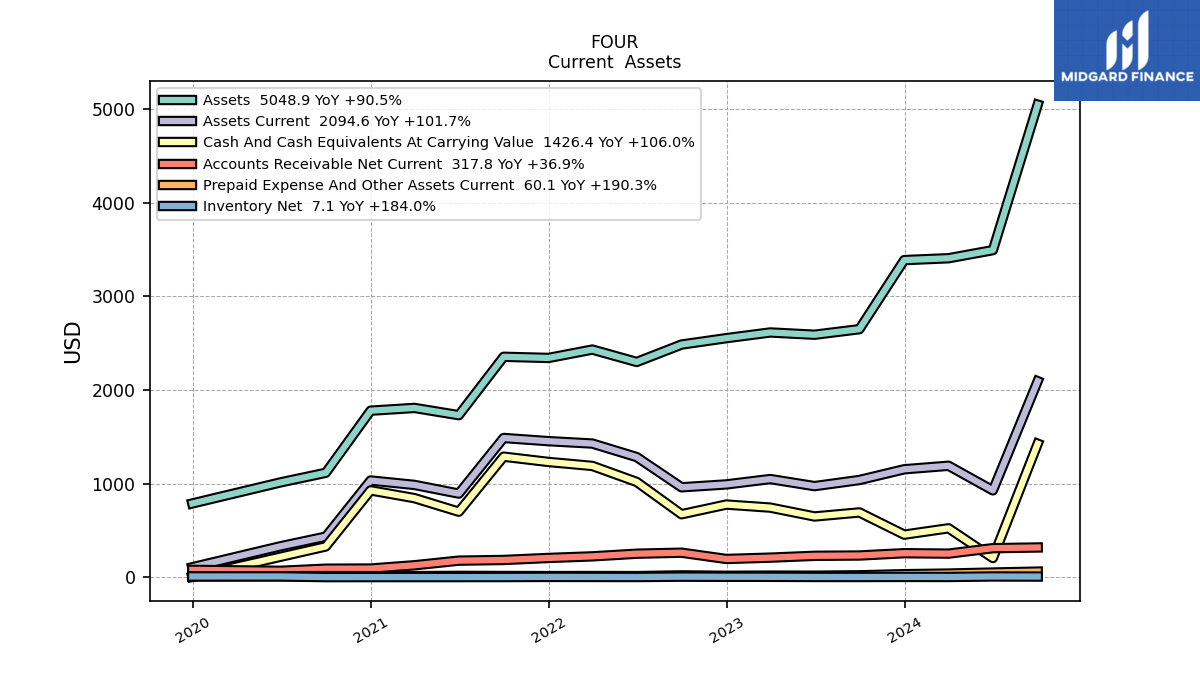
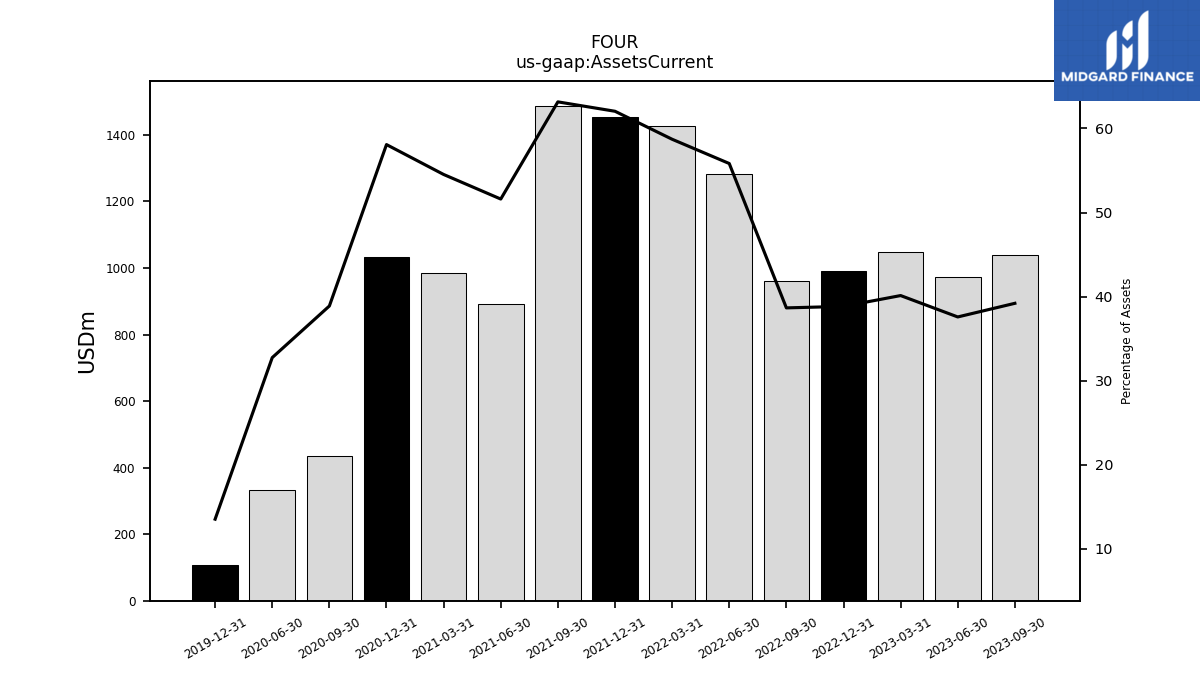
| Assets Current | 1190.80 | 1153.30 | 1038.60 | 973.30 | 1049.00 | 991.70 | 960.70 | 1283.90 | 1428.10 | 1453.60 | 1487.70 | 893.30 | 986.20 | 1033.50 | 433.70 | 332.00 | NA | 106.40 | NA | NA | NA | |
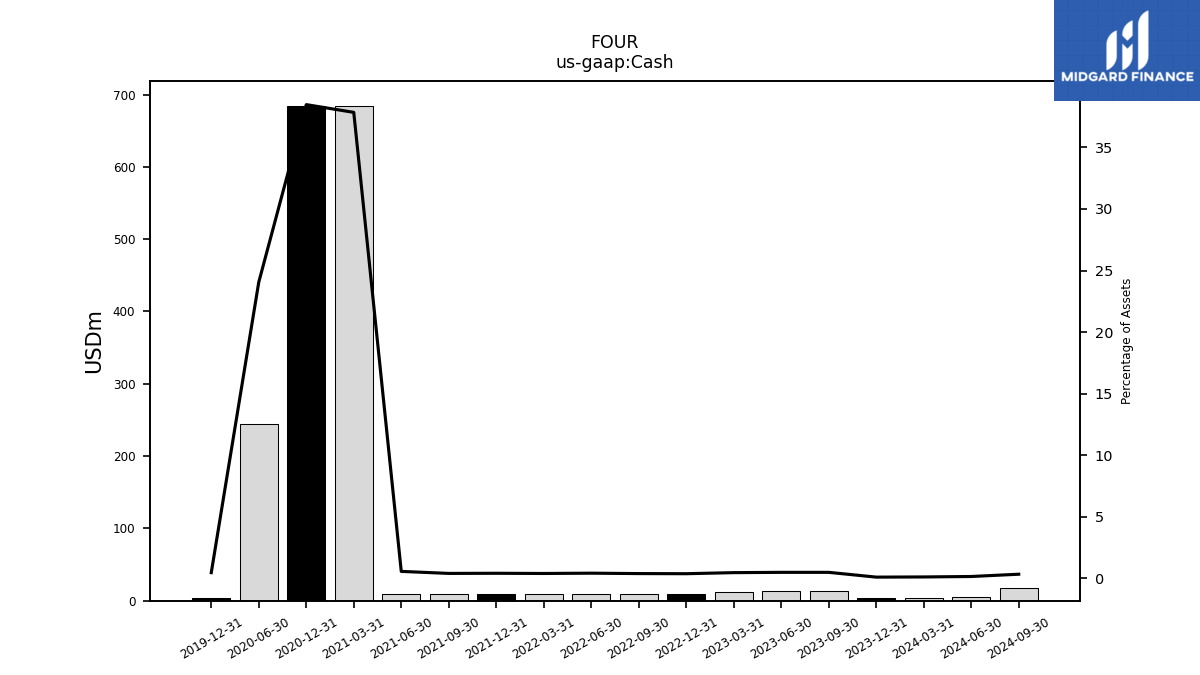
| Cash | 4.10 | 3.60 | 13.10 | 12.80 | 12.30 | 9.80 | 9.80 | 9.80 | 9.80 | 9.80 | 9.60 | 9.90 | 684.40 | 684.50 | NA | 244.00 | NA | 3.70 | NA | NA | NA | |
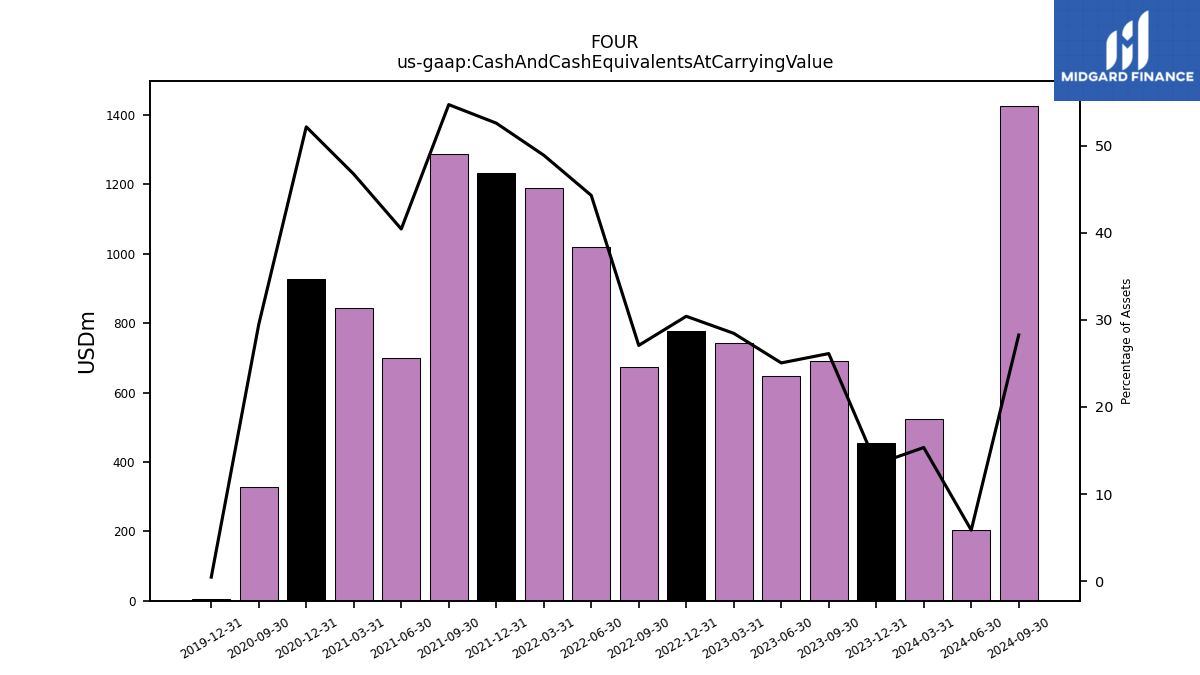
| Cash And Cash Equivalents At Carrying Value | 522.90 | 455.00 | 692.30 | 649.00 | 743.90 | 776.50 | 672.70 | 1018.20 | 1189.00 | 1231.50 | 1288.10 | 699.70 | 844.90 | 927.80 | 328.90 | NA | NA | 3.70 | NA | NA | NA | |
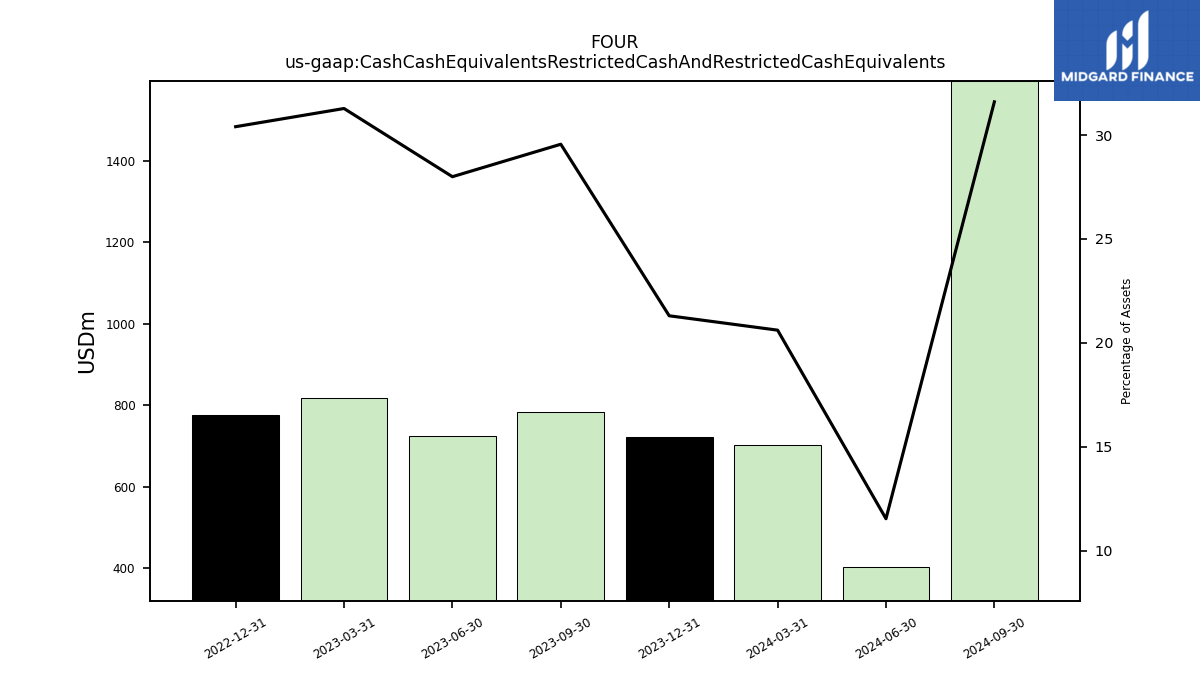
| Cash Cash Equivalents Restricted Cash And Restricted Cash Equivalents | 702.50 | 721.80 | NA | NA | 817.90 | 776.50 | NA | NA | NA | NA | NA | NA | NA | NA | NA | NA | NA | NA | NA | NA | NA | |
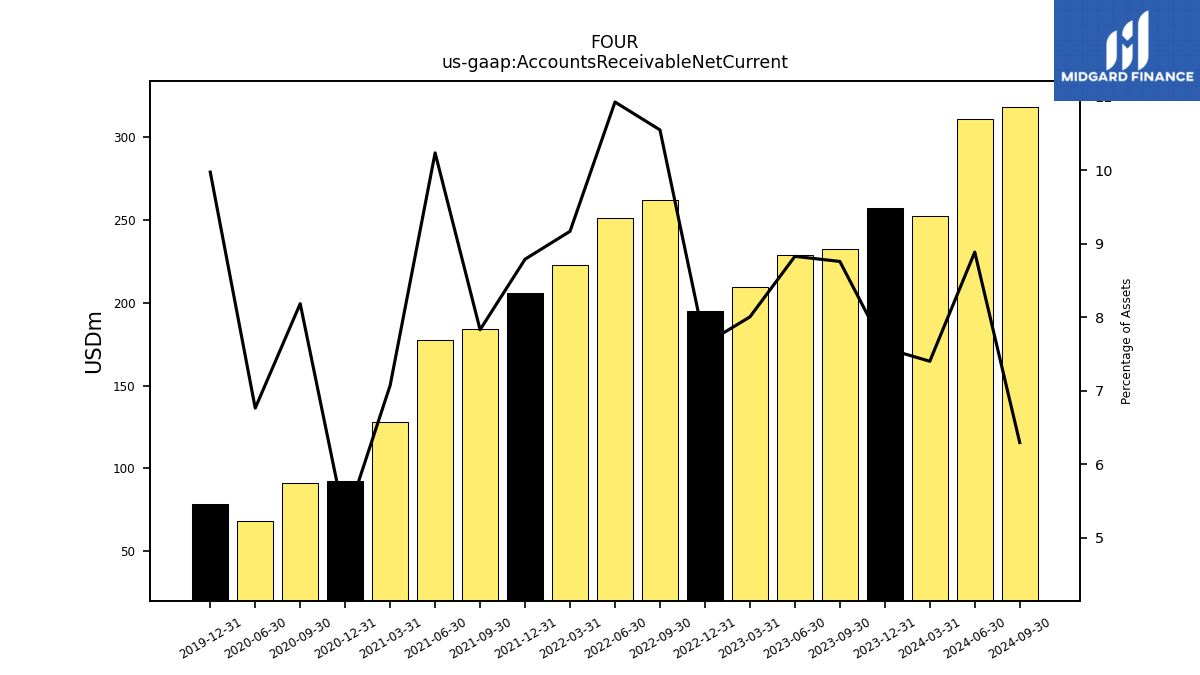
| Accounts Receivable Net Current | 252.20 | 256.80 | 232.10 | 228.70 | 209.30 | 195.00 | 262.20 | 251.30 | 223.00 | 205.90 | 184.40 | 177.20 | 127.90 | 92.70 | 91.30 | 68.60 | NA | 78.60 | NA | NA | NA | |
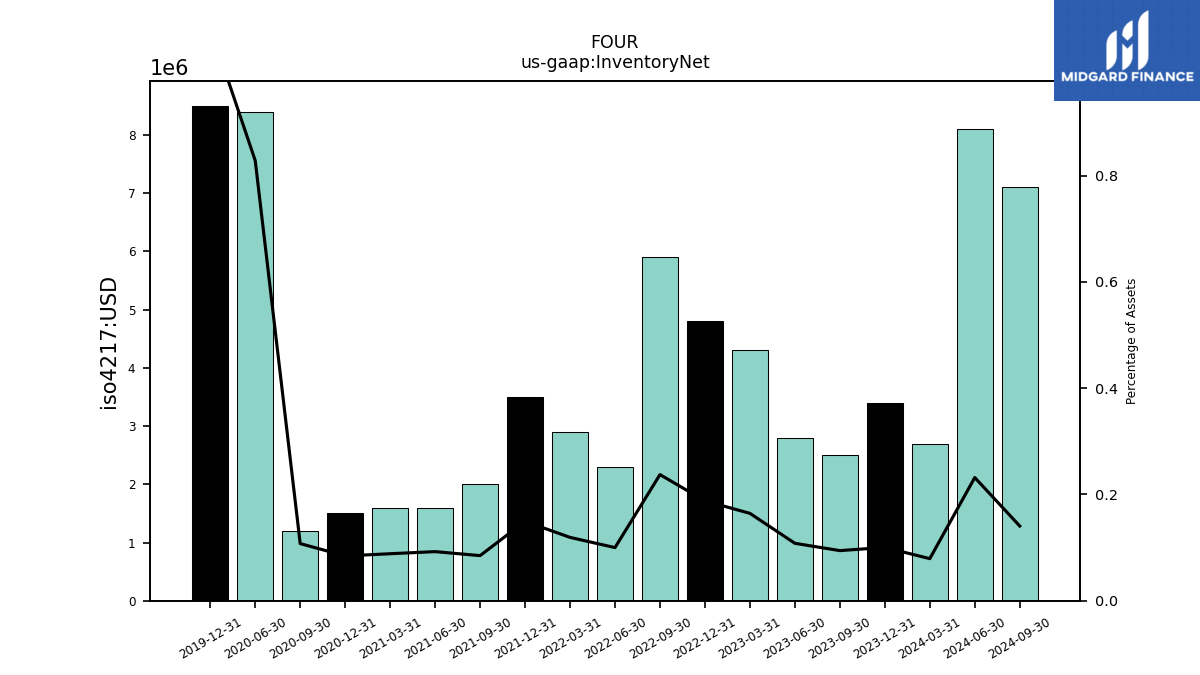
| Inventory Net | 2.70 | 3.40 | 2.50 | 2.80 | 4.30 | 4.80 | 5.90 | 2.30 | 2.90 | 3.50 | 2.00 | 1.60 | 1.60 | 1.50 | 1.20 | 8.40 | NA | 8.50 | NA | NA | NA | |
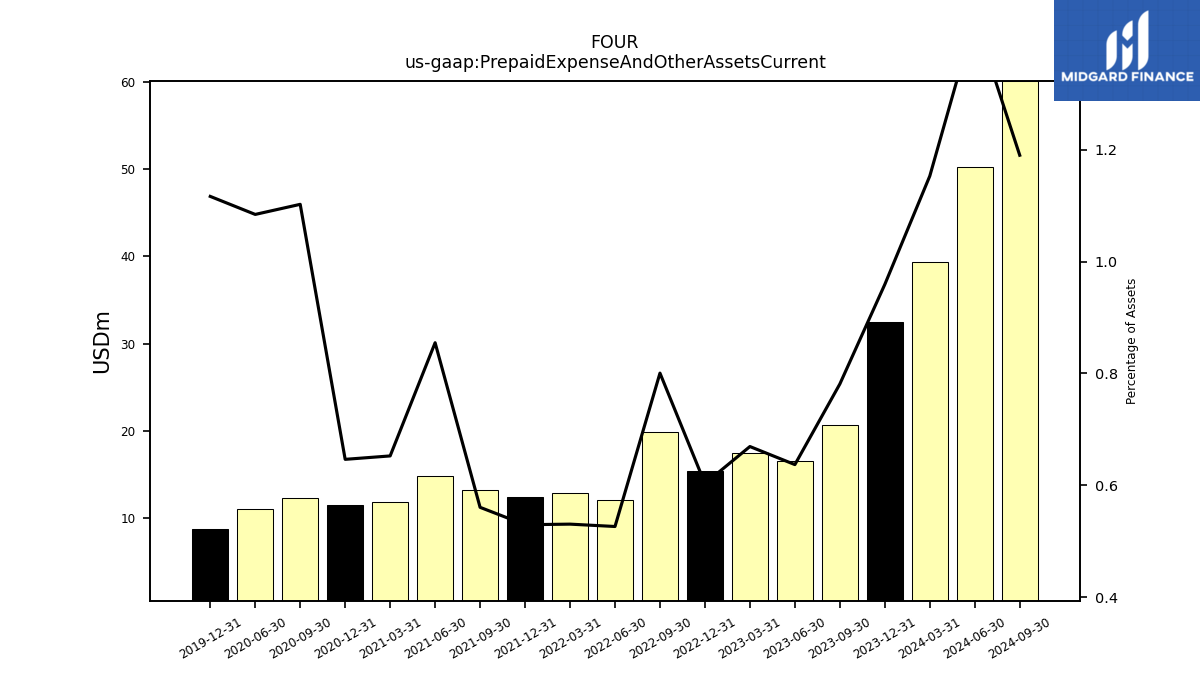
| Prepaid Expense And Other Assets Current | 39.30 | 32.50 | 20.70 | 16.50 | 17.50 | 15.40 | 19.90 | 12.10 | 12.90 | 12.40 | 13.20 | 14.80 | 11.80 | 11.50 | 12.30 | 11.00 | NA | 8.80 | NA | NA | NA |
| 2024-03-31 | 2023-12-31 | 2023-09-30 | 2023-06-30 | 2023-03-31 | 2022-12-31 | 2022-09-30 | 2022-06-30 | 2022-03-31 | 2021-12-31 | 2021-09-30 | 2021-06-30 | 2021-03-31 | 2020-12-31 | 2020-09-30 | 2020-06-30 | 2020-03-31 | 2019-12-31 | 2019-09-30 | 2019-06-30 | 2019-03-31 | ||
|---|---|---|---|---|---|---|---|---|---|---|---|---|---|---|---|---|---|---|---|---|---|---|
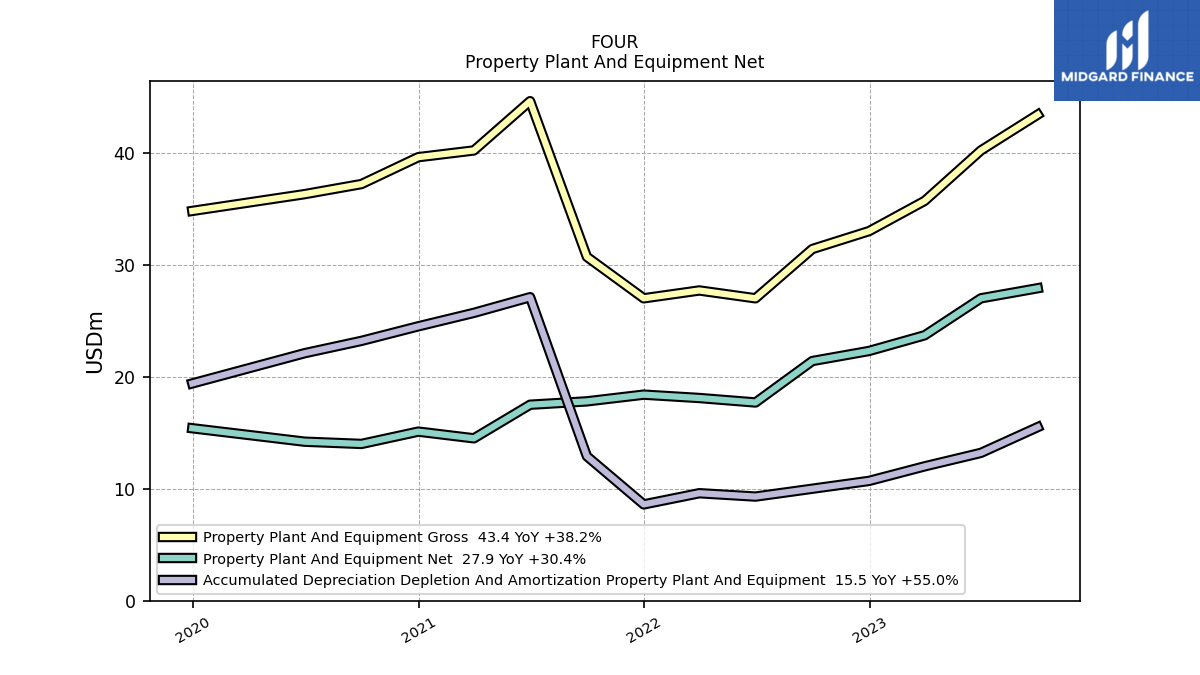
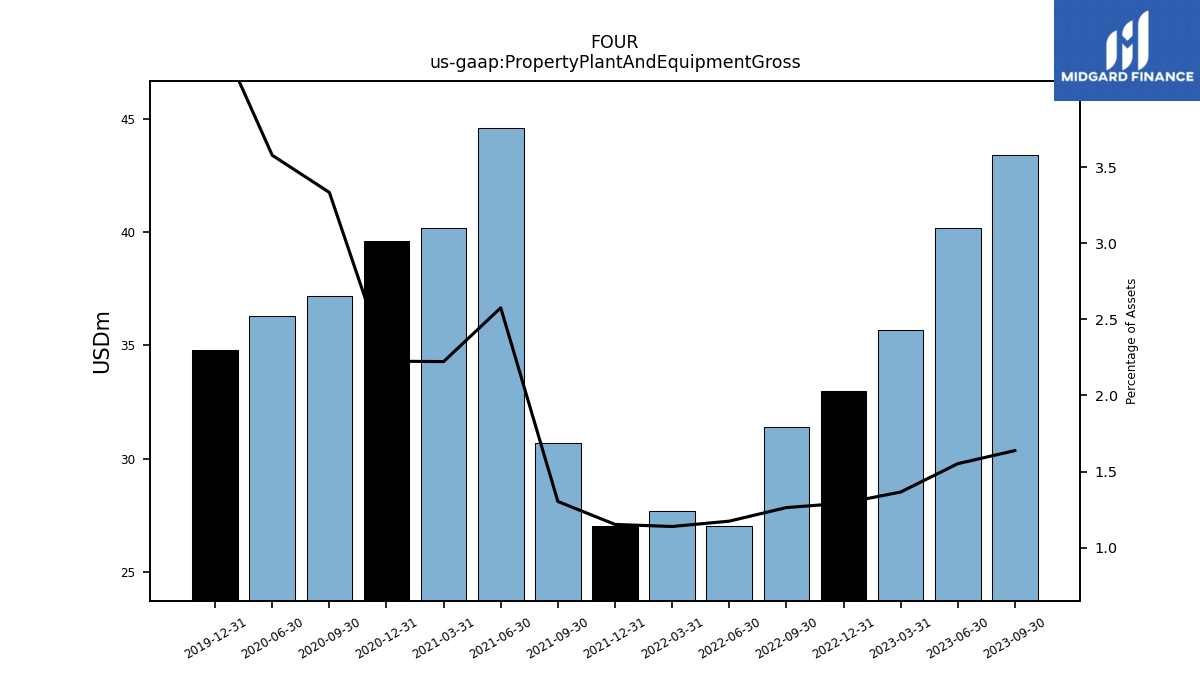
| Property Plant And Equipment Gross | 47.10 | 46.70 | 43.40 | 40.20 | 35.70 | 33.00 | 31.40 | 27.00 | 27.70 | 27.00 | 30.70 | 44.60 | 40.20 | 39.60 | 37.20 | 36.30 | NA | 34.80 | NA | NA | NA | |
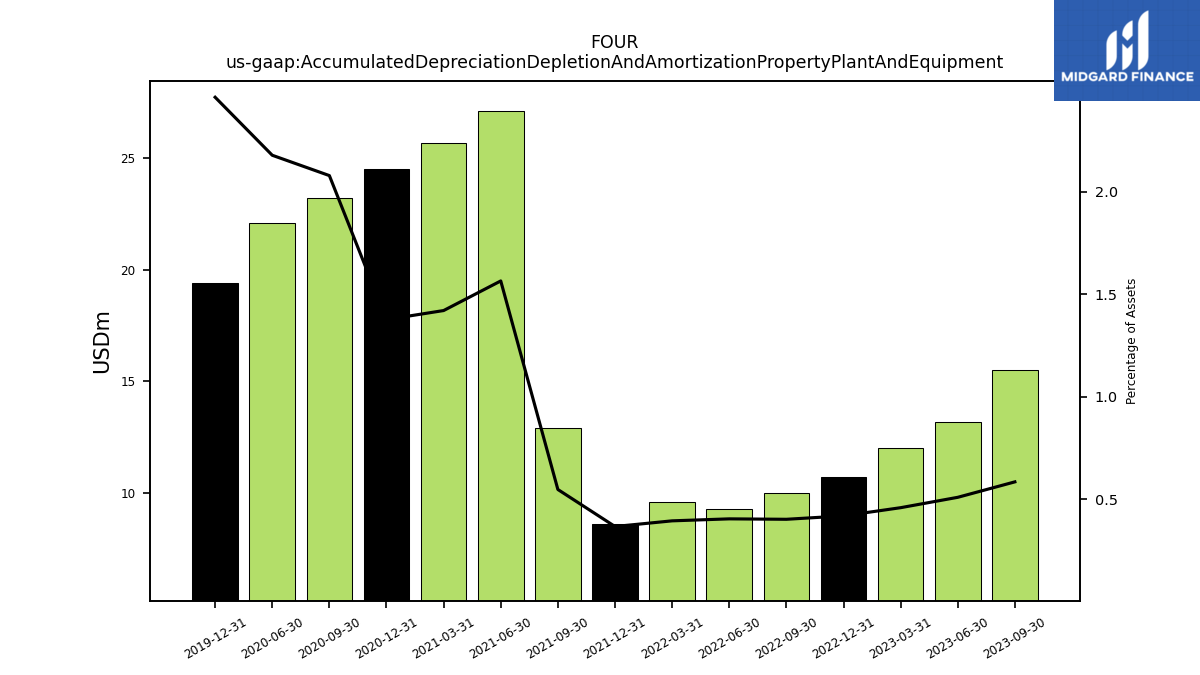
| Accumulated Depreciation Depletion And Amortization Property Plant And Equipment | 19.80 | 18.10 | 15.50 | 13.20 | 12.00 | 10.70 | 10.00 | 9.30 | 9.60 | 8.60 | 12.90 | 27.10 | 25.70 | 24.50 | 23.20 | 22.10 | NA | 19.40 | NA | NA | NA | |
| Property Plant And Equipment Net | 27.30 | 28.60 | 27.90 | 27.00 | 23.70 | 22.30 | 21.40 | 17.70 | 18.10 | 18.40 | 17.80 | 17.50 | 14.50 | 15.10 | 14.00 | 14.20 | NA | 15.40 | NA | NA | NA | |
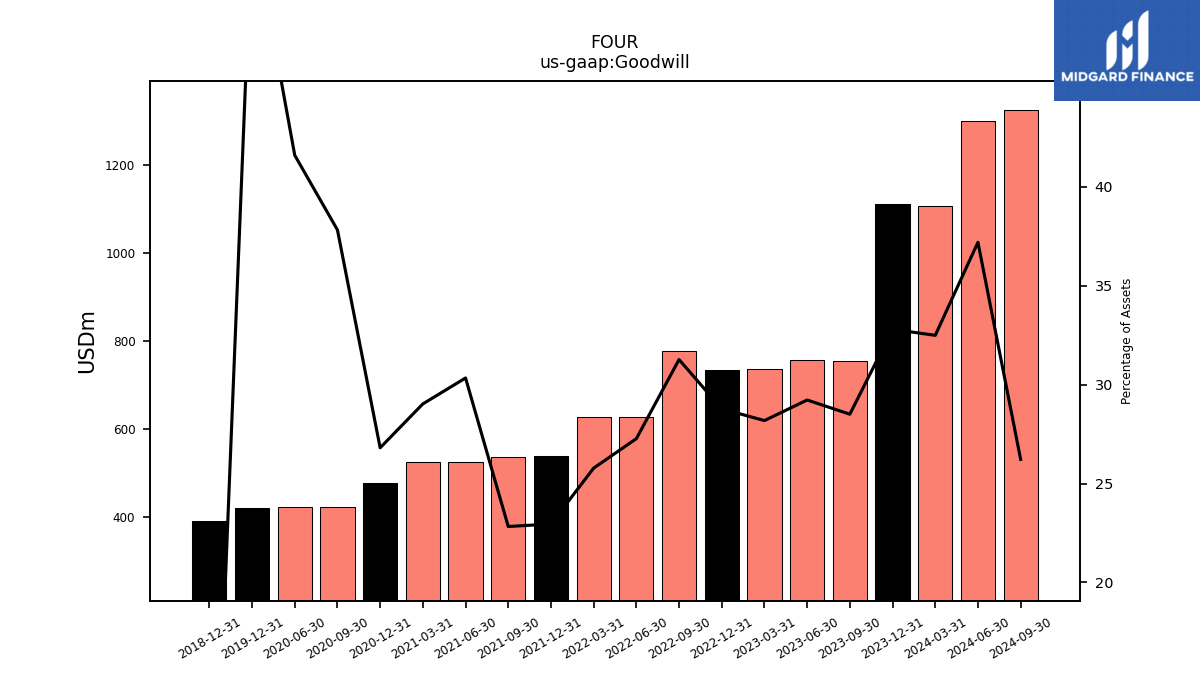
| Goodwill | 1107.40 | 1111.30 | 755.40 | 757.10 | 737.00 | 735.00 | 777.30 | 627.10 | 627.00 | 537.70 | 537.60 | 525.20 | 525.00 | 477.00 | 422.00 | 422.00 | NA | 421.30 | NA | NA | NA | |
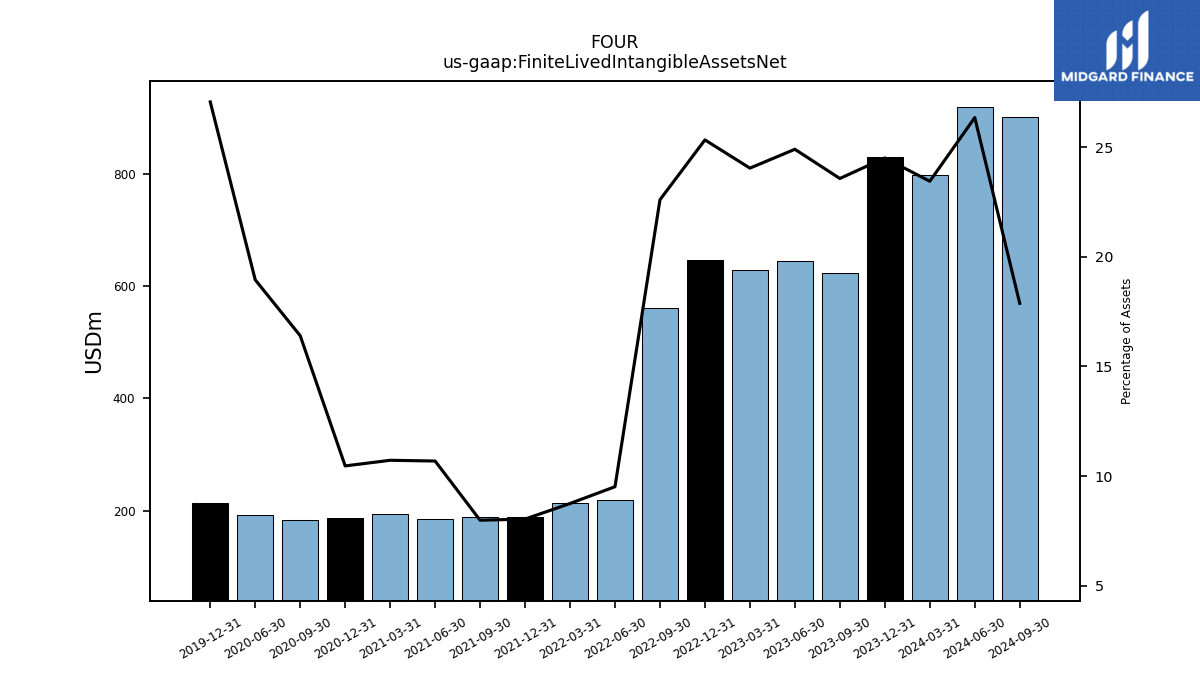
| Finite Lived Intangible Assets Net | 798.80 | 830.10 | 624.50 | 645.00 | 628.60 | 646.80 | 561.70 | 219.00 | 213.00 | 188.50 | 188.30 | 185.10 | 194.00 | 186.30 | 183.00 | 192.20 | NA | 213.20 | NA | NA | NA | |
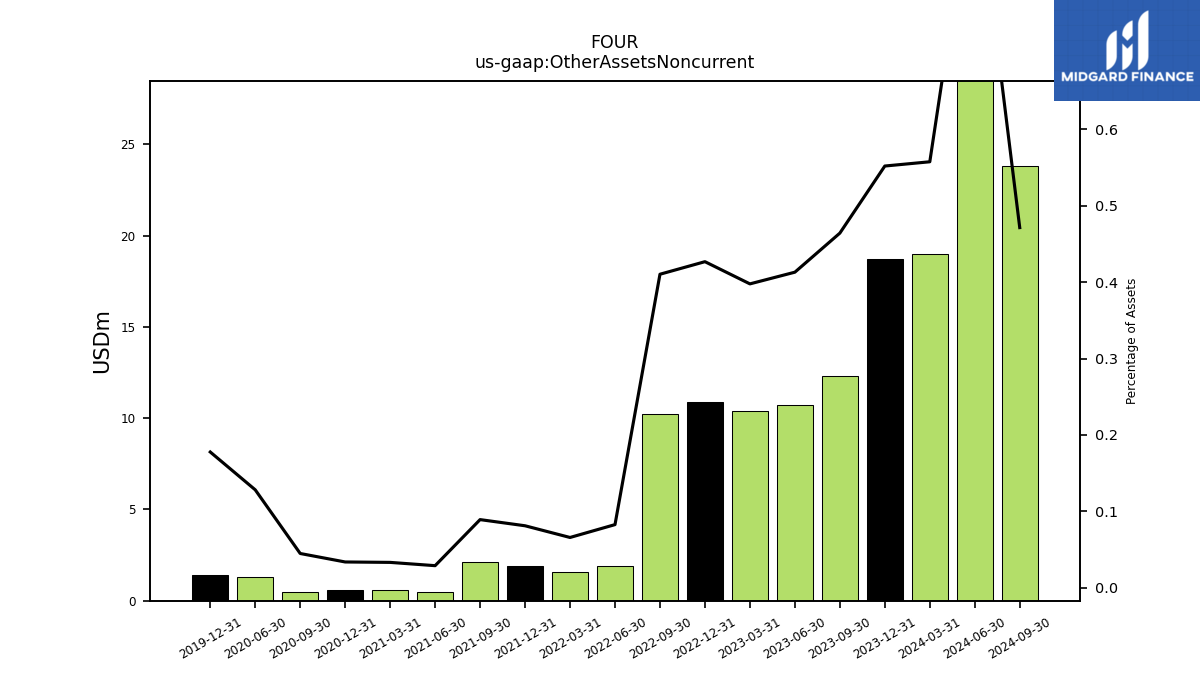
| Other Assets Noncurrent | 19.00 | 18.70 | 12.30 | 10.70 | 10.40 | 10.90 | 10.20 | 1.90 | 1.60 | 1.90 | 2.10 | 0.50 | 0.60 | 0.60 | 0.50 | 1.30 | NA | 1.40 | NA | NA | NA |
| 2024-03-31 | 2023-12-31 | 2023-09-30 | 2023-06-30 | 2023-03-31 | 2022-12-31 | 2022-09-30 | 2022-06-30 | 2022-03-31 | 2021-12-31 | 2021-09-30 | 2021-06-30 | 2021-03-31 | 2020-12-31 | 2020-09-30 | 2020-06-30 | 2020-03-31 | 2019-12-31 | 2019-09-30 | 2019-06-30 | 2019-03-31 | ||
|---|---|---|---|---|---|---|---|---|---|---|---|---|---|---|---|---|---|---|---|---|---|---|
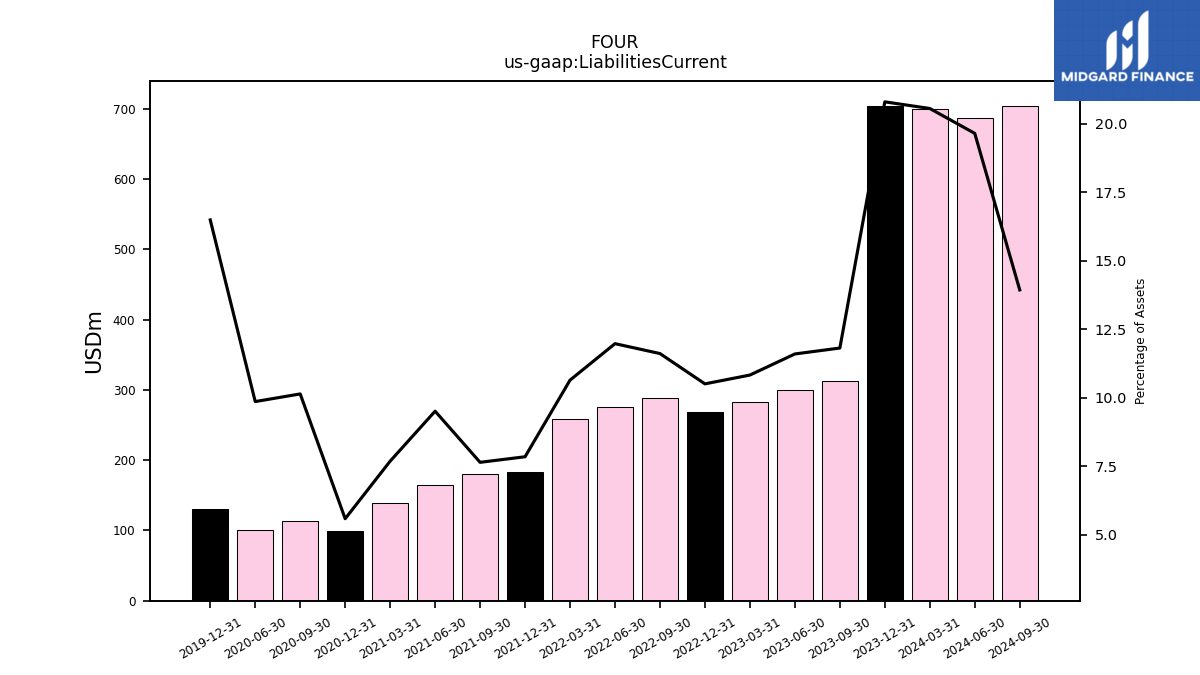
| Liabilities Current | 700.30 | 704.40 | 313.00 | 300.40 | 283.10 | 268.30 | 288.60 | 275.30 | 258.80 | 183.80 | 180.00 | 164.60 | 139.00 | 99.40 | 113.10 | 100.00 | NA | 129.90 | NA | NA | NA | |
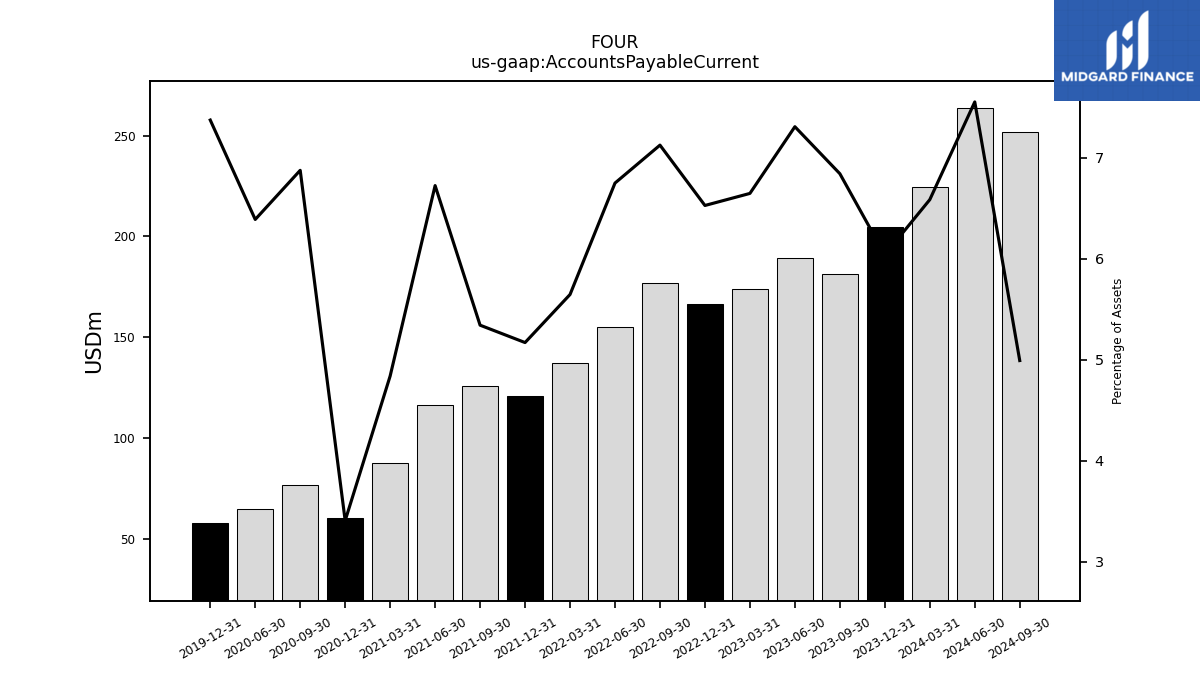
| Accounts Payable Current | 224.40 | 204.60 | 181.30 | 189.30 | 173.80 | 166.70 | 177.10 | 155.20 | 137.30 | 121.10 | 125.80 | 116.40 | 87.50 | 60.60 | 76.70 | 64.80 | NA | 58.10 | NA | NA | NA | |
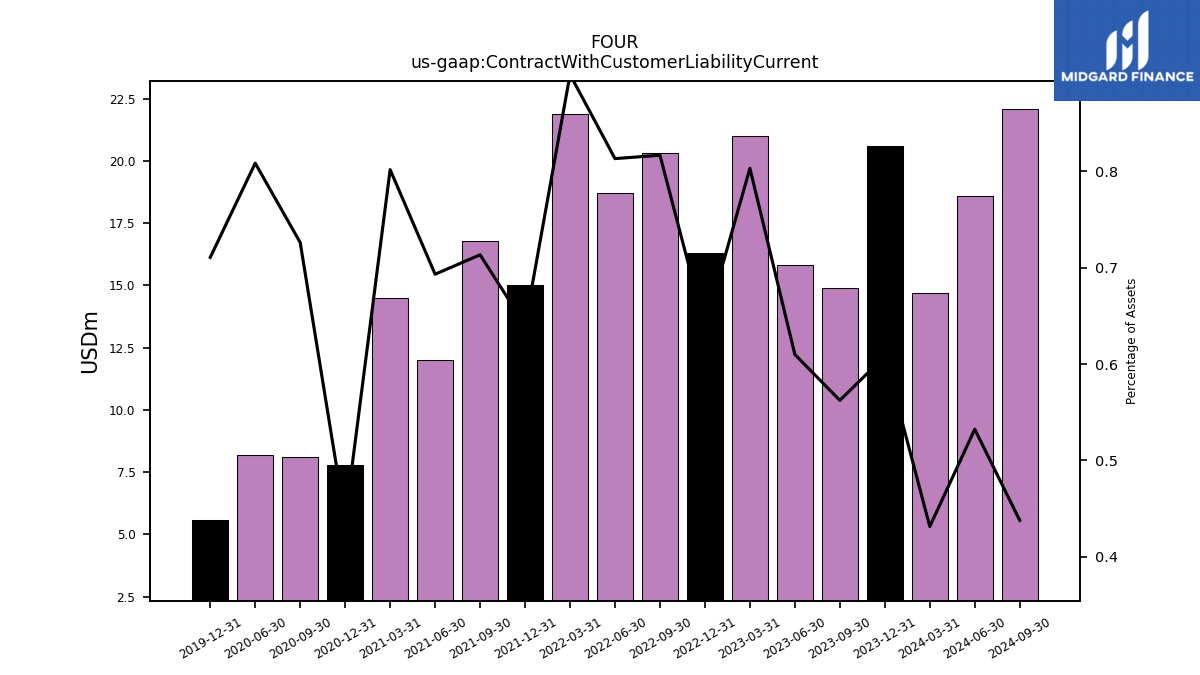
| Contract With Customer Liability Current | 14.70 | 20.60 | 14.90 | 15.80 | 21.00 | 16.30 | 20.30 | 18.70 | 21.90 | 15.00 | 16.80 | 12.00 | 14.50 | 7.80 | 8.10 | 8.20 | NA | 5.60 | NA | NA | NA | |
| Deposits | NA | 72.30 | NA | NA | NA | NA | NA | NA | NA | NA | NA | NA | NA | NA | NA | NA | NA | NA | NA | NA | NA |
| 2024-03-31 | 2023-12-31 | 2023-09-30 | 2023-06-30 | 2023-03-31 | 2022-12-31 | 2022-09-30 | 2022-06-30 | 2022-03-31 | 2021-12-31 | 2021-09-30 | 2021-06-30 | 2021-03-31 | 2020-12-31 | 2020-09-30 | 2020-06-30 | 2020-03-31 | 2019-12-31 | 2019-09-30 | 2019-06-30 | 2019-03-31 | ||
|---|---|---|---|---|---|---|---|---|---|---|---|---|---|---|---|---|---|---|---|---|---|---|
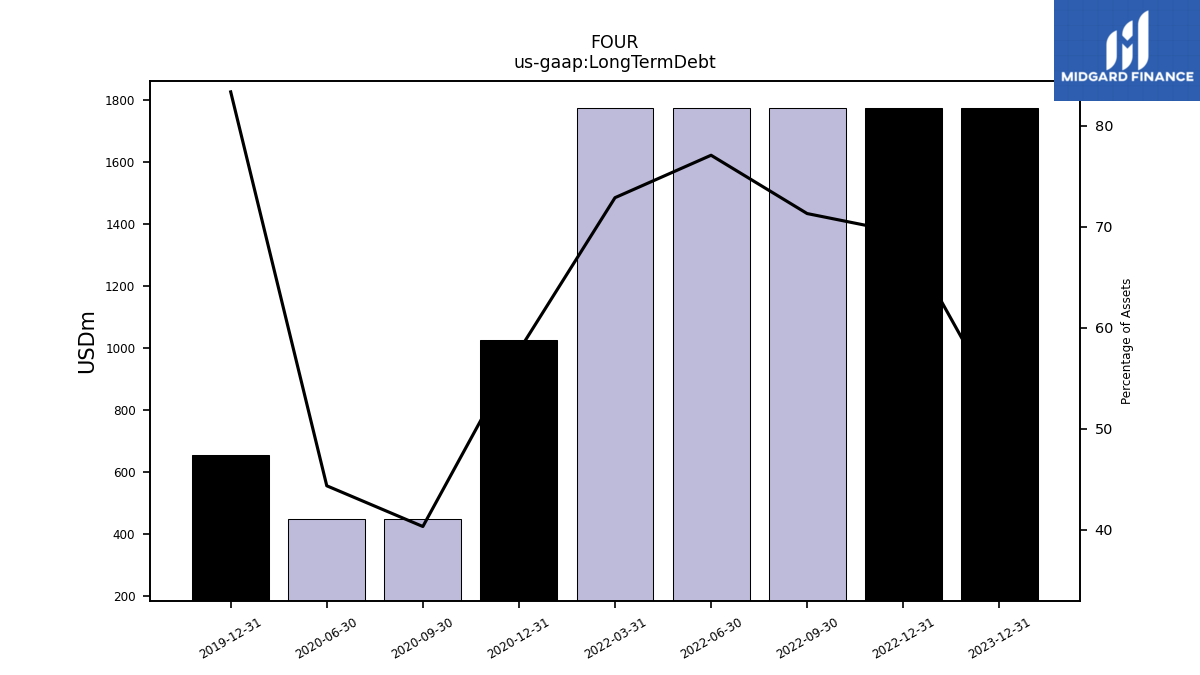
| Long Term Debt | NA | 1772.50 | NA | NA | NA | 1772.50 | 1772.50 | 1772.50 | 1772.50 | NA | NA | NA | NA | 1027.50 | 450.00 | 450.00 | NA | 656.80 | NA | NA | NA | |
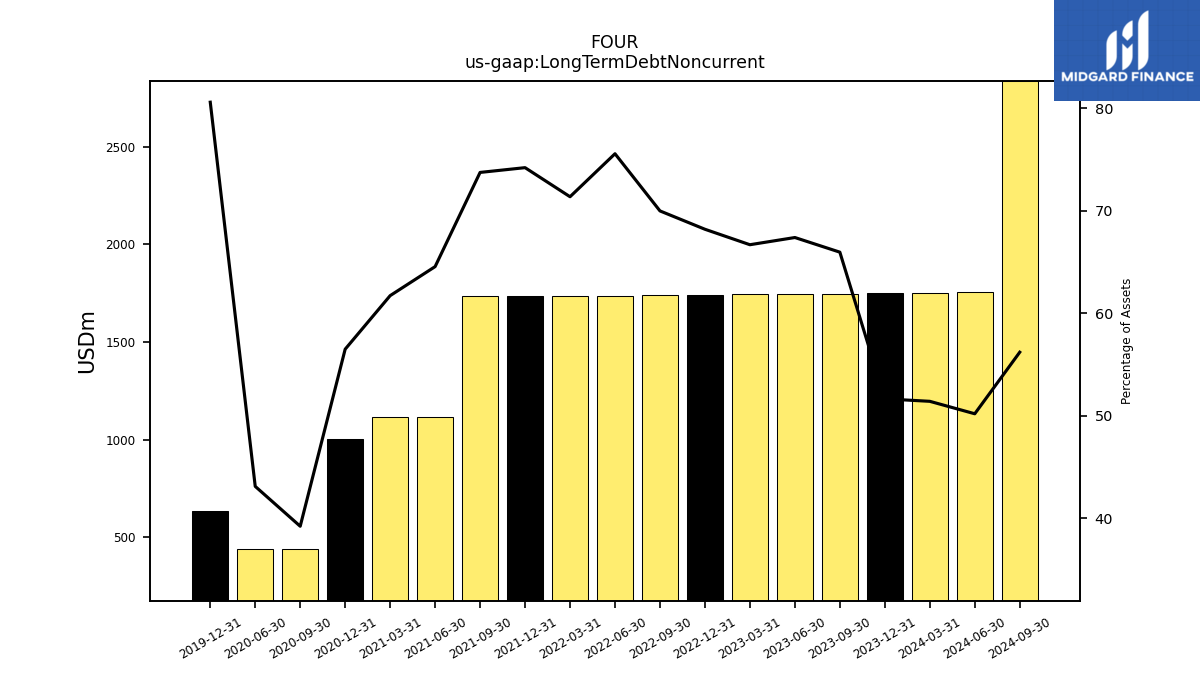
| Long Term Debt Noncurrent | 1752.30 | 1750.20 | 1748.10 | 1746.00 | 1744.00 | 1741.90 | 1739.80 | 1737.80 | 1735.90 | 1738.50 | 1736.80 | 1117.60 | 1116.40 | 1005.40 | 437.70 | 437.40 | NA | 635.10 | NA | NA | NA | |
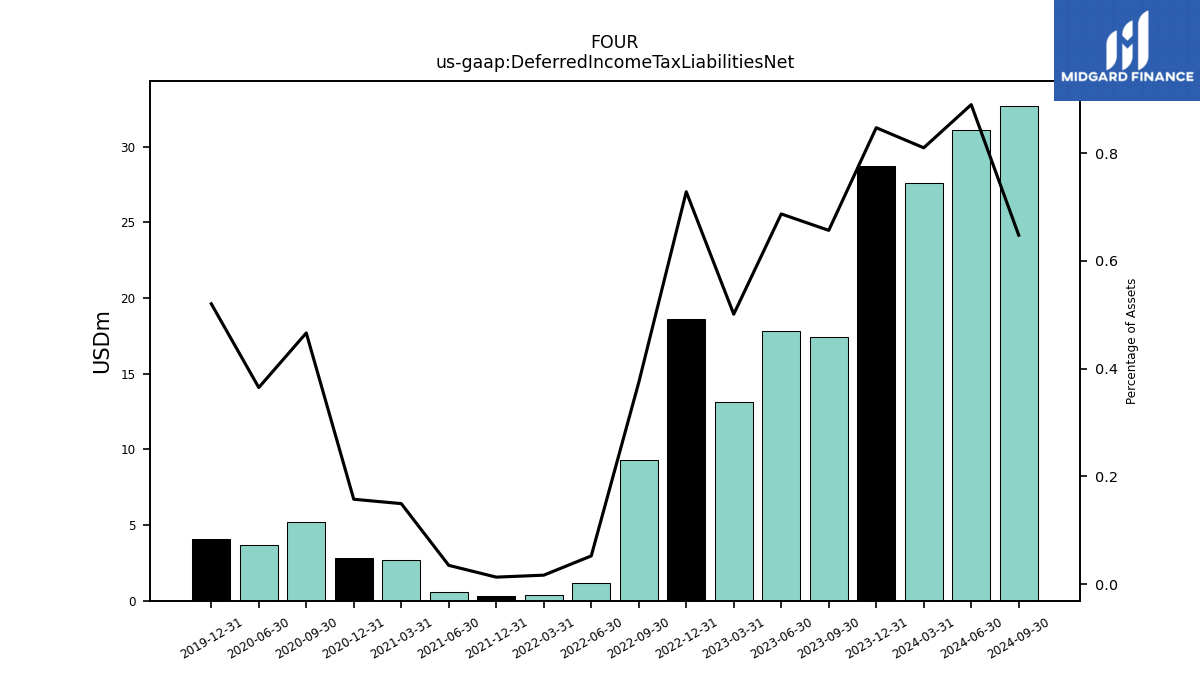
| Deferred Income Tax Liabilities Net | 27.60 | 28.70 | 17.40 | 17.80 | 13.10 | 18.60 | 9.30 | 1.20 | 0.40 | 0.30 | NA | 0.60 | 2.70 | 2.80 | 5.20 | 3.70 | NA | 4.10 | NA | NA | NA | |
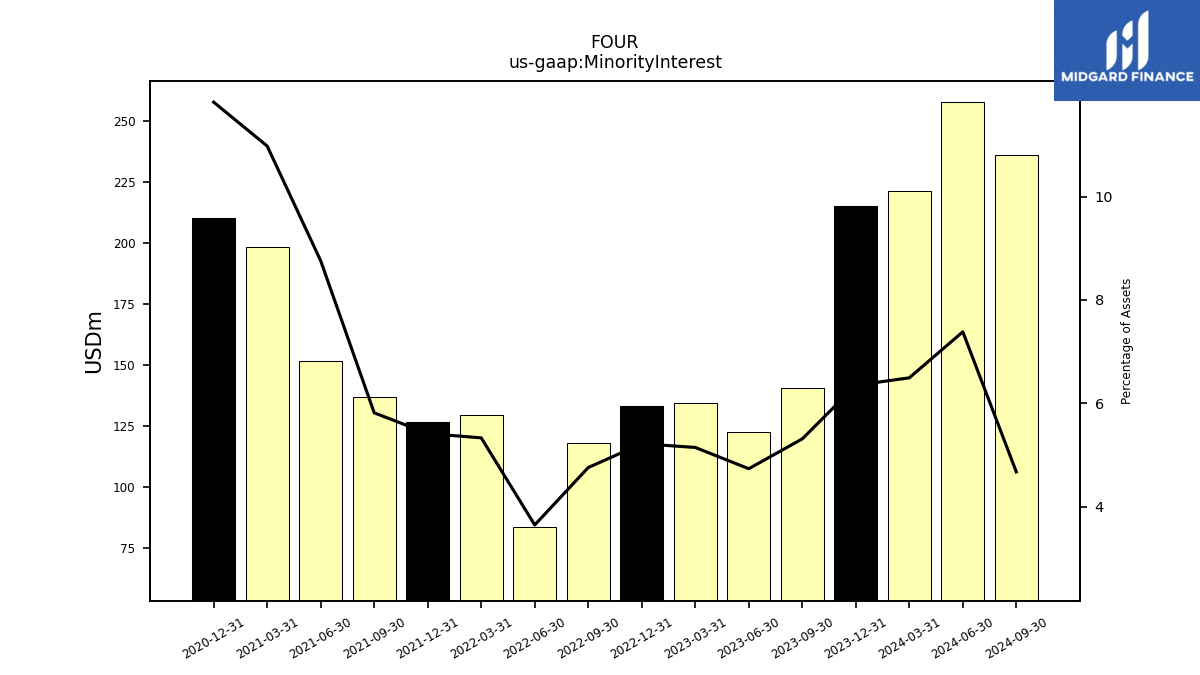
| Minority Interest | 221.30 | 215.10 | 140.80 | 122.70 | 134.60 | 133.30 | 118.30 | 83.90 | 129.70 | 126.90 | 137.00 | 151.60 | 198.50 | 210.40 | NA | NA | NA | NA | NA | NA | NA | |
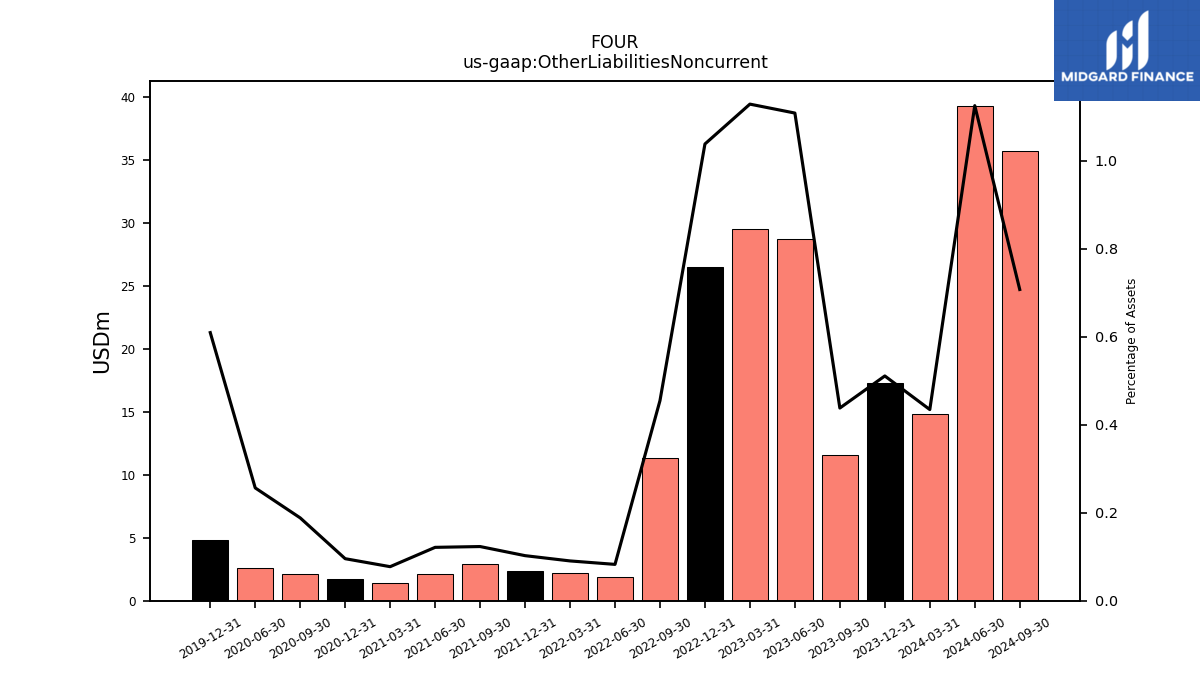
| Other Liabilities Noncurrent | 14.80 | 17.30 | 11.60 | 28.70 | 29.50 | 26.50 | 11.30 | 1.90 | 2.20 | 2.40 | 2.90 | 2.10 | 1.40 | 1.70 | 2.10 | 2.60 | NA | 4.80 | NA | NA | NA | |
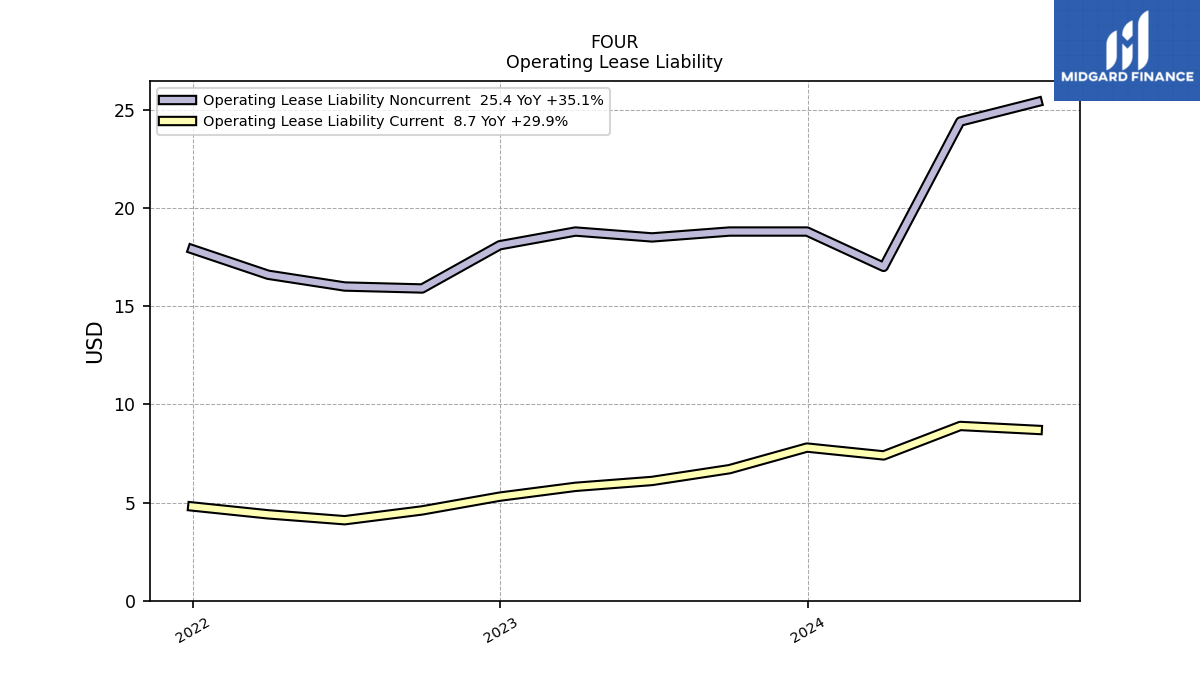
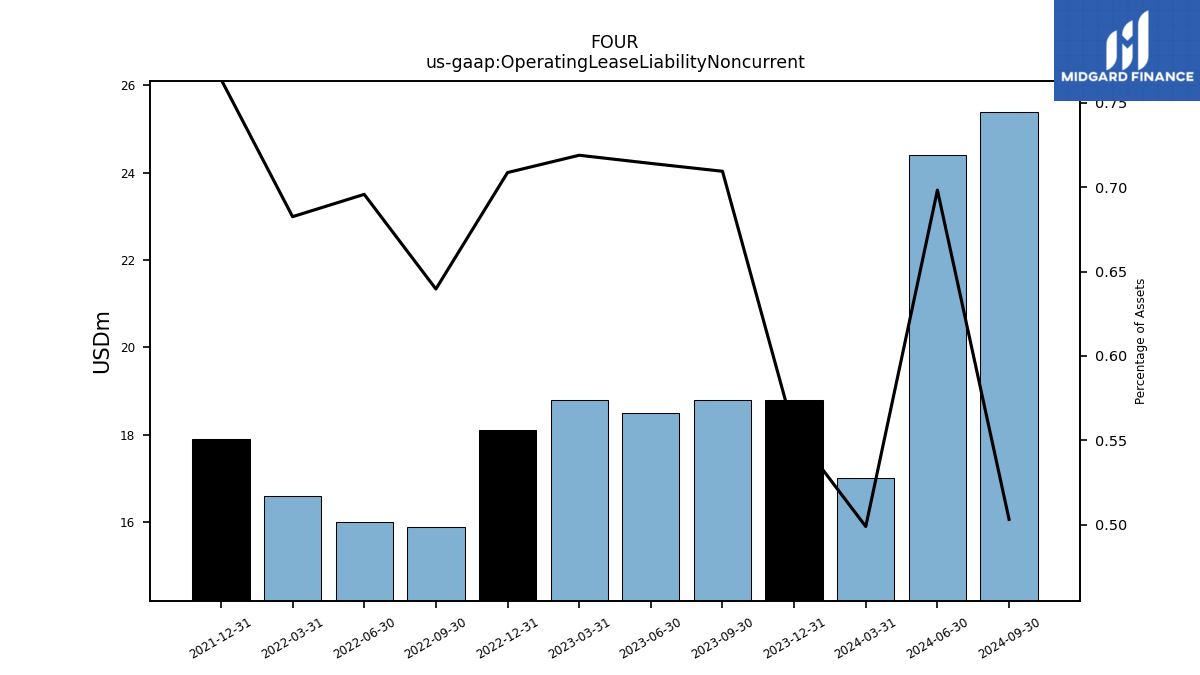
| Operating Lease Liability Noncurrent | 17.00 | 18.80 | 18.80 | 18.50 | 18.80 | 18.10 | 15.90 | 16.00 | 16.60 | 17.90 | NA | NA | NA | NA | NA | NA | NA | NA | NA | NA | NA |
| 2024-03-31 | 2023-12-31 | 2023-09-30 | 2023-06-30 | 2023-03-31 | 2022-12-31 | 2022-09-30 | 2022-06-30 | 2022-03-31 | 2021-12-31 | 2021-09-30 | 2021-06-30 | 2021-03-31 | 2020-12-31 | 2020-09-30 | 2020-06-30 | 2020-03-31 | 2019-12-31 | 2019-09-30 | 2019-06-30 | 2019-03-31 | ||
|---|---|---|---|---|---|---|---|---|---|---|---|---|---|---|---|---|---|---|---|---|---|---|
| Stockholders Equity | 674.50 | 653.30 | 400.20 | 356.50 | 391.80 | 347.30 | 302.50 | 183.50 | 288.50 | 272.80 | 298.40 | 294.60 | 350.60 | 459.60 | 310.00 | 260.10 | -39.30 | -28.90 | NA | NA | NA | |
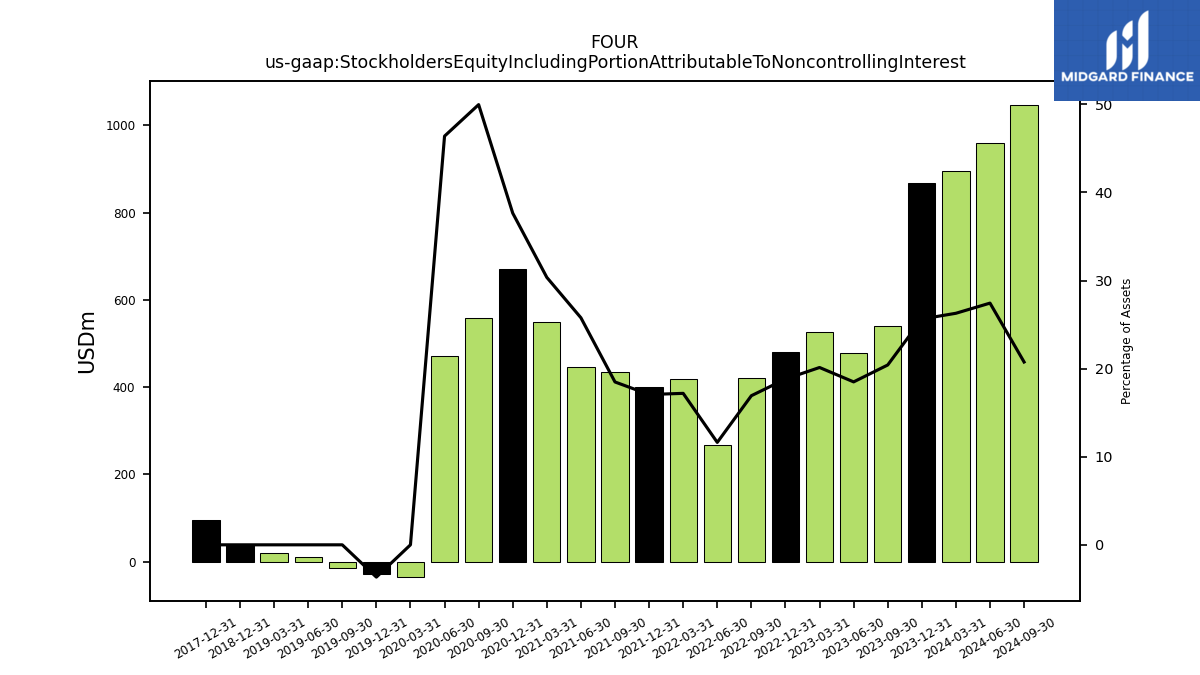
| Stockholders Equity Including Portion Attributable To Noncontrolling Interest | 895.80 | 868.40 | 541.00 | 479.20 | 526.40 | 480.60 | 420.80 | 267.40 | 418.20 | 399.70 | 435.40 | 446.20 | 549.10 | 670.00 | 557.50 | 470.60 | -35.40 | -28.90 | -13.90 | 10.10 | 19.70 | |
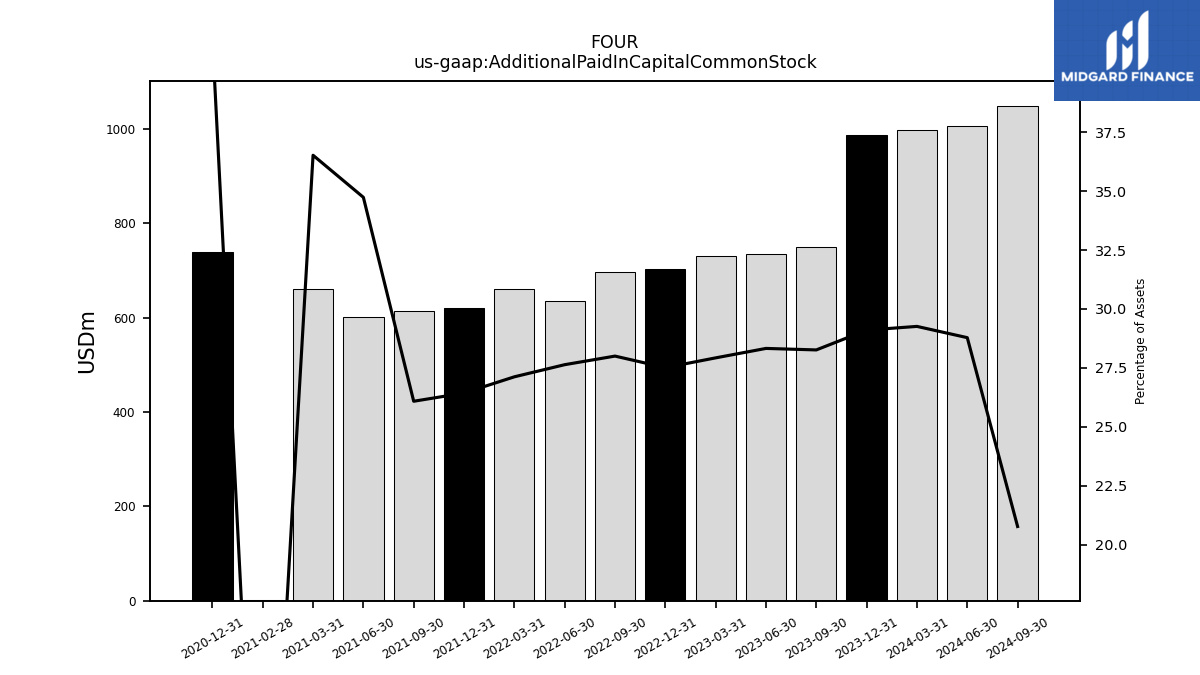
| Additional Paid In Capital Common Stock | 997.10 | 985.90 | 748.90 | 733.80 | 730.20 | 702.60 | 696.00 | 635.50 | 659.60 | 619.20 | 614.30 | 601.30 | 660.50 | 738.30 | NA | NA | NA | NA | NA | NA | NA | |
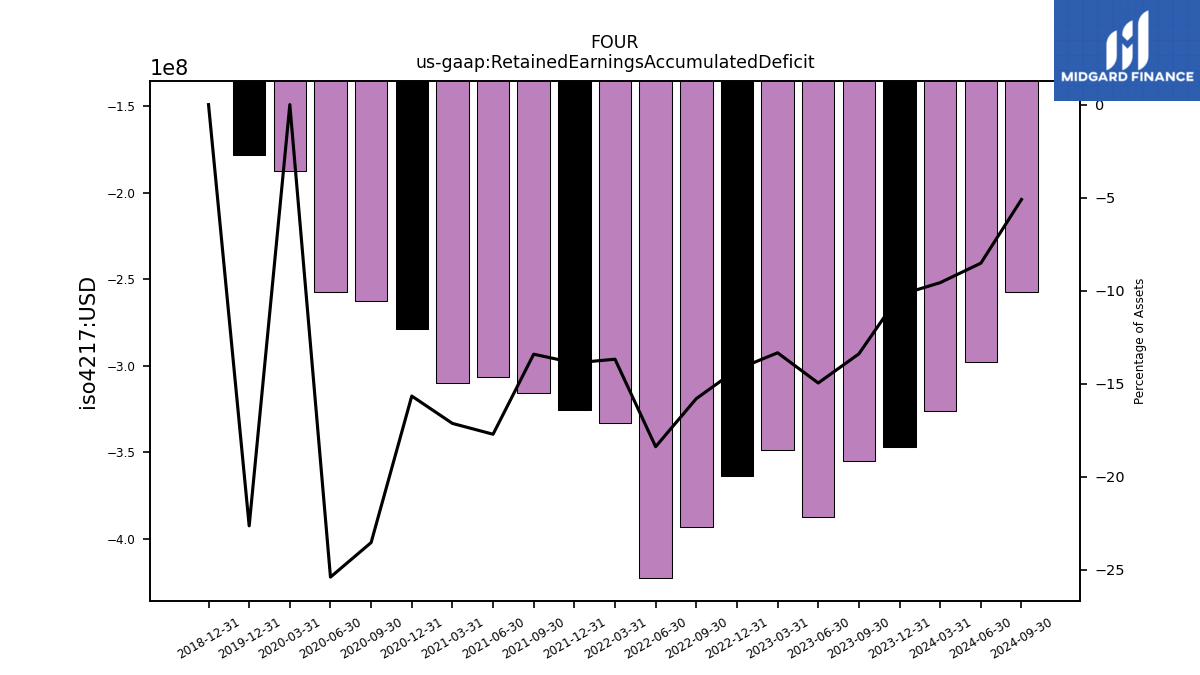
| Retained Earnings Accumulated Deficit | -326.10 | -346.70 | -355.00 | -387.60 | -348.80 | -363.60 | -392.80 | -422.80 | -332.80 | -325.30 | -315.90 | -306.70 | -309.90 | -278.70 | -262.60 | -257.60 | -187.50 | -178.40 | NA | NA | NA | |
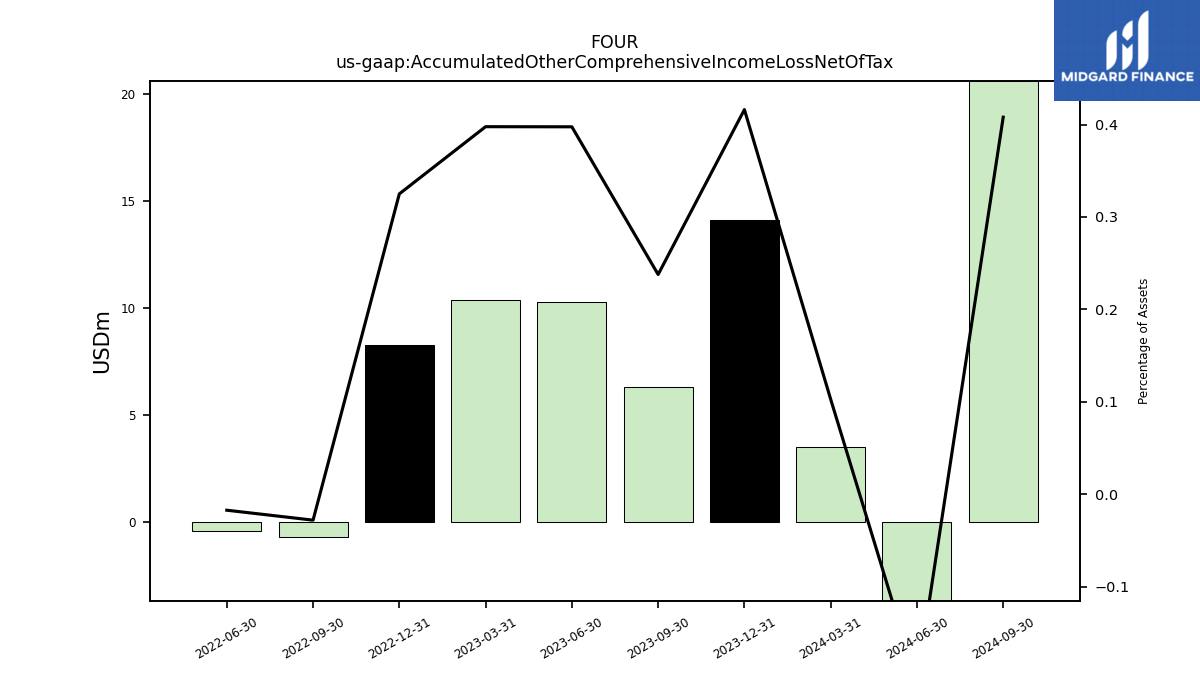
| Accumulated Other Comprehensive Income Loss Net Of Tax | 3.50 | 14.10 | 6.30 | 10.30 | 10.40 | 8.30 | -0.70 | -0.40 | NA | NA | NA | NA | NA | NA | NA | NA | NA | NA | NA | NA | NA | |
| Minority Interest | 221.30 | 215.10 | 140.80 | 122.70 | 134.60 | 133.30 | 118.30 | 83.90 | 129.70 | 126.90 | 137.00 | 151.60 | 198.50 | 210.40 | NA | NA | NA | NA | NA | NA | NA | |
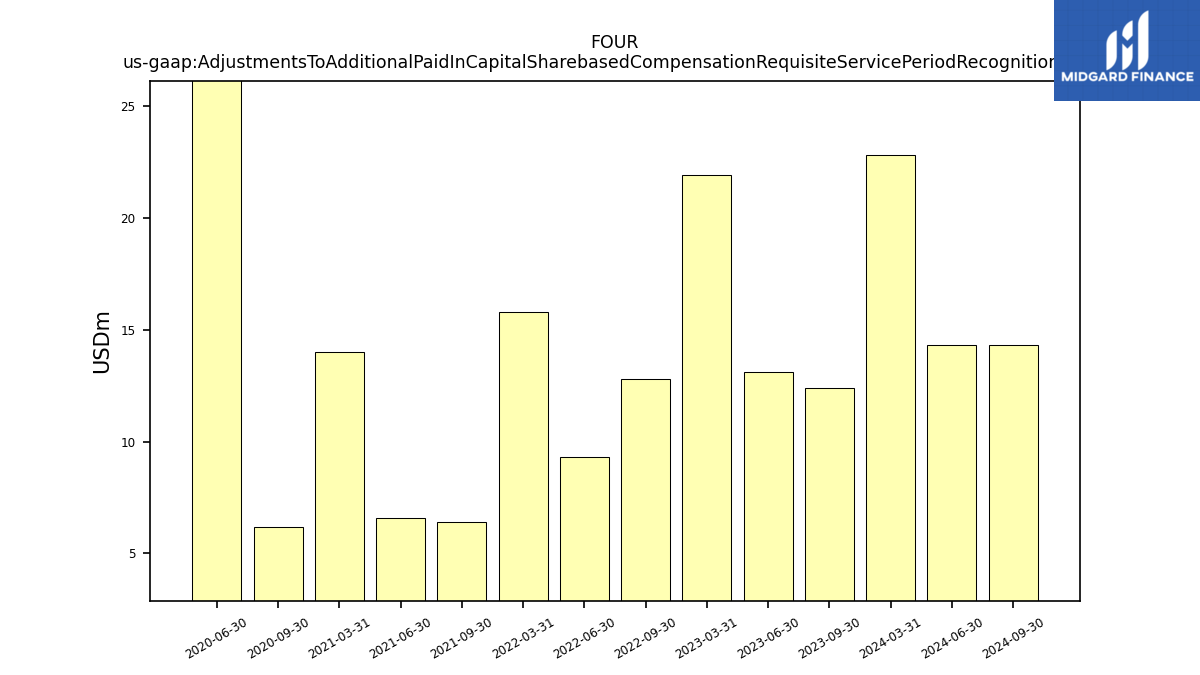
| Adjustments To Additional Paid In Capital Sharebased Compensation Requisite Service Period Recognition Value | 22.80 | NA | 12.40 | 13.10 | 21.90 | NA | 12.80 | 9.30 | 15.80 | NA | 6.40 | 6.60 | 14.00 | NA | 6.20 | 50.00 | NA | NA | NA | NA | NA | |
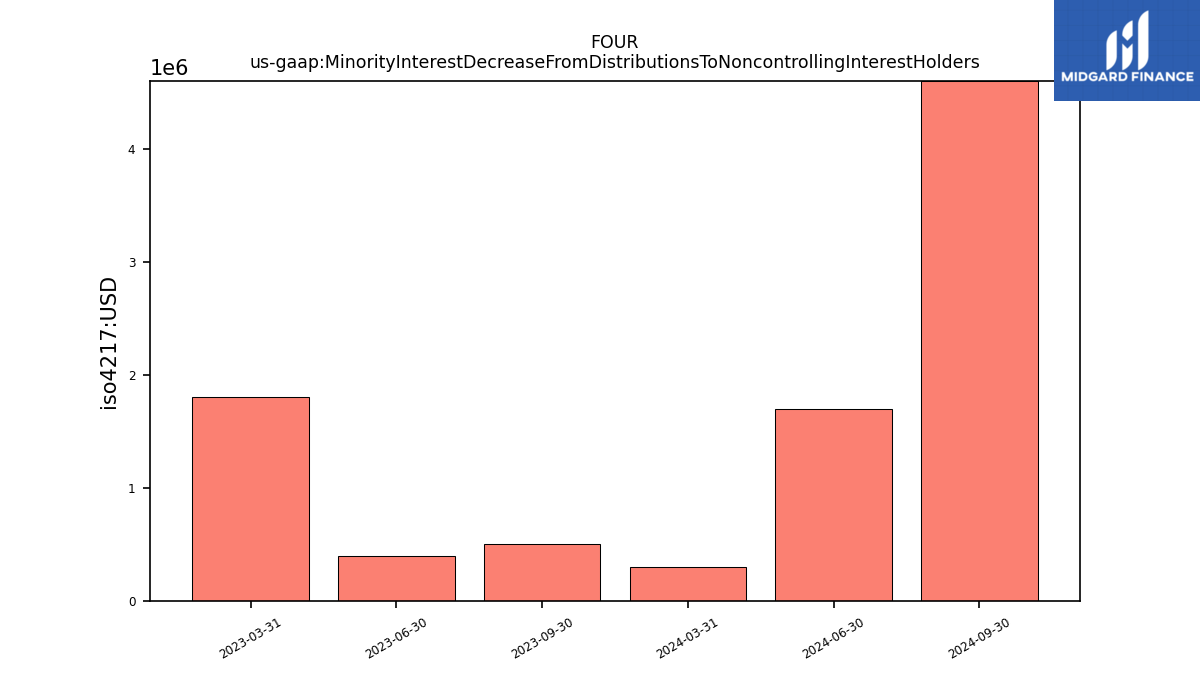
| Minority Interest Decrease From Distributions To Noncontrolling Interest Holders | 0.30 | NA | 0.50 | 0.40 | 1.80 | NA | NA | NA | NA | NA | NA | NA | NA | NA | NA | NA | NA | NA | NA | NA | NA |
| 2024-03-31 | 2023-12-31 | 2023-09-30 | 2023-06-30 | 2023-03-31 | 2022-12-31 | 2022-09-30 | 2022-06-30 | 2022-03-31 | 2021-12-31 | 2021-09-30 | 2021-06-30 | 2021-03-31 | 2020-12-31 | 2020-09-30 | 2020-06-30 | 2020-03-31 | 2019-12-31 | 2019-09-30 | 2019-06-30 | 2019-03-31 | ||
|---|---|---|---|---|---|---|---|---|---|---|---|---|---|---|---|---|---|---|---|---|---|---|
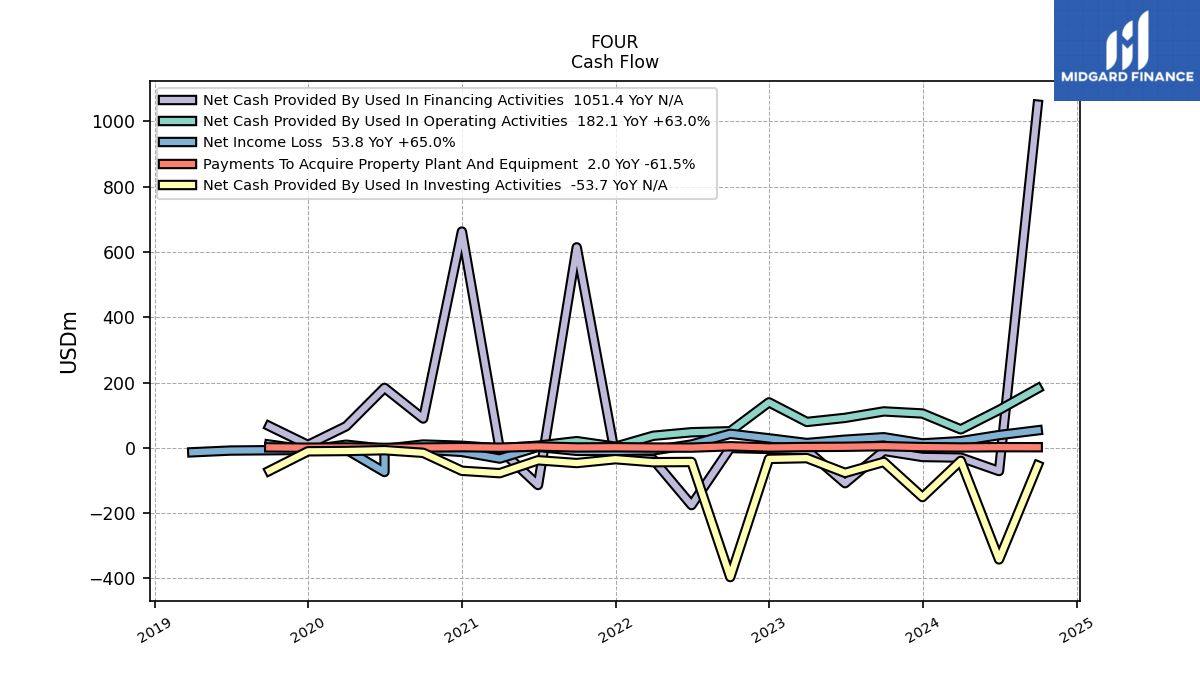
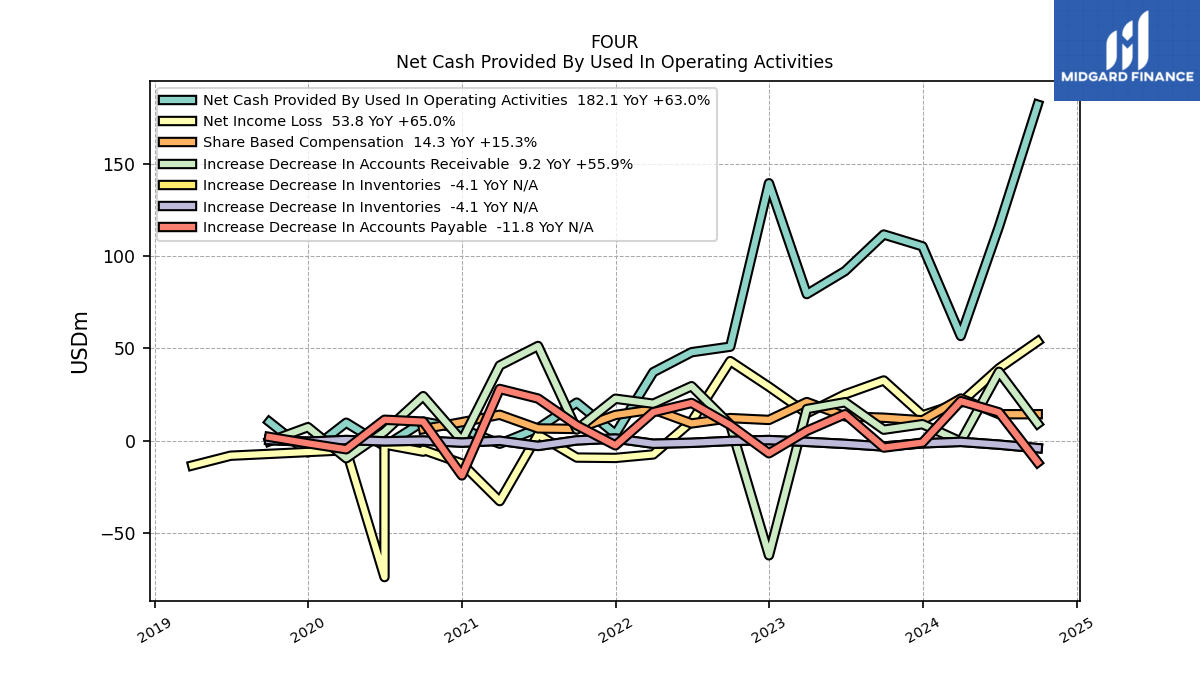
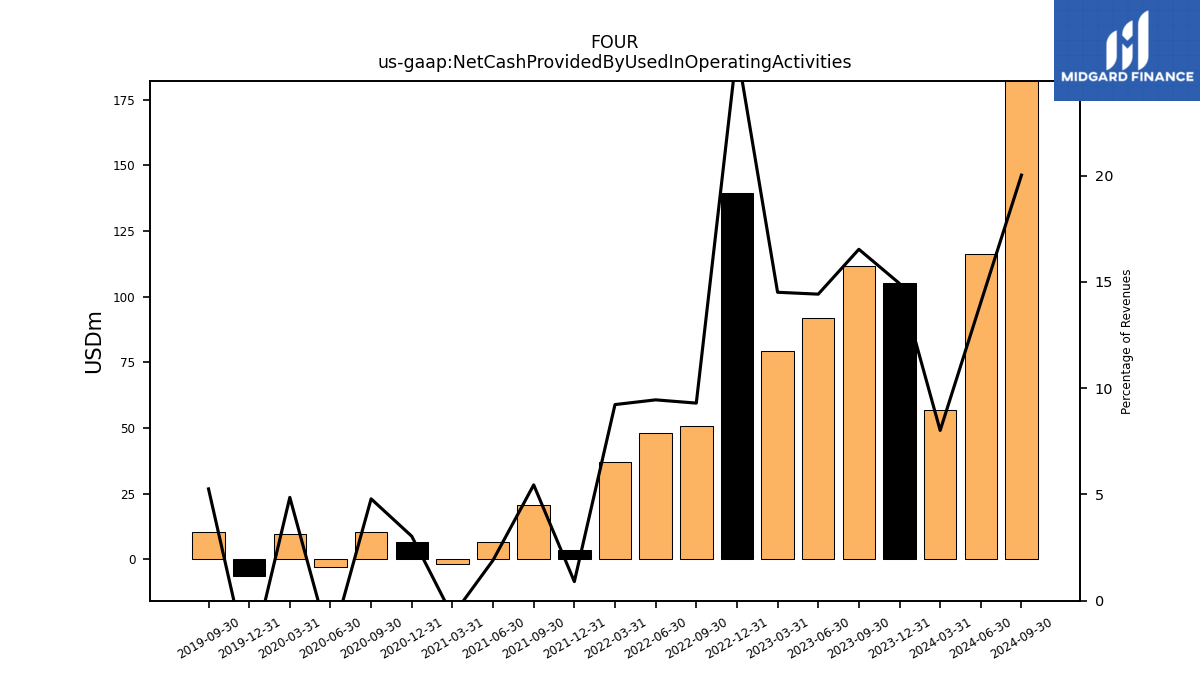
| Net Cash Provided By Used In Operating Activities | 56.70 | 105.30 | 111.70 | 91.90 | 79.40 | 139.50 | 50.90 | 47.90 | 37.10 | 3.60 | 20.60 | 6.70 | -1.70 | 6.40 | 10.30 | -3.00 | 9.70 | -6.40 | 10.20 | NA | NA | |
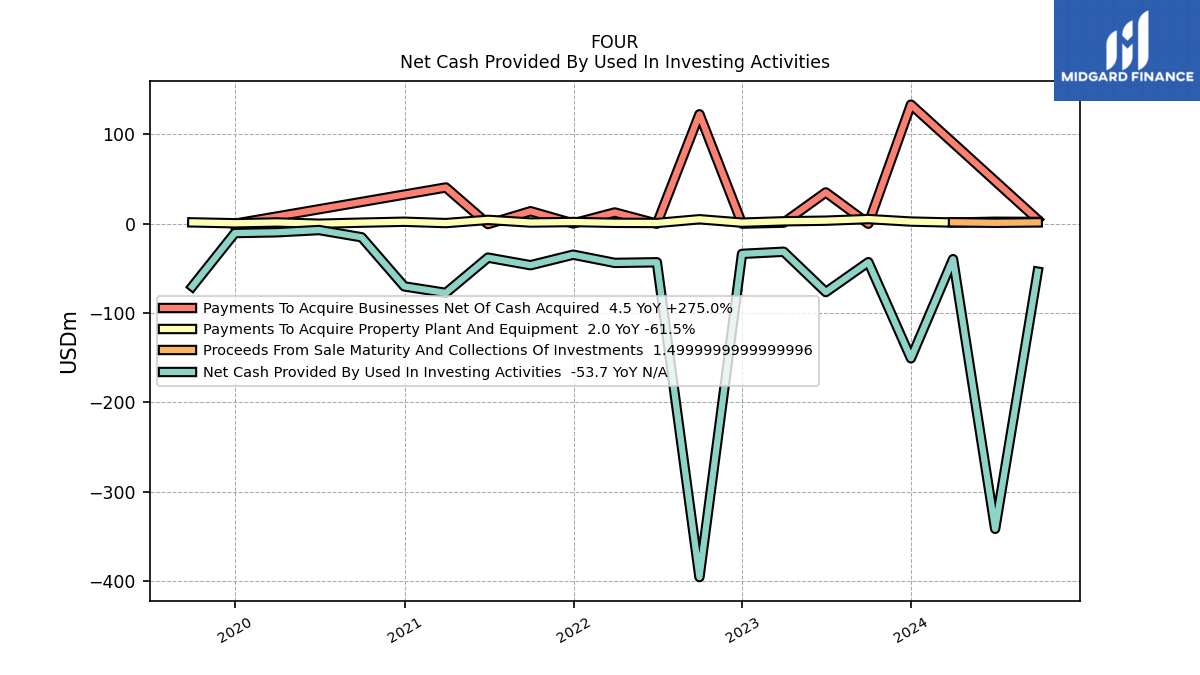
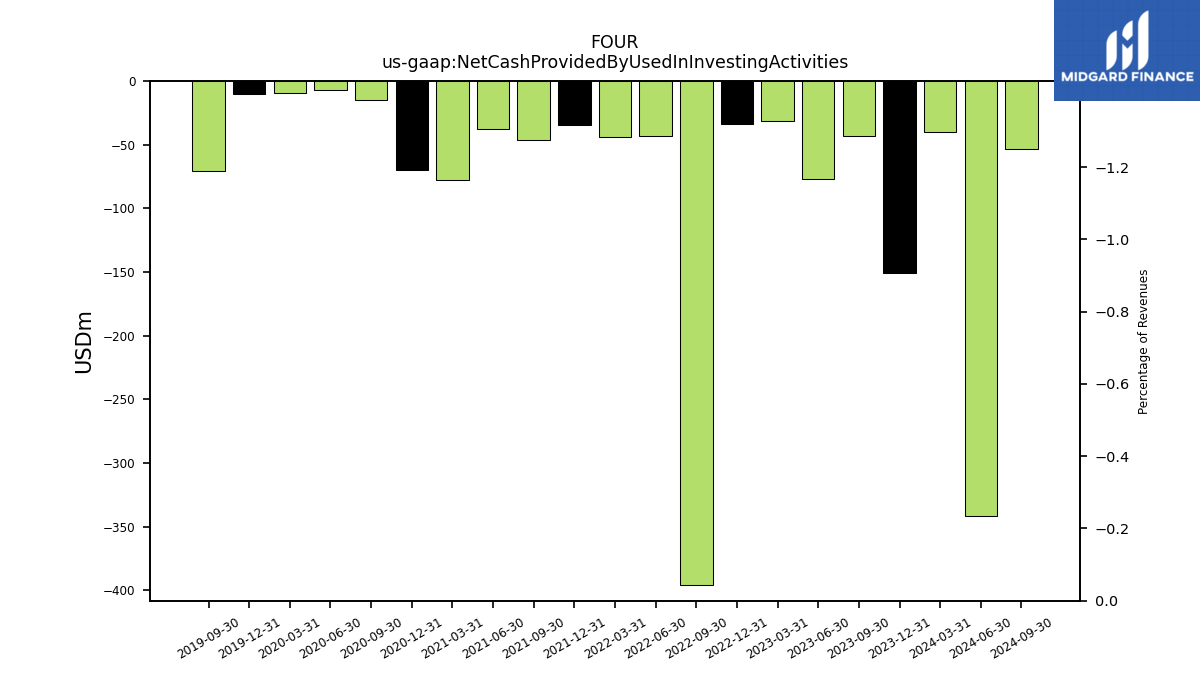
| Net Cash Provided By Used In Investing Activities | -39.70 | -150.80 | -43.10 | -76.60 | -31.40 | -33.80 | -395.90 | -43.20 | -43.90 | -34.70 | -46.50 | -38.00 | -77.50 | -70.20 | -15.20 | -7.10 | -9.60 | -10.50 | -70.40 | NA | NA | |
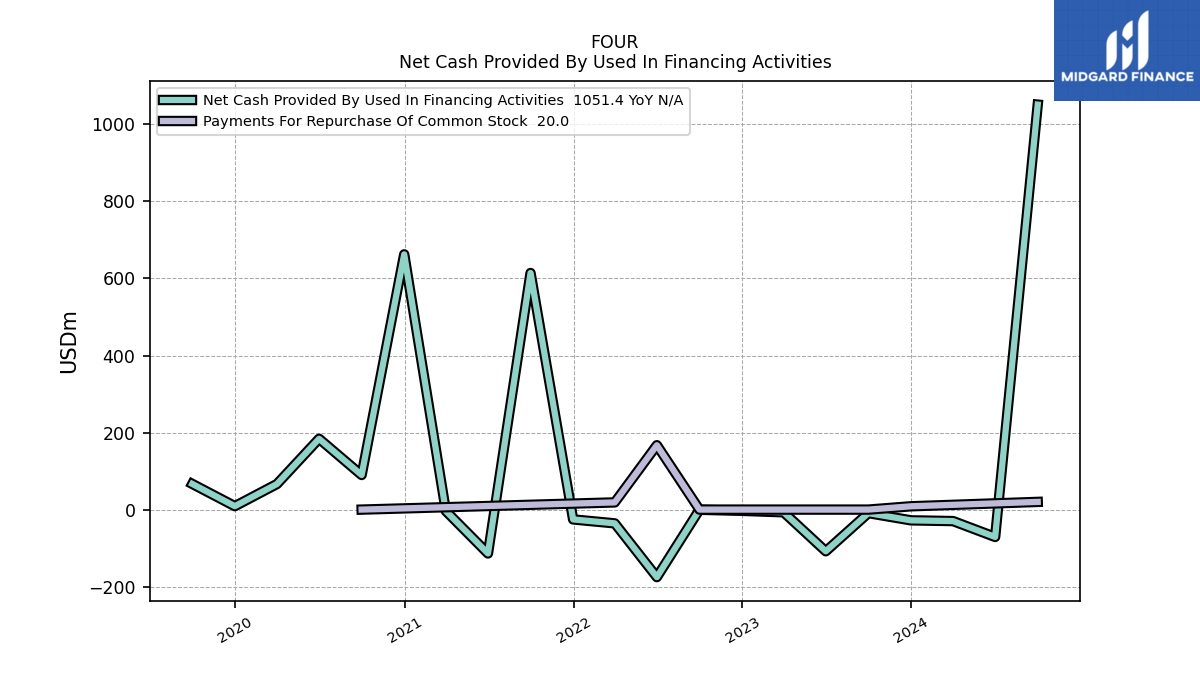
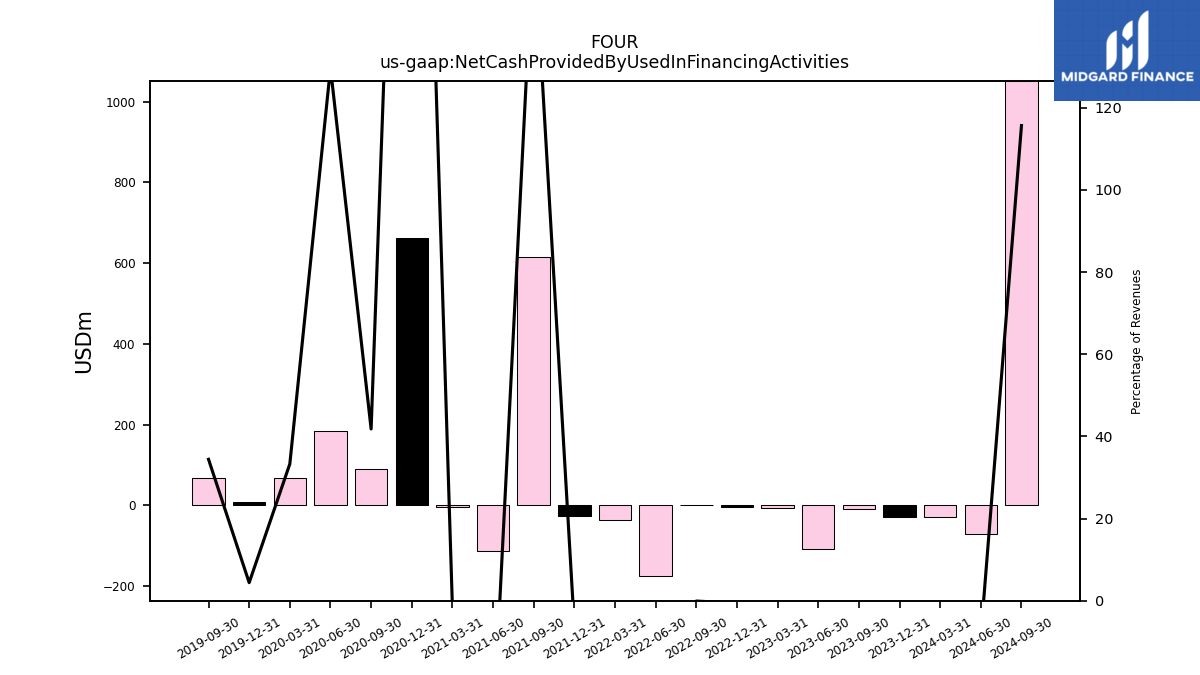
| Net Cash Provided By Used In Financing Activities | -29.80 | -27.90 | -9.10 | -108.20 | -7.00 | -3.20 | -0.40 | -175.30 | -35.70 | -25.50 | 614.30 | -113.90 | -3.70 | 662.70 | 89.80 | 183.90 | 66.40 | 8.90 | 66.70 | NA | NA |
| 2024-03-31 | 2023-12-31 | 2023-09-30 | 2023-06-30 | 2023-03-31 | 2022-12-31 | 2022-09-30 | 2022-06-30 | 2022-03-31 | 2021-12-31 | 2021-09-30 | 2021-06-30 | 2021-03-31 | 2020-12-31 | 2020-09-30 | 2020-06-30 | 2020-03-31 | 2019-12-31 | 2019-09-30 | 2019-06-30 | 2019-03-31 | ||
|---|---|---|---|---|---|---|---|---|---|---|---|---|---|---|---|---|---|---|---|---|---|---|
| Net Cash Provided By Used In Operating Activities | 56.70 | 105.30 | 111.70 | 91.90 | 79.40 | 139.50 | 50.90 | 47.90 | 37.10 | 3.60 | 20.60 | 6.70 | -1.70 | 6.40 | 10.30 | -3.00 | 9.70 | -6.40 | 10.20 | NA | NA | |
| Net Income Loss | 20.60 | 13.70 | 32.60 | 25.10 | 14.80 | 29.20 | 43.10 | 10.30 | -7.50 | -9.40 | -9.20 | 3.20 | -32.80 | -12.40 | -5.00 | -74.00 | -5.20 | NA | NA | -8.20 | -13.50 | |
| Profit Loss | 28.50 | 19.20 | 46.50 | 36.80 | 20.40 | 38.50 | 46.40 | 15.00 | -13.20 | -13.70 | -13.80 | 4.50 | -51.00 | -21.70 | -9.90 | -75.00 | -5.20 | -13.40 | -22.60 | -8.20 | -13.50 | |
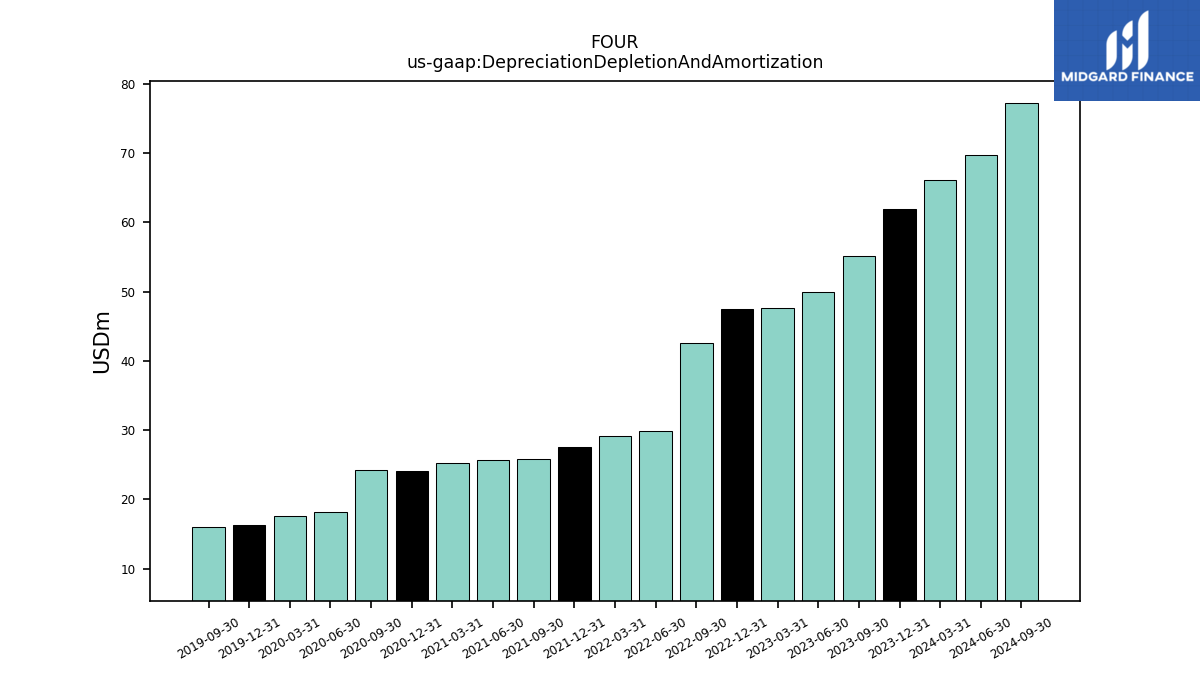
| Depreciation Depletion And Amortization | 66.10 | 61.90 | 55.10 | 50.00 | 47.60 | 47.50 | 42.60 | 29.90 | 29.10 | 27.60 | 25.80 | 25.70 | 25.30 | 24.10 | 24.30 | 18.20 | 17.60 | 16.30 | 16.10 | NA | NA | |
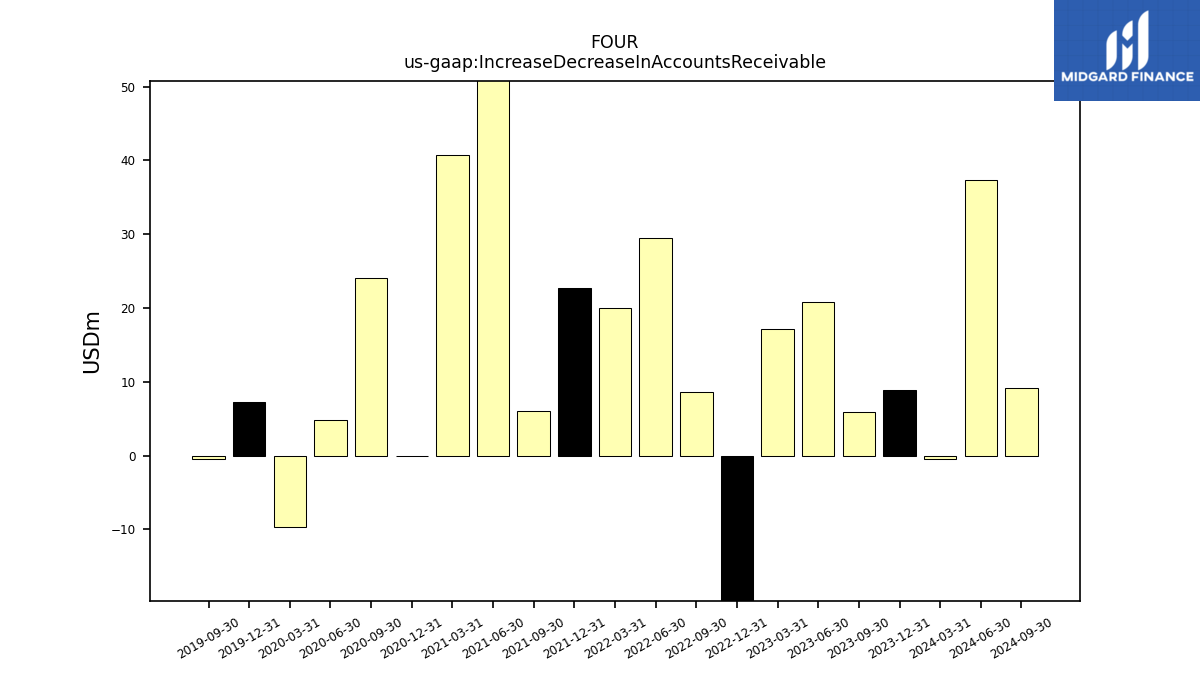
| Increase Decrease In Accounts Receivable | -0.50 | 8.90 | 5.90 | 20.80 | 17.10 | -62.20 | 8.60 | 29.50 | 20.00 | 22.70 | 6.00 | 51.30 | 40.70 | 0.00 | 24.10 | 4.80 | -9.60 | 7.30 | -0.40 | NA | NA | |
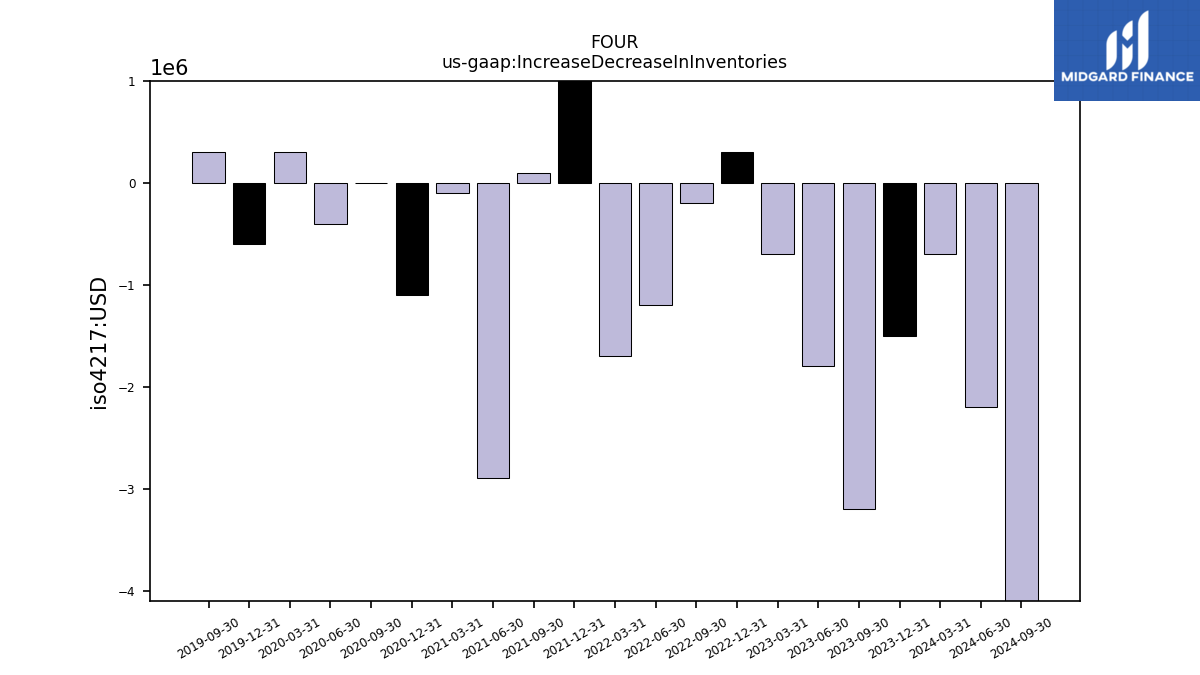
| Increase Decrease In Inventories | -0.70 | -1.50 | -3.20 | -1.80 | -0.70 | 0.30 | -0.20 | -1.20 | -1.70 | 1.10 | 0.10 | -2.90 | -0.10 | -1.10 | 0.00 | -0.40 | 0.30 | -0.60 | 0.30 | NA | NA | |
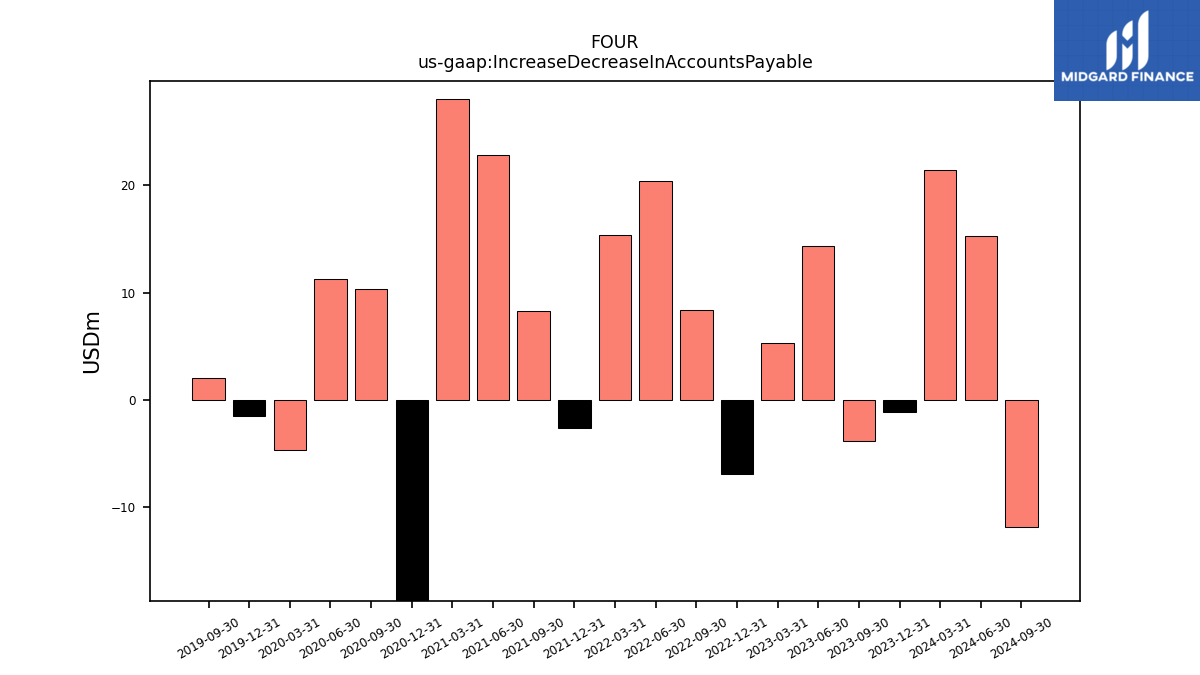
| Increase Decrease In Accounts Payable | 21.40 | -1.10 | -3.80 | 14.30 | 5.30 | -6.90 | 8.40 | 20.40 | 15.40 | -2.60 | 8.30 | 22.80 | 28.00 | -18.90 | 10.30 | 11.30 | -4.70 | -1.50 | 2.00 | NA | NA | |
| Share Based Compensation | 22.80 | 11.00 | 12.40 | 13.10 | 20.90 | 11.20 | 12.20 | 9.30 | 16.90 | 13.90 | 6.30 | 6.60 | 14.00 | 10.00 | 6.20 | NA | NA | NA | NA | NA | NA | |
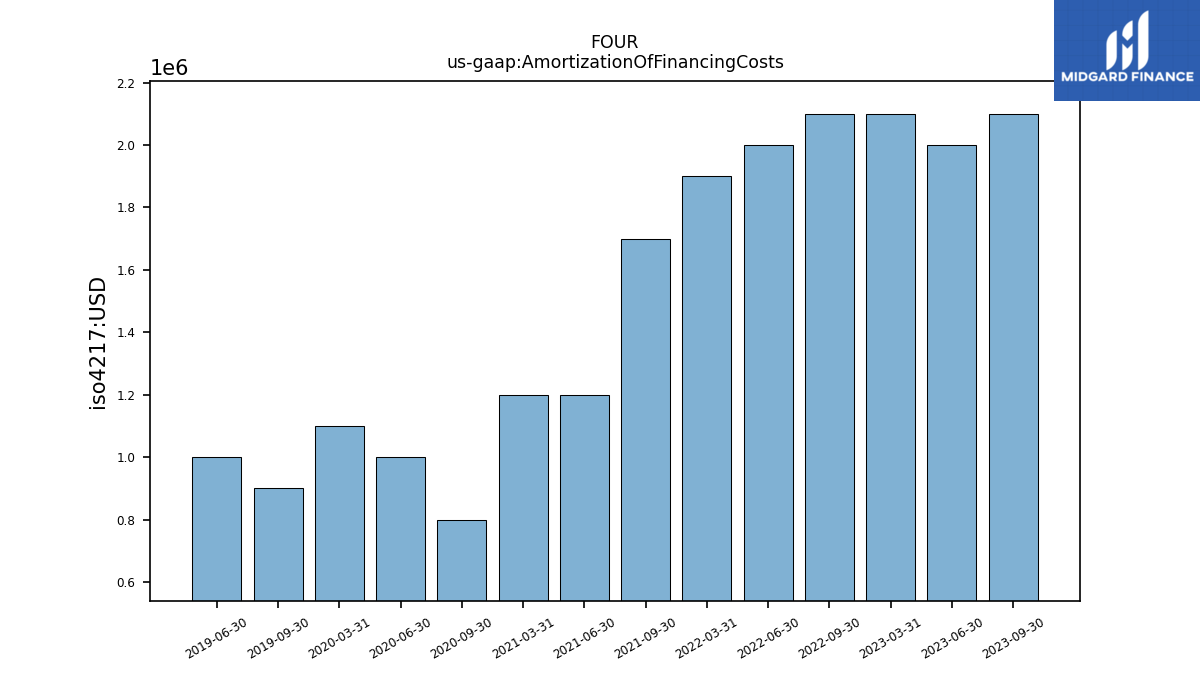
| Amortization Of Financing Costs | 2.10 | 2.10 | 2.10 | 2.00 | 2.10 | 2.10 | 2.10 | 2.00 | 1.90 | 1.80 | 1.70 | 1.20 | 1.20 | NA | 0.80 | 1.00 | 1.10 | NA | 0.90 | 1.00 | NA |
| 2024-03-31 | 2023-12-31 | 2023-09-30 | 2023-06-30 | 2023-03-31 | 2022-12-31 | 2022-09-30 | 2022-06-30 | 2022-03-31 | 2021-12-31 | 2021-09-30 | 2021-06-30 | 2021-03-31 | 2020-12-31 | 2020-09-30 | 2020-06-30 | 2020-03-31 | 2019-12-31 | 2019-09-30 | 2019-06-30 | 2019-03-31 | ||
|---|---|---|---|---|---|---|---|---|---|---|---|---|---|---|---|---|---|---|---|---|---|---|
| Net Cash Provided By Used In Investing Activities | -39.70 | -150.80 | -43.10 | -76.60 | -31.40 | -33.80 | -395.90 | -43.20 | -43.90 | -34.70 | -46.50 | -38.00 | -77.50 | -70.20 | -15.20 | -7.10 | -9.60 | -10.50 | -70.40 | NA | NA | |
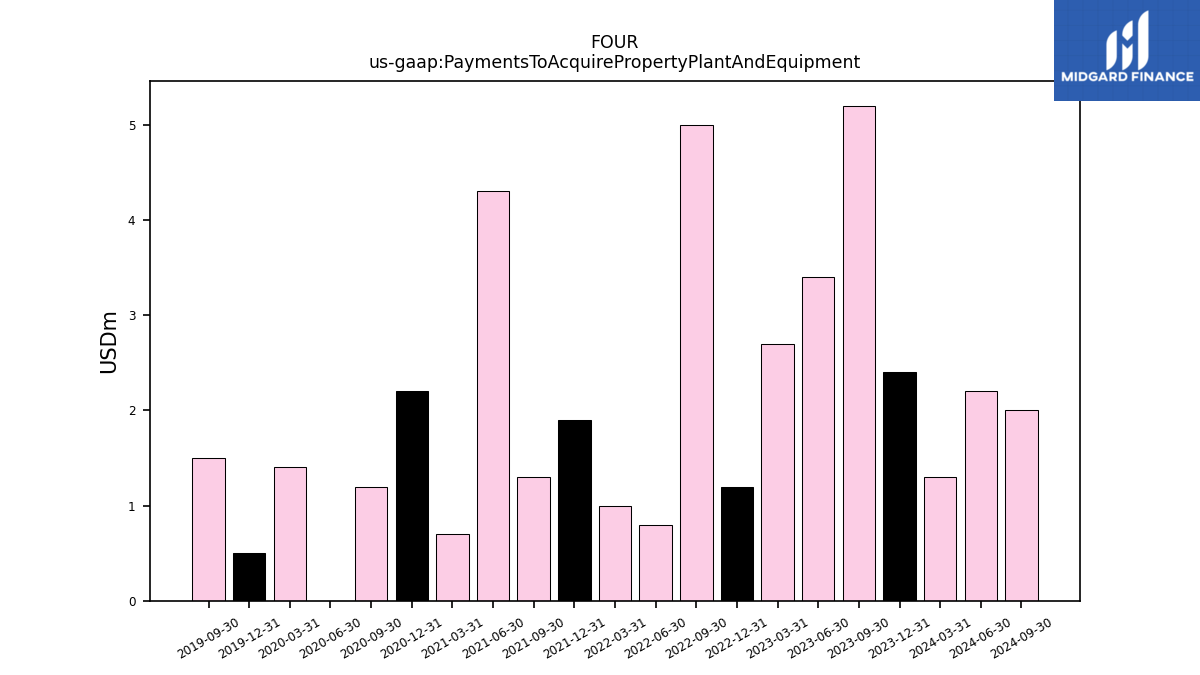
| Payments To Acquire Property Plant And Equipment | 1.30 | 2.40 | 5.20 | 3.40 | 2.70 | 1.20 | 5.00 | 0.80 | 1.00 | 1.90 | 1.30 | 4.30 | 0.70 | 2.20 | 1.20 | 0.00 | 1.40 | 0.50 | 1.50 | NA | NA |
| 2024-03-31 | 2023-12-31 | 2023-09-30 | 2023-06-30 | 2023-03-31 | 2022-12-31 | 2022-09-30 | 2022-06-30 | 2022-03-31 | 2021-12-31 | 2021-09-30 | 2021-06-30 | 2021-03-31 | 2020-12-31 | 2020-09-30 | 2020-06-30 | 2020-03-31 | 2019-12-31 | 2019-09-30 | 2019-06-30 | 2019-03-31 | ||
|---|---|---|---|---|---|---|---|---|---|---|---|---|---|---|---|---|---|---|---|---|---|---|
| Net Cash Provided By Used In Financing Activities | -29.80 | -27.90 | -9.10 | -108.20 | -7.00 | -3.20 | -0.40 | -175.30 | -35.70 | -25.50 | 614.30 | -113.90 | -3.70 | 662.70 | 89.80 | 183.90 | 66.40 | 8.90 | 66.70 | NA | NA | |
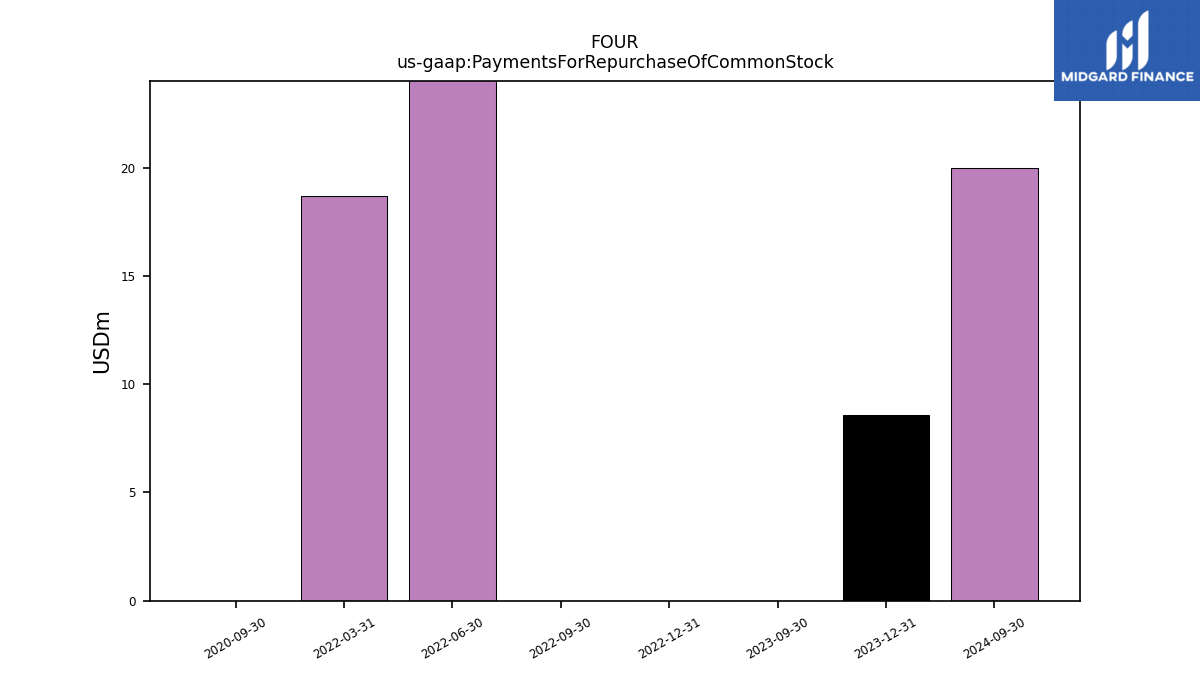
| Payments For Repurchase Of Common Stock | NA | 8.60 | 0.00 | NA | NA | 0.00 | 0.00 | 167.20 | 18.70 | NA | NA | NA | NA | NA | 0.00 | NA | NA | NA | NA | NA | NA |
| 2024-03-31 | 2023-12-31 | 2023-09-30 | 2023-06-30 | 2023-03-31 | 2022-12-31 | 2022-09-30 | 2022-06-30 | 2022-03-31 | 2021-12-31 | 2021-09-30 | 2021-06-30 | 2021-03-31 | 2020-12-31 | 2020-09-30 | 2020-06-30 | 2020-03-31 | 2019-12-31 | 2019-09-30 | 2019-06-30 | 2019-03-31 | ||
|---|---|---|---|---|---|---|---|---|---|---|---|---|---|---|---|---|---|---|---|---|---|---|
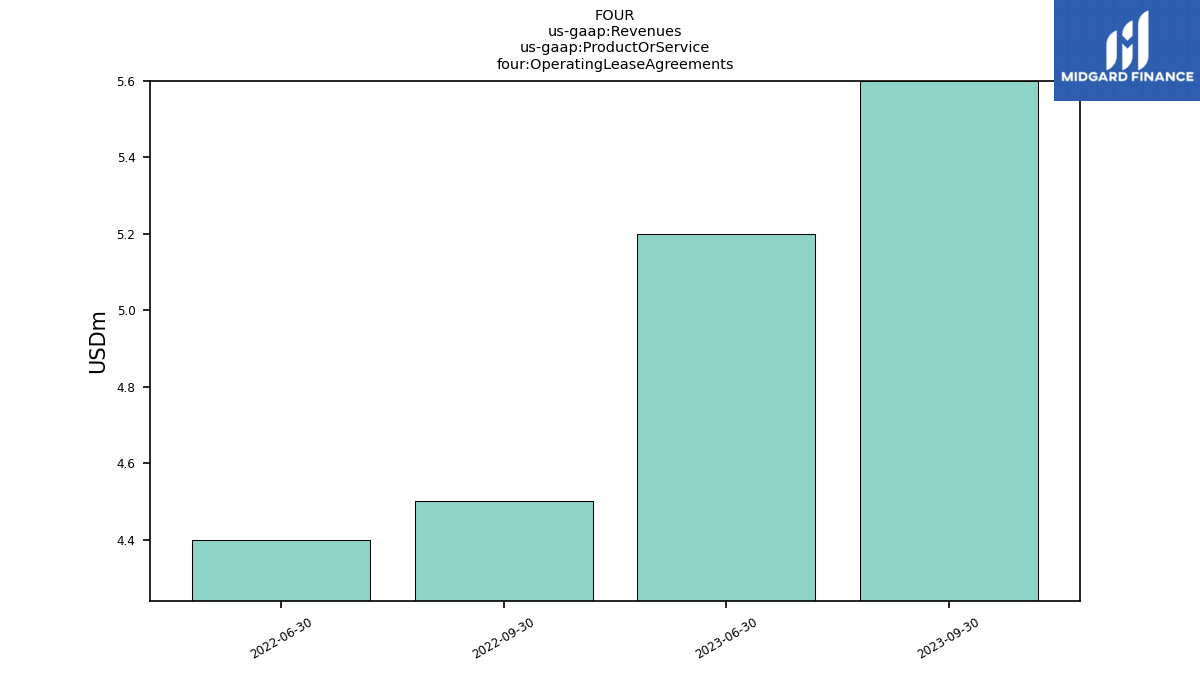
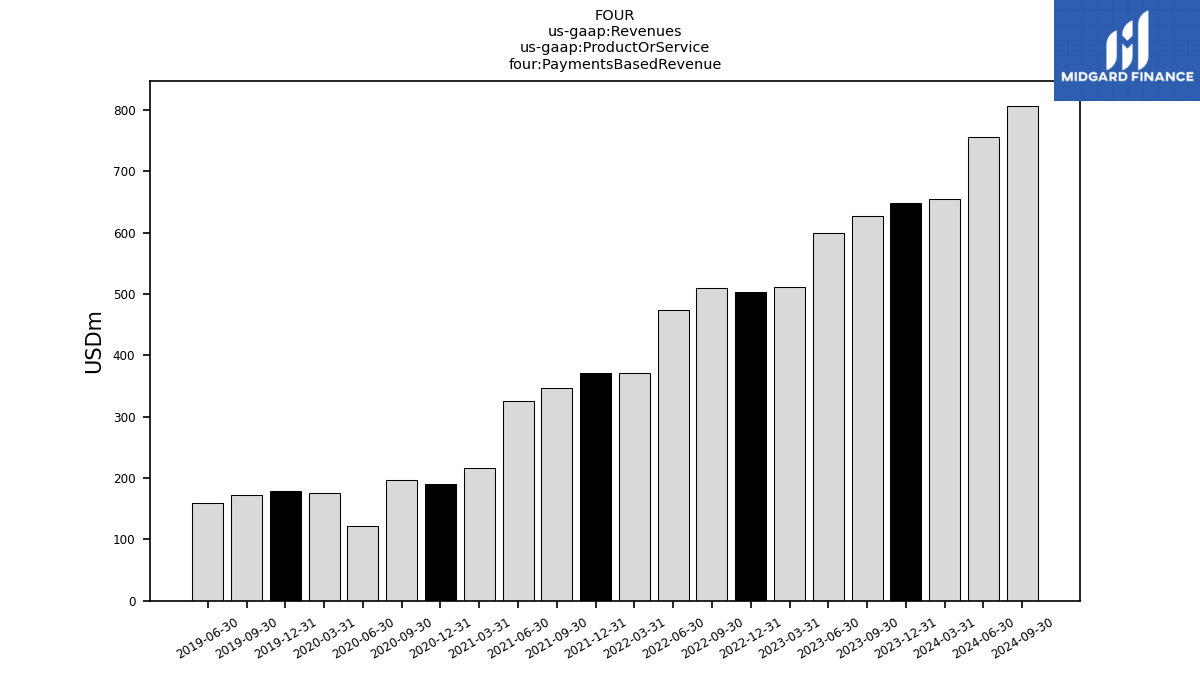
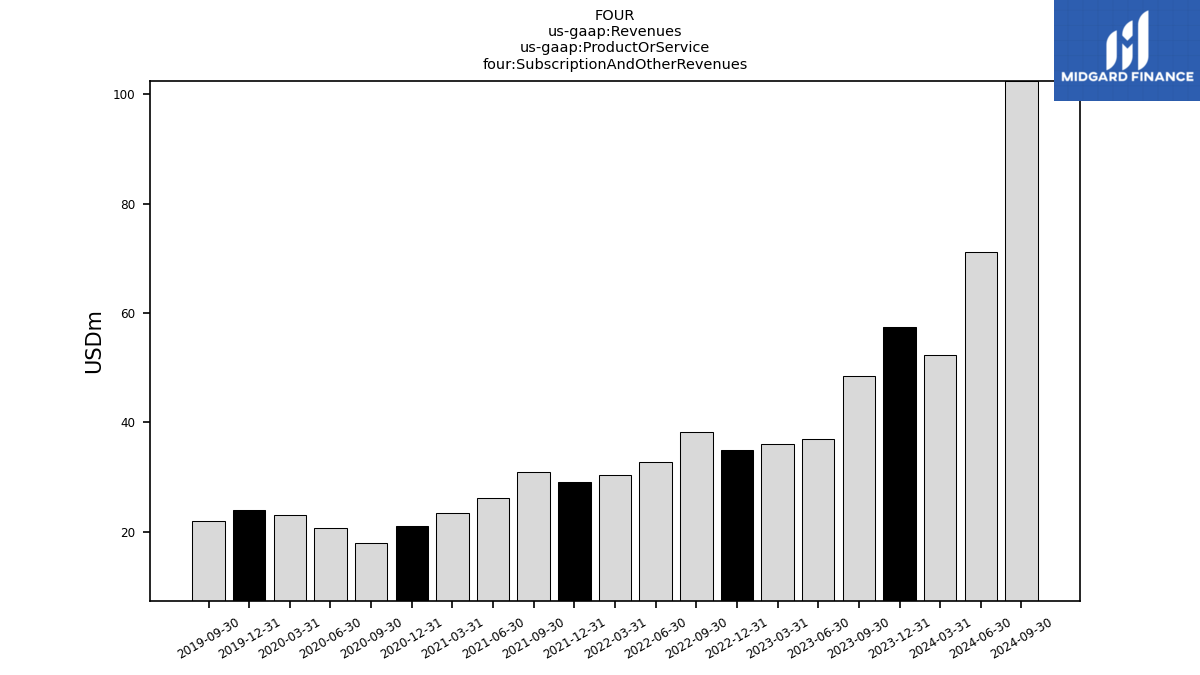
| Revenues | 707.40 | 705.40 | 675.40 | 637.00 | 547.00 | 537.70 | 547.30 | 506.70 | 401.90 | 399.40 | 377.80 | 351.00 | 239.30 | 210.90 | 214.80 | 141.80 | 199.40 | 202.10 | 193.80 | 180.50 | 155.00 | |
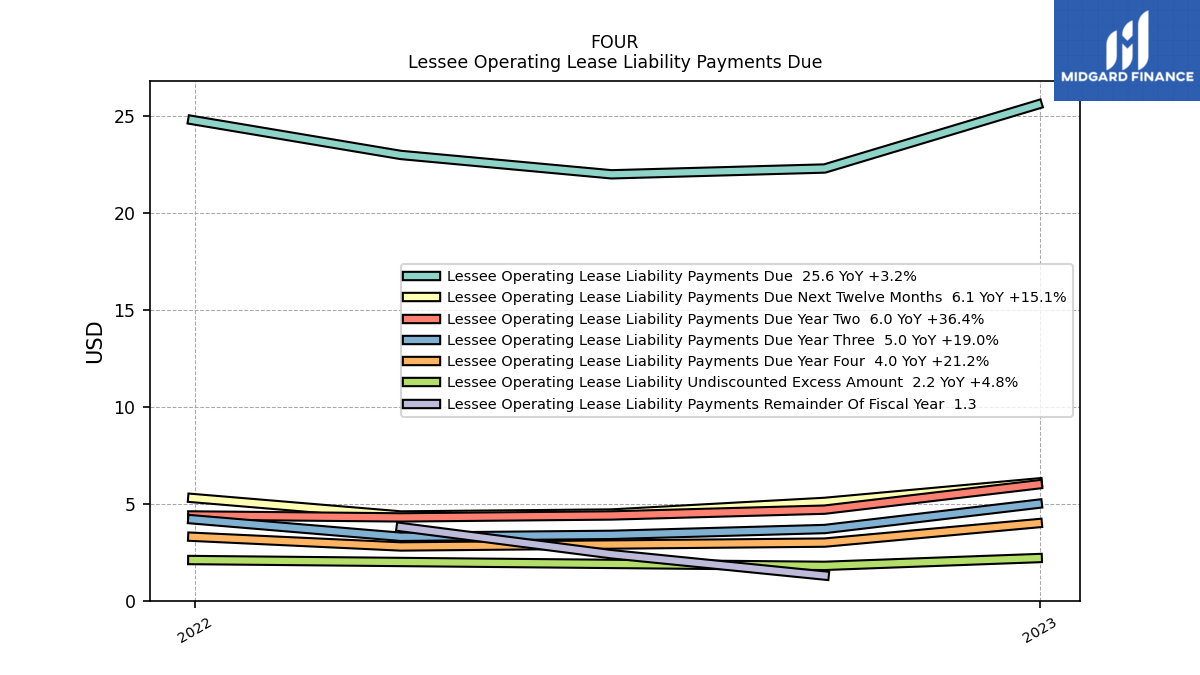
| Operating Lease Agreements | 5.40 | 5.50 | 5.60 | 5.20 | 5.30 | 5.10 | 4.50 | 4.40 | NA | NA | NA | NA | NA | NA | NA | NA | NA | NA | NA | NA | NA | |
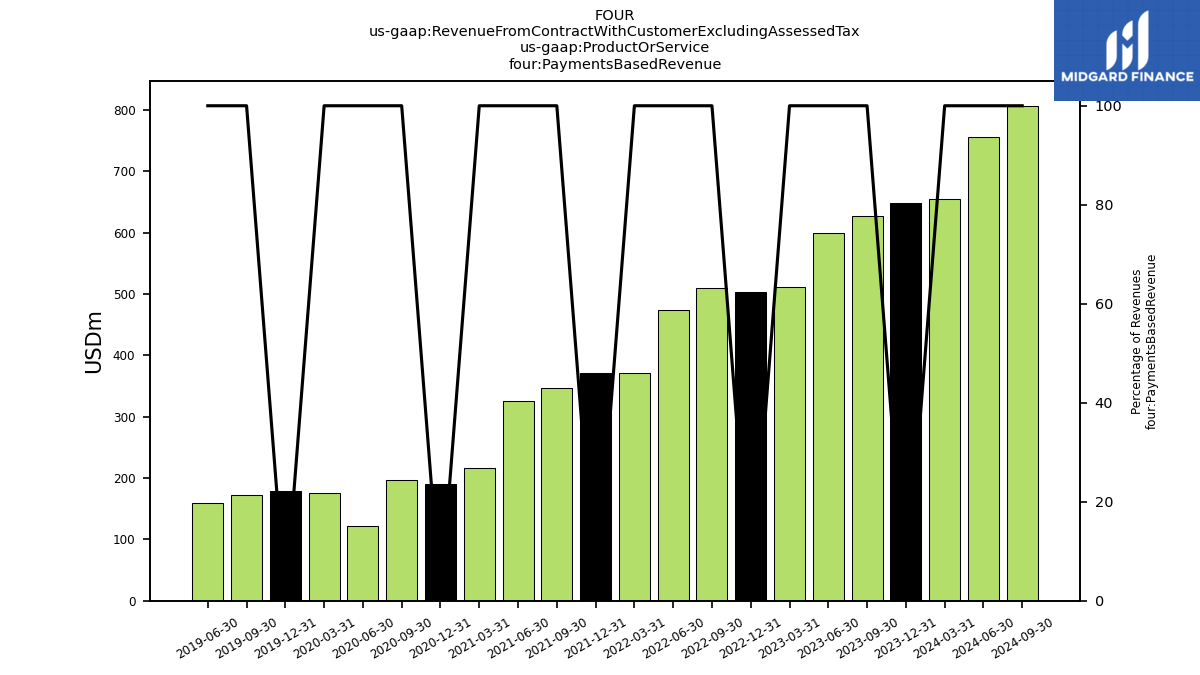
| Payments Based Revenue | 655.10 | 648.00 | 626.90 | 600.10 | 511.00 | 502.70 | 509.00 | 473.90 | 371.50 | 370.40 | 346.90 | 324.80 | 215.90 | 189.80 | 196.80 | 121.20 | 176.40 | 178.20 | 171.90 | 159.50 | NA | |
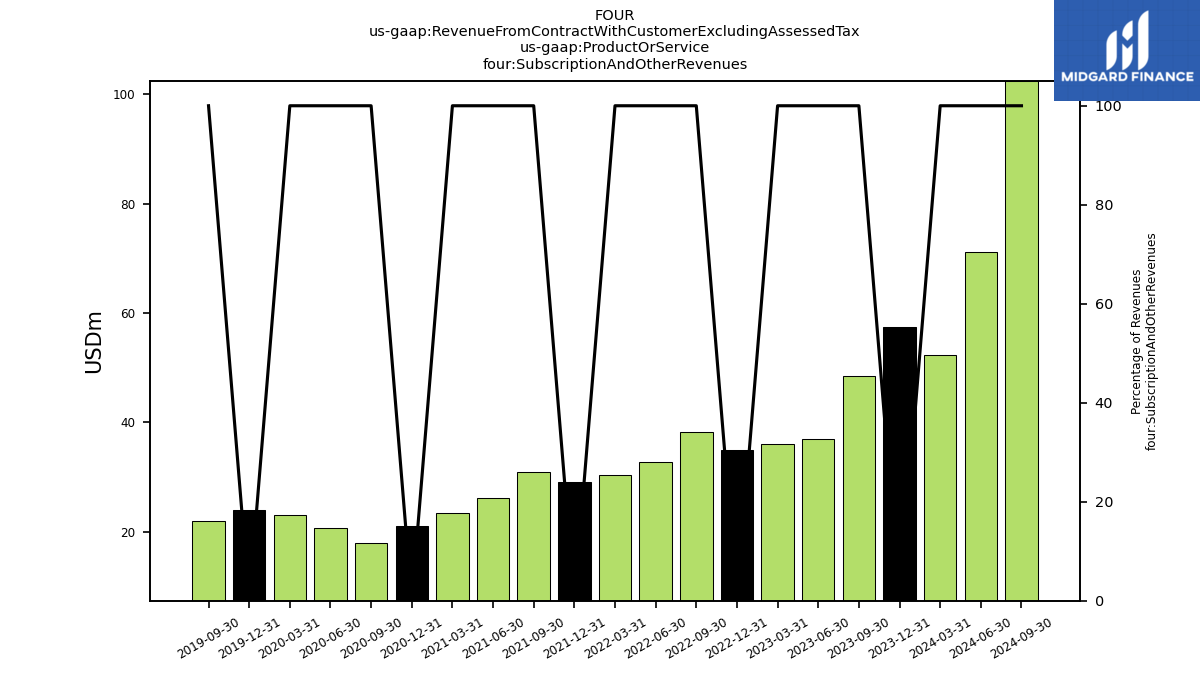
| Subscription And Other Revenues | 52.30 | 57.40 | 48.50 | 36.90 | 36.00 | 35.00 | 38.30 | 32.80 | 30.40 | 29.00 | 30.90 | 26.20 | 23.40 | 21.10 | 18.00 | 20.60 | 23.00 | 23.90 | 21.90 | NA | NA | |
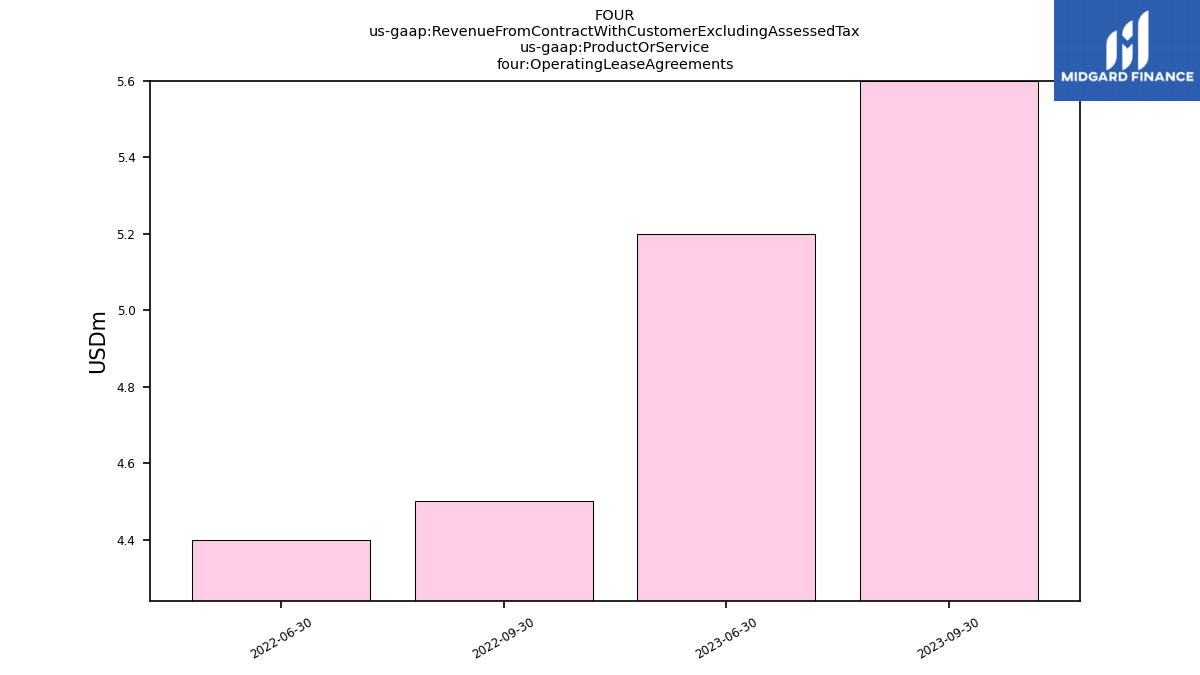
| Revenue From Contract With Customer Excluding Assessed Tax | 707.40 | 705.40 | 675.40 | 637.00 | 547.00 | 537.70 | 547.30 | 506.70 | 401.90 | 399.40 | 377.80 | 351.00 | 239.30 | 210.90 | 214.80 | 141.80 | 199.40 | 202.10 | 193.80 | 180.50 | 155.00 | |
| Operating Lease Agreements | 5.40 | 5.50 | 5.60 | 5.20 | 5.30 | 5.10 | 4.50 | 4.40 | NA | NA | NA | NA | NA | NA | NA | NA | NA | NA | NA | NA | NA | |
| Payments Based Revenue | 655.10 | 648.00 | 626.90 | 600.10 | 511.00 | 502.70 | 509.00 | 473.90 | 371.50 | 370.40 | 346.90 | 324.80 | 215.90 | 189.80 | 196.80 | 121.20 | 176.40 | 178.20 | 171.90 | 159.50 | NA | |
| Subscription And Other Revenues | 52.30 | 57.40 | 48.50 | 36.90 | 36.00 | 35.00 | 38.30 | 32.80 | 30.40 | 29.00 | 30.90 | 26.20 | 23.40 | 21.10 | 18.00 | 20.60 | 23.00 | 23.90 | 21.90 | NA | NA |
