
| 2024-03-31 | 2023-12-31 | 2023-09-30 | 2023-06-30 | 2023-03-31 | 2022-12-31 | 2022-09-30 | 2022-06-30 | 2022-03-31 | 2021-12-31 | 2021-09-30 | 2021-06-30 | 2021-03-31 | 2020-12-31 | 2020-09-30 | 2020-06-30 | 2020-03-31 | 2019-12-31 | 2019-09-30 | 2019-06-30 | 2019-03-31 | 2018-12-31 | 2018-09-30 | 2018-06-30 | 2018-03-31 | 2017-12-31 | 2017-09-30 | ||
|---|---|---|---|---|---|---|---|---|---|---|---|---|---|---|---|---|---|---|---|---|---|---|---|---|---|---|---|---|
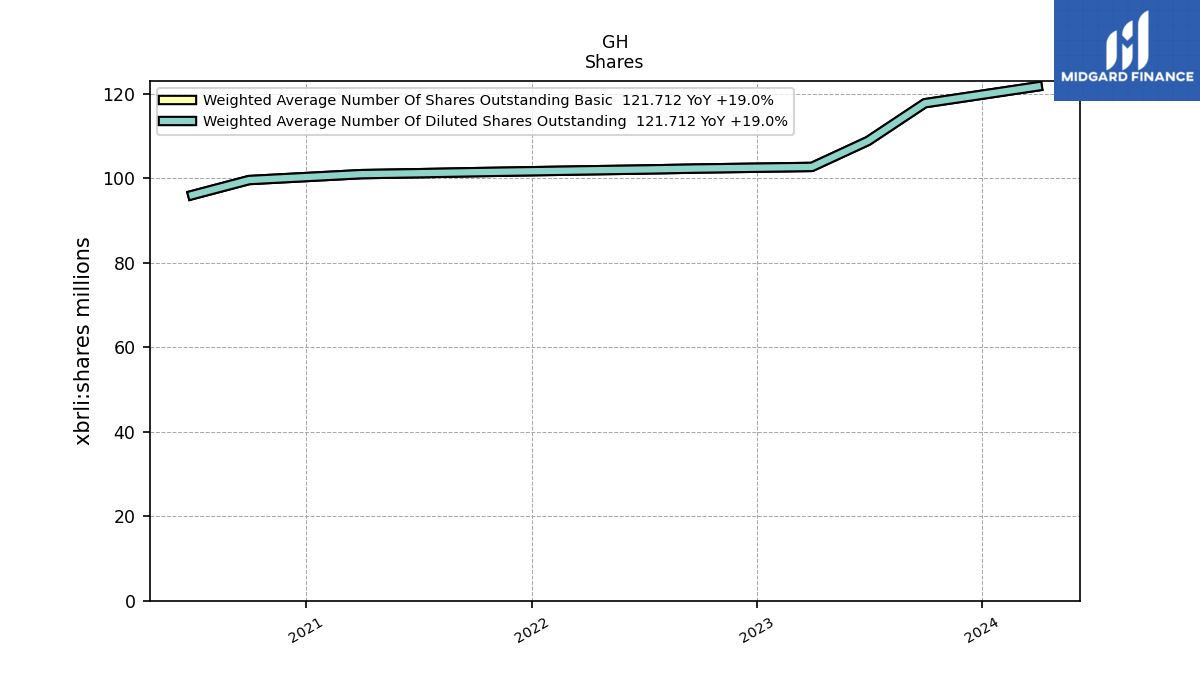
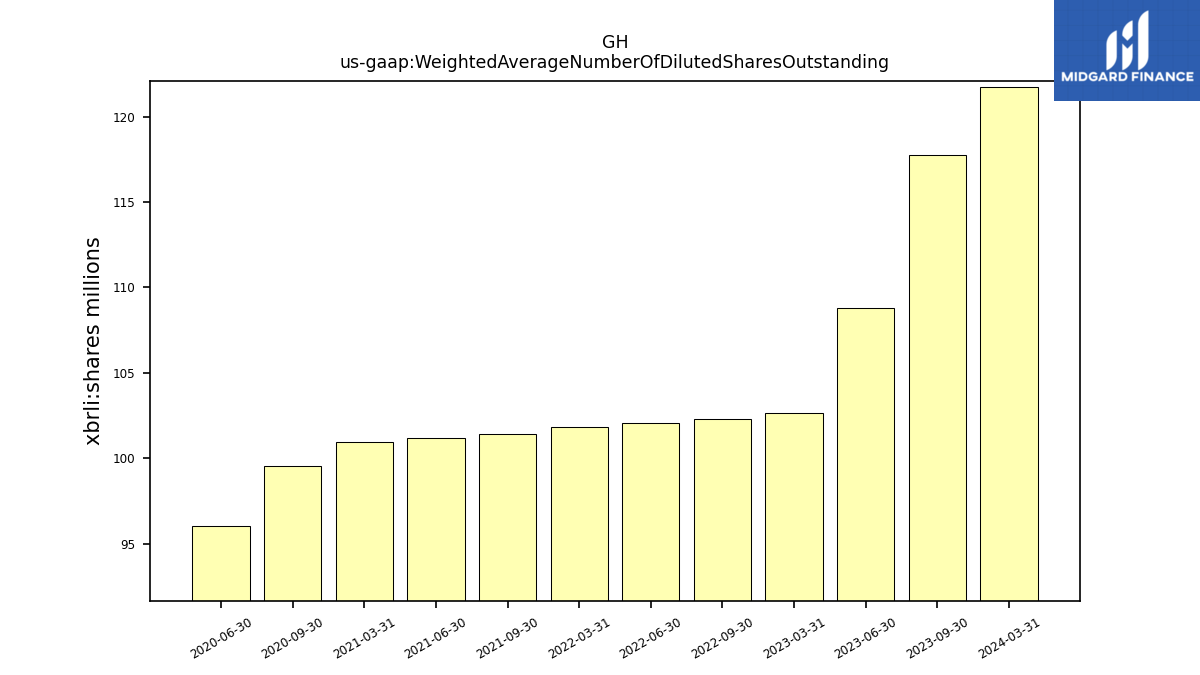
| Weighted Average Number Of Diluted Shares Outstanding | 121.71 | NA | 117.74 | 108.81 | 102.66 | NA | 102.29 | 102.05 | 101.85 | NA | 101.42 | 101.17 | 100.95 | NA | 99.55 | 96.01 | NA | NA | NA | NA | NA | NA | NA | NA | NA | NA | NA | |
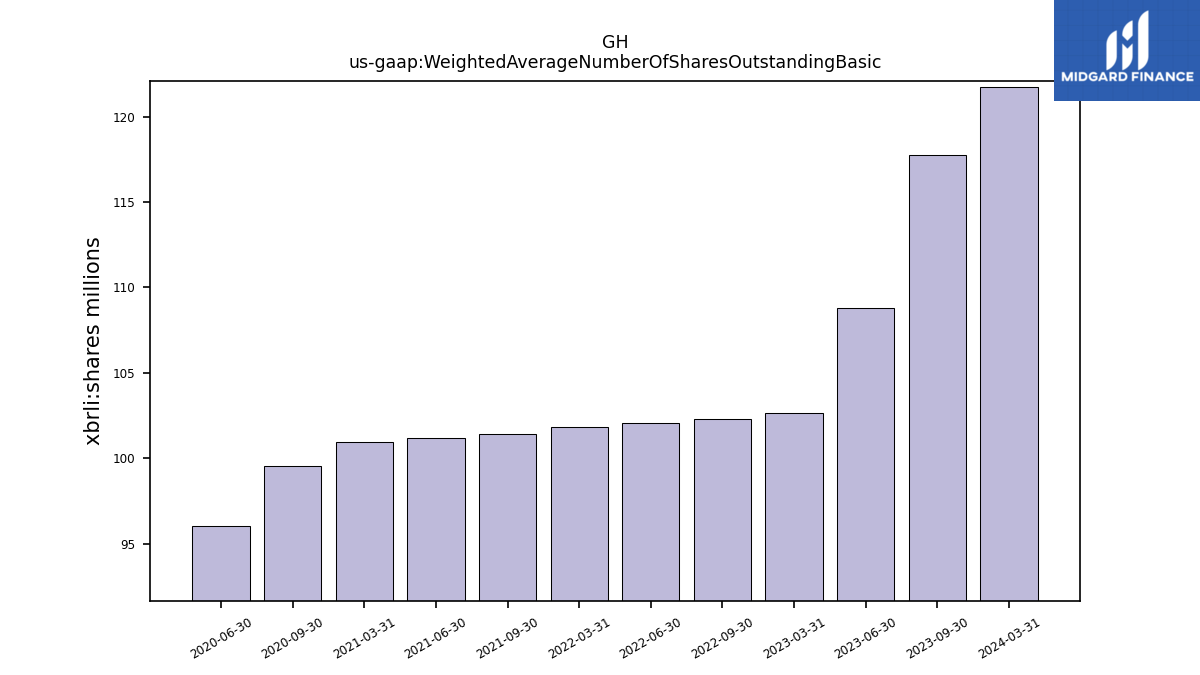
| Weighted Average Number Of Shares Outstanding Basic | 121.71 | NA | 117.74 | 108.81 | 102.66 | NA | 102.29 | 102.05 | 101.85 | NA | 101.42 | 101.17 | 100.95 | NA | 99.55 | 96.01 | NA | NA | NA | NA | NA | NA | NA | NA | NA | NA | NA | |
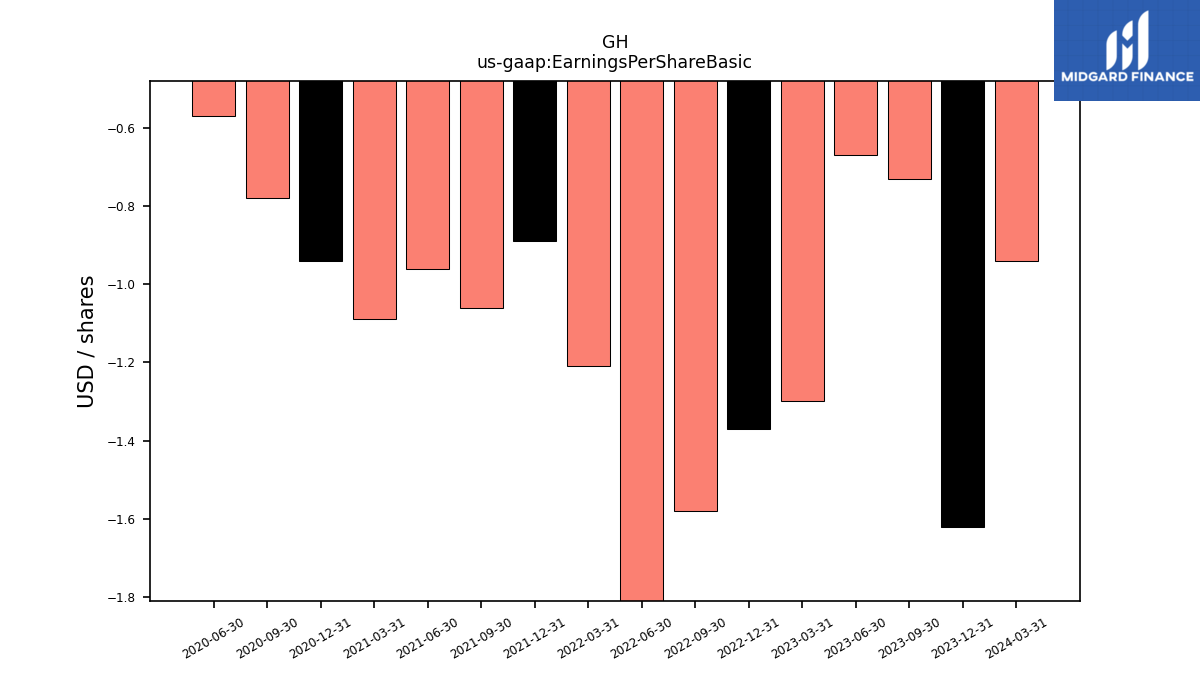
| Earnings Per Share Basic | -0.94 | -1.62 | -0.73 | -0.67 | -1.30 | -1.37 | -1.58 | -2.25 | -1.21 | -0.89 | -1.06 | -0.96 | -1.09 | -0.94 | -0.78 | -0.57 | NA | NA | NA | NA | NA | NA | NA | NA | NA | NA | NA | |
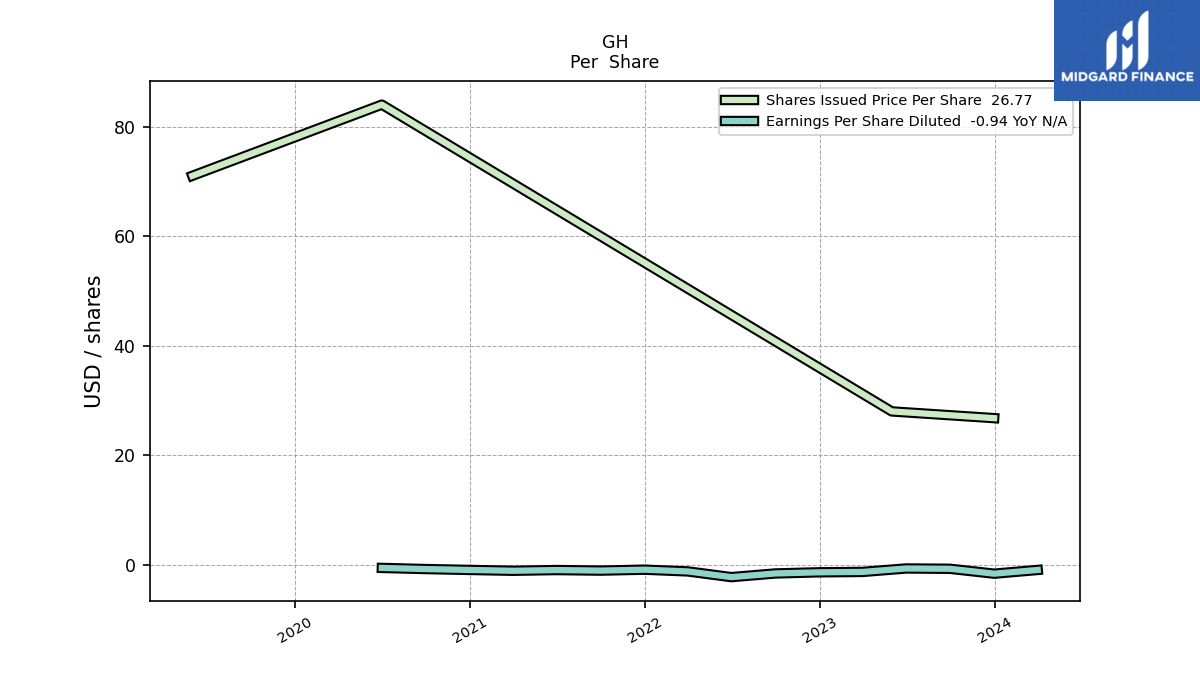
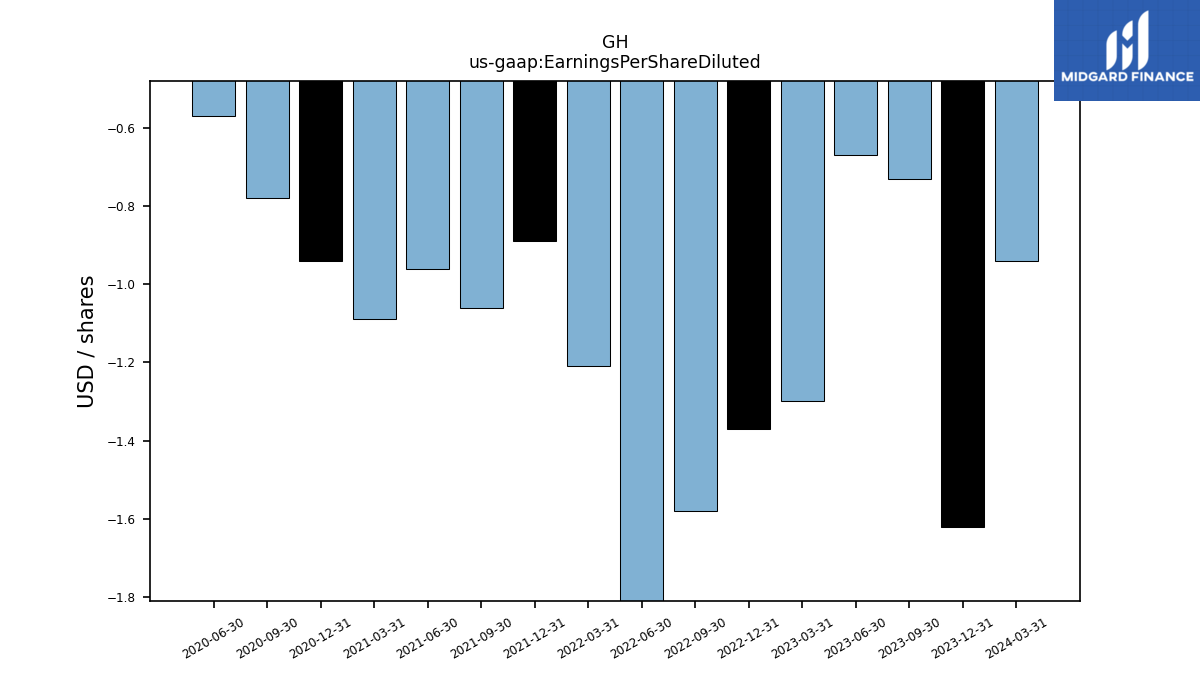
| Earnings Per Share Diluted | -0.94 | -1.62 | -0.73 | -0.67 | -1.30 | -1.37 | -1.58 | -2.25 | -1.21 | -0.89 | -1.06 | -0.96 | -1.09 | -0.94 | -0.78 | -0.57 | NA | NA | NA | NA | NA | NA | NA | NA | NA | NA | NA |
| 2024-03-31 | 2023-12-31 | 2023-09-30 | 2023-06-30 | 2023-03-31 | 2022-12-31 | 2022-09-30 | 2022-06-30 | 2022-03-31 | 2021-12-31 | 2021-09-30 | 2021-06-30 | 2021-03-31 | 2020-12-31 | 2020-09-30 | 2020-06-30 | 2020-03-31 | 2019-12-31 | 2019-09-30 | 2019-06-30 | 2019-03-31 | 2018-12-31 | 2018-09-30 | 2018-06-30 | 2018-03-31 | 2017-12-31 | 2017-09-30 | ||
|---|---|---|---|---|---|---|---|---|---|---|---|---|---|---|---|---|---|---|---|---|---|---|---|---|---|---|---|---|
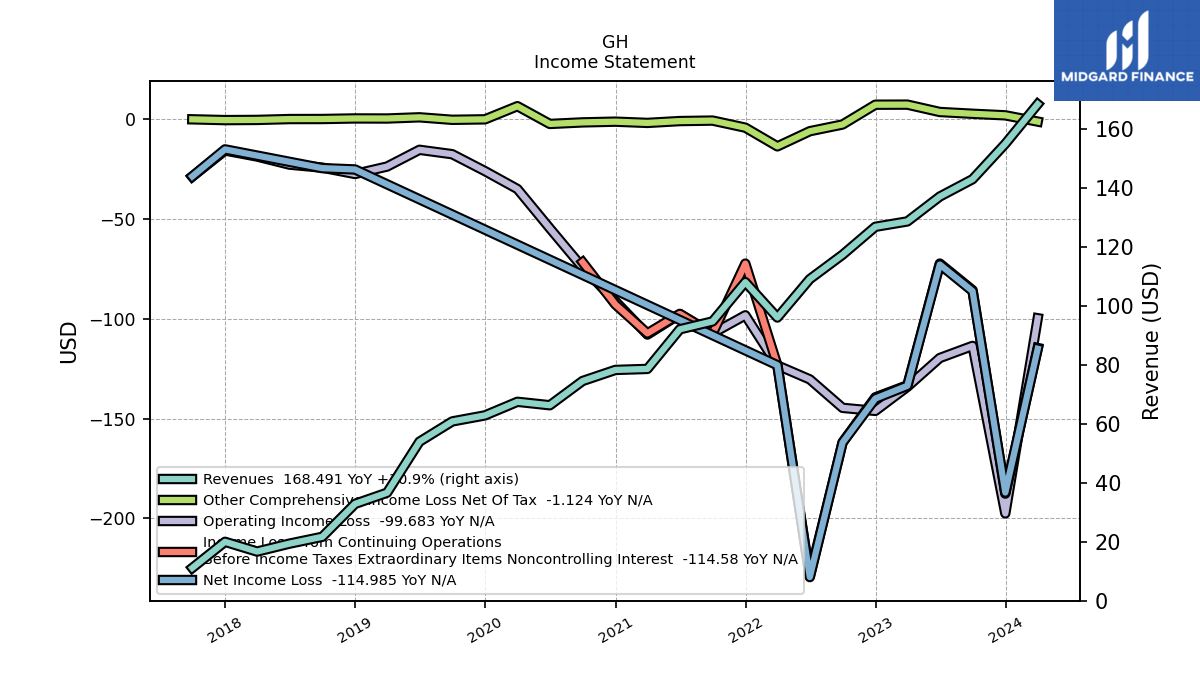
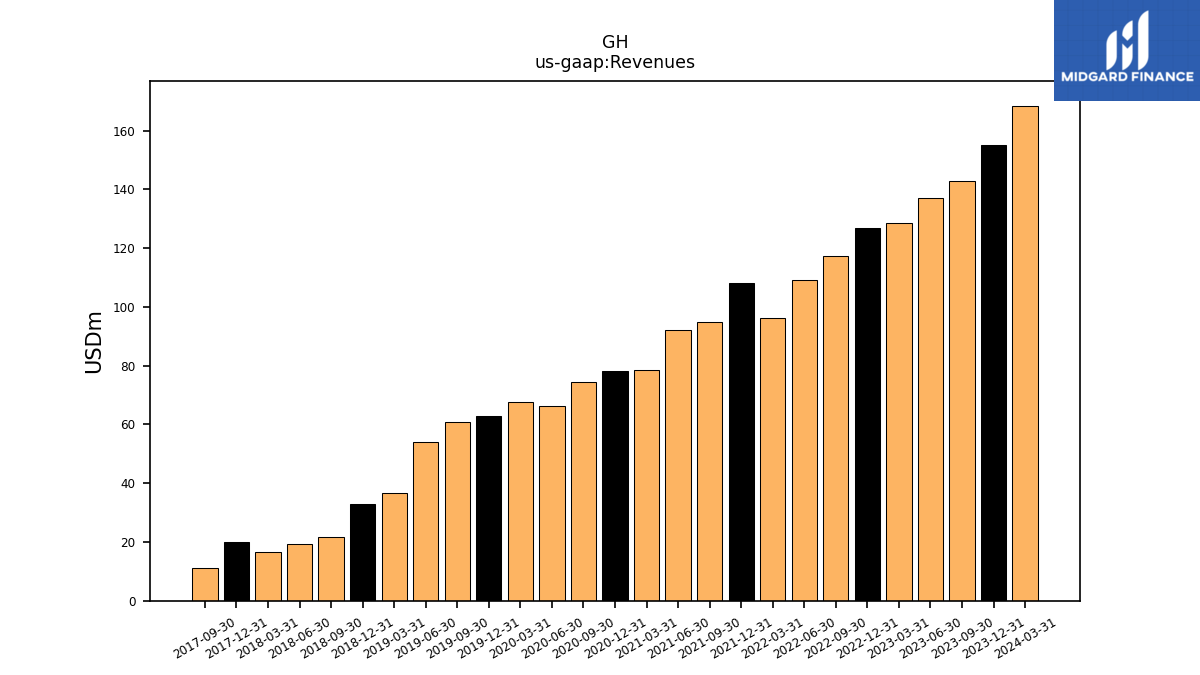
| Revenues | 168.49 | 155.05 | 143.03 | 137.15 | 128.71 | 126.89 | 117.40 | 109.14 | 96.10 | 108.11 | 94.78 | 92.10 | 78.67 | 78.32 | 74.57 | 66.33 | 67.51 | 62.90 | 60.85 | 53.98 | 36.66 | 32.87 | 21.69 | 19.38 | 16.69 | 20.00 | 11.13 | |
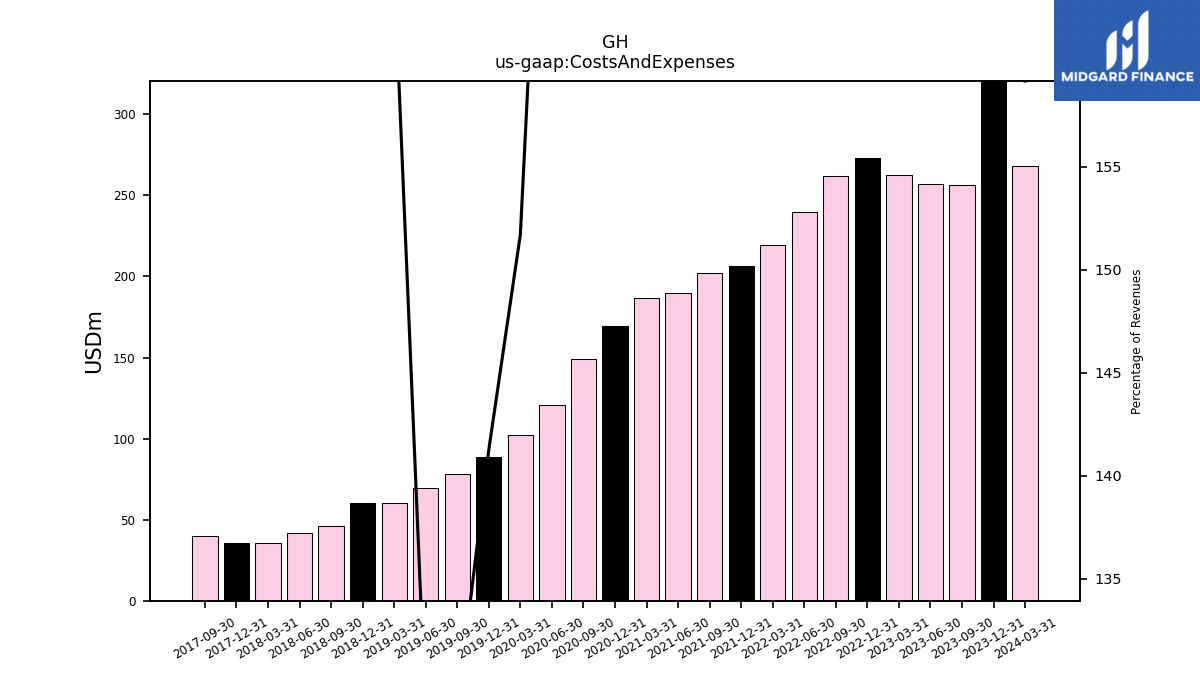
| Costs And Expenses | 268.17 | 352.56 | 256.57 | 256.77 | 262.77 | 273.01 | 262.00 | 239.47 | 219.44 | 206.32 | 202.07 | 189.74 | 186.53 | 169.48 | 148.82 | 120.95 | 102.42 | 88.86 | 78.33 | 69.24 | 60.32 | 60.26 | 45.90 | 42.09 | 35.34 | 35.62 | 39.81 | |
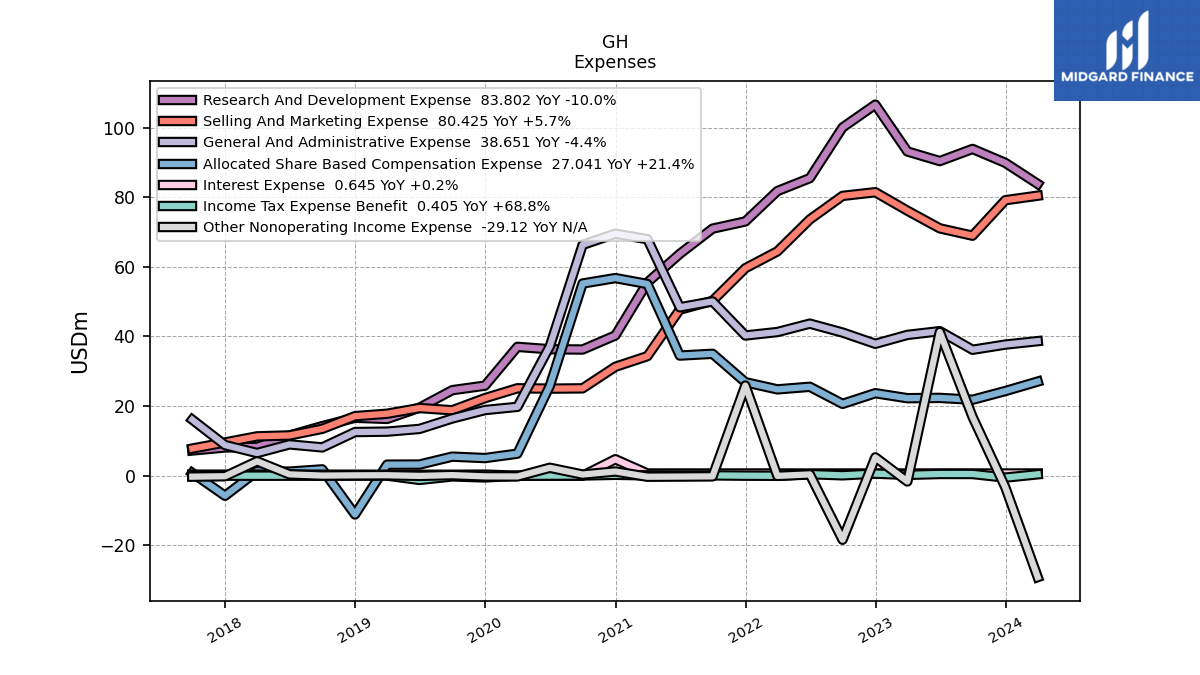
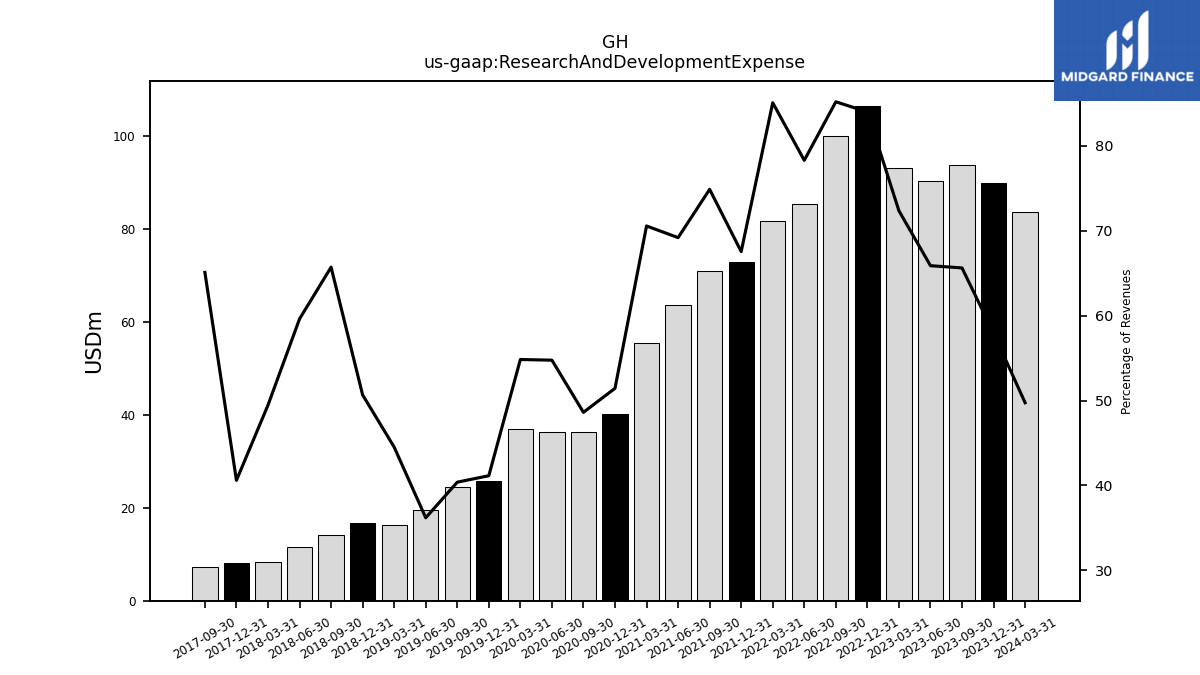
| Research And Development Expense | 83.80 | 89.86 | 93.85 | 90.36 | 93.13 | 106.58 | 100.02 | 85.45 | 81.76 | 73.02 | 70.97 | 63.72 | 55.51 | 40.28 | 36.24 | 36.32 | 37.02 | 25.88 | 24.57 | 19.53 | 16.32 | 16.65 | 14.25 | 11.55 | 8.26 | 8.12 | 7.25 | |
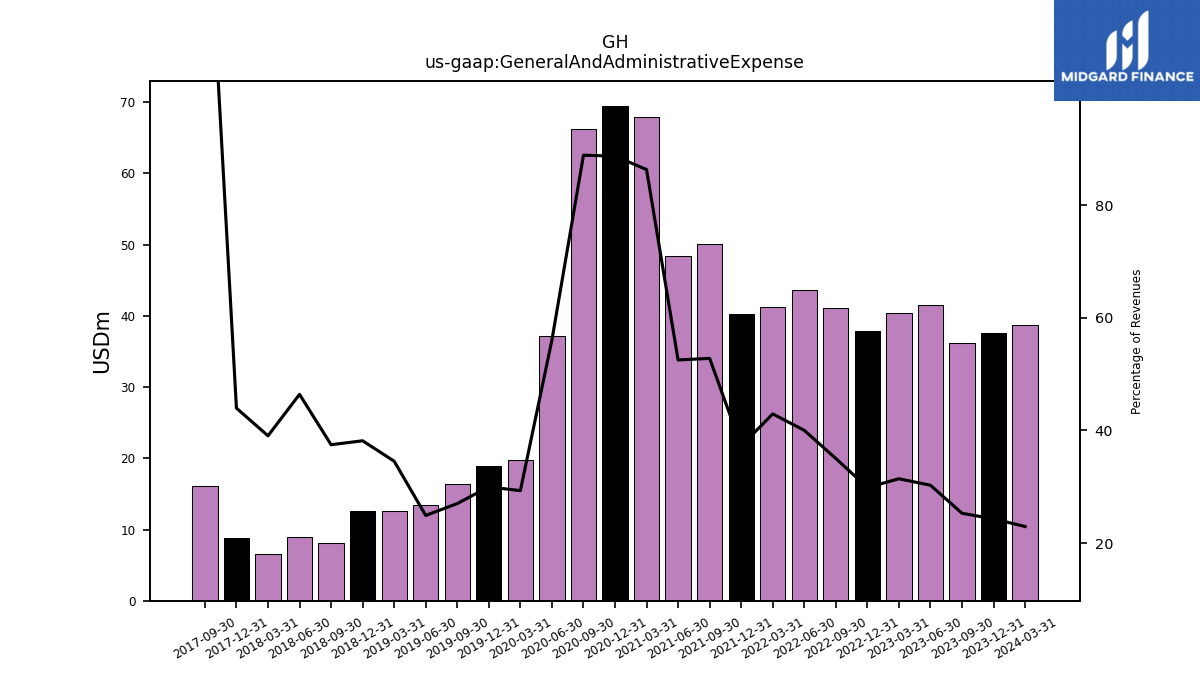
| General And Administrative Expense | 38.65 | 37.66 | 36.17 | 41.52 | 40.45 | 37.89 | 41.12 | 43.68 | 41.27 | 40.27 | 50.05 | 48.38 | 67.94 | 69.50 | 66.29 | 37.19 | 19.79 | 18.86 | 16.44 | 13.44 | 12.66 | 12.55 | 8.13 | 9.00 | 6.52 | 8.79 | 16.09 | |
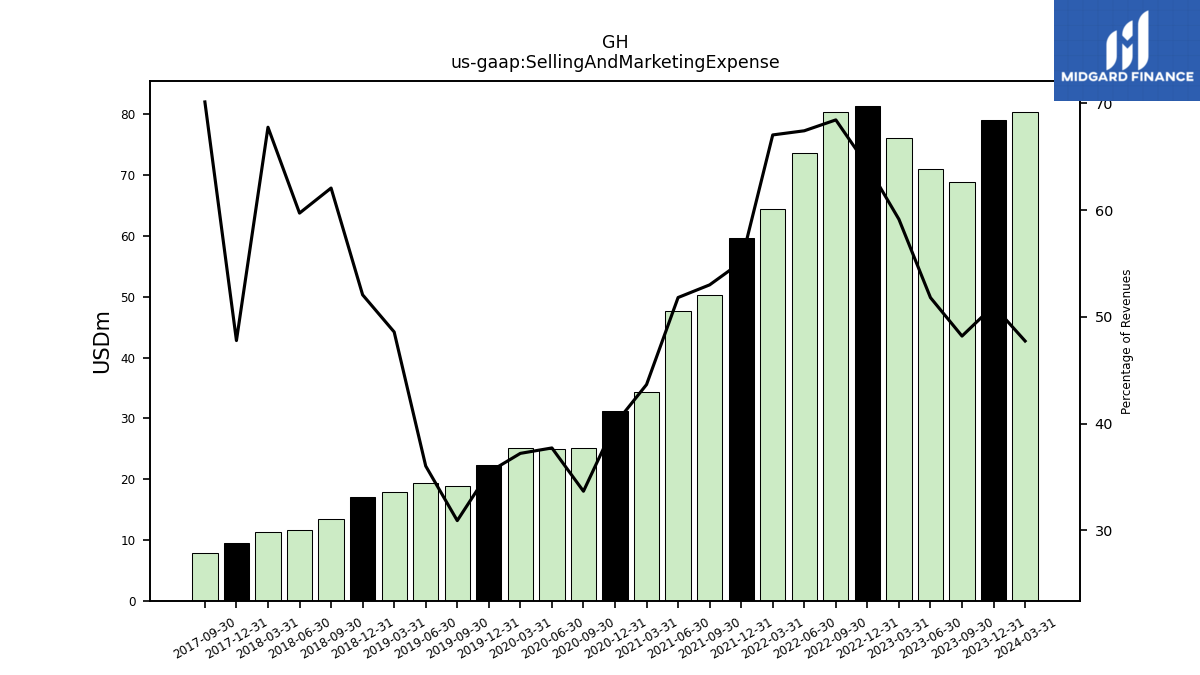
| Selling And Marketing Expense | 80.42 | 79.13 | 68.93 | 71.04 | 76.12 | 81.42 | 80.37 | 73.60 | 64.43 | 59.60 | 50.23 | 47.72 | 34.34 | 31.29 | 25.09 | 25.02 | 25.11 | 22.29 | 18.80 | 19.44 | 17.81 | 17.11 | 13.46 | 11.57 | 11.31 | 9.56 | 7.81 | |
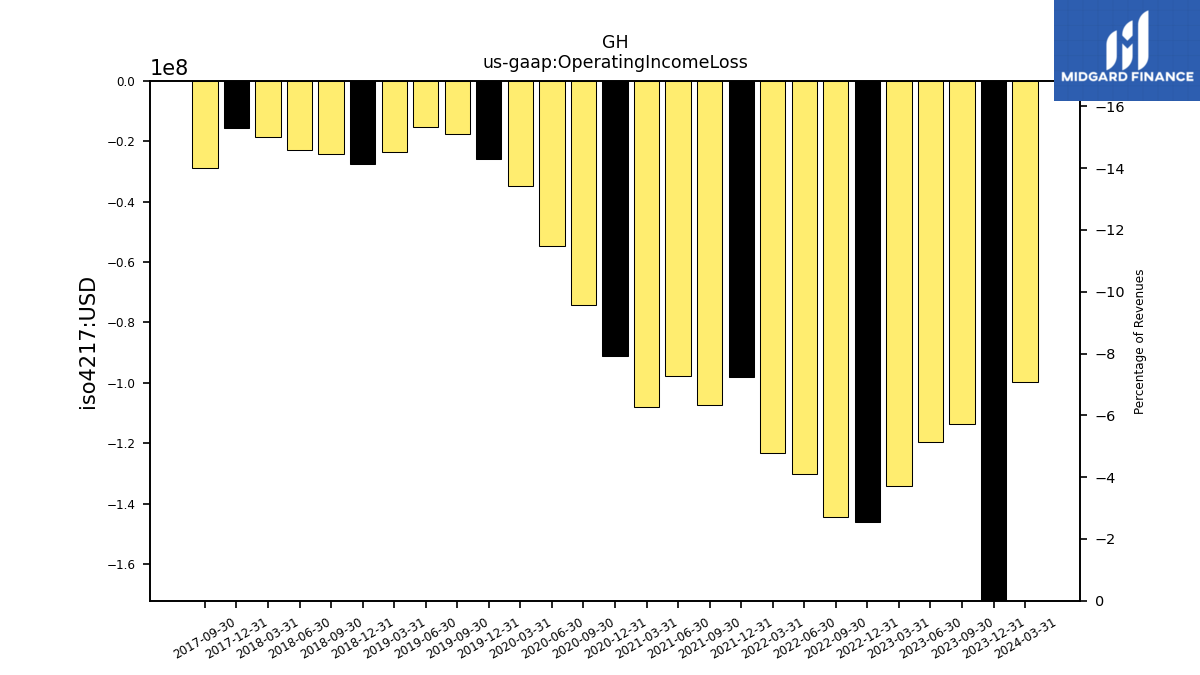
| Operating Income Loss | -99.68 | -197.51 | -113.54 | -119.62 | -134.06 | -146.12 | -144.60 | -130.32 | -123.34 | -98.21 | -107.29 | -97.64 | -107.86 | -91.17 | -74.25 | -54.62 | -34.91 | -25.96 | -17.48 | -15.27 | -23.66 | -27.39 | -24.20 | -22.70 | -18.65 | -15.62 | -28.68 | |
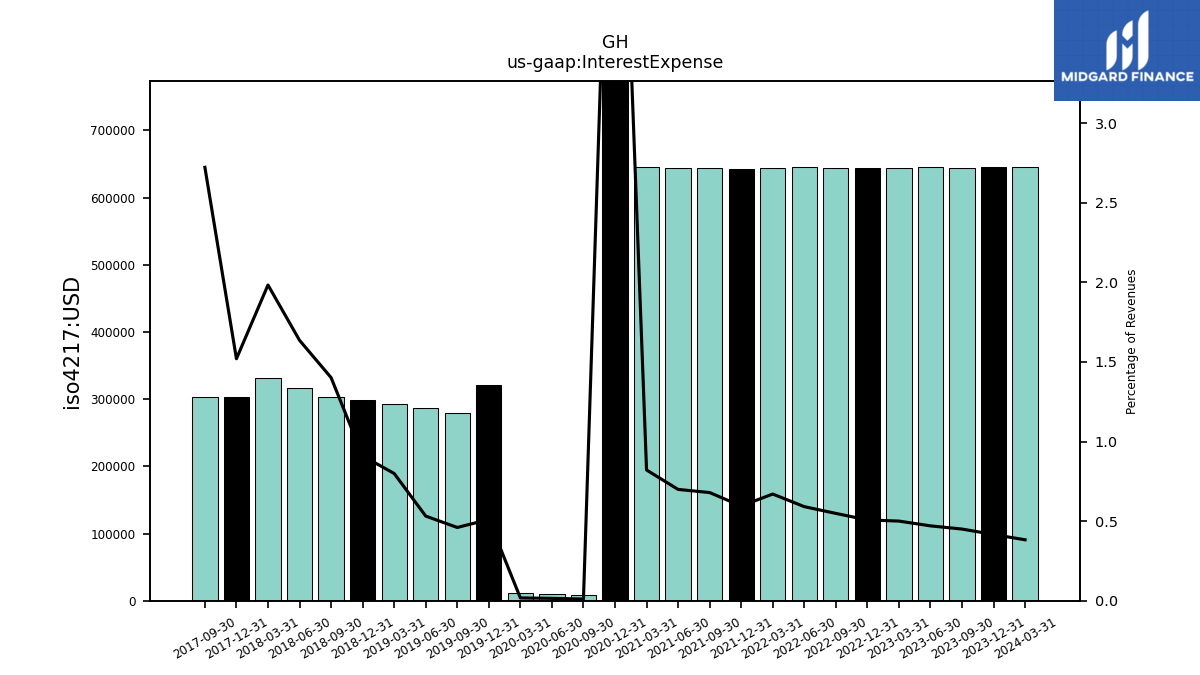
| Interest Expense | 0.65 | 0.65 | 0.64 | 0.65 | 0.64 | 0.64 | 0.64 | 0.65 | 0.64 | 0.64 | 0.64 | 0.64 | 0.65 | 4.74 | 0.01 | 0.01 | 0.01 | 0.32 | 0.28 | 0.29 | 0.29 | 0.30 | 0.30 | 0.32 | 0.33 | 0.30 | 0.30 | |
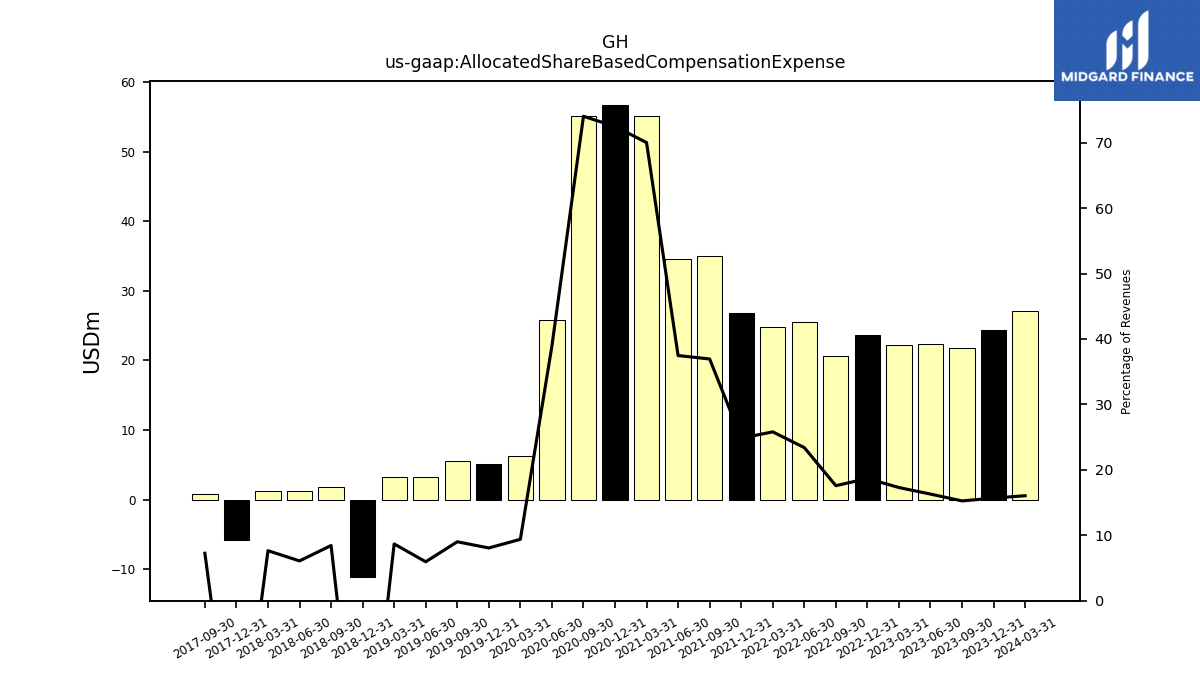
| Allocated Share Based Compensation Expense | 27.04 | 24.32 | 21.82 | 22.35 | 22.27 | 23.70 | 20.64 | 25.54 | 24.80 | 26.86 | 35.02 | 34.51 | 55.07 | 56.76 | 55.20 | 25.82 | 6.34 | 5.07 | 5.48 | 3.21 | 3.18 | -11.14 | 1.83 | 1.18 | 1.28 | -5.77 | 0.81 | |
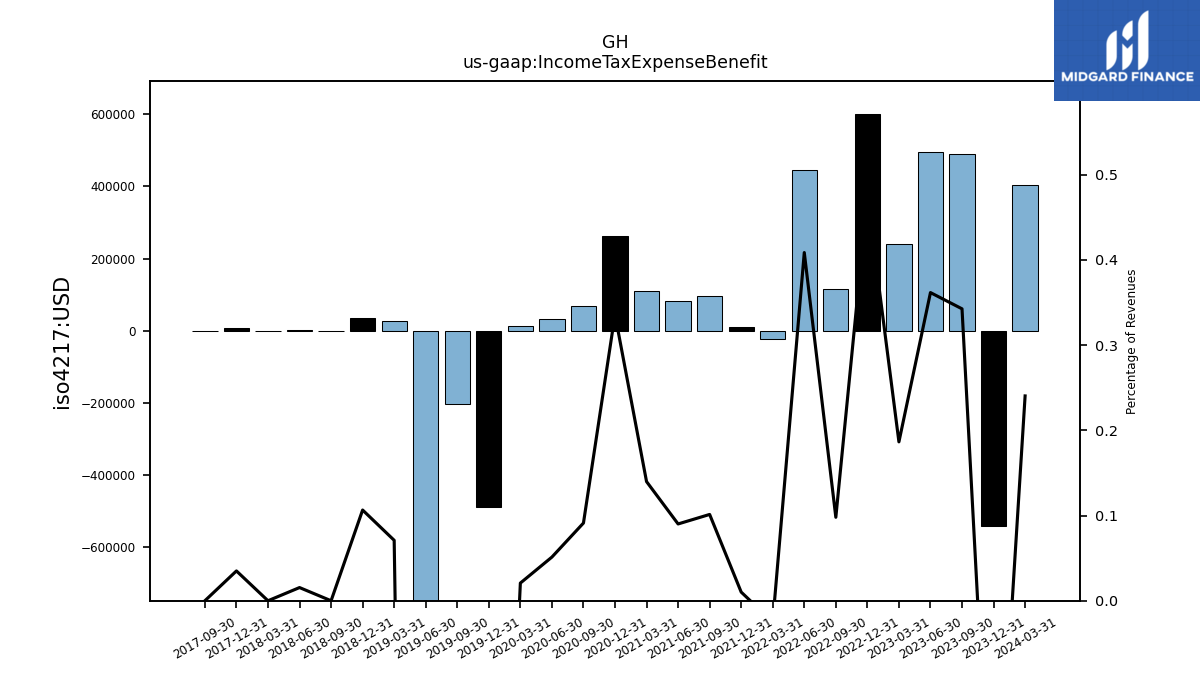
| Income Tax Expense Benefit | 0.41 | -0.54 | 0.49 | 0.50 | 0.24 | 0.60 | 0.12 | 0.45 | -0.02 | 0.01 | 0.10 | 0.08 | 0.11 | 0.26 | 0.07 | 0.03 | 0.01 | -0.49 | -0.20 | -1.21 | 0.03 | 0.04 | 0.00 | 0.00 | 0.00 | 0.01 | 0.00 | |
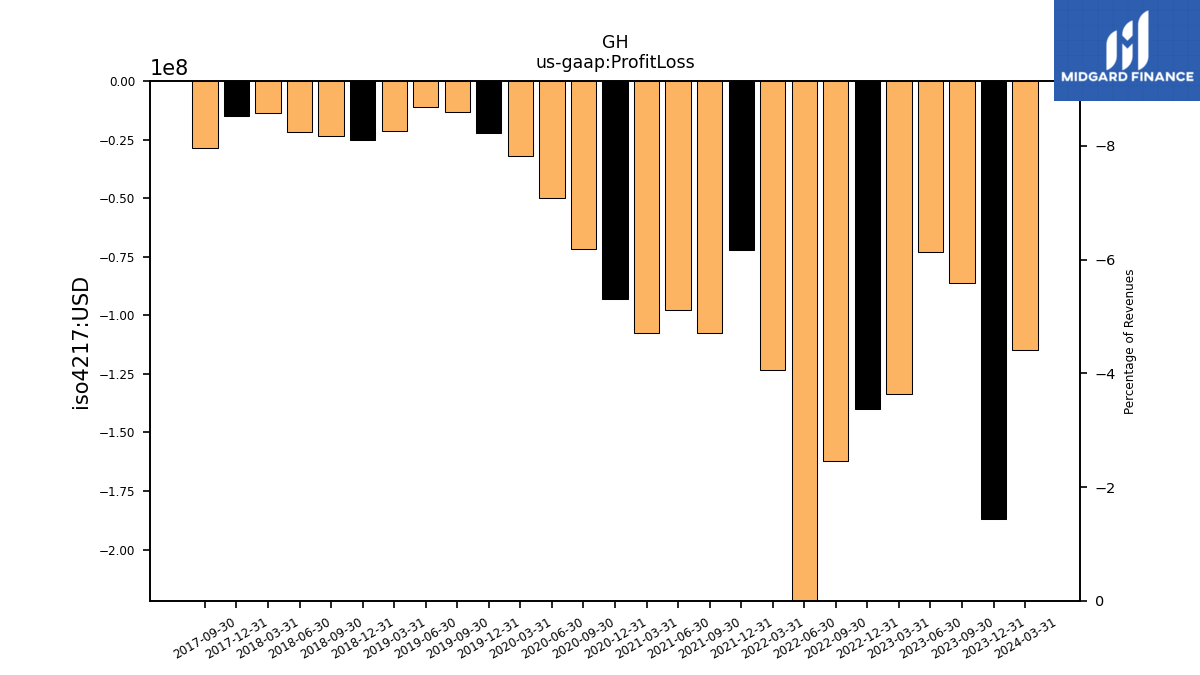
| Profit Loss | -114.98 | -187.04 | -86.10 | -72.77 | -133.53 | -139.93 | -161.99 | -229.43 | -123.23 | -72.31 | -107.53 | -97.58 | -107.36 | -93.05 | -71.67 | -49.74 | -31.83 | -22.11 | -13.09 | -11.30 | -21.35 | -25.27 | -23.51 | -21.64 | -13.84 | -15.06 | -28.59 | |
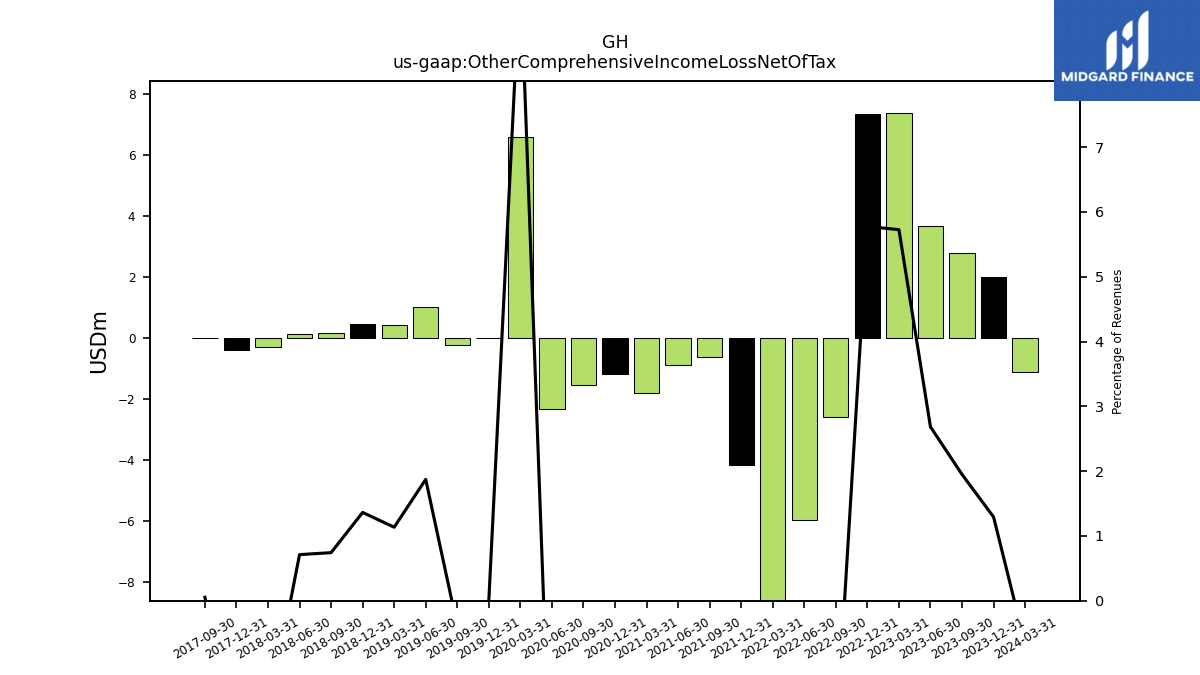
| Other Comprehensive Income Loss Net Of Tax | -1.12 | 2.00 | 2.79 | 3.68 | 7.37 | 7.33 | -2.59 | -5.95 | -13.55 | -4.17 | -0.63 | -0.87 | -1.79 | -1.17 | -1.53 | -2.31 | 6.59 | 0.00 | -0.23 | 1.01 | 0.42 | 0.45 | 0.16 | 0.14 | -0.30 | -0.39 | 0.01 | |
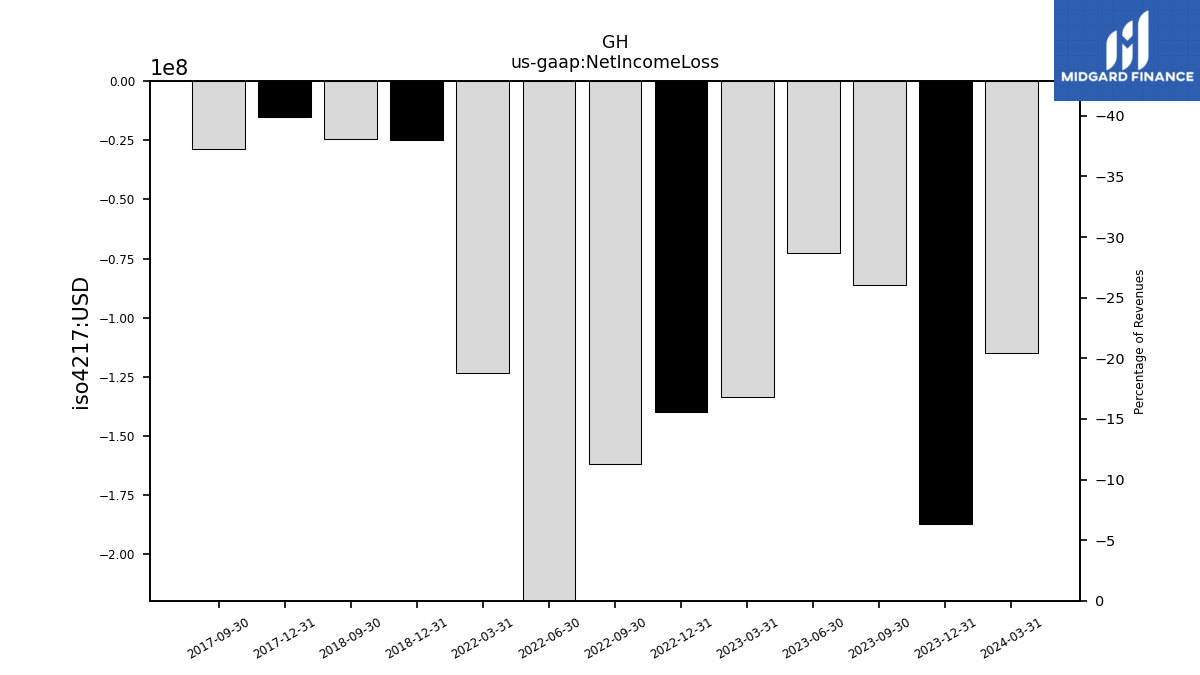
| Net Income Loss | -114.98 | -187.04 | -86.10 | -72.77 | -133.53 | -139.93 | -161.99 | -229.43 | -123.23 | NA | NA | NA | NA | NA | NA | NA | NA | NA | NA | NA | NA | -25.12 | -24.46 | NA | NA | -15.06 | -28.59 | |
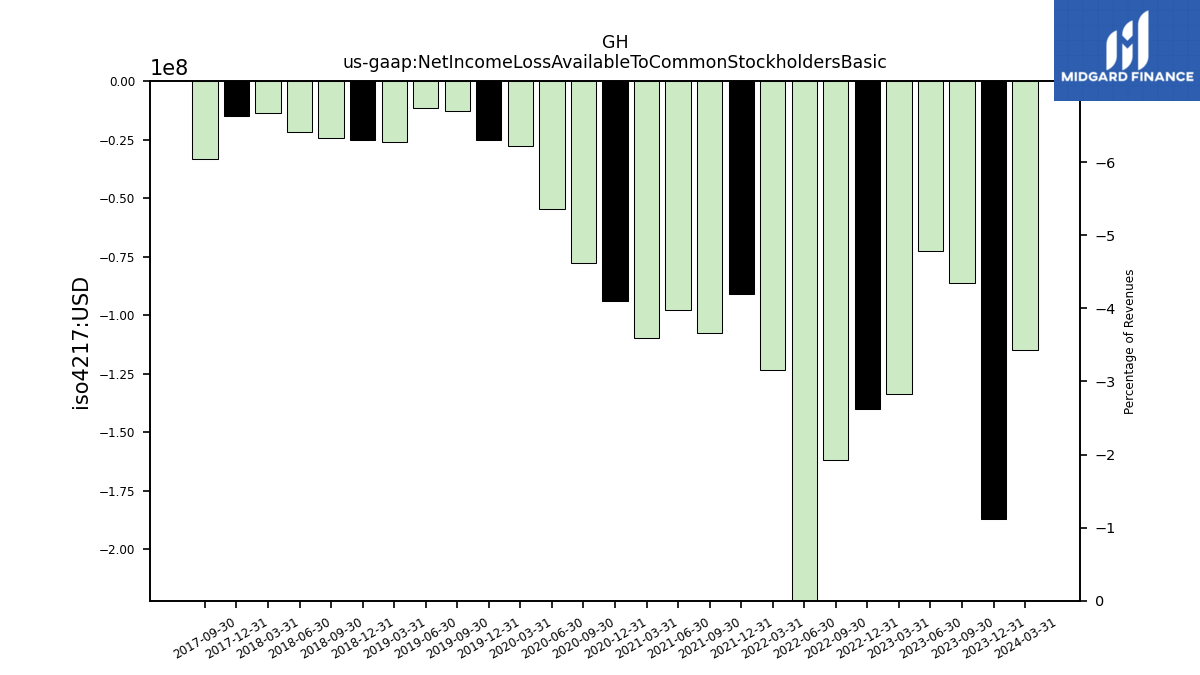
| Net Income Loss Available To Common Stockholders Basic | -114.98 | -187.04 | -86.10 | -72.77 | -133.53 | -139.93 | -161.99 | -229.43 | -123.23 | -90.91 | -107.53 | -97.58 | -109.66 | -93.75 | -77.67 | -54.64 | -27.73 | -25.21 | -12.79 | -11.60 | -26.05 | -25.12 | -24.46 | -21.64 | -13.84 | -15.06 | -33.31 | |
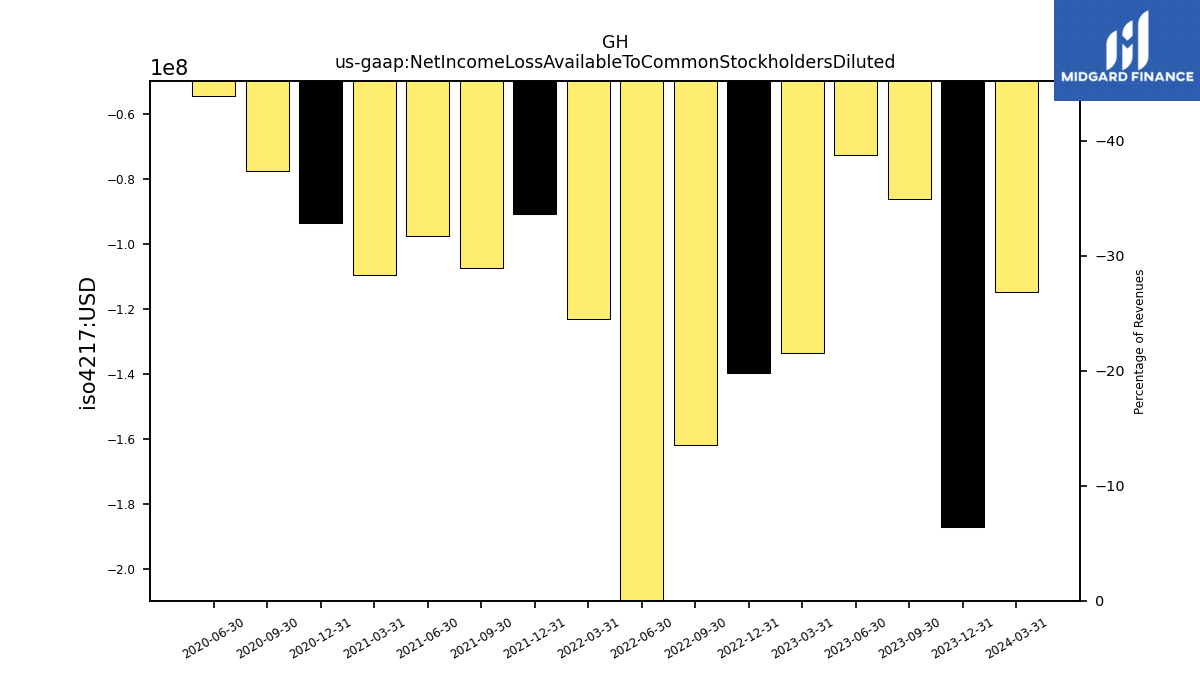
| Net Income Loss Available To Common Stockholders Diluted | -114.98 | -187.04 | -86.10 | -72.77 | -133.53 | -139.93 | -161.99 | -229.43 | -123.23 | -90.91 | -107.53 | -97.58 | -109.66 | -93.75 | -77.67 | -54.64 | NA | NA | NA | NA | NA | NA | NA | NA | NA | NA | NA |
| 2024-03-31 | 2023-12-31 | 2023-09-30 | 2023-06-30 | 2023-03-31 | 2022-12-31 | 2022-09-30 | 2022-06-30 | 2022-03-31 | 2021-12-31 | 2021-09-30 | 2021-06-30 | 2021-03-31 | 2020-12-31 | 2020-09-30 | 2020-06-30 | 2020-03-31 | 2019-12-31 | 2019-09-30 | 2019-06-30 | 2019-03-31 | 2018-12-31 | 2018-09-30 | 2018-06-30 | 2018-03-31 | 2017-12-31 | 2017-09-30 | ||
|---|---|---|---|---|---|---|---|---|---|---|---|---|---|---|---|---|---|---|---|---|---|---|---|---|---|---|---|---|
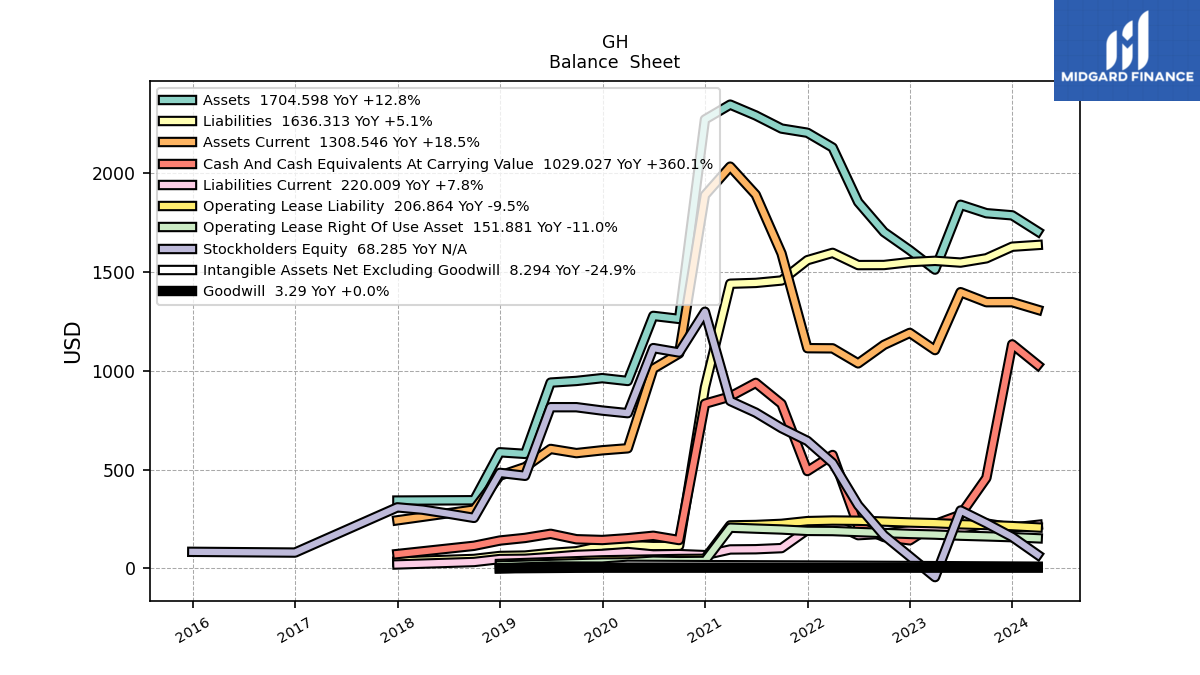
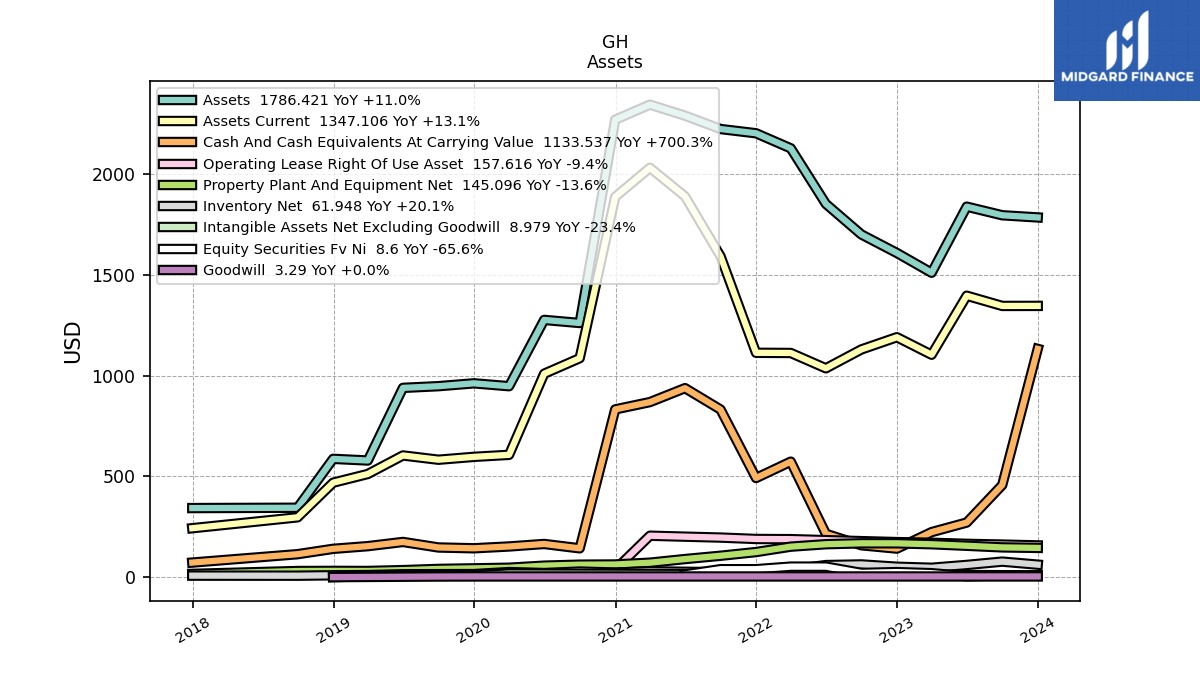
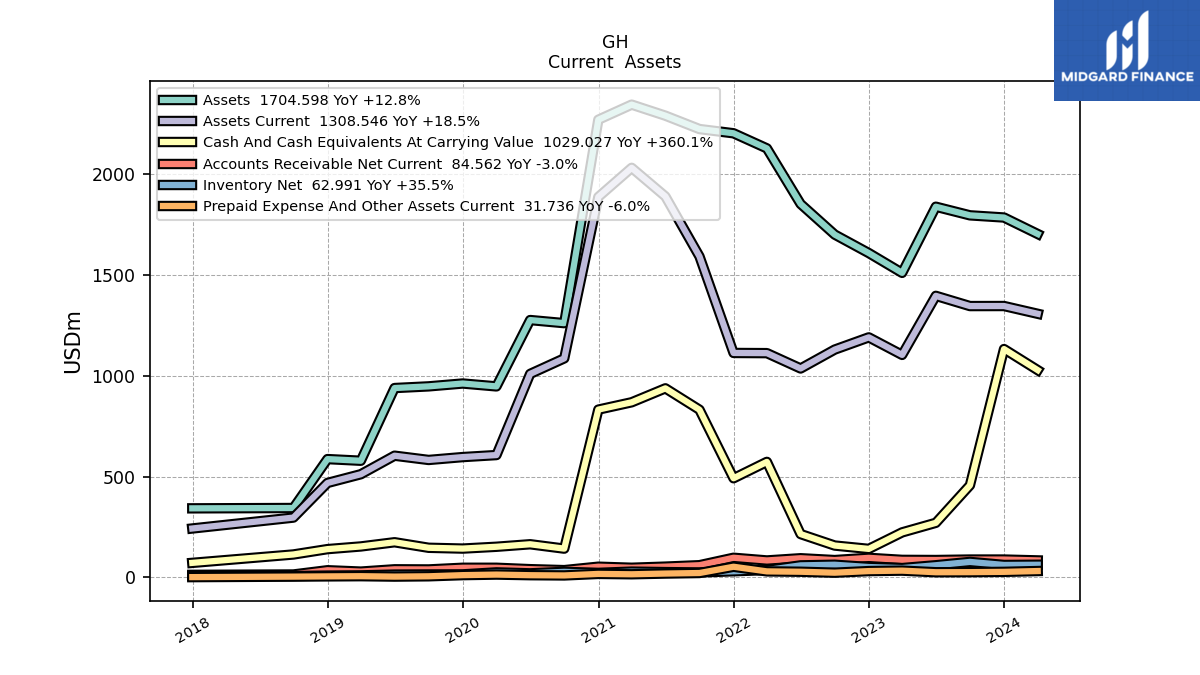
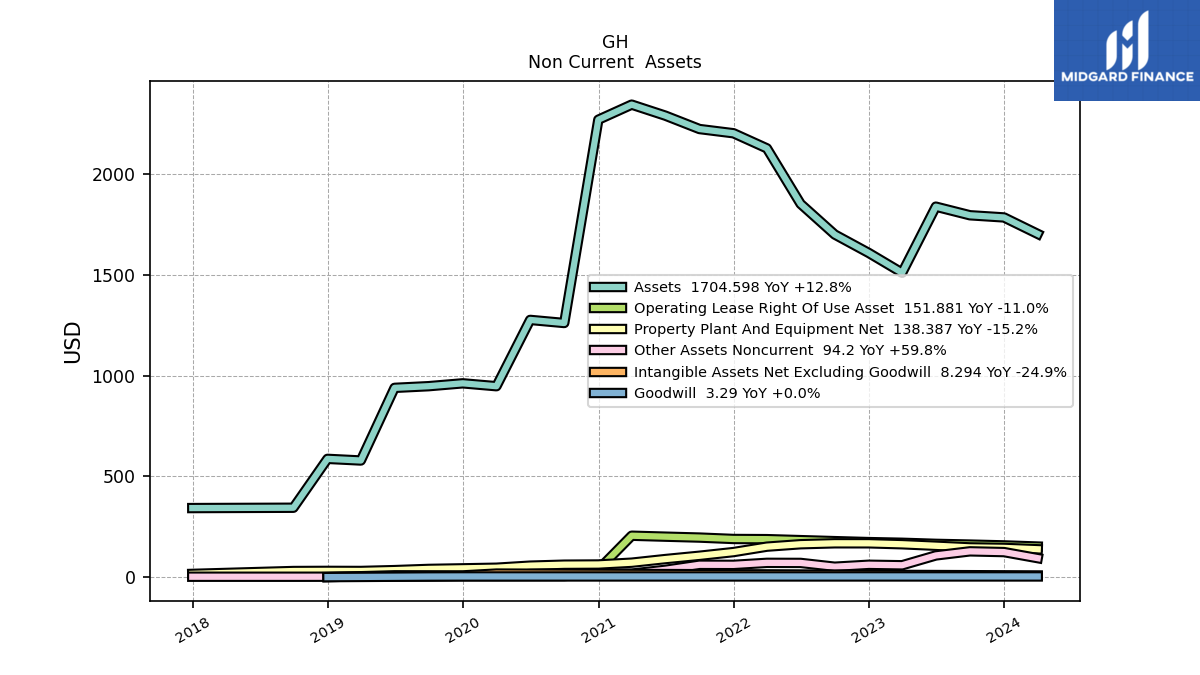
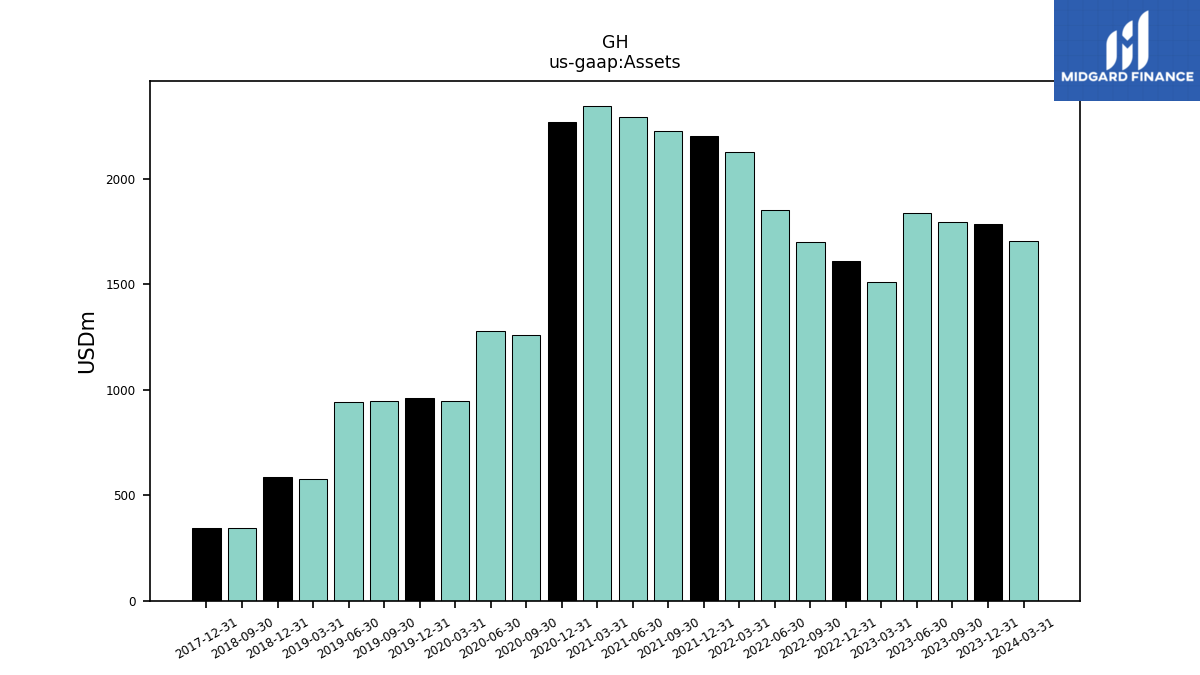
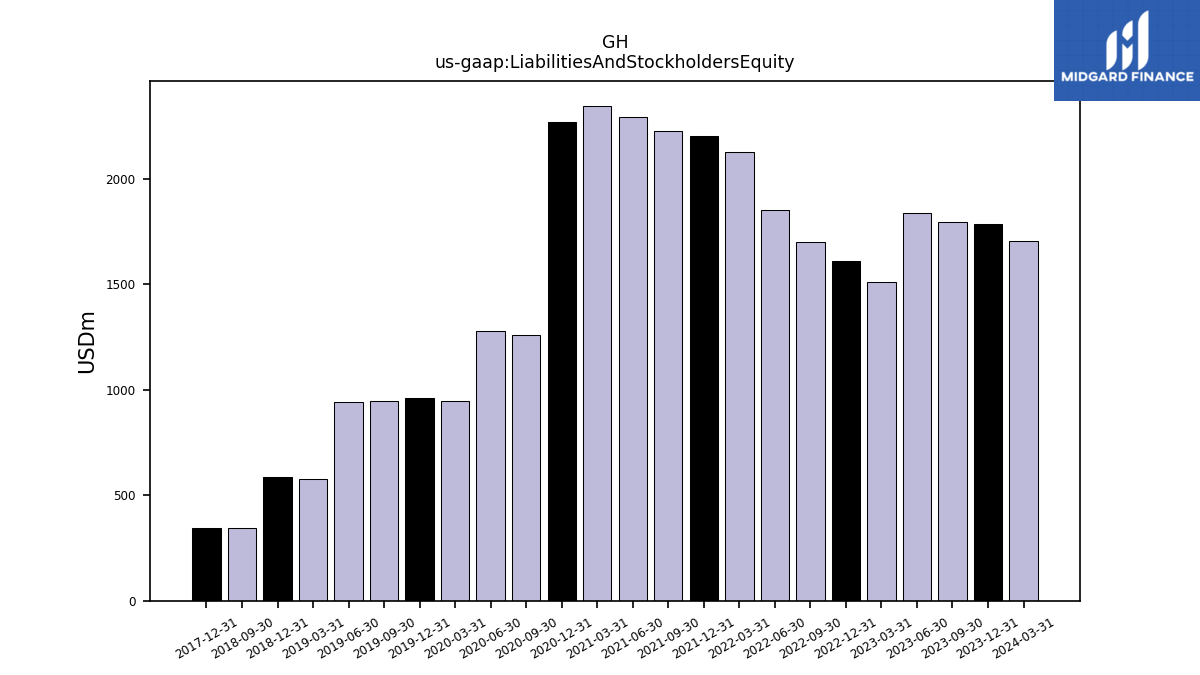
| Assets | 1704.60 | 1786.42 | 1797.23 | 1840.02 | 1511.63 | 1609.98 | 1701.78 | 1853.74 | 2129.60 | 2204.50 | 2225.53 | 2291.89 | 2346.74 | 2271.78 | 1262.11 | 1277.54 | 948.17 | 962.53 | 948.33 | 939.99 | 579.17 | 587.40 | 344.60 | NA | NA | 342.94 | NA | |
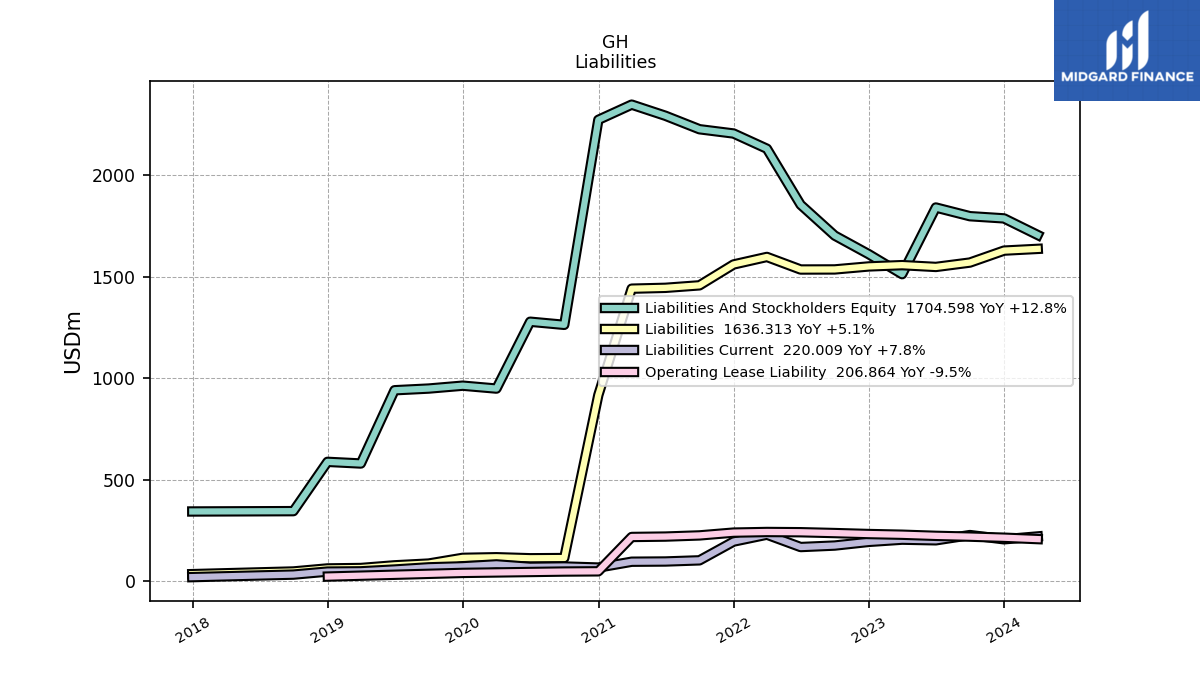
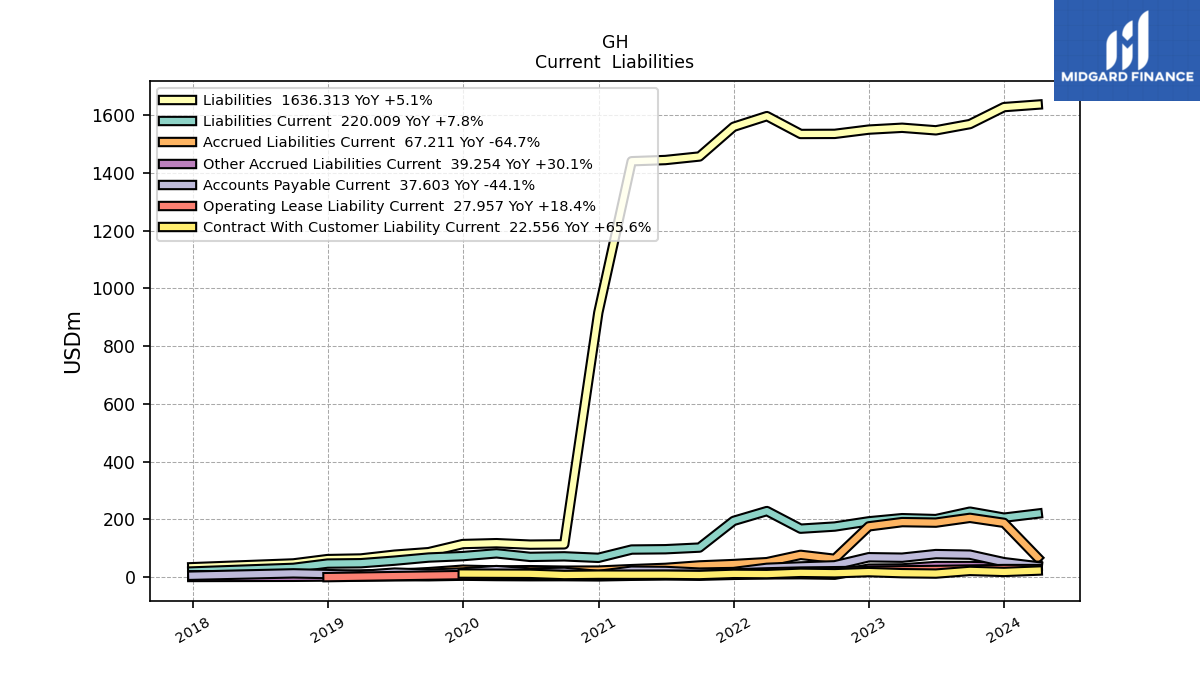
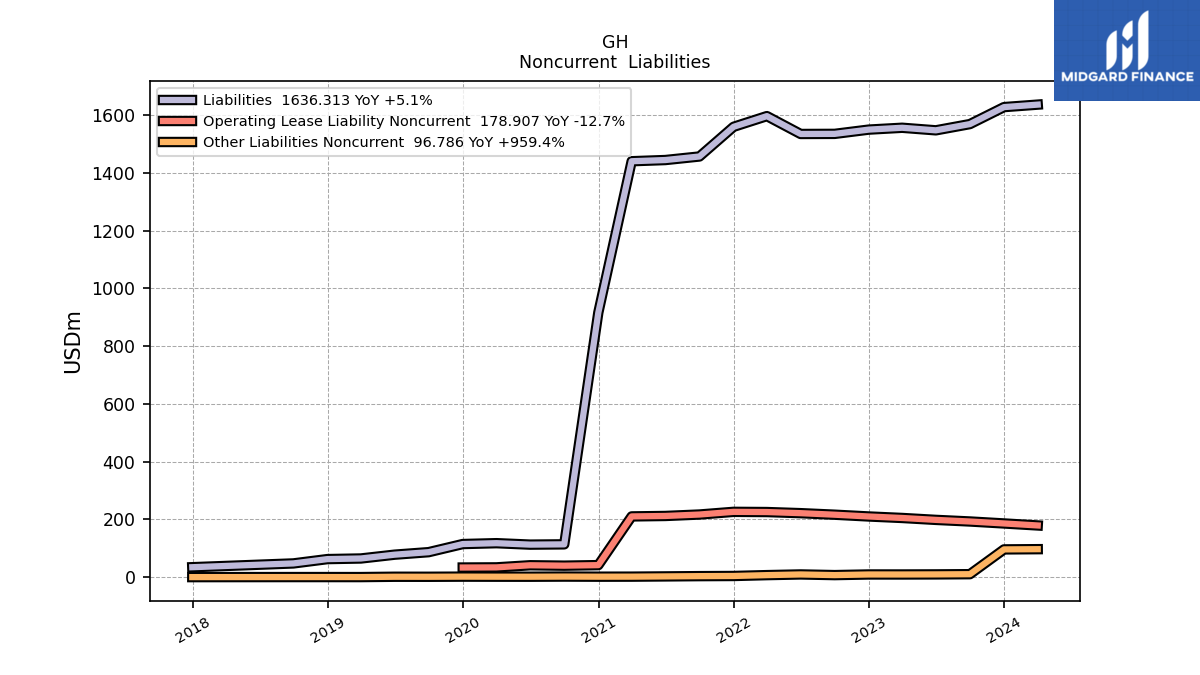
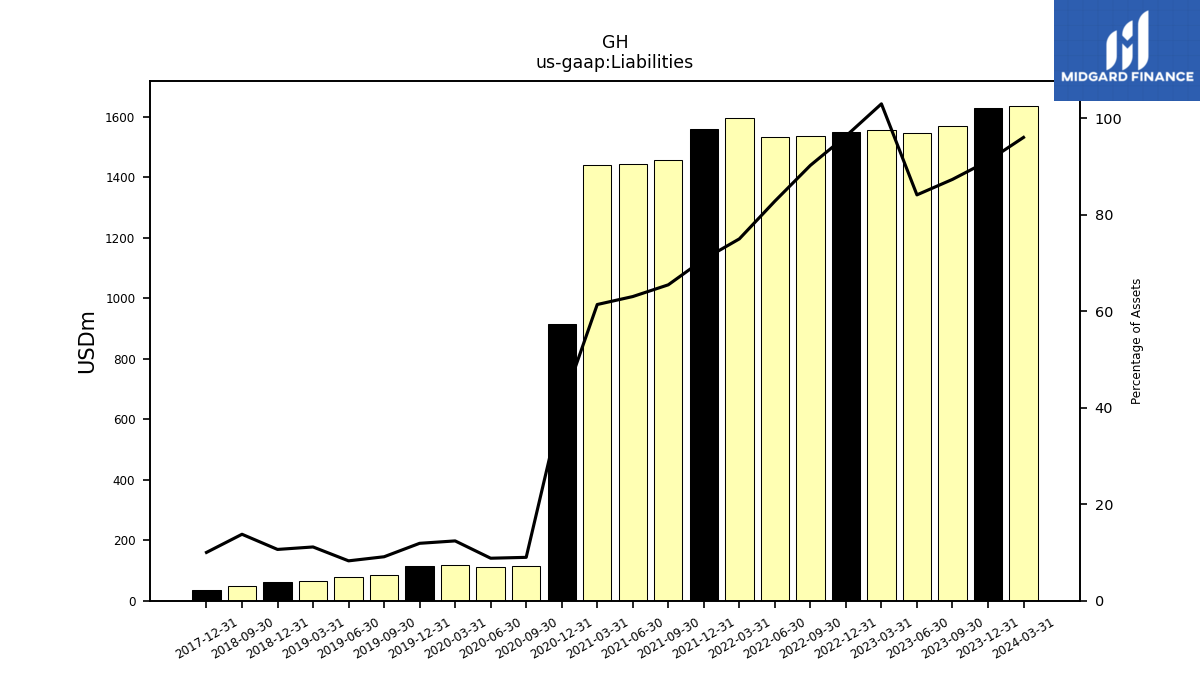
| Liabilities | 1636.31 | 1627.74 | 1568.93 | 1547.29 | 1556.18 | 1549.81 | 1535.03 | 1534.65 | 1596.56 | 1559.49 | 1456.71 | 1444.42 | 1440.30 | 916.19 | 113.50 | 112.55 | 117.55 | 114.54 | 86.44 | 77.72 | 64.54 | 62.45 | 47.46 | NA | NA | 34.33 | NA | |
| Liabilities And Stockholders Equity | 1704.60 | 1786.42 | 1797.23 | 1840.02 | 1511.63 | 1609.98 | 1701.78 | 1853.74 | 2129.60 | 2204.50 | 2225.53 | 2291.89 | 2346.74 | 2271.78 | 1262.11 | 1277.54 | 948.17 | 962.53 | 948.33 | 939.99 | 579.17 | 587.40 | 344.60 | NA | NA | 342.94 | NA | |
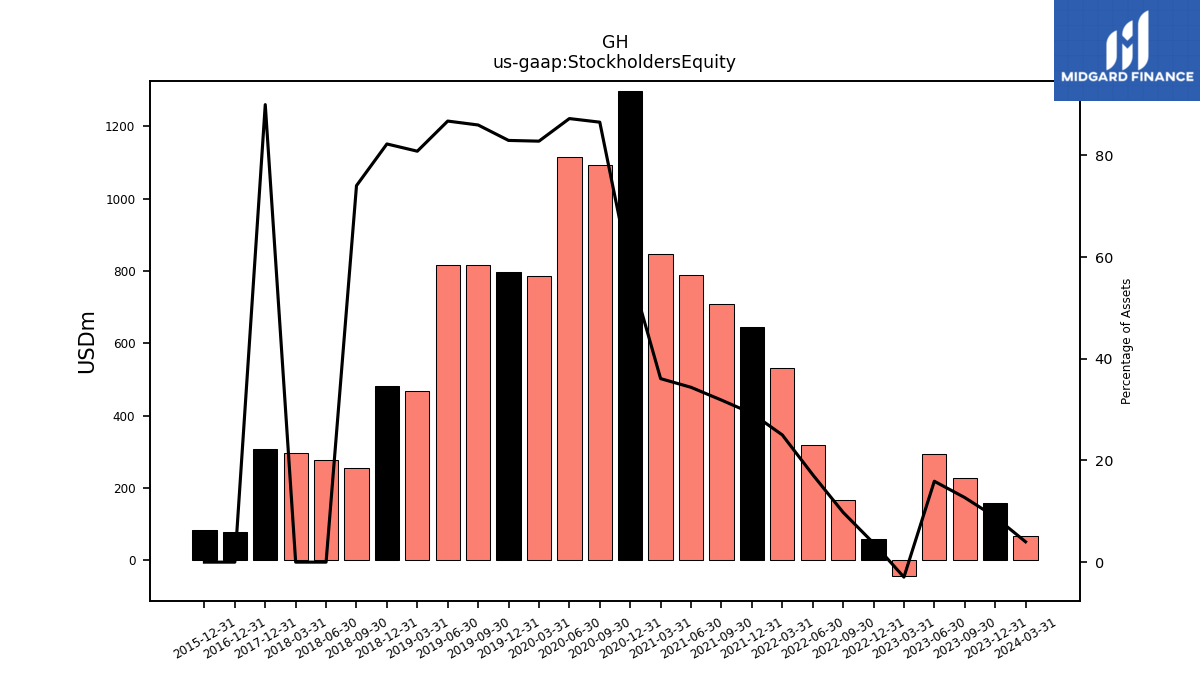
| Stockholders Equity | 68.28 | 158.68 | 228.30 | 292.73 | -44.55 | 60.18 | 166.75 | 319.09 | 533.04 | 645.00 | 709.42 | 788.07 | 847.05 | 1298.49 | 1092.20 | 1114.59 | 785.11 | 798.39 | 815.40 | 815.47 | 468.13 | 483.15 | 255.19 | 276.78 | 296.85 | 308.61 | NA |
| 2024-03-31 | 2023-12-31 | 2023-09-30 | 2023-06-30 | 2023-03-31 | 2022-12-31 | 2022-09-30 | 2022-06-30 | 2022-03-31 | 2021-12-31 | 2021-09-30 | 2021-06-30 | 2021-03-31 | 2020-12-31 | 2020-09-30 | 2020-06-30 | 2020-03-31 | 2019-12-31 | 2019-09-30 | 2019-06-30 | 2019-03-31 | 2018-12-31 | 2018-09-30 | 2018-06-30 | 2018-03-31 | 2017-12-31 | 2017-09-30 | ||
|---|---|---|---|---|---|---|---|---|---|---|---|---|---|---|---|---|---|---|---|---|---|---|---|---|---|---|---|---|
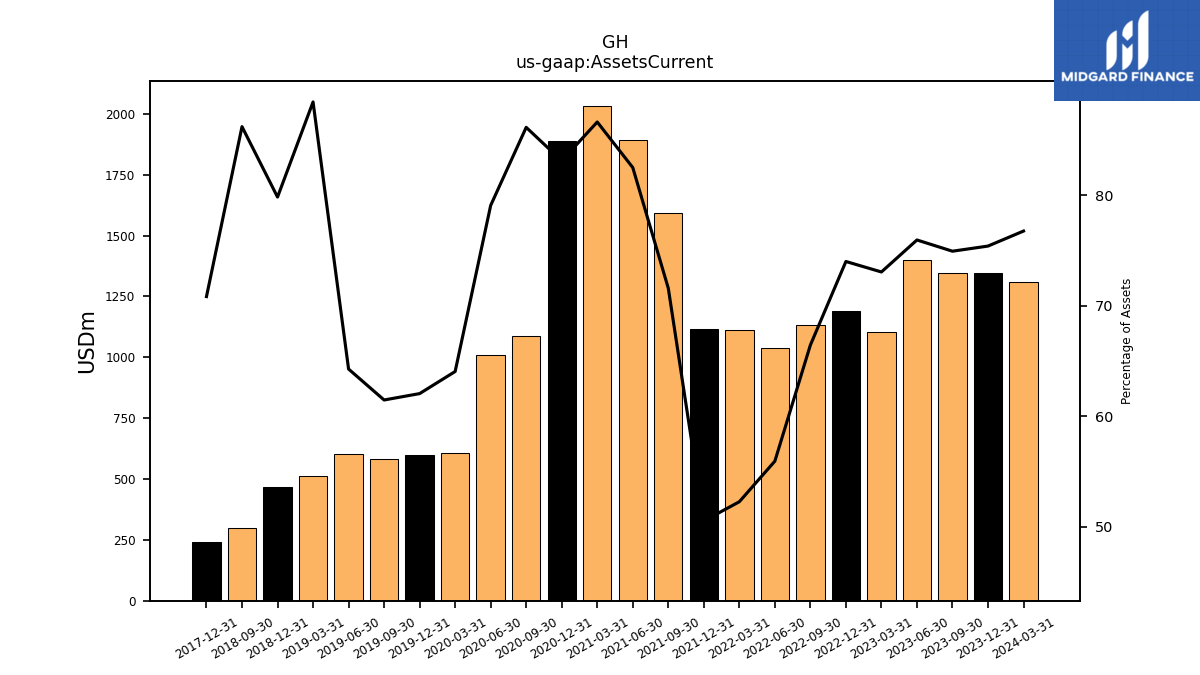
| Assets Current | 1308.55 | 1347.11 | 1346.90 | 1397.65 | 1104.46 | 1191.59 | 1130.85 | 1037.14 | 1113.28 | 1114.13 | 1593.41 | 1891.06 | 2033.04 | 1888.36 | 1087.29 | 1010.30 | 607.39 | 597.36 | 583.06 | 604.25 | 512.25 | 468.99 | 297.08 | NA | NA | 242.94 | NA | |
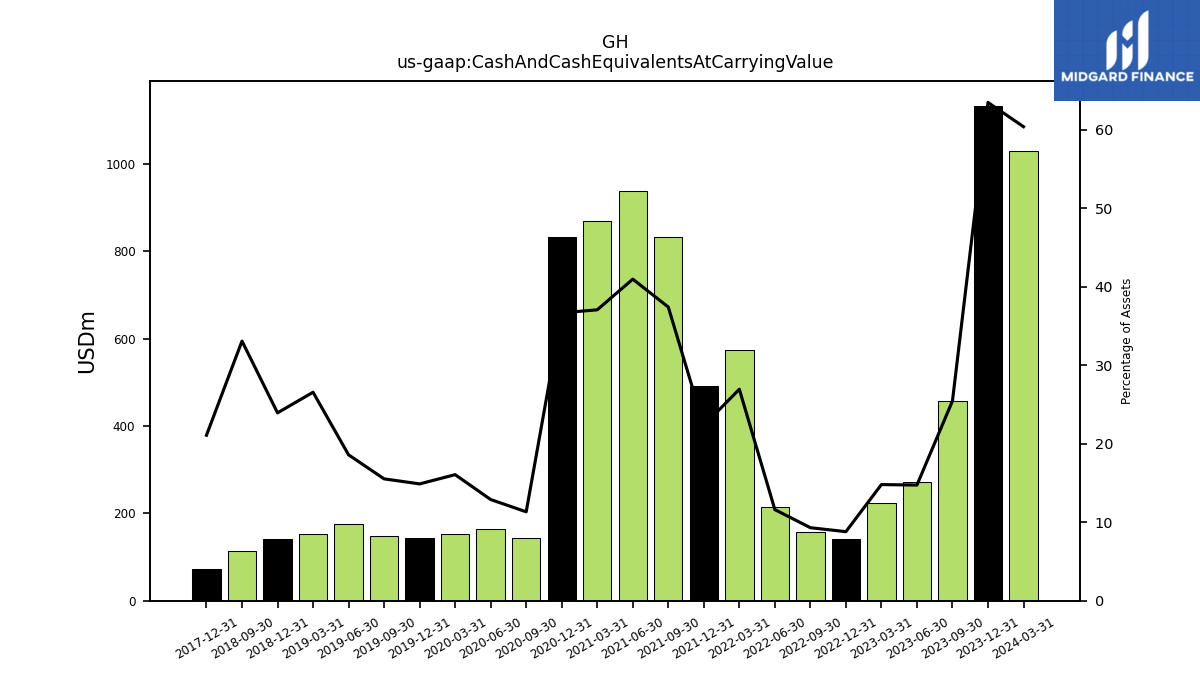
| Cash And Cash Equivalents At Carrying Value | 1029.03 | 1133.54 | 457.34 | 271.07 | 223.64 | 141.65 | 158.31 | 215.17 | 573.60 | 492.20 | 832.37 | 938.59 | 869.37 | 832.98 | 142.94 | 164.67 | 152.24 | 143.23 | 147.19 | 174.65 | 153.79 | 140.54 | 113.96 | NA | NA | 72.28 | NA | |
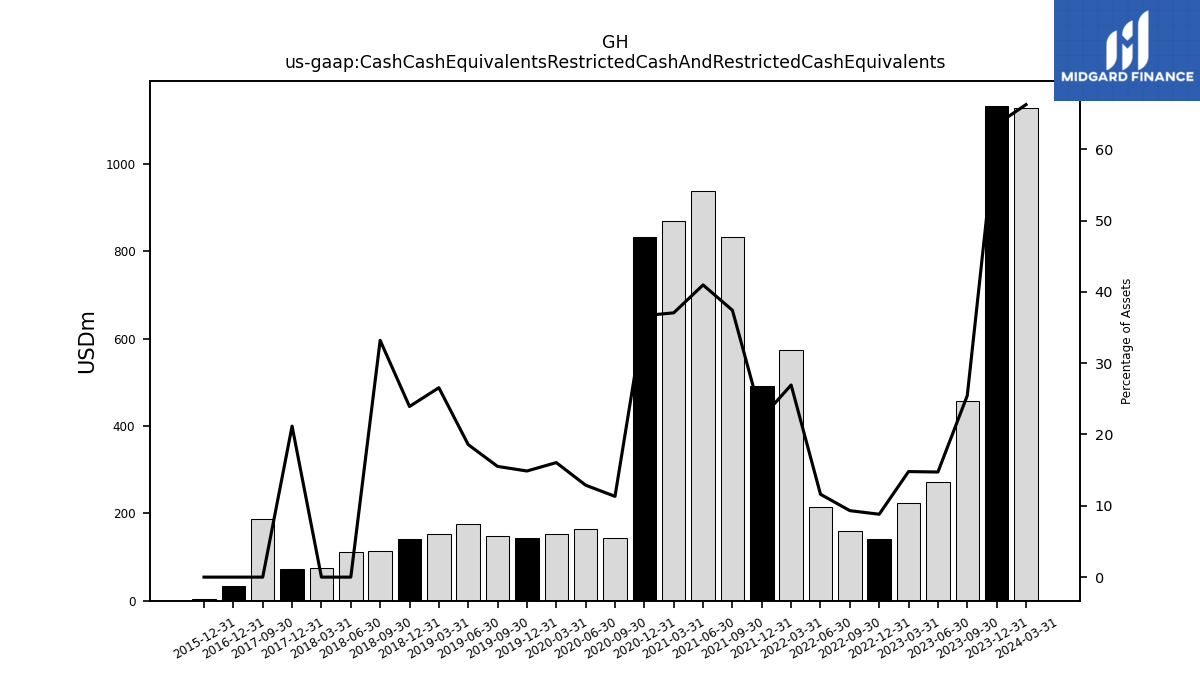
| Cash Cash Equivalents Restricted Cash And Restricted Cash Equivalents | 1129.26 | 1133.69 | 457.36 | 271.17 | 223.71 | 141.95 | 158.61 | 215.34 | 573.67 | 492.29 | 832.69 | 938.90 | 869.52 | 832.98 | 142.94 | 164.67 | 152.24 | 143.23 | 147.19 | 174.65 | 153.79 | 140.54 | 114.38 | 111.19 | 75.77 | 72.60 | 186.37 | |
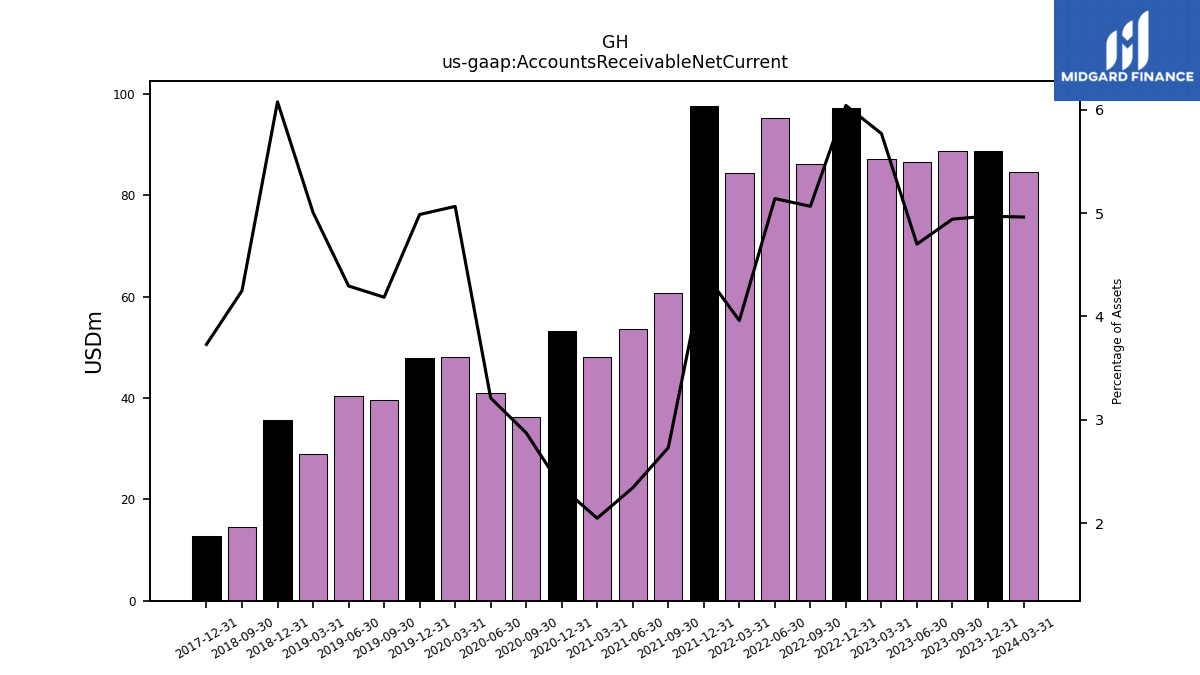
| Accounts Receivable Net Current | 84.56 | 88.78 | 88.80 | 86.47 | 87.20 | 97.26 | 86.20 | 95.28 | 84.33 | 97.65 | 60.74 | 53.67 | 48.04 | 53.30 | 36.26 | 41.02 | 48.02 | 47.99 | 39.69 | 40.36 | 28.99 | 35.69 | 14.64 | NA | NA | 12.79 | NA | |
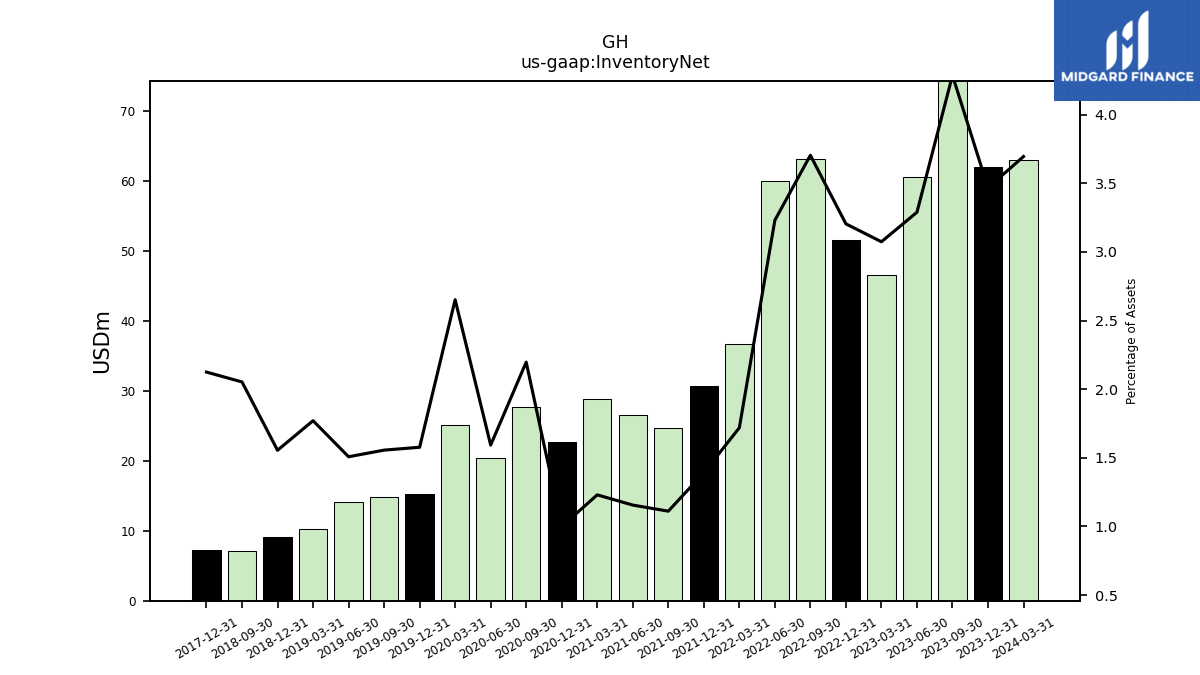
| Inventory Net | 62.99 | 61.95 | 77.04 | 60.53 | 46.47 | 51.60 | 63.05 | 59.89 | 36.61 | 30.67 | 24.74 | 26.49 | 28.88 | 22.72 | 27.73 | 20.35 | 25.15 | 15.18 | 14.76 | 14.18 | 10.26 | 9.14 | 7.08 | NA | NA | 7.29 | NA | |
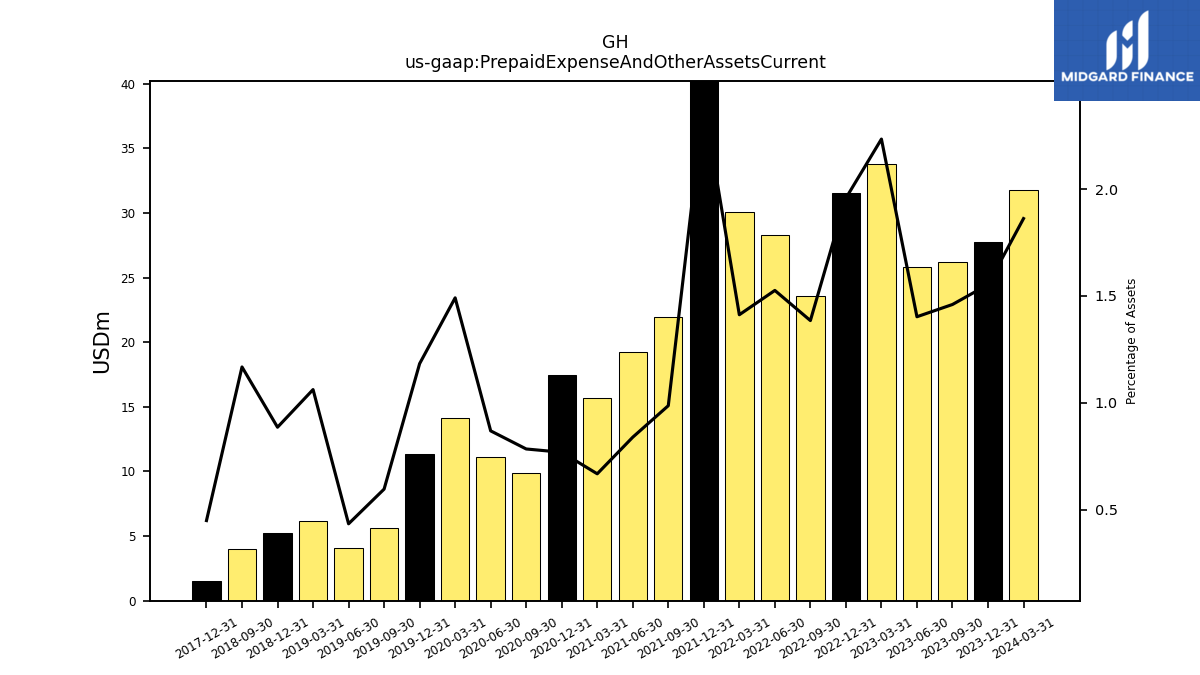
| Prepaid Expense And Other Assets Current | 31.74 | 27.74 | 26.24 | 25.81 | 33.76 | 31.51 | 23.57 | 28.28 | 30.07 | 53.05 | 21.96 | 19.24 | 15.68 | 17.47 | 9.90 | 11.10 | 14.14 | 11.39 | 5.66 | 4.08 | 6.15 | 5.20 | 4.02 | NA | NA | 1.54 | NA | |
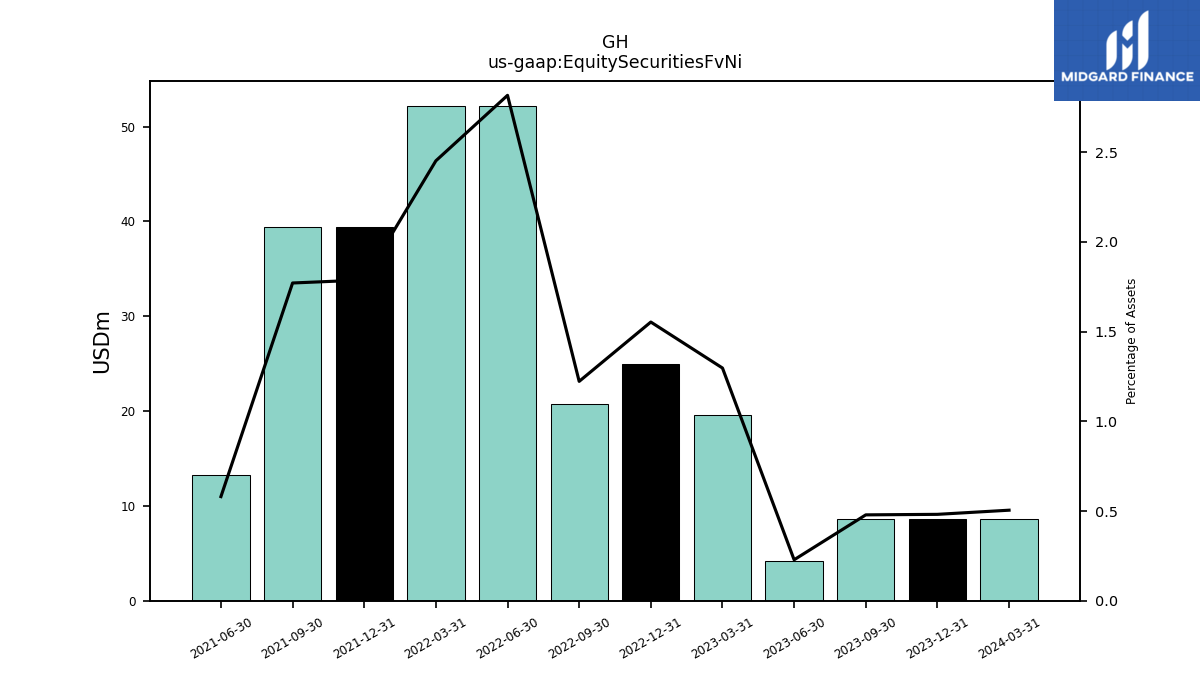
| Equity Securities Fv Ni | 8.60 | 8.60 | 8.60 | 4.20 | 19.60 | 25.00 | 20.80 | 52.20 | 52.20 | 39.40 | 39.40 | 13.30 | NA | NA | NA | NA | NA | NA | NA | NA | NA | NA | NA | NA | NA | NA | NA |
| 2024-03-31 | 2023-12-31 | 2023-09-30 | 2023-06-30 | 2023-03-31 | 2022-12-31 | 2022-09-30 | 2022-06-30 | 2022-03-31 | 2021-12-31 | 2021-09-30 | 2021-06-30 | 2021-03-31 | 2020-12-31 | 2020-09-30 | 2020-06-30 | 2020-03-31 | 2019-12-31 | 2019-09-30 | 2019-06-30 | 2019-03-31 | 2018-12-31 | 2018-09-30 | 2018-06-30 | 2018-03-31 | 2017-12-31 | 2017-09-30 | ||
|---|---|---|---|---|---|---|---|---|---|---|---|---|---|---|---|---|---|---|---|---|---|---|---|---|---|---|---|---|
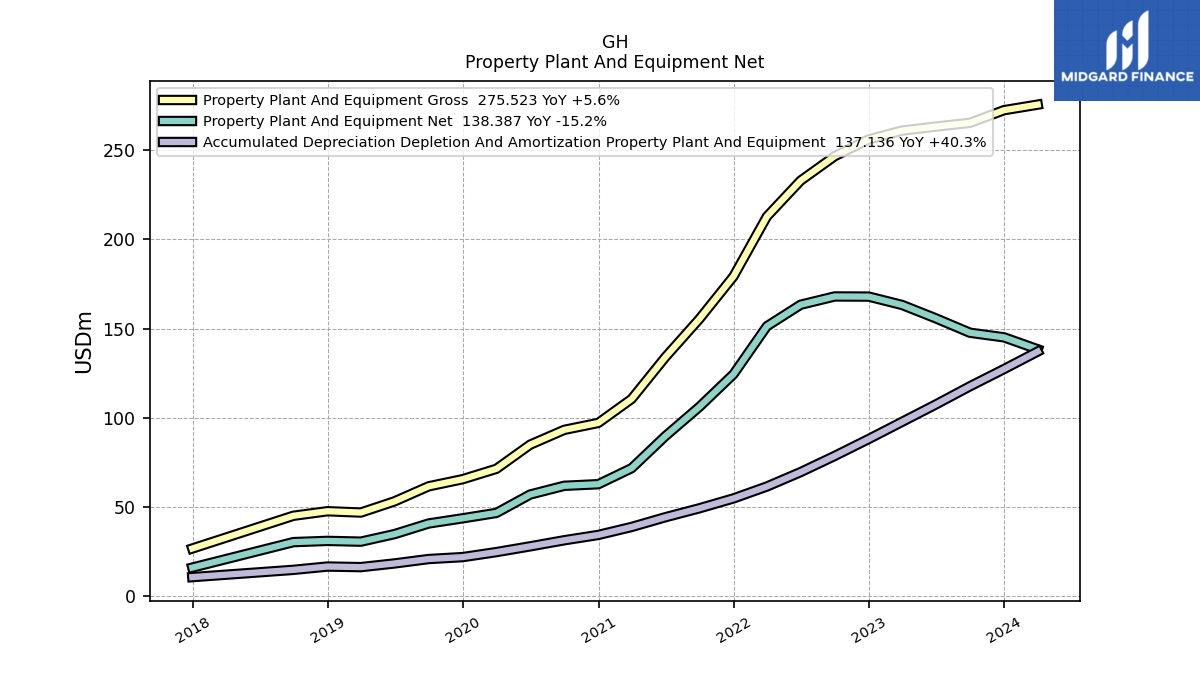
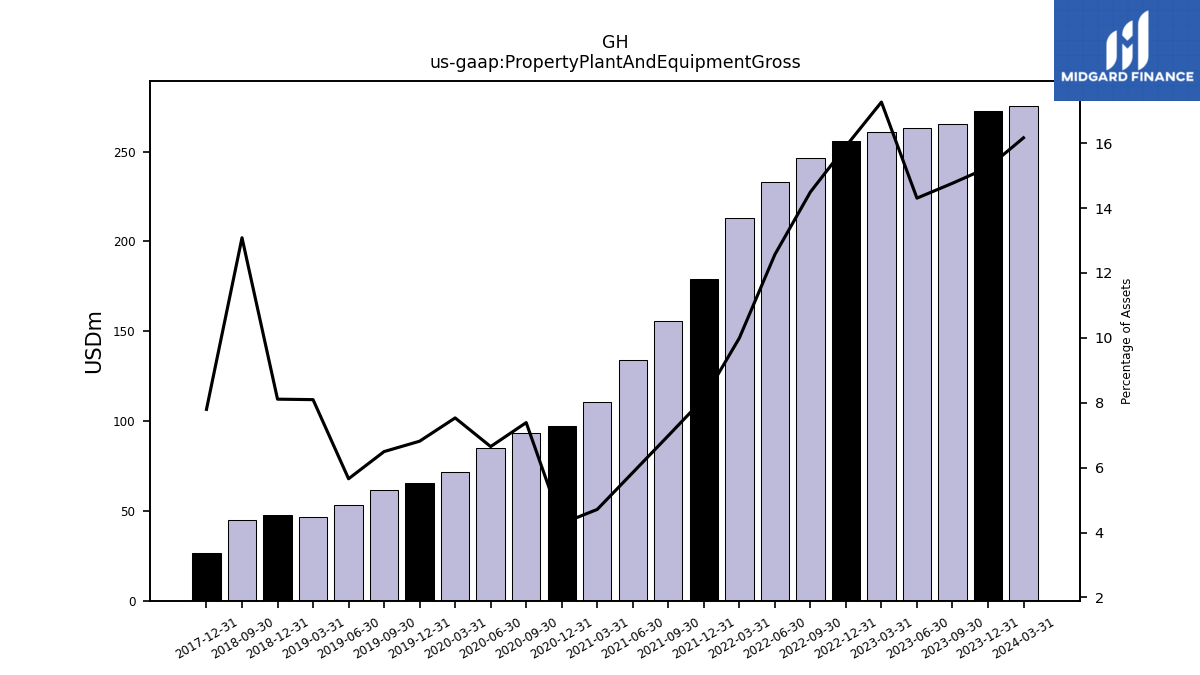
| Property Plant And Equipment Gross | 275.52 | 272.40 | 265.32 | 263.21 | 260.98 | 256.05 | 246.63 | 232.92 | 212.80 | 179.28 | 155.44 | 134.01 | 110.58 | 97.13 | 93.24 | 84.94 | 71.41 | 65.59 | 61.59 | 53.18 | 46.88 | 47.64 | 45.09 | NA | NA | 26.73 | NA | |
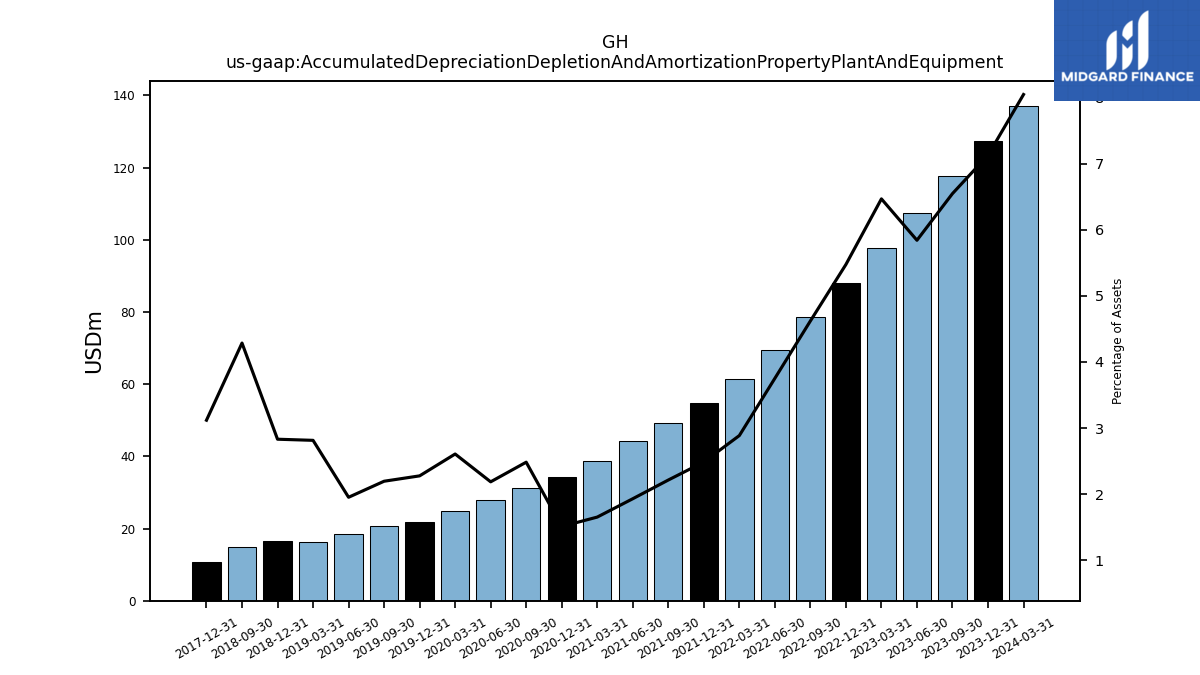
| Accumulated Depreciation Depletion And Amortization Property Plant And Equipment | 137.14 | 127.31 | 117.65 | 107.47 | 97.75 | 88.13 | 78.62 | 69.56 | 61.48 | 54.82 | 49.28 | 44.27 | 38.82 | 34.34 | 31.36 | 27.95 | 24.73 | 21.92 | 20.83 | 18.36 | 16.30 | 16.63 | 14.77 | NA | NA | 10.70 | NA | |
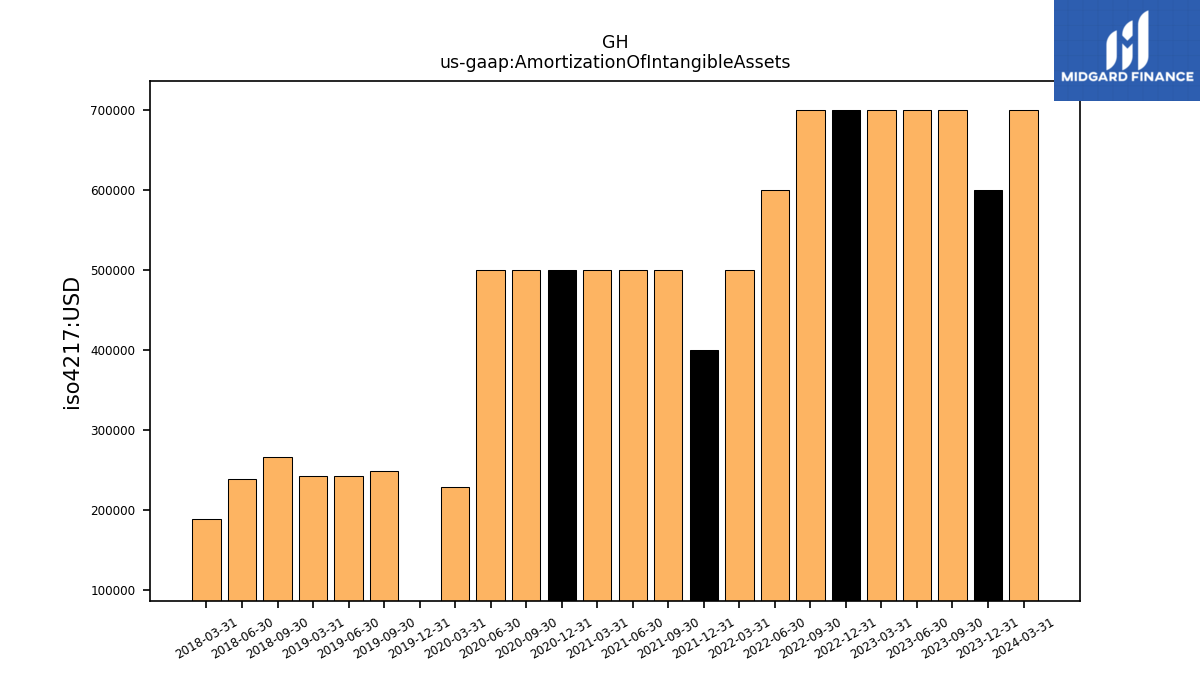
| Amortization Of Intangible Assets | 0.70 | 0.60 | 0.70 | 0.70 | 0.70 | 0.70 | 0.70 | 0.60 | 0.50 | 0.40 | 0.50 | 0.50 | 0.50 | 0.50 | 0.50 | 0.50 | 0.23 | -0.04 | 0.25 | 0.24 | 0.24 | NA | 0.27 | 0.24 | 0.19 | NA | NA | |
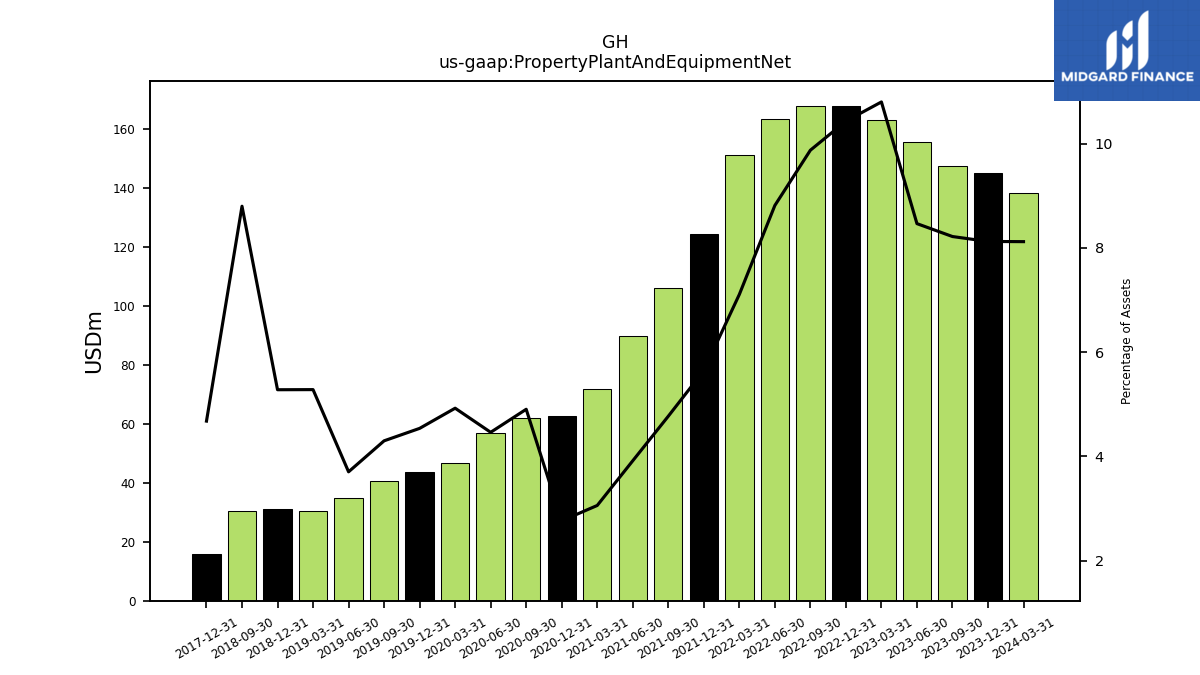
| Property Plant And Equipment Net | 138.39 | 145.10 | 147.67 | 155.74 | 163.23 | 167.92 | 168.01 | 163.36 | 151.32 | 124.46 | 106.16 | 89.74 | 71.77 | 62.78 | 61.88 | 56.99 | 46.69 | 43.67 | 40.76 | 34.81 | 30.58 | 31.00 | 30.32 | NA | NA | 16.04 | NA | |
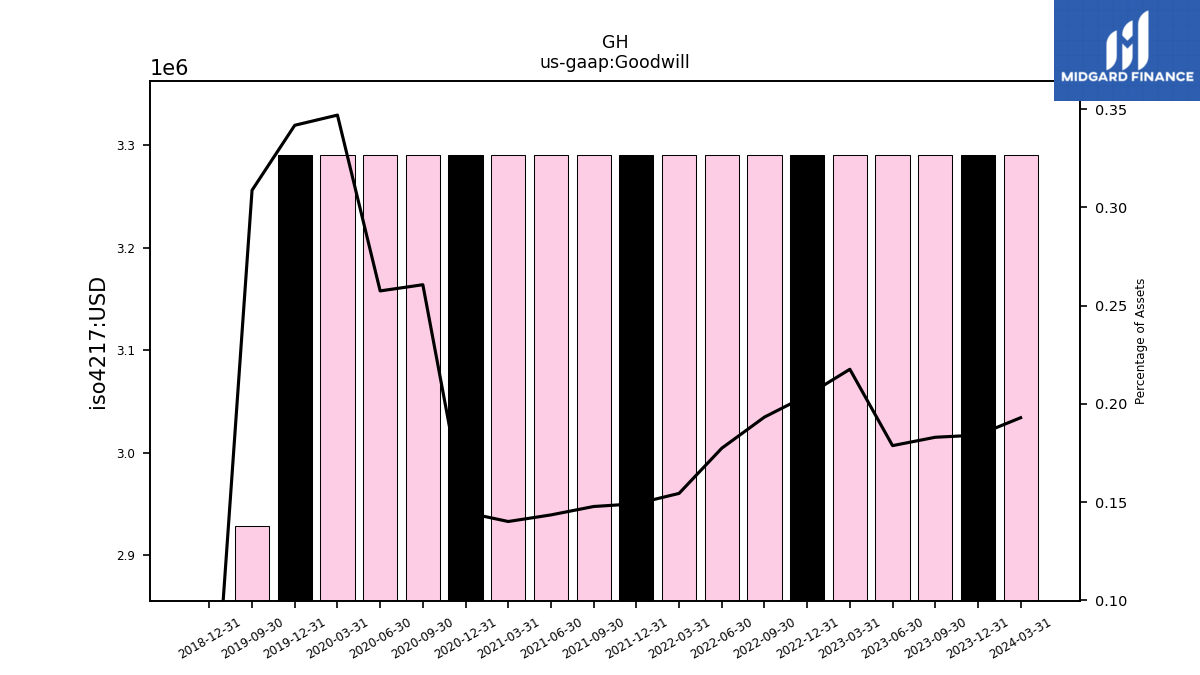
| Goodwill | 3.29 | 3.29 | 3.29 | 3.29 | 3.29 | 3.29 | 3.29 | 3.29 | 3.29 | 3.29 | 3.29 | 3.29 | 3.29 | 3.29 | 3.29 | 3.29 | 3.29 | 3.29 | 2.93 | NA | NA | 0.00 | NA | NA | NA | NA | NA | |
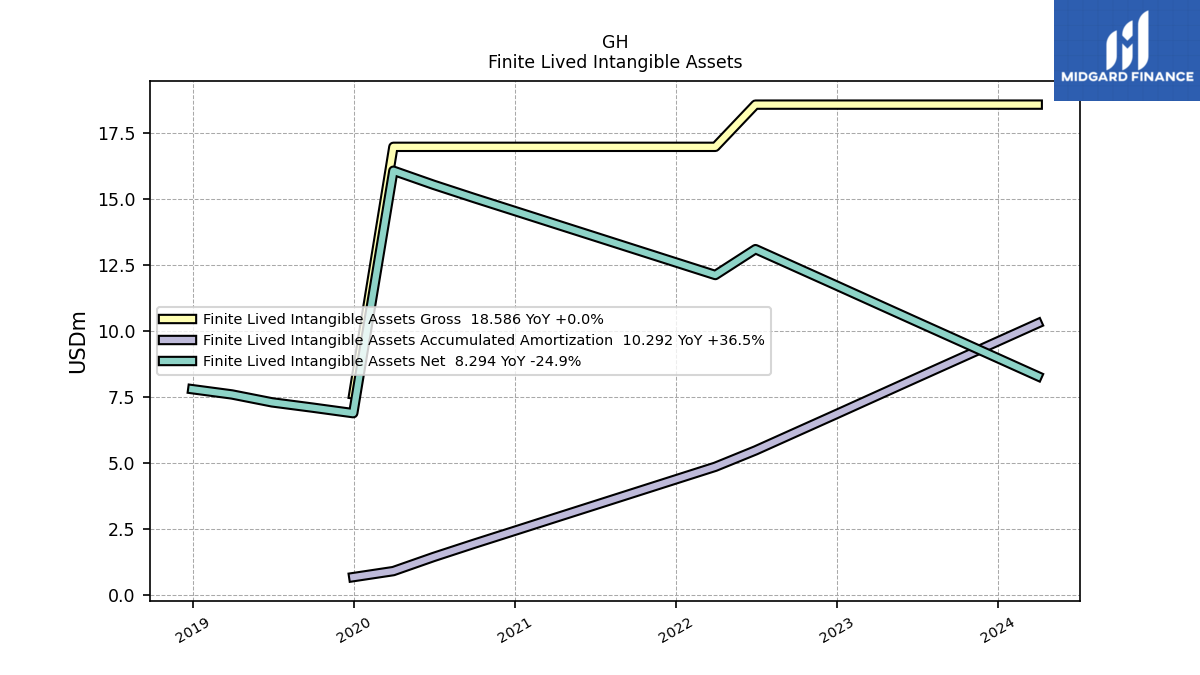
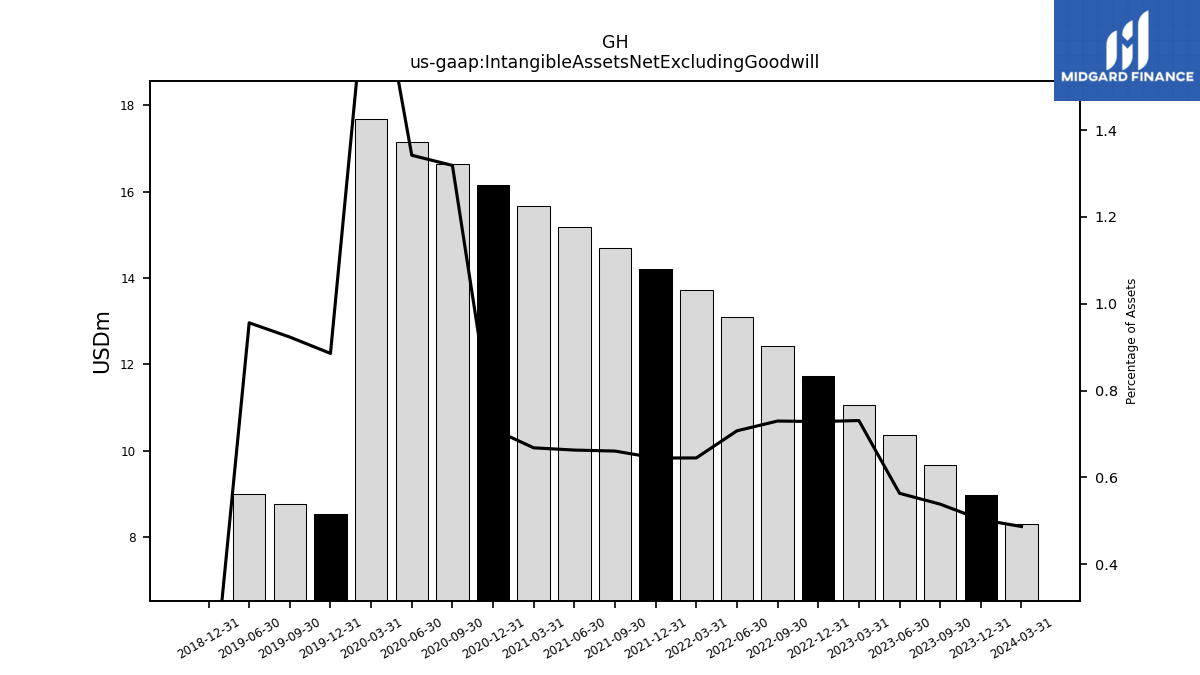
| Intangible Assets Net Excluding Goodwill | 8.29 | 8.98 | 9.67 | 10.36 | 11.05 | 11.73 | 12.42 | 13.11 | 13.73 | 14.21 | 14.70 | 15.19 | 15.67 | 16.16 | 16.64 | 17.15 | 17.68 | 8.52 | 8.76 | 8.99 | NA | 0.00 | NA | NA | NA | NA | NA | |
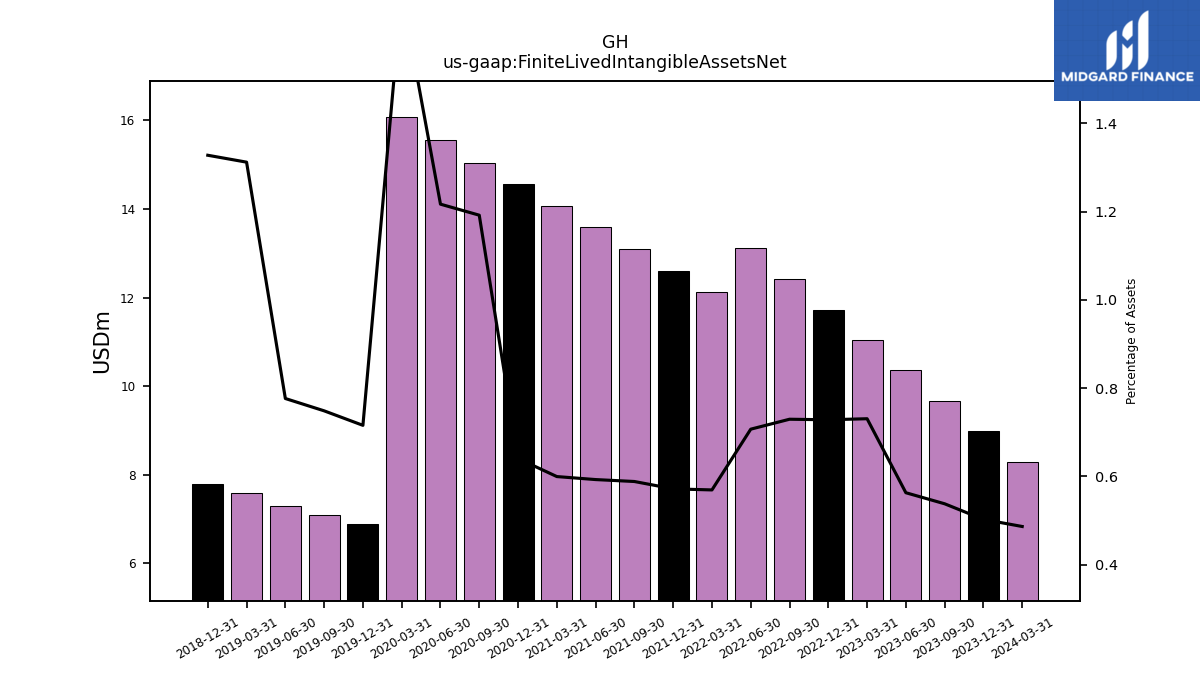
| Finite Lived Intangible Assets Net | 8.29 | 8.98 | 9.67 | 10.36 | 11.05 | 11.73 | 12.42 | 13.11 | 12.13 | 12.61 | 13.10 | 13.59 | 14.07 | 14.55 | 15.04 | 15.55 | 16.08 | 6.89 | 7.10 | 7.30 | 7.60 | 7.80 | NA | NA | NA | NA | NA | |
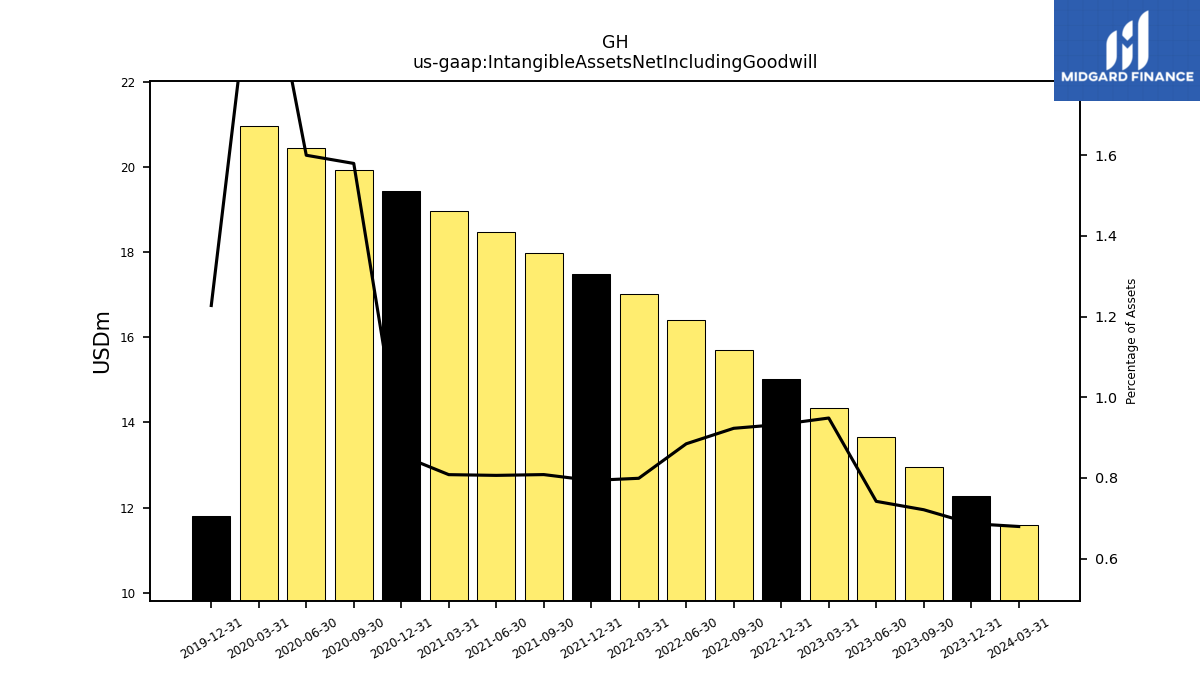
| Intangible Assets Net Including Goodwill | 11.58 | 12.27 | 12.96 | 13.65 | 14.34 | 15.02 | 15.71 | 16.40 | 17.02 | 17.50 | 17.99 | 18.48 | 18.96 | 19.45 | 19.93 | 20.44 | 20.97 | 11.81 | NA | NA | NA | NA | NA | NA | NA | NA | NA | |
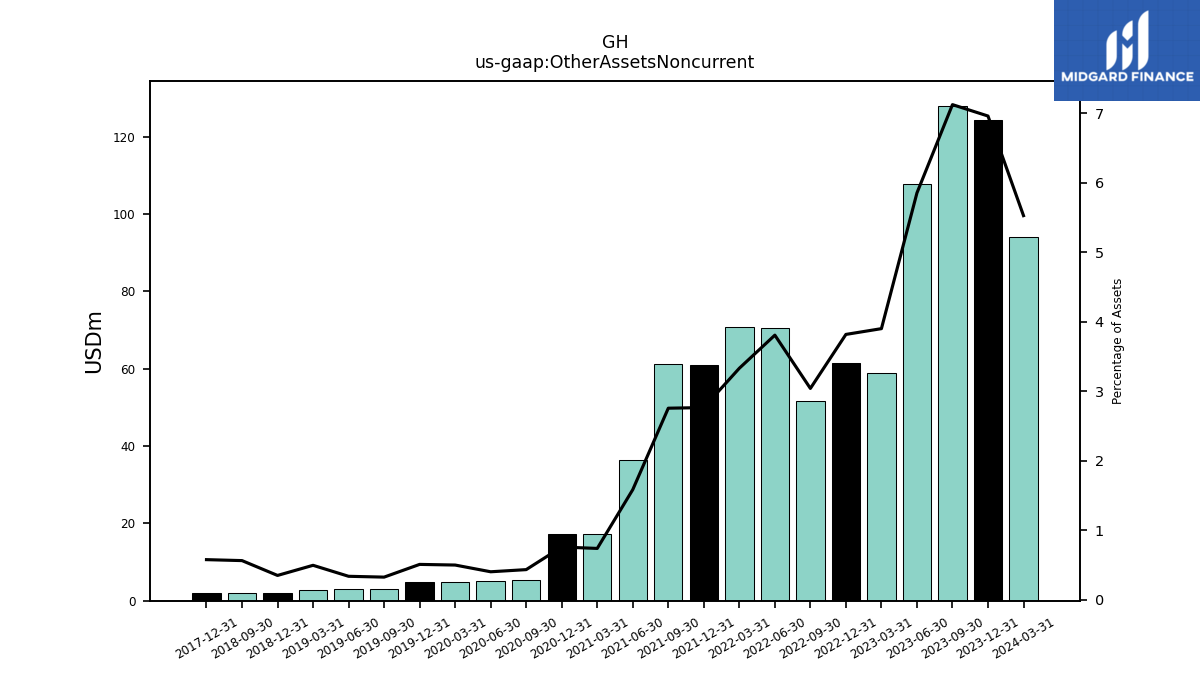
| Other Assets Noncurrent | 94.20 | 124.33 | 128.03 | 107.70 | 58.95 | 61.45 | 51.73 | 70.56 | 70.92 | 60.94 | 61.32 | 36.28 | 17.30 | 17.21 | 5.45 | 5.12 | 4.72 | 4.88 | 3.07 | 3.16 | 2.86 | 2.05 | 1.94 | NA | NA | 1.97 | NA | |
| Equity Securities Fv Ni | 8.60 | 8.60 | 8.60 | 4.20 | 19.60 | 25.00 | 20.80 | 52.20 | 52.20 | 39.40 | 39.40 | 13.30 | NA | NA | NA | NA | NA | NA | NA | NA | NA | NA | NA | NA | NA | NA | NA |
| 2024-03-31 | 2023-12-31 | 2023-09-30 | 2023-06-30 | 2023-03-31 | 2022-12-31 | 2022-09-30 | 2022-06-30 | 2022-03-31 | 2021-12-31 | 2021-09-30 | 2021-06-30 | 2021-03-31 | 2020-12-31 | 2020-09-30 | 2020-06-30 | 2020-03-31 | 2019-12-31 | 2019-09-30 | 2019-06-30 | 2019-03-31 | 2018-12-31 | 2018-09-30 | 2018-06-30 | 2018-03-31 | 2017-12-31 | 2017-09-30 | ||
|---|---|---|---|---|---|---|---|---|---|---|---|---|---|---|---|---|---|---|---|---|---|---|---|---|---|---|---|---|
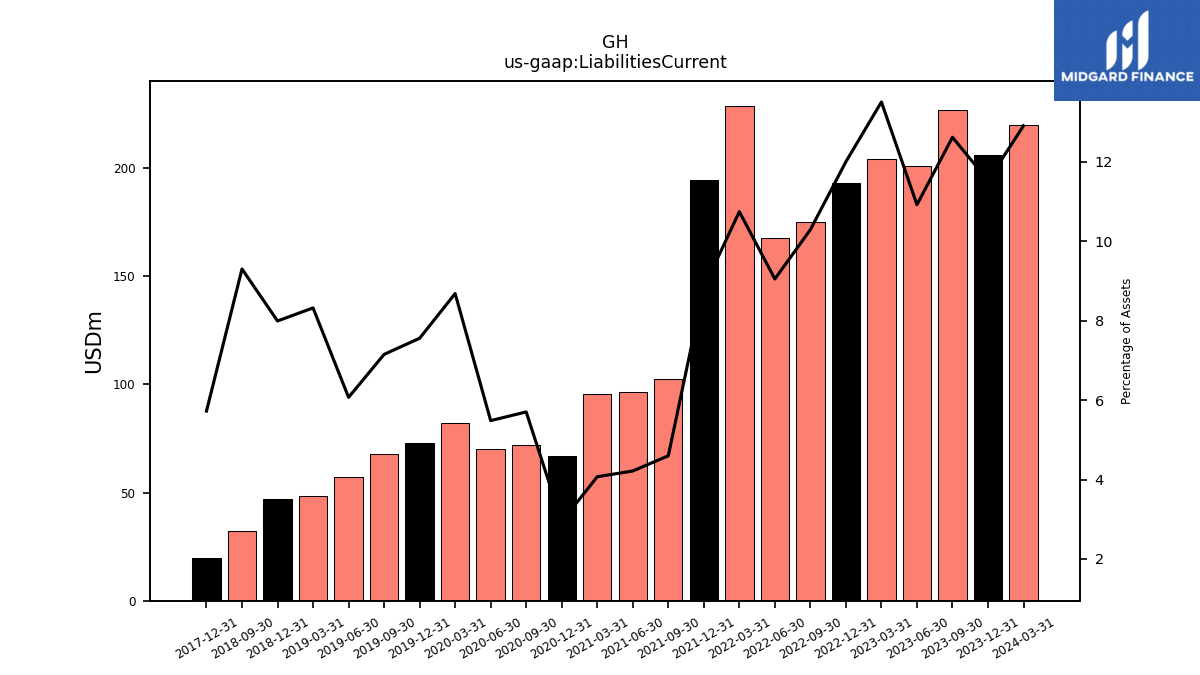
| Liabilities Current | 220.01 | 205.92 | 226.75 | 200.93 | 204.16 | 193.22 | 175.12 | 167.75 | 228.81 | 194.69 | 102.30 | 96.61 | 95.50 | 66.81 | 71.97 | 70.05 | 82.32 | 72.73 | 67.82 | 57.05 | 48.19 | 46.94 | 32.05 | NA | NA | 19.63 | NA | |
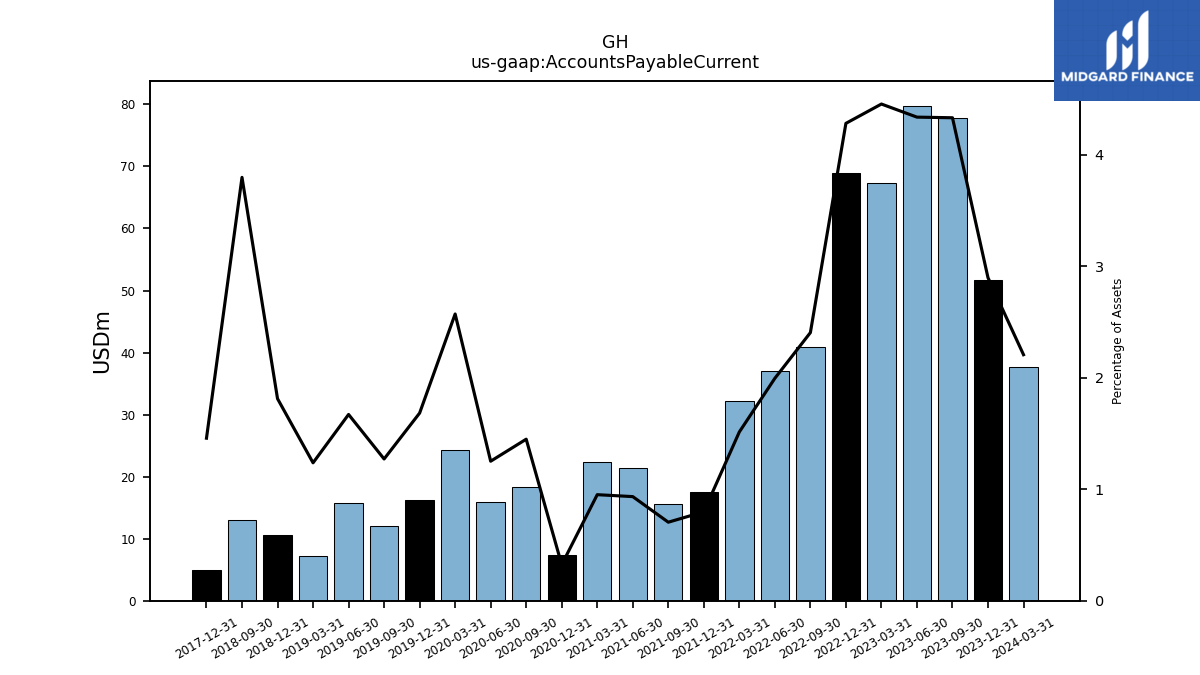
| Accounts Payable Current | 37.60 | 51.74 | 77.83 | 79.78 | 67.32 | 68.91 | 40.91 | 36.97 | 32.23 | 17.58 | 15.67 | 21.40 | 22.32 | 7.34 | 18.28 | 15.98 | 24.38 | 16.20 | 12.05 | 15.70 | 7.16 | 10.64 | 13.08 | NA | NA | 5.00 | NA | |
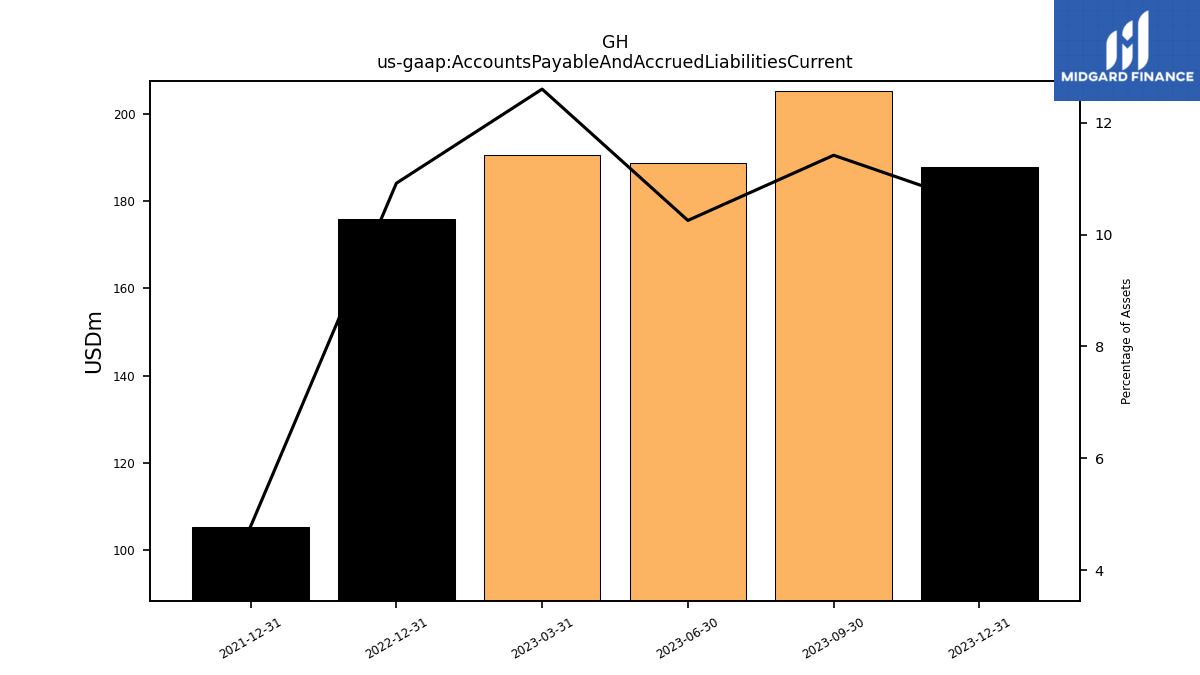
| Accounts Payable And Accrued Liabilities Current | NA | 187.95 | 205.27 | 188.70 | 190.53 | 175.82 | NA | NA | NA | 105.36 | NA | NA | NA | NA | NA | NA | NA | NA | NA | NA | NA | NA | NA | NA | NA | NA | NA | |
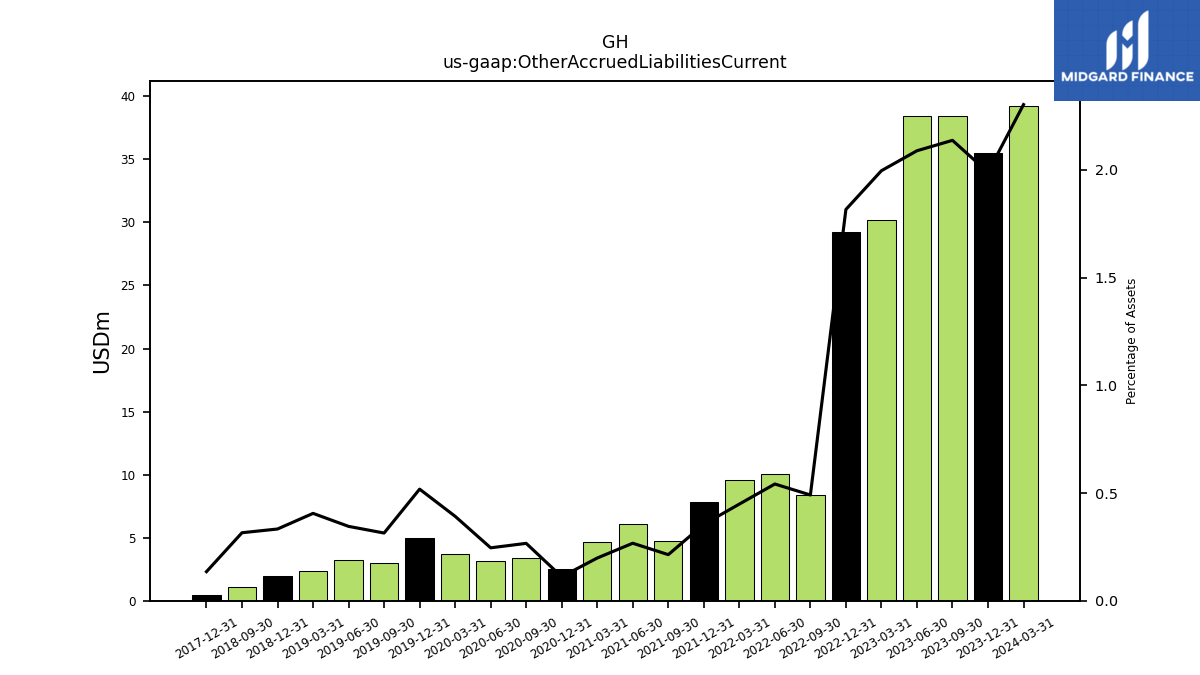
| Other Accrued Liabilities Current | 39.25 | 35.52 | 38.41 | 38.43 | 30.17 | 29.24 | 8.35 | 10.04 | 9.55 | 7.82 | 4.76 | 6.12 | 4.65 | 2.54 | 3.36 | 3.14 | 3.72 | 4.99 | 2.98 | 3.25 | 2.35 | 1.96 | 1.09 | NA | NA | 0.46 | NA | |
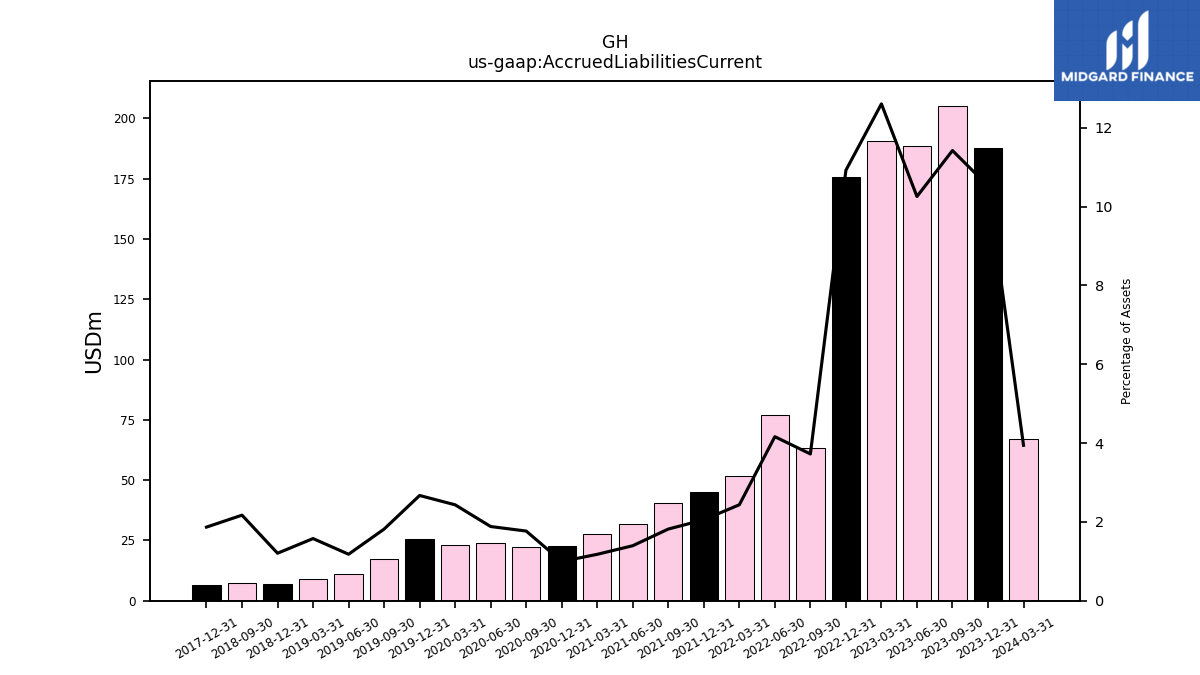
| Accrued Liabilities Current | 67.21 | 187.95 | 205.27 | 188.70 | 190.53 | 175.82 | 63.37 | 77.16 | 51.85 | 45.28 | 40.48 | 32.00 | 27.64 | 22.64 | 22.31 | 24.05 | 23.07 | 25.70 | 17.24 | 11.09 | 9.14 | 7.08 | 7.48 | NA | NA | 6.41 | NA | |
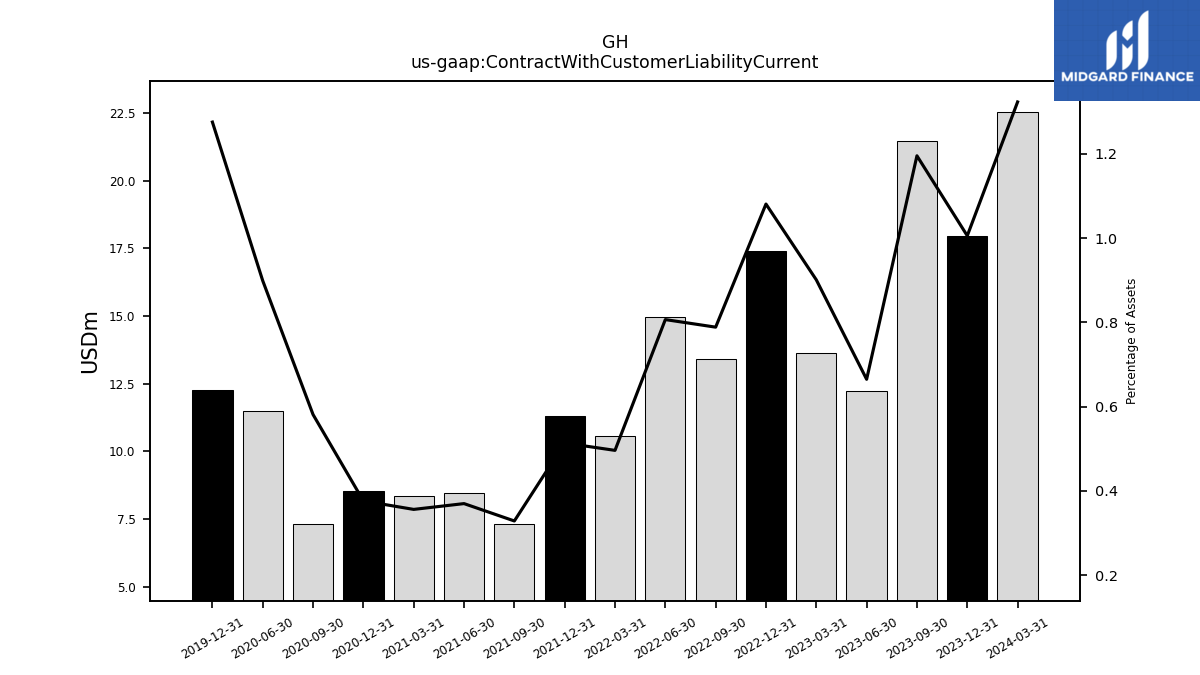
| Contract With Customer Liability Current | 22.56 | 17.96 | 21.48 | 12.24 | 13.62 | 17.40 | 13.42 | 14.96 | 10.57 | 11.33 | 7.32 | 8.48 | 8.36 | 8.55 | 7.34 | 11.48 | NA | 12.28 | NA | NA | NA | NA | NA | NA | NA | NA | NA |
| 2024-03-31 | 2023-12-31 | 2023-09-30 | 2023-06-30 | 2023-03-31 | 2022-12-31 | 2022-09-30 | 2022-06-30 | 2022-03-31 | 2021-12-31 | 2021-09-30 | 2021-06-30 | 2021-03-31 | 2020-12-31 | 2020-09-30 | 2020-06-30 | 2020-03-31 | 2019-12-31 | 2019-09-30 | 2019-06-30 | 2019-03-31 | 2018-12-31 | 2018-09-30 | 2018-06-30 | 2018-03-31 | 2017-12-31 | 2017-09-30 | ||
|---|---|---|---|---|---|---|---|---|---|---|---|---|---|---|---|---|---|---|---|---|---|---|---|---|---|---|---|---|
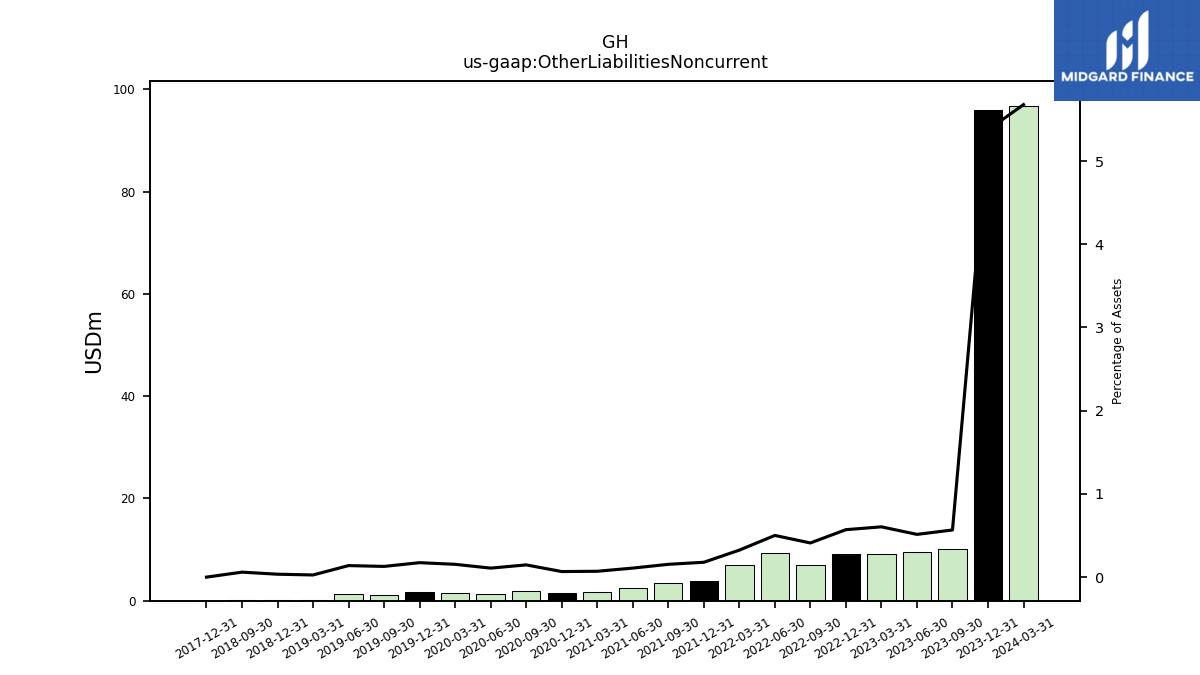
| Other Liabilities Noncurrent | 96.79 | 96.01 | 10.18 | 9.45 | 9.14 | 9.18 | 6.99 | 9.29 | 6.91 | 3.93 | 3.42 | 2.49 | 1.65 | 1.52 | 1.86 | 1.38 | 1.46 | 1.67 | 1.22 | 1.30 | 0.15 | 0.21 | 0.21 | NA | NA | 0.00 | NA | |
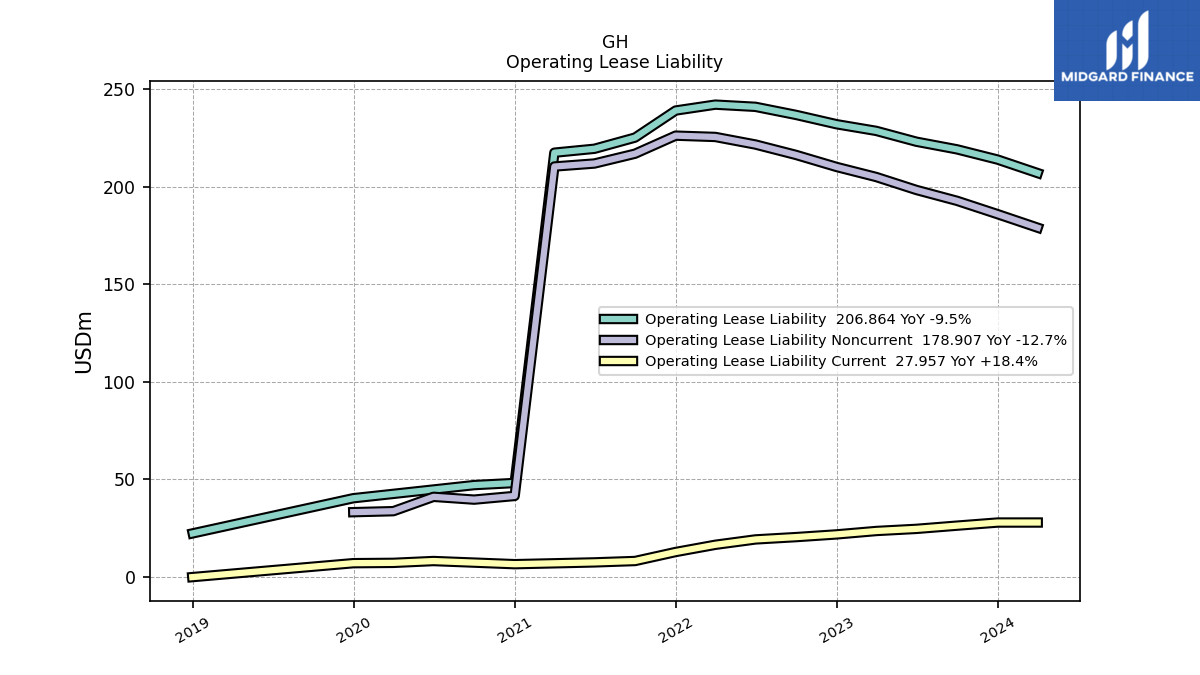
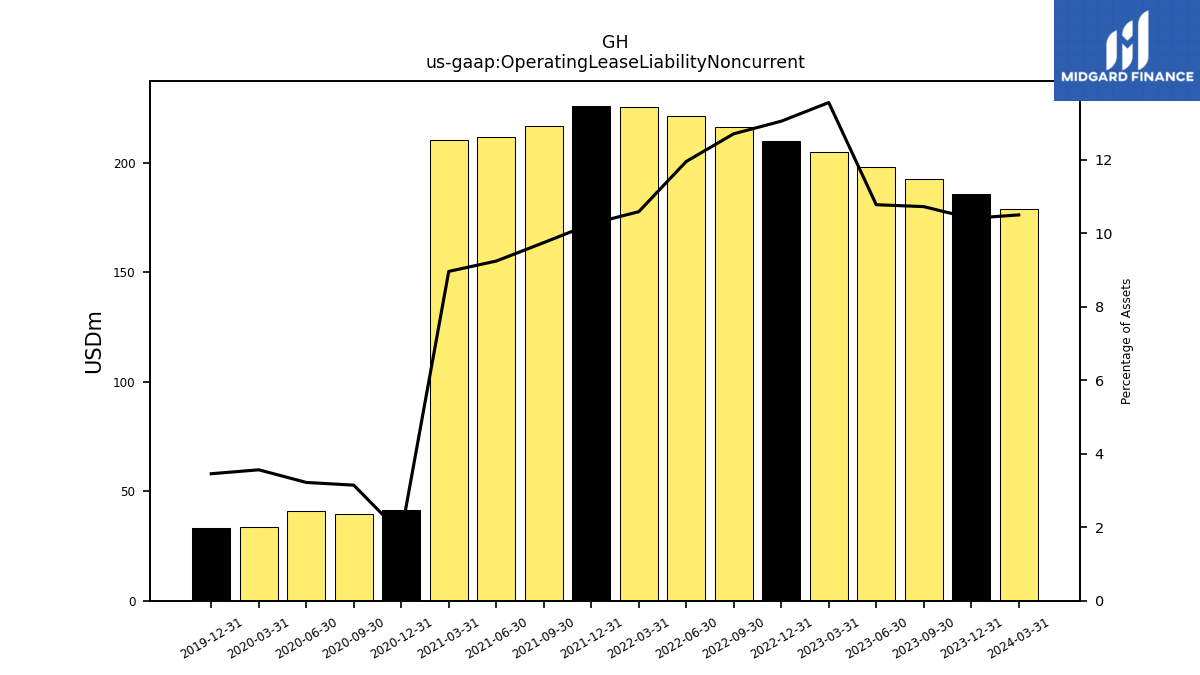
| Operating Lease Liability Noncurrent | 178.91 | 185.85 | 192.68 | 198.23 | 204.86 | 210.01 | 216.17 | 221.50 | 225.38 | 226.05 | 216.81 | 211.78 | 210.24 | 41.56 | 39.68 | 41.12 | 33.77 | 33.26 | NA | NA | NA | NA | NA | NA | NA | NA | NA |
| 2024-03-31 | 2023-12-31 | 2023-09-30 | 2023-06-30 | 2023-03-31 | 2022-12-31 | 2022-09-30 | 2022-06-30 | 2022-03-31 | 2021-12-31 | 2021-09-30 | 2021-06-30 | 2021-03-31 | 2020-12-31 | 2020-09-30 | 2020-06-30 | 2020-03-31 | 2019-12-31 | 2019-09-30 | 2019-06-30 | 2019-03-31 | 2018-12-31 | 2018-09-30 | 2018-06-30 | 2018-03-31 | 2017-12-31 | 2017-09-30 | ||
|---|---|---|---|---|---|---|---|---|---|---|---|---|---|---|---|---|---|---|---|---|---|---|---|---|---|---|---|---|
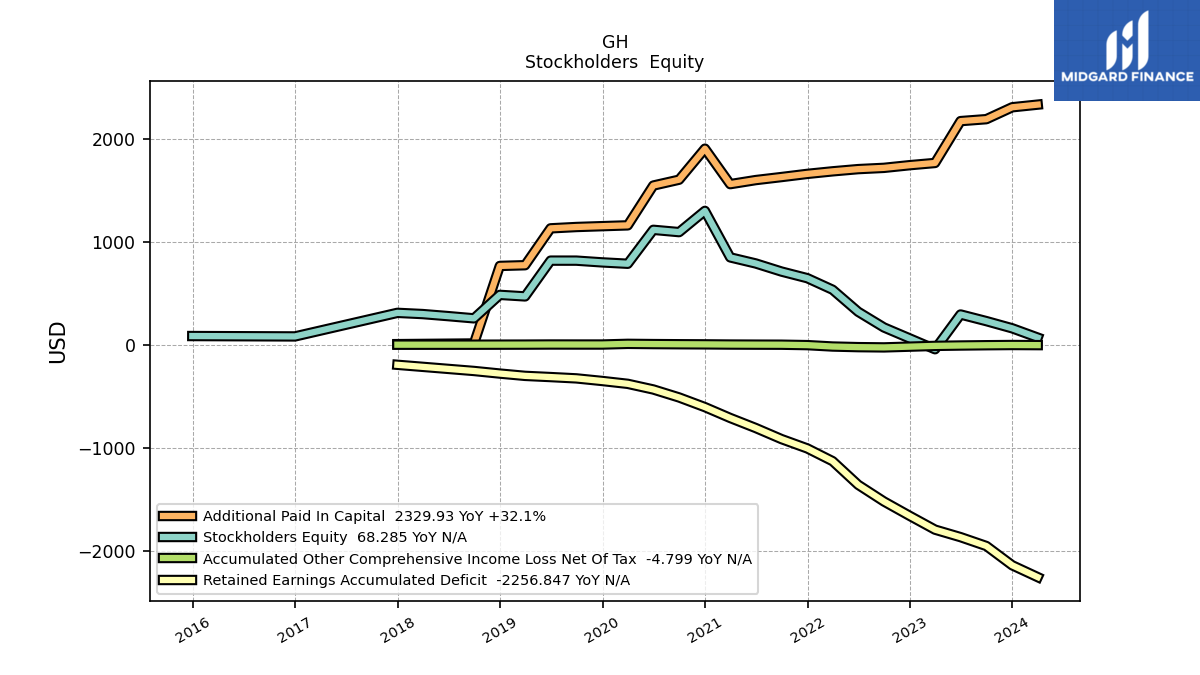
| Stockholders Equity | 68.28 | 158.68 | 228.30 | 292.73 | -44.55 | 60.18 | 166.75 | 319.09 | 533.04 | 645.00 | 709.42 | 788.07 | 847.05 | 1298.49 | 1092.20 | 1114.59 | 785.11 | 798.39 | 815.40 | 815.47 | 468.13 | 483.15 | 255.19 | 276.78 | 296.85 | 308.61 | NA | |
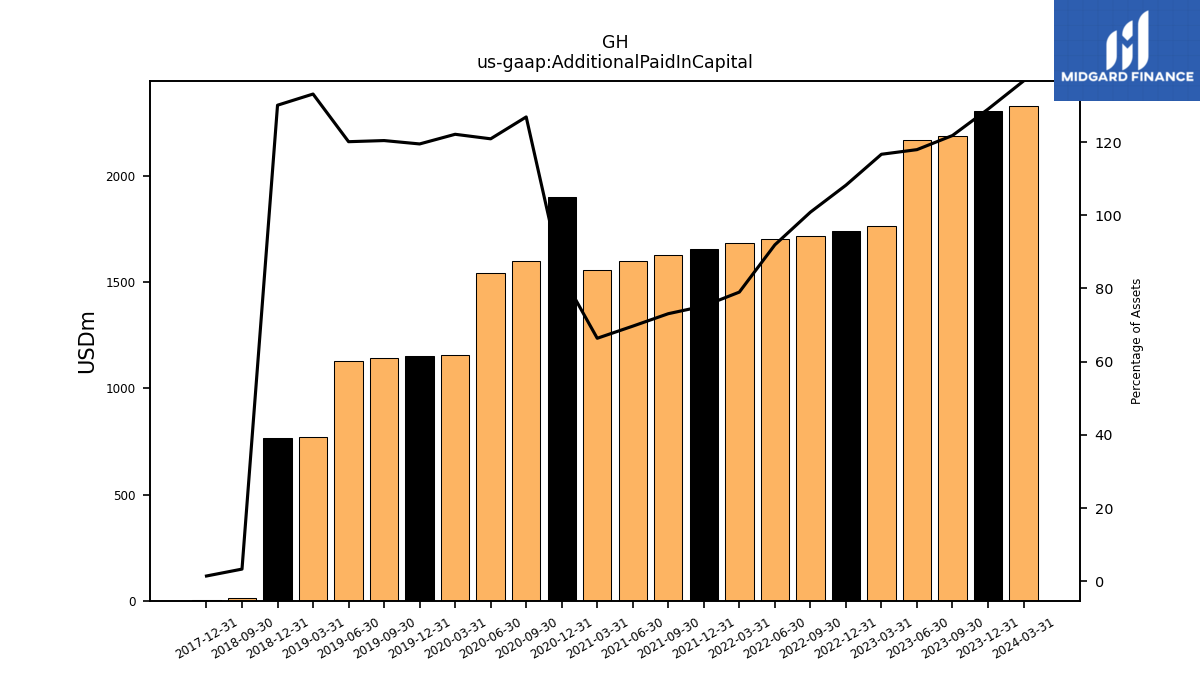
| Additional Paid In Capital | 2329.93 | 2304.22 | 2188.80 | 2169.91 | 1763.54 | 1742.11 | 1716.08 | 1703.83 | 1682.41 | 1657.59 | 1626.93 | 1597.42 | 1557.95 | 1902.39 | 1601.19 | 1544.37 | 1157.94 | 1150.09 | 1141.88 | 1128.94 | 771.01 | 764.03 | 11.42 | NA | NA | 4.90 | NA | |
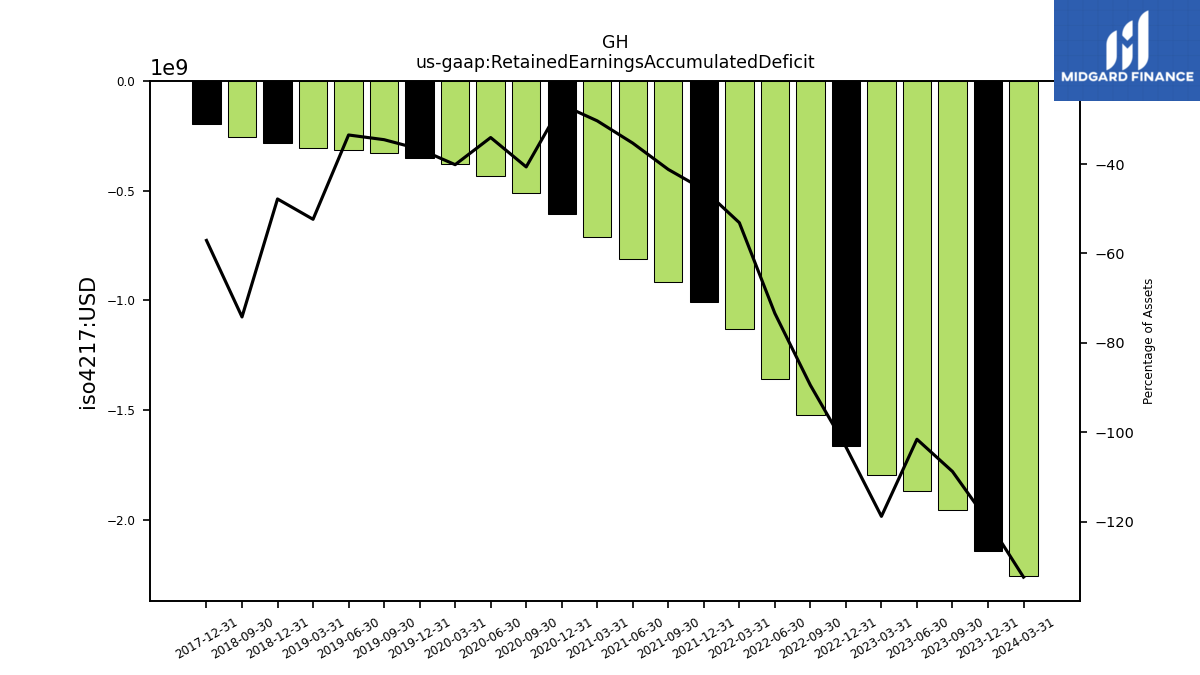
| Retained Earnings Accumulated Deficit | -2256.85 | -2141.86 | -1954.82 | -1868.72 | -1795.95 | -1662.41 | -1522.48 | -1360.48 | -1131.05 | -1007.83 | -916.91 | -809.39 | -711.81 | -606.59 | -512.85 | -435.18 | -380.54 | -352.81 | -327.60 | -314.81 | -303.21 | -280.80 | -255.68 | NA | NA | -195.74 | NA | |
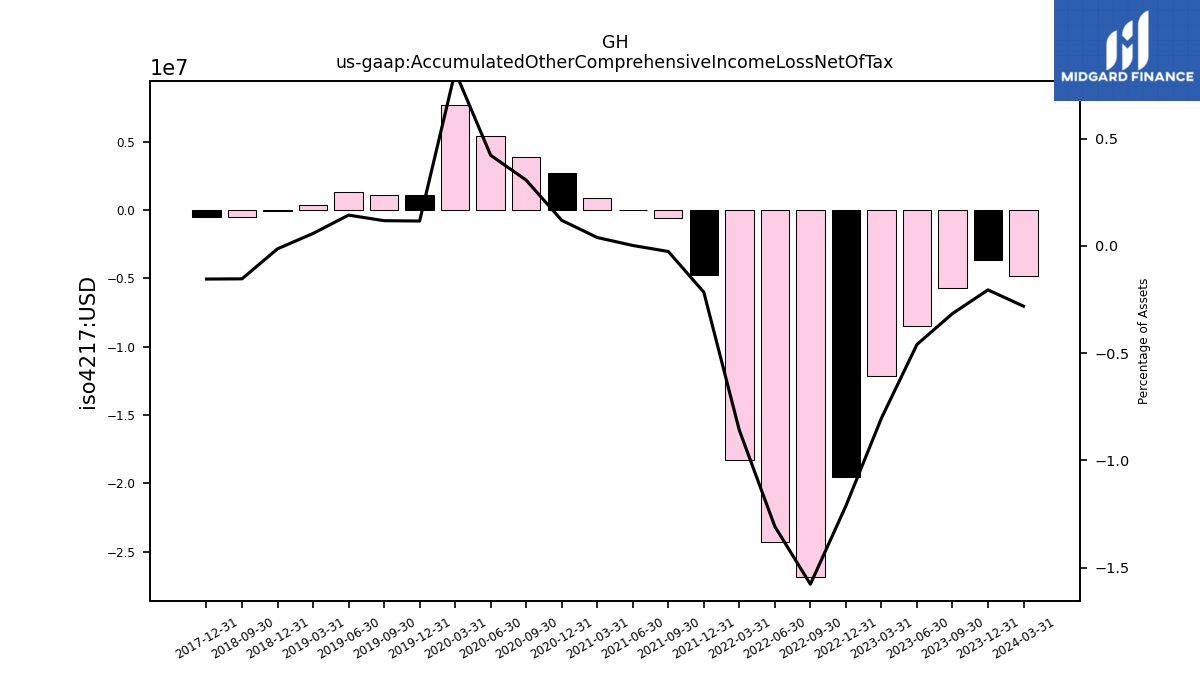
| Accumulated Other Comprehensive Income Loss Net Of Tax | -4.80 | -3.67 | -5.68 | -8.47 | -12.15 | -19.52 | -26.85 | -24.26 | -18.31 | -4.76 | -0.59 | 0.03 | 0.90 | 2.70 | 3.86 | 5.39 | 7.71 | 1.11 | 1.11 | 1.34 | 0.33 | -0.08 | -0.53 | NA | NA | -0.53 | NA | |
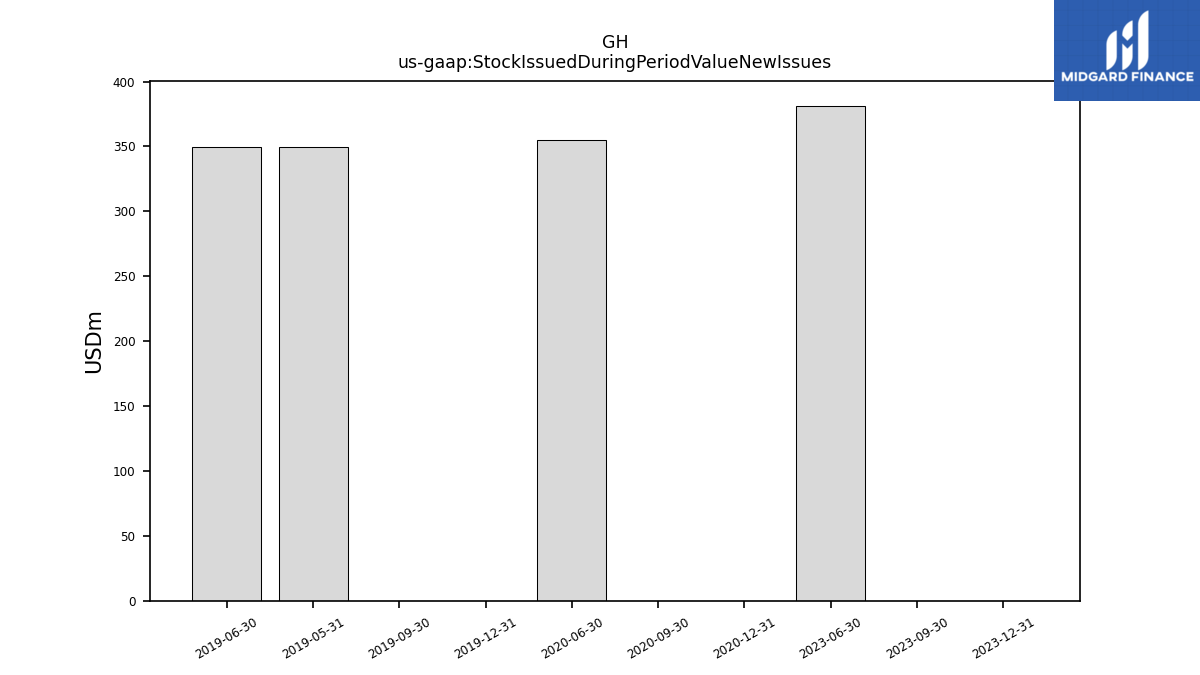
| Stock Issued During Period Value New Issues | NA | 0.00 | 0.00 | 381.37 | NA | NA | NA | NA | NA | NA | NA | NA | NA | 0.00 | 0.00 | 354.60 | NA | 0.00 | 0.00 | 349.71 | NA | NA | NA | NA | NA | NA | NA | |
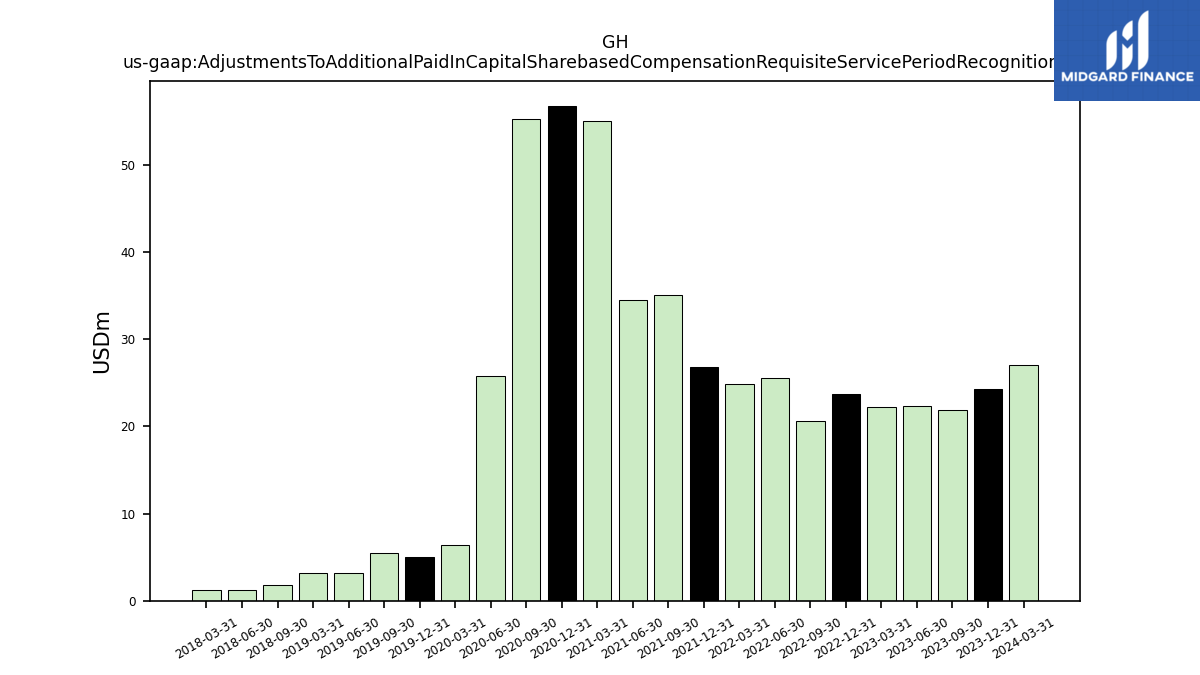
| Adjustments To Additional Paid In Capital Sharebased Compensation Requisite Service Period Recognition Value | 27.04 | 24.32 | 21.82 | 22.35 | 22.27 | 23.70 | 20.64 | 25.54 | 24.80 | 26.86 | 35.02 | 34.51 | 55.07 | 56.76 | 55.20 | 25.82 | 6.34 | 5.07 | 5.48 | 3.21 | 3.18 | NA | 1.83 | 1.18 | 1.28 | NA | NA |
| 2024-03-31 | 2023-12-31 | 2023-09-30 | 2023-06-30 | 2023-03-31 | 2022-12-31 | 2022-09-30 | 2022-06-30 | 2022-03-31 | 2021-12-31 | 2021-09-30 | 2021-06-30 | 2021-03-31 | 2020-12-31 | 2020-09-30 | 2020-06-30 | 2020-03-31 | 2019-12-31 | 2019-09-30 | 2019-06-30 | 2019-03-31 | 2018-12-31 | 2018-09-30 | 2018-06-30 | 2018-03-31 | 2017-12-31 | 2017-09-30 | ||
|---|---|---|---|---|---|---|---|---|---|---|---|---|---|---|---|---|---|---|---|---|---|---|---|---|---|---|---|---|
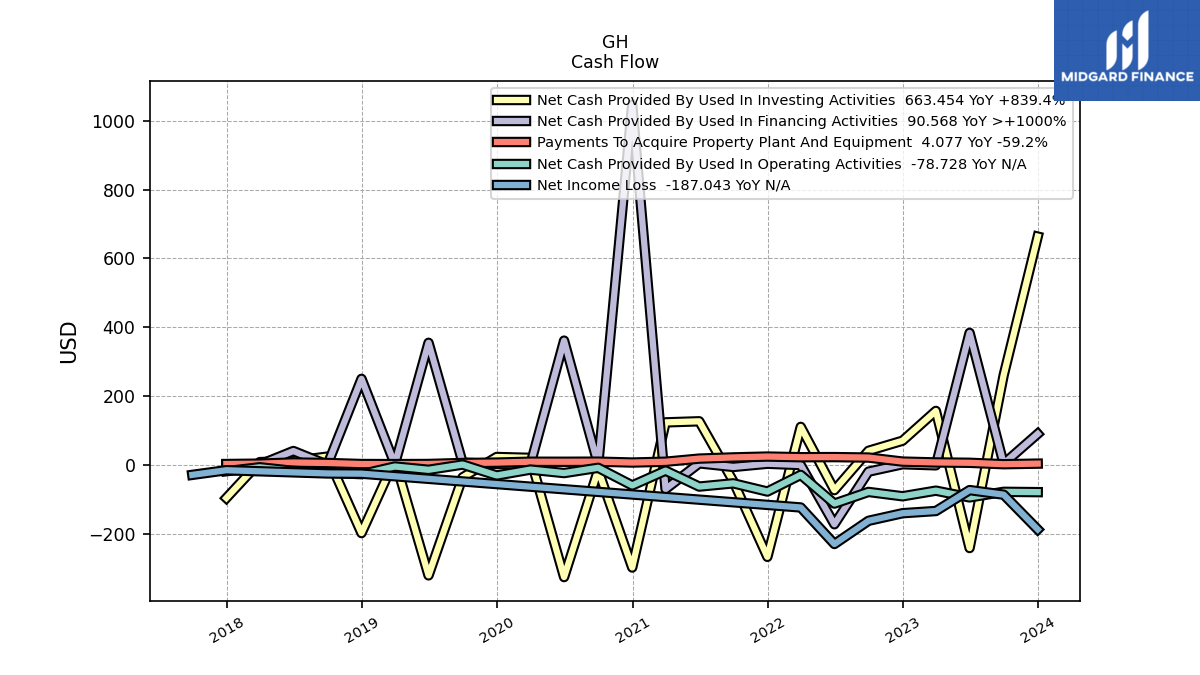
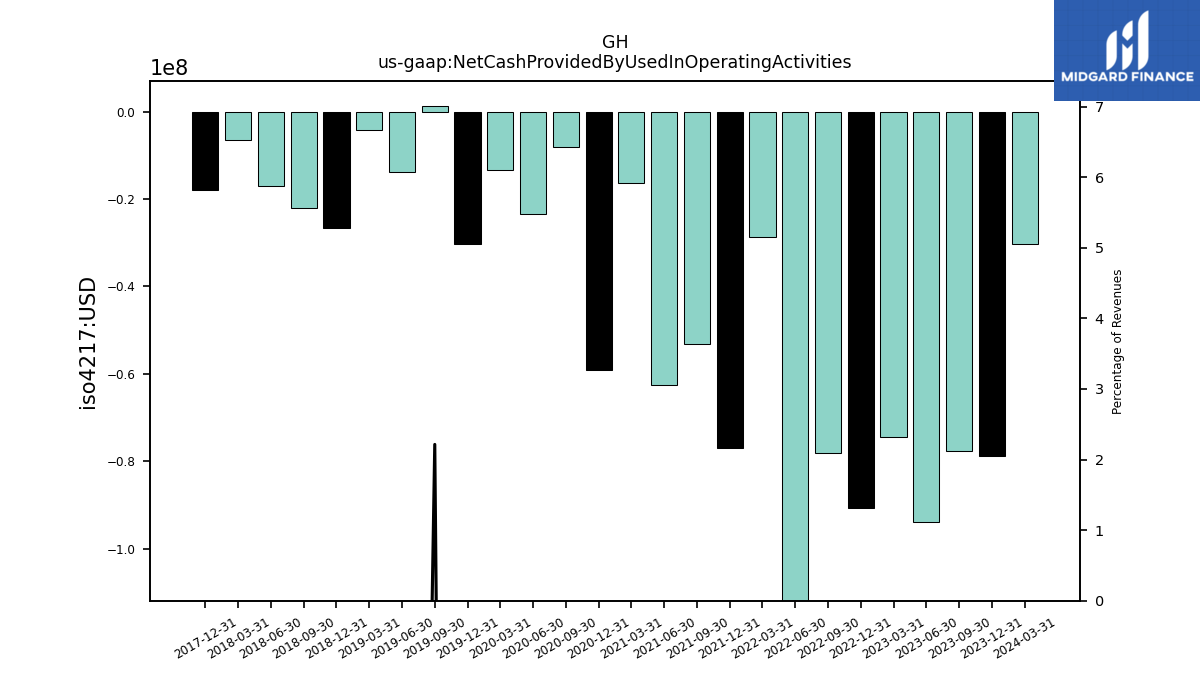
| Net Cash Provided By Used In Operating Activities | -30.28 | -78.73 | -77.79 | -94.02 | -74.44 | -90.75 | -78.16 | -111.94 | -28.62 | -76.99 | -53.15 | -62.59 | -16.29 | -59.22 | -8.06 | -23.36 | -13.28 | -30.34 | 1.35 | -13.84 | -4.30 | -26.54 | -22.05 | -17.04 | -6.56 | -17.99 | NA | |
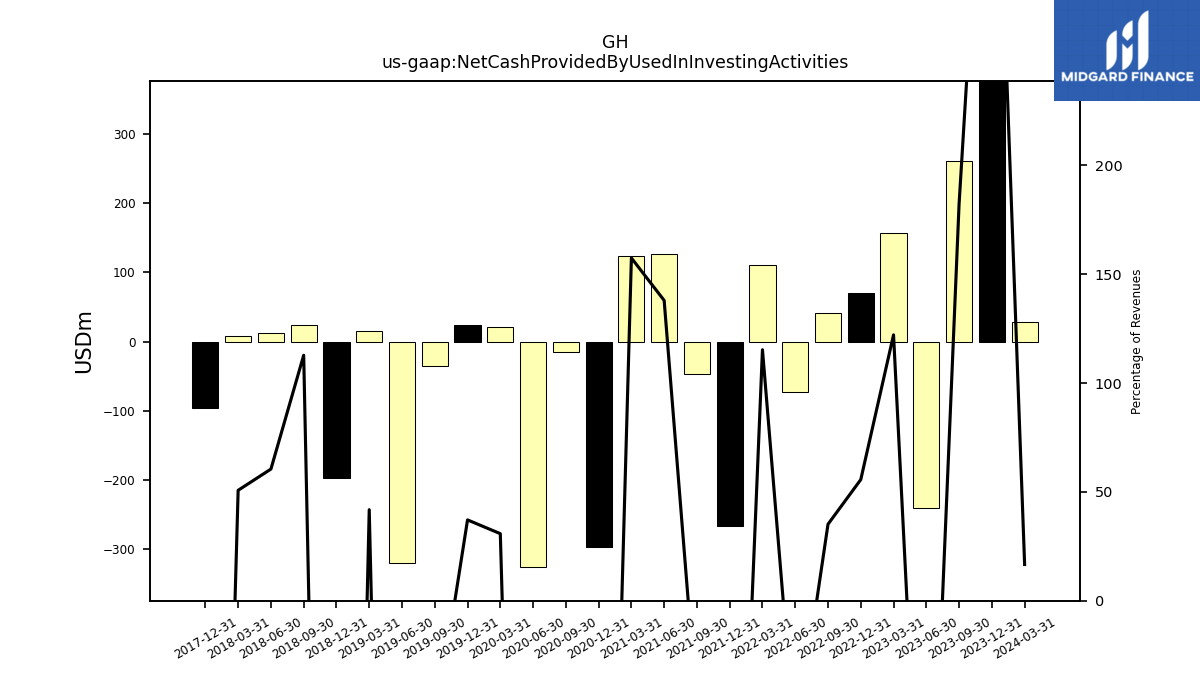
| Net Cash Provided By Used In Investing Activities | 28.07 | 663.45 | 260.70 | -241.13 | 157.22 | 70.63 | 41.27 | -72.89 | 110.81 | -266.70 | -47.39 | 127.07 | 123.87 | -297.69 | -14.66 | -325.55 | 20.80 | 23.36 | -35.73 | -320.53 | 15.33 | -197.69 | 24.46 | 11.72 | 8.47 | -95.83 | NA | |
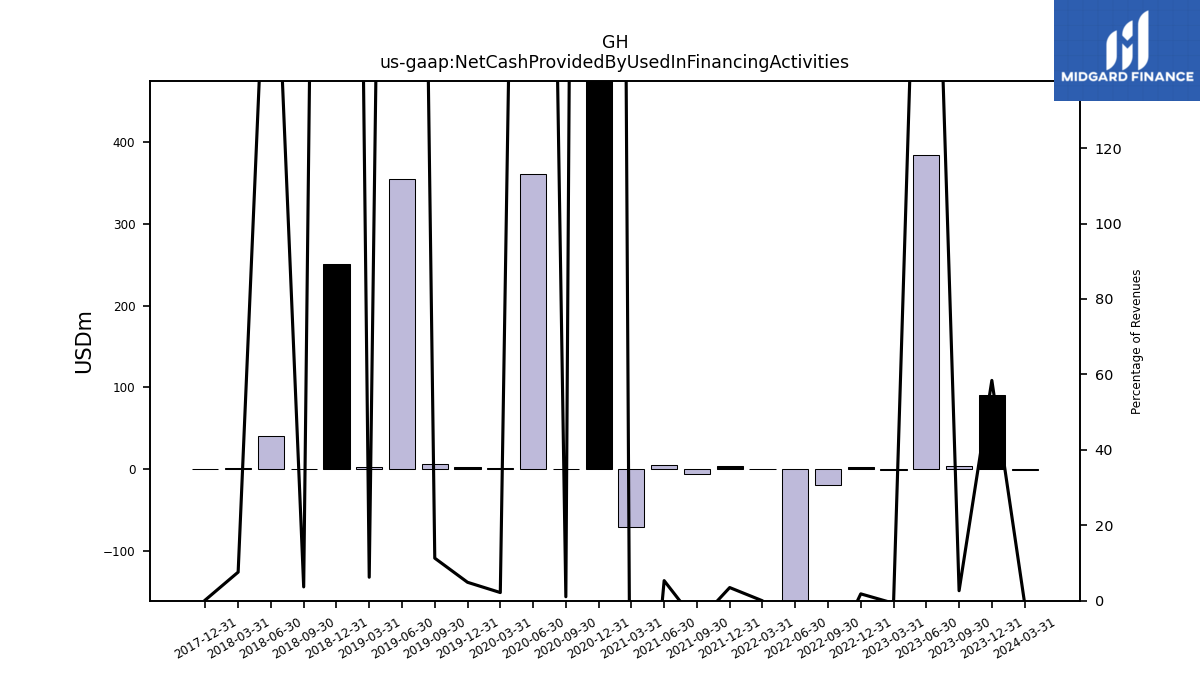
| Net Cash Provided By Used In Financing Activities | -1.07 | 90.57 | 3.81 | 383.85 | -0.85 | 2.32 | -19.31 | -172.09 | -0.01 | 3.78 | -5.56 | 4.91 | -69.95 | 1046.72 | 0.80 | 361.32 | 1.47 | 3.08 | 6.87 | 355.07 | 2.29 | 250.36 | 0.80 | 40.73 | 1.27 | 0.04 | NA |
| 2024-03-31 | 2023-12-31 | 2023-09-30 | 2023-06-30 | 2023-03-31 | 2022-12-31 | 2022-09-30 | 2022-06-30 | 2022-03-31 | 2021-12-31 | 2021-09-30 | 2021-06-30 | 2021-03-31 | 2020-12-31 | 2020-09-30 | 2020-06-30 | 2020-03-31 | 2019-12-31 | 2019-09-30 | 2019-06-30 | 2019-03-31 | 2018-12-31 | 2018-09-30 | 2018-06-30 | 2018-03-31 | 2017-12-31 | 2017-09-30 | ||
|---|---|---|---|---|---|---|---|---|---|---|---|---|---|---|---|---|---|---|---|---|---|---|---|---|---|---|---|---|
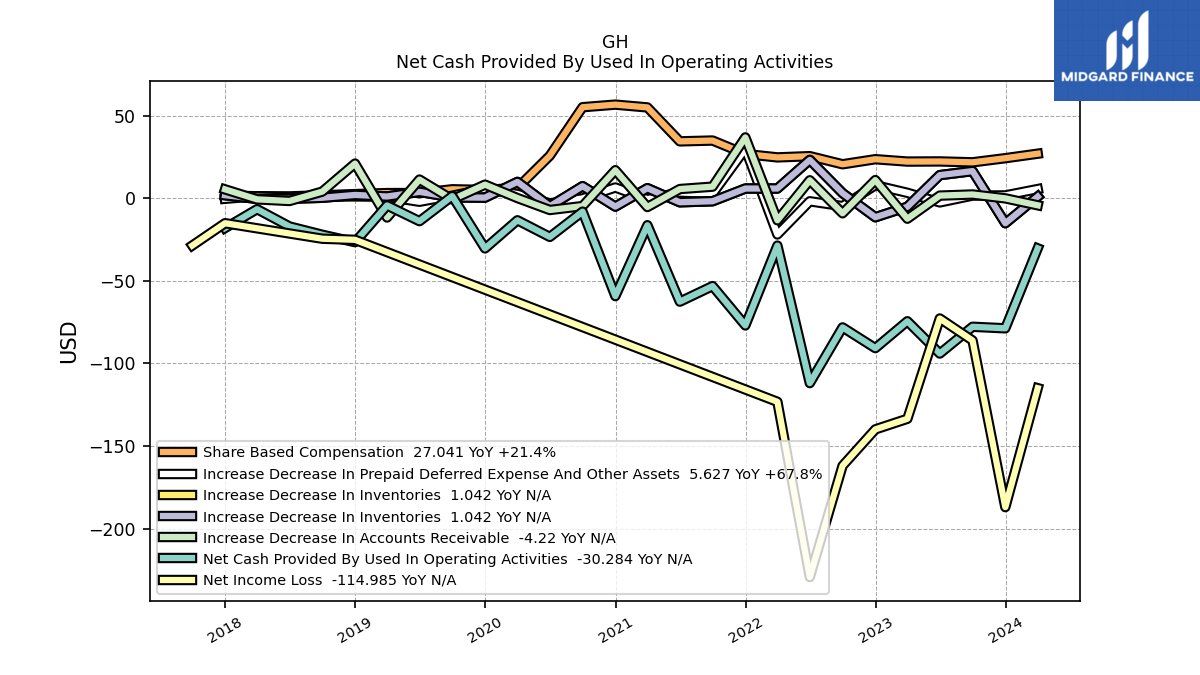
| Net Cash Provided By Used In Operating Activities | -30.28 | -78.73 | -77.79 | -94.02 | -74.44 | -90.75 | -78.16 | -111.94 | -28.62 | -76.99 | -53.15 | -62.59 | -16.29 | -59.22 | -8.06 | -23.36 | -13.28 | -30.34 | 1.35 | -13.84 | -4.30 | -26.54 | -22.05 | -17.04 | -6.56 | -17.99 | NA | |
| Net Income Loss | -114.98 | -187.04 | -86.10 | -72.77 | -133.53 | -139.93 | -161.99 | -229.43 | -123.23 | NA | NA | NA | NA | NA | NA | NA | NA | NA | NA | NA | NA | -25.12 | -24.46 | NA | NA | -15.06 | -28.59 | |
| Profit Loss | -114.98 | -187.04 | -86.10 | -72.77 | -133.53 | -139.93 | -161.99 | -229.43 | -123.23 | -72.31 | -107.53 | -97.58 | -107.36 | -93.05 | -71.67 | -49.74 | -31.83 | -22.11 | -13.09 | -11.30 | -21.35 | -25.27 | -23.51 | -21.64 | -13.84 | -15.06 | -28.59 | |
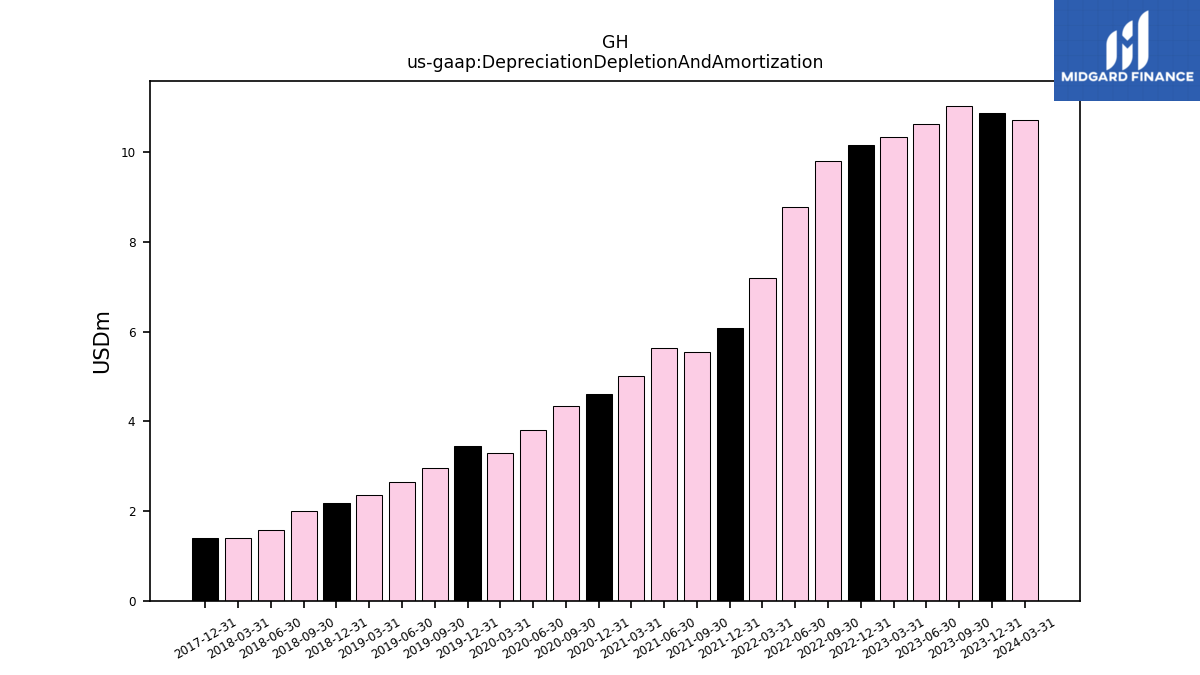
| Depreciation Depletion And Amortization | 10.71 | 10.87 | 11.04 | 10.63 | 10.35 | 10.17 | 9.81 | 8.79 | 7.20 | 6.09 | 5.54 | 5.63 | 5.01 | 4.60 | 4.35 | 3.81 | 3.30 | 3.45 | 2.95 | 2.66 | 2.35 | 2.17 | 2.00 | 1.57 | 1.40 | 1.39 | NA | |
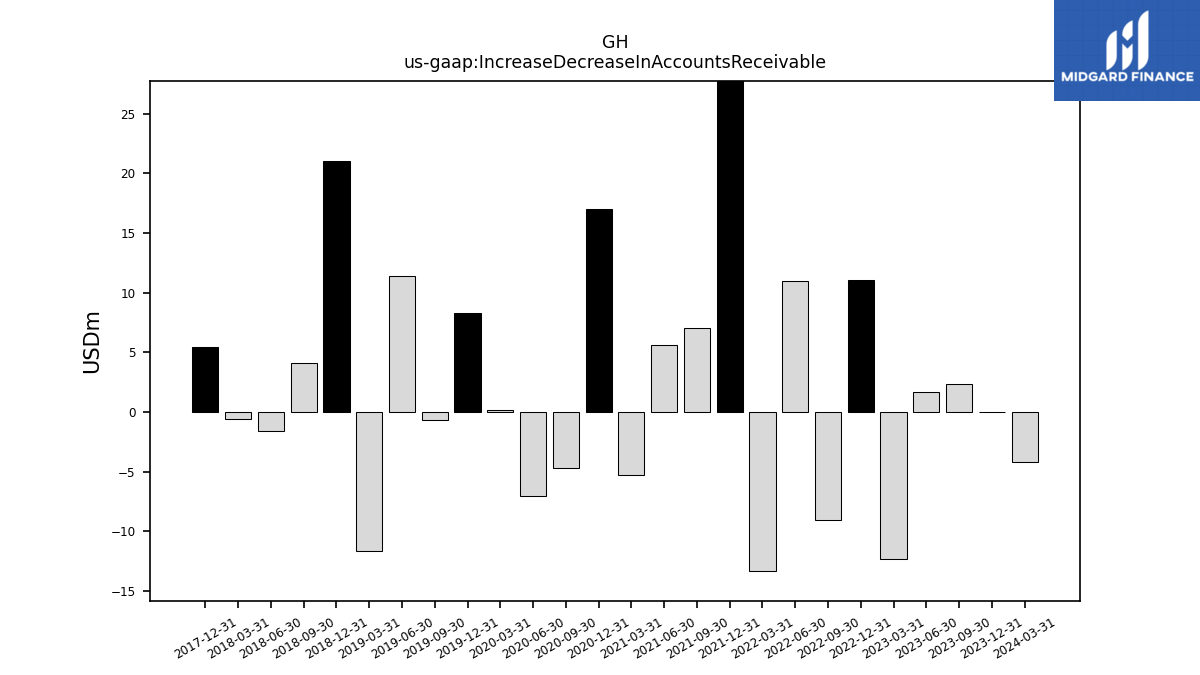
| Increase Decrease In Accounts Receivable | -4.22 | -0.02 | 2.33 | 1.65 | -12.35 | 11.06 | -9.08 | 10.94 | -13.30 | 36.91 | 7.08 | 5.63 | -5.26 | 17.04 | -4.69 | -7.07 | 0.18 | 8.30 | -0.67 | 11.37 | -11.61 | 21.05 | 4.08 | -1.60 | -0.62 | 5.44 | NA | |
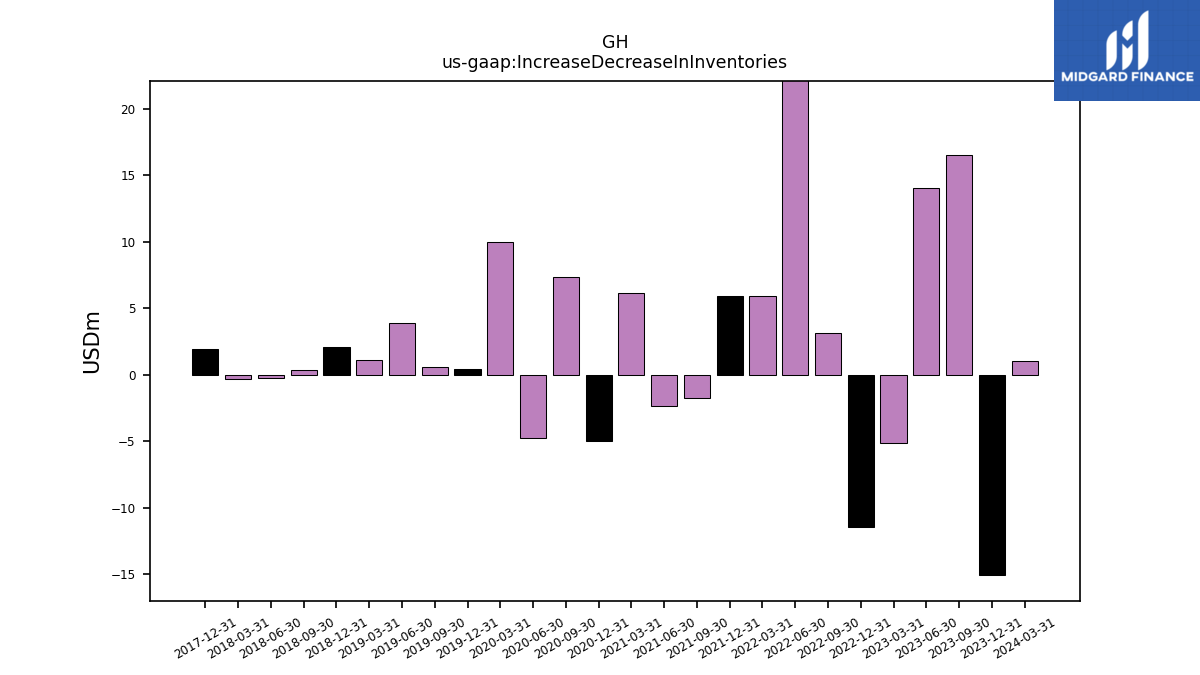
| Increase Decrease In Inventories | 1.04 | -15.09 | 16.50 | 14.06 | -5.12 | -11.45 | 3.16 | 23.28 | 5.94 | 5.93 | -1.75 | -2.38 | 6.16 | -5.01 | 7.38 | -4.79 | 9.97 | 0.42 | 0.58 | 3.92 | 1.12 | 2.06 | 0.35 | -0.24 | -0.32 | 1.90 | NA | |
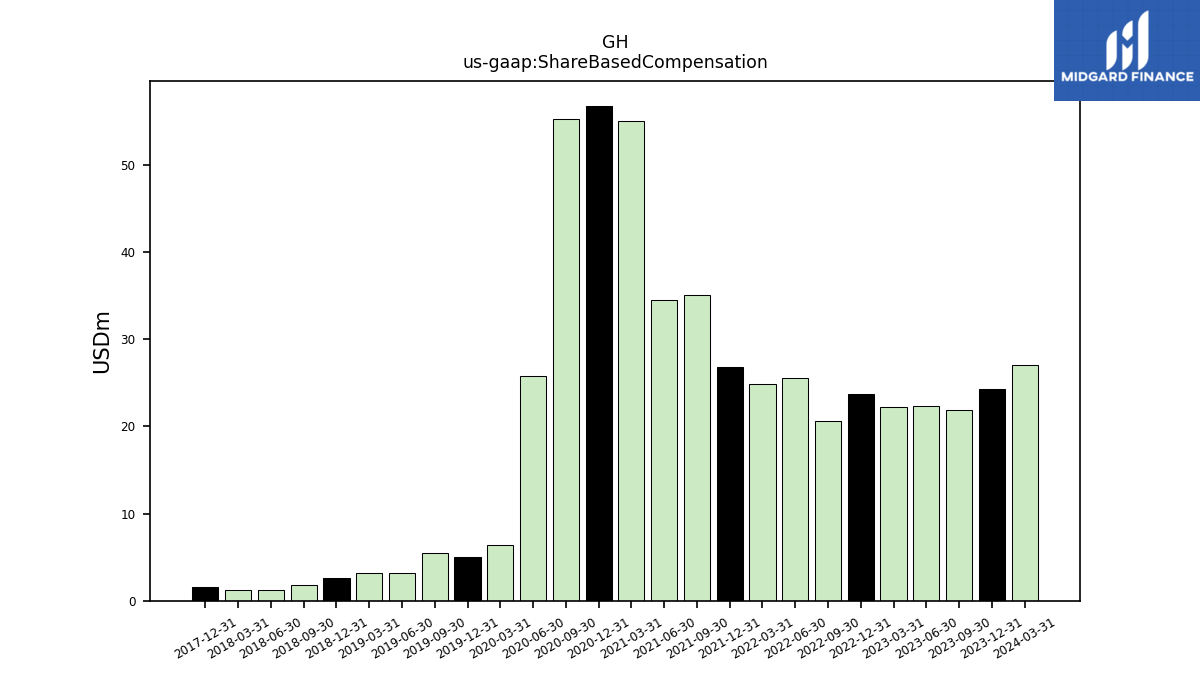
| Share Based Compensation | 27.04 | 24.32 | 21.82 | 22.35 | 22.27 | 23.70 | 20.64 | 25.54 | 24.80 | 26.86 | 35.02 | 34.51 | 55.07 | 56.76 | 55.20 | 25.82 | 6.34 | 5.07 | 5.49 | 3.21 | 3.18 | 2.56 | 1.83 | 1.18 | 1.28 | 1.57 | NA | |
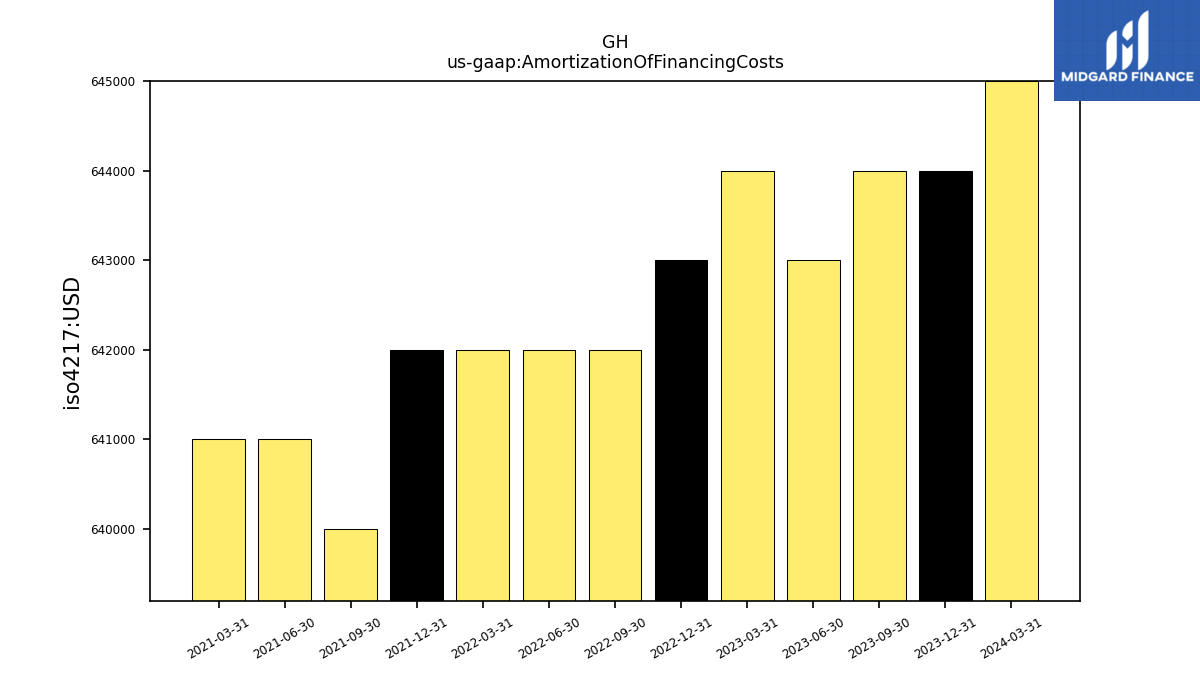
| Amortization Of Financing Costs | 0.65 | 0.64 | 0.64 | 0.64 | 0.64 | 0.64 | 0.64 | 0.64 | 0.64 | 0.64 | 0.64 | 0.64 | 0.64 | NA | NA | NA | NA | NA | NA | NA | NA | NA | NA | NA | NA | NA | NA |
| 2024-03-31 | 2023-12-31 | 2023-09-30 | 2023-06-30 | 2023-03-31 | 2022-12-31 | 2022-09-30 | 2022-06-30 | 2022-03-31 | 2021-12-31 | 2021-09-30 | 2021-06-30 | 2021-03-31 | 2020-12-31 | 2020-09-30 | 2020-06-30 | 2020-03-31 | 2019-12-31 | 2019-09-30 | 2019-06-30 | 2019-03-31 | 2018-12-31 | 2018-09-30 | 2018-06-30 | 2018-03-31 | 2017-12-31 | 2017-09-30 | ||
|---|---|---|---|---|---|---|---|---|---|---|---|---|---|---|---|---|---|---|---|---|---|---|---|---|---|---|---|---|
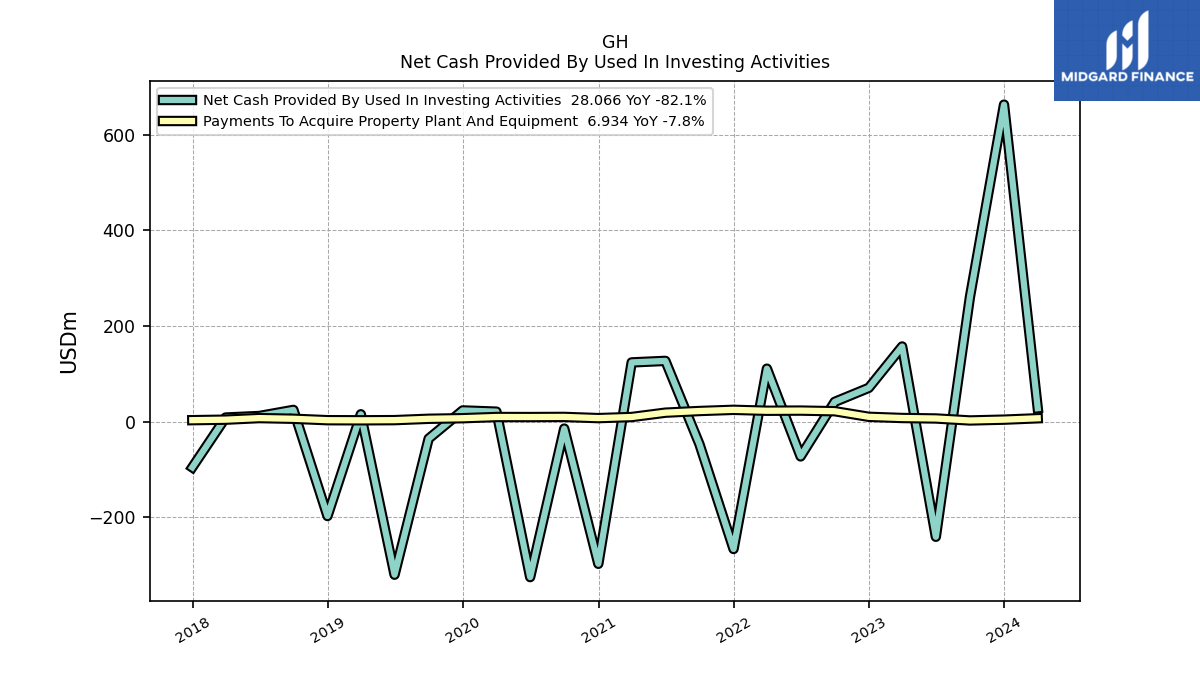
| Net Cash Provided By Used In Investing Activities | 28.07 | 663.45 | 260.70 | -241.13 | 157.22 | 70.63 | 41.27 | -72.89 | 110.81 | -266.70 | -47.39 | 127.07 | 123.87 | -297.69 | -14.66 | -325.55 | 20.80 | 23.36 | -35.73 | -320.53 | 15.33 | -197.69 | 24.46 | 11.72 | 8.47 | -95.83 | NA | |
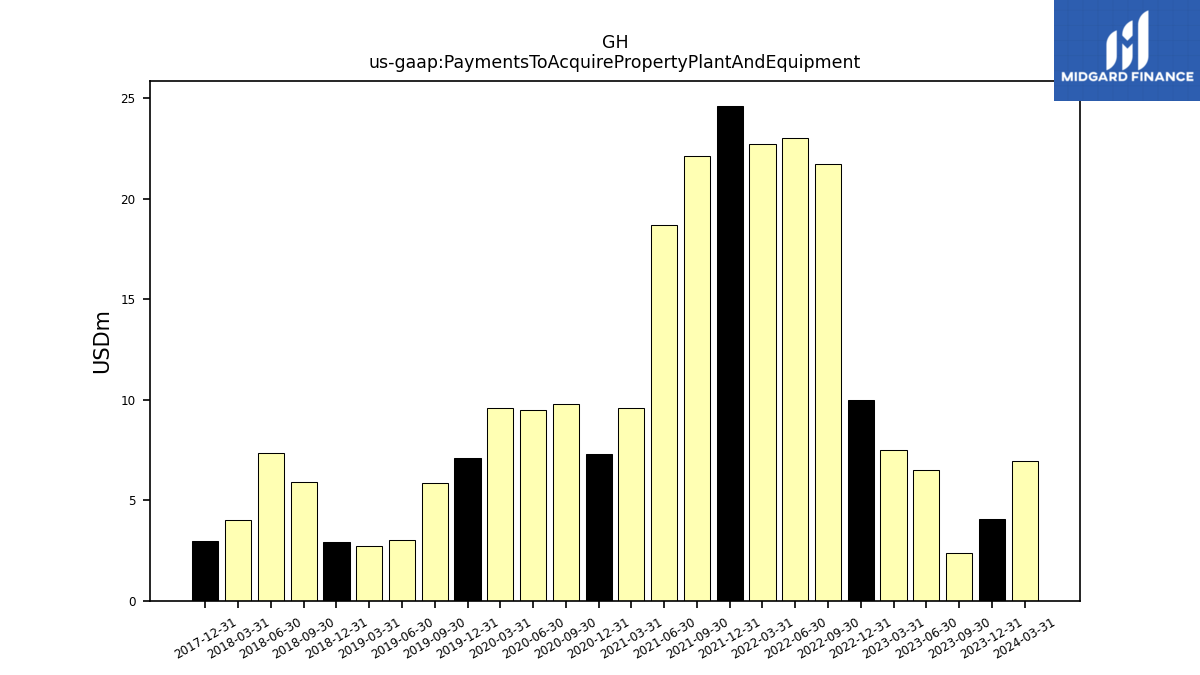
| Payments To Acquire Property Plant And Equipment | 6.93 | 4.08 | 2.37 | 6.51 | 7.52 | 10.00 | 21.73 | 23.03 | 22.70 | 24.62 | 22.15 | 18.68 | 9.59 | 7.28 | 9.79 | 9.51 | 9.60 | 7.09 | 5.88 | 3.05 | 2.71 | 2.93 | 5.91 | 7.34 | 4.02 | 2.96 | NA |
| 2024-03-31 | 2023-12-31 | 2023-09-30 | 2023-06-30 | 2023-03-31 | 2022-12-31 | 2022-09-30 | 2022-06-30 | 2022-03-31 | 2021-12-31 | 2021-09-30 | 2021-06-30 | 2021-03-31 | 2020-12-31 | 2020-09-30 | 2020-06-30 | 2020-03-31 | 2019-12-31 | 2019-09-30 | 2019-06-30 | 2019-03-31 | 2018-12-31 | 2018-09-30 | 2018-06-30 | 2018-03-31 | 2017-12-31 | 2017-09-30 | ||
|---|---|---|---|---|---|---|---|---|---|---|---|---|---|---|---|---|---|---|---|---|---|---|---|---|---|---|---|---|
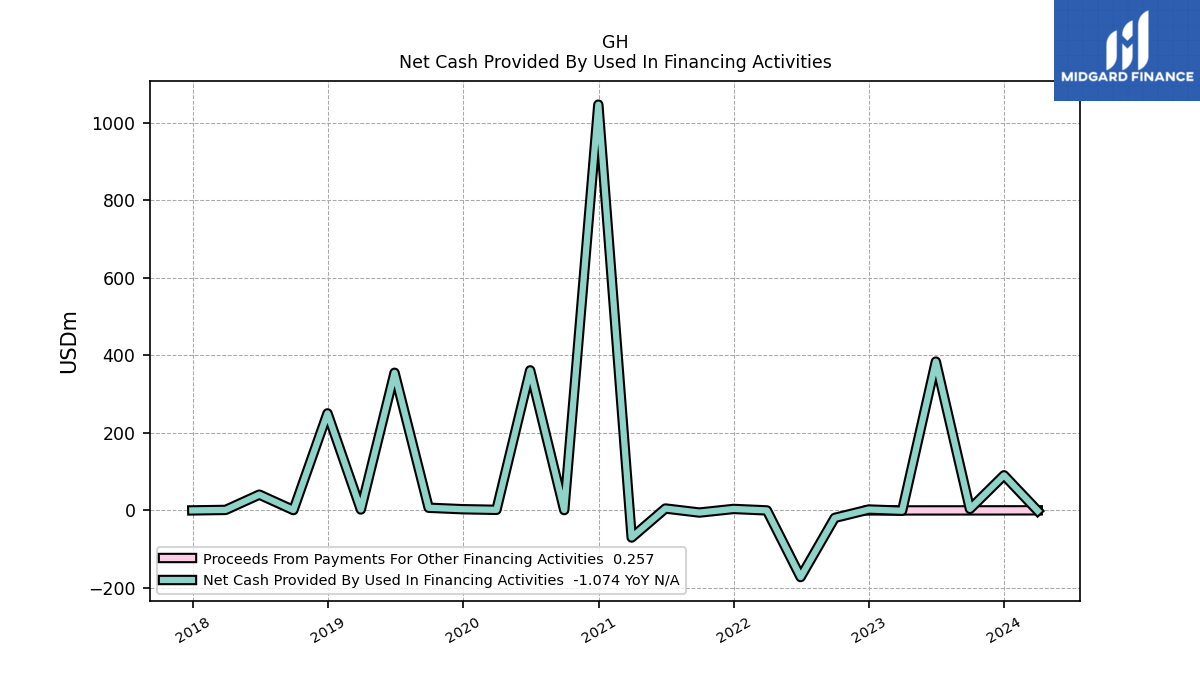
| Net Cash Provided By Used In Financing Activities | -1.07 | 90.57 | 3.81 | 383.85 | -0.85 | 2.32 | -19.31 | -172.09 | -0.01 | 3.78 | -5.56 | 4.91 | -69.95 | 1046.72 | 0.80 | 361.32 | 1.47 | 3.08 | 6.87 | 355.07 | 2.29 | 250.36 | 0.80 | 40.73 | 1.27 | 0.04 | NA |
| 2024-03-31 | 2023-12-31 | 2023-09-30 | 2023-06-30 | 2023-03-31 | 2022-12-31 | 2022-09-30 | 2022-06-30 | 2022-03-31 | 2021-12-31 | 2021-09-30 | 2021-06-30 | 2021-03-31 | 2020-12-31 | 2020-09-30 | 2020-06-30 | 2020-03-31 | 2019-12-31 | 2019-09-30 | 2019-06-30 | 2019-03-31 | 2018-12-31 | 2018-09-30 | 2018-06-30 | 2018-03-31 | 2017-12-31 | 2017-09-30 | ||
|---|---|---|---|---|---|---|---|---|---|---|---|---|---|---|---|---|---|---|---|---|---|---|---|---|---|---|---|---|
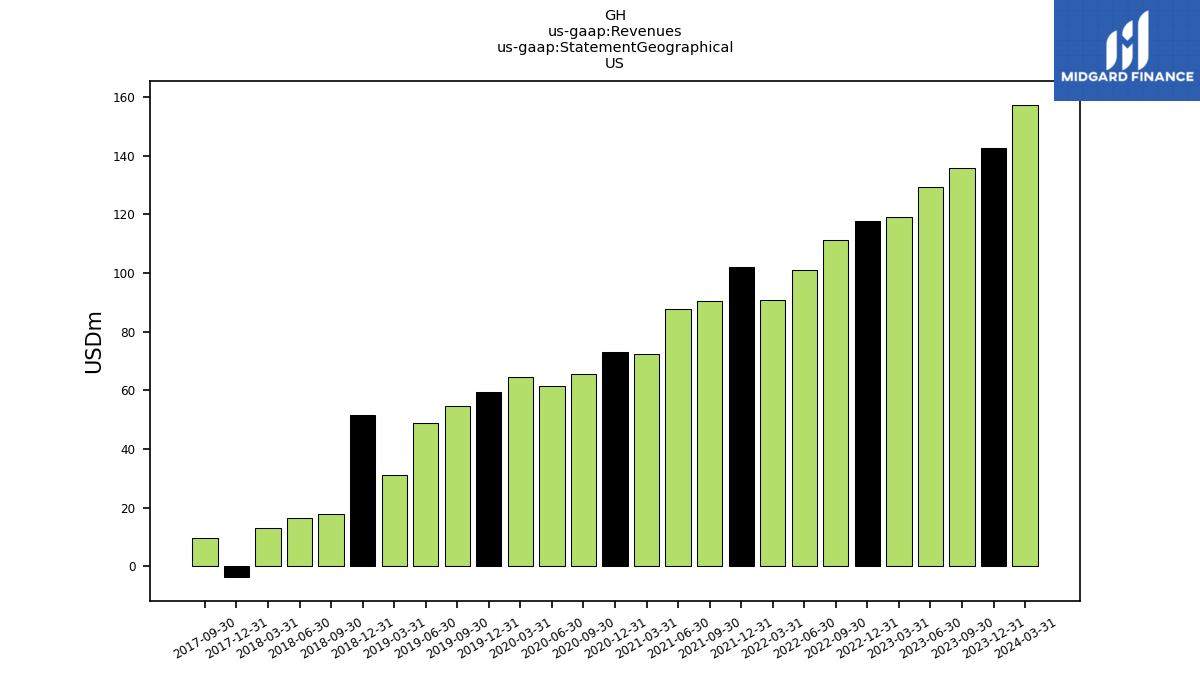
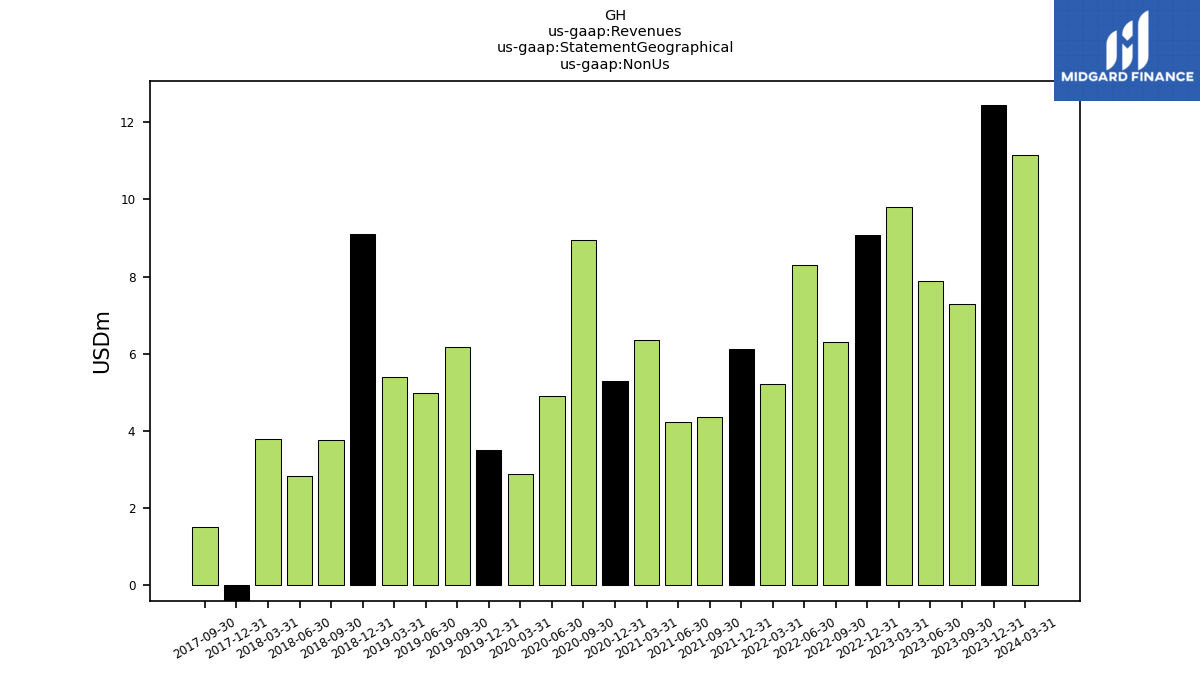
| Revenues | 168.49 | 155.05 | 143.03 | 137.15 | 128.71 | 126.89 | 117.40 | 109.14 | 96.10 | 108.11 | 94.78 | 92.10 | 78.67 | 78.32 | 74.57 | 66.33 | 67.51 | 62.90 | 60.85 | 53.98 | 36.66 | 32.87 | 21.69 | 19.38 | 16.69 | 20.00 | 11.13 | |
| US | 157.35 | 142.62 | 135.74 | 129.26 | 118.91 | 117.81 | 111.10 | 100.84 | 90.87 | 101.97 | 90.42 | 87.87 | 72.30 | 73.01 | 65.61 | 61.42 | 64.61 | 59.40 | 54.67 | 49.00 | 31.25 | 51.69 | 17.93 | 16.56 | 12.90 | -3.67 | 9.61 | |
| Non Us | 11.14 | 12.44 | 7.29 | 7.89 | 9.80 | 9.08 | 6.31 | 8.31 | 5.23 | 6.14 | 4.36 | 4.23 | 6.37 | 5.31 | 8.96 | 4.91 | 2.90 | 3.50 | 6.17 | 4.98 | 5.41 | 9.11 | 3.76 | 2.83 | 3.79 | -4.25 | 1.52 |