
| 2024-06-30 | 2024-03-31 | 2023-12-31 | 2023-09-30 | 2023-06-30 | 2023-03-31 | 2022-12-31 | 2022-09-30 | 2022-06-30 | 2022-03-31 | 2021-12-31 | 2021-09-30 | 2021-06-30 | 2021-03-31 | 2020-12-31 | 2020-09-30 | 2020-06-30 | 2020-03-31 | 2019-12-31 | 2019-09-30 | 2019-06-30 | 2019-03-31 | 2018-12-31 | 2018-09-30 | 2018-06-30 | 2018-03-31 | 2017-12-31 | 2017-09-30 | 2017-06-30 | 2017-03-31 | 2016-12-31 | 2016-09-30 | 2016-06-30 | 2016-03-31 | 2015-12-31 | 2015-09-30 | 2015-06-30 | 2015-03-31 | 2014-12-31 | 2014-09-30 | 2014-06-30 | 2014-03-31 | 2013-12-31 | 2013-09-30 | 2013-06-30 | 2013-03-31 | 2012-12-31 | 2012-09-30 | 2012-06-30 | 2012-03-31 | ||
|---|---|---|---|---|---|---|---|---|---|---|---|---|---|---|---|---|---|---|---|---|---|---|---|---|---|---|---|---|---|---|---|---|---|---|---|---|---|---|---|---|---|---|---|---|---|---|---|---|---|---|---|
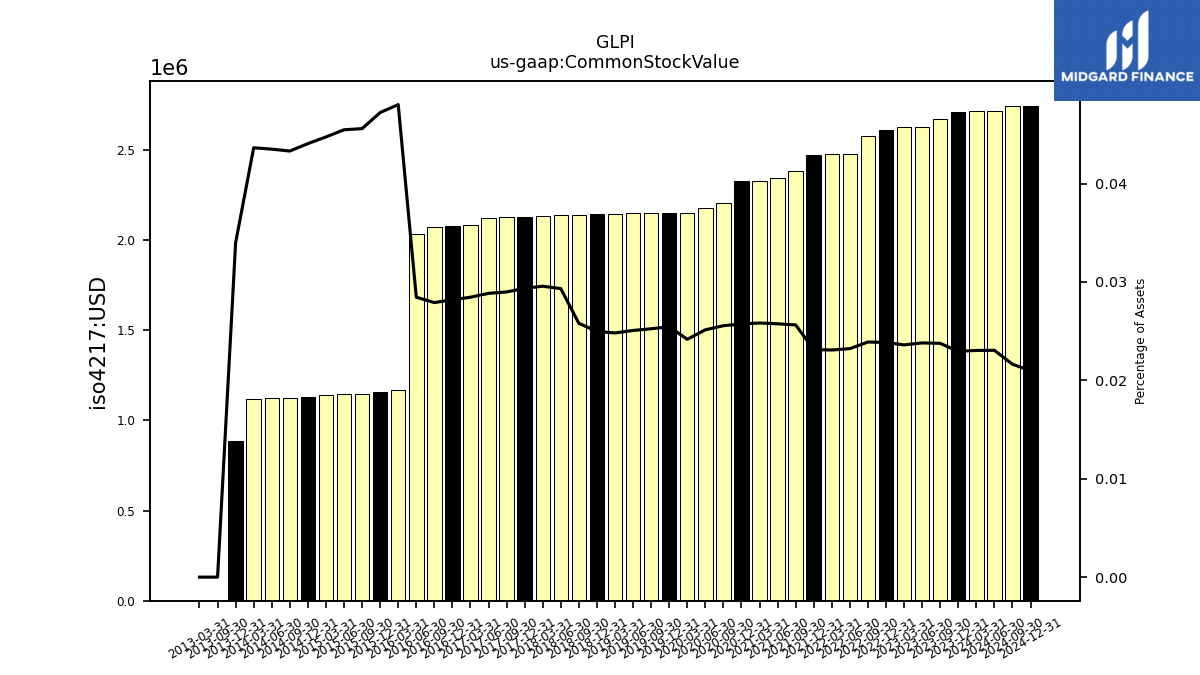
| Common Stock Value | 2.71 | 2.71 | 2.71 | 2.67 | 2.63 | 2.62 | 2.61 | 2.58 | 2.48 | 2.48 | 2.47 | 2.38 | 2.34 | 2.33 | 2.33 | 2.21 | 2.18 | 2.15 | 2.15 | 2.15 | 2.15 | 2.15 | 2.14 | 2.14 | 2.14 | 2.13 | 2.13 | 2.13 | 2.12 | 2.08 | 2.08 | 2.07 | 2.03 | 1.17 | 1.16 | 1.15 | 1.14 | 1.14 | 1.13 | 1.12 | 1.12 | 1.12 | 0.89 | 0.00 | NA | 0.00 | NA | NA | NA | NA | |
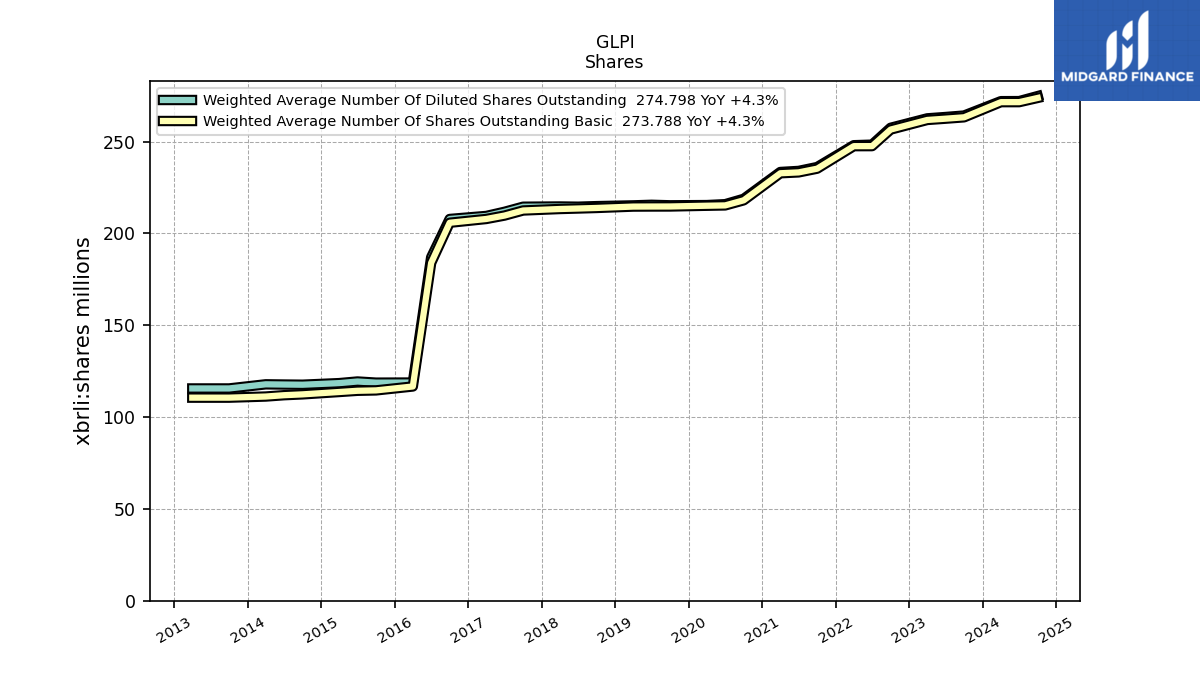
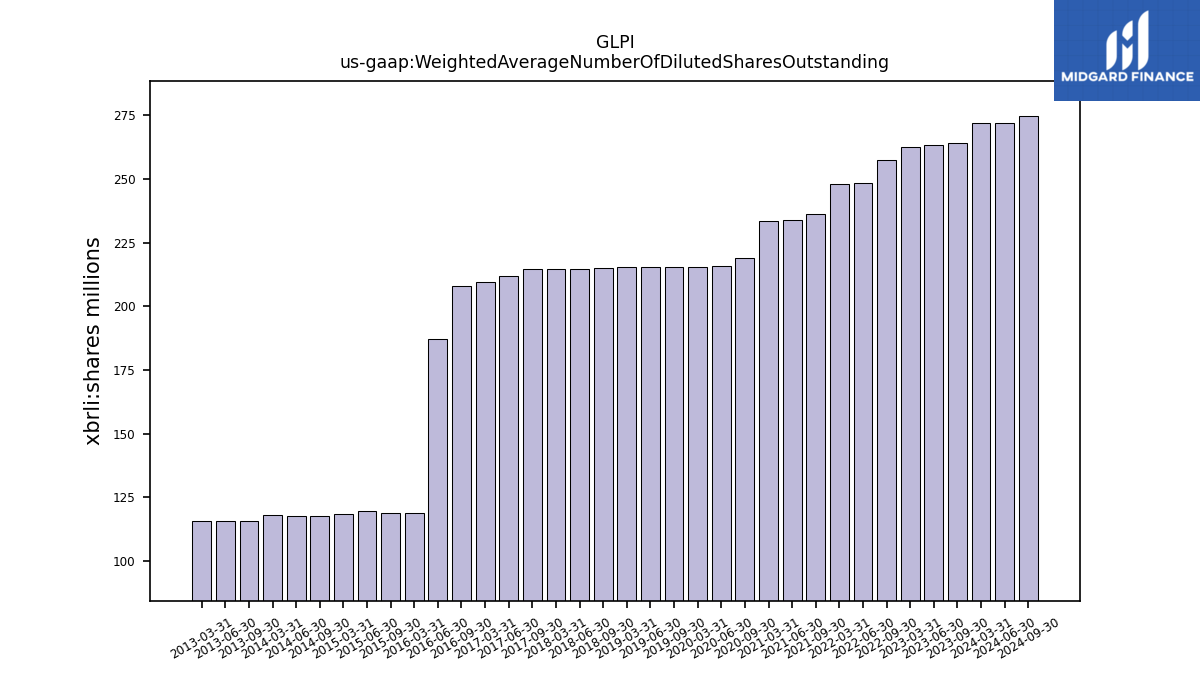
| Weighted Average Number Of Diluted Shares Outstanding | 272.06 | 272.03 | NA | 264.21 | 263.40 | 262.67 | NA | 257.53 | 248.36 | 248.04 | NA | 236.15 | 234.05 | 233.47 | NA | 218.85 | 215.93 | 215.45 | NA | 215.32 | 215.60 | 215.29 | NA | 214.87 | 214.56 | 214.68 | NA | 214.55 | 211.80 | 209.53 | NA | 207.88 | 186.98 | 118.82 | NA | 118.76 | 119.39 | 118.50 | NA | 117.63 | 117.73 | 117.85 | NA | 115.60 | 115.60 | 115.60 | NA | NA | NA | NA | |
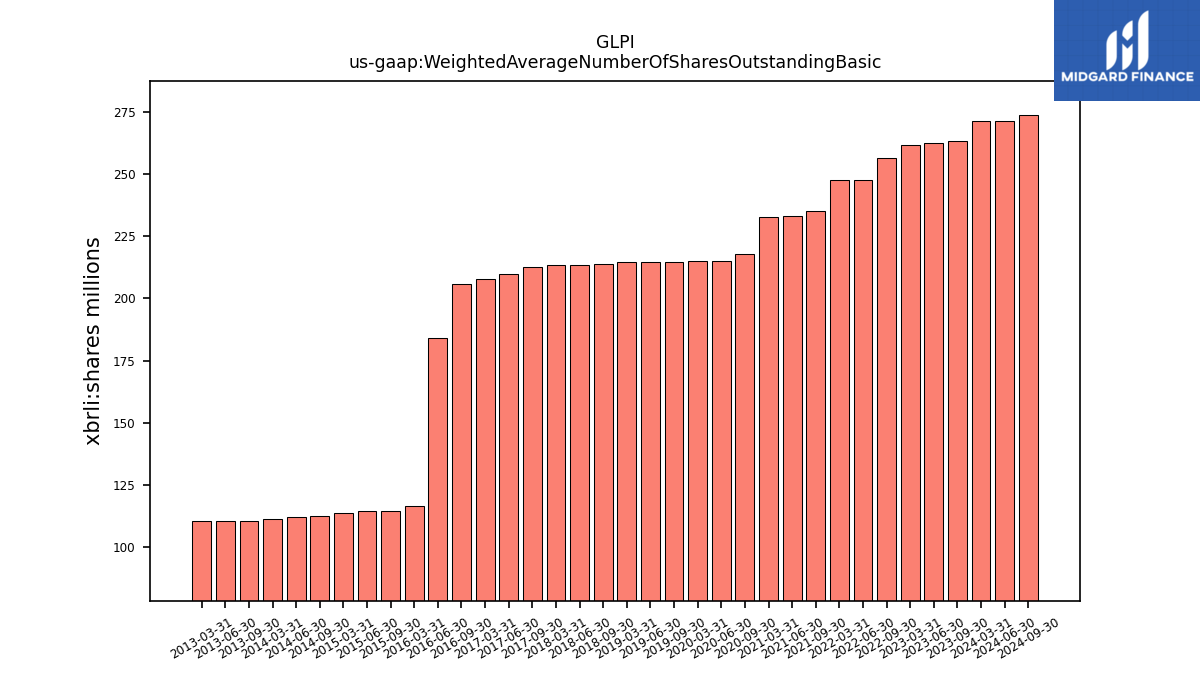
| Weighted Average Number Of Shares Outstanding Basic | 271.50 | 271.49 | NA | 263.24 | 262.49 | 261.79 | NA | 256.56 | 247.54 | 247.53 | NA | 235.27 | 233.25 | 232.78 | NA | 218.04 | 215.27 | 215.09 | NA | 214.68 | 214.66 | 214.63 | NA | 213.88 | 213.58 | 213.30 | NA | 212.50 | 209.75 | 207.88 | NA | 205.83 | 183.97 | 116.67 | NA | 114.54 | 114.33 | 113.67 | NA | 112.38 | 111.92 | 111.20 | NA | 110.58 | 110.58 | 110.58 | NA | NA | NA | NA | |
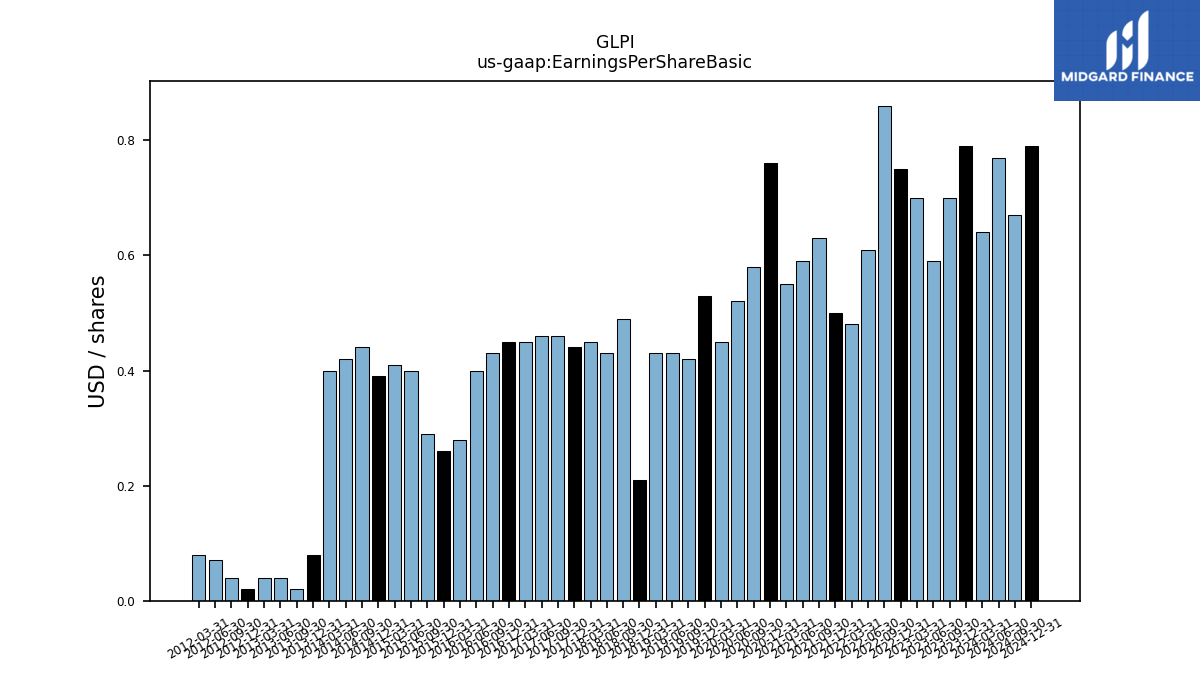
| Earnings Per Share Basic | 0.77 | 0.64 | 0.79 | 0.70 | 0.59 | 0.70 | 0.75 | 0.86 | 0.61 | 0.48 | 0.50 | 0.63 | 0.59 | 0.55 | 0.76 | 0.58 | 0.52 | 0.45 | 0.53 | 0.42 | 0.43 | 0.43 | 0.21 | 0.49 | 0.43 | 0.45 | 0.44 | 0.46 | 0.46 | 0.45 | 0.45 | 0.43 | 0.40 | 0.28 | 0.26 | 0.29 | 0.40 | 0.41 | 0.39 | 0.44 | 0.42 | 0.40 | 0.08 | 0.02 | 0.04 | 0.04 | 0.02 | 0.04 | 0.07 | 0.08 | |
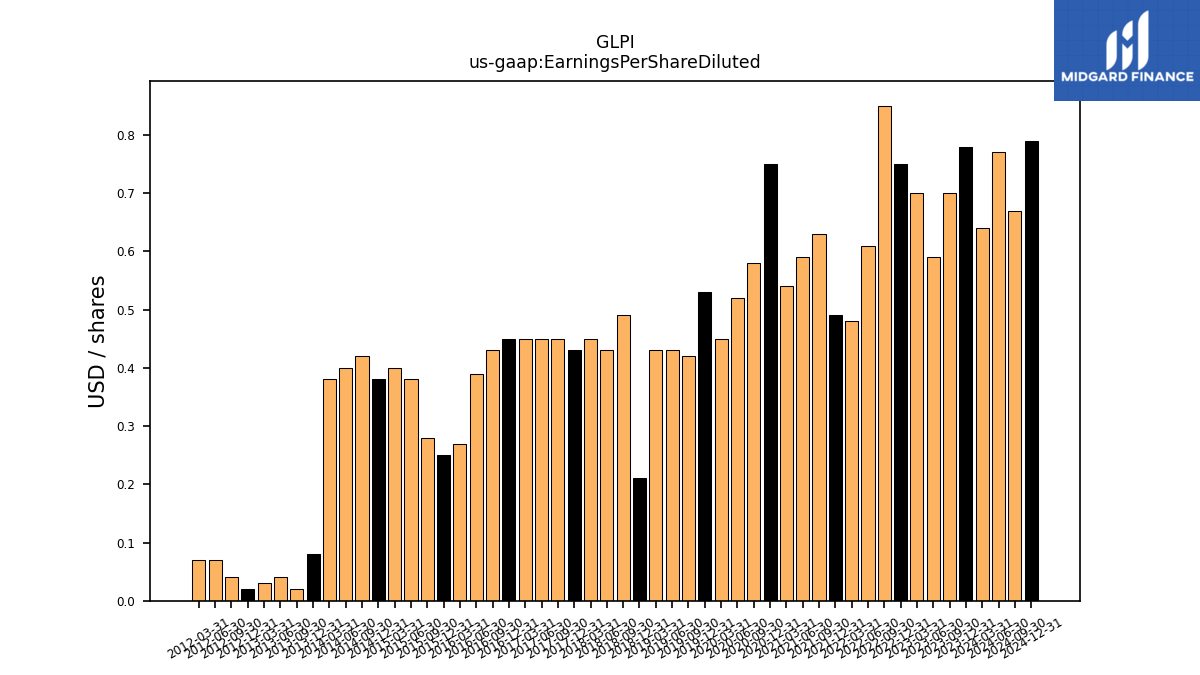
| Earnings Per Share Diluted | 0.77 | 0.64 | 0.78 | 0.70 | 0.59 | 0.70 | 0.75 | 0.85 | 0.61 | 0.48 | 0.49 | 0.63 | 0.59 | 0.54 | 0.75 | 0.58 | 0.52 | 0.45 | 0.53 | 0.42 | 0.43 | 0.43 | 0.21 | 0.49 | 0.43 | 0.45 | 0.43 | 0.45 | 0.45 | 0.45 | 0.45 | 0.43 | 0.39 | 0.27 | 0.25 | 0.28 | 0.38 | 0.40 | 0.38 | 0.42 | 0.40 | 0.38 | 0.08 | 0.02 | 0.04 | 0.03 | 0.02 | 0.04 | 0.07 | 0.07 |
| 2024-06-30 | 2024-03-31 | 2023-12-31 | 2023-09-30 | 2023-06-30 | 2023-03-31 | 2022-12-31 | 2022-09-30 | 2022-06-30 | 2022-03-31 | 2021-12-31 | 2021-09-30 | 2021-06-30 | 2021-03-31 | 2020-12-31 | 2020-09-30 | 2020-06-30 | 2020-03-31 | 2019-12-31 | 2019-09-30 | 2019-06-30 | 2019-03-31 | 2018-12-31 | 2018-09-30 | 2018-06-30 | 2018-03-31 | 2017-12-31 | 2017-09-30 | 2017-06-30 | 2017-03-31 | 2016-12-31 | 2016-09-30 | 2016-06-30 | 2016-03-31 | 2015-12-31 | 2015-09-30 | 2015-06-30 | 2015-03-31 | 2014-12-31 | 2014-09-30 | 2014-06-30 | 2014-03-31 | 2013-12-31 | 2013-09-30 | 2013-06-30 | 2013-03-31 | 2012-12-31 | 2012-09-30 | 2012-06-30 | 2012-03-31 | ||
|---|---|---|---|---|---|---|---|---|---|---|---|---|---|---|---|---|---|---|---|---|---|---|---|---|---|---|---|---|---|---|---|---|---|---|---|---|---|---|---|---|---|---|---|---|---|---|---|---|---|---|---|
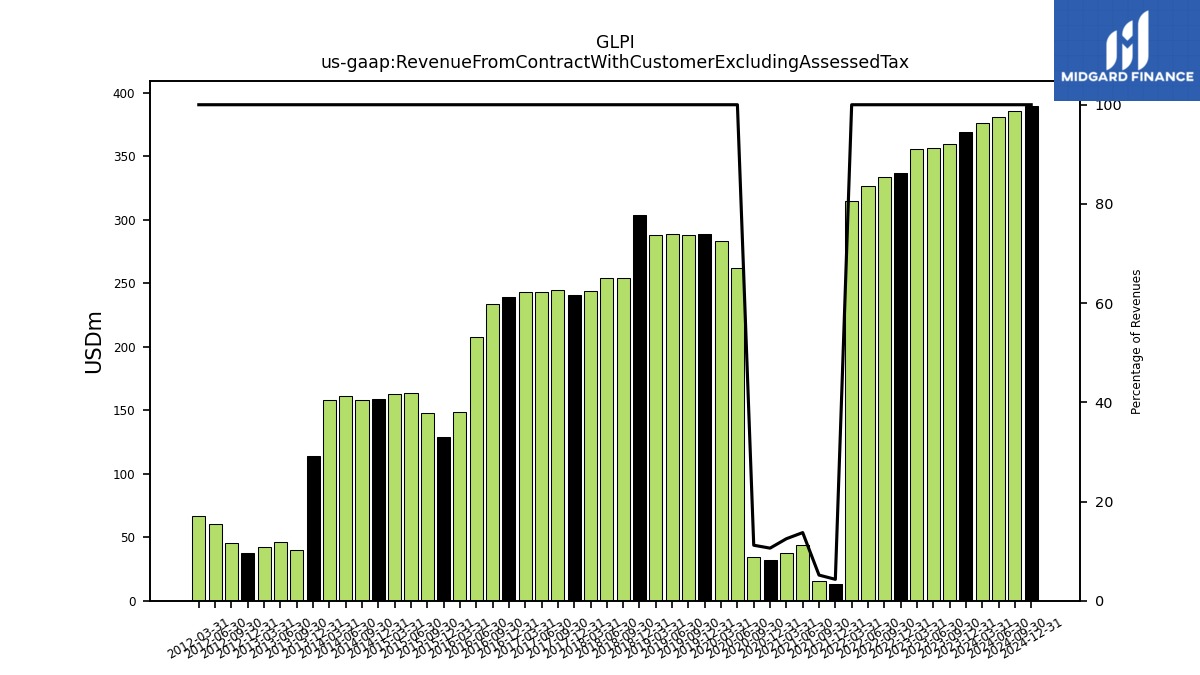
| Revenue From Contract With Customer Excluding Assessed Tax | 380.63 | 375.96 | 369.03 | 359.56 | 356.59 | 355.21 | 336.39 | 333.82 | 326.51 | 314.97 | 12.87 | 15.46 | 43.66 | 37.70 | 31.84 | 34.42 | 261.97 | 283.48 | 288.98 | 287.61 | 289.01 | 287.86 | 303.32 | 254.14 | 254.22 | 244.05 | 240.70 | 244.51 | 243.39 | 242.71 | 238.80 | 233.28 | 207.36 | 148.82 | 128.69 | 147.79 | 163.82 | 162.66 | 159.04 | 157.79 | 160.79 | 158.33 | 113.78 | 39.63 | 46.07 | 42.65 | 37.66 | 45.82 | 60.25 | 66.91 | |
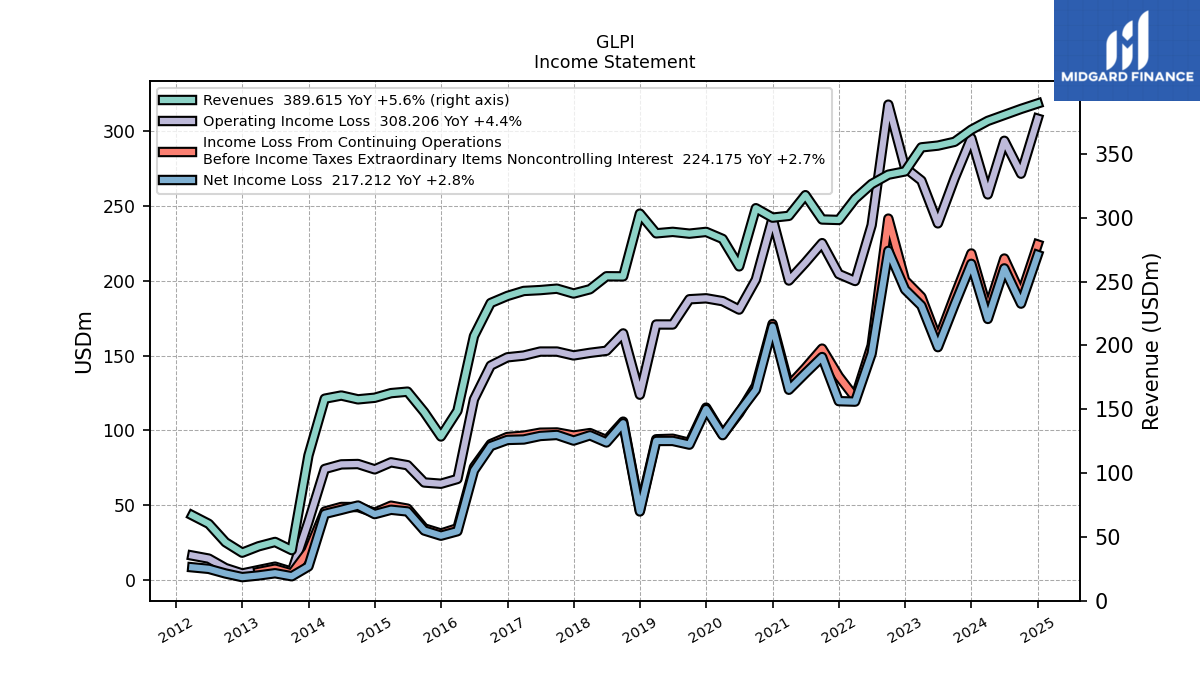
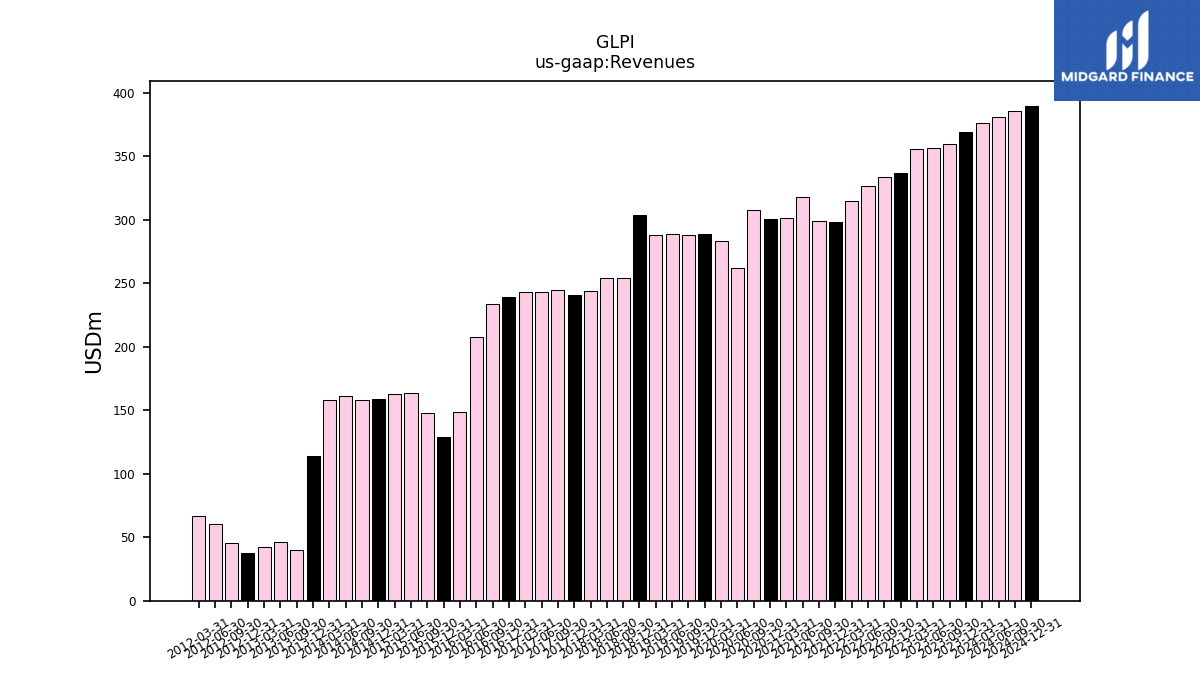
| Revenues | 380.63 | 375.96 | 369.03 | 359.56 | 356.59 | 355.21 | 336.39 | 333.82 | 326.51 | 314.97 | 298.33 | 298.71 | 317.76 | 301.54 | 300.16 | 307.55 | 261.97 | 283.48 | 288.98 | 287.61 | 289.01 | 287.86 | 303.32 | 254.14 | 254.22 | 244.05 | 240.70 | 244.51 | 243.39 | 242.71 | 238.80 | 233.28 | 207.36 | 148.82 | 128.69 | 147.79 | 163.82 | 162.66 | 159.04 | 157.79 | 160.79 | 158.33 | 113.78 | 39.63 | 46.07 | 42.65 | 37.66 | 45.82 | 60.25 | 66.91 | |
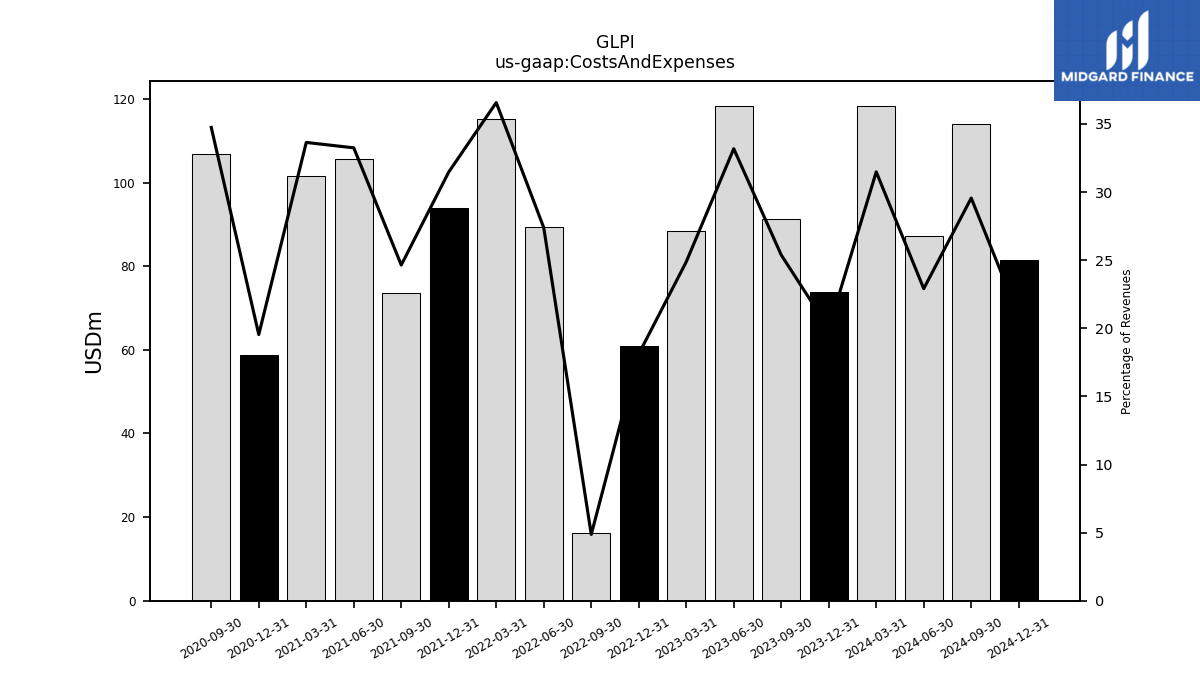
| Costs And Expenses | 87.20 | 118.36 | 73.75 | 91.26 | 118.31 | 88.36 | 60.93 | 16.25 | 89.42 | 115.17 | 93.89 | 73.61 | 105.64 | 101.44 | 58.65 | 106.85 | NA | NA | NA | NA | NA | NA | NA | NA | NA | NA | NA | NA | NA | NA | NA | NA | NA | NA | NA | NA | NA | NA | NA | NA | NA | NA | NA | NA | NA | NA | NA | NA | NA | NA | |
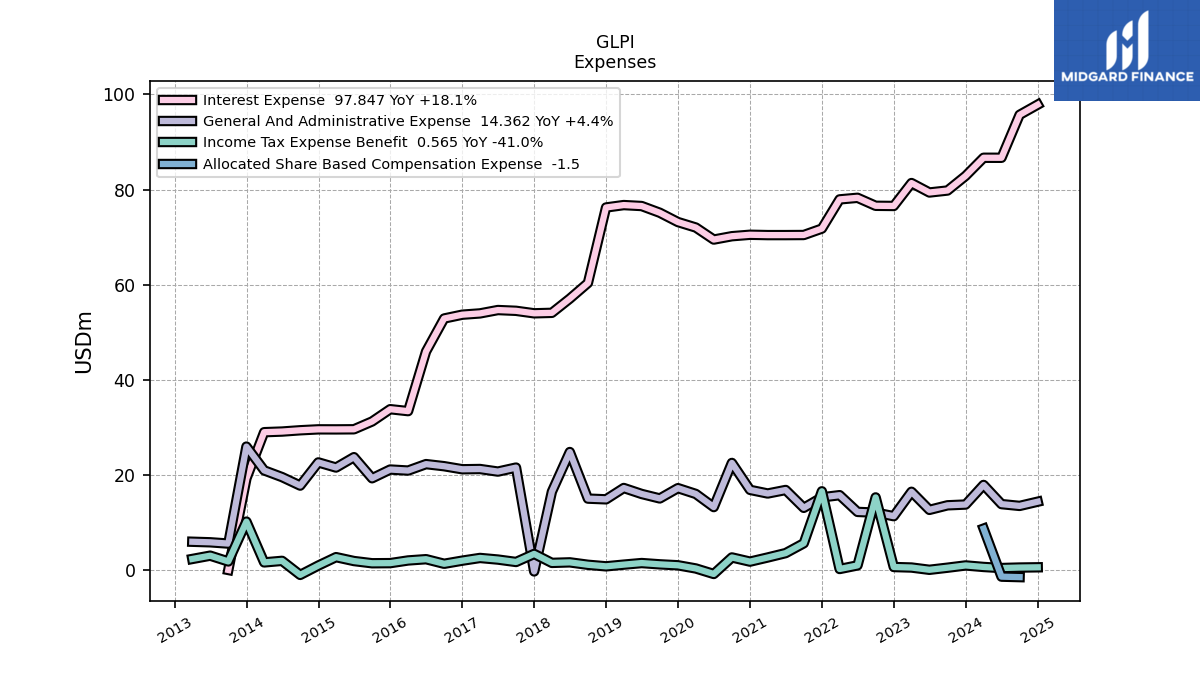
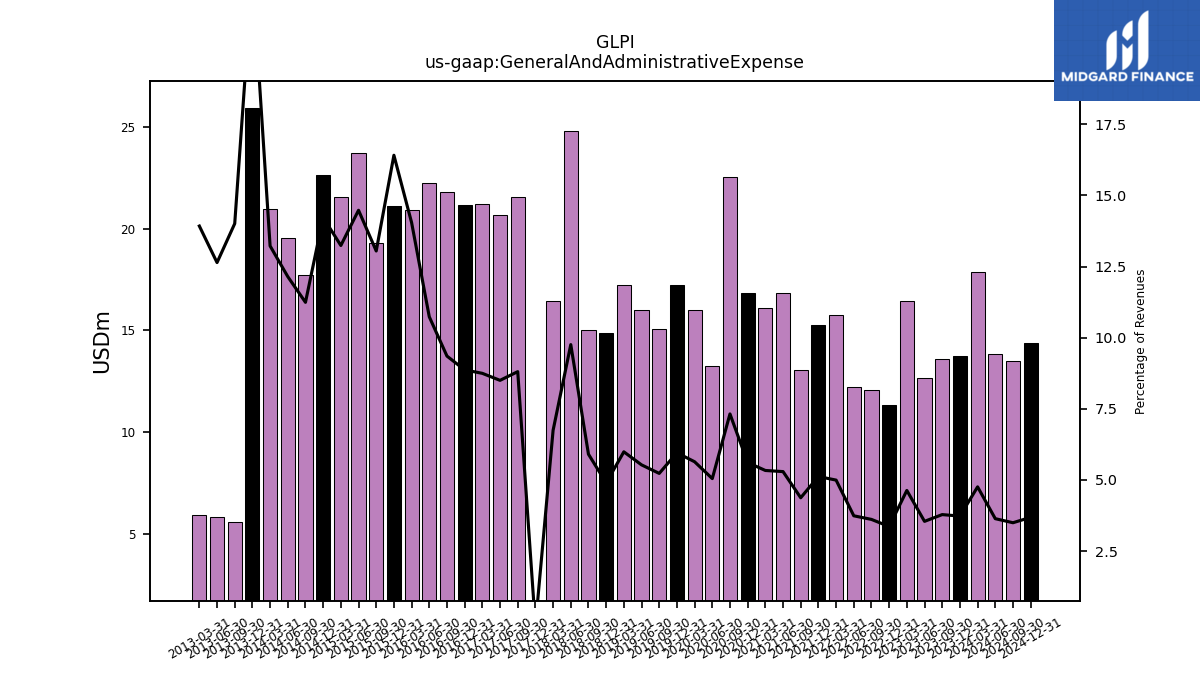
| General And Administrative Expense | 13.85 | 17.89 | 13.76 | 13.60 | 12.64 | 16.45 | 11.31 | 12.06 | 12.21 | 15.73 | 15.28 | 13.07 | 16.82 | 16.08 | 16.85 | 22.51 | 13.22 | 15.99 | 17.21 | 15.04 | 15.98 | 17.24 | 14.86 | 15.01 | 24.81 | 16.46 | -0.30 | 21.53 | 20.69 | 21.23 | 21.18 | 21.82 | 22.26 | 20.91 | 21.12 | 19.29 | 23.72 | 21.54 | 22.62 | 17.74 | 19.53 | 20.94 | 25.95 | 5.55 | 5.82 | 5.94 | NA | NA | NA | NA | |
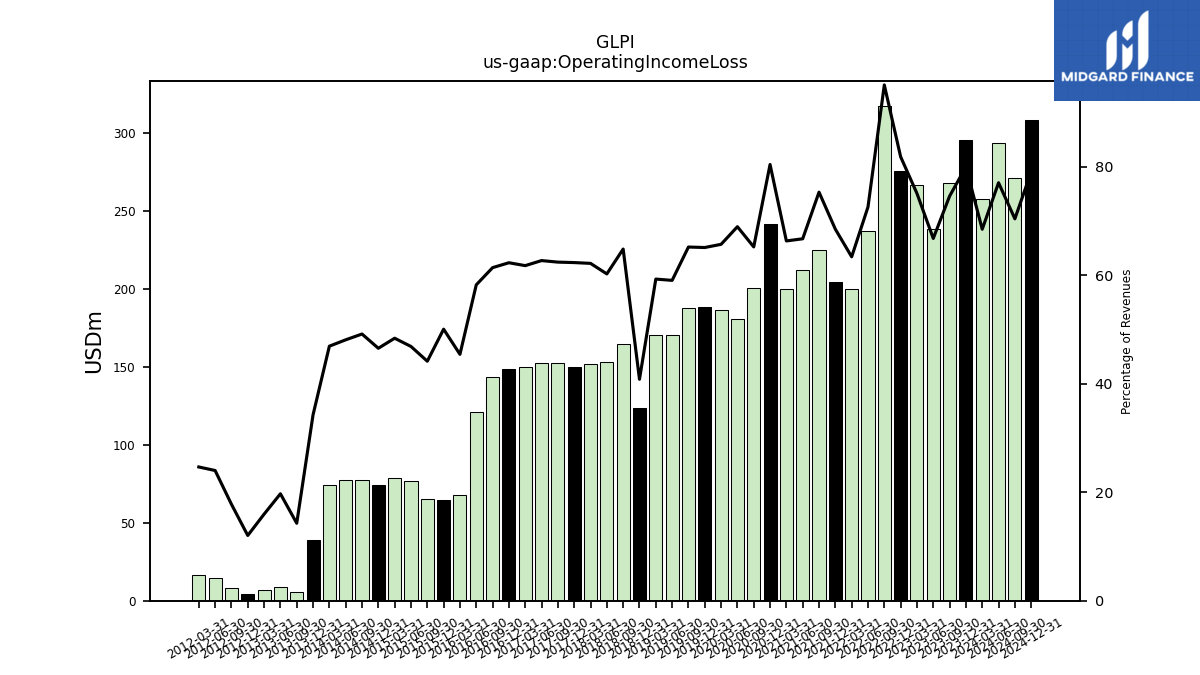
| Operating Income Loss | 293.43 | 257.61 | 295.28 | 268.30 | 238.28 | 266.85 | 275.46 | 317.57 | 237.10 | 199.80 | 204.44 | 225.10 | 212.12 | 200.10 | 241.51 | 200.70 | 180.72 | 186.35 | 188.26 | 187.62 | 170.77 | 170.78 | 123.88 | 164.83 | 153.24 | 151.85 | 150.12 | 152.70 | 152.70 | 150.01 | 148.86 | 143.31 | 120.82 | 67.64 | 64.45 | 65.29 | 76.83 | 78.76 | 74.05 | 77.62 | 77.37 | 74.33 | 39.02 | 5.67 | 9.09 | 6.81 | 4.53 | 8.15 | 14.47 | 16.51 | |
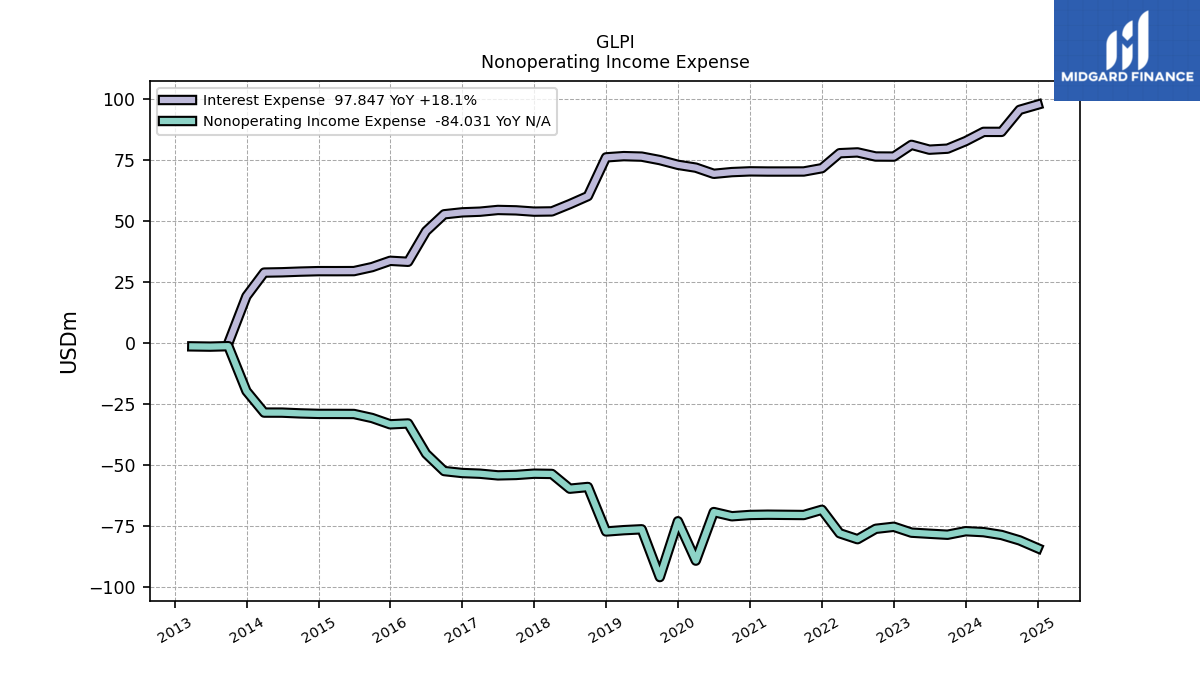
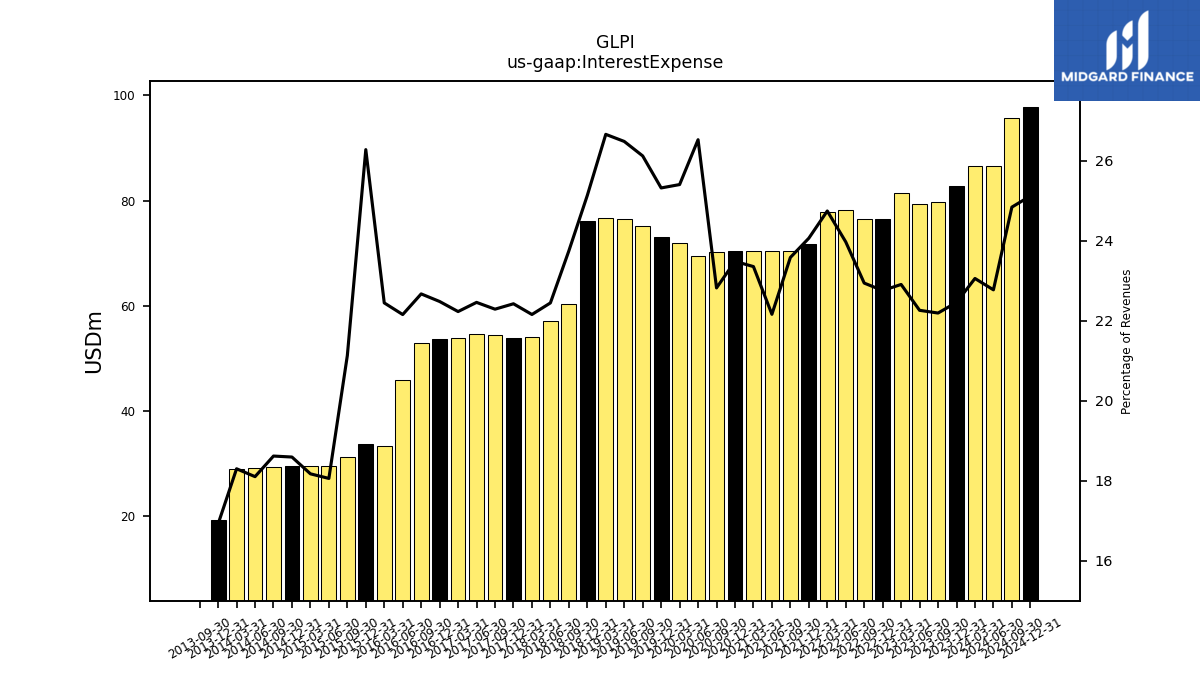
| Interest Expense | 86.67 | 86.67 | 82.87 | 79.79 | 79.37 | 81.36 | 76.54 | 76.57 | 78.26 | 77.92 | 71.78 | 70.43 | 70.41 | 70.41 | 70.48 | 70.18 | 69.47 | 72.00 | 73.16 | 75.11 | 76.52 | 76.73 | 76.22 | 60.34 | 57.05 | 54.07 | 53.97 | 54.49 | 54.66 | 53.95 | 53.68 | 52.88 | 45.94 | 33.40 | 33.81 | 31.23 | 29.59 | 29.56 | 29.57 | 29.38 | 29.11 | 28.97 | 19.25 | 0.00 | NA | NA | NA | NA | NA | NA | |
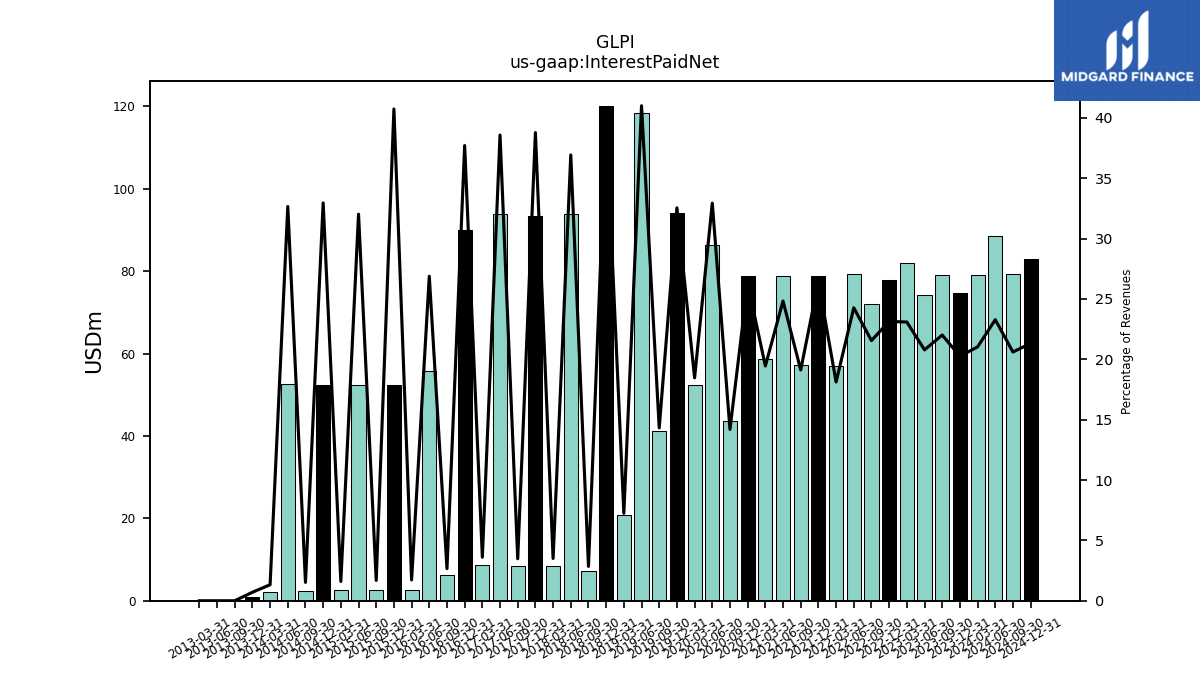
| Interest Paid Net | 88.59 | 79.03 | 74.71 | 79.13 | 74.09 | 82.00 | 77.82 | 71.93 | 79.22 | 57.08 | 78.86 | 57.09 | 78.88 | 58.65 | 78.87 | 43.65 | 86.27 | 52.34 | 94.04 | 41.16 | 118.48 | 20.85 | 120.14 | 7.23 | 93.86 | 8.55 | 93.33 | 8.50 | 93.87 | 8.74 | 90.03 | 6.20 | 55.73 | 2.57 | 52.41 | 2.49 | 52.45 | 2.60 | 52.40 | 2.40 | 52.50 | 2.10 | 0.80 | 0.00 | 0.00 | 0.00 | NA | NA | NA | NA | |
| Gains Losses On Extinguishment Of Debt | NA | NA | 0.00 | 0.00 | 0.00 | -0.56 | 0.00 | 0.00 | -2.19 | NA | NA | NA | NA | NA | 0.00 | -0.78 | -0.01 | -17.33 | 0.00 | -21.01 | 0.00 | 0.00 | 0.00 | 0.00 | -3.47 | NA | 0.00 | 0.00 | 0.00 | NA | NA | NA | NA | NA | NA | NA | NA | NA | NA | NA | NA | NA | NA | NA | NA | NA | NA | NA | NA | NA | |
| Allocated Share Based Compensation Expense | -1.40 | 8.70 | NA | NA | NA | NA | NA | NA | NA | NA | NA | NA | NA | NA | NA | NA | NA | NA | NA | NA | NA | NA | NA | NA | NA | NA | NA | NA | NA | NA | NA | NA | NA | NA | NA | NA | NA | NA | NA | NA | NA | NA | NA | NA | NA | NA | NA | NA | NA | NA | |
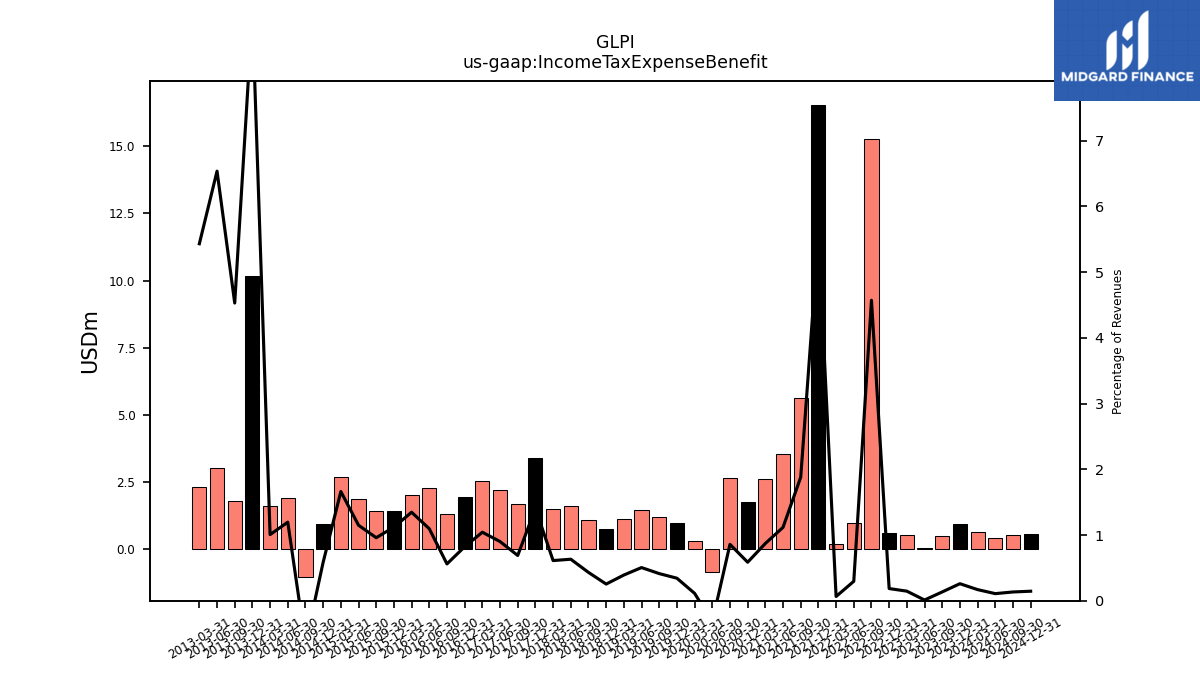
| Income Tax Expense Benefit | 0.41 | 0.64 | 0.96 | 0.48 | 0.04 | 0.52 | 0.62 | 15.26 | 0.97 | 0.20 | 16.55 | 5.61 | 3.55 | 2.63 | 1.76 | 2.64 | -0.84 | 0.32 | 0.99 | 1.19 | 1.46 | 1.13 | 0.77 | 1.10 | 1.61 | 1.49 | 3.38 | 1.68 | 2.19 | 2.53 | 1.96 | 1.31 | 2.27 | 2.00 | 1.44 | 1.42 | 1.88 | 2.70 | 0.93 | -1.03 | 1.92 | 1.59 | 10.17 | 1.79 | 3.01 | 2.32 | NA | NA | NA | NA | |
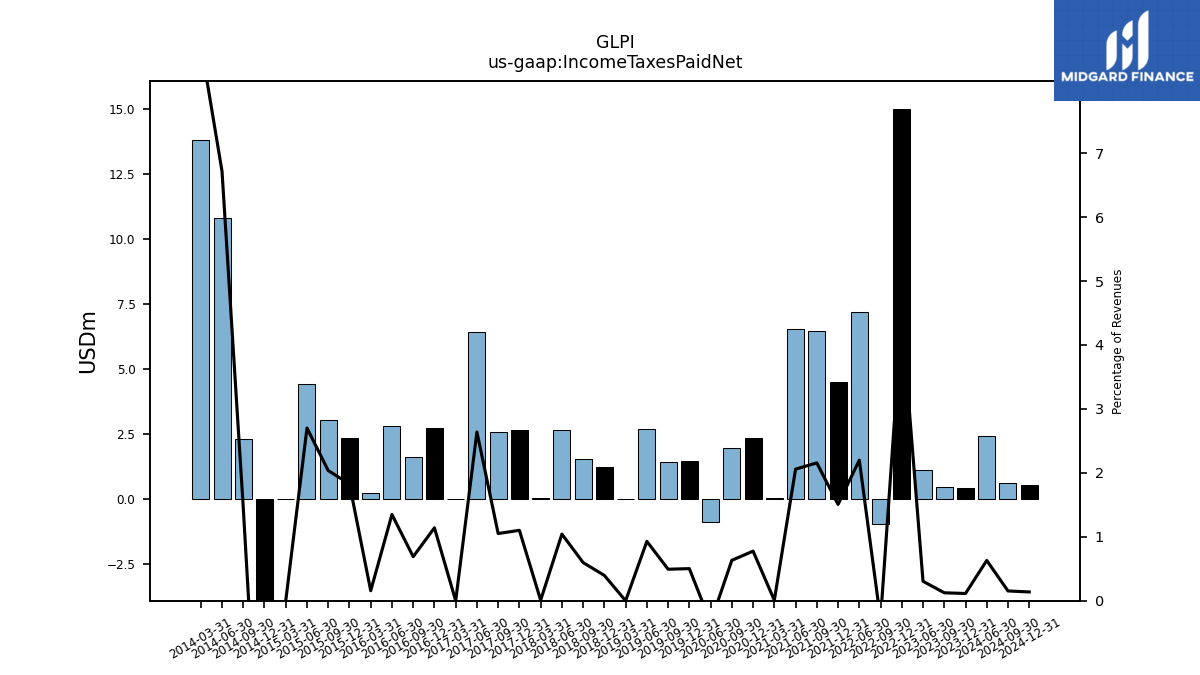
| Income Taxes Paid Net | 2.40 | NA | 0.42 | 0.45 | 1.09 | NA | 14.99 | -0.98 | 7.18 | NA | 4.50 | 6.44 | 6.54 | 0.02 | 2.33 | 1.95 | -0.89 | NA | 1.45 | 1.42 | 2.68 | 0.00 | 1.20 | 1.52 | 2.65 | 0.02 | 2.65 | 2.57 | 6.42 | 0.00 | 2.72 | 1.61 | 2.80 | 0.23 | 2.35 | 3.01 | 4.42 | 0.00 | -6.80 | 2.30 | 10.80 | 13.80 | NA | NA | NA | NA | NA | NA | NA | NA | |
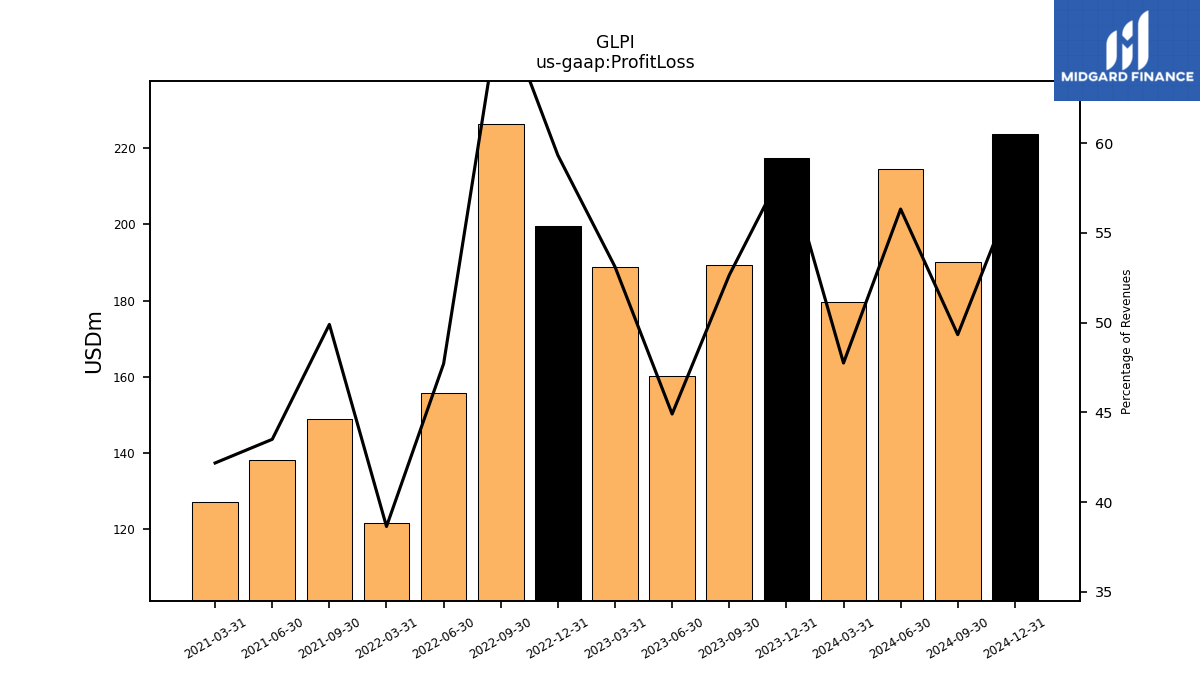
| Profit Loss | 214.41 | 179.53 | 217.26 | 189.31 | 160.14 | 188.67 | 199.59 | 226.22 | 155.79 | 121.69 | NA | 149.06 | 138.22 | 127.18 | NA | NA | NA | NA | NA | NA | NA | NA | NA | NA | NA | NA | NA | NA | NA | NA | NA | NA | NA | NA | NA | NA | NA | NA | NA | NA | NA | NA | NA | NA | NA | NA | NA | NA | NA | NA | |
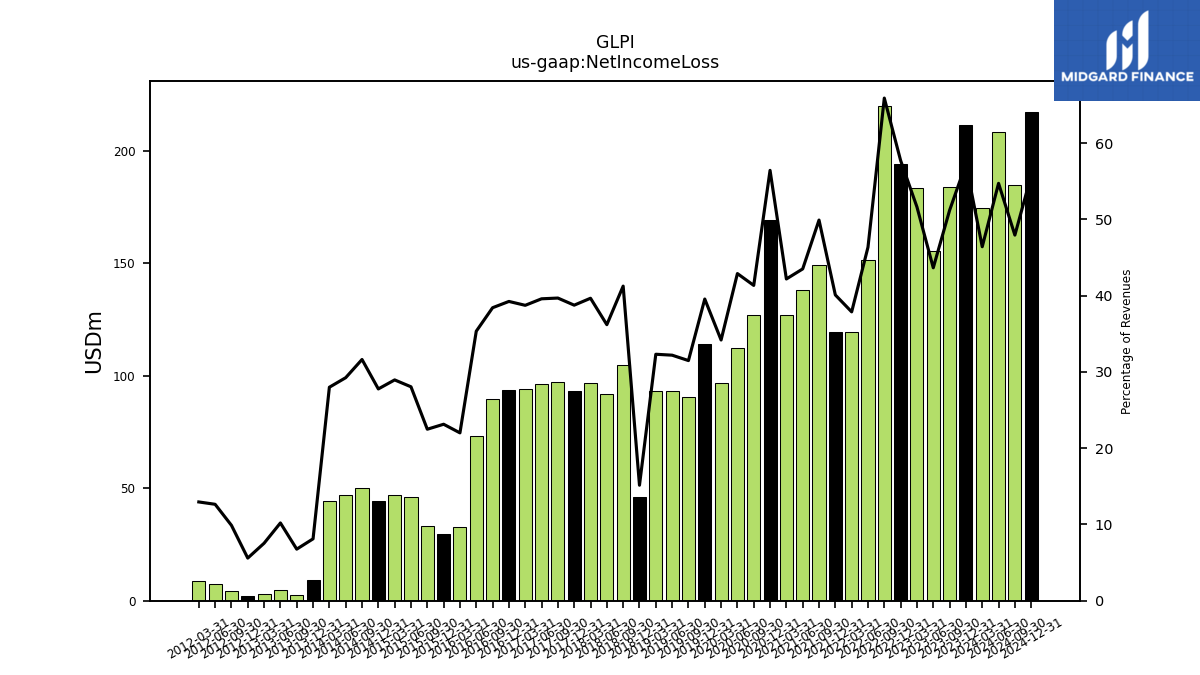
| Net Income Loss | 208.25 | 174.46 | 211.29 | 184.01 | 155.63 | 183.35 | 194.12 | 219.95 | 151.31 | 119.27 | 119.59 | 149.06 | 138.22 | 127.18 | 169.34 | 127.13 | 112.35 | 96.89 | 114.29 | 90.55 | 93.03 | 93.01 | 45.93 | 104.81 | 92.00 | 96.77 | 93.26 | 97.01 | 96.33 | 93.99 | 93.69 | 89.60 | 73.26 | 32.75 | 29.77 | 33.23 | 45.95 | 47.09 | 44.16 | 49.90 | 47.01 | 44.31 | 9.23 | 2.68 | 4.70 | 3.22 | 2.11 | 4.53 | 7.62 | 8.66 | |
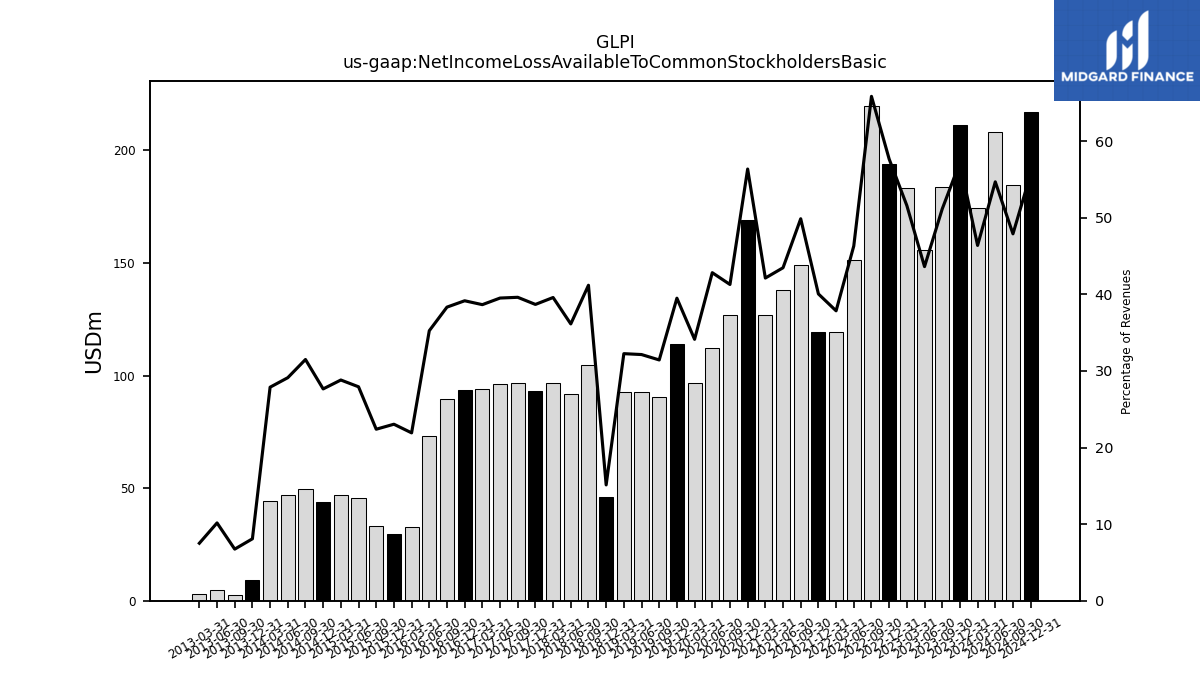
| Net Income Loss Available To Common Stockholders Basic | 208.15 | 174.39 | 211.15 | 183.89 | 155.54 | 183.26 | 193.97 | 219.80 | 151.23 | 119.21 | 119.50 | 148.96 | 138.13 | 127.03 | 169.16 | 126.97 | 112.19 | 96.75 | 114.14 | 90.41 | 92.89 | 92.85 | 45.87 | 104.67 | 91.87 | 96.61 | 93.11 | 96.86 | 96.17 | 93.82 | 93.51 | 89.42 | 73.09 | 32.61 | 29.66 | 33.09 | 45.76 | 46.87 | 43.98 | 49.69 | 46.82 | 44.14 | 9.20 | 2.67 | 4.68 | 3.20 | NA | NA | NA | NA |
| 2024-06-30 | 2024-03-31 | 2023-12-31 | 2023-09-30 | 2023-06-30 | 2023-03-31 | 2022-12-31 | 2022-09-30 | 2022-06-30 | 2022-03-31 | 2021-12-31 | 2021-09-30 | 2021-06-30 | 2021-03-31 | 2020-12-31 | 2020-09-30 | 2020-06-30 | 2020-03-31 | 2019-12-31 | 2019-09-30 | 2019-06-30 | 2019-03-31 | 2018-12-31 | 2018-09-30 | 2018-06-30 | 2018-03-31 | 2017-12-31 | 2017-09-30 | 2017-06-30 | 2017-03-31 | 2016-12-31 | 2016-09-30 | 2016-06-30 | 2016-03-31 | 2015-12-31 | 2015-09-30 | 2015-06-30 | 2015-03-31 | 2014-12-31 | 2014-09-30 | 2014-06-30 | 2014-03-31 | 2013-12-31 | 2013-09-30 | 2013-06-30 | 2013-03-31 | 2012-12-31 | 2012-09-30 | 2012-06-30 | 2012-03-31 | ||
|---|---|---|---|---|---|---|---|---|---|---|---|---|---|---|---|---|---|---|---|---|---|---|---|---|---|---|---|---|---|---|---|---|---|---|---|---|---|---|---|---|---|---|---|---|---|---|---|---|---|---|---|
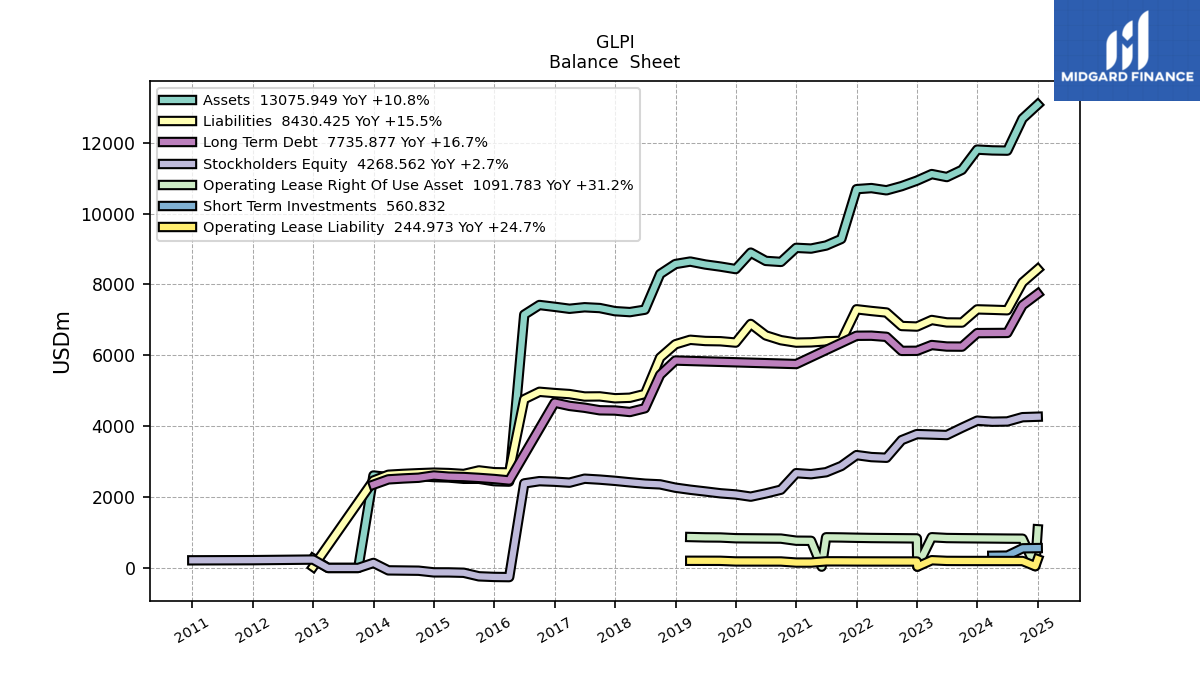
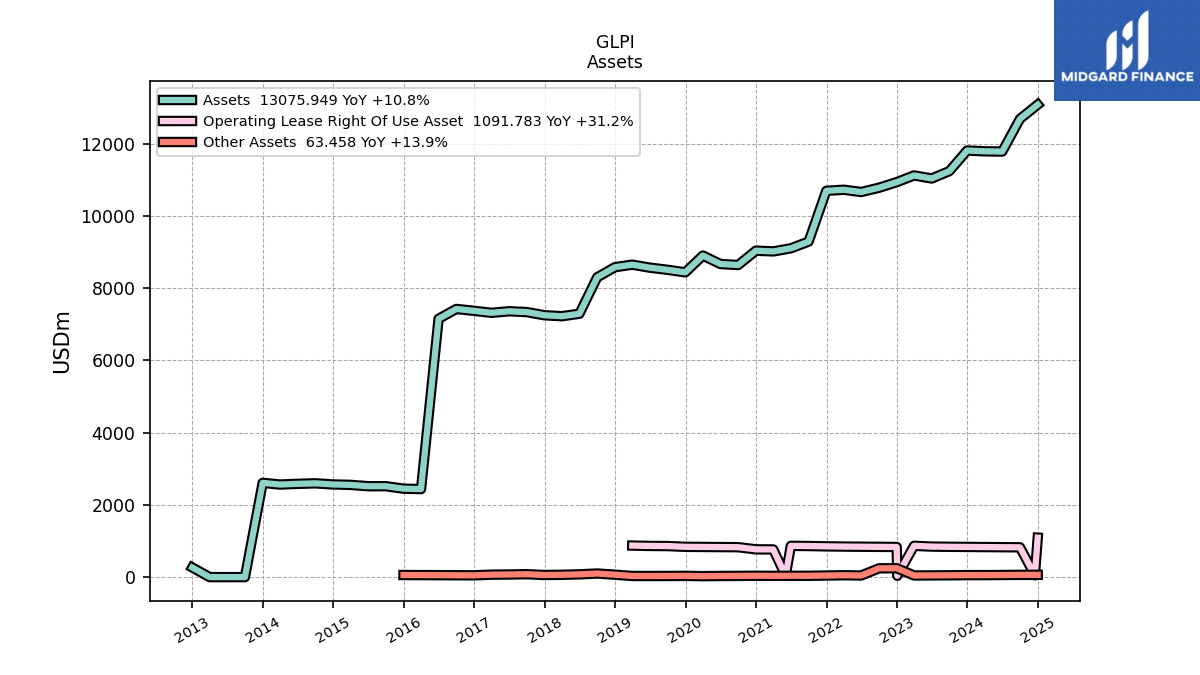
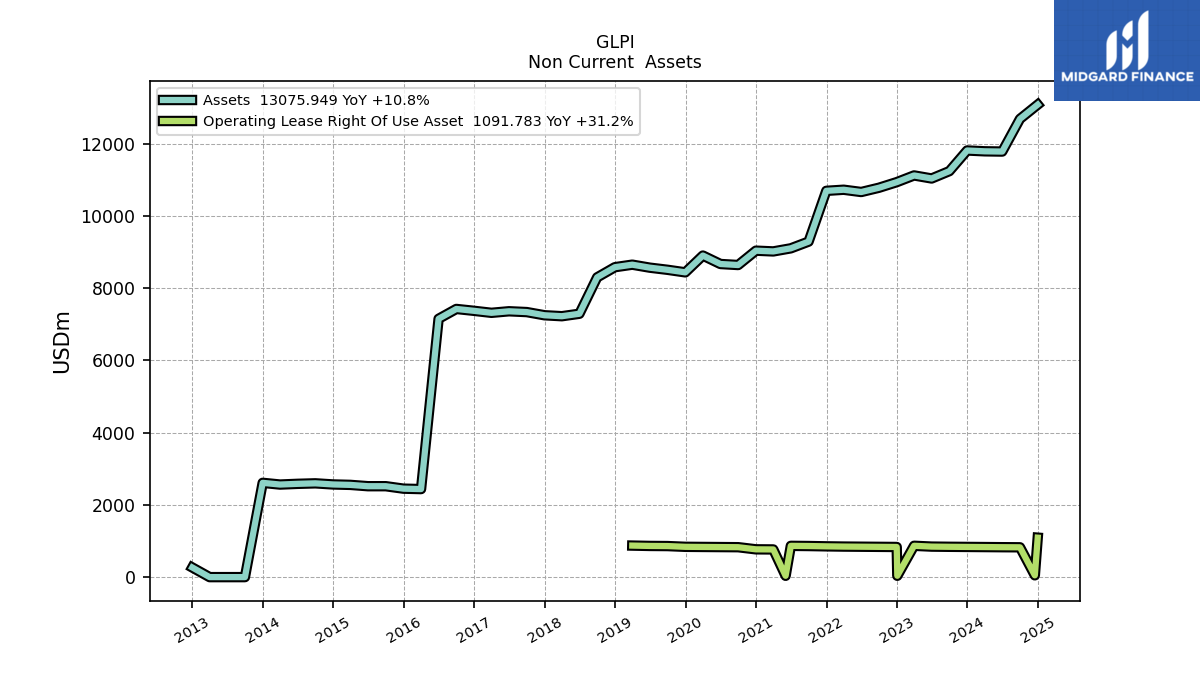
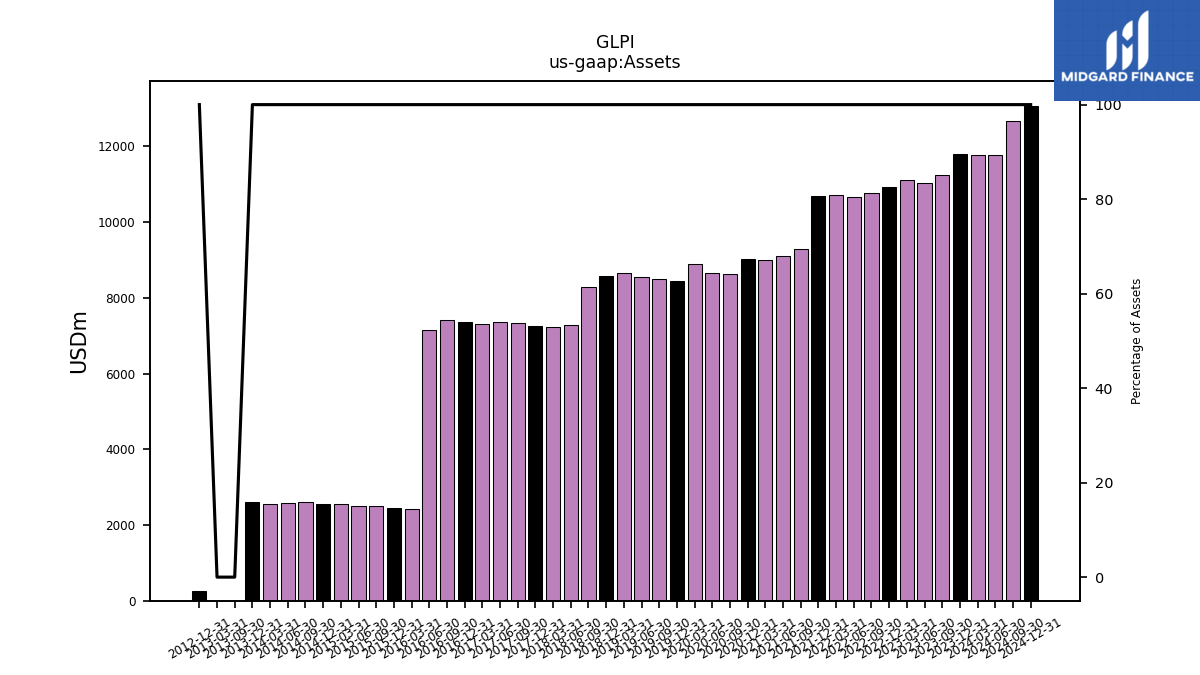
| Assets | 11777.17 | 11784.02 | 11806.66 | 11235.62 | 11031.94 | 11116.09 | 10930.39 | 10775.74 | 10657.73 | 10720.48 | 10690.45 | 9284.77 | 9099.32 | 9013.49 | 9034.37 | 8636.98 | 8665.42 | 8899.16 | 8434.30 | 8504.75 | 8563.86 | 8646.83 | 8577.29 | 8295.90 | 7288.56 | 7220.45 | 7246.88 | 7334.81 | 7357.22 | 7314.40 | 7369.33 | 7421.32 | 7149.06 | 2436.23 | 2448.16 | 2516.11 | 2515.97 | 2552.48 | 2564.58 | 2595.44 | 2581.68 | 2561.89 | 2609.24 | 0.00 | NA | 0.00 | 267.07 | NA | NA | NA | |
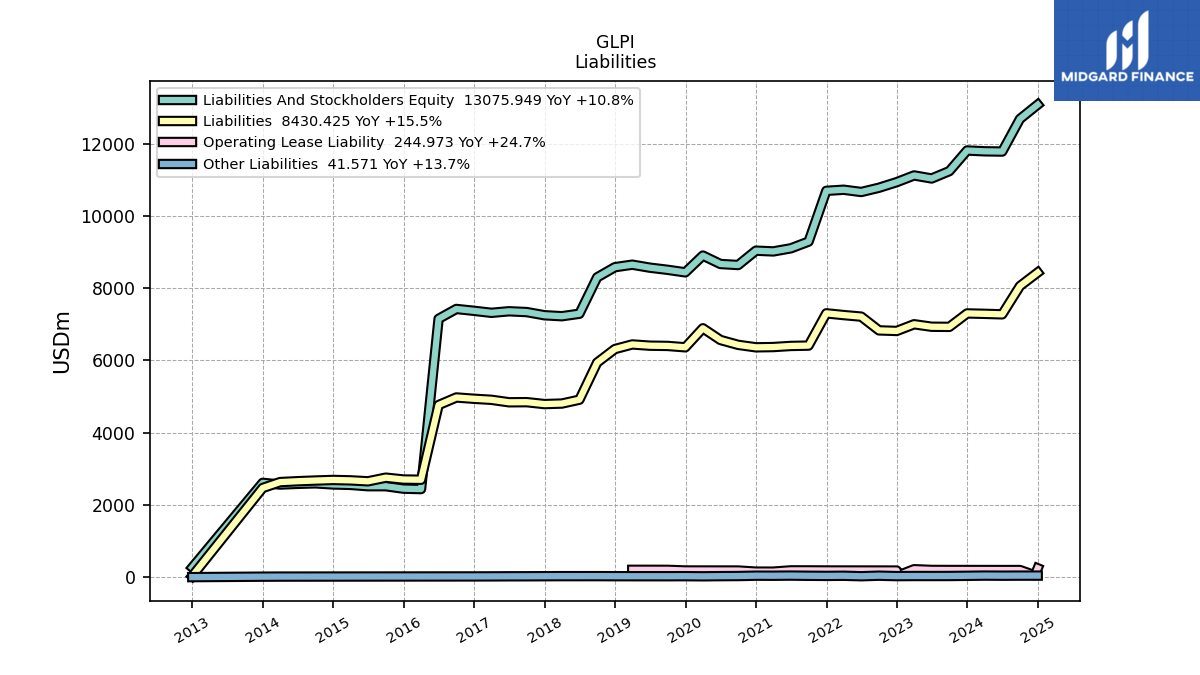
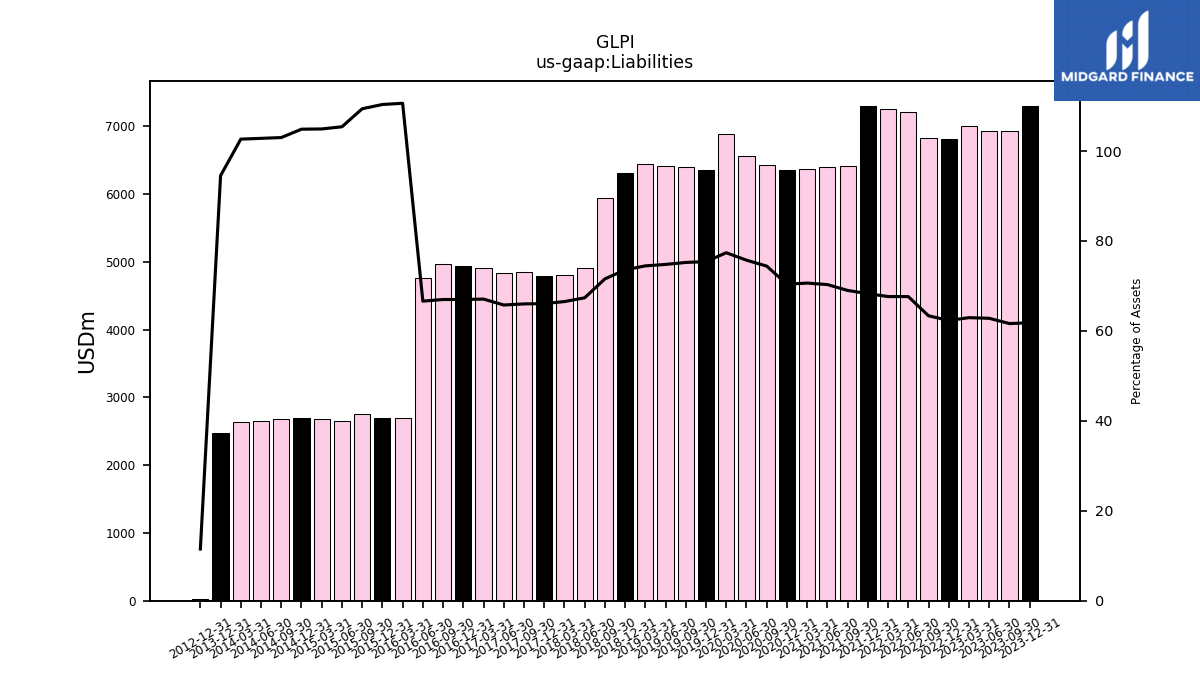
| Liabilities | 7272.24 | 7286.20 | 7297.70 | 6925.41 | 6929.06 | 6997.90 | 6812.29 | 6828.39 | 7209.07 | 7251.99 | 7300.31 | 6407.03 | 6397.59 | 6366.85 | 6359.35 | 6427.71 | 6562.66 | 6886.86 | 6360.05 | 6398.12 | 6405.18 | 6439.15 | 6311.69 | 5937.50 | 4909.79 | 4803.60 | 4788.64 | 4841.70 | 4838.45 | 4907.06 | 4935.46 | 4971.66 | 4762.89 | 2695.04 | 2701.67 | 2752.70 | 2651.82 | 2678.02 | 2689.32 | 2673.34 | 2654.60 | 2629.91 | 2466.81 | NA | NA | NA | 30.75 | NA | NA | NA | |
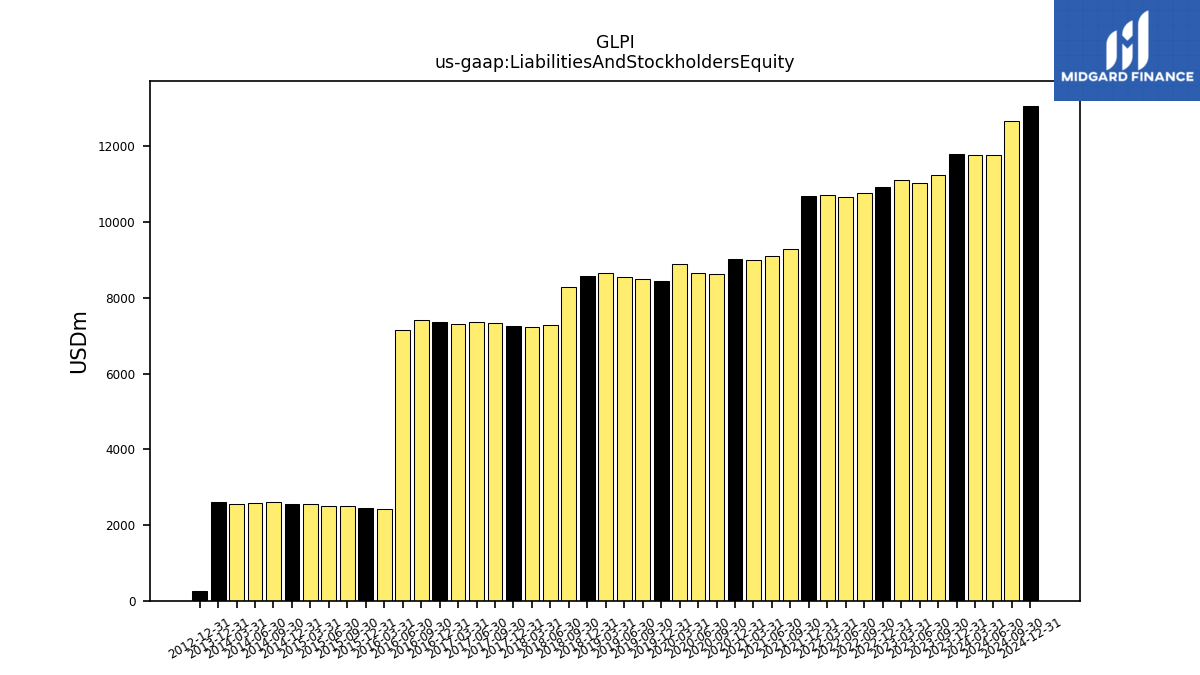
| Liabilities And Stockholders Equity | 11777.17 | 11784.02 | 11806.66 | 11235.62 | 11031.94 | 11116.09 | 10930.39 | 10775.74 | 10657.73 | 10720.48 | 10690.45 | 9284.77 | 9099.32 | 9013.49 | 9034.37 | 8636.98 | 8665.42 | 8899.16 | 8434.30 | 8504.75 | 8563.86 | 8646.83 | 8577.29 | 8295.90 | 7288.56 | 7220.45 | 7246.88 | 7334.81 | 7357.22 | 7314.40 | 7369.33 | 7421.32 | 7149.06 | 2436.23 | 2448.16 | 2516.11 | 2515.97 | 2552.48 | 2564.58 | 2595.44 | 2581.68 | 2561.89 | 2609.24 | NA | NA | NA | 267.07 | NA | NA | NA | |
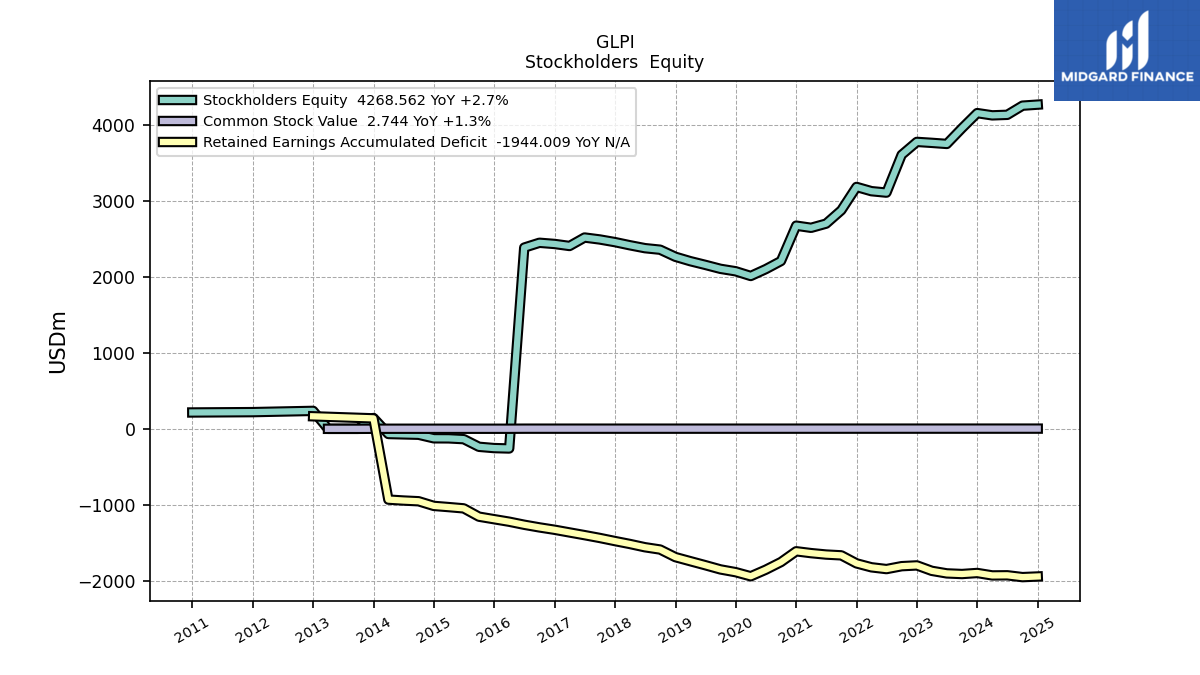
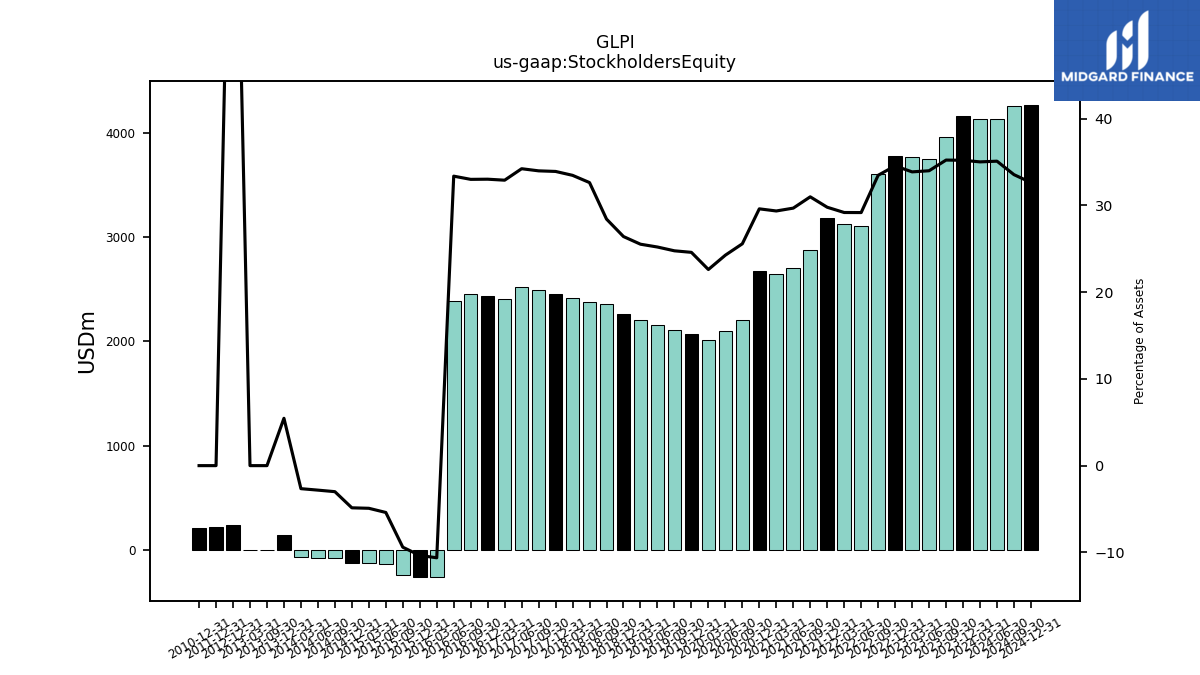
| Stockholders Equity | 4134.31 | 4127.22 | 4156.90 | 3958.54 | 3750.91 | 3765.23 | 3777.96 | 3607.49 | 3109.87 | 3128.97 | 3185.01 | 2877.74 | 2701.73 | 2646.64 | 2675.02 | 2209.28 | 2102.76 | 2012.31 | 2074.24 | 2106.63 | 2158.69 | 2207.68 | 2265.61 | 2358.40 | 2378.77 | 2416.85 | 2458.25 | 2493.10 | 2518.77 | 2407.34 | 2433.87 | 2449.66 | 2386.17 | -258.81 | -253.51 | -236.59 | -135.85 | -125.54 | -124.74 | -77.90 | -72.92 | -68.03 | 142.43 | 0.00 | NA | 0.00 | 236.33 | NA | NA | NA |
| 2024-06-30 | 2024-03-31 | 2023-12-31 | 2023-09-30 | 2023-06-30 | 2023-03-31 | 2022-12-31 | 2022-09-30 | 2022-06-30 | 2022-03-31 | 2021-12-31 | 2021-09-30 | 2021-06-30 | 2021-03-31 | 2020-12-31 | 2020-09-30 | 2020-06-30 | 2020-03-31 | 2019-12-31 | 2019-09-30 | 2019-06-30 | 2019-03-31 | 2018-12-31 | 2018-09-30 | 2018-06-30 | 2018-03-31 | 2017-12-31 | 2017-09-30 | 2017-06-30 | 2017-03-31 | 2016-12-31 | 2016-09-30 | 2016-06-30 | 2016-03-31 | 2015-12-31 | 2015-09-30 | 2015-06-30 | 2015-03-31 | 2014-12-31 | 2014-09-30 | 2014-06-30 | 2014-03-31 | 2013-12-31 | 2013-09-30 | 2013-06-30 | 2013-03-31 | 2012-12-31 | 2012-09-30 | 2012-06-30 | 2012-03-31 | ||
|---|---|---|---|---|---|---|---|---|---|---|---|---|---|---|---|---|---|---|---|---|---|---|---|---|---|---|---|---|---|---|---|---|---|---|---|---|---|---|---|---|---|---|---|---|---|---|---|---|---|---|---|
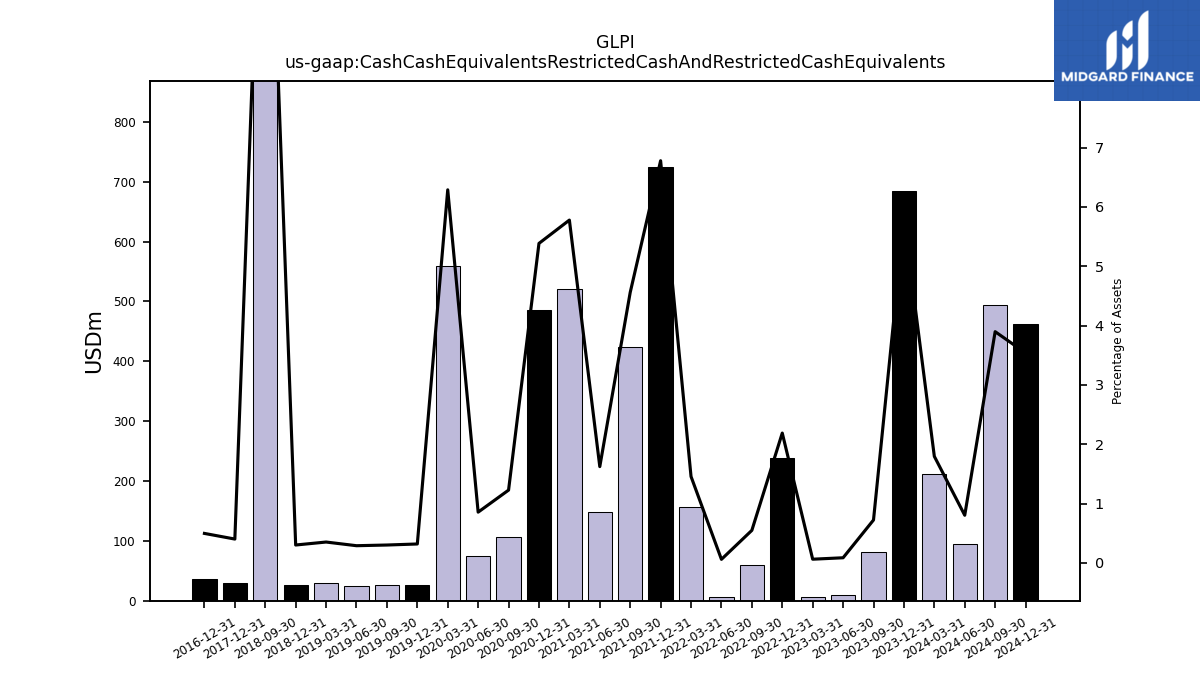
| Cash Cash Equivalents Restricted Cash And Restricted Cash Equivalents | 94.49 | 211.53 | 683.98 | 81.15 | 9.45 | 6.82 | 239.08 | 59.03 | 6.29 | 156.02 | 724.60 | 423.22 | 147.59 | 520.74 | 486.45 | 105.89 | 74.05 | 559.54 | 26.82 | 25.56 | 24.74 | 30.33 | 25.78 | 1162.77 | NA | NA | 29.05 | NA | NA | NA | 36.56 | NA | NA | NA | NA | NA | NA | NA | NA | NA | NA | NA | NA | NA | NA | NA | NA | NA | NA | NA | |
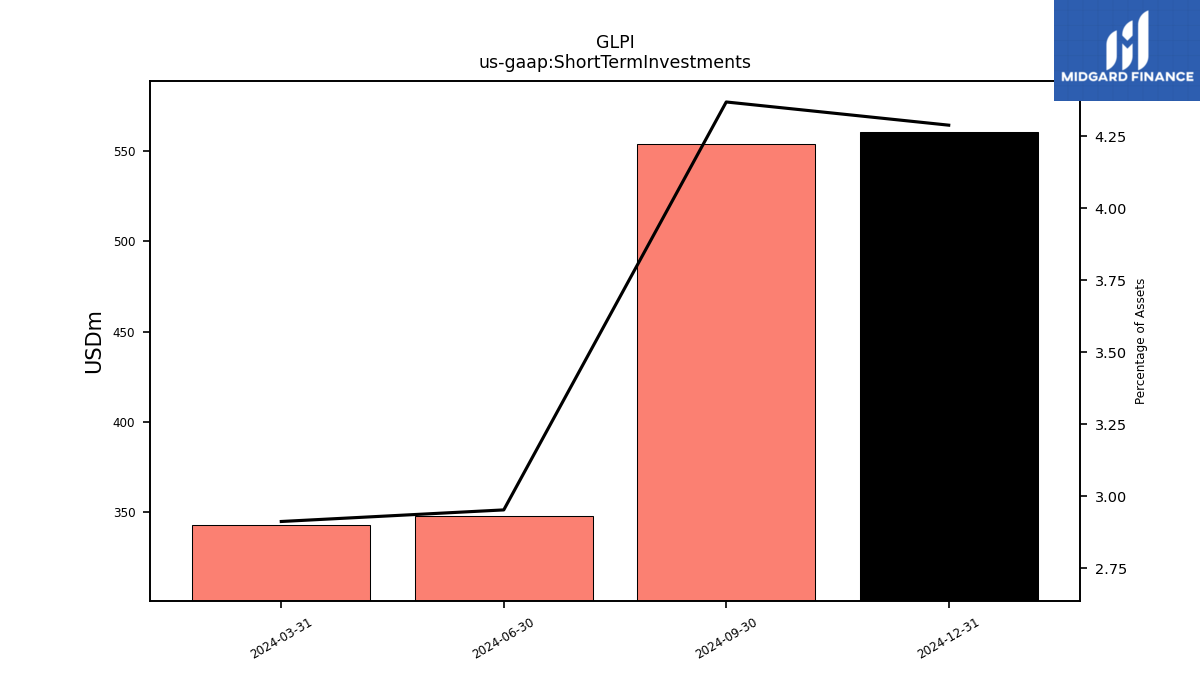
| Short Term Investments | 347.78 | 343.24 | NA | NA | NA | NA | NA | NA | NA | NA | NA | NA | NA | NA | NA | NA | NA | NA | NA | NA | NA | NA | NA | NA | NA | NA | NA | NA | NA | NA | NA | NA | NA | NA | NA | NA | NA | NA | NA | NA | NA | NA | NA | NA | NA | NA | NA | NA | NA | NA |
| 2024-06-30 | 2024-03-31 | 2023-12-31 | 2023-09-30 | 2023-06-30 | 2023-03-31 | 2022-12-31 | 2022-09-30 | 2022-06-30 | 2022-03-31 | 2021-12-31 | 2021-09-30 | 2021-06-30 | 2021-03-31 | 2020-12-31 | 2020-09-30 | 2020-06-30 | 2020-03-31 | 2019-12-31 | 2019-09-30 | 2019-06-30 | 2019-03-31 | 2018-12-31 | 2018-09-30 | 2018-06-30 | 2018-03-31 | 2017-12-31 | 2017-09-30 | 2017-06-30 | 2017-03-31 | 2016-12-31 | 2016-09-30 | 2016-06-30 | 2016-03-31 | 2015-12-31 | 2015-09-30 | 2015-06-30 | 2015-03-31 | 2014-12-31 | 2014-09-30 | 2014-06-30 | 2014-03-31 | 2013-12-31 | 2013-09-30 | 2013-06-30 | 2013-03-31 | 2012-12-31 | 2012-09-30 | 2012-06-30 | 2012-03-31 | ||
|---|---|---|---|---|---|---|---|---|---|---|---|---|---|---|---|---|---|---|---|---|---|---|---|---|---|---|---|---|---|---|---|---|---|---|---|---|---|---|---|---|---|---|---|---|---|---|---|---|---|---|---|
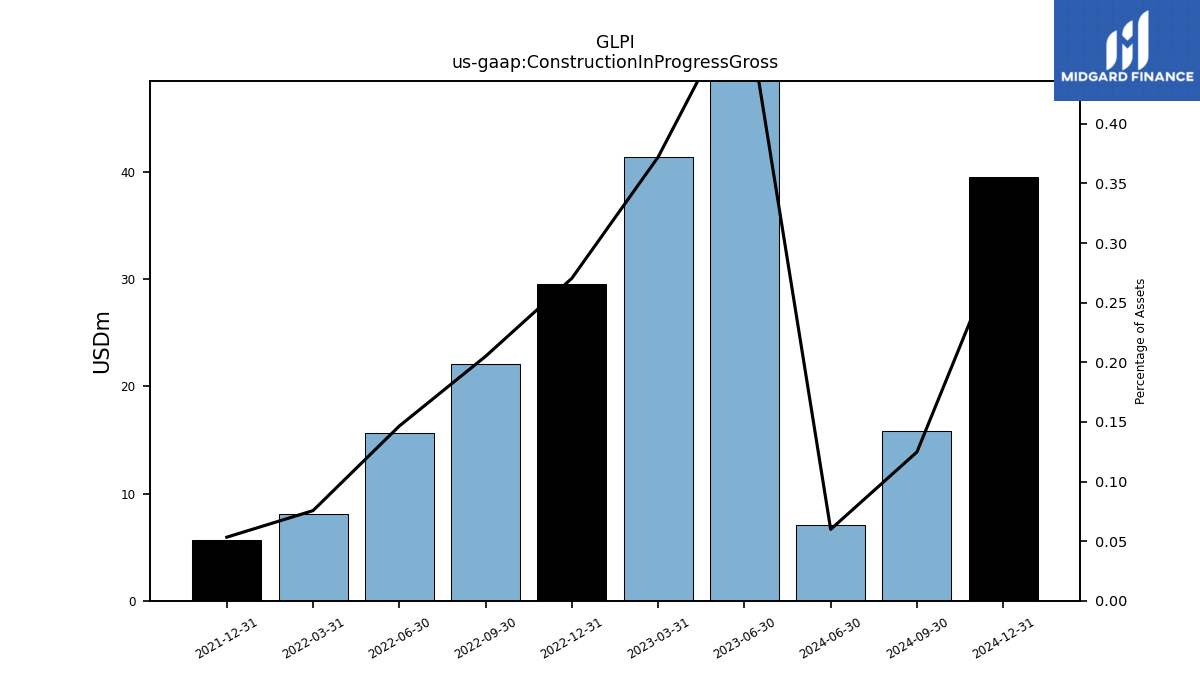
| Construction In Progress Gross | 7.05 | NA | NA | NA | 56.38 | 41.37 | 29.56 | 22.09 | 15.62 | 8.11 | 5.70 | NA | NA | NA | NA | NA | NA | NA | NA | NA | NA | NA | NA | NA | NA | NA | NA | NA | NA | NA | NA | NA | NA | NA | NA | NA | NA | NA | NA | NA | NA | NA | NA | NA | NA | NA | NA | NA | NA | NA |
| 2024-06-30 | 2024-03-31 | 2023-12-31 | 2023-09-30 | 2023-06-30 | 2023-03-31 | 2022-12-31 | 2022-09-30 | 2022-06-30 | 2022-03-31 | 2021-12-31 | 2021-09-30 | 2021-06-30 | 2021-03-31 | 2020-12-31 | 2020-09-30 | 2020-06-30 | 2020-03-31 | 2019-12-31 | 2019-09-30 | 2019-06-30 | 2019-03-31 | 2018-12-31 | 2018-09-30 | 2018-06-30 | 2018-03-31 | 2017-12-31 | 2017-09-30 | 2017-06-30 | 2017-03-31 | 2016-12-31 | 2016-09-30 | 2016-06-30 | 2016-03-31 | 2015-12-31 | 2015-09-30 | 2015-06-30 | 2015-03-31 | 2014-12-31 | 2014-09-30 | 2014-06-30 | 2014-03-31 | 2013-12-31 | 2013-09-30 | 2013-06-30 | 2013-03-31 | 2012-12-31 | 2012-09-30 | 2012-06-30 | 2012-03-31 | ||
|---|---|---|---|---|---|---|---|---|---|---|---|---|---|---|---|---|---|---|---|---|---|---|---|---|---|---|---|---|---|---|---|---|---|---|---|---|---|---|---|---|---|---|---|---|---|---|---|---|---|---|---|
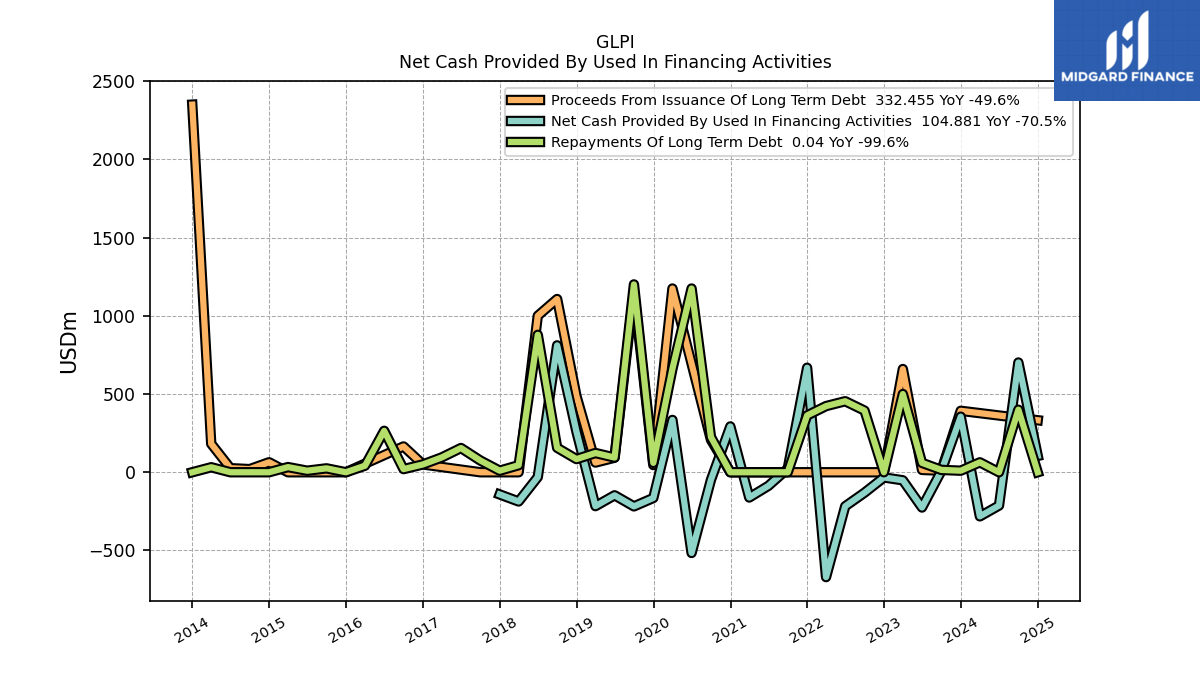
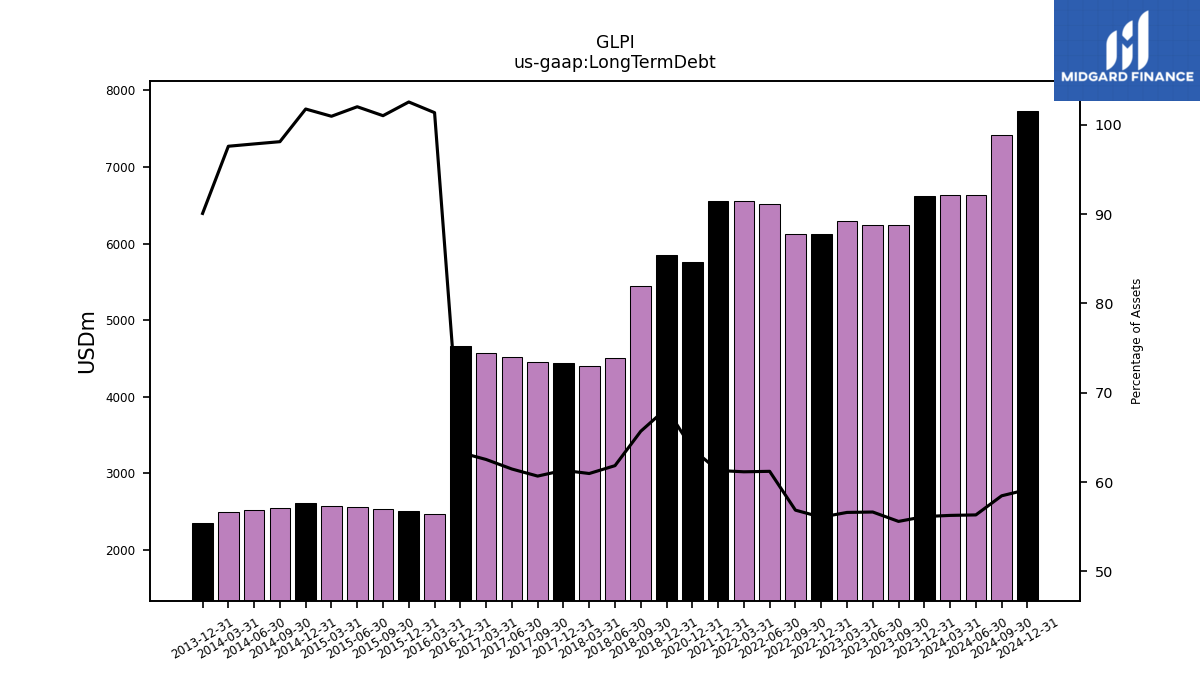
| Long Term Debt | 6632.84 | 6630.20 | 6627.55 | 6246.21 | 6248.84 | 6291.47 | 6128.47 | 6126.14 | 6522.31 | 6555.08 | 6552.37 | NA | NA | NA | 5754.69 | NA | NA | NA | NA | NA | NA | NA | 5853.50 | 5449.15 | 4506.74 | 4401.11 | 4442.88 | 4449.65 | 4521.42 | 4573.19 | 4664.97 | NA | NA | 2468.99 | 2510.34 | 2541.41 | 2566.44 | 2576.46 | 2609.49 | 2546.00 | 2526.00 | 2500.00 | 2350.00 | NA | NA | NA | NA | NA | NA | NA |
| 2024-06-30 | 2024-03-31 | 2023-12-31 | 2023-09-30 | 2023-06-30 | 2023-03-31 | 2022-12-31 | 2022-09-30 | 2022-06-30 | 2022-03-31 | 2021-12-31 | 2021-09-30 | 2021-06-30 | 2021-03-31 | 2020-12-31 | 2020-09-30 | 2020-06-30 | 2020-03-31 | 2019-12-31 | 2019-09-30 | 2019-06-30 | 2019-03-31 | 2018-12-31 | 2018-09-30 | 2018-06-30 | 2018-03-31 | 2017-12-31 | 2017-09-30 | 2017-06-30 | 2017-03-31 | 2016-12-31 | 2016-09-30 | 2016-06-30 | 2016-03-31 | 2015-12-31 | 2015-09-30 | 2015-06-30 | 2015-03-31 | 2014-12-31 | 2014-09-30 | 2014-06-30 | 2014-03-31 | 2013-12-31 | 2013-09-30 | 2013-06-30 | 2013-03-31 | 2012-12-31 | 2012-09-30 | 2012-06-30 | 2012-03-31 | ||
|---|---|---|---|---|---|---|---|---|---|---|---|---|---|---|---|---|---|---|---|---|---|---|---|---|---|---|---|---|---|---|---|---|---|---|---|---|---|---|---|---|---|---|---|---|---|---|---|---|---|---|---|
| Stockholders Equity | 4134.31 | 4127.22 | 4156.90 | 3958.54 | 3750.91 | 3765.23 | 3777.96 | 3607.49 | 3109.87 | 3128.97 | 3185.01 | 2877.74 | 2701.73 | 2646.64 | 2675.02 | 2209.28 | 2102.76 | 2012.31 | 2074.24 | 2106.63 | 2158.69 | 2207.68 | 2265.61 | 2358.40 | 2378.77 | 2416.85 | 2458.25 | 2493.10 | 2518.77 | 2407.34 | 2433.87 | 2449.66 | 2386.17 | -258.81 | -253.51 | -236.59 | -135.85 | -125.54 | -124.74 | -77.90 | -72.92 | -68.03 | 142.43 | 0.00 | NA | 0.00 | 236.33 | NA | NA | NA | |
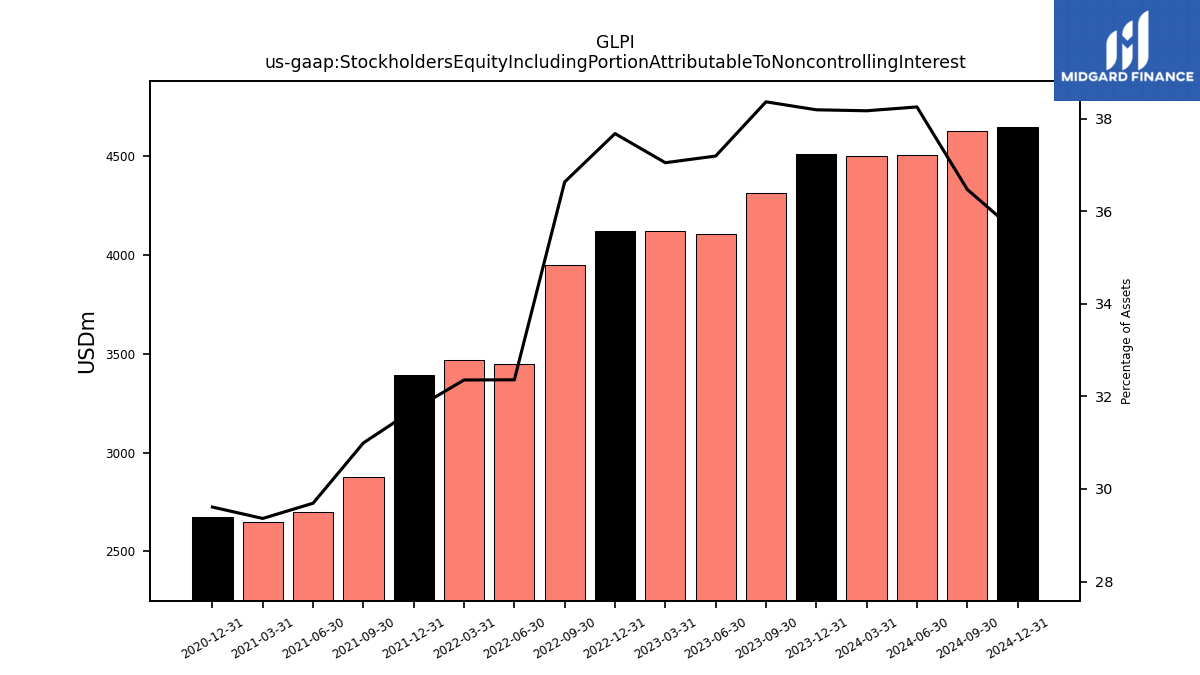
| Stockholders Equity Including Portion Attributable To Noncontrolling Interest | 4504.93 | 4497.82 | 4508.95 | 4310.21 | 4102.87 | 4118.19 | 4118.10 | 3947.35 | 3448.66 | 3468.49 | 3390.14 | 2877.74 | 2701.73 | 2646.64 | 2675.02 | NA | NA | NA | NA | NA | NA | NA | NA | NA | NA | NA | NA | NA | NA | NA | NA | NA | NA | NA | NA | NA | NA | NA | NA | NA | NA | NA | NA | NA | NA | NA | NA | NA | NA | NA | |
| Common Stock Value | 2.71 | 2.71 | 2.71 | 2.67 | 2.63 | 2.62 | 2.61 | 2.58 | 2.48 | 2.48 | 2.47 | 2.38 | 2.34 | 2.33 | 2.33 | 2.21 | 2.18 | 2.15 | 2.15 | 2.15 | 2.15 | 2.15 | 2.14 | 2.14 | 2.14 | 2.13 | 2.13 | 2.13 | 2.12 | 2.08 | 2.08 | 2.07 | 2.03 | 1.17 | 1.16 | 1.15 | 1.14 | 1.14 | 1.13 | 1.12 | 1.12 | 1.12 | 0.89 | 0.00 | NA | 0.00 | NA | NA | NA | NA | |
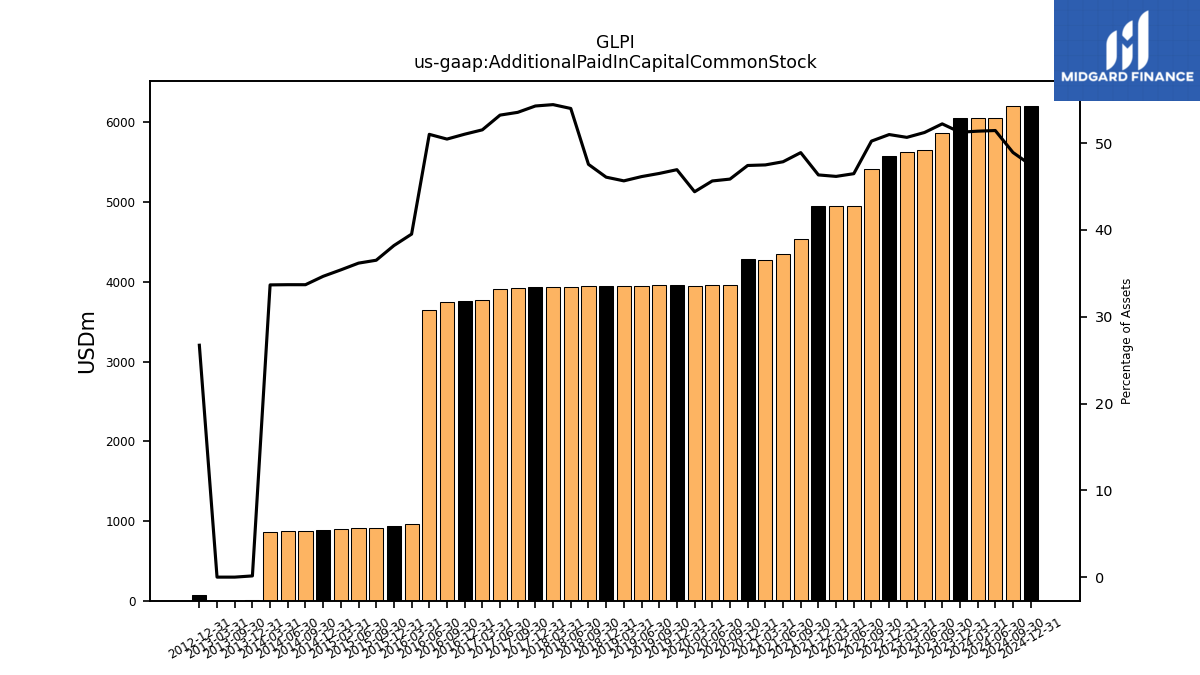
| Additional Paid In Capital Common Stock | 6059.96 | 6054.53 | 6052.11 | 5867.49 | 5651.61 | 5632.25 | 5573.57 | 5413.26 | 4953.95 | 4949.64 | 4953.94 | 4541.16 | 4354.64 | 4280.72 | 4284.79 | 3960.86 | 3955.29 | 3951.34 | 3959.38 | 3955.55 | 3951.95 | 3947.77 | 3952.50 | 3945.39 | 3935.52 | 3930.78 | 3933.83 | 3927.79 | 3916.33 | 3769.50 | 3760.73 | 3745.51 | 3647.14 | 962.83 | 935.22 | 918.67 | 910.23 | 903.61 | 888.86 | 874.43 | 869.86 | 862.59 | 3.65 | 0.00 | NA | 0.00 | 71.36 | NA | NA | NA | |
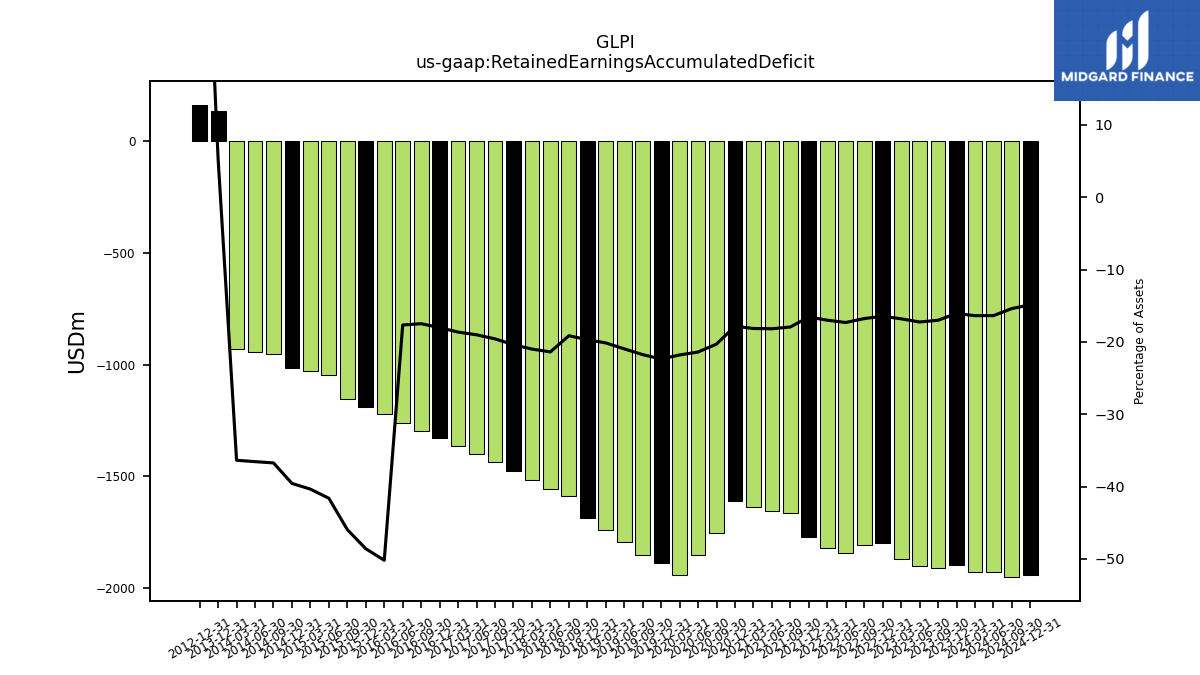
| Retained Earnings Accumulated Deficit | -1928.36 | -1930.03 | -1897.91 | -1911.62 | -1903.33 | -1869.64 | -1798.22 | -1808.35 | -1846.55 | -1823.14 | -1771.40 | -1665.80 | -1655.26 | -1636.41 | -1612.10 | -1753.79 | -1854.71 | -1941.19 | -1887.29 | -1851.07 | -1795.41 | -1742.23 | -1689.04 | -1589.14 | -1558.89 | -1516.06 | -1477.71 | -1436.81 | -1399.68 | -1364.25 | -1328.94 | -1297.92 | -1263.00 | -1222.81 | -1189.89 | -1156.40 | -1047.22 | -1030.29 | -1014.73 | -953.46 | -943.91 | -931.73 | 137.89 | NA | NA | NA | 164.97 | NA | NA | NA | |
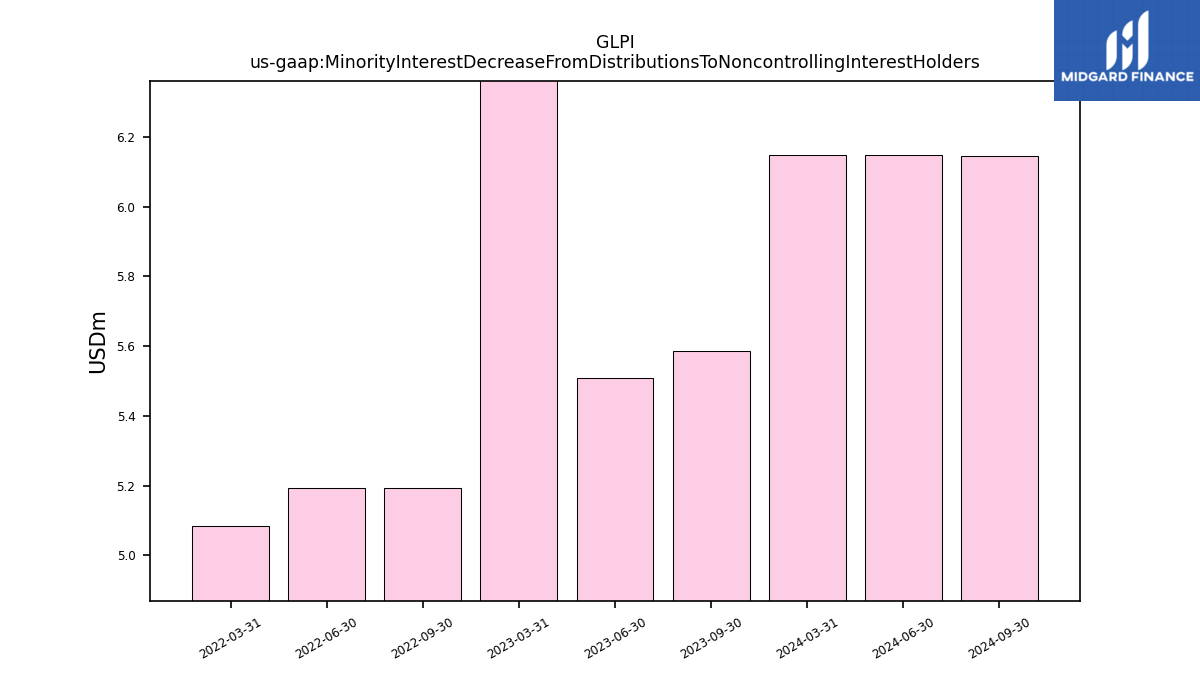
| Minority Interest Decrease From Distributions To Noncontrolling Interest Holders | 6.15 | 6.15 | NA | 5.59 | 5.51 | 7.42 | NA | 5.19 | 5.19 | 5.08 | NA | NA | NA | NA | NA | NA | NA | NA | NA | NA | NA | NA | NA | NA | NA | NA | NA | NA | NA | NA | NA | NA | NA | NA | NA | NA | NA | NA | NA | NA | NA | NA | NA | NA | NA | NA | NA | NA | NA | NA |
| 2024-06-30 | 2024-03-31 | 2023-12-31 | 2023-09-30 | 2023-06-30 | 2023-03-31 | 2022-12-31 | 2022-09-30 | 2022-06-30 | 2022-03-31 | 2021-12-31 | 2021-09-30 | 2021-06-30 | 2021-03-31 | 2020-12-31 | 2020-09-30 | 2020-06-30 | 2020-03-31 | 2019-12-31 | 2019-09-30 | 2019-06-30 | 2019-03-31 | 2018-12-31 | 2018-09-30 | 2018-06-30 | 2018-03-31 | 2017-12-31 | 2017-09-30 | 2017-06-30 | 2017-03-31 | 2016-12-31 | 2016-09-30 | 2016-06-30 | 2016-03-31 | 2015-12-31 | 2015-09-30 | 2015-06-30 | 2015-03-31 | 2014-12-31 | 2014-09-30 | 2014-06-30 | 2014-03-31 | 2013-12-31 | 2013-09-30 | 2013-06-30 | 2013-03-31 | 2012-12-31 | 2012-09-30 | 2012-06-30 | 2012-03-31 | ||
|---|---|---|---|---|---|---|---|---|---|---|---|---|---|---|---|---|---|---|---|---|---|---|---|---|---|---|---|---|---|---|---|---|---|---|---|---|---|---|---|---|---|---|---|---|---|---|---|---|---|---|---|
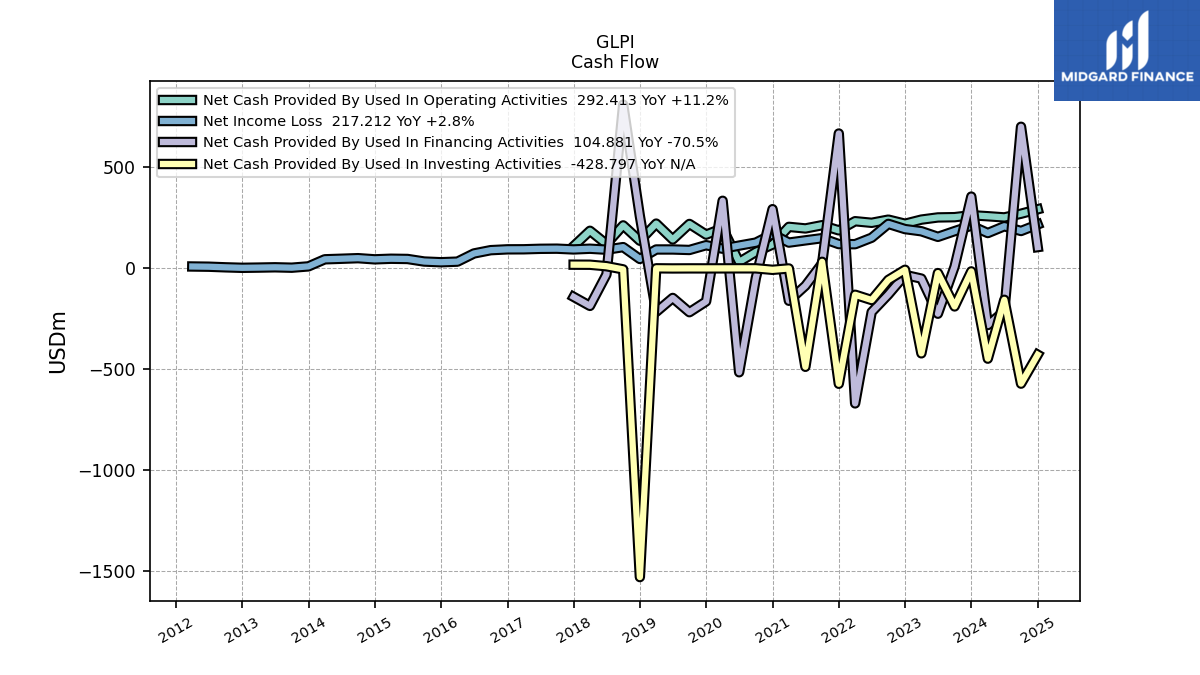
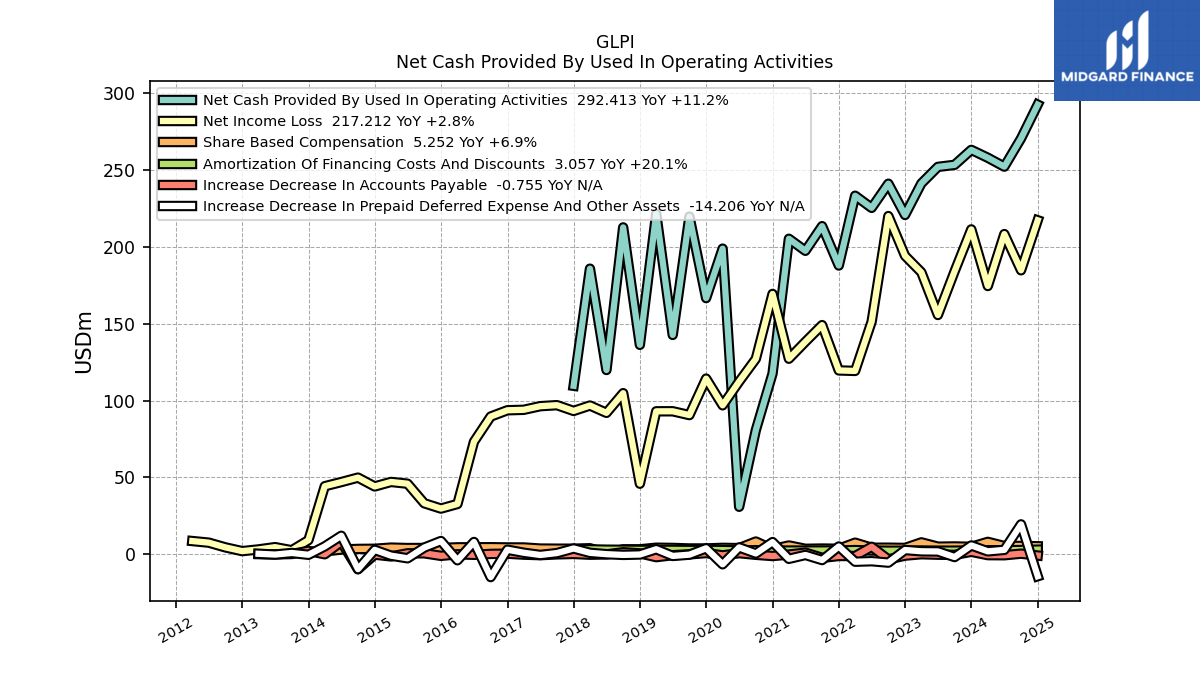
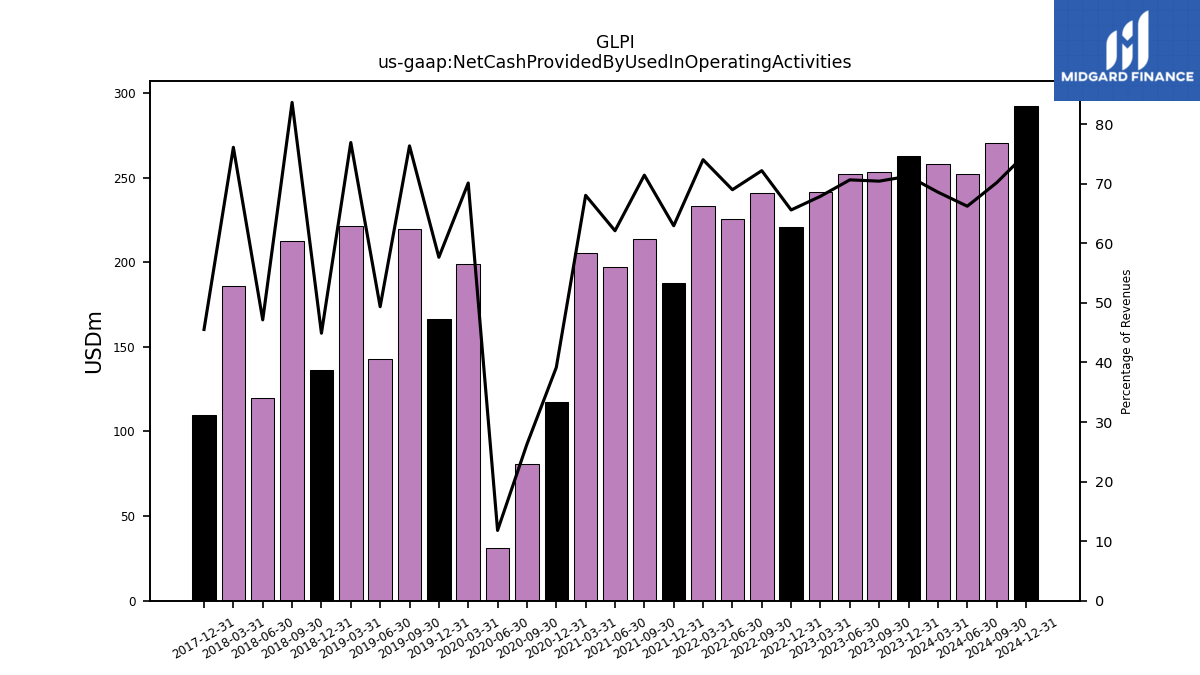
| Net Cash Provided By Used In Operating Activities | 252.09 | 257.87 | 263.00 | 253.26 | 251.93 | 241.18 | 220.66 | 241.00 | 225.28 | 233.18 | 187.79 | 213.41 | 197.36 | 205.21 | 117.55 | 80.82 | 30.93 | 198.78 | 166.62 | 219.60 | 142.66 | 221.42 | 136.22 | 212.60 | 119.87 | 185.76 | 109.61 | NA | NA | NA | NA | NA | NA | NA | NA | NA | NA | NA | NA | NA | NA | NA | NA | NA | NA | NA | NA | NA | NA | NA | |
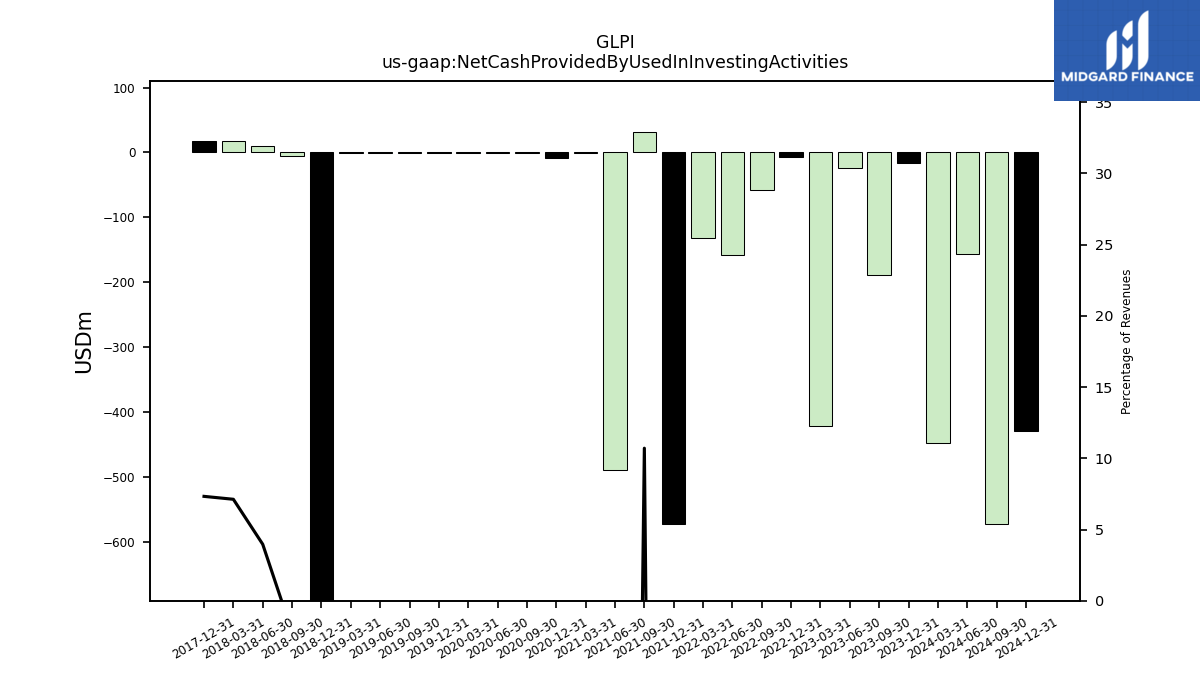
| Net Cash Provided By Used In Investing Activities | -156.36 | -448.40 | -15.53 | -189.41 | -23.80 | -422.08 | -7.53 | -57.88 | -157.66 | -131.42 | -573.00 | 31.99 | -488.78 | -1.04 | -7.87 | -0.48 | -0.49 | -0.65 | -0.77 | -0.69 | -1.01 | -0.35 | -1531.64 | -5.61 | 10.08 | 17.39 | 17.64 | NA | NA | NA | NA | NA | NA | NA | NA | NA | NA | NA | NA | NA | NA | NA | NA | NA | NA | NA | NA | NA | NA | NA | |
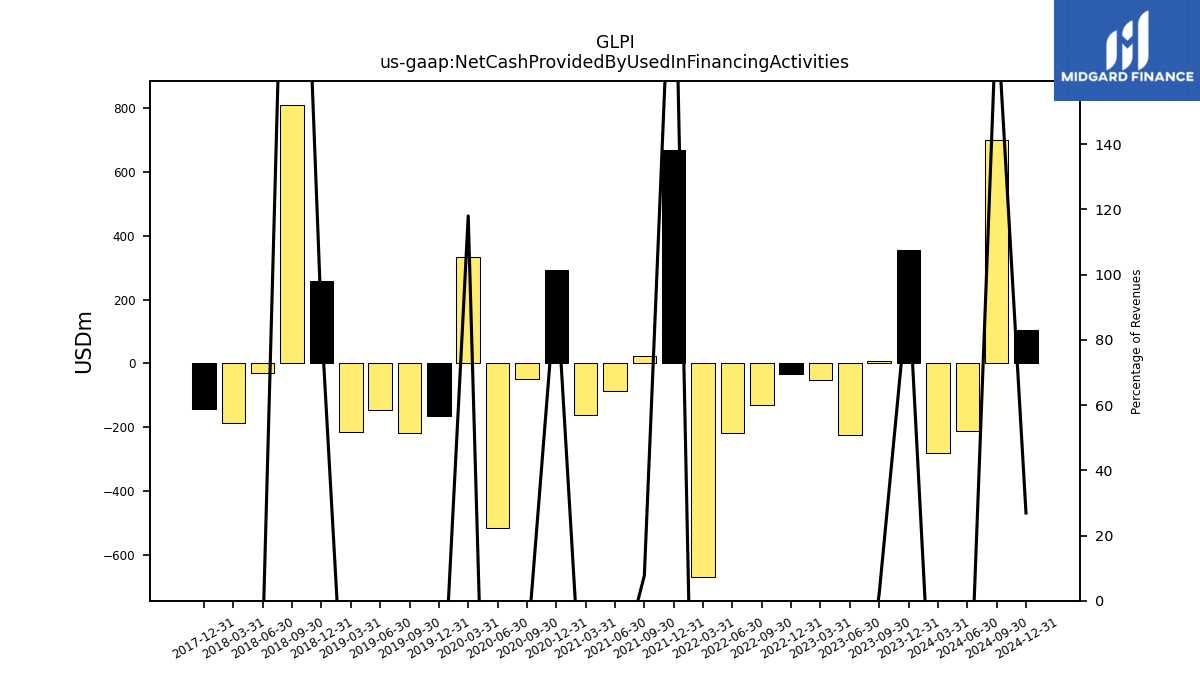
| Net Cash Provided By Used In Financing Activities | -212.77 | -281.92 | 355.37 | 7.85 | -225.50 | -51.37 | -33.07 | -130.38 | -217.35 | -670.34 | 668.09 | 23.13 | -86.77 | -161.38 | 293.01 | -48.49 | -515.93 | 334.58 | -164.58 | -218.10 | -147.24 | -216.52 | 258.44 | 811.31 | -30.89 | -186.78 | -141.83 | NA | NA | NA | NA | NA | NA | NA | NA | NA | NA | NA | NA | NA | NA | NA | NA | NA | NA | NA | NA | NA | NA | NA |
| 2024-06-30 | 2024-03-31 | 2023-12-31 | 2023-09-30 | 2023-06-30 | 2023-03-31 | 2022-12-31 | 2022-09-30 | 2022-06-30 | 2022-03-31 | 2021-12-31 | 2021-09-30 | 2021-06-30 | 2021-03-31 | 2020-12-31 | 2020-09-30 | 2020-06-30 | 2020-03-31 | 2019-12-31 | 2019-09-30 | 2019-06-30 | 2019-03-31 | 2018-12-31 | 2018-09-30 | 2018-06-30 | 2018-03-31 | 2017-12-31 | 2017-09-30 | 2017-06-30 | 2017-03-31 | 2016-12-31 | 2016-09-30 | 2016-06-30 | 2016-03-31 | 2015-12-31 | 2015-09-30 | 2015-06-30 | 2015-03-31 | 2014-12-31 | 2014-09-30 | 2014-06-30 | 2014-03-31 | 2013-12-31 | 2013-09-30 | 2013-06-30 | 2013-03-31 | 2012-12-31 | 2012-09-30 | 2012-06-30 | 2012-03-31 | ||
|---|---|---|---|---|---|---|---|---|---|---|---|---|---|---|---|---|---|---|---|---|---|---|---|---|---|---|---|---|---|---|---|---|---|---|---|---|---|---|---|---|---|---|---|---|---|---|---|---|---|---|---|
| Net Cash Provided By Used In Operating Activities | 252.09 | 257.87 | 263.00 | 253.26 | 251.93 | 241.18 | 220.66 | 241.00 | 225.28 | 233.18 | 187.79 | 213.41 | 197.36 | 205.21 | 117.55 | 80.82 | 30.93 | 198.78 | 166.62 | 219.60 | 142.66 | 221.42 | 136.22 | 212.60 | 119.87 | 185.76 | 109.61 | NA | NA | NA | NA | NA | NA | NA | NA | NA | NA | NA | NA | NA | NA | NA | NA | NA | NA | NA | NA | NA | NA | NA | |
| Net Income Loss | 208.25 | 174.46 | 211.29 | 184.01 | 155.63 | 183.35 | 194.12 | 219.95 | 151.31 | 119.27 | 119.59 | 149.06 | 138.22 | 127.18 | 169.34 | 127.13 | 112.35 | 96.89 | 114.29 | 90.55 | 93.03 | 93.01 | 45.93 | 104.81 | 92.00 | 96.77 | 93.26 | 97.01 | 96.33 | 93.99 | 93.69 | 89.60 | 73.26 | 32.75 | 29.77 | 33.23 | 45.95 | 47.09 | 44.16 | 49.90 | 47.01 | 44.31 | 9.23 | 2.68 | 4.70 | 3.22 | 2.11 | 4.53 | 7.62 | 8.66 | |
| Profit Loss | 214.41 | 179.53 | 217.26 | 189.31 | 160.14 | 188.67 | 199.59 | 226.22 | 155.79 | 121.69 | NA | 149.06 | 138.22 | 127.18 | NA | NA | NA | NA | NA | NA | NA | NA | NA | NA | NA | NA | NA | NA | NA | NA | NA | NA | NA | NA | NA | NA | NA | NA | NA | NA | NA | NA | NA | NA | NA | NA | NA | NA | NA | NA | |
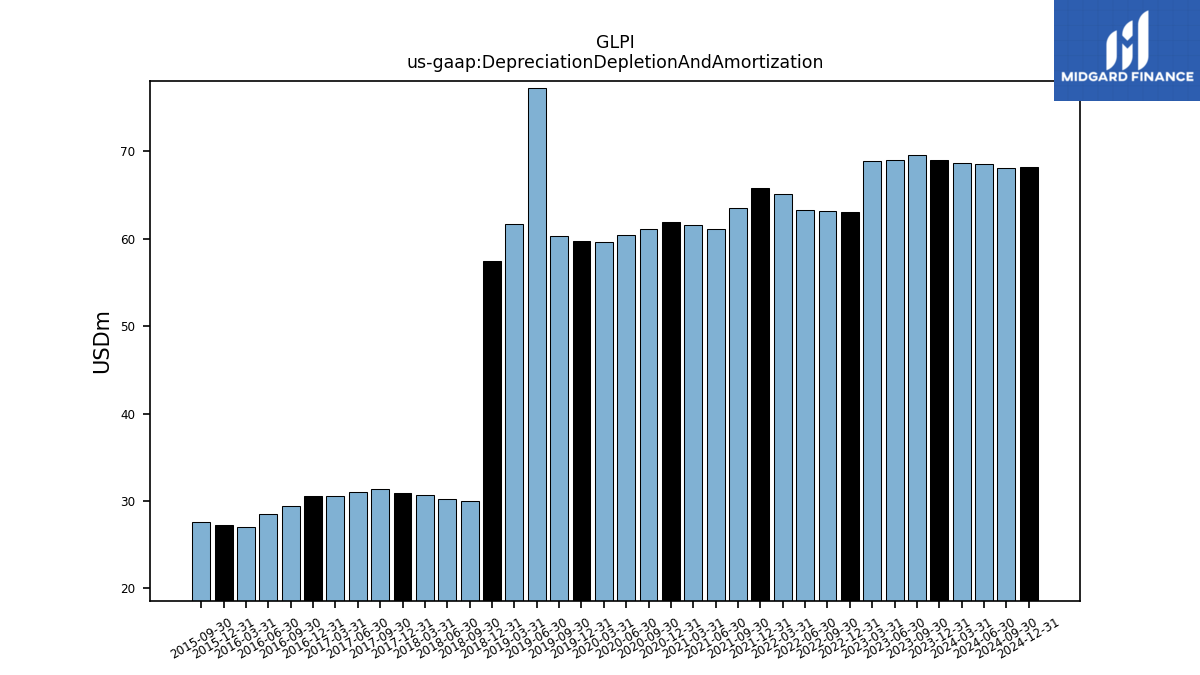
| Depreciation Depletion And Amortization | 68.54 | 68.64 | 69.02 | 69.55 | 69.02 | 68.84 | 63.00 | 63.18 | 63.25 | 65.12 | 65.84 | 63.50 | 61.16 | 61.54 | 61.90 | 61.10 | 60.41 | 59.58 | 59.71 | 60.32 | 77.27 | 61.67 | 57.44 | 29.99 | 30.25 | 30.68 | 30.90 | 31.36 | 31.01 | 30.57 | 30.60 | 29.48 | 28.56 | 27.08 | 27.20 | 27.56 | NA | NA | NA | NA | NA | NA | NA | NA | NA | NA | NA | NA | NA | NA | |
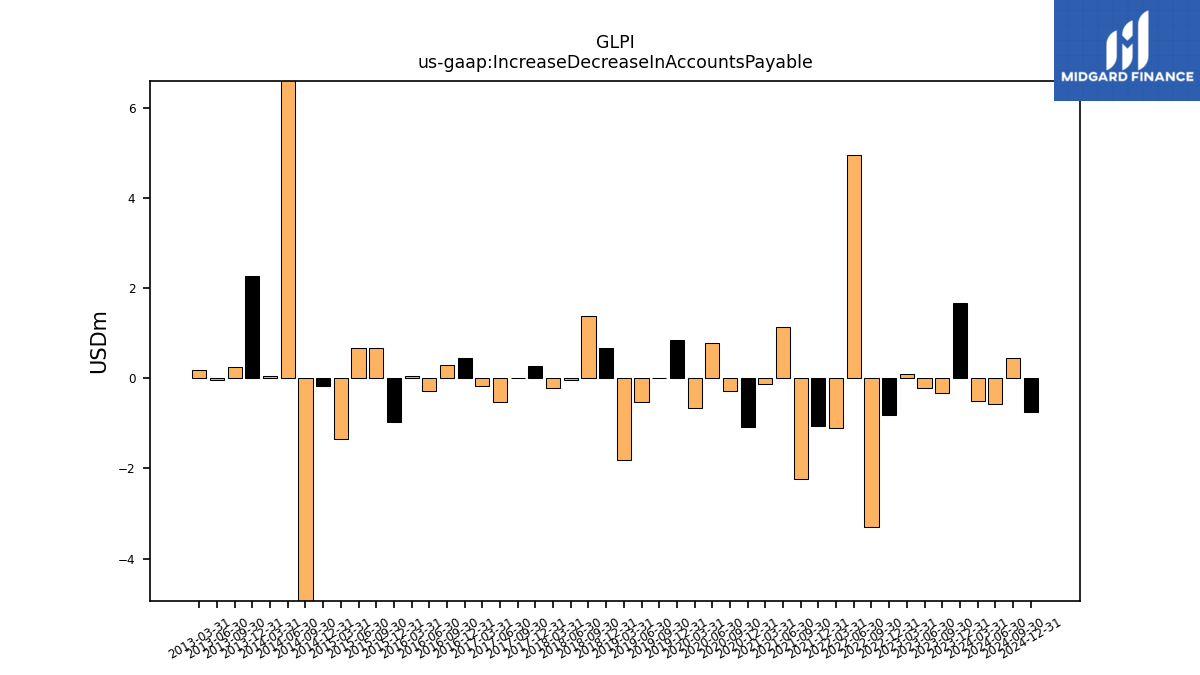
| Increase Decrease In Accounts Payable | -0.57 | -0.51 | NA | -0.33 | -0.22 | 0.09 | NA | -3.29 | 4.95 | -1.10 | -1.06 | -2.24 | 1.13 | -0.13 | -1.09 | -0.28 | 0.79 | -0.67 | 0.84 | -0.01 | -0.53 | -1.81 | 0.66 | 1.39 | -0.03 | -0.23 | 0.28 | 0.00 | -0.52 | -0.18 | 0.45 | 0.30 | -0.29 | 0.04 | -0.96 | 0.68 | 0.68 | -1.34 | -0.17 | -9.66 | 8.14 | 0.04 | 2.26 | 0.24 | -0.04 | 0.18 | NA | NA | NA | NA | |
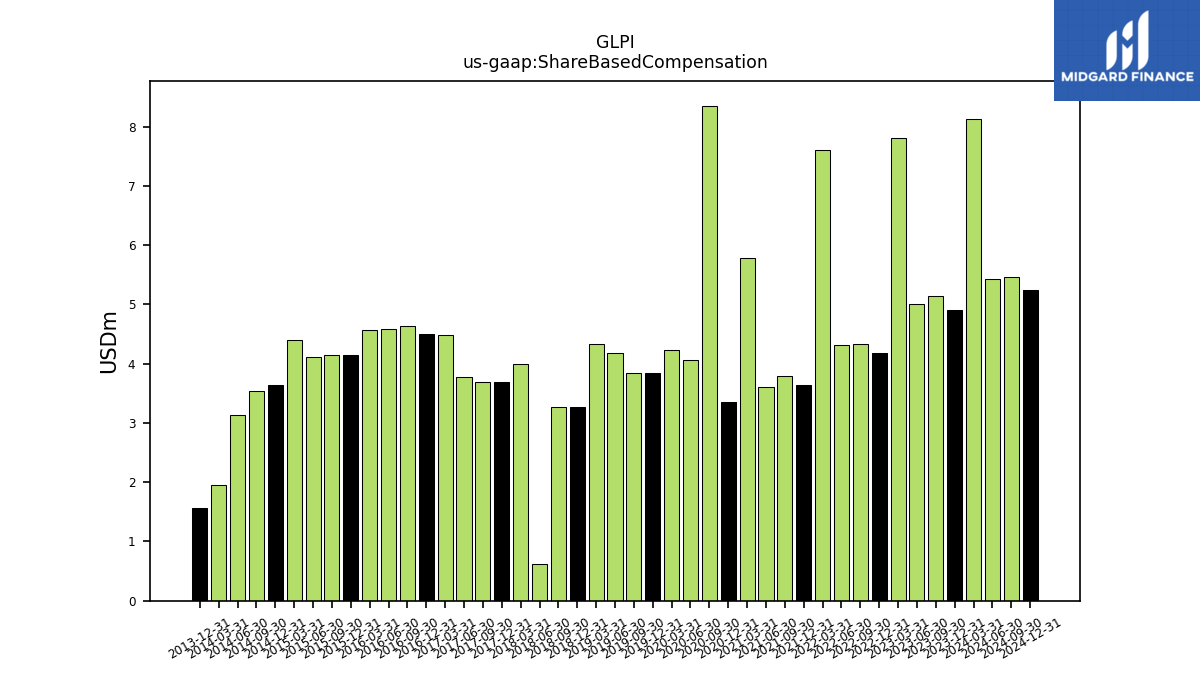
| Share Based Compensation | 5.42 | 8.12 | 4.91 | 5.14 | 5.01 | 7.81 | 4.18 | 4.34 | 4.31 | 7.60 | 3.65 | 3.79 | 3.61 | 5.79 | 3.35 | 8.35 | 4.06 | 4.24 | 3.85 | 3.85 | 4.18 | 4.33 | 3.27 | 3.27 | 0.62 | 3.99 | 3.69 | 3.69 | 3.77 | 4.48 | 4.51 | 4.64 | 4.59 | 4.57 | 4.15 | 4.15 | 4.11 | 4.39 | 3.63 | 3.54 | 3.14 | 1.95 | 1.57 | NA | NA | NA | NA | NA | NA | NA |
| 2024-06-30 | 2024-03-31 | 2023-12-31 | 2023-09-30 | 2023-06-30 | 2023-03-31 | 2022-12-31 | 2022-09-30 | 2022-06-30 | 2022-03-31 | 2021-12-31 | 2021-09-30 | 2021-06-30 | 2021-03-31 | 2020-12-31 | 2020-09-30 | 2020-06-30 | 2020-03-31 | 2019-12-31 | 2019-09-30 | 2019-06-30 | 2019-03-31 | 2018-12-31 | 2018-09-30 | 2018-06-30 | 2018-03-31 | 2017-12-31 | 2017-09-30 | 2017-06-30 | 2017-03-31 | 2016-12-31 | 2016-09-30 | 2016-06-30 | 2016-03-31 | 2015-12-31 | 2015-09-30 | 2015-06-30 | 2015-03-31 | 2014-12-31 | 2014-09-30 | 2014-06-30 | 2014-03-31 | 2013-12-31 | 2013-09-30 | 2013-06-30 | 2013-03-31 | 2012-12-31 | 2012-09-30 | 2012-06-30 | 2012-03-31 | ||
|---|---|---|---|---|---|---|---|---|---|---|---|---|---|---|---|---|---|---|---|---|---|---|---|---|---|---|---|---|---|---|---|---|---|---|---|---|---|---|---|---|---|---|---|---|---|---|---|---|---|---|---|
| Net Cash Provided By Used In Investing Activities | -156.36 | -448.40 | -15.53 | -189.41 | -23.80 | -422.08 | -7.53 | -57.88 | -157.66 | -131.42 | -573.00 | 31.99 | -488.78 | -1.04 | -7.87 | -0.48 | -0.49 | -0.65 | -0.77 | -0.69 | -1.01 | -0.35 | -1531.64 | -5.61 | 10.08 | 17.39 | 17.64 | NA | NA | NA | NA | NA | NA | NA | NA | NA | NA | NA | NA | NA | NA | NA | NA | NA | NA | NA | NA | NA | NA | NA | |
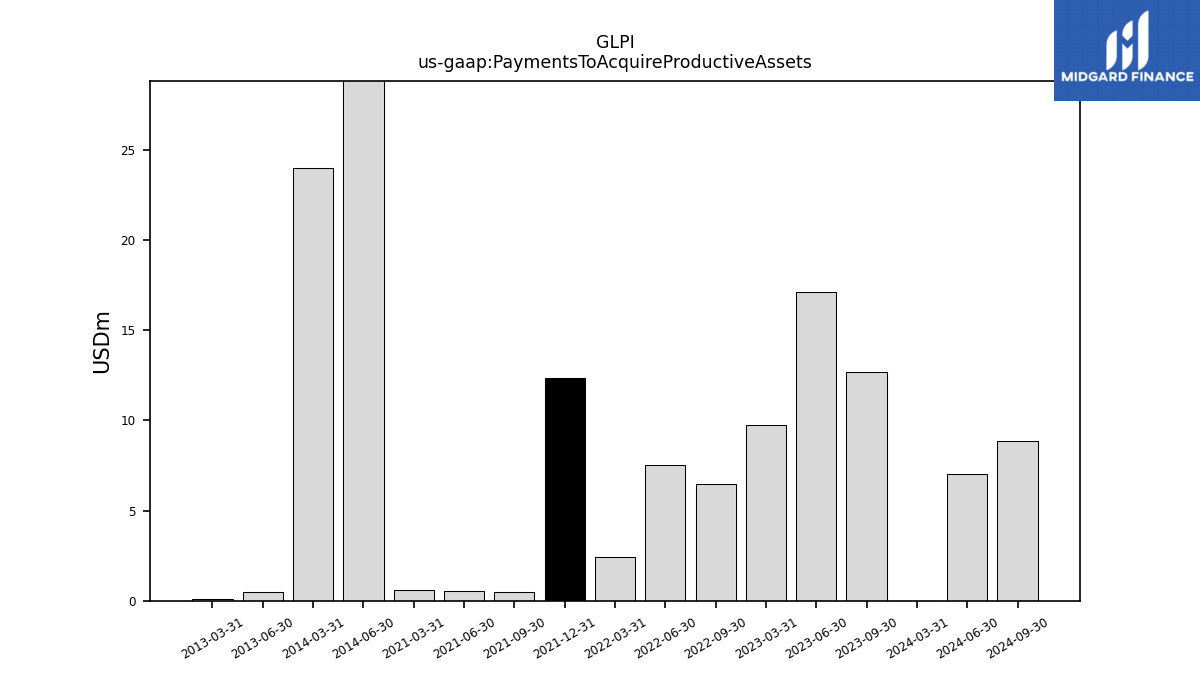
| Payments To Acquire Productive Assets | 7.05 | 0.01 | NA | 12.67 | 17.12 | 9.74 | NA | 6.47 | 7.51 | 2.41 | 12.32 | 0.49 | 0.51 | 0.61 | NA | NA | NA | NA | NA | NA | NA | NA | NA | NA | NA | NA | NA | NA | NA | NA | NA | NA | NA | NA | NA | NA | NA | NA | NA | NA | 31.50 | 24.00 | NA | NA | 0.48 | 0.08 | NA | NA | NA | NA |
| 2024-06-30 | 2024-03-31 | 2023-12-31 | 2023-09-30 | 2023-06-30 | 2023-03-31 | 2022-12-31 | 2022-09-30 | 2022-06-30 | 2022-03-31 | 2021-12-31 | 2021-09-30 | 2021-06-30 | 2021-03-31 | 2020-12-31 | 2020-09-30 | 2020-06-30 | 2020-03-31 | 2019-12-31 | 2019-09-30 | 2019-06-30 | 2019-03-31 | 2018-12-31 | 2018-09-30 | 2018-06-30 | 2018-03-31 | 2017-12-31 | 2017-09-30 | 2017-06-30 | 2017-03-31 | 2016-12-31 | 2016-09-30 | 2016-06-30 | 2016-03-31 | 2015-12-31 | 2015-09-30 | 2015-06-30 | 2015-03-31 | 2014-12-31 | 2014-09-30 | 2014-06-30 | 2014-03-31 | 2013-12-31 | 2013-09-30 | 2013-06-30 | 2013-03-31 | 2012-12-31 | 2012-09-30 | 2012-06-30 | 2012-03-31 | ||
|---|---|---|---|---|---|---|---|---|---|---|---|---|---|---|---|---|---|---|---|---|---|---|---|---|---|---|---|---|---|---|---|---|---|---|---|---|---|---|---|---|---|---|---|---|---|---|---|---|---|---|---|
| Net Cash Provided By Used In Financing Activities | -212.77 | -281.92 | 355.37 | 7.85 | -225.50 | -51.37 | -33.07 | -130.38 | -217.35 | -670.34 | 668.09 | 23.13 | -86.77 | -161.38 | 293.01 | -48.49 | -515.93 | 334.58 | -164.58 | -218.10 | -147.24 | -216.52 | 258.44 | 811.31 | -30.89 | -186.78 | -141.83 | NA | NA | NA | NA | NA | NA | NA | NA | NA | NA | NA | NA | NA | NA | NA | NA | NA | NA | NA | NA | NA | NA | NA | |
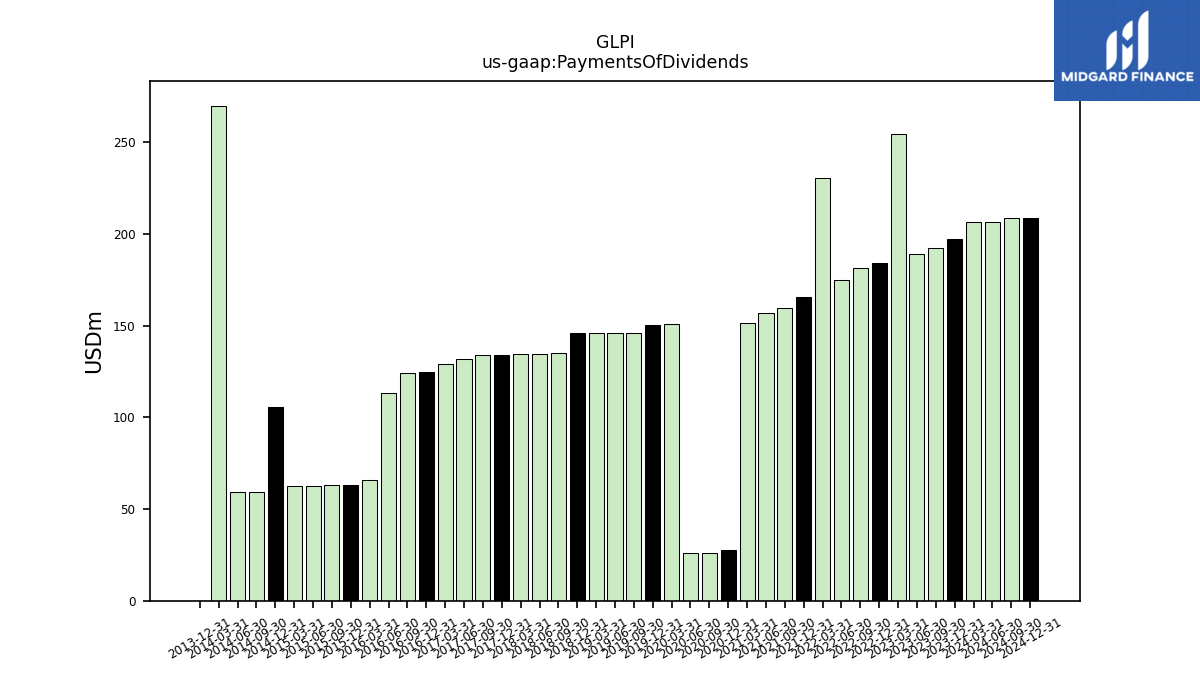
| Payments Of Dividends | 206.58 | 206.58 | 197.58 | 192.31 | 189.31 | 254.78 | 183.99 | 181.75 | 174.72 | 230.40 | 165.74 | 159.60 | 157.06 | 151.50 | 27.64 | 26.21 | 25.87 | 150.80 | 150.51 | 146.21 | 146.21 | 146.20 | 145.83 | 135.06 | 134.82 | 134.72 | 134.16 | 134.14 | 131.77 | 129.30 | 124.71 | 124.52 | 113.45 | 65.67 | 63.26 | 62.95 | 62.87 | 62.65 | 105.43 | 59.45 | 59.18 | 270.04 | 0.00 | NA | NA | NA | NA | NA | NA | NA | |
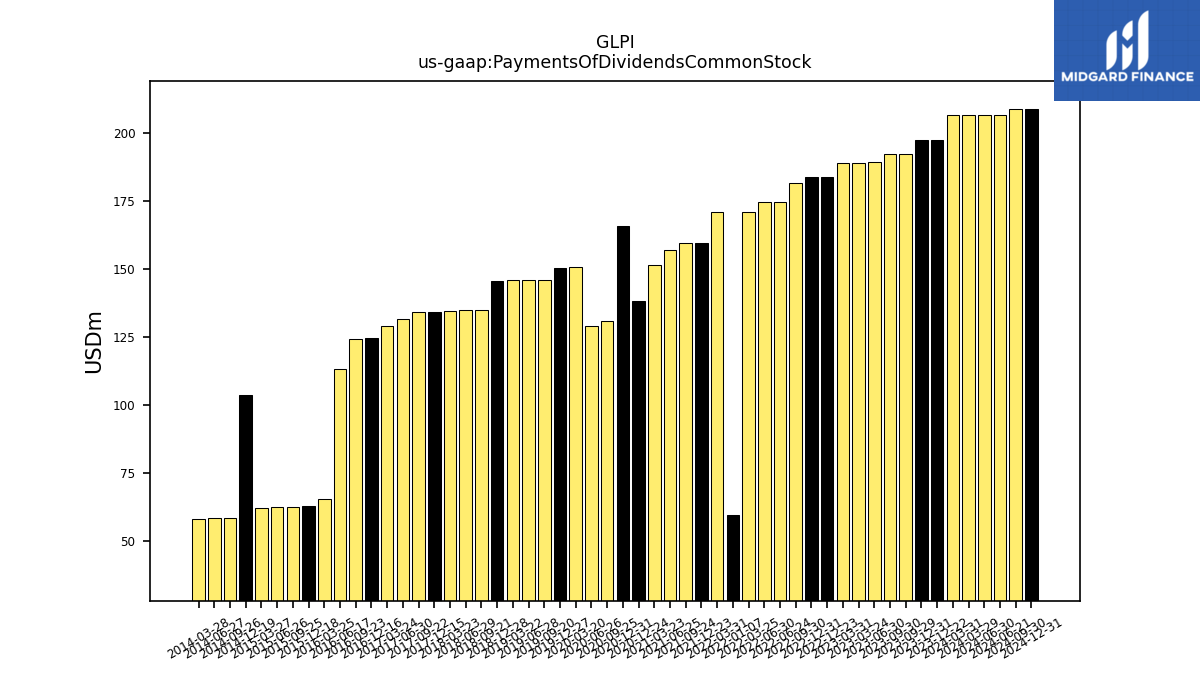
| Payments Of Dividends Common Stock | NA | NA | NA | NA | 189.09 | NA | NA | 181.55 | NA | NA | NA | NA | NA | NA | 165.63 | NA | NA | NA | NA | NA | NA | NA | NA | NA | NA | NA | NA | NA | 131.55 | NA | NA | NA | NA | NA | NA | NA | NA | NA | NA | NA | NA | NA | NA | NA | NA | NA | NA | NA | NA | NA | |
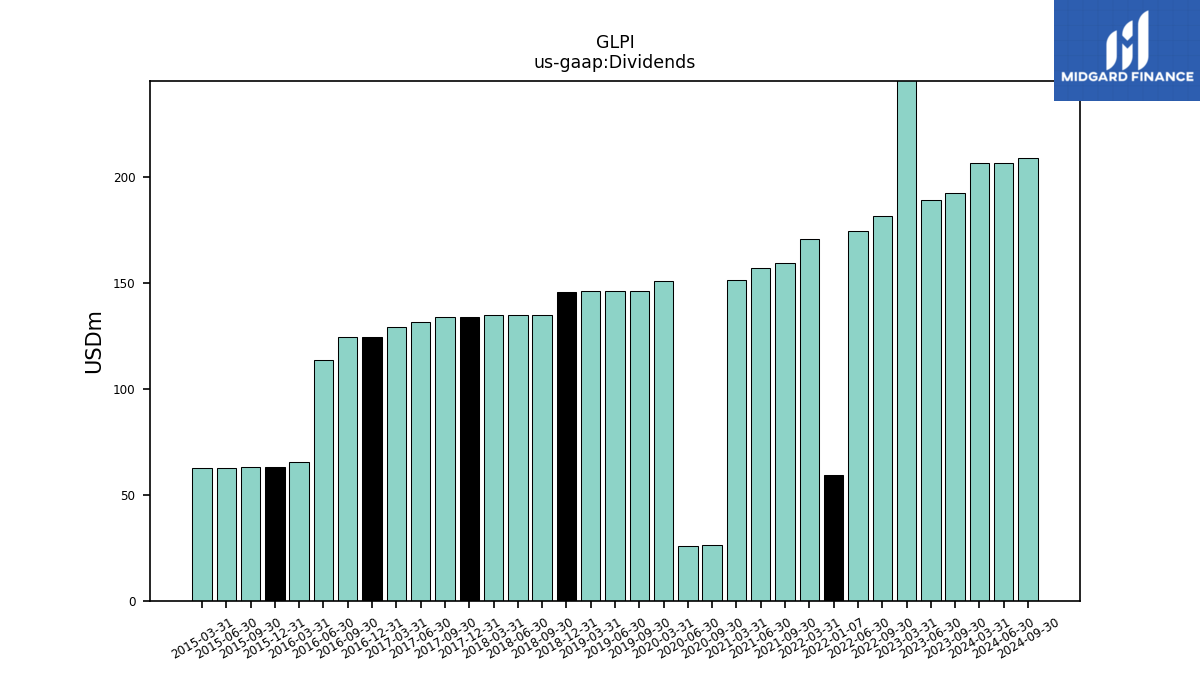
| Dividends | 206.58 | 206.58 | NA | 192.31 | 189.31 | 254.78 | NA | 181.75 | 174.72 | 171.00 | NA | 159.60 | 157.06 | 151.50 | NA | 26.21 | 25.87 | 150.80 | NA | 146.21 | 146.21 | 146.20 | 145.83 | 135.06 | 134.82 | 134.72 | 134.16 | 134.14 | 131.77 | 129.30 | 124.71 | 124.52 | 113.45 | 65.67 | 63.26 | 62.95 | 62.87 | 62.65 | NA | NA | NA | NA | NA | NA | NA | NA | NA | NA | NA | NA |
| 2024-06-30 | 2024-03-31 | 2023-12-31 | 2023-09-30 | 2023-06-30 | 2023-03-31 | 2022-12-31 | 2022-09-30 | 2022-06-30 | 2022-03-31 | 2021-12-31 | 2021-09-30 | 2021-06-30 | 2021-03-31 | 2020-12-31 | 2020-09-30 | 2020-06-30 | 2020-03-31 | 2019-12-31 | 2019-09-30 | 2019-06-30 | 2019-03-31 | 2018-12-31 | 2018-09-30 | 2018-06-30 | 2018-03-31 | 2017-12-31 | 2017-09-30 | 2017-06-30 | 2017-03-31 | 2016-12-31 | 2016-09-30 | 2016-06-30 | 2016-03-31 | 2015-12-31 | 2015-09-30 | 2015-06-30 | 2015-03-31 | 2014-12-31 | 2014-09-30 | 2014-06-30 | 2014-03-31 | 2013-12-31 | 2013-09-30 | 2013-06-30 | 2013-03-31 | 2012-12-31 | 2012-09-30 | 2012-06-30 | 2012-03-31 | ||
|---|---|---|---|---|---|---|---|---|---|---|---|---|---|---|---|---|---|---|---|---|---|---|---|---|---|---|---|---|---|---|---|---|---|---|---|---|---|---|---|---|---|---|---|---|---|---|---|---|---|---|---|
| Revenues | 380.63 | 375.96 | 369.03 | 359.56 | 356.59 | 355.21 | 336.39 | 333.82 | 326.51 | 314.97 | 298.33 | 298.71 | 317.76 | 301.54 | 300.16 | 307.55 | 261.97 | 283.48 | 288.98 | 287.61 | 289.01 | 287.86 | 303.32 | 254.14 | 254.22 | 244.05 | 240.70 | 244.51 | 243.39 | 242.71 | 238.80 | 233.28 | 207.36 | 148.82 | 128.69 | 147.79 | 163.82 | 162.66 | 159.04 | 157.79 | 160.79 | 158.33 | 113.78 | 39.63 | 46.07 | 42.65 | 37.66 | 45.82 | 60.25 | 66.91 | |
| Revenue From Contract With Customer Excluding Assessed Tax | 380.63 | 375.96 | 369.03 | 359.56 | 356.59 | 355.21 | 336.39 | 333.82 | 326.51 | 314.97 | 12.87 | 15.46 | 43.66 | 37.70 | 31.84 | 34.42 | 261.97 | 283.48 | 288.98 | 287.61 | 289.01 | 287.86 | 303.32 | 254.14 | 254.22 | 244.05 | 240.70 | 244.51 | 243.39 | 242.71 | 238.80 | 233.28 | 207.36 | 148.82 | 128.69 | 147.79 | 163.82 | 162.66 | 159.04 | 157.79 | 160.79 | 158.33 | 113.78 | 39.63 | 46.07 | 42.65 | 37.66 | 45.82 | 60.25 | 66.91 |