
| 2023-09-30 | 2023-06-30 | 2023-03-31 | 2022-12-31 | 2022-09-30 | 2022-06-30 | 2022-03-31 | 2021-12-31 | 2021-09-30 | 2021-06-30 | 2021-03-31 | 2020-12-31 | 2020-09-30 | 2020-06-30 | 2020-03-31 | 2019-12-31 | 2019-09-30 | 2019-06-30 | 2019-03-31 | 2018-12-31 | 2018-09-30 | 2018-06-30 | 2018-03-31 | 2017-12-31 | 2017-09-30 | 2017-06-30 | 2017-03-31 | 2016-12-31 | 2016-09-30 | 2016-06-30 | 2016-03-31 | 2015-12-31 | 2015-09-30 | 2015-06-30 | 2015-03-31 | 2014-12-31 | 2014-09-30 | 2014-06-30 | 2014-03-31 | 2013-12-31 | 2013-09-30 | 2013-06-30 | 2013-03-31 | 2012-12-31 | 2012-09-30 | 2012-06-30 | 2012-03-31 | 2011-12-31 | 2011-09-30 | 2011-06-30 | 2011-03-31 | 2010-12-31 | 2010-09-30 | 2010-06-30 | 2010-03-31 | ||
|---|---|---|---|---|---|---|---|---|---|---|---|---|---|---|---|---|---|---|---|---|---|---|---|---|---|---|---|---|---|---|---|---|---|---|---|---|---|---|---|---|---|---|---|---|---|---|---|---|---|---|---|---|---|---|---|---|
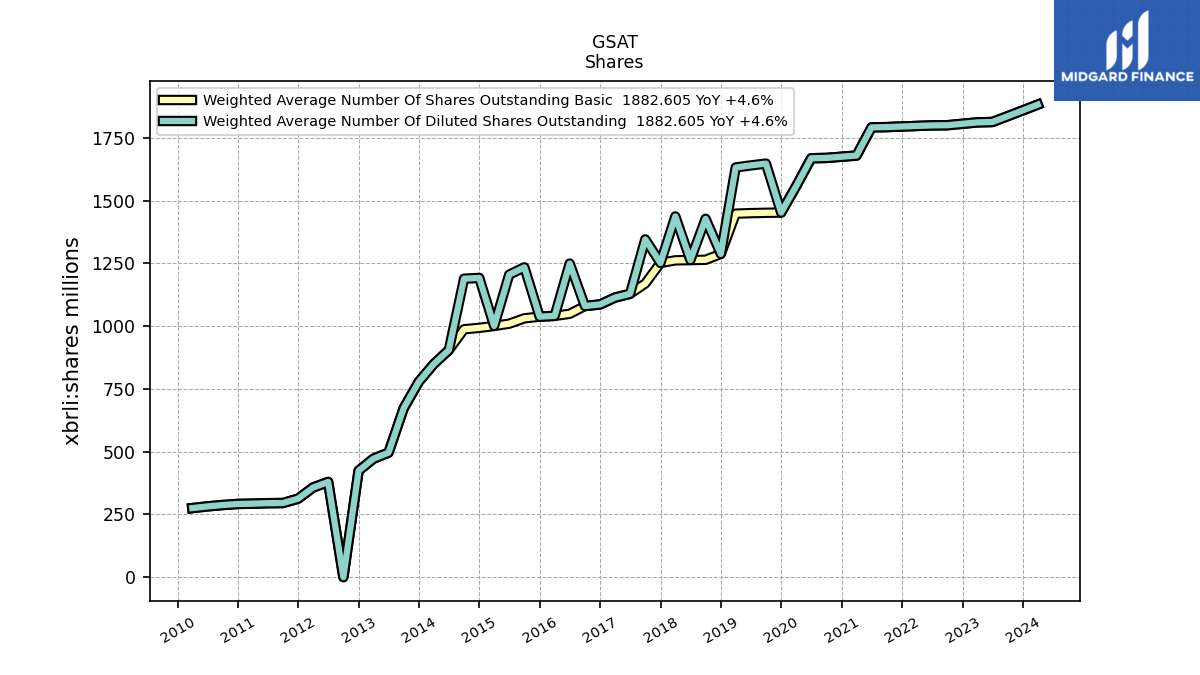
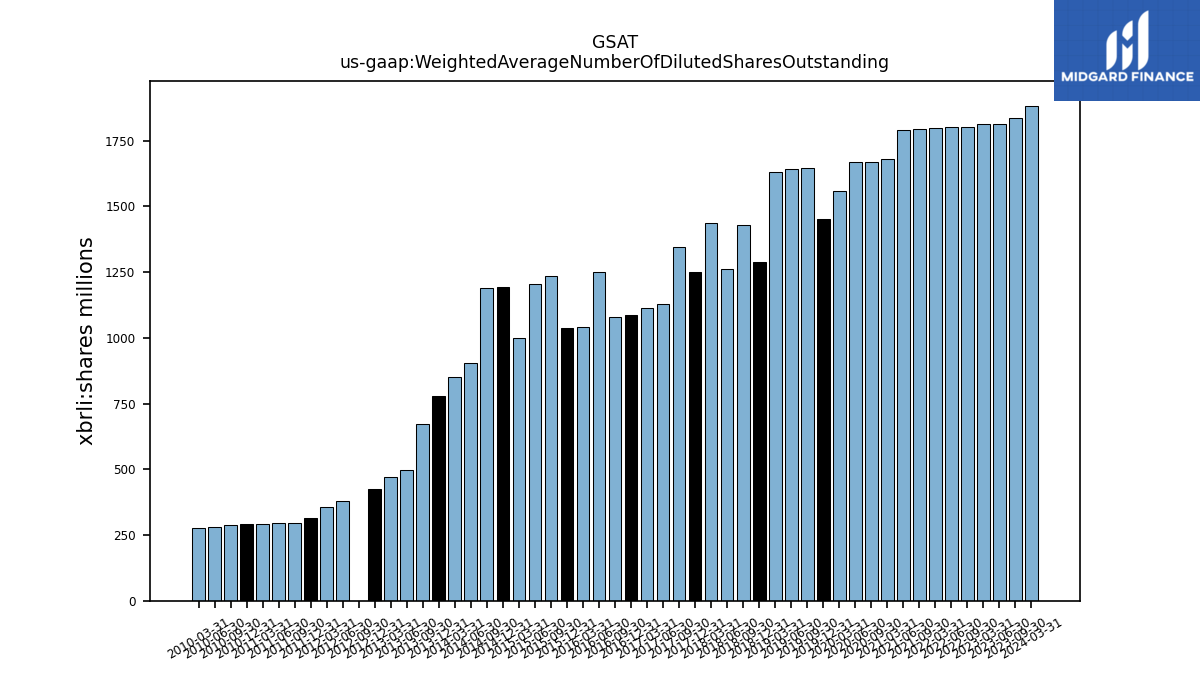
| Weighted Average Number Of Diluted Shares Outstanding | 1836.25 | 1813.39 | 1811.83 | NA | 1800.50 | 1799.89 | 1797.67 | NA | 1793.14 | 1791.94 | 1679.75 | NA | 1670.32 | 1668.97 | 1557.96 | 1452.61 | 1647.73 | 1640.44 | 1632.26 | 1287.74 | 1427.80 | 1263.37 | 1437.33 | 1251.83 | 1345.90 | 1128.98 | 1113.97 | 1086.63 | 1080.31 | 1249.67 | 1041.03 | 1037.88 | 1234.55 | 1205.45 | 1000.85 | 1192.26 | 1189.19 | 904.99 | 849.32 | 779.48 | 673.55 | 496.17 | 472.19 | 424.18 | 0.39 | 379.43 | 357.42 | 312.87 | 295.51 | 294.96 | 293.05 | 291.82 | 287.50 | 282.08 | 275.37 | |
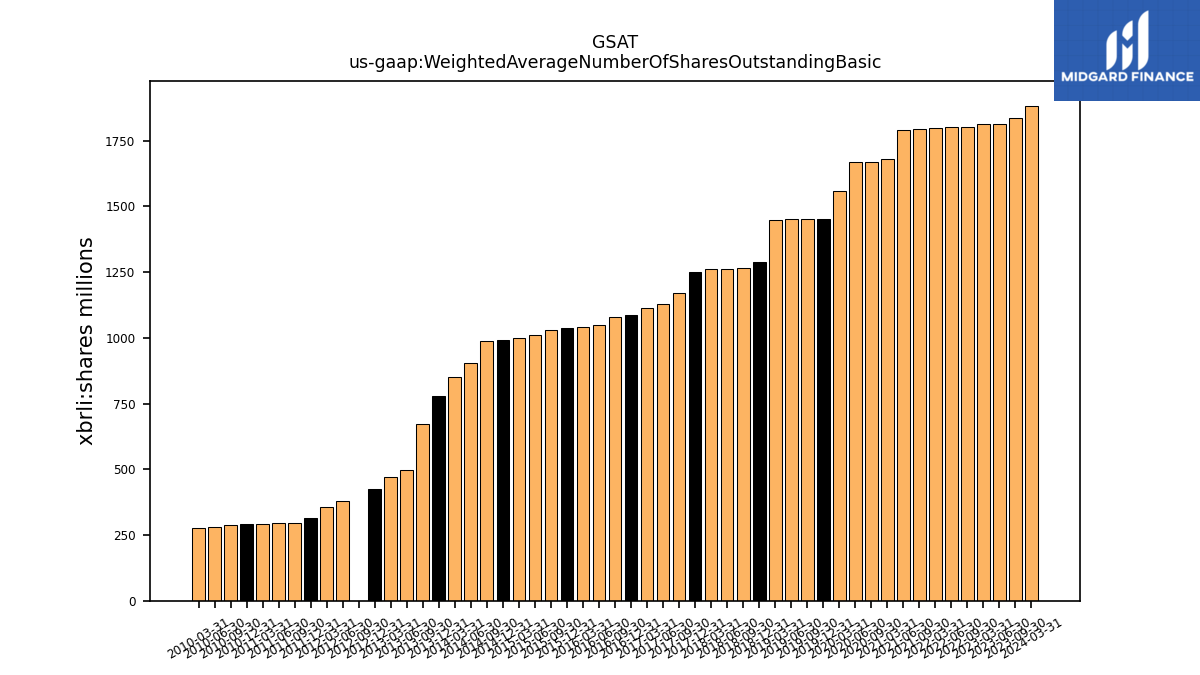
| Weighted Average Number Of Shares Outstanding Basic | 1836.25 | 1813.39 | 1811.83 | NA | 1800.50 | 1799.89 | 1797.67 | NA | 1793.14 | 1791.94 | 1679.75 | NA | 1670.32 | 1668.97 | 1557.96 | 1452.61 | 1451.70 | 1450.38 | 1448.32 | 1287.74 | 1264.52 | 1263.37 | 1262.34 | 1251.83 | 1169.99 | 1128.98 | 1113.97 | 1086.63 | 1080.31 | 1049.38 | 1041.03 | 1037.88 | 1031.40 | 1009.92 | 1000.85 | 993.43 | 987.67 | 904.99 | 849.32 | 779.48 | 673.55 | 496.17 | 472.19 | 424.18 | 0.39 | 379.43 | 357.42 | 312.87 | 295.51 | 294.96 | 293.05 | 291.82 | 287.50 | 282.08 | 275.37 | |
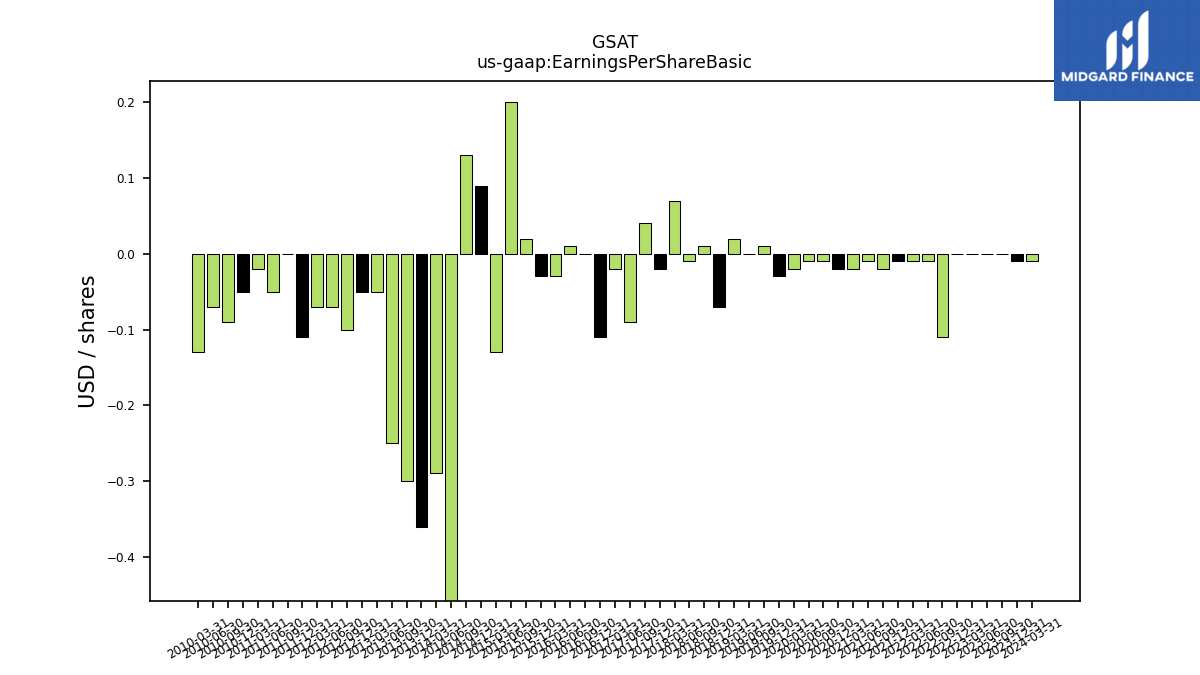
| Earnings Per Share Basic | 0.00 | 0.00 | -0.00 | 0.00 | -0.11 | -0.01 | -0.01 | -0.01 | -0.02 | -0.01 | -0.02 | -0.02 | -0.01 | -0.01 | -0.02 | -0.03 | 0.01 | 0.00 | 0.02 | -0.07 | 0.01 | -0.01 | 0.07 | -0.02 | 0.04 | -0.09 | -0.02 | -0.11 | 0.00 | 0.01 | -0.03 | -0.03 | 0.02 | 0.20 | -0.13 | 0.09 | 0.13 | -0.48 | -0.29 | -0.36 | -0.30 | -0.25 | -0.05 | -0.05 | -0.10 | -0.07 | -0.07 | -0.11 | 0.00 | -0.05 | -0.02 | -0.05 | -0.09 | -0.07 | -0.13 | |
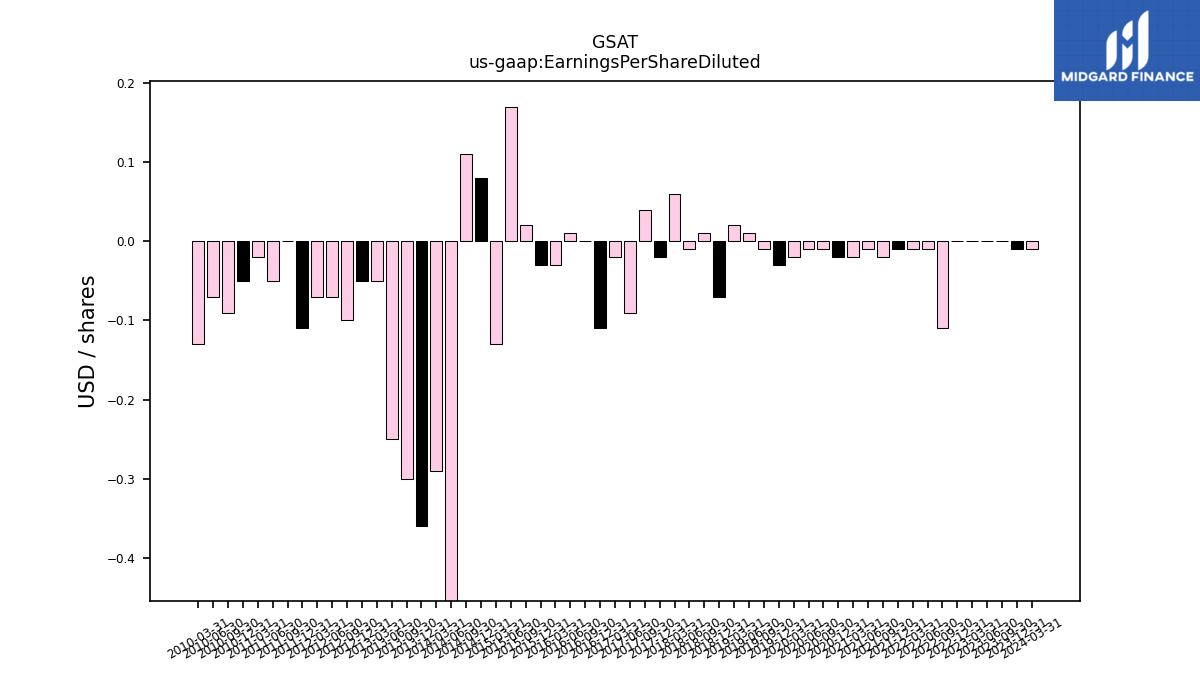
| Earnings Per Share Diluted | 0.00 | 0.00 | -0.00 | 0.00 | -0.11 | -0.01 | -0.01 | -0.01 | -0.02 | -0.01 | -0.02 | -0.02 | -0.01 | -0.01 | -0.02 | -0.03 | -0.01 | 0.01 | 0.02 | -0.07 | 0.01 | -0.01 | 0.06 | -0.02 | 0.04 | -0.09 | -0.02 | -0.11 | 0.00 | 0.01 | -0.03 | -0.03 | 0.02 | 0.17 | -0.13 | 0.08 | 0.11 | -0.48 | -0.29 | -0.36 | -0.30 | -0.25 | -0.05 | -0.05 | -0.10 | -0.07 | -0.07 | -0.11 | 0.00 | -0.05 | -0.02 | -0.05 | -0.09 | -0.07 | -0.13 |
| 2023-09-30 | 2023-06-30 | 2023-03-31 | 2022-12-31 | 2022-09-30 | 2022-06-30 | 2022-03-31 | 2021-12-31 | 2021-09-30 | 2021-06-30 | 2021-03-31 | 2020-12-31 | 2020-09-30 | 2020-06-30 | 2020-03-31 | 2019-12-31 | 2019-09-30 | 2019-06-30 | 2019-03-31 | 2018-12-31 | 2018-09-30 | 2018-06-30 | 2018-03-31 | 2017-12-31 | 2017-09-30 | 2017-06-30 | 2017-03-31 | 2016-12-31 | 2016-09-30 | 2016-06-30 | 2016-03-31 | 2015-12-31 | 2015-09-30 | 2015-06-30 | 2015-03-31 | 2014-12-31 | 2014-09-30 | 2014-06-30 | 2014-03-31 | 2013-12-31 | 2013-09-30 | 2013-06-30 | 2013-03-31 | 2012-12-31 | 2012-09-30 | 2012-06-30 | 2012-03-31 | 2011-12-31 | 2011-09-30 | 2011-06-30 | 2011-03-31 | 2010-12-31 | 2010-09-30 | 2010-06-30 | 2010-03-31 | ||
|---|---|---|---|---|---|---|---|---|---|---|---|---|---|---|---|---|---|---|---|---|---|---|---|---|---|---|---|---|---|---|---|---|---|---|---|---|---|---|---|---|---|---|---|---|---|---|---|---|---|---|---|---|---|---|---|---|
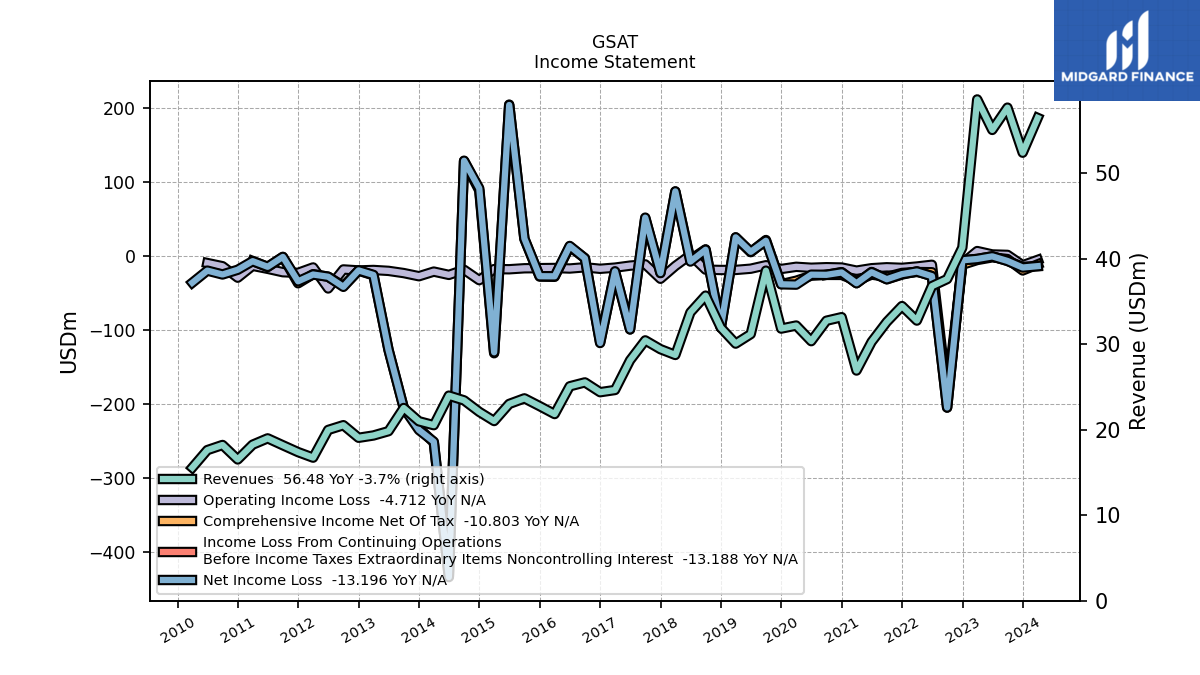
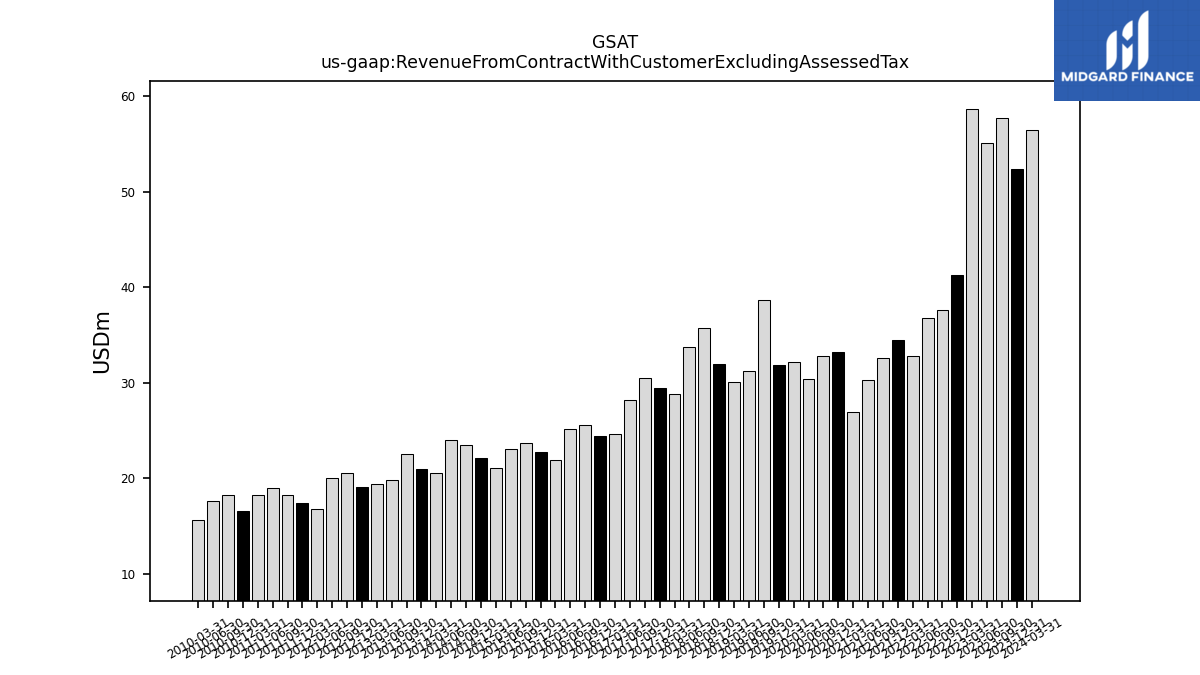
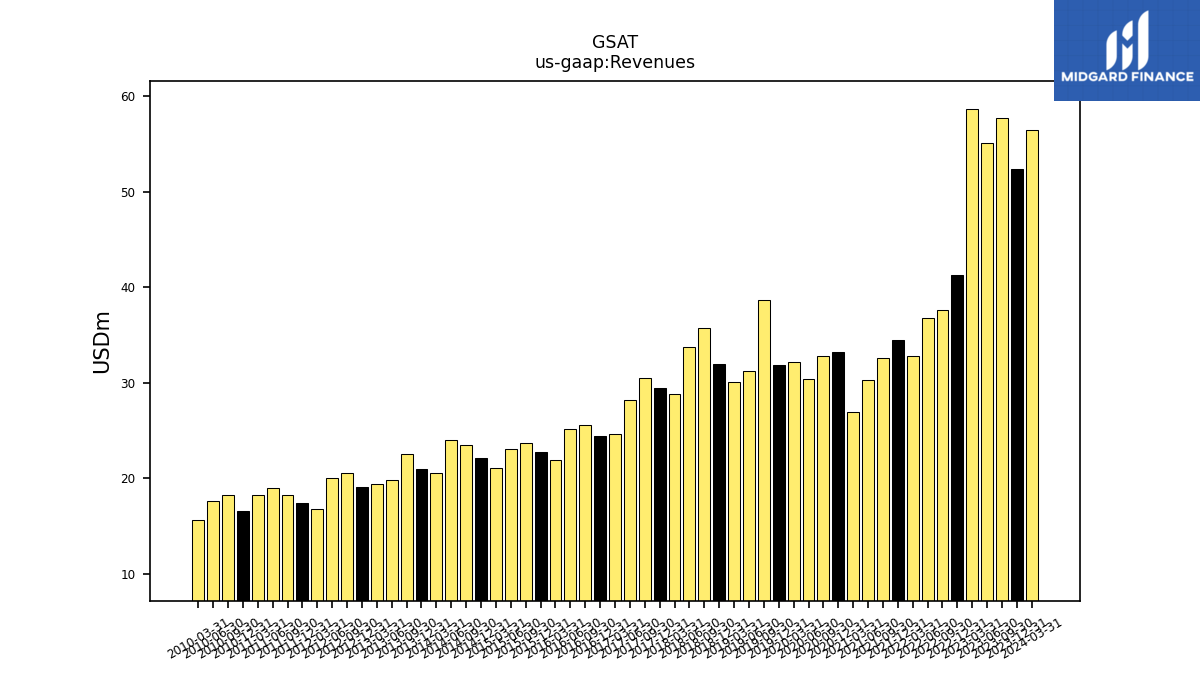
| Revenue From Contract With Customer Excluding Assessed Tax | 57.68 | 55.07 | 58.64 | 41.31 | 37.63 | 36.80 | 32.77 | 34.48 | 32.61 | 30.28 | 26.93 | 33.17 | 32.76 | 30.36 | 32.19 | 31.84 | 38.61 | 31.19 | 30.08 | 31.95 | 35.69 | 33.73 | 28.75 | 29.43 | 30.46 | 28.12 | 24.65 | 24.39 | 25.54 | 25.09 | 21.84 | 22.77 | 23.68 | 23.02 | 21.02 | 22.09 | 23.44 | 23.99 | 20.54 | 20.99 | 22.55 | 19.84 | 19.33 | 19.06 | 20.54 | 19.98 | 16.74 | 17.39 | 18.19 | 19.00 | 18.25 | 16.52 | 18.22 | 17.62 | 15.57 | |
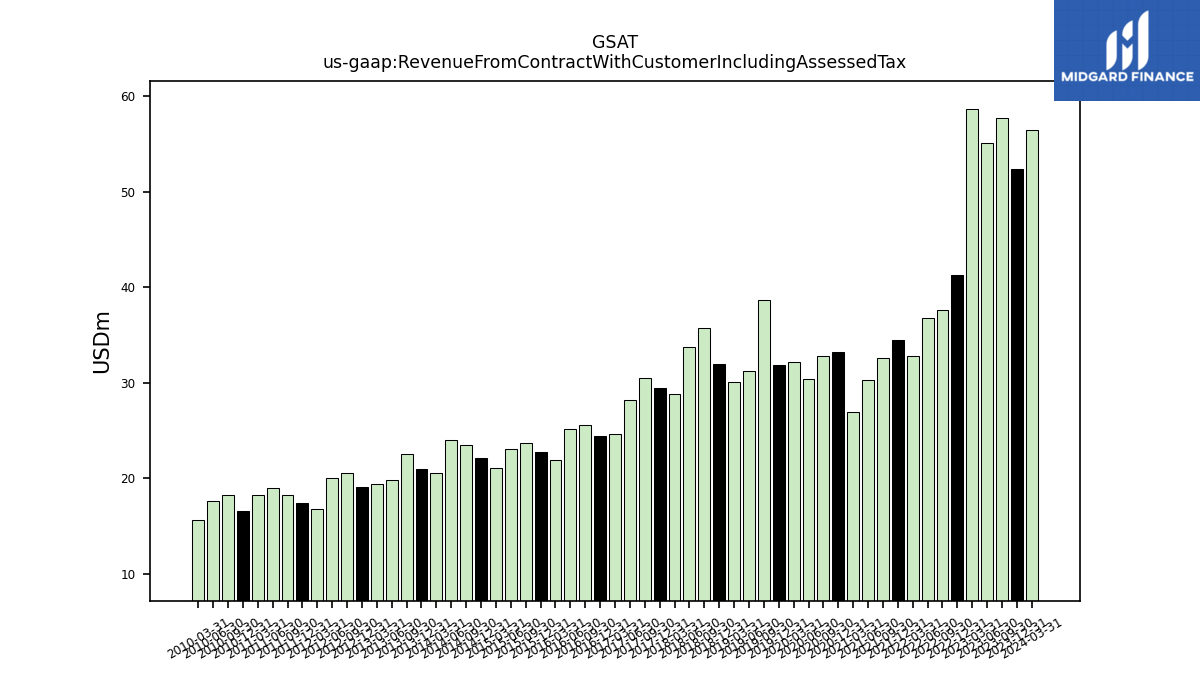
| Revenue From Contract With Customer Including Assessed Tax | 57.68 | 55.07 | 58.64 | 41.31 | 37.63 | 36.80 | 32.77 | 34.48 | 32.61 | 30.28 | 26.93 | 33.17 | 32.76 | 30.36 | 32.19 | 31.84 | 38.61 | 31.19 | 30.08 | 31.95 | 35.69 | 33.73 | 28.75 | 29.43 | 30.46 | 28.12 | 24.65 | 24.39 | 25.54 | 25.09 | 21.84 | 22.77 | 23.68 | 23.02 | 21.02 | 22.09 | 23.44 | 23.99 | 20.54 | 20.99 | 22.55 | 19.84 | 19.33 | 19.06 | 20.54 | 19.98 | 16.74 | 17.39 | 18.19 | 19.00 | 18.25 | 16.52 | 18.22 | 17.62 | 15.57 | |
| Revenues | 57.68 | 55.07 | 58.64 | 41.31 | 37.63 | 36.80 | 32.77 | 34.48 | 32.61 | 30.28 | 26.93 | 33.17 | 32.76 | 30.36 | 32.19 | 31.84 | 38.61 | 31.19 | 30.08 | 31.95 | 35.69 | 33.73 | 28.75 | 29.43 | 30.46 | 28.12 | 24.65 | 24.39 | 25.54 | 25.09 | 21.84 | 22.77 | 23.68 | 23.02 | 21.02 | 22.09 | 23.44 | 23.99 | 20.54 | 20.99 | 22.55 | 19.84 | 19.33 | 19.06 | 20.54 | 19.98 | 16.74 | 17.39 | 18.19 | 19.00 | 18.25 | 16.52 | 18.22 | 17.62 | 15.57 | |
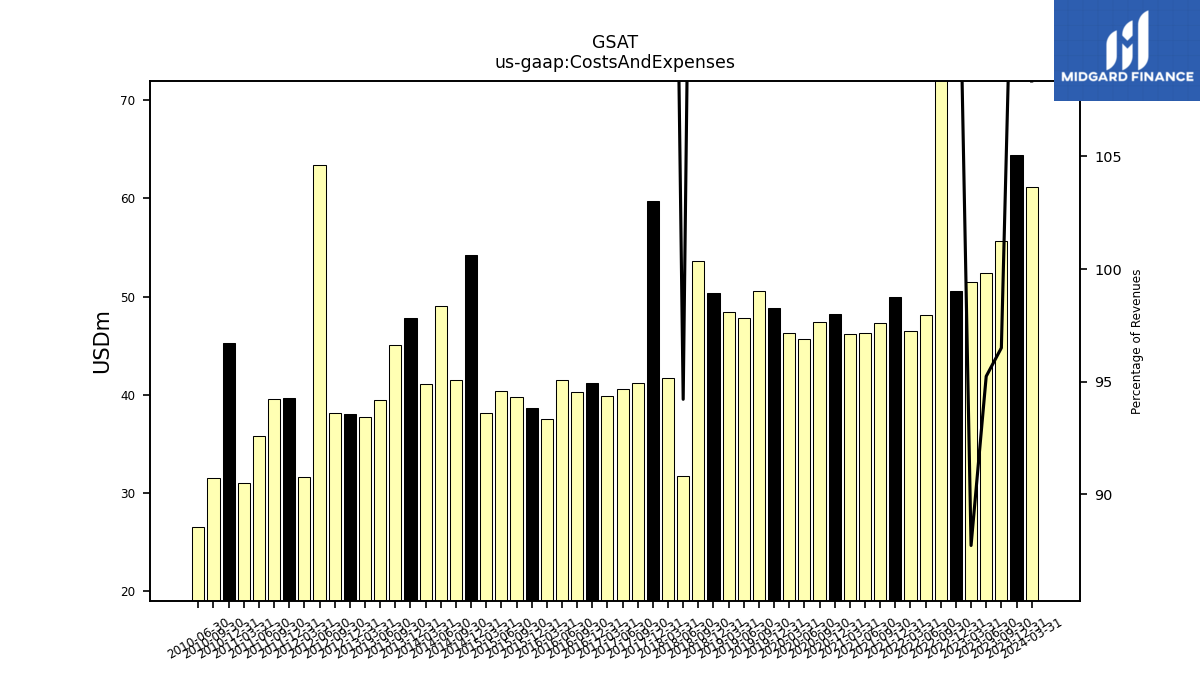
| Costs And Expenses | 55.67 | 52.45 | 51.45 | 50.63 | 224.27 | 48.16 | 46.48 | 50.00 | 47.33 | 46.29 | 46.19 | 48.24 | 47.39 | 45.74 | 46.28 | 48.89 | 50.62 | 47.85 | 48.41 | 50.35 | 53.65 | 31.78 | 41.71 | 59.71 | 41.25 | 40.63 | 39.85 | 41.20 | 40.31 | 41.50 | 37.53 | 38.68 | 39.77 | 40.44 | 38.21 | 54.28 | 41.53 | 49.03 | 41.11 | 47.83 | 45.12 | 39.44 | 37.72 | 38.07 | 38.19 | 63.38 | 31.67 | 39.66 | 39.58 | 35.82 | 31.01 | 45.34 | 31.54 | 26.61 | NA | |
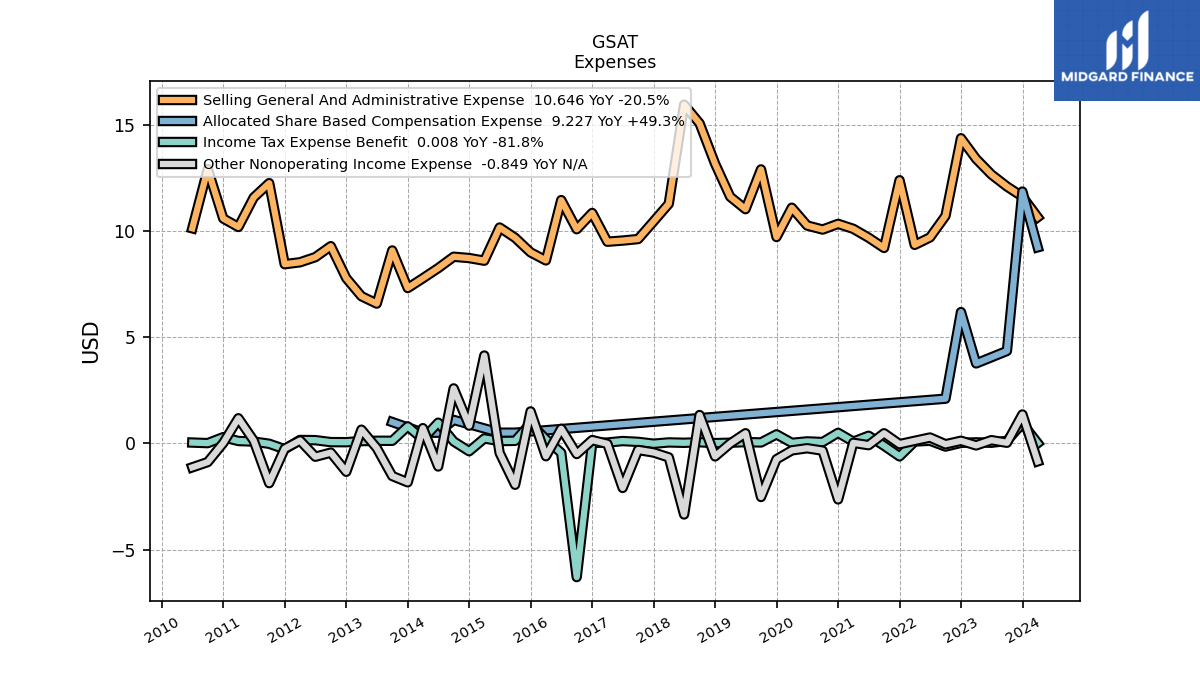
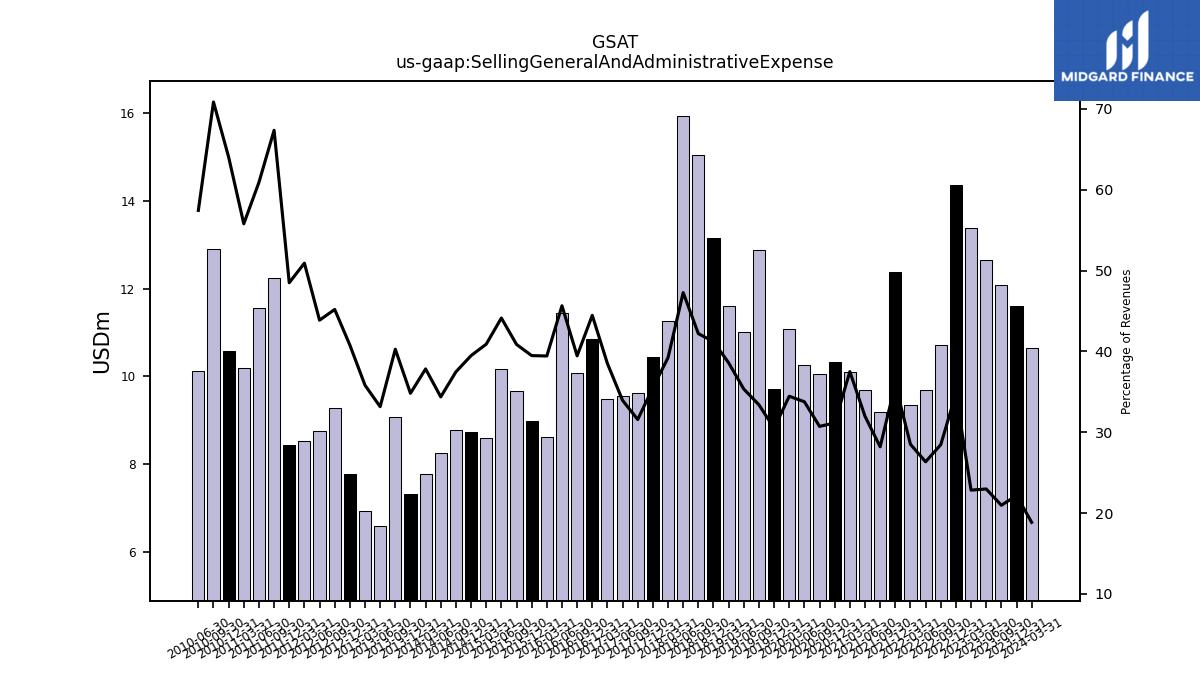
| Selling General And Administrative Expense | 12.09 | 12.65 | 13.39 | 14.36 | 10.71 | 9.69 | 9.34 | 12.38 | 9.20 | 9.68 | 10.10 | 10.33 | 10.06 | 10.25 | 11.09 | 9.71 | 12.89 | 11.02 | 11.61 | 13.16 | 15.06 | 15.94 | 11.28 | 10.45 | 9.62 | 9.54 | 9.49 | 10.85 | 10.08 | 11.45 | 8.61 | 8.99 | 9.68 | 10.16 | 8.60 | 8.72 | 8.78 | 8.25 | 7.77 | 7.31 | 9.08 | 6.58 | 6.92 | 7.77 | 9.28 | 8.76 | 8.52 | 8.43 | 12.25 | 11.57 | 10.18 | 10.58 | 12.91 | 10.12 | NA | |
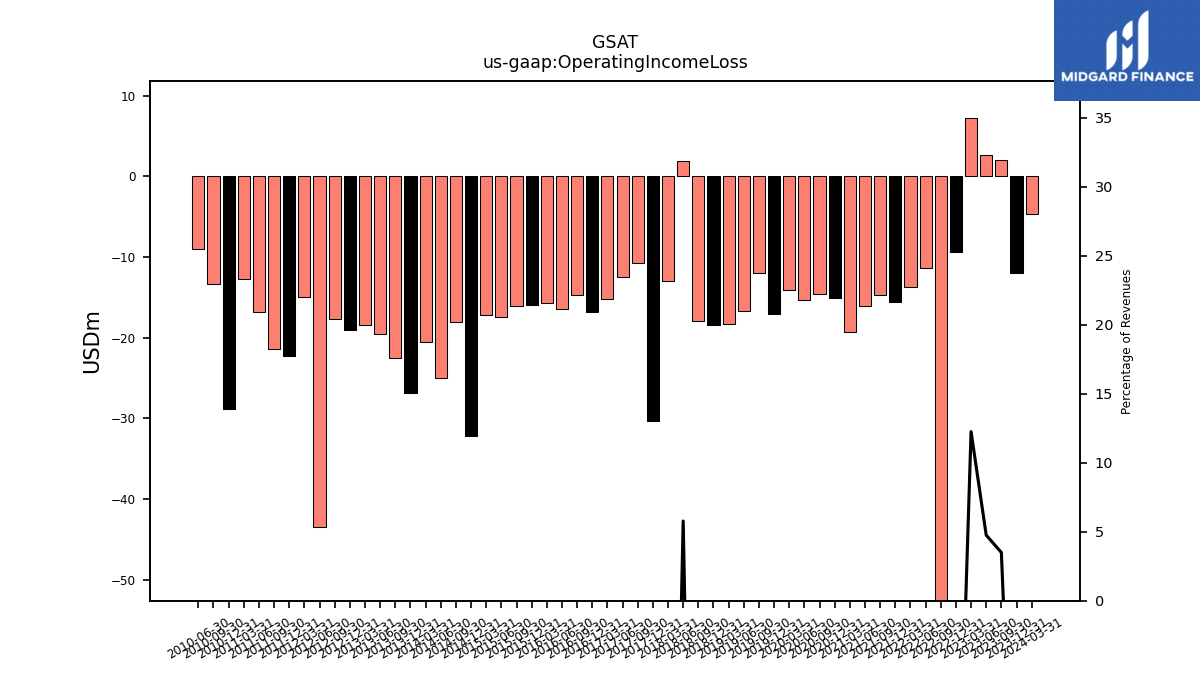
| Operating Income Loss | 2.02 | 2.62 | 7.19 | -9.32 | -186.64 | -11.36 | -13.71 | -15.52 | -14.71 | -16.01 | -19.26 | -15.06 | -14.63 | -15.38 | -14.09 | -17.05 | -12.01 | -16.66 | -18.33 | -18.41 | -17.96 | 1.95 | -12.96 | -30.28 | -10.79 | -12.51 | -15.20 | -16.80 | -14.76 | -16.41 | -15.70 | -15.91 | -16.09 | -17.42 | -17.18 | -32.19 | -18.09 | -25.04 | -20.57 | -26.83 | -22.57 | -19.60 | -18.39 | -19.00 | -17.66 | -43.40 | -14.93 | -22.27 | -21.39 | -16.82 | -12.76 | -28.81 | -13.31 | -8.98 | NA | |
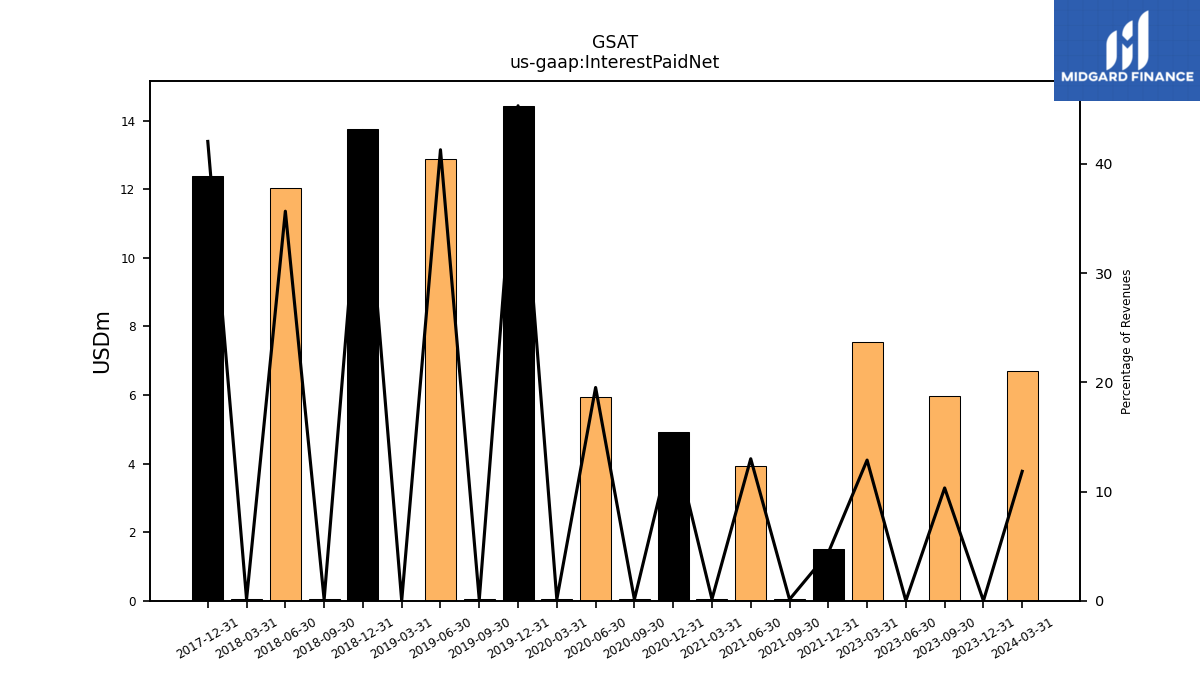
| Interest Paid Net | 5.96 | 0.00 | 7.55 | NA | NA | NA | NA | 1.52 | 0.04 | 3.94 | 0.04 | 4.91 | 0.04 | 5.93 | 0.04 | 14.43 | 0.04 | 12.88 | 0.00 | 13.76 | 0.04 | 12.03 | 0.04 | 12.38 | NA | NA | NA | NA | NA | NA | NA | NA | NA | NA | NA | NA | NA | NA | NA | NA | NA | NA | NA | NA | NA | NA | NA | NA | NA | NA | NA | NA | NA | NA | NA | |
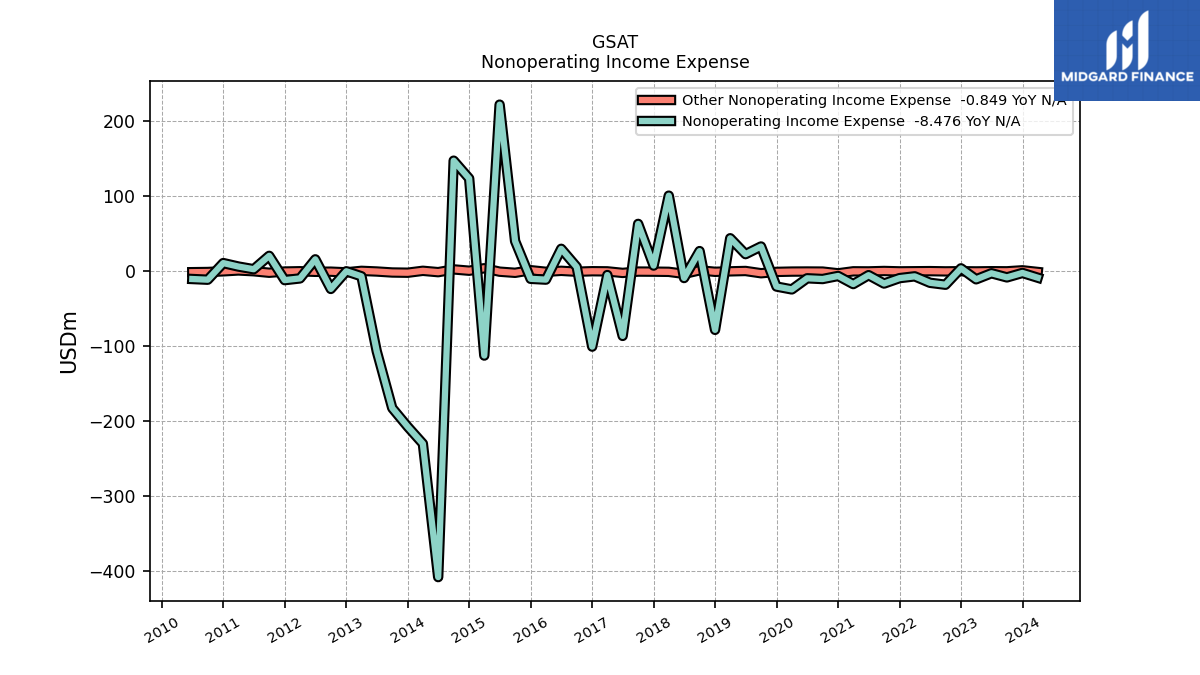
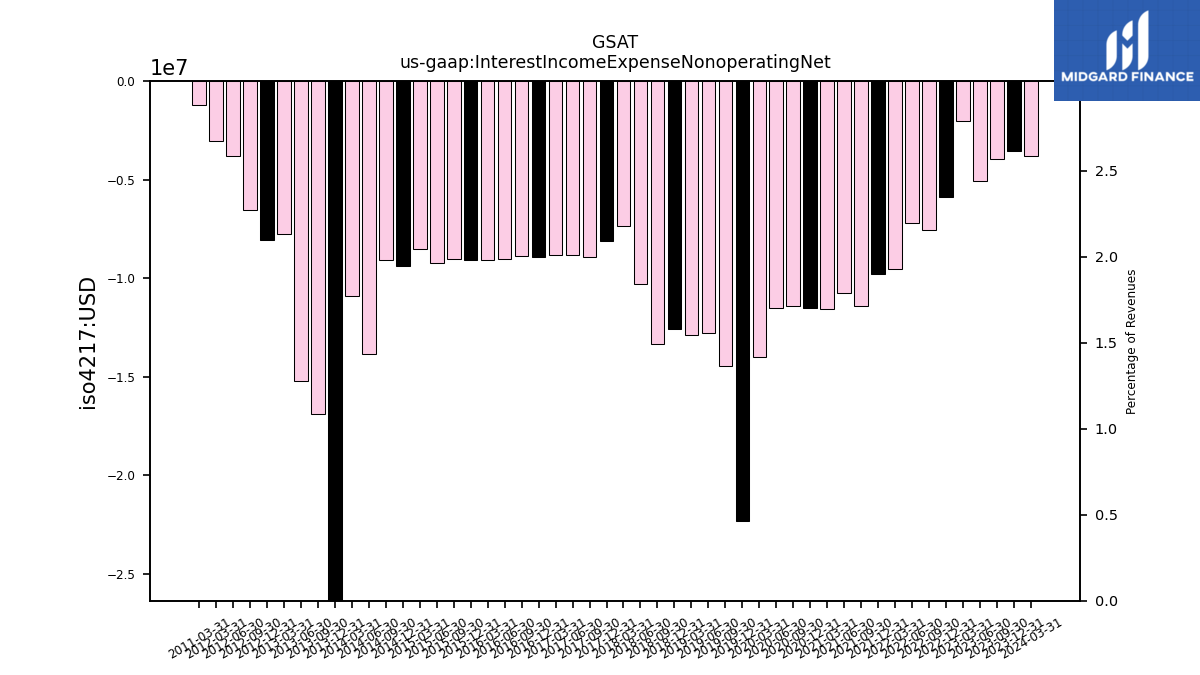
| Interest Income Expense Nonoperating Net | -3.94 | -5.07 | -2.03 | -5.87 | -7.58 | -7.19 | -9.53 | -9.78 | -11.41 | -10.78 | -11.57 | -11.51 | -11.40 | -11.51 | -14.01 | -22.32 | -14.47 | -12.81 | -12.87 | -12.60 | -13.36 | -10.30 | -7.35 | -8.14 | -8.95 | -8.85 | -8.83 | -8.93 | -8.87 | -9.05 | -9.11 | -9.07 | -9.02 | -9.24 | -8.52 | -9.38 | -9.07 | -13.86 | -10.92 | -27.96 | -16.90 | -15.22 | -7.75 | -8.09 | -6.57 | -3.78 | -3.05 | NA | NA | NA | -1.21 | NA | NA | NA | NA | |
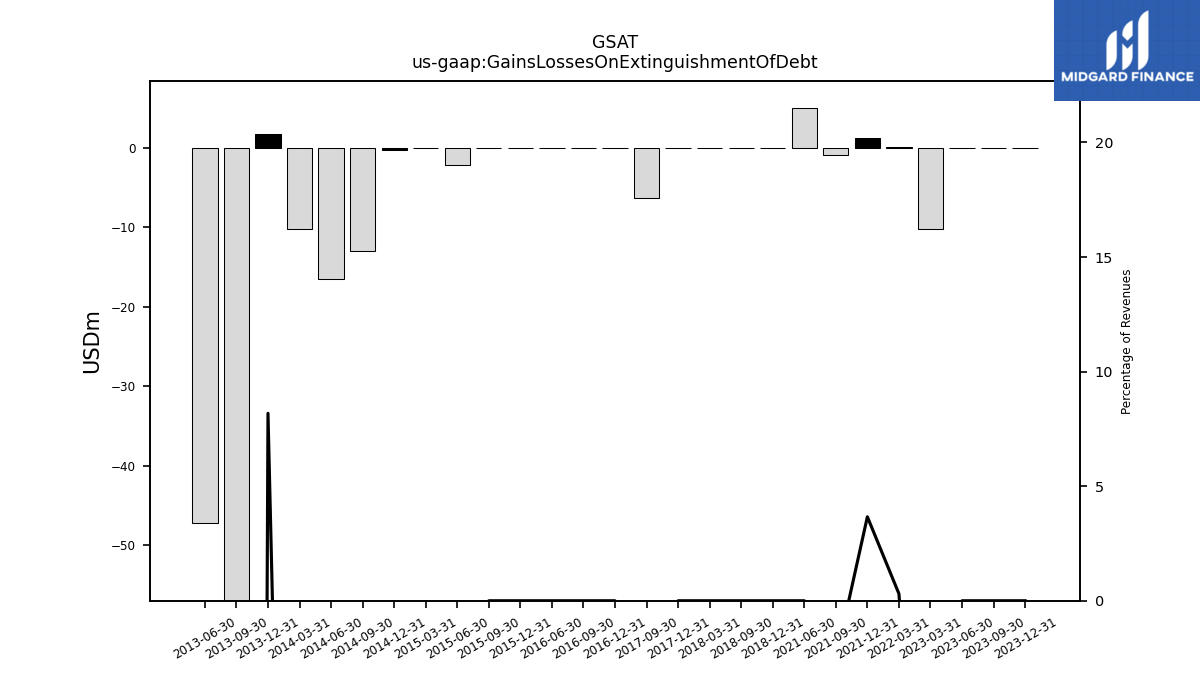
| Gains Losses On Extinguishment Of Debt | 0.00 | 0.00 | -10.19 | NA | NA | NA | 0.10 | 1.26 | -0.83 | 5.00 | NA | NA | NA | NA | NA | NA | NA | NA | NA | 0.00 | 0.00 | NA | 0.00 | 0.00 | -6.31 | NA | NA | 0.00 | 0.00 | 0.00 | NA | 0.00 | 0.00 | -2.19 | -0.07 | -0.23 | -12.94 | -16.48 | -10.20 | 1.72 | -63.57 | -47.24 | NA | NA | NA | NA | NA | NA | NA | NA | NA | NA | NA | NA | NA | |
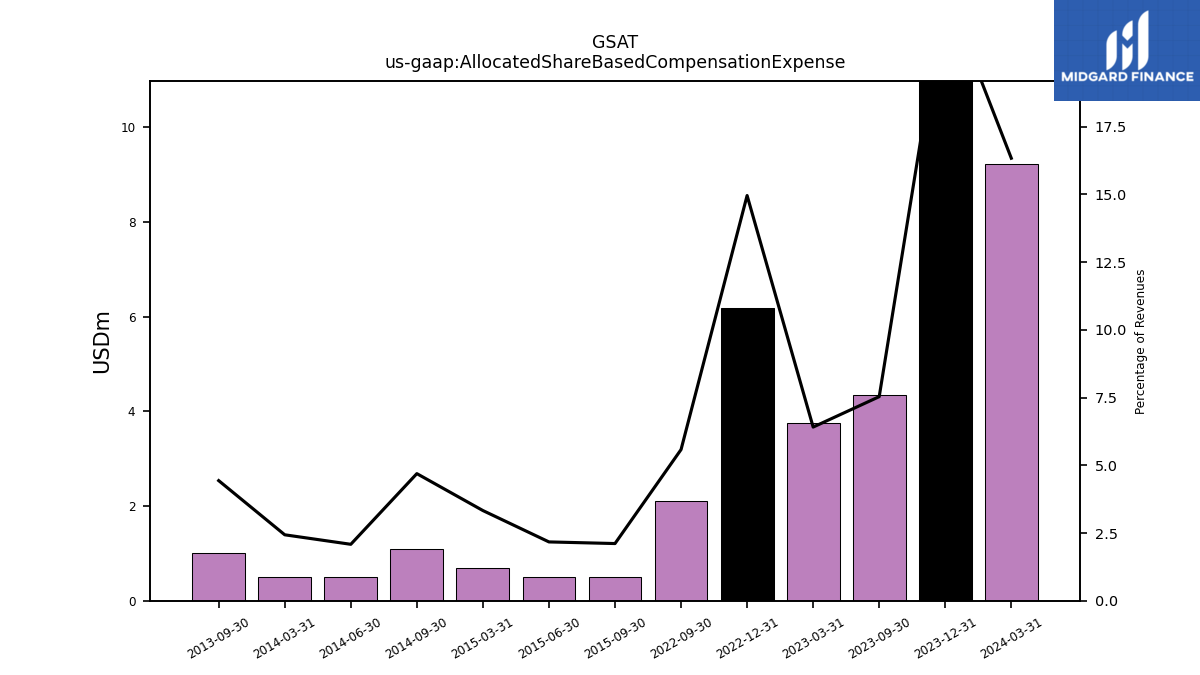
| Allocated Share Based Compensation Expense | 4.35 | NA | NA | NA | 2.10 | NA | NA | NA | NA | NA | NA | NA | NA | NA | NA | NA | NA | NA | NA | NA | NA | NA | NA | NA | NA | NA | NA | NA | NA | NA | NA | NA | 0.50 | 0.50 | 0.70 | NA | 1.10 | 0.50 | 0.50 | NA | 1.00 | NA | NA | NA | NA | NA | NA | NA | NA | NA | NA | NA | NA | NA | NA | |
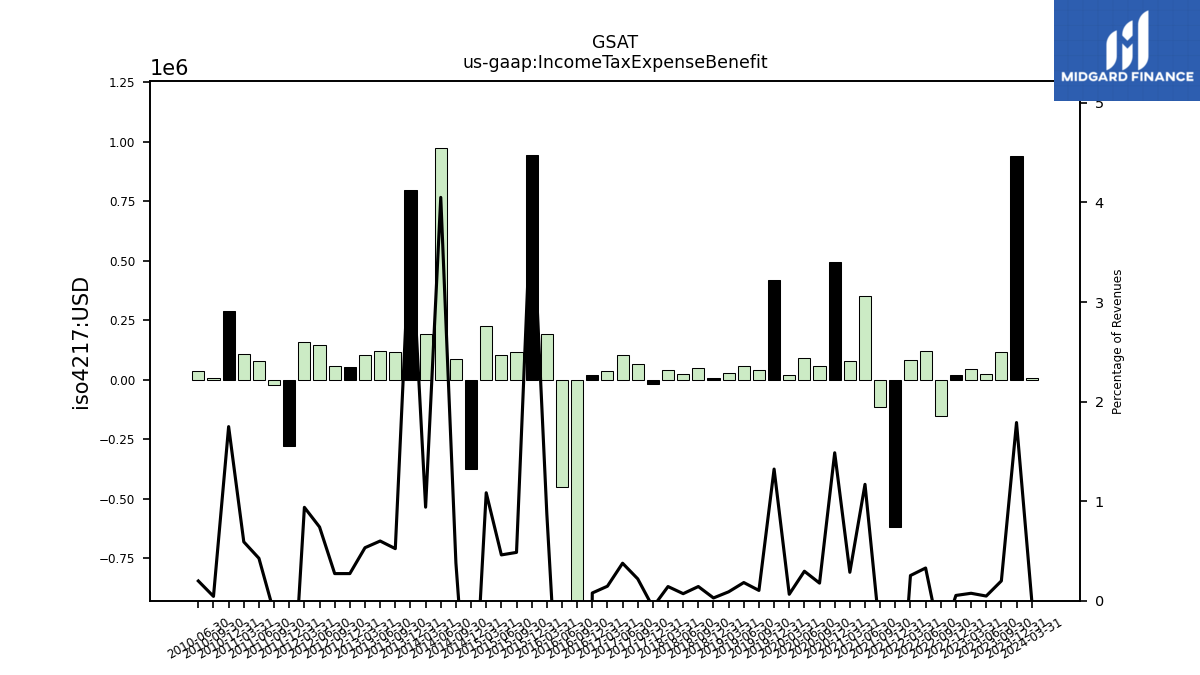
| Income Tax Expense Benefit | 0.12 | 0.03 | 0.04 | 0.02 | -0.15 | 0.12 | 0.08 | -0.62 | -0.11 | 0.35 | 0.08 | 0.49 | 0.06 | 0.09 | 0.02 | 0.42 | 0.04 | 0.06 | 0.03 | 0.01 | 0.05 | 0.02 | 0.04 | -0.02 | 0.07 | 0.11 | 0.04 | 0.02 | -6.30 | -0.45 | 0.19 | 0.94 | 0.12 | 0.11 | 0.23 | -0.37 | 0.09 | 0.97 | 0.19 | 0.80 | 0.12 | 0.12 | 0.10 | 0.05 | 0.06 | 0.15 | 0.16 | -0.28 | -0.02 | 0.08 | 0.11 | 0.29 | 0.01 | 0.04 | NA | |
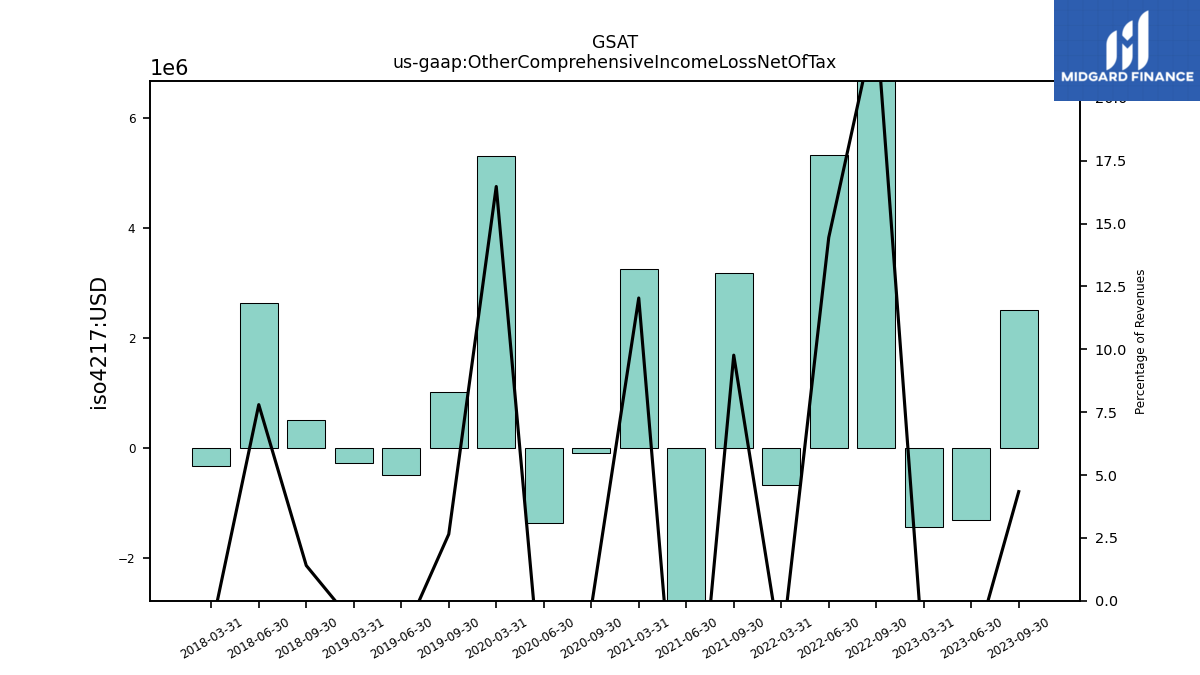
| Other Comprehensive Income Loss Net Of Tax | 2.50 | -1.31 | -1.43 | NA | 8.69 | 5.32 | -0.68 | NA | 3.19 | -3.16 | 3.24 | NA | -0.09 | -1.37 | 5.30 | NA | 1.02 | -0.50 | -0.27 | NA | 0.50 | 2.63 | -0.33 | NA | NA | NA | NA | NA | NA | NA | NA | NA | NA | NA | NA | NA | NA | NA | NA | NA | NA | NA | NA | NA | NA | NA | NA | NA | NA | NA | NA | NA | NA | NA | NA | |
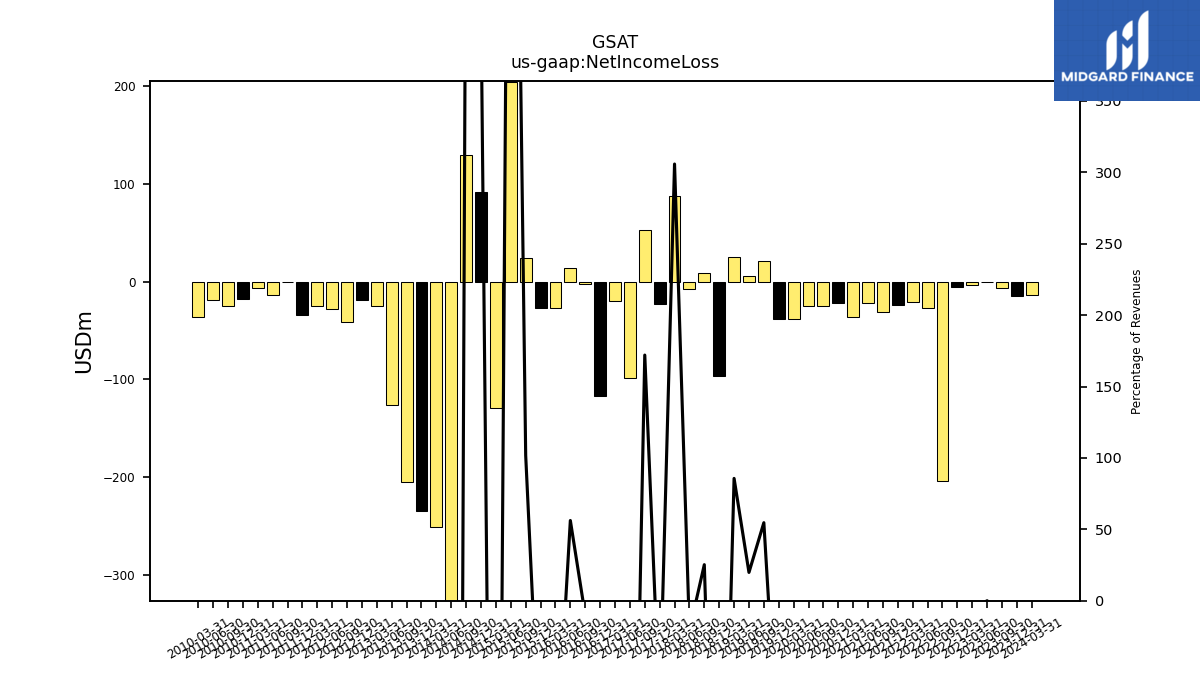
| Net Income Loss | -6.17 | 0.01 | -3.48 | -5.33 | -204.36 | -26.76 | -20.46 | -23.96 | -30.89 | -21.45 | -36.33 | -21.73 | -24.95 | -24.74 | -38.22 | -37.75 | 21.11 | 6.19 | 25.77 | -96.45 | 9.02 | -7.01 | 87.93 | -22.59 | 52.41 | -98.73 | -20.16 | -117.22 | -2.58 | 14.10 | -26.95 | -26.82 | 24.10 | 204.77 | -129.73 | 92.02 | 129.39 | -433.73 | -250.54 | -234.80 | -204.97 | -126.27 | -25.08 | -18.95 | -41.19 | -27.53 | -24.52 | -33.71 | -0.68 | -14.07 | -6.47 | -18.08 | -24.49 | -19.25 | -35.64 | |
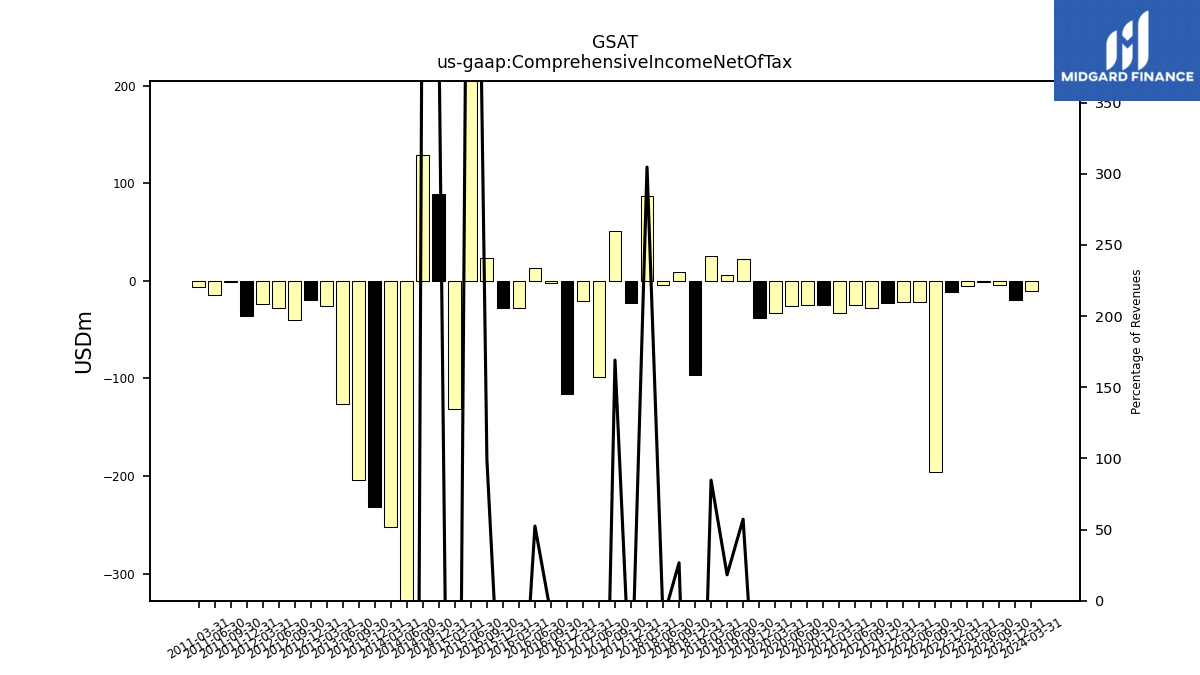
| Comprehensive Income Net Of Tax | -3.67 | -1.30 | -4.91 | -11.30 | -195.68 | -21.44 | -21.14 | -22.39 | -27.70 | -24.61 | -33.09 | -25.07 | -25.04 | -26.10 | -32.92 | -37.61 | 22.13 | 5.69 | 25.50 | -96.15 | 9.52 | -4.38 | 87.60 | -22.38 | 51.50 | -98.78 | -20.98 | -116.27 | -2.49 | 13.17 | -27.60 | -27.29 | 23.48 | 205.21 | -131.02 | 89.12 | 128.90 | -432.88 | -251.78 | -232.07 | -204.42 | -126.35 | -25.65 | -19.28 | -40.07 | -27.44 | -24.07 | -36.40 | -0.81 | -14.32 | -6.22 | NA | NA | NA | NA | |
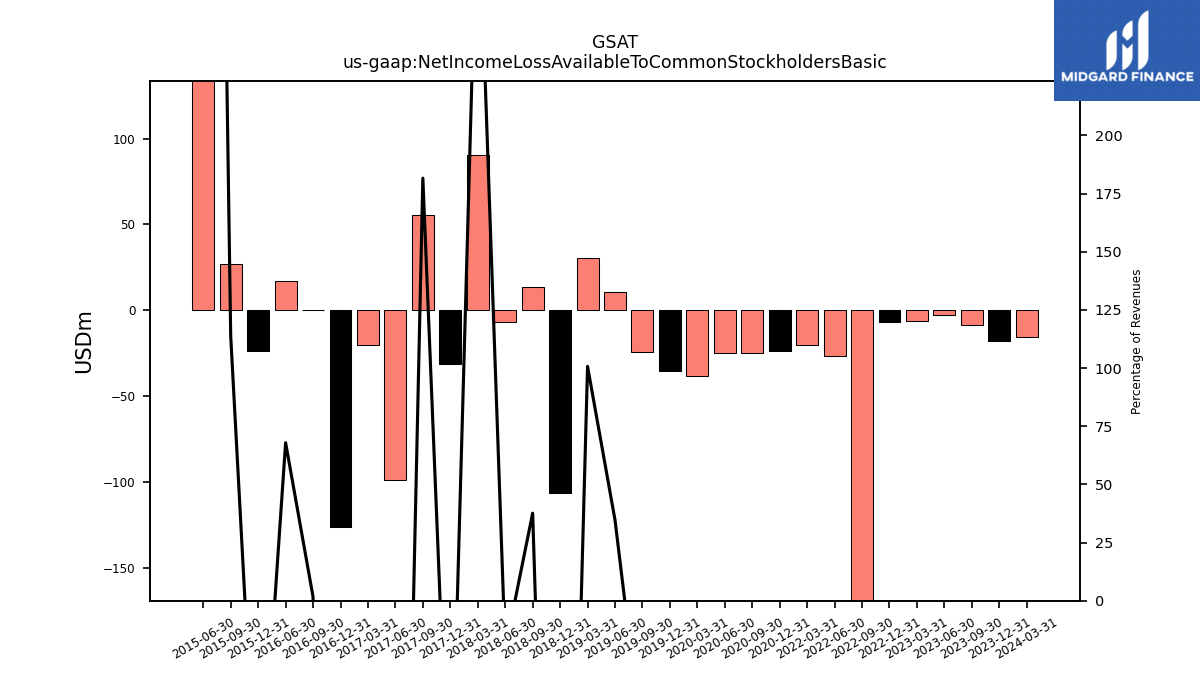
| Net Income Loss Available To Common Stockholders Basic | -8.84 | -2.63 | -6.09 | -6.67 | -204.36 | -26.76 | -20.46 | NA | NA | NA | NA | -23.95 | -25.02 | -24.73 | -38.22 | -35.46 | -24.23 | 10.84 | 30.30 | -106.78 | 13.43 | -7.01 | 90.34 | -31.50 | 55.31 | -98.73 | -20.16 | -126.06 | 0.43 | 17.04 | NA | -23.92 | 26.94 | 207.51 | NA | NA | NA | NA | NA | NA | NA | NA | NA | NA | NA | NA | NA | NA | NA | NA | NA | NA | NA | NA | NA |
| 2023-09-30 | 2023-06-30 | 2023-03-31 | 2022-12-31 | 2022-09-30 | 2022-06-30 | 2022-03-31 | 2021-12-31 | 2021-09-30 | 2021-06-30 | 2021-03-31 | 2020-12-31 | 2020-09-30 | 2020-06-30 | 2020-03-31 | 2019-12-31 | 2019-09-30 | 2019-06-30 | 2019-03-31 | 2018-12-31 | 2018-09-30 | 2018-06-30 | 2018-03-31 | 2017-12-31 | 2017-09-30 | 2017-06-30 | 2017-03-31 | 2016-12-31 | 2016-09-30 | 2016-06-30 | 2016-03-31 | 2015-12-31 | 2015-09-30 | 2015-06-30 | 2015-03-31 | 2014-12-31 | 2014-09-30 | 2014-06-30 | 2014-03-31 | 2013-12-31 | 2013-09-30 | 2013-06-30 | 2013-03-31 | 2012-12-31 | 2012-09-30 | 2012-06-30 | 2012-03-31 | 2011-12-31 | 2011-09-30 | 2011-06-30 | 2011-03-31 | 2010-12-31 | 2010-09-30 | 2010-06-30 | 2010-03-31 | ||
|---|---|---|---|---|---|---|---|---|---|---|---|---|---|---|---|---|---|---|---|---|---|---|---|---|---|---|---|---|---|---|---|---|---|---|---|---|---|---|---|---|---|---|---|---|---|---|---|---|---|---|---|---|---|---|---|---|
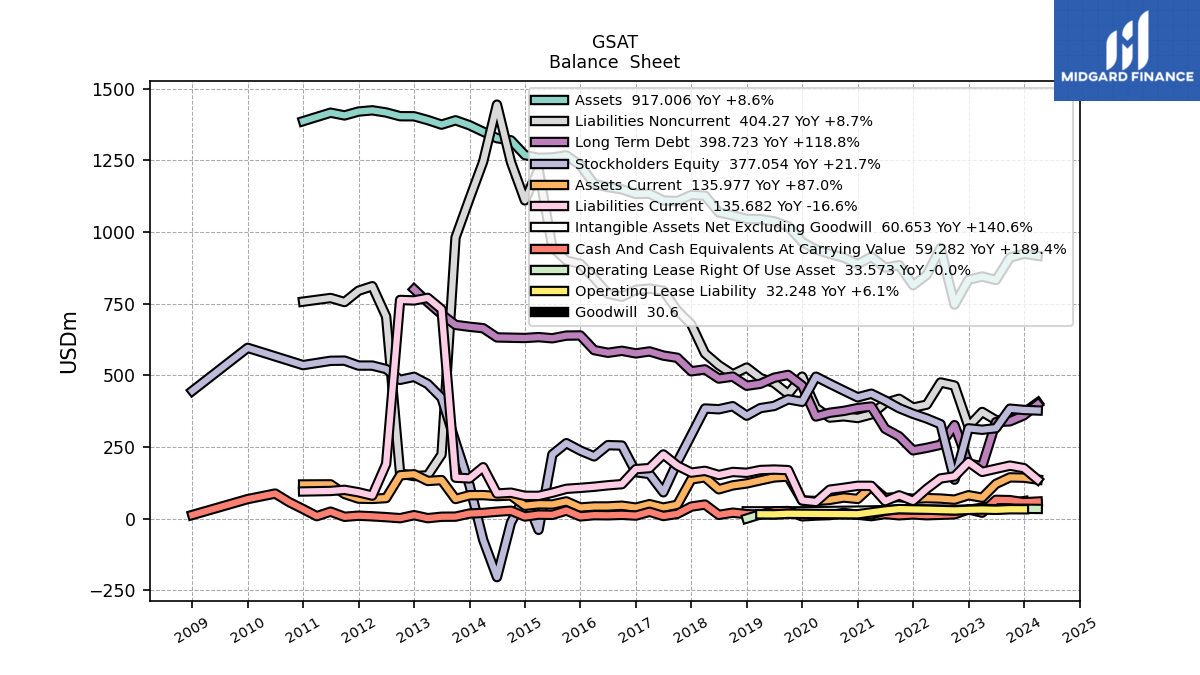
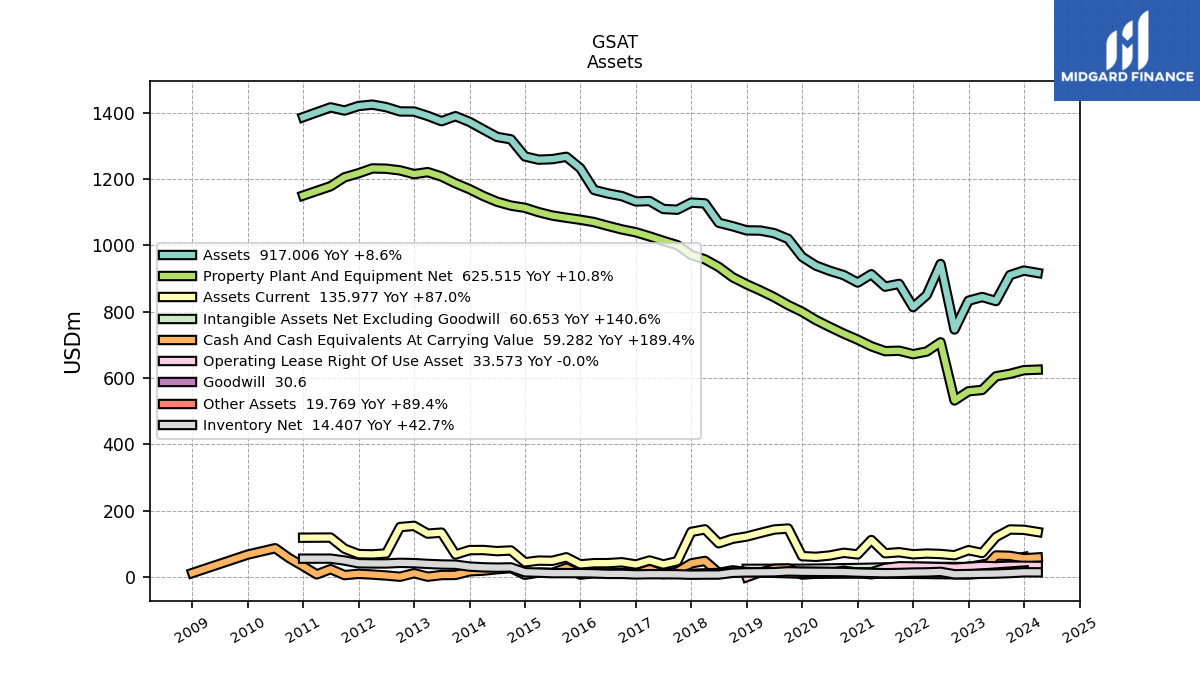
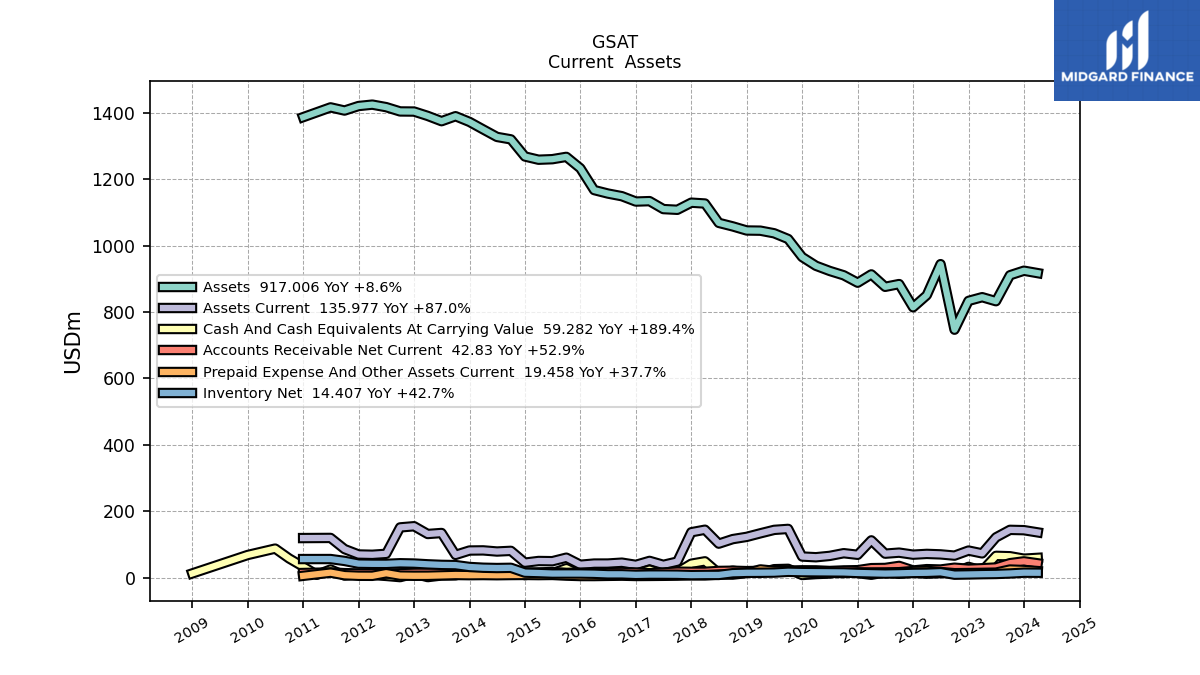
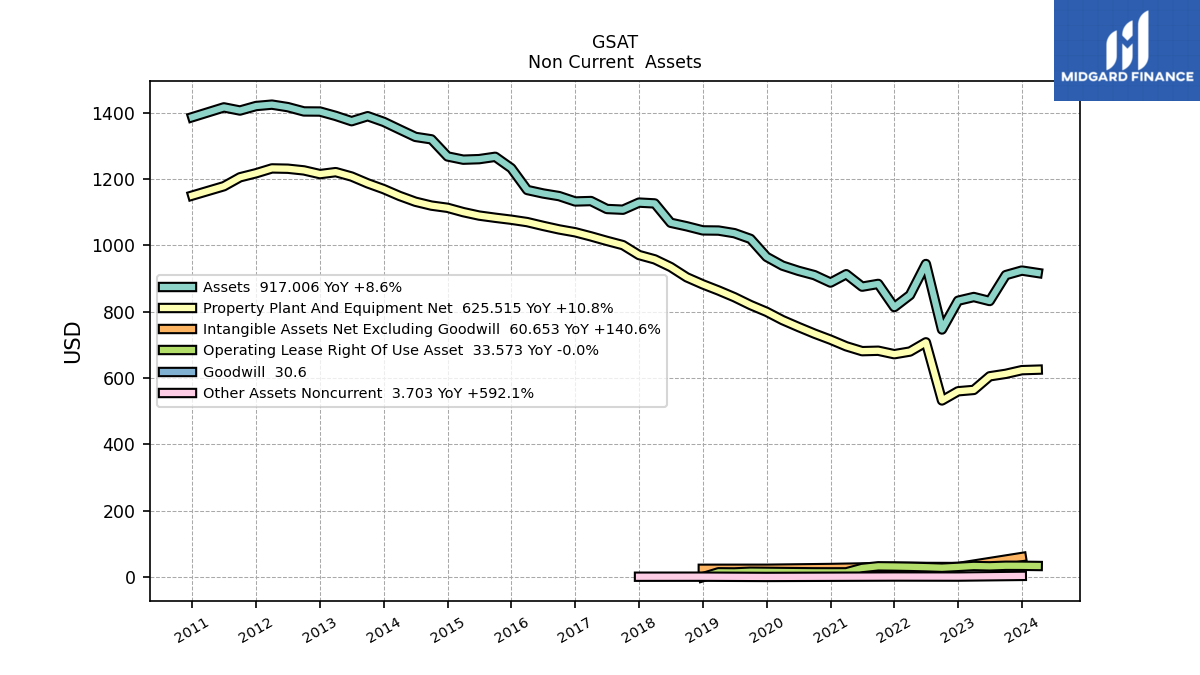
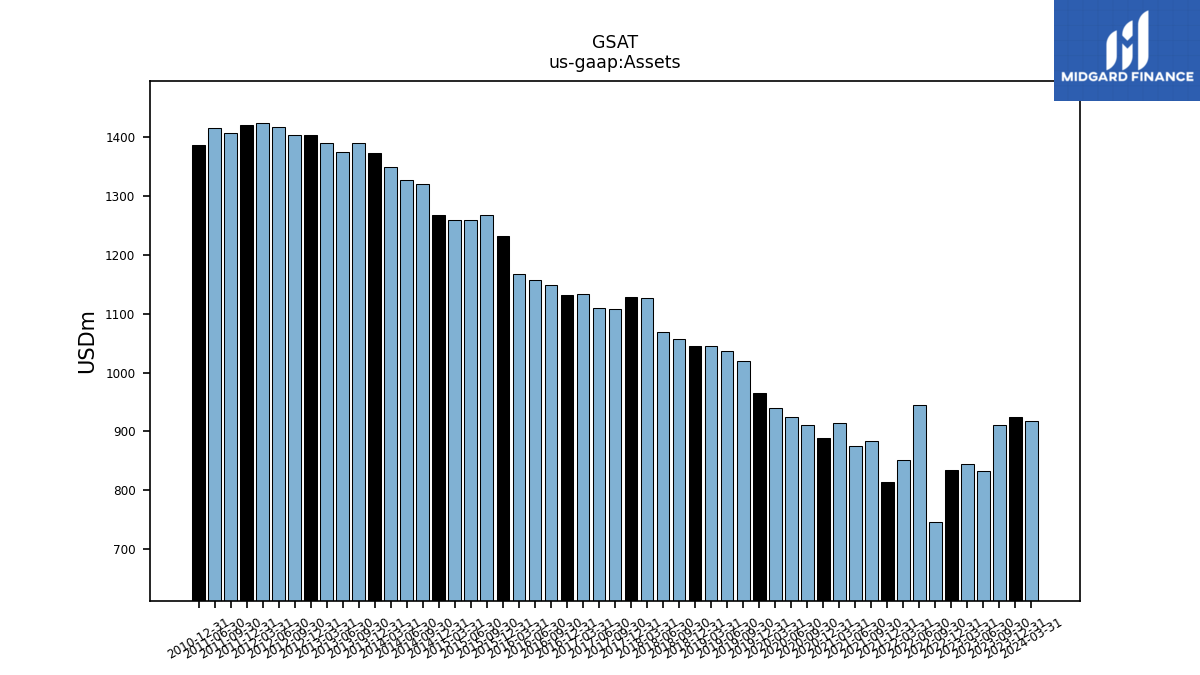
| Assets | 910.61 | 832.44 | 844.55 | 833.39 | 746.54 | 944.15 | 850.43 | 814.11 | 884.12 | 875.77 | 913.30 | 888.09 | 910.51 | 923.55 | 939.14 | 965.59 | 1019.84 | 1037.06 | 1044.91 | 1045.48 | 1057.82 | 1068.44 | 1126.75 | 1129.27 | 1107.81 | 1109.97 | 1133.93 | 1132.61 | 1148.76 | 1156.76 | 1167.26 | 1232.92 | 1267.31 | 1260.28 | 1258.67 | 1268.42 | 1319.96 | 1327.36 | 1349.99 | 1372.61 | 1389.77 | 1374.70 | 1390.60 | 1403.78 | 1404.11 | 1417.08 | 1424.64 | 1420.40 | 1406.80 | 1416.35 | NA | 1386.81 | NA | NA | NA | |
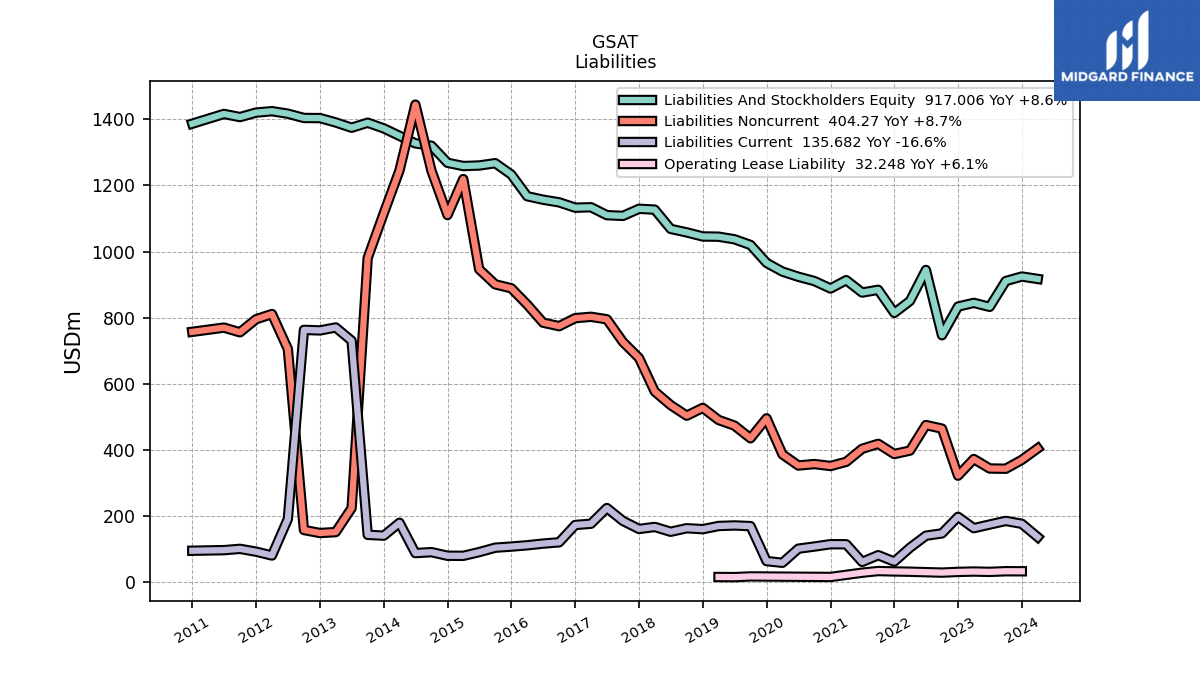
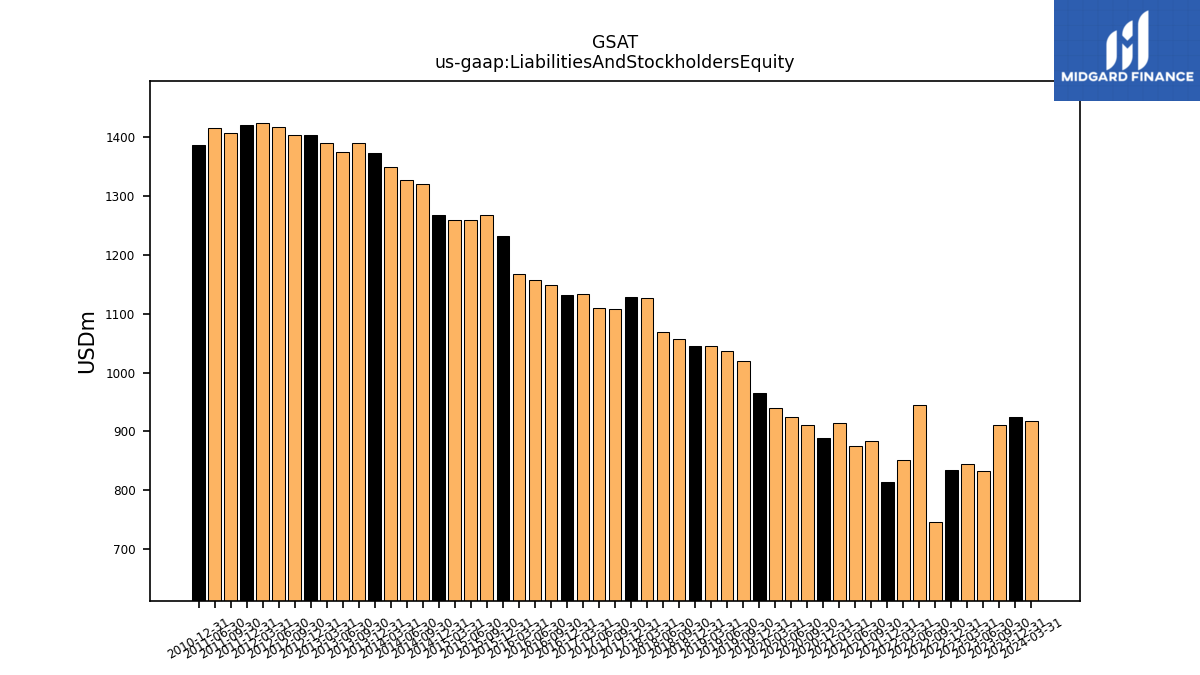
| Liabilities And Stockholders Equity | 910.61 | 832.44 | 844.55 | 833.39 | 746.54 | 944.15 | 850.43 | 814.11 | 884.12 | 875.77 | 913.30 | 888.09 | 910.51 | 923.55 | 939.14 | 965.59 | 1019.84 | 1037.06 | 1044.91 | 1045.48 | 1057.82 | 1068.44 | 1126.75 | 1129.27 | 1107.81 | 1109.97 | 1133.93 | 1132.61 | 1148.76 | 1156.76 | 1167.26 | 1232.92 | 1267.31 | 1260.28 | 1258.67 | 1268.42 | 1319.96 | 1327.36 | 1349.99 | 1372.61 | 1389.77 | 1374.70 | 1390.60 | 1403.78 | 1404.11 | 1417.08 | 1424.64 | 1420.40 | 1406.80 | 1416.35 | NA | 1386.81 | NA | NA | NA | |
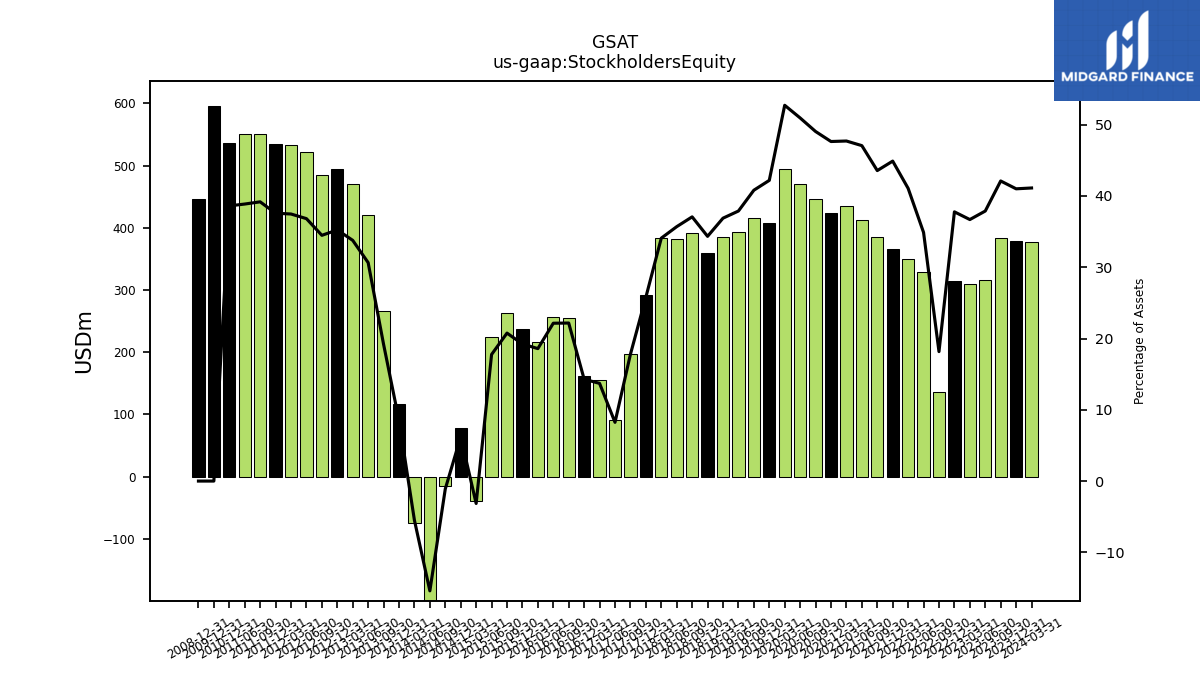
| Stockholders Equity | 383.37 | 315.37 | 309.85 | 314.77 | 135.58 | 329.33 | 349.23 | 365.43 | 385.12 | 412.13 | 435.71 | 423.06 | 446.56 | 470.49 | 495.12 | 407.34 | 416.14 | 392.89 | 385.38 | 358.94 | 392.10 | 381.34 | 383.99 | 291.22 | 197.04 | 91.47 | 155.41 | 161.82 | 254.70 | 256.14 | 216.90 | 237.13 | 263.07 | 223.79 | -39.58 | 78.92 | -14.53 | -204.45 | -74.28 | 116.75 | 266.60 | 421.26 | 469.60 | 494.54 | 484.07 | 521.70 | 533.77 | 533.79 | 551.10 | 550.46 | NA | 535.42 | NA | NA | NA |
| 2023-09-30 | 2023-06-30 | 2023-03-31 | 2022-12-31 | 2022-09-30 | 2022-06-30 | 2022-03-31 | 2021-12-31 | 2021-09-30 | 2021-06-30 | 2021-03-31 | 2020-12-31 | 2020-09-30 | 2020-06-30 | 2020-03-31 | 2019-12-31 | 2019-09-30 | 2019-06-30 | 2019-03-31 | 2018-12-31 | 2018-09-30 | 2018-06-30 | 2018-03-31 | 2017-12-31 | 2017-09-30 | 2017-06-30 | 2017-03-31 | 2016-12-31 | 2016-09-30 | 2016-06-30 | 2016-03-31 | 2015-12-31 | 2015-09-30 | 2015-06-30 | 2015-03-31 | 2014-12-31 | 2014-09-30 | 2014-06-30 | 2014-03-31 | 2013-12-31 | 2013-09-30 | 2013-06-30 | 2013-03-31 | 2012-12-31 | 2012-09-30 | 2012-06-30 | 2012-03-31 | 2011-12-31 | 2011-09-30 | 2011-06-30 | 2011-03-31 | 2010-12-31 | 2010-09-30 | 2010-06-30 | 2010-03-31 | ||
|---|---|---|---|---|---|---|---|---|---|---|---|---|---|---|---|---|---|---|---|---|---|---|---|---|---|---|---|---|---|---|---|---|---|---|---|---|---|---|---|---|---|---|---|---|---|---|---|---|---|---|---|---|---|---|---|---|
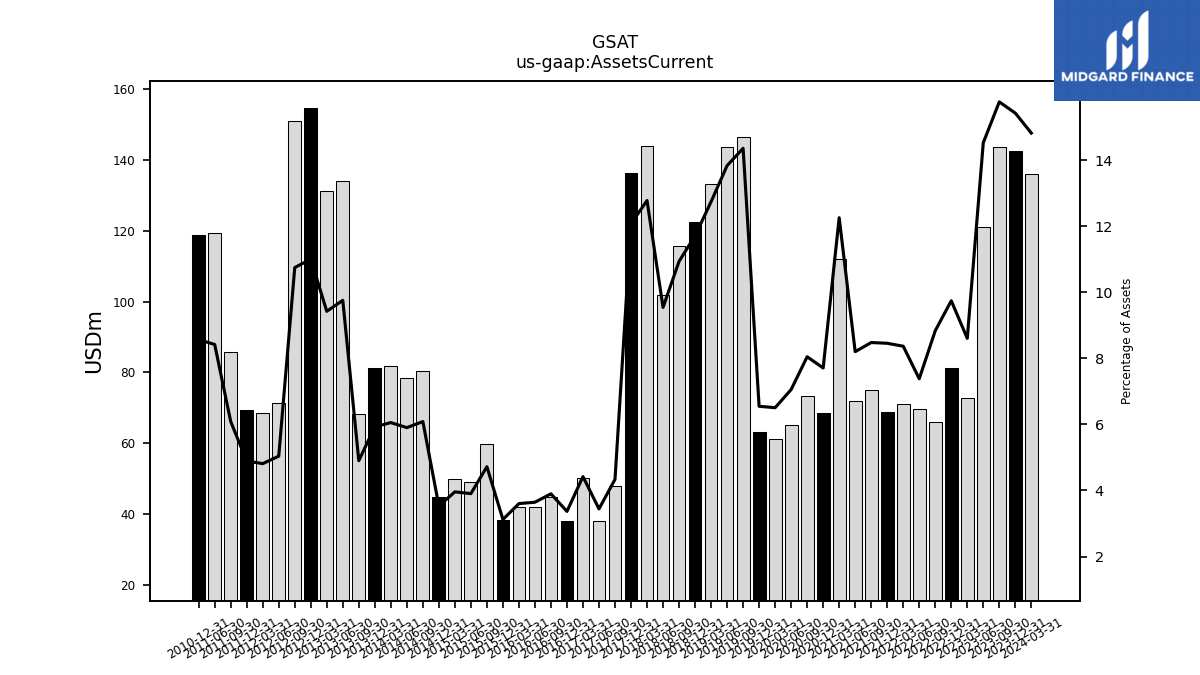
| Assets Current | 143.64 | 121.00 | 72.72 | 81.24 | 65.99 | 69.73 | 71.19 | 68.87 | 75.00 | 71.86 | 112.01 | 68.49 | 73.31 | 65.18 | 61.12 | 63.26 | 146.51 | 143.55 | 133.21 | 122.50 | 115.73 | 102.00 | 144.06 | 136.41 | 48.05 | 38.21 | 50.13 | 38.13 | 44.80 | 42.16 | 42.06 | 38.49 | 59.82 | 49.22 | 49.82 | 44.81 | 80.37 | 78.37 | 81.78 | 81.37 | 68.15 | 134.19 | 131.12 | 154.55 | 150.99 | 71.43 | 68.58 | 69.47 | 85.69 | 119.31 | NA | 118.88 | NA | NA | NA | |
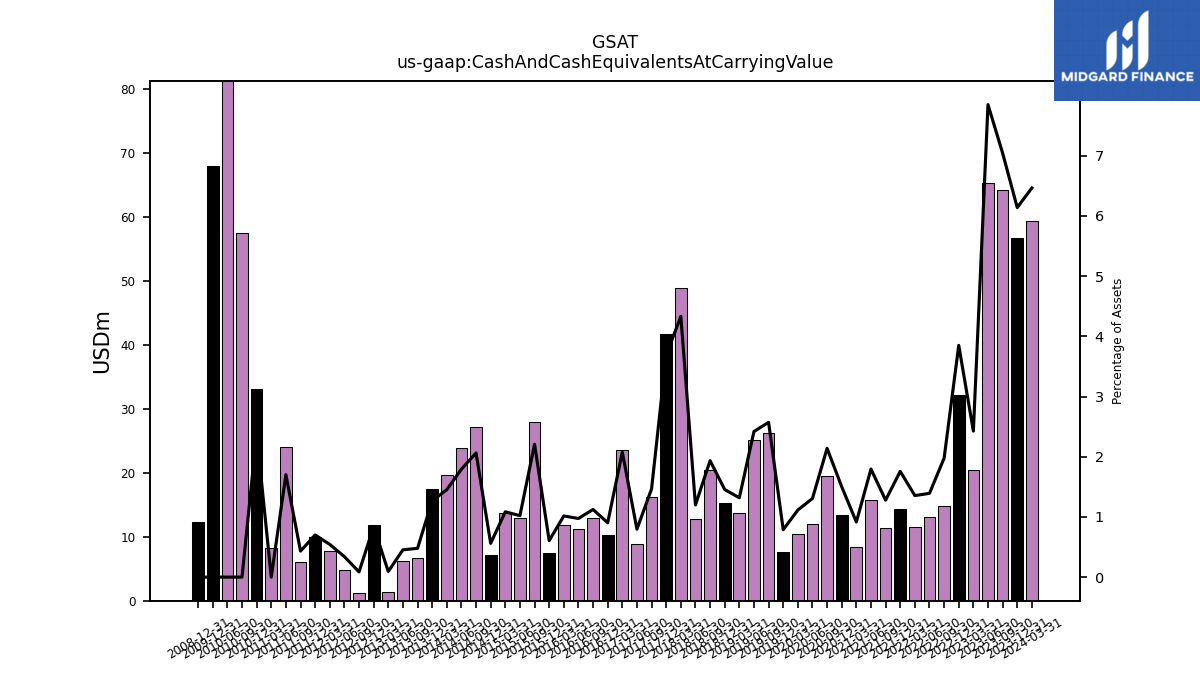
| Cash And Cash Equivalents At Carrying Value | 64.14 | 65.33 | 20.49 | 32.08 | 14.75 | 13.14 | 11.52 | 14.30 | 11.31 | 15.72 | 8.37 | 13.33 | 19.48 | 12.07 | 10.46 | 7.61 | 26.23 | 25.09 | 13.77 | 15.21 | 20.46 | 12.81 | 48.81 | 41.64 | 16.24 | 8.84 | 23.54 | 10.23 | 12.91 | 11.27 | 11.86 | 7.48 | 27.97 | 12.87 | 13.65 | 7.12 | 27.22 | 23.80 | 19.59 | 17.41 | 6.64 | 6.24 | 1.30 | 11.79 | 1.22 | 4.82 | 7.74 | 9.95 | 6.08 | 24.09 | 8.25 | 33.02 | 57.45 | 87.19 | NA | |
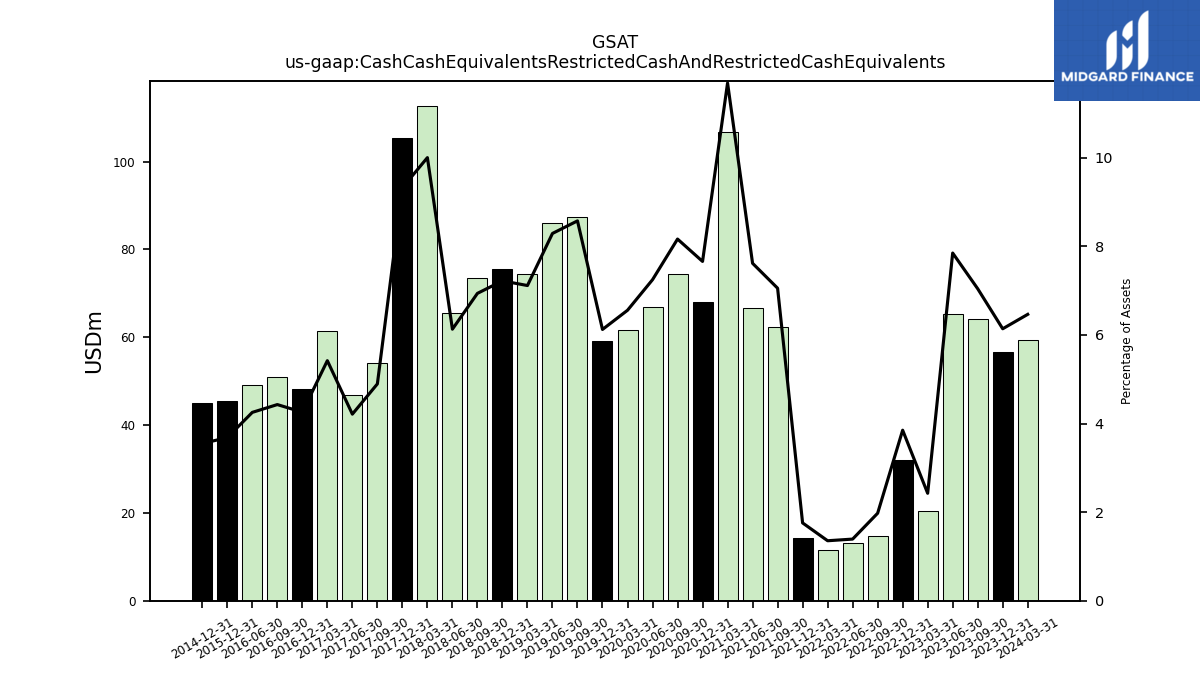
| Cash Cash Equivalents Restricted Cash And Restricted Cash Equivalents | 64.14 | 65.33 | 20.49 | 32.08 | 14.75 | 13.14 | 11.52 | 14.30 | 62.37 | 66.71 | 106.74 | 68.02 | 74.34 | 66.93 | 61.58 | 59.13 | 87.45 | 85.98 | 74.35 | 75.49 | 73.40 | 65.50 | 112.70 | 105.28 | 54.23 | 46.75 | 61.45 | 48.21 | 50.87 | 49.19 | NA | 45.39 | NA | NA | NA | 45.04 | NA | NA | NA | NA | NA | NA | NA | NA | NA | NA | NA | NA | NA | NA | NA | NA | NA | NA | NA | |
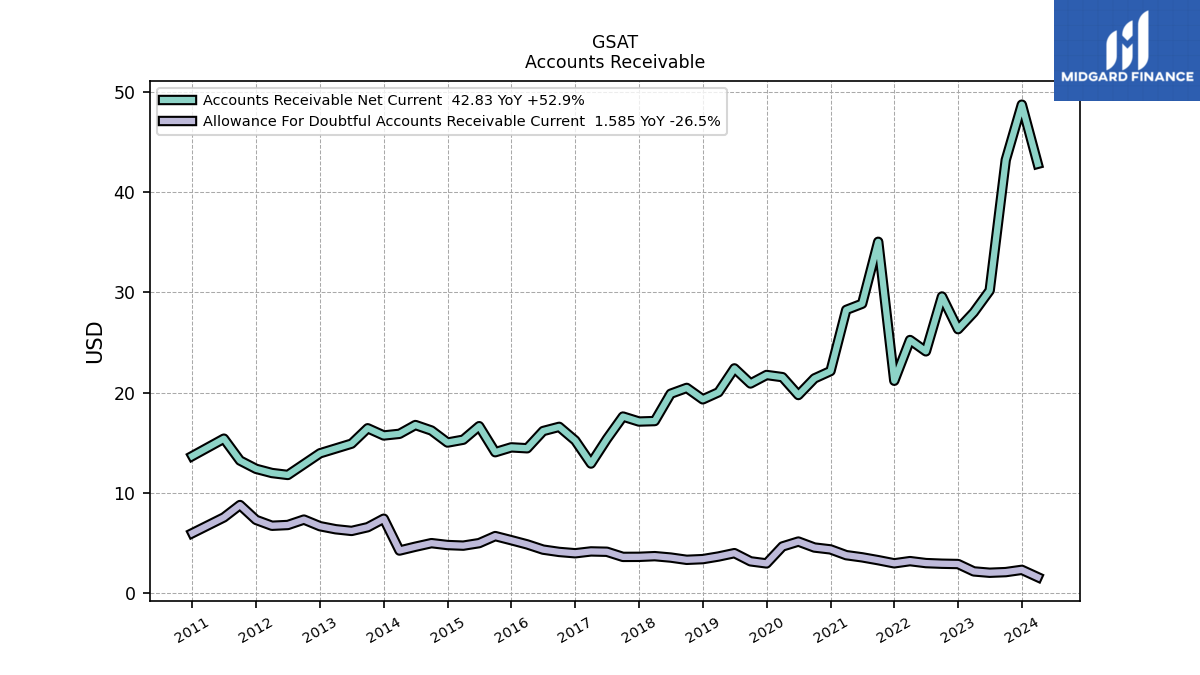
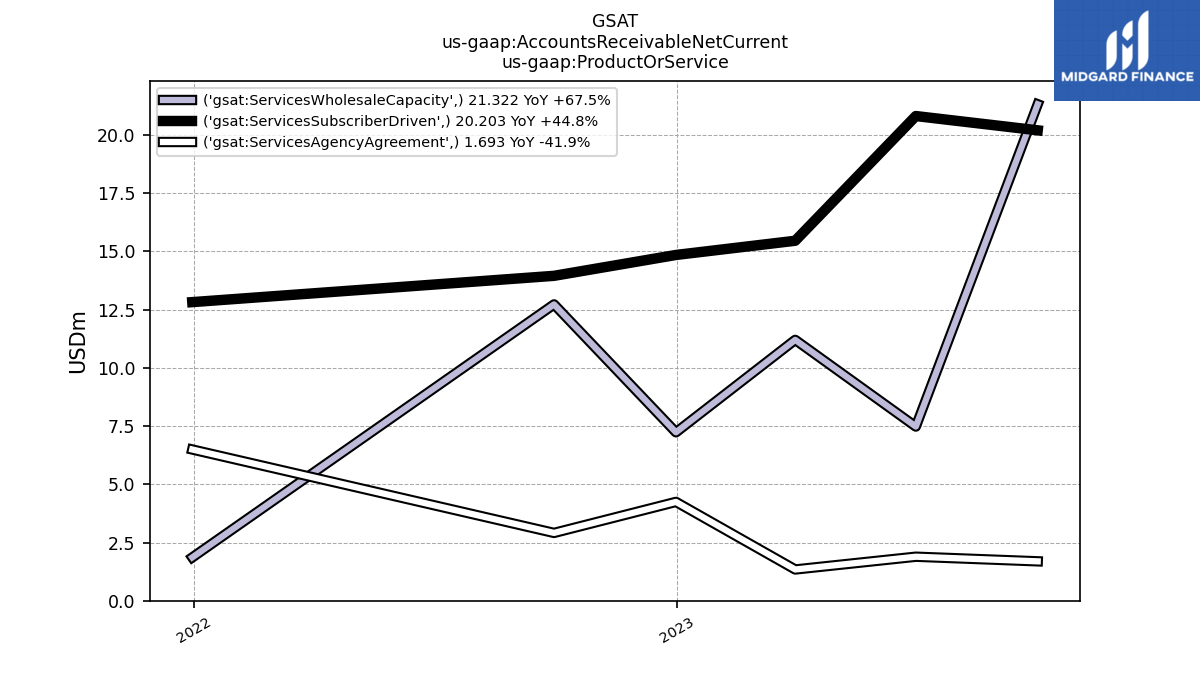
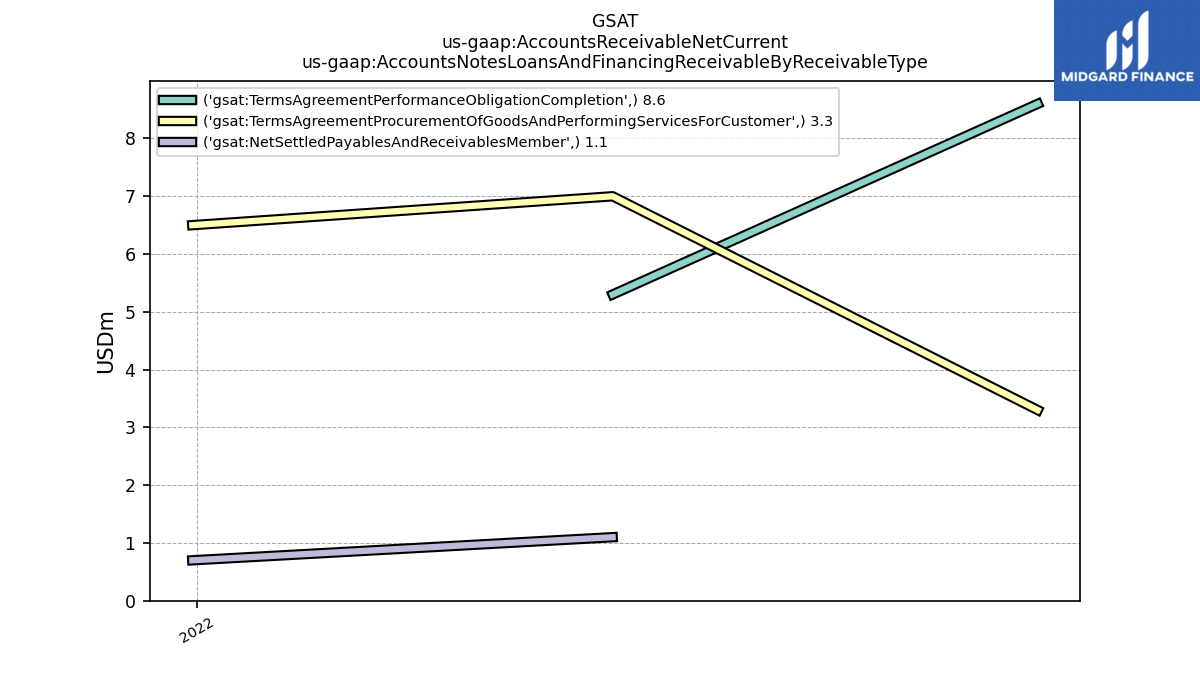
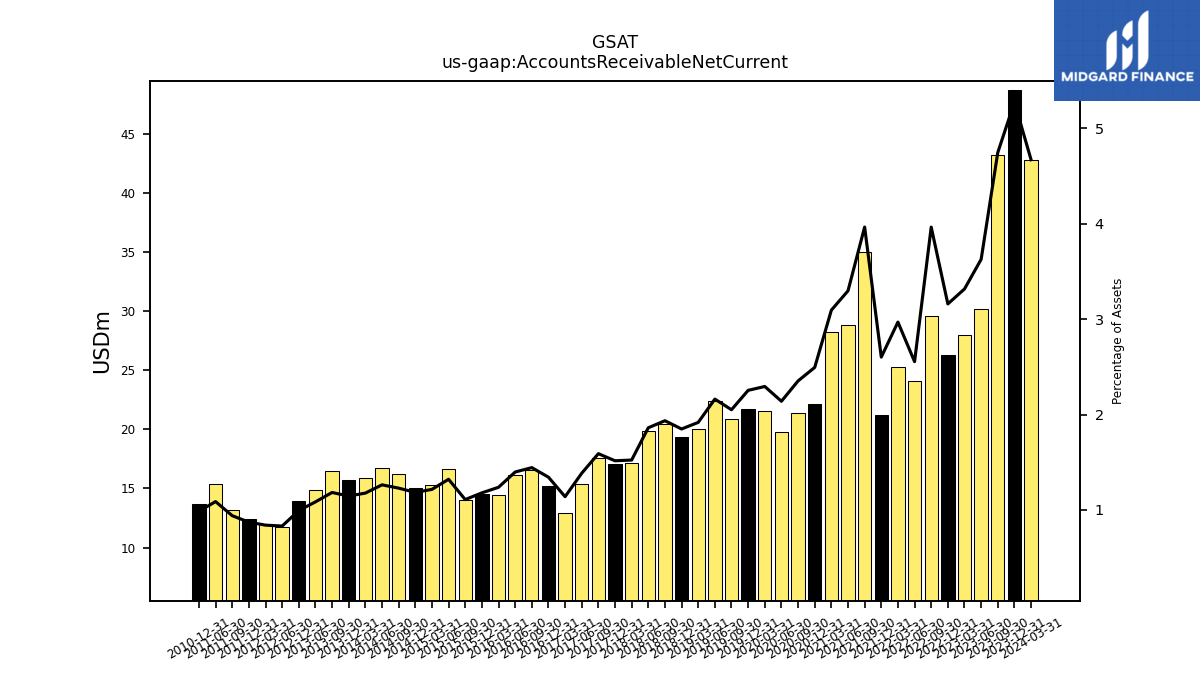
| Accounts Receivable Net Current | 43.22 | 30.19 | 28.01 | 26.33 | 29.59 | 24.12 | 25.25 | 21.18 | 35.05 | 28.87 | 28.26 | 22.15 | 21.42 | 19.76 | 21.54 | 21.76 | 20.91 | 22.42 | 20.04 | 19.33 | 20.47 | 19.89 | 17.16 | 17.11 | 17.61 | 15.37 | 12.92 | 15.22 | 16.59 | 16.16 | 14.45 | 14.54 | 14.05 | 16.65 | 15.30 | 15.02 | 16.22 | 16.77 | 15.89 | 15.72 | 16.44 | 14.91 | NA | 13.94 | NA | 11.78 | 11.98 | 12.39 | 13.22 | 15.41 | NA | 13.67 | NA | NA | NA | |
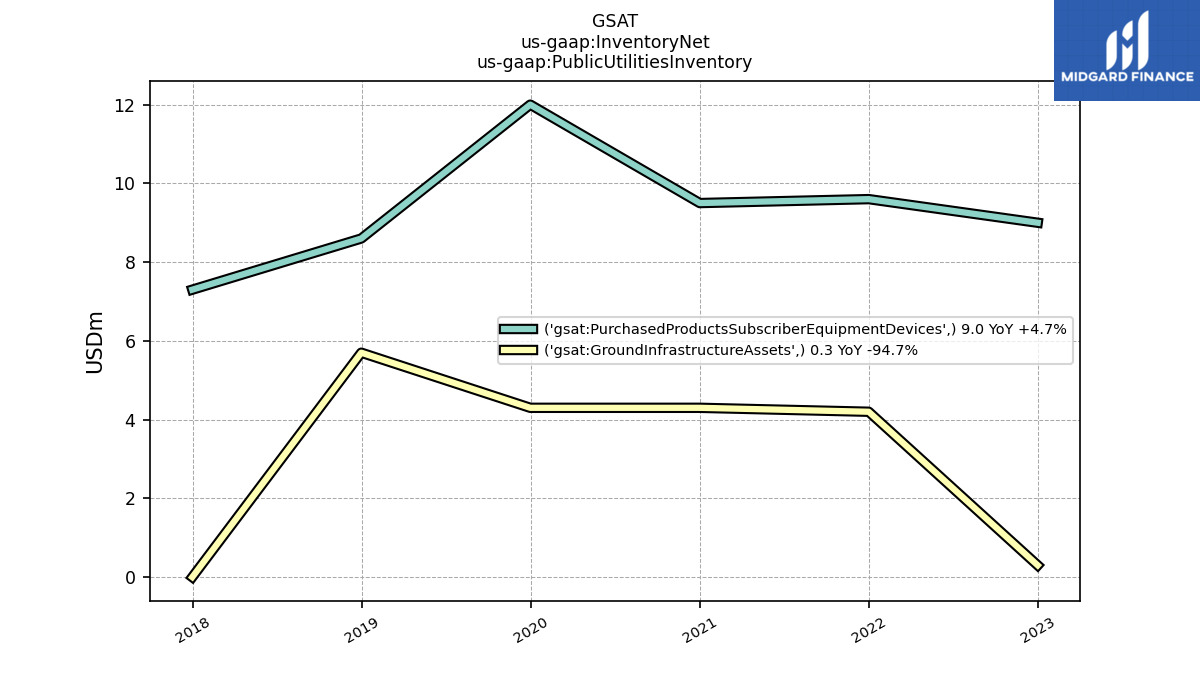
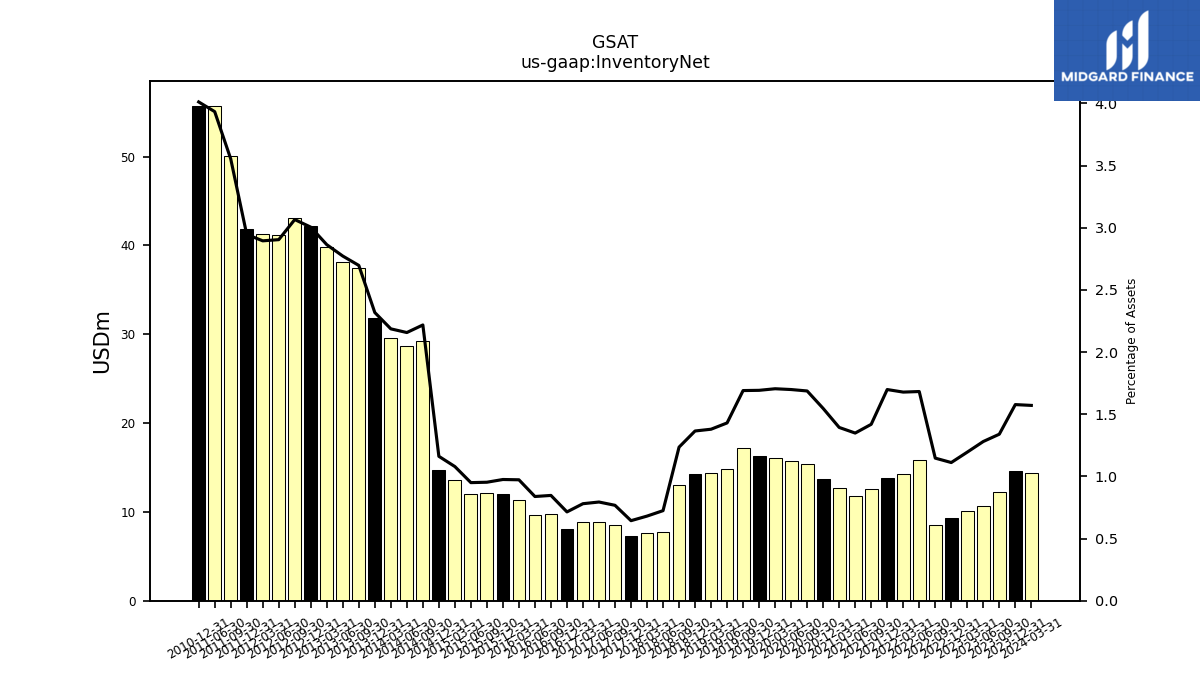
| Inventory Net | 12.20 | 10.66 | 10.10 | 9.26 | 8.56 | 15.89 | 14.27 | 13.83 | 12.54 | 11.81 | 12.73 | 13.74 | 15.36 | 15.69 | 16.01 | 16.34 | 17.24 | 14.83 | 14.41 | 14.27 | 13.07 | 7.74 | 7.67 | 7.27 | 8.50 | 8.81 | 8.85 | 8.09 | 9.73 | 9.70 | 11.36 | 12.02 | 12.08 | 11.97 | 13.58 | 14.73 | 29.28 | 28.63 | 29.52 | 31.82 | 37.48 | 38.11 | 39.82 | 42.18 | 43.05 | 41.15 | 41.24 | 41.85 | 50.00 | 55.72 | NA | 55.63 | NA | NA | NA | |
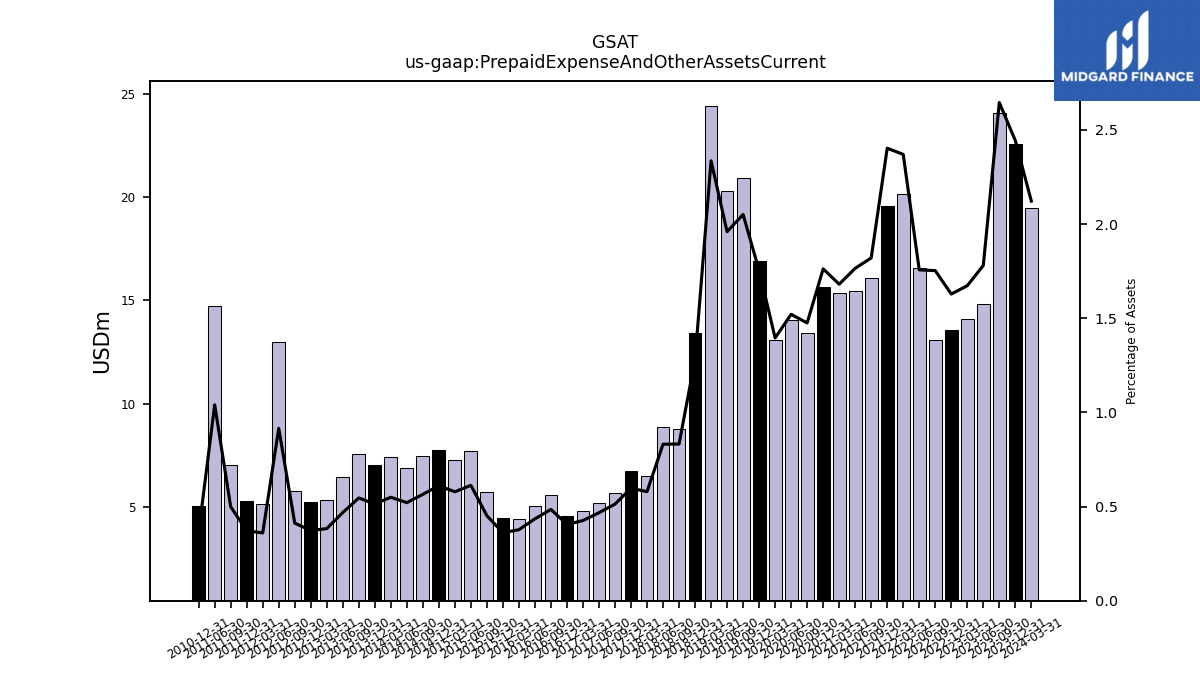
| Prepaid Expense And Other Assets Current | 24.09 | 14.82 | 14.13 | 13.57 | 13.09 | 16.59 | 20.15 | 19.56 | 16.09 | 15.46 | 15.35 | 15.65 | 13.43 | 14.04 | 13.11 | 16.93 | 20.92 | 20.32 | 24.41 | 13.41 | 8.80 | 8.88 | 6.53 | 6.75 | 5.68 | 5.19 | 4.83 | 4.59 | 5.57 | 5.03 | 4.40 | 4.46 | 5.72 | 7.72 | 7.28 | 7.75 | 7.46 | 6.91 | 7.42 | 7.06 | 7.58 | 6.44 | 5.33 | 5.23 | 5.79 | 12.97 | 5.13 | 5.28 | 7.02 | 14.73 | NA | 5.06 | NA | NA | NA |
| 2023-09-30 | 2023-06-30 | 2023-03-31 | 2022-12-31 | 2022-09-30 | 2022-06-30 | 2022-03-31 | 2021-12-31 | 2021-09-30 | 2021-06-30 | 2021-03-31 | 2020-12-31 | 2020-09-30 | 2020-06-30 | 2020-03-31 | 2019-12-31 | 2019-09-30 | 2019-06-30 | 2019-03-31 | 2018-12-31 | 2018-09-30 | 2018-06-30 | 2018-03-31 | 2017-12-31 | 2017-09-30 | 2017-06-30 | 2017-03-31 | 2016-12-31 | 2016-09-30 | 2016-06-30 | 2016-03-31 | 2015-12-31 | 2015-09-30 | 2015-06-30 | 2015-03-31 | 2014-12-31 | 2014-09-30 | 2014-06-30 | 2014-03-31 | 2013-12-31 | 2013-09-30 | 2013-06-30 | 2013-03-31 | 2012-12-31 | 2012-09-30 | 2012-06-30 | 2012-03-31 | 2011-12-31 | 2011-09-30 | 2011-06-30 | 2011-03-31 | 2010-12-31 | 2010-09-30 | 2010-06-30 | 2010-03-31 | ||
|---|---|---|---|---|---|---|---|---|---|---|---|---|---|---|---|---|---|---|---|---|---|---|---|---|---|---|---|---|---|---|---|---|---|---|---|---|---|---|---|---|---|---|---|---|---|---|---|---|---|---|---|---|---|---|---|---|
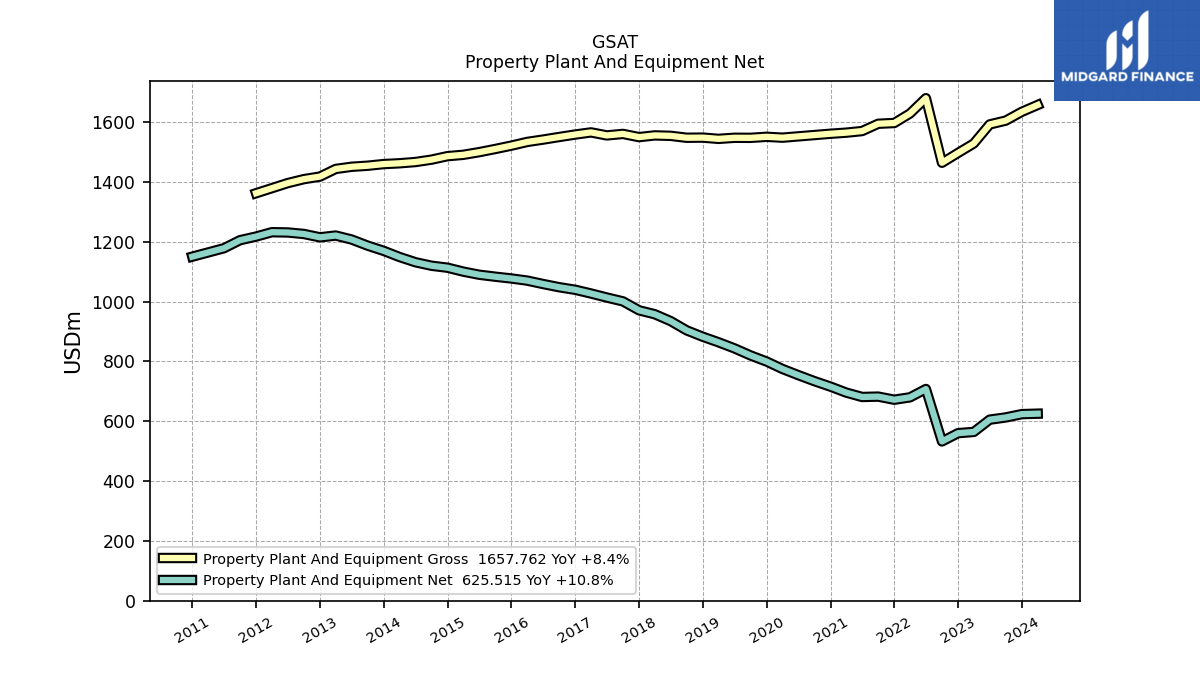
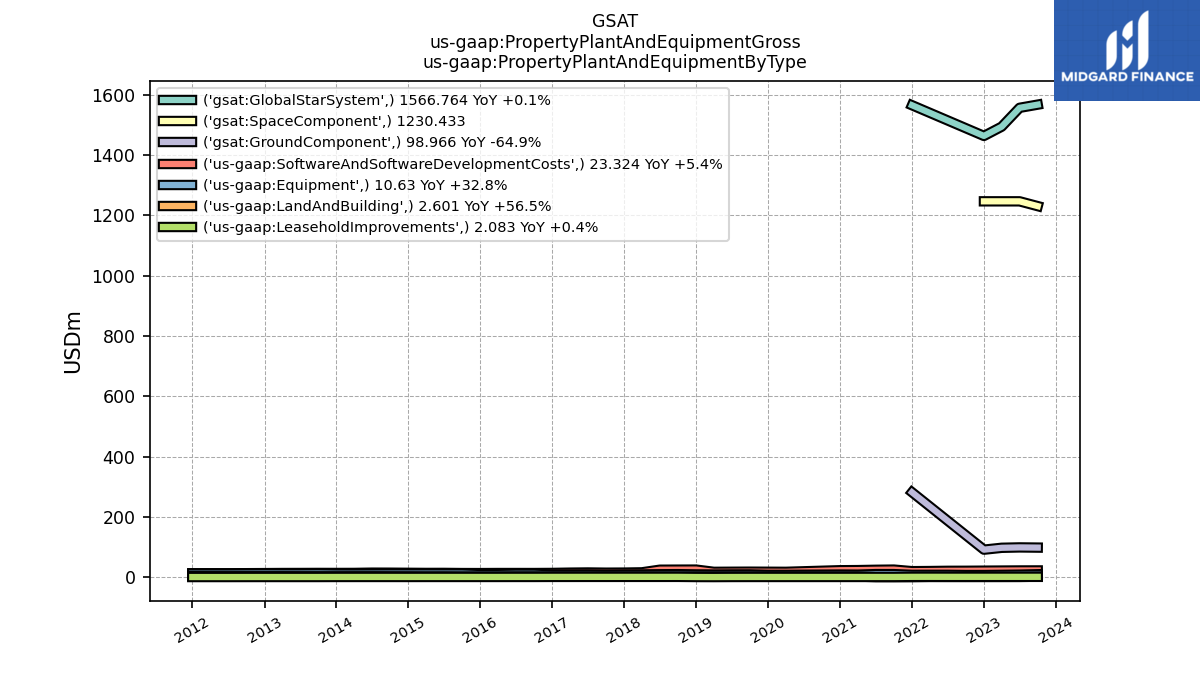
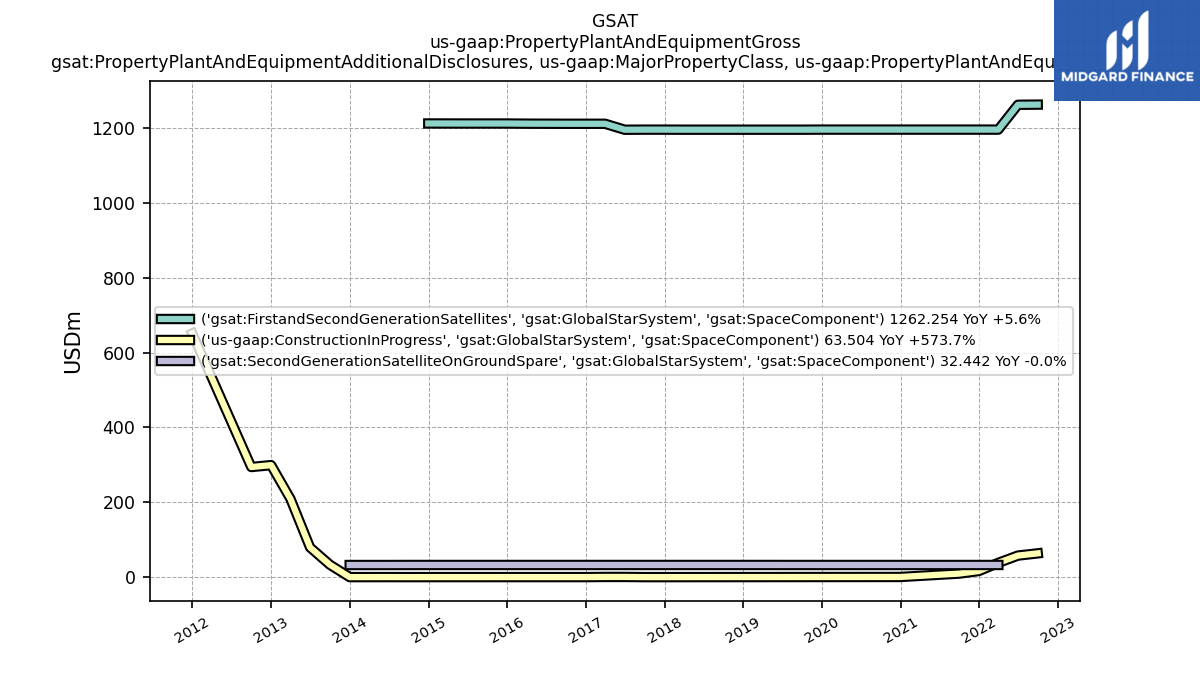
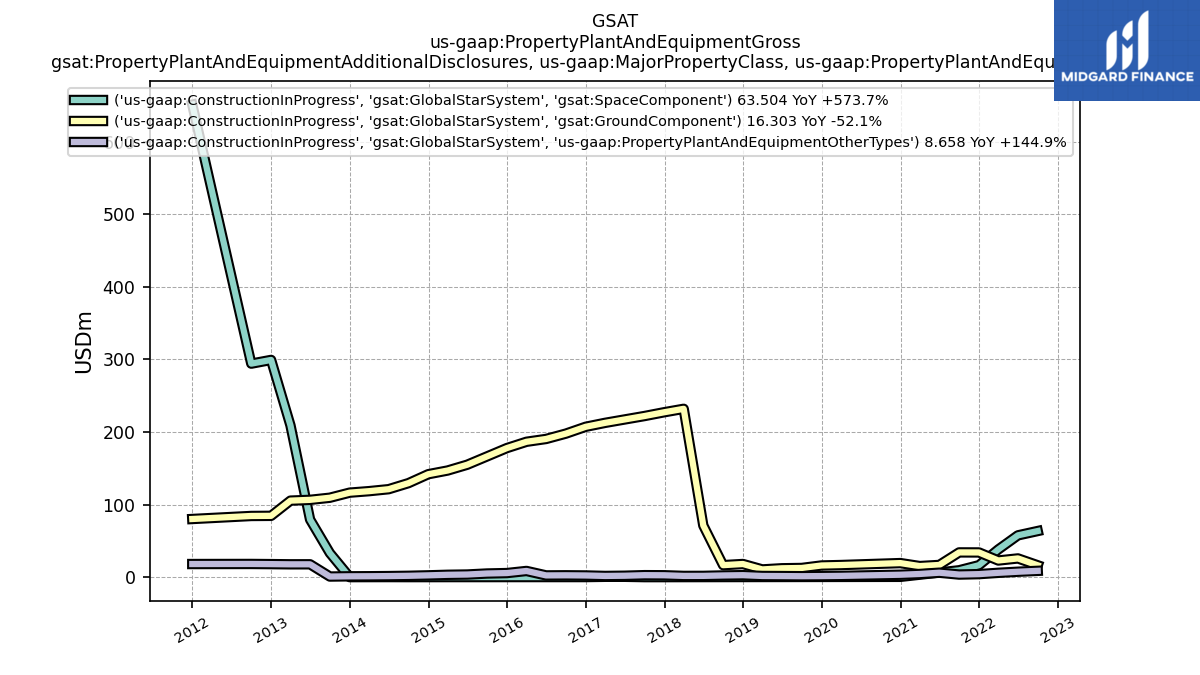
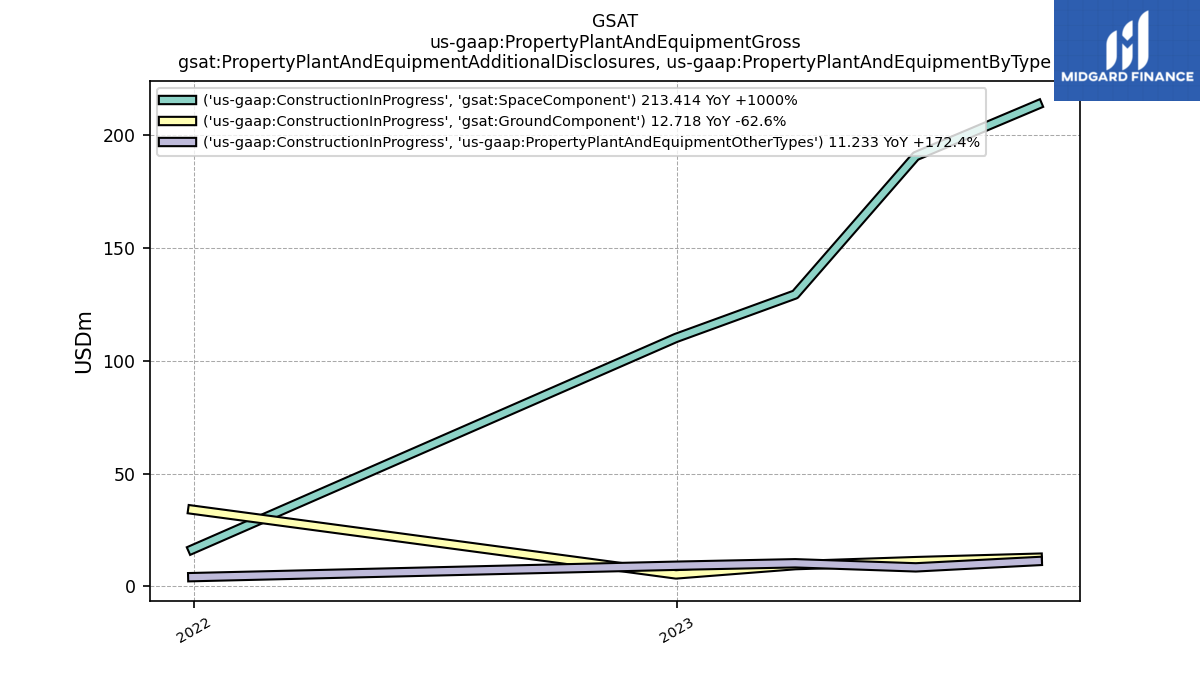
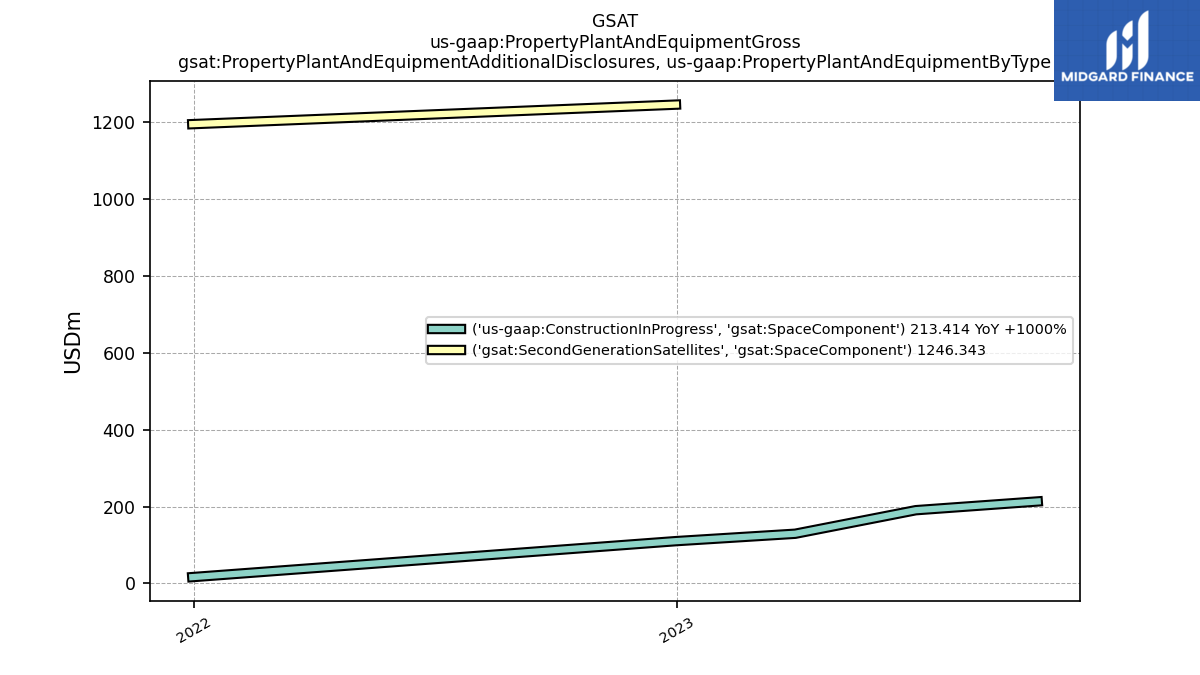
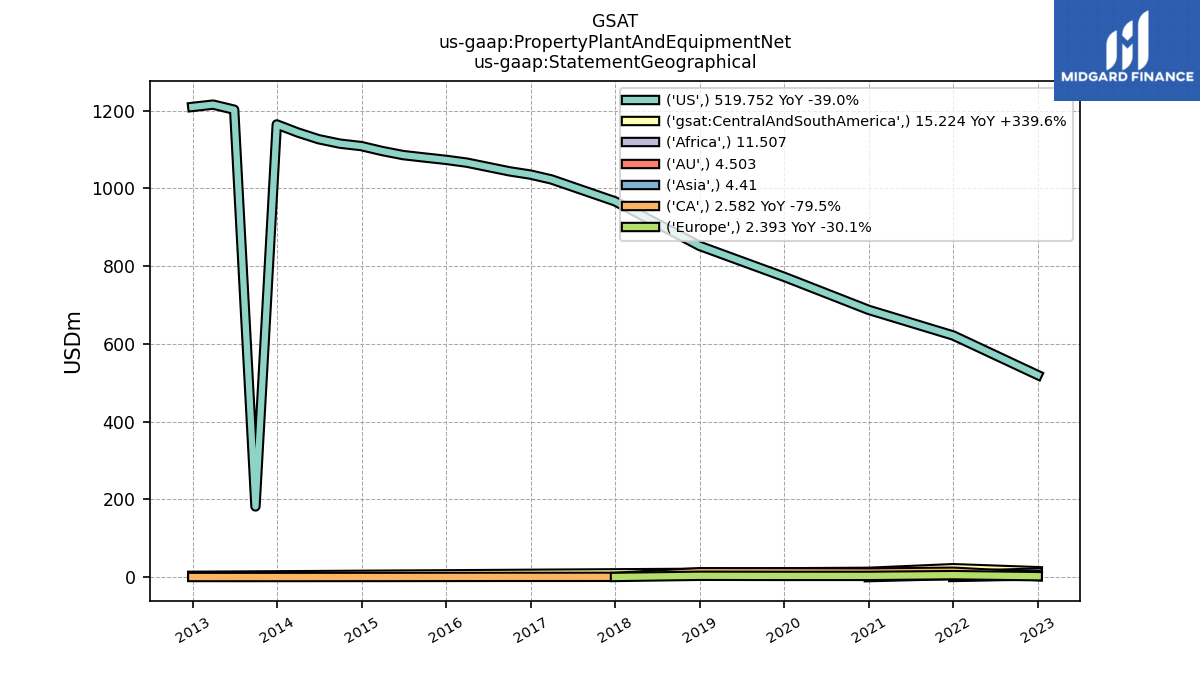
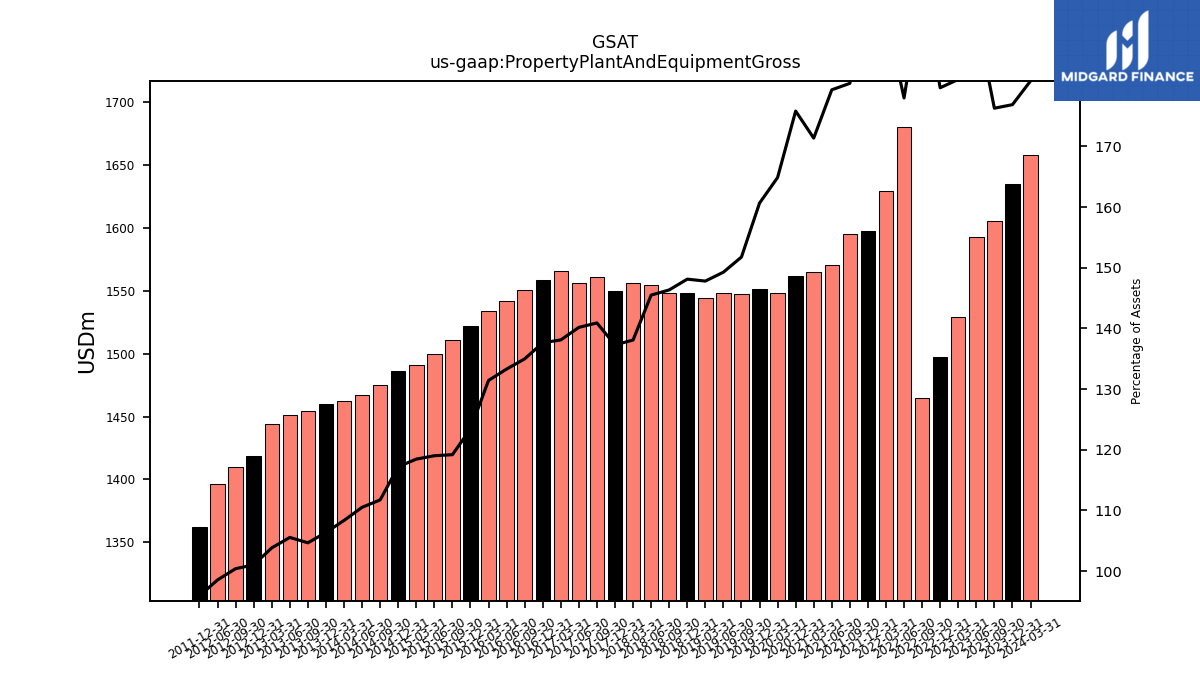
| Property Plant And Equipment Gross | 1605.40 | 1592.63 | 1528.96 | 1497.33 | 1464.43 | 1680.45 | 1629.24 | 1597.38 | 1594.88 | 1570.50 | 1565.09 | 1561.50 | NA | NA | 1548.37 | 1551.24 | 1547.77 | 1548.00 | 1544.37 | 1548.57 | 1548.05 | 1554.48 | 1555.92 | 1550.16 | 1560.92 | 1555.88 | 1566.01 | 1558.84 | 1550.58 | 1541.97 | 1534.09 | 1521.73 | 1510.49 | 1499.90 | 1490.99 | 1486.55 | 1474.82 | 1466.92 | 1462.70 | 1460.10 | 1454.56 | 1451.06 | 1443.80 | 1418.27 | 1409.71 | 1396.53 | NA | 1362.55 | NA | NA | NA | NA | NA | NA | NA | |
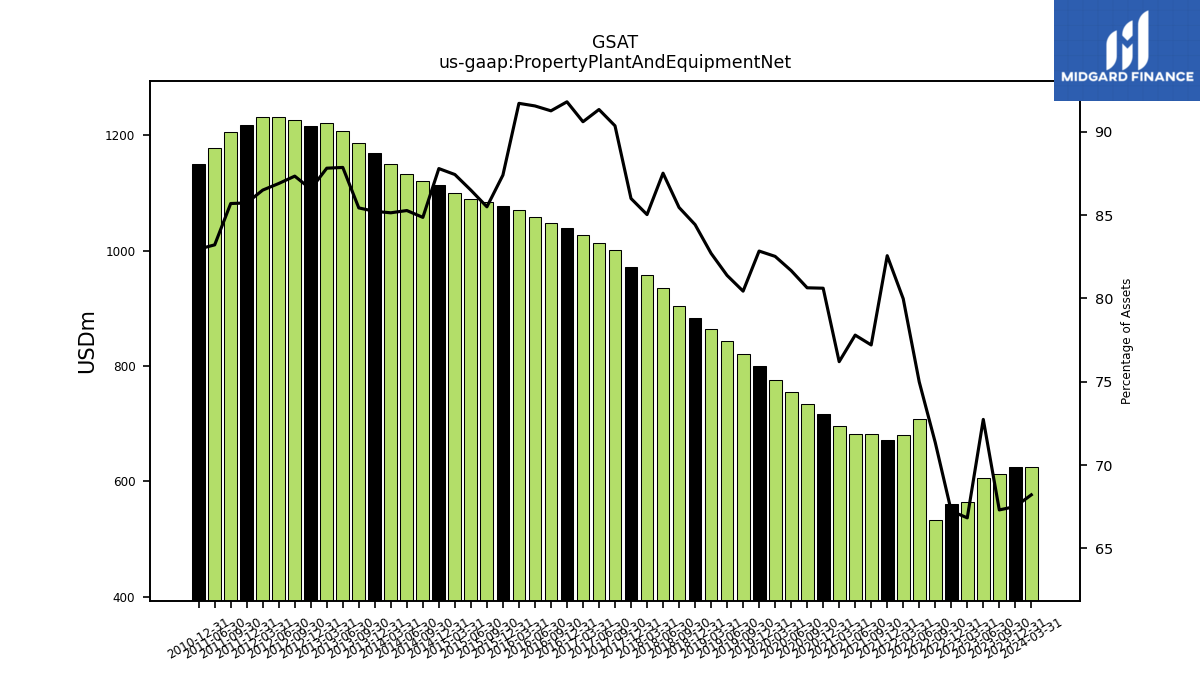
| Property Plant And Equipment Net | 612.91 | 605.50 | 564.43 | 560.37 | 532.68 | 708.00 | 680.17 | 672.16 | 682.59 | 681.33 | 695.97 | 715.91 | 734.21 | 754.26 | 775.00 | 799.91 | 820.32 | 843.95 | 864.20 | 882.70 | 903.99 | 935.04 | 958.07 | 971.12 | 1000.99 | 1013.80 | 1027.36 | 1039.72 | 1048.32 | 1059.02 | 1070.44 | 1077.56 | 1083.52 | 1090.09 | 1100.50 | 1113.56 | 1120.16 | 1131.88 | 1149.36 | 1169.79 | 1187.29 | 1207.81 | 1221.14 | 1215.16 | 1226.31 | 1231.39 | 1232.31 | 1217.72 | 1205.54 | 1178.60 | NA | 1150.47 | NA | NA | NA | |
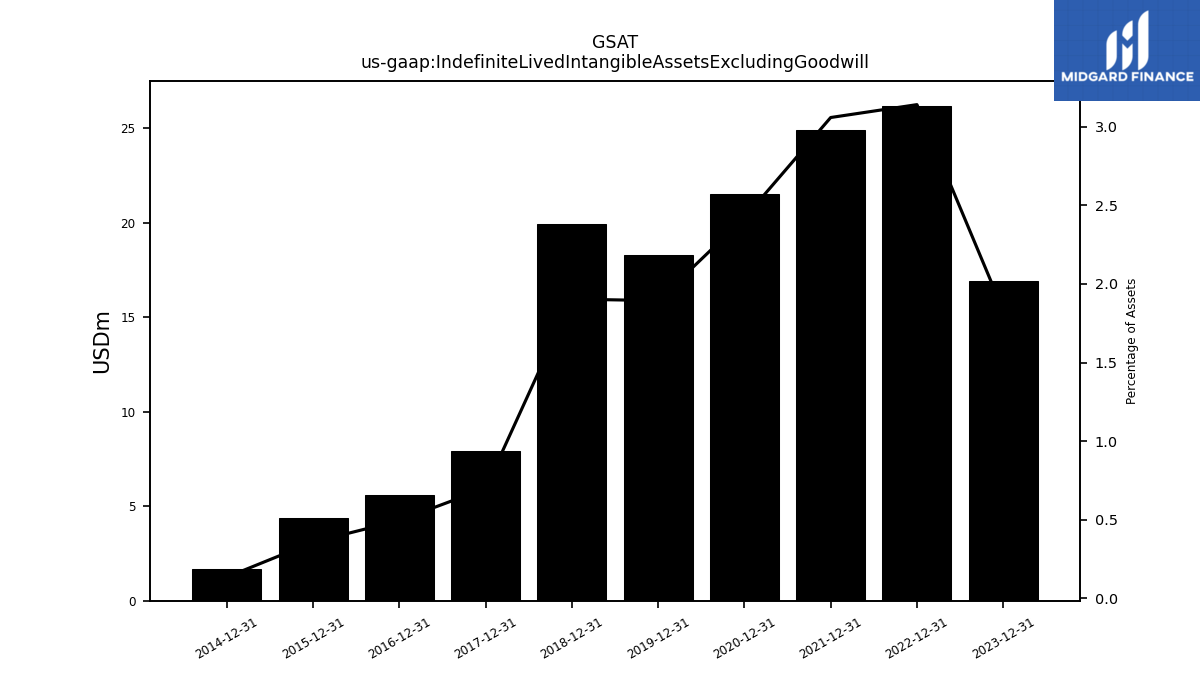
| Indefinite Lived Intangible Assets Excluding Goodwill | NA | NA | NA | 26.18 | NA | NA | NA | 24.91 | NA | NA | NA | 21.50 | NA | NA | NA | 18.29 | NA | NA | NA | 19.90 | NA | NA | NA | 7.90 | NA | NA | NA | 5.60 | NA | NA | NA | 4.40 | NA | NA | NA | 1.70 | NA | NA | NA | NA | NA | NA | NA | NA | NA | NA | NA | NA | NA | NA | NA | NA | NA | NA | NA | |
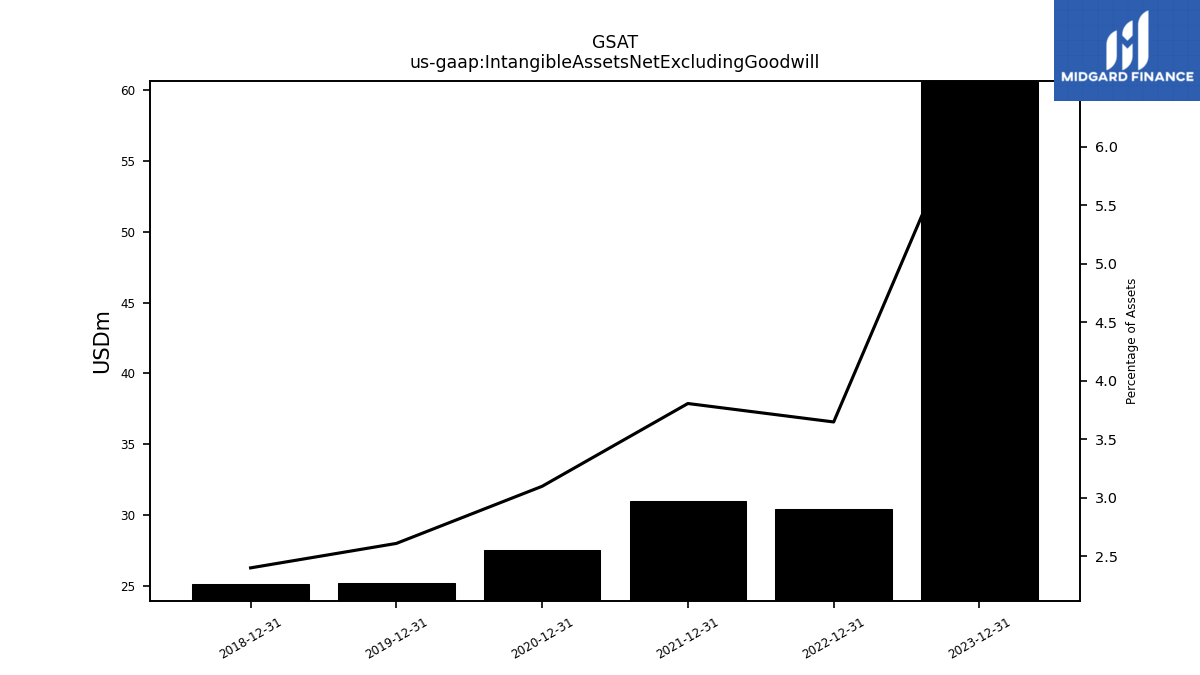
| Intangible Assets Net Excluding Goodwill | NA | NA | NA | 30.41 | NA | NA | NA | 30.99 | NA | NA | NA | 27.52 | NA | NA | NA | 25.21 | NA | NA | NA | 25.11 | NA | NA | NA | NA | NA | NA | NA | NA | NA | NA | NA | NA | NA | NA | NA | NA | NA | NA | NA | NA | NA | NA | NA | NA | NA | NA | NA | NA | NA | NA | NA | NA | NA | NA | NA | |
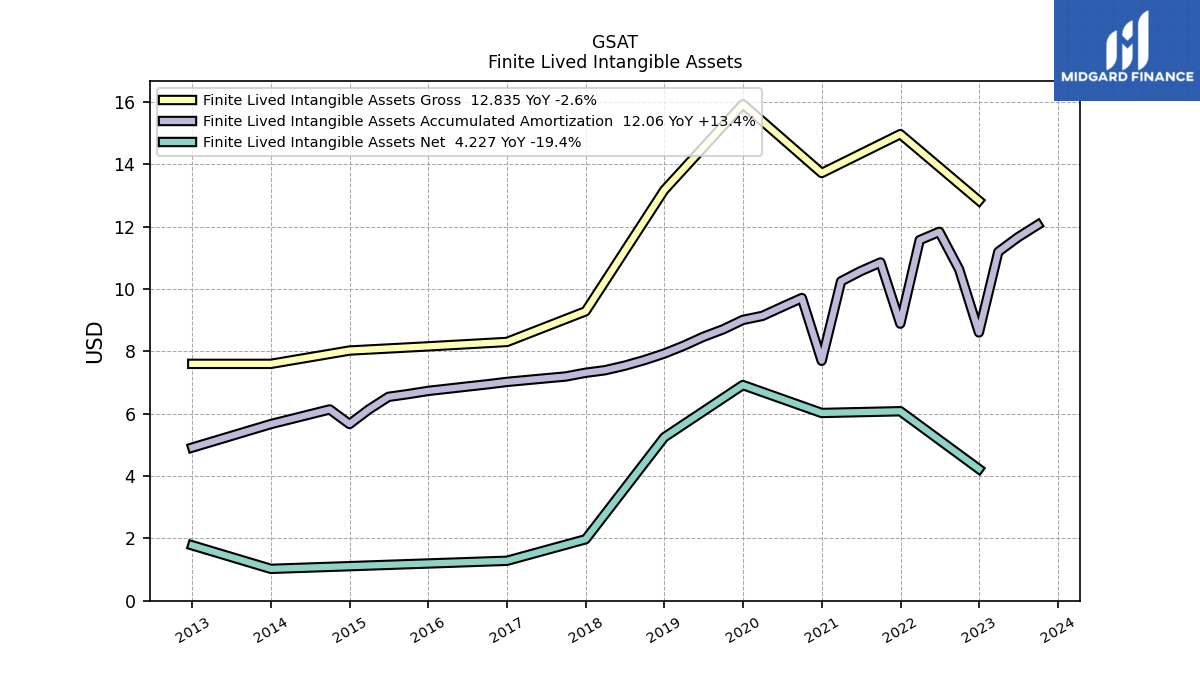
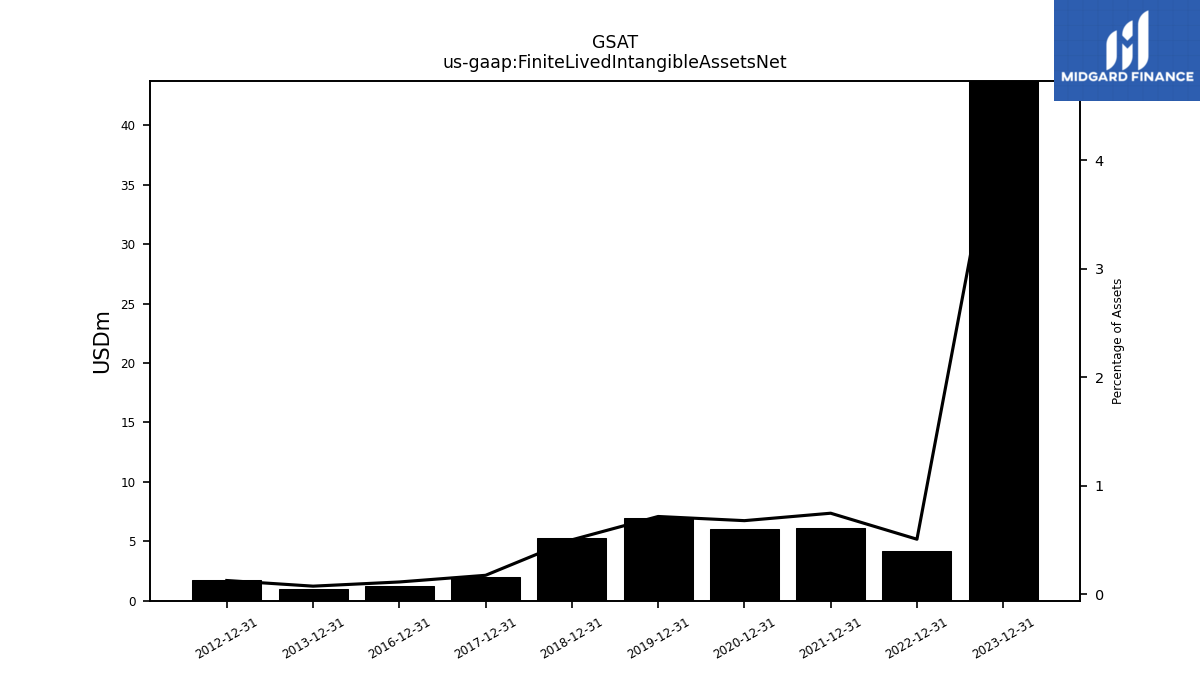
| Finite Lived Intangible Assets Net | NA | NA | NA | 4.23 | NA | NA | NA | 6.08 | NA | NA | NA | 6.02 | NA | NA | NA | 6.92 | NA | NA | NA | 5.24 | NA | NA | NA | 1.97 | NA | NA | NA | 1.28 | NA | NA | NA | NA | NA | NA | NA | NA | NA | NA | NA | 1.02 | NA | NA | NA | 1.78 | NA | NA | NA | NA | NA | NA | NA | NA | NA | NA | NA | |
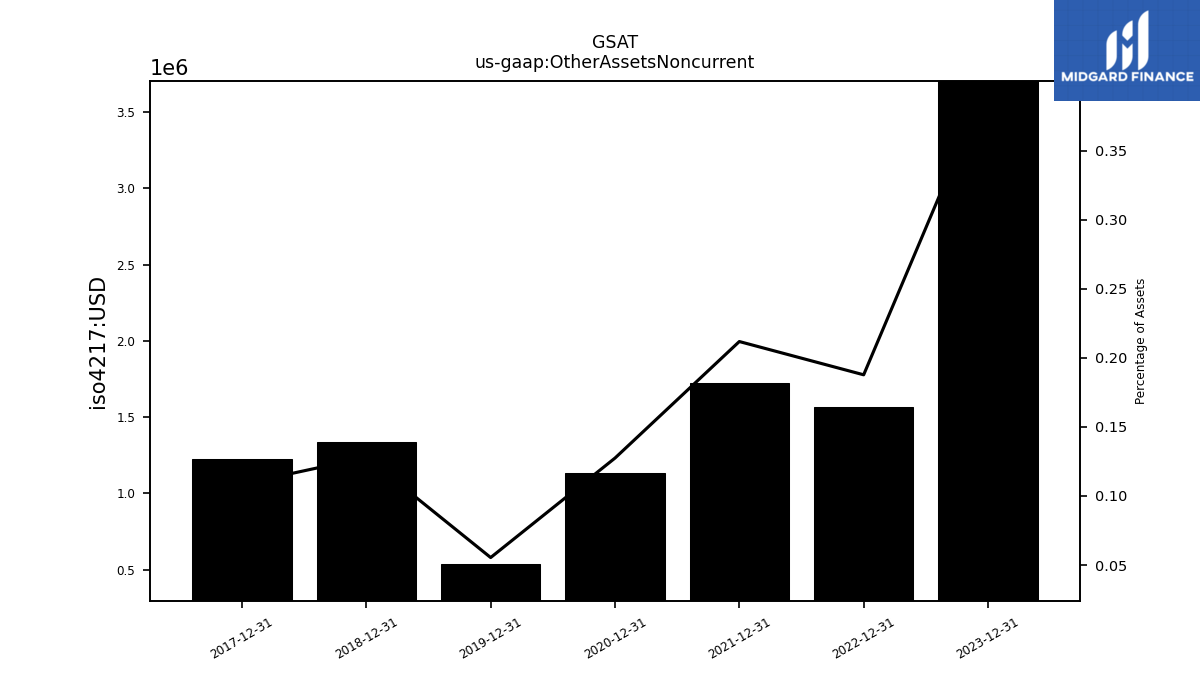
| Other Assets Noncurrent | NA | NA | NA | 1.56 | NA | NA | NA | 1.73 | NA | NA | NA | 1.13 | NA | NA | NA | 0.54 | NA | NA | NA | 1.34 | NA | NA | NA | 1.23 | NA | NA | NA | NA | NA | NA | NA | NA | NA | NA | NA | NA | NA | NA | NA | NA | NA | NA | NA | NA | NA | NA | NA | NA | NA | NA | NA | NA | NA | NA | NA |
| 2023-09-30 | 2023-06-30 | 2023-03-31 | 2022-12-31 | 2022-09-30 | 2022-06-30 | 2022-03-31 | 2021-12-31 | 2021-09-30 | 2021-06-30 | 2021-03-31 | 2020-12-31 | 2020-09-30 | 2020-06-30 | 2020-03-31 | 2019-12-31 | 2019-09-30 | 2019-06-30 | 2019-03-31 | 2018-12-31 | 2018-09-30 | 2018-06-30 | 2018-03-31 | 2017-12-31 | 2017-09-30 | 2017-06-30 | 2017-03-31 | 2016-12-31 | 2016-09-30 | 2016-06-30 | 2016-03-31 | 2015-12-31 | 2015-09-30 | 2015-06-30 | 2015-03-31 | 2014-12-31 | 2014-09-30 | 2014-06-30 | 2014-03-31 | 2013-12-31 | 2013-09-30 | 2013-06-30 | 2013-03-31 | 2012-12-31 | 2012-09-30 | 2012-06-30 | 2012-03-31 | 2011-12-31 | 2011-09-30 | 2011-06-30 | 2011-03-31 | 2010-12-31 | 2010-09-30 | 2010-06-30 | 2010-03-31 | ||
|---|---|---|---|---|---|---|---|---|---|---|---|---|---|---|---|---|---|---|---|---|---|---|---|---|---|---|---|---|---|---|---|---|---|---|---|---|---|---|---|---|---|---|---|---|---|---|---|---|---|---|---|---|---|---|---|---|
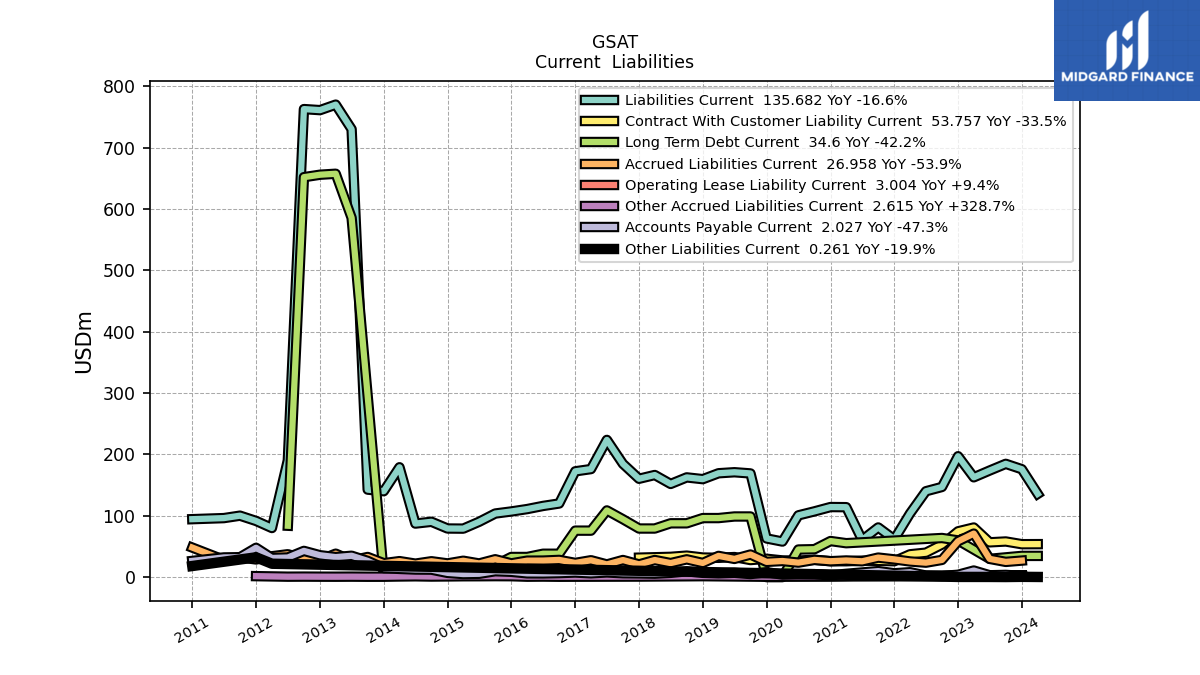
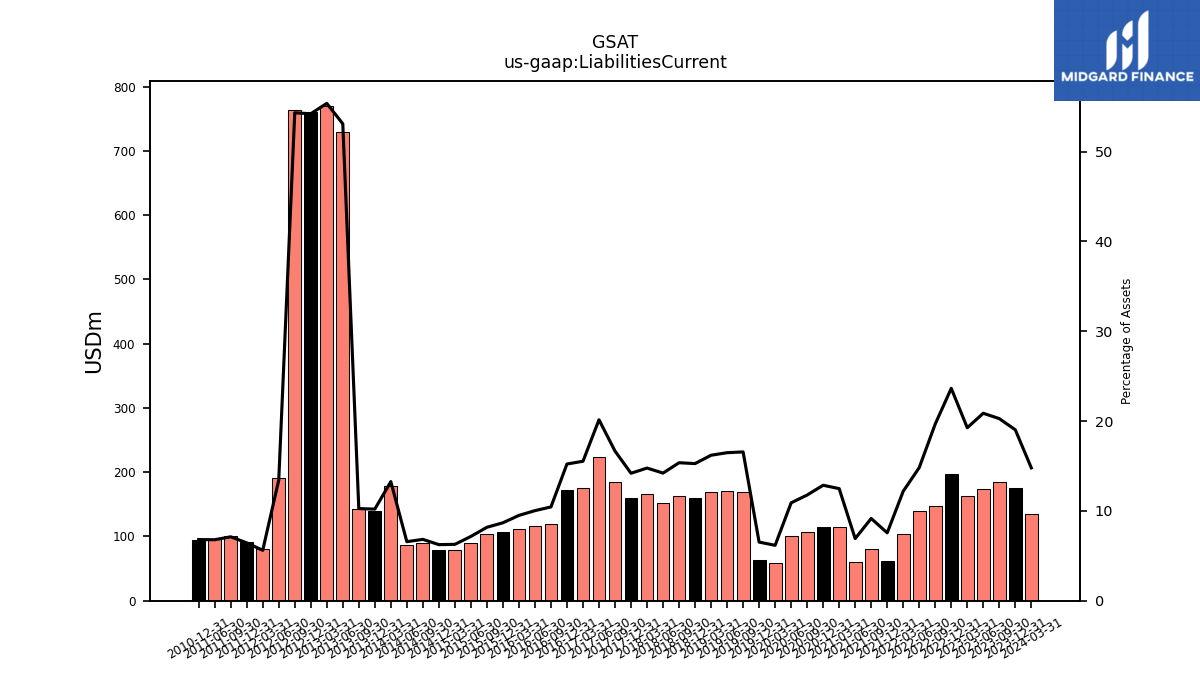
| Liabilities Current | 184.66 | 173.78 | 162.69 | 197.08 | 146.94 | 139.98 | 103.68 | 61.56 | 81.00 | 60.62 | 114.02 | 114.22 | 107.18 | 100.69 | 57.97 | 63.06 | 169.01 | 170.96 | 169.29 | 159.68 | 162.55 | 151.88 | 166.45 | 160.32 | 184.63 | 223.67 | 176.11 | 172.45 | 120.00 | 116.04 | 110.93 | 107.03 | 103.65 | 90.23 | 79.05 | 79.24 | 90.20 | 87.29 | 179.06 | 140.04 | 142.63 | 730.08 | 770.14 | 761.16 | 762.87 | 190.27 | 80.02 | 91.58 | 100.17 | 96.20 | NA | 94.46 | NA | NA | NA | |
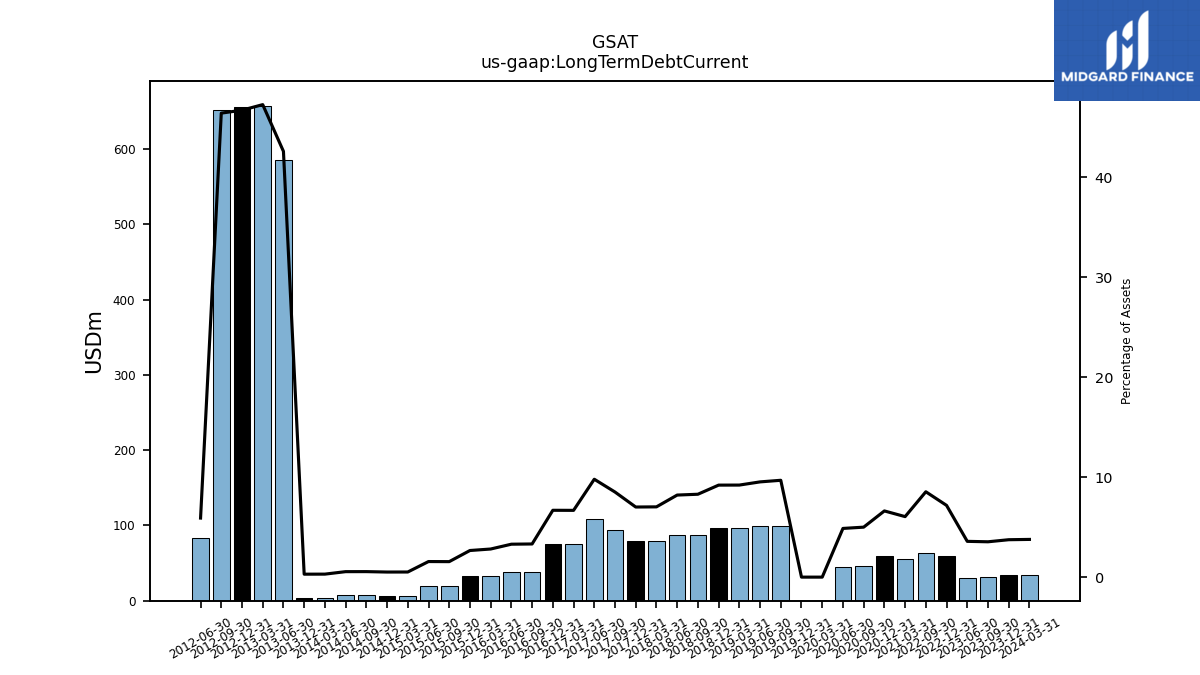
| Long Term Debt Current | 32.20 | 29.80 | NA | 59.82 | 63.77 | NA | NA | NA | NA | NA | 55.30 | 58.82 | 45.53 | 45.00 | 0.00 | 0.00 | 98.83 | 98.83 | 96.25 | 96.25 | 87.73 | 87.73 | 79.22 | 79.22 | 94.33 | 108.72 | 75.75 | 75.75 | 38.11 | 38.11 | 32.84 | 32.84 | 19.64 | 19.64 | 6.45 | 6.45 | 7.27 | 7.27 | 4.05 | 4.05 | NA | 585.67 | 657.47 | 655.87 | 651.91 | 83.75 | NA | NA | NA | NA | NA | NA | NA | NA | NA | |
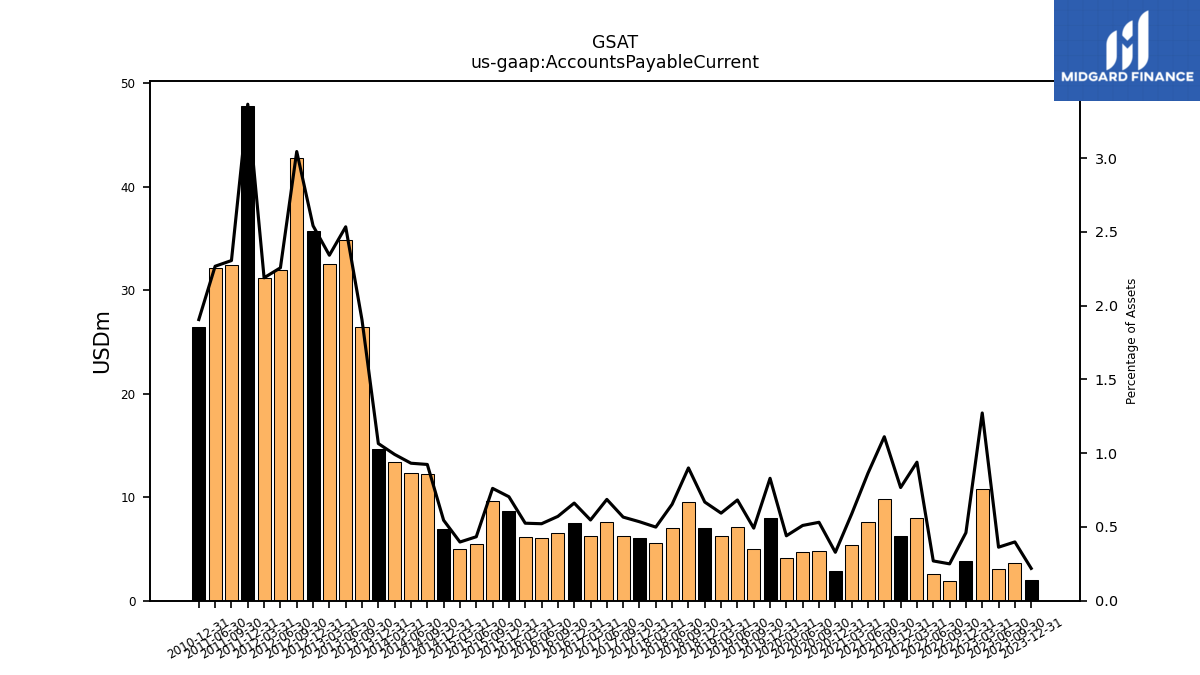
| Accounts Payable Current | 3.63 | 3.02 | 10.75 | 3.84 | 1.87 | 2.55 | 7.99 | 6.25 | 9.83 | 7.57 | 5.37 | 2.92 | 4.84 | 4.71 | 4.13 | 8.02 | 5.02 | 7.08 | 6.21 | 7.00 | 9.53 | 6.99 | 5.62 | 6.05 | 6.28 | 7.62 | 6.21 | 7.50 | 6.57 | 6.04 | 6.13 | 8.69 | 9.65 | 5.47 | 5.01 | 6.92 | 12.20 | 12.37 | 13.39 | 14.63 | 26.44 | 34.84 | 32.57 | 35.69 | 42.76 | 31.98 | 31.19 | 47.81 | 32.44 | 32.11 | NA | 26.43 | NA | NA | NA | |
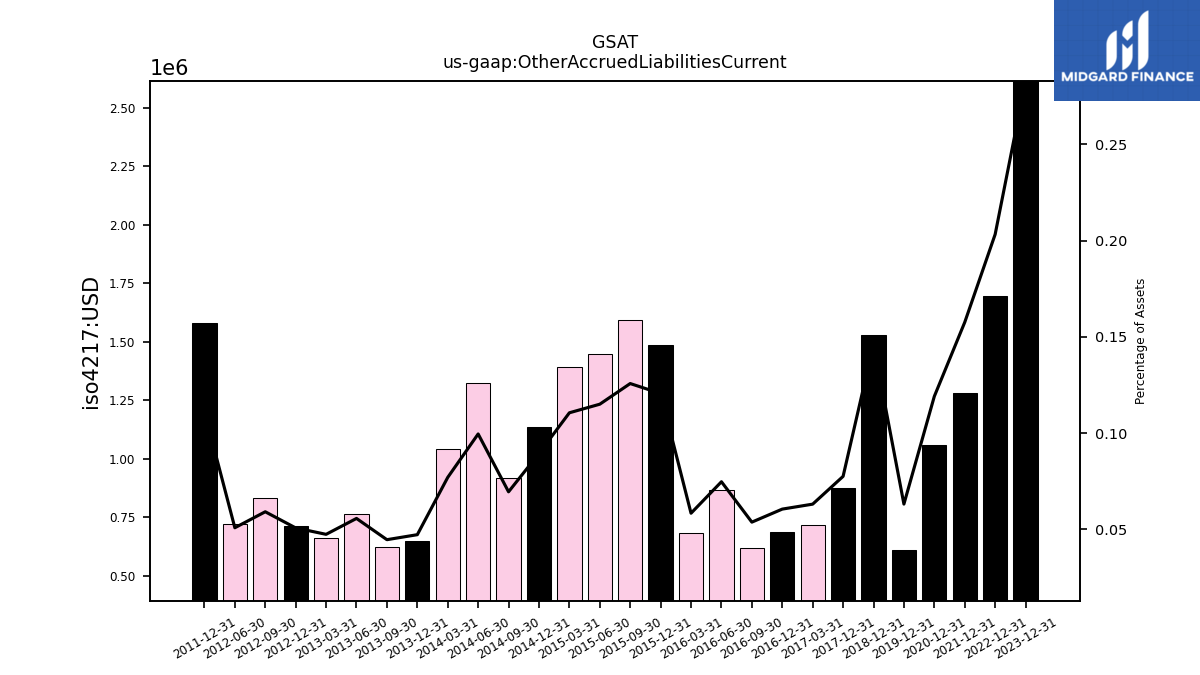
| Other Accrued Liabilities Current | NA | NA | NA | 1.69 | NA | NA | NA | 1.28 | NA | NA | NA | 1.06 | NA | NA | NA | 0.61 | NA | NA | NA | 1.53 | NA | NA | NA | 0.88 | NA | NA | 0.72 | 0.69 | 0.62 | 0.86 | 0.68 | 1.49 | 1.59 | 1.45 | 1.39 | 1.14 | 0.92 | 1.32 | 1.04 | 0.65 | 0.62 | 0.77 | 0.66 | 0.71 | 0.83 | 0.72 | NA | 1.58 | NA | NA | NA | NA | NA | NA | NA | |
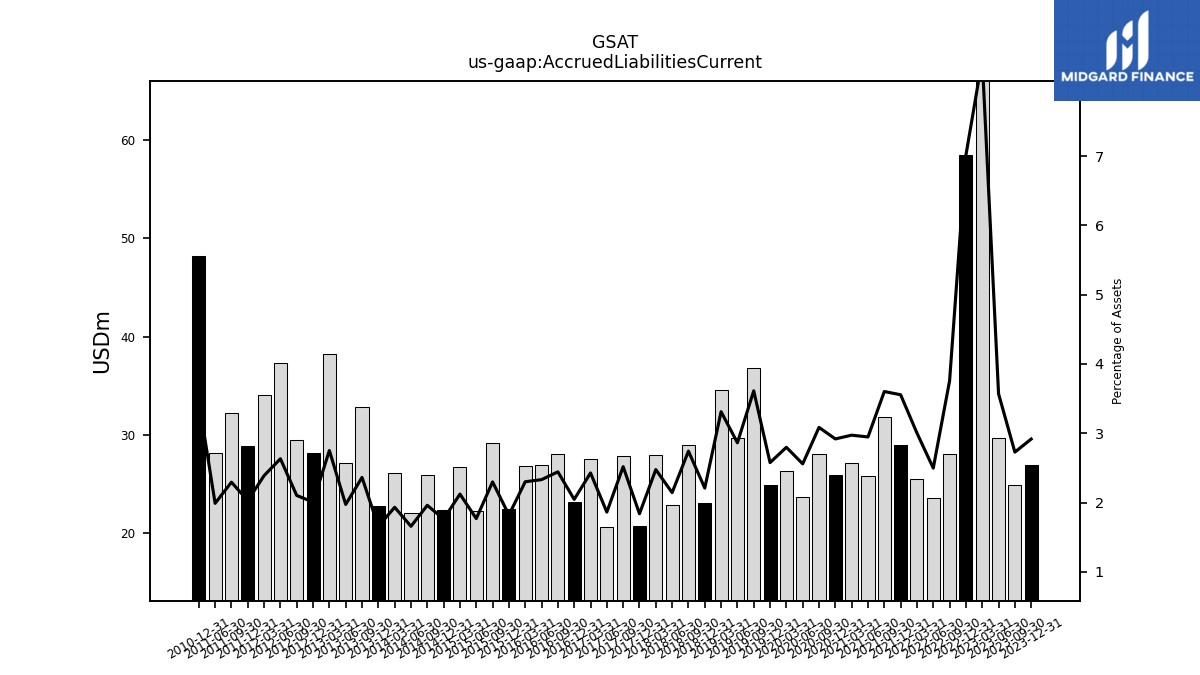
| Accrued Liabilities Current | 24.84 | 29.72 | 70.93 | 58.45 | 28.05 | 23.57 | 25.54 | 28.95 | 31.85 | 25.80 | 27.14 | 25.92 | 28.08 | 23.62 | 26.27 | 24.87 | 36.84 | 29.69 | 34.59 | 23.09 | 29.00 | 22.89 | 27.89 | 20.75 | 27.89 | 20.66 | 27.52 | 23.16 | 28.07 | 26.95 | 26.84 | 22.44 | 29.12 | 22.28 | 26.70 | 22.34 | 25.87 | 21.99 | 26.07 | 22.70 | 32.83 | 27.11 | 38.25 | 28.16 | 29.51 | 37.30 | 34.02 | 28.81 | 32.26 | 28.16 | NA | 48.16 | NA | NA | NA | |
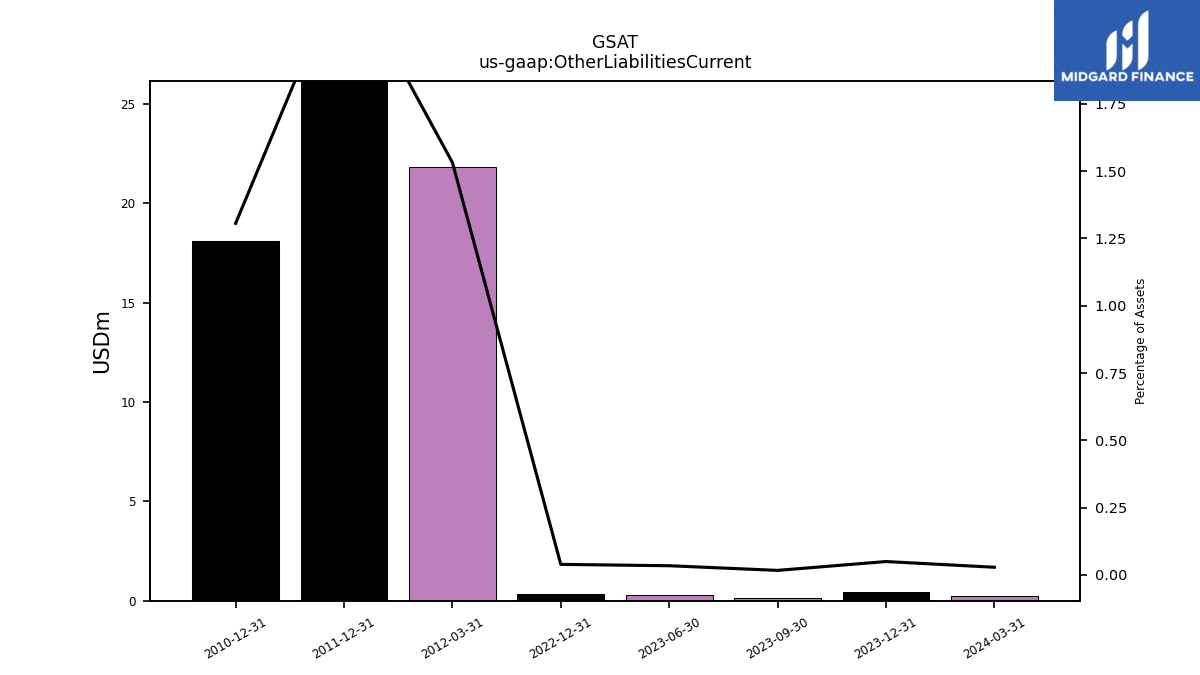
| Other Liabilities Current | 0.15 | 0.28 | NA | 0.33 | NA | NA | NA | NA | NA | NA | NA | NA | NA | NA | NA | NA | NA | NA | NA | NA | NA | NA | NA | NA | NA | NA | NA | NA | NA | NA | NA | NA | NA | NA | NA | NA | NA | NA | NA | NA | NA | NA | NA | NA | NA | NA | 21.82 | 32.27 | NA | NA | NA | 18.11 | NA | NA | NA | |
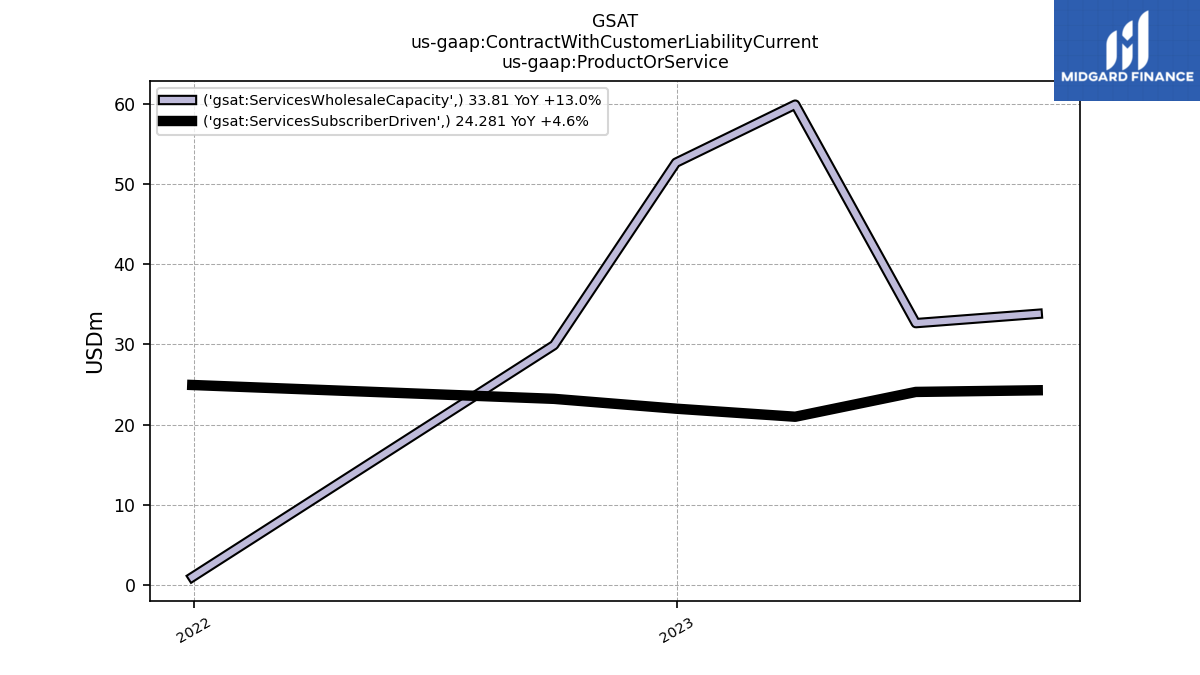
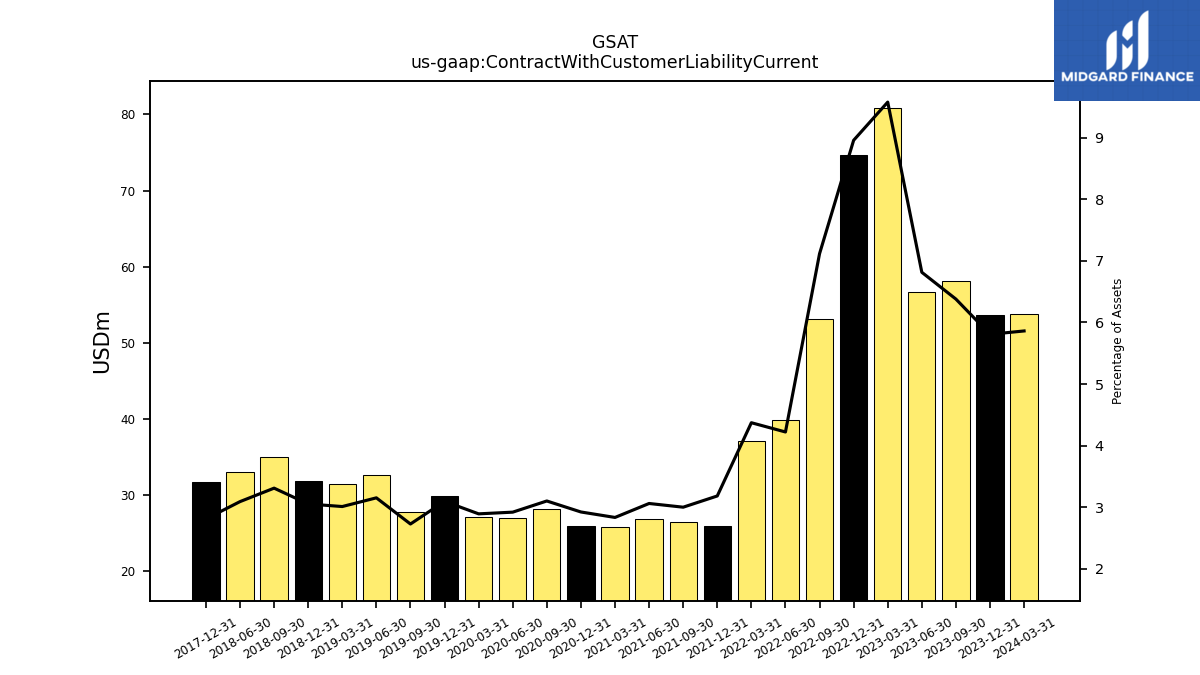
| Contract With Customer Liability Current | 58.09 | 56.72 | 80.87 | 74.64 | 53.12 | 39.87 | 37.19 | 25.93 | 26.55 | 26.82 | 25.90 | 25.98 | 28.26 | 26.99 | 27.18 | 29.91 | 27.84 | 32.71 | 31.48 | 31.94 | 35.03 | 33.05 | NA | 31.75 | NA | NA | NA | NA | NA | NA | NA | NA | NA | NA | NA | NA | NA | NA | NA | NA | NA | NA | NA | NA | NA | NA | NA | NA | NA | NA | NA | NA | NA | NA | NA |
| 2023-09-30 | 2023-06-30 | 2023-03-31 | 2022-12-31 | 2022-09-30 | 2022-06-30 | 2022-03-31 | 2021-12-31 | 2021-09-30 | 2021-06-30 | 2021-03-31 | 2020-12-31 | 2020-09-30 | 2020-06-30 | 2020-03-31 | 2019-12-31 | 2019-09-30 | 2019-06-30 | 2019-03-31 | 2018-12-31 | 2018-09-30 | 2018-06-30 | 2018-03-31 | 2017-12-31 | 2017-09-30 | 2017-06-30 | 2017-03-31 | 2016-12-31 | 2016-09-30 | 2016-06-30 | 2016-03-31 | 2015-12-31 | 2015-09-30 | 2015-06-30 | 2015-03-31 | 2014-12-31 | 2014-09-30 | 2014-06-30 | 2014-03-31 | 2013-12-31 | 2013-09-30 | 2013-06-30 | 2013-03-31 | 2012-12-31 | 2012-09-30 | 2012-06-30 | 2012-03-31 | 2011-12-31 | 2011-09-30 | 2011-06-30 | 2011-03-31 | 2010-12-31 | 2010-09-30 | 2010-06-30 | 2010-03-31 | ||
|---|---|---|---|---|---|---|---|---|---|---|---|---|---|---|---|---|---|---|---|---|---|---|---|---|---|---|---|---|---|---|---|---|---|---|---|---|---|---|---|---|---|---|---|---|---|---|---|---|---|---|---|---|---|---|---|---|
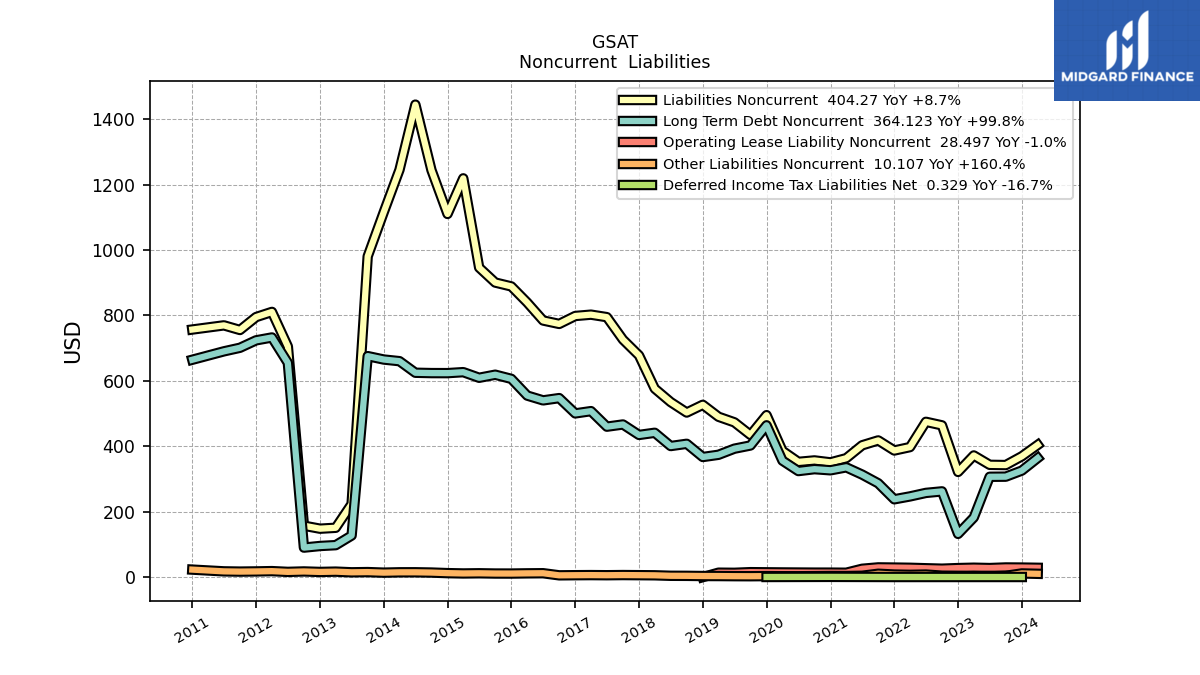
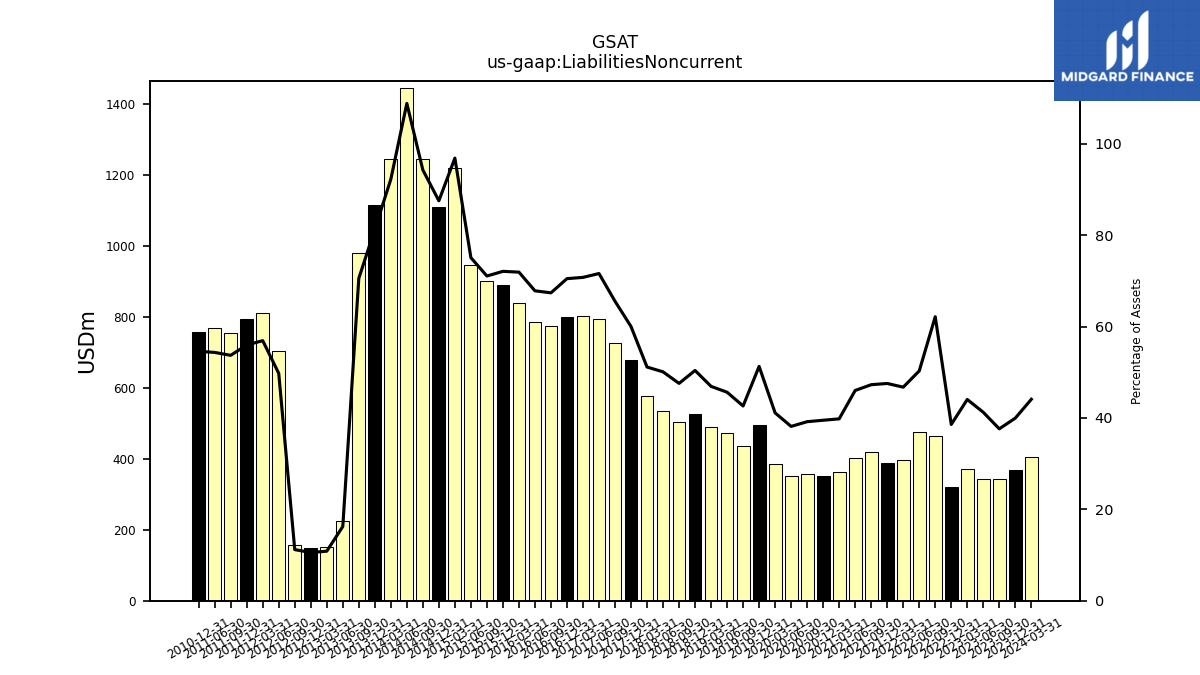
| Liabilities Noncurrent | 342.59 | 343.30 | 372.01 | 321.55 | 464.01 | 474.84 | 397.51 | 387.11 | 418.00 | 403.02 | 363.57 | 350.81 | 356.78 | 352.38 | 386.05 | 495.19 | 434.69 | 473.22 | 490.24 | 526.86 | 503.17 | 535.21 | 576.30 | 677.72 | 726.13 | 794.82 | 802.42 | 798.35 | 774.06 | 784.58 | 839.42 | 888.76 | 900.59 | 946.25 | 1219.20 | 1110.26 | 1244.29 | 1444.52 | 1245.21 | 1115.81 | 980.54 | 223.37 | 150.86 | 148.07 | 157.16 | 705.11 | 810.85 | 795.03 | 755.53 | 769.69 | NA | 756.93 | NA | NA | NA | |
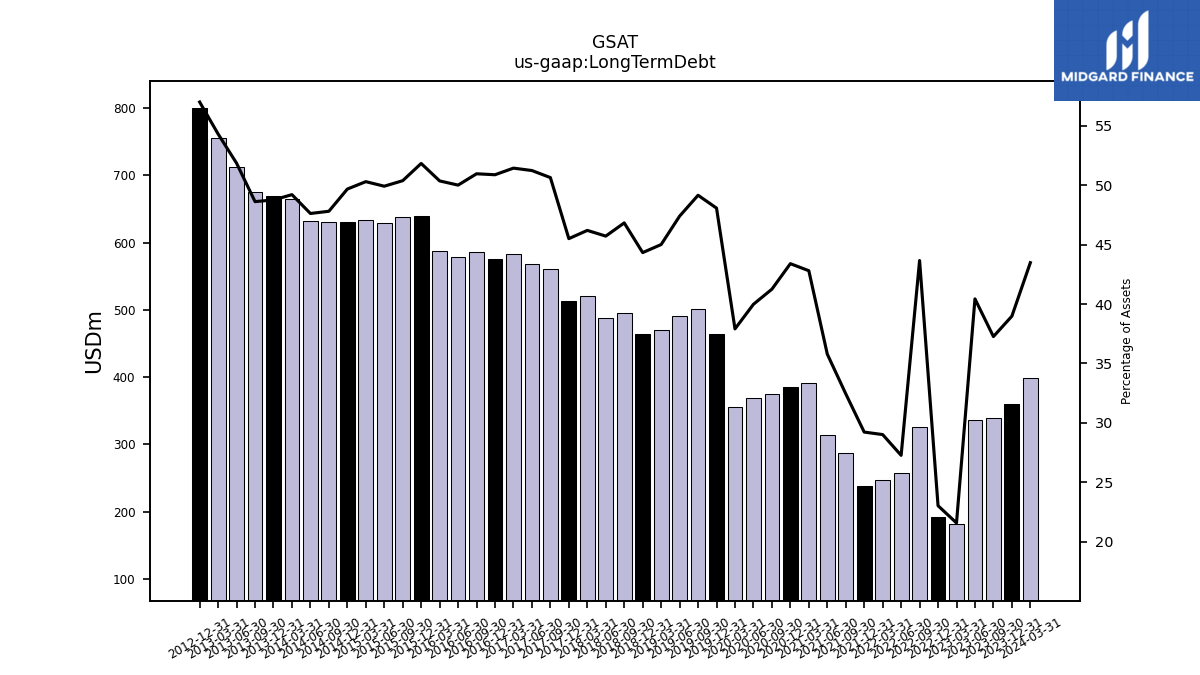
| Long Term Debt | 339.33 | 336.59 | 182.24 | 191.94 | 325.94 | 257.45 | 246.76 | 237.93 | 286.88 | 313.42 | 390.93 | 385.41 | 375.60 | 369.23 | 356.04 | 464.18 | 501.30 | 491.54 | 470.29 | 463.45 | 495.35 | 488.46 | 520.52 | 513.87 | 561.00 | 568.69 | 583.26 | 576.28 | 585.42 | 578.46 | 587.85 | 639.03 | 638.48 | 629.08 | 633.10 | 630.09 | 631.04 | 632.09 | 664.26 | 669.28 | 675.69 | 712.78 | 755.22 | 800.12 | NA | NA | NA | NA | NA | NA | NA | NA | NA | NA | NA | |
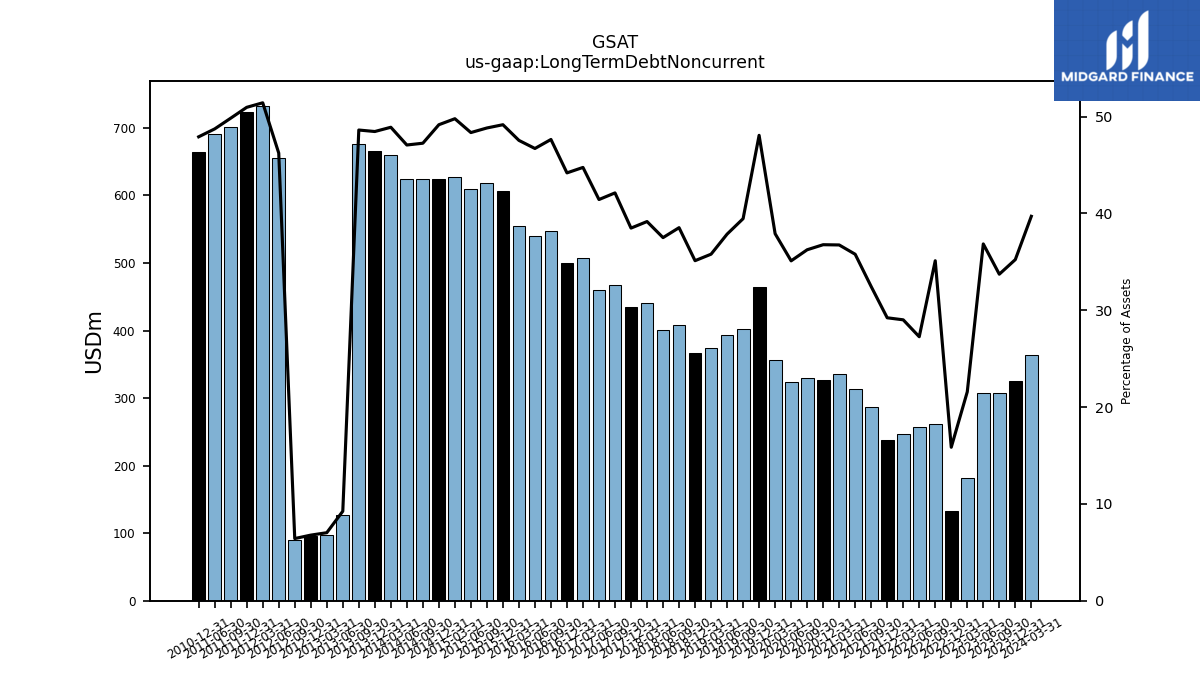
| Long Term Debt Noncurrent | 307.13 | 306.79 | 182.24 | 132.12 | 262.18 | 257.45 | 246.76 | 237.93 | 286.88 | 313.42 | 335.63 | 326.59 | 330.07 | 324.23 | 356.04 | 464.18 | 402.47 | 392.71 | 374.04 | 367.20 | 407.62 | 400.73 | 441.31 | 434.65 | 466.67 | 459.97 | 507.50 | 500.52 | 547.31 | 540.35 | 555.01 | 606.19 | 618.84 | 609.43 | 626.65 | 623.64 | 623.77 | 624.82 | 660.21 | 665.24 | 675.69 | 127.11 | 97.74 | 95.16 | 90.20 | 655.21 | 732.73 | 723.89 | 701.17 | 690.25 | NA | 664.54 | NA | NA | NA | |
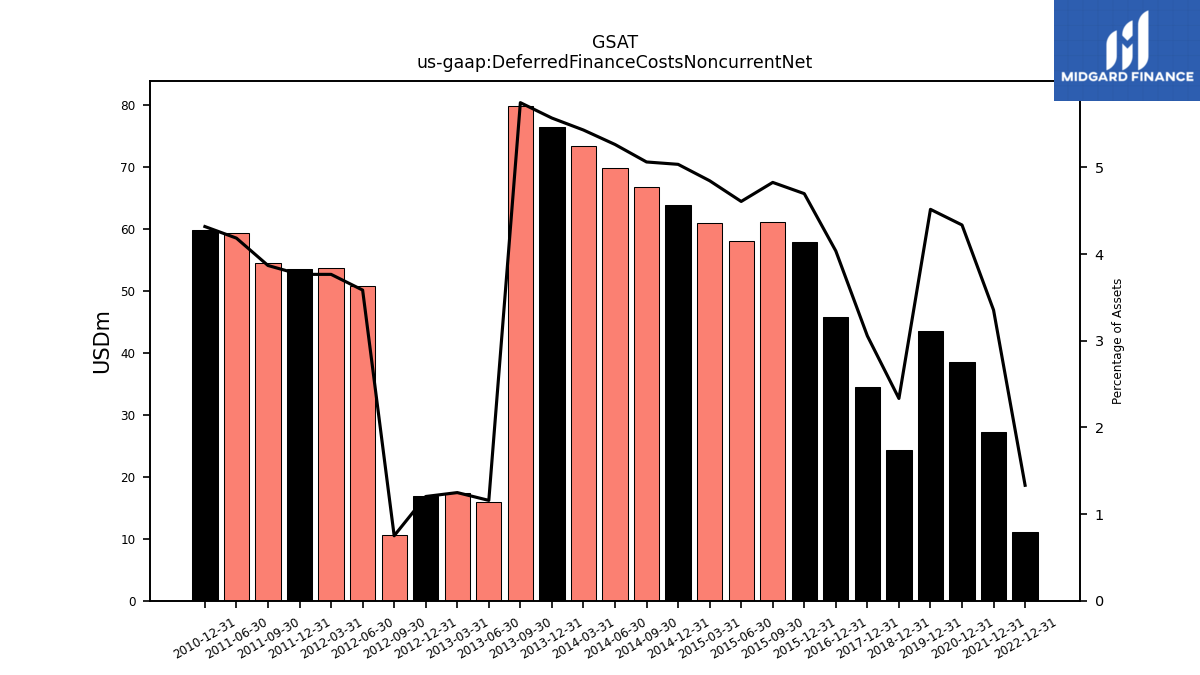
| Deferred Finance Costs Noncurrent Net | NA | NA | NA | 11.10 | NA | NA | NA | 27.30 | NA | NA | NA | 38.50 | NA | NA | NA | 43.60 | NA | NA | NA | 24.40 | NA | NA | NA | 34.50 | NA | NA | NA | 45.70 | NA | NA | NA | 57.91 | 61.16 | 58.06 | 60.99 | 63.86 | 66.82 | 69.87 | 73.31 | 76.44 | 79.86 | 15.92 | 17.35 | 16.88 | 10.53 | 50.79 | 53.64 | 53.48 | 54.41 | 59.25 | NA | 59.87 | NA | NA | NA | |
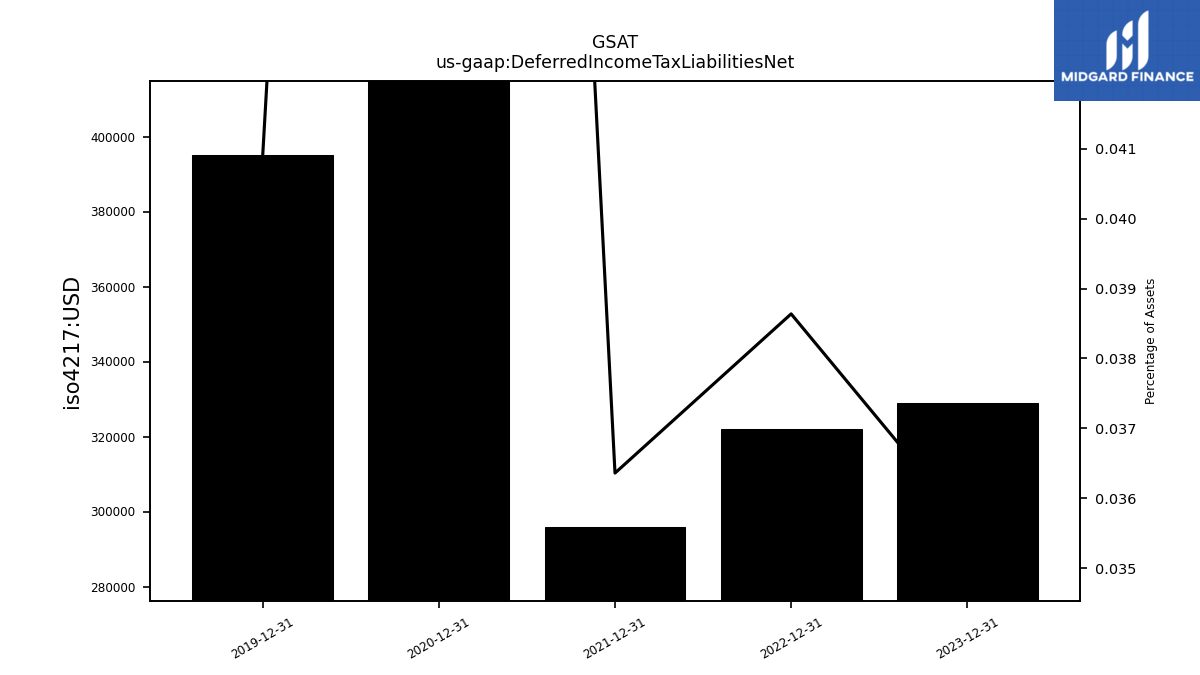
| Deferred Income Tax Liabilities Net | NA | NA | NA | 0.32 | NA | NA | NA | 0.30 | NA | NA | NA | 0.76 | NA | NA | NA | 0.40 | NA | NA | NA | NA | NA | NA | NA | NA | NA | NA | NA | NA | NA | NA | NA | NA | NA | NA | NA | NA | NA | NA | NA | NA | NA | NA | NA | NA | NA | NA | NA | NA | NA | NA | NA | NA | NA | NA | NA | |
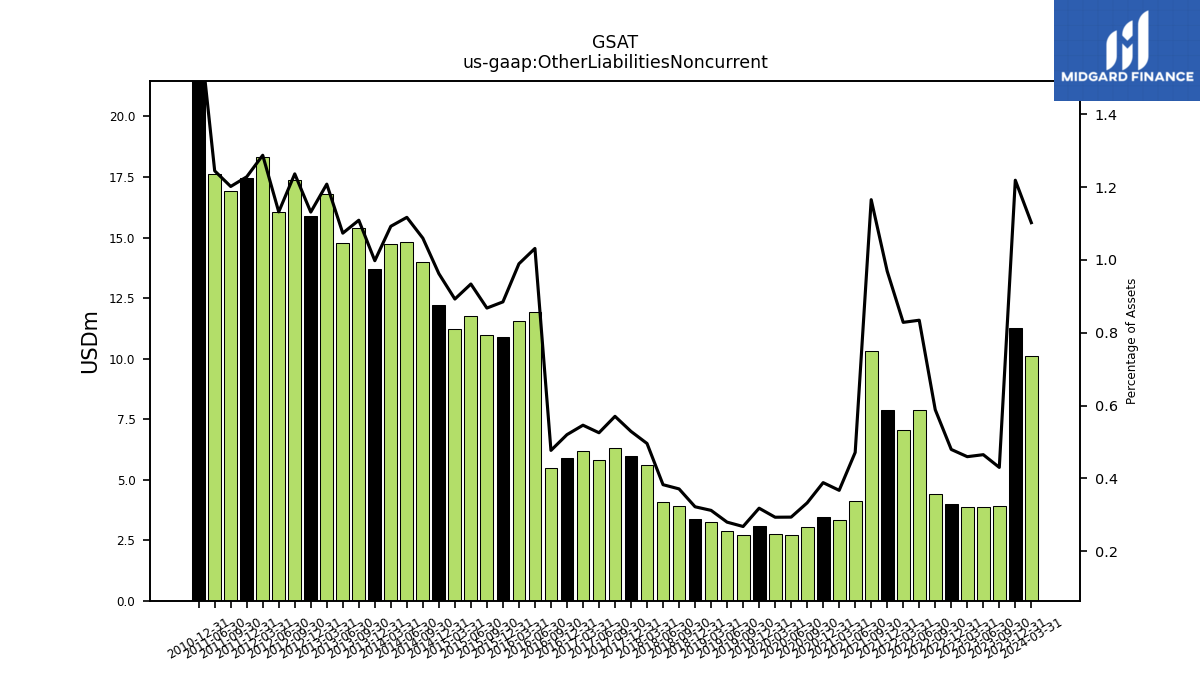
| Other Liabilities Noncurrent | 3.92 | 3.87 | 3.88 | 4.00 | 4.39 | 7.88 | 7.04 | 7.89 | 10.30 | 4.13 | 3.35 | 3.45 | 3.03 | 2.71 | 2.75 | 3.07 | 2.73 | 2.90 | 3.26 | 3.37 | 3.92 | 4.09 | 5.59 | 5.97 | 6.32 | 5.83 | 6.19 | 5.89 | 5.48 | 11.93 | 11.55 | 10.91 | 11.00 | 11.77 | 11.23 | 12.21 | 13.99 | 14.82 | 14.74 | 13.70 | 15.41 | 14.76 | 16.80 | 15.88 | 17.36 | 16.04 | 18.34 | 17.44 | 16.90 | 17.63 | NA | 22.97 | NA | NA | NA | |
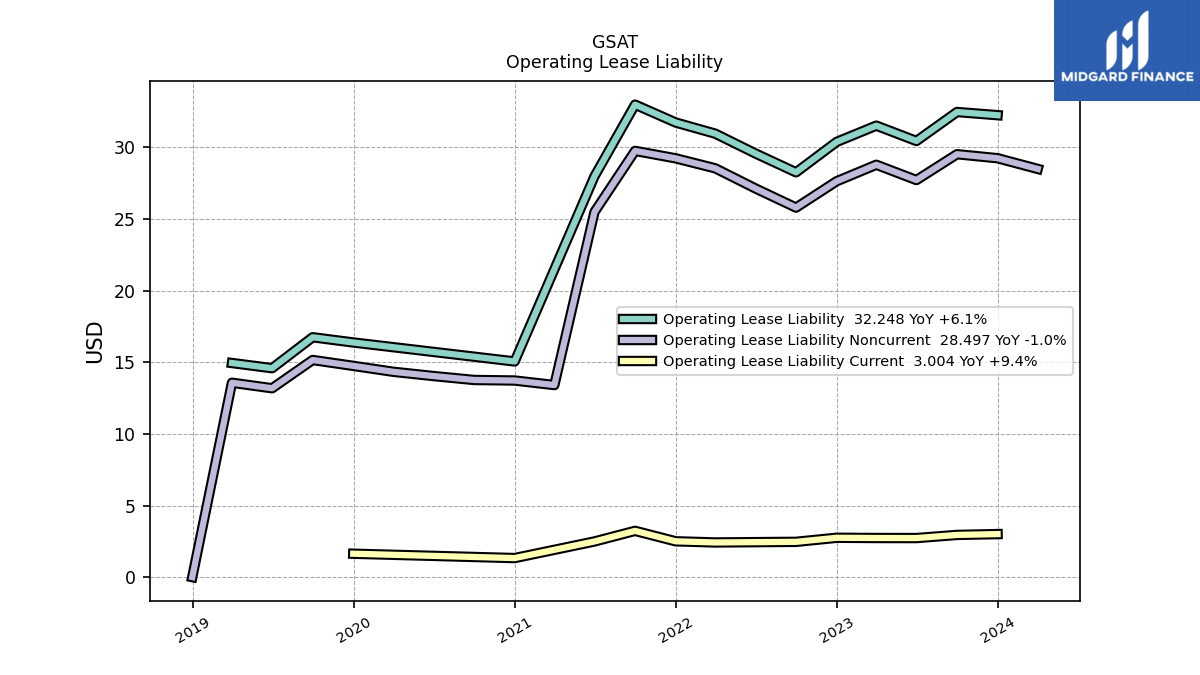
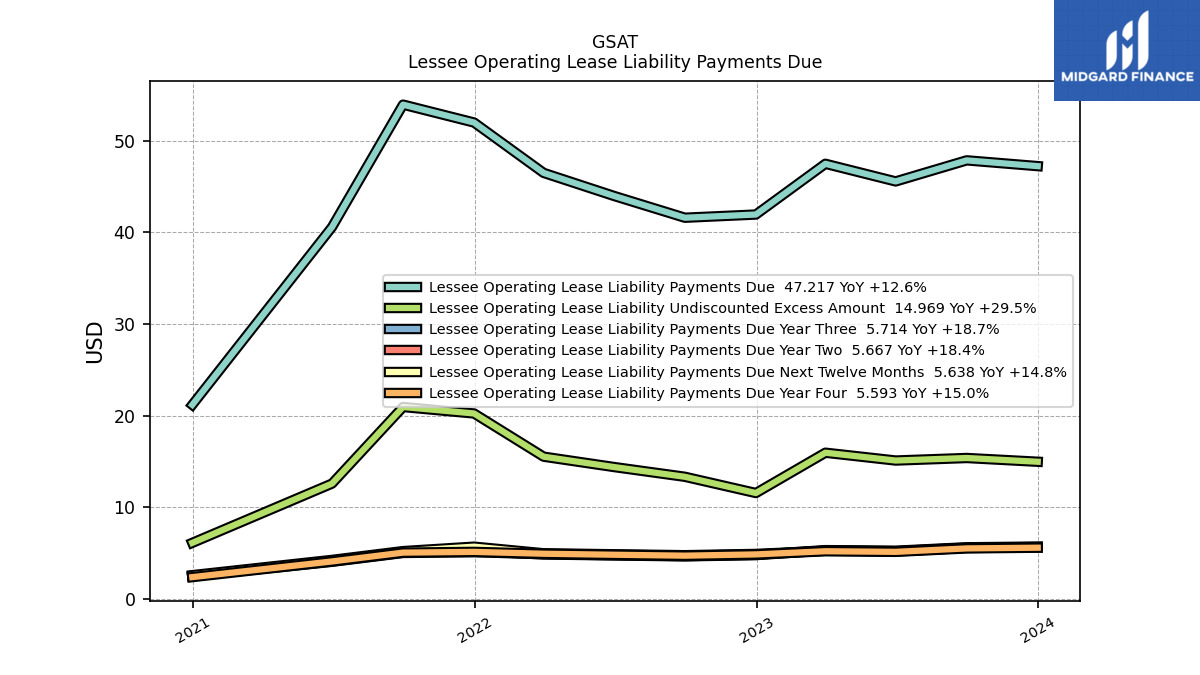
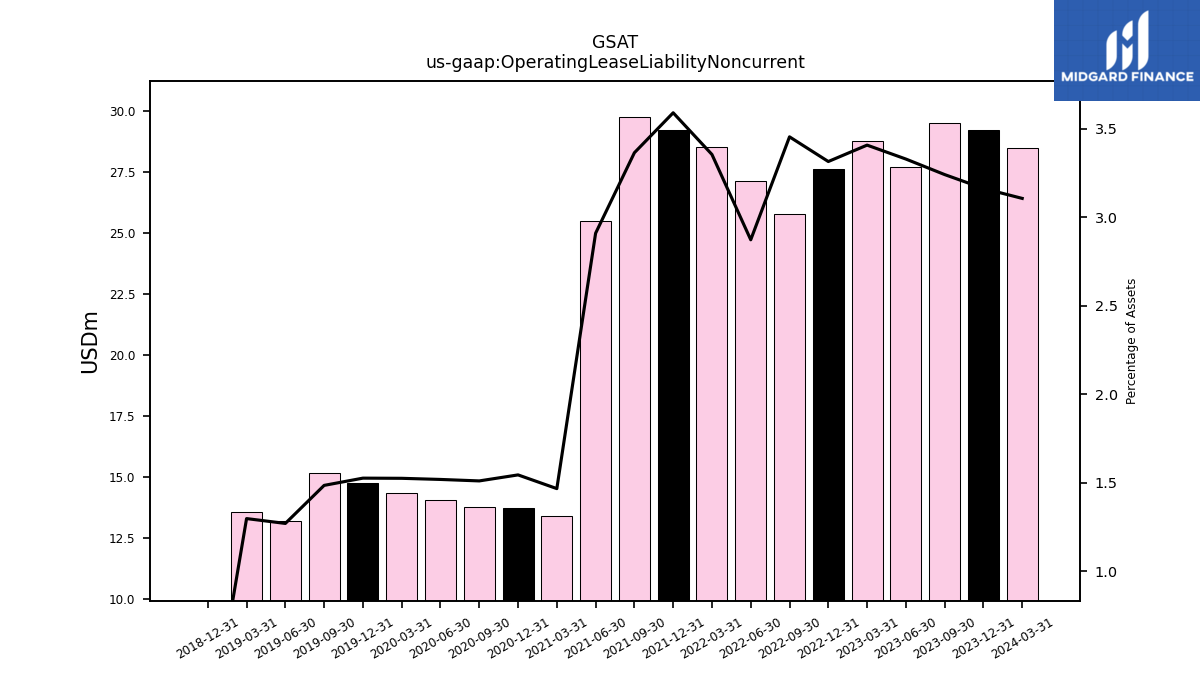
| Operating Lease Liability Noncurrent | 29.52 | 27.72 | 28.79 | 27.64 | 25.80 | 27.13 | 28.54 | 29.24 | 29.76 | 25.49 | 13.41 | 13.73 | 13.76 | 14.04 | 14.33 | 14.75 | 15.16 | 13.19 | 13.57 | 0.00 | NA | NA | NA | NA | NA | NA | NA | NA | NA | NA | NA | NA | NA | NA | NA | NA | NA | NA | NA | NA | NA | NA | NA | NA | NA | NA | NA | NA | NA | NA | NA | NA | NA | NA | NA |
| 2023-09-30 | 2023-06-30 | 2023-03-31 | 2022-12-31 | 2022-09-30 | 2022-06-30 | 2022-03-31 | 2021-12-31 | 2021-09-30 | 2021-06-30 | 2021-03-31 | 2020-12-31 | 2020-09-30 | 2020-06-30 | 2020-03-31 | 2019-12-31 | 2019-09-30 | 2019-06-30 | 2019-03-31 | 2018-12-31 | 2018-09-30 | 2018-06-30 | 2018-03-31 | 2017-12-31 | 2017-09-30 | 2017-06-30 | 2017-03-31 | 2016-12-31 | 2016-09-30 | 2016-06-30 | 2016-03-31 | 2015-12-31 | 2015-09-30 | 2015-06-30 | 2015-03-31 | 2014-12-31 | 2014-09-30 | 2014-06-30 | 2014-03-31 | 2013-12-31 | 2013-09-30 | 2013-06-30 | 2013-03-31 | 2012-12-31 | 2012-09-30 | 2012-06-30 | 2012-03-31 | 2011-12-31 | 2011-09-30 | 2011-06-30 | 2011-03-31 | 2010-12-31 | 2010-09-30 | 2010-06-30 | 2010-03-31 | ||
|---|---|---|---|---|---|---|---|---|---|---|---|---|---|---|---|---|---|---|---|---|---|---|---|---|---|---|---|---|---|---|---|---|---|---|---|---|---|---|---|---|---|---|---|---|---|---|---|---|---|---|---|---|---|---|---|---|
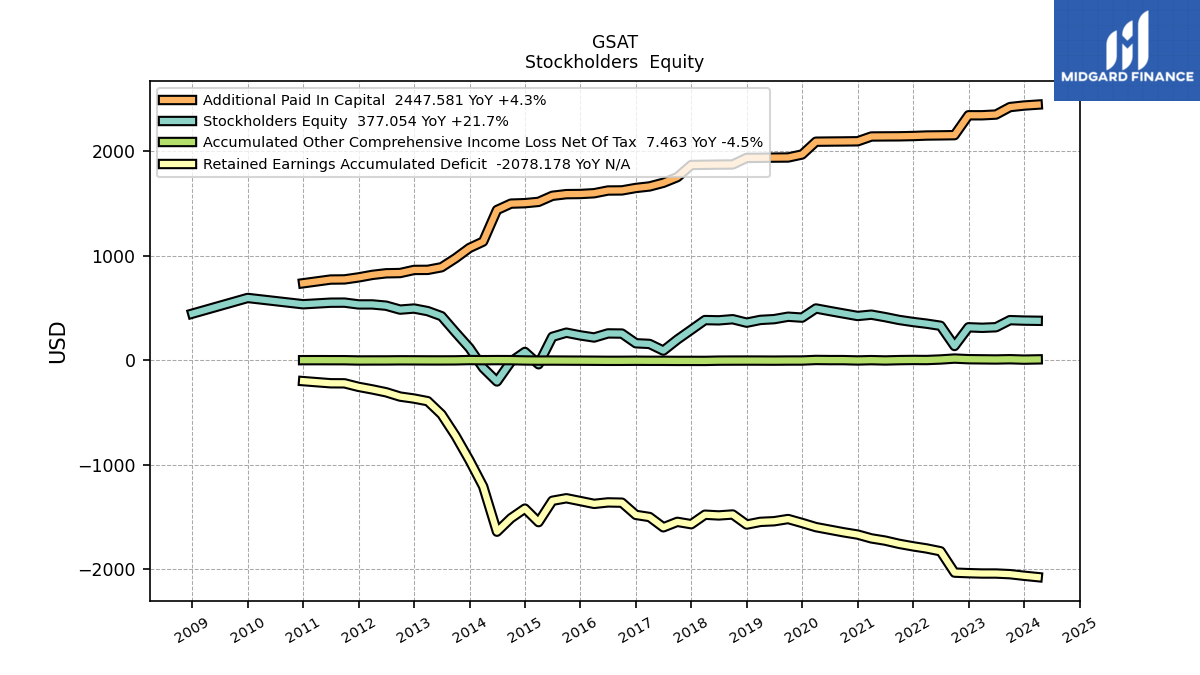
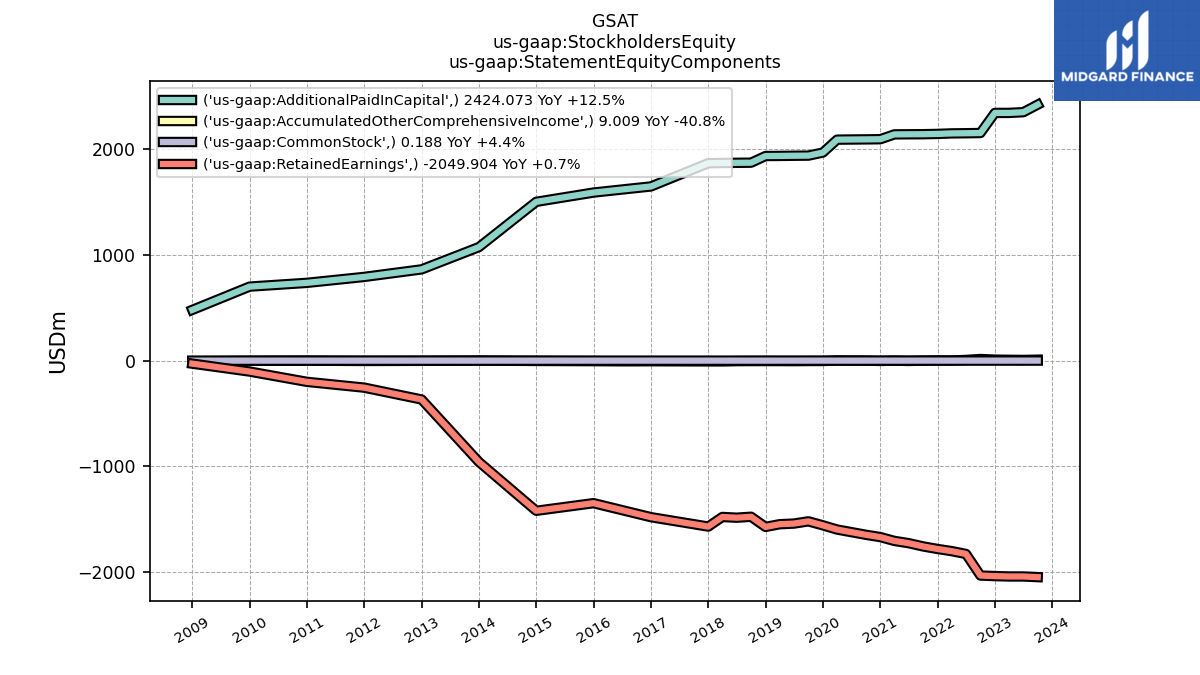
| Stockholders Equity | 383.37 | 315.37 | 309.85 | 314.77 | 135.58 | 329.33 | 349.23 | 365.43 | 385.12 | 412.13 | 435.71 | 423.06 | 446.56 | 470.49 | 495.12 | 407.34 | 416.14 | 392.89 | 385.38 | 358.94 | 392.10 | 381.34 | 383.99 | 291.22 | 197.04 | 91.47 | 155.41 | 161.82 | 254.70 | 256.14 | 216.90 | 237.13 | 263.07 | 223.79 | -39.58 | 78.92 | -14.53 | -204.45 | -74.28 | 116.75 | 266.60 | 421.26 | 469.60 | 494.54 | 484.07 | 521.70 | 533.77 | 533.79 | 551.10 | 550.46 | NA | 535.42 | NA | NA | NA | |
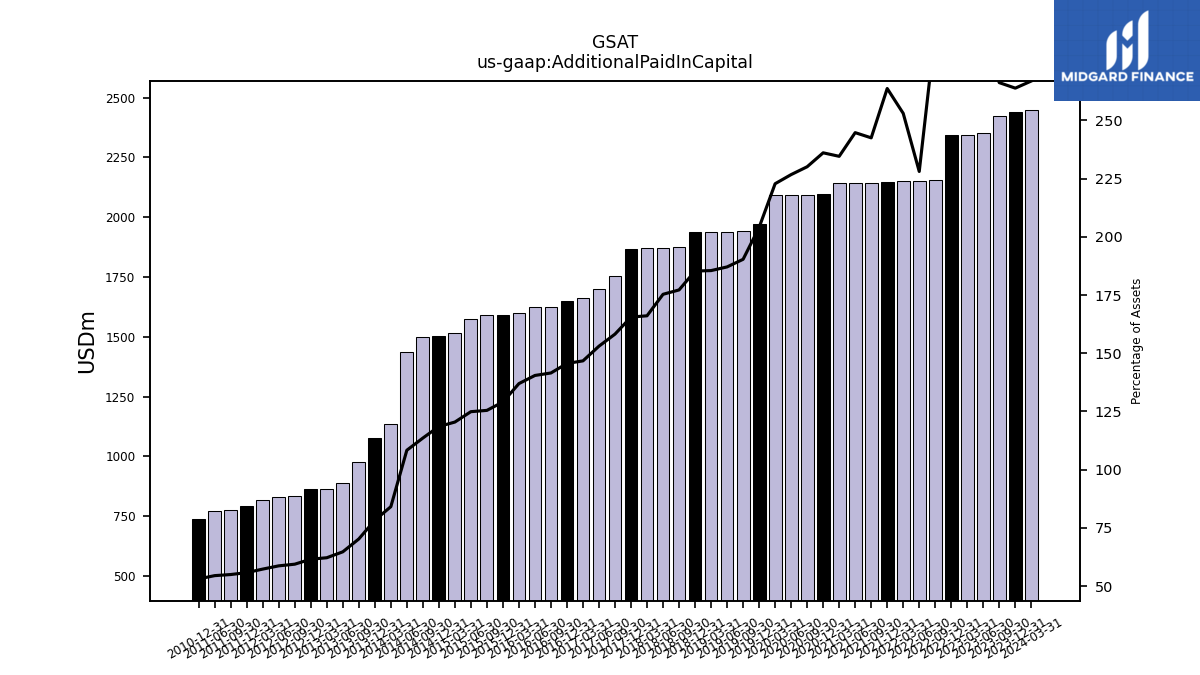
| Additional Paid In Capital | 2424.07 | 2352.41 | 2345.60 | 2345.61 | 2155.12 | 2153.20 | 2151.65 | 2146.71 | 2144.01 | 2143.32 | 2142.29 | 2096.57 | 2094.98 | 2093.88 | 2092.41 | 1970.05 | 1941.24 | 1940.11 | 1938.29 | 1937.36 | 1874.38 | 1873.15 | 1871.41 | 1869.34 | 1752.79 | 1698.72 | 1663.88 | 1649.32 | 1625.93 | 1624.88 | 1598.81 | 1591.44 | 1590.09 | 1574.30 | 1516.14 | 1503.62 | 1499.29 | 1438.27 | 1135.58 | 1074.84 | 976.39 | 889.91 | 864.88 | 864.17 | 834.43 | 832.00 | 816.62 | 792.58 | 773.50 | 772.04 | NA | 736.46 | NA | NA | NA | |
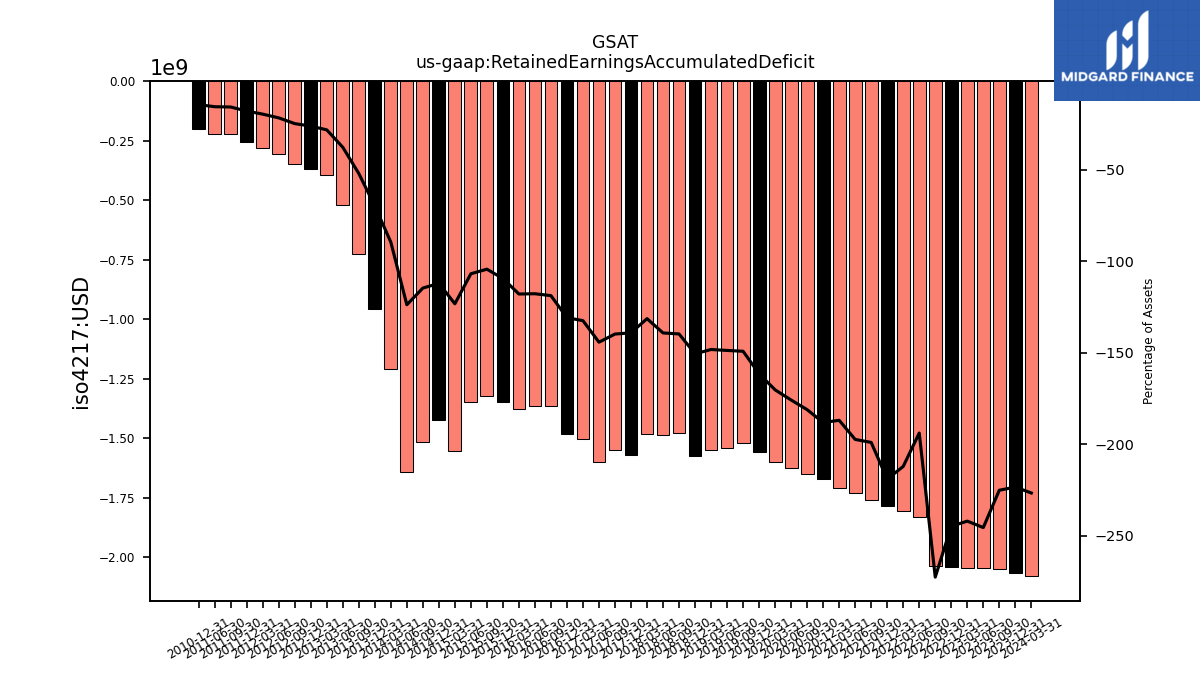
| Retained Earnings Accumulated Deficit | -2049.90 | -2043.73 | -2043.74 | -2040.26 | -2034.93 | -1830.57 | -1803.81 | -1783.35 | -1759.39 | -1728.51 | -1707.06 | -1670.72 | -1648.99 | -1624.04 | -1599.31 | -1559.40 | -1521.65 | -1542.77 | -1548.95 | -1574.72 | -1478.27 | -1487.29 | -1480.28 | -1571.30 | -1548.72 | -1601.12 | -1502.39 | -1482.23 | -1365.01 | -1362.43 | -1376.53 | -1349.58 | -1322.77 | -1346.86 | -1551.63 | -1421.90 | -1513.92 | -1643.31 | -1209.58 | -959.04 | -724.24 | -519.27 | -393.00 | -367.92 | -348.97 | -307.78 | -280.25 | -255.72 | -222.01 | -221.33 | NA | -200.80 | NA | NA | NA | |
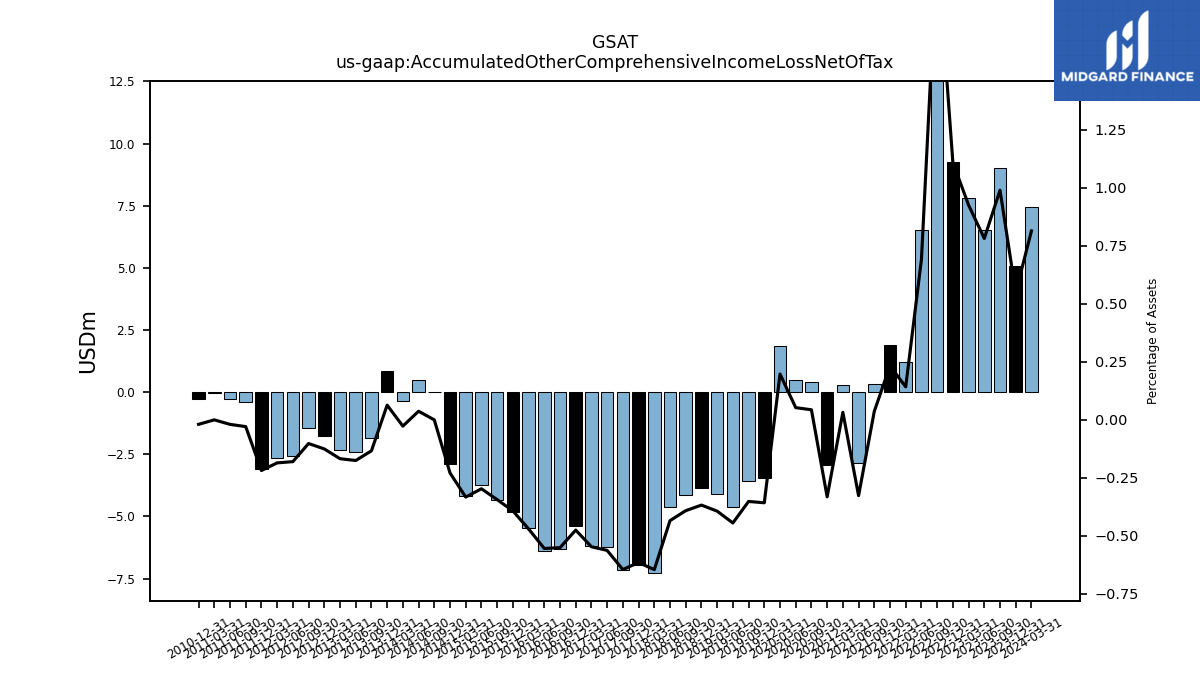
| Accumulated Other Comprehensive Income Loss Net Of Tax | 9.01 | 6.51 | 7.81 | 9.24 | 15.21 | 6.53 | 1.21 | 1.89 | 0.33 | -2.86 | 0.30 | -2.94 | 0.40 | 0.49 | 1.85 | -3.45 | -3.58 | -4.61 | -4.11 | -3.84 | -4.14 | -4.64 | -7.27 | -6.94 | -7.14 | -6.24 | -6.20 | -5.38 | -6.33 | -6.41 | -5.48 | -4.83 | -4.36 | -3.74 | -4.19 | -2.90 | 0.00 | 0.49 | -0.36 | 0.87 | -1.85 | -2.41 | -2.33 | -1.76 | -1.43 | -2.55 | -2.64 | -3.10 | -0.41 | -0.28 | -0.02 | -0.27 | NA | NA | NA |
| 2023-09-30 | 2023-06-30 | 2023-03-31 | 2022-12-31 | 2022-09-30 | 2022-06-30 | 2022-03-31 | 2021-12-31 | 2021-09-30 | 2021-06-30 | 2021-03-31 | 2020-12-31 | 2020-09-30 | 2020-06-30 | 2020-03-31 | 2019-12-31 | 2019-09-30 | 2019-06-30 | 2019-03-31 | 2018-12-31 | 2018-09-30 | 2018-06-30 | 2018-03-31 | 2017-12-31 | 2017-09-30 | 2017-06-30 | 2017-03-31 | 2016-12-31 | 2016-09-30 | 2016-06-30 | 2016-03-31 | 2015-12-31 | 2015-09-30 | 2015-06-30 | 2015-03-31 | 2014-12-31 | 2014-09-30 | 2014-06-30 | 2014-03-31 | 2013-12-31 | 2013-09-30 | 2013-06-30 | 2013-03-31 | 2012-12-31 | 2012-09-30 | 2012-06-30 | 2012-03-31 | 2011-12-31 | 2011-09-30 | 2011-06-30 | 2011-03-31 | 2010-12-31 | 2010-09-30 | 2010-06-30 | 2010-03-31 | ||
|---|---|---|---|---|---|---|---|---|---|---|---|---|---|---|---|---|---|---|---|---|---|---|---|---|---|---|---|---|---|---|---|---|---|---|---|---|---|---|---|---|---|---|---|---|---|---|---|---|---|---|---|---|---|---|---|---|
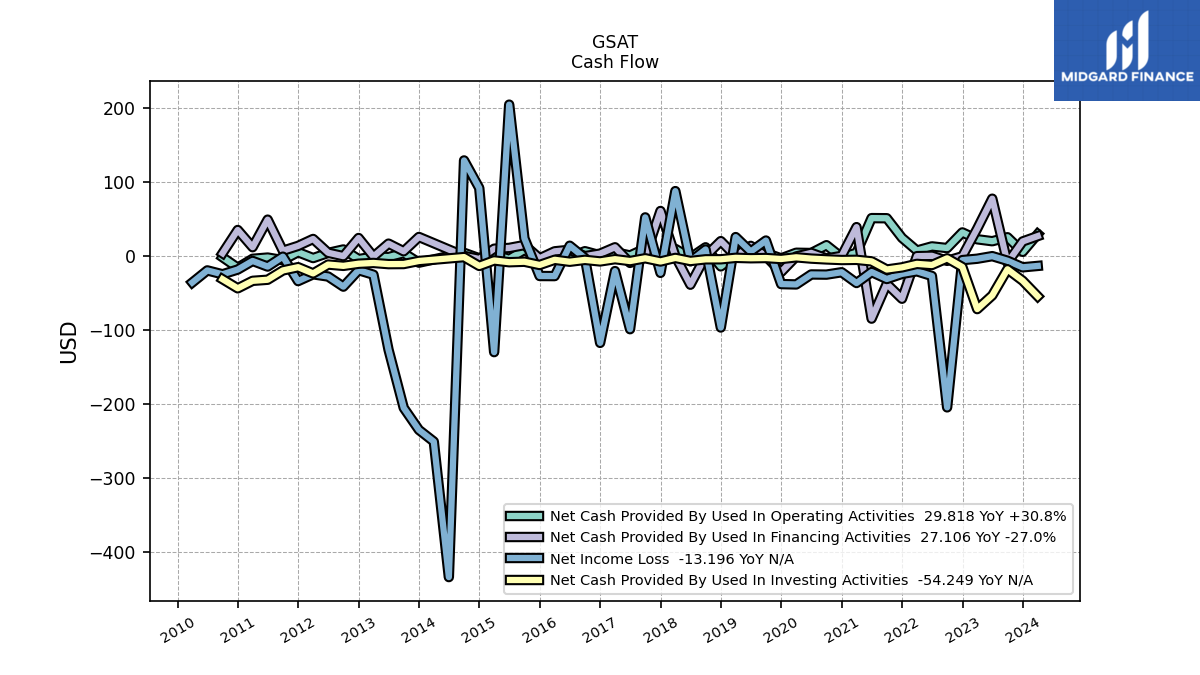
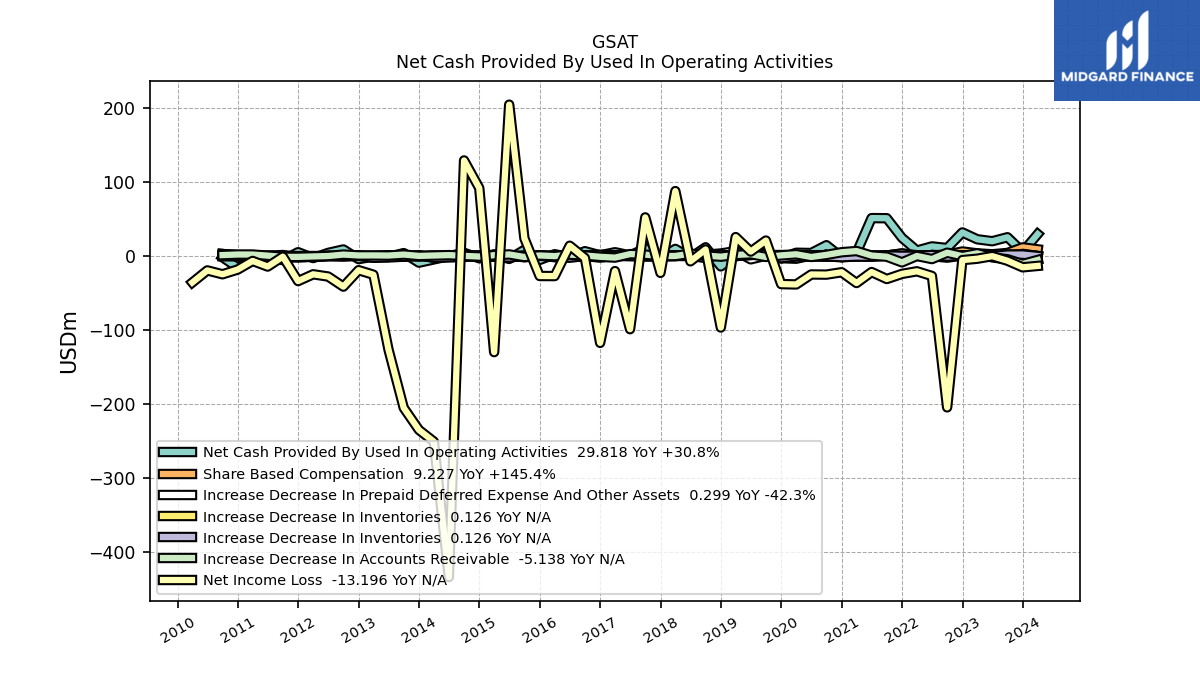
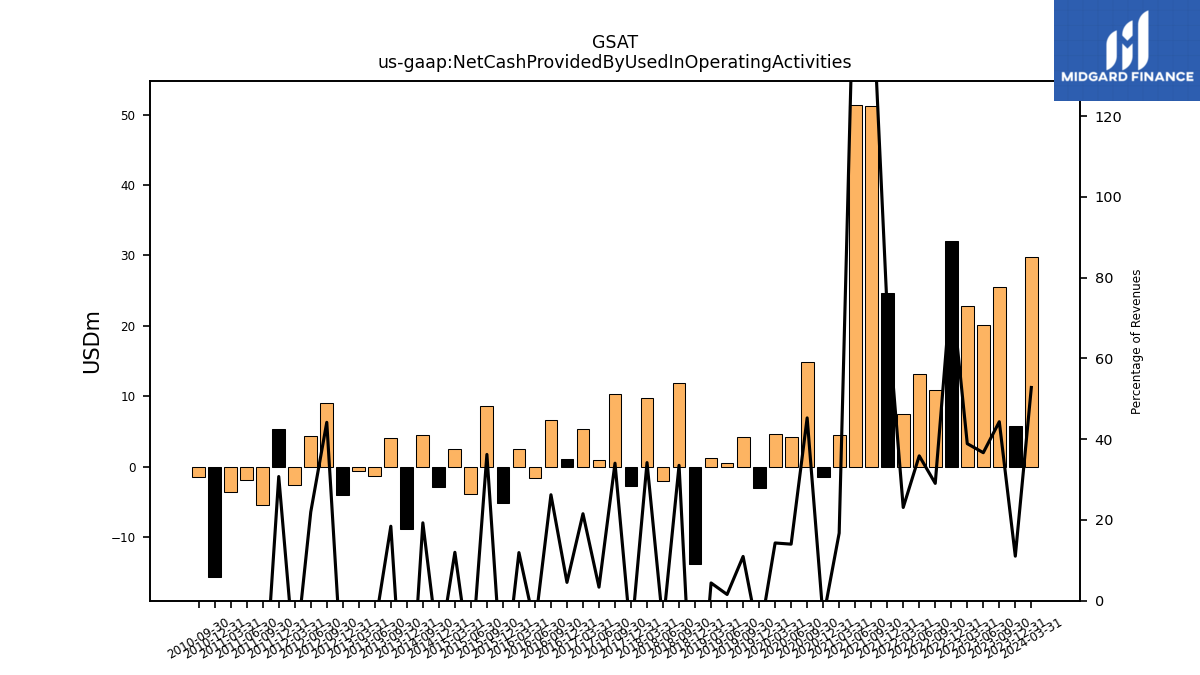
| Net Cash Provided By Used In Operating Activities | 25.56 | 20.19 | 22.80 | 32.09 | 10.93 | 13.20 | 7.57 | 24.71 | 51.25 | 51.41 | 4.51 | -1.47 | 14.83 | 4.25 | 4.61 | -3.00 | 4.23 | 0.48 | 1.32 | -13.85 | 11.96 | -2.03 | 9.83 | -2.77 | 10.37 | 0.95 | 5.31 | 1.11 | 6.70 | -1.60 | 2.60 | -5.15 | 8.58 | -3.78 | 2.52 | -2.89 | 4.52 | NA | NA | -8.80 | 4.16 | -1.29 | -0.53 | -4.00 | 9.07 | 4.39 | -2.58 | 5.35 | -5.37 | -1.89 | -3.59 | -15.65 | -1.46 | NA | NA | |
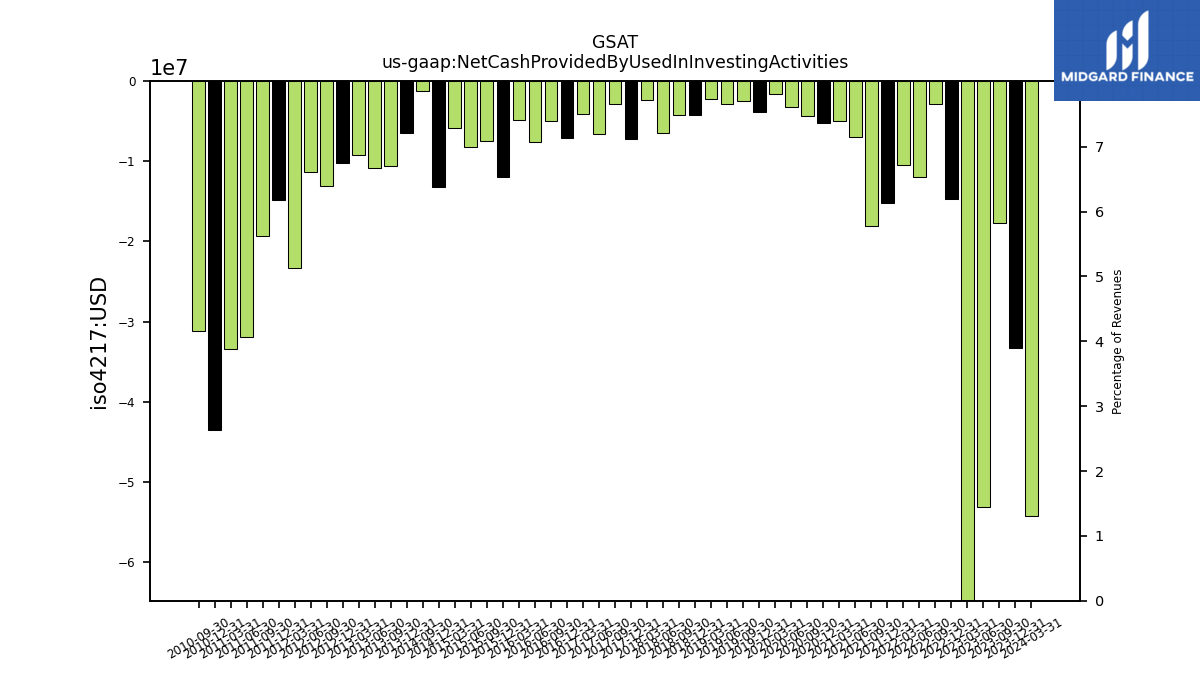
| Net Cash Provided By Used In Investing Activities | -17.75 | -53.06 | -71.58 | -14.65 | -2.91 | -11.94 | -10.45 | -15.15 | -18.04 | -7.02 | -4.97 | -5.24 | -4.42 | -3.30 | -1.58 | -3.87 | -2.53 | -2.84 | -2.26 | -4.22 | -4.28 | -6.51 | -2.39 | -7.21 | -2.88 | -6.60 | -4.09 | -7.13 | -5.03 | -7.55 | -4.91 | -11.93 | -7.53 | -8.20 | -5.81 | -13.21 | -1.27 | NA | NA | -6.50 | -10.65 | -10.78 | -9.18 | -10.22 | -13.13 | -11.35 | -23.31 | -14.89 | -19.30 | -31.87 | -33.35 | -43.49 | -31.12 | NA | NA | |
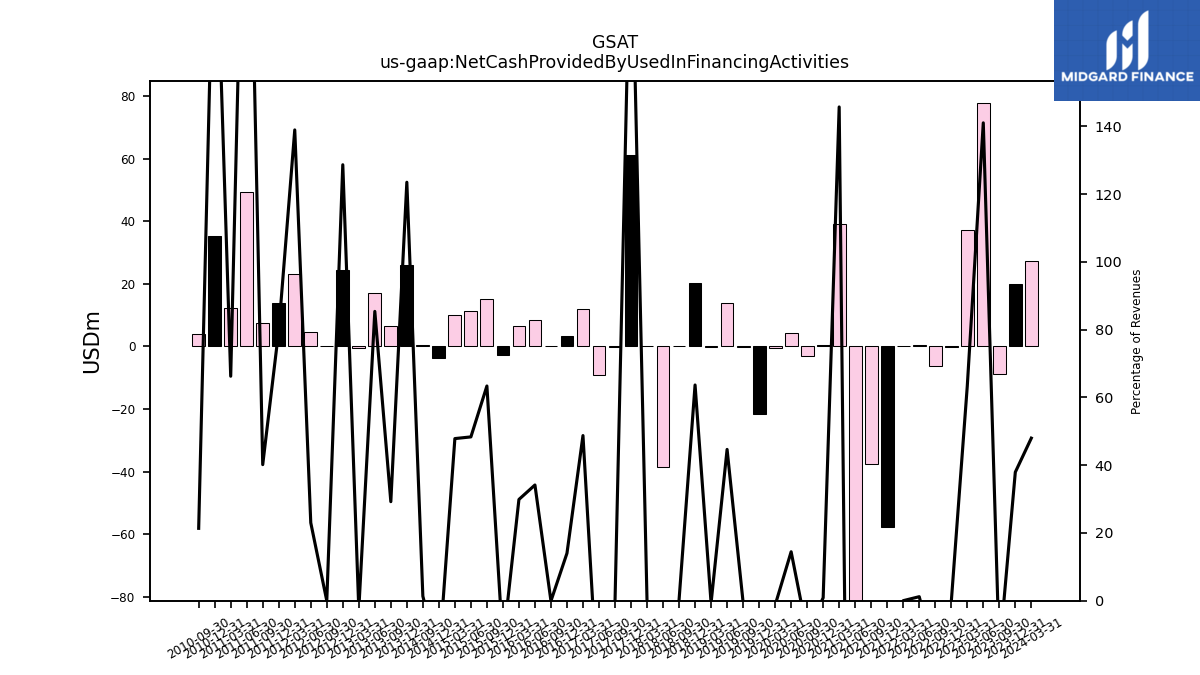
| Net Cash Provided By Used In Financing Activities | -8.92 | 77.67 | 37.15 | -0.16 | -6.33 | 0.44 | 0.01 | -57.56 | -37.50 | -84.47 | 39.24 | 0.29 | -3.10 | 4.39 | -0.42 | -21.49 | -0.17 | 13.93 | -0.19 | 20.34 | 0.08 | -38.61 | 0.00 | 61.05 | -0.15 | -9.13 | 12.02 | 3.42 | -0.01 | 8.57 | 6.53 | -2.92 | 15.01 | 11.13 | 10.06 | -3.80 | 0.32 | NA | NA | 25.93 | 6.59 | 16.94 | -0.49 | 24.53 | 0.00 | 4.60 | 23.26 | 13.88 | 7.31 | 49.36 | 12.10 | 35.37 | 3.90 | NA | NA |
| 2023-09-30 | 2023-06-30 | 2023-03-31 | 2022-12-31 | 2022-09-30 | 2022-06-30 | 2022-03-31 | 2021-12-31 | 2021-09-30 | 2021-06-30 | 2021-03-31 | 2020-12-31 | 2020-09-30 | 2020-06-30 | 2020-03-31 | 2019-12-31 | 2019-09-30 | 2019-06-30 | 2019-03-31 | 2018-12-31 | 2018-09-30 | 2018-06-30 | 2018-03-31 | 2017-12-31 | 2017-09-30 | 2017-06-30 | 2017-03-31 | 2016-12-31 | 2016-09-30 | 2016-06-30 | 2016-03-31 | 2015-12-31 | 2015-09-30 | 2015-06-30 | 2015-03-31 | 2014-12-31 | 2014-09-30 | 2014-06-30 | 2014-03-31 | 2013-12-31 | 2013-09-30 | 2013-06-30 | 2013-03-31 | 2012-12-31 | 2012-09-30 | 2012-06-30 | 2012-03-31 | 2011-12-31 | 2011-09-30 | 2011-06-30 | 2011-03-31 | 2010-12-31 | 2010-09-30 | 2010-06-30 | 2010-03-31 | ||
|---|---|---|---|---|---|---|---|---|---|---|---|---|---|---|---|---|---|---|---|---|---|---|---|---|---|---|---|---|---|---|---|---|---|---|---|---|---|---|---|---|---|---|---|---|---|---|---|---|---|---|---|---|---|---|---|---|
| Net Cash Provided By Used In Operating Activities | 25.56 | 20.19 | 22.80 | 32.09 | 10.93 | 13.20 | 7.57 | 24.71 | 51.25 | 51.41 | 4.51 | -1.47 | 14.83 | 4.25 | 4.61 | -3.00 | 4.23 | 0.48 | 1.32 | -13.85 | 11.96 | -2.03 | 9.83 | -2.77 | 10.37 | 0.95 | 5.31 | 1.11 | 6.70 | -1.60 | 2.60 | -5.15 | 8.58 | -3.78 | 2.52 | -2.89 | 4.52 | NA | NA | -8.80 | 4.16 | -1.29 | -0.53 | -4.00 | 9.07 | 4.39 | -2.58 | 5.35 | -5.37 | -1.89 | -3.59 | -15.65 | -1.46 | NA | NA | |
| Net Income Loss | -6.17 | 0.01 | -3.48 | -5.33 | -204.36 | -26.76 | -20.46 | -23.96 | -30.89 | -21.45 | -36.33 | -21.73 | -24.95 | -24.74 | -38.22 | -37.75 | 21.11 | 6.19 | 25.77 | -96.45 | 9.02 | -7.01 | 87.93 | -22.59 | 52.41 | -98.73 | -20.16 | -117.22 | -2.58 | 14.10 | -26.95 | -26.82 | 24.10 | 204.77 | -129.73 | 92.02 | 129.39 | -433.73 | -250.54 | -234.80 | -204.97 | -126.27 | -25.08 | -18.95 | -41.19 | -27.53 | -24.52 | -33.71 | -0.68 | -14.07 | -6.47 | -18.08 | -24.49 | -19.25 | -35.64 | |
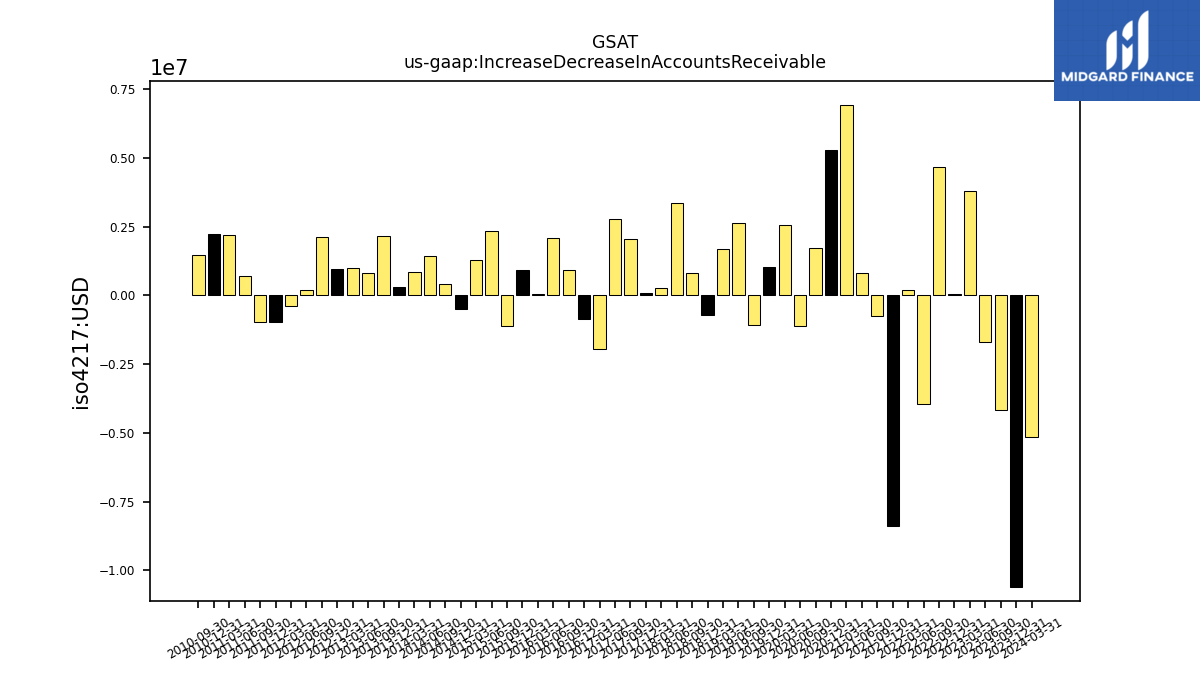
| Increase Decrease In Accounts Receivable | -4.18 | -1.69 | 3.79 | 0.06 | 4.69 | -3.95 | 0.21 | -8.37 | -0.74 | 0.82 | 6.93 | 5.31 | 1.74 | -1.11 | 2.56 | 1.05 | -1.08 | 2.65 | 1.68 | -0.69 | 0.83 | 3.38 | 0.27 | 0.11 | 2.05 | 2.78 | -1.96 | -0.87 | 0.92 | 2.09 | 0.06 | 0.92 | -1.12 | 2.34 | 1.31 | -0.50 | 0.41 | 1.42 | 0.86 | 0.32 | 2.15 | 0.83 | 1.02 | 0.96 | 2.12 | 0.18 | -0.39 | -0.98 | -0.96 | 0.71 | 2.21 | 2.24 | 1.47 | NA | NA | |
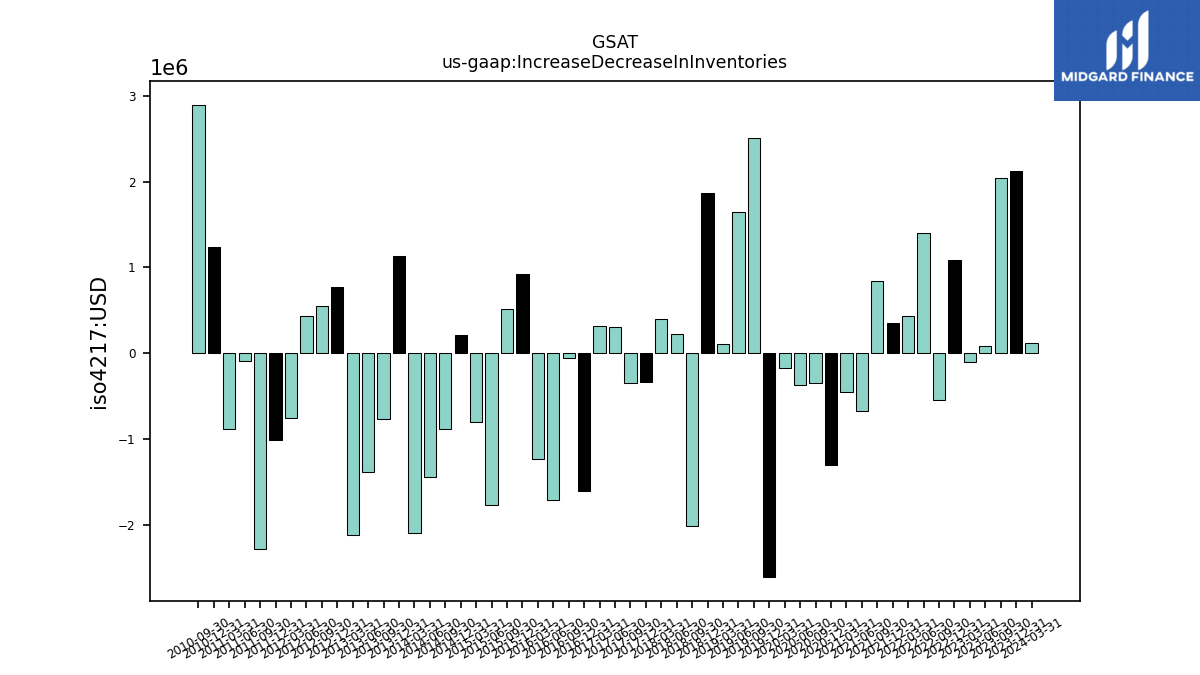
| Increase Decrease In Inventories | 2.04 | 0.09 | -0.10 | 1.08 | -0.55 | 1.40 | 0.44 | 0.36 | 0.84 | -0.67 | -0.45 | -1.30 | -0.34 | -0.36 | -0.17 | -2.60 | 2.51 | 1.65 | 0.11 | 1.87 | -2.01 | 0.22 | 0.40 | -0.33 | -0.34 | 0.30 | 0.32 | -1.60 | -0.05 | -1.70 | -1.22 | 0.93 | 0.52 | -1.77 | -0.79 | 0.22 | -0.88 | -1.44 | -2.09 | 1.13 | -0.76 | -1.38 | -2.11 | 0.78 | 0.56 | 0.44 | -0.76 | -1.01 | -2.28 | -0.09 | -0.88 | 1.24 | 2.90 | NA | NA | |
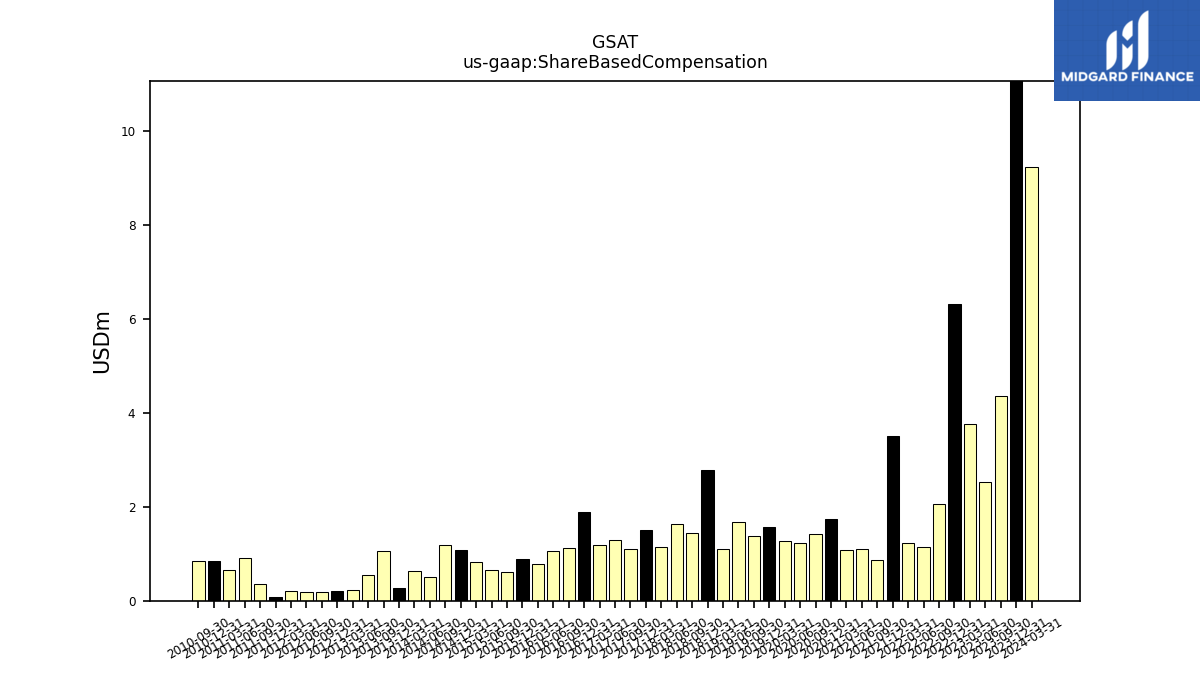
| Share Based Compensation | 4.35 | 2.53 | 3.76 | 6.32 | 2.05 | 1.15 | 1.23 | 3.50 | 0.86 | 1.10 | 1.09 | 1.75 | 1.42 | 1.23 | 1.28 | 1.56 | 1.38 | 1.67 | 1.09 | 2.78 | 1.44 | 1.63 | 1.15 | 1.50 | 1.10 | 1.30 | 1.19 | 1.90 | 1.11 | 1.06 | 0.79 | 0.88 | 0.60 | 0.65 | 0.82 | 1.09 | 1.18 | 0.51 | 0.63 | 0.28 | 1.06 | 0.56 | 0.24 | 0.21 | 0.19 | 0.19 | 0.21 | 0.09 | 0.35 | 0.90 | 0.65 | 0.83 | 0.85 | NA | NA | |
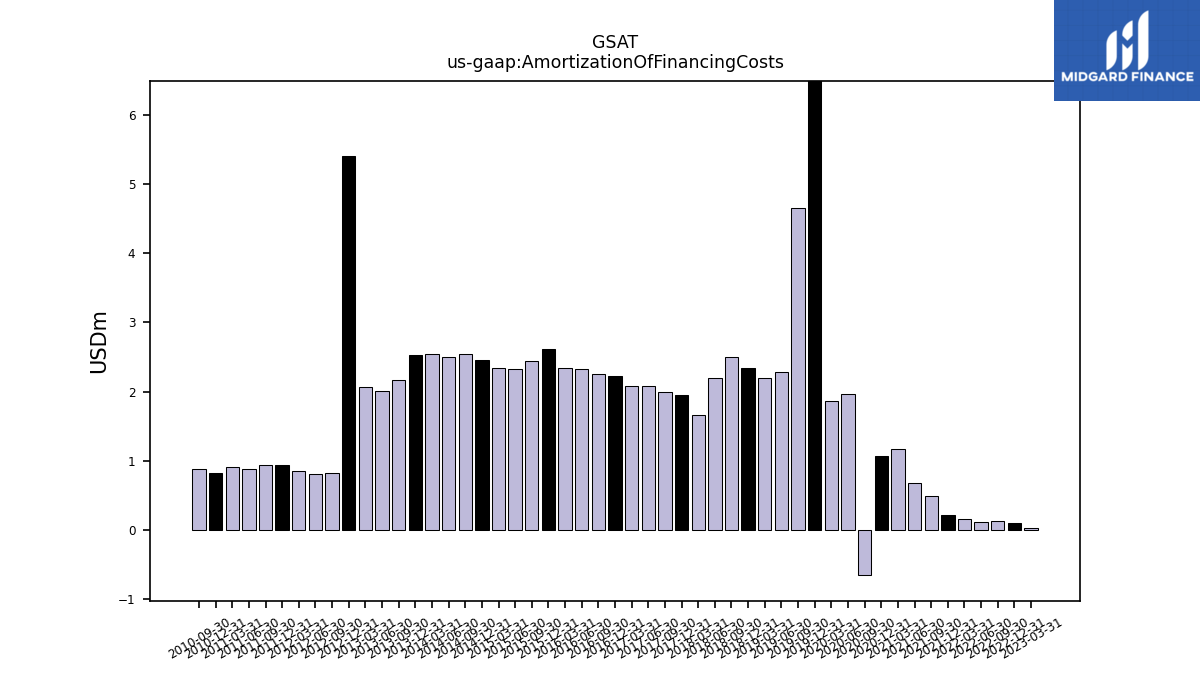
| Amortization Of Financing Costs | NA | NA | 0.03 | 0.10 | 0.13 | 0.12 | 0.17 | 0.22 | 0.50 | 0.68 | 1.17 | 1.07 | -0.65 | 1.96 | 1.86 | 6.76 | 4.66 | 2.28 | 2.20 | 2.34 | 2.50 | 2.19 | 1.66 | 1.95 | 1.99 | 2.08 | 2.08 | 2.23 | 2.26 | 2.33 | 2.35 | 2.61 | 2.44 | 2.33 | 2.34 | 2.45 | 2.55 | 2.50 | 2.54 | 2.54 | 2.17 | 2.01 | 2.07 | 5.41 | 0.82 | 0.82 | 0.86 | 0.94 | 0.94 | 0.89 | 0.91 | 0.82 | 0.89 | NA | NA |
| 2023-09-30 | 2023-06-30 | 2023-03-31 | 2022-12-31 | 2022-09-30 | 2022-06-30 | 2022-03-31 | 2021-12-31 | 2021-09-30 | 2021-06-30 | 2021-03-31 | 2020-12-31 | 2020-09-30 | 2020-06-30 | 2020-03-31 | 2019-12-31 | 2019-09-30 | 2019-06-30 | 2019-03-31 | 2018-12-31 | 2018-09-30 | 2018-06-30 | 2018-03-31 | 2017-12-31 | 2017-09-30 | 2017-06-30 | 2017-03-31 | 2016-12-31 | 2016-09-30 | 2016-06-30 | 2016-03-31 | 2015-12-31 | 2015-09-30 | 2015-06-30 | 2015-03-31 | 2014-12-31 | 2014-09-30 | 2014-06-30 | 2014-03-31 | 2013-12-31 | 2013-09-30 | 2013-06-30 | 2013-03-31 | 2012-12-31 | 2012-09-30 | 2012-06-30 | 2012-03-31 | 2011-12-31 | 2011-09-30 | 2011-06-30 | 2011-03-31 | 2010-12-31 | 2010-09-30 | 2010-06-30 | 2010-03-31 | ||
|---|---|---|---|---|---|---|---|---|---|---|---|---|---|---|---|---|---|---|---|---|---|---|---|---|---|---|---|---|---|---|---|---|---|---|---|---|---|---|---|---|---|---|---|---|---|---|---|---|---|---|---|---|---|---|---|---|
| Net Cash Provided By Used In Investing Activities | -17.75 | -53.06 | -71.58 | -14.65 | -2.91 | -11.94 | -10.45 | -15.15 | -18.04 | -7.02 | -4.97 | -5.24 | -4.42 | -3.30 | -1.58 | -3.87 | -2.53 | -2.84 | -2.26 | -4.22 | -4.28 | -6.51 | -2.39 | -7.21 | -2.88 | -6.60 | -4.09 | -7.13 | -5.03 | -7.55 | -4.91 | -11.93 | -7.53 | -8.20 | -5.81 | -13.21 | -1.27 | NA | NA | -6.50 | -10.65 | -10.78 | -9.18 | -10.22 | -13.13 | -11.35 | -23.31 | -14.89 | -19.30 | -31.87 | -33.35 | -43.49 | -31.12 | NA | NA |
| 2023-09-30 | 2023-06-30 | 2023-03-31 | 2022-12-31 | 2022-09-30 | 2022-06-30 | 2022-03-31 | 2021-12-31 | 2021-09-30 | 2021-06-30 | 2021-03-31 | 2020-12-31 | 2020-09-30 | 2020-06-30 | 2020-03-31 | 2019-12-31 | 2019-09-30 | 2019-06-30 | 2019-03-31 | 2018-12-31 | 2018-09-30 | 2018-06-30 | 2018-03-31 | 2017-12-31 | 2017-09-30 | 2017-06-30 | 2017-03-31 | 2016-12-31 | 2016-09-30 | 2016-06-30 | 2016-03-31 | 2015-12-31 | 2015-09-30 | 2015-06-30 | 2015-03-31 | 2014-12-31 | 2014-09-30 | 2014-06-30 | 2014-03-31 | 2013-12-31 | 2013-09-30 | 2013-06-30 | 2013-03-31 | 2012-12-31 | 2012-09-30 | 2012-06-30 | 2012-03-31 | 2011-12-31 | 2011-09-30 | 2011-06-30 | 2011-03-31 | 2010-12-31 | 2010-09-30 | 2010-06-30 | 2010-03-31 | ||
|---|---|---|---|---|---|---|---|---|---|---|---|---|---|---|---|---|---|---|---|---|---|---|---|---|---|---|---|---|---|---|---|---|---|---|---|---|---|---|---|---|---|---|---|---|---|---|---|---|---|---|---|---|---|---|---|---|
| Net Cash Provided By Used In Financing Activities | -8.92 | 77.67 | 37.15 | -0.16 | -6.33 | 0.44 | 0.01 | -57.56 | -37.50 | -84.47 | 39.24 | 0.29 | -3.10 | 4.39 | -0.42 | -21.49 | -0.17 | 13.93 | -0.19 | 20.34 | 0.08 | -38.61 | 0.00 | 61.05 | -0.15 | -9.13 | 12.02 | 3.42 | -0.01 | 8.57 | 6.53 | -2.92 | 15.01 | 11.13 | 10.06 | -3.80 | 0.32 | NA | NA | 25.93 | 6.59 | 16.94 | -0.49 | 24.53 | 0.00 | 4.60 | 23.26 | 13.88 | 7.31 | 49.36 | 12.10 | 35.37 | 3.90 | NA | NA | |
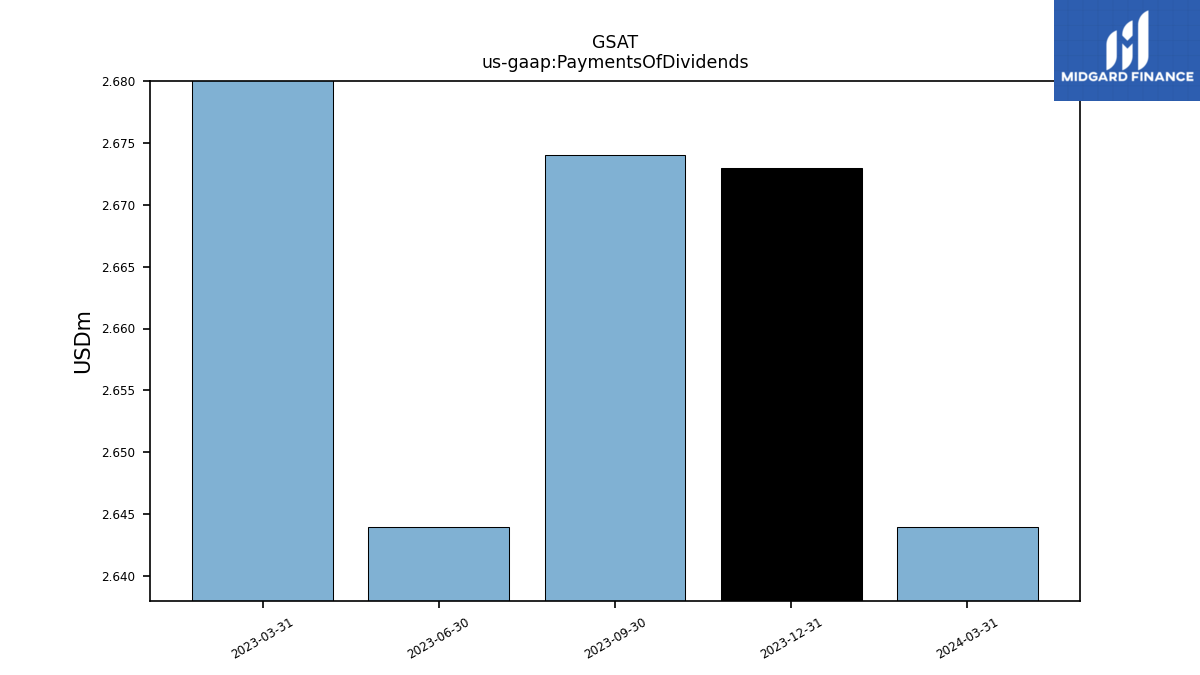
| Payments Of Dividends | 2.67 | 2.64 | 3.95 | NA | NA | NA | NA | NA | NA | NA | NA | NA | NA | NA | NA | NA | NA | NA | NA | NA | NA | NA | NA | NA | NA | NA | NA | NA | NA | NA | NA | NA | NA | NA | NA | NA | NA | NA | NA | NA | NA | NA | NA | NA | NA | NA | NA | NA | NA | NA | NA | NA | NA | NA | NA |
| 2023-09-30 | 2023-06-30 | 2023-03-31 | 2022-12-31 | 2022-09-30 | 2022-06-30 | 2022-03-31 | 2021-12-31 | 2021-09-30 | 2021-06-30 | 2021-03-31 | 2020-12-31 | 2020-09-30 | 2020-06-30 | 2020-03-31 | 2019-12-31 | 2019-09-30 | 2019-06-30 | 2019-03-31 | 2018-12-31 | 2018-09-30 | 2018-06-30 | 2018-03-31 | 2017-12-31 | 2017-09-30 | 2017-06-30 | 2017-03-31 | 2016-12-31 | 2016-09-30 | 2016-06-30 | 2016-03-31 | 2015-12-31 | 2015-09-30 | 2015-06-30 | 2015-03-31 | 2014-12-31 | 2014-09-30 | 2014-06-30 | 2014-03-31 | 2013-12-31 | 2013-09-30 | 2013-06-30 | 2013-03-31 | 2012-12-31 | 2012-09-30 | 2012-06-30 | 2012-03-31 | 2011-12-31 | 2011-09-30 | 2011-06-30 | 2011-03-31 | 2010-12-31 | 2010-09-30 | 2010-06-30 | 2010-03-31 | ||
|---|---|---|---|---|---|---|---|---|---|---|---|---|---|---|---|---|---|---|---|---|---|---|---|---|---|---|---|---|---|---|---|---|---|---|---|---|---|---|---|---|---|---|---|---|---|---|---|---|---|---|---|---|---|---|---|---|
| Revenues | 57.68 | 55.07 | 58.64 | 41.31 | 37.63 | 36.80 | 32.77 | 34.48 | 32.61 | 30.28 | 26.93 | 33.17 | 32.76 | 30.36 | 32.19 | 31.84 | 38.61 | 31.19 | 30.08 | 31.95 | 35.69 | 33.73 | 28.75 | 29.43 | 30.46 | 28.12 | 24.65 | 24.39 | 25.54 | 25.09 | 21.84 | 22.77 | 23.68 | 23.02 | 21.02 | 22.09 | 23.44 | 23.99 | 20.54 | 20.99 | 22.55 | 19.84 | 19.33 | 19.06 | 20.54 | 19.98 | 16.74 | 17.39 | 18.19 | 19.00 | 18.25 | 16.52 | 18.22 | 17.62 | 15.57 | |
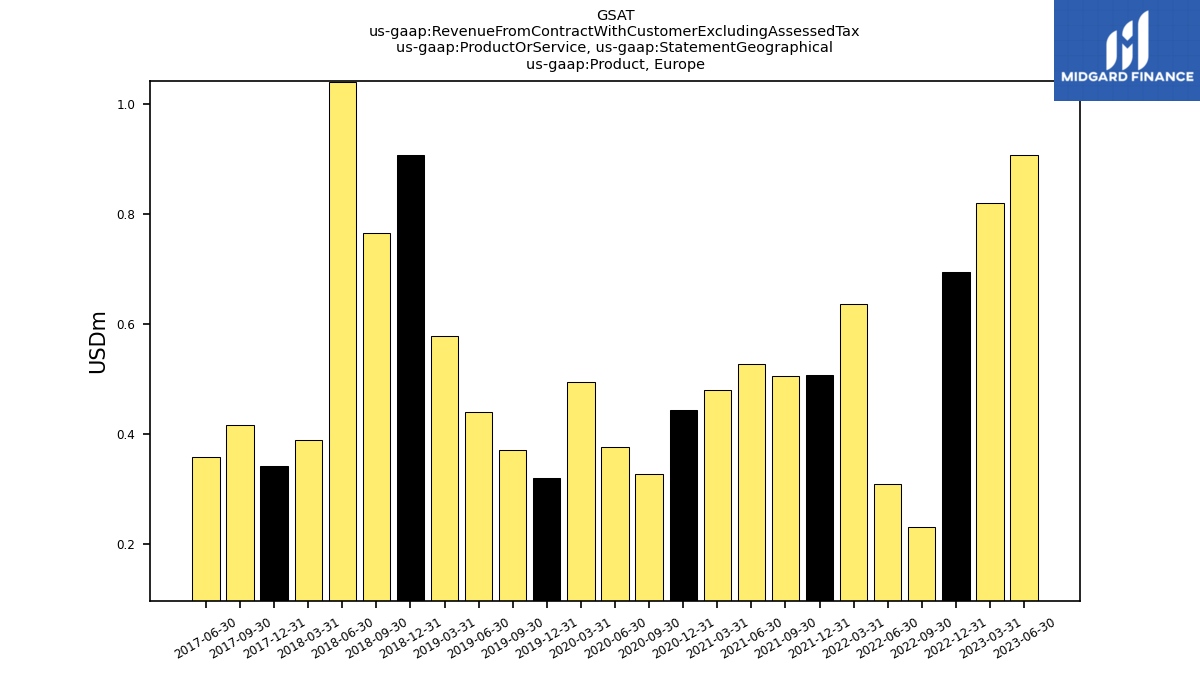
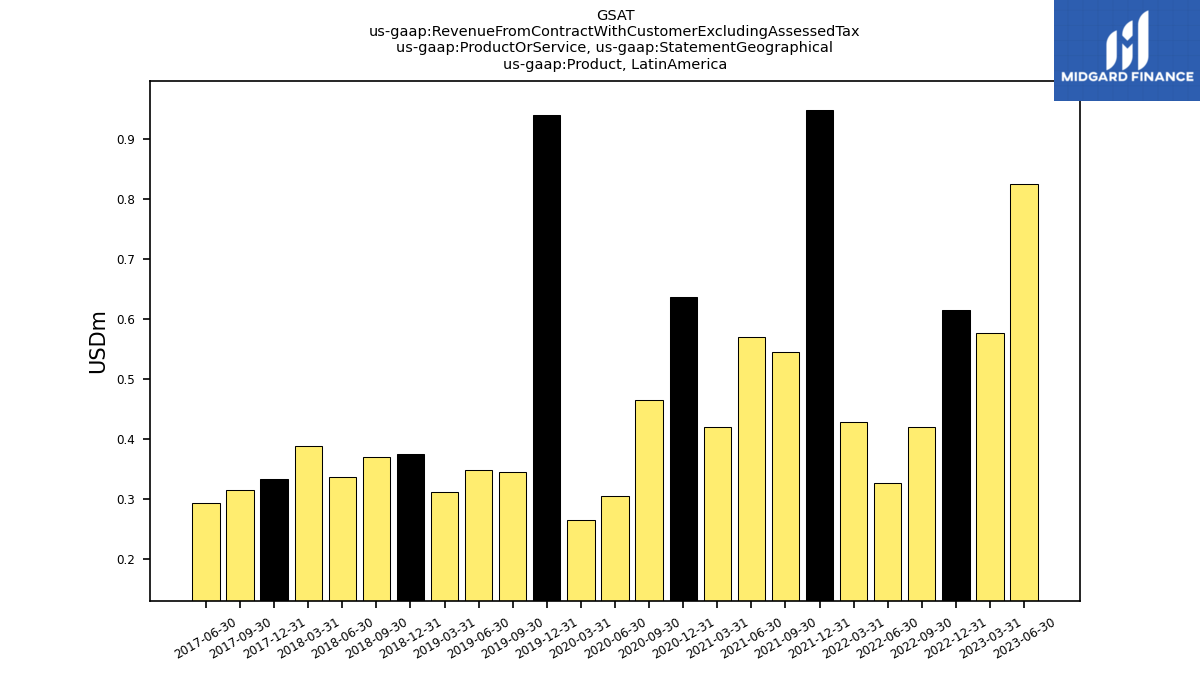
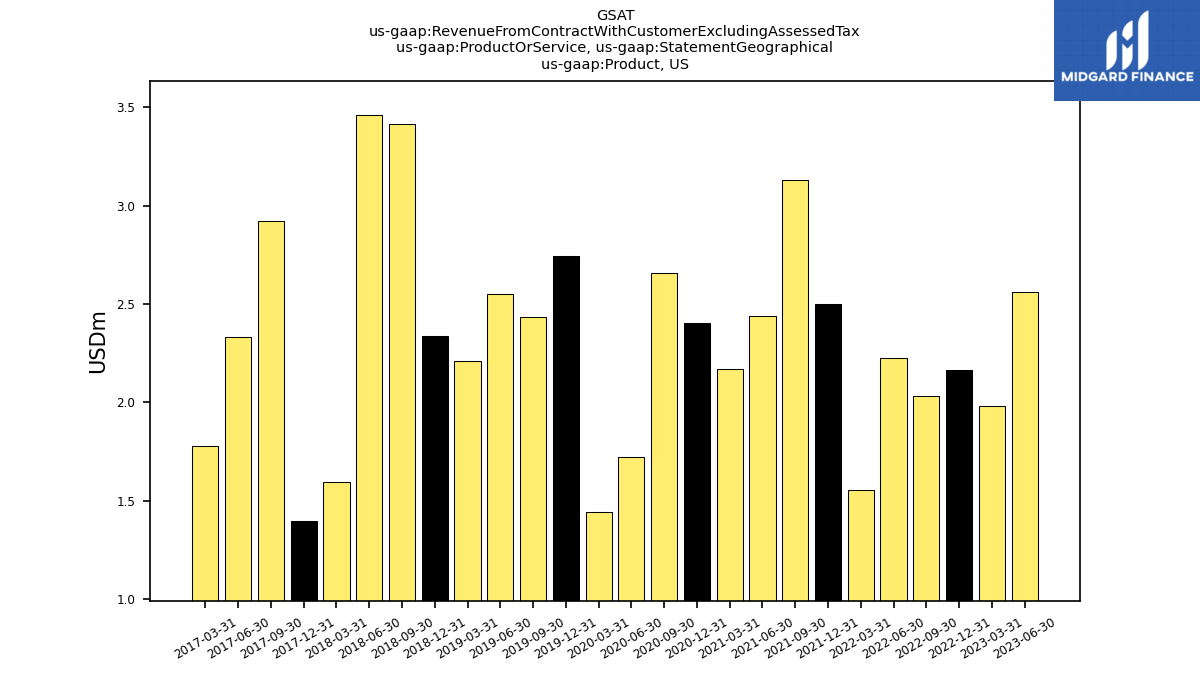
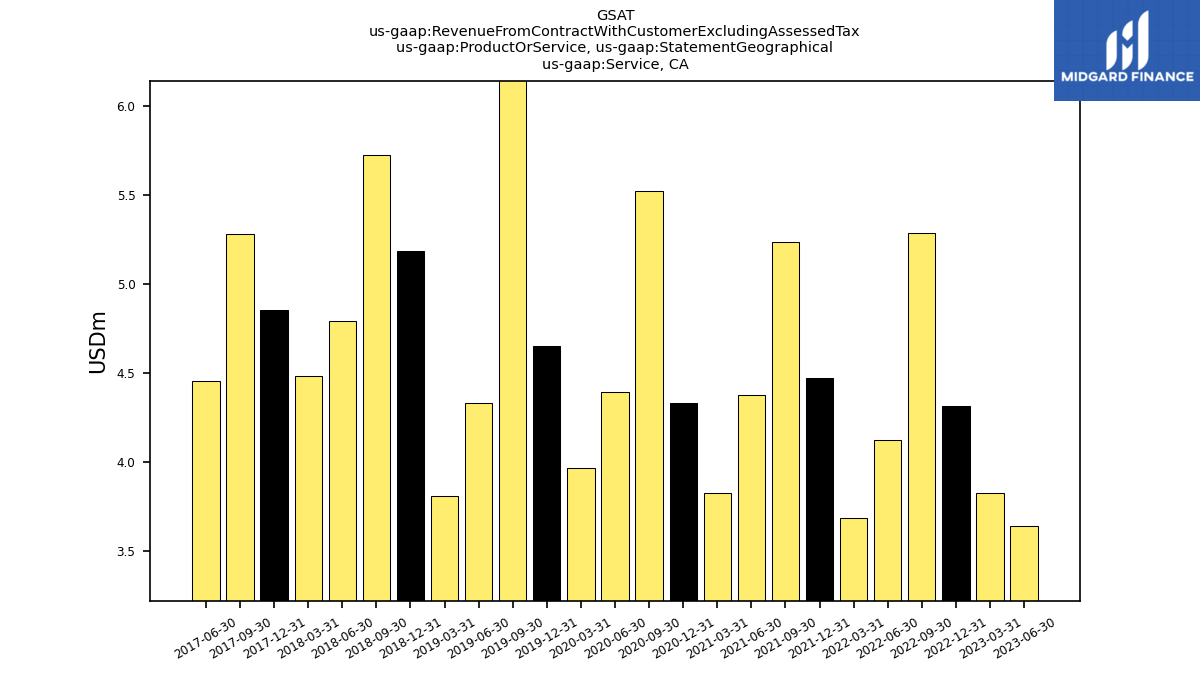
| Revenue From Contract With Customer Excluding Assessed Tax | 57.68 | 55.07 | 58.64 | 41.31 | 37.63 | 36.80 | 32.77 | 34.48 | 32.61 | 30.28 | 26.93 | 33.17 | 32.76 | 30.36 | 32.19 | 31.84 | 38.61 | 31.19 | 30.08 | 31.95 | 35.69 | 33.73 | 28.75 | 29.43 | 30.46 | 28.12 | 24.65 | 24.39 | 25.54 | 25.09 | 21.84 | 22.77 | 23.68 | 23.02 | 21.02 | 22.09 | 23.44 | 23.99 | 20.54 | 20.99 | 22.55 | 19.84 | 19.33 | 19.06 | 20.54 | 19.98 | 16.74 | 17.39 | 18.19 | 19.00 | 18.25 | 16.52 | 18.22 | 17.62 | 15.57 | |
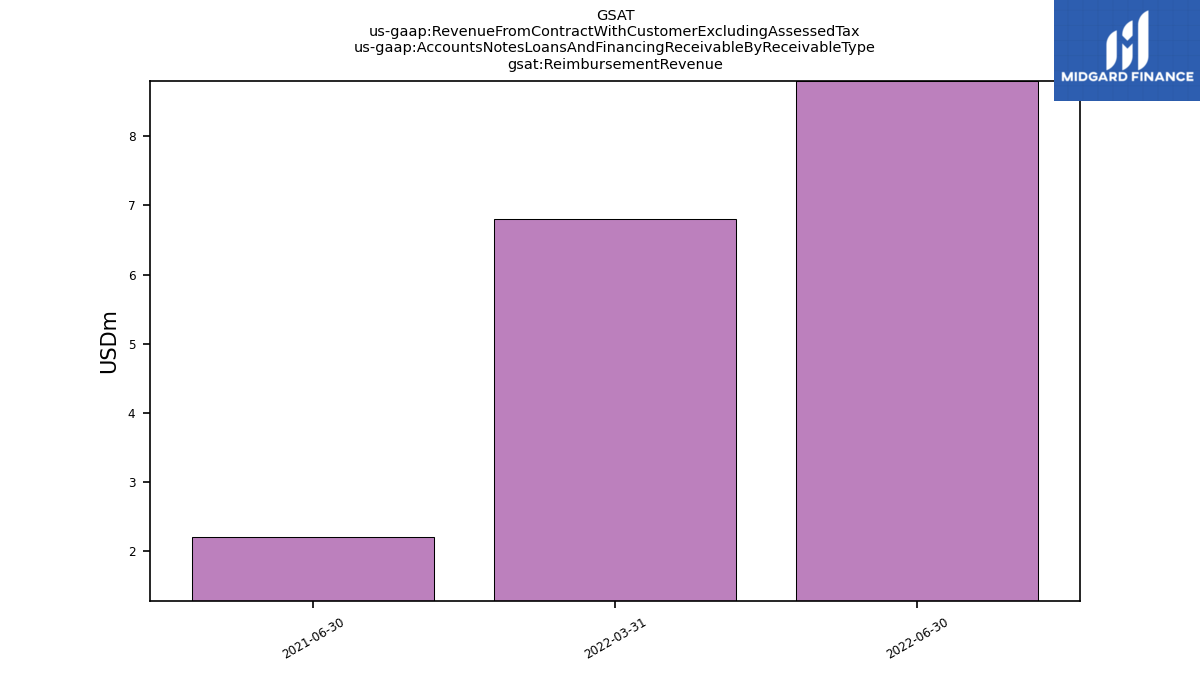
| Reimbursement Revenue | NA | NA | NA | NA | NA | 8.80 | 6.80 | NA | NA | 2.20 | NA | NA | NA | NA | NA | NA | NA | NA | NA | NA | NA | NA | NA | NA | NA | NA | NA | NA | NA | NA | NA | NA | NA | NA | NA | NA | NA | NA | NA | NA | NA | NA | NA | NA | NA | NA | NA | NA | NA | NA | NA | NA | NA | NA | NA | |
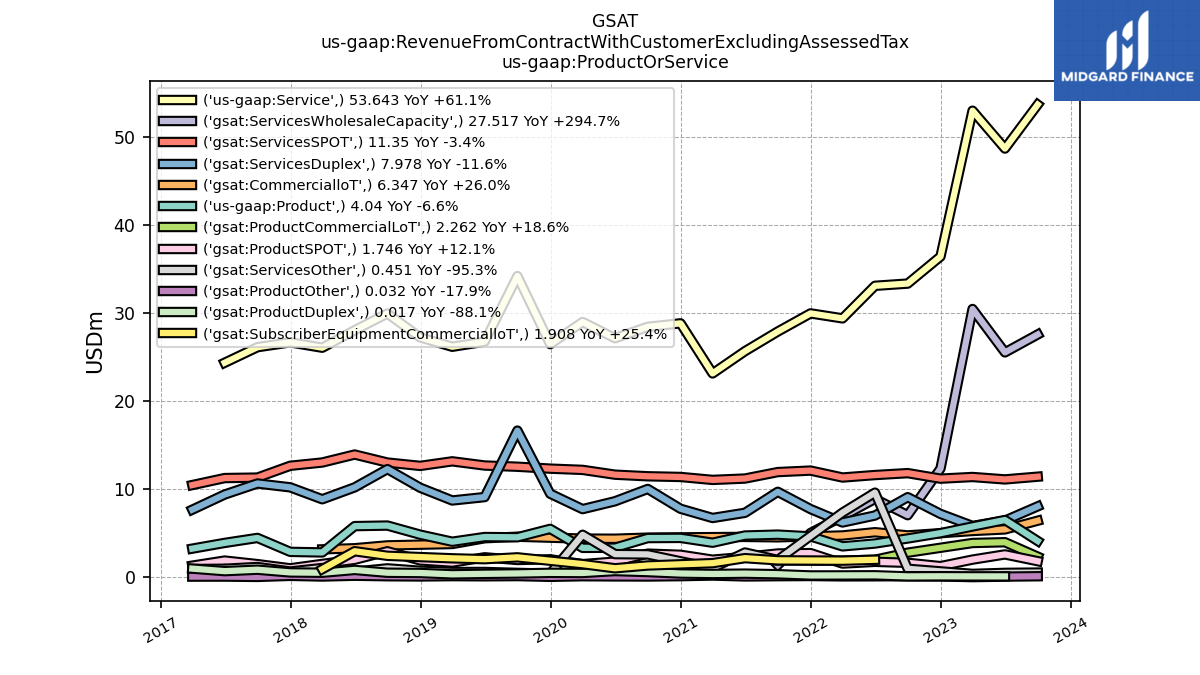
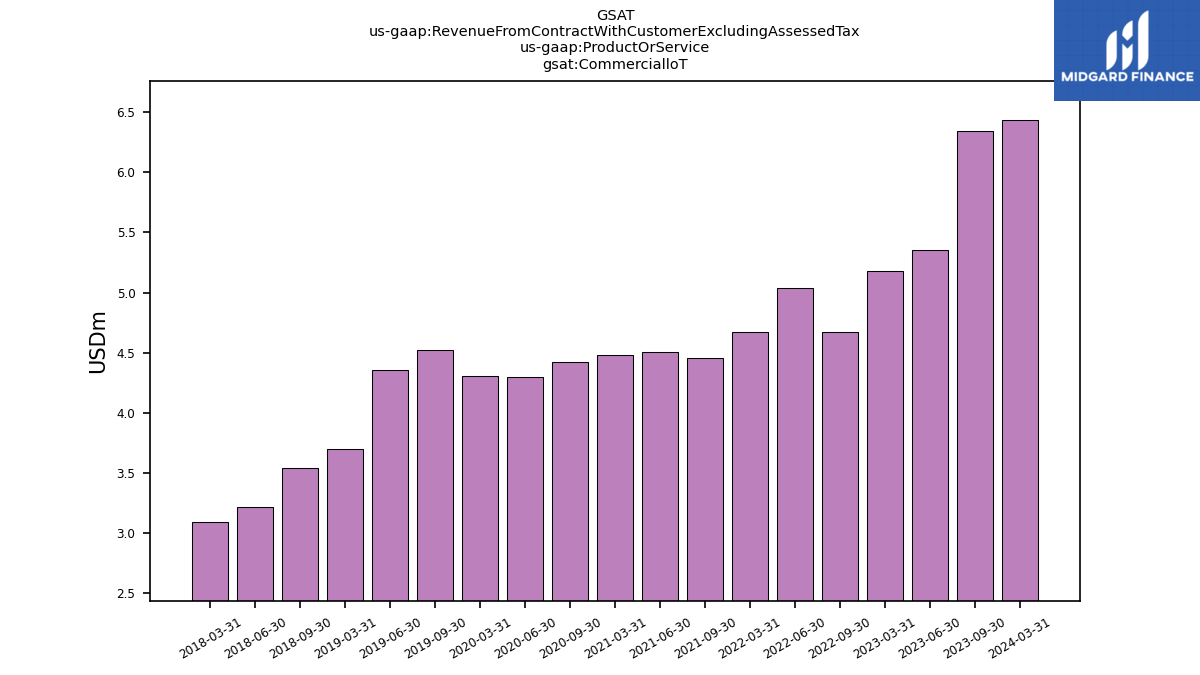
| Commerciallo T | 6.35 | 5.36 | 5.18 | NA | 4.67 | 5.04 | 4.67 | NA | 4.46 | 4.50 | 4.48 | NA | 4.42 | 4.30 | 4.31 | NA | 4.53 | 4.35 | 3.70 | NA | 3.54 | 3.22 | 3.09 | NA | NA | NA | NA | NA | NA | NA | NA | NA | NA | NA | NA | NA | NA | NA | NA | NA | NA | NA | NA | NA | NA | NA | NA | NA | NA | NA | NA | NA | NA | NA | NA | |
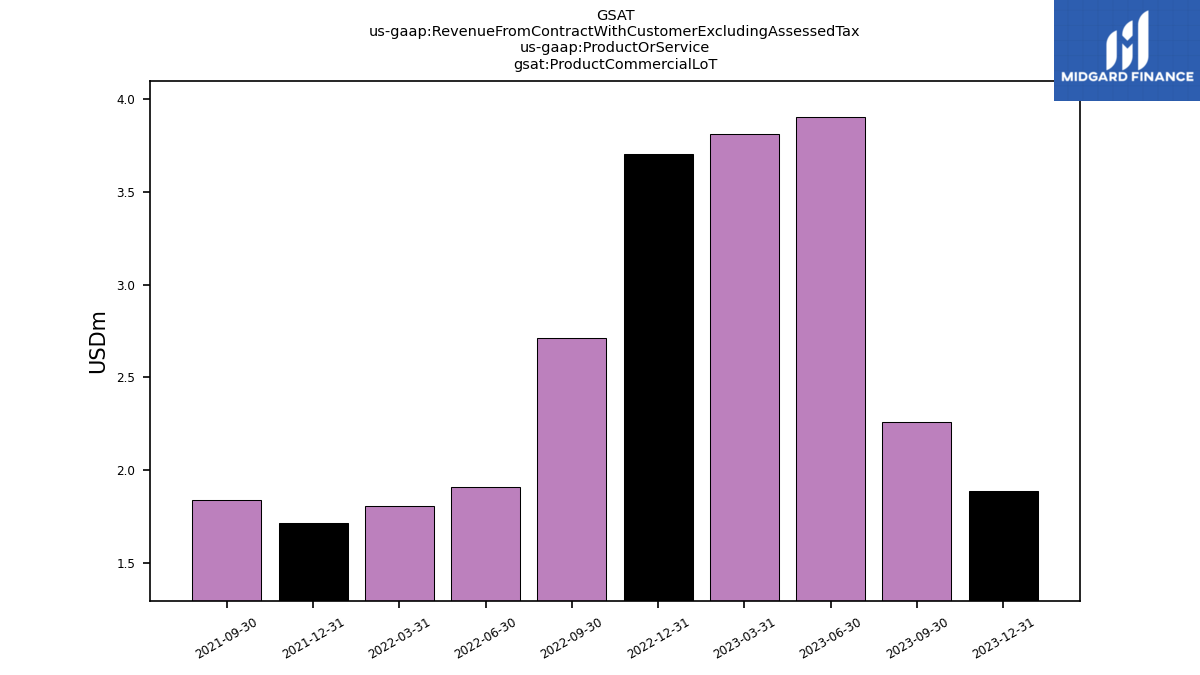
| Product Commercial Lo T | 2.26 | 3.90 | 3.81 | NA | 2.71 | 1.91 | 1.81 | NA | 1.84 | NA | NA | NA | NA | NA | NA | NA | NA | NA | NA | NA | NA | NA | NA | NA | NA | NA | NA | NA | NA | NA | NA | NA | NA | NA | NA | NA | NA | NA | NA | NA | NA | NA | NA | NA | NA | NA | NA | NA | NA | NA | NA | NA | NA | NA | NA | |
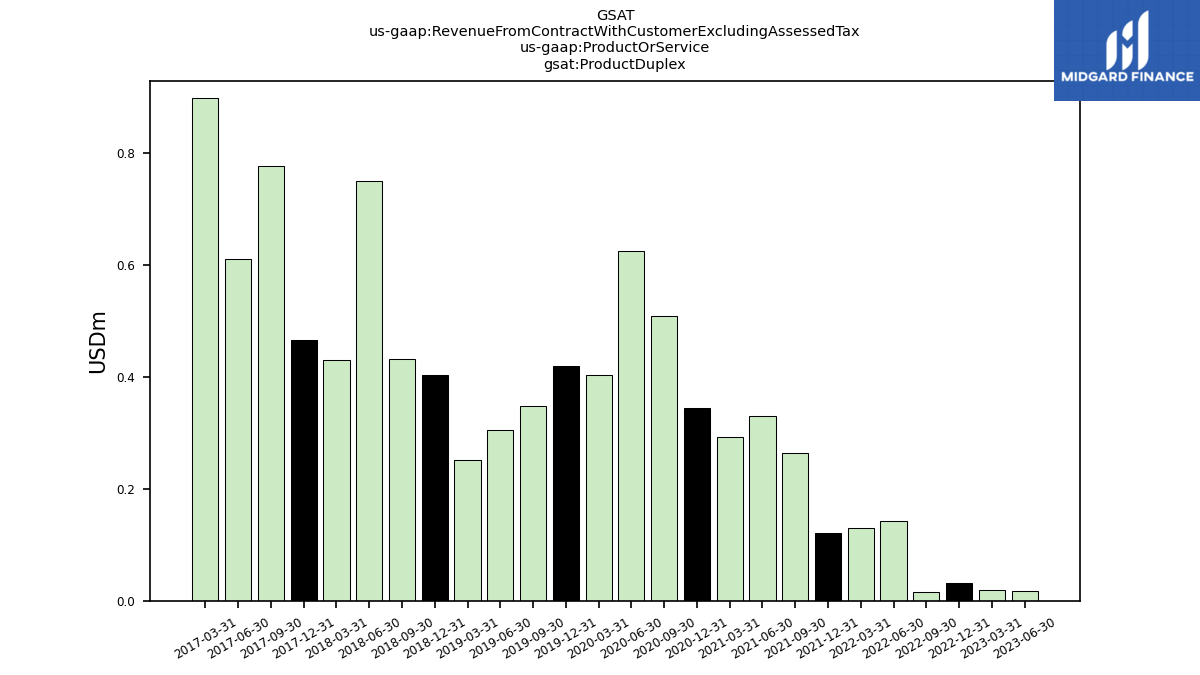
| Product Duplex | NA | 0.02 | 0.02 | 0.03 | 0.01 | 0.14 | 0.13 | 0.12 | 0.27 | 0.33 | 0.29 | 0.34 | 0.51 | 0.62 | 0.40 | 0.42 | 0.35 | 0.31 | 0.25 | 0.40 | 0.43 | 0.75 | 0.43 | 0.47 | 0.78 | 0.61 | 0.90 | NA | NA | NA | NA | NA | NA | NA | NA | NA | NA | NA | NA | NA | NA | NA | NA | NA | NA | NA | NA | NA | NA | NA | NA | NA | NA | NA | NA | |
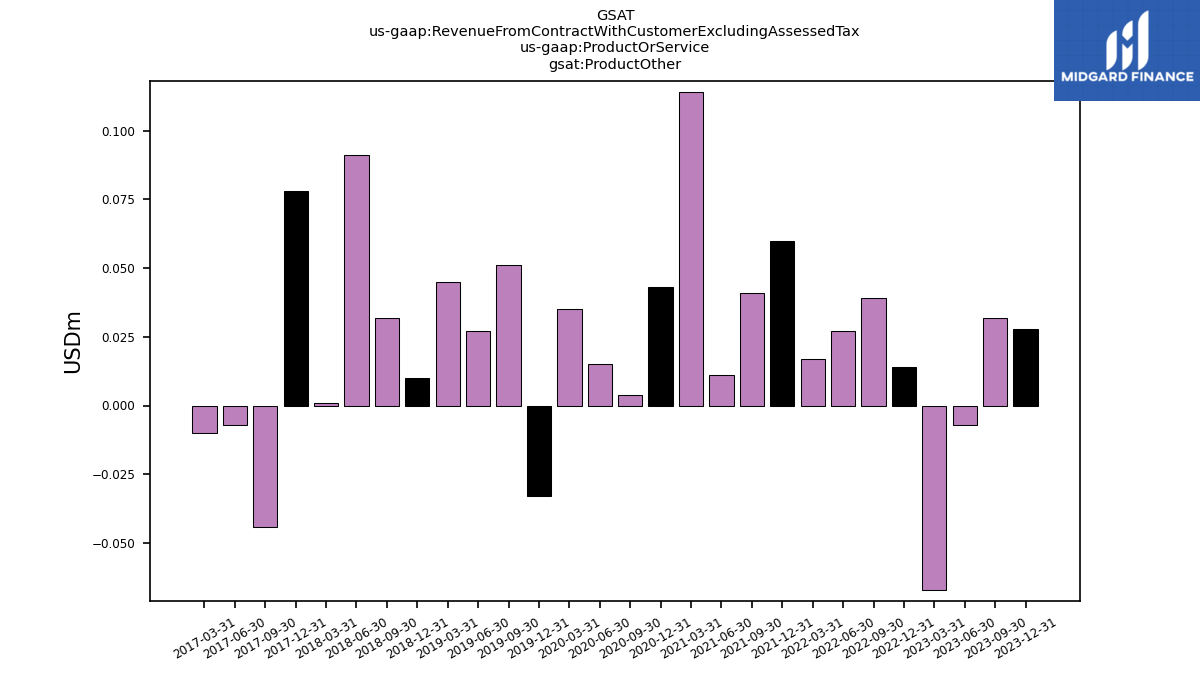
| Product Other | 0.03 | -0.01 | -0.07 | 0.01 | 0.04 | 0.03 | 0.02 | 0.06 | 0.04 | 0.01 | 0.11 | 0.04 | 0.00 | 0.01 | 0.04 | -0.03 | 0.05 | 0.03 | 0.04 | 0.01 | 0.03 | 0.09 | 0.00 | 0.08 | -0.04 | -0.01 | -0.01 | NA | NA | NA | NA | NA | NA | NA | NA | NA | NA | NA | NA | NA | NA | NA | NA | NA | NA | NA | NA | NA | NA | NA | NA | NA | NA | NA | NA | |
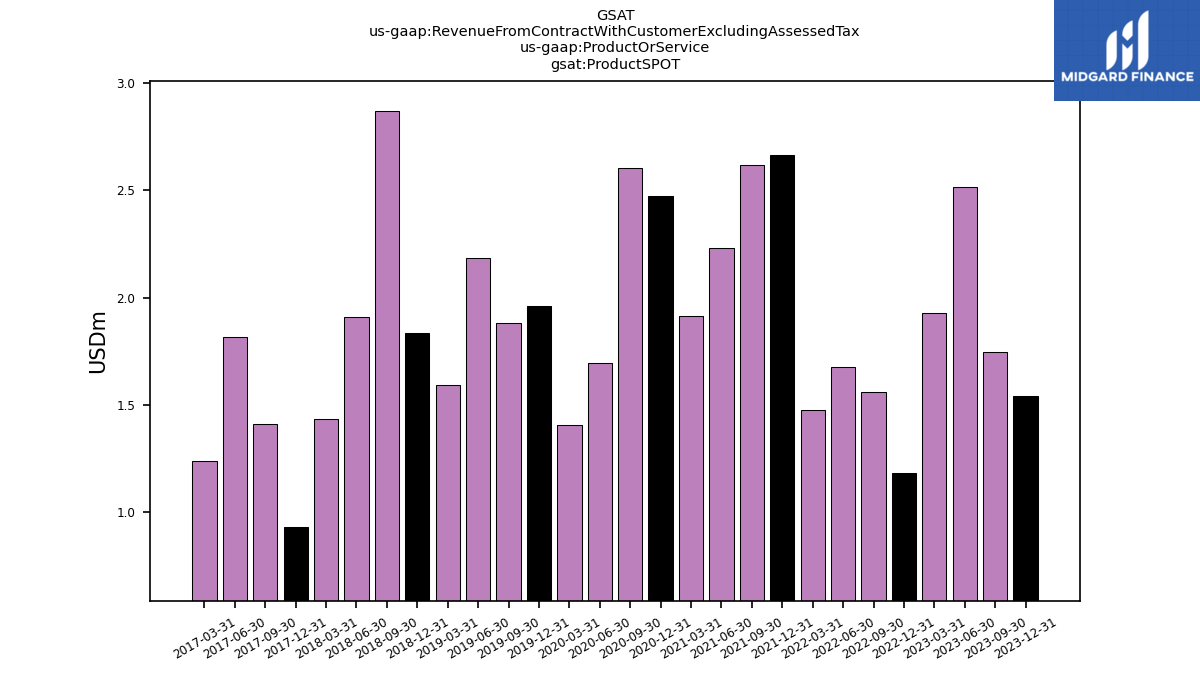
| Product S P O T | 1.75 | 2.51 | 1.93 | 1.18 | 1.56 | 1.67 | 1.48 | 2.66 | 2.62 | 2.23 | 1.92 | 2.47 | 2.60 | 1.70 | 1.41 | 1.96 | 1.88 | 2.19 | 1.59 | 1.83 | 2.87 | 1.91 | 1.43 | 0.93 | 1.41 | 1.81 | 1.24 | NA | NA | NA | NA | NA | NA | NA | NA | NA | NA | NA | NA | NA | NA | NA | NA | NA | NA | NA | NA | NA | NA | NA | NA | NA | NA | NA | NA | |
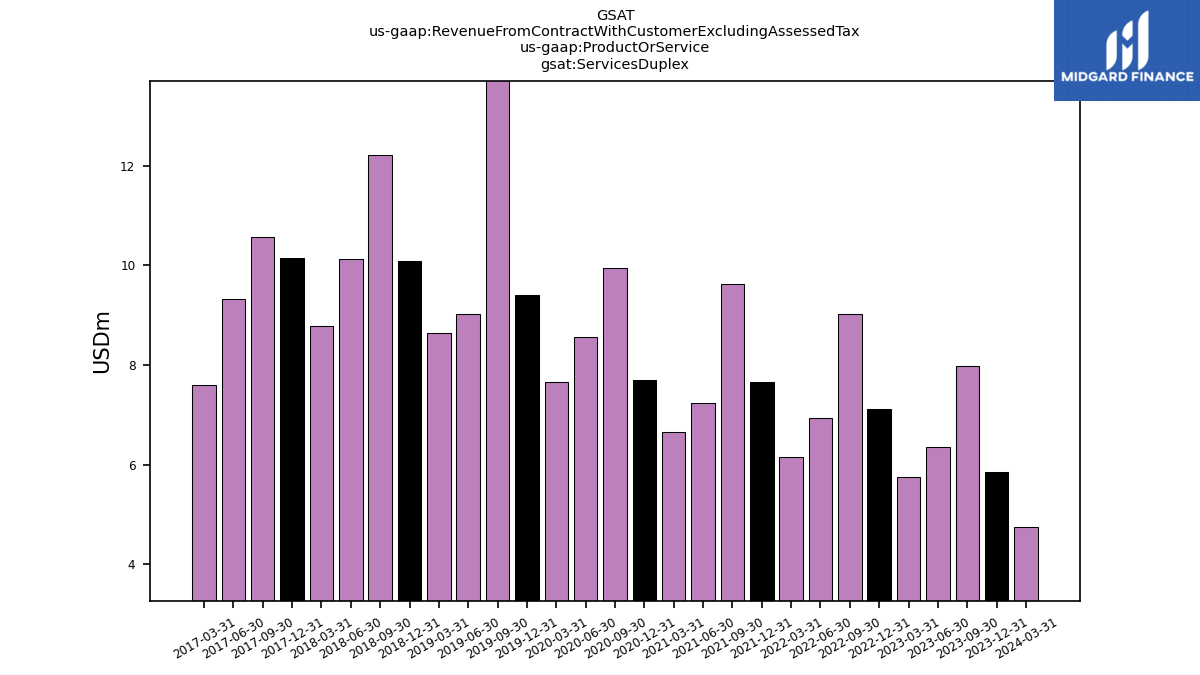
| Services Duplex | 7.98 | 6.36 | 5.75 | 7.12 | 9.02 | 6.94 | 6.15 | 7.67 | 9.63 | 7.24 | 6.66 | 7.70 | 9.96 | 8.56 | 7.66 | 9.41 | 16.59 | 9.03 | 8.64 | 10.09 | 12.21 | 10.13 | 8.78 | 10.14 | 10.58 | 9.32 | 7.60 | NA | NA | NA | NA | NA | NA | NA | NA | NA | NA | NA | NA | NA | NA | NA | NA | NA | NA | NA | NA | NA | NA | NA | NA | NA | NA | NA | NA | |
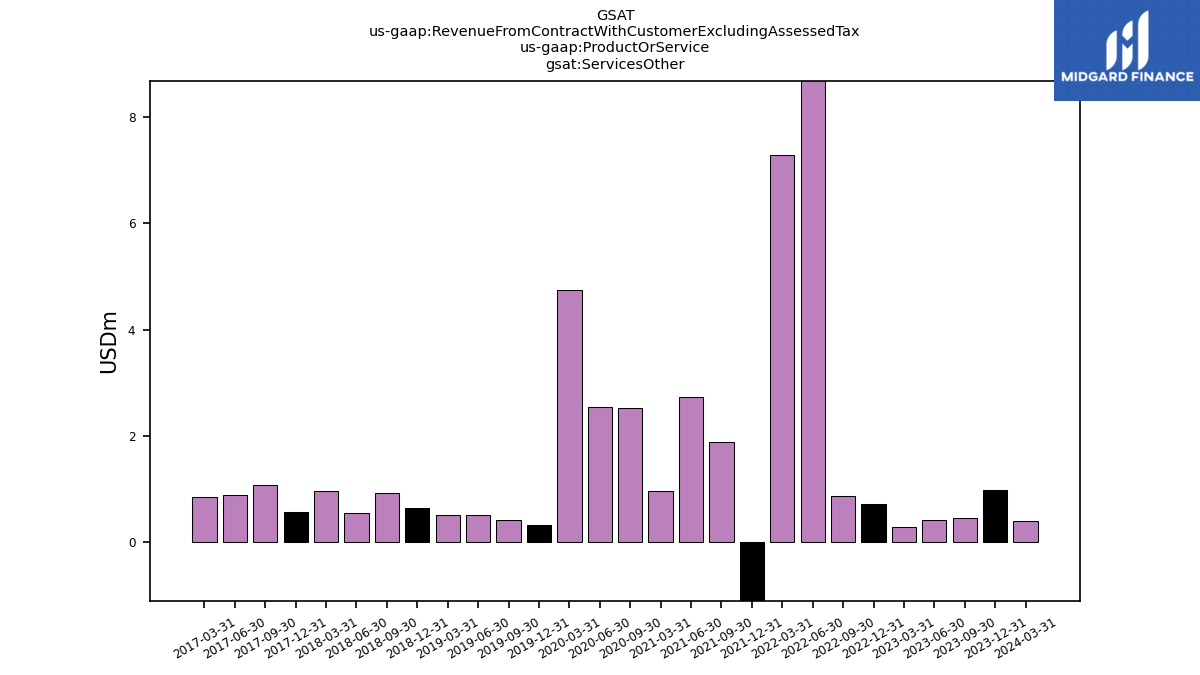
| Services Other | 0.45 | 0.42 | 0.30 | NA | 0.88 | 9.54 | 7.27 | NA | 1.89 | 2.73 | 0.97 | NA | 2.52 | 2.55 | 4.75 | 0.33 | 0.42 | 0.52 | 0.52 | 0.66 | 0.93 | 0.56 | 0.97 | 0.57 | 1.08 | 0.88 | 0.86 | NA | NA | NA | NA | NA | NA | NA | NA | NA | NA | NA | NA | NA | NA | NA | NA | NA | NA | NA | NA | NA | NA | NA | NA | NA | NA | NA | NA | |
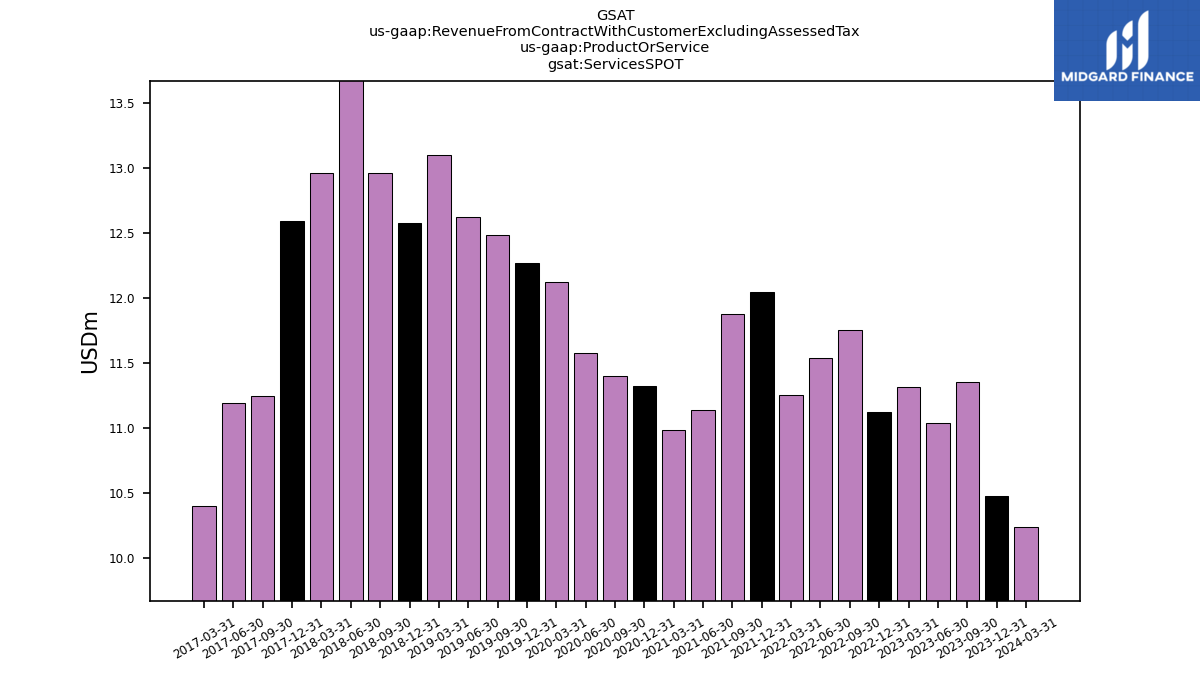
| Services S P O T | 11.35 | 11.04 | 11.31 | 11.13 | 11.75 | 11.54 | 11.26 | 12.04 | 11.87 | 11.14 | 10.98 | 11.32 | 11.40 | 11.58 | 12.12 | 12.27 | 12.48 | 12.62 | 13.10 | 12.58 | 12.96 | 13.87 | 12.96 | 12.59 | 11.25 | 11.19 | 10.40 | NA | NA | NA | NA | NA | NA | NA | NA | NA | NA | NA | NA | NA | NA | NA | NA | NA | NA | NA | NA | NA | NA | NA | NA | NA | NA | NA | NA | |
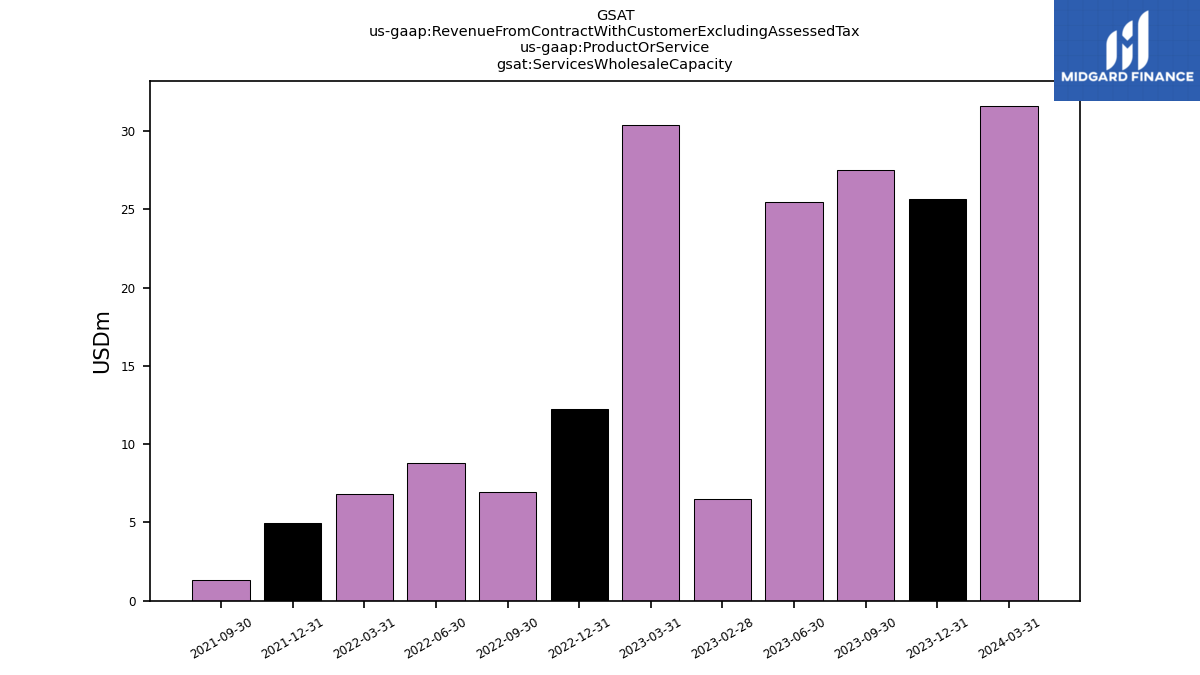
| Services Wholesale Capacity | 27.52 | 25.48 | 30.41 | 12.27 | 6.97 | 8.82 | 6.84 | 4.95 | 1.30 | NA | NA | NA | NA | NA | NA | NA | NA | NA | NA | NA | NA | NA | NA | NA | NA | NA | NA | NA | NA | NA | NA | NA | NA | NA | NA | NA | NA | NA | NA | NA | NA | NA | NA | NA | NA | NA | NA | NA | NA | NA | NA | NA | NA | NA | NA | |
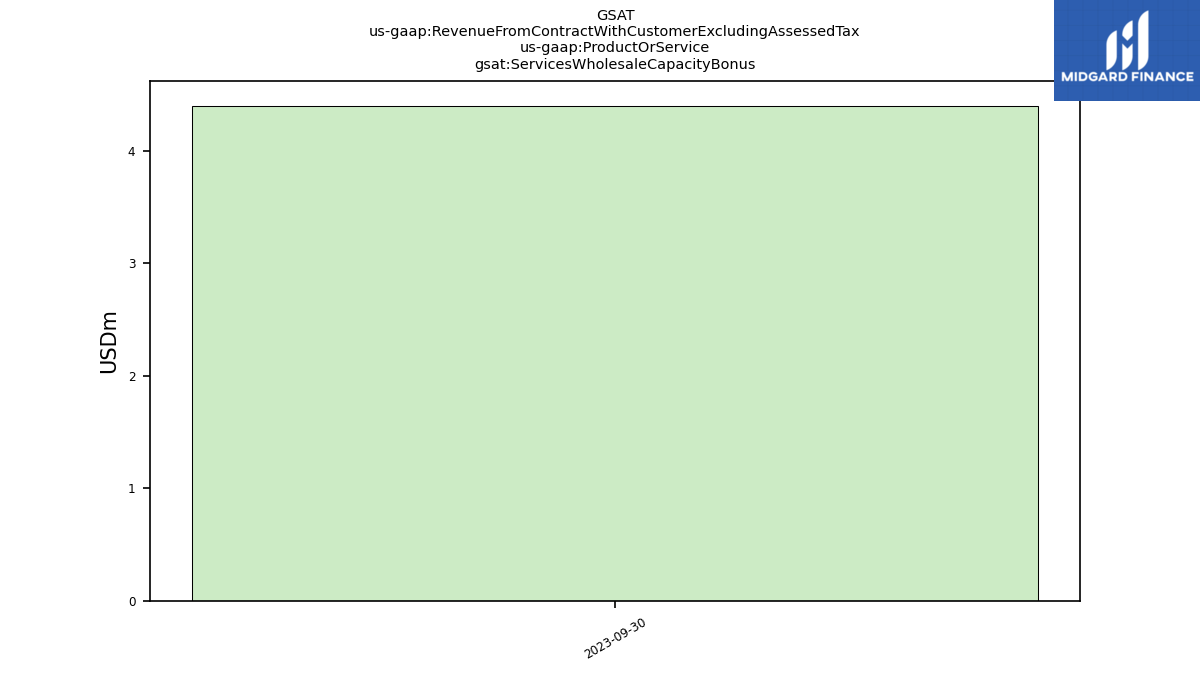
| Services Wholesale Capacity Bonus | 4.40 | NA | NA | NA | NA | NA | NA | NA | NA | NA | NA | NA | NA | NA | NA | NA | NA | NA | NA | NA | NA | NA | NA | NA | NA | NA | NA | NA | NA | NA | NA | NA | NA | NA | NA | NA | NA | NA | NA | NA | NA | NA | NA | NA | NA | NA | NA | NA | NA | NA | NA | NA | NA | NA | NA | |
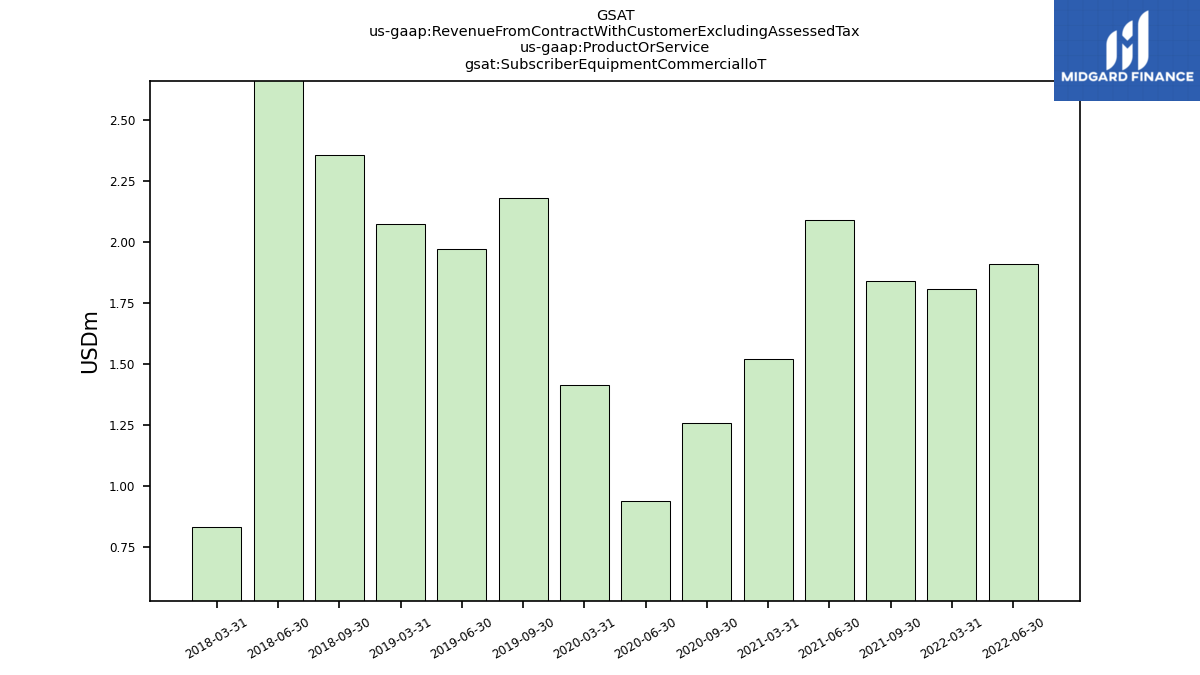
| Subscriber Equipment Commerciallo T | NA | NA | NA | NA | NA | 1.91 | 1.81 | NA | 1.84 | 2.09 | 1.52 | NA | 1.26 | 0.94 | 1.41 | NA | 2.18 | 1.97 | 2.07 | NA | 2.36 | 2.88 | 0.83 | NA | NA | NA | NA | NA | NA | NA | NA | NA | NA | NA | NA | NA | NA | NA | NA | NA | NA | NA | NA | NA | NA | NA | NA | NA | NA | NA | NA | NA | NA | NA | NA | |
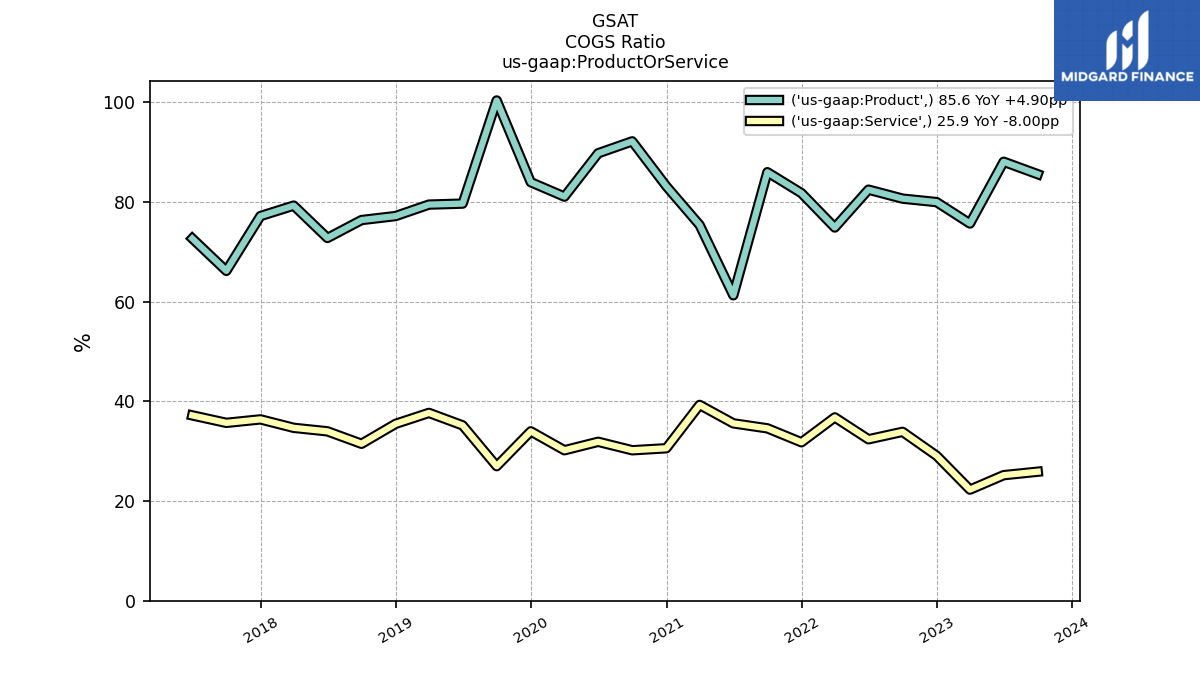
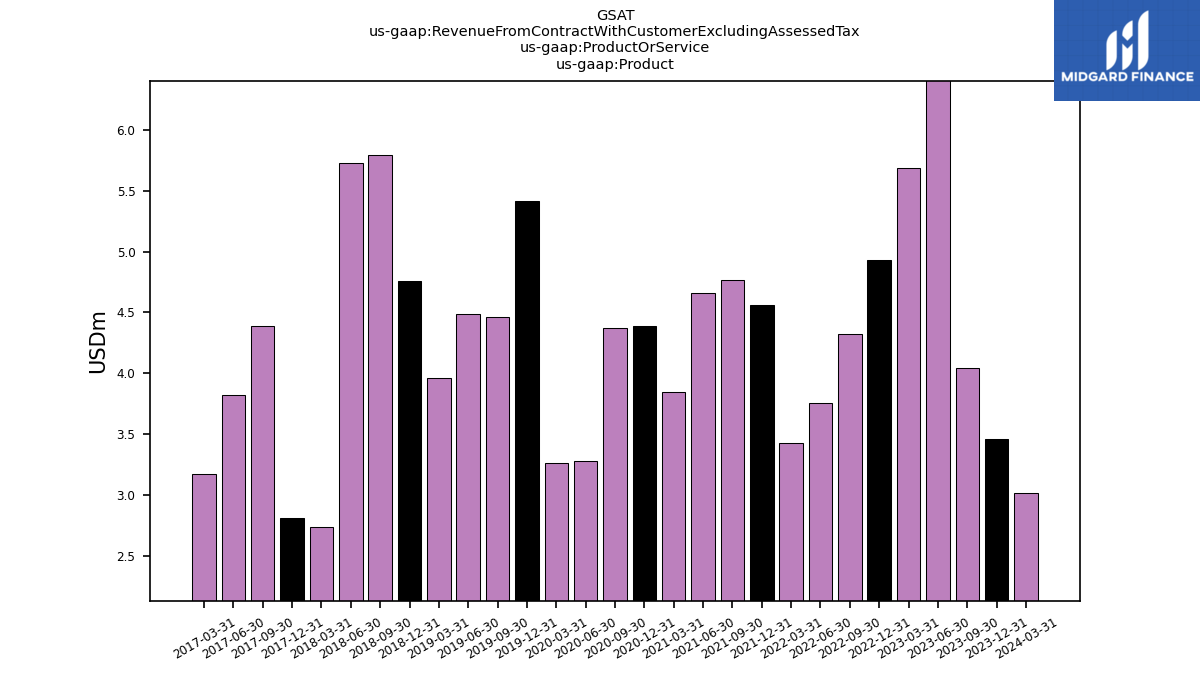
| Product | 4.04 | 6.42 | 5.69 | 4.93 | 4.33 | 3.75 | 3.43 | 4.56 | 4.77 | 4.66 | 3.84 | 4.39 | 4.37 | 3.27 | 3.26 | 5.42 | 4.46 | 4.49 | 3.96 | 4.76 | 5.79 | 5.73 | 2.74 | 2.81 | 4.39 | 3.82 | 3.17 | NA | NA | NA | NA | NA | NA | NA | NA | NA | NA | NA | NA | NA | NA | NA | NA | NA | NA | NA | NA | NA | NA | NA | NA | NA | NA | NA | NA | |
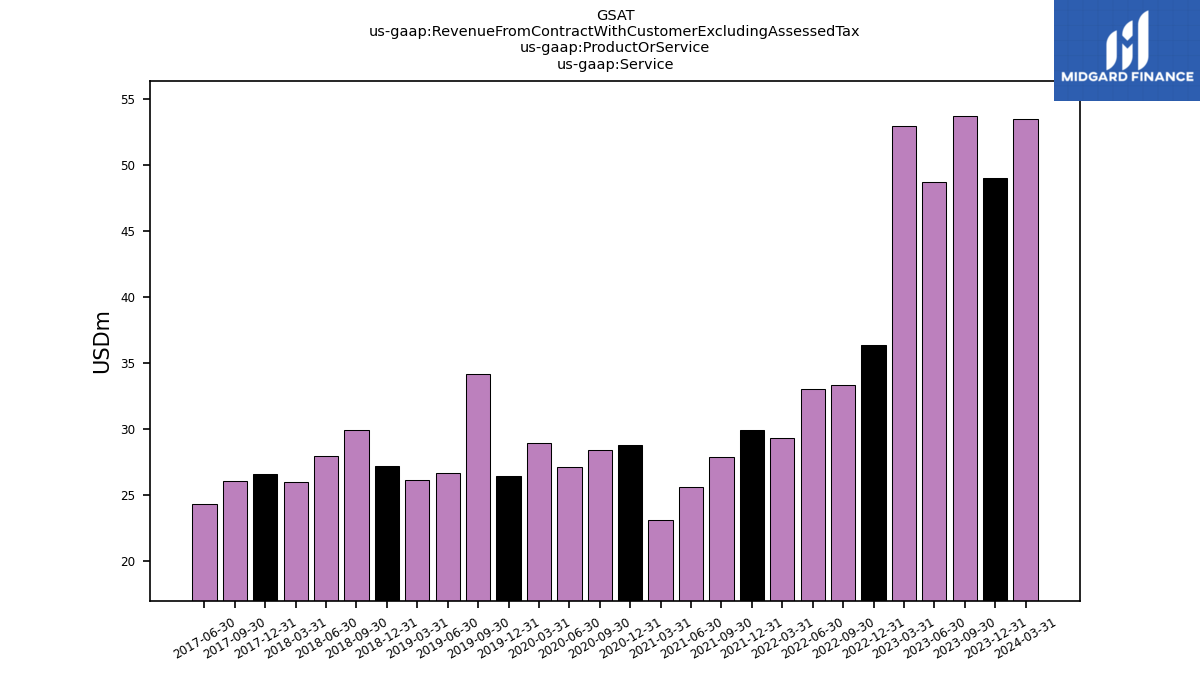
| Service | 53.64 | 48.65 | 52.95 | 36.38 | 33.30 | 33.05 | 29.34 | 29.91 | 27.85 | 25.62 | 23.09 | 28.78 | 28.39 | 27.09 | 28.93 | 26.41 | 34.15 | 26.70 | 26.12 | 27.19 | 29.90 | 28.00 | 26.01 | 26.62 | 26.07 | 24.30 | NA | NA | NA | NA | NA | NA | NA | NA | NA | NA | NA | NA | NA | NA | NA | NA | NA | NA | NA | NA | NA | NA | NA | NA | NA | NA | NA | NA | NA | |
| Product, | NA | 2.13 | 2.31 | 1.43 | 1.63 | 0.88 | 0.80 | 0.60 | 0.56 | 1.12 | 0.75 | 0.89 | 0.91 | 0.86 | 1.08 | 1.40 | 1.29 | 1.13 | 0.81 | 1.08 | 1.12 | 0.79 | 0.35 | 0.73 | 0.72 | 0.83 | 0.71 | NA | NA | NA | NA | NA | NA | NA | NA | NA | NA | NA | NA | NA | NA | NA | NA | NA | NA | NA | NA | NA | NA | NA | NA | NA | NA | NA | NA | |
| Product, | NA | 0.91 | 0.82 | 0.69 | 0.23 | 0.31 | 0.64 | 0.51 | 0.51 | 0.53 | 0.48 | 0.44 | 0.33 | 0.38 | 0.49 | 0.32 | 0.37 | 0.44 | 0.58 | 0.91 | 0.77 | 1.04 | 0.39 | 0.34 | 0.42 | 0.36 | NA | NA | NA | NA | NA | NA | NA | NA | NA | NA | NA | NA | NA | NA | NA | NA | NA | NA | NA | NA | NA | NA | NA | NA | NA | NA | NA | NA | NA | |
| Product, | NA | 0.82 | 0.58 | 0.62 | 0.42 | 0.33 | 0.43 | 0.95 | 0.55 | 0.57 | 0.42 | 0.64 | 0.47 | 0.31 | 0.27 | 0.94 | 0.34 | 0.35 | 0.31 | 0.38 | 0.37 | 0.34 | 0.39 | 0.33 | 0.32 | 0.29 | NA | NA | NA | NA | NA | NA | NA | NA | NA | NA | NA | NA | NA | NA | NA | NA | NA | NA | NA | NA | NA | NA | NA | NA | NA | NA | NA | NA | NA | |
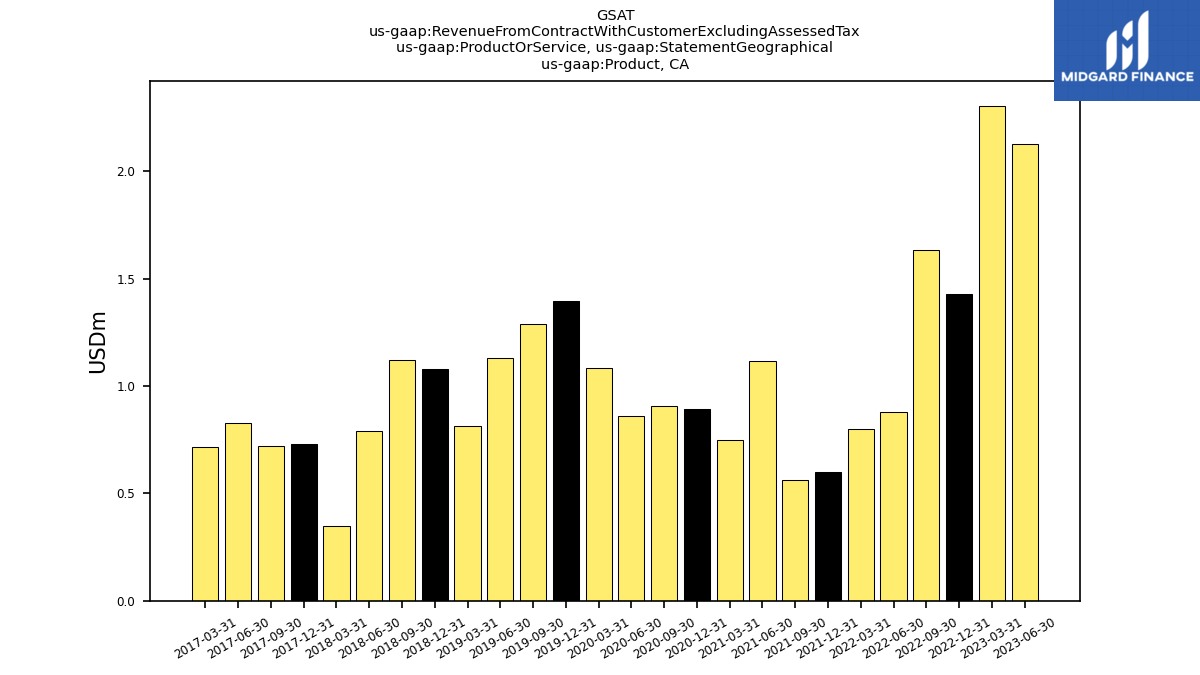
| Product,US | NA | 2.56 | 1.98 | 2.16 | 2.03 | 2.23 | 1.56 | 2.50 | 3.13 | 2.44 | 2.17 | 2.40 | 2.66 | 1.72 | 1.44 | 2.74 | 2.44 | 2.55 | 2.21 | 2.34 | 3.41 | 3.46 | 1.59 | 1.40 | 2.92 | 2.33 | 1.78 | NA | NA | NA | NA | NA | NA | NA | NA | NA | NA | NA | NA | NA | NA | NA | NA | NA | NA | NA | NA | NA | NA | NA | NA | NA | NA | NA | NA | |
| Product, Other Countries | NA | 0.00 | 0.00 | 0.03 | 0.01 | 0.01 | 0.01 | 0.01 | 0.02 | 0.01 | 0.02 | 0.01 | 0.02 | 0.01 | -0.03 | 0.02 | 0.02 | 0.02 | 0.05 | 0.06 | 0.12 | 0.10 | 0.02 | 0.00 | 0.01 | 0.01 | 0.00 | NA | NA | NA | NA | NA | NA | NA | NA | NA | NA | NA | NA | NA | NA | NA | NA | NA | NA | NA | NA | NA | NA | NA | NA | NA | NA | NA | NA | |
| Service, | NA | 3.64 | 3.83 | 4.32 | 5.29 | 4.13 | 3.69 | 4.47 | 5.24 | 4.38 | 3.83 | 4.33 | 5.52 | 4.39 | 3.97 | 4.65 | 7.91 | 4.33 | 3.81 | 5.18 | 5.72 | 4.79 | 4.49 | 4.86 | 5.28 | 4.46 | NA | NA | NA | NA | NA | NA | NA | NA | NA | NA | NA | NA | NA | NA | NA | NA | NA | NA | NA | NA | NA | NA | NA | NA | NA | NA | NA | NA | NA | |
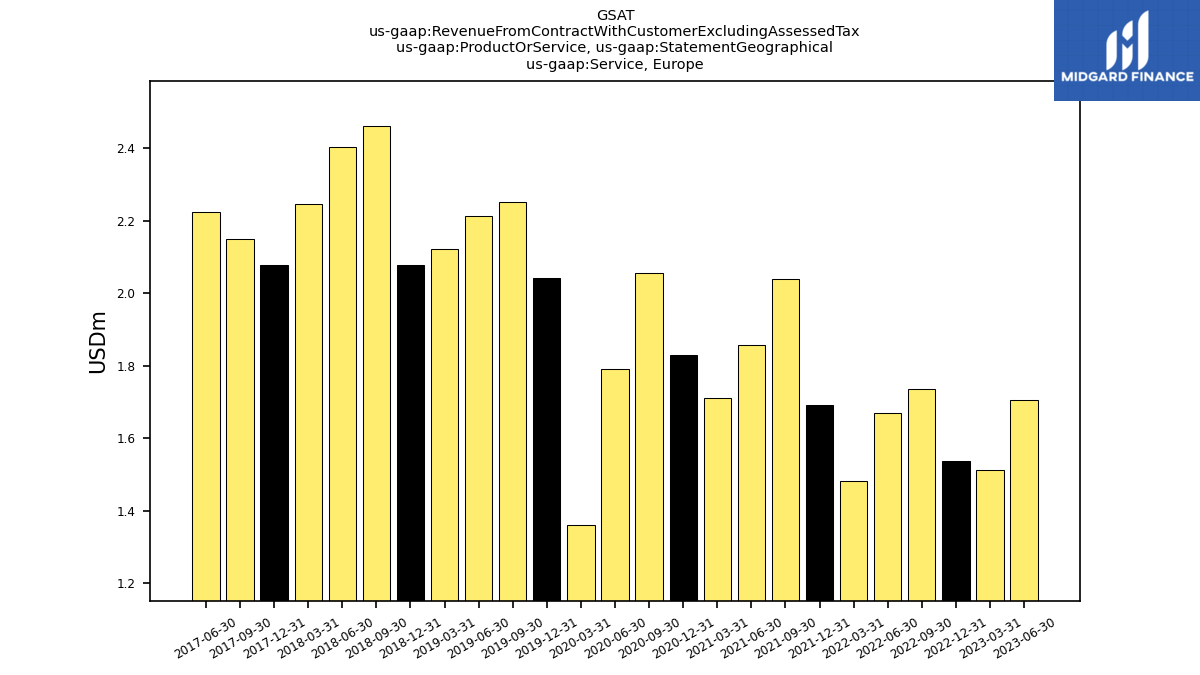
| Service, | NA | 1.71 | 1.51 | 1.54 | 1.74 | 1.67 | 1.48 | 1.69 | 2.04 | 1.86 | 1.71 | 1.83 | 2.06 | 1.79 | 1.36 | 2.04 | 2.25 | 2.21 | 2.12 | 2.08 | 2.46 | 2.40 | 2.25 | 2.08 | 2.15 | 2.22 | NA | NA | NA | NA | NA | NA | NA | NA | NA | NA | NA | NA | NA | NA | NA | NA | NA | NA | NA | NA | NA | NA | NA | NA | NA | NA | NA | NA | NA | |
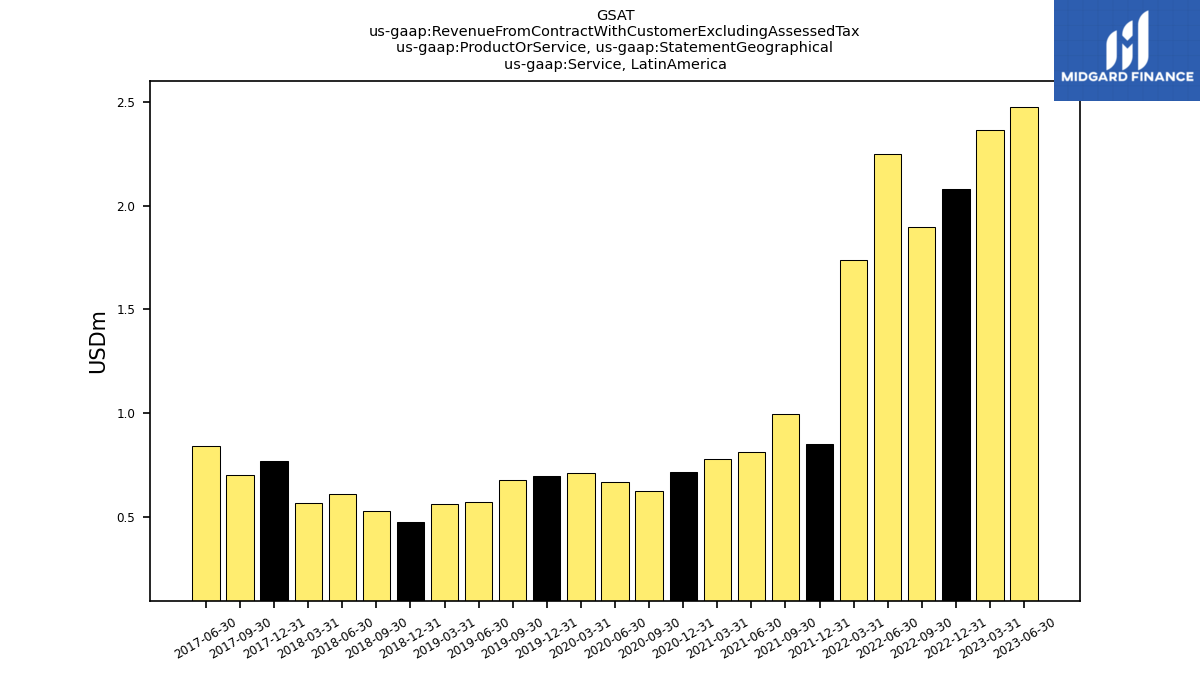
| Service, | NA | 2.48 | 2.37 | 2.08 | 1.90 | 2.25 | 1.74 | 0.85 | 1.00 | 0.81 | 0.78 | 0.71 | 0.62 | 0.67 | 0.71 | 0.70 | 0.68 | 0.57 | 0.56 | 0.47 | 0.53 | 0.61 | 0.57 | 0.77 | 0.70 | 0.84 | NA | NA | NA | NA | NA | NA | NA | NA | NA | NA | NA | NA | NA | NA | NA | NA | NA | NA | NA | NA | NA | NA | NA | NA | NA | NA | NA | NA | NA | |
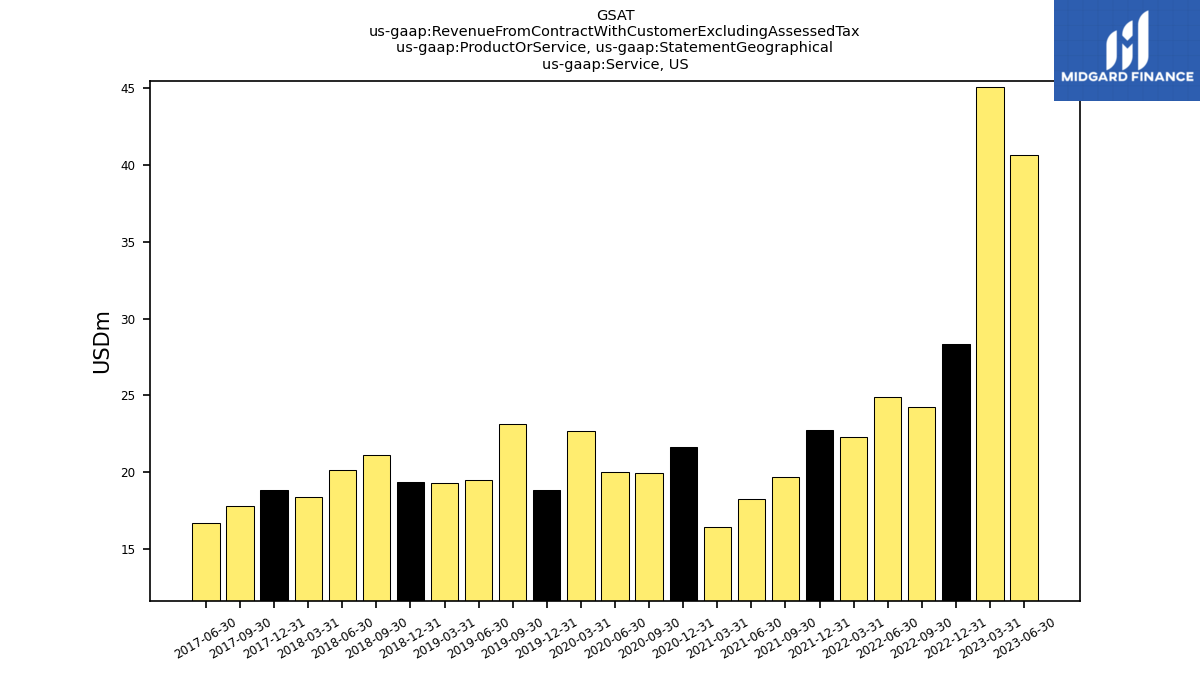
| Service,US | NA | 40.64 | 45.06 | 28.32 | 24.25 | 24.88 | 22.29 | 22.71 | 19.68 | 18.23 | 16.44 | 21.63 | 19.96 | 20.02 | 22.69 | 18.84 | 23.16 | 19.45 | 19.25 | 19.34 | 21.10 | 20.11 | 18.38 | 18.81 | 17.81 | 16.66 | NA | NA | NA | NA | NA | NA | NA | NA | NA | NA | NA | NA | NA | NA | NA | NA | NA | NA | NA | NA | NA | NA | NA | NA | NA | NA | NA | NA | NA | |
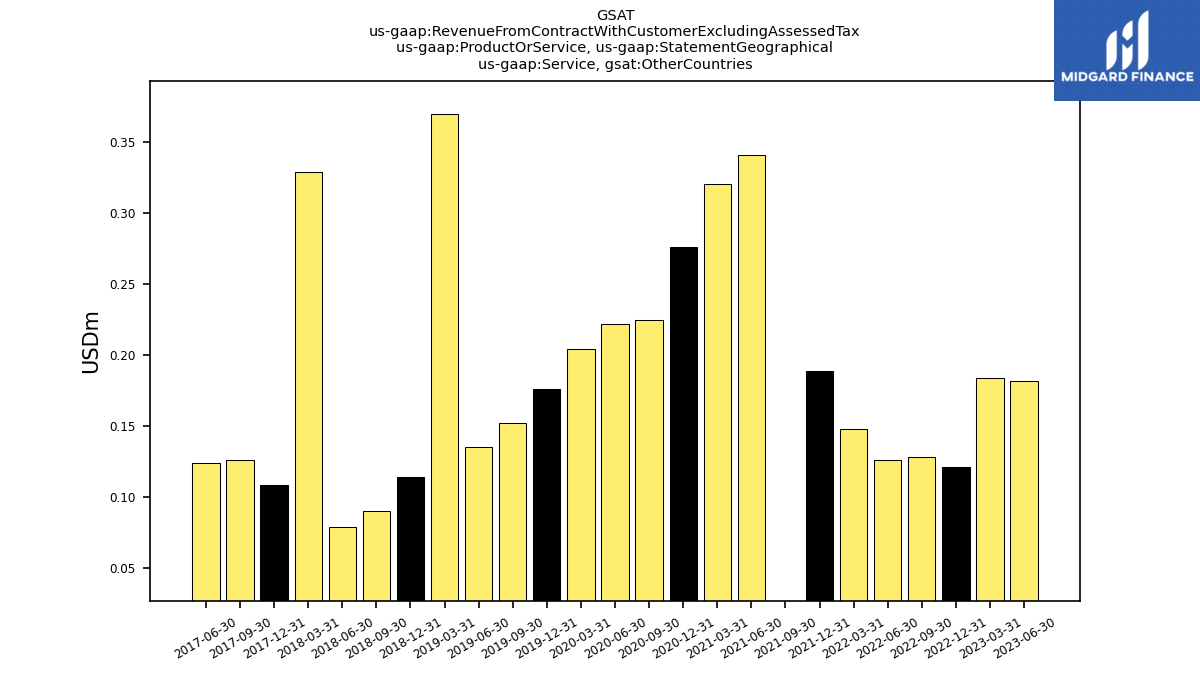
| Service, Other Countries | NA | 0.18 | 0.18 | 0.12 | 0.13 | 0.13 | 0.15 | 0.19 | -0.10 | 0.34 | 0.32 | 0.28 | 0.23 | 0.22 | 0.20 | 0.18 | 0.15 | 0.14 | 0.37 | 0.11 | 0.09 | 0.08 | 0.33 | 0.11 | 0.13 | 0.12 | NA | NA | NA | NA | NA | NA | NA | NA | NA | NA | NA | NA | NA | NA | NA | NA | NA | NA | NA | NA | NA | NA | NA | NA | NA | NA | NA | NA | NA | |
| Revenue From Contract With Customer Including Assessed Tax | 57.68 | 55.07 | 58.64 | 41.31 | 37.63 | 36.80 | 32.77 | 34.48 | 32.61 | 30.28 | 26.93 | 33.17 | 32.76 | 30.36 | 32.19 | 31.84 | 38.61 | 31.19 | 30.08 | 31.95 | 35.69 | 33.73 | 28.75 | 29.43 | 30.46 | 28.12 | 24.65 | 24.39 | 25.54 | 25.09 | 21.84 | 22.77 | 23.68 | 23.02 | 21.02 | 22.09 | 23.44 | 23.99 | 20.54 | 20.99 | 22.55 | 19.84 | 19.33 | 19.06 | 20.54 | 19.98 | 16.74 | 17.39 | 18.19 | 19.00 | 18.25 | 16.52 | 18.22 | 17.62 | 15.57 |

